2020 ANNUAL REPORT - PGE
564
2020 ANNUAL REPORT of Pacific Gas and Electric Company 77 Beale Street P.O. Box 770000, B7C San Francisco, CA 94177 to the Public Utilities Commission of the State of California For the Year Ended December 31, 2020 Volume No. 1 (Form 1)
-
Upload
khangminh22 -
Category
Documents
-
view
1 -
download
0
Transcript of 2020 ANNUAL REPORT - PGE

2020ANNUAL REPORT
of
Pacific Gas and Electric Company 77 Beale Street
P.O. Box 770000, B7C San Francisco, CA 94177
to the
Public Utilities Commission of the
State of California For the Year Ended December 31, 2020
Volume No. 1 (Form 1)

INDEPENDENT AUDITORS’ REPORT
To the Board of Directors of Pacific Gas and Electric Company
We have audited the accompanying financial statements of Pacific Gas and Electric Company (the “Company”), which comprise the balance sheet – regulatory basis as of December 31, 2020, the related statements of income – regulatory basis, retained earnings – regulatory basis, and cash flows – regulatory basis for the year then ended, included on pages 110 through 123 of the accompanying Federal Energy Regulatory Commission Form 1, and the related notes to the financial statements.
Management’s Responsibility for the Financial Statements
Management is responsible for the preparation and fair presentation of these financial statements in accordance with the accounting requirements of the Federal Energy Regulatory Commission as set forth in its applicable Uniform System of Accounts and published accounting releases; this includes the design, implementation, and maintenance of internal control relevant to the preparation and fair presentation of financial statements that are free from material misstatement, whether due to fraud or error.
Auditors’ Responsibility
Our responsibility is to express an opinion on these financial statements based on our audit. We conducted our audit in accordance with auditing standards generally accepted in the United States of America. Those standards require that we plan and perform the audit to obtain reasonable assurance about whether the financial statements are free from material misstatement.
An audit involves performing procedures to obtain audit evidence about the amounts and disclosures in the financial statements. The procedures selected depend on the auditor’s judgment, including the assessment of the risks of material misstatement of the financial statements, whether due to fraud or error. In making those risk assessments, the auditor considers internal control relevant to the Company’s preparation and fair presentation of the financial statements in order to design audit procedures that are appropriate in the circumstances, but not for the purpose of expressing an opinion on the effectiveness of the Company’s internal control. Accordingly, we express no such opinion. An audit also includes evaluating the appropriateness of accounting policies used and the reasonableness of significant accounting estimates made by management, as well as evaluating the overall presentation of the financial statements.
We believe that the audit evidence we have obtained is sufficient and appropriate to provide a basis for our audit opinion.
Opinion
In our opinion, the regulatory‐basis financial statements referred to above present fairly, in all material respects, the assets, liabilities, and proprietary capital of Pacific Gas & Electric Company as of December 31, 2020, and the results of its operations and its cash flows for the year then ended in
‐ 2 ‐
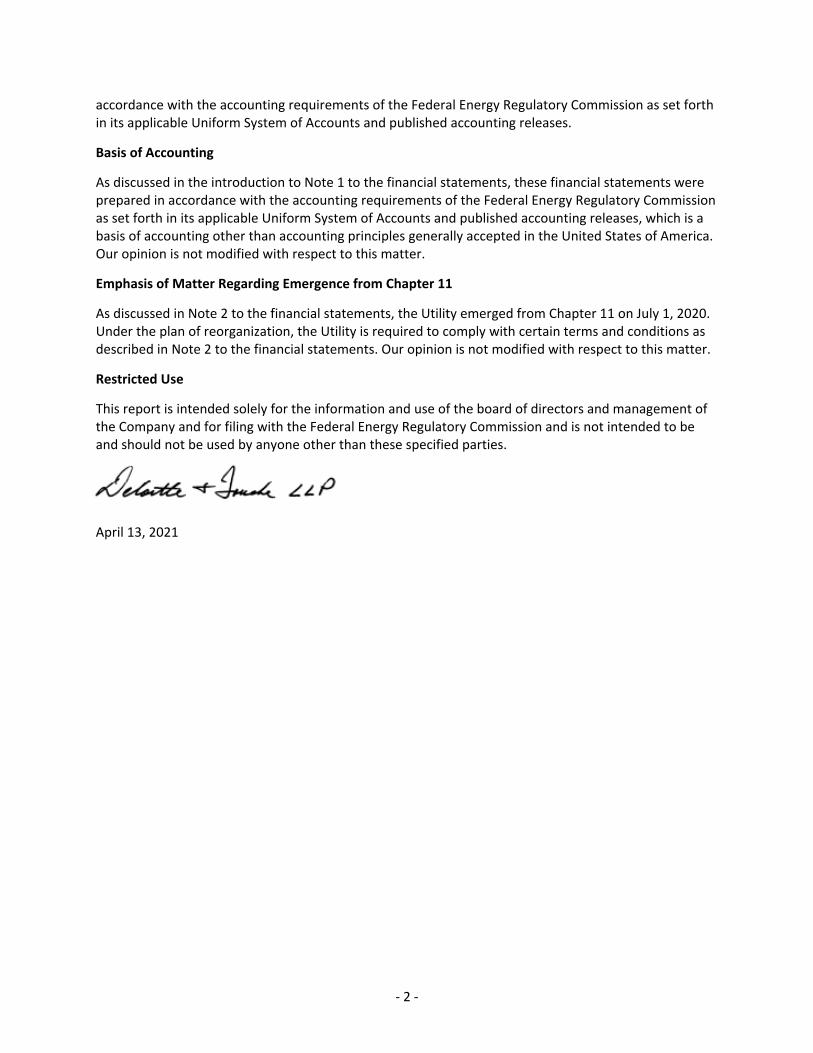
accordance with the accounting requirements of the Federal Energy Regulatory Commission as set forth in its applicable Uniform System of Accounts and published accounting releases.
Basis of Accounting
As discussed in the introduction to Note 1 to the financial statements, these financial statements were prepared in accordance with the accounting requirements of the Federal Energy Regulatory Commission as set forth in its applicable Uniform System of Accounts and published accounting releases, which is a basis of accounting other than accounting principles generally accepted in the United States of America. Our opinion is not modified with respect to this matter.
Emphasis of Matter Regarding Emergence from Chapter 11
As discussed in Note 2 to the financial statements, the Utility emerged from Chapter 11 on July 1, 2020. Under the plan of reorganization, the Utility is required to comply with certain terms and conditions as described in Note 2 to the financial statements. Our opinion is not modified with respect to this matter.
Restricted Use
This report is intended solely for the information and use of the board of directors and management of the Company and for filing with the Federal Energy Regulatory Commission and is not intended to be and should not be used by anyone other than these specified parties.
April 13, 2021

IDENTIFICATION
FERC FORM NO. 1/3-Q:REPORT OF MAJOR ELECTRIC UTILITIES, LICENSEES AND OTHER
DAVID THOMASON
77 BEALE STREET, P.O BOX 770000, SAN FRANCISCO, CA 94177
2020/Q4
77 BEALE STREET, MAIL CODE B7A, P.O BOX 770000, SAN FRANCISCO, CA 94177
01 Exact Legal Name of Respondent
(1) An Original (2) A ResubmissionX
02 Year/Period of Report
End ofPACIFIC GAS AND ELECTRIC COMPANY
03 Previous Name and Date of Change (if name changed during year)
04 Address of Principal Office at End of Period (Street, City, State, Zip Code)
05 Name of Contact Person 06 Title of Contact Person
07 Address of Contact Person (Street, City, State, Zip Code)
08 Telephone of Contact Person,IncludingArea Code
09 This Report Is
01 Name
02 Title
03 Signature 04 Date Signed
(Mo, Da, Yr)
Title 18, U.S.C. 1001 makes it a crime for any person to knowingly and willingly to make to any Agency or Department of the United States anyfalse, fictitious or fraudulent statements as to any matter within its jurisdiction.
/ /
JENNIFER GARBODEN DIRECTOR, CORP ACCOUNTING
(415) 973-5456
10 Date of Report (Mo, Da, Yr)
04/13/2021
DAVID THOMASON
VP, CONTROLLER, UTILITY CFO 04/13/2021
ANNUAL CORPORATE OFFICER CERTIFICATION
The undersigned officer certifies that:
I have examined this report and to the best of my knowledge, information, and belief all statements of fact contained in this report are correct statementsof the business affairs of the respondent and the financial statements, and other financial information contained in this report, conform in all materialrespects to the Uniform System of Accounts.
FERC FORM No.1/3-Q (REV. 02-04) Page 1
l2me
Stamp

Name of Respondent This Report Is:(1) An Original
(2) A Resubmission
Date of Report(Mo, Da, Yr)
Year/Period of Report
End of
LIST OF SCHEDULES (Electric Utility)
PACIFIC GAS AND ELECTRIC COMPANYX
04/13/20212020/Q4
Line
No.
Title of Schedule Reference
Page No.
Remarks
(c)(b)(a)
Enter in column (c) the terms "none," "not applicable," or "NA," as appropriate, where no information or amounts have been reported for
certain pages. Omit pages where the respondents are "none," "not applicable," or "NA".
101General Information 1
102Control Over Respondent 2
103Corporations Controlled by Respondent 3
104Officers 4
105Directors 5
106(a)(b)Information on Formula Rates 6
108-109Important Changes During the Year 7
110-113Comparative Balance Sheet 8
114-117Statement of Income for the Year 9
118-119Statement of Retained Earnings for the Year 10
120-121Statement of Cash Flows 11
122-123Notes to Financial Statements 12
122(a)(b)Statement of Accum Comp Income, Comp Income, and Hedging Activities 13
200-201Summary of Utility Plant & Accumulated Provisions for Dep, Amort & Dep 14
202-203Nuclear Fuel Materials 15
204-207Electric Plant in Service 16
NONE213Electric Plant Leased to Others 17
NONE214Electric Plant Held for Future Use 18
216Construction Work in Progress-Electric 19
219Accumulated Provision for Depreciation of Electric Utility Plant 20
224-225Investment of Subsidiary Companies 21
227Materials and Supplies 22
228(ab)-229(ab)Allowances 23
NONE230Extraordinary Property Losses 24
230Unrecovered Plant and Regulatory Study Costs 25
231Transmission Service and Generation Interconnection Study Costs 26
232Other Regulatory Assets 27
233Miscellaneous Deferred Debits 28
234Accumulated Deferred Income Taxes 29
250-251Capital Stock 30
253Other Paid-in Capital 31
254Capital Stock Expense 32
256-257Long-Term Debt 33
261Reconciliation of Reported Net Income with Taxable Inc for Fed Inc Tax 34
262-263Taxes Accrued, Prepaid and Charged During the Year 35
266-267Accumulated Deferred Investment Tax Credits 36
FERC FORM NO. 1 (ED. 12-96) Page 2

LIST OF SCHEDULES (Electric Utility) (continued)
Name of Respondent This Report Is:(1) An Original
(2) A Resubmission
Date of Report(Mo, Da, Yr)
Year/Period of Report
End ofPACIFIC GAS AND ELECTRIC COMPANYX
04/13/20212020/Q4
Line
No.
Title of Schedule Reference
Page No.
Remarks
(c)(b)(a)
Enter in column (c) the terms "none," "not applicable," or "NA," as appropriate, where no information or amounts have been reported for
certain pages. Omit pages where the respondents are "none," "not applicable," or "NA".
269Other Deferred Credits 37
272-273Accumulated Deferred Income Taxes-Accelerated Amortization Property 38
274-275Accumulated Deferred Income Taxes-Other Property 39
276-277Accumulated Deferred Income Taxes-Other 40
278Other Regulatory Liabilities 41
300-301Electric Operating Revenues 42
NONE302Regional Transmission Service Revenues (Account 457.1) 43
304Sales of Electricity by Rate Schedules 44
310-311Sales for Resale 45
320-323Electric Operation and Maintenance Expenses 46
326-327Purchased Power 47
328-330Transmission of Electricity for Others 48
NONE331Transmission of Electricity by ISO/RTOs 49
332Transmission of Electricity by Others 50
335Miscellaneous General Expenses-Electric 51
336-337Depreciation and Amortization of Electric Plant 52
350-351Regulatory Commission Expenses 53
352-353Research, Development and Demonstration Activities 54
354-355Distribution of Salaries and Wages 55
356Common Utility Plant and Expenses 56
397Amounts included in ISO/RTO Settlement Statements 57
398Purchase and Sale of Ancillary Services 58
400Monthly Transmission System Peak Load 59
NONE400aMonthly ISO/RTO Transmission System Peak Load 60
401Electric Energy Account 61
401Monthly Peaks and Output 62
402-403Steam Electric Generating Plant Statistics 63
406-407Hydroelectric Generating Plant Statistics 64
408-409Pumped Storage Generating Plant Statistics 65
410-411Generating Plant Statistics Pages 66
FERC FORM NO. 1 (ED. 12-96) Page 3

LIST OF SCHEDULES (Electric Utility) (continued)
Name of Respondent This Report Is:(1) An Original
(2) A Resubmission
Date of Report(Mo, Da, Yr)
Year/Period of Report
End ofPACIFIC GAS AND ELECTRIC COMPANYX
04/13/20212020/Q4
Line
No.
Title of Schedule Reference
Page No.
Remarks
(c)(b)(a)
Enter in column (c) the terms "none," "not applicable," or "NA," as appropriate, where no information or amounts have been reported for
certain pages. Omit pages where the respondents are "none," "not applicable," or "NA".
422-423Transmission Line Statistics Pages 67
424-425Transmission Lines Added During the Year 68
426-427Substations 69
429Transactions with Associated (Affiliated) Companies 70
450Footnote Data 71
Stockholders' Reports Check appropriate box:
X Two copies will be submitted
No annual report to stockholders is prepared
FERC FORM NO. 1 (ED. 12-96) Page 4

Name of Respondent This Report Is:
(1) An Original
(2) A Resubmission
Date of Report(Mo, Da, Yr)
Year/Period of Report
End of
GENERAL INFORMATION
PACIFIC GAS AND ELECTRIC COMPANY X
04/13/20212020/Q4
California, October 1905
David S. Thomason, Vice President, Controller and CFO
77 Beale Street, B11H
San Francisco, Ca 94105
1. Provide name and title of officer having custody of the general corporate books of account and address of
office where the general corporate books are kept, and address of office where any other corporate books of account
are kept, if different from that where the general corporate books are kept.
2. Provide the name of the State under the laws of which respondent is incorporated, and date of incorporation.
If incorporated under a special law, give reference to such law. If not incorporated, state that fact and give the type
of organization and the date organized.
3. If at any time during the year the property of respondent was held by a receiver or trustee, give (a) name of
receiver or trustee, (b) date such receiver or trustee took possession, (c) the authority by which the receivership or
trusteeship was created, and (d) date when possession by receiver or trustee ceased.
4. State the classes or utility and other services furnished by respondent during the year in each State in which
the respondent operated.
5. Have you engaged as the principal accountant to audit your financial statements an accountant who is not
the principal accountant for your previous year's certified financial statements?
(1) Yes...Enter the date when such independent accountant was initially engaged:
(2) NoX
Not Applicable
Electricity and natural gas distribution, electric generation, procurement, and transmission, and natural
gas procurement, transportation, and storage.
State of California only.
FERC FORM No.1 (ED. 12-87) PAGE 101

Name of Respondent This Report Is:
(1) An Original
(2) A Resubmission
Date of Report(Mo, Da, Yr)
Year/Period of Report
End of
CONTROL OVER RESPONDENT
PACIFIC GAS AND ELECTRIC COMPANY X
04/13/20212020/Q4
1. If any corporation, business trust, or similar organization or a combination of such organizations jointly held
control over the repondent at the end of the year, state name of controlling corporation or organization, manner inwhich control was held, and extent of control. If control was in a holding company organization, show the chain
of ownership or control to the main parent company or organization. If control was held by a trustee(s), state name of trustee(s), name of beneficiary or beneficiearies for whom trust was maintained, and purpose of the trust.
Effective January 1, 1997, PG&E Corporation became the holding company of Pacific Gas and Electric Company.
Page 102FERC FORM NO. 1 (ED. 12-96)

Name of Respondent This Report Is:(1) An Original
(2) A Resubmission
Date of Report(Mo, Da, Yr)
Year/Period of Report
End of
CORPORATIONS CONTROLLED BY RESPONDENT
PACIFIC GAS AND ELECTRIC COMPANYX
04/13/20212020/Q4
Line
No.
Name of Company Controlled Kind of Business Percent VotingStock Owned
(c)(b)(a)
FootnoteRef.(d)
1. Report below the names of all corporations, business trusts, and similar organizations, controlled directly or indirectly by respondent
at any time during the year. If control ceased prior to end of year, give particulars (details) in a footnote.
2. If control was by other means than a direct holding of voting rights, state in a footnote the manner in which control was held, naming
any intermediaries involved.
3. If control was held jointly with one or more other interests, state the fact in a footnote and name the other interests.
Definitions
1. See the Uniform System of Accounts for a definition of control.
2. Direct control is that which is exercised without interposition of an intermediary.
3. Indirect control is that which is exercised by the interposition of an intermediary which exercises direct control.
4. Joint control is that in which neither interest can effectively control or direct action without the consent of the other, as where the
voting control is equally divided between two holders, or each party holds a veto power over the other. Joint control may exist by mutual
agreement or understanding between two or more parties who together have control within the meaning of the definition of control in the
Uniform System of Accounts, regardless of the relative voting rights of each party.
Formerly managed 100 1 Eureka Energy Company
the Utility's Utah coal 2
venture. Currently holds 3
part of the Marre Ranch 4
property in San Luis 5
Obispo County. 6
7
Formed to be the ownership 100 8 Midway Power, LLC
entity for real estate and 9
licenses for a suspended 10
development project. 11
12
Entity used to amortize 100 13 Natural Gas Corporation of California (NGC)
remaining Gas 14
Exploration and 15
Development Account 16
assets. 17
18
Formed to share costs and 50 19 FuelCo LLC 1
reduce fuel acquisition 20
costs. 21
22
Formed to own and 100 23 Pacific Energy Fuels Company
finance the nuclear fuel 24
inventory previously owned 25
by Pacific Energy Trust 26
27
FERC FORM NO. 1 (ED. 12-96) Page 103

Name of Respondent This Report Is:(1) An Original
(2) A Resubmission
Date of Report(Mo, Da, Yr)
Year/Period of Report
End of
CORPORATIONS CONTROLLED BY RESPONDENT
PACIFIC GAS AND ELECTRIC COMPANYX
04/13/20212020/Q4
Line
No.
Name of Company Controlled Kind of Business Percent VotingStock Owned
(c)(b)(a)
FootnoteRef.(d)
1. Report below the names of all corporations, business trusts, and similar organizations, controlled directly or indirectly by respondent
at any time during the year. If control ceased prior to end of year, give particulars (details) in a footnote.
2. If control was by other means than a direct holding of voting rights, state in a footnote the manner in which control was held, naming
any intermediaries involved.
3. If control was held jointly with one or more other interests, state the fact in a footnote and name the other interests.
Definitions
1. See the Uniform System of Accounts for a definition of control.
2. Direct control is that which is exercised without interposition of an intermediary.
3. Indirect control is that which is exercised by the interposition of an intermediary which exercises direct control.
4. Joint control is that in which neither interest can effectively control or direct action without the consent of the other, as where the
voting control is equally divided between two holders, or each party holds a veto power over the other. Joint control may exist by mutual
agreement or understanding between two or more parties who together have control within the meaning of the definition of control in the
Uniform System of Accounts, regardless of the relative voting rights of each party.
1
Engaged in the transportation 85.71 2 Standard Pacific Gas Line Incorporated
of natural gas in California. 3
The Utility owns an 85.71% 4
interest and Chevron Pipe 5
Line Company owns the 6
remaining 14.29% interest. 7
8
9
10
11
Formed to jointly hold 50 12 Morro Bay Mutual Water Company 2
property rights in connection 13
with the divestiture of the 14
Morro Bay Power Plant. 15
16
Formed to jointly hold 33 17 Moss Landing Mutual Water Company 3
propert rights in connection 18
with the divestiture of the 19
Moss Landing Power Plant. 20
21
Formed to explore, 50 22 Alaska Gas Exploration Associates 4
develop, produce, acquire, 23
and market oil and gas 24
reserves in Alaska. 25
26
27
FERC FORM NO. 1 (ED. 12-96) Page 103.1

Name of Respondent This Report Is:(1) An Original
(2) A Resubmission
Date of Report(Mo, Da, Yr)
Year/Period of Report
End of
CORPORATIONS CONTROLLED BY RESPONDENT
PACIFIC GAS AND ELECTRIC COMPANYX
04/13/20212020/Q4
Line
No.
Name of Company Controlled Kind of Business Percent VotingStock Owned
(c)(b)(a)
FootnoteRef.(d)
1. Report below the names of all corporations, business trusts, and similar organizations, controlled directly or indirectly by respondent
at any time during the year. If control ceased prior to end of year, give particulars (details) in a footnote.
2. If control was by other means than a direct holding of voting rights, state in a footnote the manner in which control was held, naming
any intermediaries involved.
3. If control was held jointly with one or more other interests, state the fact in a footnote and name the other interests.
Definitions
1. See the Uniform System of Accounts for a definition of control.
2. Direct control is that which is exercised without interposition of an intermediary.
3. Indirect control is that which is exercised by the interposition of an intermediary which exercises direct control.
4. Joint control is that in which neither interest can effectively control or direct action without the consent of the other, as where the
voting control is equally divided between two holders, or each party holds a veto power over the other. Joint control may exist by mutual
agreement or understanding between two or more parties who together have control within the meaning of the definition of control in the
Uniform System of Accounts, regardless of the relative voting rights of each party.
Formed to increase efficiency 25 1 STARS Alliance, LLC 5
and reduce costs related to 2
the operation of the members 3
nuclear generation 4
facilities. 5
6
Formed for potential accounts 100 7 PG&E AR Facility, LLC
receivable securitization 8
transactions 9
10
11
12
13
14
15
16
17
18
19
20
21
22
23
24
25
26
27
FERC FORM NO. 1 (ED. 12-96) Page 103.2

Schedule Page: 103 Line No.: 19 Column: dMembers include: Union Electric Company d/b/a AmerenMO. 12/8/17 - Certificate ofWithdrawal filed with the state of Texas.
Schedule Page: 103.1 Line No.: 12 Column: dMembers include: Dynergy Moss Landing. Pacific Gas and Electric Company is one of 2members of the non-profit mutual benefit corporation.
Schedule Page: 103.1 Line No.: 17 Column: dMembers include: Dynergy Moss Landing and Moon Glow Dairy. Pacific Gas and ElectricCompany is one of 3 members of the non-profit mutual benefit corporation.
Schedule Page: 103.1 Line No.: 22 Column: d Currently inactive.
Schedule Page: 103.2 Line No.: 1 Column: dMembers include: Arizona Public Service Company, Union Electric Company, d/b/a AmerenMO,and Wolf Creek Nuclear Operating Corporation. Pacific Gas and Electric Company has a 1/4equity interest.
Waiting for confirmation of withdrawal from Texas.
Name of Respondent
PACIFIC GAS AND ELECTRIC COMPANY
This Report is:(1) X An Original(2) A Resubmission
Date of Report(Mo, Da, Yr)
04/13/2021
Year/Period of Report
2020/Q4
FOOTNOTE DATA
FERC FORM NO. 1 (ED. 12-87) Page 450.1

Name of Respondent This Report Is:(1) An Original
(2) A Resubmission
Date of Report(Mo, Da, Yr)
Year/Period of Report
End of
OFFICERS
PACIFIC GAS AND ELECTRIC COMPANYX
04/13/20212020/Q4
Line
No.
Title Name of Officer Salaryfor Year
(c)(b)(a)
1. Report below the name, title and salary for each executive officer whose salary is $50,000 or more. An "executive officer" of a
respondent includes its president, secretary, treasurer, and vice president in charge of a principal business unit, division or function
(such as sales, administration or finance), and any other person who performs similar policy making functions.
2. If a change was made during the year in the incumbent of any position, show name and total remuneration of the previous
incumbent, and the date the change in incumbency was made.
Interim President, Pacific Gas and Electric Company 951,933Michael A. Lewis 1
Senior Vice President, Generation and Chief Nuclear 572,250James M. Welsch 2
Officer, Pacific Gas and Electric Company 3
Vice President, Chief Financial Officer and Controller, 339,479David S. Thomason 4
Pacific Gas and Electric Company 5
Chief Executive Officer and President, Pacific Gas and 587,310Andrew M. Vesey 6
Electric Company 7
Senior Vice President and General Counsel, Pacific 380,096Janet C. Loduca 8
Gas and Electric Company 9
10
11
12
13
14
15
16
17
18
19
20
21
22
23
24
25
26
27
28
29
30
31
32
33
34
35
36
37
38
39
40
41
42
43
44
FERC FORM NO. 1 (ED. 12-96) Page 104

Schedule Page: 104 Line No.: 1 Column: bMr. Lewis, formerly Senior Vice President, Electric Operations, became Interim President
on August 1, 2020. Mr. Lewis' employment ended January 1, 2021.
Schedule Page: 104 Line No.: 6 Column: bMr. Vesey's employment ended August 4, 2020.
Schedule Page: 104 Line No.: 8 Column: bMs. Loduca's employment ended August 16, 2020.
Name of Respondent
PACIFIC GAS AND ELECTRIC COMPANY
This Report is:(1) X An Original(2) A Resubmission
Date of Report(Mo, Da, Yr)
04/13/2021
Year/Period of Report
2020/Q4
FOOTNOTE DATA
FERC FORM NO. 1 (ED. 12-87) Page 450.1

Name of Respondent This Report Is:(1) An Original
(2) A Resubmission
Date of Report(Mo, Da, Yr)
Year/Period of Report
End of
DIRECTORS
PACIFIC GAS AND ELECTRIC COMPANYX
04/13/20212020/Q4
Line Name (and Title) of Director Principal Business Address(b)(a)No.
1. Report below the information called for concerning each director of the respondent who held office at any time during the year. Include in column (a), abbreviated
titles of the directors who are officers of the respondent.
2. Designate members of the Executive Committee by a triple asterisk and the Chairman of the Executive Committee by a double asterisk.
c/o PG&E CorporationRajat Bahri 1
77 Beale Street, 32nd Floor 2
San Francisco, CA 94105 3
4
c/o PG&E CorporationRichard R. Barrera 5
77 Beale Street, 32nd Floor 6
San Francisco, CA 94105 7
8
c/o PG&E CorporationJeffrey L. Bleich 9
77 Beale Street, 32nd Floor 10
San Francisco, CA 94105 11
12
c/o PG&E CorporationNora Mead Brownell 13
77 Beale Street, 32nd Floor 14
San Francisco, CA 94105 15
16
c/o PG&E CorporationCheryl F. Campbell 17
77 Beale Street, 32nd Floor 18
San Francisco, CA 94105 19
20
c/o PG&E CorporationKerry W. Cooper 21
77 Beale Street, 32nd Floor 22
San Francisco, CA 94105 23
24
c/o PG&E CorporationJessica L. Denecour 25
77 Beale Street, 32nd Floor 26
San Francisco, CA 94105 27
28
c/o PG&E CorporationMark E. Ferguson, III 29
77 Beale Street, 32nd Floor 30
San Francisco, CA 94105 31
32
c/o PG&E CorporationRobert C. Flexon 33
77 Beale Street, 32nd Floor 34
San Francisco, CA 94105 35
36
c/o PG&E CorporationFred J. Fowler 37
77 Beale Street, 32nd Floor 38
San Francisco, CA 94105 39
40
c/o PG&E CorporationW. Craig Fugate 41
77 Beale Street, 32nd Floor 42
San Francisco, CA 94105 43
44
c/o PG&E CorporationArno L. Harris 45
77 Beale Street, 32nd Floor 46
San Francisco, CA 94105 47
48
FERC FORM NO. 1 (ED. 12-95) Page 105

Name of Respondent This Report Is:(1) An Original
(2) A Resubmission
Date of Report(Mo, Da, Yr)
Year/Period of Report
End of
DIRECTORS
PACIFIC GAS AND ELECTRIC COMPANYX
04/13/20212020/Q4
Line Name (and Title) of Director Principal Business Address(b)(a)No.
1. Report below the information called for concerning each director of the respondent who held office at any time during the year. Include in column (a), abbreviated
titles of the directors who are officers of the respondent.
2. Designate members of the Executive Committee by a triple asterisk and the Chairman of the Executive Committee by a double asterisk.
c/o PG&E CorporationWilliam D. Johnson 1
77 Beale Street, 32nd Floor 2
San Francisco, CA 94105 3
4
c/o PG&E CorporationMichael J. Leffell 5
77 Beale Street, 32nd Floor 6
San Francisco, CA 94105 7
8
c/o PG&E CorporationMichael A. Lewis 9
77 Beale Street, 32nd Floor 10
San Francisco, CA 94105 11
12
c/o PG&E CorporationDominique Mielle 13
77 Beale Street, 32nd Floor 14
San Francisco, CA 94105 15
16
c/o PG&E CorporationMeridee A. Moore 17
77 Beale Street, 32nd Floor 18
San Francisco, CA 94105 19
20
c/o PG&E CorporationEric D. Mullins 21
77 Beale Street, 32nd Floor 22
San Francisco, CA 94105 23
24
c/o PG&E CorporationMichael R. Niggli 25
77 Beale Street, 32nd Floor 26
San Francisco, CA 94105 27
28
c/o PG&E CorporationKristine M. Schmidt 29
77 Beale Street, 32nd Floor 30
San Francisco, CA 94105 31
32
c/o PG&E CorporationDean L. Seavers 33
77 Beale Street, 32nd Floor 34
San Francisco, CA 94105 35
36
c/o PG&E CorporationWilliam L. Smith 37
77 Beale Street, 32nd Floor 38
San Francisco, CA 94105 39
40
c/o PG&E CorporationOluwadara (Dara) J. Treseder 41
77 Beale Street, 32nd Floor 42
San Francisco, CA 94105 43
44
c/o PG&E CorporationAndrew M. Vesey, Chief Executive Officer and President, 45
77 Beale Street, 32nd FloorPacific Gas and Electric Company *** 46
San Francisco, CA 94105 47
48
FERC FORM NO. 1 (ED. 12-95) Page 105.1

Name of Respondent This Report Is:(1) An Original
(2) A Resubmission
Date of Report(Mo, Da, Yr)
Year/Period of Report
End of
DIRECTORS
PACIFIC GAS AND ELECTRIC COMPANYX
04/13/20212020/Q4
Line Name (and Title) of Director Principal Business Address(b)(a)No.
1. Report below the information called for concerning each director of the respondent who held office at any time during the year. Include in column (a), abbreviated
titles of the directors who are officers of the respondent.
2. Designate members of the Executive Committee by a triple asterisk and the Chairman of the Executive Committee by a double asterisk.
c/o PG&E CorporationBenjamin F. Wilson 1
77 Beale Street, 32nd Floor 2
San Francisco, CA 94105 3
4
c/o PG&E CorporationAlejandro D. Wolff 5
77 Beale Street, 32nd Floor 6
San Francisco, CA 94105 7
8
c/o PG&E CorporationJohn M. Woolard 9
77 Beale Street, 32nd Floor 10
San Francisco, CA 94105 11
12
13
14
15
16
17
18
19
20
21
22
23
24
25
26
27
28
29
30
31
32
33
34
35
36
37
38
39
40
41
42
43
44
45
46
47
48
FERC FORM NO. 1 (ED. 12-95) Page 105.2

Schedule Page: 105 Line No.: 5 Column: aRichard R. Barrera resigned on 7/1/2020.
Schedule Page: 105 Line No.: 9 Column: aJeffrey L. Bleich resigned on 5/1/2020.
Schedule Page: 105 Line No.: 13 Column: aNora Mead Brownell resigned on 7/1/2020.
Schedule Page: 105 Line No.: 37 Column: aFred J. Fowler resigned on 7/1/2020.
Schedule Page: 105.1 Line No.: 1 Column: aWilliam D. Johnson resigned on 6/30/2020.
Schedule Page: 105.1 Line No.: 5 Column: aMichael J. Leffell resigned on 7/1/2020.
Schedule Page: 105.1 Line No.: 9 Column: aMichael A. Lewis resigned on 12/31/2020.
Schedule Page: 105.1 Line No.: 13 Column: aDominique Mielle resigned on 6/30/2020.
Schedule Page: 105.1 Line No.: 17 Column: aMeridee A. Moore resigned on 7/1/2020.
Schedule Page: 105.1 Line No.: 21 Column: aEric D. Mullins resigned on 7/1/2020.
Schedule Page: 105.1 Line No.: 29 Column: aKristine M. Schmidt resigned on 7/1/2020.
Schedule Page: 105.1 Line No.: 45 Column: aAndrew M. Vesey resigned on 8/3/2020.
Schedule Page: 105.2 Line No.: 5 Column: aAlejandro D. Wolff resigned on 7/1/2020.
Name of Respondent
PACIFIC GAS AND ELECTRIC COMPANY
This Report is:(1) X An Original(2) A Resubmission
Date of Report(Mo, Da, Yr)
04/13/2021
Year/Period of Report
2020/Q4
FOOTNOTE DATA
FERC FORM NO. 1 (ED. 12-87) Page 450.1

Name of Respondent This Report Is:(1) An Original
(2) A Resubmission
Date of Report(Mo, Da, Yr)
Year/Period of Report
End of
INFORMATION ON FORMULA RATES
PACIFIC GAS AND ELECTRIC COMPANYX
04/13/20212020/Q4
Line
No. FERC Rate Schedule or Tariff Number FERC Proceeding
Does the respondent have formula rates? Yes
No
X
1. Please list the Commission accepted formula rates including FERC Rate Schedule or Tariff Number and FERC proceeding (i.e. Docket No)accepting the rate(s) or changes in the accepted rate.
FERC Rate Schedule/Tariff Number FERC Proceeding
ER19-13-000PG&E FERC Electric Tariff Volume No. 5 1
ER20-2878-000PG&E FERC Electric Tariff Volume No. 4 2
3
4
5
6
7
8
9
10
11
12
13
14
15
16
17
18
19
20
21
22
23
24
25
26
27
28
29
30
31
32
33
34
35
36
37
38
39
40
41
FERC FORM NO. 1 (NEW. 12-08) Page 106
Name of Respondent This Report Is:(1) An Original
(2) A Resubmission
Date of Report(Mo, Da, Yr)
Year/Period of Report
End ofPACIFIC GAS AND ELECTRIC COMPANYX
04/13/20212020/Q4
Line
No. \ Filed DateAccession No.
Date
Docket No. Description
Formula Rate FERC RateSchedule Number orTariff Number
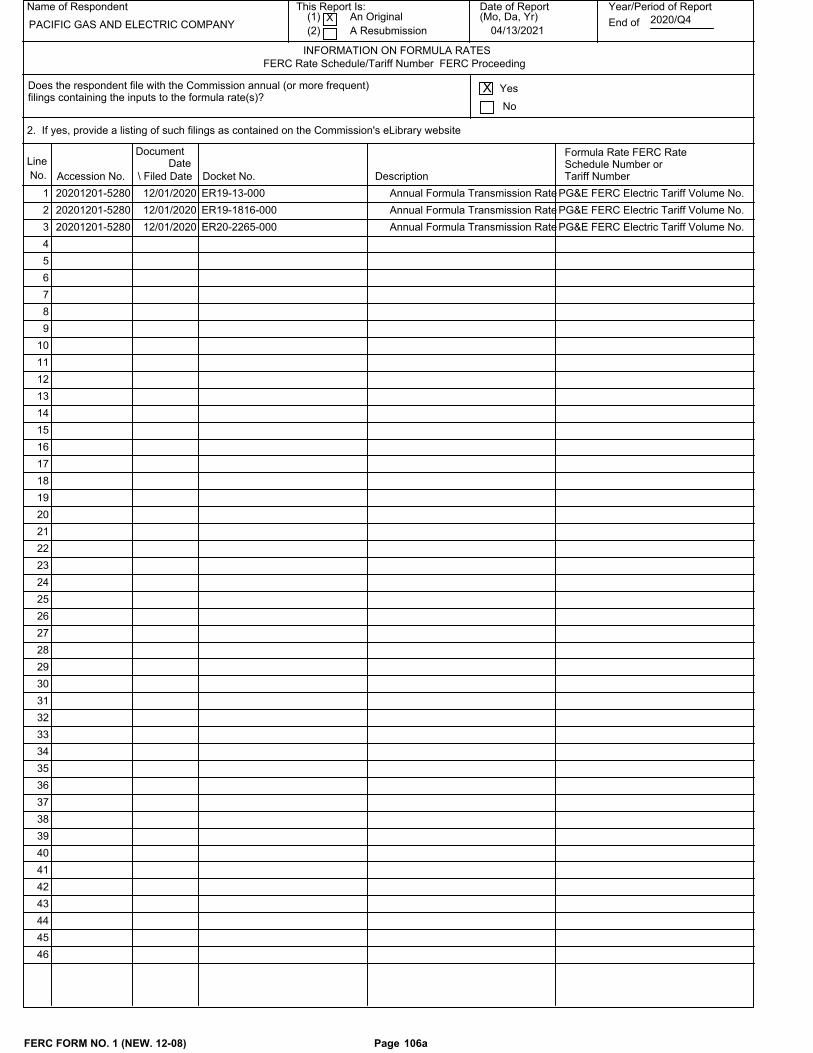
INFORMATION ON FORMULA RATES
Does the respondent file with the Commission annual (or more frequent) Yes
No
X
2. If yes, provide a listing of such filings as contained on the Commission's eLibrary website
FERC Rate Schedule/Tariff Number FERC Proceeding
filings containing the inputs to the formula rate(s)?
Document
12/01/202020201201-5280 ER19-13-000 Annual Formula Transmission Rate PG&E FERC Electric Tariff Volume No. 1
12/01/202020201201-5280 ER19-1816-000 Annual Formula Transmission Rate PG&E FERC Electric Tariff Volume No. 2
12/01/202020201201-5280 ER20-2265-000 Annual Formula Transmission Rate PG&E FERC Electric Tariff Volume No. 3
4
5
6
7
8
9
10
11
12
13
14
15
16
17
18
19
20
21
22
23
24
25
26
27
28
29
30
31
32
33
34
35
36
37
38
39
40
41
42
43
44
45
46
FERC FORM NO. 1 (NEW. 12-08) Page 106a

Name of Respondent This Report Is:(1) An Original
(2) A Resubmission
Date of Report(Mo, Da, Yr)
Year/Period of Report
End ofPACIFIC GAS AND ELECTRIC COMPANYX
04/13/20212020/Q4
Line
No. Page No(s). Schedule Column Line No
INFORMATION ON FORMULA RATES
1. If a respondent does not submit such filings then indicate in a footnote to the applicable Form 1 schedule where formula rate inputs differ from
Formula Rate Variances
amounts reported in the Form 1.2. The footnote should provide a narrative description explaining how the "rate" (or billing) was derived if different from the reported amount in the
Form 1.3. The footnote should explain amounts excluded from the ratebase or where labor or other allocation factors, operating expenses, or other items
impacting formula rate inputs differ from amounts reported in Form 1 schedule amounts.4. Where the Commission has provided guidance on formula rate inputs, the specific proceeding should be noted in the footnote.
NOT APPLICABLE 1
2
3
4
5
6
7
8
9
10
11
12
13
14
15
16
17
18
19
20
21
22
23
24
25
26
27
28
29
30
31
32
33
34
35
36
37
38
39
40
41
42
43
44
FERC FORM NO. 1 (NEW. 12-08) Page 106b

Name of Respondent This Report Is:(1) An Original
(2) A Resubmission
Date of Report Year/Period of Report
End of
IMPORTANT CHANGES DURING THE QUARTER/YEAR
PACIFIC GAS AND ELECTRIC COMPANY X04/13/2021
2020/Q4
PAGE 108 INTENTIONALLY LEFT BLANK
SEE PAGE 109 FOR REQUIRED INFORMATION.
Give particulars (details) concerning the matters indicated below. Make the statements explicit and precise, and number them in
accordance with the inquiries. Each inquiry should be answered. Enter "none," "not applicable," or "NA" where applicable. If
information which answers an inquiry is given elsewhere in the report, make a reference to the schedule in which it appears.
1. Changes in and important additions to franchise rights: Describe the actual consideration given therefore and state from whom the
franchise rights were acquired. If acquired without the payment of consideration, state that fact.
2. Acquisition of ownership in other companies by reorganization, merger, or consolidation with other companies: Give names of
companies involved, particulars concerning the transactions, name of the Commission authorizing the transaction, and reference to
Commission authorization.
3. Purchase or sale of an operating unit or system: Give a brief description of the property, and of the transactions relating thereto,
and reference to Commission authorization, if any was required. Give date journal entries called for by the Uniform System of Accounts
were submitted to the Commission.
4. Important leaseholds (other than leaseholds for natural gas lands) that have been acquired or given, assigned or surrendered: Give
effective dates, lengths of terms, names of parties, rents, and other condition. State name of Commission authorizing lease and give
reference to such authorization.
5. Important extension or reduction of transmission or distribution system: State territory added or relinquished and date operations
began or ceased and give reference to Commission authorization, if any was required. State also the approximate number of
customers added or lost and approximate annual revenues of each class of service. Each natural gas company must also state major
new continuing sources of gas made available to it from purchases, development, purchase contract or otherwise, giving location and
approximate total gas volumes available, period of contracts, and other parties to any such arrangements, etc.
6. Obligations incurred as a result of issuance of securities or assumption of liabilities or guarantees including issuance of short-term
debt and commercial paper having a maturity of one year or less. Give reference to FERC or State Commission authorization, as
appropriate, and the amount of obligation or guarantee.
7. Changes in articles of incorporation or amendments to charter: Explain the nature and purpose of such changes or amendments.
8. State the estimated annual effect and nature of any important wage scale changes during the year.
9. State briefly the status of any materially important legal proceedings pending at the end of the year, and the results of any such
proceedings culminated during the year.
10. Describe briefly any materially important transactions of the respondent not disclosed elsewhere in this report in which an officer,
director, security holder reported on Page 104 or 105 of the Annual Report Form No. 1, voting trustee, associated company or known
associate of any of these persons was a party or in which any such person had a material interest.
11. (Reserved.)
12. If the important changes during the year relating to the respondent company appearing in the annual report to stockholders are
applicable in every respect and furnish the data required by Instructions 1 to 11 above, such notes may be included on this page.
13. Describe fully any changes in officers, directors, major security holders and voting powers of the respondent that may have
occurred during the reporting period.
14. In the event that the respondent participates in a cash management program(s) and its proprietary capital ratio is less than 30
percent please describe the significant events or transactions causing the proprietary capital ratio to be less than 30 percent, and the
extent to which the respondent has amounts loaned or money advanced to its parent, subsidiary, or affiliated companies through a
cash management program(s). Additionally, please describe plans, if any to regain at least a 30 percent proprietary ratio.
FERC FORM NO. 1 (ED. 12-96) Page 108
PACIFIC GAS AND ELECTRIC COMPANYs
IMPORTANT CHANGES DURING THE YEAR
For the Year Ended December 31, 2020
1. Changes in and important additions to franchise rights:
PG&E has received a request from the City of Richmond proposing a change in the
franchise fee rate for the electric and gas franchises with the City. The parties
have been unable to informally resolve the matter and it has been referred to
arbitration to address whether the City has met the conditions set forth in the
franchise agreements for requesting a change to the franchise fee rate, and if so,
what would be the appropriate change in the franchise fee rate.
2. Acquisition of ownership in other companies by reorganization, merger, or
consolidation with other companies:
None.
3. Purchase or sale of an operating unit or system:
Sale:
None.
Purchase:
None.
4. Important leaseholds that have been acquired or given, assigned or surrendered:
On June 5, 2020, the Utility entered into an Agreement to Enter Into Lease and
Purchase Option (the “Agreement”) with TMG Bay Area Investments II, LLC (“TMG”). The
Agreement provides that, contingent on (i) entry of an order by the Bankruptcy Court
authorizing the Utility to enter into the Agreement and the Lease Agreement (as
defined below), subject to certain conditions, and (ii) acquisition of the Lakeside
Building by BA2 300 Lakeside LLC (“Landlord”), a wholly owned subsidiary of TMG, the
Utility and Landlord will enter into an office lease agreement (the “Lease
Agreement”) for approximately 910,000 rentable square feet of space within the
building located at the Lakeside Building to serve as the Utility’s principal
administrative headquarters (the “Lease”). On June 9, 2020, PG&E Corporation and the
Utility filed a motion with the Bankruptcy Court authorizing them to enter into the
Agreement and grant related relief. The Bankruptcy Court entered an order approving
the motion on June 24, 2020.
Pursuant to the terms of the Agreement, concurrent with the Landlord’s acquisition of
the Lakeside Building, on October 23, 2020, the Utility and the Landlord entered into
the Lease, and the Utility issued to Landlord (i) an option payment letter of credit
in the amount of $75 million, and (ii) a lease security letter of credit in the
amount of $75 million.
The term of the Lease will begin on or about March 1, 2022. The Lease term will
expire 34 years and 11 months after the commencement date, unless earlier terminated
in accordance with the terms of the Lease. In addition to base rent, the Utility will
be responsible for certain costs and charges specified in the Lease, including
Name of Respondent
PACIFIC GAS AND ELECTRIC COMPANY
This Report is:(1) X An Original(2) A Resubmission
Date of Report(Mo, Da, Yr)
04/13/2021
Year/Period of Report
2020/Q4
IMPORTANT CHANGES DURING THE QUARTER/YEAR (Continued)
FERC FORM NO. 1 (ED. 12-96) Page 109.1

insurance costs, maintenance costs and taxes.
The Lease requires the Landlord to pursue approvals to subdivide the real estate it
owns surrounding the Lakeside Building to create a separate legal parcel that
contains the Lakeside Building (the “Property”) that can be sold to the Utility. The
Lease grants to the Utility an option to purchase the Property, following such
subdivision, at a price of $892 million, subject to certain adjustments (the
“Purchase Price”). The Purchase Price would not be paid until 2023.
In connection with entry into the Agreement, the Utility intends to sell its current
office space generally located at 77 Beale Street, 215 Market Street, 245 Market
Street and 50 Main Street, San Francisco, California 94105, and associated properties
owned by the Utility (“SFGO”). Any sale of the SFGO would be subject to approval by
the CPUC. On September 30, 2020, the Utility filed an application with the CPUC
seeking authorization to sell the SFGO.
At December 31, 2020, the Agreement had no impact on the Utility’s Condensed
Consolidated Financial Statements.
5. Important extension or reduction of transmission or distribution system:
Electric:
On April 20, 2020, the Gates 500/230 kV Transformer No. 2 Installation Project was
released to operations. This project, located in Fresno County, added a second
500/230 kV Transformer at the Gates 500/230/70 kV Substation. This project was built
to provide full deliverability to renewable generation in the Fresno area and
additional flexibility for pumping operations at Helms Pumped Storage Plant.
On October 8, 2020, the Delevan 230 kV Shunt Reactor Project was released to
operations. This project, located in Colusa County, installed three steps for a total
of 202 MVar shunt reactors at Delevan 230kV Substation to help control system
voltages.
Gas:
None.
6. Obligations incurred as a result of issuance of securities or assumption of
liabilities or guarantees including issuance of short-term debt and commercial paper
having maturity of one year or less. Give reference to FERC or State Commission
authorization, as appropriate, and the amount of obligation or guarantee:
a) Financings:
As part of its emergence from bankruptcy, PG&E issued $8.925 billion in First
Mortgage Bonds on June 16, 2020. The proceeds from this issuance were used to pay
off claims related to PG&E’s filing for Ch. 11 bankruptcy in 2019.
On July 1, 2020, the Utility issued $11.9 billion of its first mortgage bonds in
satisfaction of certain of its pre-petition senior unsecured debt.
Name of Respondent
PACIFIC GAS AND ELECTRIC COMPANY
This Report is:(1) X An Original(2) A Resubmission
Date of Report(Mo, Da, Yr)
04/13/2021
Year/Period of Report
2020/Q4
IMPORTANT CHANGES DURING THE QUARTER/YEAR (Continued)
FERC FORM NO. 1 (ED. 12-96) Page 109.2

On July 1, 2020, the Utility reinstated $9.6 billion aggregate principal amount
of the Utility Senior Notes. Each series of the Utility Reinstated Senior Notes
was collateralized by the Utility’s delivery of a first mortgage bond in a
corresponding principal amount to the applicable trustee for the benefit of the
holders of the Utility Reinstated Senior Notes.
On November 16, 2020, the Utility completed the sale of $1.45 billion aggregate
principal amount of floating rate first mortgage bonds due November 15, 2021.
Proceeds from the sale of the mortgage bonds were used for general corporate
purposes, including the repayment of borrowings outstanding under the Receivables
Securitization Program and borrowings outstanding under the Utility Revolving
Credit Facility.
b) Bank Credit Facilities:
On January 29, 2020, PG&E drew the $500 million delayed draw term loan available
through the Debtor-In-Possession (DIP Facility).
On July 1, 2020, the Debtor-In-Possession facilities were repaid in full and all
commitments thereunder were terminated in connection with emergence from Chapter
11.
On July 1, 2020, the Utility entered into a $3.5 billion revolving credit
agreement with JPM, and Citibank, N.A. as co-administrative agents, and Citibank,
N.A., as designated agent. The Utility Revolving Credit Agreement has a maturity
date of three years after July 1, 2020, subject to two one-year extensions at the
option of the Utility. The Utility Revolving Credit Facility has a maximum
letter of credit sublimit equal to $1.5 billion. As of December 31, 2020, the
Utility had outstanding borrowings of $605 million and $1.0 billion of letters of
credit outstanding under this credit facility.
On July 1, 2020, the Utility obtained a $3.0 billion secured term loan under a
term loan credit agreement with JPM, as administrative agent. The credit
facilities under the Utility Term Loan Credit Facility consist of a $1.5 billion
364-day term loan facility and a $1.5 billion 18-month term loan facility. The
maturity date for the 364-day term loan facility is June 30, 2021 and the
maturity date for the Utility 18-month term loan facility is January 1, 2022. As
of December 31, 2020, the Utility had outstanding borrowings of $3.0 billion
under this term loan facility.
Non-bankruptcy short-term borrowings are authorized by CPUC Decision No.
09-05-002.
Bankruptcy short-term borrowings were authorized by CPUC Decision No. 19-01-025.
c) Surety Bonds and Financial Guarantees Backed by Insurance:
From January 1, 2020 to December 31, 2020 $79,784,735 in surety bond obligations
were issued in conformance with the CPUC Decision No. 12-04-015. As of December
31, 2020, there was a total of $210,966,744.81 of surety bond obligations
Name of Respondent
PACIFIC GAS AND ELECTRIC COMPANY
This Report is:(1) X An Original(2) A Resubmission
Date of Report(Mo, Da, Yr)
04/13/2021
Year/Period of Report
2020/Q4
IMPORTANT CHANGES DURING THE QUARTER/YEAR (Continued)
FERC FORM NO. 1 (ED. 12-96) Page 109.3

outstanding.
d) Capital Support:
CPUC Decision No. 91-12-057 (as modified by Decision No. 99-04-068) authorized
the Utility to provide capital support to regulated and unregulated subsidiaries.
At December 31, 2020, the Utility has no outstanding future capital commitments
to unregulated subsidiaries and affiliates.
e) Preferred stock repayments:
None.
7. Changes in articles of incorporation or amendments to charter. Explain the nature
and purpose of such changes or amendments:
On June 22, 2020, the Utility’s Articles of Incorporation were amended and restated
in connection with confirmation of the Utility’s Plan of Reorganization to:
• prohibit the issuance of any non-voting equity securities to the extent prohibited
by section 1123(a)(6) of the Bankruptcy Code; and
• establish ownership and transfer restrictions with respect to equity securities of
the Utility in order to reduce the possibility of an equity ownership shift that
could result in limitations on the Utility’s ability to utilize net operating loss
carryforwards and other tax attributes from prior taxable years for federal income
tax purposes
• incorporate into the Articles the terms of the authorized Series of Preferred Stock
and delete unnecessary references to Certificates of Determination for such Series.
8. State the estimated annual effect and nature of any important wage scale changes
during the period:
As provided for in labor agreements with the International Brotherhood of Electrical
Workers (“IBEW”), Local 1245, representing a majority of the Utility’s employees in
physical and clerical classifications; the Engineers and Scientists of California,
(“ESC”), representing certain Utility employees in the technical and engineering
classifications; and the Service Employees International Union (“SEIU”), representing
certain Utility security officers at Diablo Canyon Nuclear Power Plant, the following
general wage increases were granted effective January 1, 2020:
IBEW Clerical classifications 3.00%
IBEW Physical classifications 3.00%
ESC non-exempt and some exempt classifications 3.00%
ESC other exempt classifications 3.00%
SEIU classifications 3.00%
Name of Respondent
PACIFIC GAS AND ELECTRIC COMPANY
This Report is:(1) X An Original(2) A Resubmission
Date of Report(Mo, Da, Yr)
04/13/2021
Year/Period of Report
2020/Q4
IMPORTANT CHANGES DURING THE QUARTER/YEAR (Continued)
FERC FORM NO. 1 (ED. 12-96) Page 109.4

The full annual cost of the above general wage increase is approximately
$46,994,205.
9. State briefly the status of any materially important legal proceedings pending at the
end of the period and the results of any such proceedings culminated during the
period:
Refer to Part I, Item 1A. Risk Factors, Part II, Item 7. MD&A “Enforcement and
Litigation Matters” and Notes 2, 14, and 15 of the Notes to the Consolidated
Financial Statements in Item 8 of PG&E Corporation’s and the Utility’s joint Annual
Report on Form 10-K for the year ended December 31, 2020. Four copies of the Form
10—K report are filed in accordance with Instruction III(c) of Instructions For
Filing the FERC Form No. 1.
10. Describe briefly any materially important transactions of the not disclosed elsewhere
in this report in which an officer, director, security holder reported on Page 106,
voting trustee, associated company or known associate of any of these persons was a
party or in which any such person had a material interest:
“Five Percent Owners”
During 2020, multiple beneficial owners of at least 5 percent of PG&E Corporation
common stock provided services to PG&E Corporation, Pacific Gas and Electric Company
(“Utility”), and related entities. These entities were identified based solely on a
review of Schedule 13Gs (or any amendments) filed with the Securities and Exchange
Commission as of the date of this report. Consistent with SEC rules, if a beneficial
owner’s holdings fell below 5 percent during the year, the descriptions only discuss
transactions until the party was no longer a 5 percent owner.
•• The Vanguard Group (“Vanguard”) provided asset management services to the
trusts securing benefits in the event of a change in control, and The PG&E
Corporation Foundation. In each of these cases, the services are subject to
terms comparable to those that could be obtained in arm's-length dealings with
an unrelated third party. PG&E Corporation and the Utility expect that these
entities will continue to provide similar services and products in the future,
in the normal course of business operations.
The value of payments to Vanguard for the period January 2020 through March
2021 was below the $120,000 disclosure threshold set forth in SEC Reg. S-K,
Item 404(a).
• Gallagher Financial Advisory Services (“Gallagher”) provided independent
fiduciary services to the PG&E Corporation Stock Fund in the 401(k) Plan, and,
solely by reason of that fact, is deemed to beneficially own the fund’s shares
(and thereby is deemed a five percent owner of PG&E Corporation common stock).
Gallagher was selected from among five different candidates to provide these
services, and any provider similarly would have become a five percent owner if
selected as the independent fiduciary. The terms of the engagement are
consistent with those obtainable in arm’s-length negotiations.
NOTE: Following PG&E Corporation’s and the Utility’s emergence from Chapter
11 and related changes to ownership of PG&E Corporation common stock,
Name of Respondent
PACIFIC GAS AND ELECTRIC COMPANY
This Report is:(1) X An Original(2) A Resubmission
Date of Report(Mo, Da, Yr)
04/13/2021
Year/Period of Report
2020/Q4
IMPORTANT CHANGES DURING THE QUARTER/YEAR (Continued)
FERC FORM NO. 1 (ED. 12-96) Page 109.5
Gallagher no longer is a 5% owner.
• Affiliates of Fidelity Management and Research Company LLC (FMC) provide
recordkeeper and trustee services for compensation and benefit plans sponsored
by PG&E Corporation and the Utility. The terms of the engagements are
comparable to those that could be obtained in arm’s-length dealings with an
unrelated third party. PG&E Corporation and the Utility expect that these
entities will continue to provide similar services and products in the future,
in the normal course of business operations.
The value of payments to FMC affiliates during 2020 was approximately
$860,000, which exceeds the $120,000 disclosure threshold set forth in SEC Reg
S-K Item 404.
• Fire Victim Trust (the “Trust”) – In connection with the Plan of
Reorganization, in July and August 2020, the Utility distributed 477,743,590
shares of PG&E Corporation common stock to the Trust and entered into the
following agreements with the Trust:
• Assignment Agreement: On July 1, 2020, the Utility and the Trust entered
into an assignment agreement (the “Assignment Agreement”). Pursuant to
the Assignment Agreement, the Utility funded the Trust with aggregate
consideration consisting of $6.75 billion in cash (including
$1.35 billion on a deferred basis in accordance with the Tax Benefits
Payment Agreement described below) and 476,995,175 shares of PG&E
Corporation common stock (the “Initial Plan Shares”). On August 3, 2020,
pursuant to an antidilution provision in the Assignment Agreement, the
Utility distributed an additional 748,415 shares of PG&E Corporation
common stock to the Trust (together with the Initial Plan Shares, the
“Plan Shares”).
• Registration Rights Agreement: In addition to various obligations
relating to registration of the Common Stock (summarized in PG&E
Corporation’s Current Report on Form 8-K filed on June 24, 2020), PG&E
Corporation is required to pay the fees and expenses for one counsel for
the Trust (subject to a cap of $100,000 for the initial registration and
for each assisted underwritten offering) in connection with the initial
registration and each assisted underwritten offering, but excluding any
underwriting discounts or commissions or fees and expenses of the Trust.
• Tax Benefits Payment Agreement: The Utility agreed to pay to the Trust
in cash an aggregate amount of $1.35 billion, comprising (i) at least
$650 million of tax benefits for fiscal year 2020 to be paid on or
before January 15, 2021 (the “First Payment Date”), and (ii) of the
remainder of the $1.35 billion of tax benefits for fiscal year 2021 to
be paid on or before January 15, 2022. On January 15, 2021, the Utility
paid the first tranche of tax benefits of approximately $758 million
pursuant to the Tax Benefits Agreement.
During the first quarter of 2020, one group of beneficial owners of at least 5% of
PG&E Corporation common stock (Knighthead Capital Management (Knighthead) and Abrams
Name of Respondent
PACIFIC GAS AND ELECTRIC COMPANY
This Report is:(1) X An Original(2) A Resubmission
Date of Report(Mo, Da, Yr)
04/13/2021
Year/Period of Report
2020/Q4
IMPORTANT CHANGES DURING THE QUARTER/YEAR (Continued)
FERC FORM NO. 1 (ED. 12-96) Page 109.6

Capital Management (Abrams), together), and one owner of at least 5% of Pacific Gas
and Electric Company First Preferred Stock (Stonehill Capital Partners (Stonehill))
entered into amendments to previously executed backstop commitment letters with PG&E
Corporation. The backstop commitment letters, as amended, were entered into in
connection with the companies’ Plan of Reorganization, and generally provide that
these related parties committed to fund the companies in consideration of the
issuance of new shares of PG&E Corporation common stock.
As of the second quarter of 2020, backstop commitment letters had been entered with
one owner of at least 5% of Pacific Gas and Electric Company First Preferred Stock
(Stonehill Capital Partners). There were no changes to these backstop commitment
letters during the remainder of 2020. The backstop commitment letters terminated upon
emergence from Chapter 11.
NOTE: Backstop commitment letters also had been entered into with one group of
beneficial owners of at least 5% of PG&E Corporation common stock (Knighthead Capital
Management (Knighthead) and Abrams Capital Management (Abrams), (“Knighthead and
Abrams” together). However, Knighthead and Abrams ceased to be 5% shareholders
during Q1 2020.
“Immediate Family Members”
Kathy Thomason is employed by the Utility as a Strategic Analyst, Principal. She is
the wife of David Thomason, who is Vice President, Chief Financial Officer, and
Controller of the Utility and an executive officer of the Utility. Ms. Thomason is,
therefore, an “immediate family member” for purposes of SEC related person
transaction disclosure rules. While Ms. Thomason is employed with the Utility, she
will receive salary, short-term incentive awards, and other cash compensation and
benefits, including increases in compensation, consistent with the Utility’s standard
compensation practices and policies.
We expect that the value of payments to Ms. Thomason for the period January 2020
through March 2021 (assuming she remains employed with the Utility during that
period) will exceed the $120,000 disclosure threshold set forth in SEC Reg S-K. Item
404(a), and intend to disclose that the value of annual transactions is approximately
$170,000.
11. (Reserved)
12. If the important changes during the year relating to the respondent company appearing
in the annual report to stockholders are applicable in every respect and furnish the
data required by instructions to 1 to 11 above, such notes may be included on this
page.
Not applicable.
13. Describe fully any changes in officers, directors, major security holders and voting
powers of the respondent that may have occurred during the reporting period:
Directors
The following individuals were elected as Directors of the Utility:
• Rajat Behri
• Kerry W. Cooper
Name of Respondent
PACIFIC GAS AND ELECTRIC COMPANY
This Report is:(1) X An Original(2) A Resubmission
Date of Report(Mo, Da, Yr)
04/13/2021
Year/Period of Report
2020/Q4
IMPORTANT CHANGES DURING THE QUARTER/YEAR (Continued)
FERC FORM NO. 1 (ED. 12-96) Page 109.7

• Jessica L. Dencour
• Mark E. Ferguson, III
• Robert C. Flexon
• W. Craig Fugate
• Arno L. Harris
• Michael A. Lewis
• Michael R. Niggli
• Dean L. Seavers
• Oluwadara (Dara) Treseder
• Benjamin F. Wilson
The following individuals are no longer Directors of the Utility:
• Richard R. Barrera
• Jeffrey L. Bleich
• Nora Mead Brownell
• Fred J. Fowler
• William D. Johnson
• Michael J. Leffell
• Michael A. Lewis
• Dominique Mielle
• Meridee A. Moore
• Eric D. Mullins
• Kristine M. Schmidt
• Andrew M. Vesey
• Alejandro D. Wolff
Officers
The following individuals became officers of the Utility:
• Dean L. Seavers, Chair of the Board
• Francisco Benavides, Vice President and Chief Safety Officer
• Sumeet Singh, Senior Vice President and Chief Risk Officer
• Aaron A. August, Vice President, Business Development & Customer Engagement
• Vincent M. Davis, Vice President, Customer Experience Operations
• David E. Hatton, Vice President, Human Resources Solutions
• William V. Manheim, Vice President, Deputy General Counsel, Operations
• Jan A. Nimick, Vice President, Power Generation
• Mark R. Seveska, Vice President, IT Products & Enterprise Platforms
• Alejandro (Alex) Vallejo, Vice President, Compliance & Ethics, and Deputy General
Counsel
• Stephanie Williams, Vice President, Business Finance and Planning
• Brian M. Wong, Vice President, Deputy General Counsel, and Corporate Secretary
• Maureen R. Zawalick, Vice President, Generation Business & Technical Services
• Chris Zenner, Vice President, Residential Services & Digital Channels
• Lisa J. Crawford, Assistant Corporate Secretary
• Sujata Pagedar, Assistant Corporate Secretary
The following individuals’ titles changed:
• Michael A. Lewis, Interim President (formerly Senior Vice President, Electric
Operations)
• Francisco Benavides, Senior Vice President and Chief Safety Officer (formerly Vice
Name of Respondent
PACIFIC GAS AND ELECTRIC COMPANY
This Report is:(1) X An Original(2) A Resubmission
Date of Report(Mo, Da, Yr)
04/13/2021
Year/Period of Report
2020/Q4
IMPORTANT CHANGES DURING THE QUARTER/YEAR (Continued)
FERC FORM NO. 1 (ED. 12-96) Page 109.8

President and Chief Safety Officer)
• Stephen J. Cairns, Vice President and Chief Audit Officer (formerly Vice President,
Internal Audit and Chief Risk Officer)
• Linda Y.H. Cheng, Vice President (formerly Vice President, Corporate Governance and
Corporate Secretary)
• Aaron J. Johnson, Vice President, Wildfire Safety and Public Engagement (formerly
Vice President, Customer Energy Solutions)
• Mary K. King, Vice President Talent and Chief Diversity Officer (formerly Vice
President, Human Resources and Chief Diversity Officer)
• Deborah W. Powell, Vice President, Asset, Risk Management and Community Wildfire
Safety Program (formerly Vice President, Power Generation)
• Brian M. Wong, Vice President, General Counsel, and Corporate Secretary (formerly
Vice President, Deputy General Counsel, and Corporate Secretary)
• Margaret (Mari) K. Becker, Treasurer (formerly Assistant Treasurer)
The following individuals are no longer officers of the Utility:
• Jeffrey L. Bleich, Chair of the Board
• Michael A. Lewis, Interim President
• Andrew M. Vesey, Chief Executive Officer and President
• Julie M. Kane, Senior Vice President, Chief Ethics and Compliance officer, and
Deputy General Counsel
• Kathleen B. Kay, Senior Vice President and Chief Information Officer
• Janet C. Loduca, Senior Vice President and General Counsel
• Dinyar B. Mistry, Senior Vice President, Human Resources
• Nicholas M. Bijur, Vice President and Treasurer
• Linda Y.H. Cheng, Vice President
• Thomas M. French, Vice President, Electric Transmission Operations
• Roy M. Kuga, Vice President, Energy Policy and Procurement Bankruptcy Strategy
• Rolando I. Trevino, Vice President, Gas Engineering and Design
• Wondy S. Lee, Assistant Corporate Secretary
• Eric A. Montizambert, Assistant Corporate Secretary
Major Security Holders
Changes to the major holders of the Utility’s First Preferred Stock are as follows:
• Cede & Co., C/O DTCC-Transfer Operation Dept., 570 Washington Blvd Floor 1, Jersey
City, NJ 08857, increased its share ownership from 9,710,090 shares as of December
31, 2019 to 9,738,824 shares as of December 31, 2020. (Approximately 94 percent of
the total preferred shares outstanding).
• Rinehart C. Heinitz 3680 Camanche Parkway N, Ione, CA 95640-9464 became a major
holder with 6,540 shares.
• Josephine S. Allen TR UDT Dec 4 91, 118 Scenic Dr, Orinda, CA 94563-3414 is no
longer a major holder.
Dividend Payments
Refer to Note 6, Equity, of the Notes to Financial Statements on page 122-123 of the
FERC Form 1.
Name of Respondent
PACIFIC GAS AND ELECTRIC COMPANY
This Report is:(1) X An Original(2) A Resubmission
Date of Report(Mo, Da, Yr)
04/13/2021
Year/Period of Report
2020/Q4
IMPORTANT CHANGES DURING THE QUARTER/YEAR (Continued)
FERC FORM NO. 1 (ED. 12-96) Page 109.9

14. In the event that the respondent participates in a cash management program(s) and its
proprietary capital ratio is less than 30 percent please describe the significant
events or transactions causing the proprietary capital ratio to be less than 30
percent, and the extent to which the respondent has amounts loaned or money advanced
to its parent, subsidiary, or affiliated companies through a cash management
program(s). Additionally, please describe plans, if any to regain at least a 30
percent proprietary ratio:
Not applicable.
Name of Respondent
PACIFIC GAS AND ELECTRIC COMPANY
This Report is:(1) X An Original(2) A Resubmission
Date of Report(Mo, Da, Yr)
04/13/2021
Year/Period of Report
2020/Q4
IMPORTANT CHANGES DURING THE QUARTER/YEAR (Continued)
FERC FORM NO. 1 (ED. 12-96) Page 109.10

Name of Respondent This Report Is:
(1) An Original
(2) A ResubmissionX
Date of Report(Mo, Da, Yr)
Year/Period of Report
End of
COMPARATIVE BALANCE SHEET (ASSETS AND OTHER DEBITS)
Line
No.Title of Account
(a)
Ref.
Page No.
(b)
Current Year
End of Quarter/Year
Balance
(c)
Prior Year
End Balance
12/31
(d)
PACIFIC GAS AND ELECTRIC COMPANY04/13/2021 2020/Q4
UTILITY PLANT 1
99,319,294,639 93,917,917,269200-201Utility Plant (101-106, 114) 2
2,758,242,099 2,672,175,058200-201Construction Work in Progress (107) 3
102,077,536,738 96,590,092,327TOTAL Utility Plant (Enter Total of lines 2 and 3) 4
41,313,895,992 39,506,642,610200-201(Less) Accum. Prov. for Depr. Amort. Depl. (108, 110, 111, 115) 5
60,763,640,746 57,083,449,717Net Utility Plant (Enter Total of line 4 less 5) 6
178,852,456 134,676,856202-203Nuclear Fuel in Process of Ref., Conv.,Enrich., and Fab. (120.1) 7
0 0Nuclear Fuel Materials and Assemblies-Stock Account (120.2) 8
359,475,767 397,424,984Nuclear Fuel Assemblies in Reactor (120.3) 9
2,681,225,483 2,566,969,545Spent Nuclear Fuel (120.4) 10
0 0Nuclear Fuel Under Capital Leases (120.6) 11
2,853,008,174 2,743,468,286202-203(Less) Accum. Prov. for Amort. of Nucl. Fuel Assemblies (120.5) 12
366,545,532 355,603,099Net Nuclear Fuel (Enter Total of lines 7-11 less 12) 13
61,130,186,278 57,439,052,816Net Utility Plant (Enter Total of lines 6 and 13) 14
0 0Utility Plant Adjustments (116) 15
55,907,325 55,907,325Gas Stored Underground - Noncurrent (117) 16
OTHER PROPERTY AND INVESTMENTS 17
30,315,734 29,974,881Nonutility Property (121) 18
0 0(Less) Accum. Prov. for Depr. and Amort. (122) 19
0 0Investments in Associated Companies (123) 20
134,313,797 48,216,341224-225Investment in Subsidiary Companies (123.1) 21
(For Cost of Account 123.1, See Footnote Page 224, line 42) 22
104,757,860 361,842,950228-229Noncurrent Portion of Allowances 23
0 0Other Investments (124) 24
0 0Sinking Funds (125) 25
0 0Depreciation Fund (126) 26
0 0Amortization Fund - Federal (127) 27
3,577,735,621 3,212,389,977Other Special Funds (128) 28
1,153,128,788 879,638,841Special Funds (Non Major Only) (129) 29
135,917,617 123,756,001Long-Term Portion of Derivative Assets (175) 30
0 0Long-Term Portion of Derivative Assets – Hedges (176) 31
5,136,169,417 4,655,818,991TOTAL Other Property and Investments (Lines 18-21 and 23-31) 32
CURRENT AND ACCRUED ASSETS 33
0 0Cash and Working Funds (Non-major Only) (130) 34
59,291,720 294,434,921Cash (131) 35
143,144,862 7,195,190Special Deposits (132-134) 36
18,975 147,415Working Fund (135) 37
196,000,000 824,500,000Temporary Cash Investments (136) 38
0 0Notes Receivable (141) 39
341,025,012 1,391,312,162Customer Accounts Receivable (142) 40
1,624,531,567 3,075,983,285Other Accounts Receivable (143) 41
27,986,632 58,239,935(Less) Accum. Prov. for Uncollectible Acct.-Credit (144) 42
1,504,095,027 0Notes Receivable from Associated Companies (145) 43
46,819,315 62,212,613Accounts Receivable from Assoc. Companies (146) 44
1,378,183 961,981227Fuel Stock (151) 45
0 0227Fuel Stock Expenses Undistributed (152) 46
0 0227Residuals (Elec) and Extracted Products (153) 47
533,278,843 549,615,749227Plant Materials and Operating Supplies (154) 48
0 0227Merchandise (155) 49
0 0227Other Materials and Supplies (156) 50
0 0202-203/227Nuclear Materials Held for Sale (157) 51
512,269,640 409,110,109228-229Allowances (158.1 and 158.2) 52
FERC FORM NO. 1 (REV. 12-03) Page 110

Name of Respondent This Report Is:
(1) An Original
(2) A ResubmissionX
Date of Report(Mo, Da, Yr)
Year/Period of Report
End of
COMPARATIVE BALANCE SHEET (ASSETS AND OTHER DEBITS)
Line
No.Title of Account
(a)
Ref.
Page No.
(b)
Current Year
End of Quarter/Year
Balance
(c)
Prior Year
End Balance
12/31
(d)
PACIFIC GAS AND ELECTRIC COMPANY04/13/2021 2020/Q4
(Continued)
104,757,860 361,842,950(Less) Noncurrent Portion of Allowances 53
0 0227Stores Expense Undistributed (163) 54
93,819,226 95,650,896Gas Stored Underground - Current (164.1) 55
0 0Liquefied Natural Gas Stored and Held for Processing (164.2-164.3) 56
698,753,381 410,148,517Prepayments (165) 57
0 0Advances for Gas (166-167) 58
3,420 1,560,329Interest and Dividends Receivable (171) 59
0 0Rents Receivable (172) 60
123,798,662 968,707,535Accrued Utility Revenues (173) 61
613,965,320 185,743,895Miscellaneous Current and Accrued Assets (174) 62
167,726,528 153,330,724Derivative Instrument Assets (175) 63
135,917,617 123,756,001(Less) Long-Term Portion of Derivative Instrument Assets (175) 64
0 0Derivative Instrument Assets - Hedges (176) 65
0 0(Less) Long-Term Portion of Derivative Instrument Assets - Hedges (176 66
6,391,257,572 7,886,776,435Total Current and Accrued Assets (Lines 34 through 66) 67
DEFERRED DEBITS 68
198,238,360 693,998Unamortized Debt Expenses (181) 69
0 0230aExtraordinary Property Losses (182.1) 70
51,795,210 68,590,956230bUnrecovered Plant and Regulatory Study Costs (182.2) 71
16,056,902,402 7,027,240,817232Other Regulatory Assets (182.3) 72
-558 -558Prelim. Survey and Investigation Charges (Electric) (183) 73
0 0Preliminary Natural Gas Survey and Investigation Charges 183.1) 74
0 0Other Preliminary Survey and Investigation Charges (183.2) 75
3,056,319 1,358,396Clearing Accounts (184) 76
0 0Temporary Facilities (185) 77
5,832,130,624 45,196,485233Miscellaneous Deferred Debits (186) 78
0 0Def. Losses from Disposition of Utility Plt. (187) 79
0 0352-353Research, Devel. and Demonstration Expend. (188) 80
62,997,566 77,021,591Unamortized Loss on Reaquired Debt (189) 81
9,318,986,643 9,503,725,902234Accumulated Deferred Income Taxes (190) 82
0 0Unrecovered Purchased Gas Costs (191) 83
31,524,106,566 16,723,827,587Total Deferred Debits (lines 69 through 83) 84
104,237,627,158 86,761,383,154TOTAL ASSETS (lines 14-16, 32, 67, and 84) 85
FERC FORM NO. 1 (REV. 12-03) Page 111

Year/Period of ReportName of Respondent This Report is:
(1) An Original
(2) A Resubmissionx
Date of Report(mo, da, yr)
end of
Line
No.Title of Account
(a)
Ref.
Page No.
(b)
Current Year
End of Quarter/Year
Balance
(c)
Prior Year
End Balance
12/31
(d)
PACIFIC GAS AND ELECTRIC COMPANY04/13/2021 2020/Q4
COMPARATIVE BALANCE SHEET (LIABILITIES AND OTHER CREDITS)
PROPRIETARY CAPITAL 1
1,321,874,0451,321,874,045Common Stock Issued (201) 2 250-251
257,994,575257,994,575Preferred Stock Issued (204) 3 250-251
00Capital Stock Subscribed (202, 205) 4
00Stock Liability for Conversion (203, 206) 5
1,805,194,2301,805,194,230Premium on Capital Stock (207) 6
6,780,547,92826,516,580,090Other Paid-In Capital (208-211) 7 253
00Installments Received on Capital Stock (212) 8 252
6,916,8996,916,899(Less) Discount on Capital Stock (213) 9 254
28,951,88628,951,886(Less) Capital Stock Expense (214) 10 254b
-4,735,473,388-4,351,842,483Retained Earnings (215, 215.1, 216) 11 118-119
-59,869,210-32,541,627Unappropriated Undistributed Subsidiary Earnings (216.1) 12 118-119
00(Less) Reaquired Capital Stock (217) 13 250-251
00 Noncorporate Proprietorship (Non-major only) (218) 14
1,017,789-4,621,218Accumulated Other Comprehensive Income (219) 15 122(a)(b)
5,335,417,18425,476,768,827Total Proprietary Capital (lines 2 through 15) 16
LONG-TERM DEBT 17
19,887,100,00031,852,940,000Bonds (221) 18 256-257
00(Less) Reaquired Bonds (222) 19 256-257
00Advances from Associated Companies (223) 20 256-257
00Other Long-Term Debt (224) 21 256-257
00Unamortized Premium on Long-Term Debt (225) 22
020,595,301(Less) Unamortized Discount on Long-Term Debt-Debit (226) 23
19,887,100,00031,832,344,699Total Long-Term Debt (lines 18 through 23) 24
OTHER NONCURRENT LIABILITIES 25
1,732,629,8771,211,735,102Obligations Under Capital Leases - Noncurrent (227) 26
00Accumulated Provision for Property Insurance (228.1) 27
26,007,532,9822,769,431,843Accumulated Provision for Injuries and Damages (228.2) 28
1,914,041,3832,342,629,053Accumulated Provision for Pensions and Benefits (228.3) 29
1,530,158,1861,338,475,830Accumulated Miscellaneous Operating Provisions (228.4) 30
00Accumulated Provision for Rate Refunds (229) 31
124,040,367194,661,444Long-Term Portion of Derivative Instrument Liabilities 32
00Long-Term Portion of Derivative Instrument Liabilities - Hedges 33
5,853,792,1946,412,100,889Asset Retirement Obligations (230) 34
37,162,194,98914,269,034,161Total Other Noncurrent Liabilities (lines 26 through 34) 35
CURRENT AND ACCRUED LIABILITIES 36
3,138,570,7583,555,000,000Notes Payable (231) 37
3,902,787,1433,185,186,054Accounts Payable (232) 38
00Notes Payable to Associated Companies (233) 39
118,946,82946,554,806Accounts Payable to Associated Companies (234) 40
180,930,636113,023,366Customer Deposits (235) 41
466,656,094453,585,015Taxes Accrued (236) 42 262-263
967,014,530451,126,305Interest Accrued (237) 43
00Dividends Declared (238) 44
00Matured Long-Term Debt (239) 45
FERC FORM NO. 1 (rev. 12-03) Page 112

Year/Period of ReportName of Respondent This Report is:
(1) An Original
(2) A Resubmissionx
Date of Report(mo, da, yr)
end of
Line
No.Title of Account
(a)
Ref.
Page No.
(b)
Current Year
End of Quarter/Year
Balance
(c)
Prior Year
End Balance
12/31
(d)
PACIFIC GAS AND ELECTRIC COMPANY04/13/2021 2020/Q4
(continued)COMPARATIVE BALANCE SHEET (LIABILITIES AND OTHER CREDITS)
00Matured Interest (240) 46
30,322,24336,799,544Tax Collections Payable (241) 47
768,630,9011,378,666,788Miscellaneous Current and Accrued Liabilities (242) 48
555,099,542531,682,197Obligations Under Capital Leases-Current (243) 49
146,893,267217,016,272Derivative Instrument Liabilities (244) 50
124,040,367194,661,444(Less) Long-Term Portion of Derivative Instrument Liabilities 51
00Derivative Instrument Liabilities - Hedges (245) 52
00(Less) Long-Term Portion of Derivative Instrument Liabilities-Hedges 53
10,151,811,5769,773,978,903Total Current and Accrued Liabilities (lines 37 through 53) 54
DEFERRED CREDITS 55
355,228,141326,181,304Customer Advances for Construction (252) 56
102,885,10295,893,290Accumulated Deferred Investment Tax Credits (255) 57 266-267
00Deferred Gains from Disposition of Utility Plant (256) 58
242,148,0491,573,140,970Other Deferred Credits (253) 59 269
3,411,145,9099,886,546,578Other Regulatory Liabilities (254) 60 278
572,251429,928Unamortized Gain on Reaquired Debt (257) 61
00Accum. Deferred Income Taxes-Accel. Amort.(281) 62 272-277
8,462,844,6598,980,592,464Accum. Deferred Income Taxes-Other Property (282) 63
1,650,035,2942,022,716,034Accum. Deferred Income Taxes-Other (283) 64
14,224,859,40522,885,500,568Total Deferred Credits (lines 56 through 64) 65
86,761,383,154104,237,627,158TOTAL LIABILITIES AND STOCKHOLDER EQUITY (lines 16, 24, 35, 54 and 65) 66
FERC FORM NO. 1 (rev. 12-03) Page 113

Name of Respondent This Report Is:(1) An Original
(2) A Resubmission
Date of Report(Mo, Da, Yr)
Year/Period of Report
End of
STATEMENT OF INCOME
PACIFIC GAS AND ELECTRIC COMPANYX
04/13/20212020/Q4
Line
(c)(b)(a)
Title of Account
No.
Total
Current Year to
Date Balance for
Quarter/Year
(d)
(Ref.)
Page No.
Quarterly
1. Report in column (c) the current year to date balance. Column (c) equals the total of adding the data in column (g) plus the data in column (i) plus the
data in column (k). Report in column (d) similar data for the previous year. This information is reported in the annual filing only.
2. Enter in column (e) the balance for the reporting quarter and in column (f) the balance for the same three month period for the prior year.
3. Report in column (g) the quarter to date amounts for electric utility function; in column (i) the quarter to date amounts for gas utility, and in column (k)
the quarter to date amounts for other utility function for the current year quarter.
4. Report in column (h) the quarter to date amounts for electric utility function; in column (j) the quarter to date amounts for gas utility, and in column (l)
the quarter to date amounts for other utility function for the prior year quarter.
5. If additional columns are needed, place them in a footnote.
Annual or Quarterly if applicable
5. Do not report fourth quarter data in columns (e) and (f)
6. Report amounts for accounts 412 and 413, Revenues and Expenses from Utility Plant Leased to Others, in another utility columnin a similar manner to
a utility department. Spread the amount(s) over lines 2 thru 26 as appropriate. Include these amounts in columns (c) and (d) totals.
7. Report amounts in account 414, Other Utility Operating Income, in the same manner as accounts 412 and 413 above.
Current 3 Months
Ended
Quarterly Only
No 4th Quarter
(e)
Prior 3 Months
Ended
Quarterly Only
No 4th Quarter
(f)
Total
Prior Year to
Date Balance for
Quarter/Year
UTILITY OPERATING INCOME 1
20,627,134,250 18,842,698,287300-301Operating Revenues (400) 2
Operating Expenses 3
12,450,954,263 21,770,132,822320-323Operation Expenses (401) 4
3,289,692,994 2,572,214,173320-323Maintenance Expenses (402) 5
3,152,310,569 2,915,778,086336-337Depreciation Expense (403) 6
336-337Depreciation Expense for Asset Retirement Costs (403.1) 7
268,182,440 312,345,977336-337Amort. & Depl. of Utility Plant (404-405) 8
336-337Amort. of Utility Plant Acq. Adj. (406) 9
44,858,959 2,113,770Amort. Property Losses, Unrecov Plant and Regulatory Study Costs (407) 10
Amort. of Conversion Expenses (407) 11
12,060,000 2,613Regulatory Debits (407.3) 12
1,232,030,318(Less) Regulatory Credits (407.4) 13
687,990,525 676,420,547262-263Taxes Other Than Income Taxes (408.1) 14
-18,742,076 457,455262-263Income Taxes - Federal (409.1) 15
15,226,597 168,031,963262-263 - Other (409.1) 16
987,062,652 367,396,283234, 272-277Provision for Deferred Income Taxes (410.1) 17
352,833,793 3,619,594,973234, 272-277(Less) Provision for Deferred Income Taxes-Cr. (411.1) 18
266Investment Tax Credit Adj. - Net (411.4) 19
1,930,139 9,459,742(Less) Gains from Disp. of Utility Plant (411.6) 20
1,764,604Losses from Disp. of Utility Plant (411.7) 21
(Less) Gains from Disposition of Allowances (411.8) 22
Losses from Disposition of Allowances (411.9) 23
Accretion Expense (411.10) 24
19,304,567,277 25,155,838,974TOTAL Utility Operating Expenses (Enter Total of lines 4 thru 24) 25
1,322,566,973 -6,313,140,687Net Util Oper Inc (Enter Tot line 2 less 25) Carry to Pg117,line 27 26
FERC FORM NO. 1/3-Q (REV. 02-04) Page 114

Name of Respondent This Report Is:(1) An Original
(2) A Resubmission
Date of Report(Mo, Da, Yr)
Year/Period of Report
End of
STATEMENT OF INCOME FOR THE YEAR (Continued)
PACIFIC GAS AND ELECTRIC COMPANYX
04/13/20212020/Q4
Line Previous Year to Date
(in dollars)
(k)(j)(g)
ELECTRIC UTILITY
No.Current Year to Date
(in dollars)
OTHER UTILITY
(l)
GAS UTILITY
Previous Year to Date
(in dollars)
Current Year to Date
(in dollars)
Previous Year to Date
(in dollars)
Current Year to Date
(in dollars)
(h) (i)
9. Use page 122 for important notes regarding the statement of income for any account thereof.
10. Give concise explanations concerning unsettled rate proceedings where a contingency exists such that refunds of a material amount may need to be
made to the utility's customers or which may result in material refund to the utility with respect to power or gas purchases. State for each year effected
the gross revenues or costs to which the contingency relates and the tax effects together with an explanation of the major factors which affect the rights
of the utility to retain such revenues or recover amounts paid with respect to power or gas purchases.
11 Give concise explanations concerning significant amounts of any refunds made or received during the year resulting from settlement of any rate
proceeding affecting revenues received or costs incurred for power or gas purches, and a summary of the adjustments made to balance sheet, income,
and expense accounts.
12. If any notes appearing in the report to stokholders are applicable to the Statement of Income, such notes may be included at page 122.
13. Enter on page 122 a concise explanation of only those changes in accounting methods made during the year which had an effect on net income,
including the basis of allocations and apportionments from those used in the preceding year. Also, give the appropriate dollar effect of such changes.
14. Explain in a footnote if the previous year's/quarter's figures are different from that reported in prior reports.
15. If the columns are insufficient for reporting additional utility departments, supply the appropriate account titles report the information in a footnote to
this schedule.
1
15,790,806,398 4,600,533,514 4,836,327,852 14,242,164,773 2
3
9,856,775,900 2,370,286,496 2,594,178,363 19,399,846,326 4
2,673,921,209 733,138,121 615,771,785 1,839,076,052 5
2,461,733,443 678,026,964 690,577,126 2,237,751,122 6
7
192,418,079 93,846,021 75,764,361 218,499,956 8
9
44,858,959 2,113,770 10
11
12,060,000 2,613 12
1,014,812,993 217,217,325 13
497,930,437 177,934,935 190,060,088 498,485,612 14
-18,788,436 20,887,268 46,360 -20,429,813 15
-43,266,945 82,431,668 58,493,542 85,600,295 16
465,052,214 -206,067,844 522,010,438 573,464,127 17
24,320,202 -108,572,017 328,513,591 3,728,166,990 18
19
1,930,127 2,818,287 12 6,641,455 20
1,764,604 21
22
23
24
15,103,396,142 4,056,237,359 4,201,171,135 21,099,601,615 25
687,410,256 544,296,155 635,156,717 -6,857,436,842 26
FERC FORM NO. 1 (ED. 12-96) Page 115

Name of Respondent This Report Is:(1) An Original
(2) A Resubmission
Date of Report(Mo, Da, Yr)
Year/Period of Report
End of
STATEMENT OF INCOME FOR THE YEAR (continued)
PACIFIC GAS AND ELECTRIC COMPANYX
04/13/20212020/Q4
Line
Previous Year
(c)(b)(a)
Title of Account
No.
Current Year
TOTAL
(d)
(Ref.)
Page No.
Current 3 Months
Ended
Quarterly Only
No 4th Quarter
(e)
Prior 3 Months
Ended
Quarterly Only
No 4th Quarter
(f)
1,322,566,973 -6,313,140,687Net Utility Operating Income (Carried forward from page 114) 27
Other Income and Deductions 28
Other Income 29
Nonutilty Operating Income 30
Revenues From Merchandising, Jobbing and Contract Work (415) 31
(Less) Costs and Exp. of Merchandising, Job. & Contract Work (416) 32
6,120,577Revenues From Nonutility Operations (417) 33
(Less) Expenses of Nonutility Operations (417.1) 34
Nonoperating Rental Income (418) 35
29,086,863 -91,657119Equity in Earnings of Subsidiary Companies (418.1) 36
56,861,975 131,791,178Interest and Dividend Income (419) 37
140,080,186 79,271,096Allowance for Other Funds Used During Construction (419.1) 38
21,522,402 14,613,757Miscellaneous Nonoperating Income (421) 39
81,540 4,832,442Gain on Disposition of Property (421.1) 40
253,753,543 230,416,816TOTAL Other Income (Enter Total of lines 31 thru 40) 41
Other Income Deductions 42
43,530,137Loss on Disposition of Property (421.2) 43
Miscellaneous Amortization (425) 44
8,172,778 9,792,051 Donations (426.1) 45
Life Insurance (426.2) 46
25,533,353 49,111,094 Penalties (426.3) 47
7,796,638 7,827,488 Exp. for Certain Civic, Political & Related Activities (426.4) 48
189,124,167 788,346,091 Other Deductions (426.5) 49
274,157,073 855,076,724TOTAL Other Income Deductions (Total of lines 43 thru 49) 50
Taxes Applic. to Other Income and Deductions 51
262-263Taxes Other Than Income Taxes (408.2) 52
651,449 5,078,589262-263Income Taxes-Federal (409.2) 53
-1,770,469 -80,871,606262-263Income Taxes-Other (409.2) 54
-121,916,110 6,976,547234, 272-277Provision for Deferred Inc. Taxes (410.2) 55
90,390,785 247,415,278234, 272-277(Less) Provision for Deferred Income Taxes-Cr. (411.2) 56
-6,991,812 -5,498,780Investment Tax Credit Adj.-Net (411.5) 57
(Less) Investment Tax Credits (420) 58
-220,417,727 -321,730,528TOTAL Taxes on Other Income and Deductions (Total of lines 52-58) 59
200,014,197 -302,929,380Net Other Income and Deductions (Total of lines 41, 50, 59) 60
Interest Charges 61
909,242,062 677,880,030Interest on Long-Term Debt (427) 62
49,782,057 126,739,333Amort. of Debt Disc. and Expense (428) 63
14,024,025 16,352,937Amortization of Loss on Reaquired Debt (428.1) 64
743,550 743,550(Less) Amort. of Premium on Debt-Credit (429) 65
142,323 144,644(Less) Amortization of Gain on Reaquired Debt-Credit (429.1) 66
Interest on Debt to Assoc. Companies (430) 67
174,148,932 240,449,603Other Interest Expense (431) 68
34,688,521 54,836,103(Less) Allowance for Borrowed Funds Used During Construction-Cr. (432) 69
1,111,622,682 1,005,697,606Net Interest Charges (Total of lines 62 thru 69) 70
410,958,488 -7,621,767,673Income Before Extraordinary Items (Total of lines 27, 60 and 70) 71
Extraordinary Items 72
Extraordinary Income (434) 73
(Less) Extraordinary Deductions (435) 74
Net Extraordinary Items (Total of line 73 less line 74) 75
262-263Income Taxes-Federal and Other (409.3) 76
Extraordinary Items After Taxes (line 75 less line 76) 77
410,958,488 -7,621,767,673Net Income (Total of line 71 and 77) 78
FERC FORM NO. 1 (ED. 12-96) Page 117

Schedule Page: 114 Line No.: 2 Column: c Includes interdepartmental operating revenues in Line 2 and operations expenses in Line 4 for the year-to-date period endedDecember 31:
2020 2019
Revenues Expenses Revenues Expenses
Electric 51,081,618 72,093,081
48,794,887 69,214,107
Gas 230,448,154 169,994,817
216,890,392 158,968,136
Total 281,529,772 242,087,898
265,685,279 228,182,243
Schedule Page: 114 Line No.: 4 Column: c See footnote in row 2, column c
Name of Respondent
PACIFIC GAS AND ELECTRIC COMPANY
This Report is:(1) X An Original(2) A Resubmission
Date of Report(Mo, Da, Yr)
04/13/2021
Year/Period of Report
2020/Q4
FOOTNOTE DATA
FERC FORM NO. 1 (ED. 12-87) Page 450.1

Name of Respondent This Report Is:(1) An Original
(2) A Resubmission
Date of Report(Mo, Da, Yr)
Year/Period of Report
End of
STATEMENT OF RETAINED EARNINGS
PACIFIC GAS AND ELECTRIC COMPANYX
04/13/2021
2020/Q4
Line
Current
Quarter/Year
Year to Date
Balance
(c)(b)(a)
ItemContra Primary
No.
Account Affected
1. Do not report Lines 49-53 on the quarterly version.
2. Report all changes in appropriated retained earnings, unappropriated retained earnings, year to date, and unappropriated
undistributed subsidiary earnings for the year.
3. Each credit and debit during the year should be identified as to the retained earnings account in which recorded (Accounts 433, 436
- 439 inclusive). Show the contra primary account affected in column (b)
4. State the purpose and amount of each reservation or appropriation of retained earnings.
5. List first account 439, Adjustments to Retained Earnings, reflecting adjustments to the opening balance of retained earnings. Follow
by credit, then debit items in that order.
6. Show dividends for each class and series of capital stock.
7. Show separately the State and Federal income tax effect of items shown in account 439, Adjustments to Retained Earnings.
8. Explain in a footnote the basis for determining the amount reserved or appropriated. If such reservation or appropriation is to be
recurrent, state the number and annual amounts to be reserved or appropriated as well as the totals eventually to be accumulated.
9. If any notes appearing in the report to stockholders are applicable to this statement, include them on pages 122-123.
Previous
Quarter/Year
Year to Date
Balance
(d)
UNAPPROPRIATED RETAINED EARNINGS (Account 216)
2,598,414,708 -5,021,494,323 1 Balance-Beginning of Period
2 Changes
3 Adjustments to Retained Earnings (Account 439)
4
5
6
7
8
9 TOTAL Credits to Retained Earnings (Acct. 439)
10
11
12
13
14
15 TOTAL Debits to Retained Earnings (Acct. 439)
( 7,621,676,016) 381,871,625 16 Balance Transferred from Income (Account 433 less Account 418.1)
17 Appropriations of Retained Earnings (Acct. 436)
18 Reserves for excess earnings on FERC hydroelectric
2,274,513215 19 project licenses pursuant to Federal Power Act Section 10 (d)
20
21
2,274,513 22 TOTAL Appropriations of Retained Earnings (Acct. 436)
23 Dividends Declared-Preferred Stock (Account 437)
24
25
26
27
28
29 TOTAL Dividends Declared-Preferred Stock (Acct. 437)
30 Dividends Declared-Common Stock (Account 438)
31
32
33
34
35
36 TOTAL Dividends Declared-Common Stock (Acct. 438)
1,766,985 1,759,280 37 Transfers from Acct 216.1, Unapprop. Undistrib. Subsidiary Earnings
( 5,021,494,323) -4,635,588,905 38 Balance - End of Period (Total 1,9,15,16,22,29,36,37)
APPROPRIATED RETAINED EARNINGS (Account 215)
39
40 Reserves for excess earnings on FERC hydroelectric
FERC FORM NO. 1/3-Q (REV. 02-04) Page 118

Name of Respondent This Report Is:(1) An Original
(2) A Resubmission
Date of Report(Mo, Da, Yr)
Year/Period of Report
End of
STATEMENT OF RETAINED EARNINGS
PACIFIC GAS AND ELECTRIC COMPANYX
04/13/2021
2020/Q4
Line
Current
Quarter/Year
Year to Date
Balance
(c)(b)(a)
ItemContra Primary
No.
Account Affected
1. Do not report Lines 49-53 on the quarterly version.
2. Report all changes in appropriated retained earnings, unappropriated retained earnings, year to date, and unappropriated
undistributed subsidiary earnings for the year.
3. Each credit and debit during the year should be identified as to the retained earnings account in which recorded (Accounts 433, 436
- 439 inclusive). Show the contra primary account affected in column (b)
4. State the purpose and amount of each reservation or appropriation of retained earnings.
5. List first account 439, Adjustments to Retained Earnings, reflecting adjustments to the opening balance of retained earnings. Follow
by credit, then debit items in that order.
6. Show dividends for each class and series of capital stock.
7. Show separately the State and Federal income tax effect of items shown in account 439, Adjustments to Retained Earnings.
8. Explain in a footnote the basis for determining the amount reserved or appropriated. If such reservation or appropriation is to be
recurrent, state the number and annual amounts to be reserved or appropriated as well as the totals eventually to be accumulated.
9. If any notes appearing in the report to stockholders are applicable to this statement, include them on pages 122-123.
Previous
Quarter/Year
Year to Date
Balance
(d)
-2,274,513 41 project licenses pursuant to Federal Power Act Section 10 (d)
42
43
44
-2,274,513 45 TOTAL Appropriated Retained Earnings (Account 215)
APPROP. RETAINED EARNINGS - AMORT. Reserve, Federal (Account 215.1)
286,020,935 286,020,935 46 TOTAL Approp. Retained Earnings-Amort. Reserve, Federal (Acct. 215.1)
286,020,935 283,746,422 47 TOTAL Approp. Retained Earnings (Acct. 215, 215.1) (Total 45,46)
( 4,735,473,388) -4,351,842,483 48 TOTAL Retained Earnings (Acct. 215, 215.1, 216) (Total 38, 47) (216.1)
UNAPPROPRIATED UNDISTRIBUTED SUBSIDIARY EARNINGS (Account
Report only on an Annual Basis, no Quarterly
( 58,010,567) -59,869,210 49 Balance-Beginning of Year (Debit or Credit)
( 91,657) 29,086,863 50 Equity in Earnings for Year (Credit) (Account 418.1)
51 (Less) Dividends Received (Debit)
( 1,766,986) -1,759,280 52
( 59,869,210) -32,541,627 53 Balance-End of Year (Total lines 49 thru 52)
FERC FORM NO. 1/3-Q (REV. 02-04) Page 119

(1) Codes to be used:(a) Net Proceeds or Payments;(b)Bonds, debentures and other long-term debt; (c) Include commercial paper; and (d) Identify separately such items as
investments, fixed assets, intangibles, etc.
(2) Information about noncash investing and financing activities must be provided in the Notes to the Financial statements. Also provide a reconciliation between "Cash and Cash
Equivalents at End of Period" with related amounts on the Balance Sheet.
(3) Operating Activities - Other: Include gains and losses pertaining to operating activities only. Gains and losses pertaining to investing and financing activities should be reported
in those activities. Show in the Notes to the Financials the amounts of interest paid (net of amount capitalized) and income taxes paid.
(4) Investing Activities: Include at Other (line 31) net cash outflow to acquire other companies. Provide a reconciliation of assets acquired with liabilities assumed in the Notes to
the Financial Statements. Do not include on this statement the dollar amount of leases capitalized per the USofA General Instruction 20; instead provide a reconciliation of the
dollar amount of leases capitalized with the plant cost.
Name of Respondent This Report Is:(1) An Original
(2) A Resubmission
Date of Report(Mo, Da, Yr)
Year/Period of Report
End of
STATEMENT OF CASH FLOWS
PACIFIC GAS AND ELECTRIC COMPANYX
04/13/20212020/Q4
Line Description (See Instruction No. 1 for Explanation of Codes)Current Year to Date
Quarter/Year
(b)(a)No.
Previous Year to Date
Quarter/Year
(c)
1 Net Cash Flow from Operating Activities:
-7,621,767,673 410,958,488 2 Net Income (Line 78(c) on page 117)
3 Noncash Charges (Credits) to Income:
3,230,237,833 3,465,351,968 4 Depreciation and Depletion
580,881,000 17,075,000 5 Disallowed Capital Expenditures
16,208,293 13,881,702 6 Amortization of Unamortized Loss or Gain on Reacquired Debt
19,417,546 42,542,882 7 Amortization of Expenses, Discount and Premium - Long Term Debt
-2,945,141,198 1,088,231,805 8 Deferred Income Taxes (Net)
-5,498,780 -6,991,812 9 Investment Tax Credit Adjustment (Net)
-102,302,285 1,686,127,869 10 Net (Increase) Decrease in Receivables
-79,838,426 5,575,918 11 Net (Increase) Decrease in Inventory
12 Net (Increase) Decrease in Allowances Inventory
1,737,800,074 -742,272,258 13 Net Increase (Decrease) in Payables and Accrued Expenses
-1,116,620,873 -8,410,713,378 14 Net (Increase) Decrease in Other Regulatory Assets
-302,763,969 6,353,639,907 15 Net Increase (Decrease) in Other Regulatory Liabilities
79,271,096 140,080,186 16 (Less) Allowance for Other Funds Used During Construction
-1,866,004 36,097,456 17 (Less) Undistributed Earnings from Subsidiary Companies
11,473,354,719-21,747,716,028 18 Other (provide details in footnote):
19
20
21
4,806,561,169-18,000,485,579 22 Net Cash Provided by (Used in) Operating Activities (Total 2 thru 21)
23
24 Cash Flows from Investment Activities:
25 Construction and Acquisition of Plant (including land):
-6,313,356,194 -7,709,459,133 26 Gross Additions to Utility Plant (less nuclear fuel)
-77,742,004 -120,482,321 27 Gross Additions to Nuclear Fuel
28 Gross Additions to Common Utility Plant
29 Gross Additions to Nonutility Plant
-79,271,096 -140,080,186 30 (Less) Allowance for Other Funds Used During Construction
31 Other (provide details in footnote):
32
33
-6,311,827,102 -7,689,861,268 34 Cash Outflows for Plant (Total of lines 26 thru 33)
35
36 Acquisition of Other Noncurrent Assets (d)
11,111,891 14,055,510 37 Proceeds from Disposal of Noncurrent Assets (d)
38
-1,740,858 -51,407,722 39 Investments in and Advances to Assoc. and Subsidiary Companies
40 Contributions and Advances from Assoc. and Subsidiary Companies
41 Disposition of Investments in (and Advances to)
42 Associated and Subsidiary Companies
43
44 Purchase of Investment Securities (a)
45 Proceeds from Sales of Investment Securities (a)
FERC FORM NO. 1 (ED. 12-96) Page 120

(1) Codes to be used:(a) Net Proceeds or Payments;(b)Bonds, debentures and other long-term debt; (c) Include commercial paper; and (d) Identify separately such items as
investments, fixed assets, intangibles, etc.
(2) Information about noncash investing and financing activities must be provided in the Notes to the Financial statements. Also provide a reconciliation between "Cash and Cash
Equivalents at End of Period" with related amounts on the Balance Sheet.
(3) Operating Activities - Other: Include gains and losses pertaining to operating activities only. Gains and losses pertaining to investing and financing activities should be reported
in those activities. Show in the Notes to the Financials the amounts of interest paid (net of amount capitalized) and income taxes paid.
(4) Investing Activities: Include at Other (line 31) net cash outflow to acquire other companies. Provide a reconciliation of assets acquired with liabilities assumed in the Notes to
the Financial Statements. Do not include on this statement the dollar amount of leases capitalized per the USofA General Instruction 20; instead provide a reconciliation of the
dollar amount of leases capitalized with the plant cost.
Name of Respondent This Report Is:(1) An Original
(2) A Resubmission
Date of Report(Mo, Da, Yr)
Year/Period of Report
End of
STATEMENT OF CASH FLOWS
PACIFIC GAS AND ELECTRIC COMPANYX
04/13/20212020/Q4
Line Description (See Instruction No. 1 for Explanation of Codes)Current Year to Date
Quarter/Year
(b)(a)No.
Previous Year to Date
Quarter/Year
(c)
46 Loans Made or Purchased
47 Collections on Loans
48
49 Net (Increase) Decrease in Receivables
50 Net (Increase ) Decrease in Inventory
51 Net (Increase) Decrease in Allowances Held for Speculation
52 Net Increase (Decrease) in Payables and Accrued Expenses
53 Other (provide details in footnote):
956,151,549 1,517,679,122 54 Proceeds from nuclear decommissioning trust investments
-1,032,116,370 -1,589,720,889 55 Purhcases of nuclear decommissioning trust investments and other
56 Net Cash Provided by (Used in) Investing Activities
-6,378,420,890 -7,799,255,247 57 Total of lines 34 thru 55)
58
59 Cash Flows from Financing Activities:
60 Proceeds from Issuance of:
1,753,430,038 10,335,736,841 61 Long-Term Debt (b)
62 Preferred Stock
63 Common Stock
64 Other (provide details in footnote):
65
2,055,000,000 66 Net Increase in Short-Term Debt (c)
67 Other (provide details in footnote):
12,986,032,164 68 Equity contribution from PG&E Corporation
69
1,753,430,038 25,376,769,005 70 Cash Provided by Outside Sources (Total 61 thru 69)
71
72 Payments for Retirement of:
-350,000,000 -100,000,000 73 Long-term Debt (b)
74 Preferred Stock
75 Common Stock
76 Other (provide details in footnote):
52,905,338 60,348,682 77 Customer Advances for Construction
78 Net Decrease in Short-Term Debt (c)
-56,559,554 -265,198,830 79 Other
80 Dividends on Preferred Stock
81 Dividends on Common Stock
82 Net Cash Provided by (Used in) Financing Activities
1,399,775,822 25,071,918,857 83 (Total of lines 70 thru 81)
84
85 Net Increase (Decrease) in Cash and Cash Equivalents
-172,083,899 -727,821,969 86 (Total of lines 22,57 and 83)
87
1,298,361,425 1,126,277,526 88 Cash and Cash Equivalents at Beginning of Period
89
1,126,277,526 398,455,557 90 Cash and Cash Equivalents at End of period
FERC FORM NO. 1 (ED. 12-96) Page 121
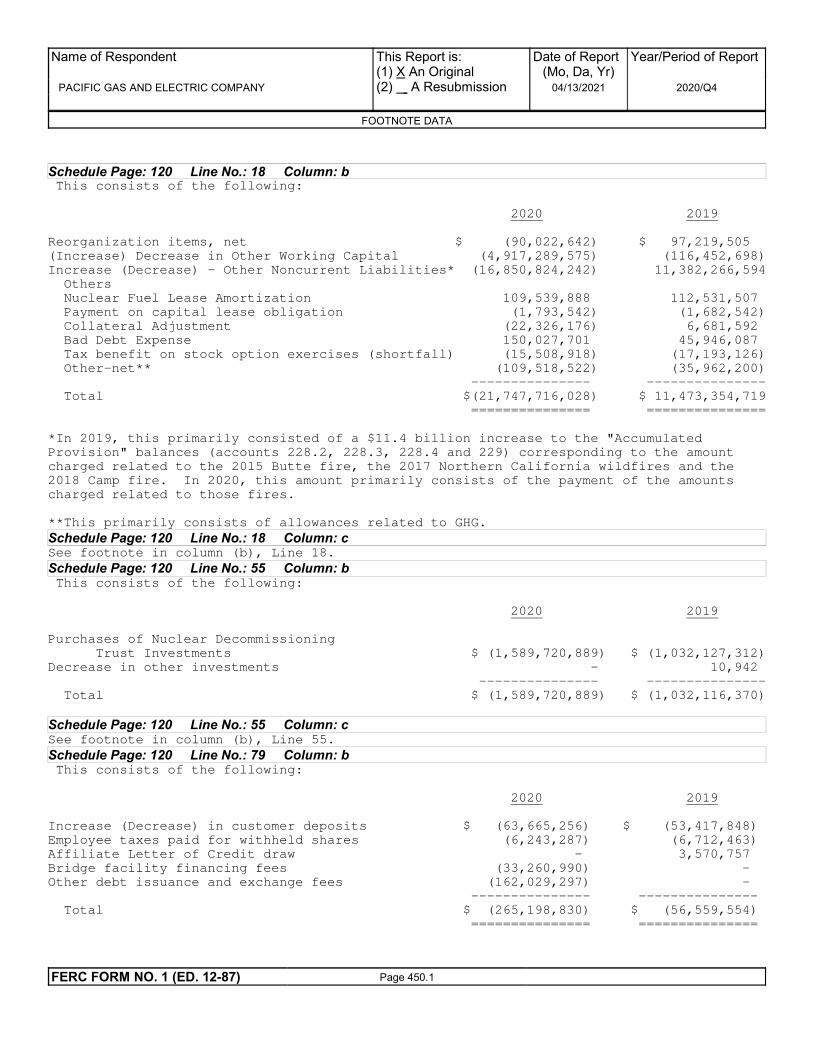
Schedule Page: 120 Line No.: 18 Column: b This consists of the following:
2020 2019
Reorganization items, net $ (90,022,642) $ 97,219,505
(Increase) Decrease in Other Working Capital (4,917,289,575) (116,452,698)
Increase (Decrease) - Other Noncurrent Liabilities* (16,850,824,242) 11,382,266,594
Others
Nuclear Fuel Lease Amortization 109,539,888 112,531,507
Payment on capital lease obligation (1,793,542) (1,682,542)
Collateral Adjustment (22,326,176) 6,681,592
Bad Debt Expense 150,027,701 45,946,087
Tax benefit on stock option exercises (shortfall) (15,508,918) (17,193,126)
Other-net** (109,518,522) (35,962,200)
--------------- ---------------
Total $(21,747,716,028) $ 11,473,354,719
=============== ===============
*In 2019, this primarily consisted of a $11.4 billion increase to the "Accumulated
Provision" balances (accounts 228.2, 228.3, 228.4 and 229) corresponding to the amount
charged related to the 2015 Butte fire, the 2017 Northern California wildfires and the
2018 Camp fire. In 2020, this amount primarily consists of the payment of the amounts
charged related to those fires.
**This primarily consists of allowances related to GHG.
Schedule Page: 120 Line No.: 18 Column: cSee footnote in column (b), Line 18.
Schedule Page: 120 Line No.: 55 Column: b This consists of the following:
2020 2019
Purchases of Nuclear Decommissioning
Trust Investments $ (1,589,720,889) $ (1,032,127,312)
Decrease in other investments - 10,942
--------------- ---------------
Total $ (1,589,720,889) $ (1,032,116,370)
Schedule Page: 120 Line No.: 55 Column: cSee footnote in column (b), Line 55.
Schedule Page: 120 Line No.: 79 Column: b This consists of the following:
2020 2019
Increase (Decrease) in customer deposits $ (63,665,256) $ (53,417,848)
Employee taxes paid for withheld shares (6,243,287) (6,712,463)
Affiliate Letter of Credit draw - 3,570,757
Bridge facility financing fees (33,260,990) -
Other debt issuance and exchange fees (162,029,297) -
--------------- ---------------
Total $ (265,198,830) $ (56,559,554)
=============== ===============
Name of Respondent
PACIFIC GAS AND ELECTRIC COMPANY
This Report is:(1) X An Original(2) A Resubmission
Date of Report(Mo, Da, Yr)
04/13/2021
Year/Period of Report
2020/Q4
FOOTNOTE DATA
FERC FORM NO. 1 (ED. 12-87) Page 450.1

Schedule Page: 120 Line No.: 79 Column: cSee footnote in column (b), Line 79.
Schedule Page: 120 Line No.: 90 Column: b This consists of the following:
2020 2019
Cash (131) $ 59,291,720 $ 294,434,921
Special Deposits (132-134) 143,144,862 7,195,190
Working Funds (135) 18,975 147,415
Temporary Cash Investment (136) 196,000,000 824,500,000
--------------- ---------------
Total $ 398,455,557 $ 1,126,277,526
=============== ===============
Supplemental disclosure of cash flow information (in millions):
Cash paid for:
Interest (net of amounts capitalized) $ (1,458) $ (7)
Supplemental disclosures of noncash investing and financing activities:
Capital expenditures financed through
accounts payable 515 826
Operating lease liabilities arising from
obtaining ROU assets 13 2,807
Common stock equity infusion from PG&E
Corporation used to satisfy liabilities 6,750 -
Transfer of receivables to subsidiary company 1,504 -
Schedule Page: 120 Line No.: 90 Column: cSee footnote in column (b), Line 90.
Name of Respondent
PACIFIC GAS AND ELECTRIC COMPANY
This Report is:(1) X An Original(2) A Resubmission
Date of Report(Mo, Da, Yr)
04/13/2021
Year/Period of Report
2020/Q4
FOOTNOTE DATA
FERC FORM NO. 1 (ED. 12-87) Page 450.2

Name of Respondent This Report Is:(1) An Original
(2) A Resubmission
Date of Report Year/Period of Report
End of
NOTES TO FINANCIAL STATEMENTS
PACIFIC GAS AND ELECTRIC COMPANY X04/13/2021
2020/Q4
PAGE 122 INTENTIONALLY LEFT BLANK
SEE PAGE 123 FOR REQUIRED INFORMATION.
1. Use the space below for important notes regarding the Balance Sheet, Statement of Income for the year, Statement of Retained
Earnings for the year, and Statement of Cash Flows, or any account thereof. Classify the notes according to each basic statement,
providing a subheading for each statement except where a note is applicable to more than one statement.
2. Furnish particulars (details) as to any significant contingent assets or liabilities existing at end of year, including a brief explanation of
any action initiated by the Internal Revenue Service involving possible assessment of additional income taxes of material amount, or of
a claim for refund of income taxes of a material amount initiated by the utility. Give also a brief explanation of any dividends in arrears
on cumulative preferred stock.
3. For Account 116, Utility Plant Adjustments, explain the origin of such amount, debits and credits during the year, and plan of
disposition contemplated, giving references to Cormmission orders or other authorizations respecting classification of amounts as plant
adjustments and requirements as to disposition thereof.
4. Where Accounts 189, Unamortized Loss on Reacquired Debt, and 257, Unamortized Gain on Reacquired Debt, are not used, give
an explanation, providing the rate treatment given these items. See General Instruction 17 of the Uniform System of Accounts.
5. Give a concise explanation of any retained earnings restrictions and state the amount of retained earnings affected by such
restrictions.
6. If the notes to financial statements relating to the respondent company appearing in the annual report to the stockholders are
applicable and furnish the data required by instructions above and on pages 114-121, such notes may be included herein.
7. For the 3Q disclosures, respondent must provide in the notes sufficient disclosures so as to make the interim information not
misleading. Disclosures which would substantially duplicate the disclosures contained in the most recent FERC Annual Report may be
omitted.
8. For the 3Q disclosures, the disclosures shall be provided where events subsequent to the end of the most recent year have occurred
which have a material effect on the respondent. Respondent must include in the notes significant changes since the most recently
completed year in such items as: accounting principles and practices; estimates inherent in the preparation of the financial statements;
status of long-term contracts; capitalization including significant new borrowings or modifications of existing financing agreements; and
changes resulting from business combinations or dispositions. However were material contingencies exist, the disclosure of such
matters shall be provided even though a significant change since year end may not have occurred.
9. Finally, if the notes to the financial statements relating to the respondent appearing in the annual report to the stockholders are
applicable and furnish the data required by the above instructions, such notes may be included herein.
FERC FORM NO. 1 (ED. 12-96) Page 122

Introduction:
The notes below are excerpts from PG&E Corporation and the Utility’s combined Report on Form 10-K for the
year ended December 31, 2020, as filed with the Securities and Exchange Commission (“SEC”) on February 25,
2021. The following disclosures contain information in accordance with SEC reporting requirements. As such,
due to the differences between FERC and SEC reporting requirements, certain amounts disclosed in the
following notes may not agree to balances in the FERC financial statements.
The accompanying financial statements were prepared in accordance with the accounting requirements of the
Federal Energy Regulatory Commission (“FERC”) as set forth in its applicable Uniform System of Accounts
and published accounting releases, which is a comprehensive basis of accounting other than accounting
principles generally accepted in the United States of America (“GAAP”). The primary differences from the
Utility’s GAAP basis financial statements as presented in the Form 1 are that (1) subsidiaries are not
consolidated and are shown under the equity method of accounting, (2) deferred income tax assets and liabilities
are not offset against each other but are shown as separate items on the balance sheet, are long-term, and
exclude the impact of uncertain temporary tax positions, (3) cost of removal is reported in accumulated
depreciation for FERC reporting purposes (GAAP requires that cost of removal be classified as a regulatory
liability), (4) there is no current liability classification of the current portion of long-term debt for FERC
reporting, (5) there is no reclassification of balancing accounts from current assets to current liabilities for
FERC reporting, (6) interdepartmental revenues and expenses between electric and gas operations of the Utility
are not eliminated for FERC reporting, (7) penalties and disallowances are reported in other income deductions
for FERC reporting, and (8) payments on capital lease obligations are disclosed in operating activities in the
statement of cash flows, (9) debt issuance costs are not deducted from the carrying amount of that debt liability
for FERC reporting, (10) there is no current liability classification of the current portion of accumulated
provision for injuries and damages, in which the estimated losses associated with third-party wildfire claims are
recorded, for FERC reporting, (11) FERC reporting does not reclass non-service costs related to pension
benefits on the income statement pursuant to ASU 2017-07, (12) there are no separate reporting categories
included on the FERC balance sheet for lease assets and liabilities pursuant to ASU 2016-02, (13) there is no
reclassification to liabilities subject to compromise for FERC reporting, and (14) there is no reclassification of
bankruptcy-related costs to reorganization costs for FERC reporting.
Subsequent Events:
Management has evaluated the impact of events occurring after December 31, 2020 up to February 25, 2021, the
date that Pacific Gas and Electric Company’s U.S. GAAP financial statements were issued and has updated such
evaluation for disclosure purposes through April 13, 2021. These financial statements include all necessary
adjustments and disclosures resulting from these evaluations.
Energy Storage Assets (FERC Order No. 784):
The following disclosure has been included to comply with accounting and reporting guidance issued by the
FERC for new electric storage technologies as a result of FERC Order No. 784.
Name of Respondent
PACIFIC GAS AND ELECTRIC COMPANY
This Report is:(1) X An Original(2) A Resubmission
Date of Report(Mo, Da, Yr)
04/13/2021
Year/Period of Report
2020/Q4
NOTES TO FINANCIAL STATEMENTS (Continued)
FERC FORM NO. 1 (ED. 12-88) Page 123.1

Energy Plant Account
Energy storage assets totaled $30,056,380 at December 31, 2020, all of which is recorded in account 363 in
accordance with FERC Order No. 784.
Power Purchased Account
Energy storage-related purchased power costs totaled $187,246 for the year ended December 31, 2020, all of
which is recorded in account 555.1 in accordance with FERC Order No. 784.
Operation and Maintenance Expense Accounts
Energy storage-related operating expenses totaled $0 for the year ended December 31, 2020, of which $0 is
recorded in account 582 and $0 is recorded in account 588. Amounts associated with distribution functional use
would have been recorded in account 584.1 and amounts associated with production functional use would have
been recorded in account 548.1, in accordance with FERC Order No. 784. Please see table below.
Energy storage-related maintenance expenses totaled $52,154 for the year ended December 31, 2020, of which
$0 is recorded in account 570 and $52,154 is recorded in account 592. Amounts associated with distribution
functional use would have been recorded in account 592.2 and amounts associated with production functional
use would have been recorded in account 553.1, in accordance with FERC Order No. 784. Please see table
below.
Other Expense Accounts
Energy storage-related employee pension and benefits expenses are recorded in account 926 in the amount of $0
for the year ended December 31, 2020.
Energy storage-related payroll tax expenses are recorded in account 408.1 in the amount of $0 for the year ended
December 31, 2020.
The following information to be reported in the newly adopted schedule pages 419-420 can be submitted as part
of pages 122-123:
Energy Storage Operations (Small Plants)
Line
no.
Name of
Energy
Storage
Project
Functional
classification
Location
of the
Project
Project Cost Operations
(Excluding
Fuel used
in Storage
Maintenance Cost of
fuel used
in storage
operations
Account
No. 555.1,
Power
Purchased
Other
Expenses
Name of Respondent
PACIFIC GAS AND ELECTRIC COMPANY
This Report is:(1) X An Original(2) A Resubmission
Date of Report(Mo, Da, Yr)
04/13/2021
Year/Period of Report
2020/Q4
NOTES TO FINANCIAL STATEMENTS (Continued)
FERC FORM NO. 1 (ED. 12-88) Page 123.2

Operations) for Storage
Operations
1 Vaca-Dixon Production Vacaville,
CA
$9,199,887 $0 $0 $0 $187,246 $0
2 Hitachi Distribution San Jose,
CA
$20,856,493 $0 $49,141 $0 $0 $0
3 Browns
Valley
Distribution Marysville,
CA
$0 $0 $3,013 $0 $0 $0
Totals $30,056,380 $0 $52,154 $0 $187,246 $0
NOTES TO THE CONSOLIDATED FINANCIAL STATEMENTS
NOTE 1: ORGANIZATION AND BASIS OF PRESENTATION
Organization and Basis of Presentation
PG&E Corporation is a holding company whose primary operating subsidiary is Pacific Gas and Electric Company, a public utility
serving northern and central California. The Utility generates revenues mainly through the sale and delivery of electricity and natural
gas to customers. The Utility is primarily regulated by the CPUC and the FERC. In addition, the NRC oversees the licensing,
construction, operation, and decommissioning of the Utility’s nuclear generation facilities.
This is a combined annual report of PG&E Corporation and the Utility. PG&E Corporation’s Consolidated Financial Statements
include the accounts of PG&E Corporation, the Utility, and other wholly owned and controlled subsidiaries. The Utility’s
Consolidated Financial Statements include the accounts of the Utility and its wholly owned and controlled subsidiaries. All
intercompany transactions have been eliminated in consolidation. The Notes to the Consolidated Financial Statements apply to both
PG&E Corporation and the Utility. PG&E Corporation and the Utility assess financial performance and allocate resources on a
consolidated basis (i.e., the companies operate in one segment).
The accompanying Consolidated Financial Statements have been prepared in conformity with GAAP and in accordance with the
reporting requirements of Form 10-K. The preparation of financial statements in conformity with GAAP requires the use of estimates
and assumptions that affect the reported amounts of assets, liabilities, revenues and expenses and the disclosure of contingent assets
and liabilities. Some of the more significant estimates and assumptions relate to the Utility’s regulatory assets and liabilities,
wildfire-related liabilities, legal and regulatory contingencies, the Wildfire Fund, environmental remediation liabilities, AROs,
insurance receivables, and pension and other post-retirement benefit plan obligations. Management believes that its estimates and
assumptions reflected in the Consolidated Financial Statements are appropriate and reasonable. A change in management’s estimates
or assumptions could result in an adjustment that would have a material impact on PG&E Corporation’s and the Utility’s financial
condition, results of operations, liquidity, and cash flows during the period in which such change occurred.
Chapter 11 Filing and Going Concern
Name of Respondent
PACIFIC GAS AND ELECTRIC COMPANY
This Report is:(1) X An Original(2) A Resubmission
Date of Report(Mo, Da, Yr)
04/13/2021
Year/Period of Report
2020/Q4
NOTES TO FINANCIAL STATEMENTS (Continued)
FERC FORM NO. 1 (ED. 12-88) Page 123.3
The accompanying Consolidated Financial Statements have been prepared on a going concern basis, which contemplates the continuity
of operations, the realization of assets and the satisfaction of liabilities in the normal course of business. PG&E Corporation and the
Utility suffered material losses as a result of the 2017 Northern California wildfires and the 2018 Camp fire, which contributed to the
decision to file for Chapter 11 protection on January 29, 2019. Uncertainty regarding these matters previously raised substantial doubt
about PG&E Corporation’s and the Utility’s abilities to continue as going concerns.
As a result of PG&E Corporation’s and the Utility’s emergence from Chapter 11 on the Effective Date of July 1, 2020, substantial
doubt has been alleviated regarding the Company’s ability to meet its obligations as they become due within one year after the date the
financial statements were issued. (For more information regarding the Chapter 11 Cases, see Note 2 below.)
NOTE 2: BANKRUPTCY FILING
Chapter 11 Proceedings
On the Petition Date, PG&E Corporation and the Utility commenced the Chapter 11 Cases with the Bankruptcy Court. Prior to the
Effective Date, PG&E Corporation and the Utility continued to operate their business as debtors-in-possession under the jurisdiction of
the Bankruptcy Court and in accordance with the applicable provisions of the Bankruptcy Code and orders of the Bankruptcy Court.
Except as otherwise set forth in the Plan, the Confirmation Order or another order of the Bankruptcy Court, substantially all
pre-petition liabilities were discharged under the Plan.
Significant Bankruptcy Court Actions
Plan of Reorganization and Restructuring Support Agreements
On June 19, 2020, PG&E Corporation and the Utility and the Shareholder Proponents filed the Plan. On June 20, 2020, the
Bankruptcy Court confirmed the Plan by issuing the Confirmation Order. PG&E Corporation and the Utility emerged from Chapter 11
on the Effective Date of July 1, 2020.
On September 22, 2019, PG&E Corporation and the Utility entered into the Subrogation RSA with certain holders of wildfire
insurance subrogation claims (such claims, the “Subrogation Claims”). On December 19, 2019, the Bankruptcy Court entered an order
approving the Subrogation RSA. As of December 31, 2020, PG&E Corporation and the Utility incurred $53 million in professional
fees related to the Subrogation RSA. See “Restructuring Support Agreement with Holders of Subrogation Claims” in Note 14 for
further information on the Subrogation RSA.
On December 6, 2019, PG&E Corporation and the Utility entered the TCC RSA, which was subsequently amended on December 16,
2019, with the TCC, the attorneys and other advisors and agents for holders of claims against PG&E Corporation and the Utility
relating to the 2015 Butte fire, the 2017 Northern California wildfires and the 2018 Camp fire (other than the Subrogation Claims and
Public Entity Wildfire Claims (as defined below)) (the “Fire Victim Claims”) that are signatories to the TCC RSA, and the Shareholder
Proponents. On December 19, 2019, the Bankruptcy Court entered an order approving the TCC RSA. See “Restructuring Support
Agreement with the TCC” in Note 14 for further information on the TCC RSA.
Name of Respondent
PACIFIC GAS AND ELECTRIC COMPANY
This Report is:(1) X An Original(2) A Resubmission
Date of Report(Mo, Da, Yr)
04/13/2021
Year/Period of Report
2020/Q4
NOTES TO FINANCIAL STATEMENTS (Continued)
FERC FORM NO. 1 (ED. 12-88) Page 123.4

On January 22, 2020, PG&E Corporation and the Utility entered into the Noteholder RSA with those holders of senior unsecured debt
of the Utility that are identified as “Consenting Noteholders” therein and the Shareholder Proponents. On February 5, 2020, the
Bankruptcy Court entered an order approving the Noteholder RSA.
Confirmation of the Plan of Reorganization
The Plan as confirmed by the Confirmation Order provides for certain transactions and the satisfaction and treatment of claims against
and interests in PG&E Corporation and the Utility, each in accordance with the terms of the Plan, including the transactions described
below. The Plan provides for the following treatment of various classes of claims as described below. PG&E Corporation and the
Utility are in the process of resolving and paying claims pursuant to the treatment provided under the Plan.
• PG&E Corporation and the Utility funded the Fire Victim Trust for the benefit of all holders of Fire Victim Claims, whose claims
were channeled to the Fire Victim Trust on the Effective Date with no recourse to PG&E Corporation and the Utility. In full and
final satisfaction, release, and discharge of all Fire Victim Claims, the Fire Victim Trust was funded with $5.4 billion in cash (with
an additional $1.35 billion in cash to be funded on a deferred basis), common stock of PG&E Corporation representing 22.19% of
the outstanding common stock of PG&E Corporation as of the Effective Date (subject to potential adjustments), plus the
assignment of certain rights and causes of action. As a result of such funding, all Fire Victim Claims have been satisfied, released,
discharged and channeled to the Fire Victim Trust with no recourse to PG&E Corporation or the Utility;
• PG&E Corporation and the Utility funded a trust (the “Subrogation Wildfire Trust”) for the benefit of holders of Subrogation
Claims in the amount of $11.0 billion in cash. Such amount was initially funded into escrow and later paid to the Subrogation
Wildfire Trust. As a result of such funding, all Subrogation Claims have been satisfied, released and discharged and channeled to
the Subrogation Wildfire Trust with no recourse to PG&E Corporation or the Utility;
• PG&E Corporation and the Utility paid $1.0 billion in cash to certain local public entities (the “Settling Public Entities”) that
entered into PSAs with PG&E Corporation and the Utility and established a segregated fund in the amount of $10 million to be
used to reimburse the Settling Public Entities for any and all legal fees and costs associated with the defense or resolution of any
third party claims against the Settling Public Entities in full and final satisfaction, release and discharge of such Settling Public
Entities’ wildfire related claims;
• The following pre-petition notes of the Utility: (a) 3.50% Senior Notes due October 1, 2020; (b) 4.25% Senior Notes due May 15,
2021; (c) 3.25% Senior Notes due September 15, 2021; and (d) 2.45% Senior Notes due August 15, 2022), (collectively, the
“Utility Short-Term Senior Notes”); the following pre-petition notes of the Utility: (a) 6.05% Senior Notes due March 1, 2034; (b)
5.80% Senior Notes due March 1, 2037; (c) 6.35% Senior Notes due February 15, 2038; (d) 6.25% Senior Notes due March 1,
2039; (e) 5.40% Senior Notes due January 15, 2040; and (f) 5.125% Senior Notes due November 15, 2043, (collectively, the
“Utility Long-Term Senior Notes) and the pre-petition credit agreements of the Utility, including in connection with the pollution
control bonds (except for $100 million of pollution control bonds (Series 2008F and 2010E), which were repaid in cash)
(collectively, the “Utility Funded Debt”) were refinanced and all other Utility pre-petition senior notes (collectively, the “Utility
Reinstated Senior Notes”) were reinstated and collateralized on or around the Effective Date through the issuance of a
corresponding series of first mortgage bonds of the Utility;
• PG&E Corporation paid in full all of its pre-petition funded debt obligations that were allowed in the Chapter 11 Cases;
Name of Respondent
PACIFIC GAS AND ELECTRIC COMPANY
This Report is:(1) X An Original(2) A Resubmission
Date of Report(Mo, Da, Yr)
04/13/2021
Year/Period of Report
2020/Q4
NOTES TO FINANCIAL STATEMENTS (Continued)
FERC FORM NO. 1 (ED. 12-88) Page 123.5

• PG&E Corporation and the Utility repaid all borrowings under the DIP Facilities and have paid all other allowed administrative
expense claims in accordance with the Plan;
• Holders of allowed claims by a governmental authority entitled to priority in payment under sections 502(i) and 507(a)(8) of the
Bankruptcy Code (“Priority Tax Claims”) have received or will receive in the future, cash in an amount equal to such allowed
Priority Tax Claims;
• Holders of allowed secured claims other than Priority Tax Claims or secured claims related to the DIP Facilities (“Other Secured
Claims”) have received or will receive cash in an amount equal to such Other Secured Claims;
• Holders of allowed claims other than administrative expense claims or Priority Tax Claims, entitled to priority in payment as
specified in section 507(a)(3), (4), (5), (6), (7), or (9) of the Bankruptcy Code (“Priority Non-Tax Claims”) have received or will
receive cash in an amount equal to such allowed Priority Non-Tax Claims;
• PG&E Corporation and the Utility will pay in full all pre-petition unsecured claims that do not fall within any of the other classes
of unsecured claims under the Plan (“General Unsecured Claims”) that are allowed in the Chapter 11 Cases; and
• PG&E Corporation and the Utility will pay in full all allowed claims that are subject to subordination under section 510(b) of the
Bankruptcy Code other than subordinated claims related to the common stock of PG&E Corporation (“Subordinated Debt
Claims”). PG&E Corporation will provide to each holder of an allowed claim that relates to the common stock of PG&E
Corporation that is subject to subordination under section 510(b) of the Bankruptcy Code (a “HoldCo Rescission or Damage
Claim”) a number of shares of PG&E Corporation common stock based on a formula as specified in the Plan that varies depending
on when the claimant purchased the affected shares of common stock and reduces the amount of the allowed claim by the amount
of insurance proceeds, if any, received by the claimant on account of all or any portion of an allowed HoldCo Rescission or
Damage Claim.
In addition, the Plan also provides for the following in connection with or following the implementation of the Plan:
• Holders of claims related to the 2016 Ghost Ship fire are entitled to pursue their claims against PG&E Corporation and the Utility
(with any recovery being limited to amounts available under PG&E Corporation’s and the Utility’s insurance policies for the 2016
year);
• Holders of certain claims may be able to pursue their claims against PG&E Corporation and the Utility, such as administrative
expense claims that have not been satisfied or come due by the Effective Date, claims arising from wildfires occurring after the
Petition Date that have not been satisfied by the Effective Date (including the 2019 Kincade fire (as defined in Note 14 below)),
and claims relating to certain FERC refund proceedings, workers’ compensation benefits and certain environmental claims;
• PG&E Corporation or the Utility, as applicable, assumed all of their respective power purchase agreements and community choice
aggregation servicing agreements; and
• PG&E Corporation or the Utility, as applicable, assumed all of their respective pension obligations, other employee obligations,
and collective bargaining agreements with labor.
Name of Respondent
PACIFIC GAS AND ELECTRIC COMPANY
This Report is:(1) X An Original(2) A Resubmission
Date of Report(Mo, Da, Yr)
04/13/2021
Year/Period of Report
2020/Q4
NOTES TO FINANCIAL STATEMENTS (Continued)
FERC FORM NO. 1 (ED. 12-88) Page 123.6
The Confirmation Order contains a channeling injunction that is also in the Plan that provides, among other things, that the sole source
of recovery for holders of Subrogation Claims will be from the Subrogation Wildfire Trust and the sole source of recovery for holders
of Fire Victim Claims will be from the Fire Victim Trust. The holders of such claims will have no recourse to or claims whatsoever
against PG&E Corporation and the Utility or their assets and properties on account of such claims.
The Plan as confirmed by the Confirmation Order provides for certain financing transactions as follows:
• one or more equity offerings of up to $9.0 billion of gross proceeds in cash through the issuance of common stock and/or other
equity and/or equity-linked securities pursuant to one or more offerings and/or private placements;
• the issuance of $4.75 billion of new PG&E Corporation debt;
• the reinstatement of $9.575 billion of pre-petition debt of the Utility; and
• the issuance of $23.775 billion of new Utility debt, consisting of (i) $6.2 billion of the Utility’s 4.55% Senior Notes due 2030 and
4.95% Senior Notes due 2050 (the “New Utility Long-Term Bonds”) to be issued to holders of certain pre-petition senior notes of
the Utility pursuant to the Plan, (ii) $1.75 billion of the Utility’s 3.45% Senior Notes due 2025 and 3.75% Senior Notes due 2028
(the “New Utility Short-Term Bonds”) to be issued to holders of certain pre-petition senior notes of the Utility pursuant to the
Plan, (iii) $3.9 billion of the Utility’s 3.15% Senior Notes due 2026 and 4.50% Senior Notes due 2040 (the “New Utility Funded
Debt Exchange Bonds”) to be issued to holders of certain pre-petition indebtedness of the Utility pursuant to the Plan and (iv)
$11.925 billion of new debt securities or bank debt of the Utility to be issued to third parties for cash on or prior to the Effective
Date (of which $6.0 billion is expected to be repaid with the proceeds of a new securitization transaction after the Effective Date)
(see Note 5 below for a description of the debt transactions that occurred on or before the Effective Date).
The foregoing financing transactions occurred on or around the Effective Date.
On the Effective Date, pursuant to the Plan, the Utility entered into a tax benefits payment agreement (the “Tax Benefits Payment
Agreement”) with the Fire Victim Trust, pursuant to which the Utility agreed to pay to the Fire Victim Trust in cash an aggregate
amount of $1.35 billion, comprising (i) at least $650 million of tax benefits arising from certain tax deductions related to pre-petition
wildfires (“Tax Benefits”) for fiscal year 2020 to be paid on or before January 15, 2021 and (ii) of the remainder of $1.35 billion of
Tax Benefits for fiscal year 2021 to be paid on or before January 15, 2022. On January 15, 2021, the Utility paid the first tranche of
tax benefits of approximately $758 million pursuant to the Tax Benefits Payment Agreement.
Also on the Effective Date, pursuant to the Plan, the Utility entered into an assignment agreement with the Fire Victim Trust (the “Fire
Victim Trust Assignment Agreement”), pursuant to which the Utility agreed to transfer to the Fire Victim Trust on the Effective Date
477.0 million shares of PG&E Corporation common stock. As a result of the Additional Units Issuance (as described in Note 6 below)
on August 3, 2020, PG&E Corporation made an equity contribution of 748,415 shares to the Utility which delivered such additional
shares of common stock to the Fire Victim Trust pursuant to an anti-dilution provision in the Fire Victim Trust Assignment Agreement.
Name of Respondent
PACIFIC GAS AND ELECTRIC COMPANY
This Report is:(1) X An Original(2) A Resubmission
Date of Report(Mo, Da, Yr)
04/13/2021
Year/Period of Report
2020/Q4
NOTES TO FINANCIAL STATEMENTS (Continued)
FERC FORM NO. 1 (ED. 12-88) Page 123.7

Further, on the Effective Date, PG&E Corporation and the Utility funded a $10 million fund established for the benefit of the
Supporting Public Entities (refer to “Plan Support Agreements with Public Entities” in Note 14 below) under the PSAs in accordance
with the terms of the Plan and the PSAs with the Supporting Public Entities, and also made a payment of $1.0 billion in cash to the
public entities who are party to the PSAs with the Supporting Public Entities. Also, on the Effective Date, PG&E Corporation and the
Utility funded $100 million to the Subrogation Wildfire Trust and placed the balance of the $11.0 billion in a segregated escrow
account established and owned by the Subrogation Wildfire Trust for the benefit of holders of Subrogation Claims, which was
subsequently paid to the Subrogation Wildfire Trust.
Equity Financing
In connection with its emergence from Chapter 11 in July 2020, PG&E raised an aggregate of $9.0 billion of gross proceeds through
the issuance of common stock and other equity-linked instruments. For more information, see Note 6 below.
Equity Backstop Commitments and Forward Stock Purchase Agreements
As of March 6, 2020, PG&E Corporation entered into Chapter 11 Plan Backstop Commitment Letters (collectively, as amended by the
Consent Agreements (as defined below), the “Backstop Commitment Letters”) with the Backstop Parties, pursuant to which the
Backstop Parties severally agreed to fund up to $12.0 billion of proceeds to finance the Plan through the purchase of PG&E
Corporation common stock, subject to the terms and conditions set forth in such Backstop Commitment Letters (the “Backstop
Commitments”). As a result of PG&E Corporation emerging from Chapter 11 on July 1, 2020, the Backstop Commitments were not
utilized and terminated in accordance with their terms.
The commitment premium for the Backstop Commitments was paid in shares (the “Backstop Commitment Premium Shares”) of
PG&E Corporation’s common stock (with each Backstop Party receiving its pro rata share of 119 million shares of PG&E
Corporation’s common stock based on the proportion of the amount of such Backstop Party’s Backstop Commitment to $12.0 billion).
PG&E Corporation issued the Backstop Commitment Premium Shares to the Backstop Parties on the Effective Date in connection with
emerging from Chapter 11.
On June 30, 2020, PG&E Corporation recorded approximately $1.1 billion of expense related to the Backstop Commitment Premium
Shares in Reorganization items, net (as defined below). This amount was primarily based on PG&E Corporation’s closing stock price
on June 30, 2020 of $8.87 per share. On the Effective Date, PG&E Corporation’s closing price was $9.03 per share and as a result,
PG&E Corporation recorded an additional $19 million expense in the third quarter of 2020.
Under the Backstop Commitment Letters, PG&E Corporation and the Utility have also agreed to reimburse the Backstop Parties for
reasonable professional fees and expenses of up to $34 million in the aggregate for the legal advisors and $19 million in the aggregate
for the financial advisor, upon the terms and conditions set forth in the Backstop Commitment Letters. As of December 31, 2020,
PG&E Corporation recorded $49 million in professional fees and related expenses to the Backstop Parties in Reorganization items,
net.
In connection with PG&E Corporation’s underwritten offerings of up to $5.75 billion of equity securities to finance the transactions
contemplated by the Plan (the “Offerings”), up to $523 million was issuable pursuant to customary options granted to the underwriters
thereof to purchase the Option Securities (as defined below in Note 6).
Name of Respondent
PACIFIC GAS AND ELECTRIC COMPANY
This Report is:(1) X An Original(2) A Resubmission
Date of Report(Mo, Da, Yr)
04/13/2021
Year/Period of Report
2020/Q4
NOTES TO FINANCIAL STATEMENTS (Continued)
FERC FORM NO. 1 (ED. 12-88) Page 123.8

On June 19, 2020, PG&E Corporation entered into the Forward Stock Purchase Agreements with the Backstop Parties. Each Forward
Stock Purchase Agreement provided that, subject to certain conditions, the Backstop Party would purchase on the Effective Date, and
receive on such settlement date as designated in the Forward Stock Purchase Agreement (the “Settlement Date”) an amount of common
stock of PG&E Corporation (such shares, each Backstop Party’s “Greenshoe Backstop Shares”) equal to its pro rata share of the value
of the Option Securities not purchased by the underwriters (such amount, each Backstop Party’s “Greenshoe Backstop Purchase
Amount” and all Greenshoe Backstop Purchase Amounts in the aggregate, the “Aggregate Greenshoe Backstop Purchase Amount”), at
a price per share equal to the lesser of (i) the lowest per share price of common stock sold on an underwritten basis to the public in an
offering of common stock of PG&E Corporation, as disclosed on the cover page of the prospectus or prospectus supplement, and (ii)
the price per share payable by the investors party to the Investment Agreement dated as of June 7, 2020 (such lesser price, the
“Settlement Price”). The Settlement Price was $9.50 per share. Each Forward Stock Purchase Agreement expired on August 3, 2020.
On June 25, 2020, the Backstop Parties funded the Greenshoe Backstop Purchase Amount to PG&E Corporation in the amount of
$523 million, which was recorded in Other current liabilities on the Consolidated Financial Statements. PG&E Corporation applied
the proceeds of such funding to distributions under the Plan on the Effective Date. On August 3, 2020, PG&E Corporation redeemed
$120.5 million of the Forward Stock Purchase Agreements payable in cash as a result of the exercise by the underwriters of their
option to purchase Equity Units pursuant to the Equity Units Underwriting Agreement (as defined below in Note 6). On August 3,
2020, PG&E Corporation delivered 42.3 million Greenshoe Backstop Shares to the Backstop Parties to settle the portion of the
Forward Stock Purchase Agreements that was not redeemed.
Additionally, each Forward Stock Purchase Agreement provided that, subject to the consummation by PG&E Corporation of the
Offerings, PG&E Corporation would issue to each Backstop Party its pro rata share of 50 million shares of common stock (such
shares, each Backstop Party’s “Additional Backstop Premium Shares”). The Additional Backstop Premium Shares were issued to
Backstop Parties on the Effective Date. On June 30, 2020, PG&E Corporation recorded $444 million of expense related to the
Additional Backstop Premium Shares in Reorganization items, net. This amount was based primarily on PG&E Corporation’s closing
stock price on June 30, 2020 of $8.87 per share. On the Effective Date, PG&E Corporation’s closing stock price was $9.03 per share
and as a result, PG&E Corporation recorded an additional $8 million expense in the third quarter of 2020.
Financial Reporting in Reorganization
Effective on the Petition Date and up to June 30, 2020, PG&E Corporation and the Utility applied accounting standards applicable to
reorganizations, which are applicable to companies under Chapter 11 bankruptcy protection. These accounting standards require the
financial statements for periods subsequent to the Petition Date to distinguish transactions and events that are directly associated with
the reorganization from the ongoing operations of the business. Expenses, realized gains and losses, and provisions for losses that
were directly associated with reorganization proceedings must have been reported separately as reorganization items, net in the
Consolidated Statements of Income. In addition, the balance sheet must have distinguished pre-petition LSTC of PG&E Corporation
and the Utility from pre-petition liabilities that were not subject to compromise, post-petition liabilities, and liabilities of the
subsidiaries of PG&E Corporation that were not debtors in the Chapter 11 Cases in the Consolidated Balance Sheets. LSTC are
pre-petition obligations that were not fully secured and had at least a possibility of not being repaid at the full claim amount. Where
there was uncertainty about whether a secured claim would be paid or impaired pursuant to the Chapter 11 Cases, PG&E Corporation
and the Utility classified the entire amount of the claim as LSTC.
Name of Respondent
PACIFIC GAS AND ELECTRIC COMPANY
This Report is:(1) X An Original(2) A Resubmission
Date of Report(Mo, Da, Yr)
04/13/2021
Year/Period of Report
2020/Q4
NOTES TO FINANCIAL STATEMENTS (Continued)
FERC FORM NO. 1 (ED. 12-88) Page 123.9

Furthermore, the realization of assets and the satisfaction of liabilities are subject to uncertainty. Pursuant to the Plan and
Confirmation Order, actions to enforce or otherwise effect the payment of certain claims against PG&E Corporation and the Utility in
existence before the Petition Date were subject to an injunction and were subject to treatment under the Plan. These claims were
reflected as LSTC in the Consolidated Balance Sheets at December 31, 2019. Additional claims may arise for contingencies and other
unliquidated and disputed amounts.
PG&E Corporation’s Consolidated Financial Statements are presented on a consolidated basis and include the accounts of PG&E
Corporation and the Utility and other subsidiaries of PG&E Corporation and the Utility that individually and in aggregate are
immaterial. Such other subsidiaries did not file for bankruptcy.
The Utility’s Consolidated Financial Statements are presented on a consolidated basis and include the accounts of the Utility and other
subsidiaries of the Utility that individually and in aggregate are immaterial. Such other subsidiaries did not file for bankruptcy.
Upon emergence from Chapter 11 on July 1, 2020, PG&E Corporation and the Utility were not required to apply fresh start accounting
based on the provisions of ASC 852 since the entity’s reorganization value immediately before the date of confirmation was more than
the total of all its post-petition liabilities and allowed claims.
Liabilities Subject to Compromise
As a result of the commencement of the Chapter 11 Cases, the payment of pre-petition liabilities was subject to compromise or other
treatment pursuant to the Plan. Generally, actions to enforce or otherwise effect payment of pre-petition liabilities are subject to an
injunction and will be satisfied pursuant to the Plan and the Chapter 11 claims reconciliation process.
Prior to June 30, 2020, pre-petition liabilities that were subject to compromise were required to be reported at the amounts expected to
be allowed. Therefore, liabilities subject to compromise as of December 31, 2019 in the table below reflected management’s estimates
of amounts expected to be allowed in the Chapter 11 Cases, based upon, among other things, the status of negotiations with creditors.
As of June 30, 2020, such amounts were reclassified to current or non-current liabilities in the Condensed Consolidated Balance
Sheets, based upon management’s judgment as to the timing for settlement of such liabilities.
Liabilities subject to compromise as of December 31, 2019 which were settled or reclassified as of December 31, 2020 consist of the
following:
(in millions) UtilityPG&E
Corporation
(1)
December 31,
2019
PG&E
Corporation
Consolidated
Change in
Estimated
Allowed
Claim
2020 (2)
Cash
Payment
Reclassified
as of June 30,
2020 (3)
UtilityPG&E
Corporation
(1)
December
31, 2020
PG&E
Corporation
Consolidated
Financing debt $
22,450
$ 666 $ 23,116 $ 351 $ — $ (23,467) $ — $ — $ —
Wildfire-related
claims 25,548 — 25,548 18 (23) (25,543) — — —
Trade creditors
(4) 1,183 5 1,188 6 (14) (1,180) — — —
Non-qualified20 137 157 — — (157) — — —
Name of Respondent
PACIFIC GAS AND ELECTRIC COMPANY
This Report is:(1) X An Original(2) A Resubmission
Date of Report(Mo, Da, Yr)
04/13/2021
Year/Period of Report
2020/Q4
NOTES TO FINANCIAL STATEMENTS (Continued)
FERC FORM NO. 1 (ED. 12-88) Page 123.10

benefit plan
2001 bankruptcy
disputed claims 234 — 234 4 — (238) — — —
Customer
deposits &
advances 71 — 71 12 — (83) — — —
Other 230 2 232 59 — (291) — — —
Total Liabilities
Subject to
Compromise $
49,736
$ 810 $ 50,546 $ 450 $ (37) $ (50,959) $ — $ — $ —
(1) PG&E Corporation amounts reflected under the column “PG&E Corporation” exclude the accounts of the Utility.
(2) Change in estimated allowed claim amounts are primarily due to interest accruals with the exception of the “wildfire-related claims,” “customer deposits &
advances,” and “other” line items which are mainly due to the adjustment to recorded liabilities.
(3) Amounts reclassified as of June 30, 2020 included $8.6 million to Accounts payable - other, $237.6 million to Disputed claims and customer refunds,
$1,347.4 million to Interest payable, $21,425.7 million to Long-term debt, $300.0 million to Short-term borrowings, $450.0 million to Long-term debt, classified as
current, $301.0 million to Other current liabilities, $97.9 million to Other non-current liabilities, $121.3 million to Pension and other post-retirement benefits,
$1,126.9 million to Accounts payable - trade creditors, and $25,542.7 million to Wildfire-related claims on the Condensed Consolidated Balance Sheets.
(4) As of February 18, 2021, $5 million and $941 million has been repaid by PG&E Corporation and the Utility, respectively.
Chapter 11 Claims Process
PG&E Corporation and the Utility have received over 100,000 proofs of claim since the Petition Date, of which approximately 80,000
were channeled to the Subrogation Wildfire Trust and Fire Victim Trust. The claims channeled to the Subrogation Wildfire Trust and
Fire Victim Trust will be resolved by such trusts, and PG&E Corporation and the Utility have no further liability in connection with
such claims. PG&E Corporation and the Utility continue their review and analysis of certain remaining claims including asserted
litigation claims, trade creditor claims, non-qualified benefit plan claims, along with other tax and regulatory claims, and therefore the
ultimate liability of PG&E Corporation or the Utility for such claims may differ from the amounts asserted in such claims. Allowed
claims are paid in accordance with the Plan and the Confirmation Order.
The Bankruptcy Code provides that the confirmation of a plan of reorganization discharges a debtor from substantially all debts arising
prior to confirmation, other than as provided in the Plan or the Confirmation Order.
The Plan, however, provides that the holders of certain claims may pursue their claims against PG&E Corporation and the Utility on or
after the Effective Date, including, but not limited to, the following:
• claims arising after the January 29, 2019 Petition Date that constitute administrative expense claims, which will not be discharged
pursuant to the Plan, other than allowed administrative expense claims that have been paid in cash or otherwise satisfied in the
ordinary course in an amount equal to the allowed amount of such claim on or prior to the Effective Date;
• claims of the Ghost Ship fire litigation (with any recovery being limited to amounts available under PG&E Corporation’s and the
Utility’s insurance policies for the 2016 year);
Name of Respondent
PACIFIC GAS AND ELECTRIC COMPANY
This Report is:(1) X An Original(2) A Resubmission
Date of Report(Mo, Da, Yr)
04/13/2021
Year/Period of Report
2020/Q4
NOTES TO FINANCIAL STATEMENTS (Continued)
FERC FORM NO. 1 (ED. 12-88) Page 123.11

• claims arising out of or based on the 2019 Kincade fire (as defined in Note 14 below), which the California Department of
Forestry and Fire Protection has determined was caused by the Utility’s transmission lines; which is currently under investigation
by the CPUC and the Sonoma County District Attorney’s Office; and which may also be under investigation by various other
entities, including law enforcement agencies; and
• certain FERC refund proceedings, workers’ compensation benefits and environmental claims.
Furthermore, holders of certain claims may assert that they are entitled under the Plan or the Bankruptcy Code to pursue, or continue to
pursue, their claims against PG&E Corporation and the Utility on or after the Effective Date, including but not limited to, claims
arising from or relating to:
• the purported de-energization securities class action filed in October 2019 and amended to add PG&E Corporation in April 2020.
For more information on the filing, see Note 14 below;
• the purported PSPS class action filed in December 2019 and seeking up to $2.5 billion in special and general damages, punitive
and exemplary damages and injunctive relief to require the Utility to properly maintain and inspect its power grid, was dismissed
on April 3, 2020, and subsequently appealed on April 6, 2020. For more information on the filing, see Note 15 below; and
• indemnification or contributing claims, including with respect to the 2018 Camp fire, the 2017 Northern California wildfires, and
the 2015 Butte fire.
In addition, claims continue to be pursued against PG&E Corporation and the Utility and certain of their respective current and former
directors and officers as well as certain underwriters, in connection with three purported securities class actions, as further described in
Note 14 under the heading “Securities Class Action Litigation.”
Various electricity suppliers filed claims in the Utility’s 2001 prior proceeding filed under Chapter 11 of the U.S. Bankruptcy Code
seeking payment for energy supplied to the Utility’s customers between May 2000 and June 2001. While FERC and judicial
proceedings are pending, the Utility pursued settlements with electricity suppliers and entered into a number of settlement agreements
with various electricity suppliers to resolve some of these disputed claims and to resolve the Utility’s refund claims against these
electricity suppliers. Under these settlement agreements, amounts payable by the parties, in some instances, would be subject to
adjustment based on the outcome of the various refund offset and interest issues being considered by the FERC. Generally, any net
refunds, claim offsets, or other credits that the Utility receives from electricity suppliers either through settlement or through the
conclusion of the various FERC and judicial proceedings are refunded to customers through rates in future periods. Pursuant to the
Plan, on and after the Effective Date, the holders of such claims are entitled to pursue their claims against the Reorganized Utility as if
the Chapter 11 Cases had not been commenced.
On September 1, 2020, PG&E Corporation and the Utility filed a motion with the Bankruptcy Court requesting that the court approve
an alternative dispute resolution process for resolving disputed general unsecured claims and appoint a panel of mediators in the
process. On September 25, 2020, the court approved the motion and appointed a panel of mediators. The mediators’ role will be to
assist various claims through a Standard and Abbreviated Mediation Process.
Name of Respondent
PACIFIC GAS AND ELECTRIC COMPANY
This Report is:(1) X An Original(2) A Resubmission
Date of Report(Mo, Da, Yr)
04/13/2021
Year/Period of Report
2020/Q4
NOTES TO FINANCIAL STATEMENTS (Continued)
FERC FORM NO. 1 (ED. 12-88) Page 123.12

On October 27, 2020, PG&E Corporation and the Utility filed a motion for entry of an order extending deadline for the reorganized
debtors to object to claims, requesting an additional 180 days beyond December 31, 2020 to process claims. On November 17, 2020,
the Bankruptcy Court entered an order extending the deadline under the Plan for PG&E Corporation and the Utility to object to claims
through and including June 26, 2021 (March 31, 2021, for claims held by the United States), without prejudice to the rights of PG&E
Corporation and the Utility to seek additional extensions thereof.
Reorganization Items, Net
Reorganization items, net, represent amounts incurred after the Petition Date as a direct result of the Chapter 11 Cases and are
comprised of professional fees and financing costs, net of interest income and other. Cash paid for reorganization items, net was
$102 million and $400 million for PG&E Corporation and the Utility, respectively, for the year ended December 31, 2020 as
compared to $15 million and $223 million for PG&E Corporation and the Utility, respectively, during 2019. Of the $400 million in
cash paid for the Utility’s reorganization items, during the year ended December 31, 2020, $35 million in facility fees related to the
Backstop Commitment Letters were recorded to a regulatory asset as they were deemed probable of recovery. Reorganization items,
net for the year ended December 31, 2020 include the following:
Year Ended December 31, 2020
(in millions) Utility PG&E Corporation
(1)
PG&E Corporation
Consolidated
Debtor-in-possession financing costs $ 6 $ — $ 6
Legal and other (2) 318 1,651 1,969
Interest and other (14) (2) (16)
Total reorganization items, net $ 310 $ 1,649 $ 1,959
(1) PG&E Corporation amounts reflected under the column “PG&E Corporation” exclude the accounts of the Utility.
(2) Amount includes $1.5 billion in equity backstop premium expense and bridge loan facility fees.
Reorganization items, net from the Petition Date through December 31, 2019 include the following:
Petition Date Through December 31, 2019
(in millions) Utility PG&E Corporation
(1)
PG&E Corporation
Consolidated
Debtor-in-possession financing costs $ 97 $ 17 $ 114
Legal and other 273 19 292
Interest income (50) (10) (60)
Total reorganization items, net $ 320 $ 26 $ 346
(1) PG&E Corporation amounts reflected under the column “PG&E Corporation” exclude the accounts of the Utility.
Name of Respondent
PACIFIC GAS AND ELECTRIC COMPANY
This Report is:(1) X An Original(2) A Resubmission
Date of Report(Mo, Da, Yr)
04/13/2021
Year/Period of Report
2020/Q4
NOTES TO FINANCIAL STATEMENTS (Continued)
FERC FORM NO. 1 (ED. 12-88) Page 123.13

NOTE 3: SUMMARY OF SIGNIFICANT ACCOUNTING POLICIES
Regulation and Regulated Operations
The Utility follows accounting principles for rate-regulated entities and collects rates from customers to recover “revenue
requirements” that have been authorized by the CPUC or the FERC based on the Utility’s cost of providing service. The Utility’s
ability to recover a significant portion of its authorized revenue requirements through rates is generally independent, or “decoupled,”
from the volume of the Utility’s electricity and natural gas sales. The Utility records assets and liabilities that result from the regulated
ratemaking process that would not be recorded under GAAP for nonregulated entities. The Utility capitalizes and records, as
regulatory assets, costs that would otherwise be charged to expense if it is probable that the incurred costs will be recovered in future
rates. Regulatory assets are amortized over the future periods in which the costs are recovered. If costs expected to be incurred in the
future are currently being recovered through rates, the Utility records those expected future costs as regulatory liabilities. Amounts
that are probable of being credited or refunded to customers in the future are also recorded as regulatory liabilities.
The Utility also records a regulatory balancing account asset or liability for differences between customer billings and authorized
revenue requirements that are probable of recovery or refund. In addition, the Utility records a regulatory balancing account asset or
liability for differences between incurred costs and customer billings or authorized revenue meant to recover those costs, to the extent
that these differences are probable of recovery or refund. These differences have no impact on net income. See “Revenue
Recognition” below.
Management continues to believe the use of regulatory accounting is applicable and that all regulatory assets and liabilities are
recoverable or refundable. To the extent that portions of the Utility’s operations cease to be subject to cost of service rate regulation,
or recovery is no longer probable as a result of changes in regulation or other reasons, the related regulatory assets and liabilities are
written off.
Loss Contingencies
A provision for a loss contingency is recorded when it is both probable that a liability has been incurred and the amount of the liability
can reasonably be estimated. PG&E Corporation and the Utility evaluate which potential liabilities are probable and the related range
of reasonably estimated losses and record a charge that reflects their best estimate or the lower end of the range, if there is no better
estimate. The assessment of whether a loss is probable or reasonably possible, and whether the loss or a range of losses is estimable,
often involves a series of complex judgments about future events. Loss contingencies are reviewed quarterly and estimates are
adjusted to reflect the impact of all known information, such as negotiations, discovery, settlements and payments, rulings, advice of
legal counsel, and other information and events pertaining to a particular matter. PG&E Corporation’s and the Utility’s provision for
loss and expense excludes anticipated legal costs, which are expensed as incurred.
Revenue Recognition
Revenue from Contracts with Customers
Name of Respondent
PACIFIC GAS AND ELECTRIC COMPANY
This Report is:(1) X An Original(2) A Resubmission
Date of Report(Mo, Da, Yr)
04/13/2021
Year/Period of Report
2020/Q4
NOTES TO FINANCIAL STATEMENTS (Continued)
FERC FORM NO. 1 (ED. 12-88) Page 123.14

The Utility recognizes revenues when electricity and natural gas services are delivered. The Utility records unbilled revenues for the
estimated amount of energy delivered to customers but not yet billed at the end of the period. Unbilled revenues are included in
accounts receivable on the Consolidated Balance Sheets. Rates charged to customers are based on CPUC and FERC authorized
revenue requirements. Revenues can vary significantly from period to period because of seasonality, weather, and customer usage
patterns.
Regulatory Balancing Account Revenue
The CPUC authorizes most of the Utility’s revenues in the Utility’s GRC and GT&S rate cases, which generally occur
every three or four years. The Utility's ability to recover revenue requirements authorized by the CPUC in these rate cases is
independent or “decoupled” from the volume of the Utility's sales of electricity and natural gas services. The Utility recognizes
revenues that have been authorized for rate recovery, are objectively determinable and probable of recovery, and are expected to be
collected within 24 months. Generally, electric and natural gas operating revenue is recognized ratably over the year. The Utility
records a balancing account asset or liability for differences between customer billings and authorized revenue requirements that are
probable of recovery or refund.
The CPUC also has authorized the Utility to collect additional revenue requirements to recover costs that the Utility has been
authorized to pass on to customers, including costs to purchase electricity and natural gas, and to fund public purpose, demand
response, and customer energy efficiency programs. In general, the revenue recognition criteria for pass-through costs billed to
customers are met at the time the costs are incurred. The Utility records a regulatory balancing account asset or liability for differences
between incurred costs and customer billings or authorized revenue meant to recover those costs, to the extent that these differences
are probable of recovery or refund. As a result, these differences have no impact on net income.
The following table presents the Utility’s revenues disaggregated by type of customer:
Year Ended
(in millions) 2020 2019
Electric
Revenue from contracts with customers
Residential $ 5,523 $ 4,847
Commercial 4,722 4,756
Industrial 1,530 1,493
Agricultural 1,471 1,106
Public street and highway lighting 69 67
Other (1) (130) 168
Total revenue from contracts with customers - electric 13,185 12,437
Regulatory balancing accounts (2) 673 303
Total electric operating revenue $ 13,858 $ 12,740
Name of Respondent
PACIFIC GAS AND ELECTRIC COMPANY
This Report is:(1) X An Original(2) A Resubmission
Date of Report(Mo, Da, Yr)
04/13/2021
Year/Period of Report
2020/Q4
NOTES TO FINANCIAL STATEMENTS (Continued)
FERC FORM NO. 1 (ED. 12-88) Page 123.15

Natural gas
Revenue from contracts with customers
Residential $ 2,517 $ 2,325
Commercial 597 605
Transportation service only 1,211 1,249
Other (1) 61 123
Total revenue from contracts with customers - gas 4,386 4,302
Regulatory balancing accounts (2) 225 87
Total natural gas operating revenue 4,611 4,389
Total operating revenues $ 18,469 $ 17,129
(1) This activity is primarily related to the change in unbilled revenue and amounts subject to refund, partially offset by other miscellaneous revenue items.
(2) These amounts represent revenues authorized to be billed or refunded to customers.
Cash, Cash Equivalents, and Restricted Cash
Cash and cash equivalents consist of cash and short-term, highly liquid investments with original maturities of three months or less.
Cash equivalents are stated at fair value. As of December 31, 2020, the Utility also holds restricted cash that primarily consists of cash
held in escrow to be used to pay bankruptcy related professional fees.
Allowance for Doubtful Accounts Receivable and Credit Losses
PG&E Corporation and the Utility recognize an allowance for doubtful accounts to record uncollectible customer accounts receivable
at estimated net realizable value. The allowance is determined based upon a variety of factors, including historical write-off
experience, aging of receivables, current economic conditions, and assessment of customer collectability.
In addition, upon adopting ASU 2016-13, PG&E Corporation and the Utility use the current expected credit loss model to estimate the
expected lifetime credit loss on financial assets, including trade and other receivables, rather than incurred losses over the remaining
life of most financial assets measured at amortized cost. The guidance also requires use of an allowance to record estimated credit
losses on available-for-sale debt securities. See “Financial Instruments - Credit Losses” below for more information.
Inventories
Inventories are carried at weighted-average cost and include natural gas stored underground as well as materials and supplies. Natural
gas stored underground is recorded to inventory when injected and then expensed as the gas is withdrawn for distribution to customers
or to be used as fuel for electric generation. Materials and supplies are recorded to inventory when purchased and expensed or
capitalized to plant, as appropriate, when consumed or installed.
Emission Allowances
Name of Respondent
PACIFIC GAS AND ELECTRIC COMPANY
This Report is:(1) X An Original(2) A Resubmission
Date of Report(Mo, Da, Yr)
04/13/2021
Year/Period of Report
2020/Q4
NOTES TO FINANCIAL STATEMENTS (Continued)
FERC FORM NO. 1 (ED. 12-88) Page 123.16
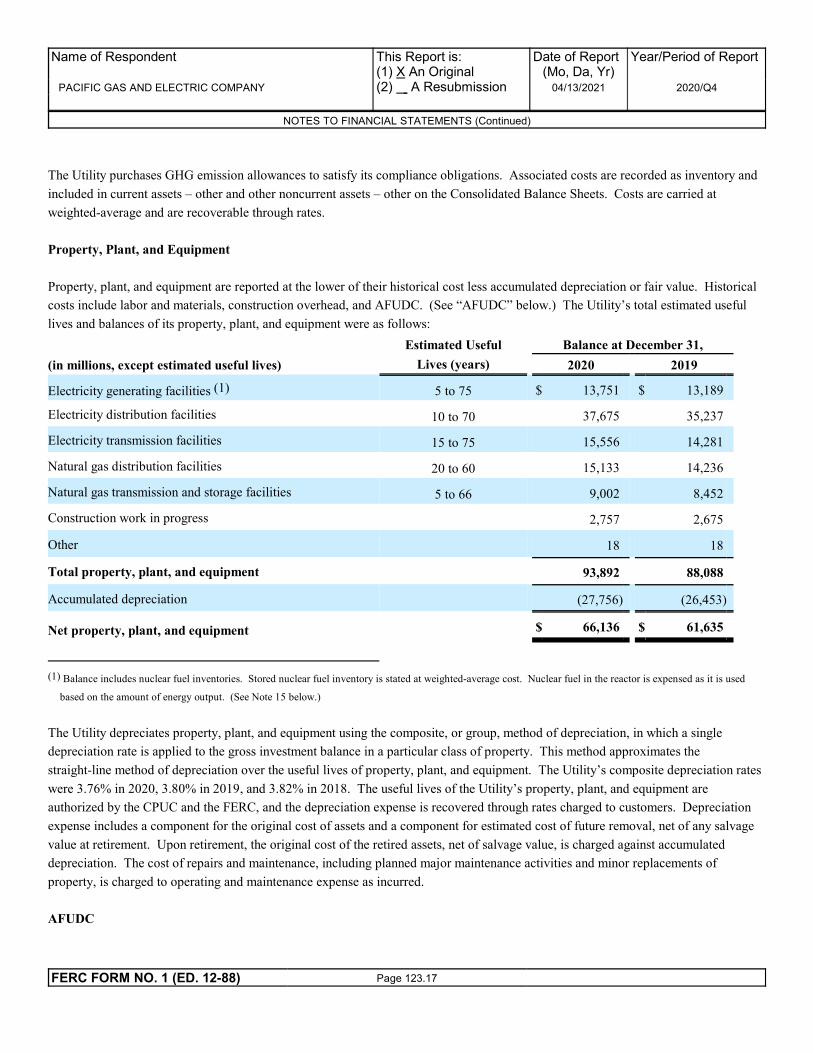
The Utility purchases GHG emission allowances to satisfy its compliance obligations. Associated costs are recorded as inventory and
included in current assets – other and other noncurrent assets – other on the Consolidated Balance Sheets. Costs are carried at
weighted-average and are recoverable through rates.
Property, Plant, and Equipment
Property, plant, and equipment are reported at the lower of their historical cost less accumulated depreciation or fair value. Historical
costs include labor and materials, construction overhead, and AFUDC. (See “AFUDC” below.) The Utility’s total estimated useful
lives and balances of its property, plant, and equipment were as follows:
Estimated Useful Balance at December 31,
(in millions, except estimated useful lives) Lives (years) 2020 2019
Electricity generating facilities (1) 5 to 75 $ 13,751 $ 13,189
Electricity distribution facilities 10 to 70 37,675 35,237
Electricity transmission facilities 15 to 75 15,556 14,281
Natural gas distribution facilities 20 to 60 15,133 14,236
Natural gas transmission and storage facilities 5 to 66 9,002 8,452
Construction work in progress 2,757 2,675
Other 18 18
Total property, plant, and equipment 93,892 88,088
Accumulated depreciation (27,756) (26,453)
Net property, plant, and equipment $ 66,136 $ 61,635
(1) Balance includes nuclear fuel inventories. Stored nuclear fuel inventory is stated at weighted-average cost. Nuclear fuel in the reactor is expensed as it is used
based on the amount of energy output. (See Note 15 below.)
The Utility depreciates property, plant, and equipment using the composite, or group, method of depreciation, in which a single
depreciation rate is applied to the gross investment balance in a particular class of property. This method approximates the
straight-line method of depreciation over the useful lives of property, plant, and equipment. The Utility’s composite depreciation rates
were 3.76% in 2020, 3.80% in 2019, and 3.82% in 2018. The useful lives of the Utility’s property, plant, and equipment are
authorized by the CPUC and the FERC, and the depreciation expense is recovered through rates charged to customers. Depreciation
expense includes a component for the original cost of assets and a component for estimated cost of future removal, net of any salvage
value at retirement. Upon retirement, the original cost of the retired assets, net of salvage value, is charged against accumulated
depreciation. The cost of repairs and maintenance, including planned major maintenance activities and minor replacements of
property, is charged to operating and maintenance expense as incurred.
AFUDC
Name of Respondent
PACIFIC GAS AND ELECTRIC COMPANY
This Report is:(1) X An Original(2) A Resubmission
Date of Report(Mo, Da, Yr)
04/13/2021
Year/Period of Report
2020/Q4
NOTES TO FINANCIAL STATEMENTS (Continued)
FERC FORM NO. 1 (ED. 12-88) Page 123.17

AFUDC represents the estimated costs of debt (i.e., interest) and equity funds used to finance regulated plant additions before they go
into service and is capitalized as part of the cost of construction. AFUDC is recoverable from customers through rates over the life of
the related property once the property is placed in service. AFUDC related to the cost of debt is recorded as a reduction to interest
expense. AFUDC related to the cost of equity is recorded in other income. The Utility recorded AFUDC related to debt and equity,
respectively, of $35 million and $140 million during 2020, $55 million and $79 million during 2019, and $53 million and $129 million
during 2018.
Asset Retirement Obligations
The following table summarizes the changes in ARO liability during 2020 and 2019, including nuclear decommissioning obligations:
(in millions) 2020 2019
ARO liability at beginning of year $ 5,854 $ 5,994
Liabilities incurred in the current period 268 —
Revision in estimated cash flows 53 (376)
Accretion 265 274
Liabilities settled (28) (38)
ARO liability at end of year $ 6,412 $ 5,854
The Utility has not recorded a liability related to certain AROs for assets that are expected to operate in perpetuity. As the Utility
cannot estimate a settlement date or range of potential settlement dates for these assets, reasonable estimates of fair value cannot be
made. As such, ARO liabilities are not recorded for retirement activities associated with substations, certain hydroelectric facilities;
removal of lead-based paint in some facilities and certain communications equipment from leased property; and restoration of land to
the conditions under certain agreements.
Nuclear Decommissioning Obligation
Detailed studies of the cost to decommission the Utility’s nuclear generation facilities are generally conducted every three years in
conjunction with the Nuclear Decommissioning Cost Triennial Proceeding conducted by the CPUC. The decommissioning cost
estimates are based on the plant location and cost characteristics for the Utility's nuclear power plants. Actual decommissioning costs
may vary from these estimates as a result of changes in assumptions such as decommissioning dates; regulatory requirements;
technology; and costs of labor, materials, and equipment. The Utility recovers its revenue requirements for decommissioning costs
from customers through a non-bypassable charge that the Utility expects will continue until those costs are fully recovered.
The total nuclear decommissioning obligation accrued was $5.1 billion and $4.9 billion at December 31, 2020 and 2019, respectively.
The estimated undiscounted nuclear decommissioning cost for the Utility’s nuclear power plants was $10.6 billion at December 31,
2020 and 2019.
Disallowance of Plant Costs
Name of Respondent
PACIFIC GAS AND ELECTRIC COMPANY
This Report is:(1) X An Original(2) A Resubmission
Date of Report(Mo, Da, Yr)
04/13/2021
Year/Period of Report
2020/Q4
NOTES TO FINANCIAL STATEMENTS (Continued)
FERC FORM NO. 1 (ED. 12-88) Page 123.18

PG&E Corporation and the Utility record a charge when it is both probable that costs incurred or projected to be incurred for recently
completed plant will not be recoverable through rates charged to customers and the amount of disallowance can be reasonably
estimated.
Nuclear Decommissioning Trusts
The Utility’s nuclear generation facilities consist of two units at Diablo Canyon and one retired facility at Humboldt Bay. Nuclear
decommissioning requires the safe removal of a nuclear generation facility from service and the reduction of residual radioactivity to a
level that permits termination of the NRC license and release of the property for unrestricted use. The Utility's nuclear
decommissioning costs are recovered from customers through rates and are held in trusts until authorized for release by the CPUC.
The Utility classifies its debt investments held in the nuclear decommissioning trusts as available-for-sale. Since the Utility’s nuclear
decommissioning trust assets are managed by external investment managers, the Utility does not have the ability to sell its investments
at its discretion. Therefore, all unrealized losses are considered other-than-temporary impairments. Gains or losses on the nuclear
decommissioning trust investments are refundable or recoverable, respectively, from customers through rates. Therefore, trust
earnings are deferred and included in the regulatory liability for recoveries in excess of the ARO. There is no impact on the Utility’s
earnings or accumulated other comprehensive income. The cost of debt and equity securities sold by the trust is determined by specific
identification.
Variable Interest Entities
A VIE is an entity that does not have sufficient equity at risk to finance its activities without additional subordinated financial support
from other parties, or whose equity investors lack any characteristics of a controlling financial interest. An enterprise that has a
controlling financial interest in a VIE is a primary beneficiary and is required to consolidate the VIE.
Consolidated VIE
The SPV is a bankruptcy remote, limited liability company wholly owned by the Utility, and its assets are not available to creditors of
PG&E Corporation or the Utility. Pursuant to the Receivables Securitization Program (as defined in Note 5 below), the Utility sells
certain of its receivables and certain related rights to payment and obligations of the Utility with respect to such receivables, and
certain other related rights to the SPV, which, in turn, obtains loans secured by the receivables from financial institutions (the
“Lenders”). Amounts received from the Lenders, the pledged receivables and the corresponding debt are included in Accounts
receivable and Long-term debt, respectively, on the Consolidated Balance Sheets. The aggregate principal amount of the loans made
by the Lenders cannot exceed $1.0 billion outstanding at any time. The Receivables Securitization Program is scheduled to terminate
on October 5, 2022, unless extended or earlier terminated.
The SPV is considered a VIE because its equity capitalization is insufficient to support its operations. The most significant activities
that impact the economic performance of the SPV are decisions made to manage receivables. The Utility is considered the primary
beneficiary and consolidates the SPV as it makes these decisions. No additional financial support was provided to the SPV during the
year ended December 31, 2020 or is expected to be provided in the future that was not previously contractually required. As of
December 31, 2020, the SPV has $2.6 billion of net accounts receivable and has outstanding borrowings of $1.0 billion under the
Receivables Securitization Program.
Non-Consolidated VIEs
Name of Respondent
PACIFIC GAS AND ELECTRIC COMPANY
This Report is:(1) X An Original(2) A Resubmission
Date of Report(Mo, Da, Yr)
04/13/2021
Year/Period of Report
2020/Q4
NOTES TO FINANCIAL STATEMENTS (Continued)
FERC FORM NO. 1 (ED. 12-88) Page 123.19

Some of the counterparties to the Utility’s power purchase agreements are considered VIEs. Each of these VIEs was designed to own
a power plant that would generate electricity for sale to the Utility. To determine whether the Utility was the primary beneficiary of
any of these VIEs at December 31, 2020, it assessed whether it absorbs any of the VIE’s expected losses or receives any portion of the
VIE’s expected residual returns under the terms of the power purchase agreement, analyzed the variability in the VIE’s gross margin,
and considered whether it had any decision-making rights associated with the activities that are most significant to the VIE’s
performance, such as dispatch rights and operating and maintenance activities. The Utility’s financial obligation is limited to the
amount the Utility pays for delivered electricity and capacity. The Utility did not have any decision-making rights associated with any
of the activities that are most significant to the economic performance of any of these VIEs. Since the Utility was not the primary
beneficiary of any of these VIEs at December 31, 2020, it did not consolidate any of them.
Contributions to the Wildfire Fund
On the Effective Date, PG&E Corporation and the Utility contributed, in accordance with AB 1054, an initial contribution of
approximately $4.8 billion and first annual contribution of approximately $193 million to the Wildfire Fund to secure participation of
the Utility therein. On December 30, 2020, the Utility made its second annual contribution of $193 million to the Wildfire Fund. As
of December 31, 2020, PG&E Corporation and the Utility have eight remaining annual contributions of $193 million. PG&E
Corporation and the Utility account for the contributions to the Wildfire Fund similarly to prepaid insurance with expense being
allocated to periods ratably based on an estimated period of coverage. The Wildfire Fund is available to pay for eligible claims arising
as of July 12, 2019, the effective date of AB 1054, subject to a limit of 40% of the amount of such claims arising between the effective
date of AB 1054 and the Utility’s emergence from Chapter 11. The 40% limit does not apply to eligible claims that arise after the
Utility’s emergence from Chapter 11. The Wildfire Fund is additionally limited to the portion of such claims that exceeds the greater
of (i) $1.0 billion in the aggregate in any year and (ii) the amount of insurance coverage required to be in place for the electric utility
company pursuant to Section 3293 of the Public Utilities Code, added by AB 1054.
As of December 31, 2020, PG&E Corporation and the Utility recorded $193 million in Other current liabilities, $1.3 billion in Other
non-current liabilities, $464 million in current assets - Wildfire fund asset, and $5.8 billion in non-current assets - Wildfire fund asset
in the Consolidated Balance Sheets. As of December 31, 2020, the Utility recorded amortization and accretion expense of
$413 million. The amortization of the asset, accretion of the liability, and if applicable, impairment of the asset is reflected in Wildfire
fund expense in the Consolidated Statements of Income. Expected contributions are discounted to the present value using the 10-year
US treasury rate at the date PG&E Corporation and the Utility satisfied all the eligibility requirements to participate in the Wildfire
Fund. A useful life of 15 years is being used to amortize the Wildfire Fund asset.
Name of Respondent
PACIFIC GAS AND ELECTRIC COMPANY
This Report is:(1) X An Original(2) A Resubmission
Date of Report(Mo, Da, Yr)
04/13/2021
Year/Period of Report
2020/Q4
NOTES TO FINANCIAL STATEMENTS (Continued)
FERC FORM NO. 1 (ED. 12-88) Page 123.20

AB 1054 did not specify a period of coverage; therefore, this accounting treatment is subject to significant accounting judgments and
estimates. In estimating the period of coverage, PG&E Corporation and the Utility use a Monte Carlo simulation that began with 12
years of historical, publicly available fire-loss data from wildfires caused by electrical equipment, and subsequently plan to add an
additional year of data each following year. The period of historic fire-loss data and the effectiveness of mitigation efforts by the
California electric utility companies are significant assumptions used to estimate the useful life. These assumptions along with the
other assumptions below create a high degree of uncertainty related to the estimated useful life of the Wildfire Fund. The simulation
results in the estimated number and severity of catastrophic fires that could occur in California within the participating electric utilities’
service territories during the term of the Wildfire Fund. Starting with a 5-year period of historical data, with average annual statewide
claims or settlements of approximately $6.5 billion, compared to approximately $2.9 billion for the 12-year historical data, would have
decreased the amortization period to 6 years. Similarly, a 10% change to the assumption around current and future mitigation effort
effectiveness would increase the amortization period to 17 years assuming greater effectiveness and would decrease the amortization
period to 12 years assuming less effectiveness.
Other assumptions used to estimate the useful life include the estimated cost of wildfires caused by other electric utilities, the amount
at which wildfire claims would be settled, the likely adjudication of the CPUC in cases of electric utility-caused wildfires, the impacts
of climate change, the level of future insurance coverage held by the electric utilities, the FERC-allocable portion of loss recovery, and
the future transmission and distribution equity rate base growth of other electric utilities. Significant changes in any of these estimates
could materially impact the amortization period.
PG&E Corporation and the Utility evaluate all assumptions quarterly, or upon claims being made from the Wildfire Fund for
catastrophic wildfires, and the expected life of the Wildfire Fund will be adjusted as required. The Wildfire Fund is available to other
participating utilities in California and the amount of claims that a participating utility incurs is not limited to their individual
contribution amounts. PG&E Corporation and the Utility will assess the Wildfire Fund asset for impairment in the event that a
participating utility's electrical equipment is found to be the substantial cause of a catastrophic wildfire. Timing of any such
impairment could lag as the emergence of sufficient cause and claims information can take many quarters and could be limited to
public disclosure of the participating electric utility, if ignition were to occur outside the Utility’s service territory. There were fires in
the Utility’s and other participating utilities’ service territories in 2020 for which the cause is currently unknown and which may in the
future be determined to be covered by the Wildfire Fund. At December 31, 2020, there were no such known events requiring a
reduction of the Wildfire Fund asset nor have there been any claims or withdrawals by the participating utilities against the Wildfire
Fund.
Other Accounting Policies
For other accounting policies impacting PG&E Corporation’s and the Utility’s Consolidated Financial Statements, see “Income Taxes”
in Note 9, “Derivatives” in Note 10, “Fair Value Measurements” in Note 11, and “Contingencies and Commitments” in Notes 14 and
15 herein.
Reporting of Amounts Reclassified Out of Accumulated Other Comprehensive Income
The changes, net of income tax, in PG&E Corporation’s accumulated other comprehensive income (loss) for the year ended December
31, 2020 consisted of the following:
(in millions, net of income tax)
Pension
Benefits
Other
Benefits Total
Name of Respondent
PACIFIC GAS AND ELECTRIC COMPANY
This Report is:(1) X An Original(2) A Resubmission
Date of Report(Mo, Da, Yr)
04/13/2021
Year/Period of Report
2020/Q4
NOTES TO FINANCIAL STATEMENTS (Continued)
FERC FORM NO. 1 (ED. 12-88) Page 123.21
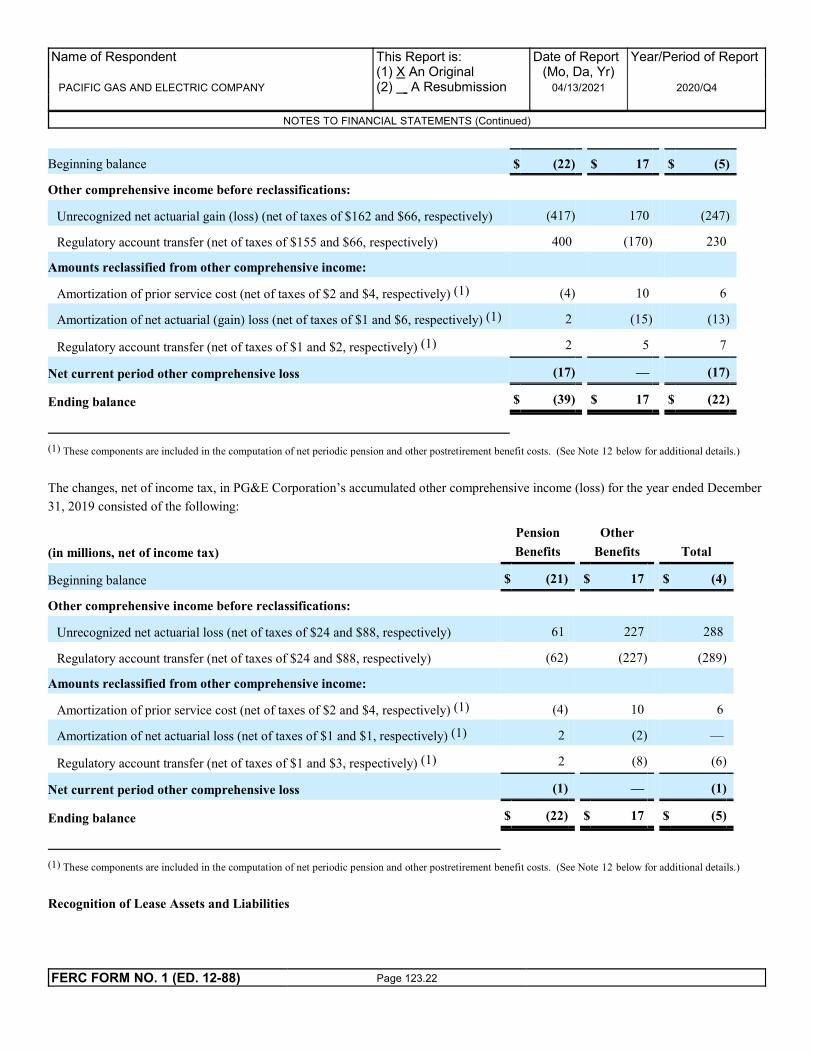
Beginning balance $ (22) $ 17 $ (5)
Other comprehensive income before reclassifications:
Unrecognized net actuarial gain (loss) (net of taxes of $162 and $66, respectively) (417) 170 (247)
Regulatory account transfer (net of taxes of $155 and $66, respectively) 400 (170) 230
Amounts reclassified from other comprehensive income:
Amortization of prior service cost (net of taxes of $2 and $4, respectively) (1) (4) 10 6
Amortization of net actuarial (gain) loss (net of taxes of $1 and $6, respectively) (1) 2 (15) (13)
Regulatory account transfer (net of taxes of $1 and $2, respectively) (1) 2 5 7
Net current period other comprehensive loss (17) — (17)
Ending balance $ (39) $ 17 $ (22)
(1) These components are included in the computation of net periodic pension and other postretirement benefit costs. (See Note 12 below for additional details.)
The changes, net of income tax, in PG&E Corporation’s accumulated other comprehensive income (loss) for the year ended December
31, 2019 consisted of the following:
(in millions, net of income tax)
Pension
Benefits
Other
Benefits Total
Beginning balance $ (21) $ 17 $ (4)
Other comprehensive income before reclassifications:
Unrecognized net actuarial loss (net of taxes of $24 and $88, respectively) 61 227 288
Regulatory account transfer (net of taxes of $24 and $88, respectively) (62) (227) (289)
Amounts reclassified from other comprehensive income:
Amortization of prior service cost (net of taxes of $2 and $4, respectively) (1) (4) 10 6
Amortization of net actuarial loss (net of taxes of $1 and $1, respectively) (1) 2 (2) —
Regulatory account transfer (net of taxes of $1 and $3, respectively) (1) 2 (8) (6)
Net current period other comprehensive loss (1) — (1)
Ending balance $ (22) $ 17 $ (5)
(1) These components are included in the computation of net periodic pension and other postretirement benefit costs. (See Note 12 below for additional details.)
Recognition of Lease Assets and Liabilities
Name of Respondent
PACIFIC GAS AND ELECTRIC COMPANY
This Report is:(1) X An Original(2) A Resubmission
Date of Report(Mo, Da, Yr)
04/13/2021
Year/Period of Report
2020/Q4
NOTES TO FINANCIAL STATEMENTS (Continued)
FERC FORM NO. 1 (ED. 12-88) Page 123.22

A lease exists when an arrangement allows the lessee to control the use of an identified asset for a stated period in exchange for
payments. This determination is made at inception of the arrangement. All leases must be recognized as a ROU asset and a lease
liability on the balance sheet of the lessee. The ROU asset reflects the lessee’s right to use the underlying asset for the lease term and
the lease liability reflects the obligation to make the lease payments. PG&E Corporation and the Utility have elected not to separate
lease and non-lease components.
The Utility estimates the ROU assets and lease liabilities at net present value using its incremental secured borrowing rates, unless the
implicit discount rate in the leasing arrangement can be ascertained. The incremental secured borrowing rate is based on observed
market data and other information available at the lease commencement date. The ROU assets and lease liabilities only include the
fixed lease payments for arrangements with terms greater than 12 months. These amounts are presented within the supplemental
disclosures of noncash activities on the Consolidated Statement of Cash Flows. Renewal and termination options only impact the lease
term if it is reasonably certain that they will be exercised. PG&E Corporation recognizes lease expense on a straight-line basis over
the lease term. The Utility recognizes lease expense in conformity with ratemaking.
Operating leases are included in operating lease ROU assets and current and noncurrent operating lease liabilities on the Consolidated
Balance Sheets. Financing leases are included in property, plant, and equipment, other current liabilities, and other noncurrent
liabilities on the Consolidated Balance Sheets. Financing leases were immaterial for the years ended December 31, 2020 and 2019.
For the years ended December 31, 2020 and 2019, the Utility made total cash payments, including fixed and variable, of $2.5 billion
and $2.4 billion, respectively, for operating leases which are presented within operating activities on the Consolidated Statement of
Cash Flows. The fixed cash payments for the principal portion of the financing lease liabilities are immaterial and continue to be
included within financing activities on the Consolidated Statement of Cash Flows. Any variable lease payments for financing leases
are included in operating activities on the Consolidated Statement of Cash Flows.
The majority of the Utility’s ROU assets and lease liabilities relate to various power purchase agreements. These power purchase
agreements primarily consist of generation plants leased to meet customer demand plus applicable reserve margins. Operating lease
variable costs include amounts from renewable energy power purchase agreements where payments are based on certain contingent
external factors such as wind, hydro, solar, biogas, and biomass power generation. See “Third-Party Power Purchase Agreements” in
Note 15 below. PG&E Corporation and the Utility have also recorded ROU assets and lease liabilities related to property and land
arrangements.
At December 31, 2020 and 2019, the Utility’s operating leases had a weighted average remaining lease term of 5.7 years and 5.9 years
and a weighted average discount rate of 6.2% and 6.2%, respectively.
The following table shows the lease expense recognized for the fixed and variable component of the Utility’s lease obligations:
Year Ended December 31,
(in millions) 2020 2019
Operating lease fixed cost $ 679 $ 686
Operating lease variable cost 1,852 1,778
Total operating lease costs $ 2,531 $ 2,464
Name of Respondent
PACIFIC GAS AND ELECTRIC COMPANY
This Report is:(1) X An Original(2) A Resubmission
Date of Report(Mo, Da, Yr)
04/13/2021
Year/Period of Report
2020/Q4
NOTES TO FINANCIAL STATEMENTS (Continued)
FERC FORM NO. 1 (ED. 12-88) Page 123.23

At December 31, 2020, the Utility’s future expected operating lease payments were as follows:
(in millions) December 31, 2020
2021 $ 624
2022 550
2023 257
2024 98
2025 91
Thereafter 513
Total lease payments 2,133
Less imputed interest (397)
Total $ 1,736
Recently Adopted Accounting Standards
Intangibles—Goodwill and Other
In August 2018, the FASB issued ASU No. 2018-15, Intangibles – Goodwill and Other – Internal - Use Software (Subtopic 350-40):
Customer’s Accounting for Implementation Costs Incurred in a Cloud Computing Arrangement that is a Service Contract. PG&E
Corporation and the Utility adopted the ASU on January 1, 2020. The adoption of this ASU did not have a material impact on the
Consolidated Financial Statements and related disclosures.
Financial Instruments—Credit Losses
In June 2016, the FASB issued ASU No. 2016-13, Financial Instruments – Credit Losses (Topic 326): Measurement of Credit Losses
On Financial Instruments, which provides a model, known as the current expected credit loss model, to estimate the expected lifetime
credit loss on financial assets, including trade and other receivables, rather than incurred losses over the remaining life of most
financial assets measured at amortized cost. The guidance also requires use of an allowance to record estimated credit losses on
available-for-sale debt securities. PG&E Corporation and the Utility adopted the ASU on January 1, 2020.
Name of Respondent
PACIFIC GAS AND ELECTRIC COMPANY
This Report is:(1) X An Original(2) A Resubmission
Date of Report(Mo, Da, Yr)
04/13/2021
Year/Period of Report
2020/Q4
NOTES TO FINANCIAL STATEMENTS (Continued)
FERC FORM NO. 1 (ED. 12-88) Page 123.24

PG&E Corporation and the Utility have three categories of financial assets in scope, each with their own associated credit risks. In
applying the new guidance, PG&E Corporation and the Utility have incorporated forward-looking data in their estimate of credit loss
as follows. Trade receivables are represented by customer accounts receivable and have credit exposure risk related to California
unemployment rates. Insurance receivables are related to the liability insurance policies PG&E Corporation and the Utility carry.
Insurance receivable risk is related to each insurance carrier’s risk of defaulting on their individual policies. Lastly, available-for-sale
debt securities requires each company to determine if a decline in fair value is below amortized costs basis, or, impaired. Furthermore,
if an impairment exists on available-for-sale debt securities, PG&E Corporation and the Utility will examine if there is an intent to sell,
if it is more likely than not a requirement to sell prior to recovery, and if a portion of the unrealized loss is a result of credit loss. As of
December 31, 2020, expected credit losses of $150 million were recorded in Operating and maintenance expense on the Consolidated
Statements of Income for credit losses associated with trade and other receivables. Of these amounts recorded at December 31, 2020,
$76 million and $10 million were deemed probable of recovery and deferred to the CPPMA and a FERC regulatory asset, respectively.
Reference Rate Reform
In March 2020, the FASB issued ASU No. 2020-04, Reference Rate Reform (Topic 848): Facilitation of the Effects of Reference Rate
Reform on Financial Reporting, which provides optional guidance for a limited period of time to ease the potential burden in
accounting for (or recognizing the effects of) reference rate reform on financial reporting. PG&E Corporation and the Utility adopted
this ASU on April 1, 2020 and elected the optional amendments for contract modifications prospectively. There was no material
impact to PG&E Corporation’s or the Utility’s Consolidated Financial Statements resulting from the adoption of this ASU.
Defined Benefit Plans
In August 2018, the FASB issued ASU No. 2018-14, Compensation - Retirement Benefits - Defined Benefit Plans - General (Subtopic
715-20): Disclosure Framework - Changes to the Disclosure Requirements for Defined Benefit Plans, which amends the existing
guidance relating to the disclosure requirements for defined benefit plans. PG&E Corporation and the Utility adopted the ASU as of
December 31, 2020. The adoption of ASU 2018-14 resulted in elimination of the disclosures of (i) the amounts in accumulated other
comprehensive income expected to be recognized as components of net periodic benefit cost over the next fiscal year and (ii) the
effects of a one-percentage-point change in assumed health care cost trend rates on the (1) aggregate of the service and interest cost
components of net periodic benefit costs and (2) benefit obligation for postretirement health care benefits. Additionally, the adoption
of this ASU resulted in new disclosures of (i) the weighted-average interest crediting rates for cash balance plans and (ii) an
explanation of the reasons for significant gains and losses related to changes in the benefit obligation for the period. These
amendments have been applied on a retrospective basis to all periods presented. See Note 12 below for further discussion of PG&E
Corporation’s and the Utility’s defined benefit pension plans.
Accounting Standards Issued But Not Yet Adopted
Income Taxes
In December 2019, the FASB issued ASU No. 2019-12, Income Taxes (Topic 740): Simplifying the Accounting for Income Taxes,
which amends the existing guidance to reduce complexity relating to Income Tax disclosures. This ASU became effective for PG&E
Corporation and the Utility on January 1, 2021 and will not have a material impact on the Consolidated Financial Statements and the
related disclosures.
Debt
Name of Respondent
PACIFIC GAS AND ELECTRIC COMPANY
This Report is:(1) X An Original(2) A Resubmission
Date of Report(Mo, Da, Yr)
04/13/2021
Year/Period of Report
2020/Q4
NOTES TO FINANCIAL STATEMENTS (Continued)
FERC FORM NO. 1 (ED. 12-88) Page 123.25

In August 2020, the FASB issued ASU No. 2020-06, Debt - Debt with Conversion and Other Options (Subtopic 470-20) and
Derivatives and Hedging - Contracts in Entity’s Own Equity (Subtopic 815-40): Accounting for Convertible Instruments and
Contracts in an Entity’s Own Equity, which simplifies the accounting for certain financial instruments with characteristics of liabilities
and equity, including convertible instruments and contracts on an entity’s own equity. This ASU will be effective for PG&E
Corporation and the Utility on January 1, 2022, with early adoption permitted. PG&E Corporation and the Utility are currently
evaluating the impact the guidance will have on their Consolidated Financial Statements and related disclosures.
NOTE 4: REGULATORY ASSETS, LIABILITIES, AND BALANCING ACCOUNTS
Regulatory Assets
Long-term regulatory assets are comprised of the following:
Balance at December 31,Recovery
Period
(in millions) 2020 2019
Pension benefits (1) $ 2,245 $ 1,823 Indefinitely
Environmental compliance costs 1,112 1,062 32 years
Utility retained generation (2) 181 228 6 years
Price risk management 204 124 19 years
Unamortized loss, net of gain, on reacquired debt 49 63 23 years
Catastrophic event memorandum account (3) 842 656 1 - 3 years
Wildfire expense memorandum account (4) 400 423 1 - 3 years
Fire hazard prevention memorandum account (5) 137 259 1 - 3 years
Fire risk mitigation memorandum account (6) 66 95 1 - 3 years
Wildfire mitigation plan memorandum account (7) 390 558 1 - 3 years
Deferred income taxes (8) 908 252 51 years
Insurance premium costs (9) 294 — 1 - 4 years
Wildfire mitigation balancing account (10) 156 — 1 - 3 years
General rate case memorandum accounts (11) 376 — 1 - 2 years
Vegetation management balancing account (12) 592 — 1 - 3 years
COVID-19 pandemic protection memorandum accounts (13) 84 — TBD years
Other 942 523 Various
Total long-term regulatory assets $ 8,978 $ 6,066
Name of Respondent
PACIFIC GAS AND ELECTRIC COMPANY
This Report is:(1) X An Original(2) A Resubmission
Date of Report(Mo, Da, Yr)
04/13/2021
Year/Period of Report
2020/Q4
NOTES TO FINANCIAL STATEMENTS (Continued)
FERC FORM NO. 1 (ED. 12-88) Page 123.26

(1) Payments into the pension and other benefits plans are based on annual contribution requirements. As these annual requirements continue indefinitely into the
future, the Utility expects to continuously recover pension benefits.
(2) In connection with the settlement agreement entered into among PG&E Corporation, the Utility, and the CPUC in 2003 to resolve the Utility’s 2001 proceeding
under Chapter 11, the CPUC authorized the Utility to recover $1.2 billion of costs related to the Utility’s retained generation assets. The individual components of
these regulatory assets are being amortized over the respective lives of the underlying generation facilities, consistent with the period over which the related revenues
are recognized.
(3) Includes costs of responding to catastrophic events that have been declared a disaster or state of emergency by competent federal or state authorities. As of
December 31, 2020, $49 million in COVID-19 related costs was recorded to CEMA regulatory assets. Recovery of CEMA costs is subject to CPUC review and
approval.
(4) Includes incremental wildfire liability insurance premium costs the CPUC approved for tracking in June 2018 for the period July 26, 2017 through December 31,
2019. Recovery of WEMA costs is subject to CPUC review and approval.
(5) Includes costs associated with the implementation of regulations and requirements adopted to protect the public from potential fire hazards associated with
overhead power line facilities and nearby aerial communication facilities that have not been previously authorized in another proceeding. Recovery of FHPMA
costs is subject to CPUC review and approval.
(6) Includes costs associated with the 2019 WMP for the period January 1, 2019 through June 4, 2019. Recovery of FRMMA costs is subject to CPUC review and
approval.
(7) Includes costs associated with the 2019 WMP for the period June 5, 2019 through December 31, 2019 and the 2020 WMP for the period of January 1, 2020
through December 31, 2020. Recovery of WMPMA costs is subject to CPUC review and approval.
(8) Represents cumulative differences between amounts recognized for ratemaking purposes and expense recognized in accordance with GAAP.
(9) Represents non-current excess liability insurance premium costs recorded to RTBA and Adjustment Mechanism for Costs Determined in Other Proceedings, as
authorized in the 2020 GRC and 2019 GT&S rate cases, respectively.
(10) Includes costs associated with certain wildfire mitigation activities for the period January 1, 2020 through December 31, 2020. Long-term balance represents
costs above 115% of adopted revenue requirements, which are subject to CPUC review and approval.
(11) The General Rate Case Memorandum Accounts record the difference between the gas and electric revenue requirements in effect on January 1, 2020 and through
the date of the final 2020 GRC decision as authorized by the CPUC in December 2020. These amounts will be recovered in rates over 17 months, beginning March
1, 2021.
(12) The 2020 GRC Decision authorized the Utility to modify the existing one-way VMBA Expense Balancing Account to a two-way balancing account to track the
difference between actual and adopted expenses resulting from its routine vegetation management and enhanced vegetation management activities previously
recorded in the FRMMA/WMPMA, and tree mortality and fire risk reduction work previously recorded in CEMA. Recovery of VMBA costs above 120% of
adopted revenue requirements is subject to CPUC review and approval.
(13) On April 16, 2020, the CPUC passed a resolution that established the CPPMA to recover costs associated with customer protections, including higher
uncollectible costs related to a moratorium on electric and gas service disconnections for residential and small business customers. The CPPMA applies only to
residential and small business customers and was approved on July 27, 2020 with an effective date of March 4, 2020. As of December 31, 2020, the Utility had
recorded an aggregate under-collection of $76 million, representing incremental bad debt expense over what was collected in rates for the period the CPPMA is in
effect. The remaining $8 million is associated with program costs and higher accounts receivable financing costs. Recovery of CPPMA costs is subject to CPUC
review and approval.
In general, regulatory assets represent the cumulative differences between amounts recognized for ratemaking purposes and expense or
accumulated other comprehensive income (loss) recognized in accordance with GAAP. Additionally, the Utility does not earn a return
on regulatory assets if the related costs do not accrue interest. Accordingly, the Utility earns a return on its regulatory assets for
retained generation, and regulatory assets for unamortized loss, net of gain, on reacquired debt.
Regulatory Liabilities
Long-term regulatory liabilities are comprised of the following:
Balance at December 31,
Name of Respondent
PACIFIC GAS AND ELECTRIC COMPANY
This Report is:(1) X An Original(2) A Resubmission
Date of Report(Mo, Da, Yr)
04/13/2021
Year/Period of Report
2020/Q4
NOTES TO FINANCIAL STATEMENTS (Continued)
FERC FORM NO. 1 (ED. 12-88) Page 123.27

(in millions) 2020 2019
Cost of removal obligations (1) $ 6,905 $ 6,456
Recoveries in excess of AROs (2) 458 393
Public purpose programs (3) 948 817
Employee benefit plans (4) 995 750
Other 1,118 854
Total long-term regulatory liabilities $ 10,424 $ 9,270
(1) Represents the cumulative differences between the recorded costs to remove assets and amounts collected in rates for expected costs to remove assets.
(2) Represents the cumulative differences between ARO expenses and amounts collected in rates. Decommissioning costs related to the Utility’s nuclear facilities are
recovered through rates and are placed in nuclear decommissioning trusts. This regulatory liability also represents the deferral of realized and unrealized gains and
losses on these nuclear decommissioning trust investments. (See Note 11 below.)
(3) Represents amounts received from customers designated for public purpose program costs expected to be incurred beyond the next 12 months, primarily related to
energy efficiency programs.
(4) Represents cumulative differences between incurred costs and amounts collected in rates for Post-Retirement Medical, Post-Retirement Life and Long-Term
Disability Plans.
Regulatory Balancing Accounts
The Utility tracks (1) differences between the Utility’s authorized revenue requirement and customer billings, and (2) differences
between incurred costs and customer billings. To the extent these differences are probable of recovery or refund over the next 12
months, the Utility records a current regulatory balancing account receivable or payable. Regulatory balancing accounts that the
Utility expects to collect or refund over a period exceeding 12 months are recorded as other noncurrent assets – regulatory assets or
noncurrent liabilities – regulatory liabilities, respectively, in the Consolidated Balance Sheets. These differences do not have an
impact on net income. Balancing accounts will fluctuate during the year based on seasonal electric and gas usage and the timing of
when costs are incurred and customer revenues are collected.
Current regulatory balancing accounts receivable and payable are comprised of the following:
Receivable
Balance at December 31,
(in millions) 2020 2019
Electric transmission $ — $ 9
Gas distribution and transmission 102 363
Energy procurement 413 901
Public purpose programs 292 209
Fire hazard prevention memorandum account 121 —
Fire risk mitigation memorandum account 33 —
Wildfire mitigation plan memorandum account
Name of Respondent
PACIFIC GAS AND ELECTRIC COMPANY
This Report is:(1) X An Original(2) A Resubmission
Date of Report(Mo, Da, Yr)
04/13/2021
Year/Period of Report
2020/Q4
NOTES TO FINANCIAL STATEMENTS (Continued)
FERC FORM NO. 1 (ED. 12-88) Page 123.28
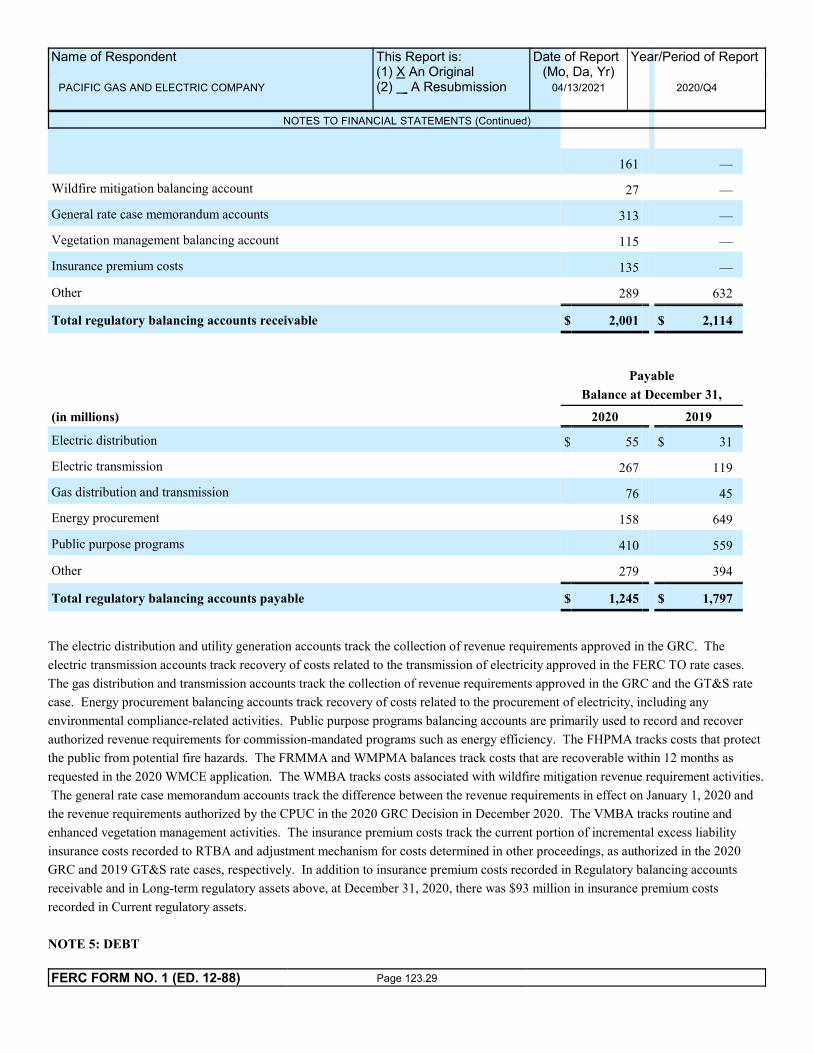
161 —
Wildfire mitigation balancing account 27 —
General rate case memorandum accounts 313 —
Vegetation management balancing account 115 —
Insurance premium costs 135 —
Other 289 632
Total regulatory balancing accounts receivable $ 2,001 $ 2,114
Payable
Balance at December 31,
(in millions) 2020 2019
Electric distribution $ 55 $ 31
Electric transmission 267 119
Gas distribution and transmission 76 45
Energy procurement 158 649
Public purpose programs 410 559
Other 279 394
Total regulatory balancing accounts payable $ 1,245 $ 1,797
The electric distribution and utility generation accounts track the collection of revenue requirements approved in the GRC. The
electric transmission accounts track recovery of costs related to the transmission of electricity approved in the FERC TO rate cases.
The gas distribution and transmission accounts track the collection of revenue requirements approved in the GRC and the GT&S rate
case. Energy procurement balancing accounts track recovery of costs related to the procurement of electricity, including any
environmental compliance-related activities. Public purpose programs balancing accounts are primarily used to record and recover
authorized revenue requirements for commission-mandated programs such as energy efficiency. The FHPMA tracks costs that protect
the public from potential fire hazards. The FRMMA and WMPMA balances track costs that are recoverable within 12 months as
requested in the 2020 WMCE application. The WMBA tracks costs associated with wildfire mitigation revenue requirement activities.
The general rate case memorandum accounts track the difference between the revenue requirements in effect on January 1, 2020 and
the revenue requirements authorized by the CPUC in the 2020 GRC Decision in December 2020. The VMBA tracks routine and
enhanced vegetation management activities. The insurance premium costs track the current portion of incremental excess liability
insurance costs recorded to RTBA and adjustment mechanism for costs determined in other proceedings, as authorized in the 2020
GRC and 2019 GT&S rate cases, respectively. In addition to insurance premium costs recorded in Regulatory balancing accounts
receivable and in Long-term regulatory assets above, at December 31, 2020, there was $93 million in insurance premium costs
recorded in Current regulatory assets.
NOTE 5: DEBT
Name of Respondent
PACIFIC GAS AND ELECTRIC COMPANY
This Report is:(1) X An Original(2) A Resubmission
Date of Report(Mo, Da, Yr)
04/13/2021
Year/Period of Report
2020/Q4
NOTES TO FINANCIAL STATEMENTS (Continued)
FERC FORM NO. 1 (ED. 12-88) Page 123.29

Debtor-In-Possession Facilities
In connection with the Chapter 11 Cases, PG&E Corporation and the Utility entered into the DIP Credit Agreement, among the Utility,
as borrower, PG&E Corporation, as guarantor, JPM, as administrative agent, Citibank, N.A., as collateral agent, and the lenders and
issuing banks party thereto.
On July 1, 2020, the DIP Facilities were repaid in full and all commitments thereunder were terminated in connection with emergence
from Chapter 11.
Credit Facilities
The following table summarizes PG&E Corporation’s and the Utility’s outstanding borrowings and availability under their credit
facilities at December 31, 2020:
(in millions) Termination
Date
Facility Limit Borrowings
Outstanding
Letters of
Credit
Outstanding
Facility
Availability
Utility revolving credit facility July 2023 $ 3,500
(1
) $ 605 $ 1,020 $ 1,875
Utility term loan credit facility Various(2) 3,000 3,000 — —
Utility receivables securitization program October 2022 1,000 1,000 — —
PG&E Corporation revolving credit facility July 2023 500 — — 500
Total credit facilities $ 8,000 $ 4,605 $ 1,020 $ 2,375
(1) Includes a $1.5 billion letter of credit sublimit.
(2) This includes a $1.5 billion term loan credit facility with a maturity date of June 30, 2021 and a $1.5 billion term loan credit facility with a maturity date of
January 1, 2022.
Utility
Utility Revolving Credit Facility
On July 1, 2020, the Utility entered into a $3.5 billion revolving credit agreement (the “Utility Revolving Credit Agreement”) with
JPM, and Citibank, N.A. as co-administrative agents, and Citibank, N.A., as designated agent. The Utility Revolving Credit
Agreement has a maturity date three years after the Effective Date, subject to two one-year extensions options.
Name of Respondent
PACIFIC GAS AND ELECTRIC COMPANY
This Report is:(1) X An Original(2) A Resubmission
Date of Report(Mo, Da, Yr)
04/13/2021
Year/Period of Report
2020/Q4
NOTES TO FINANCIAL STATEMENTS (Continued)
FERC FORM NO. 1 (ED. 12-88) Page 123.30

Borrowings under the Utility Revolving Credit Agreement bear interest based on the Utility’s election of either (1) LIBOR plus an
applicable margin of 1.375% to 2.50% based on the Utility’s credit rating or (2) the base rate plus an applicable margin of 0.375% to
1.50% based on the Utility’s credit rating. In addition to interest on outstanding principal under the Utility Revolving Credit
Agreement, the Utility is required to pay a commitment fee to the lenders in respect of the unutilized commitments thereunder, ranging
from 0.25% to 0.50% per annum depending on the Utility’s credit rating. The Utility Revolving Credit Agreement has a maximum
letter of credit sublimit equal to $1.5 billion. The Utility may also pay customary letter of credit fees based on letters of credit issued
under the Utility Revolving Credit Agreement.
The Utility’s obligations under the Utility Revolving Credit Agreement are secured by the issuance of a first mortgage bond, issued
pursuant to the Utility’s mortgage indenture, secured by a first lien on substantially all of the Utility’s real property and certain tangible
personal property related to its facilities, subject to certain exceptions, and which rank pari passu with the Utility’s other first mortgage
bonds.
The Utility Revolving Credit Agreement includes usual and customary provisions for revolving credit agreements of this type,
including covenants limiting, with certain exceptions, (1) liens, (2) indebtedness, (3) sale and leaseback transactions, and (4)
fundamental changes. In addition, the Utility Revolving Credit Agreement requires that the Utility maintain a ratio of total
consolidated debt to consolidated capitalization of no greater than 65% as of the end of each fiscal quarter. As of December 31, 2020,
the Utility was in compliance with this covenant.
In the event of a default by the Utility under the Utility Revolving Credit Agreement, including cross-defaults relating to specified
other debt of the Utility or any of its significant subsidiaries in excess of $200 million, the designated agent may, with the consent of
the required lenders (or shall upon the request of the required lenders), declare the amounts outstanding under the Utility Revolving
Credit Agreement, including all accrued interest, payable immediately. For events of default relating to insolvency, bankruptcy or
receivership, the amounts outstanding under the Utility Revolving Credit Agreement become payable immediately.
The Utility may voluntarily repay outstanding loans under the Utility Revolving Credit Agreement at any time without premium or
penalty, other than customary “breakage” costs with respect to eurodollar rate loans. Any voluntary prepayments made by the Utility
will not reduce the commitments under the Utility Revolving Credit Agreement.
Utility Term Loan Credit Facility
On July 1, 2020, the Utility obtained a $3.0 billion secured term loan under a term loan credit agreement (the “Utility Term Loan
Credit Agreement”) with JPM, as administrative agent. The credit facilities under the Utility Term Loan Credit Agreement consist of a
$1.5 billion 364-day term loan facility (the “Utility 364-Day Term Loan Facility”) and a $1.5 billion 18-month term loan facility (the
“Utility 18-Month Term Loan Facility”). The maturity date for the 364-Day Term Loan Facility is June 30, 2021 and the maturity date
for the Utility 18-Month Term Loan Facility is January 1, 2022. The Utility borrowed the entire amount of the Utility 364-Day Term
Loan Facility and the Utility 18-Month Term Loan Facility on July 1, 2020. The proceeds were used to fund, in part, transactions
contemplated under the Plan.
Borrowings under the Utility Term Loan Credit Agreement bear interest based on the Utility’s election of either (1) LIBOR plus an
applicable margin of 2.00% with respect to the Utility 364-Day Term Loan Facility and 2.25% with respect to the Utility 18-Month
Term Loan Facility, or (2) the base rate plus an applicable margin of 1.00% with respect to the Utility 364-Day Term Loan Facility and
1.25% with respect to the Utility 18-Month Term Loan Facility.
Name of Respondent
PACIFIC GAS AND ELECTRIC COMPANY
This Report is:(1) X An Original(2) A Resubmission
Date of Report(Mo, Da, Yr)
04/13/2021
Year/Period of Report
2020/Q4
NOTES TO FINANCIAL STATEMENTS (Continued)
FERC FORM NO. 1 (ED. 12-88) Page 123.31

The Utility’s obligations under the Utility Term Loan Credit Agreement are secured by the issuance of first mortgage bonds, issued
pursuant to the Utility’s mortgage indenture, secured by a first lien on substantially all of the Utility’s real property and certain tangible
personal property related to its facilities, subject to certain exceptions, and which rank pari passu with the Utility’s other first mortgage
bonds.
The Utility Term Loan Credit Agreement includes usual and customary provisions for term loan agreements of this type, including
covenants limiting, with certain exceptions, (1) liens, (2) indebtedness, (3) sale and leaseback transactions, (4) fundamental changes,
(5) entering into swap agreements and (6) modifications to the Utility’s mortgage indenture. In addition, the Utility Term Loan Credit
Agreement requires that the Utility maintain a ratio of total consolidated debt to consolidated capitalization of no greater than 65% as
of the end of each fiscal quarter. As of December 31, 2020, the Utility was in compliance with this covenant.
In the event of a default by the Utility under the Utility Term Loan Credit Agreement, including cross-defaults relating to specified
other debt of the Utility or any of its significant subsidiaries in excess of $200 million, the administrative agent may, with the consent
of the required lenders (or upon the request of the required lenders, shall), declare the amounts outstanding under the Utility Term
Loan Credit Agreement, including all accrued interest, payable immediately. For events of default relating to insolvency, bankruptcy
or receivership, the amounts outstanding under the Utility Term Loan Credit Agreement become payable immediately.
The Utility is required to prepay outstanding term loans under the Utility Term Loan Credit Agreement (with all outstanding term loans
made under the Utility 364-Day Term Loan Facility being paid first), subject to certain exceptions, with 100% of the net cash proceeds
of certain securitization transactions. The Utility may voluntarily repay outstanding loans under the Utility Term Loan Credit
Agreement at any time without premium or penalty, other than customary “breakage” costs with respect to eurodollar rate loans.
Receivables Securitization Program
On October 5, 2020, the Utility, in its individual capacity and in its capacity as initial servicer, entered into an accounts receivable
securitization program (the “Receivables Securitization Program”), providing for the sale of a portion of the Utility's accounts
receivable to the SPV, a limited liability company wholly owned by the Utility. Pursuant to the Receivables Securitization Program,
the Utility sells certain of its receivables and certain related rights to payment and obligations of the Utility with respect to such
receivables and certain other related rights to the SPV, which, in turn, obtains loans secured by the receivables from financial
institutions (the “Lenders”). The Utility has pledged to the Lenders 100% of the equity interests in the SPV as security for the
repayment of the loans. The aggregate principal amount of the loans made by the Lenders cannot exceed $1.0 billion outstanding at
any time.
Name of Respondent
PACIFIC GAS AND ELECTRIC COMPANY
This Report is:(1) X An Original(2) A Resubmission
Date of Report(Mo, Da, Yr)
04/13/2021
Year/Period of Report
2020/Q4
NOTES TO FINANCIAL STATEMENTS (Continued)
FERC FORM NO. 1 (ED. 12-88) Page 123.32

The loans under the Receivables Securitization Program bear interest based on a spread over LIBOR dependent on the tranche period
thereto and any breakage fees accrued. The receivables financing agreement contains customary LIBOR benchmark replacement
language giving the administrative agent, with consent from the SPV as to the successor rate, the right to determine such successor
rate. The Receivables Securitization Program contains certain customary representations and warranties and affirmative and negative
covenants, including as to the eligibility of the receivables being sold by the Utility and securing the loans made by the Lenders, as
well as customary reserve requirements, Receivables Securitization Program termination events, and servicer defaults. The
Receivables Securitization Program termination events permit the Lenders to terminate the agreement upon the occurrence of certain
specified events, including failure by the SPV to pay amounts when due, certain defaults on indebtedness under the Utility’s credit
facility, certain judgments, a change of control, certain events negatively affecting the overall credit quality of transferred receivables
and bankruptcy and insolvency events.
The Receivables Securitization Program is scheduled to terminate on October 5, 2022, unless extended or earlier terminated, at which
time no further advances will be available and the obligations thereunder must be repaid in full no later than (i) the date that is 180
days following such date or (ii) such earlier date on which the loans under the program become due and payable.
In general, the proceeds from the sale of the accounts receivable are used by the SPV to pay the purchase price for accounts
receivables it acquires from the Utility and may be used to fund capital expenditures, repay borrowings on the Utility Revolving Credit
Facility, satisfy maturing debt obligations, as well as fund working capital needs and other approved uses.
Although the SPV is a wholly owned consolidated subsidiary of the Utility, the SPV is legally separate from the Utility. The assets of
the SPV (including the accounts receivables) are not available to creditors of the Utility or PG&E Corporation, and the accounts
receivables are not legally assets of the Utility or PG&E Corporation. The Receivables Securitization Program is accounted for as a
secured financing. The pledged receivables and the corresponding debt are included in Accounts receivable and Long-term debt,
respectively, on the Consolidated Balance Sheets.
At December 31, 2020 the Utility had outstanding borrowings of $1.0 billion under the Receivables Securitization Program.
PG&E Corporation
On July 1, 2020, PG&E Corporation entered into a $500 million revolving credit agreement (the “Corporation Revolving Credit
Agreement”) with JPM, as administrative agent and collateral agent. The Corporation Revolving Credit Agreement has a maturity date
three years after the Effective Date, subject to two one-year extensions at the option of PG&E Corporation. The proceeds from the
loans under the Corporation Revolving Credit Agreement will be used to finance working capital needs, capital expenditures and other
general corporate purposes of PG&E Corporation and its subsidiaries.
Borrowings under the Corporation Revolving Credit Agreement bear interest based on PG&E Corporation’s election of either (1)
LIBOR plus an applicable margin of 3.00% to 4.25% based on PG&E Corporation’s credit rating or (2) the base rate plus an
applicable margin of 2.00% to 3.25% based on PG&E Corporation’s credit rating. In addition to interest on outstanding principal
under the Corporation Revolving Credit Agreement, PG&E Corporation is required to pay a commitment fee to the lenders in respect
of the unutilized commitments thereunder, ranging from 0.50% to 0.75% per annum depending on PG&E Corporation’s credit rating.
PG&E Corporation’s obligations under the Corporation Revolving Credit Agreement are secured by a pledge of PG&E Corporation’s
ownership interest in 100% of the shares of common stock of the Utility.
Name of Respondent
PACIFIC GAS AND ELECTRIC COMPANY
This Report is:(1) X An Original(2) A Resubmission
Date of Report(Mo, Da, Yr)
04/13/2021
Year/Period of Report
2020/Q4
NOTES TO FINANCIAL STATEMENTS (Continued)
FERC FORM NO. 1 (ED. 12-88) Page 123.33

The Corporation Revolving Credit Agreement includes usual and customary provisions for revolving credit agreements of this type,
including covenants limiting, with certain exceptions, (1) liens, (2) indebtedness, (3) sale and leaseback transactions, (4) investments,
(5) dispositions, (6) changes in the nature of business, (7) transactions with affiliates, (8) burdensome agreements, (9) restricted
payments, (10) fundamental changes, (11) use of proceeds, (12) entering into swap agreements and (13) the ability to dispose of
common stock of the Utility. In addition, the Corporation Revolving Credit Agreement requires that PG&E Corporation (1) maintain a
ratio of total consolidated debt to consolidated capitalization of no greater than 70% as of the end of each fiscal quarter and (2) if
revolving loans are outstanding as of the end of a fiscal quarter, a ratio of adjusted cash to fixed charges, as of the end of such fiscal
quarter, of at least 150% prior to the date that PG&E Corporation first declares a cash dividend on its common stock and at least 100%
thereafter.
In the event of a default by PG&E Corporation under the Corporation Revolving Credit Agreement, including cross-defaults relating to
specified other debt of PG&E Corporation or any of its significant subsidiaries in excess of $200 million, the administrative agent may,
with the consent of the required lenders (or upon the request of the required lenders, shall), declare the amounts outstanding under the
Corporation Revolving Credit Agreement, including all accrued interest, payable immediately. For events of default relating to
insolvency, bankruptcy or receivership, the amounts outstanding under the Corporation Revolving Credit Agreement become payable
immediately.
PG&E Corporation may voluntarily repay outstanding loans under the Corporation Revolving Credit Agreement at any time without
premium or penalty, other than customary “breakage” costs with respect to eurodollar rate loans. Any voluntary repayments made by
PG&E Corporation will not reduce the commitments under the Corporation Revolving Credit Agreement.
On the Effective Date, PG&E Corporation repaid and terminated $300 million of outstanding borrowings under the Second Amended
and Restated Credit Agreement, dated as of April 27, 2015, among PG&E Corporation, as borrower, the several lenders party thereto
and Bank of America, N.A., as administrative agent.
Other Short-term Borrowings
On November 16, 2020, the Utility completed the sale of $1.45 billion aggregate principal amount of floating rate first mortgage bonds
due November 15, 2021. Proceeds from the sale of the mortgage bonds were used for general corporate purposes, including the
repayment of borrowings outstanding under the Receivables Securitization Program and borrowings outstanding under the Utility
Revolving Credit Facility.
Long-Term Debt
Utility
Name of Respondent
PACIFIC GAS AND ELECTRIC COMPANY
This Report is:(1) X An Original(2) A Resubmission
Date of Report(Mo, Da, Yr)
04/13/2021
Year/Period of Report
2020/Q4
NOTES TO FINANCIAL STATEMENTS (Continued)
FERC FORM NO. 1 (ED. 12-88) Page 123.34

On June 19, 2020, the Utility completed the sale of (i) $500 million aggregate principal amount of Floating Rate First Mortgage Bonds
due June 16, 2022, (ii) $2.5 billion aggregate principal amount of 1.75% First Mortgage Bonds due June 16, 2022, (iii) $1.0 billion
aggregate principal amount of 2.10% First Mortgage Bonds due August 1, 2027, (iv) $2.0 billion aggregate principal amount of 2.50%
First Mortgage Bonds due February 1, 2031, (v) $1.0 billion aggregate principal amount of 3.30% First Mortgage Bonds due August 1,
2040, and (vi) $1.925 billion aggregate principal amount of 3.50% First Mortgage Bonds due August 1, 2050 (collectively, the
“Mortgage Bonds”). The proceeds of the Mortgage Bonds were deposited into an account at The Bank of New York Mellon Trust
Company, N.A., as Escrow Agent, which proceeds were held by the Escrow Agent as collateral pursuant to an escrow agreement by
and between the Escrow Agent and the Utility. On July 1, 2020, the net proceeds were released from escrow and, together with the net
proceeds from certain other Plan financing transactions, were used to effectuate the reorganization of the Utility and PG&E
Corporation in accordance with the terms and conditions contained in the Plan.
On the Effective Date, pursuant to the Plan, the Utility issued approximately $11.9 billion of its first mortgage bonds (the “New
Mortgage Bonds”) in satisfaction of certain of its pre-petition senior unsecured debt, as described in the table below.
On the Effective Date, pursuant to the Plan, the Utility reinstated approximately $9.6 billion aggregate principal amount of the Utility
Reinstated Senior Notes. On the Effective Date, each series of the Utility Reinstated Senior Notes was collateralized by the Utility’s
delivery of a first mortgage bond in a corresponding principal amount to the applicable trustee for the benefit of the holders of the
Utility Reinstated Senior Notes.
The Mortgage Bonds, the New Mortgage Bonds and the Utility Reinstated Senior Notes are secured by a first priority lien, subject to
permitted liens, on substantially all of the Utility’s real property and certain tangible property related to its facilities. The Mortgage
Bonds, the New Mortgage Bonds and the Utility Reinstated Senior Notes are the Utility’s senior obligations and rank equally in right
of payment with the Utility’s other existing or future first mortgage bonds issued under the Utility’s mortgage indenture.
On the Effective Date, by operation of the Plan, all outstanding obligations under the Utility Short-Term Senior Notes, the Utility
Long-Term Senior Notes and the Utility Funded Debt were cancelled and the applicable agreements governing such obligations were
terminated.
In addition, on July 1, 2020, the Utility obtained a $1.5 billion 18-month secured term loan under the Utility Term Loan Credit
Agreement. For more information, see “Credit Facilities” discussion above.
PG&E Corporation
On June 23, 2020, PG&E Corporation obtained a $2.75 billion secured term loan (the “PG&E Corporation Term Loan”) under a term
loan credit agreement (the “Term Loan Agreement”) with JPM, and other lenders from time to time party thereto (collectively, the
“Lenders”), JPM, as Administrative Agent and as Collateral Agent. The proceeds of the PG&E Corporation Term Loan were
deposited into an account at The Bank of New York Mellon Trust Company, N.A., as Escrow Agent, which proceeds were held by the
Escrow Agent as collateral pursuant to an escrow agreement by and among the Collateral Agent, the Escrow Agent, the Administrative
Agent and PG&E Corporation and subsequently released from escrow on the Effective Date pursuant to the Plan.
On February 1, 2021, PG&E Corporation entered into a repricing amendment (the “Repricing Amendment”) with the lenders under the
Term Loan Credit Agreement pursuant to which, among other things, the applicable interest rate was reduced.
Name of Respondent
PACIFIC GAS AND ELECTRIC COMPANY
This Report is:(1) X An Original(2) A Resubmission
Date of Report(Mo, Da, Yr)
04/13/2021
Year/Period of Report
2020/Q4
NOTES TO FINANCIAL STATEMENTS (Continued)
FERC FORM NO. 1 (ED. 12-88) Page 123.35

In accordance with the Term Loan Agreement, PG&E Corporation is required to repay the principal amount outstanding on the PG&E
Corporation Term Loan in an amount equal to $6.875 million on the last business day of each quarter. The PG&E Corporation Term
Loan matures on June 23, 2025, unless extended by PG&E Corporation pursuant to the terms of the Term Loan Agreement. The
PG&E Corporation Term Loan bears interest based, at PG&E Corporation’s election, on (1) LIBOR plus an applicable margin or (2)
ABR plus an applicable margin. The original LIBOR floor was 1.0% but was reduced to 0.5% on February 1, 2021 in connection with
the Repricing Amendment. The original ABR floor was 2.0% but was similarly reduced to 1.5% on February 1, 2021 in connection
with the Repricing Amendment. ABR will equal the highest of the following: the prime rate, 0.5% above the overnight federal funds
rate, and the one-month LIBOR plus 1.0%. The applicable margin for LIBOR loans is 3.0% (reduced from 4.5% on February 1, 2021
in connection with the Repricing Amendment) and the applicable margin for ABR loans is 2.0% (reduced from 3.5% on February 1,
2021 in connection with the Repricing Amendment). PG&E Corporation may prepay the PG&E Corporation Term Loan in whole, at
any time, and in part, from time to time, without premium or penalty, other than customary “breakage” costs with respect to eurodollar
rate loans; provided, however, that any voluntary prepayment, refinancing or repricing of the PG&E Corporation Term Loan in
connection with certain repricing transactions that occur on or prior to August 1, 2021 shall be subject to a prepayment premium of
1.0% of the principal amount of the term loans so prepaid, refinanced or repriced.
The Term Loan Agreement includes usual and customary covenants for loan agreements of this type, including covenants limiting: (1)
liens, (2) mergers, (3) sales of all or substantially all of PG&E Corporation’s assets, and (4) sale and leaseback transactions. In
addition, the Term Loan Agreement requires that PG&E Corporation maintain ownership, either directly or indirectly, through one or
more subsidiaries, of at least 100% of the outstanding common stock of the Utility.
In the event of a default by PG&E Corporation under the Term Loan Agreement, including cross-defaults relating to specified other
debt of PG&E Corporation or any of its significant subsidiaries in excess of $200 million, the Administrative Agent may, with the
consent of the required Lenders (or upon the request of the required Lenders, shall), declare the amounts outstanding under the Term
Loan Agreement, including all accrued interest, payable immediately. For events of default relating to insolvency, bankruptcy or
receivership, the amounts outstanding under the Term Loan Agreement become payable immediately.
On the Effective Date, the obligations under the Term Loan Agreement became secured by a pledge of PG&E Corporation’s
ownership interest in 100% of the shares of common stock of the Utility. On July 1, 2020, the net proceeds from the PG&E
Corporation Term Loan were released from escrow and were used to fund, in part, the transactions contemplated under the Plan.
Additionally, on June 23, 2020, PG&E Corporation completed the sale of (i) $1.0 billion aggregate principal amount of 5.00% Senior
Secured Notes due July 1, 2028 (the “2028 Notes”) and (ii) $1.0 billion aggregate principal amount of 5.25% Senior Secured Notes
due July 1, 2030 (the “2030 Notes,” and together with the 2028 Notes, the “Notes”). The proceeds of the Notes were initially
deposited into an account at The Bank of New York Mellon Trust Company, N.A., as Escrow Agent, which proceeds were held by the
Escrow Agent as collateral pursuant to an escrow agreement by and among the Escrow Agent and PG&E Corporation. Prior to July 1,
2023, in the case of the 2028 Notes, and prior to July 1, 2025, in the case of the 2030 Notes, (i) PG&E Corporation may redeem all or
part of the Notes of the applicable series, on any one or more occasions at a redemption price equal to 100% of the principal amount of
Notes of such series to be redeemed, plus a “make-whole” premium, plus accrued and unpaid interest, if any, to, but not including, the
redemption date or (ii) PG&E Corporation may redeem up to 40% of the aggregate principal amount of the Notes of the applicable
series on any one or more occasions at certain specified redemption prices with the net cash proceeds from certain equity offerings.
On or after July 1, 2023, in the case of the 2028 Notes, and July 1, 2025, in the case of the 2030 Notes, PG&E Corporation may
redeem the Notes of a series at certain specified redemption prices, plus accrued and unpaid interest thereon, if any, to but not
including, the applicable redemption date.
Name of Respondent
PACIFIC GAS AND ELECTRIC COMPANY
This Report is:(1) X An Original(2) A Resubmission
Date of Report(Mo, Da, Yr)
04/13/2021
Year/Period of Report
2020/Q4
NOTES TO FINANCIAL STATEMENTS (Continued)
FERC FORM NO. 1 (ED. 12-88) Page 123.36
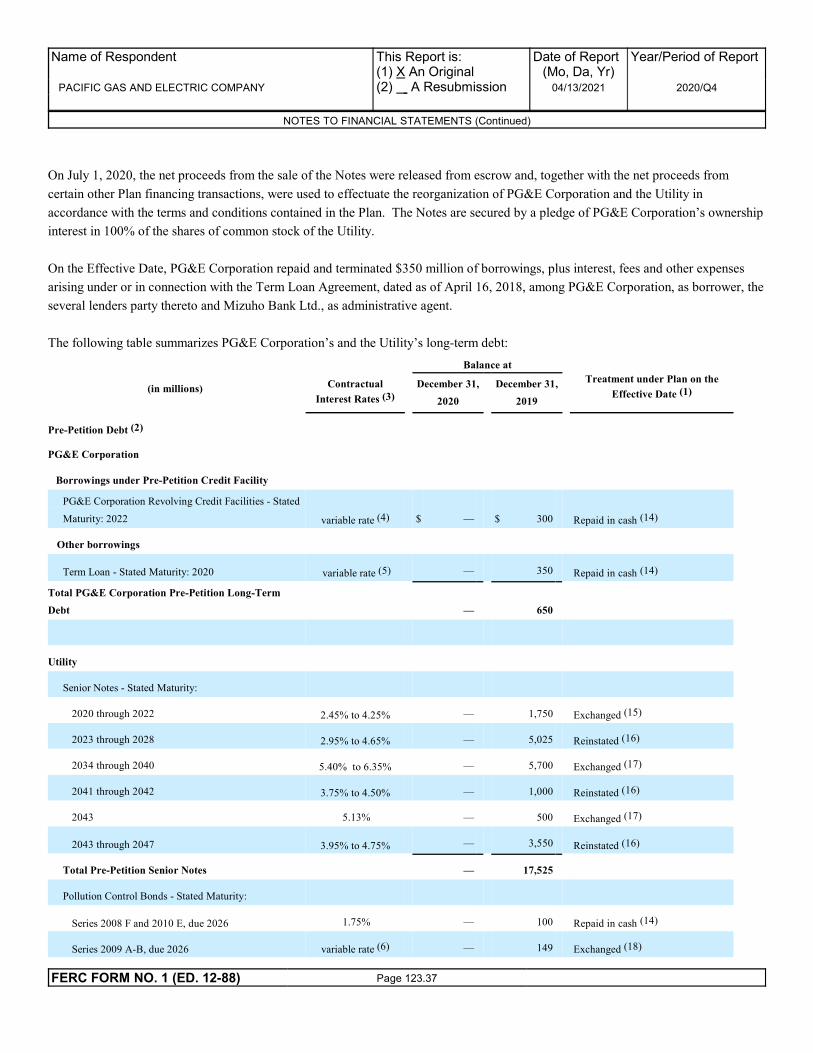
On July 1, 2020, the net proceeds from the sale of the Notes were released from escrow and, together with the net proceeds from
certain other Plan financing transactions, were used to effectuate the reorganization of PG&E Corporation and the Utility in
accordance with the terms and conditions contained in the Plan. The Notes are secured by a pledge of PG&E Corporation’s ownership
interest in 100% of the shares of common stock of the Utility.
On the Effective Date, PG&E Corporation repaid and terminated $350 million of borrowings, plus interest, fees and other expenses
arising under or in connection with the Term Loan Agreement, dated as of April 16, 2018, among PG&E Corporation, as borrower, the
several lenders party thereto and Mizuho Bank Ltd., as administrative agent.
The following table summarizes PG&E Corporation’s and the Utility’s long-term debt:
Balance at
(in millions)Contractual
Interest Rates (3)
December 31,
2020
December 31,
2019
Treatment under Plan on the
Effective Date (1)
Pre-Petition Debt (2)
PG&E Corporation
Borrowings under Pre-Petition Credit Facility
PG&E Corporation Revolving Credit Facilities - Stated
Maturity: 2022 variable rate (4) $ — $ 300 Repaid in cash (14)
Other borrowings
Term Loan - Stated Maturity: 2020 variable rate (5) — 350 Repaid in cash (14)
Total PG&E Corporation Pre-Petition Long-Term
Debt — 650
Utility
Senior Notes - Stated Maturity:
2020 through 2022 2.45% to 4.25% — 1,750 Exchanged (15)
2023 through 2028 2.95% to 4.65% — 5,025 Reinstated (16)
2034 through 2040 5.40% to 6.35% — 5,700 Exchanged (17)
2041 through 2042 3.75% to 4.50% — 1,000 Reinstated (16)
2043 5.13% — 500 Exchanged (17)
2043 through 2047 3.95% to 4.75% — 3,550 Reinstated (16)
Total Pre-Petition Senior Notes — 17,525
Pollution Control Bonds - Stated Maturity:
Series 2008 F and 2010 E, due 2026 1.75% — 100 Repaid in cash (14)
Series 2009 A-B, due 2026 variable rate (6) — 149 Exchanged (18)
Name of Respondent
PACIFIC GAS AND ELECTRIC COMPANY
This Report is:(1) X An Original(2) A Resubmission
Date of Report(Mo, Da, Yr)
04/13/2021
Year/Period of Report
2020/Q4
NOTES TO FINANCIAL STATEMENTS (Continued)
FERC FORM NO. 1 (ED. 12-88) Page 123.37

Series 1996 C, E, F, 1997 B due 2026 variable rate (7) — 614 Exchanged (18)
Total Pre-Petition Pollution Control Bonds — 863
Borrowings under Pre-Petition Credit Facilities
Utility Revolving Credit Facilities - Stated Maturity:
2022 variable rate (8) — 2,888 Exchanged (18)
Other borrowings:
Term Loan - Stated Maturity: 2019 variable rate (9) — 250 Exchanged (18)
Total Borrowings under Pre-Petition Credit Facility — 3,138
Total Utility Pre-Petition Debt — 21,526
Total PG&E Corporation Consolidated Pre-Petition
Debt $ — $ 22,176
New Long-Term Debt
PG&E Corporation
Term Loan - Stated Maturity: 2025 variable rate (10) $ 2,709 $ —
Senior Secured Notes due 2028 5.00% 1,000 —
Senior Secured Notes due 2030 5.25% 1,000 —
Unamortized discount, net of premium and debt
issuance costs (85) —
Total PG&E Corporation New Long-Term Debt 4,624 —
Utility
Pre-Petition Senior Notes Reinstated as First Mortgage
Bonds - Stated Maturity:
2023 through 2028 2.95% to 4.65% 5,025 —
2041 through 2042 3.75% to 4.50% 1,000 —
2043 through 2047 3.95% to 4.75% 3,550 —
Unamortized discount, net of premium and debt
issuance costs — —
Total Utility Reinstated New Long-Term Debt 9,575 —
Pre-Petition Debt Exchanged for First Mortgage Bonds
- Stated Maturity:
2025 3.45% 875 —
2026 3.15% 1,951 —
2028 3.75% 875 —
Name of Respondent
PACIFIC GAS AND ELECTRIC COMPANY
This Report is:(1) X An Original(2) A Resubmission
Date of Report(Mo, Da, Yr)
04/13/2021
Year/Period of Report
2020/Q4
NOTES TO FINANCIAL STATEMENTS (Continued)
FERC FORM NO. 1 (ED. 12-88) Page 123.38

2030 4.55% 3,100 —
2040 4.50% 1,951 —
2050 4.95% 3,100 —
Unamortized discount, net of premium and debt
issuance costs (98) —
Total Utility Exchanged New Long-Term Debt 11,754 —
New First Mortgage Bonds - Stated Maturity:
2022 variable rate (11) 500 —
2022 1.75% 2,500 —
2027 2.10% 1,000 —
2031 2.50% 2,000 —
2040 3.30% 1,000 —
2050 3.50% 1,925 —
Unamortized discount, net of premium and debt
issuance costs (84) —
Total Utility New First Mortgage Bonds 8,841 —
Credit Facilities - Stated Maturity: 2022
Receivables securitization program variable rate (12) 1,000 —
18-month Term Loan variable rate (13) 1,500 —
Unamortized discount, net of premium and debt
issuance costs (6) —
Total Utility New Long-Term Debt 32,664 —
Total PG&E Corporation Consolidated New
Long-Term Debt $ 37,288 $ —
(1) The treatments of pre-petition debt under the Plan, as described in this column, relate only to the treatment of principal amounts and not pre-petition or
post-petition interest. See “Plan of Reorganization and Restructuring Support Agreements” in Note 2.
(2) As of December 31, 2019, pre-petition debt was reported at the amounts expected to be allowed by the Bankruptcy Court.
(3) The contractual interest rates for pre-petition debt and new debt are presented as of December 31, 2019 and 2020, respectively.
(4) At December 31, 2019, the contractual LIBOR-based interest rate on loans was 3.24%.
(5) At December 31, 2019, the contractual LIBOR-based interest rate on the term loan was 2.96%.
(6) At December 31, 2019, the contractual interest rate on the letter of credit facilities supporting these bonds was 7.95%.
(7) At December 31, 2019, the contractual interest rate on the letter of credit facilities supporting these bonds ranged from 7.95% to 8.08%.
(8) At December 31, 2019, the contractual LIBOR-based interest rate on the loans was 3.04%.
(9) At December 31, 2019, the contractual LIBOR-based interest rate on the term loan was 2.36%.
(10) At December 31, 2020, the contractual LIBOR-based interest rate on the term loan was 5.50%.
Name of Respondent
PACIFIC GAS AND ELECTRIC COMPANY
This Report is:(1) X An Original(2) A Resubmission
Date of Report(Mo, Da, Yr)
04/13/2021
Year/Period of Report
2020/Q4
NOTES TO FINANCIAL STATEMENTS (Continued)
FERC FORM NO. 1 (ED. 12-88) Page 123.39

(11) At December 31, 2020, the contractual LIBOR-based interest rate on the first mortgage bonds was 1.70%.
(12) At December 31, 2020, the contractual LIBOR-based interest rate on the receivables securitization program was 1.57%.
(13) At December 31, 2020, the contractual LIBOR-based interest rate on the term loan was 2.44%.
(14) In accordance with the Plan, these borrowings were repaid in cash on July 1, 2020.
(15) In accordance with the Plan, on July 1, 2020, the Utility issued $875 million aggregate principal amount of 3.45% first mortgage bonds due 2025 and $875
million aggregate principal amount of 3.75% first mortgage bonds due 2028, in satisfaction of these Senior Notes. See “Pre-Petition Debt Exchanged for First
Mortgage Bonds” in the table above.
(16) In accordance with the Plan, these Senior Notes were reinstated (and secured by First Mortgage Bonds) on July 1, 2020. See “Pre-Petition Senior Notes Reinstated
(and secured by First Mortgage Bonds)” in the table above.
(17) In accordance with the Plan, on July 1, 2020, the Utility issued $3.1 billion aggregate principal amount of 4.55% first mortgage bonds due 2030 and $3.1 billion
aggregate principal amount of 4.95% first mortgage bonds due 2050, in satisfaction of these Senior Notes. See “Pre-Petition Debt Exchanged for First Mortgage
Bonds” in the table above.
(18) In accordance with the Plan, on July 1, 2020, the Utility issued $1.95 billion aggregate principal amount of 3.15% first mortgage bonds due 2026 and $1.95
billion aggregate principal amount of 4.50% first mortgage bonds due 2040, in satisfaction of these pre-petition liabilities. See “Pre-Petition Debt Exchanged for
First Mortgage Bonds” in the table above.
Pollution Control Bonds
The California Pollution Control Financing Authority and the California Infrastructure and Economic Development Bank have issued
various series of fixed rate and multi-modal tax-exempt pollution control bonds for the benefit of the Utility. Substantially all of the
net proceeds of the pollution control bonds were used to finance or refinance pollution control and sewage and solid waste disposal
facilities at the Geysers geothermal power plant or at the Utility’s Diablo Canyon nuclear power plant. In 1999, the Utility sold all
bond-financed facilities at the non-retired units of the Geysers geothermal power plant to Geysers Power Company, LLC pursuant to
purchase and sales agreements stating that Geysers Power Company, LLC will use the bond-financed facilities solely as pollution
control facilities for so long as any tax-exempt pollution control bonds issued to finance the Geysers project are outstanding. Except
for components that may have been abandoned in place or disposed of as scrap or that are permanently non-operational, the Utility has
no knowledge that Geysers Power Company, LLC intends to cease using the bond-financed facilities solely as pollution control
facilities.
In accordance with the Plan, on July 1, 2020, the Utility repaid Series 2008 F and 2010 E and exchanged Series 2009 A-B, Series 1996
C, E, F, and 1997 B for first mortgage bonds.
Contractual Repayment Schedule
PG&E Corporation’s and the Utility’s combined stated long-term debt principal repayment amounts at December 31, 2020 are
reflected in the table below:
(in millions,
except interest rates) 2021 2022 2023 2024 2025 Thereafter Total
PG&E Corporation
Average fixed interest rate — % — % — % — % — % 5.13 % 5.13 %
Fixed rate obligations — % — % — % — % — % $2,000 $2,000
Variable interest rate as of
December 31, 2020 5.50 % 5.50 % 5.50 % 5.50 % 5.50 % — % 5.50 %
Name of Respondent
PACIFIC GAS AND ELECTRIC COMPANY
This Report is:(1) X An Original(2) A Resubmission
Date of Report(Mo, Da, Yr)
04/13/2021
Year/Period of Report
2020/Q4
NOTES TO FINANCIAL STATEMENTS (Continued)
FERC FORM NO. 1 (ED. 12-88) Page 123.40

Variable rate obligations $ 28 $ 28 $ 28 $ 28 $ 2,625 $ — $ 2,737
Utility
Average fixed interest rate — % 1.75 % 3.83 % 3.60 % 3.47 % 3.87 % 3.66 %
Fixed rate obligations $ — $ 2,500 $ 1,175 $ 800 $ 1,475 $ 23,902 $ 29,852
Variable interest rate as of
December 31, 2020 — % various (1) — % — % — % — % various (1)
Variable rate obligations $ — $ 3,000 $ — $ — $ — $ — $ 3,000
Total consolidated debt $ 28 $ 5,528 $ 1,203 $ 828 $ 4,100 $ 25,902 $ 37,589
(1) At December 31, 2020, the average interest rates for the Receivables Securitization Program, the first mortgage bonds due 2022 and the 18-month term loan were
1.57%, 1.70% and 2.44% respectively.
NOTE 6: COMMON STOCK AND SHARE-BASED COMPENSATION
PG&E Corporation had 1,984,678,673 shares of common stock outstanding at December 31, 2020. PG&E Corporation held all of the
Utility’s outstanding common stock at December 31, 2020.
On July 23, 2020, PG&E Corporation sent a notice of termination to the managers of the Amended and Restated Equity Distribution
Agreement, dated as of February 17, 2017, effectively terminating the agreement on that date. As of the termination date for this
agreement, no amounts were outstanding which required repayment.
Increase in Authorized Capitalization
On June 22, 2020, PG&E Corporation filed Amended Articles of Incorporation with the Secretary of State of California which
increased the authorized number of shares of common stock to 3.6 billion and the authorized number of shares of preferred stock to
400 million.
Plan Equity Financings
In connection with emergence from Chapter 11, in July 2020, PG&E Corporation raised an aggregate of $9.0 billion of gross proceeds
through the issuance of common stock and other equity-linked instruments as described below.
PG&E Corporation Investment Agreement
On June 7, 2020, PG&E Corporation entered into an Investment Agreement (the “Investment Agreement”) with certain investors (the
“Investors”) relating to the issuance and sale to the Investors of an aggregate of $3.25 billion of PG&E Corporation’s common stock.
Per the Investment Agreement, the price per share was equal to $9.50 per share, which was the public equity offering price in the
Common Stock Offering (as defined below in “Equity Offerings”).
Name of Respondent
PACIFIC GAS AND ELECTRIC COMPANY
This Report is:(1) X An Original(2) A Resubmission
Date of Report(Mo, Da, Yr)
04/13/2021
Year/Period of Report
2020/Q4
NOTES TO FINANCIAL STATEMENTS (Continued)
FERC FORM NO. 1 (ED. 12-88) Page 123.41

On July 1, 2020, pursuant to the terms of the Investment Agreement, PG&E Corporation issued to the Investors 342.1 million shares of
common stock. The Investors and their affiliates have certain customary registration rights with respect to the Shares held by such
Investor pursuant to the terms of the Investment Agreement.
Equity Offerings
On June 25, 2020, PG&E Corporation priced (i) the Common Stock Offering of 423.4 million shares of its common stock, and (ii) the
concurrent Equity Units Offering of 14.5 million of its Equity Units, for total net proceeds to PG&E Corporation, after deducting the
underwriting discounts and before estimated offering expenses payable by the PG&E Corporation, of $3.97 billion and $1.19 billion,
respectively.
On June 25, 2020, in connection with the Common Stock Offering, PG&E Corporation entered into an underwriting agreement (the
“Common Stock Underwriting Agreement”) with Goldman Sachs & Co. LLC and J.P. Morgan Securities LLC, as representatives of
several underwriters named in the Common Stock Underwriting Agreement (the “Common Stock Underwriters”), pursuant to which
PG&E Corporation agreed to issue and sell 423.4 million shares of its common stock to the Common Stock Underwriters. In addition,
on June 25, 2020, PG&E Corporation entered into an underwriting agreement (the “Equity Units Underwriting Agreement”) with
Goldman Sachs & Co. LLC and J.P. Morgan Securities LLC, as representatives of the several underwriters named in the Equity Units
Underwriting Agreement (the “Equity Units Underwriters”), pursuant to which PG&E Corporation agreed to issue and sell 14.5
million prepaid forward stock purchase contracts (the “Purchase Contracts”) to the Equity Underwriters in order for the Equity Units
Underwriters to sell 14.5 million Equity Units.
In connection with the Common Stock Offering and pursuant to the Common Stock Underwriting Agreement, PG&E Corporation
granted the underwriters a 30-day over-allotment option to purchase up to an additional 42.3 million shares of common stock. In
addition, in connection with the Equity Units Offering and pursuant to the Equity Units Underwriting Agreement, PG&E Corporation
also granted the underwriters a 30-day over-allotment option to purchase up to an additional 1.45 million Purchase Contracts to be
used by the Equity Units Underwriters to create up to an additional 1.45 million Equity Units (together with the 42.3 million shares of
common stock, the “Option Securities”).
The Common Stock Offering and the Equity Units Offering closed on July 1, 2020, and PG&E Corporation issued and sold a total of
423.4 million shares of its common stock and 14.5 million Purchase Contracts for total net proceeds of $5.2 billion. On July 24, 2020,
the Equity Units Underwriters exercised in full, the over-allotment option in the Equity Units Underwriting Agreement and on August
3, 2020, PG&E Corporation issued and sold 1.45 million Equity Units to the Equity Units Underwriters (the “Additional Units
Issuance”). The prepaid forward stock purchase contract portion of the Equity Units issued in the Equity Units Offering and the
Additional Units Issuance represents the right of the unitholders to receive, on the settlement date, between 125 million and
153 million shares, and between 12.5 million and 15.3 million shares, respectively, of PG&E Corporation common stock, based on the
value of PG&E Corporation common stock over a measurement period specified in the purchase contracts and subject to certain
adjustments as provided herein. The settlement date of the purchase contract is August 16, 2023, subject to acceleration or
postponement as provided in the purchase contracts. The Common Stock Underwriters did not exercise their option to purchase any
additional shares of common stock.
Name of Respondent
PACIFIC GAS AND ELECTRIC COMPANY
This Report is:(1) X An Original(2) A Resubmission
Date of Report(Mo, Da, Yr)
04/13/2021
Year/Period of Report
2020/Q4
NOTES TO FINANCIAL STATEMENTS (Continued)
FERC FORM NO. 1 (ED. 12-88) Page 123.42

PG&E Corporation applied accounting standards applicable to prepaid forward contracts to purchase common stock in order to
determine the proper balance sheet classification for the Equity Units issued and sold during the three months ended, September 30,
2020. The Equity Units are considered a range forward contract, in that the settlement of common stock shares is based on a range of
potential settlement outcomes. PG&E Corporation used various inputs, including stock price volatility, and determined that the
potential outcomes are predominantly fixed share settlements. As such, PG&E Corporation does not view the Equity Units as an
obligation to issue a variable number of shares and has concluded that the Equity Units meet all conditions for equity classification and
do not meet any of the other conditions that would result in asset or liability classification. The Equity Units issued and sold are
classified as Common stock on PG&E Corporation’s Consolidated Balance Sheet.
Equity Backstop Commitments and Forward Stock Purchase Agreements
See “Equity Financing” in Note 2 above for discussion of the equity backstop commitments which resulted in total net proceeds of
$523 million (of which $120.5 million were returned to the Backstop Parties pursuant to the Forward Stock Purchase Agreements, as
described below).
In connection with the Additional Units Issuance and pursuant to the terms of the Forward Stock Purchase Agreements, on August 3,
2020, PG&E Corporation (i) redeemed a portion of the rights under the Forward Stock Purchase Agreements to receive shares of
Common Stock and returned approximately $120.5 million to the Backstop Parties and (ii) issued and delivered to the Backstop
Parties 42.3 million Greenshoe Backstop Shares, representing the unredeemed portion of the Aggregate Greenshoe Backstop Purchase
Amount divided by the Settlement Price (without any issuance in respect of fractional shares).
Equity Issuances to the Fire Victim Trust
On the Effective Date, pursuant to the Plan, the Utility entered into the Fire Victim Trust Assignment Agreement, pursuant to which
the Utility transferred to the Fire Victim Trust 477 million shares of common stock of PG&E Corporation. As a result of the
Additional Units Issuance, on August 3, 2020, PG&E Corporation made an equity contribution of 748,415 shares to the Utility which
delivered such additional shares of common stock to the Fire Victim Trust pursuant to an anti-dilution provision in the Fire Victim
Trust Assignment Agreement.
Cash Contribution to the Utility Pursuant to the Plan
On the Effective Date, PG&E Corporation made an equity contribution of $12.9 billion in cash to the Utility, which used the funds to
satisfy and discharge certain liabilities of PG&E Corporation and the Utility under the Plan. PG&E Corporation’s cash equity
contribution was funded by proceeds from the financing transactions described herein.
Ownership Restrictions in PG&E Corporation’s Amended Articles
Name of Respondent
PACIFIC GAS AND ELECTRIC COMPANY
This Report is:(1) X An Original(2) A Resubmission
Date of Report(Mo, Da, Yr)
04/13/2021
Year/Period of Report
2020/Q4
NOTES TO FINANCIAL STATEMENTS (Continued)
FERC FORM NO. 1 (ED. 12-88) Page 123.43

Under Section 382 of the Internal Revenue Code, if a corporation (or a consolidated group) undergoes an “ownership change,” net
operating loss carryforwards and other tax attributes may be subject to certain limitations (which could limit PG&E Corporation or the
Utility’s ability to use these deferred tax assets to offset taxable income). In general, an ownership change occurs if the aggregate
stock ownership of certain shareholders (generally five percent shareholders, applying certain look-through and aggregation rules)
increases by more than 50% over such shareholders’ lowest percentage ownership during the testing period (generally three years).
PG&E Corporation’s and the Utility’s Amended Articles limit Transfers (as defined in the Amended Articles) that increase a person’s
or entity’s (including certain groups of persons) ownership of PG&E Corporation’s equity securities to more than 4.75% prior to the
Restriction Release Date without approval by the Board of Directors. The calculation of the percentage ownership may differ
depending on whether the Fire Victim Trust is treated as a qualified settlement trust or grantor trust.
As of the date of this report, it is more likely than not that PG&E Corporation has not undergone an ownership change and
consequently, its net operating loss carryforwards and other tax attributes are not limited by Section 382 of the Internal Revenue Code.
In 2019, $6.75 billion of the liability to be paid to the Fire Victim Trust in PG&E Corporation’s common stock was accrued by the
Utility. Because the corresponding tax deduction generally occurs no earlier than payment, the Utility established a deferred tax asset
for the accrual in 2019. On July 1, 2020, the Utility issued to the Fire Victim Trust 477 million shares of PG&E Corporation’s
common stock. The shares transferred to the Fire Victim Trust were valued at $4.53 billion on the date of transfer, $2.2 billion less
than the $6.75 billion that had been accrued as a liability in the Condensed Consolidated Financial Statements. Therefore, in the
quarter ended June 30, 2020, the Utility recorded a charge of $619 million to adjust the measurement of the deferred tax asset to reflect
the tax-effected difference between the accrual of $6.75 billion and the tax deduction of $4.53 billion for the transfer of PG&E
Corporation’s shares to the Fire Victim Trust.
In addition, the tax deduction recorded reflects PG&E Corporation’s conclusion as of December 31, 2020 that it is more likely than not
that the Fire Victim Trust will be treated as a “qualified settlement fund” for U.S. federal income tax purposes, in which case the
corresponding tax deduction will have occurred at the time the PG&E Corporation common stock was transferred to the Fire Victim
Trust. In January 2021, PG&E Corporation received an IRS ruling that states the Utility is eligible to make a grantor trust election for
U.S. federal income tax purposes with respect to the Fire Victim Trust and addressed certain, but not all, related issues. PG&E
Corporation believes benefits associated with “grantor trust” treatment could be realized, but only if PG&E Corporation and the Fire
Victim Trust can meet certain requirements of the Internal Revenue Code and Treasury Regulations thereunder, relating to sales of
PG&E Corporation stock. PG&E Corporation expects to elect grantor trust treatment, subject to entering into a definitive agreement
with the Fire Victim Trust. There can be no assurance that such an agreement will be reached or that PG&E Corporation will be able
to avail itself of the benefits of a grantor trust election. If PG&E Corporation makes a “grantor trust” election for the Fire Victim
Trust, the Utility’s tax deduction will occur only at the time the Fire Victim Trust pays the fire victims and will be impacted by the
price at which the Fire Victim Trust sells the shares, rather than the price at the time such shares were contributed to the Fire Victim
Trust.
Dividends
On December 20, 2017, the Boards of Directors of PG&E Corporation and the Utility suspended quarterly cash dividends on both
PG&E Corporation’s and the Utility’s common stock, beginning the fourth quarter of 2017, as well as the Utility’s preferred stock,
beginning the three-month period ending January 31, 2018.
Name of Respondent
PACIFIC GAS AND ELECTRIC COMPANY
This Report is:(1) X An Original(2) A Resubmission
Date of Report(Mo, Da, Yr)
04/13/2021
Year/Period of Report
2020/Q4
NOTES TO FINANCIAL STATEMENTS (Continued)
FERC FORM NO. 1 (ED. 12-88) Page 123.44
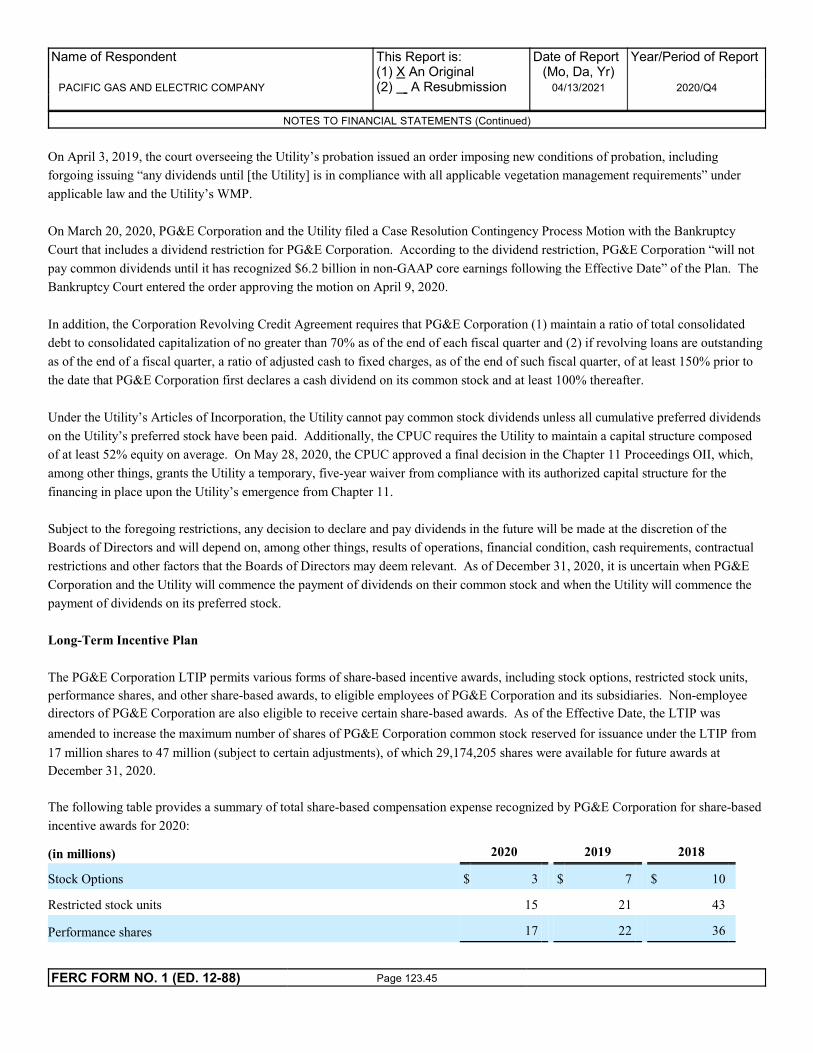
On April 3, 2019, the court overseeing the Utility’s probation issued an order imposing new conditions of probation, including
forgoing issuing “any dividends until [the Utility] is in compliance with all applicable vegetation management requirements” under
applicable law and the Utility’s WMP.
On March 20, 2020, PG&E Corporation and the Utility filed a Case Resolution Contingency Process Motion with the Bankruptcy
Court that includes a dividend restriction for PG&E Corporation. According to the dividend restriction, PG&E Corporation “will not
pay common dividends until it has recognized $6.2 billion in non-GAAP core earnings following the Effective Date” of the Plan. The
Bankruptcy Court entered the order approving the motion on April 9, 2020.
In addition, the Corporation Revolving Credit Agreement requires that PG&E Corporation (1) maintain a ratio of total consolidated
debt to consolidated capitalization of no greater than 70% as of the end of each fiscal quarter and (2) if revolving loans are outstanding
as of the end of a fiscal quarter, a ratio of adjusted cash to fixed charges, as of the end of such fiscal quarter, of at least 150% prior to
the date that PG&E Corporation first declares a cash dividend on its common stock and at least 100% thereafter.
Under the Utility’s Articles of Incorporation, the Utility cannot pay common stock dividends unless all cumulative preferred dividends
on the Utility’s preferred stock have been paid. Additionally, the CPUC requires the Utility to maintain a capital structure composed
of at least 52% equity on average. On May 28, 2020, the CPUC approved a final decision in the Chapter 11 Proceedings OII, which,
among other things, grants the Utility a temporary, five-year waiver from compliance with its authorized capital structure for the
financing in place upon the Utility’s emergence from Chapter 11.
Subject to the foregoing restrictions, any decision to declare and pay dividends in the future will be made at the discretion of the
Boards of Directors and will depend on, among other things, results of operations, financial condition, cash requirements, contractual
restrictions and other factors that the Boards of Directors may deem relevant. As of December 31, 2020, it is uncertain when PG&E
Corporation and the Utility will commence the payment of dividends on their common stock and when the Utility will commence the
payment of dividends on its preferred stock.
Long-Term Incentive Plan
The PG&E Corporation LTIP permits various forms of share-based incentive awards, including stock options, restricted stock units,
performance shares, and other share-based awards, to eligible employees of PG&E Corporation and its subsidiaries. Non-employee
directors of PG&E Corporation are also eligible to receive certain share-based awards. As of the Effective Date, the LTIP was
amended to increase the maximum number of shares of PG&E Corporation common stock reserved for issuance under the LTIP from
17 million shares to 47 million (subject to certain adjustments), of which 29,174,205 shares were available for future awards at
December 31, 2020.
The following table provides a summary of total share-based compensation expense recognized by PG&E Corporation for share-based
incentive awards for 2020:
(in millions) 2020 2019 2018
Stock Options $ 3 $ 7 $ 10
Restricted stock units 15 21 43
Performance shares 17 22 36
Name of Respondent
PACIFIC GAS AND ELECTRIC COMPANY
This Report is:(1) X An Original(2) A Resubmission
Date of Report(Mo, Da, Yr)
04/13/2021
Year/Period of Report
2020/Q4
NOTES TO FINANCIAL STATEMENTS (Continued)
FERC FORM NO. 1 (ED. 12-88) Page 123.45

Total compensation expense (pre-tax) $ 35 $ 50 $ 89
Total compensation expense (after-tax) $ 25 $ 35 $ 63
Share-based compensation costs are generally not capitalized. There was no material difference between PG&E Corporation and the
Utility for the information disclosed above.
Stock Options
The exercise price of stock options granted under the LTIP and all other outstanding stock options is equal to the market price of
PG&E Corporation’s common stock on the date of grant. Stock options generally have a 10-year term and vest over three years of
continuous service, subject to accelerated vesting in certain circumstances. As of December 31, 2020, $0.5 million of total
unrecognized compensation costs related to nonvested stock options were expected to be recognized over a weighted average period of
0.16 years for PG&E Corporation.
The fair value of each stock option on the date of grant is estimated using the Black-Scholes valuation method. The weighted average
grant date fair value of options granted using the Black-Scholes valuation method in 2019 was $3.87 per share. No stock options were
granted in 2020. The significant assumptions used for shares granted in 2019 were:
2019
Expected stock price volatility 57.00 %
Expected annual dividend payment — %
Risk-free interest rate 1.51% to 1.52%
Expected life (years) 4.5
Expected volatilities are based on historical volatility of PG&E Corporation’s common stock. The expected dividend payment is the
dividend yield at the date of grant. The risk-free interest rate for periods within the contractual term of the stock option is based on the
U.S. Treasury rates in effect at the date of grant. The expected life of stock options is derived from historical data that estimates stock
option exercises and employee departure behavior.
There was no tax benefit recognized from stock options for the year ended December 31, 2020.
The following table summarizes stock option activity for PG&E Corporation and the Utility for 2020:
Number of
Stock Options
Weighted
Average
Grant-
Date Fair
Value
Weighted
Average
Remaining
Contractual
Term
Aggregate
Intrinsic Value
Outstanding at January 1 4,281,403 $ 5.98 $ —
Granted (1) 20,065 3.87 —
Exercised — — —
Name of Respondent
PACIFIC GAS AND ELECTRIC COMPANY
This Report is:(1) X An Original(2) A Resubmission
Date of Report(Mo, Da, Yr)
04/13/2021
Year/Period of Report
2020/Q4
NOTES TO FINANCIAL STATEMENTS (Continued)
FERC FORM NO. 1 (ED. 12-88) Page 123.46

Forfeited or expired (2,080,221) 3.87 —
Outstanding at December 31 2,221,247 7.45 5.33 years —
Vested or expected to vest at December 31 2,215,076 7.43 5.31 years —
Exercisable at December 31 1,840,893 $ 6.86 4.93 years $ —
(1) Represents additional payout of existing stock option grants.
Restricted Stock Units
Restricted stock units granted after 2014 generally vest equally over three years. Vested restricted stock units are settled in shares of
PG&E Corporation common stock accompanied by cash payments to settle any dividend equivalents associated with the vested
restricted stock units. Compensation expense is generally recognized ratably over the vesting period based on grant-date fair value.
The weighted average grant-date fair value for restricted stock units granted during 2020, 2019, and 2018 was $9.25, $18.57, and
$40.92, respectively. The total fair value of restricted stock units that vested during 2020, 2019, and 2018 was $31 million, $42
million, and $41 million, respectively. The tax detriment from restricted stock units that vested in 2020 was $19 million. In general,
forfeitures are recorded ratably over the vesting period, using historical averages and adjusted to actuals when vesting occurs. As of
December 31, 2020, $6 million of total unrecognized compensation costs related to nonvested restricted stock units was expected to be
recognized over the remaining weighted average period of 1.58 years.
The following table summarizes restricted stock unit activity for 2020:
Number of
Restricted Stock Units
Weighted Average Grant-
Date Fair Value
Nonvested at January 1 1,040,835 $ 44.06
Granted 1,007,782 9.25
Vested (944,090) 33.14
Forfeited (214,174) 15.75
Nonvested at December 31 890,353 $ 23.05
Performance Shares
Performance shares generally will vest three years after the grant date. Upon vesting, performance shares are settled in shares of
common stock based on either PG&E Corporation’s total shareholder return relative to a specified group of industry peer companies
over a three-year performance period or, for a small number of awards, an internal PG&E Corporation metric. Dividend equivalents
are paid in cash based on the amount of common stock to which the recipients are entitled.
Name of Respondent
PACIFIC GAS AND ELECTRIC COMPANY
This Report is:(1) X An Original(2) A Resubmission
Date of Report(Mo, Da, Yr)
04/13/2021
Year/Period of Report
2020/Q4
NOTES TO FINANCIAL STATEMENTS (Continued)
FERC FORM NO. 1 (ED. 12-88) Page 123.47

Compensation expense attributable to performance shares is generally recognized ratably over the applicable three-year period based
on the grant-date fair value determined using a Monte Carlo simulation valuation model for the total shareholder return based awards
or the grant-date market value of PG&E Corporation common stock for internal metric based awards. The weighted average
grant-date fair value for performance shares granted during 2020, 2019, and 2018 was $9.62, $15.39, and $36.92 respectively. The tax
detriment from performance shares that vested in 2020 was $49 million. In general, forfeitures are recorded ratably over the vesting
period, using historical averages and adjusted to actuals when vesting occurs. As of December 31, 2020, $54 million of total
unrecognized compensation costs related to nonvested performance shares was expected to be recognized over the remaining weighted
average period of 2.2 years.
The following table summarizes activity for performance shares in 2020:
Number of
Performance Shares
Weighted Average Grant-
Date Fair Value
Nonvested at January 1 688,423 $ 36.92
Granted 7,951,541 9.62
Vested (132,526) 41.27
Forfeited (1) (1,218,656) 24.38
Nonvested at December 31 7,288,782 $ 9.16
(1) Includes performance shares that expired with zero value as performance targets were not met.
NOTE 7: PREFERRED STOCK
PG&E Corporation has authorized 400 million shares of preferred stock, none of which is outstanding.
The Utility has authorized 75 million shares of first preferred stock, with a par value of $25 per share, and 10 million shares of $100
first preferred stock, with a par value of $100 per share. At December 31, 2020 and December 31, 2019, the Utility’s preferred stock
outstanding included $145 million of shares with interest rates between 5% and 6% designated as nonredeemable preferred stock and
$113 million of shares with interest rates between 4.36% and 5% that are redeemable between $25.75 and $27.25 per share. The
Utility’s preferred stock outstanding are not subject to mandatory redemption. No shares of $100 first preferred stock are outstanding.
At December 31, 2020, annual dividends on the Utility’s nonredeemable preferred stock ranged from $1.25 to $1.50 per share. The
Utility’s redeemable preferred stock is subject to redemption at the Utility’s option, in whole or in part, if the Utility pays the specified
redemption price plus accumulated and unpaid dividends through the redemption date. At December 31, 2020, annual dividends on
redeemable preferred stock ranged from $1.09 to $1.25 per share.
Dividends on all Utility preferred stock are cumulative. All shares of preferred stock have voting rights and an equal preference in
dividend and liquidation rights. Upon liquidation or dissolution of the Utility, holders of preferred stock would be entitled to the par
value of such shares plus all accumulated and unpaid dividends, as specified for the class and series. The Utility paid no dividends on
preferred stock in 2020, 2019, or 2018.
Name of Respondent
PACIFIC GAS AND ELECTRIC COMPANY
This Report is:(1) X An Original(2) A Resubmission
Date of Report(Mo, Da, Yr)
04/13/2021
Year/Period of Report
2020/Q4
NOTES TO FINANCIAL STATEMENTS (Continued)
FERC FORM NO. 1 (ED. 12-88) Page 123.48

NOTE 8: EARNINGS PER SHARE
PG&E Corporation’s basic EPS is calculated by dividing the income (loss) available for common shareholders by the weighted
average number of common shares outstanding. PG&E Corporation applies the treasury stock method of reflecting the dilutive effect
of outstanding share-based compensation in the calculation of diluted EPS. The following is a reconciliation of PG&E Corporation’s
income (loss) available for common shareholders and weighted average common shares outstanding for calculating diluted EPS for
2020, 2019, and 2018.
Year Ended December 31,
(in millions, except per share amounts) 2020 2019 2018
Loss attributable to common shareholders $ (1,318) $ (7,656) $ (6,851)
Weighted average common shares outstanding, basic 1,257 528 517
Add incremental shares from assumed conversions:
Employee share-based compensation — — —
Equity Units — — —
Weighted average common share outstanding, diluted 1,257 528 517
Total Loss per common share, diluted $ (1.05) $ (14.50) $ (13.25)
For each of the periods presented above, the calculation of outstanding common shares on a diluted basis excluded an insignificant
amount of options and securities that were antidilutive.
NOTE 9: INCOME TAXES
PG&E Corporation and the Utility use the asset and liability method of accounting for income taxes. The income tax provision
includes current and deferred income taxes resulting from operations during the year. PG&E Corporation and the Utility estimate
current period tax expense in addition to calculating deferred tax assets and liabilities. Deferred tax assets and liabilities result from
temporary tax and accounting timing differences, such as those arising from depreciation expense.
PG&E Corporation and the Utility recognize a tax benefit if it is more likely than not that a tax position taken or expected to be taken
in a tax return will be sustained upon examination by taxing authorities based on the merits of the position. The tax benefit recognized
in the financial statements is measured based on the largest amount of benefit that is greater than 50% likely of being realized upon
settlement. As such, the difference between a tax position taken or expected to be taken in a tax return in future periods and the benefit
recognized and measured pursuant to this guidance in the financial statements represents an unrecognized tax benefit.
Investment tax credits are deferred and amortized to income over time. PG&E Corporation amortizes its investment tax credits over
the projected investment recovery period. The Utility amortizes its investment tax credits over the life of the related property in
accordance with regulatory treatment.
Name of Respondent
PACIFIC GAS AND ELECTRIC COMPANY
This Report is:(1) X An Original(2) A Resubmission
Date of Report(Mo, Da, Yr)
04/13/2021
Year/Period of Report
2020/Q4
NOTES TO FINANCIAL STATEMENTS (Continued)
FERC FORM NO. 1 (ED. 12-88) Page 123.49

PG&E Corporation files a consolidated U.S. federal income tax return that includes the Utility and domestic subsidiaries in which its
ownership is 80% or more. PG&E Corporation files a combined state income tax return in California. PG&E Corporation and the
Utility are parties to a tax-sharing agreement under which the Utility determines its income tax provision (benefit) on a stand-alone
basis.
The significant components of income tax provision (benefit) by taxing jurisdiction were as follows:
PG&E Corporation Utility
Year Ended December 31,
(in millions) 2020 2019 2018 2020 2019 2018
Current:
Federal $ (26) $ 1 $ (5) $ (26) $ 4 $ 5
State (34) 101 (8) (34) 94 (7)
Deferred:
Federal 258 (2,361) (2,264) 290 (2,363) (2,278)
State 171 (1,136) (1,009) 185 (1,137) (1,009)
Tax credits (7) (5) (6) (7) (5) (6)
Income tax provision (benefit) $ 362 $ (3,400) $ (3,292) $ 408 $ (3,407) $ (3,295)
The following tables describe net deferred income tax assets and liabilities:
PG&E Corporation Utility
Year Ended December 31,
(in millions) 2020 2019 2020 2019
Deferred income tax assets:
Tax carryforwards $ 7,641 $ 1,390 $ 7,529 $ 1,308
Compensation 187 151 109 92
Wildfire-related claims (1) 544 6,520 544 6,520
Operating lease liability 489 642 488 640
Other (2) 212 112 219 121
Total deferred income tax assets $ 9,073 $ 8,815 $ 8,889 $ 8,681
Deferred income tax liabilities:
Property related basis differences 8,311 7,984 8,300 7,973
Regulatory balancing accounts 763 381 763 381
Debt financing costs 526 — 526 —
Name of Respondent
PACIFIC GAS AND ELECTRIC COMPANY
This Report is:(1) X An Original(2) A Resubmission
Date of Report(Mo, Da, Yr)
04/13/2021
Year/Period of Report
2020/Q4
NOTES TO FINANCIAL STATEMENTS (Continued)
FERC FORM NO. 1 (ED. 12-88) Page 123.50

Operating lease right of use asset 489 642 488 640
Income tax regulatory asset(3) 254 71 254 71
Other (4) 128 57 128 58
Total deferred income tax liabilities $ 10,471 $ 9,135 $ 10,459 $ 9,123
Total net deferred income tax liabilities $ 1,398 $ 320 $ 1,570 $ 442
(1) Amounts primarily relate to wildfire-related claims, net of estimated insurance recoveries, and legal and other costs related to various wildfires that have occurred
on PG&E Corporation’s and the Utility’s service territory over the past several years.
(2) Amounts include benefits, environmental reserve, and customer advances for construction.
(3) Represents the tax gross up portion of the deferred income tax for the cumulative differences between amounts recognized for ratemaking purposes and amounts
recognized for tax, including the impact of changes in net deferred taxes associated with a lower federal income tax rate as a result of the Tax Act.
(4) Amount primarily includes an environmental reserve.
The following table reconciles income tax expense at the federal statutory rate to the income tax provision:
PG&E Corporation Utility
Year Ended December 31,
2020 2019 2018 2020 2019 2018
Federal statutory income tax rate 21.0 % 21.0 % 21.0 % 21.0 % 21.0 % 21.0 %
Increase (decrease) in income tax rate
resulting from:
State income tax (net of federal benefit)
(1) (15.3) 7.5 7.9 19.1 7.5 7.9
Effect of regulatory treatment of fixed
asset differences (2) 39.0 2.8 3.6 (44.9) 2.8 3.6
Tax credits 1.5 0.1 0.1 (1.7) 0.1 0.1
Bankruptcy and emergence (3) (82.5) — — 54.1 — —
Other, net (4) (2.1) (0.6) (0.1) 2.2 (0.5) —
Effective tax rate (38.4)% 30.8 % 32.5 % 49.8 % 30.9 % 32.6 %
(1) Includes the effect of state flow-through ratemaking treatment.
(2) Includes the effect of federal flow-through ratemaking treatment for certain property-related costs. For these temporary tax differences, PG&E Corporation and the
Utility recognize the deferred tax impact in the current period and record offsetting regulatory assets and liabilities. Therefore, PG&E Corporation’s and the
Utility’s effective tax rates are impacted as these differences arise and reverse. PG&E Corporation and the Utility recognize such differences as regulatory assets or
liabilities as it is probable that these amounts will be recovered from or returned to customers in future rates. In 2020, 2019, and 2018, the amounts also reflect the
impact of the amortization of excess deferred tax benefits to be refunded to customers as a result of the Tax Act passed in December 2017.
Name of Respondent
PACIFIC GAS AND ELECTRIC COMPANY
This Report is:(1) X An Original(2) A Resubmission
Date of Report(Mo, Da, Yr)
04/13/2021
Year/Period of Report
2020/Q4
NOTES TO FINANCIAL STATEMENTS (Continued)
FERC FORM NO. 1 (ED. 12-88) Page 123.51

(3) The Utility includes an adjustment for the measurement of the deferred tax asset associated with the difference between the liability recorded related to the TCC
RSA and the ultimate value of PG&E Corporation stock contributed to the Fire Victim Trust. PG&E Corporation includes the same adjustment as the Utility and a
permanent non-deductible equity backstop premium expense. This combined with a pre-tax loss and a pre-tax income for PG&E Corporation and the Utility,
respectively, accounts for the remaining difference.
(4) These amounts primarily represent the impact of tax audit settlements and non-tax deductible costs in 2020 and 2019.
Unrecognized Tax Benefits
The following table reconciles the changes in unrecognized tax benefits:
PG&E Corporation Utility
(in millions) 2020 2019 2018 2020 2019 2018
Balance at beginning of year $ 420 $ 377 $ 349 $ 420 $ 377 $ 349
Reductions for tax position taken during a
prior year (43) (1) (27) (43) (1) (27)
Additions for tax position taken during the
current year 60 44 55 60 44 55
Settlements — — — — — —
Expiration of statute — — — — — —
Balance at end of year $ 437 $ 420 $ 377 $ 437 $ 420 $ 377
The component of unrecognized tax benefits that, if recognized, would affect the effective tax rate at December 31, 2020 for PG&E
Corporation and the Utility was $16 million.
PG&E Corporation’s and the Utility’s unrecognized tax benefits are not likely to change significantly within the next 12 months.
Interest income, interest expense and penalties associated with income taxes are reflected in income tax expense on the Consolidated
Statements of Income. For the years ended December 31, 2020, 2019, and 2018, these amounts were immaterial.
Tax Settlements
PG&E Corporation’s tax returns have been accepted through 2015 for federal income tax purposes, except for a few matters, the most
significant of which relate to deductible repair costs for gas transmission and distribution lines of business and tax deductions claimed
for regulatory fines and fees assessed as part of the penalty decision issued in 2015 for the San Bruno natural gas explosion in
September of 2010.
Tax years after 2007 remain subject to examination by the State of California.
Carryforwards
The following table describes PG&E Corporation’s operating loss and tax credit carryforward balances:
Name of Respondent
PACIFIC GAS AND ELECTRIC COMPANY
This Report is:(1) X An Original(2) A Resubmission
Date of Report(Mo, Da, Yr)
04/13/2021
Year/Period of Report
2020/Q4
NOTES TO FINANCIAL STATEMENTS (Continued)
FERC FORM NO. 1 (ED. 12-88) Page 123.52

(in millions) December 31,
2020
Expiration
Year
Federal:
Net operating loss carryforward - Pre-2018 $ 3,600 2031 - 2036
Net operating loss carryforward - Post-2017 24,887 N/A
Tax credit carryforward 134 2029 - 2040
State:
Net operating loss carryforward $ 25,364 2039 - 2040
Tax credit carryforward 100 Various
On the Petition Date, PG&E Corporation and the Utility filed voluntary petitions for relief under Chapter 11 in the Bankruptcy Court.
PG&E Corporation does not believe that the Chapter 11 Cases resulted in loss of or limitation on the utilization of any of the tax
carryforwards. PG&E Corporation will continue to monitor the status of tax carryforwards.
Other Tax Matters
PG&E Corporation’s and the Utility’s unrecognized tax benefits are not likely to change significantly within the next 12 months. At
December 31, 2020, it is reasonably possible that within the next 12 months, unrecognized tax benefits will decrease. The amount is
not expected to be material.
As of the date of this report, PG&E Corporation does not believe that it had undergone an ownership change, and consequently, its net
operating loss carryforwards and other tax attributes are not limited by Section 382 of the Internal Revenue Code.
In March 2020, Congress passed, and the President signed into law the Coronavirus Aid, Relief and Economic Security (“CARES”)
Act. Under the CARES Act, PG&E Corporation and the Utility have deferred the payment of 2020 payroll taxes for the remainder of
the year to 2021 and 2022.
During June 2020, the State of California enacted AB 85, which increases taxes on corporations over a three-year period beginning in
2020 by suspension of the net operating loss deduction and a limit of $5 million per year on business tax credits. PG&E Corporation
and the Utility do not anticipate any material impacts to PG&E Corporation’s Consolidated Financial Statements due to this
legislation.
In December 2020, Congress passed, and the President signed into law the Consolidations and Appropriations Act of 2021. PG&E
Corporation and the Utility do not expect this legislation to have a material impact to PG&E Corporation’s Consolidated Financial
Statements.
See “Ownership Restrictions in PG&E Corporation’s Amended Articles” in Note 6 of the Notes to the Consolidated Financial
Statements in Item 8 for information on the possible election to treat the Fire Victim Trust as a “grantor trust” for federal income tax
purposes.
Name of Respondent
PACIFIC GAS AND ELECTRIC COMPANY
This Report is:(1) X An Original(2) A Resubmission
Date of Report(Mo, Da, Yr)
04/13/2021
Year/Period of Report
2020/Q4
NOTES TO FINANCIAL STATEMENTS (Continued)
FERC FORM NO. 1 (ED. 12-88) Page 123.53

NOTE 10: DERIVATIVES
Use of Derivative Instruments
The Utility is exposed to commodity price risk as a result of its electricity and natural gas procurement activities. Procurement costs
are recovered through customer rates. The Utility uses both derivative and non-derivative contracts to manage volatility in customer
rates due to fluctuating commodity prices. Derivatives include contracts, such as power purchase agreements, forwards, futures,
swaps, options, and CRRs that are traded either on an exchange or over-the-counter.
Derivatives are presented in the Utility’s Consolidated Balance Sheets and recorded at fair value and on a net basis in accordance with
master netting arrangements for each counterparty. The fair value of derivative instruments is further offset by cash collateral paid or
received where the right of offset and the intention to offset exist.
Price risk management activities that meet the definition of derivatives are recorded at fair value on the Consolidated Balance Sheets.
These instruments are not held for speculative purposes and are subject to certain regulatory requirements. The Utility expects to fully
recover in rates all costs related to derivatives under the applicable ratemaking mechanism in place as long as the Utility’s price risk
management activities are carried out in accordance with CPUC directives. Therefore, all unrealized gains and losses associated with
the change in fair value of these derivatives are deferred and recorded within the Utility’s regulatory assets and liabilities on the
Consolidated Balance Sheets. Net realized gains or losses on commodity derivatives are recorded in the cost of electricity or the cost
of natural gas with corresponding increases or decreases to regulatory balancing accounts for recovery from or refund to customers.
The Utility elects the normal purchase and sale exception for eligible derivatives. Eligible derivatives are those that require physical
delivery in quantities that are expected to be used by the Utility over a reasonable period in the normal course of business, and do not
contain pricing provisions unrelated to the commodity delivered. These items are not reflected in the Consolidated Balance Sheets at
fair value.
Volume of Derivative Activity
The volumes of the Utility’s outstanding derivatives were as follows:
Contract Volume
At December 31,
Underlying Product Instruments 2020 2019
Natural Gas (1) (MMBtus (2)) Forwards, Futures and Swaps 146,642,863 131,896,159
Options 14,140,000 14,720,000
Electricity (Megawatt-hours) Forwards, Futures and Swaps 9,435,830 18,675,852
Options — —
Congestion Revenue Rights (3) 266,091,470 308,467,999
(1) Amounts shown are for the combined positions of the electric fuels and core gas supply portfolios.
Name of Respondent
PACIFIC GAS AND ELECTRIC COMPANY
This Report is:(1) X An Original(2) A Resubmission
Date of Report(Mo, Da, Yr)
04/13/2021
Year/Period of Report
2020/Q4
NOTES TO FINANCIAL STATEMENTS (Continued)
FERC FORM NO. 1 (ED. 12-88) Page 123.54

(2) Million British Thermal Units.
(3) CRRs are financial instruments that enable the holders to manage variability in electric energy congestion charges due to transmission grid limitations.
Presentation of Derivative Instruments in the Financial Statements
At December 31, 2020, the Utility’s outstanding derivative balances were as follows:
Commodity Risk
(in millions)
Gross Derivative
Balance Netting Cash Collateral
Total Derivative
Balance
Current assets – other $ 33 $ — $ 115 $ 148
Other noncurrent assets – other 136 — — 136
Current liabilities – other (38) — 15 (23)
Noncurrent liabilities – other (204) — 10 (194)
Total commodity risk $ (73) $ — $ 140 $ 67
At December 31, 2019, the Utility’s outstanding derivative balances were as follows:
Commodity Risk
(in millions)
Gross Derivative
Balance Netting Cash Collateral
Total Derivative
Balance
Current assets – other $ 36 $ (6) $ 4 $ 34
Other noncurrent assets – other 130 (6) — 124
Current liabilities – other (31) 6 2 (23)
Noncurrent liabilities – other (130) 6 — (124)
Total commodity risk $ 5 $ — $ 6 $ 11
Cash inflows and outflows associated with derivatives are included in operating cash flows on the Utility’s Consolidated Statements of
Cash Flows.
Some of the Utility’s derivatives instruments, including power purchase agreements, contain collateral posting provisions tied to the
Utility’s credit rating from each of the major credit rating agencies, also known as a credit-risk-related contingent feature. Multiple
credit agencies continue to rate the Utility below investment grade, which results in the Utility posting additional collateral. As of
December 31, 2020, the Utility satisfied or has otherwise addressed its obligations related to the credit-risk related contingency
features.
NOTE 11: FAIR VALUE MEASUREMENTS
Name of Respondent
PACIFIC GAS AND ELECTRIC COMPANY
This Report is:(1) X An Original(2) A Resubmission
Date of Report(Mo, Da, Yr)
04/13/2021
Year/Period of Report
2020/Q4
NOTES TO FINANCIAL STATEMENTS (Continued)
FERC FORM NO. 1 (ED. 12-88) Page 123.55

PG&E Corporation and the Utility measure their cash equivalents, trust assets and price risk management instruments at fair value. A
three-tier fair value hierarchy is established that prioritizes the inputs to valuation methodologies used to measure fair value:
• Level 1 – Observable inputs that reflect quoted prices (unadjusted) for identical assets or liabilities in active markets.
• Level 2 – Other inputs that are directly or indirectly observable in the marketplace.
• Level 3 – Unobservable inputs which are supported by little or no market activities.
The fair value hierarchy requires an entity to maximize the use of observable inputs and minimize the use of unobservable inputs when
measuring fair value.
Assets and liabilities measured at fair value on a recurring basis for PG&E Corporation and the Utility are summarized below. Assets
held in rabbi trusts are held by PG&E Corporation and not the Utility.
Fair Value Measurements
At December 31, 2020
(in millions) Level 1 Level 2 Level 3 Netting (1) Total
Assets:
Short-term investments $ 470 $ — $ — $ — $ 470
Nuclear decommissioning trusts
Short-term investments 27 — — — 27
Global equity securities 2,398 — — — 2,398
Fixed-income securities 924 835 — — 1,759
Assets measured at NAV — — — — 25
Total nuclear decommissioning trusts (2) 3,349 835 — — 4,209
Price risk management instruments (Note 10)
Electricity — 2 166 2 170
Gas — 1 — 113 114
Total price risk management instruments — 3 166 115 284
Rabbi trusts
Fixed-income securities — 106 — — 106
Life insurance contracts — 79 — — 79
Total rabbi trusts — 185 — — 185
Long-term disability trust
Short-term investments 9 — — — 9
Name of Respondent
PACIFIC GAS AND ELECTRIC COMPANY
This Report is:(1) X An Original(2) A Resubmission
Date of Report(Mo, Da, Yr)
04/13/2021
Year/Period of Report
2020/Q4
NOTES TO FINANCIAL STATEMENTS (Continued)
FERC FORM NO. 1 (ED. 12-88) Page 123.56

Assets measured at NAV — — — — 158
Total long-term disability trust 9 — — — 167
TOTAL ASSETS $ 3,828 $ 1,023 $ 166 $ 115 $ 5,315
Liabilities:
Price risk management instruments (Note 10)
Electricity $ — $ 1 $ 238 $ (25) $ 214
Gas — 3 — — 3
TOTAL LIABILITIES $ — $ 4 $ 238 $ (25) $ 217
(1) Includes the effect of the contractual ability to settle contracts under master netting agreements and cash collateral.
(2) Represents amount before deducting $671 million, primarily related to deferred taxes on appreciation of investment value.
Fair Value Measurements
At December 31, 2019
(in millions) Level 1 Level 2 Level 3 Netting (1) Total
Assets:
Short-term investments $ 1,323 $ — $ — $ — $ 1,323
Nuclear decommissioning trusts
Short-term investments 6 — — — 6
Global equity securities 2,086 — — — 2,086
Fixed-income securities 862 728 — — 1,590
Assets measured at NAV — — — — 21
Total nuclear decommissioning trusts (2) 2,954 728 — — 3,703
Price risk management instruments (Note 10)
Electricity — 2 161 (11) 152
Gas — 3 — 3 6
Total price risk management instruments — 5 161 (8) 158
Rabbi trusts
Fixed-income securities — 100 — — 100
Life insurance contracts — 73 — — 73
Name of Respondent
PACIFIC GAS AND ELECTRIC COMPANY
This Report is:(1) X An Original(2) A Resubmission
Date of Report(Mo, Da, Yr)
04/13/2021
Year/Period of Report
2020/Q4
NOTES TO FINANCIAL STATEMENTS (Continued)
FERC FORM NO. 1 (ED. 12-88) Page 123.57

Total rabbi trusts — 173 — — 173
Long-term disability trust
Short-term investments 10 — — — 10
Assets measured at NAV — — — — 156
Total long-term disability trust 10 — — — 166
TOTAL ASSETS $ 4,287 $ 906 $ 161 $ (8) $ 5,523
Liabilities:
Price risk management instruments (Note 10)
Electricity 1 2 156 (13) 146
Gas — 2 — (1) 1
TOTAL LIABILITIES $ 1 $ 4 $ 156 $ (14) $ 147
(1) Includes the effect of the contractual ability to settle contracts under master netting agreements and cash collateral.
(2) Represents amount before deducting $530 million, primarily related to deferred taxes on appreciation of investment value.
Valuation Techniques
The following describes the valuation techniques used to measure the fair value of the assets and liabilities shown in the tables above.
There are no restrictions on the terms and conditions upon which the investments may be redeemed. There were no material transfers
between any levels for the years ended December 31, 2020 and 2019.
Trust Assets
Assets Measured at Fair Value
In general, investments held in the trusts are exposed to various risks, such as interest rate, credit, and market volatility risks. Nuclear
decommissioning trust assets and other trust assets are composed primarily of equity and fixed-income securities and also include
short-term investments that are money market funds valued at Level 1.
Global equity securities primarily include investments in common stock that are valued based on quoted prices in active markets and
are classified as Level 1.
Name of Respondent
PACIFIC GAS AND ELECTRIC COMPANY
This Report is:(1) X An Original(2) A Resubmission
Date of Report(Mo, Da, Yr)
04/13/2021
Year/Period of Report
2020/Q4
NOTES TO FINANCIAL STATEMENTS (Continued)
FERC FORM NO. 1 (ED. 12-88) Page 123.58

Fixed-income securities are primarily composed of U.S. government and agency securities, municipal securities, and other
fixed-income securities, including corporate debt securities. U.S. government and agency securities primarily consist of U.S. Treasury
securities that are classified as Level 1 because the fair value is determined by observable market prices in active markets. A market
approach is generally used to estimate the fair value of fixed-income securities classified as Level 2 using evaluated pricing data such
as broker quotes, for similar securities adjusted for observable differences. Significant inputs used in the valuation model generally
include benchmark yield curves and issuer spreads. The external credit ratings, coupon rate, and maturity of each security are
considered in the valuation model, as applicable.
Assets Measured at NAV Using Practical Expedient
Investments in the nuclear decommissioning trusts and the long-term disability trust that are measured at fair value using the NAV per
share practical expedient have not been classified in the fair value hierarchy tables above. The fair value amounts are included in the
tables above in order to reconcile to the amounts presented in the Consolidated Balance Sheets. These investments include
commingled funds that are composed of equity securities traded publicly on exchanges as well as fixed-income securities that are
composed primarily of U.S. government securities and asset-backed securities.
Price Risk Management Instruments
Price risk management instruments include physical and financial derivative contracts, such as power purchase agreements, forwards,
futures, swaps, options, and CRRs that are traded either on an exchange or over-the-counter.
Power purchase agreements, forwards, and swaps are valued using a discounted cash flow model. Exchange-traded futures that are
valued using observable market forward prices for the underlying commodity are classified as Level 1. Over-the-counter forwards and
swaps that are identical to exchange-traded futures, or are valued using forward prices from broker quotes that are corroborated with
market data are classified as Level 2. Exchange-traded options are valued using observable market data and market-corroborated data
and are classified as Level 2.
Long-dated power purchase agreements that are valued using significant unobservable data are classified as Level 3. These Level 3
contracts are valued using either estimated basis adjustments from liquid trading points or techniques, including extrapolation from
observable prices, when a contract term extends beyond a period for which market data is available. The Utility utilizes models to
derive pricing inputs for the valuation of the Utility’s Level 3 instruments using pricing inputs from brokers and historical data.
The Utility holds CRRs to hedge the financial risk of CAISO-imposed congestion charges in the day-ahead market. Limited market
data is available in the CAISO auction and between auction dates; therefore, the Utility utilizes historical prices to forecast forward
prices. CRRs are classified as Level 3.
Level 3 Measurements and Uncertainty Analysis
Inputs used and the fair value of Level 3 instruments are reviewed period-over-period and compared with market conditions to
determine reasonableness.
Significant increases or decreases in any of those inputs would result in a significantly higher or lower fair value, respectively. All
reasonable costs related to Level 3 instruments are expected to be recoverable through customer rates; therefore, there is no impact to
net income resulting from changes in the fair value of these instruments. See Note 10 above.
Name of Respondent
PACIFIC GAS AND ELECTRIC COMPANY
This Report is:(1) X An Original(2) A Resubmission
Date of Report(Mo, Da, Yr)
04/13/2021
Year/Period of Report
2020/Q4
NOTES TO FINANCIAL STATEMENTS (Continued)
FERC FORM NO. 1 (ED. 12-88) Page 123.59

Fair Value at
(in millions) At December 31, 2020
Valuation
Technique
Unobservable
Input
Fair Value Measurement Assets Liabilities
Range
(1)/Weighted-Average
Price (2)
Congestion revenue rights $ 153 $ 74 Market approach CRR auction prices$ (320.25) - 320.25 /
0.30
Power purchase agreements $ 13 $ 164 Discounted cash flow Forward prices $ 12.56 - 148.30 / 35.52
(1) Represents price per megawatt-hour.
(2) Unobservable inputs were weighted by the relative fair value of the instruments.
Fair Value at
(in millions) At December 31, 2019
Valuation
Technique
Unobservable
Input
Fair Value Measurement Assets Liabilities
Range
(1)/Weighted-Average
Price (2)
Congestion revenue rights $ 140 $ 44 Market approach CRR auction prices $ (20.20) - 20.20 / 0.28
Power purchase agreements $ 21 $ 112 Discounted cash flow Forward prices $ 11.77 - 59.38 / 33.62
(1) Represents price per megawatt-hour.
(2) Unobservable inputs were weighted by the relative fair value of the instruments.
Level 3 Reconciliation
The following table presents the reconciliation for Level 3 price risk management instruments for the years ended December 31, 2020
and 2019, respectively:
Price Risk Management Instruments
(in millions) 2020 2019
Asset (liability) balance as of January 1 $ 5 $ 95
Net realized and unrealized gains:
Included in regulatory assets and liabilities or balancing accounts (1) (77) (90)
Asset (liability) balance as of December 31 $ (72) $ 5
Name of Respondent
PACIFIC GAS AND ELECTRIC COMPANY
This Report is:(1) X An Original(2) A Resubmission
Date of Report(Mo, Da, Yr)
04/13/2021
Year/Period of Report
2020/Q4
NOTES TO FINANCIAL STATEMENTS (Continued)
FERC FORM NO. 1 (ED. 12-88) Page 123.60
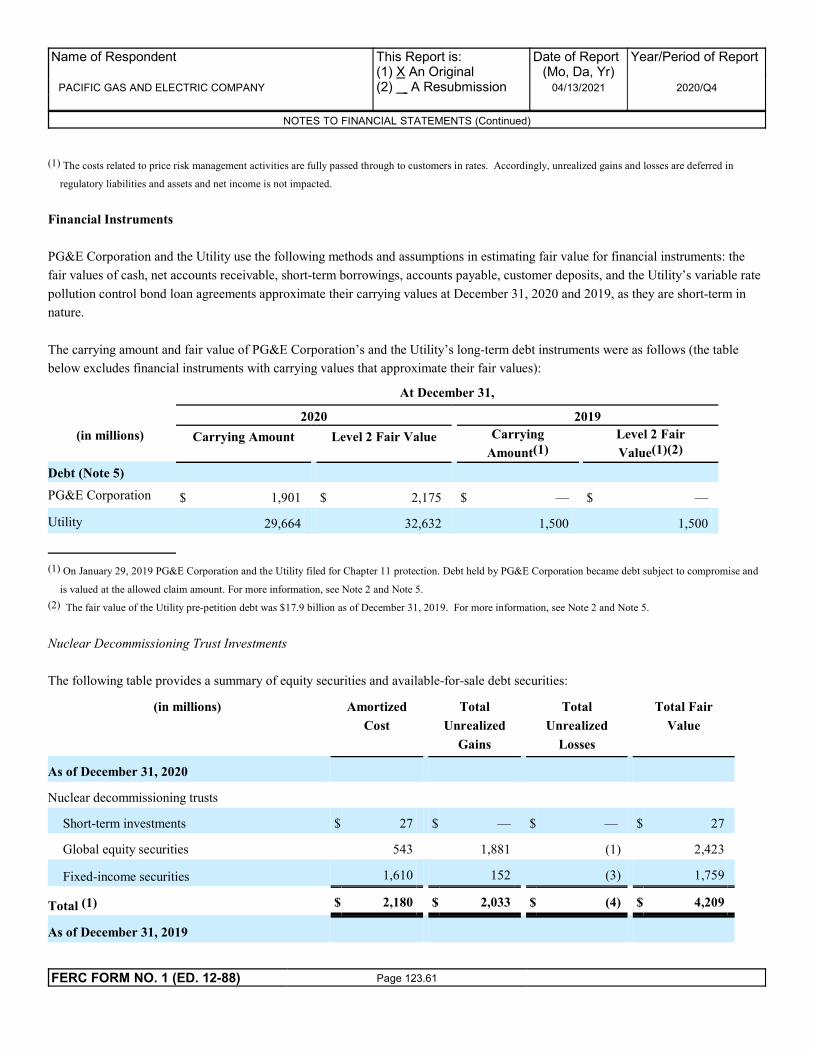
(1) The costs related to price risk management activities are fully passed through to customers in rates. Accordingly, unrealized gains and losses are deferred in
regulatory liabilities and assets and net income is not impacted.
Financial Instruments
PG&E Corporation and the Utility use the following methods and assumptions in estimating fair value for financial instruments: the
fair values of cash, net accounts receivable, short-term borrowings, accounts payable, customer deposits, and the Utility’s variable rate
pollution control bond loan agreements approximate their carrying values at December 31, 2020 and 2019, as they are short-term in
nature.
The carrying amount and fair value of PG&E Corporation’s and the Utility’s long-term debt instruments were as follows (the table
below excludes financial instruments with carrying values that approximate their fair values):
At December 31,
2020 2019
(in millions) Carrying Amount Level 2 Fair Value Carrying
Amount(1)
Level 2 Fair
Value(1)(2)
Debt (Note 5)
PG&E Corporation $ 1,901 $ 2,175 $ — $ —
Utility 29,664 32,632 1,500 1,500
(1) On January 29, 2019 PG&E Corporation and the Utility filed for Chapter 11 protection. Debt held by PG&E Corporation became debt subject to compromise and
is valued at the allowed claim amount. For more information, see Note 2 and Note 5.
(2) The fair value of the Utility pre-petition debt was $17.9 billion as of December 31, 2019. For more information, see Note 2 and Note 5.
Nuclear Decommissioning Trust Investments
The following table provides a summary of equity securities and available-for-sale debt securities:
(in millions) Amortized
Cost
Total
Unrealized
Gains
Total
Unrealized
Losses
Total Fair
Value
As of December 31, 2020
Nuclear decommissioning trusts
Short-term investments $ 27 $ — $ — $ 27
Global equity securities 543 1,881 (1) 2,423
Fixed-income securities 1,610 152 (3) 1,759
Total (1) $ 2,180 $ 2,033 $ (4) $ 4,209
As of December 31, 2019
Name of Respondent
PACIFIC GAS AND ELECTRIC COMPANY
This Report is:(1) X An Original(2) A Resubmission
Date of Report(Mo, Da, Yr)
04/13/2021
Year/Period of Report
2020/Q4
NOTES TO FINANCIAL STATEMENTS (Continued)
FERC FORM NO. 1 (ED. 12-88) Page 123.61
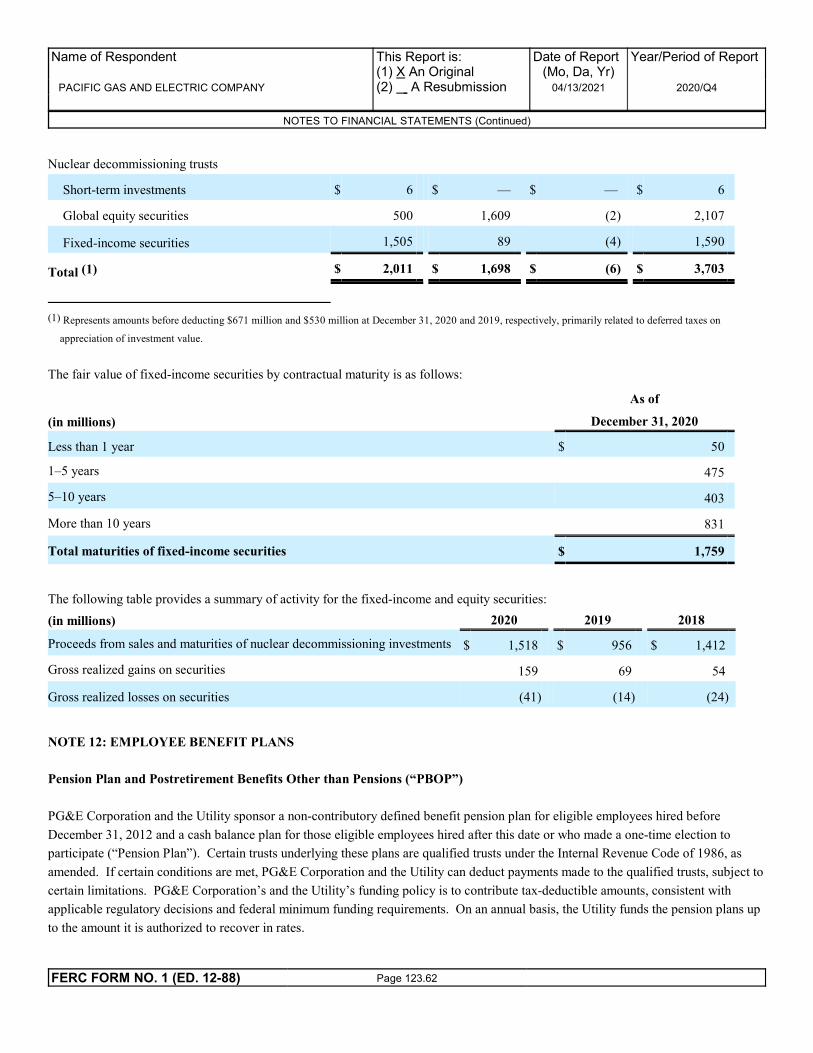
Nuclear decommissioning trusts
Short-term investments $ 6 $ — $ — $ 6
Global equity securities 500 1,609 (2) 2,107
Fixed-income securities 1,505 89 (4) 1,590
Total (1) $ 2,011 $ 1,698 $ (6) $ 3,703
(1) Represents amounts before deducting $671 million and $530 million at December 31, 2020 and 2019, respectively, primarily related to deferred taxes on
appreciation of investment value.
The fair value of fixed-income securities by contractual maturity is as follows:
As of
(in millions) December 31, 2020
Less than 1 year $ 50
1–5 years 475
5–10 years 403
More than 10 years 831
Total maturities of fixed-income securities $ 1,759
The following table provides a summary of activity for the fixed-income and equity securities:
(in millions) 2020 2019 2018
Proceeds from sales and maturities of nuclear decommissioning investments $ 1,518 $ 956 $ 1,412
Gross realized gains on securities 159 69 54
Gross realized losses on securities (41) (14) (24)
NOTE 12: EMPLOYEE BENEFIT PLANS
Pension Plan and Postretirement Benefits Other than Pensions (“PBOP”)
PG&E Corporation and the Utility sponsor a non-contributory defined benefit pension plan for eligible employees hired before
December 31, 2012 and a cash balance plan for those eligible employees hired after this date or who made a one-time election to
participate (“Pension Plan”). Certain trusts underlying these plans are qualified trusts under the Internal Revenue Code of 1986, as
amended. If certain conditions are met, PG&E Corporation and the Utility can deduct payments made to the qualified trusts, subject to
certain limitations. PG&E Corporation’s and the Utility’s funding policy is to contribute tax-deductible amounts, consistent with
applicable regulatory decisions and federal minimum funding requirements. On an annual basis, the Utility funds the pension plans up
to the amount it is authorized to recover in rates.
Name of Respondent
PACIFIC GAS AND ELECTRIC COMPANY
This Report is:(1) X An Original(2) A Resubmission
Date of Report(Mo, Da, Yr)
04/13/2021
Year/Period of Report
2020/Q4
NOTES TO FINANCIAL STATEMENTS (Continued)
FERC FORM NO. 1 (ED. 12-88) Page 123.62
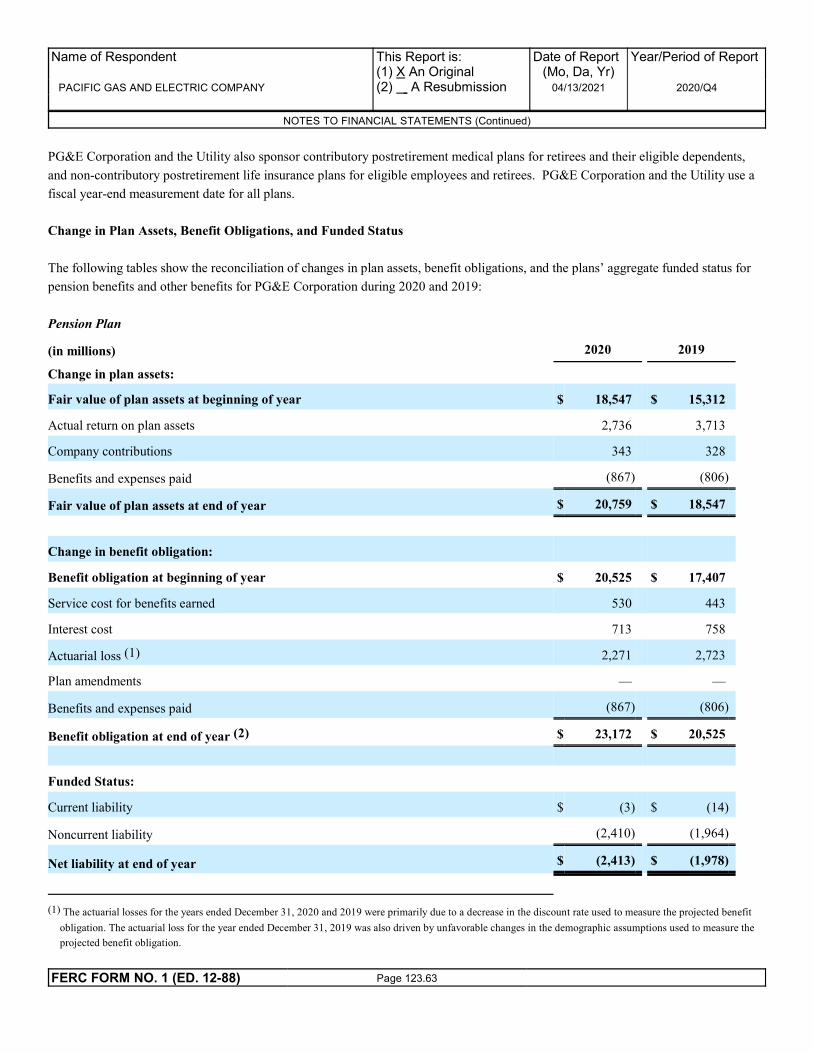
PG&E Corporation and the Utility also sponsor contributory postretirement medical plans for retirees and their eligible dependents,
and non-contributory postretirement life insurance plans for eligible employees and retirees. PG&E Corporation and the Utility use a
fiscal year-end measurement date for all plans.
Change in Plan Assets, Benefit Obligations, and Funded Status
The following tables show the reconciliation of changes in plan assets, benefit obligations, and the plans’ aggregate funded status for
pension benefits and other benefits for PG&E Corporation during 2020 and 2019:
Pension Plan
(in millions) 2020 2019
Change in plan assets:
Fair value of plan assets at beginning of year $ 18,547 $ 15,312
Actual return on plan assets 2,736 3,713
Company contributions 343 328
Benefits and expenses paid (867) (806)
Fair value of plan assets at end of year $ 20,759 $ 18,547
Change in benefit obligation:
Benefit obligation at beginning of year $ 20,525 $ 17,407
Service cost for benefits earned 530 443
Interest cost 713 758
Actuarial loss (1) 2,271 2,723
Plan amendments — —
Benefits and expenses paid (867) (806)
Benefit obligation at end of year (2) $ 23,172 $ 20,525
Funded Status:
Current liability $ (3) $ (14)
Noncurrent liability (2,410) (1,964)
Net liability at end of year $ (2,413) $ (1,978)
(1) The actuarial losses for the years ended December 31, 2020 and 2019 were primarily due to a decrease in the discount rate used to measure the projected benefit
obligation. The actuarial loss for the year ended December 31, 2019 was also driven by unfavorable changes in the demographic assumptions used to measure the
projected benefit obligation.
Name of Respondent
PACIFIC GAS AND ELECTRIC COMPANY
This Report is:(1) X An Original(2) A Resubmission
Date of Report(Mo, Da, Yr)
04/13/2021
Year/Period of Report
2020/Q4
NOTES TO FINANCIAL STATEMENTS (Continued)
FERC FORM NO. 1 (ED. 12-88) Page 123.63

(2) PG&E Corporation’s accumulated benefit obligation was $20.7 billion and $18.4 billion at December 31, 2020 and 2019, respectively.
Postretirement Benefits Other than Pensions
(in millions) 2020 2019
Change in plan assets:
Fair value of plan assets at beginning of year $ 2,678 $ 2,258
Actual return on plan assets 379 474
Company contributions 26 29
Plan participant contribution 81 82
Benefits and expenses paid (169) (165)
Fair value of plan assets at end of year $ 2,995 $ 2,678
Change in benefit obligation:
Benefit obligation at beginning of year $ 1,832 $ 1,745
Service cost for benefits earned 61 56
Interest cost 63 76
Actuarial (gain) loss (1) (14) 22
Benefits and expenses paid (149) (150)
Federal subsidy on benefits paid 3 2
Plan participant contributions 80 81
Benefit obligation at end of year $ 1,876 $ 1,832
Funded Status: (2)
Noncurrent asset $ 1,153 $ 879
Noncurrent liability (34) (33)
Net asset at end of year $ 1,119 $ 846
(1) The actuarial gain for the year ended December 31, 2020 was primarily due to favorable changes in the demographic and medical cost assumptions, offset by a
decrease in the discount rate used to measure the projected benefit obligation. The actuarial loss for the year ended December 31, 2019 was primarily due to a
decrease in the discount rate used to measure the projected benefit obligation, offset by favorable changes in the demographic assumptions and the elimination of
excise tax.
(2) At December 31, 2020 and 2019, the postretirement medical plan was in an overfunded position and the postretirement life insurance plan was in an underfunded
position. The projected benefit obligation and the fair value of plan assets for the postretirement life insurance plan were $377 million and $343 million as of
December 31, 2020, and $337 million and $305 million as of December 31, 2019, respectively.
Name of Respondent
PACIFIC GAS AND ELECTRIC COMPANY
This Report is:(1) X An Original(2) A Resubmission
Date of Report(Mo, Da, Yr)
04/13/2021
Year/Period of Report
2020/Q4
NOTES TO FINANCIAL STATEMENTS (Continued)
FERC FORM NO. 1 (ED. 12-88) Page 123.64
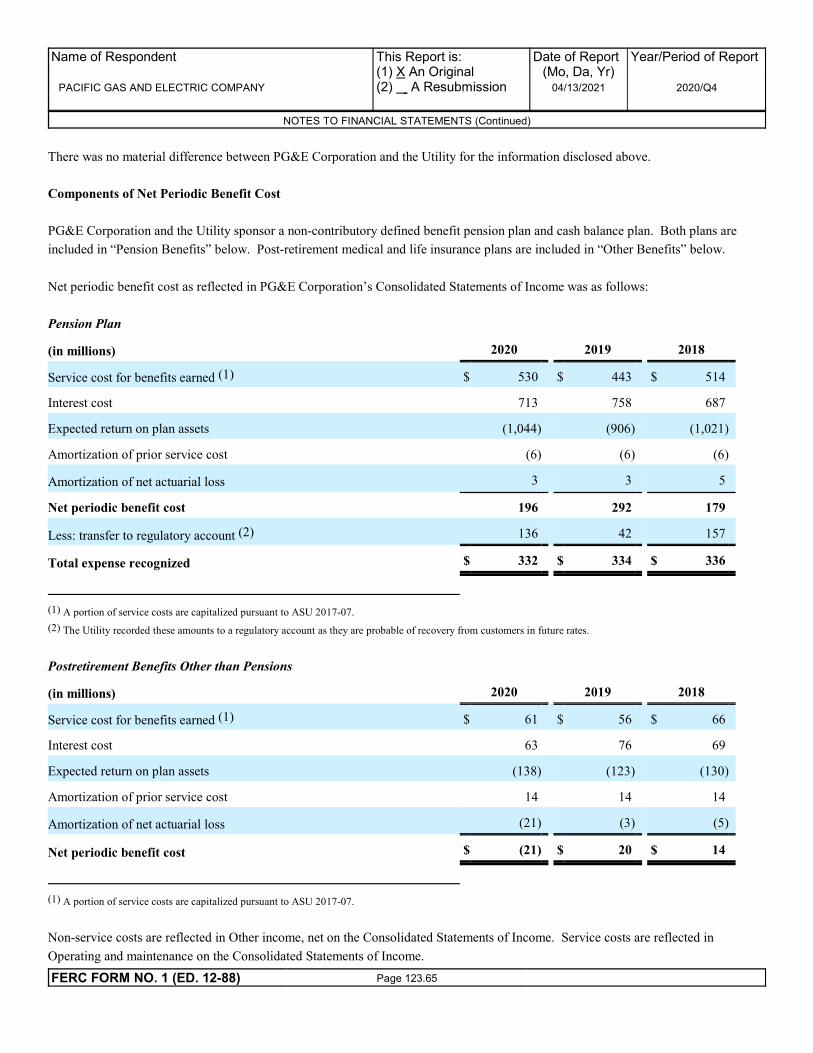
There was no material difference between PG&E Corporation and the Utility for the information disclosed above.
Components of Net Periodic Benefit Cost
PG&E Corporation and the Utility sponsor a non-contributory defined benefit pension plan and cash balance plan. Both plans are
included in “Pension Benefits” below. Post-retirement medical and life insurance plans are included in “Other Benefits” below.
Net periodic benefit cost as reflected in PG&E Corporation’s Consolidated Statements of Income was as follows:
Pension Plan
(in millions) 2020 2019 2018
Service cost for benefits earned (1) $ 530 $ 443 $ 514
Interest cost 713 758 687
Expected return on plan assets (1,044) (906) (1,021)
Amortization of prior service cost (6) (6) (6)
Amortization of net actuarial loss 3 3 5
Net periodic benefit cost 196 292 179
Less: transfer to regulatory account (2) 136 42 157
Total expense recognized $ 332 $ 334 $ 336
(1) A portion of service costs are capitalized pursuant to ASU 2017-07.
(2) The Utility recorded these amounts to a regulatory account as they are probable of recovery from customers in future rates.
Postretirement Benefits Other than Pensions
(in millions) 2020 2019 2018
Service cost for benefits earned (1) $ 61 $ 56 $ 66
Interest cost 63 76 69
Expected return on plan assets (138) (123) (130)
Amortization of prior service cost 14 14 14
Amortization of net actuarial loss (21) (3) (5)
Net periodic benefit cost $ (21) $ 20 $ 14
(1) A portion of service costs are capitalized pursuant to ASU 2017-07.
Non-service costs are reflected in Other income, net on the Consolidated Statements of Income. Service costs are reflected in
Operating and maintenance on the Consolidated Statements of Income.
Name of Respondent
PACIFIC GAS AND ELECTRIC COMPANY
This Report is:(1) X An Original(2) A Resubmission
Date of Report(Mo, Da, Yr)
04/13/2021
Year/Period of Report
2020/Q4
NOTES TO FINANCIAL STATEMENTS (Continued)
FERC FORM NO. 1 (ED. 12-88) Page 123.65

There was no material difference between PG&E Corporation and the Utility for the information disclosed above.
Components of Accumulated Other Comprehensive Income
PG&E Corporation and the Utility record unrecognized prior service costs and unrecognized gains and losses related to pension and
post-retirement benefits other than pension as components of accumulated other comprehensive income, net of tax. In addition,
regulatory adjustments are recorded in the Consolidated Statements of Income and Consolidated Balance Sheets to reflect the
difference between expense or income calculated in accordance with GAAP for accounting purposes and expense or income for
ratemaking purposes, which is based on authorized plan contributions. For pension benefits, a regulatory asset or liability is recorded
for amounts that would otherwise be recorded to accumulated other comprehensive income. For post-retirement benefits other than
pension, the Utility generally records a regulatory liability for amounts that would otherwise be recorded to accumulated other
comprehensive income. As the Utility is unable to record a regulatory asset for these other benefits, the charge remains in accumulated
other comprehensive income (loss).
Valuation Assumptions
The following weighted average year-end actuarial assumptions were used in determining the plans’ projected benefit obligations and
net benefit costs.
Pension Plan PBOP Plans
December 31, December 31,
2020 2019 2018 2020 2019 2018
Discount rate 2.77 % 3.46 % 4.35 % 2.67 - 2.80% 3.37 - 3.47% 4.29 - 4.37%
Rate of future
compensation increases 3.80 % 3.90 % 3.90 % N/A N/A N/A
Expected return on plan
assets 5.10 % 5.70 % 6.00 % 3.10 - 6.10% 3.50 - 6.60% 3.60 - 6.80%
Interest crediting rate for
cash balance plan 1.95 % 2.11 % 3.15 % N/A N/A N/A
The assumed health care cost trend rate as of December 31, 2020 was 6.3%, gradually decreasing to the ultimate trend rate of
approximately 4.5% in 2028 and beyond.
Name of Respondent
PACIFIC GAS AND ELECTRIC COMPANY
This Report is:(1) X An Original(2) A Resubmission
Date of Report(Mo, Da, Yr)
04/13/2021
Year/Period of Report
2020/Q4
NOTES TO FINANCIAL STATEMENTS (Continued)
FERC FORM NO. 1 (ED. 12-88) Page 123.66
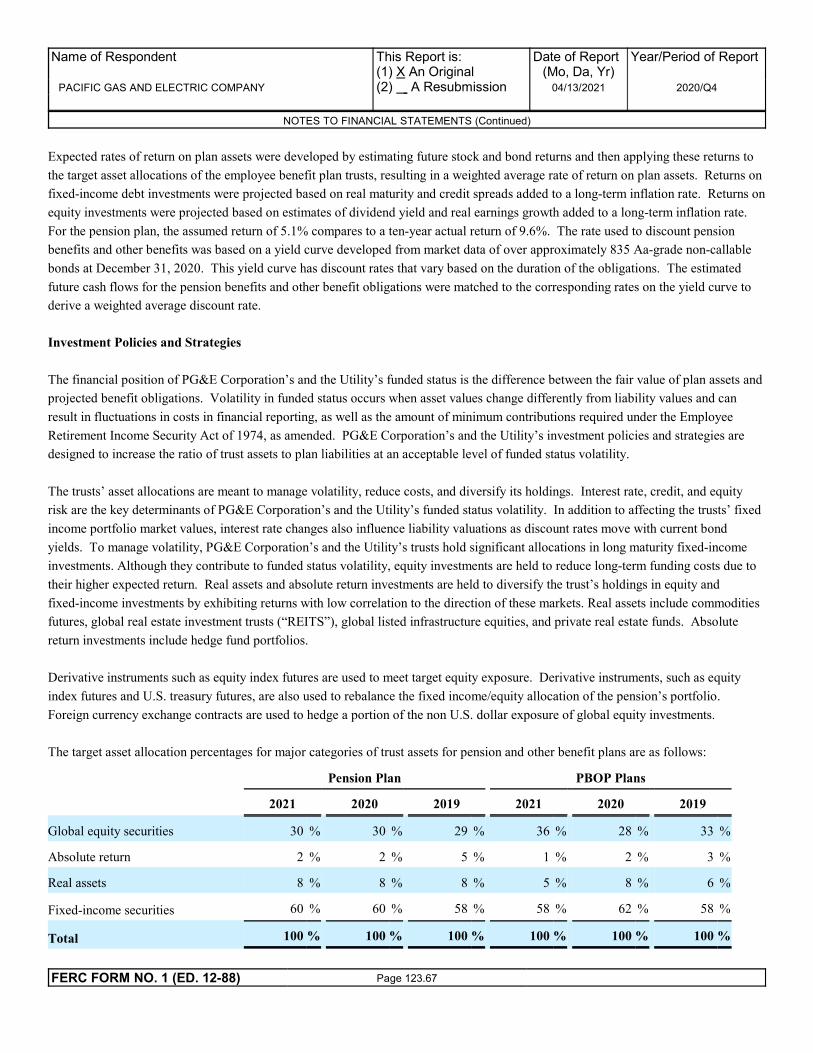
Expected rates of return on plan assets were developed by estimating future stock and bond returns and then applying these returns to
the target asset allocations of the employee benefit plan trusts, resulting in a weighted average rate of return on plan assets. Returns on
fixed-income debt investments were projected based on real maturity and credit spreads added to a long-term inflation rate. Returns on
equity investments were projected based on estimates of dividend yield and real earnings growth added to a long-term inflation rate.
For the pension plan, the assumed return of 5.1% compares to a ten-year actual return of 9.6%. The rate used to discount pension
benefits and other benefits was based on a yield curve developed from market data of over approximately 835 Aa-grade non-callable
bonds at December 31, 2020. This yield curve has discount rates that vary based on the duration of the obligations. The estimated
future cash flows for the pension benefits and other benefit obligations were matched to the corresponding rates on the yield curve to
derive a weighted average discount rate.
Investment Policies and Strategies
The financial position of PG&E Corporation’s and the Utility’s funded status is the difference between the fair value of plan assets and
projected benefit obligations. Volatility in funded status occurs when asset values change differently from liability values and can
result in fluctuations in costs in financial reporting, as well as the amount of minimum contributions required under the Employee
Retirement Income Security Act of 1974, as amended. PG&E Corporation’s and the Utility’s investment policies and strategies are
designed to increase the ratio of trust assets to plan liabilities at an acceptable level of funded status volatility.
The trusts’ asset allocations are meant to manage volatility, reduce costs, and diversify its holdings. Interest rate, credit, and equity
risk are the key determinants of PG&E Corporation’s and the Utility’s funded status volatility. In addition to affecting the trusts’ fixed
income portfolio market values, interest rate changes also influence liability valuations as discount rates move with current bond
yields. To manage volatility, PG&E Corporation’s and the Utility’s trusts hold significant allocations in long maturity fixed-income
investments. Although they contribute to funded status volatility, equity investments are held to reduce long-term funding costs due to
their higher expected return. Real assets and absolute return investments are held to diversify the trust’s holdings in equity and
fixed-income investments by exhibiting returns with low correlation to the direction of these markets. Real assets include commodities
futures, global real estate investment trusts (“REITS”), global listed infrastructure equities, and private real estate funds. Absolute
return investments include hedge fund portfolios.
Derivative instruments such as equity index futures are used to meet target equity exposure. Derivative instruments, such as equity
index futures and U.S. treasury futures, are also used to rebalance the fixed income/equity allocation of the pension’s portfolio.
Foreign currency exchange contracts are used to hedge a portion of the non U.S. dollar exposure of global equity investments.
The target asset allocation percentages for major categories of trust assets for pension and other benefit plans are as follows:
Pension Plan PBOP Plans
2021 2020 2019 2021 2020 2019
Global equity securities 30 % 30 % 29 % 36 % 28 % 33 %
Absolute return 2 % 2 % 5 % 1 % 2 % 3 %
Real assets 8 % 8 % 8 % 5 % 8 % 6 %
Fixed-income securities 60 % 60 % 58 % 58 % 62 % 58 %
Total 100 % 100 % 100 % 100 % 100 % 100 %
Name of Respondent
PACIFIC GAS AND ELECTRIC COMPANY
This Report is:(1) X An Original(2) A Resubmission
Date of Report(Mo, Da, Yr)
04/13/2021
Year/Period of Report
2020/Q4
NOTES TO FINANCIAL STATEMENTS (Continued)
FERC FORM NO. 1 (ED. 12-88) Page 123.67

PG&E Corporation and the Utility apply a risk management framework for managing the risks associated with employee benefit plan
trust assets. The guiding principles of this risk management framework are the clear articulation of roles and responsibilities,
appropriate delegation of authority, and proper accountability and documentation. Trust investment policies and investment manager
guidelines include provisions designed to ensure prudent diversification, manage risk through appropriate use of physical direct asset
holdings and derivative securities, and identify permitted and prohibited investments.
Fair Value Measurements
The following tables present the fair value of plan assets for pension and other benefits plans by major asset category at December 31,
2020 and 2019.
Fair Value Measurements
At December 31,
2020 2019
(in millions) Level 1 Level 2 Level 3 Total Level 1 Level 2 Level 3 Total
Pension Plan:
Short-term investments $ 334 $ 408 $ — $ 742 $ 613 $ 231 $ — $ 844
Global equity securities 1,875 — — 1,875 1,650 — — 1,650
Absolute Return 1 1 — 2 — 1 — 1
Real assets 517 — — 517 548 1 — 549
Fixed-income securities 2,467 7,154 12 9,633 2,227 6,413 15 8,655
Assets measured at NAV — — — 8,224 — — — 6,937
Total $ 5,194 $ 7,563 $ 12 $ 20,993 $ 5,038 $ 6,646 $ 15 $ 18,636
PBOP Plans:
Short-term investments $ 37 $ — $ — $ 37 $ 37 $ — $ — $ 37
Global equity securities 173 — — 173 151 — — 151
Real assets 54 — — 54 58 — — 58
Fixed-income securities 481 715 1 1,197 193 875 1 1,069
Assets measured at NAV — — — 1,549 — — — 1,373
Total $ 745 $ 715 $ 1 $ 3,010 $ 439 $ 875 $ 1 $ 2,688
Total plan assets at fair value $ 24,003 $ 21,324
In addition to the total plan assets disclosed at fair value in the table above, the trusts had other net liabilities of $249 million and other
net liabilities of $99 million at December 31, 2020 and 2019, respectively, comprised primarily of cash, accounts receivable, deferred
taxes, and accounts payable.
Name of Respondent
PACIFIC GAS AND ELECTRIC COMPANY
This Report is:(1) X An Original(2) A Resubmission
Date of Report(Mo, Da, Yr)
04/13/2021
Year/Period of Report
2020/Q4
NOTES TO FINANCIAL STATEMENTS (Continued)
FERC FORM NO. 1 (ED. 12-88) Page 123.68

Valuation Techniques
The following describes the valuation techniques used to measure the fair value of the assets and liabilities shown in the table above.
All investments that are valued using a net asset value per share can be redeemed quarterly with a notice not to exceed 90 days.
Short-Term Investments
Short-term investments consist primarily of commingled funds across government, credit, and asset-backed sectors. These securities
are categorized as Level 1 and Level 2 assets.
Global Equity securities
The global equity category includes investments in common stock and equity-index futures. Equity investments in common stock are
actively traded on public exchanges and are therefore considered Level 1 assets. These equity investments are generally valued based
on unadjusted prices in active markets for identical securities. Equity-index futures are valued based on unadjusted prices in active
markets and are Level 1 assets.
Real Assets
The real asset category includes portfolios of commodity futures, global REITS, global listed infrastructure equities, and private real
estate funds. The commodity futures, global REITS, and global listed infrastructure equities are actively traded on a public exchange
and are therefore considered Level 1 assets.
Fixed-Income securities
Fixed-income securities are primarily composed of U.S. government and agency securities, municipal securities, and other
fixed-income securities, including corporate debt securities. U.S. government and agency securities primarily consist of U.S. Treasury
securities that are classified as Level 1 because the fair value is determined by observable market prices in active markets. A market
approach is generally used to estimate the fair value of debt securities classified as Level 2 using evaluated pricing data such as broker
quotes, for similar securities adjusted for observable differences. Significant inputs used in the valuation model generally include
benchmark yield curves and issuer spreads. The external credit ratings, coupon rate, and maturity of each security are considered in
the valuation model, as applicable.
Assets Measured at NAV Using Practical Expedient
Investments in the trusts that are measured at fair value using the NAV per share practical expedient have not been classified in the fair
value hierarchy tables above. The fair value amounts are included in the tables above in order to reconcile to the amounts presented in
the Consolidated Balance Sheets. These investments include commingled funds that are composed of equity securities traded publicly
on exchanges as well as fixed-income securities that are composed primarily of U.S. government securities, asset-backed securities,
and private real estate funds. There are no restrictions on the terms and conditions upon which the investments may be redeemed.
Transfers Between Levels
No material transfers between levels occurred in the years ended December 31, 2020 and 2019.
Name of Respondent
PACIFIC GAS AND ELECTRIC COMPANY
This Report is:(1) X An Original(2) A Resubmission
Date of Report(Mo, Da, Yr)
04/13/2021
Year/Period of Report
2020/Q4
NOTES TO FINANCIAL STATEMENTS (Continued)
FERC FORM NO. 1 (ED. 12-88) Page 123.69
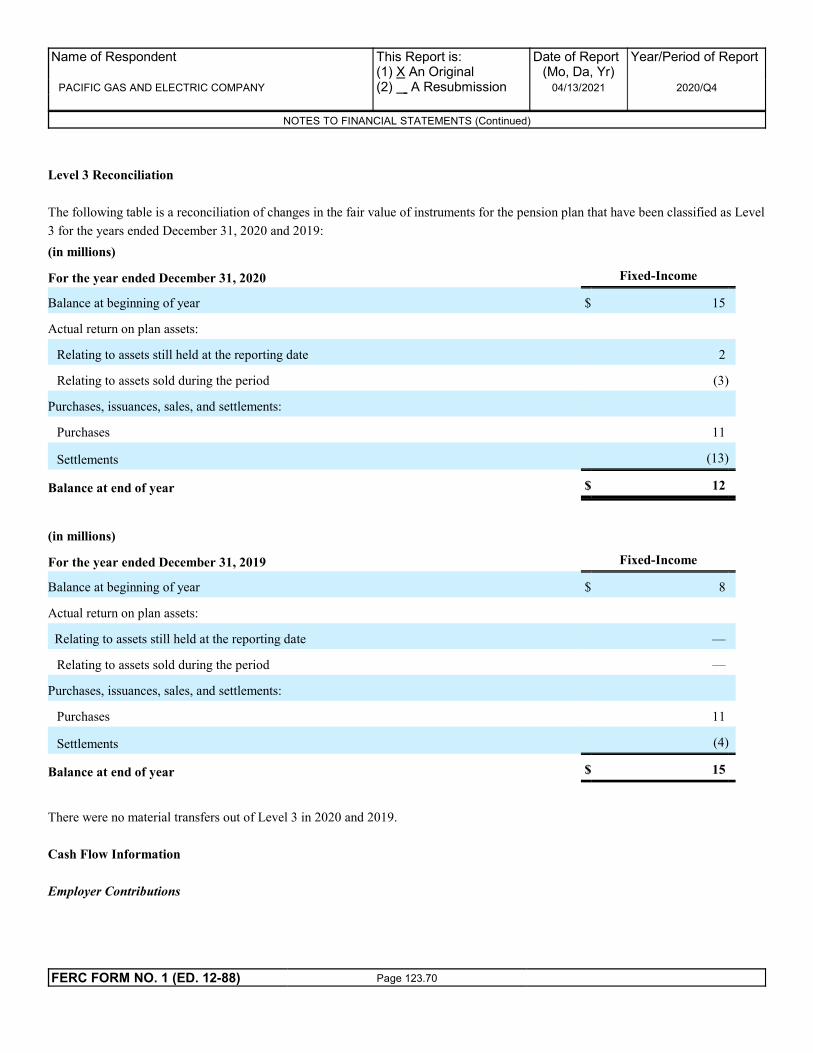
Level 3 Reconciliation
The following table is a reconciliation of changes in the fair value of instruments for the pension plan that have been classified as Level
3 for the years ended December 31, 2020 and 2019:
(in millions)
For the year ended December 31, 2020 Fixed-Income
Balance at beginning of year $ 15
Actual return on plan assets:
Relating to assets still held at the reporting date 2
Relating to assets sold during the period (3)
Purchases, issuances, sales, and settlements:
Purchases 11
Settlements (13)
Balance at end of year $ 12
(in millions)
For the year ended December 31, 2019 Fixed-Income
Balance at beginning of year $ 8
Actual return on plan assets:
Relating to assets still held at the reporting date —
Relating to assets sold during the period —
Purchases, issuances, sales, and settlements:
Purchases 11
Settlements (4)
Balance at end of year $ 15
There were no material transfers out of Level 3 in 2020 and 2019.
Cash Flow Information
Employer Contributions
Name of Respondent
PACIFIC GAS AND ELECTRIC COMPANY
This Report is:(1) X An Original(2) A Resubmission
Date of Report(Mo, Da, Yr)
04/13/2021
Year/Period of Report
2020/Q4
NOTES TO FINANCIAL STATEMENTS (Continued)
FERC FORM NO. 1 (ED. 12-88) Page 123.70

PG&E Corporation and the Utility contributed $343 million to the pension benefit plans and $26 million to the other benefit plans in
2020. These contributions are consistent with PG&E Corporation’s and the Utility’s funding policy, which is to contribute amounts
that are tax-deductible and consistent with applicable regulatory decisions and federal minimum funding requirements. None of these
pension or other benefits were subject to a minimum funding requirement requiring a cash contribution in 2020. The Utility’s pension
benefits met all the funding requirements under Employee Retirement Income Security Act. PG&E Corporation and the Utility expect
to make total contributions of approximately $327 million and $15 million to the pension plan and other postretirement benefit plans,
respectively, for 2021.
Benefits Payments and Receipts
As of December 31, 2020, the estimated benefits expected to be paid and the estimated federal subsidies expected to be received in
each of the next five fiscal years, and in aggregate for the five fiscal years thereafter, are as follows:
(in millions)
Pension
Plan
PBOP
Plans
Federal
Subsidy
2021 831 85 (6)
2022 913 89 (6)
2023 948 92 (6)
2024 980 93 (7)
2025 1,009 95 (7)
Thereafter in the succeeding five years 5,375 471 (41)
There were no material differences between the estimated benefits expected to be paid by PG&E Corporation and paid by the Utility
for the years presented above. There were also no material differences between the estimated subsidies expected to be received by
PG&E Corporation and received by the Utility for the years presented above.
Retirement Savings Plan
PG&E Corporation sponsors a retirement savings plan, which qualifies as a 401(k) defined contribution benefit plan under the Internal
Revenue Code 1986, as amended. This plan permits eligible employees to make pre-tax and after-tax contributions into the plan, and
provide for employer contributions to be made to eligible participants. Total expenses recognized for defined contribution benefit
plans reflected in PG&E Corporation’s Consolidated Statements of Income were $119 million, $109 million, and $105 million in
2020, 2019, and 2018, respectively. Beginning January 1, 2019 PG&E Corporation changed its default matching contributions under
its 401(k) plan from PG&E Corporation common stock to cash. Beginning in March 2019, at PG&E Corporation’s directive, the
401(k) plan trustee began purchasing new shares in the PG&E Corporation common stock fund on the open market rather than directly
from PG&E Corporation.
There were no material differences between the employer contribution expense for PG&E Corporation and the Utility for the years
presented above.
NOTE 13: RELATED PARTY AGREEMENTS AND TRANSACTIONS
Name of Respondent
PACIFIC GAS AND ELECTRIC COMPANY
This Report is:(1) X An Original(2) A Resubmission
Date of Report(Mo, Da, Yr)
04/13/2021
Year/Period of Report
2020/Q4
NOTES TO FINANCIAL STATEMENTS (Continued)
FERC FORM NO. 1 (ED. 12-88) Page 123.71

The Utility and other subsidiaries provide and receive various services to and from their parent, PG&E Corporation, and among
themselves. The Utility and PG&E Corporation exchange administrative and professional services in support of operations. Services
provided directly to PG&E Corporation by the Utility are priced at the higher of fully loaded cost (i.e., direct cost of good or service
and allocation of overhead costs) or fair market value, depending on the nature of the services. Services provided directly to the Utility
by PG&E Corporation are generally priced at the lower of fully loaded cost or fair market value, depending on the nature and value of
the services. PG&E Corporation also allocates various corporate administrative and general costs to the Utility and other subsidiaries
using agreed-upon allocation factors, including the number of employees, operating and maintenance expenses, total assets, and other
cost allocation methodologies. Management believes that the methods used to allocate expenses are reasonable and meet the reporting
and accounting requirements of its regulatory agencies.
The Utility’s significant related party transactions were:
Year Ended December 31,
(in millions) 2020 2019 2018
Utility revenues from:
Administrative services provided to PG&E Corporation $ 3 $ 4 $ 4
Utility expenses from:
Administrative services received from PG&E Corporation $ 108 $ 107 $ 94
Utility employee benefit due to PG&E Corporation 34 42 76
At December 31, 2020 and 2019, the Utility had receivables of $35 million and $60 million, respectively, from PG&E Corporation
included in accounts receivable – other and other noncurrent assets – other on the Utility’s Consolidated Balance Sheets, and payables
of $46 million and $118 million, respectively, to PG&E Corporation included in accounts payable – other on the Utility’s Consolidated
Balance Sheets.
NOTE 14: WILDFIRE-RELATED CONTINGENCIES
PG&E Corporation and the Utility have significant contingencies arising from their operations, including contingencies related to
wildfires. A provision for a loss contingency is recorded when it is both probable that a liability has been incurred and the amount of
the liability can be reasonably estimated. PG&E Corporation and the Utility evaluate which potential liabilities are probable and the
related range of reasonably estimated losses and record a charge that reflects their best estimate or the lower end of the range, if there
is no better estimate. The assessment of whether a loss is probable or reasonably possible, and whether the loss or a range of losses is
estimable, often involves a series of complex judgments about future events. Loss contingencies are reviewed quarterly, and estimates
are adjusted to reflect the impact of all known information, such as negotiations, discovery, settlements and payments, rulings, advice
of legal counsel, and other information and events pertaining to a particular matter. PG&E Corporation’s and the Utility’s provision
for loss and expense excludes anticipated legal costs, which are expensed as incurred. PG&E Corporation’s and the Utility’s financial
condition, results of operations, liquidity, and cash flows may be materially affected by the outcome of the following matters.
2015 Butte Fire
Name of Respondent
PACIFIC GAS AND ELECTRIC COMPANY
This Report is:(1) X An Original(2) A Resubmission
Date of Report(Mo, Da, Yr)
04/13/2021
Year/Period of Report
2020/Q4
NOTES TO FINANCIAL STATEMENTS (Continued)
FERC FORM NO. 1 (ED. 12-88) Page 123.72

In September 2015, a wildfire (the “2015 Butte fire”) ignited and spread in Amador and Calaveras Counties in Northern California.
Cal Fire concluded that the 2015 Butte fire was caused when a gray pine tree contacted the Utility’s electric line, which ignited
portions of the tree, and determined that the failure by the Utility and/or its vegetation management contractors, ACRT Inc. and Trees,
Inc., to identify certain potential hazards during its vegetation management program ultimately led to the failure of the tree.
During the quarter ended September 30, 2020, the remaining 2015 Butte fire claims were satisfied and discharged in accordance with
the Plan. See “Pre-Petition Wildfire-Related Claims and Discharge Upon Plan Effective Date” and “District Attorneys’ Office
Investigations” below for more information on the 2015 Butte fire.
2018 Camp Fire and 2017 Northern California Wildfires Background
According to Cal Fire, on November 8, 2018 at approximately 6:33 a.m., a wildfire began near the city of Paradise, Butte County,
California (the “2018 Camp fire”), which is located in the Utility’s service territory. Cal Fire’s Camp Fire Incident Information
Website as of November 15, 2019 (the “Cal Fire website”) indicated that the 2018 Camp fire consumed 153,336 acres. On the Cal
Fire website, Cal Fire reported 85 fatalities and the destruction of 18,804 structures resulting from the 2018 Camp fire.
Beginning on October 8, 2017, multiple wildfires spread through Northern California, including Napa, Sonoma, Butte, Humboldt,
Mendocino, Lake, Nevada, and Yuba Counties, as well as in the area surrounding Yuba City (the “2017 Northern California
wildfires”). According to the Cal Fire California Statewide Fire Summary dated October 30, 2017, at the peak of the 2017 Northern
California wildfires, there were 21 major fires that, in total, burned over 245,000 acres and destroyed an estimated 8,900 structures.
The 2017 Northern California wildfires resulted in 44 fatalities.
PG&E Corporation and the Utility were subject to numerous claims in connection with the 2018 Camp fire and 2017 Northern
California wildfires. These included claims by various groups of wildfire victims, including individual plaintiffs, holders of insurance
subrogation claims, and various federal, state and local entities. During the quarter ended September 30, 2020, these claims were
satisfied and discharged in accordance with the Plan, as described below.
Pre-petition Wildfire-Related Claims and Discharge Upon Plan Effective Date
Pre-petition wildfire-related claims on the Consolidated Financial Statements include amounts associated with the 2018 Camp fire, the
2017 Northern California wildfires, and the 2015 Butte fire.
Name of Respondent
PACIFIC GAS AND ELECTRIC COMPANY
This Report is:(1) X An Original(2) A Resubmission
Date of Report(Mo, Da, Yr)
04/13/2021
Year/Period of Report
2020/Q4
NOTES TO FINANCIAL STATEMENTS (Continued)
FERC FORM NO. 1 (ED. 12-88) Page 123.73

On July 1, 2020, pursuant to the Plan, PG&E Corporation and the Utility funded the Fire Victim Trust with $5.4 billion in cash (with
an additional $1.35 billion to be funded on a deferred basis), 477 million shares of common stock of PG&E Corporation (representing
22.19% of the outstanding common stock of PG&E Corporation as of the Effective Date (subject to potential adjustments)), plus the
assignment of certain rights and causes of action. Additionally, as a result of the Additional Units Issuance, on August 3, 2020, PG&E
Corporation made an equity contribution of 748,415 shares to the Utility which delivered such additional shares of common stock to
the Fire Victim Trust pursuant to an anti-dilution provision in the Fire Victim Trust Assignment Agreement. In accordance with the
Plan and the Confirmation Order, as a result of such funding, all Fire Victim Claims have been fully and finally satisfied, released and
discharged and channeled to the Fire Victim Trust with no recourse to PG&E Corporation or the Utility. Accordingly, $12.15 billion
of the $13.5 billion liability as of June 30, 2020 was extinguished in the third quarter of 2020, and the remaining $1.35 billion will be
paid out under the terms of the Tax Benefits Payment Agreement, as described in Note 2 under the heading “Significant Bankruptcy
Court Actions.” On January 15, 2021, the Utility paid approximately $758 million of the $1.35 billion, pursuant to the Tax Benefits
Payment Agreement.
On July 1, 2020, PG&E Corporation and the Utility funded the Subrogation Wildfire Trust for the benefit of holders of Subrogation
Claims in the amount of $11.0 billion in cash and paid approximately $43 million in respect of professional fees of such claimants, for
a total of approximately $52 million for subrogation wildfire claimants’ professional fees. Such amount was initially funded into
escrow and later paid to the Subrogation Wildfire Trust. In accordance with the Plan and the Confirmation Order, as a result of such
funding, all Subrogation Claims have been satisfied, released and discharged and channeled to the Subrogation Wildfire Trust with no
recourse to PG&E Corporation or the Utility. Accordingly, the $11.0 billion liability accrual for Subrogation Claims and $47.5 million
liability for professional fees were extinguished in the third quarter of 2020.
On July 1, 2020, PG&E Corporation and the Utility paid $1.0 billion in cash to the Settling Public Entities and established a
segregated fund in the amount of $10 million to be used to reimburse the Settling Public Entities for any and all legal fees and costs
associated with the defense or resolution of any third party claims against the Settling Public Entities. In accordance with the Plan and
the Confirmation Order, as a result of such payments, the $1.0 billion liability for the Public Entity Wildfire Claims (as defined below)
was satisfied, released and discharged in the third quarter of 2020.
Plan Support Agreements with Public Entities
On June 18, 2019, PG&E Corporation and the Utility entered into PSAs with certain local public entities (collectively, the “Supporting
Public Entities”) providing for an aggregate of $1.0 billion to be paid by PG&E Corporation and the Utility to such public entities
pursuant to the Plan in order to fully and finally settle and discharge such public entities’ claims against PG&E Corporation and the
Utility relating to the 2018 Camp fire, 2017 Northern California wildfires and 2015 Butte fire (collectively, “Public Entity Wildfire
Claims”).
The PSAs also provide that, following the Effective Date, PG&E Corporation and the Utility would create and promptly fund
$10 million to a segregated fund to be used by the Supporting Public Entities collectively in connection with the defense or resolution
of claims against the Supporting Public Entities by third parties relating to the wildfires noted above (“Third Party Claims”).
These elements were incorporated into the Plan which was approved by the Bankruptcy Court in the Confirmation Order. As
described in Note 2 under the heading “Significant Bankruptcy Court Actions,” the actions required by each PSA were taken on or
around the Effective Date.
Name of Respondent
PACIFIC GAS AND ELECTRIC COMPANY
This Report is:(1) X An Original(2) A Resubmission
Date of Report(Mo, Da, Yr)
04/13/2021
Year/Period of Report
2020/Q4
NOTES TO FINANCIAL STATEMENTS (Continued)
FERC FORM NO. 1 (ED. 12-88) Page 123.74

Restructuring Support Agreement with Holders of Subrogation Claims
On September 22, 2019, PG&E Corporation and the Utility entered into the Subrogation RSA. The Subrogation RSA provides for an
aggregate amount of $11.0 billion to be paid by PG&E Corporation and the Utility pursuant to the Plan in order to fully and finally
settle the Subrogation Claims, upon the terms and conditions set forth in the Subrogation RSA. Under the Subrogation RSA, PG&E
Corporation and the Utility also agreed to reimburse the holders of Subrogation Claims for professional fees of up to $55 million, upon
the terms and conditions set forth in the Subrogation RSA.
As described above under the heading “Pre-petition Wildfire-Related Claims and Discharge Upon Plan Effective Date,” the payments
described in the Subrogation RSA were made on the Effective Date.
Restructuring Support Agreement with the TCC
On December 6, 2019, PG&E Corporation and the Utility entered into the TCC RSA. The TCC RSA (as incorporated into the Plan)
provides for, among other things, a combination of cash and common stock of the reorganized PG&E Corporation to be provided by
PG&E Corporation and the Utility pursuant to the Plan (together with certain additional rights, the “Aggregate Fire Victim
Consideration”) in order to settle and discharge the Fire Victim Claims, upon the terms and conditions set forth in the TCC RSA and
the Plan. The Aggregate Fire Victim Consideration that has funded and will fund the Fire Victim Trust pursuant to the Plan for the
benefit of holders of the Fire Victim Claims consists of (a) $5.4 billion in cash that was contributed on the Effective Date of the Plan,
(b) $1.35 billion in cash consisting of (i) $758 million that was paid in cash on January 15, 2021 and (ii) the remaining balance of
$592 million to be paid in cash on or before January 15, 2022, in each case pursuant to the terms of the Tax Benefits Payment
Agreement, and (c) an amount of common stock of the reorganized PG&E Corporation valued at 14.9 times Normalized Estimated Net
Income (as defined in the TCC RSA), except that the Fire Victim Trust’s share ownership of the reorganized PG&E Corporation
would not be less than 20.9% based on the number of fully diluted shares of the reorganized PG&E Corporation outstanding as of the
Effective Date of the Plan, assuming the Utility’s allowed ROE as of the date of the TCC RSA. Under certain circumstances, including
certain change of control transactions and in connection with the monetization of certain tax benefits related to the payment of
wildfire-related claims, the payments described in clause (b) will be accelerated and payable upon an earlier date. The Aggregate Fire
Victim Consideration also included (1) the assignment by PG&E Corporation and the Utility to the Fire Victim Trust of certain rights
and causes of action related to the 2015 Butte fire, the 2017 Northern California wildfires and the 2018 Camp fire (together, the
“Fires”) that PG&E Corporation and the Utility may have against certain third parties and (2) the assignment of rights under the 2015
insurance policies to resolve any claims related to the Fires in those policy years, other than the rights of PG&E Corporation and the
Utility to be reimbursed under the 2015 insurance policies for claims submitted to and paid by PG&E Corporation and the Utility prior
to the Petition Date to resolve any claims related to the Fires in those policy years. Pursuant to a stipulation approved by the
Bankruptcy Court on June 12, 2020, PG&E Corporation and the Utility and the TCC, and the trustee of the Fire Victim Trust agreed
that the percentage ownership of the Fire Victim Trust would be 22.19% of the outstanding shares of the PG&E Corporation on the
Effective Date, subject to potential adjustments.
As described above under the heading “Pre-petition Wildfire-Related Claims and Discharge Upon Plan Effective Date,” the funding to
be made pursuant to the TCC RSA and the Plan was made on the Effective Date.
2019 Kincade Fire
Name of Respondent
PACIFIC GAS AND ELECTRIC COMPANY
This Report is:(1) X An Original(2) A Resubmission
Date of Report(Mo, Da, Yr)
04/13/2021
Year/Period of Report
2020/Q4
NOTES TO FINANCIAL STATEMENTS (Continued)
FERC FORM NO. 1 (ED. 12-88) Page 123.75

According to Cal Fire, on October 23, 2019 at approximately 9:27 p.m., a wildfire began northeast of Geyserville in Sonoma County,
California (the “2019 Kincade fire”), located in the service territory of the Utility. The Cal Fire Kincade Fire Incident Update dated
November 20, 2019, 11:02 a.m. Pacific Time (the “incident update”) indicated that the 2019 Kincade fire had consumed 77,758 acres.
In the incident update, Cal Fire reported no fatalities and four first responder injuries. The incident update also indicates the following:
structures destroyed, 374 (consisting of 174 residential structures, 11 commercial structures and 189 other structures); and structures
damaged, 60 (consisting of 35 residential structures, one commercial structure and 24 other structures). In connection with the 2019
Kincade fire, state and local officials issued numerous mandatory evacuation orders and evacuation warnings at various times for
certain areas of the region. Based on County of Sonoma information, PG&E Corporation and the Utility understand that the
geographic zones subject to either a mandatory evacuation order or an evacuation warning between October 23, 2019 and November 4,
2019 included approximately 200,000 persons.
On October 23, 2019, by 3:00 p.m. Pacific Time, the Utility had conducted a PSPS event and turned off the power to approximately
27,837 customers in Sonoma County, including Geyserville and the surrounding area. As part of the PSPS, the Utility’s distribution
lines in these areas were deenergized. Following the Utility’s established and CPUC-approved PSPS protocols and procedures,
transmission lines in these areas remained energized.
The Utility has submitted electric incident reports to the CPUC indicating that:
• at approximately 9:19 p.m. Pacific Time on October 23, 2019, the Utility became aware of a transmission level outage on the
Geysers #9 Lakeville 230 kV line when the line relayed and did not reclose;
• various generating facilities on the Geysers #9 Lakeville 230 kV line detected the disturbance and separated at approximately the
same time;
• at approximately 9:21 p.m. Pacific Time, the PG&E Grid Control Center received a report that a fire had started in an area near
transmission tower 001/006;
• at approximately 7:30 a.m. Pacific Time on October 24, 2019, a responding Utility troubleman patrolling the Geysers #9 Lakeville
230 kV line observed that Cal Fire had taped off the area around the base of transmission tower 001/006 in the area of the 2019
Kincade fire; and
• on site Cal Fire personnel brought to the troubleman’s attention what appeared to be a broken jumper on the same tower.
On July 16, 2020, Cal Fire issued a press release addressing the cause of the 2019 Kincade fire. The press release stated that Cal Fire
has determined that “the Kincade Fire was caused by electrical transmission lines owned and operated by Pacific Gas and Electric
(PG&E) located northeast of Geyserville. Tinder dry vegetation and strong winds combined with low humidity and warm temperatures
contributed to extreme rates of fire spread.”
Name of Respondent
PACIFIC GAS AND ELECTRIC COMPANY
This Report is:(1) X An Original(2) A Resubmission
Date of Report(Mo, Da, Yr)
04/13/2021
Year/Period of Report
2020/Q4
NOTES TO FINANCIAL STATEMENTS (Continued)
FERC FORM NO. 1 (ED. 12-88) Page 123.76

Cal Fire also indicated that its investigative report has been forwarded to the Sonoma County District Attorney’s Office, which is
investigating the matter. On September 25, 2020, the Utility entered into a tolling agreement with the Sonoma County District
Attorney’s Office in which the Utility agreed to waive any applicable statute of limitations for violations related to the Kincade fire that
would otherwise have expired on or about October 23, 2020, for a period of six months, until April 23, 2021. On February 24, 2021,
the Sonoma County District Attorney’s Office sent a search warrant to the Utility through its counsel in connection with the
investigation. The Utility expects to produce documents and respond to other requests for information in connection with the
investigation and the search warrant.
PG&E Corporation and the Utility are also conducting their own investigation into the cause of the 2019 Kincade fire. This
investigation is preliminary, and PG&E Corporation and the Utility do not have access to all of the evidence in the possession of Cal
Fire or other third parties.
Potential liabilities related to the 2019 Kincade fire depend on various factors, including but not limited to the cause of the fire,
contributing causes of the fire (including alternative potential origins, weather- and climate-related issues), the number, size and type
of structures damaged or destroyed, the contents of such structures and other personal property damage, the number and types of trees
damaged or destroyed, attorneys’ fees for claimants, the nature and extent of any personal injuries, the amount of fire suppression and
clean-up costs, other damages the Utility may be responsible for if found negligent, and the amount of any penalties, fines, or
restitution that may be imposed by governmental entities.
If the Utility’s facilities, such as its electric distribution and transmission lines, are judicially determined to be the substantial cause of
the 2019 Kincade fire, and the doctrine of inverse condemnation applies, the Utility could be liable for property damage, business
interruption, interest and attorneys’ fees without having been found negligent. California courts have imposed liability under the
doctrine of inverse condemnation in legal actions brought by property holders against utilities on the grounds that losses borne by the
person whose property was damaged through a public use undertaking should be spread across the community that benefited from such
undertaking, and based on the assumption that utilities have the ability to recover these costs from their customers. Further, California
courts have determined that the doctrine of inverse condemnation is applicable regardless of whether the CPUC ultimately allows
recovery by the utility for any such costs. The CPUC may decide not to authorize cost recovery even if a court decision were to
determine that the Utility is liable as a result of the application of the doctrine of inverse condemnation. (See “Loss Recoveries –
Regulatory Recovery” below for further information regarding potential cost recovery related to the wildfires.)
In light of the current state of the law concerning inverse condemnation and the information currently available to PG&E Corporation
and the Utility, including the information contained in the electric incident reports, Cal Fire’s determination of the cause, and other
information gathered as part of PG&E Corporation’s and the Utility’s investigation, PG&E Corporation and the Utility believe it is
probable that they will incur a loss in connection with the 2019 Kincade fire. Accordingly, PG&E Corporation and the Utility
recorded a charge for potential losses in connection with the 2019 Kincade fire in the amount of $625 million for the year ended
December 31, 2020 (before available insurance).
The aggregate liability of $625 million for claims in connection with the 2019 Kincade fire (before available insurance) corresponds to
the lower end of the range of PG&E Corporation’s and the Utility’s reasonably estimable range of losses and is subject to change based
on additional information. The $625 million estimate does not include, among other things: (i) any amounts for potential penalties or
fines that may be imposed by governmental entities on PG&E Corporation or the Utility, (ii) any punitive damages, (iii) any amounts
in respect of compensation claims by Federal or state agencies other than state fire suppression costs, (iv) evacuation costs or (v) any
other amounts that are not reasonably estimable.
Name of Respondent
PACIFIC GAS AND ELECTRIC COMPANY
This Report is:(1) X An Original(2) A Resubmission
Date of Report(Mo, Da, Yr)
04/13/2021
Year/Period of Report
2020/Q4
NOTES TO FINANCIAL STATEMENTS (Continued)
FERC FORM NO. 1 (ED. 12-88) Page 123.77

The Utility believes it will continue to receive additional information from potential claimants as litigation or resolution efforts
progress. Any such additional information may potentially allow PG&E Corporation and the Utility to refine such estimate and may
result in changes to the accrual depending on the information provided.
PG&E Corporation and the Utility currently believe that it is reasonably possible that the amount of loss could be greater than
$625 million (before available insurance) but are unable to reasonably estimate the additional loss and the upper end of the range
because, as described above, there are a number of unknown facts and legal considerations that may impact the amount of any potential
liability, including the total scope and nature of claims that may be asserted against PG&E Corporation and the Utility. If the liability
for the 2019 Kincade fire were to exceed $1.0 billion, it is possible the Utility would be eligible to make a claim to the Wildfire Fund
under AB 1054 for such excess amount, subject to the 40% limitation on claims arising before emergence from bankruptcy. PG&E
Corporation and the Utility intend to continue to review the available information and other information as it becomes available,
including evidence in Cal Fire’s possession, evidence from or held by other parties, claims that have not yet been submitted, and
additional information about the nature and extent of potential damages.
The process for estimating losses associated with potential claims related to the 2019 Kincade fire requires management to exercise
significant judgment based on a number of assumptions and subjective factors, including the factors identified above and estimates
based on currently available information and prior experience with wildfires. As more information becomes available, management
estimates and assumptions regarding the potential financial impact of the 2019 Kincade fire may change.
The Utility has liability insurance from various insurers, which provides coverage for third-party liability attributable to the Kincade
fire in an aggregate amount of $430 million. The Utility records insurance recoveries when it is deemed probable that recovery will
occur, and the Utility can reasonably estimate the amount or its range. As of December 31, 2020, the Utility has recorded an insurance
receivable for the full amount of the $430 million. While the Utility plans to seek recovery of all insured losses, it is unable to predict
the ultimate amount and timing of such insurance recoveries.
PG&E Corporation and the Utility have received data requests from the SED relating to the 2019 Kincade fire and have responded to
all data requests received to date. The Sonoma County District Attorney’s Office is currently investigating the fire and various other
entities may also be investigating the fire. It is uncertain when the investigations will be complete.
Name of Respondent
PACIFIC GAS AND ELECTRIC COMPANY
This Report is:(1) X An Original(2) A Resubmission
Date of Report(Mo, Da, Yr)
04/13/2021
Year/Period of Report
2020/Q4
NOTES TO FINANCIAL STATEMENTS (Continued)
FERC FORM NO. 1 (ED. 12-88) Page 123.78

As of February 24, 2021, PG&E Corporation and the Utility are aware of 22 complaints on behalf of approximately 504 plaintiffs
related to the 2019 Kincade fire and expect that they may receive further such complaints. The complaints were filed in the California
Superior Court for the County of Sonoma and the California Superior Court for the County of San Francisco and include claims based
on multiple theories of liability, including inverse condemnation, negligence, violations of the Public Utilities Code, violations of the
Health & Safety Code, premises liability, trespass, public nuisance and private nuisance. The plaintiffs in each action principally assert
that PG&E Corporation’s and the Utility’s alleged failure to properly maintain, inspect and de-energize their transmission lines was the
cause of the 2019 Kincade fire. The plaintiffs seek damages that include property damage, economic loss, punitive damages,
exemplary damages, attorneys’ fees and other damages. On December 3, 2020, PG&E Corporation and the Utility filed a petition with
the California Judicial Council to coordinate the litigation. The petition requests that the cases be coordinated in Sonoma County
Superior Court. On December 18, 2020, certain plaintiffs filed a brief in support of PG&E Corporation’s and the Utility’s petition.
On December 21, 2020, January 4, 2021 and January 27, 2021, certain plaintiffs filed briefs that supported coordination but requested
that the cases be coordinated in San Francisco County Superior Court. On February 2, 2021, pursuant to authorization from the
California Judicial Council, a judge of the Sonoma County Superior Court was assigned to serve as the coordination motion judge to
decide whether the aforementioned actions should be coordinated and, if so, recommend where the coordinated proceeding should take
place. A hearing is scheduled for April 2, 2021.
In addition to claims for property damage, business interruption, interest and attorneys’ fees, PG&E Corporation and the Utility could
be liable for fire suppression costs, evacuation costs, medical expenses, personal injury damages, punitive damages and other damages
under other theories of liability, including if PG&E Corporation or the Utility were found to have been negligent.
2020 Zogg Fire
According to Cal Fire, on September 27, 2020, a wildfire began in the area of Zogg Mine Road and Jenny Bird Lane, north of Igo in
Shasta County, California (the “2020 Zogg fire”), located in the service territory of the Utility. The Cal Fire Zogg fire Incident Update
dated October 16, 2020, 3:08 p.m. Pacific Time (the “incident update”), indicated that the 2020 Zogg fire had consumed 56,338 acres.
The incident update reported four fatalities and one injury. The incident update also indicated that 27 structures were damaged and
204 structures were destroyed. Of the 204 structures destroyed, 63 were single family homes, according to a damage inspection report
available from the Shasta County Department of Resource Management.
On October 9, 2020, the Utility submitted an electric incident report to the CPUC indicating that:
• wildfire camera and satellite data on September 27, 2020 show smoke, heat or signs of fire in the area of Zogg Mine Road and
Jenny Bird Lane between approximately 2:43 p.m. and 2:46 p.m. Pacific Time;
• according to Utility records, on September 27, 2020, a SmartMeter and a line recloser serving the area of Zogg Mine Road and
Jenny Bird Lane reported alarms and other activity starting at approximately 2:40 p.m. until 3:06 p.m. Pacific Time when the line
recloser de-energized a portion of the Girvan 1101 12 kV circuit, a distribution line that serves that area;
• the data currently available to the Utility do not establish the causes of the activity on the Girvan 1101 circuit or the locations of
these causes;
• on October 9, 2020, Cal Fire informed the Utility that they had taken possession of Utility equipment as part of Cal Fire’s ongoing
investigation into the cause of the 2020 Zogg fire and allowed the Utility access to the area; and
Name of Respondent
PACIFIC GAS AND ELECTRIC COMPANY
This Report is:(1) X An Original(2) A Resubmission
Date of Report(Mo, Da, Yr)
04/13/2021
Year/Period of Report
2020/Q4
NOTES TO FINANCIAL STATEMENTS (Continued)
FERC FORM NO. 1 (ED. 12-88) Page 123.79

• Cal Fire has not issued a determination as to the cause.
The cause of the 2020 Zogg fire remains under investigation by Cal Fire, and PG&E Corporation and the Utility are cooperating with
its investigation. PG&E Corporation and the Utility have received and are responding to data requests from the SED relating to the
2020 Zogg fire. The Shasta County District Attorney’s Office is investigating the fire, and various other entities, which may include
other law enforcement agencies, may also be investigating the fire. It is uncertain when any such investigations will be complete.
PG&E Corporation and the Utility are also conducting their own investigation into the cause of the 2020 Zogg fire. This investigation
is preliminary, and PG&E Corporation and the Utility do not have access to the evidence in the possession of Cal Fire or other third
parties.
Potential liabilities related to the 2020 Zogg fire depend on various factors, including but not limited to the cause of the fire,
contributing causes of the fire (including alternative potential origins, weather- and climate-related issues), the number, size and type
of structures damaged or destroyed, the contents of such structures and other personal property damage, the number and types of trees
damaged or destroyed, attorneys’ fees for claimants, the nature and extent of any personal injuries, including the loss of lives, the
amount of fire suppression and clean-up costs, other damages the Utility may be responsible for if found negligent, and the amount of
any penalties, fines, or restitution that may be imposed by governmental entities.
Based on the current state of the law concerning inverse condemnation in California and the facts and circumstances available to
PG&E Corporation and the Utility as of the date of this filing, including the information gathered as part of PG&E Corporation’s and
the Utility’s investigation, PG&E Corporation and the Utility believe it is probable that they will incur a loss in connection with the
2020 Zogg fire and accordingly recorded a pre-tax charge in the amount of $275 million for the quarter ending December 31, 2020
(before available insurance). If the Utility’s facilities, such as its electric distribution lines, are judicially determined to be the
substantial cause of the Zogg fire, and the doctrine of inverse condemnation applies, the Utility could be liable for property damage,
business interruption, interest and attorneys’ fees without having been found negligent. For more information regarding the inverse
condemnation doctrine, see “2019 Kincade Fire” above.
The aggregate liability of $275 million for claims in connection with the 2020 Zogg fire (before available insurance) corresponds to
the lower end of the range of PG&E Corporation’s and the Utility’s reasonably estimable range of losses, and is subject to change
based on additional information. This $275 million estimate does not include, among other things: (i) any amounts for potential
penalties or fines that may be imposed by governmental entities on PG&E Corporation or the Utility, (ii) any punitive damages, (iii)
any amounts in respect of compensation claims by federal, state, county and local government entities or agencies other than state fire
suppression costs, or (iv) any other amounts that are not reasonably estimable.
PG&E Corporation and the Utility currently believe that it is reasonably possible that the amount of the loss will be greater than
$275 million and are unable to reasonably estimate the additional loss and the upper end of the range because, as described above,
there are a number of unknown facts and legal considerations that may impact the amount of any potential liability, including the total
scope and nature of claims that may be asserted against PG&E Corporation and the Utility. If the liability for the 2020 Zogg fire were
to exceed $1.0 billion, it is possible the Utility would be eligible to make a claim to the Wildfire Fund under AB 1054 for such excess
amount. PG&E Corporation and the Utility intend to continue to review the available information and other information as it becomes
available, including evidence in Cal Fire’s possession, evidence from or held by other parties, claims that have not yet been submitted,
and additional information about the nature and extent of personal and business property damages and losses, the nature, number and
severity of personal injuries, and information made available through the discovery process. In particular, PG&E Corporation and the
Utility have not had access to all of the evidence obtained by Cal Fire or other third parties.
Name of Respondent
PACIFIC GAS AND ELECTRIC COMPANY
This Report is:(1) X An Original(2) A Resubmission
Date of Report(Mo, Da, Yr)
04/13/2021
Year/Period of Report
2020/Q4
NOTES TO FINANCIAL STATEMENTS (Continued)
FERC FORM NO. 1 (ED. 12-88) Page 123.80

The process for estimating losses associated with potential claims related to the 2020 Zogg fire requires management to exercise
significant judgment based on a number of assumptions and subjective factors, including the factors identified above and estimates
based on currently available information and prior experience with wildfires. As more information becomes available, management
estimates and assumptions regarding the potential financial impact of the 2020 Zogg fire may change.
The Utility has liability insurance from various insurers, which provides coverage for third-party liability attributable to the 2020 Zogg
fire in an aggregate amount of $867.5 million. The Utility records insurance recoveries when it is deemed probable that recovery will
occur, and the Utility can reasonably estimate the amount or its range. As of December 31, 2020, the Utility has recorded an insurance
receivable for $219 million for probable insurance recoveries in connection with the 2020 Zogg fire, which equals the $275 million
probable loss estimate less an initial self-insured retention of $60 million, plus $4 million in legal fees incurred. PG&E Corporation
and the Utility intend to seek full recovery for all insured losses. If PG&E Corporation and the Utility are unable to recover the full
amount of their insurance, PG&E Corporation’s and the Utility’s financial condition, results of operations, liquidity, and cash flows
could be materially affected.
As of February 24, 2021, PG&E Corporation and the Utility are aware of six complaints on behalf of approximately 240 plaintiffs
related to the 2020 Zogg fire and expect that they may receive further such complaints. The complaints were filed in the California
Superior Court for the County of Shasta and the California Superior Court for the County of San Francisco and include claims based
on multiple theories of liability, including inverse condemnation, negligence, violations of the Public Utilities Code, violations of the
Health & Safety Code, premises liability, trespass, public nuisance and private nuisance. The plaintiffs in each action principally assert
that PG&E Corporation’s and the Utility’s alleged failure to properly maintain, inspect and de-energize their distribution lines was the
cause of the 2020 Zogg fire. The plaintiffs seek damages that include wrongful death, property damage, economic loss, punitive
damages, exemplary damages, attorneys’ fees and other damages. On February 5, 2021, certain plaintiffs filed a petition with the
California Judicial Council to coordinate five civil cases filed against the Utility and PG&E Corporation in the Superior Courts of
Shasta and San Francisco counties. The petition requests that the cases be coordinated in San Francisco Superior Court.
In addition to claims for property damage, business interruption, interest and attorneys’ fees, PG&E Corporation and the Utility could
be liable for fire suppression costs, evacuation costs, medical expenses, wrongful death and personal injury damages, punitive damages
and other damages under other theories of liability, including if PG&E Corporation and the Utility were found to have been negligent.
Loss Recoveries
PG&E Corporation and the Utility have insurance coverage for liabilities, including wildfire. Additionally, there are several
mechanisms that allow for recovery of costs from customers. Potential for recovery is described below. Failure to obtain a substantial
or full recovery of costs related to wildfires or any conclusion that such recovery is no longer probable could have a material effect on
PG&E Corporation’s and the Utility’s financial condition, results of operations, liquidity, and cash flows. In addition, the inability to
recover costs in a timely manner could have a material effect on PG&E Corporation’s and the Utility’s financial condition, results of
operations, liquidity, and cash flows.
Name of Respondent
PACIFIC GAS AND ELECTRIC COMPANY
This Report is:(1) X An Original(2) A Resubmission
Date of Report(Mo, Da, Yr)
04/13/2021
Year/Period of Report
2020/Q4
NOTES TO FINANCIAL STATEMENTS (Continued)
FERC FORM NO. 1 (ED. 12-88) Page 123.81

Name of Respondent
PACIFIC GAS AND ELECTRIC COMPANY
This Report is:(1) X An Original(2) A Resubmission
Date of Report(Mo, Da, Yr)
04/13/2021
Year/Period of Report
2020/Q4
NOTES TO FINANCIAL STATEMENTS (Continued)
FERC FORM NO. 1 (ED. 12-88) Page 123.82

Insurance
Insurance Coverage
PG&E Corporation and the Utility have liability insurance coverage for wildfire events in an amount of $430 million (subject to an
initial self-insured retention of $10 million per occurrence) for the period from August 1, 2019 through July 31, 2020, and
approximately $1 billion in liability insurance coverage for non-wildfire events (subject to an initial self-insured retention of
$10 million per occurrence), comprised of $520 million for the period from August 1, 2019 through July 31, 2020 and $480 million for
the period from September 3, 2019 through September 2, 2020. PG&E Corporation’s and the Utility’s cost of obtaining this wildfire
and non-wildfire insurance coverage in place for the period of August 1, 2019 through September 2, 2020 is approximately
$212 million.
In July 2020, and through additional purchases in August 2020, the Utility renewed its liability insurance coverage for wildfire events
in the amount of $867.5 million (subject to an initial self-insured retention of $60 million), comprised of $825 million for the period of
August 1, 2020 to July 31, 2021 and $42.5 million in reinsurance for the period of July 1, 2020 through June 30, 2021. In addition, the
Utility renewed its liability insurance coverage for non-wildfire events in the amount of $700 million (subject to an initial self-insured
retention of $10 million) for the period from August 1, 2020 through July 31, 2021. PG&E Corporation’s and the Utility’s cost of
obtaining this wildfire and non-wildfire coverage is approximately $859 million. At December 31, 2020, PG&E Corporation and the
Utility had prepaid insurance of $536 million, reflected in Other current assets on the Consolidated Balance Sheets.
Various coverage limitations applicable to different insurance layers could result in material uninsured costs in the future depending on
the amount and type of damages resulting from covered events.
In the Utility’s 2020 GRC proceeding, the CPUC also approved a settlement agreement provision that allows the Utility to recover
annual insurance costs for up to $1.4 billion in general liability insurance coverage. An advice letter will be required for additional
coverage purchased by the Utility in excess of $1.4 billion in coverage.
The Utility will not be able to obtain any recovery from the Wildfire Fund for wildfire-related losses in any year that do not exceed the
greater of $1.0 billion in the aggregate and the amount of insurance coverage required under AB 1054. (See “Wildfire Fund under AB
1054” below.)
Insurance Receivable
PG&E Corporation and the Utility record a receivable for insurance recoveries when it is deemed probable that recovery of a recorded
loss will occur. Through December 31, 2020, PG&E Corporation and the Utility recorded $430 million for probable insurance
recoveries in connection with the 2019 Kincade fire, and $219 million for probable insurance recoveries in connection with the 2020
Zogg fire. PG&E Corporation and the Utility have recovered all of the insurance for the 2015 Butte fire and the 2018 Camp fire.
PG&E Corporation and the Utility have recovered all of the insurance except for $25 million for the 2017 Northern California
wildfires. These amounts reflect an assumption that the cause of each fire is deemed to be a separate occurrence under the insurance
policies. PG&E Corporation and the Utility intend to seek full recovery for all insured losses.
If PG&E Corporation and the Utility are unable to recover the full amount of their insurance, PG&E Corporation’s and the Utility’s
financial condition, results of operations, liquidity, and cash flows could be materially affected.
Name of Respondent
PACIFIC GAS AND ELECTRIC COMPANY
This Report is:(1) X An Original(2) A Resubmission
Date of Report(Mo, Da, Yr)
04/13/2021
Year/Period of Report
2020/Q4
NOTES TO FINANCIAL STATEMENTS (Continued)
FERC FORM NO. 1 (ED. 12-88) Page 123.83

The balances for insurance receivables with respect to wildfires are included in Other accounts receivable in PG&E Corporation’s and
the Utility’s Consolidated Balance Sheets:
Insurance Receivable (in millions) 2020
Zogg fire
2019
Kincade fire
2018 Camp
fire
2017 Northern
California
wildfires
2015
Butte fire
Total
Balance at December 31, 2019 $ — $ — $ 1,380 $ 808 $ 50 $ 2,238
Accrued insurance recoveries 219 430 — — — 649
Reimbursements — — (1,380) (783) (50) (2,213)
Balance at December 31, 2020 $ 219 $ 430 $ — $ 25 $ — $ 674
Regulatory Recovery
On June 21, 2018, the CPUC issued a decision granting the Utility’s request to establish a WEMA to track specific incremental
wildfire liability costs effective as of July 26, 2017. The decision does not grant the Utility rate recovery of any wildfire-related costs.
Any such rate recovery would require CPUC authorization in a separate proceeding. The Utility may be unable to fully recover costs
in excess of insurance, if at all. Rate recovery is uncertain; therefore, the Utility has not recorded a regulatory asset related to any
wildfire claims costs. Even if such recovery is possible, it could take a number of years to resolve and a number of years to collect.
In addition, SB 901, signed into law on September 21, 2018, requires the CPUC to establish a CHT, directing the CPUC to limit
certain disallowances in the aggregate, so that they do not exceed the maximum amount that the Utility can pay without harming
ratepayers or materially impacting its ability to provide adequate and safe service. SB 901 also authorizes the CPUC to issue a
financing order that permits recovery, through the issuance of recovery bonds (also referred to as “securitization”), of wildfire-related
costs found to be just and reasonable by the CPUC and, only for the 2017 Northern California wildfires, any amounts in excess of the
CHT.
On January 10, 2019, the CPUC adopted an OIR, which establishes a process to develop criteria and a methodology to inform
determinations of the CHT in future applications under Section 451.2(a) of the Public Utilities Code for recovery of costs related to the
2017 Northern California wildfires.
On July 8, 2019, the CPUC issued a decision in the CHT proceeding. The decision adopts a methodology to determine the CHT based
on (1) the maximum additional debt that a utility can take on and maintain a minimum investment grade credit rating; (2) excess cash
available to the utility; (3) a potential regulatory adjustment of 20% of the CHT or five percent of the total disallowed wildfire
liabilities; and (4) an adjustment to preserve for ratepayers any tax benefits associated with the CHT. The decision also requires a
utility to include proposed ratepayer protection measures to mitigate harm to ratepayers as part of an application under Section
451.2(b).
Name of Respondent
PACIFIC GAS AND ELECTRIC COMPANY
This Report is:(1) X An Original(2) A Resubmission
Date of Report(Mo, Da, Yr)
04/13/2021
Year/Period of Report
2020/Q4
NOTES TO FINANCIAL STATEMENTS (Continued)
FERC FORM NO. 1 (ED. 12-88) Page 123.84

Pursuant to SB 901 and the CPUC’s methodology adopted in the CHT OIR, on April 30, 2020, the Utility filed an application with the
CPUC seeking authorization for a post-emergence transaction to securitize $7.5 billion of 2017 wildfire claims costs that is designed to
not impact amounts billed to customers, with the proceeds used to pay or reimburse the Utility for the payment of wildfire claims costs
associated with the 2017 Northern California wildfires. As a result of the proposed transaction, the Utility would retire $6.0 billion of
Utility debt and accelerate a $592 million payment due to the Fire Victim Trust.
Failure to obtain a substantial or full recovery of costs related to wildfires could have a material effect on PG&E Corporation’s and the
Utility’s financial condition, results of operations, liquidity and cash flows.
Wildfire-Related Derivative Litigation
Two purported derivative lawsuits alleging claims for breach of fiduciary duties and unjust enrichment were filed in the San Francisco
County Superior Court on November 16, 2017 and November 20, 2017, respectively, naming as defendants certain current and former
members of the Board of Directors and certain current and former officers of PG&E Corporation and the Utility. PG&E Corporation
and the Utility are named as nominal defendants. These lawsuits were consolidated by the court on February 14, 2018 and are
denominated In Re California North Bay Fire Derivative Litigation. On April 13, 2018, the plaintiffs filed a consolidated complaint.
After the parties reached an agreement regarding a stay of the derivative proceeding pending resolution of the tort actions described
above and any regulatory proceeding relating to the 2017 Northern California wildfires, on April 24, 2018, the court entered a
stipulation and order to stay. The stay was subject to certain conditions regarding the plaintiffs’ access to discovery in other actions.
On January 28, 2019, the plaintiffs filed a request to lift the stay for the purposes of amending their complaint to add allegations
regarding the 2018 Camp fire. Prior to resolution of the plaintiffs’ request to lift the stay, this matter was automatically stayed by
PG&E Corporation’s and the Utility’s commencement of the Chapter 11 Cases, as discussed below. On November 12, 2020, the
Trustee for the Fire Victim Trust filed a motion to intervene to substitute as the plaintiff in the matter. A case management conference
is currently scheduled for March 18, 2021, at which time the court will also hear the motion to intervene.
On August 3, 2018, a third purported derivative lawsuit, entitled Oklahoma Firefighters Pension and Retirement System v. Chew, et al.
(now captioned Trotter v. PG&E Corp., et al.), was filed in the U.S. District Court for the Northern District of California, naming as
defendants certain current and former members of the Board of Directors and certain current and former officers of PG&E Corporation
and the Utility. PG&E Corporation is named as a nominal defendant. The lawsuit alleges claims for breach of fiduciary duties and
unjust enrichment as well as a claim under Section 14(a) of the federal Securities Exchange Act of 1934 alleging that PG&E
Corporation’s and the Utility’s 2017 proxy statement contained misrepresentations regarding the companies’ risk management and
safety programs. On October 15, 2018, PG&E Corporation filed a motion to stay the litigation. Prior to the scheduled hearing on this
motion, this matter was automatically stayed by PG&E Corporation’s and the Utility’s commencement of the Chapter 11 Cases, as
discussed below. On December 14, 2020, the court entered a stipulation and order to substitute the Fire Victim Trust as the plaintiff.
A case management conference is currently set for April 15, 2021.
On October 23, 2018, a fourth purported derivative lawsuit, entitled City of Warren Police and Fire Retirement System v. Chew, et al.,
was filed in San Francisco County Superior Court, alleging claims for breach of fiduciary duty, corporate waste and unjust enrichment.
It named as defendants certain current and former members of the Board of Directors and certain current and former officers of PG&E
Corporation, and named PG&E Corporation as a nominal defendant. The plaintiff filed a request with the court seeking the voluntary
dismissal of this matter without prejudice on January 18, 2019.
Name of Respondent
PACIFIC GAS AND ELECTRIC COMPANY
This Report is:(1) X An Original(2) A Resubmission
Date of Report(Mo, Da, Yr)
04/13/2021
Year/Period of Report
2020/Q4
NOTES TO FINANCIAL STATEMENTS (Continued)
FERC FORM NO. 1 (ED. 12-88) Page 123.85

On November 21, 2018, a fifth purported derivative lawsuit, entitled Williams v. Earley, Jr., et al. (now captioned Trotter v. Earley, et
al.), was filed in federal court in San Francisco, alleging claims identical to those alleged in the Oklahoma Firefighters Pension and
Retirement System v. Chew, et al. lawsuit listed above against certain current and former officers and directors, and naming PG&E
Corporation and the Utility as nominal defendants. This lawsuit includes allegations related to the 2017 Northern California wildfires
and the 2018 Camp fire. This action was stayed by stipulation of the parties and order of the court on December 21, 2018, subject to
resolution of the pending securities class action. On January 7, 2021, the court entered a stipulation and order to substitute the Fire
Victim Trust as the plaintiff. A case management conference is currently set for April 15, 2021.
On December 24, 2018, a sixth purported derivative lawsuit, entitled Bowlinger v. Chew, et al. (now captioned Trotter v. Chew, et al.),
was filed in San Francisco Superior Court, alleging claims for breach of fiduciary duty, abuse of control, corporate waste, and unjust
enrichment in connection with the 2018 Camp fire against certain current and former officers and directors, and naming PG&E
Corporation and the Utility as nominal defendants. On February 5, 2019, the plaintiff filed a response to the notice asserting that the
automatic stay did not apply to his claims. PG&E Corporation and the Utility accordingly filed a Motion to Enforce the Automatic
Stay with the Bankruptcy Court as to the Bowlinger action, which was granted. On November 5, 2020, the court entered a stipulation
and order to substitute the Fire Victim Trust as the plaintiff. On February 24, 2021, the Fire Victim Trust filed an amended complaint,
alleging two causes of action for breach of fiduciary duty against certain former officers and directors. The first cause of action alleges
breaches of fiduciary duty in connection with the 2017 Northern California wildfires, and the second cause of action alleges breaches
of fiduciary duty in connection with the 2018 Camp fire. PG&E Corporation and the Utility are no longer named as nominal
defendants. A case management conference is currently set for March 18, 2021.
On January 25, 2019, a seventh purported derivative lawsuit, entitled Hagberg v. Chew, et al., was filed in San Francisco Superior
Court, alleging claims for breach of fiduciary duty, abuse of control, corporate waste, and unjust enrichment in connection with the
2018 Camp fire against certain current and former officers and directors, and naming PG&E Corporation and the Utility as nominal
defendants. A case management conference is currently set for July 7, 2021.
On January 28, 2019, an eighth purported derivative lawsuit, entitled Blackburn v. Meserve, et al. (now captioned Trotter v. Meserve,
et al.), was filed in federal court alleging claims for breach of fiduciary duty, unjust enrichment, and waste of corporate assets in
connection with the 2017 Northern California wildfires and the 2018 Camp fire against certain current and former officers and
directors, and naming PG&E Corporation as a nominal defendant. On January 8, 2021, the court entered a stipulation and order to
substitute the Fire Victim Trust as the plaintiff. A case management conference is currently set for April 15, 2021.
Due to the commencement of the Chapter 11 Cases, PG&E Corporation and the Utility filed notices in each of these proceedings on
February 1, 2019, reflecting that the proceedings were automatically stayed through the Effective Date pursuant to section 362(a) of
the Bankruptcy Code. PG&E Corporation’s and the Utility’s rights with respect to the derivative claims asserted against former
officers and directors of PG&E Corporation and the Utility were assigned to the Fire Victim Trust under the TCC RSA. The
assignment became effective as of the Effective Date of the Plan.
The above purported derivative lawsuits were brought against the named defendants on behalf of PG&E Corporation and/or the Utility.
As a result of the assignment of these claims to the Fire Victim Trust, any recovery based on these claims would be paid to the Fire
Victim Trust. Any such recovery is limited to the extent of any director and officer insurance policy proceeds paid by any insurance
carrier to reimburse PG&E Corporation and/or the Utility for amounts paid pursuant to their indemnification obligations in connection
with such causes of action.
Securities Class Action Litigation
Name of Respondent
PACIFIC GAS AND ELECTRIC COMPANY
This Report is:(1) X An Original(2) A Resubmission
Date of Report(Mo, Da, Yr)
04/13/2021
Year/Period of Report
2020/Q4
NOTES TO FINANCIAL STATEMENTS (Continued)
FERC FORM NO. 1 (ED. 12-88) Page 123.86

Wildfire-Related Class Action
In June 2018, two purported securities class actions were filed in the United States District Court for the Northern District of
California, naming PG&E Corporation and certain of its current and former officers as defendants, entitled David C. Weston v. PG&E
Corporation, et al. and Jon Paul Moretti v. PG&E Corporation, et al., respectively. The complaints alleged material
misrepresentations and omissions related to, among other things, vegetation management and transmission line safety in various PG&E
Corporation public disclosures. The complaints asserted claims under Section 10(b) and Section 20(a) of the federal Securities
Exchange Act of 1934 and Rule 10b-5 promulgated thereunder, and sought unspecified monetary relief, interest, attorneys’ fees and
other costs. Both complaints identified a proposed class period of April 29, 2015 to June 8, 2018. On September 10, 2018, the court
consolidated both cases and the litigation is now denominated In re PG&E Corporation Securities Litigation. The court also
appointed the Public Employees Retirement Association of New Mexico (“PERA”) as lead plaintiff. The plaintiff filed a consolidated
amended complaint on November 9, 2018. After the plaintiff requested leave to amend its complaint to add allegations regarding the
2018 Camp fire, the plaintiff filed a second amended consolidated complaint on December 14, 2018.
Due to the commencement of the Chapter 11 Cases, PG&E Corporation and the Utility filed a notice on February 1, 2019, reflecting
that the proceedings were automatically stayed as to PG&E Corporation and the Utility pursuant to section 362(a) of the Bankruptcy
Code. On February 15, 2019, PG&E Corporation and the Utility filed a complaint in Bankruptcy Court against the plaintiff seeking
preliminary and permanent injunctive relief to extend the stay to the claims alleged against the individual officer defendants.
On February 22, 2019, a third purported securities class action was filed in the United States District Court for the Northern District of
California, entitled York County on behalf of the York County Retirement Fund, et al. v. Rambo, et al. (the “York County Action”).
The complaint names as defendants certain current and former officers and directors, as well as the underwriters of four public
offerings of notes from 2016 to 2018. Neither PG&E Corporation nor the Utility is named as a defendant. The complaint alleges
material misrepresentations and omissions in connection with the note offerings related to, among other things, PG&E Corporation’s
and the Utility’s vegetation management and wildfire safety measures. The complaint asserts claims under Section 11 and Section 15
of the Securities Act of 1933, and seeks unspecified monetary relief, attorneys’ fees and other costs, and injunctive relief. On May 7,
2019, the York County Action was consolidated with In re PG&E Corporation Securities Litigation.
On May 28, 2019, the plaintiffs in the consolidated securities actions filed a third amended consolidated class action complaint, which
includes the claims asserted in the previously filed actions and names as defendants PG&E Corporation, the Utility, certain current and
former officers and directors, and the underwriters. On August 28, 2019, the Bankruptcy Court denied PG&E Corporation’s and the
Utility’s request to extend the stay to the claims against the officer, director, and underwriter defendants. On October 4, 2019, the
officer, director, and underwriter defendants filed motions to dismiss the third amended complaint, which motions are currently under
submission with the District Court.
Satisfaction of HoldCo Rescission or Damage Claims and Subordinated Debt Claims
Name of Respondent
PACIFIC GAS AND ELECTRIC COMPANY
This Report is:(1) X An Original(2) A Resubmission
Date of Report(Mo, Da, Yr)
04/13/2021
Year/Period of Report
2020/Q4
NOTES TO FINANCIAL STATEMENTS (Continued)
FERC FORM NO. 1 (ED. 12-88) Page 123.87

Claims against PG&E Corporation and the Utility relating to, among others, the three purported securities class actions (described
above) that have been consolidated and denominated In re PG&E Corporation Securities Litigation, U.S. District Court for the
Northern District of California, Case No. 18-03509, will be resolved pursuant to the Plan. As described above, these claims consist of
pre-petition claims under the federal securities laws related to, among other things, allegedly misleading statements or omissions with
respect to vegetation management and wildfire safety disclosures, and are classified into separate categories under the Plan, each of
which is subject to subordination under the Bankruptcy Code. The first category of claims consists of pre-petition claims arising from
or related to the common stock of PG&E Corporation (such claims, with certain other similar claims against PG&E Corporation, the
“HoldCo Rescission or Damage Claims”). The second category of pre-petition claims, which comprises two separate classes under the
Plan, consists of claims arising from debt securities issued by PG&E Corporation and the Utility (such claims, with certain other
similar claims against PG&E Corporation and the Utility, the “Subordinated Debt Claims,” and together with the HoldCo Rescission or
Damage Claims, the “Subordinated Claims”).
While PG&E Corporation and the Utility believe they have defenses to the Subordinated Claims, as well as insurance coverage that
may be available in respect of the Subordinated Claims, these defenses may not prevail and any such insurance coverage may not be
adequate to cover the full amount of the allowed claims. In that case, PG&E Corporation and the Utility will be required, pursuant to
the Plan, to satisfy such claims as follows:
each holder of an allowed HoldCo Rescission or Damage Claim will receive a number of shares of common stock of PG&E
Corporation equal to such holder’s HoldCo Rescission or Damage Claim Share (as such term is defined in the Plan); and
each holder of an allowed Subordinated Debt Claim will receive payment in full in cash.
PG&E Corporation and the Utility have been engaged in settlement efforts with respect to the Subordinated Claims. If the
Subordinated Claims are not settled (with any such resolution being subject to the approval of the Bankruptcy Court), PG&E
Corporation and the Utility expect that the Subordinated Claims will be resolved by the Bankruptcy Court in the claims reconciliation
process and treated as described above under the Plan. Under the Plan, after the Effective Date, PG&E Corporation and the Utility
have the authority to compromise, settle, object to, or otherwise resolve proofs of claim, and the Bankruptcy Court retains jurisdiction
to hear disputes arising in connection with disputed claims. With respect to the Subordinated Claims, the claims reconciliation process
may include litigation of the merits of such claims, including the filing of motions, fact discovery, and expert discovery. The total
number and amount of allowed Subordinated Claims, if any, was not determined at the Effective Date. To the extent any such claims
are allowed, the total amount of such claims could be material, and therefore could result in (a) the issuance of a material number of
shares of common stock of PG&E Corporation with respect to allowed HoldCo Rescission or Damage Claims, and/or (b) the payment
of a material amount of cash with respect to allowed Subordinated Debt Claims. There can be no assurance that such claims will not
have a material adverse impact on PG&E Corporation’s and the Utility’s business, financial condition, results of operations, and cash
flows.
Further, if shares are issued in respect of allowed HoldCo Rescission or Damage Claims, it may be determined that under the Plan, the
Fire Victim Trust should receive additional shares of common stock of PG&E Corporation (assuming, for this purpose, that shares
issued in respect of the HoldCo Rescission or Damage Claims were issued on the Effective Date).
Name of Respondent
PACIFIC GAS AND ELECTRIC COMPANY
This Report is:(1) X An Original(2) A Resubmission
Date of Report(Mo, Da, Yr)
04/13/2021
Year/Period of Report
2020/Q4
NOTES TO FINANCIAL STATEMENTS (Continued)
FERC FORM NO. 1 (ED. 12-88) Page 123.88

The named plaintiffs in the consolidated securities actions filed proofs of claim with the Bankruptcy Court on or before the bar date
that reflect their securities litigation claims against PG&E Corporation and the Utility. On December 9, 2019, the lead plaintiff in the
consolidated securities actions filed a motion seeking approval from the Bankruptcy Court to treat its proof of claim as a class proof of
claim. On February 27, 2020, the Bankruptcy Court issued an order denying the motion, but extending the bar date for putative class
members to file proofs of claim until April 16, 2020. On March 6, 2020, the lead plaintiff filed a notice of appeal regarding the denial
of its motion. On May 15, 2020, the lead plaintiff filed the opening brief for its appeal. On June 15, 2020, PG&E Corporation and the
Utility filed its brief in response. On June 29, 2020, the lead plaintiff filed its reply. No hearing date has been set.
On July 2, 2020, PERA filed a notice of appeal of the Confirmation Order to the District Court, solely to the extent of seeking review
of that part of the Confirmation Order approving the Insurance Deduction (as defined in the Plan) with respect to the formula for the
determination of the HoldCo Rescission or Damage Claims Share. On September 3, 2020, PERA filed its principal brief in support of
the appeal. On October 5, 2020, PG&E Corporation and the Utility filed their response brief. PERA filed its reply brief on October
26, 2020. No hearing date has been set.
On September 1, 2020, PG&E Corporation and the Utility filed a motion (the “Securities Claims Procedures Motion”) with the
Bankruptcy Court to approve procedures to allow for the resolution of the outstanding and unresolved Subordinated Claims, which
motion, among other things, requests approval of certain information request procedures, standard and abbreviated mediation
processes, and procedures with respect to the potential filing of omnibus claim objections with respect to the Subordinated Claims.
PERA and a number of other parties filed objections to the Securities Claims Procedures Motion.
On September 28, 2020, PERA filed a second motion requesting the Bankruptcy Court exercise its discretion pursuant to Bankruptcy
Rule 7023 to allow PERA to file a class proof of claim on behalf of the holders of Subordinated Claims (the “Renewed 7023 Motion”).
The Bankruptcy Court set a briefing schedule that, among other things, (i) adjourned the hearing on the Securities Claims Procedures
Motion to November 17, 2020, and (ii) established a briefing scheduled with respect to the Renewed 7023 Motion with a hearing on
the motion also scheduled for November 17, 2020. PG&E Corporation and the Utility filed their objection to the Renewed 7023
Motion on October 29, 2020. On December 4, 2020, the Bankruptcy Court issued an oral decision approving PG&E Corporation’s
and the Utility’s Securities Claims Procedures Motion and denying PERA’s Renewed 7023 Motion. On January 25, 2021, following a
timeline set by the Bankruptcy Court as part of the oral decision to resolve any outstanding non-substantive objections to PG&E
Corporation’s and the Utility’s proposed order granting the Securities Claims Procedures Motion, PG&E Corporation and the Utility
filed a revised proposed order, which the Bankruptcy Court entered the same day. On January 26, 2021, the Bankruptcy Court entered
a written order denying the Renewed 7023 Motion.
De-energization Class Action
Name of Respondent
PACIFIC GAS AND ELECTRIC COMPANY
This Report is:(1) X An Original(2) A Resubmission
Date of Report(Mo, Da, Yr)
04/13/2021
Year/Period of Report
2020/Q4
NOTES TO FINANCIAL STATEMENTS (Continued)
FERC FORM NO. 1 (ED. 12-88) Page 123.89

On October 25, 2019, a purported securities class action was filed in the United States District Court for the Northern District of
California, entitled Vataj v. Johnson et al. The complaint named as defendants a current director and certain current and former
officers of PG&E Corporation. Neither PG&E Corporation nor the Utility was named as a defendant. The complaint alleged
materially false and misleading statements regarding PG&E Corporation’s wildfire prevention and safety protocols and policies,
including regarding the Utility’s public safety power shutoffs, that allegedly resulted in losses and damages to holders of PG&E
Corporation’s securities. The complaint asserted claims under Section 10(b) and Section 20(a) of the federal Securities Exchange Act
of 1934 and Rule 10b-5 promulgated thereunder, and sought unspecified monetary relief, attorneys’ fees and other costs. On February
3, 2020, the District Court granted a stipulation appointing Iron Workers Local 580 Joint Funds, Ironworkers Locals 40, 361 & 417
Union Security Funds and Robert Allustiarti co-lead plaintiffs and approving the selection of the plaintiffs’ counsel, and further
ordered the parties to submit a proposed schedule by February 13, 2020. On February 20, 2020, the District Court issued a scheduling
order that required the amended complaint to be filed by April 17, 2020.
On April 17, 2020, the plaintiffs filed an amended complaint asserting the same claims. The amended complaint added PG&E
Corporation and a former officer of PG&E Corporation as defendants, and no longer asserts claims against the other two officers of
PG&E Corporation previously named in the action.
On May 15, 2020 the officer defendants filed their motion to dismiss in Vataj. On June 19, 2020, the lead plaintiff filed its opposition
to the motion to dismiss. On July 10, 2020 the officer defendants filed their reply. In October 2020, the parties reached a settlement
agreement in principle, and on October 29, 2020, filed a joint notice of settlement, informing the District Court that they have agreed
in principle to settle the matter.
On February 16, 2021, plaintiffs filed a motion for preliminary approval of the settlement with the District Court, and the District
Court issued an order terminating as moot the pending motion to dismiss, without prejudice. Pursuant to the settlement stipulation,
subject to certain conditions: (1) PG&E Corporation will pay $10 million into an interest-bearing escrow account within 14 days after
the District Court’s preliminary approval of the settlement; and (2) plaintiffs and the Settlement Class (as defined in the stipulation of
settlement) will release the Released Persons (as defined the stipulation of settlement, including PG&E Corporation and the Utility,
and each of their officers, directors, as well as the current and former officers named in both the original and amended complaints)
from all claims that have been or could have been asserted by or on behalf of PG&E Corporation shareholders that relate to (a)
allegations that were asserted or could have been asserted in either of the complaints in Vataj, and (b) investments in PG&E
Corporation’s stock during the relevant period specified in the stipulated settlement.
The settlement is subject to the District Court’s approval and its terms may change as a result of the settlement approval process. The
preliminary settlement approval hearing is currently scheduled for March 11, 2021. The final approval hearing is not yet scheduled. If
the District Court approves the settlement and enters a judgment substantially in the form requested by the parties, the settlement will
become effective when certain conditions specified in the settlement stipulation are satisfied, including the expiration of any right to
appeal the judgment.
Indemnification Obligations
Name of Respondent
PACIFIC GAS AND ELECTRIC COMPANY
This Report is:(1) X An Original(2) A Resubmission
Date of Report(Mo, Da, Yr)
04/13/2021
Year/Period of Report
2020/Q4
NOTES TO FINANCIAL STATEMENTS (Continued)
FERC FORM NO. 1 (ED. 12-88) Page 123.90

To the extent permitted by law, PG&E Corporation and the Utility have obligations to indemnify directors and officers for certain
events or occurrences while a director or officer is or was serving in such capacity, which indemnification obligations extend to the
claims asserted against the directors and officers in the securities class action. PG&E Corporation and the Utility maintain directors’
and officers’ insurance coverage to reduce their exposure to such indemnification obligations. PG&E Corporation and the Utility have
provided notice to their insurance carriers of the claims asserted in the wildfire-related securities class actions and derivative litigation,
and are in communication with the carriers regarding the applicability of the directors and officers insurance policies to those matters.
PG&E Corporation and the Utility additionally have potential indemnification obligations to the underwriters for the Utility’s note
offerings, pursuant to the underwriting agreements associated with those offerings. PG&E Corporation’s and the Utility’s
indemnification obligations to the officers, directors and underwriters may be limited or affected by the Chapter 11 Cases.
District Attorneys’ Offices Investigations
Following the 2018 Camp fire, the Butte County District Attorney’s Office and the California Attorney General’s Office opened a
criminal investigation of the 2018 Camp fire. PG&E Corporation and the Utility were informed by the Butte County District
Attorney’s Office and the California Attorney General’s Office that a grand jury had been empaneled in Butte County.
On March 17, 2020, the Utility entered into the Plea Agreement and Settlement (the “Plea Agreement”) with the People of the State of
California, by and through the Butte County District Attorney’s office (the “People” and the “Butte DA,” respectively) to resolve the
criminal prosecution of the Utility in connection with the 2018 Camp fire. Subject to the terms and conditions of the Plea Agreement,
the Utility agreed to plead guilty to 84 counts of involuntary manslaughter in violation of Penal Code section 192(b) and one count of
unlawfully causing a fire in violation of Penal Code section 452, and to admit special allegations pursuant to Penal Code sections
452.1(a)(2), 452.1(a)(3) and 452.1(a)(4).
Per the Plea Agreement, the Utility was sentenced to pay the maximum total fine and penalty of approximately $3.5 million. The
Utility also agreed to pay $500,000 to the Butte County District Attorney Environmental and Consumer Protection Fund to reimburse
costs spent on the investigation of the 2018 Camp fire.
Simultaneous with entry into the Plea Agreement, the Utility has committed to spend up to $15 million over five years to provide water
to Butte County residents impacted by damage to the Utility’s Miocene Canal caused by the 2018 Camp fire. In addition, the Utility
has consented to the Butte District Attorney’s consulting, sharing information with and receiving information from the Monitor
overseeing the Utility’s probation related to the San Bruno explosion through the expiration of the Utility’s term of probation and in no
event until later than January 31, 2022.
On June 16, 2020 through June 18, 2020, the Butte County Superior Court held proceedings at which the Utility pled guilty and was
sentenced according to the terms of the Plea Agreement. On July 21, 2020, the Utility paid the $3.5 million fine and penalty to the
Butte County Superior Court and $500,000 to the Butte County District Attorney Environmental and Consumer Protection Fund.
On January 15, 2021, the Butte County Superior Court held a brief hearing on the status of restitution, which involves distribution of
funds from the Fire Victim Trust, which was established under the Company’s Plan of Reorganization in Bankruptcy Court and is
managed by a Trustee and a Claims Administrator. The Court continued the hearing to August 20, 2021 for a further update.
Name of Respondent
PACIFIC GAS AND ELECTRIC COMPANY
This Report is:(1) X An Original(2) A Resubmission
Date of Report(Mo, Da, Yr)
04/13/2021
Year/Period of Report
2020/Q4
NOTES TO FINANCIAL STATEMENTS (Continued)
FERC FORM NO. 1 (ED. 12-88) Page 123.91

Cal Fire announced that it had determined that “the Kincade Fire was caused by electrical transmission lines owned and operated by
Pacific Gas and Electric (PG&E) located northeast of Geyserville. Tinder dry vegetation and strong winds combined with low
humidity and warm temperatures contributed to extreme rates of fire spread.” Cal Fire also indicated that its investigative report has
been forwarded to the Sonoma County District Attorney’s Office, which is currently conducting an investigation of the fire. On
February 24, 2021, the Sonoma County District Attorney’s Office sent a search warrant to the Utility through its counsel in connection
with the investigation. The Utility expects to produce documents and respond to other requests for information in connection with the
investigation and the search warrant. For more information see “2019 Kincade Fire” above.
The Shasta County District Attorney’s Office is investigating the 2020 Zogg fire. See “2020 Zogg Fire” above for further information.
Additional investigations and other actions may arise out of the 2019 Kincade fire or the 2020 Zogg fire. The timing and outcome for
resolution of any such investigations are uncertain.
SEC Investigation
On March 20, 2019, PG&E Corporation learned that the SEC’s San Francisco Regional Office was conducting an investigation related
to PG&E Corporation’s and the Utility’s public disclosures and accounting for losses associated with the 2018 Camp fire, the 2017
Northern California wildfires and the 2015 Butte fire. PG&E Corporation and the Utility are unable to predict the timing and outcome
of the investigation.
Wildfire Fund under AB 1054
On July 12, 2019, the California governor signed into law AB 1054, a bill which provides for the establishment of a statewide fund that
will be available for eligible electric utility companies to pay eligible claims for liabilities arising from wildfires occurring after July
12, 2019 that are caused by the applicable electric utility company’s equipment, subject to the terms and conditions of AB 1054.
Eligible claims are claims for third party damages resulting from any such wildfires, limited to the portion of such claims that exceeds
the greater of (i) $1.0 billion in the aggregate in any year and (ii) the amount of insurance coverage required to be in place for the
electric utility company pursuant to Section 3293 of the Public Utilities Code, added by AB 1054.
Electric utility companies that draw from the Wildfire Fund will only be required to repay amounts that are determined by the CPUC in
an application for cost recovery not to be just and reasonable, subject to a rolling three-year disallowance cap equal to 20% of the
electric utility company’s transmission and distribution equity rate base. For the Utility, this disallowance cap is expected to be
approximately $2.7 billion for the three-year period starting in 2019, subject to adjustment based on changes in the Utility’s total
transmission and distribution equity rate base. The disallowance cap is inapplicable in certain circumstances, including if the Wildfire
Fund administrator determines that the electric utility company’s actions or inactions that resulted in the applicable wildfire constituted
“conscious or willful disregard for the rights and safety of others,” or the electric utility company fails to maintain a valid safety
certification. Costs that the CPUC determines to be just and reasonable will not need to be repaid to the Wildfire Fund, resulting in a
draw-down of the Wildfire Fund.
Name of Respondent
PACIFIC GAS AND ELECTRIC COMPANY
This Report is:(1) X An Original(2) A Resubmission
Date of Report(Mo, Da, Yr)
04/13/2021
Year/Period of Report
2020/Q4
NOTES TO FINANCIAL STATEMENTS (Continued)
FERC FORM NO. 1 (ED. 12-88) Page 123.92

On August 23, 2019, the CPUC approved the Utility’s Initial Safety Certification, which under AB 1054 entitles the Utility to certain
benefits, including eligibility for a cap on Wildfire Fund reimbursement and for a reformed prudent manager standard. The Utility
satisfied the required elements for its Initial Safety Certificate, as follows: (i) the electrical corporation has an approved WMP, (ii) the
electrical corporation is in good standing, which can be satisfied by the electrical corporation having agreed to implement the findings
of its most recent safety culture assessment, if applicable, (iii) the electrical corporation has established a safety committee of its board
of directors composed of members with relevant safety experience, and (iv) the electrical corporation has established
board-of-director-level reporting to the CPUC on safety issues. Before the expiration of any current safety certification, the Utility
must request a new safety certification for the following 12 months, which shall be issued within 90 days if the Utility has provided
documentation that it has satisfied the requirements for the safety certification pursuant to Section 8389(e) of the Public Utilities Code,
added by AB 1054. On July 29, 2020, the Utility submitted its application for a new safety certification. On January 14, 2021, the
WSD approved the Utility’s 2020 application and issued the Utility’s 2020 Safety Certification pursuant to the requirements of AB
1054. The safety certification is separate from the CPUC’s enforcement authority and does not preclude the CPUC from pursuing
remedies for safety or other applicable violations. The 2020 Safety Certification is valid for 12 months or until a timely request for a
new safety certification is acted upon, whichever occurs later. On January 26, 2021, TURN filed with the CPUC a request for review
of WSD’s issuance of the safety certification.
The Wildfire Fund and disallowance cap will be terminated when the amounts therein are exhausted. The Wildfire Fund is expected to
be capitalized with (i) $10.5 billion of proceeds of bonds supported by a 15-year extension of the Department of Water Resources
charge to ratepayers, (ii) $7.5 billion in initial contributions from California’s three IOU companies and (iii) $300 million in annual
contributions paid by California’s three IOU companies for at least a 10 year period. The contributions from the IOU companies will
be effectively borne by their respective shareholders, as they will not be permitted to recover these costs from ratepayers. The costs of
the initial and annual contributions are allocated among the three IOU companies pursuant to a “Wildfire Fund allocation metric” set
forth in AB 1054 based on land area in the applicable utility’s service territory classified as high fire threat districts and adjusted to
account for risk mitigation efforts. The Utility’s Wildfire Fund allocation metric is 64.2% (representing an initial contribution of
approximately $4.8 billion and annual contributions of approximately $193 million). The Wildfire Fund will only be available for
payment of eligible claims so long as there are sufficient funds remaining in the Wildfire Fund. Such funds could be depleted more
quickly than expected, including as a result of claims made by California’s other participating electric utility companies.
AB 1054 also provides that the first $5.0 billion expended in the aggregate by California’s three IOU companies on fire risk mitigation
capital expenditures included in their respective approved WMPs will be excluded from their respective equity rate bases. The $5.0
billion of capital expenditures will be allocated among the IOU companies in accordance with their Wildfire Fund allocation metrics
(described above). The Utility’s allocation is $3.21 billion. AB 1054 contemplates that such capital expenditures may be securitized
through a customer charge.
On the Effective Date, having satisfied the conditions for the Utility’s initial participation in the Wildfire Fund, PG&E Corporation and
the Utility contributed, in accordance with AB 1054, an initial contribution of approximately $4.8 billion and first annual contribution
of approximately $193 million to the Wildfire Fund to secure participation of the Utility therein. SDG&E and Edison made their
initial contributions to the Wildfire Fund in September 2019. On December 30, 2020, the Utility made its second annual contribution
of $193 million to the Wildfire Fund.
As of the Effective Date, the Wildfire Fund became available to the Utility to pay for eligible claims arising on or after the effective
date of AB 1054, July 12, 2019, subject to a limit of 40% of the amount of allowed claims arising between the effective date of AB
1054 and the Effective Date of the Plan.
Name of Respondent
PACIFIC GAS AND ELECTRIC COMPANY
This Report is:(1) X An Original(2) A Resubmission
Date of Report(Mo, Da, Yr)
04/13/2021
Year/Period of Report
2020/Q4
NOTES TO FINANCIAL STATEMENTS (Continued)
FERC FORM NO. 1 (ED. 12-88) Page 123.93
For additional information on the Wildfire Fund, see Note 3 above.
NOTE 15: OTHER CONTINGENCIES AND COMMITMENTS
PG&E Corporation and the Utility have significant contingencies arising from their operations, including contingencies related to
enforcement and litigation matters and environmental remediation. A provision for a loss contingency is recorded when it is both
probable that a loss has been incurred and the amount of the loss can be reasonably estimated. PG&E Corporation and the Utility
evaluate the range of reasonably estimated losses and record a provision based on the lower end of the range, unless an amount within
the range is a better estimate than any other amount. The assessment of whether a loss is probable or reasonably possible, and whether
the loss or a range of loss is estimable, often involves a series of complex judgments about future events. Loss contingencies are
reviewed quarterly and estimates are adjusted to reflect the impact of all known information, such as negotiations, discovery,
settlements and payments, rulings, penalties related to regulatory compliance, advice of legal counsel, and other information and events
pertaining to a particular matter. PG&E Corporation’s and the Utility’s policy is to exclude anticipated legal costs from the provision
for loss and expense these costs as incurred. The Utility also has substantial financial commitments in connection with agreements
entered into to support its operating activities. See “Purchase Commitments” below. PG&E Corporation and the Utility have financial
commitments described in “Other Commitments” below. PG&E Corporation’s and the Utility’s financial condition, results of
operations, liquidity, and cash flows may be materially affected by the outcome of the following matters.
Enforcement Matters
U.S. District Court Matters and Probation
In connection with the Utility’s probation proceeding, the United States District Court for the Northern District of California has the
ability to impose additional probation conditions on the Utility. Additional conditions, if implemented, could be wide-ranging and
would impact the Utility’s operations, number of employees, costs and financial performance. Depending on the terms of these
additional requirements, costs in connections with such requirements could have a material effect on PG&E Corporation’s and the
Utility’s financial condition, results of operations, liquidity, and cash flows.
CPUC and FERC Matters
Order Instituting Investigation into the 2017 Northern California Wildfires and the 2018 Camp Fire
On June 27, 2019, the CPUC issued the Wildfires OII to determine whether the Utility “violated any provision(s) of the California
Public Utilities Code (PU Code), Commission General Orders (GO) or decisions, or other applicable rules or requirements pertaining
to the maintenance and operation of its electric facilities that were involved in igniting fires in its service territory in 2017.” On
December 5, 2019, the assigned commissioner issued a second amended scoping memo and ruling that amended the scope of issues to
be considered in this proceeding to include the 2018 Camp fire.
As previously disclosed, on December 17, 2019, the Utility, the SED of the CPUC, the CPUC’s OSA, and CUE jointly submitted to
the CPUC a proposed settlement agreement in connection with this proceeding and jointly moved for its approval.
Name of Respondent
PACIFIC GAS AND ELECTRIC COMPANY
This Report is:(1) X An Original(2) A Resubmission
Date of Report(Mo, Da, Yr)
04/13/2021
Year/Period of Report
2020/Q4
NOTES TO FINANCIAL STATEMENTS (Continued)
FERC FORM NO. 1 (ED. 12-88) Page 123.94

Pursuant to the settlement agreement, the Utility agreed to (i) not seek rate recovery of wildfire-related expenses and capital
expenditures in future applications in the amount of $1.625 billion, as specified below, and (ii) incur costs of $50 million in
shareholder-funded system enhancement initiatives as described further in the settlement agreement. The settlement agreement
stipulates that no violations have been identified in the Tubbs fire. While, as a result of this finding, the settlement agreement does not
prevent the Utility from seeking recovery of costs associated with the Tubbs fire through rates, the Utility has committed not to seek
rate recovery for the Tubbs fire except through securitization. The amounts set forth in the table below include actual recorded costs
and forecasted cost estimates as of the date of the settlement agreement for expenses and capital expenditures which the Utility has
incurred or planned to incur to comply with its legal obligations to provide safe and reliable service. While actual costs incurred for
certain cost categories are different than what was assumed in the settlement agreement, the Utility has recorded $1.625 billion of the
disallowed costs through December 31, 2020.
(in millions)
Description(1) Expense Capital Total
Distribution Safety Inspections and Repairs Expense (FRMMA/WMPMA) $ 236 $ — $ 236
Transmission Safety Inspections and Repairs Expense (TO)(2) 433 — 433
Vegetation Management Support Costs (FHPMA) 36 — 36
2017 Northern California Wildfires CEMA Expense and Capital (CEMA) 82 66 148
2018 Camp Fire CEMA Expense (CEMA) 435 — 435
2018 Camp Fire CEMA Capital for Restoration (CEMA) — 253 253
2018 Camp Fire CEMA Capital for Temporary Facilities (CEMA) — 84 84
Total $ 1,222 $ 403 $ 1,625
(1) All amounts included in the table reflect actual recorded costs for 2019 and 2020.
(2) Transmission amounts are under the FERC’s regulatory authority.
PG&E Corporation and the Utility record a charge when it is both probable that costs incurred or projected to be incurred for recently
completed plant will not be recoverable through rates charged to customers and the amount of disallowance can be reasonably
estimated.
The Utility expects that the system enhancement spending pursuant to the settlement agreement will occur through 2025.
On April 20, 2020, the assigned commissioner issued a Decision Different adopting, with changes, the proposed modifications set forth
in the request for review. The Decision Different (i) increases the amount of disallowed wildfire expenditures by $198 million (as set
forth in the POD); (ii) increases the amount of shareholder funding for System Enhancement Initiatives by $64 million (as set forth in
the POD); (iii) imposes a $200 million fine but permanently suspends payment of the fine; and (iii) limits the tax savings that must be
returned to ratepayers to those savings generated by disallowed operating expenditures. The Decision Different also denies all pending
appeals of the POD and denies, in part, the Utility’s motion requesting other relief. On April 30, 2020, the Utility submitted its
comments on the Decision Different to the CPUC, accepting the modifications. The CPUC approved the Decision Different on May 7,
2020.
Name of Respondent
PACIFIC GAS AND ELECTRIC COMPANY
This Report is:(1) X An Original(2) A Resubmission
Date of Report(Mo, Da, Yr)
04/13/2021
Year/Period of Report
2020/Q4
NOTES TO FINANCIAL STATEMENTS (Continued)
FERC FORM NO. 1 (ED. 12-88) Page 123.95

The settlement agreement, as modified by the Decision Different, became effective upon: (i) approval by the CPUC in the Decision
Different, (ii) following such approval by the CPUC, the June 20, 2020 approval of the Bankruptcy Court, and (iii) the July 1, 2020
effectiveness of the Plan.
As it relates to the additional $198 million in disallowed costs as adopted in the Decision Different, the Utility has recorded charges of
$152 million primarily in WMPMA as of December 31, 2020 and intends to record the remaining charges of $46 million in 2021.
On June 8, 2020, two parties filed separate applications for rehearing, the purpose of which was to challenge the CPUC’s approval of
the settlement agreement, as modified. On June 23, 2020, the Utility and CUE filed a joint response opposing the Applications for
Rehearing. On December 3, 2020, the CPUC issued a decision denying the application for rehearing. On January 4, 2021, one party
filed a petition for review of the CPUC decision with the California court of appeals. The Utility is unable to predict the timing and
outcome of the petition.
Transmission Owner Rate Case Revenue Subject to Refund
The FERC determines the amount of authorized revenue requirements, including the rate of return on electric transmission assets, that
the Utility may collect in rates in the TO rate case. The FERC typically authorizes the Utility to charge new rates based on the
requested revenue requirement, subject to refund, before the FERC has issued a final decision. The Utility bills and records revenue
based on the amounts requested in its rate case filing and records a reserve for its estimate of the amounts that are probable of refund.
Rates subject to refund went into effect on March 1, 2017, March 1, 2018, and May 1, 2019 for TO18, TO19, and TO20, respectively.
On October 1, 2018, the ALJ issued an initial decision in the TO18 rate case and the Utility filed initial briefs on October 31, 2018, in
response to the ALJ’s recommendations. On October 15, 2020, the FERC issued an order that affirmed in part and reversed in part the
initial decision. The order reopens the record for the limited purpose of allowing the participants to this proceeding an opportunity to
present written evidence concerning the FERC’s revised ROE methodology adopted in the FERC Opinion No. 569-A, issued on May
21, 2020, that refined the methodology it established in Opinion No. 569 for setting the ROE that electric utilities are authorized to
earn on electric transmission investments. Initial briefs were filed December 14, 2020 and reply briefs were filed February 12, 2021.
In addition, the order approves depreciation rates that yield an estimated composite depreciation rate of 2.94% compared to the
Utility’s request of 3.25%. Further, the decision reduces forecasted capital, operations and maintenance, and cost of debt expense to
actual costs incurred for the rate case period. Finally, the order upheld the initial decision’s rejection of the Utility’s direct assignment
of common plant to FERC and required the allocation of all common plant between CPUC and FERC jurisdiction be based on
operating and maintenance labor ratios. Application of the operating and maintenance labor rates would result in an allocation of
6.15% of common plant to FERC in comparison to 8.84% under the Utility’s direct assignment method. The Utility filed a request for
rehearing of certain aspects of the order, which was denied by the FERC on December 17, 2020. The Utility filed a petition for review
of the order on February 11, 2021, and a separate petition for review was jointly filed the same day by two other parties. The ultimate
outcome of the items for which the Utility requested rehearing could also impact the revenues recorded for the TO19 and TO20
periods.
On September 21, 2018, the Utility filed an all-party settlement with the FERC, which was approved by the FERC on December 20,
2018, in connection with TO19. As part of the settlement, the TO19 revenue requirement will be set at 98.85% of the revenue
requirement for TO18 that will be determined upon issuance of a final unappealable decision in TO18.
Name of Respondent
PACIFIC GAS AND ELECTRIC COMPANY
This Report is:(1) X An Original(2) A Resubmission
Date of Report(Mo, Da, Yr)
04/13/2021
Year/Period of Report
2020/Q4
NOTES TO FINANCIAL STATEMENTS (Continued)
FERC FORM NO. 1 (ED. 12-88) Page 123.96

The Utility is unable to predict the timing or outcome of the FERC’s decisions in the TO18 proceeding.
Other Matters
PG&E Corporation and the Utility are subject to various claims and lawsuits that separately are not considered material. Accruals for
contingencies related to such matters (excluding amounts related to the contingencies discussed above under “Enforcement and
Litigation Matters”) totaled $144 million and $116 million at December 31, 2020 and December 31, 2019, respectively. These
amounts were included in LSTC at December 31, 2019 and were included in Other current liabilities at December 31, 2020. PG&E
Corporation and the Utility do not believe it is reasonably possible that the resolution of these matters will have a material impact on
their financial condition, results of operations, or cash flows.
PSPS Class Action
On December 19, 2019, a complaint was filed in the United States Bankruptcy Court for the Northern District of California naming
PG&E Corporation and the Utility. The plaintiff seeks certification of a class consisting of all California residents and business
owners who had their power shut off by the Utility during the October 9, October 23, October 26, October 28, or November 20, 2019
power outages and any subsequent voluntary outages occurring during the course of litigation. The plaintiff alleges that the necessity
for the October and November 2019 power shutoff events was caused by the Utility’s negligence in failing to properly maintain its
electrical lines and surrounding vegetation. The complaint seeks up to $2.5 billion in special and general damages, punitive and
exemplary damages and injunctive relief to require the Utility to properly maintain and inspect its power grid. PG&E Corporation and
the Utility believe the allegations are without merit and intend to defend this lawsuit vigorously.
On January 21, 2020, PG&E Corporation and the Utility filed a motion to dismiss the complaint or in the alternative strike the class
action allegations. The motion to dismiss and strike was heard by the Bankruptcy Court on March 10, 2020, and on April 3, 2020, the
Bankruptcy Court entered an order dismissing the action without leave to amend, finding that the action was preempted under the
California Public Utilities Code.
On March 30, 2020, the Bankruptcy Court issued an opinion granting the Utility's motion to dismiss this class action. The court held
that the plaintiff’s class action claims are preempted as a matter of law by section 1759 of the California Public Utilities Code and thus
the plaintiffs could not pursue civil damages. The court stated that “any claim for damages caused by PSPS events approved by the
CPUC, even if based on pre-existing events that may or may not have contributed to the necessity of the PSPS events, would interfere
with the CPUC’s policy-making decisions.”
On April 6, 2020, the plaintiff filed a notice of appeal of the Bankruptcy Court decision dismissing the complaint. The plaintiff has
elected to have the appeal heard by the District Court, rather than the Bankruptcy Appellate Panel. The plaintiff filed a designation of
the record and statement of the issues on April 20, 2020.
On June 8, 2020, the plaintiff filed its opening brief with the District Court. The Utility filed its opposition brief on July 6, 2020. The
plaintiff’s reply brief was filed on August 4, 2020 with a request for oral argument. On October 20, 2020, the District Court denied the
plaintiff’s request for oral argument and stated that if it wants to hear oral argument, it will inform the parties and schedule a hearing.
The Utility is unable to determine the timing and outcome of this proceeding.
Name of Respondent
PACIFIC GAS AND ELECTRIC COMPANY
This Report is:(1) X An Original(2) A Resubmission
Date of Report(Mo, Da, Yr)
04/13/2021
Year/Period of Report
2020/Q4
NOTES TO FINANCIAL STATEMENTS (Continued)
FERC FORM NO. 1 (ED. 12-88) Page 123.97

GT&S Capital Expenditures 2011-2014
On June 23, 2016, the CPUC approved a final phase one decision in the Utility’s 2015 GT&S rate case. The phase one decision
excluded from rate base $696 million of capital spending in 2011 through 2014 in excess of the amount adopted in the prior GT&S
rate case. The decision permanently disallowed $120 million of that amount and ordered that the remaining $576 million be subject to
a review of reasonableness to be conducted, or overseen, by the CPUC staff. The review was completed on June 1, 2020 and did not
result in any additional disallowances. The report certified $512 million for future recovery. The difference between the certified
amount and the $576 million previously disallowed is primarily a result of differences between capital expenditures forecasted in the
2015 GT&S rate case and recorded capital expenditures.
On July 31, 2020, the Utility filed an application seeking recovery of revenue requirements on the $512 million of capital expenditures
retroactive to January 1, 2015. On October 16, 2020, the assigned commissioner issued a scoping memo establishing the scope and
schedule for the proceeding. On January 20, 2021, the Utility provided supplemental testimony and supporting working papers
addressing the reasonableness of the capital expenditures. The scoping memo calls for the issuance of a proposed decision in the
fourth quarter of 2021.
The Utility is unable to determine the timing and outcome of this proceeding.
CZU Lightning Complex Fire Notices of Violation
Several governmental entities have raised concerns regarding the Utility’s emergency response to the 2020 CZU Lightning Complex
fire, including Cal Fire alleging violations of Public Resource Code sections related to timber harvest regulations and Forest Practice
Rules, the California Coastal Commission alleging violations of the Coastal Act related to unpermitted development in the coastal
zone, the Central Coast Regional Water Quality Control Board alleging unpermitted discharge to waters, and the Santa Cruz County
Board of Supervisors adopting a resolution to file a complaint with the CPUC. The concerns include potential environmental impacts
related to erosion and sedimentation from hazard tree removal and access road use, work in sensitive habitats, and the management of
wood debris. The Coastal Commission issued a Notice of Violation letter to the Utility on November 20, 2020, the Central Coast
Regional Water Quality Control Board issued a Notice of Violation letter on December 15, 2020, Cal Fire has issued five Notices of
Violation through February 8, 2021, and Santa Cruz County filed a complaint with the CPUC on January 25, 2021. The Utility
continues to work with all agencies, as well as Santa Cruz County, to resolve any outstanding issues.
Based on the information currently available, PG&E Corporation and the Utility believe it is probable that a liability has been incurred.
The Utility is unable to reasonably estimate the amount or range of potential penalties that could be incurred given the number of
factors that can be considered in determining penalties. PG&E Corporation and the Utility do not believe that the resolution of these
matters will have a material impact on their financial condition, results of operations, or cash flows. Violations can result in penalties,
remediation and other relief.
Environmental Remediation Contingencies
Name of Respondent
PACIFIC GAS AND ELECTRIC COMPANY
This Report is:(1) X An Original(2) A Resubmission
Date of Report(Mo, Da, Yr)
04/13/2021
Year/Period of Report
2020/Q4
NOTES TO FINANCIAL STATEMENTS (Continued)
FERC FORM NO. 1 (ED. 12-88) Page 123.98

Given the complexities of the legal and regulatory environment and the inherent uncertainties involved in the early stages of a
remediation project, the process for estimating remediation liabilities requires significant judgment. The Utility records an
environmental remediation liability when the site assessments indicate that remediation is probable, and the Utility can reasonably
estimate the loss or a range of probable amounts. The Utility records an environmental remediation liability based on the lower end of
the range of estimated probable costs, unless an amount within the range is a better estimate than any other amount. Key factors that
inform the development of estimated costs include site feasibility studies and investigations, applicable remediation actions, operations
and maintenance activities, post-remediation monitoring, and the cost of technologies that are expected to be approved to remediate the
site. Amounts recorded are not discounted to their present value. The Utility’s environmental remediation liability is primarily
included in non-current liabilities on the Consolidated Balance Sheets and is comprised of the following:
Balance at
(in millions) December 31,
2020
December 31,
2019
Topock natural gas compressor station $ 303 $ 362
Hinkley natural gas compressor station 132 138
Former manufactured gas plant sites owned by the Utility or third parties (1) 659 568
Utility-owned generation facilities (other than fossil fuel-fired),
other facilities, and third-party disposal sites (2) 111 101
Fossil fuel-fired generation facilities and sites (3) 96 106
Total environmental remediation liability $ 1,301 $ 1,275
(1) Primarily driven by the following sites: San Francisco Beach Street, Vallejo, Napa, and San Francisco East Harbor.
(2) Primarily driven by Geothermal landfill and Shell Pond site.
(3) Primarily driven by the San Francisco Potrero Power Plant.
The Utility’s gas compressor stations, former manufactured gas plant sites, power plant sites, gas gathering sites, and sites used by the
Utility for the storage, recycling, and disposal of potentially hazardous substances are subject to requirements issued by the
Environmental Protection Agency under the Federal Resource Conservation and Recovery Act in addition to other state hazardous
waste laws. The Utility has a comprehensive program in place designed to comply with federal, state, and local laws and regulations
related to hazardous materials, waste, remediation activities, and other environmental requirements. The Utility assesses and monitors
the environmental requirements on an ongoing basis and implements changes to its program as deemed appropriate. The Utility’s
remediation activities are overseen by the DTSC, several California regional water quality control boards, and various other federal,
state, and local agencies.
The Utility’s environmental remediation liability at December 31, 2020, reflects its best estimate of probable future costs for
remediation based on the current assessment data and regulatory obligations. Future costs will depend on many factors, including the
extent of work necessary to implement final remediation plans, the Utility’s time frame for remediation, and unanticipated claims filed
against the Utility. The Utility may incur actual costs in the future that are materially different than this estimate and such costs could
have a material impact on results of operations, financial condition, and cash flows during the period in which they are recorded. At
December 31, 2020, the Utility expected to recover $986 million of its environmental remediation liability for certain sites through
various ratemaking mechanisms authorized by the CPUC.
Name of Respondent
PACIFIC GAS AND ELECTRIC COMPANY
This Report is:(1) X An Original(2) A Resubmission
Date of Report(Mo, Da, Yr)
04/13/2021
Year/Period of Report
2020/Q4
NOTES TO FINANCIAL STATEMENTS (Continued)
FERC FORM NO. 1 (ED. 12-88) Page 123.99

Natural Gas Compressor Station Sites
The Utility is legally responsible for remediating groundwater contamination caused by hexavalent chromium used in the past at the
Utility’s natural gas compressor stations. The Utility is also required to take measures to abate the effects of the contamination on the
environment.
Topock Site
The Utility’s remediation and abatement efforts at the Topock site are subject to the regulatory authority of the California DTSC and
the U.S. Department of the Interior. On April 24, 2018, the DTSC authorized the Utility to build an in-situ groundwater treatment
system to convert hexavalent chromium into a non-toxic and non-soluble form of chromium. Construction activities began in October
2018 and will continue for several years. The Utility’s undiscounted future costs associated with the Topock site may increase by as
much as $216 million if the extent of contamination or necessary remediation is greater than anticipated. The costs associated with
environmental remediation at the Topock site are expected to be recovered primarily through the HSM, where 90% of the costs are
recovered in rates.
Hinkley Site
The Utility has been implementing remediation measures at the Hinkley site to reduce the mass of the chromium plume in groundwater
and to monitor and control movement of the plume. The Utility’s remediation and abatement efforts at the Hinkley site are subject to
the regulatory authority of the California Regional Water Quality Control Board, Lahontan Region. In November 2015, the California
Regional Water Quality Control Board, Lahontan Region adopted a clean-up and abatement order directing the Utility to contain and
remediate the underground plume of hexavalent chromium and the potential environmental impacts. The final order states that the
Utility must continue and improve its remediation efforts, define the boundaries of the chromium plume, and take other action.
Additionally, the final order sets plume capture requirements, requires a monitoring and reporting program, and includes deadlines for
the Utility to meet interim cleanup targets. The United States Geological Survey team is currently conducting a background study on
the site to better define the chromium plume boundaries. A draft background report was received in January 2020 and is expected to
be finalized in 2021. The Utility’s undiscounted future costs associated with the Hinkley site may increase by as much as $138 million
if the extent of contamination or necessary remediation is greater than anticipated. The costs associated with environmental
remediation at the Hinkley site will not be recovered through rates.
Former Manufactured Gas Plants
Former MGPs used coal and oil to produce gas for use by the Utility’s customers before natural gas became available. The
by-products and residues of this process were often disposed of at the MGPs themselves. The Utility has a program to manage the
residues left behind as a result of the manufacturing process; many of the sites in the program have been addressed. The Utility’s
undiscounted future costs associated with MGP sites may increase by as much as $460 million if the extent of contamination or
necessary remediation at currently identified MGP sites is greater than anticipated. The costs associated with environmental
remediation at the MGP sites are recovered through the HSM, where 90% of the costs are recovered in rates.
Utility-Owned Generation Facilities and Third-Party Disposal Sites
Name of Respondent
PACIFIC GAS AND ELECTRIC COMPANY
This Report is:(1) X An Original(2) A Resubmission
Date of Report(Mo, Da, Yr)
04/13/2021
Year/Period of Report
2020/Q4
NOTES TO FINANCIAL STATEMENTS (Continued)
FERC FORM NO. 1 (ED. 12-88) Page 123.100
Utility-owned generation facilities and third-party disposal sites often involve long-term remediation. The Utility’s undiscounted
future costs associated with Utility-owned generation facilities and third-party disposal sites may increase by as much as $67 million if
the extent of contamination or necessary remediation is greater than anticipated. The environmental remediation costs associated with
the Utility-owned generation facilities and third-party disposal sites are recovered through the HSM, where 90% of the costs are
recovered in rates.
Fossil Fuel-Fired Generation Sites
In 1998, the Utility divested its generation power plant business as part of generation deregulation. Although the Utility sold its
fossil-fueled power plants, the Utility retained the environmental remediation liability associated with each site. The Utility’s
undiscounted future costs associated with fossil fuel-fired generation sites may increase by as much as $43 million if the extent of
contamination or necessary remediation is greater than anticipated. The environmental remediation costs associated with the fossil
fuel-fired sites will not be recovered through rates.
Nuclear Insurance
The Utility maintains multiple insurance policies through NEIL, a mutual insurer owned by utilities with nuclear facilities, and
EMANI, covering nuclear or non-nuclear events at the Utility’s two nuclear generating units at Diablo Canyon and the retired
Humboldt Bay Unit 3.
NEIL provides insurance coverage for property damages and business interruption losses incurred by the Utility if a nuclear or
non-nuclear event were to occur at the Utility’s two nuclear generating units at Diablo Canyon. NEIL provides property damage and
business interruption coverage of up to $3.2 billion per nuclear incident and $2.7 billion per non-nuclear incident for Diablo Canyon.
For Humboldt Bay Unit 3, NEIL provides up to $50 million of coverage for nuclear and non-nuclear property damages.
NEIL also provides coverage for damages caused by acts of terrorism at nuclear power plants. Through NEIL, there is up to
$3.2 billion available to the membership to cover this exposure. This coverage amount is shared by all NEIL members and applies to
all terrorist acts occurring within a 12-month period against one or more commercial nuclear power plants insured by NEIL.
In addition to the nuclear insurance the Utility maintains through NEIL, the Utility also is a member of EMANI, which provides
excess insurance coverage for property damages and business interruption losses incurred by the Utility if a nuclear or non-nuclear
event were to occur at Diablo Canyon. EMANI provides an additional $200 million for any one accident and in the annual aggregate
excess of the combined amount recoverable under the Utility’s NEIL policies.
If NEIL losses in any policy year exceed accumulated funds, the Utility could be subject to a retrospective assessment. If NEIL were
to exercise this assessment, the maximum aggregate annual retrospective premium obligation for the Utility would be approximately
$43 million. If EMANI losses in any policy year exceed accumulated funds, the Utility could be subject to a retrospective assessment
of approximately $4 million.
Name of Respondent
PACIFIC GAS AND ELECTRIC COMPANY
This Report is:(1) X An Original(2) A Resubmission
Date of Report(Mo, Da, Yr)
04/13/2021
Year/Period of Report
2020/Q4
NOTES TO FINANCIAL STATEMENTS (Continued)
FERC FORM NO. 1 (ED. 12-88) Page 123.101

Under the Price-Anderson Act, public liability claims that arise from nuclear incidents that occur at Diablo Canyon, and that occur
during the transportation of material to and from Diablo Canyon are limited to approximately $13.8 billion. The Utility purchases the
maximum available public liability insurance of $450 million for Diablo Canyon. The balance of the $13.8 billion of liability
protection is provided under a loss-sharing program among utilities owning nuclear reactors. The Utility may be assessed up to
$275 million per nuclear incident under this loss sharing program, with payments in each year limited to a maximum of $41 million per
incident. Both the maximum assessment and the maximum yearly assessment are adjusted for inflation at least every five years.
The Price-Anderson Act does not apply to claims that arise from nuclear incidents that occur during shipping of nuclear material from
the nuclear fuel enricher to a fuel fabricator or that occur at the fuel fabricator’s facility. The Utility has a separate policy that provides
coverage for claims arising from some of these incidents up to a maximum of $450 million per incident. In addition, the Utility has
approximately $53 million of liability insurance for Humboldt Bay Unit 3 and has a $500 million indemnification from the NRC for
public liability arising from nuclear incidents for Humboldt Bay Unit 3, covering liabilities in excess of the $53 million in liability
insurance.
Diablo Canyon Outages
Diablo Canyon Unit 2 has experienced four outages between July 2020 and February 24, 2021, each due or related to malfunctions
within the main generator associated with excessive vibrations. Additional inspections and replacement of a redesigned component of
the generator are expected to occur during Unit 2’s planned spring 2021 refueling outage. The affected component is part of the
secondary system and does not involve a risk of release of radioactive material into the environment. The Utility is working with the
vendor that supplied the affected component to understand the root cause and to develop appropriate corrective actions.
If additional shutdowns occur in the future, or if the planned refueling outage is extended due to the inspections and replacement of the
affected component, the Utility may incur incremental costs or forgo additional power market revenues. The Utility will also be
subject to a review of the reasonableness of its actions before the CPUC.
Diablo Canyon carries property damage and outage insurance issued by NEIL. The Utility has notified NEIL of its potential claims for
loss recovery.
The Utility is unable to reasonably estimate the occurrence or length of future outages, the cost to repair the generator, the loss of
power market revenues, or the results of a reasonableness review by the CPUC.
Purchase Commitments
The following table shows the undiscounted future expected obligations under power purchase agreements that have been approved by
the CPUC and have met specified construction milestones as well as undiscounted future expected payment obligations for natural gas
supplies, natural gas transportation, natural gas storage, and nuclear fuel as of December 31, 2020:
Power Purchase Agreements
(in millions)
Renewable
Energy
Conventional
Energy Other
Natural
Gas
Nuclear
Fuel Total
2021 $ 2,270 $ 582 $ 65 $ 466 $ 64 $ 3,447
2022 2,042 511 62 191 54 2,860
Name of Respondent
PACIFIC GAS AND ELECTRIC COMPANY
This Report is:(1) X An Original(2) A Resubmission
Date of Report(Mo, Da, Yr)
04/13/2021
Year/Period of Report
2020/Q4
NOTES TO FINANCIAL STATEMENTS (Continued)
FERC FORM NO. 1 (ED. 12-88) Page 123.102

2023 1,997 223 61 158 49 2,488
2024 1,972 72 61 151 47 2,303
2025 1,962 70 61 151 — 2,244
Thereafter 21,335 281 41 184 — 21,841
Total purchase
commitments $ 31,578 $ 1,739 $ 351 $ 1,301 $ 214 $ 35,183
Third-Party Power Purchase Agreements
In the ordinary course of business, the Utility enters into various agreements, including renewable energy agreements, QF agreements,
and other power purchase agreements to purchase power and electric capacity. The price of purchased power may be fixed or
variable. Variable pricing is generally based on the current market price of either natural gas or electricity at the date of delivery.
Renewable Energy Power Purchase Agreements. In order to comply with California’s RPS requirements, the Utility is required to
deliver renewable energy to its customers at a gradually increasing rate. The Utility has entered into various agreements to purchase
renewable energy to help meet California’s requirement. The Utility’s obligations under a significant portion of these agreements are
contingent on the third party’s construction of new generation facilities, which are expected to grow. As of December 31, 2020,
renewable energy contracts expire at various dates between 2021 and 2043.
Conventional Energy Power Purchase Agreements. The Utility has entered into many power purchase agreements for conventional
generation resources, which include tolling agreements and resource adequacy agreements. The Utility’s obligation under a portion of
these agreements is contingent on the third parties’ development of new generation facilities to provide capacity and energy products to
the Utility. As of December 31, 2020, these power purchase agreements expire at various dates between 2021 and 2033.
Other Power Purchase Agreements. The Utility has entered into agreements to purchase energy and capacity with independent power
producers that own generation facilities that meet the definition of a QF under federal law. As of December 31, 2020, QF contracts in
operation expire at various dates between 2021 and 2049. In addition, the Utility has agreements with various irrigation districts and
water agencies to purchase hydroelectric power.
The net costs incurred for all power purchases and electric capacity amounted to $2.9 billion in 2020, $3.0 billion in 2019, and $3.1
billion in 2018.
Natural Gas Supply, Transportation, and Storage Commitments
The Utility purchases natural gas directly from producers and marketers in both Canada and the United States to serve its core
customers and to fuel its owned-generation facilities. The Utility also contracts for natural gas transportation from the points at which
the Utility takes delivery (typically in Canada, the US Rocky Mountain supply area, and the southwestern United States) to the points
at which the Utility’s natural gas transportation system begins. These agreements expire at various dates between 2021 and 2026. In
addition, the Utility has contracted for natural gas storage services in northern California to more reliably meet customers’ loads.
Name of Respondent
PACIFIC GAS AND ELECTRIC COMPANY
This Report is:(1) X An Original(2) A Resubmission
Date of Report(Mo, Da, Yr)
04/13/2021
Year/Period of Report
2020/Q4
NOTES TO FINANCIAL STATEMENTS (Continued)
FERC FORM NO. 1 (ED. 12-88) Page 123.103

Costs incurred for natural gas purchases, natural gas transportation services, and natural gas storage, which include contracts with
terms of less than 1 year, amounted to $0.8 billion in 2020, $0.9 billion in 2019, and $0.6 billion in 2018.
Nuclear Fuel Agreements
The Utility has entered into several purchase agreements for nuclear fuel. These agreements expire at various dates between 2021 and
2024 and are intended to ensure long-term nuclear fuel supply. The Utility relies on a number of international producers of nuclear
fuel in order to diversify its sources and provide security of supply. Pricing terms are also diversified, ranging from market-based
prices to base prices that are escalated using published indices.
Payments for nuclear fuel amounted to $111 million in 2020, $74 million in 2019, and $73 million in 2018.
Other Commitments
PG&E Corporation and the Utility have other commitments primarily related to office facilities and land leases, which expire at
various dates between 2021 and 2052. At December 31, 2020, the future minimum payments related to these commitments were as
follows:
(in millions) Other Commitments
2021 $ 40
2022 30
2023 46
2024 65
2025 60
Thereafter 2,924
Total minimum lease payments $ 3,165
Payments for other commitments amounted to $45 million in 2020, $48 million in 2019, and $43 million in 2018. Certain office
facility leases contain escalation clauses requiring annual increases in rent. The rents may increase by a fixed amount each year, a
percentage of the base rent, or the consumer price index. There are options to extend these leases for one to five years.
One of these commitments is treated as a financing lease. At December 31, 2020 and 2019, net financing leases reflected in property,
plant, and equipment on the Consolidated Balance Sheets were $7 million and $9 million including accumulated amortization of $11
million and $9 million, respectively. The present value of the future minimum lease payments due under these agreements included $2
million and $2 million in Current Liabilities and $5 million and $7 million in Noncurrent Liabilities on the Consolidated Balance
Sheet, at December 31, 2020 and 2019, respectively.
Oakland Headquarters Lease
Name of Respondent
PACIFIC GAS AND ELECTRIC COMPANY
This Report is:(1) X An Original(2) A Resubmission
Date of Report(Mo, Da, Yr)
04/13/2021
Year/Period of Report
2020/Q4
NOTES TO FINANCIAL STATEMENTS (Continued)
FERC FORM NO. 1 (ED. 12-88) Page 123.104

On June 5, 2020, the Utility entered into an Agreement to Enter Into Lease and Purchase Option (the “Agreement”) with TMG Bay
Area Investments II, LLC (“TMG”). The Agreement provides that, contingent on (i) entry of an order by the Bankruptcy Court
authorizing the Utility to enter into the Agreement and the Lease Agreement (as defined below), subject to certain conditions, and (ii)
acquisition of the Lakeside Building by BA2 300 Lakeside LLC (“Landlord”), a wholly owned subsidiary of TMG, the Utility and
Landlord will enter into an office lease agreement (the “Lease Agreement”) for approximately 910,000 rentable square feet of space
within the building located at the Lakeside Building to serve as the Utility’s principal administrative headquarters (the “Lease”). On
June 9, 2020, PG&E Corporation and the Utility filed a motion with the Bankruptcy Court authorizing them to enter into the
Agreement and grant related relief. The Bankruptcy Court entered an order approving the motion on June 24, 2020.
Pursuant to the terms of the Agreement, concurrent with the Landlord’s acquisition of the Lakeside Building, on October 23, 2020, the
Utility and the Landlord entered into the Lease, and the Utility issued to Landlord (i) an option payment letter of credit in the amount
of $75 million, and (ii) and a lease security letter of credit in the amount of $75 million.
The term of the Lease will begin on or about March 1, 2022. The Lease term will expire 34 years and 11 months after the
commencement date, unless earlier terminated in accordance with the terms of the Lease. In addition to base rent, the Utility will be
responsible for certain costs and charges specified in the Lease, including insurance costs, maintenance costs and taxes.
The Lease requires the Landlord to pursue approvals to subdivide the real estate it owns surrounding the Lakeside Building to create a
separate legal parcel that contains the Lakeside Building (the “Property”) that can be sold to the Utility. The Lease grants to the Utility
an option to purchase the Property, following such subdivision, at a price of $892 million, subject to certain adjustments (the
“Purchase Price”). The Purchase Price would not be paid until 2023.
In connection with entry into the Agreement, the Utility intends to sell its current office space generally located at 77 Beale Street, 215
Market Street, 245 Market Street and 50 Main Street, San Francisco, California 94105, and associated properties owned by the Utility
(“SFGO”). Any sale of the SFGO would be subject to approval by the CPUC. On September 30, 2020, the Utility filed an application
with the CPUC seeking authorization to sell the SFGO.
At December 31, 2020, the Lease Agreement had no impact on PG&E Corporation’s and the Utility’s Consolidated Financial
Statements.
NOTE 16: SUBSEQUENT EVENTS
Sale of Transmission Tower Wireless Licenses
On February 16, 2021, the Utility granted to a subsidiary of SBA Communications Corporation (such subsidiary, “SBA”) an exclusive
license enabling SBA to sublicense and market wireless communications equipment attachment locations (“Cell Sites”) on more than
700 of the Utility’s electric transmission towers, telecommunications towers, monopoles, buildings or other structures (collectively, the
“Effective Date Towers”) to wireless telecommunication carriers (“Carriers”) for attachment of wireless communications equipment, as
contemplated by a Master Transaction Agreement (the “Transaction Agreement”) dated February 2, 2021, between the Utility and
SBA. Pursuant to the Transaction Agreement, the Utility also assigned to SBA license agreements between the Utility and Carriers for
substantially all of the existing Cell Sites on the Effective Date Towers.
Name of Respondent
PACIFIC GAS AND ELECTRIC COMPANY
This Report is:(1) X An Original(2) A Resubmission
Date of Report(Mo, Da, Yr)
04/13/2021
Year/Period of Report
2020/Q4
NOTES TO FINANCIAL STATEMENTS (Continued)
FERC FORM NO. 1 (ED. 12-88) Page 123.105

The exclusive license was granted pursuant to a Master Multi-Site License Agreement (the “License Agreement”) between the Utility
and SBA. The term of the License Agreement is for 100 years. The Utility has the right to terminate the license for individual Cell
Sites for certain regulatory or utility operational reasons, with a corresponding payment to SBA. Pursuant to the License Agreement,
SBA is entitled to the sublicensing revenue generated by new sublicenses of Cell Sites on the Effective Date Towers, subject to the
Utility’s right to a percentage of such sublicensing revenue.
In exchange for the exclusive license and entry into the License Agreement, SBA agreed to pay the Utility a purchase price of
$973 million, subject to customary adjustments. SBA paid the Utility $954 million of such purchase price at the closing pursuant to
the Transaction Agreement, which also contemplates the post-closing assignment of additional specified Cell Sites to SBA upon the
satisfaction of certain terms and conditions, for which SBA will make additional purchase price payments to the Utility. The closing
settlement also reflected an adjustment for an estimated amount of payments received by the Utility from Carriers in the pre-closing
period that are allocable to licenses in the post-closing period, resulting in initial cash proceeds of $945 million. The purchase price is
subject to further adjustment pursuant to the terms of the Transaction Agreement.
The Utility and SBA also entered into a Master Transmission Tower Site License Agreement (the “Tower Site Agreement”), pursuant
to which SBA received the exclusive rights to sublicense and market potential additional attachment locations on approximately
28,000 of the Utility’s other electric transmission towers to Carriers for attachment of wireless communications equipment. The Tower
Site Agreement provides for a split of license fees from Carriers between the Utility and SBA. The Tower Site Agreement has a
licensing period of up to 15 years, depending on SBA’s achievement of certain performance metrics, and any sites licensed during such
licensing period will continue to be subject to the Tower Site Agreement for the same term as the License Agreement.
Name of Respondent
PACIFIC GAS AND ELECTRIC COMPANY
This Report is:(1) X An Original(2) A Resubmission
Date of Report(Mo, Da, Yr)
04/13/2021
Year/Period of Report
2020/Q4
NOTES TO FINANCIAL STATEMENTS (Continued)
FERC FORM NO. 1 (ED. 12-88) Page 123.106

Name of Respondent This Report Is:(1) An Original
(2) A Resubmission
Date of Report(Mo, Da, Yr)
Year/Period of Report
End of
STATEMENTS OF ACCUMULATED COMPREHENSIVE INCOME, COMPREHENSIVE INCOME, AND HEDGING ACTIVITIES
PACIFIC GAS AND ELECTRIC COMPANYX
04/13/20212020/Q4
Line
No.
1. Report in columns (b),(c),(d) and (e) the amounts of accumulated other comprehensive income items, on a net-of-tax basis, where appropriate.
2. Report in columns (f) and (g) the amounts of other categories of other cash flow hedges.
3. For each category of hedges that have been accounted for as "fair value hedges", report the accounts affected and the related amounts in a footnote.
4. Report data on a year-to-date basis.
Other
Adjustments
(e)
Foreign Currency
Hedges
(d)
Minimum Pension
Liability adjustment
(net amount)
(c)
Unrealized Gains and
Losses on Available-
for-Sale Securities
(b)
Item
(a)
( 986,708)
Balance of Account 219 at Beginning of
Preceding Year
1
597,861
Preceding Qtr/Yr to Date Reclassifications
from Acct 219 to Net Income
2
1,406,636
Preceding Quarter/Year to Date Changes in
Fair Value
3
2,004,497Total (lines 2 and 3) 4
1,017,789
Balance of Account 219 at End of
Preceding Quarter/Year
5
1,017,789
Balance of Account 219 at Beginning of
Current Year
6
698,516
Current Qtr/Yr to Date Reclassifications
from Acct 219 to Net Income
7
( 6,337,523)
Current Quarter/Year to Date Changes in
Fair Value
8
( 5,639,007)Total (lines 7 and 8) 9
( 4,621,218)
Balance of Account 219 at End of Current
Quarter/Year
10
FERC FORM NO. 1 (NEW 06-02) Page 122a

Other Cash Flow
Hedges
[Specify]
(g)
Other Cash Flow
Hedges
Interest Rate Swaps
(f)
Name of Respondent This Report Is:(1) An Original
(2) A Resubmission
Date of Report(Mo, Da, Yr)
Year/Period of Report
End of
STATEMENTS OF ACCUMULATED COMPREHENSIVE INCOME, COMPREHENSIVE INCOME, AND HEDGING ACTIVITIES
PACIFIC GAS AND ELECTRIC COMPANYX
04/13/20212020/Q4
Line
No.
Total
Comprehensive
Income
(j)
Net Income (Carried
Forward from
Page 117, Line 78)
(i)
Totals for each
category of items
recorded in
Account 219
(h)
( 986,708) 1
597,861 2
1,406,636 3
( 7,621,767,673) ( 7,619,763,176)2,004,497 4
1,017,789 5
1,017,789 6
698,516 7
( 6,337,523) 8
410,958,488 405,319,481( 5,639,007) 9
( 4,621,218) 10
FERC FORM NO. 1 (NEW 06-02) Page 122b

Name of Respondent This Report Is:(1) An Original
(2) A Resubmission
Date of Report(Mo, Da, Yr)
Year/Period of Report
End of
SUMMARY OF UTILITY PLANT AND ACCUMULATED PROVISIONS
PACIFIC GAS AND ELECTRIC COMPANYX
04/13/20212020/Q4
Line
No.(b)(a)
Classification Electric
(c)
FOR DEPRECIATION. AMORTIZATION AND DEPLETION
Total Company for the
Current Year/Quarter Ended
Report in Column (c) the amount for electric function, in column (d) the amount for gas function, in column (e), (f), and (g) report other (specify) and in
column (h) common function.
Utility Plant 1
In Service 2
58,872,467,824 80,418,017,616Plant in Service (Classified) 3
1,656,610,189 1,754,428,569Property Under Capital Leases 4
-345,946 -396,482Plant Purchased or Sold 5
10,194,558,560 17,147,244,936Completed Construction not Classified 6
Experimental Plant Unclassified 7
70,723,290,627 99,319,294,639Total (3 thru 7) 8
Leased to Others 9
Held for Future Use 10
1,929,075,179 2,758,242,099Construction Work in Progress 11
Acquisition Adjustments 12
72,652,365,806102,077,536,738Total Utility Plant (8 thru 12) 13
29,945,181,598 41,313,895,992Accum Prov for Depr, Amort, & Depl 14
42,707,184,208 60,763,640,746Net Utility Plant (13 less 14) 15
Detail of Accum Prov for Depr, Amort & Depl 16
In Service: 17
29,873,867,093 40,512,834,588Depreciation 18
Amort & Depl of Producing Nat Gas Land/Land Right 19
8,558,277Amort of Underground Storage Land/Land Rights 20
71,314,505 792,503,127Amort of Other Utility Plant 21
29,945,181,598 41,313,895,992Total In Service (18 thru 21) 22
Leased to Others 23
Depreciation 24
Amortization and Depletion 25
Total Leased to Others (24 & 25) 26
Held for Future Use 27
Depreciation 28
Amortization 29
Total Held for Future Use (28 & 29) 30
Abandonment of Leases (Natural Gas) 31
Amort of Plant Acquisition Adj 32
29,945,181,598 41,313,895,992Total Accum Prov (equals 14) (22,26,30,31,32) 33
FERC FORM NO. 1 (ED. 12-89) Page 200

(g)
Common
(h)
Name of Respondent This Report Is:(1) An Original
(2) A Resubmission
Date of Report(Mo, Da, Yr)
Year/Period of Report
End of
SUMMARY OF UTILITY PLANT AND ACCUMULATED PROVISIONS
PACIFIC GAS AND ELECTRIC COMPANYX
04/13/20212020/Q4
Line
No.
FOR DEPRECIATION. AMORTIZATION AND DEPLETION
Gas Other (Specify)
(d) (e) (f)
Other (Specify)Other (Specify)
1
2
15,367,031,678 6,178,518,114 3
97,818,380 4
104,025 -154,561 5
6,262,497,804 690,188,572 6
7
21,629,633,507 6,966,370,505 8
9
10
383,098,848 446,068,072 11
12
22,012,732,355 7,412,438,577 13
8,582,095,171 2,786,619,223 14
13,430,637,184 4,625,819,354 15
16
17
8,573,219,359 2,065,748,136 18
19
8,558,277 20
317,536 720,871,086 21
8,582,095,172 2,786,619,222 22
23
24
25
26
27
28
29
30
31
32
8,582,095,172 2,786,619,222 33
FERC FORM NO. 1 (ED. 12-89) Page 201

Name of Respondent This Report Is:(1) An Original
(2) A Resubmission
Date of Report(Mo, Da, Yr)
Year/Period of Report
End of
NUCLEAR FUEL MATERIALS (Account 120.1 through 120.6 and 157)
PACIFIC GAS AND ELECTRIC COMPANYX
04/13/20212020/Q4
Line
No.
Description of item Balance
(c)(b)(a)
Changes during YearBeginning of Year Additions
1. Report below the costs incurred for nuclear fuel materials in process of fabrication, on hand, in reactor, and in cooling; owned by the
respondent.
2. If the nuclear fuel stock is obtained under leasing arrangements, attach a statement showing the amount of nuclear fuel leased, the
quantity used and quantity on hand, and the costs incurred under such leasing arrangements.
Nuclear Fuel in process of Refinement, Conv, Enrichment & Fab (120.1) 1
Fabrication 2
Nuclear Materials 134,676,856 120,482,320 3
Allowance for Funds Used during Construction 4
(Other Overhead Construction Costs, provide details in footnote) 5
SUBTOTAL (Total 2 thru 5) 134,676,856 6
Nuclear Fuel Materials and Assemblies 7
In Stock (120.2) 8
In Reactor (120.3) 397,424,984 76,306,720 9
SUBTOTAL (Total 8 & 9) 397,424,984 10
Spent Nuclear Fuel (120.4) 2,566,969,545 114,255,938 11
Nuclear Fuel Under Capital Leases (120.6) 12
(Less) Accum Prov for Amortization of Nuclear Fuel Assem (120.5) 2,743,468,286 13
TOTAL Nuclear Fuel Stock (Total 6, 10, 11, 12, less 13) 355,603,099 14
Estimated net Salvage Value of Nuclear Materials in line 9 15
Estimated net Salvage Value of Nuclear Materials in line 11 16
Est Net Salvage Value of Nuclear Materials in Chemical Processing 17
Nuclear Materials held for Sale (157) 18
Uranium 19
Plutonium 20
Other (provide details in footnote): 21
TOTAL Nuclear Materials held for Sale (Total 19, 20, and 21) 22
FERC FORM NO. 1 (ED. 12-89) Page 202

Name of Respondent This Report Is:(1) An Original
(2) A Resubmission
Date of Report(Mo, Da, Yr)
Year/Period of Report
End of
NUCLEAR FUEL MATERIALS (Account 120.1 through 120.6 and 157)
PACIFIC GAS AND ELECTRIC COMPANYX
04/13/20212020/Q4
Line
No.
Balance
(f)(e)(d)
Changes during YearEnd of YearAmortization Other Reductions (Explain in a footnote)
1
2
3 76,306,720 178,852,456
4
5
6 178,852,456
7
8
9 114,255,937 359,475,767
10 359,475,767
11 2,681,225,483
12
13 2,853,008,174 -109,539,888
14 366,545,532
15
16
17
18
19
20
21
22
FERC FORM NO. 1 (ED. 12-89) Page 203

Schedule Page: 202 Line No.: 3 Column: eCost of fuel inserted into reactor during 2020; cost transferred from Nuclear Fuel inProcess to Nuclear Fuel in Reactor.
Schedule Page: 202 Line No.: 9 Column: eCost of spent fuel transferred from Nuclear Fuel in Reactor to Spent Nuclear Fuel in 2020.
Name of Respondent
PACIFIC GAS AND ELECTRIC COMPANY
This Report is:(1) X An Original(2) A Resubmission
Date of Report(Mo, Da, Yr)
04/13/2021
Year/Period of Report
2020/Q4
FOOTNOTE DATA
FERC FORM NO. 1 (ED. 12-87) Page 450.1

Name of Respondent This Report Is:(1) An Original
(2) A Resubmission
Date of Report(Mo, Da, Yr)
Year/Period of Report
End of
ELECTRIC PLANT IN SERVICE (Account 101, 102, 103 and 106)
PACIFIC GAS AND ELECTRIC COMPANYX
04/13/20212020/Q4
Line
No.
Account Balance Additions
(c)(b)(a)Beginning of Year
1. Report below the original cost of electric plant in service according to the prescribed accounts.
2. In addition to Account 101, Electric Plant in Service (Classified), this page and the next include Account 102, Electric Plant Purchased or Sold;
Account 103, Experimental Electric Plant Unclassified; and Account 106, Completed Construction Not Classified-Electric.
3. Include in column (c) or (d), as appropriate, corrections of additions and retirements for the current or preceding year.
4. For revisions to the amount of initial asset retirement costs capitalized, included by primary plant account, increases in column (c) additions and
reductions in column (e) adjustments.
5. Enclose in parentheses credit adjustments of plant accounts to indicate the negative effect of such accounts.
6. Classify Account 106 according to prescribed accounts, on an estimated basis if necessary, and include the entries in column (c). Also to be included
in column (c) are entries for reversals of tentative distributions of prior year reported in column (b). Likewise, if the respondent has a significant amount
of plant retirements which have not been classified to primary accounts at the end of the year, include in column (d) a tentative distribution of such
retirements, on an estimated basis, with appropriate contra entry to the account for accumulated depreciation provision. Include also in column (d)
1. INTANGIBLE PLANT 1
(301) Organization 2
(302) Franchises and Consents 139,001,479 182,958,569 3
(303) Miscellaneous Intangible Plant 7,142,779 6,332,789 4
TOTAL Intangible Plant (Enter Total of lines 2, 3, and 4) 146,144,258 189,291,358 5
2. PRODUCTION PLANT 6
A. Steam Production Plant 7
(310) Land and Land Rights 8,644,205 8
(311) Structures and Improvements 113,965,827 38,162 9
(312) Boiler Plant Equipment 279,931,336 3,049,383 10
(313) Engines and Engine-Driven Generators 11
(314) Turbogenerator Units 257,633,721 12
(315) Accessory Electric Equipment 52,625,551 13
(316) Misc. Power Plant Equipment 28,348,904 14
(317) Asset Retirement Costs for Steam Production 96,102,035 15
TOTAL Steam Production Plant (Enter Total of lines 8 thru 15) 837,251,579 3,087,545 16
B. Nuclear Production Plant 17
(320) Land and Land Rights 22,726,561 18
(321) Structures and Improvements 1,092,063,773 14,891,643 19
(322) Reactor Plant Equipment 3,596,796,769 6,416,319 20
(323) Turbogenerator Units 1,211,169,500 6,933,358 21
(324) Accessory Electric Equipment 867,719,122 8,811,574 22
(325) Misc. Power Plant Equipment 1,171,280,933 26,206,125 23
(326) Asset Retirement Costs for Nuclear Production 3,364,966,683 24
TOTAL Nuclear Production Plant (Enter Total of lines 18 thru 24) 11,326,723,341 63,259,019 25
C. Hydraulic Production Plant 26
(330) Land and Land Rights 44,055,068 392,696 27
(331) Structures and Improvements 536,639,786 7,974,357 28
(332) Reservoirs, Dams, and Waterways 2,141,455,482 71,705,740 29
(333) Water Wheels, Turbines, and Generators 1,050,584,857 48,814,854 30
(334) Accessory Electric Equipment 310,319,133 12,597,151 31
(335) Misc. Power PLant Equipment 119,265,133 16,772,404 32
(336) Roads, Railroads, and Bridges 97,960,943 559,858 33
(337) Asset Retirement Costs for Hydraulic Production 7,200,427 248,182,125 34
TOTAL Hydraulic Production Plant (Enter Total of lines 27 thru 34) 4,307,480,829 406,999,185 35
D. Other Production Plant 36
(340) Land and Land Rights 19,207,870 37
(341) Structures and Improvements 211,013,036 555,508 38
(342) Fuel Holders, Products, and Accessories 11,473,459 39
(343) Prime Movers 227,980,319 670,852 40
(344) Generators 353,878,262 119,389 41
(345) Accessory Electric Equipment 214,406,078 1,306,417 42
(346) Misc. Power Plant Equipment 98,908,747 3,000,847 43
(347) Asset Retirement Costs for Other Production 46,948,130 44
TOTAL Other Prod. Plant (Enter Total of lines 37 thru 44) 1,136,867,771 52,601,143 45
TOTAL Prod. Plant (Enter Total of lines 16, 25, 35, and 45) 17,608,323,520 525,946,892 46
Page 204FERC FORM NO. 1 (REV. 12-05)

(f)
Transfers Balance atEnd of Year
Name of Respondent This Report Is:(1) An Original
(2) A Resubmission
Date of Report(Mo, Da, Yr)
Year/Period of Report
End ofPACIFIC GAS AND ELECTRIC COMPANYX
04/13/20212020/Q4
Line
No.(g)
Adjustments
(e)
Retirements
(d)
ELECTRIC PLANT IN SERVICE (Account 101, 102, 103 and 106) (Continued)
distributions of these tentative classifications in columns (c) and (d), including the reversals of the prior years tentative account distributions of these
amounts. Careful observance of the above instructions and the texts of Accounts 101 and 106 will avoid serious omissions of the reported amount of
respondent’s plant actually in service at end of year.
7. Show in column (f) reclassifications or transfers within utility plant accounts. Include also in column (f) the additions or reductions of primary account
classifications arising from distribution of amounts initially recorded in Account 102, include in column (e) the amounts with respect to accumulated
provision for depreciation, acquisition adjustments, etc., and show in column (f) only the offset to the debits or credits distributed in column (f) to primary
account classifications.
8. For Account 399, state the nature and use of plant included in this account and if substantial in amount submit a supplementary statement showing
subaccount classification of such plant conforming to the requirement of these pages.
9. For each amount comprising the reported balance and changes in Account 102, state the property purchased or sold, name of vendor or purchase,
and date of transaction. If proposed journal entries have been filed with the Commission as required by the Uniform System of Accounts, give also date
1
2
318,691,374 -2,927 3,265,747 3
13,475,568 4
332,166,942 -2,927 3,265,747 5
6
7
8,600,406 -43,799 8
114,003,989 9
282,980,719 10
11
257,633,721 12
52,625,551 13
28,348,904 14
96,102,035 15
840,295,325 -43,799 16
17
22,726,561 18
1,105,009,672 1,945,744 19
3,593,453,406 9,759,682 20
1,215,745,878 2,356,980 21
871,027,636 5,503,060 22
1,190,080,356 7,406,702 23
3,364,966,683 24
11,363,010,192 26,972,168 25
26
44,124,493 323,271 27
540,594,311 4,019,832 28
2,205,051,421 8,109,801 29
1,078,992,881 20,406,830 30
313,210,073 9,706,211 31
133,961,191 2,076,346 32
97,986,863 533,938 33
255,382,552 34
4,669,303,785 45,176,229 35
36
19,207,615 255 37
211,568,544 38
11,473,459 39
228,651,171 40
353,997,651 41
215,712,495 42
101,909,594 43
46,948,130 44
1,189,468,659 255 45
18,062,077,961 -43,799 72,148,652 46
Page 205FERC FORM NO. 1 (REV. 12-05)

ELECTRIC PLANT IN SERVICE (Account 101, 102, 103 and 106) (Continued)
Name of Respondent This Report Is:(1) An Original
(2) A Resubmission
Date of Report(Mo, Da, Yr)
Year/Period of Report
End ofPACIFIC GAS AND ELECTRIC COMPANYX
04/13/20212020/Q4
Line
No.
Account Balance Additions
(c)(b)(a)Beginning of Year
3. TRANSMISSION PLANT 47
(350) Land and Land Rights 280,372,715 9,064,196 48
(352) Structures and Improvements 493,641,027 -9,932,518 49
(353) Station Equipment 6,970,636,084 664,838,833 50
(354) Towers and Fixtures 993,433,125 58,242,335 51
(355) Poles and Fixtures 1,666,570,377 300,875,946 52
(356) Overhead Conductors and Devices 1,983,526,864 214,606,791 53
(357) Underground Conduit 512,801,262 3,467,536 54
(358) Underground Conductors and Devices 276,592,706 12,454,766 55
(359) Roads and Trails 107,222,352 26,469,203 56
(359.1) Asset Retirement Costs for Transmission Plant 3,756,679 3,966,507 57
TOTAL Transmission Plant (Enter Total of lines 48 thru 57) 13,288,553,191 1,284,053,595 58
4. DISTRIBUTION PLANT 59
(360) Land and Land Rights 181,121,477 3,840,745 60
(361) Structures and Improvements 323,717,422 5,427,152 61
(362) Station Equipment 3,710,334,305 251,924,503 62
(363) Storage Battery Equipment 31,646,931 2,913,527 63
(364) Poles, Towers, and Fixtures 5,387,044,284 1,147,709,098 64
(365) Overhead Conductors and Devices 5,125,782,513 370,276,908 65
(366) Underground Conduit 3,133,089,997 164,932,642 66
(367) Underground Conductors and Devices 5,043,166,504 311,513,623 67
(368) Line Transformers 4,111,052,424 440,941,887 68
(369) Services 3,591,993,628 176,524,339 69
(370) Meters 1,249,604,097 70,861,919 70
(371) Installations on Customer Premises 29,313,948 129,307 71
(372) Leased Property on Customer Premises 895,448 72
(373) Street Lighting and Signal Systems 264,203,617 5,294,325 73
(374) Asset Retirement Costs for Distribution Plant 14,974,899 10,308,746 74
TOTAL Distribution Plant (Enter Total of lines 60 thru 74) 32,197,941,494 2,962,598,721 75
5. REGIONAL TRANSMISSION AND MARKET OPERATION PLANT 76
(380) Land and Land Rights 77
(381) Structures and Improvements 78
(382) Computer Hardware 79
(383) Computer Software 80
(384) Communication Equipment 81
(385) Miscellaneous Regional Transmission and Market Operation Plant 82
(386) Asset Retirement Costs for Regional Transmission and Market Oper 83
TOTAL Transmission and Market Operation Plant (Total lines 77 thru 83) 84
6. GENERAL PLANT 85
(389) Land and Land Rights 424,632 86
(390) Structures and Improvements 12,683,086 9,807,920 87
(391) Office Furniture and Equipment 15,278,863 186,428 88
(392) Transportation Equipment 89
(393) Stores Equipment 90
(394) Tools, Shop and Garage Equipment 156,770,157 18,103,573 91
(395) Laboratory Equipment 12,102,476 99,111 92
(396) Power Operated Equipment 93
(397) Communication Equipment 441,601,021 77,988,993 94
(398) Miscellaneous Equipment 157,070,312 -106,478,132 95
SUBTOTAL (Enter Total of lines 86 thru 95) 795,930,547 -292,107 96
(399) Other Tangible Property 468,499,422 97
(399.1) Asset Retirement Costs for General Plant 6,888,838 687,257 98
TOTAL General Plant (Enter Total of lines 96, 97 and 98) 1,271,318,807 395,150 99
TOTAL (Accounts 101 and 106) 64,512,281,270 4,962,285,716 100
(102) Electric Plant Purchased (See Instr. 8) 101
(Less) (102) Electric Plant Sold (See Instr. 8) -5,412 102
(103) Experimental Plant Unclassified 103
TOTAL Electric Plant in Service (Enter Total of lines 100 thru 103) 64,512,286,682 4,962,285,716 104
Page 206FERC FORM NO. 1 (REV. 12-05)

(f)
Transfers Balance atEnd of Year
Name of Respondent This Report Is:(1) An Original
(2) A Resubmission
Date of Report(Mo, Da, Yr)
Year/Period of Report
End ofPACIFIC GAS AND ELECTRIC COMPANYX
04/13/20212020/Q4
Line
No.(g)
Adjustments
(e)
Retirements
(d)
ELECTRIC PLANT IN SERVICE (Account 101, 102, 103 and 106) (Continued)
47
283,540,161 -5,896,750 48
483,378,190 330,319 49
7,596,309,677 19,695,451 58,860,691 50
1,047,842,184 1,472,217 5,305,493 51
1,959,904,325 7,541,998 52
2,191,610,573 6,675,897 13,198,979 53
516,268,798 54
288,772,138 275,334 55
133,163,932 -46,838 480,785 56
7,723,186 57
14,508,513,164 21,899,977 85,993,599 58
59
184,817,244 -144,925 53 60
329,144,574 61
3,895,100,252 -19,695,451 158,692 47,621,797 62
34,560,458 63
6,487,425,507 -2,086,303 45,241,572 64
5,408,298,401 87,761,020 65
3,304,236,758 6,572,760 358,641 66
5,340,560,110 14,120,017 67
4,514,625,144 37,369,167 68
3,761,919,339 6,598,628 69
1,308,864,573 11,601,443 70
29,443,255 71
895,448 72
268,886,605 611,337 73
25,283,645 74
34,894,061,313 -15,353,919 158,692 251,283,675 75
76
77
78
79
80
81
82
83
84
85
424,632 86
22,491,006 87
15,208,467 256,824 88
89
90
174,861,739 11,991 91
11,927,346 274,241 92
93
519,366,332 2,927 226,609 94
49,851,965 740,215 95
794,131,487 2,927 1,509,880 96
468,499,422 97
7,576,095 98
1,270,207,004 2,927 1,509,880 99
69,067,026,384 6,502,259 158,692 414,201,553 100
101
345,946 351,358 102
103
69,066,680,438 6,502,259 -192,666 414,201,553 104
Page 207FERC FORM NO. 1 (REV. 12-05)

Schedule Page: 204 Line No.: 95 Column: cFor 2020, PG&E refined its methodology for displaying operative CWIP balances by
allocating the balances to the respective functional groups to which they belong according
to the nature of the costs compared to 2019 where the entire balance was recorded to FERC
account 398. As such, included in the 12/31/20 FERC account 398 plant balance is a
reversal of the prior year’s operative CWIP balance in the additions column. Operative
CWIP is defined as capital orders for projects that are less than 30 days of construction
with amounts that remain in CWIP due to capital order settlement issues. The balances for
these capital orders should be classified as plant.
Schedule Page: 204 Line No.: 102 Column: gPlant Purchased or Plant Sold is a holding account for pending transactions related to
asset purchases/sales and will be cleared once pending transactions have closed.
Schedule Page: 204 Line No.: 104 Column: cNetgative additions are attributed to work orders being reclassified to detailed plant
accounts.
Schedule Page: 204 Line No.: 104 Column: gElectric Plant in Service does not include ASC 842 Operating Leases.
Name of Respondent
PACIFIC GAS AND ELECTRIC COMPANY
This Report is:(1) X An Original(2) A Resubmission
Date of Report(Mo, Da, Yr)
04/13/2021
Year/Period of Report
2020/Q4
FOOTNOTE DATA
FERC FORM NO. 1 (ED. 12-87) Page 450.1

Name of Respondent This Report Is:(1) An Original
(2) A Resubmission
Date of Report(Mo, Da, Yr)
Year/Period of Report
End of
ELECTRIC PLANT LEASED TO OTHERS (Account 104)
PACIFIC GAS AND ELECTRIC COMPANYX
04/13/20212020/Q4
Line
No.
Name of LesseeDescription of
(b)(a)
(Designate associated companieswith a double asterisk) Property Leased
CommissionAuthorization
(c)
ExpirationDate ofLease
(d)
Balance atEnd of Year
(e)
None 1
2
3
4
5
6
7
8
9
10
11
12
13
14
15
16
17
18
19
20
21
22
23
24
25
26
27
28
29
30
31
32
33
34
35
36
37
38
39
40
41
42
43
44
45
46
FERC FORM NO. 1 (ED. 12-95) Page 213
47 TOTAL

Name of Respondent This Report Is:(1) An Original
(2) A Resubmission
Date of Report(Mo, Da, Yr)
Year/Period of Report
End of
ELECTRIC PLANT HELD FOR FUTURE USE (Account 105)
PACIFIC GAS AND ELECTRIC COMPANYX
04/13/20212020/Q4
Line Description and Location Date Originally Included Balance atEnd of Year
(c)(b)(a)Of Property in This Account
Date Expected to be usedin Utility Service
(d)No.
1. Report separately each property held for future use at end of the year having an original cost of $250,000 or more. Group other items of property held
for future use.
2. For property having an original cost of $250,000 or more previously used in utility operations, now held for future use, give in column (a), in addition to
other required information, the date that utility use of such property was discontinued, and the date the original cost was transferred to Account 105.
Land and Rights: 1
None 2
3
4
5
6
7
8
9
10
11
12
13
14
15
16
17
18
19
20
Other Property: 21
None 22
23
24
25
26
27
28
29
30
31
32
33
34
35
36
37
38
39
40
41
42
43
44
45
46
FERC FORM NO. 1 (ED. 12-96) Page 214
47 Total 0

Name of Respondent This Report Is:(1) An Original
(2) A Resubmission
Date of Report(Mo, Da, Yr)
Year/Period of Report
End of
CONSTRUCTION WORK IN PROGRESS - - ELECTRIC (Account 107)
PACIFIC GAS AND ELECTRIC COMPANYX
04/13/20212020/Q4
Line
No.
Description of Project Construction work in progress -
(b)(a)Electric (Account 107)
1. Report below descriptions and balances at end of year of projects in process of construction (107)
2. Show items relating to "research, development, and demonstration" projects last, under a caption Research, Development, and Demonstrating (see
Account 107 of the Uniform System of Accounts)
3. Minor projects (5% of the Balance End of the Year for Account 107 or $1,000,000, whichever is less) may be grouped.
100,617,32774025800 ELKHORN: INSTALL ENERGY STORAGE SYSTEM 1
85,421,42674001039 SAN FRAN Y (LARKIN): REPLACE 12KV SWGR 2
64,194,24535212401 FRRB - MONTICELLO 1101 CB 3
34,797,71374007941 CALTRAIN INTERCONNECTIONS SUB SITE 3 4
34,662,15474001391 60-SOUTH OF PALERMO REINFORCEMENT (PH-1) 5
33,509,68874000343 CALTRAIN INTERCONNECTIONS SUB SITE 1 6
30,225,38474001943 WHEELER RIDGE VOLTAGE SUPPORT (SUB) 7
27,487,91174003484 WILSON: INSTALL STATCOM 8
25,315,38474001098 TABLE MOUNTAIN: REPLACE 500 KV BK 1 9
20,219,49674001432 COTTNWD-RED BLUFF - RECONDUCTOR 10
19,970,62974015502 74015502_IGNACIO - MARE ISLAND TWR REPL 11
19,425,20574000924 ESTRELLA_CPUC LIC/PER 12
18,815,85774001780 RIO OSO: INSTALL 230KV BAAH/GIS 13
18,111,16874004037 TESLA: REPLACE 500 KV SERIES SC BK 2 14
16,577,41274003069 LOS ESTEROS SHUNT REACTOR PROJECT 15
16,047,32568053001 COM: Integrated Video Mgt System Upgrade 16
15,266,78274001782 RIO OSO: INSTALL 115 KV BAAH/GIS 17
14,618,60274005121 EVERGREEN SUB: 115KV BUS UPGRADE 18
14,101,92974000925 MIDWAY ANDREW_CPUC LIC/PER 19
13,943,43974011380 74011380_GREATER BAY ER STORAGE FAC SF 20
13,520,72874000939 WRJ NONCOMPETITIVE_CPUC LIC/PER 21
13,048,43774010750 MONTA VISTA: INSTALL 230KV MPAC 22
12,555,96474002206 GLENN: REPLACE BK 1 23
12,164,57274001713 HUNTERS POINT: 115KV GIS BAAH 24
12,144,24231503650 RAVENSWD-SAN MATEO #1 25000FT BW 25
12,104,73074000901 MARTIN BUS EXTENSION_CPUC LIC/PER 26
11,992,74674008620 Fordyce Dam Leakage Reduction 27
11,523,50768017320 COM: Replacement Oily Water Separator Sy 28
11,414,42474000933 230 KV TLINE LOCKEFORD - NEW INDUSTRIAL 29
10,860,74574016300 NETWORK SCADA Y-1 30
10,827,90874001366 CORCORAN SMYRNA 115KV NERC ALERT PROJECT 31
10,698,10074005663 KERN PP: CONVERT 115KV BUS TO BAAH 32
10,695,55374001785 RIO OSO: INSTALL 230 KV MPAC 33
10,391,13874005020 MIDWAY: UPGRADE 230 KV BUS SECTION D 34
10,060,66974000714 (DA-CE) COLGATE-CHALLENGE RELIABILITY 35
9,883,21774001856 EL CERRITO G: 115KV BUS UPGRADE PHASE 2 36
9,702,59174004825 HICKS: IMPROVE 230 KV BUS RELIABILITY 37
9,208,43574001786 RIO OSO: INSTALL 115 KV MPAC 38
9,015,98674001200 EXCHEQUER SUB TO BEAR VALLEY SUB 39
8,612,79374001454 Pit 1 LLO Gate Rplc & Radial Gate Seals 40
8,517,65913003982 DS-C Relic- Cond studies for all RA 41
8,514,41274008281 Bucks Cr PH Repl U2 Turb Brg / Shaft 42
FERC FORM NO. 1 (ED. 12-87) Page 216
43 TOTAL 1,929,075,179

Name of Respondent This Report Is:(1) An Original
(2) A Resubmission
Date of Report(Mo, Da, Yr)
Year/Period of Report
End of
CONSTRUCTION WORK IN PROGRESS - - ELECTRIC (Account 107)
PACIFIC GAS AND ELECTRIC COMPANYX
04/13/20212020/Q4
Line
No.
Description of Project Construction work in progress -
(b)(a)Electric (Account 107)
1. Report below descriptions and balances at end of year of projects in process of construction (107)
2. Show items relating to "research, development, and demonstration" projects last, under a caption Research, Development, and Demonstrating (see
Account 107 of the Uniform System of Accounts)
3. Minor projects (5% of the Balance End of the Year for Account 107 or $1,000,000, whichever is less) may be grouped.
8,450,83574003264 Caribou 1 U1 Repl Runners, Bearing&Shaft 1
8,156,67974003450 CASCADE: INSTALL MPAC 2
7,939,22074003661 Bucks Creek U1 Generator Stator Rewind 3
7,920,78574001485 EP BAILEY RD CONTRA COSTA CNTY R20A 4
7,592,79274001781 RIO OSO: INSTALL BK 1 AND BK 2 5
7,546,14674002486 KERN PP: INSTALL 115KV MPAC BLDGS 6
7,471,15674002846 SANTA TERESA: INSTALL NEW SUBSTATION 7
7,427,8067089887 Kerckhoff Rel Studies 8
7,357,18074015260 CASCADE: INSTALL BK 2 PHASE 1 9
7,164,76874009587 Pit 1 U1 Rewind Generator 10
7,133,02174026141 DUNLAP SUB: EM REP BK 1 11
6,686,79474010764 MESA-SANTA MARIA 115KV NERC 12
6,648,06274016420 STANISLAUS 1701-FOREST MEADOWS UG REPL 13
6,508,50574008746 MALIN-ROUND MOUNTAIN #2-500 KV INS REPL 14
6,486,89074004826 67-HICKS: INSTALL 230KV MPAC (CONSTR 201 15
6,374,55074000900 Bucks Creek U2 Generator Rewind 16
6,182,26474008748 LOS BANOS-MIDWAY #2 500KV LINE INS REPL 17
5,995,85874000709 (DA-TRC) HUMBOLDT BAY RECOND. PROJ. 2021 18
5,962,23474016583 Electra U2 Generator Rewind 19
5,788,11074021760 MIDWAY SUB: INSTALL 230kV MPAC 20
5,714,00274001959 TABLE MOUNTAIN: REP 500KV CAP BK 3 21
5,697,32174004807 SOLEDAD: INSTALL D-BANK 7 22
5,617,81174000731 EAST SHORE-OAKLAND J 115KV RECONDUCT(TL) 23
5,537,64374022546 VGCC_IMPLEMENT EMS RTSRM 24
5,460,10368045781 PLO-COM: REPL PAC 0-1 thru 0-7 25
5,450,1657089447 Potter Valley Rel Studies 26
5,177,62374010757 TESLA-METCALF 500 KV INSULATOR REPLACE 27
4,775,72174001175 MOSHER-LOCKFORD 60KV RECOND. 28
4,736,02174004890 PEASE - REPL BANK 2 29
4,666,39535031512 MISSION X 1127 NEW FEEDER 30
4,642,66274001173 LODI: REPLACE CB 12 22 32 31
4,641,31774002227 NC_REPLACE BELLEVUE BANK 1 32
4,640,98874021027 METCALF-GREEN VALLEY 115KV: LINE RECONDU 33
4,481,24974018123 SF H (MARTIN)-REPL SHUNT REACTOR HZ2 34
4,434,42074023920 LIVERMORE: EM REP BK 1 35
4,403,88574026644 DRUM PH 1: REPLACE SW 363 STRUCTURE-WSIP 36
4,379,20474008802 INST ROSSMOOR 1109 FDR_MORAGA BK5 EMERG 37
4,318,01974014380 4TH ST EUREKA R20A 38
4,313,72274024705 C1106 NETWORK PRIMARY CABLE REPLAC-OAKLA 39
4,236,4117093365 CWSP - PIH Non Generation 40
4,201,95574000915 KERN 230KV AREA REIN MIDWAY-KERN 3 & 4 ( 41
4,135,47374008009 WILSON-LEGRAND 115KV LINE RECON TL - DO 42
FERC FORM NO. 1 (ED. 12-87) Page 216.1
43 TOTAL 1,929,075,179

Name of Respondent This Report Is:(1) An Original
(2) A Resubmission
Date of Report(Mo, Da, Yr)
Year/Period of Report
End of
CONSTRUCTION WORK IN PROGRESS - - ELECTRIC (Account 107)
PACIFIC GAS AND ELECTRIC COMPANYX
04/13/20212020/Q4
Line
No.
Description of Project Construction work in progress -
(b)(a)Electric (Account 107)
1. Report below descriptions and balances at end of year of projects in process of construction (107)
2. Show items relating to "research, development, and demonstration" projects last, under a caption Research, Development, and Demonstrating (see
Account 107 of the Uniform System of Accounts)
3. Minor projects (5% of the Balance End of the Year for Account 107 or $1,000,000, whichever is less) may be grouped.
4,042,19131066255 R20A - DIAMOND SPRINGS 1A-EL DORADO CTY 1
4,026,11174015486 ESTRELLA CPUC DATA REQUEST #3 2
3,981,21674021024 MORGAN HILL SUB: 115KV BAAH CONVERSION 3
3,856,42474001766 RAVENSWOOD-COOLEY LANDING 115 KV (TL) 4
3,855,07674001688 NC_(DA-ABB) MAPLE CREEK SUB:REACTIVE SUP 5
3,796,10835171705 BR-03-12-W (E) PENTZ RD SRTS PARB 6
3,791,02474001732 VIERRA 115 KV REINFORCEMENT (T-LINE) 7
3,779,09474000622 BELLOTA - WARNERVILLE RECONDUCTOR 8
3,777,68774000825 LEMOORE NAS 70 KV SCADA SW#55,65 9
3,767,91674021440 TSRP NS - IT OTHER SITES 10
3,708,07574026020 BUCKS CREEK PH RECONNECTION SUBSTATION N 11
3,676,88074007783 Caribou 1 U2 Repl Runners, Bearing&Shaft 12
3,668,74674017491 DOLAN SUB, INSTALL NEW BANK 13
3,648,29935118517 BR-07-05-W (E) FLICKER LN, PARB 14
3,633,24974026304 TULARE LAKE - REPLACE BANK 1 15
3,605,04368019302 PLO-U2:Cond. Polisher Cmptr Upgrade 16
3,556,02274001920 CASCADE: REPLACE 60 KV CB 42 52 62 72 17
3,545,56031209025 INSIGHT REALTY UG RELOCATION 18
3,537,43674002214 HOPLAND: REPLACE BK 2 19
3,534,92474001334 TEMBLOR-SAN LUIS OBISPO 115KV NERC 20
3,382,72374001802 PIT PH 1: REPLACE 230 KV BK 1 21
3,377,28713008740 Battle Crk - Phase 2 License Amendment 22
3,362,99274007648 MONTA VISTA: UPGRADE 230 KV BUS PHASE 2 23
3,361,80974000345 CHSR INTERCONNECTIONS SUB SITES 4-7 24
3,318,26674001047 KERN 230KV AREA REIN MIDWAY-KERN 1 & 2 25
3,291,86774019961 FAMOSO: EM REPL CB 132 & 152 26
3,290,56674000548 OAKLAND D: REPLACE 115 KV CB 112 132 152 27
3,275,73474030540 VACA DIXON: REPLACE BANK 2 28
3,253,8577049829 DC Relic Begin Prep of NOI and PAD 29
3,247,58868021225 PLO- U2: Replace AFW Chem Inj Pmp 30
3,225,32831381600 ETTM CONCORD MCC 31
3,221,07074015784 HIGHWAY 1107 NEW FEEDER 32
3,177,46074010257 Scott Dam Replace Radial Gate Hoist 33
3,176,48674015248 TSRP NBS IT NEW MPLS 34
3,152,88774018545 HERDLYN 60KV RELAY PROJECT 35
3,129,33574000341 CHSR INTERCONNECTIONS SUB SITES 8-13 36
3,083,43074035922 DRUM-RIO OSO SOUTH 115KV EMERG REINFORCE 37
3,039,10374016341 TSRP NBS IT OTHER SITES 38
3,009,59513011921 NFSL Additional Design Imp 39
3,004,63074000936 WRJ COMPETITIVE_CPUC LIC/PER 40
3,002,42074003261 Caribou 1 U1 Rewind 41
2,968,01735058273 CWSP- EL DORADO 2101 OCB ZONE PHASE 1 42
FERC FORM NO. 1 (ED. 12-87) Page 216.2
43 TOTAL 1,929,075,179

Name of Respondent This Report Is:(1) An Original
(2) A Resubmission
Date of Report(Mo, Da, Yr)
Year/Period of Report
End of
CONSTRUCTION WORK IN PROGRESS - - ELECTRIC (Account 107)
PACIFIC GAS AND ELECTRIC COMPANYX
04/13/20212020/Q4
Line
No.
Description of Project Construction work in progress -
(b)(a)Electric (Account 107)
1. Report below descriptions and balances at end of year of projects in process of construction (107)
2. Show items relating to "research, development, and demonstration" projects last, under a caption Research, Development, and Demonstrating (see
Account 107 of the Uniform System of Accounts)
3. Minor projects (5% of the Balance End of the Year for Account 107 or $1,000,000, whichever is less) may be grouped.
2,953,95874016862 AQUAMARINE WESTSIDE GATES SUB RNU 1
2,939,1347053945 DC Relic - Prepare Study Plans 2
2,936,38674022160 PLACER: EM REPL BK3 WOOD POLE STRUCTURES 3
2,904,01674000842 SEMITROPIC: 115KV LINE RECOND 4
2,850,44974001792 RED BLUFF-COLEMAN REINFORCEMENT 5
2,810,82574017381 METCALF: INSTALL 230 KV MPAC 6
2,804,42574018846 1320WD STRAUSS WIND T-LINE DA 7
2,778,45174017519 VACA DIXON: INSTALL 230 KV SMART WIRES 8
2,759,32235109547 CWSP - EL DORADO 2101 - 19752 -PHASE 2.4 9
2,752,30774015040 REINFORCE MORAGA 1102-SOBRANTE 1101 10
2,738,1077087874 Permit Holdover Project - Shasta-Trinity 11
2,732,82074010660 Balch 2 - U2 Replace Cooling Water 12
2,703,49831326189 CONTROL CENTER SYSTEM UPGRADE 13
2,697,17474002410 Pit 5 TGB Install Inline Oil Filtration 14
2,687,8097043247 RCC Lic Imp Cold Water Feasibility Study 15
2,648,32474008384 Battle Cr Salmon/Steelhead Phase 2 16
2,626,33474009061 WESTPARK: INSTALL MPAC BUILDING 17
2,589,82968058200 PLO: COM: MW Links 12A & 13A Mod 18
2,554,82574001057 Halsey PH Replace Runner and Seal Rings 19
2,552,7837089450 Phoenix Rel Studies 20
2,540,44374009960 SOBRANTE: UPGRADE PHYSICAL SECURITY 21
2,533,23535180296 BR-06-01-O (E) DELIA WAY PARB 22
2,483,75674005355 RIO OSO SUB: SVC 23
2,455,16631381602 ETTM FRIENDLY VILLAGE 24
2,446,31413002402 DS-C Relic- Conduct Pre-App Proj Man 25
2,433,91974000707 60 KINGSBURG-LEMOORE 70KV RECOND. PH1 26
2,428,6547093170 Wildfire Wire Down detection 27
2,411,32174007020 SANTA TERESA SUB TLINE WORK 28
2,386,93774032360 FMC-SAN JOSE TPS 115KV CALTRAIN INTERCON 29
2,385,14974029411 GATES BK 12 CONDUIT/TRENCH FAILURE REPL 30
2,368,36431306492 EMS Replacement Hardware 31
2,345,83574006884 MORRO BAY SUB: UPGRADE 230KV BUS 32
2,325,91174011242 IGNACIO-MARE ISL 115KV (IGN SUB/HWY SUB) 33
2,299,90374001735 POTRERO-MISSION #1 (A-X 1) SEISMIC RETRO 34
2,281,48174012040 NICOLAUS-WILKINS SLOUGH 60KV LINE POLE 35
2,276,67874031330 COLUSA: EMERGENCY REPLACE BANK 2 36
2,273,76674002827 OAKLAND L: INSTALL SCADA 37
2,257,17635029720 DOWNTOWN STOCKTON PH 1 R20A 38
2,235,16535064793 LP RECONDUCTOR, CABRILLO 1104 S006CC102 39
2,234,80774003803 Q954 FIFTH STANDARD SOLAR (NU) GATES 40
2,234,62674007157 KERN PP 115KV TLINE 41
2,204,61574002161 NC_PENNGROVE 115/12KV BK 1 42
FERC FORM NO. 1 (ED. 12-87) Page 216.3
43 TOTAL 1,929,075,179

Name of Respondent This Report Is:(1) An Original
(2) A Resubmission
Date of Report(Mo, Da, Yr)
Year/Period of Report
End of
CONSTRUCTION WORK IN PROGRESS - - ELECTRIC (Account 107)
PACIFIC GAS AND ELECTRIC COMPANYX
04/13/20212020/Q4
Line
No.
Description of Project Construction work in progress -
(b)(a)Electric (Account 107)
1. Report below descriptions and balances at end of year of projects in process of construction (107)
2. Show items relating to "research, development, and demonstration" projects last, under a caption Research, Development, and Demonstrating (see
Account 107 of the Uniform System of Accounts)
3. Minor projects (5% of the Balance End of the Year for Account 107 or $1,000,000, whichever is less) may be grouped.
2,197,9877097928 HBGS Engine 5 Repair 1
2,185,02774013481 KERN 230KV BAAH PHASE 3 2
2,181,03774002248 NV_TESLA SUB: REPLACE MOBILE TXFR T-22-2 3
2,180,73774013528 R20A - FULTON RD SANTA ROSA 4
2,146,47874036853 MORAGA-OAKLAND X 115KV #1&2 RECOND 5
2,128,14174000937 MERCY SPRINGS - CANAL SS T-LINE RECONDUC 6
2,099,48274018722 Tgr Crk Cnl Install Flume Lnr 2020/2021 7
2,098,21035112425 CWSP - EL DORADO 2101 - OCBZONE - PH 1.2 8
2,088,34374008740 GATES-MIDWAY 500KV LINE INS REPL 9
2,084,01074025701 X-1123 NETWORK PRIMARY REPLACEMENT 10
2,072,74213009580 DeSabla Replace Governor 11
2,070,33174010323 Poe PH Deck/Roof Resurface 12
2,053,36874006821 BIRDS LANDING SS-CONTRA COSTA PP 230KV. 13
2,041,21374001854 EL CERRITO G: REPL BANK 1 14
2,040,36374001993 JARVIS: REPLACE BK2 WITH 45MVA BANK 15
2,038,91474016585 Caribou 1 U2 Generator Rewind 16
2,021,8547089448 Phoenix Rel Project Management 17
2,014,17535025785 2019 WEBER INSTALL NEW FEEDER 18
2,007,18074001733 POTRERO-LARKIN #2 (A-Y2) SEISMIC RETROFI 19
1,999,51035118702 BR-11-03-W (E) GREGS WAY, PARB 20
1,991,9947094827 HBGS Warehouse and Workshop 21
1,989,96574010363 KERN PP-LIVE OAK 115KV LINE RECONDUCTOR 22
1,986,11474001734 MARTIN-LARKIN #1 115 KV CABLE (H-Y 1) 23
1,984,55874003102 Balch 2 U3 Repl Cooling Wtr Piping 24
1,964,69635170663 BUCOCAMPM CRESTA PH - HWY 70 OROVILLE 25
1,956,67731375431 ETTM VALLEJO MOBILE HOME PARK 26
1,955,6577089886 Kerckhoff Rel PAD and NOI 27
1,943,00674016340 TSRP NBS IT T-LINE SWITCHES 28
1,933,17874036404 PIERCY: EM REPLACE BK3 29
1,929,70174021700 MIDWAY SUB: T-LINE WORK 230KV 30
1,928,47074007740 CASTRO VALLEY: REP SWGR REROUTE FEEDR 31
1,917,41874021361 WOODLAND: EM INSTA CONTROL BUILDING 32
1,912,21274001686 NC_MAPLE CREEK PROJ-BUS RECONFIGURATION 33
1,892,86568061840 PLO:COM Security Def Strategy Upgde 34
1,890,88674009953 DELEVAN SUB: PHYSICAL SECURITY UPGRADE 35
1,862,93474000580 DRUM-RIO OSO #1-115KV IMPRV (STEEL) 36
1,854,92174001397 (DA-TRC)ESSEX JCT ORICK 60KV RELIABILITY 37
1,852,69035116442 CWSP-MIWUK 1702-LR 38218-PH 1.3 38
1,850,34174020313 YOSEMITE PARK: SPCC FENCING/BARRIER 39
1,849,08435094031 MISSION SF X-1128 INSTALL NEW FEEDER 40
1,838,57874002366 PITTSBURG: INSTALL 230/115KV TRANSFORMER 41
1,822,08231242522 ECEIR2Z EP BARRY ROAD SUTTER COUNTY R20A 42
FERC FORM NO. 1 (ED. 12-87) Page 216.4
43 TOTAL 1,929,075,179
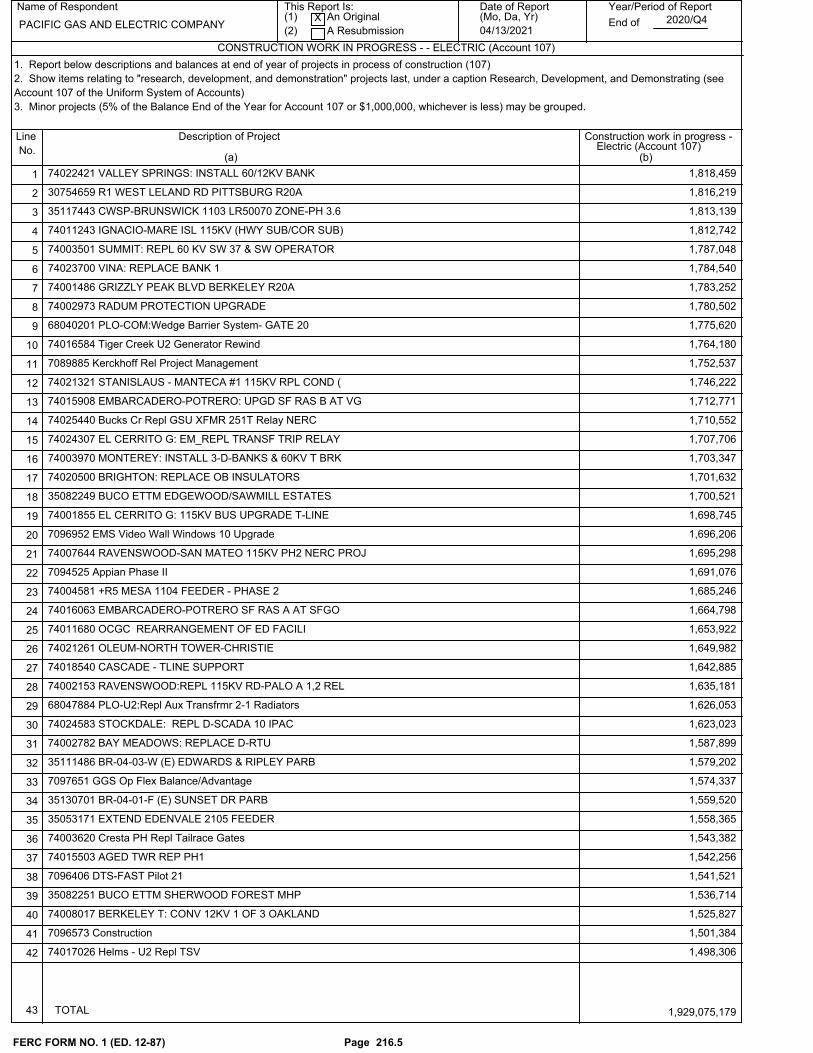
Name of Respondent This Report Is:(1) An Original
(2) A Resubmission
Date of Report(Mo, Da, Yr)
Year/Period of Report
End of
CONSTRUCTION WORK IN PROGRESS - - ELECTRIC (Account 107)
PACIFIC GAS AND ELECTRIC COMPANYX
04/13/20212020/Q4
Line
No.
Description of Project Construction work in progress -
(b)(a)Electric (Account 107)
1. Report below descriptions and balances at end of year of projects in process of construction (107)
2. Show items relating to "research, development, and demonstration" projects last, under a caption Research, Development, and Demonstrating (see
Account 107 of the Uniform System of Accounts)
3. Minor projects (5% of the Balance End of the Year for Account 107 or $1,000,000, whichever is less) may be grouped.
1,818,45974022421 VALLEY SPRINGS: INSTALL 60/12KV BANK 1
1,816,21930754659 R1 WEST LELAND RD PITTSBURG R20A 2
1,813,13935117443 CWSP-BRUNSWICK 1103 LR50070 ZONE-PH 3.6 3
1,812,74274011243 IGNACIO-MARE ISL 115KV (HWY SUB/COR SUB) 4
1,787,04874003501 SUMMIT: REPL 60 KV SW 37 & SW OPERATOR 5
1,784,54074023700 VINA: REPLACE BANK 1 6
1,783,25274001486 GRIZZLY PEAK BLVD BERKELEY R20A 7
1,780,50274002973 RADUM PROTECTION UPGRADE 8
1,775,62068040201 PLO-COM:Wedge Barrier System- GATE 20 9
1,764,18074016584 Tiger Creek U2 Generator Rewind 10
1,752,5377089885 Kerckhoff Rel Project Management 11
1,746,22274021321 STANISLAUS - MANTECA #1 115KV RPL COND ( 12
1,712,77174015908 EMBARCADERO-POTRERO: UPGD SF RAS B AT VG 13
1,710,55274025440 Bucks Cr Repl GSU XFMR 251T Relay NERC 14
1,707,70674024307 EL CERRITO G: EM_REPL TRANSF TRIP RELAY 15
1,703,34774003970 MONTEREY: INSTALL 3-D-BANKS & 60KV T BRK 16
1,701,63274020500 BRIGHTON: REPLACE OB INSULATORS 17
1,700,52135082249 BUCO ETTM EDGEWOOD/SAWMILL ESTATES 18
1,698,74574001855 EL CERRITO G: 115KV BUS UPGRADE T-LINE 19
1,696,2067096952 EMS Video Wall Windows 10 Upgrade 20
1,695,29874007644 RAVENSWOOD-SAN MATEO 115KV PH2 NERC PROJ 21
1,691,0767094525 Appian Phase II 22
1,685,24674004581 +R5 MESA 1104 FEEDER - PHASE 2 23
1,664,79874016063 EMBARCADERO-POTRERO SF RAS A AT SFGO 24
1,653,92274011680 OCGC REARRANGEMENT OF ED FACILI 25
1,649,98274021261 OLEUM-NORTH TOWER-CHRISTIE 26
1,642,88574018540 CASCADE - TLINE SUPPORT 27
1,635,18174002153 RAVENSWOOD:REPL 115KV RD-PALO A 1,2 REL 28
1,626,05368047884 PLO-U2:Repl Aux Transfrmr 2-1 Radiators 29
1,623,02374024583 STOCKDALE: REPL D-SCADA 10 IPAC 30
1,587,89974002782 BAY MEADOWS: REPLACE D-RTU 31
1,579,20235111486 BR-04-03-W (E) EDWARDS & RIPLEY PARB 32
1,574,3377097651 GGS Op Flex Balance/Advantage 33
1,559,52035130701 BR-04-01-F (E) SUNSET DR PARB 34
1,558,36535053171 EXTEND EDENVALE 2105 FEEDER 35
1,543,38274003620 Cresta PH Repl Tailrace Gates 36
1,542,25674015503 AGED TWR REP PH1 37
1,541,5217096406 DTS-FAST Pilot 21 38
1,536,71435082251 BUCO ETTM SHERWOOD FOREST MHP 39
1,525,82774008017 BERKELEY T: CONV 12KV 1 OF 3 OAKLAND 40
1,501,3847096573 Construction 41
1,498,30674017026 Helms - U2 Repl TSV 42
FERC FORM NO. 1 (ED. 12-87) Page 216.5
43 TOTAL 1,929,075,179
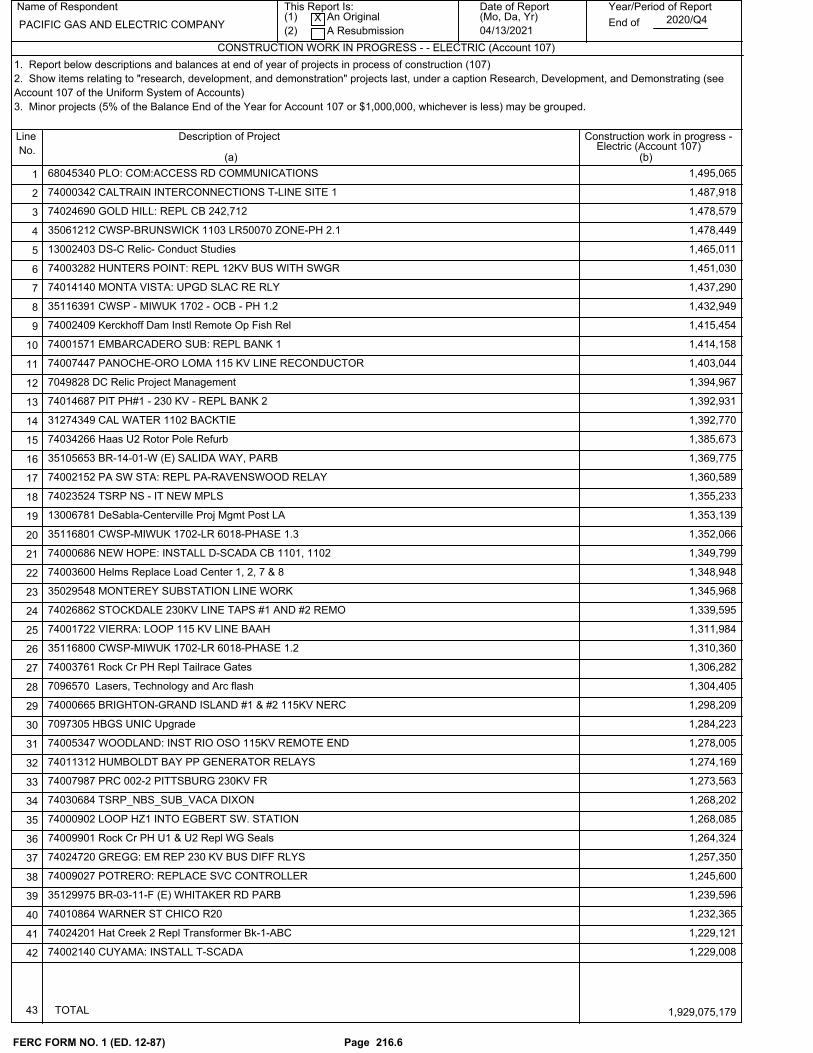
Name of Respondent This Report Is:(1) An Original
(2) A Resubmission
Date of Report(Mo, Da, Yr)
Year/Period of Report
End of
CONSTRUCTION WORK IN PROGRESS - - ELECTRIC (Account 107)
PACIFIC GAS AND ELECTRIC COMPANYX
04/13/20212020/Q4
Line
No.
Description of Project Construction work in progress -
(b)(a)Electric (Account 107)
1. Report below descriptions and balances at end of year of projects in process of construction (107)
2. Show items relating to "research, development, and demonstration" projects last, under a caption Research, Development, and Demonstrating (see
Account 107 of the Uniform System of Accounts)
3. Minor projects (5% of the Balance End of the Year for Account 107 or $1,000,000, whichever is less) may be grouped.
1,495,06568045340 PLO: COM:ACCESS RD COMMUNICATIONS 1
1,487,91874000342 CALTRAIN INTERCONNECTIONS T-LINE SITE 1 2
1,478,57974024690 GOLD HILL: REPL CB 242,712 3
1,478,44935061212 CWSP-BRUNSWICK 1103 LR50070 ZONE-PH 2.1 4
1,465,01113002403 DS-C Relic- Conduct Studies 5
1,451,03074003282 HUNTERS POINT: REPL 12KV BUS WITH SWGR 6
1,437,29074014140 MONTA VISTA: UPGD SLAC RE RLY 7
1,432,94935116391 CWSP - MIWUK 1702 - OCB - PH 1.2 8
1,415,45474002409 Kerckhoff Dam Instl Remote Op Fish Rel 9
1,414,15874001571 EMBARCADERO SUB: REPL BANK 1 10
1,403,04474007447 PANOCHE-ORO LOMA 115 KV LINE RECONDUCTOR 11
1,394,9677049828 DC Relic Project Management 12
1,392,93174014687 PIT PH#1 - 230 KV - REPL BANK 2 13
1,392,77031274349 CAL WATER 1102 BACKTIE 14
1,385,67374034266 Haas U2 Rotor Pole Refurb 15
1,369,77535105653 BR-14-01-W (E) SALIDA WAY, PARB 16
1,360,58974002152 PA SW STA: REPL PA-RAVENSWOOD RELAY 17
1,355,23374023524 TSRP NS - IT NEW MPLS 18
1,353,13913006781 DeSabla-Centerville Proj Mgmt Post LA 19
1,352,06635116801 CWSP-MIWUK 1702-LR 6018-PHASE 1.3 20
1,349,79974000686 NEW HOPE: INSTALL D-SCADA CB 1101, 1102 21
1,348,94874003600 Helms Replace Load Center 1, 2, 7 & 8 22
1,345,96835029548 MONTEREY SUBSTATION LINE WORK 23
1,339,59574026862 STOCKDALE 230KV LINE TAPS #1 AND #2 REMO 24
1,311,98474001722 VIERRA: LOOP 115 KV LINE BAAH 25
1,310,36035116800 CWSP-MIWUK 1702-LR 6018-PHASE 1.2 26
1,306,28274003761 Rock Cr PH Repl Tailrace Gates 27
1,304,4057096570 Lasers, Technology and Arc flash 28
1,298,20974000665 BRIGHTON-GRAND ISLAND #1 & #2 115KV NERC 29
1,284,2237097305 HBGS UNIC Upgrade 30
1,278,00574005347 WOODLAND: INST RIO OSO 115KV REMOTE END 31
1,274,16974011312 HUMBOLDT BAY PP GENERATOR RELAYS 32
1,273,56374007987 PRC 002-2 PITTSBURG 230KV FR 33
1,268,20274030684 TSRP_NBS_SUB_VACA DIXON 34
1,268,08574000902 LOOP HZ1 INTO EGBERT SW. STATION 35
1,264,32474009901 Rock Cr PH U1 & U2 Repl WG Seals 36
1,257,35074024720 GREGG: EM REP 230 KV BUS DIFF RLYS 37
1,245,60074009027 POTRERO: REPLACE SVC CONTROLLER 38
1,239,59635129975 BR-03-11-F (E) WHITAKER RD PARB 39
1,232,36574010864 WARNER ST CHICO R20 40
1,229,12174024201 Hat Creek 2 Repl Transformer Bk-1-ABC 41
1,229,00874002140 CUYAMA: INSTALL T-SCADA 42
FERC FORM NO. 1 (ED. 12-87) Page 216.6
43 TOTAL 1,929,075,179

Name of Respondent This Report Is:(1) An Original
(2) A Resubmission
Date of Report(Mo, Da, Yr)
Year/Period of Report
End of
CONSTRUCTION WORK IN PROGRESS - - ELECTRIC (Account 107)
PACIFIC GAS AND ELECTRIC COMPANYX
04/13/20212020/Q4
Line
No.
Description of Project Construction work in progress -
(b)(a)Electric (Account 107)
1. Report below descriptions and balances at end of year of projects in process of construction (107)
2. Show items relating to "research, development, and demonstration" projects last, under a caption Research, Development, and Demonstrating (see
Account 107 of the Uniform System of Accounts)
3. Minor projects (5% of the Balance End of the Year for Account 107 or $1,000,000, whichever is less) may be grouped.
1,222,50974001504 WESTPARK: REPLACE CB 1101 - 1104 12KV 1
1,209,41774007942 CALTRAIN INTERCONNECTIONS T-LINE SITE 3 2
1,205,36674032400 OAKLAND C REPALCE 115_12KV BANK 2 3
1,197,30874016040 Helms - U1 Repl TSV 4
1,191,26174013925 R20A - DIAMOND SPRINGS 1C-EL DORADO CTY 5
1,190,41274019702 DEL MONTE - FORT ORD#1 6
1,188,39074001363 IGNACIO-MARE ISLD #1 115KV NERC STEEL 7
1,182,66535105703 INSTALL DISTR LINE FROM NEW LARKIN SWTGR 8
1,177,16874021035 RAVENSWOOD SUB DE STRUCTURE REPLACEMENT 9
1,176,48374015250 TSRP NBS IT VSAT 10
1,170,14131403458 EMS FEP SITES POWER UPGRADES 11
1,169,47774008861 ROSSMOOR: INST 1109 FDR AND REINF TIES 12
1,166,70874002400 Pit 4 Replace PSV Valve Controls 13
1,166,49974007989 PRC 002-2 CONTRA COSTA PP 230KV FR 14
1,165,97374011503 LODI SUB:60KV T-LINE REARRG -ENGINEERING 15
1,162,06974009206 TABLE MTN:REPL 500KV TM-ROUND MTN #2 REL 16
1,157,57174026612 Electra U2 Generator Relays Rpl 17
1,152,19974001435 (DA-B&M) ELECTRA TO WEST PT SCADA SWT. 18
1,149,43174020328 HAMILTON BRANCH: REPL CB 12 RELAYS 19
1,146,01835114040 CWSP - PINE GROVE 1102 - LR1222 - PH 1.2 20
1,145,59031453483 VGCC_IMPLEMENT EMS-TOTL INTERFACE 21
1,139,01374007643 RAVENSWOOD-BAIR #2 115KV PH2 NERC PROJEC 22
1,136,33374016661 EDES: 115KV RECONDUCT FIBER INTERCONNECT 23
1,134,88074001542 OAKLAND K (CLAREMONT): REPLACE 12KV SW 24
1,133,69174017028 Helms - U3 Repl TSV 25
1,127,78274000904 REROUTE JEFFERSON_MARTIN 230KV LINE 26
1,120,08474020942 VACA DIXON: REPLACE BANK #5 27
1,117,2857093106 Phoenix Rel License Application 28
1,115,74731511908 T3 BURNS-LONE STAR #1 - 60 KV FIRE 29
1,108,58774001332 KINGSBURG CORCORAN 1 AND 2 115KV NERC 30
1,097,99374012600 STATION M REBUILD- DIST WORK 31
1,095,72674010185 Caribou 1 U1 Upgrade Gov Controls 32
1,094,50374002170 OLEMA: INSTALL SCADA SW27 & 29 33
1,091,9677096574 Monitoring Center and Networking 34
1,091,14574024207 Pit 5 U4 Rplc WGs, FPs and Seals 35
1,077,07574015501 74015501_IGNACIO - ALTO - SAUSALITO 60KV 36
1,074,00030988481 AD GEP T 8102 MOLLER RANCH@TASSAJAR 37
1,071,70674002120 Pit 4 Replace Generator Air Breakers 38
1,069,97474029542 Tiger Crk Reg Spillway Upgrade SAIP (C) 39
1,059,62235115054 CWSP - MIWUK 1701 - OCB - PH 2.2 40
1,059,25374000671 SALT SPRINGS-TIGER CREEK NERC PROJECT 41
1,056,86274015244 TSRP NBS IT CROSS CONNECTS 42
FERC FORM NO. 1 (ED. 12-87) Page 216.7
43 TOTAL 1,929,075,179

Name of Respondent This Report Is:(1) An Original
(2) A Resubmission
Date of Report(Mo, Da, Yr)
Year/Period of Report
End of
CONSTRUCTION WORK IN PROGRESS - - ELECTRIC (Account 107)
PACIFIC GAS AND ELECTRIC COMPANYX
04/13/20212020/Q4
Line
No.
Description of Project Construction work in progress -
(b)(a)Electric (Account 107)
1. Report below descriptions and balances at end of year of projects in process of construction (107)
2. Show items relating to "research, development, and demonstration" projects last, under a caption Research, Development, and Demonstrating (see
Account 107 of the Uniform System of Accounts)
3. Minor projects (5% of the Balance End of the Year for Account 107 or $1,000,000, whichever is less) may be grouped.
1,056,82774032102 COLUSA: JIT REPLACE BANK 1 1
1,023,15974032721 FAIRWAY: REPLACE BANK 2 2
1,015,16374001088 BAKERSFIELD-KERN 230KV LINE 1&2 RECOND 3
1,005,19174020261 LAMMERS-KASSON 115KV TWR REPL 4
1,003,24074010227 Tiger Ck Forebay Replace Trash Rakes 5
306,344,294See footnote for detail. 6
7
8
9
10
11
12
13
14
15
16
17
18
19
20
21
22
23
24
25
26
27
28
29
30
31
32
33
34
35
36
37
38
39
40
41
42
FERC FORM NO. 1 (ED. 12-87) Page 216.8
43 TOTAL 1,929,075,179

Schedule Page: 216.8 Line No.: 6 Column: bThis is the aggregate total of projects with less than $1,000,000 in actual costs inConstruction Work in Progress, including credits representing preliminary billings.
Name of Respondent
PACIFIC GAS AND ELECTRIC COMPANY
This Report is:(1) X An Original(2) A Resubmission
Date of Report(Mo, Da, Yr)
04/13/2021
Year/Period of Report
2020/Q4
FOOTNOTE DATA
FERC FORM NO. 1 (ED. 12-87) Page 450.1

Name of Respondent This Report Is:(1) An Original
(2) A Resubmission
Date of Report(Mo, Da, Yr)
Year/Period of Report
End of
ACCUMULATED PROVISION FOR DEPRECIATION OF ELECTRIC UTILITY PLANT (Account 108)
PACIFIC GAS AND ELECTRIC COMPANYX
04/13/20212020/Q4
Line
No.
Item Total
(c)(b)(a) (d)
Section A. Balances and Changes During Year
(c+d+e)Electric Plant in
ServiceElectric Plant Held
for Future UseElectric Plant
Leased to Others(e)
1. Explain in a footnote any important adjustments during year.
2. Explain in a footnote any difference between the amount for book cost of plant retired, Line 11, column (c), and that reported for
electric plant in service, pages 204-207, column 9d), excluding retirements of non-depreciable property.
3. The provisions of Account 108 in the Uniform System of accounts require that retirements of depreciable plant be recorded when
such plant is removed from service. If the respondent has a significant amount of plant retired at year end which has not been recorded
and/or classified to the various reserve functional classifications, make preliminary closing entries to tentatively functionalize the book
cost of the plant retired. In addition, include all costs included in retirement work in progress at year end in the appropriate functional
classifications.
4. Show separately interest credits under a sinking fund or similar method of depreciation accounting.
Balance Beginning of Year 1 28,298,971,651 28,298,971,651
Depreciation Provisions for Year, Charged to 2
(403) Depreciation Expense 3 2,461,733,443 2,461,733,443
(403.1) Depreciation Expense for Asset
Retirement Costs
4
(413) Exp. of Elec. Plt. Leas. to Others 5
Transportation Expenses-Clearing 6
Other Clearing Accounts 7
Other Accounts (Specify, details in footnote): 8
Reverse Common Allocation 9 -163,109,222 -163,109,222
TOTAL Deprec. Prov for Year (Enter Total of
lines 3 thru 9)
10 2,298,624,221 2,298,624,221
Net Charges for Plant Retired: 11
Book Cost of Plant Retired 12 410,935,805 410,935,805
Cost of Removal 13 404,547,286 404,547,286
Salvage (Credit) 14 7,650,337 7,650,337
TOTAL Net Chrgs. for Plant Ret. (Enter Total
of lines 12 thru 14)
15 807,832,754 807,832,754
Other Debit or Cr. Items (Describe, details in
footnote):
16 84,103,975 84,103,975
17
Book Cost or Asset Retirement Costs Retired 18
Balance End of Year (Enter Totals of lines 1,
10, 15, 16, and 18)
19 29,873,867,093 29,873,867,093
Steam Production 20
Section B. Balances at End of Year According to Functional Classification
359,069,008 359,069,008
Nuclear Production 21 7,261,817,389 7,261,817,389
Hydraulic Production-Conventional 22 1,527,608,258 1,527,608,258
Hydraulic Production-Pumped Storage 23 799,016,289 799,016,289
Other Production 24 428,917,631 428,917,631
Transmission 25 3,611,126,808 3,611,126,808
Distribution 26 15,216,731,320 15,216,731,320
Regional Transmission and Market Operation 27
General 28 669,580,390 669,580,390
TOTAL (Enter Total of lines 20 thru 28) 29 29,873,867,093 29,873,867,093
Page 219FERC FORM NO. 1 (REV. 12-05)

Schedule Page: 219 Line No.: 12 Column: c
Schedule Page: 219 Line No.: 16 Column: c
Schedule Page: 219 Line No.: 25 Column: cFAS 109 Gross-up on Diablo Canyon Power Plant Utility Asset I is included in General
Plant.
Name of Respondent
PACIFIC GAS AND ELECTRIC COMPANY
This Report is:(1) X An Original(2) A Resubmission
Date of Report(Mo, Da, Yr)
04/13/2021
Year/Period of Report
2020/Q4
FOOTNOTE DATA
FERC FORM NO. 1 (ED. 12-87) Page 450.1

Name of Respondent This Report Is:(1) An Original
(2) A Resubmission
Date of Report(Mo, Da, Yr)
Year/Period of Report
End of
INVESTMENTS IN SUBSIDIARY COMPANIES (Account 123.1)
PACIFIC GAS AND ELECTRIC COMPANYX
04/13/20212020/Q4
Line
No.
Description of Investment Date Acquired
(c)(b)(a)
Amount of Investment atBeginning of Year
Date Of Maturity
(d)
1. Report below investments in Accounts 123.1, investments in Subsidiary Companies.2. Provide a subheading for each company and List there under the information called for below. Sub - TOTAL by company and give a TOTAL incolumns (e),(f),(g) and (h)(a) Investment in Securities - List and describe each security owned. For bonds give also principal amount, date of issue, maturity and interest rate.(b) Investment Advances - Report separately the amounts of loans or investment advances which are subject to repayment, but which are not subject tocurrent settlement. With respect to each advance show whether the advance is a note or open account. List each note giving date of issuance, maturitydate, and specifying whether note is a renewal.3. Report separately the equity in undistributed subsidiary earnings since acquisition. The TOTAL in column (e) should equal the amount entered forAccount 418.1.
Eureka Energy Company 1
1,0001978 Common Stock 2
3,727,170 Additional Paid in Capital 3
-102,438 Undistributed Earnings 4
5
3,625,732 SUBTOTAL 6
7
Natural Gas Corporation of California 8
100,0001954 Common Stock 9
3,037,432 Additional Paid in Capital 10
-3,137,432 Undistributed Earnings 11
12
SUBTOTAL 13
14
Pacific Energy Fuels Company 15
10,0001989 Common Stock 16
4,890,952 Additional Paid in Capital 17
-5,604,573 Undistributed Earnings 18
19
-703,621 SUBTOTAL 20
21
Standard Pacific Gas Line Incorporated 22
1,2001930-32 Common Stock 23
45,890,2101954 Additional Paid in Capital 24
-29,337,919 Undistributed Earnings 25
1,127,868DEMAND05/09/1988 Advances: Note 26
2,580,000DEMAND09/06/1988 Note 27
8,712,308DEMAND12/30/1988 Note 28
2,880,000DEMAND08/22/1989 Note 29
4,200,000DEMAND10/09/1990 Note 30
3,300,000DEMAND02/25/1992 Note 31
1,518,000DEMAND12/01/1993 Note 32
33
40,871,667 SUBTOTAL 34
35
Midway Power LLC 36
26,112,4102008 Additional Paid in Capital 37
-21,689,847 Undistributed Earnings 38
39
4,422,563 SUBTOTAL 40
41
FERC FORM NO. 1 (ED. 12-89) Page 224
42 Total Cost of Account 123.1 $ TOTAL 48,216,341 0

Name of Respondent This Report Is:(1) An Original
(2) A Resubmission
Date of Report(Mo, Da, Yr)
Year/Period of Report
End of
INVESTMENTS IN SUBSIDIARY COMPANIES (Account 123.1)
PACIFIC GAS AND ELECTRIC COMPANYX
04/13/20212020/Q4
Line
No.
Description of Investment Date Acquired
(c)(b)(a)
Amount of Investment atBeginning of Year
Date Of Maturity
(d)
1. Report below investments in Accounts 123.1, investments in Subsidiary Companies.2. Provide a subheading for each company and List there under the information called for below. Sub - TOTAL by company and give a TOTAL incolumns (e),(f),(g) and (h)(a) Investment in Securities - List and describe each security owned. For bonds give also principal amount, date of issue, maturity and interest rate.(b) Investment Advances - Report separately the amounts of loans or investment advances which are subject to repayment, but which are not subject tocurrent settlement. With respect to each advance show whether the advance is a note or open account. List each note giving date of issuance, maturitydate, and specifying whether note is a renewal.3. Report separately the equity in undistributed subsidiary earnings since acquisition. The TOTAL in column (e) should equal the amount entered forAccount 418.1.
PG&E AR Facility LLC 1
2020 Additional Paid in Capital 2
Undistributed Earnings 3
4
SUBTOTAL 5
6
7
8
9
10
11
12
13
14
15
16
17
18
19
20
21
22
23
24
25
26
27
28
29
30
31
32
33
34
35
36
37
38
39
40
41
FERC FORM NO. 1 (ED. 12-89) Page 224.1
42 Total Cost of Account 123.1 $ TOTAL 48,216,341 0

Name of Respondent This Report Is:(1) An Original
(2) A Resubmission
Date of Report(Mo, Da, Yr)
Year/Period of Report
End of
INVESTMENTS IN SUBSIDIARY COMPANIES (Account 123.1) (Continued)
PACIFIC GAS AND ELECTRIC COMPANYX
04/13/20212020/Q4
Line
No.
Equity in Subsidiary Earnings of Year
Revenues for Year Amount of Investment atEnd of Year
Gain or Loss from InvestmentDisposed of
(e) (f) (g) (h)
4. For any securities, notes, or accounts that were pledged designate such securities, notes, or accounts in a footnote, and state the name of pledgee
and purpose of the pledge.
5. If Commission approval was required for any advance made or security acquired, designate such fact in a footnote and give name of Commission,
date of authorization, and case or docket number.
6. Report column (f) interest and dividend revenues form investments, including such revenues form securities disposed of during the year.
7. In column (h) report for each investment disposed of during the year, the gain or loss represented by the difference between cost of the investment (or
the other amount at which carried in the books of account if difference from cost) and the selling price thereof, not including interest adjustment includible
in column (f).
8. Report on Line 42, column (a) the TOTAL cost of Account 123.1
1
1,000 2
4,115,136 3
-328,947 -226,509 4
5
3,787,189 -226,509 6
7
8
100,000 9
3,037,432 10
-3,137,432 11
12
13
14
15
10,000 16
4,890,952 17
-5,821,189 275,326 18
19
-920,237 275,326 20
21
22
1,200 23
54,238,521 24
-30,642,022 -37,026 25
1,127,868 26
2,580,000 27
8,712,308 28
2,880,000 29
4,200,000 30
3,300,000 31
1,518,000 32
33
47,915,875 -37,026 34
35
36
26,145,744 37
-21,707,067 -17,220 38
39
4,438,677 -17,220 40
41
FERC FORM NO. 1 (ED. 12-89) Page 225
42 29,086,864 134,313,797

Name of Respondent This Report Is:(1) An Original
(2) A Resubmission
Date of Report(Mo, Da, Yr)
Year/Period of Report
End of
INVESTMENTS IN SUBSIDIARY COMPANIES (Account 123.1) (Continued)
PACIFIC GAS AND ELECTRIC COMPANYX
04/13/20212020/Q4
Line
No.
Equity in Subsidiary Earnings of Year
Revenues for Year Amount of Investment atEnd of Year
Gain or Loss from InvestmentDisposed of
(e) (f) (g) (h)
4. For any securities, notes, or accounts that were pledged designate such securities, notes, or accounts in a footnote, and state the name of pledgee
and purpose of the pledge.
5. If Commission approval was required for any advance made or security acquired, designate such fact in a footnote and give name of Commission,
date of authorization, and case or docket number.
6. Report column (f) interest and dividend revenues form investments, including such revenues form securities disposed of during the year.
7. In column (h) report for each investment disposed of during the year, the gain or loss represented by the difference between cost of the investment (or
the other amount at which carried in the books of account if difference from cost) and the selling price thereof, not including interest adjustment includible
in column (f).
8. Report on Line 42, column (a) the TOTAL cost of Account 123.1
1
50,000,000 2
29,092,293 29,092,293 3
4
79,092,293 29,092,293 5
6
7
8
9
10
11
12
13
14
15
16
17
18
19
20
21
22
23
24
25
26
27
28
29
30
31
32
33
34
35
36
37
38
39
40
41
FERC FORM NO. 1 (ED. 12-89) Page 225.1
42 29,086,864 134,313,797

Name of Respondent This Report Is:(1) An Original
(2) A Resubmission
Date of Report(Mo, Da, Yr)
Year/Period of Report
End of
MATERIALS AND SUPPLIES
PACIFIC GAS AND ELECTRIC COMPANYX
04/13/20212020/Q4
Line
No.
Account Balance Balance
(c)(b)(a)
Department orDepartments which
(d)
Beginning of Year End of YearUse Material
1. For Account 154, report the amount of plant materials and operating supplies under the primary functional classifications as indicated in column (a);
estimates of amounts by function are acceptable. In column (d), designate the department or departments which use the class of material.
2. Give an explanation of important inventory adjustments during the year (in a footnote) showing general classes of material and supplies and the
various accounts (operating expenses, clearing accounts, plant, etc.) affected debited or credited. Show separately debit or credits to stores expense
clearing, if applicable.
961,981 ELECTRIC 1,378,183 1 Fuel Stock (Account 151)
2 Fuel Stock Expenses Undistributed (Account 152)
3 Residuals and Extracted Products (Account 153)
4 Plant Materials and Operating Supplies (Account 154)
460,127,152 ALL 460,961,357 5 Assigned to - Construction (Estimated)
6 Assigned to - Operations and Maintenance
23,061,195 ALL 11,965,536 7 Production Plant (Estimated)
26,047,165 ALL 18,207,207 8 Transmission Plant (Estimated)
40,380,237 ALL 42,144,743 9 Distribution Plant (Estimated)
10 Regional Transmission and Market Operation Plant
(Estimated)
GAS 11 Assigned to - Other (provide details in footnote)
549,615,749 533,278,843 12 TOTAL Account 154 (Enter Total of lines 5 thru 11)
13 Merchandise (Account 155)
14 Other Materials and Supplies (Account 156)
15 Nuclear Materials Held for Sale (Account 157) (Not
applic to Gas Util)
16 Stores Expense Undistributed (Account 163)
17
18
19
550,577,730 534,657,026 20 TOTAL Materials and Supplies (Per Balance Sheet)
Page 227FERC FORM NO. 1 (REV. 12-05)

Name of Respondent This Report Is:(1) An Original
(2) A Resubmission
Date of Report(Mo, Da, Yr)
Year/Period of Report
End of
Allowances (Accounts 158.1 and 158.2)
PACIFIC GAS AND ELECTRIC COMPANYX
04/13/20212020/Q4
Line
No.
SO2 Allowances Inventory Current Year
(b)(a)(Account 158.1) No. Amt.
(c)No.(d)
Amt.(e)
1. Report below the particulars (details) called for concerning allowances.
2. Report all acquisitions of allowances at cost.
3. Report allowances in accordance with a weighted average cost allocation method and other accounting as prescribed by General
Instruction No. 21 in the Uniform System of Accounts.
4. Report the allowances transactions by the period they are first eligible for use: the current year’s allowances in columns (b)-(c),
allowances for the three succeeding years in columns (d)-(i), starting with the following year, and allowances for the remaining
succeeding years in columns (j)-(k).
5. Report on line 4 the Environmental Protection Agency (EPA) issued allowances. Report withheld portions Lines 36-40.
2021
157,535.00 13,860.00Balance-Beginning of Year 1
2
Acquired During Year: 3
Issued (Less Withheld Allow) 4
Returned by EPA 5
6
7
Purchases/Transfers: 8
9
10
11
12
13
14
Total 15
16
Relinquished During Year: 17
Charges to Account 509 18
Other: 19
3.00Allowances Used 20
Cost of Sales/Transfers: 21
22
23
24
25
26
27
Total 28
157,532.00 13,860.00Balance-End of Year 29
30
Sales: 31
Net Sales Proceeds(Assoc. Co.) 32
Net Sales Proceeds (Other) 33
Gains 34
Losses 35
Allowances Withheld (Acct 158.2)
199.00 199.00Balance-Beginning of Year 36
Add: Withheld by EPA 37
Deduct: Returned by EPA 38
199.00Cost of Sales 39
199.00Balance-End of Year 40
41
Sales: 42
Net Sales Proceeds (Assoc. Co.) 43
5Net Sales Proceeds (Other) 44
5Gains 45
Losses 46
FERC FORM NO. 1 (ED. 12-95) Page 228a

Name of Respondent This Report Is:(1) An Original
(2) A Resubmission
Date of Report(Mo, Da, Yr)
Year/Period of Report
End of
Allowances (Accounts 158.1 and 158.2)
PACIFIC GAS AND ELECTRIC COMPANYX
04/13/20212020/Q4
Line
No.(f) (j)No. Amt.
(g)No.(h)
Amt.(i)
No. Amt. No. Amt.(k) (l) (m)
Future Years Totals
(Continued)
6. Report on Lines 5 allowances returned by the EPA. Report on Line 39 the EPA’s sales of the withheld allowances. Report on Lines
43-46 the net sales proceeds and gains/losses resulting from the EPA’s sale or auction of the withheld allowances.
7. Report on Lines 8-14 the names of vendors/transferors of allowances acquire and identify associated companies (See "associated
company" under "Definitions" in the Uniform System of Accounts).
8. Report on Lines 22 - 27 the name of purchasers/ transferees of allowances disposed of an identify associated companies.
9. Report the net costs and benefits of hedging transactions on a separate line under purchases/transfers and sales/transfers.
10. Report on Lines 32-35 and 43-46 the net sales proceeds and gains or losses from allowance sales.
2022 2023
1 360,360.00 13,860.00 13,860.00 559,475.00
2
3
4 13,860.00 13,860.00
5
6
7
8
9
10
11
12
13
14
15
16
17
18
19
20 3.00
21
22
23
24
25
26
27
28
29 374,220.00 13,860.00 13,860.00 573,332.00
30
31
32
33
34
35
36 9,751.00 199.00 199.00 10,547.00
37 398.00 398.00
38
39 199.00 398.00
40 9,950.00 199.00 199.00 10,547.00
41
42
43
3 8 44
3 8 45
46
FERC FORM NO. 1 (ED. 12-95) Page 229a

Schedule Page: 228 Line No.: 1 Column: mTotal beginning balance of account 158.1 per this page does not agree to the correspondingbalance sheet line item on page 110. Difference is due to approximately $408,680,309 inCO2 allowances issued by the California Air Resources Board (CARB) and approximately$430,000 in alternative fuel vehicle credits.
Schedule Page: 228 Line No.: 29 Column: mTotal ending balance of account 158.1 per this page does not agree to the correspondingbalance sheet line item on page 110. Difference is due to approximately $511,839,840 inCO2 allowances issued by the California Air Resources Board (CARB) and approximately$430,000 in alternative fuel vehicle credits.
Name of Respondent
PACIFIC GAS AND ELECTRIC COMPANY
This Report is:(1) X An Original(2) A Resubmission
Date of Report(Mo, Da, Yr)
04/13/2021
Year/Period of Report
2020/Q4
FOOTNOTE DATA
FERC FORM NO. 1 (ED. 12-87) Page 450.1
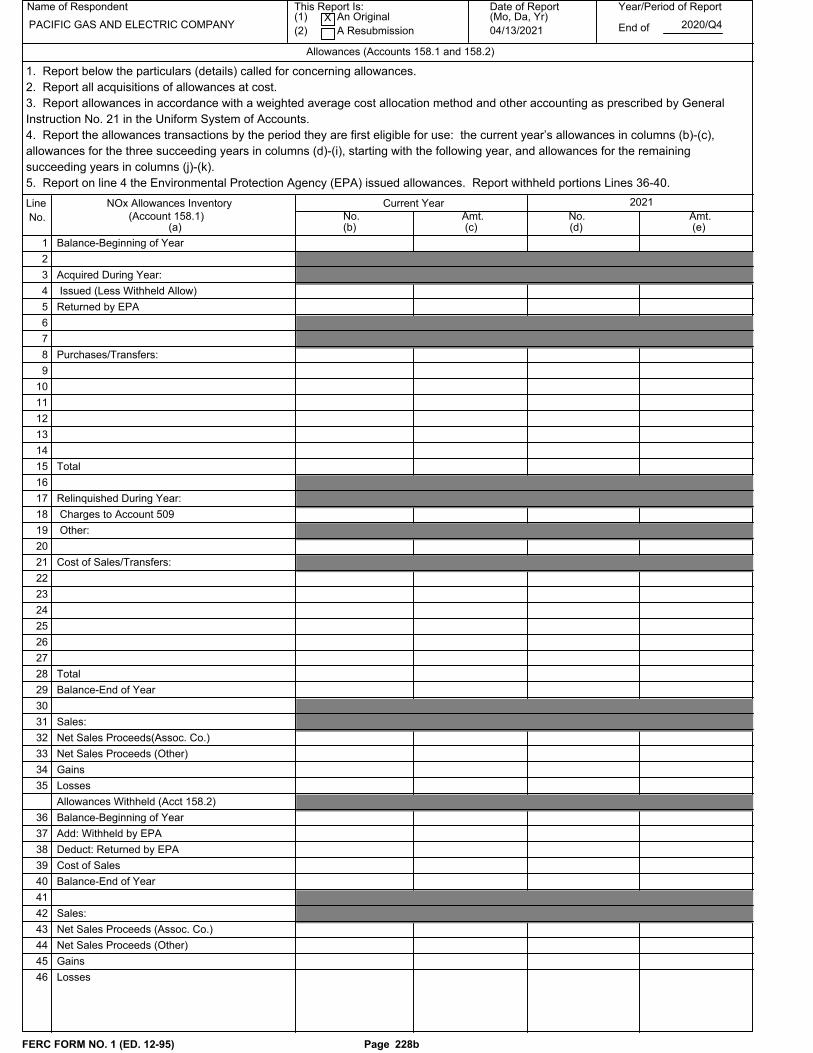
Name of Respondent This Report Is:(1) An Original
(2) A Resubmission
Date of Report(Mo, Da, Yr)
Year/Period of Report
End of
Allowances (Accounts 158.1 and 158.2)
PACIFIC GAS AND ELECTRIC COMPANYX
04/13/20212020/Q4
Line
No.
NOx Allowances Inventory Current Year
(b)(a)(Account 158.1) No. Amt.
(c)No.(d)
Amt.(e)
1. Report below the particulars (details) called for concerning allowances.
2. Report all acquisitions of allowances at cost.
3. Report allowances in accordance with a weighted average cost allocation method and other accounting as prescribed by General
Instruction No. 21 in the Uniform System of Accounts.
4. Report the allowances transactions by the period they are first eligible for use: the current year’s allowances in columns (b)-(c),
allowances for the three succeeding years in columns (d)-(i), starting with the following year, and allowances for the remaining
succeeding years in columns (j)-(k).
5. Report on line 4 the Environmental Protection Agency (EPA) issued allowances. Report withheld portions Lines 36-40.
2021
Balance-Beginning of Year 1
2
Acquired During Year: 3
Issued (Less Withheld Allow) 4
Returned by EPA 5
6
7
Purchases/Transfers: 8
9
10
11
12
13
14
Total 15
16
Relinquished During Year: 17
Charges to Account 509 18
Other: 19
20
Cost of Sales/Transfers: 21
22
23
24
25
26
27
Total 28
Balance-End of Year 29
30
Sales: 31
Net Sales Proceeds(Assoc. Co.) 32
Net Sales Proceeds (Other) 33
Gains 34
Losses 35
Allowances Withheld (Acct 158.2)
Balance-Beginning of Year 36
Add: Withheld by EPA 37
Deduct: Returned by EPA 38
Cost of Sales 39
Balance-End of Year 40
41
Sales: 42
Net Sales Proceeds (Assoc. Co.) 43
Net Sales Proceeds (Other) 44
Gains 45
Losses 46
FERC FORM NO. 1 (ED. 12-95) Page 228b

Name of Respondent This Report Is:(1) An Original
(2) A Resubmission
Date of Report(Mo, Da, Yr)
Year/Period of Report
End of
Allowances (Accounts 158.1 and 158.2)
PACIFIC GAS AND ELECTRIC COMPANYX
04/13/20212020/Q4
Line
No.(f) (j)No. Amt.
(g)No.(h)
Amt.(i)
No. Amt. No. Amt.(k) (l) (m)
Future Years Totals
(Continued)
6. Report on Lines 5 allowances returned by the EPA. Report on Line 39 the EPA’s sales of the withheld allowances. Report on Lines
43-46 the net sales proceeds and gains/losses resulting from the EPA’s sale or auction of the withheld allowances.
7. Report on Lines 8-14 the names of vendors/transferors of allowances acquire and identify associated companies (See "associated
company" under "Definitions" in the Uniform System of Accounts).
8. Report on Lines 22 - 27 the name of purchasers/ transferees of allowances disposed of an identify associated companies.
9. Report the net costs and benefits of hedging transactions on a separate line under purchases/transfers and sales/transfers.
10. Report on Lines 32-35 and 43-46 the net sales proceeds and gains or losses from allowance sales.
2022 2023
1
2
3
4
5
6
7
8
9
10
11
12
13
14
15
16
17
18
19
20
21
22
23
24
25
26
27
28
29
30
31
32
33
34
35
36
37
38
39
40
41
42
43
44
45
46
FERC FORM NO. 1 (ED. 12-95) Page 229b

Name of Respondent This Report Is:(1) An Original
(2) A Resubmission
Date of Report(Mo, Da, Yr)
Year/Period of Report
End of
EXTRAORDINARY PROPERTY LOSSES (Account 182.1)
PACIFIC GAS AND ELECTRIC COMPANYX
04/13/20212020/Q4
Line
No.
(c)(b)(a) (d)
Description of Extraordinary Loss[Include in the description the date of
Commission Authorization to use Acc 182.1and period of amortization (mo, yr to mo, yr).]
Total Amount of Loss
LossesRecognisedDuring Year
WRITTEN OFF DURING YEAR
AccountCharged Amount
Balance at
End of Year
(f)(e)
None1
2
3
4
5
6
7
8
9
10
11
12
13
14
15
16
17
18
19
FERC FORM NO. 1 (ED. 12-88) Page 230a
20 TOTAL

Name of Respondent This Report Is:(1) An Original
(2) A Resubmission
Date of Report(Mo, Da, Yr)
Year/Period of Report
End of
UNRECOVERED PLANT AND REGULATORY STUDY COSTS (182.2)
PACIFIC GAS AND ELECTRIC COMPANYX
04/13/20212020/Q4
Line
No.
(c)(b)(a) (d)
Description of Unrecovered Plant Total Amount
of Charges
CostsRecognisedDuring Year
WRITTEN OFF DURING YEAR
AccountCharged Amount
Balance at
End of Year
(f)(e)
and Regulatory Study Costs [Includein the description of costs, the date of
Commission Authorization to use Acc 182.2and period of amortization (mo, yr to mo, yr)]
Santa Cruz 115 kV Reinforcement 3,557,2223,557,22221
October 4, 2016 (03-2016 to 12-)22
23
Atlantic-Placer 115kV Transmissit 324,906324,90624
October 2019 (1/1/2020 to 12/31/)25
26
Mesa (Diablo Canyon Voltage Supp) 1,110,3441,110,34427
October 2019 (1/1/2020 to 12/31/)28
29
Gates - Gregg 7,101,3337,101,33330
March 2020 (1/1/2020 to 12/31/20)31
32
Pease - Marysville #2 60 kV Line 3,155,1913,155,19133
November 2020 (1/1/2020 to 12/31)34
35
Jefferson - Stanford #2 60 kV Lil 1,334,1161,334,11636
November 2020 (1/1/2020 to 12/31)37
38
South of San Mateo Capacity Incre 902,589902,58939
November 2020 (1/1/2020 to 12/31)40
41
Bay Meadows 115 kV Reconductoring 708,816708,81642
November 2020 (1/1/2020 to 12/31)43
44
Kerckhoff PH #2 - Oakhurst 115 ke 274,978274,97845
November 2020 (1/1/2020 to 12/31)46
47
Refer to footnote for add. lines 24,576,07776,371,287 51,795,21048
FERC FORM NO. 1 (ED. 12-88) Page 230b
49 TOTAL 94,840,782 43,045,572 51,795,210

Schedule Page: 230 Line No.: 48 Column: aDuring 2020, there were additional lines needed to present the activity for UnrecoveredPlant and Regulatory Study Costs which the FERC software would not allow to be added. Assuch, we have added the totals on the FERC pages and included the breakdown of thoseamounts below.
(a) (b) (c) (d) (e) (f)West Point - Valley Springs 60 kV Line 71,099 71,099 -
0 0
November 2020 (1/1/2020 to 12/31/2020)
Soledad 115/60 kV Transformer Capacity 46,362 46,362 -
0 0
November 2020 (1/1/2020 to 12/31/2020)
Napa - Tulucay No. 1 60 kV Line Upgrades 39,983 39,983 -
0 0
November 2020 (1/1/2020 to 12/31/2020)
Clear Lake 60 kV System Reinforcement 35,304 35,304 -
0 0
November 2020 (1/1/2020 to 12/31/2020)
Taft 115/70 kV Transformer #2 Replacement 32,372 32,372 -
0 0
November 2020 (1/1/2020 to 12/31/2020)
Monta Vista - Los Gatos - Evergreen 60 kVProject
31,157 31,157 -
0 0
November 2020 (1/1/2020 to 12/31/2020)
Cressey - North Merced 115 kV Line Addition 27,777 27,777 -
0 0
November 2020 (1/1/2020 to 12/31/2020)
Tesla - Newark 288,461 288,461 -
0 0
November 2020 (1/1/2020 to 12/31/2020)
ALMADEN (LOS GATOS) 60KV SHUNTCAPACITOR
27,579 27,579 -
0 0
November 2020 (1/1/2020 to 12/31/2020)
VACA-LAKEVILLE 5,933,926 5,933,926 - 0 0
Name of Respondent
PACIFIC GAS AND ELECTRIC COMPANY
This Report is:(1) X An Original(2) A Resubmission
Date of Report(Mo, Da, Yr)
04/13/2021
Year/Period of Report
2020/Q4
FOOTNOTE DATA
FERC FORM NO. 1 (ED. 12-87) Page 450.1

November 2020 (1/1/2020 to 12/31/2020)
Ashlan - Gregg and Ashlan - Herndon 230 kVLine Reconductor
724,676 724,676 -
0 0
November 2020 (1/1/2020 to 12/31/2020)
Evergreen - Mabury 60 to 115 kV Conversion 1,606,258 1,606,258 -
0 0
November 2020 (1/1/2020 to 12/31/2020)
Rio Oso - Atlantic 230 kV Line Project 824,979 824,979 -
0 0
November 2020 (1/1/2020 to 12/31/2020)
Watsonville Voltage Conversion 2,341,382 2,341,382 -
0 0
November 2020 (1/1/2020 to 12/31/2020)
Reedley-Dinuba 436,885 436,885 -
0 0
November 2020 (1/1/2020 to 12/31/2020)
Reedley-Orosi 304,604 304,604 -
0 0
November 2020 (1/1/2020 to 12/31/2020)
DCPP License Renewal Cost 12,302,620 2,050,436 -
0 10,252,184
January 1, 2018 (01-2018 to 12-2025)
DCPP Canceled Projects 51,295,864 9,752,837 -
0 41,543,026
January 1, 2018 (01-2020 to 12-2025)
Total 94,840,782 43,045,572 0 0 51,795,210
Name of Respondent
PACIFIC GAS AND ELECTRIC COMPANY
This Report is:(1) X An Original(2) A Resubmission
Date of Report(Mo, Da, Yr)
04/13/2021
Year/Period of Report
2020/Q4
FOOTNOTE DATA
FERC FORM NO. 1 (ED. 12-87) Page 450.2

Name of Respondent This Report Is:(1) An Original
(2) A Resubmission
Date of Report(Mo, Da, Yr)
Year/Period of Report
End of
Transmission Service and Generation Interconnection Study Costs
PACIFIC GAS AND ELECTRIC COMPANYX
04/13/20212020/Q4
Line
No. DescriptionCosts Incurred During
(b)(a)
Period Account Charged
(c)
ReimbursementsReceived During
(d)
Account CreditedWith Reimbursement
(e)
1. Report the particulars (details) called for concerning the costs incurred and the reimbursements received for performing transmission service and
generator interconnection studies.
2. List each study separately.
3. In column (a) provide the name of the study.
4. In column (b) report the cost incurred to perform the study at the end of period.
5. In column (c) report the account charged with the cost of the study.
6. In column (d) report the amounts received for reimbursement of the study costs at end of period.
7. In column (e) report the account credited with the reimbursement received for performing the study.
the Period
Transmission Studies 1
4,072,022(see details in footnotes) 186 ( 2,891,543) 186 2
3
4
5
6
7
8
9
10
11
12
13
14
15
16
17
18
19
20
Generation Studies 21
2,177,288(see details in footnotes) 186 ( 2,276,866) 186 22
23
24
25
26
27
28
29
30
31
32
33
34
35
36
37
38
39
40
FERC FORM NO. 1/1-F/3-Q (NEW. 03-07) Page 231

Schedule Page: 231 Line No.: 2 Column: a
Balance
12/31/2019
Costs
Incurred
Reimbursements
received
Balance
12/31/2020
$ $ $ $
WL -(SIS)Interconnection Merced Irr Dist (500) (500)
WG - USE - Cluster Analysis 107,759 107,759
WG Gradient Resources Project SIS 22,884 22,884
WAPA O'Neill Substation - System Impact 4,623 (4,623) 0
WG - BURNS&MCDONNELL-Cluster work 5,518 52,289 57,807
WG - C6 - Cluster 6 Phase 2 24,434 24,434
Ntwrk Eval for Calpine 115kV Geysers Gen (10,369) (10,369)
WG - C8 - SM - Quail Creek Solar 1 128 128
WAPA - Cottonwood Olinda line work 106,089 106,089
LBNL Capacity Increase 4,654 4,654
SVP Breaker Replacement (8,863) (8,863)
Travis AFB Facility Study (64,156) (64,156)
Port of Stockton Load Increase (21,890) (21,890)
WAPA SLTP 3,044 3,044
Port of Stockton FAS (40,364) (40,364)
CAISO ISP Panoche (261) (261)
SFPUC - Potrero Interconnection 5,703 5,703
WG - ISP - Porthos 1,680 1,680
WAPA Lemoore NAS 33,346 32,520 65,866
WG # Cluster 11 Phase 1 141,043 141,043
WG – Quanta Technology DG Study Rule 21 (350) 7,092 6,742
WG – Cluster 11 Phase 2 727,322 32,233 (642,701) 116,855
Cluster 12 Phase 1 551,088 565,077 (951,179) 164,987
Lemoore NAS Facilities Study (Yr 2020) 40,502 40,502
WDT/ System Impact Study 9,781 9,781
LLNL FAS for Site 300 576 576
CP-Martin 115/60 kV Upgrade Project 2,045 83 2,128
WL - Tesla Tracy 230kV Line 1 Reloc-FAS 13,216 13,216
Trans Bay Cable Quick Start Study 5,264 5,264
WDL-FAS-Mission Rock Redevelopment 2,378 2,378
WDL-FAS-2 Rankin (70,000) (70,000)
WDL-SIS-6527 Calaveras (50,000) (50,000)
WDL-SIS-2 Rankin 4,897 (25,000) (20,103)
WDL-SIS-49 S. Van Ness 7,352 (25,000) (17,648)
WDL-SIS-750 Phelps 5,803 (25,000) (19,197)
WDL-FAS-750 Phelps 5,448 (70,000) (64,552)
WDL-SIS-603 Jamestown/Candlestick 3,346 3,346
WDL-FAS-603 Jamestown/Candlestick 333 (70,000) (69,667)
WL - CA HiSpeed Train Interconnect Study 23,850 23,850
Swan Lake Affected Sys. Study 82,245 82,245
WG # ISP-South Belridge Expansion 27,453 27,453
WG - C11 - SM - Project 100 (42) (42)
WG - C11 - SM - Project 76 144 144
WG - C11 - SM - Project 78 (42) (42)
WG - C11 - SM - Project 95 35 35
WG # Cluster 10 Phase 2 31,191 31,191
WG – 2019 Reassessment and Downsizing St 391,303 (355,730) 35,573
WG – ISP Ceres Energy Storage 9,324 9,324
WG – ISP Kuiper Energy Storage 51,200 (12) (51,188)
Name of Respondent
PACIFIC GAS AND ELECTRIC COMPANY
This Report is:(1) X An Original(2) A Resubmission
Date of Report(Mo, Da, Yr)
04/13/2021
Year/Period of Report
2020/Q4
FOOTNOTE DATA
FERC FORM NO. 1 (ED. 12-87) Page 450.1

WG – ISP Riviera Solar 7,461 7,461
WG – ISP Camptonville Biopower 1 32,975 4,005 (36,979)
WG – ISP Dallas ES 3 44,187 44,187
WG – ISP Dallas ES 2 46,278 46,278
WG - C12 - SM - Project 01 (40) (40)
WG - C12 - SM - Project 02 (40) (40)
WG - C12 - SM - Project 03 (21) (21)
WG - C12 - SM - Project 04 (20) (20)
WG - C12 - SM - Project 05 (20) (20)
WG - C12 - SM - Project 06 (20) (20)
WG - C12 - SM - Project 07 (20) (20)
WG - C12 - SM - Project 08 (29) (29)
WG - C12 - SM - Project 09 (20) (20)
WG - C12 - SM - Project 10 (20) (20)
WG - C12 - SM - Project 11 (20) (20)
WG - C12 - SM - Project 12 (20) (20)
WG - C12 - SM - Project 13 (20) (20)
WG - C12 - SM - Project 14 (60) (60)
WG - C12 - SM - Project 15 (20) (20)
WG - C12 - SM - Project 16 (23) (23)
WG - C12 - SM - Project 17 (20) (20)
WG - C12 - SM - Project 18 (20) (20)
WG - C12 - SM - Project 19 (20) (20)
WG - C12 - SM - Project 20 (20) (20)
WG - C12 - SM - Project 21 (20) (20)
WG - C12 - SM - Project 22 (20) (20)
WG - C12 - SM - Project 23 (20) (20)
WG - C12 - SM - Project 24 (40) (40)
WG - C12 - SM - Project 25 (20) (20)
WG - C12 - SM - Project 26 (20) (20)
WG - C12 - SM - Project 27 (20) (20)
WG - C12 - SM - Project 28 (20) (20)
WG - C12 - SM - Project 29 (20) (20)
WG - C12 - SM - Project 30 (20) (20)
WG - C12 - SM - Project 31 (20) (20)
WG - C12 - SM - Project 32 (20) (20)
WG - C12 - SM - Project 33 (20) (20)
WG - C12 - SM - Project 34 (20) (20)
WG - C12 - SM - Project 35 (20) (20)
WG - C12 - SM - Project 36 897 897
WG - C12 - SM - Project 37 (20) (20)
WG - C12 - SM - Project 38 (20) (20)
WG - C12 - SM - Project 39 (20) (20)
WG - C12 - SM - Project 40 (20) (20)
WG - C12 - SM - Project 41 (20) (20)
WG - C12 - SM - Project 42 (20) (20)
WG - C12 - SM - Project 43 (20) (20)
WG - C12 - SM - Project 44 (20) (20)
WG - C12 - SM - Project 45 (20) (20)
WG - C12 - SM - Project 46 (20) (20)
WG - C12 - SM - Project 47 (20) (20)
WG - C12 - SM - Project 48 (20) (20)
WG - C12 - SM - Project 49 (20) (20)
WG - C12 - SM - Project 50 (19) 19
Name of Respondent
PACIFIC GAS AND ELECTRIC COMPANY
This Report is:(1) X An Original(2) A Resubmission
Date of Report(Mo, Da, Yr)
04/13/2021
Year/Period of Report
2020/Q4
FOOTNOTE DATA
FERC FORM NO. 1 (ED. 12-87) Page 450.2

WG - C12 - SM - Project 51 (20) (20)
WG - C12 - SM - Project 52 (20) (20)
WG - C12 - SM - Project 53 (20) (20)
WG - C12 - SM - Project 54 (20) (20)
WG - C12 - SM - Project 55 (20) (20)
WG - C12 - SM - Project 56 (20) (20)
WG - C12 - SM - Project 57 (20) (20)
WG - C12 - SM - Project 58 (20) (20)
WG - C12 - SM - Project 59 (20) (20)
WG - C12 - SM - Project 60 (20) (20)
WG - C12 - SM - Project 61 (20) (20)
WG - C12 - SM - Project 62 (40) (40)
WG - C12 - SM - Project 63 (20) (20)
WG - C12 - SM - Project 64 (20) (20)
WG - C12 - SM - Project 65 (20) (20)
WG - C12 - SM - Project 66 (20) (20)
WG - C12 - SM - Project 67 (20) (20)
WG - C12 - SM - Project 68 (20) (20)
WG - C12 - SM - Project 69 (20) (20)
WG - C12 - SM - Project 70 (20) (20)
WG - C12 - SM - Project 71 (20) (20)
WG - C12 - SM - Project 72 (20) (20)
WG - C12 - SM - Project 73 764 764
WG - C12 - SM - Project 74 (20) (20)
WG – Repower Diablo Canyon Repower 21,429 21,429
WG – Austin ES ISP 4,124 4,124
2020 Reassessment 811,885 811,885
WG –Repowering Oakland Unit 2 32,755 32,755
WG - C13 - SM - Project 01 8,919 (8,919)
WG - C13 - SM - Project 02 9,594 (9,594)
WG - C13 - SM - Project 03 8,618 (8,618)
WG - C13 - SM - Project 04 7,263 (7,263)
WG - C13 - SM - Project 05 7,917 (7,917)
WG - C13 - SM - Project 06 6,986 (6,986)
WG - C13 - SM - Project 07 6,850 (6,850)
WG - C13 - SM - Project 08 6,481 (6,481)
WG - C13 - SM - Project 09 6,055 (6,055)
WG - C13 - SM - Project 10 7,740 (7,740)
WG - C13 - SM - Project 11 9,808 (9,808)
WG - C13 - SM - Project 12 6,951 (6,951)
WG - C13 - SM - Project 13 6,379 (6,379)
WG - C13 - SM - Project 14 5,688 (5,688)
WG - C13 - SM - Project 15 8,830 (8,830)
WG - C13 - SM - Project 16 6,919 (6,919)
WG - C13 - SM - Project 17 7,386 (7,386)
WG - C13 - SM - Project 18 8,508 (8,508)
WG - C13 - SM - Project 19 5,891 (5,891)
WG - C13 - SM - Project 20 9,309 (9,309)
WG - C13 - SM - Project 21 5,634 (5,634)
WG - C13 - SM - Project 22 4,256 (4,256)
WG - C13 - SM - Project 23 5,571 (5,571)
WG - C13 - SM - Project 24 (4) (4)
WG - C13 - SM - Project 25 7,155 (7,155)
WG - C13 - SM - Project 26 6,885 (6,885)
Name of Respondent
PACIFIC GAS AND ELECTRIC COMPANY
This Report is:(1) X An Original(2) A Resubmission
Date of Report(Mo, Da, Yr)
04/13/2021
Year/Period of Report
2020/Q4
FOOTNOTE DATA
FERC FORM NO. 1 (ED. 12-87) Page 450.3

WG - C13 - SM - Project 27 7,292 (7,292)
WG - C13 - SM - Project 28 13,662 (13,662)
WG - C13 - SM - Project 29 8,174 (8,174)
WG - C13 - SM - Project 30 7,041 (7,041)
WG - C13 - SM - Project 31 7,187 (7,187)
WG - C13 - SM - Project 32 6,335 (6,335)
WG - C13 - SM - Project 33 7,355 (7,355)
WG - C13 - SM - Project 34 9,891 (9,891)
WG - C13 - SM - Project 35 7,634 (7,634)
WG - C13 - SM - Project 36 5,465 (5,465)
WG - C13 - SM - Project 37 4,665 (4,665)
WG - C13 - SM - Project 38 5,922 (5,922)
WG - C13 - SM - Project 39 6,595 (6,595)
WG - C13 - SM - Project 40 5,102 (5,102)
WG - C13 - SM - Project 41 6,888 (6,888)
WG - C13 - SM - Project 42 7,528 (7,528)
WG - C13 - SM - Project 43 7,152 (7,152)
WG - C13 - SM - Project 44 7,418 (7,418)
WG - C13 - SM - Project 45 5,953 (5,953)
WG - C13 - SM - Project 46 6,852 (6,852)
WG - C13 - SM - Project 47 6,368 (6,368)
WG - C13 - SM - Project 48 6,203 (6,203)
WG - C13 - SM - Project 49 5,631 (5,631)
WG - C13 - SM - Project 50 7,665 (7,665)
WG - C13 - SM - Project 52 7,617 (7,617)
WG - C13 - SM - Project 53 5,664 (5,664)
WG - C13 - SM - Project 54 4,653 (4,653)
WG - C13 - SM - Project 55 10,983 (10,983)
WG - C13 - SM - Project 56 7,744 (7,744)
WG - C13 - SM - Project 57 5,881 (6,210) (329)
WG - C13 - SM - Project 58 6,337 (6,337)
WG - C13 - SM - Project 59 5,886 (5,886)
WG - C13 - SM - Project 60 5,807 (5,807)
WG - C13 - SM - Project 61 8,893 (8,893)
WG - C13 - SM - Project 62 8,171 (8,171)
WG - C13 - SM - Project 63 13,931 (13,931)
WG - C13 - SM - Project 64 8,704 (8,704)
WG - C13 - SM - Project 65 6,925 (6,925)
WG - C13 - SM - Project 66 4,809 (4,809)
WG - C13 - SM - Project 67 9,724 (9,724)
WG - C13 - SM - Project 68 6,737 (6,737)
WG - C13 - SM - Project 69 7,023 (7,023)
WG - C13 - SM - Project 70 5,868 (5,868)
WG - C13 - SM - Project 71 9,817 (9,817)
WG - C13 - SM - Project 73 7,859 (7,859)
WG - C13 - SM - Project 74 7,833 (7,833)
WG - C13 - SM - Project 77 78 78
WG - C12 - Phase II 853,877 853,877
WG - C13 - Phase I 885,241 885,241
WG –Repowering Dollar Wind LLC 32,224 32,224
WG -Oakland ES ISP 1,649 1,649
2021 Reassessment 1,642 1,642
ISP Midland ES 177 177
Total Transmission 2,221,347 4,072,022 (2,891,543) 3,401,827
Name of Respondent
PACIFIC GAS AND ELECTRIC COMPANY
This Report is:(1) X An Original(2) A Resubmission
Date of Report(Mo, Da, Yr)
04/13/2021
Year/Period of Report
2020/Q4
FOOTNOTE DATA
FERC FORM NO. 1 (ED. 12-87) Page 450.4

Schedule Page: 231 Line No.: 22 Column: a
Balance
12/31/2019
Costs
Incurred
Reimbursements
received
Balance
12/31/2020
$ $ $ $
Estrella Substation - Facilities Study (678) 678
R21Beldrige Wtr Stor 352165 NEM2 Det Sty 3,239 3,239
WDT - Chevron USA Prod Co ISP (2,705) 1,407 (1,299)
Shiloh I Wind Project Facilities Study 38,506 38,506
Exchequer RAS - CAISO Post COD 4,296 4,296
MMA - Q1158 Slate - ISO 51731 5,800 5,800
MMA - QF Santa Clara Wind - 51155 4,211 4,211
MMA - Q1096 & QF Altamont Midway - 51156 37,940 392 38,332
MMA - QF Forebay Wind - 51154 1,565 1,565
Q877 California Flats - Roadway PEIE (480,146) 91,974 (388,172)
Kingsburg Cogen - Facility Study 1,494 1,494
1469-RD BELRIDGE WATER/Detailed (8,237) 8,237
WDT - CA-17-0097 SB43 Arco - ISP 1,226 1,226
R21 - Bear Creek - EDMUD - Detailed Stdy (5,571) 5,571
WDT-CA-17-0101 SB43 Devils Den-Fst Trk 2,507 2,507
WDT-CA-17-0102 SB43 Gates-ISP (1,840) 1,840
CA Department of Corrections #387295/Det (5,611) 5,611
WDT CA-17-0100 SB43 Derrick/ISP 1,832 1,832
R21 EBMUD Enos (387729) RESBCT/Detailed (53,810) 53,810
WDT SEPV American Canyon/FT 207 207
R21 - Bangor Solar - 1402-RD - Det Stdy (9,490) 9,490
WDT-CA-17-0090 SB43 Dulgarian/FT 233 233
R21 - City Count of SF (Enos 390303)/Det (6,049) 6,049
1529-RD City of Paso Robles/Detailed (6,672) 6,672
WDT - DRES Quarry 2.3/FT 159 159
R21-Calcom Solar-Western Sky Dairy-DS (850) 850
WDT - FT - ZGlobal - Eagle 2 Solar 1,552 1,552
WDT - FT - Morris 385 LLC - Morris 385 2,677 2,677
WDT - FT - El Pomar Parners - El Pomar 831 831
R21 - DS - Chowchilla Dairy Power (10,000) 10,000
WDT-FT-ET Solar - Midway Towers Comm Sol 1,705 1,705
WDT-FT-ET Solar - East Bay Community Sol 2,349 2,349
R21 - Musco Olive Biom Gen - Fac Study (4,729) 4,729
WDT - SR - El Pomar Partners - El Pomar (211) 211
WDT-SR-ForeFront Power-Dulgarian (250) 250
WDT - FT - Solar Electric SEPV Cuyama 2 310 310
WDT - SR - Green Light - Eagle 2 Solar 245 245
R21-DS-BNB Renewable-Campbell Soup Supp 5,331 5,331
R21-DIS-Forefront-CDCR-1569-RD 258 (516) (258)
WDT-SR-Forefront Power-Mouren Farming 558 558
WDT - FT - EPRI - SVUSD Bus Barn Storage 4,326 4,326
R21 - DIS - West Biofuels - SunWest Bio (688) 688
R21 - DIS - Syn Tech - Lisa Boone Harris (4,976) 4,976
WDT-SIS-Solar Electric-SEPV Cuyama 2 (3,554) 3,554
R21-DIS-E&J Gallo Winery-Asti Pond Solar (6,812) 6,812
R21-DIS-SunPower-EBMUD RESBCT (41,036) 41,036
R21-DIS-Maas Energy-Lakeshore Dairy Dig (7,293) 7,293
WDT - SIS - Rival Power Peterson Road 2 (5,843) 5,843
R21 - DIS - JKB Energy-Trinitas Fund II (2,070) 2,070
R21-DIS-Concentric-South County Packing 1,099 (1,099)
Name of Respondent
PACIFIC GAS AND ELECTRIC COMPANY
This Report is:(1) X An Original(2) A Resubmission
Date of Report(Mo, Da, Yr)
04/13/2021
Year/Period of Report
2020/Q4
FOOTNOTE DATA
FERC FORM NO. 1 (ED. 12-87) Page 450.5

R21-DIS-ARC Alternatives-City of Lincoln (9,033) 9,225 192
WDT-FT-REP Energy-DRES Quarry 2.4 (69) 69 77 77
WDT-FT-Renewable Prop-Palm Drive Solar C 1,763 1,763
WDT-SR-ET Capital-Midway Towers Comm (2,500) 2,500
WDT-SR-ET Capital, Inc. East Bay Com Sol (2,500) 2,500
WDT-ISP-Calbio Energy-Bar20 Dairy Biogas 2,628 2,628
WDT-ISP-Calbio Energy-MaddoxDairyBiogas (4,298) 4,298
WDT-ISP-Calbio Energy-Double Diamond (8,414) 8,414
R21-DIS--SunPower-West Valley Mission Co (5,185) 5,185
WDT-SIS-Green Light Energy-Eagle 2 Solar (3,767) 3,767
WDT-FT - DG California Solar-Lodi Solar 114 114
R21-DIS-DG Calif Solar, DPIF CA 6 Fresno (4,132) 4,132
WDT-ISP-Forefront Power-Nachtigall (7,771) 7,771
R21-DIS-ARC Alternatives-County of Kern (7,473) 7,473
WDT-SR-Sonoma School-SVUSD Bus Barn Stor (1,051) 1,051
WDT-Wireless Sur-Cenergy-NLH1 Solar-0102 190 190
WDT-ISP-Forefront Power-Broadman (5,952) 5,952
R21-DIS-Forefront-CA Dept of Corr 23100 (1,883) 1,883
R21-DIS-Forefront-CA Dept of Corr 23104 (55,018) 55,018
R21-DIS-Forefront-CA Dept of Corr 23102 (53,666) 53,666
R21-DIS-Newcomb-City of Fresno(App22373) (67,879) 67,879
WDT-EIT-Forefront-1584-WD Mouren Farming (5,246) 5,246
R21-DIS-BloomEnergy-KeysightTechnologies (5,120) 5,120
WDT-ISP-CEDWhiteRiverSolar2-WhiteRiver2 (5,292) 5,292
MMA - Collins Pine Repower - ISO 51161 18,085 3,301 (20,984) 401
WDT-SR-RenewProp-1758WD-PalmDriveSolarC (272) 272
WDT-FT-Apex Energy/ZGlobal-Jade Solar (508) 508
R21-DIS-SiliconVallCleanWater-12kVSwitch (2,686) 2,686
WDT-FT-RenewProp-Silveira Ranch Solar C 434 434
WDT-FT-RenewProp-Silveira Ranch Solar D 604 604
WDT-FT-RenewProp-Silveira Ranch Solar A 815 815
WDT-FT-RenewProp-Silveira Ranch Solar B 945 945
WDT-SR: Forefront Power-Rocha-1783-WD (732) 732
WDT-ISP: PG&E CoyoteValleyEnergyStorage 14,855 14,855
R21-DIS-Forefront- UCSantaCruz App 23113 (6,732) 6,732
WDT-FT: Forefront Power - Kern Sunset (754) (754)
WDT-FT: Forefront Power - Highway 43 1,190 1,190
WDT-FT: Forefront Power - Beard (879) 879
WDT-SR: DG Cali Solar - Lodi Solar (1,498) 1,498
WDT-ISP: ETCap-EastBayCommSolar1624-WD (2,049) 2,049
R21-DIS:CupertinoElec-WonderfulOrch33018 (5,192) (5,192)
R21-DIS: EnableEnergy-SpecialtyGran34412 (8,029) 1,629 (6,400)
WDT-FT: Zero Energy - Fallon Two Rock Rd 1,541 1,541
WDT-ISP: Ormat Nevada-Pease Reliability (9,035) 9,035
WDT-FCDS: Ormat Nevada-Pease Reliability (43,633) 4,421 (39,212)
R21-DIS: EnableEnergy-SpecialtyGran34465 (2,117) 3,997 1,880
WDT-SR: Silveira Ranch Solar A (326) 326
WDT-SR: Silveira Ranch Solar B (2,458) 2,458
WDT-SR: Silveira Ranch Solar C (2,458) 2,458
WDT-SR: Silveira Ranch Solar D (2,458) 2,458
WDT-SR: Apex Energy - Jade Solar 1865-WD 893 893
WDT-ISP: Solvida - PutahCreekSolarFarmN (10,000) 10,000
WDT-FCDS: Solvida - PutahCreekSolarFarmN 5,871 5,871
WDT-FT: BeckwourthGrid-BeckwourthGrid 1 (319) 319
Name of Respondent
PACIFIC GAS AND ELECTRIC COMPANY
This Report is:(1) X An Original(2) A Resubmission
Date of Report(Mo, Da, Yr)
04/13/2021
Year/Period of Report
2020/Q4
FOOTNOTE DATA
FERC FORM NO. 1 (ED. 12-87) Page 450.6

R21-DS: Daisy Renew - EarlJohn App 37593 922 922
R21-FS: West Biofuels-SunWest Bioenergy (6,004) 6,004
WDT-SR: Forefront Power - Kern Sunset (150) (150)
WDT-FT: Kent Solar, LLC - KS Energy (341) 341
WDT-SR: Forefront Power - Highway 43 (2,065) 2,065
R21-DS: CalCom Solar-Moonlight App 38001 (5,552) 5,552
R21-EIT: West Coast Waste-1827-RD Gen 1 (1,244) 1,244
R21-DS: Shasta College - Q#1753-RD (5,865) 5,865
WDT-CS: Calpine - Cygnus Power Bank (81,661) 4,421 (77,240)
WDT-FCDS: Calpine - Cygnus Power Bank (49,580) (49,580)
WDT-FT: CalCom Solar - Toyon (460) 460
R21-DS: NextEra-BigDPacBuildSMF3-Q1791RD (8,455) 8,455
WDT-SR: Forefront Power -Beard Q1888-WD 667 667
WDT-EIT: FFPCACommSolar Rocha - 1783WD (4,313) 4,313
R21-DS: Ecoplexus-CANatGuard-Q1786-RD (7,044) 7,044
R21-DS: Cupertino E-Wonderful Orch 41293 (3,846) (3,846)
R21-DS: SyntechBioenergy-RiverOakOrchard (1,214) 1,214
Repower - Kelly Ridge Powerhouse - SFWPA 11,235 11,235
WDT-CS: Origis Operating-Vaquero Storage (104,069) (104,069)
WDT-FCDS: OrigisOperating-VaqueroStorage (49,374) 4,421 (44,953)
WDT-SIS: Forefront Power - Kern Sunset (4,078) 4,078
WDT-SIS: Forefront Power,LLC-Highway 43 (6,676) 6,676
R21-DS: COofCali DArrigo Bros 114202422 (3,796) 3,796
WDT-FT: SFPUC-Starr King PV Installation 400 400
R21-DS: BessieDig-HilltopHolsteins 38098 441 441
WDT-SR: Zero Energy Construct-Highway 43 (2,336) 2,336
WDT-CS: Calpine Corp-Panthera Power Bank (61,866) (61,866)
WDT-FCDS: CalpineCorp-PantheraPowerBank (49,778) 4,421 (45,357)
WDT-CS: Capine Corp-Riverrun Power Bank (82,345) (82,345)
WDT-FCDS: CapineCorp-Riverrun Power Bank (49,778) 4,421 (45,357)
R21-DS: ACElectric-RogerVGroningen 45330 (5,508) 5,508
WDT-FT: Soltage-Bradley Gillett Solar 1 336 336
WDT-FT:Soltage-San Ardo Pine Vly Solar 1 (318) 318
WDT-SIS: RenewableProp-SilveiraRanchSolA 1,764 1,764
WDT-SIS: RenewableProp-SilveiraRanchSolB 6,096 6,096
WDT-SIS: RenewableProp-SilveiraRanchSolC 6,229 6,229
R21-DS: PhoenixEner-NapaRecBiomass2MW (5,943) 5,943
R21-DS: AmericanCommod-AbelRoadBioenergy 634 (634)
WDT-FT: Engie-Hayward EBCE Array 5,424 5,424
WDT-ISP:Berry Petroleum-Berry NMW Cogens (46,200) 46,200
R21-DS: AmericanCommod-Willows Bioenergy (4,133) 4,133
WDT-FAS: Bar20Dairy - Bar20Dairy1754-WD (15,000) 15,000
WDT-SR: PristineSunFund6-RGA2/SH1 Solar (915) 915
R21-DS: Sunpower-TheGapInc-App46139NEMMT (5,218) 5,218
R21-DS: City of Lincoln (Airport) (2,163) 2,163
WDT-EIT/SIS: ForefrontPower-Beard1888-WD (6,496) 6,496
WDT-SR: Kent Solar, LLC - KS Energy (783) (783)
WDT-SR: SoltageCaDevCo-SanArdoValleySol1 (85) 85
WDT-SR: Soltage,LLC-BradleyGillettSolar1 631 631
MMA1-NoQ Moss Landing Unit 6-ISO 51164 7,571 7,571
WDT-ISP: CalpineCorporation-CalSunSolar (65,348) (65,348)
WDT-FT: GoldenStateRenew-GSRETurkIsland 614 (614)
WDT-FT: GoldenStateRenew - GSRE-OSP (547) 547
R21-DS:ArcAlternativesElDoradoUHSD1782RD (7,938) 7,938
Name of Respondent
PACIFIC GAS AND ELECTRIC COMPANY
This Report is:(1) X An Original(2) A Resubmission
Date of Report(Mo, Da, Yr)
04/13/2021
Year/Period of Report
2020/Q4
FOOTNOTE DATA
FERC FORM NO. 1 (ED. 12-87) Page 450.7
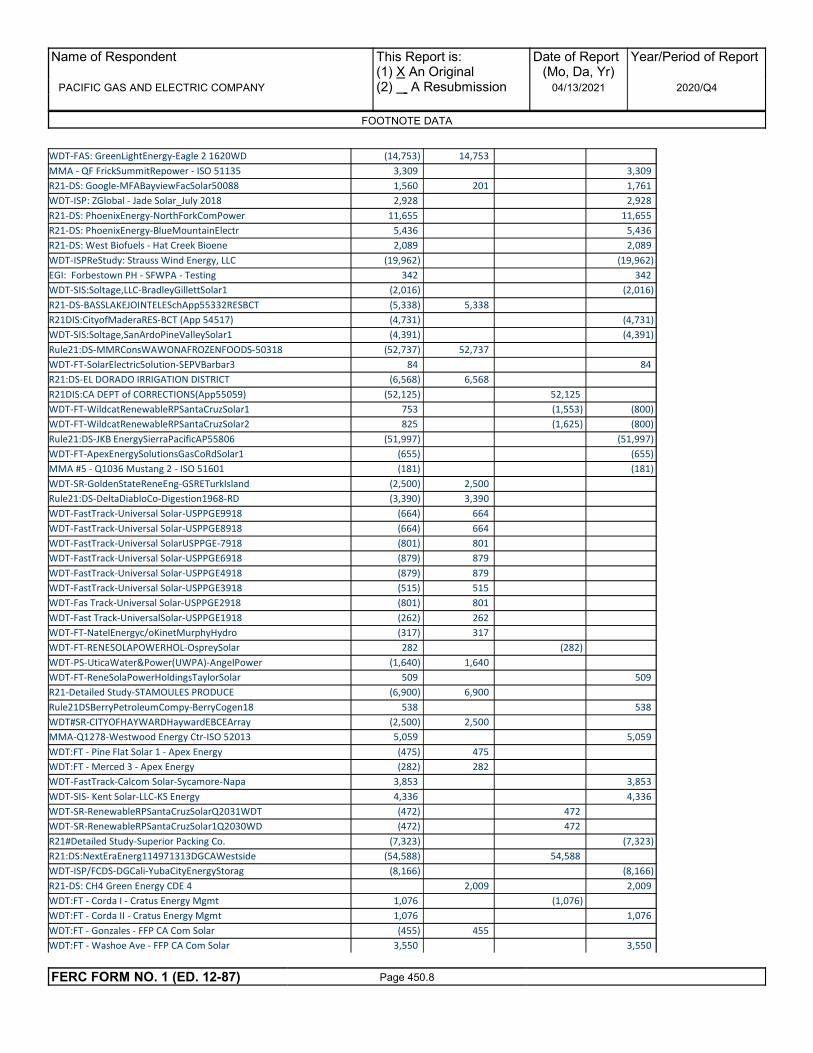
WDT-FAS: GreenLightEnergy-Eagle 2 1620WD (14,753) 14,753
MMA - QF FrickSummitRepower - ISO 51135 3,309 3,309
R21-DS: Google-MFABayviewFacSolar50088 1,560 201 1,761
WDT-ISP: ZGlobal - Jade Solar_July 2018 2,928 2,928
R21-DS: PhoenixEnergy-NorthForkComPower 11,655 11,655
R21-DS: PhoenixEnergy-BlueMountainElectr 5,436 5,436
R21-DS: West Biofuels - Hat Creek Bioene 2,089 2,089
WDT-ISPReStudy: Strauss Wind Energy, LLC (19,962) (19,962)
EGI: Forbestown PH - SFWPA - Testing 342 342
WDT-SIS:Soltage,LLC-BradleyGillettSolar1 (2,016) (2,016)
R21-DS-BASSLAKEJOINTELESchApp55332RESBCT (5,338) 5,338
R21DIS:CityofMaderaRES-BCT (App 54517) (4,731) (4,731)
WDT-SIS:Soltage,SanArdoPineValleySolar1 (4,391) (4,391)
Rule21:DS-MMRConsWAWONAFROZENFOODS-50318 (52,737) 52,737
WDT-FT-SolarElectricSolution-SEPVBarbar3 84 84
R21:DS-EL DORADO IRRIGATION DISTRICT (6,568) 6,568
R21DIS:CA DEPT of CORRECTIONS(App55059) (52,125) 52,125
WDT-FT-WildcatRenewableRPSantaCruzSolar1 753 (1,553) (800)
WDT-FT-WildcatRenewableRPSantaCruzSolar2 825 (1,625) (800)
Rule21:DS-JKB EnergySierraPacificAP55806 (51,997) (51,997)
WDT-FT-ApexEnergySolutionsGasCoRdSolar1 (655) (655)
MMA #5 - Q1036 Mustang 2 - ISO 51601 (181) (181)
WDT-SR-GoldenStateReneEng-GSRETurkIsland (2,500) 2,500
Rule21:DS-DeltaDiabloCo-Digestion1968-RD (3,390) 3,390
WDT-FastTrack-Universal Solar-USPPGE9918 (664) 664
WDT-FastTrack-Universal Solar-USPPGE8918 (664) 664
WDT-FastTrack-Universal SolarUSPPGE-7918 (801) 801
WDT-FastTrack-Universal Solar-USPPGE6918 (879) 879
WDT-FastTrack-Universal Solar-USPPGE4918 (879) 879
WDT-FastTrack-Universal Solar-USPPGE3918 (515) 515
WDT-Fas Track-Universal Solar-USPPGE2918 (801) 801
WDT-Fast Track-UniversalSolar-USPPGE1918 (262) 262
WDT-FT-NatelEnergyc/oKinetMurphyHydro (317) 317
WDT-FT-RENESOLAPOWERHOL-OspreySolar 282 (282)
WDT-PS-UticaWater&Power(UWPA)-AngelPower (1,640) 1,640
WDT-FT-ReneSolaPowerHoldingsTaylorSolar 509 509
R21-Detailed Study-STAMOULES PRODUCE (6,900) 6,900
Rule21DSBerryPetroleumCompy-BerryCogen18 538 538
WDT#SR-CITYOFHAYWARDHaywardEBCEArray (2,500) 2,500
MMA-Q1278-Westwood Energy Ctr-ISO 52013 5,059 5,059
WDT:FT - Pine Flat Solar 1 - Apex Energy (475) 475
WDT:FT - Merced 3 - Apex Energy (282) 282
WDT-FastTrack-Calcom Solar-Sycamore-Napa 3,853 3,853
WDT-SIS- Kent Solar-LLC-KS Energy 4,336 4,336
WDT-SR-RenewableRPSantaCruzSolarQ2031WDT (472) 472
WDT-SR-RenewableRPSantaCruzSolar1Q2030WD (472) 472
R21#Detailed Study-Superior Packing Co. (7,323) (7,323)
R21:DS:NextEraEnerg114971313DGCAWestside (54,588) 54,588
WDT-ISP/FCDS-DGCali-YubaCityEnergyStorag (8,166) (8,166)
R21-DS: CH4 Green Energy CDE 4 2,009 2,009
WDT:FT - Corda I - Cratus Energy Mgmt 1,076 (1,076)
WDT:FT - Corda II - Cratus Energy Mgmt 1,076 1,076
WDT:FT - Gonzales - FFP CA Com Solar (455) 455
WDT:FT - Washoe Ave - FFP CA Com Solar 3,550 3,550
Name of Respondent
PACIFIC GAS AND ELECTRIC COMPANY
This Report is:(1) X An Original(2) A Resubmission
Date of Report(Mo, Da, Yr)
04/13/2021
Year/Period of Report
2020/Q4
FOOTNOTE DATA
FERC FORM NO. 1 (ED. 12-87) Page 450.8

WDT:SR - Osprey Solar - Renesola Power (2,392) 2,392
R21-DS: WonderfulPistachios&Almonds66478 (49,389) 201 49,188
R21-DS: Wonderful Pistachios & Almonds (9,295) (9,295)
MMA2 - Q1106 Fountain Wind - ISO 51770 (60) (60)
WDT:ISP - Tranquility - FFP CA Com Solar (6,971) 6,971
WDT:ISP - Munoz - FFP CA Com Solar (4,827) (4,827)
R21-DS: WonderfulPistachios&Almonds67792 (4,837) (4,837)
WDT:SR - 2040-WD - Gas Co Road Solar 1 306 306
R21:DS - City of San Jose (App 68019) (55,283) 3,759 (51,524)
WDT:ISP - Leo Solar - Apex Energy (7,979) (7,979)
R21:DS - RWA/UCM Cogen-Merced Co RWM (10,000) 10,000
R21-DS: MacphersonOil-RoundMountainSolar (10,000) 12,441 2,441
WDT-SR: SycamoreGroup-SycamoreNapa2066WD (1,742) (1,742)
WDT–FillInStudyReneSolaPowerTaylorSolar (2,210) (2,210)
MMA1 - Q1239 Medeiros Solar - ISO 40030 5,417 3,906 9,323
WDT-FT-ApexEnergySolutionsPineFlatSolar2 (824) (824)
WDT-FT-ApexEnergSolutionGasCoRoadSolar2 (557) (557)
WDT-SR-SolarElectricSolutionSEPVBarbara3 (2,282) (2,282)
WDT–SR-Kinet Inc-Murphys Afterbay Hydro 3,643 (1,143) 2,500
Rule21:DS-GRANITEROCKCOMPANY(App69212) (1,756) (1,756)
WDT:SR-Manning Avenue-FFP CA Com Solar (1,705) 1,705
Rule21-DS-ChicoElectricRoplastApp#4959 (1,716) (1,716)
WDT-FT-Apex Energy Solutions-Lara Solar (284) (284)
WDT-FT-Apex Energy Solutions-Leo Solar2 (749) 749
WDT-FT-FFPCACommunitySolarBroadman2 (782) (782)
WDT-SR-ApexEnergySolutionsPineFlatSolar1 (1,670) 1,670
Rule21DS-GOLDENSTATEFC-App71807 (767) (767)
WDT-FT-ApexEnergySolutionsPineFlatSolar3 (697) 697
WDT-FT-UniversalSlAircoupeSolar3((30N27) 36 36
WDT:SR - 2083-WD-Corda 1 - Cratus Energy (578) 578
WDT:SR - 2084-WD-Corda II-Cratus Energy (578) (578)
WDT-FT-ApexEnergySolutionsLLCLeoSolar3 (636) (636)
WDT:FT - WHI Solano R&D - Wind Harvest (1,000) 1,000
R21:DS - Fowler Packing Co - App 76191 (7,678) (7,678)
R21:DS - Fowler Packing Co - App 76185 (5,408) (5,408)
WDT:SIS - Osprey Solar - Renesola Power (1,127) 1,127
MMA1 - Q1010-Dyer - ISO 51539 (392) 799 407
WDT-FillInStudyApexEnergySolutiJadeSolar (9,237) (9,237)
WDT-SR-FFPCACommunitySolar-WashoeAvenue (918) (918)
WDT-SR-ApexEnergySolutionsGasCoRdSolar2 (2,112) (2,112)
WDT–SIS-ApexEnergySolutioGasCoRoadSolar1 (4,984) (4,984)
WDT-ISP-CES Electron Farm One,LLC 44 44
WDT–SIS-ReneSolaPowerHoldingLLCBroadman2 (5,184) (5,184)
WDT-Fast Track-Division Solar-Lake Solar (554) (554)
WDT-IS-RenewablPropertiesLakeHermanSolar (2,288) (2,288)
Rule21DS-ATS-KaiserDublinHUBCancerCenter (3,374) (3,374)
WDT-SR-ApexEnergySolutionsLeoSolar3 (2,500) (2,500)
WDT:FT - Corda III - Cratus Energy Mgmt 348 348
WDT:FT - Lara Solar - Apex Energy Solar (53) (53)
WDT-FT-EDFRenewablesEDF-DSSeaBreezeSolar 6,059 6,059
WDT-FT-Elie MehrdadTrustsolaparkphaseA 44 44
MMA - Q1363-Sandhill C - ISO 53028 (281) (281)
WDT-SIS-CratusEnergyManagementCorda1 3,567 (3,567)
WDT-SIS-CratusEnergyManagementCorda2 (7,067) (7,067)
Name of Respondent
PACIFIC GAS AND ELECTRIC COMPANY
This Report is:(1) X An Original(2) A Resubmission
Date of Report(Mo, Da, Yr)
04/13/2021
Year/Period of Report
2020/Q4
FOOTNOTE DATA
FERC FORM NO. 1 (ED. 12-87) Page 450.9

Rule21:DS-SUNNYGEMLLC(App 84294)NEMExP (8,024) (8,024)
WDT-SIS-FFPCACommunitySolarWashoe Avenue 2,328 2,328
WDT-IS-Cratus Energy MGMT-Corda IV (3,461) (3,461)
WDT-IndepFullCapacity-VESI10-ErisStorage (50,554) 785 (49,769)
WDT–IS-esvolta-lp-TierraRobleEnerStorage (53,693) (53,693)
WDT-FT-RenewableProper-SoscolFerrySolarA 176 176
WDT-FT-RenewableProper-SoscolFerrySolarB 176 176
WDT-FT-RenewableProp-ByronHotSpringSolar 552 552
Rule21:DS-UNIVERSITYOFTHEPACIFICApp83342 (2,011) 1,234 777
WDT-IS-JATONLLC-KecksRoadSolarFacility (7,851) (7,851)
WDT-FT-RenewableProperti-WilsonHillSolar 1,043 1,043
Rule21-DetailedStud-SpecialtyGranulesINC (13,633) (13,633)
R21:DS - SunWest Bioenergy - 2076-RD (9,629) 784 (8,845)
WDT:FT-Gas Co Road Solar 3-Apex Energy (1,000) (1,000)
WDT:FT-Gas Co Road Solar 4-Apex Energy (1,000) (1,000)
WDT:SIS-Gas Co Road Solar 2-Apex Energy (8,749) (8,749)
MMA - Q1143-Alpaugh Storage - ISO 51720 (60) (60)
R21:DS - Specialty Granules - 1912-RD (13,693) (13,693)
WDT-FTCratusEnergyManagement-Mendoza 269 269
WDT-Cluster12-CalPine-CalSunSolar2004-WD (49,824) (49,824)
WDT–FullCapacity-VESI11LLC-Eris Storage (49,783) (49,783)
WDT:ISP-Redwood Coast Airport Microgrid (1,665) (1,665)
WDT-FT-GoldenStateRenewable-HuronStorage (101) (101)
WDT-IS-esvolta-lpTierraRobleIIEngStorage (55,521) 4,260 51,260
Rule21:DGS-CorcoraIrrigationDistrict-5MW (6,682) 6,979 297
WDT–SR-ZGlobal-Lara Solar 2 (2142-WD) 975 975
Rule21:Detailed Study-City of Manteca (2,741) 801 (1,940)
WDT-SR-RenewableProperti-WilsonHillSolar 1,184 1,184
WDT–IS-SunPower-UCSFDentalClinics/Cogen (57,974) 184 57,790
Rule21-DS-GRIMMWAYENTERPRI-11412MALAGARD (4,774) 786 (3,988)
WDT-FTBloomENGPosoCreekFamilyDairyBiogas (753) (753)
WDT-ISBloomENGSouthpointRanchDairyBiogas (5,112) 1,255 (3,857)
WDT–SR-RenewableProper-SoscolFerrySolarB (1,814) (1,814)
WDT–SR-RenewableProper-SoscolFerrySolarA (1,814) (1,814)
WDT-SR-RenewablePro-ByronHotSpringsSolar (1,814) (1,814)
MMA-Q1269 Capetown Wind (BESS)-ISO 51972 1,230 1,230
EGI:Facilities Study - Santa Clara Wind (4,287) 941 (3,346)
EGI:Facilities Study - Forebay Wind (3,463) 528 (2,935)
Rule21-DS-Windpower-Dole5.6MWWindTurbine (52,588) 52,588
WDT-FT-SunwalkerEnergy-ByronSolarFarmLLC 3,108 (3,108)
Rule21:DS:MESAWater-BerrendaMWD-StationA (54,423) 4,493 (49,931)
EGI:Facilities Study - Collins Pine Co. 5,835 5,835
Rule21:DS-CALIFORNIARESOURCESCORPORATION (9,325) (9,325)
Rule21-DS-TIMIRAN INC-Huller Add-On (4,569) (4,569)
WDT-Clu12FCDS-Solvida-PutahCreekFarNorth (49,929) 145 (49,785)
WDT-IS-ConflittiEnergy-CESElectroFarmOne (9,167) 6,137 (3,030)
MMA - Q1235 Hudson Solar 1 - ISO 51904 (192) (192)
Rule21:DetailedStudy-WAL-MART STORES INC (8,525) (8,525)
WDT–SR-ApexEnergySolutionGasCoRoadSolar3 2,510 2,510
WDT–SR-ApexEnergySolutionGasCoRoadSolar4 (811) (811)
CCSF Warnerville Sub Rehab (35,043) (35,043)
WDT-SR-EDFRenewables-EDFDSSeaBreezeSolar 2,284 2,284
Rule21:DS-FallRiverRCD-McArthurBioenergy 4,702 872 5,574
WDT-IS-Dimension CA 1 LLC-G3FarmingTrust (47,140) (47,140)
Name of Respondent
PACIFIC GAS AND ELECTRIC COMPANY
This Report is:(1) X An Original(2) A Resubmission
Date of Report(Mo, Da, Yr)
04/13/2021
Year/Period of Report
2020/Q4
FOOTNOTE DATA
FERC FORM NO. 1 (ED. 12-87) Page 450.10

NextEra Honey Lake Solar DTT 1,155 1,155
Rule21:DS-OLAM WEST COAST-Olam-Firebaugh (2,254) 2,123 (132)
WDT-IS-SonomaValleySVUSDBusBarnCAISO (9,052) (9,052)
WDT-FT-RenewableProper-SoscolFerrySolarC (411) (411)
WDT-FT-RenewableProper-SoscolFerrySolarD 496 496
WDT–SIS-RenewablePr-ByronHotSpringsSolar (6,706) (6,706)
Rule21:DS-RWA/UCMCOGENERATION(App104269) (7,618) 7,575 (42)
Rule21:DS-RWA/UCMCOGENERATION(App104272) (10,000) (10,000)
Rule21:DS-CityofMaderaWWTP-RES-App103889 (638) (638)
WDT-EIT-Byron Solar Farm LLC 2 5,192 2,000 (7,192)
WDT-SR-Bloom-PasoCreekFamilyDairyBiogas (1,815) (1,815)
MMA-Q557-CED White River West2-ISO 50555 (1) (1)
Rule21:DS-LionBrotherNewstone(App106347) (3,954) 1,939 (2,015)
WDT-EIT/SIS-ApexEnerg-LaraSolar2-2142-WD (5,171) 453 (4,718)
WDT-IS-EC&R SolarDevelopment LLC-Lipizan (57,578) (57,578)
WDT-FT-Renewable-HatcheryRoadSolarB 489 489
WDT-FT-Renewable-HatcheryRoadSolarA 489 489
WDT-SR-Renewable-Soscol Ferry Solar D (1,862) (1,862)
WDT-SR-Renewable-Soscol Ferry Solar C (1,419) (1,419)
WDT-SR-DivisionSolar-Lake Solar(2137-WD) (2,021) (2,021)
WDT-FT-NapaJamiesoCanyon-NapaSelfStorage 3,587 3,587
WDT-FT-GCLNewEnergyHartleySubstation 228 228
WDT-FT-GCLNewEnergyPlumasSubstation 163 2,371 2,534
WDT-FT-Dimension CA1-CA-19-0024-Jorge (99) (99)
WDT–ISP-ApexEnergySoluti-GasCoRoadSolar3 (8,325) (8,325)
WDT-ISP-ApexEnergySolutio-GasCoRoadSola4 (7,677) (7,677)
Rule21:DS-Main Campus Solar (App 111253) (7,379) 4,630 (2,749)
Rule21:DS-DREYERSNestleBakersfiApp111016 (10,000) 12,643 2,643
R21-DS-J R SIMPLOT COMPANY INC (9,463) 5,779 (3,684)
WDT-FT-SaltbrushPlainsLLC-SaltbrushPlain 374 374
Rule21-DS-GCLNew-2199-RDBESSGonzaleBank3 (7,832) (7,832)
Rule21-DS-GCLNew-2200-RDBESSGonzaleBank4 (7,464) 185 (7,279)
Rule21-DS-CARESOURCESPRODUCTI-CRC-MtPoso (59,188) 7,537 (51,651)
Rule21-DS-PlanetaryVentureMFABayviewFac (9,456) 1,176 8,281
WD-FT-SonomaUniScho-SVUSD-BusBarnCAISOII 3,558 6,944 10,502
Rule21-DS-FostPoulFmsFosterTravelFeedMil (9,830) 4,440 (5,390)
Rule21-DS-FresnoFarming-FosterBelgravia (9,830) 1,108 (8,722)
WDT-SR-RenewableProp-HatcheryRdSolarA 1,836 603 2,439
WDT-SR-RenewableProp-HatcheryRdSolarB 2,196 603 2,799
Rule21-DS-SFSpiceCo-BrightPeopleFoods (4,342) 1,477 (2,865)
Rule21-DS-TracyDesalinationProj116685552 (9,282) 7,933 1,349
WDT-FT-RenewablePropByronHighwaySolar (5,260) 1,391 (3,868)
WDT-FAS-RedwoodCoastAirportMicrogrid (13,989) (13,989)
MMA-Q779-WRIGHT SOLAR-ISO 50712 33,442 (30,480) (2,962)
Rule21-DS-Toma Tek Inc (9,101) 11,440 2,339
Rule21-DS-Amazon.com-Amazon BFL1 (7,203) 2,594 4,610
Rule21-DS-AriesLostHillsBioenergy (10,000) 4,648 5,352
WDT-FT-GoldenStateRenewEnergy-ColmaSolar 328 339 667
WDT-FT-Vesi14LLC-CeresEnergyStorage (58,593) 13,000 (45,593)
WDT-FT-ColdwellSolar1,LLC,RobinsonSolar 4,136 907 5,043
WDT-FT-Dimension CA 1 LLC-Jacobs 1 2,186 2,186
WDT-FT-Dimension CA 1 LLC-Jacobs 2 1,480 1,480
WDT-FT-ApexEnergySolutionsLLC-JadeSolar3 3,512 1,167 4,678
MMA-Q1441-Kernridge Expansion-ISO 43007 4,458 466 4,924
Name of Respondent
PACIFIC GAS AND ELECTRIC COMPANY
This Report is:(1) X An Original(2) A Resubmission
Date of Report(Mo, Da, Yr)
04/13/2021
Year/Period of Report
2020/Q4
FOOTNOTE DATA
FERC FORM NO. 1 (ED. 12-87) Page 450.11

WDT-SR-SonomaUniSch-SVUSD BusBarnCAISO (572) (572)
MMA-Q1272-Cascade Energy Storage-ISO 519 323 323
WDT-SR-NapaJamiesonCnynNapaSelfStorage2 (671) (671)
WDT-FT-Hayworth/Fabian LLC-Oakley 3 (326) (326)
WDT-FT-Dimension CA 1 LLC-Henrietta 1,918 1,918
WDT-FT-Dimension CA 1 LLC-Wellfield 779 779
WDT-FT-Dimension CA 1 LLC-EMH (59,780) 15,517 44,262
WDT-FT-GclSysIntegrn-BessUpperLake 1,046 933 (1,980)
WDT-FT-GclSysIntegrn-BessWillits 541 (541)
WDT-FT-GclSysIntegrn-BessMolino 1,046 (1,046)
WDT-FT-GclSysIntegrn-BessHopland 1,046 933 (1,980)
WDT-ISP-Dimension CA 1 LLC-Jorge (9,326) 10,577 1,250
WDT-FT-Dimension CA 1 LLC-Mendoza 935 935
EGI:FacilitiesStudy-sPowerAltamontMidway (8,570) 1,488 (7,082)
WDT-SR-ColdwellSolar1,LLC-Robinson Solar (2,500) (2,500)
MMA-Q1028 & Q1029-Little Bear1-ISO 51587 720 240 (960)
MMA-Q1235-Hudson Solar 1-ISO 51904 773 113 (886)
WDT-FT-ApexEnergySolutions-NicoleSolar1 1,193 1,401 (2,594)
WDT-FT-ApexEnergySolutions-NicoleSolar2 313 302 (615)
WDT-FT-ApexEnergySolutions-PineFlat1 581 790 1,370
WDT-FT-ApexEnergySolutions-PineFlat2 1,021 605 1,625
Rule21-DS-GILLIG LLC-GILLIG LLC (10,000) (10,000)
WDT-SR-GclSysIntegTechnology-BessPlumas (2,500) 576 (1,924)
WDT-FT-GclSysIntegTechgy-MarysvilleBESS (1,000) 462 (538)
WDT-FT-GclSysIntegTechgy-Cotati BESS (833) 737 (96)
WDT-FT-ZeroEngyCnstFallonTwoRockRdSolar (833) 340 (493)
WDT-FT-DimensionCA1AlpaughDacSolar1103 144 144
WDT-FT-GldnStatRnwEngyGsreColmaStorage 1,296 2,673 (3,969)
Rule21-GoldenStateFcLlc-SCK1 Amazon (9,334) 5,978 (3,356)
WDT-FT-GldnStatRnwEngy-ColmaLithiumIon 917 (917)
Rule21:DS:SENTINELPEAKRESCA-HopkinsSolar (10,000) 1,271 (8,729)
WDT-FT-Borrego-EarthquakeProtnSystems (10,000) 12,982 2,982
MMA-Q1036-RE Mustang 2-ISO 51601 480 2,584 (3,064)
WDT-SR-GsrEnergy-GsreColmaSolar2317-WD (1,047) (1,047)
MMA-Q877-CA Flats-ISO 51211 533 6,815 7,348
WDT-ISP-FresnoDisadvantagedCommunitySola (70,000) 11,522 (58,478)
WDT-SR-ApexEnergySolutions-JadeSolar3 (2,500) (2,500)
WDT-EIT--RenewableProp-HatcheryRdSolarB (8,708) 861 (7,847)
WDT-EIT--RenewableProp-2296WDByronHwy 1,190 3,625 4,815
WDT-EIT--RenewableProp-HatcheryRdSolarA (8,708) 861 (7,847)
Rule21-DS-Chevron-LostHills_Storage (84,000) 18,466 (65,534)
WDT-SR-GclNewEnergyBessLuchettiQ#2299-WD 1,349 (2,500) (1,151)
WDT-CSP-Carbonera-Carbonera3HybridSolar 696 (696)
WDT-SR-Hayworth/Fabian-Oakley3#2333-WD (2,500) 1,260 (1,240)
WDT-ISP-Dimension CA 1 LLC-Mendoza (10,000) 8,059 (1,941)
WDT-ISP-Dimension CA 1 LLC-Henrietta (10,000) 6,606 (3,394)
MMA-Q1103-Central 40-ISO51821 261 3,343 3,604
MMA-Q1117-Aquamarine Westside-ISO51817 261 890 1,151
MMA-Q1141-Alamo Springs 1-ISO51745 355 5,625 (5,980)
MMA-Q1157-Alamo Springs 2-ISO51708 355 4,502 (4,857)
MMA-Q1242-Pluot-ISO52008 261 234 495
MMA-Q1391-Sonrisa-ISO53017 1,046 6,635 (7,335) 346
MMA-Q272-American Kings Solar-ISO50212-C 434 (434)
MMA-Q779-Wright Solar-ISO50712 439 6,390 (5,355) 1,474
Name of Respondent
PACIFIC GAS AND ELECTRIC COMPANY
This Report is:(1) X An Original(2) A Resubmission
Date of Report(Mo, Da, Yr)
04/13/2021
Year/Period of Report
2020/Q4
FOOTNOTE DATA
FERC FORM NO. 1 (ED. 12-87) Page 450.12

MMA-Q946-Northern Orchard Solar-ISO51400 1,821 6,246 (8,067)
MMA-Q954-Fifth Standard Solar-ISO51419 1,649 6,254 (7,902)
MMA-Q1036-Mustang 2-ISO51601 267 872 (1,139)
MMA-Q1223-American kings 9-ISO51935 173 5,899 (6,072)
MMA-Q1259-NorthernOrchardSolar2-ISO51918 173 (173)
MMA-Q1350-Beltran Central Solar-ISO53069 267 12,546 12,813
MMA-Q1379-Heartland 1-ISO53048 267 10,466 (8,139) 2,593
MMA-Q1380-Hearland 2-ISO53042 958 9,378 (7,570) 2,766
MMA-Q1382-Las Camas 1-ISO53030 2,773 6,817 (9,236) 354
MMA-Q1455-Janus-ISO53174 1,130 6,517 (7,647)
MMA-Q643W-Re Mustang-ISO50630 267 5,869 (4,897) 1,239
MMA-Q643X-Re Tranquility-ISO50647 958 5,518 (5,057) 1,419
MMA-Q1120-Chestnut Westsdie-ISO51818 267 392 659
MMA-Q1129-Luna Valley-ISO51746 (Batch) 267 13,320 (7,139) 6,448
MMA-Q1139-Westlands Solar Blue-ISO51815 267 400 667
MMA-Q1244-Proxima Solar-ISO51980 267 11,653 (11,920)
MMA-Q1392-Warriors Solar-ISO53025 355 2,830 (3,185)
MMA-Q1394-Driftwood Stella-ISO53051 355 4,834 (5,189)
MMA-Q1397-Sandrini Sol 1-ISO53026 1,046 3,942 (4,988)
MMA-Q1443-Angela-ISO53205 267 7,385 (7,651)
MMA-Q1444-Beauchamp Solar-ISO53234 267 4,645 (4,911)
MMA-Q1456-Las Camas 3-ISO53203 1,218 5,175 (6,040) 354
MMA-Q1493-Azalea-ISO53229 267 3,841 (4,107)
MMA-Q1499-Jasmine-ISO53164 267 4,035 (4,301)
WDT-ISP-Dimension CA 1 LLC-Jacobs 1 (10,000) 7,284 (2,716)
WDT-ISP-Dimension CA 1 LLC-Wellfield (10,000) 13,127 (3,127)
WDT-ISP-DimensionCA1-AlpaughDacSolar1003 (10,000) 6,723 (3,277)
WDT-ISP-Dimension CA 1 LLC-Jacobs2 (10,000) 7,146 (2,854)
WDT-SR-Q#2352-WD GSRE Colma Storage (2,500) 1,743 757
WDT-SR-Q#2342-WD BESS Upper Lake (2,500) 737 (1,763)
WDT-SR-Q#2343-WD BESS Hopland (2,500) 2,035 (465)
WDT-SR-Q#2344-WD BESS Willits (2,500) 1,223 (1,277)
WDT-SR-Q#2345-WD BESS Molino (2,500) 1,223 (1,277)
WDT-SR-Q#2354-WD BESS Johnson (2,500) (2,500)
WDT-SR-Q#2356-WD BESS Lafford (2,500) 1,290 (1,210)
WDT-FT-GldnStRenewEngr-DalyCityStorage 704 (1,000) (296)
WDT-FT-Borrego-NorthCoastHwySolar1 890 (890)
WDT-FT-Borrego-NorthCoastHwySolar2 813 (357) 456
WDT-SR-Q#2288-WD Saltbrush Plains (2,500) 1,912 (588)
MMA-Q272-American Kings-ISO50212-C 320 2,833 (3,152)
Rule21-DS-Wonderful Firebaugh 4,764 (10,000) (5,236)
R21-App141055-Wonderful Kings 1,564 (10,000) (8,436)
R21-DS-App142457AtwaterWWTP-ResBctSystem 12,458 (10,000) 2,458
R21-DS-App142877-Sunnygem Huller 686 (10,000) (9,314)
WDT-FT-Victoria Lane Solar 737 (1,000) (263)
WDT-FT-River Bar Road Solar A 1,257 (1,000) 257
WDT-FT-River Bar Road Solar B 1,257 (1,000) 257
R21-DS-App143441-Danell Bros Inc 5,015 (10,000) (4,985)
MMA-Q1010-DyerSummitWindRepower-ISO51539 392 (392)
WDT-SR-Q#2365-WD-FallonTwoRockRoadSolar 553 (2,500) (1,947)
MMA-Q1111-DiabloEngy/BlckDiamnd-ISO51798 5,924 5,924
WDT-FT-TrueLeafInterconnectionExport 604 (1,000) (396)
R21-DS-2291RD-CalResourcesProductionCorp 4,044 (10,000) (5,956)
R21-DS-2300RD-CRC Yowlumme 2 South 2,447 (10,000) (7,553)
Name of Respondent
PACIFIC GAS AND ELECTRIC COMPANY
This Report is:(1) X An Original(2) A Resubmission
Date of Report(Mo, Da, Yr)
04/13/2021
Year/Period of Report
2020/Q4
FOOTNOTE DATA
FERC FORM NO. 1 (ED. 12-87) Page 450.13

WDT-FT-GSRE Clear Lake Solar 75 (29) 47
WDT-FT-ApexEnergySolutions-LeoSolar1 (1,000) (1,000)
WDT-FT-ApexEnergySolutions-LeoSolar2 (1,000) (1,000)
R21-DS-152525-CaResrcesPrdn-SW 24 28 27 13,342 (86,000) (72,658)
WDT-FT-Electra SES 1-Electra SES 1 576 (576)
WDT-SR-2399WD-NorthCoastHwySolar 1 1,183 (1,183)
WDT-SR-2400WD-NorthCoastHwySolar 2 922 (922)
WDT-SR-Q#2366-WD-GSRE ColmaSolarIon 3,218 (3,218)
R21-DS-155121-Wonderful HS 192 (10,000) (9,808)
MMA-Q1270-Corby-ISO51915 167 (167)
MMA-Q1350-BeltranCentralSolar-ISO53069 167 (167)
R21-DS-154968-Sealed Air Madera 5,867 (10,000) (4,133)
MMA-Q1472-Dallas Energy Storage-ISO53162 16,596 16,596
R21-DS-153273-SCIF- Vacaville Carports 2,947 (10,000) (7,053)
WDT-IS-2299WD-BESS Luchetti 6,838 (10,000) (3,162)
WDT-ISP-Vesi11 LLC-Eris Storage 1,229 (58,000) (56,771)
WDT-FT-CMSA CogenSystemUpgrade 459 (459)
WDT-SR-2417WD-TrueLeafIntconnectionExpt (2,500) (2,500)
WDT-ISP-2313WD-BessPlumas 1,167 (10,000) (8,833)
WDT-ISP-2354WD-BESS Johnson 5,380 (10,000) (4,620)
WDT-ISP-2356WD-BESS Laffond 711 (10,000) (9,289)
R21-DS-159578-CityofMaderaWWTP RES-BCT 8,011 (8,011)
WDT-FT-GSRE Clear Lake 1,106 (1,106)
WDT-ISP-Saltbrush 10 16,174 (60,000) (43,826)
WDT-ISP-DimensionCA1LLC-CorcoranBESS 184 (184)
MMA-Q1136-Westlands Almond-ISO51828 10,300 (10,300)
R21-DS-2387RD-HalliburtonEnergyServices 5,040 (5,040)
WDT-ISP-2343WD-BESS Hopland 3,818 (10,000) (6,182)
WDT-ISP-2342WD-BESS Upper Lake 4,252 (10,000) (5,748)
WDT-C13 FCDS-Eris Storage (50,000) (50,000)
WDT-C13 FCDS-Saltbrush 10 517 (50,000) (49,483)
WDT-FT-Humboldt Community Solar 997 (1,000) (3)
WDT-ISP-Hatchery Road Solar C 7,848 (10,000) (2,152)
WDT-FT-Stockdale Dairy Biogas 576 (1,000) (424)
WDT-ISP-Hatchery Road Solar D 7,712 (10,000) (2,288)
MMA-Q1540-Plano Storage-ISO40047 1,664 1,664
MMA-Q1539-Irving Storage-ISO40046 1,667 1,667
R21-DS-APP162754-Mendota Hydrogen 2,180 (123,000) (120,820)
WDT-SR-2434WD-Leo Solar 1 1,810 (2,500) (690)
WDT-SR-2435WD-Leo Solar 2 1,810 (2,500) (690)
WDT-C13 FCDS-Stodola BESS 6,756 (50,000) (43,244)
WDT-CLUSTER-Stodola BESS 4,621 (60,000) (55,379)
WDT-FCDS-2378WD-EarthquakePrtnSyst 1,130 (50,000) (48,870)
MMA-Q1443-GentieLineRouteProp-ISO53205 7,576 (7,576)
WDT-ISP-Callisto2Storage50MW 155 (100,000) (99,845)
WDT-C13 FCDS-Callisto2Storage50MW 32,793 (50,000) (17,207)
WDT-ISP-North Coast Highway Solar 2 3,766 (10,000) (6,234)
R21-DS-Rodeo Solar-NextEraEnergy 5,376 (82,000) (76,624)
WDT-C13 FCDS-CliftonCourtSolar 234 (50,000) (49,766)
WDT-CLUSTER-CliftonCourtSolar 3,981 (10,000) (6,019)
R21-DS-ParreiraAlmondProcessingAddOn 5,333 (10,000) (4,667)
R21-DS-2404RD-Lindt&SprungliNorthAmerica 4,326 (10,000) (5,674)
MMA-Q1129-Luna Valley-ISO51746 (COD) 498 498
R21-DS-181109-CityOfAtwaterWWTP-NEMEXP 3,978 (10,000) (6,022)
Name of Respondent
PACIFIC GAS AND ELECTRIC COMPANY
This Report is:(1) X An Original(2) A Resubmission
Date of Report(Mo, Da, Yr)
04/13/2021
Year/Period of Report
2020/Q4
FOOTNOTE DATA
FERC FORM NO. 1 (ED. 12-87) Page 450.14

WDT-ISP-PV Byron EG-I 2,047 (2,047)
EGI:TO-FS-LSPGCGatesInterconnection 128,665 (50,000) 78,665
WDT-ISP-FS Solar LLC 533 (10,000) (9,467)
WDT-SR-2477WD-HumboldtCommunitySolar 1,034 (1,034)
WDT-SR-2469WD-GSRE Clear Lake Solar 1,326 (1,326)
R21-DS-168902-Bulseye Farms Huller 2,020 (2,020)
R21-DS-166625-Cabrillo College 3,317 (10,000) (6,683)
WDT-C13 FCDS-2226WD-CesElectronFarmOne (50,000) (50,000)
WDT-C13 FCDS-2322WD-CeresEnergyStorage 192 (50,000) (49,808)
WDT-FT-Freedom Pass Storage (150,000) (150,000)
WDT-C13 FCDS-Freedom Pass Storage 9,933 (50,000) (40,067)
MMA-Q267-Lodi Energy Center-ISO50204 1,192 1,192
WDT-SR-2472WD-Electra SES 1 2,002 (2,500) (498)
R21-DS-10695 DECKER AVE (10,000) (10,000)
R21-DS-Bakersfield College 992 (10,000) (9,008)
WDT-SR-2482WD-Stockdale Dairy Biogas 157 (2,500) (2,343)
WDT-FT-Callisto Storage 4 MW 647 (647)
R21-DS-168920-WonderfulPomBeverage 4,511 (10,000) (5,489)
R21-DS-174317-WonderfulPomJuice 1,669 (10,000) (8,331)
R21-DS-174316-WonderfulPomPlant 2 4,494 (10,000) (5,506)
MMA-Q1103-Central40(Modification)-ISO518 1,827 (1,107) 720
WDT-FT-Bar20 Biogas Fuel Cell 569 (1,000) (431)
R21-DS-175509-LegacyPackingDetailedStudy 4,800 (10,000) (5,200)
WDT-FT-119016704-Madena Solar 3 1,819 1,819
WDT-ISP-119016745-Madena Solar 1 10,528 (10,000) 528
WDT-ISP-119016822-Madena Solar 2 11,029 (10,000) 1,029
R21-DS-174371-Wonderful POM Plant 1 1,263 (10,000) (8,737)
WDT-FT-119036004-MarshallRanchFIT500KW 4,497 (4,497)
WDT-SR-2474WD-CMSA CogenSystemUpgrade 1,570 (1,570)
WDT-ISP-119057258-County Road 18 990 (10,000) (9,010)
WDT-ISP-119057480-Woodland Gravel Mine 503 (163) 340
WDT-ISP-2434WD-Leo Solar 1 1,433 (10,000) (8,567)
R21-DS-178632-CrainWalnutCWS2 NEMA 708 (10,000) (9,292)
WDT-ISP-2533WD-Madena Solar 3 1,488 (10,000) (8,512)
R21-DS-178840-TaftEnergyProjects-NEMMT 1,113 (10,000) (8,887)
WDT-ISP-119130671-UticaAveSolarFacility 9,025 (10,000) (975)
R21-DS-182177-Madera WWTP-NEMExp 3,174 (10,000) (6,826)
R21-DS-179034-SierraPacificInd-ChinCamp 14,649 (10,000) 4,649
R21-DS-2411RD-UC DavisArray2BldgE2.3 (10,000) (10,000)
WDT-FT-119164447-Glendale Drive Solar 1,127 (1,127)
R21-DS-164184-ArdaghMaderaSolarNEMA 20,026 (60,000) (39,974)
R21-DS-177618-BerkeleyLabPSPS-EmgPwr 17,607 (10,000) 7,607
EGI:TO-FS-LS Power-Round Mountain 165,874 (75,000) 90,874
WDT-ISP-119292303-ZGlobalElectraSES1 2,583 (10,000) (7,417)
WDT-ISP-119304283-Apex-Merced BESS 4,920 (10,000) (5,080)
R21-DS-185649-351BelleHavenDr-NEMexp 20,077 (58,000) (37,923)
WDT-ISP-119339344-Apex-Pine Flat 1 2,637 (10,000) (7,363)
WDT-ISP-119340651-Apex-Pine Flat 2 1,530 (10,000) (8,470)
WDT-SR-2517WD-Callisto Storage 4 MW 1,060 (1,060)
WDT-SR-2544WD-MarshallRanchFITsolar500KW 1,913 (1,913)
WDT-FT-119294847-RailroadWintersCleanPwr 284 (109) 175
R21-DS-119067993-CAB000.0, BAR20 1,606 (10,000) (8,394)
R21-DS-118650627-Anthony Vineyards 1,964 (10,000) (8,036)
WDT-FAS-2378WD-Creed Road Solar 1 (15,000) (15,000)
Name of Respondent
PACIFIC GAS AND ELECTRIC COMPANY
This Report is:(1) X An Original(2) A Resubmission
Date of Report(Mo, Da, Yr)
04/13/2021
Year/Period of Report
2020/Q4
FOOTNOTE DATA
FERC FORM NO. 1 (ED. 12-87) Page 450.15

WDT-ISP-119462082-505 Solar 1,492 (10,000) (8,508)
WDT-ISP-119516120-GibsonSolarProject 185 (185)
R21-DS-198456-SE SURFACE WTP NEMMT 13,968 (10,000) 3,968
R21-DS-198470-Clovis Regional WWTP NEMPS 12,218 (65,000) (52,782)
WDT-ISP-119563843-Pine Flat 3 591 (10,000) (9,409)
WDT-ISP-119563984-Pine Flat 4 987 (10,000) (9,013)
WDT-ISP-2469WD-GSRE Clear Lake Solar 74 74
WDT-SR-2556WD-Glendale Drive Solar 2,698 (2,500) 198
R21-DS-2534RD-WCW Selma Generator 1 353 (353)
WDT-ISP-119626368-Gibson Solar Project 3,131 (70,000) (66,869)
WDT-ISP-119068517-AlamedaGrantLineSolar1 923 (10,000) (9,077)
R21-DS-2521RD-WCW Parlier Generator 1 353 (10,000) (9,647)
MMA-Q1002-Lassen Lodge-ISO50773 329 329
R21-DS-201102-VerweyHanfordPhase2NEMExp 4,317 (10,000) (5,683)
MMA-Q1378-Gonzaga Wind-ISO53004 2,956 2,956
WDT-FT-119670387-DiscoveryBaySouthClnPwr 3,341 (1,000) 2,341
WDT-FT-119303619-RanchSerenoCleanPower 1,010 (915) 95
MMA-Q877-California Flats Solar-ISO51211 12,903 12,903
MMA-Q1367-WestFordFlatEngyStrg-ISO53078 751 (751)
WDT-FT-119687649-ApplegateCleanPowerOne (1,000) (1,000)
WDT-ISP-119699805-Merced 2 788 (10,000) (9,212)
WDT-ISP-119712209-Westside Solar Project 729 (10,000) (9,271)
WDT-FT-119687771-BethelIslandCleanPwrOne 1,361 (1,000) 361
WDT-FT-119700603-SVUSD Bus Barn 2,127 (1,000) 1,127
R21-DS-2546RD-Engeman SVRC Energy 791 (10,000) (9,209)
WDT-FT-119687890-Mantova Clean Power 2,019 (1,000) 1,019
MMA-Q1454-Hummingbird-ISO53156 1,415 1,415
WDT-ISP-119763998-Byron PV 2,104 (10,000) (7,896)
MMA-Q1493-Azalea-ToReduce BESS-ISO53229 1,556 1,556
MMA-Q779-Freeman Wright Solar-ISO50712 6,350 6,350
MMA-Q1391-Sonrisa-AddBattryEngy-ISO53017 5,531 5,531
MMA-Q643X-TranquilityLLC-ISO50647 5,432 5,432
EGI:TO-FS-VistraEnergy-Oakland ES Unit 2 17,406 (15,000) 2,406
WDT-SR-2590WD-RailroadWintersCleanPwr 1,620 (2,500) (880)
MMA-Q1374-Elkhorn Energy Storage-ISO5308 720 720
MMA-Q1117-Aquamarine-ISO51817 880 880
R21-DS-210197-TomaTek-Microgrid NEMMT 2,420 (50,000) (47,580)
WDT-FT-119867810-ValleysEdgeCleanPowerA (1,000) (1,000)
WDT-ISP-119916059-Alpaugh Dac Solar 810 (10,000) (9,190)
WDT-ISP-119916650-Jacobs Dac Solar 604 (10,000) (9,396)
WDT-ISP-119712090-Wellfield Dac Solar 563 (10,000) (9,437)
WDT-ISP-119916434-Henrietta Dac Solar 646 (10,000) (9,354)
Q1010-FS-Altamonts wind-Wind Study 12,456 12,456
R21-DS-118714831-NJUHSD_NevadaUnionHS 2,918 (10,000) (7,082)
WDT-FT-119927046-Foster Clean Power A 877 (2,000) (1,123)
WDT-FT-119927197-OrovilleDamCleanPower 78 78
R21-DS-210276-Resiliency-DeptOfTheArmy (10,000) (10,000)
R21-DS-220326-Amazon DUR3 NEMPS (10,000) (10,000)
WDT-ISP-119926766-Riosa Solar 134 (10,000) (9,866)
WDT-SR-2597WD-Ranch Sereno Clean Power 1,004 (2,500) (1,496)
MMA-Q539-Frontier Solar 1-ISO60070 480 480
R21-DS-228039-SonomaValleyHospital (10,000) (10,000)
MMA-Q1277-Mulqueeney-ISO51994 1,342 1,342
MMA-Q1459-MulqueeneyRanch2Prjts-ISO53184 583 583
Name of Respondent
PACIFIC GAS AND ELECTRIC COMPANY
This Report is:(1) X An Original(2) A Resubmission
Date of Report(Mo, Da, Yr)
04/13/2021
Year/Period of Report
2020/Q4
FOOTNOTE DATA
FERC FORM NO. 1 (ED. 12-87) Page 450.16

WDT-SR-2598WD-DiscoveryBaySouthCleanPwr (2,500) (2,500)
WDT-FT-119984380-ElDoradoParkCommSolar 537 (1,000) (463)
WDT-FT-119998837-Dos Palo Clean Power (1,000) (1,000)
WDT-SR-2609WD-Mantova Clean Power (2,500) (2,500)
WDT-SR-2603WD-BethelIslandCleanPowerOne (2,500) (2,500)
R21-DS-205844-AllanHancockCollege-NEMPS (10,000) (10,000)
R21-DS-229642-River Ranch -NEMA 1,980 (10,000) (8,020)
WDT-SR-2605WD-Applegate Clean Power 1 (2,500) (2,500)
R21-DS-120090412-LibertyPackingPowerGen (62,000) (62,000)
R21-DS-120112145-HighRollerDairyNEMA 1,076 (10,000) (8,924)
R21-DS232235-BellanaveRanch-SunnyCowNEMA (10,000) (10,000)
WDT-SR-2621WD-Oroville Dam Clean Power 67 (2,500) (2,433)
WDT-FT-120150141-West Tambo Clean Power 126 (1,000) (874)
R21-DIS-Syntech Bioenergy-Carriere Fam F (4,091) 4,091
R21-DS: TONY MEIRINHO DAIRY AND SONS 3,623 3,623
R21-DS: Marysville Joint Unified School (7,724) 7,724
R21-DS: County of Kern - Industrial (8,921) 8,921
R21-DS: County of Kern - Mt. Vernon (6,995) 6,995
Rule21:DSFresnoUnifiedSchoolSunnysideH.S (7,052) 7,052
Rule21DS-Re-evaluation-SanJoaquinCounty (7,373) 7,373
R21:FS - Abel Road Bioenergy - 1986-RD (15,000) (15,000)
Rule21-Detailed Study-FIRESTONEWALKERINC (7,543) (7,543)
Rule21-DS-7THSTANDARDRA-SunPacific-Lerdo (9,186) (9,186)
Rule21:DS-CALAMCO (1,226) (1,226)
Rule21:DS-WAL-MARTSTORES-WAL-MART#1608 (19,293) (19,293)
R21-FS-TLT Enterprises-HatCreekBioenergy (15,000) (15,000)
R21-DS-118550964-Crimson PV 1,402 (10,000) (8,598)
R21-DIS-Golden State FC-Golden State (768) 768
R21-DIS-Crimson Resources-Crimson Resour (2,936) 2,936
R21-EIT: SynTech-1627-RD Colusa Ind Park (2,138) 2,138
Total Generation (3,476,259) 2,177,288 (2,276,866) (3,575,837)
Name of Respondent
PACIFIC GAS AND ELECTRIC COMPANY
This Report is:(1) X An Original(2) A Resubmission
Date of Report(Mo, Da, Yr)
04/13/2021
Year/Period of Report
2020/Q4
FOOTNOTE DATA
FERC FORM NO. 1 (ED. 12-87) Page 450.17

Name of Respondent This Report Is:(1) An Original
(2) A Resubmission
Date of Report(Mo, Da, Yr)
Year/Period of Report
End of
OTHER REGULATORY ASSETS (Account 182.3)
PACIFIC GAS AND ELECTRIC COMPANYX
04/13/20212020/Q4
Line
No.
Description and Purpose of Debits CREDITSWritten off During
the Quarter/Year
Account Charged
(d)(c)(a)
Balance at end of
Current Quarter/Year
(e)
Other Regulatory Assets Written off During
the Period
Amount
(f)
1. Report below the particulars (details) called for concerning other regulatory assets, including rate order docket number, if applicable.
2. Minor items (5% of the Balance in Account 182.3 at end of period, or amounts less than $100,000 which ever is less), may be
grouped by classes.
3. For Regulatory Assets being amortized, show period of amortization.
Balance at
Beginning of
Current
Quarter/Year
(b)
18,272,457 14,507,7191,727,476,6494001,723,711,911PURCHASED GAS BALANCING ACCOUNT 1
Amortization : < 12 MONTHS 2
( 1,950,179) -482,7651,209,3124002,676,726BCA CHARGE ACCOUNT 3
Amortization : < 12 MONTHS 4
76,355,535 184,313,464560,461,952400668,419,881CA ALTERNATE RATES FOR ENERGY 5
Amortization : < 12 MONTHS 6
( 21,476,854) 2,805,782123,843,915400148,126,551CA ALTERNATE RATES FOR ENERGY PROGRAM-GAS 7
Amortization : < 12 MONTHS 8
29,500,846 35,081,76459,281,930182.364,862,848ELECTRIC HAZARDOUS SUBSTANCE BALANCING 9
Amortization : < 12 MONTHS 10
68,835,306 81,857,448138,324,503182.3151,346,645GAS HAZARDOUS SUBSTANCE BALANCING ACCOUNT 11
Amortization : < 12 MONTHS 12
303,612,079 102,048,6142,936,678,5734002,735,115,108CORE FIXED COST GAS BALANCING ACCOUNT 13
Amortization : < 12 MONTHS 14
( 34,665,239) 2,636,512149,459,286400186,761,037TRANSITION COST - NONCORE BALANCING ACCOUNT 15
Amortization : < 12 MONTHS 16
9,971,676 -6,231,977634,286,509400618,082,856CORE PIPELINE DEMAND CHARGE ACCOUNT 17
Amortization : < 12 MONTHS 18
8,772,763 10,164,87915,396,64040016,788,756CEE INCENTIVE ELECTRIC BALANCING ACCOUNT 19
Amortization : < 12 MONTHS 20
2,933,420 5,341,4342,768,5054005,176,519CEE INCENTIVE GAS BALANCING ACCOUNT 21
Amortization : < 12 MONTHS 22
3,859,012 1,926,918247,852,893400245,920,799GAS CORE FIRM STORAGE ACCOUNT 23
Amortization : < 12 MONTHS 24
( 616,011,174) -90,507,8343,253,378,3144003,778,881,654ENERGY RESOURCE RECOVERY ACCOUNT 25
Amortization : < 12 MONTHS 26
3,668,687 25,108,9852,421,02640023,861,324ENERGY RECOVERY BONDS BALANCING ACCOUNT 27
Amortization : < 12 MONTHS 28
23,546,613 35,248,425178,882,909555190,584,721ELECTRIC PRICE RISK MANAGEMENT - CURRENT 29
Amortization : NO STATED 30
34,959,214 33,963,9705,762,976228.44,767,732ENVIRONMENTAL COMPLIANCE NON-HSM 31
Amortization : 32 YEARS 32
233,466,150 243,800,39238,204,729182.348,538,971ENVIRONMENTAL COMPLIANCE 33
Amortization : 32 YEARS 34
( 30,778,807) -54,678,0035,797,213,7024005,773,314,506DISTRIBUTION REVENUE ADJUSTMENT MECHANISM 35
Amortization : < 12 MONTHS 36
( 526,402,269) -545,990,728437,566,333400417,977,874DEFERRED DEBIT - GAS RESERVES (CONTRA BALANCING 37
Amortization : < 12 MONTHS 38
( 68,843,767) -44,205,282212,690,752400237,329,237TRANSMISSION REVENUE BALANCING ACCOUNT 39
Amortization : < 12 MONTHS 40
( 49,216,013) -6,387,4331,747,54340044,576,123RELIABILITY SERVICES BALANCING ACCOUNT 41
Amortization : < 12 MONTHS 42
( 999,999,999) -154,420,746999,999,9994001,845,579,252ELECTRIC BALANCING ACCOUNT RESERVE ACCOUNT 43
FERC FORM NO. 1/3-Q (REV. 02-04) Page 232
44 TOTAL 7,027,240,817 72,728,023,105 16,056,902,40281,757,684,690
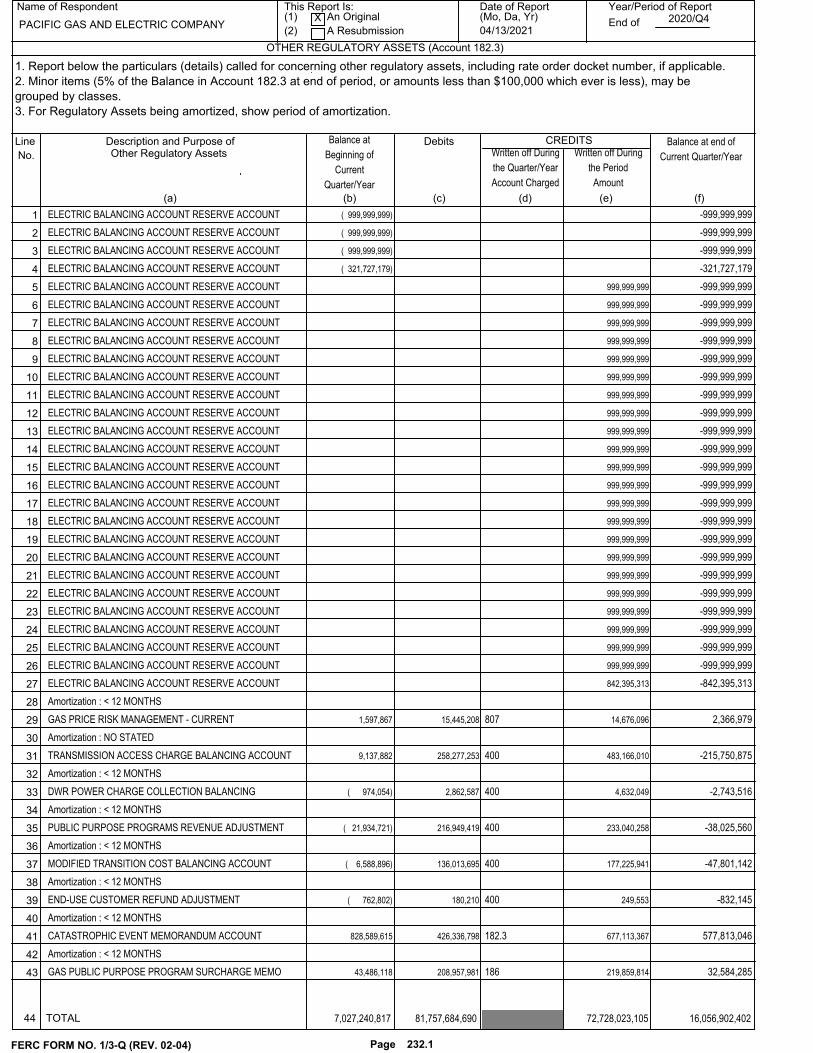
Name of Respondent This Report Is:(1) An Original
(2) A Resubmission
Date of Report(Mo, Da, Yr)
Year/Period of Report
End of
OTHER REGULATORY ASSETS (Account 182.3)
PACIFIC GAS AND ELECTRIC COMPANYX
04/13/20212020/Q4
Line
No.
Description and Purpose of Debits CREDITSWritten off During
the Quarter/Year
Account Charged
(d)(c)(a)
Balance at end of
Current Quarter/Year
(e)
Other Regulatory Assets Written off During
the Period
Amount
(f)
1. Report below the particulars (details) called for concerning other regulatory assets, including rate order docket number, if applicable.
2. Minor items (5% of the Balance in Account 182.3 at end of period, or amounts less than $100,000 which ever is less), may be
grouped by classes.
3. For Regulatory Assets being amortized, show period of amortization.
Balance at
Beginning of
Current
Quarter/Year
(b)
( 999,999,999) -999,999,999ELECTRIC BALANCING ACCOUNT RESERVE ACCOUNT 1
( 999,999,999) -999,999,999ELECTRIC BALANCING ACCOUNT RESERVE ACCOUNT 2
( 999,999,999) -999,999,999ELECTRIC BALANCING ACCOUNT RESERVE ACCOUNT 3
( 321,727,179) -321,727,179ELECTRIC BALANCING ACCOUNT RESERVE ACCOUNT 4
-999,999,999999,999,999ELECTRIC BALANCING ACCOUNT RESERVE ACCOUNT 5
-999,999,999999,999,999ELECTRIC BALANCING ACCOUNT RESERVE ACCOUNT 6
-999,999,999999,999,999ELECTRIC BALANCING ACCOUNT RESERVE ACCOUNT 7
-999,999,999999,999,999ELECTRIC BALANCING ACCOUNT RESERVE ACCOUNT 8
-999,999,999999,999,999ELECTRIC BALANCING ACCOUNT RESERVE ACCOUNT 9
-999,999,999999,999,999ELECTRIC BALANCING ACCOUNT RESERVE ACCOUNT 10
-999,999,999999,999,999ELECTRIC BALANCING ACCOUNT RESERVE ACCOUNT 11
-999,999,999999,999,999ELECTRIC BALANCING ACCOUNT RESERVE ACCOUNT 12
-999,999,999999,999,999ELECTRIC BALANCING ACCOUNT RESERVE ACCOUNT 13
-999,999,999999,999,999ELECTRIC BALANCING ACCOUNT RESERVE ACCOUNT 14
-999,999,999999,999,999ELECTRIC BALANCING ACCOUNT RESERVE ACCOUNT 15
-999,999,999999,999,999ELECTRIC BALANCING ACCOUNT RESERVE ACCOUNT 16
-999,999,999999,999,999ELECTRIC BALANCING ACCOUNT RESERVE ACCOUNT 17
-999,999,999999,999,999ELECTRIC BALANCING ACCOUNT RESERVE ACCOUNT 18
-999,999,999999,999,999ELECTRIC BALANCING ACCOUNT RESERVE ACCOUNT 19
-999,999,999999,999,999ELECTRIC BALANCING ACCOUNT RESERVE ACCOUNT 20
-999,999,999999,999,999ELECTRIC BALANCING ACCOUNT RESERVE ACCOUNT 21
-999,999,999999,999,999ELECTRIC BALANCING ACCOUNT RESERVE ACCOUNT 22
-999,999,999999,999,999ELECTRIC BALANCING ACCOUNT RESERVE ACCOUNT 23
-999,999,999999,999,999ELECTRIC BALANCING ACCOUNT RESERVE ACCOUNT 24
-999,999,999999,999,999ELECTRIC BALANCING ACCOUNT RESERVE ACCOUNT 25
-999,999,999999,999,999ELECTRIC BALANCING ACCOUNT RESERVE ACCOUNT 26
-842,395,313842,395,313ELECTRIC BALANCING ACCOUNT RESERVE ACCOUNT 27
Amortization : < 12 MONTHS 28
1,597,867 2,366,97914,676,09680715,445,208GAS PRICE RISK MANAGEMENT - CURRENT 29
Amortization : NO STATED 30
9,137,882 -215,750,875483,166,010400258,277,253TRANSMISSION ACCESS CHARGE BALANCING ACCOUNT 31
Amortization : < 12 MONTHS 32
( 974,054) -2,743,5164,632,0494002,862,587DWR POWER CHARGE COLLECTION BALANCING 33
Amortization : < 12 MONTHS 34
( 21,934,721) -38,025,560233,040,258400216,949,419PUBLIC PURPOSE PROGRAMS REVENUE ADJUSTMENT 35
Amortization : < 12 MONTHS 36
( 6,588,896) -47,801,142177,225,941400136,013,695MODIFIED TRANSITION COST BALANCING ACCOUNT 37
Amortization : < 12 MONTHS 38
( 762,802) -832,145249,553400180,210END-USE CUSTOMER REFUND ADJUSTMENT 39
Amortization : < 12 MONTHS 40
828,589,615 577,813,046677,113,367182.3426,336,798CATASTROPHIC EVENT MEMORANDUM ACCOUNT 41
Amortization : < 12 MONTHS 42
43,486,118 32,584,285219,859,814186208,957,981GAS PUBLIC PURPOSE PROGRAM SURCHARGE MEMO 43
FERC FORM NO. 1/3-Q (REV. 02-04) Page 232.1
44 TOTAL 7,027,240,817 72,728,023,105 16,056,902,40281,757,684,690

Name of Respondent This Report Is:(1) An Original
(2) A Resubmission
Date of Report(Mo, Da, Yr)
Year/Period of Report
End of
OTHER REGULATORY ASSETS (Account 182.3)
PACIFIC GAS AND ELECTRIC COMPANYX
04/13/20212020/Q4
Line
No.
Description and Purpose of Debits CREDITSWritten off During
the Quarter/Year
Account Charged
(d)(c)(a)
Balance at end of
Current Quarter/Year
(e)
Other Regulatory Assets Written off During
the Period
Amount
(f)
1. Report below the particulars (details) called for concerning other regulatory assets, including rate order docket number, if applicable.
2. Minor items (5% of the Balance in Account 182.3 at end of period, or amounts less than $100,000 which ever is less), may be
grouped by classes.
3. For Regulatory Assets being amortized, show period of amortization.
Balance at
Beginning of
Current
Quarter/Year
(b)
Amortization : < 12 MONTHS 1
( 124,810,083) -49,717,78232,545,734400107,638,035PROCUREMENT ENERGY EFFICIENCY REV. ADJ. 2
Amortization : < 12 MONTHS 3
6,968,547 11,579,1986,968,60140011,579,252FAMILY ELECTRIC RATE ASSISTANCE BALANCING ACCT 4
Amortization : < 12 MONTHS 5
999,999,999 1,031,935,86611,735,775182.343,671,642NEGATIVE ONGOING COMPETITION TRANSITION CHRG BA 6
999,999,999 999,999,999NEGATIVE ONGOING COMPETITION TRANSITION CHRG BA 7
999,999,999 999,999,999NEGATIVE ONGOING COMPETITION TRANSITION CHRG BA 8
257,964,695 257,964,695NEGATIVE ONGOING COMPETITION TRANSITION CHRG BA 9
Amortization : < 12 MONTHS 10
2,112,733 963,9352,112,733182.3963,935LAND CONSERV. PLAN ENV. REMEDIATION MEMO ACCT. 11
Amortization : < 12 MONTHS 12
9,003,658 13,715,3707,038,71140011,750,423CA SOLAR INITIATIVE THERMAL PROGRAM MEMO 13
Amortization : < 12 MONTHS 14
8,581,524 3,996,88711,834,549182.37,249,912DIABLO CANYON SEISMIC STUDIES BALANCING ACCT 15
Amortization : < 12 MONTHS 16
12,070,022 5,659,01329,799,05640023,388,047Wildfire Expense Memorandum Account - Gas 17
Amortization : > 12 MONTHS 18
14,575,884 14,490,21343,641,98240043,556,311Wildfire Expense Memorandum Account - Electric 19
Amortization : > 12 MONTHS 20
544,754,349 568,867,58089,144,367182.3113,257,598GAS HAZARDOUS SUBSTANCE REGULATORY ASSET 21
Amortization : 32 YEARS 22
132,103,733 136,639,1146,493,425228.411,028,806GAS NON-HAZARDOUS SUBSTANCE REGULATORY ASSET 23
Amortization : 32 YEARS 24
35,119,163 38,551,56973,323,891182.376,756,297NON CURRENT HSM BA ELEC 25
Amortization : > 12 MONTHS 26
81,944,713 89,953,660171,089,080182.3179,098,027NON CURRENT HSM BA GAS 27
Amortization : > 12 MONTHS 28
304,113,159 182,676,839125,769,286182.34,332,966FIRE HAZARD PREVENTION MEMO ACCT 29
Amortization : < 12 MONTHS 30
124,040,367 203,962,0391,060,576,7665551,140,498,438ELECTRIC PRICE RISK MANAGEMENT - NONCURRENT 31
Amortization : NO STATED 32
252,210,442 1,178,618,25073,592,191282999,999,999FASB 109 REGULATORY ASSET 33
999,999,999999,999,999FASB 109 REGULATORY ASSET 34
999,999,999999,999,999FASB 109 REGULATORY ASSET 35
999,999,999999,999,999FASB 109 REGULATORY ASSET 36
999,999,999999,999,999FASB 109 REGULATORY ASSET 37
999,999,999999,999,999FASB 109 REGULATORY ASSET 38
554,657,560554,657,560FASB 109 REGULATORY ASSET 39
Amortization : 1-45 YEARS 40
( 44,734,459) -75,894,511524,951,965400493,791,913GAS TRANSMISSION AND STORAGE REVENUE SHARING 41
Amortization : < 12 MONTHS 42
12,746,703 3,066,53887,128,40640077,448,241NUCLEAR DECOMMISSIONING ADJUSTMENT MECHANISM 43
FERC FORM NO. 1/3-Q (REV. 02-04) Page 232.2
44 TOTAL 7,027,240,817 72,728,023,105 16,056,902,40281,757,684,690

Name of Respondent This Report Is:(1) An Original
(2) A Resubmission
Date of Report(Mo, Da, Yr)
Year/Period of Report
End of
OTHER REGULATORY ASSETS (Account 182.3)
PACIFIC GAS AND ELECTRIC COMPANYX
04/13/20212020/Q4
Line
No.
Description and Purpose of Debits CREDITSWritten off During
the Quarter/Year
Account Charged
(d)(c)(a)
Balance at end of
Current Quarter/Year
(e)
Other Regulatory Assets Written off During
the Period
Amount
(f)
1. Report below the particulars (details) called for concerning other regulatory assets, including rate order docket number, if applicable.
2. Minor items (5% of the Balance in Account 182.3 at end of period, or amounts less than $100,000 which ever is less), may be
grouped by classes.
3. For Regulatory Assets being amortized, show period of amortization.
Balance at
Beginning of
Current
Quarter/Year
(b)
Amortization : 2 YEARS 1
( 25,354,080) -18,607,26518,614,816182.325,361,631DEPARTMENT OF ENERGY LITIGATION BALANCING 2
Amortization : > 12 MONTHS 3
( 11,113,430) -12,415,77240,291,76540038,989,423DEMAND RESPONSE EXPENDITURES BALANCING 4
Amortization : < 12 MONTHS 5
( 61,088,566) 66,392,08550,829,537400178,310,188AMCDOP-COST ADUST MECHANISM-OTHER 6
Amortization : <12 MONTHS 7
186,518,704 90,633,141383,668,940400287,783,377NEW SYSTEM GENERATION BA 8
Amortization : < 12 MONTHS 9
4,097,405 5,829,48892,049,84440093,781,927ELECTRIC PROGRAM INVESTMENT CHARGE 10
Amortization : < 12 MONTHS 11
( 612,014) -1,228,0651,213,678400597,627GREENHOUSE GAS EXPENSE MEMO ACCOUNT 12
Amortization : NO STATED 13
3,801,248 1,412,638166,959,998400164,571,388GAS PROGRAM BALANCING ACCOUNT 14
Amortization : < 12 MONTHS 15
1,124,703 226,1401,126,011400227,448GREENHOUSE GAS EXPENSE MEMORANDUM ACCOUNT - 16
Amortization : < 12 MONTHS 17
6,796,509 7,659,228636,8144001,499,533GREEN TARIFF SHARED RENEWABLES MEMORANDUM 18
Amortization : < 12 MONTHS 19
( 11,886,564) -25,310,95225,968,01840012,543,630GPBA - GHG OPERATIONAL COSTS SUBACCOUNT 20
Amortization : <12 MONTHS 21
276,572 242,34111,671,17740011,636,946GREEN TARIFF SHARED RENEWABLES BALANCING 22
Amortization : <12 MONTHS 23
4,533 275,9416,283400277,691AVOIDED COST CALC UPDATE MEMO ACCOUNT 24
Amortization : <12 MONTHS 25
2,515,273 5,857,7544003,342,481DISTRIBUTED RESOURCES PLAN MEMORANDUM ACCT 26
Amortization : > 12 MONTHS 27
( 10,606,980) -12,194,4596,498,2974004,910,818DEMAND RESPONSE EXPENDITURES BA - DRAM 28
Amortization : > 12 MONTHS 29
183,443,967 177,844,12331,049,939182.325,450,095NONCURR WILDFIRE EXP MEMO ACCT - GAS 30
Amortization : > 12 MONTHS 31
349,536,095 1,283,798,94665,737,148182.3999,999,999NONCURR WILDFIRE EXP MEMO ACCT - ELEC 32
999,999,999999,999,999NONCURR WILDFIRE EXP MEMO ACCT - ELEC 33
999,999,999999,999,999NONCURR WILDFIRE EXP MEMO ACCT - ELEC 34
999,999,999999,999,999NONCURR WILDFIRE EXP MEMO ACCT - ELEC 35
999,999,999999,999,999NONCURR WILDFIRE EXP MEMO ACCT - ELEC 36
999,999,999999,999,999NONCURR WILDFIRE EXP MEMO ACCT - ELEC 37
999,999,999999,999,999NONCURR WILDFIRE EXP MEMO ACCT - ELEC 38
999,999,999999,999,999NONCURR WILDFIRE EXP MEMO ACCT - ELEC 39
999,999,999999,999,999NONCURR WILDFIRE EXP MEMO ACCT - ELEC 40
999,999,999999,999,999NONCURR WILDFIRE EXP MEMO ACCT - ELEC 41
999,999,999999,999,999NONCURR WILDFIRE EXP MEMO ACCT - ELEC 42
999,999,999999,999,999NONCURR WILDFIRE EXP MEMO ACCT - ELEC 43
FERC FORM NO. 1/3-Q (REV. 02-04) Page 232.3
44 TOTAL 7,027,240,817 72,728,023,105 16,056,902,40281,757,684,690

Name of Respondent This Report Is:(1) An Original
(2) A Resubmission
Date of Report(Mo, Da, Yr)
Year/Period of Report
End of
OTHER REGULATORY ASSETS (Account 182.3)
PACIFIC GAS AND ELECTRIC COMPANYX
04/13/20212020/Q4
Line
No.
Description and Purpose of Debits CREDITSWritten off During
the Quarter/Year
Account Charged
(d)(c)(a)
Balance at end of
Current Quarter/Year
(e)
Other Regulatory Assets Written off During
the Period
Amount
(f)
1. Report below the particulars (details) called for concerning other regulatory assets, including rate order docket number, if applicable.
2. Minor items (5% of the Balance in Account 182.3 at end of period, or amounts less than $100,000 which ever is less), may be
grouped by classes.
3. For Regulatory Assets being amortized, show period of amortization.
Balance at
Beginning of
Current
Quarter/Year
(b)
999,999,999999,999,999NONCURR WILDFIRE EXP MEMO ACCT - ELEC 1
999,999,999999,999,999NONCURR WILDFIRE EXP MEMO ACCT - ELEC 2
999,999,999999,999,999NONCURR WILDFIRE EXP MEMO ACCT - ELEC 3
999,999,999999,999,999NONCURR WILDFIRE EXP MEMO ACCT - ELEC 4
999,999,999999,999,999NONCURR WILDFIRE EXP MEMO ACCT - ELEC 5
999,999,999999,999,999NONCURR WILDFIRE EXP MEMO ACCT - ELEC 6
999,999,999999,999,999NONCURR WILDFIRE EXP MEMO ACCT - ELEC 7
999,999,999999,999,999NONCURR WILDFIRE EXP MEMO ACCT - ELEC 8
834,054,078834,054,078NONCURR WILDFIRE EXP MEMO ACCT - ELEC 9
Amortization : > 12 MONTHS 10
752,011,872 191,305,7856,535,592,3064005,974,886,219BA - PORTFOLIO ALLOCATION BAL ACCOUNT 11
Amortization : <12 MONTHS 12
11,154,006 731,85377,961,404182.367,539,251NRCRBA - CURRENT 13
Amortization : <12 MONTHS 14
107,949,689 79,968,410227,759,038400199,777,759FIRE RISK MITIGATION MEMO ACCT 15
Amortization : <12 MONTHS 16
6,390,884 14,144,0412,586182.37,755,743CALI CONSUMER PRIVACY ACT MEMO ACCT-ELEC 17
Amortization : > 12 MONTHS 18
5,228,905 11,572,3962,117182.36,345,608CALI CONSUMER PRIVACY ACT MEMO ACCT-GAS 19
Amortization : > 12 MONTHS 20
-6,776,44922,551,347182.315,774,898Gas Storage Balancing Account 21
Amortization : > 12 MONTHS 22
3,042,9151,405,806182.34,448,721Measurement and Control Ovr-Pressure Prot 23
Amortization : > 12 MONTHS 24
67,876,26944,997,795182.3112,874,064In-Line Inspection mem account 25
Amortization : > 12 MONTHS 26
1,064,9061,652,3844002,717,290Gas Statues Rules Reg Memo Acct 27
Amortization : > 12 MONTHS 28
9,047,8347,784,16040016,831,994Internal Corrosion Direct Assessment Memo Acct 29
Amortization : > 12 MONTHS 30
1,004,3324001,004,332Integrated Resource Planning Cost Memorandum Accout 31
Amortization : < 12 months 32
277,299,275400277,299,275General Rate Case Memorandum Account - Electric - t 33
Amortization : < 12 months 34
332,759,1376,758,293,7034007,091,052,840General Rate Case Memorandum Account - Electric - t 35
Amortization : > 12 months 36
35,792,52240035,792,522General Rate Case Memorandum Account - Gas - Curret 37
Amortization : < 12 months 38
42,951,0271,939,918,0454001,982,869,072General Rate Case Memorandum Account - Gas - NonCut 39
Amortization : > 12 months 40
26,577,800300,144,152400326,721,952Wildfire Mitigation Bal Acct - Electric Curr 41
Amortization : < 12 months 42
133,059,88591,349,226400224,409,111Microgrid Memorandum Account 43
FERC FORM NO. 1/3-Q (REV. 02-04) Page 232.4
44 TOTAL 7,027,240,817 72,728,023,105 16,056,902,40281,757,684,690

Name of Respondent This Report Is:(1) An Original
(2) A Resubmission
Date of Report(Mo, Da, Yr)
Year/Period of Report
End of
OTHER REGULATORY ASSETS (Account 182.3)
PACIFIC GAS AND ELECTRIC COMPANYX
04/13/20212020/Q4
Line
No.
Description and Purpose of Debits CREDITSWritten off During
the Quarter/Year
Account Charged
(d)(c)(a)
Balance at end of
Current Quarter/Year
(e)
Other Regulatory Assets Written off During
the Period
Amount
(f)
1. Report below the particulars (details) called for concerning other regulatory assets, including rate order docket number, if applicable.
2. Minor items (5% of the Balance in Account 182.3 at end of period, or amounts less than $100,000 which ever is less), may be
grouped by classes.
3. For Regulatory Assets being amortized, show period of amortization.
Balance at
Beginning of
Current
Quarter/Year
(b)
Amortization : < 12 months 1
7,003,180 5,083,5123,541,469182.31,621,801LINE 407 MEMO ACCT NC 2
Amortization : >12 MONTHS 3
12,220,156 12,214,0608,307,822182.38,301,726CRTICAL DOCS PROGRAM MEMO ACCT NC 4
Amortization : >12 MONTHS 5
106,743,862 -18,039,505149,568,715182.324,785,348TRANSMISSION INTEGRITY MGMT BAL ACCT 6
Amortization : >12 MONTHS 7
483,765182.3483,765TRANSMISSION INTEGRITY MGMT MEMO ACCT 8
Amortization : >12 MONTHS 9
462,656 491,914545,744400575,002INTEGRATED DISTRIBUTION ENERGY RESOURCES 10
Amortization : > 12 MONTHS 11
1,901,407 16,112,3492,009,33740016,220,279CATASTROPHIC EVENT MEMORANDUM ACCOUNT - GAS 12
Amortization : < 12 MONTHS 13
60,490,225 62,955,04653,8334002,518,654MISC ELEC-CURRENT-FERC INTEREST BEARING 14
Amortization : <12 MONTHS 15
62,641,697 31,371,523109,432,37940078,162,205TREE MORTAILITY NON-BYPASSABLE CHARGE BAL ACCT 16
Amortization : <12 MONTHS 17
532,196,134 375,359,4981,351,522,508182.31,194,685,872Wildfire Mitigation Plan Memo Acct 18
Amortization : <12 MONTHS 19
12,037,758 70,450,73689,545,865VARIOUS147,958,843MISCELLANEOUS GAS REG ASSET - CURRENT 20
Amortization : < 12 MONTHS 21
70,632,093 225,109,161138,744,323VARIOUS293,221,391MISCELLANEOUS ELECTRIC REG ASSET - CURRENT 22
Amortization : < 12 MONTHS 23
3,520,575 3,520,575405ACCUM AMORT - URG PLANT REG ASSET 24
Amortization : < 12 MONTHS 25
28,908,987 27,352,8925,913,0345974,356,939MOBILE HOME PARK BA ELECTRIC NC 26
Amortization : > 12 MONTHS 27
27,669,761 26,354,3224,578,3538933,262,914MOBILE HOME PARK BA GAS NC 28
Amortization : > 12 MONTHS 29
3,339,022 3,698,2113,860,5835974,219,772MOBILE HOME PARK BA ELECTRIC CURRENT 30
Amortization : < 12 MONTHS 31
3,586,641 3,987,2594,177,7358934,578,353MOBILE HOME PARK BA GAS CURRENT 32
Amortization : < 12 MONTHS 33
142,698,840 424,225,3491,999,856,7634002,281,383,272REG ASSET - MISCELLANEOUS GAS - NON-CURRENT 34
Amortization : > 12 MONTHS 35
326,697,074 778,551,9192,063,466,9785492,515,321,823MISCELLANEOUS ELECTRIC REG ASSET - NONCURRENT 36
Amortization : 25 YEARS 37
34,688,762 6,095,44032,087,2114003,493,889REG ASSET - ABANDONED CAPITAL PROJECTS 38
Amortization : < 12 MONTHS 39
699,146,194 926,729,196877,156,5305881,104,739,532REGULATORY ASSET-CEMA-ELEC-NONCURRENT 40
Amortization : > 12 MONTHS 41
45,682,327 31,088,728121,016,764400106,423,165CEMA GAS NONCURRENT 42
Amortization : > 12 MONTHS 43
FERC FORM NO. 1/3-Q (REV. 02-04) Page 232.5
44 TOTAL 7,027,240,817 72,728,023,105 16,056,902,40281,757,684,690

Name of Respondent This Report Is:(1) An Original
(2) A Resubmission
Date of Report(Mo, Da, Yr)
Year/Period of Report
End of
OTHER REGULATORY ASSETS (Account 182.3)
PACIFIC GAS AND ELECTRIC COMPANYX
04/13/20212020/Q4
Line
No.
Description and Purpose of Debits CREDITSWritten off During
the Quarter/Year
Account Charged
(d)(c)(a)
Balance at end of
Current Quarter/Year
(e)
Other Regulatory Assets Written off During
the Period
Amount
(f)
1. Report below the particulars (details) called for concerning other regulatory assets, including rate order docket number, if applicable.
2. Minor items (5% of the Balance in Account 182.3 at end of period, or amounts less than $100,000 which ever is less), may be
grouped by classes.
3. For Regulatory Assets being amortized, show period of amortization.
Balance at
Beginning of
Current
Quarter/Year
(b)
23,373,4481,021,55588024,395,003Regulatory Asset-CEMA-Other-NonCurrent 1
Amortization : > 12 MONTHS 2
24,546,831 21,543,41740,834,202182.337,830,788MOBILE HOME PARK BALANCING ACCOUNT - ELECTRIC 3
Amortization : <12 MONTHS 4
36,180,00024,120,00040060,300,000Regulatory Asset-DCPP M&S Inventory Non Current 5
Amortization : > 12 months 6
12,060,000182.312,060,000Regulatory Asset-DCPP M&S Inventory Current 7
Amortization : > 12 months 8
24,460,775 21,879,93540,942,290182.338,361,450MOBILE HOME PARK BALANCING ACCOUNT - GAS 9
Amortization : <12 MONTHS 10
4,101,006 6,012,105105,1474002,016,246WILDFIRES CUSTOMER PROTECTIONS MEMO ACCT - E 11
Amortization : > 12 MONTHS 12
3,355,370 4,918,99386,0304001,649,653WILDFIRES CUSTOMER PROTECTIONS MEMO ACCT- G 13
Amortization : > 12 MONTHS 14
303,854,403400303,854,403Fire Hazard Prevention Memo Acct 15
Amortization : < 12 MONTHS 16
676,310,41362,508,380400738,818,793Fire Risk & Wildfire Mitigation Memo Acct 17
Amortization : < 12 MONTHS 18
180,417,893123,810,907400304,228,800Risk Transfer Bal Acct - Electric Curr 19
Amortization : < 12 months 20
63,548,01043,609,514400107,157,524Risk Transfer Bal Acct - Electric Curr 21
Amortization : < 12 months 22
87,088,82049,996,666400137,085,486Risk Transfer Bal Acct - Electric Curr 23
Amortization : < 12 months 24
30,675,01217,610,16440048,285,176Risk Transfer Bal Acct - Electric Curr 25
Amortization : < 12 months 26
1,085,199531,0654001,616,264BioMAT Non-Bypassable Charge 27
Amortization : < 12 months 28
61,068,402108,895,814400169,964,216COVID-19 Pandemic Protection Memorandum Account - 29
Amortization : > 12 MONTHS 30
23,101,30231,102,32140054,203,623COVID-19 Pandemic Protection Memo Account -Gas -NC 31
Amortization : > 12 MONTHS 32
166,026,930 181,589,83519,796,64242835,359,547FINANCING COSTS REGULATORY ASSET 33
Amortization : 20 YEARS 34
944,805,000 944,805,000407.4URG PLANT REGULATORY ASSET - NONCURRENT 35
Amortization : 22 YEARS 36
183,010,953 183,010,953182.3URG PLANT REGULATORY ASSET - TAX 37
Amortization : 11 YEARS 38
( 730,975,723) -774,327,72743,352,004405ACCUM AMORT - URG PLANT REG ASSET NON CURRENT 39
Amortization : 12 YEARS 40
( 168,928,625) -172,449,1973,520,572405ACC AMT - PLANT RA TAX 41
Amortization : 11 YEARS 42
11,107,455 10,271,260836,195428UNAMORTIZED FINANCIAL HEDGING COST 43
FERC FORM NO. 1/3-Q (REV. 02-04) Page 232.6
44 TOTAL 7,027,240,817 72,728,023,105 16,056,902,40281,757,684,690

Name of Respondent This Report Is:(1) An Original
(2) A Resubmission
Date of Report(Mo, Da, Yr)
Year/Period of Report
End of
OTHER REGULATORY ASSETS (Account 182.3)
PACIFIC GAS AND ELECTRIC COMPANYX
04/13/20212020/Q4
Line
No.
Description and Purpose of Debits CREDITSWritten off During
the Quarter/Year
Account Charged
(d)(c)(a)
Balance at end of
Current Quarter/Year
(e)
Other Regulatory Assets Written off During
the Period
Amount
(f)
1. Report below the particulars (details) called for concerning other regulatory assets, including rate order docket number, if applicable.
2. Minor items (5% of the Balance in Account 182.3 at end of period, or amounts less than $100,000 which ever is less), may be
grouped by classes.
3. For Regulatory Assets being amortized, show period of amortization.
Balance at
Beginning of
Current
Quarter/Year
(b)
Amortization : 20 YEARS 1
999,999,999 1,421,502,077136,054,740926557,556,818PENSION REGULATORY ASSET 2
823,127,653 823,127,653PENSION REGULATORY ASSET 3
Amortization : INDEFINITE 4
42,239,000 42,239,000407.4URG PLANT REGULATORY ASSET - CURRENT 5
Amortization : < 12 MONTHS 6
60,259,604 -618,436349,142,965182.3288,264,925MAJOR EMERGENCY BALANCING ACCOUNT 7
Amortization : <12 MONTHS 8
17,969,734 37,616,0051,460,57810121,106,849FIN 47 - REGULATORY ASSET 9
Amortization : NO STATED 10
13,174,261 -18,636,87067,233,766182.335,422,635RESIDENTIAL RATE REFORM MEMORANDUM ACCOUNT 11
Amortization : <12 MONTHS 12
11,058,629 11,174,52965,094400180,994REGULATORY ASSET - HYRDO NONCURRENT 13
Amortization : > 12 MONTHS 14
18,503,848 18,651,4151,803,7524281,951,319FINANCING COSTS - CURRENT 15
Amortization : < 12 MONTHS 16
836,195 836,195428UNAMORTIZED FINANCIAL HEDGING COST CURRENT 17
Amortization : < 12 MONTHS 18
20,049,085 -5,120,54141,416,84140016,247,215NEW ENVIRONMENTAL REGULATIONS BALANCING 19
Amortization : > 12 MONTHS 20
-25,887,81837,947,81840012,060,000DIABLO CANYON RETIREMENT BAL ACCT (DEPR) - 21
Amortization : > 12 MONTHS 22
54,765,700 56,662,51150,660,81140052,557,622DCRBA - DCPP EMPLOYEE RETENTION PROGRAM 23
Amortization : > 12 MONTHS 24
( 2,972,911) -10,447,5838,956,1144001,481,442San Joaq. Valley Disadv. Comm. Pilot BA 25
Amortization : < 12 MONTHS 26
3,890,985 4,465,8489,559,94140010,134,804Disadv Comm Single Family Solar Homes Memo Acct 27
Amortization : < 12 MONTHS 28
-10,380,56013,532,3614003,151,801Disadv Comm Green Tariff Program Bal Acct 29
Amortization : < 12 MONTHS 30
404,089242,543400646,632Net Energy Metering Balancing Account 31
Amortization : > 12 MONTHS 32
-5,044,7176,127,178182.31,082,461Community Solar Green Tariff Balance Account 33
Amortization : < 12 MONTHS 34
81,513,570163,027,191400244,540,761PCIA Undercollection Balancing Account 35
Amortization : < 12 MONTHS 36
299,576400299,576Disconnections Memorandum Account - Gas NC 37
Amortization : > 12 MONTHS 38
366,148400366,148Disconnections Memorandum Account - Electric NC 39
Amortization : > 12 MONTHS 40
155,768,31914,889,816501170,658,135WMBA - Electric Reason Review (Non-Curr) 41
Amortization : > 12 MONTHS 42
114,612,194730,743,522400845,355,716Vegetation Management Balancing Acct (VMBA) - Curr 43
FERC FORM NO. 1/3-Q (REV. 02-04) Page 232.7
44 TOTAL 7,027,240,817 72,728,023,105 16,056,902,40281,757,684,690

Name of Respondent This Report Is:(1) An Original
(2) A Resubmission
Date of Report(Mo, Da, Yr)
Year/Period of Report
End of
OTHER REGULATORY ASSETS (Account 182.3)
PACIFIC GAS AND ELECTRIC COMPANYX
04/13/20212020/Q4
Line
No.
Description and Purpose of Debits CREDITSWritten off During
the Quarter/Year
Account Charged
(d)(c)(a)
Balance at end of
Current Quarter/Year
(e)
Other Regulatory Assets Written off During
the Period
Amount
(f)
1. Report below the particulars (details) called for concerning other regulatory assets, including rate order docket number, if applicable.
2. Minor items (5% of the Balance in Account 182.3 at end of period, or amounts less than $100,000 which ever is less), may be
grouped by classes.
3. For Regulatory Assets being amortized, show period of amortization.
Balance at
Beginning of
Current
Quarter/Year
(b)
Amortization : < 12 MONTHS 1
592,477,035138,266,487501730,743,522Vegetation Management Balancing Acct (VMBA) - NC 2
Amortization : < 12 MONTHS 3
14,917,6434,282,56451519,200,207Adj Mechanism for Costs in Other Proceedings - NC 4
Amortization : < 12 MONTHS 5
192,374,544 224,2161,933,793,428VARIOUS1,741,643,100Miscellaneous minor items 6
7
8
9
10
11
12
13
14
15
16
17
18
19
20
21
22
23
24
25
26
27
28
29
30
31
32
33
34
35
36
37
38
39
40
41
42
43
FERC FORM NO. 1/3-Q (REV. 02-04) Page 232.8
44 TOTAL 7,027,240,817 72,728,023,105 16,056,902,40281,757,684,690

Schedule Page: 232 Line No.: 43 Column: b
The FERC software will not allow the entire ending balance of ELECTRIC BALANCING ACCOUNT RESERVE ACCOUNT of
($4,321,727,175) to be shown, as it is too large. As such, the balance has been broken into the following:
Line 43: (999,999,999)
Line 1: (999,999,999)
Line 2: (999,999,999)
Line 3: (999,999,999)
Line 4: (321,727,179)
Total (4,321,727,175)
Schedule Page: 232 Line No.: 43 Column: fThe FERC software will not allow the entire ending balance of ELECTRIC BALANCING ACCOUNT
RESERVE ACCOUNT of ($26,318,543,213) to be shown, as it is too large. As such, the
balance has been broken into the following:
Line 43: (154,420,746)
Line 1: (999,999,999)
Line 2: (999,999,999)
Line 3: (999,999,999)
Line 4: (321,727,179)
Line 5: (999,999,999)
Line 6: (999,999,999)
Line 7: (999,999,999)
Line 8: (999,999,999)
Line 9: (999,999,999)
Line 10: (999,999,999)
Line 11: (999,999,999)
Line 12: (999,999,999)
Line 13: (999,999,999)
Line 14: (999,999,999)
Line 15: (999,999,999)
Line 16: (999,999,999)
Line 17: (999,999,999)
Line 18: (999,999,999)
Line 19: (999,999,999)
Line 20: (999,999,999)
Line 21: (999,999,999)
Line 22: (999,999,999)
Line 23: (999,999,999)
Line 24: (999,999,999)
Name of Respondent
PACIFIC GAS AND ELECTRIC COMPANY
This Report is:(1) X An Original(2) A Resubmission
Date of Report(Mo, Da, Yr)
04/13/2021
Year/Period of Report
2020/Q4
FOOTNOTE DATA
FERC FORM NO. 1 (ED. 12-87) Page 450.1

Line 25: (999,999,999)
Line 26: (999,999,999)
Line 27: (842,395,313)
Total (26,318,543,213)
Schedule Page: 232.2 Line No.: 6 Column: b
The FERC software will not allow the entire ending balance of NEGATIVE ONGOING COMPETITION TRANSITION CHRG BA
of $3,257,964,692 to be shown, as it is too large. As such, the balance has been broken into the following:
Line 6: 999,999,999
Line 7: 999,999,999
Line 8: 999,999,999
Line 9: 257,964,695
Total 3,257,964,692
Schedule Page: 232.2 Line No.: 6 Column: f
The FERC software will not allow the entire ending balance of NEGATIVE ONGOING COMPETITION TRANSITIONCHRG BA of $3,289,900,559 to be shown, as it is too large. As such, the balance has been broken into the following:
Line 6: 1,031,935,866
Line 7: 999,999,999
Line 8: 999,999,999
Line 9: 289,900,562
Total 3,289,900,559
Schedule Page: 232.2 Line No.: 33 Column: fThe FERC software will not allow the entire ending balance of FASB 109 REGULATORY ASSET of
$6,733,275,805 to be shown, as it is too large. As such, the balance has been broken
into the following:
Line 33: 1,178,618,250
Line 34: 999,999,999
Line 35: 999,999,999
Line 36: 999,999,999
Line 37: 999,999,999
Line 38: 999,999,999
Line 39: 554,657,560
Total 6,733,275,805
Schedule Page: 232.3 Line No.: 32 Column: f The FERC software will not allow the entire ending balance of NONCURR WILDFIRE EXP MEMO
ACCT - ELEC of $21,117,853,005 to be shown, as it is too large. As such, the balance has
been broken into the following:
Line 32: 1,283,798,946
Name of Respondent
PACIFIC GAS AND ELECTRIC COMPANY
This Report is:(1) X An Original(2) A Resubmission
Date of Report(Mo, Da, Yr)
04/13/2021
Year/Period of Report
2020/Q4
FOOTNOTE DATA
FERC FORM NO. 1 (ED. 12-87) Page 450.2

Line 33: 999,999,999
Line 34: 999,999,999
Line 35: 999,999,999
Line 36: 999,999,999
Line 37: 999,999,999
Line 38: 999,999,999
Line 39: 999,999,999
Line 40: 999,999,999
Line 41: 999,999,999
Line 42: 999,999,999
Line 43: 999,999,999
Line 1: 999,999,999
Line 2: 999,999,999
Line 3: 999,999,999
Line 4: 999,999,999
Line 5: 999,999,999
Line 6: 999,999,999
Line 7: 999,999,999
Line 8: 999,999,999
Line 9: 834,054,078
Total 21,117,853,005
Schedule Page: 232.5 Line No.: 20 Column: d
Primarily internal labor expenses. Offset to 182.3 - Other Regulatory Assets and 254 - Other Regulatory Liabilities Schedule Page: 232.5 Line No.: 22 Column: d
Primarily internal labor expenses. Offset to 182.3 - Other Regulatory Assets, 549 - Misc. Other Power Generation
Expenses and 253 - Other Deferred Credits. Schedule Page: 232.7 Line No.: 2 Column: b
The FERC software will not allow the entire ending balance of PENSION REGULATORY ASSET of $1,823,127,652 to be
shown, as it is too large. As such, the balance has been broken into the following:
Line 2: 999,999,999
Line 3: 823,127,653
Total 1,823,127,652
Schedule Page: 232.7 Line No.: 2 Column: f The FERC software will not allow the entire ending balance of PENSION REGULATORY ASSET of
$2,244,629,730 to be shown, as it is too large. As such, the balance has been broken
into the following:
Line 2: 1,421,502,077
Line 3: 823,127,653
Total 2,244,629,730
Name of Respondent
PACIFIC GAS AND ELECTRIC COMPANY
This Report is:(1) X An Original(2) A Resubmission
Date of Report(Mo, Da, Yr)
04/13/2021
Year/Period of Report
2020/Q4
FOOTNOTE DATA
FERC FORM NO. 1 (ED. 12-87) Page 450.3

Schedule Page: 232.8 Line No.: 6 Column: d Activity primarily related to CORE BROKERAGE FEE, RENEWABLES PORTFOLIO STANDARD COST MEMO
ACCT, LAND CONSERVATION PLAN IMPLEMENTATION MEMO, GAS PRICE RISK MANAGEMENT - NONCURRENT,
HLBA - CURRENT,Disadv Comm Single Family Solar Homes Memo Acct,Wildfire Mitigation Bal
Acct - Gas Curr,DAILY BIOMETHANE SOLICITATION MEMO ACCT-NONCURRENT with offsets to 182.3,
400 and 807.
Name of Respondent
PACIFIC GAS AND ELECTRIC COMPANY
This Report is:(1) X An Original(2) A Resubmission
Date of Report(Mo, Da, Yr)
04/13/2021
Year/Period of Report
2020/Q4
FOOTNOTE DATA
FERC FORM NO. 1 (ED. 12-87) Page 450.4

Name of Respondent This Report Is:(1) An Original
(2) A Resubmission
Date of Report(Mo, Da, Yr)
Year/Period of Report
End of
MISCELLANEOUS DEFFERED DEBITS (Account 186)
PACIFIC GAS AND ELECTRIC COMPANYX
04/13/20212020/Q4
Line
No.
Description of Miscellaneous Debits CREDITSAccount
(c)(b)(a)
Balance atEnd of Year
(d)
Deferred Debits Amount
(e)
Balance at Beginning of Year
(f)Charged
1. Report below the particulars (details) called for concerning miscellaneous deferred debits.
2. For any deferred debit being amortized, show period of amortization in column (a)
3. Minor item (1% of the Balance at End of Year for Account 186 or amounts less than $100,000, whichever is less) may be grouped by
classes.
-13,361,757 -28,427,149 1,319,610,470 1,304,545,078 VARIOUSUndistributed Charges 1
7,475,301 7,450,686 554,603 529,988 VARIOUSCustomer Advance for Constructn 2
50,267,431 33,391,994 48,731,815 31,856,378 131Development Costs 3
Payments for MLX 4
1,266,847 663,520 839,156,520 838,553,193 VARIOUSand Non-Energy Invoices 5
Payments for Main Line 6
-2,763,355 -3,256,229 152,042,695 151,549,821 VARIOUSExtension 7
Clearing Account for 8
1,147,639 348,684 10,020,310 9,221,355 VARIOUSJP Morgan Chase 9
886,787 -192,754 14,402,411,521 14,401,331,980 VARIOUSPayroll Clearing Account 10
1,394,328 1,234,121 559,462 399,255 930.2Land Surplus 11
-1,142,705 -174,011 7,432,678 8,401,372 VARIOUSReimb Transm Svc, Gen Intercons 12
25,969 5,333,544 111,577,776 116,885,351 VARIOUSMiscellaneous minor items 13
5,815,758,218 232,119,758 6,047,877,976 186Wildfire Fund - NonCurr Assets 14
15
16
17
18
19
20
21
22
23
24
25
26
27
28
29
30
31
32
33
34
35
36
37
38
39
40
41
42
43
44
45
46
FERC FORM NO. 1 (ED. 12-94) Page 233
49 TOTAL
47 Misc. Work in Progress
48Deferred Regulatory Comm.
Expenses (See pages 350 - 351)
45,196,485 5,832,130,624

Schedule Page: 233 Line No.: 1 Column: dTypical Accounts charged: 131, 142
Schedule Page: 233 Line No.: 2 Column: dTypical Accounts charged: 456, 495
Schedule Page: 233 Line No.: 5 Column: dTypical Accounts charged: 131, 143
Schedule Page: 233 Line No.: 7 Column: dTypical Accounts charged: 131, 252
Schedule Page: 233 Line No.: 9 Column: dTypical Accounts charged: 131, 143, 559
Schedule Page: 233 Line No.: 10 Column: dTypical Accounts charged: 131
Schedule Page: 233 Line No.: 12 Column: dTypical Accounts charged: 131, 143
Schedule Page: 233 Line No.: 13 Column: dTypical Accounts charged 182.3 and 236
Name of Respondent
PACIFIC GAS AND ELECTRIC COMPANY
This Report is:(1) X An Original(2) A Resubmission
Date of Report(Mo, Da, Yr)
04/13/2021
Year/Period of Report
2020/Q4
FOOTNOTE DATA
FERC FORM NO. 1 (ED. 12-87) Page 450.1

Name of Respondent This Report Is:(1) An Original
(2) A Resubmission
Date of Report(Mo, Da, Yr)
Year/Period of Report
End of
ACCUMULATED DEFERRED INCOME TAXES (Account 190)
PACIFIC GAS AND ELECTRIC COMPANYX
04/13/20212020/Q4
Line
No.
Description and Location Balance of Begining
(c)(b)(a)
Balance at Endof Year of Year
1. Report the information called for below concerning the respondent’s accounting for deferred income taxes.
2. At Other (Specify), include deferrals relating to other income and deductions.
Electric 1
-43,933,700 -43,418,496Environmental 2
35,955,459 4,278,296Compensation 3
-116,370,208 -119,148,840CIAC 4
470,135,340 6,565,630,896Injuries and Damages 5
-350,949,450 91,994,688CCFT 6
7,024,504,298 946,255,053Other 7
7,019,341,739 7,445,591,597TOTAL Electric (Enter Total of lines 2 thru 7) 8
Gas 9
-136,652,000 -115,579,841Environmental 10
36,967,438 28,120,772Compensation 11
169,477,749 168,789,262CIAC 12
-42,370,119 -41,616,258Injuries and Damages 13
-22,303,313 -24,398,939CCFT 14
1,282,950,101 1,251,190,776Other 15
1,288,069,856 1,266,505,772TOTAL Gas (Enter Total of lines 10 thru 15 16
1,011,575,048 791,628,533Other (Specify) 17
9,318,986,643 9,503,725,902TOTAL (Acct 190) (Total of lines 8, 16 and 17) 18
Notes
Electric Other - Line 7 Balance at Balance
Beginning of at end of
the year the year
Vacation Paid 19,679,208 28,675,072
Severance Costs 11,452,351
Medical and Group and Life Insurance (35,507,347)
Short Term Incentive Plan 232,958
Net Operating Loss (498,617,637) 6,055,672,829
Property Tax 15,958,875 (43,659,350)
Other 1,409,234,607 1,007,637,785
Subtotal 946,255,053 7,024,504,298
Gas Other - Line 15
Vacation Paid 8,123,444 11,978,813
Severance Costs 5,132,283
Medical and Group Life Insurance (13,209,905)
Short Term Incentive Plan (323,736)
Net Operating Loss 862,880,446 1,001,134,629
Property Tax 7,749,033 (15,703,703)
Other 372,437,853 293,941,720
Subtotal 1,251,190,776 1,282,950,101
Other - Line 17
CCFT (33,432,595) (19,340,059)
Compensation 2,302,576 2,302,576
Net Operating Loss 887,460,536 891,068,935
Property Tax (78,809,974) 391,945
Other 14,107,990 137,151,651
Subtotal 791,628,533 1,011,575,048
FERC FORM NO. 1 (ED. 12-88) Page 234

Name of Respondent This Report Is:(1) An Original
(2) A Resubmission
Date of Report(Mo, Da, Yr)
Year/Period of Report
End of
CAPITAL STOCKS (Account 201 and 204)
PACIFIC GAS AND ELECTRIC COMPANYX
04/13/20212020/Q4
Line
No.
Class and Series of Stock and Number of shares
(c)(b)(a)
Call Price at
End of Year
Par or Stated
Value per share
(d)
Name of Stock Series Authorized by Charter
1. Report below the particulars (details) called for concerning common and preferred stock at end of year, distinguishing separate
series of any general class. Show separate totals for common and preferred stock. If information to meet the stock exchange reporting
requirement outlined in column (a) is available from the SEC 10-K Report Form filing, a specific reference to report form (i.e., year and
company title) may be reported in column (a) provided the fiscal years for both the 10-K report and this report are compatible.
2. Entries in column (b) should represent the number of shares authorized by the articles of incorporation as amended to end of year.
Pacific Gas and Electric Company's stock 1
is wholly owned by PG&E Corporation 2
5.00 800,000,000 Common 3
4
800,000,000TOTAL COMMON 5
6
Registered with the American Stock Exchange 7
Preferred, Cumulative 8
Redeemable: Without Mandatory Redemption 9
25.75 25.00 418,291 4.36% 10
26.00 25.00 611,142 4.50% 11
27.25 25.00 793,031 4.80% 12
26.75 25.00 1,778,172 5.00% 13
26.75 25.00 934,322 5.00% - Series A 14
25.00 3,000,000 7.04% 15
56,180,217 Undesignated in Class 16
17
63,715,175SubTotal Redeemable Without 18
Mandatory Redemption 19
20
Registered with the American Stock Exchange 21
Non-Redeemable 22
25.00 400,000 5.00% 23
25.00 1,173,163 5.50% 24
25.00 4,211,662 6.00% 25
26
5,784,825SubTotal Non-Redeemable 27
28
Redeemable: With Mandatory Redemption 29
25.00 2,500,000 6.30% 30
25.00 3,000,000 6.57% 31
100.00 10,000,000 Undesignated in Class 32
33
15,500,000SubTotal Redeemable With 34
Mandatory Redemption 35
36
85,000,000TOTAL PREFERRED 37
38
39
40
41
42
FERC FORM NO. 1 (ED. 12-91) Page 250

AS REACQUIRED STOCK (Account 217)
Name of Respondent This Report Is:(1) An Original
(2) A Resubmission
Date of Report(Mo, Da, Yr)
Year/Period of Report
End of
CAPITAL STOCKS (Account 201 and 204) (Continued)
PACIFIC GAS AND ELECTRIC COMPANYX
04/13/20212020/Q4
Line
No.
OUTSTANDING PER BALANCE SHEET HELD BY RESPONDENT
IN SINKING AND OTHER FUNDS
Shares(g)
Cost(h)
Shares SharesAmount
(Total amount outstanding without reductionfor amounts held by respondent)
Amount(e) (f) (i) (j)
3. Give particulars (details) concerning shares of any class and series of stock authorized to be issued by a regulatory commission
which have not yet been issued.
4. The identification of each class of preferred stock should show the dividend rate and whether the dividends are cumulative or
non-cumulative.
5. State in a footnote if any capital stock which has been nominally issued is nominally outstanding at end of year.
Give particulars (details) in column (a) of any nominally issued capital stock, reacquired stock, or stock in sinking and other funds which
is pledged, stating name of pledgee and purposes of pledge.
1
2
1,321,874,045 264,374,809 3
4
1,321,874,045 264,374,809 5
6
7
8
9
10,457,275 418,291 10
15,278,550 611,142 11
19,825,775 793,031 12
44,454,300 1,778,172 13
23,358,050 934,322 14
15
16
17
113,373,950 4,534,958 18
19
20
21
22
10,000,000 400,000 23
29,329,075 1,173,163 24
105,291,550 4,211,662 25
26
144,620,625 5,784,825 27
28
29
30
31
32
33
34
35
36
257,994,575 10,319,783 37
38
39
40
41
42
FERC FORM NO. 1 (ED. 12-88) Page 251

Schedule Page: 250 Line No.: 15 Column: aRedeemed on August 31, 2005.
Schedule Page: 250 Line No.: 30 Column: aThis was reclassified to Other Long-Term Debt in accordance with ASC 480 in September
2003. It was shown here since it is still part of the total number of preferred shares
authorized. They were fully redeemed on May 31, 2005.
Schedule Page: 250 Line No.: 31 Column: aThis was reclassified to Other Long-Term Debt in accordance with ASC 480 in September
2003. It was shown here since it is still part of the total number of preferred shares
authorized. They were fully redeemed on May 31, 2005.
Name of Respondent
PACIFIC GAS AND ELECTRIC COMPANY
This Report is:(1) X An Original(2) A Resubmission
Date of Report(Mo, Da, Yr)
04/13/2021
Year/Period of Report
2020/Q4
FOOTNOTE DATA
FERC FORM NO. 1 (ED. 12-87) Page 450.1

Name of Respondent This Report Is:(1) An Original
(2) A Resubmission
Date of Report(Mo, Da, Yr)
Year/Period of Report
End ofPACIFIC GAS AND ELECTRIC COMPANYX
04/13/20212020/Q4
Line Item Amount(b)(a)
OTHER PAID-IN CAPITAL (Accounts 208-211, inc.)
No.
Report below the balance at the end of the year and the information specified below for the respective other paid-in capital accounts. Provide a
subheading for each account and show a total for the account, as well as total of all accounts for reconciliation with balance sheet, Page 112. Add more
columns for any account if deemed necessary. Explain changes made in any account during the year and give the accounting entries effecting such
change.
(a) Donations Received from Stockholders (Account 208)-State amount and give brief explanation of the origin and purpose of each donation.
(b) Reduction in Par or Stated value of Capital Stock (Account 209): State amount and give brief explanation of the capital change which gave rise to
amounts reported under this caption including identification with the class and series of stock to which related.
(c) Gain on Resale or Cancellation of Reacquired Capital Stock (Account 210): Report balance at beginning of year, credits, debits, and balance at end
of year with a designation of the nature of each credit and debit identified by the class and series of stock to which related.
(d) Miscellaneous Paid-in Capital (Account 211)-Classify amounts included in this account according to captions which, together with brief explanations,
disclose the general nature of the transactions which gave rise to the reported amounts.
Account 211 - Miscellaneous Paid in Capital 1
26,465,619,786Equity Infusions from Parent Company 2
50,960,304Excess Tax Benefit on Stock Based Compensation 3
4
5
6
7
8
9
10
11
12
13
14
15
16
17
18
19
20
21
22
23
24
25
26
27
28
29
30
31
32
33
34
35
36
37
38
39
FERC FORM NO. 1 (ED. 12-87) Page 253
40 TOTAL 26,516,580,090
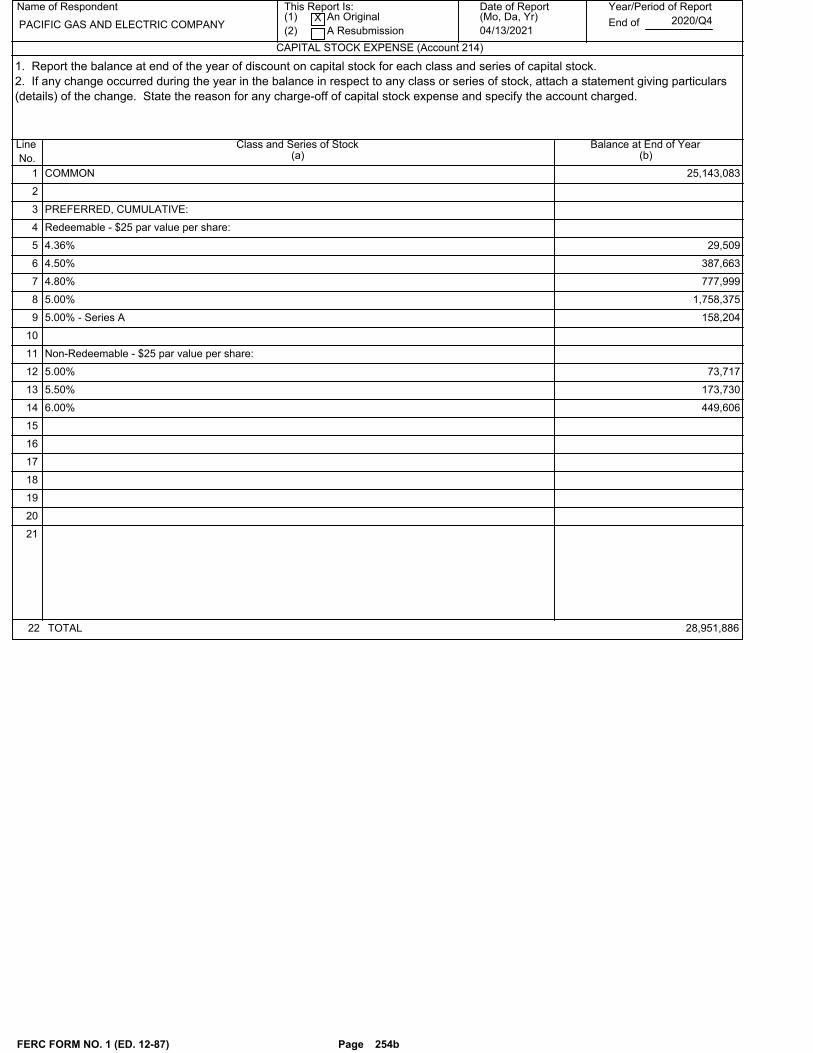
Name of Respondent This Report Is:(1) An Original
(2) A Resubmission
Date of Report(Mo, Da, Yr)
Year/Period of Report
End of
CAPITAL STOCK EXPENSE (Account 214)
PACIFIC GAS AND ELECTRIC COMPANYX
04/13/20212020/Q4
Line
No.
Class and Series of Stock Balance at End of Year(b)(a)
1. Report the balance at end of the year of discount on capital stock for each class and series of capital stock.
2. If any change occurred during the year in the balance in respect to any class or series of stock, attach a statement giving particulars
(details) of the change. State the reason for any charge-off of capital stock expense and specify the account charged.
25,143,083COMMON 1
2
PREFERRED, CUMULATIVE: 3
Redeemable - $25 par value per share: 4
29,5094.36% 5
387,6634.50% 6
777,9994.80% 7
1,758,3755.00% 8
158,2045.00% - Series A 9
10
Non-Redeemable - $25 par value per share: 11
73,7175.00% 12
173,7305.50% 13
449,6066.00% 14
15
16
17
18
19
20
21
FERC FORM NO. 1 (ED. 12-87) Page 254b
22 TOTAL 28,951,886

Name of Respondent This Report Is:(1) An Original
(2) A Resubmission
Date of Report(Mo, Da, Yr)
Year/Period of Report
End of
LONG-TERM DEBT (Account 221, 222, 223 and 224)
PACIFIC GAS AND ELECTRIC COMPANYX
04/13/20212020/Q4
Line
No.
Class and Series of Obligation, Coupon Rate
(c)(b)(a)
Total expense,
Premium or Discount
Principal Amount
Of Debt issued(For new issue, give commission Authorization numbers and dates)
1. Report by balance sheet account the particulars (details) concerning long-term debt included in Accounts 221, Bonds, 222,
Reacquired Bonds, 223, Advances from Associated Companies, and 224, Other long-Term Debt.
2. In column (a), for new issues, give Commission authorization numbers and dates.
3. For bonds assumed by the respondent, include in column (a) the name of the issuing company as well as a description of the bonds.
4. For advances from Associated Companies, report separately advances on notes and advances on open accounts. Designate
demand notes as such. Include in column (a) names of associated companies from which advances were received.
5. For receivers, certificates, show in column (a) the name of the court -and date of court order under which such certificates were
issued.
6. In column (b) show the principal amount of bonds or other long-term debt originally issued.
7. In column (c) show the expense, premium or discount with respect to the amount of bonds or other long-term debt originally issued.
8. For column (c) the total expenses should be listed first for each issuance, then the amount of premium (in parentheses) or discount.
Indicate the premium or discount with a notation, such as (P) or (D). The expenses, premium or discount should not be netted.
9. Furnish in a footnote particulars (details) regarding the treatment of unamortized debt expense, premium or discount associated with
issues redeemed during the year. Also, give in a footnote the date of the Commission’s authorization of treatment other than as
specified by the Uniform System of Accounts.
4,205,770 550,000,000Senior Notes 3.50% due 2020 (A) 1
2,728,000 2 D
1,897,267 250,000,000Senior Notes 3.50% due 2020 (A) 3
6,840,000 4 D
2,270,404 300,000,000Senior Notes 4.25% due 2021 (A) 5
243,000 6 D
1,981,515 250,000,000Senior Notes 3.25% due 2021 (A) 7
1,312,500 8 D
3,251,743 400,000,000Senior Notes 2.45% due 2022 (A) 9
1,164,000 10 D
2,924,964 375,000,000Senior Notes 3.25% due 2023 (B) 11
1,901,250 12 D
4,061,237 500,000,000Senior Notes 4.25% due 2023 (B) 13
1,175,000 14 D
2,505,170 300,000,000Senior Notes 3.85% due 2023 (B) 15
543,000 16 D
3,672,801 450,000,000Senior Notes 3.75% due 2024 (B) 17
445,500 18 D
2,788,492 350,000,000Senior Notes 3.40% due 2024 (B) 19
262,500 20 D
3,471,059 400,000,000Senior Notes 3.50% due 2025 (B) 21
2,540,000 22 D
1,716,157 200,000,000Senior Notes 3.50% due 2025 (B) 23
-2,716,000 24 P
3,645,283 875,000,000Senior Notes 3.45% due 2025 (C) 25
5,241,785 600,000,000Senior Notes 2.95% due 2026 (B) 26
1,596,000 27 D
3,233,353 1,951,470,000Senior Notes 3.15% due 2026 (C) 28
3,306,994 400,000,000Senior Notes 3.30% due 2027 (B) 29
1,420,000 30 D
9,322,742 1,150,000,000Senior Notes 3.30% due 2027 (B) 31
3,404,000 32 D
FERC FORM NO. 1 (ED. 12-96) Page 256
33 TOTAL 42,665,040,000 476,806,155
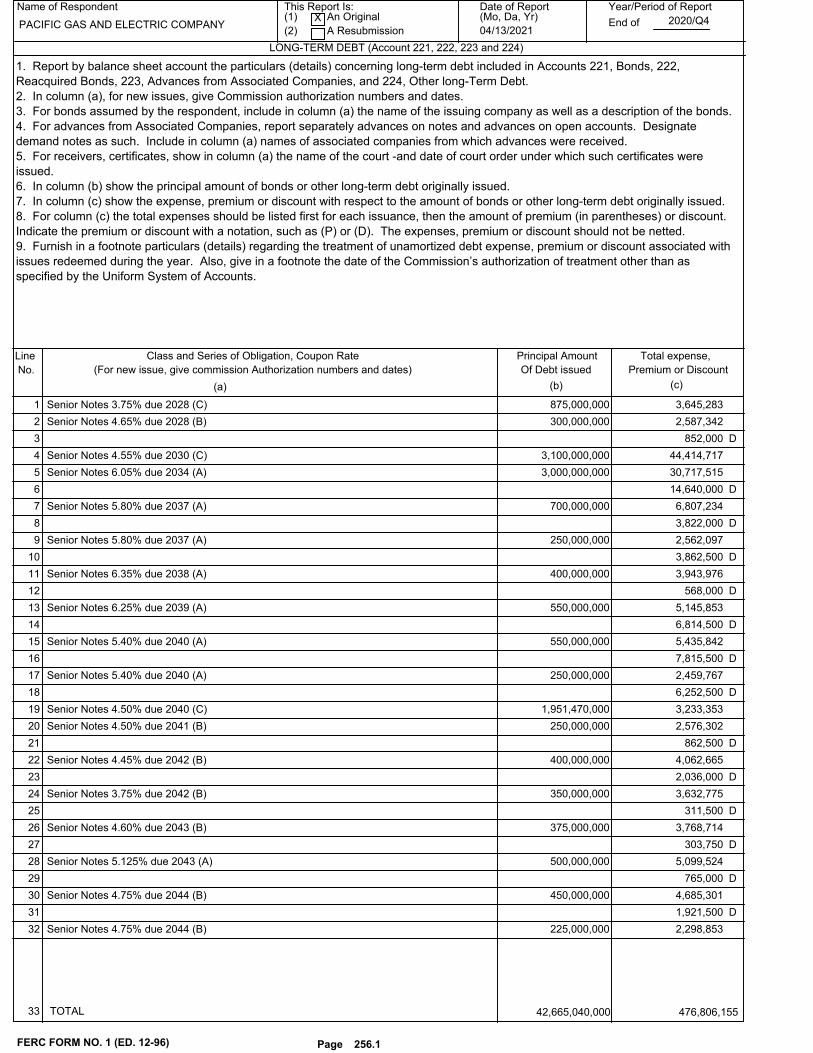
Name of Respondent This Report Is:(1) An Original
(2) A Resubmission
Date of Report(Mo, Da, Yr)
Year/Period of Report
End of
LONG-TERM DEBT (Account 221, 222, 223 and 224)
PACIFIC GAS AND ELECTRIC COMPANYX
04/13/20212020/Q4
Line
No.
Class and Series of Obligation, Coupon Rate
(c)(b)(a)
Total expense,
Premium or Discount
Principal Amount
Of Debt issued(For new issue, give commission Authorization numbers and dates)
1. Report by balance sheet account the particulars (details) concerning long-term debt included in Accounts 221, Bonds, 222,
Reacquired Bonds, 223, Advances from Associated Companies, and 224, Other long-Term Debt.
2. In column (a), for new issues, give Commission authorization numbers and dates.
3. For bonds assumed by the respondent, include in column (a) the name of the issuing company as well as a description of the bonds.
4. For advances from Associated Companies, report separately advances on notes and advances on open accounts. Designate
demand notes as such. Include in column (a) names of associated companies from which advances were received.
5. For receivers, certificates, show in column (a) the name of the court -and date of court order under which such certificates were
issued.
6. In column (b) show the principal amount of bonds or other long-term debt originally issued.
7. In column (c) show the expense, premium or discount with respect to the amount of bonds or other long-term debt originally issued.
8. For column (c) the total expenses should be listed first for each issuance, then the amount of premium (in parentheses) or discount.
Indicate the premium or discount with a notation, such as (P) or (D). The expenses, premium or discount should not be netted.
9. Furnish in a footnote particulars (details) regarding the treatment of unamortized debt expense, premium or discount associated with
issues redeemed during the year. Also, give in a footnote the date of the Commission’s authorization of treatment other than as
specified by the Uniform System of Accounts.
3,645,283 875,000,000Senior Notes 3.75% due 2028 (C) 1
2,587,342 300,000,000Senior Notes 4.65% due 2028 (B) 2
852,000 3 D
44,414,717 3,100,000,000Senior Notes 4.55% due 2030 (C) 4
30,717,515 3,000,000,000Senior Notes 6.05% due 2034 (A) 5
14,640,000 6 D
6,807,234 700,000,000Senior Notes 5.80% due 2037 (A) 7
3,822,000 8 D
2,562,097 250,000,000Senior Notes 5.80% due 2037 (A) 9
3,862,500 10 D
3,943,976 400,000,000Senior Notes 6.35% due 2038 (A) 11
568,000 12 D
5,145,853 550,000,000Senior Notes 6.25% due 2039 (A) 13
6,814,500 14 D
5,435,842 550,000,000Senior Notes 5.40% due 2040 (A) 15
7,815,500 16 D
2,459,767 250,000,000Senior Notes 5.40% due 2040 (A) 17
6,252,500 18 D
3,233,353 1,951,470,000Senior Notes 4.50% due 2040 (C) 19
2,576,302 250,000,000Senior Notes 4.50% due 2041 (B) 20
862,500 21 D
4,062,665 400,000,000Senior Notes 4.45% due 2042 (B) 22
2,036,000 23 D
3,632,775 350,000,000Senior Notes 3.75% due 2042 (B) 24
311,500 25 D
3,768,714 375,000,000Senior Notes 4.60% due 2043 (B) 26
303,750 27 D
5,099,524 500,000,000Senior Notes 5.125% due 2043 (A) 28
765,000 29 D
4,685,301 450,000,000Senior Notes 4.75% due 2044 (B) 30
1,921,500 31 D
2,298,853 225,000,000Senior Notes 4.75% due 2044 (B) 32
FERC FORM NO. 1 (ED. 12-96) Page 256.1
33 TOTAL 42,665,040,000 476,806,155

Name of Respondent This Report Is:(1) An Original
(2) A Resubmission
Date of Report(Mo, Da, Yr)
Year/Period of Report
End of
LONG-TERM DEBT (Account 221, 222, 223 and 224)
PACIFIC GAS AND ELECTRIC COMPANYX
04/13/20212020/Q4
Line
No.
Class and Series of Obligation, Coupon Rate
(c)(b)(a)
Total expense,
Premium or Discount
Principal Amount
Of Debt issued(For new issue, give commission Authorization numbers and dates)
1. Report by balance sheet account the particulars (details) concerning long-term debt included in Accounts 221, Bonds, 222,
Reacquired Bonds, 223, Advances from Associated Companies, and 224, Other long-Term Debt.
2. In column (a), for new issues, give Commission authorization numbers and dates.
3. For bonds assumed by the respondent, include in column (a) the name of the issuing company as well as a description of the bonds.
4. For advances from Associated Companies, report separately advances on notes and advances on open accounts. Designate
demand notes as such. Include in column (a) names of associated companies from which advances were received.
5. For receivers, certificates, show in column (a) the name of the court -and date of court order under which such certificates were
issued.
6. In column (b) show the principal amount of bonds or other long-term debt originally issued.
7. In column (c) show the expense, premium or discount with respect to the amount of bonds or other long-term debt originally issued.
8. For column (c) the total expenses should be listed first for each issuance, then the amount of premium (in parentheses) or discount.
Indicate the premium or discount with a notation, such as (P) or (D). The expenses, premium or discount should not be netted.
9. Furnish in a footnote particulars (details) regarding the treatment of unamortized debt expense, premium or discount associated with
issues redeemed during the year. Also, give in a footnote the date of the Commission’s authorization of treatment other than as
specified by the Uniform System of Accounts.
-13,594,500 1 P
5,051,799 500,000,000Senior Notes 4.30% due 2045 (B) 2
5,745,000 3 D
1,092,707 100,000,000Senior Notes 4.30% due 2045 (B) 4
5,231,000 5 D
4,859,582 450,000,000Senior Notes 4.25% due 2046 (B) 6
8,415,000 7 D
4,345,973 400,000,000Senior Notes 4.00% due 2046 (B) 8
7,344,000 9 D
2,102,746 200,000,000Senior Notes 4.00% due 2046 (B) 10
4,136,000 11 D
8,803,613 850,000,000Senior Notes 3.95% due 2047 (B) 12
3,706,000 13 D
44,414,717 3,100,000,000Senior Notes 4.95% due 2050 (C) 14
15
1,001,412 200,000,000Pollution Control Bonds 1996 Series C (A) 16
927,332 165,000,000Pollution Control Bonds 1996 Series E (A) 17
556,667 100,000,000Pollution Control Bonds 1996 Series F (A) 18
886,179 148,550,000Pollution Control Bonds 1997 Series B (A) 19
164,224 50,000,000Pollution Control Bonds 2008 Series F, 1.75% (A) (E) 20
403,242 74,275,000Pollution Control Bonds 2009 Series A (A) 21
403,242 74,275,000Pollution Control Bonds 2009 Series B (A) 22
328,903 50,000,000Pollution Control Bonds 2010 Series E, 1.75% (A) (E) 23
24
3,153,155 500,000,0003M-LIBOR + 1.48% First Rate Mortgage Bond due 2022 25
15,699,776 2,500,000,000First Mortgage Bonds 1.75% due 2022 26
150,000 27 D
7,539,810 1,000,000,000First Mortgage Bonds 2.10% due 2027 28
1,860,000 29 D
15,563,121 2,000,000,000First Mortgage Bonds 2.50% due 2031 30
2,080,000 31 D
10,039,810 1,000,000,000First Mortgage Bonds 3.30% due 2040 32
FERC FORM NO. 1 (ED. 12-96) Page 256.2
33 TOTAL 42,665,040,000 476,806,155

Name of Respondent This Report Is:(1) An Original
(2) A Resubmission
Date of Report(Mo, Da, Yr)
Year/Period of Report
End of
LONG-TERM DEBT (Account 221, 222, 223 and 224)
PACIFIC GAS AND ELECTRIC COMPANYX
04/13/20212020/Q4
Line
No.
Class and Series of Obligation, Coupon Rate
(c)(b)(a)
Total expense,
Premium or Discount
Principal Amount
Of Debt issued(For new issue, give commission Authorization numbers and dates)
1. Report by balance sheet account the particulars (details) concerning long-term debt included in Accounts 221, Bonds, 222,
Reacquired Bonds, 223, Advances from Associated Companies, and 224, Other long-Term Debt.
2. In column (a), for new issues, give Commission authorization numbers and dates.
3. For bonds assumed by the respondent, include in column (a) the name of the issuing company as well as a description of the bonds.
4. For advances from Associated Companies, report separately advances on notes and advances on open accounts. Designate
demand notes as such. Include in column (a) names of associated companies from which advances were received.
5. For receivers, certificates, show in column (a) the name of the court -and date of court order under which such certificates were
issued.
6. In column (b) show the principal amount of bonds or other long-term debt originally issued.
7. In column (c) show the expense, premium or discount with respect to the amount of bonds or other long-term debt originally issued.
8. For column (c) the total expenses should be listed first for each issuance, then the amount of premium (in parentheses) or discount.
Indicate the premium or discount with a notation, such as (P) or (D). The expenses, premium or discount should not be netted.
9. Furnish in a footnote particulars (details) regarding the treatment of unamortized debt expense, premium or discount associated with
issues redeemed during the year. Also, give in a footnote the date of the Commission’s authorization of treatment other than as
specified by the Uniform System of Accounts.
4,990,000 1 D
19,311,372 1,925,000,000First Mortgage Bonds 3.50% due 2050 2
12,146,750 3 D
9,187,500 2,000,000,000Debtor-In-Possession Credit Facility - Term Loan (D) 4
5
8,500,174 1,500,000,000Term Loan 18 Months 6
7
8
9
10
11
12
13
14
15
16
17
18
19
20
21
22
23
24
25
26
27
28
29
30
31
32
FERC FORM NO. 1 (ED. 12-96) Page 256.3
33 TOTAL 42,665,040,000 476,806,155

Name of Respondent This Report Is:(1) An Original
(2) A Resubmission
Date of Report(Mo, Da, Yr)
Year/Period of Report
End of
LONG-TERM DEBT (Account 221, 222, 223 and 224) (Continued)
PACIFIC GAS AND ELECTRIC COMPANYX
04/13/20212020/Q4
Line
No.Nominal Date
of IssueDate ofMaturity
AMORTIZATION PERIOD
Date From Date To
Outstanding(Total amount outstanding without
reduction for amounts held byrespondent)
Interest for YearAmount
(d) (e) (f) (g) (h) (i)
10. Identify separate undisposed amounts applicable to issues which were redeemed in prior years.
11. Explain any debits and credits other than debited to Account 428, Amortization and Expense, or credited to Account 429, Premium
on Debt - Credit.
12. In a footnote, give explanatory (details) for Accounts 223 and 224 of net changes during the year. With respect to long-term
advances, show for each company: (a) principal advanced during year, (b) interest added to principal amount, and (c) principle repaid
during year. Give Commission authorization numbers and dates.
13. If the respondent has pledged any of its long-term debt securities give particulars (details) in a footnote including name of pledgee
and purpose of the pledge.
14. If the respondent has any long-term debt securities which have been nominally issued and are nominally outstanding at end of
year, describe such securities in a footnote.
15. If interest expense was incurred during the year on any obligations retired or reacquired before end of year, include such interest
expense in column (i). Explain in a footnote any difference between the total of column (i) and the total of Account 427, interest on
Long-Term Debt and Account 430, Interest on Debt to Associated Companies.
16. Give particulars (details) concerning any long-term debt authorized by a regulatory commission but not yet issued.
7,311,21310/1/20209/15/201010/1/20209/15/2010 1
2
3,323,27810/1/202011/18/201010/1/202011/18/2010 3
4
3,977,1465/15/20215/13/20115/15/20215/13/2011 5
6
3,325,3329/15/20219/12/20119/15/20219/12/2011 7
8
5,315,6108/15/20228/16/20128/15/20228/16/2012 9
10
375,000,000 12,249,0666/15/20236/14/20136/15/20236/14/2013 11
12
500,000,000 20,910,0468/1/20238/6/20188/1/20238/6/2018 13
14
300,000,000 11,534,29411/15/202311/12/201311/15/202311/12/2013 15
16
450,000,000 16,660,3422/15/20242/21/20142/15/20242/21/2014 17
18
350,000,000 11,765,1328/15/20248/18/20148/15/20248/18/2014 19
20
400,000,000 14,075,7706/15/20256/12/20156/15/20256/12/2015 21
22
200,000,000 7,037,8856/15/202511/5/20156/15/202511/5/2015 23
24
875,000,000 15,009,8967/1/20257/1/20207/1/20257/1/2020 25
600,000,000 17,505,1573/1/20263/1/20163/1/20263/1/2016 26
27
1,951,470,000 30,397,0641/1/20267/1/20201/1/20267/1/2020 28
400,000,000 13,057,9813/15/20273/10/20173/15/20273/10/2017 29
30
1,150,000,000 38,078,65012/1/202711/29/201712/1/202711/29/2017 31
32
FERC FORM NO. 1 (ED. 12-96) Page 257
33 31,852,940,000 909,242,062

Name of Respondent This Report Is:(1) An Original
(2) A Resubmission
Date of Report(Mo, Da, Yr)
Year/Period of Report
End of
LONG-TERM DEBT (Account 221, 222, 223 and 224) (Continued)
PACIFIC GAS AND ELECTRIC COMPANYX
04/13/20212020/Q4
Line
No.Nominal Date
of IssueDate ofMaturity
AMORTIZATION PERIOD
Date From Date To
Outstanding(Total amount outstanding without
reduction for amounts held byrespondent)
Interest for YearAmount
(d) (e) (f) (g) (h) (i)
10. Identify separate undisposed amounts applicable to issues which were redeemed in prior years.
11. Explain any debits and credits other than debited to Account 428, Amortization and Expense, or credited to Account 429, Premium
on Debt - Credit.
12. In a footnote, give explanatory (details) for Accounts 223 and 224 of net changes during the year. With respect to long-term
advances, show for each company: (a) principal advanced during year, (b) interest added to principal amount, and (c) principle repaid
during year. Give Commission authorization numbers and dates.
13. If the respondent has pledged any of its long-term debt securities give particulars (details) in a footnote including name of pledgee
and purpose of the pledge.
14. If the respondent has any long-term debt securities which have been nominally issued and are nominally outstanding at end of
year, describe such securities in a footnote.
15. If interest expense was incurred during the year on any obligations retired or reacquired before end of year, include such interest
expense in column (i). Explain in a footnote any difference between the total of column (i) and the total of Account 427, interest on
Long-Term Debt and Account 430, Interest on Debt to Associated Companies.
16. Give particulars (details) concerning any long-term debt authorized by a regulatory commission but not yet issued.
875,000,000 16,315,1047/1/20287/1/20207/1/20287/1/2020 1
300,000,000 13,702,3268/1/20288/6/20188/1/20288/6/2018 2
3
3,100,000,000 70,133,1947/1/20307/1/20207/1/20307/1/2020 4
40,407,6633/1/20343/23/20043/1/20343/23/2004 5
6
9,419,0003/1/20373/13/20073/1/20373/13/2007 7
8
3,363,9283/1/20374/1/20103/1/20374/1/2010 9
10
5,409,0082/15/20383/3/20082/15/20383/3/2008 11
12
7,414,0153/1/20393/6/20093/1/20393/6/2009 13
14
7,438,6311/15/204011/18/20091/15/204011/18/2009 15
16
3,381,1961/15/204011/18/20101/15/204011/18/2010 17
18
1,951,470,000 43,424,3777/1/20407/1/20207/1/20407/1/2020 19
250,000,000 11,327,03912/15/204112/1/201112/15/204112/1/2011 20
21
400,000,000 17,686,2754/15/20424/16/20124/15/20424/16/2012 22
23
350,000,000 12,958,0448/15/20428/16/20128/15/20428/16/2012 24
25
375,000,000 17,370,5946/15/20436/14/20136/15/20436/14/2013 26
27
6,640,39611/15/204311/12/201311/15/204311/12/2013 28
29
450,000,000 21,018,3722/15/20442/21/20142/15/20442/21/2014 30
31
225,000,000 10,509,1862/15/20448/18/20142/15/20448/18/2014 32
FERC FORM NO. 1 (ED. 12-96) Page 257.1
33 31,852,940,000 909,242,062

Name of Respondent This Report Is:(1) An Original
(2) A Resubmission
Date of Report(Mo, Da, Yr)
Year/Period of Report
End of
LONG-TERM DEBT (Account 221, 222, 223 and 224) (Continued)
PACIFIC GAS AND ELECTRIC COMPANYX
04/13/20212020/Q4
Line
No.Nominal Date
of IssueDate ofMaturity
AMORTIZATION PERIOD
Date From Date To
Outstanding(Total amount outstanding without
reduction for amounts held byrespondent)
Interest for YearAmount
(d) (e) (f) (g) (h) (i)
10. Identify separate undisposed amounts applicable to issues which were redeemed in prior years.
11. Explain any debits and credits other than debited to Account 428, Amortization and Expense, or credited to Account 429, Premium
on Debt - Credit.
12. In a footnote, give explanatory (details) for Accounts 223 and 224 of net changes during the year. With respect to long-term
advances, show for each company: (a) principal advanced during year, (b) interest added to principal amount, and (c) principle repaid
during year. Give Commission authorization numbers and dates.
13. If the respondent has pledged any of its long-term debt securities give particulars (details) in a footnote including name of pledgee
and purpose of the pledge.
14. If the respondent has any long-term debt securities which have been nominally issued and are nominally outstanding at end of
year, describe such securities in a footnote.
15. If interest expense was incurred during the year on any obligations retired or reacquired before end of year, include such interest
expense in column (i). Explain in a footnote any difference between the total of column (i) and the total of Account 427, interest on
Long-Term Debt and Account 430, Interest on Debt to Associated Companies.
16. Give particulars (details) concerning any long-term debt authorized by a regulatory commission but not yet issued.
1
500,000,000 21,209,8053/15/204511/6/20143/15/204511/6/2014 2
3
100,000,000 4,241,9613/15/20456/12/20153/15/20456/12/2015 4
5
450,000,000 18,869,4823/15/204611/5/20153/15/204611/5/2015 6
7
400,000,000 16,062,68612/1/204612/1/201612/1/204612/1/2016 8
9
200,000,000 8,031,34312/1/20463/10/201712/1/20463/10/2017 10
11
850,000,000 33,705,28212/1/204711/29/201712/1/204711/29/2017 12
13
3,100,000,000 76,298,7507/1/20507/1/20207/1/20507/1/2020 14
15
2,920,97611/1/20265/23/199611/1/20265/23/1996 16
2,295,59911/1/20265/23/199611/1/20265/23/1996 17
1,372,68011/1/20265/23/199611/1/20265/23/1996 18
2,062,79611/1/20269/16/199711/1/20269/16/1997 19
659,99511/1/20266/15/201711/1/20266/15/2017 20
1,046,39111/1/20269/1/200911/1/20269/1/2009 21
1,046,39111/1/20269/1/200911/1/20269/1/2009 22
659,99511/1/20266/15/201711/1/20266/15/2017 23
24
500,000,000 4,772,3896/16/20226/19/20206/16/20226/19/2020 25
2,500,000,000 23,333,3336/16/20226/19/20206/16/20226/19/2020 26
27
1,000,000,000 11,200,0008/1/20276/19/20208/1/20276/19/2020 28
29
2,000,000,000 26,666,6672/1/20316/19/20202/1/20316/19/2020 30
31
1,000,000,000 17,600,0008/1/20406/19/20208/1/20406/19/2020 32
FERC FORM NO. 1 (ED. 12-96) Page 257.2
33 31,852,940,000 909,242,062

Name of Respondent This Report Is:(1) An Original
(2) A Resubmission
Date of Report(Mo, Da, Yr)
Year/Period of Report
End of
LONG-TERM DEBT (Account 221, 222, 223 and 224) (Continued)
PACIFIC GAS AND ELECTRIC COMPANYX
04/13/20212020/Q4
Line
No.Nominal Date
of IssueDate ofMaturity
AMORTIZATION PERIOD
Date From Date To
Outstanding(Total amount outstanding without
reduction for amounts held byrespondent)
Interest for YearAmount
(d) (e) (f) (g) (h) (i)
10. Identify separate undisposed amounts applicable to issues which were redeemed in prior years.
11. Explain any debits and credits other than debited to Account 428, Amortization and Expense, or credited to Account 429, Premium
on Debt - Credit.
12. In a footnote, give explanatory (details) for Accounts 223 and 224 of net changes during the year. With respect to long-term
advances, show for each company: (a) principal advanced during year, (b) interest added to principal amount, and (c) principle repaid
during year. Give Commission authorization numbers and dates.
13. If the respondent has pledged any of its long-term debt securities give particulars (details) in a footnote including name of pledgee
and purpose of the pledge.
14. If the respondent has any long-term debt securities which have been nominally issued and are nominally outstanding at end of
year, describe such securities in a footnote.
15. If interest expense was incurred during the year on any obligations retired or reacquired before end of year, include such interest
expense in column (i). Explain in a footnote any difference between the total of column (i) and the total of Account 427, interest on
Long-Term Debt and Account 430, Interest on Debt to Associated Companies.
16. Give particulars (details) concerning any long-term debt authorized by a regulatory commission but not yet issued.
1
1,925,000,000 35,933,3338/1/20506/19/20208/1/20506/19/2020 2
3
31,112,496N/AN/A12/31/20204/3/2019 4
5
1,500,000,000 18,687,5021/1/20227/1/20201/1/20227/1/2020 6
7
8
9
10
11
12
13
14
15
16
17
18
19
20
21
22
23
24
25
26
27
28
29
30
31
32
FERC FORM NO. 1 (ED. 12-96) Page 257.3
33 31,852,940,000 909,242,062

Schedule Page: 256 Line No.: 1 Column: a(A) Utility Funded Debt: Interest calculated using Federal Judgement rate of 2.59%. On
January 22, 2020, PG&E entered into a Restructuring Support Agreement to refinance its
unsecured debt. On July 1, 2020, PG&E issued ~ $11.9 billion of debt as noted in Note
(C) to retire ~ $9 billion of debt and ~ $2.9 billion of revolver loan and letter of
credit draw.
Schedule Page: 256 Line No.: 11 Column: a (B) Utility Reinstated Senior Notes: Interest calculated using contractual rates.
Schedule Page: 256 Line No.: 25 Column: a (C) Utility Long-Term Senior Notes: On July 1, 2020, PG&E issued approx. $11.9 billion
of debt upon emergence from bankruptcy.
Schedule Page: 256.2 Line No.: 20 Column: a (E) Pollution Control Bonds - On July 1, 2020, PG&E repaid $100 million of Pollution
Control Bonds upon emergence from bankruptcy.
Schedule Page: 256.3 Line No.: 4 Column: a (D) DIP Term Loan - On July 1, 2020, PG&E repaid $2 billion of DIP Term Loan upon
emergence from bankruptcy.
Schedule Page: 256.3 Line No.: 4 Column: fIssurance costs were recorded to amortization of debt discounts and expense (428).
Name of Respondent
PACIFIC GAS AND ELECTRIC COMPANY
This Report is:(1) X An Original(2) A Resubmission
Date of Report(Mo, Da, Yr)
04/13/2021
Year/Period of Report
2020/Q4
FOOTNOTE DATA
FERC FORM NO. 1 (ED. 12-87) Page 450.1

Name of Respondent This Report Is:(1) An Original
(2) A Resubmission
Date of Report(Mo, Da, Yr)
Year/Period of Report
End of
RECONCILIATION OF REPORTED NET INCOME WITH TAXABLE INCOME FOR FEDERAL INCOME TAXES
PACIFIC GAS AND ELECTRIC COMPANYX
04/13/20212020/Q4
Particulars (Details)(b)(a)
Amount LineNo.
1. Report the reconciliation of reported net income for the year with taxable income used in computing Federal income tax accruals and show
computation of such tax accruals. Include in the reconciliation, as far as practicable, the same detail as furnished on Schedule M-1 of the tax return for
the year. Submit a reconciliation even though there is no taxable income for the year. Indicate clearly the nature of each reconciling amount.
2. If the utility is a member of a group which files a consolidated Federal tax return, reconcile reported net income with taxable net income as if a
separate return were to be field, indicating, however, intercompany amounts to be eliminated in such a consolidated return. State names of group
member, tax assigned to each group member, and basis of allocation, assignment, or sharing of the consolidated tax among the group members.
3. A substitute page, designed to meet a particular need of a company, may be used as Long as the data is consistent and meets the requirements of
the above instructions. For electronic reporting purposes complete Line 27 and provide the substitute Page in the context of a footnote.
410,958,488Net Income for the Year (Page 117) 1
Reconciling Items for the Year 2
3
Taxable Income Not Reported on Books 4
291,283,203Contributions in Aid of Construction 5
6
7
8
Deductions Recorded on Books Not Deducted for Return 9
257,167,714Provision for Federal Income Taxes 10
150,800,009Provision for State Income Taxes 11
1,883,853,411Per attached schedule (See page 261-1) 12
13
Income Recorded on Books Not Included in Return 14
174,768,108AFUDC - Equity and debt 15
1,938,389,931Balancing Accounts 16
17
18
Deductions on Return Not Charged Against Book Income 19
23,455,568,035Per attached schedule (See page 261-1) 20
21
22
23
24
25
26
-22,574,663,848Federal Tax Net Income 27
Show Computation of Tax: 28
Federal Tax Net Income as above 29
-4,740,679,408Tax at 21% for Electric, Water. Non-Utility, and Gas 30
Other 31
651,449Add: Tax on FIN 48 Interest 32
-6,234,175Less: Research & Development Credits 33
-250,000Less: Motor Vehicle Credit 34
4,734,354,291Reclass Tax Loss to Deferred 35
-11,329,784Specified Liability Loss 36
-23,487,627Subtotal Tax 37
5,397,000FIN 48 Tax Adjustments (Net to Gross) 38
-18,090,627Total Tax 39
40
-18,090,627Federal Income Tax Accrual 41
42
43
44
FERC FORM NO. 1 (ED. 12-96) Page 261

Schedule Page: 261 Line No.: 12 Column: bAnnual Report of PACIFIC GAS AND ELECTRIC
COMPANYYear Ended December 31, 2020
Deductions recorded on books not deducted onreturn:
Tax Addback
Bad Debts 112,632,208
Bankruptcy Costs 21,826,958
Capitalized Interest 61,315,619
Compensation Related Adjustments 178,992,375
Depreciation adjustment 336,047,176
DOE Settlement 18,032,732
Executive Compensation 4,637,952
Hydro Decommissioning 12,897,000
Solar and Fuel Cell Decommissioning 6,326,000
Gas Hedge Amortization 3,668,351
Gas Stored Underground Decommissioning 17,762,400
GHG Allowances 588,893,073
Loss on Reacquired Debt 13,881,702
Meals & Entertainment & Lobbying 8,369,049
Wildfire Fund Amortization 245,996,415
Nuclear Decommissioning 50,378,643
Nuclear Fuel expense 109,539,887
Penalties 80,017,028
Plant Disallowance 12,638,843
Total $ 1,883,853,411
Deductions on return not charged against book income: Tax Deduct
Debt Financing Costs (1,879,614,414)
Computer Software (114,267,967)
Name of Respondent
PACIFIC GAS AND ELECTRIC COMPANY
This Report is:(1) X An Original(2) A Resubmission
Date of Report(Mo, Da, Yr)
04/13/2021
Year/Period of Report
2020/Q4
FOOTNOTE DATA
FERC FORM NO. 1 (ED. 12-87) Page 450.1

DCPP Community Payment (9,794,791)
DIP Financing Fees (57,058,714)
Earnings of Subsidiaries (11,791)
Environmental Cleanup (54,860,613)
Fossil Decommissioning (2,920,338)
Gas Stored Underground 263A (480,992)
NorCal Wildfires Reserve (19,518,630,919)
Property Tax & State Income Tax (10,680,390)
Repairs (1,609,916,775)
Retained Decommissioning (2,255,334)
Section 263A MSCM (172,342,335)
Other (22,732,662)
Total $ (23,455,568,035)
Schedule Page: 261 Line No.: 20 Column: bSee footnote in row 12, column (b)
Name of Respondent
PACIFIC GAS AND ELECTRIC COMPANY
This Report is:(1) X An Original(2) A Resubmission
Date of Report(Mo, Da, Yr)
04/13/2021
Year/Period of Report
2020/Q4
FOOTNOTE DATA
FERC FORM NO. 1 (ED. 12-87) Page 450.2

Name of Respondent This Report Is:(1) An Original
(2) A Resubmission
Date of Report(Mo, Da, Yr)
Year/Period of Report
End of
TAXES ACCRUED, PREPAID AND CHARGED DURING YEAR
PACIFIC GAS AND ELECTRIC COMPANYX
04/13/20212020/Q4
Line
No.Kind of Tax
(See instruction 5)
BALANCE AT BEGINNING OF YEAR
Taxes Accrued(Account 236)
Prepaid Taxes(Include in Account 165)
TaxesChargedDuringYear
TaxesPaid
DuringAdjust-
mentsYear
(a) (b) (c) (d) (e) (f)
1. Give particulars (details) of the combined prepaid and accrued tax accounts and show the total taxes charged to operations and other accounts during
the year. Do not include gasoline and other sales taxes which have been charged to the accounts to which the taxed material was charged. If the
actual, or estimated amounts of such taxes are know, show the amounts in a footnote and designate whether estimated or actual amounts.
2. Include on this page, taxes paid during the year and charged direct to final accounts, (not charged to prepaid or accrued taxes.)
Enter the amounts in both columns (d) and (e). The balancing of this page is not affected by the inclusion of these taxes.
3. Include in column (d) taxes charged during the year, taxes charged to operations and other accounts through (a) accruals credited to taxes accrued,
(b)amounts credited to proportions of prepaid taxes chargeable to current year, and (c) taxes paid and charged direct to operations or accounts other
than accrued and prepaid tax accounts.
4. List the aggregate of each kind of tax in such manner that the total tax for each State and subdivision can readily be ascertained.
120,118,052 125,347,468 9,194,082Federal - FICA 1
255,363 4,628,087 -18,090,627 314,415,630Federal - Taxes on Income 2
1,109,883 1,118,224 -45,400Federal - Unemployment 3
26,267,378 26,267,378Federal - Decommisioning 4
5
147,750,676 4,628,087 134,642,443 323,564,312SUBTOTAL FEDERAL 6
7
112,083 -18,975,571 13,456,127 139,689,999State - Taxes on Income 8
7,411,139 7,439,256 239,241State - Unemployment 9
10
7,523,222 -18,975,571 20,895,383 139,929,240SUBTOTAL STATE TAXES 11
12
524,277,868 35,518,199 488,787,259 1,103Ad Valorem property 13
38,046,053 39,030,940 3,161,439Other 14
15
562,323,921 35,518,199 527,818,199 3,162,542SUBTOTAL OTHER TAXES 16
17
18
19
20
21
22
23
24
25
26
27
28
29
30
31
32
33
34
35
36
37
38
39
40
FERC FORM NO. 1 (ED. 12-96) Page 262
TOTAL41 683,356,025 717,597,819 21,170,715 466,656,094

Name of Respondent This Report Is:(1) An Original
(2) A Resubmission
Date of Report(Mo, Da, Yr)
Year/Period of Report
End of
TAXES ACCRUED, PREPAID AND CHARGED DURING YEAR (Continued)
PACIFIC GAS AND ELECTRIC COMPANYX
04/13/20212020/Q4
Line
No.(Taxes accrued
BALANCE AT END OF YEARPrepaid Taxes Electric
(Account 408.1, 409.1)Extraordinary Items
(Account 409.3)Adjustments to Ret. OtherEarnings (Account 439)
(g) (h) (i) (j) (k) (l)Account 236) (Incl. in Account 165)
DISTRIBUTION OF TAXES CHARGED
5. If any tax (exclude Federal and State income taxes)- covers more then one year, show the required information separately for each tax year,
identifying the year in column (a).
6. Enter all adjustments of the accrued and prepaid tax accounts in column (f) and explain each adjustment in a foot- note. Designate debit adjustments
by parentheses.
7. Do not include on this page entries with respect to deferred income taxes or taxes collected through payroll deductions or otherwise pending
transmittal of such taxes to the taxing authority.
8. Report in columns (i) through (l) how the taxes were distributed. Report in column (I) only the amounts charged to Accounts 408.1 and 409.1
pertaining to electric operations. Report in column (l) the amounts charged to Accounts 408.1 and 109.1 pertaining to other utility departments and
amounts charged to Accounts 408.2 and 409.2. Also shown in column (l) the taxes charged to utility plant or other balance sheet accounts.
9. For any tax apportioned to more than one utility department or account, state in a footnote the basis (necessity) of apportioning such tax.
40,858,789 84,488,679 14,423,498 1
697,809 -18,788,436 300,697,727 2
366,282 751,942 -37,059 3
26,267,378 4
5
41,922,880 92,719,563 315,084,166 6
7
56,723,072 -43,266,945 134,058,472 8
2,436,782 5,002,474 267,358 9
10
59,159,854 -38,264,471 134,325,830 11
12
133,920,419 354,866,840 28,693 13
12,477,816 26,553,124 4,146,326 14
15
146,398,235 381,419,964 4,175,019 16
17
18
19
20
21
22
23
24
25
26
27
28
29
30
31
32
33
34
35
36
37
38
39
40
FERC FORM NO. 1 (ED. 12-96) Page 263
41 435,875,056 247,480,969 453,585,015
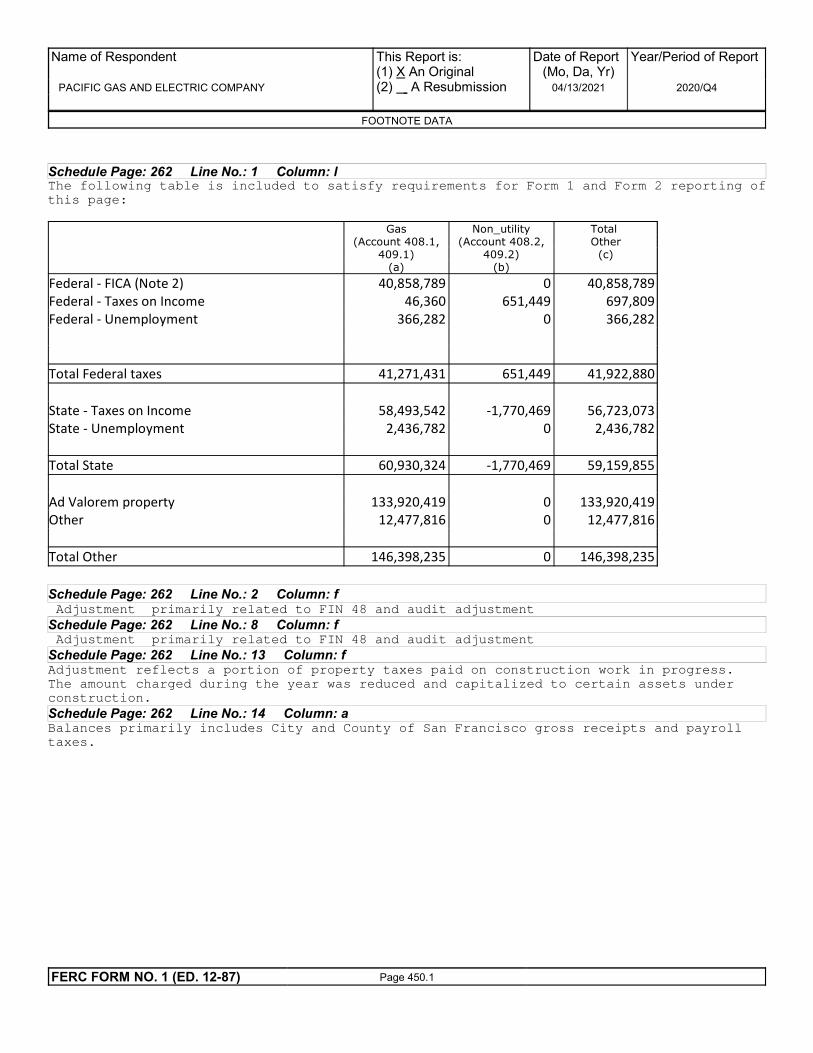
Schedule Page: 262 Line No.: 1 Column: lThe following table is included to satisfy requirements for Form 1 and Form 2 reporting of
this page:
Gas(Account 408.1,
409.1)(a)
Non_utility(Account 408.2,
409.2)(b)
Total Other
(c)
Federal - FICA (Note 2) 40,858,789 0 40,858,789
Federal - Taxes on Income 46,360 651,449 697,809
Federal - Unemployment 366,282 0 366,282
Total Federal taxes 41,271,431 651,449 41,922,880
State - Taxes on Income 58,493,542 -1,770,469 56,723,073
State - Unemployment 2,436,782 0 2,436,782
Total State 60,930,324 -1,770,469 59,159,855
Ad Valorem property 133,920,419 0 133,920,419
Other 12,477,816 0 12,477,816
Total Other 146,398,235 0 146,398,235
Schedule Page: 262 Line No.: 2 Column: f Adjustment primarily related to FIN 48 and audit adjustment
Schedule Page: 262 Line No.: 8 Column: f Adjustment primarily related to FIN 48 and audit adjustment
Schedule Page: 262 Line No.: 13 Column: fAdjustment reflects a portion of property taxes paid on construction work in progress.
The amount charged during the year was reduced and capitalized to certain assets under
construction.
Schedule Page: 262 Line No.: 14 Column: aBalances primarily includes City and County of San Francisco gross receipts and payroll
taxes.
Name of Respondent
PACIFIC GAS AND ELECTRIC COMPANY
This Report is:(1) X An Original(2) A Resubmission
Date of Report(Mo, Da, Yr)
04/13/2021
Year/Period of Report
2020/Q4
FOOTNOTE DATA
FERC FORM NO. 1 (ED. 12-87) Page 450.1

Name of Respondent This Report Is:(1) An Original
(2) A Resubmission
Date of Report(Mo, Da, Yr)
Year/Period of Report
End of
ACCUMULATED DEFERRED INVESTMENT TAX CREDITS (Account 255)
PACIFIC GAS AND ELECTRIC COMPANYX
04/13/20212020/Q4
Line
No.
Account Balance at Beginning
(c)(b)(a)
of YearSubdivisions AdjustmentsDeferred for YearAllocations to
Current Year's IncomeAccount No. Amount Account No. Amount
(d) (e) (f) (g)
Report below information applicable to Account 255. Where appropriate, segregate the balances and transactions by utility and
nonutility operations. Explain by footnote any correction adjustments to the account balance shown in column (g).Include in column (i)
the average period over which the tax credits are amortized.
Electric Utility 1
3% 2
4% 3
7% 4
10% 84,072,608 411.5 5,800,766 5
6
7
TOTAL 84,072,608 5,800,766 8
Other (List separately
and show 3%, 4%, 7%,
10% and TOTAL)
9
10
10% 18,812,494 411.5 1,191,046 11
12
TOTAL 18,812,494 1,191,046 13
14
15
16
17
18
19
20
21
22
23
24
25
26
27
28
30
31
32
33
34
35
36
37
38
39
40
41
42
43
44
45
46
47
48
FERC FORM NO. 1 (ED. 12-89) Page 266

Balance at End
(i)(h)
of Year
Name of Respondent This Report Is:(1) An Original
(2) A Resubmission
Date of Report(Mo, Da, Yr)
Year/Period of Report
End of
ACCUMULATED DEFERRED INVESTMENT TAX CREDITS (Account 255) (continued)
PACIFIC GAS AND ELECTRIC COMPANYX
04/13/20212020/Q4
Line
No.ADJUSTMENT EXPLANATIONAverage Period
of Allocationto Income
1
2
3
4
78,271,842 18 5
6
7
78,271,842 8
9
10
17,621,448 22 11
12
17,621,448 13
14
15
16
17
18
19
20
21
22
23
24
25
26
27
28
30
31
32
33
34
35
36
37
38
39
40
41
42
43
44
45
46
47
48
FERC FORM NO. 1 (ED. 12-89) Page 267

Name of Respondent This Report Is:(1) An Original
(2) A Resubmission
Date of Report(Mo, Da, Yr)
Year/Period of Report
End of
OTHER DEFFERED CREDITS (Account 253)
PACIFIC GAS AND ELECTRIC COMPANYX
04/13/20212020/Q4
Line
No.
Description and Other DEBITS Credits
Account(c)(b)(a)
Balance atEnd of Year
(d)
Deferred Credits Amount
(e)
Balance at Beginning of Year Contra
(f)
1. Report below the particulars (details) called for concerning other deferred credits.
2. For any deferred credit being amortized, show the period of amortization.
3. Minor items (5% of the Balance End of Year for Account 253 or amounts less than $100,000, whichever is greater) may be grouped by classes.
184,892,865CIAC Deferred Revenue 203,913,048 79,162,214 60,142,031143,146,456 1
2
Wildfire Fund 1,300,114,149 1,492,714,149 192,600,000242 3
4
57,255,184Other 69,113,773 54,384,898 42,526,309Various 5
6
7
8
9
10
11
12
13
14
15
16
17
18
19
20
21
22
23
24
25
26
27
28
29
30
31
32
33
34
35
36
37
38
39
40
41
42
43
44
45
46
FERC FORM NO. 1 (ED. 12-94) Page 269
47 TOTAL 1,626,261,261 295,268,340 1,573,140,970 242,148,049

Schedule Page: 269 Line No.: 1 Column: aActivity includes ~$48 million of amortization. The deferred credit is amortized over 30years.
Schedule Page: 269 Line No.: 5 Column: a "Other" consists of various other deferred credits amounts with balances of less than 5%of the year end balance (< 1,573,140,970 * 5% = 78,657,049).
Name of Respondent
PACIFIC GAS AND ELECTRIC COMPANY
This Report is:(1) X An Original(2) A Resubmission
Date of Report(Mo, Da, Yr)
04/13/2021
Year/Period of Report
2020/Q4
FOOTNOTE DATA
FERC FORM NO. 1 (ED. 12-87) Page 450.1

Name of Respondent This Report Is:(1) An Original
(2) A Resubmission
Date of Report(Mo, Da, Yr)
Year/Period of Report
End of
ACCUMULATED DEFERRED INCOME TAXES - ACCELERATED AMORTIZATION PROPERTY (Account 281)
PACIFIC GAS AND ELECTRIC COMPANYX
04/13/20212020/Q4
Line
No.Account
(a) (b) (c) (d)
Balance atBeginning of Year
CHANGES DURING YEAR
Amounts Debited Amounts Credited
to Account 410.1 to Account 411.1
1. Report the information called for below concerning the respondent’s accounting for deferred income taxes rating to amortizable
property.
2. For other (Specify),include deferrals relating to other income and deductions.
1 Accelerated Amortization (Account 281)
2 Electric
3 Defense Facilities
4 Pollution Control Facilities
5 Other (provide details in footnote):
6 Settlement Reg Asset
7
8 TOTAL Electric (Enter Total of lines 3 thru 7)
9 Gas
10 Defense Facilities
11 Pollution Control Facilities
12 Other (provide details in footnote):
13
14
15 TOTAL Gas (Enter Total of lines 10 thru 14)
16
17 TOTAL (Acct 281) (Total of 8, 15 and 16)
18 Classification of TOTAL
19 Federal Income Tax
20 State Income Tax
21 Local Income Tax
FERC FORM NO. 1 (ED. 12-96) Page 272
NOTES

Name of Respondent This Report Is:(1) An Original
(2) A Resubmission
Date of Report(Mo, Da, Yr)
Year/Period of Report
End of
ACCUMULATED DEFERRED INCOME TAXES _ ACCELERATED AMORTIZATION PROPERTY (Account 281) (Continued)
PACIFIC GAS AND ELECTRIC COMPANYX
04/13/20212020/Q4
Line
No.
CHANGES DURING YEAR ADJUSTMENTS
Balance at
End of YearDebits CreditsAmounts Debited
to Account 410.2
Amounts Credited
to Account 411.2 AccountCredited
AmountDebitedAccount Amount
(e) (f) (h) (j) (k)(g) (i)
3. Use footnotes as required.
1
2
3
4
5
6
7
8
9
10
11
12
13
14
15
16
17
18
19
20
21
FERC FORM NO. 1 (ED. 12-96) Page 273
NOTES (Continued)

Schedule Page: 272 Line No.: 3 Column: bNo activity in 2020.
Name of Respondent
PACIFIC GAS AND ELECTRIC COMPANY
This Report is:(1) X An Original(2) A Resubmission
Date of Report(Mo, Da, Yr)
04/13/2021
Year/Period of Report
2020/Q4
FOOTNOTE DATA
FERC FORM NO. 1 (ED. 12-87) Page 450.1

Name of Respondent This Report Is:(1) An Original
(2) A Resubmission
Date of Report(Mo, Da, Yr)
Year/Period of Report
End of
ACCUMULATED DEFFERED INCOME TAXES - OTHER PROPERTY (Account 282)
PACIFIC GAS AND ELECTRIC COMPANYX
04/13/20212020/Q4
Line
No.Account
(a) (b) (c) (d)
Balance atBeginning of Year
CHANGES DURING YEAR
Amounts Debited Amounts Credited
to Account 410.1 to Account 411.1
1. Report the information called for below concerning the respondent’s accounting for deferred income taxes rating to property not
subject to accelerated amortization
2. For other (Specify),include deferrals relating to other income and deductions.
Account 282 1
Electric 5,423,416,109 -256,829,527 -82,350,006 2
Gas 2,607,344,438 8,382,880 -14,015,184 3
Nonutility 432,084,112 4
TOTAL (Enter Total of lines 2 thru 4) 8,462,844,659 -248,446,647 -96,365,190 5
6
7
8
TOTAL Account 282 (Enter Total of lines 5 thru 8,462,844,659 -248,446,647 -96,365,190 9
Classification of TOTAL 10
Federal Income Tax 6,536,756,898 -238,670,003 -69,334,441 11
State Income Tax 1,926,087,761 -9,776,644 -27,030,748 12
Local Income Tax 13
FERC FORM NO. 1 (ED. 12-96) Page 274
NOTES

Name of Respondent This Report Is:(1) An Original
(2) A Resubmission
Date of Report(Mo, Da, Yr)
Year/Period of Report
End of
ACCUMULATED DEFERRED INCOME TAXES - OTHER PROPERTY (Account 282) (Continued)
PACIFIC GAS AND ELECTRIC COMPANYX
04/13/20212020/Q4
Line
No.
CHANGES DURING YEAR ADJUSTMENTS
Balance at
End of YearDebits CreditsAmounts Debited
to Account 410.2
Amounts Credited
to Account 411.2 AccountCredited
AmountDebitedAccount Amount
(e) (f) (h) (j) (k)(g) (i)
3. Use footnotes as required.
1
5,641,456,705 392,520,117 2
2,842,109,561 212,367,059 3
9,595,404 497,026,198 -55,346,682 4
9,595,404 8,980,592,464 -55,346,682 604,887,176 5
6
7
8
9,595,404 8,980,592,464 -55,346,682 604,887,176 9
10
6,570,048 6,846,468,893 -38,102,871 434,374,638 11
3,025,356 2,134,123,571 -17,243,812 170,512,538 12
13
FERC FORM NO. 1 (ED. 12-96) Page 275
NOTES (Continued)

Name of Respondent This Report Is:(1) An Original
(2) A Resubmission
Date of Report(Mo, Da, Yr)
Year/Period of Report
End of
ACCUMULATED DEFFERED INCOME TAXES - OTHER (Account 283)
PACIFIC GAS AND ELECTRIC COMPANYX
04/13/20212020/Q4
Line
No.Account
(a) (b) (c) (d)
Balance atBeginning of Year
CHANGES DURING YEAR
Amounts Debited Amounts Credited to Account 410.1 to Account 411.1
1. Report the information called for below concerning the respondent’s accounting for deferred income taxes relating to amounts
recorded in Account 283.
2. For other (Specify),include deferrals relating to other income and deductions.
Account 283 1
Electric 2
-433,646 -3,088,780 31,239,819Loss on Reacquired Debt 3
11,558,636 488,675,001 761,989,385Balancing Accounts 4
153,848,685 -115,548,878 653,180,946Other 5
6
7
8
164,973,675 370,037,343 1,446,410,150TOTAL Electric (Total of lines 3 thru 8) 9
Gas 10
-113,469 -1,343,711 15,716,424Loss on Reacquired Debt 11
-17,720,233 37,124,200 202,253,451Balancing Accounts 12
13
1,546,774 7,171,319Other 14
15
16
-16,286,928 35,780,489 225,141,194TOTAL Gas (Total of lines 11 thru 16) 17
-21,516,050Other 18
148,686,747 405,817,832 1,650,035,294TOTAL (Acct 283) (Enter Total of lines 9, 17 and 18) 19
Classification of TOTAL 20
101,716,706 241,118,447 1,132,154,215Federal Income Tax 21
46,970,041 164,699,385 517,881,079State Income Tax 22
Local Income Tax 23
FERC FORM NO. 1 (ED. 12-96) Page 276
NOTES
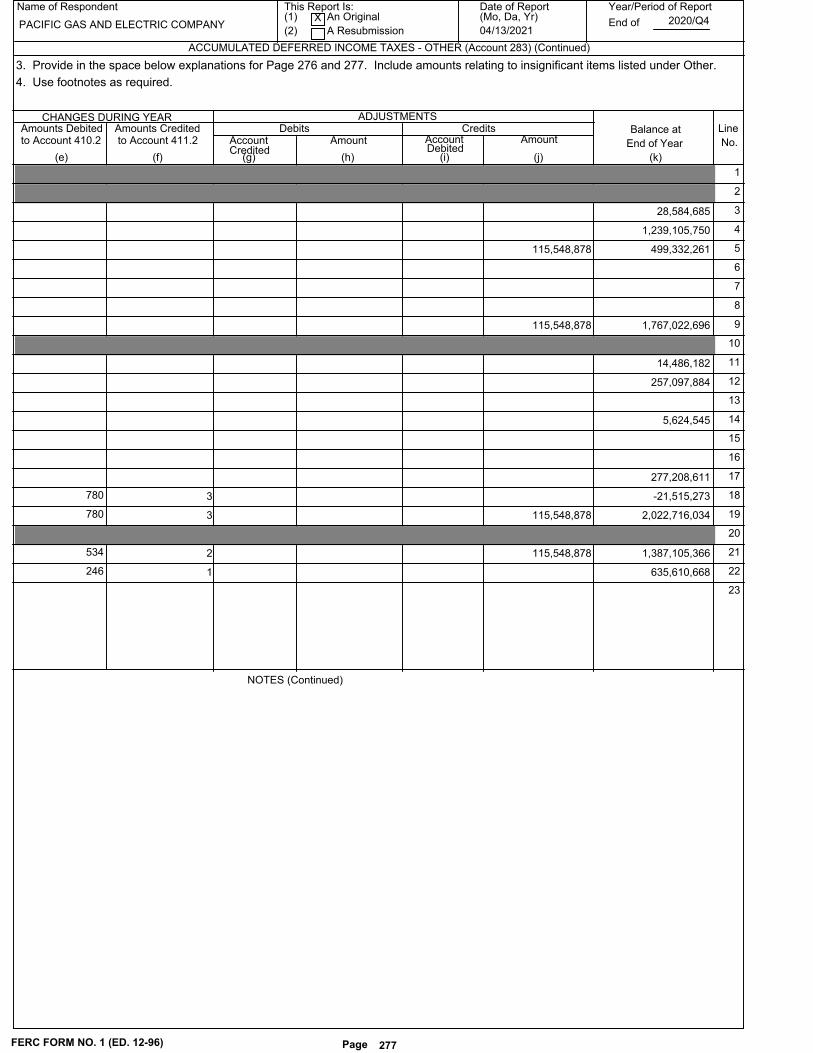
Name of Respondent This Report Is:(1) An Original
(2) A Resubmission
Date of Report(Mo, Da, Yr)
Year/Period of Report
End of
ACCUMULATED DEFERRED INCOME TAXES - OTHER (Account 283) (Continued)
PACIFIC GAS AND ELECTRIC COMPANYX
04/13/20212020/Q4
Line
No.
CHANGES DURING YEAR ADJUSTMENTS
Balance at
End of Year
Debits CreditsAmounts Debitedto Account 410.2
Amounts Credited to Account 411.2 Account
CreditedAmount
DebitedAccount Amount
(e) (f) (h) (j) (k)(g) (i)
3. Provide in the space below explanations for Page 276 and 277. Include amounts relating to insignificant items listed under Other.
4. Use footnotes as required.
1
2
28,584,685 3
1,239,105,750 4
499,332,261 115,548,878 5
6
7
8
1,767,022,696 115,548,878 9
10
14,486,182 11
257,097,884 12
13
5,624,545 14
15
16
277,208,611 17
-21,515,273 3 780 18
2,022,716,034 115,548,878 3 780 19
20
1,387,105,366 115,548,878 2 534 21
635,610,668 1 246 22
23
FERC FORM NO. 1 (ED. 12-96) Page 277
NOTES (Continued)

Name of Respondent This Report Is:(1) An Original
(2) A Resubmission
Date of Report(Mo, Da, Yr)
Year/Period of Report
End of
OTHER REGULATORY LIABILITIES (Account 254)
PACIFIC GAS AND ELECTRIC COMPANYX
04/13/20212020/Q4
Line
No.
Description and Purpose of DEBITS
CreditsAccount
(d)(c)(a)
Balance at End
of Current
Quarter/Year
(e)
Other Regulatory Liabilities Amount
(f)Credited
1. Report below the particulars (details) called for concerning other regulatory liabilities, including rate order docket number, if applicable.
2. Minor items (5% of the Balance in Account 254 at end of period, or amounts less than $100,000 which ever is less), may be grouped
by classes.
3. For Regulatory Liabilities being amortized, show period of amortization.
Balance at Begining
of Current
Quarter/Year
(b)
749,685,174 44,112,853 995,178,317289,605,996REGULATORY LIABILITY RETIREM 520 1
Amortization : INDEFINITE 2
60,707,975 184,389,920 59,277,119182,959,064PROCUREMENT ENERGY EFFICIENCY BALANCING 400 3
Amortization : <12 MONTHS 4
14,233,493 76,779,085 16,717,52279,263,114PUBL PURP PROG ENERGY EFFICIENCY BAL ACCT - 400 5
Amortization : <12 MONTHS 6
2,855,145 8,917,700 2,959,0009,021,555PPCBA-Disadv Comm Single Family Solar Homes Subat 400 7
Amortization : <12 MONTHS 8
5,658,622 55,124,852 32,580,26582,046,495MISCELLANEOUS GAS REG LIAB - CURRENT 495 9
Amortization : <12 MONTHS 10
5,520,201 34,743,028 131,670,121160,892,948MISCELLANEOUS ELECTRIC REG LIAB - CURRENT 449 11
Amortization : < 12 MONTHS 12
3,600,455 10,229,841 3,665,18510,294,571PPP SURCHARGE RDD - CURRENT 182.3 13
Amortization : < 12 MONTHS 14
78,949,832 221,222 82,234,2613,505,651REG LIABILITY-MISC ELEC CURRENT -FERC INTEREST 400 15
Amortization : <12 MONTHS 16
25,529,009 203,819,139 13,814,784192,104,914MISCELLANEOUS GAS REG LIAB - NONCURRENT 549 17
Amortization : >12 MONTHS 18
633,392,777 1,236,534,761 836,854,5941,439,996,578MISCELLANEOUS ELECTRIC REG LIAB - NONCURRENT 549 19
Amortization : NO STATED 20
42,335,168 2,260,506 40,165,63990,977NON CURRENT REG LIAB-CC8 SETTLEMENT 108 21
Amortization : 25YEARS 22
( 103,583,344) 722,012 -104,305,356TAMA - GAS 182.3 23
Amortization : 2 YEARS 24
11,337,578,825 21,879,765*,***,***,***REGULATORY LIABILITY TO - CURRENT 400 25
Amortization : < 12 MONTHS 26
87,933,299 7,667,286 132,277,38452,011,371SOLAR ON MULTIFAMILY AFFORDABLE HOUSING BAL 400 27
Amortization : < 12 MONTHS 28
174,873 5,825,628,3175,825,803,190FAS 109 REGULATORY LIABILITY 400 29
Amortization : > 12 MONTHS 30
1,335,325 27,495,017 414,82526,574,517GAS PRICE RISK MANAGEMENT - CURRENT 807 31
Amortization : NO STATED 32
28,239,398 194,522,538 31,394,086197,677,226ELECTRIC PRICE RISK MANAGEMENT - CURRENT 555 33
Amortization : NO STATED 34
(1,938,296,141) 292,541,704 -2,202,730,58428,107,261FAS 143 REGULATORY LIABILITY VARIOUS 35
Amortization : NO STATED 36
3,172,689,361 704,951,347 3,600,224,9411,132,486,927FAS 143 REGULATORY LIABILITY-NUCLEAR DECOMM 128 37
Amortization : NO STATED 38
( 148,954,572) 3,663,590 -152,618,162FAS 143 REGULATORY LIABILITY VARIOUS 39
Amortization : NO STATED 40
FERC FORM NO. 1/3-Q (REV 02-04) Page 278
41 TOTAL 25,237,128,60918,761,727,940 9,886,546,578 3,411,145,909

Name of Respondent This Report Is:(1) An Original
(2) A Resubmission
Date of Report(Mo, Da, Yr)
Year/Period of Report
End of
OTHER REGULATORY LIABILITIES (Account 254)
PACIFIC GAS AND ELECTRIC COMPANYX
04/13/20212020/Q4
Line
No.
Description and Purpose of DEBITS
CreditsAccount
(d)(c)(a)
Balance at End
of Current
Quarter/Year
(e)
Other Regulatory Liabilities Amount
(f)Credited
1. Report below the particulars (details) called for concerning other regulatory liabilities, including rate order docket number, if applicable.
2. Minor items (5% of the Balance in Account 254 at end of period, or amounts less than $100,000 which ever is less), may be grouped
by classes.
3. For Regulatory Liabilities being amortized, show period of amortization.
Balance at Begining
of Current
Quarter/Year
(b)
163,280,033 5,712,514 164,956,5797,389,060FAS 143 REGULATORY LIABILITY 228.4 1
Amortization : NO STATED 2
( 873,255,499) 544,143,610 -1,006,375,992411,023,117FIN 47 REGULATORY LIABILITY VARIOUS 3
Amortization : NO STATED 4
57,889,363 4,432,018 62,442,1138,984,768CALIFORNIA SOLAR INITIATIVE 400 5
Amortization : < 12 MONTHS 6
61,503,379 33,978,937 73,634,92246,110,480DEMAND RESPONSE EXPENDITURES BALANCING 400 7
Amortization : NO STATED 8
1,889,463 1,751,055 1,710,2201,571,812PPP ENERGY EFFICIENCY-GAS 400 9
Amortization : NO STATED 10
11,780,800 82,068,581 3,138,22273,426,003PPP SURCHARGE ENERGY EFFICIENCY - GAS 400 11
Amortization : < 12 MONTHS 12
54,363,148 58,874,001 3,241,1487,752,001PPP SURCHARGE LOW INCOME - GAS 400 13
Amortization : < 12 MONTHS 14
( 191,748) 10,805,313 -636,51110,360,550GAS PPP SURCHARGE-RDD 400 15
Amortization : < 12 MONTHS 16
571,257 3,091,360 534,2793,054,382NON-TARIFFED PRODUCTS AND SVCS BA-ELECTRIC 182.3 17
Amortization : < 12 MONTHS 18
465,118 624,830 434,758594,470NON-TARIFFED PRODUCTS AND SVCS BA-GAS 182.3 19
Amortization : < 12 MONTHS 20
30,249,170 20,673,032 30,844,36421,268,226ON BILL FINANCING BALANCING ELECTRIC 930.2 21
Amortization : NO STATED 22
5,286,357 8,768,682 5,530,8089,013,133ON BILL FINANCING BALANCING GAS 930.2 23
Amortization : NO STATED 24
238,315,154 73,634,939 259,484,09294,803,877ELECTRIC PROGRAM INVESTMENT CHARGE 400 25
Amortization : NO STATED 26
8,433,116 7,977,515 7,615,2677,159,666PROCUREMENT ENERGY EFFICIENCY 400 27
Amortization : NO STATED 28
263,873,397 28,973,897 296,265,57761,366,077SELF GENERATION PROGRAM - ELECTRIC 400 29
Amortization : NO STATED 30
53,148,406 6,360,124 60,225,60113,437,319SELF GENERATION PROGARM-GAS 400 31
Amortization : NO STATED 32
31,234,556 66,188,682 34,242,02669,196,152PPP (PPPLIBA)-GAS 400 33
Amortization : < 12 MONTHS 34
193,399,246 130,293,264 163,170,121100,064,139PPP (PPPLIBA)-ELECTRIC 400 35
Amortization : < 12 MONTHS 36
4,989,277 9,799,802 6,776,11211,586,637SW MARKETING, EDUCATION AND OUTREACH 400 37
Amortization : < 12 MONTHS 38
837,394 1,084,030 1,036,5411,283,177SW MARKETING, EDUCATION AND OUTREACH 400 39
Amortization : < 12 MONTHS 40
FERC FORM NO. 1/3-Q (REV 02-04) Page 278.1
41 TOTAL 25,237,128,60918,761,727,940 9,886,546,578 3,411,145,909

Name of Respondent This Report Is:(1) An Original
(2) A Resubmission
Date of Report(Mo, Da, Yr)
Year/Period of Report
End of
OTHER REGULATORY LIABILITIES (Account 254)
PACIFIC GAS AND ELECTRIC COMPANYX
04/13/20212020/Q4
Line
No.
Description and Purpose of DEBITS
CreditsAccount
(d)(c)(a)
Balance at End
of Current
Quarter/Year
(e)
Other Regulatory Liabilities Amount
(f)Credited
1. Report below the particulars (details) called for concerning other regulatory liabilities, including rate order docket number, if applicable.
2. Minor items (5% of the Balance in Account 254 at end of period, or amounts less than $100,000 which ever is less), may be grouped
by classes.
3. For Regulatory Liabilities being amortized, show period of amortization.
Balance at Begining
of Current
Quarter/Year
(b)
6,243,560 167,832,648 -16,289,941145,299,147GPBA - GREENHOUSE GAS REVENUE SUBACCOUNT 400 1
Amortization : < 12 MONTHS 2
25,038,303 460,161,190 -48,340,296386,782,591GHGRBA - GREENHOUSE GAS REVENUE 400 3
Amortization : NO STATED 4
745,975 10,503 759,76824,296CA ENERGY SYSTEMS FOR 21ST CENTURY B/A-ELEC - 182.3 5
Amortization : 5 YEARS 6
521,864 562,601 136,119176,856GPBA - LOW CARBON FUELS STANDARD REVENUE 400 7
Amortization : < 12 MONTHS 8
156,543,316 108,887,430 147,734,893100,079,007GHGRBA - LOW CARBON FUELS STANDARD REVENUE 400 9
Amortization : < 12 MONTHS 10
15,878,253 42,264,427 -11,181,46715,204,707ENGINEERING CRTICIAL ASSESSMENT BAL NC 182.3 11
Amortization : >12 MONTHS 12
19,820,982 41,564,897 25,661,39547,405,310ELECT VEHICLE PRGM BA CURRENT 400 13
Amortization : < 12 MONTHS 14
11,818,144 35,080,536 10,793,09934,055,491RULE 20A BALANCING ACCOUNT (RBA) NONCURRENT 400 15
Amortization : > 12 MONTHS 16
430,217430,217GPBA-BIOMETHANE ENVIRONMENTAL PROCEEDS 400 17
Amortization : > 12 MONTHS 18
17,442,642 -2,556,50514,886,137STATEWIDE ENERGY EFFICIENCY BALANCING 400 19
Amortization : AMORTIZATION : < 12 MONTHS 20
4,360,623 -639,1273,721,496STATEWIDE ENERGY EFFICIENCY BALANCING 400 21
Amortization : AMORTIZATION : < 12 MONTHS 22
17,762,400 35,524,80017,762,400FAS143 REGLIAB GUS LM and PC 228.4 23
Amortization : NO STATED 24
31,344,626 53,018,30884,362,934HYDROSTATIC TESTING BAL ACCOUNT 400 25
Amortization : >12 MONTHS 26
1,438,353 820,4102,258,763ATMOSPHERIC CORROSION BAL ACCT 400 27
Amortization : >12 MONTHS 28
12,897,00012,897,000FAS REGULATORY LIABILITY - HYDRO 228.4 29
Amortization : Not Stated 30
6,326,0006,326,000FAS REGULATORY LIABILITY - OTHER ELECTRIC 228.4 31
Amortization : Not Stated 32
123,659,056 750,335,790 135,917,617762,594,351ELECTRIC PRICE RISK MANAGEMENT - NONCURRENT 555 33
Amortization : NO STATED 34
3,221,492 1,574,755,389 -17,9821,571,515,915Miscellanous minor items VARIOUS 35
36
37
38
39
40
FERC FORM NO. 1/3-Q (REV 02-04) Page 278.2
41 TOTAL 25,237,128,60918,761,727,940 9,886,546,578 3,411,145,909

Schedule Page: 278 Line No.: 35 Column: cOffset to account 108 - Accumulated Depreciation, and 230 - ARO - Liability. Schedule Page: 278 Line No.: 39 Column: c
Offset to account 108 - Accumulated Depreciation, and 230 - ARO - Liability. Schedule Page: 278.1 Line No.: 3 Column: c
Offset to account 108 - Accumulated Depreciation, and 230 - ARO - Liability. Schedule Page: 278.2 Line No.: 35 Column: c
Activity primarily related to DREBA OPERATIONS BALANCING ACCOUNT - CURRENT, DISTRIBUTION RESOURCES
PLAN DEMONSTRATION BAL ACCT CURR, NGLAPBA - CURRENT, and Dairy Biomethane Pilot Balancing Accountwith offset to 400.
Name of Respondent
PACIFIC GAS AND ELECTRIC COMPANY
This Report is:(1) X An Original(2) A Resubmission
Date of Report(Mo, Da, Yr)
04/13/2021
Year/Period of Report
2020/Q4
FOOTNOTE DATA
FERC FORM NO. 1 (ED. 12-87) Page 450.1

Name of Respondent This Report Is:(1) An Original
(2) A Resubmission
Date of Report(Mo, Da, Yr)
Year/Period of Report
End of
ELECTRIC OPERATING REVENUES (Account 400)
PACIFIC GAS AND ELECTRIC COMPANYX
04/13/20212020/Q4
Line
No.Title of Account
(c)(b)(a)
Operating Revenues Year
to Date Quarterly/Annual
1. The following instructions generally apply to the annual version of these pages. Do not report quarterly data in columns (c), (e), (f), and (g). Unbilled revenues and MWH
related to unbilled revenues need not be reported separately as required in the annual version of these pages.
2. Report below operating revenues for each prescribed account, and manufactured gas revenues in total.
3. Report number of customers, columns (f) and (g), on the basis of meters, in addition to the number of flat rate accounts; except that where separate meter readings are added
for billing purposes, one customer should be counted for each group of meters added. The -average number of customers means the average of twelve figures at the close of
each month.
4. If increases or decreases from previous period (columns (c),(e), and (g)), are not derived from previously reported figures, explain any inconsistencies in a footnote.
5. Disclose amounts of $250,000 or greater in a footnote for accounts 451, 456, and 457.2.
Operating Revenues
Previous year (no Quarterly)
Sales of Electricity 1
4,846,946,484(440) Residential Sales 5,522,669,106 2
(442) Commercial and Industrial Sales 3
5,862,972,960Small (or Comm.) (See Instr. 4) 6,193,136,336 4
1,493,456,812Large (or Ind.) (See Instr. 4) 1,530,028,729 5
58,051,541(444) Public Street and Highway Lighting 61,588,250 6
2,184,785(445) Other Sales to Public Authorities 1,819,316 7
7,244,471(446) Sales to Railroads and Railways 6,055,152 8
48,794,887(448) Interdepartmental Sales 51,081,618 9
12,319,651,940TOTAL Sales to Ultimate Consumers 13,366,378,507 10
1,462,736,215(447) Sales for Resale 1,897,859,429 11
13,782,388,155TOTAL Sales of Electricity 15,264,237,936 12
-308,209,362(Less) (449.1) Provision for Rate Refunds 62,826,628 13
14,090,597,517TOTAL Revenues Net of Prov. for Refunds 15,201,411,308 14
Other Operating Revenues 15
3,013,879(450) Forfeited Discounts 733,289 16
8,400,066(451) Miscellaneous Service Revenues 7,472,766 17
3,769,463(453) Sales of Water and Water Power 4,720,958 18
83,262,832(454) Rent from Electric Property 98,163,916 19
(455) Interdepartmental Rents 20
-252,724,684(456) Other Electric Revenues -197,139,050 21
2,558,524(456.1) Revenues from Transmission of Electricity of Others 2,874,769 22
(457.1) Regional Control Service Revenues 23
(457.2) Miscellaneous Revenues 24
303,287,176(400) Balancing Accounts 672,568,442 25
151,567,256TOTAL Other Operating Revenues 589,395,090 26
14,242,164,773TOTAL Electric Operating Revenues 15,790,806,398 27
Page 300FERC FORM NO. 1/3-Q (REV. 12-05)

Name of Respondent This Report Is:(1) An Original
(2) A Resubmission
Date of Report(Mo, Da, Yr)
Year/Period of Report
End of
ELECTRIC OPERATING REVENUES (Account 400)
PACIFIC GAS AND ELECTRIC COMPANYX
04/13/20212020/Q4
Line
No.
MEGAWATT HOURS SOLD
Previous Year (no Quarterly)Current Year (no Quarterly)
AVG.NO. CUSTOMERS PER MONTH
Year to Date Quarterly/Annual Amount Previous year (no Quarterly)
(d) (e) (f) (g)
6. Commercial and industrial Sales, Account 442, may be classified according to the basis of classification (Small or Commercial, and Large or Industrial) regularly used by the
respondent if such basis of classification is not generally greater than 1000 Kw of demand. (See Account 442 of the Uniform System of Accounts. Explain basis of classification
in a footnote.)
7. See pages 108-109, Important Changes During Period, for important new territory added and important rate increase or decreases.
8. For Lines 2,4,5,and 6, see Page 304 for amounts relating to unbilled revenue by accounts.
9. Include unmetered sales. Provide details of such Sales in a footnote.
1
27,513,436 4,845,484 4,910,767 29,814,086 2
3
35,098,781 641,100 641,984 33,954,854 4
14,711,024 1,288 1,287 14,100,505 5
296,641 36,176 36,492 291,953 6
10,879 5 4 8,701 7
440,880 28 28 326,696 8
300,575 296,120 9
78,372,216 5,524,081 5,590,562 78,792,915 10
21,907,744 18,328,235 11
100,279,960 5,524,081 5,590,562 97,121,150 12
13
100,279,960 5,524,081 5,590,562 97,121,150 14
Page 301
Line 12, column (b) includes $ of unbilled revenues.
Line 12, column (d) includes MWH relating to unbilled revenues
70,574,259
0
FERC FORM NO. 1/3-Q (REV. 12-05)

Schedule Page: 300 Line No.: 4 Column: bLine 4 includes all other commercial and industrial customers including irrigationpumping.
Schedule Page: 300 Line No.: 4 Column: cLine 4 includes all other commercial and industrial customers including irrigationpumping.
Schedule Page: 300 Line No.: 5 Column: bLine 5 includes commercial and industrial customers with demands of 1,000 Kw or greater.
Schedule Page: 300 Line No.: 5 Column: cLine 5 includes commercial and industrial customers with demands of 1,000 Kw or greater.
Schedule Page: 300 Line No.: 10 Column: b Column (b) includes California Department of Water Resources ("DWR") revenues of$416,607,371 which was deducted from Line 21 below.
Schedule Page: 300 Line No.: 10 Column: cColumn (b) includes California Department of Water Resources ("DWR") revenues of$367,368,862 which was deducted from Line 21 below.
Schedule Page: 300 Line No.: 17 Column: b
This consists of :
NSF fees and rent charges to customers' refundable deposits
1,455,932
Misc Elec Svs RevPro
3,760
NRD Revenue
1,429,251
MLX billings to electric residential customers
3,034,496
MLX billings to electric non-residential customers
966,915
Reimbursable third-party labor requested on behalf of customers
582,412
Total
7,472,766
Schedule Page: 300 Line No.: 17 Column: c
This consists of:
1 NSF fees and rent charges to customers' refundable deposits 1,700,170
2 NRD Revenue 1,822,179
3 MLX billings to electric residential customers 3,246,059
4 MLX billings to electric non-residential customers 954,594
5 Reimbursable third-party labor requested on behalf of customers 677,064
Total 8,400,066
Schedule Page: 300 Line No.: 21 Column: b
This consists of :
Unbilled revenues
Name of Respondent
PACIFIC GAS AND ELECTRIC COMPANY
This Report is:(1) X An Original(2) A Resubmission
Date of Report(Mo, Da, Yr)
04/13/2021
Year/Period of Report
2020/Q4
FOOTNOTE DATA
FERC FORM NO. 1 (ED. 12-87) Page 450.1

70,574,259
Reimbursement to the Utility for costs spent on customer projects
39,784,410
Reimbursement to the Utility for costs spent on customer billing
13,757,318
Reimbursement fees paid to the CPUC based on sales
(56,360,402)
Employee transfer fees
71,012
Other revenue-damage claim
2,382,664
Recreational Facilities Revenue
523,630
Revenue assigned - base
(32,969,093)
Pass-through franchise fees and uncollectible revenue
32,969,881
Transition Cost Revenue Account for non-bypassable charges
32,208,380
Fees for utility energy service contracts
52,107,815
Other electric revenues not classified elsewhere
63,723,129
MCI rights of way
650,161
DWR
(416,607,371)
Miscellaneous (items under $250,000)
45,157
Total
(197,139,050)
The DWR revenues of $416,607,371 represents amount passed through to the DWR. The Utility acts as a pass-through
entity for DWR charges collected from the Utility's customers. Although charges for the DWR are included in total
electric revenues, the Utility deducts pass through amounts from electric revenues. These pass-through revenues are
excluded from the Utility's electric revenues in its Statement of Income.
Schedule Page: 300 Line No.: 21 Column: c
This consists of :
Unbilled revenues (39,025,952)
Reimbursement to the Utility for costs spent on customer projects 30,211,138
Reimbursement to the Utility for costs spent on customer billing 12,843,596
Reimbursement fees paid to the CPUC based on sales (42,640,694)
Employee transfer fees 185,885
Other revenue-damage claim 1,255,339
Name of Respondent
PACIFIC GAS AND ELECTRIC COMPANY
This Report is:(1) X An Original(2) A Resubmission
Date of Report(Mo, Da, Yr)
04/13/2021
Year/Period of Report
2020/Q4
FOOTNOTE DATA
FERC FORM NO. 1 (ED. 12-87) Page 450.2

Recreational Facilities Revenue 1,085,671
Revenue assigned - base (24,165,208)
Pass-through franchise fees and uncollectible revenue 24,165,208
Transition Cost Revenue Account for non-bypassable charges 38,034,266
Fees for utility energy service contracts 52,451,511
Other electric revenues not classified elsewhere 59,451,590
MCI rights of way 650,161
DWR (367,368,862)
Miscellaneous (items under $250,000) 141,667
Total (252,724,684)
The DWR revenues of $367,368,862 represents amount passed through to the DWR. The Utility acts as a pass-through
entity for DWR charges collected from the Utility's customers. Although charges for the DWR are included in total
electric revenues, the Utility deducts pass through amounts from electric revenues. These pass-through revenues are
excluded from the Utility's electric revenues in its Statement of Income.
Name of Respondent
PACIFIC GAS AND ELECTRIC COMPANY
This Report is:(1) X An Original(2) A Resubmission
Date of Report(Mo, Da, Yr)
04/13/2021
Year/Period of Report
2020/Q4
FOOTNOTE DATA
FERC FORM NO. 1 (ED. 12-87) Page 450.3
Name of Respondent This Report Is:(1) An Original
(2) A Resubmission
Date of Report(Mo, Da, Yr)
Year/Period of Report
End ofPACIFIC GAS AND ELECTRIC COMPANYX
04/13/20212020/Q4
Line
No.Description of Service
(a)
REGIONAL TRANSMISSION SERVICE REVENUES (Account 457.1)
1. The respondent shall report below the revenue collected for each service (i.e., control area administration, market administration,
etc.) performed pursuant to a Commission approved tariff. All amounts separately billed must be detailed below.
Balance at End of
(c)(b)
Balance at End ofQuarter 1 Quarter 2
Balance at End ofQuarter 3
(d) (e)
Balance at End ofYear
1 NONE
2
3
4
5
6
7
8
9
10
11
12
13
14
15
16
17
18
19
20
21
22
23
24
25
26
27
28
29
30
31
32
33
34
35
36
37
38
39
40
41
42
43
44
45
FERC FORM NO. 1/3-Q (NEW. 12-05) Page 302
46 TOTAL

Name of Respondent This Report Is:(1) An Original
(2) A Resubmission
Date of Report(Mo, Da, Yr)
Year/Period of Report
End of
SALES OF ELECTRICITY BY RATE SCHEDULES
PACIFIC GAS AND ELECTRIC COMPANYX
04/13/20212020/Q4
Line
No.
Number and Title of Rate schedule MWh Sold
(b)(a)
Revenue
(c)
Average Numberof Customers
(d)
KWh of SalesPer Customer
(e)
Revenue PerKWh Sold
(f)
1. Report below for each rate schedule in effect during the year the MWH of electricity sold, revenue, average number of customer, average Kwh per
customer, and average revenue per Kwh, excluding date for Sales for Resale which is reported on Pages 310-311.
2. Provide a subheading and total for each prescribed operating revenue account in the sequence followed in "Electric Operating Revenues," Page
300-301. If the sales under any rate schedule are classified in more than one revenue account, List the rate schedule and sales data under each
applicable revenue account subheading.
3. Where the same customers are served under more than one rate schedule in the same revenue account classification (such as a general residential
schedule and an off peak water heating schedule), the entries in column (d) for the special schedule should denote the duplication in number of reported
customers.
4. The average number of customers should be the number of bills rendered during the year divided by the number of billing periods during the year (12
if all billings are made monthly).
5. For any rate schedule having a fuel adjustment clause state in a footnote the estimated additional revenue billed pursuant thereto.
6. Report amount of unbilled revenue as of end of year for each applicable revenue account subheading.
1 440 Residential Sales:
17,355,610 3,072,483 5,649 0.2043 3,546,352,652 2 E1 Individually Metered
7,502,670 1,161,835 6,458 0.1338 1,004,008,254 3 EL1 Residential Care Program S
416,524 78,679 5,294 0.2007 83,575,738 4 E6 Residential Time-of-Use Servic
39,852 6,214 6,413 0.1297 5,167,737 5 EL6 Residential Care Time-of-U
-3 0.0110 -33 6 E7 Time-of-Use
538,836 159,653 3,375 0.2285 123,139,972 7 ETOUA Residential Time-of-Use Ser
122,878 28,480 4,315 0.1329 16,324,384 8 EL-TOUA Residential Care Time-of-
1,111,761 89,972 12,357 0.2206 245,283,555 9 ETOUB Residential Time-of-Use Ser
231,249 21,302 10,856 0.1419 32,825,135 10 EL-TOUB Residential Care Time-of-
904,711 159,143 5,685 0.2255 204,050,870 11 ETOUC Residential Time-of-Use Ser
189,080 33,342 5,671 0.1368 25,861,121 12 EL-TOUC Residential Care Time-of-
139,251 16,186 8,603 0.1780 24,783,724 13 ETOUD Residential TOU Peak Pricin
785 14 ECLSD
73,782 13,774 5,357 0.1476 10,887,012 15 EVA Residential TOU Service for P
1,006 395 2,547 0.1570 157,898 16 EVB Residential TOU Service for P
510,512 50,204 10,169 0.1744 89,026,762 17 EV2A Residential TOU Service for
212,480 15,459 13,745 0.1783 37,892,459 18 EM Master-Metered Multi-family Se
24,942 186 134,097 0.0903 2,252,492 19 EML Multifamily CARE Program - Ma
3,763 609 6,179 0.2471 929,816 20 EMTOU Residential Time of Use Ser
23,776 285 83,425 0.1542 3,665,249 21 ES Multi-family Service
24,816 253 98,087 0.1561 3,872,676 22 ESL Multifamily CARE Program Serv
2,279 31 73,516 0.1853 422,268 23 ESR RV Park and Residential Marin
10,765 84 128,155 0.1736 1,868,797 24 ESRL RV Park and Residential Mari
15,735 284 55,405 0.1772 2,788,170 25 ET Mobilehome Park Service
355,637 1,886 188,567 0.1606 57,101,978 26 ETL Low-Income Mobile Home
81 2 40,500 0.3625 29,359 27 SE1 Standby - Individually Metere
1,965 10 196,500 0.1658 325,893 28 SEM1 Standby - Master-Metered Mul
14 60,471 29 STOUS Standby - TOU Secondary -
25 1 25,000 0.4116 10,291 30 SETOUB Standby Service
30 1 30,000 0.1207 3,621 31 SEV2A Standby Service
74 32 UNCLASSIFIED
29,814,087 4,910,767 6,071 0.1852 5,522,669,106 33 Total Residential
34
35
36
37
38
39
40 442 Commercial and Industrial Sal
78,792,911 15,264,237,936 5,590,562 14,094 0.1937
0 0 0 0 0.0000
78,792,911 15,264,237,936 5,590,562 14,094 0.1937
FERC FORM NO. 1 (ED. 12-95) Page 304
41 TOTAL Billed
42 Total Unbilled Rev.(See Instr. 6)
43 TOTAL

Name of Respondent This Report Is:(1) An Original
(2) A Resubmission
Date of Report(Mo, Da, Yr)
Year/Period of Report
End of
SALES OF ELECTRICITY BY RATE SCHEDULES
PACIFIC GAS AND ELECTRIC COMPANYX
04/13/20212020/Q4
Line
No.
Number and Title of Rate schedule MWh Sold
(b)(a)
Revenue
(c)
Average Numberof Customers
(d)
KWh of SalesPer Customer
(e)
Revenue PerKWh Sold
(f)
1. Report below for each rate schedule in effect during the year the MWH of electricity sold, revenue, average number of customer, average Kwh per
customer, and average revenue per Kwh, excluding date for Sales for Resale which is reported on Pages 310-311.
2. Provide a subheading and total for each prescribed operating revenue account in the sequence followed in "Electric Operating Revenues," Page
300-301. If the sales under any rate schedule are classified in more than one revenue account, List the rate schedule and sales data under each
applicable revenue account subheading.
3. Where the same customers are served under more than one rate schedule in the same revenue account classification (such as a general residential
schedule and an off peak water heating schedule), the entries in column (d) for the special schedule should denote the duplication in number of reported
customers.
4. The average number of customers should be the number of bills rendered during the year divided by the number of billing periods during the year (12
if all billings are made monthly).
5. For any rate schedule having a fuel adjustment clause state in a footnote the estimated additional revenue billed pursuant thereto.
6. Report amount of unbilled revenue as of end of year for each applicable revenue account subheading.
1,078,983 49,005 22,018 0.1989 214,603,001 1 A1 Small General Service
71,976 17,521 4,108 0.2273 16,357,416 2 A1F Small General Service
4,619,660 341,919 13,511 0.2194 1,013,403,299 3 A1X Small General Service
355 346 1,026 0.5767 204,722 4 A15 Small General Service
994,204 25,324 39,259 0.2207 219,438,248 5 A6 Time-of-Use
6,914,099 40,251 171,775 0.1807 1,249,190,883 6 A10 Medium General
11,743,352 27,875 421,286 0.1414 1,660,518,609 7 E19 500 to 999 Kw Demand
11,483,676 917 12,523,093 0.1051 1,207,040,170 8 E20 1000 Kw Demand or More
68,080 4,137 16,456 0.3188 21,701,659 9 AG1 Agricultural Power
1,329,724 54,343 24,469 0.3076 409,072,241 10 AG4 TOU Agricultural Power
247,323 3,463 71,419 0.2304 56,975,273 11 AGA, AGB, ACG TOU Agricultural
20,557 246 83,565 0.2269 4,663,548 12 AGF Flexible Off-Peak TOU Agricul
4,920,466 25,847 190,369 0.1951 959,926,478 13 AG5 Large TOU Agricultural Power
32,782 1,708 19,193 0.3107 10,185,750 14 AGR Split-Wk TOU Agricultural Pow
24,648 1,161 21,230 0.2818 6,945,324 15 AGV Short-Pk TOU Agricultural Pow
346,870 21,886 15,849 0.2169 75,244,305 16 B1 Small General Service
153,644 9,318 16,489 0.2108 32,385,035 17 B6 Small General Time-of-Use Serv
545,678 2,494 218,796 0.1917 104,618,104 18 B10 Medium General Demand
707,406 1,597 442,959 0.1513 107,007,446 19 B19 Medium Demand Metered TOU
908,335 88 10,321,989 0.1022 92,853,412 20 B20 Service to Customers with Max
54,369 113 481,142 0.1422 7,733,723 21 BEV Business Electric Vehicle
5,423 12,917 420 0.4923 2,669,980 22 OL1 Outdoor Area Lighting Service
-2,825 7 -403,571 -0.0044 12,442 23 SA1 Standby & General Service
21,687 11 1,971,545 0.0615 1,332,976 24 SA6 Standby & Small TOU
10,033 20 501,650 0.1744 1,750,224 25 SA10 Standby & Alt. Rate for Med-
38,232 17 2,248,941 0.1420 5,430,629 26 SB Standby Electric
21,646 40 541,150 0.1263 2,734,920 27 SE19 Standby & 500 to 999 Kw
1,367,905 83 16,480,783 0.1202 164,481,066 28 SE20 Standby & 1000 Kw Demand
-38,020 256 -148,516 -0.3106 11,809,986 29 STOUP Standby - TOU Primary
2,496 114 21,895 0.7383 1,842,889 30 STOUS Standby - TOU Secondary -
349,388 244 1,431,918 0.1697 59,279,116 31 STOUT Standby - TOU Transformer
13,204 3 4,401,333 0.1327 1,752,191 32 UNCLASSIFIED
33
34
35
48,055,356 643,271 74,705 0.1607 7,723,165,065 36 Total Commercial and Industrial
37
38
39
40
78,792,911 15,264,237,936 5,590,562 14,094 0.1937
0 0 0 0 0.0000
78,792,911 15,264,237,936 5,590,562 14,094 0.1937
FERC FORM NO. 1 (ED. 12-95) Page 304.1
41 TOTAL Billed
42 Total Unbilled Rev.(See Instr. 6)
43 TOTAL

Name of Respondent This Report Is:(1) An Original
(2) A Resubmission
Date of Report(Mo, Da, Yr)
Year/Period of Report
End of
SALES OF ELECTRICITY BY RATE SCHEDULES
PACIFIC GAS AND ELECTRIC COMPANYX
04/13/20212020/Q4
Line
No.
Number and Title of Rate schedule MWh Sold
(b)(a)
Revenue
(c)
Average Numberof Customers
(d)
KWh of SalesPer Customer
(e)
Revenue PerKWh Sold
(f)
1. Report below for each rate schedule in effect during the year the MWH of electricity sold, revenue, average number of customer, average Kwh per
customer, and average revenue per Kwh, excluding date for Sales for Resale which is reported on Pages 310-311.
2. Provide a subheading and total for each prescribed operating revenue account in the sequence followed in "Electric Operating Revenues," Page
300-301. If the sales under any rate schedule are classified in more than one revenue account, List the rate schedule and sales data under each
applicable revenue account subheading.
3. Where the same customers are served under more than one rate schedule in the same revenue account classification (such as a general residential
schedule and an off peak water heating schedule), the entries in column (d) for the special schedule should denote the duplication in number of reported
customers.
4. The average number of customers should be the number of bills rendered during the year divided by the number of billing periods during the year (12
if all billings are made monthly).
5. For any rate schedule having a fuel adjustment clause state in a footnote the estimated additional revenue billed pursuant thereto.
6. Report amount of unbilled revenue as of end of year for each applicable revenue account subheading.
1
2
3
4
5
6 444 Public Street and Highway Lig
11,148 5,157 2,162 0.5970 6,655,133 7 LS1-A Utility-Owned Street & High
3 2 1,500 0.4973 1,492 8 LS1-B Utility-Owned Street & High
4,233 555 7,627 0.5162 2,185,031 9 LS1-C Utility-Owned Street & High
7,473 1,088 6,869 0.5003 3,738,828 10 LS1-D Utility-Owned Street & High
8,041 1,803 4,460 0.7952 6,394,234 11 LS1-E Utility-Owned Street & High
3,451 1,606 2,149 0.6128 2,114,797 12 LS1-F Utility-Owned Street & High
202,858 9,692 20,930 0.1452 29,448,443 13 LS2-A Customer-Owned Street & Hig
2,932 385 7,616 0.2412 707,128 14 LS2-C Customer-Owned Street & Hig
7,896 1,506 5,243 0.1662 1,312,440 15 LS3 Cust-Owned Street & Highway L
4,108 2,209 1,860 0.1821 748,271 16 LS3-F Cust-Owned Street & Highway
38,599 11,906 3,242 0.2075 8,010,743 17 TC1 Traffic Control Service
1,209 583 2,074 0.2247 271,710 18 TC1F Traffic Control Service
19
291,951 36,492 8,000 0.2110 61,588,250 20 Total Public Street and Highway
21
22 445 Other Sales to Public Authori
8,701 4 2,175,250 0.2091 1,819,316 23 Special Contracts
8,701 4 2,175,250 0.2091 1,819,316 24 Total Other Sales to Public Aut
25
26 446 Sales to Railroads and Railwa
326,696 28 11,667,714 0.0185 6,055,152 27 Special Contracts
326,696 28 11,667,714 0.0185 6,055,152 28 Total Sales to Railroads and Ra
29
30 447 Sales for Resale
1,897,859,429 31 Special Contracts
1,897,859,429 32 Total Sales for Resale
33
296,120 0.1725 51,081,618 34 448 Interdepartmental Sales
296,120 0.1725 51,081,618 35 Total Interdepartmental Sales
36
37
38
39
40
78,792,911 15,264,237,936 5,590,562 14,094 0.1937
0 0 0 0 0.0000
78,792,911 15,264,237,936 5,590,562 14,094 0.1937
FERC FORM NO. 1 (ED. 12-95) Page 304.2
41 TOTAL Billed
42 Total Unbilled Rev.(See Instr. 6)
43 TOTAL

Name of Respondent This Report Is:(1) An Original
(2) A Resubmission
Date of Report(Mo, Da, Yr)
Year/Period of Report
End of
SALES FOR RESALE (Account 447)
PACIFIC GAS AND ELECTRIC COMPANYX
04/13/20212020/Q4
Line
No.
Name of Company or Public Authority
(c)(b)(a)
FERC RateMonthly Billing
Average
(d)
Statistical
cationClassifi- Schedule or
Tariff Number Demand (MW)
(e) (f)
(Footnote Affiliations)
Actual Demand (MW)Average Average
Monthly NCP Demand Monthly CP Demand
1. Report all sales for resale (i.e., sales to purchasers other than ultimate consumers) transacted on a settlement basis other than
power exchanges during the year. Do not report exchanges of electricity ( i.e., transactions involving a balancing of debits and credits
for energy, capacity, etc.) and any settlements for imbalanced exchanges on this schedule. Power exchanges must be reported on the
Purchased Power schedule (Page 326-327).
2. Enter the name of the purchaser in column (a). Do note abbreviate or truncate the name or use acronyms. Explain in a footnote any
ownership interest or affiliation the respondent has with the purchaser.
3. In column (b), enter a Statistical Classification Code based on the original contractual terms and conditions of the service as follows:
RQ - for requirements service. Requirements service is service which the supplier plans to provide on an ongoing basis (i.e., the
supplier includes projected load for this service in its system resource planning). In addition, the reliability of requirements service must
be the same as, or second only to, the supplier's service to its own ultimate consumers.
LF - for tong-term service. "Long-term" means five years or Longer and "firm" means that service cannot be interrupted for economic
reasons and is intended to remain reliable even under adverse conditions (e.g., the supplier must attempt to buy emergency energy
from third parties to maintain deliveries of LF service). This category should not be used for Long-term firm service which meets the
definition of RQ service. For all transactions identified as LF, provide in a footnote the termination date of the contract defined as the
earliest date that either buyer or setter can unilaterally get out of the contract.
IF - for intermediate-term firm service. The same as LF service except that "intermediate-term" means longer than one year but Less
than five years.
SF - for short-term firm service. Use this category for all firm services where the duration of each period of commitment for service is
one year or less.
LU - for Long-term service from a designated generating unit. "Long-term" means five years or Longer. The availability and reliability of
service, aside from transmission constraints, must match the availability and reliability of designated unit.
IU - for intermediate-term service from a designated generating unit. The same as LU service except that "intermediate-term" means
Longer than one year but Less than five years.
RQ Sales: 1
Silicon Valley Power 248RQ 2
California Independent System Operator 6RQ 3
4
5
6
7
8
9
10
11
12
13
14
FERC FORM NO. 1 (ED. 12-90) Page 310
0
0
0
Subtotal RQ
Subtotal non-RQ
Total
0 0
0
0
0
0

Name of Respondent This Report Is:(1) An Original
(2) A Resubmission
Date of Report(Mo, Da, Yr)
Year/Period of Report
End of
SALES FOR RESALE (Account 447) (Continued)
PACIFIC GAS AND ELECTRIC COMPANYX
04/13/20212020/Q4
Line
No.
MegaWatt Hours
(i)(h)(g) (j)
Demand Charges Energy Charges Other Charges
(k)
Sold (h+i+j)Total ($)
REVENUE
($) ($) ($)
OS - for other service. use this category only for those services which cannot be placed in the above-defined categories, such as allnon-firm service regardless of the Length of the contract and service from designated units of Less than one year. Describe the natureof the service in a footnote.AD - for Out-of-period adjustment. Use this code for any accounting adjustments or "true-ups" for service provided in prior reportingyears. Provide an explanation in a footnote for each adjustment.4. Group requirements RQ sales together and report them starting at line number one. After listing all RQ sales, enter "Subtotal - RQ"in column (a). The remaining sales may then be listed in any order. Enter "Subtotal-Non-RQ" in column (a) after this Listing. Enter"Total'' in column (a) as the Last Line of the schedule. Report subtotals and total for columns (9) through (k)5. In Column (c), identify the FERC Rate Schedule or Tariff Number. On separate Lines, List all FERC rate schedules or tariffs underwhich service, as identified in column (b), is provided.6. For requirements RQ sales and any type of-service involving demand charges imposed on a monthly (or Longer) basis, enter theaverage monthly billing demand in column (d), the average monthly non-coincident peak (NCP) demand in column (e), and the averagemonthly coincident peak (CP)demand in column (f). For all other types of service, enter NA in columns (d), (e) and (f). Monthly NCP demand is the maximummetered hourly (60-minute integration) demand in a month. Monthly CP demand is the metered demand during the hour (60-minuteintegration) in which the supplier's system reaches its monthly peak. Demand reported in columns (e) and (f) must be in megawatts.Footnote any demand not stated on a megawatt basis and explain.7. Report in column (g) the megawatt hours shown on bills rendered to the purchaser.8. Report demand charges in column (h), energy charges in column (i), and the total of any other types of charges, includingout-of-period adjustments, in column (j). Explain in a footnote all components of the amount shown in column (j). Report in column (k)the total charge shown on bills rendered to the purchaser.9. The data in column (g) through (k) must be subtotaled based on the RQ/Non-RQ grouping (see instruction 4), and then totaled onthe Last -line of the schedule. The "Subtotal - RQ" amount in column (g) must be reported as Requirements Sales For Resale on Page401, line 23. The "Subtotal - Non-RQ" amount in column (g) must be reported as Non-Requirements Sales For Resale on Page401,iine 24.10. Footnote entries as required and provide explanations following all required data.
1
2
426,288,961 1,471,570,468 1,897,859,429 18,328,235 3
4
5
6
7
8
9
10
11
12
13
14
FERC FORM NO. 1 (ED. 12-90) Page 311
426,288,961
0
426,288,961
18,328,235
0
18,328,235
1,471,570,468 1,897,859,429
0
1,471,570,468
0
1,897,859,429
0
0
0

Schedule Page: 310 Line No.: 2 Column: a• Sales represent the Grizzly Power Sale.
• Silicon Valley Power was formally the City of Santa Clara.
The Rate Schedule for Grizzly was changed in FERC Docket No. ER17-1752-000.
Schedule Page: 310 Line No.: 3 Column: a Represents amounts included in ISO Settlement Statement on page 397.
Name of Respondent
PACIFIC GAS AND ELECTRIC COMPANY
This Report is:(1) X An Original(2) A Resubmission
Date of Report(Mo, Da, Yr)
04/13/2021
Year/Period of Report
2020/Q4
FOOTNOTE DATA
FERC FORM NO. 1 (ED. 12-87) Page 450.1

ELECTRIC OPERATION AND MAINTENANCE EXPENSES
Name of Respondent This Report Is:(1) An Original
(2) A Resubmission
Date of Report(Mo, Da, Yr)
Year/Period of Report
End ofPACIFIC GAS AND ELECTRIC COMPANYX
04/13/20212020/Q4
Line
No.
Account Amount for
(c)(b)(a)Current Year Previous Year
Amount for
If the amount for previous year is not derived from previously reported figures, explain in footnote.
1. POWER PRODUCTION EXPENSES 1
A. Steam Power Generation 2
Operation 3
(500) Operation Supervision and Engineering 4 6,129 1,142
(501) Fuel 5 204,525,672 184,061,721
(502) Steam Expenses 6 10,488 11,238
(503) Steam from Other Sources 7
(Less) (504) Steam Transferred-Cr. 8
(505) Electric Expenses 9
(506) Miscellaneous Steam Power Expenses 10 66,148 19,142
(507) Rents 11
(509) Allowances 12 33,701,353 37,602,471
TOTAL Operation (Enter Total of Lines 4 thru 12) 13 238,309,790 221,695,714
Maintenance 14
(510) Maintenance Supervision and Engineering 15 39,355 23,428
(511) Maintenance of Structures 16
(512) Maintenance of Boiler Plant 17 2,192,474 1,343,014
(513) Maintenance of Electric Plant 18 10,822,436 945,338
(514) Maintenance of Miscellaneous Steam Plant 19 5,534,351 2,307,586
TOTAL Maintenance (Enter Total of Lines 15 thru 19) 20 18,588,616 4,619,366
TOTAL Power Production Expenses-Steam Power (Entr Tot lines 13 & 20) 21 256,898,406 226,315,080
B. Nuclear Power Generation 22
Operation 23
(517) Operation Supervision and Engineering 24 4,915,613 5,839,138
(518) Fuel 25 113,567,860 110,507,650
(519) Coolants and Water 26 35,186,370 31,711,282
(520) Steam Expenses 27 41,818,534 40,847,332
(521) Steam from Other Sources 28
(Less) (522) Steam Transferred-Cr. 29
(523) Electric Expenses 30 4,021,766 2,727,700
(524) Miscellaneous Nuclear Power Expenses 31 222,449,476 231,270,908
(525) Rents 32
TOTAL Operation (Enter Total of lines 24 thru 32) 33 421,959,619 422,904,010
Maintenance 34
(528) Maintenance Supervision and Engineering 35 2,623,727 2,245,067
(529) Maintenance of Structures 36 4,274,664 3,354,092
(530) Maintenance of Reactor Plant Equipment 37 31,444,584 30,162,140
(531) Maintenance of Electric Plant 38 42,240,924 34,113,684
(532) Maintenance of Miscellaneous Nuclear Plant 39 115,868,215 48,223,871
TOTAL Maintenance (Enter Total of lines 35 thru 39) 40 196,452,114 118,098,854
TOTAL Power Production Expenses-Nuc. Power (Entr tot lines 33 & 40) 41 618,411,733 541,002,864
C. Hydraulic Power Generation 42
Operation 43
(535) Operation Supervision and Engineering 44 439,376 2,168,007
(536) Water for Power 45 1,662,236 2,638,553
(537) Hydraulic Expenses 46 2,170,419 2,283,235
(538) Electric Expenses 47 25,142,375 34,053,376
(539) Miscellaneous Hydraulic Power Generation Expenses 48 68,497,209 73,827,172
(540) Rents 49 803,141 822,487
TOTAL Operation (Enter Total of Lines 44 thru 49) 50 98,714,756 115,792,830
C. Hydraulic Power Generation (Continued) 51
Maintenance 52
(541) Mainentance Supervision and Engineering 53 1,210,247 684,008
(542) Maintenance of Structures 54 3,991,198 4,656,985
(543) Maintenance of Reservoirs, Dams, and Waterways 55 28,368,557 37,001,129
(544) Maintenance of Electric Plant 56 21,946,833 23,583,421
(545) Maintenance of Miscellaneous Hydraulic Plant 57 7,060,275 6,559,988
TOTAL Maintenance (Enter Total of lines 53 thru 57) 58 62,577,110 72,485,531
TOTAL Power Production Expenses-Hydraulic Power (tot of lines 50 & 58) 59 161,291,866 188,278,361
FERC FORM NO. 1 (ED. 12-93) Page 320
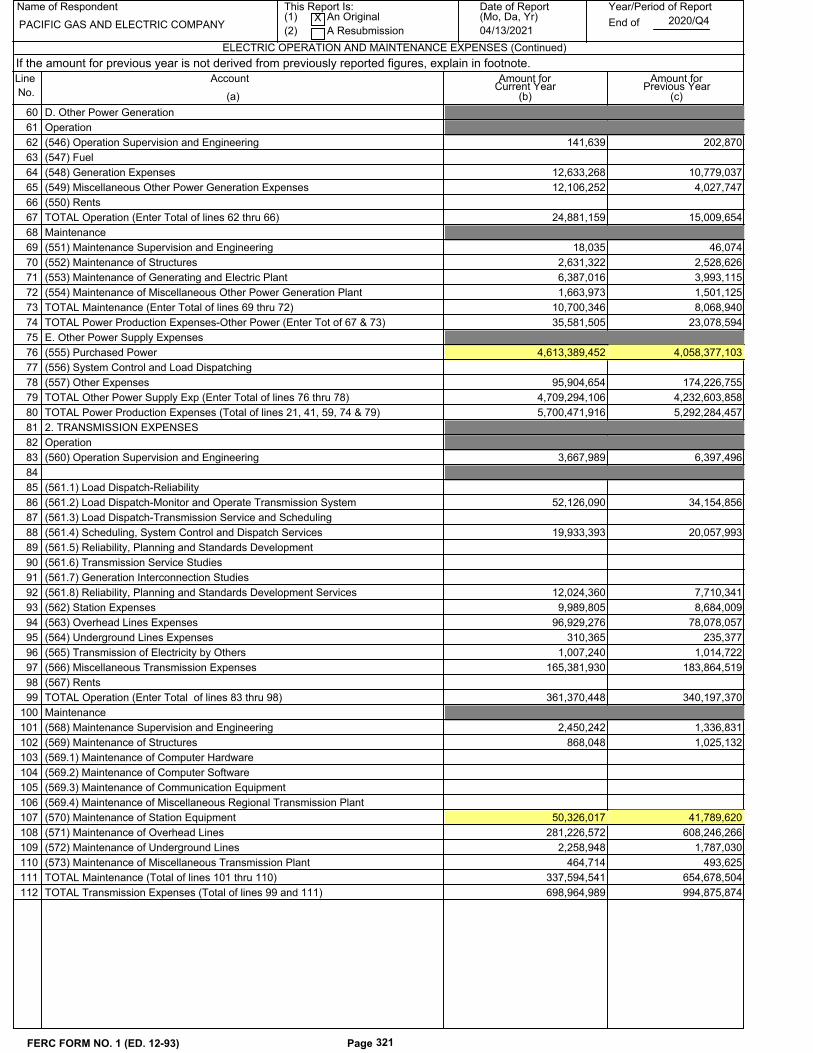
ELECTRIC OPERATION AND MAINTENANCE EXPENSES (Continued)
Name of Respondent This Report Is:(1) An Original
(2) A Resubmission
Date of Report(Mo, Da, Yr)
Year/Period of Report
End ofPACIFIC GAS AND ELECTRIC COMPANYX
04/13/20212020/Q4
Line
No.
Account Amount for
(c)(b)(a)Current Year Previous Year
Amount for
If the amount for previous year is not derived from previously reported figures, explain in footnote.
D. Other Power Generation 60
Operation 61
(546) Operation Supervision and Engineering 62 202,870 141,639
(547) Fuel 63
(548) Generation Expenses 64 10,779,037 12,633,268
(549) Miscellaneous Other Power Generation Expenses 65 4,027,747 12,106,252
(550) Rents 66
TOTAL Operation (Enter Total of lines 62 thru 66) 67 15,009,654 24,881,159
Maintenance 68
(551) Maintenance Supervision and Engineering 69 46,074 18,035
(552) Maintenance of Structures 70 2,528,626 2,631,322
(553) Maintenance of Generating and Electric Plant 71 3,993,115 6,387,016
(554) Maintenance of Miscellaneous Other Power Generation Plant 72 1,501,125 1,663,973
TOTAL Maintenance (Enter Total of lines 69 thru 72) 73 8,068,940 10,700,346
TOTAL Power Production Expenses-Other Power (Enter Tot of 67 & 73) 74 23,078,594 35,581,505
E. Other Power Supply Expenses 75
(555) Purchased Power 76 4,058,377,103 4,613,389,452
(556) System Control and Load Dispatching 77
(557) Other Expenses 78 174,226,755 95,904,654
TOTAL Other Power Supply Exp (Enter Total of lines 76 thru 78) 79 4,232,603,858 4,709,294,106
TOTAL Power Production Expenses (Total of lines 21, 41, 59, 74 & 79) 80 5,292,284,457 5,700,471,916
2. TRANSMISSION EXPENSES 81
Operation 82
(560) Operation Supervision and Engineering 83 6,397,496 3,667,989
84
(561.1) Load Dispatch-Reliability 85
(561.2) Load Dispatch-Monitor and Operate Transmission System 86 34,154,856 52,126,090
(561.3) Load Dispatch-Transmission Service and Scheduling 87
(561.4) Scheduling, System Control and Dispatch Services 88 20,057,993 19,933,393
(561.5) Reliability, Planning and Standards Development 89
(561.6) Transmission Service Studies 90
(561.7) Generation Interconnection Studies 91
(561.8) Reliability, Planning and Standards Development Services 92 7,710,341 12,024,360
(562) Station Expenses 93 8,684,009 9,989,805
(563) Overhead Lines Expenses 94 78,078,057 96,929,276
(564) Underground Lines Expenses 95 235,377 310,365
(565) Transmission of Electricity by Others 96 1,014,722 1,007,240
(566) Miscellaneous Transmission Expenses 97 183,864,519 165,381,930
(567) Rents 98
TOTAL Operation (Enter Total of lines 83 thru 98) 99 340,197,370 361,370,448
Maintenance 100
(568) Maintenance Supervision and Engineering 101 1,336,831 2,450,242
(569) Maintenance of Structures 102 1,025,132 868,048
(569.1) Maintenance of Computer Hardware 103
(569.2) Maintenance of Computer Software 104
(569.3) Maintenance of Communication Equipment 105
(569.4) Maintenance of Miscellaneous Regional Transmission Plant 106
(570) Maintenance of Station Equipment 107 41,789,620 50,326,017
(571) Maintenance of Overhead Lines 108 608,246,266 281,226,572
(572) Maintenance of Underground Lines 109 1,787,030 2,258,948
(573) Maintenance of Miscellaneous Transmission Plant 110 493,625 464,714
TOTAL Maintenance (Total of lines 101 thru 110) 111 654,678,504 337,594,541
TOTAL Transmission Expenses (Total of lines 99 and 111) 112 994,875,874 698,964,989
FERC FORM NO. 1 (ED. 12-93) Page 321

ELECTRIC OPERATION AND MAINTENANCE EXPENSES (Continued)
Name of Respondent This Report Is:(1) An Original
(2) A Resubmission
Date of Report(Mo, Da, Yr)
Year/Period of Report
End ofPACIFIC GAS AND ELECTRIC COMPANYX
04/13/20212020/Q4
Line
No.
Account Amount for
(c)(b)(a)Current Year Previous Year
Amount for
If the amount for previous year is not derived from previously reported figures, explain in footnote.
3. REGIONAL MARKET EXPENSES 113
Operation 114
(575.1) Operation Supervision 115
(575.2) Day-Ahead and Real-Time Market Facilitation 116
(575.3) Transmission Rights Market Facilitation 117
(575.4) Capacity Market Facilitation 118
(575.5) Ancillary Services Market Facilitation 119
(575.6) Market Monitoring and Compliance 120
(575.7) Market Facilitation, Monitoring and Compliance Services 121 13,723,909 9,782,303
(575.8) Rents 122
Total Operation (Lines 115 thru 122) 123 13,723,909 9,782,303
Maintenance 124
(576.1) Maintenance of Structures and Improvements 125
(576.2) Maintenance of Computer Hardware 126
(576.3) Maintenance of Computer Software 127
(576.4) Maintenance of Communication Equipment 128
(576.5) Maintenance of Miscellaneous Market Operation Plant 129
Total Maintenance (Lines 125 thru 129) 130
TOTAL Regional Transmission and Market Op Expns (Total 123 and 130) 131 13,723,909 9,782,303
4. DISTRIBUTION EXPENSES 132
Operation 133
(580) Operation Supervision and Engineering 134 6,014,879 20,709,462
(581) Load Dispatching 135
(582) Station Expenses 136 3,079,056 5,081,362
(583) Overhead Line Expenses 137 41,788,851 67,025,442
(584) Underground Line Expenses 138 47,446,039 58,350,200
(585) Street Lighting and Signal System Expenses 139
(586) Meter Expenses 140 1,073,918 1,549,953
(587) Customer Installations Expenses 141 14,723,638 16,827,291
(588) Miscellaneous Expenses 142 414,577,885 650,635,035
(589) Rents 143 569,576 448,661
TOTAL Operation (Enter Total of lines 134 thru 143) 144 529,273,842 820,627,406
Maintenance 145
(590) Maintenance Supervision and Engineering 146 6,211,857 -4,640,219
(591) Maintenance of Structures 147 1,132,501 3,497,667
(592) Maintenance of Station Equipment 148 48,729,079 48,931,712
(593) Maintenance of Overhead Lines 149 775,894,931 2,023,359,973
(594) Maintenance of Underground Lines 150 49,179,380 40,316,858
(595) Maintenance of Line Transformers 151 1,509,530 2,683,080
(596) Maintenance of Street Lighting and Signal Systems 152 1,543,961 1,602,826
(597) Maintenance of Meters 153 8,695,292 10,029,432
(598) Maintenance of Miscellaneous Distribution Plant 154 1,585,045 1,158,682
TOTAL Maintenance (Total of lines 146 thru 154) 155 894,481,576 2,126,940,011
TOTAL Distribution Expenses (Total of lines 144 and 155) 156 1,423,755,418 2,947,567,417
5. CUSTOMER ACCOUNTS EXPENSES 157
Operation 158
(901) Supervision 159 6,778,388 5,729,173
(902) Meter Reading Expenses 160 6,653,089 6,940,157
(903) Customer Records and Collection Expenses 161 204,050,050 213,766,303
(904) Uncollectible Accounts 162 34,941,999 104,122,312
(905) Miscellaneous Customer Accounts Expenses 163 1,308,400 865,493
TOTAL Customer Accounts Expenses (Total of lines 159 thru 163) 164 253,731,926 331,423,438
FERC FORM NO. 1 (ED. 12-93) Page 322

ELECTRIC OPERATION AND MAINTENANCE EXPENSES (Continued)
Name of Respondent This Report Is:(1) An Original
(2) A Resubmission
Date of Report(Mo, Da, Yr)
Year/Period of Report
End ofPACIFIC GAS AND ELECTRIC COMPANYX
04/13/20212020/Q4
Line
No.
Account Amount for
(c)(b)(a)Current Year Previous Year
Amount for
If the amount for previous year is not derived from previously reported figures, explain in footnote.
6. CUSTOMER SERVICE AND INFORMATIONAL EXPENSES 165
Operation 166
(907) Supervision 167
(908) Customer Assistance Expenses 168 462,729,169 351,431,709
(909) Informational and Instructional Expenses 169
(910) Miscellaneous Customer Service and Informational Expenses 170 162,912 295,649
TOTAL Customer Service and Information Expenses (Total 167 thru 170) 171 462,892,081 351,727,358
7. SALES EXPENSES 172
Operation 173
(911) Supervision 174
(912) Demonstrating and Selling Expenses 175 1,039,813 2,214,952
(913) Advertising Expenses 176
(916) Miscellaneous Sales Expenses 177
TOTAL Sales Expenses (Enter Total of lines 174 thru 177) 178 1,039,813 2,214,952
8. ADMINISTRATIVE AND GENERAL EXPENSES 179
Operation 180
(920) Administrative and General Salaries 181 398,482,342 307,671,632
(921) Office Supplies and Expenses 182 73,887,712 91,699,147
(Less) (922) Administrative Expenses Transferred-Credit 183 103,181,563 82,886,864
(923) Outside Services Employed 184 568,349,816 497,380,727
(924) Property Insurance 185 13,751,290 7,948,063
(925) Injuries and Damages 186 11,371,690,540 1,198,782,625
(926) Employee Pensions and Benefits 187 357,000,223 336,845,887
(927) Franchise Requirements 188 89,389,579 99,830,022
(928) Regulatory Commission Expenses 189
(929) (Less) Duplicate Charges-Cr. 190
(930.1) General Advertising Expenses 191
(930.2) Miscellaneous General Expenses 192 23,019,768 27,790,938
(931) Rents 193
TOTAL Operation (Enter Total of lines 181 thru 193) 194 12,792,389,707 2,485,062,177
Maintenance 195
(935) Maintenance of General Plant 196 4,229,193 3,482,559
TOTAL Administrative & General Expenses (Total of lines 194 and 196) 197 12,796,618,900 2,488,544,736
TOTAL Elec Op and Maint Expns (Total 80,112,131,156,164,171,178,197) 198 21,238,922,378 12,530,697,109
FERC FORM NO. 1 (ED. 12-93) Page 323
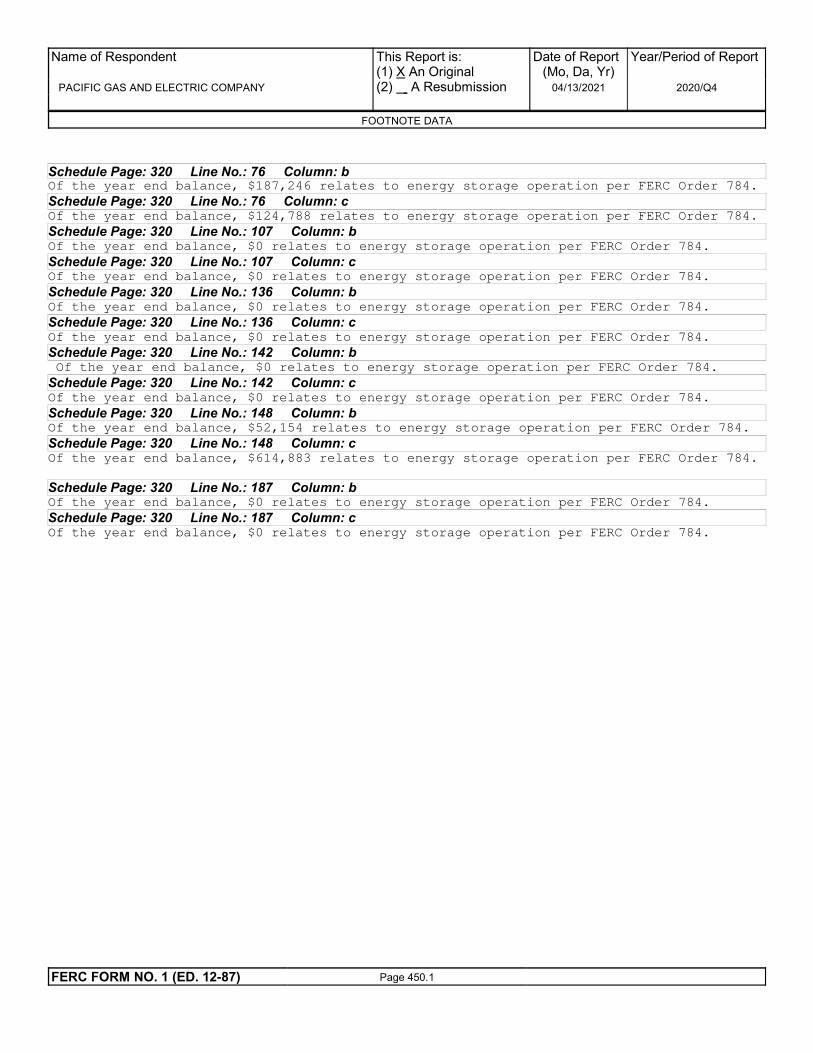
Schedule Page: 320 Line No.: 76 Column: bOf the year end balance, $187,246 relates to energy storage operation per FERC Order 784.
Schedule Page: 320 Line No.: 76 Column: cOf the year end balance, $124,788 relates to energy storage operation per FERC Order 784.
Schedule Page: 320 Line No.: 107 Column: bOf the year end balance, $0 relates to energy storage operation per FERC Order 784.
Schedule Page: 320 Line No.: 107 Column: cOf the year end balance, $0 relates to energy storage operation per FERC Order 784.
Schedule Page: 320 Line No.: 136 Column: bOf the year end balance, $0 relates to energy storage operation per FERC Order 784.
Schedule Page: 320 Line No.: 136 Column: cOf the year end balance, $0 relates to energy storage operation per FERC Order 784.
Schedule Page: 320 Line No.: 142 Column: b Of the year end balance, $0 relates to energy storage operation per FERC Order 784.
Schedule Page: 320 Line No.: 142 Column: cOf the year end balance, $0 relates to energy storage operation per FERC Order 784.
Schedule Page: 320 Line No.: 148 Column: bOf the year end balance, $52,154 relates to energy storage operation per FERC Order 784.
Schedule Page: 320 Line No.: 148 Column: cOf the year end balance, $614,883 relates to energy storage operation per FERC Order 784.
Schedule Page: 320 Line No.: 187 Column: bOf the year end balance, $0 relates to energy storage operation per FERC Order 784.
Schedule Page: 320 Line No.: 187 Column: cOf the year end balance, $0 relates to energy storage operation per FERC Order 784.
Name of Respondent
PACIFIC GAS AND ELECTRIC COMPANY
This Report is:(1) X An Original(2) A Resubmission
Date of Report(Mo, Da, Yr)
04/13/2021
Year/Period of Report
2020/Q4
FOOTNOTE DATA
FERC FORM NO. 1 (ED. 12-87) Page 450.1
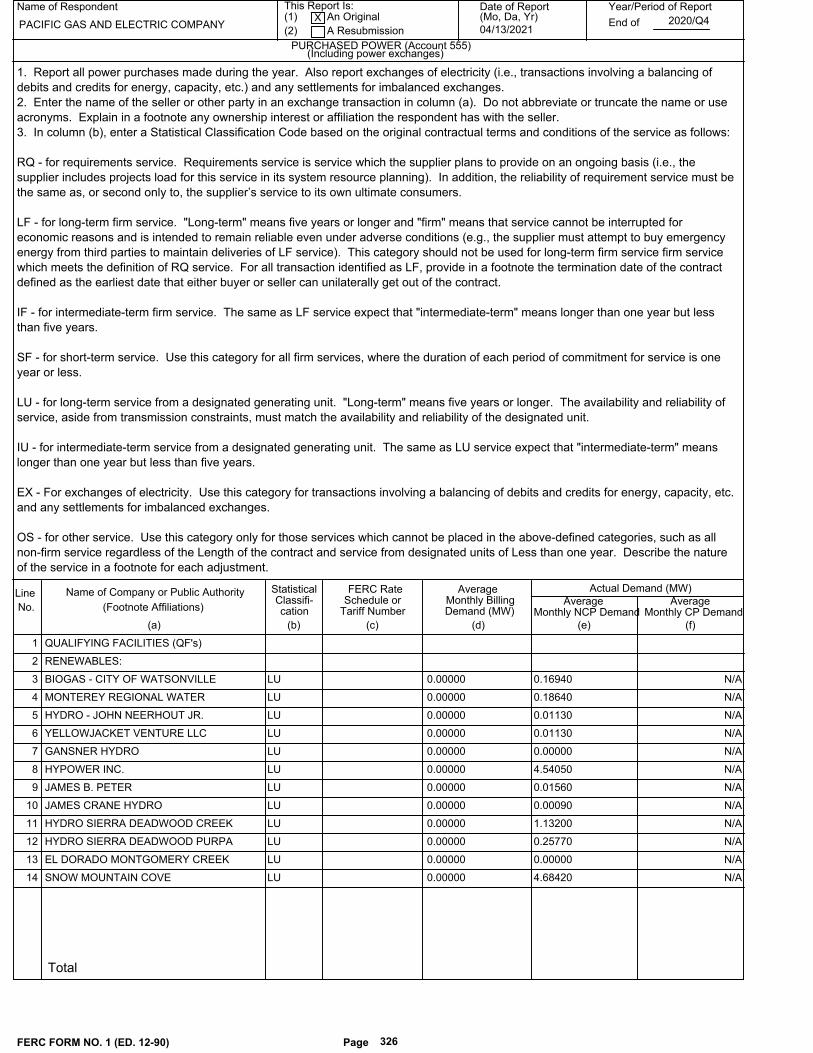
Name of Respondent This Report Is:(1) An Original
(2) A Resubmission
Date of Report(Mo, Da, Yr)
Year/Period of Report
End of
PURCHASED POWER (Account 555)
PACIFIC GAS AND ELECTRIC COMPANYX
04/13/20212020/Q4
Line
No.
Name of Company or Public Authority
(c)(b)(a)
FERC RateMonthly Billing
Average
(d)
Statistical
cationClassifi- Schedule or
Tariff Number Demand (MW)
(e) (f)
(Footnote Affiliations)
Actual Demand (MW)
Average AverageMonthly NCP Demand Monthly CP Demand
(Including power exchanges)
1. Report all power purchases made during the year. Also report exchanges of electricity (i.e., transactions involving a balancing of
debits and credits for energy, capacity, etc.) and any settlements for imbalanced exchanges.
2. Enter the name of the seller or other party in an exchange transaction in column (a). Do not abbreviate or truncate the name or use
acronyms. Explain in a footnote any ownership interest or affiliation the respondent has with the seller.
3. In column (b), enter a Statistical Classification Code based on the original contractual terms and conditions of the service as follows:
RQ - for requirements service. Requirements service is service which the supplier plans to provide on an ongoing basis (i.e., the
supplier includes projects load for this service in its system resource planning). In addition, the reliability of requirement service must be
the same as, or second only to, the supplier’s service to its own ultimate consumers.
LF - for long-term firm service. "Long-term" means five years or longer and "firm" means that service cannot be interrupted for
economic reasons and is intended to remain reliable even under adverse conditions (e.g., the supplier must attempt to buy emergency
energy from third parties to maintain deliveries of LF service). This category should not be used for long-term firm service firm service
which meets the definition of RQ service. For all transaction identified as LF, provide in a footnote the termination date of the contract
defined as the earliest date that either buyer or seller can unilaterally get out of the contract.
IF - for intermediate-term firm service. The same as LF service expect that "intermediate-term" means longer than one year but less
than five years.
SF - for short-term service. Use this category for all firm services, where the duration of each period of commitment for service is one
year or less.
LU - for long-term service from a designated generating unit. "Long-term" means five years or longer. The availability and reliability of
service, aside from transmission constraints, must match the availability and reliability of the designated unit.
IU - for intermediate-term service from a designated generating unit. The same as LU service expect that "intermediate-term" means
longer than one year but less than five years.
EX - For exchanges of electricity. Use this category for transactions involving a balancing of debits and credits for energy, capacity, etc.
and any settlements for imbalanced exchanges.
OS - for other service. Use this category only for those services which cannot be placed in the above-defined categories, such as all
non-firm service regardless of the Length of the contract and service from designated units of Less than one year. Describe the nature
of the service in a footnote for each adjustment.
QUALIFYING FACILITIES (QF's) 1
RENEWABLES: 2
N/A0.169400.00000BIOGAS - CITY OF WATSONVILLE LU 3
N/A0.186400.00000MONTEREY REGIONAL WATER LU 4
N/A0.011300.00000HYDRO - JOHN NEERHOUT JR. LU 5
N/A0.011300.00000YELLOWJACKET VENTURE LLC LU 6
N/A0.000000.00000GANSNER HYDRO LU 7
N/A4.540500.00000HYPOWER INC. LU 8
N/A0.015600.00000JAMES B. PETER LU 9
N/A0.000900.00000JAMES CRANE HYDRO LU 10
N/A1.132000.00000HYDRO SIERRA DEADWOOD CREEK LU 11
N/A0.257700.00000HYDRO SIERRA DEADWOOD PURPA LU 12
N/A0.000000.00000EL DORADO MONTGOMERY CREEK LU 13
N/A4.684200.00000SNOW MOUNTAIN COVE LU 14
FERC FORM NO. 1 (ED. 12-90) Page 326
Total

Name of Respondent This Report Is:(1) An Original
(2) A Resubmission
Date of Report(Mo, Da, Yr)
Year/Period of Report
End of
PURCHASED POWER (Account 555)
PACIFIC GAS AND ELECTRIC COMPANYX
04/13/20212020/Q4
Line
No.
Name of Company or Public Authority
(c)(b)(a)
FERC RateMonthly Billing
Average
(d)
Statistical
cationClassifi- Schedule or
Tariff Number Demand (MW)
(e) (f)
(Footnote Affiliations)
Actual Demand (MW)
Average AverageMonthly NCP Demand Monthly CP Demand
(Including power exchanges)
1. Report all power purchases made during the year. Also report exchanges of electricity (i.e., transactions involving a balancing of
debits and credits for energy, capacity, etc.) and any settlements for imbalanced exchanges.
2. Enter the name of the seller or other party in an exchange transaction in column (a). Do not abbreviate or truncate the name or use
acronyms. Explain in a footnote any ownership interest or affiliation the respondent has with the seller.
3. In column (b), enter a Statistical Classification Code based on the original contractual terms and conditions of the service as follows:
RQ - for requirements service. Requirements service is service which the supplier plans to provide on an ongoing basis (i.e., the
supplier includes projects load for this service in its system resource planning). In addition, the reliability of requirement service must be
the same as, or second only to, the supplier’s service to its own ultimate consumers.
LF - for long-term firm service. "Long-term" means five years or longer and "firm" means that service cannot be interrupted for
economic reasons and is intended to remain reliable even under adverse conditions (e.g., the supplier must attempt to buy emergency
energy from third parties to maintain deliveries of LF service). This category should not be used for long-term firm service firm service
which meets the definition of RQ service. For all transaction identified as LF, provide in a footnote the termination date of the contract
defined as the earliest date that either buyer or seller can unilaterally get out of the contract.
IF - for intermediate-term firm service. The same as LF service expect that "intermediate-term" means longer than one year but less
than five years.
SF - for short-term service. Use this category for all firm services, where the duration of each period of commitment for service is one
year or less.
LU - for long-term service from a designated generating unit. "Long-term" means five years or longer. The availability and reliability of
service, aside from transmission constraints, must match the availability and reliability of the designated unit.
IU - for intermediate-term service from a designated generating unit. The same as LU service expect that "intermediate-term" means
longer than one year but less than five years.
EX - For exchanges of electricity. Use this category for transactions involving a balancing of debits and credits for energy, capacity, etc.
and any settlements for imbalanced exchanges.
OS - for other service. Use this category only for those services which cannot be placed in the above-defined categories, such as all
non-firm service regardless of the Length of the contract and service from designated units of Less than one year. Describe the nature
of the service in a footnote for each adjustment.
N/A1.219000.00000SNOW MOUNTAIN BURNEY CREEK LU 1
N/A0.000000.00000OLSEN POWER PARTNERS LU 2
N/A3.450500.00000OLSEN POWER QPA LU 3
N/A0.669700.00000SNOW MT. PONDEROSA BAILEY CREEK LU 4
N/A16.529600.00000MALACHA HYDRO L.P. LU 5
N/A0.098300.00000LOFTON RANCH LU 6
N/A0.043100.00000HAT CREEK HEREFORD RANCH LU 7
N/A0.000000.00000STEVE & BONNIE TETRICK LU 8
N/A1.234600.00000EIF HAYPRESS LLC LU 9
N/A0.000000.00000EAGLE HYDRO LU 10
N/A0.000500.00000CHARCOAL RAVINE LU 11
N/A0.037200.00000SWISS AMERICA LU 12
N/A0.000000.00000WRIGHT RANCH HYDROELECTRIC LU 13
N/A0.049900.00000SCHAADS HYDRO LU 14
FERC FORM NO. 1 (ED. 12-90) Page 326.1
Total

Name of Respondent This Report Is:(1) An Original
(2) A Resubmission
Date of Report(Mo, Da, Yr)
Year/Period of Report
End of
PURCHASED POWER (Account 555)
PACIFIC GAS AND ELECTRIC COMPANYX
04/13/20212020/Q4
Line
No.
Name of Company or Public Authority
(c)(b)(a)
FERC RateMonthly Billing
Average
(d)
Statistical
cationClassifi- Schedule or
Tariff Number Demand (MW)
(e) (f)
(Footnote Affiliations)
Actual Demand (MW)
Average AverageMonthly NCP Demand Monthly CP Demand
(Including power exchanges)
1. Report all power purchases made during the year. Also report exchanges of electricity (i.e., transactions involving a balancing of
debits and credits for energy, capacity, etc.) and any settlements for imbalanced exchanges.
2. Enter the name of the seller or other party in an exchange transaction in column (a). Do not abbreviate or truncate the name or use
acronyms. Explain in a footnote any ownership interest or affiliation the respondent has with the seller.
3. In column (b), enter a Statistical Classification Code based on the original contractual terms and conditions of the service as follows:
RQ - for requirements service. Requirements service is service which the supplier plans to provide on an ongoing basis (i.e., the
supplier includes projects load for this service in its system resource planning). In addition, the reliability of requirement service must be
the same as, or second only to, the supplier’s service to its own ultimate consumers.
LF - for long-term firm service. "Long-term" means five years or longer and "firm" means that service cannot be interrupted for
economic reasons and is intended to remain reliable even under adverse conditions (e.g., the supplier must attempt to buy emergency
energy from third parties to maintain deliveries of LF service). This category should not be used for long-term firm service firm service
which meets the definition of RQ service. For all transaction identified as LF, provide in a footnote the termination date of the contract
defined as the earliest date that either buyer or seller can unilaterally get out of the contract.
IF - for intermediate-term firm service. The same as LF service expect that "intermediate-term" means longer than one year but less
than five years.
SF - for short-term service. Use this category for all firm services, where the duration of each period of commitment for service is one
year or less.
LU - for long-term service from a designated generating unit. "Long-term" means five years or longer. The availability and reliability of
service, aside from transmission constraints, must match the availability and reliability of the designated unit.
IU - for intermediate-term service from a designated generating unit. The same as LU service expect that "intermediate-term" means
longer than one year but less than five years.
EX - For exchanges of electricity. Use this category for transactions involving a balancing of debits and credits for energy, capacity, etc.
and any settlements for imbalanced exchanges.
OS - for other service. Use this category only for those services which cannot be placed in the above-defined categories, such as all
non-firm service regardless of the Length of the contract and service from designated units of Less than one year. Describe the nature
of the service in a footnote for each adjustment.
N/A0.153000.00000ROCK CREEK WATER DISTRICT LU 1
N/A0.000000.00000TOM BENNINGHOVEN LU 2
N/A0.435800.00000ORANGE COVE IRRIGATION DISTRICT LU 3
N/A0.273200.00000FISHWATER RELEASE LU 4
N/A0.296400.00000KINGS RIVER HYDRO LU 5
N/A1.350000.00000ETIWANDA POWER PLANT LU 6
N/A0.000000.00000SOLAR- VILLA SORRISO SOLAR LU 7
N/A0.000000.00000WIND- DONALD R. CHENOWETH LU 8
N/A235.69920240.00000COGEN - CROCKETT COGEN LU 9
N/A9.425500.00000PHILLIPS 66 LU 10
N/A3.531400.00000BERKELEY COGENERATION LU 11
N/A0.000000.00000STANFORD ENERGY GROUP LU 12
N/A0.186300.00000ECO SERVICES OPERATIONS LLC LU 13
N/A0.008400.00000SATELLITE SENIOR HOMES LU 14
FERC FORM NO. 1 (ED. 12-90) Page 326.2
Total

Name of Respondent This Report Is:(1) An Original
(2) A Resubmission
Date of Report(Mo, Da, Yr)
Year/Period of Report
End of
PURCHASED POWER (Account 555)
PACIFIC GAS AND ELECTRIC COMPANYX
04/13/20212020/Q4
Line
No.
Name of Company or Public Authority
(c)(b)(a)
FERC RateMonthly Billing
Average
(d)
Statistical
cationClassifi- Schedule or
Tariff Number Demand (MW)
(e) (f)
(Footnote Affiliations)
Actual Demand (MW)
Average AverageMonthly NCP Demand Monthly CP Demand
(Including power exchanges)
1. Report all power purchases made during the year. Also report exchanges of electricity (i.e., transactions involving a balancing of
debits and credits for energy, capacity, etc.) and any settlements for imbalanced exchanges.
2. Enter the name of the seller or other party in an exchange transaction in column (a). Do not abbreviate or truncate the name or use
acronyms. Explain in a footnote any ownership interest or affiliation the respondent has with the seller.
3. In column (b), enter a Statistical Classification Code based on the original contractual terms and conditions of the service as follows:
RQ - for requirements service. Requirements service is service which the supplier plans to provide on an ongoing basis (i.e., the
supplier includes projects load for this service in its system resource planning). In addition, the reliability of requirement service must be
the same as, or second only to, the supplier’s service to its own ultimate consumers.
LF - for long-term firm service. "Long-term" means five years or longer and "firm" means that service cannot be interrupted for
economic reasons and is intended to remain reliable even under adverse conditions (e.g., the supplier must attempt to buy emergency
energy from third parties to maintain deliveries of LF service). This category should not be used for long-term firm service firm service
which meets the definition of RQ service. For all transaction identified as LF, provide in a footnote the termination date of the contract
defined as the earliest date that either buyer or seller can unilaterally get out of the contract.
IF - for intermediate-term firm service. The same as LF service expect that "intermediate-term" means longer than one year but less
than five years.
SF - for short-term service. Use this category for all firm services, where the duration of each period of commitment for service is one
year or less.
LU - for long-term service from a designated generating unit. "Long-term" means five years or longer. The availability and reliability of
service, aside from transmission constraints, must match the availability and reliability of the designated unit.
IU - for intermediate-term service from a designated generating unit. The same as LU service expect that "intermediate-term" means
longer than one year but less than five years.
EX - For exchanges of electricity. Use this category for transactions involving a balancing of debits and credits for energy, capacity, etc.
and any settlements for imbalanced exchanges.
OS - for other service. Use this category only for those services which cannot be placed in the above-defined categories, such as all
non-firm service regardless of the Length of the contract and service from designated units of Less than one year. Describe the nature
of the service in a footnote for each adjustment.
N/A0.037300.00000HAYWARD AREA RECREATION AND PARK LU 1
N/A5.691700.00000CHEVRON RICHMOND REFINERY LU 2
N/A0.016500.00000ORINDA SENIOR VILLAGE LU 3
N/A1.690600.00000SRI INTERNATIONAL LU 4
N/A0.001400.00000ARDEN WOOD BENEVOLENT ASSOC. LU 5
N/A0.019300.000001080 CHESTNUT CORP. LU 6
N/A0.019900.00000NIHONMACHI TERRACE LU 7
N/A0.008000.00000GREATER VALLEJO RECREATION DIST. LU 8
N/A0.017800.00000AIRPORT CLUB LU 9
N/A0.000000.00000SANTA CRUZ COUNTY WATER ST. JAIL LU 10
N/A0.000000.00000CITY OF MILPITAS LU 11
N/A0.000000.00000GREENLEAF UNIT 2 LU 12
N/A38.7342046.00000YUBA CITY COGEN LU 13
N/A0.000000.00000YUBA CITY RACQUET CLUB LU 14
FERC FORM NO. 1 (ED. 12-90) Page 326.3
Total

Name of Respondent This Report Is:(1) An Original
(2) A Resubmission
Date of Report(Mo, Da, Yr)
Year/Period of Report
End of
PURCHASED POWER (Account 555)
PACIFIC GAS AND ELECTRIC COMPANYX
04/13/20212020/Q4
Line
No.
Name of Company or Public Authority
(c)(b)(a)
FERC RateMonthly Billing
Average
(d)
Statistical
cationClassifi- Schedule or
Tariff Number Demand (MW)
(e) (f)
(Footnote Affiliations)
Actual Demand (MW)
Average AverageMonthly NCP Demand Monthly CP Demand
(Including power exchanges)
1. Report all power purchases made during the year. Also report exchanges of electricity (i.e., transactions involving a balancing of
debits and credits for energy, capacity, etc.) and any settlements for imbalanced exchanges.
2. Enter the name of the seller or other party in an exchange transaction in column (a). Do not abbreviate or truncate the name or use
acronyms. Explain in a footnote any ownership interest or affiliation the respondent has with the seller.
3. In column (b), enter a Statistical Classification Code based on the original contractual terms and conditions of the service as follows:
RQ - for requirements service. Requirements service is service which the supplier plans to provide on an ongoing basis (i.e., the
supplier includes projects load for this service in its system resource planning). In addition, the reliability of requirement service must be
the same as, or second only to, the supplier’s service to its own ultimate consumers.
LF - for long-term firm service. "Long-term" means five years or longer and "firm" means that service cannot be interrupted for
economic reasons and is intended to remain reliable even under adverse conditions (e.g., the supplier must attempt to buy emergency
energy from third parties to maintain deliveries of LF service). This category should not be used for long-term firm service firm service
which meets the definition of RQ service. For all transaction identified as LF, provide in a footnote the termination date of the contract
defined as the earliest date that either buyer or seller can unilaterally get out of the contract.
IF - for intermediate-term firm service. The same as LF service expect that "intermediate-term" means longer than one year but less
than five years.
SF - for short-term service. Use this category for all firm services, where the duration of each period of commitment for service is one
year or less.
LU - for long-term service from a designated generating unit. "Long-term" means five years or longer. The availability and reliability of
service, aside from transmission constraints, must match the availability and reliability of the designated unit.
IU - for intermediate-term service from a designated generating unit. The same as LU service expect that "intermediate-term" means
longer than one year but less than five years.
EX - For exchanges of electricity. Use this category for transactions involving a balancing of debits and credits for energy, capacity, etc.
and any settlements for imbalanced exchanges.
OS - for other service. Use this category only for those services which cannot be placed in the above-defined categories, such as all
non-firm service regardless of the Length of the contract and service from designated units of Less than one year. Describe the nature
of the service in a footnote for each adjustment.
N/A1.135000.00000FRITO-LAY COGEN QPA2 LU 1
N/A6.958200.00000FRESNO COGEN LP LU 2
N/A16.8003034.50000PE KES KINGSBURG LLC LU 3
N/A4.910600.00000EOR- CHEVRON MCKITTRICK FHP LU 4
N/A2.949600.00000CHEVRON USA TAFT/CADET LU 5
N/A5.086100.00000CHEVRON USA CYMRIC LU 6
N/A1.855300.00000AERA ENERGY SOUTH BELRIDGE QAA2 LU 7
N/A4.195800.00000CHEVRON USA COALINGA LU 8
N/A18.2236017.75000WESTERN POWER & STEAM INC LU 9
N/A13.578007.50000BERRY PETROLEUM CO TANNEHILL 2 LU 10
N/A7.257600.00000CHEVRON USA INC SE KERN RIVER LU 11
N/A15.742700.00000CHEVRON USA INC EASTRIDGE LU 12
N/A2.043300.00000AERA ENERGY LLC COALINGA LU 13
N/A2.706700.00000FREEPORT MCMORAN DOME LU 14
FERC FORM NO. 1 (ED. 12-90) Page 326.4
Total

Name of Respondent This Report Is:(1) An Original
(2) A Resubmission
Date of Report(Mo, Da, Yr)
Year/Period of Report
End of
PURCHASED POWER (Account 555)
PACIFIC GAS AND ELECTRIC COMPANYX
04/13/20212020/Q4
Line
No.
Name of Company or Public Authority
(c)(b)(a)
FERC RateMonthly Billing
Average
(d)
Statistical
cationClassifi- Schedule or
Tariff Number Demand (MW)
(e) (f)
(Footnote Affiliations)
Actual Demand (MW)
Average AverageMonthly NCP Demand Monthly CP Demand
(Including power exchanges)
1. Report all power purchases made during the year. Also report exchanges of electricity (i.e., transactions involving a balancing of
debits and credits for energy, capacity, etc.) and any settlements for imbalanced exchanges.
2. Enter the name of the seller or other party in an exchange transaction in column (a). Do not abbreviate or truncate the name or use
acronyms. Explain in a footnote any ownership interest or affiliation the respondent has with the seller.
3. In column (b), enter a Statistical Classification Code based on the original contractual terms and conditions of the service as follows:
RQ - for requirements service. Requirements service is service which the supplier plans to provide on an ongoing basis (i.e., the
supplier includes projects load for this service in its system resource planning). In addition, the reliability of requirement service must be
the same as, or second only to, the supplier’s service to its own ultimate consumers.
LF - for long-term firm service. "Long-term" means five years or longer and "firm" means that service cannot be interrupted for
economic reasons and is intended to remain reliable even under adverse conditions (e.g., the supplier must attempt to buy emergency
energy from third parties to maintain deliveries of LF service). This category should not be used for long-term firm service firm service
which meets the definition of RQ service. For all transaction identified as LF, provide in a footnote the termination date of the contract
defined as the earliest date that either buyer or seller can unilaterally get out of the contract.
IF - for intermediate-term firm service. The same as LF service expect that "intermediate-term" means longer than one year but less
than five years.
SF - for short-term service. Use this category for all firm services, where the duration of each period of commitment for service is one
year or less.
LU - for long-term service from a designated generating unit. "Long-term" means five years or longer. The availability and reliability of
service, aside from transmission constraints, must match the availability and reliability of the designated unit.
IU - for intermediate-term service from a designated generating unit. The same as LU service expect that "intermediate-term" means
longer than one year but less than five years.
EX - For exchanges of electricity. Use this category for transactions involving a balancing of debits and credits for energy, capacity, etc.
and any settlements for imbalanced exchanges.
OS - for other service. Use this category only for those services which cannot be placed in the above-defined categories, such as all
non-firm service regardless of the Length of the contract and service from designated units of Less than one year. Describe the nature
of the service in a footnote for each adjustment.
1
BILATERALS 2
0.000000.000002041 ALVARES 3
0.000000.000002056 JARDINE 4
0.000000.000002059 SCHERZ 5
0.000000.000002065 ROGERS 6
0.000000.000002081 TERZIAN 7
0.000000.000002094 BUZZELLE 8
0.000000.000002096 COTTON 9
0.000000.000002097 HELTON 10
0.000000.000002102 CHRISTENSEN 11
0.000000.000002103 HILL 12
0.000000.000002105 HART 13
0.000000.000002105 HART (Oroville Solar) 14
FERC FORM NO. 1 (ED. 12-90) Page 326.5
Total

Name of Respondent This Report Is:(1) An Original
(2) A Resubmission
Date of Report(Mo, Da, Yr)
Year/Period of Report
End of
PURCHASED POWER (Account 555)
PACIFIC GAS AND ELECTRIC COMPANYX
04/13/20212020/Q4
Line
No.
Name of Company or Public Authority
(c)(b)(a)
FERC RateMonthly Billing
Average
(d)
Statistical
cationClassifi- Schedule or
Tariff Number Demand (MW)
(e) (f)
(Footnote Affiliations)
Actual Demand (MW)
Average AverageMonthly NCP Demand Monthly CP Demand
(Including power exchanges)
1. Report all power purchases made during the year. Also report exchanges of electricity (i.e., transactions involving a balancing of
debits and credits for energy, capacity, etc.) and any settlements for imbalanced exchanges.
2. Enter the name of the seller or other party in an exchange transaction in column (a). Do not abbreviate or truncate the name or use
acronyms. Explain in a footnote any ownership interest or affiliation the respondent has with the seller.
3. In column (b), enter a Statistical Classification Code based on the original contractual terms and conditions of the service as follows:
RQ - for requirements service. Requirements service is service which the supplier plans to provide on an ongoing basis (i.e., the
supplier includes projects load for this service in its system resource planning). In addition, the reliability of requirement service must be
the same as, or second only to, the supplier’s service to its own ultimate consumers.
LF - for long-term firm service. "Long-term" means five years or longer and "firm" means that service cannot be interrupted for
economic reasons and is intended to remain reliable even under adverse conditions (e.g., the supplier must attempt to buy emergency
energy from third parties to maintain deliveries of LF service). This category should not be used for long-term firm service firm service
which meets the definition of RQ service. For all transaction identified as LF, provide in a footnote the termination date of the contract
defined as the earliest date that either buyer or seller can unilaterally get out of the contract.
IF - for intermediate-term firm service. The same as LF service expect that "intermediate-term" means longer than one year but less
than five years.
SF - for short-term service. Use this category for all firm services, where the duration of each period of commitment for service is one
year or less.
LU - for long-term service from a designated generating unit. "Long-term" means five years or longer. The availability and reliability of
service, aside from transmission constraints, must match the availability and reliability of the designated unit.
IU - for intermediate-term service from a designated generating unit. The same as LU service expect that "intermediate-term" means
longer than one year but less than five years.
EX - For exchanges of electricity. Use this category for transactions involving a balancing of debits and credits for energy, capacity, etc.
and any settlements for imbalanced exchanges.
OS - for other service. Use this category only for those services which cannot be placed in the above-defined categories, such as all
non-firm service regardless of the Length of the contract and service from designated units of Less than one year. Describe the nature
of the service in a footnote for each adjustment.
0.000000.000002113 FITZJARRELL PRISTINE SUN 1
0.000000.000002125 JARVIS PRISTINE SUN 2
0.000000.000002127 HARRIS 3
0.000000.000002154 FOOTE 4
0.000000.000002154 FOOTE (Oroville Solar) 5
0.000000.000002158 STROING PRISTINE SUN 6
0.000000.000002179 SMOTHERMAN 7
0.000000.000002184 GRUBER 8
0.000000.000002184 GRUBER (ENERPARC) 9
0.000000.000002192 RAMIREZ 10
0.000000.000002192 RAMIREZ (Oroville Solar) 11
0.000000.000003 PHASES RA - BU 12
0.000000.000003 PHASES RENEWABLES 13
0.000000.00000ABEC #2 LLC 14
FERC FORM NO. 1 (ED. 12-90) Page 326.6
Total

Name of Respondent This Report Is:(1) An Original
(2) A Resubmission
Date of Report(Mo, Da, Yr)
Year/Period of Report
End of
PURCHASED POWER (Account 555)
PACIFIC GAS AND ELECTRIC COMPANYX
04/13/20212020/Q4
Line
No.
Name of Company or Public Authority
(c)(b)(a)
FERC RateMonthly Billing
Average
(d)
Statistical
cationClassifi- Schedule or
Tariff Number Demand (MW)
(e) (f)
(Footnote Affiliations)
Actual Demand (MW)
Average AverageMonthly NCP Demand Monthly CP Demand
(Including power exchanges)
1. Report all power purchases made during the year. Also report exchanges of electricity (i.e., transactions involving a balancing of
debits and credits for energy, capacity, etc.) and any settlements for imbalanced exchanges.
2. Enter the name of the seller or other party in an exchange transaction in column (a). Do not abbreviate or truncate the name or use
acronyms. Explain in a footnote any ownership interest or affiliation the respondent has with the seller.
3. In column (b), enter a Statistical Classification Code based on the original contractual terms and conditions of the service as follows:
RQ - for requirements service. Requirements service is service which the supplier plans to provide on an ongoing basis (i.e., the
supplier includes projects load for this service in its system resource planning). In addition, the reliability of requirement service must be
the same as, or second only to, the supplier’s service to its own ultimate consumers.
LF - for long-term firm service. "Long-term" means five years or longer and "firm" means that service cannot be interrupted for
economic reasons and is intended to remain reliable even under adverse conditions (e.g., the supplier must attempt to buy emergency
energy from third parties to maintain deliveries of LF service). This category should not be used for long-term firm service firm service
which meets the definition of RQ service. For all transaction identified as LF, provide in a footnote the termination date of the contract
defined as the earliest date that either buyer or seller can unilaterally get out of the contract.
IF - for intermediate-term firm service. The same as LF service expect that "intermediate-term" means longer than one year but less
than five years.
SF - for short-term service. Use this category for all firm services, where the duration of each period of commitment for service is one
year or less.
LU - for long-term service from a designated generating unit. "Long-term" means five years or longer. The availability and reliability of
service, aside from transmission constraints, must match the availability and reliability of the designated unit.
IU - for intermediate-term service from a designated generating unit. The same as LU service expect that "intermediate-term" means
longer than one year but less than five years.
EX - For exchanges of electricity. Use this category for transactions involving a balancing of debits and credits for energy, capacity, etc.
and any settlements for imbalanced exchanges.
OS - for other service. Use this category only for those services which cannot be placed in the above-defined categories, such as all
non-firm service regardless of the Length of the contract and service from designated units of Less than one year. Describe the nature
of the service in a footnote for each adjustment.
0.000000.00000ABEC #3 LLC 1
0.000000.00000ABEC #4 LLC 2
0.000000.00000ABEC 2 3
0.000000.00000ABEC 3 4
0.000000.00000ABEC 4 5
0.000000.00000ABEC BIDART OLD RIVER 6
0.000000.00000ABEC BIDART STOCKDALE 7
0.000000.00000ABEC BIDART-STOCKDALE LLC 8
0.000000.00000AGUA CALIENTE SOLAR 9
0.000000.00000AGUA CALIENTE SOLAR, LLC 10
0.000000.00000ALAMO SOLAR 11
0.000000.00000ALAMO SOLAR RAM 2 12
0.000000.00000ALGONQUIN SANGER - BU 13
0.000000.00000ALGONQUIN SKIC 20 SOLAR 14
FERC FORM NO. 1 (ED. 12-90) Page 326.7
Total

Name of Respondent This Report Is:(1) An Original
(2) A Resubmission
Date of Report(Mo, Da, Yr)
Year/Period of Report
End of
PURCHASED POWER (Account 555)
PACIFIC GAS AND ELECTRIC COMPANYX
04/13/20212020/Q4
Line
No.
Name of Company or Public Authority
(c)(b)(a)
FERC RateMonthly Billing
Average
(d)
Statistical
cationClassifi- Schedule or
Tariff Number Demand (MW)
(e) (f)
(Footnote Affiliations)
Actual Demand (MW)
Average AverageMonthly NCP Demand Monthly CP Demand
(Including power exchanges)
1. Report all power purchases made during the year. Also report exchanges of electricity (i.e., transactions involving a balancing of
debits and credits for energy, capacity, etc.) and any settlements for imbalanced exchanges.
2. Enter the name of the seller or other party in an exchange transaction in column (a). Do not abbreviate or truncate the name or use
acronyms. Explain in a footnote any ownership interest or affiliation the respondent has with the seller.
3. In column (b), enter a Statistical Classification Code based on the original contractual terms and conditions of the service as follows:
RQ - for requirements service. Requirements service is service which the supplier plans to provide on an ongoing basis (i.e., the
supplier includes projects load for this service in its system resource planning). In addition, the reliability of requirement service must be
the same as, or second only to, the supplier’s service to its own ultimate consumers.
LF - for long-term firm service. "Long-term" means five years or longer and "firm" means that service cannot be interrupted for
economic reasons and is intended to remain reliable even under adverse conditions (e.g., the supplier must attempt to buy emergency
energy from third parties to maintain deliveries of LF service). This category should not be used for long-term firm service firm service
which meets the definition of RQ service. For all transaction identified as LF, provide in a footnote the termination date of the contract
defined as the earliest date that either buyer or seller can unilaterally get out of the contract.
IF - for intermediate-term firm service. The same as LF service expect that "intermediate-term" means longer than one year but less
than five years.
SF - for short-term service. Use this category for all firm services, where the duration of each period of commitment for service is one
year or less.
LU - for long-term service from a designated generating unit. "Long-term" means five years or longer. The availability and reliability of
service, aside from transmission constraints, must match the availability and reliability of the designated unit.
IU - for intermediate-term service from a designated generating unit. The same as LU service expect that "intermediate-term" means
longer than one year but less than five years.
EX - For exchanges of electricity. Use this category for transactions involving a balancing of debits and credits for energy, capacity, etc.
and any settlements for imbalanced exchanges.
OS - for other service. Use this category only for those services which cannot be placed in the above-defined categories, such as all
non-firm service regardless of the Length of the contract and service from designated units of Less than one year. Describe the nature
of the service in a footnote for each adjustment.
0.000000.00000ALPAUGH 50 LLC 1
0.000000.00000ALPAUGH NORTH LLC 2
0.000000.00000ANGELS POWERHOUSE 3
0.000000.00000ANGELS POWERHOUSE (UTICA) 4
0.000000.00000Annual True-up GTSRBA 5
0.000000.00000APEX 646-460 6
0.000000.00000ARBUCKLE MOUNTAIN HYDRO 7
0.000000.00000ARLINGTON WIND POWER PROJECT 8
0.000000.00000ARLINGTON WIND RATTLESNAKE ROAD 9
0.000000.00000ASPIRATION SOLAR G 10
0.000000.00000ATWELL ISLAND 11
0.000000.00000AV SOLAR RANCH ONE 12
0.000000.00000Avangrid Renewables, LLC - Energy and 13
0.000000.00000AVENAL SOLAR PROJECT A 14
FERC FORM NO. 1 (ED. 12-90) Page 326.8
Total

Name of Respondent This Report Is:(1) An Original
(2) A Resubmission
Date of Report(Mo, Da, Yr)
Year/Period of Report
End of
PURCHASED POWER (Account 555)
PACIFIC GAS AND ELECTRIC COMPANYX
04/13/20212020/Q4
Line
No.
Name of Company or Public Authority
(c)(b)(a)
FERC RateMonthly Billing
Average
(d)
Statistical
cationClassifi- Schedule or
Tariff Number Demand (MW)
(e) (f)
(Footnote Affiliations)
Actual Demand (MW)
Average AverageMonthly NCP Demand Monthly CP Demand
(Including power exchanges)
1. Report all power purchases made during the year. Also report exchanges of electricity (i.e., transactions involving a balancing of
debits and credits for energy, capacity, etc.) and any settlements for imbalanced exchanges.
2. Enter the name of the seller or other party in an exchange transaction in column (a). Do not abbreviate or truncate the name or use
acronyms. Explain in a footnote any ownership interest or affiliation the respondent has with the seller.
3. In column (b), enter a Statistical Classification Code based on the original contractual terms and conditions of the service as follows:
RQ - for requirements service. Requirements service is service which the supplier plans to provide on an ongoing basis (i.e., the
supplier includes projects load for this service in its system resource planning). In addition, the reliability of requirement service must be
the same as, or second only to, the supplier’s service to its own ultimate consumers.
LF - for long-term firm service. "Long-term" means five years or longer and "firm" means that service cannot be interrupted for
economic reasons and is intended to remain reliable even under adverse conditions (e.g., the supplier must attempt to buy emergency
energy from third parties to maintain deliveries of LF service). This category should not be used for long-term firm service firm service
which meets the definition of RQ service. For all transaction identified as LF, provide in a footnote the termination date of the contract
defined as the earliest date that either buyer or seller can unilaterally get out of the contract.
IF - for intermediate-term firm service. The same as LF service expect that "intermediate-term" means longer than one year but less
than five years.
SF - for short-term service. Use this category for all firm services, where the duration of each period of commitment for service is one
year or less.
LU - for long-term service from a designated generating unit. "Long-term" means five years or longer. The availability and reliability of
service, aside from transmission constraints, must match the availability and reliability of the designated unit.
IU - for intermediate-term service from a designated generating unit. The same as LU service expect that "intermediate-term" means
longer than one year but less than five years.
EX - For exchanges of electricity. Use this category for transactions involving a balancing of debits and credits for energy, capacity, etc.
and any settlements for imbalanced exchanges.
OS - for other service. Use this category only for those services which cannot be placed in the above-defined categories, such as all
non-firm service regardless of the Length of the contract and service from designated units of Less than one year. Describe the nature
of the service in a footnote for each adjustment.
0.000000.00000AVENAL SOLAR PROJECT B 1
0.000000.00000BADGER CREEK LIMITED 2
0.000000.00000BADGER CREEK LIMITED CHP RFO-2 3
0.000000.00000BAKER CREEK HYDROELECTRIC 4
0.000000.00000BAKERSFIELD 111 LLC 5
0.000000.00000BAKERSFIELD INDUSTRIAL 1 6
0.000000.00000BAKERSFIELD PV 1 7
0.000000.00000BAYSHORE SOLAR A 8
0.000000.00000BAYSHORE SOLAR B 9
0.000000.00000BAYSHORE SOLAR C 10
0.000000.00000BEAR CREEK SOLAR LLC 11
0.000000.00000BEAR MOUNTAIN LIMITED 12
0.000000.00000BEAR MOUNTAIN LIMITED (2013 CHP 13
0.000000.00000BIG CREEK WATER WORKS 14
FERC FORM NO. 1 (ED. 12-90) Page 326.9
Total

Name of Respondent This Report Is:(1) An Original
(2) A Resubmission
Date of Report(Mo, Da, Yr)
Year/Period of Report
End of
PURCHASED POWER (Account 555)
PACIFIC GAS AND ELECTRIC COMPANYX
04/13/20212020/Q4
Line
No.
Name of Company or Public Authority
(c)(b)(a)
FERC RateMonthly Billing
Average
(d)
Statistical
cationClassifi- Schedule or
Tariff Number Demand (MW)
(e) (f)
(Footnote Affiliations)
Actual Demand (MW)
Average AverageMonthly NCP Demand Monthly CP Demand
(Including power exchanges)
1. Report all power purchases made during the year. Also report exchanges of electricity (i.e., transactions involving a balancing of
debits and credits for energy, capacity, etc.) and any settlements for imbalanced exchanges.
2. Enter the name of the seller or other party in an exchange transaction in column (a). Do not abbreviate or truncate the name or use
acronyms. Explain in a footnote any ownership interest or affiliation the respondent has with the seller.
3. In column (b), enter a Statistical Classification Code based on the original contractual terms and conditions of the service as follows:
RQ - for requirements service. Requirements service is service which the supplier plans to provide on an ongoing basis (i.e., the
supplier includes projects load for this service in its system resource planning). In addition, the reliability of requirement service must be
the same as, or second only to, the supplier’s service to its own ultimate consumers.
LF - for long-term firm service. "Long-term" means five years or longer and "firm" means that service cannot be interrupted for
economic reasons and is intended to remain reliable even under adverse conditions (e.g., the supplier must attempt to buy emergency
energy from third parties to maintain deliveries of LF service). This category should not be used for long-term firm service firm service
which meets the definition of RQ service. For all transaction identified as LF, provide in a footnote the termination date of the contract
defined as the earliest date that either buyer or seller can unilaterally get out of the contract.
IF - for intermediate-term firm service. The same as LF service expect that "intermediate-term" means longer than one year but less
than five years.
SF - for short-term service. Use this category for all firm services, where the duration of each period of commitment for service is one
year or less.
LU - for long-term service from a designated generating unit. "Long-term" means five years or longer. The availability and reliability of
service, aside from transmission constraints, must match the availability and reliability of the designated unit.
IU - for intermediate-term service from a designated generating unit. The same as LU service expect that "intermediate-term" means
longer than one year but less than five years.
EX - For exchanges of electricity. Use this category for transactions involving a balancing of debits and credits for energy, capacity, etc.
and any settlements for imbalanced exchanges.
OS - for other service. Use this category only for those services which cannot be placed in the above-defined categories, such as all
non-firm service regardless of the Length of the contract and service from designated units of Less than one year. Describe the nature
of the service in a footnote for each adjustment.
0.000000.00000BLACKSPRING RIDGE 1A 1
0.000000.00000BLACKSPRING RIDGE 1B 2
0.000000.00000BLACKWELL SOLAR 3
0.000000.00000BLAKE'S LANDING FARMS INC 4
0.000000.00000BNPP_FCM_BU 5
0.000000.00000BP ENERGY CO. - BU 6
0.000000.00000BROWNS VALLEY IRRIGATION DIST 7
0.000000.00000BUCKEYE HYDROELECTRIC PROJECT 8
0.000000.00000Burney Forest - BIOMASS 9
0.000000.00000CALAVERAS PUBLIC UTILI. DIST. 1 10
0.000000.00000CALAVERAS PUBLIC UTILI. DIST. 2 11
0.000000.00000CALAVERAS PUBLIC UTILI. DIST. 3 12
0.000000.00000CALIFORNIA FLATS SOLAR 150 13
0.000000.00000California Flats Solar Project 14
FERC FORM NO. 1 (ED. 12-90) Page 326.10
Total

Name of Respondent This Report Is:(1) An Original
(2) A Resubmission
Date of Report(Mo, Da, Yr)
Year/Period of Report
End of
PURCHASED POWER (Account 555)
PACIFIC GAS AND ELECTRIC COMPANYX
04/13/20212020/Q4
Line
No.
Name of Company or Public Authority
(c)(b)(a)
FERC RateMonthly Billing
Average
(d)
Statistical
cationClassifi- Schedule or
Tariff Number Demand (MW)
(e) (f)
(Footnote Affiliations)
Actual Demand (MW)
Average AverageMonthly NCP Demand Monthly CP Demand
(Including power exchanges)
1. Report all power purchases made during the year. Also report exchanges of electricity (i.e., transactions involving a balancing of
debits and credits for energy, capacity, etc.) and any settlements for imbalanced exchanges.
2. Enter the name of the seller or other party in an exchange transaction in column (a). Do not abbreviate or truncate the name or use
acronyms. Explain in a footnote any ownership interest or affiliation the respondent has with the seller.
3. In column (b), enter a Statistical Classification Code based on the original contractual terms and conditions of the service as follows:
RQ - for requirements service. Requirements service is service which the supplier plans to provide on an ongoing basis (i.e., the
supplier includes projects load for this service in its system resource planning). In addition, the reliability of requirement service must be
the same as, or second only to, the supplier’s service to its own ultimate consumers.
LF - for long-term firm service. "Long-term" means five years or longer and "firm" means that service cannot be interrupted for
economic reasons and is intended to remain reliable even under adverse conditions (e.g., the supplier must attempt to buy emergency
energy from third parties to maintain deliveries of LF service). This category should not be used for long-term firm service firm service
which meets the definition of RQ service. For all transaction identified as LF, provide in a footnote the termination date of the contract
defined as the earliest date that either buyer or seller can unilaterally get out of the contract.
IF - for intermediate-term firm service. The same as LF service expect that "intermediate-term" means longer than one year but less
than five years.
SF - for short-term service. Use this category for all firm services, where the duration of each period of commitment for service is one
year or less.
LU - for long-term service from a designated generating unit. "Long-term" means five years or longer. The availability and reliability of
service, aside from transmission constraints, must match the availability and reliability of the designated unit.
IU - for intermediate-term service from a designated generating unit. The same as LU service expect that "intermediate-term" means
longer than one year but less than five years.
EX - For exchanges of electricity. Use this category for transactions involving a balancing of debits and credits for energy, capacity, etc.
and any settlements for imbalanced exchanges.
OS - for other service. Use this category only for those services which cannot be placed in the above-defined categories, such as all
non-firm service regardless of the Length of the contract and service from designated units of Less than one year. Describe the nature
of the service in a footnote for each adjustment.
0.000000.00000CALPINE ENERGY - AGNEWS, INC 1
0.000000.00000CALPINE ENERGY SERVICES REC 2019 2
0.000000.00000Calpine Energy Services, LP 3
0.000000.00000CALPINE GEYSERS (200/425 MW) 4
0.000000.00000CALPINE LOS ESTEROS 5
0.000000.00000CALPINE PEAKERS 6
0.000000.00000CALPINE RETAINED ASSET 7
0.000000.00000CALPINE RUSSELL CITY 8
0.000000.00000CALRENEW CLEANTECH 9
0.000000.00000CALRENEW-1 LLC 10
0.000000.00000CAMS DOUBLE C LIMITED 11
0.000000.00000CAMS HIGH SIERRA LIMITED 12
0.000000.00000CAMS KERN FRONT LIMITED 13
0.000000.00000CAMS-DOUBLE C LIMITED 14
FERC FORM NO. 1 (ED. 12-90) Page 326.11
Total

Name of Respondent This Report Is:(1) An Original
(2) A Resubmission
Date of Report(Mo, Da, Yr)
Year/Period of Report
End of
PURCHASED POWER (Account 555)
PACIFIC GAS AND ELECTRIC COMPANYX
04/13/20212020/Q4
Line
No.
Name of Company or Public Authority
(c)(b)(a)
FERC RateMonthly Billing
Average
(d)
Statistical
cationClassifi- Schedule or
Tariff Number Demand (MW)
(e) (f)
(Footnote Affiliations)
Actual Demand (MW)
Average AverageMonthly NCP Demand Monthly CP Demand
(Including power exchanges)
1. Report all power purchases made during the year. Also report exchanges of electricity (i.e., transactions involving a balancing of
debits and credits for energy, capacity, etc.) and any settlements for imbalanced exchanges.
2. Enter the name of the seller or other party in an exchange transaction in column (a). Do not abbreviate or truncate the name or use
acronyms. Explain in a footnote any ownership interest or affiliation the respondent has with the seller.
3. In column (b), enter a Statistical Classification Code based on the original contractual terms and conditions of the service as follows:
RQ - for requirements service. Requirements service is service which the supplier plans to provide on an ongoing basis (i.e., the
supplier includes projects load for this service in its system resource planning). In addition, the reliability of requirement service must be
the same as, or second only to, the supplier’s service to its own ultimate consumers.
LF - for long-term firm service. "Long-term" means five years or longer and "firm" means that service cannot be interrupted for
economic reasons and is intended to remain reliable even under adverse conditions (e.g., the supplier must attempt to buy emergency
energy from third parties to maintain deliveries of LF service). This category should not be used for long-term firm service firm service
which meets the definition of RQ service. For all transaction identified as LF, provide in a footnote the termination date of the contract
defined as the earliest date that either buyer or seller can unilaterally get out of the contract.
IF - for intermediate-term firm service. The same as LF service expect that "intermediate-term" means longer than one year but less
than five years.
SF - for short-term service. Use this category for all firm services, where the duration of each period of commitment for service is one
year or less.
LU - for long-term service from a designated generating unit. "Long-term" means five years or longer. The availability and reliability of
service, aside from transmission constraints, must match the availability and reliability of the designated unit.
IU - for intermediate-term service from a designated generating unit. The same as LU service expect that "intermediate-term" means
longer than one year but less than five years.
EX - For exchanges of electricity. Use this category for transactions involving a balancing of debits and credits for energy, capacity, etc.
and any settlements for imbalanced exchanges.
OS - for other service. Use this category only for those services which cannot be placed in the above-defined categories, such as all
non-firm service regardless of the Length of the contract and service from designated units of Less than one year. Describe the nature
of the service in a footnote for each adjustment.
0.000000.00000CAMS-HIGH SIERRA LIMITED 1
0.000000.00000CAMS-KERN FRONT LIMITED 2
0.000000.00000CASTOR SOLAR PROJECT 3
0.000000.00000CCCE - BU 4
0.000000.00000CED CORCORAN SOLAR 3 LLC 5
0.000000.00000CED WHITE RIVER SOLAR 2, LLC 6
0.000000.00000CED WHITE RIVER SOLAR, LLC 7
0.000000.00000CEDAR FLAT 8
0.000000.00000CEDAR FLAT (Hudson Power) 9
0.000000.00000CENTRAL COAST COMMUNITY ENERGY 10
0.000000.00000CHALK CLIFF LIMITED 11
0.000000.00000CHEVRON NATURAL - BU 12
0.000000.00000CHOICE NATURAL GAS - BU 13
0.000000.00000CID SOLAR LLC RAM 2 14
FERC FORM NO. 1 (ED. 12-90) Page 326.12
Total

Name of Respondent This Report Is:(1) An Original
(2) A Resubmission
Date of Report(Mo, Da, Yr)
Year/Period of Report
End of
PURCHASED POWER (Account 555)
PACIFIC GAS AND ELECTRIC COMPANYX
04/13/20212020/Q4
Line
No.
Name of Company or Public Authority
(c)(b)(a)
FERC RateMonthly Billing
Average
(d)
Statistical
cationClassifi- Schedule or
Tariff Number Demand (MW)
(e) (f)
(Footnote Affiliations)
Actual Demand (MW)
Average AverageMonthly NCP Demand Monthly CP Demand
(Including power exchanges)
1. Report all power purchases made during the year. Also report exchanges of electricity (i.e., transactions involving a balancing of
debits and credits for energy, capacity, etc.) and any settlements for imbalanced exchanges.
2. Enter the name of the seller or other party in an exchange transaction in column (a). Do not abbreviate or truncate the name or use
acronyms. Explain in a footnote any ownership interest or affiliation the respondent has with the seller.
3. In column (b), enter a Statistical Classification Code based on the original contractual terms and conditions of the service as follows:
RQ - for requirements service. Requirements service is service which the supplier plans to provide on an ongoing basis (i.e., the
supplier includes projects load for this service in its system resource planning). In addition, the reliability of requirement service must be
the same as, or second only to, the supplier’s service to its own ultimate consumers.
LF - for long-term firm service. "Long-term" means five years or longer and "firm" means that service cannot be interrupted for
economic reasons and is intended to remain reliable even under adverse conditions (e.g., the supplier must attempt to buy emergency
energy from third parties to maintain deliveries of LF service). This category should not be used for long-term firm service firm service
which meets the definition of RQ service. For all transaction identified as LF, provide in a footnote the termination date of the contract
defined as the earliest date that either buyer or seller can unilaterally get out of the contract.
IF - for intermediate-term firm service. The same as LF service expect that "intermediate-term" means longer than one year but less
than five years.
SF - for short-term service. Use this category for all firm services, where the duration of each period of commitment for service is one
year or less.
LU - for long-term service from a designated generating unit. "Long-term" means five years or longer. The availability and reliability of
service, aside from transmission constraints, must match the availability and reliability of the designated unit.
IU - for intermediate-term service from a designated generating unit. The same as LU service expect that "intermediate-term" means
longer than one year but less than five years.
EX - For exchanges of electricity. Use this category for transactions involving a balancing of debits and credits for energy, capacity, etc.
and any settlements for imbalanced exchanges.
OS - for other service. Use this category only for those services which cannot be placed in the above-defined categories, such as all
non-firm service regardless of the Length of the contract and service from designated units of Less than one year. Describe the nature
of the service in a footnote for each adjustment.
0.000000.00000CID SOLAR, LLC 1
0.000000.00000CITADEL ENERGY MARKETING LL - BU 2
0.000000.00000CITY OF SAN JOSE 3
0.000000.00000City of San Jos‚ 4
0.000000.00000CLEAN PWR ALLIANCE 5
0.000000.00000CLEANPOWERSF 6
0.000000.00000CLOVER FLAT LFG 7
0.000000.00000CLOVERDALE SOLAR 1 LLC 8
0.000000.00000COLUMBIA SOLAR ENERGY LLC 9
0.000000.00000COMMERCIAL ENERGY OF MT - BU 10
0.000000.00000CONOCOPHILLIPS CO. - BU 11
0.000000.00000COPPER MOUNTAIN 10 12
0.000000.00000COPPER MOUNTAIN 2 SEMPRA 13
0.000000.00000COPPER MOUNTAIN SOLAR 48 14
FERC FORM NO. 1 (ED. 12-90) Page 326.13
Total

Name of Respondent This Report Is:(1) An Original
(2) A Resubmission
Date of Report(Mo, Da, Yr)
Year/Period of Report
End of
PURCHASED POWER (Account 555)
PACIFIC GAS AND ELECTRIC COMPANYX
04/13/20212020/Q4
Line
No.
Name of Company or Public Authority
(c)(b)(a)
FERC RateMonthly Billing
Average
(d)
Statistical
cationClassifi- Schedule or
Tariff Number Demand (MW)
(e) (f)
(Footnote Affiliations)
Actual Demand (MW)
Average AverageMonthly NCP Demand Monthly CP Demand
(Including power exchanges)
1. Report all power purchases made during the year. Also report exchanges of electricity (i.e., transactions involving a balancing of
debits and credits for energy, capacity, etc.) and any settlements for imbalanced exchanges.
2. Enter the name of the seller or other party in an exchange transaction in column (a). Do not abbreviate or truncate the name or use
acronyms. Explain in a footnote any ownership interest or affiliation the respondent has with the seller.
3. In column (b), enter a Statistical Classification Code based on the original contractual terms and conditions of the service as follows:
RQ - for requirements service. Requirements service is service which the supplier plans to provide on an ongoing basis (i.e., the
supplier includes projects load for this service in its system resource planning). In addition, the reliability of requirement service must be
the same as, or second only to, the supplier’s service to its own ultimate consumers.
LF - for long-term firm service. "Long-term" means five years or longer and "firm" means that service cannot be interrupted for
economic reasons and is intended to remain reliable even under adverse conditions (e.g., the supplier must attempt to buy emergency
energy from third parties to maintain deliveries of LF service). This category should not be used for long-term firm service firm service
which meets the definition of RQ service. For all transaction identified as LF, provide in a footnote the termination date of the contract
defined as the earliest date that either buyer or seller can unilaterally get out of the contract.
IF - for intermediate-term firm service. The same as LF service expect that "intermediate-term" means longer than one year but less
than five years.
SF - for short-term service. Use this category for all firm services, where the duration of each period of commitment for service is one
year or less.
LU - for long-term service from a designated generating unit. "Long-term" means five years or longer. The availability and reliability of
service, aside from transmission constraints, must match the availability and reliability of the designated unit.
IU - for intermediate-term service from a designated generating unit. The same as LU service expect that "intermediate-term" means
longer than one year but less than five years.
EX - For exchanges of electricity. Use this category for transactions involving a balancing of debits and credits for energy, capacity, etc.
and any settlements for imbalanced exchanges.
OS - for other service. Use this category only for those services which cannot be placed in the above-defined categories, such as all
non-firm service regardless of the Length of the contract and service from designated units of Less than one year. Describe the nature
of the service in a footnote for each adjustment.
0.000000.00000CORAM BRODIE WIND 1
0.000000.00000CORCORAN SOLAR 2
0.000000.00000CRC MARKETING, INC. - BU 3
0.000000.00000CUYAMA SOLAR 4
0.000000.00000Delano Land 1 5
0.000000.00000DELANO PV 1 LLC 6
0.000000.00000DESERT CENTER SOLAR FARM 7
0.000000.00000DIGGER CREEK HYDRO 8
0.000000.00000Direct Energy 9
0.000000.00000DIRECT ENERGY - BU 10
0.000000.00000DTE POTRERO HILL ENERGY PRODCERS 11
0.000000.00000DTE STOCKTON 12
0.000000.00000DTE SUNSHINE GAS LANDFILL 13
0.000000.00000DTE WOODLAND BIOMASS 14
FERC FORM NO. 1 (ED. 12-90) Page 326.14
Total
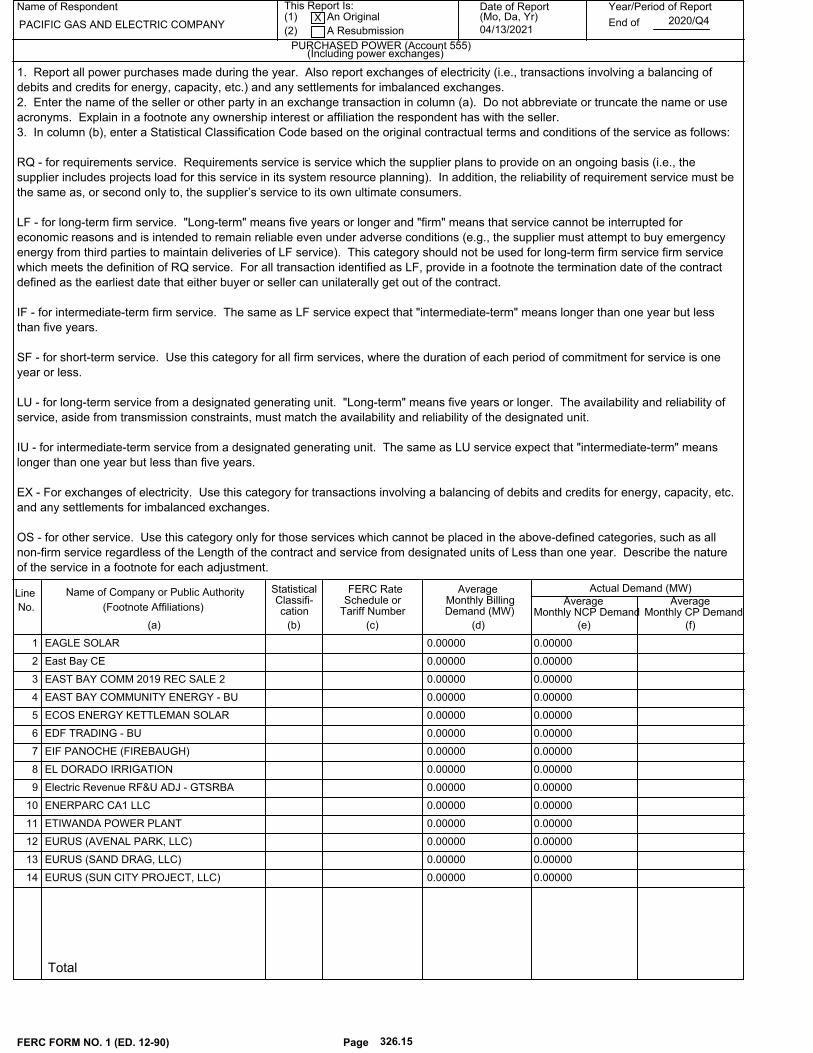
Name of Respondent This Report Is:(1) An Original
(2) A Resubmission
Date of Report(Mo, Da, Yr)
Year/Period of Report
End of
PURCHASED POWER (Account 555)
PACIFIC GAS AND ELECTRIC COMPANYX
04/13/20212020/Q4
Line
No.
Name of Company or Public Authority
(c)(b)(a)
FERC RateMonthly Billing
Average
(d)
Statistical
cationClassifi- Schedule or
Tariff Number Demand (MW)
(e) (f)
(Footnote Affiliations)
Actual Demand (MW)
Average AverageMonthly NCP Demand Monthly CP Demand
(Including power exchanges)
1. Report all power purchases made during the year. Also report exchanges of electricity (i.e., transactions involving a balancing of
debits and credits for energy, capacity, etc.) and any settlements for imbalanced exchanges.
2. Enter the name of the seller or other party in an exchange transaction in column (a). Do not abbreviate or truncate the name or use
acronyms. Explain in a footnote any ownership interest or affiliation the respondent has with the seller.
3. In column (b), enter a Statistical Classification Code based on the original contractual terms and conditions of the service as follows:
RQ - for requirements service. Requirements service is service which the supplier plans to provide on an ongoing basis (i.e., the
supplier includes projects load for this service in its system resource planning). In addition, the reliability of requirement service must be
the same as, or second only to, the supplier’s service to its own ultimate consumers.
LF - for long-term firm service. "Long-term" means five years or longer and "firm" means that service cannot be interrupted for
economic reasons and is intended to remain reliable even under adverse conditions (e.g., the supplier must attempt to buy emergency
energy from third parties to maintain deliveries of LF service). This category should not be used for long-term firm service firm service
which meets the definition of RQ service. For all transaction identified as LF, provide in a footnote the termination date of the contract
defined as the earliest date that either buyer or seller can unilaterally get out of the contract.
IF - for intermediate-term firm service. The same as LF service expect that "intermediate-term" means longer than one year but less
than five years.
SF - for short-term service. Use this category for all firm services, where the duration of each period of commitment for service is one
year or less.
LU - for long-term service from a designated generating unit. "Long-term" means five years or longer. The availability and reliability of
service, aside from transmission constraints, must match the availability and reliability of the designated unit.
IU - for intermediate-term service from a designated generating unit. The same as LU service expect that "intermediate-term" means
longer than one year but less than five years.
EX - For exchanges of electricity. Use this category for transactions involving a balancing of debits and credits for energy, capacity, etc.
and any settlements for imbalanced exchanges.
OS - for other service. Use this category only for those services which cannot be placed in the above-defined categories, such as all
non-firm service regardless of the Length of the contract and service from designated units of Less than one year. Describe the nature
of the service in a footnote for each adjustment.
0.000000.00000EAGLE SOLAR 1
0.000000.00000East Bay CE 2
0.000000.00000EAST BAY COMM 2019 REC SALE 2 3
0.000000.00000EAST BAY COMMUNITY ENERGY - BU 4
0.000000.00000ECOS ENERGY KETTLEMAN SOLAR 5
0.000000.00000EDF TRADING - BU 6
0.000000.00000EIF PANOCHE (FIREBAUGH) 7
0.000000.00000EL DORADO IRRIGATION 8
0.000000.00000Electric Revenue RF&U ADJ - GTSRBA 9
0.000000.00000ENERPARC CA1 LLC 10
0.000000.00000ETIWANDA POWER PLANT 11
0.000000.00000EURUS (AVENAL PARK, LLC) 12
0.000000.00000EURUS (SAND DRAG, LLC) 13
0.000000.00000EURUS (SUN CITY PROJECT, LLC) 14
FERC FORM NO. 1 (ED. 12-90) Page 326.15
Total

Name of Respondent This Report Is:(1) An Original
(2) A Resubmission
Date of Report(Mo, Da, Yr)
Year/Period of Report
End of
PURCHASED POWER (Account 555)
PACIFIC GAS AND ELECTRIC COMPANYX
04/13/20212020/Q4
Line
No.
Name of Company or Public Authority
(c)(b)(a)
FERC RateMonthly Billing
Average
(d)
Statistical
cationClassifi- Schedule or
Tariff Number Demand (MW)
(e) (f)
(Footnote Affiliations)
Actual Demand (MW)
Average AverageMonthly NCP Demand Monthly CP Demand
(Including power exchanges)
1. Report all power purchases made during the year. Also report exchanges of electricity (i.e., transactions involving a balancing of
debits and credits for energy, capacity, etc.) and any settlements for imbalanced exchanges.
2. Enter the name of the seller or other party in an exchange transaction in column (a). Do not abbreviate or truncate the name or use
acronyms. Explain in a footnote any ownership interest or affiliation the respondent has with the seller.
3. In column (b), enter a Statistical Classification Code based on the original contractual terms and conditions of the service as follows:
RQ - for requirements service. Requirements service is service which the supplier plans to provide on an ongoing basis (i.e., the
supplier includes projects load for this service in its system resource planning). In addition, the reliability of requirement service must be
the same as, or second only to, the supplier’s service to its own ultimate consumers.
LF - for long-term firm service. "Long-term" means five years or longer and "firm" means that service cannot be interrupted for
economic reasons and is intended to remain reliable even under adverse conditions (e.g., the supplier must attempt to buy emergency
energy from third parties to maintain deliveries of LF service). This category should not be used for long-term firm service firm service
which meets the definition of RQ service. For all transaction identified as LF, provide in a footnote the termination date of the contract
defined as the earliest date that either buyer or seller can unilaterally get out of the contract.
IF - for intermediate-term firm service. The same as LF service expect that "intermediate-term" means longer than one year but less
than five years.
SF - for short-term service. Use this category for all firm services, where the duration of each period of commitment for service is one
year or less.
LU - for long-term service from a designated generating unit. "Long-term" means five years or longer. The availability and reliability of
service, aside from transmission constraints, must match the availability and reliability of the designated unit.
IU - for intermediate-term service from a designated generating unit. The same as LU service expect that "intermediate-term" means
longer than one year but less than five years.
EX - For exchanges of electricity. Use this category for transactions involving a balancing of debits and credits for energy, capacity, etc.
and any settlements for imbalanced exchanges.
OS - for other service. Use this category only for those services which cannot be placed in the above-defined categories, such as all
non-firm service regardless of the Length of the contract and service from designated units of Less than one year. Describe the nature
of the service in a footnote for each adjustment.
0.000000.00000EURUS AVENAL PARK LLC 1
0.000000.00000EURUS SAND DRAG LLC 2
0.000000.00000EURUS SUN CITY LLC 3
0.000000.00000EVOL MKTS FTS LLC - FIN BRK -BU 4
0.000000.00000EVOLUTION MARKETS INC. - BU 5
0.000000.00000Exelon 6
0.000000.00000FALL RIVER MILLS A ACHOMAWI 7
0.000000.00000FALL RIVER MILLS B AHJUMAWI 8
0.000000.00000FRESH AIR ENERGY IV SONORA 1 9
0.000000.00000FRESNO SOLAR SOUTH 10
0.000000.00000FRESNO SOLAR WEST 11
0.000000.00000GAS TRANSPORT ASSOC WITH PANOCHE 12
0.000000.00000GAS TRANSPORT ASSOC. WITH MARSH 13
0.000000.00000GENESIS SOLAR, LLC 14
FERC FORM NO. 1 (ED. 12-90) Page 326.16
Total

Name of Respondent This Report Is:(1) An Original
(2) A Resubmission
Date of Report(Mo, Da, Yr)
Year/Period of Report
End of
PURCHASED POWER (Account 555)
PACIFIC GAS AND ELECTRIC COMPANYX
04/13/20212020/Q4
Line
No.
Name of Company or Public Authority
(c)(b)(a)
FERC RateMonthly Billing
Average
(d)
Statistical
cationClassifi- Schedule or
Tariff Number Demand (MW)
(e) (f)
(Footnote Affiliations)
Actual Demand (MW)
Average AverageMonthly NCP Demand Monthly CP Demand
(Including power exchanges)
1. Report all power purchases made during the year. Also report exchanges of electricity (i.e., transactions involving a balancing of
debits and credits for energy, capacity, etc.) and any settlements for imbalanced exchanges.
2. Enter the name of the seller or other party in an exchange transaction in column (a). Do not abbreviate or truncate the name or use
acronyms. Explain in a footnote any ownership interest or affiliation the respondent has with the seller.
3. In column (b), enter a Statistical Classification Code based on the original contractual terms and conditions of the service as follows:
RQ - for requirements service. Requirements service is service which the supplier plans to provide on an ongoing basis (i.e., the
supplier includes projects load for this service in its system resource planning). In addition, the reliability of requirement service must be
the same as, or second only to, the supplier’s service to its own ultimate consumers.
LF - for long-term firm service. "Long-term" means five years or longer and "firm" means that service cannot be interrupted for
economic reasons and is intended to remain reliable even under adverse conditions (e.g., the supplier must attempt to buy emergency
energy from third parties to maintain deliveries of LF service). This category should not be used for long-term firm service firm service
which meets the definition of RQ service. For all transaction identified as LF, provide in a footnote the termination date of the contract
defined as the earliest date that either buyer or seller can unilaterally get out of the contract.
IF - for intermediate-term firm service. The same as LF service expect that "intermediate-term" means longer than one year but less
than five years.
SF - for short-term service. Use this category for all firm services, where the duration of each period of commitment for service is one
year or less.
LU - for long-term service from a designated generating unit. "Long-term" means five years or longer. The availability and reliability of
service, aside from transmission constraints, must match the availability and reliability of the designated unit.
IU - for intermediate-term service from a designated generating unit. The same as LU service expect that "intermediate-term" means
longer than one year but less than five years.
EX - For exchanges of electricity. Use this category for transactions involving a balancing of debits and credits for energy, capacity, etc.
and any settlements for imbalanced exchanges.
OS - for other service. Use this category only for those services which cannot be placed in the above-defined categories, such as all
non-firm service regardless of the Length of the contract and service from designated units of Less than one year. Describe the nature
of the service in a footnote for each adjustment.
0.000000.00000GEYSERS 50/250/425 MW 1
0.000000.00000GLOBAL AMPERSAND CHOWCHILLA 2
0.000000.00000GLOBAL AMPERSAND EL NIDO 3
0.000000.00000GOOSE VALLEY FARMING 4
0.000000.00000GRASSHOPPER FLAT 5
0.000000.00000GRASSHOPPER FLAT (EMMERSON) - 6
0.000000.00000GREEN LIGHT ENERGY SIRUIS SOLAR 7
0.000000.00000GREEN LIGHT MADERA 1 8
0.000000.00000GWF HANFORD 9
0.000000.00000GWF HENRIETTA 10
0.000000.00000GWF TRACY 11
0.000000.00000HALKIRK I WIND PROJECT 12
0.000000.00000HATCHET RIDGE WIND LLC 13
0.000000.00000HENRIETTA SOLAR 14
FERC FORM NO. 1 (ED. 12-90) Page 326.17
Total

Name of Respondent This Report Is:(1) An Original
(2) A Resubmission
Date of Report(Mo, Da, Yr)
Year/Period of Report
End of
PURCHASED POWER (Account 555)
PACIFIC GAS AND ELECTRIC COMPANYX
04/13/20212020/Q4
Line
No.
Name of Company or Public Authority
(c)(b)(a)
FERC RateMonthly Billing
Average
(d)
Statistical
cationClassifi- Schedule or
Tariff Number Demand (MW)
(e) (f)
(Footnote Affiliations)
Actual Demand (MW)
Average AverageMonthly NCP Demand Monthly CP Demand
(Including power exchanges)
1. Report all power purchases made during the year. Also report exchanges of electricity (i.e., transactions involving a balancing of
debits and credits for energy, capacity, etc.) and any settlements for imbalanced exchanges.
2. Enter the name of the seller or other party in an exchange transaction in column (a). Do not abbreviate or truncate the name or use
acronyms. Explain in a footnote any ownership interest or affiliation the respondent has with the seller.
3. In column (b), enter a Statistical Classification Code based on the original contractual terms and conditions of the service as follows:
RQ - for requirements service. Requirements service is service which the supplier plans to provide on an ongoing basis (i.e., the
supplier includes projects load for this service in its system resource planning). In addition, the reliability of requirement service must be
the same as, or second only to, the supplier’s service to its own ultimate consumers.
LF - for long-term firm service. "Long-term" means five years or longer and "firm" means that service cannot be interrupted for
economic reasons and is intended to remain reliable even under adverse conditions (e.g., the supplier must attempt to buy emergency
energy from third parties to maintain deliveries of LF service). This category should not be used for long-term firm service firm service
which meets the definition of RQ service. For all transaction identified as LF, provide in a footnote the termination date of the contract
defined as the earliest date that either buyer or seller can unilaterally get out of the contract.
IF - for intermediate-term firm service. The same as LF service expect that "intermediate-term" means longer than one year but less
than five years.
SF - for short-term service. Use this category for all firm services, where the duration of each period of commitment for service is one
year or less.
LU - for long-term service from a designated generating unit. "Long-term" means five years or longer. The availability and reliability of
service, aside from transmission constraints, must match the availability and reliability of the designated unit.
IU - for intermediate-term service from a designated generating unit. The same as LU service expect that "intermediate-term" means
longer than one year but less than five years.
EX - For exchanges of electricity. Use this category for transactions involving a balancing of debits and credits for energy, capacity, etc.
and any settlements for imbalanced exchanges.
OS - for other service. Use this category only for those services which cannot be placed in the above-defined categories, such as all
non-firm service regardless of the Length of the contract and service from designated units of Less than one year. Describe the nature
of the service in a footnote for each adjustment.
0.000000.00000HETCH HETCHY - BU 1
0.000000.00000HIGH PLAIN RANCH II 2
0.000000.00000HIGH PLAINS RANCH II 3
0.000000.00000HIGH PLAINS RANCH III 4
0.000000.00000HOLLISTER SOLAR ECOS ENERGY 5
0.000000.00000IBERDROLA KLONDIKE (AKA PPM 6
0.000000.00000IBERDROLA RENEWABLES (AKA PPM 7
0.000000.00000ICAP - BU 8
0.000000.00000ICE - BU 9
0.000000.00000IMMODO LEMOORE 10
0.000000.00000IVANPAH UNIT 1 11
0.000000.00000IVANPAH UNIT 3 12
0.000000.00000JACKSON VALLEY IRRIGATION DIST 13
0.000000.00000KANSAS 14
FERC FORM NO. 1 (ED. 12-90) Page 326.18
Total

Name of Respondent This Report Is:(1) An Original
(2) A Resubmission
Date of Report(Mo, Da, Yr)
Year/Period of Report
End of
PURCHASED POWER (Account 555)
PACIFIC GAS AND ELECTRIC COMPANYX
04/13/20212020/Q4
Line
No.
Name of Company or Public Authority
(c)(b)(a)
FERC RateMonthly Billing
Average
(d)
Statistical
cationClassifi- Schedule or
Tariff Number Demand (MW)
(e) (f)
(Footnote Affiliations)
Actual Demand (MW)
Average AverageMonthly NCP Demand Monthly CP Demand
(Including power exchanges)
1. Report all power purchases made during the year. Also report exchanges of electricity (i.e., transactions involving a balancing of
debits and credits for energy, capacity, etc.) and any settlements for imbalanced exchanges.
2. Enter the name of the seller or other party in an exchange transaction in column (a). Do not abbreviate or truncate the name or use
acronyms. Explain in a footnote any ownership interest or affiliation the respondent has with the seller.
3. In column (b), enter a Statistical Classification Code based on the original contractual terms and conditions of the service as follows:
RQ - for requirements service. Requirements service is service which the supplier plans to provide on an ongoing basis (i.e., the
supplier includes projects load for this service in its system resource planning). In addition, the reliability of requirement service must be
the same as, or second only to, the supplier’s service to its own ultimate consumers.
LF - for long-term firm service. "Long-term" means five years or longer and "firm" means that service cannot be interrupted for
economic reasons and is intended to remain reliable even under adverse conditions (e.g., the supplier must attempt to buy emergency
energy from third parties to maintain deliveries of LF service). This category should not be used for long-term firm service firm service
which meets the definition of RQ service. For all transaction identified as LF, provide in a footnote the termination date of the contract
defined as the earliest date that either buyer or seller can unilaterally get out of the contract.
IF - for intermediate-term firm service. The same as LF service expect that "intermediate-term" means longer than one year but less
than five years.
SF - for short-term service. Use this category for all firm services, where the duration of each period of commitment for service is one
year or less.
LU - for long-term service from a designated generating unit. "Long-term" means five years or longer. The availability and reliability of
service, aside from transmission constraints, must match the availability and reliability of the designated unit.
IU - for intermediate-term service from a designated generating unit. The same as LU service expect that "intermediate-term" means
longer than one year but less than five years.
EX - For exchanges of electricity. Use this category for transactions involving a balancing of debits and credits for energy, capacity, etc.
and any settlements for imbalanced exchanges.
OS - for other service. Use this category only for those services which cannot be placed in the above-defined categories, such as all
non-firm service regardless of the Length of the contract and service from designated units of Less than one year. Describe the nature
of the service in a footnote for each adjustment.
0.000000.00000KEKAWAKA CREEK (STS) 1
0.000000.00000KENT SOUTH - PV 2 2
0.000000.00000KERN RIVER COGEN 3
0.000000.00000KERN RIVER COGEN (KRCC) 4
0.000000.00000KINGSBURG 1 TULARE PV II LLC 5
0.000000.00000KINGSBURG 2 TULARE PV II LLC 6
0.000000.00000KINGSBURG 3 TULARE PV II LLC 7
0.000000.00000KLONDIKE III 8
0.000000.00000KLONDIKE III S&F 9
0.000000.00000LA JOYA DEL SOL 1 10
0.000000.00000LASSEN STATION 11
0.000000.00000LEMOORE PV 1, LLC 12
0.000000.00000LIVE OAK LIMITED 13
0.000000.00000LOST CREEK 1 14
FERC FORM NO. 1 (ED. 12-90) Page 326.19
Total

Name of Respondent This Report Is:(1) An Original
(2) A Resubmission
Date of Report(Mo, Da, Yr)
Year/Period of Report
End of
PURCHASED POWER (Account 555)
PACIFIC GAS AND ELECTRIC COMPANYX
04/13/20212020/Q4
Line
No.
Name of Company or Public Authority
(c)(b)(a)
FERC RateMonthly Billing
Average
(d)
Statistical
cationClassifi- Schedule or
Tariff Number Demand (MW)
(e) (f)
(Footnote Affiliations)
Actual Demand (MW)
Average AverageMonthly NCP Demand Monthly CP Demand
(Including power exchanges)
1. Report all power purchases made during the year. Also report exchanges of electricity (i.e., transactions involving a balancing of
debits and credits for energy, capacity, etc.) and any settlements for imbalanced exchanges.
2. Enter the name of the seller or other party in an exchange transaction in column (a). Do not abbreviate or truncate the name or use
acronyms. Explain in a footnote any ownership interest or affiliation the respondent has with the seller.
3. In column (b), enter a Statistical Classification Code based on the original contractual terms and conditions of the service as follows:
RQ - for requirements service. Requirements service is service which the supplier plans to provide on an ongoing basis (i.e., the
supplier includes projects load for this service in its system resource planning). In addition, the reliability of requirement service must be
the same as, or second only to, the supplier’s service to its own ultimate consumers.
LF - for long-term firm service. "Long-term" means five years or longer and "firm" means that service cannot be interrupted for
economic reasons and is intended to remain reliable even under adverse conditions (e.g., the supplier must attempt to buy emergency
energy from third parties to maintain deliveries of LF service). This category should not be used for long-term firm service firm service
which meets the definition of RQ service. For all transaction identified as LF, provide in a footnote the termination date of the contract
defined as the earliest date that either buyer or seller can unilaterally get out of the contract.
IF - for intermediate-term firm service. The same as LF service expect that "intermediate-term" means longer than one year but less
than five years.
SF - for short-term service. Use this category for all firm services, where the duration of each period of commitment for service is one
year or less.
LU - for long-term service from a designated generating unit. "Long-term" means five years or longer. The availability and reliability of
service, aside from transmission constraints, must match the availability and reliability of the designated unit.
IU - for intermediate-term service from a designated generating unit. The same as LU service expect that "intermediate-term" means
longer than one year but less than five years.
EX - For exchanges of electricity. Use this category for transactions involving a balancing of debits and credits for energy, capacity, etc.
and any settlements for imbalanced exchanges.
OS - for other service. Use this category only for those services which cannot be placed in the above-defined categories, such as all
non-firm service regardless of the Length of the contract and service from designated units of Less than one year. Describe the nature
of the service in a footnote for each adjustment.
0.000000.00000LOST CREEK 2 1
0.000000.00000LOST HILLS SOLAR 2
0.000000.00000MACQUARIE FUTURES_FCM - BU 3
0.000000.00000MADERA CHOWCHILLA - SITE 1923 4
0.000000.00000MADERA CHOWCHILLA SITE 1174 5
0.000000.00000MADERA CHOWCHILLA SITE 1302 6
0.000000.00000MADERA CHOWCHILLA SITE 980 7
0.000000.00000MAMMOTH G1 (ORMAT) - RAM 2 8
0.000000.00000MAMMOTH G3 RAM 1 9
0.000000.00000MANTECA LAND 1 10
0.000000.00000MARIN CLEAN ENERGY 11
0.000000.00000MARIPOSA ENERGY LLC 12
0.000000.00000MARSH LANDING 13
0.000000.00000MARSH LANDING CGT 14
FERC FORM NO. 1 (ED. 12-90) Page 326.20
Total

Name of Respondent This Report Is:(1) An Original
(2) A Resubmission
Date of Report(Mo, Da, Yr)
Year/Period of Report
End of
PURCHASED POWER (Account 555)
PACIFIC GAS AND ELECTRIC COMPANYX
04/13/20212020/Q4
Line
No.
Name of Company or Public Authority
(c)(b)(a)
FERC RateMonthly Billing
Average
(d)
Statistical
cationClassifi- Schedule or
Tariff Number Demand (MW)
(e) (f)
(Footnote Affiliations)
Actual Demand (MW)
Average AverageMonthly NCP Demand Monthly CP Demand
(Including power exchanges)
1. Report all power purchases made during the year. Also report exchanges of electricity (i.e., transactions involving a balancing of
debits and credits for energy, capacity, etc.) and any settlements for imbalanced exchanges.
2. Enter the name of the seller or other party in an exchange transaction in column (a). Do not abbreviate or truncate the name or use
acronyms. Explain in a footnote any ownership interest or affiliation the respondent has with the seller.
3. In column (b), enter a Statistical Classification Code based on the original contractual terms and conditions of the service as follows:
RQ - for requirements service. Requirements service is service which the supplier plans to provide on an ongoing basis (i.e., the
supplier includes projects load for this service in its system resource planning). In addition, the reliability of requirement service must be
the same as, or second only to, the supplier’s service to its own ultimate consumers.
LF - for long-term firm service. "Long-term" means five years or longer and "firm" means that service cannot be interrupted for
economic reasons and is intended to remain reliable even under adverse conditions (e.g., the supplier must attempt to buy emergency
energy from third parties to maintain deliveries of LF service). This category should not be used for long-term firm service firm service
which meets the definition of RQ service. For all transaction identified as LF, provide in a footnote the termination date of the contract
defined as the earliest date that either buyer or seller can unilaterally get out of the contract.
IF - for intermediate-term firm service. The same as LF service expect that "intermediate-term" means longer than one year but less
than five years.
SF - for short-term service. Use this category for all firm services, where the duration of each period of commitment for service is one
year or less.
LU - for long-term service from a designated generating unit. "Long-term" means five years or longer. The availability and reliability of
service, aside from transmission constraints, must match the availability and reliability of the designated unit.
IU - for intermediate-term service from a designated generating unit. The same as LU service expect that "intermediate-term" means
longer than one year but less than five years.
EX - For exchanges of electricity. Use this category for transactions involving a balancing of debits and credits for energy, capacity, etc.
and any settlements for imbalanced exchanges.
OS - for other service. Use this category only for those services which cannot be placed in the above-defined categories, such as all
non-firm service regardless of the Length of the contract and service from designated units of Less than one year. Describe the nature
of the service in a footnote for each adjustment.
0.000000.00000MATTHEWS DAM HYDRO 1
0.000000.00000MCE 2
0.000000.00000MCFADDEN HYDRO FACILITY 3
0.000000.00000MCKITTRICK LIMITED 4
0.000000.00000MERCED 1 5
0.000000.00000MERCED SOLAR ECOS ENERGY 6
0.000000.00000MESQUITE SOLAR 7
0.000000.00000MIDWAY SOLAR FARM 1 8
0.000000.00000MIDWAY SOLAR FARM 2 9
0.000000.00000MIDWAY SUNSET COGENERATION 10
0.000000.00000MIECO INC. - BU 11
0.000000.00000MILL SULPHUR CREEK PROJECT 12
0.000000.00000MISSION SOLAR ECOS ENERGY 13
0.000000.00000MOJAVE SOLAR 14
FERC FORM NO. 1 (ED. 12-90) Page 326.21
Total

Name of Respondent This Report Is:(1) An Original
(2) A Resubmission
Date of Report(Mo, Da, Yr)
Year/Period of Report
End of
PURCHASED POWER (Account 555)
PACIFIC GAS AND ELECTRIC COMPANYX
04/13/20212020/Q4
Line
No.
Name of Company or Public Authority
(c)(b)(a)
FERC RateMonthly Billing
Average
(d)
Statistical
cationClassifi- Schedule or
Tariff Number Demand (MW)
(e) (f)
(Footnote Affiliations)
Actual Demand (MW)
Average AverageMonthly NCP Demand Monthly CP Demand
(Including power exchanges)
1. Report all power purchases made during the year. Also report exchanges of electricity (i.e., transactions involving a balancing of
debits and credits for energy, capacity, etc.) and any settlements for imbalanced exchanges.
2. Enter the name of the seller or other party in an exchange transaction in column (a). Do not abbreviate or truncate the name or use
acronyms. Explain in a footnote any ownership interest or affiliation the respondent has with the seller.
3. In column (b), enter a Statistical Classification Code based on the original contractual terms and conditions of the service as follows:
RQ - for requirements service. Requirements service is service which the supplier plans to provide on an ongoing basis (i.e., the
supplier includes projects load for this service in its system resource planning). In addition, the reliability of requirement service must be
the same as, or second only to, the supplier’s service to its own ultimate consumers.
LF - for long-term firm service. "Long-term" means five years or longer and "firm" means that service cannot be interrupted for
economic reasons and is intended to remain reliable even under adverse conditions (e.g., the supplier must attempt to buy emergency
energy from third parties to maintain deliveries of LF service). This category should not be used for long-term firm service firm service
which meets the definition of RQ service. For all transaction identified as LF, provide in a footnote the termination date of the contract
defined as the earliest date that either buyer or seller can unilaterally get out of the contract.
IF - for intermediate-term firm service. The same as LF service expect that "intermediate-term" means longer than one year but less
than five years.
SF - for short-term service. Use this category for all firm services, where the duration of each period of commitment for service is one
year or less.
LU - for long-term service from a designated generating unit. "Long-term" means five years or longer. The availability and reliability of
service, aside from transmission constraints, must match the availability and reliability of the designated unit.
IU - for intermediate-term service from a designated generating unit. The same as LU service expect that "intermediate-term" means
longer than one year but less than five years.
EX - For exchanges of electricity. Use this category for transactions involving a balancing of debits and credits for energy, capacity, etc.
and any settlements for imbalanced exchanges.
OS - for other service. Use this category only for those services which cannot be placed in the above-defined categories, such as all
non-firm service regardless of the Length of the contract and service from designated units of Less than one year. Describe the nature
of the service in a footnote for each adjustment.
0.000000.00000MONTEREY BAY COMM PWR AUTHORITY 1
0.000000.00000Monterey Bay Community Power - Carbon 2
0.000000.00000MORELOS SOLAR LLC - RAM 3 3
0.000000.00000MORGAN STANLEY 4
0.000000.00000MT. POSO (RED HAWK) 5
0.000000.00000NEVP - NORTH DELIVERY - BU 6
0.000000.00000NEXTERA DIABLO WINDS 7
0.000000.00000NEXTERA MONTEZUMA WIND 8
0.000000.00000NEXTERA MONTEZUMA WIND II 9
0.000000.00000NEXTERA MONTEZUMA WIND II 10
0.000000.00000NGX USD - BU 11
0.000000.00000NGX_ICE - BU 12
0.000000.00000NICKEL 1 NLH1 SOLAR 13
0.000000.00000NID CHICAGO PARK 14
FERC FORM NO. 1 (ED. 12-90) Page 326.22
Total

Name of Respondent This Report Is:(1) An Original
(2) A Resubmission
Date of Report(Mo, Da, Yr)
Year/Period of Report
End of
PURCHASED POWER (Account 555)
PACIFIC GAS AND ELECTRIC COMPANYX
04/13/20212020/Q4
Line
No.
Name of Company or Public Authority
(c)(b)(a)
FERC RateMonthly Billing
Average
(d)
Statistical
cationClassifi- Schedule or
Tariff Number Demand (MW)
(e) (f)
(Footnote Affiliations)
Actual Demand (MW)
Average AverageMonthly NCP Demand Monthly CP Demand
(Including power exchanges)
1. Report all power purchases made during the year. Also report exchanges of electricity (i.e., transactions involving a balancing of
debits and credits for energy, capacity, etc.) and any settlements for imbalanced exchanges.
2. Enter the name of the seller or other party in an exchange transaction in column (a). Do not abbreviate or truncate the name or use
acronyms. Explain in a footnote any ownership interest or affiliation the respondent has with the seller.
3. In column (b), enter a Statistical Classification Code based on the original contractual terms and conditions of the service as follows:
RQ - for requirements service. Requirements service is service which the supplier plans to provide on an ongoing basis (i.e., the
supplier includes projects load for this service in its system resource planning). In addition, the reliability of requirement service must be
the same as, or second only to, the supplier’s service to its own ultimate consumers.
LF - for long-term firm service. "Long-term" means five years or longer and "firm" means that service cannot be interrupted for
economic reasons and is intended to remain reliable even under adverse conditions (e.g., the supplier must attempt to buy emergency
energy from third parties to maintain deliveries of LF service). This category should not be used for long-term firm service firm service
which meets the definition of RQ service. For all transaction identified as LF, provide in a footnote the termination date of the contract
defined as the earliest date that either buyer or seller can unilaterally get out of the contract.
IF - for intermediate-term firm service. The same as LF service expect that "intermediate-term" means longer than one year but less
than five years.
SF - for short-term service. Use this category for all firm services, where the duration of each period of commitment for service is one
year or less.
LU - for long-term service from a designated generating unit. "Long-term" means five years or longer. The availability and reliability of
service, aside from transmission constraints, must match the availability and reliability of the designated unit.
IU - for intermediate-term service from a designated generating unit. The same as LU service expect that "intermediate-term" means
longer than one year but less than five years.
EX - For exchanges of electricity. Use this category for transactions involving a balancing of debits and credits for energy, capacity, etc.
and any settlements for imbalanced exchanges.
OS - for other service. Use this category only for those services which cannot be placed in the above-defined categories, such as all
non-firm service regardless of the Length of the contract and service from designated units of Less than one year. Describe the nature
of the service in a footnote for each adjustment.
0.000000.00000NID DUTCH FLAT ROLLINS BOWMAN 1
0.000000.00000NID NORTH COMBIE FIT 2
0.000000.00000NID SCOTTS FLAT 3
0.000000.00000NID SOUTH COMBIE FIT 4
0.000000.00000NID-CHICAGO PARK 5
0.000000.00000NID-DUTCH FLATS, ROLLINS, BOWMAN 6
0.000000.00000NORTH SKY RIVER ENERGY CENTER 7
0.000000.00000NORTH STAR SOLAR 8
0.000000.00000NRG ALPINE SOLAR 9
0.000000.00000NRG SOLAR KANSAS SOUTH 10
0.000000.00000OAKLEY EXECUTIVE LLC 11
0.000000.00000OLD RIVER ONE LLC - RAM 3 12
0.000000.00000OPEN SKY DAIRY DIGESTER #2 13
0.000000.00000OPEN SKY DIARY DIGESTER #2 - NEW 14
FERC FORM NO. 1 (ED. 12-90) Page 326.23
Total

Name of Respondent This Report Is:(1) An Original
(2) A Resubmission
Date of Report(Mo, Da, Yr)
Year/Period of Report
End of
PURCHASED POWER (Account 555)
PACIFIC GAS AND ELECTRIC COMPANYX
04/13/20212020/Q4
Line
No.
Name of Company or Public Authority
(c)(b)(a)
FERC RateMonthly Billing
Average
(d)
Statistical
cationClassifi- Schedule or
Tariff Number Demand (MW)
(e) (f)
(Footnote Affiliations)
Actual Demand (MW)
Average AverageMonthly NCP Demand Monthly CP Demand
(Including power exchanges)
1. Report all power purchases made during the year. Also report exchanges of electricity (i.e., transactions involving a balancing of
debits and credits for energy, capacity, etc.) and any settlements for imbalanced exchanges.
2. Enter the name of the seller or other party in an exchange transaction in column (a). Do not abbreviate or truncate the name or use
acronyms. Explain in a footnote any ownership interest or affiliation the respondent has with the seller.
3. In column (b), enter a Statistical Classification Code based on the original contractual terms and conditions of the service as follows:
RQ - for requirements service. Requirements service is service which the supplier plans to provide on an ongoing basis (i.e., the
supplier includes projects load for this service in its system resource planning). In addition, the reliability of requirement service must be
the same as, or second only to, the supplier’s service to its own ultimate consumers.
LF - for long-term firm service. "Long-term" means five years or longer and "firm" means that service cannot be interrupted for
economic reasons and is intended to remain reliable even under adverse conditions (e.g., the supplier must attempt to buy emergency
energy from third parties to maintain deliveries of LF service). This category should not be used for long-term firm service firm service
which meets the definition of RQ service. For all transaction identified as LF, provide in a footnote the termination date of the contract
defined as the earliest date that either buyer or seller can unilaterally get out of the contract.
IF - for intermediate-term firm service. The same as LF service expect that "intermediate-term" means longer than one year but less
than five years.
SF - for short-term service. Use this category for all firm services, where the duration of each period of commitment for service is one
year or less.
LU - for long-term service from a designated generating unit. "Long-term" means five years or longer. The availability and reliability of
service, aside from transmission constraints, must match the availability and reliability of the designated unit.
IU - for intermediate-term service from a designated generating unit. The same as LU service expect that "intermediate-term" means
longer than one year but less than five years.
EX - For exchanges of electricity. Use this category for transactions involving a balancing of debits and credits for energy, capacity, etc.
and any settlements for imbalanced exchanges.
OS - for other service. Use this category only for those services which cannot be placed in the above-defined categories, such as all
non-firm service regardless of the Length of the contract and service from designated units of Less than one year. Describe the nature
of the service in a footnote for each adjustment.
0.000000.00000ORION SOLAR I LLC 1
0.000000.00000OROVILLE COGEN 2
0.000000.00000OROVILLE COGEN TOLLING 3
0.000000.00000ORTIGALITA POWER COMPANY LLC 4
0.000000.00000PACIFIC SUMMIT - BU 5
0.000000.00000PACIFICORP - BU 6
0.000000.00000PANOCHE ENERGY CGT 7
0.000000.00000PCWA LINCOLN HYDRO 8
0.000000.00000PEACOCK SOLAR PROJ - GREEN LIGHT 9
0.000000.00000PEACOCK SOLAR PROJECT 10
0.000000.00000Peninsula CEA 11
0.000000.00000PENINSULA CLEAN ENERGY 2022 12
0.000000.00000Peninsula Clean Energy Authority - Ene 13
0.000000.00000PILOT POWER - BU 14
FERC FORM NO. 1 (ED. 12-90) Page 326.24
Total

Name of Respondent This Report Is:(1) An Original
(2) A Resubmission
Date of Report(Mo, Da, Yr)
Year/Period of Report
End of
PURCHASED POWER (Account 555)
PACIFIC GAS AND ELECTRIC COMPANYX
04/13/20212020/Q4
Line
No.
Name of Company or Public Authority
(c)(b)(a)
FERC RateMonthly Billing
Average
(d)
Statistical
cationClassifi- Schedule or
Tariff Number Demand (MW)
(e) (f)
(Footnote Affiliations)
Actual Demand (MW)
Average AverageMonthly NCP Demand Monthly CP Demand
(Including power exchanges)
1. Report all power purchases made during the year. Also report exchanges of electricity (i.e., transactions involving a balancing of
debits and credits for energy, capacity, etc.) and any settlements for imbalanced exchanges.
2. Enter the name of the seller or other party in an exchange transaction in column (a). Do not abbreviate or truncate the name or use
acronyms. Explain in a footnote any ownership interest or affiliation the respondent has with the seller.
3. In column (b), enter a Statistical Classification Code based on the original contractual terms and conditions of the service as follows:
RQ - for requirements service. Requirements service is service which the supplier plans to provide on an ongoing basis (i.e., the
supplier includes projects load for this service in its system resource planning). In addition, the reliability of requirement service must be
the same as, or second only to, the supplier’s service to its own ultimate consumers.
LF - for long-term firm service. "Long-term" means five years or longer and "firm" means that service cannot be interrupted for
economic reasons and is intended to remain reliable even under adverse conditions (e.g., the supplier must attempt to buy emergency
energy from third parties to maintain deliveries of LF service). This category should not be used for long-term firm service firm service
which meets the definition of RQ service. For all transaction identified as LF, provide in a footnote the termination date of the contract
defined as the earliest date that either buyer or seller can unilaterally get out of the contract.
IF - for intermediate-term firm service. The same as LF service expect that "intermediate-term" means longer than one year but less
than five years.
SF - for short-term service. Use this category for all firm services, where the duration of each period of commitment for service is one
year or less.
LU - for long-term service from a designated generating unit. "Long-term" means five years or longer. The availability and reliability of
service, aside from transmission constraints, must match the availability and reliability of the designated unit.
IU - for intermediate-term service from a designated generating unit. The same as LU service expect that "intermediate-term" means
longer than one year but less than five years.
EX - For exchanges of electricity. Use this category for transactions involving a balancing of debits and credits for energy, capacity, etc.
and any settlements for imbalanced exchanges.
OS - for other service. Use this category only for those services which cannot be placed in the above-defined categories, such as all
non-firm service regardless of the Length of the contract and service from designated units of Less than one year. Describe the nature
of the service in a footnote for each adjustment.
0.000000.00000PIONEER COMM ENERGY - BU 1
0.000000.00000PORTAL RIDGE SOLAR C PROJECT 2
0.000000.00000POTRERO HILLS ENERGY LLC 3
0.000000.00000POWEREX CORP 4
0.000000.00000POWEREX SHAPING FIRMING 5
0.000000.00000PUTAH CREEK SOLAR FARMS 6
0.000000.00000RE ASTORIA 7
0.000000.00000RE TRANQUILLITY 8 AMARILLO 8
0.000000.00000REDWOOD 4 SOLAR FARM 9
0.000000.00000RISING TREE WIND FARM II LLC 10
0.000000.00000RISING TREE WIND FARM II LLC - RAM 4 11
0.000000.00000ROCK CREEK HYDRO 12
0.000000.00000SACRAMENTO MUNICIPAL UTILITY DIS 13
0.000000.00000SALMON CREEK HYDROELECTRIC 14
FERC FORM NO. 1 (ED. 12-90) Page 326.25
Total

Name of Respondent This Report Is:(1) An Original
(2) A Resubmission
Date of Report(Mo, Da, Yr)
Year/Period of Report
End of
PURCHASED POWER (Account 555)
PACIFIC GAS AND ELECTRIC COMPANYX
04/13/20212020/Q4
Line
No.
Name of Company or Public Authority
(c)(b)(a)
FERC RateMonthly Billing
Average
(d)
Statistical
cationClassifi- Schedule or
Tariff Number Demand (MW)
(e) (f)
(Footnote Affiliations)
Actual Demand (MW)
Average AverageMonthly NCP Demand Monthly CP Demand
(Including power exchanges)
1. Report all power purchases made during the year. Also report exchanges of electricity (i.e., transactions involving a balancing of
debits and credits for energy, capacity, etc.) and any settlements for imbalanced exchanges.
2. Enter the name of the seller or other party in an exchange transaction in column (a). Do not abbreviate or truncate the name or use
acronyms. Explain in a footnote any ownership interest or affiliation the respondent has with the seller.
3. In column (b), enter a Statistical Classification Code based on the original contractual terms and conditions of the service as follows:
RQ - for requirements service. Requirements service is service which the supplier plans to provide on an ongoing basis (i.e., the
supplier includes projects load for this service in its system resource planning). In addition, the reliability of requirement service must be
the same as, or second only to, the supplier’s service to its own ultimate consumers.
LF - for long-term firm service. "Long-term" means five years or longer and "firm" means that service cannot be interrupted for
economic reasons and is intended to remain reliable even under adverse conditions (e.g., the supplier must attempt to buy emergency
energy from third parties to maintain deliveries of LF service). This category should not be used for long-term firm service firm service
which meets the definition of RQ service. For all transaction identified as LF, provide in a footnote the termination date of the contract
defined as the earliest date that either buyer or seller can unilaterally get out of the contract.
IF - for intermediate-term firm service. The same as LF service expect that "intermediate-term" means longer than one year but less
than five years.
SF - for short-term service. Use this category for all firm services, where the duration of each period of commitment for service is one
year or less.
LU - for long-term service from a designated generating unit. "Long-term" means five years or longer. The availability and reliability of
service, aside from transmission constraints, must match the availability and reliability of the designated unit.
IU - for intermediate-term service from a designated generating unit. The same as LU service expect that "intermediate-term" means
longer than one year but less than five years.
EX - For exchanges of electricity. Use this category for transactions involving a balancing of debits and credits for energy, capacity, etc.
and any settlements for imbalanced exchanges.
OS - for other service. Use this category only for those services which cannot be placed in the above-defined categories, such as all
non-firm service regardless of the Length of the contract and service from designated units of Less than one year. Describe the nature
of the service in a footnote for each adjustment.
0.000000.00000SAN JOSE CLEAN ENERGY - BU 1
0.000000.00000SAN JOSE WATER COX AVE HYDRO 2
0.000000.00000SAN LUIS BYPASS 3
0.000000.00000SAN LUIS OBISPO AD 4
0.000000.00000SAN LUIS OBISPO AD - NEW 5
0.000000.00000SANTA MARIA II LFG POWER 6
0.000000.00000SEMPRA GAS & POWER - BU 7
0.000000.00000SEMPRA MESQUITE SOLAR 8
0.000000.00000SFWP SLY CREEK KELLY RIDGE 9
0.000000.00000SFWP WOODLEAF FORBESTOWN 10
0.000000.00000SHAFTER SOLAR LLC 11
0.000000.00000SHAFTER SOLAR LLC RAM 3 12
0.000000.00000Shell Energy 13
0.000000.00000SHELL ENERGY 2019 REC SALE 1 14
FERC FORM NO. 1 (ED. 12-90) Page 326.26
Total

Name of Respondent This Report Is:(1) An Original
(2) A Resubmission
Date of Report(Mo, Da, Yr)
Year/Period of Report
End of
PURCHASED POWER (Account 555)
PACIFIC GAS AND ELECTRIC COMPANYX
04/13/20212020/Q4
Line
No.
Name of Company or Public Authority
(c)(b)(a)
FERC RateMonthly Billing
Average
(d)
Statistical
cationClassifi- Schedule or
Tariff Number Demand (MW)
(e) (f)
(Footnote Affiliations)
Actual Demand (MW)
Average AverageMonthly NCP Demand Monthly CP Demand
(Including power exchanges)
1. Report all power purchases made during the year. Also report exchanges of electricity (i.e., transactions involving a balancing of
debits and credits for energy, capacity, etc.) and any settlements for imbalanced exchanges.
2. Enter the name of the seller or other party in an exchange transaction in column (a). Do not abbreviate or truncate the name or use
acronyms. Explain in a footnote any ownership interest or affiliation the respondent has with the seller.
3. In column (b), enter a Statistical Classification Code based on the original contractual terms and conditions of the service as follows:
RQ - for requirements service. Requirements service is service which the supplier plans to provide on an ongoing basis (i.e., the
supplier includes projects load for this service in its system resource planning). In addition, the reliability of requirement service must be
the same as, or second only to, the supplier’s service to its own ultimate consumers.
LF - for long-term firm service. "Long-term" means five years or longer and "firm" means that service cannot be interrupted for
economic reasons and is intended to remain reliable even under adverse conditions (e.g., the supplier must attempt to buy emergency
energy from third parties to maintain deliveries of LF service). This category should not be used for long-term firm service firm service
which meets the definition of RQ service. For all transaction identified as LF, provide in a footnote the termination date of the contract
defined as the earliest date that either buyer or seller can unilaterally get out of the contract.
IF - for intermediate-term firm service. The same as LF service expect that "intermediate-term" means longer than one year but less
than five years.
SF - for short-term service. Use this category for all firm services, where the duration of each period of commitment for service is one
year or less.
LU - for long-term service from a designated generating unit. "Long-term" means five years or longer. The availability and reliability of
service, aside from transmission constraints, must match the availability and reliability of the designated unit.
IU - for intermediate-term service from a designated generating unit. The same as LU service expect that "intermediate-term" means
longer than one year but less than five years.
EX - For exchanges of electricity. Use this category for transactions involving a balancing of debits and credits for energy, capacity, etc.
and any settlements for imbalanced exchanges.
OS - for other service. Use this category only for those services which cannot be placed in the above-defined categories, such as all
non-firm service regardless of the Length of the contract and service from designated units of Less than one year. Describe the nature
of the service in a footnote for each adjustment.
0.000000.00000SHELL ENERGY 2019 REC SALE 2 1
0.000000.00000SHELL ENERGY 2019 REC SALE 3 2
0.000000.00000SHILOH I WIND 3
0.000000.00000SHILOH II WIND (AKA ENXCO) 4
0.000000.00000SHILOH II WIND PROJECT AR 5
0.000000.00000SHILOH IV 6
0.000000.00000SIERRA GREEN ENERGY LLC 7
0.000000.00000SIERRA PACIFIC INDUSTRIES 8
0.000000.00000SIERRA PACIFIC POWER TSA 9
0.000000.00000SILICON VALLEY CLEAN ENERGY - BU 10
0.000000.00000SILVER SPRINGS 11
0.000000.00000Silver Springs (Mega) 12
0.000000.00000SMUD - BU 13
0.000000.00000SO CAL EDISON - BU 14
FERC FORM NO. 1 (ED. 12-90) Page 326.27
Total
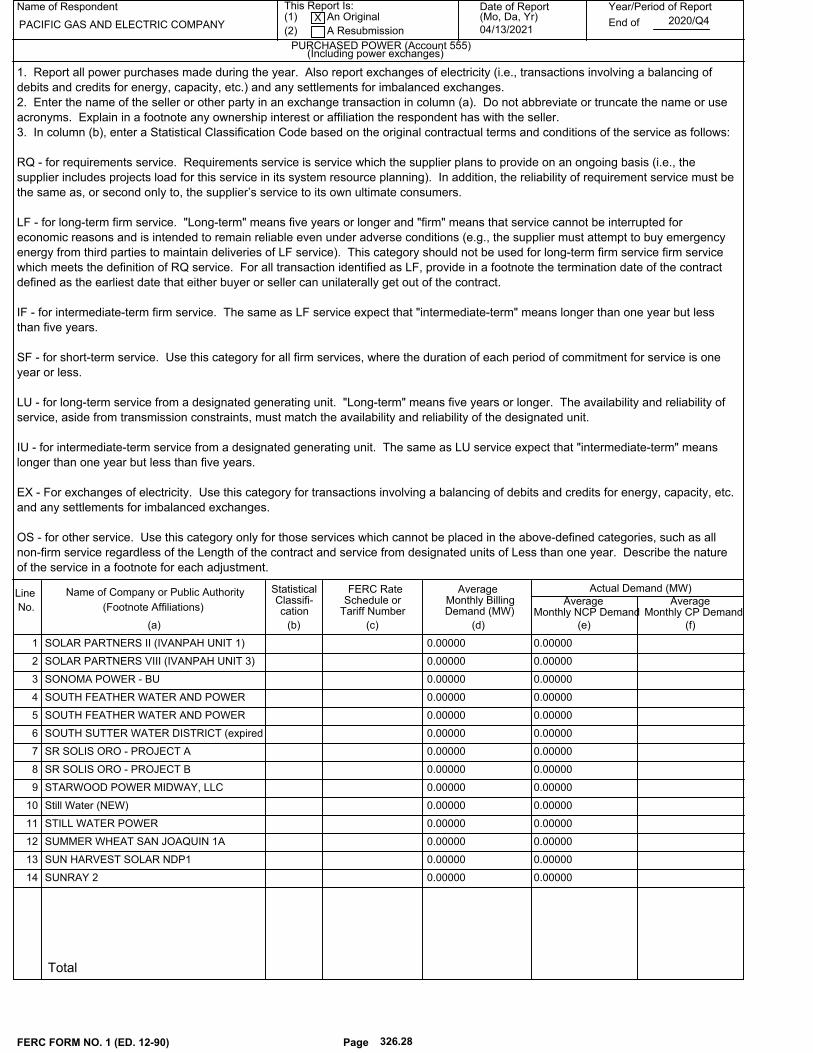
Name of Respondent This Report Is:(1) An Original
(2) A Resubmission
Date of Report(Mo, Da, Yr)
Year/Period of Report
End of
PURCHASED POWER (Account 555)
PACIFIC GAS AND ELECTRIC COMPANYX
04/13/20212020/Q4
Line
No.
Name of Company or Public Authority
(c)(b)(a)
FERC RateMonthly Billing
Average
(d)
Statistical
cationClassifi- Schedule or
Tariff Number Demand (MW)
(e) (f)
(Footnote Affiliations)
Actual Demand (MW)
Average AverageMonthly NCP Demand Monthly CP Demand
(Including power exchanges)
1. Report all power purchases made during the year. Also report exchanges of electricity (i.e., transactions involving a balancing of
debits and credits for energy, capacity, etc.) and any settlements for imbalanced exchanges.
2. Enter the name of the seller or other party in an exchange transaction in column (a). Do not abbreviate or truncate the name or use
acronyms. Explain in a footnote any ownership interest or affiliation the respondent has with the seller.
3. In column (b), enter a Statistical Classification Code based on the original contractual terms and conditions of the service as follows:
RQ - for requirements service. Requirements service is service which the supplier plans to provide on an ongoing basis (i.e., the
supplier includes projects load for this service in its system resource planning). In addition, the reliability of requirement service must be
the same as, or second only to, the supplier’s service to its own ultimate consumers.
LF - for long-term firm service. "Long-term" means five years or longer and "firm" means that service cannot be interrupted for
economic reasons and is intended to remain reliable even under adverse conditions (e.g., the supplier must attempt to buy emergency
energy from third parties to maintain deliveries of LF service). This category should not be used for long-term firm service firm service
which meets the definition of RQ service. For all transaction identified as LF, provide in a footnote the termination date of the contract
defined as the earliest date that either buyer or seller can unilaterally get out of the contract.
IF - for intermediate-term firm service. The same as LF service expect that "intermediate-term" means longer than one year but less
than five years.
SF - for short-term service. Use this category for all firm services, where the duration of each period of commitment for service is one
year or less.
LU - for long-term service from a designated generating unit. "Long-term" means five years or longer. The availability and reliability of
service, aside from transmission constraints, must match the availability and reliability of the designated unit.
IU - for intermediate-term service from a designated generating unit. The same as LU service expect that "intermediate-term" means
longer than one year but less than five years.
EX - For exchanges of electricity. Use this category for transactions involving a balancing of debits and credits for energy, capacity, etc.
and any settlements for imbalanced exchanges.
OS - for other service. Use this category only for those services which cannot be placed in the above-defined categories, such as all
non-firm service regardless of the Length of the contract and service from designated units of Less than one year. Describe the nature
of the service in a footnote for each adjustment.
0.000000.00000SOLAR PARTNERS II (IVANPAH UNIT 1) 1
0.000000.00000SOLAR PARTNERS VIII (IVANPAH UNIT 3) 2
0.000000.00000SONOMA POWER - BU 3
0.000000.00000SOUTH FEATHER WATER AND POWER 4
0.000000.00000SOUTH FEATHER WATER AND POWER 5
0.000000.00000SOUTH SUTTER WATER DISTRICT (expired 6
0.000000.00000SR SOLIS ORO - PROJECT A 7
0.000000.00000SR SOLIS ORO - PROJECT B 8
0.000000.00000STARWOOD POWER MIDWAY, LLC 9
0.000000.00000Still Water (NEW) 10
0.000000.00000STILL WATER POWER 11
0.000000.00000SUMMER WHEAT SAN JOAQUIN 1A 12
0.000000.00000SUN HARVEST SOLAR NDP1 13
0.000000.00000SUNRAY 2 14
FERC FORM NO. 1 (ED. 12-90) Page 326.28
Total

Name of Respondent This Report Is:(1) An Original
(2) A Resubmission
Date of Report(Mo, Da, Yr)
Year/Period of Report
End of
PURCHASED POWER (Account 555)
PACIFIC GAS AND ELECTRIC COMPANYX
04/13/20212020/Q4
Line
No.
Name of Company or Public Authority
(c)(b)(a)
FERC RateMonthly Billing
Average
(d)
Statistical
cationClassifi- Schedule or
Tariff Number Demand (MW)
(e) (f)
(Footnote Affiliations)
Actual Demand (MW)
Average AverageMonthly NCP Demand Monthly CP Demand
(Including power exchanges)
1. Report all power purchases made during the year. Also report exchanges of electricity (i.e., transactions involving a balancing of
debits and credits for energy, capacity, etc.) and any settlements for imbalanced exchanges.
2. Enter the name of the seller or other party in an exchange transaction in column (a). Do not abbreviate or truncate the name or use
acronyms. Explain in a footnote any ownership interest or affiliation the respondent has with the seller.
3. In column (b), enter a Statistical Classification Code based on the original contractual terms and conditions of the service as follows:
RQ - for requirements service. Requirements service is service which the supplier plans to provide on an ongoing basis (i.e., the
supplier includes projects load for this service in its system resource planning). In addition, the reliability of requirement service must be
the same as, or second only to, the supplier’s service to its own ultimate consumers.
LF - for long-term firm service. "Long-term" means five years or longer and "firm" means that service cannot be interrupted for
economic reasons and is intended to remain reliable even under adverse conditions (e.g., the supplier must attempt to buy emergency
energy from third parties to maintain deliveries of LF service). This category should not be used for long-term firm service firm service
which meets the definition of RQ service. For all transaction identified as LF, provide in a footnote the termination date of the contract
defined as the earliest date that either buyer or seller can unilaterally get out of the contract.
IF - for intermediate-term firm service. The same as LF service expect that "intermediate-term" means longer than one year but less
than five years.
SF - for short-term service. Use this category for all firm services, where the duration of each period of commitment for service is one
year or less.
LU - for long-term service from a designated generating unit. "Long-term" means five years or longer. The availability and reliability of
service, aside from transmission constraints, must match the availability and reliability of the designated unit.
IU - for intermediate-term service from a designated generating unit. The same as LU service expect that "intermediate-term" means
longer than one year but less than five years.
EX - For exchanges of electricity. Use this category for transactions involving a balancing of debits and credits for energy, capacity, etc.
and any settlements for imbalanced exchanges.
OS - for other service. Use this category only for those services which cannot be placed in the above-defined categories, such as all
non-firm service regardless of the Length of the contract and service from designated units of Less than one year. Describe the nature
of the service in a footnote for each adjustment.
0.000000.00000SUNSHINE GAS LANDFILL 1
0.000000.00000SUTTERS MILL HYDROELECTRIC PLANT 2
0.000000.00000TENASKA MKTG - BU 3
0.000000.00000TENASKA POWER SERVICES - BU 4
0.000000.00000TESORO - MARTINEZ COGEN LP 5
0.000000.00000TESORO REFINING & MARKETING LLC 6
0.000000.00000THE ENERGY AUTHORITY - BU 7
0.000000.00000THREE FORKS 8
0.000000.00000TOPAZ SOLAR FARM 9
0.000000.00000TORO SLO LANDFILL 10
0.000000.00000TRANSALTA - BU 11
0.000000.00000TULLETT PREBON AMERICAS COR - BU 12
0.000000.00000TUNNEL HILL HYDRO 13
0.000000.00000TWIN VALLEY HYDRO 14
FERC FORM NO. 1 (ED. 12-90) Page 326.29
Total

Name of Respondent This Report Is:(1) An Original
(2) A Resubmission
Date of Report(Mo, Da, Yr)
Year/Period of Report
End of
PURCHASED POWER (Account 555)
PACIFIC GAS AND ELECTRIC COMPANYX
04/13/20212020/Q4
Line
No.
Name of Company or Public Authority
(c)(b)(a)
FERC RateMonthly Billing
Average
(d)
Statistical
cationClassifi- Schedule or
Tariff Number Demand (MW)
(e) (f)
(Footnote Affiliations)
Actual Demand (MW)
Average AverageMonthly NCP Demand Monthly CP Demand
(Including power exchanges)
1. Report all power purchases made during the year. Also report exchanges of electricity (i.e., transactions involving a balancing of
debits and credits for energy, capacity, etc.) and any settlements for imbalanced exchanges.
2. Enter the name of the seller or other party in an exchange transaction in column (a). Do not abbreviate or truncate the name or use
acronyms. Explain in a footnote any ownership interest or affiliation the respondent has with the seller.
3. In column (b), enter a Statistical Classification Code based on the original contractual terms and conditions of the service as follows:
RQ - for requirements service. Requirements service is service which the supplier plans to provide on an ongoing basis (i.e., the
supplier includes projects load for this service in its system resource planning). In addition, the reliability of requirement service must be
the same as, or second only to, the supplier’s service to its own ultimate consumers.
LF - for long-term firm service. "Long-term" means five years or longer and "firm" means that service cannot be interrupted for
economic reasons and is intended to remain reliable even under adverse conditions (e.g., the supplier must attempt to buy emergency
energy from third parties to maintain deliveries of LF service). This category should not be used for long-term firm service firm service
which meets the definition of RQ service. For all transaction identified as LF, provide in a footnote the termination date of the contract
defined as the earliest date that either buyer or seller can unilaterally get out of the contract.
IF - for intermediate-term firm service. The same as LF service expect that "intermediate-term" means longer than one year but less
than five years.
SF - for short-term service. Use this category for all firm services, where the duration of each period of commitment for service is one
year or less.
LU - for long-term service from a designated generating unit. "Long-term" means five years or longer. The availability and reliability of
service, aside from transmission constraints, must match the availability and reliability of the designated unit.
IU - for intermediate-term service from a designated generating unit. The same as LU service expect that "intermediate-term" means
longer than one year but less than five years.
EX - For exchanges of electricity. Use this category for transactions involving a balancing of debits and credits for energy, capacity, etc.
and any settlements for imbalanced exchanges.
OS - for other service. Use this category only for those services which cannot be placed in the above-defined categories, such as all
non-firm service regardless of the Length of the contract and service from designated units of Less than one year. Describe the nature
of the service in a footnote for each adjustment.
0.000000.00000VANTAGE WIND ENERGY LLC 1
0.000000.00000VASCO WINDS (NEXTERA) 2
0.000000.00000VECINO VINEYARDS LLC 3
0.000000.00000VERWEY HANFORD DAIRY 2 - NEW 4
0.000000.00000VERWEY HANFORD DAIRY 3 - NEW 5
0.000000.00000VERWEY MADERA DAIRY DIGESTER 2 6
0.000000.00000VERWEY MADERA DAIRY DIGESTER 2 7
0.000000.00000VERWEY-HANFORD DAIRY 2 8
0.000000.00000VERWEY-HANFORD DAIRY 3 9
0.000000.00000VINTNER SOLAR LLC 10
0.000000.00000WATER WHEEL RANCH 11
0.000000.00000WECC WREGIS FEES 12
0.000000.00000WEST ANTELOPE - RAM 1 13
0.000000.00000WESTERN ANTELOPE BLUE SKY 14
FERC FORM NO. 1 (ED. 12-90) Page 326.30
Total

Name of Respondent This Report Is:(1) An Original
(2) A Resubmission
Date of Report(Mo, Da, Yr)
Year/Period of Report
End of
PURCHASED POWER (Account 555)
PACIFIC GAS AND ELECTRIC COMPANYX
04/13/20212020/Q4
Line
No.
Name of Company or Public Authority
(c)(b)(a)
FERC RateMonthly Billing
Average
(d)
Statistical
cationClassifi- Schedule or
Tariff Number Demand (MW)
(e) (f)
(Footnote Affiliations)
Actual Demand (MW)
Average AverageMonthly NCP Demand Monthly CP Demand
(Including power exchanges)
1. Report all power purchases made during the year. Also report exchanges of electricity (i.e., transactions involving a balancing of
debits and credits for energy, capacity, etc.) and any settlements for imbalanced exchanges.
2. Enter the name of the seller or other party in an exchange transaction in column (a). Do not abbreviate or truncate the name or use
acronyms. Explain in a footnote any ownership interest or affiliation the respondent has with the seller.
3. In column (b), enter a Statistical Classification Code based on the original contractual terms and conditions of the service as follows:
RQ - for requirements service. Requirements service is service which the supplier plans to provide on an ongoing basis (i.e., the
supplier includes projects load for this service in its system resource planning). In addition, the reliability of requirement service must be
the same as, or second only to, the supplier’s service to its own ultimate consumers.
LF - for long-term firm service. "Long-term" means five years or longer and "firm" means that service cannot be interrupted for
economic reasons and is intended to remain reliable even under adverse conditions (e.g., the supplier must attempt to buy emergency
energy from third parties to maintain deliveries of LF service). This category should not be used for long-term firm service firm service
which meets the definition of RQ service. For all transaction identified as LF, provide in a footnote the termination date of the contract
defined as the earliest date that either buyer or seller can unilaterally get out of the contract.
IF - for intermediate-term firm service. The same as LF service expect that "intermediate-term" means longer than one year but less
than five years.
SF - for short-term service. Use this category for all firm services, where the duration of each period of commitment for service is one
year or less.
LU - for long-term service from a designated generating unit. "Long-term" means five years or longer. The availability and reliability of
service, aside from transmission constraints, must match the availability and reliability of the designated unit.
IU - for intermediate-term service from a designated generating unit. The same as LU service expect that "intermediate-term" means
longer than one year but less than five years.
EX - For exchanges of electricity. Use this category for transactions involving a balancing of debits and credits for energy, capacity, etc.
and any settlements for imbalanced exchanges.
OS - for other service. Use this category only for those services which cannot be placed in the above-defined categories, such as all
non-firm service regardless of the Length of the contract and service from designated units of Less than one year. Describe the nature
of the service in a footnote for each adjustment.
0.000000.00000WESTERN ELECTRICITY COORDINATING 1
0.000000.00000WESTLANDS SOLAR FARMS LLC 2
0.000000.00000WESTSIDE SOLAR LLC 3
0.000000.00000WHEELABRATOR SHASTA BIOMASS 4
0.000000.00000WHITE RIVER SOLAR 2 5
0.000000.00000WHITE RIVER SOLAR CED 6
0.000000.00000WIND RESOURCE 1 CALWIND RAM 1 7
0.000000.00000WIND RESOURCE 2 CALWIND RAM 2 8
0.000000.00000WINTER WHEAT SAN JOAQUIN 1B 9
0.000000.00000WOLFSEN BYPASS (CCID) 10
0.000000.00000WOODLAND BIOMASS 11
0.000000.00000WOODMERE SOLAR FARM 12
0.000000.00000WOODMERE SOLAR RAM 4 13
0.000000.00000YCWA MINI HYDRO 14
FERC FORM NO. 1 (ED. 12-90) Page 326.31
Total

Name of Respondent This Report Is:(1) An Original
(2) A Resubmission
Date of Report(Mo, Da, Yr)
Year/Period of Report
End of
PURCHASED POWER (Account 555)
PACIFIC GAS AND ELECTRIC COMPANYX
04/13/20212020/Q4
Line
No.
Name of Company or Public Authority
(c)(b)(a)
FERC RateMonthly Billing
Average
(d)
Statistical
cationClassifi- Schedule or
Tariff Number Demand (MW)
(e) (f)
(Footnote Affiliations)
Actual Demand (MW)
Average AverageMonthly NCP Demand Monthly CP Demand
(Including power exchanges)
1. Report all power purchases made during the year. Also report exchanges of electricity (i.e., transactions involving a balancing of
debits and credits for energy, capacity, etc.) and any settlements for imbalanced exchanges.
2. Enter the name of the seller or other party in an exchange transaction in column (a). Do not abbreviate or truncate the name or use
acronyms. Explain in a footnote any ownership interest or affiliation the respondent has with the seller.
3. In column (b), enter a Statistical Classification Code based on the original contractual terms and conditions of the service as follows:
RQ - for requirements service. Requirements service is service which the supplier plans to provide on an ongoing basis (i.e., the
supplier includes projects load for this service in its system resource planning). In addition, the reliability of requirement service must be
the same as, or second only to, the supplier’s service to its own ultimate consumers.
LF - for long-term firm service. "Long-term" means five years or longer and "firm" means that service cannot be interrupted for
economic reasons and is intended to remain reliable even under adverse conditions (e.g., the supplier must attempt to buy emergency
energy from third parties to maintain deliveries of LF service). This category should not be used for long-term firm service firm service
which meets the definition of RQ service. For all transaction identified as LF, provide in a footnote the termination date of the contract
defined as the earliest date that either buyer or seller can unilaterally get out of the contract.
IF - for intermediate-term firm service. The same as LF service expect that "intermediate-term" means longer than one year but less
than five years.
SF - for short-term service. Use this category for all firm services, where the duration of each period of commitment for service is one
year or less.
LU - for long-term service from a designated generating unit. "Long-term" means five years or longer. The availability and reliability of
service, aside from transmission constraints, must match the availability and reliability of the designated unit.
IU - for intermediate-term service from a designated generating unit. The same as LU service expect that "intermediate-term" means
longer than one year but less than five years.
EX - For exchanges of electricity. Use this category for transactions involving a balancing of debits and credits for energy, capacity, etc.
and any settlements for imbalanced exchanges.
OS - for other service. Use this category only for those services which cannot be placed in the above-defined categories, such as all
non-firm service regardless of the Length of the contract and service from designated units of Less than one year. Describe the nature
of the service in a footnote for each adjustment.
0.000000.00000YOLO COUNTY GRASSLAND 3 1
0.000000.00000YOLO COUNTY GRASSLAND 4 2
0.000000.00000ZERO WASTE ENERGY 3
0.000000.00000MISC. CONTRACT DATA 4
5
0.000000.00000Pipeline charges 6
0.000000.00000RUBY PIPELINE 7
0.000000.00000WILLIAMS FIELD SERVICES - 8
0.000000.00000SOUTHERN CA GAS - BU 9
0.000000.00000Gas Transmission Northwest 10
11
0.000000.00000Other charges 12
0.000000.00000Irrigation districts 13
0.000000.00000Liberty Utilities 14
FERC FORM NO. 1 (ED. 12-90) Page 326.32
Total

Name of Respondent This Report Is:(1) An Original
(2) A Resubmission
Date of Report(Mo, Da, Yr)
Year/Period of Report
End of
PURCHASED POWER (Account 555)
PACIFIC GAS AND ELECTRIC COMPANYX
04/13/20212020/Q4
Line
No.
Name of Company or Public Authority
(c)(b)(a)
FERC RateMonthly Billing
Average
(d)
Statistical
cationClassifi- Schedule or
Tariff Number Demand (MW)
(e) (f)
(Footnote Affiliations)
Actual Demand (MW)
Average AverageMonthly NCP Demand Monthly CP Demand
(Including power exchanges)
1. Report all power purchases made during the year. Also report exchanges of electricity (i.e., transactions involving a balancing of
debits and credits for energy, capacity, etc.) and any settlements for imbalanced exchanges.
2. Enter the name of the seller or other party in an exchange transaction in column (a). Do not abbreviate or truncate the name or use
acronyms. Explain in a footnote any ownership interest or affiliation the respondent has with the seller.
3. In column (b), enter a Statistical Classification Code based on the original contractual terms and conditions of the service as follows:
RQ - for requirements service. Requirements service is service which the supplier plans to provide on an ongoing basis (i.e., the
supplier includes projects load for this service in its system resource planning). In addition, the reliability of requirement service must be
the same as, or second only to, the supplier’s service to its own ultimate consumers.
LF - for long-term firm service. "Long-term" means five years or longer and "firm" means that service cannot be interrupted for
economic reasons and is intended to remain reliable even under adverse conditions (e.g., the supplier must attempt to buy emergency
energy from third parties to maintain deliveries of LF service). This category should not be used for long-term firm service firm service
which meets the definition of RQ service. For all transaction identified as LF, provide in a footnote the termination date of the contract
defined as the earliest date that either buyer or seller can unilaterally get out of the contract.
IF - for intermediate-term firm service. The same as LF service expect that "intermediate-term" means longer than one year but less
than five years.
SF - for short-term service. Use this category for all firm services, where the duration of each period of commitment for service is one
year or less.
LU - for long-term service from a designated generating unit. "Long-term" means five years or longer. The availability and reliability of
service, aside from transmission constraints, must match the availability and reliability of the designated unit.
IU - for intermediate-term service from a designated generating unit. The same as LU service expect that "intermediate-term" means
longer than one year but less than five years.
EX - For exchanges of electricity. Use this category for transactions involving a balancing of debits and credits for energy, capacity, etc.
and any settlements for imbalanced exchanges.
OS - for other service. Use this category only for those services which cannot be placed in the above-defined categories, such as all
non-firm service regardless of the Length of the contract and service from designated units of Less than one year. Describe the nature
of the service in a footnote for each adjustment.
0.000000.00000ISO charges for storage cost 1
0.000000.00000ISO charges ( net of storage cost but 2
0.000000.00000Gas purchases, storage cost & forex 3
0.000000.00000CARB fees 4
0.000000.00000Consultancy fees 5
0.000000.00000Gas Hedges & brokers fees 6
0.000000.00000RECS from customers 7
0.000000.00000RA MPB True-up to RA Adder and Revenue 8
9
Rounding in column I 10
11
12
13
14
FERC FORM NO. 1 (ED. 12-90) Page 326.33
Total

Name of Respondent This Report Is:(1) An Original
(2) A Resubmission
Date of Report(Mo, Da, Yr)
Year/Period of Report
End of
PURCHASED POWER(Account 555) (Continued)
PACIFIC GAS AND ELECTRIC COMPANYX
04/13/20212020/Q4
Line
No.MegaWatt Hours
(i)(h)(g) (j)
Demand Charges Energy Charges Other Charges
(k)
Purchased(j+k+l)Total
COST/SETTLEMENT OF POWER
($) ($) ($)
(Including power exchanges)
POWER EXCHANGES
MegaWatt HoursReceived
MegaWatt HoursDelivered
(l) (m)of Settlement ($)
AD - for out-of-period adjustment. Use this code for any accounting adjustments or "true-ups" for service provided in prior reporting
years. Provide an explanation in a footnote for each adjustment.
4. In column (c), identify the FERC Rate Schedule Number or Tariff, or, for non-FERC jurisdictional sellers, include an appropriate
designation for the contract. On separate lines, list all FERC rate schedules, tariffs or contract designations under which service, as
identified in column (b), is provided.
5. For requirements RQ purchases and any type of service involving demand charges imposed on a monnthly (or longer) basis, enter
the monthly average billing demand in column (d), the average monthly non-coincident peak (NCP) demand in column (e), and the
average monthly coincident peak (CP) demand in column (f). For all other types of service, enter NA in columns (d), (e) and (f). Monthly
NCP demand is the maximum metered hourly (60-minute integration) demand in a month. Monthly CP demand is the metered demand
during the hour (60-minute integration) in which the supplier's system reaches its monthly peak. Demand reported in columns (e) and (f)
must be in megawatts. Footnote any demand not stated on a megawatt basis and explain.
6. Report in column (g) the megawatthours shown on bills rendered to the respondent. Report in columns (h) and (i) the megawatthours
of power exchanges received and delivered, used as the basis for settlement. Do not report net exchange.
7. Report demand charges in column (j), energy charges in column (k), and the total of any other types of charges, including
out-of-period adjustments, in column (l). Explain in a footnote all components of the amount shown in column (l). Report in column (m)
the total charge shown on bills received as settlement by the respondent. For power exchanges, report in column (m) the settlement
amount for the net receipt of energy. If more energy was delivered than received, enter a negative amount. If the settlement amount (l)
include credits or charges other than incremental generation expenses, or (2) excludes certain credits or charges covered by the
agreement, provide an explanatory footnote.
8. The data in column (g) through (m) must be totalled on the last line of the schedule. The total amount in column (g) must be
reported as Purchases on Page 401, line 10. The total amount in column (h) must be reported as Exchange Received on Page 401,
line 12. The total amount in column (i) must be reported as Exchange Delivered on Page 401, line 13.
9. Footnote entries as required and provide explanations following all required data.
1
2
797 6,606 7,403 3 196
3,636 18,422 22,058 4 571
63 1,763 1,826 5 52
6
2 2 7
126,740 214,786 341,526 8 8,918
118 1,616 1,734 9 66
3 57 60 10 2
1,487 6,311 7,798 11 150
1,642 11,874 13,516 12 426
13
21,306 106,920 128,226 14 2,690
FERC FORM NO. 1 (ED. 12-90) Page 327
59,363,830 685,933,482 2,310,043,645 1,617,412,325 4,613,389,452

Name of Respondent This Report Is:(1) An Original
(2) A Resubmission
Date of Report(Mo, Da, Yr)
Year/Period of Report
End of
PURCHASED POWER(Account 555) (Continued)
PACIFIC GAS AND ELECTRIC COMPANYX
04/13/20212020/Q4
Line
No.MegaWatt Hours
(i)(h)(g) (j)
Demand Charges Energy Charges Other Charges
(k)
Purchased(j+k+l)Total
COST/SETTLEMENT OF POWER
($) ($) ($)
(Including power exchanges)
POWER EXCHANGES
MegaWatt HoursReceived
MegaWatt HoursDelivered
(l) (m)of Settlement ($)
AD - for out-of-period adjustment. Use this code for any accounting adjustments or "true-ups" for service provided in prior reporting
years. Provide an explanation in a footnote for each adjustment.
4. In column (c), identify the FERC Rate Schedule Number or Tariff, or, for non-FERC jurisdictional sellers, include an appropriate
designation for the contract. On separate lines, list all FERC rate schedules, tariffs or contract designations under which service, as
identified in column (b), is provided.
5. For requirements RQ purchases and any type of service involving demand charges imposed on a monnthly (or longer) basis, enter
the monthly average billing demand in column (d), the average monthly non-coincident peak (NCP) demand in column (e), and the
average monthly coincident peak (CP) demand in column (f). For all other types of service, enter NA in columns (d), (e) and (f). Monthly
NCP demand is the maximum metered hourly (60-minute integration) demand in a month. Monthly CP demand is the metered demand
during the hour (60-minute integration) in which the supplier's system reaches its monthly peak. Demand reported in columns (e) and (f)
must be in megawatts. Footnote any demand not stated on a megawatt basis and explain.
6. Report in column (g) the megawatthours shown on bills rendered to the respondent. Report in columns (h) and (i) the megawatthours
of power exchanges received and delivered, used as the basis for settlement. Do not report net exchange.
7. Report demand charges in column (j), energy charges in column (k), and the total of any other types of charges, including
out-of-period adjustments, in column (l). Explain in a footnote all components of the amount shown in column (l). Report in column (m)
the total charge shown on bills received as settlement by the respondent. For power exchanges, report in column (m) the settlement
amount for the net receipt of energy. If more energy was delivered than received, enter a negative amount. If the settlement amount (l)
include credits or charges other than incremental generation expenses, or (2) excludes certain credits or charges covered by the
agreement, provide an explanatory footnote.
8. The data in column (g) through (m) must be totalled on the last line of the schedule. The total amount in column (g) must be
reported as Purchases on Page 401, line 10. The total amount in column (h) must be reported as Exchange Received on Page 401,
line 12. The total amount in column (i) must be reported as Exchange Delivered on Page 401, line 13.
9. Footnote entries as required and provide explanations following all required data.
2,119 10,593 12,712 1 269
2
51,852 245,088 296,940 3 8,882
374 -637 -263 4 64
561,312 718,013 1,279,325 5 18,166
5,038 23,961 28,999 6 762
831 8,949 9,780 7 273
8
23,847 56,038 79,885 9 2,846
10
3 3 11
2,132 8,925 11,057 12 248
13
468 1,565 2,033 14 43
FERC FORM NO. 1 (ED. 12-90) Page 327.1
59,363,830 685,933,482 2,310,043,645 1,617,412,325 4,613,389,452

Name of Respondent This Report Is:(1) An Original
(2) A Resubmission
Date of Report(Mo, Da, Yr)
Year/Period of Report
End of
PURCHASED POWER(Account 555) (Continued)
PACIFIC GAS AND ELECTRIC COMPANYX
04/13/20212020/Q4
Line
No.MegaWatt Hours
(i)(h)(g) (j)
Demand Charges Energy Charges Other Charges
(k)
Purchased(j+k+l)Total
COST/SETTLEMENT OF POWER
($) ($) ($)
(Including power exchanges)
POWER EXCHANGES
MegaWatt HoursReceived
MegaWatt HoursDelivered
(l) (m)of Settlement ($)
AD - for out-of-period adjustment. Use this code for any accounting adjustments or "true-ups" for service provided in prior reporting
years. Provide an explanation in a footnote for each adjustment.
4. In column (c), identify the FERC Rate Schedule Number or Tariff, or, for non-FERC jurisdictional sellers, include an appropriate
designation for the contract. On separate lines, list all FERC rate schedules, tariffs or contract designations under which service, as
identified in column (b), is provided.
5. For requirements RQ purchases and any type of service involving demand charges imposed on a monnthly (or longer) basis, enter
the monthly average billing demand in column (d), the average monthly non-coincident peak (NCP) demand in column (e), and the
average monthly coincident peak (CP) demand in column (f). For all other types of service, enter NA in columns (d), (e) and (f). Monthly
NCP demand is the maximum metered hourly (60-minute integration) demand in a month. Monthly CP demand is the metered demand
during the hour (60-minute integration) in which the supplier's system reaches its monthly peak. Demand reported in columns (e) and (f)
must be in megawatts. Footnote any demand not stated on a megawatt basis and explain.
6. Report in column (g) the megawatthours shown on bills rendered to the respondent. Report in columns (h) and (i) the megawatthours
of power exchanges received and delivered, used as the basis for settlement. Do not report net exchange.
7. Report demand charges in column (j), energy charges in column (k), and the total of any other types of charges, including
out-of-period adjustments, in column (l). Explain in a footnote all components of the amount shown in column (l). Report in column (m)
the total charge shown on bills received as settlement by the respondent. For power exchanges, report in column (m) the settlement
amount for the net receipt of energy. If more energy was delivered than received, enter a negative amount. If the settlement amount (l)
include credits or charges other than incremental generation expenses, or (2) excludes certain credits or charges covered by the
agreement, provide an explanatory footnote.
8. The data in column (g) through (m) must be totalled on the last line of the schedule. The total amount in column (g) must be
reported as Purchases on Page 401, line 10. The total amount in column (h) must be reported as Exchange Received on Page 401,
line 12. The total amount in column (i) must be reported as Exchange Delivered on Page 401, line 13.
9. Footnote entries as required and provide explanations following all required data.
7,702 22,203 29,905 1 726
2
48,562 73,597 122,159 3 2,356
35 28,871 28,906 4 744
19,494 19,021 38,515 5 606
607,223 607,223 6 20,139
-372 -372 7 9
8
53,811,096 45,303,715 99,114,811 9 1,344,212
122,996 848,234 971,230 10 25,503
26,029 202,109 228,138 11 7,039
12
299 2,999 3,298 13 86
155 155 14 6
FERC FORM NO. 1 (ED. 12-90) Page 327.2
59,363,830 685,933,482 2,310,043,645 1,617,412,325 4,613,389,452

Name of Respondent This Report Is:(1) An Original
(2) A Resubmission
Date of Report(Mo, Da, Yr)
Year/Period of Report
End of
PURCHASED POWER(Account 555) (Continued)
PACIFIC GAS AND ELECTRIC COMPANYX
04/13/20212020/Q4
Line
No.MegaWatt Hours
(i)(h)(g) (j)
Demand Charges Energy Charges Other Charges
(k)
Purchased(j+k+l)Total
COST/SETTLEMENT OF POWER
($) ($) ($)
(Including power exchanges)
POWER EXCHANGES
MegaWatt HoursReceived
MegaWatt HoursDelivered
(l) (m)of Settlement ($)
AD - for out-of-period adjustment. Use this code for any accounting adjustments or "true-ups" for service provided in prior reporting
years. Provide an explanation in a footnote for each adjustment.
4. In column (c), identify the FERC Rate Schedule Number or Tariff, or, for non-FERC jurisdictional sellers, include an appropriate
designation for the contract. On separate lines, list all FERC rate schedules, tariffs or contract designations under which service, as
identified in column (b), is provided.
5. For requirements RQ purchases and any type of service involving demand charges imposed on a monnthly (or longer) basis, enter
the monthly average billing demand in column (d), the average monthly non-coincident peak (NCP) demand in column (e), and the
average monthly coincident peak (CP) demand in column (f). For all other types of service, enter NA in columns (d), (e) and (f). Monthly
NCP demand is the maximum metered hourly (60-minute integration) demand in a month. Monthly CP demand is the metered demand
during the hour (60-minute integration) in which the supplier's system reaches its monthly peak. Demand reported in columns (e) and (f)
must be in megawatts. Footnote any demand not stated on a megawatt basis and explain.
6. Report in column (g) the megawatthours shown on bills rendered to the respondent. Report in columns (h) and (i) the megawatthours
of power exchanges received and delivered, used as the basis for settlement. Do not report net exchange.
7. Report demand charges in column (j), energy charges in column (k), and the total of any other types of charges, including
out-of-period adjustments, in column (l). Explain in a footnote all components of the amount shown in column (l). Report in column (m)
the total charge shown on bills received as settlement by the respondent. For power exchanges, report in column (m) the settlement
amount for the net receipt of energy. If more energy was delivered than received, enter a negative amount. If the settlement amount (l)
include credits or charges other than incremental generation expenses, or (2) excludes certain credits or charges covered by the
agreement, provide an explanatory footnote.
8. The data in column (g) through (m) must be totalled on the last line of the schedule. The total amount in column (g) must be
reported as Purchases on Page 401, line 10. The total amount in column (h) must be reported as Exchange Received on Page 401,
line 12. The total amount in column (i) must be reported as Exchange Delivered on Page 401, line 13.
9. Footnote entries as required and provide explanations following all required data.
667 7,067 7,734 1 195
9,298 166,203 175,501 2 4,845
2 550 552 3 16
20,738 262,808 283,546 4 7,503
23 23 5 1
121 1,930 2,051 6 55
32 1,251 1,283 7 34
59 570 629 8 15
103 1,740 1,843 9 48
1 1 10
11
-1,088 -1,088 12 -5,521
10,485,766 1,269,052 11,754,818 13 37,719
14
FERC FORM NO. 1 (ED. 12-90) Page 327.3
59,363,830 685,933,482 2,310,043,645 1,617,412,325 4,613,389,452
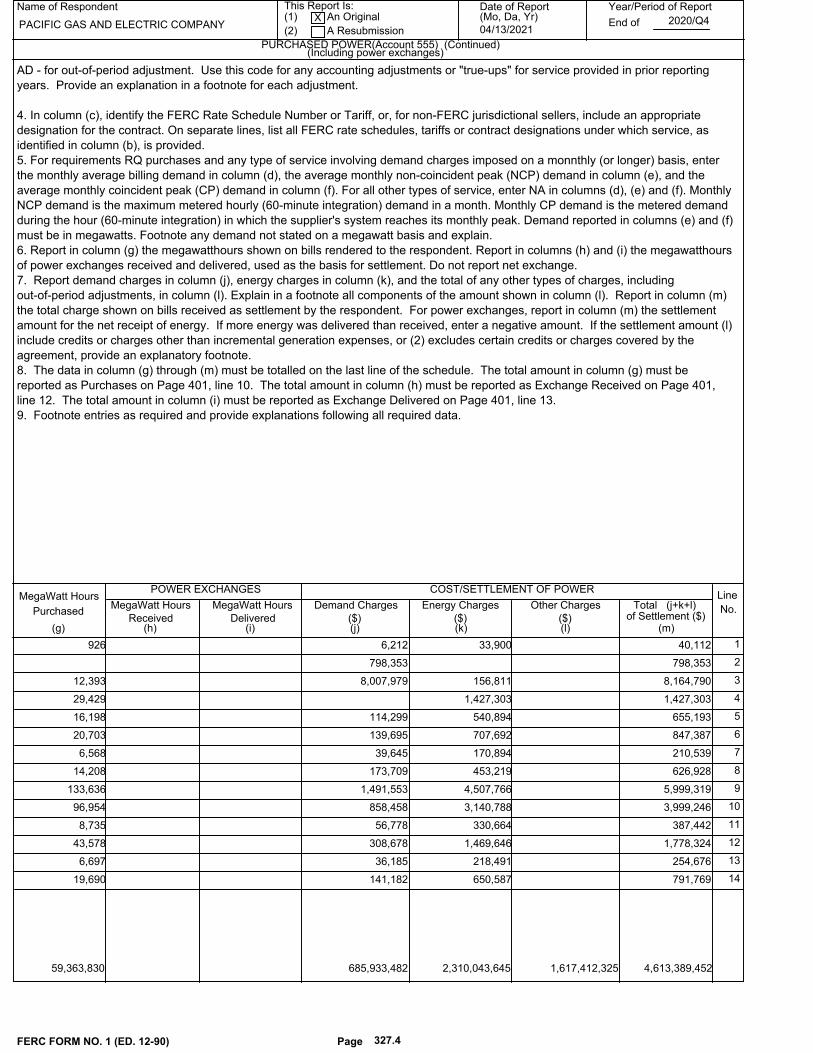
Name of Respondent This Report Is:(1) An Original
(2) A Resubmission
Date of Report(Mo, Da, Yr)
Year/Period of Report
End of
PURCHASED POWER(Account 555) (Continued)
PACIFIC GAS AND ELECTRIC COMPANYX
04/13/20212020/Q4
Line
No.MegaWatt Hours
(i)(h)(g) (j)
Demand Charges Energy Charges Other Charges
(k)
Purchased(j+k+l)Total
COST/SETTLEMENT OF POWER
($) ($) ($)
(Including power exchanges)
POWER EXCHANGES
MegaWatt HoursReceived
MegaWatt HoursDelivered
(l) (m)of Settlement ($)
AD - for out-of-period adjustment. Use this code for any accounting adjustments or "true-ups" for service provided in prior reporting
years. Provide an explanation in a footnote for each adjustment.
4. In column (c), identify the FERC Rate Schedule Number or Tariff, or, for non-FERC jurisdictional sellers, include an appropriate
designation for the contract. On separate lines, list all FERC rate schedules, tariffs or contract designations under which service, as
identified in column (b), is provided.
5. For requirements RQ purchases and any type of service involving demand charges imposed on a monnthly (or longer) basis, enter
the monthly average billing demand in column (d), the average monthly non-coincident peak (NCP) demand in column (e), and the
average monthly coincident peak (CP) demand in column (f). For all other types of service, enter NA in columns (d), (e) and (f). Monthly
NCP demand is the maximum metered hourly (60-minute integration) demand in a month. Monthly CP demand is the metered demand
during the hour (60-minute integration) in which the supplier's system reaches its monthly peak. Demand reported in columns (e) and (f)
must be in megawatts. Footnote any demand not stated on a megawatt basis and explain.
6. Report in column (g) the megawatthours shown on bills rendered to the respondent. Report in columns (h) and (i) the megawatthours
of power exchanges received and delivered, used as the basis for settlement. Do not report net exchange.
7. Report demand charges in column (j), energy charges in column (k), and the total of any other types of charges, including
out-of-period adjustments, in column (l). Explain in a footnote all components of the amount shown in column (l). Report in column (m)
the total charge shown on bills received as settlement by the respondent. For power exchanges, report in column (m) the settlement
amount for the net receipt of energy. If more energy was delivered than received, enter a negative amount. If the settlement amount (l)
include credits or charges other than incremental generation expenses, or (2) excludes certain credits or charges covered by the
agreement, provide an explanatory footnote.
8. The data in column (g) through (m) must be totalled on the last line of the schedule. The total amount in column (g) must be
reported as Purchases on Page 401, line 10. The total amount in column (h) must be reported as Exchange Received on Page 401,
line 12. The total amount in column (i) must be reported as Exchange Delivered on Page 401, line 13.
9. Footnote entries as required and provide explanations following all required data.
6,212 33,900 40,112 1 926
798,353 798,353 2
8,007,979 156,811 8,164,790 3 12,393
1,427,303 1,427,303 4 29,429
114,299 540,894 655,193 5 16,198
139,695 707,692 847,387 6 20,703
39,645 170,894 210,539 7 6,568
173,709 453,219 626,928 8 14,208
1,491,553 4,507,766 5,999,319 9 133,636
858,458 3,140,788 3,999,246 10 96,954
56,778 330,664 387,442 11 8,735
308,678 1,469,646 1,778,324 12 43,578
36,185 218,491 254,676 13 6,697
141,182 650,587 791,769 14 19,690
FERC FORM NO. 1 (ED. 12-90) Page 327.4
59,363,830 685,933,482 2,310,043,645 1,617,412,325 4,613,389,452

Name of Respondent This Report Is:(1) An Original
(2) A Resubmission
Date of Report(Mo, Da, Yr)
Year/Period of Report
End of
PURCHASED POWER(Account 555) (Continued)
PACIFIC GAS AND ELECTRIC COMPANYX
04/13/20212020/Q4
Line
No.MegaWatt Hours
(i)(h)(g) (j)
Demand Charges Energy Charges Other Charges
(k)
Purchased(j+k+l)Total
COST/SETTLEMENT OF POWER
($) ($) ($)
(Including power exchanges)
POWER EXCHANGES
MegaWatt HoursReceived
MegaWatt HoursDelivered
(l) (m)of Settlement ($)
AD - for out-of-period adjustment. Use this code for any accounting adjustments or "true-ups" for service provided in prior reporting
years. Provide an explanation in a footnote for each adjustment.
4. In column (c), identify the FERC Rate Schedule Number or Tariff, or, for non-FERC jurisdictional sellers, include an appropriate
designation for the contract. On separate lines, list all FERC rate schedules, tariffs or contract designations under which service, as
identified in column (b), is provided.
5. For requirements RQ purchases and any type of service involving demand charges imposed on a monnthly (or longer) basis, enter
the monthly average billing demand in column (d), the average monthly non-coincident peak (NCP) demand in column (e), and the
average monthly coincident peak (CP) demand in column (f). For all other types of service, enter NA in columns (d), (e) and (f). Monthly
NCP demand is the maximum metered hourly (60-minute integration) demand in a month. Monthly CP demand is the metered demand
during the hour (60-minute integration) in which the supplier's system reaches its monthly peak. Demand reported in columns (e) and (f)
must be in megawatts. Footnote any demand not stated on a megawatt basis and explain.
6. Report in column (g) the megawatthours shown on bills rendered to the respondent. Report in columns (h) and (i) the megawatthours
of power exchanges received and delivered, used as the basis for settlement. Do not report net exchange.
7. Report demand charges in column (j), energy charges in column (k), and the total of any other types of charges, including
out-of-period adjustments, in column (l). Explain in a footnote all components of the amount shown in column (l). Report in column (m)
the total charge shown on bills received as settlement by the respondent. For power exchanges, report in column (m) the settlement
amount for the net receipt of energy. If more energy was delivered than received, enter a negative amount. If the settlement amount (l)
include credits or charges other than incremental generation expenses, or (2) excludes certain credits or charges covered by the
agreement, provide an explanatory footnote.
8. The data in column (g) through (m) must be totalled on the last line of the schedule. The total amount in column (g) must be
reported as Purchases on Page 401, line 10. The total amount in column (h) must be reported as Exchange Received on Page 401,
line 12. The total amount in column (i) must be reported as Exchange Delivered on Page 401, line 13.
9. Footnote entries as required and provide explanations following all required data.
1
2
85,782 85,782 3 604
331,993 331,993 4 2,412
146,977 146,977 5 1,075
75,186 75,186 6 534
-818 351,433 350,615 7 2,537
178,032 178,032 8 1,239
202,910 202,910 9 1,414
550,038 550,038 10 3,693
298,050 298,050 11 2,035
98,978 98,978 12 726
72,957 72,957 13 1,099
1,577 1,577 14 48
FERC FORM NO. 1 (ED. 12-90) Page 327.5
59,363,830 685,933,482 2,310,043,645 1,617,412,325 4,613,389,452

Name of Respondent This Report Is:(1) An Original
(2) A Resubmission
Date of Report(Mo, Da, Yr)
Year/Period of Report
End of
PURCHASED POWER(Account 555) (Continued)
PACIFIC GAS AND ELECTRIC COMPANYX
04/13/20212020/Q4
Line
No.MegaWatt Hours
(i)(h)(g) (j)
Demand Charges Energy Charges Other Charges
(k)
Purchased(j+k+l)Total
COST/SETTLEMENT OF POWER
($) ($) ($)
(Including power exchanges)
POWER EXCHANGES
MegaWatt HoursReceived
MegaWatt HoursDelivered
(l) (m)of Settlement ($)
AD - for out-of-period adjustment. Use this code for any accounting adjustments or "true-ups" for service provided in prior reporting
years. Provide an explanation in a footnote for each adjustment.
4. In column (c), identify the FERC Rate Schedule Number or Tariff, or, for non-FERC jurisdictional sellers, include an appropriate
designation for the contract. On separate lines, list all FERC rate schedules, tariffs or contract designations under which service, as
identified in column (b), is provided.
5. For requirements RQ purchases and any type of service involving demand charges imposed on a monnthly (or longer) basis, enter
the monthly average billing demand in column (d), the average monthly non-coincident peak (NCP) demand in column (e), and the
average monthly coincident peak (CP) demand in column (f). For all other types of service, enter NA in columns (d), (e) and (f). Monthly
NCP demand is the maximum metered hourly (60-minute integration) demand in a month. Monthly CP demand is the metered demand
during the hour (60-minute integration) in which the supplier's system reaches its monthly peak. Demand reported in columns (e) and (f)
must be in megawatts. Footnote any demand not stated on a megawatt basis and explain.
6. Report in column (g) the megawatthours shown on bills rendered to the respondent. Report in columns (h) and (i) the megawatthours
of power exchanges received and delivered, used as the basis for settlement. Do not report net exchange.
7. Report demand charges in column (j), energy charges in column (k), and the total of any other types of charges, including
out-of-period adjustments, in column (l). Explain in a footnote all components of the amount shown in column (l). Report in column (m)
the total charge shown on bills received as settlement by the respondent. For power exchanges, report in column (m) the settlement
amount for the net receipt of energy. If more energy was delivered than received, enter a negative amount. If the settlement amount (l)
include credits or charges other than incremental generation expenses, or (2) excludes certain credits or charges covered by the
agreement, provide an explanatory footnote.
8. The data in column (g) through (m) must be totalled on the last line of the schedule. The total amount in column (g) must be
reported as Purchases on Page 401, line 10. The total amount in column (h) must be reported as Exchange Received on Page 401,
line 12. The total amount in column (i) must be reported as Exchange Delivered on Page 401, line 13.
9. Footnote entries as required and provide explanations following all required data.
82,225 82,225 1 609
45,361 45,361 2 313
256,990 256,990 3 2,427
79,788 79,788 4 580
-9,537 -9,537 5 24
145,649 145,649 6 1,053
75,407 75,407 7 522
322,581 322,581 8 3,447
5,457 5,457 9 151
82,852 82,852 10 659
-2,449 -2,449 11
-164,784 -164,784 12
-812,500 -812,500 13 -50,000
-26,970 -26,970 14 726
FERC FORM NO. 1 (ED. 12-90) Page 327.6
59,363,830 685,933,482 2,310,043,645 1,617,412,325 4,613,389,452

Name of Respondent This Report Is:(1) An Original
(2) A Resubmission
Date of Report(Mo, Da, Yr)
Year/Period of Report
End of
PURCHASED POWER(Account 555) (Continued)
PACIFIC GAS AND ELECTRIC COMPANYX
04/13/20212020/Q4
Line
No.MegaWatt Hours
(i)(h)(g) (j)
Demand Charges Energy Charges Other Charges
(k)
Purchased(j+k+l)Total
COST/SETTLEMENT OF POWER
($) ($) ($)
(Including power exchanges)
POWER EXCHANGES
MegaWatt HoursReceived
MegaWatt HoursDelivered
(l) (m)of Settlement ($)
AD - for out-of-period adjustment. Use this code for any accounting adjustments or "true-ups" for service provided in prior reporting
years. Provide an explanation in a footnote for each adjustment.
4. In column (c), identify the FERC Rate Schedule Number or Tariff, or, for non-FERC jurisdictional sellers, include an appropriate
designation for the contract. On separate lines, list all FERC rate schedules, tariffs or contract designations under which service, as
identified in column (b), is provided.
5. For requirements RQ purchases and any type of service involving demand charges imposed on a monnthly (or longer) basis, enter
the monthly average billing demand in column (d), the average monthly non-coincident peak (NCP) demand in column (e), and the
average monthly coincident peak (CP) demand in column (f). For all other types of service, enter NA in columns (d), (e) and (f). Monthly
NCP demand is the maximum metered hourly (60-minute integration) demand in a month. Monthly CP demand is the metered demand
during the hour (60-minute integration) in which the supplier's system reaches its monthly peak. Demand reported in columns (e) and (f)
must be in megawatts. Footnote any demand not stated on a megawatt basis and explain.
6. Report in column (g) the megawatthours shown on bills rendered to the respondent. Report in columns (h) and (i) the megawatthours
of power exchanges received and delivered, used as the basis for settlement. Do not report net exchange.
7. Report demand charges in column (j), energy charges in column (k), and the total of any other types of charges, including
out-of-period adjustments, in column (l). Explain in a footnote all components of the amount shown in column (l). Report in column (m)
the total charge shown on bills received as settlement by the respondent. For power exchanges, report in column (m) the settlement
amount for the net receipt of energy. If more energy was delivered than received, enter a negative amount. If the settlement amount (l)
include credits or charges other than incremental generation expenses, or (2) excludes certain credits or charges covered by the
agreement, provide an explanatory footnote.
8. The data in column (g) through (m) must be totalled on the last line of the schedule. The total amount in column (g) must be
reported as Purchases on Page 401, line 10. The total amount in column (h) must be reported as Exchange Received on Page 401,
line 12. The total amount in column (i) must be reported as Exchange Delivered on Page 401, line 13.
9. Footnote entries as required and provide explanations following all required data.
-3,476 -3,476 1 427
-11,983 -11,983 2 589
1,520,278 1,520,278 3 8,381
1,292,307 1,292,307 4 6,704
1,411,831 1,411,831 5 7,650
1,970,444 1,970,444 6 14,858
195,225 195,225 7 1,094
488 488 8 62
-22,500 125,393,031 125,370,531 9 718,309
729,655 729,655 10 46,593
57,686 57,686 11 1,612
-3,500 3,523,222 3,519,722 12 41,081
1,478,440 1,478,440 13
4,052,695 4,052,695 14 48,480
FERC FORM NO. 1 (ED. 12-90) Page 327.7
59,363,830 685,933,482 2,310,043,645 1,617,412,325 4,613,389,452

Name of Respondent This Report Is:(1) An Original
(2) A Resubmission
Date of Report(Mo, Da, Yr)
Year/Period of Report
End of
PURCHASED POWER(Account 555) (Continued)
PACIFIC GAS AND ELECTRIC COMPANYX
04/13/20212020/Q4
Line
No.MegaWatt Hours
(i)(h)(g) (j)
Demand Charges Energy Charges Other Charges
(k)
Purchased(j+k+l)Total
COST/SETTLEMENT OF POWER
($) ($) ($)
(Including power exchanges)
POWER EXCHANGES
MegaWatt HoursReceived
MegaWatt HoursDelivered
(l) (m)of Settlement ($)
AD - for out-of-period adjustment. Use this code for any accounting adjustments or "true-ups" for service provided in prior reporting
years. Provide an explanation in a footnote for each adjustment.
4. In column (c), identify the FERC Rate Schedule Number or Tariff, or, for non-FERC jurisdictional sellers, include an appropriate
designation for the contract. On separate lines, list all FERC rate schedules, tariffs or contract designations under which service, as
identified in column (b), is provided.
5. For requirements RQ purchases and any type of service involving demand charges imposed on a monnthly (or longer) basis, enter
the monthly average billing demand in column (d), the average monthly non-coincident peak (NCP) demand in column (e), and the
average monthly coincident peak (CP) demand in column (f). For all other types of service, enter NA in columns (d), (e) and (f). Monthly
NCP demand is the maximum metered hourly (60-minute integration) demand in a month. Monthly CP demand is the metered demand
during the hour (60-minute integration) in which the supplier's system reaches its monthly peak. Demand reported in columns (e) and (f)
must be in megawatts. Footnote any demand not stated on a megawatt basis and explain.
6. Report in column (g) the megawatthours shown on bills rendered to the respondent. Report in columns (h) and (i) the megawatthours
of power exchanges received and delivered, used as the basis for settlement. Do not report net exchange.
7. Report demand charges in column (j), energy charges in column (k), and the total of any other types of charges, including
out-of-period adjustments, in column (l). Explain in a footnote all components of the amount shown in column (l). Report in column (m)
the total charge shown on bills received as settlement by the respondent. For power exchanges, report in column (m) the settlement
amount for the net receipt of energy. If more energy was delivered than received, enter a negative amount. If the settlement amount (l)
include credits or charges other than incremental generation expenses, or (2) excludes certain credits or charges covered by the
agreement, provide an explanatory footnote.
8. The data in column (g) through (m) must be totalled on the last line of the schedule. The total amount in column (g) must be
reported as Purchases on Page 401, line 10. The total amount in column (h) must be reported as Exchange Received on Page 401,
line 12. The total amount in column (i) must be reported as Exchange Delivered on Page 401, line 13.
9. Footnote entries as required and provide explanations following all required data.
21,560,663 21,560,663 1 123,402
7,714,100 7,714,100 2 46,358
495,922 495,922 3 5,596
-18,153 -18,153 4 514
-101,870 -101,870 5
198,579 198,579 6 1,821
-427 -427 7
1,192,029 1,192,029 8 19,541
25,297,757 25,297,757 9 251,291
1,431,231 1,431,231 10 22,146
5,630,067 5,630,067 11 34,289
87,967,714 87,967,714 12 598,584
13
1,091,288 1,091,288 14 14,162
FERC FORM NO. 1 (ED. 12-90) Page 327.8
59,363,830 685,933,482 2,310,043,645 1,617,412,325 4,613,389,452

Name of Respondent This Report Is:(1) An Original
(2) A Resubmission
Date of Report(Mo, Da, Yr)
Year/Period of Report
End of
PURCHASED POWER(Account 555) (Continued)
PACIFIC GAS AND ELECTRIC COMPANYX
04/13/20212020/Q4
Line
No.MegaWatt Hours
(i)(h)(g) (j)
Demand Charges Energy Charges Other Charges
(k)
Purchased(j+k+l)Total
COST/SETTLEMENT OF POWER
($) ($) ($)
(Including power exchanges)
POWER EXCHANGES
MegaWatt HoursReceived
MegaWatt HoursDelivered
(l) (m)of Settlement ($)
AD - for out-of-period adjustment. Use this code for any accounting adjustments or "true-ups" for service provided in prior reporting
years. Provide an explanation in a footnote for each adjustment.
4. In column (c), identify the FERC Rate Schedule Number or Tariff, or, for non-FERC jurisdictional sellers, include an appropriate
designation for the contract. On separate lines, list all FERC rate schedules, tariffs or contract designations under which service, as
identified in column (b), is provided.
5. For requirements RQ purchases and any type of service involving demand charges imposed on a monnthly (or longer) basis, enter
the monthly average billing demand in column (d), the average monthly non-coincident peak (NCP) demand in column (e), and the
average monthly coincident peak (CP) demand in column (f). For all other types of service, enter NA in columns (d), (e) and (f). Monthly
NCP demand is the maximum metered hourly (60-minute integration) demand in a month. Monthly CP demand is the metered demand
during the hour (60-minute integration) in which the supplier's system reaches its monthly peak. Demand reported in columns (e) and (f)
must be in megawatts. Footnote any demand not stated on a megawatt basis and explain.
6. Report in column (g) the megawatthours shown on bills rendered to the respondent. Report in columns (h) and (i) the megawatthours
of power exchanges received and delivered, used as the basis for settlement. Do not report net exchange.
7. Report demand charges in column (j), energy charges in column (k), and the total of any other types of charges, including
out-of-period adjustments, in column (l). Explain in a footnote all components of the amount shown in column (l). Report in column (m)
the total charge shown on bills received as settlement by the respondent. For power exchanges, report in column (m) the settlement
amount for the net receipt of energy. If more energy was delivered than received, enter a negative amount. If the settlement amount (l)
include credits or charges other than incremental generation expenses, or (2) excludes certain credits or charges covered by the
agreement, provide an explanatory footnote.
8. The data in column (g) through (m) must be totalled on the last line of the schedule. The total amount in column (g) must be
reported as Purchases on Page 401, line 10. The total amount in column (h) must be reported as Exchange Received on Page 401,
line 12. The total amount in column (i) must be reported as Exchange Delivered on Page 401, line 13.
9. Footnote entries as required and provide explanations following all required data.
1,044,564 1,044,564 1 13,627
3,891,874 440,044 4,331,918 2 18,615
-35,793 -35,793 3 308
-2,509 196,178 193,669 4 2,200
-3,000 427,882 424,882 5 3,408
197,151 197,151 6 2,367
695,061 695,061 7 10,006
3,039,265 3,039,265 8 54,509
2,870,485 2,870,485 9 51,093
2,870,289 2,870,289 10 50,906
577,962 577,962 11 4,037
3,891,874 838,256 4,730,130 12 41,877
-21,035 -21,035 13 1,282
295,892 295,892 14 2,963
FERC FORM NO. 1 (ED. 12-90) Page 327.9
59,363,830 685,933,482 2,310,043,645 1,617,412,325 4,613,389,452

Name of Respondent This Report Is:(1) An Original
(2) A Resubmission
Date of Report(Mo, Da, Yr)
Year/Period of Report
End of
PURCHASED POWER(Account 555) (Continued)
PACIFIC GAS AND ELECTRIC COMPANYX
04/13/20212020/Q4
Line
No.MegaWatt Hours
(i)(h)(g) (j)
Demand Charges Energy Charges Other Charges
(k)
Purchased(j+k+l)Total
COST/SETTLEMENT OF POWER
($) ($) ($)
(Including power exchanges)
POWER EXCHANGES
MegaWatt HoursReceived
MegaWatt HoursDelivered
(l) (m)of Settlement ($)
AD - for out-of-period adjustment. Use this code for any accounting adjustments or "true-ups" for service provided in prior reporting
years. Provide an explanation in a footnote for each adjustment.
4. In column (c), identify the FERC Rate Schedule Number or Tariff, or, for non-FERC jurisdictional sellers, include an appropriate
designation for the contract. On separate lines, list all FERC rate schedules, tariffs or contract designations under which service, as
identified in column (b), is provided.
5. For requirements RQ purchases and any type of service involving demand charges imposed on a monnthly (or longer) basis, enter
the monthly average billing demand in column (d), the average monthly non-coincident peak (NCP) demand in column (e), and the
average monthly coincident peak (CP) demand in column (f). For all other types of service, enter NA in columns (d), (e) and (f). Monthly
NCP demand is the maximum metered hourly (60-minute integration) demand in a month. Monthly CP demand is the metered demand
during the hour (60-minute integration) in which the supplier's system reaches its monthly peak. Demand reported in columns (e) and (f)
must be in megawatts. Footnote any demand not stated on a megawatt basis and explain.
6. Report in column (g) the megawatthours shown on bills rendered to the respondent. Report in columns (h) and (i) the megawatthours
of power exchanges received and delivered, used as the basis for settlement. Do not report net exchange.
7. Report demand charges in column (j), energy charges in column (k), and the total of any other types of charges, including
out-of-period adjustments, in column (l). Explain in a footnote all components of the amount shown in column (l). Report in column (m)
the total charge shown on bills received as settlement by the respondent. For power exchanges, report in column (m) the settlement
amount for the net receipt of energy. If more energy was delivered than received, enter a negative amount. If the settlement amount (l)
include credits or charges other than incremental generation expenses, or (2) excludes certain credits or charges covered by the
agreement, provide an explanatory footnote.
8. The data in column (g) through (m) must be totalled on the last line of the schedule. The total amount in column (g) must be
reported as Purchases on Page 401, line 10. The total amount in column (h) must be reported as Exchange Received on Page 401,
line 12. The total amount in column (i) must be reported as Exchange Delivered on Page 401, line 13.
9. Footnote entries as required and provide explanations following all required data.
19,601,937 19,601,937 1
20,955,000 20,955,000 2
3,236,506 3,236,506 3 32,522
7,944 7,944 4 176
10,985 10,985 5
18 18 6
139,609 139,609 7 1,616
122,471 122,471 8 1,314
23,410,300 -14,500 23,395,800 9 231,980
47,343 47,343 10 299
12,662 12,662 11 276
18,146 18,146 12 182
27,230,763 27,230,763 13 364,717
316,886 316,886 14 19,361
FERC FORM NO. 1 (ED. 12-90) Page 327.10
59,363,830 685,933,482 2,310,043,645 1,617,412,325 4,613,389,452

Name of Respondent This Report Is:(1) An Original
(2) A Resubmission
Date of Report(Mo, Da, Yr)
Year/Period of Report
End of
PURCHASED POWER(Account 555) (Continued)
PACIFIC GAS AND ELECTRIC COMPANYX
04/13/20212020/Q4
Line
No.MegaWatt Hours
(i)(h)(g) (j)
Demand Charges Energy Charges Other Charges
(k)
Purchased(j+k+l)Total
COST/SETTLEMENT OF POWER
($) ($) ($)
(Including power exchanges)
POWER EXCHANGES
MegaWatt HoursReceived
MegaWatt HoursDelivered
(l) (m)of Settlement ($)
AD - for out-of-period adjustment. Use this code for any accounting adjustments or "true-ups" for service provided in prior reporting
years. Provide an explanation in a footnote for each adjustment.
4. In column (c), identify the FERC Rate Schedule Number or Tariff, or, for non-FERC jurisdictional sellers, include an appropriate
designation for the contract. On separate lines, list all FERC rate schedules, tariffs or contract designations under which service, as
identified in column (b), is provided.
5. For requirements RQ purchases and any type of service involving demand charges imposed on a monnthly (or longer) basis, enter
the monthly average billing demand in column (d), the average monthly non-coincident peak (NCP) demand in column (e), and the
average monthly coincident peak (CP) demand in column (f). For all other types of service, enter NA in columns (d), (e) and (f). Monthly
NCP demand is the maximum metered hourly (60-minute integration) demand in a month. Monthly CP demand is the metered demand
during the hour (60-minute integration) in which the supplier's system reaches its monthly peak. Demand reported in columns (e) and (f)
must be in megawatts. Footnote any demand not stated on a megawatt basis and explain.
6. Report in column (g) the megawatthours shown on bills rendered to the respondent. Report in columns (h) and (i) the megawatthours
of power exchanges received and delivered, used as the basis for settlement. Do not report net exchange.
7. Report demand charges in column (j), energy charges in column (k), and the total of any other types of charges, including
out-of-period adjustments, in column (l). Explain in a footnote all components of the amount shown in column (l). Report in column (m)
the total charge shown on bills received as settlement by the respondent. For power exchanges, report in column (m) the settlement
amount for the net receipt of energy. If more energy was delivered than received, enter a negative amount. If the settlement amount (l)
include credits or charges other than incremental generation expenses, or (2) excludes certain credits or charges covered by the
agreement, provide an explanatory footnote.
8. The data in column (g) through (m) must be totalled on the last line of the schedule. The total amount in column (g) must be
reported as Purchases on Page 401, line 10. The total amount in column (h) must be reported as Exchange Received on Page 401,
line 12. The total amount in column (i) must be reported as Exchange Delivered on Page 401, line 13.
9. Footnote entries as required and provide explanations following all required data.
4,366,615 300,113 4,666,728 1 13,398
-2,250,000 -2,250,000 2 -125,000
138,750 138,750 3
4,494,011 4,494,011 4 180,250
67,414,776 6,207,634 73,622,410 5 287,971
32,723,614 3,828,900 36,552,514 6 99,546
12,365 12,365 7
139,964,688 18,178,193 158,142,881 8 1,159,603
2,045,012 2,045,012 9 9,072
31,279 31,279 10 615
5,124,730 481,085 260,077 5,865,892 11 21,679
5,124,730 486,828 283,105 5,894,663 12 21,885
5,042,466 423,904 265,836 5,732,206 13 18,619
-456,840 -16,771 -25,000 -498,611 14
FERC FORM NO. 1 (ED. 12-90) Page 327.11
59,363,830 685,933,482 2,310,043,645 1,617,412,325 4,613,389,452

Name of Respondent This Report Is:(1) An Original
(2) A Resubmission
Date of Report(Mo, Da, Yr)
Year/Period of Report
End of
PURCHASED POWER(Account 555) (Continued)
PACIFIC GAS AND ELECTRIC COMPANYX
04/13/20212020/Q4
Line
No.MegaWatt Hours
(i)(h)(g) (j)
Demand Charges Energy Charges Other Charges
(k)
Purchased(j+k+l)Total
COST/SETTLEMENT OF POWER
($) ($) ($)
(Including power exchanges)
POWER EXCHANGES
MegaWatt HoursReceived
MegaWatt HoursDelivered
(l) (m)of Settlement ($)
AD - for out-of-period adjustment. Use this code for any accounting adjustments or "true-ups" for service provided in prior reporting
years. Provide an explanation in a footnote for each adjustment.
4. In column (c), identify the FERC Rate Schedule Number or Tariff, or, for non-FERC jurisdictional sellers, include an appropriate
designation for the contract. On separate lines, list all FERC rate schedules, tariffs or contract designations under which service, as
identified in column (b), is provided.
5. For requirements RQ purchases and any type of service involving demand charges imposed on a monnthly (or longer) basis, enter
the monthly average billing demand in column (d), the average monthly non-coincident peak (NCP) demand in column (e), and the
average monthly coincident peak (CP) demand in column (f). For all other types of service, enter NA in columns (d), (e) and (f). Monthly
NCP demand is the maximum metered hourly (60-minute integration) demand in a month. Monthly CP demand is the metered demand
during the hour (60-minute integration) in which the supplier's system reaches its monthly peak. Demand reported in columns (e) and (f)
must be in megawatts. Footnote any demand not stated on a megawatt basis and explain.
6. Report in column (g) the megawatthours shown on bills rendered to the respondent. Report in columns (h) and (i) the megawatthours
of power exchanges received and delivered, used as the basis for settlement. Do not report net exchange.
7. Report demand charges in column (j), energy charges in column (k), and the total of any other types of charges, including
out-of-period adjustments, in column (l). Explain in a footnote all components of the amount shown in column (l). Report in column (m)
the total charge shown on bills received as settlement by the respondent. For power exchanges, report in column (m) the settlement
amount for the net receipt of energy. If more energy was delivered than received, enter a negative amount. If the settlement amount (l)
include credits or charges other than incremental generation expenses, or (2) excludes certain credits or charges covered by the
agreement, provide an explanatory footnote.
8. The data in column (g) through (m) must be totalled on the last line of the schedule. The total amount in column (g) must be
reported as Purchases on Page 401, line 10. The total amount in column (h) must be reported as Exchange Received on Page 401,
line 12. The total amount in column (i) must be reported as Exchange Delivered on Page 401, line 13.
9. Footnote entries as required and provide explanations following all required data.
-456,840 -18,796 -25,000 -500,636 1
-456,840 -14,542 -25,000 -496,382 2
-4,500 400,675 396,175 3 3,142
-862,781 -862,781 4
2,351,764 2,351,764 5 47,959
33,434 33,434 6 2,239
84,941 84,941 7 2,378
54,014 54,014 8 613
-10,184 -10,184 9
-6,631,488 -6,631,488 10 -407,841
3,888,786 327,417 4,216,203 11 12,570
6 6 12
3,678 3,678 13
5,215,152 5,215,152 14 47,278
FERC FORM NO. 1 (ED. 12-90) Page 327.12
59,363,830 685,933,482 2,310,043,645 1,617,412,325 4,613,389,452

Name of Respondent This Report Is:(1) An Original
(2) A Resubmission
Date of Report(Mo, Da, Yr)
Year/Period of Report
End of
PURCHASED POWER(Account 555) (Continued)
PACIFIC GAS AND ELECTRIC COMPANYX
04/13/20212020/Q4
Line
No.MegaWatt Hours
(i)(h)(g) (j)
Demand Charges Energy Charges Other Charges
(k)
Purchased(j+k+l)Total
COST/SETTLEMENT OF POWER
($) ($) ($)
(Including power exchanges)
POWER EXCHANGES
MegaWatt HoursReceived
MegaWatt HoursDelivered
(l) (m)of Settlement ($)
AD - for out-of-period adjustment. Use this code for any accounting adjustments or "true-ups" for service provided in prior reporting
years. Provide an explanation in a footnote for each adjustment.
4. In column (c), identify the FERC Rate Schedule Number or Tariff, or, for non-FERC jurisdictional sellers, include an appropriate
designation for the contract. On separate lines, list all FERC rate schedules, tariffs or contract designations under which service, as
identified in column (b), is provided.
5. For requirements RQ purchases and any type of service involving demand charges imposed on a monnthly (or longer) basis, enter
the monthly average billing demand in column (d), the average monthly non-coincident peak (NCP) demand in column (e), and the
average monthly coincident peak (CP) demand in column (f). For all other types of service, enter NA in columns (d), (e) and (f). Monthly
NCP demand is the maximum metered hourly (60-minute integration) demand in a month. Monthly CP demand is the metered demand
during the hour (60-minute integration) in which the supplier's system reaches its monthly peak. Demand reported in columns (e) and (f)
must be in megawatts. Footnote any demand not stated on a megawatt basis and explain.
6. Report in column (g) the megawatthours shown on bills rendered to the respondent. Report in columns (h) and (i) the megawatthours
of power exchanges received and delivered, used as the basis for settlement. Do not report net exchange.
7. Report demand charges in column (j), energy charges in column (k), and the total of any other types of charges, including
out-of-period adjustments, in column (l). Explain in a footnote all components of the amount shown in column (l). Report in column (m)
the total charge shown on bills received as settlement by the respondent. For power exchanges, report in column (m) the settlement
amount for the net receipt of energy. If more energy was delivered than received, enter a negative amount. If the settlement amount (l)
include credits or charges other than incremental generation expenses, or (2) excludes certain credits or charges covered by the
agreement, provide an explanatory footnote.
8. The data in column (g) through (m) must be totalled on the last line of the schedule. The total amount in column (g) must be
reported as Purchases on Page 401, line 10. The total amount in column (h) must be reported as Exchange Received on Page 401,
line 12. The total amount in column (i) must be reported as Exchange Delivered on Page 401, line 13.
9. Footnote entries as required and provide explanations following all required data.
40,422 40,422 1 2,118
-4 -4 2
-9,440,000 -9,440,000 3 -510,000
190,000 190,000 4
136,299 -18,853,000 -18,716,701 5 -1,150,000
-1,898,056 -1,898,056 6
457,796 457,796 7 5,319
-17,500 292,831 275,331 8 1,975
3,207,588 3,207,588 9 33,899
534,700 534,700 10
-1,038,190 12 -1,038,178 11 155,152
3,036,867 3,036,867 12 22,463
49,179,077 49,179,077 13 391,417
16,410,125 16,410,125 14 105,728
FERC FORM NO. 1 (ED. 12-90) Page 327.13
59,363,830 685,933,482 2,310,043,645 1,617,412,325 4,613,389,452

Name of Respondent This Report Is:(1) An Original
(2) A Resubmission
Date of Report(Mo, Da, Yr)
Year/Period of Report
End of
PURCHASED POWER(Account 555) (Continued)
PACIFIC GAS AND ELECTRIC COMPANYX
04/13/20212020/Q4
Line
No.MegaWatt Hours
(i)(h)(g) (j)
Demand Charges Energy Charges Other Charges
(k)
Purchased(j+k+l)Total
COST/SETTLEMENT OF POWER
($) ($) ($)
(Including power exchanges)
POWER EXCHANGES
MegaWatt HoursReceived
MegaWatt HoursDelivered
(l) (m)of Settlement ($)
AD - for out-of-period adjustment. Use this code for any accounting adjustments or "true-ups" for service provided in prior reporting
years. Provide an explanation in a footnote for each adjustment.
4. In column (c), identify the FERC Rate Schedule Number or Tariff, or, for non-FERC jurisdictional sellers, include an appropriate
designation for the contract. On separate lines, list all FERC rate schedules, tariffs or contract designations under which service, as
identified in column (b), is provided.
5. For requirements RQ purchases and any type of service involving demand charges imposed on a monnthly (or longer) basis, enter
the monthly average billing demand in column (d), the average monthly non-coincident peak (NCP) demand in column (e), and the
average monthly coincident peak (CP) demand in column (f). For all other types of service, enter NA in columns (d), (e) and (f). Monthly
NCP demand is the maximum metered hourly (60-minute integration) demand in a month. Monthly CP demand is the metered demand
during the hour (60-minute integration) in which the supplier's system reaches its monthly peak. Demand reported in columns (e) and (f)
must be in megawatts. Footnote any demand not stated on a megawatt basis and explain.
6. Report in column (g) the megawatthours shown on bills rendered to the respondent. Report in columns (h) and (i) the megawatthours
of power exchanges received and delivered, used as the basis for settlement. Do not report net exchange.
7. Report demand charges in column (j), energy charges in column (k), and the total of any other types of charges, including
out-of-period adjustments, in column (l). Explain in a footnote all components of the amount shown in column (l). Report in column (m)
the total charge shown on bills received as settlement by the respondent. For power exchanges, report in column (m) the settlement
amount for the net receipt of energy. If more energy was delivered than received, enter a negative amount. If the settlement amount (l)
include credits or charges other than incremental generation expenses, or (2) excludes certain credits or charges covered by the
agreement, provide an explanatory footnote.
8. The data in column (g) through (m) must be totalled on the last line of the schedule. The total amount in column (g) must be
reported as Purchases on Page 401, line 10. The total amount in column (h) must be reported as Exchange Received on Page 401,
line 12. The total amount in column (i) must be reported as Exchange Delivered on Page 401, line 13.
9. Footnote entries as required and provide explanations following all required data.
-26,000 28,227,809 28,201,809 1 259,832
7,918,725 7,918,725 2 50,858
3
9,758,548 9,758,548 4 97,304
224 224 5 82
157,668 -3,314 154,354 6 1,769
-7,000 112,434,610 112,427,610 7 682,736
215,263 215,263 8 2,681
1,380,800 1,380,800 9
-1,037,597 -6,748,000 -7,785,597 10 -400,000
-8,166 -8,166 11 5,375
-2,813,408 49,646,136 46,832,728 12 412,770
41,904 41,904 13 11,276
-1,268,319 -1,268,319 14
FERC FORM NO. 1 (ED. 12-90) Page 327.14
59,363,830 685,933,482 2,310,043,645 1,617,412,325 4,613,389,452

Name of Respondent This Report Is:(1) An Original
(2) A Resubmission
Date of Report(Mo, Da, Yr)
Year/Period of Report
End of
PURCHASED POWER(Account 555) (Continued)
PACIFIC GAS AND ELECTRIC COMPANYX
04/13/20212020/Q4
Line
No.MegaWatt Hours
(i)(h)(g) (j)
Demand Charges Energy Charges Other Charges
(k)
Purchased(j+k+l)Total
COST/SETTLEMENT OF POWER
($) ($) ($)
(Including power exchanges)
POWER EXCHANGES
MegaWatt HoursReceived
MegaWatt HoursDelivered
(l) (m)of Settlement ($)
AD - for out-of-period adjustment. Use this code for any accounting adjustments or "true-ups" for service provided in prior reporting
years. Provide an explanation in a footnote for each adjustment.
4. In column (c), identify the FERC Rate Schedule Number or Tariff, or, for non-FERC jurisdictional sellers, include an appropriate
designation for the contract. On separate lines, list all FERC rate schedules, tariffs or contract designations under which service, as
identified in column (b), is provided.
5. For requirements RQ purchases and any type of service involving demand charges imposed on a monnthly (or longer) basis, enter
the monthly average billing demand in column (d), the average monthly non-coincident peak (NCP) demand in column (e), and the
average monthly coincident peak (CP) demand in column (f). For all other types of service, enter NA in columns (d), (e) and (f). Monthly
NCP demand is the maximum metered hourly (60-minute integration) demand in a month. Monthly CP demand is the metered demand
during the hour (60-minute integration) in which the supplier's system reaches its monthly peak. Demand reported in columns (e) and (f)
must be in megawatts. Footnote any demand not stated on a megawatt basis and explain.
6. Report in column (g) the megawatthours shown on bills rendered to the respondent. Report in columns (h) and (i) the megawatthours
of power exchanges received and delivered, used as the basis for settlement. Do not report net exchange.
7. Report demand charges in column (j), energy charges in column (k), and the total of any other types of charges, including
out-of-period adjustments, in column (l). Explain in a footnote all components of the amount shown in column (l). Report in column (m)
the total charge shown on bills received as settlement by the respondent. For power exchanges, report in column (m) the settlement
amount for the net receipt of energy. If more energy was delivered than received, enter a negative amount. If the settlement amount (l)
include credits or charges other than incremental generation expenses, or (2) excludes certain credits or charges covered by the
agreement, provide an explanatory footnote.
8. The data in column (g) through (m) must be totalled on the last line of the schedule. The total amount in column (g) must be
reported as Purchases on Page 401, line 10. The total amount in column (h) must be reported as Exchange Received on Page 401,
line 12. The total amount in column (i) must be reported as Exchange Delivered on Page 401, line 13.
9. Footnote entries as required and provide explanations following all required data.
369,999 369,999 1 8,240
1,850,000 1,850,000 2
-21,100,000 -21,100,000 3 -1,100,000
-3,686,711 -3,686,711 4
-1,500 334,976 333,476 5 2,653
-94,900 -94,900 6
51,151,454 3,951,834 55,103,288 7 616,494
7,322,855 7,322,855 8 67,618
576 576 9
-18,000 460,238 442,238 10 3,291
11
139,526 139,526 12 716
437,500 437,500 13 2,245
461,084 461,084 14 2,367
FERC FORM NO. 1 (ED. 12-90) Page 327.15
59,363,830 685,933,482 2,310,043,645 1,617,412,325 4,613,389,452

Name of Respondent This Report Is:(1) An Original
(2) A Resubmission
Date of Report(Mo, Da, Yr)
Year/Period of Report
End of
PURCHASED POWER(Account 555) (Continued)
PACIFIC GAS AND ELECTRIC COMPANYX
04/13/20212020/Q4
Line
No.MegaWatt Hours
(i)(h)(g) (j)
Demand Charges Energy Charges Other Charges
(k)
Purchased(j+k+l)Total
COST/SETTLEMENT OF POWER
($) ($) ($)
(Including power exchanges)
POWER EXCHANGES
MegaWatt HoursReceived
MegaWatt HoursDelivered
(l) (m)of Settlement ($)
AD - for out-of-period adjustment. Use this code for any accounting adjustments or "true-ups" for service provided in prior reporting
years. Provide an explanation in a footnote for each adjustment.
4. In column (c), identify the FERC Rate Schedule Number or Tariff, or, for non-FERC jurisdictional sellers, include an appropriate
designation for the contract. On separate lines, list all FERC rate schedules, tariffs or contract designations under which service, as
identified in column (b), is provided.
5. For requirements RQ purchases and any type of service involving demand charges imposed on a monnthly (or longer) basis, enter
the monthly average billing demand in column (d), the average monthly non-coincident peak (NCP) demand in column (e), and the
average monthly coincident peak (CP) demand in column (f). For all other types of service, enter NA in columns (d), (e) and (f). Monthly
NCP demand is the maximum metered hourly (60-minute integration) demand in a month. Monthly CP demand is the metered demand
during the hour (60-minute integration) in which the supplier's system reaches its monthly peak. Demand reported in columns (e) and (f)
must be in megawatts. Footnote any demand not stated on a megawatt basis and explain.
6. Report in column (g) the megawatthours shown on bills rendered to the respondent. Report in columns (h) and (i) the megawatthours
of power exchanges received and delivered, used as the basis for settlement. Do not report net exchange.
7. Report demand charges in column (j), energy charges in column (k), and the total of any other types of charges, including
out-of-period adjustments, in column (l). Explain in a footnote all components of the amount shown in column (l). Report in column (m)
the total charge shown on bills received as settlement by the respondent. For power exchanges, report in column (m) the settlement
amount for the net receipt of energy. If more energy was delivered than received, enter a negative amount. If the settlement amount (l)
include credits or charges other than incremental generation expenses, or (2) excludes certain credits or charges covered by the
agreement, provide an explanatory footnote.
8. The data in column (g) through (m) must be totalled on the last line of the schedule. The total amount in column (g) must be
reported as Purchases on Page 401, line 10. The total amount in column (h) must be reported as Exchange Received on Page 401,
line 12. The total amount in column (i) must be reported as Exchange Delivered on Page 401, line 13.
9. Footnote entries as required and provide explanations following all required data.
2,777,578 2,777,578 1 11,064
8,880,336 8,880,336 2 35,332
9,365,695 9,365,695 3 37,108
14,573 14,573 4
4,845 4,845 5
6,669 -20,200,000 -20,193,331 6 -1,220,131
556,450 556,450 7 3,872
469,884 469,884 8 3,169
405,412 405,412 9 3,743
419,773 419,773 10 3,309
416,202 416,202 11 3,308
12
13
-10,000 131,060,423 131,050,423 14 619,268
FERC FORM NO. 1 (ED. 12-90) Page 327.16
59,363,830 685,933,482 2,310,043,645 1,617,412,325 4,613,389,452

Name of Respondent This Report Is:(1) An Original
(2) A Resubmission
Date of Report(Mo, Da, Yr)
Year/Period of Report
End of
PURCHASED POWER(Account 555) (Continued)
PACIFIC GAS AND ELECTRIC COMPANYX
04/13/20212020/Q4
Line
No.MegaWatt Hours
(i)(h)(g) (j)
Demand Charges Energy Charges Other Charges
(k)
Purchased(j+k+l)Total
COST/SETTLEMENT OF POWER
($) ($) ($)
(Including power exchanges)
POWER EXCHANGES
MegaWatt HoursReceived
MegaWatt HoursDelivered
(l) (m)of Settlement ($)
AD - for out-of-period adjustment. Use this code for any accounting adjustments or "true-ups" for service provided in prior reporting
years. Provide an explanation in a footnote for each adjustment.
4. In column (c), identify the FERC Rate Schedule Number or Tariff, or, for non-FERC jurisdictional sellers, include an appropriate
designation for the contract. On separate lines, list all FERC rate schedules, tariffs or contract designations under which service, as
identified in column (b), is provided.
5. For requirements RQ purchases and any type of service involving demand charges imposed on a monnthly (or longer) basis, enter
the monthly average billing demand in column (d), the average monthly non-coincident peak (NCP) demand in column (e), and the
average monthly coincident peak (CP) demand in column (f). For all other types of service, enter NA in columns (d), (e) and (f). Monthly
NCP demand is the maximum metered hourly (60-minute integration) demand in a month. Monthly CP demand is the metered demand
during the hour (60-minute integration) in which the supplier's system reaches its monthly peak. Demand reported in columns (e) and (f)
must be in megawatts. Footnote any demand not stated on a megawatt basis and explain.
6. Report in column (g) the megawatthours shown on bills rendered to the respondent. Report in columns (h) and (i) the megawatthours
of power exchanges received and delivered, used as the basis for settlement. Do not report net exchange.
7. Report demand charges in column (j), energy charges in column (k), and the total of any other types of charges, including
out-of-period adjustments, in column (l). Explain in a footnote all components of the amount shown in column (l). Report in column (m)
the total charge shown on bills received as settlement by the respondent. For power exchanges, report in column (m) the settlement
amount for the net receipt of energy. If more energy was delivered than received, enter a negative amount. If the settlement amount (l)
include credits or charges other than incremental generation expenses, or (2) excludes certain credits or charges covered by the
agreement, provide an explanatory footnote.
8. The data in column (g) through (m) must be totalled on the last line of the schedule. The total amount in column (g) must be
reported as Purchases on Page 401, line 10. The total amount in column (h) must be reported as Exchange Received on Page 401,
line 12. The total amount in column (i) must be reported as Exchange Delivered on Page 401, line 13.
9. Footnote entries as required and provide explanations following all required data.
12,425,000 158,895,115 171,320,115 1 2,136,029
7,316,719 7,316,719 2 72,949
6,870,083 6,870,083 3 61,122
17,338 17,338 4 191
99,543 99,543 5 1,162
-8,006 -8,006 6
219,405 219,405 7 2,114
-2,639 155,726 153,087 8 2,858
8,360,536 813,473 9,174,009 9 18,817
8,305,211 767,577 9,072,788 10 30,356
67,254,850 11,410,816 78,665,666 11 861,061
20,016,892 20,016,892 12
31,737,004 31,737,004 13 305,202
25,091,849 25,091,849 14 250,671
FERC FORM NO. 1 (ED. 12-90) Page 327.17
59,363,830 685,933,482 2,310,043,645 1,617,412,325 4,613,389,452

Name of Respondent This Report Is:(1) An Original
(2) A Resubmission
Date of Report(Mo, Da, Yr)
Year/Period of Report
End of
PURCHASED POWER(Account 555) (Continued)
PACIFIC GAS AND ELECTRIC COMPANYX
04/13/20212020/Q4
Line
No.MegaWatt Hours
(i)(h)(g) (j)
Demand Charges Energy Charges Other Charges
(k)
Purchased(j+k+l)Total
COST/SETTLEMENT OF POWER
($) ($) ($)
(Including power exchanges)
POWER EXCHANGES
MegaWatt HoursReceived
MegaWatt HoursDelivered
(l) (m)of Settlement ($)
AD - for out-of-period adjustment. Use this code for any accounting adjustments or "true-ups" for service provided in prior reporting
years. Provide an explanation in a footnote for each adjustment.
4. In column (c), identify the FERC Rate Schedule Number or Tariff, or, for non-FERC jurisdictional sellers, include an appropriate
designation for the contract. On separate lines, list all FERC rate schedules, tariffs or contract designations under which service, as
identified in column (b), is provided.
5. For requirements RQ purchases and any type of service involving demand charges imposed on a monnthly (or longer) basis, enter
the monthly average billing demand in column (d), the average monthly non-coincident peak (NCP) demand in column (e), and the
average monthly coincident peak (CP) demand in column (f). For all other types of service, enter NA in columns (d), (e) and (f). Monthly
NCP demand is the maximum metered hourly (60-minute integration) demand in a month. Monthly CP demand is the metered demand
during the hour (60-minute integration) in which the supplier's system reaches its monthly peak. Demand reported in columns (e) and (f)
must be in megawatts. Footnote any demand not stated on a megawatt basis and explain.
6. Report in column (g) the megawatthours shown on bills rendered to the respondent. Report in columns (h) and (i) the megawatthours
of power exchanges received and delivered, used as the basis for settlement. Do not report net exchange.
7. Report demand charges in column (j), energy charges in column (k), and the total of any other types of charges, including
out-of-period adjustments, in column (l). Explain in a footnote all components of the amount shown in column (l). Report in column (m)
the total charge shown on bills received as settlement by the respondent. For power exchanges, report in column (m) the settlement
amount for the net receipt of energy. If more energy was delivered than received, enter a negative amount. If the settlement amount (l)
include credits or charges other than incremental generation expenses, or (2) excludes certain credits or charges covered by the
agreement, provide an explanatory footnote.
8. The data in column (g) through (m) must be totalled on the last line of the schedule. The total amount in column (g) must be
reported as Purchases on Page 401, line 10. The total amount in column (h) must be reported as Exchange Received on Page 401,
line 12. The total amount in column (i) must be reported as Exchange Delivered on Page 401, line 13.
9. Footnote entries as required and provide explanations following all required data.
-258,746 -258,746 1
74,179,806 74,179,806 2 535,949
1,004,749 1,004,749 3 28,747
-1,500 15,263,678 15,262,178 4 108,188
506,352 506,352 5 3,948
199,320 199,320 6 12,621
468,802 468,802 7
5,479 5,479 8
129,417 129,417 9
-4,016 -4,016 10 85
46,161,812 46,161,812 11 280,913
47,384,805 47,384,805 12 283,875
32,979 32,979 13 328
4,569,944 4,569,944 14 46,844
FERC FORM NO. 1 (ED. 12-90) Page 327.18
59,363,830 685,933,482 2,310,043,645 1,617,412,325 4,613,389,452

Name of Respondent This Report Is:(1) An Original
(2) A Resubmission
Date of Report(Mo, Da, Yr)
Year/Period of Report
End of
PURCHASED POWER(Account 555) (Continued)
PACIFIC GAS AND ELECTRIC COMPANYX
04/13/20212020/Q4
Line
No.MegaWatt Hours
(i)(h)(g) (j)
Demand Charges Energy Charges Other Charges
(k)
Purchased(j+k+l)Total
COST/SETTLEMENT OF POWER
($) ($) ($)
(Including power exchanges)
POWER EXCHANGES
MegaWatt HoursReceived
MegaWatt HoursDelivered
(l) (m)of Settlement ($)
AD - for out-of-period adjustment. Use this code for any accounting adjustments or "true-ups" for service provided in prior reporting
years. Provide an explanation in a footnote for each adjustment.
4. In column (c), identify the FERC Rate Schedule Number or Tariff, or, for non-FERC jurisdictional sellers, include an appropriate
designation for the contract. On separate lines, list all FERC rate schedules, tariffs or contract designations under which service, as
identified in column (b), is provided.
5. For requirements RQ purchases and any type of service involving demand charges imposed on a monnthly (or longer) basis, enter
the monthly average billing demand in column (d), the average monthly non-coincident peak (NCP) demand in column (e), and the
average monthly coincident peak (CP) demand in column (f). For all other types of service, enter NA in columns (d), (e) and (f). Monthly
NCP demand is the maximum metered hourly (60-minute integration) demand in a month. Monthly CP demand is the metered demand
during the hour (60-minute integration) in which the supplier's system reaches its monthly peak. Demand reported in columns (e) and (f)
must be in megawatts. Footnote any demand not stated on a megawatt basis and explain.
6. Report in column (g) the megawatthours shown on bills rendered to the respondent. Report in columns (h) and (i) the megawatthours
of power exchanges received and delivered, used as the basis for settlement. Do not report net exchange.
7. Report demand charges in column (j), energy charges in column (k), and the total of any other types of charges, including
out-of-period adjustments, in column (l). Explain in a footnote all components of the amount shown in column (l). Report in column (m)
the total charge shown on bills received as settlement by the respondent. For power exchanges, report in column (m) the settlement
amount for the net receipt of energy. If more energy was delivered than received, enter a negative amount. If the settlement amount (l)
include credits or charges other than incremental generation expenses, or (2) excludes certain credits or charges covered by the
agreement, provide an explanatory footnote.
8. The data in column (g) through (m) must be totalled on the last line of the schedule. The total amount in column (g) must be
reported as Purchases on Page 401, line 10. The total amount in column (h) must be reported as Exchange Received on Page 401,
line 12. The total amount in column (i) must be reported as Exchange Delivered on Page 401, line 13.
9. Footnote entries as required and provide explanations following all required data.
16 16 1
4,189,504 4,189,504 2 49,881
17,925,660 15,859,913 33,785,573 3 461,653
-164,677 -28,810 -193,487 4 1,023
352,335 352,335 5 2,645
384,924 384,924 6 2,937
143,871 143,871 7 1,463
13,703,492 13,703,492 8 234,248
5,127,314 5,127,314 9
-26,000 187,648 161,648 10 1,494
76,796 76,796 11 879
165,518 165,518 12 1,356
3,903,454 425,789 4,329,243 13 21,376
49,195 49,195 14 520
FERC FORM NO. 1 (ED. 12-90) Page 327.19
59,363,830 685,933,482 2,310,043,645 1,617,412,325 4,613,389,452

Name of Respondent This Report Is:(1) An Original
(2) A Resubmission
Date of Report(Mo, Da, Yr)
Year/Period of Report
End of
PURCHASED POWER(Account 555) (Continued)
PACIFIC GAS AND ELECTRIC COMPANYX
04/13/20212020/Q4
Line
No.MegaWatt Hours
(i)(h)(g) (j)
Demand Charges Energy Charges Other Charges
(k)
Purchased(j+k+l)Total
COST/SETTLEMENT OF POWER
($) ($) ($)
(Including power exchanges)
POWER EXCHANGES
MegaWatt HoursReceived
MegaWatt HoursDelivered
(l) (m)of Settlement ($)
AD - for out-of-period adjustment. Use this code for any accounting adjustments or "true-ups" for service provided in prior reporting
years. Provide an explanation in a footnote for each adjustment.
4. In column (c), identify the FERC Rate Schedule Number or Tariff, or, for non-FERC jurisdictional sellers, include an appropriate
designation for the contract. On separate lines, list all FERC rate schedules, tariffs or contract designations under which service, as
identified in column (b), is provided.
5. For requirements RQ purchases and any type of service involving demand charges imposed on a monnthly (or longer) basis, enter
the monthly average billing demand in column (d), the average monthly non-coincident peak (NCP) demand in column (e), and the
average monthly coincident peak (CP) demand in column (f). For all other types of service, enter NA in columns (d), (e) and (f). Monthly
NCP demand is the maximum metered hourly (60-minute integration) demand in a month. Monthly CP demand is the metered demand
during the hour (60-minute integration) in which the supplier's system reaches its monthly peak. Demand reported in columns (e) and (f)
must be in megawatts. Footnote any demand not stated on a megawatt basis and explain.
6. Report in column (g) the megawatthours shown on bills rendered to the respondent. Report in columns (h) and (i) the megawatthours
of power exchanges received and delivered, used as the basis for settlement. Do not report net exchange.
7. Report demand charges in column (j), energy charges in column (k), and the total of any other types of charges, including
out-of-period adjustments, in column (l). Explain in a footnote all components of the amount shown in column (l). Report in column (m)
the total charge shown on bills received as settlement by the respondent. For power exchanges, report in column (m) the settlement
amount for the net receipt of energy. If more energy was delivered than received, enter a negative amount. If the settlement amount (l)
include credits or charges other than incremental generation expenses, or (2) excludes certain credits or charges covered by the
agreement, provide an explanatory footnote.
8. The data in column (g) through (m) must be totalled on the last line of the schedule. The total amount in column (g) must be
reported as Purchases on Page 401, line 10. The total amount in column (h) must be reported as Exchange Received on Page 401,
line 12. The total amount in column (i) must be reported as Exchange Delivered on Page 401, line 13.
9. Footnote entries as required and provide explanations following all required data.
16,504 16,504 1 235
5,375,247 5,375,247 2 54,052
-2,982,050 -2,982,050 3
52,921 52,921 4 579
70,435 70,435 5 775
41,004 41,004 6 449
-561 191,035 190,474 7 2,085
5,555,247 5,555,247 8 63,072
-10,000 11,062,473 11,052,473 9 112,831
172,116 172,116 10 1,959
-1,724,000 -9,278,000 -11,002,000 11 -500,000
29,043,647 1,480,260 30,523,907 12 115,597
117,276,977 6,528,980 123,805,957 13 278,759
16,845 16,845 14
FERC FORM NO. 1 (ED. 12-90) Page 327.20
59,363,830 685,933,482 2,310,043,645 1,617,412,325 4,613,389,452

Name of Respondent This Report Is:(1) An Original
(2) A Resubmission
Date of Report(Mo, Da, Yr)
Year/Period of Report
End of
PURCHASED POWER(Account 555) (Continued)
PACIFIC GAS AND ELECTRIC COMPANYX
04/13/20212020/Q4
Line
No.MegaWatt Hours
(i)(h)(g) (j)
Demand Charges Energy Charges Other Charges
(k)
Purchased(j+k+l)Total
COST/SETTLEMENT OF POWER
($) ($) ($)
(Including power exchanges)
POWER EXCHANGES
MegaWatt HoursReceived
MegaWatt HoursDelivered
(l) (m)of Settlement ($)
AD - for out-of-period adjustment. Use this code for any accounting adjustments or "true-ups" for service provided in prior reporting
years. Provide an explanation in a footnote for each adjustment.
4. In column (c), identify the FERC Rate Schedule Number or Tariff, or, for non-FERC jurisdictional sellers, include an appropriate
designation for the contract. On separate lines, list all FERC rate schedules, tariffs or contract designations under which service, as
identified in column (b), is provided.
5. For requirements RQ purchases and any type of service involving demand charges imposed on a monnthly (or longer) basis, enter
the monthly average billing demand in column (d), the average monthly non-coincident peak (NCP) demand in column (e), and the
average monthly coincident peak (CP) demand in column (f). For all other types of service, enter NA in columns (d), (e) and (f). Monthly
NCP demand is the maximum metered hourly (60-minute integration) demand in a month. Monthly CP demand is the metered demand
during the hour (60-minute integration) in which the supplier's system reaches its monthly peak. Demand reported in columns (e) and (f)
must be in megawatts. Footnote any demand not stated on a megawatt basis and explain.
6. Report in column (g) the megawatthours shown on bills rendered to the respondent. Report in columns (h) and (i) the megawatthours
of power exchanges received and delivered, used as the basis for settlement. Do not report net exchange.
7. Report demand charges in column (j), energy charges in column (k), and the total of any other types of charges, including
out-of-period adjustments, in column (l). Explain in a footnote all components of the amount shown in column (l). Report in column (m)
the total charge shown on bills received as settlement by the respondent. For power exchanges, report in column (m) the settlement
amount for the net receipt of energy. If more energy was delivered than received, enter a negative amount. If the settlement amount (l)
include credits or charges other than incremental generation expenses, or (2) excludes certain credits or charges covered by the
agreement, provide an explanatory footnote.
8. The data in column (g) through (m) must be totalled on the last line of the schedule. The total amount in column (g) must be
reported as Purchases on Page 401, line 10. The total amount in column (h) must be reported as Exchange Received on Page 401,
line 12. The total amount in column (i) must be reported as Exchange Delivered on Page 401, line 13.
9. Footnote entries as required and provide explanations following all required data.
278,310 278,310 1 3,329
5,628,000 5,628,000 2
7,454 7,454 3 143
3,903,454 395,067 4,298,521 4 16,097
387,932 387,932 5 6,937
519,883 519,883 6 3,968
226,013 226,013 7 25,032
2,360,752 2,360,752 8 40,212
483,490 483,490 9 8,295
12,250,221 -1,287,652 10,962,569 10 610,011
11
73,713 73,713 12 983
-17,000 532,059 515,059 13 4,105
-1,000 112,447,274 112,446,274 14 566,756
FERC FORM NO. 1 (ED. 12-90) Page 327.21
59,363,830 685,933,482 2,310,043,645 1,617,412,325 4,613,389,452

Name of Respondent This Report Is:(1) An Original
(2) A Resubmission
Date of Report(Mo, Da, Yr)
Year/Period of Report
End of
PURCHASED POWER(Account 555) (Continued)
PACIFIC GAS AND ELECTRIC COMPANYX
04/13/20212020/Q4
Line
No.MegaWatt Hours
(i)(h)(g) (j)
Demand Charges Energy Charges Other Charges
(k)
Purchased(j+k+l)Total
COST/SETTLEMENT OF POWER
($) ($) ($)
(Including power exchanges)
POWER EXCHANGES
MegaWatt HoursReceived
MegaWatt HoursDelivered
(l) (m)of Settlement ($)
AD - for out-of-period adjustment. Use this code for any accounting adjustments or "true-ups" for service provided in prior reporting
years. Provide an explanation in a footnote for each adjustment.
4. In column (c), identify the FERC Rate Schedule Number or Tariff, or, for non-FERC jurisdictional sellers, include an appropriate
designation for the contract. On separate lines, list all FERC rate schedules, tariffs or contract designations under which service, as
identified in column (b), is provided.
5. For requirements RQ purchases and any type of service involving demand charges imposed on a monnthly (or longer) basis, enter
the monthly average billing demand in column (d), the average monthly non-coincident peak (NCP) demand in column (e), and the
average monthly coincident peak (CP) demand in column (f). For all other types of service, enter NA in columns (d), (e) and (f). Monthly
NCP demand is the maximum metered hourly (60-minute integration) demand in a month. Monthly CP demand is the metered demand
during the hour (60-minute integration) in which the supplier's system reaches its monthly peak. Demand reported in columns (e) and (f)
must be in megawatts. Footnote any demand not stated on a megawatt basis and explain.
6. Report in column (g) the megawatthours shown on bills rendered to the respondent. Report in columns (h) and (i) the megawatthours
of power exchanges received and delivered, used as the basis for settlement. Do not report net exchange.
7. Report demand charges in column (j), energy charges in column (k), and the total of any other types of charges, including
out-of-period adjustments, in column (l). Explain in a footnote all components of the amount shown in column (l). Report in column (m)
the total charge shown on bills received as settlement by the respondent. For power exchanges, report in column (m) the settlement
amount for the net receipt of energy. If more energy was delivered than received, enter a negative amount. If the settlement amount (l)
include credits or charges other than incremental generation expenses, or (2) excludes certain credits or charges covered by the
agreement, provide an explanatory footnote.
8. The data in column (g) through (m) must be totalled on the last line of the schedule. The total amount in column (g) must be
reported as Purchases on Page 401, line 10. The total amount in column (h) must be reported as Exchange Received on Page 401,
line 12. The total amount in column (i) must be reported as Exchange Delivered on Page 401, line 13.
9. Footnote entries as required and provide explanations following all required data.
84,510 -7,350,263 -73,901 -7,339,654 1 -1,177,150
2
3,242,097 3,242,097 3 36,803
786,495 786,495 4
-1,500 39,319,168 39,317,668 5 313,219
8,664 8,664 6
3,069,205 3,069,205 7 57,534
8,970,222 8,970,222 8 92,829
21,068,861 21,068,861 9 206,557
-117,202 -117,202 10 6,469
158,892 158,892 11
17,052 17,052 12
-1,111 331,936 330,825 13 2,536
10,446,771 10,446,771 14 85,209
FERC FORM NO. 1 (ED. 12-90) Page 327.22
59,363,830 685,933,482 2,310,043,645 1,617,412,325 4,613,389,452

Name of Respondent This Report Is:(1) An Original
(2) A Resubmission
Date of Report(Mo, Da, Yr)
Year/Period of Report
End of
PURCHASED POWER(Account 555) (Continued)
PACIFIC GAS AND ELECTRIC COMPANYX
04/13/20212020/Q4
Line
No.MegaWatt Hours
(i)(h)(g) (j)
Demand Charges Energy Charges Other Charges
(k)
Purchased(j+k+l)Total
COST/SETTLEMENT OF POWER
($) ($) ($)
(Including power exchanges)
POWER EXCHANGES
MegaWatt HoursReceived
MegaWatt HoursDelivered
(l) (m)of Settlement ($)
AD - for out-of-period adjustment. Use this code for any accounting adjustments or "true-ups" for service provided in prior reporting
years. Provide an explanation in a footnote for each adjustment.
4. In column (c), identify the FERC Rate Schedule Number or Tariff, or, for non-FERC jurisdictional sellers, include an appropriate
designation for the contract. On separate lines, list all FERC rate schedules, tariffs or contract designations under which service, as
identified in column (b), is provided.
5. For requirements RQ purchases and any type of service involving demand charges imposed on a monnthly (or longer) basis, enter
the monthly average billing demand in column (d), the average monthly non-coincident peak (NCP) demand in column (e), and the
average monthly coincident peak (CP) demand in column (f). For all other types of service, enter NA in columns (d), (e) and (f). Monthly
NCP demand is the maximum metered hourly (60-minute integration) demand in a month. Monthly CP demand is the metered demand
during the hour (60-minute integration) in which the supplier's system reaches its monthly peak. Demand reported in columns (e) and (f)
must be in megawatts. Footnote any demand not stated on a megawatt basis and explain.
6. Report in column (g) the megawatthours shown on bills rendered to the respondent. Report in columns (h) and (i) the megawatthours
of power exchanges received and delivered, used as the basis for settlement. Do not report net exchange.
7. Report demand charges in column (j), energy charges in column (k), and the total of any other types of charges, including
out-of-period adjustments, in column (l). Explain in a footnote all components of the amount shown in column (l). Report in column (m)
the total charge shown on bills received as settlement by the respondent. For power exchanges, report in column (m) the settlement
amount for the net receipt of energy. If more energy was delivered than received, enter a negative amount. If the settlement amount (l)
include credits or charges other than incremental generation expenses, or (2) excludes certain credits or charges covered by the
agreement, provide an explanatory footnote.
8. The data in column (g) through (m) must be totalled on the last line of the schedule. The total amount in column (g) must be
reported as Purchases on Page 401, line 10. The total amount in column (h) must be reported as Exchange Received on Page 401,
line 12. The total amount in column (i) must be reported as Exchange Delivered on Page 401, line 13.
9. Footnote entries as required and provide explanations following all required data.
12,695,916 12,695,916 1 78,960
135,953 135,953 2 1,315
70,650 70,650 3 985
123,880 123,880 4 2,422
29,884 29,884 5 3,716
33,120 33,120 6 3,092
37,466,987 37,466,987 7 449,476
19,076,850 19,076,850 8 148,203
22,880,131 22,880,131 9 163,641
4,927,527 4,927,527 10 50,088
-3,500 313,766 310,266 11 2,238
3,963,826 3,963,826 12 49,103
1,048,700 1,048,700 13 5,506
-78,604 -78,604 14
FERC FORM NO. 1 (ED. 12-90) Page 327.23
59,363,830 685,933,482 2,310,043,645 1,617,412,325 4,613,389,452

Name of Respondent This Report Is:(1) An Original
(2) A Resubmission
Date of Report(Mo, Da, Yr)
Year/Period of Report
End of
PURCHASED POWER(Account 555) (Continued)
PACIFIC GAS AND ELECTRIC COMPANYX
04/13/20212020/Q4
Line
No.MegaWatt Hours
(i)(h)(g) (j)
Demand Charges Energy Charges Other Charges
(k)
Purchased(j+k+l)Total
COST/SETTLEMENT OF POWER
($) ($) ($)
(Including power exchanges)
POWER EXCHANGES
MegaWatt HoursReceived
MegaWatt HoursDelivered
(l) (m)of Settlement ($)
AD - for out-of-period adjustment. Use this code for any accounting adjustments or "true-ups" for service provided in prior reporting
years. Provide an explanation in a footnote for each adjustment.
4. In column (c), identify the FERC Rate Schedule Number or Tariff, or, for non-FERC jurisdictional sellers, include an appropriate
designation for the contract. On separate lines, list all FERC rate schedules, tariffs or contract designations under which service, as
identified in column (b), is provided.
5. For requirements RQ purchases and any type of service involving demand charges imposed on a monnthly (or longer) basis, enter
the monthly average billing demand in column (d), the average monthly non-coincident peak (NCP) demand in column (e), and the
average monthly coincident peak (CP) demand in column (f). For all other types of service, enter NA in columns (d), (e) and (f). Monthly
NCP demand is the maximum metered hourly (60-minute integration) demand in a month. Monthly CP demand is the metered demand
during the hour (60-minute integration) in which the supplier's system reaches its monthly peak. Demand reported in columns (e) and (f)
must be in megawatts. Footnote any demand not stated on a megawatt basis and explain.
6. Report in column (g) the megawatthours shown on bills rendered to the respondent. Report in columns (h) and (i) the megawatthours
of power exchanges received and delivered, used as the basis for settlement. Do not report net exchange.
7. Report demand charges in column (j), energy charges in column (k), and the total of any other types of charges, including
out-of-period adjustments, in column (l). Explain in a footnote all components of the amount shown in column (l). Report in column (m)
the total charge shown on bills received as settlement by the respondent. For power exchanges, report in column (m) the settlement
amount for the net receipt of energy. If more energy was delivered than received, enter a negative amount. If the settlement amount (l)
include credits or charges other than incremental generation expenses, or (2) excludes certain credits or charges covered by the
agreement, provide an explanatory footnote.
8. The data in column (g) through (m) must be totalled on the last line of the schedule. The total amount in column (g) must be
reported as Purchases on Page 401, line 10. The total amount in column (h) must be reported as Exchange Received on Page 401,
line 12. The total amount in column (i) must be reported as Exchange Delivered on Page 401, line 13.
9. Footnote entries as required and provide explanations following all required data.
3,415,871 3,415,871 1 27,279
-103,329 -103,329 2
906,533 56,247 962,780 3 201
4
5
-62 -62 6
172,869 172,869 7
98,909 98,909 8 984
5,611 5,611 9 127
234,274 234,274 10 1,748
-1,763,236 -3,450,000 -5,213,236 11 -250,000
-6,833,152 -6,833,152 12 -283,413
13
-320,100 -320,100 14
FERC FORM NO. 1 (ED. 12-90) Page 327.24
59,363,830 685,933,482 2,310,043,645 1,617,412,325 4,613,389,452

Name of Respondent This Report Is:(1) An Original
(2) A Resubmission
Date of Report(Mo, Da, Yr)
Year/Period of Report
End of
PURCHASED POWER(Account 555) (Continued)
PACIFIC GAS AND ELECTRIC COMPANYX
04/13/20212020/Q4
Line
No.MegaWatt Hours
(i)(h)(g) (j)
Demand Charges Energy Charges Other Charges
(k)
Purchased(j+k+l)Total
COST/SETTLEMENT OF POWER
($) ($) ($)
(Including power exchanges)
POWER EXCHANGES
MegaWatt HoursReceived
MegaWatt HoursDelivered
(l) (m)of Settlement ($)
AD - for out-of-period adjustment. Use this code for any accounting adjustments or "true-ups" for service provided in prior reporting
years. Provide an explanation in a footnote for each adjustment.
4. In column (c), identify the FERC Rate Schedule Number or Tariff, or, for non-FERC jurisdictional sellers, include an appropriate
designation for the contract. On separate lines, list all FERC rate schedules, tariffs or contract designations under which service, as
identified in column (b), is provided.
5. For requirements RQ purchases and any type of service involving demand charges imposed on a monnthly (or longer) basis, enter
the monthly average billing demand in column (d), the average monthly non-coincident peak (NCP) demand in column (e), and the
average monthly coincident peak (CP) demand in column (f). For all other types of service, enter NA in columns (d), (e) and (f). Monthly
NCP demand is the maximum metered hourly (60-minute integration) demand in a month. Monthly CP demand is the metered demand
during the hour (60-minute integration) in which the supplier's system reaches its monthly peak. Demand reported in columns (e) and (f)
must be in megawatts. Footnote any demand not stated on a megawatt basis and explain.
6. Report in column (g) the megawatthours shown on bills rendered to the respondent. Report in columns (h) and (i) the megawatthours
of power exchanges received and delivered, used as the basis for settlement. Do not report net exchange.
7. Report demand charges in column (j), energy charges in column (k), and the total of any other types of charges, including
out-of-period adjustments, in column (l). Explain in a footnote all components of the amount shown in column (l). Report in column (m)
the total charge shown on bills received as settlement by the respondent. For power exchanges, report in column (m) the settlement
amount for the net receipt of energy. If more energy was delivered than received, enter a negative amount. If the settlement amount (l)
include credits or charges other than incremental generation expenses, or (2) excludes certain credits or charges covered by the
agreement, provide an explanatory footnote.
8. The data in column (g) through (m) must be totalled on the last line of the schedule. The total amount in column (g) must be
reported as Purchases on Page 401, line 10. The total amount in column (h) must be reported as Exchange Received on Page 401,
line 12. The total amount in column (i) must be reported as Exchange Delivered on Page 401, line 13.
9. Footnote entries as required and provide explanations following all required data.
1
1,881,255 1,881,255 2 30,056
7,907,921 7,907,921 3 63,529
-4,727,750 -4,727,750 4 -275,000
9,625,197 9,625,197 5
534,873 534,873 6 5,032
19,404,349 19,404,349 7 298,677
3,592,547 3,592,547 8 54,774
3,167,274 3,167,274 9 51,730
3,190,517 3,190,517 10 52,701
25,960 25,960 11 2,754
46,738 46,738 12 556
-3,723,270 -3,723,270 13 -237,000
129,203 129,203 14 1,705
FERC FORM NO. 1 (ED. 12-90) Page 327.25
59,363,830 685,933,482 2,310,043,645 1,617,412,325 4,613,389,452

Name of Respondent This Report Is:(1) An Original
(2) A Resubmission
Date of Report(Mo, Da, Yr)
Year/Period of Report
End of
PURCHASED POWER(Account 555) (Continued)
PACIFIC GAS AND ELECTRIC COMPANYX
04/13/20212020/Q4
Line
No.MegaWatt Hours
(i)(h)(g) (j)
Demand Charges Energy Charges Other Charges
(k)
Purchased(j+k+l)Total
COST/SETTLEMENT OF POWER
($) ($) ($)
(Including power exchanges)
POWER EXCHANGES
MegaWatt HoursReceived
MegaWatt HoursDelivered
(l) (m)of Settlement ($)
AD - for out-of-period adjustment. Use this code for any accounting adjustments or "true-ups" for service provided in prior reporting
years. Provide an explanation in a footnote for each adjustment.
4. In column (c), identify the FERC Rate Schedule Number or Tariff, or, for non-FERC jurisdictional sellers, include an appropriate
designation for the contract. On separate lines, list all FERC rate schedules, tariffs or contract designations under which service, as
identified in column (b), is provided.
5. For requirements RQ purchases and any type of service involving demand charges imposed on a monnthly (or longer) basis, enter
the monthly average billing demand in column (d), the average monthly non-coincident peak (NCP) demand in column (e), and the
average monthly coincident peak (CP) demand in column (f). For all other types of service, enter NA in columns (d), (e) and (f). Monthly
NCP demand is the maximum metered hourly (60-minute integration) demand in a month. Monthly CP demand is the metered demand
during the hour (60-minute integration) in which the supplier's system reaches its monthly peak. Demand reported in columns (e) and (f)
must be in megawatts. Footnote any demand not stated on a megawatt basis and explain.
6. Report in column (g) the megawatthours shown on bills rendered to the respondent. Report in columns (h) and (i) the megawatthours
of power exchanges received and delivered, used as the basis for settlement. Do not report net exchange.
7. Report demand charges in column (j), energy charges in column (k), and the total of any other types of charges, including
out-of-period adjustments, in column (l). Explain in a footnote all components of the amount shown in column (l). Report in column (m)
the total charge shown on bills received as settlement by the respondent. For power exchanges, report in column (m) the settlement
amount for the net receipt of energy. If more energy was delivered than received, enter a negative amount. If the settlement amount (l)
include credits or charges other than incremental generation expenses, or (2) excludes certain credits or charges covered by the
agreement, provide an explanatory footnote.
8. The data in column (g) through (m) must be totalled on the last line of the schedule. The total amount in column (g) must be
reported as Purchases on Page 401, line 10. The total amount in column (h) must be reported as Exchange Received on Page 401,
line 12. The total amount in column (i) must be reported as Exchange Delivered on Page 401, line 13.
9. Footnote entries as required and provide explanations following all required data.
400,706 400,706 1
2
56,142 56,142 3 540
207,531 207,531 4 1,765
12,922 12,922 5 112
581,002 581,002 6 6,257
7 172,800
24 66,675,362 66,675,386 8 413,569
1,906,580 2,176,332 -449,169 3,633,743 9 59,965
2,792,593 7,020,825 9,813,418 10 187,933
41,869 41,869 11 2,492
4,696,207 4,696,207 12 49,386
-863,203 5,250,000 4,386,797 13
-1,500,000 -1,500,000 14 -100,000
FERC FORM NO. 1 (ED. 12-90) Page 327.26
59,363,830 685,933,482 2,310,043,645 1,617,412,325 4,613,389,452

Name of Respondent This Report Is:(1) An Original
(2) A Resubmission
Date of Report(Mo, Da, Yr)
Year/Period of Report
End of
PURCHASED POWER(Account 555) (Continued)
PACIFIC GAS AND ELECTRIC COMPANYX
04/13/20212020/Q4
Line
No.MegaWatt Hours
(i)(h)(g) (j)
Demand Charges Energy Charges Other Charges
(k)
Purchased(j+k+l)Total
COST/SETTLEMENT OF POWER
($) ($) ($)
(Including power exchanges)
POWER EXCHANGES
MegaWatt HoursReceived
MegaWatt HoursDelivered
(l) (m)of Settlement ($)
AD - for out-of-period adjustment. Use this code for any accounting adjustments or "true-ups" for service provided in prior reporting
years. Provide an explanation in a footnote for each adjustment.
4. In column (c), identify the FERC Rate Schedule Number or Tariff, or, for non-FERC jurisdictional sellers, include an appropriate
designation for the contract. On separate lines, list all FERC rate schedules, tariffs or contract designations under which service, as
identified in column (b), is provided.
5. For requirements RQ purchases and any type of service involving demand charges imposed on a monnthly (or longer) basis, enter
the monthly average billing demand in column (d), the average monthly non-coincident peak (NCP) demand in column (e), and the
average monthly coincident peak (CP) demand in column (f). For all other types of service, enter NA in columns (d), (e) and (f). Monthly
NCP demand is the maximum metered hourly (60-minute integration) demand in a month. Monthly CP demand is the metered demand
during the hour (60-minute integration) in which the supplier's system reaches its monthly peak. Demand reported in columns (e) and (f)
must be in megawatts. Footnote any demand not stated on a megawatt basis and explain.
6. Report in column (g) the megawatthours shown on bills rendered to the respondent. Report in columns (h) and (i) the megawatthours
of power exchanges received and delivered, used as the basis for settlement. Do not report net exchange.
7. Report demand charges in column (j), energy charges in column (k), and the total of any other types of charges, including
out-of-period adjustments, in column (l). Explain in a footnote all components of the amount shown in column (l). Report in column (m)
the total charge shown on bills received as settlement by the respondent. For power exchanges, report in column (m) the settlement
amount for the net receipt of energy. If more energy was delivered than received, enter a negative amount. If the settlement amount (l)
include credits or charges other than incremental generation expenses, or (2) excludes certain credits or charges covered by the
agreement, provide an explanatory footnote.
8. The data in column (g) through (m) must be totalled on the last line of the schedule. The total amount in column (g) must be
reported as Purchases on Page 401, line 10. The total amount in column (h) must be reported as Exchange Received on Page 401,
line 12. The total amount in column (i) must be reported as Exchange Delivered on Page 401, line 13.
9. Footnote entries as required and provide explanations following all required data.
-3,000,000 -3,000,000 1 -200,000
-14,250,000 -14,250,000 2 -800,000
11,248,718 11,248,718 3 204,273
-122,508 -122,508 4 24,403
-159,000 64,589,757 64,430,757 5 650,603
-67,000 24,909,726 24,842,726 6 287,350
17,557 17,557 7 147
502,615 38,153,174 38,655,789 8 433,361
32,922 32,922 9
-2,687,510 -9,900,000 -12,587,510 10 -600,000
152,854 152,854 11 1,721
-1,645 -1,645 12 123
-592,450 3 -592,447 13
897,000 897,000 14
FERC FORM NO. 1 (ED. 12-90) Page 327.27
59,363,830 685,933,482 2,310,043,645 1,617,412,325 4,613,389,452

Name of Respondent This Report Is:(1) An Original
(2) A Resubmission
Date of Report(Mo, Da, Yr)
Year/Period of Report
End of
PURCHASED POWER(Account 555) (Continued)
PACIFIC GAS AND ELECTRIC COMPANYX
04/13/20212020/Q4
Line
No.MegaWatt Hours
(i)(h)(g) (j)
Demand Charges Energy Charges Other Charges
(k)
Purchased(j+k+l)Total
COST/SETTLEMENT OF POWER
($) ($) ($)
(Including power exchanges)
POWER EXCHANGES
MegaWatt HoursReceived
MegaWatt HoursDelivered
(l) (m)of Settlement ($)
AD - for out-of-period adjustment. Use this code for any accounting adjustments or "true-ups" for service provided in prior reporting
years. Provide an explanation in a footnote for each adjustment.
4. In column (c), identify the FERC Rate Schedule Number or Tariff, or, for non-FERC jurisdictional sellers, include an appropriate
designation for the contract. On separate lines, list all FERC rate schedules, tariffs or contract designations under which service, as
identified in column (b), is provided.
5. For requirements RQ purchases and any type of service involving demand charges imposed on a monnthly (or longer) basis, enter
the monthly average billing demand in column (d), the average monthly non-coincident peak (NCP) demand in column (e), and the
average monthly coincident peak (CP) demand in column (f). For all other types of service, enter NA in columns (d), (e) and (f). Monthly
NCP demand is the maximum metered hourly (60-minute integration) demand in a month. Monthly CP demand is the metered demand
during the hour (60-minute integration) in which the supplier's system reaches its monthly peak. Demand reported in columns (e) and (f)
must be in megawatts. Footnote any demand not stated on a megawatt basis and explain.
6. Report in column (g) the megawatthours shown on bills rendered to the respondent. Report in columns (h) and (i) the megawatthours
of power exchanges received and delivered, used as the basis for settlement. Do not report net exchange.
7. Report demand charges in column (j), energy charges in column (k), and the total of any other types of charges, including
out-of-period adjustments, in column (l). Explain in a footnote all components of the amount shown in column (l). Report in column (m)
the total charge shown on bills received as settlement by the respondent. For power exchanges, report in column (m) the settlement
amount for the net receipt of energy. If more energy was delivered than received, enter a negative amount. If the settlement amount (l)
include credits or charges other than incremental generation expenses, or (2) excludes certain credits or charges covered by the
agreement, provide an explanatory footnote.
8. The data in column (g) through (m) must be totalled on the last line of the schedule. The total amount in column (g) must be
reported as Purchases on Page 401, line 10. The total amount in column (h) must be reported as Exchange Received on Page 401,
line 12. The total amount in column (i) must be reported as Exchange Delivered on Page 401, line 13.
9. Footnote entries as required and provide explanations following all required data.
-637,892 -637,892 1 9,912
-907,095 -907,095 2 12,746
-709,937 -709,937 3
178,735 -320,779 -142,044 4 5,471
232,716 -947,485 -714,769 5 15,673
14,200 14,200 6
1,312,165 1,312,165 7 26,431
1,295,051 1,295,051 8 26,025
13,755,636 460,494 14,216,130 9 32,490
112,402 112,402 10 555
104,914 104,914 11 2,380
-500 2,181,083 2,180,583 12 41,785
242,847 242,847 13 2,739
3,777,815 3,777,815 14 61,129
FERC FORM NO. 1 (ED. 12-90) Page 327.28
59,363,830 685,933,482 2,310,043,645 1,617,412,325 4,613,389,452

Name of Respondent This Report Is:(1) An Original
(2) A Resubmission
Date of Report(Mo, Da, Yr)
Year/Period of Report
End of
PURCHASED POWER(Account 555) (Continued)
PACIFIC GAS AND ELECTRIC COMPANYX
04/13/20212020/Q4
Line
No.MegaWatt Hours
(i)(h)(g) (j)
Demand Charges Energy Charges Other Charges
(k)
Purchased(j+k+l)Total
COST/SETTLEMENT OF POWER
($) ($) ($)
(Including power exchanges)
POWER EXCHANGES
MegaWatt HoursReceived
MegaWatt HoursDelivered
(l) (m)of Settlement ($)
AD - for out-of-period adjustment. Use this code for any accounting adjustments or "true-ups" for service provided in prior reporting
years. Provide an explanation in a footnote for each adjustment.
4. In column (c), identify the FERC Rate Schedule Number or Tariff, or, for non-FERC jurisdictional sellers, include an appropriate
designation for the contract. On separate lines, list all FERC rate schedules, tariffs or contract designations under which service, as
identified in column (b), is provided.
5. For requirements RQ purchases and any type of service involving demand charges imposed on a monnthly (or longer) basis, enter
the monthly average billing demand in column (d), the average monthly non-coincident peak (NCP) demand in column (e), and the
average monthly coincident peak (CP) demand in column (f). For all other types of service, enter NA in columns (d), (e) and (f). Monthly
NCP demand is the maximum metered hourly (60-minute integration) demand in a month. Monthly CP demand is the metered demand
during the hour (60-minute integration) in which the supplier's system reaches its monthly peak. Demand reported in columns (e) and (f)
must be in megawatts. Footnote any demand not stated on a megawatt basis and explain.
6. Report in column (g) the megawatthours shown on bills rendered to the respondent. Report in columns (h) and (i) the megawatthours
of power exchanges received and delivered, used as the basis for settlement. Do not report net exchange.
7. Report demand charges in column (j), energy charges in column (k), and the total of any other types of charges, including
out-of-period adjustments, in column (l). Explain in a footnote all components of the amount shown in column (l). Report in column (m)
the total charge shown on bills received as settlement by the respondent. For power exchanges, report in column (m) the settlement
amount for the net receipt of energy. If more energy was delivered than received, enter a negative amount. If the settlement amount (l)
include credits or charges other than incremental generation expenses, or (2) excludes certain credits or charges covered by the
agreement, provide an explanatory footnote.
8. The data in column (g) through (m) must be totalled on the last line of the schedule. The total amount in column (g) must be
reported as Purchases on Page 401, line 10. The total amount in column (h) must be reported as Exchange Received on Page 401,
line 12. The total amount in column (i) must be reported as Exchange Delivered on Page 401, line 13.
9. Footnote entries as required and provide explanations following all required data.
16,968,715 16,968,715 1 140,819
31,084 31,084 2 408
3
570,000 570,000 4
-77,323 966,156 888,833 5 26,063
2,524,802 12,422,812 -16,500 14,931,114 6 288,667
-203,620 -203,620 7
375,216 375,216 8 4,556
210,095,537 210,095,537 9 1,348,224
1,178,929 1,178,929 10 11,486
-92,004 -92,004 11
2,685 2,685 12
212,377 212,377 13 2,247
145,646 145,646 14 1,230
FERC FORM NO. 1 (ED. 12-90) Page 327.29
59,363,830 685,933,482 2,310,043,645 1,617,412,325 4,613,389,452

Name of Respondent This Report Is:(1) An Original
(2) A Resubmission
Date of Report(Mo, Da, Yr)
Year/Period of Report
End of
PURCHASED POWER(Account 555) (Continued)
PACIFIC GAS AND ELECTRIC COMPANYX
04/13/20212020/Q4
Line
No.MegaWatt Hours
(i)(h)(g) (j)
Demand Charges Energy Charges Other Charges
(k)
Purchased(j+k+l)Total
COST/SETTLEMENT OF POWER
($) ($) ($)
(Including power exchanges)
POWER EXCHANGES
MegaWatt HoursReceived
MegaWatt HoursDelivered
(l) (m)of Settlement ($)
AD - for out-of-period adjustment. Use this code for any accounting adjustments or "true-ups" for service provided in prior reporting
years. Provide an explanation in a footnote for each adjustment.
4. In column (c), identify the FERC Rate Schedule Number or Tariff, or, for non-FERC jurisdictional sellers, include an appropriate
designation for the contract. On separate lines, list all FERC rate schedules, tariffs or contract designations under which service, as
identified in column (b), is provided.
5. For requirements RQ purchases and any type of service involving demand charges imposed on a monnthly (or longer) basis, enter
the monthly average billing demand in column (d), the average monthly non-coincident peak (NCP) demand in column (e), and the
average monthly coincident peak (CP) demand in column (f). For all other types of service, enter NA in columns (d), (e) and (f). Monthly
NCP demand is the maximum metered hourly (60-minute integration) demand in a month. Monthly CP demand is the metered demand
during the hour (60-minute integration) in which the supplier's system reaches its monthly peak. Demand reported in columns (e) and (f)
must be in megawatts. Footnote any demand not stated on a megawatt basis and explain.
6. Report in column (g) the megawatthours shown on bills rendered to the respondent. Report in columns (h) and (i) the megawatthours
of power exchanges received and delivered, used as the basis for settlement. Do not report net exchange.
7. Report demand charges in column (j), energy charges in column (k), and the total of any other types of charges, including
out-of-period adjustments, in column (l). Explain in a footnote all components of the amount shown in column (l). Report in column (m)
the total charge shown on bills received as settlement by the respondent. For power exchanges, report in column (m) the settlement
amount for the net receipt of energy. If more energy was delivered than received, enter a negative amount. If the settlement amount (l)
include credits or charges other than incremental generation expenses, or (2) excludes certain credits or charges covered by the
agreement, provide an explanatory footnote.
8. The data in column (g) through (m) must be totalled on the last line of the schedule. The total amount in column (g) must be
reported as Purchases on Page 401, line 10. The total amount in column (h) must be reported as Exchange Received on Page 401,
line 12. The total amount in column (i) must be reported as Exchange Delivered on Page 401, line 13.
9. Footnote entries as required and provide explanations following all required data.
30,267,814 30,267,814 1 324,588
24,506,702 24,506,702 2 235,193
3
-24,392 -24,392 4 302
-34,438 -34,438 5 264
826,391 826,391 6 3,807
-38,425 -38,425 7 192
1,239,688 1,239,688 8 6,032
1,189,222 1,189,222 9 5,800
584,310 584,310 10 4,212
177,281 177,281 11 2,154
80,899 80,899 12
5,101,916 5,101,916 13 60,576
3,375,415 -1,308,467 2,066,948 14 47,680
FERC FORM NO. 1 (ED. 12-90) Page 327.30
59,363,830 685,933,482 2,310,043,645 1,617,412,325 4,613,389,452

Name of Respondent This Report Is:(1) An Original
(2) A Resubmission
Date of Report(Mo, Da, Yr)
Year/Period of Report
End of
PURCHASED POWER(Account 555) (Continued)
PACIFIC GAS AND ELECTRIC COMPANYX
04/13/20212020/Q4
Line
No.MegaWatt Hours
(i)(h)(g) (j)
Demand Charges Energy Charges Other Charges
(k)
Purchased(j+k+l)Total
COST/SETTLEMENT OF POWER
($) ($) ($)
(Including power exchanges)
POWER EXCHANGES
MegaWatt HoursReceived
MegaWatt HoursDelivered
(l) (m)of Settlement ($)
AD - for out-of-period adjustment. Use this code for any accounting adjustments or "true-ups" for service provided in prior reporting
years. Provide an explanation in a footnote for each adjustment.
4. In column (c), identify the FERC Rate Schedule Number or Tariff, or, for non-FERC jurisdictional sellers, include an appropriate
designation for the contract. On separate lines, list all FERC rate schedules, tariffs or contract designations under which service, as
identified in column (b), is provided.
5. For requirements RQ purchases and any type of service involving demand charges imposed on a monnthly (or longer) basis, enter
the monthly average billing demand in column (d), the average monthly non-coincident peak (NCP) demand in column (e), and the
average monthly coincident peak (CP) demand in column (f). For all other types of service, enter NA in columns (d), (e) and (f). Monthly
NCP demand is the maximum metered hourly (60-minute integration) demand in a month. Monthly CP demand is the metered demand
during the hour (60-minute integration) in which the supplier's system reaches its monthly peak. Demand reported in columns (e) and (f)
must be in megawatts. Footnote any demand not stated on a megawatt basis and explain.
6. Report in column (g) the megawatthours shown on bills rendered to the respondent. Report in columns (h) and (i) the megawatthours
of power exchanges received and delivered, used as the basis for settlement. Do not report net exchange.
7. Report demand charges in column (j), energy charges in column (k), and the total of any other types of charges, including
out-of-period adjustments, in column (l). Explain in a footnote all components of the amount shown in column (l). Report in column (m)
the total charge shown on bills received as settlement by the respondent. For power exchanges, report in column (m) the settlement
amount for the net receipt of energy. If more energy was delivered than received, enter a negative amount. If the settlement amount (l)
include credits or charges other than incremental generation expenses, or (2) excludes certain credits or charges covered by the
agreement, provide an explanatory footnote.
8. The data in column (g) through (m) must be totalled on the last line of the schedule. The total amount in column (g) must be
reported as Purchases on Page 401, line 10. The total amount in column (h) must be reported as Exchange Received on Page 401,
line 12. The total amount in column (i) must be reported as Exchange Delivered on Page 401, line 13.
9. Footnote entries as required and provide explanations following all required data.
1
5,625,968 5,625,968 2 44,333
3,256,018 3,256,018 3 52,243
32,896,306 40,003 32,936,309 4 302,725
4,751,574 4,751,574 5 49,080
7,999,736 7,999,736 6 48,363
1,021,540 1,021,540 7 14,674
3,273,365 3,273,365 8 47,043
165,456 -6,000 159,456 9 2,780
257,781 257,781 10 2,587
4,315,106 4,315,106 11 46,280
20,866 20,866 12 1,681
2,619,990 2,619,990 13 35,735
104,600 104,600 14 1,282
FERC FORM NO. 1 (ED. 12-90) Page 327.31
59,363,830 685,933,482 2,310,043,645 1,617,412,325 4,613,389,452
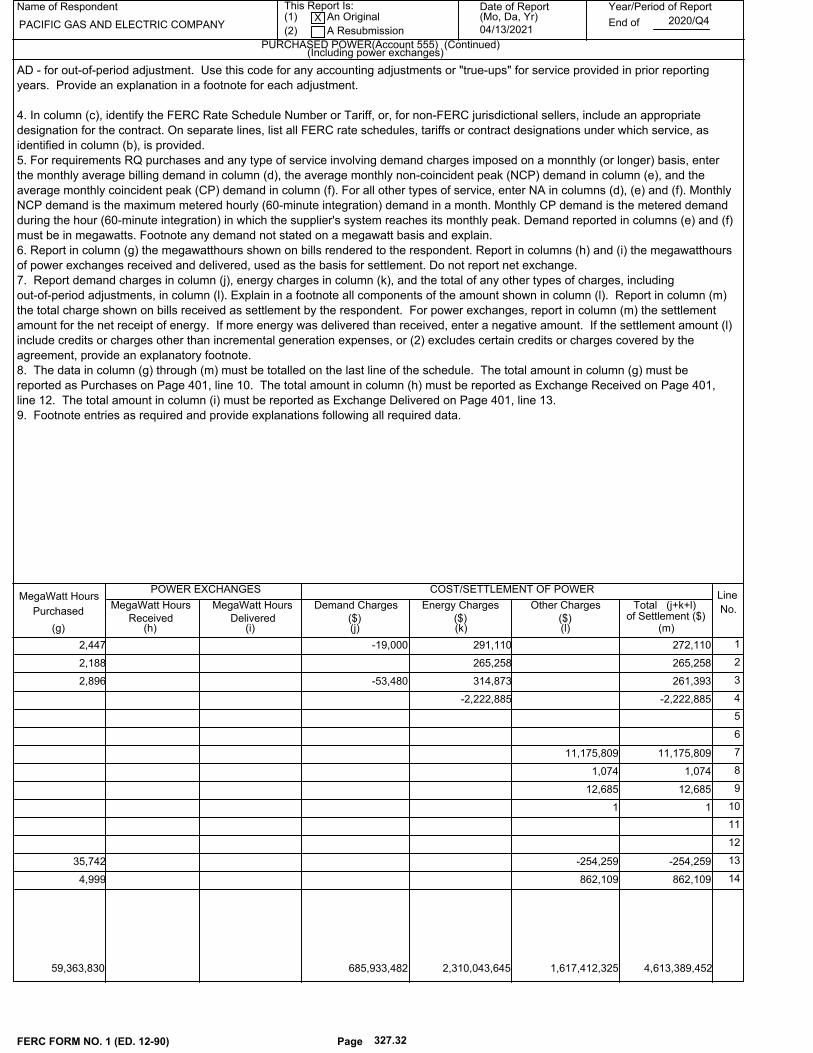
Name of Respondent This Report Is:(1) An Original
(2) A Resubmission
Date of Report(Mo, Da, Yr)
Year/Period of Report
End of
PURCHASED POWER(Account 555) (Continued)
PACIFIC GAS AND ELECTRIC COMPANYX
04/13/20212020/Q4
Line
No.MegaWatt Hours
(i)(h)(g) (j)
Demand Charges Energy Charges Other Charges
(k)
Purchased(j+k+l)Total
COST/SETTLEMENT OF POWER
($) ($) ($)
(Including power exchanges)
POWER EXCHANGES
MegaWatt HoursReceived
MegaWatt HoursDelivered
(l) (m)of Settlement ($)
AD - for out-of-period adjustment. Use this code for any accounting adjustments or "true-ups" for service provided in prior reporting
years. Provide an explanation in a footnote for each adjustment.
4. In column (c), identify the FERC Rate Schedule Number or Tariff, or, for non-FERC jurisdictional sellers, include an appropriate
designation for the contract. On separate lines, list all FERC rate schedules, tariffs or contract designations under which service, as
identified in column (b), is provided.
5. For requirements RQ purchases and any type of service involving demand charges imposed on a monnthly (or longer) basis, enter
the monthly average billing demand in column (d), the average monthly non-coincident peak (NCP) demand in column (e), and the
average monthly coincident peak (CP) demand in column (f). For all other types of service, enter NA in columns (d), (e) and (f). Monthly
NCP demand is the maximum metered hourly (60-minute integration) demand in a month. Monthly CP demand is the metered demand
during the hour (60-minute integration) in which the supplier's system reaches its monthly peak. Demand reported in columns (e) and (f)
must be in megawatts. Footnote any demand not stated on a megawatt basis and explain.
6. Report in column (g) the megawatthours shown on bills rendered to the respondent. Report in columns (h) and (i) the megawatthours
of power exchanges received and delivered, used as the basis for settlement. Do not report net exchange.
7. Report demand charges in column (j), energy charges in column (k), and the total of any other types of charges, including
out-of-period adjustments, in column (l). Explain in a footnote all components of the amount shown in column (l). Report in column (m)
the total charge shown on bills received as settlement by the respondent. For power exchanges, report in column (m) the settlement
amount for the net receipt of energy. If more energy was delivered than received, enter a negative amount. If the settlement amount (l)
include credits or charges other than incremental generation expenses, or (2) excludes certain credits or charges covered by the
agreement, provide an explanatory footnote.
8. The data in column (g) through (m) must be totalled on the last line of the schedule. The total amount in column (g) must be
reported as Purchases on Page 401, line 10. The total amount in column (h) must be reported as Exchange Received on Page 401,
line 12. The total amount in column (i) must be reported as Exchange Delivered on Page 401, line 13.
9. Footnote entries as required and provide explanations following all required data.
-19,000 291,110 272,110 1 2,447
265,258 265,258 2 2,188
-53,480 314,873 261,393 3 2,896
-2,222,885 -2,222,885 4
5
6
11,175,809 11,175,809 7
1,074 1,074 8
12,685 12,685 9
1 1 10
11
12
-254,259 -254,259 13 35,742
862,109 862,109 14 4,999
FERC FORM NO. 1 (ED. 12-90) Page 327.32
59,363,830 685,933,482 2,310,043,645 1,617,412,325 4,613,389,452
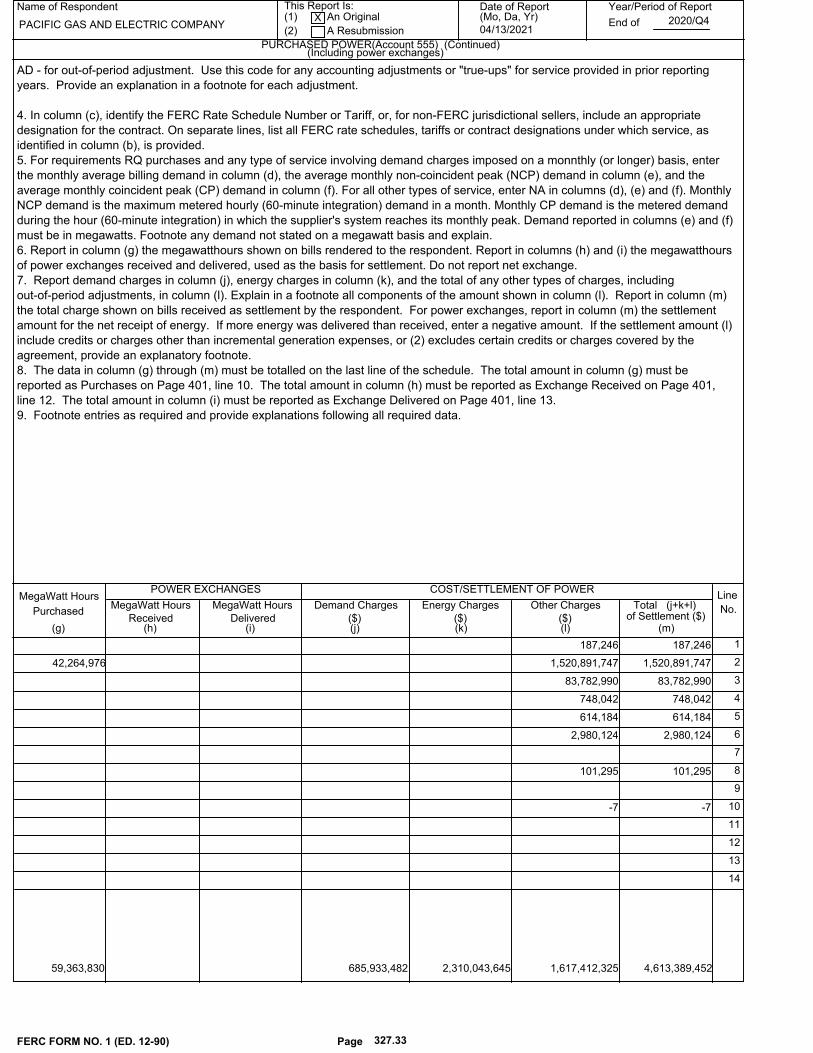
Name of Respondent This Report Is:(1) An Original
(2) A Resubmission
Date of Report(Mo, Da, Yr)
Year/Period of Report
End of
PURCHASED POWER(Account 555) (Continued)
PACIFIC GAS AND ELECTRIC COMPANYX
04/13/20212020/Q4
Line
No.MegaWatt Hours
(i)(h)(g) (j)
Demand Charges Energy Charges Other Charges
(k)
Purchased(j+k+l)Total
COST/SETTLEMENT OF POWER
($) ($) ($)
(Including power exchanges)
POWER EXCHANGES
MegaWatt HoursReceived
MegaWatt HoursDelivered
(l) (m)of Settlement ($)
AD - for out-of-period adjustment. Use this code for any accounting adjustments or "true-ups" for service provided in prior reporting
years. Provide an explanation in a footnote for each adjustment.
4. In column (c), identify the FERC Rate Schedule Number or Tariff, or, for non-FERC jurisdictional sellers, include an appropriate
designation for the contract. On separate lines, list all FERC rate schedules, tariffs or contract designations under which service, as
identified in column (b), is provided.
5. For requirements RQ purchases and any type of service involving demand charges imposed on a monnthly (or longer) basis, enter
the monthly average billing demand in column (d), the average monthly non-coincident peak (NCP) demand in column (e), and the
average monthly coincident peak (CP) demand in column (f). For all other types of service, enter NA in columns (d), (e) and (f). Monthly
NCP demand is the maximum metered hourly (60-minute integration) demand in a month. Monthly CP demand is the metered demand
during the hour (60-minute integration) in which the supplier's system reaches its monthly peak. Demand reported in columns (e) and (f)
must be in megawatts. Footnote any demand not stated on a megawatt basis and explain.
6. Report in column (g) the megawatthours shown on bills rendered to the respondent. Report in columns (h) and (i) the megawatthours
of power exchanges received and delivered, used as the basis for settlement. Do not report net exchange.
7. Report demand charges in column (j), energy charges in column (k), and the total of any other types of charges, including
out-of-period adjustments, in column (l). Explain in a footnote all components of the amount shown in column (l). Report in column (m)
the total charge shown on bills received as settlement by the respondent. For power exchanges, report in column (m) the settlement
amount for the net receipt of energy. If more energy was delivered than received, enter a negative amount. If the settlement amount (l)
include credits or charges other than incremental generation expenses, or (2) excludes certain credits or charges covered by the
agreement, provide an explanatory footnote.
8. The data in column (g) through (m) must be totalled on the last line of the schedule. The total amount in column (g) must be
reported as Purchases on Page 401, line 10. The total amount in column (h) must be reported as Exchange Received on Page 401,
line 12. The total amount in column (i) must be reported as Exchange Delivered on Page 401, line 13.
9. Footnote entries as required and provide explanations following all required data.
187,246 187,246 1
1,520,891,747 1,520,891,747 2 42,264,976
83,782,990 83,782,990 3
748,042 748,042 4
614,184 614,184 5
2,980,124 2,980,124 6
7
101,295 101,295 8
9
-7 -7 10
11
12
13
14
FERC FORM NO. 1 (ED. 12-90) Page 327.33
59,363,830 685,933,482 2,310,043,645 1,617,412,325 4,613,389,452

Schedule Page: 326.32 Line No.: 4 Column: aIndividual demand, energy, and other charges represented above are based upon the best
available vendor invoice and estimate data at the time of filing. The total settlement
difference of ($2.2M) represents additional adjustments made throughout 2020, these
additional adjustments tie back to information reported to the FERC (account 9555000).
The volumetric data by vendor is based on the invoiced and estimated trade data available
at the time of filing.
Schedule Page: 326.33 Line No.: 10 Column: aThe original entries in column l were in two decimal places, which the FERC software
rounds automatically to whole numbers. The entry here is an adjustment to present the
correct total.
Name of Respondent
PACIFIC GAS AND ELECTRIC COMPANY
This Report is:(1) X An Original(2) A Resubmission
Date of Report(Mo, Da, Yr)
04/13/2021
Year/Period of Report
2020/Q4
FOOTNOTE DATA
FERC FORM NO. 1 (ED. 12-87) Page 450.1

TRANSMISSION OF ELECTRICITY FOR OTHERS (Account 456.1)
Name of Respondent This Report Is:(1) An Original
(2) A Resubmission
Date of Report(Mo, Da, Yr)
Year/Period of Report
End ofPACIFIC GAS AND ELECTRIC COMPANYX
04/13/20212020/Q4
Line
No.
Payment By
(c)(b)(a) (d)
Statistical
cation
Classifi-
(Footnote Affiliation)
(Including transactions referred to as 'wheeling')
(Company of Public Authority)
(Footnote Affiliation)
(Company of Public Authority)
(Footnote Affiliation)
(Company of Public Authority)Energy Received From Energy Delivered To
1. Report all transmission of electricity, i.e., wheeling, provided for other electric utilities, cooperatives, other public authorities,
qualifying facilities, non-traditional utility suppliers and ultimate customers for the quarter.
2. Use a separate line of data for each distinct type of transmission service involving the entities listed in column (a), (b) and (c).
3. Report in column (a) the company or public authority that paid for the transmission service. Report in column (b) the company or
public authority that the energy was received from and in column (c) the company or public authority that the energy was delivered to.
Provide the full name of each company or public authority. Do not abbreviate or truncate name or use acronyms. Explain in a footnote
any ownership interest in or affiliation the respondent has with the entities listed in columns (a), (b) or (c)
4. In column (d) enter a Statistical Classification code based on the original contractual terms and conditions of the service as follows:
FNO - Firm Network Service for Others, FNS - Firm Network Transmission Service for Self, LFP - "Long-Term Firm Point to Point
Transmission Service, OLF - Other Long-Term Firm Transmission Service, SFP - Short-Term Firm Point to Point Transmission
Reservation, NF - non-firm transmission service, OS - Other Transmission Service and AD - Out-of-Period Adjustments. Use this code
for any accounting adjustments or "true-ups" for service provided in prior reporting periods. Provide an explanation in a footnote for
each adjustment. See General Instruction for definitions of codes.
1
TRANSMISSION AGENCY OF 2
NORTHERN CALIFORNIA (TANC) Various Various LFP 3
4
5
6
7
8
9
10
11
12
13
14
15
16
17
18
19
20
21
22
23
24
25
26
27
28
29
30
31
32
33
34
FERC FORM NO. 1 (ED. 12-90) Page 328
TOTAL

Name of Respondent This Report Is:(1) An Original
(2) A Resubmission
Date of Report(Mo, Da, Yr)
Year/Period of Report
End of
TRANSMISSION OF ELECTRICITY FOR OTHERS (Account 456)(Continued)
PACIFIC GAS AND ELECTRIC COMPANYX
04/13/20212020/Q4
Line
No.
(Including transactions reffered to as 'wheeling')
FERC RateSchedule of
Tariff Number(e)
Point of Receipt(Subsatation or Other
Designation)(f)
Point of Delivery(Substation or Other
(g)
BillingDemand
(MW)(h)
TRANSFER OF ENERGY
MegaWatt HoursReceived
(i)Delivered
(j)
MegaWatt HoursDesignation)
5. In column (e), identify the FERC Rate Schedule or Tariff Number, On separate lines, list all FERC rate schedules or contract
designations under which service, as identified in column (d), is provided.
6. Report receipt and delivery locations for all single contract path, "point to point" transmission service. In column (f), report the
designation for the substation, or other appropriate identification for where energy was received as specified in the contract. In column
(g) report the designation for the substation, or other appropriate identification for where energy was delivered as specified in the
contract.
7. Report in column (h) the number of megawatts of billing demand that is specified in the firm transmission service contract. Demand
reported in column (h) must be in megawatts. Footnote any demand not stated on a megawatts basis and explain.
8. Report in column (i) and (j) the total megawatthours received and delivered.
1
2
Midway143 Various 233 553,931 543,456 3
4
5
6
7
8
9
10
11
12
13
14
15
16
17
18
19
20
21
22
23
24
25
26
27
28
29
30
31
32
33
34
FERC FORM NO. 1 (ED. 12-90) Page 329
233 553,931 543,456

Name of Respondent This Report Is:(1) An Original
(2) A Resubmission
Date of Report(Mo, Da, Yr)
Year/Period of Report
End of
TRANSMISSION OF ELECTRICITY FOR OTHERS (Account 456) (Continued)
PACIFIC GAS AND ELECTRIC COMPANYX
04/13/20212020/Q4
Line
No.(m)(l)(k) (n)
(k+l+m)Total Revenues ($)
(Including transactions reffered to as 'wheeling')
($)Energy Charges
($)(Other Charges)Demand Charges
($)
REVENUE FROM TRANSMISSION OF ELECTRICITY FOR OTHERS
9. In column (k) through (n), report the revenue amounts as shown on bills or vouchers. In column (k), provide revenues from demand
charges related to the billing demand reported in column (h). In column (I), provide revenues from energy charges related to the
amount of energy transferred. In column (m), provide the total revenues from all other charges on bills or vouchers rendered, including
out of period adjustments. Explain in a footnote all components of the amount shown in column (m). Report in column (n) the total
charge shown on bills rendered to the entity Listed in column (a). If no monetary settlement was made, enter zero (11011) in column
(n). Provide a footnote explaining the nature of the non-monetary settlement, including the amount and type of energy or service
rendered.
10. The total amounts in columns (i) and (j) must be reported as Transmission Received and Transmission Delivered for annual report
purposes only on Page 401, Lines 16 and 17, respectively.
11. Footnote entries and provide explanations following all required data.
1
2
2,874,769 87,000 2,787,769 3
4
5
6
7
8
9
10
11
12
13
14
15
16
17
18
19
20
21
22
23
24
25
26
27
28
29
30
31
32
33
34
FERC FORM NO. 1 (ED. 12-90) Page 330
0 2,874,769 87,000 2,787,769

Schedule Page: 328 Line No.: 3 Column: a
Other Charges represent booking estimate adjustments. In September 2003 the Utility changed billing methodology
using energy as billing determinants rather than contract demand. The change was pursuant to the TO6 Settlement
Agreement under FERC Docket No. ER03-666-000.
Transmission is provided under the Midway Transmission Service.
Recorded here are the Midway Transmission Service data for TANC members which include Modesto Irrigation District,
Sacramento Municipal Utility District, City of Redding, and the Turlock Irrigation District.
Name of Respondent
PACIFIC GAS AND ELECTRIC COMPANY
This Report is:(1) X An Original(2) A Resubmission
Date of Report(Mo, Da, Yr)
04/13/2021
Year/Period of Report
2020/Q4
FOOTNOTE DATA
FERC FORM NO. 1 (ED. 12-87) Page 450.1

Name of Respondent This Report Is:(1) An Original
(2) A Resubmission
Date of Report(Mo, Da, Yr)
Year/Period of Report
End of
TRANSMISSION OF ELECTRICITY BY ISO/RTOs
PACIFIC GAS AND ELECTRIC COMPANYX
04/13/20212020/Q4
Line
No.
Payment Received by Statistical
(b)(a)(Transmission Owner Name) Classification
FERC Rate Scheduleor Tariff Number
(c)
Total Revenue by RateSchedule or Tarirff
(d)
Total Revenue
(e)
1. Report in Column (a) the Transmission Owner receiving revenue for the transmission of electricity by the ISO/RTO.
2. Use a separate line of data for each distinct type of transmission service involving the entities listed in Column (a).
3. In Column (b) enter a Statistical Classification code based on the original contractual terms and conditions of the service as follows: FNO – Firm
Network Service for Others, FNS – Firm Network Transmission Service for Self, LFP – Long-Term Firm Point-to-Point Transmission Service, OLF – Other
Long-Term Firm Transmission Service, SFP – Short-Term Firm Point-to-Point Transmission Reservation, NF – Non-Firm Transmission Service, OS –
Other Transmission Service and AD- Out-of-Period Adjustments. Use this code for any accounting adjustments or “true-ups” for service provided in prior
reporting periods. Provide an explanation in a footnote for each adjustment. See General Instruction for definitions of codes.
4. In column (c) identify the FERC Rate Schedule or tariff Number, on separate lines, list all FERC rate schedules or contract designations under which
service, as identified in column (b) was provided.
5. In column (d) report the revenue amounts as shown on bills or vouchers.
6. Report in column (e) the total revenues distributed to the entity listed in column (a).
NONE 1
2
3
4
5
6
7
8
9
10
11
12
13
14
15
16
17
18
19
20
21
22
23
24
25
26
27
28
29
30
31
32
33
34
35
36
37
38
39
Page 331
40 TOTAL
FERC FORM NO. 1/3-Q (REV 03-07)

Name of Respondent This Report Is:(1) An Original
(2) A Resubmission
Date of Report(Mo, Da, Yr)
Year/Period of Report
End of
TRANSMISSION OF ELECTRICITY BY OTHERS (Account 565)
PACIFIC GAS AND ELECTRIC COMPANYX
04/13/20212020/Q4
Line
No. Name of Company or Public
(d)(c)(a)Authority (Footnote Affiliations)
TRANSFER OF ENERGY
Magawatt-hours
Received
Magawatt-
Deliveredhours
EXPENSES FOR TRANSMISSION OF ELECTRICITY BY OTHERSDemandCharges
($)(e)
EnergyCharges
(f)($)
OtherCharges
($)(g)
($)
Total Cost ofTransmission
(h)
(Including transactions referred to as "wheeling")
1. Report all transmission, i.e. wheeling or electricity provided by other electric utilities, cooperatives, municipalities, other public
authorities, qualifying facilities, and others for the quarter.
2. In column (a) report each company or public authority that provided transmission service. Provide the full name of the company,
abbreviate if necessary, but do not truncate name or use acronyms. Explain in a footnote any ownership interest in or affiliation with the
transmission service provider. Use additional columns as necessary to report all companies or public authorities that provided
transmission service for the quarter reported.
3. In column (b) enter a Statistical Classification code based on the original contractual terms and conditions of the service as follows:
FNS - Firm Network Transmission Service for Self, LFP - Long-Term Firm Point-to-Point Transmission Reservations. OLF - Other
Long-Term Firm Transmission Service, SFP - Short-Term Firm Point-to- Point Transmission Reservations, NF - Non-Firm Transmission
Service, and OS - Other Transmission Service. See General Instructions for definitions of statistical classifications.
4. Report in column (c) and (d) the total megawatt hours received and delivered by the provider of the transmission service.
5. Report in column (e), (f) and (g) expenses as shown on bills or vouchers rendered to the respondent. In column (e) report the
demand charges and in column (f) energy charges related to the amount of energy transferred. On column (g) report the total of all
other charges on bills or vouchers rendered to the respondent, including any out of period adjustments. Explain in a footnote all
components of the amount shown in column (g). Report in column (h) the total charge shown on bills rendered to the respondent. If no
monetary settlement was made, enter zero in column (h). Provide a footnote explaining the nature of the non-monetary settlement,
including the amount and type of energy or service rendered.
6. Enter "TOTAL" in column (a) as the last line.
7. Footnote entries and provide explanations following all required data.
Statistical
Classification(b)
CALIFORNIA-OREGON 1
OS 427,872 427,872TRANSMISSION PROJECT 2
OS 132,006 37,742 94,264PACIFICORP 3
SACRAMENTO MUNICIPAL 4
OSUTILITY DISTRICT 5
WESTERN AREA POWER 6
OS 100,280 98,000 2,280ADMINISTRATION 7
CALIFORNIA-OREGON 8
OS 347,082 347,082INTERTIE 9
OSOTHER 10
11
12
13
14
15
16
FERC FORM NO. 1/3-Q (REV. 02-04) Page 332
96,544 910,696 1,007,240TOTAL

Schedule Page: 332 Line No.: 2 Column: gRepresents payments for operations and maintenance costs.
Schedule Page: 332 Line No.: 3 Column: eRepresents payments for lease of transmission capacity.
Schedule Page: 332 Line No.: 3 Column: gRepresents payments for operations and maintenance costs.
Schedule Page: 332 Line No.: 7 Column: eRepresents payments for lease of transmission capacity.
Schedule Page: 332 Line No.: 9 Column: gRepresents payments for administrative costs of scheduling services provided by the
California Independent Systems Operator (CAISO).
Name of Respondent
PACIFIC GAS AND ELECTRIC COMPANY
This Report is:(1) X An Original(2) A Resubmission
Date of Report(Mo, Da, Yr)
04/13/2021
Year/Period of Report
2020/Q4
FOOTNOTE DATA
FERC FORM NO. 1 (ED. 12-87) Page 450.1

Name of Respondent This Report Is:(1) An Original
(2) A Resubmission
Date of Report(Mo, Da, Yr)
Year/Period of Report
End of
MISCELLANEOUS GENERAL EXPENSES (Account 930.2) (ELECTRIC)
PACIFIC GAS AND ELECTRIC COMPANY X04/13/2021
2020/Q4
Line Description Amount(b)(a)No.
10Industry Association Dues 1
Nuclear Power Research Expenses 2
Other Experimental and General Research Expenses 3
Pub & Dist Info to Stkhldrs...expn servicing outstanding Securities 4
Oth Expn >=5,000 show purpose, recipient, amount. Group if < $5,000 5
6
4,432,405Clearing Account Adjustments 7
3,662,973Intervenor Compensation 8
650,161MCI-PG&E Exchange Rights 9
15,928,580Bank Service Fees 10
-96,511Consulting Serv, Outside Attorney Fees and Contracts 11
3,085,859Intercompany Billing (Cost belongs in Acct 923) 12
-2,604Misc cash receipt (recovery of unclaimed funds) 13
117,756Write off from miscellaneous reconciliations 14
12,309Other miscellaneous adjustments 15
16
17
18
19
20
21
22
23
24
25
26
27
28
29
30
31
32
33
34
35
36
37
38
39
40
41
42
43
44
45
27,790,938
FERC FORM NO. 1 (ED. 12-94) Page 335
46 TOTAL
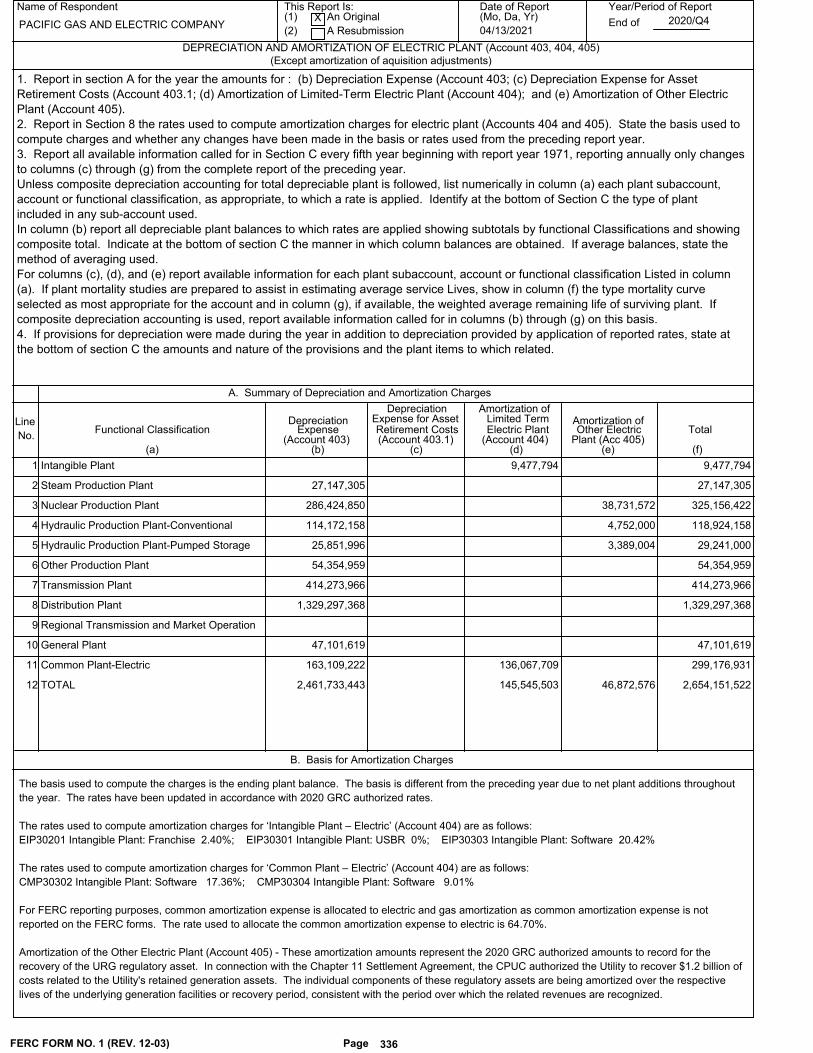
Name of Respondent This Report Is:(1) An Original
(2) A Resubmission
Date of Report(Mo, Da, Yr)
Year/Period of Report
End of
DEPRECIATION AND AMORTIZATION OF ELECTRIC PLANT (Account 403, 404, 405)
PACIFIC GAS AND ELECTRIC COMPANYX
04/13/20212020/Q4
Line
No.Functional Classification
Depreciation
(d)(b)(a)
Amortization of
Total
(Except amortization of aquisition adjustments)
A. Summary of Depreciation and Amortization Charges
Expense(Account 403)
Limited TermElectric Plant
Amortization ofOther Electric
Plant (Acc 405)(e) (f)
1. Report in section A for the year the amounts for : (b) Depreciation Expense (Account 403; (c) Depreciation Expense for Asset
Retirement Costs (Account 403.1; (d) Amortization of Limited-Term Electric Plant (Account 404); and (e) Amortization of Other Electric
Plant (Account 405).
2. Report in Section 8 the rates used to compute amortization charges for electric plant (Accounts 404 and 405). State the basis used to
compute charges and whether any changes have been made in the basis or rates used from the preceding report year.
3. Report all available information called for in Section C every fifth year beginning with report year 1971, reporting annually only changes
to columns (c) through (g) from the complete report of the preceding year.
Unless composite depreciation accounting for total depreciable plant is followed, list numerically in column (a) each plant subaccount,
account or functional classification, as appropriate, to which a rate is applied. Identify at the bottom of Section C the type of plant
included in any sub-account used.
In column (b) report all depreciable plant balances to which rates are applied showing subtotals by functional Classifications and showing
composite total. Indicate at the bottom of section C the manner in which column balances are obtained. If average balances, state the
method of averaging used.
For columns (c), (d), and (e) report available information for each plant subaccount, account or functional classification Listed in column
(a). If plant mortality studies are prepared to assist in estimating average service Lives, show in column (f) the type mortality curve
selected as most appropriate for the account and in column (g), if available, the weighted average remaining life of surviving plant. If
composite depreciation accounting is used, report available information called for in columns (b) through (g) on this basis.
4. If provisions for depreciation were made during the year in addition to depreciation provided by application of reported rates, state at
the bottom of section C the amounts and nature of the provisions and the plant items to which related.
(Account 404)(c)
DepreciationExpense for AssetRetirement Costs(Account 403.1)
9,477,794 9,477,794 1 Intangible Plant
27,147,305 27,147,305 2 Steam Production Plant
325,156,422 286,424,850 38,731,572 3 Nuclear Production Plant
118,924,158 114,172,158 4,752,000 4 Hydraulic Production Plant-Conventional
29,241,000 25,851,996 3,389,004 5 Hydraulic Production Plant-Pumped Storage
54,354,959 54,354,959 6 Other Production Plant
414,273,966 414,273,966 7 Transmission Plant
1,329,297,368 1,329,297,368 8 Distribution Plant
9 Regional Transmission and Market Operation
47,101,619 47,101,619 10 General Plant
299,176,931 163,109,222 136,067,709 11 Common Plant-Electric
2,654,151,522 2,461,733,443 145,545,503 46,872,576 12 TOTAL
The basis used to compute the charges is the ending plant balance. The basis is different from the preceding year due to net plant additions throughout
the year. The rates have been updated in accordance with 2020 GRC authorized rates.
The rates used to compute amortization charges for ‘Intangible Plant – Electric’ (Account 404) are as follows:
EIP30201 Intangible Plant: Franchise 2.40%; EIP30301 Intangible Plant: USBR 0%; EIP30303 Intangible Plant: Software 20.42%
The rates used to compute amortization charges for ‘Common Plant – Electric’ (Account 404) are as follows:
CMP30302 Intangible Plant: Software 17.36%; CMP30304 Intangible Plant: Software 9.01%
For FERC reporting purposes, common amortization expense is allocated to electric and gas amortization as common amortization expense is not
reported on the FERC forms. The rate used to allocate the common amortization expense to electric is 64.70%.
Amortization of the Other Electric Plant (Account 405) - These amortization amounts represent the 2020 GRC authorized amounts to record for the
recovery of the URG regulatory asset. In connection with the Chapter 11 Settlement Agreement, the CPUC authorized the Utility to recover $1.2 billion of
costs related to the Utility's retained generation assets. The individual components of these regulatory assets are being amortized over the respective
lives of the underlying generation facilities or recovery period, consistent with the period over which the related revenues are recognized.
FERC FORM NO. 1 (REV. 12-03) Page 336
B. Basis for Amortization Charges

Name of Respondent This Report Is:(1) An Original
(2) A Resubmission
Date of Report(Mo, Da, Yr)
Year/Period of Report
End of
DEPRECIATION AND AMORTIZATION OF ELECTRIC PLANT (Continued)
PACIFIC GAS AND ELECTRIC COMPANYX
04/13/20212020/Q4
Line
No. Account No.
(c)(b)(a) (d) (e)
C. Factors Used in Estimating Depreciation Charges
DepreciablePlant Base
(In Thousands)
EstimatedAvg. Service
Life
NetSalvage
(Percent)
AppliedDepr. rates
MortalityCurveType
AverageRemaining
Life(f) (g)
(Percent)
Steam Prod - Fossil 12
2.38 SQ310.02 4,801 13
75.00 3.43 17.90R1311 114,004 14
50.00 3.62 17.30R1312 282,647 15
313 16
40.00 3.55 17.50R2.5314 257,634 17
45.00 3.59 17.90R2.5315 52,626 18
40.00 3.70 16.50S0.5316 28,349 19
SUBTOTAL 740,061 20
21
Nuclear Prod - Diablo 22
5.00 4.30Life Span321 1,096,477 23
5.00 3.90Life Span322 3,596,678 24
5.00 3.70Life Span323 1,215,746 25
5.00 4.10Life Span324 870,127 26
5.00 4.20Life Span325 1,189,936 27
SUBTOTAL 7,968,964 28
29
Hydraulic Production 30
2.10 SQ330 17,279 31
80.00 -6.00 2.91 12.60R2331 540,755 32
120.00 -3.00 1.93 16.40R2.5332 2,204,008 33
71.00 -4.00 4.72 12.80S0,SQ333 1,081,479 34
65.00 -6.00 3.25 15.20S0.5334 315,250 35
55.00 -10.00 4.32 12.90S0335 134,986 36
80.00 -3.00 3.04 15.50S1336 97,987 37
SUBTOTAL 4,391,744 38
39
Other Production 40
0.69 SQ340.02 3,121 41
59.00 3.66 17.70R1,SQ341 211,569 42
50.00 3.61 17.40R1342 11,473 43
40.00 3.55 17.70R2.5343 228,651 44
27.00 4.43 16.40R2.5,SQ,R2344 353,998 45
31.00 6.31 13.80R2.5,S2.5,SQ345 215,712 46
35.00 3.83 16.60S0.5,SQ346 101,910 47
SUBTOTAL 1,126,434 48
49
50
FERC FORM NO. 1 (REV. 12-03) Page 337

Name of Respondent This Report Is:(1) An Original
(2) A Resubmission
Date of Report(Mo, Da, Yr)
Year/Period of Report
End of
DEPRECIATION AND AMORTIZATION OF ELECTRIC PLANT (Continued)
PACIFIC GAS AND ELECTRIC COMPANYX
04/13/20212020/Q4
Line
No. Account No.
(c)(b)(a) (d) (e)
C. Factors Used in Estimating Depreciation Charges
DepreciablePlant Base
(In Thousands)
EstimatedAvg. Service
Life
NetSalvage
(Percent)
AppliedDepr. rates
MortalityCurveType
AverageRemaining
Life(f) (g)
(Percent)
Transmission 12
39.00 1.34 21.60R4350.02 218,714 13
70.00 -20.00 1.65 57.70R3352.00 523,565 14
2.00 0.07 31.50R1.5353.00 7,341,814 15
1.00 -2.00 0.13 53.30R4354 1,033,962 16
54.00 -75.00 3.16 43.50R1.5355 1,961,139 17
65.00 -75.00 2.74 48.80R2356 2,195,913 18
65.00 1.53 51.80R4357 516,190 19
55.00 -10.00 1.99 40.70R3358 288,767 20
60.00 -10.00 1.86 49.80R1.5359 132,270 21
SUBTOTAL 14,212,334 22
23
Transmission - Diablo 24
5.00 -0.62 4.40352.01 4,981 25
50.00 -39.00 6.51 8.40R2353.01 89,979 26
SUBTOTAL 94,960 27
28
Distribution 29
40.00 2.18 17.30SQ360.02 121,789 30
70.00 -20.00 1.60 50.90R3361 329,238 31
46.00 -40.00 3.06 33.20R1.5362 3,901,000 32
15.00 6.45 7.30R2,S3363 34,560 33
44.00 -150.00 6.07 29.90R2364 6,139,824 34
46.00 -90.00 3.96 31.30R2365 5,371,284 35
65.00 -50.00 2.41 44.40R4366 3,303,829 36
50.00 -65.00 3.12 32.40R3367 5,359,204 37
32.00 -29.00 4.26 20.20R2.5368 4,514,370 38
51.00 -67.00 3.06 30.50R2.5,R4369 3,763,523 39
20.00 -20.00 6.86 12.00R2370 1,308,865 40
40.00 -3.00 0.24 5.50S1,R4371 29,443 41
25.00 L1372 895 42
29.00 -23.00 3.23 9.60R1,S1.5,L0373 268,830 43
SUBTOTAL 34,446,654 44
45
General Plant 46
59.00 2.92 28.90SQ389.02 415 47
50.00 -10.00 1.58 31.00R2390 22,491 48
20.00 5.93 8.40SQ391.00 10,700 49
25.00 3.94 14.40SQ394 173,971 50
FERC FORM NO. 1 (REV. 12-03) Page 337.1

Name of Respondent This Report Is:(1) An Original
(2) A Resubmission
Date of Report(Mo, Da, Yr)
Year/Period of Report
End of
DEPRECIATION AND AMORTIZATION OF ELECTRIC PLANT (Continued)
PACIFIC GAS AND ELECTRIC COMPANYX
04/13/20212020/Q4
Line
No. Account No.
(c)(b)(a) (d) (e)
C. Factors Used in Estimating Depreciation Charges
DepreciablePlant Base
(In Thousands)
EstimatedAvg. Service
Life
NetSalvage
(Percent)
AppliedDepr. rates
MortalityCurveType
AverageRemaining
Life(f) (g)
(Percent)
20.00 4.74 10.80SQ395 11,927 12
396 13
15.00 6.89 10.10SQ397 519,375 14
20.00 6.85 16.70SQ398.00 34,109 15
SUBTOTAL 772,988 16
17
General Plant - Diablo 18
5.00 12.25 3.40Life Span391.01 4,508 19
5.00 12.36 4.80Life Span398.01 15,882 20
SUBTOTAL 20,390 21
22
TOTAL 63,774,529 23
24
25
26
27
28
29
30
31
32
33
34
35
36
37
38
39
40
41
42
43
44
45
46
47
48
49
50
FERC FORM NO. 1 (REV. 12-03) Page 337.2

Name of Respondent This Report Is:(1) An Original
(2) A Resubmission
Date of Report(Mo, Da, Yr)
Year/Period of Report
End of
REGULATORY COMMISSION EXPENSES
PACIFIC GAS AND ELECTRIC COMPANYX
04/13/20212020/Q4
Line
No.
Description Assessed by
(c)(b)(a)
Total Expense for
Expenses
of
(d)
(Furnish name of regulatory commission or body the Regulatory
docket or case number and a description of the case) Commission UtilityCurrent Year
(b) + (c)
Deferredin Account182.3 at
Beginning of Year(e)
1. Report particulars (details) of regulatory commission expenses incurred during the current year (or incurred in previous years, if
being amortized) relating to format cases before a regulatory body, or cases in which such a body was a party.
2. Report in columns (b) and (c), only the current year's expenses that are not deferred and the current year's amortization of amounts
deferred in previous years.
Annual fees paid for Diablo Canyon Power Plant 1
in accordance with Part 171 2
Docket 5000275 4,809,059 4,809,059 3
Docket 5000323 4,809,059 4,809,059 4
5
Fees paid for Diablo Canyon Power Plant 6
for inspection, license renewal, operator 7
examination in accordance with Part 170 8
Docket 5000275 1,065,719 1,065,719 9
Docket 5000275 125,668 125,668 10
Docket 5000323 1,023,956 1,023,956 11
Docket 5000323 91,757 91,757 12
General Accrual 120,378 120,378 13
General Accrual -64,913 -64,913 14
15
Annual fees paid for Humbolt Bay Power Plant 16
in accordance with Part 171 17
Docket 5000133 197,202 197,202 18
19
*All paid to US Nuclear Regulatory Commission 20
21
22
23
24
25
26
27
28
29
30
31
32
33
34
35
36
37
38
39
40
41
42
43
44
45
FERC FORM NO. 1 (ED. 12-96) Page 350
46 TOTAL 12,177,885 12,177,885

Name of Respondent This Report Is:(1) An Original
(2) A Resubmission
Date of Report(Mo, Da, Yr)
Year/Period of Report
End of
REGULATORY COMMISSION EXPENSES (Continued)
PACIFIC GAS AND ELECTRIC COMPANYX
04/13/20212020/Q4
Line
No.(j)(i)(f) (k) (l)
EXPENSES INCURRED DURING YEAR AMORTIZED DURING YEAR
CURRENTLY CHARGED TODepartment Account
No.(g)
Amount
(h)
Deferred toAccount 182.3
ContraAccount
Amount Deferred in Account 182.3End of Year
3. Show in column (k) any expenses incurred in prior years which are being amortized. List in column (a) the period of amortization.
4. List in column (f), (g), and (h) expenses incurred during year which were charged currently to income, plant, or other accounts.
5. Minor items (less than $25,000) may be grouped.
1
2
3 4,809,059 524
4 4,809,059 524
5
6
7
8
9 1,065,719 524
10 125,668 930
11 1,023,956 524
12 91,757 930
13 120,378 524
14 -64,913 930
15
16
17
18 197,202 930
19
20
21
22
23
24
25
26
27
28
29
30
31
32
33
34
35
36
37
38
39
40
41
42
43
44
45
FERC FORM NO. 1 (ED. 12-96) Page 351
46 12,177,885

Name of Respondent This Report Is:(1) An Original
(2) A Resubmission
Date of Report(Mo, Da, Yr)
Year/Period of Report
End of
RESEARCH, DEVELOPMENT, AND DEMONSTRATION ACTIVITIES
PACIFIC GAS AND ELECTRIC COMPANYX
04/13/20212020/Q4
Line
No.
Description
(b)(a)
Classification
1. Describe and show below costs incurred and accounts charged during the year for technological research, development, and demonstration (R, D &
D) project initiated, continued or concluded during the year. Report also support given to others during the year for jointly-sponsored projects.(Identify
recipient regardless of affiliation.) For any R, D & D work carried with others, show separately the respondent's cost for the year and cost chargeable to
others (See definition of research, development, and demonstration in Uniform System of Accounts).
2. Indicate in column (a) the applicable classification, as shown below:
Classifications:
A. Electric R, D & D Performed Internally: a. Overhead
(1) Generation b. Underground
a. hydroelectric (3) Distribution
i. Recreation fish and wildlife (4) Regional Transmission and Market Operation
ii Other hydroelectric (5) Environment (other than equipment)
b. Fossil-fuel steam (6) Other (Classify and include items in excess of $50,000.)
c. Internal combustion or gas turbine (7) Total Cost Incurred
d. Nuclear B. Electric, R, D & D Performed Externally:
e. Unconventional generation (1) Research Support to the electrical Research Council or the Electric
f. Siting and heat rejection Power Research Institute
(2) Transmission
Electric Program Investment ChargeA2, A3 1
2
3
4
5
Customer Energy Services -A2, A3 6
7
8
9
10
11
12
13
14
15
16
17
18
19
20
21
22
23
24
25
26
27
28
29
30
31
32
33
34
35
36
37
38
FERC FORM NO. 1 (ED. 12-87) Page 352

Name of Respondent This Report Is:(1) An Original
(2) A Resubmission
Date of Report(Mo, Da, Yr)
Year/Period of Report
End of
RESEARCH, DEVELOPMENT, AND DEMONSTRATION ACTIVITIES (Continued)
PACIFIC GAS AND ELECTRIC COMPANYX
04/13/20212020/Q4
Line
No.
AMOUNTS CHARGED IN CURRENT YEAR
(e)(c)
Costs Incurred InternallyCurrent Year
Costs Incurred ExternallyCurrent Year
(d)Account Amount
(f)
Unamortized
Accumulation(g)
(2) Research Support to Edison Electric Institute
(3) Research Support to Nuclear Power Groups
(4) Research Support to Others (Classify)
(5) Total Cost Incurred
3. Include in column (c) all R, D & D items performed internally and in column (d) those items performed outside the company costing $50,000 or more,
briefly describing the specific area of R, D & D (such as safety, corrosion control, pollution, automation, measurement, insulation, type of appliance, etc.).
Group items under $50,000 by classifications and indicate the number of items grouped. Under Other, (A (6) and B (4)) classify items by type of R, D &
D activity.
4. Show in column (e) the account number charged with expenses during the year or the account to which amounts were capitalized during the year,
listing Account 107, Construction Work in Progress, first. Show in column (f) the amounts related to the account charged in column (e)
5. Show in column (g) the total unamortized accumulating of costs of projects. This total must equal the balance in Account 188, Research,
Development, and Demonstration Expenditures, Outstanding at the end of the year.
6. If costs have not been segregated for R, D &D activities or projects, submit estimates for columns (c), (d), and (f) with such amounts identified by
"Est."
7. Report separately research and related testing facilities operated by the respondent.
-20,998 1408 13,850
2588 -76,578
3926 41,579
4930 151
5
-8,617 6408 15
7588 -8,678
8926 46
9
10
11
12
13
14
15
16
17
18
19
20
21
22
23
24
25
26
27
28
29
30
31
32
33
34
35
36
37
38
FERC FORM NO. 1 (ED. 12-87) Page 353
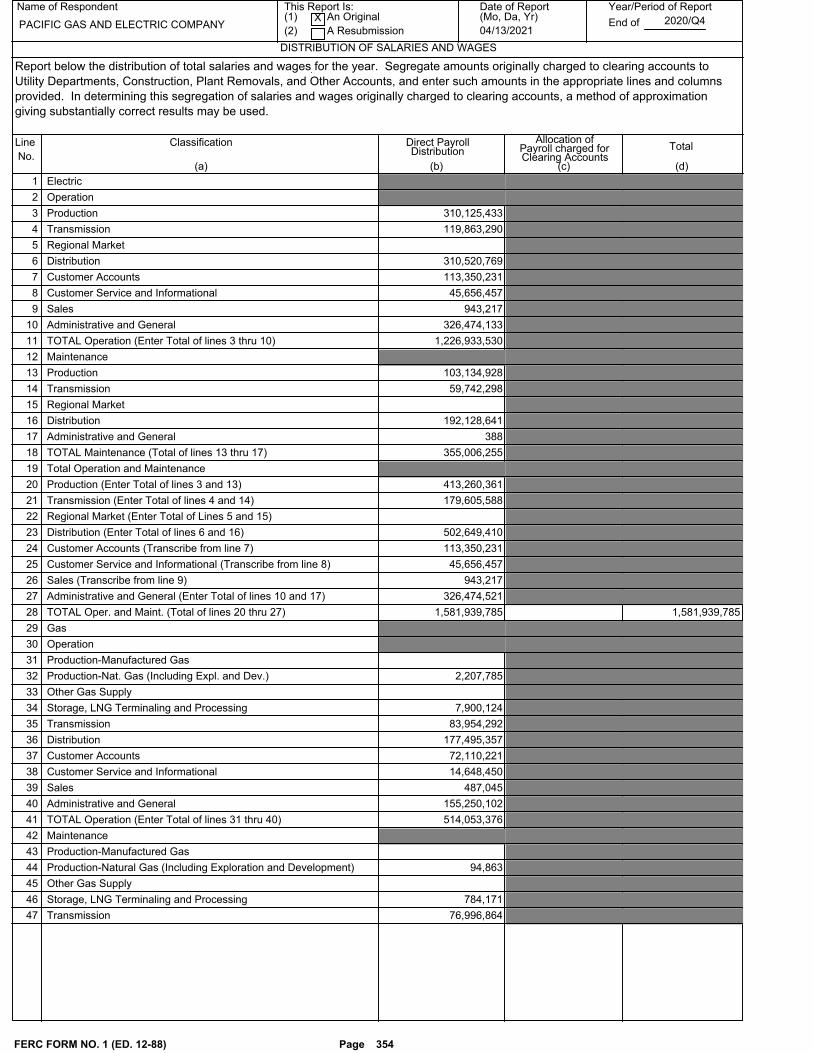
Name of Respondent This Report Is:(1) An Original
(2) A Resubmission
Date of Report(Mo, Da, Yr)
Year/Period of Report
End of
DISTRIBUTION OF SALARIES AND WAGES
PACIFIC GAS AND ELECTRIC COMPANYX
04/13/20212020/Q4
Line
No.
Classification
(c)(b)(a)
Direct Payroll Allocation ofTotal
(d)
Distribution Payroll charged forClearing Accounts
Report below the distribution of total salaries and wages for the year. Segregate amounts originally charged to clearing accounts to
Utility Departments, Construction, Plant Removals, and Other Accounts, and enter such amounts in the appropriate lines and columns
provided. In determining this segregation of salaries and wages originally charged to clearing accounts, a method of approximation
giving substantially correct results may be used.
Electric 1
Operation 2
310,125,433Production 3
119,863,290Transmission 4
Regional Market 5
310,520,769Distribution 6
113,350,231Customer Accounts 7
45,656,457Customer Service and Informational 8
943,217Sales 9
326,474,133Administrative and General 10
1,226,933,530TOTAL Operation (Enter Total of lines 3 thru 10) 11
Maintenance 12
103,134,928Production 13
59,742,298Transmission 14
Regional Market 15
192,128,641Distribution 16
388Administrative and General 17
355,006,255TOTAL Maintenance (Total of lines 13 thru 17) 18
Total Operation and Maintenance 19
413,260,361Production (Enter Total of lines 3 and 13) 20
179,605,588Transmission (Enter Total of lines 4 and 14) 21
Regional Market (Enter Total of Lines 5 and 15) 22
502,649,410Distribution (Enter Total of lines 6 and 16) 23
113,350,231Customer Accounts (Transcribe from line 7) 24
45,656,457Customer Service and Informational (Transcribe from line 8) 25
943,217Sales (Transcribe from line 9) 26
326,474,521Administrative and General (Enter Total of lines 10 and 17) 27
1,581,939,785 1,581,939,785TOTAL Oper. and Maint. (Total of lines 20 thru 27) 28
Gas 29
Operation 30
Production-Manufactured Gas 31
2,207,785Production-Nat. Gas (Including Expl. and Dev.) 32
Other Gas Supply 33
7,900,124Storage, LNG Terminaling and Processing 34
83,954,292Transmission 35
177,495,357Distribution 36
72,110,221Customer Accounts 37
14,648,450Customer Service and Informational 38
487,045Sales 39
155,250,102Administrative and General 40
514,053,376TOTAL Operation (Enter Total of lines 31 thru 40) 41
Maintenance 42
Production-Manufactured Gas 43
94,863Production-Natural Gas (Including Exploration and Development) 44
Other Gas Supply 45
784,171Storage, LNG Terminaling and Processing 46
76,996,864Transmission 47
FERC FORM NO. 1 (ED. 12-88) Page 354

Name of Respondent This Report Is:(1) An Original
(2) A Resubmission
Date of Report(Mo, Da, Yr)
Year/Period of Report
End ofPACIFIC GAS AND ELECTRIC COMPANYX
04/13/20212020/Q4
Line
No.
Classification
(c)(b)(a)
Direct Payroll Allocation ofTotal
(d)
Distribution Payroll charged forClearing Accounts
DISTRIBUTION OF SALARIES AND WAGES (Continued)
88,352,448Distribution 48
189Administrative and General 49
166,228,535TOTAL Maint. (Enter Total of lines 43 thru 49) 50
Total Operation and Maintenance 51
Production-Manufactured Gas (Enter Total of lines 31 and 43) 52
2,302,648Production-Natural Gas (Including Expl. and Dev.) (Total lines 32, 53
Other Gas Supply (Enter Total of lines 33 and 45) 54
8,684,295Storage, LNG Terminaling and Processing (Total of lines 31 thru 55
160,951,156Transmission (Lines 35 and 47) 56
265,847,805Distribution (Lines 36 and 48) 57
72,110,221Customer Accounts (Line 37) 58
14,648,450Customer Service and Informational (Line 38) 59
487,045Sales (Line 39) 60
155,250,291Administrative and General (Lines 40 and 49) 61
680,281,911 680,281,911TOTAL Operation and Maint. (Total of lines 52 thru 61) 62
Other Utility Departments 63
Operation and Maintenance 64
2,262,221,696 2,262,221,696TOTAL All Utility Dept. (Total of lines 28, 62, and 64) 65
Utility Plant 66
Construction (By Utility Departments) 67
997,888,709 997,888,709Electric Plant 68
353,499,992 353,499,992Gas Plant 69
188,898,026 188,898,026Other (provide details in footnote): 70
1,540,286,727 1,540,286,727TOTAL Construction (Total of lines 68 thru 70) 71
Plant Removal (By Utility Departments) 72
85,838,799 85,838,799Electric Plant 73
26,149,748 26,149,748Gas Plant 74
593,142 593,142Other (provide details in footnote): 75
112,581,689 112,581,689TOTAL Plant Removal (Total of lines 73 thru 75) 76
Other Accounts (Specify, provide details in footnote): 77
14,125,323 14,125,323Other Balance Sheet Salaries and Wages 78
11,585,602 11,585,602Other Non-Operating Salaries and Wages 79
80
81
82
83
84
85
86
87
88
89
90
91
92
93
94
25,710,925 25,710,925TOTAL Other Accounts 95
3,940,801,037 3,940,801,037TOTAL SALARIES AND WAGES 96
FERC FORM NO. 1 (ED. 12-88) Page 355

Name of Respondent This Report Is:
(1) An Original
(2) A Resubmission
Date of Report(Mo, Da, Yr)
Year/Period of Report
End of
COMMON UTILITY PLANT AND EXPENSES
PACIFIC GAS AND ELECTRIC COMPANY X
04/13/20212020/Q4
1. Describe the property carried in the utility's accounts as common utility plant and show the book cost of such plant at end of year classified by
accounts as provided by Plant Instruction 13, Common Utility Plant, of the Uniform System of Accounts. Also show the allocation of such plant costs to
the respective departments using the common utility plant and explain the basis of allocation used, giving the allocation factors.
2. Furnish the accumulated provisions for depreciation and amortization at end of year, showing the amounts and classifications of such accumulated
provisions, and amounts allocated to utility departments using the Common utility plant to which such accumulated provisions relate, including
explanation of basis of allocation and factors used.
3. Give for the year the expenses of operation, maintenance, rents, depreciation, and amortization for common utility plant classified by accounts as
provided by the Uniform System of Accounts. Show the allocation of such expenses to the departments using the common utility plant to which such
expenses are related. Explain the basis of allocation used and give the factors of allocation.
4. Give date of approval by the Commission for use of the common utility plant classification and reference to order of the Commission or other
authorization.
COMMON UTILITY PLANT IN SERVICE
-------------------------------
Balance Transfers Balance
Acct Beginning and End
No. Description of Year Additions Retirements Adjustments of Year
---- ------------------- ------------- ----------- ------------ ----------- -------------
301 Organization 132,411 425,404 0 0 557,815
302 Franchises/Consents 214,735 0 0 0 214,735
303 Intangible Plant 1,598,916,619 192,364,370 (519,424,027) (109,920) 1,271,747,042
------------- ----------- ------------ ----------- -------------
Total Intangible Plant 1,599,263,765 192,789,774 (519,424,027) (109,920) 1,272,519,592
------------- ----------- ------------ ----------- -------------
389 Land and Land Rights 104,505,016 30,529,172 0 (16,450) 135,017,738
------------- ----------- ------------ ----------- -------------
390 Structures and Improvements 2,089,726,553 165,172,726 (26,899,241) 0 2,228,000,038
391b Personal Computer Hardware 61,150,999 3,135,382 (23,044,051) 0 41,242,330
391a Office Machines 326,483,043 31,273,768 (90,217,757) 109,920 267,648,974
391c Office Furniture and Equipment 125,900,276 2,131,533 (3,979,070) 0 124,052,739
392 Transportation Equipment 1,112,226,555 65,438,403 (22,308,653) 0 1,155,356,305
393 Stores Equipment 10,855,901 553,274 0 0 11,409,175
FERC FORM NO. 1 (ED. 12-87) Page 356

Name of Respondent This Report Is:
(1) An Original
(2) A Resubmission
Date of Report(Mo, Da, Yr)
Year/Period of Report
End of
COMMON UTILITY PLANT AND EXPENSES
PACIFIC GAS AND ELECTRIC COMPANY X
04/13/20212020/Q4
1. Describe the property carried in the utility's accounts as common utility plant and show the book cost of such plant at end of year classified by
accounts as provided by Plant Instruction 13, Common Utility Plant, of the Uniform System of Accounts. Also show the allocation of such plant costs to
the respective departments using the common utility plant and explain the basis of allocation used, giving the allocation factors.
2. Furnish the accumulated provisions for depreciation and amortization at end of year, showing the amounts and classifications of such accumulated
provisions, and amounts allocated to utility departments using the Common utility plant to which such accumulated provisions relate, including
explanation of basis of allocation and factors used.
3. Give for the year the expenses of operation, maintenance, rents, depreciation, and amortization for common utility plant classified by accounts as
provided by the Uniform System of Accounts. Show the allocation of such expenses to the departments using the common utility plant to which such
expenses are related. Explain the basis of allocation used and give the factors of allocation.
4. Give date of approval by the Commission for use of the common utility plant classification and reference to order of the Commission or other
authorization.
394 Tools, Shop, and Garage Equipment 70,920,807 9,144,208 (6,330) 0 80,058,685
395 Laboratory Equipment 13,382,250 0 (355,242) 0 13,027,008
396 Power Operated Equipment 190,664,008 46,214,603 (4,582,112) 0 232,296,499
397 Communication Equipment 1,258,046,347 104,913,094 (70,950,549) 0 1,292,008,892
398 Miscellaneous Equipment 40,646,806 (24,465,978) (112,796) 0 16,068,032(a)
399 Other Tangible Property 679 0 0 0 679
------------- ----------- ------------ ----------- -------------
Total Non-Landed 5,300,004,224 403,511,013 (242,455,801) 109,920 5,461,169,356
Total 7,003,773,005 626,829,959 (761,879,828) (16,450) 6,868,706,686
------------- ----------- ------------ ----------- -------------
101 Property Under Capital Leases 114,312,070 0 0 (16,493,691) 97,818,380
101 Plant Purchased/Sold (42,345) 0 0 (112,216) (154,561)(b)
------------- ----------- ------------ ----------- -------------
Total Common Utility Plant in Service7,118,042,730 626,829,959 (761,879,828) (16,622,356) 6,966,370,505
107 Construction Work in Progress - 270,765,820 177,857,260 0 (2,555,008) 446,068,072
Common Utility Plt.
------------- ----------- ------------ ----------- -------------
Total Common Utility Plant 7,388,808,550 804,687,219 (761,879,828) (19,177,364) 7,412,438,577
============= =========== ============ =========== =============
NOTES:
(a) For 2020, PG&E refined its methodology for displaying operative CWIP balances by allocating the balances
to the respective functional groups to which they belong according to the nature of the costs compared to
2019 where the entire balance was recorded to FERC account 398. As such, included in the 12/31/20 FERC
account 398 plant balance is a reversal of the prior year's operative CWIP balance in the additions column.
Operative CWIP is defined as capital orders for projects that are less than 30 days of construction with
amounts that remain in CWIP due to capital order settlement issues. The balances for these capital orders
should be classified as plant.
(b) Plant Purchased or Plant Sold is a holding account for pending transactions related to asset
purchases/sales and will be cleared once pending transactions have closed.
ALLOCATION OF COMMON UTILITY PLANT AND
ACCUMULATED PROVISION FOR DEPRECIATION
BASED ON CPUC APPROVED 2020 GENERAL RATE CASE DECISION (D.) 20-12-005
---------------------------------------------------------------------
Description Total Electric Gas
----------- ------------- ------------- -------------
Common Utility Plant in Service (a) 6,966,370,505 4,506,899,905 2,459,470,600
Accumulated Provision for Depreciation (a) 2,699,377,396 1,746,767,113 952,610,283
FERC FORM NO. 1 (ED. 12-87) Page 356.1

Name of Respondent This Report Is:
(1) An Original
(2) A Resubmission
Date of Report(Mo, Da, Yr)
Year/Period of Report
End of
COMMON UTILITY PLANT AND EXPENSES
PACIFIC GAS AND ELECTRIC COMPANY X
04/13/20212020/Q4
1. Describe the property carried in the utility's accounts as common utility plant and show the book cost of such plant at end of year classified by
accounts as provided by Plant Instruction 13, Common Utility Plant, of the Uniform System of Accounts. Also show the allocation of such plant costs to
the respective departments using the common utility plant and explain the basis of allocation used, giving the allocation factors.
2. Furnish the accumulated provisions for depreciation and amortization at end of year, showing the amounts and classifications of such accumulated
provisions, and amounts allocated to utility departments using the Common utility plant to which such accumulated provisions relate, including
explanation of basis of allocation and factors used.
3. Give for the year the expenses of operation, maintenance, rents, depreciation, and amortization for common utility plant classified by accounts as
provided by the Uniform System of Accounts. Show the allocation of such expenses to the departments using the common utility plant to which such
expenses are related. Explain the basis of allocation used and give the factors of allocation.
4. Give date of approval by the Commission for use of the common utility plant classification and reference to order of the Commission or other
authorization.
ALLOCATION OF AD VALOREM TAXES APPLICABLE TO COMMON UTILITY PLANT
BASED ON CPUC APPROVED 2020 GENERAL RATE CASE DECISION (D.) 20-12-005
---------------------------------------------------------------------
Amount Account 408
Charged ------------------------------
Description During Year Electric Gas
----------- ------------- ------------- -------------
Taxes
Operative Property (b) 488,787,259 354,866,840 133,920,419
(from page 262-263)
Common Utility Plant (c) 39,383,201 28,453,286 10,929,915
included in above amount
NOTES:
(a) 2020 allocations are based on the methodology of unbundling Common Plant as approved in the 2020
General Rate Case (GRC).
Electric Gas
------------- -------------
Common Plant in Service Allocation Factors 64.70% 35.30%
Common Plant Accumulated Depreciation Allocation Factors 64.71% 35.29%
(b) Amounts are based on direct charges.
(c) 2020 allocations are based on the methodology of unbundling Common Plant as approved in the 2020
General Rate Case (GRC). 2020 allocations are based on December 2019 and December 2018 allocation
factors.
Property tax - Common Allocation Factors 72.26% 27.74%
ALLOCATION OF DEPRECIATION EXPENSE APPLICABLE TO COMMON UTILITY PLANT
BASED ON CPUC APPROVED 2020 GENERAL RATE CASE DECISION (D.) 20-12-005
---------------------------------------------------------------------
Amount Account 403
Charged ------------------------------
Description Account During Year Electric Gas
FERC FORM NO. 1 (ED. 12-87) Page 356.2

Name of Respondent This Report Is:
(1) An Original
(2) A Resubmission
Date of Report(Mo, Da, Yr)
Year/Period of Report
End of
COMMON UTILITY PLANT AND EXPENSES
PACIFIC GAS AND ELECTRIC COMPANY X
04/13/20212020/Q4
1. Describe the property carried in the utility's accounts as common utility plant and show the book cost of such plant at end of year classified by
accounts as provided by Plant Instruction 13, Common Utility Plant, of the Uniform System of Accounts. Also show the allocation of such plant costs to
the respective departments using the common utility plant and explain the basis of allocation used, giving the allocation factors.
2. Furnish the accumulated provisions for depreciation and amortization at end of year, showing the amounts and classifications of such accumulated
provisions, and amounts allocated to utility departments using the Common utility plant to which such accumulated provisions relate, including
explanation of basis of allocation and factors used.
3. Give for the year the expenses of operation, maintenance, rents, depreciation, and amortization for common utility plant classified by accounts as
provided by the Uniform System of Accounts. Show the allocation of such expenses to the departments using the common utility plant to which such
expenses are related. Explain the basis of allocation used and give the factors of allocation.
4. Give date of approval by the Commission for use of the common utility plant classification and reference to order of the Commission or other
authorization.
----------- ------- ------------- ------------- -------------
Depreciation (a) 403 249,209,578 161,263,518 87,946,060
Amortization (a) 404 210,273,078 136,067,709 74,205,369
------------- ------------- -------------
Total 459,482,657 297,331,227 162,151,430
============= ============= =============
ALLOCATION OF MAINTENANCE EXPENSES OF COMMON UTILITY PLANT
BASED ON CPUC APPROVED 2020 GENERAL RATE CASE DECISION (D.) 20-12-005
---------------------------------------------------------------------
Amount Account 935
Charged ------------------------------
Description During Year Electric Gas
----------- ------------- ------------- -------------
Maintenance of General Plant (d) 5,166,398 3,482,559 1,683,839
Note: Operation expense data was not available.
(d) Allocations factors are based on the 2017 and 2020 Maintenance and Operation Labor Factors approved
in the 2017 and 2020 General Rate Cases (GRC). January to November's allocation was based on the
2017 GRC, while December's allocation was based on the 2020 GRC (which was approved in December
2020).
CONSTRUCTION WORK IN PROGRESS (CWIP) - COMMON (ACCOUNT 107)
-----------------------------------------------------------
Description of Project Amount
--------------------------------------- --------
7093891 ADMS Phase 0 Cap 23,088,009
7096325 N. Region - Emergency Generation Enhance 18,222,271
70035445 IO - SmartMeterSSN Transition PG&E (CAP) 13,075,760
7096247 Lemoore SC - New Maintenance Building 12,025,424
70038246 FAN Field Area Network 9,804,947
70036182 CC2020 Salesforce - Cap 9,173,680
70042601 Out of Support ESXi Hosts 7,979,883
7096305 Materials & Spoils Bay Covers PH2 7,516,984
70041443 EDGIS/LBGIS Infra/App Re-Arch Ph 2 (CAP) 7,468,137
70042606 Hitachi SAN (Out of Support) 7,190,129
7097606 ADMS Prod Env Concord DCC 6,943,071
7095466 Santa Cruz SC - Site Improvements 6,665,155
FERC FORM NO. 1 (ED. 12-87) Page 356.3

Name of Respondent This Report Is:
(1) An Original
(2) A Resubmission
Date of Report(Mo, Da, Yr)
Year/Period of Report
End of
COMMON UTILITY PLANT AND EXPENSES
PACIFIC GAS AND ELECTRIC COMPANY X
04/13/20212020/Q4
1. Describe the property carried in the utility's accounts as common utility plant and show the book cost of such plant at end of year classified by
accounts as provided by Plant Instruction 13, Common Utility Plant, of the Uniform System of Accounts. Also show the allocation of such plant costs to
the respective departments using the common utility plant and explain the basis of allocation used, giving the allocation factors.
2. Furnish the accumulated provisions for depreciation and amortization at end of year, showing the amounts and classifications of such accumulated
provisions, and amounts allocated to utility departments using the Common utility plant to which such accumulated provisions relate, including
explanation of basis of allocation and factors used.
3. Give for the year the expenses of operation, maintenance, rents, depreciation, and amortization for common utility plant classified by accounts as
provided by the Uniform System of Accounts. Show the allocation of such expenses to the departments using the common utility plant to which such
expenses are related. Explain the basis of allocation used and give the factors of allocation.
4. Give date of approval by the Commission for use of the common utility plant classification and reference to order of the Commission or other
authorization.
7091574 Network Improvements - Add Alternate 6,559,286
70040540 Recording Systems Lifecycle Replacement 6,344,915
7090325 Auburn SC Regional GC Conversion 5,857,382
7096345 Bay Region-Emergency Generation Enhance 5,703,788
70033756 Bentley SAP Integration - Phase3 5,632,177
7096347 C. Valley - Emergency Generation Enhance 5,430,174
7096346 C. Coast - Emergency Generation Enhance 5,216,110
7096628 ODN Port Enumeration-ICS Patrol (Cap) 4,491,434
7096950 ADMS R1 Build 4,488,061
7097608 ADMS Prod Env Rocklin DCC 4,190,071
7096028 Sacramento SC - Fence Replacement 4,144,066
70039760 Smart Connect (One Portal) CAP 3,878,364
70040221 Sherlock Tool 2.0(C) TO 3,752,255
7096025 Marysville SC - Fence Replacement 3,645,273
7095625 Stockton Mat'l Ctr - Site Improvements 3,422,479
7097607 ADMS Prod Env Fresno DCC 3,392,030
74023500 MII Initiatives 2019 3,219,418
70040222 Sherlock Tool 2.0 (C) DIST 3,148,808
70039263 INSPECT/ENGAGE 2.0 GT (CAP) 3,092,079
7090825 Corp Security-SIS Replacement-Capital 2,945,339
70033741 Express Connects Cap 2,925,692
7095746 San Rafael SC - Fence Replacement 2,717,603
7097565 Wheatland Marysville MDC - Fence Repl 2,687,750
70040983 MTC: Cust Rate - PDP (C) 2,675,761
70039262 INSPECT/ENGAGE 2.0 GD (CAP) 2,665,739
7090505 Corp Security-Replacement of Legacy CCTV 2,641,469
70036362 Extnd PwrBase Line Equip SetMgmt 2,568,291
70043367 SQL Software License 2,565,135
70038240 SCADA Mountain Tops Radios 2,552,183
7097505 R1 ADMS Cutover, CMO & Deploy - CAP 2,547,727
70042761 EGI 2020 Tariff Changes CAP 2,545,138
7094727 GD/GT-GIS Upgrade 2019 2,536,487
7092805 Fresno Thorne Avenue - Develop OU-3 2,512,554
70041340 FT - Common Facilities Coordinated Upgra 2,458,879
7097650 Seismic Racking Improvements PH1 2,428,435
70036143 EES Ph2 (CAP) 2,426,437
70041144 IGP FAN Field Node - Central 2,316,651
70041704 Replace DCPP Storage Hardware VM Sftwr 2,304,308
70041603 Digital Mobile Radio (DMR) Proj Phase II 2,233,249
7094732 GD/GT-GIS Upgrade 2019 2,164,113
70043105 SAF 2.0 Cloud Applications (Detect) 2,059,184
70041464 FT - Router Lifecycle - Internal 2,026,682
7097427 Ukiah SC - Improvements 2,002,488
7097945 NRegion-Emergency Generation Enhance PH2 1,978,500
7096845 San Francisco SC - Investments 1,954,979
70040201 GPOM (GT&S) CAP 1,953,378
FERC FORM NO. 1 (ED. 12-87) Page 356.4

Name of Respondent This Report Is:
(1) An Original
(2) A Resubmission
Date of Report(Mo, Da, Yr)
Year/Period of Report
End of
COMMON UTILITY PLANT AND EXPENSES
PACIFIC GAS AND ELECTRIC COMPANY X
04/13/20212020/Q4
1. Describe the property carried in the utility's accounts as common utility plant and show the book cost of such plant at end of year classified by
accounts as provided by Plant Instruction 13, Common Utility Plant, of the Uniform System of Accounts. Also show the allocation of such plant costs to
the respective departments using the common utility plant and explain the basis of allocation used, giving the allocation factors.
2. Furnish the accumulated provisions for depreciation and amortization at end of year, showing the amounts and classifications of such accumulated
provisions, and amounts allocated to utility departments using the Common utility plant to which such accumulated provisions relate, including
explanation of basis of allocation and factors used.
3. Give for the year the expenses of operation, maintenance, rents, depreciation, and amortization for common utility plant classified by accounts as
provided by the Uniform System of Accounts. Show the allocation of such expenses to the departments using the common utility plant to which such
expenses are related. Explain the basis of allocation used and give the factors of allocation.
4. Give date of approval by the Commission for use of the common utility plant classification and reference to order of the Commission or other
authorization.
70042500 FT - Network Tools Expansion 1,931,360
7096306 Merced SC - Post Op Readiness 1,925,172
7095885 Sacramento Area - T-Line Fab Shop 1,920,837
7091573 GDCC Predictive Health Analytics 1,867,121
70041140 IGP FAN Field Node - North 1,856,881
70040923 NT - Network 20/20 CAPITAL 1,800,945
70033814 BENTLEY-SAP INTEGRATION DISTRIBUTIVE ENG 1,761,218
70039925 Canal Inspections Ph2 1,629,044
7095229 San Rafael SC - Paving 1,580,075
7093670 CSO AMAG Security Upgrades (75 Sites) 1,577,946
7095210 ODN Network Protection 1009 1,545,729
70041345 FT - DS0 Conversion to MPLS 1,538,723
70038245 FAN SCADA Leases 1,532,338
70042061 2020 Tufin Lifecycle (Cap) 1,489,128
70038243 SCADA Communication Failures 1,462,328
7094665 Gas SCADA Upgrade 1,461,743
70042224 FT -Enterprise Network Management System 1,458,716
70042649 Remediation LAM Ph2 (Cap) 1,456,738
7095745 Lakeville Sub - Fence Replacement 1,443,881
7091575 Network Improvements - Improve WAN 1,435,874
70042604 VNX 7500 Storage 1,427,664
7094728 Locusview 1,415,883
7094666 Gas SCADA Upgrade 1,404,432
70036680 Lifecycle Active Directory (Cap) 1,373,821
70041103 CAISO Initiatives 2020 (C) 1,371,692
70042581 ROADM System Capacity Increase 1,365,563
7095766 San Rafael SC - Investments 1,349,075
70041343 SCADA Radio Capacity/Reliablity Imprvmts 1,335,884
7097685 ADMS Cybersecurity Phase 2 CAP 1,317,096
70041143 IGP FAN Field Node - South 1,299,961
70040965 CS - RegAffair Model Integratn Data (C) 1,286,675
7095725 PSPS Capital Equipment - Radio Hardware 1,269,156
70040969 ES - DCPP - PIMS Nuclear Archival (C) 1,267,751
70036150 ET Asset Registry - (CAP) 1,226,177
70041961 MRAD 4.0 Platform Cap 1,223,193
70043205 Pandemic-Deployed Laptops 1,209,137
7095365 AMPS NERC Portal 1,172,412
7097586 Radar and Anti-Drone Tech TO 1,161,296
70041800 ABB Service Suite Upgrade (GD)iOS 1,138,550
70043120 Data Domain - DELL TPA 1,135,798
7095747 Santa Rosa SC - Fence Replacement 1,119,967
70040986 DGT - Consent & Preference Mgmt Ph2 (C) 1,110,590
7096286 EDPI Data Warehouse-CAP 1,108,425
7096185 ADMS Cutover Tool Deployment 1,098,399
7096708 ADMS - Apigee API Platform 1,070,269
70042586 ABB Service Suite Modification TCOM Tech 1,068,228
FERC FORM NO. 1 (ED. 12-87) Page 356.5

Name of Respondent This Report Is:
(1) An Original
(2) A Resubmission
Date of Report(Mo, Da, Yr)
Year/Period of Report
End of
COMMON UTILITY PLANT AND EXPENSES
PACIFIC GAS AND ELECTRIC COMPANY X
04/13/20212020/Q4
1. Describe the property carried in the utility's accounts as common utility plant and show the book cost of such plant at end of year classified by
accounts as provided by Plant Instruction 13, Common Utility Plant, of the Uniform System of Accounts. Also show the allocation of such plant costs to
the respective departments using the common utility plant and explain the basis of allocation used, giving the allocation factors.
2. Furnish the accumulated provisions for depreciation and amortization at end of year, showing the amounts and classifications of such accumulated
provisions, and amounts allocated to utility departments using the Common utility plant to which such accumulated provisions relate, including
explanation of basis of allocation and factors used.
3. Give for the year the expenses of operation, maintenance, rents, depreciation, and amortization for common utility plant classified by accounts as
provided by the Uniform System of Accounts. Show the allocation of such expenses to the departments using the common utility plant to which such
expenses are related. Explain the basis of allocation used and give the factors of allocation.
4. Give date of approval by the Commission for use of the common utility plant classification and reference to order of the Commission or other
authorization.
7098113 NWPU Project 2020 Capex 1,066,108
70040380 IGP FAN Gateway-South 1,055,276
7097506 R1 ADMS Testing - CAP 1,028,644
7083729 TO Radio System Expansion - Gato Ridge 1,022,022
70040303 IGP FAN Gateway-Central 1,012,706
70041548 FT - Network Lifecycle Critical Location 1,008,982
70035447 DCPP Network Switch and WiFi Replacement 1,001,806
70042800 STAR ADF 2.0 (CAP) 997,573
7096951 Harden CRC - IT Kits and Equipment 2020 992,864
70041620 GRC Solution Tool (Cap) 985,619
7094726 Operator Training Simulator 980,826
7096485 Stockton Mat'l Center-Bldg Improvements 979,826
7096907 Strategic Gap Closure Elevated Site GRC 975,976
70035662 DC - OSI PI Platform Capacity Phase 3 - 973,344
70039561 DC Consolidation: CDW Server Upgrade 972,478
7094731 Operator Training Simulator 955,489
7096567 Petaluma SC - Fence Replacement 951,001
7097046 Placerville SC - Risk Mitigation 949,036
7095912 Fresno SC - Fleet Bldg Renov-Expansion 936,393
70039920 DAM Safety Enhancements Ph4 CAP 931,715
7098045 FFIOC - UPS Replacement 926,293
7095985 Merced Regional Center - IT Warehouse 917,282
70041101 FBS Upgrade - Battery Bids (C) 913,545
7097905 CIP003 Low Impact BES PAC 904,837
7097425 Antioch SC - Fence Replacement 895,294
70040975 MTC: Cust Rate - Non Residnt Default (C) 888,863
70042322 MSO - Cust Rev Critical Rpt 2.5 (C) 882,993
7093169 FFIOC-Install Emergency Power Off (EPO) 872,791
7095545 PSPS - IT Equipment for Trailers 854,919
70041241 Lifecycle 2020 Cybersecurity Network Pro 851,815
70037088 IGP - SCADA -ODN Upgrades 847,158
7096225 Wheatland Marysville MDC - Improvements 830,411
70040042 Application Retirement Ph3 823,752
7096707 Marysville SC - Roof Replacement 815,755
70038624 ARAD 5.0 CAP 813,148
70041583 IO-Mcrowv Radio Capcty & Reliab (GRC) 812,767
70043209 ERIM IT Migrate MAOP Rcrd ECTS to Doc C 801,717
70039260 INSPECT/ENGAGE 2.0 ED (CAP) 790,687
70039460 Cyber Gas Data Network (GDN) Segregation 789,701
70040762 Safe Enterprise (Cap) 785,669
7096949 Stockton Mat'l Ctr - Fence Replacement 772,269
70037127 EPM - CHANGE CNTRL & AUTH/RE-AUTH CAP TO 757,018
70037128 EPM - CHANGE CNTRL & AUTH/RE-AUTH CAP ED 757,018
70037129 EPM - CHANGE CNTRL & AUTH/RE-AUTH CAP GD 757,018
70037130 EPM - CHANGE CNTRL & AUTH/RE-AUTH CAP IT 757,018
70037131 EPM - CHANGE CNTRL & AUTH/RE-AUTH CAP HG 757,018
FERC FORM NO. 1 (ED. 12-87) Page 356.6

Name of Respondent This Report Is:
(1) An Original
(2) A Resubmission
Date of Report(Mo, Da, Yr)
Year/Period of Report
End of
COMMON UTILITY PLANT AND EXPENSES
PACIFIC GAS AND ELECTRIC COMPANY X
04/13/20212020/Q4
1. Describe the property carried in the utility's accounts as common utility plant and show the book cost of such plant at end of year classified by
accounts as provided by Plant Instruction 13, Common Utility Plant, of the Uniform System of Accounts. Also show the allocation of such plant costs to
the respective departments using the common utility plant and explain the basis of allocation used, giving the allocation factors.
2. Furnish the accumulated provisions for depreciation and amortization at end of year, showing the amounts and classifications of such accumulated
provisions, and amounts allocated to utility departments using the Common utility plant to which such accumulated provisions relate, including
explanation of basis of allocation and factors used.
3. Give for the year the expenses of operation, maintenance, rents, depreciation, and amortization for common utility plant classified by accounts as
provided by the Uniform System of Accounts. Show the allocation of such expenses to the departments using the common utility plant to which such
expenses are related. Explain the basis of allocation used and give the factors of allocation.
4. Give date of approval by the Commission for use of the common utility plant classification and reference to order of the Commission or other
authorization.
70043200 IGP DCC Cooling Concord 749,814
70042583 CS - BW and BOBJ Modernization (C) 739,649
70040142 ETAR Facility Rating (CAP) 737,463
7095726 SIPT Radios for SIPT Crews 729,553
70035960 IO-SCADA Radio Cap Reliablty Imrv (TO) 721,918
74017109 Copper Fiber Replacement - Battle Creek 717,101
70034622 Hinkley Comp Station Ntwrk Remediation 711,367
70037242 IO - SCADA Power Reliability: Metcalf Su 704,395
70035941 IO - Kings Craine Microwave Radio Cap In 699,244
7096705 Antioch SC - Investment PH1 687,465
7094646 EM Tool 2019-2020 683,918
70040964 CorpSvc - HR Compensation Mandatory (C) 679,246
70041709 Firewall Lifecycle: MPLS (CAP) 678,985
70042180 CS - Fleet Anywhere Infras Refresh (C) 677,003
70043202 IGP DCC Cooling Rocklin 673,975
70040200 GPOM (GRCGD) CAP 673,754
7094225 ST - PHYS AMAG SFGO Jump Hosts 663,897
7096565 Red Bluff SC - Fence Replacement 661,150
7096265 SFGO/FFIOC - BMS Control Upgrades 636,807
70041943 FT - UCCE Upgrade: Empirix Lifecycle 626,860
70043384 Network 20/20 Microwave Replacements - A 598,715
70033549 Cyber SS ST - 3rd Party Security and Ris 598,615
70040922 OT - Telecom Circuit Database 587,701
70040984 MTC: Cust Rate - WF POR Securitizatn (C) 587,418
70040040 Substation Record and RecordKeeping PH3 579,605
70036380 IO - SCADA Power Reliability: Table Mtn. 574,782
7097907 CValley-Emergency Generation Enhance PH2 574,552
70043201 IGP DCC Cooling Fresno 573,751
7096245 San Carlos SC - Investments 570,380
70035931 User Behavior Analytics Cap TO 562,872
7096205 Quantum Safe and Key Mgmt (Cap) 552,540
70039926 Canal Inspections Ph2 Web Dashboard 550,042
70042658 FT-Netwrk LC Critical Locations Data Ctr 549,618
7097711 Oakland SC - Fence Replacement 548,179
70032303 Bentley-SAP Integration CAP ED 541,528
7096566 Oroville SC - Fence Replacement 536,603
7095088 MDI - Blast Resist Modular Offices 527,533
7096847 Fremont MDC - Seismic Racking 527,111
70033771 OP: AMSM - Enterprise Network Mgmt Syst 518,828
70033147 Pole Loading Tool Upgrade with Industry 518,727
7096826 Vallejo SC - Trailer Installation 508,812
70032800 Battle Creek - VSAT Emergency Phones 508,089
70042960 DGT - Agency Online Pledge Portal LIP (C 498,635
7096268 ADMS Build Sprint 1 – Protocol Develop. 488,587
70042624 Gas - Transaction Sys Framewrk Upgrd (C) 482,245
7096065 UST - AST Replacement - Colma 480,653
FERC FORM NO. 1 (ED. 12-87) Page 356.7

Name of Respondent This Report Is:
(1) An Original
(2) A Resubmission
Date of Report(Mo, Da, Yr)
Year/Period of Report
End of
COMMON UTILITY PLANT AND EXPENSES
PACIFIC GAS AND ELECTRIC COMPANY X
04/13/20212020/Q4
1. Describe the property carried in the utility's accounts as common utility plant and show the book cost of such plant at end of year classified by
accounts as provided by Plant Instruction 13, Common Utility Plant, of the Uniform System of Accounts. Also show the allocation of such plant costs to
the respective departments using the common utility plant and explain the basis of allocation used, giving the allocation factors.
2. Furnish the accumulated provisions for depreciation and amortization at end of year, showing the amounts and classifications of such accumulated
provisions, and amounts allocated to utility departments using the Common utility plant to which such accumulated provisions relate, including
explanation of basis of allocation and factors used.
3. Give for the year the expenses of operation, maintenance, rents, depreciation, and amortization for common utility plant classified by accounts as
provided by the Uniform System of Accounts. Show the allocation of such expenses to the departments using the common utility plant to which such
expenses are related. Explain the basis of allocation used and give the factors of allocation.
4. Give date of approval by the Commission for use of the common utility plant classification and reference to order of the Commission or other
authorization.
74019740 RPM Wave 2 CAP 479,192
7092166 Software & Servers 457,171
7096885 Stockton SC - Emergency Gas Line Repl 453,905
7096445 Livermore SC - Investments 450,520
70039261 INSPECT/ENGAGE 2.0 ET (CAP) 448,731
70041482 IGP PMO (Cap) 441,632
70040000 MW Radio CI& RI (GRC) Harris Upgrades 438,218
70041705 WAN Backhaul Upgrade for Radio WilliamsH 430,749
70041283 ERIM IT Documnt Repository Consolida (C) 426,207
74017108 Kings-Crane Network Extension 426,118
70037126 EPM - CHANGE CNTRL & AUTH/RE-AUTH CAP GT 420,565
7094647 EM Tool 2019-2020 417,830
7096569 Lakeport SC - Fence Replacement 414,744
70037087 IGP - SCADA - Communication Updgrade 412,194
70041645 ET Substation Asset Registry - (CAP) 408,472
7097085 Grass Valley SC - AST Installation 405,534
70041342 FT - Teleprotection (TO) 401,953
7097605 ADMS R2 Design CAP 401,790
7097688 San Carlos SC - Paving 401,098
70042900 Critical IT Asset Infra: Infra Assets 400,565
70040321 IGP FAN Gateway-North 389,162
70042182 CS: SIMS Worker Comp Compliance (C) 387,857
7096231 Richmond SC - Improvements 384,216
70041549 FT - Mntr Hrdwr Infra Lfcycl 371,728
7096210 Geyserville SC - Improvements 367,924
7096146 SFGO - RAS Relocation 366,865
70042923 Outage Management Tool - CC Server Upgrd 361,418
70041543 Intelligence Actioning Solution (Cap) 357,005
70029581 EMS SMP Server Replacement 355,629
7095685 Salinas SC - Fence Replacement 352,150
7096672 AMAG Panels and Readers Replc Hydro 349,251
7097445 Willits SC - Building Improvements 347,455
70043121 Gas - Materials Traceability CI P2 (C) 345,259
70038244 SCADA ODN Communications Replacement 342,164
70042823 ODMS Upgrade (C) 336,454
70042643 Click ED CAP 332,248
70037081 IGP - SCADA - Leases 328,483
70043228 FT - AWS Foundational Readiness Phase 1 322,336
7096213 Santa Rosa Office - Improvements 320,440
70042347 FT - Salinas Fiber Replacement 316,769
70038241 SCADA Radios Backhaul & VSAT Upgrade 314,848
7089965 Livermore Sub Training - New Facility 311,192
7097846 NVR Upgrade Replacement 310,800
7097725 DRP DIDF Capital Account 1 308,149
7097050 NERC CIP-013 Supply Chain Risk Managemen 305,952
70041547 FT - WAN Backhaul Upgrade for Radio 305,419
FERC FORM NO. 1 (ED. 12-87) Page 356.8

Name of Respondent This Report Is:
(1) An Original
(2) A Resubmission
Date of Report(Mo, Da, Yr)
Year/Period of Report
End of
COMMON UTILITY PLANT AND EXPENSES
PACIFIC GAS AND ELECTRIC COMPANY X
04/13/20212020/Q4
1. Describe the property carried in the utility's accounts as common utility plant and show the book cost of such plant at end of year classified by
accounts as provided by Plant Instruction 13, Common Utility Plant, of the Uniform System of Accounts. Also show the allocation of such plant costs to
the respective departments using the common utility plant and explain the basis of allocation used, giving the allocation factors.
2. Furnish the accumulated provisions for depreciation and amortization at end of year, showing the amounts and classifications of such accumulated
provisions, and amounts allocated to utility departments using the Common utility plant to which such accumulated provisions relate, including
explanation of basis of allocation and factors used.
3. Give for the year the expenses of operation, maintenance, rents, depreciation, and amortization for common utility plant classified by accounts as
provided by the Uniform System of Accounts. Show the allocation of such expenses to the departments using the common utility plant to which such
expenses are related. Explain the basis of allocation used and give the factors of allocation.
4. Give date of approval by the Commission for use of the common utility plant classification and reference to order of the Commission or other
authorization.
7095908 Burney SC - Investments 300,483
70039983 MW Radio CI&RI (GRC) Rnd Top Mtn MW Upgr 299,657
70043260 JUMP 2 (Capital) 292,981
7096212 Lakeport SC - Improvements 284,606
70038242 SCADA Master Radios Redundancy 283,997
74017101 Helms T1 Gate House Telecom Path 274,680
7096208 Willits SC - Improvements 272,613
7097285 Systemwide - Weld Shop CAP Improvements 272,379
7096785 SRVCC - PEC Relocation 272,141
7097245 San Carlos SC - Fence Replacement 272,112
70038552 IO - Flea Mtn. Tower Replacement 270,884
70041703 WAN Backhaul Upgrade for Radio UnionHill 265,921
70041702 WAN Backhaul Upgrade for Radio SunsetHil 260,380
7097325 Livermore SC - Fence Replacement 259,267
7096230 Hayward SC - Improvements 255,882
70043227 DGT - Medical Baseline Dr Portal (C) 251,540
-------------
Subtotal - Projects with more than $250,000
in actual costs in CWIP, excluding Research,
Development, & Demonstration jobs $436,330,671
Aggregate total of projects with less than $250,000 in actual
costs in Construction Work in Progress, including credits
representing preliminary billings.
$9,737,401
--------------
TOTAL CWIP - COMMON $ 446,068,072
FERC FORM NO. 1 (ED. 12-87) Page 356.9

Name of Respondent This Report Is:(1) An Original
(2) A Resubmission
Date of Report(Mo, Da, Yr)
Year/Period of Report
End ofPACIFIC GAS AND ELECTRIC COMPANYX
04/13/20212020/Q4
Line
No.
Description of Item(s) Balance at End of
(c)(b)(a)
Balance at End of
AMOUNTS INCLUDED IN ISO/RTO SETTLEMENT STATEMENTS
Quarter 1 Quarter 2Balance at End of
Quarter 3(d) (e)
1. The respondent shall report below the details called for concerning amounts it recorded in Account 555, Purchase Power, and Account 447, Sales for
Resale, for items shown on ISO/RTO Settlement Statements. Transactions should be separately netted for each ISO/RTO administered energy market
for purposes of determining whether an entity is a net seller or purchaser in a given hour. Net megawatt hours are to be used as the basis for determining
whether a net purchase or sale has occurred. In each monthly reporting period, the hourly sale and purchase net amounts are to be aggregated and
separately reported in Account 447, Sales for Resale, or Account 555, Purchased Power, respectively.
Balance at End ofYear
Energy 1
Net Purchases (Account 555) 2 116,045,7339,322,939 4,219,801 45,302,902
Net Sales (Account 447) 3 ( 426,288,961)( 116,645,002) ( 52,111,118) ( 196,925,007)
Transmission Rights 4
Ancillary Services 5 ( 26,204,880)( 6,745,604) ( 2,597,942) ( 12,787,154)
Other Items (list separately) 6
Grid Management Charges 7 43,195,92011,589,521 10,436,589 12,794,170
FERC Fees 8 3,397,206640,504 633,885 1,412,985
ISO Congestion 9
Unaccounted for Energy 10 21,595,6508,999,107 16,949,178 14,043,972
Congestion Revenue Rights-Hedge 11 ( 32,709,217)( 2,906,629) ( 16,101,424) ( 5,238,604)
Congestion Revenue Rights-Auction 12
Convergence Bidding 13
Other ISO-related charges: 14
Minimum Load 15
Neutrality 16 77,321( 1,143) ( 5,793) 323,224
Voltage Support 17
Other 18 ( 2,000,339)( 485,057) ( 2,452,211) 710,919
Cost Recovery 19 ( 18,074,382)( 1,700,385) ( 5,330,652) ( 6,466,123)
Inter Day Ahead SC Trade 20
Inter Real Time SC Trade 21
Interest 22 ( 381,245)( 291,255) ( 245,487) 102,636
Capacity - Other 23 17,460,9631,324,150 589,278 6,835,939
DA IFM Credit Allocation 24 ( 26,192,249)( 3,526,265) ( 4,098,706) ( 11,673,073)
RT Offset/Allocation 25 36,344,2361,258,896 3,557,985 29,091,718
Net Purchases for Energy Storage 26 187,24638,315 19,652 31,967
27
28
29
30
31
32
33
34
35
36
37
38
39
40
41
42
43
44
45
( 293,546,998)( 99,127,908) ( 46,536,965) ( 122,439,529)
FERC FORM NO. 1/3-Q (NEW. 12-05) Page 397
46 TOTAL

Name of Respondent This Report Is:(1) An Original
(2) A Resubmission
Date of Report(Mo, Da, Yr)
Year/Period of Report
End of
PURCHASES AND SALES OF ANCILLARY SERVICES
PACIFIC GAS AND ELECTRIC COMPANYX
04/13/20212020/Q4
Line
No.
Type of Ancillary Service
(a)
Report the amounts for each type of ancillary service shown in column (a) for the year as specified in Order No. 888 and defined in the
respondents Open Access Transmission Tariff.
In columns for usage, report usage-related billing determinant and the unit of measure.
(1) On line 1 columns (b), (c), (d), (e), (f) and (g) report the amount of ancillary services purchased and sold during the year.
(2) On line 2 columns (b) (c), (d), (e), (f), and (g) report the amount of reactive supply and voltage control services purchased and sold
during the year.
(3) On line 3 columns (b) (c), (d), (e), (f), and (g) report the amount of regulation and frequency response services purchased and sold
during the year.
(4) On line 4 columns (b), (c), (d), (e), (f), and (g) report the amount of energy imbalance services purchased and sold during the year.
(5) On lines 5 and 6, columns (b), (c), (d), (e), (f), and (g) report the amount of operating reserve spinning and supplement services
purchased and sold during the period.
(6) On line 7 columns (b), (c), (d), (e), (f), and (g) report the total amount of all other types ancillary services purchased or sold during
the year. Include in a footnote and specify the amount for each type of other ancillary service provided.
Number of Units
Unit of
Measure Dollars
(b) (c) (d)
Number of Units
Unit of
Measure Dollars
(e) (f) (g)
Usage - Related Billing Determinant Usage - Related Billing Determinant
Amount Purchased for the Year Amount Sold for the Year
N/AScheduling, System Control and Dispatch 1
kW-MonthReactive Supply and Voltage 2
kW-MonthRegulation and Frequency Response 3
kWhEnergy Imbalance 4
kW-MonthOperating Reserve - Spinning 5
kW-MonthOperating Reserve - Supplement 6
28,374,759Various 2,169,879VariousOther 7
28,374,759 2,169,879Total (Lines 1 thru 7) 8
FERC FORM NO. 1 (New 2-04) Page 398

Schedule Page: 398 Line No.: 1 Column: bAll Ancillary Services (AS) purchases and sales are covered under the FERC approved ISO
Tariff. Definitions of AS under Order No.888 and the ISO Tariff are not consistent with
one another. In order to avoid confusion as to meanings and terminologies, ISO AS amounts
are not included on these lines but are reported on Line 7.
Schedule Page: 398 Line No.: 7 Column: b
Name of Respondent
PACIFIC GAS AND ELECTRIC COMPANY
This Report is:(1) X An Original(2) A Resubmission
Date of Report(Mo, Da, Yr)
04/13/2021
Year/Period of Report
2020/Q4
FOOTNOTE DATA
FERC FORM NO. 1 (ED. 12-87) Page 450.1

Name of Respondent This Report Is:(1) An Original
(2) A Resubmission
Date of Report(Mo, Da, Yr)
Year/Period of Report
End of
MONTHLY TRANSMISSION SYSTEM PEAK LOAD
PACIFIC GAS AND ELECTRIC COMPANYX
04/13/20212020/Q4
Line
No.
Monthly Peak
MW - Total
(c)(b)(a)
Month
NAME OF SYSTEM:
Day of
Monthly
Peak
(1) Report the monthly peak load on the respondent's transmission system. If the respondent has two or more power systems which are not physically
integrated, furnish the required information for each non-integrated system.
(2) Report on Column (b) by month the transmission system's peak load.
(3) Report on Columns (c ) and (d) the specified information for each monthly transmission - system peak load reported on Column (b).
(4) Report on Columns (e) through (j) by month the system' monthly maximum megawatt load by statistical classifications. See General Instruction for the
definition of each statistical classification.
(d)
Hour of
Monthly
Peak
(e)
Firm Network
Service for Self
(f)
Firm Network
Service for
Others
(g)
Long-Term Firm
Point-to-point
Reservations
(h)
Other Long-
Term Firm
Service
(i)
Short-Term Firm
Point-to-point
Reservation
(j)
Other
Service
100 8,467 5,077190016 13,644January 1
100 8,557 4,8521900 3 13,509February 2
100 8,107 4,7911900 4 12,998March 3
300 25,131 14,720Total for Quarter 1 4
75 7,354 6,118200028 13,547April 5
55 10,320 8,381190026 18,756May 6
100 9,933 8,4901900 3 18,523June 7
230 27,607 22,989Total for Quarter 2 8
100 9,241 8,740190011 18,081July 9
100 11,148 9,263180014 20,511August 10
10,893 9,1871800 7 20,080September 11
200 31,282 27,190Total for Quarter 3 12
100 9,322 7,4331800 1 16,855October 13
100 7,814 5,059190030 12,973November 14
100 13,152 6,246190023 13,252December 15
300 30,288 18,738Total for Quarter 4 16
1,030 114,308 83,637
Total Year to
Date/Year
17
FERC FORM NO. 1/3-Q (NEW. 07-04) Page 400

Schedule Page: 400 Line No.: 11 Column: bEntry was estimated in prior period and is now updated to reflect actuals.
Schedule Page: 400 Line No.: 15 Column: eActual data is not available at time of filing. Entry reflects estimated data.
Schedule Page: 400 Line No.: 16 Column: hEntries here represent transmission service to the following Existing Transmission
Contract customers:
Transmission Agency of Northern California
Schedule Page: 400 Line No.: 16 Column: jTransmission services utilizing the Utility's transmission system are also sold by the
California Independent System Operator ("ISO") to other wholesale entities. The ISO tracks
this data and reports it separately to the FERC. The Utility does not have access to this
data. The ISO numbers reported in this column were derived by subtracting columns (e)-(i)
from column (b).
Name of Respondent
PACIFIC GAS AND ELECTRIC COMPANY
This Report is:(1) X An Original(2) A Resubmission
Date of Report(Mo, Da, Yr)
04/13/2021
Year/Period of Report
2020/Q4
FOOTNOTE DATA
FERC FORM NO. 1 (ED. 12-87) Page 450.1

Name of Respondent This Report Is:(1) An Original
(2) A Resubmission
Date of Report(Mo, Da, Yr)
Year/Period of Report
End of
MONTHLY ISO/RTO TRANSMISSION SYSTEM PEAK LOAD
PACIFIC GAS AND ELECTRIC COMPANYX
04/13/20212020/Q4
Line
No.
Monthly Peak
MW - Total
(c)(b)(a)
Month
NAME OF SYSTEM:
Day of
Monthly
Peak
(1) Report the monthly peak load on the respondent's transmission system. If the Respondent has two or more power systems which are not physically
integrated, furnish the required information for each non-integrated system.
(2) Report on Column (b) by month the transmission system's peak load.
(3) Report on Column (c) and (d) the specified information for each monthly transmission - system peak load reported on Column (b).
(4) Report on Columns (e) through (i) by month the system’s transmission usage by classification. Amounts reported as Through and Out Service in
Column (g) are to be excluded from those amounts reported in Columns (e) and (f).
(5) Amounts reported in Column (j) for Total Usage is the sum of Columns (h) and (i).
(d)
Hour of
Monthly
Peak
(e)
Imports into
ISO/RTO
(f)
Exports from
ISO/RTO
(g)
Through and
Out Service
(h)
Network
Service Usage
(i)
Point-to-Point
Service Usage
(j)
Total Usage
January 1
February 2
March 3
Total for Quarter 1 4
April 5
May 6
June 7
Total for Quarter 2 8
July 9
August 10
September 11
Total for Quarter 3 12
October 13
November 14
December 15
Total for Quarter 4 16
Total Year to
Date/Year
17
FERC FORM NO. 1/3-Q (NEW. 07-04) Page 400a

Name of Respondent This Report Is:(1) An Original
(2) A Resubmission
Date of Report(Mo, Da, Yr)
Year/Period of Report
End of
ELECTRIC ENERGY ACCOUNT
PACIFIC GAS AND ELECTRIC COMPANYX
04/13/20212020/Q4
Line
No.
Item
(a)(b)(a) (b)
Line
No.MegaWatt Hours Item MegaWatt Hours
Report below the information called for concerning the disposition of electric energy generated, purchased, exchanged and wheeled during the year.
SOURCES OF ENERGY1
Generation (Excluding Station Use):2
5,892,957Steam3
16,284,423Nuclear4
6,285,290Hydro-Conventional5
624,145Hydro-Pumped Storage6
777,026Other7
978,655Less Energy for Pumping8
28,885,186Net Generation (Enter Total of lines 3
through 8)
9
59,363,830Purchases10
Power Exchanges:11
Received12
Delivered13
Net Exchanges (Line 12 minus line 13)14
Transmission For Other (Wheeling)15
553,931Received16
543,456Delivered17
10,475Net Transmission for Other (Line 16 minus
line 17)
18
Transmission By Others Losses19
88,259,491TOTAL (Enter Total of lines 9, 10, 14, 18
and 19)
20
DISPOSITION OF ENERGY21
36,530,075Sales to Ultimate Consumers (Including
Interdepartmental Sales)
22
18,328,235Requirements Sales for Resale (See
instruction 4, page 311.)
23
Non-Requirements Sales for Resale (See
instruction 4, page 311.)
24
Energy Furnished Without Charge25
Energy Used by the Company (Electric
Dept Only, Excluding Station Use)
26
33,401,185Total Energy Losses27
88,259,495TOTAL (Enter Total of Lines 22 Through
27) (MUST EQUAL LINE 20)
28
FERC FORM NO. 1 (ED. 12-90) Page 401a

(d)
Day of Month
Name of Respondent This Report Is:(1) An Original
(2) A Resubmission
Date of Report(Mo, Da, Yr)
Year/Period of Report
End of
MONTHLY PEAKS AND OUTPUT
PACIFIC GAS AND ELECTRIC COMPANYX
04/13/20212020/Q4
Line
No. Total Monthly Energy Megawatts
(c)(b)(a)
Hour
(e)
MONTHLY PEAK
Month
NAME OF SYSTEM: PACIFIC GAS AND ELECTRIC COMPANY
Monthly Non-RequirmentsSales for Resale &Associated Losses (See Instr. 4)
1. Report the monthly peak load and energy output. If the respondent has two or more power which are not physically integrated, furnish the required
information for each non- integrated system.
2. Report in column (b) by month the system’s output in Megawatt hours for each month.
3. Report in column (c) by month the non-requirements sales for resale. Include in the monthly amounts any energy losses associated with the sales.
4. Report in column (d) by month the system’s monthly maximum megawatt load (60 minute integration) associated with the system.
5. Report in column (e) and (f) the specified information for each monthly peak load reported in column (d).
(f)
January 29 16 12,139 1900 7,050,503
February 30 3 11,885 1900 6,381,625
March 31 4 11,601 1900 6,674,251
April 32 28 12,231 2000 6,088,314
May 33 26 17,051 1900 7,049,894
June 34 3 16,772 1900 7,830,269
July 35 11 16,480 1900 8,632,136
August 36 14 18,700 1800 9,228,219
September 37 7 18,444 1800 8,083,445
October 38 1 15,383 1900 7,466,132
November 39 9 11,652 1900 6,608,249
December 40 21 11,949 1900 7,166,458
FERC FORM NO. 1 (ED. 12-90) Page 401b
41 TOTAL 88,259,495

Schedule Page: 401 Line No.: 3 Column: bThis line includes combined cycle plants only. It does not include internal combustion
reciprocating engines, which are included on Line 7.
Schedule Page: 401 Line No.: 7 Column: bThis line includes internal combustion reciprocating engines, photo voltaic and Fuel
Cells.
This includes photo voltaic generation of 276,791 MWh.
Schedule Page: 401 Line No.: 10 Column: bFor purposes only of accounting for the total energy that went through the Utility's
electric system, the MWH for Direct Access ("DA") is 42,262,840 MWH. It should be noted
that DA and DWR megawatts are not Utility purchases and were reported here only because
page 401 of the Form 1 does not have any other available line where DA and DWR deliveries
can be shown more appropriately.
The Utility acts as a pass-through entity for electricity purchased by the DWR that is
sold to the Utility's customers. Although charges for electricity provided by the DWR are
included in the amounts the Utility bills its customers, the Utility deducts from
electricity revenue amounts passed through to the DWR. The pass-through amounts are based
on the quantities of electricity provided by the DWR that are consumed by customers,
priced at the related CPUC-approved remittance rate. These pass-through amounts are
excluded from the Utility's electricity revenues in its Statement of Income.
Schedule Page: 401 Line No.: 22 Column: bThis includes MWH sales for DWR and DA as discussed in the footnote to Line 10, column b.
Schedule Page: 401 Line No.: 26 Column: bData for energy used by the Electric department is not separately available but is
included on Line 22.
Name of Respondent
PACIFIC GAS AND ELECTRIC COMPANY
This Report is:(1) X An Original(2) A Resubmission
Date of Report(Mo, Da, Yr)
04/13/2021
Year/Period of Report
2020/Q4
FOOTNOTE DATA
FERC FORM NO. 1 (ED. 12-87) Page 450.1

Colusa Gen StationDIABLO CANYON 1 & 2
Name of Respondent This Report Is:(1) An Original
(2) A Resubmission
Date of Report(Mo, Da, Yr)
Year/Period of Report
End ofPACIFIC GAS AND ELECTRIC COMPANYX
04/13/20212020/Q4
Line
No.
Item
(b)(a) (c)
Plant
Name:
Plant
Name:
STEAM-ELECTRIC GENERATING PLANT STATISTICS (Large Plants)
1. Report data for plant in Service only. 2. Large plants are steam plants with installed capacity (name plate rating) of 25,000 Kw or more. Report in
this page gas-turbine and internal combustion plants of 10,000 Kw or more, and nuclear plants. 3. Indicate by a footnote any plant leased or operated
as a joint facility. 4. If net peak demand for 60 minutes is not available, give data which is available, specifying period. 5. If any employees attend
more than one plant, report on line 11 the approximate average number of employees assignable to each plant. 6. If gas is used and purchased on a
therm basis report the Btu content or the gas and the quantity of fuel burned converted to Mct. 7. Quantities of fuel burned (Line 38) and average cost
per unit of fuel burned (Line 41) must be consistent with charges to expense accounts 501 and 547 (Line 42) as show on Line 20. 8. If more than one
fuel is burned in a plant furnish only the composite heat rate for all fuels burned.
Combined CycleNuclear 1 Kind of Plant (Internal Comb, Gas Turb, Nuclear
OutdoorConventional 2 Type of Constr (Conventional, Outdoor, Boiler, etc)
20101968 3 Year Originally Constructed
20101986 4 Year Last Unit was Installed
711.452323.00 5 Total Installed Cap (Max Gen Name Plate Ratings-MW)
6572240 6 Net Peak Demand on Plant - MW (60 minutes)
63568335 7 Plant Hours Connected to Load
00 8 Net Continuous Plant Capability (Megawatts)
02240 9 When Not Limited by Condenser Water
02240 10 When Limited by Condenser Water
241265 11 Average Number of Employees
303765670016284422576 12 Net Generation, Exclusive of Plant Use - KWh
788927422726560 13 Cost of Plant: Land and Land Rights
1168612781104971166 14 Structures and Improvements
5480000516869258263 15 Equipment Costs
39125582701010462 16 Asset Retirement Costs
6766631611.069E+10 17 Total Cost
951.10434605.2374 18 Cost per KW of Installed Capacity (line 17/5) Including
664855839138 19 Production Expenses: Oper, Supv, & Engr
76421468110507650 20 Fuel
031711282 21 Coolants and Water (Nuclear Plants Only)
040847332 22 Steam Expenses
00 23 Steam From Other Sources
00 24 Steam Transferred (Cr)
49692402727700 25 Electric Expenses
615313212567566 26 Misc Steam (or Nuclear) Power Expenses
00 27 Rents
173637950 28 Allowances
84672245067 29 Maintenance Supervision and Engineering
20389423354092 30 Maintenance of Structures
71516230162140 31 Maintenance of Boiler (or reactor) Plant
599503134113684 32 Maintenance of Electric Plant
-2067448223871 33 Maintenance of Misc Steam (or Nuclear) Plant
108173229522299522 34 Total Production Expenses
0.03560.0321 35 Expenses per Net KWh
Nuclear Gas 36 Fuel: Kind (Coal, Gas, Oil, or Nuclear)
MWH Mcf 37 Unit (Coal-tons/Oil-barrel/Gas-mcf/Nuclear-indicate)
2058618 0 0 18421187 0 0 38 Quantity (Units) of Fuel Burned
0 0 0 1039182 0 0 39 Avg Heat Cont - Fuel Burned (btu/indicate if nuclear)
0.000 0.000 0.000 3.580 0.000 0.000 40 Avg Cost of Fuel/unit, as Delvd f.o.b. during year
53.442 0.000 0.000 3.570 0.000 0.000 41 Average Cost of Fuel per Unit Burned
0.653 0.000 0.000 3.430 0.000 0.000 42 Average Cost of Fuel Burned per Million BTU
0.007 0.000 0.000 0.020 0.000 0.000 43 Average Cost of Fuel Burned per KWh Net Gen
10352.408 0.000 0.000 6302.000 0.000 0.000 44 Average BTU per KWh Net Generation
FERC FORM NO. 1 (REV. 12-03) Page 402

9. Items under Cost of Plant are based on U. S. of A. Accounts. Production expenses do not include Purchased Power, System Control and Load
Dispatching, and Other Expenses Classified as Other Power Supply Expenses. 10. For IC and GT plants, report Operating Expenses, Account Nos.
547 and 549 on Line 25 "Electric Expenses," and Maintenance Account Nos. 553 and 554 on Line 32, "Maintenance of Electric Plant." Indicate plants
designed for peak load service. Designate automatically operated plants. 11. For a plant equipped with combinations of fossil fuel steam, nuclear
steam, hydro, internal combustion or gas-turbine equipment, report each as a separate plant. However, if a gas-turbine unit functions in a combined
cycle operation with a conventional steam unit, include the gas-turbine with the steam plant. 12. If a nuclear power generating plant, briefly explain by
footnote (a) accounting method for cost of power generated including any excess costs attributed to research and development; (b) types of cost units
used for the various components of fuel cost; and (c) any other informative data concerning plant type fuel used, fuel enrichment type and quantity for the
report period and other physical and operating characteristics of plant.
Humboldt Gen StationGateway Gen Station
Name of Respondent This Report Is:(1) An Original
(2) A Resubmission
Date of Report(Mo, Da, Yr)
Year/Period of Report
End of
STEAM-ELECTRIC GENERATING PLANT STATISTICS (Large Plants)
PACIFIC GAS AND ELECTRIC COMPANYX
04/13/20212020/Q4
Line
No.
(e) (f)
Plant
Name:
Plant
Name:
(d)
Plant
Name:
(Continued)
Combined Cycle Internal Combustion 1
Outdoor Indoor 2
2009 2010 3
2009 2011 4
0.00619.65 162.70 5
0580 163 6
06916 8721 7
00 0 8
00 0 9
00 0 10
024 18 11
02855299915 484335703 12
05040000 161399 13
072595612 67489321 14
0385694039 157587761 15
03004029 1925852 16
0466333680 227164333 17
0752.5759 1396.2159 18
058695 16458 19
073094919 15065602 20
00 0 21
011239 0 22
00 0 23
00 0 24
04126271 3537761 25
0742859 1302161 26
00 0 27
016901031 3337645 28
07475 2095 29
08702 153192 30
0549302 78551 31
03819588 5101746 32
01104636 0 33
0100424717 28595211 34
0.00000.0352 0.0590 35
Gas Oil Gas 36
Mcf Bbl Mcf 37
17459945 0 0 0 0 05509 3747399 0 38
1041818 0 0 0 0 05619132 1041727 0 39
3.600 0.000 0.000 0.000 0.000 0.00094.870 3.560 0.000 40
3.600 0.000 0.000 0.000 0.000 0.00097.310 4.600 0.000 41
3.450 0.000 0.000 0.000 0.000 0.00017.320 4.420 0.000 42
0.020 0.000 0.000 0.000 0.000 0.0000.140 0.040 0.000 43
6371.000 0.000 0.000 0.000 0.000 0.0008856.000 8181.000 0.000 44
FERC FORM NO. 1 (REV. 12-03) Page 403
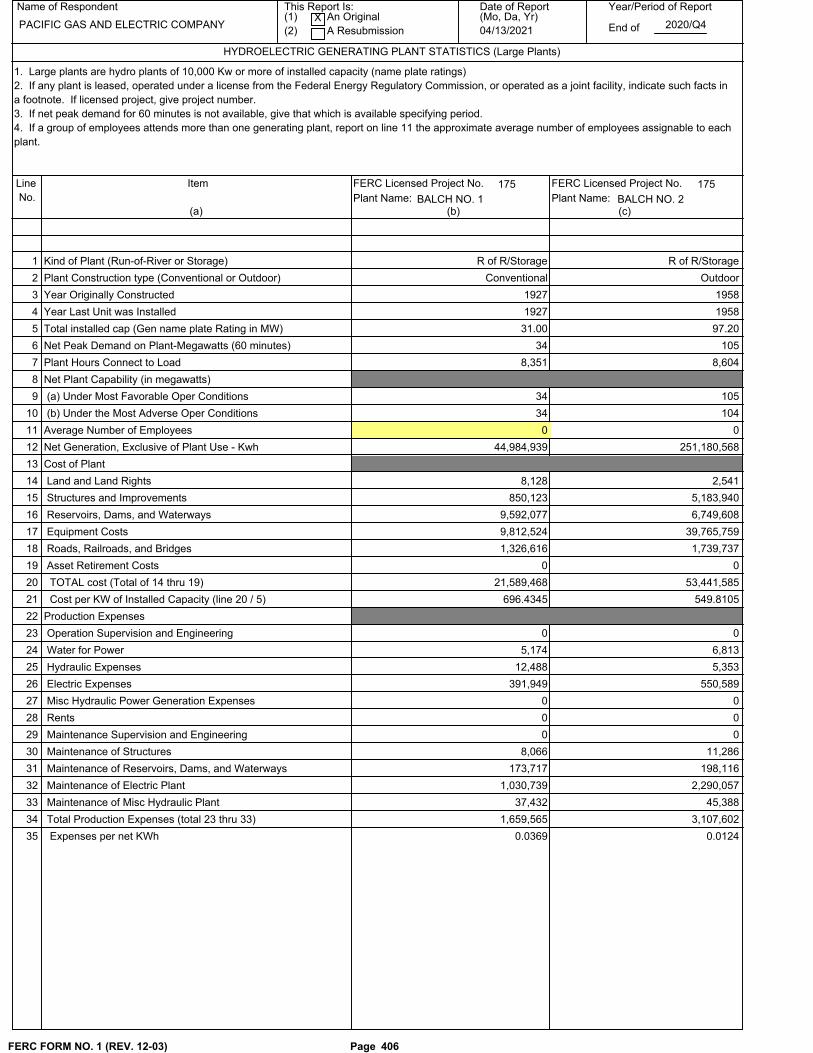
175
BALCH NO. 2
175
BALCH NO. 1
Name of Respondent This Report Is:(1) An Original
(2) A Resubmission
Date of Report(Mo, Da, Yr)
Year/Period of Report
End of
HYDROELECTRIC GENERATING PLANT STATISTICS (Large Plants)
PACIFIC GAS AND ELECTRIC COMPANYX
04/13/20212020/Q4
Line
No.
Item FERC Licensed Project No.
(b)(a) (c)
Plant Name:
FERC Licensed Project No.
Plant Name:
1. Large plants are hydro plants of 10,000 Kw or more of installed capacity (name plate ratings)
2. If any plant is leased, operated under a license from the Federal Energy Regulatory Commission, or operated as a joint facility, indicate such facts in
a footnote. If licensed project, give project number.
3. If net peak demand for 60 minutes is not available, give that which is available specifying period.
4. If a group of employees attends more than one generating plant, report on line 11 the approximate average number of employees assignable to each
plant.
Kind of Plant (Run-of-River or Storage) 1 R of R/Storage R of R/Storage
Plant Construction type (Conventional or Outdoor) 2 Conventional Outdoor
Year Originally Constructed 3 1927 1958
Year Last Unit was Installed 4 1927 1958
Total installed cap (Gen name plate Rating in MW) 5 31.00 97.20
Net Peak Demand on Plant-Megawatts (60 minutes) 6 34 105
Plant Hours Connect to Load 7 8,351 8,604
Net Plant Capability (in megawatts) 8
(a) Under Most Favorable Oper Conditions 9 34 105
(b) Under the Most Adverse Oper Conditions 10 34 104
Average Number of Employees 11 0 0
Net Generation, Exclusive of Plant Use - Kwh 12 44,984,939 251,180,568
Cost of Plant 13
Land and Land Rights 14 8,128 2,541
Structures and Improvements 15 850,123 5,183,940
Reservoirs, Dams, and Waterways 16 9,592,077 6,749,608
Equipment Costs 17 9,812,524 39,765,759
Roads, Railroads, and Bridges 18 1,326,616 1,739,737
Asset Retirement Costs 19 0 0
TOTAL cost (Total of 14 thru 19) 20 21,589,468 53,441,585
Cost per KW of Installed Capacity (line 20 / 5) 21 696.4345 549.8105
Production Expenses 22
Operation Supervision and Engineering 23 0 0
Water for Power 24 5,174 6,813
Hydraulic Expenses 25 12,488 5,353
Electric Expenses 26 391,949 550,589
Misc Hydraulic Power Generation Expenses 27 0 0
Rents 28 0 0
Maintenance Supervision and Engineering 29 0 0
Maintenance of Structures 30 8,066 11,286
Maintenance of Reservoirs, Dams, and Waterways 31 173,717 198,116
Maintenance of Electric Plant 32 1,030,739 2,290,057
Maintenance of Misc Hydraulic Plant 33 37,432 45,388
Total Production Expenses (total 23 thru 33) 34 1,659,565 3,107,602
Expenses per net KWh 35 0.0369 0.0124
FERC FORM NO. 1 (REV. 12-03) Page 406

2105
CARIBOU NO. 1
2105
BUTT VALLEY
Name of Respondent This Report Is:(1) An Original
(2) A Resubmission
Date of Report(Mo, Da, Yr)
Year/Period of Report
End of
HYDROELECTRIC GENERATING PLANT STATISTICS (Large Plants)
PACIFIC GAS AND ELECTRIC COMPANYX
04/13/20212020/Q4
Line
No.
Item FERC Licensed Project No.
(b)(a) (c)
Plant Name:
FERC Licensed Project No.
Plant Name:
1. Large plants are hydro plants of 10,000 Kw or more of installed capacity (name plate ratings)
2. If any plant is leased, operated under a license from the Federal Energy Regulatory Commission, or operated as a joint facility, indicate such facts in
a footnote. If licensed project, give project number.
3. If net peak demand for 60 minutes is not available, give that which is available specifying period.
4. If a group of employees attends more than one generating plant, report on line 11 the approximate average number of employees assignable to each
plant.
Kind of Plant (Run-of-River or Storage) 1 R of R/Storage R of R/Storage
Plant Construction type (Conventional or Outdoor) 2 Outdoor Conventional
Year Originally Constructed 3 1958 1921
Year Last Unit was Installed 4 1958 1924
Total installed cap (Gen name plate Rating in MW) 5 40.00 73.85
Net Peak Demand on Plant-Megawatts (60 minutes) 6 41 75
Plant Hours Connect to Load 7 7,531 6,533
Net Plant Capability (in megawatts) 8
(a) Under Most Favorable Oper Conditions 9 41 75
(b) Under the Most Adverse Oper Conditions 10 38 74
Average Number of Employees 11 0 0
Net Generation, Exclusive of Plant Use - Kwh 12 105,969,069 95,026,628
Cost of Plant 13
Land and Land Rights 14 429,639 343,751
Structures and Improvements 15 7,023,193 8,883,823
Reservoirs, Dams, and Waterways 16 36,933,095 28,867,770
Equipment Costs 17 20,645,054 33,691,117
Roads, Railroads, and Bridges 18 3,372,230 5,299,173
Asset Retirement Costs 19 0 0
TOTAL cost (Total of 14 thru 19) 20 68,403,211 77,085,634
Cost per KW of Installed Capacity (line 20 / 5) 21 1,710.0803 1,043.8136
Production Expenses 22
Operation Supervision and Engineering 23 0 0
Water for Power 24 158,914 551,526
Hydraulic Expenses 25 42,045 104,780
Electric Expenses 26 202,077 2,009,325
Misc Hydraulic Power Generation Expenses 27 1,108,377 3,846,722
Rents 28 0 0
Maintenance Supervision and Engineering 29 0 0
Maintenance of Structures 30 9,715 144,762
Maintenance of Reservoirs, Dams, and Waterways 31 54,433 333,163
Maintenance of Electric Plant 32 292,350 335,972
Maintenance of Misc Hydraulic Plant 33 95,830 284,260
Total Production Expenses (total 23 thru 33) 34 1,963,741 7,610,510
Expenses per net KWh 35 0.0185 0.0801
FERC FORM NO. 1 (REV. 12-03) Page 406.1

2310
DRUM NO. 1
803
DE SABLA
Name of Respondent This Report Is:(1) An Original
(2) A Resubmission
Date of Report(Mo, Da, Yr)
Year/Period of Report
End of
HYDROELECTRIC GENERATING PLANT STATISTICS (Large Plants)
PACIFIC GAS AND ELECTRIC COMPANYX
04/13/20212020/Q4
Line
No.
Item FERC Licensed Project No.
(b)(a) (c)
Plant Name:
FERC Licensed Project No.
Plant Name:
1. Large plants are hydro plants of 10,000 Kw or more of installed capacity (name plate ratings)
2. If any plant is leased, operated under a license from the Federal Energy Regulatory Commission, or operated as a joint facility, indicate such facts in
a footnote. If licensed project, give project number.
3. If net peak demand for 60 minutes is not available, give that which is available specifying period.
4. If a group of employees attends more than one generating plant, report on line 11 the approximate average number of employees assignable to each
plant.
Kind of Plant (Run-of-River or Storage) 1 R of R/Storage R of R/Storage
Plant Construction type (Conventional or Outdoor) 2 Outdoor Conventional
Year Originally Constructed 3 1963 1913
Year Last Unit was Installed 4 1963 1928
Total installed cap (Gen name plate Rating in MW) 5 18.45 49.20
Net Peak Demand on Plant-Megawatts (60 minutes) 6 19 54
Plant Hours Connect to Load 7 4,567 1,179
Net Plant Capability (in megawatts) 8
(a) Under Most Favorable Oper Conditions 9 19 54
(b) Under the Most Adverse Oper Conditions 10 19 54
Average Number of Employees 11 0 0
Net Generation, Exclusive of Plant Use - Kwh 12 33,537,615 15,547,318
Cost of Plant 13
Land and Land Rights 14 146,949 1,627,066
Structures and Improvements 15 3,277,838 5,798,355
Reservoirs, Dams, and Waterways 16 42,127,690 43,404,192
Equipment Costs 17 7,009,604 25,589,253
Roads, Railroads, and Bridges 18 4,418,919 1,471,450
Asset Retirement Costs 19 0 0
TOTAL cost (Total of 14 thru 19) 20 56,981,000 77,890,316
Cost per KW of Installed Capacity (line 20 / 5) 21 3,088.4011 1,583.1365
Production Expenses 22
Operation Supervision and Engineering 23 0 0
Water for Power 24 3,796 27,228
Hydraulic Expenses 25 37,911 25,463
Electric Expenses 26 260,409 653,444
Misc Hydraulic Power Generation Expenses 27 519,706 5,528
Rents 28 0 0
Maintenance Supervision and Engineering 29 0 0
Maintenance of Structures 30 134,674 69,604
Maintenance of Reservoirs, Dams, and Waterways 31 1,866,885 616,053
Maintenance of Electric Plant 32 176,170 143,729
Maintenance of Misc Hydraulic Plant 33 434,076 35,087
Total Production Expenses (total 23 thru 33) 34 3,433,627 1,576,136
Expenses per net KWh 35 0.1024 0.1014
FERC FORM NO. 1 (REV. 12-03) Page 406.2

2130
HALSEY
1988
HAAS
Name of Respondent This Report Is:(1) An Original
(2) A Resubmission
Date of Report(Mo, Da, Yr)
Year/Period of Report
End of
HYDROELECTRIC GENERATING PLANT STATISTICS (Large Plants)
PACIFIC GAS AND ELECTRIC COMPANYX
04/13/20212020/Q4
Line
No.
Item FERC Licensed Project No.
(b)(a) (c)
Plant Name:
FERC Licensed Project No.
Plant Name:
1. Large plants are hydro plants of 10,000 Kw or more of installed capacity (name plate ratings)
2. If any plant is leased, operated under a license from the Federal Energy Regulatory Commission, or operated as a joint facility, indicate such facts in
a footnote. If licensed project, give project number.
3. If net peak demand for 60 minutes is not available, give that which is available specifying period.
4. If a group of employees attends more than one generating plant, report on line 11 the approximate average number of employees assignable to each
plant.
Kind of Plant (Run-of-River or Storage) 1 R of R/Storage R of R/Storage
Plant Construction type (Conventional or Outdoor) 2 Conventional Conventional
Year Originally Constructed 3 1958 1916
Year Last Unit was Installed 4 1958 1916
Total installed cap (Gen name plate Rating in MW) 5 135.00 13.60
Net Peak Demand on Plant-Megawatts (60 minutes) 6 144 11
Plant Hours Connect to Load 7 8,338 6,797
Net Plant Capability (in megawatts) 8
(a) Under Most Favorable Oper Conditions 9 144 11
(b) Under the Most Adverse Oper Conditions 10 138 11
Average Number of Employees 11 0 0
Net Generation, Exclusive of Plant Use - Kwh 12 203,137,734 34,207,653
Cost of Plant 13
Land and Land Rights 14 27,695 1,052,759
Structures and Improvements 15 10,986,073 3,083,810
Reservoirs, Dams, and Waterways 16 28,191,129 29,945,323
Equipment Costs 17 41,633,823 10,873,031
Roads, Railroads, and Bridges 18 731,458 296,672
Asset Retirement Costs 19 0 0
TOTAL cost (Total of 14 thru 19) 20 81,570,178 45,251,595
Cost per KW of Installed Capacity (line 20 / 5) 21 604.2235 3,327.3232
Production Expenses 22
Operation Supervision and Engineering 23 0 0
Water for Power 24 7,872 14,807
Hydraulic Expenses 25 5,959 14,844
Electric Expenses 26 646,757 135,998
Misc Hydraulic Power Generation Expenses 27 26,627 2,640
Rents 28 0 0
Maintenance Supervision and Engineering 29 0 0
Maintenance of Structures 30 90,496 2,360
Maintenance of Reservoirs, Dams, and Waterways 31 91,790 1,911,600
Maintenance of Electric Plant 32 500,124 122,155
Maintenance of Misc Hydraulic Plant 33 61,030 662,433
Total Production Expenses (total 23 thru 33) 34 1,430,655 2,866,837
Expenses per net KWh 35 0.0070 0.0838
FERC FORM NO. 1 (REV. 12-03) Page 406.3

1988
KINGS RIVER
96
KERCKHOFF NO. 2
Name of Respondent This Report Is:(1) An Original
(2) A Resubmission
Date of Report(Mo, Da, Yr)
Year/Period of Report
End of
HYDROELECTRIC GENERATING PLANT STATISTICS (Large Plants)
PACIFIC GAS AND ELECTRIC COMPANYX
04/13/20212020/Q4
Line
No.
Item FERC Licensed Project No.
(b)(a) (c)
Plant Name:
FERC Licensed Project No.
Plant Name:
1. Large plants are hydro plants of 10,000 Kw or more of installed capacity (name plate ratings)
2. If any plant is leased, operated under a license from the Federal Energy Regulatory Commission, or operated as a joint facility, indicate such facts in
a footnote. If licensed project, give project number.
3. If net peak demand for 60 minutes is not available, give that which is available specifying period.
4. If a group of employees attends more than one generating plant, report on line 11 the approximate average number of employees assignable to each
plant.
Kind of Plant (Run-of-River or Storage) 1 R of R/Storage R of R/Storage
Plant Construction type (Conventional or Outdoor) 2 Underground Semi-Outdoor
Year Originally Constructed 3 1983 1962
Year Last Unit was Installed 4 1983 1962
Total installed cap (Gen name plate Rating in MW) 5 139.50 48.60
Net Peak Demand on Plant-Megawatts (60 minutes) 6 155 52
Plant Hours Connect to Load 7 5,820 7,708
Net Plant Capability (in megawatts) 8
(a) Under Most Favorable Oper Conditions 9 155 52
(b) Under the Most Adverse Oper Conditions 10 151 52
Average Number of Employees 11 0 0
Net Generation, Exclusive of Plant Use - Kwh 12 252,400,000 66,425,532
Cost of Plant 13
Land and Land Rights 14 584,467 18,829
Structures and Improvements 15 39,020,136 6,078,665
Reservoirs, Dams, and Waterways 16 90,616,637 21,601,373
Equipment Costs 17 52,200,615 24,241,857
Roads, Railroads, and Bridges 18 7,536,560 421,355
Asset Retirement Costs 19 0 0
TOTAL cost (Total of 14 thru 19) 20 189,958,415 52,362,079
Cost per KW of Installed Capacity (line 20 / 5) 21 1,361.7091 1,077.4090
Production Expenses 22
Operation Supervision and Engineering 23 0 0
Water for Power 24 74,387 3,408
Hydraulic Expenses 25 7,720 3,235
Electric Expenses 26 167,782 257,731
Misc Hydraulic Power Generation Expenses 27 1,068,797 4,099
Rents 28 0 0
Maintenance Supervision and Engineering 29 0 0
Maintenance of Structures 30 62,193 4,956
Maintenance of Reservoirs, Dams, and Waterways 31 121,638 54,877
Maintenance of Electric Plant 32 315,149 190,702
Maintenance of Misc Hydraulic Plant 33 14,344 6
Total Production Expenses (total 23 thru 33) 34 1,832,010 519,014
Expenses per net KWh 35 0.0073 0.0078
FERC FORM NO. 1 (REV. 12-03) Page 406.4

233
PIT NO. 4
233
PIT NO. 3
Name of Respondent This Report Is:(1) An Original
(2) A Resubmission
Date of Report(Mo, Da, Yr)
Year/Period of Report
End of
HYDROELECTRIC GENERATING PLANT STATISTICS (Large Plants)
PACIFIC GAS AND ELECTRIC COMPANYX
04/13/20212020/Q4
Line
No.
Item FERC Licensed Project No.
(b)(a) (c)
Plant Name:
FERC Licensed Project No.
Plant Name:
1. Large plants are hydro plants of 10,000 Kw or more of installed capacity (name plate ratings)
2. If any plant is leased, operated under a license from the Federal Energy Regulatory Commission, or operated as a joint facility, indicate such facts in
a footnote. If licensed project, give project number.
3. If net peak demand for 60 minutes is not available, give that which is available specifying period.
4. If a group of employees attends more than one generating plant, report on line 11 the approximate average number of employees assignable to each
plant.
Kind of Plant (Run-of-River or Storage) 1 R of R/Storage R of R/Storage
Plant Construction type (Conventional or Outdoor) 2 Conventional Conventional
Year Originally Constructed 3 1925 1955
Year Last Unit was Installed 4 1925 1955
Total installed cap (Gen name plate Rating in MW) 5 80.19 103.50
Net Peak Demand on Plant-Megawatts (60 minutes) 6 70 95
Plant Hours Connect to Load 7 8,125 8,493
Net Plant Capability (in megawatts) 8
(a) Under Most Favorable Oper Conditions 9 70 95
(b) Under the Most Adverse Oper Conditions 10 70 95
Average Number of Employees 11 0 0
Net Generation, Exclusive of Plant Use - Kwh 12 260,775,254 330,830,296
Cost of Plant 13
Land and Land Rights 14 3,845,487 298,517
Structures and Improvements 15 13,455,739 3,662,948
Reservoirs, Dams, and Waterways 16 68,856,984 40,926,929
Equipment Costs 17 45,482,082 38,133,250
Roads, Railroads, and Bridges 18 7,811,011 3,731,760
Asset Retirement Costs 19 0 0
TOTAL cost (Total of 14 thru 19) 20 139,451,303 86,753,404
Cost per KW of Installed Capacity (line 20 / 5) 21 1,739.0111 838.1971
Production Expenses 22
Operation Supervision and Engineering 23 0 0
Water for Power 24 58,732 68,595
Hydraulic Expenses 25 20,724 18,821
Electric Expenses 26 462,742 215,450
Misc Hydraulic Power Generation Expenses 27 762,528 486,493
Rents 28 0 0
Maintenance Supervision and Engineering 29 0 0
Maintenance of Structures 30 31,493 11,297
Maintenance of Reservoirs, Dams, and Waterways 31 83,637 16,861
Maintenance of Electric Plant 32 565,634 368,764
Maintenance of Misc Hydraulic Plant 33 512,317 83,481
Total Production Expenses (total 23 thru 33) 34 2,497,807 1,269,762
Expenses per net KWh 35 0.0096 0.0038
FERC FORM NO. 1 (REV. 12-03) Page 406.5

1962
ROCK CREEK
2107
POE
Name of Respondent This Report Is:(1) An Original
(2) A Resubmission
Date of Report(Mo, Da, Yr)
Year/Period of Report
End of
HYDROELECTRIC GENERATING PLANT STATISTICS (Large Plants)
PACIFIC GAS AND ELECTRIC COMPANYX
04/13/20212020/Q4
Line
No.
Item FERC Licensed Project No.
(b)(a) (c)
Plant Name:
FERC Licensed Project No.
Plant Name:
1. Large plants are hydro plants of 10,000 Kw or more of installed capacity (name plate ratings)
2. If any plant is leased, operated under a license from the Federal Energy Regulatory Commission, or operated as a joint facility, indicate such facts in
a footnote. If licensed project, give project number.
3. If net peak demand for 60 minutes is not available, give that which is available specifying period.
4. If a group of employees attends more than one generating plant, report on line 11 the approximate average number of employees assignable to each
plant.
Kind of Plant (Run-of-River or Storage) 1 R of R/Storage R of R/Storage
Plant Construction type (Conventional or Outdoor) 2 Outdoor Conventional
Year Originally Constructed 3 1958 1950
Year Last Unit was Installed 4 1958 1950
Total installed cap (Gen name plate Rating in MW) 5 142.83 125.37
Net Peak Demand on Plant-Megawatts (60 minutes) 6 120 126
Plant Hours Connect to Load 7 7,724 8,493
Net Plant Capability (in megawatts) 8
(a) Under Most Favorable Oper Conditions 9 120 119
(b) Under the Most Adverse Oper Conditions 10 120 119
Average Number of Employees 11 0 0
Net Generation, Exclusive of Plant Use - Kwh 12 236,435,773 287,650,524
Cost of Plant 13
Land and Land Rights 14 821,540 1,777,488
Structures and Improvements 15 4,254,214 22,736,983
Reservoirs, Dams, and Waterways 16 67,309,729 51,799,439
Equipment Costs 17 42,378,946 106,690,007
Roads, Railroads, and Bridges 18 2,019,530 354,677
Asset Retirement Costs 19 0 0
TOTAL cost (Total of 14 thru 19) 20 116,783,959 183,358,594
Cost per KW of Installed Capacity (line 20 / 5) 21 817.6431 1,462.5396
Production Expenses 22
Operation Supervision and Engineering 23 0 0
Water for Power 24 5,147 11,957
Hydraulic Expenses 25 824,302 67,151
Electric Expenses 26 358,683 1,632,326
Misc Hydraulic Power Generation Expenses 27 2,189,228 4,772,727
Rents 28 0 0
Maintenance Supervision and Engineering 29 0 0
Maintenance of Structures 30 100,055 410,452
Maintenance of Reservoirs, Dams, and Waterways 31 200,502 1,159,976
Maintenance of Electric Plant 32 352,883 571,258
Maintenance of Misc Hydraulic Plant 33 29,978 24,709
Total Production Expenses (total 23 thru 33) 34 4,060,778 8,650,556
Expenses per net KWh 35 0.0172 0.0301
FERC FORM NO. 1 (REV. 12-03) Page 406.6

2310
WISE NO. 1
137
WEST POINT
Name of Respondent This Report Is:(1) An Original
(2) A Resubmission
Date of Report(Mo, Da, Yr)
Year/Period of Report
End of
HYDROELECTRIC GENERATING PLANT STATISTICS (Large Plants)
PACIFIC GAS AND ELECTRIC COMPANYX
04/13/20212020/Q4
Line
No.
Item FERC Licensed Project No.
(b)(a) (c)
Plant Name:
FERC Licensed Project No.
Plant Name:
1. Large plants are hydro plants of 10,000 Kw or more of installed capacity (name plate ratings)
2. If any plant is leased, operated under a license from the Federal Energy Regulatory Commission, or operated as a joint facility, indicate such facts in
a footnote. If licensed project, give project number.
3. If net peak demand for 60 minutes is not available, give that which is available specifying period.
4. If a group of employees attends more than one generating plant, report on line 11 the approximate average number of employees assignable to each
plant.
Kind of Plant (Run-of-River or Storage) 1 R of R/Storage R of R/Storage
Plant Construction type (Conventional or Outdoor) 2 Conventional Conventional
Year Originally Constructed 3 1948 1917
Year Last Unit was Installed 4 1948 1917
Total installed cap (Gen name plate Rating in MW) 5 13.60 13.60
Net Peak Demand on Plant-Megawatts (60 minutes) 6 15 14
Plant Hours Connect to Load 7 7,798 7,443
Net Plant Capability (in megawatts) 8
(a) Under Most Favorable Oper Conditions 9 15 14
(b) Under the Most Adverse Oper Conditions 10 13 14
Average Number of Employees 11 0 0
Net Generation, Exclusive of Plant Use - Kwh 12 67,512,660 57,948,822
Cost of Plant 13
Land and Land Rights 14 141,605 803,771
Structures and Improvements 15 1,005,039 4,119,349
Reservoirs, Dams, and Waterways 16 6,618,927 17,918,597
Equipment Costs 17 7,398,878 10,715,002
Roads, Railroads, and Bridges 18 285,886 226,736
Asset Retirement Costs 19 0 0
TOTAL cost (Total of 14 thru 19) 20 15,450,335 33,783,455
Cost per KW of Installed Capacity (line 20 / 5) 21 1,136.0540 2,484.0776
Production Expenses 22
Operation Supervision and Engineering 23 0 0
Water for Power 24 3,074 31,189
Hydraulic Expenses 25 134,160 27,547
Electric Expenses 26 449,436 1,437,662
Misc Hydraulic Power Generation Expenses 27 36,493 5,561
Rents 28 0 0
Maintenance Supervision and Engineering 29 0 0
Maintenance of Structures 30 110,505 20,843
Maintenance of Reservoirs, Dams, and Waterways 31 381,206 4,272,817
Maintenance of Electric Plant 32 361,871 144,067
Maintenance of Misc Hydraulic Plant 33 20,895 1,804,221
Total Production Expenses (total 23 thru 33) 34 1,497,640 7,743,907
Expenses per net KWh 35 0.0222 0.1336
FERC FORM NO. 1 (REV. 12-03) Page 406.7

0 0
Name of Respondent This Report Is:(1) An Original
(2) A Resubmission
Date of Report(Mo, Da, Yr)
Year/Period of Report
End of
HYDROELECTRIC GENERATING PLANT STATISTICS (Large Plants)
PACIFIC GAS AND ELECTRIC COMPANYX
04/13/20212020/Q4
Line
No.
Item FERC Licensed Project No.
(b)(a) (c)
Plant Name:
FERC Licensed Project No.
Plant Name:
1. Large plants are hydro plants of 10,000 Kw or more of installed capacity (name plate ratings)
2. If any plant is leased, operated under a license from the Federal Energy Regulatory Commission, or operated as a joint facility, indicate such facts in
a footnote. If licensed project, give project number.
3. If net peak demand for 60 minutes is not available, give that which is available specifying period.
4. If a group of employees attends more than one generating plant, report on line 11 the approximate average number of employees assignable to each
plant.
Kind of Plant (Run-of-River or Storage) 1
Plant Construction type (Conventional or Outdoor) 2
Year Originally Constructed 3
Year Last Unit was Installed 4
Total installed cap (Gen name plate Rating in MW) 5 0.00 0.00
Net Peak Demand on Plant-Megawatts (60 minutes) 6 0 0
Plant Hours Connect to Load 7 0 0
Net Plant Capability (in megawatts) 8
(a) Under Most Favorable Oper Conditions 9 0 0
(b) Under the Most Adverse Oper Conditions 10 0 0
Average Number of Employees 11 0 0
Net Generation, Exclusive of Plant Use - Kwh 12 0 0
Cost of Plant 13
Land and Land Rights 14 0 0
Structures and Improvements 15 0 0
Reservoirs, Dams, and Waterways 16 0 0
Equipment Costs 17 0 0
Roads, Railroads, and Bridges 18 0 0
Asset Retirement Costs 19 0 0
TOTAL cost (Total of 14 thru 19) 20 0 0
Cost per KW of Installed Capacity (line 20 / 5) 21 0.0000 0.0000
Production Expenses 22
Operation Supervision and Engineering 23 0 0
Water for Power 24 0 0
Hydraulic Expenses 25 0 0
Electric Expenses 26 0 0
Misc Hydraulic Power Generation Expenses 27 0 0
Rents 28 0 0
Maintenance Supervision and Engineering 29 0 0
Maintenance of Structures 30 0 0
Maintenance of Reservoirs, Dams, and Waterways 31 0 0
Maintenance of Electric Plant 32 0 0
Maintenance of Misc Hydraulic Plant 33 0 0
Total Production Expenses (total 23 thru 33) 34 0 0
Expenses per net KWh 35 0.0000 0.0000
FERC FORM NO. 1 (REV. 12-03) Page 406.8

2105
BELDEN BUCKS CREEK
619
JAMES B. BLACK
2106
Name of Respondent This Report Is:(1) An Original
(2) A Resubmission
Date of Report(Mo, Da, Yr)
Year/Period of Report
End of
HYDROELECTRIC GENERATING PLANT STATISTICS (Large Plants) (Continued)
PACIFIC GAS AND ELECTRIC COMPANYX
04/13/20212020/Q4
FERC Licensed Project No.
(e)(d) (f)
Plant Name:
FERC Licensed Project No.
Plant Name:
FERC Licensed Project No.
Plant Name:
Line
No.
5. The items under Cost of Plant represent accounts or combinations of accounts prescribed by the Uniform System of Accounts. Production Expenses
do not include Purchased Power, System control and Load Dispatching, and Other Expenses classified as "Other Power Supply Expenses."
6. Report as a separate plant any plant equipped with combinations of steam, hydro, internal combustion engine, or gas turbine equipment.
R of R/Storage R of R/StorageR of R/Storage 1
Outdoor ConventionalOutdoor 2
1965 19281969 3
1966 19281969 4
168.66 66.00117.90 5
172 65125 6
8,661 3,3417,346 7
8
172 65125 9
172 53125 10
0 00 11
448,920,247 36,082,488247,390,983 12
13
509,178 811,840616,617 14
763,768 1,511,50911,899,731 15
66,295,308 43,801,10758,367,520 16
19,352,619 32,723,66464,198,554 17
2,073,862 3,068,4721,220,208 18
0 00 19
88,994,735 81,916,592136,302,630 20
527.6576 1,241.16051,156.0868 21
22
0 00 23
20,206 123,430261,741 24
17,696 25,00552,383 25
598,447 202,021176,303 26
173,943 2,055,2461,825,563 27
0 00 28
0 00 29
34,063 116,79116,737 30
414,737 2,789,2631,067,742 31
455,937 185,467245,121 32
89,357 27,33177,636 33
1,804,386 5,524,5543,723,226 34
0.0040 0.15310.0151 35
FERC FORM NO. 1 (REV. 12-03) Page 407

2105
CARIBOU NO. 2 CRESTA
1962
COLEMAN
1121
Name of Respondent This Report Is:(1) An Original
(2) A Resubmission
Date of Report(Mo, Da, Yr)
Year/Period of Report
End of
HYDROELECTRIC GENERATING PLANT STATISTICS (Large Plants) (Continued)
PACIFIC GAS AND ELECTRIC COMPANYX
04/13/20212020/Q4
FERC Licensed Project No.
(e)(d) (f)
Plant Name:
FERC Licensed Project No.
Plant Name:
FERC Licensed Project No.
Plant Name:
Line
No.
5. The items under Cost of Plant represent accounts or combinations of accounts prescribed by the Uniform System of Accounts. Production Expenses
do not include Purchased Power, System control and Load Dispatching, and Other Expenses classified as "Other Power Supply Expenses."
6. Report as a separate plant any plant equipped with combinations of steam, hydro, internal combustion engine, or gas turbine equipment.
R of R/Storage R of R/StorageR of R/Storage 1
Conventional ConventionalOutdoor 2
1979 19491958 3
1979 19501958 4
12.15 73.80117.90 5
13 70120 6
7,968 8,5448,349 7
8
13 70120 9
5 72119 10
0 00 11
28,316,978 159,092,995343,680,363 12
13
180,892 1,365,100364,657 14
1,704,843 11,465,06411,137,669 15
23,729,148 25,396,95835,963,846 16
17,868,667 14,952,18234,398,480 17
606,322 135,447464,414 18
0 00 19
44,089,872 53,314,75182,329,066 20
3,628.7960 722.4221698.2957 21
22
0 00 23
1,020 5,464243,045 24
12,880 30,01646,174 25
432,403 179,945121,042 26
252,972 2,180,9151,696,038 27
0 00 28
0 00 29
64,058 88,50821,226 30
243,065 568,19663,705 31
174,281 281,432245,581 32
191,141 12,43671,226 33
1,371,820 3,346,9122,508,037 34
0.0484 0.02100.0073 35
FERC FORM NO. 1 (REV. 12-03) Page 407.1

2310
DRUM NO. 2 ELECTRA
137
DUTCH FLAT
2310
Name of Respondent This Report Is:(1) An Original
(2) A Resubmission
Date of Report(Mo, Da, Yr)
Year/Period of Report
End of
HYDROELECTRIC GENERATING PLANT STATISTICS (Large Plants) (Continued)
PACIFIC GAS AND ELECTRIC COMPANYX
04/13/20212020/Q4
FERC Licensed Project No.
(e)(d) (f)
Plant Name:
FERC Licensed Project No.
Plant Name:
FERC Licensed Project No.
Plant Name:
Line
No.
5. The items under Cost of Plant represent accounts or combinations of accounts prescribed by the Uniform System of Accounts. Production Expenses
do not include Purchased Power, System control and Load Dispatching, and Other Expenses classified as "Other Power Supply Expenses."
6. Report as a separate plant any plant equipped with combinations of steam, hydro, internal combustion engine, or gas turbine equipment.
R of R/Storage R of R/StorageR of R/Storage 1
Conventional ConventionalOutdoor 2
1943 19481965 3
1943 19481965 4
22.00 102.5053.10 5
22 9850 6
8,126 8,3158,174 7
8
22 9850 9
23 9849 10
0 00 11
89,141,758 286,154,201215,240,832 12
13
824,090 728,576428,615 14
2,757,169 2,651,8801,157,249 15
21,282,219 31,045,14012,131,958 16
16,618,809 29,915,5058,187,656 17
762,178 1,506,420488,443 18
0 00 19
42,244,465 65,847,52122,393,921 20
1,920.2030 642.4148421.7311 21
22
0 00 23
11,703 166,73521,550 24
11,360 457,05919,033 25
259,957 1,211,558439,823 26
14,380 79,4054,375 27
0 00 28
0 00 29
55,986 176,32043,705 30
235,693 920,690375,416 31
65,849 1,665,63752,007 32
34,933 72,34028,430 33
689,861 4,749,744984,339 34
0.0077 0.01660.0046 35
FERC FORM NO. 1 (REV. 12-03) Page 407.2

2661
HAT CREEK NO. 1 KERCKHOFF NO. 1
96
HAT CREEK NO. 2
2661
Name of Respondent This Report Is:(1) An Original
(2) A Resubmission
Date of Report(Mo, Da, Yr)
Year/Period of Report
End of
HYDROELECTRIC GENERATING PLANT STATISTICS (Large Plants) (Continued)
PACIFIC GAS AND ELECTRIC COMPANYX
04/13/20212020/Q4
FERC Licensed Project No.
(e)(d) (f)
Plant Name:
FERC Licensed Project No.
Plant Name:
FERC Licensed Project No.
Plant Name:
Line
No.
5. The items under Cost of Plant represent accounts or combinations of accounts prescribed by the Uniform System of Accounts. Production Expenses
do not include Purchased Power, System control and Load Dispatching, and Other Expenses classified as "Other Power Supply Expenses."
6. Report as a separate plant any plant equipped with combinations of steam, hydro, internal combustion engine, or gas turbine equipment.
R of R/Storage R of R/StorageR of R/Storage 1
Conventional ConventionalConventional 2
1921 19201921 3
1921 19201921 4
10.00 22.7210.00 5
9 259 6
6,944 08,625 7
8
9 259 9
9 04 10
0 00 11
33,543,126 032,343,278 12
13
712,895 6,974778,661 14
283,934 1,651,079755,686 15
1,887,400 3,359,6312,778,514 16
3,628,621 6,210,7123,964,049 17
390,699 6,2081,178,525 18
0 00 19
6,903,549 11,234,6049,455,435 20
690.3549 494.4808945.5435 21
22
0 00 23
0 35,4950 24
3,591 04,247 25
94,332 72,34571,137 26
59,126 509,99069,919 27
0 00 28
0 00 29
27,133 49911,248 30
608,475 9,934612,601 31
95,667 31,39672,898 32
37,425 036,602 33
925,749 659,659878,652 34
0.0276 0.00000.0272 35
FERC FORM NO. 1 (REV. 12-03) Page 407.3

1403
NARROWS PIT NO.1
2687
NEWCASTLE
2310
Name of Respondent This Report Is:(1) An Original
(2) A Resubmission
Date of Report(Mo, Da, Yr)
Year/Period of Report
End of
HYDROELECTRIC GENERATING PLANT STATISTICS (Large Plants) (Continued)
PACIFIC GAS AND ELECTRIC COMPANYX
04/13/20212020/Q4
FERC Licensed Project No.
(e)(d) (f)
Plant Name:
FERC Licensed Project No.
Plant Name:
FERC Licensed Project No.
Plant Name:
Line
No.
5. The items under Cost of Plant represent accounts or combinations of accounts prescribed by the Uniform System of Accounts. Production Expenses
do not include Purchased Power, System control and Load Dispatching, and Other Expenses classified as "Other Power Supply Expenses."
6. Report as a separate plant any plant equipped with combinations of steam, hydro, internal combustion engine, or gas turbine equipment.
R of R/Storage R of R/StorageR of R/Storage 1
Conventional ConventionalConventional 2
1986 19221942 3
1986 19221942 4
12.70 69.3010.20 5
12 6112 6
2,471 7,9160 7
8
12 6112 9
0 6112 10
0 00 11
7,131,112 182,376,839-63,288 12
13
2,025,507 2,049,440-12 14
6,630,371 2,249,969-9 15
48,879,331 13,460,80879,966 16
8,339,602 39,063,634-374,233 17
3,084,821 1,448,906-2 18
0 00 19
68,959,632 58,272,757-294,290 20
5,429.8923 840.8767-28.8520 21
22
0 00 23
13,432 51,762152,745 24
11,863 11,8240 25
110,640 146,55512,937 26
2,395 522,0893,345 27
0 00 28
0 00 29
407 32,2690 30
1,737,099 226,32919,682 31
116,289 320,8443,756 32
777,006 66,6880 33
2,769,131 1,378,360192,465 34
0.3883 0.00760.0000 35
FERC FORM NO. 1 (REV. 12-03) Page 407.4

233
PIT NO. 5 PIT NO. 7
2106
PIT NO. 6
2106
Name of Respondent This Report Is:(1) An Original
(2) A Resubmission
Date of Report(Mo, Da, Yr)
Year/Period of Report
End of
HYDROELECTRIC GENERATING PLANT STATISTICS (Large Plants) (Continued)
PACIFIC GAS AND ELECTRIC COMPANYX
04/13/20212020/Q4
FERC Licensed Project No.
(e)(d) (f)
Plant Name:
FERC Licensed Project No.
Plant Name:
FERC Licensed Project No.
Plant Name:
Line
No.
5. The items under Cost of Plant represent accounts or combinations of accounts prescribed by the Uniform System of Accounts. Production Expenses
do not include Purchased Power, System control and Load Dispatching, and Other Expenses classified as "Other Power Supply Expenses."
6. Report as a separate plant any plant equipped with combinations of steam, hydro, internal combustion engine, or gas turbine equipment.
R of R/Storage R of R/StorageR of R/Storage 1
Outdoor OutdoorConventional 2
1965 19651944 3
1965 19651944 4
79.20 109.80141.84 5
80 112160 6
6,304 8,3318,784 7
8
80 112160 9
80 112160 10
0 00 11
194,070,518 311,413,199547,242,680 12
13
414,645 356,018647,714 14
6,212,220 5,978,26018,876,047 15
36,662,218 32,655,90845,534,631 16
26,634,990 24,233,87489,496,343 17
687,466 406,2778,953,497 18
0 00 19
70,611,539 63,630,337163,508,232 20
891.5598 579.51131,152.7653 21
22
0 00 23
16,236 16,0990 24
11,655 8,68830,918 25
423,852 428,3071,761,722 26
139,889 138,707897,257 27
0 00 28
0 00 29
21,100 33,56651,762 30
17,469 392,755120,951 31
382,799 320,373391,078 32
34,174 77,410164,280 33
1,047,174 1,415,9053,417,968 34
0.0054 0.00450.0062 35
FERC FORM NO. 1 (REV. 12-03) Page 407.5

137
SALT SPRINGS TIGER CREEK
137
STANISLAUS
2130
Name of Respondent This Report Is:(1) An Original
(2) A Resubmission
Date of Report(Mo, Da, Yr)
Year/Period of Report
End of
HYDROELECTRIC GENERATING PLANT STATISTICS (Large Plants) (Continued)
PACIFIC GAS AND ELECTRIC COMPANYX
04/13/20212020/Q4
FERC Licensed Project No.
(e)(d) (f)
Plant Name:
FERC Licensed Project No.
Plant Name:
FERC Licensed Project No.
Plant Name:
Line
No.
5. The items under Cost of Plant represent accounts or combinations of accounts prescribed by the Uniform System of Accounts. Production Expenses
do not include Purchased Power, System control and Load Dispatching, and Other Expenses classified as "Other Power Supply Expenses."
6. Report as a separate plant any plant equipped with combinations of steam, hydro, internal combustion engine, or gas turbine equipment.
R of R/Storage R of R/StorageR of R/Storage 1
Outdoor ConventionalConventional 2
1963 19311931 3
1963 19311953 4
81.90 52.2842.03 5
91 5844 6
7,882 7,5917,123 7
8
91 5844 9
91 5834 10
0 00 11
240,723,747 235,205,760109,081,748 12
13
428,811 2,499,715195,719 14
7,041,739 8,890,8522,401,784 15
38,401,614 80,018,64136,156,785 16
20,550,135 29,346,78813,529,600 17
1,071,183 8,105,7731,634,846 18
0 00 19
67,493,482 128,861,76953,918,734 20
824.0962 2,464.83871,282.8631 21
22
0 00 23
426,212 8,7557,336 24
36,718 383,973337,239 25
632,605 1,106,844639,564 26
109,013 63,62253,310 27
0 00 28
0 00 29
27,767 261,95158,623 30
1,307,334 2,379,696799,874 31
333,899 1,052,358736,772 32
82,337 69,927114,664 33
2,955,885 5,327,1262,747,382 34
0.0123 0.02260.0252 35
FERC FORM NO. 1 (REV. 12-03) Page 407.6

1354
A.G. WISHON
0 0
Name of Respondent This Report Is:(1) An Original
(2) A Resubmission
Date of Report(Mo, Da, Yr)
Year/Period of Report
End of
HYDROELECTRIC GENERATING PLANT STATISTICS (Large Plants) (Continued)
PACIFIC GAS AND ELECTRIC COMPANYX
04/13/20212020/Q4
FERC Licensed Project No.
(e)(d) (f)
Plant Name:
FERC Licensed Project No.
Plant Name:
FERC Licensed Project No.
Plant Name:
Line
No.
5. The items under Cost of Plant represent accounts or combinations of accounts prescribed by the Uniform System of Accounts. Production Expenses
do not include Purchased Power, System control and Load Dispatching, and Other Expenses classified as "Other Power Supply Expenses."
6. Report as a separate plant any plant equipped with combinations of steam, hydro, internal combustion engine, or gas turbine equipment.
R of R/Storage 1
Conventional 2
1910 3
1910 4
0.00 0.0012.80 5
0 020 6
0 06,326 7
8
0 020 9
0 012 10
0 00 11
0 031,547,914 12
13
0 0974,124 14
0 01,518,393 15
0 050,243,503 16
0 06,412,671 17
0 029,459 18
0 00 19
0 059,178,150 20
0.0000 0.00004,623.2930 21
22
0 00 23
0 01,065 24
0 00 25
0 0160,693 26
0 0461,887 27
0 00 28
0 00 29
0 047,433 30
0 081,595 31
0 0157,484 32
0 04,860 33
0 0915,017 34
0.0000 0.00000.0290 35
FERC FORM NO. 1 (REV. 12-03) Page 407.7

0 0 0
Name of Respondent This Report Is:(1) An Original
(2) A Resubmission
Date of Report(Mo, Da, Yr)
Year/Period of Report
End of
HYDROELECTRIC GENERATING PLANT STATISTICS (Large Plants) (Continued)
PACIFIC GAS AND ELECTRIC COMPANYX
04/13/20212020/Q4
FERC Licensed Project No.
(e)(d) (f)
Plant Name:
FERC Licensed Project No.
Plant Name:
FERC Licensed Project No.
Plant Name:
Line
No.
5. The items under Cost of Plant represent accounts or combinations of accounts prescribed by the Uniform System of Accounts. Production Expenses
do not include Purchased Power, System control and Load Dispatching, and Other Expenses classified as "Other Power Supply Expenses."
6. Report as a separate plant any plant equipped with combinations of steam, hydro, internal combustion engine, or gas turbine equipment.
1
2
3
4
0.00 0.000.00 5
0 00 6
0 00 7
8
0 00 9
0 00 10
0 00 11
0 00 12
13
0 00 14
0 00 15
0 00 16
0 00 17
0 00 18
0 00 19
0 00 20
0.0000 0.00000.0000 21
22
0 00 23
0 00 24
0 00 25
0 00 26
0 00 27
0 00 28
0 00 29
0 00 30
0 00 31
0 00 32
0 00 33
0 00 34
0.0000 0.00000.0000 35
FERC FORM NO. 1 (REV. 12-03) Page 407.8

Schedule Page: 406 Line No.: 11 Column: bPACIFIC GAS AND ELECTRIC COMPANY
FOOTNOTES TO HYDRO GENERATING PLANTS - PAGES 406-407
Year ended December 31, 2020
Schedule Page: 406 Line No.: 11 Column: bAverage Number of Employees on pages 406 and 407 line 11 left blank due to remoteoperation and remote area headquarters. Refer to the table below for further details onoperations and maintenance staffing for each plant. Many of these plants are attended byroving operators as well additional support staff.
PLANT NAME:
REMOTELY
OPERATED (Y/N):
REGIONAL
OPERATING
CENTER:
NUMBER OF
OPERATORS:
OPERATIONS
HEADQUATERS:
NUMER OF
OPERATORS:
MAINTENANCE
HEADQUATERS:
NUMBER OF
SUPPORT STAFF:
PIT NO. 1 Y None None Pit 3 Switching Center 12 Burney Service Center 36
PIT NO. 3 N
PIT NO. 4 Y
HAT CREEK NO. 1 Y
HAT CREEK NO. 2 Y
PIT NO. 5 N Pit 5 Switching Center 12
PIT NO. 6 Y
PIT NO. 7 Y
JAMES B. BLACK Y
COLEMAN Y Manton Service Center 2 Manton Service Center 10
BUTT VALLEY Y
Rock Creek Switching
Center
19 Rogers Flat Service
Center
50
CARIBOU NO. 1 Y
CARIBOU NO. 2 Y
BELDEN Y
ROCK CREEK Y
BUCKS CREEK Y
CRESTA Y
POE Y
DE SABLA N Camp 1 3
Potter Valley PH 2 Potter Valley PH 1
DRUM NO. 1 N Drum Switching Center 15 Auburn Service Center 26
DRUM NO. 2 Y
DUTCH FLAT Y
HALSEY Y Wise Switching Center 9 Wise PH 3
WISE NO. 1 N Alta Service Center 8
NEWCASTLE Y
SALT SPRINGS Y
Tiger Creek Switching
Center
10 Tiger Creek Service
Center
15
TIGER CREEK Y
WEST POINT Y
ELECTRA Y
STANISLAUS Y
Angels Camp Service
Center
3 Angels Camp Service
Center
16
Sonora Service Center 7
HAAS Y 5 Balch Camp 4 33
BALCH NO. 1 Y
BALCH NO. 2 Y
KINGS RIVER Y
KERCKHOFF NO. 2 Y 3
A. G. WISHON N
Fresno Operating
Center
Auberry Service Center
Auberry Service Center
Schedule Page: 406.3 Line No.: 7 Column: f Schedule Page: 406 Line No.: 7 Column: xKERCKHOFF NO. 1 hydroelectric plant is no longer operating.
Schedule Page: 406.4 Line No.: 7 Column: d Schedule Page: 406 Line No.: 7 Column: aaNARROWS hydroelectric plant was sold to Yuba Water Agency on March 31, 2020.
Name of Respondent
PACIFIC GAS AND ELECTRIC COMPANY
This Report is:(1) X An Original(2) A Resubmission
Date of Report(Mo, Da, Yr)
04/13/2021
Year/Period of Report
2020/Q4
FOOTNOTE DATA
FERC FORM NO. 1 (ED. 12-87) Page 450.1

2735
HELMS PUMPED STORAGE
FERC Licensed Project No.
Plant Name:
(b)
Name of Respondent This Report Is:(1) An Original
(2) A Resubmission
Date of Report(Mo, Da, Yr)
Year/Period of Report
End of
PUMPED STORAGE GENERATING PLANT STATISTICS (Large Plants)
PACIFIC GAS AND ELECTRIC COMPANYX
04/13/20212020/Q4
Line
No.
Item
(a)
1. Large plants and pumped storage plants of 10,000 Kw or more of installed capacity (name plate ratings)
2. If any plant is leased, operating under a license from the Federal Energy Regulatory Commission, or operated as a joint facility, indicate such facts in
a footnote. Give project number.
3. If net peak demand for 60 minutes is not available, give the which is available, specifying period.
4. If a group of employees attends more than one generating plant, report on line 8 the approximate average number of employees assignable to each
plant.
5. The items under Cost of Plant represent accounts or combinations of accounts prescribed by the Uniform System of Accounts. Production Expenses
do not include Purchased Power System Control and Load Dispatching, and Other Expenses classified as "Other Power Supply Expenses."
1 Type of Plant Construction (Conventional or Outdoor) Underground
2 Year Originally Constructed 1984
3 Year Last Unit was Installed 1984
4 Total installed cap (Gen name plate Rating in MW) 1,053
5 Net Peak Demaind on Plant-Megawatts (60 minutes) 1,050
6 Plant Hours Connect to Load While Generating 3,306
7 Net Plant Capability (in megawatts) 1,212
8 Average Number of Employees 24
9 Generation, Exclusive of Plant Use - Kwh 624,145,471
10 Energy Used for Pumping 978,654,714
11 Net Output for Load (line 9 - line 10) - Kwh -354,509,243
12 Cost of Plant
13 Land and Land Rights 750,368
14 Structures and Improvements 186,954,368
15 Reservoirs, Dams, and Waterways 451,534,690
16 Water Wheels, Turbines, and Generators 284,232,525
17 Accessory Electric Equipment 69,208,995
18 Miscellaneous Powerplant Equipment 37,711,126
19 Roads, Railroads, and Bridges 8,780,883
20 Asset Retirement Costs
21 Total cost (total 13 thru 20) 1,039,172,955
22 Cost per KW of installed cap (line 21 / 4) 986.8689
23 Production Expenses
24 Operation Supervision and Engineering 1,043,093
25 Water for Power 507,567
26 Pumped Storage Expenses 1,774,490
27 Electric Expenses 2,052,044
28 Misc Pumped Storage Power generation Expenses 2,017,171
29 Rents
30 Maintenance Supervision and Engineering 5,251
31 Maintenance of Structures 783,427
32 Maintenance of Reservoirs, Dams, and Waterways 3,855,815
33 Maintenance of Electric Plant 6,275,514
34 Maintenance of Misc Pumped Storage Plant 1,463,013
35 Production Exp Before Pumping Exp (24 thru 34) 19,777,385
36 Pumping Expenses
37 Total Production Exp (total 35 and 36) 19,777,385
38 Expenses per KWh (line 37 / 9) 0.0317
FERC FORM NO. 1 (REV. 12-03) Page 408

0 0 0FERC Licensed Project No.
Plant Name:
FERC Licensed Project No.
Plant Name:(d)
Name of Respondent This Report Is:(1) An Original
(2) A Resubmission
Date of Report(Mo, Da, Yr)
Year/Period of Report
End of
PUMPED STORAGE GENERATING PLANT STATISTICS (Large Plants) (Continued)
PACIFIC GAS AND ELECTRIC COMPANYX
04/13/20212020/Q4
Line
No.
FERC Licensed Project No.
Plant Name:
(e)(c)
6. Pumping energy (Line 10) is that energy measured as input to the plant for pumping purposes.
7. Include on Line 36 the cost of energy used in pumping into the storage reservoir. When this item cannot be accurately computed leave Lines 36, 37
and 38 blank and describe at the bottom of the schedule the company's principal sources of pumping power, the estimated amounts of energy from each
station or other source that individually provides more than 10 percent of the total energy used for pumping, and production expenses per net MWH as
reported herein for each source described. Group together stations and other resources which individually provide less than 10 percent of total pumping
energy. If contracts are made with others to purchase power for pumping, give the supplier contract number, and date of contract.
1
2
3
4
5
6
7
8
9
10
11
12
13
14
15
16
17
18
19
20
21
22
23
24
25
26
27
28
29
30
31
32
33
34
35
36
37
38
FERC FORM NO. 1 (REV. 12-03) Page 409

Name of Respondent This Report Is:(1) An Original
(2) A Resubmission
Date of Report(Mo, Da, Yr)
Year/Period of Report
End of
GENERATING PLANT STATISTICS (Small Plants)
PACIFIC GAS AND ELECTRIC COMPANYX
04/13/20212020/Q4
Line
No.Name of Plant
Installed Capacity
(c)(b)(a)
Cost of PlantNet PeakDemand
(d)
YearOrig.
Const.Name Plate Rating
(In MW) MW(60 min.)
Net GenerationExcludingPlant Use
(e) (f)
1. Small generating plants are steam plants of, less than 25,000 Kw; internal combustion and gas turbine-plants, conventional hydro plants and pumped
storage plants of less than 10,000 Kw installed capacity (name plate rating). 2. Designate any plant leased from others, operated under a license from
the Federal Energy Regulatory Commission, or operated as a joint facility, and give a concise statement of the facts in a footnote. If licensed project,
give project number in footnote.
HYDROELECTRIC GENERATING PLANTS: 1
1.00 1.0 2,433,010 14,081,5511902 Alta FERC No.2310 2
6.40 6.4 17,450,3981904 Centerville FERC No.803 3
7.02 7.0 20,342,175 18,112,6201965 Chili Bar FERC No.2155 4
7,033,9811907Coal Canyon 5
1.44 1.8 4,221,901 3,379,7671907 Cow Creek FERC No.606 6
0.99 0.9 611,252 22,743,4271919 Crane Valley FERC No.1354 7
5.50 5.7 18,088,488 88,088,8661908 Deer Creek FERC No.2310 8
5.39 4.8 -119,562 8,594,2501921 Hamilton Branch 9
7.65 8.0 23,482,3621979 Inskip FERC No.1121 10
9.54 11.51921 Kern Canyon FERC No. 178 11
3.00 1.6 -62,043 4,325,9691904 Kilarc FERC No.606 12
2.00 2.0 18,755,0131906 Lime Saddle 13
1930 Merced Falls FERC No.2467 14
1.40 1.3 6,225,877 8,614,3841985 Oak Flat FERC No.2105 15
1.60 2.0 6,056,579 15,570,0711940 Phoenix FERC No.1061 16
9.46 9.2 13,134,684 49,456,4351910 Potter Valley FERC No.77 17
0.42 0.4 35,436,2531919 San Joaquin No. 1-A FERC No.1354 18
2.88 3.2 32,695,6381917 San Joaquin No. 2 FERC No.1354 19
4.00 4.2 26,943,0421923 San Joaquin No. 3 FERC No.1354 20
6.75 7.0 11,239,977 16,879,8731979 South FERC No.1121 21
7.04 7.0 14,094,763 43,591,6381928 Spaulding No. 1 FERC No.2310 22
3.70 4.4 4,491,750 20,611,2381928 Spaulding No. 2 FERC No.2310 23
6.61 5.8 21,276,186 18,460,8001929 Spaulding No. 3 FERC No.2310 24
6.00 7.0 20,139,364 12,912,7451921 Spring Gap FERC No.2130 25
1.80 1.5 1,966,049 7,281,7181986 Toadtown FERC No.803 26
4.50 6.4 15,033,0211914 Tule FERC No.1333 27
8.55 9.0 17,547,670 21,257,0371980 Volta No.1 FERC No.1121 28
0.95 0.9 1,423,165 3,099,2451981 Volta No.2 FERC No.1121 29
2.87 3.2 -29,049 13,420,5131986 Wise II FERC No.2310 30
6,809,021 Miscellaneous Minor 31
32
Photo Voltaic Generating Plants: 33
0.11 0.1 98,257 1,990,9282007AT&T PARK SOLAR ARRAYS 34
0.18 0.2 33,679 72,9592007SF SERVICE CENTER SOLAR ARRAY 1 & 2 35
2.00 2.0 3,578,543 10,881,9652009Vaca Dixon Solar Station 36
15.00 15.0 24,139,525 54,818,1282011Five Points - Schindler Solar Station #1 37
15.00 15.0 24,388,943 48,383,1002011Westside - Schindler Solar Station #2 38
20.00 20.0 33,705,355 62,417,2802011Stroud Solar Station 39
20.00 20.0 42,368,078 56,349,0262012Cantua Solar Station 40
10.00 10.0 19,036,014 31,412,7612012Giffen Solar Station 41
20.00 20.0 37,664,438 61,792,6472012Huron Solar Station 42
20.00 20.0 30,953,940 65,649,0562013Gates Solar Station 43
10.00 10.0 19,002,096 77,159,5532013West Gates Solar Station 44
20.00 20.0 41,821,844 35,775,2792013Guernsey Solar Station 45
46
FERC FORM NO. 1 (REV. 12-03) Page 410

Name of Respondent This Report Is:(1) An Original
(2) A Resubmission
Date of Report(Mo, Da, Yr)
Year/Period of Report
End of
GENERATING PLANT STATISTICS (Small Plants)
PACIFIC GAS AND ELECTRIC COMPANYX
04/13/20212020/Q4
Line
No.Name of Plant
Installed Capacity
(c)(b)(a)
Cost of PlantNet PeakDemand
(d)
YearOrig.
Const.Name Plate Rating
(In MW) MW(60 min.)
Net GenerationExcludingPlant Use
(e) (f)
1. Small generating plants are steam plants of, less than 25,000 Kw; internal combustion and gas turbine-plants, conventional hydro plants and pumped
storage plants of less than 10,000 Kw installed capacity (name plate rating). 2. Designate any plant leased from others, operated under a license from
the Federal Energy Regulatory Commission, or operated as a joint facility, and give a concise statement of the facts in a footnote. If licensed project,
give project number in footnote.
Fuel Cell: 1
1.60 1.6 5,707,956 8,504,5032011San Francisco State 2
1.40 1.4 10,191,423 6,582,6402011California State University East Bay 3
4
INTERNAL COMBUSTION: 5
(EMERGENCY STANDBY UNITS) 6
0.75 95,2891966 Downieville Diesel Plant 7
0.25 38,4971971 Grass Valley Mobile Diesel Generator 8
0.33 49,0541972 Sierra City Mobile Diesel Generator 9
10
11
12
13
14
15
16
17
18
19
20
21
22
23
24
25
26
27
28
29
30
31
32
33
34
35
36
37
38
39
40
41
42
43
44
45
46
FERC FORM NO. 1 (REV. 12-03) Page 410.1

Name of Respondent This Report Is:(1) An Original
(2) A Resubmission
Date of Report(Mo, Da, Yr)
Year/Period of Report
End of
GENERATING PLANT STATISTICS (Small Plants) (Continued)
PACIFIC GAS AND ELECTRIC COMPANYX
04/13/20212020/Q4
Line
No.(i)(h)(g) (j) (k) (l)
Operation
Exc'l. Fuel
Production Expenses
Fuel Maintenance Kind of FuelFuel Costs (in cents
(per Million Btu)
3. List plants appropriately under subheadings for steam, hydro, nuclear, internal combustion and gas turbine plants. For nuclear, see instruction 11,
Page 403. 4. If net peak demand for 60 minutes is not available, give the which is available, specifying period. 5. If any plant is equipped with
combinations of steam, hydro internal combustion or gas turbine equipment, report each as a separate plant. However, if the exhaust heat from the gas
turbine is utilized in a steam turbine regenerative feed water cycle, or for preheated combustion air in a boiler, report as one plant.
Plant Cost (Incl AssetRetire. Costs) Per MW
1
330,802 14,081,551 2Water 197,357
154,283 2,726,625 3Water 274,844
171,850 2,580,145 4Water 232,665
146,811 5Water 21,880
376,263 2,347,060 6Water 815,798
238,505 22,973,159 7Water 300,418
765,451 16,016,157 8Water 57,339
87,180 1,594,481 9Water 1,066,540
312,319 3,069,590 10Water 412,813
45,562 11Water 142,121
301,389 1,441,990 12Water 1,060,569
318,656 9,377,507 13Water 154,681
14Water
106,407 6,153,131 15Water 477,580
642,749 9,731,294 16Water 486,636
2,330,528 5,227,953 17Water 2,674,419
187,924 84,372,031 18Water 197,019
49,411 11,352,652 19Water 298,379
52,967 6,735,761 20Water 286,303
345,692 2,500,722 21Water 428,400
474,558 6,191,994 22Water 281,879
230,869 5,570,605 23Water 222,902
292,750 2,792,859 24Water 241,348
523,315 2,152,124 25Water 290,412
135,065 4,045,399 26Water 216,359
43,969 3,340,671 27Water 33,814
2,377,952 2,486,203 28Water 758,845
366,949 3,262,363 29Water 240,932
1,401,953 4,676,137 30Water 64,429
31Water
32
33
50,485 17,936,287 34Solar
405,327 35Solar
16,193 5,440,983 36Solar 107,842
106,467 3,654,542 37Solar 59,023
97,171 3,225,540 38Solar 78,449
710,461 3,120,864 39Solar 102,128
149,033 2,817,451 40Solar 81,076
56,137 3,141,276 41Solar 64,281
95,791 3,089,632 42Solar 70,019
62,072 3,282,453 43Solar 39,487
36,739 7,715,955 44Solar 30,701
128,617 1,788,764 45Solar 41,858
46
FERC FORM NO. 1 (REV. 12-03) Page 411

Name of Respondent This Report Is:(1) An Original
(2) A Resubmission
Date of Report(Mo, Da, Yr)
Year/Period of Report
End of
GENERATING PLANT STATISTICS (Small Plants) (Continued)
PACIFIC GAS AND ELECTRIC COMPANYX
04/13/20212020/Q4
Line
No.(i)(h)(g) (j) (k) (l)
Operation
Exc'l. Fuel
Production Expenses
Fuel Maintenance Kind of FuelFuel Costs (in cents
(per Million Btu)
3. List plants appropriately under subheadings for steam, hydro, nuclear, internal combustion and gas turbine plants. For nuclear, see instruction 11,
Page 403. 4. If net peak demand for 60 minutes is not available, give the which is available, specifying period. 5. If any plant is equipped with
combinations of steam, hydro internal combustion or gas turbine equipment, report each as a separate plant. However, if the exhaust heat from the gas
turbine is utilized in a steam turbine regenerative feed water cycle, or for preheated combustion air in a boiler, report as one plant.
Plant Cost (Incl AssetRetire. Costs) Per MW
1
345,810 5,315,314 2Natural Gas 262,677
183,191 4,701,886 3Natural Gas 142,200
4
5
6
7Diesel
8Diesel
9Diesel
10
11
12
13
14
15
16
17
18
19
20
21
22
23
24
25
26
27
28
29
30
31
32
33
34
35
36
37
38
39
40
41
42
43
44
45
46
FERC FORM NO. 1 (REV. 12-03) Page 411.1
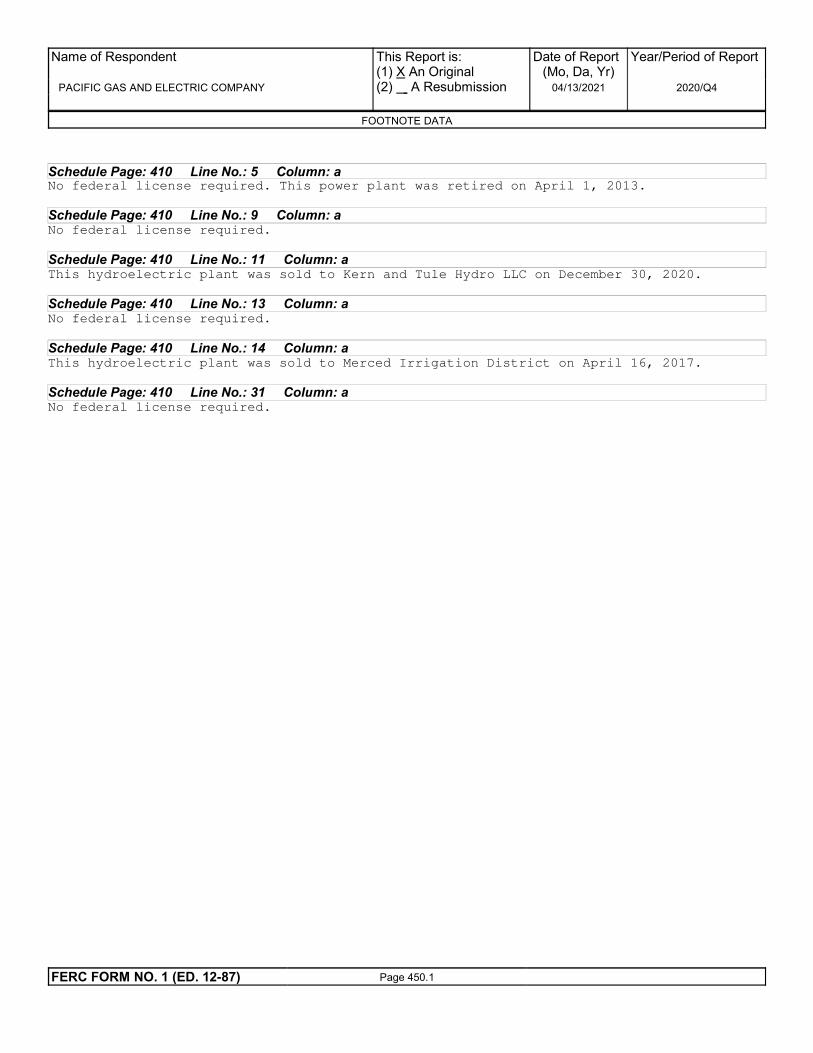
Schedule Page: 410 Line No.: 5 Column: aNo federal license required. This power plant was retired on April 1, 2013.
Schedule Page: 410 Line No.: 9 Column: aNo federal license required.
Schedule Page: 410 Line No.: 11 Column: aThis hydroelectric plant was sold to Kern and Tule Hydro LLC on December 30, 2020.
Schedule Page: 410 Line No.: 13 Column: aNo federal license required.
Schedule Page: 410 Line No.: 14 Column: aThis hydroelectric plant was sold to Merced Irrigation District on April 16, 2017.
Schedule Page: 410 Line No.: 31 Column: aNo federal license required.
Name of Respondent
PACIFIC GAS AND ELECTRIC COMPANY
This Report is:(1) X An Original(2) A Resubmission
Date of Report(Mo, Da, Yr)
04/13/2021
Year/Period of Report
2020/Q4
FOOTNOTE DATA
FERC FORM NO. 1 (ED. 12-87) Page 450.1

Name of Respondent This Report Is:(1) An Original
(2) A Resubmission
Date of Report(Mo, Da, Yr)
Year/Period of Report
End of
TRANSMISSION LINE STATISTICS
PACIFIC GAS AND ELECTRIC COMPANYX
04/13/20212020/Q4
Line
No.
(c)(b)(a) (d) (e)
DESIGNATION
From To
(f) (g)
VOLTAGE (KV)(Indicate whereother than60 cycle, 3 phase)
Operating Designed
Type of
Supporting
Structure
LENGTH (Pole miles)(In the case of
underground linesreport circuit miles)
On Structureof Line
Designated
On Structuresof Another
Line
Number
Of
Circuits
(h)
1. Report information concerning transmission lines, cost of lines, and expenses for year. List each transmission line having nominal voltage of 132
kilovolts or greater. Report transmission lines below these voltages in group totals only for each voltage.
2. Transmission lines include all lines covered by the definition of transmission system plant as given in the Uniform System of Accounts. Do not report
substation costs and expenses on this page.
3. Report data by individual lines for all voltages if so required by a State commission.
4. Exclude from this page any transmission lines for which plant costs are included in Account 121, Nonutility Property.
5. Indicate whether the type of supporting structure reported in column (e) is: (1) single pole wood or steel; (2) H-frame wood, or steel poles; (3) tower;
or (4) underground construction If a transmission line has more than one type of supporting structure, indicate the mileage of each type of construction
by the use of brackets and extra lines. Minor portions of a transmission line of a different type of construction need not be distinguished from the
remainder of the line.
6. Report in columns (f) and (g) the total pole miles of each transmission line. Show in column (f) the pole miles of line on structures the cost of which is
reported for the line designated; conversely, show in column (g) the pole miles of line on structures the cost of which is reported for another line. Report
pole miles of line on leased or partly owned structures in column (g). In a footnote, explain the basis of such occupancy and state whether expenses with
respect to such structures are included in the expenses reported for the line designated.
T SSP 115.00 115.00 1.61 1 1 STELLING MONTA VISTA
SSP 230.00 230.00 17.44 1 2 LAS AGUILAS SW STA PANOCHE #2
T SSP 230.00 230.00 17.44 1 3 LAS AGUILAS SW STA PANOCHE #1
T 115.00 115.00 5.97 1 4 WHISMAN MONTA VISTA
T SSP 115.00 115.00 7.31 1 5 ATWATER EL CAPITAN
SWP SSP 60.00 60.00 6.59 1 6 FULTON WINDSOR
SWP SSP 115.00 115.00 24.26 1 7 ATWATER LIVINGSTON-MERCED
SWP SSP 115.00 115.00 4.20 1 8 GALLO LIVINGSTON
SWP SSP 115.00 115.00 5.91 1 9 ATWATER CRESSEY
SWP SSP 115.00 115.00 14.43 1 10 GALLO CRESSEY
SSP 70.00 0.04 1 11 CRESCENT SW STA SCULPIN PV
SSP 115.00 115.00 3.64 1 12 BAIR BELMONT
SWP SSP 60.00 6.13 1 13 IGNACIO STAFFORD
T SSP 115.00 115.00 35.62 1 14 BALCH SANGER
SWP 115.00 115.00 0.10 1 15 PANOCHE CAL PEAK-STARWOOD
SSP 70.00 70.00 0.06 1 16 FIVE POINTS SW WHITNEY POINT PV
T SSP 115.00 115.00 11.65 1 17 BARTON AIRWAYS-SANGER
SWP SSP 115.00 115.00 9.14 1 18 RIPON MANTECA
SWP T SSP 115.00 115.00 44.65 1 19 BELLOTA RIVERBANK-MELONES SW
SWP SSP 115.00 115.00 0.31 1 20 TULLOCH TAP
SWP SSP 115.00 115.00 8.40 1 21 MI WUK-CURTIS
SWP T 115.00 0.02 1 22 BIG BEND CLAYTON #1
T SSP 230.00 230.00 6.22 1 23 BORDEN GREGG #1
T SSP 230.00 230.00 3.69 1 24 LOS BANOS PADRE FLAT SW STA
T SSP 115.00 115.00 21.24 1 25 BOGUE RIO OSO
SWP SSP 115.00 115.00 4.84 1 26 GREENLEAF #1 TAP
SWP 115.00 115.00 4.46 1 27 LAS GALLINAS SAN RAFAEL
SWP T SSP 115.00 115.00 86.06 1 28 BRIDGEVILLE COTTONWOOD
T SSP 70.00 70.00 5.00 1 29 INDIAN FLAT YOSEMITE
T 115.00 115.00 6.72 1 30 BRIGHTON CLAYTON #1
SSP 70.00 0.16 1 31 BORDEN LOTUS PV
115.00 115.00 6.72 1 32 BRIGHTON CLAYTON #2
SWP T SSP 115.00 115.00 42.73 1 33 BRIGHTON DAVIS
SWP T SSP 115.00 115.00 17.36 1 34 BRIGHTON DAVIS
SWP 115.00 115.00 1.62 1 35 BARKER SLOUGH TAP
FERC FORM NO. 1 (ED. 12-87) Page 422
36 TOTAL 36,671.97 1,451

Name of Respondent This Report Is:(1) An Original
(2) A Resubmission
Date of Report(Mo, Da, Yr)
Year/Period of Report
End of
TRANSMISSION LINE STATISTICS
PACIFIC GAS AND ELECTRIC COMPANYX
04/13/20212020/Q4
Line
No.
(c)(b)(a) (d) (e)
DESIGNATION
From To
(f) (g)
VOLTAGE (KV)(Indicate whereother than60 cycle, 3 phase)
Operating Designed
Type of
Supporting
Structure
LENGTH (Pole miles)(In the case of
underground linesreport circuit miles)
On Structureof Line
Designated
On Structuresof Another
Line
Number
Of
Circuits
(h)
1. Report information concerning transmission lines, cost of lines, and expenses for year. List each transmission line having nominal voltage of 132
kilovolts or greater. Report transmission lines below these voltages in group totals only for each voltage.
2. Transmission lines include all lines covered by the definition of transmission system plant as given in the Uniform System of Accounts. Do not report
substation costs and expenses on this page.
3. Report data by individual lines for all voltages if so required by a State commission.
4. Exclude from this page any transmission lines for which plant costs are included in Account 121, Nonutility Property.
5. Indicate whether the type of supporting structure reported in column (e) is: (1) single pole wood or steel; (2) H-frame wood, or steel poles; (3) tower;
or (4) underground construction If a transmission line has more than one type of supporting structure, indicate the mileage of each type of construction
by the use of brackets and extra lines. Minor portions of a transmission line of a different type of construction need not be distinguished from the
remainder of the line.
6. Report in columns (f) and (g) the total pole miles of each transmission line. Show in column (f) the pole miles of line on structures the cost of which is
reported for the line designated; conversely, show in column (g) the pole miles of line on structures the cost of which is reported for another line. Report
pole miles of line on leased or partly owned structures in column (g). In a footnote, explain the basis of such occupancy and state whether expenses with
respect to such structures are included in the expenses reported for the line designated.
SWP T SSP 115.00 115.00 24.99 1 1 BRIGHTON GRAND ISLAND #1
SWP T SSP 115.00 115.00 0.14 1 2 BRIGHTON GRAND ISLAND #1
SWP SSP 115.00 115.00 25.04 1 3 BRIGHTON GRAND ISLAND #2
SWP SSP 115.00 115.00 0.14 1 4 BRIGHTON GRAND ISLAND #2
SSP 115.00 115.00 7.17 1 5 BRITTON MONTA VISTA
SWP T SSP 115.00 115.00 7.44 1 6 BUTTE VALLEY CARIBOU
SWP SSP 115.00 115.00 18.17 1 7 BUTTE SYCAMORE CREEK
SWP SSP 115.00 115.00 14.59 1 8 CABRILLO SANTA YNEZ SW STA
SWP 115.00 115.00 1.75 1 9 BUELLTON TAP
SWP T SSP 115.00 115.00 13.77 1 10 CALLENDER SW STA MESA
SWP SSP 115.00 115.00 5.22 1 11 CAMP EVERS PAUL SWEET
T SSP 230.00 230.00 0.45 1 12 CAMANCHE PUMPING
SWP T 115.00 115.00 0.16 1 13 GRIZZLY TAP (SVP)
SWP T SSP 115.00 115.00 19.46 1 14 CASCADE COTTONWOOD
SWP T SSP 115.00 115.00 42.52 1 15 CHOWCHILLA KERCKHOFF
SWP SSP 115.00 115.00 2.57 1 16 SHARON PRISON TAP
SWP SSP 115.00 115.00 18.16 1 17 OAKHURST TAP
T 115.00 115.00 7.84 1 18 CHRISTIE SOBRANTE
SWP SSP 115.00 115.00 2.11 1 19 TEICHERT TAP
SWP SSP 115.00 115.00 7.06 1 20 CLAYTON MEADOW LANE
T SSP 115.00 115.00 11.15 1 21 CONTRA COSTA #1
SWP 115.00 115.00 0.02 1 22 LEPRINO FOODS (TRACY)
SWP 115.00 115.00 11.37 1 23 WILSON DAIRYLAND (12KV)
115.00 115.00 1.41 1 24 CONTRA COSTA #2
SWP T SSP 115.00 115.00 1.03 1 25 FIBREBOARD TAP
SWP SSP 115.00 115.00 2.72 1 26 COOLEY LANDING PALO ALTO
T SSP 115.00 115.00 36.83 1 27 CORCORAN OLIVE SW STA
SWP 115.00 115.00 4.35 1 28 QUEBEC TAP
SWP SSP 115.00 115.00 11.02 1 29 RIO OSO LINCOLN
SWP T 115.00 115.00 60.95 1 30 CORTINA MENDOCINO #1
SWP SSP 115.00 115.00 0.23 1 31 LUCERNE #1 TAP
SWP SSP 115.00 115.00 2.95 1 32 COTTONWOOD PANORAMA
SWP T 115.00 115.00 21.61 1 33 CRAG VIEW CASCADE
SWP T SSP 115.00 115.00 28.69 1 34 DAIRYLAND MENDOTA
SWP SSP 115.00 115.00 11.55 1 35 DIVIDE CABRILLO #2
FERC FORM NO. 1 (ED. 12-87) Page 422.1
36 TOTAL 36,671.97 1,451

Name of Respondent This Report Is:(1) An Original
(2) A Resubmission
Date of Report(Mo, Da, Yr)
Year/Period of Report
End of
TRANSMISSION LINE STATISTICS
PACIFIC GAS AND ELECTRIC COMPANYX
04/13/20212020/Q4
Line
No.
(c)(b)(a) (d) (e)
DESIGNATION
From To
(f) (g)
VOLTAGE (KV)(Indicate whereother than60 cycle, 3 phase)
Operating Designed
Type of
Supporting
Structure
LENGTH (Pole miles)(In the case of
underground linesreport circuit miles)
On Structureof Line
Designated
On Structuresof Another
Line
Number
Of
Circuits
(h)
1. Report information concerning transmission lines, cost of lines, and expenses for year. List each transmission line having nominal voltage of 132
kilovolts or greater. Report transmission lines below these voltages in group totals only for each voltage.
2. Transmission lines include all lines covered by the definition of transmission system plant as given in the Uniform System of Accounts. Do not report
substation costs and expenses on this page.
3. Report data by individual lines for all voltages if so required by a State commission.
4. Exclude from this page any transmission lines for which plant costs are included in Account 121, Nonutility Property.
5. Indicate whether the type of supporting structure reported in column (e) is: (1) single pole wood or steel; (2) H-frame wood, or steel poles; (3) tower;
or (4) underground construction If a transmission line has more than one type of supporting structure, indicate the mileage of each type of construction
by the use of brackets and extra lines. Minor portions of a transmission line of a different type of construction need not be distinguished from the
remainder of the line.
6. Report in columns (f) and (g) the total pole miles of each transmission line. Show in column (f) the pole miles of line on structures the cost of which is
reported for the line designated; conversely, show in column (g) the pole miles of line on structures the cost of which is reported for another line. Report
pole miles of line on leased or partly owned structures in column (g). In a footnote, explain the basis of such occupancy and state whether expenses with
respect to such structures are included in the expenses reported for the line designated.
SWP SSP 115.00 115.00 1.37 1 1 CITY #2 TAP
SWP SSP 115.00 115.00 5.54 1 2 MANVILLE TAP
SWP SSP 115.00 115.00 14.60 1 3 DIVIDE CABRILLO #1
SWP SSP 115.00 115.00 11.38 1 4 SURF TAP
SWP 115.00 115.00 0.07 1 5 CITY #1 TAP
SWP SSP 115.00 115.00 8.30 1 6 DIXON LANDING MCKEE
SWP T SSP 115.00 115.00 18.46 1 7 DONNELLS MI-WUK
SWP T 115.00 115.00 2.20 1 8 BEARDSLEY TAP
SWP T SSP 115.00 115.00 1.64 1 9 SPRING GAP TAP
SSP OTHERS 115.00 115.00 0.10 1 10 SANDBAR TAP
SWP OTHERS 115.00 115.00 0.02 1 11 FIBREBOARD STANDARD
SWP SSP 60.00 60.00 2.78 1 12 DEL MAR ATLANTIC #1
SWP T SSP 115.00 115.00 18.77 1 13 HIGGINS BELL
SSP 230.00 230.00 0.11 1 14 BIRDS LANDING SW STA SHILOH
T SSP 115.00 115.00 44.64 1 15 DRUM RIO OSO #1
SWP T SSP 115.00 115.00 0.43 1 16 DUTCH FLAT #2 TAP
T 115.00 115.00 6.98 1 17 BRUNSWICK #1 TAP
T SSP 115.00 115.00 44.65 1 18 DRUM RIO OSO #2
T 115.00 115.00 7.00 1 19 BRUNSWICK #2 TAP
SWP T SSP 115.00 115.00 27.36 1 20 DRUM SUMMIT #1
SWP T SSP 115.00 115.00 28.36 1 21 DRUM SUMMIT #2
T SSP 115.00 115.00 7.14 1 22 DUMBARTON NEWARK
SWP SSP 115.00 115.00 43.38 1 23 EAGLE ROCK CORTINA
SWP T SSP 115.00 115.00 23.31 1 24 EAGLE ROCK REDBUD
SWP SSP 115.00 115.00 16.12 1 25 LOWER LAKE HOMESTAKE
T SSP 115.00 115.00 7.89 1 26 EAST GRAND SAN MATEO
T SSP 115.00 115.00 12.38 1 27 EASTSHORE DUMBARTON
T 115.00 115.00 1.04 1 28 EASTSHORE MT EDEN #1
115.00 115.00 1.00 1 29 EASTSHORE MT EDEN #2
T SSP 115.00 115.00 8.12 1 30 EL CAPITAN WILSON
SWP T SSP 115.00 115.00 7.08 1 31 EL PATIO SAN JOSE A
SWP T SSP 115.00 115.00 14.43 1 32 EL DORADO MISSOURI FLAT #1
SWP SSP 115.00 115.00 1.42 1 33 APPLE HILL #1 TAP
SWP SSP 115.00 115.00 14.41 1 34 EL DORADO MISSOURI FLAT #2
SWP SSP 115.00 115.00 1.43 1 35 APPLE HILL #2 TAP
FERC FORM NO. 1 (ED. 12-87) Page 422.2
36 TOTAL 36,671.97 1,451

Name of Respondent This Report Is:(1) An Original
(2) A Resubmission
Date of Report(Mo, Da, Yr)
Year/Period of Report
End of
TRANSMISSION LINE STATISTICS
PACIFIC GAS AND ELECTRIC COMPANYX
04/13/20212020/Q4
Line
No.
(c)(b)(a) (d) (e)
DESIGNATION
From To
(f) (g)
VOLTAGE (KV)(Indicate whereother than60 cycle, 3 phase)
Operating Designed
Type of
Supporting
Structure
LENGTH (Pole miles)(In the case of
underground linesreport circuit miles)
On Structureof Line
Designated
On Structuresof Another
Line
Number
Of
Circuits
(h)
1. Report information concerning transmission lines, cost of lines, and expenses for year. List each transmission line having nominal voltage of 132
kilovolts or greater. Report transmission lines below these voltages in group totals only for each voltage.
2. Transmission lines include all lines covered by the definition of transmission system plant as given in the Uniform System of Accounts. Do not report
substation costs and expenses on this page.
3. Report data by individual lines for all voltages if so required by a State commission.
4. Exclude from this page any transmission lines for which plant costs are included in Account 121, Nonutility Property.
5. Indicate whether the type of supporting structure reported in column (e) is: (1) single pole wood or steel; (2) H-frame wood, or steel poles; (3) tower;
or (4) underground construction If a transmission line has more than one type of supporting structure, indicate the mileage of each type of construction
by the use of brackets and extra lines. Minor portions of a transmission line of a different type of construction need not be distinguished from the
remainder of the line.
6. Report in columns (f) and (g) the total pole miles of each transmission line. Show in column (f) the pole miles of line on structures the cost of which is
reported for the line designated; conversely, show in column (g) the pole miles of line on structures the cost of which is reported for another line. Report
pole miles of line on leased or partly owned structures in column (g). In a footnote, explain the basis of such occupancy and state whether expenses with
respect to such structures are included in the expenses reported for the line designated.
SWP SSP 115.00 115.00 8.56 1 1 SAN JOSE B STONE-EVERGREEN
SSP 115.00 115.00 2.21 1 2 NORTECH NORTHERN RECEIVING
T OTHERS 115.00 115.00 0.17 1 3 H P #3
SWP SSP 115.00 115.00 29.75 1 4 EXCHEQUER LE GRAND
SWP SSP 115.00 115.00 4.92 1 5 FELLOWS MIDSUN
SWP T SSP 115.00 115.00 7.93 1 6 FELLOWS TAFT
SWP 115.00 115.00 0.72 1 7 MIDSET TAP
T SSP 115.00 115.00 11.93 1 8 FULTON JCT VACA
SWP SSP 115.00 115.00 0.49 1 9 AMERIGAS TAP
SWP T SSP 115.00 115.00 59.95 1 10 FULTON PUEBLO
T SSP 115.00 115.00 0.57 1 11 RINCON #1 TAP
SWP SSP 115.00 115.00 0.62 1 12 MONTICELLO PH TAP
SWP T SSP 115.00 115.00 26.16 1 13 SILVERADO FULTON JCT
SSP 115.00 115.00 0.55 1 14 RINCON #2 TAP
SWP T SSP 115.00 115.00 6.69 1 15 FULTON SANTA ROSA #1
SWP SSP 115.00 115.00 6.29 1 16 FULTON SANTA ROSA #2
SWP T SSP 115.00 115.00 12.07 1 17 GEYSERS #3 CLOVERDALE
SWP SSP 115.00 115.00 1.94 1 18 MISSION POWER TAP
SWP SSP 115.00 115.00 1.77 1 19 GEYSERS #3 EAGLE ROCK
SWP 115.00 115.00 0.49 1 20 GEYSERS #5 GEYSERS #3
SWP T SSP 115.00 115.00 1.40 1 21 GEYSERS #7 EAGLE ROCK
T SSP 115.00 115.00 87.28 1 22 GOLD HILL BELLOTA-LOCKEFORD
SWP SSP 115.00 115.00 6.71 1 23 CAMANCHE TAP
T SSP 115.00 115.00 4.33 1 24 GRANT EASTSHORE #1
T 115.00 115.00 4.20 1 25 GRANT EASTSHORE #2
SWP T SSP 115.00 115.00 18.56 1 26 GREEN VALLEY CAMP EVERS
SWP T SSP 115.00 115.00 24.85 1 27 GREEN VALLEY LLAGAS
T 115.00 115.00 1.94 1 28 METCALF SALINAS #1
SWP T SSP 115.00 115.00 15.83 1 29 GREEN VALLEY PAUL SWEET
115.00 115.00 6.80 1 30 METCALF SALINAS #2 (12KV)
SWP SSP 115.00 115.00 6.03 1 31 HENRIETTA LEPRINO SW STA
SSP 115.00 115.00 0.06 1 32 LEPRINO SW STA HENRIETTA PV
SSP 115.00 115.00 0.17 1 33 KANSAS PV LEPRINO SW STA
SWP SSP 115.00 115.00 12.38 1 34 LEPRINO SW STA GWF HANFORD SW STA
SWP SSP 115.00 115.00 6.41 1 35 LEPRINO FOODS LEPRINO SW STA
FERC FORM NO. 1 (ED. 12-87) Page 422.3
36 TOTAL 36,671.97 1,451

Name of Respondent This Report Is:(1) An Original
(2) A Resubmission
Date of Report(Mo, Da, Yr)
Year/Period of Report
End of
TRANSMISSION LINE STATISTICS
PACIFIC GAS AND ELECTRIC COMPANYX
04/13/20212020/Q4
Line
No.
(c)(b)(a) (d) (e)
DESIGNATION
From To
(f) (g)
VOLTAGE (KV)(Indicate whereother than60 cycle, 3 phase)
Operating Designed
Type of
Supporting
Structure
LENGTH (Pole miles)(In the case of
underground linesreport circuit miles)
On Structureof Line
Designated
On Structuresof Another
Line
Number
Of
Circuits
(h)
1. Report information concerning transmission lines, cost of lines, and expenses for year. List each transmission line having nominal voltage of 132
kilovolts or greater. Report transmission lines below these voltages in group totals only for each voltage.
2. Transmission lines include all lines covered by the definition of transmission system plant as given in the Uniform System of Accounts. Do not report
substation costs and expenses on this page.
3. Report data by individual lines for all voltages if so required by a State commission.
4. Exclude from this page any transmission lines for which plant costs are included in Account 121, Nonutility Property.
5. Indicate whether the type of supporting structure reported in column (e) is: (1) single pole wood or steel; (2) H-frame wood, or steel poles; (3) tower;
or (4) underground construction If a transmission line has more than one type of supporting structure, indicate the mileage of each type of construction
by the use of brackets and extra lines. Minor portions of a transmission line of a different type of construction need not be distinguished from the
remainder of the line.
6. Report in columns (f) and (g) the total pole miles of each transmission line. Show in column (f) the pole miles of line on structures the cost of which is
reported for the line designated; conversely, show in column (g) the pole miles of line on structures the cost of which is reported for another line. Report
pole miles of line on leased or partly owned structures in column (g). In a footnote, explain the basis of such occupancy and state whether expenses with
respect to such structures are included in the expenses reported for the line designated.
SWP SSP 115.00 115.00 9.15 1 1 GILL RANCH TAP
SWP SSP 115.00 115.00 21.64 1 2 GWF KINGSBURG
SWP SSP 115.00 115.00 0.57 1 3 PARAMOUNT FARMS TAP
SWP T SSP 115.00 115.00 12.68 1 4 HERNDON BARTON
T SSP 115.00 115.00 11.43 1 5 HERNDON BULLARD #1
SWP SSP 115.00 115.00 11.42 1 6 HERNDON BULLARD #2
SWP SSP 115.00 115.00 9.27 1 7 HERNDON MANCHESTER
SWP T SSP 115.00 115.00 12.97 1 8 HERNDON WOODWARD
T SSP 115.00 115.00 6.31 1 9 HUMBOLDT BAY HUMBOLDT #1
SWP T SSP 115.00 115.00 30.28 1 10 HUMBOLDT BRIDGEVILLE
SWP T SSP 115.00 115.00 68.57 1 11 HUMBOLDT TRINITY
SWP T SSP 115.00 115.00 39.49 1 12 IGNACIO MARE ISLAND #1
T SSP 115.00 115.00 0.51 1 13 CARQUINEZ #1 TAP
T 115.00 115.00 0.59 1 14 SKAGGS ISLAND #1 TAP
SSP 115.00 115.00 0.19 1 15 JAMESON CANYON
T OTHERS 115.00 115.00 43.08 1 16 IGNACIO MARE ISLAND #2
SSP 115.00 115.00 0.52 1 17 CARQUINEZ #2 TAP
T 115.00 115.00 0.60 1 18 SKAGGS ISLAND #2 TAP
T SSP 115.00 115.00 11.54 1 19 IGNACIO SAN RAFAEL #1
SWP 115.00 115.00 4.15 1 20 IGNACIO LAS GALLINAS
T 115.00 115.00 0.03 1 21 JARVIS CRYOGENICS
T SSP 115.00 115.00 1.58 1 22 KERCKHOFF #1 KERCKHOFF #2
SWP T SSP 115.00 115.00 37.05 1 23 KERCKHOFF CLOVIS-SANGER #1
SWP SSP 115.00 115.00 4.84 1 24 WOODWARD SHEPHERD
SWP T SSP 115.00 115.00 32.05 1 25 KERCKHOFF CLOVIS-SANGER #2
SWP 115.00 115.00 0.44 1 26 KERN OIL DEXZEL
T SSP 115.00 115.00 4.20 1 27 KERN OIL WITCO
SWP 115.00 115.00 2.10 1 28 DISCOVERY TAP
SWP SSP 115.00 115.00 7.28 1 29 RIO BRAVO KERN OIL
T SSP 115.00 115.00 22.09 1 30 OLIVE SW STA SMYRNA
SWP SSP 115.00 115.00 12.50 1 31 KERN KERN FRONT
SWP 115.00 115.00 0.06 1 32 DOUBLE C (PSE) TAP
SWP 115.00 115.00 1.07 1 33 BADGER CREEK (PSE) TAP
SWP SSP 115.00 115.00 1.81 1 34 SIERRA (PSE) TAP
SWP T SSP 115.00 115.00 21.52 1 35 KERN TEVIS-STOCKDALE-LAMON
FERC FORM NO. 1 (ED. 12-87) Page 422.4
36 TOTAL 36,671.97 1,451

Name of Respondent This Report Is:(1) An Original
(2) A Resubmission
Date of Report(Mo, Da, Yr)
Year/Period of Report
End of
TRANSMISSION LINE STATISTICS
PACIFIC GAS AND ELECTRIC COMPANYX
04/13/20212020/Q4
Line
No.
(c)(b)(a) (d) (e)
DESIGNATION
From To
(f) (g)
VOLTAGE (KV)(Indicate whereother than60 cycle, 3 phase)
Operating Designed
Type of
Supporting
Structure
LENGTH (Pole miles)(In the case of
underground linesreport circuit miles)
On Structureof Line
Designated
On Structuresof Another
Line
Number
Of
Circuits
(h)
1. Report information concerning transmission lines, cost of lines, and expenses for year. List each transmission line having nominal voltage of 132
kilovolts or greater. Report transmission lines below these voltages in group totals only for each voltage.
2. Transmission lines include all lines covered by the definition of transmission system plant as given in the Uniform System of Accounts. Do not report
substation costs and expenses on this page.
3. Report data by individual lines for all voltages if so required by a State commission.
4. Exclude from this page any transmission lines for which plant costs are included in Account 121, Nonutility Property.
5. Indicate whether the type of supporting structure reported in column (e) is: (1) single pole wood or steel; (2) H-frame wood, or steel poles; (3) tower;
or (4) underground construction If a transmission line has more than one type of supporting structure, indicate the mileage of each type of construction
by the use of brackets and extra lines. Minor portions of a transmission line of a different type of construction need not be distinguished from the
remainder of the line.
6. Report in columns (f) and (g) the total pole miles of each transmission line. Show in column (f) the pole miles of line on structures the cost of which is
reported for the line designated; conversely, show in column (g) the pole miles of line on structures the cost of which is reported for another line. Report
pole miles of line on leased or partly owned structures in column (g). In a footnote, explain the basis of such occupancy and state whether expenses with
respect to such structures are included in the expenses reported for the line designated.
SWP SSP 115.00 115.00 3.55 1 1 LAMONT GRIMMWAY MALAGA
SWP T SSP 115.00 115.00 16.35 1 2 LERDO KERN OIL-7TH STANDARD
T SSP 115.00 115.00 10.83 1 3 KERN LIVE OAK
SWP T SSP 115.00 115.00 19.58 1 4 KERN MAGUNDEN-WITCO
SWP SSP 115.00 115.00 0.67 1 5 KERNWATER TAP
SWP 115.00 115.00 0.03 1 6 WITCO (REFINERY) TAP
SWP SSP 115.00 115.00 1.77 1 7 KERN ROSEDALE
SWP T SSP 115.00 115.00 6.75 1 8 7TH STANDARD KERN
SWP SSP 115.00 115.00 1.34 1 9 WHEELER RIDGE ADOBE SW STA
SWP T SSP 115.00 115.00 15.95 1 10 KERN TEVIS-STOCKDALE
SWP T SSP 115.00 115.00 3.71 1 11 KERN TEVIS-STOCKDALE (21KV)
T SSP 115.00 115.00 3.84 1 12 KERN WESTPARK #1
T 115.00 115.00 3.83 1 13 KERN WESTPARK #2
T SSP 115.00 115.00 6.02 1 14 KIFER FMC
SSP 115.00 115.00 1.61 1 15 FMC SAN JOSE B
SWP T SSP 115.00 115.00 43.35 1 16 KINGS RIVER SANGER-REEDLEY
T SSP 115.00 115.00 2.59 1 17 RAINBOW TAP
T SSP 115.00 115.00 27.48 1 18 KINGSBURG CORCORAN #1
T SSP 115.00 115.00 25.26 1 19 KINGSBURG WAUKENA SW STA
SWP SSP 60.00 60.00 24.02 1 20 FORT BRAGG ELK
SWP 115.00 115.00 0.81 1 21 PENNGROVE SUB TAP
SWP SSP 115.00 115.00 3.08 1 22 STONY POINT TAP
SWP SSP 115.00 115.00 6.68 1 23 LAKEVILLE SONOMA #1
SWP SSP 115.00 115.00 7.18 1 24 LAKEVILLE SONOMA #2
SWP T SSP 115.00 115.00 9.55 1 25 LAKEWOOD MEADOW LANE-CLAYTON
OTHERS 115.00 115.00 0.02 1 26 EBMUD TAP
SSP 115.00 115.00 5.52 1 27 LAKEWOOD CLAYTON
SWP T SSP 115.00 115.00 9.44 1 28 LAWRENCE MONTA VISTA
SWP T SSP 115.00 115.00 11.40 1 29 LE GRAND DAIRYLAND
SWP T SSP 115.00 115.00 10.94 1 30 LE GRAND CHOWCHILLA
SWP SSP 115.00 115.00 2.53 1 31 CERTAINTEED TAP
SWP 115.00 115.00 1.24 1 32 CHOWCHILLA #1 TAP
115.00 115.00 0.03 1 33 MENDOTA NORTH STAR SOLAR
SWP T SSP 115.00 115.00 13.45 1 34 LERDO FAMOSO
SWP SSP 115.00 115.00 2.45 1 35 ULTRAPOWER (OGLE) TAP
FERC FORM NO. 1 (ED. 12-87) Page 422.5
36 TOTAL 36,671.97 1,451

Name of Respondent This Report Is:(1) An Original
(2) A Resubmission
Date of Report(Mo, Da, Yr)
Year/Period of Report
End of
TRANSMISSION LINE STATISTICS
PACIFIC GAS AND ELECTRIC COMPANYX
04/13/20212020/Q4
Line
No.
(c)(b)(a) (d) (e)
DESIGNATION
From To
(f) (g)
VOLTAGE (KV)(Indicate whereother than60 cycle, 3 phase)
Operating Designed
Type of
Supporting
Structure
LENGTH (Pole miles)(In the case of
underground linesreport circuit miles)
On Structureof Line
Designated
On Structuresof Another
Line
Number
Of
Circuits
(h)
1. Report information concerning transmission lines, cost of lines, and expenses for year. List each transmission line having nominal voltage of 132
kilovolts or greater. Report transmission lines below these voltages in group totals only for each voltage.
2. Transmission lines include all lines covered by the definition of transmission system plant as given in the Uniform System of Accounts. Do not report
substation costs and expenses on this page.
3. Report data by individual lines for all voltages if so required by a State commission.
4. Exclude from this page any transmission lines for which plant costs are included in Account 121, Nonutility Property.
5. Indicate whether the type of supporting structure reported in column (e) is: (1) single pole wood or steel; (2) H-frame wood, or steel poles; (3) tower;
or (4) underground construction If a transmission line has more than one type of supporting structure, indicate the mileage of each type of construction
by the use of brackets and extra lines. Minor portions of a transmission line of a different type of construction need not be distinguished from the
remainder of the line.
6. Report in columns (f) and (g) the total pole miles of each transmission line. Show in column (f) the pole miles of line on structures the cost of which is
reported for the line designated; conversely, show in column (g) the pole miles of line on structures the cost of which is reported for another line. Report
pole miles of line on leased or partly owned structures in column (g). In a footnote, explain the basis of such occupancy and state whether expenses with
respect to such structures are included in the expenses reported for the line designated.
SWP SSP 115.00 115.00 1.33 1 1 CAWELO C TAP
SWP SSP 115.00 115.00 3.97 1 2 LIVE OAK TAP
T 115.00 115.00 4.40 1 3 LIVE OAK KERN OIL
SWP SSP 115.00 115.00 11.09 1 4 VEDDER TAP
115.00 115.00 0.03 1 5 VALLEY CHILDRENS
SWP 115.00 115.00 1.98 1 6 LLAGAS GILROY FOODS
SWP 115.00 115.00 0.28 1 7 GILROY ENERGY TAP
T SSP 115.00 115.00 8.95 1 8 CRAZY HORSE CANYON SAN BENITO
SSP 115.00 115.00 17.23 1 9 CRAZY HORSE CANYON HOLLISTER
SWP T SSP 115.00 115.00 22.99 1 10 MADISON VACA
T SSP 115.00 115.00 15.07 1 11 MANCHESTER AIRWAYS-SANGER
SWP SSP 115.00 115.00 0.85 1 12 LAS PALMAS TAP
SWP T SSP 115.00 115.00 3.98 1 13 MANTECA VIERRA
SWP 115.00 115.00 0.90 1 14 HOWLAND ROAD TAP
SWP 115.00 0.79 1 15 HEINZ TAP
T 115.00 115.00 3.93 1 16 MARTIN DALY CITY #1
115.00 115.00 3.93 1 17 MARTIN DALY CITY #2
T SSP 115.00 115.00 2.55 1 18 SERRAMONTE TAP
SWP T SSP 115.00 115.00 3.96 1 19 MARTIN EAST GRAND
T SSP 115.00 115.00 7.28 1 20 MARTIN MILLBRAE #1
T SSP 115.00 115.00 5.43 1 21 MARTIN SF AIRPORT
SWP SSP 115.00 115.00 0.68 1 22 UNITED COGEN INC TAP
SSP 115.00 115.00 16.40 1 23 MARTINEZ SOBRANTE
SWP 115.00 115.00 0.10 1 24 FAIRVIEW MARTINEZ SW STA
SWP T SSP 115.00 115.00 11.65 1 25 MCCALL KINGSBURG #1
SWP 115.00 115.00 1.22 1 26 KINGSBURG COGEN TAP
SWP 115.00 115.00 0.13 1 27 GUARDIAN #2 TAP
SSP 230.00 230.00 0.09 1 28 PANOCHE PANOCHE ENERGY
SWP 115.00 115.00 0.99 1 29 MALAGA KRCD
SSP 115.00 115.00 11.57 1 30 MCCALL KINGSBURG #2
SWP 115.00 115.00 0.75 1 31 GUARDIAN #1 TAP
SWP T SSP 115.00 115.00 10.96 1 32 MCCALL MALAGA
SWP SSP 115.00 115.00 2.10 1 33 RANCHERS COTTON TAP
SWP OTHERS 115.00 115.00 0.32 1 34 RIO BRAVO (FRESNO) TAP
SWP 115.00 115.00 0.29 1 35 AIR PRODUCTS TAP
FERC FORM NO. 1 (ED. 12-87) Page 422.6
36 TOTAL 36,671.97 1,451

Name of Respondent This Report Is:(1) An Original
(2) A Resubmission
Date of Report(Mo, Da, Yr)
Year/Period of Report
End of
TRANSMISSION LINE STATISTICS
PACIFIC GAS AND ELECTRIC COMPANYX
04/13/20212020/Q4
Line
No.
(c)(b)(a) (d) (e)
DESIGNATION
From To
(f) (g)
VOLTAGE (KV)(Indicate whereother than60 cycle, 3 phase)
Operating Designed
Type of
Supporting
Structure
LENGTH (Pole miles)(In the case of
underground linesreport circuit miles)
On Structureof Line
Designated
On Structuresof Another
Line
Number
Of
Circuits
(h)
1. Report information concerning transmission lines, cost of lines, and expenses for year. List each transmission line having nominal voltage of 132
kilovolts or greater. Report transmission lines below these voltages in group totals only for each voltage.
2. Transmission lines include all lines covered by the definition of transmission system plant as given in the Uniform System of Accounts. Do not report
substation costs and expenses on this page.
3. Report data by individual lines for all voltages if so required by a State commission.
4. Exclude from this page any transmission lines for which plant costs are included in Account 121, Nonutility Property.
5. Indicate whether the type of supporting structure reported in column (e) is: (1) single pole wood or steel; (2) H-frame wood, or steel poles; (3) tower;
or (4) underground construction If a transmission line has more than one type of supporting structure, indicate the mileage of each type of construction
by the use of brackets and extra lines. Minor portions of a transmission line of a different type of construction need not be distinguished from the
remainder of the line.
6. Report in columns (f) and (g) the total pole miles of each transmission line. Show in column (f) the pole miles of line on structures the cost of which is
reported for the line designated; conversely, show in column (g) the pole miles of line on structures the cost of which is reported for another line. Report
pole miles of line on leased or partly owned structures in column (g). In a footnote, explain the basis of such occupancy and state whether expenses with
respect to such structures are included in the expenses reported for the line designated.
SWP T SSP 115.00 115.00 15.20 1 1 MCCALL REEDLEY
T SSP 115.00 115.00 9.23 1 2 MCCALL SANGER #1
115.00 115.00 9.20 1 3 MCCALL SANGER #2
SWP 115.00 115.00 8.30 1 4 MCCALL SANGER #3
SWP T SSP 115.00 115.00 23.66 1 5 CALIFORNIA AVE MCCALL
SWP T 115.00 115.00 4.90 1 6 WEST FRESNO CALIFORNIA AVE
SWP 115.00 115.00 1.20 1 7 DANISH CREAMERY TAP
T SSP 115.00 115.00 19.61 1 8 MCCALL WEST FRESNO #2
T 115.00 115.00 7.75 1 9 MCKEE PIERCY
SSP 115.00 115.00 4.64 1 10 LOS ESTEROS MONTAGUE
SWP SSP 115.00 115.00 14.80 1 11 MELONES CURTIS
SWP SSP 115.00 115.00 0.85 1 12 PEORIA TAP
SWP SSP 115.00 115.00 2.09 1 13 CHINESE CAMP (ULTRA
SWP SSP 115.00 115.00 3.55 1 14 RACETRACK TAP
SWP 115.00 115.00 4.22 1 15 OCEANO CALLENDER SW STA
SWP SSP 115.00 115.00 10.20 1 16 MELONES RACETRACK
115.00 115.00 34.83 1 17 MENDOCINO REDBUD
SWP SSP 115.00 115.00 0.23 1 18 LUCERNE #2 TAP
SWP T SSP 115.00 115.00 9.83 1 19 MENDOCINO UKIAH
T SSP 115.00 115.00 14.71 1 20 MESA DIVIDE #1
115.00 115.00 14.72 1 21 MESA DIVIDE #2
SWP T SSP 115.00 115.00 4.36 1 22 MESA SANTA MARIA
SWP SSP 115.00 115.00 2.83 1 23 FAIRWAY #1 TAP
SWP T SSP 115.00 115.00 17.60 1 24 MESA SISQUOC
SWP 115.00 115.00 0.24 1 25 SANTA MARIA COGEN TAP
SWP SSP 115.00 115.00 7.86 1 26 METCALF COYOTE PUMPING PLANT
T SSP 115.00 115.00 5.73 1 27 METCALF EDENVALE #1
SSP 115.00 115.00 0.58 1 28 IBM HARRY RD #2 TAP
SSP 115.00 115.00 0.10 1 29 AMES DISTRIBUTION AMES
T 115.00 115.00 5.60 1 30 METCALF EDENVALE #2
SWP SSP 115.00 115.00 2.00 1 31 IBM BAILEY AVE TAP
T SSP 115.00 115.00 14.39 1 32 METCALF EL PATIO #1
T 115.00 115.00 0.58 1 33 IBM HARRY RD #1 TAP
115.00 115.00 14.40 1 34 METCALF EL PATIO #2
T 115.00 115.00 10.63 1 35 METCALF EVERGREEN #1
FERC FORM NO. 1 (ED. 12-87) Page 422.7
36 TOTAL 36,671.97 1,451

Name of Respondent This Report Is:(1) An Original
(2) A Resubmission
Date of Report(Mo, Da, Yr)
Year/Period of Report
End of
TRANSMISSION LINE STATISTICS
PACIFIC GAS AND ELECTRIC COMPANYX
04/13/20212020/Q4
Line
No.
(c)(b)(a) (d) (e)
DESIGNATION
From To
(f) (g)
VOLTAGE (KV)(Indicate whereother than60 cycle, 3 phase)
Operating Designed
Type of
Supporting
Structure
LENGTH (Pole miles)(In the case of
underground linesreport circuit miles)
On Structureof Line
Designated
On Structuresof Another
Line
Number
Of
Circuits
(h)
1. Report information concerning transmission lines, cost of lines, and expenses for year. List each transmission line having nominal voltage of 132
kilovolts or greater. Report transmission lines below these voltages in group totals only for each voltage.
2. Transmission lines include all lines covered by the definition of transmission system plant as given in the Uniform System of Accounts. Do not report
substation costs and expenses on this page.
3. Report data by individual lines for all voltages if so required by a State commission.
4. Exclude from this page any transmission lines for which plant costs are included in Account 121, Nonutility Property.
5. Indicate whether the type of supporting structure reported in column (e) is: (1) single pole wood or steel; (2) H-frame wood, or steel poles; (3) tower;
or (4) underground construction If a transmission line has more than one type of supporting structure, indicate the mileage of each type of construction
by the use of brackets and extra lines. Minor portions of a transmission line of a different type of construction need not be distinguished from the
remainder of the line.
6. Report in columns (f) and (g) the total pole miles of each transmission line. Show in column (f) the pole miles of line on structures the cost of which is
reported for the line designated; conversely, show in column (g) the pole miles of line on structures the cost of which is reported for another line. Report
pole miles of line on leased or partly owned structures in column (g). In a footnote, explain the basis of such occupancy and state whether expenses with
respect to such structures are included in the expenses reported for the line designated.
SWP SSP 115.00 115.00 12.86 1 1 STONE EVERGREEN-METCALF
SWP T SSP 115.00 115.00 25.28 1 2 METCALF GREEN VALLEY
SSP 115.00 115.00 3.73 1 3 LOS ESTEROS TRIMBLE
SSP 115.00 115.00 2.07 1 4 MONTAGUE TRIMBLE
SSP 115.00 115.00 9.72 1 5 METCALF MORGAN HILL
SWP T SSP 115.00 115.00 18.86 1 6 MIDSUN MIDWAY
SWP 115.00 115.00 0.18 1 7 CYMRIC TAP
T SSP 115.00 115.00 22.60 1 8 MIDWAY RENFRO-TUPMAN
SWP SSP 115.00 115.00 6.67 1 9 TUPMAN-NORCO TAP
SWP 115.00 115.00 0.22 1 10 COLES LEVEE TAP
SWP T SSP 115.00 115.00 26.59 1 11 MIDWAY TUPMAN-RIO
SWP SSP 115.00 115.00 0.53 1 12 FRITO LAY TAP
SWP SSP 115.00 115.00 1.59 1 13 GOLDEN VALLEY TAP
T SSP 230.00 230.00 13.17 1 14 GATES MUSTANG SW STA #1
T SSP 230.00 230.00 13.18 1 15 GATES MUSTANG SW STA #2
SWP T SSP 115.00 115.00 13.63 1 16 MIDWAY SHAFTER
T SSP 115.00 115.00 19.33 1 17 MIDWAY TAFT
SWP SSP 115.00 115.00 7.15 1 18 CHARCA FAMOSO
SWP T SSP 115.00 115.00 14.53 1 19 MIDWAY TEMBLOR
SWP SSP 115.00 115.00 6.94 1 20 BELRIDGE TAP
SWP 115.00 115.00 5.21 1 21 PSE MCKITTRICK TAP
T SSP 115.00 115.00 4.71 1 22 MILLBRAE SAN MATEO #1
T SSP 115.00 115.00 8.86 1 23 MILPITAS SWIFT
SWP SSP 115.00 115.00 2.81 1 24 MABURY TAP
SWP SSP 115.00 115.00 0.48 1 25 LAS PLUMAS TAP
T SSP 115.00 115.00 19.73 1 26 MISSOURI FLAT GOLD HILL #1
T 115.00 115.00 19.69 1 27 MISSOURI FLAT GOLD HILL #2
T SSP 115.00 115.00 1.46 1 28 STELLING WOLFE
SWP SSP 115.00 115.00 1.37 1 29 LOS ESTEROS AGNEW
T OTHERS 115.00 115.00 5.28 1 30 MORAGA CLAREMONT #1
T OTHERS 115.00 115.00 5.30 1 31 MORAGA CLAREMONT #2
T SSP 115.00 115.00 5.04 1 32 MORAGA OAKLAND #1
115.00 115.00 5.04 1 33 MORAGA OAKLAND #2
SWP T SSP 115.00 115.00 5.05 1 34 MORAGA OAKLAND #3
SWP 115.00 115.00 5.05 1 35 MORAGA OAKLAND #4
FERC FORM NO. 1 (ED. 12-87) Page 422.8
36 TOTAL 36,671.97 1,451

Name of Respondent This Report Is:(1) An Original
(2) A Resubmission
Date of Report(Mo, Da, Yr)
Year/Period of Report
End of
TRANSMISSION LINE STATISTICS
PACIFIC GAS AND ELECTRIC COMPANYX
04/13/20212020/Q4
Line
No.
(c)(b)(a) (d) (e)
DESIGNATION
From To
(f) (g)
VOLTAGE (KV)(Indicate whereother than60 cycle, 3 phase)
Operating Designed
Type of
Supporting
Structure
LENGTH (Pole miles)(In the case of
underground linesreport circuit miles)
On Structureof Line
Designated
On Structuresof Another
Line
Number
Of
Circuits
(h)
1. Report information concerning transmission lines, cost of lines, and expenses for year. List each transmission line having nominal voltage of 132
kilovolts or greater. Report transmission lines below these voltages in group totals only for each voltage.
2. Transmission lines include all lines covered by the definition of transmission system plant as given in the Uniform System of Accounts. Do not report
substation costs and expenses on this page.
3. Report data by individual lines for all voltages if so required by a State commission.
4. Exclude from this page any transmission lines for which plant costs are included in Account 121, Nonutility Property.
5. Indicate whether the type of supporting structure reported in column (e) is: (1) single pole wood or steel; (2) H-frame wood, or steel poles; (3) tower;
or (4) underground construction If a transmission line has more than one type of supporting structure, indicate the mileage of each type of construction
by the use of brackets and extra lines. Minor portions of a transmission line of a different type of construction need not be distinguished from the
remainder of the line.
6. Report in columns (f) and (g) the total pole miles of each transmission line. Show in column (f) the pole miles of line on structures the cost of which is
reported for the line designated; conversely, show in column (g) the pole miles of line on structures the cost of which is reported for another line. Report
pole miles of line on leased or partly owned structures in column (g). In a footnote, explain the basis of such occupancy and state whether expenses with
respect to such structures are included in the expenses reported for the line designated.
SWP 115.00 115.00 17.67 1 1 MORAGA OAKLAND J
T SSP 115.00 115.00 11.14 1 2 MORAGA SAN LEANDRO #1
SWP 115.00 115.00 11.01 1 3 MORAGA SAN LEANDRO #2
T SSP 115.00 115.00 11.00 1 4 MORAGA SAN LEANDRO #3
SWP T 115.00 115.00 10.84 1 5 MORGAN HILL LLAGAS
T 115.00 115.00 16.01 1 6 MORRO BAY SAN LUIS OBISPO #1
T 115.00 115.00 16.02 1 7 MORRO BAY SAN LUIS OBISPO #2
SWP SSP 115.00 115.00 2.30 1 8 GOLDTREE TAP
230.00 230.00 15.84 1 9 FULTON LAKEVILLE-IGNACIO
T SSP 115.00 115.00 23.25 1 10 MOSS LANDING DEL MONTE #1
T SSP 115.00 115.00 23.29 1 11 MOSS LANDING DEL MONTE #2
T SSP 115.00 115.00 14.22 1 12 MOSS LANDING GREEN VALLEY #1
SWP SSP 115.00 115.00 14.36 1 13 MOSS LANDING GREEN VALLEY #2
SWP SSP 115.00 115.00 1.54 1 14 SARGENT SW STA HOLLISTER
T SSP 115.00 115.00 11.99 1 15 MOSS LANDING SALINAS #1
T SSP 115.00 115.00 0.32 1 16 DOLAN RD #1 TAP
SSP 115.00 115.00 12.03 1 17 MOSS LANDING SALINAS #2
T SSP 115.00 115.00 0.33 1 18 DOLAN RD #2 TAP
T SSP 115.00 115.00 35.35 1 19 CRAZY HORSE CANYON SALINAS-SOLEDAD #1
SSP 115.00 115.00 8.31 1 20 SAN BENITO HOLLISTER
T SSP 115.00 115.00 35.41 1 21 CRAZY HORSE CANYON SALINAS-SOLEDAD #2
SWP T SSP 115.00 115.00 21.56 1 22 LLAGAS HOLLISTER
115.00 115.00 4.80 1 23 MTN VIEW MONTA VISTA
T SSP 115.00 115.00 10.52 1 24 MOSS LANDING CRAZY HORSE CANYON #1
T 115.00 115.00 8.30 1 25 NEWARK AMES #1
115.00 115.00 8.28 1 26 NEWARK AMES #2
SWP T 115.00 115.00 8.28 1 27 NEWARK AMES #3
SSP 230.00 230.00 5.65 1 28 NEWARK LOS ESTEROS
SWP T SSP 115.00 115.00 11.37 1 29 NEWARK APPLIED MATERIALS
SWP SSP 115.00 115.00 1.28 1 30 LOCKHEED #2 TAP
SSP 115.00 115.00 10.60 1 31 MOSS LANDING CRAZY HORSE CANYON #2
SSP 115.00 115.00 4.69 1 32 NEWARK DIXON LANDING
T SSP 115.00 115.00 3.71 1 33 NEWARK FREMONT #1
SSP 115.00 115.00 3.75 1 34 NEWARK FREMONT #2
T SSP 115.00 115.00 14.25 1 35 NEWARK JARVIS #1
FERC FORM NO. 1 (ED. 12-87) Page 422.9
36 TOTAL 36,671.97 1,451

Name of Respondent This Report Is:(1) An Original
(2) A Resubmission
Date of Report(Mo, Da, Yr)
Year/Period of Report
End of
TRANSMISSION LINE STATISTICS
PACIFIC GAS AND ELECTRIC COMPANYX
04/13/20212020/Q4
Line
No.
(c)(b)(a) (d) (e)
DESIGNATION
From To
(f) (g)
VOLTAGE (KV)(Indicate whereother than60 cycle, 3 phase)
Operating Designed
Type of
Supporting
Structure
LENGTH (Pole miles)(In the case of
underground linesreport circuit miles)
On Structureof Line
Designated
On Structuresof Another
Line
Number
Of
Circuits
(h)
1. Report information concerning transmission lines, cost of lines, and expenses for year. List each transmission line having nominal voltage of 132
kilovolts or greater. Report transmission lines below these voltages in group totals only for each voltage.
2. Transmission lines include all lines covered by the definition of transmission system plant as given in the Uniform System of Accounts. Do not report
substation costs and expenses on this page.
3. Report data by individual lines for all voltages if so required by a State commission.
4. Exclude from this page any transmission lines for which plant costs are included in Account 121, Nonutility Property.
5. Indicate whether the type of supporting structure reported in column (e) is: (1) single pole wood or steel; (2) H-frame wood, or steel poles; (3) tower;
or (4) underground construction If a transmission line has more than one type of supporting structure, indicate the mileage of each type of construction
by the use of brackets and extra lines. Minor portions of a transmission line of a different type of construction need not be distinguished from the
remainder of the line.
6. Report in columns (f) and (g) the total pole miles of each transmission line. Show in column (f) the pole miles of line on structures the cost of which is
reported for the line designated; conversely, show in column (g) the pole miles of line on structures the cost of which is reported for another line. Report
pole miles of line on leased or partly owned structures in column (g). In a footnote, explain the basis of such occupancy and state whether expenses with
respect to such structures are included in the expenses reported for the line designated.
T SSP 115.00 115.00 14.48 1 1 NEWARK JARVIS #2
T SSP 115.00 115.00 10.61 1 2 NEWARK KIFER
SWP SSP 115.00 115.00 0.72 1 3 ZANKER #2 TAP
T OTHERS 115.00 115.00 10.25 1 4 NEWARK LAWRENCE
SWP SSP 115.00 115.00 1.72 1 5 LOCKHEED #1 TAP
SWP 115.00 115.00 0.16 1 6 MOFFETT FIELD TAP
T 115.00 115.00 12.21 1 7 NEWARK LAWRENCE LAB
T SSP 115.00 115.00 8.48 1 8 NEWARK MILPITAS #1
SWP SSP 115.00 115.00 10.30 1 9 NEWARK MILPITAS #2
SWP T SSP 115.00 115.00 4.94 1 10 NEWARK NUMMI
T SSP 115.00 115.00 8.76 1 11 NEWARK NORTHERN RECEIVING
T SSP 115.00 115.00 2.08 1 12 NORTHERN RECEIVING SCOTT #1
T SSP 115.00 115.00 8.67 1 13 NEWARK NORTHERN RECEIVING
SSP 115.00 115.00 1.98 1 14 NORTHERN RECEIVING SCOTT #2
T SSP 115.00 115.00 12.36 1 15 NEWARK TRIMBLE
SWP SSP 115.00 115.00 0.60 1 16 ZANKER #1 TAP
SWP SSP 115.00 115.00 1.32 1 17 AGNEW TAP
T SSP 115.00 115.00 0.28 1 18 P X #2
T 115.00 115.00 2.61 1 19 NORTH TOWER MARTINEZ JCT #1 (21KV)
SWP SSP 115.00 115.00 2.36 1 20 OAKLAND C MARITIME
SWP SSP 115.00 115.00 0.19 1 21 OAKLAND C TURBINES
T SSP 115.00 115.00 14.81 1 22 OAKLAND J GRANT
SWP T 115.00 115.00 0.04 1 23 EDES #2 TAP
T SSP 115.00 115.00 11.29 1 24 OLEUM G #1
SSP 115.00 115.00 0.96 1 25 VALLEY VIEW #1 TAP
OTHERS 115.00 115.00 11.30 1 26 OLEUM G #2
SSP 115.00 115.00 0.97 1 27 VALLEY VIEW #2 TAP
SWP T SSP 115.00 115.00 10.50 1 28 OLEUM MARTINEZ
SWP T SSP 115.00 115.00 8.33 1 29 OLEUM NORTH TOWER-CHRISTIE
SWP T SSP 115.00 115.00 55.05 1 30 CARIBOU PALERMO
T SSP 115.00 115.00 35.74 1 31 PALERMO BOGUE
T SSP 115.00 115.00 1.65 1 32 HONCUT TAP
SWP T SSP 115.00 115.00 41.18 1 33 PALERMO NICOLAUS
T SSP 115.00 115.00 26.53 1 34 PALERMO PEASE
SWP SSP 115.00 115.00 10.08 1 35 PANOCHE MENDOTA
FERC FORM NO. 1 (ED. 12-87) Page 422.10
36 TOTAL 36,671.97 1,451

Name of Respondent This Report Is:(1) An Original
(2) A Resubmission
Date of Report(Mo, Da, Yr)
Year/Period of Report
End of
TRANSMISSION LINE STATISTICS
PACIFIC GAS AND ELECTRIC COMPANYX
04/13/20212020/Q4
Line
No.
(c)(b)(a) (d) (e)
DESIGNATION
From To
(f) (g)
VOLTAGE (KV)(Indicate whereother than60 cycle, 3 phase)
Operating Designed
Type of
Supporting
Structure
LENGTH (Pole miles)(In the case of
underground linesreport circuit miles)
On Structureof Line
Designated
On Structuresof Another
Line
Number
Of
Circuits
(h)
1. Report information concerning transmission lines, cost of lines, and expenses for year. List each transmission line having nominal voltage of 132
kilovolts or greater. Report transmission lines below these voltages in group totals only for each voltage.
2. Transmission lines include all lines covered by the definition of transmission system plant as given in the Uniform System of Accounts. Do not report
substation costs and expenses on this page.
3. Report data by individual lines for all voltages if so required by a State commission.
4. Exclude from this page any transmission lines for which plant costs are included in Account 121, Nonutility Property.
5. Indicate whether the type of supporting structure reported in column (e) is: (1) single pole wood or steel; (2) H-frame wood, or steel poles; (3) tower;
or (4) underground construction If a transmission line has more than one type of supporting structure, indicate the mileage of each type of construction
by the use of brackets and extra lines. Minor portions of a transmission line of a different type of construction need not be distinguished from the
remainder of the line.
6. Report in columns (f) and (g) the total pole miles of each transmission line. Show in column (f) the pole miles of line on structures the cost of which is
reported for the line designated; conversely, show in column (g) the pole miles of line on structures the cost of which is reported for another line. Report
pole miles of line on leased or partly owned structures in column (g). In a footnote, explain the basis of such occupancy and state whether expenses with
respect to such structures are included in the expenses reported for the line designated.
SWP T SSP 115.00 115.00 4.10 1 1 CHENEY #1 TAP
SWP T SSP 115.00 115.00 18.96 1 2 PANOCHE ORO LOMA
SWP 115.00 115.00 3.87 1 3 OXFORD TAP
SWP SSP 115.00 115.00 1.05 1 4 WESTLANDS #1 RA
SWP SSP 115.00 115.00 1.88 1 5 SAN LUIS #5 TAP
SWP T SSP 115.00 115.00 16.11 1 6 SAN LUIS #3 TAP
SWP SSP 115.00 115.00 1.02 1 7 DE FRANCESCO TAP
115.00 115.00 0.03 1 8 EXCELSIOR SW STA FIVE POINTS PV
T SSP 115.00 115.00 5.24 1 9 EXCELSIOR SW STA SCHINDLER #1
SSP 115.00 115.00 5.23 1 10 EXCELSIOR SW STA SCHINDLER #2
T SSP 115.00 115.00 28.50 1 11 PANOCHE EXCELSIOR SW STA #1
SWP SSP 115.00 115.00 1.83 1 12 CANTUA TAP
SWP SSP 115.00 115.00 3.52 1 13 WESTLANDS #18 RA TAP
SWP OTHERS 115.00 115.00 0.52 1 14 KAMM TAP
SSP 115.00 115.00 28.50 1 15 PANOCHE EXCELSIOR SW STA #2
SWP SSP 115.00 115.00 1.97 1 16 CHENEY #2 TAP
SWP T SSP 115.00 115.00 27.61 1 17 PEASE RIO OSO
115.00 115.00 3.15 1 18 SAN FRANCISCO #2
T SSP 115.00 115.00 16.82 1 19 PITTSBURG CLAYTON #1
T SSP 115.00 115.00 8.41 1 20 PITTSBURG CLAYTON #3
T SSP 115.00 115.00 8.32 1 21 PITTSBURG CLAYTON #4
T SSP 115.00 115.00 9.23 1 22 PITTSBURG COLUMBIA STEEL
SWP SSP 115.00 115.00 0.45 1 23 COLUMBIA SOLAR 115kV
SWP SSP 115.00 115.00 0.62 1 24 LINDE TAP
SSP 115.00 115.00 0.54 1 25 PITTSBURG LOS MEDANOS #1
SSP 115.00 115.00 0.54 1 26 PITTSBURG LOS MEDANOS #2
SSP 115.00 115.00 9.26 1 27 PITTSBURG KIRKER-COLUMBIA STEEL
T SSP 115.00 115.00 17.22 1 28 PITTSBURG MARTINEZ #1
T SSP 115.00 115.00 2.14 1 29 BOLLMAN #1 TAP
SWP SSP 115.00 115.00 1.43 1 30 IMHOFF TAP
115.00 115.00 15.83 1 31 PITTSBURG MARTINEZ #2
T SSP 115.00 115.00 2.19 1 32 BOLLMAN #2 TAP
T SSP 115.00 115.00 20.67 1 33 PLACER GOLD HILL #1
SWP T SSP 115.00 115.00 1.96 1 34 FLINT TAP
T 115.00 115.00 7.07 1 35 RAVENSWOOD AMES #1
FERC FORM NO. 1 (ED. 12-87) Page 422.11
36 TOTAL 36,671.97 1,451

Name of Respondent This Report Is:(1) An Original
(2) A Resubmission
Date of Report(Mo, Da, Yr)
Year/Period of Report
End of
TRANSMISSION LINE STATISTICS
PACIFIC GAS AND ELECTRIC COMPANYX
04/13/20212020/Q4
Line
No.
(c)(b)(a) (d) (e)
DESIGNATION
From To
(f) (g)
VOLTAGE (KV)(Indicate whereother than60 cycle, 3 phase)
Operating Designed
Type of
Supporting
Structure
LENGTH (Pole miles)(In the case of
underground linesreport circuit miles)
On Structureof Line
Designated
On Structuresof Another
Line
Number
Of
Circuits
(h)
1. Report information concerning transmission lines, cost of lines, and expenses for year. List each transmission line having nominal voltage of 132
kilovolts or greater. Report transmission lines below these voltages in group totals only for each voltage.
2. Transmission lines include all lines covered by the definition of transmission system plant as given in the Uniform System of Accounts. Do not report
substation costs and expenses on this page.
3. Report data by individual lines for all voltages if so required by a State commission.
4. Exclude from this page any transmission lines for which plant costs are included in Account 121, Nonutility Property.
5. Indicate whether the type of supporting structure reported in column (e) is: (1) single pole wood or steel; (2) H-frame wood, or steel poles; (3) tower;
or (4) underground construction If a transmission line has more than one type of supporting structure, indicate the mileage of each type of construction
by the use of brackets and extra lines. Minor portions of a transmission line of a different type of construction need not be distinguished from the
remainder of the line.
6. Report in columns (f) and (g) the total pole miles of each transmission line. Show in column (f) the pole miles of line on structures the cost of which is
reported for the line designated; conversely, show in column (g) the pole miles of line on structures the cost of which is reported for another line. Report
pole miles of line on leased or partly owned structures in column (g). In a footnote, explain the basis of such occupancy and state whether expenses with
respect to such structures are included in the expenses reported for the line designated.
115.00 115.00 7.09 1 1 RAVENSWOOD AMES #2
T 115.00 115.00 7.43 1 2 RAVENSWOOD BAIR #1
SWP T SSP 115.00 115.00 1.38 1 3 SHREDDER TAP
T SSP 115.00 115.00 11.29 1 4 RAVENSWOOD BAIR #2
T 115.00 115.00 1.62 1 5 RAVENSWOOD COOLEY LANDING #1
115.00 115.00 1.62 1 6 RAVENSWOOD COOLEY LANDING #2
SWP T SSP 115.00 115.00 4.28 1 7 RAVENSWOOD PALO ALTO #1
SWP SSP 115.00 115.00 4.26 1 8 RAVENSWOOD PALO ALTO #2
T 115.00 115.00 12.04 1 9 RAVENSWOOD SAN MATEO
T 115.00 115.00 5.39 1 10 RIO OSO NICOLAUS
SWP T SSP 115.00 115.00 43.56 1 11 RIO OSO WEST SACRAMENTO
SWP T SSP 115.00 115.00 45.25 1 12 RIO OSO WOODLAND #1
SWP T SSP 115.00 115.00 53.37 1 13 RIO OSO WOODLAND #2
SWP SSP 115.00 115.00 1.92 1 14 ZAMORA TAP
SWP SSP 115.00 115.00 18.87 1 15 BELLOTA RIVERBANK
T SSP 115.00 115.00 16.48 1 16 SALT SPRINGS TIGER CREEK
SSP 115.00 115.00 0.20 1 17 KM GREEN TAP
SSP 115.00 115.00 1.15 1 18 SAN JOSE A SAN JOSE B
T SSP 115.00 115.00 6.70 1 19 SAN LEANDRO OAKLND J #1
SWP SSP 115.00 115.00 0.05 1 20 EDES #1 TAP
SWP T SSP 115.00 115.00 19.90 1 21 SAN LUIS OBISPO OCEANO
SWP SSP 115.00 115.00 25.96 1 22 SAN LUIS OBISPO SANTA MARIA
T 115.00 115.00 4.30 1 23 SAN MATEO BAY MEADOWS #1
T 115.00 115.00 4.26 1 24 SAN MATEO BAY MEADOWS #2
SWP SSP 115.00 115.00 7.20 1 25 SAN MATEO BELMONT
SWP T SSP 115.00 115.00 11.55 1 26 SAN MATEO MARTIN #3
SSP 115.00 115.00 11.68 1 27 SAN MATEO MARTIN #6
SWP SSP 115.00 115.00 8.82 1 28 SANGER MALAGA
SWP SSP 115.00 115.00 10.57 1 29 SANTA MARIA SISQUOC
115.00 115.00 1.52 1 30 FAIRWAY #2 TAP
SWP SSP 115.00 115.00 6.91 1 31 SEMITROPIC CHARCA
SWP T SSP 115.00 115.00 14.10 1 32 SEMITROPIC MIDWAY #1
SWP T SSP 115.00 115.00 20.11 1 33 SEMITROPIC MIDWAY #2
SWP 115.00 115.00 0.54 1 34 WASCO PRISON TAP
T SSP 115.00 115.00 6.09 1 35 SF AIRPORT SAN MATEO
FERC FORM NO. 1 (ED. 12-87) Page 422.12
36 TOTAL 36,671.97 1,451

Name of Respondent This Report Is:(1) An Original
(2) A Resubmission
Date of Report(Mo, Da, Yr)
Year/Period of Report
End of
TRANSMISSION LINE STATISTICS
PACIFIC GAS AND ELECTRIC COMPANYX
04/13/20212020/Q4
Line
No.
(c)(b)(a) (d) (e)
DESIGNATION
From To
(f) (g)
VOLTAGE (KV)(Indicate whereother than60 cycle, 3 phase)
Operating Designed
Type of
Supporting
Structure
LENGTH (Pole miles)(In the case of
underground linesreport circuit miles)
On Structureof Line
Designated
On Structuresof Another
Line
Number
Of
Circuits
(h)
1. Report information concerning transmission lines, cost of lines, and expenses for year. List each transmission line having nominal voltage of 132
kilovolts or greater. Report transmission lines below these voltages in group totals only for each voltage.
2. Transmission lines include all lines covered by the definition of transmission system plant as given in the Uniform System of Accounts. Do not report
substation costs and expenses on this page.
3. Report data by individual lines for all voltages if so required by a State commission.
4. Exclude from this page any transmission lines for which plant costs are included in Account 121, Nonutility Property.
5. Indicate whether the type of supporting structure reported in column (e) is: (1) single pole wood or steel; (2) H-frame wood, or steel poles; (3) tower;
or (4) underground construction If a transmission line has more than one type of supporting structure, indicate the mileage of each type of construction
by the use of brackets and extra lines. Minor portions of a transmission line of a different type of construction need not be distinguished from the
remainder of the line.
6. Report in columns (f) and (g) the total pole miles of each transmission line. Show in column (f) the pole miles of line on structures the cost of which is
reported for the line designated; conversely, show in column (g) the pole miles of line on structures the cost of which is reported for another line. Report
pole miles of line on leased or partly owned structures in column (g). In a footnote, explain the basis of such occupancy and state whether expenses with
respect to such structures are included in the expenses reported for the line designated.
SWP SSP 115.00 115.00 8.31 1 1 SHAFTER RIO BRAVO
T 115.00 115.00 5.47 1 2 SIERRA #1
115.00 115.00 4.86 1 3 SIERRA #2
SWP SSP 115.00 115.00 5.02 1 4 SISQUOC GAREY
SWP SSP 115.00 115.00 22.12 1 5 SISQUOC SANTA YNEZ SW STA
SWP SSP 115.00 115.00 4.06 1 6 SANTA YNEZ TAP
SWP T SSP 115.00 115.00 44.63 1 7 SMYRNA SEMITROPIC-MIDWAY
SWP T SSP 115.00 115.00 5.34 1 8 SOBRANTE G #1
SSP 115.00 115.00 5.39 1 9 SOBRANTE G #2
SWP T SSP 115.00 115.00 19.58 1 10 SOBRANTE GRIZZLY-CLAREMONT #1
T SSP 115.00 115.00 15.11 1 11 MORAGA LAKEWOOD
SWP T SSP 115.00 115.00 5.68 1 12 SOBRANTE MORAGA
T 230.00 230.00 14.53 1 13 LAKEVILLE IGNACIO #2
SWP T SSP 115.00 115.00 19.30 1 14 SOBRANTE GRIZZLY-CLAREMONT #2
T SSP 115.00 115.00 5.54 1 15 SOBRANTE R #1
115.00 115.00 5.53 1 16 SOBRANTE R #2
SSP 115.00 115.00 18.89 1 17 SOBRANTE STANDARD OIL SW STA #2
T SSP 115.00 115.00 0.45 1 18 SAN PABLO #2 TAP
SWP SSP 115.00 115.00 1.30 1 19 POINT PINOLE TAP
T SSP 115.00 115.00 18.89 1 20 SOBRANTE STANDARD OIL SW STA #1
SSP 115.00 115.00 0.44 1 21 SAN PABLO #1 TAP
SWP SSP 115.00 115.00 18.48 1 22 SONOMA PUEBLO
SWP T SSP 115.00 115.00 53.95 1 23 STANISLAUS MANTECA #2
SWP T SSP 115.00 115.00 61.15 1 24 STANISLAUS MELONES SW
T 115.00 115.00 0.12 1 25 FROGTOWN #1 TAP
T SSP 115.00 115.00 43.80 1 26 STANISLAUS MELONES SW
SWP SSP 115.00 115.00 18.00 1 27 RIVERBANK JCT SW STA RIPON
115.00 115.00 0.11 1 28 FROGTOWN #2 TAP
T SSP 115.00 115.00 15.04 1 29 STANISLAUS NEWARK #1 (12KV)
T SSP 115.00 115.00 18.17 1 30 STANISLAUS NEWARK #2 (12KV)
T SSP 115.00 115.00 2.72 1 31 MONTA VISTA WOLFE
SWP T SSP 115.00 115.00 34.80 1 32 STOCKTON A LOCKEFORD-BELLOTA #1
SWP T SSP 115.00 115.00 34.49 1 33 STOCKTON A LOCKEFORD-BELLOTA #2
SWP SSP 115.00 115.00 2.20 1 34 KYOHO TAP
T 115.00 115.00 8.93 1 35 SWIFT METCALF
FERC FORM NO. 1 (ED. 12-87) Page 422.13
36 TOTAL 36,671.97 1,451

Name of Respondent This Report Is:(1) An Original
(2) A Resubmission
Date of Report(Mo, Da, Yr)
Year/Period of Report
End of
TRANSMISSION LINE STATISTICS
PACIFIC GAS AND ELECTRIC COMPANYX
04/13/20212020/Q4
Line
No.
(c)(b)(a) (d) (e)
DESIGNATION
From To
(f) (g)
VOLTAGE (KV)(Indicate whereother than60 cycle, 3 phase)
Operating Designed
Type of
Supporting
Structure
LENGTH (Pole miles)(In the case of
underground linesreport circuit miles)
On Structureof Line
Designated
On Structuresof Another
Line
Number
Of
Circuits
(h)
1. Report information concerning transmission lines, cost of lines, and expenses for year. List each transmission line having nominal voltage of 132
kilovolts or greater. Report transmission lines below these voltages in group totals only for each voltage.
2. Transmission lines include all lines covered by the definition of transmission system plant as given in the Uniform System of Accounts. Do not report
substation costs and expenses on this page.
3. Report data by individual lines for all voltages if so required by a State commission.
4. Exclude from this page any transmission lines for which plant costs are included in Account 121, Nonutility Property.
5. Indicate whether the type of supporting structure reported in column (e) is: (1) single pole wood or steel; (2) H-frame wood, or steel poles; (3) tower;
or (4) underground construction If a transmission line has more than one type of supporting structure, indicate the mileage of each type of construction
by the use of brackets and extra lines. Minor portions of a transmission line of a different type of construction need not be distinguished from the
remainder of the line.
6. Report in columns (f) and (g) the total pole miles of each transmission line. Show in column (f) the pole miles of line on structures the cost of which is
reported for the line designated; conversely, show in column (g) the pole miles of line on structures the cost of which is reported for another line. Report
pole miles of line on leased or partly owned structures in column (g). In a footnote, explain the basis of such occupancy and state whether expenses with
respect to such structures are included in the expenses reported for the line designated.
SWP T SSP 115.00 115.00 19.54 1 1 TABLE MTN BUTTE #1
T SSP 115.00 115.00 15.82 1 2 TABLE MTN BUTTE #2
SWP SSP 115.00 115.00 7.18 1 3 TAFT CHALK CLIFF
SWP 115.00 115.00 0.22 1 4 UNIVERSITY COGEN TAP
SWP SSP 115.00 115.00 4.78 1 5 TEMBLOR KERNRIDGE
SWP SSP 115.00 115.00 2.15 1 6 CAL WATER TAP
SWP T SSP 115.00 115.00 57.79 1 7 TEMBLOR SAN LUIS OBISPO
SSP 115.00 115.00 0.04 1 8 CARRIZO PLAINS TAP
T SSP 115.00 115.00 7.34 1 9 TESLA SCHULTE SW STA #2
SWP 115.00 115.00 0.68 1 10 OWENS ILLINOIS TAP
SWP T SSP 115.00 115.00 8.23 1 11 LAMMERS KASSON
SWP T SSP 115.00 115.00 7.39 1 12 TESLA SCHULTE SW STA #1
SWP T 115.00 115.00 9.41 1 13 LAWRENCE LIVERMORE
SWP T 115.00 115.00 1.60 1 14 AEC SITE #1 TAP
SWP SSP 115.00 115.00 2.16 1 15 AEC SITE #2 TAP
SWP SSP 115.00 115.00 0.68 1 16 SAFEWAY TAP
SWP T SSP 115.00 115.00 32.07 1 17 TESLA SALADO #1
SWP T SSP 115.00 115.00 21.26 1 18 MILLER #1 TAP
T SSP 115.00 115.00 0.69 1 19 SCHULTE SW STA LAMMERS
SWP T SSP 115.00 115.00 53.96 1 20 TESLA SALADO-MANTECA
SWP SSP 115.00 115.00 0.50 1 21 INGRAM CREEK TAP
SWP SSP 115.00 115.00 12.32 1 22 MILLER #2 TAP
SWP T SSP 115.00 115.00 44.44 1 23 TESLA STOCKTON COGEN JCT
SWP SSP 115.00 115.00 0.74 1 24 THERMAL ENERGY TAP
SWP 115.00 115.00 0.04 1 25 SAN JOAQUIN COGEN TAP
SWP T SSP 115.00 115.00 25.23 1 26 TESLA TRACY
SWP 115.00 115.00 0.17 1 27 ELLIS TAP
SSP 115.00 115.00 2.53 1 28 TRIMBLE SAN JOSE B
SWP 115.00 115.00 0.96 1 29 GISH TAP
SSP 115.00 115.00 1.98 1 30 LOS ESTEROS NORTECH
SWP T SSP 115.00 115.00 45.97 1 31 TRINITY COTTONWOOD
SWP SSP 115.00 115.00 0.86 1 32 JESSUP TAP
SWP SSP 115.00 115.00 31.17 1 33 UKIAH HOPLAND-CLOVERDALE
SWP T SSP 115.00 115.00 23.06 1 34 VACA SUISUN
SWP T SSP 115.00 115.00 25.46 1 35 VACA SUISUN-JAMESON
FERC FORM NO. 1 (ED. 12-87) Page 422.14
36 TOTAL 36,671.97 1,451

Name of Respondent This Report Is:(1) An Original
(2) A Resubmission
Date of Report(Mo, Da, Yr)
Year/Period of Report
End of
TRANSMISSION LINE STATISTICS
PACIFIC GAS AND ELECTRIC COMPANYX
04/13/20212020/Q4
Line
No.
(c)(b)(a) (d) (e)
DESIGNATION
From To
(f) (g)
VOLTAGE (KV)(Indicate whereother than60 cycle, 3 phase)
Operating Designed
Type of
Supporting
Structure
LENGTH (Pole miles)(In the case of
underground linesreport circuit miles)
On Structureof Line
Designated
On Structuresof Another
Line
Number
Of
Circuits
(h)
1. Report information concerning transmission lines, cost of lines, and expenses for year. List each transmission line having nominal voltage of 132
kilovolts or greater. Report transmission lines below these voltages in group totals only for each voltage.
2. Transmission lines include all lines covered by the definition of transmission system plant as given in the Uniform System of Accounts. Do not report
substation costs and expenses on this page.
3. Report data by individual lines for all voltages if so required by a State commission.
4. Exclude from this page any transmission lines for which plant costs are included in Account 121, Nonutility Property.
5. Indicate whether the type of supporting structure reported in column (e) is: (1) single pole wood or steel; (2) H-frame wood, or steel poles; (3) tower;
or (4) underground construction If a transmission line has more than one type of supporting structure, indicate the mileage of each type of construction
by the use of brackets and extra lines. Minor portions of a transmission line of a different type of construction need not be distinguished from the
remainder of the line.
6. Report in columns (f) and (g) the total pole miles of each transmission line. Show in column (f) the pole miles of line on structures the cost of which is
reported for the line designated; conversely, show in column (g) the pole miles of line on structures the cost of which is reported for another line. Report
pole miles of line on leased or partly owned structures in column (g). In a footnote, explain the basis of such occupancy and state whether expenses with
respect to such structures are included in the expenses reported for the line designated.
SWP T 115.00 115.00 22.04 1 1 VACA VACAVILLE-CORDELIA
SWP T SSP 115.00 115.00 36.18 1 2 VACA VACAVILLE-JAMESON-NOR
T SSP 115.00 115.00 13.97 1 3 WEST SACRAMENTO BRIGHTON
SWP SSP 115.00 115.00 2.45 1 4 DEEPWATER #2 TAP
SWP SSP 115.00 115.00 12.14 1 5 WEST SACRAMENTO DAVIS
T SSP 115.00 115.00 2.29 1 6 DEEPWATER #1 TAP
SWP SSP 115.00 115.00 0.75 1 7 POST OFFICE TAP
SWP T SSP 115.00 115.00 12.29 1 8 WESTPARK MAGUNDEN
SWP SSP 115.00 115.00 1.27 1 9 BEAR MTN TAP
SWP 115.00 115.00 0.11 1 10 BOLTHOUSE FARMS TAP
SWP T SSP 115.00 115.00 21.20 1 11 ADOBE SW STA LAMONT
SWP 115.00 115.00 1.06 1 12 ARVIN EDISON TAP
SWP T 115.00 115.00 3.54 1 13 WHISMAN MTN VIEW
T SSP 115.00 115.00 15.41 1 14 WILSON ATWATER #2
SWP T SSP 115.00 115.00 14.04 1 15 WILSON LE GRAND
SWP T SSP 115.00 115.00 5.58 1 16 WILSON MERCED #1
SWP T SSP 115.00 115.00 6.20 1 17 WILSON MERCED #2
SWP T SSP 115.00 115.00 43.56 1 18 WILSON ORO LOMA
SWP SSP 115.00 115.00 11.71 1 19 WOODLAND DAVIS
SWP 115.00 115.00 0.87 1 20 WOODLAND BIOMASS TAP
SWP T SSP 115.00 115.00 19.62 1 21 WOODLEAF PALERMO
SWP SSP 115.00 115.00 5.33 1 22 SLY CREEK TAP
SSP OTHERS 115.00 115.00 0.22 1 23 FORBESTOWN TAP
SWP SSP 115.00 115.00 2.59 1 24 KANAKA TAP
SWP 115.00 115.00 0.11 1 25 CAL PEAK VACA
T 230.00 230.00 71.07 1 26 DELEVAN VACA #2
SSP 230.00 230.00 3.56 1 27 SHILOH II BIRDS LANDING SW STA
SWP T SSP 115.00 115.00 9.00 1 28 TESLA LAWRENCE LAB
115.00 115.00 0.01 1 29 OLEUM UNOCAL #1
SWP 115.00 115.00 0.05 1 30 OLEUM UNOCAL #2
SWP SSP 115.00 115.00 0.50 1 31 UNION OIL TAP
SSP 115.00 115.00 20.67 1 32 PLACER GOLD HILL #2
SSP 115.00 115.00 0.47 1 33 APPLIED MATERIALS BRITTON
SWP SSP 115.00 115.00 14.39 1 34 SANTA ROSA CORONA
SWP T SSP 115.00 115.00 10.49 1 35 VIERRA TRACY-KASSON
FERC FORM NO. 1 (ED. 12-87) Page 422.15
36 TOTAL 36,671.97 1,451

Name of Respondent This Report Is:(1) An Original
(2) A Resubmission
Date of Report(Mo, Da, Yr)
Year/Period of Report
End of
TRANSMISSION LINE STATISTICS
PACIFIC GAS AND ELECTRIC COMPANYX
04/13/20212020/Q4
Line
No.
(c)(b)(a) (d) (e)
DESIGNATION
From To
(f) (g)
VOLTAGE (KV)(Indicate whereother than60 cycle, 3 phase)
Operating Designed
Type of
Supporting
Structure
LENGTH (Pole miles)(In the case of
underground linesreport circuit miles)
On Structureof Line
Designated
On Structuresof Another
Line
Number
Of
Circuits
(h)
1. Report information concerning transmission lines, cost of lines, and expenses for year. List each transmission line having nominal voltage of 132
kilovolts or greater. Report transmission lines below these voltages in group totals only for each voltage.
2. Transmission lines include all lines covered by the definition of transmission system plant as given in the Uniform System of Accounts. Do not report
substation costs and expenses on this page.
3. Report data by individual lines for all voltages if so required by a State commission.
4. Exclude from this page any transmission lines for which plant costs are included in Account 121, Nonutility Property.
5. Indicate whether the type of supporting structure reported in column (e) is: (1) single pole wood or steel; (2) H-frame wood, or steel poles; (3) tower;
or (4) underground construction If a transmission line has more than one type of supporting structure, indicate the mileage of each type of construction
by the use of brackets and extra lines. Minor portions of a transmission line of a different type of construction need not be distinguished from the
remainder of the line.
6. Report in columns (f) and (g) the total pole miles of each transmission line. Show in column (f) the pole miles of line on structures the cost of which is
reported for the line designated; conversely, show in column (g) the pole miles of line on structures the cost of which is reported for another line. Report
pole miles of line on leased or partly owned structures in column (g). In a footnote, explain the basis of such occupancy and state whether expenses with
respect to such structures are included in the expenses reported for the line designated.
SWP SSP 115.00 115.00 5.79 1 1 CORONA LAKEVILLE
SWP SSP 115.00 115.00 2.02 1 2 NOTRE DAME BUTTE
SWP SSP 115.00 115.00 8.25 1 3 NEWARK AMES DISTRIBUTION
SWP SSP 115.00 115.00 20.33 1 4 SYCAMORE CREEK NOTRE DAME-TABLE MTN
SWP T SSP 115.00 115.00 5.30 1 5 PALERMO WYANDOTTE
SWP T SSP 115.00 115.00 33.73 1 6 PARADISE TABLE MTN
T SSP 115.00 115.00 6.62 1 7 METCALF HICKS 1 & 2
T 115.00 115.00 4.72 1 8 PIERCY METCALF
T SSP 230.00 230.00 43.36 1 9 ARCO MIDWAY
T 230.00 230.00 11.11 1 10 ATLANTIC GOLD HILL
T 230.00 230.00 26.92 1 11 BAHIA MORAGA
230.00 230.00 39.76 1 12 BALCH MCCALL
T 230.00 230.00 19.87 1 13 BELLOTA COTTLE
SSP 230.00 230.00 37.94 1 14 BELLOTA TESLA #2
SSP 230.00 230.00 22.47 1 15 BELLOTA WARNERVILLE
T 230.00 230.00 17.97 1 16 DELEVAN CORTINA
T SSP 230.00 230.00 14.26 1 17 BELLOTA WEBER
SSP 115.00 115.00 0.64 1 18 GEYSERS #11 EAGLE ROCK
T SSP 115.00 115.00 46.94 1 19 EAGLE ROCK FULTON-SILVERADO
SWP T SSP 115.00 115.00 47.75 1 20 DRUM HIGGINS
SWP T 115.00 115.00 7.94 1 21 BELL PLACER
SSP OTHERS 115.00 115.00 13.58 1 22 PARADISE BUTTE
SSP 230.00 230.00 6.21 1 23 BORDEN GREGG #2
T SSP 230.00 230.00 16.41 1 24 BRENTWOOD KELSO
T 230.00 230.00 42.51 1 25 BRIGHTON BELLOTA
T SSP 230.00 230.00 9.39 1 26 BUCKS CREEK ROCK CREEK-CRESTA
SWP T SSP 230.00 230.00 54.34 1 27 CARIBOU TABLE MTN
SSP 230.00 230.00 0.02 1 28 BELDEN TAP
T 230.00 230.00 22.71 1 29 CASTRO VALLEY NEWARK
T SSP 230.00 230.00 63.97 1 30 COBURN LAS AGUILAS SW STA
T 230.00 230.00 1.89 1 31 CONTRA COSTA PP CONTRA COSTA SUB
T SSP 230.00 230.00 10.06 1 32 CONTRA COSTA BRENTWOOD
T 230.00 230.00 18.46 1 33 CONTRA COSTA DELTA SWITCHYARD
SSP 230.00 230.00 0.11 1 34 WINDMASTER TAP
T 230.00 230.00 3.02 1 35 NORTH DUBLIN CAYETANO
FERC FORM NO. 1 (ED. 12-87) Page 422.16
36 TOTAL 36,671.97 1,451

Name of Respondent This Report Is:(1) An Original
(2) A Resubmission
Date of Report(Mo, Da, Yr)
Year/Period of Report
End of
TRANSMISSION LINE STATISTICS
PACIFIC GAS AND ELECTRIC COMPANYX
04/13/20212020/Q4
Line
No.
(c)(b)(a) (d) (e)
DESIGNATION
From To
(f) (g)
VOLTAGE (KV)(Indicate whereother than60 cycle, 3 phase)
Operating Designed
Type of
Supporting
Structure
LENGTH (Pole miles)(In the case of
underground linesreport circuit miles)
On Structureof Line
Designated
On Structuresof Another
Line
Number
Of
Circuits
(h)
1. Report information concerning transmission lines, cost of lines, and expenses for year. List each transmission line having nominal voltage of 132
kilovolts or greater. Report transmission lines below these voltages in group totals only for each voltage.
2. Transmission lines include all lines covered by the definition of transmission system plant as given in the Uniform System of Accounts. Do not report
substation costs and expenses on this page.
3. Report data by individual lines for all voltages if so required by a State commission.
4. Exclude from this page any transmission lines for which plant costs are included in Account 121, Nonutility Property.
5. Indicate whether the type of supporting structure reported in column (e) is: (1) single pole wood or steel; (2) H-frame wood, or steel poles; (3) tower;
or (4) underground construction If a transmission line has more than one type of supporting structure, indicate the mileage of each type of construction
by the use of brackets and extra lines. Minor portions of a transmission line of a different type of construction need not be distinguished from the
remainder of the line.
6. Report in columns (f) and (g) the total pole miles of each transmission line. Show in column (f) the pole miles of line on structures the cost of which is
reported for the line designated; conversely, show in column (g) the pole miles of line on structures the cost of which is reported for another line. Report
pole miles of line on leased or partly owned structures in column (g). In a footnote, explain the basis of such occupancy and state whether expenses with
respect to such structures are included in the expenses reported for the line designated.
T 230.00 230.00 12.46 1 1 NORTH DUBLIN VINEYARD
T SSP 230.00 230.00 23.83 1 2 CONTRA COSTA LAS POSITAS
SSP 230.00 230.00 0.06 1 3 US WINDPOWER #3 TAP
T SSP 230.00 230.00 25.94 1 4 COTTLE MELONES
SWP T SSP 230.00 230.00 3.28 1 5 TES TAP
230.00 230.00 5.61 1 6 CONTRA COSTA LONE TREE
T 230.00 230.00 14.36 1 7 VINEYARD NEWARK
T 230.00 230.00 53.29 1 8 CORTINA VACA
T SSP 230.00 230.00 71.55 1 9 COTTONWOOD DELEVAN #1
T 230.00 230.00 48.33 1 10 COTTONWOOD GLENN
T 230.00 230.00 59.28 1 11 COTTONWOOD LOGAN CREEK
T 230.00 230.00 71.54 1 12 COTTONWOOD DELEVAN #2
T SSP 230.00 230.00 64.79 1 13 CRESTA RIO OSO
T 230.00 230.00 7.70 1 14 DELTA SWITCHING YARD TESLA
T SSP 230.00 230.00 0.46 1 15 DIABLO PP STANDBY
T 230.00 230.00 40.34 1 16 DIABLO MESA
T SSP 230.00 230.00 23.68 1 17 DOS AMIGOS PUMPING PANOCHE
230.00 230.00 0.22 1 18 NEWARK E F BUS TIE
SSP 230.00 230.00 12.43 1 19 EASTSHORE SAN MATEO
T SSP 230.00 230.00 26.64 1 20 EIGHT MILE ROAD TESLA
T SSP 230.00 230.00 29.23 1 21 ELECTRA BELLOTA
T SSP 230.00 230.00 40.73 1 22 FULTON IGNACIO #1
T 230.00 230.00 35.18 1 23 GATES ARCO
T SSP 230.00 230.00 45.47 1 24 MUSTANG SW STA GREGG
T SSP 230.00 230.00 42.11 1 25 MUSTANG SW STA MCCALL
T SSP 230.00 230.00 43.79 1 26 GATES PANOCHE #1
T SSP 230.00 230.00 43.80 1 27 GATES PANOCHE #2
T SSP 230.00 230.00 24.09 1 28 GEYSERS #12 FULTON
T 230.00 230.00 1.29 1 29 GEYSERS #16 TAP
T SSP 230.00 230.00 26.14 1 30 GEYSERS #17 FULTON
T 230.00 230.00 1.07 1 31 BOTTLE ROCK TAP D.W.R.
SSP 230.00 230.00 41.19 1 32 GEYSERS #9 LAKEVILLE
SSP 230.00 230.00 0.51 1 33 GEYSERS #9 LAKEVILLE
T 230.00 230.00 2.06 1 34 GEYSERS #13 TAP
T SSP 230.00 230.00 1.04 1 35 SANTA FE GEOTHERMAL
FERC FORM NO. 1 (ED. 12-87) Page 422.17
36 TOTAL 36,671.97 1,451

Name of Respondent This Report Is:(1) An Original
(2) A Resubmission
Date of Report(Mo, Da, Yr)
Year/Period of Report
End of
TRANSMISSION LINE STATISTICS
PACIFIC GAS AND ELECTRIC COMPANYX
04/13/20212020/Q4
Line
No.
(c)(b)(a) (d) (e)
DESIGNATION
From To
(f) (g)
VOLTAGE (KV)(Indicate whereother than60 cycle, 3 phase)
Operating Designed
Type of
Supporting
Structure
LENGTH (Pole miles)(In the case of
underground linesreport circuit miles)
On Structureof Line
Designated
On Structuresof Another
Line
Number
Of
Circuits
(h)
1. Report information concerning transmission lines, cost of lines, and expenses for year. List each transmission line having nominal voltage of 132
kilovolts or greater. Report transmission lines below these voltages in group totals only for each voltage.
2. Transmission lines include all lines covered by the definition of transmission system plant as given in the Uniform System of Accounts. Do not report
substation costs and expenses on this page.
3. Report data by individual lines for all voltages if so required by a State commission.
4. Exclude from this page any transmission lines for which plant costs are included in Account 121, Nonutility Property.
5. Indicate whether the type of supporting structure reported in column (e) is: (1) single pole wood or steel; (2) H-frame wood, or steel poles; (3) tower;
or (4) underground construction If a transmission line has more than one type of supporting structure, indicate the mileage of each type of construction
by the use of brackets and extra lines. Minor portions of a transmission line of a different type of construction need not be distinguished from the
remainder of the line.
6. Report in columns (f) and (g) the total pole miles of each transmission line. Show in column (f) the pole miles of line on structures the cost of which is
reported for the line designated; conversely, show in column (g) the pole miles of line on structures the cost of which is reported for another line. Report
pole miles of line on leased or partly owned structures in column (g). In a footnote, explain the basis of such occupancy and state whether expenses with
respect to such structures are included in the expenses reported for the line designated.
230.00 230.00 0.03 1 1 GEYSERS #20 TAP
T SSP 230.00 230.00 0.74 1 2 GEYSERS #18 TAP
T 230.00 230.00 71.08 1 3 DELEVAN VACA #3
T SSP 230.00 230.00 48.80 1 4 GOLD HILL EIGHT MILE ROAD
T 230.00 230.00 46.67 1 5 GOLD HILL LODI STIG
T SSP 230.00 230.00 7.00 1 6 GREGG ASHLAN
T 230.00 230.00 0.60 1 7 GREGG HERNDON #1
T 230.00 230.00 0.63 1 8 GREGG HERNDON #2
T SSP 230.00 230.00 44.21 1 9 HAAS MCCALL
T 230.00 230.00 30.84 1 10 HELM MCCALL
T 230.00 230.00 60.67 1 11 HELMS GREGG #1
T 230.00 230.00 60.68 1 12 HELMS GREGG #2
T SSP 230.00 230.00 6.39 1 13 HERNDON ASHLAN
T SSP 230.00 230.00 63.86 1 14 GATES MIDWAY
T 230.00 230.00 10.81 1 15 HERNDON KEARNEY
T SSP 230.00 230.00 9.07 1 16 HICKS METCALF
T SSP 230.00 230.00 42.49 1 17 IGNACIO SOBRANTE
T SSP 230.00 230.00 7.95 1 18 KELSO TESLA
SSP 230.00 230.00 0.06 1 19 RALPH TAP
T SSP 230.00 230.00 15.49 1 20 LAKEVILLE IGNACIO #1
T SSP 230.00 230.00 25.51 1 21 FULTON LAKEVILLE
SSP 230.00 230.00 47.89 1 22 LAKEVILLE SOBRANTE #2
T SSP 230.00 230.00 17.22 1 23 LAKEVILLE TULUCAY
T SSP 230.00 230.00 20.93 1 24 LAS POSITAS NEWARK
T 230.00 230.00 12.32 1 25 LOCKEFORD BELLOTA
T SSP 230.00 230.00 12.14 1 26 PANOCHE TRANQUILLITY SW STA #1
T SSP 230.00 230.00 2.18 1 27 LODI STIG EIGHT MILE ROAD
T SSP 230.00 230.00 7.20 1 28 EIGHT MILE ROAD STAGG
T 230.00 230.00 71.04 1 29 DELEVAN VACA #1
T 230.00 230.00 14.31 1 30 LOS BANOS DOS AMIGOS
T SSP 230.00 230.00 33.58 1 31 PADRE FLAT SW STA PANOCHE
T SSP 230.00 230.00 37.13 1 32 LOS BANOS PANOCHE #2
T 230.00 230.00 3.43 1 33 LOS BANOS SAN LUIS PUMPS #1
T 230.00 230.00 3.43 1 34 LOS BANOS SAN LUIS PUMPS #2
T 230.00 230.00 57.55 1 35 QUINTO SW STA WESTLEY
FERC FORM NO. 1 (ED. 12-87) Page 422.18
36 TOTAL 36,671.97 1,451

Name of Respondent This Report Is:(1) An Original
(2) A Resubmission
Date of Report(Mo, Da, Yr)
Year/Period of Report
End of
TRANSMISSION LINE STATISTICS
PACIFIC GAS AND ELECTRIC COMPANYX
04/13/20212020/Q4
Line
No.
(c)(b)(a) (d) (e)
DESIGNATION
From To
(f) (g)
VOLTAGE (KV)(Indicate whereother than60 cycle, 3 phase)
Operating Designed
Type of
Supporting
Structure
LENGTH (Pole miles)(In the case of
underground linesreport circuit miles)
On Structureof Line
Designated
On Structuresof Another
Line
Number
Of
Circuits
(h)
1. Report information concerning transmission lines, cost of lines, and expenses for year. List each transmission line having nominal voltage of 132
kilovolts or greater. Report transmission lines below these voltages in group totals only for each voltage.
2. Transmission lines include all lines covered by the definition of transmission system plant as given in the Uniform System of Accounts. Do not report
substation costs and expenses on this page.
3. Report data by individual lines for all voltages if so required by a State commission.
4. Exclude from this page any transmission lines for which plant costs are included in Account 121, Nonutility Property.
5. Indicate whether the type of supporting structure reported in column (e) is: (1) single pole wood or steel; (2) H-frame wood, or steel poles; (3) tower;
or (4) underground construction If a transmission line has more than one type of supporting structure, indicate the mileage of each type of construction
by the use of brackets and extra lines. Minor portions of a transmission line of a different type of construction need not be distinguished from the
remainder of the line.
6. Report in columns (f) and (g) the total pole miles of each transmission line. Show in column (f) the pole miles of line on structures the cost of which is
reported for the line designated; conversely, show in column (g) the pole miles of line on structures the cost of which is reported for another line. Report
pole miles of line on leased or partly owned structures in column (g). In a footnote, explain the basis of such occupancy and state whether expenses with
respect to such structures are included in the expenses reported for the line designated.
T 230.00 230.00 12.06 1 1 LOS BANOS QUINTO SW STA
T SSP 230.00 230.00 61.61 1 2 MELONES WILSON
T 230.00 230.00 27.83 1 3 MONTA VISTA COYOTE SW STA
230.00 230.00 28.59 1 4 METCALF MONTA VISTA #3
T 230.00 230.00 0.88 1 5 COYOTE SW STA METCALF
T SSP 230.00 230.00 35.76 1 6 METCALF MOSS LANDING #1
SSP 230.00 230.00 35.76 1 7 METCALF MOSS LANDING #2
SWP T SSP 230.00 230.00 44.08 1 8 MIDDLE FORK GOLD HILL
T SSP 230.00 230.00 40.93 1 9 MIDWAY KERN #1
T SSP 230.00 230.00 7.29 1 10 BAKERSFIELD #1 TAP
T SSP 230.00 230.00 6.25 1 11 STOCKDALE #1 TAP
T SSP 230.00 230.00 20.94 1 12 MIDWAY KERN #3
T 230.00 230.00 6.16 1 13 STOCKDALE #2 TAP
T SSP 230.00 230.00 20.78 1 14 MIDWAY KERN #4
T 230.00 230.00 6.62 1 15 BAKERSFIELD #2 TAP
T 230.00 230.00 52.68 1 16 MIDWAY WHEELER RIDGE #1
T 230.00 230.00 1.18 1 17 BUENA VISTA PUMPING
T 230.00 230.00 0.25 1 18 WHEELER RIDGE PUMPING
T 230.00 230.00 1.64 1 19 WIND GAP PUMPING PLANT
T 230.00 230.00 0.57 1 20 MIDWAY SUNSET
230.00 230.00 52.65 1 21 MIDWAY WHEELER RIDGE #2
T 230.00 230.00 1.21 1 22 BUENA VISTA PUMPING
230.00 230.00 0.23 1 23 WHEELER RIDGE PUMPING
230.00 230.00 1.62 1 24 WIND GAP PUMPING PLANT
T SSP 230.00 230.00 13.27 1 25 MONTA VISTA HICKS
T 230.00 230.00 8.22 1 26 SOLAR SW STA CALIENTE SW STA #1
T SSP 230.00 230.00 27.17 1 27 CALIENTE SW STA MIDWAY #1
T SSP 230.00 230.00 19.72 1 28 MONTA VISTA JEFFERSON #1
T 230.00 230.00 8.22 1 29 SOLAR SW STA CALIENTE SW STA #2
T 230.00 230.00 27.16 1 30 CALIENTE SW STA MIDWAY #2
SSP 230.00 230.00 19.73 1 31 MONTA VISTA JEFFERSON #2
T SSP 230.00 230.00 5.49 1 32 MONTA VISTA SARATOGA
T 230.00 230.00 14.92 1 33 MORAGA CASTRO VALLEY
230.00 230.00 15.78 1 34 MORRO BAY DIABLO
T SSP 230.00 230.00 46.19 1 35 MORRO BAY CALIFORNIA FLATS SW STA
FERC FORM NO. 1 (ED. 12-87) Page 422.19
36 TOTAL 36,671.97 1,451

Name of Respondent This Report Is:(1) An Original
(2) A Resubmission
Date of Report(Mo, Da, Yr)
Year/Period of Report
End of
TRANSMISSION LINE STATISTICS
PACIFIC GAS AND ELECTRIC COMPANYX
04/13/20212020/Q4
Line
No.
(c)(b)(a) (d) (e)
DESIGNATION
From To
(f) (g)
VOLTAGE (KV)(Indicate whereother than60 cycle, 3 phase)
Operating Designed
Type of
Supporting
Structure
LENGTH (Pole miles)(In the case of
underground linesreport circuit miles)
On Structureof Line
Designated
On Structuresof Another
Line
Number
Of
Circuits
(h)
1. Report information concerning transmission lines, cost of lines, and expenses for year. List each transmission line having nominal voltage of 132
kilovolts or greater. Report transmission lines below these voltages in group totals only for each voltage.
2. Transmission lines include all lines covered by the definition of transmission system plant as given in the Uniform System of Accounts. Do not report
substation costs and expenses on this page.
3. Report data by individual lines for all voltages if so required by a State commission.
4. Exclude from this page any transmission lines for which plant costs are included in Account 121, Nonutility Property.
5. Indicate whether the type of supporting structure reported in column (e) is: (1) single pole wood or steel; (2) H-frame wood, or steel poles; (3) tower;
or (4) underground construction If a transmission line has more than one type of supporting structure, indicate the mileage of each type of construction
by the use of brackets and extra lines. Minor portions of a transmission line of a different type of construction need not be distinguished from the
remainder of the line.
6. Report in columns (f) and (g) the total pole miles of each transmission line. Show in column (f) the pole miles of line on structures the cost of which is
reported for the line designated; conversely, show in column (g) the pole miles of line on structures the cost of which is reported for another line. Report
pole miles of line on leased or partly owned structures in column (g). In a footnote, explain the basis of such occupancy and state whether expenses with
respect to such structures are included in the expenses reported for the line designated.
T SSP 230.00 230.00 22.57 1 1 CALIFORNIA FLATS SW STA GATES
T 230.00 230.00 35.27 1 2 MORRO BAY MESA
T SSP 230.00 230.00 45.55 1 3 MORRO BAY SOLAR SW STA #1
T SSP 230.00 230.00 45.56 1 4 MORRO BAY SOLAR SW STA #2
SWP T SSP 230.00 230.00 64.03 1 5 MOSS LANDING COBURN
SSP 230.00 230.00 51.89 1 6 MOSS LANDING LAS AGUILAS SW STA - 230
SSP 230.00 230.00 11.88 1 7 RAVENSWOOD SAN MATEO #2
T SSP 230.00 230.00 63.25 1 8 LOS ESTEROS METCALF
SWP T SSP 230.00 230.00 40.88 1 9 TESLA NEWARK #2
T SSP 230.00 230.00 29.60 1 10 PALERMO COLGATE
T SSP 230.00 230.00 12.68 1 11 TRANQUILLITY SW STA HELM
T SSP 230.00 230.00 36.90 1 12 TRANQUILLITY SW STA KEARNEY
SWP T SSP 230.00 230.00 59.75 1 13 PIT #1 COTTONWOOD
T 230.00 230.00 0.04 1 14 BURNEY FOREST
T 230.00 230.00 0.05 1 15 SPI (BURNEY) TAP
T SSP 230.00 230.00 22.69 1 16 PIT #3 PIT #1
T SSP 230.00 230.00 12.61 1 17 CARBERRY SW STA ROUND MTN
SWP T SSP 230.00 230.00 13.12 1 18 PIT #5 ROUND MTN #1
SSP 230.00 230.00 0.11 1 19 COVE ROAD TAP
SWP T SSP 230.00 230.00 13.11 1 20 PIT #5 ROUND MTN #2
T 230.00 230.00 0.51 1 21 BLACK TAP
T SSP 230.00 230.00 7.03 1 22 PIT #4 TAP
SWP T SSP 230.00 230.00 8.15 1 23 PIT #6 JCT ROUND MTN
SWP T SSP 230.00 230.00 3.43 1 24 PIT #6 TAP
SWP T 230.00 230.00 3.59 1 25 PIT #7 TAP
T SSP 230.00 230.00 10.91 1 26 PIT #3 CARBERRY SW STA
T 230.00 230.00 0.69 1 27 ROSSMOOR #1 TAP
T SSP 230.00 230.00 26.76 1 28 CONTRA COSTA MORAGA #1
T SSP 230.00 230.00 26.83 1 29 CONTRA COSTA MORAGA #2
T 230.00 230.00 0.66 1 30 ROSSMOOR #2 TAP
SWP T SSP 230.00 230.00 34.92 1 31 PITTSBURG EASTSHORE
T SSP 230.00 230.00 47.40 1 32 PITTSBURG SAN MATEO
SSP 230.00 230.00 17.36 1 33 PITTSBURG TASSAJARA
T SSP 230.00 230.00 12.14 1 34 PANOCHE TRANQUILLITY SW STA #2
SWP T SSP 230.00 230.00 21.66 1 35 PITTSBURG SAN RAMON
FERC FORM NO. 1 (ED. 12-87) Page 422.20
36 TOTAL 36,671.97 1,451

Name of Respondent This Report Is:(1) An Original
(2) A Resubmission
Date of Report(Mo, Da, Yr)
Year/Period of Report
End of
TRANSMISSION LINE STATISTICS
PACIFIC GAS AND ELECTRIC COMPANYX
04/13/20212020/Q4
Line
No.
(c)(b)(a) (d) (e)
DESIGNATION
From To
(f) (g)
VOLTAGE (KV)(Indicate whereother than60 cycle, 3 phase)
Operating Designed
Type of
Supporting
Structure
LENGTH (Pole miles)(In the case of
underground linesreport circuit miles)
On Structureof Line
Designated
On Structuresof Another
Line
Number
Of
Circuits
(h)
1. Report information concerning transmission lines, cost of lines, and expenses for year. List each transmission line having nominal voltage of 132
kilovolts or greater. Report transmission lines below these voltages in group totals only for each voltage.
2. Transmission lines include all lines covered by the definition of transmission system plant as given in the Uniform System of Accounts. Do not report
substation costs and expenses on this page.
3. Report data by individual lines for all voltages if so required by a State commission.
4. Exclude from this page any transmission lines for which plant costs are included in Account 121, Nonutility Property.
5. Indicate whether the type of supporting structure reported in column (e) is: (1) single pole wood or steel; (2) H-frame wood, or steel poles; (3) tower;
or (4) underground construction If a transmission line has more than one type of supporting structure, indicate the mileage of each type of construction
by the use of brackets and extra lines. Minor portions of a transmission line of a different type of construction need not be distinguished from the
remainder of the line.
6. Report in columns (f) and (g) the total pole miles of each transmission line. Show in column (f) the pole miles of line on structures the cost of which is
reported for the line designated; conversely, show in column (g) the pole miles of line on structures the cost of which is reported for another line. Report
pole miles of line on leased or partly owned structures in column (g). In a footnote, explain the basis of such occupancy and state whether expenses with
respect to such structures are included in the expenses reported for the line designated.
230.00 230.00 11.27 1 1 PITTSBURG TESORO
T SSP 230.00 230.00 31.35 1 2 PITTSBURG TESLA #1
SWP T SSP 230.00 230.00 31.32 1 3 PITTSBURG TESLA #2
T 230.00 230.00 11.27 1 4 PITTSBURG TIDEWATER
T SSP 230.00 230.00 56.09 1 5 POE RIO OSO
T 230.00 230.00 27.39 1 6 RANCHO SECO BELLOTA #1
230.00 230.00 27.36 1 7 RANCHO SECO BELLOTA #2
T SSP 230.00 230.00 11.89 1 8 RAVENSWOOD SAN MATEO #1
T SSP 230.00 230.00 17.68 1 9 RIO OSO ATLANTIC
T 230.00 230.00 27.17 1 10 RIO OSO BRIGHTON
T 230.00 230.00 28.63 1 11 RIO OSO GOLD HILL
T 230.00 230.00 65.13 1 12 RIO OSO LOCKEFORD
SWP T SSP 230.00 230.00 26.98 1 13 ROCK CREEK POE
T OTHERS 230.00 230.00 33.67 1 14 ROUND MTN COTTONWOOD #2
T OTHERS 230.00 230.00 33.36 1 15 ROUND MTN COTTONWOOD #3
T SSP 230.00 230.00 22.24 1 16 SAN RAMON MORAGA
230.00 230.00 12.32 1 17 TESORO SOBRANTE
230.00 230.00 23.64 1 18 STAGG TESLA
T OTHERS 230.00 230.00 14.57 1 19 TABLE MTN PALERMO
230.00 230.00 50.18 1 20 TABLE MTN RIO OSO
SSP 230.00 230.00 3.30 1 21 JEFFERSON MARTIN
T 230.00 230.00 28.19 1 22 TESLA NEWARK #1
SSP 230.00 230.00 37.14 1 23 TESLA RAVENSWOOD
T 230.00 230.00 5.68 1 24 TESLA TRACY #1
230.00 230.00 5.68 1 25 TESLA TRACY #2
T 230.00 230.00 45.06 1 26 TESLA WESTLEY
T SSP 230.00 230.00 12.32 1 27 TIDEWATER SOBRANTE
T OTHERS 230.00 230.00 13.65 1 28 TIGER CREEK ELECTRA
T OTHERS 230.00 230.00 24.22 1 29 TIGER CREEK VALLEY SPRINGS
T SSP 230.00 230.00 23.63 1 30 TULUCAY VACA
T SSP 230.00 230.00 33.90 1 31 VACA BAHIA
T 230.00 230.00 7.04 1 32 LAMBIE SW STA BIRDS LANDING SW STA
T SSP 230.00 230.00 9.69 1 33 VACA PEABODY
T SSP 230.00 230.00 10.20 1 34 BIRDS LANDING SW STA CONTRA COSTA PP
T SSP 230.00 230.00 40.93 1 35 VACA LAKEVILLE #1
FERC FORM NO. 1 (ED. 12-87) Page 422.21
36 TOTAL 36,671.97 1,451

Name of Respondent This Report Is:(1) An Original
(2) A Resubmission
Date of Report(Mo, Da, Yr)
Year/Period of Report
End of
TRANSMISSION LINE STATISTICS
PACIFIC GAS AND ELECTRIC COMPANYX
04/13/20212020/Q4
Line
No.
(c)(b)(a) (d) (e)
DESIGNATION
From To
(f) (g)
VOLTAGE (KV)(Indicate whereother than60 cycle, 3 phase)
Operating Designed
Type of
Supporting
Structure
LENGTH (Pole miles)(In the case of
underground linesreport circuit miles)
On Structureof Line
Designated
On Structuresof Another
Line
Number
Of
Circuits
(h)
1. Report information concerning transmission lines, cost of lines, and expenses for year. List each transmission line having nominal voltage of 132
kilovolts or greater. Report transmission lines below these voltages in group totals only for each voltage.
2. Transmission lines include all lines covered by the definition of transmission system plant as given in the Uniform System of Accounts. Do not report
substation costs and expenses on this page.
3. Report data by individual lines for all voltages if so required by a State commission.
4. Exclude from this page any transmission lines for which plant costs are included in Account 121, Nonutility Property.
5. Indicate whether the type of supporting structure reported in column (e) is: (1) single pole wood or steel; (2) H-frame wood, or steel poles; (3) tower;
or (4) underground construction If a transmission line has more than one type of supporting structure, indicate the mileage of each type of construction
by the use of brackets and extra lines. Minor portions of a transmission line of a different type of construction need not be distinguished from the
remainder of the line.
6. Report in columns (f) and (g) the total pole miles of each transmission line. Show in column (f) the pole miles of line on structures the cost of which is
reported for the line designated; conversely, show in column (g) the pole miles of line on structures the cost of which is reported for another line. Report
pole miles of line on leased or partly owned structures in column (g). In a footnote, explain the basis of such occupancy and state whether expenses with
respect to such structures are included in the expenses reported for the line designated.
T 230.00 230.00 13.95 1 1 VACA LAMBIE SW STA
T SSP 230.00 230.00 27.76 1 2 VACA PARKWAY
T 230.00 230.00 20.67 1 3 VALLEY SPRINGS BELLOTA
230.00 230.00 38.40 1 4 WARNERVILLE WILSON
T 230.00 230.00 23.71 1 5 WEBER TESLA
T SSP 230.00 230.00 35.31 1 6 WILSON BORDEN #1
T 230.00 230.00 40.89 1 7 COLGATE RIO OSO
T 230.00 230.00 0.12 1 8 MALACHA TAP
T SSP 230.00 230.00 31.80 1 9 TASSAJARA NEWARK
T SSP 230.00 230.00 3.27 1 10 SAN RAMON RESEARCH
T 230.00 230.00 23.64 1 11 PARKWAY MORAGA
T SSP 230.00 230.00 3.41 1 12 SARATOGA VASONA
T SSP 230.00 230.00 13.29 1 13 VASONA METCALF
T SSP 230.00 230.00 16.43 1 14 MORRO BAY TEMPLETON
T 230.00 230.00 52.18 1 15 TEMPLETON GATES
T 230.00 230.00 3.08 1 16 VACA DIXON MORAGA #1
T 230.00 230.00 8.91 1 17 NEWARK RAVENSWOOD
T 500.00 500.00 0.54 1 18 DIABLO UNIT #1
T 500.00 500.00 0.57 1 19 DIABLO UNIT #2
T 500.00 500.00 79.23 1 20 DIABLO GATES #1
T 500.00 500.00 84.07 1 21 DIABLO MIDWAY #2
T 500.00 500.00 84.67 1 22 DIABLO MIDWAY #3
T SSP 500.00 500.00 63.78 1 23 GATES MIDWAY
T 500.00 500.00 80.85 1 24 LOS BANOS GATES #1
T 500.00 500.00 144.82 1 25 LOS BANOS MIDWAY #2
T OTHERS 500.00 500.00 46.90 1 26 MALIN ROUND MTN #2
T 500.00 500.00 52.77 1 27 MIDWAY WHIRLWIND
T SSP 500.00 500.00 51.33 1 28 MOSS LANDING LOS BANOS
T 500.00 500.00 34.98 1 29 MOSS LANDING METCALF
T SSP 500.00 500.00 89.03 1 30 ROUND MTN TABLE MTN #1
T SSP 500.00 500.00 89.02 1 31 ROUND MTN TABLE MTN #2
T OTHERS 500.00 500.00 134.99 1 32 TABLE MTN TESLA
T 500.00 500.00 83.30 1 33 TABLE MTN VACA
T 500.00 500.00 57.14 1 34 TESLA LOS BANOS #1
T 500.00 500.00 35.31 1 35 TESLA METCALF
FERC FORM NO. 1 (ED. 12-87) Page 422.22
36 TOTAL 36,671.97 1,451

Name of Respondent This Report Is:(1) An Original
(2) A Resubmission
Date of Report(Mo, Da, Yr)
Year/Period of Report
End of
TRANSMISSION LINE STATISTICS
PACIFIC GAS AND ELECTRIC COMPANYX
04/13/20212020/Q4
Line
No.
(c)(b)(a) (d) (e)
DESIGNATION
From To
(f) (g)
VOLTAGE (KV)(Indicate whereother than60 cycle, 3 phase)
Operating Designed
Type of
Supporting
Structure
LENGTH (Pole miles)(In the case of
underground linesreport circuit miles)
On Structureof Line
Designated
On Structuresof Another
Line
Number
Of
Circuits
(h)
1. Report information concerning transmission lines, cost of lines, and expenses for year. List each transmission line having nominal voltage of 132
kilovolts or greater. Report transmission lines below these voltages in group totals only for each voltage.
2. Transmission lines include all lines covered by the definition of transmission system plant as given in the Uniform System of Accounts. Do not report
substation costs and expenses on this page.
3. Report data by individual lines for all voltages if so required by a State commission.
4. Exclude from this page any transmission lines for which plant costs are included in Account 121, Nonutility Property.
5. Indicate whether the type of supporting structure reported in column (e) is: (1) single pole wood or steel; (2) H-frame wood, or steel poles; (3) tower;
or (4) underground construction If a transmission line has more than one type of supporting structure, indicate the mileage of each type of construction
by the use of brackets and extra lines. Minor portions of a transmission line of a different type of construction need not be distinguished from the
remainder of the line.
6. Report in columns (f) and (g) the total pole miles of each transmission line. Show in column (f) the pole miles of line on structures the cost of which is
reported for the line designated; conversely, show in column (g) the pole miles of line on structures the cost of which is reported for another line. Report
pole miles of line on leased or partly owned structures in column (g). In a footnote, explain the basis of such occupancy and state whether expenses with
respect to such structures are included in the expenses reported for the line designated.
T SSP 500.00 500.00 1.13 1 1 TESLA TRACY
T SSP 500.00 500.00 56.23 1 2 TRACY LOS BANOS
T 500.00 500.00 57.00 1 3 VACA TESLA
SWP SSP 60.00 60.00 24.90 1 4 ALMENDRA JCT NICOLAUS
SSP 230.00 230.00 1.19 1 5 RUSSELL CITY ENERGY EASTSHORE #1
SSP 230.00 230.00 1.20 1 6 RUSSELL CITY ENERGY EASTSHORE #2
T SSP 230.00 230.00 15.40 1 7 LONE TREE CAYETANO
T SSP 230.00 230.00 9.46 1 8 BIRDS LANDING SW STA CONTRA COSTA SUB
SWP SSP 60.00 60.00 4.42 1 9 DEL MAR ATLANTIC #2
SWP T SSP 230.00 230.00 19.85 1 10 PEABODY BIRDS LANDING SW STA
SWP T SSP 115.00 115.00 5.33 1 11 ATLANTIC PLEASANT GROVE #1
SWP T SSP 60.00 60.00 5.55 1 12 BAIR COOLEY LANDING #1
SWP SSP 60.00 60.00 0.45 1 13 BELLE HAVEN #1 TAP
T SSP 60.00 60.00 5.60 1 14 BAIR COOLEY LANDING #2
SWP 60.00 60.00 0.40 1 15 BELLE HAVEN #2 TAP
SWP SSP 60.00 60.00 36.16 1 16 BRIDGEVILLE GARBERVILLE
SWP SSP 60.00 60.00 4.26 1 17 FRUITLAND TAP
SWP SSP 60.00 60.00 7.70 1 18 FORT SEWARD TAP
SWP SSP 60.00 60.00 5.44 1 19 BURNS LONE STAR #1
SWP 60.00 60.00 1.18 1 20 LONE STAR TAP
SWP SSP 60.00 60.00 6.31 1 21 BURNS LONE STAR #2
SWP SSP 60.00 60.00 1.94 1 22 CRUSHER TAP
SWP 60.00 60.00 0.79 1 23 BUTTE CHICO #1
SWP 60.00 60.00 0.74 1 24 BUTTE CHICO #2
SWP SSP 60.00 60.00 9.87 1 25 BUTTE ESQUON
SWP SSP 60.00 60.00 42.08 1 26 CARIBOU #2
SWP SSP 60.00 60.00 21.26 1 27 CARIBOU PLUMAS JCT
SWP 60.00 60.00 0.75 1 28 PLUMAS-SIERRA TAP
SWP 60.00 60.00 0.17 1 29 SIERRA PAC IND (QUINCY)
SWP SSP 60.00 60.00 21.10 1 30 CARIBOU WESTWOOD
SWP SSP 60.00 60.00 15.98 1 31 CASCADE BENTON-DESCHUTES
SWP SSP 60.00 60.00 1.86 1 32 WINTU TAP
SWP SSP 60.00 60.00 21.50 1 33 CENTERVILLE TABLE MTN
SWP SSP 60.00 60.00 26.11 1 34 CENTERVILLE TABLE MTN-OROVILLE
T 230.00 230.00 12.35 1 35 LOGAN CREEK DELEVAN
FERC FORM NO. 1 (ED. 12-87) Page 422.23
36 TOTAL 36,671.97 1,451

Name of Respondent This Report Is:(1) An Original
(2) A Resubmission
Date of Report(Mo, Da, Yr)
Year/Period of Report
End of
TRANSMISSION LINE STATISTICS
PACIFIC GAS AND ELECTRIC COMPANYX
04/13/20212020/Q4
Line
No.
(c)(b)(a) (d) (e)
DESIGNATION
From To
(f) (g)
VOLTAGE (KV)(Indicate whereother than60 cycle, 3 phase)
Operating Designed
Type of
Supporting
Structure
LENGTH (Pole miles)(In the case of
underground linesreport circuit miles)
On Structureof Line
Designated
On Structuresof Another
Line
Number
Of
Circuits
(h)
1. Report information concerning transmission lines, cost of lines, and expenses for year. List each transmission line having nominal voltage of 132
kilovolts or greater. Report transmission lines below these voltages in group totals only for each voltage.
2. Transmission lines include all lines covered by the definition of transmission system plant as given in the Uniform System of Accounts. Do not report
substation costs and expenses on this page.
3. Report data by individual lines for all voltages if so required by a State commission.
4. Exclude from this page any transmission lines for which plant costs are included in Account 121, Nonutility Property.
5. Indicate whether the type of supporting structure reported in column (e) is: (1) single pole wood or steel; (2) H-frame wood, or steel poles; (3) tower;
or (4) underground construction If a transmission line has more than one type of supporting structure, indicate the mileage of each type of construction
by the use of brackets and extra lines. Minor portions of a transmission line of a different type of construction need not be distinguished from the
remainder of the line.
6. Report in columns (f) and (g) the total pole miles of each transmission line. Show in column (f) the pole miles of line on structures the cost of which is
reported for the line designated; conversely, show in column (g) the pole miles of line on structures the cost of which is reported for another line. Report
pole miles of line on leased or partly owned structures in column (g). In a footnote, explain the basis of such occupancy and state whether expenses with
respect to such structures are included in the expenses reported for the line designated.
SWP SSP 60.00 60.00 5.01 1 1 CHRISTIE FRANKLIN #1
SWP SSP 60.00 60.00 1.04 1 2 UNION CHEMICAL TAP
SWP SSP 60.00 60.00 5.11 1 3 CHRISTIE FRANKLIN #2
SWP 60.00 60.00 0.40 1 4 SEQUOIA TAP
SWP T SSP 60.00 60.00 15.93 1 5 CHRISTIE WILLOW PASS
SWP SSP 60.00 60.00 0.05 1 6 PORT COSTA BRICK TAP
SWP SSP 60.00 60.00 1.84 1 7 PORT COSTA BRICK TAP
SWP SSP 60.00 60.00 0.58 1 8 STAUFFER TAP
SWP 60.00 60.00 0.21 1 9 URICH TAP
SWP SSP 115.00 115.00 0.09 1 10 DRUM PH #2 TAP
SWP SSP 60.00 60.00 19.87 1 11 KONOCTI MIDDLETOWN
SWP SSP 60.00 60.00 11.54 1 12 CLEAR LAKE HOPLAND
SWP SSP 60.00 60.00 3.39 1 13 COBURN BASIC ENERGY
SWP SSP 60.00 60.00 29.46 1 14 COBURN OIL FIELDS #1
SWP SSP 60.00 60.00 0.72 1 15 TEXACO TAP
SWP SSP 60.00 60.00 31.05 1 16 COBURN OIL FIELDS #2
SWP SSP 60.00 60.00 0.34 1 17 SAN ARDO TAP
SWP SSP 60.00 60.00 8.58 1 18 COLEMAN COTTONWOOD
SWP SSP 60.00 60.00 48.31 1 19 COLEMAN RED BLUFF
SWP SSP 60.00 60.00 13.39 1 20 COLEMAN SOUTH
SSP 60.00 60.00 0.19 1 21 COLGATE PH COLGATE SW STA
SWP SSP 60.00 60.00 24.55 1 22 COLGATE ALLEGHANY
SWP SSP 60.00 60.00 13.04 1 23 COLGATE CHALLENGE
SWP T SSP 60.00 60.00 13.17 1 24 COLGATE GRASS VALLEY
SWP SSP 60.00 60.00 22.65 1 25 COLGATE PALERMO
SWP SSP 60.00 60.00 11.26 1 26 COLGATE SMARTVILLE #1
SWP SSP 60.00 60.00 2.65 1 27 NARROWS #1 TAP
SWP SSP 60.00 60.00 11.19 1 28 COLGATE SMARTVILLE #2
SWP SSP 60.00 60.00 3.10 1 29 NARROWS #2 TAP
SWP 60.00 60.00 0.09 1 30 SMARTVILLE TAP
SWP T 60.00 60.00 2.65 1 31 CONTRA COSTA DU PONT
SWP T 60.00 60.00 0.25 1 32 GWF #4 TAP
SWP T SSP 60.00 60.00 6.28 1 33 CONTRA COSTA PITTSBURG
60.00 60.00 9.55 1 34 CONTRA COSTA SHELL CHEMICAL#1(21KV)
SSP 60.00 60.00 1.15 1 35 PITTSBURG #1 TAP (NO
FERC FORM NO. 1 (ED. 12-87) Page 422.24
36 TOTAL 36,671.97 1,451

Name of Respondent This Report Is:(1) An Original
(2) A Resubmission
Date of Report(Mo, Da, Yr)
Year/Period of Report
End of
TRANSMISSION LINE STATISTICS
PACIFIC GAS AND ELECTRIC COMPANYX
04/13/20212020/Q4
Line
No.
(c)(b)(a) (d) (e)
DESIGNATION
From To
(f) (g)
VOLTAGE (KV)(Indicate whereother than60 cycle, 3 phase)
Operating Designed
Type of
Supporting
Structure
LENGTH (Pole miles)(In the case of
underground linesreport circuit miles)
On Structureof Line
Designated
On Structuresof Another
Line
Number
Of
Circuits
(h)
1. Report information concerning transmission lines, cost of lines, and expenses for year. List each transmission line having nominal voltage of 132
kilovolts or greater. Report transmission lines below these voltages in group totals only for each voltage.
2. Transmission lines include all lines covered by the definition of transmission system plant as given in the Uniform System of Accounts. Do not report
substation costs and expenses on this page.
3. Report data by individual lines for all voltages if so required by a State commission.
4. Exclude from this page any transmission lines for which plant costs are included in Account 121, Nonutility Property.
5. Indicate whether the type of supporting structure reported in column (e) is: (1) single pole wood or steel; (2) H-frame wood, or steel poles; (3) tower;
or (4) underground construction If a transmission line has more than one type of supporting structure, indicate the mileage of each type of construction
by the use of brackets and extra lines. Minor portions of a transmission line of a different type of construction need not be distinguished from the
remainder of the line.
6. Report in columns (f) and (g) the total pole miles of each transmission line. Show in column (f) the pole miles of line on structures the cost of which is
reported for the line designated; conversely, show in column (g) the pole miles of line on structures the cost of which is reported for another line. Report
pole miles of line on leased or partly owned structures in column (g). In a footnote, explain the basis of such occupancy and state whether expenses with
respect to such structures are included in the expenses reported for the line designated.
SWP T SSP 60.00 60.00 14.89 1 1 COOLEY LANDING LOS ALTOS
SWP T SSP 60.00 60.00 1.41 1 2 COOLEY LANDING LOS ALTOS (I2KV)
SWP T SSP 60.00 60.00 7.97 1 3 WESTINGHOUSE TAP
SWP SSP 60.00 60.00 6.04 1 4 COOLEY LANDING STANFORD
SWP 60.00 60.00 0.36 1 5 MENLO TAP
SWP SSP 60.00 60.00 26.29 1 6 CORTINA #1
SWP 60.00 60.00 0.53 1 7 HARRINGTON TAP
SWP SSP 60.00 60.00 26.61 1 8 CORTINA #2
SWP SSP 60.00 60.00 0.82 1 9 ARBUCKLE TAP
SWP SSP 60.00 60.00 24.80 1 10 CORTINA #3
SWP 60.00 60.00 1.68 1 11 WADHAM TAP
SSP 230.00 230.00 0.11 1 12 BIRDS LANDING SW STA RUSSELL
SWP SSP 60.00 60.00 45.28 1 13 CORTINA #4
SWP T SSP 60.00 60.00 48.16 1 14 COTTONWOOD #1
SWP T SSP 60.00 60.00 23.63 1 15 COTTONWOOD #2
SWP SSP 60.00 60.00 0.68 1 16 RED BANK TAP
SWP SSP 60.00 60.00 15.53 1 17 COTTONWOOD BENTON #1
SWP SSP 60.00 60.00 14.67 1 18 COTTONWOOD BENTON #2
SWP SSP 60.00 60.00 16.78 1 19 COTTONWOOD RED BLUFF
SWP SSP 115.00 115.00 1.64 1 20 UC DAVIS #1 TAP
SWP SSP 115.00 115.00 1.61 1 21 UC DAVIS #2 TAP
SWP SSP 60.00 60.00 6.24 1 22 DEER CREEK DRUM
SWP SSP 60.00 60.00 2.53 1 23 DEL MONTE MONTEREY
SWP SSP 60.00 60.00 7.92 1 24 DEL MONTE VIEJO
SWP 60.00 60.00 0.19 1 25 NAVY LAB TAP
SWP T SSP 60.00 60.00 5.86 1 26 DESABLA CENTERVILLE
SWP SSP 60.00 60.00 1.30 1 27 ORO FINO TAP
SWP 60.00 60.00 0.20 1 28 FORKS OF THE BUTTE TAP
SWP T SSP 60.00 60.00 18.35 1 29 DIXON VACA #1
SWP SSP 60.00 60.00 2.88 1 30 TRAVIS TAP
SWP SSP 60.00 60.00 26.77 1 31 DIXON VACA #2
SWP SSP 60.00 60.00 6.85 1 32 CACHE SLOUGH TAP
SWP T SSP 60.00 60.00 15.14 1 33 DELTA MTN GATE JCT
SWP SSP 60.00 60.00 0.98 1 34 LODI INDUSTRIAL
SWP SSP 60.00 60.00 31.17 1 35 DRUM GRASS VALLEY-WEIMAR
FERC FORM NO. 1 (ED. 12-87) Page 422.25
36 TOTAL 36,671.97 1,451

Name of Respondent This Report Is:(1) An Original
(2) A Resubmission
Date of Report(Mo, Da, Yr)
Year/Period of Report
End of
TRANSMISSION LINE STATISTICS
PACIFIC GAS AND ELECTRIC COMPANYX
04/13/20212020/Q4
Line
No.
(c)(b)(a) (d) (e)
DESIGNATION
From To
(f) (g)
VOLTAGE (KV)(Indicate whereother than60 cycle, 3 phase)
Operating Designed
Type of
Supporting
Structure
LENGTH (Pole miles)(In the case of
underground linesreport circuit miles)
On Structureof Line
Designated
On Structuresof Another
Line
Number
Of
Circuits
(h)
1. Report information concerning transmission lines, cost of lines, and expenses for year. List each transmission line having nominal voltage of 132
kilovolts or greater. Report transmission lines below these voltages in group totals only for each voltage.
2. Transmission lines include all lines covered by the definition of transmission system plant as given in the Uniform System of Accounts. Do not report
substation costs and expenses on this page.
3. Report data by individual lines for all voltages if so required by a State commission.
4. Exclude from this page any transmission lines for which plant costs are included in Account 121, Nonutility Property.
5. Indicate whether the type of supporting structure reported in column (e) is: (1) single pole wood or steel; (2) H-frame wood, or steel poles; (3) tower;
or (4) underground construction If a transmission line has more than one type of supporting structure, indicate the mileage of each type of construction
by the use of brackets and extra lines. Minor portions of a transmission line of a different type of construction need not be distinguished from the
remainder of the line.
6. Report in columns (f) and (g) the total pole miles of each transmission line. Show in column (f) the pole miles of line on structures the cost of which is
reported for the line designated; conversely, show in column (g) the pole miles of line on structures the cost of which is reported for another line. Report
pole miles of line on leased or partly owned structures in column (g). In a footnote, explain the basis of such occupancy and state whether expenses with
respect to such structures are included in the expenses reported for the line designated.
SWP 60.00 60.00 0.31 1 1 CAPE HORN TAP
SWP SSP 60.00 60.00 0.73 1 2 ROLLINS TAP
SWP SSP 60.00 60.00 9.36 1 3 DRUM SPAULDING
SWP T SSP 60.00 60.00 16.05 1 4 ESSEX JCT ARCATA-FAIRHAVEN
SWP SSP 60.00 60.00 3.70 1 5 BLUE LAKE TAP
SWP 60.00 60.00 0.42 1 6 BLUE CHIP MILLING TAP
SWP SSP 60.00 60.00 1.17 1 7 ULTRA POWER TAP
SWP 60.00 60.00 0.39 1 8 SIMPSON-KORBEL TAP
SWP 60.00 60.00 1.78 1 9 JANES CREEK TAP
SWP SSP 60.00 60.00 31.29 1 10 ESSEX JCT ORICK
SWP 60.00 60.00 1.34 1 11 TRINIDAD TAP
SWP 60.00 60.00 0.22 1 12 EUREKA STA A
SWP SSP 60.00 60.00 6.38 1 13 ALMADEN LOS GATOS
SWP 60.00 60.00 4.96 1 14 EVERGREEN ALMADEN
SWP T 60.00 60.00 9.05 1 15 JEFFERSON #1
SWP 60.00 60.00 5.48 1 16 EVERGREEN MABURY
SWP 60.00 60.00 0.23 1 17 SENTER #1 TAP
SWP 60.00 60.00 0.14 1 18 JENNINGS TAP
SWP SSP 60.00 60.00 0.47 1 19 FAIRHAVEN #1
SWP SSP 60.00 60.00 10.99 1 20 CLEAR LAKE KONOCTI
SWP SSP 60.00 60.00 0.50 1 21 FAIRHAVEN POWER CO
SWP SSP 60.00 60.00 15.54 1 22 FAIRHAVEN HUMBOLDT
SWP SSP 60.00 60.00 9.66 1 23 KONOCTI EAGLE ROCK
SWP SSP 60.00 60.00 13.19 1 24 FRENCH MEADOWS MIDDLE FORK
SWP SSP 60.00 60.00 64.61 1 25 FULTON CALISTOGA
SWP SSP 60.00 60.00 41.10 1 26 FULTON HOPLAND
SWP SSP 60.00 60.00 0.86 1 27 FITCH MTN #1 TAP
SWP SSP 60.00 60.00 0.25 1 28 HEALDSBURG #1 TAP
SWP SSP 60.00 60.00 21.24 1 29 WINDSOR FITCH MOUNTAIN
SWP 60.00 60.00 0.07 1 30 FITCH MTN #2 TAP
SWP SSP 60.00 60.00 0.16 1 31 HEALDSBURG #2 TAP
SWP SSP 60.00 60.00 20.52 1 32 FULTON MOLINO-COTATI
SWP SSP 60.00 60.00 0.35 1 33 FULTON MOLINO-COTATI
SWP SSP 60.00 60.00 1.04 1 34 WASHOE TAP
SWP SSP 60.00 60.00 1.68 1 35 LAGUNA TAP
FERC FORM NO. 1 (ED. 12-87) Page 422.26
36 TOTAL 36,671.97 1,451

Name of Respondent This Report Is:(1) An Original
(2) A Resubmission
Date of Report(Mo, Da, Yr)
Year/Period of Report
End of
TRANSMISSION LINE STATISTICS
PACIFIC GAS AND ELECTRIC COMPANYX
04/13/20212020/Q4
Line
No.
(c)(b)(a) (d) (e)
DESIGNATION
From To
(f) (g)
VOLTAGE (KV)(Indicate whereother than60 cycle, 3 phase)
Operating Designed
Type of
Supporting
Structure
LENGTH (Pole miles)(In the case of
underground linesreport circuit miles)
On Structureof Line
Designated
On Structuresof Another
Line
Number
Of
Circuits
(h)
1. Report information concerning transmission lines, cost of lines, and expenses for year. List each transmission line having nominal voltage of 132
kilovolts or greater. Report transmission lines below these voltages in group totals only for each voltage.
2. Transmission lines include all lines covered by the definition of transmission system plant as given in the Uniform System of Accounts. Do not report
substation costs and expenses on this page.
3. Report data by individual lines for all voltages if so required by a State commission.
4. Exclude from this page any transmission lines for which plant costs are included in Account 121, Nonutility Property.
5. Indicate whether the type of supporting structure reported in column (e) is: (1) single pole wood or steel; (2) H-frame wood, or steel poles; (3) tower;
or (4) underground construction If a transmission line has more than one type of supporting structure, indicate the mileage of each type of construction
by the use of brackets and extra lines. Minor portions of a transmission line of a different type of construction need not be distinguished from the
remainder of the line.
6. Report in columns (f) and (g) the total pole miles of each transmission line. Show in column (f) the pole miles of line on structures the cost of which is
reported for the line designated; conversely, show in column (g) the pole miles of line on structures the cost of which is reported for another line. Report
pole miles of line on leased or partly owned structures in column (g). In a footnote, explain the basis of such occupancy and state whether expenses with
respect to such structures are included in the expenses reported for the line designated.
SWP SSP 60.00 60.00 33.37 1 1 GLENN #1
SWP SSP 60.00 60.00 20.44 1 2 ELK CREEK TAP
SWP SSP 60.00 60.00 34.69 1 3 GLENN #2
SWP SSP 60.00 60.00 28.51 1 4 GLENN #3
SWP SSP 60.00 60.00 0.97 1 5 HEADGATE TAP
SWP SSP 60.00 60.00 27.85 1 6 GOLD HILL #1
SWP SSP 60.00 60.00 4.74 1 7 GREEN VALLEY WATSONVILLE
SWP 60.00 60.00 0.13 1 8 CIC TAP
SWP 60.00 60.00 0.51 1 9 DEAN FOODS TAP
SWP SSP 60.00 60.00 14.30 1 10 MONTE RIO FORT ROSS
SWP SSP 60.00 60.00 29.76 1 11 FORT ROSS GUALALA
SWP SSP 60.00 60.00 10.51 1 12 SALMON CREEK TAP
SWP SSP 60.00 60.00 4.94 1 13 HALSEY PLACER
SWP SSP 60.00 60.00 2.63 1 14 MTN QUARRIES TAP
SWP SSP 60.00 60.00 0.75 1 15 AUBURN TAP
SWP SSP 60.00 60.00 12.27 1 16 HAMILTON BRANCH CHESTER
SWP 60.00 60.00 1.00 1 17 COLLINS PINE TAP
SWP SSP 60.00 60.00 8.82 1 18 HAMMER COUNTRY CLUB
SWP SSP 115.00 115.00 3.00 1 19 CHCF TAP
SWP T SSP 60.00 60.00 6.08 1 20 HAT CREEK #1 PIT #1
SWP SSP 60.00 60.00 55.74 1 21 HAT CREEK #1 WESTWOOD
SWP SSP 60.00 60.00 12.96 1 22 PIT #1 HAT CREEK #2-BURNEY
SWP SSP 60.00 60.00 1.09 1 23 BURNEY TAP
T SSP 230.00 230.00 37.42 1 24 GLENN DELEVAN
SWP SSP 60.00 60.00 20.50 1 25 HERDLYN BALFOUR
SWP SSP 60.00 60.00 7.02 1 26 MIDDLE RIVER TAP
SWP SSP 60.00 60.00 5.88 1 27 MCDONALD TAP
SWP SSP 60.00 60.00 3.97 1 28 MARSH TAP
SWP SSP 60.00 60.00 7.00 1 29 BRIONES TAP
SWP 60.00 60.00 0.55 1 30 BIXLER TAP
SWP SSP 60.00 60.00 6.82 1 31 HILLSDALE JCT HALF MOON BAY
SWP SSP 60.00 60.00 5.61 1 32 HUMBOLDT BAY EUREKA
SWP SSP 60.00 60.00 8.34 1 33 HUMBOLDT BAY HUMBOLDT #1
SWP SSP 60.00 60.00 6.45 1 34 HUMBOLDT BAY HUMBOLDT #2
SWP SSP 60.00 60.00 18.40 1 35 HUMBOLDT BAY RIO DELL JCT
FERC FORM NO. 1 (ED. 12-87) Page 422.27
36 TOTAL 36,671.97 1,451

Name of Respondent This Report Is:(1) An Original
(2) A Resubmission
Date of Report(Mo, Da, Yr)
Year/Period of Report
End of
TRANSMISSION LINE STATISTICS
PACIFIC GAS AND ELECTRIC COMPANYX
04/13/20212020/Q4
Line
No.
(c)(b)(a) (d) (e)
DESIGNATION
From To
(f) (g)
VOLTAGE (KV)(Indicate whereother than60 cycle, 3 phase)
Operating Designed
Type of
Supporting
Structure
LENGTH (Pole miles)(In the case of
underground linesreport circuit miles)
On Structureof Line
Designated
On Structuresof Another
Line
Number
Of
Circuits
(h)
1. Report information concerning transmission lines, cost of lines, and expenses for year. List each transmission line having nominal voltage of 132
kilovolts or greater. Report transmission lines below these voltages in group totals only for each voltage.
2. Transmission lines include all lines covered by the definition of transmission system plant as given in the Uniform System of Accounts. Do not report
substation costs and expenses on this page.
3. Report data by individual lines for all voltages if so required by a State commission.
4. Exclude from this page any transmission lines for which plant costs are included in Account 121, Nonutility Property.
5. Indicate whether the type of supporting structure reported in column (e) is: (1) single pole wood or steel; (2) H-frame wood, or steel poles; (3) tower;
or (4) underground construction If a transmission line has more than one type of supporting structure, indicate the mileage of each type of construction
by the use of brackets and extra lines. Minor portions of a transmission line of a different type of construction need not be distinguished from the
remainder of the line.
6. Report in columns (f) and (g) the total pole miles of each transmission line. Show in column (f) the pole miles of line on structures the cost of which is
reported for the line designated; conversely, show in column (g) the pole miles of line on structures the cost of which is reported for another line. Report
pole miles of line on leased or partly owned structures in column (g). In a footnote, explain the basis of such occupancy and state whether expenses with
respect to such structures are included in the expenses reported for the line designated.
SWP T SSP 60.00 60.00 2.31 1 1 EEL RIVER TAP
SWP 60.00 60.00 7.28 1 2 ARCATA HUMBOLDT
SWP 60.00 60.00 0.51 1 3 LP FLAKEBOARD TAP
SWP T SSP 60.00 60.00 11.08 1 4 HUMBOLDT #1
SWP SSP 60.00 60.00 4.73 1 5 HUMBOLDT EUREKA
SWP SSP 60.00 60.00 14.13 1 6 HUMBOLDT MAPLE CREEK
SWP SSP 60.00 60.00 15.02 1 7 IGNACIO BOLINAS #1
SWP SSP 60.00 60.00 17.79 1 8 IGNACIO ALTO
SWP T SSP 60.00 60.00 17.95 1 9 IGNACIO ALTO-SAUSALITO #1
SWP SSP 60.00 60.00 17.95 1 10 IGNACIO ALTO-SAUSALITO #2
SWP SSP 60.00 60.00 28.22 1 11 IGNACIO BOLINAS #2
SWP T SSP 60.00 60.00 14.73 1 12 JEFFERSON HILLSDALE JCT
SWP SSP 60.00 60.00 0.28 1 13 WATERSHED TAP
SWP SSP 60.00 60.00 6.00 1 14 JEFFERSON LAS PULGAS
SWP T SSP 60.00 60.00 7.19 1 15 MARTIN SNEATH LANE
SWP SSP 60.00 60.00 0.28 1 16 CRYSTAL SPRINGS TAP
SWP SSP 60.00 60.00 15.41 1 17 SNEATH LANE HALF MOON BAY
SWP SSP 60.00 60.00 7.64 1 18 JEFFERSON STANFORD
SWP 60.00 60.00 1.41 1 19 SLAC TAP
SWP SSP 60.00 60.00 0.19 1 20 KASSON #1
SWP SSP 60.00 60.00 7.32 1 21 KASSON CARBONA
SWP 60.00 60.00 1.34 1 22 LYOTH TAP
SWP 60.00 60.00 5.64 1 23 CARBONA #2 TAP
SWP 60.00 60.00 1.05 1 24 KASSON BANTA #1
SWP SSP 60.00 60.00 8.77 1 25 KASSON LOUISE
SWP 60.00 60.00 0.54 1 26 CALVO TAP
SSP 115.00 115.00 0.48 1 27 EASTSHORE CERBERUS
SWP SSP 60.00 60.00 9.36 1 28 KESWICK CASCADE
SWP SSP 60.00 60.00 30.42 1 29 KESWICK TRINITY
SWP SSP 60.00 60.00 13.33 1 30 KILARC CEDAR CREEK
SWP 60.00 60.00 0.02 1 31 CLOVER CREEK TAP
SWP SSP 60.00 60.00 27.29 1 32 KILARC DESCHUTES
T 60.00 60.00 1.93 1 33 KILARC VOLTA TIE
SWP SSP 60.00 60.00 21.89 1 34 KING CITY COBURN #1
SWP SSP 60.00 60.00 15.87 1 35 JOLON TAP
FERC FORM NO. 1 (ED. 12-87) Page 422.28
36 TOTAL 36,671.97 1,451
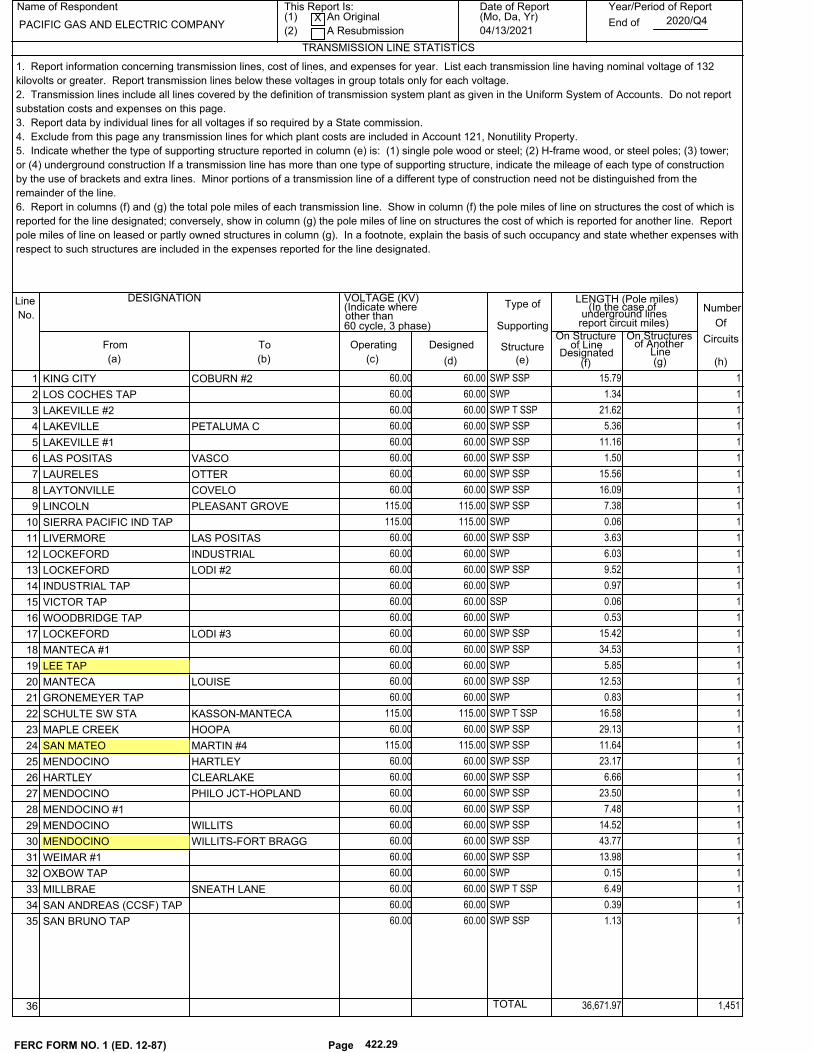
Name of Respondent This Report Is:(1) An Original
(2) A Resubmission
Date of Report(Mo, Da, Yr)
Year/Period of Report
End of
TRANSMISSION LINE STATISTICS
PACIFIC GAS AND ELECTRIC COMPANYX
04/13/20212020/Q4
Line
No.
(c)(b)(a) (d) (e)
DESIGNATION
From To
(f) (g)
VOLTAGE (KV)(Indicate whereother than60 cycle, 3 phase)
Operating Designed
Type of
Supporting
Structure
LENGTH (Pole miles)(In the case of
underground linesreport circuit miles)
On Structureof Line
Designated
On Structuresof Another
Line
Number
Of
Circuits
(h)
1. Report information concerning transmission lines, cost of lines, and expenses for year. List each transmission line having nominal voltage of 132
kilovolts or greater. Report transmission lines below these voltages in group totals only for each voltage.
2. Transmission lines include all lines covered by the definition of transmission system plant as given in the Uniform System of Accounts. Do not report
substation costs and expenses on this page.
3. Report data by individual lines for all voltages if so required by a State commission.
4. Exclude from this page any transmission lines for which plant costs are included in Account 121, Nonutility Property.
5. Indicate whether the type of supporting structure reported in column (e) is: (1) single pole wood or steel; (2) H-frame wood, or steel poles; (3) tower;
or (4) underground construction If a transmission line has more than one type of supporting structure, indicate the mileage of each type of construction
by the use of brackets and extra lines. Minor portions of a transmission line of a different type of construction need not be distinguished from the
remainder of the line.
6. Report in columns (f) and (g) the total pole miles of each transmission line. Show in column (f) the pole miles of line on structures the cost of which is
reported for the line designated; conversely, show in column (g) the pole miles of line on structures the cost of which is reported for another line. Report
pole miles of line on leased or partly owned structures in column (g). In a footnote, explain the basis of such occupancy and state whether expenses with
respect to such structures are included in the expenses reported for the line designated.
SWP SSP 60.00 60.00 15.79 1 1 KING CITY COBURN #2
SWP 60.00 60.00 1.34 1 2 LOS COCHES TAP
SWP T SSP 60.00 60.00 21.62 1 3 LAKEVILLE #2
SWP SSP 60.00 60.00 5.36 1 4 LAKEVILLE PETALUMA C
SWP SSP 60.00 60.00 11.16 1 5 LAKEVILLE #1
SWP SSP 60.00 60.00 1.50 1 6 LAS POSITAS VASCO
SWP SSP 60.00 60.00 15.56 1 7 LAURELES OTTER
SWP SSP 60.00 60.00 16.09 1 8 LAYTONVILLE COVELO
SWP SSP 115.00 115.00 7.38 1 9 LINCOLN PLEASANT GROVE
SWP 115.00 115.00 0.06 1 10 SIERRA PACIFIC IND TAP
SWP SSP 60.00 60.00 3.63 1 11 LIVERMORE LAS POSITAS
SWP 60.00 60.00 6.03 1 12 LOCKEFORD INDUSTRIAL
SWP SSP 60.00 60.00 9.52 1 13 LOCKEFORD LODI #2
SWP 60.00 60.00 0.97 1 14 INDUSTRIAL TAP
SSP 60.00 60.00 0.06 1 15 VICTOR TAP
SWP 60.00 60.00 0.53 1 16 WOODBRIDGE TAP
SWP SSP 60.00 60.00 15.42 1 17 LOCKEFORD LODI #3
SWP SSP 60.00 60.00 34.53 1 18 MANTECA #1
SWP 60.00 60.00 5.85 1 19 LEE TAP
SWP SSP 60.00 60.00 12.53 1 20 MANTECA LOUISE
SWP 60.00 60.00 0.83 1 21 GRONEMEYER TAP
SWP T SSP 115.00 115.00 16.58 1 22 SCHULTE SW STA KASSON-MANTECA
SWP SSP 60.00 60.00 29.13 1 23 MAPLE CREEK HOOPA
SWP SSP 115.00 115.00 11.64 1 24 SAN MATEO MARTIN #4
SWP SSP 60.00 60.00 23.17 1 25 MENDOCINO HARTLEY
SWP SSP 60.00 60.00 6.66 1 26 HARTLEY CLEARLAKE
SWP SSP 60.00 60.00 23.50 1 27 MENDOCINO PHILO JCT-HOPLAND
SWP SSP 60.00 60.00 7.48 1 28 MENDOCINO #1
SWP SSP 60.00 60.00 14.52 1 29 MENDOCINO WILLITS
SWP SSP 60.00 60.00 43.77 1 30 MENDOCINO WILLITS-FORT BRAGG
SWP SSP 60.00 60.00 13.98 1 31 WEIMAR #1
SWP 60.00 60.00 0.15 1 32 OXBOW TAP
SWP T SSP 60.00 60.00 6.49 1 33 MILLBRAE SNEATH LANE
SWP 60.00 60.00 0.39 1 34 SAN ANDREAS (CCSF) TAP
SWP SSP 60.00 60.00 1.13 1 35 SAN BRUNO TAP
FERC FORM NO. 1 (ED. 12-87) Page 422.29
36 TOTAL 36,671.97 1,451

Name of Respondent This Report Is:(1) An Original
(2) A Resubmission
Date of Report(Mo, Da, Yr)
Year/Period of Report
End of
TRANSMISSION LINE STATISTICS
PACIFIC GAS AND ELECTRIC COMPANYX
04/13/20212020/Q4
Line
No.
(c)(b)(a) (d) (e)
DESIGNATION
From To
(f) (g)
VOLTAGE (KV)(Indicate whereother than60 cycle, 3 phase)
Operating Designed
Type of
Supporting
Structure
LENGTH (Pole miles)(In the case of
underground linesreport circuit miles)
On Structureof Line
Designated
On Structuresof Another
Line
Number
Of
Circuits
(h)
1. Report information concerning transmission lines, cost of lines, and expenses for year. List each transmission line having nominal voltage of 132
kilovolts or greater. Report transmission lines below these voltages in group totals only for each voltage.
2. Transmission lines include all lines covered by the definition of transmission system plant as given in the Uniform System of Accounts. Do not report
substation costs and expenses on this page.
3. Report data by individual lines for all voltages if so required by a State commission.
4. Exclude from this page any transmission lines for which plant costs are included in Account 121, Nonutility Property.
5. Indicate whether the type of supporting structure reported in column (e) is: (1) single pole wood or steel; (2) H-frame wood, or steel poles; (3) tower;
or (4) underground construction If a transmission line has more than one type of supporting structure, indicate the mileage of each type of construction
by the use of brackets and extra lines. Minor portions of a transmission line of a different type of construction need not be distinguished from the
remainder of the line.
6. Report in columns (f) and (g) the total pole miles of each transmission line. Show in column (f) the pole miles of line on structures the cost of which is
reported for the line designated; conversely, show in column (g) the pole miles of line on structures the cost of which is reported for another line. Report
pole miles of line on leased or partly owned structures in column (g). In a footnote, explain the basis of such occupancy and state whether expenses with
respect to such structures are included in the expenses reported for the line designated.
SWP SSP 60.00 60.00 3.26 1 1 SNEATH LANE PACIFICA
SSP 115.00 115.00 0.09 1 2 SANTA PAULA MILLBRAE
SWP SSP 60.00 60.00 18.06 1 3 MONTA VISTA BURNS
SWP SSP 60.00 60.00 7.13 1 4 MONTA VISTA LOS ALTOS
SWP SSP 60.00 60.00 10.88 1 5 MONTA VISTA LOS GATOS
SWP T SSP 60.00 60.00 1.19 1 6 MONTA VISTA PERMANENTE
SWP 60.00 60.00 0.31 1 7 PERMANENTE #1 TAP
SWP SSP 60.00 60.00 0.51 1 8 PERMANENTE #2 TAP
SWP SSP 60.00 60.00 22.56 1 9 MONTE RIO FULTON
SWP 60.00 60.00 1.44 1 10 WOHLER TAP
SWP SSP 60.00 60.00 6.57 1 11 MTN GATE JCT CASCADE
SWP 60.00 60.00 0.70 1 12 MTN GATE TAP
SWP T SSP 60.00 60.00 6.28 1 13 NEWARK DECOTO
SWP T SSP 60.00 60.00 19.05 1 14 NEWARK LIVERMORE
SWP T SSP 60.00 60.00 12.39 1 15 NEWARK VALLECITOS
SWP OTHERS 60.00 60.00 0.08 1 16 SUNOL TAP
SWP T SSP 60.00 60.00 20.16 1 17 NICOLAUS CATLETT JCT
SWP T SSP 60.00 60.00 4.45 1 18 NICOLAUS CATLETT JCT
SWP T SSP 60.00 60.00 14.18 1 19 NICOLAUS CATLETT JCT (12KV)
SWP SSP 60.00 60.00 18.74 1 20 NICOLAUS MARYSVILLE
SWP T SSP 60.00 60.00 30.63 1 21 NICOLAUS PLAINFIELD
SWP 60.00 60.00 1.47 1 22 DISTRICT 1001 TAP
SWP T SSP 60.00 60.00 42.72 1 23 NICOLAUS WILKINS SLOUGH
SWP SSP 60.00 60.00 3.61 1 24 DISTRICT 1500 TAP
SWP OTHERS 60.00 60.00 1.03 1 25 TOCALOMA TAP
SWP 60.00 60.00 2.02 1 26 OILFIELDS SARGENT CANYON
SWP SSP 60.00 70.00 0.35 1 27 AERA ENERGY TAP
SWP 60.00 60.00 1.46 1 28 OILFIELDS SALINAS RIVER
SWP 60.00 60.00 0.80 1 29 YUBA CITY COGEN TAP
SWP SSP 60.00 60.00 6.97 1 30 PALERMO OROVILLE #1
SWP 60.00 60.00 0.78 1 31 PACIFIC OROVILLE POWER
SWP 60.00 60.00 0.16 1 32 LOUISIANA PACIFIC
SWP SSP 60.00 60.00 10.13 1 33 PALERMO OROVILLE #2
SWP SSP 60.00 60.00 1.43 1 34 ENCINAL TAP
SWP SSP 60.00 60.00 15.88 1 35 PEASE HARTER
FERC FORM NO. 1 (ED. 12-87) Page 422.30
36 TOTAL 36,671.97 1,451

Name of Respondent This Report Is:(1) An Original
(2) A Resubmission
Date of Report(Mo, Da, Yr)
Year/Period of Report
End of
TRANSMISSION LINE STATISTICS
PACIFIC GAS AND ELECTRIC COMPANYX
04/13/20212020/Q4
Line
No.
(c)(b)(a) (d) (e)
DESIGNATION
From To
(f) (g)
VOLTAGE (KV)(Indicate whereother than60 cycle, 3 phase)
Operating Designed
Type of
Supporting
Structure
LENGTH (Pole miles)(In the case of
underground linesreport circuit miles)
On Structureof Line
Designated
On Structuresof Another
Line
Number
Of
Circuits
(h)
1. Report information concerning transmission lines, cost of lines, and expenses for year. List each transmission line having nominal voltage of 132
kilovolts or greater. Report transmission lines below these voltages in group totals only for each voltage.
2. Transmission lines include all lines covered by the definition of transmission system plant as given in the Uniform System of Accounts. Do not report
substation costs and expenses on this page.
3. Report data by individual lines for all voltages if so required by a State commission.
4. Exclude from this page any transmission lines for which plant costs are included in Account 121, Nonutility Property.
5. Indicate whether the type of supporting structure reported in column (e) is: (1) single pole wood or steel; (2) H-frame wood, or steel poles; (3) tower;
or (4) underground construction If a transmission line has more than one type of supporting structure, indicate the mileage of each type of construction
by the use of brackets and extra lines. Minor portions of a transmission line of a different type of construction need not be distinguished from the
remainder of the line.
6. Report in columns (f) and (g) the total pole miles of each transmission line. Show in column (f) the pole miles of line on structures the cost of which is
reported for the line designated; conversely, show in column (g) the pole miles of line on structures the cost of which is reported for another line. Report
pole miles of line on leased or partly owned structures in column (g). In a footnote, explain the basis of such occupancy and state whether expenses with
respect to such structures are included in the expenses reported for the line designated.
SWP 60.00 60.00 0.62 1 1 GREENLEAF #2 TAP
SWP SSP 60.00 60.00 10.31 1 2 PEASE MARYSVILLE-HARTER
SWP SSP 60.00 60.00 37.25 1 3 PHILO JCT ELK
SWP SSP 60.00 60.00 7.30 1 4 PIT #1 MCARTHUR
SWP SSP 60.00 60.00 10.81 1 5 PLACER DEL MAR
SWP 60.00 60.00 0.40 1 6 SIERRA PINES LIMITED
SWP SSP 60.00 60.00 10.94 1 7 POTTER VALLEY MENDOCINO
SWP SSP 60.00 60.00 13.16 1 8 POTTER VALLEY WILLITS
SWP SSP 60.00 60.00 4.66 1 9 RADUM LIVERMORE
SWP SSP 60.00 60.00 21.25 1 10 RIO DELL JCT BRIDGEVILLE
SWP SSP 60.00 60.00 5.36 1 11 RIO DELL TAP
SWP OTHERS 60.00 60.00 0.52 1 12 PACIFIC LUMBER (SCOTIA)
SWP SSP 60.00 60.00 3.77 1 13 SALADO CROW CREEK SW STA
SSP 60.00 60.00 0.02 1 14 CROW CREEK SW STA FRONTIER SOLAR PV
SWP SSP 60.00 60.00 11.14 1 15 CROW CREEK SW STA NEWMAN
SWP 60.00 60.00 0.11 1 16 STANISLAUS RECOVERY
SWP SSP 60.00 60.00 7.56 1 17 GUSTINE #1 TAP
SWP SSP 60.00 60.00 21.56 1 18 SALADO NEWMAN #2
SWP 60.00 60.00 5.28 1 19 CROWS LANDING TAP
SWP 60.00 60.00 4.44 1 20 GUSTINE #2 TAP
SWP T SSP 60.00 60.00 10.22 1 21 SALINAS FORT ORD #1
SWP SSP 60.00 60.00 6.15 1 22 SALINAS FIRESTONE #1
SWP 60.00 60.00 0.56 1 23 FRESH EXPRESS TAP
SWP SSP 60.00 60.00 13.31 1 24 SALINAS FIRESTONE #2
SWP SSP 60.00 60.00 5.81 1 25 SALINAS LAGUNITAS
SWP SSP 60.00 60.00 27.46 1 26 SALINAS LAURELES
T SSP 60.00 60.00 13.99 1 27 SAN MATEO BAIR
SWP SSP 60.00 60.00 6.89 1 28 SAN MATEO HILLSDALE JCT
SWP 60.00 60.00 7.06 1 29 SAN RAMON RADUM
SWP 60.00 60.00 0.45 1 30 PARKS TAP
SWP 60.00 60.00 0.04 1 31 EAST DUBLIN (BART) TAP
SWP SSP 60.00 60.00 17.81 1 32 SMARTVILLE CAMP FAR WEST
SWP SSP 60.00 60.00 7.15 1 33 SMARTVILLE CAMP FAR WEST (12KV)
SWP SSP 60.00 60.00 0.14 1 34 BEALE AFB (WAPA) #2 TAP
SSP OTHERS 230.00 230.00 0.54 1 35 MONTEZUMA SW STA BIRDS LANDING SW STA
FERC FORM NO. 1 (ED. 12-87) Page 422.31
36 TOTAL 36,671.97 1,451

Name of Respondent This Report Is:(1) An Original
(2) A Resubmission
Date of Report(Mo, Da, Yr)
Year/Period of Report
End of
TRANSMISSION LINE STATISTICS
PACIFIC GAS AND ELECTRIC COMPANYX
04/13/20212020/Q4
Line
No.
(c)(b)(a) (d) (e)
DESIGNATION
From To
(f) (g)
VOLTAGE (KV)(Indicate whereother than60 cycle, 3 phase)
Operating Designed
Type of
Supporting
Structure
LENGTH (Pole miles)(In the case of
underground linesreport circuit miles)
On Structureof Line
Designated
On Structuresof Another
Line
Number
Of
Circuits
(h)
1. Report information concerning transmission lines, cost of lines, and expenses for year. List each transmission line having nominal voltage of 132
kilovolts or greater. Report transmission lines below these voltages in group totals only for each voltage.
2. Transmission lines include all lines covered by the definition of transmission system plant as given in the Uniform System of Accounts. Do not report
substation costs and expenses on this page.
3. Report data by individual lines for all voltages if so required by a State commission.
4. Exclude from this page any transmission lines for which plant costs are included in Account 121, Nonutility Property.
5. Indicate whether the type of supporting structure reported in column (e) is: (1) single pole wood or steel; (2) H-frame wood, or steel poles; (3) tower;
or (4) underground construction If a transmission line has more than one type of supporting structure, indicate the mileage of each type of construction
by the use of brackets and extra lines. Minor portions of a transmission line of a different type of construction need not be distinguished from the
remainder of the line.
6. Report in columns (f) and (g) the total pole miles of each transmission line. Show in column (f) the pole miles of line on structures the cost of which is
reported for the line designated; conversely, show in column (g) the pole miles of line on structures the cost of which is reported for another line. Report
pole miles of line on leased or partly owned structures in column (g). In a footnote, explain the basis of such occupancy and state whether expenses with
respect to such structures are included in the expenses reported for the line designated.
SWP 115.00 115.00 0.40 1 1 RIO BRAVO (ROCKLIN) TAP
SWP SSP 60.00 60.00 20.13 1 2 SMARTVILLE MARYSVILLE
SWP SSP 60.00 60.00 29.60 1 3 SMARTVILLE NICOLAUS #1
SWP SSP 60.00 60.00 30.16 1 4 SMARTVILLE NICOLAUS #2
SSP 60.00 60.00 0.11 1 5 BEALE AFB (WAPA) #1 TAP
SWP SSP 60.00 60.00 19.38 1 6 SOLEDAD #1
SWP SSP 60.00 60.00 0.20 1 7 GONZALES #1 TAP
SWP 60.00 60.00 1.43 1 8 CHUALAR TAP
SWP SSP 60.00 60.00 18.86 1 9 SOLEDAD #2
SWP SSP 60.00 60.00 0.30 1 10 GONZALES #2 TAP
SWP SSP 60.00 60.00 1.63 1 11 SOLEDAD #3
SWP SSP 60.00 60.00 6.08 1 12 SOLEDAD #4
SWP SSP 60.00 60.00 1.09 1 13 SPAULDING #3 SPAULDING #1
SWP T SSP 60.00 60.00 19.65 1 14 SPAULDING SUMMIT
SWP 60.00 60.00 0.34 1 15 CISCO GROVE TAP
SWP SSP 60.00 60.00 29.77 1 16 SUTTER HOME SW STA LOCKEFORD-LODI
SSP 60.00 60.00 0.03 1 17 SUTTER HOME SUTTER HOME SW STA
SWP SSP 60.00 60.00 17.13 1 18 SUTTER HOME SW STA STAGG
SWP 60.00 60.00 3.01 1 19 TERMINOUS TAP
SWP 60.00 60.00 0.01 1 20 SEBASTIANI TAP
SWP SSP 60.00 60.00 2.43 1 21 STAGG COUNTRY CLUB #1
SWP SSP 60.00 60.00 2.46 1 22 STAGG COUNTRY CLUB #2
SWP SSP 60.00 60.00 4.25 1 23 STAGG HAMMER
SWP T SSP 60.00 60.00 5.58 1 24 STOCKTON A #1
SWP 60.00 60.00 0.29 1 25 NEWARK-SIERRA
SWP SSP 60.00 60.00 13.20 1 26 STOCKTON A WEBER #1
SWP 60.00 60.00 9.88 1 27 STOCKTON A WEBER #2
SWP SSP 60.00 60.00 9.82 1 28 STOCKTON A WEBER #3
SWP 60.00 60.00 0.19 1 29 SUMIDEN WIRE PRODUCTS
SWP SSP 60.00 60.00 0.87 1 30 OAK PARK TAP
SWP T SSP 60.00 60.00 14.59 1 31 STOCKTON NEWARK
SWP T SSP 60.00 60.00 55.49 1 32 TRINITY MAPLE CREEK
SWP T SSP 60.00 60.00 9.72 1 33 TULUCAY NAPA #1
SWP T 60.00 60.00 1.18 1 34 BASALT #1 TAP
SWP SSP 60.00 60.00 7.69 1 35 CORDELIA #1 TAP
FERC FORM NO. 1 (ED. 12-87) Page 422.32
36 TOTAL 36,671.97 1,451

Name of Respondent This Report Is:(1) An Original
(2) A Resubmission
Date of Report(Mo, Da, Yr)
Year/Period of Report
End of
TRANSMISSION LINE STATISTICS
PACIFIC GAS AND ELECTRIC COMPANYX
04/13/20212020/Q4
Line
No.
(c)(b)(a) (d) (e)
DESIGNATION
From To
(f) (g)
VOLTAGE (KV)(Indicate whereother than60 cycle, 3 phase)
Operating Designed
Type of
Supporting
Structure
LENGTH (Pole miles)(In the case of
underground linesreport circuit miles)
On Structureof Line
Designated
On Structuresof Another
Line
Number
Of
Circuits
(h)
1. Report information concerning transmission lines, cost of lines, and expenses for year. List each transmission line having nominal voltage of 132
kilovolts or greater. Report transmission lines below these voltages in group totals only for each voltage.
2. Transmission lines include all lines covered by the definition of transmission system plant as given in the Uniform System of Accounts. Do not report
substation costs and expenses on this page.
3. Report data by individual lines for all voltages if so required by a State commission.
4. Exclude from this page any transmission lines for which plant costs are included in Account 121, Nonutility Property.
5. Indicate whether the type of supporting structure reported in column (e) is: (1) single pole wood or steel; (2) H-frame wood, or steel poles; (3) tower;
or (4) underground construction If a transmission line has more than one type of supporting structure, indicate the mileage of each type of construction
by the use of brackets and extra lines. Minor portions of a transmission line of a different type of construction need not be distinguished from the
remainder of the line.
6. Report in columns (f) and (g) the total pole miles of each transmission line. Show in column (f) the pole miles of line on structures the cost of which is
reported for the line designated; conversely, show in column (g) the pole miles of line on structures the cost of which is reported for another line. Report
pole miles of line on leased or partly owned structures in column (g). In a footnote, explain the basis of such occupancy and state whether expenses with
respect to such structures are included in the expenses reported for the line designated.
SWP SSP 60.00 60.00 0.36 1 1 CORDELIA INTERIM
SWP SSP 60.00 60.00 6.87 1 2 CORDELIA #2 TAP
SWP SSP 60.00 60.00 3.93 1 3 TULUCAY NAPA #2
SWP SSP 60.00 60.00 29.83 1 4 VACA PLAINFIELD
SWP SSP 60.00 60.00 27.27 1 5 VALLEY SPRINGS #1
SWP 60.00 60.00 0.06 1 6 NEW HOGAN TAP
SWP SSP 60.00 60.00 7.91 1 7 VALLEY SPRINGS CALAVERAS CEMENT
SWP 60.00 60.00 4.33 1 8 PARDEE #1 TAP
SWP SSP 60.00 60.00 12.75 1 9 VALLEY SPRINGS MARTELL #1
SWP 60.00 60.00 1.08 1 10 AMFOR TAP
SWP SSP 60.00 60.00 21.49 1 11 CLAY MARTEL
SWP 60.00 60.00 0.09 1 12 PARDEE #2 TAP
SWP SSP 60.00 60.00 1.01 1 13 BUENA VISTA BIOMASS
SWP SSP 60.00 60.00 4.09 1 14 IONE TAP
60.00 60.00 0.01 1 15 MULE CREEK TAP
SWP SSP 60.00 60.00 10.97 1 16 VASCO HERDLYN
SWP 60.00 60.00 1.52 1 17 US WINDPOWER TAP
SWP SSP 60.00 60.00 17.30 1 18 VALLEY SPRINGS CLAY
SWP SSP 60.00 60.00 2.28 1 19 VIEJO MONTEREY
SWP T SSP 60.00 60.00 10.62 1 20 RADUM VALLECITOS
SWP 60.00 60.00 0.49 1 21 IUKA TAP
SWP SSP 60.00 60.00 20.86 1 22 VOLTA DESCHUTES
SWP SSP 60.00 60.00 4.86 1 23 VOLTA SOUTH
SWP SSP 60.00 60.00 28.39 1 24 WATSONVILLE SALINAS
SWP SSP 60.00 60.00 2.39 1 25 GRANITE ROCK TAP
SWP 60.00 60.00 0.60 1 26 LAGUNITAS TAP
SWP SSP 60.00 60.00 6.07 1 27 WEBER FRENCH CAMP #1
SWP T SSP 60.00 60.00 10.89 1 28 WEBER FRENCH CAMP #2
SWP 60.00 60.00 0.82 1 29 ROBERTSON TAP
SWP 60.00 60.00 0.56 1 30 COGENERATION NATIONAL
SWP SSP 60.00 60.00 0.95 1 31 ROUGH & READY TAP
SWP 60.00 60.00 0.68 1 32 PACIFIC ETHANOL TAP
SWP SSP 115.00 115.00 0.43 1 33 RIO BRAVO TOMATO TAP
SWP SSP 60.00 60.00 17.67 1 34 WEBER MORMON JCT
SWP SSP 60.00 60.00 6.28 1 35 WEIMAR HALSEY
FERC FORM NO. 1 (ED. 12-87) Page 422.33
36 TOTAL 36,671.97 1,451
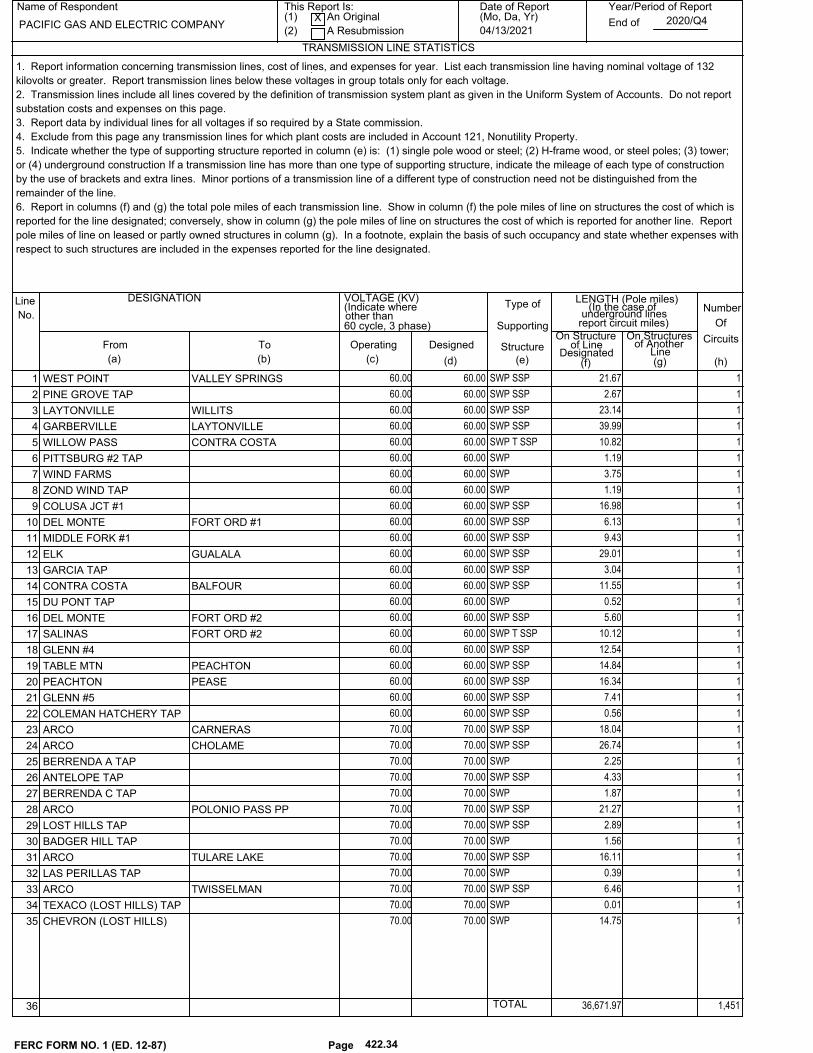
Name of Respondent This Report Is:(1) An Original
(2) A Resubmission
Date of Report(Mo, Da, Yr)
Year/Period of Report
End of
TRANSMISSION LINE STATISTICS
PACIFIC GAS AND ELECTRIC COMPANYX
04/13/20212020/Q4
Line
No.
(c)(b)(a) (d) (e)
DESIGNATION
From To
(f) (g)
VOLTAGE (KV)(Indicate whereother than60 cycle, 3 phase)
Operating Designed
Type of
Supporting
Structure
LENGTH (Pole miles)(In the case of
underground linesreport circuit miles)
On Structureof Line
Designated
On Structuresof Another
Line
Number
Of
Circuits
(h)
1. Report information concerning transmission lines, cost of lines, and expenses for year. List each transmission line having nominal voltage of 132
kilovolts or greater. Report transmission lines below these voltages in group totals only for each voltage.
2. Transmission lines include all lines covered by the definition of transmission system plant as given in the Uniform System of Accounts. Do not report
substation costs and expenses on this page.
3. Report data by individual lines for all voltages if so required by a State commission.
4. Exclude from this page any transmission lines for which plant costs are included in Account 121, Nonutility Property.
5. Indicate whether the type of supporting structure reported in column (e) is: (1) single pole wood or steel; (2) H-frame wood, or steel poles; (3) tower;
or (4) underground construction If a transmission line has more than one type of supporting structure, indicate the mileage of each type of construction
by the use of brackets and extra lines. Minor portions of a transmission line of a different type of construction need not be distinguished from the
remainder of the line.
6. Report in columns (f) and (g) the total pole miles of each transmission line. Show in column (f) the pole miles of line on structures the cost of which is
reported for the line designated; conversely, show in column (g) the pole miles of line on structures the cost of which is reported for another line. Report
pole miles of line on leased or partly owned structures in column (g). In a footnote, explain the basis of such occupancy and state whether expenses with
respect to such structures are included in the expenses reported for the line designated.
SWP SSP 60.00 60.00 21.67 1 1 WEST POINT VALLEY SPRINGS
SWP SSP 60.00 60.00 2.67 1 2 PINE GROVE TAP
SWP SSP 60.00 60.00 23.14 1 3 LAYTONVILLE WILLITS
SWP SSP 60.00 60.00 39.99 1 4 GARBERVILLE LAYTONVILLE
SWP T SSP 60.00 60.00 10.82 1 5 WILLOW PASS CONTRA COSTA
SWP 60.00 60.00 1.19 1 6 PITTSBURG #2 TAP
SWP 60.00 60.00 3.75 1 7 WIND FARMS
SWP 60.00 60.00 1.19 1 8 ZOND WIND TAP
SWP SSP 60.00 60.00 16.98 1 9 COLUSA JCT #1
SWP SSP 60.00 60.00 6.13 1 10 DEL MONTE FORT ORD #1
SWP SSP 60.00 60.00 9.43 1 11 MIDDLE FORK #1
SWP SSP 60.00 60.00 29.01 1 12 ELK GUALALA
SWP SSP 60.00 60.00 3.04 1 13 GARCIA TAP
SWP SSP 60.00 60.00 11.55 1 14 CONTRA COSTA BALFOUR
SWP 60.00 60.00 0.52 1 15 DU PONT TAP
SWP SSP 60.00 60.00 5.60 1 16 DEL MONTE FORT ORD #2
SWP T SSP 60.00 60.00 10.12 1 17 SALINAS FORT ORD #2
SWP SSP 60.00 60.00 12.54 1 18 GLENN #4
SWP SSP 60.00 60.00 14.84 1 19 TABLE MTN PEACHTON
SWP SSP 60.00 60.00 16.34 1 20 PEACHTON PEASE
SWP SSP 60.00 60.00 7.41 1 21 GLENN #5
SWP SSP 60.00 60.00 0.56 1 22 COLEMAN HATCHERY TAP
SWP SSP 70.00 70.00 18.04 1 23 ARCO CARNERAS
SWP SSP 70.00 70.00 26.74 1 24 ARCO CHOLAME
SWP 70.00 70.00 2.25 1 25 BERRENDA A TAP
SWP SSP 70.00 70.00 4.33 1 26 ANTELOPE TAP
SWP 70.00 70.00 1.87 1 27 BERRENDA C TAP
SWP SSP 70.00 70.00 21.27 1 28 ARCO POLONIO PASS PP
SWP SSP 70.00 70.00 2.89 1 29 LOST HILLS TAP
SWP 70.00 70.00 1.56 1 30 BADGER HILL TAP
SWP SSP 70.00 70.00 16.11 1 31 ARCO TULARE LAKE
SWP 70.00 70.00 0.39 1 32 LAS PERILLAS TAP
SWP SSP 70.00 70.00 6.46 1 33 ARCO TWISSELMAN
SWP 70.00 70.00 0.01 1 34 TEXACO (LOST HILLS) TAP
SWP 70.00 70.00 14.75 1 35 CHEVRON (LOST HILLS)
FERC FORM NO. 1 (ED. 12-87) Page 422.34
36 TOTAL 36,671.97 1,451

Name of Respondent This Report Is:(1) An Original
(2) A Resubmission
Date of Report(Mo, Da, Yr)
Year/Period of Report
End of
TRANSMISSION LINE STATISTICS
PACIFIC GAS AND ELECTRIC COMPANYX
04/13/20212020/Q4
Line
No.
(c)(b)(a) (d) (e)
DESIGNATION
From To
(f) (g)
VOLTAGE (KV)(Indicate whereother than60 cycle, 3 phase)
Operating Designed
Type of
Supporting
Structure
LENGTH (Pole miles)(In the case of
underground linesreport circuit miles)
On Structureof Line
Designated
On Structuresof Another
Line
Number
Of
Circuits
(h)
1. Report information concerning transmission lines, cost of lines, and expenses for year. List each transmission line having nominal voltage of 132
kilovolts or greater. Report transmission lines below these voltages in group totals only for each voltage.
2. Transmission lines include all lines covered by the definition of transmission system plant as given in the Uniform System of Accounts. Do not report
substation costs and expenses on this page.
3. Report data by individual lines for all voltages if so required by a State commission.
4. Exclude from this page any transmission lines for which plant costs are included in Account 121, Nonutility Property.
5. Indicate whether the type of supporting structure reported in column (e) is: (1) single pole wood or steel; (2) H-frame wood, or steel poles; (3) tower;
or (4) underground construction If a transmission line has more than one type of supporting structure, indicate the mileage of each type of construction
by the use of brackets and extra lines. Minor portions of a transmission line of a different type of construction need not be distinguished from the
remainder of the line.
6. Report in columns (f) and (g) the total pole miles of each transmission line. Show in column (f) the pole miles of line on structures the cost of which is
reported for the line designated; conversely, show in column (g) the pole miles of line on structures the cost of which is reported for another line. Report
pole miles of line on leased or partly owned structures in column (g). In a footnote, explain the basis of such occupancy and state whether expenses with
respect to such structures are included in the expenses reported for the line designated.
SWP SSP 70.00 70.00 11.80 1 1 ATASCADERO CAYUCOS
T SSP 70.00 70.00 15.47 1 2 ATASCADERO SAN LUIS OBISPO
SWP SSP 70.00 70.00 19.96 1 3 BORDEN COPPERMINE
SWP 70.00 70.00 1.21 1 4 RIVER ROCK TAP
SWP SSP 70.00 70.00 6.62 1 5 BORDEN GLASS
SWP SSP 70.00 70.00 5.81 1 6 BORDEN MADERA #2
SWP 70.00 70.00 3.20 1 7 CALIFORNIA AVE KEARNEY
SWP SSP 70.00 70.00 34.92 1 8 CARNERAS TAFT
SWP 70.00 70.00 0.04 1 9 CELERON TAP
SWP 70.00 70.00 3.06 1 10 LIGHTNER TAP
SWP SSP 70.00 70.00 25.17 1 11 CARUTHERS LEMOORE NAS-CAMDEN
SWP SSP 70.00 70.00 17.73 1 12 CAYUCOS CAMBRIA
SWP SSP 70.00 70.00 8.61 1 13 COALINGA #1 COALINGA #2
SWP 70.00 70.00 4.91 1 14 COALINGA COGEN TAP
SWP 70.00 70.00 0.06 1 15 TORNADO TAP
SWP 70.00 70.00 0.85 1 16 DERRICK TAP
SWP 70.00 70.00 0.05 1 17 OIL CITY TAP
SWP 70.00 70.00 4.99 1 18 PENN ZIER TAP
SWP T SSP 70.00 70.00 38.01 1 19 COALINGA #1 SAN MIGUEL
SWP SSP 70.00 70.00 24.01 1 20 COPPERMINE TIVY VALLEY
SWP SSP 70.00 70.00 8.94 1 21 CORCORAN ANGIOLA
SWP 70.00 70.00 1.39 1 22 BOSWELL TAP
SWP SSP 70.00 70.00 9.83 1 23 DINUBA OROSI
SWP SSP 70.00 70.00 7.56 1 24 STONE CORRAL TAP
SWP SSP 70.00 70.00 6.64 1 25 DIVIDE VANDENBERG #1
SWP SSP 70.00 70.00 6.57 1 26 DIVIDE VANDENBERG #2
SWP 70.00 70.00 10.55 1 27 DIVIDE ZACA-LOMPOC (12KV)
SWP T SSP 70.00 70.00 19.48 1 28 EXCHEQUER MARIPOSA
SWP T SSP 70.00 70.00 29.91 1 29 EXCHEQUER INDIAN FLAT
SWP SSP 70.00 70.00 7.78 1 30 BRICEBURG
SWP SSP 70.00 70.00 0.68 1 31 GATES JAYNE SW STA
SWP SSP 70.00 70.00 14.93 1 32 CAMDEN KINGSBURG
SWP 70.00 70.00 8.30 1 33 FRIANT COPPERMINE
SWP SSP 70.00 70.00 11.81 1 34 JAYNE SW STA COALINGA
SWP SSP 70.00 70.00 17.26 1 35 GATES COALINGA #2
FERC FORM NO. 1 (ED. 12-87) Page 422.35
36 TOTAL 36,671.97 1,451

Name of Respondent This Report Is:(1) An Original
(2) A Resubmission
Date of Report(Mo, Da, Yr)
Year/Period of Report
End of
TRANSMISSION LINE STATISTICS
PACIFIC GAS AND ELECTRIC COMPANYX
04/13/20212020/Q4
Line
No.
(c)(b)(a) (d) (e)
DESIGNATION
From To
(f) (g)
VOLTAGE (KV)(Indicate whereother than60 cycle, 3 phase)
Operating Designed
Type of
Supporting
Structure
LENGTH (Pole miles)(In the case of
underground linesreport circuit miles)
On Structureof Line
Designated
On Structuresof Another
Line
Number
Of
Circuits
(h)
1. Report information concerning transmission lines, cost of lines, and expenses for year. List each transmission line having nominal voltage of 132
kilovolts or greater. Report transmission lines below these voltages in group totals only for each voltage.
2. Transmission lines include all lines covered by the definition of transmission system plant as given in the Uniform System of Accounts. Do not report
substation costs and expenses on this page.
3. Report data by individual lines for all voltages if so required by a State commission.
4. Exclude from this page any transmission lines for which plant costs are included in Account 121, Nonutility Property.
5. Indicate whether the type of supporting structure reported in column (e) is: (1) single pole wood or steel; (2) H-frame wood, or steel poles; (3) tower;
or (4) underground construction If a transmission line has more than one type of supporting structure, indicate the mileage of each type of construction
by the use of brackets and extra lines. Minor portions of a transmission line of a different type of construction need not be distinguished from the
remainder of the line.
6. Report in columns (f) and (g) the total pole miles of each transmission line. Show in column (f) the pole miles of line on structures the cost of which is
reported for the line designated; conversely, show in column (g) the pole miles of line on structures the cost of which is reported for another line. Report
pole miles of line on leased or partly owned structures in column (g). In a footnote, explain the basis of such occupancy and state whether expenses with
respect to such structures are included in the expenses reported for the line designated.
SWP T SSP 70.00 70.00 4.50 1 1 GATES HURON
SWP SSP 70.00 70.00 18.34 1 2 GATES TULARE LAKE
SWP SSP 70.00 70.00 1.02 1 3 KETTLEMAN HILLS TAP
SWP SSP 70.00 70.00 5.40 1 4 AVENAL TAP
SWP 70.00 70.00 1.17 1 5 CHEVRON PIPELINE
SWP SSP 70.00 70.00 4.91 1 6 BORDEN MADERA #1
SWP SSP 70.00 70.00 18.44 1 7 GUERNSEY HENRIETTA
SWP 70.00 70.00 0.58 1 8 RESERVE OIL TAP
SWP 70.00 70.00 0.44 1 9 ARMSTRONG TAP
SWP 70.00 70.00 0.32 1 10 GWF HANFORD COGEN
SWP SSP 70.00 70.00 6.79 1 11 HAAS WOODCHUCK
SWP SSP 70.00 70.00 13.25 1 12 HELM KERMAN
SWP 70.00 70.00 3.17 1 13 FRESNO COGEN (AGRICO)
SWP SSP 70.00 70.00 4.92 1 14 HELM CRESCENT SW STA
SWP 70.00 70.00 7.43 1 15 HELM STROUD
SWP SSP 70.00 70.00 9.37 1 16 HENRIETTA LEMOORE
SWP 70.00 70.00 0.47 1 17 LEPRINO TAP
115.00 115.00 2.37 1 18 WAUKENA SW STA CORCORAN
SWP OTHERS 70.00 70.00 0.12 1 19 GWF HENRIETTA
SWP SSP 70.00 70.00 1.69 1 20 HENRIETTA LEMOORE NAS
SWP T SSP 70.00 70.00 15.93 1 21 KENT SW STA TULARE LAKE
SWP SSP 70.00 70.00 1.47 1 22 HENRIETTA KENT SW STA
SWP 70.00 70.00 2.06 1 23 HERDLYN TRACY
SWP SSP 70.00 70.00 19.14 1 24 KEARNEY BIOLA
SWP SSP 70.00 70.00 9.29 1 25 KEARNEY BOWLES
SWP SSP 70.00 70.00 12.05 1 26 KEARNEY CARUTHERS
SWP SSP 70.00 70.00 10.98 1 27 KEARNEY KERMAN
SWP T SSP 70.00 70.00 20.69 1 28 KERN CANYON MAGUNDEN-WEEDPATCH
SWP SSP 70.00 70.00 7.86 1 29 MARICOPA COPUS
SWP T 70.00 70.00 0.16 1 30 KERN FRUITVALE
SWP T SSP 70.00 70.00 24.69 1 31 KERN KERN OIL-FAMOSO
SWP 70.00 70.00 0.40 1 32 CAWELO B TAP
SWP T SSP 70.00 70.00 20.61 1 33 KERN MAGUNDEN
SWP T 70.00 70.00 0.12 1 34 FRUITVALE TAP
SWP 70.00 70.00 1.86 1 35 EISEN TAP
FERC FORM NO. 1 (ED. 12-87) Page 422.36
36 TOTAL 36,671.97 1,451
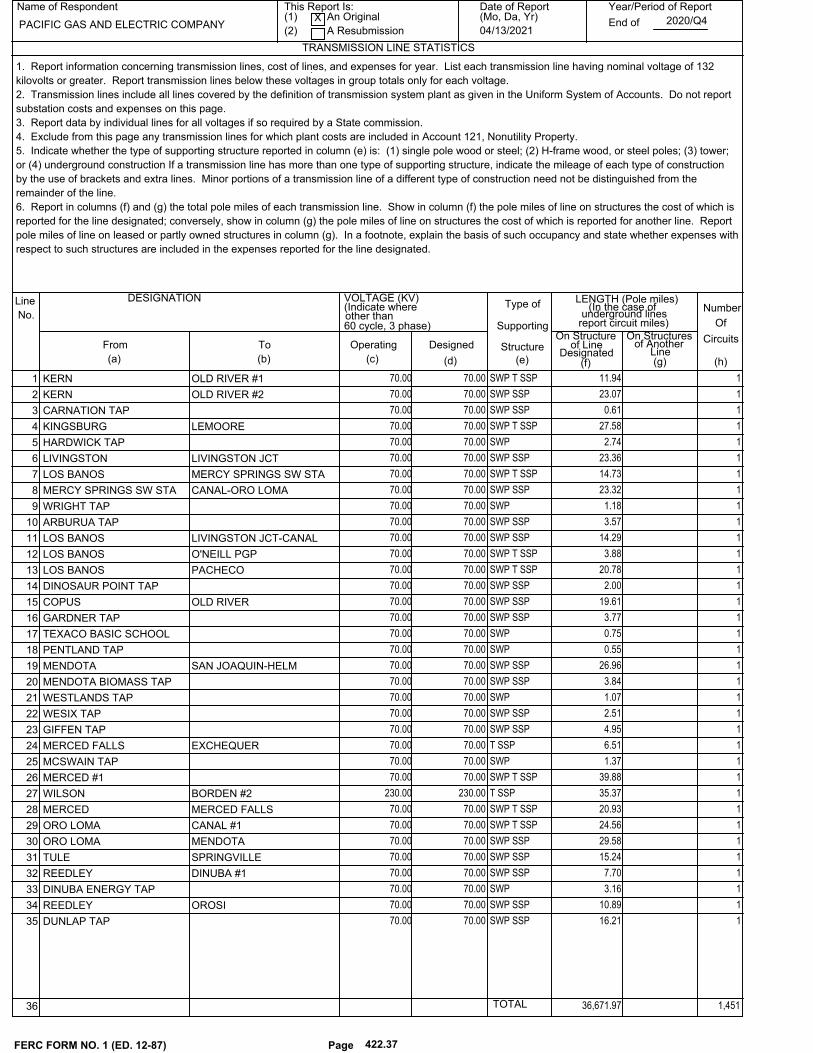
Name of Respondent This Report Is:(1) An Original
(2) A Resubmission
Date of Report(Mo, Da, Yr)
Year/Period of Report
End of
TRANSMISSION LINE STATISTICS
PACIFIC GAS AND ELECTRIC COMPANYX
04/13/20212020/Q4
Line
No.
(c)(b)(a) (d) (e)
DESIGNATION
From To
(f) (g)
VOLTAGE (KV)(Indicate whereother than60 cycle, 3 phase)
Operating Designed
Type of
Supporting
Structure
LENGTH (Pole miles)(In the case of
underground linesreport circuit miles)
On Structureof Line
Designated
On Structuresof Another
Line
Number
Of
Circuits
(h)
1. Report information concerning transmission lines, cost of lines, and expenses for year. List each transmission line having nominal voltage of 132
kilovolts or greater. Report transmission lines below these voltages in group totals only for each voltage.
2. Transmission lines include all lines covered by the definition of transmission system plant as given in the Uniform System of Accounts. Do not report
substation costs and expenses on this page.
3. Report data by individual lines for all voltages if so required by a State commission.
4. Exclude from this page any transmission lines for which plant costs are included in Account 121, Nonutility Property.
5. Indicate whether the type of supporting structure reported in column (e) is: (1) single pole wood or steel; (2) H-frame wood, or steel poles; (3) tower;
or (4) underground construction If a transmission line has more than one type of supporting structure, indicate the mileage of each type of construction
by the use of brackets and extra lines. Minor portions of a transmission line of a different type of construction need not be distinguished from the
remainder of the line.
6. Report in columns (f) and (g) the total pole miles of each transmission line. Show in column (f) the pole miles of line on structures the cost of which is
reported for the line designated; conversely, show in column (g) the pole miles of line on structures the cost of which is reported for another line. Report
pole miles of line on leased or partly owned structures in column (g). In a footnote, explain the basis of such occupancy and state whether expenses with
respect to such structures are included in the expenses reported for the line designated.
SWP T SSP 70.00 70.00 11.94 1 1 KERN OLD RIVER #1
SWP SSP 70.00 70.00 23.07 1 2 KERN OLD RIVER #2
SWP SSP 70.00 70.00 0.61 1 3 CARNATION TAP
SWP T SSP 70.00 70.00 27.58 1 4 KINGSBURG LEMOORE
SWP 70.00 70.00 2.74 1 5 HARDWICK TAP
SWP SSP 70.00 70.00 23.36 1 6 LIVINGSTON LIVINGSTON JCT
SWP T SSP 70.00 70.00 14.73 1 7 LOS BANOS MERCY SPRINGS SW STA
SWP SSP 70.00 70.00 23.32 1 8 MERCY SPRINGS SW STA CANAL-ORO LOMA
SWP 70.00 70.00 1.18 1 9 WRIGHT TAP
SWP SSP 70.00 70.00 3.57 1 10 ARBURUA TAP
SWP SSP 70.00 70.00 14.29 1 11 LOS BANOS LIVINGSTON JCT-CANAL
SWP T SSP 70.00 70.00 3.88 1 12 LOS BANOS O'NEILL PGP
SWP T SSP 70.00 70.00 20.78 1 13 LOS BANOS PACHECO
SWP SSP 70.00 70.00 2.00 1 14 DINOSAUR POINT TAP
SWP SSP 70.00 70.00 19.61 1 15 COPUS OLD RIVER
SWP SSP 70.00 70.00 3.77 1 16 GARDNER TAP
SWP 70.00 70.00 0.75 1 17 TEXACO BASIC SCHOOL
SWP 70.00 70.00 0.55 1 18 PENTLAND TAP
SWP SSP 70.00 70.00 26.96 1 19 MENDOTA SAN JOAQUIN-HELM
SWP SSP 70.00 70.00 3.84 1 20 MENDOTA BIOMASS TAP
SWP 70.00 70.00 1.07 1 21 WESTLANDS TAP
SWP SSP 70.00 70.00 2.51 1 22 WESIX TAP
SWP SSP 70.00 70.00 4.95 1 23 GIFFEN TAP
T SSP 70.00 70.00 6.51 1 24 MERCED FALLS EXCHEQUER
SWP 70.00 70.00 1.37 1 25 MCSWAIN TAP
SWP T SSP 70.00 70.00 39.88 1 26 MERCED #1
T SSP 230.00 230.00 35.37 1 27 WILSON BORDEN #2
SWP T SSP 70.00 70.00 20.93 1 28 MERCED MERCED FALLS
SWP T SSP 70.00 70.00 24.56 1 29 ORO LOMA CANAL #1
SWP SSP 70.00 70.00 29.58 1 30 ORO LOMA MENDOTA
SWP SSP 70.00 70.00 15.24 1 31 TULE SPRINGVILLE
SWP SSP 70.00 70.00 7.70 1 32 REEDLEY DINUBA #1
SWP 70.00 70.00 3.16 1 33 DINUBA ENERGY TAP
SWP SSP 70.00 70.00 10.89 1 34 REEDLEY OROSI
SWP SSP 70.00 70.00 16.21 1 35 DUNLAP TAP
FERC FORM NO. 1 (ED. 12-87) Page 422.37
36 TOTAL 36,671.97 1,451

Name of Respondent This Report Is:(1) An Original
(2) A Resubmission
Date of Report(Mo, Da, Yr)
Year/Period of Report
End of
TRANSMISSION LINE STATISTICS
PACIFIC GAS AND ELECTRIC COMPANYX
04/13/20212020/Q4
Line
No.
(c)(b)(a) (d) (e)
DESIGNATION
From To
(f) (g)
VOLTAGE (KV)(Indicate whereother than60 cycle, 3 phase)
Operating Designed
Type of
Supporting
Structure
LENGTH (Pole miles)(In the case of
underground linesreport circuit miles)
On Structureof Line
Designated
On Structuresof Another
Line
Number
Of
Circuits
(h)
1. Report information concerning transmission lines, cost of lines, and expenses for year. List each transmission line having nominal voltage of 132
kilovolts or greater. Report transmission lines below these voltages in group totals only for each voltage.
2. Transmission lines include all lines covered by the definition of transmission system plant as given in the Uniform System of Accounts. Do not report
substation costs and expenses on this page.
3. Report data by individual lines for all voltages if so required by a State commission.
4. Exclude from this page any transmission lines for which plant costs are included in Account 121, Nonutility Property.
5. Indicate whether the type of supporting structure reported in column (e) is: (1) single pole wood or steel; (2) H-frame wood, or steel poles; (3) tower;
or (4) underground construction If a transmission line has more than one type of supporting structure, indicate the mileage of each type of construction
by the use of brackets and extra lines. Minor portions of a transmission line of a different type of construction need not be distinguished from the
remainder of the line.
6. Report in columns (f) and (g) the total pole miles of each transmission line. Show in column (f) the pole miles of line on structures the cost of which is
reported for the line designated; conversely, show in column (g) the pole miles of line on structures the cost of which is reported for another line. Report
pole miles of line on leased or partly owned structures in column (g). In a footnote, explain the basis of such occupancy and state whether expenses with
respect to such structures are included in the expenses reported for the line designated.
SWP 70.00 70.00 0.24 1 1 RIO BRAVO HYDRO
SWP SSP 70.00 70.00 6.96 1 2 SAN BERNARD TEJON
SWP SSP 70.00 70.00 23.39 1 3 SAN LUIS OBISPO CAYUCOS
SWP SSP 70.00 70.00 0.71 1 4 MUSTANG TAP
SWP SSP 70.00 70.00 13.33 1 5 SAN LUIS OBISPO SANTA MARIA *
SWP SSP 70.00 70.00 9.23 1 6 SANGER CALIFORNIA AVE #1
SWP SSP 115.00 115.00 9.33 1 7 SANGER CALIFORNIA AVE
SWP SSP 115.00 115.00 20.42 1 8 SANGER REEDLEY
SWP SSP 115.00 115.00 0.83 1 9 SANGER COGEN TAP
SWP SSP 70.00 70.00 17.24 1 10 SCHINDLER COALINGA #2
SWP T SSP 70.00 70.00 19.78 1 11 FIVE POINTS SW STA HURON-GATES
SWP SSP 70.00 70.00 1.70 1 12 SCHINDLER FIVE POINTS SW STA
SWP T SSP 70.00 70.00 6.32 1 13 SEMITROPIC WASCO
SWP 70.00 70.00 5.99 1 14 MCFARLAND TAP
SWP SSP 70.00 70.00 10.80 1 15 CRESCENT SW STA SCHINDLER
SWP SSP 70.00 70.00 3.61 1 16 CRESCENT SW STA STROUD
SWP SSP 70.00 70.00 19.25 1 17 TAFT CUYAMA #1
SWP SSP 70.00 70.00 18.75 1 18 TAFT CUYAMA #2
SWP SSP 70.00 70.00 12.39 1 19 TAFT ELK HILLS
SWP 70.00 70.00 0.10 1 20 TEXACO BUENA VISTA
SWP T 70.00 70.00 5.98 1 21 TAFT MARICOPA
SWP 70.00 70.00 2.65 1 22 SOLAR TANNEHILL TAP
SWP 70.00 70.00 0.12 1 23 CADET TAP
SWP 70.00 70.00 1.64 1 24 MOCO TAP
SWP SSP 70.00 70.00 7.13 1 25 WASCO FAMOSO
SWP SSP 70.00 70.00 13.00 1 26 TEJON LEBEC
SWP 70.00 70.00 0.31 1 27 ROSE TAP
SWP SSP 70.00 70.00 0.14 1 28 GRAPEVINE TAP
SWP 70.00 70.00 0.02 1 29 CASTAIC TAP
SWP 70.00 70.00 12.30 1 30 TIVY VALLEY REEDLEY
SWP SSP 70.00 70.00 9.27 1 31 WEEDPATCH SAN BERNARD
SWP SSP 70.00 70.00 5.89 1 32 WEEDPATCH WELLFIELD
SWP SSP 70.00 70.00 2.04 1 33 SYCAMORE TAP
SWP SSP 70.00 70.00 7.51 1 34 WHEELER RIDGE LAKEVIEW
SWP SSP 70.00 70.00 3.07 1 35 EMIDIO TAP
FERC FORM NO. 1 (ED. 12-87) Page 422.38
36 TOTAL 36,671.97 1,451

Name of Respondent This Report Is:(1) An Original
(2) A Resubmission
Date of Report(Mo, Da, Yr)
Year/Period of Report
End of
TRANSMISSION LINE STATISTICS
PACIFIC GAS AND ELECTRIC COMPANYX
04/13/20212020/Q4
Line
No.
(c)(b)(a) (d) (e)
DESIGNATION
From To
(f) (g)
VOLTAGE (KV)(Indicate whereother than60 cycle, 3 phase)
Operating Designed
Type of
Supporting
Structure
LENGTH (Pole miles)(In the case of
underground linesreport circuit miles)
On Structureof Line
Designated
On Structuresof Another
Line
Number
Of
Circuits
(h)
1. Report information concerning transmission lines, cost of lines, and expenses for year. List each transmission line having nominal voltage of 132
kilovolts or greater. Report transmission lines below these voltages in group totals only for each voltage.
2. Transmission lines include all lines covered by the definition of transmission system plant as given in the Uniform System of Accounts. Do not report
substation costs and expenses on this page.
3. Report data by individual lines for all voltages if so required by a State commission.
4. Exclude from this page any transmission lines for which plant costs are included in Account 121, Nonutility Property.
5. Indicate whether the type of supporting structure reported in column (e) is: (1) single pole wood or steel; (2) H-frame wood, or steel poles; (3) tower;
or (4) underground construction If a transmission line has more than one type of supporting structure, indicate the mileage of each type of construction
by the use of brackets and extra lines. Minor portions of a transmission line of a different type of construction need not be distinguished from the
remainder of the line.
6. Report in columns (f) and (g) the total pole miles of each transmission line. Show in column (f) the pole miles of line on structures the cost of which is
reported for the line designated; conversely, show in column (g) the pole miles of line on structures the cost of which is reported for another line. Report
pole miles of line on leased or partly owned structures in column (g). In a footnote, explain the basis of such occupancy and state whether expenses with
respect to such structures are included in the expenses reported for the line designated.
SWP SSP 70.00 70.00 2.79 1 1 KELLEY TAP
SWP SSP 70.00 70.00 5.88 1 2 WHEELER RIDGE SAN BERNARD
SWP T 70.00 70.00 5.01 1 3 WHEELER RIDGE TEJON
SWP SSP 70.00 70.00 1.91 1 4 TECUYA TAP
SWP SSP 70.00 70.00 22.38 1 5 WHEELER RIDGE WEEDPATCH
SWP T SSP 70.00 70.00 19.99 1 6 WISHON COPPERMINE
SWP SSP 70.00 70.00 2.29 1 7 AUBERRY TAP
SWP SSP 70.00 70.00 7.66 1 8 WISHON SAN JOAQUIN #3
SWP 70.00 70.00 0.42 1 9 YANKE (NORTH FORK) TAP
SWP SSP 70.00 70.00 18.83 1 10 BIOLA GLASS-MADERA
SWP 70.00 70.00 0.29 1 11 CANANDAIGUA WINERY
SWP SSP 70.00 70.00 3.04 1 12 BONITA TAP
SWP 70.00 70.00 3.02 1 13 EL PECO TAP
SWP SSP 70.00 70.00 13.49 1 14 CORCORAN GUERNSEY
SWP T 70.00 70.00 0.15 1 15 KEARNEY TIE
SWP T 70.00 70.00 0.30 1 16 KEARNEY ALTERNATE TIE
SWP SSP 70.00 70.00 9.92 1 17 SAN MIGUEL PASO ROBLES
SWP SSP 70.00 70.00 4.90 1 18 PASO ROBLES TEMPLETON
SWP SSP 70.00 70.00 8.82 1 19 TEMPLETON ATASCADERO
SWP SSP 115.00 115.00 5.36 1 20 ATLANTIC PLEASANT GROVE #2
T SSP 115.00 115.00 5.77 1 21 GOLD HILL CLARKSVILLE
SWP SSP 60.00 60.00 25.65 1 22 VALLEY SPRINGS #2
SWP SSP 60.00 60.00 12.85 1 23 LOCKEFORD #1
T 60.00 60.00 4.16 1 24 STANDARD #1 & #2 (12KV)
N/A 0.35 1 25 A Y #1 (UNDERGROUND IDLE)
N/A 115.00 0.33 1 26 SOBRANTE R #1
N/A 115.00 0.33 1 27 SOBRANTE R #1
N/A 115.00 0.30 1 28 SOBRANTE R #2
N/A 115.00 0.30 1 29 SOBRANTE R #2
N/A 230.00 230.00 3.41 1 30 ZA 1
N/A 115.00 115.00 3.67 1 31 C X #3
N/A 115.00 115.00 5.16 1 32 H P #4
N/A 115.00 115.00 0.55 1 33 LAKEVILLE SONOMA #1
N/A 230.00 230.00 2.81 1 34 NORTH DUBLIN CAYETANO
N/A 60.00 60.00 1.18 1 35 DEL MAR ATLANTIC #1
FERC FORM NO. 1 (ED. 12-87) Page 422.39
36 TOTAL 36,671.97 1,451

Name of Respondent This Report Is:(1) An Original
(2) A Resubmission
Date of Report(Mo, Da, Yr)
Year/Period of Report
End of
TRANSMISSION LINE STATISTICS
PACIFIC GAS AND ELECTRIC COMPANYX
04/13/20212020/Q4
Line
No.
(c)(b)(a) (d) (e)
DESIGNATION
From To
(f) (g)
VOLTAGE (KV)(Indicate whereother than60 cycle, 3 phase)
Operating Designed
Type of
Supporting
Structure
LENGTH (Pole miles)(In the case of
underground linesreport circuit miles)
On Structureof Line
Designated
On Structuresof Another
Line
Number
Of
Circuits
(h)
1. Report information concerning transmission lines, cost of lines, and expenses for year. List each transmission line having nominal voltage of 132
kilovolts or greater. Report transmission lines below these voltages in group totals only for each voltage.
2. Transmission lines include all lines covered by the definition of transmission system plant as given in the Uniform System of Accounts. Do not report
substation costs and expenses on this page.
3. Report data by individual lines for all voltages if so required by a State commission.
4. Exclude from this page any transmission lines for which plant costs are included in Account 121, Nonutility Property.
5. Indicate whether the type of supporting structure reported in column (e) is: (1) single pole wood or steel; (2) H-frame wood, or steel poles; (3) tower;
or (4) underground construction If a transmission line has more than one type of supporting structure, indicate the mileage of each type of construction
by the use of brackets and extra lines. Minor portions of a transmission line of a different type of construction need not be distinguished from the
remainder of the line.
6. Report in columns (f) and (g) the total pole miles of each transmission line. Show in column (f) the pole miles of line on structures the cost of which is
reported for the line designated; conversely, show in column (g) the pole miles of line on structures the cost of which is reported for another line. Report
pole miles of line on leased or partly owned structures in column (g). In a footnote, explain the basis of such occupancy and state whether expenses with
respect to such structures are included in the expenses reported for the line designated.
N/A 230.00 230.00 24.40 1 1 JEFFERSON MARTIN
N/A 115.00 115.00 2.46 1 2 A P #1
N/A 230.00 230.00 2.30 1 3 LONE TREE CAYETANO
N/A 230.00 230.00 2.75 1 4 NEWARK LOS ESTEROS
N/A 230.00 230.00 2.73 1 5 LOS ESTEROS METCALF
N/A 230.00 230.00 5.94 1 6 VINEYARD NEWARK
N/A 230.00 230.00 11.07 1 7 NORTH DUBLIN VINEYARD
N/A 115.00 115.00 4.95 1 8 A H-W #1
N/A 115.00 115.00 2.67 1 9 A X #1
N/A 115.00 115.00 3.33 1 10 A Y #1
N/A 115.00 115.00 2.85 1 11 A Y #2
N/A 115.00 115.00 3.80 1 12 H P #1
N/A 115.00 115.00 5.06 1 13 A H-W #2
N/A 115.00 115.00 7.23 1 14 H Y #1
N/A 115.00 115.00 3.59 1 15 H P #3
N/A 115.00 115.00 4.01 1 16 P X #1
N/A 115.00 115.00 3.95 1 17 P X #2 (UNDERGROUND)
N/A 115.00 115.00 0.57 1 18 X Y #1
N/A 115.00 115.00 1.10 1 19 C L #1
N/A 115.00 115.00 3.38 1 20 C X #2
N/A 115.00 115.00 2.31 1 21 D L #1
N/A 115.00 115.00 4.16 1 22 SOBRANTE R #1
N/A 115.00 115.00 4.11 1 23 SOBRANTE R #2
N/A 115.00 115.00 2.44 1 24 K D #1
N/A 115.00 115.00 2.57 1 25 K D #2
N/A 115.00 115.00 0.94 1 26 EBMUD TAP
N/A 115.00 115.00 0.21 1 27 SAN MATEO MARTIN #4
N/A 115.00 115.00 0.21 1 28 SAN MATEO MARTIN #3
N/A 115.00 115.00 0.22 1 29 EAST GRAND SAN MATEO
N/A 115.00 115.00 0.22 1 30 MARTIN MILLBRAE #1
N/A 115.00 115.00 0.23 1 31 MARTIN SF AIRPORT
N/A 115.00 115.00 0.23 1 32 SAN MATEO MARTIN #6
N/A 60.00 60.00 1.59 1 33 COOLEY LANDING STANFORD
N/A 60.00 60.00 1.52 1 34 JEFFERSON STANFORD
N/A 115.00 115.00 1.11 1 35 TRIMBLE SAN JOSE B
FERC FORM NO. 1 (ED. 12-87) Page 422.40
36 TOTAL 36,671.97 1,451

Name of Respondent This Report Is:(1) An Original
(2) A Resubmission
Date of Report(Mo, Da, Yr)
Year/Period of Report
End of
TRANSMISSION LINE STATISTICS
PACIFIC GAS AND ELECTRIC COMPANYX
04/13/20212020/Q4
Line
No.
(c)(b)(a) (d) (e)
DESIGNATION
From To
(f) (g)
VOLTAGE (KV)(Indicate whereother than60 cycle, 3 phase)
Operating Designed
Type of
Supporting
Structure
LENGTH (Pole miles)(In the case of
underground linesreport circuit miles)
On Structureof Line
Designated
On Structuresof Another
Line
Number
Of
Circuits
(h)
1. Report information concerning transmission lines, cost of lines, and expenses for year. List each transmission line having nominal voltage of 132
kilovolts or greater. Report transmission lines below these voltages in group totals only for each voltage.
2. Transmission lines include all lines covered by the definition of transmission system plant as given in the Uniform System of Accounts. Do not report
substation costs and expenses on this page.
3. Report data by individual lines for all voltages if so required by a State commission.
4. Exclude from this page any transmission lines for which plant costs are included in Account 121, Nonutility Property.
5. Indicate whether the type of supporting structure reported in column (e) is: (1) single pole wood or steel; (2) H-frame wood, or steel poles; (3) tower;
or (4) underground construction If a transmission line has more than one type of supporting structure, indicate the mileage of each type of construction
by the use of brackets and extra lines. Minor portions of a transmission line of a different type of construction need not be distinguished from the
remainder of the line.
6. Report in columns (f) and (g) the total pole miles of each transmission line. Show in column (f) the pole miles of line on structures the cost of which is
reported for the line designated; conversely, show in column (g) the pole miles of line on structures the cost of which is reported for another line. Report
pole miles of line on leased or partly owned structures in column (g). In a footnote, explain the basis of such occupancy and state whether expenses with
respect to such structures are included in the expenses reported for the line designated.
N/A 115.00 115.00 1.11 1 1 KIFER FMC
N/A 230.00 230.00 13.00 1 2 SAN MATEO MARTIN
N/A 230.00 230.00 6.92 1 3 H Z #1
N/A 230.00 230.00 6.96 1 4 H Z #2
N/A 230.00 230.00 0.85 1 5 FIGARDEN #1 TAP
N/A 230.00 230.00 1.19 1 6 FULTON LAKEVILLE
N/A 230.00 230.00 1.24 1 7 GEYSERS #9 LAKEVILLE
N/A 60.00 60.00 0.18 1 8 JEFFERSON LAS PULGAS
N/A 115.00 115.00 0.74 1 9 NEWARK APPLIED MATERIALS
N/A 115.00 115.00 0.74 1 10 APPLIED MATERIALS BRITTON
N/A 70.00 70.00 0.39 1 11 BORDEN GLASS; XLPE; 70 KV
N/A 115.00 115.00 1.14 1 12 STELLING MONTA VISTA
N/A 115.00 115.00 1.12 1 13 MONTA VISTA WOLFE
N/A 115.00 115.00 0.88 1 14 PITTSBURG LOS MEDANOS #1
N/A 115.00 115.00 0.89 1 15 PITTSBURG LOS MEDANOS #2
N/A 230.00 230.00 0.83 1 16 FIGARDEN #2 TAP
17
18
19
20
21
22 Summary of lines
23 listed individually above
500.00 1,328.00 24 Towers & Poles
230.00 5,334.00 25
115.00 6,071.00 26
70.00 1,545.00 27
60.00 3,882.00 28
29
230.00 86.00 30 Other Underground
115.00 85.00 31 Transmission Lines
70.00 32
60.00 5.00 33
34
35 Transmission Roads
FERC FORM NO. 1 (ED. 12-87) Page 422.41
36 TOTAL 36,671.97 1,451

Name of Respondent This Report Is:(1) An Original
(2) A Resubmission
Date of Report(Mo, Da, Yr)
Year/Period of Report
End of
TRANSMISSION LINE STATISTICS (Continued)
PACIFIC GAS AND ELECTRIC COMPANYX
04/13/20212020/Q4
Line
No.
COST OF LINE (Include in Column (j) Land,
Size of
Conductor
and Material
Land rights, and clearing right-of-way)EXPENSES, EXCEPT DEPRECIATION AND TAXES
OperationExpenses
Maintenance Rents TotalLand Construction andOther Costs
Total Cost
(i) (j) (k) (l) (m) (n) (o) (p)Expenses Expenses
7. Do not report the same transmission line structure twice. Report Lower voltage Lines and higher voltage lines as one line. Designate in a footnote if
you do not include Lower voltage lines with higher voltage lines. If two or more transmission line structures support lines of the same voltage, report the
pole miles of the primary structure in column (f) and the pole miles of the other line(s) in column (g)
8. Designate any transmission line or portion thereof for which the respondent is not the sole owner. If such property is leased from another company,
give name of lessor, date and terms of Lease, and amount of rent for year. For any transmission line other than a leased line, or portion thereof, for
which the respondent is not the sole owner but which the respondent operates or shares in the operation of, furnish a succinct statement explaining the
arrangement and giving particulars (details) of such matters as percent ownership by respondent in the line, name of co-owner, basis of sharing
expenses of the Line, and how the expenses borne by the respondent are accounted for, and accounts affected. Specify whether lessor, co-owner, or
other party is an associated company.
9. Designate any transmission line leased to another company and give name of Lessee, date and terms of lease, annual rent for year, and how
determined. Specify whether lessee is an associated company.
10. Base the plant cost figures called for in columns (j) to (l) on the book cost at end of year.
477 - ACSS - SING 1
1113 - AAC - SING 2
795 - ACSR - SING 3
715.5 - AAC - SIN 4
715.5 - AAC - SIN 5
477 - ACSS - SING 6
715.5 - AAC - SIN 7
715.5 - AAC - SIN 8
715.5 - AAC - SIN 9
715.5 - AAC - SIN 10
1113 - AAC - SING 11
477 - ACSS - SING 12
477 - ACSS - SING 13
715.5 - AAC - SIN 14
1113 - AAC - SING 15
715.5 - AAC - SIN 16
1113 - AAC - SING 17
715.5 - AAC - SIN 18
715.5 - AAC - SIN 19
397.5 - AAC - SIN 20
397.5 - ACSR - SI 21
22
1113 - AAC - SING 23
1113 - AAC - SING 24
477 - ACSS - SING 25
715.5 - AAC - SIN 26
715.5 - AAC - SIN 27
336.4 - AAC - SIN 28
4/0 - ACSR - SING 29
3/0 - CU - SINGLE 30
715.5 - AAC - SIN 31
3/0 - CU - SINGLE 32
715.5 - AAC - SIN 33
715.5 - AAC - SIN 34
4/0 - AAC - SINGL 35
FERC FORM NO. 1 (ED. 12-87) Page 423
36 244,090,607 6,128,240,893 6,372,331,500 128,540,450 285,558,082 414,098,532

Name of Respondent This Report Is:(1) An Original
(2) A Resubmission
Date of Report(Mo, Da, Yr)
Year/Period of Report
End of
TRANSMISSION LINE STATISTICS (Continued)
PACIFIC GAS AND ELECTRIC COMPANYX
04/13/20212020/Q4
Line
No.
COST OF LINE (Include in Column (j) Land,
Size of
Conductor
and Material
Land rights, and clearing right-of-way)EXPENSES, EXCEPT DEPRECIATION AND TAXES
OperationExpenses
Maintenance Rents TotalLand Construction andOther Costs
Total Cost
(i) (j) (k) (l) (m) (n) (o) (p)Expenses Expenses
7. Do not report the same transmission line structure twice. Report Lower voltage Lines and higher voltage lines as one line. Designate in a footnote if
you do not include Lower voltage lines with higher voltage lines. If two or more transmission line structures support lines of the same voltage, report the
pole miles of the primary structure in column (f) and the pole miles of the other line(s) in column (g)
8. Designate any transmission line or portion thereof for which the respondent is not the sole owner. If such property is leased from another company,
give name of lessor, date and terms of Lease, and amount of rent for year. For any transmission line other than a leased line, or portion thereof, for
which the respondent is not the sole owner but which the respondent operates or shares in the operation of, furnish a succinct statement explaining the
arrangement and giving particulars (details) of such matters as percent ownership by respondent in the line, name of co-owner, basis of sharing
expenses of the Line, and how the expenses borne by the respondent are accounted for, and accounts affected. Specify whether lessor, co-owner, or
other party is an associated company.
9. Designate any transmission line leased to another company and give name of Lessee, date and terms of lease, annual rent for year, and how
determined. Specify whether lessee is an associated company.
10. Base the plant cost figures called for in columns (j) to (l) on the book cost at end of year.
715.5 - AAC - SIN 1
715.5 - AAC - SIN 2
715.5 - AAC - SIN 3
715.5 - AAC - SIN 4
477 - ACSS - SING 5
795 - ACSR - SING 6
4/0 - AAC - SINGL 7
715.5 - AAC - SIN 8
4/0 - AAC - SINGL 9
336.4 - AAC - SIN 10
715.5 - AAC - SIN 11
1113 - AAC - SING 12
13
250 - CU - SINGLE 14
715.5 - AAC - SIN 15
4/0 - AAC - SINGL 16
4/0 - AAC - SINGL 17
715.5 - AAC - SIN 18
4/0 - AAC - SINGL 19
715.5 - AAC - SIN 20
1113 - AAC - SING 21
4/0 - AAC - SINGL 22
266.8 - AAC - SIN 23
250 - CU - SINGLE 24
4/0 - AAC - SINGL 25
715.5 - AAC - SIN 26
1113 - AAC - SING 27
4/0 - AAC - SINGL 28
1113 - AAC - SING 29
397.5 - ACSR - SI 30
4/0 - ACSR - SING 31
397.5 - AAC - SIN 32
250 - CU - SINGLE 33
477 - ACSS - SING 34
715.5 - AAC - SIN 35
FERC FORM NO. 1 (ED. 12-87) Page 423.1
36 244,090,607 6,128,240,893 6,372,331,500 128,540,450 285,558,082 414,098,532

Name of Respondent This Report Is:(1) An Original
(2) A Resubmission
Date of Report(Mo, Da, Yr)
Year/Period of Report
End of
TRANSMISSION LINE STATISTICS (Continued)
PACIFIC GAS AND ELECTRIC COMPANYX
04/13/20212020/Q4
Line
No.
COST OF LINE (Include in Column (j) Land,
Size of
Conductor
and Material
Land rights, and clearing right-of-way)EXPENSES, EXCEPT DEPRECIATION AND TAXES
OperationExpenses
Maintenance Rents TotalLand Construction andOther Costs
Total Cost
(i) (j) (k) (l) (m) (n) (o) (p)Expenses Expenses
7. Do not report the same transmission line structure twice. Report Lower voltage Lines and higher voltage lines as one line. Designate in a footnote if
you do not include Lower voltage lines with higher voltage lines. If two or more transmission line structures support lines of the same voltage, report the
pole miles of the primary structure in column (f) and the pole miles of the other line(s) in column (g)
8. Designate any transmission line or portion thereof for which the respondent is not the sole owner. If such property is leased from another company,
give name of lessor, date and terms of Lease, and amount of rent for year. For any transmission line other than a leased line, or portion thereof, for
which the respondent is not the sole owner but which the respondent operates or shares in the operation of, furnish a succinct statement explaining the
arrangement and giving particulars (details) of such matters as percent ownership by respondent in the line, name of co-owner, basis of sharing
expenses of the Line, and how the expenses borne by the respondent are accounted for, and accounts affected. Specify whether lessor, co-owner, or
other party is an associated company.
9. Designate any transmission line leased to another company and give name of Lessee, date and terms of lease, annual rent for year, and how
determined. Specify whether lessee is an associated company.
10. Base the plant cost figures called for in columns (j) to (l) on the book cost at end of year.
397.5 - AAC - SIN 1
715.5 - AAC - SIN 2
715.5 - AAC - SIN 3
397.5 - AAC - SIN 4
397.5 - AAC - SIN 5
477 - ACSS - SING 6
397.5 - ACSR - SI 7
4/0 - ACSR - SING 8
397.5 - ACSR - SI 9
397.5 - ACSR - SI 10
11
477 - ACSS - SING 12
715.5 - AAC - SIN 13
954 - AAC - SINGL 14
3/4 - CU-STEEL - 15
715.5 - AAC - SIN 16
397.5 - ACSR - SI 17
3/4 - CU-STEEL - 18
397.5 - ACSR - SI 19
397.5 - ACSR - SI 20
397.5 - ACSR - SI 21
795 - ACSS - SING 22
715.5 - AAC - SIN 23
715.5 - AAC - SIN 24
4/0 - AAC - SINGL 25
477 - ACSS - SING 26
477 - ACSS - BUND 27
715.5 - AAC - SIN 28
715.5 - AAC - SIN 29
715.5 - AAC - SIN 30
715.5 - AAC - PAR 31
397.5 - AAC - SIN 32
4/0 - AAC - SINGL 33
397.5 - AAC - SIN 34
397.5 - AAC - SIN 35
FERC FORM NO. 1 (ED. 12-87) Page 423.2
36 244,090,607 6,128,240,893 6,372,331,500 128,540,450 285,558,082 414,098,532

Name of Respondent This Report Is:(1) An Original
(2) A Resubmission
Date of Report(Mo, Da, Yr)
Year/Period of Report
End of
TRANSMISSION LINE STATISTICS (Continued)
PACIFIC GAS AND ELECTRIC COMPANYX
04/13/20212020/Q4
Line
No.
COST OF LINE (Include in Column (j) Land,
Size of
Conductor
and Material
Land rights, and clearing right-of-way)EXPENSES, EXCEPT DEPRECIATION AND TAXES
OperationExpenses
Maintenance Rents TotalLand Construction andOther Costs
Total Cost
(i) (j) (k) (l) (m) (n) (o) (p)Expenses Expenses
7. Do not report the same transmission line structure twice. Report Lower voltage Lines and higher voltage lines as one line. Designate in a footnote if
you do not include Lower voltage lines with higher voltage lines. If two or more transmission line structures support lines of the same voltage, report the
pole miles of the primary structure in column (f) and the pole miles of the other line(s) in column (g)
8. Designate any transmission line or portion thereof for which the respondent is not the sole owner. If such property is leased from another company,
give name of lessor, date and terms of Lease, and amount of rent for year. For any transmission line other than a leased line, or portion thereof, for
which the respondent is not the sole owner but which the respondent operates or shares in the operation of, furnish a succinct statement explaining the
arrangement and giving particulars (details) of such matters as percent ownership by respondent in the line, name of co-owner, basis of sharing
expenses of the Line, and how the expenses borne by the respondent are accounted for, and accounts affected. Specify whether lessor, co-owner, or
other party is an associated company.
9. Designate any transmission line leased to another company and give name of Lessee, date and terms of lease, annual rent for year, and how
determined. Specify whether lessee is an associated company.
10. Base the plant cost figures called for in columns (j) to (l) on the book cost at end of year.
477 - ACSS - SING 1
795 - ACSS - SING 2
715.5 - AAC - SIN 3
266.8 - AAC - SIN 4
715.5 - AAC - SIN 5
1113 - AAC - SING 6
715.5 - AAC - SIN 7
477 - ACSS - SING 8
715.5 - AAC - SIN 9
715.5 - AAC - SIN 10
397.5 - AAC - SIN 11
4/0 - AAC - SINGL 12
4/0 - CU - SINGLE 13
397.5 - AAC - SIN 14
477 - ACSS - SING 15
477 - ACSS - SING 16
715.5 - AAC - SIN 17
397.5 - ACSR - SI 18
715.5 - AAC - SIN 19
715.5 - AAC - SIN 20
715.5 - AAC - SIN 21
4/0 - CU - SINGLE 22
4/0 - AAC - SINGL 23
715.5 - AAC - SIN 24
715.5 - AAC - SIN 25
715.5 - AAC - SIN 26
715.5 - AAC - SIN 27
2/0 - CU - SINGLE 28
715.5 - AAC - SIN 29
2/0 - CU - SINGLE 30
1113 - AAC - SING 31
1113 - AAC - SING 32
1113 - AAC - SING 33
1113 - AAC - SING 34
715.5 - AAC - SIN 35
FERC FORM NO. 1 (ED. 12-87) Page 423.3
36 244,090,607 6,128,240,893 6,372,331,500 128,540,450 285,558,082 414,098,532
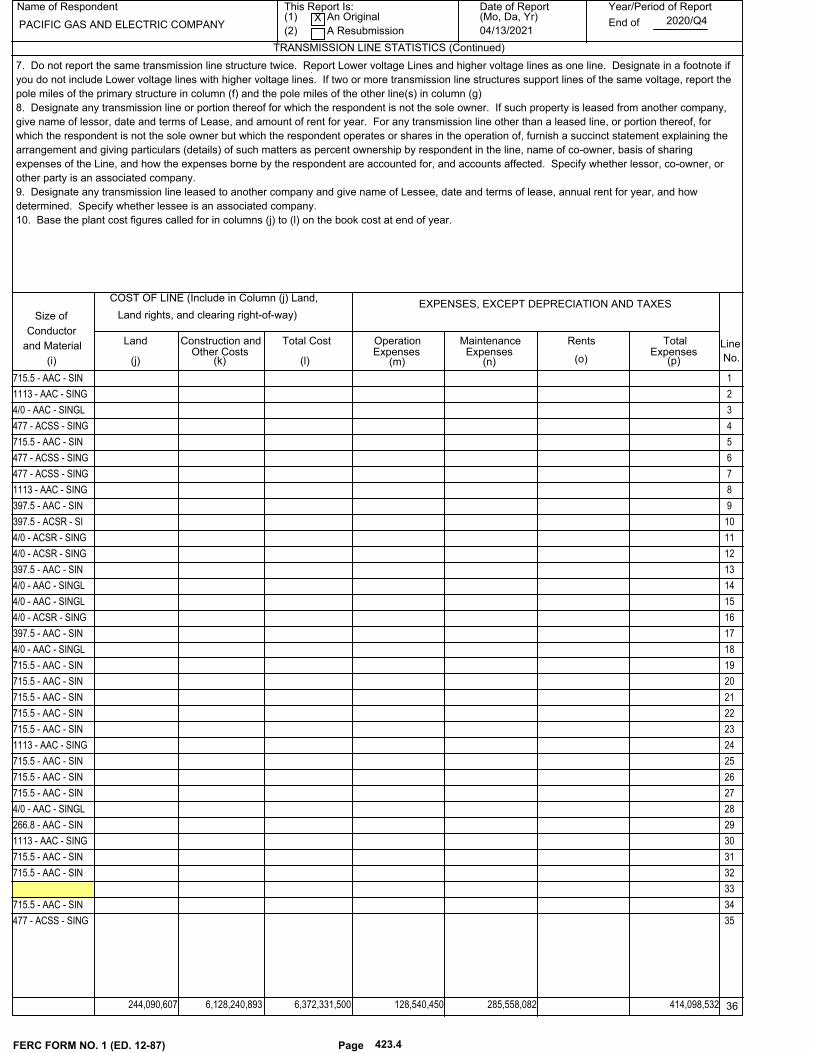
Name of Respondent This Report Is:(1) An Original
(2) A Resubmission
Date of Report(Mo, Da, Yr)
Year/Period of Report
End of
TRANSMISSION LINE STATISTICS (Continued)
PACIFIC GAS AND ELECTRIC COMPANYX
04/13/20212020/Q4
Line
No.
COST OF LINE (Include in Column (j) Land,
Size of
Conductor
and Material
Land rights, and clearing right-of-way)EXPENSES, EXCEPT DEPRECIATION AND TAXES
OperationExpenses
Maintenance Rents TotalLand Construction andOther Costs
Total Cost
(i) (j) (k) (l) (m) (n) (o) (p)Expenses Expenses
7. Do not report the same transmission line structure twice. Report Lower voltage Lines and higher voltage lines as one line. Designate in a footnote if
you do not include Lower voltage lines with higher voltage lines. If two or more transmission line structures support lines of the same voltage, report the
pole miles of the primary structure in column (f) and the pole miles of the other line(s) in column (g)
8. Designate any transmission line or portion thereof for which the respondent is not the sole owner. If such property is leased from another company,
give name of lessor, date and terms of Lease, and amount of rent for year. For any transmission line other than a leased line, or portion thereof, for
which the respondent is not the sole owner but which the respondent operates or shares in the operation of, furnish a succinct statement explaining the
arrangement and giving particulars (details) of such matters as percent ownership by respondent in the line, name of co-owner, basis of sharing
expenses of the Line, and how the expenses borne by the respondent are accounted for, and accounts affected. Specify whether lessor, co-owner, or
other party is an associated company.
9. Designate any transmission line leased to another company and give name of Lessee, date and terms of lease, annual rent for year, and how
determined. Specify whether lessee is an associated company.
10. Base the plant cost figures called for in columns (j) to (l) on the book cost at end of year.
715.5 - AAC - SIN 1
1113 - AAC - SING 2
4/0 - AAC - SINGL 3
477 - ACSS - SING 4
715.5 - AAC - SIN 5
477 - ACSS - SING 6
477 - ACSS - SING 7
1113 - AAC - SING 8
397.5 - AAC - SIN 9
397.5 - ACSR - SI 10
4/0 - ACSR - SING 11
4/0 - ACSR - SING 12
397.5 - AAC - SIN 13
4/0 - AAC - SINGL 14
4/0 - AAC - SINGL 15
4/0 - ACSR - SING 16
397.5 - AAC - SIN 17
4/0 - AAC - SINGL 18
715.5 - AAC - SIN 19
715.5 - AAC - SIN 20
715.5 - AAC - SIN 21
715.5 - AAC - SIN 22
715.5 - AAC - SIN 23
1113 - AAC - SING 24
715.5 - AAC - SIN 25
715.5 - AAC - SIN 26
715.5 - AAC - SIN 27
4/0 - AAC - SINGL 28
266.8 - AAC - SIN 29
1113 - AAC - SING 30
715.5 - AAC - SIN 31
715.5 - AAC - SIN 32
33
715.5 - AAC - SIN 34
477 - ACSS - SING 35
FERC FORM NO. 1 (ED. 12-87) Page 423.4
36 244,090,607 6,128,240,893 6,372,331,500 128,540,450 285,558,082 414,098,532

Name of Respondent This Report Is:(1) An Original
(2) A Resubmission
Date of Report(Mo, Da, Yr)
Year/Period of Report
End of
TRANSMISSION LINE STATISTICS (Continued)
PACIFIC GAS AND ELECTRIC COMPANYX
04/13/20212020/Q4
Line
No.
COST OF LINE (Include in Column (j) Land,
Size of
Conductor
and Material
Land rights, and clearing right-of-way)EXPENSES, EXCEPT DEPRECIATION AND TAXES
OperationExpenses
Maintenance Rents TotalLand Construction andOther Costs
Total Cost
(i) (j) (k) (l) (m) (n) (o) (p)Expenses Expenses
7. Do not report the same transmission line structure twice. Report Lower voltage Lines and higher voltage lines as one line. Designate in a footnote if
you do not include Lower voltage lines with higher voltage lines. If two or more transmission line structures support lines of the same voltage, report the
pole miles of the primary structure in column (f) and the pole miles of the other line(s) in column (g)
8. Designate any transmission line or portion thereof for which the respondent is not the sole owner. If such property is leased from another company,
give name of lessor, date and terms of Lease, and amount of rent for year. For any transmission line other than a leased line, or portion thereof, for
which the respondent is not the sole owner but which the respondent operates or shares in the operation of, furnish a succinct statement explaining the
arrangement and giving particulars (details) of such matters as percent ownership by respondent in the line, name of co-owner, basis of sharing
expenses of the Line, and how the expenses borne by the respondent are accounted for, and accounts affected. Specify whether lessor, co-owner, or
other party is an associated company.
9. Designate any transmission line leased to another company and give name of Lessee, date and terms of lease, annual rent for year, and how
determined. Specify whether lessee is an associated company.
10. Base the plant cost figures called for in columns (j) to (l) on the book cost at end of year.
4/0 - AAC - SINGL 1
715.5 - AAC - SIN 2
715.5 - AAC - SIN 3
250 - CU - PARALL 4
4/0 - AAC - SINGL 5
4/0 - AAC - SINGL 6
715.5 - AAC - SIN 7
715.5 - AAC - SIN 8
715.5 - AAC - SIN 9
715.5 - AAC - SIN 10
715.5 - AAC - SIN 11
715.5 - AAC - SIN 12
715.5 - AAC - SIN 13
715.5 - AAC - SIN 14
795 - ACSS - SING 15
715.5 - AAC - SIN 16
715.5 - AAC - SIN 17
715.5 - AAC - SIN 18
1113 - AAC - SING 19
397.5 - AAC - SIN 20
4/0 - AAC - SINGL 21
4/0 - AAC - SINGL 22
477 - ACSS - SING 23
477 - ACSS - SING 24
715.5 - AAC - SIN 25
26
477 - ACSS - SING 27
477 - ACSS - SING 28
715.5 - AAC - SIN 29
1113 - AAC - SING 30
4/0 - AAC - SINGL 31
397.5 - AAC - SIN 32
397.5 - AAC - SIN 33
715.5 - AAC - SIN 34
1113 - AAC - SING 35
FERC FORM NO. 1 (ED. 12-87) Page 423.5
36 244,090,607 6,128,240,893 6,372,331,500 128,540,450 285,558,082 414,098,532

Name of Respondent This Report Is:(1) An Original
(2) A Resubmission
Date of Report(Mo, Da, Yr)
Year/Period of Report
End of
TRANSMISSION LINE STATISTICS (Continued)
PACIFIC GAS AND ELECTRIC COMPANYX
04/13/20212020/Q4
Line
No.
COST OF LINE (Include in Column (j) Land,
Size of
Conductor
and Material
Land rights, and clearing right-of-way)EXPENSES, EXCEPT DEPRECIATION AND TAXES
OperationExpenses
Maintenance Rents TotalLand Construction andOther Costs
Total Cost
(i) (j) (k) (l) (m) (n) (o) (p)Expenses Expenses
7. Do not report the same transmission line structure twice. Report Lower voltage Lines and higher voltage lines as one line. Designate in a footnote if
you do not include Lower voltage lines with higher voltage lines. If two or more transmission line structures support lines of the same voltage, report the
pole miles of the primary structure in column (f) and the pole miles of the other line(s) in column (g)
8. Designate any transmission line or portion thereof for which the respondent is not the sole owner. If such property is leased from another company,
give name of lessor, date and terms of Lease, and amount of rent for year. For any transmission line other than a leased line, or portion thereof, for
which the respondent is not the sole owner but which the respondent operates or shares in the operation of, furnish a succinct statement explaining the
arrangement and giving particulars (details) of such matters as percent ownership by respondent in the line, name of co-owner, basis of sharing
expenses of the Line, and how the expenses borne by the respondent are accounted for, and accounts affected. Specify whether lessor, co-owner, or
other party is an associated company.
9. Designate any transmission line leased to another company and give name of Lessee, date and terms of lease, annual rent for year, and how
determined. Specify whether lessee is an associated company.
10. Base the plant cost figures called for in columns (j) to (l) on the book cost at end of year.
397.5 - AAC - SIN 1
715.5 - AAC - SIN 2
715.5 - AAC - SIN 3
4/0 - AAC - SINGL 4
4/0 - AAC - SINGL 5
715.5 - AAC - BUN 6
715.5 - AAC - BUN 7
477 - ACSS - SING 8
477 - ACSS - SING 9
477 - ACSS - SING 10
1113 - AAC - SING 11
4/0 - AAC - SINGL 12
477 - ACSS - SING 13
4/0 - AAC - SINGL 14
4/0 - AAC - SINGL 15
397.5 - AAC - SIN 16
397.5 - AAC - SIN 17
397.5 - AAC - SIN 18
477 - ACSS - SING 19
477 - ACSS - SING 20
477 - ACSS - SING 21
397.5 - AAC - SIN 22
715.5 - AAC - SIN 23
24
715.5 - AAC - SIN 25
397.5 - AAC - SIN 26
4/0 - AAC - SINGL 27
1113 - AAC - BUND 28
1113 - AAC - SING 29
715.5 - AAC - SIN 30
4/0 - AAC - SINGL 31
715.5 - AAC - SIN 32
397.5 - AAC - SIN 33
4/0 - AAC - SINGL 34
4/0 - AAC - SINGL 35
FERC FORM NO. 1 (ED. 12-87) Page 423.6
36 244,090,607 6,128,240,893 6,372,331,500 128,540,450 285,558,082 414,098,532

Name of Respondent This Report Is:(1) An Original
(2) A Resubmission
Date of Report(Mo, Da, Yr)
Year/Period of Report
End of
TRANSMISSION LINE STATISTICS (Continued)
PACIFIC GAS AND ELECTRIC COMPANYX
04/13/20212020/Q4
Line
No.
COST OF LINE (Include in Column (j) Land,
Size of
Conductor
and Material
Land rights, and clearing right-of-way)EXPENSES, EXCEPT DEPRECIATION AND TAXES
OperationExpenses
Maintenance Rents TotalLand Construction andOther Costs
Total Cost
(i) (j) (k) (l) (m) (n) (o) (p)Expenses Expenses
7. Do not report the same transmission line structure twice. Report Lower voltage Lines and higher voltage lines as one line. Designate in a footnote if
you do not include Lower voltage lines with higher voltage lines. If two or more transmission line structures support lines of the same voltage, report the
pole miles of the primary structure in column (f) and the pole miles of the other line(s) in column (g)
8. Designate any transmission line or portion thereof for which the respondent is not the sole owner. If such property is leased from another company,
give name of lessor, date and terms of Lease, and amount of rent for year. For any transmission line other than a leased line, or portion thereof, for
which the respondent is not the sole owner but which the respondent operates or shares in the operation of, furnish a succinct statement explaining the
arrangement and giving particulars (details) of such matters as percent ownership by respondent in the line, name of co-owner, basis of sharing
expenses of the Line, and how the expenses borne by the respondent are accounted for, and accounts affected. Specify whether lessor, co-owner, or
other party is an associated company.
9. Designate any transmission line leased to another company and give name of Lessee, date and terms of lease, annual rent for year, and how
determined. Specify whether lessee is an associated company.
10. Base the plant cost figures called for in columns (j) to (l) on the book cost at end of year.
1113 - AAC - SING 1
477 - ACSS - SING 2
477 - ACSS - SING 3
477 - ACSS - SING 4
477 - ACSS - SING 5
477 - ACSS - SING 6
4/0 - AAC - SINGL 7
477 - ACSS - SING 8
477 - ACSS - SING 9
795 - ACSS - SING 10
715.5 - AAC - SIN 11
397.5 - ACSR - SI 12
4/0 - ACSR - SING 13
397.5 - AAC - SIN 14
715.5 - AAC - SIN 15
397.5 - AAC - SIN 16
397.5 - AAC - SIN 17
4/0 - ACSR - SING 18
715.5 - AAC - SIN 19
715.5 - AAC - SIN 20
715.5 - AAC - SIN 21
715.5 - AAC - SIN 22
266.8 - AAC - SIN 23
1113 - AAC - SING 24
397.5 - AAC - SIN 25
397.5 - AAC - SIN 26
715.5 - AAC - SIN 27
397.5 - AAC - SIN 28
715.5 - AAC - SIN 29
715.5 - AAC - SIN 30
397.5 - AAC - SIN 31
477 - ACSS - SING 32
397.5 - AAC - SIN 33
477 - ACSS - SING 34
477 - ACSS - SING 35
FERC FORM NO. 1 (ED. 12-87) Page 423.7
36 244,090,607 6,128,240,893 6,372,331,500 128,540,450 285,558,082 414,098,532

Name of Respondent This Report Is:(1) An Original
(2) A Resubmission
Date of Report(Mo, Da, Yr)
Year/Period of Report
End of
TRANSMISSION LINE STATISTICS (Continued)
PACIFIC GAS AND ELECTRIC COMPANYX
04/13/20212020/Q4
Line
No.
COST OF LINE (Include in Column (j) Land,
Size of
Conductor
and Material
Land rights, and clearing right-of-way)EXPENSES, EXCEPT DEPRECIATION AND TAXES
OperationExpenses
Maintenance Rents TotalLand Construction andOther Costs
Total Cost
(i) (j) (k) (l) (m) (n) (o) (p)Expenses Expenses
7. Do not report the same transmission line structure twice. Report Lower voltage Lines and higher voltage lines as one line. Designate in a footnote if
you do not include Lower voltage lines with higher voltage lines. If two or more transmission line structures support lines of the same voltage, report the
pole miles of the primary structure in column (f) and the pole miles of the other line(s) in column (g)
8. Designate any transmission line or portion thereof for which the respondent is not the sole owner. If such property is leased from another company,
give name of lessor, date and terms of Lease, and amount of rent for year. For any transmission line other than a leased line, or portion thereof, for
which the respondent is not the sole owner but which the respondent operates or shares in the operation of, furnish a succinct statement explaining the
arrangement and giving particulars (details) of such matters as percent ownership by respondent in the line, name of co-owner, basis of sharing
expenses of the Line, and how the expenses borne by the respondent are accounted for, and accounts affected. Specify whether lessor, co-owner, or
other party is an associated company.
9. Designate any transmission line leased to another company and give name of Lessee, date and terms of lease, annual rent for year, and how
determined. Specify whether lessee is an associated company.
10. Base the plant cost figures called for in columns (j) to (l) on the book cost at end of year.
477 - ACSS - SING 1
715.5 - AAC - SIN 2
795 - ACSS - SING 3
795 - ACSS - SING 4
715.5 - AAC - SIN 5
715.5 - AAC - SIN 6
397.5 - AAC - SIN 7
477 - ACSS - SING 8
715.5 - AAC - SIN 9
4/0 - AAC - SINGL 10
477 - ACSS - SING 11
4/0 - AAC - SINGL 12
4/0 - AAC - SINGL 13
1113 - ACSS - SIN 14
1113 - ACSS - SIN 15
715.5 - AAC - SIN 16
1113 - AAC - SING 17
250 - CU - SINGLE 18
336.4 - AAC - SIN 19
4/0 - AAC - SINGL 20
715.5 - AAC - SIN 21
477 - ACSS - SING 22
477 - ACSS - SING 23
336.4 - AAC - SIN 24
1113 - AAC - SING 25
715.5 - AAC - SIN 26
715.5 - AAC - SIN 27
477 - ACSS - SING 28
715.5 - AAC - SIN 29
477 - ACSS - SING 30
715.5 - AAC - SIN 31
3/0 - CU - SINGLE 32
3/0 - CU - SINGLE 33
715.5 - AAC - SIN 34
715.5 - AAC - SIN 35
FERC FORM NO. 1 (ED. 12-87) Page 423.8
36 244,090,607 6,128,240,893 6,372,331,500 128,540,450 285,558,082 414,098,532

Name of Respondent This Report Is:(1) An Original
(2) A Resubmission
Date of Report(Mo, Da, Yr)
Year/Period of Report
End of
TRANSMISSION LINE STATISTICS (Continued)
PACIFIC GAS AND ELECTRIC COMPANYX
04/13/20212020/Q4
Line
No.
COST OF LINE (Include in Column (j) Land,
Size of
Conductor
and Material
Land rights, and clearing right-of-way)EXPENSES, EXCEPT DEPRECIATION AND TAXES
OperationExpenses
Maintenance Rents TotalLand Construction andOther Costs
Total Cost
(i) (j) (k) (l) (m) (n) (o) (p)Expenses Expenses
7. Do not report the same transmission line structure twice. Report Lower voltage Lines and higher voltage lines as one line. Designate in a footnote if
you do not include Lower voltage lines with higher voltage lines. If two or more transmission line structures support lines of the same voltage, report the
pole miles of the primary structure in column (f) and the pole miles of the other line(s) in column (g)
8. Designate any transmission line or portion thereof for which the respondent is not the sole owner. If such property is leased from another company,
give name of lessor, date and terms of Lease, and amount of rent for year. For any transmission line other than a leased line, or portion thereof, for
which the respondent is not the sole owner but which the respondent operates or shares in the operation of, furnish a succinct statement explaining the
arrangement and giving particulars (details) of such matters as percent ownership by respondent in the line, name of co-owner, basis of sharing
expenses of the Line, and how the expenses borne by the respondent are accounted for, and accounts affected. Specify whether lessor, co-owner, or
other party is an associated company.
9. Designate any transmission line leased to another company and give name of Lessee, date and terms of lease, annual rent for year, and how
determined. Specify whether lessee is an associated company.
10. Base the plant cost figures called for in columns (j) to (l) on the book cost at end of year.
715.5 - AAC - SIN 1
715.5 - AAC - SIN 2
715.5 - AAC - SIN 3
715.5 - AAC - SIN 4
715.5 - AAC - SIN 5
715.5 - AAC - SIN 6
715.5 - AAC - SIN 7
397.5 - AAC - SIN 8
1113 - AAC - SING 9
715.5 - AAC - SIN 10
715.5 - AAC - SIN 11
477 - ACSS - SING 12
477 - ACSS - SING 13
1 - UNKNOWN - 14
477 - ACSS - SING 15
266.8 - AAC - SIN 16
477 - ACSS - SING 17
266.8 - AAC - SIN 18
477 - ACSS - SING 19
477 - ACSS - SING 20
477 - ACSS - SING 21
2/0 - CU - SINGLE 22
715.5 - AAC - SIN 23
477 - ACSS - SING 24
715.5 - AAC - SIN 25
715.5 - AAC - SIN 26
715.5 - AAC - SIN 27
1113 - AAC - BUND 28
477 - ACSS - SING 29
397.5 - AAC - SIN 30
477 - ACSS - SING 31
477 - ACSS - SING 32
477 - ACSS - SING 33
477 - ACSS - SING 34
715.5 - AAC - SIN 35
FERC FORM NO. 1 (ED. 12-87) Page 423.9
36 244,090,607 6,128,240,893 6,372,331,500 128,540,450 285,558,082 414,098,532
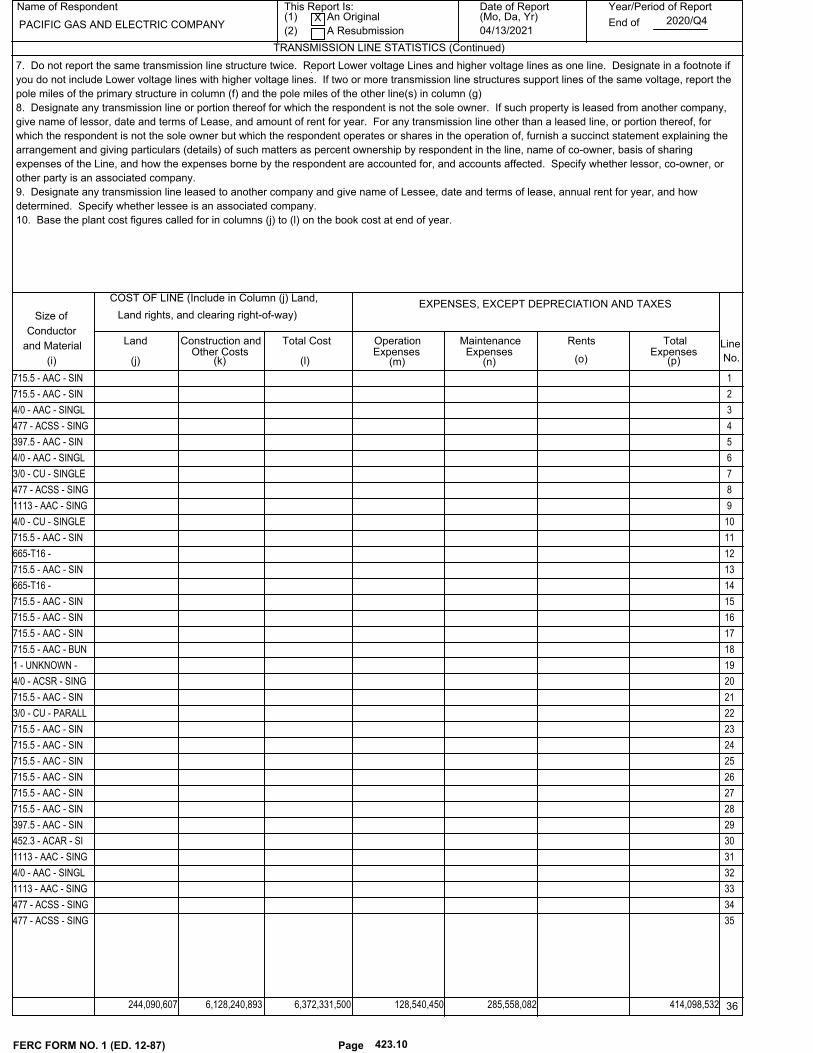
Name of Respondent This Report Is:(1) An Original
(2) A Resubmission
Date of Report(Mo, Da, Yr)
Year/Period of Report
End of
TRANSMISSION LINE STATISTICS (Continued)
PACIFIC GAS AND ELECTRIC COMPANYX
04/13/20212020/Q4
Line
No.
COST OF LINE (Include in Column (j) Land,
Size of
Conductor
and Material
Land rights, and clearing right-of-way)EXPENSES, EXCEPT DEPRECIATION AND TAXES
OperationExpenses
Maintenance Rents TotalLand Construction andOther Costs
Total Cost
(i) (j) (k) (l) (m) (n) (o) (p)Expenses Expenses
7. Do not report the same transmission line structure twice. Report Lower voltage Lines and higher voltage lines as one line. Designate in a footnote if
you do not include Lower voltage lines with higher voltage lines. If two or more transmission line structures support lines of the same voltage, report the
pole miles of the primary structure in column (f) and the pole miles of the other line(s) in column (g)
8. Designate any transmission line or portion thereof for which the respondent is not the sole owner. If such property is leased from another company,
give name of lessor, date and terms of Lease, and amount of rent for year. For any transmission line other than a leased line, or portion thereof, for
which the respondent is not the sole owner but which the respondent operates or shares in the operation of, furnish a succinct statement explaining the
arrangement and giving particulars (details) of such matters as percent ownership by respondent in the line, name of co-owner, basis of sharing
expenses of the Line, and how the expenses borne by the respondent are accounted for, and accounts affected. Specify whether lessor, co-owner, or
other party is an associated company.
9. Designate any transmission line leased to another company and give name of Lessee, date and terms of lease, annual rent for year, and how
determined. Specify whether lessee is an associated company.
10. Base the plant cost figures called for in columns (j) to (l) on the book cost at end of year.
715.5 - AAC - SIN 1
715.5 - AAC - SIN 2
4/0 - AAC - SINGL 3
477 - ACSS - SING 4
397.5 - AAC - SIN 5
4/0 - AAC - SINGL 6
3/0 - CU - SINGLE 7
477 - ACSS - SING 8
1113 - AAC - SING 9
4/0 - CU - SINGLE 10
715.5 - AAC - SIN 11
665-T16 - 12
715.5 - AAC - SIN 13
665-T16 - 14
715.5 - AAC - SIN 15
715.5 - AAC - SIN 16
715.5 - AAC - SIN 17
715.5 - AAC - BUN 18
1 - UNKNOWN - 19
4/0 - ACSR - SING 20
715.5 - AAC - SIN 21
3/0 - CU - PARALL 22
715.5 - AAC - SIN 23
715.5 - AAC - SIN 24
715.5 - AAC - SIN 25
715.5 - AAC - SIN 26
715.5 - AAC - SIN 27
715.5 - AAC - SIN 28
397.5 - AAC - SIN 29
452.3 - ACAR - SI 30
1113 - AAC - SING 31
4/0 - AAC - SINGL 32
1113 - AAC - SING 33
477 - ACSS - SING 34
477 - ACSS - SING 35
FERC FORM NO. 1 (ED. 12-87) Page 423.10
36 244,090,607 6,128,240,893 6,372,331,500 128,540,450 285,558,082 414,098,532

Name of Respondent This Report Is:(1) An Original
(2) A Resubmission
Date of Report(Mo, Da, Yr)
Year/Period of Report
End of
TRANSMISSION LINE STATISTICS (Continued)
PACIFIC GAS AND ELECTRIC COMPANYX
04/13/20212020/Q4
Line
No.
COST OF LINE (Include in Column (j) Land,
Size of
Conductor
and Material
Land rights, and clearing right-of-way)EXPENSES, EXCEPT DEPRECIATION AND TAXES
OperationExpenses
Maintenance Rents TotalLand Construction andOther Costs
Total Cost
(i) (j) (k) (l) (m) (n) (o) (p)Expenses Expenses
7. Do not report the same transmission line structure twice. Report Lower voltage Lines and higher voltage lines as one line. Designate in a footnote if
you do not include Lower voltage lines with higher voltage lines. If two or more transmission line structures support lines of the same voltage, report the
pole miles of the primary structure in column (f) and the pole miles of the other line(s) in column (g)
8. Designate any transmission line or portion thereof for which the respondent is not the sole owner. If such property is leased from another company,
give name of lessor, date and terms of Lease, and amount of rent for year. For any transmission line other than a leased line, or portion thereof, for
which the respondent is not the sole owner but which the respondent operates or shares in the operation of, furnish a succinct statement explaining the
arrangement and giving particulars (details) of such matters as percent ownership by respondent in the line, name of co-owner, basis of sharing
expenses of the Line, and how the expenses borne by the respondent are accounted for, and accounts affected. Specify whether lessor, co-owner, or
other party is an associated company.
9. Designate any transmission line leased to another company and give name of Lessee, date and terms of lease, annual rent for year, and how
determined. Specify whether lessee is an associated company.
10. Base the plant cost figures called for in columns (j) to (l) on the book cost at end of year.
397.5 - AAC - SIN 1
477 - ACSS - SING 2
4/0 - AAC - SINGL 3
4/0 - AAC - SINGL 4
4/0 - AAC - SINGL 5
397.5 - ACSR - SI 6
4/0 - AAC - SINGL 7
715.5 - AAC - SIN 8
715.5 - AAC - SIN 9
715.5 - AAC - SIN 10
715.5 - AAC - SIN 11
397.5 - AAC - SIN 12
4/0 - AAC - SINGL 13
4/0 - AAC - SINGL 14
715.5 - AAC - SIN 15
397.5 - AAC - SIN 16
477 - ACSS - SING 17
1 - UNKNOWN - 18
715.5 - AAC - BUN 19
477 - ACSS - SING 20
715.5 - AAC - BUN 21
715.5 - AAC - SIN 22
4/0 - AAC - SINGL 23
397.5 - AAC - SIN 24
2300 - AAC - BUND 25
2300 - AAC - BUND 26
715.5 - AAC - SIN 27
477 - ACSS - SING 28
4/0 - AAC - SINGL 29
4/0 - AAC - SINGL 30
477 - ACSS - SING 31
4/0 - AAC - SINGL 32
477 - ACSS - SING 33
4/0 - AAC - SINGL 34
477 - ACSS - SING 35
FERC FORM NO. 1 (ED. 12-87) Page 423.11
36 244,090,607 6,128,240,893 6,372,331,500 128,540,450 285,558,082 414,098,532

Name of Respondent This Report Is:(1) An Original
(2) A Resubmission
Date of Report(Mo, Da, Yr)
Year/Period of Report
End of
TRANSMISSION LINE STATISTICS (Continued)
PACIFIC GAS AND ELECTRIC COMPANYX
04/13/20212020/Q4
Line
No.
COST OF LINE (Include in Column (j) Land,
Size of
Conductor
and Material
Land rights, and clearing right-of-way)EXPENSES, EXCEPT DEPRECIATION AND TAXES
OperationExpenses
Maintenance Rents TotalLand Construction andOther Costs
Total Cost
(i) (j) (k) (l) (m) (n) (o) (p)Expenses Expenses
7. Do not report the same transmission line structure twice. Report Lower voltage Lines and higher voltage lines as one line. Designate in a footnote if
you do not include Lower voltage lines with higher voltage lines. If two or more transmission line structures support lines of the same voltage, report the
pole miles of the primary structure in column (f) and the pole miles of the other line(s) in column (g)
8. Designate any transmission line or portion thereof for which the respondent is not the sole owner. If such property is leased from another company,
give name of lessor, date and terms of Lease, and amount of rent for year. For any transmission line other than a leased line, or portion thereof, for
which the respondent is not the sole owner but which the respondent operates or shares in the operation of, furnish a succinct statement explaining the
arrangement and giving particulars (details) of such matters as percent ownership by respondent in the line, name of co-owner, basis of sharing
expenses of the Line, and how the expenses borne by the respondent are accounted for, and accounts affected. Specify whether lessor, co-owner, or
other party is an associated company.
9. Designate any transmission line leased to another company and give name of Lessee, date and terms of lease, annual rent for year, and how
determined. Specify whether lessee is an associated company.
10. Base the plant cost figures called for in columns (j) to (l) on the book cost at end of year.
477 - ACSS - SING 1
715.5 - AAC - SIN 2
2/0 - CU - SINGLE 3
715.5 - AAC - SIN 4
715.5 - AAC - SIN 5
715.5 - AAC - SIN 6
715.5 - AAC - SIN 7
715.5 - AAC - SIN 8
715.5 - AAC - SIN 9
477 - ACSS - SING 10
477 - ACSS - SING 11
715.5 - AAC - SIN 12
715.5 - AAC - SIN 13
397.5 - AAC - SIN 14
715.5 - AAC - SIN 15
4/0 - CU - SINGLE 16
397.5 - ACSR - SI 17
1113 - AAC - SING 18
715.5 - AAC - SIN 19
715.5 - AAC - SIN 20
715.5 - AAC - SIN 21
336.4 - AAC - SIN 22
397.5 - ACSR - SI 23
4/0 - CU - SINGLE 24
715.5 - AAC - SIN 25
477 - ACSS - SING 26
477 - ACSS - SING 27
715.5 - AAC - SIN 28
1113 - AAC - SING 29
397.5 - AAC - SIN 30
397.5 - AAC - SIN 31
1113 - AAC - SING 32
715.5 - AAC - SIN 33
4/0 - AAC - SINGL 34
477 - ACSS - SING 35
FERC FORM NO. 1 (ED. 12-87) Page 423.12
36 244,090,607 6,128,240,893 6,372,331,500 128,540,450 285,558,082 414,098,532

Name of Respondent This Report Is:(1) An Original
(2) A Resubmission
Date of Report(Mo, Da, Yr)
Year/Period of Report
End of
TRANSMISSION LINE STATISTICS (Continued)
PACIFIC GAS AND ELECTRIC COMPANYX
04/13/20212020/Q4
Line
No.
COST OF LINE (Include in Column (j) Land,
Size of
Conductor
and Material
Land rights, and clearing right-of-way)EXPENSES, EXCEPT DEPRECIATION AND TAXES
OperationExpenses
Maintenance Rents TotalLand Construction andOther Costs
Total Cost
(i) (j) (k) (l) (m) (n) (o) (p)Expenses Expenses
7. Do not report the same transmission line structure twice. Report Lower voltage Lines and higher voltage lines as one line. Designate in a footnote if
you do not include Lower voltage lines with higher voltage lines. If two or more transmission line structures support lines of the same voltage, report the
pole miles of the primary structure in column (f) and the pole miles of the other line(s) in column (g)
8. Designate any transmission line or portion thereof for which the respondent is not the sole owner. If such property is leased from another company,
give name of lessor, date and terms of Lease, and amount of rent for year. For any transmission line other than a leased line, or portion thereof, for
which the respondent is not the sole owner but which the respondent operates or shares in the operation of, furnish a succinct statement explaining the
arrangement and giving particulars (details) of such matters as percent ownership by respondent in the line, name of co-owner, basis of sharing
expenses of the Line, and how the expenses borne by the respondent are accounted for, and accounts affected. Specify whether lessor, co-owner, or
other party is an associated company.
9. Designate any transmission line leased to another company and give name of Lessee, date and terms of lease, annual rent for year, and how
determined. Specify whether lessee is an associated company.
10. Base the plant cost figures called for in columns (j) to (l) on the book cost at end of year.
715.5 - AAC - SIN 1
4/0 - CU - SINGLE 2
4/0 - CU - SINGLE 3
397.5 - AAC - SIN 4
4/0 - AAC - SINGL 5
397.5 - AAC - SIN 6
1113 - AAC - SING 7
715.5 - AAC - SIN 8
715.5 - AAC - SIN 9
250 - CU - PARALL 10
1113 - AAC - SING 11
477 - ACSS - SING 12
1113 - AAC - SING 13
250 - CU - PARALL 14
715.5 - AAC - SIN 15
715.5 - AAC - SIN 16
715.5 - AAC - SIN 17
715.5 - AAC - SIN 18
715.5 - AAC - SIN 19
715.5 - AAC - SIN 20
715.5 - AAC - SIN 21
477 - ACSS - SING 22
715.5 - AAC - SIN 23
715.5 - AAC - SIN 24
2/0 - CU - SINGLE 25
715.5 - AAC - SIN 26
715.5 - AAC - SIN 27
2/0 - CU - SINGLE 28
2/0 - CU - SINGLE 29
2/0 - CU - SINGLE 30
477 - ACSS - SING 31
715.5 - AAC - SIN 32
715.5 - AAC - SIN 33
397.5 - AAC - SIN 34
477 - ACSS - SING 35
FERC FORM NO. 1 (ED. 12-87) Page 423.13
36 244,090,607 6,128,240,893 6,372,331,500 128,540,450 285,558,082 414,098,532

Name of Respondent This Report Is:(1) An Original
(2) A Resubmission
Date of Report(Mo, Da, Yr)
Year/Period of Report
End of
TRANSMISSION LINE STATISTICS (Continued)
PACIFIC GAS AND ELECTRIC COMPANYX
04/13/20212020/Q4
Line
No.
COST OF LINE (Include in Column (j) Land,
Size of
Conductor
and Material
Land rights, and clearing right-of-way)EXPENSES, EXCEPT DEPRECIATION AND TAXES
OperationExpenses
Maintenance Rents TotalLand Construction andOther Costs
Total Cost
(i) (j) (k) (l) (m) (n) (o) (p)Expenses Expenses
7. Do not report the same transmission line structure twice. Report Lower voltage Lines and higher voltage lines as one line. Designate in a footnote if
you do not include Lower voltage lines with higher voltage lines. If two or more transmission line structures support lines of the same voltage, report the
pole miles of the primary structure in column (f) and the pole miles of the other line(s) in column (g)
8. Designate any transmission line or portion thereof for which the respondent is not the sole owner. If such property is leased from another company,
give name of lessor, date and terms of Lease, and amount of rent for year. For any transmission line other than a leased line, or portion thereof, for
which the respondent is not the sole owner but which the respondent operates or shares in the operation of, furnish a succinct statement explaining the
arrangement and giving particulars (details) of such matters as percent ownership by respondent in the line, name of co-owner, basis of sharing
expenses of the Line, and how the expenses borne by the respondent are accounted for, and accounts affected. Specify whether lessor, co-owner, or
other party is an associated company.
9. Designate any transmission line leased to another company and give name of Lessee, date and terms of lease, annual rent for year, and how
determined. Specify whether lessee is an associated company.
10. Base the plant cost figures called for in columns (j) to (l) on the book cost at end of year.
4/0 - AAC - SINGL 1
477 - ACSS - SING 2
715.5 - AAC - SIN 3
715.5 - AAC - SIN 4
715.5 - AAC - SIN 5
715.5 - AAC - SIN 6
336.4 - AAC - SIN 7
715.5 - AAC - SIN 8
715.5 - AAC - SIN 9
4/0 - AAC - SINGL 10
477 - ACSS - SING 11
715.5 - AAC - SIN 12
2/0 - CU - SINGLE 13
4/0 - AAC - SINGL 14
15
477 - ACSS - SING 16
715.5 - AAC - SIN 17
4/0 - AAC - SINGL 18
954 - ACSS - SING 19
477 - ACSS - SING 20
4/0 - AAC - SINGL 21
4/0 - AAC - SINGL 22
715.5 - AAC - SIN 23
715.5 - AAC - SIN 24
715.5 - AAC - SIN 25
477 - ACSS - SING 26
4/0 - AAC - SINGL 27
715.5 - AAC - SIN 28
1 - UNKNOWN - 29
715.5 - AAC - BUN 30
336.4 - ACAR - SI 31
397.5 - ACSR - SI 32
715.5 - AAC - SIN 33
715.5 - AAC - SIN 34
397.5 - AAC - SIN 35
FERC FORM NO. 1 (ED. 12-87) Page 423.14
36 244,090,607 6,128,240,893 6,372,331,500 128,540,450 285,558,082 414,098,532

Name of Respondent This Report Is:(1) An Original
(2) A Resubmission
Date of Report(Mo, Da, Yr)
Year/Period of Report
End of
TRANSMISSION LINE STATISTICS (Continued)
PACIFIC GAS AND ELECTRIC COMPANYX
04/13/20212020/Q4
Line
No.
COST OF LINE (Include in Column (j) Land,
Size of
Conductor
and Material
Land rights, and clearing right-of-way)EXPENSES, EXCEPT DEPRECIATION AND TAXES
OperationExpenses
Maintenance Rents TotalLand Construction andOther Costs
Total Cost
(i) (j) (k) (l) (m) (n) (o) (p)Expenses Expenses
7. Do not report the same transmission line structure twice. Report Lower voltage Lines and higher voltage lines as one line. Designate in a footnote if
you do not include Lower voltage lines with higher voltage lines. If two or more transmission line structures support lines of the same voltage, report the
pole miles of the primary structure in column (f) and the pole miles of the other line(s) in column (g)
8. Designate any transmission line or portion thereof for which the respondent is not the sole owner. If such property is leased from another company,
give name of lessor, date and terms of Lease, and amount of rent for year. For any transmission line other than a leased line, or portion thereof, for
which the respondent is not the sole owner but which the respondent operates or shares in the operation of, furnish a succinct statement explaining the
arrangement and giving particulars (details) of such matters as percent ownership by respondent in the line, name of co-owner, basis of sharing
expenses of the Line, and how the expenses borne by the respondent are accounted for, and accounts affected. Specify whether lessor, co-owner, or
other party is an associated company.
9. Designate any transmission line leased to another company and give name of Lessee, date and terms of lease, annual rent for year, and how
determined. Specify whether lessee is an associated company.
10. Base the plant cost figures called for in columns (j) to (l) on the book cost at end of year.
715.5 - AAC - SIN 1
4/0 - ACSR - SING 2
477 - ACSS - SING 3
715.5 - AAC - SIN 4
715.5 - AAC - SIN 5
715.5 - AAC - SIN 6
4/0 - AAC - SINGL 7
477 - ACSS - SING 8
715.5 - AAC - SIN 9
4/0 - AAC - SINGL 10
715.5 - AAC - SIN 11
397.5 - AAC - SIN 12
715.5 - AAC - SIN 13
715.5 - AAC - SIN 14
715.5 - AAC - SIN 15
715.5 - AAC - SIN 16
266.8 - AAC - SIN 17
715.5 - AAC - SIN 18
715.5 - AAC - SIN 19
4/0 - AAC - SINGL 20
715.5 - AAC - SIN 21
4/0 - ACSR - SING 22
397.5 - ACSR - SI 23
4/0 - ACSR - SING 24
715.5 - AAC - SIN 25
954 - AAC - SINGL 26
1431 - AAC - SING 27
1113 - AAC - SING 28
250 - CU - SINGLE 29
715.5 - AAC - SIN 30
4/0 - AAC - SINGL 31
477 - ACSS - SING 32
477 - ACSS - SING 33
477 - ACSS - SING 34
715.5 - AAC - SIN 35
FERC FORM NO. 1 (ED. 12-87) Page 423.15
36 244,090,607 6,128,240,893 6,372,331,500 128,540,450 285,558,082 414,098,532

Name of Respondent This Report Is:(1) An Original
(2) A Resubmission
Date of Report(Mo, Da, Yr)
Year/Period of Report
End of
TRANSMISSION LINE STATISTICS (Continued)
PACIFIC GAS AND ELECTRIC COMPANYX
04/13/20212020/Q4
Line
No.
COST OF LINE (Include in Column (j) Land,
Size of
Conductor
and Material
Land rights, and clearing right-of-way)EXPENSES, EXCEPT DEPRECIATION AND TAXES
OperationExpenses
Maintenance Rents TotalLand Construction andOther Costs
Total Cost
(i) (j) (k) (l) (m) (n) (o) (p)Expenses Expenses
7. Do not report the same transmission line structure twice. Report Lower voltage Lines and higher voltage lines as one line. Designate in a footnote if
you do not include Lower voltage lines with higher voltage lines. If two or more transmission line structures support lines of the same voltage, report the
pole miles of the primary structure in column (f) and the pole miles of the other line(s) in column (g)
8. Designate any transmission line or portion thereof for which the respondent is not the sole owner. If such property is leased from another company,
give name of lessor, date and terms of Lease, and amount of rent for year. For any transmission line other than a leased line, or portion thereof, for
which the respondent is not the sole owner but which the respondent operates or shares in the operation of, furnish a succinct statement explaining the
arrangement and giving particulars (details) of such matters as percent ownership by respondent in the line, name of co-owner, basis of sharing
expenses of the Line, and how the expenses borne by the respondent are accounted for, and accounts affected. Specify whether lessor, co-owner, or
other party is an associated company.
9. Designate any transmission line leased to another company and give name of Lessee, date and terms of lease, annual rent for year, and how
determined. Specify whether lessee is an associated company.
10. Base the plant cost figures called for in columns (j) to (l) on the book cost at end of year.
477 - ACSS - SING 1
715.5 - AAC - SIN 2
477 - ACSS - SING 3
477 - ACSS - SING 4
715.5 - AAC - SIN 5
336.4 - AAC - SIN 6
1 - UNKNOWN - 7
477 - ACSS - SING 8
1113 - AAC - SING 9
1113 - AAC - SING 10
804.5 - ACSR - SI 11
954 - AAC - SINGL 12
1113 - AAC - SING 13
954 - ACSS - SING 14
954 - ACSR - SING 15
954 - ACSR - SING 16
954 - ACSS - SING 17
1113 - AAC - SING 18
4/0 - CU - SINGLE 19
4/0 - CU - SINGLE 20
715.5 - AAC - SIN 21
715.5 - AAC - SIN 22
1113 - AAC - SING 23
1113 - AAC - SING 24
1113 - AAC - SING 25
795 - ACSS - SING 26
954 - AAC - SINGL 27
795 - ACSR - SING 28
1113 - AAC - SING 29
1113 - AAC - SING 30
1113 - ACSS - SIN 31
1113 - AAC - SING 32
1113 - AAC - SING 33
1113 - AAC - SING 34
954 - ACSS - SING 35
FERC FORM NO. 1 (ED. 12-87) Page 423.16
36 244,090,607 6,128,240,893 6,372,331,500 128,540,450 285,558,082 414,098,532

Name of Respondent This Report Is:(1) An Original
(2) A Resubmission
Date of Report(Mo, Da, Yr)
Year/Period of Report
End of
TRANSMISSION LINE STATISTICS (Continued)
PACIFIC GAS AND ELECTRIC COMPANYX
04/13/20212020/Q4
Line
No.
COST OF LINE (Include in Column (j) Land,
Size of
Conductor
and Material
Land rights, and clearing right-of-way)EXPENSES, EXCEPT DEPRECIATION AND TAXES
OperationExpenses
Maintenance Rents TotalLand Construction andOther Costs
Total Cost
(i) (j) (k) (l) (m) (n) (o) (p)Expenses Expenses
7. Do not report the same transmission line structure twice. Report Lower voltage Lines and higher voltage lines as one line. Designate in a footnote if
you do not include Lower voltage lines with higher voltage lines. If two or more transmission line structures support lines of the same voltage, report the
pole miles of the primary structure in column (f) and the pole miles of the other line(s) in column (g)
8. Designate any transmission line or portion thereof for which the respondent is not the sole owner. If such property is leased from another company,
give name of lessor, date and terms of Lease, and amount of rent for year. For any transmission line other than a leased line, or portion thereof, for
which the respondent is not the sole owner but which the respondent operates or shares in the operation of, furnish a succinct statement explaining the
arrangement and giving particulars (details) of such matters as percent ownership by respondent in the line, name of co-owner, basis of sharing
expenses of the Line, and how the expenses borne by the respondent are accounted for, and accounts affected. Specify whether lessor, co-owner, or
other party is an associated company.
9. Designate any transmission line leased to another company and give name of Lessee, date and terms of lease, annual rent for year, and how
determined. Specify whether lessee is an associated company.
10. Base the plant cost figures called for in columns (j) to (l) on the book cost at end of year.
954 - ACSS - SING 1
954 - ACSS - SING 2
1113 - AAC - SING 3
1113 - AAC - SING 4
1113 - AAC - SING 5
954 - ACSS - SING 6
1113 - AAC - SING 7
643.7 - HOLO-CU - 8
643.7 - HOLO-CU - 9
954 - AAC - SINGL 10
1113 - AAC - SING 11
954 - AAC - SINGL 12
795 - ACSR - SING 13
1113 - AAC - SING 14
1113 - AAC - SING 15
1113 - AAC - SING 16
795 - ACSR - SING 17
1113 - AAC - BUND 18
954 - ACSS - SING 19
1113 - AAC - SING 20
518 - ACSR - SING 21
1113 - AAC - SING 22
1113 - AAC - SING 23
1113 - ACSS - SIN 24
1113 - ACSS - SIN 25
795 - ACSR - SING 26
795 - ACSR - SING 27
1113 - AAC - SING 28
1113 - AAC - SING 29
1113 - AAC - SING 30
1113 - AAC - SING 31
2300 - AAC - BUND 32
2300 - AAC - BUND 33
1431 - AAC - SING 34
1113 - AAC - SING 35
FERC FORM NO. 1 (ED. 12-87) Page 423.17
36 244,090,607 6,128,240,893 6,372,331,500 128,540,450 285,558,082 414,098,532

Name of Respondent This Report Is:(1) An Original
(2) A Resubmission
Date of Report(Mo, Da, Yr)
Year/Period of Report
End of
TRANSMISSION LINE STATISTICS (Continued)
PACIFIC GAS AND ELECTRIC COMPANYX
04/13/20212020/Q4
Line
No.
COST OF LINE (Include in Column (j) Land,
Size of
Conductor
and Material
Land rights, and clearing right-of-way)EXPENSES, EXCEPT DEPRECIATION AND TAXES
OperationExpenses
Maintenance Rents TotalLand Construction andOther Costs
Total Cost
(i) (j) (k) (l) (m) (n) (o) (p)Expenses Expenses
7. Do not report the same transmission line structure twice. Report Lower voltage Lines and higher voltage lines as one line. Designate in a footnote if
you do not include Lower voltage lines with higher voltage lines. If two or more transmission line structures support lines of the same voltage, report the
pole miles of the primary structure in column (f) and the pole miles of the other line(s) in column (g)
8. Designate any transmission line or portion thereof for which the respondent is not the sole owner. If such property is leased from another company,
give name of lessor, date and terms of Lease, and amount of rent for year. For any transmission line other than a leased line, or portion thereof, for
which the respondent is not the sole owner but which the respondent operates or shares in the operation of, furnish a succinct statement explaining the
arrangement and giving particulars (details) of such matters as percent ownership by respondent in the line, name of co-owner, basis of sharing
expenses of the Line, and how the expenses borne by the respondent are accounted for, and accounts affected. Specify whether lessor, co-owner, or
other party is an associated company.
9. Designate any transmission line leased to another company and give name of Lessee, date and terms of lease, annual rent for year, and how
determined. Specify whether lessee is an associated company.
10. Base the plant cost figures called for in columns (j) to (l) on the book cost at end of year.
1431 - AAC - SING 1
1113 - AAC - SING 2
954 - AAC - SINGL 3
1113 - AAC - SING 4
1113 - AAC - SING 5
1113 - AAC - SING 6
1113 - AAC - BUND 7
1113 - AAC - BUND 8
954 - AAC - SINGL 9
1113 - ACSS - SIN 10
1272 - ACSR - BUN 11
1272 - ACSR - BUN 12
1113 - AAC - SING 13
795 - ACSR - SING 14
958-T16 - 15
2300 - AAC - BUND 16
1113 - AAC - SING 17
954 - ACSS - SING 18
1113 - AAC - SING 19
2300 - AAC - BUND 20
1113 - AAC - SING 21
2156 - ACSS - SIN 22
1113 - AAC - SING 23
1113 - AAC - SING 24
1113 - AAC - SING 25
1113 - ACSS - SIN 26
1113 - AAC - SING 27
1113 - AAC - SING 28
1113 - AAC - SING 29
795 - ACSR - SING 30
1113 - AAC - SING 31
1113 - AAC - SING 32
1113 - AAC - SING 33
1113 - AAC - SING 34
795 - ACSS - BUND 35
FERC FORM NO. 1 (ED. 12-87) Page 423.18
36 244,090,607 6,128,240,893 6,372,331,500 128,540,450 285,558,082 414,098,532

Name of Respondent This Report Is:(1) An Original
(2) A Resubmission
Date of Report(Mo, Da, Yr)
Year/Period of Report
End of
TRANSMISSION LINE STATISTICS (Continued)
PACIFIC GAS AND ELECTRIC COMPANYX
04/13/20212020/Q4
Line
No.
COST OF LINE (Include in Column (j) Land,
Size of
Conductor
and Material
Land rights, and clearing right-of-way)EXPENSES, EXCEPT DEPRECIATION AND TAXES
OperationExpenses
Maintenance Rents TotalLand Construction andOther Costs
Total Cost
(i) (j) (k) (l) (m) (n) (o) (p)Expenses Expenses
7. Do not report the same transmission line structure twice. Report Lower voltage Lines and higher voltage lines as one line. Designate in a footnote if
you do not include Lower voltage lines with higher voltage lines. If two or more transmission line structures support lines of the same voltage, report the
pole miles of the primary structure in column (f) and the pole miles of the other line(s) in column (g)
8. Designate any transmission line or portion thereof for which the respondent is not the sole owner. If such property is leased from another company,
give name of lessor, date and terms of Lease, and amount of rent for year. For any transmission line other than a leased line, or portion thereof, for
which the respondent is not the sole owner but which the respondent operates or shares in the operation of, furnish a succinct statement explaining the
arrangement and giving particulars (details) of such matters as percent ownership by respondent in the line, name of co-owner, basis of sharing
expenses of the Line, and how the expenses borne by the respondent are accounted for, and accounts affected. Specify whether lessor, co-owner, or
other party is an associated company.
9. Designate any transmission line leased to another company and give name of Lessee, date and terms of lease, annual rent for year, and how
determined. Specify whether lessee is an associated company.
10. Base the plant cost figures called for in columns (j) to (l) on the book cost at end of year.
795 - ACSR - PARA 1
1113 - AAC - SING 2
2300 - AAC - BUND 3
2300 - AAC - BUND 4
2300 - AAC - BUND 5
954 - ACSS - SING 6
954 - ACSS - SING 7
1113 - AAC - SING 8
1113 - AAC - BUND 9
1113 - AAC - SING 10
1113 - AAC - SING 11
1113 - AAC - SING 12
1113 - AAC - SING 13
1113 - AAC - BUND 14
1113 - AAC - SING 15
1113 - AAC - SING 16
1113 - AAC - SING 17
1113 - AAC - SING 18
1113 - AAC - SING 19
1113 - AAC - BUND 20
1113 - AAC - SING 21
1113 - AAC - SING 22
1113 - AAC - SING 23
1113 - AAC - SING 24
1113 - AAC - SING 25
954 - ACSS - SING 26
954 - ACSS - SING 27
1113 - AAC - SING 28
954 - ACSS - SING 29
954 - ACSS - SING 30
1113 - AAC - SING 31
1113 - AAC - SING 32
954 - ACSR - SING 33
1113 - AAC - SING 34
1113 - AAC - SING 35
FERC FORM NO. 1 (ED. 12-87) Page 423.19
36 244,090,607 6,128,240,893 6,372,331,500 128,540,450 285,558,082 414,098,532

Name of Respondent This Report Is:(1) An Original
(2) A Resubmission
Date of Report(Mo, Da, Yr)
Year/Period of Report
End of
TRANSMISSION LINE STATISTICS (Continued)
PACIFIC GAS AND ELECTRIC COMPANYX
04/13/20212020/Q4
Line
No.
COST OF LINE (Include in Column (j) Land,
Size of
Conductor
and Material
Land rights, and clearing right-of-way)EXPENSES, EXCEPT DEPRECIATION AND TAXES
OperationExpenses
Maintenance Rents TotalLand Construction andOther Costs
Total Cost
(i) (j) (k) (l) (m) (n) (o) (p)Expenses Expenses
7. Do not report the same transmission line structure twice. Report Lower voltage Lines and higher voltage lines as one line. Designate in a footnote if
you do not include Lower voltage lines with higher voltage lines. If two or more transmission line structures support lines of the same voltage, report the
pole miles of the primary structure in column (f) and the pole miles of the other line(s) in column (g)
8. Designate any transmission line or portion thereof for which the respondent is not the sole owner. If such property is leased from another company,
give name of lessor, date and terms of Lease, and amount of rent for year. For any transmission line other than a leased line, or portion thereof, for
which the respondent is not the sole owner but which the respondent operates or shares in the operation of, furnish a succinct statement explaining the
arrangement and giving particulars (details) of such matters as percent ownership by respondent in the line, name of co-owner, basis of sharing
expenses of the Line, and how the expenses borne by the respondent are accounted for, and accounts affected. Specify whether lessor, co-owner, or
other party is an associated company.
9. Designate any transmission line leased to another company and give name of Lessee, date and terms of lease, annual rent for year, and how
determined. Specify whether lessee is an associated company.
10. Base the plant cost figures called for in columns (j) to (l) on the book cost at end of year.
1113 - AAC - SING 1
1113 - AAC - SING 2
1113 - AAC - SING 3
1113 - AAC - SING 4
1113 - AAC - SING 5
1113 - AAC - SING 6
1113 - AAC - BUND 7
795 - ACSR - PARA 8
1113 - AAC - SING 9
795 - ACSS - SING 10
1113 - ACSS - SIN 11
1113 - ACSS - SIN 12
518 - ACSR - SING 13
795 - ACSR - SING 14
795 - ACSR - SING 15
518 - ACSR - SING 16
1113 - AAC - SING 17
1113 - AAC - SING 18
1113 - AAC - SING 19
1113 - AAC - SING 20
795 - ACSR - SING 21
1113 - AAC - SING 22
518 - ACSR - SING 23
795 - ACSR - SING 24
795 - ACSR - SING 25
518 - ACSR - SING 26
1113 - AAC - SING 27
954 - ACSS - SING 28
954 - ACSS - SING 29
1113 - AAC - SING 30
1113 - AAC - SING 31
1113 - AAC - SING 32
954 - ACSS - SING 33
1113 - ACSS - SIN 34
1113 - AAC - SING 35
FERC FORM NO. 1 (ED. 12-87) Page 423.20
36 244,090,607 6,128,240,893 6,372,331,500 128,540,450 285,558,082 414,098,532

Name of Respondent This Report Is:(1) An Original
(2) A Resubmission
Date of Report(Mo, Da, Yr)
Year/Period of Report
End of
TRANSMISSION LINE STATISTICS (Continued)
PACIFIC GAS AND ELECTRIC COMPANYX
04/13/20212020/Q4
Line
No.
COST OF LINE (Include in Column (j) Land,
Size of
Conductor
and Material
Land rights, and clearing right-of-way)EXPENSES, EXCEPT DEPRECIATION AND TAXES
OperationExpenses
Maintenance Rents TotalLand Construction andOther Costs
Total Cost
(i) (j) (k) (l) (m) (n) (o) (p)Expenses Expenses
7. Do not report the same transmission line structure twice. Report Lower voltage Lines and higher voltage lines as one line. Designate in a footnote if
you do not include Lower voltage lines with higher voltage lines. If two or more transmission line structures support lines of the same voltage, report the
pole miles of the primary structure in column (f) and the pole miles of the other line(s) in column (g)
8. Designate any transmission line or portion thereof for which the respondent is not the sole owner. If such property is leased from another company,
give name of lessor, date and terms of Lease, and amount of rent for year. For any transmission line other than a leased line, or portion thereof, for
which the respondent is not the sole owner but which the respondent operates or shares in the operation of, furnish a succinct statement explaining the
arrangement and giving particulars (details) of such matters as percent ownership by respondent in the line, name of co-owner, basis of sharing
expenses of the Line, and how the expenses borne by the respondent are accounted for, and accounts affected. Specify whether lessor, co-owner, or
other party is an associated company.
9. Designate any transmission line leased to another company and give name of Lessee, date and terms of lease, annual rent for year, and how
determined. Specify whether lessee is an associated company.
10. Base the plant cost figures called for in columns (j) to (l) on the book cost at end of year.
2300 - AAC - BUND 1
1113 - AAC - SING 2
1113 - AAC - SING 3
2300 - AAC - BUND 4
795 - ACSR - SING 5
2300 - AAC - SING 6
2300 - AAC - SING 7
1113 - AAC - BUND 8
1113 - AAC - SING 9
795 - ACSR - SING 10
1113 - AAC - SING 11
1113 - AAC - SING 12
795 - ACSR - SING 13
795 - ACSR - SING 14
500 - CU - SINGLE 15
1113 - AAC - SING 16
2300 - AAC - BUND 17
1113 - AAC - SING 18
795 - ACSS - SING 19
795 - ACSS - SING 20
954 - ACSS - SING 21
2300 - AAC - BUND 22
954 - ACSS - BUND 23
954 - ACSS - SING 24
954 - ACSS - SING 25
795 - ACSR - PARA 26
2300 - AAC - BUND 27
1113 - AAC - SING 28
1113 - AAC - SING 29
1113 - AAC - SING 30
954 - AAC - SINGL 31
1113 - ACSS - SIN 32
1113 - ACSS - SIN 33
1113 - ACSS - SIN 34
1113 - AAC - SING 35
FERC FORM NO. 1 (ED. 12-87) Page 423.21
36 244,090,607 6,128,240,893 6,372,331,500 128,540,450 285,558,082 414,098,532

Name of Respondent This Report Is:(1) An Original
(2) A Resubmission
Date of Report(Mo, Da, Yr)
Year/Period of Report
End of
TRANSMISSION LINE STATISTICS (Continued)
PACIFIC GAS AND ELECTRIC COMPANYX
04/13/20212020/Q4
Line
No.
COST OF LINE (Include in Column (j) Land,
Size of
Conductor
and Material
Land rights, and clearing right-of-way)EXPENSES, EXCEPT DEPRECIATION AND TAXES
OperationExpenses
Maintenance Rents TotalLand Construction andOther Costs
Total Cost
(i) (j) (k) (l) (m) (n) (o) (p)Expenses Expenses
7. Do not report the same transmission line structure twice. Report Lower voltage Lines and higher voltage lines as one line. Designate in a footnote if
you do not include Lower voltage lines with higher voltage lines. If two or more transmission line structures support lines of the same voltage, report the
pole miles of the primary structure in column (f) and the pole miles of the other line(s) in column (g)
8. Designate any transmission line or portion thereof for which the respondent is not the sole owner. If such property is leased from another company,
give name of lessor, date and terms of Lease, and amount of rent for year. For any transmission line other than a leased line, or portion thereof, for
which the respondent is not the sole owner but which the respondent operates or shares in the operation of, furnish a succinct statement explaining the
arrangement and giving particulars (details) of such matters as percent ownership by respondent in the line, name of co-owner, basis of sharing
expenses of the Line, and how the expenses borne by the respondent are accounted for, and accounts affected. Specify whether lessor, co-owner, or
other party is an associated company.
9. Designate any transmission line leased to another company and give name of Lessee, date and terms of lease, annual rent for year, and how
determined. Specify whether lessee is an associated company.
10. Base the plant cost figures called for in columns (j) to (l) on the book cost at end of year.
1113 - ACSS - SIN 1
1113 - AAC - SING 2
1113 - AAC - SING 3
1113 - AAC - SING 4
954 - ACSS - SING 5
1113 - AAC - SING 6
795 - ACSS - SING 7
954 - ACSR - SING 8
954 - AAC - SINGL 9
1113 - AAC - SING 10
1113 - AAC - SING 11
1113 - AAC - SING 12
954 - ACSS - SING 13
954 - AAC - SINGL 14
1113 - AAC - SING 15
954 - ACSS - SING 16
954 - ACSS - BUND 17
2300 - AAC - BUND 18
2300 - AAC - BUND 19
2300 - AAC - BUND 20
2300 - AAC - BUND 21
2300 - AAC - BUND 22
2300 - AAC - BUND 23
2300 - AAC - BUND 24
2300 - AAC - BUND 25
2300 - AAC - BUND 26
2300 - AAC - BUND 27
2300 - AAC - BUND 28
2300 - AAC - BUND 29
2300 - AAC - BUND 30
2300 - AAC - BUND 31
2300 - AAC - BUND 32
2300 - AAC - BUND 33
2300 - AAC - BUND 34
2300 - AAC - BUND 35
FERC FORM NO. 1 (ED. 12-87) Page 423.22
36 244,090,607 6,128,240,893 6,372,331,500 128,540,450 285,558,082 414,098,532
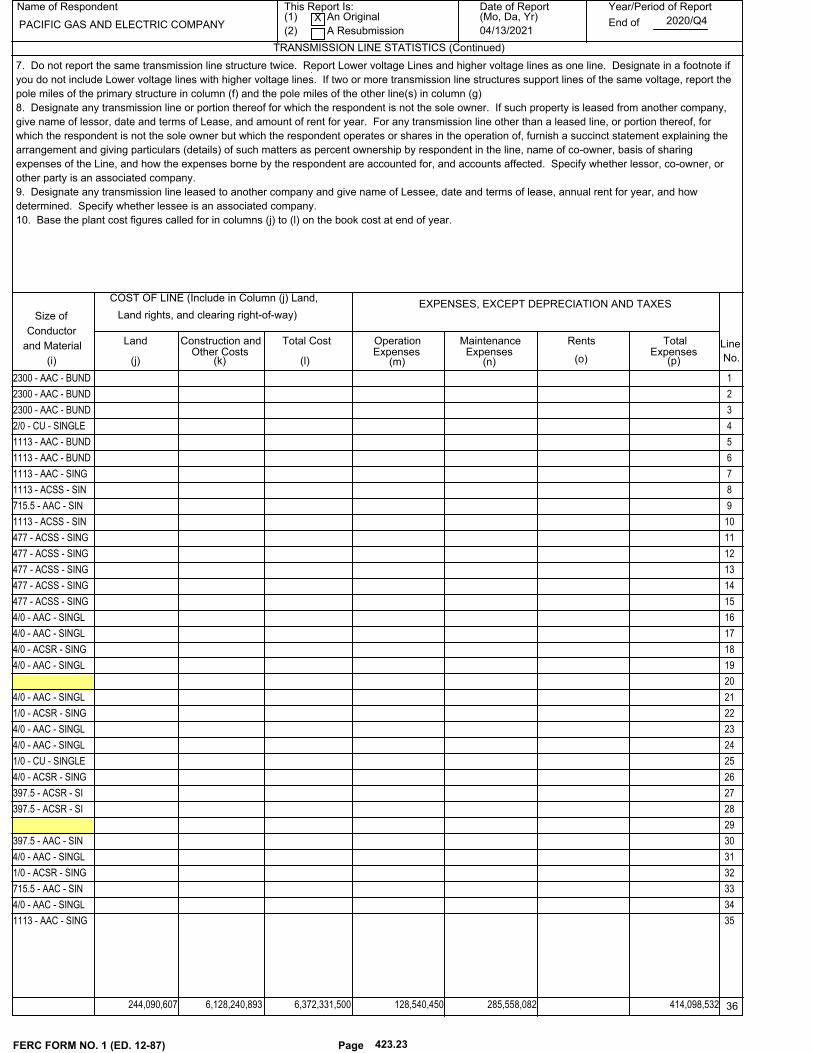
Name of Respondent This Report Is:(1) An Original
(2) A Resubmission
Date of Report(Mo, Da, Yr)
Year/Period of Report
End of
TRANSMISSION LINE STATISTICS (Continued)
PACIFIC GAS AND ELECTRIC COMPANYX
04/13/20212020/Q4
Line
No.
COST OF LINE (Include in Column (j) Land,
Size of
Conductor
and Material
Land rights, and clearing right-of-way)EXPENSES, EXCEPT DEPRECIATION AND TAXES
OperationExpenses
Maintenance Rents TotalLand Construction andOther Costs
Total Cost
(i) (j) (k) (l) (m) (n) (o) (p)Expenses Expenses
7. Do not report the same transmission line structure twice. Report Lower voltage Lines and higher voltage lines as one line. Designate in a footnote if
you do not include Lower voltage lines with higher voltage lines. If two or more transmission line structures support lines of the same voltage, report the
pole miles of the primary structure in column (f) and the pole miles of the other line(s) in column (g)
8. Designate any transmission line or portion thereof for which the respondent is not the sole owner. If such property is leased from another company,
give name of lessor, date and terms of Lease, and amount of rent for year. For any transmission line other than a leased line, or portion thereof, for
which the respondent is not the sole owner but which the respondent operates or shares in the operation of, furnish a succinct statement explaining the
arrangement and giving particulars (details) of such matters as percent ownership by respondent in the line, name of co-owner, basis of sharing
expenses of the Line, and how the expenses borne by the respondent are accounted for, and accounts affected. Specify whether lessor, co-owner, or
other party is an associated company.
9. Designate any transmission line leased to another company and give name of Lessee, date and terms of lease, annual rent for year, and how
determined. Specify whether lessee is an associated company.
10. Base the plant cost figures called for in columns (j) to (l) on the book cost at end of year.
2300 - AAC - BUND 1
2300 - AAC - BUND 2
2300 - AAC - BUND 3
2/0 - CU - SINGLE 4
1113 - AAC - BUND 5
1113 - AAC - BUND 6
1113 - AAC - SING 7
1113 - ACSS - SIN 8
715.5 - AAC - SIN 9
1113 - ACSS - SIN 10
477 - ACSS - SING 11
477 - ACSS - SING 12
477 - ACSS - SING 13
477 - ACSS - SING 14
477 - ACSS - SING 15
4/0 - AAC - SINGL 16
4/0 - AAC - SINGL 17
4/0 - ACSR - SING 18
4/0 - AAC - SINGL 19
20
4/0 - AAC - SINGL 21
1/0 - ACSR - SING 22
4/0 - AAC - SINGL 23
4/0 - AAC - SINGL 24
1/0 - CU - SINGLE 25
4/0 - ACSR - SING 26
397.5 - ACSR - SI 27
397.5 - ACSR - SI 28
29
397.5 - AAC - SIN 30
4/0 - AAC - SINGL 31
1/0 - ACSR - SING 32
715.5 - AAC - SIN 33
4/0 - AAC - SINGL 34
1113 - AAC - SING 35
FERC FORM NO. 1 (ED. 12-87) Page 423.23
36 244,090,607 6,128,240,893 6,372,331,500 128,540,450 285,558,082 414,098,532

Name of Respondent This Report Is:(1) An Original
(2) A Resubmission
Date of Report(Mo, Da, Yr)
Year/Period of Report
End of
TRANSMISSION LINE STATISTICS (Continued)
PACIFIC GAS AND ELECTRIC COMPANYX
04/13/20212020/Q4
Line
No.
COST OF LINE (Include in Column (j) Land,
Size of
Conductor
and Material
Land rights, and clearing right-of-way)EXPENSES, EXCEPT DEPRECIATION AND TAXES
OperationExpenses
Maintenance Rents TotalLand Construction andOther Costs
Total Cost
(i) (j) (k) (l) (m) (n) (o) (p)Expenses Expenses
7. Do not report the same transmission line structure twice. Report Lower voltage Lines and higher voltage lines as one line. Designate in a footnote if
you do not include Lower voltage lines with higher voltage lines. If two or more transmission line structures support lines of the same voltage, report the
pole miles of the primary structure in column (f) and the pole miles of the other line(s) in column (g)
8. Designate any transmission line or portion thereof for which the respondent is not the sole owner. If such property is leased from another company,
give name of lessor, date and terms of Lease, and amount of rent for year. For any transmission line other than a leased line, or portion thereof, for
which the respondent is not the sole owner but which the respondent operates or shares in the operation of, furnish a succinct statement explaining the
arrangement and giving particulars (details) of such matters as percent ownership by respondent in the line, name of co-owner, basis of sharing
expenses of the Line, and how the expenses borne by the respondent are accounted for, and accounts affected. Specify whether lessor, co-owner, or
other party is an associated company.
9. Designate any transmission line leased to another company and give name of Lessee, date and terms of lease, annual rent for year, and how
determined. Specify whether lessee is an associated company.
10. Base the plant cost figures called for in columns (j) to (l) on the book cost at end of year.
336.4 - AAC - SIN 1
715.5 - AAC - SIN 2
336.4 - AAC - SIN 3
4/0 - AAC - SINGL 4
336.4 - AAC - SIN 5
3/0 - CU - SINGLE 6
3/0 - CU - SINGLE 7
1/0 - ACSR - SING 8
4/0 - AAC - SINGL 9
250 - CU - SINGLE 10
715.5 - AAC - SIN 11
4/0 - AAC - SINGL 12
4/0 - AAC - SINGL 13
715.5 - AAC - SIN 14
397.5 - AAC - SIN 15
715.5 - AAC - SIN 16
715.5 - AAC - SIN 17
715.5 - AAC - SIN 18
1 - CU - SINGLE 2 19
715.5 - AAC - SIN 20
1113 - AAC - BUND 21
4 - ACSR - SINGLE 22
4 - CU - SINGLE 4 23
2/0 - CU - SINGLE 24
4/0 - CU - SINGLE 25
477 - ACSS - SING 26
715.5 - AAC - SIN 27
4/0 - CU - SINGLE 28
715.5 - AAC - SIN 29
715.5 - AAC - SIN 30
715.5 - AAC - SIN 31
397.5 - AAC - SIN 32
715.5 - AAC - SIN 33
4/0 - CU - SINGLE 34
4/0 - CU - SINGLE 35
FERC FORM NO. 1 (ED. 12-87) Page 423.24
36 244,090,607 6,128,240,893 6,372,331,500 128,540,450 285,558,082 414,098,532

Name of Respondent This Report Is:(1) An Original
(2) A Resubmission
Date of Report(Mo, Da, Yr)
Year/Period of Report
End of
TRANSMISSION LINE STATISTICS (Continued)
PACIFIC GAS AND ELECTRIC COMPANYX
04/13/20212020/Q4
Line
No.
COST OF LINE (Include in Column (j) Land,
Size of
Conductor
and Material
Land rights, and clearing right-of-way)EXPENSES, EXCEPT DEPRECIATION AND TAXES
OperationExpenses
Maintenance Rents TotalLand Construction andOther Costs
Total Cost
(i) (j) (k) (l) (m) (n) (o) (p)Expenses Expenses
7. Do not report the same transmission line structure twice. Report Lower voltage Lines and higher voltage lines as one line. Designate in a footnote if
you do not include Lower voltage lines with higher voltage lines. If two or more transmission line structures support lines of the same voltage, report the
pole miles of the primary structure in column (f) and the pole miles of the other line(s) in column (g)
8. Designate any transmission line or portion thereof for which the respondent is not the sole owner. If such property is leased from another company,
give name of lessor, date and terms of Lease, and amount of rent for year. For any transmission line other than a leased line, or portion thereof, for
which the respondent is not the sole owner but which the respondent operates or shares in the operation of, furnish a succinct statement explaining the
arrangement and giving particulars (details) of such matters as percent ownership by respondent in the line, name of co-owner, basis of sharing
expenses of the Line, and how the expenses borne by the respondent are accounted for, and accounts affected. Specify whether lessor, co-owner, or
other party is an associated company.
9. Designate any transmission line leased to another company and give name of Lessee, date and terms of lease, annual rent for year, and how
determined. Specify whether lessee is an associated company.
10. Base the plant cost figures called for in columns (j) to (l) on the book cost at end of year.
336.4 - AAC - SIN 1
336.4 - AAC - SIN 2
4/0 - CU - SINGLE 3
4/0 - AAC - SINGL 4
715.5 - AAC - BUN 5
2 - ACSR - SINGLE 6
1/0 - ACSR - SING 7
715.5 - AAC - SIN 8
715.5 - AAC - SIN 9
4/0 - AAC - SINGL 10
4/0 - AAC - SINGL 11
1431 - AAC - SING 12
336.4 - AAC - SIN 13
4/0 - AAC - SINGL 14
715.5 - AAC - SIN 15
1/0 - ACSR - SING 16
4/0 - CU - SINGLE 17
250 - CU - SINGLE 18
4/0 - ACSR - SING 19
715.5 - AAC - SIN 20
715.5 - AAC - SIN 21
2/0 - CU - SINGLE 22
715.5 - AAC - SIN 23
715.5 - AAC - SIN 24
2 - CU - SINGLE 25
350 - AAC - SINGL 26
2 - ACSR - SINGLE 27
350 - AAC - SINGL 28
715.5 - AAC - SIN 29
715.5 - AAC - SIN 30
715.5 - AAC - SIN 31
4/0 - AAC - SINGL 32
518 - ACSR - SING 33
715.5 - AAC - SIN 34
4/0 - CU - SINGLE 35
FERC FORM NO. 1 (ED. 12-87) Page 423.25
36 244,090,607 6,128,240,893 6,372,331,500 128,540,450 285,558,082 414,098,532

Name of Respondent This Report Is:(1) An Original
(2) A Resubmission
Date of Report(Mo, Da, Yr)
Year/Period of Report
End of
TRANSMISSION LINE STATISTICS (Continued)
PACIFIC GAS AND ELECTRIC COMPANYX
04/13/20212020/Q4
Line
No.
COST OF LINE (Include in Column (j) Land,
Size of
Conductor
and Material
Land rights, and clearing right-of-way)EXPENSES, EXCEPT DEPRECIATION AND TAXES
OperationExpenses
Maintenance Rents TotalLand Construction andOther Costs
Total Cost
(i) (j) (k) (l) (m) (n) (o) (p)Expenses Expenses
7. Do not report the same transmission line structure twice. Report Lower voltage Lines and higher voltage lines as one line. Designate in a footnote if
you do not include Lower voltage lines with higher voltage lines. If two or more transmission line structures support lines of the same voltage, report the
pole miles of the primary structure in column (f) and the pole miles of the other line(s) in column (g)
8. Designate any transmission line or portion thereof for which the respondent is not the sole owner. If such property is leased from another company,
give name of lessor, date and terms of Lease, and amount of rent for year. For any transmission line other than a leased line, or portion thereof, for
which the respondent is not the sole owner but which the respondent operates or shares in the operation of, furnish a succinct statement explaining the
arrangement and giving particulars (details) of such matters as percent ownership by respondent in the line, name of co-owner, basis of sharing
expenses of the Line, and how the expenses borne by the respondent are accounted for, and accounts affected. Specify whether lessor, co-owner, or
other party is an associated company.
9. Designate any transmission line leased to another company and give name of Lessee, date and terms of lease, annual rent for year, and how
determined. Specify whether lessee is an associated company.
10. Base the plant cost figures called for in columns (j) to (l) on the book cost at end of year.
2 - ACSR - SINGLE 1
4/0 - ACSR - SING 2
397.5 - ACSR - SI 3
4/0 - ACAR - SING 4
4/0 - ACAR - SING 5
4/0 - AAC - SINGL 6
4/0 - AAC - SINGL 7
4/0 - AAC - SINGL 8
4/0 - AAC - SINGL 9
4/0 - AAC - SINGL 10
1 - CU - SINGLE 11
715.5 - AAC - SIN 12
336.4 - AAC - SIN 13
715.5 - AAC - SIN 14
715.5 - AAC - SIN 15
336.4 - AAC - SIN 16
336.4 - AAC - SIN 17
336.4 - AAC - SIN 18
397.5 - AAC - SIN 19
715.5 - AAC - SIN 20
4/0 - AAC - SINGL 21
715.5 - AAC - SIN 22
715.5 - AAC - SIN 23
4/0 - ACSR - SING 24
397.5 - ACSR - SI 25
477 - ACSS - SING 26
477 - ACSS - SING 27
4/0 - AAC - SINGL 28
4/0 - AAC - SINGL 29
2/0 - CU - SINGLE 30
471 - AAC - SINGL 31
715.5 - AAC - SIN 32
715.5 - AAC - SIN 33
4/0 - AAC - SINGL 34
4/0 - AAC - SINGL 35
FERC FORM NO. 1 (ED. 12-87) Page 423.26
36 244,090,607 6,128,240,893 6,372,331,500 128,540,450 285,558,082 414,098,532

Name of Respondent This Report Is:(1) An Original
(2) A Resubmission
Date of Report(Mo, Da, Yr)
Year/Period of Report
End of
TRANSMISSION LINE STATISTICS (Continued)
PACIFIC GAS AND ELECTRIC COMPANYX
04/13/20212020/Q4
Line
No.
COST OF LINE (Include in Column (j) Land,
Size of
Conductor
and Material
Land rights, and clearing right-of-way)EXPENSES, EXCEPT DEPRECIATION AND TAXES
OperationExpenses
Maintenance Rents TotalLand Construction andOther Costs
Total Cost
(i) (j) (k) (l) (m) (n) (o) (p)Expenses Expenses
7. Do not report the same transmission line structure twice. Report Lower voltage Lines and higher voltage lines as one line. Designate in a footnote if
you do not include Lower voltage lines with higher voltage lines. If two or more transmission line structures support lines of the same voltage, report the
pole miles of the primary structure in column (f) and the pole miles of the other line(s) in column (g)
8. Designate any transmission line or portion thereof for which the respondent is not the sole owner. If such property is leased from another company,
give name of lessor, date and terms of Lease, and amount of rent for year. For any transmission line other than a leased line, or portion thereof, for
which the respondent is not the sole owner but which the respondent operates or shares in the operation of, furnish a succinct statement explaining the
arrangement and giving particulars (details) of such matters as percent ownership by respondent in the line, name of co-owner, basis of sharing
expenses of the Line, and how the expenses borne by the respondent are accounted for, and accounts affected. Specify whether lessor, co-owner, or
other party is an associated company.
9. Designate any transmission line leased to another company and give name of Lessee, date and terms of lease, annual rent for year, and how
determined. Specify whether lessee is an associated company.
10. Base the plant cost figures called for in columns (j) to (l) on the book cost at end of year.
715.5 - AAC - SIN 1
2 - ACSR - SINGLE 2
1 - CU - BUNDLE 3 3
1 - CU - SINGLE 3 4
4/0 - AAC - SINGL 5
4/0 - CU - SINGLE 6
397.5 - AAC - SIN 7
397.5 - AAC - SIN 8
397.5 - AAC - SIN 9
715.5 - AAC - SIN 10
397.5 - AAC - SIN 11
4/0 - AAC - SINGL 12
397.5 - AAC - SIN 13
397.5 - AAC - SIN 14
4/0 - AAC - SINGL 15
4/0 - ACSR - SING 16
2 - ACSR - SINGLE 17
477 - ACSS - SING 18
397.5 - AAC - SIN 19
1/0 - ACSR - SING 20
4/0 - CU - SINGLE 21
3/0 - CU - SINGLE 22
1/0 - ACSR - SING 23
954 - AAC - SINGL 24
1 - CU - SINGLE 4 25
4/0 - AAC - SINGL 26
1/0 - ACSR - SING 27
1/0 - ACSR - SING 28
4/0 - AAC - SINGL 29
4/0 - AAC - SINGL 30
397.5 - AAC - SIN 31
715.5 - AAC - SIN 32
336.4 - AAC - SIN 33
1113 - AAC - SING 34
1113 - AAC - SING 35
FERC FORM NO. 1 (ED. 12-87) Page 423.27
36 244,090,607 6,128,240,893 6,372,331,500 128,540,450 285,558,082 414,098,532

Name of Respondent This Report Is:(1) An Original
(2) A Resubmission
Date of Report(Mo, Da, Yr)
Year/Period of Report
End of
TRANSMISSION LINE STATISTICS (Continued)
PACIFIC GAS AND ELECTRIC COMPANYX
04/13/20212020/Q4
Line
No.
COST OF LINE (Include in Column (j) Land,
Size of
Conductor
and Material
Land rights, and clearing right-of-way)EXPENSES, EXCEPT DEPRECIATION AND TAXES
OperationExpenses
Maintenance Rents TotalLand Construction andOther Costs
Total Cost
(i) (j) (k) (l) (m) (n) (o) (p)Expenses Expenses
7. Do not report the same transmission line structure twice. Report Lower voltage Lines and higher voltage lines as one line. Designate in a footnote if
you do not include Lower voltage lines with higher voltage lines. If two or more transmission line structures support lines of the same voltage, report the
pole miles of the primary structure in column (f) and the pole miles of the other line(s) in column (g)
8. Designate any transmission line or portion thereof for which the respondent is not the sole owner. If such property is leased from another company,
give name of lessor, date and terms of Lease, and amount of rent for year. For any transmission line other than a leased line, or portion thereof, for
which the respondent is not the sole owner but which the respondent operates or shares in the operation of, furnish a succinct statement explaining the
arrangement and giving particulars (details) of such matters as percent ownership by respondent in the line, name of co-owner, basis of sharing
expenses of the Line, and how the expenses borne by the respondent are accounted for, and accounts affected. Specify whether lessor, co-owner, or
other party is an associated company.
9. Designate any transmission line leased to another company and give name of Lessee, date and terms of lease, annual rent for year, and how
determined. Specify whether lessee is an associated company.
10. Base the plant cost figures called for in columns (j) to (l) on the book cost at end of year.
4/0 - AAC - SINGL 1
715.5 - AAC - SIN 2
397.5 - AAC - SIN 3
715.5 - AAC - SIN 4
715.5 - AAC - SIN 5
4/0 - AAC - SINGL 6
715.5 - AAC - SIN 7
477 - ACSS - SING 8
4/0 - AAC - SINGL 9
477 - ACSS - SING 10
2 - ACSR - SINGLE 11
477 - ACSS - SING 12
4/0 - AAC - SINGL 13
715.5 - AAC - SIN 14
715.5 - AAC - SIN 15
4/0 - AAC - SINGL 16
715.5 - AAC - SIN 17
715.5 - AAC - SIN 18
397.5 - AAC - SIN 19
715.5 - AAC - SIN 20
715.5 - AAC - SIN 21
4/0 - AAC - SINGL 22
397.5 - AAC - SIN 23
715.5 - AAC - SIN 24
715.5 - AAC - SIN 25
2 - ACSR - SINGLE 26
397.5 - AAC - SIN 27
4/0 - AAC - SINGL 28
4/0 - AAC - SINGL 29
1/0 - ACSR - SING 30
31
1/0 - ACSR - SING 32
1/0 - ACSR - SING 33
4/0 - AAC - SINGL 34
4/0 - AAC - SINGL 35
FERC FORM NO. 1 (ED. 12-87) Page 423.28
36 244,090,607 6,128,240,893 6,372,331,500 128,540,450 285,558,082 414,098,532

Name of Respondent This Report Is:(1) An Original
(2) A Resubmission
Date of Report(Mo, Da, Yr)
Year/Period of Report
End of
TRANSMISSION LINE STATISTICS (Continued)
PACIFIC GAS AND ELECTRIC COMPANYX
04/13/20212020/Q4
Line
No.
COST OF LINE (Include in Column (j) Land,
Size of
Conductor
and Material
Land rights, and clearing right-of-way)EXPENSES, EXCEPT DEPRECIATION AND TAXES
OperationExpenses
Maintenance Rents TotalLand Construction andOther Costs
Total Cost
(i) (j) (k) (l) (m) (n) (o) (p)Expenses Expenses
7. Do not report the same transmission line structure twice. Report Lower voltage Lines and higher voltage lines as one line. Designate in a footnote if
you do not include Lower voltage lines with higher voltage lines. If two or more transmission line structures support lines of the same voltage, report the
pole miles of the primary structure in column (f) and the pole miles of the other line(s) in column (g)
8. Designate any transmission line or portion thereof for which the respondent is not the sole owner. If such property is leased from another company,
give name of lessor, date and terms of Lease, and amount of rent for year. For any transmission line other than a leased line, or portion thereof, for
which the respondent is not the sole owner but which the respondent operates or shares in the operation of, furnish a succinct statement explaining the
arrangement and giving particulars (details) of such matters as percent ownership by respondent in the line, name of co-owner, basis of sharing
expenses of the Line, and how the expenses borne by the respondent are accounted for, and accounts affected. Specify whether lessor, co-owner, or
other party is an associated company.
9. Designate any transmission line leased to another company and give name of Lessee, date and terms of lease, annual rent for year, and how
determined. Specify whether lessee is an associated company.
10. Base the plant cost figures called for in columns (j) to (l) on the book cost at end of year.
336.4 - AAC - SIN 1
4/0 - AAC - SINGL 2
397.5 - AAC - SIN 3
250 - CU - SINGLE 4
397.5 - AAC - SIN 5
715.5 - AAC - SIN 6
4/0 - AAC - SINGL 7
715.5 - AAC - SIN 8
1113 - AAC - SING 9
4/0 - AAC - SINGL 10
715.5 - AAC - SIN 11
715.5 - AAC - SIN 12
715.5 - AAC - SIN 13
715.5 - AAC - SIN 14
4/0 - AAC - SINGL 15
4/0 - AAC - SINGL 16
1113 - AAC - SING 17
4/0 - AAC - UNKNO 18
4/0 - AAC - SINGL 19
4/0 - AAC - SINGL 20
4/0 - AAC - SINGL 21
477 - ACSS - SING 22
4/0 - ACAR - SING 23
477 - ACSS - SING 24
4/0 - AAC - SINGL 25
4/0 - AAC - SINGL 26
266.8 - AAC - SIN 27
4/0 - AAC - SINGL 28
4/0 - AAC - SINGL 29
715.5 - ALUM - SI 30
4/0 - ACSR - SING 31
4/0 - ACSR - SING 32
477 - ACSS - SING 33
397.5 - AAC - SIN 34
1/0 - ACSR - SING 35
FERC FORM NO. 1 (ED. 12-87) Page 423.29
36 244,090,607 6,128,240,893 6,372,331,500 128,540,450 285,558,082 414,098,532

Name of Respondent This Report Is:(1) An Original
(2) A Resubmission
Date of Report(Mo, Da, Yr)
Year/Period of Report
End of
TRANSMISSION LINE STATISTICS (Continued)
PACIFIC GAS AND ELECTRIC COMPANYX
04/13/20212020/Q4
Line
No.
COST OF LINE (Include in Column (j) Land,
Size of
Conductor
and Material
Land rights, and clearing right-of-way)EXPENSES, EXCEPT DEPRECIATION AND TAXES
OperationExpenses
Maintenance Rents TotalLand Construction andOther Costs
Total Cost
(i) (j) (k) (l) (m) (n) (o) (p)Expenses Expenses
7. Do not report the same transmission line structure twice. Report Lower voltage Lines and higher voltage lines as one line. Designate in a footnote if
you do not include Lower voltage lines with higher voltage lines. If two or more transmission line structures support lines of the same voltage, report the
pole miles of the primary structure in column (f) and the pole miles of the other line(s) in column (g)
8. Designate any transmission line or portion thereof for which the respondent is not the sole owner. If such property is leased from another company,
give name of lessor, date and terms of Lease, and amount of rent for year. For any transmission line other than a leased line, or portion thereof, for
which the respondent is not the sole owner but which the respondent operates or shares in the operation of, furnish a succinct statement explaining the
arrangement and giving particulars (details) of such matters as percent ownership by respondent in the line, name of co-owner, basis of sharing
expenses of the Line, and how the expenses borne by the respondent are accounted for, and accounts affected. Specify whether lessor, co-owner, or
other party is an associated company.
9. Designate any transmission line leased to another company and give name of Lessee, date and terms of lease, annual rent for year, and how
determined. Specify whether lessee is an associated company.
10. Base the plant cost figures called for in columns (j) to (l) on the book cost at end of year.
715.5 - AAC - SIN 1
397.5 - AAC - SIN 2
3/0 - CU - SINGLE 3
336.4 - AAC - SIN 4
715.5 - AAC - SIN 5
397.5 - AAC - SIN 6
397.5 - AAC - SIN 7
397.5 - AAC - SIN 8
477 - ACSS - SING 9
2 - ACSR - SINGLE 10
4/0 - AAC - SINGL 11
1/0 - ACSR - SING 12
715.5 - AAC - SIN 13
336.4 - AAC - SIN 14
715.5 - AAC - SIN 15
4/0 - AAC - SINGL 16
715.5 - AAC - SIN 17
715.5 - AAC - SIN 18
715.5 - AAC - SIN 19
4/0 - CU - SINGLE 20
397.5 - AAC - SIN 21
4 - CU - SINGLE 22
397.5 - AAC - SIN 23
4/0 - AAC - SINGL 24
2 - ACSR - SINGLE 25
715.5 - AAC - SIN 26
397.5 - ALUM - SI 27
715.5 - AAC - SIN 28
477 - ACSS - SING 29
715.5 - AAC - SIN 30
4/0 - AAC - SINGL 31
1/0 - ACSR - SING 32
4/0 - AAC - SINGL 33
4 - CU - SINGLE 34
397.5 - AAC - SIN 35
FERC FORM NO. 1 (ED. 12-87) Page 423.30
36 244,090,607 6,128,240,893 6,372,331,500 128,540,450 285,558,082 414,098,532

Name of Respondent This Report Is:(1) An Original
(2) A Resubmission
Date of Report(Mo, Da, Yr)
Year/Period of Report
End of
TRANSMISSION LINE STATISTICS (Continued)
PACIFIC GAS AND ELECTRIC COMPANYX
04/13/20212020/Q4
Line
No.
COST OF LINE (Include in Column (j) Land,
Size of
Conductor
and Material
Land rights, and clearing right-of-way)EXPENSES, EXCEPT DEPRECIATION AND TAXES
OperationExpenses
Maintenance Rents TotalLand Construction andOther Costs
Total Cost
(i) (j) (k) (l) (m) (n) (o) (p)Expenses Expenses
7. Do not report the same transmission line structure twice. Report Lower voltage Lines and higher voltage lines as one line. Designate in a footnote if
you do not include Lower voltage lines with higher voltage lines. If two or more transmission line structures support lines of the same voltage, report the
pole miles of the primary structure in column (f) and the pole miles of the other line(s) in column (g)
8. Designate any transmission line or portion thereof for which the respondent is not the sole owner. If such property is leased from another company,
give name of lessor, date and terms of Lease, and amount of rent for year. For any transmission line other than a leased line, or portion thereof, for
which the respondent is not the sole owner but which the respondent operates or shares in the operation of, furnish a succinct statement explaining the
arrangement and giving particulars (details) of such matters as percent ownership by respondent in the line, name of co-owner, basis of sharing
expenses of the Line, and how the expenses borne by the respondent are accounted for, and accounts affected. Specify whether lessor, co-owner, or
other party is an associated company.
9. Designate any transmission line leased to another company and give name of Lessee, date and terms of lease, annual rent for year, and how
determined. Specify whether lessee is an associated company.
10. Base the plant cost figures called for in columns (j) to (l) on the book cost at end of year.
715.5 - AAC - SIN 1
477 - ACSS - SING 2
397.5 - AAC - SIN 3
1/0 - ACSR - SING 4
715.5 - AAC - SIN 5
4/0 - AAC - SINGL 6
266.8 - AAC - SIN 7
1/0 - ACSR - SING 8
1113 - AAC - SING 9
4/0 - AAC - SINGL 10
4/0 - AAC - SINGL 11
4/0 - AAC - SINGL 12
266.8 - AAC - SIN 13
715.5 - AAC - SIN 14
715.5 - AAC - SIN 15
397.5 - AAC - SIN 16
4/0 - AAC - SINGL 17
715.5 - AAC - SIN 18
4/0 - CU - SINGLE 19
715.5 - AAC - SIN 20
715.5 - AAC - SIN 21
715.5 - AAC - SIN 22
4 - CU - SINGLE 2 23
397.5 - AAC - SIN 24
4/0 - CU - SINGLE 25
397.5 - AAC - SIN 26
336.4 - AAC - SIN 27
397.5 - AAC - SIN 28
715.5 - AAC - SIN 29
1/0 - ACSR - SING 30
715.5 - AAC - SIN 31
397.5 - AAC - SIN 32
397.5 - AAC - SIN 33
2/0 - CU - SINGLE 34
1431 - AAC - SING 35
FERC FORM NO. 1 (ED. 12-87) Page 423.31
36 244,090,607 6,128,240,893 6,372,331,500 128,540,450 285,558,082 414,098,532
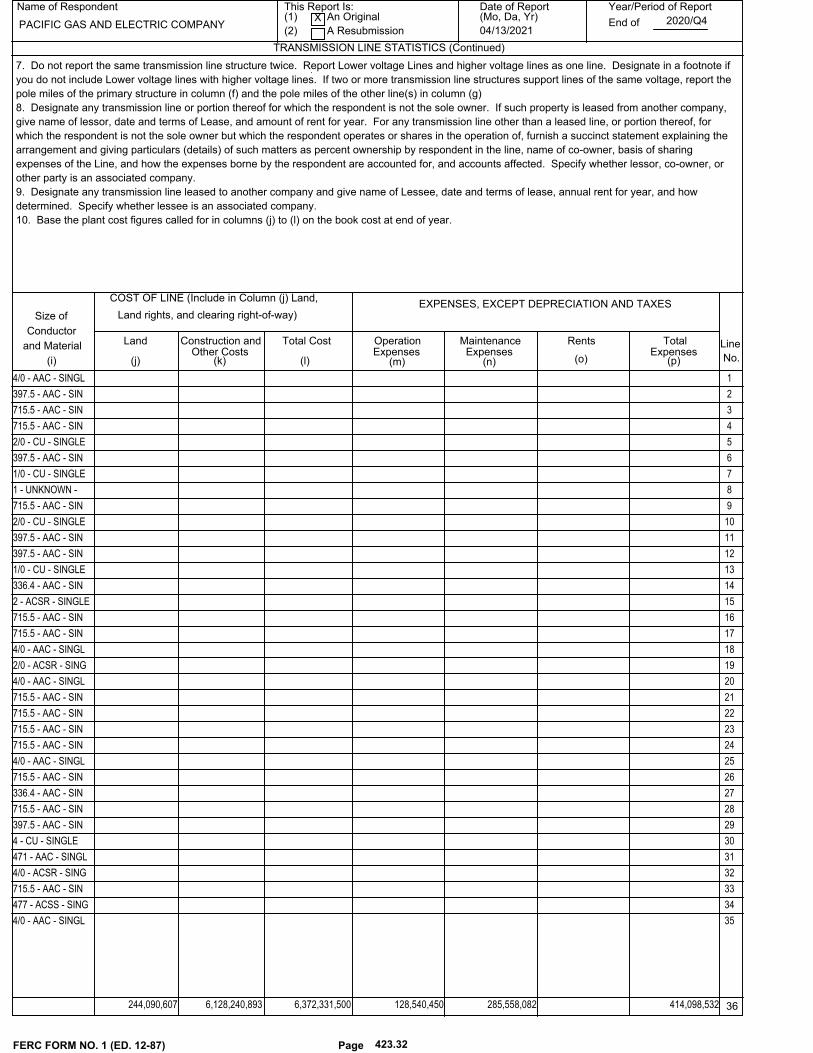
Name of Respondent This Report Is:(1) An Original
(2) A Resubmission
Date of Report(Mo, Da, Yr)
Year/Period of Report
End of
TRANSMISSION LINE STATISTICS (Continued)
PACIFIC GAS AND ELECTRIC COMPANYX
04/13/20212020/Q4
Line
No.
COST OF LINE (Include in Column (j) Land,
Size of
Conductor
and Material
Land rights, and clearing right-of-way)EXPENSES, EXCEPT DEPRECIATION AND TAXES
OperationExpenses
Maintenance Rents TotalLand Construction andOther Costs
Total Cost
(i) (j) (k) (l) (m) (n) (o) (p)Expenses Expenses
7. Do not report the same transmission line structure twice. Report Lower voltage Lines and higher voltage lines as one line. Designate in a footnote if
you do not include Lower voltage lines with higher voltage lines. If two or more transmission line structures support lines of the same voltage, report the
pole miles of the primary structure in column (f) and the pole miles of the other line(s) in column (g)
8. Designate any transmission line or portion thereof for which the respondent is not the sole owner. If such property is leased from another company,
give name of lessor, date and terms of Lease, and amount of rent for year. For any transmission line other than a leased line, or portion thereof, for
which the respondent is not the sole owner but which the respondent operates or shares in the operation of, furnish a succinct statement explaining the
arrangement and giving particulars (details) of such matters as percent ownership by respondent in the line, name of co-owner, basis of sharing
expenses of the Line, and how the expenses borne by the respondent are accounted for, and accounts affected. Specify whether lessor, co-owner, or
other party is an associated company.
9. Designate any transmission line leased to another company and give name of Lessee, date and terms of lease, annual rent for year, and how
determined. Specify whether lessee is an associated company.
10. Base the plant cost figures called for in columns (j) to (l) on the book cost at end of year.
4/0 - AAC - SINGL 1
397.5 - AAC - SIN 2
715.5 - AAC - SIN 3
715.5 - AAC - SIN 4
2/0 - CU - SINGLE 5
397.5 - AAC - SIN 6
1/0 - CU - SINGLE 7
1 - UNKNOWN - 8
715.5 - AAC - SIN 9
2/0 - CU - SINGLE 10
397.5 - AAC - SIN 11
397.5 - AAC - SIN 12
1/0 - CU - SINGLE 13
336.4 - AAC - SIN 14
2 - ACSR - SINGLE 15
715.5 - AAC - SIN 16
715.5 - AAC - SIN 17
4/0 - AAC - SINGL 18
2/0 - ACSR - SING 19
4/0 - AAC - SINGL 20
715.5 - AAC - SIN 21
715.5 - AAC - SIN 22
715.5 - AAC - SIN 23
715.5 - AAC - SIN 24
4/0 - AAC - SINGL 25
715.5 - AAC - SIN 26
336.4 - AAC - SIN 27
715.5 - AAC - SIN 28
397.5 - AAC - SIN 29
4 - CU - SINGLE 30
471 - AAC - SINGL 31
4/0 - ACSR - SING 32
715.5 - AAC - SIN 33
477 - ACSS - SING 34
4/0 - AAC - SINGL 35
FERC FORM NO. 1 (ED. 12-87) Page 423.32
36 244,090,607 6,128,240,893 6,372,331,500 128,540,450 285,558,082 414,098,532

Name of Respondent This Report Is:(1) An Original
(2) A Resubmission
Date of Report(Mo, Da, Yr)
Year/Period of Report
End of
TRANSMISSION LINE STATISTICS (Continued)
PACIFIC GAS AND ELECTRIC COMPANYX
04/13/20212020/Q4
Line
No.
COST OF LINE (Include in Column (j) Land,
Size of
Conductor
and Material
Land rights, and clearing right-of-way)EXPENSES, EXCEPT DEPRECIATION AND TAXES
OperationExpenses
Maintenance Rents TotalLand Construction andOther Costs
Total Cost
(i) (j) (k) (l) (m) (n) (o) (p)Expenses Expenses
7. Do not report the same transmission line structure twice. Report Lower voltage Lines and higher voltage lines as one line. Designate in a footnote if
you do not include Lower voltage lines with higher voltage lines. If two or more transmission line structures support lines of the same voltage, report the
pole miles of the primary structure in column (f) and the pole miles of the other line(s) in column (g)
8. Designate any transmission line or portion thereof for which the respondent is not the sole owner. If such property is leased from another company,
give name of lessor, date and terms of Lease, and amount of rent for year. For any transmission line other than a leased line, or portion thereof, for
which the respondent is not the sole owner but which the respondent operates or shares in the operation of, furnish a succinct statement explaining the
arrangement and giving particulars (details) of such matters as percent ownership by respondent in the line, name of co-owner, basis of sharing
expenses of the Line, and how the expenses borne by the respondent are accounted for, and accounts affected. Specify whether lessor, co-owner, or
other party is an associated company.
9. Designate any transmission line leased to another company and give name of Lessee, date and terms of lease, annual rent for year, and how
determined. Specify whether lessee is an associated company.
10. Base the plant cost figures called for in columns (j) to (l) on the book cost at end of year.
1/0 - ACSR - SING 1
4/0 - AAC - SINGL 2
715.5 - AAC - SIN 3
4/0 - AAC - SINGL 4
3/0 - CU - BUNDLE 5
1/0 - ACSR - SING 6
715.5 - AAC - SIN 7
2/0 - CU - SINGLE 8
4/0 - AAC - SINGL 9
4/0 - AAC - SINGL 10
715.5 - AAC - SIN 11
2/0 - CU - SINGLE 12
715.5 - AAC - SIN 13
4/0 - AAC - SINGL 14
4/0 - AAC - SINGL 15
4/0 - AAC - SINGL 16
4/0 - AAC - SINGL 17
1113 - AAC - SING 18
715.5 - AAC - SIN 19
4/0 - CU - SINGLE 20
4 - CU - SINGLE 21
4/0 - AAC - SINGL 22
1 - CU - SINGLE 1 23
4/0 - AAC - SINGL 24
4/0 - AAC - SINGL 25
26
715.5 - AAC - SIN 27
336.4 - AAC - SIN 28
4/0 - AAC - SINGL 29
715.5 - AAC - SIN 30
4/0 - AAC - SINGL 31
715.5 - AAC - SIN 32
1113 - AAC - SING 33
336.4 - AAC - SIN 34
397.5 - AAC - SIN 35
FERC FORM NO. 1 (ED. 12-87) Page 423.33
36 244,090,607 6,128,240,893 6,372,331,500 128,540,450 285,558,082 414,098,532

Name of Respondent This Report Is:(1) An Original
(2) A Resubmission
Date of Report(Mo, Da, Yr)
Year/Period of Report
End of
TRANSMISSION LINE STATISTICS (Continued)
PACIFIC GAS AND ELECTRIC COMPANYX
04/13/20212020/Q4
Line
No.
COST OF LINE (Include in Column (j) Land,
Size of
Conductor
and Material
Land rights, and clearing right-of-way)EXPENSES, EXCEPT DEPRECIATION AND TAXES
OperationExpenses
Maintenance Rents TotalLand Construction andOther Costs
Total Cost
(i) (j) (k) (l) (m) (n) (o) (p)Expenses Expenses
7. Do not report the same transmission line structure twice. Report Lower voltage Lines and higher voltage lines as one line. Designate in a footnote if
you do not include Lower voltage lines with higher voltage lines. If two or more transmission line structures support lines of the same voltage, report the
pole miles of the primary structure in column (f) and the pole miles of the other line(s) in column (g)
8. Designate any transmission line or portion thereof for which the respondent is not the sole owner. If such property is leased from another company,
give name of lessor, date and terms of Lease, and amount of rent for year. For any transmission line other than a leased line, or portion thereof, for
which the respondent is not the sole owner but which the respondent operates or shares in the operation of, furnish a succinct statement explaining the
arrangement and giving particulars (details) of such matters as percent ownership by respondent in the line, name of co-owner, basis of sharing
expenses of the Line, and how the expenses borne by the respondent are accounted for, and accounts affected. Specify whether lessor, co-owner, or
other party is an associated company.
9. Designate any transmission line leased to another company and give name of Lessee, date and terms of lease, annual rent for year, and how
determined. Specify whether lessee is an associated company.
10. Base the plant cost figures called for in columns (j) to (l) on the book cost at end of year.
397.5 - ACSR - SI 1
4/0 - AAC - SINGL 2
4/0 - ACAR - SING 3
715.5 - AAC - SIN 4
4/0 - CU - SINGLE 5
3/0 - CU - SINGLE 6
715.5 - AAC - SIN 7
8
715.5 - AAC - SIN 9
715.5 - AAC - SIN 10
4/0 - ACSR - SING 11
1/0 - CU - SINGLE 12
1/0 - ACSR - SING 13
4/0 - AAC - SINGL 14
4/0 - AAC - SINGL 15
715.5 - AAC - SIN 16
715.5 - AAC - SIN 17
715.5 - AAC - SIN 18
715.5 - AAC - SIN 19
715.5 - AAC - SIN 20
715.5 - AAC - SIN 21
4/0 - AAC - SINGL 22
397.5 - AAC - SIN 23
4/0 - ACSR - SING 24
4/0 - AAC - SINGL 25
4/0 - AAC - SINGL 26
4/0 - AAC - SINGL 27
715.5 - AAC - SIN 28
1/0 - ACSR - SING 29
1/0 - ACSR - SING 30
3/0 - AAC - SINGL 31
1/0 - ACSR - SING 32
715.5 - AAC - SIN 33
397.5 - AAC - SIN 34
397.5 - AAC - SIN 35
FERC FORM NO. 1 (ED. 12-87) Page 423.34
36 244,090,607 6,128,240,893 6,372,331,500 128,540,450 285,558,082 414,098,532

Name of Respondent This Report Is:(1) An Original
(2) A Resubmission
Date of Report(Mo, Da, Yr)
Year/Period of Report
End of
TRANSMISSION LINE STATISTICS (Continued)
PACIFIC GAS AND ELECTRIC COMPANYX
04/13/20212020/Q4
Line
No.
COST OF LINE (Include in Column (j) Land,
Size of
Conductor
and Material
Land rights, and clearing right-of-way)EXPENSES, EXCEPT DEPRECIATION AND TAXES
OperationExpenses
Maintenance Rents TotalLand Construction andOther Costs
Total Cost
(i) (j) (k) (l) (m) (n) (o) (p)Expenses Expenses
7. Do not report the same transmission line structure twice. Report Lower voltage Lines and higher voltage lines as one line. Designate in a footnote if
you do not include Lower voltage lines with higher voltage lines. If two or more transmission line structures support lines of the same voltage, report the
pole miles of the primary structure in column (f) and the pole miles of the other line(s) in column (g)
8. Designate any transmission line or portion thereof for which the respondent is not the sole owner. If such property is leased from another company,
give name of lessor, date and terms of Lease, and amount of rent for year. For any transmission line other than a leased line, or portion thereof, for
which the respondent is not the sole owner but which the respondent operates or shares in the operation of, furnish a succinct statement explaining the
arrangement and giving particulars (details) of such matters as percent ownership by respondent in the line, name of co-owner, basis of sharing
expenses of the Line, and how the expenses borne by the respondent are accounted for, and accounts affected. Specify whether lessor, co-owner, or
other party is an associated company.
9. Designate any transmission line leased to another company and give name of Lessee, date and terms of lease, annual rent for year, and how
determined. Specify whether lessee is an associated company.
10. Base the plant cost figures called for in columns (j) to (l) on the book cost at end of year.
3/0 - AAC - SINGL 1
715.5 - AAC - SIN 2
4/0 - CU - SINGLE 3
4/0 - AAC - SINGL 4
715.5 - AAC - SIN 5
715.5 - AAC - SIN 6
715.5 - AAC - SIN 7
4/0 - AAC - SINGL 8
4/0 - AAC - SINGL 9
1 - UNKNOWN - 10
3/0 - AAC - SINGL 11
4/0 - AAC - SINGL 12
1113 - AAC - SING 13
715.5 - AAC - SIN 14
1/0 - ACSR - SING 15
397.5 - AAC - SIN 16
4/0 - AAC - SINGL 17
715.5 - AAC - SIN 18
4/0 - AAC - SINGL 19
715.5 - AAC - SIN 20
4/0 - AAC - SINGL 21
4/0 - ACSR - SING 22
4/0 - AAC - SINGL 23
3/0 - AAC - SINGL 24
266.8 - AAC - SIN 25
715.5 - AAC - SIN 26
397.5 - AAC - SIN 27
715.5 - AAC - SIN 28
1/0 - AAC - SINGL 29
715.5 - AAC - SIN 30
715.5 - AAC - SIN 31
266.8 - AAC - SIN 32
715.5 - AAC - SIN 33
715.5 - AAC - SIN 34
715.5 - AAC - SIN 35
FERC FORM NO. 1 (ED. 12-87) Page 423.35
36 244,090,607 6,128,240,893 6,372,331,500 128,540,450 285,558,082 414,098,532

Name of Respondent This Report Is:(1) An Original
(2) A Resubmission
Date of Report(Mo, Da, Yr)
Year/Period of Report
End of
TRANSMISSION LINE STATISTICS (Continued)
PACIFIC GAS AND ELECTRIC COMPANYX
04/13/20212020/Q4
Line
No.
COST OF LINE (Include in Column (j) Land,
Size of
Conductor
and Material
Land rights, and clearing right-of-way)EXPENSES, EXCEPT DEPRECIATION AND TAXES
OperationExpenses
Maintenance Rents TotalLand Construction andOther Costs
Total Cost
(i) (j) (k) (l) (m) (n) (o) (p)Expenses Expenses
7. Do not report the same transmission line structure twice. Report Lower voltage Lines and higher voltage lines as one line. Designate in a footnote if
you do not include Lower voltage lines with higher voltage lines. If two or more transmission line structures support lines of the same voltage, report the
pole miles of the primary structure in column (f) and the pole miles of the other line(s) in column (g)
8. Designate any transmission line or portion thereof for which the respondent is not the sole owner. If such property is leased from another company,
give name of lessor, date and terms of Lease, and amount of rent for year. For any transmission line other than a leased line, or portion thereof, for
which the respondent is not the sole owner but which the respondent operates or shares in the operation of, furnish a succinct statement explaining the
arrangement and giving particulars (details) of such matters as percent ownership by respondent in the line, name of co-owner, basis of sharing
expenses of the Line, and how the expenses borne by the respondent are accounted for, and accounts affected. Specify whether lessor, co-owner, or
other party is an associated company.
9. Designate any transmission line leased to another company and give name of Lessee, date and terms of lease, annual rent for year, and how
determined. Specify whether lessee is an associated company.
10. Base the plant cost figures called for in columns (j) to (l) on the book cost at end of year.
715.5 - AAC - SIN 1
1 - CU - SINGLE 7 2
715.5 - AAC - SIN 3
397.5 - AAC - SIN 4
4/0 - AAC - SINGL 5
715.5 - AAC - SIN 6
397.5 - AAC - SIN 7
1/0 - ACSR - SING 8
4/0 - AAC - SINGL 9
397.5 - AAC - SIN 10
4/0 - ACSR - SING 11
715.5 - AAC - SIN 12
715.5 - AAC - SIN 13
715.5 - AAC - SIN 14
4/0 - AAC - SINGL 15
715.5 - AAC - SIN 16
4/0 - AAC - SINGL 17
1113 - AAC - SING 18
477 - ACSS - SING 19
715.5 - AAC - SIN 20
715.5 - AAC - SIN 21
715.5 - AAC - SIN 22
715.5 - AAC - SIN 23
4/0 - CU - SINGLE 24
4/0 - AAC - SINGL 25
715.5 - AAC - SIN 26
715.5 - AAC - SIN 27
1113 - AAC - SING 28
715.5 - AAC - SIN 29
397.5 - AAC - SIN 30
477 - ACSS - SING 31
4/0 - AAC - SINGL 32
1/0 - AAC - SINGL 33
4/0 - CU - SINGLE 34
1/0 - ACSR - SING 35
FERC FORM NO. 1 (ED. 12-87) Page 423.36
36 244,090,607 6,128,240,893 6,372,331,500 128,540,450 285,558,082 414,098,532

Name of Respondent This Report Is:(1) An Original
(2) A Resubmission
Date of Report(Mo, Da, Yr)
Year/Period of Report
End of
TRANSMISSION LINE STATISTICS (Continued)
PACIFIC GAS AND ELECTRIC COMPANYX
04/13/20212020/Q4
Line
No.
COST OF LINE (Include in Column (j) Land,
Size of
Conductor
and Material
Land rights, and clearing right-of-way)EXPENSES, EXCEPT DEPRECIATION AND TAXES
OperationExpenses
Maintenance Rents TotalLand Construction andOther Costs
Total Cost
(i) (j) (k) (l) (m) (n) (o) (p)Expenses Expenses
7. Do not report the same transmission line structure twice. Report Lower voltage Lines and higher voltage lines as one line. Designate in a footnote if
you do not include Lower voltage lines with higher voltage lines. If two or more transmission line structures support lines of the same voltage, report the
pole miles of the primary structure in column (f) and the pole miles of the other line(s) in column (g)
8. Designate any transmission line or portion thereof for which the respondent is not the sole owner. If such property is leased from another company,
give name of lessor, date and terms of Lease, and amount of rent for year. For any transmission line other than a leased line, or portion thereof, for
which the respondent is not the sole owner but which the respondent operates or shares in the operation of, furnish a succinct statement explaining the
arrangement and giving particulars (details) of such matters as percent ownership by respondent in the line, name of co-owner, basis of sharing
expenses of the Line, and how the expenses borne by the respondent are accounted for, and accounts affected. Specify whether lessor, co-owner, or
other party is an associated company.
9. Designate any transmission line leased to another company and give name of Lessee, date and terms of lease, annual rent for year, and how
determined. Specify whether lessee is an associated company.
10. Base the plant cost figures called for in columns (j) to (l) on the book cost at end of year.
477 - ACSS - SING 1
477 - ACSS - SING 2
4/0 - AAC - SINGL 3
266.8 - AAC - SIN 4
266.8 - AAC - SIN 5
4/0 - AAC - SINGL 6
1113 - AAC - SING 7
715.5 - AAC - SIN 8
4/0 - AAC - SINGL 9
2 - ACSR - SINGLE 10
1113 - AAC - SING 11
715.5 - AAC - SIN 12
397.5 - AAC - SIN 13
2/0 - CU - SINGLE 14
1113 - AAC - SING 15
4/0 - AAC - SINGL 16
4/0 - AAC - SINGL 17
4/0 - AAC - SINGL 18
715.5 - AAC - SIN 19
397.5 - AAC - SIN 20
1/0 - ACSR - SING 21
2 - ACSR - SINGLE 22
1113 - AAC - SING 23
4/0 - AAC - SINGL 24
4/0 - AAC - SINGL 25
2 - UNKNOWN - 26
1113 - AAC - SING 27
715.5 - AAC - SIN 28
3/0 - AAC - SINGL 29
477 - ACSS - SING 30
1/0 - CU - SINGLE 31
715.5 - AAC - SIN 32
397.5 - AAC - SIN 33
715.5 - AAC - SIN 34
715.5 - AAC - SIN 35
FERC FORM NO. 1 (ED. 12-87) Page 423.37
36 244,090,607 6,128,240,893 6,372,331,500 128,540,450 285,558,082 414,098,532

Name of Respondent This Report Is:(1) An Original
(2) A Resubmission
Date of Report(Mo, Da, Yr)
Year/Period of Report
End of
TRANSMISSION LINE STATISTICS (Continued)
PACIFIC GAS AND ELECTRIC COMPANYX
04/13/20212020/Q4
Line
No.
COST OF LINE (Include in Column (j) Land,
Size of
Conductor
and Material
Land rights, and clearing right-of-way)EXPENSES, EXCEPT DEPRECIATION AND TAXES
OperationExpenses
Maintenance Rents TotalLand Construction andOther Costs
Total Cost
(i) (j) (k) (l) (m) (n) (o) (p)Expenses Expenses
7. Do not report the same transmission line structure twice. Report Lower voltage Lines and higher voltage lines as one line. Designate in a footnote if
you do not include Lower voltage lines with higher voltage lines. If two or more transmission line structures support lines of the same voltage, report the
pole miles of the primary structure in column (f) and the pole miles of the other line(s) in column (g)
8. Designate any transmission line or portion thereof for which the respondent is not the sole owner. If such property is leased from another company,
give name of lessor, date and terms of Lease, and amount of rent for year. For any transmission line other than a leased line, or portion thereof, for
which the respondent is not the sole owner but which the respondent operates or shares in the operation of, furnish a succinct statement explaining the
arrangement and giving particulars (details) of such matters as percent ownership by respondent in the line, name of co-owner, basis of sharing
expenses of the Line, and how the expenses borne by the respondent are accounted for, and accounts affected. Specify whether lessor, co-owner, or
other party is an associated company.
9. Designate any transmission line leased to another company and give name of Lessee, date and terms of lease, annual rent for year, and how
determined. Specify whether lessee is an associated company.
10. Base the plant cost figures called for in columns (j) to (l) on the book cost at end of year.
4/0 - AAC - SINGL 1
715.5 - AAC - SIN 2
715.5 - AAC - SIN 3
4/0 - AAC - SINGL 4
4/0 - AAC - SINGL 5
266.8 - AAC - SIN 6
1113 - AAC - SING 7
1113 - AAC - SING 8
715.5 - AAC - SIN 9
4/0 - AAC - SINGL 10
4/0 - CU - SINGLE 11
4/0 - CU - SINGLE 12
1113 - AAC - SING 13
1/0 - CU - SINGLE 14
1113 - AAC - SING 15
4/0 - AAC - SINGL 16
4/0 - AAC - SINGL 17
2 - ACSR - SINGLE 18
4/0 - AAC - SINGL 19
4/0 - AAC - SINGL 20
397.5 - ALUM - SI 21
715.5 - AAC - SIN 22
397.5 - AAC - SIN 23
397.5 - AAC - SIN 24
715.5 - AAC - SIN 25
4/0 - AAC - SINGL 26
4/0 - AAC - SINGL 27
1/0 - ACSR - SING 28
2 - ACSR - SINGLE 29
397.5 - AAC - SIN 30
1113 - AAC - SING 31
1113 - AAC - SING 32
4/0 - AAC - SINGL 33
715.5 - AAC - SIN 34
4/0 - AAC - SINGL 35
FERC FORM NO. 1 (ED. 12-87) Page 423.38
36 244,090,607 6,128,240,893 6,372,331,500 128,540,450 285,558,082 414,098,532

Name of Respondent This Report Is:(1) An Original
(2) A Resubmission
Date of Report(Mo, Da, Yr)
Year/Period of Report
End of
TRANSMISSION LINE STATISTICS (Continued)
PACIFIC GAS AND ELECTRIC COMPANYX
04/13/20212020/Q4
Line
No.
COST OF LINE (Include in Column (j) Land,
Size of
Conductor
and Material
Land rights, and clearing right-of-way)EXPENSES, EXCEPT DEPRECIATION AND TAXES
OperationExpenses
Maintenance Rents TotalLand Construction andOther Costs
Total Cost
(i) (j) (k) (l) (m) (n) (o) (p)Expenses Expenses
7. Do not report the same transmission line structure twice. Report Lower voltage Lines and higher voltage lines as one line. Designate in a footnote if
you do not include Lower voltage lines with higher voltage lines. If two or more transmission line structures support lines of the same voltage, report the
pole miles of the primary structure in column (f) and the pole miles of the other line(s) in column (g)
8. Designate any transmission line or portion thereof for which the respondent is not the sole owner. If such property is leased from another company,
give name of lessor, date and terms of Lease, and amount of rent for year. For any transmission line other than a leased line, or portion thereof, for
which the respondent is not the sole owner but which the respondent operates or shares in the operation of, furnish a succinct statement explaining the
arrangement and giving particulars (details) of such matters as percent ownership by respondent in the line, name of co-owner, basis of sharing
expenses of the Line, and how the expenses borne by the respondent are accounted for, and accounts affected. Specify whether lessor, co-owner, or
other party is an associated company.
9. Designate any transmission line leased to another company and give name of Lessee, date and terms of lease, annual rent for year, and how
determined. Specify whether lessee is an associated company.
10. Base the plant cost figures called for in columns (j) to (l) on the book cost at end of year.
1/0 - ACSR - SING 1
397.5 - ACSR - SI 2
715.5 - AAC - SIN 3
1/0 - ACSR - SING 4
1113 - AAC - SING 5
336.4 - AAC - SIN 6
1/0 - ACSR - SING 7
1 - CU - SINGLE 8
397.5 - AAC - SIN 9
715.5 - AAC - SIN 10
4/0 - AAC - SINGL 11
2 - CU - SINGLE 12
397.5 - AAC - SIN 13
1113 - AAC - SING 14
1113 - AAC - SING 15
1113 - AAC - SING 16
4/0 - AAC - SINGL 17
1113 - AAC - SING 18
1113 - AAC - SING 19
1113 - AAC - SING 20
477 - ACSS - SING 21
1 - CU - SINGLE 3 22
715.5 - AAC - SIN 23
1 - UNKNOWN - 24
25
26
27
28
29
2000 KCMIL - CU 30
3500 KCMIL - CU 31
3500 KCMIL - CU 32
2500 KCMIL - CU 33
2000 KCMIL - CU 34
3000 KCMIL - CU 35
FERC FORM NO. 1 (ED. 12-87) Page 423.39
36 244,090,607 6,128,240,893 6,372,331,500 128,540,450 285,558,082 414,098,532

Name of Respondent This Report Is:(1) An Original
(2) A Resubmission
Date of Report(Mo, Da, Yr)
Year/Period of Report
End of
TRANSMISSION LINE STATISTICS (Continued)
PACIFIC GAS AND ELECTRIC COMPANYX
04/13/20212020/Q4
Line
No.
COST OF LINE (Include in Column (j) Land,
Size of
Conductor
and Material
Land rights, and clearing right-of-way)EXPENSES, EXCEPT DEPRECIATION AND TAXES
OperationExpenses
Maintenance Rents TotalLand Construction andOther Costs
Total Cost
(i) (j) (k) (l) (m) (n) (o) (p)Expenses Expenses
7. Do not report the same transmission line structure twice. Report Lower voltage Lines and higher voltage lines as one line. Designate in a footnote if
you do not include Lower voltage lines with higher voltage lines. If two or more transmission line structures support lines of the same voltage, report the
pole miles of the primary structure in column (f) and the pole miles of the other line(s) in column (g)
8. Designate any transmission line or portion thereof for which the respondent is not the sole owner. If such property is leased from another company,
give name of lessor, date and terms of Lease, and amount of rent for year. For any transmission line other than a leased line, or portion thereof, for
which the respondent is not the sole owner but which the respondent operates or shares in the operation of, furnish a succinct statement explaining the
arrangement and giving particulars (details) of such matters as percent ownership by respondent in the line, name of co-owner, basis of sharing
expenses of the Line, and how the expenses borne by the respondent are accounted for, and accounts affected. Specify whether lessor, co-owner, or
other party is an associated company.
9. Designate any transmission line leased to another company and give name of Lessee, date and terms of lease, annual rent for year, and how
determined. Specify whether lessee is an associated company.
10. Base the plant cost figures called for in columns (j) to (l) on the book cost at end of year.
2500 KCMIL - CU 1
3500 KCMIL - CU 2
2000 KCMIL - CU 3
2500 KCMIL - CU 4
2500 KCMIL - CU 5
2000 KCMIL - CU 6
UNKNOWN - 7
1250 KCMIL - CU 8
1250 KCMIL 9
1250 KCMIL - CU 10
3000 KCMIL - 11
1000 KCMIL - CU 12
1250 KCMIL 13
1250 KCMIL - CU 14
1250 KCMIL - CU 15
1000 KCMIL - CU 16
1000 KCMIL - CU 17
1250 KCMIL - CU 18
3000 KCMIL 19
1250 KCMIL - CU 20
3000 KCMIL 21
3000 KCMIL - 22
UNKNOWN - 23
2000 KCMIL - CU 24
3000 KCMIL - CU 25
500 KCMIL - 26
3000 KCMIL - 27
3000 KCMIL - 28
3000 KCMIL - 29
3000 KCMIL - 30
3000 KCMIL - 31
3000 KCMIL - 32
2000 KCMIL - 33
UNKNOWN - 34
UNKNOWN - 35
FERC FORM NO. 1 (ED. 12-87) Page 423.40
36 244,090,607 6,128,240,893 6,372,331,500 128,540,450 285,558,082 414,098,532

Name of Respondent This Report Is:(1) An Original
(2) A Resubmission
Date of Report(Mo, Da, Yr)
Year/Period of Report
End of
TRANSMISSION LINE STATISTICS (Continued)
PACIFIC GAS AND ELECTRIC COMPANYX
04/13/20212020/Q4
Line
No.
COST OF LINE (Include in Column (j) Land,
Size of
Conductor
and Material
Land rights, and clearing right-of-way)EXPENSES, EXCEPT DEPRECIATION AND TAXES
OperationExpenses
Maintenance Rents TotalLand Construction andOther Costs
Total Cost
(i) (j) (k) (l) (m) (n) (o) (p)Expenses Expenses
7. Do not report the same transmission line structure twice. Report Lower voltage Lines and higher voltage lines as one line. Designate in a footnote if
you do not include Lower voltage lines with higher voltage lines. If two or more transmission line structures support lines of the same voltage, report the
pole miles of the primary structure in column (f) and the pole miles of the other line(s) in column (g)
8. Designate any transmission line or portion thereof for which the respondent is not the sole owner. If such property is leased from another company,
give name of lessor, date and terms of Lease, and amount of rent for year. For any transmission line other than a leased line, or portion thereof, for
which the respondent is not the sole owner but which the respondent operates or shares in the operation of, furnish a succinct statement explaining the
arrangement and giving particulars (details) of such matters as percent ownership by respondent in the line, name of co-owner, basis of sharing
expenses of the Line, and how the expenses borne by the respondent are accounted for, and accounts affected. Specify whether lessor, co-owner, or
other party is an associated company.
9. Designate any transmission line leased to another company and give name of Lessee, date and terms of lease, annual rent for year, and how
determined. Specify whether lessee is an associated company.
10. Base the plant cost figures called for in columns (j) to (l) on the book cost at end of year.
UNKNOWN - 1
3500 KCMIL 2
2500 KCMIL - CU 3
2500 KCMIL - CU 4
1250 KCMIL - 5
3500 KCMIL - 6
3500 KCMIL - 7
1750 KCMIL - 8
2500 KCMIL - CU 9
2500 KCMIL - CU 10
1750 KCMIL - 11
UNKNOWN - CU 12
UNKNOWN - CU 13
3000 KCMIL - CU 14
3000 KCMIL - CU 15
1250 KCMIL - 16
17
18
19
20
21
22
23
578,939,238 550,658,158 28,281,080 30,079,576 20,711,609 9,367,967 24
2,225,888,078 2,150,499,783 75,388,295 120,835,875 83,202,815 37,633,060 25
1,444,673,098 1,355,050,205 89,622,893 137,541,588 94,705,710 42,835,878 26
309,168,355 294,815,205 14,353,150 35,005,401 24,103,338 10,902,063 27
797,765,463 764,229,266 33,536,197 87,950,361 60,559,148 27,391,213 28
29
241,300,145 238,509,403 2,790,742 1,315,069 1,114,515 200,554 30
617,014,768 616,896,518 118,250 1,295,833 1,098,213 197,620 31
32
25,260,269 25,260,269 74,829 62,734 12,095 33
34
132,322,086 132,322,086 35
FERC FORM NO. 1 (ED. 12-87) Page 423.41
36 244,090,607 6,128,240,893 6,372,331,500 128,540,450 285,558,082 414,098,532

Schedule Page: 422 Line No.: 1 Column: eSSP - Single Steel Poles; SWP - Single Wood Poles; T - Steel Towers; Other - Multi_Pole Structures or Other Materials
Schedule Page: 422 Line No.: 1 Column: f
Timing differences may exist between ETGIS operational data on page 422-423 and the financial records on page
424-425.
Schedule Page: 422 Line No.: 15 Column: a Bundle
Schedule Page: 422 Line No.: 22 Column: aIdle
Schedule Page: 422 Line No.: 22 Column: iInformation not available as of the date of this report
Schedule Page: 422 Line No.: 23 Column: aBundle
Schedule Page: 422 Line No.: 30 Column: aIdle
Schedule Page: 422 Line No.: 32 Column: aIdle
Schedule Page: 422 Line No.: 32 Column: eInformation not available as of the date of this report
Schedule Page: 422 Line No.: 33 Column: aIdle
Schedule Page: 422.1 Line No.: 1 Column: aIdle
Schedule Page: 422.1 Line No.: 3 Column: aIdle
Schedule Page: 422.1 Line No.: 7 Column: aBundle
Schedule Page: 422.1 Line No.: 13 Column: iInformation not available as of the date of this report
Schedule Page: 422.1 Line No.: 23 Column: aIdle
Schedule Page: 422.1 Line No.: 24 Column: eInformation not available as of the date of this report
Schedule Page: 422.2 Line No.: 11 Column: iInformation not available as of the date of this report
Schedule Page: 422.2 Line No.: 26 Column: aAlum
Schedule Page: 422.2 Line No.: 27 Column: aBundle
Schedule Page: 422.2 Line No.: 29 Column: eInformation not available as of the date of this report
Schedule Page: 422.3 Line No.: 5 Column: aAlum
Schedule Page: 422.3 Line No.: 28 Column: aIdle
Schedule Page: 422.3 Line No.: 30 Column: aIdle
Schedule Page: 422.3 Line No.: 30 Column: eInformation not available as of the date of this report
Schedule Page: 422.4 Line No.: 29 Column: aIdle
Name of Respondent
PACIFIC GAS AND ELECTRIC COMPANY
This Report is:(1) X An Original(2) A Resubmission
Date of Report(Mo, Da, Yr)
04/13/2021
Year/Period of Report
2020/Q4
FOOTNOTE DATA
FERC FORM NO. 1 (ED. 12-87) Page 450.1

Schedule Page: 422.4 Line No.: 31 Column: aBundle
Schedule Page: 422.4 Line No.: 33 Column: iInformation not available as of the date of this report
Schedule Page: 422.4 Line No.: 35 Column: aIdle
Schedule Page: 422.5 Line No.: 26 Column: iInformation not available as of the date of this report
Schedule Page: 422.5 Line No.: 33 Column: eInformation not available as of the date of this report
Schedule Page: 422.6 Line No.: 4 Column: aAlum
Schedule Page: 422.6 Line No.: 5 Column: eInformation not available as of the date of this report
Schedule Page: 422.6 Line No.: 6 Column: aBundle
Schedule Page: 422.6 Line No.: 7 Column: aBundle
Schedule Page: 422.6 Line No.: 15 Column: aIdle
Schedule Page: 422.6 Line No.: 17 Column: eInformation not available as of the date of this report
Schedule Page: 422.6 Line No.: 20 Column: aAlum
Schedule Page: 422.6 Line No.: 21 Column: aAlum
Schedule Page: 422.6 Line No.: 24 Column: iInformation not available as of the date of this report
Schedule Page: 422.6 Line No.: 28 Column: aBundle
Schedule Page: 422.7 Line No.: 3 Column: eInformation not available as of the date of this report
Schedule Page: 422.7 Line No.: 17 Column: eInformation not available as of the date of this report
Schedule Page: 422.7 Line No.: 21 Column: eInformation not available as of the date of this report
Schedule Page: 422.7 Line No.: 27 Column: aBundle
Schedule Page: 422.7 Line No.: 30 Column: aBundle
Schedule Page: 422.7 Line No.: 34 Column: eInformation not available as of the date of this report
Schedule Page: 422.7 Line No.: 35 Column: aBundle
Schedule Page: 422.8 Line No.: 33 Column: eInformation not available as of the date of this report
Schedule Page: 422.9 Line No.: 9 Column: aIdle
Schedule Page: 422.9 Line No.: 9 Column: eInformation not available as of the date of this report
Schedule Page: 422.9 Line No.: 10 Column: aBundle
Schedule Page: 422.9 Line No.: 11 Column: aBundle
Name of Respondent
PACIFIC GAS AND ELECTRIC COMPANY
This Report is:(1) X An Original(2) A Resubmission
Date of Report(Mo, Da, Yr)
04/13/2021
Year/Period of Report
2020/Q4
FOOTNOTE DATA
FERC FORM NO. 1 (ED. 12-87) Page 450.2

Schedule Page: 422.9 Line No.: 14 Column: aIdle
Schedule Page: 422.9 Line No.: 23 Column: eInformation not available as of the date of this report
Schedule Page: 422.9 Line No.: 26 Column: eInformation not available as of the date of this report
Schedule Page: 422.9 Line No.: 28 Column: aBundle
Schedule Page: 422.10 Line No.: 18 Column: aBundle
Schedule Page: 422.10 Line No.: 19 Column: aIdle
Schedule Page: 422.11 Line No.: 8 Column: eInformation not available as of the date of this report
Schedule Page: 422.11 Line No.: 18 Column: aIdle
Schedule Page: 422.11 Line No.: 18 Column: eInformation not available as of the date of this report
Schedule Page: 422.11 Line No.: 19 Column: aBundle
Schedule Page: 422.11 Line No.: 20 Column: aBundle
Schedule Page: 422.11 Line No.: 21 Column: aBundle
Schedule Page: 422.11 Line No.: 25 Column: aBundle
Schedule Page: 422.11 Line No.: 26 Column: aBundle
Schedule Page: 422.11 Line No.: 31 Column: eInformation not available as of the date of this report
Schedule Page: 422.12 Line No.: 1 Column: eInformation not available as of the date of this report
Schedule Page: 422.12 Line No.: 6 Column: eInformation not available as of the date of this report
Schedule Page: 422.12 Line No.: 26 Column: aAlum
Schedule Page: 422.12 Line No.: 27 Column: aAlum
Schedule Page: 422.12 Line No.: 30 Column: eInformation not available as of the date of this report
Schedule Page: 422.13 Line No.: 2 Column: aIdle
Schedule Page: 422.13 Line No.: 3 Column: aIdle
Schedule Page: 422.13 Line No.: 3 Column: eInformation not available as of the date of this report
Schedule Page: 422.13 Line No.: 10 Column: aBundle
Schedule Page: 422.13 Line No.: 16 Column: eInformation not available as of the date of this report
Schedule Page: 422.13 Line No.: 28 Column: eInformation not available as of the date of this report
Schedule Page: 422.13 Line No.: 29 Column: aIdle
Name of Respondent
PACIFIC GAS AND ELECTRIC COMPANY
This Report is:(1) X An Original(2) A Resubmission
Date of Report(Mo, Da, Yr)
04/13/2021
Year/Period of Report
2020/Q4
FOOTNOTE DATA
FERC FORM NO. 1 (ED. 12-87) Page 450.3

Schedule Page: 422.13 Line No.: 30 Column: aIdle
Schedule Page: 422.14 Line No.: 15 Column: iInformation not available as of the date of this report
Schedule Page: 422.14 Line No.: 23 Column: aBundle
Schedule Page: 422.14 Line No.: 29 Column: aIdle
Schedule Page: 422.14 Line No.: 30 Column: aBundle
Schedule Page: 422.15 Line No.: 29 Column: eInformation not available as of the date of this report
Schedule Page: 422.16 Line No.: 7 Column: aIdle
Schedule Page: 422.16 Line No.: 11 Column: aBundle
Schedule Page: 422.16 Line No.: 12 Column: eInformation not available as of the date of this report
Schedule Page: 422.16 Line No.: 14 Column: aBundle
Schedule Page: 422.16 Line No.: 17 Column: aBundle
Schedule Page: 422.16 Line No.: 19 Column: aBundle
Schedule Page: 422.16 Line No.: 23 Column: aBundle
Schedule Page: 422.17 Line No.: 6 Column: eInformation not available as of the date of this report
Schedule Page: 422.17 Line No.: 18 Column: aBundle
Schedule Page: 422.17 Line No.: 18 Column: eInformation not available as of the date of this report
Schedule Page: 422.17 Line No.: 28 Column: aBundle
Schedule Page: 422.17 Line No.: 30 Column: aBundle
Schedule Page: 422.17 Line No.: 32 Column: aBundle
Schedule Page: 422.17 Line No.: 33 Column: aBundle, Idle
Schedule Page: 422.18 Line No.: 1 Column: eInformation not available as of the date of this report
Schedule Page: 422.18 Line No.: 6 Column: aBundle
Schedule Page: 422.18 Line No.: 7 Column: aBundle
Schedule Page: 422.18 Line No.: 8 Column: aBundle
Schedule Page: 422.18 Line No.: 11 Column: aBundle
Schedule Page: 422.18 Line No.: 12 Column: aBundle
Schedule Page: 422.18 Line No.: 15 Column: aBundle
Name of Respondent
PACIFIC GAS AND ELECTRIC COMPANY
This Report is:(1) X An Original(2) A Resubmission
Date of Report(Mo, Da, Yr)
04/13/2021
Year/Period of Report
2020/Q4
FOOTNOTE DATA
FERC FORM NO. 1 (ED. 12-87) Page 450.4
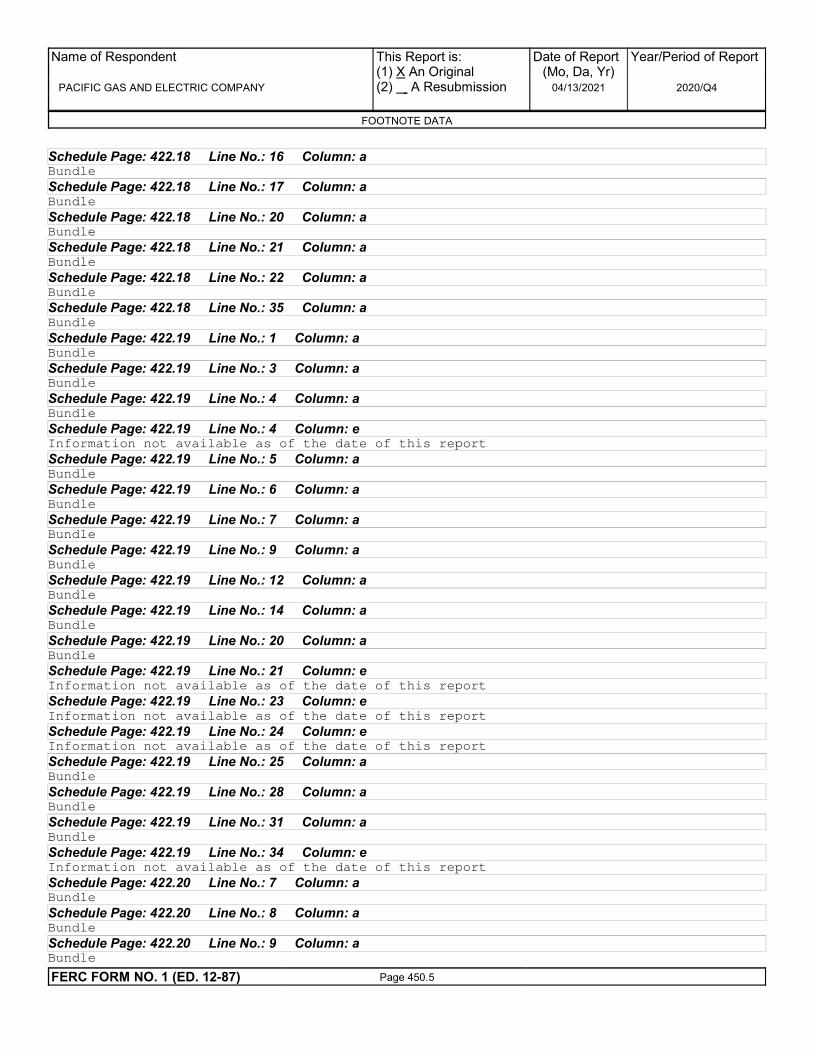
Schedule Page: 422.18 Line No.: 16 Column: aBundle
Schedule Page: 422.18 Line No.: 17 Column: aBundle
Schedule Page: 422.18 Line No.: 20 Column: aBundle
Schedule Page: 422.18 Line No.: 21 Column: aBundle
Schedule Page: 422.18 Line No.: 22 Column: aBundle
Schedule Page: 422.18 Line No.: 35 Column: aBundle
Schedule Page: 422.19 Line No.: 1 Column: aBundle
Schedule Page: 422.19 Line No.: 3 Column: aBundle
Schedule Page: 422.19 Line No.: 4 Column: aBundle
Schedule Page: 422.19 Line No.: 4 Column: eInformation not available as of the date of this report
Schedule Page: 422.19 Line No.: 5 Column: aBundle
Schedule Page: 422.19 Line No.: 6 Column: aBundle
Schedule Page: 422.19 Line No.: 7 Column: aBundle
Schedule Page: 422.19 Line No.: 9 Column: aBundle
Schedule Page: 422.19 Line No.: 12 Column: aBundle
Schedule Page: 422.19 Line No.: 14 Column: aBundle
Schedule Page: 422.19 Line No.: 20 Column: aBundle
Schedule Page: 422.19 Line No.: 21 Column: eInformation not available as of the date of this report
Schedule Page: 422.19 Line No.: 23 Column: eInformation not available as of the date of this report
Schedule Page: 422.19 Line No.: 24 Column: eInformation not available as of the date of this report
Schedule Page: 422.19 Line No.: 25 Column: aBundle
Schedule Page: 422.19 Line No.: 28 Column: aBundle
Schedule Page: 422.19 Line No.: 31 Column: aBundle
Schedule Page: 422.19 Line No.: 34 Column: eInformation not available as of the date of this report
Schedule Page: 422.20 Line No.: 7 Column: aBundle
Schedule Page: 422.20 Line No.: 8 Column: aBundle
Schedule Page: 422.20 Line No.: 9 Column: aBundle
Name of Respondent
PACIFIC GAS AND ELECTRIC COMPANY
This Report is:(1) X An Original(2) A Resubmission
Date of Report(Mo, Da, Yr)
04/13/2021
Year/Period of Report
2020/Q4
FOOTNOTE DATA
FERC FORM NO. 1 (ED. 12-87) Page 450.5

Schedule Page: 422.20 Line No.: 33 Column: aBundle
Schedule Page: 422.21 Line No.: 1 Column: aBundle
Schedule Page: 422.21 Line No.: 1 Column: eInformation not available as of the date of this report
Schedule Page: 422.21 Line No.: 2 Column: aBundle
Schedule Page: 422.21 Line No.: 3 Column: aBundle
Schedule Page: 422.21 Line No.: 4 Column: aBundle
Schedule Page: 422.21 Line No.: 7 Column: eInformation not available as of the date of this report
Schedule Page: 422.21 Line No.: 8 Column: aBundle
Schedule Page: 422.21 Line No.: 17 Column: aBundle
Schedule Page: 422.21 Line No.: 17 Column: eInformation not available as of the date of this report
Schedule Page: 422.21 Line No.: 18 Column: eInformation not available as of the date of this report
Schedule Page: 422.21 Line No.: 20 Column: eInformation not available as of the date of this report
Schedule Page: 422.21 Line No.: 22 Column: aBundle
Schedule Page: 422.21 Line No.: 23 Column: aBundle
Schedule Page: 422.21 Line No.: 25 Column: eInformation not available as of the date of this report
Schedule Page: 422.21 Line No.: 26 Column: aBundle
Schedule Page: 422.21 Line No.: 27 Column: aBundle
Schedule Page: 422.21 Line No.: 31 Column: aBundle
Schedule Page: 422.22 Line No.: 4 Column: eInformation not available as of the date of this report
Schedule Page: 422.22 Line No.: 5 Column: aBundle
Schedule Page: 422.22 Line No.: 17 Column: aBundle
Schedule Page: 422.22 Line No.: 18 Column: aBundle
Schedule Page: 422.22 Line No.: 19 Column: aBundle
Schedule Page: 422.22 Line No.: 20 Column: aBundle
Schedule Page: 422.22 Line No.: 21 Column: aBundle
Schedule Page: 422.22 Line No.: 22 Column: aBundle
Schedule Page: 422.22 Line No.: 23 Column: aBundle
Name of Respondent
PACIFIC GAS AND ELECTRIC COMPANY
This Report is:(1) X An Original(2) A Resubmission
Date of Report(Mo, Da, Yr)
04/13/2021
Year/Period of Report
2020/Q4
FOOTNOTE DATA
FERC FORM NO. 1 (ED. 12-87) Page 450.6

Schedule Page: 422.22 Line No.: 24 Column: aBundle
Schedule Page: 422.22 Line No.: 25 Column: aBundle
Schedule Page: 422.22 Line No.: 26 Column: aBundle
Schedule Page: 422.22 Line No.: 27 Column: aBundle
Schedule Page: 422.22 Line No.: 28 Column: aBundle
Schedule Page: 422.22 Line No.: 29 Column: aBundle
Schedule Page: 422.22 Line No.: 30 Column: aBundle
Schedule Page: 422.22 Line No.: 31 Column: aBundle
Schedule Page: 422.22 Line No.: 32 Column: aBundle
Schedule Page: 422.22 Line No.: 33 Column: aBundle
Schedule Page: 422.22 Line No.: 34 Column: aBundle
Schedule Page: 422.22 Line No.: 35 Column: aBundle
Schedule Page: 422.23 Line No.: 1 Column: aBundle
Schedule Page: 422.23 Line No.: 2 Column: aBundle
Schedule Page: 422.23 Line No.: 3 Column: aBundle
Schedule Page: 422.23 Line No.: 5 Column: aBundle
Schedule Page: 422.23 Line No.: 6 Column: aBundle
Schedule Page: 422.23 Line No.: 20 Column: iInformation not available as of the date of this report
Schedule Page: 422.23 Line No.: 25 Column: aBundle
Schedule Page: 422.23 Line No.: 29 Column: iInformation not available as of the date of this report
Schedule Page: 422.24 Line No.: 4 Column: aIdle
Schedule Page: 422.24 Line No.: 7 Column: aIdle
Schedule Page: 422.24 Line No.: 13 Column: aBundle
Schedule Page: 422.24 Line No.: 21 Column: aBundle
Schedule Page: 422.24 Line No.: 34 Column: aIdle
Schedule Page: 422.24 Line No.: 34 Column: eInformation not available as of the date of this report
Schedule Page: 422.24 Line No.: 35 Column: aIdle
Name of Respondent
PACIFIC GAS AND ELECTRIC COMPANY
This Report is:(1) X An Original(2) A Resubmission
Date of Report(Mo, Da, Yr)
04/13/2021
Year/Period of Report
2020/Q4
FOOTNOTE DATA
FERC FORM NO. 1 (ED. 12-87) Page 450.7

Schedule Page: 422.25 Line No.: 2 Column: aIdle
Schedule Page: 422.25 Line No.: 4 Column: aBundle
Schedule Page: 422.25 Line No.: 5 Column: aBundle
Schedule Page: 422.25 Line No.: 24 Column: aBundle
Schedule Page: 422.26 Line No.: 32 Column: aIdle
Schedule Page: 422.27 Line No.: 3 Column: aBundle
Schedule Page: 422.28 Line No.: 14 Column: aAlum
Schedule Page: 422.28 Line No.: 31 Column: iInformation not available as of the date of this report
Schedule Page: 422.29 Line No.: 19 Column: aIdle
Schedule Page: 422.29 Line No.: 24 Column: aAlum
Schedule Page: 422.29 Line No.: 30 Column: aAlum
Schedule Page: 422.30 Line No.: 13 Column: aIdle
Schedule Page: 422.30 Line No.: 17 Column: aIdle
Schedule Page: 422.30 Line No.: 19 Column: aIdle
Schedule Page: 422.30 Line No.: 26 Column: aAlum
Schedule Page: 422.30 Line No.: 27 Column: aAlum
Schedule Page: 422.31 Line No.: 30 Column: aIdle
Schedule Page: 422.31 Line No.: 33 Column: aIdle
Schedule Page: 422.32 Line No.: 8 Column: aIdle
Schedule Page: 422.32 Line No.: 31 Column: aIdle
Schedule Page: 422.33 Line No.: 5 Column: aBundle
Schedule Page: 422.33 Line No.: 15 Column: eInformation not available as of the date of this report
Schedule Page: 422.33 Line No.: 26 Column: iInformation not available as of the date of this report
Schedule Page: 422.34 Line No.: 8 Column: iInformation not available as of the date of this report
Schedule Page: 422.35 Line No.: 10 Column: aIdle
Schedule Page: 422.35 Line No.: 27 Column: aIdle
Schedule Page: 422.36 Line No.: 18 Column: eInformation not available as of the date of this report
Name of Respondent
PACIFIC GAS AND ELECTRIC COMPANY
This Report is:(1) X An Original(2) A Resubmission
Date of Report(Mo, Da, Yr)
04/13/2021
Year/Period of Report
2020/Q4
FOOTNOTE DATA
FERC FORM NO. 1 (ED. 12-87) Page 450.8

Schedule Page: 422.38 Line No.: 5 Column: aIdle
Schedule Page: 422.38 Line No.: 6 Column: aIdle
Schedule Page: 422.38 Line No.: 17 Column: aAlum
Schedule Page: 422.38 Line No.: 21 Column: aAlum
Schedule Page: 422.39 Line No.: 9 Column: aIdle
Schedule Page: 422.39 Line No.: 24 Column: aIdle
Schedule Page: 422.39 Line No.: 25 Column: aIdle
Schedule Page: 422.39 Line No.: 25 Column: iInformation not available as of the date of this report
Schedule Page: 422.39 Line No.: 26 Column: aIdle
Schedule Page: 422.39 Line No.: 26 Column: iInformation not available as of the date of this report
Schedule Page: 422.39 Line No.: 27 Column: aIdle
Schedule Page: 422.39 Line No.: 27 Column: iInformation not available as of the date of this report
Schedule Page: 422.39 Line No.: 28 Column: aIdle
Schedule Page: 422.39 Line No.: 28 Column: iInformation not available as of the date of this report
Schedule Page: 422.39 Line No.: 29 Column: aIdle
Schedule Page: 422.39 Line No.: 29 Column: iInformation not available as of the date of this report
Schedule Page: 422.40 Line No.: 11 Column: aAlum
Schedule Page: 422.40 Line No.: 22 Column: aIdle
Schedule Page: 422.40 Line No.: 33 Column: aAlum
Schedule Page: 422.41 Line No.: 5 Column: aAlum
Schedule Page: 422.41 Line No.: 6 Column: aAlum
Schedule Page: 422.41 Line No.: 7 Column: aAlum
Schedule Page: 422.41 Line No.: 11 Column: aAlum
Schedule Page: 422.41 Line No.: 16 Column: aAlum
Name of Respondent
PACIFIC GAS AND ELECTRIC COMPANY
This Report is:(1) X An Original(2) A Resubmission
Date of Report(Mo, Da, Yr)
04/13/2021
Year/Period of Report
2020/Q4
FOOTNOTE DATA
FERC FORM NO. 1 (ED. 12-87) Page 450.9

Name of Respondent This Report Is:(1) An Original
(2) A Resubmission
Date of Report(Mo, Da, Yr)
Year/Period of Report
End of
TRANSMISSION LINES ADDED DURING YEAR
PACIFIC GAS AND ELECTRIC COMPANYX
04/13/20212020/Q4
Line
No.
(c)(b)(a) (d) (e)
LINE DESIGNATION
From To
LineLength
inMiles
SUPPORTING STRUCTURE
TypeAverage
Number perMiles
CIRCUITS PER STRUCTURE
Present Ultimate
(f) (g)
1. Report below the information called for concerning Transmission lines added or altered during the year. It is not necessary to report
minor revisions of lines.
2. Provide separate subheadings for overhead and under- ground construction and show each transmission line separately. If actual
costs of competed construction are not readily available for reporting columns (l) to (o), it is permissible to report in these columns the
1 Removals
2 Underground Construction
3 Overhead Construction
4
5 Caribou-Palermo Removal
7.80Lattice Towers 1 1 6 Caribou Palermo 20.00
7 Job Order # 31509392,
8
9 Reconductors
10 Underground Construction
11 Overhead Construction
12
13 GEYSERS 12-FULTON
9.50LDSP and TSP 1 1 14 Geysers 12 Fulton 2.00
15 Job Order # 74017860
16
17 PH 2-CARIBOU#2 GRAYS
7.50WP and LDSP 1 1 18 Carbou #2 Gray flat Spanish Creek 4.30
19 Job Order # 74020221
20
21 TRINITY-COTTONWOOD
5.202 & 3 wood pos 1 1 22 Trinity Cottonwood 7.10
23 Job Order # 74024159
24
25 60-SOUTH OF PALERMO
2.90TSP and hybris 1 1 26 Palermo-Pease and Pease substation 5.80
27 Job Order # 74001396
28
29 (DA-B&M) ELECTRA-VALLEY
16.00WP and LDSP 1 1 30 Electric Substation Vallley Spring Substation 5.90
31 Job Order # 74001436
32
33 Q272 AMERICAN KINGS
20.00TSP and LDSP 1 1 34 Henrietta Sub American Kings Solar 0.20
35 Job Order # 74001134
36
37 CLEAR LAKE KONOCTI
3.00LDSP and TSP 1 1 38 Clear Lake/Konocti State route 29 0.50
39 Job Order # 74005352
40
41 SMARTVILLE-MARYSVILLE
3.00LDSP 1 1 42 Smartville Marysville 1.30
43 Job Order # 74008565
70.67 375.84 22 22
FERC FORM NO. 1 (REV. 12-03) Page 424
44 TOTAL

Name of Respondent This Report Is:(1) An Original
(2) A Resubmission
Date of Report(Mo, Da, Yr)
Year/Period of Report
End of
TRANSMISSION LINES ADDED DURING YEAR
PACIFIC GAS AND ELECTRIC COMPANYX
04/13/20212020/Q4
Line
No.
(c)(b)(a) (d) (e)
LINE DESIGNATION
From To
LineLength
inMiles
SUPPORTING STRUCTURE
TypeAverage
Number perMiles
CIRCUITS PER STRUCTURE
Present Ultimate
(f) (g)
1. Report below the information called for concerning Transmission lines added or altered during the year. It is not necessary to report
minor revisions of lines.
2. Provide separate subheadings for overhead and under- ground construction and show each transmission line separately. If actual
costs of competed construction are not readily available for reporting columns (l) to (o), it is permissible to report in these columns the
1
2 SMARTVILLE-MARYSVILLE
136.00WP 1 1 3 Smartville Marysville 0.30
4 Job Order # 74011401
5
6 MANTECA #1 60 KV RELO-
7 Manteca #1
35.30WP and LDSP 1 1 8 Job Order # 74014541 Manteca #1 0.17
9
10 SCHINDLER-COALINGA#2
11 Schindler
22.20WP 1 1 12 Job Order # 74014542 Coalinga #2 0.09
13
14 TESLA-STOCKTON 115KV
5.00WP and TSP 1 1 15 Tesla Stockton Cogen Jct 1.00
16 Job Order # 74016342
17
18 SURF TAP 115KV RELO
19 Surf tap Surf tap
21.00TSP 1 1 20 Job Order # 74017320 0.19
21
22 TABLE
11.60TSP 1 1 23 Table mountain Peachton 1.12
24 Job Order # 74019009
25
26 TABLE
12.00WP 1 1 27 Table mountain Peachton 1.24
28 Job Order # 74019010
29
30 FULTON-CALISTOGA 60 KV
8.85WP and LDSP 1 1 31 Fulton Calistoga 11.40
32 Job Order # 74024721
33
34 KASSON-LOUISE
8.00WP, TSP, LDSP 1 1 35 Kasson Louise 1.50
36 Job Order # 74020723
37
38 ALMENDRA JCT-NICOLAUS
10.00WP and LDSP 1 1 39 Almendra Jct Nicolaus 0.20
40 Job Order # 74028140
41
42 PLACER-DEL MAR 60 KV:
5.71WP 1 1 43 Placer Del Mar 0.35
70.67 375.84 22 22
FERC FORM NO. 1 (REV. 12-03) Page 424.1
44 TOTAL

Name of Respondent This Report Is:(1) An Original
(2) A Resubmission
Date of Report(Mo, Da, Yr)
Year/Period of Report
End of
TRANSMISSION LINES ADDED DURING YEAR
PACIFIC GAS AND ELECTRIC COMPANYX
04/13/20212020/Q4
Line
No.
(c)(b)(a) (d) (e)
LINE DESIGNATION
From To
LineLength
inMiles
SUPPORTING STRUCTURE
TypeAverage
Number perMiles
CIRCUITS PER STRUCTURE
Present Ultimate
(f) (g)
1. Report below the information called for concerning Transmission lines added or altered during the year. It is not necessary to report
minor revisions of lines.
2. Provide separate subheadings for overhead and under- ground construction and show each transmission line separately. If actual
costs of competed construction are not readily available for reporting columns (l) to (o), it is permissible to report in these columns the
1 Job Order # 74030084
2
3 SYCAMORE CRK-NOTRE
18.00WP 1 1 4 Sycamore Creek Notre Dame 0.11
5 Job Order # 74032063
6
7 MERCED
7.28LSP 1 1 8 Merced Falls Exchequer 5.90
9 Job Order # 74001076
10
11
12
13
14
15
16
17
18
19
20
21
22
23
24
25
26
27
28
29
30
31
32
33
34
35
36
37
38
39
40
41
42
43
70.67 375.84 22 22
FERC FORM NO. 1 (REV. 12-03) Page 424.2
44 TOTAL

Total
Name of Respondent This Report Is:(1) An Original
(2) A Resubmission
Date of Report(Mo, Da, Yr)
Year/Period of Report
End of
TRANSMISSION LINES ADDED DURING YEAR (Continued)
PACIFIC GAS AND ELECTRIC COMPANYX
04/13/20212020/Q4
Line
No.
(k)(j)(h) (l) (m)
CONDUCTORS
Size Configuration
Voltage
KV
LINE COST
Land and Poles, Towersand Fixtures
Conductors
(n) (p)
Specificationand Spacing (Operating) Land Rights and Devices
(i)
costs. Designate, however, if estimated amounts are reported. Include costs of Clearing Land and Rights-of-Way, and Roads and
Trails, in column (l) with appropriate footnote, and costs of Underground Conduit in column (m).
3. If design voltage differs from operating voltage, indicate such fact by footnote; also where line is other than 60 cycle, 3 phase,
indicate such other characteristic.
Asset
(o)Retire. Costs
1
2
3
4
5
variousCU -AAC3/0 - 397 -1,130,533 -9,016,297 -7,885,764 115 6
7
8
9
10
11
12
13
variousACSS477 10,275,436 13,213,924 2,938,488 230 14
15
16
17
variousACSR397 2,581,323 8,755,312 6,173,989 60 18
19
20
21
variousACSR336.4 3,693,340 6,798,529 3,105,189 115 22
23
24
25
variousACSS477 8,963,996 24,558,922 6,265,851 9,329,075 115 26
27
28
29
variousACSR795 -94,453 13,350,968 13,445,421 60 30
31
32
33
variousAAC715.5 866,071 1,489,121 615,340 7,710 70 34
35
36
37
variousACSR397 821,431 1,656,606 835,175 60 38
39
40
41
variousACC4/0 70,123 141,177 63,906 7,148 60 42
43
40,607,541 71,804,969
FERC FORM NO. 1 (REV. 12-03) Page 425
44 12,952,223 125,364,733

Total
Name of Respondent This Report Is:(1) An Original
(2) A Resubmission
Date of Report(Mo, Da, Yr)
Year/Period of Report
End of
TRANSMISSION LINES ADDED DURING YEAR (Continued)
PACIFIC GAS AND ELECTRIC COMPANYX
04/13/20212020/Q4
Line
No.
(k)(j)(h) (l) (m)
CONDUCTORS
Size Configuration
Voltage
KV
LINE COST
Land and Poles, Towersand Fixtures
Conductors
(n) (p)
Specificationand Spacing (Operating) Land Rights and Devices
(i)
costs. Designate, however, if estimated amounts are reported. Include costs of Clearing Land and Rights-of-Way, and Roads and
Trails, in column (l) with appropriate footnote, and costs of Underground Conduit in column (m).
3. If design voltage differs from operating voltage, indicate such fact by footnote; also where line is other than 60 cycle, 3 phase,
indicate such other characteristic.
Asset
(o)Retire. Costs
1
2
variousKCM397.5 715,514 2,615,900 1,892,005 8,381 60 3
4
5
6
7
variousKCM715.5 12,838 1,157,581 1,144,298 445 60 8
9
10
11
variousAWG4/0 364 3,074 2,673 37 70 12
13
14
variousKCM1113 -387,184 881,284 1,245,520 22,948 115 15
16
17
18
19
variousKCML250 113,289 557,664 428,066 16,309 115 20
21
22
variousKCM715.5 477,089 714,967 237,878 60 23
24
25
26
variousKCM715.5 -38,390 -170,320 -131,930 60 27
28
29
30
variousKCM397.5 8,096,795 47,775,845 39,195,089 483,961 60 31
32
33
34
variousKCM715.5 2,438,426 4,052,964 1,504,066 110,472 60 35
36
37
38
variousAWG4/0 133,408 235,218 74,561 27,249 60 39
40
41
42
variousKCM715.5 951 -65,113 -66,064 115 43
40,607,541 71,804,969
FERC FORM NO. 1 (REV. 12-03) Page 425.1
44 12,952,223 125,364,733

Total
Name of Respondent This Report Is:(1) An Original
(2) A Resubmission
Date of Report(Mo, Da, Yr)
Year/Period of Report
End of
TRANSMISSION LINES ADDED DURING YEAR (Continued)
PACIFIC GAS AND ELECTRIC COMPANYX
04/13/20212020/Q4
Line
No.
(k)(j)(h) (l) (m)
CONDUCTORS
Size Configuration
Voltage
KV
LINE COST
Land and Poles, Towersand Fixtures
Conductors
(n) (p)
Specificationand Spacing (Operating) Land Rights and Devices
(i)
costs. Designate, however, if estimated amounts are reported. Include costs of Clearing Land and Rights-of-Way, and Roads and
Trails, in column (l) with appropriate footnote, and costs of Underground Conduit in column (m).
3. If design voltage differs from operating voltage, indicate such fact by footnote; also where line is other than 60 cycle, 3 phase,
indicate such other characteristic.
Asset
(o)Retire. Costs
1
2
3
variousKCM397.5 169,147 276,033 106,886 115 4
5
6
7
variousACSR4/0-6/6/1 2,828,560 6,381,374 3,552,814 70 8
9
10
11
12
13
14
15
16
17
18
19
20
21
22
23
24
25
26
27
28
29
30
31
32
33
34
35
36
37
38
39
40
41
42
43
40,607,541 71,804,969
FERC FORM NO. 1 (REV. 12-03) Page 425.2
44 12,952,223 125,364,733

Name of Respondent This Report Is:(1) An Original
(2) A Resubmission
Date of Report(Mo, Da, Yr)
Year/Period of Report
End of
SUBSTATIONS
PACIFIC GAS AND ELECTRIC COMPANYX
04/13/20212020/Q4
Line
No.Name and Location of Substation
Primary
(c)(b)(a)
Tertiary
(d)
Character of Substation
(e)
Secondary
VOLTAGE (In MVa)
1. Report below the information called for concerning substations of the respondent as of the end of the year.
2. Substations which serve only one industrial or street railway customer should not be listed below.
3. Substations with capacities of Less than 10 MVa except those serving customers with energy for resale, may be grouped according
to functional character, but the number of such substations must be shown.
4. Indicate in column (b) the functional character of each substation, designating whether transmission or distribution and whether
attended or unattended. At the end of the page, summarize according to function the capacities reported for the individual stations in
column (f).
ARCO SUB, Lost Hills 70.00 230.00 13.20Transmission 1
ATLANTIC SUB, Roseville 60.00 230.00 13.20Transmission 2
ATLANTIC SUB, Roseville 115.00 230.00 13.20Transmission 3
BAIR SUB, Redwood City 60.00 115.00 13.20Transmission 4
BELLOTA SUB, Bellota 115.00 230.00 13.20Transmission 5
BORDEN SUB, Madera 70.00 230.00 13.20Transmission 6
BRIDGEVILLE SUB, Bridgeville 60.00 115.00 13.20Transmission 7
BRIGHTON SUB, Sacramento 115.00 230.00 13.20Transmission 8
BUTTE SUB, Chico 60.00 115.00 13.20Transmission 9
CASCADE SUB, Pine Grove 60.00 115.00 13.20Transmission 10
CHRISTIE SUB, Hercules 60.00 115.00 13.20Transmission 11
COBURN SUB, King City 60.00 230.00 13.20Transmission 12
CONTRA COSTA SUBSTATION, Antioch 60.00 115.00 13.20Transmission 13
CONTRA COSTA SUBSTATION, Antioch 115.00 230.00 13.20Transmission 14
COOLEY LANDING SUB, Palo Alto 60.00 115.00 13.80Transmission 15
CORCORAN SUB, Corcoran 70.00 115.00 13.20Transmission 16
CORTINA SUB, Williams 60.00 115.00 13.20Transmission 17
CORTINA SUB, Williams 115.00 230.00 13.20Transmission 18
COTTONWOOD SUB, Cottonwood 60.00 230.00 13.20Transmission 19
COTTONWOOD SUB, Cottonwood 115.00 230.00 13.20Transmission 20
DEL MONTE SUB, Monterey 60.00 115.00 13.20Transmission 21
DIVIDE SUB, Orcutt 70.00 115.00 13.20Transmission 22
EAGLE ROCK SUB, Geysers 60.00 115.00Transmission 23
EAST NICOLAUS SUB, E. Nicolaus 60.00 115.00Transmission 24
EASTSHORE SUB, Hayward 115.00 230.00Transmission 25
EVERGREEN SUB, San Jose 60.00 115.00 13.20Transmission 26
FULTON SUB, Fulton 60.00 115.00 13.20Transmission 27
FULTON SUB, Fulton 115.00 230.00 13.20Transmission 28
GATES SUB, Huron 70.00 230.00 13.20Transmission 29
GATES SUB, Huron 115.00 230.00 13.20Transmission 30
GATES SUB, Huron 230.00 500.00 13.20Transmission 31
GLENN SUB, Orland 60.00 230.00 13.20Transmission 32
GOLD HILL SUB, Folsom 60.00 115.00 13.20Transmission 33
GOLD HILL SUB, Folsom 115.00 230.00 13.20Transmission 34
GREEN VALLEY SUB, Watsonville 60.00 115.00Transmission 35
HELM SUB, San Joaquin 70.00 230.00 13.20Transmission 36
HENRIETTA SUB, Lamoore 70.00 230.00 13.20Transmission 37
HENRIETTA SUB, Lamoore 115.00 230.00 2.40Transmission 38
HERDLYN SUB, Tracy 60.00 70.00 2.40Transmission 39
HERNDON SUB, Herndon 115.00 230.00 13.20Transmission 40
FERC FORM NO. 1 (ED. 12-96) Page 426

Name of Respondent This Report Is:(1) An Original
(2) A Resubmission
Date of Report(Mo, Da, Yr)
Year/Period of Report
End of
SUBSTATIONS
PACIFIC GAS AND ELECTRIC COMPANYX
04/13/20212020/Q4
Line
No.Name and Location of Substation
Primary
(c)(b)(a)
Tertiary
(d)
Character of Substation
(e)
Secondary
VOLTAGE (In MVa)
1. Report below the information called for concerning substations of the respondent as of the end of the year.
2. Substations which serve only one industrial or street railway customer should not be listed below.
3. Substations with capacities of Less than 10 MVa except those serving customers with energy for resale, may be grouped according
to functional character, but the number of such substations must be shown.
4. Indicate in column (b) the functional character of each substation, designating whether transmission or distribution and whether
attended or unattended. At the end of the page, summarize according to function the capacities reported for the individual stations in
column (f).
HOPLAND SUB, Hopland 60.00 115.00 13.20Transmission 1
HUMBOLDT SUB SUB, Eureka 60.00 115.00 13.20Transmission 2
IGNACIO SUB, Ignacio 60.00 115.00 13.20Transmission 3
IGNACIO SUB, Ignacio 115.00 230.00 13.20Transmission 4
JEFFERSON SUB, Redwood City 60.00 230.00 13.20Transmission 5
KASSON SUB, Tracy 60.00 115.00 13.20Transmission 6
KERN PP SUB, Bakersfield 70.00 115.00 13.20Transmission 7
KERN PP SUB, Bakersfield 115.00 230.00 13.20Transmission 8
KINGSBURG SUB, Kingsburg 70.00 115.00 13.80Transmission 9
LAKEVILLE SUB, Petaluma 60.00 230.00 13.20Transmission 10
LAKEVILLE SUB, Petaluma 115.00 230.00 13.20Transmission 11
LAS POSITAS SUB, Livermore 60.00 230.00 13.20Transmission 12
LOCKEFORD SUB, Lockeford 60.00 230.00 13.20Transmission 13
LOS BANOS SUB, Los Banos 70.00 230.00 13.20Transmission 14
LOS BANOS SUB, Los Banos 230.00 500.00 13.80Transmission 15
LOS ESTEROS SUB, 115.00 230.00 12.00Transmission 16
MANTECA SUB, Manteca 60.00 115.00 13.20Transmission 17
MCCALL SUB, Selma 115.00 230.00 13.20Transmission 18
MENDOCINO SUB, Redwood Valley 60.00 115.00 13.20Transmission 19
MENDOTA SUB, Mendota 70.00 115.00 12.00Transmission 20
MERCED SUB, Merced 70.00 115.00 6.60Transmission 21
MESA SUB, Nipomo 115.00 230.00 13.20Transmission 22
METCALF SUB, San Jose 230.00 500.00 13.80Transmission 23
METCALF SUB, San Jose 115.00 230.00 13.20Transmission 24
MIDWAY SUB, Buttonwillow 115.00 230.00 13.20Transmission 25
MIDWAY SUB, Buttonwillow 230.00 500.00 13.80Transmission 26
MILLBRAE SUB, Millbrae 60.00 115.00 13.80Transmission 27
MONTA VISTA SUB, Cupertino 60.00 115.00 13.20Transmission 28
MONTA VISTA SUB, Cupertino 60.00 230.00Transmission 29
MONTA VISTA SUB, Cupertino 115.00 230.00 13.20Transmission 30
MORAGA SUB, Orinda 115.00 230.00 13.20Transmission 31
MORRO BAY PP SWYD, Morro Bay 115.00 230.00 13.20Transmission 32
MOSS LANDING PP SUB, Moss Landing 115.00 230.00 13.20Transmission 33
MOSS LANDING PP SUB, Moss Landing 230.00 500.00 13.80Transmission 34
NEW KEARNEY SUB, FRESNO 70.00 230.00 13.20Transmission 35
NEWARK SUB, Fremont 60.00 115.00 13.20Transmission 36
NEWARK SUB, Fremont 115.00 230.00 13.20Transmission 37
ORO LOMA SUB, Dos Palos 70.00 115.00 13.20Transmission 38
PALERMO SUB, Palermo 60.00 230.00Transmission 39
PALERMO SUB, Palermo 115.00 230.00 13.20Transmission 40
FERC FORM NO. 1 (ED. 12-96) Page 426.1

Name of Respondent This Report Is:(1) An Original
(2) A Resubmission
Date of Report(Mo, Da, Yr)
Year/Period of Report
End of
SUBSTATIONS
PACIFIC GAS AND ELECTRIC COMPANYX
04/13/20212020/Q4
Line
No.Name and Location of Substation
Primary
(c)(b)(a)
Tertiary
(d)
Character of Substation
(e)
Secondary
VOLTAGE (In MVa)
1. Report below the information called for concerning substations of the respondent as of the end of the year.
2. Substations which serve only one industrial or street railway customer should not be listed below.
3. Substations with capacities of Less than 10 MVa except those serving customers with energy for resale, may be grouped according
to functional character, but the number of such substations must be shown.
4. Indicate in column (b) the functional character of each substation, designating whether transmission or distribution and whether
attended or unattended. At the end of the page, summarize according to function the capacities reported for the individual stations in
column (f).
PANOCHE SUB, Mendota 115.00 230.00 13.20Transmission 1
PEASE SUB, Tierra Buena 60.00 115.00 13.20Transmission 2
PITTSBURG PP SUB, 115.00 230.00 13.20Transmission 3
PLACER SUB, Auburn 60.00 115.00Transmission 4
RAVENSWOOD SUB, Menlo Park 115.00 230.00 13.20Transmission 5
REEDLEY SUB, Reedley 70.00 115.00 13.20Transmission 6
RIO OSO SUB, Rio Oso 115.00 230.00 13.20Transmission 7
ROUND MOUNTAIN SUB, Rd Mtn 230.00 500.00 13.80Transmission 8
SALADO SUB, Patterson 60.00 115.00 13.20Transmission 9
SALINAS SUB, Salinas 60.00 115.00 13.20Transmission 10
SAN FRAN A (POTRERO PP) SUB, San Francisco 115.00 230.00 13.20Transmission 11
SAN FRAN H (MARTIN) SUB, Daly City 60.00 115.00Transmission 12
SAN FRAN H (MARTIN) SUB, Daly City 115.00 230.00Transmission 13
SAN LUIS OBISPO SUB, SLO 70.00 115.00 13.20Transmission 14
SAN MATEO SUB, San Mateo 60.00 115.00Transmission 15
SAN MATEO SUB, San Mateo 115.00 230.00Transmission 16
SAN RAMON SUB, San Ramon 60.00 230.00 13.20Transmission 17
SANGER SUB, Fresno 70.00 115.00 6.60Transmission 18
SCHINDLER SUB, Five Points 70.00 115.00 13.20Transmission 19
SEMITROPIC SUB, Wasco 70.00 115.00 13.80Transmission 20
SOBRANTE SUB, Orinda 115.00 230.00Transmission 21
SOLEDAD SUB, Soledad 60.00 115.00Transmission 22
STAGG SUB, Stockton 60.00 230.00 13.20Transmission 23
TABLE MOUNTAIN SUB, Oroville 115.00 230.00Transmission 24
TABLE MOUNTAIN SUB, Oroville 230.00 500.00 13.80Transmission 25
TAFT SUB, Taft 70.00 115.00 13.20Transmission 26
TEMPLETON SUB, TEMPLETON 70.00 230.00 13.20Transmission 27
TESLA SUB, Tracy 115.00 230.00 13.20Transmission 28
TESLA SUB, Tracy 230.00 500.00 13.20Transmission 29
TRINITY SUB, Weaverville 60.00 115.00 13.20Transmission 30
TULUCAY SUB, Napa 60.00 230.00 13.20Transmission 31
VACA DIXON SUB, Vacaville 60.00 115.00 13.20Transmission 32
VACA DIXON SUB, Vacaville 115.00 230.00 13.20Transmission 33
VACA DIXON SUB, Vacaville 230.00 500.00 13.80Transmission 34
VALLEY SPRINGS SUB, Valley Springs 60.00 230.00 13.20Transmission 35
WEBER SUB, Stockton 60.00 230.00 13.20Transmission 36
WHEELER RIDGE SUB, Bakersfield 70.00 115.00 13.20Transmission 37
WHEELER RIDGE SUB, Bakersfield 70.00 230.00 13.20Transmission 38
WILSON SUB, Merced 115.00 230.00 13.20Transmission 39
7th STANDARD SUB, Bakersfield 21.00 115.00Distribution 40
FERC FORM NO. 1 (ED. 12-96) Page 426.2

Name of Respondent This Report Is:(1) An Original
(2) A Resubmission
Date of Report(Mo, Da, Yr)
Year/Period of Report
End of
SUBSTATIONS
PACIFIC GAS AND ELECTRIC COMPANYX
04/13/20212020/Q4
Line
No.Name and Location of Substation
Primary
(c)(b)(a)
Tertiary
(d)
Character of Substation
(e)
Secondary
VOLTAGE (In MVa)
1. Report below the information called for concerning substations of the respondent as of the end of the year.
2. Substations which serve only one industrial or street railway customer should not be listed below.
3. Substations with capacities of Less than 10 MVa except those serving customers with energy for resale, may be grouped according
to functional character, but the number of such substations must be shown.
4. Indicate in column (b) the functional character of each substation, designating whether transmission or distribution and whether
attended or unattended. At the end of the page, summarize according to function the capacities reported for the individual stations in
column (f).
AIRWAYS SUB, Fresno, Ca. 12.00 115.00 7.20Distribution 1
ALHAMBRA SUB, Martinez 12.00 115.00 7.20Distribution 2
ALLEGHANY SUB, Alleghany 12.00 60.00 7.20Distribution 3
ALMADEN SUB, San Jose 12.00 60.00 7.20Distribution 4
ALPAUGH SUB, Tulare 12.00 115.00Distribution 5
ALTO SUB, Mill Valley 12.00 60.00 2.40Distribution 6
AMES DISTRIBUTION SUB, Mountain View 12.00 115.00 7.20Distribution 7
ANDERSON SUB, Anderson 12.00 60.00 2.40Distribution 8
ANGIOLA SUB, Kings 12.00 70.00 7.20Distribution 9
ANITA SUB, Chico 12.00 60.00 2.40Distribution 10
ANTELOPE SUB, Blackwell Corner 12.00 70.00 2.40Distribution 11
ANTLER SUB, Lakehead 12.00 60.00 2.40Distribution 12
APPLE HILL SUB, Camino 12.00 115.00 7.20Distribution 13
APPLE HILL SUB, Camino 21.00 115.00 7.20Distribution 14
ARBUCKLE SUB, ARBUCKLE 12.00 60.00 7.20Distribution 15
ARCATA SUB, Arcata 12.00 60.00 2.40Distribution 16
ARVIN SUB, Arvin 12.00 70.00 2.40Distribution 17
ASHLAN AVENUE SUB, Fresno 12.00 230.00 7.20Distribution 18
ATASCADERO SUB, Atascadero 12.00 115.00 7.20Distribution 19
ATWATER SUB, Atwater 12.00 115.00 7.20Distribution 20
AUBERRY SUB, Auberry 12.00 70.00 7.20Distribution 21
AVENA SUB, Escalon 12.00 115.00Distribution 22
AVENAL SUB, Avenal 12.00 70.00Distribution 23
BAHIA SUB, Benicia 12.00 230.00 7.20Distribution 24
BAIR SUB, Redwood City 12.00 115.00 7.20Transmission 25
BAKERSFIELD SUB, Bakersfield 21.00 230.00 7.20Distribution 26
BANGOR SUB, Bangor 12.00 60.00 7.20Distribution 27
BARTON SUB, Fresno 12.00 115.00 7.20Distribution 28
BASALT SUB, Napa 12.00 60.00 2.40Distribution 29
BAY MEADOWS SUB, San Mateo 21.00 115.00 7.20Distribution 30
BAY MEADOWS SUB, San Mateo 12.00 115.00 7.20Distribution 31
BAYWOOD SUB, Morro Bay 12.00 70.00 2.40Distribution 32
BEAR VALLEY SUB, Bear Valley 21.00 70.00 7.20Distribution 33
BELL SUB, Auburn 12.00 115.00 7.20Distribution 34
BELLE HAVEN SUB, Menlo Park 12.00 60.00 2.40Distribution 35
BELLE HAVEN SUB, Menlo Park 4.00 60.00 2.40Distribution 36
BELLEVUE SUB, Santa Rosa 12.00 115.00 7.20Distribution 37
BELMONT SUB, Belmont 12.00 115.00 7.20Distribution 38
BERRENDA A SUB, 4.00 70.00 2.40Distribution 39
BIG BASIN SUB, Santa Cruz 12.00 60.00Distribution 40
FERC FORM NO. 1 (ED. 12-96) Page 426.3

Name of Respondent This Report Is:(1) An Original
(2) A Resubmission
Date of Report(Mo, Da, Yr)
Year/Period of Report
End of
SUBSTATIONS
PACIFIC GAS AND ELECTRIC COMPANYX
04/13/20212020/Q4
Line
No.Name and Location of Substation
Primary
(c)(b)(a)
Tertiary
(d)
Character of Substation
(e)
Secondary
VOLTAGE (In MVa)
1. Report below the information called for concerning substations of the respondent as of the end of the year.
2. Substations which serve only one industrial or street railway customer should not be listed below.
3. Substations with capacities of Less than 10 MVa except those serving customers with energy for resale, may be grouped according
to functional character, but the number of such substations must be shown.
4. Indicate in column (b) the functional character of each substation, designating whether transmission or distribution and whether
attended or unattended. At the end of the page, summarize according to function the capacities reported for the individual stations in
column (f).
BIG MEADOWS SUB, Greenville 44.00 60.00 2.40Distribution 1
BIOLA SUB, Biola 12.00 70.00 2.40Distribution 2
BLACKWELL SUB, Blackwell Corner 12.00 70.00 2.40Distribution 3
BLUE LAKE SUB, Blue Lake 12.00 60.00 2.40Distribution 4
BOGUE SUB, Yuba City 12.00 115.00 7.20Distribution 5
BOLINAS SUB, Boninas 12.00 60.00 7.20Distribution 6
BONITA SUB, Madera 12.00 70.00 7.20Distribution 7
BORDEN SUB, Madera 12.00 230.00 7.20Transmission 8
BOWLES SUB, Bowles 12.00 70.00 7.20Distribution 9
BRENTWOOD SUB, Brentwood 21.00 230.00 7.20Distribution 10
BRITTON SUB, Sunnyvale 12.00 115.00Distribution 11
BRUNSWICK SUB, Grass Valley 12.00 115.00 7.20Distribution 12
BUELLTON SUB, Buellton /93427 12.00 115.00 7.20Distribution 13
BUENA VISTA SUB, Salinas 12.00 60.00 7.20Distribution 14
BULLARD SUB, Fresno 12.00 115.00 7.20Distribution 15
BULLARD SUB, Fresno 21.00 115.00 7.20Distribution 16
BURLINGAME SUB, Burlingame 21.00 115.00 7.20Distribution 17
BUTTE SUB, Chico 12.00 115.00 7.20Transmission 18
CABRILLO SUB, LOMPOC 12.00 115.00 7.20Distribution 19
CADET SUB, Maricopa 12.00 70.00Distribution 20
CAL WATER SUB, 12.00 115.00 7.20Distribution 21
CALAVERAS CEMENT SUB, San Andreas 12.00 60.00 7.20Distribution 22
CALFLAX SUB, Huron 12.00 70.00 2.40Distribution 23
CALIFORNIA AVE SUB, Fresno 12.00 115.00 7.20Distribution 24
CALISTOGA SUB, Calistoga 12.00 60.00 7.20Distribution 25
CALPELLA SUB, Calpella 12.00 115.00 7.20Distribution 26
CAMDEN SUB, Riverdale 12.00 70.00 2.40Distribution 27
CAMP EVERS SUB, Santa Cruz 21.00 115.00 7.20Distribution 28
CAMPHORA SUB, Monterey 12.00 60.00 7.20Distribution 29
CAMPHORA SUB, Monterey 4.00 60.00Distribution 30
CANAL SUB, Los Banos 12.00 70.00 7.20Distribution 31
CANTUA SUB, Cantua Creek 12.00 115.00Distribution 32
CAPAY SUB, Orland 12.00 60.00 2.40Distribution 33
CARBONA SUB, Tracy 12.00 60.00 7.20Distribution 34
CARNATION SUB, Bakersfield 21.00 70.00 7.20Distribution 35
CARNERAS SUB, Blackwells Corner 12.00 70.00 7.20Distribution 36
CAROLANDS SUB, Hillsborough 4.00 60.00Distribution 37
CARQUINEZ SUB, Vallejo 12.00 115.00 2.40Distribution 38
CARUTHERS SUB, Fresno 12.00 70.00 2.40Distribution 39
CASSIDY SUB, Madera 12.00 70.00 2.40Distribution 40
FERC FORM NO. 1 (ED. 12-96) Page 426.4

Name of Respondent This Report Is:(1) An Original
(2) A Resubmission
Date of Report(Mo, Da, Yr)
Year/Period of Report
End of
SUBSTATIONS
PACIFIC GAS AND ELECTRIC COMPANYX
04/13/20212020/Q4
Line
No.Name and Location of Substation
Primary
(c)(b)(a)
Tertiary
(d)
Character of Substation
(e)
Secondary
VOLTAGE (In MVa)
1. Report below the information called for concerning substations of the respondent as of the end of the year.
2. Substations which serve only one industrial or street railway customer should not be listed below.
3. Substations with capacities of Less than 10 MVa except those serving customers with energy for resale, may be grouped according
to functional character, but the number of such substations must be shown.
4. Indicate in column (b) the functional character of each substation, designating whether transmission or distribution and whether
attended or unattended. At the end of the page, summarize according to function the capacities reported for the individual stations in
column (f).
CASTRO VALLEY SUB, Castro Valley 12.00 230.00Distribution 1
CASTROVILLE SUB, Castroville 21.00 115.00 7.20Distribution 2
CATLETT SUB, Pleasant Grove 12.00 60.00Distribution 3
CAWELO B SUB, Famosa 4.00 70.00Distribution 4
CAYETANO SUB, Danville 21.00 230.00 7.20Distribution 5
CAYUCOS SUB, Cayucos 12.00 70.00 7.20Distribution 6
CHANNEL SUB, Stockton 12.00 60.00Distribution 7
CHARCA SUB, Wasco 12.00 115.00 7.20Distribution 8
CHEROKEE SUB, Stockton 12.00 60.00 7.20Distribution 9
CHICO A SUB, Chico 12.00 60.00 7.20Distribution 10
CHICO B SUB, Chico 12.00 115.00 7.20Distribution 11
CHOLAME SUB, Cholame/93431 12.00 70.00 2.40Distribution 12
CHOLAME SUB, Cholame/93431 21.00 70.00 2.40Distribution 13
CHOWCHILLA SUB, Chowchilla 12.00 115.00 7.20Distribution 14
CLARK ROAD SUB, Paradise 12.00 60.00 2.40Distribution 15
CLARKSVILLE SUB, Clarksville 21.00 115.00 7.20Distribution 16
CLAY SUB, Ione 12.00 60.00 2.40Distribution 17
CLAYTON SUB, Concord 21.00 115.00 7.20Distribution 18
CLAYTON SUB, Concord 12.00 115.00 7.20Distribution 19
CLEAR LAKE SUB, Finley 12.00 60.00 2.40Distribution 20
CLOVERDALE SUB, Cloverdale 12.00 115.00 7.20Distribution 21
CLOVIS SUB, Clovis 12.00 115.00 7.20Distribution 22
CLOVIS SUB, Clovis 21.00 115.00 7.20Distribution 23
COALINGA #1 SUB, Coalinga 12.00 70.00 7.20Distribution 24
COALINGA #2 SUB, Coalinga 12.00 70.00 2.40Distribution 25
COARSEGOLD SUB, Coursegold 21.00 115.00 7.20Distribution 26
COLUMBUS SUB, Bakersfield 12.00 115.00 7.20Distribution 27
COLUSA JUNCT SUB, Colusa 12.00 60.00 7.20Distribution 28
COLUSA SUB, Colusa 12.00 60.00Distribution 29
CONTRA COSTA SUBSTATION, Antioch 21.00 230.00 7.20Transmission 30
CONTRA COSTA SUBSTATION, Antioch 21.00 115.00 6.60Transmission 31
COPPERMINE SUB, Clovis 12.00 70.00 2.40Distribution 32
COPUS SUB, Bakersfield 12.00 70.00Distribution 33
CORCORAN SUB, Corcoran 12.00 115.00 7.20Transmission 34
CORDELIA SUB, Cordelia 12.00 115.00 7.20Distribution 35
CORDELIA SUB, Cordelia 12.00 60.00 2.40Distribution 36
CORNING SUB, Corning 12.00 60.00 2.40Distribution 37
CORONA SUB, 12.00 115.00 7.20Distribution 38
CORRAL SUB, Bellota 12.00 60.00 7.20Distribution 39
CORTINA SUB, Williams 12.00 115.00 7.20Transmission 40
FERC FORM NO. 1 (ED. 12-96) Page 426.5

Name of Respondent This Report Is:(1) An Original
(2) A Resubmission
Date of Report(Mo, Da, Yr)
Year/Period of Report
End of
SUBSTATIONS
PACIFIC GAS AND ELECTRIC COMPANYX
04/13/20212020/Q4
Line
No.Name and Location of Substation
Primary
(c)(b)(a)
Tertiary
(d)
Character of Substation
(e)
Secondary
VOLTAGE (In MVa)
1. Report below the information called for concerning substations of the respondent as of the end of the year.
2. Substations which serve only one industrial or street railway customer should not be listed below.
3. Substations with capacities of Less than 10 MVa except those serving customers with energy for resale, may be grouped according
to functional character, but the number of such substations must be shown.
4. Indicate in column (b) the functional character of each substation, designating whether transmission or distribution and whether
attended or unattended. At the end of the page, summarize according to function the capacities reported for the individual stations in
column (f).
COTATI SUB, Cotati 12.00 60.00Distribution 1
COTTLE SUB, Oakdale 17.00 230.00Distribution 2
COTTONWOOD SUB, Cottonwood 12.00 115.00 7.20Transmission 3
COUNTRY CLUB SUB, Stockton 12.00 60.00Distribution 4
COUNTRY CLUB SUB, Stockton 4.00 60.00Distribution 5
CRESSEY SUB, Merced 21.00 115.00Distribution 6
CURTIS SUB, Sonora 18.00 115.00Distribution 7
CUYAMA SUB, Cuyama 12.00 70.00Distribution 8
CUYAMA SUB, Cuyama 21.00 70.00 7.20Distribution 9
CYMRIC SUB, McKitrick 12.00 115.00 7.20Distribution 10
DAIRYLAND SUB, Chowchilla 12.00 115.00 7.20Distribution 11
DALY CITY SUB, Daly City 12.00 115.00 7.20Distribution 12
DAVIS SUB, Davis 12.00 115.00 7.20Distribution 13
DEEPWATER SUB, W. Sactramento 12.00 115.00 7.20Distribution 14
DEL MAR SUB, Rocklin 21.00 60.00 7.20Distribution 15
DEL MAR SUB, Rocklin 12.00 60.00 7.20Distribution 16
DEL MONTE SUB, Monterey 21.00 115.00 7.20Transmission 17
DERRICK SUB, Kettleman 12.00 70.00 2.40Distribution 18
DESCHUTES SUB, Palo Cedro 12.00 60.00 7.20Distribution 19
DIAMOND SPRINGS SUB, Placerville 12.00 115.00 7.20Distribution 20
DINUBA SUB, Dinuba 12.00 70.00 7.20Distribution 21
DIVIDE SUB, Orcutt 12.00 70.00 2.40Transmission 22
DIVIDE SUB, Orcutt 12.00 115.00 7.20Transmission 23
DIXON LANDING SUB, 21.00 115.00 7.20Distribution 24
DIXON SUB, Dixon 12.00 60.00Distribution 25
DOLAN ROAD SUB, Moss Landing 12.00 115.00Distribution 26
DOS PALOS SUB, Dos Palos 12.00 70.00 7.20Distribution 27
DUMBARTON SUB, Fremont 12.00 115.00Distribution 28
DUNBAR SUB, Glen Ellen 12.00 60.00Distribution 29
EAST GRAND SUB, So San Fran. 12.00 115.00 7.20Distribution 30
EAST MARYSVILLE SUB, Marysville, 12.00 115.00 7.20Distribution 31
EAST NICOLAUS SUB, E. Nicolaus 12.00 115.00Transmission 32
EAST STOCKTON SUB, Stockton 12.00 60.00 7.20Distribution 33
EAST STOCKTON SUB, Stockton 4.00 60.00Distribution 34
EDENVALE SUB, San Jose 21.00 115.00 7.20Distribution 35
EDENVALE SUB, San Jose 12.00 115.00 7.20Distribution 36
EDES SUB, Oakland 12.00 115.00 7.20Distribution 37
EEL RIVER SUB, Ferndale 12.00 60.00 7.20Distribution 38
EIGHT MILE SUB, Stockton 21.00 230.00 7.20Distribution 39
EL CAPITAN SUB, Snelling 12.00 115.00Distribution 40
FERC FORM NO. 1 (ED. 12-96) Page 426.6

Name of Respondent This Report Is:(1) An Original
(2) A Resubmission
Date of Report(Mo, Da, Yr)
Year/Period of Report
End of
SUBSTATIONS
PACIFIC GAS AND ELECTRIC COMPANYX
04/13/20212020/Q4
Line
No.Name and Location of Substation
Primary
(c)(b)(a)
Tertiary
(d)
Character of Substation
(e)
Secondary
VOLTAGE (In MVa)
1. Report below the information called for concerning substations of the respondent as of the end of the year.
2. Substations which serve only one industrial or street railway customer should not be listed below.
3. Substations with capacities of Less than 10 MVa except those serving customers with energy for resale, may be grouped according
to functional character, but the number of such substations must be shown.
4. Indicate in column (b) the functional character of each substation, designating whether transmission or distribution and whether
attended or unattended. At the end of the page, summarize according to function the capacities reported for the individual stations in
column (f).
EL CAPITAN SUB, Snelling 21.00 115.00Distribution 1
EL CERRITO G SUB, El Cerrito 12.00 115.00Distribution 2
EL NIDO SUB, Merced 12.00 115.00 7.20Distribution 3
EL PATIO SUB, Campbell 12.00 115.00 7.20Distribution 4
EL PECO SUB, Madera 12.00 70.00Distribution 5
ELECTRA SUB, 12.00 60.00Distribution 6
ELK HILLS SUB, Valley Acres 12.00 70.00Distribution 7
ELK SUB, Elk 12.00 60.00 2.40Distribution 8
EUREKA A SUB, Eureka 12.00 60.00 7.20Distribution 9
EUREKA E SUB, Eureka 12.00 60.00Distribution 10
EVERGREEN SUB, San Jose 21.00 115.00 7.20Transmission 11
FAIRHAVEN SUB, Fairhaven 12.00 60.00 7.20Distribution 12
FAIRVIEW SUB, Martinez 21.00 115.00 12.00Distribution 13
FAIRWAY SUB, Santa Maria 12.00 115.00 7.20Distribution 14
FAMOSO SUB, Famosa 12.00 115.00Distribution 15
FELLOWS SUB, Fellows 21.00 115.00Distribution 16
FIGARDEN SUB, Fresno 21.00 230.00 7.20Distribution 17
FIREBAUGH SUB, Firebaugh 12.00 70.00 7.20Distribution 18
FITCH MOUNTAIN SUB, Healdsburg 12.00 60.00 7.20Distribution 19
FLINT SUB, Auburn 12.00 115.00 7.20Distribution 20
FMC SUB, San Jose 12.00 115.00 7.20Distribution 21
FOOTHILL SUB, SLO 12.00 115.00 2.40Distribution 22
FORESTHILL SUB, Foresthill, 12.00 60.00 7.20Distribution 23
FORT BRAGG A SUB, Fort Bragg 12.00 60.00Distribution 24
FORT ORD SUB, Fort Ord 21.00 60.00 7.20Distribution 25
FORT ORD SUB, Fort Ord 12.00 60.00 2.40Distribution 26
FRANKLIN SUB, Hercules 12.00 60.00 7.20Distribution 27
FREMONT SUB, Fremont 12.00 115.00 7.20Distribution 28
FRENCH CAMP SUB, Stockton 12.00 60.00Distribution 29
FROGTOWN SUB, Angels Camp 17.00 115.00Distribution 30
FRUITVALE SUB, Bakersfield 12.00 70.00 2.40Distribution 31
FULTON SUB, Fulton 12.00 230.00 7.20Transmission 32
GABILAN SUB, Salinas 12.00 115.00 7.20Distribution 33
GALLO SUB, Livingston 12.00 115.00Distribution 34
GANSNER SUB, Quincy 12.00 60.00 7.20Distribution 35
GANSO SUB, Buttonwillow 12.00 115.00 7.20Distribution 36
GARBERVILLE SUB, Garberville 12.00 60.00 7.20Distribution 37
GATES SUB, Huron 12.00 230.00 7.20Transmission 38
GATES SUB, Huron 12.00 115.00Transmission 39
GEYSERVILLE SUB, Geyserville 12.00 60.00 2.40Distribution 40
FERC FORM NO. 1 (ED. 12-96) Page 426.7

Name of Respondent This Report Is:(1) An Original
(2) A Resubmission
Date of Report(Mo, Da, Yr)
Year/Period of Report
End of
SUBSTATIONS
PACIFIC GAS AND ELECTRIC COMPANYX
04/13/20212020/Q4
Line
No.Name and Location of Substation
Primary
(c)(b)(a)
Tertiary
(d)
Character of Substation
(e)
Secondary
VOLTAGE (In MVa)
1. Report below the information called for concerning substations of the respondent as of the end of the year.
2. Substations which serve only one industrial or street railway customer should not be listed below.
3. Substations with capacities of Less than 10 MVa except those serving customers with energy for resale, may be grouped according
to functional character, but the number of such substations must be shown.
4. Indicate in column (b) the functional character of each substation, designating whether transmission or distribution and whether
attended or unattended. At the end of the page, summarize according to function the capacities reported for the individual stations in
column (f).
GIFFEN SUB, San Joaquin 12.00 70.00 2.40Distribution 1
GIRVAN SUB, Redding 12.00 60.00 7.20Distribution 2
GLENN SUB, Orland 12.00 60.00Transmission 3
GLENWOOD SUB, Menlo Park 12.00 60.00 7.20Distribution 4
GLENWOOD SUB, Menlo Park 4.00 60.00Distribution 5
GOLDTREE SUB, SLO 12.00 115.00 7.20Distribution 6
GONZALES SUB, Gonzales 12.00 60.00Distribution 7
GOOSE LAKE SUB, Wasco 12.00 115.00 7.20Distribution 8
GRAND ISLAND SUB, Ryde 21.00 115.00 7.20Distribution 9
GRANT SUB, San Lorenzo 12.00 115.00 7.20Distribution 10
GRASS VALLEY SUB, Grass Valley 12.00 60.00Distribution 11
GREEN VALLEY SUB, Watsonville 21.00 115.00 7.20Transmission 12
GREENBRAE SUB, Larkspur 12.00 60.00 7.20Distribution 13
GUALALA SUB, Gualala 12.00 60.00 2.40Distribution 14
GUERNSEY SUB, Hanford 12.00 70.00Distribution 15
GUSTINE SUB, Gustine 12.00 60.00 7.20Distribution 16
HALF MOON BAY SUB, Half Moon Bay 12.00 60.00 2.40Distribution 17
HAMMER SUB, Stockton 12.00 60.00 7.20Distribution 18
HAMMONDS SUB, Fresno 12.00 115.00Distribution 19
HARDING SUB, Stockton 4.00 60.00Distribution 20
HARDWICK SUB, Layton 12.00 70.00 7.20Distribution 21
HARRIS SUB, Eureka 12.00 60.00 7.20Distribution 22
HARTER SUB, Yuba City 12.00 60.00 7.20Distribution 23
HARTLEY SUB, Lakeport 12.00 60.00 7.20Distribution 24
HATTON SUB, Carmel Valley 12.00 60.00 2.40Distribution 25
HENRIETTA SUB, Lemoore 12.00 70.00 2.40Transmission 26
HERDLYN SUB, Tracy 12.00 60.00 2.40Transmission 27
HICKS SUB, San Jose 21.00 230.00 7.20Distribution 28
HICKS SUB, San Jose 12.00 230.00 7.20Distribution 29
HIGGINS SUB, Higgins Corner 12.00 115.00 7.20Distribution 30
HIGHLANDS SUB, Clear Lake 12.00 115.00 7.20Distribution 31
HIGHWAY SUB, Petaluma 12.00 115.00 7.20Distribution 32
HOLLISTER SUB, Hollister 21.00 115.00 7.20Distribution 33
HOLLISTER SUB, Hollister 21.00 60.00Distribution 34
HONCUT SUB, Honcut 12.00 115.00 7.20Distribution 35
HOPLAND SUB, Hopland 12.00 60.00 2.40Transmission 36
HORSESHOE SUB, Granite Bay 12.00 115.00 7.20Distribution 37
HOWLAND ROAD SUB, Manteca 12.00 115.00 7.20Distribution 38
HUMBOLDT BAY PP SUB, Eureka 13.80 60.00Distribution 39
HUMBOLDT BAY PP SUB, Eureka 13.80 115.00Distribution 40
FERC FORM NO. 1 (ED. 12-96) Page 426.8
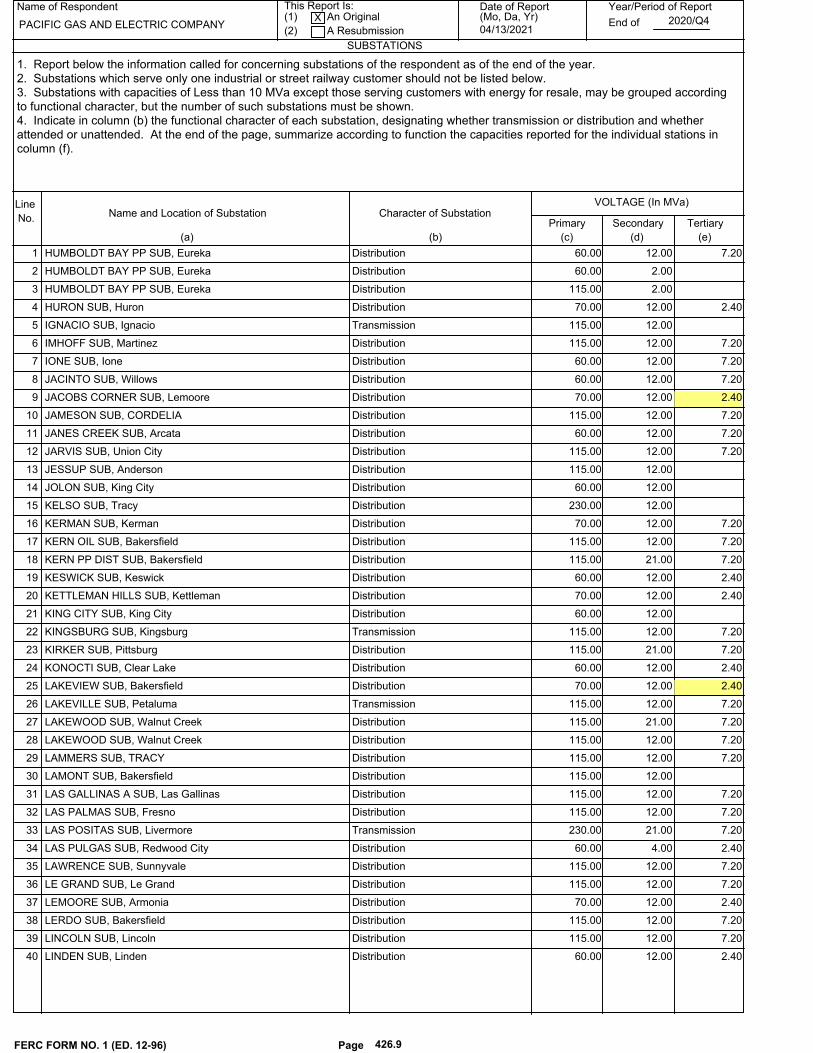
Name of Respondent This Report Is:(1) An Original
(2) A Resubmission
Date of Report(Mo, Da, Yr)
Year/Period of Report
End of
SUBSTATIONS
PACIFIC GAS AND ELECTRIC COMPANYX
04/13/20212020/Q4
Line
No.Name and Location of Substation
Primary
(c)(b)(a)
Tertiary
(d)
Character of Substation
(e)
Secondary
VOLTAGE (In MVa)
1. Report below the information called for concerning substations of the respondent as of the end of the year.
2. Substations which serve only one industrial or street railway customer should not be listed below.
3. Substations with capacities of Less than 10 MVa except those serving customers with energy for resale, may be grouped according
to functional character, but the number of such substations must be shown.
4. Indicate in column (b) the functional character of each substation, designating whether transmission or distribution and whether
attended or unattended. At the end of the page, summarize according to function the capacities reported for the individual stations in
column (f).
HUMBOLDT BAY PP SUB, Eureka 12.00 60.00 7.20Distribution 1
HUMBOLDT BAY PP SUB, Eureka 2.00 60.00Distribution 2
HUMBOLDT BAY PP SUB, Eureka 2.00 115.00Distribution 3
HURON SUB, Huron 12.00 70.00 2.40Distribution 4
IGNACIO SUB, Ignacio 12.00 115.00Transmission 5
IMHOFF SUB, Martinez 12.00 115.00 7.20Distribution 6
IONE SUB, Ione 12.00 60.00 7.20Distribution 7
JACINTO SUB, Willows 12.00 60.00 7.20Distribution 8
JACOBS CORNER SUB, Lemoore 12.00 70.00 2.40Distribution 9
JAMESON SUB, CORDELIA 12.00 115.00 7.20Distribution 10
JANES CREEK SUB, Arcata 12.00 60.00 7.20Distribution 11
JARVIS SUB, Union City 12.00 115.00 7.20Distribution 12
JESSUP SUB, Anderson 12.00 115.00Distribution 13
JOLON SUB, King City 12.00 60.00Distribution 14
KELSO SUB, Tracy 12.00 230.00Distribution 15
KERMAN SUB, Kerman 12.00 70.00 7.20Distribution 16
KERN OIL SUB, Bakersfield 12.00 115.00 7.20Distribution 17
KERN PP DIST SUB, Bakersfield 21.00 115.00 7.20Distribution 18
KESWICK SUB, Keswick 12.00 60.00 2.40Distribution 19
KETTLEMAN HILLS SUB, Kettleman 12.00 70.00 2.40Distribution 20
KING CITY SUB, King City 12.00 60.00Distribution 21
KINGSBURG SUB, Kingsburg 12.00 115.00 7.20Transmission 22
KIRKER SUB, Pittsburg 21.00 115.00 7.20Distribution 23
KONOCTI SUB, Clear Lake 12.00 60.00 2.40Distribution 24
LAKEVIEW SUB, Bakersfield 12.00 70.00 2.40Distribution 25
LAKEVILLE SUB, Petaluma 12.00 115.00 7.20Transmission 26
LAKEWOOD SUB, Walnut Creek 21.00 115.00 7.20Distribution 27
LAKEWOOD SUB, Walnut Creek 12.00 115.00 7.20Distribution 28
LAMMERS SUB, TRACY 12.00 115.00 7.20Distribution 29
LAMONT SUB, Bakersfield 12.00 115.00Distribution 30
LAS GALLINAS A SUB, Las Gallinas 12.00 115.00 7.20Distribution 31
LAS PALMAS SUB, Fresno 12.00 115.00 7.20Distribution 32
LAS POSITAS SUB, Livermore 21.00 230.00 7.20Transmission 33
LAS PULGAS SUB, Redwood City 4.00 60.00 2.40Distribution 34
LAWRENCE SUB, Sunnyvale 12.00 115.00 7.20Distribution 35
LE GRAND SUB, Le Grand 12.00 115.00 7.20Distribution 36
LEMOORE SUB, Armonia 12.00 70.00 2.40Distribution 37
LERDO SUB, Bakersfield 12.00 115.00 7.20Distribution 38
LINCOLN SUB, Lincoln 12.00 115.00 7.20Distribution 39
LINDEN SUB, Linden 12.00 60.00 2.40Distribution 40
FERC FORM NO. 1 (ED. 12-96) Page 426.9

Name of Respondent This Report Is:(1) An Original
(2) A Resubmission
Date of Report(Mo, Da, Yr)
Year/Period of Report
End of
SUBSTATIONS
PACIFIC GAS AND ELECTRIC COMPANYX
04/13/20212020/Q4
Line
No.Name and Location of Substation
Primary
(c)(b)(a)
Tertiary
(d)
Character of Substation
(e)
Secondary
VOLTAGE (In MVa)
1. Report below the information called for concerning substations of the respondent as of the end of the year.
2. Substations which serve only one industrial or street railway customer should not be listed below.
3. Substations with capacities of Less than 10 MVa except those serving customers with energy for resale, may be grouped according
to functional character, but the number of such substations must be shown.
4. Indicate in column (b) the functional character of each substation, designating whether transmission or distribution and whether
attended or unattended. At the end of the page, summarize according to function the capacities reported for the individual stations in
column (f).
LIVE OAK SUB, Live Oak 12.00 60.00Distribution 1
LIVERMORE SUB, Livermore 12.00 60.00 2.40Distribution 2
LIVINGSTON SUB, Livingston 12.00 115.00 7.20Distribution 3
LIVINGSTON SUB, Livingston 12.00 70.00Distribution 4
LLAGAS SUB, Gilroy 21.00 115.00 12.00Distribution 5
LOCKEFORD SUB, Lockeford 21.00 115.00 7.20Transmission 6
LOCKHEED #1 SUB, Sunnyvale 12.00 115.00 7.20Distribution 7
LOCKHEED #2 SUB, Sunnyvale 12.00 115.00Distribution 8
LODI SUB, Lodi 12.00 60.00 2.40Distribution 9
LODI SUB, Lodi 4.00 60.00Distribution 10
LOGAN CREEK SUB, Willows 21.00 230.00Distribution 11
LONETREE SUB, Antioch 21.00 230.00 7.20Distribution 12
LOS ALTOS SUB, Los Altos 12.00 60.00Distribution 13
LOS COCHES SUB, Greenfield 12.00 60.00Distribution 14
LOS GATOS SUB, Los Gatos 12.00 60.00 7.20Distribution 15
LOS MOLINOS SUB, Los Molinos 12.00 60.00 7.20Distribution 16
LOS OSITOS SUB, Monterey 21.00 60.00 7.20Distribution 17
LOYOLA SUB, Loyola 12.00 60.00 7.20Distribution 18
LOYOLA SUB, Loyola 4.00 60.00 2.40Distribution 19
LUCERNE SUB, Lucerne 12.00 115.00 7.20Distribution 20
MABURY SUB, San Jose 12.00 60.00 2.40Distribution 21
MABURY SUB, San Jose 12.00 60.00 7.20Distribution 22
MADERA SUB, Madera 12.00 70.00Distribution 23
MADISON SUB, Madison 12.00 60.00 7.20Distribution 24
MADISON SUB, Madison 12.00 115.00Distribution 25
MAGUNDEN SUB, Bakersfield 12.00 115.00 7.20Distribution 26
MAGUNDEN SUB, Bakersfield 21.00 115.00 7.20Distribution 27
MALAGA SUB, Fresno 12.00 115.00 7.20Distribution 28
MANCHESTER SUB, Fresno 12.00 115.00 7.20Distribution 29
MANTECA SUB, Manteca 17.00 115.00Transmission 30
MARICOPA SUB, Maricopa 12.00 70.00 2.40Distribution 31
MARIPOSA SUB, Mariposa 21.00 70.00Distribution 32
MARTELL SUB, Martell 12.00 60.00 2.40Distribution 33
MARYSVILLE SUB, Marysville 12.00 60.00Distribution 34
MAXWELL SUB, Maxwell 12.00 60.00Distribution 35
MCARTHUR SUB, McArthur 12.00 60.00 2.40Distribution 36
MCCALL SUB, Selma 12.00 115.00 7.20Transmission 37
MCDONALD-MCDONALDISLAND SUB, Stockton 4.00 60.00 2.40Distribution 38
MCFARLAND SUB, McFarland 12.00 70.00 7.20Distribution 39
MCKEE SUB, San Jose 12.00 115.00 7.20Distribution 40
FERC FORM NO. 1 (ED. 12-96) Page 426.10

Name of Respondent This Report Is:(1) An Original
(2) A Resubmission
Date of Report(Mo, Da, Yr)
Year/Period of Report
End of
SUBSTATIONS
PACIFIC GAS AND ELECTRIC COMPANYX
04/13/20212020/Q4
Line
No.Name and Location of Substation
Primary
(c)(b)(a)
Tertiary
(d)
Character of Substation
(e)
Secondary
VOLTAGE (In MVa)
1. Report below the information called for concerning substations of the respondent as of the end of the year.
2. Substations which serve only one industrial or street railway customer should not be listed below.
3. Substations with capacities of Less than 10 MVa except those serving customers with energy for resale, may be grouped according
to functional character, but the number of such substations must be shown.
4. Indicate in column (b) the functional character of each substation, designating whether transmission or distribution and whether
attended or unattended. At the end of the page, summarize according to function the capacities reported for the individual stations in
column (f).
MCKITTRICK SUB, MCKITTRICK 12.00 70.00Distribution 1
MCMULLIN SUB, Fresno 12.00 230.00 7.20Distribution 2
MEADOW LANE SUB, Concord 21.00 115.00 7.20Distribution 3
MENDOCINO SUB, Redwood Valley 12.00 60.00 2.40Transmission 4
MENDOTA SUB, Mendota 12.00 115.00 7.20Transmission 5
MENLO SUB, Menlo Park 12.00 60.00 7.20Distribution 6
MENLO SUB, Menlo Park 4.00 60.00Distribution 7
MERCED SUB, Merced 12.00 115.00 7.20Transmission 8
MERCED SUB, Merced 21.00 115.00 7.20Transmission 9
MERIDIAN SUB, Meridian 12.00 60.00Distribution 10
MESA SUB, Nipomo 12.00 230.00Transmission 11
METTLER SUB, Stockton 12.00 60.00Distribution 12
MIDDLETOWN SUB, Middletown 12.00 60.00 7.20Distribution 13
MIDWAY SUB, Buttonwillow 12.00 115.00 7.20Transmission 14
MILLBRAE SUB, Millbrae 12.00 115.00Transmission 15
MILLBRAE SUB, Millbrae 4.00 60.00Transmission 16
MILPITAS SUB, Milpitas 21.00 115.00 7.20Distribution 17
MILPITAS SUB, Milpitas 12.00 115.00 7.20Distribution 18
MIRABEL SUB, Forestville 12.00 60.00Distribution 19
MI-WUK SUB, Sugarpine 17.00 115.00Distribution 20
MOLINO SUB, Sebastopol 12.00 60.00 7.20Distribution 21
MONROE SUB, Santa Rosa 21.00 115.00 7.20Distribution 22
MONROE SUB, Santa Rosa 12.00 115.00 7.20Distribution 23
MONTAGUE SUB, San Jose 21.00 115.00 7.20Distribution 24
MONTE RIO SUB, Monte Rio 12.00 60.00 7.20Distribution 25
MONTEREY SUB, Monterey 4.00 60.00Distribution 26
MORAGA SUB, Orinda 12.00 115.00Transmission 27
MORGAN HILL SUB, Morgan Hill 21.00 115.00 7.20Distribution 28
MORMON SUB, Stockton 12.00 60.00 7.20Distribution 29
MORRO BAY PP SWYD, Morro Bay 12.00 115.00 7.20Transmission 30
MOSHER SUB, Stockton 21.00 60.00 7.20Distribution 31
MOUNTAIN VIEW SUB, Mt. View 12.00 115.00 7.20Distribution 32
MT. EDEN SUB, Hayward 12.00 115.00 7.20Distribution 33
MT. QUARRIES SUB, Cool 12.00 60.00 7.20Distribution 34
NAPA SUB, Napa 12.00 60.00Distribution 35
NARROWS SUB, 21.00 60.00 7.20Distribution 36
NEWARK DIST SUB, Fremont 21.00 230.00 7.20Distribution 37
NEWARK SUB, Fremont 12.00 115.00 7.20Transmission 38
NEWBURG SUB, Fortuna 12.00 60.00 2.40Distribution 39
NEWHALL SUB, Firebaugh 12.00 115.00 7.20Distribution 40
FERC FORM NO. 1 (ED. 12-96) Page 426.11

Name of Respondent This Report Is:(1) An Original
(2) A Resubmission
Date of Report(Mo, Da, Yr)
Year/Period of Report
End of
SUBSTATIONS
PACIFIC GAS AND ELECTRIC COMPANYX
04/13/20212020/Q4
Line
No.Name and Location of Substation
Primary
(c)(b)(a)
Tertiary
(d)
Character of Substation
(e)
Secondary
VOLTAGE (In MVa)
1. Report below the information called for concerning substations of the respondent as of the end of the year.
2. Substations which serve only one industrial or street railway customer should not be listed below.
3. Substations with capacities of Less than 10 MVa except those serving customers with energy for resale, may be grouped according
to functional character, but the number of such substations must be shown.
4. Indicate in column (b) the functional character of each substation, designating whether transmission or distribution and whether
attended or unattended. At the end of the page, summarize according to function the capacities reported for the individual stations in
column (f).
NEWMAN SUB, Newman 12.00 60.00 7.20Distribution 1
NORCO SUB, Bakersfield 12.00 115.00 7.20Distribution 2
NORD SUB, Chico 12.00 115.00 7.20Distribution 3
NORTECH SUB, San Jose 21.00 115.00 7.20Distribution 4
NORTH DUBLIN SUB, Pleasanton 21.00 230.00 12.00Distribution 5
NORTH TOWER SUB, Vallejo 12.00 115.00 7.20Distribution 6
NOTRE DAME SUB, Chico 12.00 115.00 7.20Distribution 7
NOVATO SUB, Novato 12.00 60.00 7.20Distribution 8
OAKHURST SUB, Oakhurst 12.00 115.00 2.40Distribution 9
OAKLAND C (OAKLAND PP) SUB, Oakland 12.00 115.00 7.20Distribution 10
OAKLAND D SUB, Oakland 12.00 115.00 7.20Distribution 11
OAKLAND J SUB, Oakland 12.00 115.00 7.20Distribution 12
OAKLAND K (CLAREMONT) SUB, Oakland 12.00 115.00 6.60Distribution 13
OAKLAND L SUB, Oakland 12.00 115.00 7.20Distribution 14
OAKLAND X SUB, Oakland 12.00 115.00 7.20Distribution 15
OCEANO SUB, Oceano 12.00 115.00 7.20Distribution 16
OILFIELDS SUB, San Ardo 12.00 60.00Distribution 17
OLD KEARNEY SUB, Fresno 12.00 70.00 13.20Distribution 18
OLD RIVER SUB, Knob Hill 12.00 70.00 2.40Distribution 19
OLD RIVER SUB, Knob Hill 12.00 70.00 7.20Distribution 20
OLETA SUB, Plymouth 12.00 60.00 2.40Distribution 21
OLIVEHURST SUB, Olivehurst 12.00 115.00 7.20Distribution 22
OREGON TRAIL SUB, Redding 12.00 115.00 7.20Distribution 23
OREGON TRAIL SUB, Redding 12.00 60.00 2.40Distribution 24
ORLAND B SUB, Orland 12.00 60.00 2.40Distribution 25
ORO FINO SUB, Magalia 12.00 60.00 2.40Distribution 26
ORO LOMA SUB, Dos Palos 12.00 70.00 2.40Transmission 27
ORO LOMA SUB, Dos Palos 12.00 115.00Transmission 28
OROSI SUB, Orosi 12.00 70.00 7.20Distribution 29
OROVILLE SUB, Oroville 12.00 60.00 7.20Distribution 30
OROVILLE SUB, Oroville 4.00 60.00 2.40Distribution 31
ORTIGA SUB, Los Banos 12.00 70.00 2.40Distribution 32
PACIFICA SUB, Pacifica 12.00 60.00Distribution 33
PALMER SUB, Sisquat 12.00 115.00 7.20Distribution 34
PANAMA SUB, Bakersfield 21.00 70.00 7.20Distribution 35
PANOCHE SUB, Mendota 12.00 230.00 7.20Transmission 36
PANORAMA SUB, Anderson 12.00 115.00Distribution 37
PARADISE SUB, Paradise 12.00 60.00 7.20Distribution 38
PARADISE SUB, Paradise 12.00 115.00Distribution 39
PARKWAY SUB, Vallejo 12.00 230.00 7.20Distribution 40
FERC FORM NO. 1 (ED. 12-96) Page 426.12

Name of Respondent This Report Is:(1) An Original
(2) A Resubmission
Date of Report(Mo, Da, Yr)
Year/Period of Report
End of
SUBSTATIONS
PACIFIC GAS AND ELECTRIC COMPANYX
04/13/20212020/Q4
Line
No.Name and Location of Substation
Primary
(c)(b)(a)
Tertiary
(d)
Character of Substation
(e)
Secondary
VOLTAGE (In MVa)
1. Report below the information called for concerning substations of the respondent as of the end of the year.
2. Substations which serve only one industrial or street railway customer should not be listed below.
3. Substations with capacities of Less than 10 MVa except those serving customers with energy for resale, may be grouped according
to functional character, but the number of such substations must be shown.
4. Indicate in column (b) the functional character of each substation, designating whether transmission or distribution and whether
attended or unattended. At the end of the page, summarize according to function the capacities reported for the individual stations in
column (f).
PARLIER SUB, Parlier 12.00 115.00 7.20Distribution 1
PASO ROBLES SUB, Paso Robles 12.00 70.00 2.40Distribution 2
PAUL SWEET SUB, Santa Cruz 21.00 115.00 7.20Distribution 3
PEABODY SUB, Fairfield 21.00 230.00 7.20Distribution 4
PEACHTON SUB, Gridley 12.00 60.00 2.40Distribution 5
PEASE SUB, Tierra Buena 12.00 115.00Transmission 6
PENNGROVE SUB, Penngrove 12.00 115.00Distribution 7
PENRYN SUB, Penryn 12.00 60.00 7.20Distribution 8
PEORIA SUB, Jamestown 18.00 115.00Distribution 9
PETALUMA C SUB, Petaluma 12.00 60.00Distribution 10
PIERCY SUB, San Jose 21.00 115.00 7.20Distribution 11
PINE GROVE SUB, Pine Grove 12.00 60.00 2.40Distribution 12
PINEDALE SUB, FRESNO 21.00 115.00 7.20Distribution 13
PLACER SUB, Auburn 12.00 115.00Transmission 14
PLACERVILLE SUB, Placerville 12.00 115.00 7.20Distribution 15
PLACERVILLE SUB, Placerville 21.00 115.00Distribution 16
PLAINFIELD SUB, Davis 12.00 60.00 2.40Distribution 17
PLEASANT GROVE SUB, Pleasant Grove 21.00 60.00 7.20Distribution 18
PLUMAS SUB, Wheatland 21.00 60.00 7.20Distribution 19
PLUMAS SUB, Wheatland 12.00 60.00 7.20Distribution 20
POINT MORETTI SUB, Davenport 12.00 60.00 2.40Distribution 21
POINT PINOLE SUB, Richmond 12.00 115.00 6.60Distribution 22
POSO MOUNTAIN SUB, Kern 21.00 115.00Distribution 23
PRUNEDALE SUB, Prunedale 12.00 115.00 7.20Distribution 24
PUEBLO SUB, Napa 12.00 115.00Distribution 25
PUEBLO SUB, Napa 21.00 115.00Distribution 26
PURISIMA SUB, Lompoc 12.00 115.00 7.20Distribution 27
PUTAH CREEK SUB, Winters 12.00 115.00Distribution 28
RACE TRACK SUB, Jamestown 17.00 115.00Distribution 29
RADUM SUB, Pleasanton 12.00 60.00Distribution 30
RAINBOW SUB, Sanger 12.00 115.00 7.20Distribution 31
RALSTON SUB, Belmont 12.00 60.00Distribution 32
RANCHERS COTTON SUB, Fresno 12.00 115.00 7.20Distribution 33
RAWSON SUB, Red Bluff 12.00 60.00 2.40Distribution 34
RED BLUFF SUB, Red Bluff 12.00 60.00 2.40Distribution 35
REDBUD SUB, Clearlake Oaks 12.00 115.00 7.20Distribution 36
REDWOOD CITY SUB, Redwood City 12.00 60.00 7.20Distribution 37
REEDLEY SUB, Reedley 12.00 115.00 7.20Transmission 38
REEDLEY SUB, Reedley 12.00 70.00 2.40Transmission 39
RENFRO SUB, BAKERSFIELD 12.00 115.00 7.20Distribution 40
FERC FORM NO. 1 (ED. 12-96) Page 426.13

Name of Respondent This Report Is:(1) An Original
(2) A Resubmission
Date of Report(Mo, Da, Yr)
Year/Period of Report
End of
SUBSTATIONS
PACIFIC GAS AND ELECTRIC COMPANYX
04/13/20212020/Q4
Line
No.Name and Location of Substation
Primary
(c)(b)(a)
Tertiary
(d)
Character of Substation
(e)
Secondary
VOLTAGE (In MVa)
1. Report below the information called for concerning substations of the respondent as of the end of the year.
2. Substations which serve only one industrial or street railway customer should not be listed below.
3. Substations with capacities of Less than 10 MVa except those serving customers with energy for resale, may be grouped according
to functional character, but the number of such substations must be shown.
4. Indicate in column (b) the functional character of each substation, designating whether transmission or distribution and whether
attended or unattended. At the end of the page, summarize according to function the capacities reported for the individual stations in
column (f).
RESEARCH SUB, San Ramon 21.00 230.00 7.20Distribution 1
RESERVATION ROAD SUB, Salinas 12.00 60.00 2.40Distribution 2
RICE SUB, Princeton 12.00 60.00 4.16Distribution 3
RICHMOND R SUB, Richmond 12.00 115.00 7.20Distribution 4
RINCON SUB, Santa Rosa 12.00 115.00Distribution 5
RIO BRAVO SUB, Shafter 12.00 115.00 7.20Distribution 6
RIO DELL SUB, Rio Dell 12.00 60.00Distribution 7
RIPON SUB, Ripon 17.00 115.00Distribution 8
RISING RIVER SUB, Cassell, 12.00 60.00 2.40Distribution 9
RIVER OAKS SUB, San Jose 21.00 115.00 7.20Distribution 10
RIVERBANK SUB, Escalon 12.00 115.00Distribution 11
ROB ROY SUB, Watsonville 21.00 115.00 7.20Distribution 12
ROCKLIN SUB, Rocklin 12.00 60.00 7.20Distribution 13
ROSEDALE SUB, Bakersfield 12.00 115.00 7.20Distribution 14
ROSSMOOR SUB, Walnut Creek 12.00 230.00Distribution 15
ROUGH & READY ISLAND SUB, Stockton 12.00 60.00 7.20Distribution 16
SALINAS SUB, Salinas 12.00 115.00 7.20Transmission 17
SALMON CREEK SUB, Bodega Bay 12.00 60.00 2.40Distribution 18
SAN ARDO SUB, San Ardo 12.00 60.00Distribution 19
SAN BENITO SUB, San Benito 21.00 115.00 7.20Distribution 20
SAN BERNARD SUB, Lamont 12.00 70.00 2.40Distribution 21
SAN CARLOS SUB, San Carlos 12.00 60.00 7.20Distribution 22
SAN CARLOS SUB, San Carlos 4.00 60.00 2.40Distribution 23
SAN FRAN A (POTRERO PP) SUB, San Francisco 12.00 115.00 7.20Transmission 24
SAN FRAN H (MARTIN) SUB, Daly City 12.00 115.00Transmission 25
SAN FRAN P-HUNTERS POINT SUB, San Francisco 12.00 115.00Distribution 26
SAN FRAN X (MISSION) SUB, San Francisco 12.00 115.00 7.20Distribution 27
SAN FRAN Y (LARKIN) SUB, San Francisco 12.00 115.00 7.20Distribution 28
SAN FRAN Z (Embarcadero), San Francisco 34.50 230.00 7.20Distribution 29
SAN JOAQUIN SUB, San Joaquin 12.00 70.00 7.20Distribution 30
SAN JOSE A SUB, San Jose 4.00 115.00 7.20Distribution 31
SAN JOSE A SUB, San Jose 12.00 115.00Distribution 32
SAN JOSE B SUB, San Jose 12.00 115.00 7.20Distribution 33
SAN LEANDRO U SUB, San Leandro 12.00 115.00Distribution 34
SAN LUIS OBISPO SUB, SLO 12.00 115.00 7.20Transmission 35
SAN MATEO SUB, San Mateo 21.00 115.00Transmission 36
SAN MATEO SUB, San Mateo 4.00 60.00Transmission 37
SAN MIGUEL SUB, San Miguel 12.00 70.00 7.20Distribution 38
SAN PABLO SUB, Richmond 12.00 115.00 7.20Distribution 39
SAN RAFAEL SUB, San Rafael 12.00 115.00Distribution 40
FERC FORM NO. 1 (ED. 12-96) Page 426.14

Name of Respondent This Report Is:(1) An Original
(2) A Resubmission
Date of Report(Mo, Da, Yr)
Year/Period of Report
End of
SUBSTATIONS
PACIFIC GAS AND ELECTRIC COMPANYX
04/13/20212020/Q4
Line
No.Name and Location of Substation
Primary
(c)(b)(a)
Tertiary
(d)
Character of Substation
(e)
Secondary
VOLTAGE (In MVa)
1. Report below the information called for concerning substations of the respondent as of the end of the year.
2. Substations which serve only one industrial or street railway customer should not be listed below.
3. Substations with capacities of Less than 10 MVa except those serving customers with energy for resale, may be grouped according
to functional character, but the number of such substations must be shown.
4. Indicate in column (b) the functional character of each substation, designating whether transmission or distribution and whether
attended or unattended. At the end of the page, summarize according to function the capacities reported for the individual stations in
column (f).
SAN RAMON SUB, San Ramon 21.00 230.00 12.00Transmission 1
SANGER SUB, Fresno 12.00 115.00 7.20Transmission 2
SANTA MARIA SUB, Santa Maria 12.00 115.00 7.20Distribution 3
SANTA NELLA SUB, Santa Nella 12.00 70.00 2.40Distribution 4
SANTA RITA SUB, Dos Palos 12.00 70.00 2.40Distribution 5
SANTA ROSA A SUB, Santa Rosa 12.00 115.00 7.20Distribution 6
SANTA YNEZ SUB, Santa Maria 12.00 115.00 7.20Distribution 7
SARATOGA SUB, Saratoga 12.00 230.00 7.20Distribution 8
SAUSALITO SUB, Sausalito 12.00 60.00 2.40Distribution 9
SAUSALITO SUB, Sausalito 4.00 60.00Distribution 10
SCHINDLER SUB, Five Points 12.00 115.00 7.20Transmission 11
SEMITROPIC SUB, Wasco 12.00 115.00 7.20Transmission 12
SERRAMONTE SUB, Daly City 12.00 115.00Distribution 13
SHAFTER SUB, Shafter 12.00 115.00 7.20Distribution 14
SHARON SUB, Chowchilla 12.00 115.00Distribution 15
SHEPARD SUB, Clovis 21.00 115.00 7.20Distribution 16
SHINGLE SPRINGS SUB, Shingle Springs 21.00 115.00 7.20Distribution 17
SHINGLE SPRINGS SUB, Shingle Springs 12.00 115.00 7.20Distribution 18
SHREDDER SUB, Redwood City 4.00 115.00 6.60Distribution 19
SILVERADO SUB, St. Helena 21.00 115.00Distribution 20
SISQUOC SUB, Orcutt 12.00 115.00 7.20Distribution 21
SMYRNA SUB, Wasco 12.00 115.00 7.20Distribution 22
SNEATH LANE SUB, San Bruno 12.00 60.00 2.40Distribution 23
SOBRANTE SUB, Orinda 12.00 115.00 7.20Transmission 24
SOLEDAD SUB, Soledad 12.00 60.00Transmission 25
SONOMA A SUB, Sonoma 12.00 115.00Distribution 26
SOUTH BAY #1 & #2 SUB, Tracy 4.00 60.00Distribution 27
SPANISH CREEK SUB, 44.00 60.00Distribution 28
SPENCE SUB, Salinas 12.00 60.00Distribution 29
SRI SUB, Menlo Park 12.00 60.00Distribution 30
STAFFORD SUB, Novato 12.00 60.00Distribution 31
STAGG SUB, Stockton 21.00 230.00 7.20Transmission 32
STAGG SUB, Stockton 12.00 60.00 2.40Transmission 33
STELLING SUB, Cupertino 12.00 115.00 7.20Distribution 34
STILLWATER STA SUB, Project City 12.00 60.00 2.40Distribution 35
STOCKDALE SUB, Bakersfield 21.00 230.00 7.20Distribution 36
STOCKDALE SUB, Bakersfield 12.00 115.00 7.20Distribution 37
STOCKTON A SUB, Stockton 12.00 115.00Distribution 38
STOCKTON A SUB, Stockton 4.00 60.00Distribution 39
STONE CORRAL SUB, Woodlake 12.00 70.00 2.40Distribution 40
FERC FORM NO. 1 (ED. 12-96) Page 426.15

Name of Respondent This Report Is:(1) An Original
(2) A Resubmission
Date of Report(Mo, Da, Yr)
Year/Period of Report
End of
SUBSTATIONS
PACIFIC GAS AND ELECTRIC COMPANYX
04/13/20212020/Q4
Line
No.Name and Location of Substation
Primary
(c)(b)(a)
Tertiary
(d)
Character of Substation
(e)
Secondary
VOLTAGE (In MVa)
1. Report below the information called for concerning substations of the respondent as of the end of the year.
2. Substations which serve only one industrial or street railway customer should not be listed below.
3. Substations with capacities of Less than 10 MVa except those serving customers with energy for resale, may be grouped according
to functional character, but the number of such substations must be shown.
4. Indicate in column (b) the functional character of each substation, designating whether transmission or distribution and whether
attended or unattended. At the end of the page, summarize according to function the capacities reported for the individual stations in
column (f).
STONE SUB, San Jose 12.00 115.00 7.20Distribution 1
STOREY SUB, Madera 12.00 230.00 7.20Distribution 2
STROUD SUB, Helm 12.00 70.00 2.40Distribution 3
SUISUN SUB, Fairfield 12.00 115.00 7.20Distribution 4
SUNOL SUB, Sunol 12.00 60.00 7.20Distribution 5
SWIFT SUB, San Jose 21.00 115.00 7.20Distribution 6
SYCAMORE CREEK SUB, Chico 12.00 115.00Distribution 7
TAFT SUB, Taft 12.00 115.00 7.20Transmission 8
TAMARACK SUB, Soda Springs 12.00 60.00 7.20Distribution 9
TASSAJARA SUB, Danville 21.00 230.00 7.20Distribution 10
TEJON SUB, Leboc 12.00 70.00 2.40Distribution 11
TEMBLOR SUB, McKittrick 12.00 115.00 2.40Distribution 12
TEMPLETON SUB, TEMPLETON 21.00 230.00 7.20Transmission 13
TEVIS SUB, Oildale 21.00 115.00 7.20Distribution 14
TIDEWATER SUB, Martinez 21.00 230.00Distribution 15
TIVY VALLEY SUB, Fresno 12.00 70.00 7.20Distribution 16
TRACY SUB, Tracy 12.00 115.00 7.20Distribution 17
TRES VIAS SUB, Oroville 12.00 60.00 7.20Distribution 18
TRIMBLE SUB, San Jose 12.00 115.00 7.20Distribution 19
TRIMBLE SUB, San Jose 21.00 115.00 7.20Distribution 20
TULARE LAKE SUB, Kettleman 12.00 70.00 2.40Distribution 21
TULUCAY SUB, Napa 12.00 60.00 7.20Transmission 22
TUPMAN SUB, Tupman 12.00 115.00 7.20Distribution 23
TWISSELMAN SUB, Blackwell Corners 12.00 70.00 7.20Distribution 24
TYLER SUB, Red Bluff 12.00 60.00 2.40Distribution 25
UKIAH SUB, Ukiah 12.00 115.00 7.20Distribution 26
URICH SUB, Martinez 4.00 60.00Distribution 27
VACA DIXON SUB, Vacaville 12.00 115.00 7.20Transmission 28
VACAVILLE SUB, Vacaville 12.00 115.00 7.20Distribution 29
VALLEY HOME SUB, Valley Home 17.00 60.00Distribution 30
VALLEY HOME SUB, Valley Home 17.00 115.00Distribution 31
VALLEY VIEW SUB, El Sobrante 12.00 115.00Distribution 32
VASCO SUB, Livermore 12.00 60.00Distribution 33
VASONA SUB, Los Gatos 12.00 230.00 7.20Distribution 34
VICTOR SUB, Lodi 12.00 60.00 2.40Distribution 35
VIEJO SUB, Monterey 21.00 60.00 7.20Distribution 36
VIERRA SUB, Lathrop 17.00 115.00 7.20Distribution 37
VINEYARD SUB, Pleasanton 21.00 230.00 7.20Distribution 38
VOLTA #1PH SUB, Shingletown 12.00 60.00 2.40Distribution 39
WAHTOKE SUB, Reedley 12.00 115.00 7.20Distribution 40
FERC FORM NO. 1 (ED. 12-96) Page 426.16

Name of Respondent This Report Is:(1) An Original
(2) A Resubmission
Date of Report(Mo, Da, Yr)
Year/Period of Report
End of
SUBSTATIONS
PACIFIC GAS AND ELECTRIC COMPANYX
04/13/20212020/Q4
Line
No.Name and Location of Substation
Primary
(c)(b)(a)
Tertiary
(d)
Character of Substation
(e)
Secondary
VOLTAGE (In MVa)
1. Report below the information called for concerning substations of the respondent as of the end of the year.
2. Substations which serve only one industrial or street railway customer should not be listed below.
3. Substations with capacities of Less than 10 MVa except those serving customers with energy for resale, may be grouped according
to functional character, but the number of such substations must be shown.
4. Indicate in column (b) the functional character of each substation, designating whether transmission or distribution and whether
attended or unattended. At the end of the page, summarize according to function the capacities reported for the individual stations in
column (f).
WASCO SUB, Wasco 12.00 70.00 2.40Distribution 1
WATERLOO SUB, Stockton 12.00 60.00 2.40Distribution 2
WATSONVILLE SUB, Watsonville 12.00 60.00 7.20Distribution 3
WATSONVILLE SUB, Watsonville 4.00 60.00Distribution 4
WEBER SUB, Stockton 12.00 60.00 7.20Transmission 5
WEBER SUB, Stockton 12.00 230.00 7.20Transmission 6
WEEDPATCH SUB, Weedpatch 12.00 70.00 7.20Distribution 7
WELLFIELD SUB, Lamont 12.00 70.00 2.40Distribution 8
WEST FRESNO SUB, Fresno 12.00 115.00 7.20Distribution 9
WEST LANE SUB, Stockton 12.00 60.00 7.20Distribution 10
WEST SACRAMENTO SUB, WEST SACRAMENTO 12.00 115.00 7.20Distribution 11
WESTLEY SUB, Westley 12.00 60.00 2.40Distribution 12
WESTPARK SUB, Bakersfield 12.00 115.00 7.20Distribution 13
WHEATLAND SUB, Wheatland 12.00 60.00 7.20Distribution 14
WHEELER RIDGE SUB, Bakersfield 12.00 70.00 7.20Transmission 15
WHISMAN SUB, Mt. View 12.00 115.00 7.20Distribution 16
WILLIAMS SUB, Williams 12.00 60.00 7.20Distribution 17
WILLITS A SUB, Willits 12.00 60.00 2.40Distribution 18
WILLOW CREEK SUB, Willow Creek 12.00 60.00 2.40Distribution 19
WILLOW PASS SUB, Pittsburg 21.00 115.00 7.20Distribution 20
WILLOW PASS SUB, Pittsburg 12.00 60.00 2.40Distribution 21
WILLOWS A SUB, Willows 12.00 60.00Distribution 22
WILSON SUB, Merced 12.00 115.00Transmission 23
WINDSOR SUB, Windsor 12.00 60.00Distribution 24
WINTERS SUB, Winters 12.00 60.00Distribution 25
WOLFE SUB, Cupertino 12.00 115.00Distribution 26
WOODCHUCK SUB, Wilson Village 21.00 70.00Distribution 27
WOODLAND SUB, Woodland 12.00 115.00 7.20Distribution 28
WOODSIDE SUB, Woodside 12.00 60.00Distribution 29
WOODWARD SUB, Fresno 21.00 115.00 7.20Distribution 30
WRIGHT SUB, Los Banos 12.00 70.00 2.40Distribution 31
WYANDOTTE SUB, Oroville 12.00 115.00 7.20Distribution 32
ZACA SUB, Santa Maria 12.00 115.00 7.20Distribution 33
ZAMORA SUB, Zamora 12.00 115.00Distribution 34
ALTAMONT SUB, Livermore 4.00 60.00Distribution 35
ANNAPOLIS SUB, Annapolis 12.00 60.00 2.40Distribution 36
AUBURN SUB, Auburn 12.00 60.00 2.40Distribution 37
BALFOUR SUB, Brentwood 12.00 60.00 4.16Distribution 38
BANTA SUB, Tracy 12.00 60.00 2.40Distribution 39
BARRY SUB, Barry 12.00 60.00 7.20Distribution 40
FERC FORM NO. 1 (ED. 12-96) Page 426.17

Name of Respondent This Report Is:(1) An Original
(2) A Resubmission
Date of Report(Mo, Da, Yr)
Year/Period of Report
End of
SUBSTATIONS
PACIFIC GAS AND ELECTRIC COMPANYX
04/13/20212020/Q4
Line
No.Name and Location of Substation
Primary
(c)(b)(a)
Tertiary
(d)
Character of Substation
(e)
Secondary
VOLTAGE (In MVa)
1. Report below the information called for concerning substations of the respondent as of the end of the year.
2. Substations which serve only one industrial or street railway customer should not be listed below.
3. Substations with capacities of Less than 10 MVa except those serving customers with energy for resale, may be grouped according
to functional character, but the number of such substations must be shown.
4. Indicate in column (b) the functional character of each substation, designating whether transmission or distribution and whether
attended or unattended. At the end of the page, summarize according to function the capacities reported for the individual stations in
column (f).
BATAVIA SUB, Dixon 12.00 60.00 2.40Distribution 1
BELLRIDGE 1A SUB, ButtonWillow 4.00 115.00Distribution 2
BELLRIDGE 1B SUB, ButtonWillow 4.00 115.00Distribution 3
BERESFORD SUB, San Mateo 4.00 60.00Distribution 4
BERRENDA C SUB, Keck's Corner 12.00 70.00 2.40Distribution 5
BIG LAGOON SUB, Big Lagoon Park 12.00 60.00 2.40Distribution 6
BIG RIVER SUB, Mendocino 12.00 60.00 2.40Distribution 7
BOGARD SUB, Old Station 12.00 60.00Distribution 8
BONNIE NOOK SUB, Dutch Flat 12.00 60.00 2.40Distribution 9
BORONDA SUB, Salinas 12.00 60.00 2.40Distribution 10
BOSWELL SUB, Corcoran 12.00 70.00 2.40Distribution 11
BRIDGEVILLE SUB, Bridgeville 12.00 60.00 7.20Transmission 12
BROWNS VALLEY SUB, Browns Valley 12.00 60.00 2.40Distribution 13
BURNEY SUB, Burney 12.00 60.00 2.40Distribution 14
CAMBRIA SUB, Cambria 12.00 70.00 2.40Distribution 15
CARLOTTA SUB, Carlotta 12.00 60.00 2.40Distribution 16
CARRIZO PLAINS SUB, Carrizo Plains 12.00 115.00 2.40Distribution 17
CAWELO C SUB, Famosa 4.00 115.00Distribution 18
CHESTER SUB, Plumas 13.80 60.00Distribution 19
CEDAR CREEK SUB, Round Mountain 12.00 60.00 2.40Distribution 20
CELERON HILL SUB, N. Belridge 12.00 70.00Distribution 21
CHALLENGE SUB, Challenge 12.00 60.00 2.40Distribution 22
COLONY SUB, Lodi 12.00 60.00 2.40Distribution 23
COLUMBIA HILL SUB, Sweetland 12.00 60.00 2.40Distribution 24
COVELO SUB, Covelo 12.00 60.00 2.40Distribution 25
CROWS LANDING SUB, Crows Landing 12.00 60.00 2.40Distribution 26
CRUSHER SUB, Bonny Doon 4.00 60.00Distribution 27
CRYSTAL SPRINGS SUB, San Mateo 4.00 60.00Distribution 28
DAIRYVILLE SUB, Dairyville 12.00 60.00 2.40Distribution 29
DEVILS DEN SUB, Avenal 12.00 70.00 2.40Distribution 30
DOBBINS SUB, Dobbins 12.00 60.00 2.40Distribution 31
DRAKE SUB, Arbuckle 2.00 60.00 2.40Distribution 32
DUNLAP SUB, Fresno 12.00 70.00Distribution 33
DUNNIGAN SUB, Dunnigan 12.00 60.00 2.40Distribution 34
EAST QUINCY SUB, Quincy 12.00 60.00 2.40Distribution 35
ELK CREEK SUB, Elk Creek 12.00 60.00 2.40Distribution 36
EMERALD LAKE SUB, Emerald Lake 4.00 60.00 2.40Distribution 37
ENCINAL SUB, Live Oak 2.00 60.00 2.40Distribution 38
ERTA SUB, Watsonville 4.00 60.00Distribution 39
ESQUON SUB, Durham 12.00 60.00 2.40Distribution 40
FERC FORM NO. 1 (ED. 12-96) Page 426.18

Name of Respondent This Report Is:(1) An Original
(2) A Resubmission
Date of Report(Mo, Da, Yr)
Year/Period of Report
End of
SUBSTATIONS
PACIFIC GAS AND ELECTRIC COMPANYX
04/13/20212020/Q4
Line
No.Name and Location of Substation
Primary
(c)(b)(a)
Tertiary
(d)
Character of Substation
(e)
Secondary
VOLTAGE (In MVa)
1. Report below the information called for concerning substations of the respondent as of the end of the year.
2. Substations which serve only one industrial or street railway customer should not be listed below.
3. Substations with capacities of Less than 10 MVa except those serving customers with energy for resale, may be grouped according
to functional character, but the number of such substations must be shown.
4. Indicate in column (b) the functional character of each substation, designating whether transmission or distribution and whether
attended or unattended. At the end of the page, summarize according to function the capacities reported for the individual stations in
column (f).
FORT ROSS SUB, Fort Ross 12.00 60.00 2.40Distribution 1
FORT SEWARD SUB, Fort Seward 12.00 60.00 2.40Distribution 2
FRENCH GULCH SUB, French Gulch 12.00 60.00 2.40Distribution 3
FRUITLAND SUB, Myers Flat 12.00 60.00 2.40Distribution 4
GARCIA SUB, Point Arena 4.00 60.00 2.40Distribution 5
GARDNER SUB, Taft 4.00 70.00Distribution 6
GERBER SUB, Gerber 12.00 60.00 2.40Distribution 7
GRAYS FLAT SUB, Twain 4.00 60.00 2.40Distribution 8
HAMILTON SUB, 12.00 60.00 2.40Distribution 9
HARRINGTON SUB, Arbuckle 2.00 60.00Distribution 10
HILLSDALE SUB, San Mateo 4.00 60.00 2.40Distribution 11
HOOPA SUB, Hoopa 12.00 60.00 2.40Distribution 12
INDIAN FLAT SUB, Incline 12.00 70.00Distribution 13
INDUSTRIAL ACRES SUB, Salinas 4.00 60.00Distribution 14
IUKA SUB, Pleasanton 4.00 60.00Distribution 15
JACALITOS SUB, 12.00 70.00 2.40Distribution 16
KANAKA SUB, Feather Falls 12.00 115.00 7.20Distribution 17
KERN WATER SUB, Bakersfield 4.00 115.00Distribution 18
KNIGHTS LANDING SUB, Knights Landing 12.00 115.00Distribution 19
LAGUNITAS SUB, Salinas 2.40 60.00Distribution 20
LAURELES SUB, Carmel 12.00 60.00Distribution 21
LAYTONVILLE SUB, Laytonville, 12.00 60.00 2.40Distribution 22
LEARNER SUB, Stockton 4.00 60.00Distribution 23
LIMESTONE SUB, Shingle Springs 2.00 60.00Distribution 24
LOST HILLS SUB, Blackwell Corners 12.00 70.00 2.40Distribution 25
LOW GAP SUB, Mad River 12.00 60.00Distribution 26
MAINE PRAIRIE SUB, DIXON 4.00 60.00 2.40Distribution 27
MANZANITA SUB, Seaside 4.00 60.00Distribution 28
MAPLE CREEK SUB, Blue Lake 12.00 60.00 2.40Distribution 29
MARSH SUB, Brentwood 12.00 60.00 2.40Distribution 30
MERCY SPRINGS SUB, Los Banos 12.00 60.00 2.40Distribution 31
MIDDLE RIVER SUB, Stockton 12.00 60.00 2.40Distribution 32
MONARCH SUB, Stockton 4.00 60.00 2.40Distribution 33
MONTICELLO SUB, Winters 12.00 115.00Distribution 34
NAVY LAB SUB, Monterey 4.00 60.00Distribution 35
NAVY SCHOOL SUB, Monterey 4.00 60.00Distribution 36
NEW HOPE SUB, Lodi 12.00 60.00 2.40Distribution 37
NORTH BRANCH SUB, San Andreas 12.00 60.00 2.40Distribution 38
OAK PARK SUB, Stockton 4.00 60.00Distribution 39
OLEMA SUB, Olema 12.00 60.00Distribution 40
FERC FORM NO. 1 (ED. 12-96) Page 426.19

Name of Respondent This Report Is:(1) An Original
(2) A Resubmission
Date of Report(Mo, Da, Yr)
Year/Period of Report
End of
SUBSTATIONS
PACIFIC GAS AND ELECTRIC COMPANYX
04/13/20212020/Q4
Line
No.Name and Location of Substation
Primary
(c)(b)(a)
Tertiary
(d)
Character of Substation
(e)
Secondary
VOLTAGE (In MVa)
1. Report below the information called for concerning substations of the respondent as of the end of the year.
2. Substations which serve only one industrial or street railway customer should not be listed below.
3. Substations with capacities of Less than 10 MVa except those serving customers with energy for resale, may be grouped according
to functional character, but the number of such substations must be shown.
4. Indicate in column (b) the functional character of each substation, designating whether transmission or distribution and whether
attended or unattended. At the end of the page, summarize according to function the capacities reported for the individual stations in
column (f).
ORICK SUB, Orick 12.00 60.00 2.40Distribution 1
OTTER SUB, Carmel 12.00 60.00Distribution 2
PERRY SUB, Cambria 12.00 70.00 2.40Distribution 3
PETALUMA A SUB, Petaluma 4.00 60.00 2.40Distribution 4
PHILO SUB, Philo 12.00 60.00 2.40Distribution 5
PIKE CITY SUB, Camptonville 12.00 60.00 2.40Distribution 6
PITTSBURG SUB, Pittsburg 4.00 60.00 2.40Distribution 7
POINT ARENA SUB, Pt Arena 12.00 60.00 2.40Distribution 8
PORT COSTA BRICK SUB, Port Costa 4.00 60.00Distribution 9
RECLAMATION DIST#108 SUB, KNIGHTS LANDING 2.00 60.00Distribution 10
RECLAMATION DIST#1500 SUB, KNIGHTS LANDING 2.00 60.00Distribution 11
RECLAMATION DIST#2047 SUB, KNIGHTS LANDING 2.00 60.00Distribution 12
RESERVE OIL SUB, Hanford 12.00 70.00 2.40Distribution 13
RESERVE OIL SUB, Hanford 4.00 70.00Distribution 14
RIDGE CABIN SUB, 12.00 60.00Distribution 15
RIVER ROCK SUB, Fresno 12.00 70.00 2.40Distribution 16
RUSS RANCH SUB, Blue Lake 12.00 60.00Distribution 17
SAN ANDREAS SUB, Millbrae 34.60 60.00Distribution 18
SAN BRUNO SUB, San Bruno 4.00 60.00Distribution 19
SAN LUIS #3 SUB, Los Banos 2.00 115.00 2.40Distribution 20
SAN LUIS #5 SUB, Los Banos 2.00 115.00 2.40Distribution 21
SAND CREEK SUB, Orosi 12.00 70.00Distribution 22
SHADY GLEN SUB, Colfax 12.00 60.00 2.40Distribution 23
SKAGGS ISLAND SUB, Skaggs Island 12.00 115.00 2.40Distribution 24
SMARTVILLE SUB, Smartville 12.00 60.00Distribution 25
STAUFFER SUB, Martinez 4.00 60.00Distribution 26
STOCKTON ACRES SUB, Stockton 4.00 60.00Distribution 27
SUMMIT SUB, Soda Springs 12.00 60.00 2.40Distribution 28
TECUYA SUB, Bakersfield 2.00 70.00 2.40Distribution 29
TERMINOUS SUB, Lodi 12.00 60.00Distribution 30
TOCALOMA SUB, Tocaloma 4.00 60.00Distribution 31
TRINIDAD SUB, Trinidad 12.00 60.00 2.40Distribution 32
TUDOR SUB, Tudor 12.00 60.00Distribution 33
UPPER LAKE SUB, Upper Lake 12.00 60.00 2.40Distribution 34
VALLECITOS SUB, Sunol 12.00 60.00Distribution 35
VINA SUB, Vina 12.00 60.00 2.40Distribution 36
WATERSHED SUB, Redwood City 4.00 60.00Distribution 37
WEIMAR SUB, Weimar 12.00 60.00 2.40Distribution 38
WEST SIDE SUB, Tracy 2.00 60.00Distribution 39
WESTLANDS SUB, San Joaquin 4.00 70.00Distribution 40
FERC FORM NO. 1 (ED. 12-96) Page 426.20

Name of Respondent This Report Is:(1) An Original
(2) A Resubmission
Date of Report(Mo, Da, Yr)
Year/Period of Report
End of
SUBSTATIONS
PACIFIC GAS AND ELECTRIC COMPANYX
04/13/20212020/Q4
Line
No.Name and Location of Substation
Primary
(c)(b)(a)
Tertiary
(d)
Character of Substation
(e)
Secondary
VOLTAGE (In MVa)
1. Report below the information called for concerning substations of the respondent as of the end of the year.
2. Substations which serve only one industrial or street railway customer should not be listed below.
3. Substations with capacities of Less than 10 MVa except those serving customers with energy for resale, may be grouped according
to functional character, but the number of such substations must be shown.
4. Indicate in column (b) the functional character of each substation, designating whether transmission or distribution and whether
attended or unattended. At the end of the page, summarize according to function the capacities reported for the individual stations in
column (f).
WHITMORE SUB, Whitmore 12.00 60.00 2.40Distribution 1
WILDWOOD SUB, Wildwood 12.00 115.00Distribution 2
WILKINS SLOUGH SUB, Arbuckle 12.00 60.00 2.40Distribution 3
WOODACRE SUB, Woodacre 12.00 60.00Distribution 4
YOSEMITE PARK SUB, 12.00 70.00 7.20Distribution 5
Rounding issues in column f -130.00 -37.20 6
Total Distribution and Transmission Substations 20080.90 91065.00 4260.52 7
Transmission only Substations 8
9
Combined Dist Subs < 10MVA (130 substations) 10
11
12
13
14
15
16
17
18
19
20
21
22
23
24
25
26
27
28
29
30
31
32
33
34
35
36
37
38
39
40
FERC FORM NO. 1 (ED. 12-96) Page 426.21

Name of Respondent This Report Is:(1) An Original
(2) A Resubmission
Date of Report(Mo, Da, Yr)
Year/Period of Report
End of
SUBSTATIONS
PACIFIC GAS AND ELECTRIC COMPANYX
04/13/20212020/Q4
Line
No.Number of Units
(g)(f) (h)
CONVERSION APPARATUS AND SPECIAL EQUIPMENT
(k)
Total Capacity
(Continued)
Capacity of Substation
(In Service) (In MVa)
Number ofTransformers
In ServiceSpare
Type of Equipment
Number of
Transformers(In MVa)
(i) (j)
5. Show in columns (I), (j), and (k) special equipment such as rotary converters, rectifiers, condensers, etc. and auxiliary equipment for
increasing capacity.
6. Designate substations or major items of equipment leased from others, jointly owned with others, or operated otherwise than by
reason of sole ownership by the respondent. For any substation or equipment operated under lease, give name of lessor, date and
period of lease, and annual rent. For any substation or equipment operated other than by reason of sole ownership or lease, give name
of co-owner or other party, explain basis of sharing expenses or other accounting between the parties, and state amounts and accounts
affected in respondent's books of account. Specify in each case whether lessor, co-owner, or other party is an associated company.
360 6 1 2.00000 1
334 4 1 2.00000 2
840 2 2.00000 3
80 3 1.00000 4
400 2 2.00000 5
400 2 2.00000 6
90 3 1 1.00000 7
840 2 2.00000 8
90 3 1 1.00000 9
76 3 1.00000 10
190 4 1 2.00000 11
214 6 1 2.00000 12
120 6 2 2.00000 13
180 3 1 1.00000 14
400 2 2.00000 15
90 3 1 1.00000 16
200 1 1.00000 17
588 4 2 2.00000 18
400 2 2.00000 19
240 6 1 2.00000 20
400 2 2.00000 21
170 6 1 2.00000 22
68 3 1 1.00000 23
400 2 2.00000 24
840 2 2.00000 25
80 3 1 1.00000 26
600 2 2.00000 27
823 4 1 2.00000 28
180 3 1 1.00000 29
0.00000 30
2244 6 1 2.00000 31
255 4 1 2.00000 32
84 3 1.00000 33
840 2 2.00000 34
38 3 1.00000 35
134 3 1.00000 36
400 2 2.00000 37
180 3 1 1.00000 38
50 3 1 1.00000 39
1260 3 3.00000 40
FERC FORM NO. 1 (ED. 12-96) Page 427

Name of Respondent This Report Is:(1) An Original
(2) A Resubmission
Date of Report(Mo, Da, Yr)
Year/Period of Report
End of
SUBSTATIONS
PACIFIC GAS AND ELECTRIC COMPANYX
04/13/20212020/Q4
Line
No.Number of Units
(g)(f) (h)
CONVERSION APPARATUS AND SPECIAL EQUIPMENT
(k)
Total Capacity
(Continued)
Capacity of Substation
(In Service) (In MVa)
Number ofTransformers
In ServiceSpare
Type of Equipment
Number of
Transformers(In MVa)
(i) (j)
5. Show in columns (I), (j), and (k) special equipment such as rotary converters, rectifiers, condensers, etc. and auxiliary equipment for
increasing capacity.
6. Designate substations or major items of equipment leased from others, jointly owned with others, or operated otherwise than by
reason of sole ownership by the respondent. For any substation or equipment operated under lease, give name of lessor, date and
period of lease, and annual rent. For any substation or equipment operated other than by reason of sole ownership or lease, give name
of co-owner or other party, explain basis of sharing expenses or other accounting between the parties, and state amounts and accounts
affected in respondent's books of account. Specify in each case whether lessor, co-owner, or other party is an associated company.
40 1 1.00000 1
400 2 2.00000 2
400 2 2.00000 3
823 4 1 2.00000 4
400 2 2.00000 5
90 3 1 1.00000 6
400 2 2.00000 7
1260 3 3.00000 8
90 3 1 1.00000 9
400 2 2.00000 10
840 2 2.00000 11
90 3 1.00000 12
400 2 2.00000 13
334 4 2.00000 14
840 3 1 1.00000 15
840 2 2.00000 16
100 1 1 2.00000 17
1243 5 1 3.00000 18
280 4 1 2.00000 19
90 3 1 1.00000 20
50 3 1.00000 21
840 2 2.00000 22
3366 9 2 3.00000 23
1630 10 1 4.00000 24
1260 3 3.00000 25
3364 9 2 3.00000 26
90 3 1.00000 27
400 2 2.00000 28
0.00000 29
1260 3 3.00000 30
1243 5 1 3.00000 31
269 3 1 1.00000 32
1680 4 2.00000 33
1122 3 1 1.00000 34
200 4 1 1.00000 35
80 3 1.00000 36
1646 8 1 4.00000 37
200 2 2.00000 38
168 3 1 1.00000 39
420 1 1.00000 40
FERC FORM NO. 1 (ED. 12-96) Page 427.1

Name of Respondent This Report Is:(1) An Original
(2) A Resubmission
Date of Report(Mo, Da, Yr)
Year/Period of Report
End of
SUBSTATIONS
PACIFIC GAS AND ELECTRIC COMPANYX
04/13/20212020/Q4
Line
No.Number of Units
(g)(f) (h)
CONVERSION APPARATUS AND SPECIAL EQUIPMENT
(k)
Total Capacity
(Continued)
Capacity of Substation
(In Service) (In MVa)
Number ofTransformers
In ServiceSpare
Type of Equipment
Number of
Transformers(In MVa)
(i) (j)
5. Show in columns (I), (j), and (k) special equipment such as rotary converters, rectifiers, condensers, etc. and auxiliary equipment for
increasing capacity.
6. Designate substations or major items of equipment leased from others, jointly owned with others, or operated otherwise than by
reason of sole ownership by the respondent. For any substation or equipment operated under lease, give name of lessor, date and
period of lease, and annual rent. For any substation or equipment operated other than by reason of sole ownership or lease, give name
of co-owner or other party, explain basis of sharing expenses or other accounting between the parties, and state amounts and accounts
affected in respondent's books of account. Specify in each case whether lessor, co-owner, or other party is an associated company.
840 2 2.00000 1
80 3 1 1.00000 2
840 2 2.00000 3
95 3 1.00000 4
823 4 1 2.00000 5
190 4 1 2.00000 6
254 6 2.00000 7
1122 3 1 1.00000 8
200 2 2.00000 9
400 2 2.00000 10
420 1 1.00000 11
100 1 1.00000 12
840 2 2.00000 13
200 1 1.00000 14
200 2 2.00000 15
1260 3 3.00000 16
90 3 1 1.00000 17
0.00000 18
90 3 1 1.00000 19
90 3 1 1.00000 20
823 4 1 2.00000 21
75 6 2.00000 22
600 2 2.00000 23
1008 5 1 3.00000 24
1122 3 1 1.00000 25
162 4 2.00000 26
175 1 1.00000 27
806 6 1 2.00000 28
3366 9 2 3.00000 29
90 3 1 1.00000 30
400 2 2.00000 31
290 4 1 2.00000 32
1094 8 3.00000 33
2244 6 1 2.00000 34
334 4 1 2.00000 35
600 2 2.00000 36
60 3 1 1.00000 37
400 2 2.00000 38
689 4 1 2.00000 39
45 1 1.00000 40
FERC FORM NO. 1 (ED. 12-96) Page 427.2

Name of Respondent This Report Is:(1) An Original
(2) A Resubmission
Date of Report(Mo, Da, Yr)
Year/Period of Report
End of
SUBSTATIONS
PACIFIC GAS AND ELECTRIC COMPANYX
04/13/20212020/Q4
Line
No.Number of Units
(g)(f) (h)
CONVERSION APPARATUS AND SPECIAL EQUIPMENT
(k)
Total Capacity
(Continued)
Capacity of Substation
(In Service) (In MVa)
Number ofTransformers
In ServiceSpare
Type of Equipment
Number of
Transformers(In MVa)
(i) (j)
5. Show in columns (I), (j), and (k) special equipment such as rotary converters, rectifiers, condensers, etc. and auxiliary equipment for
increasing capacity.
6. Designate substations or major items of equipment leased from others, jointly owned with others, or operated otherwise than by
reason of sole ownership by the respondent. For any substation or equipment operated under lease, give name of lessor, date and
period of lease, and annual rent. For any substation or equipment operated other than by reason of sole ownership or lease, give name
of co-owner or other party, explain basis of sharing expenses or other accounting between the parties, and state amounts and accounts
affected in respondent's books of account. Specify in each case whether lessor, co-owner, or other party is an associated company.
90 2 2.00000 1
27 2 2.00000 2
13 1 1.00000 3
60 2 2.00000 4
41 2 2.00000 5
49 4 1 2.00000 6
30 1 1.00000 7
19 3 1 1.00000 8
16 1 1.00000 9
38 2 2.00000 10
16 1 1.00000 11
11 3 1 1.00000 12
16 1 1.00000 13
16 1 1.00000 14
27 4 1 2.00000 15
60 2 2.00000 16
13 3 1 1.00000 17
210 3 3.00000 18
30 1 1.00000 19
90 2 2.00000 20
25 2 2.00000 21
16 3 1 1.00000 22
16 1 1.00000 23
112 2 2.00000 24
45 1 1.00000 25
225 3 3.00000 26
13 1 1.00000 27
120 3 3.00000 28
39 4 2.00000 29
90 2 2.00000 30
75 2 2.00000 31
16 1 1.00000 32
13 1 1.00000 33
57 2 2.00000 34
57 3 3.00000 35
16 6 1 2.00000 36
70 3 3.00000 37
135 3 3.00000 38
16 2 2.00000 39
11 3 1 1.00000 40
FERC FORM NO. 1 (ED. 12-96) Page 427.3

Name of Respondent This Report Is:(1) An Original
(2) A Resubmission
Date of Report(Mo, Da, Yr)
Year/Period of Report
End of
SUBSTATIONS
PACIFIC GAS AND ELECTRIC COMPANYX
04/13/20212020/Q4
Line
No.Number of Units
(g)(f) (h)
CONVERSION APPARATUS AND SPECIAL EQUIPMENT
(k)
Total Capacity
(Continued)
Capacity of Substation
(In Service) (In MVa)
Number ofTransformers
In ServiceSpare
Type of Equipment
Number of
Transformers(In MVa)
(i) (j)
5. Show in columns (I), (j), and (k) special equipment such as rotary converters, rectifiers, condensers, etc. and auxiliary equipment for
increasing capacity.
6. Designate substations or major items of equipment leased from others, jointly owned with others, or operated otherwise than by
reason of sole ownership by the respondent. For any substation or equipment operated under lease, give name of lessor, date and
period of lease, and annual rent. For any substation or equipment operated other than by reason of sole ownership or lease, give name
of co-owner or other party, explain basis of sharing expenses or other accounting between the parties, and state amounts and accounts
affected in respondent's books of account. Specify in each case whether lessor, co-owner, or other party is an associated company.
15 3 1.00000 1
20 3 1.00000 2
13 1 1.00000 3
13 3 1 1.00000 4
90 2 2.00000 5
13 1 1.00000 6
16 1 1.00000 7
30 1 1.00000 8
30 1 1.00000 9
225 3 3.00000 10
120 3 3.00000 11
90 3 3.00000 12
21 2 2.00000 13
76 3 3.00000 14
90 2 2.00000 15
45 1 1.00000 16
30 1 1.00000 17
75 2 2.00000 18
11 1 1.00000 19
20 3 1.00000 20
30 1 1.00000 21
15 3 1.00000 22
19 3 1.00000 23
135 3 3.00000 24
21 3 1 1.00000 25
16 1 1.00000 26
41 2 2.00000 27
90 2 2.00000 28
11 1 1.00000 29
6 3 1 1.00000 30
60 2 2.00000 31
24 1 1.00000 32
11 6 1.00000 33
37 3 2.00000 34
16 1 1.00000 35
16 1 1.00000 36
14 2 2.00000 37
25 2 2.00000 38
50 4 2.00000 39
45 1 1.00000 40
FERC FORM NO. 1 (ED. 12-96) Page 427.4

Name of Respondent This Report Is:(1) An Original
(2) A Resubmission
Date of Report(Mo, Da, Yr)
Year/Period of Report
End of
SUBSTATIONS
PACIFIC GAS AND ELECTRIC COMPANYX
04/13/20212020/Q4
Line
No.Number of Units
(g)(f) (h)
CONVERSION APPARATUS AND SPECIAL EQUIPMENT
(k)
Total Capacity
(Continued)
Capacity of Substation
(In Service) (In MVa)
Number ofTransformers
In ServiceSpare
Type of Equipment
Number of
Transformers(In MVa)
(i) (j)
5. Show in columns (I), (j), and (k) special equipment such as rotary converters, rectifiers, condensers, etc. and auxiliary equipment for
increasing capacity.
6. Designate substations or major items of equipment leased from others, jointly owned with others, or operated otherwise than by
reason of sole ownership by the respondent. For any substation or equipment operated under lease, give name of lessor, date and
period of lease, and annual rent. For any substation or equipment operated other than by reason of sole ownership or lease, give name
of co-owner or other party, explain basis of sharing expenses or other accounting between the parties, and state amounts and accounts
affected in respondent's books of account. Specify in each case whether lessor, co-owner, or other party is an associated company.
90 2 2.00000 1
30 3 1 1.00000 2
39 4 1 2.00000 3
11 1 1.00000 4
45 1 1.00000 5
25 2 2.00000 6
13 1 1.00000 7
41 2 2.00000 8
16 1 1.00000 9
21 3 1 1.00000 10
32 2 2.00000 11
13 1 1.00000 12
13 1 1.00000 13
61 2 2.00000 14
11 3 1 1.00000 15
135 3 3.00000 16
29 2 2.00000 17
135 3 3.00000 18
16 1 1.00000 19
20 6 1 2.00000 20
19 3 1 1.00000 21
90 2 2.00000 22
45 1 1.00000 23
27 2 2.00000 24
21 3 1.00000 25
61 2 2.00000 26
59 3 3.00000 27
12 1 1.00000 28
21 6 1 2.00000 29
225 3 3.00000 30
42 3 1 1.00000 31
20 3 1 1.00000 32
28 4 2.00000 33
46 2 2.00000 34
45 1 1.00000 35
13 3 2 1.00000 36
58 10 3 2.00000 37
30 1 1.00000 38
43 2 2.00000 39
7 1 1.00000 40
FERC FORM NO. 1 (ED. 12-96) Page 427.5

Name of Respondent This Report Is:(1) An Original
(2) A Resubmission
Date of Report(Mo, Da, Yr)
Year/Period of Report
End of
SUBSTATIONS
PACIFIC GAS AND ELECTRIC COMPANYX
04/13/20212020/Q4
Line
No.Number of Units
(g)(f) (h)
CONVERSION APPARATUS AND SPECIAL EQUIPMENT
(k)
Total Capacity
(Continued)
Capacity of Substation
(In Service) (In MVa)
Number ofTransformers
In ServiceSpare
Type of Equipment
Number of
Transformers(In MVa)
(i) (j)
5. Show in columns (I), (j), and (k) special equipment such as rotary converters, rectifiers, condensers, etc. and auxiliary equipment for
increasing capacity.
6. Designate substations or major items of equipment leased from others, jointly owned with others, or operated otherwise than by
reason of sole ownership by the respondent. For any substation or equipment operated under lease, give name of lessor, date and
period of lease, and annual rent. For any substation or equipment operated other than by reason of sole ownership or lease, give name
of co-owner or other party, explain basis of sharing expenses or other accounting between the parties, and state amounts and accounts
affected in respondent's books of account. Specify in each case whether lessor, co-owner, or other party is an associated company.
29 6 1 2.00000 1
130 3 3.00000 2
75 2 2.00000 3
35 3 3.00000 4
7 1 1.00000 5
30 1 1.00000 6
90 2 2.00000 7
19 3 1 1.00000 8
16 3 1.00000 9
16 1 1.00000 10
60 2 2.00000 11
135 3 3.00000 12
135 3 3.00000 13
90 2 2.00000 14
75 2 2.00000 15
16 1 1.00000 16
75 2 2.00000 17
14 1 1.00000 18
43 2 2.00000 19
61 2 2.00000 20
60 2 2.00000 21
11 3 1 1.00000 22
30 1 1.00000 23
135 3 3.00000 24
75 2 2.00000 25
11 1 1.00000 26
13 1 1.00000 27
105 3 3.00000 28
32 6 1 2.00000 29
180 4 4.00000 30
25 2 1 2.00000 31
16 1 1.00000 32
16 1 1.00000 33
8 1 1.00000 34
135 3 3.00000 35
45 1 1.00000 36
90 2 2.00000 37
25 4 2.00000 38
90 2 2.00000 39
63 2 2.00000 40
FERC FORM NO. 1 (ED. 12-96) Page 427.6

Name of Respondent This Report Is:(1) An Original
(2) A Resubmission
Date of Report(Mo, Da, Yr)
Year/Period of Report
End of
SUBSTATIONS
PACIFIC GAS AND ELECTRIC COMPANYX
04/13/20212020/Q4
Line
No.Number of Units
(g)(f) (h)
CONVERSION APPARATUS AND SPECIAL EQUIPMENT
(k)
Total Capacity
(Continued)
Capacity of Substation
(In Service) (In MVa)
Number ofTransformers
In ServiceSpare
Type of Equipment
Number of
Transformers(In MVa)
(i) (j)
5. Show in columns (I), (j), and (k) special equipment such as rotary converters, rectifiers, condensers, etc. and auxiliary equipment for
increasing capacity.
6. Designate substations or major items of equipment leased from others, jointly owned with others, or operated otherwise than by
reason of sole ownership by the respondent. For any substation or equipment operated under lease, give name of lessor, date and
period of lease, and annual rent. For any substation or equipment operated other than by reason of sole ownership or lease, give name
of co-owner or other party, explain basis of sharing expenses or other accounting between the parties, and state amounts and accounts
affected in respondent's books of account. Specify in each case whether lessor, co-owner, or other party is an associated company.
45 1 1.00000 1
127 3 3.00000 2
46 2 2.00000 3
180 4 4.00000 4
23 2 2.00000 5
11 1 1.00000 6
13 1 1.00000 7
11 3 1 1.00000 8
13 1 1.00000 9
21 3 1 1.00000 10
90 2 1 2.00000 11
13 1 1.00000 12
50 3 1.00000 13
60 2 2.00000 14
30 1 1.00000 15
60 2 2.00000 16
225 3 3.00000 17
30 1 1.00000 18
22 2 2.00000 19
30 3 1.00000 20
50 2 2.00000 21
11 1 1.00000 22
21 3 1 1.00000 23
60 2 2.00000 24
45 1 1.00000 25
19 3 1 1.00000 26
60 2 2.00000 27
105 3 3.00000 28
32 2 2.00000 29
25 4 2.00000 30
49 4 1 2.00000 31
60 2 2.00000 32
16 1 1.00000 33
25 1 1.00000 34
13 1 1.00000 35
16 1 1.00000 36
21 3 1 1.00000 37
90 2 2.00000 38
0.00000 39
22 4 2.00000 40
FERC FORM NO. 1 (ED. 12-96) Page 427.7

Name of Respondent This Report Is:(1) An Original
(2) A Resubmission
Date of Report(Mo, Da, Yr)
Year/Period of Report
End of
SUBSTATIONS
PACIFIC GAS AND ELECTRIC COMPANYX
04/13/20212020/Q4
Line
No.Number of Units
(g)(f) (h)
CONVERSION APPARATUS AND SPECIAL EQUIPMENT
(k)
Total Capacity
(Continued)
Capacity of Substation
(In Service) (In MVa)
Number ofTransformers
In ServiceSpare
Type of Equipment
Number of
Transformers(In MVa)
(i) (j)
5. Show in columns (I), (j), and (k) special equipment such as rotary converters, rectifiers, condensers, etc. and auxiliary equipment for
increasing capacity.
6. Designate substations or major items of equipment leased from others, jointly owned with others, or operated otherwise than by
reason of sole ownership by the respondent. For any substation or equipment operated under lease, give name of lessor, date and
period of lease, and annual rent. For any substation or equipment operated other than by reason of sole ownership or lease, give name
of co-owner or other party, explain basis of sharing expenses or other accounting between the parties, and state amounts and accounts
affected in respondent's books of account. Specify in each case whether lessor, co-owner, or other party is an associated company.
19 3 1.00000 1
16 1 1.00000 2
30 1 1.00000 3
32 2 2.00000 4
7 1 1.00000 5
16 1 1.00000 6
22 2 2.00000 7
27 2 2.00000 8
81 3 3.00000 9
90 2 2.00000 10
19 3 1 1.00000 11
60 2 2.00000 12
32 2 2.00000 13
18 7 1 2.00000 14
60 2 2.00000 15
21 3 3.00000 16
50 5 3.00000 17
90 3 3.00000 18
16 1 1.00000 19
13 2 2.00000 20
12 1 1.00000 21
29 2 2.00000 22
60 2 2.00000 23
19 2 2.00000 24
16 3 1.00000 25
46 2 2.00000 26
13 1 1.00000 27
150 2 2.00000 28
90 2 2.00000 29
77 3 3.00000 30
60 2 2.00000 31
90 2 2.00000 32
70 2 2.00000 33
25 1 1.00000 34
16 1 1.00000 35
13 3 1 1.00000 36
90 2 2.00000 37
16 1 1.00000 38
133 6 2.00000 39
77 3 2.00000 40
FERC FORM NO. 1 (ED. 12-96) Page 427.8

Name of Respondent This Report Is:(1) An Original
(2) A Resubmission
Date of Report(Mo, Da, Yr)
Year/Period of Report
End of
SUBSTATIONS
PACIFIC GAS AND ELECTRIC COMPANYX
04/13/20212020/Q4
Line
No.Number of Units
(g)(f) (h)
CONVERSION APPARATUS AND SPECIAL EQUIPMENT
(k)
Total Capacity
(Continued)
Capacity of Substation
(In Service) (In MVa)
Number ofTransformers
In ServiceSpare
Type of Equipment
Number of
Transformers(In MVa)
(i) (j)
5. Show in columns (I), (j), and (k) special equipment such as rotary converters, rectifiers, condensers, etc. and auxiliary equipment for
increasing capacity.
6. Designate substations or major items of equipment leased from others, jointly owned with others, or operated otherwise than by
reason of sole ownership by the respondent. For any substation or equipment operated under lease, give name of lessor, date and
period of lease, and annual rent. For any substation or equipment operated other than by reason of sole ownership or lease, give name
of co-owner or other party, explain basis of sharing expenses or other accounting between the parties, and state amounts and accounts
affected in respondent's books of account. Specify in each case whether lessor, co-owner, or other party is an associated company.
11 1 1.00000 1
4 1 1.00000 2
4 1 1.00000 3
20 3 1.00000 4
46 2 2.00000 5
16 1 1.00000 6
13 1 1.00000 7
16 1 1.00000 8
29 2 2.00000 9
90 2 2.00000 10
39 2 2.00000 11
105 3 3.00000 12
22 1 1.00000 13
27 2 2.00000 14
30 1 1.00000 15
60 2 2.00000 16
135 3 3.00000 17
90 2 2.00000 18
11 3 1 1.00000 19
11 3 1.00000 20
47 3 3.00000 21
90 2 2.00000 22
135 3 3.00000 23
23 2 2.00000 24
49 4 2.00000 25
75 2 2.00000 26
215 4 4.00000 27
25 3 1 1.00000 28
90 2 2.00000 29
75 2 2.00000 30
76 3 3.00000 31
30 1 1.00000 32
165 3 3.00000 33
14 2 2.00000 34
145 5 1 3.00000 35
45 1 1.00000 36
75 2 2.00000 37
90 2 2.00000 38
91 3 3.00000 39
21 3 1 1.00000 40
FERC FORM NO. 1 (ED. 12-96) Page 427.9

Name of Respondent This Report Is:(1) An Original
(2) A Resubmission
Date of Report(Mo, Da, Yr)
Year/Period of Report
End of
SUBSTATIONS
PACIFIC GAS AND ELECTRIC COMPANYX
04/13/20212020/Q4
Line
No.Number of Units
(g)(f) (h)
CONVERSION APPARATUS AND SPECIAL EQUIPMENT
(k)
Total Capacity
(Continued)
Capacity of Substation
(In Service) (In MVa)
Number ofTransformers
In ServiceSpare
Type of Equipment
Number of
Transformers(In MVa)
(i) (j)
5. Show in columns (I), (j), and (k) special equipment such as rotary converters, rectifiers, condensers, etc. and auxiliary equipment for
increasing capacity.
6. Designate substations or major items of equipment leased from others, jointly owned with others, or operated otherwise than by
reason of sole ownership by the respondent. For any substation or equipment operated under lease, give name of lessor, date and
period of lease, and annual rent. For any substation or equipment operated other than by reason of sole ownership or lease, give name
of co-owner or other party, explain basis of sharing expenses or other accounting between the parties, and state amounts and accounts
affected in respondent's books of account. Specify in each case whether lessor, co-owner, or other party is an associated company.
27 2 2.00000 1
25 6 2.00000 2
45 1 1.00000 3
11 3 1.00000 4
115 3 3.00000 5
30 1 1 1.00000 6
90 2 2.00000 7
46 2 2.00000 8
21 3 1 1.00000 9
5 3 1 1.00000 10
45 1 1.00000 11
45 1 1.00000 12
51 3 3.00000 13
13 3 1 1.00000 14
32 2 2.00000 15
13 3 1 1.00000 16
43 2 2.00000 17
21 3 1 1.00000 18
5 3 1 1.00000 19
29 2 2.00000 20
19 3 1.00000 21
45 1 1.00000 22
71 7 3.00000 23
30 1 1.00000 24
21 2 2.00000 25
45 1 1.00000 26
45 1 1.00000 27
105 3 3.00000 28
135 3 3.00000 29
135 8 1 4.00000 30
11 3 1.00000 31
32 2 2.00000 32
13 3 1 1.00000 33
49 4 1 2.00000 34
43 4 1 2.00000 35
11 3 1 1.00000 36
90 2 2.00000 37
21 2 2.00000 38
32 2 2.00000 39
105 3 3.00000 40
FERC FORM NO. 1 (ED. 12-96) Page 427.10

Name of Respondent This Report Is:(1) An Original
(2) A Resubmission
Date of Report(Mo, Da, Yr)
Year/Period of Report
End of
SUBSTATIONS
PACIFIC GAS AND ELECTRIC COMPANYX
04/13/20212020/Q4
Line
No.Number of Units
(g)(f) (h)
CONVERSION APPARATUS AND SPECIAL EQUIPMENT
(k)
Total Capacity
(Continued)
Capacity of Substation
(In Service) (In MVa)
Number ofTransformers
In ServiceSpare
Type of Equipment
Number of
Transformers(In MVa)
(i) (j)
5. Show in columns (I), (j), and (k) special equipment such as rotary converters, rectifiers, condensers, etc. and auxiliary equipment for
increasing capacity.
6. Designate substations or major items of equipment leased from others, jointly owned with others, or operated otherwise than by
reason of sole ownership by the respondent. For any substation or equipment operated under lease, give name of lessor, date and
period of lease, and annual rent. For any substation or equipment operated other than by reason of sole ownership or lease, give name
of co-owner or other party, explain basis of sharing expenses or other accounting between the parties, and state amounts and accounts
affected in respondent's books of account. Specify in each case whether lessor, co-owner, or other party is an associated company.
13 4 1 1.00000 1
45 1 1.00000 2
170 3 3.00000 3
5 3 1 1.00000 4
30 1 1.00000 5
32 2 2.00000 6
18 2 2.00000 7
45 1 1.00000 8
45 1 1.00000 9
21 3 1 1.00000 10
45 1 1.00000 11
11 1 1.00000 12
34 4 1 2.00000 13
43 2 2.00000 14
60 2 2.00000 15
6 3 1 1.00000 16
90 2 2.00000 17
75 2 2.00000 18
11 1 1.00000 19
14 3 1 1.00000 20
43 2 2.00000 21
90 2 2.00000 22
45 1 1.00000 23
135 3 3.00000 24
29 2 2.00000 25
11 3 1 1.00000 26
45 1 1.00000 27
120 3 3.00000 28
30 1 1.00000 29
16 1 1.00000 30
105 3 3.00000 31
115 3 2.00000 32
135 3 2.00000 33
16 1 1.00000 34
79 5 3.00000 35
30 1 1.00000 36
150 2 2.00000 37
90 2 2.00000 38
20 4 1 2.00000 39
29 2 2.00000 40
FERC FORM NO. 1 (ED. 12-96) Page 427.11

Name of Respondent This Report Is:(1) An Original
(2) A Resubmission
Date of Report(Mo, Da, Yr)
Year/Period of Report
End of
SUBSTATIONS
PACIFIC GAS AND ELECTRIC COMPANYX
04/13/20212020/Q4
Line
No.Number of Units
(g)(f) (h)
CONVERSION APPARATUS AND SPECIAL EQUIPMENT
(k)
Total Capacity
(Continued)
Capacity of Substation
(In Service) (In MVa)
Number ofTransformers
In ServiceSpare
Type of Equipment
Number of
Transformers(In MVa)
(i) (j)
5. Show in columns (I), (j), and (k) special equipment such as rotary converters, rectifiers, condensers, etc. and auxiliary equipment for
increasing capacity.
6. Designate substations or major items of equipment leased from others, jointly owned with others, or operated otherwise than by
reason of sole ownership by the respondent. For any substation or equipment operated under lease, give name of lessor, date and
period of lease, and annual rent. For any substation or equipment operated other than by reason of sole ownership or lease, give name
of co-owner or other party, explain basis of sharing expenses or other accounting between the parties, and state amounts and accounts
affected in respondent's books of account. Specify in each case whether lessor, co-owner, or other party is an associated company.
41 4 2.00000 1
16 1 1.00000 2
32 2 2.00000 3
90 2 2.00000 4
45 1 1.00000 5
90 2 2.00000 6
45 1 1.00000 7
23 2 2.00000 8
43 3 2.00000 9
195 4 4.00000 10
175 4 4.00000 11
120 3 3.00000 12
38 3 1 1.00000 13
135 3 3.00000 14
90 3 3.00000 15
90 2 2.00000 16
42 6 1 2.00000 17
31 4 2.00000 18
16 1 1.00000 19
45 1 1.00000 20
18 4 2.00000 21
60 2 2.00000 22
16 1 1.00000 23
6 3 1.00000 24
25 7 2.00000 25
11 1 1.00000 26
22 3 1.00000 27
45 1 1.00000 28
41 2 2.00000 29
25 2 2.00000 30
5 3 1 1.00000 31
16 1 1.00000 32
23 2 2.00000 33
11 1 1.00000 34
45 1 1.00000 35
30 1 1.00000 36
30 1 1.00000 37
45 1 1.00000 38
45 1 1.00000 39
30 1 1.00000 40
FERC FORM NO. 1 (ED. 12-96) Page 427.12
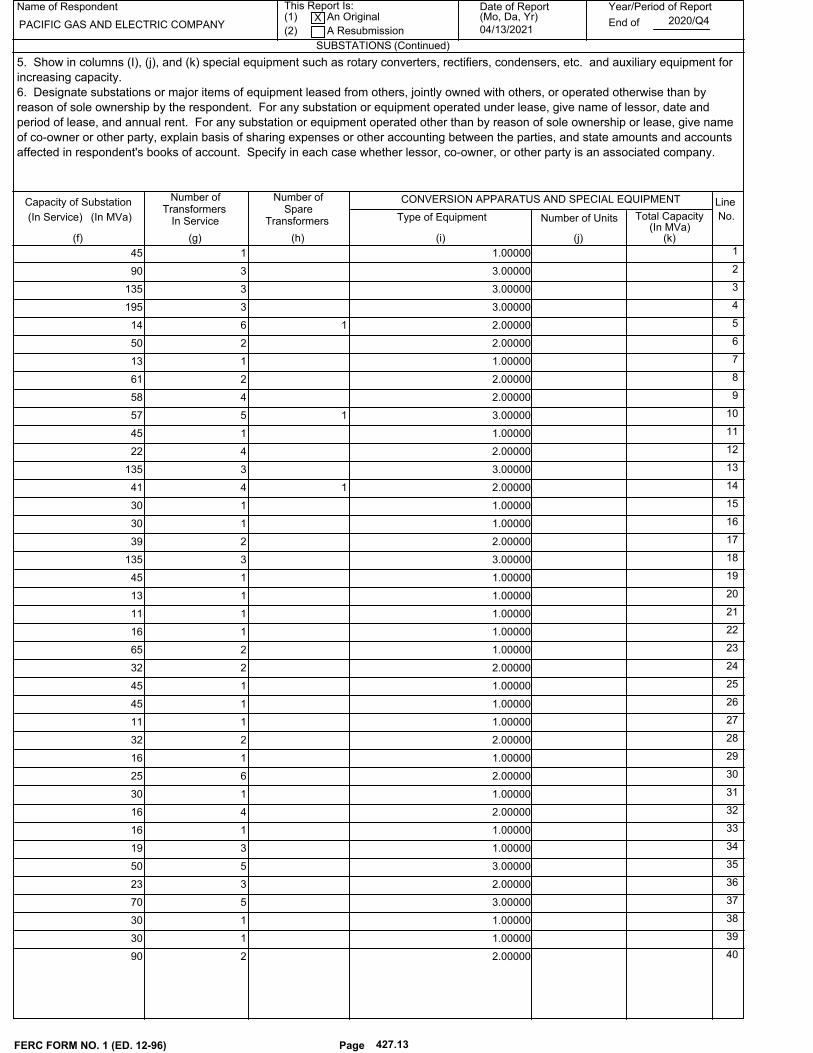
Name of Respondent This Report Is:(1) An Original
(2) A Resubmission
Date of Report(Mo, Da, Yr)
Year/Period of Report
End of
SUBSTATIONS
PACIFIC GAS AND ELECTRIC COMPANYX
04/13/20212020/Q4
Line
No.Number of Units
(g)(f) (h)
CONVERSION APPARATUS AND SPECIAL EQUIPMENT
(k)
Total Capacity
(Continued)
Capacity of Substation
(In Service) (In MVa)
Number ofTransformers
In ServiceSpare
Type of Equipment
Number of
Transformers(In MVa)
(i) (j)
5. Show in columns (I), (j), and (k) special equipment such as rotary converters, rectifiers, condensers, etc. and auxiliary equipment for
increasing capacity.
6. Designate substations or major items of equipment leased from others, jointly owned with others, or operated otherwise than by
reason of sole ownership by the respondent. For any substation or equipment operated under lease, give name of lessor, date and
period of lease, and annual rent. For any substation or equipment operated other than by reason of sole ownership or lease, give name
of co-owner or other party, explain basis of sharing expenses or other accounting between the parties, and state amounts and accounts
affected in respondent's books of account. Specify in each case whether lessor, co-owner, or other party is an associated company.
45 1 1.00000 1
90 3 3.00000 2
135 3 3.00000 3
195 3 3.00000 4
14 6 1 2.00000 5
50 2 2.00000 6
13 1 1.00000 7
61 2 2.00000 8
58 4 2.00000 9
57 5 1 3.00000 10
45 1 1.00000 11
22 4 2.00000 12
135 3 3.00000 13
41 4 1 2.00000 14
30 1 1.00000 15
30 1 1.00000 16
39 2 2.00000 17
135 3 3.00000 18
45 1 1.00000 19
13 1 1.00000 20
11 1 1.00000 21
16 1 1.00000 22
65 2 1.00000 23
32 2 2.00000 24
45 1 1.00000 25
45 1 1.00000 26
11 1 1.00000 27
32 2 2.00000 28
16 1 1.00000 29
25 6 2.00000 30
30 1 1.00000 31
16 4 2.00000 32
16 1 1.00000 33
19 3 1.00000 34
50 5 3.00000 35
23 3 2.00000 36
70 5 3.00000 37
30 1 1.00000 38
30 1 1.00000 39
90 2 2.00000 40
FERC FORM NO. 1 (ED. 12-96) Page 427.13

Name of Respondent This Report Is:(1) An Original
(2) A Resubmission
Date of Report(Mo, Da, Yr)
Year/Period of Report
End of
SUBSTATIONS
PACIFIC GAS AND ELECTRIC COMPANYX
04/13/20212020/Q4
Line
No.Number of Units
(g)(f) (h)
CONVERSION APPARATUS AND SPECIAL EQUIPMENT
(k)
Total Capacity
(Continued)
Capacity of Substation
(In Service) (In MVa)
Number ofTransformers
In ServiceSpare
Type of Equipment
Number of
Transformers(In MVa)
(i) (j)
5. Show in columns (I), (j), and (k) special equipment such as rotary converters, rectifiers, condensers, etc. and auxiliary equipment for
increasing capacity.
6. Designate substations or major items of equipment leased from others, jointly owned with others, or operated otherwise than by
reason of sole ownership by the respondent. For any substation or equipment operated under lease, give name of lessor, date and
period of lease, and annual rent. For any substation or equipment operated other than by reason of sole ownership or lease, give name
of co-owner or other party, explain basis of sharing expenses or other accounting between the parties, and state amounts and accounts
affected in respondent's books of account. Specify in each case whether lessor, co-owner, or other party is an associated company.
45 1 1.00000 1
11 1 1.00000 2
32 2 2.00000 3
90 2 2.00000 4
32 2 2.00000 5
64 4 2.00000 6
11 3 1.00000 7
73 2 2.00000 8
11 3 1 1.00000 9
90 2 2.00000 10
73 4 1 2.00000 11
23 1 1.00000 12
27 4 1 2.00000 13
30 1 1.00000 14
90 2 2.00000 15
16 1 1.00000 16
90 2 2.00000 17
11 3 1 1.00000 18
11 3 1 1.00000 19
30 1 1.00000 20
19 3 1.00000 21
29 2 2.00000 22
12 3 1 1.00000 23
186 3 3.00000 24
180 4 4.00000 25
98 2 2.00000 26
375 5 5.00000 27
450 6 6.00000 28
565 4 4.00000 29
18 2 2.00000 30
40 2 3.00000 31
30 1 1.00000 32
180 4 2.00000 33
160 4 4.00000 34
135 3 3.00000 35
45 1 1.00000 36
13 3 1 1.00000 37
16 1 1.00000 38
45 1 1.00000 39
135 3 3.00000 40
FERC FORM NO. 1 (ED. 12-96) Page 427.14

Name of Respondent This Report Is:(1) An Original
(2) A Resubmission
Date of Report(Mo, Da, Yr)
Year/Period of Report
End of
SUBSTATIONS
PACIFIC GAS AND ELECTRIC COMPANYX
04/13/20212020/Q4
Line
No.Number of Units
(g)(f) (h)
CONVERSION APPARATUS AND SPECIAL EQUIPMENT
(k)
Total Capacity
(Continued)
Capacity of Substation
(In Service) (In MVa)
Number ofTransformers
In ServiceSpare
Type of Equipment
Number of
Transformers(In MVa)
(i) (j)
5. Show in columns (I), (j), and (k) special equipment such as rotary converters, rectifiers, condensers, etc. and auxiliary equipment for
increasing capacity.
6. Designate substations or major items of equipment leased from others, jointly owned with others, or operated otherwise than by
reason of sole ownership by the respondent. For any substation or equipment operated under lease, give name of lessor, date and
period of lease, and annual rent. For any substation or equipment operated other than by reason of sole ownership or lease, give name
of co-owner or other party, explain basis of sharing expenses or other accounting between the parties, and state amounts and accounts
affected in respondent's books of account. Specify in each case whether lessor, co-owner, or other party is an associated company.
300 4 4.00000 1
60 2 2.00000 2
90 2 2.00000 3
27 2 2.00000 4
12 3 1.00000 5
135 3 3.00000 6
41 2 2.00000 7
161 3 3.00000 8
21 3 1 1.00000 9
5 3 1 1.00000 10
60 2 2.00000 11
30 1 1.00000 12
13 1 1.00000 13
90 2 2.00000 14
11 1 1.00000 15
45 1 1.00000 16
61 2 2.00000 17
16 1 1.00000 18
15 3 1 1.00000 19
60 2 2.00000 20
32 2 2.00000 21
49 4 2.00000 22
19 6 2.00000 23
30 1 1.00000 24
11 1 1.00000 25
60 2 2.00000 26
25 3 3.00000 27
19 1 1.00000 28
40 4 1 2.00000 29
13 1 1.00000 30
25 2 2.00000 31
150 2 2.00000 32
51 4 1 2.00000 33
105 3 2.00000 34
11 3 1 1.00000 35
225 3 3.00000 36
75 2 2.00000 37
105 3 3.00000 38
22 6 1.00000 39
17 2 2.00000 40
FERC FORM NO. 1 (ED. 12-96) Page 427.15

Name of Respondent This Report Is:(1) An Original
(2) A Resubmission
Date of Report(Mo, Da, Yr)
Year/Period of Report
End of
SUBSTATIONS
PACIFIC GAS AND ELECTRIC COMPANYX
04/13/20212020/Q4
Line
No.Number of Units
(g)(f) (h)
CONVERSION APPARATUS AND SPECIAL EQUIPMENT
(k)
Total Capacity
(Continued)
Capacity of Substation
(In Service) (In MVa)
Number ofTransformers
In ServiceSpare
Type of Equipment
Number of
Transformers(In MVa)
(i) (j)
5. Show in columns (I), (j), and (k) special equipment such as rotary converters, rectifiers, condensers, etc. and auxiliary equipment for
increasing capacity.
6. Designate substations or major items of equipment leased from others, jointly owned with others, or operated otherwise than by
reason of sole ownership by the respondent. For any substation or equipment operated under lease, give name of lessor, date and
period of lease, and annual rent. For any substation or equipment operated other than by reason of sole ownership or lease, give name
of co-owner or other party, explain basis of sharing expenses or other accounting between the parties, and state amounts and accounts
affected in respondent's books of account. Specify in each case whether lessor, co-owner, or other party is an associated company.
45 1 1.00000 1
90 2 2.00000 2
21 3 1 1.00000 3
120 3 3.00000 4
13 1 1.00000 5
135 3 3.00000 6
90 3 3.00000 7
27 2 2.00000 8
13 1 1.00000 9
225 3 3.00000 10
49 4 2.00000 11
21 3 1 1.00000 12
90 2 2.00000 13
90 2 2.00000 14
150 2 2.00000 15
13 1 1.00000 16
121 4 4.00000 17
16 1 1.00000 18
90 2 2.00000 19
90 2 2.00000 20
24 4 2 2.00000 21
30 1 1.00000 22
61 2 2.00000 23
32 2 2.00000 24
23 4 2.00000 25
29 2 2.00000 26
10 3 1 1.00000 27
105 3 3.00000 28
120 3 3.00000 29
6 3 1 1.00000 30
30 1 1.00000 31
29 2 2.00000 32
17 6 2.00000 33
90 2 4.00000 34
30 1 1.00000 35
60 2 2.00000 36
90 2 2.00000 37
150 2 1 2.00000 38
21 3 1 1.00000 39
60 2 2.00000 40
FERC FORM NO. 1 (ED. 12-96) Page 427.16

Name of Respondent This Report Is:(1) An Original
(2) A Resubmission
Date of Report(Mo, Da, Yr)
Year/Period of Report
End of
SUBSTATIONS
PACIFIC GAS AND ELECTRIC COMPANYX
04/13/20212020/Q4
Line
No.Number of Units
(g)(f) (h)
CONVERSION APPARATUS AND SPECIAL EQUIPMENT
(k)
Total Capacity
(Continued)
Capacity of Substation
(In Service) (In MVa)
Number ofTransformers
In ServiceSpare
Type of Equipment
Number of
Transformers(In MVa)
(i) (j)
5. Show in columns (I), (j), and (k) special equipment such as rotary converters, rectifiers, condensers, etc. and auxiliary equipment for
increasing capacity.
6. Designate substations or major items of equipment leased from others, jointly owned with others, or operated otherwise than by
reason of sole ownership by the respondent. For any substation or equipment operated under lease, give name of lessor, date and
period of lease, and annual rent. For any substation or equipment operated other than by reason of sole ownership or lease, give name
of co-owner or other party, explain basis of sharing expenses or other accounting between the parties, and state amounts and accounts
affected in respondent's books of account. Specify in each case whether lessor, co-owner, or other party is an associated company.
20 3 1.00000 1
11 1 1.00000 2
16 1 1.00000 3
8 1 1.00000 4
50 2 2.00000 5
90 2 2.00000 6
30 1 1.00000 7
24 4 2.00000 8
135 3 3.00000 9
30 1 1.00000 10
105 3 3.00000 11
29 2 2.00000 12
105 3 3.00000 13
44 4 1 2.00000 14
30 1 1.00000 15
105 3 3.00000 16
27 2 2.00000 17
19 3 1 1.00000 18
13 3 1 1.00000 19
30 1 1.00000 20
11 3 1 1.00000 21
14 3 1 1.00000 22
14 1 1.00000 23
30 1 1.00000 24
13 1 1.00000 25
120 3 3.00000 26
23 3 1.00000 27
135 3 3.00000 28
60 2 2.00000 29
135 3 3.00000 30
13 1 1.00000 31
120 3 3.00000 32
11 1 1.00000 33
27 2 2.00000 34
1 1 1.00000 35
2 3 1.00000 36
9 3 1 1.00000 37
7 1 1.00000 38
9 3 1 1.00000 39
6 3 1.00000 40
FERC FORM NO. 1 (ED. 12-96) Page 427.17

Name of Respondent This Report Is:(1) An Original
(2) A Resubmission
Date of Report(Mo, Da, Yr)
Year/Period of Report
End of
SUBSTATIONS
PACIFIC GAS AND ELECTRIC COMPANYX
04/13/20212020/Q4
Line
No.Number of Units
(g)(f) (h)
CONVERSION APPARATUS AND SPECIAL EQUIPMENT
(k)
Total Capacity
(Continued)
Capacity of Substation
(In Service) (In MVa)
Number ofTransformers
In ServiceSpare
Type of Equipment
Number of
Transformers(In MVa)
(i) (j)
5. Show in columns (I), (j), and (k) special equipment such as rotary converters, rectifiers, condensers, etc. and auxiliary equipment for
increasing capacity.
6. Designate substations or major items of equipment leased from others, jointly owned with others, or operated otherwise than by
reason of sole ownership by the respondent. For any substation or equipment operated under lease, give name of lessor, date and
period of lease, and annual rent. For any substation or equipment operated other than by reason of sole ownership or lease, give name
of co-owner or other party, explain basis of sharing expenses or other accounting between the parties, and state amounts and accounts
affected in respondent's books of account. Specify in each case whether lessor, co-owner, or other party is an associated company.
5 3 1.00000 1
9 1 1.00000 2
5 1 1.00000 3
9 2 2.00000 4
5 1 1.00000 5
3 6 1.00000 6
6 6 1 1.00000 7
1 3 1.00000 8
2 3 1 1.00000 9
6 3 1 1.00000 10
9 3 1.00000 11
6 3 1 1.00000 12
3 3 1.00000 13
7 6 1 2.00000 14
5 3 1 1.00000 15
3 3 1.00000 16
2 1 1.00000 17
5 1 1.00000 18
8 1 1.00000 19
6 3 1 1.00000 20
9 3 1.00000 21
3 3 1 1.00000 22
6 3 1.00000 23
3 3 1 1.00000 24
6 3 1 1.00000 25
5 3 1.00000 26
5 1 1.00000 27
6 3 1.00000 28
6 3 1.00000 29
5 1 1.00000 30
3 6 1 1.00000 31
2 3 1.00000 32
4 3 1 1.00000 33
9 6 1.00000 34
6 3 1 1.00000 35
3 3 1 1.00000 36
7 1 1.00000 37
2 3 1 1.00000 38
6 1 1.00000 39
9 3 1 1.00000 40
FERC FORM NO. 1 (ED. 12-96) Page 427.18

Name of Respondent This Report Is:(1) An Original
(2) A Resubmission
Date of Report(Mo, Da, Yr)
Year/Period of Report
End of
SUBSTATIONS
PACIFIC GAS AND ELECTRIC COMPANYX
04/13/20212020/Q4
Line
No.Number of Units
(g)(f) (h)
CONVERSION APPARATUS AND SPECIAL EQUIPMENT
(k)
Total Capacity
(Continued)
Capacity of Substation
(In Service) (In MVa)
Number ofTransformers
In ServiceSpare
Type of Equipment
Number of
Transformers(In MVa)
(i) (j)
5. Show in columns (I), (j), and (k) special equipment such as rotary converters, rectifiers, condensers, etc. and auxiliary equipment for
increasing capacity.
6. Designate substations or major items of equipment leased from others, jointly owned with others, or operated otherwise than by
reason of sole ownership by the respondent. For any substation or equipment operated under lease, give name of lessor, date and
period of lease, and annual rent. For any substation or equipment operated other than by reason of sole ownership or lease, give name
of co-owner or other party, explain basis of sharing expenses or other accounting between the parties, and state amounts and accounts
affected in respondent's books of account. Specify in each case whether lessor, co-owner, or other party is an associated company.
2 3 1 1.00000 1
6 3 1 1.00000 2
2 3 1 1.00000 3
5 3 1.00000 4
2 3 1 1.00000 5
5 1 1.00000 6
9 3 1.00000 7
2 3 1 1.00000 8
8 6 1 1.00000 9
2 3 1.00000 10
9 3 1 1.00000 11
9 3 1.00000 12
3 3 1.00000 13
9 3 1 1.00000 14
5 3 1 1.00000 15
5 1 1.00000 16
3 1 1.00000 17
5 1 1.00000 18
9 1 1.00000 19
6 3 1.00000 20
7 3 1 1.00000 21
8 6 1 1.00000 22
7 1 1.00000 23
1 3 1 1.00000 24
4 1 1.00000 25
4 1 1.00000 26
3 3 1.00000 27
5 1 1.00000 28
2 3 1 1.00000 29
6 3 1.00000 30
5 3 1.00000 31
6 3 1 1.00000 32
7 1 1.00000 33
7 2 2.00000 34
2 3 1.00000 35
3 3 1.00000 36
5 3 1.00000 37
6 6 1.00000 38
4 1 1.00000 39
6 3 1 1.00000 40
FERC FORM NO. 1 (ED. 12-96) Page 427.19

Name of Respondent This Report Is:(1) An Original
(2) A Resubmission
Date of Report(Mo, Da, Yr)
Year/Period of Report
End of
SUBSTATIONS
PACIFIC GAS AND ELECTRIC COMPANYX
04/13/20212020/Q4
Line
No.Number of Units
(g)(f) (h)
CONVERSION APPARATUS AND SPECIAL EQUIPMENT
(k)
Total Capacity
(Continued)
Capacity of Substation
(In Service) (In MVa)
Number ofTransformers
In ServiceSpare
Type of Equipment
Number of
Transformers(In MVa)
(i) (j)
5. Show in columns (I), (j), and (k) special equipment such as rotary converters, rectifiers, condensers, etc. and auxiliary equipment for
increasing capacity.
6. Designate substations or major items of equipment leased from others, jointly owned with others, or operated otherwise than by
reason of sole ownership by the respondent. For any substation or equipment operated under lease, give name of lessor, date and
period of lease, and annual rent. For any substation or equipment operated other than by reason of sole ownership or lease, give name
of co-owner or other party, explain basis of sharing expenses or other accounting between the parties, and state amounts and accounts
affected in respondent's books of account. Specify in each case whether lessor, co-owner, or other party is an associated company.
5 3 1 1.00000 1
9 1 1.00000 2
5 1 1.00000 3
3 3 1 1.00000 4
5 3 1.00000 5
6 3 1 1.00000 6
6 3 1 1.00000 7
2 3 1.00000 8
3 3 1.00000 9
3 3 1 1.00000 10
8 3 1 1.00000 11
3 3 1.00000 12
4 1 1.00000 13
3 1 1.00000 14
1 1.00000 15
6 1 1.00000 16
1 1 1.00000 17
9 1 1.00000 18
6 3 1 1.00000 19
5 1 1.00000 20
5 1 1.00000 21
8 3 1 1.00000 22
9 3 1 1.00000 23
4 1 1.00000 24
3 3 1 1.00000 25
5 1 1.00000 26
4 1 1.00000 27
9 3 1 1.00000 28
5 1 1.00000 29
5 3 1.00000 30
2 3 1 1.00000 31
10 3 1 1.00000 32
5 1 1.00000 33
3 3 1.00000 34
5 1 1.00000 35
3 3 1 1.00000 36
2 3 1.00000 37
9 3 1 1.00000 38
4 3 1.00000 39
4 1 1.00000 40
FERC FORM NO. 1 (ED. 12-96) Page 427.20

Name of Respondent This Report Is:(1) An Original
(2) A Resubmission
Date of Report(Mo, Da, Yr)
Year/Period of Report
End of
SUBSTATIONS
PACIFIC GAS AND ELECTRIC COMPANYX
04/13/20212020/Q4
Line
No.Number of Units
(g)(f) (h)
CONVERSION APPARATUS AND SPECIAL EQUIPMENT
(k)
Total Capacity
(Continued)
Capacity of Substation
(In Service) (In MVa)
Number ofTransformers
In ServiceSpare
Type of Equipment
Number of
Transformers(In MVa)
(i) (j)
5. Show in columns (I), (j), and (k) special equipment such as rotary converters, rectifiers, condensers, etc. and auxiliary equipment for
increasing capacity.
6. Designate substations or major items of equipment leased from others, jointly owned with others, or operated otherwise than by
reason of sole ownership by the respondent. For any substation or equipment operated under lease, give name of lessor, date and
period of lease, and annual rent. For any substation or equipment operated other than by reason of sole ownership or lease, give name
of co-owner or other party, explain basis of sharing expenses or other accounting between the parties, and state amounts and accounts
affected in respondent's books of account. Specify in each case whether lessor, co-owner, or other party is an associated company.
6 3 1 1.00000 1
3 1 1 2.00000 2
9 3 1 1.00000 3
9 3 1 1.00000 4
5 1 1 1.00000 5
-58 6
98658 2094 209 7
8
9
675 331 53 10
11
12
13
14
15
16
17
18
19
20
21
22
23
24
25
26
27
28
29
30
31
32
33
34
35
36
37
38
39
40
FERC FORM NO. 1 (ED. 12-96) Page 427.21

Schedule Page: 426.3 Line No.: 29 Column: e
2.4 and 7.2 Schedule Page: 426.3 Line No.: 35 Column: e2.4 and 7.2
Schedule Page: 426.4 Line No.: 27 Column: e2.4 and 7.2
Schedule Page: 426.5 Line No.: 17 Column: e2.4 and 7.2
Schedule Page: 426.8 Line No.: 17 Column: e2.4 and 7.2
Schedule Page: 426.9 Line No.: 9 Column: e2.4 and 7.2
Schedule Page: 426.9 Line No.: 25 Column: e2.4 and 7.2
Schedule Page: 426.10 Line No.: 22 Column: c60 or 115
Schedule Page: 426.12 Line No.: 20 Column: c70 or 115
Schedule Page: 426.13 Line No.: 2 Column: e2.4 and 7.2
Schedule Page: 426.13 Line No.: 17 Column: e2.4 and 7.2
Schedule Page: 426.16 Line No.: 11 Column: e2.4 and 7.2
Schedule Page: 426.21 Line No.: 6 Column: aThe original entries in column f were in two decimal places, which the FERC softwarerounds automatically to whole numbers. The entry here is an adjustment to present thecorrect total.
Schedule Page: 426.21 Line No.: 8 Column: a
Substation voltage classes are listed separately for each substation. Therefore, there will be multiple line entries for substations
having more than one voltage class. Substations having combined total capacity of =>10 MVA are listed individually. Substations
with less than 10 MVA capacity are lumped together in one line item. All transmission substations are =>10 MVA.
There are 92 Transmission Substations and 605 Distribution Substations. This represents a total of 697 physical transmission and
distribution substations (92+605=697). All transmission and distribution substations are unattended.
Any substation that has a transmission-to-transmission transformation (Primary voltage >=60kV and secondary voltage >= 60kV) is
defined as a transmission station, regardless of the number of distribution assets in the station. Hence, substations with both
transmission and distribution (secondary voltage <60 kV) transformers are characterized as Transmission in the list. There are 59
Transmission Substations with both transmission and distribution transformers; one of them <10MVA. There are 664 substations
Name of Respondent
PACIFIC GAS AND ELECTRIC COMPANY
This Report is:(1) X An Original(2) A Resubmission
Date of Report(Mo, Da, Yr)
04/13/2021
Year/Period of Report
2020/Q4
FOOTNOTE DATA
FERC FORM NO. 1 (ED. 12-87) Page 450.1

with distribution transformer banks. (605+59 = 664)
Name of Respondent
PACIFIC GAS AND ELECTRIC COMPANY
This Report is:(1) X An Original(2) A Resubmission
Date of Report(Mo, Da, Yr)
04/13/2021
Year/Period of Report
2020/Q4
FOOTNOTE DATA
FERC FORM NO. 1 (ED. 12-87) Page 450.2

Name of Respondent This Report Is:(1) An Original
(2) A Resubmission
Date of Report(Mo, Da, Yr)
Year/Period of Report
End of
TRANSACTIONS WITH ASSOCIATED (AFFILIATED) COMPANIES
PACIFIC GAS AND ELECTRIC COMPANYX
04/13/20212020/Q4
Line
No. Description of the Non-Power Good or Service
Name of
(c)(b)(a) (d)
Associated/AffiliatedCompany
AccountCharged or
Credited
Amount
Credited
1. Report below the information called for concerning all non-power goods or services received from or provided to associated (affiliated) companies.2. The reporting threshold for reporting purposes is $250,000. The threshold applies to the annual amount billed to the respondent or billed to
an associated/affiliated company for non-power goods and services. The good or service must be specific in nature. Respondents should notattempt to include or aggregate amounts in a nonspecific category such as "general".
3. Where amounts billed to or received from the associated (affiliated) company are based on an allocation process, explain in a footnote.
Charged or
1 Non-power Goods or Services Provided by Affiliated
2 PG&E Corporation
3
4 Corporate A&G Allocations 105,180,139923.0, 426.5
5 Total - Administrative & General Expenses 105,180,139
6
7 Eureka Energy Company
8 Rent Expense 321,288532.0
9
10 Total Non-power Goods/Srv.provided by Affiliates 105,501,427
11
12
13
14
15
16
17
18
19
20 Non-power Goods or Services Provided for Affiliate
21 PG&E Corporation 930.2
22 ACCOUNTING 542,720
23 ADMINISTRATION 87,601
24 AFFILIATE RULES COMPLIANCE SUPPORT 24,561
25 BANKING SERVICES 34,380
26 EMPLOYEE TRANSFER FEE 105,609
27 BUSINESS PLANNING SERVICES 26,747
28 COMPLIANCE & ETHICS SUPPORT 8,194
29 CONSULTING SERVICES 5,722
30 CORPORATE SECRETARY SUPPORT 1,780
31 CORPORATE SUSTAINABILITY SUPPORT 248,154
32 FINANCIAL FORECASTING AND ANALYSIS 57,603
33 FLEET SERVICES 373
34 HUMAN RESOURCES SUPPORT 219,472
35 INFORMATION TECHNOLOGY 361,552
36 INSURANCE SUPPORT 9,284
37 INTERNAL AUDIT SERVICES 6,071
38 INVESTOR RELATIONS SUPPORT 9,917
39 LEGAL 45,113
40 MISC EXPENSE 621
41 REAL ESTATE AND FACILITY 102,714
42 SECURITY SUPPORT 932,812
1 Non-power Goods or Services Provided by Affiliated
2
FERC FORM NO. 1 (New) Page 429
FERC FORM NO. 1-F (New)

Name of Respondent This Report Is:(1) An Original
(2) A Resubmission
Date of Report(Mo, Da, Yr)
Year/Period of Report
End of
TRANSACTIONS WITH ASSOCIATED (AFFILIATED) COMPANIES
PACIFIC GAS AND ELECTRIC COMPANYX
04/13/20212020/Q4
Line
No. Description of the Non-Power Good or Service
Name of
(c)(b)(a) (d)
Associated/AffiliatedCompany
AccountCharged or
Credited
Amount
Credited
1. Report below the information called for concerning all non-power goods or services received from or provided to associated (affiliated) companies.2. The reporting threshold for reporting purposes is $250,000. The threshold applies to the annual amount billed to the respondent or billed to
an associated/affiliated company for non-power goods and services. The good or service must be specific in nature. Respondents should notattempt to include or aggregate amounts in a nonspecific category such as "general".
3. Where amounts billed to or received from the associated (affiliated) company are based on an allocation process, explain in a footnote.
Charged or
3
4
5
6
7
8
9
10
11
12
13
14
15
16
17
18
19
20 Non-power Goods or Services Provided for Affiliate
21
22 SOURCING SUPPORT 123,984
23 STRATEGIC ANALYSIS SUPPORT 48,014
24 TAX SERVICES 64,684
25 INTEREST 394,718
26
27
28 Total - A&G Direct Charges to PG&E Corp 3,462,400
29
30 FUELCO 930.2
31 ACCOUNTING 18,231
32 CFO SUPPORT 6,077
33 FUEL PURCHASING SUPPORT 483,151
34 LEGAL 2,024
35 SUPPLY CHAIN SUPPORT 9,151
36
37 Total - A&G Direct Charges to FUELCO 518,634
38
39
40
41 TOTAL NON-POWER GOODS/SRV PROVIDED FOR 3,981,034
42
FERC FORM NO. 1 (New) Page 429.1
FERC FORM NO. 1-F (New)

Schedule Page: 429 Line No.: 10 Column: a
Note
The 2020 Corporation’s A&G Allocation Rate is calculated below and will be rounded up to 99% (Three-Factor
Methodology and Headcount).
1. Three-Factor Methodology – 99.99%
It is the simple average of the following three ratios:
a. Affiliate Assets/Total Consolidated Assets
b. Affiliate Operating Expenses less Fuel purchase costs /Total Consolidated Operating Expenses
less Fuel purchase costs
c. Affiliate Headcount/Total Consolidate Headcount
2. Capitalization: 100%
It is the ratio of affiliate’s capitalization over total consolidated capitalization.
3. Headcount: 99.9%
It is the ratio of affiliate’s headcount over total headcount for all entities.
All Corporation’s cost centers allocate its charges based on Three Factor Methodology, except for the following
cost centers.
COST CENTER Description Allocation Approach
PCC 20036 HOLD-Banking & Money Management Capitalization
PCC 20039 HOLD-Investments & Benefits Headcount
PCC 20041 HOLD- Investor Relations Capitalization
PCC 20050 HOLD – Senior VP Human Resource Headcount
Name of Respondent
PACIFIC GAS AND ELECTRIC COMPANY
This Report is:(1) X An Original(2) A Resubmission
Date of Report(Mo, Da, Yr)
04/13/2021
Year/Period of Report
2020/Q4
FOOTNOTE DATA
FERC FORM NO. 1 (ED. 12-87) Page 450.1

SELECTED FINANCIAL DATA - CLASS A, B, C, AND D ELECTRIC UTILITIES
PACIFIC GAS AND ELECTRIC COMPANY
PERSON RESPONSIBLE FOR THIS REPORT: David Thomason, Vice President, CFO and Controller
(PREPARED FROM INFORMATION IN THE 2020 FERC ANNUAL REPORTS)
December 31
2019 2020 Annual Average
NET ELECTRIC PLANT INVESTMENT (a)
Electric Utility Plant (California Only)
1. Intangible Plant 1,180,995,855$ 1,155,424,681$ 1,168,210,268$
2. Land and Land Rights 624,175,634 650,790,964 637,483,299
3. Depreciable Plant 67,239,111,217 71,704,526,946 69,471,819,082
4. Nuclear Fuel 3,099,071,385 3,219,553,706 3,159,312,546
5. Gross Electric Utility Plant 72,143,354,091 76,730,296,297 74,436,825,195
6. Electric Plant Held for Future Use - Net 0 0 0
7. Construction Work in Progress - Electric 2,278,121,533 2,211,726,113 2,244,923,823
8. Accumulated Deferred Income Taxes 7,445,591,597 7,019,341,739 7,232,466,668
9. Less: Reserves for Depreciation - Electric
Utility Plant 29,566,029,119 31,210,612,711 30,388,320,915
10. Less: Amortization and Depletion Reserves 3,471,973,667 3,390,798,359 3,431,386,013
11. Less: Customer Advances and Contribution
in Aid of Construction 229,861,025 211,023,299 220,442,162
12. Less: Accumulated Deferred Income and Investment
Tax Credits 6,953,898,868 7,486,751,242 7,220,325,055
13. Material and Supplies - Electric Only 356,607,340 346,383,429 351,495,385
14. Net Electric Plant Investment 42,001,911,882$ 44,008,561,966$ 43,005,236,926$
CAPITALIZATION (Total Company)
15. Common Stock 1,321,874,045$ 1,321,874,045$ 1,321,874,045$
16. Capital Stock (Premium, Discount and Expense)-Net 1,769,325,445 1,769,325,445 1,769,325,445
17. Other Paid in Capital 6,780,547,928 26,516,580,090 16,648,564,009
18. Retained Earnings (4,794,324,809) (4,389,005,328) (4,591,665,069)
19. Other Miscellaneous Capital Accounts 0 0 0
20. Common Stock and Equity (Lines 15 through 19) 5,077,422,609 25,218,774,252 15,148,098,430
21. Preferred Stock 257,994,575 257,994,575 257,994,575
22. Long-Term Debt 19,887,100,000 31,832,344,699 25,859,722,350
23. Notes Payable and Current Portion of Long-Term Debt 3,138,570,758 3,555,000,000 3,346,785,379
24. Total Capitalization (Lines 20 through 23) 28,361,087,942$ 60,864,113,526$ 44,612,600,734$
-
(a) Includes Common Plant Allocations.
Page 600

PACIFIC GAS AND ELECTRIC COMPANY
INCOME STATEMENT DATA
FOR CALIFORNIA INTRASTATE ELECTRIC OPERATIONS ONLY (b)
Annual Amount
25. Operating Revenues 13,890,072,200
26. Operating and Maintenance Expense 11,022,381,199
27. Depreciation 2,165,415,394
28. Depreciation for Asset Retirement Costs -
29. Amortization and Depletion Expenses and Property Losses 208,716,079
30. Regulatory Debits 10,608,342
31. Regulatory Credits (892,660,285)
32. Property Taxes (Ad Valorem) 312,151,635
33. Taxes Other than Income and Property Taxes 125,843,078
34. Operating Revenue Deductions (Before Federal and
California Income Taxes) 12,952,455,442
35. Federal and California Income Taxes - Net 333,095,449
36. Gains and Losses from Disposition of Electric Plant - Net (145,599)
37. Accretion Expense -
38. Total Utility Operating Expenses 13,285,405,292
39. Net Operating Income (California Intrastate Electric Operations Only) 604,666,908
OTHER INCOME AND EXPENSE (Total Company)
40. Net Operating Income from Other Utility Operations (Total) 717,900,065
41. Net Other Income and Deductions 200,014,197
42. Income Before Interest Charges 1,522,581,170
43. Interest Charges 1,111,622,682
44. Income Before Extraordinary Items 410,958,488
45. Extraordinary Items - Net of Income Tax -
46. Net Income 410,958,488
47. Preferred Stock Dividends and Redemption Premium -
48. Income Available for Common Stock 410,958,488$
49. Common Stock Dividends -
OTHER DATA (CALIFORNIA INTRASTATE ELECTRIC OPERATIONS ONLY) (b) Items (48-50)
50. Payroll Charged to Operating and Maintenance Expense 1,391,522,211$
51. Payroll Capitalized to Utility Plant - Electric 985,270,819
52.Total Payroll 2,376,793,030$
53. Purchased Power 4,613,389,452$
54. Allowance for Funds Used During Construction 140,607,684$
55. Interdepartmental Revenues 51,081,618$
56. Interdepartmental Expenses 72,093,081$
57. Revenue from Sales to Residential Customers 5,522,669,106$
58. Residential Sales in Kwhs 29,814,086,000
59. Total Revenue Sales to Ultimate Customers 13,366,378,507$
60. Kwhs Sold to Ultimate Customers 78,792,915,000
61. Average Number of Residential Customers 4,910,767
62. Average Number of Ultimate Customers 5,590,562
(b) Assumes CPUC Jurisdictional Portion of Electric Operations.
Page 601