Annual Report 2020 - wahlee.com
319
WAH LEE INDUSTRIAL CORP. Annual Report 2020 Printed on March 31, 2021 Taiwan Stock Exchange: http://www.twse.com.tw Market Observation Post System: http://mops.twse.com.tw The Company: http://www.wahlee.com Stock Ticker: 3010
-
Upload
khangminh22 -
Category
Documents
-
view
1 -
download
0
Transcript of Annual Report 2020 - wahlee.com

WAH LEE INDUSTRIAL
CORP.
Annual Report 2020
Printed on March 31, 2021
Taiwan Stock Exchange: http://www.twse.com.tw
Market Observation Post System: http://mops.twse.com.tw
The Company: http://www.wahlee.com
Stock Ticker: 3010

I. Contact Information:
Spokesperson:
Name: Lulu Huang
Title: Executive Assistant to the Chairman
Tel: (02)2715-2087
Email: [email protected]
Acting Spokesperson:
Name: Lin, Ren-Chih
Title: Director, Finance Department
Tel: (07)216-4311
Email: [email protected]
II. Headquarters and Branches
Headquarters: 10F, No. 235, Chung Cheng 4th Rd., Qianjin Dist., Kaohsiung City
Tel: (07)216-4311
Taichung Branch: No.68-11, Gongyequ 1st Rd., Xitun Dist., Taichung City
Tel: (04) 359-2845
Taipei Branch: 11~12F No.369, Fuxing N. Rd. Taipei City
Tel: (02) 2715-2087
III. Stock Transfer Agency
Agency: Stock Affair, Taishin International Bank
Adds: B1 No.96, Sec. 3 Jianguo North Rd, Taipei City
Tel: (02) 2504-8125
Web: http://www.taishinbank.com.tw
IV. 2020 Independent Auditor:
CPAs: Wu, Chiu-Yen and Chen, Chen-Li
Accounting Firm: Deloitte & Touche Taiwan
Add: 3F No.88, Chenggong 2nd Rd. Kaohsiung City
Tel: (07) 530-1888
Web: http://www.deloitte.com.tw
V. Exchange of Securities Traded Overseas and Access to the Securities Information: Nil
VI. Company Website: http://www.wahlee.com

Table of Contents
Page One. Letter to Shareholders .............................................................................................................................. 1 Two.Company Profile 3 Three: Corporate Governance ................................................................................................................................... 6
I. Organization ................................................................................................................................................ 6 II. Management team information ................................................................................................................... 9 III. Compensation paid to Directors and general managers .............................................................................. 17 IV. Corporate governance ................................................................................................................................. 22 V. Information on CPA fees ............................................................................................................................. 63 VI. Replacement of CPA ................................................................................................................................... 65 VII. Chairman, general managers, or accounting or finance managers who had held positions in CPA firms
or its associated entities in the past year ...................................................................................................
66 VIII. Changes of shareholding by Directors, managers, and major Shareholders............................................. 66 IX. Mutual relationships among top ten shareholders .................................................................................... 68 X. Syndicated shareholdings in an affiliate by the Company, Directors, supervisors, managers or other
affiliates directly or directly held .............................................................................................................
69
Four: Capital Raising ................................................................................................................................................ 72 I. Capital and shares .................................................................................................................................... 72 II. Corporate bonds ....................................................................................................................................... 76 III. Preference shares ...................................................................................................................................... 76 IV. Overseas depositary receipts .................................................................................................................... 76 V. New share issuance for employee stock warrants and employee restricted stock plans ........................... 76 VI. New share issuance in connection with mergers and acquisitions ........................................................... 76 VII. Capital utilization plan ............................................................................................................................. 76
Five. Operational Overview ...................................................................................................................................... 77
I. Business activities .................................................................................................................................... 77 II. Market, production, and sales................................................................................................................... 88 III. Employee profile ...................................................................................................................................... 98 IV. Environmental protection expenditures .................................................................................................... 99 V. Labor-management relations .................................................................................................................... 99 VI. Important contracts ................................................................................................................................... 103
Six. Financial Highlights ........................................................................................................................................... 105
I. Condensed financial statements in the past five years with auditors’ opinions ........................................ 105 II. Five-year financial analysis ...................................................................................................................... 109 III. 2020 Audit committee's report for financial statements ......................................................................... 112 IV. 2020 Financial statement for the most recent year ................................................................................... 113 V. Stand-along financial statements, certified by a CPA............................................................................... 113 VI. Financial difficulties occurred by the Company and its affiliates ............................................................ 113 VII. Other material disclosures: ....................................................................................................................... 113
Seven. Review of the Financial Position, Business Performance, and Risk Management ........................................ 114
I. Financial position ..................................................................................................................................... 114 II. Financial performance .............................................................................................................................. 114 III. Cash flow ................................................................................................................................................. 115 IV. Effect upon financial operations of any major capital expenditures in the most recent year ................... 115 V. Review of investment policies, performance and improving plans with investment plans in the coming
year 115 VI. Risk management analysis and assessment .............................................................................................. 117 VII. Risk matters analysis and assessment ...................................................................................................... 118 VIII. Other important matters ........................................................................................................................... 123

Eight: Special Notes .................................................................................................................................................. 124
I. Subsidiary information ............................................................................................................................. 124 II. Private placements of securities ............................................................................................................. 134 III. Shares of the Company held or disposed by subsidiaries ......................................................................... 134 IV. Other supplementary information and notes ............................................................................................ 134
Nine: Events with Material Impacts on Equity or Stock Price ................................................................................ 135

- 1 -
One. Letter to Shareholders
Dear shareholders,
2020 is a year full of challenges. Amid the continuing trade war between China and the U.S.,
technology war, financial war, and geopolitical war have put a spotlight on Taiwan on the world's
economic stage. Wah Lee not only continues playing a pivotal role of total solution provider in
Greater China and Asian area, but also expects ourselves to become a world-class total solution
provider in the future. Besides, the relentless spread of covid-19 overshadows the world economy.
The GDP of the U.S. in 2020 was 3.5% of negative growth, the worst since the second world war.
On the other hand, Taiwan’s GDP in 2020 grew by 2.98% since Taiwan successfully controlled the
pandemic, outperforming the main economic entities worldwide. Taiwan’s technology industry
thus stood out in the global supply chain during last year.
Despite the global recession, Wah Lee performed well last year. In 2020, the record-breaking
consolidated revenue of NT$59.08 billion passed the US$2 billion threshold, suggesting the
Company’s continuous growing business scale. The gross profit reached $4.8 billion whilst the net
operating income reached $2.11 billion. Last year the profits from equity-method investment
companies also contributed to a wealthy non-operating income. These resulted in the consolidated
profit before tax of $2.64 billion. In 2020, both the Company’s profit after tax of $2.05 billion and
earnings per share of $8.03 reached the record high, increased by 31.2% from previous year. In
terms of financial indicators, Wah Lee’s consolidated current ratio and quick ratio during 2020 were
158% and 125%, respectively. Cash turnover days of 86 days is 4 days less than the previous year.
15% of return on equity in 2020 is also the highest during the recent years. Cash inflow from
operating activities amounted to $1.21 billion. Each financial indicator performed well.
There have been high demand on production capacity as in semiconductor industry the major
clients’ advanced process developed rapidly. Wah Lee is renowned for its global leading IC foundry
concept stock because it is the biggest supplier of consumables, such as photoresist, electronic-
grade chemicals and specialty gases, photoresist strippers, CMP slurry as well as machinery spare
parts. The sales grow rapidly with the boost from global chip shortages and technology upgrades.
The increasing demand following the emergence of 5G application in high-end servers, routers,
switch, a5ntenna module and telecommunication equipment urges PCB factories and IC substrate
makers to lift their production capacities. It thus stimulates Wah Lee’s sales in PCB-related
materials such as low dielectric CCL, DI high resolution dry film, PCB equipment, high frequency
connectors, electronic components and ICs.
Automotive market has become the most potential industry for engineering plastics in recent
years. We foresee a wider application of plastic in automotive exterior parts since the plastic has
been primarily used in interior materials. Plastic makers are competing to enter the automotive parts
market which requires high intensity standard. In response to the stricter emission regulations
around the world, automakers consider vehicle weight reduction their priority by replacing metals
with plastic in general. Wah Lee’s high-end engineering plastics have been widely applied in
traditional automotive parts. Its products are also equipped in electric vehicles and used in ECU
connectors, navigators, speedometers, camera modules.

- 2 -
Business opportunities emerge amid working from home since pandemic outbreak last year
and online learning to reduce physical contact. Wah Lee’s sales in heat resistant nylon materials
has been skyrocketing to meet the great demand of computers, notebooks, servers and 5G mobile
phones. Furthermore, sales of opto-electronics rapidly increased including in the upper and down-
stream panel products, video-related electronic devices, driver ICs, electronic components and
automatic equipment. The growth expands to overseas electronic products as well.
Wah Lee is considered to be an aircraft carrier in the advanced material industry. Since it was
founded more than 50 years ago, Wah Lee has always been able to follow the technology
development and seize the opportunities in mainstream industries to create striking business results
one after another. Wah Lee precisely captures global economic development trends, for example,
5G, HPC, artificial intelligence and AIOT, electric vehicles, clean and environmental friendly green
energy, biotech medical and industry 4.0 (i.e. industrial automation and smart factory). We had set
out the business plans in the aforementioned fields. In addition, we will remain our leading material
and equipment supplier position in each significant technology industry. To sustain the next 50
years of dynamic growth, we are confident to grasp development of each mainstream industry.
At last, we appreciate our shareholders’ supports for a long period of time as well as our
employees’ dedicated efforts. Wah Lee will stride into becoming the world-class technology
application total solution provider.
Chairman: Ray-Ching Chang Vice Chairman: Chun-Ying Chen CEO: Tsun-Hsien Chang
- 3 -
Two. Company Profile
I. Date of establishment: October 1, 1968.
II. Company history:
1968 : Founded in Kaohsiung with a registered capital of NT$500,000 to engage in the
sale of chemicals.
1970 : Established Composite Material Division, to promote fiber glass of Asahi Fiber
Glass and polyester resin of Nippon Shokubai Co., Ltd. in Taiwan market.
1972 : Established Industrial Material Division, to promote Toray polyester film and
printed circuit board of Sumitomo Bakelite Co. in Taiwan market.
1973 : Established Plastic Material Division, to promote engineering plastics of General
Electric (GE) and Asahi Chemical Industry Co. in Taiwan market.
Established
1975 : Established Taipei Branch.
1976 : Established Machinery Division, to promote injection molding machine of Japan
Steel Works (JSW) and PCB exposure equipment from ORC in Taiwan market.
1978 : Established Taichung Branch.
1981 : Established Research & Development Division, to promote semiconductor
related materials.
1987 : Purchased and relocated to unit 11F-1 of BaoFu Commercial Building in Taipei
for business expansion.
1988 : Renamed R&D Division as Electronic Material Division.
1989 : Founded joint venture - Chang Wah Electromaterials, Inc. with NAGASE Co.,
Ltd.
1990 : Founded joint venture - Nagase Wahlee Plastics Corp. with NAGASE Co., Ltd.
Purchased 10F of the building located at No.235, Chung-Cheng 4th Road
inKaohsiung, to be used as the headquarter.
1997 : Founded joint venture - Asahi Kasei Wah Lee Hi-Tech Corp. with Asahi Kasei
Corp..
1999 : Reorganized sales divisions to Semiconductor Material Business Division,
Electronic Machinery Business Division, Engineering Plastic Business Division,
Advanced Material Business Division, Composite Material Business Division
and Optoelectronics Business Division.
2000 : Received approval from the securities authority to list for trading on TPEX on
September 19.
2001 : Acquired majority shareholding in Raycong Industrial (Hong Kong) Limited.
Founded Wah Lee Japan Corporation.
2002 : Founded Hua Fu International Trading (Shen Zhen) Co., Ltd.
Received approval from the securities authority to list for trading on TWSE on

- 4 -
July 22.
Acquired 12F of BaoFu Commercial Building in Taipei.
2003 : Affiliated company Chang Wah Electromaterials, Inc. received approval from
the securities authority to list for trading on TPEX on October 30.
Hsinchu office and warehouse were accredited ISO9001 and ISO14001
certifications.
Founded joint venture - Shanghai Hua Chang Trading Co., Ltd. with NAGASE
Co., Ltd.
2004 : Acquired majority shareholding in hanghai Yikang Chemicals & Industries Co.,
Ltd.
Integrated Advanced Material Business Division and PCB related business of
Electronic Machinery Business Division into "Printed Circuit Board Business
Division".
Kaohsiung and Tainan Offices were accredited ISO9001 and 14001
certifications.
2005 : Affiliated company Wah Hong Industrial Corp. received approval from the
securities authority to list for trading on TPEXon June 23.
Renamed Composite Material Business Division to Composite Industrial Material
Business Division.
Taipei and Taichung Offices were accredited ISO9001 and 14001 certifications.
2006 : Invested into Wah Lee Tech (Singapore) Ptd, Ltd.
Shanghai Yikang founded Suzhou Branch.
2007 : Founded Dong Guan Hua Gang International Trading Co., Ltd.
Implemented SAP ERP system.
Dong Guan Hua Gang founded Xiamen Branch.
2008 : Acquired office space located at Ziqiang South Road, Zhubei City, Hsinchu
County.
2009 : Established Green Energy & Optoelectronics Business Division.
2010 : Liquidated Hua Fu International Trading (Shen Zhen) Co., Ltd. and re-allocated
business activities to Dong Guan Hua Gang International Trading Co., Ltd.
Dong Guan Hua Gang founded Guangdong Zhongshan Branch.
2011 : Adjusted investment structure in China, and transferred shareholding in
Shanghai Yikang Chemicals & Industries Co., Ltd. to Raycong Industrial (Hong
Kong) Limited.
Renamed Printed Circuit Board Business Division to Electronics and Mechanical
Products Business Division.Dong Guan Hua Gang founded Chongqing Branch.
Shanghai Yi Kang founded Tianjin Branch.
2012 : Founded Skypower LLC to invest in solar power stations in Japan.
Shanghai Yi Kang founded Wuhan Branch.

- 5 -
2013 : Integrated Industrial Material Business Division and parts of Green Energy &
Optoelectronics Business Division into Green Energy & Industrial Material
Business Division.
Renamed Green Energy & Optoelectronics Business Division as Optoelectronics
Business Division.
2014 : Founded Okayama, Sakuragawa, and Miyazaki Solar LLC to invest in solar
power stations in Japan.
2015 : Founded subsidiaries Hua Ying Supply Chain Management (Shenzhen) Co.,
Ltd., PT. Wah Lee Indonesia, and Wah Lee (Vietnam) Co., Ltd.
2016 : Mr. Chang Tsuen-Hsien assumed the role of CEO and President.
2017 : An Audit Committee was assembled according to corporate governance rules of
the authority.
Sold Skypower LLC and solar power stations held in its possession.
Acquired majority shareholding in Chuan Shun Logistic Co., Ltd.
2018 : Acquired majority shareholding in Wah Tech Industrial Co., Ltd. (Thailand) to
establish presence in Southeast Asia.
Sold solar power stations held by Okayama Solar LLC and liquidated the
company.
The Company celebrated its 50th anniversary.
2019 : Acquired majority shareholding in Kingstone Energy Technology Corp. and
commenced deployment of solar power stations.
Founded Wah Lee Philippines.
Founded Guangzhou Xingxian Medical Management Consulting Co., Ltd. as a
gateway to the biotechnology industry.
Invested into Cyuan Cheng Logistic Co., Ltd. for broader exposure to the
logistics industry.
2020 : Founded Hua Heng Energy Co., Ltd.

- 6 -
Three: Corporate Governance
I. Organization of the Company:
(I) Organizational chart
Chairman Office (Vice Chairman)
Business Planning Department
Human Resources
Department
Audit
Office
Finance Division
President Office
Advisory
Committee
MIS Department
Accounting Department
Finance Department
Investor Relations and
Investment Management
Department
Engineering Plastic
Business Division
OPTO-Electronics
Division
Semiconductor Material
Business Division
Electronics and Mechanical
Products Business Division
Green Energy and Industrial
Material Business Division
Operation Support Department
Logistics Administration
Department
Shareholders’ Meeting
Board of Directors
Operation Procedure
Control Department
Strategic Planning Division
CEO Office
Legal Section
Advanced Development Department
Compensation Committee
Investment Management
Department
Audit Committee

- 7 -
(II) Role and Responsibility of Various Functions
Function Role and Responsibility
Chairman Office
1. Develop, plan and execute the medium and long-term operating strategies of the
Company.
2. Manage the Company’s image and corporate relations.
Advisory Committee
1. Provide advice on the long-term operating directions and advisory on management
strategies of the Company.
2. Provide advisory on the investment directions and individual issues.
CEO Office
1. Plan and execute the medium and long-term operating strategies of the Company.
2. Provide leadership to various departments and divisions in implementing operating
strategies to achieve the yearly budgeting and financial targets of the Company.
3. Plan for major investment decisions and expand new businesses.
Audit Office
1. Devise and execute the internal audit plan.
2. Submit internal audit review report to the board of directors and monitor the results
of improvement measures.
3. Establish/manage relationship with supervisors and other related personnel.
President Office
1. Plan and execute the short, medium and long-term operating planning of the
business divisions.
2. Achieve the yearly budgeting and financial targets of the business divisions.
3. Manage and oversee the operating performance of the business divisions.
4. Manage the relationships with suppliers and customers, and assist the business
divisions in developing the distribution of new products.
Finance Division
1. Plan and establish the short, medium and long-term financial and investment
strategies of the Company.
2. Establish and manage the spokesperson mechanism and investor relations. Plan and
execute the external financing planing of the Company.
3. Provide the top management with financial advisory, investment planning and
financial risk assessment.
4. Manage and oversee the operation of the financial and accounting systems.
Strategic Planning
Division
1. Assist to devise the operating, development and human resource strategies of the
Company and Group. Devise the investment plans. Devise and establish the overall
information technology framework of the Company.
2. Manage and oversee the operations of “Human Resources”, “MIS”, “Legal
Section”, “Business Planning”, “Investment Management”, “Operation Procedure
Control” and “Advanced Development” Departments.
Various Business
Divisions
1. Engage in market development and sales.
2. Engage in operating procurements.
3. Engage in various customer services and consultations.
4. Plan, manage and utilize operating resources.
5. Engage in international market development and trading matters.
Operation Support
Department
1. Undertake environment management, property management and miscellaneous
matters.
Logistics 1. Manage the storage, transportation and delivery of raw materials and merchandise.

- 8 -
Function Role and Responsibility
Administration
Department
2. Oversee and assess the storage management, and the cost and efficiency of storage
and transportation.
Finance Division
1. Implement financial policies.
2. Undertake stock affairs.
3. Source for capital and manage its utilization.
4. Execute the evaluation and planning of the financing activities of the Company.
5. Undertake customer credit review, investigation and control.
Accounting
Department
1. Undertake and execute the planning for accounting and financial budgeting
procedures.
2. Undertake and execute the planning for tax matters.
Investor Relations and
Investment
Management
Department
1. Establish communication channels between external investors and the Company.
Devise or execute the internal PR mechanism.
2. Oversee the management of investees.
3. Assist the implementation of various systems of the Company in the investees.
4. Undertake and execute the planning for the financial budgeting procedures of the
investees and their operating performance assessment.
Human Resources
Department
1. Establish the human resource strategy of the Company. Effectively oversee the
execution of recruitment, staffing, training and retainment systems.
2. Undertake and promote a comprehensive human resource management and
development planning.
3. Plan for and execute the organizational assessment and development.
4. Plan for and execute the use of human resources.
Investment
Management
Department
1. Devise the planning and evaluation of future development of various investment
strategies and directions.
2. Devise and execute the investment strategic projects of the Company.
Business Planning
Department
1. Devise and implement the operating strategies of the Company and new
development projects for business divisions.
2. Analyze industry environment and development trends.
3. Oversee performance management and budgeting.
MIS Department
1. Devise the planing and design of the overall MIS. Manage computer resources and
equipment and promote computerization.
2. Oversee the execution of the internal control of computing cycle and the audit of
internal security.
Advanced
Development
Department
1. Devise and execute the new strategic development programs of the business
divisions.
2. Establish the latest industry development trends of the market research mechanism
and the new optimization program of collaboration with industrial suppliers.
3. Seek out appropriate strategic alliances and devise the strategic alliance planning.
Operation Procedure
Control Department
1. Coordinate and manage the operating transaction procedures and regulations.
2. Optimize and coordinate the procedures of the transaction system.
Legal Section
1. Undertake legal advisory and affairs.
2. Review, plan for, undertake and execute all contracts, litigations and other legal
affairs.

- 9 -
II. Directors, Supervisors and Management Team:
(I) Directors Directors (1) March 31, 2021
Job title)
Nationality
or place of
incorporation
Name Gender Date
elected Tenure
Date of
initial
appointment
Shareholding when
appointed Current shareholding
Current shareholdings
of spouse and minor
child(ren)
Shareholding under
other person(s) Education and
experience
Concurrent Position(s) in the Company
and other companies
Spouse or relative within the
second degree of kinship
holding other managerial,
director or supervisor position
Remarks
Shares Shareholding
percentage Shares
Shareholding
percentage Shares
Shareholding
percentage Shares
Shareholding
percentage Title Name Relation
Chairman
R.O.C.
Kang Tai
Investment
Corporation
NA May 28,
2020
3
years
June 7,
2005 14,439,155 6.24% 16,660,155 7.20% 0 0.00% 0 0.00% None None None None None None
R.O.C.
Kang Tai
Investment
Corporation
Representative:
Chang, Ray-
Ching
Male May 28,
2020
3
years
May 26,
1971 14,910,397 6.44% 6,598,397 2.85% 1,295,656 0.56% 7,300,000 3.15%
Honorary Doctorate,
National Sun Yat-sen
University
Honorary Doctorate,
National Cheng
Kung University
Wah Lee Industrial
Corporation
CEO
Chairman and CEO of Wah Hong
Industrial Corporation
Chairman of Nagase Wahlee Plastics
Corporation
Chairman of Wah Hong Holding Ltd.
ChairmanChairman of Wah Hong
Technology Ltd.
Chairman of Wah Hong International
Ltd.
Chairman of Wah Hong Development
Ltd.
Chairman of Wah Lee Holding Ltd.
Chairman of SHC Holding Ltd.
Chairman of Regent King International
Ltd.
Chairman of Fu Wang Hung Ltd.
Vice
Chairman
Directors
CEO
Chun-Yin
Chen
Lin, Shu-
Chen
Chang,
Tsuen-
Hsien
Affinity
Spouse
Father
and son
Note 1
Vice
Chairman R.O.C. Chun-Yin Chen Male
May 28,
2020
3
years
September
7, 1990 3,796,014 1.64% 3,796,014 1.64% 54,089 0.02% 0 0.00%
Department of Metal
& Mining, Waseda
University, Japan
Wah Lee Industrial
Corporation
Vice CEO
Director of Nagase Wahlee Plastics
Corporation
Director of ORC Electrical Machinery
Co., Ltd
Director of Asahi Kasei Wah Lee Hi-
Tech Corporation
Director of Hsin Hao Company
Chairman
Directors
Vice
president
Chang,
Ray-Ching
Lin, Shu-
Chen
Chen, Chih-
Yuan
Affinity
Affinity
Father
and son
None
Directors
R.O.C.
Kung Tai
Investment
Corporation
NA May 28,
2020
3
years
June 7,
2005 14,439,155 6.24% 16,660,155 7.20% 0 0.00% 0 0.00% None None None None None None
R.O.C.
Kung Tai
Investment
Corporation
Representative:
Chang, Tsuen-
Hsien
Male May 28,
2020
3
years
May 26,
2017 0 0.00% 410,000 0.18% 0 0.00% 0 0.00%
University of
Southern California
Department of
Electrical
Engineering &
Department of
Biomedical
Engineering
CEO and president of Wah Lee
Industrial Corporation
Director of Chang Wah Electromaterials
Inc.
Director of Wah Hong Industrial
Corporation
Chairman of Raycong Industrial (Hong
Kong) Limited
Chairman of Shanghai Yi Kang
Chemicals & Industries Co., Ltd.
Director of Shanghai Hua Chang
Trading Co., Ltd.
Chairman of Dongguan Huagang
International Trading Co., Ltd.
Director of ORC Electrical Machinery
Co., Ltd
Chairman of Wah Lee Tech (Singapore)
Pte. Ltd.
Director of Hua Ying Supply Chain
Management (Shenzhen) Co., Ltd.
Director of Wah Tech Industrial Co.,
Ltd.
Chairman
Director
Chang,
Ray-Ching
Lin, Shu-
Chen
Father
and son
Mother
and son
Note 1
Directors R.O.C. Lin, Chi-Hai Male May 28,
2020
3
years
September
17, 1969 2,609,959 1.13% 2,609,959 1.13% 0 0.00% 0 0.00%
Department of
Chemical
Engineering,
National Cheng
Kung University
Chairman of Toa
Resin Corporation
Chairman of Toa Resin Corporation
Director of Mingtai Chemical Co., Ltd.
Director of Yu Feng Rubber Industrial
Co., Ltd.
Director of Zhi Hui Technology Co.
None None None None

- 10 -
Directors
R.O.C.
Bau Guang
Investment
Corporation
NA May 28,
2020
3
years
June 18,
2008 1,971,873 0.85% 1,971,873 0.85% 0 0.00% 0 0.00% None
Director of Wah Hong Industrial
Corporation None None None None
R.O.C.
Bau Guang
Investment
Corporation
Representative:
Lin, Shu-Chen
(Note 2)
Female May 28,
2020
3
years
December
1, 2012 1,689,656 0.73% 1,295,656 0.56% 6,598,397 2.85% 7,300,000 3.15%
Department of
Accounting,
Kaohsiung
Vocational
Commercial School
Bank manager of
Taiwan Business
Bank Co., Ltd.
Senior advisor of Wah Lee Industrial
Corporation
Chairman of Bau Guang Investment
Corporation
Chairman
Vice
Chairman
CEO
Chang,
Ray-Ching
Chun-Yin
Chen
Chang,
Tsuen-
Hsien
Spouse
Affinity
Mother
and son None
Directors R.O.C. Yeh, Ching-Pin Male May 28,
2020
3
years
September
7, 1990 3,356,263 1.45% 3,356,263 1.45% 1,298,985 0.56% 0 0.00%
EMBA, National Sun
Yat-sen University
Wah Lee Industrial
Corporation
Senior vice president
Director and president of Wah Hong
Industrial Corporation
Director of Daily Polymer Corp.
Director of Jin Tai Sheng Co., Ltd.
Director of Wah Ma Technology Sdn.
Bhd.
Director of Jun Hong Optometric
Corporation
None None None None
Independent
Director R.O.C. Chu, Hau-Min Male
May 28,
2020
3
years
May 30,
2002 0 0.00% 0 0.00% 0 0.00% 0 0.00%
Ph.D., Economics,
Brown University
Head of Department
of Finance, National
Cheng Chi
University
President of Hsing
Kuo Management
College
Adjunct professor, Department of
Finance, National Chengchi University
Chair professor of Ching Kuo Institute
of Management and Health
Chairman of IIH Management
Consultancy Co.
Chairman of IIH Biomedical Venture
Fund I Co., Ltd.
Independent director of Chiawei Life
Co.
Independent director of BNP Paribas
Cardif TCB Life
Director of Central Deposit Insurance
Corporation
Director of Vivasolis Biotechnology
Co., Ltd.
None None None None
Independent
Director R.O.C. Wang, Yea-Kang Male
May 28,
2020
3
years
June 18,
2008 0 0.00% 0 0.00% 0 0.00% 0 0.00%
Master of Urban and
Regional Planning,
National Chung
Hsing University
Director of
Department of
Commerce, MOEA
Director of Industrial
Development
Bureau, MOEA
Director of Small
and Medium
Enterprise
Administration,
MOEA
Secretary General,
Chinese National
Federation of
Industries
Chairman of Taiwan
Textile Research
Institute
Consultant of Chinese National
Federation of Industries
Evaluation Expert of Public
Constitution Commission, Executive
Yuan
Consultant of Taiwan Textile Research
Institute
Dean of Knowledge Service Center,
Industrial Development Foundation,
National Cheng Kung University
Director of Johnson Health Tech Co.,
Ltd.
Director of Wisher Industrial Co., Ltd.
Independent director of Eclat Textile
Co., Ltd.
Independent director of Feng Hsin Steel
Co., Ltd.
None None None None
Independent
Director R.O.C. Shyu, So-De Male
May 28,
2020
3
years
May 26,
2017 0 0.00% 0 0.00% 0 0.00% 0 0.00%
Ph.D., Finance,
University of
Alabama
Professor of
Department of
Finance
Management,
National Sun Yat-sen
University
Principal and
professor of Takming
University of
Science and
Technology
None None None None None

- 11 -
Note 1: Where the chairman and the general manager, or the equivalent position holder (the highest management position) are the same person or spouses, or first-degree relatives, the rationale, reasonableness, necessity and countermeasures for the
arrangement must be provided:
Although the Chairman and president are first-degree relatives, the decision making process for the business operation is still subject to the internal control provision, that is, the “Regulations Governing the Duties of Job Positions and Authentication of
Authorities”. Further, the Chairman regularly communicates the operating status of the Company with the directors to implement corporate governance. “Procedures for Performance Assessment of the Board of Directors and Functional Committees” is
also established to enhance the operating efficiency targets of the board of directors and functional committees.
Currently, the Company has established the following measures:
1. Currently, all three independent directors are experts in the financial, legal and industry development areas respectively and therefore, able to assume the supervisory function.
2. Every year, the Company shall arrange for various directors to attend training courses held by the Securities and Futures Institute and other external parties, so as to enhance the functionality of the board of directors.
3. The independent directors are able to participate in extensive discussions of various functional committees and submit their recommendations to the board of directors for reference, thus effectuating the implementation of corporate governance.
4. More than half of the board of directors do not held concurrent positions as the Company’s employees or managers.
Note 2: Shareholding under other person(s) of spouse
Corporate Director/Supervisor March, 31, 2021
Corporate Shareholder Major Shareholder
Kang Tai Investment Corporation Fortune Investment Co., Ltd. (94.28%) and Dragon Investment Co., Ltd. (5.72%)
Bau Guang Investment Corporation Fortune Investment Co., Ltd. (100%)
Major Shareholders of Major Corporate Shareholders March, 31, 2021
Corporate Shareholder Major Shareholder
Fortune Investment Co., Ltd. Raycong Investment Co. Ltd. (98.90%) and Crystal Investment Co. Ltd. (1.1%)
Dragon Investment Co., Ltd. Titino Investment (B.V.I.) Co., Ltd. (100%)

- 12 -
Directors (2)
Criteria
Name
(Note 1)
Having met one of the following
professional qualifications, together with at
least five years work experience
Independence Criteria (Note 2)
Number of
other public
companies in
which the
individual is
concurrently
serving as an
independent
director
An instructor
or higher
position in a
department
of
commerce,
law, finance,
accounting,
or other
academic
department
related to the
business
needs of the
company in
a public or
private
junior
college,
college or
university
A judge, public
prosecutor,
attorney,
certified public
accountant, or
other
professional or
technical
specialist who
has passed a
national
examination
and been
awarded a
certificate in a
profession
necessary for
the business of
the company
Having work
experience in
the areas of
commerce,
law, finance,
or
accounting,
or otherwise
necessary for
the business
of the
company 1 2 3 4 5 6 7 8 9 10 11 12
Kang Tai Investment
Corporation
Representative: Chang,
Ray-Ching
None
Chun-Yin Chen None
Kang Tai Investment
Corporation
Representative: Chang,
Tsuen-Hsien
None
Lin, Chi-Hai None
Bau Guang Investment
Corporation
Representative: Lin, Shu-
Chen
None
Yeh, Ching-Pin None
Chu, Hao-Min 2
Wang, Yea-Kang 3
Shyu, So-De None
Note 1: The number of columns is adjusted based on the actual number.
Note 2: Director and supervisors who meet the following conditions two years prior to appointment or during the term of appointment, indicate with
“” at the corresponding boxes below.
(1) Not an employee of the Company or any of its affiliates.
(2) Not a director or supervisor of the Company or any of its affiliates. (The same does not apply, however, in cases where the person is an
independent director of the company, its parent company, or any subsidiary, or subsidiary of the same parent company as appointed in
accordance with the laws of Taiwan or with the laws of the country of the parent company or subsidiary.)
(3) Not a natural-person shareholder who holds shares, together with those held by the person’s spouse, minor children, or held by the person
under others’ names, in an aggregate amount of one percent or more of the total number of issued shares of the Company or ranks as one of its
top ten shareholders.
(4) Not a managerial officer mentioned in paragraph (1), or a spouse, relative within the second degree of kinship, or lineal relative within the
third degree of kinship mentioned in paragraphs (2) and (3).
(5) Not a director, supervisor, or Employee of an institutional shareholder that directly holds five percent or more of the total number of issued
shares of the Company, or ranks as its top five shareholders, or the designated representative pursuant to Article 27 Section 1 or 2 of Company
Act in the Company as director/supervisor. (The same does not apply, however, in cases where the person is an independent director of the
company, its parent company, or any subsidiary, or subsidiary of the same parent company as appointed in accordance with the laws of
Taiwan or with the laws of the. country of the parent company or subsidiary.)
(6) Not a director, supervisor, or employee of other company with the Board seats or more than half of the voting shares under control of one
person. (The same does not apply, however, in cases where the person is an independent director of the company, its parent company, or any
subsidiary, or subsidiary of the same parent company as appointed in accordance with the laws of Taiwan or with the laws of the country of
the parent company or subsidiary.)
(7) Not a director, supervisor, or employee of other company whose chairman or general manager are the same person or spouse of the company.
(The same does not apply, however, in cases where the person is an independent director of the company, its parent company, or any

- 13 -
subsidiary, or subsidiary of the same parent company as appointed in accordance with the laws of Taiwan or with the laws of the country of
the parent company or subsidiary)
(8) Not a director, supervisor, managerial officer, or shareholder holding five percent or more of the shares of a specified company or institution
that has a financial or business relationship with the company. (The same does not apply, however, if specified company or institution
possessing shareholdings of more than 20% and less than 50% of the total number of issued shares of the Company, and in cases where the
person is an independent director of the company, its parent company, or any subsidiary, or subsidiary of the same parent company as
appointed in accordance with the laws of Taiwan or with the laws of the country of the parent company or subsidiary)
(9) Not a professional individual who, or an owner, partner, director, supervisor, or managerial officer of a sole proprietorship, partnership,
company, or institution that provides auditing services or for the past two years, has provided commercial, legal, financial, accounting services
or consultation amounted to less than a cumulative NTD500,000 to the Company or to any affiliate of the company, or a spouse thereof.
However, this does not apply to members of Compensation Committee, Public Tender Offer Review Committee or Special Merger and
Acquisition Committee carrying out their duties in accordance with Securities and Exchange Act or Business Mergers and Acquisitions Act.
(10) Not a spouse or a relative within two degrees of consanguinity to any director.
(11) Does not meet any of the criteria described in Article 30 of the Company Act.
(12) Not the proxy of any government agency, juridical person, or their representative that is a shareholder in the Company as outlined in Article
27 of the Company Act.

- 14 -
(II) Information on President, Vice President, Director, Heads of Departments and Branches March 31, 2021
Title Nationality Name Gender Date of
appointment
Shareholding Shareholdings of spouse
and minor child(ren) Shareholding under
other person(s) Education and experience Concurrent Position(s) in the Company and other
companies
Spouse or relative within the
second degree of kinship
holding other managerial
positions Remarks
Shares Shareholding
percentage Shares Shareholding
percentage Shares Shareholding
percentage Title Name Relation
CEO & president R.O.C. Chang,
Tsuen-Hsien Male September
1, 2016 410,000 0.18% 0 0.00% 0 0.00% University of Southern California
Department of Electrical Engineering &
Department of Biomedical Engineering
Director of Chang Wah Electromaterials Inc.
Director of Wah Hong Industrial Corporation
Chairman of Raycong Industrial (Hong Kong)
Limited
Chairman of Shanghai Yi Kang Chemicals &
Industries Co., Ltd.
Director of Shanghai Hua Chang Trading Co., Ltd.
Chairman of Dongguan Huagang International
Trading Co., Ltd.
Director of ORC Electrical Machinery Co., Ltd
Chairman of Wah Lee Tech (Singapore) Pte. Ltd.
Director of Hua Ying Supply Chain Management
(Shenzhen) Co., Ltd.
Director of Wah Tech Industrial Co., Ltd.
None None None (Note 1)
CEO Office
Vice president R.O.C. Lu, Jui-
Ming Male March 1,
2017 0 0.00% 0 0.00% 0 0.00%
Department of Business Administration, National
Chengchi University
Senior VP of Chem One Holdings
(Executive) VP of Neo Solar Power Energy
Corporation (Energy Trend)
Vice Chairman of Raycong Industrial (Hong Kong)
Limited
Director and president of Founded Dongguan
Huagang International Trading Co., Ltd.
Chairman and president of Hua Ying Supply Chain
Management (Shenzhen) Co., Ltd.
Chairman of Xiamen Hua Cheng Da Logistics Co.,
Ltd.
Chairman of Guangzhou Xing Xian Medical
Management Consultation Co., Ltd.
None None None None
CEO Office
Vice president R.O.C. Yeh, Ching-
Wen Male July 1, 2018 0 0.00% 0 0.00% 0 0.00%
National Taipei Institute of Technology
Department of Mechanical Engineering
Senior manager of Nagase Wahlee Plastics
Corporation
Director of Wah Tech Industrial Co., Ltd.
Director of Wah Lee Vietnam Co., Ltd.
Chairman of Wah Lee Philippines International
Corp.
Chairman of Wah Lee Philippines Inc.
None None None None
CEO Office
Vice president R.O.C. Chang, Jui-
Sen Male July 1, 2019 265,525 0.11% 168,457 0.07% 0 0.00% Department of Biomedical Engineering, Chung
Yuan Christianity University None Director Lin, Fang-
Su Spouse None
Semiconductor
Material Division
Vice president R.O.C. Chen, Chih-
Yuan Male July 1, 2016 103,233 0.04% 23,439 0.01% 0 0.00% Department of Psychology, Columbia University
Chief of Planning of Human Resources
Department, Acer Inc.
Vice president of Wah Lee Tech (Singapore) Pte.
Ltd.
Chairman of Hsin Hao Company None None None None
OPTO-Electronics
Division
Vice president R.O.C. Liu, Feng-
Jung Male July 1, 2018 4,466 0.00% 0 0.00% 0 0.00%
Department of Electronic Engineering, Feng Chia
University
Manager of OEM Development Department, ADI
Corporation
Director of Marketing Planning and Sales
Department, Atoz-Pullman Co., Ltd.
None None None None None
Engineering Plastic
Division
Vice president
R.O.C. Su, Yu-
Liang Male July 1, 2019 0 0.00% 0 0.00% 0 0.00% Commercial and Industrial Department, Nan Kai
Institute of Technology None None None None None
Senior Director of
Engineering Plastic
Division & head of
Taichung Office
R.O.C. Chang, Jui-
Yu Male July 1, 1996 1,002,765 0.43% 174,546 0.08% 0 0.00% Department of Business Administration, Tunghai
University None None None None None
CEO Office
Senior Director R.O.C. Yu, Ching-
Tien Male April, 9,
2019 0 0.00% 0 0.00% 0 0.00% Department of Textile Engineering, National Taipei
Institute of Technology
Research assistant of Taiwan Textile Federation Director and president of Shanghai Yi Kang
Chemicals & Industries Co., Ltd. None None None None
Engineering Plastic
Division
Senior Director R.O.C. Yang, Chen-
Ming Male July 1, 2014 32,044 0.01% 0 0.00% 0 0.00% Department of Chemical Engineering, Tamkang
University
Research engineer of Chang Chun Plastics Co., Ltd. None None None None None
Engineering Plastic R.O.C. Chen, Yi- Male July 1, 2014 131 0.00% 0 0.00% 0 0.00% Department of Business Decision Making, Sanno None None None None None
10

- 15 -
Title Nationality Name Gender Date of
appointment
Shareholding Shareholdings of spouse
and minor child(ren) Shareholding under
other person(s) Education and experience Concurrent Position(s) in the Company and other
companies
Spouse or relative within the
second degree of kinship
holding other managerial
positions Remarks
Shares Shareholding
percentage Shares Shareholding
percentage Shares Shareholding
percentage Title Name Relation
Division
Director Jen University
Engineering Plastic
Division
Project Director R.O.C. Pan, Ching-
Feng Male July 1, 2014 954 0.00% 0 0.00% 0 0.00% Department of Chemical Engineering, Chinese
Culture University
Research engineer of Tai Chin Chemical Industry
Co., Ltd. None None None None None
Semiconductor
Material Division
Project Director R.O.C. Wu, Hsiu-I Male January 1,
2007 0 0.00% 0 0.00% 0 0.00% Department of Chemistry, Chung Yuan Christian
University
Researcher of Industrial Technology Research
Institute None None None None None
Semiconductor
Material Division
Acting Senior Director R.O.C. Yang,
Cheng-Ju Male July 3, 2014 0 0.00% 0 0.00% 0 0.00% Department of Chemical Engineering, National
Cheng Kung University
Assistant researcher of Industrial Technology
Research Institute None None None None None
Semiconductor
Material Division
Director R.O.C. Chang, Chi-
An Male July 1, 2016 0 0.00% 0 0.00% 0 0.00% Department of Mechanical Engineering, Feng Chia
University
Research engineer of Taiwan Sakura Corporation Director of Wah Lee Tech (Singapore) Pte. Ltd. None None None None
Semiconductors
Division
Director R.O.C. Chen, Mao-
Hua Male July 1, 2019 447 0.00% 0 0.00% 0 0.00% Department of Chemical Engineering, National
Taiwan University of Science and Technology None None None None None
Semiconductors
Division
Director R.O.C. Chang, Tzu-
Cheng Male July 1, 2020 0 0.00% 0 0.00% 0 0.00%
University of Massachusetts Lowell
Department of Chemical Engineering
Vice president of Formosa Technologies
Corporation
Director of Forcera Materials Co., Ltd. None None None None
Electronics and
Mechanical Products
Division
Director
R.O.C. Wang, Shi-
Min Male June 19,
2018 0 0.00% 0 0.00% 0 0.00% Eindhoven University of
Technology / Netherlands
Department of Electrical Engineering
Senior director of Navitas Semiconductor Ltd.
None None None None None
Electronics and
Mechanical Products
Division
Director
R.O.C. Tsai, Yu-
Tang Male July 1, 2014 0 0.00% 1,075 0.00% 0 0.00% Department of Chemical Engineering, Chinese
Culture University
Material development engineer of Kao (Taiwan)
Corporation Supervisor of ORC Electrical Machinery Co., Ltd None None None None
Green Energy and
Industrial Material
Division
Senior Director
R.O.C. Shao,
Kuang-Wei Male April 13,
2015 0 0.00% 0 0.00% 0 0.00% Department of Chemical Engineering, Kuang Wu
Industry and Commerce Junior College Director of Kingstone Energy Technology Co., Ltd. None None None None
Green Energy and
Industrial Material
Division
Senior Director
R.O.C. Lin, Li-
Chang Male July 1, 2007 81,984 0.04% 94,936 0.04% 0 0.00% Kaohsiung Industrial High School None None None None None
Strategic Planning
Division
Senior Director R.O.C. Chang, Yu-
Wen Male July 1, 2010 53,204 0.02% 0 0.00% 0 0.00% Department of Chemical Engineering, Yuan Ze
University
Manager of Hsin Song Electronics Co., Ltd. None None None None None
Strategic Planning
Division
Director R.O.C. Liu, Tsung-
Ming Male June 9,
2006 0 0.00% 0 0.00% 0 0.00% Graduate Institute of Business Adminstration,
National Sun Yat-sen University
Corporate management executive director of Yen Li
En Co., Ltd. None None None None None
Strategic Planning
Division
Director R.O.C. Lin, Fang-
Su Female July 1, 2010 168,457 0.07% 265,525 0.11% 0 0.00% Department of International Trade and Business
Administration, Ming Chuan Junior College None Vice
President Chang, Jui-
Sen Spouse None
Strategic Planning
Division
Senior Director R.O.C. Chiang,
Kuo-Jui Male March 10,
2021 0 0.00% 0 0.00% 0 0.00% Department of Chemistry, Chinese Culture
University
Chief of Hon Hai Precision Industry Co., Ltd. None None None None None
MIS Department
Director R.O.C. Shih,
Ching-
Hsien Male July 1, 2014 0 0.00% 0 0.00% 0 0.00%
Department of Information Management, Yuan Ze
University
Senior manager of MIS Department, Ichia
Technologies Inc. None None None None None
Finance Department
Director R.O.C. Lin, Ren-
Chih Male July 1, 2008 0 0.00% 0 0.00% 0 0.00% Graduate Institute of Industrial Economics,
National Central University
Project manager of Chien Hung Securities Co., Ltd. None None None None None
Finance Division
Director R.O.C. Tsai, Shu-
Fen Female July 1, 2019 100,280 0.04% 0 0.00% 0 0.00% Department of Accounting, National Cheng Kung
University (Open Junior College) Chairman, Kang Tai Investment Corporation None None None None

- 16 -
Title Nationality Name Gender Date of
appointment
Shareholding Shareholdings of spouse
and minor child(ren) Shareholding under
other person(s) Education and experience Concurrent Position(s) in the Company and other
companies
Spouse or relative within the
second degree of kinship
holding other managerial
positions Remarks
Shares Shareholding
percentage Shares Shareholding
percentage Shares Shareholding
percentage Title Name Relation
Accounting personnel of Cheng Hsin CPA Firm Accounting
Department
Director R.O.C. Li, Kuo-
Ping Male July 1, 2013 25,865 0.01% 0 0.00% 0 0.00% Department of Accounting, Chung Yuan Christian
University
Manager of Finance Division, Wus Printed Circuit
Co., Ltd.
Director of Dongguan Huagang International
Trading Co., Ltd.
Director of Raycong Industrial (Hong Kong)
Limited
None None None None
Note 1: Where the chairman and the general manager, or the equivalent position holder (the highest management position) are the same person or spouses, or first-degree relatives, the rationale, reasonableness, necessity and countermeasures for the
arrangement must be provided:
Although the Chairman and president are first-degree relatives, the decision making process for the business operation is still subject to the internal control provision, that is, the “Regulations Governing the Duties of Job Positions and Authentication
of Authorities”. Further, the Chairman regularly communicates the operating status of the Company with the directors to implement corporate governance. “Procedures for Performance Assessment of the Board of Directors and Functional
Committees” is also established to enhance the operating efficiency targets of the board of directors and functional committees.
Currently, the Company has established the following measures:
1. Currently, all three independent directors are experts in the financial, legal and industry development areas respectively and therefore, able to assume the supervisory function.
2. Every year, the Company shall arrange for various directors to attend training courses held by the Securities and Futures Institute and other external parties, so as to enhance the functionality of the board of directors.
3. The independent directors are able to participate in extensive discussions of various functional committees and submit their recommendations to the board of directors for reference, thus effectuating the implementation of corporate governance.
4. More than half of the board of directors do not held concurrent positions as the Company’s employees or managers.
- 17 -
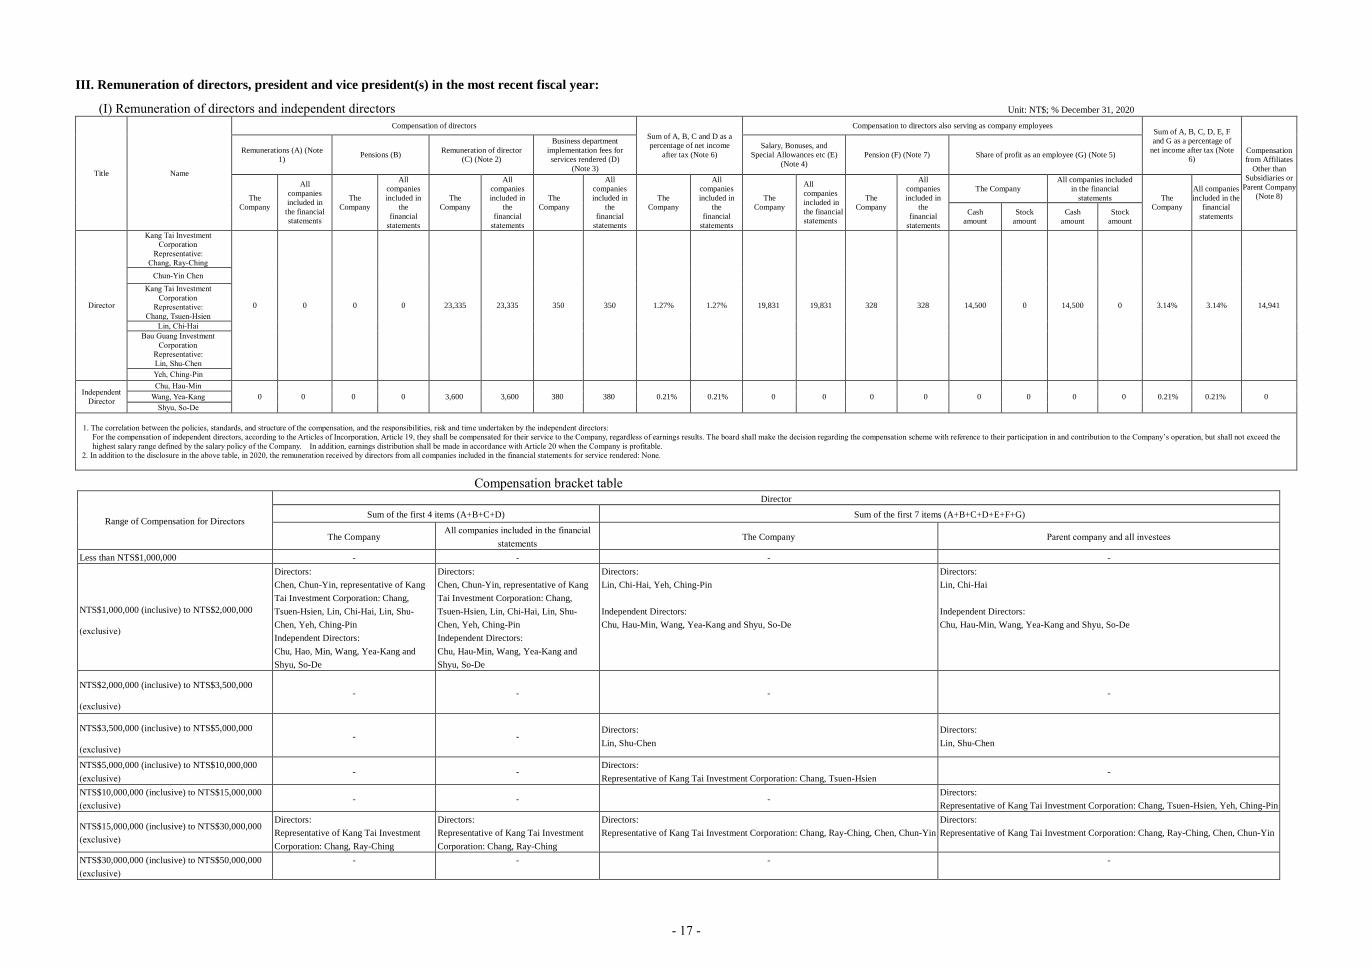
III. Remuneration of directors, president and vice president(s) in the most recent fiscal year:
(I) Remuneration of directors and independent directors Unit: NT$; % December 31, 2020
Title Name
Compensation of directors Sum of A, B, C and D as a
percentage of net income
after tax (Note 6)
Compensation to directors also serving as company employees Sum of A, B, C, D, E, F
and G as a percentage of
net income after tax (Note
6) Compensation
from Affiliates
Other than
Subsidiaries or
Parent Company
(Note 8)
Remunerations (A) (Note
1) Pensions (B) Remuneration of director
(C) (Note 2)
Business department
implementation fees for
services rendered (D)
(Note 3)
Salary, Bonuses, and
Special Allowances etc (E)
(Note 4) Pension (F) (Note 7) Share of profit as an employee (G) (Note 5)
The
Company
All
companies
included in
the financial
statements
The
Company
All
companies
included in
the
financial
statements
The
Company
All
companies
included in
the
financial
statements
The
Company
All
companies
included in
the
financial
statements
The
Company
All
companies
included in
the
financial
statements
The
Company
All
companies
included in
the financial
statements
The
Company
All
companies
included in
the
financial
statements
The Company All companies included
in the financial
statements The
Company
All companies
included in the
financial
statements Cash
amount Stock
amount Cash
amount Stock
amount
Director
Kang Tai Investment
Corporation
Representative:
Chang, Ray-Ching
0 0 0 0 23,335 23,335 350 350 1.27% 1.27% 19,831 19,831 328 328 14,500 0 14,500 0 3.14% 3.14% 14,941
Chun-Yin Chen
Kang Tai Investment
Corporation
Representative:
Chang, Tsuen-Hsien Lin, Chi-Hai
Bau Guang Investment
Corporation
Representative:
Lin, Shu-Chen Yeh, Ching-Pin
Independent
Director
Chu, Hau-Min 0 0 0 0 3,600 3,600 380 380 0.21% 0.21% 0 0 0 0 0 0 0 0 0.21% 0.21% 0 Wang, Yea-Kang
Shyu, So-De
1. The correlation between the policies, standards, and structure of the compensation, and the responsibilities, risk and time undertaken by the independent directors:
For the compensation of independent directors, according to the Articles of Incorporation, Article 19, they shall be compensated for their service to the Company, regardless of earnings results. The board shall make the decision regarding the compensation scheme with reference to their participation in and contribution to the Company’s operation, but shall not exceed the
highest salary range defined by the salary policy of the Company. In addition, earnings distribution shall be made in accordance with Article 20 when the Company is profitable.
2. In addition to the disclosure in the above table, in 2020, the remuneration received by directors from all companies included in the financial statements for service rendered: None.
Compensation bracket table
Range of Compensation for Directors
Director
Sum of the first 4 items (A+B+C+D) Sum of the first 7 items (A+B+C+D+E+F+G)
The Company All companies included in the financial
statements The Company Parent company and all investees
Less than NTS$1,000,000 - - - -
NTS$1,000,000 (inclusive) to NTS$2,000,000
(exclusive)
Directors:
Chen, Chun-Yin, representative of Kang
Tai Investment Corporation: Chang,
Tsuen-Hsien, Lin, Chi-Hai, Lin, Shu-
Chen, Yeh, Ching-Pin
Independent Directors:
Chu, Hao, Min, Wang, Yea-Kang and
Shyu, So-De
Directors:
Chen, Chun-Yin, representative of Kang
Tai Investment Corporation: Chang,
Tsuen-Hsien, Lin, Chi-Hai, Lin, Shu-
Chen, Yeh, Ching-Pin
Independent Directors:
Chu, Hau-Min, Wang, Yea-Kang and
Shyu, So-De
Directors:
Lin, Chi-Hai, Yeh, Ching-Pin
Independent Directors:
Chu, Hau-Min, Wang, Yea-Kang and Shyu, So-De
Directors:
Lin, Chi-Hai
Independent Directors:
Chu, Hau-Min, Wang, Yea-Kang and Shyu, So-De
NTS$2,000,000 (inclusive) to NTS$3,500,000
(exclusive) - - - -
NTS$3,500,000 (inclusive) to NTS$5,000,000
(exclusive) - -
Directors:
Lin, Shu-Chen Directors:
Lin, Shu-Chen
NTS$5,000,000 (inclusive) to NTS$10,000,000
(exclusive) - -
Directors:
Representative of Kang Tai Investment Corporation: Chang, Tsuen-Hsien -
NTS$10,000,000 (inclusive) to NTS$15,000,000
(exclusive) - - -
Directors:
Representative of Kang Tai Investment Corporation: Chang, Tsuen-Hsien, Yeh, Ching-Pin
NTS$15,000,000 (inclusive) to NTS$30,000,000
(exclusive)
Directors:
Representative of Kang Tai Investment
Corporation: Chang, Ray-Ching
Directors:
Representative of Kang Tai Investment
Corporation: Chang, Ray-Ching
Directors:
Representative of Kang Tai Investment Corporation: Chang, Ray-Ching, Chen, Chun-Yin Directors:
Representative of Kang Tai Investment Corporation: Chang, Ray-Ching, Chen, Chun-Yin
NTS$30,000,000 (inclusive) to NTS$50,000,000
(exclusive) - - - -

- 18 -
NTS$50,000,000 (inclusive) to NTS$100,000,000
(exclusive) - - - -
More than NTS$100,000,000 - - - - Total 9 9 9 9
Note 1: Referring to director salaries, allowance, severance package, various rewards, bonuses and etc.
Note 2: Referring to appropriation of director remuneration for 2020 that has been resolved by the board of directors.
Note 3: Referring to professional fees for services rendered made to directors for 2020 (including honorarium and compensation for Compensation Committee members).
Note 4: Referring to salaries, allowance, severance package, various rewards, bonuses, honorarium, special allowance, various allowances, dormitories, cars and other material provisions made to directors who held concurrent positions as company employees (including president, vice presidents, other managers and
employees) for 2020.
Note 5: Referring to employee cash salaries made to directors who held concurrent positions as company employees (including president, vice presidents, other managers and employees) for 2020; the amount for distribution which was resolved by the board of directors was extrapolated based on the pro rata disbursement in
the preceding year.
Note 6: The net income after tax refers to the net income after tax for 2020.
Note 7: Referring to pension appropriation for 2020.
Note 8: (1) If the director receives compensation from investees other than the Company’s subsidiary or the parent company, the said compensation shall be incorporated in column I of the compensation bracket table. The column shall be renamed” parent company and all investees”.
(2) Compensation refers to the remuneration, stipends (including stipends as employee, director and supervisor) and business department implementation fees for services rendered made to directors for holding concurrent director, supervisor or manager positions in investees other than the Company’s subsidiary or the
parent company.
(II) Compensation of supervisors: Since the shareholders’ meeting on May 26, 2017, the Audit Committee has been established to replace the functions of supervisors.
(III) Compensation of president and vice president Unit: NT$; % December 31, 2020
Title Name
Salary (A) (Note 1) Pensions (B) (Note 5) Bonuses and Special
Allowance (C) (Note 2) Employee Earnings Distribution (D) (Note 3)
Sum of A, B, C and D as a percentage
of net income after tax (%) (Note 4)
Parent company and all
investees (Note 6)
The
Company
All companies
included in the
financial statements
The
Company
All companies
included in the
financial statements
The
Company
All companies
included in the
financial statements
The Company All companies included in the
financial statements The Company
All companies
included in the
financial statements Cash amount Stock amount Cash amount Stock amount
CEO & president Chang, Tsuen-
Hsien
14,775 21,202 485 485 12,741 20,537 21,466 0 21,466 0 2.66% 3.43% 1,830
Vice president Lu, Jui-Ming Vice president (Note 7) Chen, Chi-Hsing
Vice president Chen, Chih-Yuan Vice president Liu, Feng-Jung Vice president Yeh, Ching-Wen Vice president Chang, Jui-Sen Vice president Su, Yu-Liang
Compensation bracket table
The compensation awarded to the president and vice presidents of the
Company
President and vice president
The Company Parent company and all investees (E)
Less than NTS$1,000,000 - -
NTS$1,000,000 (inclusive) to NTS$2,000,000 (exclusive) - -
NTS$2,000,000 (inclusive) to NTS$3,500,000 (exclusive) Chen, Chi-Hsing Chen, Chi-Hsing
NTS$3,500,000 (inclusive) to NTS$5,000,000 (exclusive) Lu, Jui-Ming -
NTS$5,000,000 (inclusive) to NTS$10,000,000 (exclusive) Chang, Tsuen-Hsien, Chen, Chih-Yuan, Liu, Feng-Jung, Yeh, Ching-Wen, Chang, Jui-Sen, Su,
Yu-Liang
Chang, Tsuen-Hsien, Lu, Jui-Ming, Chen, Chih-Yuan, Liu, Feng-Jung, Yeh, Ching-Wen, Chang, Jui-Sen, Su,
Yu-Liang
NTS$10,000,000 (inclusive) to NTS$15,000,000 (exclusive) - -
NTS$15,000,000 (inclusive) to NTS$30,000,000 (exclusive) - -
NTS$30,000,000 (inclusive) to NTS$50,000,000 (exclusive) - -
NTS$50,000,000 (inclusive) to NTS$100,000,000 (exclusive) - -
More than NTS$100,000,000 - -
Total 8 8

- 19 -
Note 1: Referring to president and vice president salaries, allowances, severance package and etc for 2020.
Note 2: Referring to president and vice presidents’ various rewards and bonuses for 2020.
Note 3: The employee compensation for 2020 resolved by the board of directors was extrapolated based on the pro rata disbursement in the preceding year.
Note 4: The net income after tax refers to the net income after tax for 2020.
Note 5: Referring to pension appropriation for 2020.
Note 6: (1) If the president and vice presidents receive compensation from investees other than the Company’s subsidiary or the parent company, the said compensation shall be incorporated in column I of the compensation bracket table. The column shall be renamed ”parent
company and all investees”.
(2) Compensation refers to the remuneration, allowance (including stipends as employee, director and supervisor) and professional fees for services rendered made to president and vice presidents for holding concurrent director, supervisor or manager positions in investees other
than the Company’s subsidiary or the parent company.
Note 7: Retired in February 2020.

- 20 -
(IV) The percentage of total remuneration paid by the Company and by all companies included in the consolidated
financial statements for the two most recent fiscal years to directors, supervisors, president and vice presidents of
the company, relative to net income, and the correlation between policies, standards, and portfolios for the
payment of remuneration, the procedures for determining remuneration, and business performance and future
risks.
Title The Company Consolidated Financial Statements
2019 2020 2019 2020 Director 4.08% 3.35% 4.08% 3.35%
Supervisor 0.00% 0.00% 0.00% 0.00% President and vice president 4.02% 2.66% 4.90% 3.43%
Note: The information for 2020 includes earnings distribution items. The earnings distribution was proposed by
the board of directors and extrapolated based on the information of the preceding year. It is yet to be
resolved by the shareholders’ meeting.
Description:
(1) The director compensation made by the Company and its subsidiaries includes honorarium and
compensation. Meanwhile, the compensation for directors who hold concurrent managerial positions includes
salary, bonuses and employee compensation. The president and vice president compensation made by the
Company and its subsidiaries includes salary, bonuses and employee compensation.
(2) The performance assessment and basis of compensation for directors and managers:
According to the Articles of Incorporation, Article 19, the directors and supervisors shall be compensated for
their service to the Company, regardless of earnings results. The board shall make the decision regarding the
compensation scheme with reference to their participation in and contribution to the Company’s operation,
but shall not exceed the highest salary range defined by the salary policy of the Company. Earnings
distribution shall be made in accordance with Article 20 when the Company is profitable; the managers of
the Company and its subsidiaries are compensated according to the Company’s compensation standard.
Per Articles of Incorporation, Article 20:
When the Company is profitable for the fiscal year, 9% to 13% shall be appropriated as employee
compensation and not more than 2% shall be appropriated as director compensation. However, the profit
shall be retained when there are accumulated losses yet to be offset.
Employee compensation stated above may be made in cash or stock and shall also be allocated to employees
of affiliated companies who have met certain criteria.
The two items above shall be executed according to the board’s resolution and reported in the shareholders’
meeting.
The compensation made to the managers by the Company and its subsidiaries includes salary and bonuses.
Of which, the education and experience qualification, professional capabilities, scope of management and
industry standard are taken into consideration for the salary compensation, which is payable monthly and
according to job ranking.
Job appraisal, contribution to the Company, management skills and future potential are some of the factors to
be considered in terms of the annual salary adjustment, promotion and job ranking.
For bonus payments to managers, various performance evaluation items are taken into consideration,
including financial indicators (e.g. effectiveness in achieving revenue and profit targets) and non-financial
indicators (e.g. innovations and integration, risk and security management). The Compensation Committee
shall take the job position, scope of duty and contribution of achieving operating targets into consideration
and make reference to the yearly operating performance improvement proposal in determining the bonuses
before resolving within the committee and forwarding the payment proposal to the board of directors for
resolution.
(3) Apart from honorarium, the compensation made to directors from the Company and its subsidiaries mainly

- 21 -
consists of bonuses resolved by the board of directors; apart from fixed salaries, the compensation made to
president and vice presidents also mainly consists of bonuses. As such, the compensation made is mainly
related to the operating performance of the Company and its subsidiaries.
(4) Analysis on the fluctuation for the most recent two years:
1. The director and employee compensation ratio for 2020 was lower compared to the previous year. This
was mainly due to while the profit before tax for 2020 was higher as compared to 2019, the distribution
percentage of compensation had been lowered. The fluctuation was reasonable.
2. The compensation to president and vice presidents for 2020 was lower compared to the previous year,
mainly due to a decrease in the number of the top management by one person and that the distribution
percentage of compensation had been lowered. The fluctuation was reasonable.
(V) Distribution of compensation to management Unit: NT$; % December 31, 2020
Title Name Stock amount Cash amount
(Note 1) Total
Total as a
percentage of
after-tax profit
(%)
Manager
CEO & president Chang, Tsuen-
Hsien
0 54,597 54,597 2.94%
Vice president (Note
2)
Chen, Chi-
Hsing
Vice president Chen, Chih-
Yuan
Vice president Lu, Jui-Ming
Vice president Liu, Feng-Jung
Vice president Yeh, Ching-
Wen
Vice president Su, Yu-Liang
Vice president Chang, Jui-Sen
Director Chang, Jui-Yu
Director Lin, Li-Chang
Director Liu, Tsung-
Ming
Director (Note 2) Wu, Hsi-Lin
Director Lin, Fang-Su
Director Wu, Hsiu-I
Director Chang, Yu-Wen
Director Yang, Chen-
Ming
Director Yu, Ching-Tien
Director Shih, Ching-
Hsien
Director Tsai, Yu-Tang
Director Chen, Yi-Jen
Director Pan, Ching-
Feng

- 22 -
Director Yang, Cheng-Ju
Director (Note 2) Weng, Chen-
Tsang
Director Shao, Kuang-
Wei
Director Chang, Chi-An
Director Wang, Shi-Min
Director Tsai, Shu-Fen
Director Chen, Mao-
Hua
Director (Note 3) Chang, Tzu-
Cheng
Director (Note 4) Chiang, Kuo-
Jui
Director Lin, Ren-Chih
Director Li, Kuo-Ping
Note 1: The employee compensation paid to managers in cash which was resolved by the board of directors was
extrapolated based on the pro rata disbursement in the preceding year.
Note 2: Retired in 2020.
Note 3: Promoted in 2020.
Note 4: Appointed in 2021.
IV. Implementation of corporate governance:
(I) Participation of board of directors:
1. There were 6 board meetings (A) in 2020. The attendance of directors is as follows:
Title Name Attendance in
Person (B)
By proxy Attendance in Person (%)
[B/A] (Note 1) Remarks
Chairman
Kang Tai Investment
Corporation
Representative: Chang, Ray-
Ching
6 0 100%
Vice Chairman Chun-Yin Chen 6 0 100%
Directors
Kang Tai Investment
Corporation
Representative: Chang,
Tsuen-Hsien
5 1 83%
Directors Lin, Chi-Hai 6 0 100%
Directors
Bau Guang Investment
Corporation
Representative: Lin, Shu-
Chen
6 0 100%
Directors Yeh, Ching-Pin 6 0 100%
Independent
Director Chu, Hau-Min 5 1 83%
Independent
Director Wang, Yea-Kang 6 0 100%
Independent
Director Shyu, So-De 6 0 100%

- 23 -
Note 1: The Attendance in Person (%) is computed based on the number of board meetings during the directors’ tenure and
the actual attendance in person.
Other matters:
I. For board meetings that meet any of the following descriptions, state the date, session, the resolutions, independent
directors' opinions and how the company has responded to such opinions:
(1) Conditions described in Article 14-3 of the Securities and Exchange Act:
Please see the participation of board of directors for 2020 below.
(2) Other issues opposed by independent directors or of which, the directors have reservations about that have been noted
in the record or declared in writing: None.
II. Recusal by directors due to conflict of interests: None.
III. The frequency, assessment, scope, method and content of the self (or peer) assessment of Board of Directors for public
listed companies. Attachment 2 indicates the implementation of assessments for the board of directors.
IV. Evaluation of the target achievement and execution by the board of directors in the current and most recent year:
(1) Audit report:
To enable the comprehension of the board members on the Company’s systems, the head of internal audit shall
make reports on the internal audit operations to the board meetings.
(2) Increase the information transparency:
The Company upholds the principle of transparency in operation and respects the shareholders’ interest. After every
board meeting, the Company shall announce important resolutions passed by the board of directors. This practice
shall be continued in the future to achieve information transparency.
(3) On May 8, 2020, the board of directors passed a resolution regarding the purchase of liability insurance for all board
members and managers. The insured period is between June 19, 2020 to June 18, 2021.
2. Attendance of Independent Directors in 2020:
◎: Attendance in Person;: By proxy; : Absence; N/A: Not applicable
2020 First meeting Second
meeting Third meeting Fourth meeting Fifth meeting Sixth meeting
Chu, Hau-Min ◎ ◎ ◎ ◎ ◎
Wang, Yea-Kang ◎ ◎ ◎ ◎ ◎ ◎
Shyu, So-De ◎ ◎ ◎ ◎ ◎ ◎
3. Implementation of performance evaluation for the board of directors:
As per the “Procedures for Performance Assessment of the Board of Directors and Functional Committees”, before the end of the
fiscal year, various units shall collect the related information regarding the board members and their activities, and distribute
Attachment 1 “Self-assessment Questionnaire of the Board of Directors” and Attachment 2, “Board Members (Self or Peer)
Assessment Questionnaire”, Attachment 3, “Self-assessment Questionnaire of the Compensation Committee” and Attachment 4
“Self-assessment Questionnaire of the Audit Committee” for them to fill in. Lastly, the coordinating unit shall consolidate the
information. Pursuant to Article 8, for the scoring of the performance indicators, the coordinating unit shall prepare and submit the
assessment report to the board of directors for review and improvement.

- 24 -
The performance assessment result of the board of directors is as follows:
Method of
assessment
<Note 1>
Assessment
period
<Note 2>
Scope of assessment
<Check all that
apply>
Content of assessment
<Note 3> Assessment result
<Note 4>
Board of
directors
Internal self-
assessment
□Self-assessment
by director
□Peer assessment
□External
assessment
Start date:
January 1, 2020
End date:
December 31,
2020
Board of directors
□Individual board
member
□Functional
committee
1. Participation level in the
management of the Company.
2. Enhancement of the decision-
making quality of the Board.
3. Composition and structure of the
Board of Directors.
4. Appointment of director and
continuing education.
5. Internal control.
Item awaiting
improvement: Some
board members have
not met the minimum
requirement for
continuing education
of 6 hours per year.
The improvement
measure is to provide
further training courses
from time to time.
The rest of the
assessment items are
met.
The overall
performance
assessment scores lie
in the Outstanding
category at 92.95%.
□Board of
directors
Internal self-
assessment
Self-assessment
by director
□Peer assessment
□External
assessment
Start date:
January 1, 2020
End date:
December 31,
2020
□Board of directors
Individual board
member
□Functional
committee
1. Comprehension of the goals and
missions of the Company;
2. Comprehension of the duties of
director;
3. Participation level in the
management of the Company.
4. Management of internal relationship
and communication;
5. Professionalism and continuing
education of director; and
6. Internal control.
Item awaiting
improvement: Three
members have not met
the minimum
requirement for
continuing education
of 6 hours per year.
The improvement
measure is to provide
training courses from
time to time.
The rest of the
assessment items are
met.
The performance
assessment scores for
individual board
members lie in the
Outstanding category
at 90.40%.
□Board of
directors
Internal self-
assessment
□Self-assessment
by director
Peer
assessment
□External
assessment
Start date:
January 1, 2020
End date:
December 31,
2020
□Board of directors
□Individual board
member
Functional
committee
1. Participation level in the
management of the Company.
2. Comprehension of the duties of
functional committee.
3. Enhancement of the decision-
making quality of the functional
committee.
4. Composition of functional
committee and appointment of
members.
5. Internal control.
The rest of the
assessment items are
met.
Attachment 3: For the
Self-assessment
Questionnaire of the
Compensation
Committee, there were
a total of 53 items
scoring Excellent and
4 items scoring Good.
Attachment 4: For the
Self-assessment
Questionnaire of the
Audit Committee,
there were a total of 59
items scoring Excellent
and 4 items scoring
Good.
Note 1: Method of assessment includes the internal self-assessment undertaken by the board of directors, the self-assessment
undertaken by individual board members, peer assessment and assessment conducted by external professional agencies and
experts, or other appropriate methods.
Note 2: Indicate the period covered for the performance assessment of the board of directors. If the assessment period is less than one
year, please indicate the reasons at the remark column (e.g. the re-election of directors).

- 25 -
Note 3: According to the scope of assessment, the content of assessment shall at least the following items:
(1) Performance assessment of board of directors: Includes at least the participation level in the management of the
Company, the decision-making quality of the board, composition and structure of the board of directors, election of
directors, continuing education of directors and the execution of the internal control.
(2) Performance assessment of individual directors: Includes at least the monitoring of company goals and tasks, the
comprehension of duties of director, the participation level in the management of the Company, the management and
communication of internal relationships, the professionalism and continuing education of directors, and internal control.
(3) Performance assessment of functional committees: Includes at least the participation level in the management of the
Company, the comprehension of duties of functional committees, the decision-making quality of the functional
committees, composition and structure of the functional committees, election of functional committees, and internal
control.
Note 4: Summarize the performance assessment result of the board of directors, e.g. the areas/items for improvement, and
recommendation and measures for improvements.
Participation of board of directors for 2020:
Date of board
meeting Session Resolution
Opinion of Independent
Directors
Actions to
be taken
February 21,
2020
First
meeting
Operational plan for 2020. Resolution passed
unanimously.
Not
applicable
Authorization for business transactions with the banks for 2020. Resolution passed
unanimously.
Not
applicable
Continued to provide endorsement and guarantee of US$3.1 million to
subsidiary, PT. Wah Lee Indonesia.
Resolution passed
unanimously.
Not
applicable
Continued to provide endorsement and guarantee of US$8.1 million to
subsidiary, Wah Lee (Vietnam) Co., Ltd.
Resolution passed
unanimously.
Not
applicable
Continued to provide endorsement and guarantee of NT$25,194,000 to
investee, ASAHI KASEI WAH LEE HI-TECH CORPORATION
Resolution passed
unanimously.
Not
applicable
Continued to provide endorsement and guarantee of NT$360 million
and material procurement guarantee of NT$120 million to investee,
Nagase Wahlee Plastics Corporation.
Resolution passed
unanimously.
Not
applicable
Continued to provide endorsement and guarantee of NT$17.7 million
and material procurement guarantee of US$7 million to investee,
Shanghai Hua Chang Trading Co., Ltd.
Resolution passed
unanimously.
Not
applicable
Establishment of “Procedures for Handling Reports on Illegal or
Unethical Conduct”.
Resolution passed
unanimously.
Not
applicable
Amendments to partial articles of “Procedures for Audit Committee
Meetings”.
Resolution passed
unanimously.
Not
applicable
Amendments to audit plan for 2020. Resolution passed
unanimously.
Not
applicable
Election of the board of directors. Resolution passed
unanimously.
Not
applicable
Determination of the date and venue of the shareholders’ meeting for
2020.
Resolution passed
unanimously.
Not
applicable
March 25,
2020
Second
meeting
Business reports, standalone and consolidated financial statements for
2019.
Resolution passed
unanimously.
Not
applicable
Earnings distribution for 2019. Resolution passed
unanimously.
Not
applicable
Appropriation of the director and employee compensation for 2019. Resolution passed
unanimously.
Not
applicable
Appropriation of the director and employee compensation for 2020. Resolution passed
unanimously.
Not
applicable

- 26 -
Continued to provide procurement performance bond to Raycong
Industrial (Hong Kong) Limited, Dong Guan Hua Gang International
Trading Co., Ltd. and Shanghai Yi Kang Chemicals & Industries Co.,
Ltd. to Shinkong Synthetic Fiber Corporation and its subsidiary,
Shinkong Industrial (Hangzhou) Co., Ltd, all of which amounted to
NT$120 million.
Resolution passed
unanimously.
Not
applicable
Provided endorsement and guarantee of US$5.2 million to subsidiary,
Shanghai Yi Kang Chemicals & Industries Co., Ltd. who makes
procurement from Japanese supplier, JSR.
Resolution passed
unanimously.
Not
applicable
Continued to provide endorsement and guarantee of US$7.5 million to
subsidiary, Wah Lee Tech (Singapore) Pte., Ltd. for procurement
guarantee to JSR of US$7.4 million.
Resolution passed
unanimously.
Not
applicable
Amendments to partial articles of the “Procedures for Endorsements
and Guarantees”, “Articles of Incorporation” and “Rules of Procedure
for Shareholders Meetings”.
Resolution passed
unanimously.
Not
applicable
Establishment of the “Procedures for Performance Assessment of the
Board of Directors and Functional Committees”.
Resolution passed
unanimously.
Not
applicable
Statement of Internal Control System for 2019. Resolution passed
unanimously.
Not
applicable
Nomination and review of the director and independent director
candidates.
Resolution passed
unanimously.
Not
applicable
Rescission of prohibiting the participation in competing businesses for
newly appointed directors.
Resolution passed
unanimously.
Not
applicable
Change of the venue of shareholders’ meeting and amendments to the
shareholders’ meeting agenda.
Resolution passed
unanimously.
Not
applicable
May 8, 2020 Third
meeting
Purchase of liability insurance for all board members and managers. Resolution passed
unanimously.
Not
applicable
Land sale of subsidiary, Kingstone Energy Technology Co., Ltd. Resolution passed
unanimously.
Not
applicable
Application for medium-term work capital loan to the bank. Resolution passed
unanimously.
Not
applicable
May 28, 2020 Fourth
meeting
Election of Chairman and Vice Chairman.
Resolution passed
unanimously.
Director, Chang, Ray-
Ching (representative
of Kang Tai
Investment Co., Ltd.)
takes office as the
Chairman of the
Company and director,
Chen, Chun-Yin takes
office as the Vice
Chairman.
Not
applicable
Appointment of the Fourth Compensation Committee members.
Attending Directors
(excluding Wang, Yea-
Kang and Chu, Hau-
Min who recused due
to conflict of interests)
passed the resolution
unanimously after the
convener solicited
opinion from the
Board.
Not
applicable
Matters regarding the disbursement of cash dividends for 2019. Resolution passed
unanimously.
Not
applicable

- 27 -
August 12,
2020
Fifth
meeting
Deliberation of the manager compensation by the Compensation
Committee.
Resolution passed
unanimously.
Not
applicable
Adjustment to the percentage of employee compensation for 2020. Resolution passed
unanimously.
Not
applicable
Deliberation on whether to classify overdue accounts receivable in the
second quarter as funds lent.
Resolution passed
unanimously.
Not
applicable
Continued to provide endorsement and guarantee of THB468 million to
subsidiary, Wah Tech Industrial Co., Ltd. (Thailand).
Resolution passed
unanimously.
Not
applicable
Continued to provide endorsement and guarantee of US$6.7 million to
subsidiary, Shanghai Yi Kang Chemicals & Industries Co., Ltd. who
makes procurement guarantee from Japanese supplier, JSR.
Resolution passed
unanimously.
Not
applicable
Continued to provide procurement guarantee of US$7.7 million to
subsidiary, Wah Lee Tech (Singapore) Pte., Ltd.
Resolution passed
unanimously.
Not
applicable
New endorsement and guarantee of US$2 million to subsidiary, Wah
Lee Philippines Inc.
Resolution passed
unanimously.
Not
applicable
Establishment of the officer of corporate governance Resolution passed
unanimously.
Not
applicable
November 12,
2020
Sixth
meeting
Provided additional shares of stock of Kingstone Energy Tech. Co.,
Ltd. acquired from stock dividend as collateral for the syndicated loan
taken up by subsidiary, Kingstone Energy Technology Co., Ltd.
Resolution passed
unanimously.
Not
applicable
Purchased office space at Neihu from ORC Electrical Machinery Co.,
Ltd.
Resolution passed
unanimously.
Not
applicable
Deliberation on whether to classify overdue accounts receivable in the
third quarter as funds lent to others.
Resolution passed
unanimously.
Not
applicable
Audit plan for 2021. Resolution passed
unanimously.
Not
applicable
(II) Participation of Audit Committee:
1. Participation of Audit Committee:
There were 6 Audit Committee meetings (A) in 2020. The attendance of independent directors is as follows:
Title Name Attendance in
Person (B) By proxy
Attendance in Person (%)
(B/A) (Note 1) Remarks
Independent
Director Shyu, So-De 6 0 100%
Independent
Director Chu, Hau-Min 6 0 100%
Independent
Director Wang, Yea-Kang 6 0 100%
Note 1: The Attendance in Person (%) is computed based on the number of board meetings during the independent directors’
tenure and the actual attendance in person.
Other matters:
I. Duties of the Audit Committee:
1.Establish or amend internal control system in accordance with the Securities and Exchange Act, Article 14-1.
2.Assess the effectiveness of internal control system.
3.Establish or amend procedures for material financial activities including acquisition or disposal of assets, derivative
transactions, funds lending to others, provision of endorsement or guarantee in accordance with the Securities and
Exchange Act, Article 36-1.
4.Oversee matters involving conflict of interest of Directors.
5.Oversee transactions involving material assets or derivatives.
6.Oversee major funds lending, and provision of endorsement or guarantee.

- 28 -
7.Oversee offering, issuance, or private placement of equity-type securities.
8.Oversee the appointment or discharge of a certified public accountant, or their fees.
9.Oversee appointment or discharge of a financial, accounting, or internal audit officer.
10.Oversee annual and semi-annual financial reports.
11. Prepare the proposal of surplus earnings distribution or loss off-setting proposals.
12.Oversee other material matters as may be required by the Company or by the competent authority.
II.Participation of Audit Committee:
(1) Matters described in the Securities and Exchange Act, Article 14-5:
Please see the participation of Audit Committee for 2020 below.
(2) Apart from the aforementioned matters, resolutions that have not been passed by the Audit Committee but passed by
two-thirds or more of all directors: None.
III. In situations where independent directors recuse themselves due to conflict of interest, the director's name, content of the
resolution, reason for recusal, and the voting participation should be properly recorded: None.
IV. Communication between independent directors, head of internal auditor, and external auditors:
(1) Communication between independent directors and external auditors
Date Matters communicated Result
August 12,
2020 [Audit Committee’s Report] The summary of audit and follow-up
report for the second quarter of 2020. Good
November 12,
2020 [Audit Committee’s Report] Audit Plan for 2020 Financial Statements Good
(2) Communication between independent directors and head of internal auditor:
Date Matters communicated Result
March 25,
2020 [Report to the board of directors] The summary of audit and follow-up
report for the period between February and March 2020. Good
May 8, 2020 [Report to the board of directors] The summary of audit and follow-up
report for April 2020 Good
May 8, 2020
[Summary of seminar]
1. Follow-up on previous directives.
2. Execution progress of the audit plan and status of improvement.
3. Directives of independent directors:
(1) Perform a three-year analysis on the gross profit margin of key
accounts for the decision making of top management.
(2) Develop early alarm information system for abnormal items as a
preventive measure.
(3) Analyze and review issued raised by corporate entities and
departments in the system, management and IT systems areas, and link
them to performance appraisal.
(4) For the corporate governance result for 2019, the Company fell in the
36% to 50% range. Please assist to improve the ranking of the Company
within the scope of responsibility and authority.
Good
May 28, 2020 [Report to the board of directors] The summary of audit and follow-up
report for May 2020 Good
August 12,
2020 [Report to the board of directors] The summary of audit and follow-up
report for the period between June and July 2020. Good
November 12,
2020 [Report to the board of directors] The summary of audit and follow-up
report for the period between August and September 2020. Good
Participation of Audit Committee for 2020:

- 29 -
Date of Audit
Committee
meeting
Session Resolution Audit Committee’s opinion Actions to
be taken
February 21,
2020 First meeting
Operational plan for 2020. Resolution passed
unanimously.
Not
applicable
Authorization for business transactions with the banks for 2020. Resolution passed
unanimously.
Not
applicable
Continued to provide endorsement and guarantee of US$3.1 million to
subsidiary, PT Wah Lee Indonesia.
Resolution passed
unanimously.
Not
applicable
Continued to provide endorsement and guarantee of US$8.1 million
to subsidiary, Wah Lee (Vietnam) Co., Ltd.
Resolution passed
unanimously.
Not
applicable
Continued to provide endorsement and guarantee of NT$25,194,000
to investee, ASAHI KASEI WAH LEE HI-TECH CORPORATION.
Resolution passed
unanimously.
Not
applicable
Continued to provide endorsement and guarantee of NT$360 million
and material procurement guarantee of NT$120 million to investee,
Nagase Wahlee Plastics Corporation.
Resolution passed
unanimously.
Not
applicable
Continued to provide endorsement and guarantee of NT$17.7 million
and material procurement guarantee of US$7 million to investee,
Shanghai Hua Chang Trading Co., Ltd.
Resolution passed
unanimously.
Not
applicable
Establishment of “Procedures for Handling Reports on Illegal or
Unethical Conduct”.
Resolution passed
unanimously.
Not
applicable
Amendments to partial articles of “Procedures for Audit Committee
Meetings”.
Resolution passed
unanimously.
Not
applicable
Amendments to audit plan for 2020. Resolution passed
unanimously.
Not
applicable
Election of the board of directors. Resolution passed
unanimously.
Not
applicable
Determination of the date and venue of the shareholders’ meeting for
2020.
Resolution passed
unanimously.
Not
applicable
March 25, 2020 Second
meeting
Business reports, standalone and consolidated financial statements
for 2019.
Resolution passed
unanimously.
Not
applicable
Earnings distribution for 2019. Resolution passed
unanimously.
Not
applicable
Continued to provide material procurement performance bond to
Raycong Industrial (Hong Kong) Limited, Dong Guan Hua Gang
International Trading Co., Ltd. and Shanghai Yi Kang Chemicals &
Industries Co., Ltd. to Shinkong Synthetic Fiber Corporation and its
subsidiary, Shinkong Industrial (Hangzhou) Co., Ltd, all of which
amounted to NT$120 million.
Resolution passed
unanimously.
Not
applicable
Provided endorsement and guarantee of US$5.2 million to subsidiary,
Shanghai Yi Kang Chemicals & Industries Co., Ltd. who makes
procurement from Japanese supplier, JSR.
Resolution passed
unanimously.
Not
applicable
Continued to provide endorsement and guarantee of US$7.5 million
to subsidiary, Wah Lee Tech (Singapore) Pte., Ltd. and procurement
guarantee to JSR of US$7.4 million.
Resolution passed
unanimously.
Not
applicable
Amendments to partial articles of the “Procedures for Endorsements
and Guarantees”, “Articles of Incorporation” and “Rules of Procedure
for Shareholders Meetings”.
Resolution passed
unanimously.
Not
applicable
Establishment of the “Procedures for Performance Assessment of the
Board of Directors and Functional Committees”.
Resolution passed
unanimously.
Not
applicable
Statement of Internal Control System for 2019. Resolution passed
unanimously.
Not
applicable
Nomination and review of the director and independent director
candidates.
Resolution passed
unanimously.
Not
applicable

- 30 -
Date of Audit
Committee
meeting
Session Resolution Audit Committee’s opinion Actions to
be taken
Rescission of prohibiting the participation in competing businesses
for newly appointed directors.
Resolution passed
unanimously.
Not
applicable
Change of the venue of shareholders’ meeting and amendments to the
shareholders’ meeting agenda.
Resolution passed
unanimously.
Not
applicable
May 8, 2020 Third
meeting
Purchase of liability insurance for all board members and managers. Resolution passed
unanimously.
Not
applicable
Land sale of subsidiary, Kingstone Energy Technology Co., Ltd. Resolution passed
unanimously.
Not
applicable
Application for medium-term work capital loan to the bank. Resolution passed
unanimously.
Not
applicable
May 28, 2020
First
extraordinary
meeting
Election of Audit Committee’s Chairman.
After deliberation, the
Audit Committee
members elected
Shyu, So-De as the
convener and the
Chairman of the
meeting unanimously.
Not
applicable
August 12, 2020
Fourth
meeting
Deliberation on whether to classify overdue accounts receivable in
the second quarter as funds lent.
Resolution passed
unanimously.
Not
applicable
Continued to provide endorsement and guarantee of THB468 million
to subsidiary, Wah Tech Industrial Co., Ltd. (Thailand).
Resolution passed
unanimously.
Not
applicable
Continued to provide endorsement and guarantee of US$6.7 million
to subsidiary, Shanghai Yi Kang Chemicals & Industries Co., Ltd.
who makes procurement guarantee from Japanese supplier, JSR.
Resolution passed
unanimously.
Not
applicable
Continued to provide procurement guarantee of US$7.7 million to
subsidiary, Wah Lee Tech (Singapore) Pte., Ltd.
Resolution passed
unanimously.
Not
applicable
New endorsement and guarantee of US$2 million to subsidiary, Wah
Lee Philippines Inc.
Resolution passed
unanimously.
Not
applicable
Establishment of the officer of corporate governance Resolution passed
unanimously.
Not
applicable
November 12,
2020
Fifth
meeting
Provided additional shares of stock of Kingstone Energy Tech. Co.,
Ltd. acquired from stock dividend as collateral for the syndicated
loan taken up by subsidiary, Kingstone Energy Technology Co., Ltd.
Resolution passed
unanimously.
Not
applicable
Purchased office space at Neihu from ORC Electrical Machinery Co.,
Ltd.
Resolution passed
unanimously.
Not
applicable
Deliberation on whether to classify overdue accounts receivable in the
third quarter as funds lent.
Resolution passed
unanimously.
Not
applicable
Audit plan for 2021. Resolution passed
unanimously.
Not
applicable
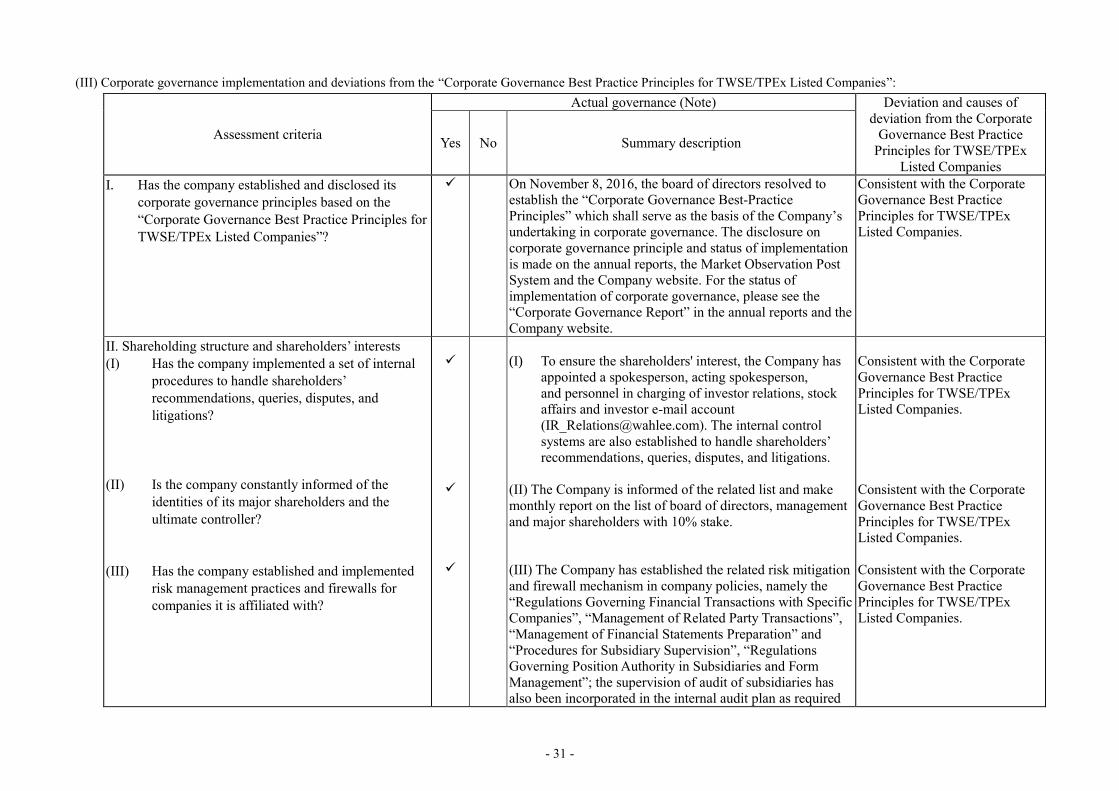
- 31 -
(III) Corporate governance implementation and deviations from the “Corporate Governance Best Practice Principles for TWSE/TPEx Listed Companies”:
Assessment criteria
Actual governance (Note) Deviation and causes of
deviation from the Corporate
Governance Best Practice
Principles for TWSE/TPEx
Listed Companies
Yes No Summary description
I. Has the company established and disclosed its
corporate governance principles based on the
“Corporate Governance Best Practice Principles for
TWSE/TPEx Listed Companies”?
On November 8, 2016, the board of directors resolved to
establish the “Corporate Governance Best-Practice
Principles” which shall serve as the basis of the Company’s
undertaking in corporate governance. The disclosure on
corporate governance principle and status of implementation
is made on the annual reports, the Market Observation Post
System and the Company website. For the status of
implementation of corporate governance, please see the
“Corporate Governance Report” in the annual reports and the
Company website.
Consistent with the Corporate
Governance Best Practice
Principles for TWSE/TPEx
Listed Companies.
II. Shareholding structure and shareholders’ interests
(I) Has the company implemented a set of internal
procedures to handle shareholders’
recommendations, queries, disputes, and
litigations?
(II) Is the company constantly informed of the
identities of its major shareholders and the
ultimate controller?
(III) Has the company established and implemented
risk management practices and firewalls for
companies it is affiliated with?
(I) To ensure the shareholders' interest, the Company has
appointed a spokesperson, acting spokesperson,
and personnel in charging of investor relations, stock
affairs and investor e-mail account
([email protected]). The internal control
systems are also established to handle shareholders’
recommendations, queries, disputes, and litigations.
(II) The Company is informed of the related list and make
monthly report on the list of board of directors, management
and major shareholders with 10% stake.
(III) The Company has established the related risk mitigation
and firewall mechanism in company policies, namely the
“Regulations Governing Financial Transactions with Specific
Companies”, “Management of Related Party Transactions”,
“Management of Financial Statements Preparation” and
“Procedures for Subsidiary Supervision”, “Regulations Governing Position Authority in Subsidiaries and Form
Management”; the supervision of audit of subsidiaries has
also been incorporated in the internal audit plan as required
Consistent with the Corporate
Governance Best Practice
Principles for TWSE/TPEx
Listed Companies.
Consistent with the Corporate
Governance Best Practice
Principles for TWSE/TPEx
Listed Companies.
Consistent with the Corporate
Governance Best Practice
Principles for TWSE/TPEx
Listed Companies.

- 32 -
Assessment criteria
Actual governance (Note) Deviation and causes of
deviation from the Corporate
Governance Best Practice
Principles for TWSE/TPEx
Listed Companies
Yes No Summary description
(IV) Has the company established internal policies that
prevent insiders from trading securities against
non-public information?
by the internal control system. For abnormal items,
improvement measures shall be provided and follow-up shall
be performed.
(IV) The Company has established the “Code of Conduct for
Directors, Supervisors and Managers” and an internal control
policy, “Procedures on Insider Trading Prevention and
Control” to prevent insider trading.
Consistent with the Corporate
Governance Best Practice
Principles for TWSE/TPEx
Listed Companies.
III. Composition and duties of the board of directors
(I) Has the board established and implemented
policies to ensure the diversity of its members?
(II) Apart from the Compensation Committee and
Audit Committee, has the company assembled
other functional committees at its own discretion?
(III) Has the company established a set of policies and
assessment methodology to evaluate the
performance of the board? Is regular performance
evaluation conducted, at least once a year, and the
evaluation result is submitted to the board to serve
as a reference in determining the remuneration of
individual directors and nomination for a re-
(I) As per the Articles of Incorporation, the Company
adopts the nomination system for the election of
directors. On May 28, 2020, three independent
directors (with business management, industry
technology expertise) were elected in the shareholders’
meeting to strengthen the functionality of the board of
directors.
For the status of professionalism, independence and
diversity of the board of directors, please see page 37
and 38 of the annual reports.
(II) As per the law and regulation, the Company has
established the Compensation Committee and Audit
Committee. Other functional committees have yet to be
established.
(III) On March 25, 2020, the board of directors passed the
resolution to establish the “Procedures for Performance
Assessment of the Board of Directors and Functional
Committees”. The performance assessment shall be conducted at the year-end of 2020. The result of the
assessment shall be reported to the board of directors
on January 26, 2021.
No evident deviation from the
Corporate Governance Best
Practice Principles for
TWSE/TPEx Listed Companies.
Consistent with the Corporate
Governance Best Practice
Principles for TWSE/TPEx
Listed Companies.
The Company shall establish the
related policies in accordance
with the law and regulations in
the future.

- 33 -
Assessment criteria
Actual governance (Note) Deviation and causes of
deviation from the Corporate
Governance Best Practice
Principles for TWSE/TPEx
Listed Companies
Yes No Summary description
election?
(IV) Does the company assess the independence of
external auditors on a regular basis?
(IV) For at least once a year, the Company shall evaluate the
independence and qualification of the independent
auditors. Pertaining the scale and reputation of the
public accounting firm, the Company shall compare the
nature and fees of the audit and non-audit services for
the most recent two years. The Company requires the
independent auditors to produce the “Independence
Declaration” every year. The board of directors is
designated to assess the qualification and independence
of the independent auditors on a yearly basis. The
assessment result for the most recent two years were
produced on February 21, 2020 and January 26, 2021
respectively.
Consistent with the Corporate
Governance Best Practice
Principles for TWSE/TPEx
Listed Companies.
IV. Does the TWSE/TPEx listed company dedicate
competent managers or sufficient number of
managers to take charge of corporate governance,
and designate supervisors thereof to oversee the
corporate governance affairs (including but not
limited to providing information required for
director/supervisor's operations, assisting the board
and supervisors in legal compliance, convening
board/shareholders’ meetings in accordance with the
law, applying for/changing company registry, and
producing meeting minutes of board/shareholders’
meetings)?
1. The Company has established an integrity management
committee which comprises members of the management
team. The Chairman of the committee is assumed by the
CEO. Further, the executive secretary shall call upon the
committee members on a regular basis to assist the
Chairman of the committee to manage affairs related to
integrity management.
2. On August 12, 2020, the board of directors passed a
resolution to appoint Lin, Ren-Chih as the officer of
corporate governance to ensure the shareholders' interest
and strengthen the functionality of the board of directors.
Director, Lin, Ren-Chih possesses more than three years of
experience as a supervisor overseeing financial and stock
affairs. The duties of the officer of corporate governance
include undertaking matters pertaining to the board and
shareholders’ meetings, preparing the board and
shareholders’ meeting minutes, assisting the directors
taking office and their continuing education, providing the
information needed by the directors to execute their duties
Consistent with the Corporate
Governance Best Practice
Principles for TWSE/TPEx
Listed Companies.

- 34 -
Assessment criteria
Actual governance (Note) Deviation and causes of
deviation from the Corporate
Governance Best Practice
Principles for TWSE/TPEx
Listed Companies
Yes No Summary description
and assisting the directors in compliance.
For the status of execution for 2020, please see page 38
and 39 of the annual reports.
V. Has the company established a means of
communicating with its stakeholders (including but
not limited to shareholders, employees, customers,
suppliers, et cetera) or created stakeholder section
on the company website? Does the company
respond to stakeholders’ questions on corporate
responsibilities?
1. According to the daily undertakings of the Company, the
related units designated for communication with
stakeholders include: (1) spokesperson, investor relations
and stock affairs units handle the feedback from external
investors and shareholders and hold institutional investor
conferences to reveal the company operation and
development; (2) Finance Department who is in charge
of communication with financial institutions; (3) Human
Resources Department and Operation Support
Department who are in charge of communication with
employees, protection of personal information and
fostering of working relationships; (5) various business
divisions who are in charge of communication with
suppliers and customers in a way that respects their legal
interests.
2. The Company website comprises an Investor Relations
section with contact information, including an e-mail
address ([email protected]), as well as a
Contact-Us e-mail for external communication
([email protected]). Both serve as communication
channels between stakeholders and the Company. These
e-mails are managed by designated personnel, which
shall be forwarded to the related departments according
to product information, business dealing queries,
investor services, job opportunity queries, corporate
social responsibility and etc.
Consistent with the Corporate
Governance Best Practice
Principles for TWSE/TPEx
Listed Companies.
VI. Does the company appoint the professional stock
transfer agent to handle the stock affairs?
The Company has engaged stock affair agency department of
Taishin Bank to handle stock matters.
Consistent with the Corporate
Governance Best Practice
Principles for TWSE/TPEx
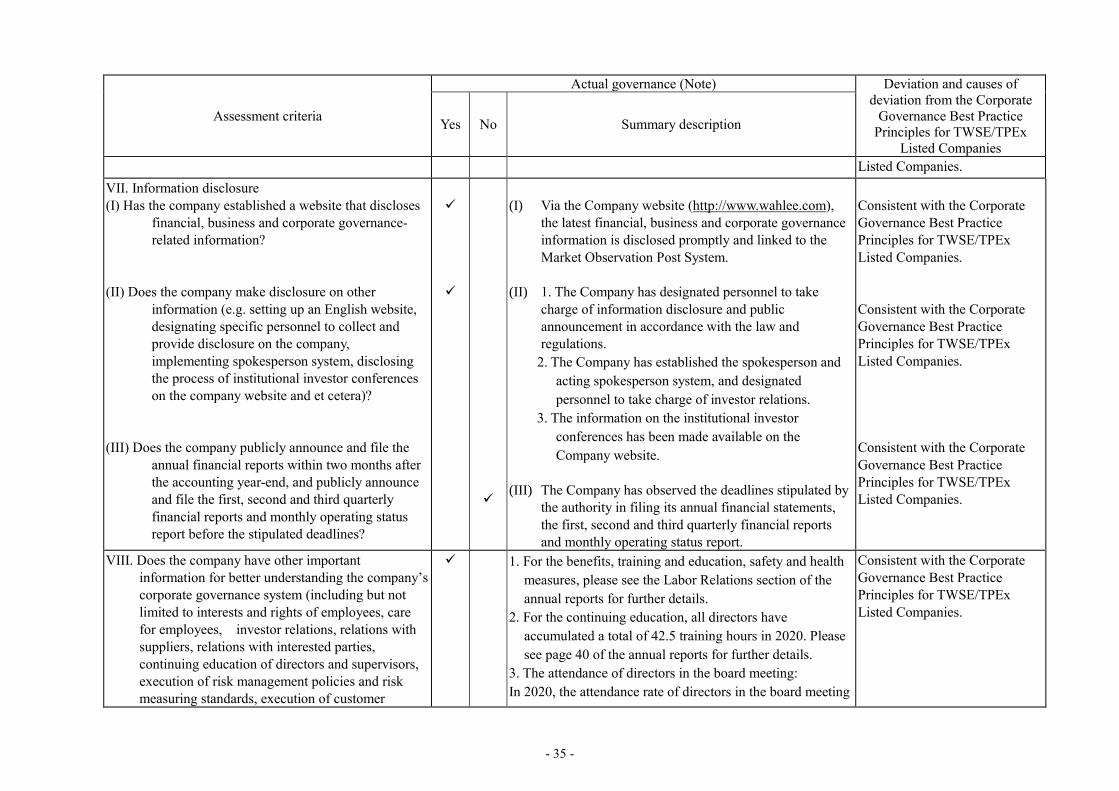
- 35 -
Assessment criteria
Actual governance (Note) Deviation and causes of
deviation from the Corporate
Governance Best Practice
Principles for TWSE/TPEx
Listed Companies
Yes No Summary description
Listed Companies.
VII. Information disclosure
(I) Has the company established a website that discloses
financial, business and corporate governance-
related information?
(II) Does the company make disclosure on other
information (e.g. setting up an English website,
designating specific personnel to collect and
provide disclosure on the company,
implementing spokesperson system, disclosing
the process of institutional investor conferences
on the company website and et cetera)?
(III) Does the company publicly announce and file the
annual financial reports within two months after
the accounting year-end, and publicly announce
and file the first, second and third quarterly
financial reports and monthly operating status
report before the stipulated deadlines?
(I) Via the Company website (http://www.wahlee.com),
the latest financial, business and corporate governance
information is disclosed promptly and linked to the
Market Observation Post System.
(II) 1. The Company has designated personnel to take
charge of information disclosure and public
announcement in accordance with the law and
regulations.
2. The Company has established the spokesperson and
acting spokesperson system, and designated
personnel to take charge of investor relations.
3. The information on the institutional investor
conferences has been made available on the
Company website.
(III) The Company has observed the deadlines stipulated by
the authority in filing its annual financial statements,
the first, second and third quarterly financial reports
and monthly operating status report.
Consistent with the Corporate
Governance Best Practice
Principles for TWSE/TPEx
Listed Companies.
Consistent with the Corporate
Governance Best Practice
Principles for TWSE/TPEx
Listed Companies.
Consistent with the Corporate
Governance Best Practice
Principles for TWSE/TPEx
Listed Companies.
VIII. Does the company have other important
information for better understanding the company’s
corporate governance system (including but not
limited to interests and rights of employees, care
for employees, investor relations, relations with
suppliers, relations with interested parties,
continuing education of directors and supervisors,
execution of risk management policies and risk
measuring standards, execution of customer
1. For the benefits, training and education, safety and health
measures, please see the Labor Relations section of the
annual reports for further details.
2. For the continuing education, all directors have
accumulated a total of 42.5 training hours in 2020. Please
see page 40 of the annual reports for further details.
3. The attendance of directors in the board meeting:
In 2020, the attendance rate of directors in the board meeting
Consistent with the Corporate
Governance Best Practice
Principles for TWSE/TPEx
Listed Companies.

- 36 -
Assessment criteria
Actual governance (Note) Deviation and causes of
deviation from the Corporate
Governance Best Practice
Principles for TWSE/TPEx
Listed Companies
Yes No Summary description
policies, liability insurance for the company’s
directors and supervisors)?
amounted to 96%, which was fairly good.
4. Since the shareholders’ meeting on May 25, 2017, the
Audit Committee has been established to replace the
functions of supervisors.
5. Participation of managers in the training and education
related to corporate governance:
Please see page 101 of the annual reports on “Participation
of managers in the training and education related to corporate
governance” for further details.
6. To promote sustainable development, risk management
and reduction of impact on environment, the Company
conducts safety, health and environment management
courses for employees on a regular basis and undertakes
various procedures in accordance with the environmental
protection regulations.
7. The Company has purchased liability insurance for all
board members and managers.
8. For the risk management policy, please see page 117 to
118 of the annual reports on “Analysis and evaluation of
risk management” for further details.
9. Please see page 41 of the annual reports on the succession
planning for board members and key management for
further details.
IX. Please describe improvements that have been made pertaining to the results of the corporate governance evaluation as prescribed by the Taiwan Stock Exchange
Corporate Governance Center, as well as priorities and measures for matters that have yet to be improved.
In 2019, the sixth corporate governance assessment fell in the 36% to 50% range among the public listed companies. To strengthen the composition and operation
of the board of directors, the Company has established the Audit Committee which is in operation. On March 25, 2020, the board passed the resolution to
establish the “Procedures for Performance Assessment of the Board of Directors and Functional Committees”, which shall serve as the basis for the performance
assessment at the year-end of 2020. For the implementation of corporate social responsibility (CSR), the Company shall comply with the code of conduct issued
by Responsible Business Alliance (RBA). The Company also acknowledges and implements policies pertaining to various issues, namely labor, health and safety,

- 37 -
Assessment criteria
Actual governance (Note) Deviation and causes of
deviation from the Corporate
Governance Best Practice
Principles for TWSE/TPEx
Listed Companies
Yes No Summary description
environmental protection, ethics and management systems, thus ensuring the work place safety, employee morale, eco-friendliness and morality. The Company is
thus listed as one of the “Taiwan High Compensation 100 Index “companies in consecutive years. In the future, the Company shall establish plans for energy
conservation, carbon reduction, greenhouse gas emission, reduction in water use or waste treatment policies, so as to continue to strengthen its commitment to the
CSR.
Status of professionalism, independence and diversity of the board of directors:
To strengthen corporate governance and promote a healthy composition and structure of the board of directors, the “Corporate Governance Best Practice Principles”
established by the Company lists five points, of which Section 5.1 Structure of the board of directors provides for the diversity policy of the board members:
5.1 Structure of the board of directors
5.1.1. The board of directors shall instruct the Company’s policies and supervise the management. It is responsible to the Company and shareholders. Pertaining to
various corporate governance system, the board of directors must observe the law and regulations, Articles of Incorporation or any resolutions passed by the
shareholders’ meeting in undertaking its duties.
5.1.2. For the structure of the board of directors, the Company shall consider the business development, the shareholding of major shareholders, as well as the actual
operational needs when determining more than five people suitable to assume the director seats.
5.1.3. The composition of the board of directors shall take diversity into consideration. The number of directors holding concurrent managerial positions in the
Company shall not exceed one third of the total board seats. By accounting for the operation, business model and development needs, the Company shall
establish the appropriate diversity policy, including but not limited to the following two aspects:
5.1.3.1. Basic criteria and values: Gender, age, nationality and culture.
5.1.3.2. Professional knowledge and skill sets: Professional background (e.g. legal, accounting, industry, financial, marketing or technology), professional skill
sets and industry experience.
5.1.4. The board members shall possess the necessary knowledge, skills and temperament. To achieve the corporate governance ideals of the Company, the board
altogether shall possess the following capabilities:
5.1.4.1. Business judgement.
5.1.4.2. Accounting and financial analytical skills.
5.1.4.3. Business management skills.
5.1.4.4. Crisis management skills.
5.1.4.5. Industry knowledge.

- 38 -
5.1.4.6. Knowledge on international market.
5.1.4.7. Leadership.
5.1.4.8. Decision making capability.
The independence and diversity of the board members are important to the Company, as well as their professional knowledge and skill sets. The existing board of directors
consists of nine members, in which 44% holding concurrent positions as the Company’s employees, 33% are independent directors and 11% are female directors. The
board members altogether possess much experience and professional knowledge in the financial, electronic, chemical and management sectors. Amongst the board
members, Chairman, Chang, Ray-Ching, Vice Chairman, Chen, Chun-Yin, directors, Lin, Chi-Hai, Chang, Tsuen-Hsien and Yeh, Ching-Pin possess industry knowledge
and are experts in chemical and electronic engineering, and business management; directors, Lin, Shu-Chen, Chu, Hau-Min and Shyu, So-De possess financial and
accounting expertise; independent director, Wang, Yea-Kang possesses business administration and legal expertise. All three independent directors possess academic
background. The diverse background of the board members in industry, academic and knowledge allows them to offer professional opinion from different perspectives to
enhance the management efficiency and performance result of the Company.
Business undertaking of the officer of corporate governance in 2020:
1. Assisted independent directors and directors in performing their duties, provided information needed and arranged for their training courses:
(1) Kept the board members updated on a regular basis with the latest development of amendments to the law and regulations pertaining to business management and
corporate governance.
(2) Reviewed the confidentiality level of the related information and provided directors with company information. Maintained and facilitated communication between
directors and managers.
(3) Assisted the independent directors in gaining understanding of the Company’s financial and business aspects from the head of internal auditor or independent auditors
pursuant to the Corporate Governance Best Practice Principles by arranging their meetings.
(4) Assisted the independent directors and directors in planning their continuing education and arranging for their training courses according to the characteristics of the
Company’s industry and their education and experience.
2. Assisted in performing the procedures of the board and shareholders’ meetings, and ensuring the conformity to resolutions passed.
(1) Reported the status of implementation of corporate governance to the board of directors and Audit Committee, and ensured that the shareholders’ and board meetings
were convened in accordance with the law and regulations and corporate governance guidelines.
(2) Assisted and kept the directors posted to observe the regulations in performing their duties or passing resolutions, as well as reminding the board of directors when the
resolutions they intended to pass violated the regulations.
(3) Assisted with checking the significant information of major resolutions before the public announcements after the meetings to ensure the appropriateness and accuracy of
the information and secure the information symmetry of the investors.
3. Prepared the agenda of the board meetings and informed the directors seven days prior to the meetings. Convened the meetings and provided the meeting information.
Reminded the related directors on issues that required their recusal and prepared the minutes 20 days after the meetings.

- 39 -
4. Made registration prior to the date of the shareholders’ meeting in accordance with the regulations, prepared the meeting notice, handbook and minutes within the stipulated
deadline, and performed change registration for amendments to the Articles of Incorporation and director election.
Continuing education of management for 2020:
Date of training
Organizer Course name Training
Hours
Total training
hours for the
year
Start End
September 2,
2020
September 2,
2020
Securities and Futures Institute of R.O.C.
Discussion on the Practical Aspects of Anti-Money
Laundering Mechanism and Counter-Terrorist
Financing Measures
3 hours
18 hours
September 4,
2020
September 4,
2020
Discussion of Issues Pertaining to Employee and
Director Compensation - from the perspective of
Securities and Exchange Act, Article 14 3 hours
September
24, 2020
September
24, 2020
Discussion on Planning of Shareholding and Defense
Strategies in Board and Shareholders’ Meetings from
the Perspective of Recent Case Studies on Right of
Management Dispute
3 hours
October 6,
2020
October 6,
2020
Discussion on the Duties of the Board of Directors
from the Perspective of Fraud 3 hours
October 14,
2020
October 14,
2020
Discussion on the Duties of Directors from the
Perspective of Violation Case Studies in Securities
Market
3 hours
October 21,
2020
October 21,
2020
Sharing Session on the Practical Aspect of Corporate
Mergers - From the Perspective of Hostile Takeover 3 hours

- 40 -
Continuing education of directors for 2020:
Title Name Organizer Course name Training Hours
Directors Chun-Yin
Chen
Taiwan Printed Circuit Association Benchmark Forum - What Will and Will not Change in the
World after the Pandemic
7.5 hours Taiwan Academy of Banking and Finance Corporate Governance Forum - Practical Aspects of the
Company Act and Tax Governance
Taiwan Corporate Governance Association Latest Must-Know Trend in Corporate Governance
Assessment for Directors and Supervisors - Intellectual
Property Management
Directors Chang, Tsuen-
Hsien
Taiwan Corporate Governance Association Key Technologies and Market Application of 5G and IoT and
Market Application
9 hours Taiwan Corporate Governance Association Discussion on Right of Management Dispute from the
Perspective of Corporate Governance
Taiwan Academy of Banking and Finance Corporate Governance Forum - Global Political and
Economic Outlook and Risks of Corporate Management
Directors Yeh, Ching-Pin Taiwan Stock Exchange Corporation
2020 Awareness Forum for Directors and Supervisors in
Corporate Governance and Ethics 6 hours
Taiwan Institute of Directors 2020, Year of Strategic Turning Point - Seeking New Growth
Momentum
Independent
Director Wang, Yea-
Kang
Taiwan Academy of Banking and Finance Corporate Governance Forum - Global Political and
Economic Outlook and Risks of Corporate Management 6 hours
Taiwan Academy of Banking and Finance Corporate Governance Forum - Trend and Impact of Risk-
Oriented Anti-Money Laundering
Independent
Director Chu, Hau-Min
Securities and Futures Institute of R.O.C. Alarm for Financial Crisis of Companies and Pattern
Analysis 6 hours
Securities and Futures Institute of R.O.C. Sharing Session on the Practical Aspect of Corporate
Mergers - From the Perspective of Hostile Takeover
Independent
Director Shyu, So-De
Taiwan Listed Company Association Common Malpractices in Corporate Governance
8 hours Taiwan Academy of Banking and Finance Corporate Governance Forum - Discussion on Corporate
Ethics from the Perspective of Business Reputation Risks
Taiwan Stock Exchange Corporation Summit of Corporate Governance 3.0 - Blueprint of
Sustainable Development

- 41 -
Succession planning for board members and key management:
In addition to professional background and skill sets. the board members shall possess the capabilities in business planning and industry knowledge. To enhance the board members
on their professionalism and constant improvement, by considering the scope beyond the professional capabilities of the directors, the Company selects training courses that cover
the financial, industry, legal, risk management, business management, corporate governance and other areas to groom the top management to join the board of directors in May 2017.
The management has familiarized with the board, which has since functioned well.
When making the succession plan for key management, the successor must possess the core competencies and management capabilities. The areas of training for the top
management level is divided into management competency, professional capabilities and personal development planning, which include human resources, financial risks, risk
management, business development and strategic planning. Meanwhile, the management of the Company is also encouraged to interact with high level management of other
companies. The training for each stage lasts for three to five years. The training for professional competencies and practice shall be able to cultivate the decision-making ability and
judgement of the high level management.
On June 17, 2016, the board of directors passed a resolution to have a younger management team. The Company appointed Chang, Tsuen-Hsien as the CEO and President. The
previous CEO, Chang, Ray-Ching was exempted from holding the CEO position concurrently and was appointed as the Chairman. They have since carried out their management
roles with the Company core value of “Integrity, Enthusiasm, Respect, Consistency, Innovation”.

- 42 -
(IV)Composition, duties and status of operation of the Compensation Committee:
(1) Members of Compensation Committee
Title (Note 1)
Criteria
Name
Having met one of the following professional
qualifications, together with at least five years work experience
Independence Criteria (Note 2)
Number of other public
companies
in which the individual is
concurrently
serving as the
Remuneration Committee
member
Remarks
An instructor or
higher position in
a department of commerce, law,
finance,
accounting, or other academic
department
related to the business needs of
the company in a
public or private junior college,
college or
university
A judge, public
prosecutor, attorney,
certified public accountant, or other
professional or
technical specialist who has passed a
national examination
and been awarded a certificate in a
profession necessary
for the business of the company
Having work
experience in
the areas of commerce,
law, finance,
or accounting,
or otherwise
necessary for the business
of the
company
1 2 3 4 5 6 7 8 9 10
Independent
Director
Chu, Hau-Min 1
Independent
Director
Wang, Yea-
Kang 3
Others Chen, Yi-Ming 2
Note 1: For title, please indicate whether it is a director, independent director or others.
Note 2: Members who meet the following conditions two years prior to appointment or during the term of appointment, indicate with
“ ” at the corresponding boxes below.
(1) Not an employee of the Company or any of its affiliates.
(2) Not a director or supervisor of the Company or any of its affiliates. (The same does not apply, however, in cases where the
person is an independent director of the company, its parent company, or any subsidiary, or subsidiary of the same parent
company as appointed in accordance with the laws of Taiwan or with the laws of the country of the parent company or
subsidiary.)
(3) Not a natural-person shareholder who holds shares, together with those held by the person’s spouse, minor children, or held by
the person under others’ names, in an aggregate amount of one percent or more of the total number of issued shares of the
Company or ranks as one of its top ten shareholders.
(4) Not a managerial officer mentioned in paragraph (1), or a spouse, relative within the second degree of kinship, or lineal
relative within the third degree of kinship mentioned in paragraphs (2) and (3).
(5) Not a director, supervisor, or employee of an institutional shareholder that directly holds five percent or more of the total
number of issued shares of the Company, or ranks as its top five shareholders, or the designated representative pursuant to
Article 27 Section 1 or 2 in the Company as director/supervisor. (The same does not apply, however, in cases where the
person is an independent director of the company, its parent company, or any subsidiary, or subsidiary of the same parent
company as appointed in accordance with the laws of Taiwan or with the laws of the. country of the parent company or
subsidiary.)
(6) Not a director, supervisor, or employee of other company with the Board seats or more than half of the voting shares under
control of one person. (The same does not apply, however, in cases where the person is an independent director of the
company, its parent company, or any subsidiary, or subsidiary of the same parent company as appointed in accordance with
the laws of Taiwan or with the laws of the country of the parent company or subsidiary.)
(7) Not a director, supervisor, or employee of other company whose chairman or general manager are the same person or spouse
of the company. (The same does not apply, however, in cases where the person is an independent director of the company, its
parent company, or any subsidiary, or subsidiary of the same parent company as appointed in accordance with the laws of
Taiwan or with the laws of the country of the parent company or subsidiary)
(8) Not a director, supervisor, managerial officer, or shareholder holding five percent or more of the shares of a specified
company or institution that has a financial or business relationship with the company. (The same does not apply, however, if
specified company or institution possessing shareholdings of more than 20% and less than 50% of the total number of issued
shares of the Company, and in cases where the person is an independent director of the company, its parent company, or any
subsidiary, or subsidiary of the same parent company as appointed in accordance with the laws of Taiwan or with the laws of
the country of the parent company or subsidiary)

- 43 -
(9) Not a professional individual who, or an owner, partner, director, supervisor, or managerial officer of a sole proprietorship,
partnership, company, or institution that provides auditing services or for the past two years, has provided commercial, legal,
financial, accounting services or consultation amounted to less than a cumulative NTD500,000 to the Company or to any
affiliate of the company, or a spouse thereof. However, this does not apply to members of Compensation Committee, Public
Tender Offer Review Committee or Special Merger and Acquisition Committee carrying out their duties in accordance with
Securities and Exchange Act or Business Mergers and Acquisitions Act. - -
(10) Does not meet any of the criteria described in Article 30 of the Company Act.
(2) Participation of Compensation Committee
I. The Compensation Committee consists of three members.
II. Tenure: May 28, 2020 to May 27, 2023. There were 3 Compensation Committee meetings (A) in 2020. The attendance of
committee members is as follows:
III. Regular review of salary and compensation:
The Compensation Committee shall practice duty of care when performing the following responsibilities and answering to the
board of directors as required by forwarding all recommendations it makes to the board for discussion.
1. Duties of the Compensation Committee:
(1) Regularly review the performance appraisal of directors and managers, the compensation policy, system, standard and
structure.
(2) Regularly evaluate and establish the salary and compensation of directors and managers.
2.When performing the aforementioned duties, the Committee shall observe the following principles:
(1) When deliberating on the performance evaluation, salary and compensation of directors (members of Audit Committee)
and managers, and the industry standard shall be taken into consideration, as well as the reasonableness of the correlation
between individual performance, company performance and future risks.
(2) The Committee shall not guide the directors and managers to engage in activities that is beyond the risk appetite of the
Company to pursue personal salary and compensation.
(3) For the percentage of short-term performance bonus given to directors and managers and partial change of the
disbursement date of salary and compensation, the characteristics of the industry and the Company’s business shall be
taken into account.
Title Name Attendance in Person
(B) By proxy
Attendance in Person (%)
(B/A) (Note) Remarks
Convener Wang, Yea-
Kang 3 0 100%
Member Chu, Hau-
Min 3 0 100%
Member Chen, Yi-
Ming 3 0 100%
Note: The Attendance in Person (%) is computed based on the number of Compensation Committee meetings during their
tenure and the actual attendance in person.
Other matters:
I. Circumstances where the board of directors declines to adopt or modify a recommendation of the remuneration
committee: None.
II. Resolutions of the compensation committee objected by members or become subjected to a qualified opinion, which
has been recorded or declared in writing: None.

- 44 -
IV. Participation of Compensation Committee for 2020
Date of
Compensation
Committee
meeting
Session Resolution Voting result
Company’s response to the
Compensation Committee’s
opinion
March 25,
2020 First meeting
Establishment of the
appropriation of the director and
employee compensation for
2019.
All committee members
passed the resolution
unanimously.
Forwarding to the board of
directors for unanimous
approval by all attending
directors and reporting to the
shareholders’ meeting.
Establishment of the
appropriation of the director and
employee compensation for
2020.
All committee members
passed the resolution
unanimously.
Forwarding to the board of
directors for unanimous
approval by all attending
directors.
May 28, 2020
First
extraordinary
meeting
Election of the convener of
Compensation Committee.
After deliberation, the
committee members elected
Wang, Yea-Kang as the
convener and the Chairman
of the meeting
unanimously.
August 12,
2020
Second
meeting
Appropriation of management
compensation for 2019 and
management salary for 2020
All committee members
passed the resolution
unanimously.
Forwarding to the board of
directors for unanimous
approval by all attending
directors.
Adjustment to the percentage of
employee compensation for
2020.
All committee members
passed the resolution
unanimously.
Forwarding to the board of
directors for unanimous
approval by all attending
directors.

- 45 -
(V) Implementation of corporate social responsibilities:
Assessment criteria
Participation (Note 1) Deviation and causes of
deviation from Corporate Social
Responsibility Best Practice
Principles for TWSE/GTSM
Listed Companies
Yes No Summary description (Note 2)
I. Has the company performed risk assessment pertaining to
the environment, community and corporate governance
issues related to the operation of the company in
accordance with materiality principle, and established
the corresponding risk management policies or
strategies? (Note 3)
“Integrity, Enthusiasm, Respect, Consistency, Innovation”
is the business philosophy and major principle of the
Company. While pursuing sustainable development and
profitability, the Company shall perform its CSR and
respect the stakeholders’ interests. The Company shall
also pay close attention to the environmental, social and
corporate governance issues, which shall be incorporated
into the management policies and operating activities to
achieve sustainable development.
Consistent with the Corporate
Social Responsibility Best
Practice Principles for
TWSE/GTSM Listed
Companies.
II. Does the company have a unit that specializes (or is
involved) in CSR practices? Is the CSR unit run by
senior management and reports its progress to the board
of directors?
The units responsible for promoting CSR are the
Chairman Office, CEO Office, Finance Division, Human
Resources Department, Operation Support Department
and Logistics Administration Department. These units are
collectively responsible to the undertakings of CSR.
Meanwhile, the board of directors has yet to authorize the
top management to take over the CSR and report to the
board.
In the future, the board of
directors may authorize the top
management to take over the
CSR and report to the board
depending on actual needs.
III. Environmental issues
(I) Has the company developed an appropriate environmental
management system, given the distinctive characteristics
of its industry?
(I) The Company continues to increase value-adding
services and adopt the management philosophy
that benefit the employees, customers and
(I) Consistent with the Corporate
Social Responsibility
Best Practice Principles
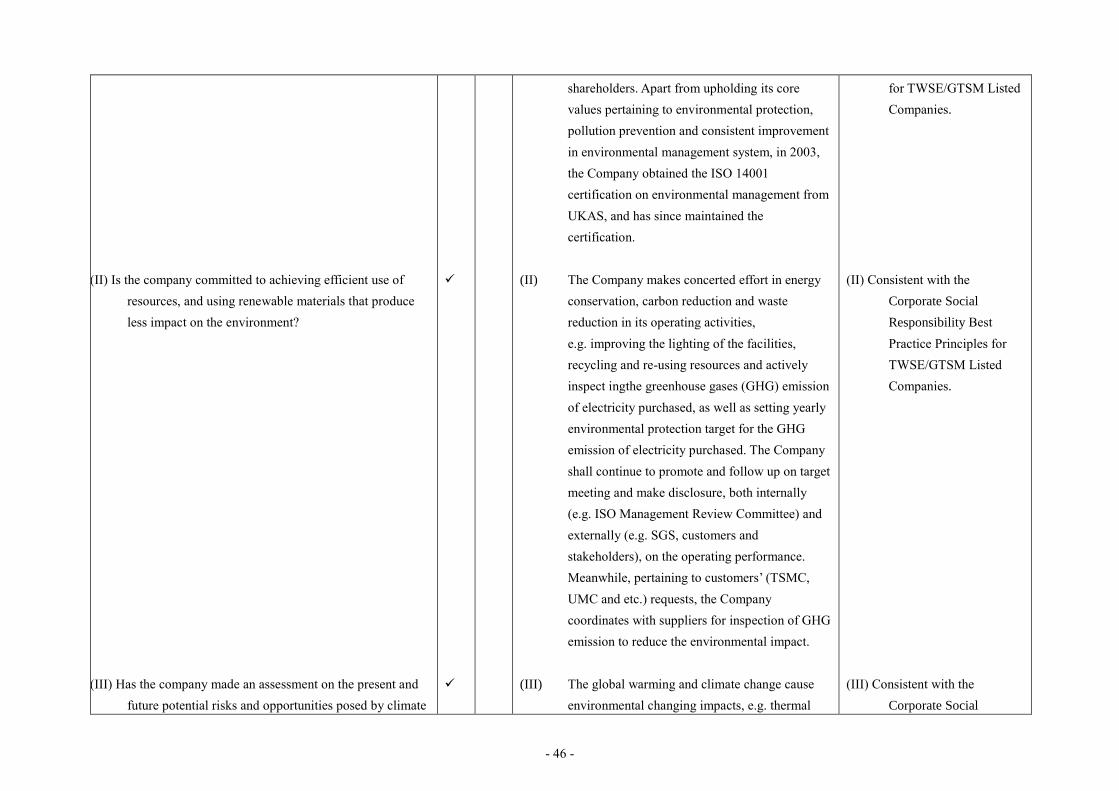
- 46 -
(II) Is the company committed to achieving efficient use of
resources, and using renewable materials that produce
less impact on the environment?
(III) Has the company made an assessment on the present and
future potential risks and opportunities posed by climate
shareholders. Apart from upholding its core
values pertaining to environmental protection,
pollution prevention and consistent improvement
in environmental management system, in 2003,
the Company obtained the ISO 14001
certification on environmental management from
UKAS, and has since maintained the
certification.
(II) The Company makes concerted effort in energy
conservation, carbon reduction and waste
reduction in its operating activities,
e.g. improving the lighting of the facilities,
recycling and re-using resources and actively
inspect ingthe greenhouse gases (GHG) emission
of electricity purchased, as well as setting yearly
environmental protection target for the GHG
emission of electricity purchased. The Company
shall continue to promote and follow up on target
meeting and make disclosure, both internally
(e.g. ISO Management Review Committee) and
externally (e.g. SGS, customers and
stakeholders), on the operating performance.
Meanwhile, pertaining to customers’ (TSMC,
UMC and etc.) requests, the Company
coordinates with suppliers for inspection of GHG
emission to reduce the environmental impact.
(III) The global warming and climate change cause
environmental changing impacts, e.g. thermal
for TWSE/GTSM Listed
Companies.
(II) Consistent with the
Corporate Social
Responsibility Best
Practice Principles for
TWSE/GTSM Listed
Companies.
(III) Consistent with the
Corporate Social

- 47 -
changes to the company and undertaken
countermeasures pertaining to climate changes?
(IV) Has the company measured its greenhouse gas emission,
water use and total weight of waste for the past two
years, and established policies pertaining to energy
conservation, reduction in carbon and greenhouse gas
emission, reduction in water use, or management of
waste disposal?
effect, extreme climate, air pollution and
infectious diseases. Apart from ISO 14001
certification on environmental management in
2003, the Company reviews the impact of
climate change on the potential risks and
opportunities facing its product sales and
services. Via the marketing activities, the
Company guides its customers in identifying
green products, thus enabling the promotion and
sales of these products.
(IV) The Company upholds its environmental
protection and improvement policy consistently.
In 2020, the total GHG emission index caused by
electricity supply purchased dropped from 0.533
in 2018 to 0.509 in 2019 by 4.5%. The GHG
emission caused by electricity supply purchased
in 2020 amounted to 454.97 metric tons of
carbon dioxide, down by 0.91 metric ton from
455.88 metric tons in 2019.
The emission factor of water usage for 2020 was
computed using the emission factor of 0.15 for
2019 or 0.9113 metric ton of carbon dioxide.
2019 is also set to be the Company’s base year
for emission factor of water use. The Company
shall continue to follow up, gather statistics and
make improvements in accordance with
company policy.
Responsibility Best
Practice Principles for
TWSE/GTSM Listed
Companies.
(IV) Consistent with the
Corporate Social
Responsibility Best
Practice Principles for
TWSE/GTSM Listed
Companies.
IV. Social issues
(I) Has the company developed its policies and procedures in
(I) 1. In accordance with the Labor Standard Act, Act of
(I) Consistent with the Corporate

- 48 -
accordance with laws and International Bill of Human
Rights?
Gender Equality in Employment and other labor
law, the Company has established the
“Regulations Governing Employee Work”,
“Procedures for Handling Work Place Sexual
Harassment Complaints”, “Declaration of
Prevention of Work Place Violence” and other
management policies and procedures, and made
effort to institutionalize them, so as to foster a
conducive working environment, protecting the
employee interests and welfare. At the same
time, the Company conforms to the Universal
Declaration of Human Rights of the International
Bill of Human Rights adopted by the United
Nations. Thus, the Company has prohibited the
hiring of labor less than 18 years old and child
labor. For the hiring policy, the Company adopts
a non-discriminatory treatment, whereby
ethnicity, skin color, age, gender, race or
nationality, disability, pregnancy, religion,
political views, organization background, marital
status, etc. do not constitute reasons for
discriminatory treatment or any form of
discrimination. The Company is keen to foster a
work place that is dignified, safe, equal and
harassment free.
2. The Company has established the Staff Benefit
Committee and provided various subsidies for
employees (e.g. wedding congratulatory
money and scholarship for the children of
employees, etc.), as well as sponsoring social
Social Responsibility
Best Practice Principles
for TWSE/GTSM Listed
Companies.

- 49 -
(II) Has the Company established and implemented reasonable
Employee benefit measures (including salary, leave and
other benefits), reasonably reflecting the operating
results in Employee salary?
(III) Does the company provide employees with a safe and
healthy work environment? Are employees trained
regularly on safety and health issues?
events and staff retreats of employees.
3.The Company provides group insurance and
travel insurance to ensure the rights and
welfare of employees.
4. The Company has established an employee
stock ownership plan (ESOP) to assist
employees in long-term saving and wealth
accumulation, as well as protecting the
security of their future lives and promoting
their sense of belongs toward the Company.
(II) The Company makes concerted effort in ensuring the
fairness of salaries, both internally and externally.
Its long-term participation and referencing of the
industry salary research shall be able to maintain
the competitiveness in this area. For staff welfare,
apart from leave stipulated by the law and
regulations, the Company also provides pay leave
and sick leave quota, as well as a diverse and
flexible welfare measures.
(III) 1. The Company provides a conducive working
environment. Employee health examinations are
performed on a regular basis every year.
Consultation provided by medical professional
on the medical report and education on safety
and hygiene are provided. In addition, in
accordance with the law and regulations, the
Company has hired “the diplomate with
(II) Consistent with the
Corporate Social
Responsibility Best
Practice Principles for
TWSE/GTSM Listed
Companies.
(III) Consistent with the
Corporate Social
Responsibility Best
Practice Principles for
TWSE/GTSM Listed
Companies.

- 50 -
(IV) Has the company implemented an effective training
program that helps employees develop skills over the
course of their career?
(V) Pertaining to the health and safety of customer when
using the company’s products and services, consumer
privacy, marketing and labeling, does the company
comply with the relevant regulations and
international standards, and establish relevant
policies on consumer protection and complaint
procedure?
(VI) Has the company established policy on supplier
management, demanding suppliers to observe code of
conduct pertaining to environmental protection, labor
safety and health or labor rights, and monitoring their
implementation?
occupational medicine” and “nurse practitioner
with occupational medicine” to conduct on-site
health management service on a regular basis.
2. To provide a friendly work place, as well as
empathizing with female employees who have
breastfeeding needs, the Company has establish
“Breastfeeding Rooms” in its facilities at
Kaohsiung, Hsinchu and Taipei.
(IV) The Company holds employee seminars regularly
every year to establish its communication with
employees and the mechanism of promoting
company policies.
(V) The marketing and labeling of products and
services are compliant with the respective domestic
regulations of the customers and suppliers, and the
regulations of international standards.
(VI) In accordance with supplier review standard of
ISO9001,
the Company has established “Procedures for
Supplier and Subcontractor Management” to
select, evaluate, review suppliers and
subcontractors to satisfy customer requirements
in the product quality, delivery, pricing, service,
safety and environmental protection.
(IV) Consistent with the
Corporate Social
Responsibility Best
Practice Principles for
TWSE/GTSM Listed
Companies.
(V) Consistent with the
Corporate Social
Responsibility Best
Practice Principles for
TWSE/GTSM Listed
Companies.
(VI) Consistent with the
Corporate Social
Responsibility Best
Practice Principles for
TWSE/GTSM Listed
Companies.

- 51 -
The Company has established the “Supplier Evaluation
Checklist” and “Subcontractor’s Basic Information
Evaluation Checklist”, consistently encouraging the
collaboration with suppliers and subcontractors to fulfill
its CSR, and providing assistance to them in making
improvements. For the annual supplier and subcontractor
evaluation, the Company incorporates the environmental
protection, occupational health and safety, labor rights
and other environmental and social risks, as well as status
of improvements into the evaluation items and audit plan.
If violations are found, the Company may suspend, cease
or terminate the business relationship.
V. Does the company refer to universal standard or guideline
for report preparation when preparing for CSR report
and other non-financial disclosure reports? Does the
company obtain the confirmation or affirmation opinion
from third certification party for the aforementioned
reports?
The Company has yet to prepare the CSR Report.
However, at the Company website, annual reports and the
Market Observation Post System, the Company has made
disclosure pertaining to its non-financial information.
From time to time, the updates on the Company website
shall provide more information for the reference of the
public.
Consistent with the Corporate
Social Responsibility Best
Practice Principles for
TWSE/GTSM Listed
Companies.
VI. If the company has established corporate social responsibility in accordance with “Corporate Social Responsibility Best Practice Principles for TWSE/GTSM Listed
Companies”, please describe the current practices and any deviations from the Best Practice Principles:
The Company has yet to establish its corporate social responsibility. However, the Company aspires to become a model enterprise and is committed to its employees,
shareholders and customers. In addition to implementation of information transparency, the Company is also keen to introduce new industrial technologies, new materials
and new equipment, as well as providing devoted services. These measures are beneficial to the corporate growth and success, and at the same, creating more job
opportunities. All in which, these measures have ensured the Company’s conformity to the “Corporate Social Responsibility Best Practice Principles for TWSE/GTSM
Listed Companies.

- 52 -
VII. Other information relevant to understanding the company’s corporate social responsibility:
(1) The Company participated in making donation for the medical building of National Sun Yat-sen University, which shall provide much medical benefit to the residents at
Kaohsiung, Pingtung, Taitung and Penghu, thus adding to a healthy balance in medical resource distribution of the northern and southern Taiwan: In southern Taiwan,
for almost 40 years, there had not been a new public medical college. In 2020, the Company donated NT$3.4 million to assist National Sun Yat-sen University to
cultivate public medical professionals that will cater to the needs of residents at the rural areas, outlying islands and aboriginal inhabited areas, thus narrowing the
medical resource gap between the north and the south. In the future, long-distance AI medicine, economic medicine, ecological medicine, precision and preventive
medicine are some of the aspects that will see much development in the medical field, thus heightening the competitiveness of the Kaohsiung, Pingtung, Taitung and
Penghu and cultivating smart medical talents at these areas.
(2) The Company made donation for the mobile library van of the public library, thus enhancing the book resources at rural areas and solidifying equal reading right; the
Company also donated the second generation mobile library vans to Kaohsiung City, facilitating resource sharing between the city and rural areas.
Every reader at every corner of Kaohsiung County thus has access to 6 million books via the book vans; the second generation book vans combine drawing and reading
for children, thus becoming a much anticipated facility for young readers. The book vans are believed to be able to increase the reading momentum at Kaohsiung
County.
(3) The Company has been sponsoring many scholarship at universities to help underprivileged and outstanding students: In 2020, the Company made a donation of a total
of NT$2.1 million to Culture and Education Foundation of Department of Chemistry, National Cheng Kung University, as well as National Sun Yat-sen University and
Takming University of Science and Technology for assisting the underprivileged students; the management of the Company also participated in the Elite Forum held by
National Cheng Kung University, sharing the entrepreneurial journey and life experience with students.
(4) The Company consistently sponsors external culture and education foundations and charity foundations to contribute to the regional development of culture, education
and social welfare: In 2020, the Company donated NT$290 thousand to Fu Tse Social Foundation, Christian Mennonite Church, Xue Xue Foundation, Taiwan Reading
Culture Foundation, facilitating the organization of cultural and charity activities and promoting a society of kindness and grace.
(5) The Company has been sponsoring musical bands and musicians consistently to enhance artistic and cultural appreciation: In 2020, the Company sponsored NT$100
thousand for the Baroque Camerata to support artists and foster a gracious, kind and wondrous life spheres.
(6) The Company has been actively joining various associations, organizations and alliances to enhance industrial technologies and expanding markets, as well as being part
of a competitive player nationally: In 2020, the Company sponsored a total of NT$430 thousand to Taiwan Industrial Technology Association, Composite Materials
Industry Association, International Federation of Inventors' Associations, Taiwan Printed Circuit Association to promote industry upgrading.
(7) Human rights:

- 53 -
1. Equal opportunities: By upholding the principles of equal opportunities and acknowledging the diverse contribution made by talents, the Company hires employees
by holding open recruitments. The Company believes in meritocracy and the right person for the right job, and not in discrimination by ethnicity, gender, age, lifestyle,
religion, nationality or political views.
2. Act of Gender Equality in Employment: The Company has established sexual preventive measures for filing of complaint and punishment procedures.
(8) Stakeholders’ rights:
In accordance with the provisions of the competent authorities, the Company announces its operating, financial and other related information on a regular basis. Major
policies must receive the board’s resolution before coming into effect.
Note 1: For operating conditions in which “Yes” is selected, please indicate the major policies, strategies, measures and implementation status; for operating conditions in
which “No” is selected, please indicate the reason and the related policies, strategies and measures to be made in the future.
Note 2: The Company has prepared the CSR Report. For the annotation of the status of implementation, please replace with the method of reference and page number of the
CSR Report.
Note 3: Major principles are pertaining to the environmental, social, corporate governance issues that may pose major impact on the Company’s investors and other
stakeholders.
(VI) Implementation of integrity management:
Assessment item
Participation (Note 1) Deviation and causes of deviation from
the Ethical Corporate Management
Best Practice Principles for
TWSE/GTSM Listed Companies Yes No Summary description
I.Establishment of Corporate Conduct and Ethics Policy and
Implementation Measures
(I) Does the Company establish corporate conduct and ethics
policy that is approved by the Board of Directors and
document such policy and procedure, as well as
ensuring the commitment of the Board and
Management team in the implementation of the
policy thereof, in the bylaws and publicly available
(I) The Company has established the “Ethical Corporate
Management Best Practice Principles”, in which directors,
supervisors, managers, employees and person(s) with de
facto control must comply with the law and regulations.
Integrity is the number one core value in the Company’s
culture. By upholding its commitment, mutual trust and
reciprocity, the Company insists on professional ethics and
morality of the utmost level when conducting all operating
activities.
(I) Consistent with the Ethical
Corporate Management Best
Practice Principles for
TWSE/GTSM Listed
Companies.

- 54 -
Assessment item
Participation (Note 1) Deviation and causes of deviation from
the Ethical Corporate Management
Best Practice Principles for
TWSE/GTSM Listed Companies Yes No Summary description
documents?
(II) Does the Company establish relevant policies which are
duly enforced to prevent unethical conduct, provide
and implement operating procedures, behavioral
guidelines, penalty for violation and appeal system
in such policies?
(II) To prevent unethical conducts, apart from prohibiting
directors, supervisors, managers and employees from
giving out and receiving bribery, and making illegal
political contribution in the course of conducting business
activities, the Company has also prohibited any direct or
indirect receipt of unreasonable gifts, receptions or other
illegal interests, to avoid employees compromising the
Company’s interest for personal gains. The employees and
the board members strictly comply with the regulations.
(II) Consistent with the Ethical
Corporate Management Best
Practice Principles for
TWSE/GTSM Listed
Companies.
(III) Has the company established measures for the
prevention of unethical conduct covered by the
“Ethical Corporate Management Best Practice
Principles for TWSE/GTSM Listed Companies”,
Article 7, Paragraph 2?
(III) To promote and raise the awareness of ethical conduct, the
Company has established the “Ethical Corporate
Management Best Practice Principles” and other related
regulations, which are made available on the Company’s
intranet to facilitate reference and compliance. The
Company has also established that it shall hold any
violators accountable.
(III) Consistent with the Ethical
Corporate Management Best
Practice Principles for
TWSE/GTSM Listed
Companies.
II. Implementation of integrity management
(I) Does the company evaluate the integrity of all
counterparties it has business relationships with?
Are there any integrity clauses in the agreements it
signs with business partners?
(I) The customers and suppliers of the Company are mostly
well-known companies. Their information regarding
integrity management are more easily obtained. If business
contracts are made, the importance of integrity is also
underscored in these contracts.
(I) Consistent with the Ethical
Corporate Management Best
Practice Principles for
TWSE/GTSM Listed
Companies.
(II) Does the company task a unit that reports directly to the
board of directors and with promoting ethical
standards, making periodical updates (at least once a
(II) The Company has established the Professionalism
Promotion Committee to oversee and supervise the
implementation, and shall report to the board of directors,
(II) Consistent with the Ethical
Corporate Management Best
Practice Principles for

- 55 -
Assessment item
Participation (Note 1) Deviation and causes of deviation from
the Ethical Corporate Management
Best Practice Principles for
TWSE/GTSM Listed Companies Yes No Summary description
year) to the board on the status of implementation?
(III) Does the company have any policy that prevents
conflict of interest, and channels that facilitate the
report of conflicting interests?
depending on circumstances.
(III) The Company has executed the related regulations. The
documents signed by employees also contain terms for
avoidance of conflict of interests and confidentiality
clause. Meanwhile, the Company has established an e-
mail for whistle-blowing.
TWSE/GTSM Listed
Companies.
(III) Consistent with the Ethical
Corporate Management Best
Practice Principles for
TWSE/GTSM Listed
Companies.
(IV) Has the company implemented effective accounting
and internal control systems for the purpose of
maintaining business integrity, and had the internal
audit unit or external auditors conducted regular audits
on a regular basis?
(IV) The Company has established the accounting and internal
control systems. Amendments shall be made in tandem
with the changes in environment and regulations to ensure
the effectiveness of the systems. The Audit Office reports
to the board of directors directly. This is to ensure the
independence and objectivity of the execution of the
auditing activities. Every year, the office shall make risk
assessment to prepare the audit plan and execute the
review as per the plan. Regular reports are made to the
board of directors to ensure that the management level is
familiar with the execution status of the systems.
(IV) Consistent with the Ethical
Corporate Management Best
Practice Principles for
TWSE/GTSM Listed
Companies.
(V) Does the company conduct internal and external ethical
training programs on a regular basis?
(V) To promote and raise the awareness for ethical conducts,
the Company has conducted training for all employees in
this regard. The related regulations are disclosed on the
Company website for convenient reference of all
employees.
(V) Consistent with the Ethical
Corporate Management Best
Practice Principles for
TWSE/GTSM Listed
Companies.
III. Implementation of whistle-blowing system

- 56 -
Assessment item
Participation (Note 1) Deviation and causes of deviation from
the Ethical Corporate Management
Best Practice Principles for
TWSE/GTSM Listed Companies Yes No Summary description
(I) Does the company provide incentives and means for
employees to report malpractice, and implement an
accessible whistle-blowing channel? Does the
company dedicate personnel to investigate the
reported malpractice?
(I) The Company has established a whistle-blowing channel
and the related punishment and complaint system, while
observing the personal information protection and
prohibiting retaliation behavior. The whistle-blowing
information is managed by designated personnel.
(I) Consistent with the Ethical
Corporate Management Best
Practice Principles for
TWSE/GTSM Listed
Companies.
(II) Has the company implemented any standard procedures
or confidentiality measures for handling reported
malpractices?
(II) The “Ethical Corporate Management Best Practice
Principles” stipulates the procedures in conducting
investigation. The parties involved shall maintain
confidentiality and conduct the investigation in accordance
with these principles.
(II) Consistent with the Ethical
Corporate Management Best
Practice Principles for
TWSE/GTSM Listed
Companies.
(III) Does the company assure malpractice reporters that they
will not be mistreated for making such reports?
(III) The identity of the whistle-blower is protected throughout
the complaint process. The whistle-blower shall not be
subject to inappropriate measures due to making a
complaint.
(III) Consistent with the Ethical
Corporate Management Best
Practice Principles for
TWSE/GTSM Listed
Companies.
IV. Strengthening information disclosure
(I) Has the company disclosed relevant CSR principles and
implementation on its website and Market
Observation Post System?
(I) The “Ethical Corporate Management Best Practice
Principles” are disclosed on the Company website, annual
reports and the Market Observation Post System. The
updates on its implementation shall be disclosed on the
Company website from time to time.
(I) Consistent with the Ethical
Corporate Management Best
Practice Principles for
TWSE/GTSM Listed
Companies.
V. If the company has established business integrity policies in accordance with “Ethical Corporate Management Best Practice Principles for TWSE/GTSM Listed Companies”,

- 57 -
Assessment item
Participation (Note 1) Deviation and causes of deviation from
the Ethical Corporate Management
Best Practice Principles for
TWSE/GTSM Listed Companies Yes No Summary description
please describe its current practices and any deviations from the Best Practice Principles:
To establish a corporate culture that is based on integrity and promote a robust management system, by referring to the “Ethical Corporate Management Best Practice
Principles for TWSE/GTSM Listed Companies”, the Company established the “Ethical Corporate Management Best Practice Principles” and has observed these principles in
the implementation. There is no deviation from these principles so far.
VI. Other information relevant to understanding the company’s business integrity (e.g. review the company’s corporate conduct and ethics policy):
Integrity is the number one core value in the Company’s culture. By upholding its commitment, mutual trust and reciprocity, the Company insists on professional ethics and
morality of the utmost level when conducting all operating activities.
In accordance with the “Ethical Corporate Management Best Practice Principles for TWSE/GTSM Listed Companies”, on August 9, 2017, the board of directors passed the
resolution to establish the “Ethical Corporate Management Best Practice Principles” and announced publicly.
(VII) For corporate governance guidelines and regulations and other relevant internal policies, the company should disclose how to access to these policies:
(1) The Company has established the “Rules and Procedures of Board of Director Meetings”, “Rules of Procedure for Shareholders Meetings”, “Procedures for Election of
Directors”, “Procedures for Acquisition or Disposal of Assets”, “Procedures for Endorsements and Guarantees”, “Procedures for Lending Funds to Other Parties”, “Rules for
Continuing Education of Directors”, “Code of Conduct of Wah Lee”, “Procedures on Insider Trading Prevention and Control”, “Ethical Corporate Management Best Practice
Principles”, “Corporate Governance Best Practice Principles”, “Audit Committee Charter”, “Compensation Committee Charter”, “Articles of Incorporation” and “Procedures
for Handling Reports on Illegal or Unethical Conduct”.
(2) The related company regulations and procedures are disclosed in the annual report, shareholder’s meeting handbook, the Market Observation Post System
(http://mops.tse.com.tw) and the Company website (http://www.wahlee.com).
(VIII) Other material information that may enhance the understanding of the corporate governance status of the company: Please see page 31 to 37 of the annual report.

- 58 -
(IX) Disclosure pertaining to internal control systems:
1. Statement of Internal Control System
WAH LEE INDUSTRIAL CORP.
Statement of Internal Control System
March 26, 2021
Based on the findings of a self-assessment, WAH LEE INDUSTRIAL CORP. states the following with regard to its
internal control system during the year 2020:
1. The Company’s Board of Directors and management are responsible for establishing, implementing, and
maintaining an adequate internal control system. Internal control system is designed to provide reasonable
assurance over the effectiveness and efficiency of our operations (including profitability, performance and
safeguarding of assets), reliability, timeliness, transparency and regulatory compliance of our reporting, and
compliance with applicable rulings, laws and regulations.
2. An internal control system has inherent limitations. No matter how perfectly designed, an effective internal
control system can provide only reasonable assurance of accomplishing its stated objectives. Moreover, the
effectiveness of an internal control system may be subject to changes due to extenuating circumstances
beyond our control. Nevertheless, our internal control system contains self-monitoring mechanisms, and the
Company takes immediate remedial actions in response to any identified deficiencies.
3. The Company evaluates the design and operating effectiveness of its internal control system based on the
criteria provided in the Regulations Governing the Establishment of Internal Control Systems by Public
Companies (herein below, the “Regulations”). The criteria adopted by the Regulations identify five key
components of managerial internal control: (1) control environment, (2) risk assessment, (3) control
activities, (4) information and communication, and (5) monitoring activities. Each component also includes
several items which can be found in the Regulations.
4. The Company has evaluated the design and operating effectiveness of its internal control system according
to the aforesaid Regulations.
5. Based on the findings of such evaluation, the Company believes that, on December 31, 2020, it has
maintained, in all material respects, an effective internal control system (that includes the supervision and
management of our subsidiaries), to provide reasonable assurance over our operational effectiveness and
efficiency, reliability, timeliness, transparency and regulatory compliance of reporting, and compliance with
applicable rulings, laws and regulations.
6. This Statement is an integral part of the Company’s annual report and prospectus, and will be made public.
Any falsehood, concealment, or other illegality in the content made public will entail legal liability under
Articles 20, 32, 171, and 174 of the Securities and Exchange Law.
7. This Statement was passed by the Board of Directors in their meeting held on March 26, 2021, with none of
the nine attending directors expressing dissenting opinions, and the remainder all affirming the content of
this Statement.
WAH LEE INDUSTRIAL CORP.
Chairman
Chief Executive Officer

- 59 -
2. Hiring an accountant to audit the company’s internal control system, the audit report prepared by the CPAs
should be disclosed: None.
(X) For the most recent year until the publication date of the annual report, penalties imposed against the company and
its staff, or penalties imposed by the company against its staff for violations of internal control or regulations, all of
which may impact the Shareholders' interest or the share price. State any corrective actions taken in the most recent
years up to the date of the annual report: None.
The Company has established the related regulations and procedures, and disclosed on the Company website the
complaints on violation of the law and misconducts by internal and external parties.
(XI) For the most recent year until the publication date of the annual report, major resolutions made in shareholders’ and
board meetings:
1. Material resolutions in shareholders’ meeting:
Name of meeting (date) Major resolutions
Annual Shareholders’
Meeting for 2020
(May 28, 2020)
I. Ratification of Business Report and Financial Statements for 2019.
II. Resolution passed for earnings distribution for 2019. Cash dividends of NT$3.3
per share was appropriated.
III. Resolution passed for amendments to “Articles of Incorporation”.
IV. Resolution passed for amendments to partial articles of the “Procedures for
Endorsements and Guarantees”.
V. Resolution passed for amendments to partial articles of the “Rules of Procedure
for Shareholders Meetings”.
VI. Resolution passed for election of the board of directors. (The board consists of
nine directors, of which three is independent directors)
VII. Resolution passed for rescission of prohibiting the participation in competing
businesses for newly appointed directors.
2. Major resolutions of the board of directors
Date of
board
meeting
Session Resolution Voting result
February
21, 2020 First meeting
Operational plan for 2020. Resolution passed
unanimously.
Authorization for business transactions with the banks for 2020. Resolution passed
unanimously.
Continued to provide endorsement and guarantee of US$3.1 million to
subsidiary, PT Wah Lee Indonesia.
Resolution passed
unanimously.
Continued to provide endorsement and guarantee of US$8.1 million to
subsidiary, Wah Lee (Vietnam) Co., Ltd.
Resolution passed
unanimously.
Continued to provide endorsement and guarantee of NT$25,194,000 to
investee, ASAHI KASEI WAH LEE HI-TECH CORPORATION.
Resolution passed
unanimously.
Continued to provide endorsement and guarantee of NT$360 million and
procurement guarantee of NT$120 million to investee, Nagase Wahlee
Plastics Corporation.
Resolution passed
unanimously.
Continued to provide endorsement and guarantee of NT$17.7 million and
procurement guarantee of US$7 million to investee, Shanghai Hua Chang
Resolution passed
unanimously.

- 60 -
Date of
board
meeting
Session Resolution Voting result
Trading Co., Ltd.
Establishment of “Procedures for Handling Reports on Illegal or Unethical
Conduct”.
Resolution passed
unanimously.
Amendments to partial articles of “Procedures for Audit Committee
Meetings”.
Resolution passed
unanimously.
Amendments to audit plan for 2020. Resolution passed
unanimously.
Election of the board of directors. Resolution passed
unanimously.
Determination of the date and venue of the shareholders’ meeting for 2020. Resolution passed
unanimously.
March 25,
2020
Second
meeting
Business reports, standalone and consolidated financial statements for 2019. Resolution passed
unanimously.
Earnings distribution for 2019. Resolution passed
unanimously.
Appropriation of the director and employee compensation for 2019. Resolution passed
unanimously.
Appropriation of the director and employee compensation for 2020. Resolution passed
unanimously.
Continued to provide material procurement performance bond to Raycong
Industrial (Hong Kong) Limited, Dong Guan Hua Gang International Trading
Co., Ltd. and Shanghai Yi Kang Chemicals & Industries Co., Ltd. to
Shinkong Synthetic Fiber Corporation and its subsidiary, Shinkong Industrial
(Hangzhou) Co., Ltd, all of which amounted to NT$120 million.
Resolution passed
unanimously.
Provided endorsement and guarantee of US$5.2 million to subsidiary,
Shanghai Yi Kang Chemicals & Industries Co., Ltd. who makes procurement
from Japanese supplier, JSR.
Resolution passed
unanimously.
Continued to provide endorsement and guarantee of US$7.5 million to
subsidiary, Wah Lee Tech (Singapore) Pte., Ltd. and procurement guarantee
to JSR of US$7.4 million.
Resolution passed
unanimously.
Amendments to partial articles of the “Procedures for Endorsements and
Guarantees”, “Articles of Incorporation” and “Rules of Procedure for
Shareholders Meetings”.
Resolution passed
unanimously.
Establishment of the “Procedures for Performance Assessment of the Board
of Directors and Functional Committees”.
Resolution passed
unanimously.
Statement of Internal Control System for 2019. Resolution passed
unanimously.
Nomination and review of the director and independent director candidates. Resolution passed
unanimously.
Rescission of prohibiting the participation in competing businesses for newly
appointed directors.
Resolution passed
unanimously.
Change of the venue of shareholders’ meeting and amendments to the
shareholders’ meeting agenda.
Resolution passed
unanimously.
May 8,
2020
Third
meeting
Purchase of liability insurance for all board members and managers. Resolution passed
unanimously.
Land sale of subsidiary, Kingstone Energy Technology Co., Ltd. Resolution passed
unanimously.
Application for medium-term work capital loan to the bank. Resolution passed
unanimously.
May 28,
2020
Fourth
meeting Election of Chairman and Vice Chairman.
Resolution passed
unanimously.

- 61 -
Date of
board
meeting
Session Resolution Voting result
Director, Chang, Ray-
Ching (representative of
Kang Tai Investment Co.,
Ltd.) takes office as the
Chairman of the Company
and director, Chen, Chun-
Yin takes office as the Vice
Chairman.
Appointment of the Fourth Compensation Committee members.
Attending Directors
(excluding Wang, Yea-
Kang and Chu, Hau-Min
who recused due to conflict
of interests) passed the
resolution unanimously
after the convener solicited
opinion from the Board.
Matters regarding the disbursement of cash dividends for 2019. Resolution passed
unanimously.
August 12,
2020
Fifth
meeting
Deliberation of the manager compensation by the Compensation Committee. Resolution passed
unanimously.
Adjustment to the percentage of employee compensation for 2020. Resolution passed
unanimously.
Deliberation on whether to classify overdue accounts receivable in the
second quarter as funds lent.
Resolution passed
unanimously.
Continued to provide endorsement and guarantee of THB468 million to
subsidiary, Wah Tech Industrial Co., Ltd. (Thailand).
Resolution passed
unanimously.
Continued to provide endorsement and guarantee of US$6.7 million to
subsidiary, Shanghai Yi Kang Chemicals & Industries Co., Ltd. who makes
procurement guarantee from Japanese supplier, JSR.
Resolution passed
unanimously.
Continued to provide procurement guarantee of US$7.7 million to
subsidiary, Wah Lee Tech (Singapore) Pte., Ltd.
Resolution passed
unanimously.
New endorsement and guarantee of US$2 million to subsidiary, Wah Lee
Philippines Inc.
Resolution passed
unanimously.
Establishment of the officer of corporate governance Resolution passed
unanimously.
November
12, 2020
Sixth
meeting
New provision of shares and dividends as collateral for the syndicated loan
taken up by subsidiary, Kingstone Energy Technology Co., Ltd.
Resolution passed
unanimously.
Purchased office space at Neihu from ORC Electrical Machinery Co., Ltd. Resolution passed
unanimously.
Deliberation on whether to classify overdue accounts receivable in the third
quarter as funds lent.
Resolution passed
unanimously.
Audit plan for 2021. Resolution passed
unanimously.
January 7,
2021
First
extraordinary
meeting
Resolution passed for the participation of capital increase by cash in Le Chia
Regeneration Technology Co., Ltd.
Resolution passed
unanimously.
January 26,
2021 First meeting
Resolution passed for the authorization for business transactions with the
banks for 2021.
Resolution passed
unanimously.
Approval for continuing to provide endorsement and guarantee of
NT$25,194,000 to investee, ASAHI KASEI WAH LEE HI-TECH
Resolution passed
unanimously.

- 62 -
Date of
board
meeting
Session Resolution Voting result
CORPORATION.
Approval for continuing to provide endorsement and guarantee of NT$480
million and procurement guarantee of NT$120 million to investee, Nagase
Wahlee Plastics Corporation.
Resolution passed
unanimously.
Approval for continuing to provide endorsement and guarantee of NT$19.2
million and procurement guarantee of US$9 million to investee, Shanghai
Hua Chang Trading Co., Ltd.
Resolution passed
unanimously.
Resolution passed for the date and venue of the shareholders’ meeting for
2020.
Resolution passed
unanimously.
Resolution passed for the proposal to invest in Hua Hsuan Energy Co., Ltd. Resolution passed
unanimously.
March 26,
2021
Second
meeting
Resolution passed for the discussion of the business reports, standalone and
consolidated financial statements for 2021.
Resolution passed
unanimously.
Resolution passed for earnings distribution for 2020. Dividends of
NT$925,560,552 was appropriated and shall be disbursed in cash (NT$4 per
share).
Resolution passed
unanimously.
Resolution passed for the proposal of capitalization of capital surplus to
issue new shares.
Resolution passed
unanimously.
Resolution passed for the appropriation of the director and employee
compensation for 2020.
Resolution passed
unanimously.
Resolution passed for the distribution percentages of director and employee
compensations for 2021.
Resolution passed
unanimously.
Approval for continuing to provide material procurement performance bond
to Raycong Industrial (Hong Kong) Limited, Dong Guan Hua Gang
International Trading Co., Ltd. and Shanghai Yi Kang Chemicals &
Industries Co., Ltd. to Shinkong Synthetic Fiber Corporation and its
subsidiary, Shinkong Synthetic Fiber (Jiangsu) Co., Ltd, all of which
amounted to NT$120 million.
Resolution passed
unanimously.
Approval for continuing to provide endorsement and guarantee of US$5.4
million to subsidiary, Shanghai Yi Kang Chemicals & Industries Co., Ltd.
who makes procurement from Japanese supplier, JSR.
Resolution passed
unanimously.
Approval for continuing to provide endorsement and guarantee of US$10.5
million to subsidiary, Wah Lee Tech (Singapore) Pte., Ltd. and procurement
guarantee to JSR of US$8.4 million.
Resolution passed
unanimously.
Resolution passed for lending funds to subsidiary, Kingstone Energy
Technology Co., Ltd.
Resolution passed
unanimously.
Resolution passed for application for medium-term work capital loan to the
bank.
Resolution passed
unanimously.
Resolution passed for amendments to “Articles of Incorporation”. Resolution passed
unanimously.
Resolution passed for the partial articles of “Procedures for Acquisition or
Disposal of Assets”.
Resolution passed
unanimously.
Resolution passed for amendments to partial articles of the “Rules of
Procedure for Shareholders Meetings”.
Resolution passed
unanimously.
Resolution passed for the Statement of Internal Control System for 2020. Resolution passed
unanimously.
Resolution passed for amendments made to agenda of shareholders’ meeting
for 2021.
Resolution passed
unanimously.

- 63 -
(XII) Review of the implementation of resolutions passed in shareholders’ meeting:
Resolutions passed in shareholders’ meeting for 2020
(May 28, 2020) Implementation of resolution
Resolution passed for earnings distribution for 2019.
The resolution passed on May 28, 2020 by the board of directors stipulated that July
8, 2020 as ex-dividend date. The cash dividends disbursed on July 29, 2020
amounted to NT$763,587,456.
Resolution passed for amendments to “Articles of
Incorporation”.
Reviewed and registered as documented in June 24, 2020 DOC, MOEA Doc. No.
10901106060.
Resolution passed for amendments to partial articles
of the “Procedures for Endorsements and Guarantees”
and “Rules of Procedure for Shareholders Meetings”.
Subsequent undertakings have been performed in accordance with the amended
procedures.
Resolution passed for election of the board of
directors.
Election of nine directors (including three independent directors) had been reviewed
and registered as documented in DOC, MOEA Doc. No. 10901106060.
(XIII) For the most recent year until the publication date of the annual report, major issues of record or written
statements made by any director or supervisor dissenting to important resolutions passed by the board of
directors: None.
(XIV) For the most recent year until the publication date of the annual report, resignation or discharge of the company’s
key individuals, including the chairman, general manager, and heads of accounting, finance, internal audit, and
R&D: None.
V. Audit Fees:
CPA Firm Independent auditor Period covered by audit Remark
Deloitte & Touche
Taiwan Wu, Chiu-Yen Chen, Chen-Li
January 1, 2020 to
December 31, 2020
Audit fees table
Fees
Amount Audit fee Non-audit fee Total
1 Less than NT$2,000 thousand
2 NT$2,000 thousand (inclusive) to
NTS$4,000 thousand
3 NT$4,000 thousand (inclusive) to
NTS$6,000 thousand
4 NT$6,000 thousand (inclusive) to
NTS$8,000 thousand
5 NT$8,000 thousand (inclusive) to
NTS$10,000 thousand
6 More than NT$10,000 thousand
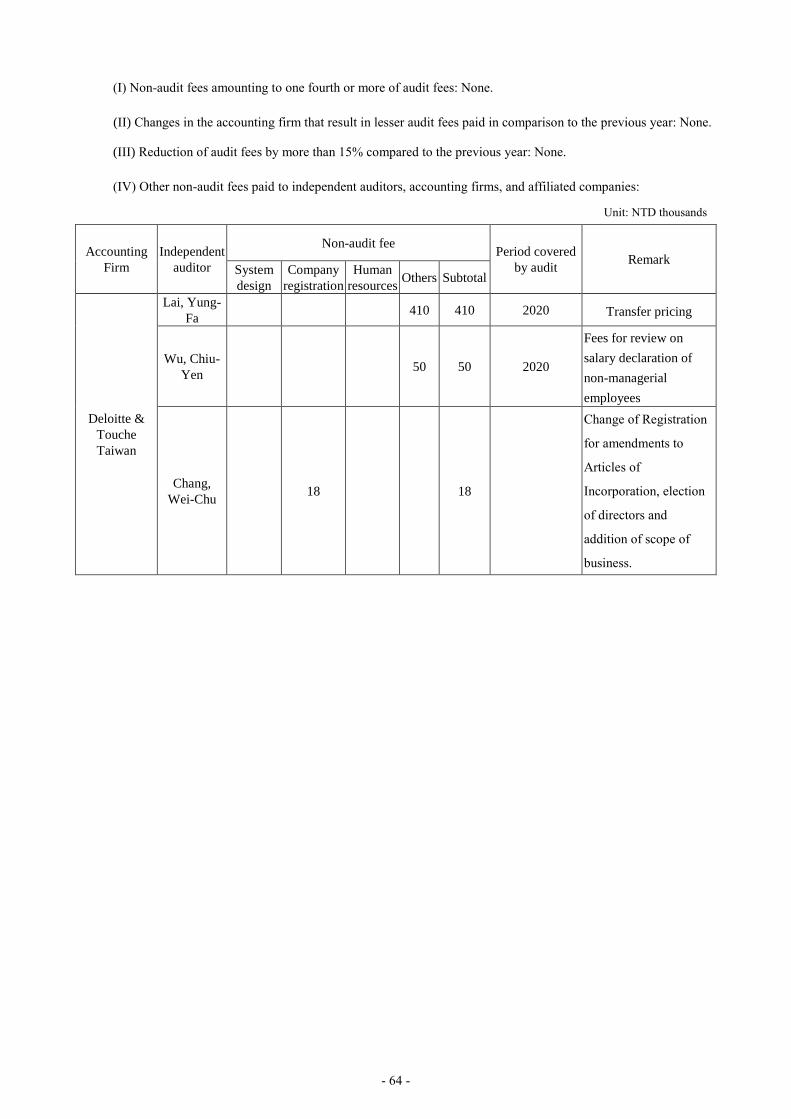
- 64 -
(I) Non-audit fees amounting to one fourth or more of audit fees: None.
(II) Changes in the accounting firm that result in lesser audit fees paid in comparison to the previous year: None.
(III) Reduction of audit fees by more than 15% compared to the previous year: None.
(IV) Other non-audit fees paid to independent auditors, accounting firms, and affiliated companies:
Unit: NTD thousands
Accounting
Firm Independent
auditor
Non-audit fee Period covered
by audit Remark
System
design Company
registration Human
resources Others Subtotal
Deloitte &
Touche
Taiwan
Lai, Yung-
Fa 410 410 2020 Transfer pricing
Wu, Chiu-
Yen
50 50 2020
Fees for review on
salary declaration of
non-managerial
employees
Chang,
Wei-Chu
18
18
Change of Registration
for amendments to
Articles of
Incorporation, election
of directors and
addition of scope of
business.

- 65 -
VI. Replacement of independent auditors:
(I) Previous independent auditors
Date of replacement Resolution passed by the board of directors on November 11, 2019
Causes for the replacement
The original independent auditors from Deloitte & Touche Taiwan
were Chen, Chen-Li and Kung, Chun-Chi. Due to internal adjustment
in Deloitte, from the fourth quarter of 2019 onward, the financial
statements were audited by Wu, Chiu-Yen and Chen, Chen-Li from
Deloitte & Touche Taiwan.
Causes of termination or rejection of
appointment of the appointer or
independent auditors
Parties involved
Circumstance
Certified Public
Accountant Appointer
Termination of appointment Not applicable
Rejection of appointment
For the most recent two years, the
causes for audit opinion other than
unqualified audit opinion
Not applicable
Opinion differing from the issuer
Accounting principles or practice
Yes Disclosure of financial statements
Audit scope or procedures
Others
None
Explanation Not applicable
Other disclosures (Disclosure in
pursuant of Article 10, Paragraph
6, Subparagraph 1(4) to 1(7))
None
(II) Re-appointed independent auditors:
Accounting Firm Deloitte & Touche Taiwan
Independent auditor Wu, Chiu-Yen and Chen, Chen-Li
Date of engagement Resolution passed by the board of directors on November 11,
2019
Prior to formal engagement, any inquiry or
consultation on the accounting treatment or
accounting principles for specific transactions,
and the type of audit opinion that might be
rendered on the financial report
Not applicable
Written opinions from the successor
independent auditors that are different from
the former independent auditors’ opinions
Not applicable

- 66 -
(III) Reply from previous independent auditors in pursuant of Article 10, Paragraph 6, Subparagraph 1, 2(3):
None.
VII. For any of the Company’s Chairman, General Manager, or managers responsible for Financial
or Accounting Affairs Being Employed by the Auditor’s Firm or Any of Its Affiliated Company
in the Most Recent Year, Name, Job Title and Tenure of Employment Shall be Disclosed: None.
VIII. For the Most Recent Year until the Publication Date of the Annual Report, the Transfer of Equity Interest
and Change in Stock Pledge of Directors, Supervisors, Managers and Shareholders with Stake of 10% or
More:
(I) Transfer of equity interest and change in stock pledge of directors, supervisors, managers and shareholders:
Job title Name
2020 As of March 31, 2021
Increase
(decrease) in
shares held
Increase
(decrease) in
shares pledged
Increase
(decrease) in
shares held
Increase
(decrease) in
shares pledged
Chairman Kang Tai Investment
Corporation 1,960,000 0 286,000 0
Representative of
Chairman Chang, Ray-Ching (8,302,000) 0 (10,000) 0
Vice Chairman Chun-Yin Chen 0 0 0 0
Directors Lin, Chi-Hai 0 0 0 0
Representative of
director Chang, Tsuen-Hsien 410,000 0 0 0
Directors Bau Guang Investment
Corporation 0 0 0 0
Representative of
director Lin, Shu-Chen (394,000) 0 0 0
Directors Yeh, Ching-Pin 0 0 0 0
Independent
Director Wang, Yea-Kang 0 0 0 0
Independent
Director Chu, Hau-Min 0 0 0 0
Independent
Director Shyu, So-De 0 0 0 0
CEO &
President Chang, Tsuen-Hsien 410,000 0 0 0
Vice president
(Note 1) Chen, Chi-Hsing 0 0
Not
applicable
Not
applicable
Vice president Chen, Chih-Yuan 0 0 0 0
Vice president Liu, Feng-Jung 0 0 0 0
Vice president Yeh, Ching-Wen 0 0 0 0
Vice president Lu, Jui-Ming 0 0 0 0
Vice president Su, Yu-Liang 0 0 (94,504) 0

- 67 -
Job title Name
2020 As of March 31, 2021
Increase
(decrease) in
shares held
Increase
(decrease) in
shares pledged
Increase
(decrease) in
shares held
Increase
(decrease) in
shares pledged
Vice president Chang, Jui-Sen 0 0 0 0
Director Chang, Jui-Yu 0 0 0 0
Director Lin, Li-Chang 0 0 0 0
Director Liu, Tsung-Ming 0 0 0 0
Director (Note 1) Wu, Hsi-Lin 0 0 Not
applicable
Not
applicable
Director Wu, Hsiu-I 0 0 0 0
Director Yang, Chen-Ming 0 0 0 0
Director Chang, Yu-Wen (18,000) 0 0 0
Director Lin, Fang-Su 0 0 0 0
Director Yu, Ching-Tien 0 0 0 0
Director Pan, Ching-Feng 0 0 0 0
Director Tsai, Yu-Tang 0 0 0 0
Director Chen, Yi-Jen 0 0 0 0
Director Shih, Ching-Hsien 0 0 0 0
Director Yang, Cheng-Ju 0 0 0 0
Director (Note 1) Weng, Chen-Tsang 0 0
Not
applicable
Not
applicable
Director Shao, Kuang-Wei 0 0 0 0
Director Chang, Chi-An (6,988) 0 0 0
Director Wang, Shi-Min 0 0 0 0
Director Tsai, Shu-Fen 0 0 0 0
Director Chen, Mao-Hua 0 0 0 0
Director (Note 2) Chang, Tzu-Cheng Not
applicable
Not
applicable 0 0
Director (Note 2) Chiang, Kuo-Jui
Not
applicable
Not
applicable 0 0
Director Lin, Ren-Chih 0 0 0 0
Director Li, Kuo-Ping 0 0 0 0
Note 1: Discharged in 2020.
Note 2: Promoted in 2021.

- 68 -
(II) Transfer of equity interest Unit: Share; NT$
Name
Reason for
the transfer
of equity
interest
Trade date Transacted party
Relation of
transacted party
with the
Company,
directors,
supervisors,
managers and
shareholders
with a 10% stake
or more
Shares Transaction
price
Chang,
Ray-
Ching Gift
November
26, 2020 Chang, Tsuen-Hsien Father and son 213,000 58.6
Chang,
Ray-
Ching Gift
December 8,
2020 Chang, Tsuen-Hsien Father and son 197,000 63.3
Lin, Shu-
Chen Gift
December 8,
2020 Chang, Tsuen-Yi Mother and son 394,000 63.3
Chang,
Ray-
Ching
Transacted
party December 9,
2020
Provisional Office of Ting Pao Co., Ltd
Representative: Chang, Ray-Ching
Shareholding under
other person(s) 7,300,000 75.0
(III) Pledge of equity interest: None.
IX. Shareholding Percentage of Top 10 Shareholders and Their Affiliated Persons, Spouses, or Other Relatives
within Two Degrees of Consanguinity:
March 31, 2021
Name
Shareholding Shareholdings of spouse and
minor child(ren)
Shareholding under other
person(s)
Names of spouse or other
relatives within two degrees of
consanguinity who are also
among the Company’s top 10
largest shareholders
Remarks
Shares Shareholding
percentage Shares
Shareholding
percentage Shares
Shareholding
percentage Name Relation
Kang Tai
Investment
Corporation
16,660,155 7.20% 0 0.00% 0 0.00%
Fortune
Investment
Co., Ltd.
Parent
company of
the Company
Kang Tai
Investment
Corporation
Representative:
Tsai, Shu-Fen
100,280 0.04% 0 0.00% 0 0.00% None None
Fortune
Investment Co.,
Ltd.
13,246,583 5.72% 0 0.00% 0 0.00%
Kang Tai
Investment
Corporation
Subsidiary of
the Company
Fortune
Investment Co.,
Ltd.
Representative:
Chang, Yu-Jen
0 0.00% 0 0.00% 0 0.00% None None
Dragon
Investment Co.,
Ltd.
11,017,422 4.76% 0 0.00% 0 0.00% None None
Dragon
Investment Co.,
Ltd.
Representative:
Hsieh, Hsin-Mo
1,061 0.00% 0 0.00% 0 0.00% None None
Ting Pao Co., Ltd 7,300,000 3.15% 0 0.00% 0 0.00% Chang, Ray-
Ching
Chairman of
Ting Pao Co.,
Ltd
Ting Pao Co., Ltd
Representative:
Chang, Ray-
Ching
6,598,397 2.85% 1,295,656 0.56% 7,300,000 3.15% Ting Pao
Co., Ltd
is held by
Chang, Ray-
Ching under
other
person(s)
Cathay Life
Insurance Co.,
Ltd.
7,182,000 3.10% 0 0.00% 0 0.00% None None
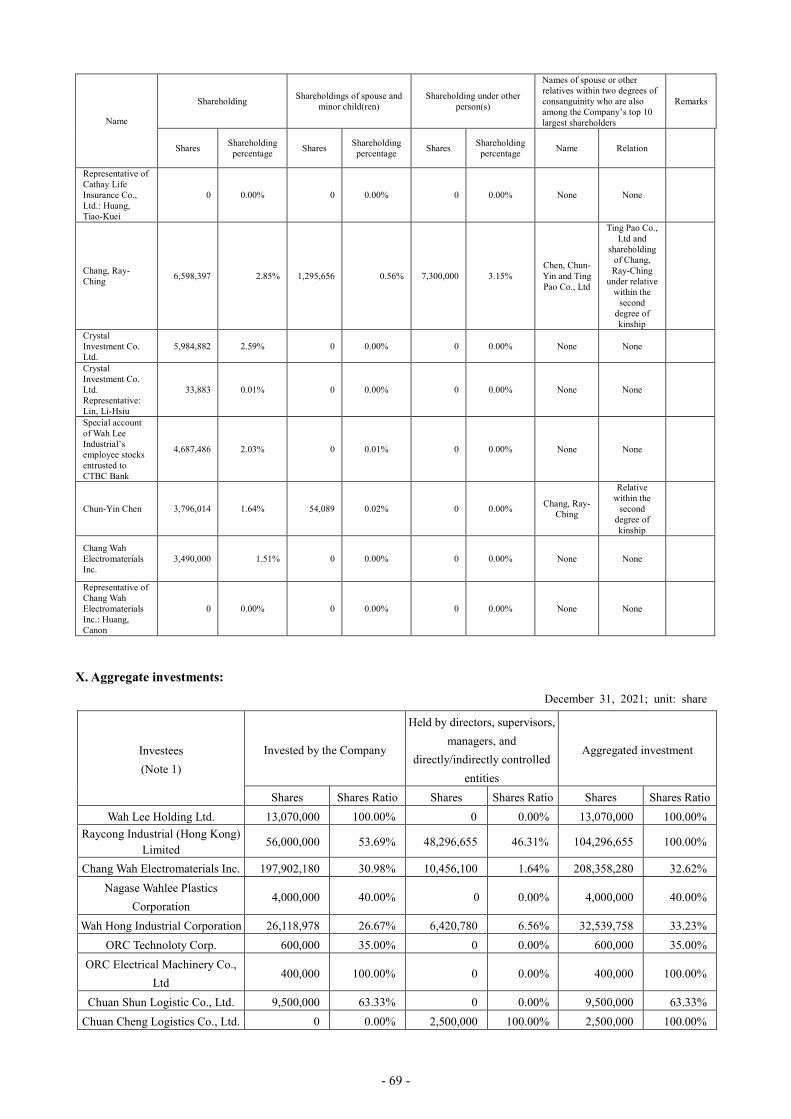
- 69 -
Name
Shareholding Shareholdings of spouse and
minor child(ren)
Shareholding under other
person(s)
Names of spouse or other
relatives within two degrees of
consanguinity who are also
among the Company’s top 10
largest shareholders
Remarks
Shares Shareholding
percentage Shares
Shareholding
percentage Shares
Shareholding
percentage Name Relation
Representative of
Cathay Life
Insurance Co.,
Ltd.: Huang,
Tiao-Kuei
0 0.00% 0 0.00% 0 0.00% None None
Chang, Ray-
Ching 6,598,397 2.85% 1,295,656 0.56% 7,300,000 3.15%
Chen, Chun-
Yin and Ting
Pao Co., Ltd
Ting Pao Co.,
Ltd and
shareholding
of Chang,
Ray-Ching
under relative
within the
second
degree of
kinship
Crystal
Investment Co.
Ltd.
5,984,882 2.59% 0 0.00% 0 0.00% None None
Crystal
Investment Co.
Ltd.
Representative:
Lin, Li-Hsiu
33,883 0.01% 0 0.00% 0 0.00% None None
Special account
of Wah Lee
Industrial’s
employee stocks
entrusted to
CTBC Bank
4,687,486 2.03% 0 0.01% 0 0.00% None None
Chun-Yin Chen 3,796,014 1.64% 54,089 0.02% 0 0.00% Chang, Ray-
Ching
Relative
within the
second
degree of
kinship
Chang Wah
Electromaterials
Inc.
3,490,000 1.51% 0 0.00% 0 0.00% None None
Representative of
Chang Wah
Electromaterials
Inc.: Huang,
Canon
0 0.00% 0 0.00% 0 0.00% None None
X. Aggregate investments:
December 31, 2021; unit: share
Investees
(Note 1)
Invested by the Company
Held by directors, supervisors,
managers, and
directly/indirectly controlled
entities
Aggregated investment
Shares Shares Ratio Shares Shares Ratio Shares Shares Ratio
Wah Lee Holding Ltd. 13,070,000 100.00% 0 0.00% 13,070,000 100.00%
Raycong Industrial (Hong Kong)
Limited 56,000,000 53.69% 48,296,655 46.31% 104,296,655 100.00%
Chang Wah Electromaterials Inc. 197,902,180 30.98% 10,456,100 1.64% 208,358,280 32.62%
Nagase Wahlee Plastics
Corporation 4,000,000 40.00% 0 0.00% 4,000,000 40.00%
Wah Hong Industrial Corporation 26,118,978 26.67% 6,420,780 6.56% 32,539,758 33.23%
ORC Technoloty Corp. 600,000 35.00% 0 0.00% 600,000 35.00%
ORC Electrical Machinery Co.,
Ltd 400,000 100.00% 0 0.00% 400,000 100.00%
Chuan Shun Logistic Co., Ltd. 9,500,000 63.33% 0 0.00% 9,500,000 63.33%
Chuan Cheng Logistics Co., Ltd. 0 0.00% 2,500,000 100.00% 2,500,000 100.00%

- 70 -
Investees
(Note 1)
Invested by the Company
Held by directors, supervisors,
managers, and
directly/indirectly controlled
entities
Aggregated investment
Shares Shares Ratio Shares Shares Ratio Shares Shares Ratio
Hua Heng Energy Co., Ltd. 3,000,000 100.00% 0 0.00% 3,000,000 100.00%
Kingstone Energy Technology
Co., Ltd. 17,962,577 51.00% 0 0.00% 17,962,577 51.00%
KSD Energy Corporation 0 0.00% 6,700,000 100.00% 6,700,000 100.00%
KSA Energy Corporation 0 00.00% 6,130,000 100.00% 6,130,000 100.00%
KSB Energy Corporation 0 00.00% 1,113,000 100.00% 1,113,000 100.00%
Wahlee Green Energy
Corporation (dissolved) 200,000 25.00% 432,000 51.00% 643,000 76.00%
Eco Energy Corporation 8,000,000 20.00% 8,000,000 20.00% 16,000,000 40.00%
KSC Energy Corporation 0 00.00% 100,000 100.00% 100,000 100.00%
Wah Lee Japan Co., Ltd. 1,500 83.33% 0 0.00% 1,500 83.33%
Wah Lee Korea Ltd. 147,000 100.00% 0 0.00% 147,000 100.00%
Sakuragawa Solar GK. -
(Note 4) 99.99%
-
(Note 4) 0.00%
-
(Note 4) 99.99%
Miyazaki Solar GK. -
(Note 4) 99.99%
-
(Note 4) 0.00%
-
(Note 4) 99.99%
Hua Ying Supply Chain
Management (Shenzhen) Co.,
Ltd.
-
(Note 2) 0.00%
-
(Note 2) 100.00%
-
(Note 2) 100.00%
PT. Wah Lee Indonesia 1,610,000 70.00% 0 0.00% 1,610,000 70.00%
Wah Lee Vietnam Co., Ltd. - 100.00% 0 0.00% - 100.00%
Regent King International Ltd. - 0.00% (Note 2) 100.00% (Note 2) 100.00%
Dongguan Huagang International
Trading Co., Ltd. -
(Note 2) 0.00%
-
(Note 2) 100.00%
-
(Note 2) 100.00%
Shanghai Yi Kang Chemicals &
Industries Co., Ltd. -
(Note 2) 0.00%
-
(Note 2) 70.00%
-
(Note 2) 70.00%
SHC Holding Ltd. 0 0.00% 1,290,000 100.00% 1,290,000 100.00%
Wah Lee Tech (Singapore) Pte.
Ltd. Ltd. 0 0.00% 1,600,000 100.00% 1,600,000 100.00%
Shanghai Hua Chang Trading
Co., Ltd. -
(Note 2) 0.00%
-
(Note 2) 30.00%
-
(Note 2) 30.00%
Adi International Trading
(Shanghai) Co., Ltd -
(Note 2) 0.00%
-
(Note 2) 49.00%
(Note 3) -
(Note 2) 49.00%
(Note 3)
Shanghai Li Huang Co., Ltd. -
(Note 2) 0.00%
-
(Note 2) 48.98%
-
(Note 2) 48.98%
Guangzhou Xing Xian Co., Ltd. -
(Note 2) 0.00%
-
(Note 2) 100.00%
-
(Note 2) 100.00%
WT Industrial 7,650 51.00% 0 0.00% 7,650 51.00%
WT Indonesia 0 00.00% 18,150 66.00% 18,150 66.00%
Gishine Tech -
(Note 2) 00.00%
-
(Note 2) 49.00%
-
(Note 2) 49.00%
Wah Lee Philippines
International Corp. 127,495 99.99% 1 0.00% 127,496 99.99%
Wah Lee Philippines Inc. 126,997 99.99% 1 0.00% 126,998 99.99%
Xiamen Hua Cheng Da Logistics
Co., Ltd. - 0.00% (Note 2) 70% (Note 2) 70%

- 71 -
Investees
(Note 1)
Invested by the Company
Held by directors, supervisors,
managers, and
directly/indirectly controlled
entities
Aggregated investment
Shares Shares Ratio Shares Shares Ratio Shares Shares Ratio
Xiamen Jian Yuan Rong Logistics
Co., Ltd. - 0.00% (Note 2) 30% (Note 2) 30%
Xiamen Jia Sheng Yuan Trading
Development Co., Ltd. - 0.00% (Note 2) 30% (Note 2) 30%
Note 1: Long-term investment of the Company accounted for using equity method.
Note 2: As a limited liability company, no shares held.
Note 3: The Company and its subsidiary, Wah Lee Holding Ltd. hold a combined stake of 100% in Raycong Industrial (Hong Kong) Ltd.; Raycong
Industrial (Hong Kong) Ltd. holds a 70% stake in Shanghai Yi Kang Chemicals & Industries Co., Ltd.; Shanghai Yi Kang Chemicals &
Industries Co., Ltd holds a 70% stake in Adi International Trading (Shanghai) Co., Ltd. As such, the Company’s aggregate stake in Adi
International Trading (Shanghai) Co., Ltd. amounts to 49%.
Note 4: See page 248 to 250 of this Annual Report.

- 72 -
Four: Capital Raising
I. Capital and shares
(I) 1. Source of capital
March 31, 2021; unit: share/NT$
Month/Year Issue
price
Authorized capital Paid-in capital Remarks
Shares Amount Shares Amount Sources Assets other than
cash contributed
as equity capital Others
February
2006 NT$10 240,000,000 2,400,000,000 196,495,062 1,964,950,620
Corporate bonds of
NT$7,667,270
converted to shares None
February 20, 2006
DOC, MOEA
Doc. No. 09501028140
June
2006 NT$10 300,000,000 3,000,000,000 209,354,864 2,093,548,640
Capitalization of
retained earnings
NT$128,598,020 None
June 6, 2006
SFB, FSC
Doc. No. 0950122737
June
2007 NT$10 300,000,000 3,000,000,000 219,635,510 2,196,355,100
Capitalization of
retained earnings
NT$102,806,460 None
June 28, 2007
SFB, FSC
Doc. No. 0960032751
August
2008 NT$10 300,000,000 3,000,000,000 230,134,006 2,301,340,060
Capitalization of
retained earnings
NT$104,984,960 None
August 6, 2008
SFB, FSC
Doc. No. 0970039612
June
2009 NT$10 300,000,000 3,000,000,000 234,409,138 2,344,091,380
Capitalization of
retained earnings
NT$42,751,320 None
June 23, 2009
CFD, SFB, FSC
Doc. No. 0980031087
June
2010 NT$10 300,000,000 3,000,000,000 231,390,138 2,313,901,380
Treasury shares
retired
NT$30,190,000 None
June 30, 2010
DOC, MOEA Doc. No.
09901134430
Change of Registration
June
2019 NT$10 500,000,000 5,000,000,000 231,390,138 2,313,901,380 None
June 21, 2019
DOC, MOEA Doc. No.
10801072090
Change of Registration
March 31, 2021; unit: share
Type of shares Authorized capital
Note Outstanding shares Unissued shares Total
Common share 231,390,138 268,609,862 500,000,000 Taiwan Stock
Exchange listed
1.2 Information on shelf registration: None.
(II) Shareholder structure
March 31, 2021
Shareholder
structure
Amount
Government
agencies
Financial
institution
Other corporate
entities Individual
Overseas entities
and individuals Total
Number of holders 2 20 166 21,280 170 21,638
Number of shares held 583,047 16,148,844 72,380,544 106,180,087 36,097,616 231,390,138
Shareholding percentage 0.25% 6.98% 31.28% 45.89% 15.60% 100.00%

- 73 -
(III) Shareholding distribution
Par value of NT$10 per share March 31, 2021
Shareholding brackets Number of shareholders Number of shares held Shareholding percentage
1-999 10,358 562,357 0.24%
1,000-5,000 8,473 16,970,263 7.33%
5,001-10,000 1,294 10,099,282 4.36%
10,001-15,000 458 5,813,308 2.51%
15,001-20,000 244 4,453,126 1.92%
20,001-30,000 245 6,176,191 2.67%
30,001-40,000 129 4,583,811 1.98%
40,001-50,000 77 3,556,285 1.54%
50,001-100,000 154 10,889,669 4.71%
100,001-200,000 100 14,053,676 6.07%
200,001-400,000 37 11,226,316 4.85%
400,001-600,000 21 10,300,202 4.45%
600,001-800,000 10 6,938,358 3.00%
800,001-1,000,000 5 4,507,337 1.95%
Over 1,000,001 33 121,259,917 52.40%
Total 21,638 231,390,138 100.00%
Preference share: None.
(IV) Major shareholders March 31, 2021
Share
Shareholder No. of shares held Shares Ratio
Kang Tai Investment Co., Ltd. 16,660,155 7.20%
Fortune Investment Co., Ltd. 13,246,583 5.72%
Dragon Investment Co., Ltd. 11,017,422 4.76%
Ting Bao Co., Ltd. 7,300,000 3.15%
Cathay Life Insurance Co., Ltd. 7,182,000 3.10%
Chang, Ray-Ching 6,598,397 2.85%
Crystal Investment Co., Ltd. 5,984,882 2.59%
Special account of Wah Lee Industrial’s employee stocks
entrusted to CTBC Bank 4,687,486 2.03%
Chun-Ying Chen 3,796,014 1.64%
Chang Wah Electromaterial Inc. 3,490,000 1.51%
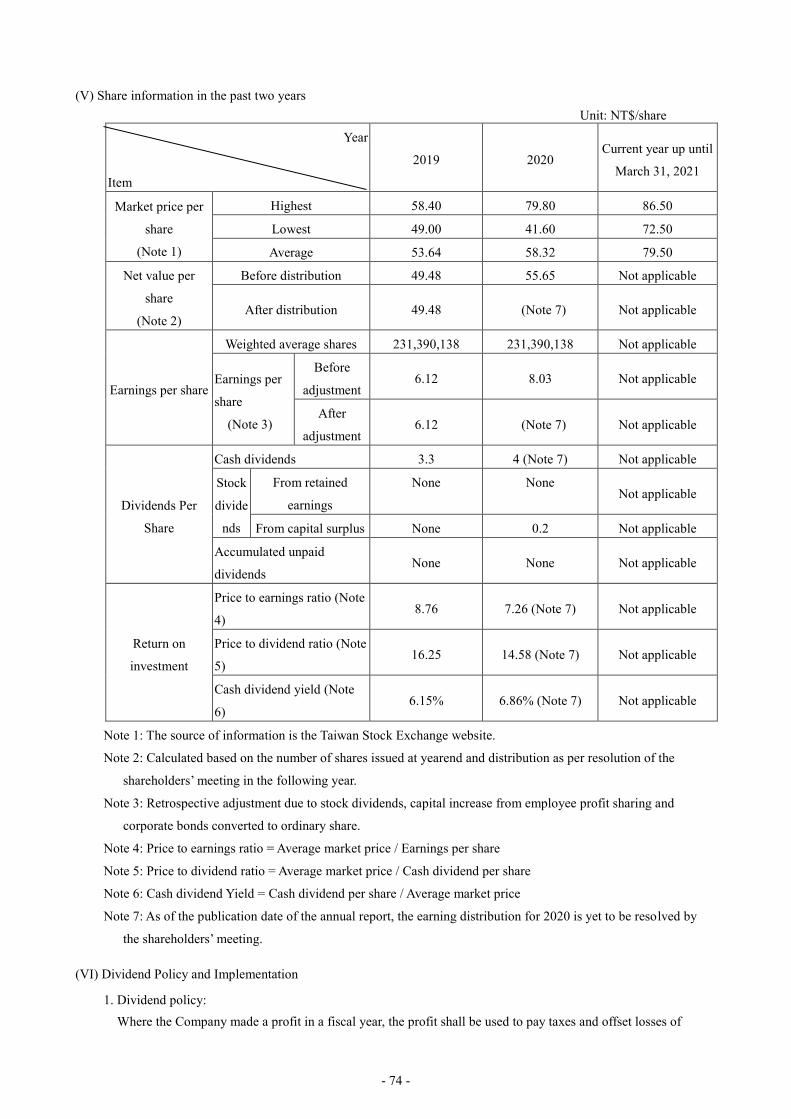
- 74 -
(V) Share information in the past two years
Unit: NT$/share
Year
Item
2019 2020 Current year up until
March 31, 2021
Market price per
share
(Note 1)
Highest 58.40 79.80 86.50
Lowest 49.00 41.60 72.50
Average 53.64 58.32 79.50
Net value per
share
(Note 2)
Before distribution 49.48 55.65 Not applicable
After distribution 49.48 (Note 7) Not applicable
Earnings per share
Weighted average shares 231,390,138 231,390,138 Not applicable
Earnings per
share
(Note 3)
Before
adjustment 6.12 8.03 Not applicable
After
adjustment 6.12 (Note 7) Not applicable
Dividends Per
Share
Cash dividends 3.3 4 (Note 7) Not applicable
Stock
divide
nds
From retained
earnings
None None Not applicable
From capital surplus None 0.2 Not applicable
Accumulated unpaid
dividends None None Not applicable
Return on
investment
Price to earnings ratio (Note
4) 8.76 7.26 (Note 7) Not applicable
Price to dividend ratio (Note
5) 16.25 14.58 (Note 7) Not applicable
Cash dividend yield (Note
6) 6.15% 6.86% (Note 7) Not applicable
Note 1: The source of information is the Taiwan Stock Exchange website.
Note 2: Calculated based on the number of shares issued at yearend and distribution as per resolution of the
shareholders’ meeting in the following year.
Note 3: Retrospective adjustment due to stock dividends, capital increase from employee profit sharing and
corporate bonds converted to ordinary share.
Note 4: Price to earnings ratio = Average market price / Earnings per share
Note 5: Price to dividend ratio = Average market price / Cash dividend per share
Note 6: Cash dividend Yield = Cash dividend per share / Average market price
Note 7: As of the publication date of the annual report, the earning distribution for 2020 is yet to be resolved by
the shareholders’ meeting.
(VI) Dividend Policy and Implementation
1. Dividend policy:
Where the Company made a profit in a fiscal year, the profit shall be used to pay taxes and offset losses of

- 75 -
previous years. 10% of the remaining profit shall be set aside as legal reserve. However, if the legal reserve has
reached the amount of the paid-in capital, no appropriation shall be made. The remaining profit shall be
appropriated to or subject to reversal of special reserve in accordance with the laws and regulations. Any
remaining profit, along with the accumulated undistributed earnings shall be used by the Company’s board of
directors as the basis for proposing an earning distribution plan, which should be resolved in the shareholders’
meeting for dividends and bonus distribution to shareholders.
The Company's dividend policy is stipulated based on its current and future development plans, together with
the consideration of the investment environment, capital requirements, domestic and international competition,
and shareholders' interests. Earnings distribution to common shareholders shall not be less than 10% of
distributable earnings. However, no distribution shall be made if the balance of distributable earnings is less than
1% of paid-in capital. Dividends may be distributed to shareholders in cash or shares, with cash dividends being
no less than 50% of the total dividends.
2. Status of dividend distribution proposal for the coming shareholders’ meeting: The shareholders’ meeting shall
propose to distribute cash dividends of NT$4 per share and stock dividends of NT$0.2 per share.
(VII) The impact on the operating performance of the Company and EPS posed by the proposal of the
shareholders’ meeting to issue free allotment shares:
The shareholders’ meeting proposes to distribute stock dividend from capital surplus of NT$0.2 per share,
which shall increase the capital of the Company by 2%. As such, the impact on the operating performance
and EPS is approximately 2%.
(VIII) Employee compensation and director remuneration
1. Employee and director remuneration policies stated in the Articles of Incorporation:
The Company shall set aside 9%~13% and no more than 2%, respectively, from profit as employee
compensation, and director and supervisor remuneration. However, the profit shall be retained when there are
accumulated losses yet to be offset.
Employee compensation stated above may be made in cash or stock and shall also be allocated to employees of
affiliated companies who have met certain criteria.
The two items above shall be executed according to the board’s resolution and reported in the shareholders’
meeting.
2. The estimation basis of the employee compensation, and director remuneration for the current period, the
computation basis for the number of shares issued as stock dividend serving as employee compensation, and
accounting treatments for any discrepancies between the estimation and the actual allotment:
The employee compensation and director remunerations for 2020 are NT$210,798,000 and NT$26,935,000
respectively, which are appropriated in accordance with the Articles of Incorporation, Article 20. Any
discrepancy between the amount approved by the Board and the estimation recognized shall be treated as a
change in accounting estimate and recognized in profit or loss for 2020.
3. Remuneration proposal passed by the Board of directors:
(1) Director and supervisor remuneration in cash compensation or stock dividend:
The employee compensation and director and supervisor remunerations for 2020 are NT$210,798,000 and
NT$26,935,000 respectively.
(2) Percentage of compensation to employees by stock dividends over net income in stand-alone Financial

- 76 -
Statements, and over total compensation to employees: Not applicable, as the Company did not distribute
stock dividends as employee compensation for the current period.
4.Actual disbursement of employee compensation and director and supervisor remuneration for the preceding year:
On March 25, 2020, the Board resolved that NT$200,997,000 was distributed as employee compensation and
NT$21,013,000 was distributed as director remuneration, both of which are in cash from 2019 earnings.
(IX) Share repurchase by the Company: None.
II. Corporate bonds: None.
III. Preference share: None.
IV. Overseas depositary receipt: None.
V. Subscription of warrants for employee and new employee restricted stock plans: None.
VI. New share issuance in connection with mergers and acquisitions: None.
VII. Capital utilization plan: None.

- 77 -
Five. Operational Overview
I. Business activities:
(I) Scope of business
1. Principal business activities
(1) International Trade.
(2) Wholesale of Precision Chemical Materials.
(3) Wholesale of Raw Plastic Material.
(4) Wholesale of Electronic Materials.
(5) Wholesale of Batteries.
(6) Wholesale of Telecom Instruments.
(7) Retail Sale of Electrical Appliances.
(8) Wholesale of Medical Devices.
(9) Wholesale of Synthetic Resin.
(10) Wholesale of Synthetic Rubber.
(11) Wholesale of Industrial Catalyst.
(12) Wholesale of Pollution Controlling Equipments.
(13) Wholesale of Refractory Materials.
(14) Wholesale of Other Chemical Products (photoresist, stripper, metal oxides, silicon oxide polishing
compound, silicon carbide heating element, glass substrate, conductive glass, liquid crystal, dry film
resist, foaming agent, refrigerant, air conditioner coolant, automobile and refrigerator coolant, elastic
fiber, glass fiber, carbon fiber, boron fiber, polyethylene fiber).
(15) Wholesale of Precision Instruments.
(16) Wholesale of Animal Feeds.
(17) Retail Sale of Feeds.
(18) Self-usage Power Generation Equipment Utilizing Renewable Energy Industry.
(19) Electric Appliance Construction.
(20) Energy Technical Services.
(21) Information Software Services.
(22) Data Processing Services.
(23) Waste Treatment.
(24) Wastewater (Sewage) Treatment.
(25) Waste Recycling.
(26) Wholesale of Plumbing Materials.
(27) Wholesale of Furniture, Bedding, Kitchen Utensils and Fixtures.
(28) Wholesale of Ceramic and Glassware.
(29) All business items that are not prohibited or restricted by law, except those that are subject to special
approval.

- 78 -
2. Main products and sales percentage
Unit: NTD thousands
Product 2020 consolidated revenues Sales percentage (%)
Information and communication 20,224,937 34.2%
Flat-panel displays 16,249,182 27.5%
Semiconductors 12,129,747 20.5%
PCB/motherboard 6,369,176 10.8%
Green energy 1,640,036 2.8%
Others 2,467,842 4.2%
Total 59,080,920 100.0%
3. Products of the Company
The Company operates with the vision of sourcing advanced materials, components, systems,
equipment, technologies, and integrated services for world's key or growing industries, and promotes them
to global markets, particularly Greater China Region and Southeast Asia, to satisfy the one-stop shopping
needs of customers in high-tech, prominent, and high-profile industries. The Company currently offers
products in five main categories, namely: (1) IT/communication and electronics assembly (such as high-
speed servers, 5G mobile devices and materials, AI-powered devices, cloud computing, artificial intelligence
of things (AIoT) related, car imaging and radar, electronic power modules etc.); (2) semiconductors; (3)
opto-electronics, optical communication, and flat-panel display (materials/IC/parts/modules/systems); (4)
green energy (solar power, wind power, hydro electricity, biofuel, marsh gas etc.), energy conservation, and
energy storage (e.g. LED, energy storage equipment, charging equipment…); and (5) others (such as
environmental protection/circular economy, biotech/biomedicine, food additives and packaging materials,
advanced manufacturing materials…). Product categories by industry:
Industry Main product categories
IT/communication and electronics
assembly
High-performance engineering plastics, thermosetting engineering plastics,
general purpose engineering plastics, plastic films & sheets, Dry Films,
substrates, exposure machines and parts, copper balls/copper wires, separation
films, other PCB assembly materials and equipment, materials for high
frequency application, optical inspection machines…….
Semiconductors Process photoresist, electronic-grade gas, semiconductor assembly materials,
Slurry, Developer, Spare Parts, Polyimide, target materials……
Opto-electronics, optical communication,
and flat-panel display
Optical display materials and equipment: Display systems and materials, T-
Con ICs, IC Chemicals, polaroids, FPD Materials, Non T-Con ICs, opto-
electronic equipment/parts, OLED materials and parts, LCM Panel & glass
slimming; optical communication materials ….
Green energy (solar power, wind power,
hydro electricity, biofuel, marsh gas etc.),
energy conservation, and energy storage
LED finished goods/semi-finished goods/assembly materials, solar cell
materials, solar cells, solar power system/equipment, solar system
engineering, energy storage device, fan blade materials, rechargeable battery
materials……
Others Ship engine and parts, coolants, foaming agents, glass fiber, carbon fiber,
resin, core materials, functional materials, special chemicals, silica fume,

- 79 -
automated equipment and control components, other industrial materials…
4. New products under development
The Company operates with the vision of supplying to the needs of world's growing industries and
markets, particularly in the Greater China Region and Southeast Asia. It pays close and constant attention to
trends and needs of relevant industries/markets, and looks for opportunities to cooperate with suppliers on
researching, developing, and introducing the latest products and technologies in order to supply high-quality,
high-performance, and fairly priced materials, components, modules, equipment, and consumables for
manufacturers as well as end users. The Company also cooperates with business partners on the research and
development of integrated solutions, and plays its role of an industry integrator and total solution provider.
Below is a list of new products that the Company is actively developing in the five main industries:
Industry Agency or distribution of new products
IT/communication and
electronics assembly
Handheld Device, NB, Smart Phone: High Stiffness Computer Case, new USB Type
C connectors and DDR4/DDR5 applications; car electronics, 3C applications: Pulley,
Water Pump, Piston, Gasket, LIB Separator Film, car lens, 5G antenna station, small
cells, household WiFi, set up box and smart home applications; solar power: solar
power connections; consumer goods: luggage, glasses frame; 3C, home appliance:
TAFK PE Maskings; new applications of food packaging, consumer goods, and
medical instrument; PCB/motherboard/electronics assembly: Copper clad laminate for
fine-line HDI/flexible copper clad laminate/IC substrate/low flow PP for Rigid-Flex,
Ultra Low Dk & Df copper clad laminate and LCP Film for high-frequency and low
wear applications, next generation ultra-high resolution direct imaging dry film
photoresist, 3D optical inspection machines, contactless electrical tester, high-
frequency materials for 5G communication.
Semiconductors Next-generation EUV photoresist, 3D IC Package Material, IC Bumping chemicals,
low Dk & Df materials needed for high frequency applications, electroformed stencil,
electronic-grade gas (NF3, WF6, TCS, DCS, CO, HCL, CO2, SO2, C3H6, Si2H6,
CF4….), laser gas mixture, coolant, reclaimed wafers, CVD SiC consumers, and
secondhand machines.
Opto-electronics, optical
communication, and flat-
panel display
Materials and equipment relating to OLED panels, organic light-emitting materials
and packaging materials, Touch Panel Controller, Power Management Unit, Timing
Controller Board Solution, DisplayPort IC (NB, TV, Smart Phone), public information
display (PID), optical communication ICs and modules, YPI, CPI.
Green energy, energy
conservation, and energy
storage
OLED Lighting, high-performance/dual wave/shingled array modules, fuel cell
materials, solar modules, equipment, and power stations, wind power materials,
modules, and equipment, energy storage systems, green energy products, distributed
natural gas generator, marsh gas generator, large natural gas generator.
Environmental protection,
biomedicine, and others
Pharmaceutical materials (excipients, additives), biotech applications (biotech
materials), class 1/2 medical supplies, cosmetic medicine supplies, medical service
terminals, ship engines/generators and related equipment and coating materials, IoT-
and mobile device-related products and integrated solutions, graphene and related
products and applications, environmental-friendly products, air pollution control and
water treatment technologies and materials

- 80 -
(II) Industry overview
1. Current and future industry prospects
(1) Overall industry development
Although CES 2021 was initially intended to be held as a physical event, it eventually succumbed to
the threat of the pandemic and progressed online for the very first time. This year's CES emphasized on
people's day-to-day needs in the post-pandemic era, such as: personalized disease prevention and precision
health care on the individual level, transforming home into work and lifestyle headquarter on the
household level, and public health and contactless business opportunities on the urban level. All these
visions are based upon the foundation of a complete communication and application platform. Outside of
conceptualization, the practical discussions still revolved around known technologies such as AIOT, 5G,
and self-driving cars.
(2) Semiconductors industry
Due to the combined effect of the China-USA trade war and the COVID-19 pandemic, major
consumer electronics brands around the world have overbooked the supply of ICs, causing the
semiconductor industry to operate at near full capacity from foundry, IC design, to assembly. Production
value of Taiwan's semiconductor industry grew by 20.7% in 2020, and as production capacity constraints
are brought to attention in 2021, semiconductors are expected to remain in short supply at least until Q3
2021. Unlike the year before, the market is growing concerned towards the possibility of idle capacity in
Q4. Overall, semiconductor industry in 2021 is still full of optimistic expectation.
(3) FPD industry
The pandemic caused a surge in demand for flat panel displays, from home entertainment to remote
teaching, in the first quarter of 2020. Sale of 70-inch models and above grew nearly 6% in 2020.
From manufacturers' perspective, however, Korean and Japanese panel manufacturers are slowly
exiting the market, giving way to China manufacturers who now have to exercise more careful discretion
on future production decisions. The pandemic first caused a decrease in labor demand in early 2020, but
later resulted in a surge of demand for video solutions. In response to this drastic swing in demand,
major manufacturers in China, including BOE, TCL, and HKC, first cut back on production activities
and then quickly reversed to normal production capacity later in the year, but overall, flat panel displays
were still in slight oversupply in 2020. As for 2021, the surge in demand caused by the pandemic will
reduce over time, and the oversupply and prices fall may happen again in Q3 of 2021.
(4) PCB industry
According to data consolidated by Taiwan Printed Circuit Association (TPCA), Taiwan's PCB
industry may have been the best-performing industry during the pandemic. 2021 is expected to be the best
performing year for Taiwan's PCB industry since 2001. Due to the effect of the pandemic, deployment of
5G infrastructures has slowed down in most parts of the world except China, but demand for mobile
phones and servers rose against expectation. There has also been strong demand for other IC substrates
and high-end HDI boards. In terms of HDI boards, manufacturers such as Compeq, Tripod Technology,
Zhen Ding, and Dynamic Electronics all took actions to expand production capacity in 2020 and 2021.
Production value of substrates in Taiwan averaged an annual compound growth rate of 3.55% between
2016 and 2021, compared to global average of 0.14%.

- 81 -
(5) Green energy industry
Growth of green energy had been stagnant in most parts of the world due to the pandemic. Wind
power and solar power remained the main drivers of green energy, but there are drastic differences in
their state of progression. In Taiwan, wind power is an emerging industry that has the strong support of
the local government. Not only were environmental assessments conducted on new sites in 2020, the
government also encouraged developers to submit development proposals for the phase 3 site. In
countries where wind power is relatively mature, such as Germany and UK, deployment of wind power
facilities has been postponed by a significant extent. Overall, impact of the pandemic on Taiwan's wind
power and solar power industries was significantly less compared to the ITC industry. The global wind
power market as a whole is expected to grow by 17% in 2021.
Green energywas affected by the China-USA trade war, and while wind farm constructions
continued in China, projects are no longer subsidized as strongly as they had been at the end of
2019. In the United States, green energy development was severely impaired by the pandemic,
but overall, offshore wind power and electric cars still made noticeable progress during the year.
2. Connection between upstream, midstream, and downstream industry participants
The Company is a midstream/upstream provider/distributor of high-tech materials, chemicals,
gases, parts, modules, equipment, technical support, and integrated solutions. It serves customers
across a vast number of industries including but not limited to ITC and electronics assembly,
semiconductors, opto-electronics, optical communication, flat-panel display, green energy, energy
conservation and energy storage, biotech and biomedicine, consumer goods, environmental
protections, and material and chemical engineering. The Company sources supply mainly from
local and foreign manufacturers/suppliers of the above industries, and sells products to finished
and semi-finished goods manufacturers, system integrators, and service providers of the above
industries. In addition to distributing products/services from upstream manufacturers/suppliers to
downstream customers, the Company also provides integrated technical services and collaborates
with suppliers, customers, industry participants, government agencies, academic institutions, and
research institutions to explore and invest into new business models. Association between
upstream, midstream, and downstream industry participants is depicted in the following figure.

- 82 -
3. Product trends
The Company is a supplier of high-tech materials, chemicals, gases, parts, modules, and equipment,
both as individual products and as total solutions. The Company distributes a broad variety of products, and
all of its services and products are highly relevant to the growth and needs of high-tech industries in Greater
China Region, Southeast Asia, and the world.
The Company has long been monitoring future trends and demands in private consumption,
environment safety, medical care, lifestyle, industry localization, and smart production, and taken pro-active
steps to secure supply of related materials. Noticeable progress has been made with regards to: carbon fiber,
graphene, smart packaging, nano coat, anti-corrosion paint, lightweight materials, biomass material, self-
healing material, quantum dot, water treatment film etc.
The Company still possesses leading position in the supply of high-performance engineering plastics for
the ITC industry, and has made successful entry into optical lens materials, smartphone antenna modules,
non-metallic alternative auto parts, self-driving camera modules, and medical instruments. In the
semiconductors industry, the Company maintains its lead in advanced processes and continues to achieve
revenue growth from the supply of advanced electronic-grade chemicals, materials, gases and consumables.
The company’s strength in the PCB industry lies in its ability to supply high-end consumables such as dry
films and copper clad laminates; given the rise of advanced applications such as 5G communication, cloud
computing, high-frequency transmission, smartphone, and auto electronics, we will aim to supply the raw
materials, consumables, and equipment needed and thereby capitalize on the rapid growth of the PCB
industry inspired by 5G applications. As for opto-electronics, we expect growing sales from the industry's
increasing demand for chemical consumables, optical sheets, and electronic components as well as our
introduction of next-generation electronics and systems to Europe, USA, and India. In light of the
government's active support for the green energy industry, the Company not only supplies raw materials and
Upstream
manufacturers/suppliers Materials/chemicals/gases/parts/
modules/equipment/systems
Wah Lee A value-adding distributor that
provides high-tech materials,
gases, parts, modules,
equipment, technology, and total
solutions. (product flow, cash flow,
logistics, information flow,
technology flow)
Downstream customers Semi-finished or finished goods
Manufacturer/system
provider/service provider
Product and technical service
Integrated solutions (product composition, technical service,
operational model)
Strategic partners Industries, government, academia,
research institution, financial sector
Demand Demand
Technology Capital Information Expertise

- 83 -
equipment and facilitates system integration in the upstream and downstream, but also acquired a solar
power solution provider to construct solar power stations in Taiwan through EPC, and invested into wind
power companies to generate consistent income while at the same time fulfill corporate social
responsibilities to the benefit of the general public.
We shall adhere to our tradition of pragmatic business practices, and approach next-generation
technologies and emerging industries such as biotech/biomedicine, environmental protection, 5G
communication, AI, IOT, electric cars, and self-driving cars with caution and optimism. These new
technologies and industries should provide opportunities for the Company to grow against the challenges
ahead.
The Company's growth path has been largely in sync with industrial developments in Taiwan and the
Greater China Region. Apart from strengthening its role as a materials distributor, the Company has also
committed substantial efforts into vertical supply chain integration and application market establishment
exporting to ensure the success of its well-developed products in local markets. The Company sets its goals
to add more products to the portfolio each year to sustain performance growth, and has envisioned itself as
the driver of industry innovations from Greater China Region, Southeast Asia to the rest of the world.
4. Product competition
The Group as a whole sells more than 620 different product categories; 90 of which generated more
than NT$100 million in revenues whereas 240 of which generated more than NT$10 million of revenues for
the Group in 2020. The Company sells products to nearly 6 thousand customers, and more than 600 of which
purchased more than NT$10 million from the Company in 2020. These results are indicative of the strong
competitiveness and high acceptability of the Company's products and services in the market.
Furthermore, the Company would segment its markets for various products depending on the attributes
of the products offered or characteristics of market participants, and target specific market segments in which
it has the highest competitive advantage. The Company mostly targets mid-level and high-end markets and
customers, and has gained a strong share in all its target customers. The Company sells such a diverse range
of products to customers spread across many industries that its share of customers' purchases is inconsistent
from customer to customer. For this reason, the report will focus on products that have top three market
shares in their respective target markets namely: engineering plastics, flat-panel display materials, IC and
equipment, coolant, photoresist, stripper, developer, CVD Precursor, Bulk Chemical, dry film photoresist,
and ship engine. Detailed descriptions are as follows:
The Company has long maintained market leadership in engineering plastics; it supplies to a broad
range of applications from IT/IA products, mobile/wearable devices, auto parts, medical instruments to food
packaging, and has made successful entry to the supply of parts for electric car charging equipment and
wireless charging stations for smartphones. High-end engineering plastics have showed growth as high as in
the double digits in recent years. It is apparent that the Company has secured a strong leadership position in
the supply of high-end engineering plastics.
The Company is a long-time player in the semiconductor industry and has grown to become a key
supplier for semiconductor industries in both Taiwan and China. The Company distributes high-end

- 84 -
semiconductor process chemicals, gases, materials, and equipment for key manufacturers around the world,
and is often invited to participate in customers' research and development projects. For this reason, the
Company takes benefits whenever customers make a breakthrough in high-end processes.
The Company has more than 40 years of experience in the PCB industry. Apart from conventional
applications such as communication, server, and semiconductors, the Company also explores new
applications involving cryptocurrency, cloud computing, and next-generation high frequency
communication/5G. Its recent efforts to expand into the upstream and downstream have been successful at
generating new revenues from PCB materials and equipment, which enabled the Company to report high
level of growth in 2020.
Governments on both sides of the strait are actively encouraging localization of material and equipment
supply; this uprise of local suppliers with improved technical capacity and undercutting practices intensifies
competition within the market. In response, the Company will continue adding value to existing products
with integrated services and enhanced technology, while at the same time invest into the development of
next-generation materials, equipment, and total solutions. The Company will also support ongoing
movements toward localized production and trade/economic policies of local governments by engaging local
strategic partners in localized research, development, and manufacturing activities to reduce production and
transportation costs. These efforts will help the Company connect with local industry partners, and put it in a
favorable position to lead the local industry in innovation, and thereby develop competitive advantage in
terms of technology, quality, service, pricing, and maintenance.
(III) Technological research and development
1. R&D expense
The Company plays the role of distributor in the industry chain, and does not have a separate R&D
department like manufacturers. However, the Company pays close attention to industry and market trends
(through paid membership with industry think tanks, and close interaction with industry
participants/government agencies/academic institutions such as NCKU Innovation Headquarters) and
positions itself at the frontline to gather information on customers' needs and suppliers' R&D roadmaps, so
that new products and business models can be developed in time to support industry innovations. Not only
do all employees perceive new product and new technology introduction a critical part of their
responsibilities, the Company also established a Marketing and Planning Team and New Businesses
Department at the group level to support development of new industries and products and to expand alliance
with viable business partners. Furthermore, the Company adopts project management concepts and practices
advocated by Project Management Institute (PMI), and introduces the use of business development rewards
and funds to stimulate and support business development activities throughout the Company. As of 2020, the
Company generated more than NT$4 billion in revenues from new products introduced in the last 3 years.
If we were to treat training expenses, think tank implementation expenses, NCKU Innovation
Headquarters membership fees, New Businesses Department expenses, new business development rewards,
and market survey expenses as R&D expenses, the Company had incurred a total of approximately NT$38
million in 2020. However, actual amounts incurred on the development of new businesses and products far
exceeded this sum. In addition to budgeting comparable amounts of the above expenses for 2021, the
Company plans to expand its new business development fund further and hire more business personnel and

- 85 -
commit more resources as needed.
2. 2020 development outcomes:
Industry Agency or distribution of new products
IT/communication
(engineering plastics)
and electronics
assembly
LDS materials, 5G-related plastic materials, PVC, XLPE, rare earth
oxides/metals/neodymium magnet, SiC semiconductors, Ultra Low Dk & Df
organic resins for 5G high-frequency and low wear applications, non-organic
fillers, electrical property-enhancing chemicals, LCP FCCL (liquid crystal polymer
flexible copper clad laminate substrates), next generation ultra-high resolution
direct imaging dry film photoresist, rolling LDI equipment, contactless tester, LCP
high-speed laminating press, IC substrate solder mask UV protection film.
Semiconductors Advanced production materials (including PR and Slurry), IC Bumping Chemical,
electroformed stencil, electronic-grade gas (NF3, WF6, TCS, DCS, CO, HCL, CO2,
SO2, C3H6, Si2H6, CF4…), laser gas mixture, coolant, reclaimed wafers, CVD SiC
consumables.
Opto-electronics,
optical communication,
and FPD applications
OLED panel-related equipment, process chemicals and consumables, Power
Management Unit, mobile and wearable devices and Internet solutions, GPS
Module, optical communication transmitter/receiver IC and modules, OLED
materials (e.g. Driver IC, quartz crystal, light-emitting materials, NOR Flash.),
Black Column Spacer for FPD, e-ink display.
Green energy, energy
conservation, and
energy storage
Assessment, design, installation, and maintenance of solar power plant, high
efficiency solar wafer/cell/module, roof/ground-mounted solar power station,
lithium batter materials, hard carbon negative electrode materials, fast charging
negative electrodes, separator films, energy storage systems, beamformers, relays.
Environmental
protection and others
Environment purification materials and equipment, antibody development, water
treatment materials, 100% bio-degradable packaging materials for medical supply
and food, environment-friendly coolant, hemodialysis equipment and consumables.
(IV) Long, medium, and short-term business plans
1. Short-term plans
(1) Marketing strategies
A. Grow relationship with key customers, expand product portfolio, broaden integrated solutions and
increase share in existing markets/customers, offer localized services, and establish new offices in
line with customers' growth.
B. Strive to win distributionship for new products offered from existing suppliers to optimize product
portfolio.
C. Adjust product portfolio and pricing strategy, and appeal to new customers by exploring new
applications for existing products.
D. Integrate and develop solutions relevant to the industry chain, using popular end user products at the
base.

- 86 -
E. Coordinate with suppliers to explore influential customers on a case-by-case basis; provide timely
feedback to supply partners and cooperate on the development of new specifications and
applications.
(2) Product development strategies
A. Expand application of engineering plastics to areas such as home appliance, healthcare, food
packaging, container, consumer goods, electrical vehicle, lighting, 3C, solar energy, communication
etc. Develop new technologies such as high stiffness computer case, NMT, or NMT-like solutions.
B. For opto-electronics and flat-panel display industries, the Company will continue introducing
existing and new generation of flat-panel display-related materials, ICs, parts, modules, and
equipment, and work with downstream users on the development of relevant solutions and source
the materials, parts, and systems needed.
C. Continue development of products and solutions for new green energy, energy conservation,
environment protection (water treatment and air purification), biotech, mobile device, cloud
computing, IoT, next-generation communication etc.
D. For the semiconductors industry, the Company will work with customers on researching new
generation production lines and source new materials accordingly.
(3) Management strategies
A. Continue enhancement of employee training and technical capacity for improved work efficiency and
professionalism.
B. Continue enforcement of a total performance-driven culture for improved service and communication
efficiency.
C. Integrate business, financial, human resource, and reward strategies across overseas subsidiaries, and
standardize performance management.
D. Closely monitor operations of key business investments to enhance the investment performance.
E. Continue introduction of practices from Project Management Institute (PMI), enhance project
management awareness and capabilities across employees, and integrate resources and support
across the Company for greater organizational efficiency.
F. Cooperate with external industry participants, academia, and research institutions on market survey
and joint development.
G. Continue enforcement of the new business development reward system to encourage and reward
employees' business development efforts.
H. Expand development funds, and actively invest the resources needed for new business development.
I. Introduce KPIs and reward systems for key managers to raise competitiveness of the management.
2. Medium and long-term business plans
(1) Marketing strategies
A. Consolidate resources across the Greater China Region; grow sales and market share in China,
Southeast Asia, Northeast Asia, as well as European and American markets; optimize terms with
existing suppliers to maintain reasonable levels of procurement and sales cost, and maximize sales
margin in a low-interest environment.

- 87 -
B. Continue enhancement to the group's technological capacity and integration capabilities, as well as its
ability to provide high value-adding and integrated solutions.
C. Leverage long-established advantage in cross-strait businesses and strong relationship with overseas
customers, and set up new offices in emerging markets to gain overseas agency rights, exclusive
distributorship, and long-term supply commitments.
D. Make synergistic and strategic investments in the supply chain to secure supply and sales channels.
E. Take initiative in the development of new industries, new applications, and new operating models;
engage in strategic investments and alliances for rapid expansion in product line and technology.
F. Establish office in technologically advanced countries and pay close attention to trends of new
technologies and products.
(2) Product development strategies
A. Pay close attention to new technologies/processes and explore materials, equipment, and solutions
for future mainstream industries such as semiconductors, new man-machine interface, next-
generation display, solar energy, rechargeable battery, green energy, new energy, energy
conservation, energy storage, biomedicine, flexible electronics, smart city, biotech, environmental
protection (water treatment, waste treatment, air pollution control), cloud computing, wearable
device, IoT, and next-generation communication.
B. Place emphasis on the development of high value-adding products and government-incentivized
high-tech industries.
C. Balance between expansive and maintenance development efforts, and strive to increase revenue
weight from expansive development efforts.
(3) Management strategies
A. Continue optimizations to the organizational structure, and develop core knowledge, professional
skills, and essential characters across all employees.
B. Continue enforcement of the total performance management system; help employees build up the
habit to observe and make improvements with respect to customers/suppliers, internal processes,
learning, and growth, in addition to financial performance.
C. Emphasize on department specialization while at the same time maintain organizational flexibility
and responsiveness; continually enforce the project management philosophy and culture, and raise
teamwork, productivity, and problem-solving efficiency across teams.
D. Continue helping employees develop the skills needed to plan new business developments and
manage projects; improve association between new business development progress and
rewards.

- 88 -
II. Market and sales overview:
(I) Market analysis
1. Regions of products sold
Unit: NTD thousands
Year
Sales
destination
2018 2019 2020
Sales amount % Sales amount % Sales amount %
Domestic sale 15,442,928 29.2 14,823,120 27.1 17,279,051 29.2
Export
sale
Asia 34,213,346 64.6 35,868,372 65.6 37,379,654 63.3
America 1,219,132 2.3 1,938,248 3.5 1,908,834 3.2
Europe 1,972,066 3.7 1,909,887 3.5 2,344,155 4.0
Others 87,544 0.2 142,202 0.3 169,226 0.3
Total 37,492,088 70.8 39,858,709 72.9 41,801,869 70.8
Total 52,935,016 100.0 54,681,829 100.0 59,080,920 100.0%
2. Main competitors and market share
(1) Main competitors
The Company mainly distributes midstream/upstream materials and equipment, and has recently
been offering technology value-added integrated services to the sales portfolio. The Company has also
been active in promoting supply chain vertical integrations and even overseas investment in application
markets; the establishment and operation of solar power stations in Japan and investments into solar
power companies and water treatment companies via EPC are prominent examples. These practices set
the Company apart from other TWSE/TPEX listed IT/communication/IC distributors, which mostly
focus on the distribution of mid and downstream products and components. Topco, Unic, and Nagase
Wahlee Plastics are the only ones that offer partially similar products as the Company's Semiconductors
Business Division and Engineering Plastics Business Division, but due to the broad variety and
differences in application, it is impractical to estimate and compare market share across competitors.
However, judging by 2020 consolidated revenues, the Company is considered to be in the leading
position.
The Company supplies a wide range of products across industries and stay at the forefront of new
industries. It has developed strong capabilities to contribute and add value to industry integration,
thereby making it an increasingly important member to industry growth. Having been recognized by
Commonwealth Magazine as iconic company among industry generation 2.5 and outstanding "Resource
Integrator" and "Technology Innovator" in Ministry of Economic Affair's "2025 Taiwan Industry
Research" indicates a level of competitiveness that is not easily surpassed by ordinary distributors.
In the future, the Company will continue drawing support from industry participants, government
agencies, academic institutions, research institutions, and the financial sector, and shall strive to broaden
industry exposure and explore diversified business types and models through new product introduction,
strategic investments, and strategic alliances. The Company will also engage in vertical integrations to
connect critical players throughout the industry chain, and expand technical capacity further to form its

- 89 -
distinctive competitive advantage.
(2) Future market supply, demand and growth
Demand for the Company's products is closely related to the prospect of the end user industries, and
below is an analysis of the Company's market growth potentials based on prospects of the end solutions.
(Note: Year is presented in Gregorian calendar)
A. Consumer electronics
General trends of the industry's main terminal products are explained below:
1. AIOT
The term AIOT was first introduced in 2018, and it provided a more feasible solution to how AI
can be used for commercial applications. However, the issue of "fragmentation" persists even till this
day. Today, AIOT is mostly used in commercial applications of small scale and fine quality, whereas
large-scale applications are dominated by large platform operators (EX: Google). Although the
pandemic has slowed down development of ITC technologies by a significant extent, it does give rise
to new demands such as remote healthcare that present opportunities in favor of AIOT. China, for
example, commissioned nearly 500 health stations during the pandemic to serve people seeking for
medical attention. Meanwhile, IOT solutions are still being developed, but large-scale commercial
applications have yet to surface.
In terms of sensor applications, growth in the next three years will continue to be driven by
smartphone facial recognition and camera and recognition needs of electric cars (self-driving cars).
Facial recognition technologies such as ToF and CMOS imaging modules will become the focus of
senor technologies in the future. CAGR for sensors is expected to reach 14.5% between 2018 and
2023, and the market value is estimated to reach US$80 billion by 2023.
2. 5G and mobile connection
Discussion of 5G peaked at the end of 2019, and was once believed to bring profound changes to
the world. However, the outbreak of COVID-19 turned governments' attention to mitigating economic
impacts of the pandemic. In terms of state support, China is still the country that is most active in the
installation of 5G infrastructures. China had a total of 4.78 million 4G base stations installed at the
end of 2018; 2.41 million of which were owned by China Mobile, 1.38 million of which were owned
by China Telecom, and 990,000 of which were owned by China Unicom. Although deployment of 5G
base stations has been revised downward significantly from 2 million, the country still managed to
deploy nearly 650,000 units, a number that far surpassed any other country in the world.
Aside from 5G base stations, another challenge of 5G is the inherent limitations of mmWave, and
while base stations are still under construction, users will begin redirecting resources back to Sub 6
GHz. For this reason, end uses such as servers and 5G smartphones will shift more focus towards the
use of Sub 6 GHz. As for servers, higher end RF features and components will encourage suppliers to
plan for materials in sync with server IC developers. Most 5G smartphones today have been designed
mainly for Sub 6 GHz, and only very few of which can truly take advantage of mmwave. This
demand for 5G smartphone was not necessarily inspired by the technology itself, but because of how
the pandemic has changed people's lifestyles.
3. Transportation and automobile technologies
Development of self-driving vehicles still requires massive volume of data to progress, and the
technology is essentially in standstill due to the effect of the pandemic. As for electric vehicles, the
Chinese government's decision to cut back subsidies on lithium iron phosphate battery has affirmed
the dominance of ternary lithium battery. The public's attention now turns toward TESLA, which was
estimated to have sold 490,000 electric vehicles in 2020, representing a market share of 18%, or 26%
in terms of pure electric vehicles.
TESLA continues to lower the prices of its vehicles, and while it seems like a move to increase
popularity of Tesla vehicles, the company's ultimate goal is actually to sell its self-driving service.
TESLA's logic has significantly affected the mindset of potential newcomers, and being able to work
with a major platform will be critical for future success. The MIH open platform for electric vehicles
recently proposed by Foxconn would provide an ideal entry point for Taiwanese manufacturers that
are competing using old technologies. MIH still emphasizes the use of lithium batteries, which is an
area that Taiwanese manufacturers are familiar with.

- 90 -
B. Semiconductors
COVID-19 has had swift and devastating impact on the global economy including the
automobile industry, with semiconductors being a rare exception that outgrew all other industries.
This phenomenon can be attributed to the introduction of 5G smartphones and the China-USA trade
war, which had the combined effect of driving market demand. The pandemic also brought changes to
people's lifestyles, and the ongoing movement towards remote offices, online courses, and "home-
based economy" puts PCs and data center equipment in hot demand. Simply put, global demand for
semiconductors had recovered in 2020 from its slump in early 2019.
Global shipment of semiconductors amounted to US$41.84 billion in September 2020; compared
to the same period in 2019, sales in the U.S. market increased by 21.3%, and virtually all of which
was attributed to remote working and data centers. In China, sales for September 2020 grew 8.5%
year-on-year, which was significantly higher compared to the 2%-3% reported in August.
As for individual companies, TSMC is still competing with Samsung on advanced processes
(3nm-5nm), and TSMC is very likely to win the next round according to market forecasts. Intel, on
the other hand, reduced capital expenditure from US$17 billion to US$14.4145 billion in 2020, sold a
major part of its NAND business to SK Hynix, and postponed construction of its 7nm production line
by two years. It is reasonable to infer that Intel might be focusing on the development of 10nm
process, and is very likely to outsource more advanced processes (above 10nm) to TSMC.
Lastly, the WSTS report revised growth estimate of the global semiconductors industry to
5.1% for 2020 after delivering such a strong performance in Q3 2020. The industry as a whole
should fully emerge from its slump in 2019 to achieve growth at 8.4% for 2021.
C. Flat-panel displays
The outbreak of COVID-19 eventually spread to South Korea after causing damage in China.
China had emerged as one of the world's major producers of TFT LCD panels at the time, and
measures such city-wide lockdown and quarantine did cause stress on the supply of certain parts,
but the return of factory workforce in early 2020 was much better than what the market had initially
expected; furthermore, this unexpected disaster also gave rise to new opportunities and demands.
Driven by a global movement towards home office and remote teaching, desktop displays and
NBs performed exceptionally well in 2020. While desktop displays grew 7.1% to 150 million units,
NB shipments increased at a more stunning rate of 22% to 200 million units; both of which were
record-high figures.
As for individual companies, Japanese and Korean manufacturers have announced their exits
from LCD panel manufacturing, leaving BOE, AUO, Innolux, and LGD to secure 86% of NB
supply. Among the top 4 panel manufacturers, LGD and Innolux posted the strongest growth at
Current technologies and processes of major foundries

- 91 -
25% and 23.1%, respectively. The former mainly benefited from strong shipment of Macbooks and
stocking requirements following introduction of the new M1 processor, while the latter had
benefited for the reasons explained above. Innolux's shift of business focus towards NB panels was
rewarded with surprising results in 2020.
Although many countries have begun vaccination in 2021, COVID-19 should remain active
for at least another 6 months considering the slow increase of vaccination coverage and threats of
viral mutation. For this reason, demand for remote solutions and ITC products should persist for
additional periods of time. According to Topology Research Institute, growth of display panels in
2021 should come mainly from desktop displays and NB, and shipments of which are estimated at
152 million units and 217 million units, respectively, for 2021.
D. PCB
According to TPCA, factors including the pandemic, the competitive trade environment, rate
of digitalization, and the smart manufacturing movement will remain critical to the growth of the
PCB industry. 5G, on the other hand, is less affected by the pandemic and may continue to drive
demands and investments.
With regards to the outlook of the pandemic, discovery of COVID-19 mutation was reported
in various parts of the world between Q4 2020 and Q1 2021, at the same time when vaccines were
becoming available. This once again casts doubt on the hopes of ending the pandemic early, forcing
people to explore ways of globalization amidst the disease. Currently, it is possible for business
traveling to be permitted at the end of 2021.
As for the competitive trade environment, tension induced by the China-USA trade war should
wear off now that Biden is elected into office. However, industry participants will continue
transitioning from a global supply chain to a regional supply chain, and begin exploring Southeast
Asia as the next viable production site. For PCB manufacturers, the quick surge in demand in 2020
gave Taiwanese manufacturers a reason to expand production capacity in Taiwan. Given the fact
that manufacturers including Compeq, Tripod Technology, Zhen Ding, and Dynamic Electronics
have settled plant facilities almost entirely in Taiwan or China, expansion of PCB production into
Southeast Asia is unlikely to happen in the short term.
In 2021, remote applications such as NB, servers, and 5G smartphones should remain the key
drivers to PCB growth, and we may see growth at a rate similar to 2020. Of all product categories,
high-end HDI and IC substrates are still the mainstream, with possibilities of a slight supply
shortage. In 2021, value of the global PCB market is expected to expand by 6%.
E. Green energy
Growth of the green energy industry had slowed down in 2020 due to effects of the pandemic;
however, the industry still exhibited strong resilience compared to others thanks to policy support.
According to the International Energy Agency (IEA), increase of global renewable energy capacity
set a new record in 2020; nearly 90% of additional power capacity was renewable energy-based,
and only 10% was natural gas and coal-based. This trend shows that green energy will replace coal
as the largest energy source by 2025, ending the 50-year dominance of coal-fired power.

- 92 -
The world's rising awareness to the importance of green energy has made renewable energy
an increasingly appealing investment to investors. IEA pointed out that shares of renewable energy
equipment manufacturers and energy exploration companies have outperformed the market index
in all capital markets around the world. In comparison, the petrochemical industry performed
relatively poor due to lockdown measures. This was part of the reason why IEA predicts renewable
energy to become the world's primary energy source by 2025, generating approximately one-third
of total electricity. Solar power would still be the mainstream form of green energy in the future.
IEA also estimated global renewal energy capacity to reach record-high level of 200GW in
2020, which was mainly attributed to China and U.S. developers having made a last-ditch effort to
install additional capacity before the subsidy expired. Capacity in 2021 may grow at a faster rate, as
India and the European Union will also be undertaking expansions. According to IEA, global
renewable energy capacity is estimated to increase by nearly 10% in 2021, and remain largely
unaffected by the pandemic.
3. Competitive advantages, opportunities, threats, and response strategies:
(1) Competitive advantage
A. More than 50 years of experience, and a strong corporate culture and brand image of Integrity,
comprehensive, visionary leadership.
B. A mutually trusting and benefiting partner to customers and suppliers. Ability to develop flexible,
customized, and satisfying integrated services according to customers' requirements, and possession of
a complete product line supported by exceptional technical know-how, service capacity, total solutions,
and value-adding services. Ability to integrate across the industry chain and establish application
markets in collaboration with suppliers and customers.
C. Accurate foresight to acquire the latest products, information, technologies, and intelligence from
China, USA, Japan and other countries; ability to launch new materials, equipment, and technologies
Additions of global renewable energy capacity
Unit: GW
USA
Other
countries India EU
Note: Represents newly added renewable energy capacity
(Year)
Source: IEA
Mainland China

- 93 -
that create demand and motivate research among suppliers and customers; and a role-model global
resource integrator that is competent in industry generation 2.5.
D. Strong funding capacity that is favorable to new business development and corporate expansion.
E. Established presence in Greater China Region, Southeast Asia, Northeast Asia, Europe, and USA, and
valid extension of regional distributorship.
F. Comprehensive and diversified industry exposure; ability to satisfy customers' one-stop shopping
requirements, and balance between business and cyclical risks.
G. Support of a strong technical team and a globalized, talented marketing and market development team.
(2) Opportunities
A. Prospects of the Greater China market, the industry, and the global environment are consistent with the
Company's industry/product development efforts.
B. The Company's long-established relationship in China and Southeast Asia has paid off as businesses
migrate into China and ASEAN countries. This provides the Company with the advantage to expand
into inland areas of China as well as Korea and Japan, and assist in customers' transition into new
regions and markets.
C. High-tech companies are starting to diversify business activities and make purchases at the group level,
and are desperately in need of suppliers that can provide one-stop access to the needed products and
services. It emphasizes the Company's advantage and value as an all-round distributor and global
resource integrator.
(3) Threats
A. Like all distributors, the Company is prone to the risk of suppliers competing and selling directly to
the target market through branch establishment.
Response measures:
(a) Cooperate with suppliers to set up joint ventures at customers' locations, which in turn secures
business relationship and enables proximity to customers.
(b) Leverage the Company's local advantages to provide product information, technical support,
logistics integration, maintenance consultation, and value-adding services; create competitive
advantages that competing suppliers are unable to replicate.
(c) Focus on introducing total solutions and leveraging the Company's advantages in product
integration; offer packaged services and solutions that are more advantageous and irreplaceable
than if products are sold separately.
(d) Enhance robustness of financial position and the warehousing/logistics system; prepare adequate
working capital to emphasize the Company's added value as a distributor in terms of cash flow,
logistics, and operations.
(e) Adhere to integrity and commit to delivering satisfying services; strive to become a critical
strategic partner to customers and suppliers.
B. The speed at which the industry, products, and technologies are changing presents tough challenge to
distributors.
Response measures:

- 94 -
(a) Enhance professional training for employees; develop sales culture and skills across employees,
and thereby improve sensitivity and responsiveness to market changes.
(b) Strengthen collaboration with external research institutions and academic institutions to expand
the source of industry information; develop an industry think tank and improve industry analysis
capabilities within each individual to help identify viable products and technologies at an early
time; explore new distributorships and develop new products, technologies, services, and business
models quickly through investments and alliances.
(c) Enhance project management skills, raise new business development rewards and the development
fund, and effectively integrate company resources to improve the efficiency and success rate of
new products/projects.
C. Advent of the "low profit era" poses substantial challenges to operational performance.
Response measures:
(a) Develop value-adding services and packages; develop products of high uniqueness, high value-
adding, high technological threshold, and high margin that increase the value and profitability of
total solutions.
(b) Tighten control over purchases, sales, and inventory; strive to increase inventory turnover and
reduce slow-moving inventory.
(c) Make use of available funding channels and undertake appropriate treasury transactions to reduce
cost of funds during business expansion.
(d) Make optimal adjustments to the organization and enhance employees' competency and
contributions.
(e) Apply rigorous management practices and strive to improve operational performance and
efficiency while maintaining expenses at reasonable level.
(f) Enhance customer credit risk investigation and control, and exercise proper accounts receivable
management.
D. Impact of major environmental changes (e.g.: pandemic or trade war)
Response measures:
(a) Monitor collection of customer accounts with the support of robust and timely credit analysis to
reduce risks.
(b) Control spending and operating expenses without compromising business operations. Have
business units review accomplishment of monthly budget targets and take action plans
accordingly. Maintain frequent communication with suppliers and customers'
upstream/downstream partners; maintain inventory at the optimal level and avoid shortage and
excess where possible.

- 95 -
(II) Main product applications and production processes
1. Main product applications
Main product
categories Main products Applications
IT/communication/elec
tronics assembly/PCB
materials, parts, and
equipment
Engineering plastics: (1) Plastic materials for
computers, networking, communication, and new-
generation electronics/appliances; (2) Plastic
materials and optical films for TFT LCD; (3) Heat-
resistant engineering plastics for electronic
connectors; (4) High-performance engineering
plastics for electronic/appliance components; (5)
Plastic materials for optical components; (6)
Electronic/appliance insulators and functional
plastic films; (7) Other plastics.
Electronic assembly materials: PCB copper clad
laminate, base/auxiliary materials for
semiconductor assembly, process equipment, base
materials for 5G high-frequency communication,
assembly/packaging materials for power module,
materials for high-capacity fast-charging lithium
battery
3C electronics, handheld and
wearable devices, connectors,
antenna base stations, modems,
gaming consoles, PCB,
motherboards, appliance parts,
films/plates for FPD,
automobiles, consumer goods,
medicine, and packaging
materials.
Semiconductor
materials and
production chemicals,
gas, and equipment.
(1) Photoresist and developer; (2) Stripper,
remover; (3) IC process chemical and specialty
gases; (4) chemical mechanical polishing, cleaning
fluid; (5) quartz/silicon/ceramics spare parts; (6)
silicon wafer (7) high-end semiconductor assembly
materials
Semiconductor wafer
manufacturing, assembly, and
testing
Opto-electronics,
optical communication,
and flat-panel display
materials, equipment,
parts, modules,
systems, and solutions
Total solution for flat-panel display and touch panel
applications: (1) Touch control panel materials, IC
(e.g. timing controller IC, Touch Panel Controller,
Driver IC, power management), and equipment. (2)
LCD materials/parts/ IC/manufacturing equipment
and consumables/process chemicals and gases. (3)
New display (e.g. Rigid/Flexible AM OLED, Mini
LED, Micro LED, QD) materials, IC, modules, and
equipment. (4) End-user display applications (e.g.
public information display (PID), digital
whiteboard, GPS module). (5) Optical
communication components and modules
Liquid crystal displays, touch
panels, and OLED panel
manufacturing. Flat-panel
display-related applications
and optical communication
market

- 96 -
Main product
categories Main products Applications
Green energy, energy
conservation, and
energy storage
materials, equipment,
parts, modules,
systems, and solutions
(1) Silicon wafer for solar cell, battery, aluminum
paste and processing materials, solar module and
assembly materials such as glass, EVA, and
Junction Box. (2) Power generation (e.g. solar
power station), regional power grid, environment-
friendly energy and energy conservation systems.
(3) Electric vehicle and energy storage/battery
materials, modules, and systems. (4) Wind power
materials. (5) LED-related products (process and
assembly materials, components, and modules)
Solar power, energy storage
system, LED, wind power,
lithium battery manufacturing
Environmental
protection and other
industrial materials,
equipment, parts,
modules, systems, and
solutions
Environmental protection: waste water, air
pollution, and environment-cleansing equipment
and materials such as ammonia-nitrogen treatment,
water treatment films, sludge dryer.
Industrial materials: (1) Composite materials - glass
fiber, core materials, and resin; (2) Ship engines -
diesel engine generator for yacht; (3) Bulletproof
fiber, carbon fiber, high-tenacity fiber, abrasive
material; (4) Environment-friendly coolant; (5)
Special chemicals-silica fume, anti-static agent; (6)
Other industrial products
(e.g. 3D printing, graphene, nano material)
Other industries: (1) Biotech material; (2) Antibody
development, agent, reagent; (3) Medical
instrument; (4) Enzyme application; (5)
Medicine/food packaging material, biomass
material, biodegradable material; (6) Hemodialysis
material, equipment, and business.
Plastics, home appliance,
refrigeration, coating material,
heat dissipation, aerospace,
national defense, auto parts,
sports equipment, fire proof
material, household supply,
precision ceramic components
and environmental protection
systems, vessels, biomedicine,
models, packaging materials,
environmental protection
industry, advanced
manufacturing.
2. Production processes of main products: Not applicable.
(The Company is not involved in manufacturing activities, hence there is no production process)

- 97 -
(III) Supply of main products
Main product categories Top 5 suppliers Supply status
IT/communication
industry materials
(engineering plastics)
MITSUBISHI ENGINEERING-PLASTICS CO.
MITSUBISHI GAS CHEMICAL COMPANY INC.
SUMITOMO CHEMICAL CO. LTD.
TORAY INTERNATIONAL, INC.
Chi Mei Corporation
Good
Semiconductor
manufacturing,
assembly, and testing
materials and process
chemicals, gas, and
equipment
DU PONT ELECTRONIC TECHNOLOGIES
JSR CORPORATION
Mitsubishi Chemical Taiwan Co., Ltd.
Kemitek Industrial Corp.
Purification Equipment Research Institute of CSIC
Good
Opto-electronics, optical
communication, and flat-
panel display materials,
equipment, parts,
modules, systems, and
solutions
Fitipower Integrated Technology Inc.
Megachips Taiwan Corporation
Guangzhou Shikun Electronic Technology Company Limited
Guangzhou Shiyuan Electronic Technology Company Limited
Guangzhou Shirui Electronic Technology Company Limited
Good
Electronics
assembly/PCB materials,
parts, and equipment
AGC Chemicals
ORC MANUFACTURING CO., LTD.
PANASONIC CORPORATION
Panasonic Industrial Devices Materials Taiwan Co., Ltd.
Asahi Kasei Electronics Materials Suzhou Co., Ltd.
Good
Green energy, energy
conservation, and energy
storage materials,
equipment, parts,
modules, systems, and
solutions
KURARAY CO., LTD.
SEOUL SEMICONDUCTOR CO., LTD
Kwang Myung Semiconductor (Tianjin) Co., Ltd.
Konca Solar Cell Co., Ltd.
Motech Industries Inc.
TSEC Corporation
Good
Environmental protection
and other industrial
materials, equipment,
parts, modules, systems,
and solutions
BELL POLYESTER PRODUCTS, INC.
YANMAR ENGINE (SHANGHAI) CO., LTD.
Daily Polymer Corporation
Taiwan Glass Industry Corporation
Formosa Plastics Corporation
Good
(IV) Name of trade partner representing more than 10% of total purchases (sales) in any of the previous two years, and
the amount and percentage of purchase (sale). Describe causes of any variation:
1. Main suppliers in the last two years: The Company did not have any supplier that represented more than 10%
of consolidated total purchases.

- 98 -
2. Main buyers in the last two years: The Company did not have any buyer that represented more than 10% of
consolidated total sales.
(V) Production and sales volume/amount in the last two years:
The Company is not a manufacturer; there is no data on production capacity or volume, hence analysis is
performed on the amount of purchase instead of production amount. Furthermore, due to the wide variety of
products and the different units of measurement involved, sales are presented in amount by category only for
consistent comparison.
Year
Main product category
2019 2020
Amount of
purchase
Amount of sales Amount of
purchase
Amount of sales
Domestic
sales
Export
sales
Domestic
sales
Export
sales
Information and
communication 16,209,690 1,789,429 17,052,974 18,414,616 1,946,529 18,278,408
Semiconductors 9,707,526 7,189,094 3,527,986 11,108,066 8,158,828 3,970,919
Flat-panel displays 14,707,772 1,732,842 13,370,912 15,705,068 2,482,461 13,766,721
Green energy 1,879,887 394,166 1,684,368 1,427,298 520,192 1,119,844
PCB/motherboard 4,799,612 2,671,673 2,687,914 5,679,505 3,275,004 3,094,172
Others 1,634,777 1,045,915 1,534,556 1,558,415 896,037 1,571,805
Total 48,939,264 14,823,119 39,858,710 53,892,968 17,279,051 41,801,869
III. Employees:
Year 2019 2020 Current year up until March
31, 2021
Employee
count
Sales personnel 689 701 701
Administrative
personnel 290 289 296
Total 979 990 997
Average age 38.34 39.77 39.89
Average years of service 7.25 8.79 8.80
Academic
background
Doctoral Degree 0.20% 0.10% 0.20%
Masters Degree 11.75% 11.21% 11.43%
Bachelor Degree 77.63% 76.26% 76.22%
Senior high school 7.76% 9.50% 9.39%
Below senior high
school 2.66% 2.93% 2.76%

- 99 -
IV. Contribution to environmental protection:
Environment-related spending in the last year up until the publication date of annual report:
No. Item Amount
(NTD)
1 Losses (including compensations) and fines
incurred due to pollution 0
2 Maintenance of the environmental management
system 4.5 million
2-1 SGS annual certification for ISO14001
Environmental Management System
2-2 Ongoing green transformation of the work
environment
2-3 Maintenance of lighting equipment (replacement
with T-5 energy-efficient tubes)
2-4 Waste sorting, recycling, and reuse
2-5 Purchase and installation of environment-friendly,
energy-saving equipment
2-6 Greenhouse gas reduction for purchased
electricity
2-7 Greenhouse gas reduction on water usage
2-8 Ongoing promotion of energy conservation,
carbon reduction, and waste reduction awareness
2-9 Elimination and replacement of outdated
company vehicles
2-10 Commissioning of certified service providers for
waste treatment
V. Labor-management relations:
(I) Availability and execution of employee welfare, education, training and retirement policies; elaborate on the
agreements between employers and employees, and protection of employees' rights:
1. Appropriate compensation system:
The Company has established its work rules in accordance with the Labor Standards Act. Employees'
compensations are determined based on academic background, career experience, and responsibilities of each
individual after taking into consideration the market salary level. Salary adjustment and bonus decisions are made
according to the Company's annual profitability, employees' individual performance/contribution, the current
price level, and market salary level.
2. Complete employee welfare:
Chairman Chang is a role-model entrepreneur; having built the Company from scratch, the Chairman has
sincere gratitude for employees who stood by and supported the organization through challenging times. This is
why the Chairman and the management team are highly attentive to employees' living and working conditions, and
strive to offer the best welfare measures and work environment in return. Aside from mandatory Labor Insurance

- 100 -
coverage, National Health Insurance coverage, and pension contributions, the Company also offers subsidies on
group insurance and employee shareholding trust, and has an Employee Welfare Committee in place to oversee
employees' welfare.
Below is a list of key welfare measures offered by the Company:
(1) Sponsorship for social clubs and recreational activities.
(2) Group insurance and travel insurance.
(3) Festive cash and vouchers.
(4) Commendation for senior employees.
(5) Gathering and lucky draw for festive and year-end occasions.
(6) Year-end bonus and profit sharing.
(7) Subsidy for domestic and overseas trips.
(8) Compassionate benefits for work-related injury and illness, and emergency aid.
(9) Wedding/funeral cash and childbirth subsidy.
(10) Annual employee health examination.
(11) Allocation of company laptop.
(12) Incentive for employee shareholding trust.
(13) Paid leave of absence and illness leave up to a prescribed limit.
(14) Commendation for outstanding team.
(15) Education scholarship.
3. Diversified talent training plan:
The Company makes annual talent development plans to help employees develop the skills needed to succeed
in their roles and responsibilities. Employees are trained in ways that enforce the Company's mission to provide
customers with total solutions and satisfying services, and deliver outstanding operational performance. The
Company trains talents on the four main aspects below:
(1) Management capacity:
Training activities are organized to help managers of all grades, from entry-level, mid-level to senior level,
develop the management skills needed to accomplish their duties.
(2) Specialized skills:
Depending on the characters and skills needed for each role, the Company makes plans and arrangements to
have employees undergo specialized training on topics including but not limited to sales, customer service,
information service, human resources, finance, accounting, legal affairs, credit management, and logistics.
(3) General knowledge:
General courses on international trade practices, information system workshops, compliance overview, and
worker safety and health are organized.
(4) New employee Orientation:
Training courses including: introduction to company history, personnel/administrative processes, the credit
management system, international trade flow, products, industry development, and logistics system, message
from mid-level and senior managers, and team building activities are organized for new recruits.

- 101 -
(5-1) Execution of employee development plan - 2020:
Course category Course name Training subject Course
hours
No. of
sessions
Participant
count
General
knowledge 2020 information security & system upgrade seminar All employees 3 1 138
General
knowledge Training for point-to-point video conferencing equipment
Applicable
employees 1 1 13
General
knowledge Occupational health on-site seminar by physicians/nurses Hsinchu, Taipei 1 2 18
General
knowledge Health seminar (Hsinchu session) Hsinchu employees 1 1 12
Specialized skills Training course on brand enhancement Logistics employees 7 2 36
Sales skills Electronics assembly sales training Sales Department
employees 7 1 36
Sales skills New product/market/knowledge training for engineering
plastics
Sales Department
employees 63 21 40
Sales skills Basic concepts of international trade/cost calculation, and
explanation on company procedures
Sales Department
employees 2 1 15
Information
technology Information skill/technology course
IT Department
employees 3 6 29
Sales skills Compliance training for audit personnel Internal Audit
Office employees 8 18 7
(5-2) Managers' participation in corporate governance-related training - 2020:
Title Name Organizer Course name Training
hours
Director Lee, Kuo-Ping Accounting Research and Development
Foundation of the R.O.C. On-job Training for Chief Accountant 12
Director Lin, Jen-Chih Securities and Futures Institute
Advanced Practical Workshop for Directors,
Supervisors (including Independent Directors)
and Corporate Governance Officers
18
Director Shih, Ching-Hsien UCOM
EC-Council CEH
Certification Course 40
ITIL® 4 Foundation Certification Course 28
4. Retirement system:
The Company has assembled an Employee Pension Fund Supervisory Committee in accordance with the
Labor Standards Act. The Company currently makes monthly contributions at 8% of employees' gross salary to a
pension account held with the Trust Department of Bank of Taiwan; for employees who are subject to the new
labor pension scheme introduced since July 1, 2005, the Company makes monthly contributions of no less than 6% of
employees' gross salary to their individual accounts held with Bureau of Labor Insurance, Ministry of Labor. By providing

- 102 -
security over employees' life after retirement, the Company ensures that employees are able to work free of
worries throughout the entirety of their employment.
5. Open labor-management communication channels:
The Company complies with regulations on all matters concerning employment, and has maintained strong
labor-management relations to date. Any changes to employment terms are fully communicated with employees
through "labor-management meetings" before implementation, hence no employment dispute has arisen to date.
6. Other employee rights measures:
Issues concerning employees' rights have been properly addressed in recent years up until the publication
date of annual report. In addition to maintaining open channels of labor-management communication, the human
resources department has long been interacting and serving employees using an AO (account officer) system, in
which dedicated officers are assigned to gather, track, and make improvements on various issues for the protection
of employees' interests.
7. Protective measures in work environment and personal safety of employees:
Items Description
Access control
1. The access control and surveillance system are in place at all hours. Visitors are required
to register themselves and shall be companied by employees.
2. Face recognition mainframe (to confirm employee attendance and control access),
security mainframes for the Company and each building, and automatic alarm mainframe
(emergency phones for building management offices and important personnel of the
Company) are installed. After working hours, the elevators for the different floors may be
locked.
Maintenance and
checks on fire
equipment
1. Monthly check on dry chemical/foam fire extinguisher;
1.1 Check if there is damage on safety pins and nozzles.
1.2 Check if pressure indicator is normal.
1.3 Check the expiration date of the chemicals.
1.4 Check if there are items blocking the fire extinguishers.
2. Smoke detectors are installed in the Company facilities. Yearly checks are performed on
the mainframes, sensors and alarms.
3. Conduct building fire drills (at least once a year).
4. Batteries of the emergency exit lights are charged once every three months to ensure that
they are working well.
5. Fire door and smoke exhaust space are installed at lobby.
Health and
hygiene
1. Employee health examination are performed on a regular basis every year. Consultation
from medical professional on the medical report and education on safety and hygiene are
provided. In addition, in accordance with the law and regulations, the Company has hired
“the diplomate with occupational medicine” and “nurse practitioner with occupational
medicine” to conduct on-site health management service on a regular basis.
2. Janitors clean restrooms and offices, and empty the trash on a daily basis.
(II) Actual or estimated losses arising as a result of employment dispute in the last year up until the publication date of
annual report, and any response measures taken:

- 103 -
The Company has been able to maintain open communication and productive interaction with employees since
incorporation. Due to the rationality and harmony of existing employment relationship, the Company encountered
no employment-related dispute or loss in the most recent year up until the publication date of annual report, and
foresees extremely low possibility of encountering such a dispute in the future. Further, the Company has been and
will continue to ensure full compliance with labor regulations, enhance welfare measures, implement diverse range
of communication and grievance channels, and assign relevant units to keep track of ongoing issues and solutions,
and thereby maintain productive employment relations.
VI. Major contracts:
Nature of contract Parties involved Contract start/end date Main contents Restrictive clauses
Agency/distribution
contract Sabic Innovative Plastics Hong Kong Limited 2018.9.1-2021.8.31 Agency and distribution of thin film and sheet
materials Location: Taiwan, Hong Kong, and
the Mainland
Agency sales
contract KURARAY Trading Co., Ltd. 2002.1.1-2002.12.31
(automatically renewable) Agency sale of high-performance nylon Location: The Mainland, Taiwan,
and Hong Kong
Agency sales
contract Nagase & Co., Ltd. 1998.1.1-2000.12.31
(automatically renewable) Agency sale of engineering plastics Location: Taiwan
Agency sales
contract Sumidurez Singapore Pte. Ltd. 1999.8.20-2001.8.19
(automatically renewable) Agency sale of phenol formaldehyde resin Location: Taiwan
Agency sales
contract Teijin Dupont Films Japan Ltd. 2000.1.1-2000.12.31
(automatically renewable) Agency sale of PET materials Location: The Mainland, Taiwan,
and Hong Kong
Intermediary sales
contract Chi Mei Corporation 1999.1.1-2001.12.31
(automatically renewable) Agency sale of engineering plastics Overseas (outside Taiwan)
Distribution
contract Nagase Wahlee Plastics Corp. 2000.1.1-2003.12.31
(automatically renewable) Distribution of engineering plastics materials
Trading contract Teijin Kasei Taiwan Co., Ltd. 2007.9.10-2008.9.9
(automatically renewable) Distribution of engineering plastics materials
Sales contract SUMIKA Electronic Materials (Shanghai)
(Hong Kong) (Wuxi) Corporation 2008-(automatically renewable) Polaroid/phase plate
Diffuser/LCP, PES, electronic materials The Mainland
Distribution
contract Victrex Manufacturing Limited. 2020.6.1-2021.5.31 Distribution of PEEK materials Taiwan, Southeast Asia
Basic trading
contract Mitsubishi Chemical Taiwan Co., Ltd. (Tai-
Young High Tech Co., Ltd.) 1999.6.1- (expiry not specified) Commodity chemicals
Agency contract JSR Corp 2007.12.1- (expiry not specified) Photoresist for semiconductors, CMP Slurries,
PCMP
Agency contract Sumitomo Seika Chemicals Co., Ltd. 2007.11.1-2012.10.31 Gases, PVSA Gas Generator Automatically renewed for one
year six months before expiry if no
objection is raised
Agency sales
contract Asahi Kasei Corporation
(Asahi Chemical Industry Co.,Ltd.) 1997.8.1-1998.7.31
(automatically renewable) Agency sale of dry films Location: Taiwan, China
Agency sales
contract Sumitomo Bakelite Company Ltd. 2000.1.1-2000.12.31
(automatically renewable) Agency sale of separation film Location: Taiwan, China
Agency contract Seho Robot Ind. Co., Ltd. 2008.11.1-2010.10.30
(automatically renewable) Agency sale of flexible printed circuit
automation equipment Location: Taiwan, China
Agency proof LAN Technical Service Ltd. 2002.1.1-
(automatically renewable) Agency sale of OLED equipment All except Chi Mei
Agency contract Megachips Taiwan Corporation 2010.6.15- (automatically
renewable) Agency sale of timing controller IC

- 104 -
Nature of contract Parties involved Contract start/end date Main contents Restrictive clauses
Agency contract Mitsubishi Chemical Corporation 2011.1.1-
(automatically renewable) Agency sale of color photoresist Location: Taiwan and certain parts
in China
Distribution
contract The Chemours (Taiwan) Company Ltd. 2020.1.1-2020.12.31 Agency sale of environment-friendly coolant Location: Taiwan
Agency sales
contract Fukuoka Cloth Industry Co., Ltd. 1998.1.1-2000.12.31
(automatically renewable) Agency sale of waterstop for cables Location: Taiwan
(specific customers)
Agency sales
contract OG Corporation 1998.1.1-2000.12.31
(automatically renewable) Agency sale of synthetic rubber Location: Taiwan
Agency sales
contract Teijin Shoji 1992.2.28-1993.2.27
(automatically renewable) Agency sale of TeijinConex Fiber Location: Taiwan
Distribution
contract Taiwan Glass Industry Corporation 2000.1.1-2002.12.31
(automatically renewable) Agency sale of glass fiber Distributor in Taiwan
Distribution
contract Daily Polymer Corporation 1999.1.1-2001.12.31
(automatically renewable) Agency sale of unsaturated polyester resin One of the distributors in Taiwan
Solar power
module
procurement
contract
Southern Taiwan Business Group, Chunghwa
Telecom Co., Ltd. 2020.01.20-2022.01.19 Supply of solar power module Location: Taiwan
Distribution
contract EUKA Power Co., Ltd. 2020.3.13-2023.3.12 Energy storage system (including
commercial/household) Location: Taiwan
Distribution
contract eTreego Co., Ltd 2020.7.28-2021.7.31 Charging facility for electric cars and
motorcycles of all models Location: Taiwan
Medium/long-term
syndicated loan
contract
Bank of Taiwan, Taiwan Cooperative Bank, Hua
Nan Bank, Land Bank of Taiwan, Mega Bank,
First Commercial Bank, CTBC Bank, E.Sun
Bank, Bank Sinopac, HSBC, Taishin Bank
2018.12 -2023.12 To repay liabilities owed to financial
institutions and to source medium-term working
capital.
The Company is required to meet
the following financial covenants:
1. Current ratio (current
assets/current liabilities): ≧
100%.
2. Debt ratio (total
liabilities/tangible net worth): ≦
200%.
3. Interest coverage ratio (profit
before tax + interest expenses +
depreciation +
amortization)/interest expenses: ≧
6 times.
4. Total tangible net worth (equity -
intangible assets): ≧ Eight
billion New Taiwan Dollars.
Kingstone-
Medium/long-term
syndicated loan
contract
Bank SinoPac, Hua Nan Bank, CTBC Bank,
Mega International Commercial Bank and
Chang Hwa Bank
2019.9.6-2024.9.30 To finance the capital need for the construction
of solar cell manufacturing plant and repay the
existing borrowings from financial institutions.
The Company is required to meet
the following financial covenants:
1. Debt ratio: Balances of
borrowings from financial
institutions/Equity fund
(shareholders' equity plus
borrowings from associates) ≦
400%.
2. Interest coverage ratio:
Maintained at 1.1 times.

- 105 -
Six. Financial Highlights
I. Condensed financial statements 2016 to 2020 with auditors’ opinions:
(I) Condensed Balance Sheet
1-1Stand-alone statement, prepared under International Financial Reporting Standards
Unit: NTD thousands
Year
Item
5- Year Financials (Note 1)
2016 2017 2018 2019 2020
Current asset 9,026,423 9,746,180 10,597,321 10,496,154 11,918,175
Property, plant and equipment 1,162,604 1,165,000 1,171,401 1,165,900 1,147,658
Intangible asset 2,713 7,933 15,576 24,539 23,619
Other assets 10,060,593 10,850,800 11,712,414 12,410,025 13,768,174
Total assets 20,252,333 21,769,913 23,496,712 24,096,618 26,857,626
Current
liabilities
Before distribution 7,721,120 7,554,178 8,775,118 8,036,523 9,707,477
After distribution 8,322,735 8,317,765
9,515,566 8,800,110 (Note 2)
Non-current liabilities 2,645,045 3,429,481 3,655,940 4,615,198 4,272,140
Total
liabilities
Before distribution 10,366,165 10,983,659 12,431,058 12,651,721 13,979,617
After distribution 10,967,780 11,747,246 13,171,506 13,415,308 (Note 2)
Equity attributable to shareholders
of the company 9,886,168 10,786,254 11,065,654 11,444,897 12,878,009
Share Capital 2,313,901 2,313,901 2,313,901 2,313,901 2,313,901
Capital surplus 1,378,680 1,440,508 1,331,880 1,318,065 1,331,725
Retained
earnings
Before distribution 6,318,424 7,110,005 8,099,220 8,793,018 9,869,001
After distribution 5,716,809 6,346,418 7,358,772 8,029,431 (Note 2)
Other equities (124,837) (78,160) (679,347) (980,087) (636,618)
Treasury shares - - - -
Non-controlling interests - - - -
Total
Equity
Before distribution 9,886,168 10,786,254 11,065,654 11,444,897 12,878,009
After distribution 9,284,553 10,022,667 10,325,206 10,681,310 (Note 2)
Note 1: 2016~2020 Financial Statements were audited by Deloitte & Touche Taiwan
Note 2: Proposal for 2020 earnings distribution has yet approved by the shareholders’ meeting.
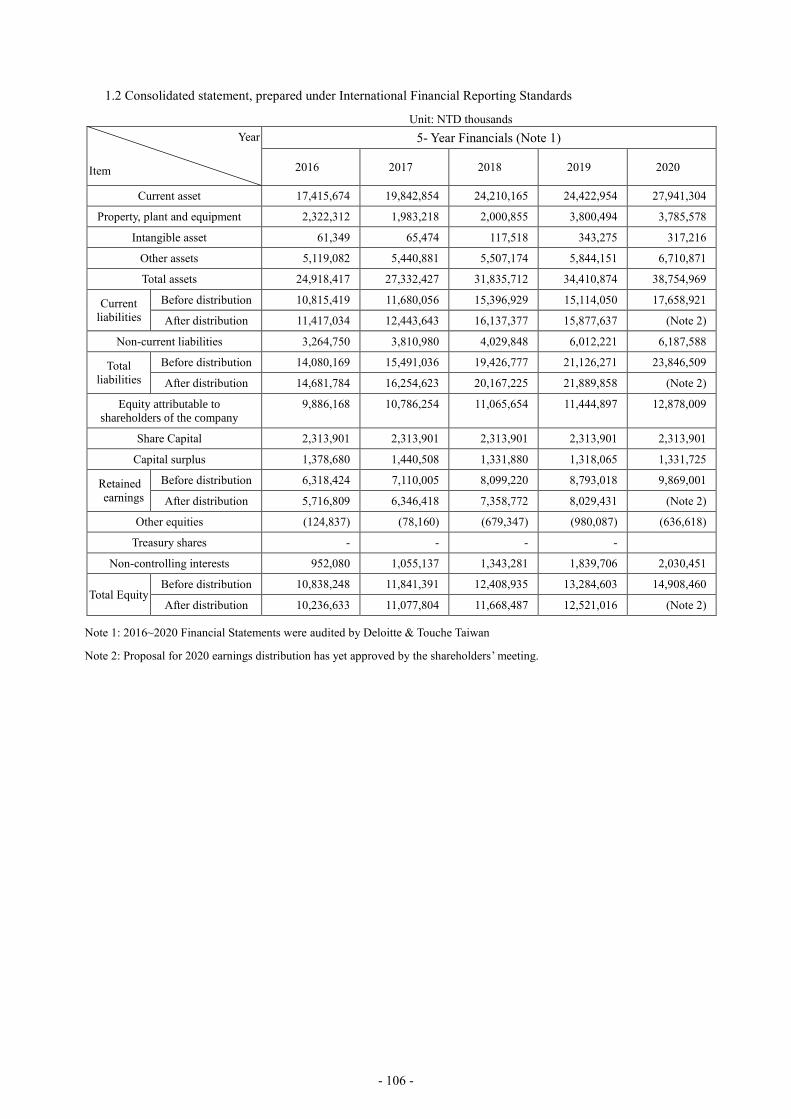
- 106 -
1.2 Consolidated statement, prepared under International Financial Reporting Standards
Unit: NTD thousands
Year
Item
5- Year Financials (Note 1)
2016 2017 2018 2019 2020
Current asset 17,415,674 19,842,854 24,210,165 24,422,954 27,941,304
Property, plant and equipment 2,322,312 1,983,218 2,000,855 3,800,494 3,785,578
Intangible asset 61,349 65,474 117,518 343,275 317,216
Other assets 5,119,082 5,440,881 5,507,174 5,844,151 6,710,871
Total assets 24,918,417 27,332,427 31,835,712 34,410,874 38,754,969
Current
liabilities
Before distribution 10,815,419 11,680,056 15,396,929 15,114,050 17,658,921
After distribution 11,417,034 12,443,643 16,137,377 15,877,637 (Note 2)
Non-current liabilities 3,264,750 3,810,980 4,029,848 6,012,221 6,187,588
Total
liabilities
Before distribution 14,080,169 15,491,036 19,426,777 21,126,271 23,846,509
After distribution 14,681,784 16,254,623 20,167,225 21,889,858 (Note 2)
Equity attributable to
shareholders of the company 9,886,168 10,786,254 11,065,654 11,444,897 12,878,009
Share Capital 2,313,901 2,313,901 2,313,901 2,313,901 2,313,901
Capital surplus 1,378,680 1,440,508 1,331,880 1,318,065 1,331,725
Retained
earnings
Before distribution 6,318,424 7,110,005 8,099,220 8,793,018 9,869,001
After distribution 5,716,809 6,346,418 7,358,772 8,029,431 (Note 2)
Other equities (124,837) (78,160) (679,347) (980,087) (636,618)
Treasury shares - - - -
Non-controlling interests 952,080 1,055,137 1,343,281 1,839,706 2,030,451
Total Equity Before distribution 10,838,248 11,841,391 12,408,935 13,284,603 14,908,460
After distribution 10,236,633 11,077,804 11,668,487 12,521,016 (Note 2)
Note 1: 2016~2020 Financial Statements were audited by Deloitte & Touche Taiwan
Note 2: Proposal for 2020 earnings distribution has yet approved by the shareholders’ meeting.

- 107 -
(II) Statement of Comprehensive Income
1-1. Statement of Comprehensive Income (stand-alone), prepared under International Financial Reporting
Standards
Unit: NTD thousands
Year
Item
5- Year Financials (Note)
2016 2017 2018 2019 2020
Operating income 24,758,119 26,391,454 29,844,070 29,225,800 33,236,491
Gross profit 1,754,529 1,924,545 2,046,929 1,976,531 2,269,072
Income from operations 529,754 439,242 573,758 479,573 640,341
Non-operating income
and expense 752,657
1,218,566 1,088,558 1,125,665 1,464,128
Profit before tax 1,282,411 1,657,808 1,662,316 1,605,238 2,104,469
Income from continuing
operation 1,045,390 1,409,506 1,345,959 1,415,822 1,859,120
Loss from discontinuing
operation - -
Net income (loss) 1,045,390 1,409,506 1,345,959 1,415,822 1,859,120
Other comprehensive
income of the current
year (net amount after-
tax)
(370,874) 30,367 (194,344) (274,267) 374,301
Total comprehensive
income in the current
period 674,516 1,439,873
1,151,615 1,141,555 2,233,421
Net income attributable
to shareholders of the
parent 1,045,390 1,409,506 1,345,959 1,415,822 1,859,120
Net income attributable
to noncontrolling
Interests - -
Total comprehensive
income attributable to
shareholders of the
parent
674,516 1,439,873 1,151,615 1,141,555 2,233,421
Total comprehensive
income attributable to
noncontrolling Interests - -
Earnings per share 4.52 6.09 5.82 6.12 8.03
Note: 2016~2020 Financial Statements were audited and certified by Deloitte & Touche Taiwan

- 108 -
1-2. Consolidated statement, prepared under International Financial Reporting Standards
Unit: NTD thousands
Year
Item
5- Year Financials (Note)
2016 2017 2018 2019 2020
Operating income 39,541,801 42,915,920 52,935,016 54,681,829 59,080,920
Gross profit 3,754,379 3,916,941 4,210,352 4,184,691 4,800,690
Income from operations 1,439,386 1,459,896 1,747,290 1,574,435 2,107,915
Non-operating income and
expense 132,282
510,311 282,848 391,729 527,720
Profit before tax 1,571,668 1,970,207 2,030,138 1,966,164 2,635,635
Income from continuing
operation 1,145,917 1,538,006 1,489,361 1,559,081 2,046,116
Loss from discontinuing
operation - -
Net income (loss) 1,145,917 1,538,006 1,489,361 1,559,081 2,046,116
Other comprehensive
income of the current year
(net amount after-tax) (445,940) 18,840 (219,216) (310,875) 372,397
Total comprehensive
income in the current period 699,977 1,556,846
1,270,145 1,248,206 2,418,513
Net income attributable to
shareholders of the parent 1,045,390 1,409,506 1,345,959 1,415,822 1,859,120
Net income attributable to
noncontrolling Interests 100,527 128,500 143,402 143,259 186,996
Total comprehensive
income attributable to
shareholders of the parent 674,516 1,439,873 1,151,615 1,141,555 2,233,421
Total comprehensive
income attributable to
noncontrolling Interests 25,461 116,973 118,530 106,651 185,092
Earnings per share 4.52 6.09 5.82 6.12 8.03
Note: 2016~2020 Financial Statements were audited and certified by Deloitte & Touche Taiwan
(III) Auditors’ Opinions from 2016 to 2020
Year CPA Firm CPA Audit Opinion
2016 Deloitte & Touche Taiwan Chen, Chen-Li and
Gong, Jun-Ji Unqualified opinion with other
explanatory paragraphs
2017 Deloitte & Touche Taiwan Chen, Chen-Li and
Gong, Jun-Ji Unqualified opinion
2018 Deloitte & Touche Taiwan Chen, Chen-Li and
Gong, Jun-Ji Unqualified opinion with other
explanatory paragraphs
2019 Deloitte & Touche Taiwan Wu, Chiu-Yen and
Chen, Chen-Li Unqualified opinion with other
explanatory paragraphs
2020 Deloitte & Touche Taiwan Wu, Chiu-Yen and
Chen, Chen-Li Unqualified opinion with other
explanatory paragraphs

- 109 -
II. Five-year financial analysis:
1-1. Stand-alone statement, prepared under International Financial Reporting Standards
Year
Item
Five-year financial statements (Note)
2016 2017 2018 2019 2020
Capital
Structure
(%)
Total liabilities to total assets 51.19 50.45 52.91 52.5 52.05
Long-term fund to property, plant
and equipment ratio 1,077.86 1,220.23 1,256.75 1,377.48 1,494.36
Solvency
(%)
Current ratio 116.91 129.02 120.77 130.61 122.77
Quick ratio 96.93 103.07 93.12 99.05 93.51
Times interest earned 24.7 29.99 15.35 13.79 28.18
Operation
Performance
Average collection turnover (times) 3.85 4.23 4.49 4.31 4.68
Average collection days 95 86 81 85 78
Average inventory turnover (times) 13.56 15.73 14.88 13.52 15.97
Average payables turnover (times) 5.25 5.54 6.24 6.91 8.40
Average inventory turnover days 27 23 25 27 23
Property, plant and equipment
turnover (times) 22.64
22.68 25.55 25.01 28.73
Total assets turnover (times) 1.19 1.26 1.32 1.23 1.30
Profitability
Return on total assets (%) 5.23 6.94 6.36 6.41 7.57
Return on equity (%) 10.63 13.64 12.32 12.58 15.29
Pre-tax income to total paid-in
capital (%) (Note) 55.42 71.65 71.84 69.37 90.95
Net income ratio (%) 4.22 5.34 4.51 4.84 5.59
Earnings per Share (NT$) 4.52 6.09 5.82 6.12 8.03
Cash flows
Cash flow ratio (%) 22.01 2.48 (4.36) 0.82 6.86
Cash flow adequacy ratio (%) 67.77 60.79 37.12 39.83 39.02
Cash flow reinvestment ratio (%) 8.28 (2.82) (7.53) (4.06) (0.55)
Leverage Operation leverage 1.48 1.72 1.55 1.69 1.57
Financial leverage 1.11 1.15 1.25 1.35 1.14
Deviation of 2020 vs. 2019 over 20%:
1. A higher profitability in 2020 increased times interest earned, pre-tax income to total paid-in capital and EPS in the stand-alone
statements.
2. To cope with the purchase payment terms, accounts payables were settled within a shorter cycle and increased the average
payables turnover
3. Cash flow and cash flow reinvestment ratios went up due to a higher net inflow from the operating activities, compared with
2019.

- 110 -
1-2. Consolidated statement, prepared under International Financial Reporting Standards
Year
Item
Five-year financial statements (Note)
2016 2017 2018 2019 2020
Capital
Structure
(%)
Total liabilities to total
assets 56.51 56.68 61.02 61.39 61.53
Long-term fund to
property, plant and
equipment ratio 607.28 789.24 821.59 507.75 557.27
Solvency
(%)
Current ratio 161.03 169.89 157.24 161.59 158.23
Quick ratio 127.92 130.81 117.36 126.85 124.85
Times interest earned 18.09 21.13 9.63 8.31 14.37
Operation
Performance
Average collection
turnover (times) 3.56 3.64 3.81 3.54 3.52
Average collection days 103 100 96 103 104
Average inventory
turnover (times) 9.56 10.73 10.64 10.81
12.58
Average payables
turnover (times) 5.66 6.16 7.50 7.83 7.88
Average inventory
turnover days 38 34 34 34 29
Property, plant and
equipment turnover
(times) 16.46 19.94 26.57 18.85 15.58
Total assets turnover
(times) 1.53 1.64 1.79 1.65
1.61
Profitability
Return on total assets (%) 4.70 6.18 5.62 5.35 6.01
Return on equity (%) 10.63 13.56 12.28 12.14 14.52
Pre-tax income to total
paid-in capital (%) (Note) 67.92 85.15 87.74 84.97 113.90
Net income ratio (%) 2.90 3.58 2.81 2.85 3.46
Earnings per Share (NT$) 4.52 6.09 5.82 6.12 8.03
Cash flows
Cash flow ratio (%) 23.76 (7.68) (12.41) 11.90 6.84
Cash flow adequacy ratio
(%) 75.8 41.11 6.85 37.32 38.33
Cash flow reinvestment
ratio (%) 13.15 (9.16) (15.49) 5.21 2
Leverage Operation leverage 1.27 1.29 1.28 1.38 1.30
Financial leverage 1.07 1.07 1.16 1.21 1.10
Deviation of 2020 vs. 2019 over 20%:
1. A higher profitability in 2020 increased times interest earned, pre-tax income to total paid-in capital, net margin and EPS
under the stand-alone statements.
2. Due to working capital required in a growing operation, the consolidated cash inflow from operating activities went down
and the consolidated current liabilities went up, which resulted in a lower consolidated cash flow ratio.
3. A lower consolidated cash inflow from operating activities led to decrease in cash flow reinvestment ratio.

- 111 -
Analysis Formula:
1. Capital Structure
(1) Total liabilities to total assets ratio = Total liabilities / Total assets
(2) Long-term fund to fixed assets ratio = (Shareholders’ equity + Noncurrent liabilities) / Net fixed assets
2. Solvency
(1) Current ratio (Current assets/Current liabilities)
(2) Quick ratio = (Current assets - Inventories - Prepaid expenses) / Current liabilities
(3) Times interest earned = Earnings before interest and taxes / Interest expenses
3. Operation Performance
(1) Average collection turnover = Net Sales / Average receivables (including account receivables and bill
receivables due from trades)
(2) Average collection days = 365 / Average collection turnover
(3) Average inventory turnover = Cost of sales / Average inventory
(4) Account payables turnover = Cost of goods sold /Average account payable (including account payable and
note payable from operation)
(5) Average inventory turnover days =365/ Average inventory turnover
(6) Total fixed assets turnover = Net sales / Fixed assets, net
(7) Total assets turnover = Net sales / Average total assets
4. Profitability
(1) Return on total assets = (Net income + Interest expenses * (1 - Tax Rate)) /Average total assets
(2) Return on equity = Net income / Average shareholders’ equity
(3) Net margin = Net income / Net sales
(4) Earnings Per Share = (Net income - preferred stock dividend) / Weighted average number of shares
outstanding
5. Cash Flows
(1) Cash flow ratio = Net cash flow from operating activities / Current liabilities
(2) Cash flow adequacy ratio = Net cash flow from operating activities for the past five years / (Capital
expenditure+Increases in inventory + Cash dividends) over the past five years
(3) Cash reinvestment ratio = (Net cash flow from operating activities – Cash dividends) / (Gross fixed assets+
Long-term investments + Other assets + Working capital)
6. Leverage:
(1) Operations leverage = (Operating income – Variable cost and expenses from operations) / Income from
operations
(2) Financial leverage = Income from operations / (Income from operations - Interest expenses)

- 112 -
III. 2020 Audit committee's report for financial statements:
Audit Committee’s Review Report
The Board of Directors has prepared the Company’s 2020 Business Report, Financial Statements, and proposal
for allocation of quarterly earnings. The CPA firm of Deloitte & Touche was retained to audit the Company’s
Financial Statements and has issued an audit report relating to the Financial Statements. The Business Report,
Financial Statements, and quarterly earnings allocation proposal have been reviewed and determined to be correct
and accurate by the Audit Committee members of WAH LEE INDUSTRIAL CORP. According to relevant
requirements of the Securities and Exchange Act and the Company Law, we hereby submit this report.
WAH LEE INDUSTRIAL CORP.
Chairman of the Audit Committee: Shyu, So-De

- 113 -
IV. For 2019 Financial Statement: please refer to P.136~223 in this annual report.
V. 2020 certified parent-only Financial Statements: please refer for P.224~314 in this annual report.
VI. Any financial difficulties in the Company and subsidiaries in 2020 and up to the date of publication of this
annual report, and the effects on the Company's financial situation: Nil.
VII. Other material disclosures:
Certifications and training obtained by accounting and auditing personnel
1. Certifications obtained by personnel in charge of financial transparency, required by the authority and regulator
Bookkeeping x 2, Level B technician for accounting x 3, Level C technician for accounting x 13 and Certified
Internal Auditor x 1
2. 2020 Training attended by accounting and auditing personnel
Accounting
Department
Position/Name Training Course Training
Hours Accounting
manager
Li, Kuo-Ping
Continuing education for accounting manager in listed
companies 12 hours
Accounting
personnel Quarterly seminars for law and regulation compliance 12 hours Quarterly seminars held by Taxation Bureau 12 hours
Audit
Office
Position/Name Training Course Training Hours
Senior Audit
Manager
Yang, Yu-Guang
Case studies on anti-money laundering and countering
the financing of terrorism 6 hours
Practical operation and new order letters after the
implementation of Company Act 6 hours
Audit/ personnel
Tsai, Kuen-Chiau
Compliance risks and corresponding practice by audit
personnel 6 hours
Working practices for business contract management and
audit 6 hours
Audit/ personnel
Lin, Yo-Da
Working practices for subsidiary audit 6 hours
Auditing essentials for sales & collection cycle and law
compliance 6 hours
Audit/ personnel
Wei, Li-Chun
How to detect frauds in financial reports by auditing
personnel 6 hours
Preventing financial frauds (embezzlement, insider
trading, tunneling, share price manipulation, abnormal
trading, false financial statements, etc.) 6 hours
Working practices for information audit 6 hours
Working practices for auditing enterprise costs and value
creation 6 hours
Audit/ personnel
Wang, Tzu-Jen
Internal audit essentials for law compliance 6 hours
Orientation for corporate auditing freshmen 18 hours
Audit/ personnel
Wang Yi-Lin
Working practice for self-evaluation 6 hours
Orientation for corporate auditing freshmen 18 hours
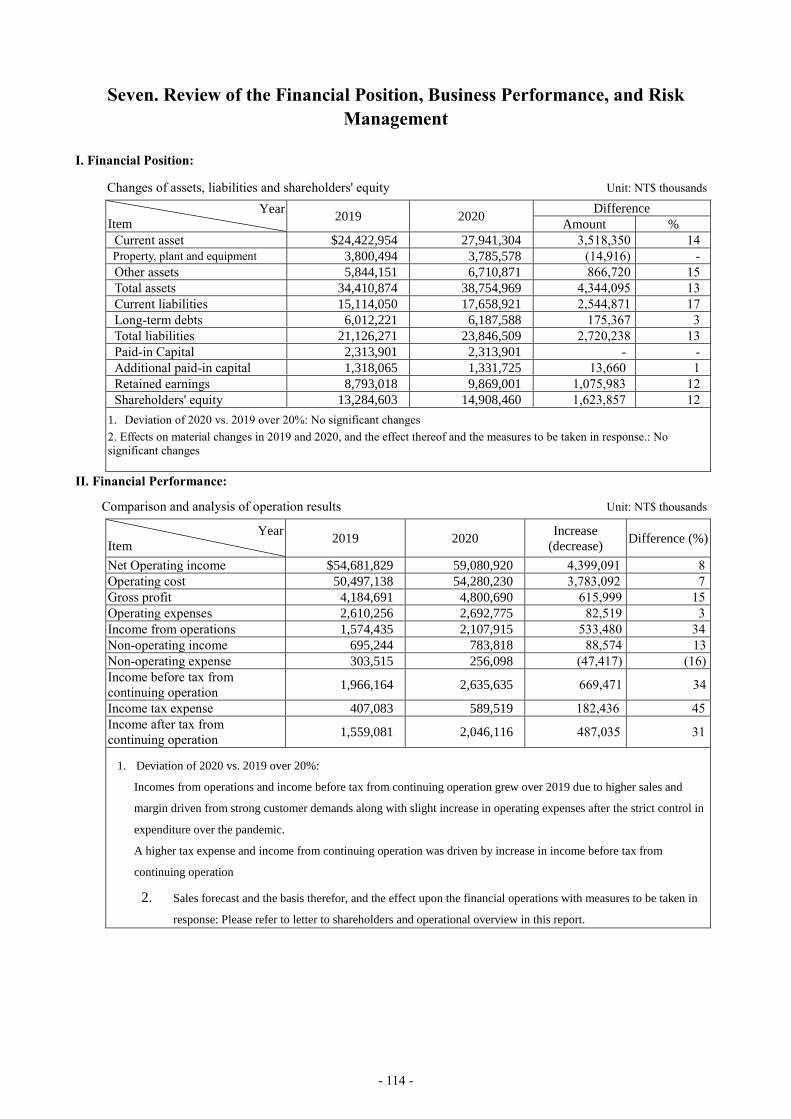
- 114 -
Seven. Review of the Financial Position, Business Performance, and Risk
Management
I. Financial Position:
Changes of assets, liabilities and shareholders' equity Unit: NT$ thousands
Year
Item 2019 2020
Difference Amount %
Current asset $24,422,954 27,941,304 3,518,350 14 Property, plant and equipment 3,800,494 3,785,578 (14,916) - Other assets 5,844,151 6,710,871 866,720 15 Total assets 34,410,874 38,754,969 4,344,095 13 Current liabilities 15,114,050 17,658,921 2,544,871 17 Long-term debts 6,012,221 6,187,588 175,367 3 Total liabilities 21,126,271 23,846,509 2,720,238 13 Paid-in Capital 2,313,901 2,313,901 - - Additional paid-in capital 1,318,065 1,331,725 13,660 1 Retained earnings 8,793,018 9,869,001 1,075,983 12 Shareholders' equity 13,284,603 14,908,460 1,623,857 12
1. Deviation of 2020 vs. 2019 over 20%: No significant changes
2. Effects on material changes in 2019 and 2020, and the effect thereof and the measures to be taken in response.: No
significant changes
II. Financial Performance:
Comparison and analysis of operation results Unit: NT$ thousands
Year
Item 2019 2020
Increase
(decrease) Difference (%)
Net Operating income $54,681,829 59,080,920 4,399,091 8 Operating cost 50,497,138 54,280,230 3,783,092 7 Gross profit 4,184,691 4,800,690 615,999 15 Operating expenses 2,610,256 2,692,775 82,519 3 Income from operations 1,574,435 2,107,915 533,480 34 Non-operating income 695,244 783,818 88,574 13 Non-operating expense 303,515 256,098 (47,417) (16) Income before tax from
continuing operation 1,966,164 2,635,635 669,471 34
Income tax expense 407,083 589,519 182,436 45 Income after tax from
continuing operation 1,559,081 2,046,116 487,035 31
1. Deviation of 2020 vs. 2019 over 20%:
Incomes from operations and income before tax from continuing operation grew over 2019 due to higher sales and
margin driven from strong customer demands along with slight increase in operating expenses after the strict control in
expenditure over the pandemic.
A higher tax expense and income from continuing operation was driven by increase in income before tax from
continuing operation
2. Sales forecast and the basis therefor, and the effect upon the financial operations with measures to be taken in
response: Please refer to letter to shareholders and operational overview in this report.

- 115 -
III. Cash Flow:
(I) Change in cash flow in 2020 and the analysis
Unit: NTD thousands
Beginning cash
balance
Annual net cash
flow from
operating activities
Annual cash
inflow (outflow)
Cash balance
(insufficiency)
Remedy for cash
shortages
Investment
plans
Financial
management
plans
792,785 666,069 (264,150) 1,194,704 - -
1. Analysis of cash flow changes:
2020 operating activities generated a net inflow of cash under stand-alone statement. Cash outflow was
mainly due to cash dividend distribution.
2. Measures to be taken in response to cash shortage: Not applicable.
3. Liquidity analysis for the coming year: Not applicable.
(II) Change in consolidated cash flow in 2020 and the analysis
Unit: NTD thousands
Beginning
consolidated cash
balance
Annual net cash flow
from consolidated
operating activities
Annual
consolidated cash
inflow (outflow)
Consolidated
cash balance
(insufficiency)
Remedy for consolidated
cash shortages
Investment
plans
Financial
management
plans
2,348,526 1,208,075 (503,419) 3,053,182 - -
1. Analysis of cash flow changes:
2020 consolidated operating activities generated a net inflow of cash under consolidated statement. Cash
outflow was mainly for cash distribution and facility acquisition for solar station
2. Measures to be taken in response to consolidated cash shortage: Not applicable.
3. Consolidated liquidity analysis for the coming year: Not applicable.
IV. Effect upon financial operations of any major capital expenditures in the most recent year: No major capital
investments were made during the year.
V. Review of investment policies, performance and improving plans in the coming year:
Explanation
Investment
Policy Reasons for gains or
losses
Improvement plan Investment
plans in the
coming year
Wah Lee Holding
(Including Shanghai
Yikang, Shanghai Wah
Chung, Wah Lee Tech
(Singapore), Raycong
Industrial (including
Dongguan Huagang) and
Regent King
International
Core business
expansion into
Mainland China,
Hong Kong and
Southeast Asia to
meet customers’
demands
Despite impacts from
Covid-19, benefited from
loosening tension
between China and
U.S.A. and properly
adjusted market strategy,
the profitability has
improved mildly
compared with last year.
Focusing on
customer service
and new product
development
Evaluation
pending on
further
market
indication
on overseas
needs.

- 116 -
Explanation
Investment
Policy Reasons for gains or
losses
Improvement plan Investment
plans in the
coming year
Nagase Wahlee Plastics
Corporation
ORC Electrical
Machinery Co., Ltd
Strengthen
collaboration with
suppliers in Japan
and seek for reward
in stock dividends
Earning has improved
gradually compared with
last year as tension
between China and
U.S.A. loosened and
market demand
improved.
Focusing on
customer service
and new product
development
Evaluation
pending on
further
operation
needs
Chang Wah
Electromaterials Inc.
Long-term
investment for
dividend earnings
Earning decreased due to
one-off recognition on
investment earnings
despite strong in the
semiconductor industry.
Pursuing new
product
opportunities and
customers
Evaluation
pending on
further
operation
needs
Wah Hong Industrial
Corporation
Long-term
investment for
dividend earnings
Earning increased due to
new demands brought by
pandemic lockdown and
good market feedback
from the new products
Pursuing new
product
opportunities and
customers
Evaluation
pending on
further
operation
needs
Sakuragawa Solar GK.,
Miyazaki Solar GK.
Investing in power
station to expand
the solar energy
business
Sakuragawa Solar has
started to operate with
steady earnings.
Miyazaki Solar has
combined to the grid in
June 2019 and started to
generate steady profit.
None None
Adi International Trading
(Shanghai) Co., Ltd
developing medical
care industry for
long-term operation
momentum.
Currently at loss due to
fixed expenses while
continuing the business
development
Continuous
business
expansion
Evaluation
pending on
further
operation
needs
Chuan Shun Logistic
Co., Ltd.
Catering customer
needs with shorter
circulation hour and
lower costs for
value-added service
Due to increased
manpower, salary and
administration expenses
went up and the earning
was cu despite steady
operating income growth
Continuous
business
expansion for
bigger market
share
Evaluation
pending on
further
operation
needs
Xiamen Hua Cheng Da
Logistics Co., Ltd., Hua
Ying Supply Chain
Management (Shenzhen)
Co., Ltd.
Expanding the
logistic business in
Mainland China
based on the
Company’s strategy
Affected by Covid-19,
logistic sector in China
declined in the first half
of 2020. The trend
reversed in the second
half but the business was
disbursed by cargo
shortage; therefore the
operation resulted in a
loss.
Earnings is
expected as the
revenue shall pick
up for better
control of the
pandemic
None

- 117 -
Explanation
Investment
Policy Reasons for gains or
losses
Improvement plan Investment
plans in the
coming year
Wah Tech Industrial Co.,
Ltd. (Thailand)
Expansion in
Southeast Asia
through
cooperation with
the local operator,
Wah Tech
Earnings increased over
the year, due to proper
expense control by
management during the
pandemic.
Focusing on
customer service
and new product
development
Evaluation
pending on
further
market
indication on
overseas
needs.
Kingstone Energy
Technology Corporation
Solar power station
investment for
making stable
income from power
generation, as well
as for associated
business
developments in the
field.
Steady income stream
shall kick off following
the completion of the
stations in construction.
Develop new
projects which
continuing
finishing the
station in
construction
Making
associated
investment in
the field
while
developing
new projects.
Eco Energy Corporation Energy
conservation and
related field
development and
expansion.
Earning improved as we
dedicated in core
business along with
associated businesses
(such as solar power and
other projects)
Continue the
expansion in core
business and solar
power field.
Making
associated
investment in
the field
while
developing
new projects.
VI. Risk management analysis and assessment:
(I) Risk management policy
1. Continue reinforcing a risk-driven operation model.
2. Create a risk management mechanism which enables early recognition, accurate assessment, effective and
strict monitoring and control.
3. Structure an integrated risk management system which limits the risk exposure within a manageable range.
(II) Risk management framework:
The Board recognizes and manages the economic risks of the Company along with a risk management
framework which, based on the business nature, is divided into the following working units:
1. Strategic materials committee: Inspecting the controlling operation of the strategic goods and continuing
improving the controlling procedures in order to lower operation risks.
2. Information security committee: In charge of the stipulation and promotion of the information security
policy to safeguard all data and systems in order to lower information security risks.
3. Crisis management team: Handling any incidents that require immediate attention and threaten the business
fundamentals and survivals according to the type of the incident and necessary actions taken in order to
lower the damages.
4. Chairman office: In charge of developing, planning and implementing mid to long terms operation strategies
for the Company, including ensuring the delivery of annual operation targets, making major investment
decisions for business expansion and managing the corporate image and enterprise relationships in order to
lower operation risks.

- 118 -
5. CEO office: In charge of regularly reviewing potential risks associating with operation and funding and
ensuring the alignment of business strategies and operation direction in order to lower operation risks.
6. General manager office: In charge of planning and implementing short to mid term operation plans, covering
managing and supervising cooperation among operating units and logistic efficiency. In addition, the office
shall strategize corresponding measures upon changes of laws, strategies and market in order to lower
operation risks relating to business accounts.
7.Strategy making division: In charge of devising the operating and human resources strategies of the
Company along the overall information technology framework in order to lower strategic risks.
8. Finance division: Establishing financial strategies for short, mid and long terms to assist top executive in
financial assessment when making major decisions.
9. Audit office: Reviewing risk impacts on operation goals. Examining efficiencies of the internal control
system for high-risk projects and following up the correction results to enhance organization value and
improve operation and management risks.
VII. Risk matters analysis and assessment:
1. The effect upon profits (losses) of interest and exchange rate fluctuations and changes in the inflation rate, and
responding measures to be taken:
(1) Interest rate fluctuation:
Interest rate risk exposure incurred by the group from fixed or floating rates of loans taken by each individual
entity. A properly-managed portfolio mixed with fixed and floating rates will be maintained by the group to
control interest rate risk.
All factor unchanged, when the interest rate increased/decreased by 1%, the combined profit before tax
would decrease/increase by NT$ 37,118 thousand and NT$ 50,495 thousand, respectively in 2010 and 2019
as of the result of the consolidated entity’s deposits and borrowings.
The Company will assess the interest rate trend from time to time and work closely with financial institutions
to obtain favorable interest rates.
(2) The effect upon profits (losses) of exchange rate fluctuations and responding measures in the future:
Exchange losses in 2020 was NT$ 31,107 thousand, or 1.18% of profit before tax. With more than 50%
goods are imported from overseas dominated mainly in USD and JPY and export sales are quoted in foreign
currencies (mostly USD, JPY and CNY), the consolidated statements are susceptible to currency fluctuation
and related risks. Sensitivity ratio applied by for internal reporting to the top management, on currency risk
assessment was 1%. The sensitivity analysis was limited to foreign currency outstanding as of the balance
sheet date. The consolidated profit before tax would increase (or decrease) by NT$ 3,837 thousand and NT$
6,252 thousand, respectively in 2010 and 2019 if the functional currency as of the currency date depreciated
(appreciate) by 1% against USD. Overall, the Company adopts a natural hedging strategy as it maintains a
relatively low levels of exposure or sensitivity gap. When necessary, derivative tools or changes of quoting
currency will be used to avoid the currency risk.
(3) The effect upon profits (losses) of inflation rate and responding measures in the future:
Due to a short trading cycle of materials and equipment in high-tech industries, inflation rates have minor
impacts to the Company.
2. The effect upon profits (losses) of undertaking high-risk investments, highly leveraged investments, loans to
other parties, endorsements, guarantees, and derivatives transactions and responding measures in the future:
- 119 -
(1) The Company focus has been devoted to core businesses and upheld practical operation. It undertakes no
high-risk or highly leveraged investments. All investments are made after prudent assessment.
(2) All loans made, guarantees endorsed and derivatives dealt were conducted according the pertaining
procedures and guidance. No losses were incurred from the transaction mentioned above.
3. Future research and development work and the related expenditures:
The Company plays the role of distributor in the industry chain, and does not have a separate R&D
department like manufacturing industry. However, the Company pays close attention to industry and market
trends (through enrolling membership with industry think tanks and NCKU Innovation Headquarters, and
close interaction with industry participants/government agencies/academic institutions such) and positions
itself at the frontline to gather information on customers' needs and suppliers' R&D roadmaps through
cooperation with customers, so that new products and business models can be developed in time to support
industry innovations. Not only do all employees perceive new product and new technology introduction a
critical part of their responsibilities, the Company also established a New Businesses Department and a
Marketing Planning Team and at the group level to support and speed up developments of new industries and
products and to expand alliance with viable business partners. Furthermore, the Company adopts project
management concepts and practices advocated by Project Management Institute (PMI), and introduces
business development rewards and funding to stimulate and support business development activities with
better effects throughout the Company. As of 2020, the Company generated more than NT$4 billion in
revenues from new products introduced in the past 3 years.
To sum up, the research & development budget has been deployed in promoting current businesses for
greater synergy. The Company did not allocate stand-alone R&D budget, as it is in a distributing business, not
manufacturing. Actual R&D expenses in 2020 amounted to NT$38 million, which covered employee training,
building the industry think tank, membership fee for NCKU Innovation Headquarters, expenditures and
developing rewards paid for new business lines and market research. However, actual amounts incurred on the
development of new businesses and products far exceeded this sum.
For 2021, we have made a R&D budget covering the expenses items above plus a higher funding for new
business development. The budget is adjustable when necessary. Development achievement in 2020 are as
follows:

- 120 -
Industry Agency or distribution of new products
IT/communication
(engineering plastics)
and electronics
assembly
LDS materials, 5G-related plastic materials, PVC, XLPE, rare earth
oxides/metals/neodymium magnet, SiC semiconductors, Ultra Low Dk & Df
organic resins for 5G high-frequency and low wear applications, non-organic
fillers, electrical property-enhancing chemicals, LCP FCCL (liquid crystal polymer
flexible copper clad laminate substrates), next generation ultra-high resolution
direct imaging dry film photoresist, rolling LDI equipment, contactless tester, LCP
high-speed laminating press, IC substrate solder mask UV protection film.
Semiconductors Advanced production materials (including PR and Slurry), IC Bumping Chemical,
electroformed stencil, electronic-grade gas (NF3, WF6, TCS, DCS, CO, HCL, CO2,
SO2, C3H6, Si2H6, CF4…), laser gas mixture, coolant, reclaimed wafers, CVD SiC
consumables.
Opto-electronics,
optical communication,
and FPD applications
OLED panel-related equipment, process chemicals and consumables, Power
Management Unit, mobile and wearable devices and Internet solutions, GPS
Module, optical communication transmitter/receiver IC and modules, OLED
materials (e.g. Driver IC, quartz crystal, light-emitting materials, NOR Flash),
Black Column Spacer for FPD, e-ink display.
Green energy, energy
conservation, and
energy storage
Assessment, design, installation, and maintenance of solar power plant, high
efficiency solar wafer/cell/module, roof/ground-mounted solar power station,
lithium battery materials, hard carbon negative electrode materials, fast charging
negative electrodes, separator films, energy storage systems, beamformers, relays.
Environmental
protection and others
Environment purification materials and equipment, antibody development, water
treatment materials, 100% bio-degradable packaging materials for medical supply
and food, environment-friendly coolant, hemodialysis equipment and consumables.
4. Effect on the financial operations of important policies adopted and changes in the legal environment at
domestic and abroad, and measures to be taken in response
(1) Labor and health insurance premium:
Labor insurance premium adopted by the Company stayed intact for the current year. The average family
member covered under the health insurance went down to 1.58% from 1.61%, which accounted for 0.05%
salary expenses in the current year.
(2) Amendments to Labor Standard Act:
According to the amendments, in recent years, to articles regarding annual paid leave to employees, unused
vacation leaves shall be, after the negotiation between the employer and employee, carried forward to the
next year or reimbursed in cash based on overtime ratio. Reimbursements for unused vacation leaves and
overtime payment rose in 2020 and accounted for 0.81% salary expenses in the year due to put-off vacation
in 2019 and less vacation taken during Covid-19 in 2020.
5. Effect on the financial operations of developments in science and technology as well as industrial change, and
measures to be taken in response.
Changes of un-written off consolidated revenue by sectors in 2020, compared with 2019, are as follows:

- 121 -
IT/communication engineering plastics, +8%; electronics assembly, +19%; semiconductors, +13%; opto-
electronics, optical communication, and flat-panel display, +4.6%; green energy, energy conservation, and
energy storage, -21%; others, -6.7%. Effect upon changes of important technology and industry trend to the
Company and measures to be taken are as follows:
World attention to energy-saving, new energy, renewable energy and other green energy industries has
come back to the center stage since the nuclear disaster happened in Japan caused by an earthquake few years
back. The Company has been making solid progresses with substantial sales revenue in the sector from
product lines covering silicon and wafers, solar battery/module solar power plant, LED materials, lithium
battery materials, wind power materials, etc. Solar industry is currently experiencing a temporary setback
due to contracting government grant worldwide, rising manufacturers in local markets, our suppliers’ lagging
competitiveness and the delay of the construction of power stations and the government's green energy policy.
It’s certain that pushes of green energy, energy conservation and energy storage has become important and
non-stoppable priorities for governments around the world. Therefore, the Company will continue to grow in
related sectors, especially when we have made solid progress in in the energy storage system and wind power.
We are expecting to rake up rewarding revenue when related government policies start to deploy. In addition,
we are making efforts to the new clean energy sectors, such as wind power, energy conserving system, biogas
power generation while involving in power station building sector.
Declining business lines (such as resin, glass fiber, refrigerant) are mainly due to product adjustment and
elimination on laggard and low-margin product lines. In the future, the Company will cooperate with existing
and new suppliers to develop products of competitive pricing and larger markets.
We are currently engaged in bio-medicine, long-term care and environment protection, water resources,
air pollution control, hazardous waste treatment and recycling economy industries, as well as sectors
contributing to carbon reduction, intelligent packaging under the rising awareness of civic rights, environment
friendly and aging society. We are expecting revenues and profits generated from these sectors will account
for a significant percentage.
Following the technology advancements, the company is phasing in corresponding new materials,
covering OLED, new semiconductor and IC packaging developments, thinning 3C products, the new
structure of touch panels, electric vehicle, 5G communication, as well as graphene and nano materials, AIOT,
bio medical, etc. We are capable of grasping the technology road maps through co-working with existing
suppliers and investments and mergers for new product development and distribution to ensure timely product
and technology availability. By becoming a best partner to our customers, we are forming strengthening
relationship with them.
To cut down impacts brought by Covid-19 starting from early 2020, apart from operating under a
diversified business lines, we have also adjusted management and marketing costs to maximize the marginal
benefits from overhead expenses and manpower, with new business initiations to minimize the adversities.
We, therefore, were able to push further growth in both revenue and profitability.
We continued to stay ahead of the emerging sectors and demands to introduce, timely or in advance, the
right materials, components, modules, systems and equipment to underpin our robust growth in the revenue.
Under our long-term strategy of diversified business, we were able to reduce the impact from the macro
economy and industry cycles and continue the growing trend.
6. Effect on crisis management of changes in corporate image, and measures to be taken in response: None
7. Expected benefits and possible risks associated with any merger and acquisitions, and measures to be taken in

- 122 -
response: None
8. Expected benefits and possible risks associated with any plant expansion, and measures to be taken in response:
None
9. Risks associated with any consolidation of sales or purchasing operations, and measures to be taken in response:
(1) The Company’s sales and purchase activities have been evenly distributed in five industries. No single
customer or supplier has taken up 10% or more of sales or purchases, respectively.
(2) We are less vulnerable to industry cycles, as we operate on a multiple-industry combination. In addition, no
sales or purchase is concentrated on a single particular customer or supplier that can affect our overall
operation or profitability significantly.
10. Effect upon and risk in the event a huge quantity of shares belonging to a director, supervisor, or shareholder
holding more than 10% stake has been transferred or has otherwise changed hands, and measures to be taken in
response: None
11. Effect upon and risk associated with any change in top management, and measures to be taken in response:
None
12. Major litigious, non-litigious or administrative disputes that: (1) involve the Company, any director, supervisor,
general manager, any person with actual responsibility for the Company, any major shareholder with
shareholding greater than 10%, and any associated entities controlled by the Company; and (2) have been
concluded by means of a final and unappealable judgment, or are still under litigation. Where such a dispute
could materially affect shareholders' equity or the prices of the Company's securities:
(1) Company A filed a law suit to Taipei District Court against Kingstone Energy Technology Co., Ltd. for not
making orders based on the purchase agreement, and asked for a damage of NT$ 50,363 thousand. A verdict
was made in favor of Company A in October, 2020. Kingstone Energy Technology has appealed. The Company
believes that the plaintiff's claims are without merit; still, the outcome of the litigation is subject to material
uncertainty. The related losses were not recognized in the financial statements.
(2) In November 2020, Company B sent a letter to Kingstone Energy Technology Co., Ltd. to terminate a lease
contract of a solar power station and asked the subsidiary to pay a penalty of NT$41,704,000 with the
performance bond confiscated According to the opinions of lawyers hired by Kingstone Energy, it could be
exempted from the penalty, as there were relevant non-culpable reasons. The losses from performance bond and
unfinished construction were recognized but the penalty was not recognized in the financial statements.
13. Other important risks, and measures to be taken in response: None
Information security risk and policy
>Framework for information security management:
The Company, in accordance with the laws, has established a cross-department Information Security
Committee, in charge of policy formation, promotion, execution, and audit. The committee holds a discussion
covering the latest policy developments and risk matters with responding measures. All working progress
shall be reported to the top executive from the strategic planning division and the Chairman.
>Information security policy
Apart from regular risk assessment by the audit unit, employee training, email reminder to lower down
information risks, suggested under Cyber Security Management Act, the Company continues to improve its
authorization and online control systems. In addition, computer room control and monitoring measures are on
the work priority list to ensure a stable and certain system and sound operation environment.
>Internet safety risk management
Despite impacts brought by Covid-19 in 2020, the cyber attacks have not slowed down; international
enterprises continue to suffer from the incidents. The Company has been paying increased attention to the
network security after some minor damages caused by attacks to a few working computers in 2019. We are
completing the vulnerability upgrades to achieve a planned and layered protection framework. We have

- 123 -
installed advanced firewall in our branches in Taiwan, China and Southeast Asia, inspection system for
weakness points and attacks, mechanism of multi-factor authentication and personal device protection. We are
now able to protect ourselves from malwares, including but not limited to Trojan, and phishing, etc.
Conquering challenges from external information is a continuous and non-stopping process, the
Company will invest in related manpower in all group locations to build up a group safety net. However, with
the continuous attacks and threats, the Company is unable to guarantee a perfect and flawless protection. Still,
the Company will exercise all its power to mitigate operation risks incurred by information security incidents
to strengthen its position as the key equipment, materials and parts in the greater China market and to
maximum the profit of our partners and stakeholders as our goal.
VIII. Other important matters: None

- 124 -
Eight: Special Notes
I. Subsidiary Information:
(I) Consolidated business report
1. Overview
(1) Subsidiaries chart
Wahlee Green Energy
Corporation
51%
Dongguan Huagang
International Trading Co.,
Ltd. 100%
Shanghai Yi Kang Chemicals &
Industries Co., Ltd.
70%
Hua Ying Supply Chain
Management (Shenzhen) Co.,
Ltd. 100%
Adi International
Trading (Shanghai) Co.,
Ltd 70%
Xiamen Hua Cheng Da
Logistics Co., Ltd.
70%
Lee Huang Medical
Equipment (Shanghai)
Co., Ltd 69.97 %
Guangzhou Xing Xian
Medical Management
Consultation Co., Ltd.
100%
KSD Energy Corporation
100%
KSA Energy Corporation
100%
KSB Energy Corporation
100%
KSC Energy Corporation
100%
SHC Holding Ltd
100%
Regent King International
Ltd. 100%
Wah Lee Tech (Singapore)
Pte.,Ltd. 100%
PT. Wah Tech Indonesia
66%
Wah Heng Energy Co.,
Ltd. 100% 25%
46.31%
53.69%
Chuan Shun Logistic Co., Ltd.
63.33%
Wah Lee Philippines Inc.
99.99%
Wah Lee Korea Ltd
100%
Wah Lee Holding Ltd 100% Raycong Industrial (Hong Kong)
Limited
Wah Lee Japan Corp.
83.33%
Wah Lee Philippines International
Corp 99.99%
Sakuragawa Solar GK.
99.99%
Miyazaki Solar GK.
99.99%
PT. Wah Lee Indonesia
60%
Wah Lee Vietnam
Co., Ltd 100%
Wah Tech Industrial Co.,
Ltd 51% Kingstone Energy Technology
Co., Ltd. 51%
Chuan Cheng Logistics Co.,
Ltd. 100%
WAH LEE INDUSTRIAL CORP.

- 125 -
(2) Subsidiary information Unit: NT$
Company Date of
incorporation Address Currency Paid-in Capital Core business or product
Wah Lee Holding Limited 2003.12.05 Jipfa Building, 3rd Floor, Main Street, Road Town, Tortola, British
Virgin Islands. USD
13,070,000 International investment
Raycong Industrial (Hong Kong) Limited 1990.06.08 Units 1008~1011, 10th floor, Tower II, Metroplaza, Hing Fong
Road, Kwai Chung, N.T. Hong Kong HKD
104,296,655 Selling and distributing engineering plastics, high-performance composite
materials, industrial materials and equipment
Wah Lee Korea Ltd. 2010.08.26 #208, Hyoseong Intellian, 1594-1, Gwanyang-dong, Dongan-gu,
Anyang-si, Gyeonggi-do, 431-060, Kroea. KRW
735,000,000 Selling and distributing engineering plastics, high-performance composite
materials, industrial materials and equipment
Sakuragawa Solar GK. 2014.11.7 Yodoyabashisogo Kaikei, 4-3-7 Kita Bld., Koraibashi, Chuo-ku,
Osaka-shi, Osaka, 541-0043, Japan JPY
10,000 Solar power station operation
Miyazaki Solar GK. 2014.11.7 Yodoyabashisogo Kaikei, 4-3-7 Kita Bld., Koraibashi, Chuo-ku,
Osaka-shi, Osaka, 541-0043, Japan JPY
10,000 Solar power station operation
PT. Wah Lee Indonesia 2015.6.11 Jl. Cakung Industri I No. 12 Kawasan Industri Cakung, Jakarta Utara, 14140
USD
2,300,000 International trade
Wah Lee Vietnam Co., Ltd. 2015.6.24 5th Floor,Petroland Tower, 12 Tan Trao, Tan Phu Ward, District 7,
Ho Chi Minh City,Vietnam USD
500,000 International trade
Wah Tech Industrial Co., Ltd. 1989.8.21 141/21-22 Skulthai Surawongse Tower, 18F,Surawongse Rd.,
Bangrak, Bangkok 10500 THB
15,000,000 Trading industrial materials
Chuan Shun Logistic Co., Ltd. 2012.2.22 F11-2, No. 235, Chung Cheng 4th Rd., Kaohsiung City NTD
150,000,000 Automobile Cargo Transportation Business, Container Truck Transportation
Enterprise, international trade, warehousing
Kingstone Energy Technology
Corporation 2010.11.8 F8-2., No. 55, Dongguang Rd., East Dist., Hsinchu City NTD
352,188,000 Manufacture of Batteries and Accumulators, self-usage power generation
equipment utilizing renewable energy industry
Hua Heng Energy Co., Ltd. 2020.7.13 F8-2., No. 55, Dongguang Rd., East Dist., Hsinchu City NTD
90,000,000 Manufacture of Batteries and Accumulators, self-usage power generation
equipment utilizing renewable energy industry
Wah Lee Philippines International Corp. 2019.9.28 122 East Science Drive, Laguna Technopark - SEZ, Binan(Poblacion), CITY OF BlnAN, REGION IV-A, LAGUNA,
Philippines PHP
12,750,000 Trading industrial materials

- 126 -
Company Date of
incorporation Address Currency Paid-in Capital Core business or product
Wah Lee Philippines Inc. 2019.11.8 123 East Science Drive, Laguna Technopark - SEZ, Binan(Poblacion), CITY OF BlnAN, REGION IV-A, LAGUNA,
Philippines PHP
12,700,000 Trading industrial materials
Wah Lee Japan Corporation 2001.05.01 4F Kyobashi 3 Chome Bldg.,3-1-3 Kyobashi, Chuo-ku,Tokyo 104-
0031,JAPAN JPY
90,000,000 Selling and distributing engineering plastics, high-performance composite
materials, industrial materials and equipment
Chuan Cheng Logistic Co., Ltd. 2017.08.31 F11-2, No. 235, Chung Cheng 4th Rd., Qianjin Dist., Kaohsiung
City NTD
25,000,000 Automobile Cargo Transportation Business, Container Truck Transportation
Enterprise, international trade, warehousing
KSA Energy Corporation 2016.12.26 F8-2., No. 55, Dongguang Rd., East Dist., Hsinchu City NTD
61,300,000 Manufacture of Batteries and Accumulators, self-usage power generation
equipment utilizing renewable energy industry
KSB Energy Corporation 2015.11.17 F8-2., No. 55, Dongguang Rd., East Dist., Hsinchu City NTD
11,130,000 Manufacture of Batteries and Accumulators, self-usage power generation
equipment utilizing renewable energy industry
Wahlee Green Energy Corporation
(under dissolution and liquidation) 2018.3.16 # 23, Ln. 69, Anxiang Rd., Xindian Dist., New Taipei City NTD
20,000,000 Manufacture of Batteries and Accumulators, self-usage power generation
equipment utilizing renewable energy industry
KSC Energy Corporation 2020.06.30 F8-2., No. 55, Dongguang Rd., Hsinchu City NTD
1,000,000 Manufacture of Batteries and Accumulators, self-usage power generation
equipment utilizing renewable energy industry
KSD Energy Corporation 2020.11.03 #11, Ln. 666, Sec. 2, Zhongshan Rd., Changhua City, Changhua
County NTD
67,000,000 Manufacture of Batteries and Accumulators, self-usage power generation
equipment utilizing renewable energy industry
Wah Lee Tech (Singapore) Pte., Ltd 2003.10.04 20 Science Park Road,Teletech Park,#01-03A,Singapore 117674
#208, Hyoseong Intellian, 1594-1, Gwanyang-dong, SGD
1,600,000 Selling and distributing semiconductor materials and equipment
SHC Holding Limited 2003.12.17 Suite 802,St James Court, St Denis Street, Port Louis, Mauritius USD
1,290,000 International investment
Regent King International Ltd. 2013.5.10 Room 803, Tung Hip Commercial Building, 248 Des Voeux Road
Central, Hong Kong HKD
10,000 Selling and distributing engineering plastics, high-performance composite
materials, industrial materials and equipment
PT. Wah Tech Indonesia 2015.11.6 Jl. Cakung Industri I No. 12 Kawasan Industri Cakung, Jakarta Utara, 14140
RP
2,750,000,000 Trading industrial materials
Shanghai Yi Kang Chemicals & Industries Co., Ltd.
1993.10.09 Rm 204C, F2, 4 Department, Bld. 1, No. 2001, Yanggao N. Rd, Ziyoumaoyi Testing District, Shanghai, China
USD
30,200,000 International trading and trade brokerage
Dongguan Huagang International Trading
Co., Ltd. 2007.01.31
F23, Di-WangGuangChang, , Changqing Road, Changan Town,
Dongguan City HKD
300,000,000 Selling and distributing engineering plastics, high-performance composite
materials, industrial materials and equipment

- 127 -
Company Date of
incorporation Address Currency Paid-in Capital Core business or product
Hua Ying Supply Chain Management
(Shenzhen) Co., Ltd. 2015.2.9
Rm 201, Bld. A, No. 1, Qianwanyi Road, Qianhai Shengang
Cooperative District, Shenzhen City HKD
7,000,000 Supply chain management, selling&distributing engineering plastics, high-
performance composite materials, industrial materials and equipment
Adi International Trading (Shanghai) Co.,
Ltd 2013.8.1
Rm 203, F2, Bld. 5, No. 350, Yuanqu Road, Anting Town, Jiading
District, Shanghai City CNY
3,000,000 Good and technology trading and medical and biotech equipment service
Lee Huang Medical Equipment (Shanghai) 2014.1.22 Rm 205, F2, Bld. 5, No. 350, Yuanqu Road, Anting Town, Jiading District, Shanghai City
CNY
3,330,000 Selling medical equipment
Xiamen Hua Cheng Da Logistics Co., Ltd. 2018.3.2 Unit 21-2, F3, Baoshui Market Building, No. 88, Xiangyu Rd, Baoshui District, Xiamenpian District, Free Trade Testing District,
Fujian CNY
3,000,000 Warehousing and logistics
Guangzhou Xing Xian Medical
Management Consultation Co., Ltd. 2019.8.1
Rm 1808, No. 180, Jiangnan Blvd, Haizhu District, Guangzhou
City CNY
1,000,000 Hospital management, medical equipment service and supplies selling and
distribution.
(3) Affiliated deemed as a controlled or subordinate entities under Company Act #369-3 and their shareholder information: None
(4) Business sectors covered by subsidiaries
A. Business sectors covered by subsidiaries
High-tech material and equipment sales distribution, including semiconductor, IC packaging, TFT-LCD, OLED, PCB, fiber-optic communication, solar power, etc.
B. Business engagement among subsidiaries.
(A) Wah Lee Japan and Wah Lee Korea were set up to enhance the relationship with local customers and suppliers, as well as to collect the latest product information to
maintain industry competitiveness. Japan is the number-one market for solar power station in the world, many international institutions have made presence in the local
market. We have set up Sakuragawa Solar GK. and Miyazaki Solar GK. to take the advantage of the trend.
(B) To cope with our customers’ migration to Southeast Asia and China, we have also extended our selling and production network to overseas and, via a third country to
enter China market. We have set up Raycong Industrial (Hong Kong) Limited, Shanghai Yi Kang Chemicals & Industries, Wah Lee Holding, SHC Holding, Dongguan
Huagang International Trading, Hong Kong Meidi Investment, Adi International Trading (Shanghai) Co., Regent King International, Hua Ying Supply Chain
Management (Shenzhen) and Xiamen Hua Cheng Da Logistics. Following the government’s New Southbound Initiative, we’ve also established several footholds in the
region, including Wah Lee Tech (Singapore), Wah Tech Industrial in Thailand, Wah Tech Indonesia, Wah Lee (Vietnam) and WL Philippines. Wah Tech Indonesia、

- 128 -
Wah Lee (Vietnam) Co., Ltd、WL Philippines and etc.
(C) Under government’s “Non-nuclear home in 2025” target, solar power has become a highlighted industry. We, thus, invested in Kingstone Energy Technology
Corporation to devote into solar energy sector and strengthen operation advantage.
(5) Directors, Supervisors, and Presidents of Subsidiaries
Company Title Name Shareholding
Shares Shares Ratio
Wah Lee Holding Limited (BVI) Chairman Chang, Ray-Ching Wah Lee: 13,070,000 shares 100%
Raycong Industrial (Hong Kong)
Limited
Chairman Chang, Tsuen-Hsien Wah Lee: 56,000,000 shares
100% Directors Lu, Jui-Ming Wah Lee Holding: 48,296,655 shares
Directors Li, Kuo-Ping
Wah Lee Korea Ltd. Chairman Wang, Yi-Wen Wah Lee: 147,000 shares 100%
Sakuragawa Solar GK. Directors Yuichiro Yasuda - 99.99% owned by Wah Lee
Miyazaki Solar GK. Directors Yuichiro Yasuda - 99.99% owned by Wah Lee
PT. Wah Lee Indonesia Directors You, Kai-Yuan Wah Lee: 1,610,000 shares 70%
Wah Lee Vietnam Co., Ltd. Directors Yeh, Ching-Wen
- 100% owned by Wah Lee Supervisor Chang, Yu-Dian
Wah Tech Industrial Co., Ltd. Directors Chang, Tsuen-Hsien
Wah Lee: 7,650 shares 51% Directors Yeh, Ching-Wen
Chuan Shun Logistic Co., Ltd.
Chairman Shih, Chia-Sheng (representing Wah
Lee)
Wah Lee: 9,500,000 shares 63.33% Directors
Zhao, Kuang-Chi (representing Wah
Lee)
Directors Kao, Hsu-Ke (representing Wah Lee)
Supervisor Tsai, Chung-Min
Chuan Cheng Logistic Co., Ltd.
Chairman Shih, Chia-Sheng (representing Chuan
Shun Logistic) Chuan Shun: 2,500,000 shares 100%
Supervisor Tsai, Chung-Min (representing Chuan
Shun Logistic)

- 129 -
Company Title Name Shareholding
Shares Shares Ratio
Kingstone Energy Technology
Corporation
Chairman Tsai, Yun-Ray (representing Wah Lee)
Wah Lee: 17,962,577 shares 51% Directors
Shao, Kuang-Wei (representing Wah
Lee)
Directors Shih, Tung-Yi (representing Open Sky
Technology Corp) Open Sky: 7,562,276 shares 21.47%
Supervisor Hsiao, Han-Yueh
KSD Energy Corporation
Chairman Tsai, Yun-Ray (representing Kingstone
Energy Technology) Kingstone Energy Technology:
6,700,000 shares 100%
Supervisor Hsiao, Han-Yueh (representing
Kingstone Energy Technology)
Wah Lee Philippines International
Corp.
Chairman Yeh, Ching-Wen
Wah Lee: 127,495 shares 99.99%
Directors Wang, Yi-Wen
Directors Lin, Chen-Chuan
Directors Tsai, Yun-Ray
Directors Darren Lim Jee Heng
Wah Lee Philippines Inc.
Chairman Yeh, Ching-Wen
Wah Lee: 126,997 shares 99.99% Directors Wang, Yi-Wen
Directors Lin, Chen-Chuan
Wah Lee Japan Corp.
Chairman Yeh, Yi-Lin
Wah Lee: 1,500 shares 83.33% Directors Lin, Chen-Chuan
Directors Kao, Hsu-Ke
Supervisor Wang, Yi-Wen
Hua Heng Energy Co., Ltd.
Chairman Tsai, Yun-Ray (representing Wah Lee)
Wah Lee: 9,000,000 shares 100% Supervisor
Hsiao, Han-Yueh (representing Wah
Lee)
Wahlee Green Energy Corporation
(under dissolution and liquidation) Supervisor Chen,Yu-Cheng
Wah Lee: 500,000 shares 25%
Kingstone Energy Technology:
1,020,000 shares 51%

- 130 -
Company Title Name Shareholding
Shares Shares Ratio
KSA Energy Corporation
Chairman Tsai, Yun-Ray (representing Kingstone
Energy Technology) Kingstone Energy Technology:
6,130,000 shares 100%
Supervisor Hsiao, Han-Yueh (representing
Kingstone Energy Technology)
KSB Energy Corporation
Chairman Tsai, Yun-Ray (representing Kingstone
Energy Technology) Kingstone Energy Technology:
1,113,000 shares 100%
Supervisor Hsiao, Han-Yueh (representing
Kingstone Energy Technology)
KSC Energy Corporation
Chairman Tsai, Yun-Ray (representing Kingstone
Energy Technology) Kingstone Energy Technology: 100,000
shares 100%
Supervisor Hsiao, Han-Yueh (representing
Kingstone Energy Technology)
Wah Lee Tech (Singapore) Pte., Ltd Chairman Chang, Tsuen-Hsien
Wah Lee Holding: 1,600,000 shares 100% Directors Chang, Chi-An
SHC Holding Limited (Mauritius) Chairman Chang, Ray-Ching Wah Lee Holding: 1,290,000 shares 100%
Regent King International Ltd. Directors Chang, Ray-Ching Wah Lee Holding: 10,000 shares 100%
PT. Wah Tech Indonesia Directors You, Kai-Yuan Wah Tech: 18,150 shares 66%
Shanghai Yi Kang Chemicals &
Industries Co., Ltd.
Chairman Chang, Tsuen-Hsien
- 70% owned by Raycong (Hong Kong)
Directors and
general manager Yu, Ching-Tien
Directors Chen, Chi-Hsing
Supervisor Lulu Huang
Dongguan Huagang International
Trading Co., Ltd.
Chairman Chang, Tsuen-Hsien
- 100% owned by Raycong (Hong Kong) Directors Lu, Jui-Ming
Directors Li, Kuo-Ping
Supervisor Tsai, Yun-Ray
Hua Ying Supply Chain Management
(Shenzhen) Co., Ltd.
Chairman Lu, Jui-Ming
- 100% owned by Raycong (Hong Kong) Directors Chang, Tsuen-Hsien
Directors Shih, Chia-Sheng

- 131 -
Company Title Name Shareholding
Shares Shares Ratio
Supervisor Tsai, Yun-Ray
Adi International Trading (Shanghai)
Co., Ltd
Chairman Ren, You-Ming
-
70% owned by Shanghai Yikang
Directors and
general manager Zhao, Guo-Bin 30% owned by Zhao, Guo-Bin
Directors Wu, Zhi-Long
Supervisor Huang, Liang-Rao
Lee Huang Medical Equipment
(Shanghai)
Chairman Ren, You-Ming
-
69.97% owned by Shanghai Yikang
Directors Zhao, Guo-Bin 30.03% owned by Zhao, Guo-Bin
Directors Wu, Zhi-Long
Supervisor Huang, Liang-Rao
Xiamen Hua Cheng Da Logistics Co.,
Ltd.
Executive
Director and
general manager
Shih, Chia-Sheng -
70% owned by Hua Ying Supply Chain
Supervisor Li Ping 10% owned by Li Ping
Guangzhou Xing Xian Medical
Management Consultation Co., Ltd.
Executive
Director and
general manager
Lu, Jui-Ming - 100 % owned by Dongguan Huagang
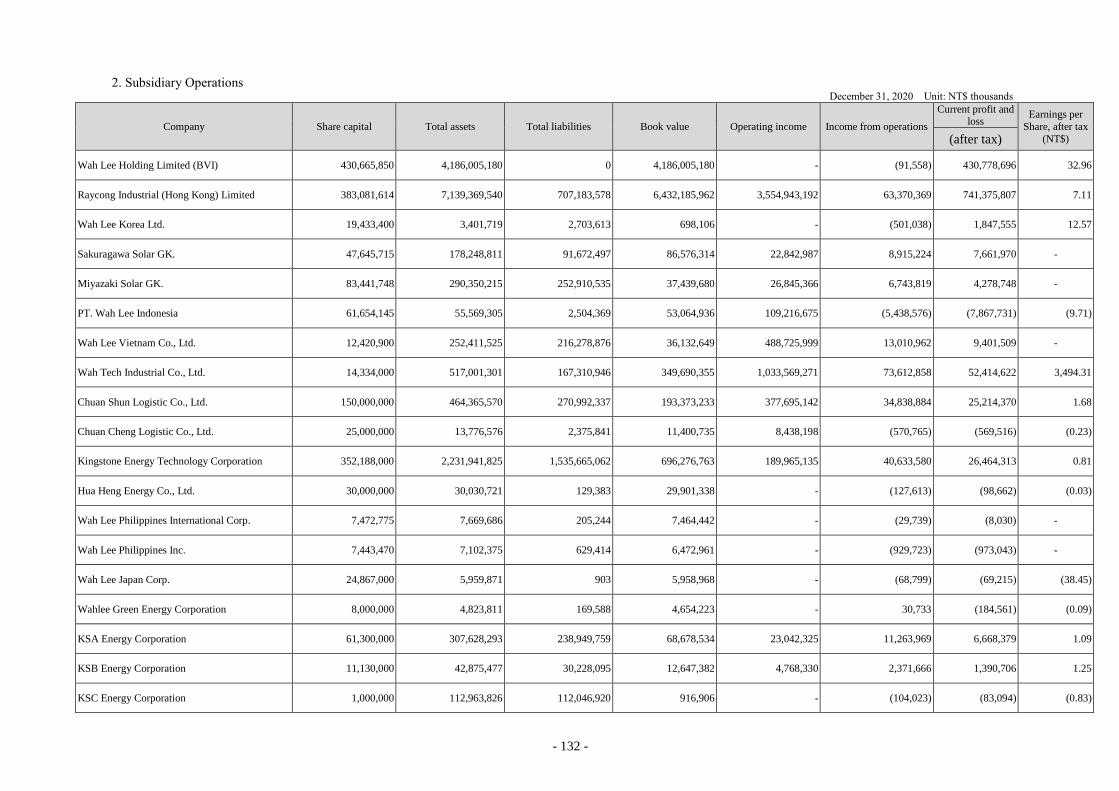
- 132 -
2. Subsidiary Operations December 31, 2020 Unit: NT$ thousands
Company Share capital Total assets Total liabilities Book value Operating income Income from operations
Current profit and loss
Earnings per
Share, after tax
(NT$) (after tax)
Wah Lee Holding Limited (BVI) 430,665,850 4,186,005,180 0 4,186,005,180 - (91,558) 430,778,696 32.96
Raycong Industrial (Hong Kong) Limited 383,081,614 7,139,369,540 707,183,578 6,432,185,962 3,554,943,192 63,370,369 741,375,807 7.11
Wah Lee Korea Ltd. 19,433,400 3,401,719 2,703,613 698,106 - (501,038) 1,847,555 12.57
Sakuragawa Solar GK. 47,645,715 178,248,811 91,672,497 86,576,314 22,842,987 8,915,224 7,661,970 -
Miyazaki Solar GK. 83,441,748 290,350,215 252,910,535 37,439,680 26,845,366 6,743,819 4,278,748 -
PT. Wah Lee Indonesia 61,654,145 55,569,305 2,504,369 53,064,936 109,216,675 (5,438,576) (7,867,731) (9.71)
Wah Lee Vietnam Co., Ltd. 12,420,900 252,411,525 216,278,876 36,132,649 488,725,999 13,010,962 9,401,509 -
Wah Tech Industrial Co., Ltd. 14,334,000 517,001,301 167,310,946 349,690,355 1,033,569,271 73,612,858 52,414,622 3,494.31
Chuan Shun Logistic Co., Ltd. 150,000,000 464,365,570 270,992,337 193,373,233 377,695,142 34,838,884 25,214,370 1.68
Chuan Cheng Logistic Co., Ltd. 25,000,000 13,776,576 2,375,841 11,400,735 8,438,198 (570,765) (569,516) (0.23)
Kingstone Energy Technology Corporation 352,188,000 2,231,941,825 1,535,665,062 696,276,763 189,965,135 40,633,580 26,464,313 0.81
Hua Heng Energy Co., Ltd. 30,000,000 30,030,721 129,383 29,901,338 - (127,613) (98,662) (0.03)
Wah Lee Philippines International Corp. 7,472,775 7,669,686 205,244 7,464,442 - (29,739) (8,030) -
Wah Lee Philippines Inc. 7,443,470 7,102,375 629,414 6,472,961 - (929,723) (973,043) -
Wah Lee Japan Corp. 24,867,000 5,959,871 903 5,958,968 - (68,799) (69,215) (38.45)
Wahlee Green Energy Corporation 8,000,000 4,823,811 169,588 4,654,223 - 30,733 (184,561) (0.09)
KSA Energy Corporation 61,300,000 307,628,293 238,949,759 68,678,534 23,042,325 11,263,969 6,668,379 1.09
KSB Energy Corporation 11,130,000 42,875,477 30,228,095 12,647,382 4,768,330 2,371,666 1,390,706 1.25
KSC Energy Corporation 1,000,000 112,963,826 112,046,920 916,906 - (104,023) (83,094) (0.83)

- 133 -
Company Share capital Total assets Total liabilities Book value Operating income Income from operations
Current profit and
loss Earnings per
Share, after tax
(NT$) (after tax)
KSD Energy Corporation 67,000,000 90,734,251 23,927,315 66,806,936 - (210,350) (193,064) (0.03)
Wah Lee Tech (Singapore) Pte., Ltd 28,810,846 777,917,648 441,691,699 336,225,949 1,158,062,368 40,968,314 34,963,429 21.85
SHC Holding Limited(Mauritius) 35,026,449 763,090,263 - 763,090,263 - (90,590) 53,095,471 41.16
Regent King International Ltd. 34,938 4,053,292 1,745,908 2,307,384 6,778,369 1,514,445 1,064,830 106.48
PT. Wah Tech Indonesia 5,582,500 34,566,749 31,714,097 2,852,652 112,014,552 (3,482,750) (3,224,592) (117.26)
Shanghai Yi Kang Chemicals & Industries Co., Ltd.
990,731,212 8,520,021,913 4,090,622,487 4,429,399,426 12,745,909,094 638,596,605 503,201,031 -
Dongguan Huagang International Trading Co.,
Ltd. 1,137,186,415 4,982,731,332 2,652,249,295 2,330,482,037 9,959,825,842 446,750,313 317,690,899 -
Hua Ying Supply Chain Management (Shenzhen)
Co., Ltd. 24,084,105 253,748,466 45,881,422 207,867,044 62,272,999 7,785,233 8,597,325 -
Adi International Trading (Shanghai) Co., Ltd 13,085,229 95,101,193 57,628,402 37,472,791 76,424,719 (6,328,441) (6,354,711) -
Lee Huang Medical Equipment (Shanghai) 14,524,604 3,941,550 4,031,635 (90,085) 14,182,707 861,763 919,046 -
Xiamen Hua Cheng Da Logistics Co., Ltd. 13,085,229 30,061,419 19,359,755 10,701,664 30,409,450 (139,579) (238,539) -
Guangzhou Xing Xian Medical Management
Consultation Co., Ltd. 21,808,715 149,485,946 105,153,124 44,332,822 121,495,862 18,609,121 12,216,469 -
Note: 1. Not applicable. It is a limited company; no shares were issued.
2. Exchange rates used in reports are as follows: 1USD = NT$28.48; 1 JPY = NT$ 0.2763; 1 HKD 1 = NT$3.673; 1 SGD = NT$21.56; 1 KRW = NT$ 0.02644; 1 IDR = NT$ 0.00203; 1 VND = NT$ 0.00111.
3. Par value per share is 50,000 JPY for Wah Lee Japan, 5,000 KRW for Wah Lee Korea, 1000 Piso for Wah Lee Philippines, NT$ 1,000 for Wah Lee Thailand and NT$ 10,000 for Wah Lee Indonesia.

- 134 -
II. Private placements of securities in 2019 and 2020 and as of the date of report publication: None
III. Shares of the Company held and disposed by subsidiaries in 2019 and 2020 and as of the date of report
publication: None
IV. Other supplementary information and notes: None.

- 135 -
Nine: Events with Material Impacts on Equity or Stock Price
Any events in 2020 and as of the date of report publication that had material impacts on shareholders’ interests
or securities prices as stated in Item 3 Paragraph 2 of Article 36 under Securities and Exchange Law of Taiwan:
None

- 136 -
V. For 2019 Financial Statement
DECLARATION OF CONSOLIDATED FINANCIAL STATEMENTS OF AFFILIATES
The entities required to be included in the consolidated financial statements of affiliates of Wah Lee
Industrial Corporation for the year ended December 31, 2020, under the “Criteria Governing the Preparation
of Affiliation Reports, Consolidated Business Reports and Consolidated Financial Statements of Affiliated
Enterprises”, are the same as those included in the consolidated financial statements of parent and
subsidiary companies prepared in conformity with International Financial Reporting Standard 10,
“Consolidated Financial Statements”. In addition, relevant information required to be disclosed in the
consolidated financial statements of affiliates has all been disclosed in the consolidated financial statements
of parent and subsidiary companies. Consequently, Wah Lee Industrial Corporation and its subsidiaries did
not prepare a separate set of consolidated financial statements of affiliates.
Very truly yours,
Wah Lee Industrial Corporation
By
Jui-Chin Chung
Chairman
March 26, 2021

- 137 -
INDEPENDENT AUDITORS’ REPORT
The Board of Directors and Shareholders
Wah Lee Industrial Corporation
Opinion
We have audited the accompanying consolidated financial statements of Wah Lee Industrial Corporation
(the :Company”) and its subsidiaries (collectively referred to as the “Group”), which comprise the consolidated
balance sheets as of December 31, 2020 and 2019, and the consolidated statements of comprehensive income,
changes in equity and cash flows for the years then ended, and the notes to the consolidated financial statements,
including a summary of significant accounting policies (collectively referred to as the “consolidated financial
statements”).
In our opinion, based on our audits and the reports of other auditors (refer to Other Matter paragraph), the
accompanying consolidated financial statements present fairly, in all material respects, the consolidated financial
position of the Group as of December 31, 2020 and 2019, and its consolidated financial performance and its
consolidated cash flows for the years then ended in accordance with the Regulations Governing the Preparation
of Financial Reports by Securities Issuers and International Financial Reporting Standards (IFRS), International
Accounting Standards (IAS), IFRIC Interpretations (IFRIC), and SIC Interpretations (SIC) endorsed and issued
into effect by the Financial Supervisory Commission of the Republic of China.
Basis for Opinion
We conducted our audit of the consolidated financial statements for the year ended December 31, 2020 in
accordance with the Regulations Governing Auditing and Attestation of Financial Statements by Certified Public
Accountants and auditing standards generally accepted in the Republic of China. We conducted our audit of the
consolidated financial statements for the year ended December 31, 2019 in accordance with the Regulations
Governing Auditing and Attestation of Financial Statements by Certified Public Accountants, Rule No.
1090360805 issued by the Financial Supervisory Commission of the Republic of China on February 25, 2020,
and auditing standards generally accepted in the Republic of China. Our responsibilities under those standards are
further described in the Auditors’ Responsibilities for the Audit of the Consolidated Financial Statements section
of our report. We are independent of the Group in accordance with The Norm of Professional Ethics for Certified
Public Accountant of the Republic of China, and we have fulfilled our other ethical responsibilities in accordance
with these requirements. We believe that the audit evidence we have obtained is sufficient and appropriate to
provide a basis for our opinion.
Key Audit Matters
Key audit matters are those matters that, in our professional judgment, were of most significance in our audit of
the consolidated financial statements for the year ended December 31, 2020. These matters were addressed in the
context of our audit of the consolidated financial statements as a whole, and in forming our opinion thereon, and
we do not provide a separate opinion on these matters.
The key audit matter identified in the Group’s consolidated financial statements for the year ended December 31,
2020 is discussed as follows:

- 138 -
Occurrence of revenue from specific customers
The operating revenue of the Group for the year ended December 31, 2020 was NT$59,080,920 thousand, of
which the revenue and gross profit from specific customers show significant growth over the past year. In addition,
based on the ROC GAAS, revenue recognition is presumed to have a significant risk. Therefore, we considered
the occurrence of revenue from specific customers as a key audit matter.
Refer to Note 4 to the consolidated financial statements for the related accounting policy on revenue recognition.
The main audit procedures that we performed to address the occurrence of the revenue from specific customers
were as follows:
1. We understood and tested the design and operating effectiveness of the internal controls relevant to shipment
and revenue recognition.
2. We verified, on a sampling basis, the occurrence of recorded revenue from specific customers against
supporting documents, including shipping and collection documents, and we checked whether the payer is
the same as the buyer.
Other Matter
The financial statements of certain investees accounted for using the equity method in the Group’s consolidated
financial statements for the years ended December 31, 2020 and 2019 were audited by other independent auditors;
accordingly, our opinion insofar as it relates to the amounts and information disclosed, is based solely on the
reports of other independent auditors.
The carrying values of the investments accounted for using the equity method as of December 31, 2020 and 2019
were NT$728,537 thousand and NT$675,514 thousand, respectively, both representing 2% of total consolidated
assets; and the amounts of the share of profit of associates for the years ended December 31, 2020 and 2019 were
NT$111,793 thousand and NT$69,036 thousand, both representing 4% of consolidated profit before income tax.
We have also audited the parent company only financial statements of Wah Lee Industrial Corporation as of and
for the years ended December 31, 2020 and 2019 on which we have issued an unmodified opinion with other
matter paragraph.
Responsibilities of Management and Those Charged with Governance for the Consolidated Financial
Statements
Management is responsible for the preparation and fair presentation of the consolidated financial statements in
accordance with the Regulations Governing the Preparation of Financial Reports by Securities Issuers, and the
IFRS, IAS, IFRIC, and SIC endorsed and issued into effect by the Financial Supervisory Commission of the
Republic of China, and for such internal control as management determines is necessary to enable the preparation
of consolidated financial statements that are free from material misstatement, whether due to fraud or error.
In preparing the consolidated financial statements, management is responsible for assessing the Group’s ability
to continue as a going concern, disclosing, as applicable, matters related to going concern and using the going
concern basis of accounting unless management either intends to liquidate the Group or to cease operations, or
has no realistic alternative but to do so.
Those charged with governance, including the audit committee, are responsible for overseeing the Group’s
financial reporting process.

- 139 -
Auditors’ Responsibilities for the Audit of the Consolidated Financial Statements
Our objectives are to obtain reasonable assurance about whether the consolidated financial statements as a whole
are free from material misstatement, whether due to fraud or error, and to issue an auditors’ report that includes
our opinion. Reasonable assurance is a high level of assurance, but is not a guarantee that an audit conducted in
accordance with the auditing standards generally accepted in the Republic of China will always detect a material
misstatement when it exists. Misstatements can arise from fraud or error and are considered material if,
individually or in the aggregate, they could reasonably be expected to influence the economic decisions of users
taken on the basis of these consolidated financial statements.
As part of an audit in accordance with the auditing standards generally accepted in the Republic of China, we
exercise professional judgment and maintain professional skepticism throughout the audit. We also:
1. Identify and assess the risks of material misstatement of the consolidated financial statements, whether due
to fraud or error, design and perform audit procedures responsive to those risks, and obtain audit evidence
that is sufficient and appropriate to provide a basis for our opinion. The risk of not detecting a material
misstatement resulting from fraud is higher than for one resulting from error, as fraud may involve collusion,
forgery, intentional omissions, misrepresentations, or the override of internal control.
2. Obtain an understanding of internal control relevant to the audit in order to design audit procedures that are
appropriate in the circumstances, but not for the purpose of expressing an opinion on the effectiveness of the
Group’s internal control.
3. Evaluate the appropriateness of accounting policies used and the reasonableness of accounting estimates and
related disclosures made by management.
4. Conclude on the appropriateness of management’s use of the going concern basis of accounting and, based
on the audit evidence obtained, whether a material uncertainty exists related to events or conditions that may
cast significant doubt on the Group’s ability to continue as a going concern. If we conclude that a material
uncertainty exists, we are required to draw attention in our auditors’ report to the related disclosures in the
consolidated financial statements or, if such disclosures are inadequate, to modify our opinion. Our
conclusions are based on the audit evidence obtained up to the date of our auditors’ report. However, future
events or conditions may cause the Group to cease to continue as a going concern.
5. Evaluate the overall presentation, structure and content of the consolidated financial statements, including
the disclosures, and whether the consolidated financial statements represent the underlying transactions and
events in a manner that achieves fair presentation.
6. Obtain sufficient and appropriate audit evidence regarding the financial information of entities or business
activities within the Group to express an opinion on the consolidated financial statements. We are responsible
for the direction, supervision, and performance of the group audit. We remain solely responsible for our audit
opinion.
We communicate with those charged with governance regarding, among other matters, the planned scope and
timing of the audit and significant audit findings, including any significant deficiencies in internal control that we
identify during our audit.
We also provide those charged with governance with a statement that we have complied with relevant ethical
requirements regarding independence, and to communicate with them all relationships and other matters that may
reasonably be thought to bear on our independence, and where applicable, related safeguards.
From the matters communicated with those charged with governance, we determine those matters that were of
most significance in the audit of the consolidated financial statements for the year ended December 31, 2020 and
are therefore the key audit matters. We describe these matters in our auditors’ report unless law or regulation
precludes public disclosure about the matter or when, in extremely rare circumstances, we determine that a matter

- 140 -
should not be communicated in our report because the adverse consequences of doing so would reasonably be
expected to outweigh the public interest benefits of such communication.
The engagement partners on the audits resulting in this independent auditors’ report are Chiu-Yen Wu and Chen-
Li Chen.
Deloitte & Touche
Taipei, Taiwan
Republic of China
March 26, 2021
Notice to Readers
The accompanying consolidated financial statements are intended only to present the consolidated financial
position, financial performance and cash flows in accordance with accounting principles and practices generally
accepted in the Republic of China and not those of any other jurisdictions. The standards, procedures and
practices to audit such consolidated financial statements are those generally applied in the Republic of China.
For the convenience of readers, the independent auditors’ report and the accompanying consolidated financial
statements have been translated into English from the original Chinese version prepared and used in the Republic
of China. If there is any conflict between the English version and the original Chinese version or any difference
in the interpretation of the two versions, the Chinese-language independent auditors’ report and consolidated
financial statements shall prevail.

- 141 -
WAH LEE INDUSTRIAL CORPORATION AND SUBSIDIARIES
CONSOLIDATED BALANCE SHEETS
(In Thousands of New Taiwan Dollars)
December 31, 2020 December 31, 2019
ASSETS Amount % Amount % CURRENT ASSETS
Cash and cash equivalents (Notes 4 and 6) $ 3,053,182 8 $ 2,348,526 7 Financial assets at fair value through profit or loss - current (Notes 4 and 7) 211,665 1 172,741 1 Financial assets at fair value through other comprehensive income - current (Notes 4 and 8) 119,600 - 68,900 - Notes receivable (Notes 9, 28 and 30) 2,399,770 6 1,972,660 6 Notes receivable - related parties 6,925 - 15,538 - Accounts receivable, net (Notes 4, 5 and 9) 15,111,761 39 13,482,001 39 Accounts receivable - related parties (Notes 4, 5, 9 and 29) 113,442 - 105,120 - Other receivables 132,686 - 65,284 - Other receivables - related parties (Note 29) 59,752 - 83,571 - Current tax assets 114 - - - Merchandise (Notes 4, 5 and 10) 4,286,609 11 3,935,974 11 Prepayments for purchases 1,398,090 4 1,018,095 3 Other financial assets - current (Notes 11 and 30) 838,212 2 858,536 3 Other current assets 209,496 1 296,008 1
Total current assets 27,941,304 72 24,422,954 71
NONCURRENT ASSETS
Financial assets at fair value through other comprehensive income - noncurrent (Notes 4 and 8) 634,098 2 572,981 2 Investments accounted for using the equity method (Notes 4 and 13) 4,826,082 12 4,555,030 13 Property, plant and equipment (Notes 4, 14, 29 and 30) 3,785,578 10 3,800,494 11 Right-of-use assets (Notes 4 and 15) 624,245 2 147,846 - Goodwill (Notes 4 and 25) 111,809 - 112,668 - Other intangible assets 205,407 1 230,607 1 Deferred tax assets (Notes 4 and 23) 345,131 1 325,649 1 Prepayments for equipment 20,663 - 1,706 - Prepayments for investments 10,000 - - - Other financial assets - noncurrent (Notes 11 and 30) 196,403 - 188,572 1 Other noncurrent assets 54,249 - 52,367 -
Total noncurrent assets 10,813,665 28 9,987,920 29
TOTAL $ 38,754,969 100 $ 34,410,874 100 LIABILITIES AND EQUITY
CURRENT LIABILITIES
Short-term borrowings (Notes 16, 28 and 29) $ 7,400,936 19 $ 6,790,253 20
Short-term bills payable (Note 16) 59,917 - - -
Financial liabilities at fair value through profit or loss - current (Notes 4 and 7) 280 - 1,372 -
Contract liabilities - current (Note 21) 345,351 1 289,480 1
Notes payable (Note 17) 102,174 - 335,214 1
Notes payable - related parties (Notes 17 and 29) 1,261 - 201 -
Accounts payable (Note 17) 7,066,208 18 5,532,981 16
Accounts payable - related parties (Notes 17 and 29) 378,004 1 354,710 1
Dividends payable 1,400 - 10,352 -
Other payables (Notes 18 and 29) 1,223,813 3 1,118,228 3
Current tax liabilities (Note 23) 272,968 1 221,112 1
Lease liabilities - current (Notes 4 and 15) 64,747 - 32,649 -
Current portion of long-term borrowings (Note 16) 538,534 2 250,456 1
Refund liabilities - current 174,275 1 161,493 -
Other current liabilities 29,053 - 15,549 -
Total current liabilities 17,658,921 46 15,114,050 44
NONCURRENT LIABILITIES
Long-term borrowings (Note 16) 4,107,003 11 4,510,009 13
Provision for employee benefits - noncurrent (Note 4) 41,875 - 14,760 -
Lease liabilities - noncurrent (Notes 4 and 15) 566,902 1 109,532 -
Net defined benefit liabilities - noncurrent (Notes 4 and 19) 314,840 1 320,668 1
Guarantee deposits received 1,616 - 419 -
Deferred tax liabilities (Notes 4 and 23) 1,155,352 3 1,056,833 3
Total noncurrent liabilities 6,187,588 16 6,012,221 17
Total liabilities 23,846,509 62 21,126,271 61
EQUITY ATTRIBUTABLE TO OWNERS OF THE COMPANY (Note 20)
Share Capital 2,313,901 6 2,313,901 7
Capital surplus 1,331,725 3 1,318,065 4
Retained earnings
Legal reserve 2,228,083 6 2,084,659 6
Special reserve 980,087 3 679,347 2
Unappropriated earnings 6,660,831 17 6,029,012 17
Total retained earnings 9,869,001 26 8,793,018 25
Other equity (636,618) (2 ) (980,087)
(3 )
Total equity attributable to owners of the Company 12,878,009 33 11,444,897 33
NON-CONTROLLING INTERESTS (Notes 20 and 25) 2,030,451 5 1,839,706 6
Total equity 14,908,460 38 13,284,603 39
TOTAL $ 38,754,969 100 $ 34,410,874 100
The accompanying notes are an integral part of the consolidated financial statements. (With Deloitte & Touche auditors’ report dated March 26, 2021)

- 142 -
WAH LEE INDUSTRIAL CORPORATION AND SUBSIDIARIES
CONSOLIDATED STATEMENTS OF COMPREHENSIVE INCOME
(In Thousands of New Taiwan Dollars, Except Earnings Per Share)
For the Year Ended December 31
2020 2019
Amount % Amount % OPERATING REVENUE (Notes 4, 21 and 28) $ 59,080,920 100 $ 54,681,829 100 OPERATING COSTS (Notes 10, 22 and 29) 54,280,230 92 50,497,138 92 GROSS PROFIT 4,800,690 8 4,184,691 8 OPERATING EXPENSES (Notes 9 and 22)
Selling and marketing expenses 2,051,331 4 2,015,201 4 General and administrative expenses 531,187 1 505,988 1 Expected credit loss 110,257 - 89,067 -
Total operating expenses 2,692,775 5 2,610,256 5
OPERATING INCOME 2,107,915 3 1,574,435 3 NON-OPERATING INCOME AND EXPENSES
Interest income 52,018 - 14,879 - Other income (Notes 22 and 29) 151,737 - 149,958 - Other gains and losses (Note 22) (51,449) - (29,489) - Finance costs (Notes 22 and 28) (204,649) - (274,026) - Share of profit of associates and joint ventures 580,063 1 530,407 1
Total non-operating income and expenses 527,720 1 391,729 1
PROFIT BEFORE INCOME TAX 2,635,635 4 1,966,164 4 INCOME TAX EXPENSE (Notes 4 and 23) 589,519 1 407,083 1 NET PROFIT FOR THE YEAR 2,046,116 3 1,559,081 3 OTHER COMPREHENSIVE INCOME (Notes 20 and
23) Items that will not be reclassified subsequently to
profit or loss: Remeasurement of defined benefit plans (4,470) - 9,375 - Unrealized gain (loss) on investments in equity
instruments designated as at fair value through other comprehensive income 110,390 - (114,290) -
Share of other comprehensive income of associates accounted for using the equity method 236,698 1 72,454 -
Income tax relating to items that will not be reclassified subsequently to profit or loss 7,804 - 9,797 -
(Continued)

- 143 -
WAH LEE INDUSTRIAL CORPORATION AND SUBSIDIARIES
CONSOLIDATED STATEMENTS OF COMPREHENSIVE INCOME
(In Thousands of New Taiwan Dollars, Except Earnings Per Share)
For the Year Ended December 31
2020 2019
Amount % Amount %
Items that may be reclassified subsequently to profit or loss: Exchange differences on translation of the
financial statements of foreign operations $ 16,626 - $ (240,268) (1) Share of other comprehensive gain (loss) of
associates accounted for using the equity method 9,920 - (93,657) -
Income tax relating to items that may be reclassified subsequently to profit or loss (4,571) - 45,714 -
Other comprehensive gain (loss) for the year,
net of income tax 372,397 1 (310,875) (1) TOTAL COMPREHENSIVE INCOME FOR THE
YEAR $ 2,418,513 4 $ 1,248,206 2 NET PROFIT ATTRIBUTABLE TO:
Owners of the Company $ 1,859,120 3 $ 1,415,822 3 Non-controlling interests 186,996 - 143,259 -
$ 2,046,116 3 $ 1,559,081 3
TOTAL COMPREHENSIVE INCOME
ATTRIBUTABLE TO: Owners of the Company $ 2,233,421 4 $ 1,141,555 2 Non-controlling interests 185,092 - 106,651 -
$ 2,418,513 4 $ 1,248,206 2
EARNINGS PER SHARE (Note 24)
Basic $ 8.03 $ 6.12
Diluted $ 7.81 $ 5.93
The accompanying notes are an integral part of the consolidated financial statements.
(With Deloitte & Touche auditors’ report dated March 26, 2021) (Concluded)

- 144 -
WAH LEE INDUSTRIAL CORPORATION AND SUBSIDIARIES
CONSOLIDATED STATEMENTS OF CHANGES IN EQUITY
FOR THE YEARS ENDED DECEMBER 31, 2020 AND 2019
(In Thousands of New Taiwan Dollars)
Equity Attributable to Owners of the Company Other Equity Unrealized Exchange Gain/(Loss) on Differences on Financial Translation of the Assets at Fair Financial Value Through Retained Earnings Statements of Other Unappropriated Foreign Comprehensive Non-Controlling Share Capital Capital Surplus Legal Reserve Special Reserve Earnings Operations Income Subtotal Total Interests Total Equity BALANCE AT JANUARY 1, 2019 $ 2,313,901 $ 1,331,880 $ 1,950,063 $ 78,160 $ 6,070,997 $ (355,909) $ (323,438) $ (679,347) $ 11,065,654 $ 1,343,281 $ 12,408,935 Appropriation of 2018 earnings
Legal reserve - - 134,596 - (134,596) - - - - - - Special reserve - - - 601,187 (601,187) - - - - - - Cash dividends distributed by the Company - - - - (740,448) - - - (740,448) - (740,448)
- - 134,596 601,187 (1,476,231) - - - (740,448) - (740,448) Changes in percentage of ownership interests in subsidiaries (Notes 12
and 23) - - - - (8,049) - - - (8,049) - (8,049) Changes in capital surplus from investments in associates accounted for
using the equity method - (13,815) - - - - - - (13,815) - (13,815) Net profit for the year ended December 31, 2019 - - - - 1,415,822 - - - 1,415,822 143,259 1,559,081 Other comprehensive income (loss) for the year ended December 31,
2019, net of income tax - - - - 7,550 (251,603) (30,214) (281,817) (274,267) (36,608) (310,875) Total comprehensive income (loss) for the year ended December 31,
2019 - - - - 1,423,372 (251,603) (30,214) (281,817) 1,141,555 106,651 1,248,206 Cash dividends distributed by the subsidiaries - - - - - - - - - (20,328) (20,328) Disposals of investments in equity instruments designated as at fair value
through other comprehensive income (Notes 8 and 20) - - - - (4,652) - 4,652 4,652 - - - Associates disposed the investments in equity instruments designated as
at fair value through other comprehensive income (Note 20) - - - - 23,575 - (23,575) (23,575) - - - Increase in non-controlling interests - - - - - - - - - 410,102 410,102 BALANCE AT DECEMBER 31, 2019 2,313,901 1,318,065 2,084,659 679,347 6,029,012 (607,512) (372,575) (980,087) 11,444,897 1,839,706 13,284,603 Appropriation of 2019 earnings
Legal reserve - - 143,424 - (143,424) - - - - - - Special reserve - - - 300,740 (300,740) - - - - - - Cash dividends distributed by the Company - - - - (763,587) - - - (763,587) - (763,587)
- - 143,424 300,740 (1,207,751) - - - (763,587) - (763,587) Changes in percentage of ownership interests in subsidiaries (Note 12) - (846) - - - - - - (846) 846 - Changes in capital surplus from investments in associates accounted for
using the equity method - 14,506 - - (50,382) - - - (35,876) - (35,876) Net profit for the year ended December 31, 2020 - - - - 1,859,120 - - - 1,859,120 186,996 2,046,116 Other comprehensive income (loss) for the year ended December 31,
2020, net of income tax - - - - (2,328) 23,879 352,750 376,629 374,301 (1,904) 372,397 Total comprehensive income for the year ended December 31, 2020 - - - - 1,856,792 23,879 352,750 376,629 2,233,421 185,092 2,418,513 Cash dividends distributed by the subsidiaries - - - - - - - - - (3,196) (3,196) Disposals of investments in equity instruments designated as at fair value
through other comprehensive income (Notes 8 and 20) - - - - 18,567 - (18,567) (18,567) - - - Associates disposed the investments in equity instruments designated as
at fair value through other comprehensive income (Note 20) - - - - 14,593 - (14,593) (14,593) - - - Increase in non-controlling interests - - - - - - - - - 8,003 8,003 BALANCE AT DECEMBER 31, 2020 $ 2,313,901 $ 1,331,725 $ 2,228,083 $ 980,087 $ 6,660,831 $ (583,633) $ (52,985) $ (636,618) $ 12,878,009 $ 2,030,451 $ 14,908,460
The accompanying notes are an integral part of the consolidated financial statements.
(With Deloitte & Touche auditors’ report dated March 26, 2021)

- 145 -
WAH LEE INDUSTRIAL CORPORATION AND SUBSIDIARIES
CONSOLIDATED STATEMENTS OF CASH FLOWS
(In Thousands of New Taiwan Dollars)
For the Years Ended December 31
2020 2019 CASH FLOWS FROM OPERATING ACTIVITIES
Income before income tax $ 2,635,635 $ 1,966,164 Adjustments for:
Depreciation expense 277,884 214,504 Amortization expense 41,073 31,815 Expected credit loss 110,257 89,067 Net loss of financial instruments at fair value through profit or loss 6,464 4,814 Finance costs 204,649 274,026 Interest income (52,018) (14,879) Dividend income (16,696) (12,714) Share of profit of associates accounted for using the equity method (580,063) (530,407) Gain on disposal of property, plant and equipment (24,182) (1,189) Impairment loss recognized (reversed) on non-financial assets (9,074) 53,689 Net loss (gain) on foreign currency exchange 38,430 (87,709) Others 8,059 (67) Changes in operating assets and liabilities
Financial assets mandatorily classified as at fair value through profit or loss
778 9,650
Notes receivable (427,110) (149,619) Notes receivable - related parties 8,613 (15,496) Accounts receivable (1,739,094) (329,574) Accounts receivable - related parties (9,033) 63,701 Other receivables (10,692) (6,490) Other receivables - related parties (5,746) 18,924 Inventories (340,836) 1,039,205 Prepayments for purchases (379,995) (117,963) Other current assets 86,540 (8,369) Financial liabilities held for trading (9,837) (19,023) Contract liabilities 55,871 107,283 Notes payable (233,040) (195,890) Notes payable - related parties 1,060 (1,347) Accounts payable 1,533,227 (376,444) Accounts payable - related parties 23,294 (57,542) Other payables 117,421 151,966 Refund liabilities 12,782 29,170 Other current liabilities 13,504 (4,777) Net defined benefit liabilities (9,540) (9,222)
Cash generated from operations 1,328,585 2,115,257 Interest received 51,433 14,879 Dividends received 485,434 335,880 Interest paid (202,930) (269,021) Income tax paid (454,447) (398,971)
Net cash generated from operating activities 1,208,075 1,798,024
(Continued)

- 146 -
WAH LEE INDUSTRIAL CORPORATION AND SUBSIDIARIES
CONSOLIDATED STATEMENTS OF CASH FLOWS
(In Thousands of New Taiwan Dollars)
For the Years Ended December 31
2020 2019 CASH FLOWS FROM INVESTING ACTIVITIES
Purchase of financial assets at fair value through other comprehensive income
$ (50,000) $ -
Proceeds from disposal of financial assets at fair value through other comprehensive income
47,285 4,782
Proceeds from the capital reduction of financial assets at fair value through other comprehensive income
1,288 -
Purchase of financial assets at fair value through profit or loss (478,692) (304,141) Proceeds from disposal of financial assets at fair value through profit
or loss
443,877 291,853 Purchase of investments accounted for using the equity method (7,005) (7,310) Proceeds from disposal of investments accounted for using the equity
method
82,897 - Net cash outflow on acquisition of subsidiaries (Notes 25 and 26) (3,000) (401,261) Payments for property, plant and equipment (348,003) (430,499) Proceeds from disposal of property, plant and equipment 137,265 3,373 Payments for intangible assets (5,850) (13,776) Decrease (increase) in other financial assets 12,493 (776,529) Increase in other noncurrent assets (9,031) (4,168) Prepayments for investments (10,000) -
Net cash used in investing activities (186,476) (1,637,676)
CASH FLOWS FROM FINANCING ACTIVITIES
Increase (decrease) in short-term borrowings 551,400 (114,677) Increase (decrease) in short-term bills payable 59,840 (100,000) Proceeds from long-term borrowings 8,147,702 5,575,433 Repayment of long-term borrowings (8,264,918) (4,588,851) Decrease in guarantee deposits received 1,197 - Repayment of the principal portion of lease liabilities (66,892) (54,833) Cash dividends (763,587) (740,448) Change in non-controlling interests (4,145) (13,651)
Net cash used in financing activities (339,403) (37,027)
EFFECT OF EXCHANGE RATE CHANGES ON THE BALANCE OF
CASH AND CASH EQUIVALENTS
22,460 (316,646) NET INCREASE (DECREASE) IN CASH AND CASH
EQUIVALENTS
704,656 (193,325) CASH AND CASH EQUIVALENTS AT THE BEGINNING OF THE
YEAR
2,348,526 2,541,851 CASH AND CASH EQUIVALENTS AT THE END OF THE YEAR $ 3,053,182 $ 2,348,526 The accompanying notes are an integral part of the consolidated financial statements. (With Deloitte & Touche auditors’ report dated March 26, 2021) (Concluded)

- 147 -
WAH LEE INDUSTRIAL CORPORATION AND SUBSIDIARIES
NOTES TO CONSOLIDATED FINANCIAL STATEMENTS
FOR THE YEARS ENDED DECEMBER 31, 2020 AND 2019
(In Thousands of New Taiwan Dollars, Unless Stated Otherwise)
1. ORGANIZATION
Wah Lee Industrial Corporation (the “Company”) was incorporated in October 1968, and is mainly engaged
in the import/export and agency business of composite materials, engineering plastic, printed circuit board,
semiconductor, and computer related manufacturing materials and equipment.
The Company’s shares have been listed and traded on the Taiwan Stock Exchange since July 22, 2002.
The consolidated financial statements, which include the Company and its subsidiaries (collectively, the
“Group”), are presented in the Company’s functional currency, the New Taiwan dollar.
2. APPROVAL OF FINANCIAL STATEMENTS
The consolidated financial statements were approved and authorized for issue by the Company’s board of
directors on March 26, 2021.
3. APPLICATION OF NEW, AMENDED AND REVISED STANDARDS AND INTERPRETATIONS
a. Initial application of the International Financial Reporting Standards (IFRS), International Accounting
Standards (IAS), IFRIC Interpretations (IFRIC), and SIC Interpretations (SIC) (collectively, the “IFRSs”)
endorsed and issued into effect by the Financial Supervisory Commission (FSC)
Except for the following impact, the initial application of the IFRSs endorsed and issued into effect by
the FSC did not have a material impact on the Group’s accounting policies:
Amendments to IFRS 3 “Definition of a Business”
The Group applies the amendments to IFRS 3 to transactions that occur on or after January 1, 2020. The
amendments require that for an entity to be considered a business, an acquired set of activities and assets
must include, at a minimum, an input and a substantive process that together significantly contribute to
the ability to create outputs. To judge whether the acquired process is substantive, there will be different
judgement requirements depending on whether there is output on the acquisition date. In addition, the
amendments introduce an optional concentration test that permits a simplified assessment of whether or
not an acquired set of activities and assets is a business.
b. The IFRSs endorsed by the FSC for application starting from 2021
New IFRSs
Effective Date
Announced by IASB
Amendments to IFRS 4 “Extension of the Temporary Exemption from
Applying IFRS 9”
Effective immediately upon
promulgation by the IASB
Amendments to IFRS 9, IAS 39, IFRS 7, IFRS 4 and IFRS 16
“Interest Rate Benchmark Reform - Phase 2”
January 1, 2021

- 148 -
As of the date the consolidated financial statements were authorized for issue, the Group assessed that
the application of standards and interpretations will not have a material impact on the Group’s financial
position and financial performance.
c. New IFRSs in issue but not yet endorsed and issued into effect by the FSC
New IFRSs
Effective Date
Announced by IASB (Note 1)
“Annual Improvements to IFRS Standards 2018-2020” January 1, 2022 (Note 2)
Amendments to IFRS 3 “Reference to the Conceptual Framework” January 1, 2022 (Note 3)
Amendments to IFRS 10 and IAS 28 “Sale or Contribution of Assets
between an Investor and its Associate or Joint Venture”
To be determined by IASB
Amendments to IAS 1 “Classification of Liabilities as Current or
Noncurrent”
January 1, 2023
Amendments to IAS 1 “Disclosure of Accounting Policies” January 1, 2023 (Note 6)
Amendments to IAS 8 “Definition of Accounting Estimates” January 1, 2023 (Note 7)
Amendments to IAS 16 “Property, Plant and Equipment - Proceeds
before Intended Use”
January 1, 2022 (Note 4)
Amendments to IAS 37 “Onerous Contracts - Cost of Fulfilling a
Contract”
January 1, 2022 (Note 5)
Note 1: Unless stated otherwise, the above New IFRSs are effective for annual reporting periods
beginning on or after their respective effective dates.
Note 2: The amendments to IFRS 9 will be applied prospectively to modifications and exchanges of
financial liabilities that occur on or after the annual reporting periods beginning on or after
January 1, 2022.
Note 3: The amendments are applicable to business combinations for which the acquisition date is on
or after the beginning of the annual reporting period beginning on or after January 1, 2022.
Note 4: The amendments are applicable to property, plant and equipment that are brought to the location
and condition necessary for them to be capable of operating in the manner intended by
management on or after January 1, 2021.
Note 5: The amendments are applicable to contracts for which the entity has not yet fulfilled all its
obligations on January 1, 2022.
Note 6: The amendments will be applied prospectively for annual reporting periods beginning on or
after January 1, 2023.
Note 7: The amendments are applicable to changes in accounting estimates and changes in accounting
policies that occur on or after the beginning of the annual reporting period beginning on or after
January 1, 2023.
As of the date the consolidated financial statements were authorized for issue, the Group is continuously
assessing the possible impact that the application of standards and interpretations will have on the Group’s
financial position and financial performance and will disclose the relevant impact when the assessment
is completed.

- 149 -
4. SUMMARY OF SIGNIFICANT ACCOUNTING POLICIES
a. Statement of Compliance
The consolidated financial statements have been prepared in accordance with the Regulations Governing
the Preparation of Financial Reports by Securities Issuers, and IFRSs as endorsed and issued into effect
by the FSC.
b. Basis of Preparation
The consolidated financial statements have been prepared on the historical cost basis except for financial
instruments which are measured at fair value, and net defined benefit liabilities which are measured at
the present value of the defined benefit obligation less the fair value of plan assets.
The fair value measurements, which are grouped into Levels 1 to 3 based on the degree to which the fair
value measurement inputs are observable and based on the significance of the inputs to the fair value
measurement in its entirety, are described as follows:
1) Level 1 inputs are quoted prices (unadjusted) in active markets for identical assets or liabilities;
2) Level 2 inputs are inputs other than quoted prices included within Level 1 that are observable for the
asset or liability, either directly (i.e., as prices) or indirectly (i.e., derived from prices); and
3) Level 3 inputs are unobservable inputs for the asset or liability.
c. Classification of Current and Noncurrent Assets and Liabilities
Current assets include:
1) Assets held primarily for the purpose of trading;
2) Assets expected to be realized within 12 months after the reporting period; and
3) Cash and cash equivalents unless the asset is restricted from being exchanged or used to settle a
liability for at least 12 months after the reporting period.
Current liabilities include:
1) Liabilities held primarily for the purpose of trading;
2) Liabilities due to be settled within 12 months after the reporting period; and
3) Liabilities for which the Group does not have an unconditional right to defer settlement for at least
12 months after the reporting period.
Assets and liabilities that are not classified as current are classified as noncurrent.
d. Basis of Consolidation
The consolidated financial statements incorporate the financial statements of the Company and the
entities controlled by the Company (i.e., its subsidiaries). When necessary, adjustments are made to the
financial statements of subsidiaries to bring their accounting policies into line with those used by the
Company. All intra-group transactions, balances, income and expenses are eliminated in full upon
consolidation. Total comprehensive income of subsidiaries is attributed to the owners of the Company
and to the non-controlling interests even if it results in the non-controlling interests having a deficit
balance.
- 150 -
Changes in the Group’s ownership interests in subsidiaries that do not result in the Group losing control
over the subsidiaries are accounted for as equity transactions. The carrying amounts of the Group’s
interests and the non-controlling interests are adjusted to reflect the changes in their relative interests in
the subsidiaries. Any difference between the amount by which the non-controlling interests are adjusted
and the fair value of the consideration paid or received is recognized directly in equity and attributed to
the owners of the Company.
When the Group loses control of a subsidiary, a gain or loss is recognized in profit or loss and is calculated
as the difference between the aggregate of the fair value of consideration received and the previous
carrying amount of the assets, and liabilities of the subsidiary and any non-controlling interest. The Group
shall account for all amounts recognized in other comprehensive income in relation to the subsidiary on
the same basis as would be required if the Group had directly disposed of the related assets and liabilities.
The detailed information of subsidiaries (including the percentage of ownership and main business) is
referred to Note 12, Tables 6 and 7.
e. Business Combinations
Acquisitions of businesses are accounted for using the acquisition method. Acquisition-related costs are
generally recognized in profit or loss as they are incurred.
Goodwill is measured as the excess of the sum of the consideration transferred, the amount of any non-
controlling interests in the acquiree, and the fair value of the acquirer’s previously held interests in the
acquiree, over the net of the acquisition-date amounts of the identifiable assets acquired and the liabilities
assumed. If, after re-assessment, the net of the acquisition date amounts of the identifiable assets acquired
and liabilities assumed exceeds the sum of the consideration transferred, the amount of any non-
controlling interests in the acquiree, and the fair value of the acquirer’s previously held interests in the
acquiree, the excess is recognized immediately in profit or loss as a bargain purchase gain.
Non-controlling interests that are present ownership interests and entitle their holders to a proportionate
share of the entity’s net assets in the event of liquidation may be initially measured at fair value.
f. Acquisition of a subsidiary that does not constitute a business
When the Group acquires a subsidiary that does not constitute a business, the Group will identify and
recognize the individual identifiable assets acquired (including intangible assets) and liabilities assumed,
and then allocate the transaction price to the individual identifiable assets and liabilities. When allocating
the transaction price, first, any identifiable assets or liabilities initially measured at an amount other than
cost are initially measured at the amount specified in the applicable IFRS standards. Then the amounts of
the assets and liabilities determined according to the applicable IFRS standards are deducted from the
transaction price; the residual transaction price is then allocated to the remaining identifiable assets and
liabilities (i.e., assets and liabilities initially measured at cost) based on their relative fair values at the
date of the acquisition.
g. Foreign Currencies
In preparing the financial statements of each individual entity, transactions in currencies other than [the
entity’s functional currency (i.e., foreign currencies) are recognized at the rates of exchange prevailing at
the dates of the transactions.
At the end of each reporting period, monetary items denominated in foreign currencies are retranslated at
the rates prevailing at that date. Exchange differences on monetary items arising from settlement or
translation are recognized in profit or loss in the year in which they arise.
Non-monetary items measured at fair value that are denominated in foreign currencies are retranslated at
the rates prevailing at the date when the fair value was determined. Exchange differences arising from

- 151 -
the retranslation of non-monetary items are included in profit or loss for the period except for exchange
differences arising from the retranslation of non-monetary items in respect of which gains and losses are
recognized directly in other comprehensive income, in which cases, the exchange differences are also
recognized directly in other comprehensive income.
Non-monetary items that are measured at historical cost in a foreign currency are translated using the
exchange rate at the date of the transaction, and not retranslated subsequently.
For the purpose of presenting the consolidated financial statements, the assets and liabilities of the
Group’s foreign operations (including subsidiaries and associates in other countries that use currencies
which are different from the currency of the Company) are translated into the New Taiwan dollar at the
exchange rates prevailing at the end of the reporting period. Income and expense items are translated at
the average exchange rates for the period. The resulting currency translation differences are recognized
in other comprehensive income and accumulated in equity attributed to the owners of the Company and
non-controlling interests as appropriate.
Goodwill and fair value adjustments recognized on identifiable assets and liabilities of acquired foreign
operation are treated as assets and liabilities of the foreign operation and translated at the rates of exchange
prevailing at the end of each reporting period. Exchange differences are recognized in other
comprehensive income.
h. Merchandise
Merchandise is stated at the lower of cost or net realizable value; comparison of cost and net realizable
value and recognition of write-downs are made by item. The net realizable value is the estimated selling
price of merchandise less all estimated costs necessary to make the sale. Inventories are recorded at
weighted-average cost on the balance sheet date.
i. Investments in Associates and joint ventures
An associate is an entity over which the Group has significant influence and which is neither a subsidiary
nor an interest in a joint venture. A joint venture is a joint arrangement whereby the Group and other
parties that have joint control of the arrangement have rights to the net assets of the arrangement.
The Group uses the equity method to account for its investments in associates and joint ventures.
Under the equity method, investments in an associate and a joint venture are initially recognized at cost
and adjusted thereafter to recognize the Group’s share of the profit or loss and other comprehensive
income of the associate and joint venture. The Group also recognizes the changes in the Group’s share of
the equity of associates and joint ventures.
Any excess of the cost of acquisition over the Group’s share of the net fair value of the identifiable assets
and liabilities of an associate and a joint venture at the date of acquisition is recognized as goodwill,
which is included within the carrying amount of the investment and is not amortized. Any excess of the
Group’s share of the net fair value of the identifiable assets and liabilities over the cost of acquisition,
after reassessment, is recognized immediately in profit or loss.
When the Group subscribes for additional new shares of an associate and a joint venture at a percentage
different from its existing ownership percentage, the resulting carrying amount of the investment differs
from the amount of the Group’s proportionate interest in the associate and joint venture. The Group
records such a difference as an adjustment to investments with the corresponding amount charged or
credited to capital surplus - changes in capital surplus from investments in associates and joint ventures
accounted for using the equity method. If the Group’s ownership interest is reduced due to its additional
subscription of the new shares of the associate and joint venture, the proportionate amount of the gains
or losses previously recognized in other comprehensive income in relation to that associate and joint
venture is reclassified to profit or loss on the same basis as would be required had the investee directly

- 152 -
disposed of the related assets or liabilities. When the adjustment should be debited to capital surplus, but
the capital surplus recognized from investments accounted for using the equity method is insufficient, the
shortage is debited to retained earnings.
The entire carrying amount of an investment (including goodwill) is tested for impairment as a single
asset by comparing its recoverable amount with its carrying amount. Any impairment loss recognized is
not allocated to any asset, including goodwill, that forms part of the carrying amount of the investment.
Any reversal of that impairment loss is recognized to the extent that the recoverable amount of the
investment subsequently increases.
When the Group transacts with its associate and joint venture, profits and losses resulting from the
transactions with the associate and joint venture are recognized in the Group’s consolidated financial
statements only to the extent of interests in the associate and joint venture that are not related to the Group.
j. Property, Plant, and Equipment
Property, plant and equipment are measured at cost less accumulated depreciation and accumulated
impairment loss.
Property, plant and equipment in the course of construction are measured at cost less any recognized
impairment loss. Cost includes professional fees and borrowing costs eligible for capitalization. Such
assets are depreciated and classified to the appropriate categories of property, plant and equipment when
completed and ready for their intended use.
Freehold land is not depreciated.
Depreciation of property, plant and equipment is recognized using the straight-line method. Each
significant part is depreciated separately. The estimated useful lives, residual values and depreciation
methods are reviewed at the end of each reporting period, with the effects of any changes in the estimates
accounted for on a prospective basis.
On derecognition of an item of property, plant and equipment, the difference between the sales proceeds
and the carrying amount of the asset is recognized in profit or loss.
k. Goodwill
Goodwill arising from the acquisition of a business is carried at cost as established at the date of
acquisition of the business less accumulated impairment loss.
For the purposes of impairment testing, goodwill is allocated to each of the Group’s cash-generating units
or groups of cash-generating units (referred to as “cash-generating unit”) that is expected to benefit from
the synergies of the combination.
A cash-generating unit to which goodwill has been allocated is tested for impairment annually or more
frequently when there is an indication that the unit may be impaired, by comparing its carrying amount,
including the attributed goodwill, with its recoverable amount. However, if the goodwill allocated to a
cash-generating unit was acquired in a business combination during the current annual period, that unit
shall be tested for impairment before the end of the current annual period. If the recoverable amount of
the cash-generating unit is less than its carrying amount, the impairment loss is allocated first to reduce
the carrying amount of any goodwill allocated to the unit and then pro rata to the other assets of the unit
based on the carrying amount of each asset in the unit. Any impairment loss is recognized directly in
profit or loss. An impairment loss recognized on goodwill is not reversed in subsequent periods.
If goodwill has been allocated to a cash-generating unit and the entity disposes of an operation within that
unit, the goodwill associated with the operation which is disposed of is included in the carrying amount
of the operation when determining the gain or loss on disposal and is measured on the basis of the relative

- 153 -
values of the operation disposed of and the portion of the cash-generating unit retained.
l. Impairment of property, plant and equipment and right-of-use assets
At the end of each reporting period, the Group reviews the carrying amounts of its property, plant and
equipment and right-of-use assets to determine whether there is any indication that those assets have
suffered any impairment loss. If any such indication exists, the recoverable amount of the asset is
estimated in order to determine the extent of the impairment loss. When it is not possible to estimate the
recoverable amount of an individual asset, the Group estimates the recoverable amount of the cash-
generating unit to which the asset belongs. Corporate assets are allocated to the individual cash-generating
unit on a reasonable and consistent basis of allocation.
The recoverable amount is the higher of fair value less costs to sell and value in use. If the recoverable
amount of an asset or cash-generating unit is estimated to be less than its carrying amount, the carrying
amount of the asset or cash-generating unit is reduced to its recoverable amount, with the resulting
impairment loss recognized in profit or loss.
When an impairment loss is subsequently reversed, the carrying amount of the asset or cash-generating
unit is increased to the revised estimate of its recoverable amount, but only to the extent of the carrying
amount that would have been determined had no impairment loss been recognized on the asset or cash-
generating unit in prior years. A reversal of an impairment loss is recognized in profit or loss.
m. Financial Instruments
Financial assets and financial liabilities are recognized when an entity in the Group becomes a party to
the contractual provisions of the instruments.
Financial assets and financial liabilities are initially measured at fair value. Transaction costs that are
directly attributable to the acquisition or issuance of financial assets and financial liabilities (other than
financial assets and financial liabilities at fair value through profit or loss (FVTPL)) are added to or
deducted from the fair value of the financial assets or financial liabilities, as appropriate, on initial
recognition. Transaction costs directly attributable to the acquisition of financial assets or financial
liabilities at FVTPL are recognized immediately in profit or loss.
1) Financial assets
All regular way purchases or sales of financial assets are recognized and derecognized on a trade date
basis.
a) Measurement category
Financial assets are classified into the following categories: financial assets at FVTPL, financial
assets at amortized cost, and investments in equity instruments at fair value through other
comprehensive income (FVTOCI).
i Financial assets at FVTPL
1.
2. Financial assets are classified as at FVTPL when such financial assets are mandatorily
classified as at FVTPL; such assets include debt instruments that do not meet the amortized
cost criteria or the FVTOCI criteria.
3.
4. Financial assets at FVTPL are subsequently measured at fair value, with any gains or
losses arising on remeasurement recognized in profit or loss. The net gain or loss recognized
in profit or loss incorporates any dividends or interest earned on such a financial asset. Fair
value is determined in the manner described in Note 28.
5.
- 154 -
ii Financial assets at amortized cost
6.
7. Financial assets that meet the following conditions are subsequently measured at
amortized cost:
8.
9. i) The financial asset is held within a business model whose objective is to hold financial
assets in order to collect contractual cash flows; and
10. 11. ii) The contractual terms of the financial asset give rise on specified dates to cash flows
that are solely payments of principal and interest on the principal amount outstanding.
12.
13. Subsequent to initial recognition, financial assets at amortized cost, including cash and
cash equivalents, notes and accounts receivable, other receivables, and other financial assets,
are measured at amortized cost, which equals the gross carrying amount determined using the
effective interest method less any impairment loss. Exchange differences are recognized in
profit or loss.
14.
15. Interest income is calculated by applying the effective interest rate to the gross
carrying amount of a financial asset.
16.
17. Cash equivalents include time deposits with original maturities within 3 months from
the date of acquisition, which are highly liquid, readily convertible to a known amount of cash
and are subject to an insignificant risk of changes in value. These cash equivalents are held
for the purpose of meeting short-term cash commitments.
18.
iii Investments in equity instruments at FVTOCI
19.
20. On initial recognition, the Group may make an irrevocable election to designate
investments in equity instruments as at FVTOCI. Designation as at FVTOCI is not permitted
if the equity investment is held for trading or if it is contingent consideration recognized by
an acquirer in a business combination.
21.
22. Investments in equity instruments at FVTOCI are subsequently measured at fair value
with gains and losses arising from changes in fair value recognized in other comprehensive
income and accumulated in other equity. The cumulative gain or loss will not be reclassified
to profit or loss on disposal of the equity investments, instead, it will be transferred to retained
earnings.
23.
24. Dividends on these investments in equity instruments are recognized in profit or loss
when the Group’s right to receive the dividends is established, unless the dividends clearly
represent a recovery of part of the cost of the investment.
b) Impairment of financial assets
The Group recognizes a loss allowance for expected credit losses on financial assets at amortized
cost (including accounts receivable).
The Group always recognizes lifetime expected credit losses (ECLs) for accounts receivable. For
all other financial instruments, the Group recognizes lifetime ECLs when there has been a
significant increase in credit risk since initial recognition. If, on the other hand, the credit risk on
the financial instruments has not increased significantly since initial recognition, the Group
measures the loss allowance for that financial instruments at an amount equal to 12-month ECLs.
Expected credit losses reflect the weighted average of credit losses with the respective risks of
default occurring as the weights. Lifetime ECLs represent the expected credit losses that will
result from all possible default events over the expected life of a financial instrument. In contrast,

- 155 -
12-month ECLs represent the portion of lifetime ECLs that is expected to result from default
events on a financial instrument that are possible within 12 months after the reporting date.
For internal credit risk management purposes, the Group determines that the following situations
indicate that a financial asset is in default without taking into account any collateral held by the
Group:
i Internal or external information shows that the debtor is unlikely to pay its creditors.
ii When a financial asset is more than 180 days past due unless the Group has reasonable and
corroborative information to support a more lagged default criterion.
The Group recognizes an impairment gain or loss in profit or loss for all financial instruments
with a corresponding adjustment to their carrying amount through a loss allowance account.
c) Derecognition of financial assets
The Group derecognizes a financial asset only when the contractual rights to the cash flows from
the asset expire or when it transfers the financial asset and substantially all the risks and rewards
of ownership of the asset to another party.
If the Group neither transfers nor retains substantially all the risks and rewards of ownership and
continues to control the transferred asset, the Group recognizes its retained interest in the asset
and any associated liability for amounts it may have to pay. If the Group retains substantially all
the risks and rewards of ownership of a transferred financial asset, the Group continues to
recognize the financial asset and also recognizes a collateralized borrowing for the proceeds
received.
On derecognition of a financial asset at amortized cost in its entirety, the difference between the
asset’s carrying amount and the sum of the consideration received and receivable is recognized
in profit or loss. On derecognition of an investment in an equity instrument at FVTOCI, the
cumulative gain or loss which had been recognized in other comprehensive income is transferred
directly to retained earnings, without recycling through profit or loss.
2) Equity instruments
Debt and equity instruments issued by the Company are classified as either financial liabilities or as
equity in accordance with the substance of the contractual arrangements and the definitions of a
financial liability and an equity instrument.
Equity instruments issued by the Company are recognized at the proceeds received, net of direct issue
costs.
The repurchase of the Company’s own equity instruments is recognized in and deducted directly from
equity. No gain or loss is recognized in profit or loss on the purchase, sale, issuance or cancellation
of the Company’s own equity instruments.

- 156 -
3) Financial liabilities
a) Subsequent measurement
The Group’s financial liabilities, except for derivative financial instruments, are measured at
amortized cost using the effective interest method.
b) Derecognition of financial liabilities
The difference between the carrying amount of the financial liability derecognized and the
consideration paid, including any non-cash assets transferred or liabilities assumed, is recognized
in profit or loss.
4) Derivative financial instruments
The Group enters into a variety of derivative financial instruments to manage its exposure to foreign
exchange rate risks, including foreign exchange options or forward contracts.
Derivatives are initially recognized at fair value at the date on which the derivative contracts are
entered into and are subsequently remeasured to their fair value at the end of each reporting period.
The resulting gain or loss is recognized in profit or loss immediately unless the derivative is
designated and effective as a hedging instrument; in which event, the timing of the recognition in
profit or loss depends on the nature of the hedging relationship. When the fair value of a derivative
financial instrument is positive, the derivative is recognized as a financial asset; when the fair value
of a derivative financial instrument is negative, the derivative is recognized as a financial liability.
n. Provisions
Provisions, including levies imposed by governments, are measured at the best estimate of the discounted
cash flows of the consideration required to settle the present obligation at the end of the reporting period,
taking into account the risks and uncertainties surrounding the obligation.
o. Revenue Recognition
The Group identifies contracts with customers, allocates the transaction price to the performance
obligations and recognizes revenue when performance obligations are satisfied.
1) Revenue from sale of goods
Revenue from sale of goods comes from sales of composite materials, engineering plastic and
semiconductor. Sales of goods are recognized as revenue when the goods are shipped or delivered to
the customer’s specific location because it is the time when the customer has full discretion over the
manner of distribution and price to sell the goods, has the primary responsibility for sales to future
customers and bears the risks of obsolescence. Accounts receivable are recognized concurrently.
2) Revenue from rendering of services
Commission revenue comes from providing intermediary or agency service to client in the transfer
of merchandise to clients’ customers. The Group recognizes revenue as control of the goods is
transferred to the customer, and the Group has no further obligations to the customer. Other revenue
from rendering of services is recognized as the Group fulfills the obligation.
p. Leasing
At the inception of a contract, the Group assesses whether the contract is, or contains, a lease.

- 157 -
When the Group is a lessee, the Group recognizes right-of-use assets and lease liabilities for all leases at
the commencement date of a lease, except for short-term leases and low-value asset leases accounted for
applying a recognition exemption where lease payments are recognized as expenses on a straight-line
basis over the lease terms.
Right-of-use assets are initially measured at cost, which comprises the initial measurement of lease
liabilities adjusted for lease payments made at or before the commencement date. Right-of-use assets are
subsequently measured at cost less accumulated depreciation and impairment losses and adjusted for any
remeasurement of the lease liabilities. Right-of-use assets are presented on a separate line in the
consolidated balance sheets.
Right-of-use assets are depreciated using the straight-line method from the commencement dates to the
end of the lease terms.
Lease liabilities are initially measured at the present value of the lease payments, which comprise fixed
payments. The lease payments are discounted using the interest rate implicit in a lease. If that rate can be
readily determined. If that rate cannot be readily determined, the Group uses its incremental borrowing
rate.
Subsequently, lease liabilities are measured at amortized cost using the effective interest method, with
interest expense recognized over the lease terms. When there is a change in a lease term, the Group
remeasures the lease liabilities with a corresponding adjustment to the right-of-use-assets. However, if
the carrying amount of the right-of-use assets is reduced to zero, any remaining amount of the
remeasurement is recognized in profit or loss. Lease liabilities are presented on a separate line in the
consolidated balance sheets.
Variable lease payments that do not depend on an index or a rate are recognized as expenses in the periods
in which they are incurred.
q. Borrowing Costs
Borrowing costs directly attributable to an acquisition, construction or production of qualifying assets are
added to the cost of those assets, until such time as the assets are substantially ready for their intended
use or sale.
Other than those stated above, all other borrowing costs are recognized in profit or loss in the year in
which they are incurred.
r. Government Grants
Government grants are not recognized until there is reasonable assurance that the Group will comply with
the conditions attached to them and that the grants will be received.
Government grants related to income are recognized in other income on a systematic basis over the
periods in which the Group recognizes as expenses the related costs that the grants intend to compensate.
s. Employee benefits
1) Short-term employee benefits
Liabilities recognized in respect of short-term employee benefits are measured at the undiscounted
amount of the benefits expected to be paid in exchange for the related services.

- 158 -
2) Retirement benefits
Payments to defined contribution retirement benefit plans are recognized as expenses when
employees have rendered services entitling them to the contributions.
Defined benefit costs (including service cost, net interest and remeasurement) under the defined
benefit retirement benefit plans are determined using the projected unit credit method. Service cost
(including current service cost) and net interest on the net defined benefit liabilities (assets) are
recognized as employee benefits expenses in the period in which they occur. Remeasurement,
comprising actuarial gains and losses and the return on plan assets (excluding interest), is recognized
in other comprehensive income in the period in which it occurs. Remeasurement recognized in other
comprehensive income is reflected immediately in retained earnings and will not be reclassified to
profit or loss.
Net defined benefit liabilities represent the actual deficit in the Group’s defined benefit plans.
t. Taxation
Income tax expense represents the sum of the tax currently payable and deferred tax.
1) Current tax
Income tax payable (refundable) is based on taxable profit (loss) for the year determined according
to the applicable tax laws of each tax jurisdiction.
According to the Income Tax Act of the ROC, an additional tax on unappropriated earnings is
provided for in the year the shareholders approve to retain the earnings.
Adjustments of prior years’ tax liabilities are added to or deducted from the current year’s tax
provision.
2) Deferred tax
Deferred tax is recognized on temporary differences between the carrying amounts of assets and
liabilities and the corresponding tax bases used in the computation of taxable profit.
Deferred tax liabilities are generally recognized for all taxable temporary differences. Deferred tax
assets are generally recognized for all deductible temporary differences to the extent that it is probable
that taxable profits will be available against which those deductible temporary differences can be
utilized.
Deferred tax liabilities are recognized for taxable temporary differences associated with investments
in subsidiaries, except where the Group is able to control the reversal of the temporary difference and
it is probable that the temporary difference will not reverse in the foreseeable future. Deferred tax
assets arising from deductible temporary differences associated with such investments and interests
are only recognized to the extent that it is probable that there will be sufficient taxable profits against
which to utilize the benefits of the temporary differences and they are expected to reverse in the
foreseeable future.
The carrying amount of deferred tax assets is reviewed at the end of each reporting period and reduced
to the extent that it is no longer probable that sufficient taxable profits will be available to allow all
or part of the assets to be recovered. A previously unrecognized deferred tax asset is also reviewed at
the end of each reporting period and recognized to the extent that it has become probable that future
taxable profit will allow the deferred tax asset to be recovered.

- 159 -
Deferred tax liabilities and assets are measured at the tax rates that are expected to apply in the period
in which the liabilities are settled or the assets are realized, based on tax rates and tax laws that have
been enacted or substantively enacted by the end of the reporting period. The measurement of deferred
tax liabilities and assets reflects the tax consequences that would follow from the manner in which
the Group expects, at the end of the reporting period, to recover or settle the carrying amount of its
assets and liabilities.
3) Current and deferred taxes for the year
Current and deferred taxes are recognized in profit or loss, except when they relate to items that are
recognized in other comprehensive income or directly in equity, in which case, the current and
deferred taxes are also recognized in other comprehensive income or directly in equity, respectively.
5. CRITICAL ACCOUNTING JUDGMENTS AND KEY SOURCES OF ESTIMATION
UNCERTAINTY
In the application of the Group’s accounting policies, management is required to make judgments, estimations
and assumptions about the carrying amounts of assets and liabilities that are not readily apparent from other
sources. The estimates and associated assumptions are based on historical experience and other factors that
are considered relevant. Actual results may differ from these estimates.
The Group considers the economic implications of the COVID-19 when making its critical accounting
estimates. The estimates and underlying assumptions are reviewed on an ongoing basis. Revisions to
accounting estimates are recognized in the year in which the estimates are revised if the revisions affect only
that year or in the year of the revisions and future years if the revisions affect both current and future years.
Key sources of estimation uncertainty
a. Estimated impairment of accounts receivable
The provision for impairment of accounts receivable is based on assumptions about risk of default and
expected loss rates. The Group uses judgment in making these assumptions and in selecting the inputs to
the impairment calculation, based on the Group’s historical experience, existing market conditions as
well as forward looking estimates as of the end of each reporting period. For details of the key
assumptions and inputs used, see Note 9. Where the actual future cash inflows are less than expected, a
material impairment loss may arise.
b. Impairment of inventories
The net realizable value of inventories is the estimated selling price in the ordinary course of business
less the estimated costs necessary to make the sale. The estimation of net realizable value is based on
current market conditions and historical experience with product sales of a similar nature. Changes in
market conditions may have a material impact on the estimation of the net realizable value.
6. CASH AND CASH EQUIVALENTS
December 31
2020 2019
Cash on hand $ 1,702 $ 2,742
Demand deposits 2,865,503 1,939,221
Checking accounts 17,702 214,936
(Continued)

- 160 -
December 31
2020 2019
Cash equivalents
Time deposits with original maturities of 3 months or less $ 168,275 $ 191,627
$ 3,053,182 $ 2,348,526
(Concluded)
a. The market rate intervals of cash equivalents at the end of the reporting period were as follows:
December 31
2020 2019
Time deposits (%) 0.20-1.10 0.85-1.97
b. The Group interacts with a variety of financial institutions with sound credit ratings to disperse credit
risk, hence, there was no expected credit loss.
7. FINANCIAL INSTRUMENTS AT FAIR VALUE THROUGH PROFIT OR LOSS - CURRENT
December 31
2020 2019
Financial assets
Mandatorily classified as at FVTPL Hybrid instruments - structured deposits (a) $ 139,576 $ 99,007 Non-derivative financial assets - mutual funds 72,066 72,611 Derivate instruments (not designated for hedge) (b)
Foreign exchange forward contracts 23 - Foreign exchange options contracts - 1,123
$ 211,665 $ 172,741
Financial liabilities
Held for trading Derivative instruments (not designated for hedge) (b)
Foreign exchange forward contracts $ 280 $ 1,372
a. The Group entered into a structured time deposit contract with Bank. The structured time deposit contract
includes an embedded derivative instrument which is not closely related to the host contract. The entire
contract was assessed and mandatorily classified as at FVTPL since it contained a host that is an asset
within the scope of IFRS 9.
b. The Group entered into foreign exchange options or forward contracts to manage exposures to exchange
rate fluctuations of foreign currency denominated assets and liabilities. These contracts did not meet the
criteria of hedge effectiveness and, therefore, were not accounted for using hedge accounting.
At the end of the year, outstanding foreign exchange options contracts were as follows:

- 161 -
December 31, 2020
Currency Maturity Date
Notional Amount
(In Thousands)
Buy USD/Sell RMB 2021.01-2021.02 USD2,000/RMB13,147
Buy JPY/Sell RMB 2021.01 JPY50,000/RMB3,163
December 31, 2019
Currency Maturity Date
Notional Amount
(In Thousands)
Buy RMB/Sell USD 2020.01-2020.03 RMB21,243/USD3,000
Buy THB/Sell USD 2020.01-2020.02 THB9,055/USD300
Buy IDR/Sell USD 2020.01 IDR1,404,500/USD100
As of December 31, 2019, outstanding foreign exchange forward contracts were as follows:
Currency Maturity Date
Notional Amount
(In Thousands)
Buy RMB/Sell USD 2020.01-2020.04 RMB17,630/USD2,500
Buy RMB/Sell JPY 2020.01-2020.02 RMB6,470/JPY100,000
8. FINANCIAL ASSETS AT FAIR VALUE THROUGH OTHER COMPREHENSIVE INCOME
December 31
2020 2019
Current
Domestic investments in equity instruments
Listed shares $ 119,600 $ 68,900
Noncurrent
Domestic investments in equity instruments
Listed shares $ 109,962 $ 30,808
Unlisted shares 426,667 419,792
536,629 450,600
Foreign investments in equity instruments
Listed shares 19,956 30,679
Unlisted shares 77,513 91,702
97,469 122,381
$ 634,098 $ 572,981
These investments in equity instruments are held for medium to long-term strategic purposes. Accordingly,
the management elected to designate these investments in equity instruments as at FVTOCI as they consider
that recognizing short-term fluctuations in these investments’ fair value in profit or loss would not be
consistent with the Group’s strategy of holding these investments for long-term purposes.

- 162 -
In 2020 and 2019, the Group sold some equity shares in order to manage credit concentration risk. The sold
shares had fair values of $47,285 thousand and $4,782 thousand, respectively, and their related unrealized
valuation gain of $26,285 thousand and loss of $4,652 thousand, respectively, were transferred from other
equity to retained earnings.
In 2020, Telelynx Inc. has been liquidated, and the Group received the capital reduction of $1,288 thousand
and transferred the unrealized valuation loss of $7,718 thousand from other equity to retained earnings.
Dividends of $16,696 thousand and $12,714 thousand, respectively, recognized in 2020 and 2019 were all
related to the investments held at December 31, 2020 and 2019, respectively.
9. NOTES RECEIVABLE AND ACCOUNTS RECEIVABLE, NET
December 31
2020 2019
Notes receivable - unrelated parties
Notes receivable - operating $ 2,399,770 $ 1,972,660
Notes receivable - related parties
Notes receivable - operating $ 6,925 $ 15,538
Accounts receivable - unrelated parties
At amortized cost
Gross carrying amount $ 15,327,728 $ 13,596,297
Less: Allowance for impairment loss 215,967 114,296
$ 15,111,761 $ 13,482,001
Accounts receivable - related parties
At amortized cost
Gross carrying amount $ 114,448 $ 105,415
Less: Allowance for impairment loss 1,006 295
$ 113,442 $ 105,120
For the amounts and related terms of factored notes receivable and the carrying amount of notes receivable
pledged as collateral for borrowing, refer to Notes 28 and 30.
The main credit period of sales of goods was 60-90 days. No interest was charged on receivables. In order to
minimize credit risk, the management of the Group has delegated a team responsible for determining credit
limits, credit approvals and other monitoring procedures to ensure that follow-up action is taken to recover
overdue debts. In addition, the Group reviews the recoverable amount of each individual trade debt at the end
of the reporting period to ensure that adequate allowance is made for possible irrecoverable amounts. In this
regard, the management believes the Group’s credit risk was significantly reduced.
The Group measures the loss allowance for accounts receivable at an amount equal to lifetime ECLs. The
expected credit losses on receivables are estimated using a provision matrix prepared by reference to the past
default experience of the customer, the customer’s current financial position, economic condition of the
industry in which the customer operates. As the Group’s historical credit loss experience does not show
significantly different loss patterns for different customer segments, the provision for loss allowance based
on past due status is not further distinguished according to the Group’s different customer base.
The Group writes off receivables when there is evidence indicating that the debtor is in severe financial
difficulty and there is no realistic prospect of recovery, e.g., when the debtor has been placed under

- 163 -
liquidation. For receivables that have been written off, the Group continues to engage in enforcement activity
to attempt to recover the receivables due. Where recoveries are made, these are recognized in profit or loss.
The following table details the loss allowance of receivables as of December 31, 2020 based on the Group’s
provision matrix.
Customers without Signs of Default Customers
Not Past Due
Past Due
1-60 Days
Past Due
61-180 Days
Past Due Over
181 Days
With Signs of
Default Total
Expected credit loss rate (%) 0.01-1 1-10 10-100 50-100 100
Gross carrying amount $ 17,029,388 $ 550,724 $ 69,676 $ 85,484 $ 113,599 $ 17,848,871
Loss allowance (Lifetime ECL) (26,308 ) (15,840 ) (17,301 ) (45,615 ) (111,909 ) (216,973 )
Amortized cost $ 17,003,080 $ 534,884 $ 52,375 $ 39,869 $ 1,690 $ 17,631,898
The following table details the loss allowance of accounts receivable as of December 31, 2019 based on the
Group’s different customer industry categories.
Customers without Signs of Default Customers
Flat Panel
Display
Information
Technology PCB/Mobo Semiconductor Green Energy Other
With Signs of
Default Total
Expected credit loss rate (%) 0.01-0.26 0.01-3.80 0.01-0.15 0.01-0.50 0.01-0.21 0.01-1.21 30-100
Gross carrying amount $ 2,896,513 $ 2,709,290 $ 1,405,816 $ 1,674,667 $ 361,551 $ 4,550,129 $ 103,746 $ 13,701,712
Loss allowance (Lifetime ECL) (1,850 ) (11,572 ) (597 ) (546 ) (109 ) (3,406 ) (96,511 ) (114,591 )
Amortized cost $ 2,894,663 $ 2,697,718 $ 1,405,219 $ 1,674,121 $ 361,442 $ 4,546,723 $ 7,235 $ 13,587,121
The aging of receivables based on the past due days from invoice date was as follows:
December 31,
2019
Up to 90 days $ 12,418,582
91-150 days 2,381,209
151-180 days 156,880
Over 181 days 733,239 $ 15,689,910
The movements of the loss allowance of receivables were as follows:
For the Year Ended December 31
2020 2019
Balance at January 1 $ 114,591 $ 14,748
Acquisitions through business combinations - 12,040
Impairment losses recognized 110,257 89,067
Amounts written off (7,663) (896)
Foreign exchange translation losses (212) (368)
Balance at December 31 $ 216,973 $ 114,591
10. MERCHANDISE
The costs of inventories recognized in cost of goods sold for the years ended December 31, 2020 and 2019
were $53,661,734 thousand and $49,952,454 thousand respectively, which included the following items:
For the Year Ended December 31

- 164 -
2020 2019
Write-downs (reversal) of inventories $ (9,074) $ 53,689
11. OTHER FINANCIAL ASSETS
December 31
2020 2019
Current
Time deposits with original maturities of more than 3 months $ 63,055 $ 66,044
Structured deposits 767,667 791,147
Pledged deposits 1,300 1,345
Refundable deposits 6,190 -
$ 838,212 $ 858,536
Noncurrent
Pledged deposits $ 89,330 $ 79,673
Refundable deposits 107,073 108,899
$ 196,403 $ 188,572
a. The market rate intervals of other financial assets at the end of the reporting period were as follows:
December 31
2020 2019
Time deposits (%) 0.25-3.58 1.00-3.80
b. The counterparties of the Group’s time deposits were banks with good credit ratings with no significant
default concerns, hence, there was no expected credit loss.
c. Refer to Note 30 for information of other financial assets pledged as collateral.
12. SUBSIDIARIES
The subsidiaries in the consolidated financial statements
The detailed information of the subsidiaries at the end of the reporting period was as follows:
Percentage of Ownership
Investor Investee Main Businesses
December 31,
2020
December 31,
2019
Remark
The Company Wah Lee Holding Ltd. International investment 100.00 100.00
Raycong Industrial (H.K.)
Ltd. (Raycong H.K.)
Trading business of
engineering plastic, composite materials and
equipment
53.69 53.69
(Continued)

- 165 -
Percentage of Ownership
Investor Investee Main Businesses
December 31,
2020
December 31,
2019
Remark
Wah Lee Japan Corp. (WL
Japan)
Trading business of
synthetic resin, industrial
plastic, molding machine and electromechanical
parts
83.33 83.33
Wah Lee Korea Ltd. (WL Korea)
Trading business of synthetic resin, industrial
plastic, molding machine
and electromechanical parts
100.00 100.00
Okayama Solar Ltd. Solar power generation
business
- - Note 1
Sakuragawa Solar Ltd. Solar power generation
business
99.99 99.99
Miyazaki Solar Ltd. Solar power generation business
99.99 99.99
P.T. Wahlee Indonesia
(WL Indonesia)
Trading business of
industrial materials
70.00 60.00 Note 2
Meidi H.K. International investment - 80.00 Note 3
Wah Lee Vietnam Co.,
Ltd. (WL Vietnam)
Trading business of
industrial materials
100.00 100.00
QuanShun Logistics Co.,
Ltd. (QuanShun Logistics)
Freight forwarders and
leasing business
63.33 63.33
Wah Tech Industrial Co.,
Ltd. (WL Industrial)
Trading business of
industrial materials
51.00 51.00
Kingstone Energy
Technology Corporation
(KS Corp.)
Battery manufacturing,
renewable energy self-use
power generation equipment business
51.00 51.00 Note 4
Wahlee Green Energy
Corporation (WL Green Corp.)
Battery manufacturing,
renewable energy self-use power generation
equipment business
25.00 25.00 Note 4
Wah Lee Philippines International Corp. (WL
Philippines Corp.)
Trading business of industrial materials
99.99 99.99 Note 5
Wah Lee Philippines Inc. (WL Philippines Inc.)
Trading business of industrial materials
99.99 99.99 Note 6
Wah Heng Energy
Technology Corp. (WH Energy)
Solar power generation
business
100.00 - Note 7
Wah Lee Holding Ltd. SHC Holding Ltd. International investment 100.00 100.00
Wah Lee Teach ( Singapore) Pte., Ltd.
(WL Singapore )
Agency of semiconductor materials and equipment
100.00 100.00
Raycong H.K. Trading business of engineering plastic,
composite materials and
equipment
46.31 46.31
Regent King International
Limited (Regent King
H.K.)
Trading business of
engineering plastic
composite materials and equipment
100.00 100.00
Raycong H.K. Hua Gang International
Trading Co., Ltd.
(Dongguan Hua Gang)
Trading business of
industrial materials
100.00 100.00
Shanghai Yikang
Chemicals and Industries Co., Ltd. (Shanghai
Yikang)
Trading business of
industrial materials
70.00 70.00
Huaying Supply Chain Management (Shenzhen)
Co., Ltd. (Shenzhen
Huaying)
Supply chain management and consultancy service
100.00 100.00
Shanghai Yikang Yadi International Trading
Co., (Shanghai) Ltd.
(Shanghai Yadi)
Import and export business
of goods and techniques
70.00 70.00 Note 8
Lihuang Medical Devices
(Shanghai) Co., Ltd.
(Shanghai Lihuang)
Trading business of
medical devices and
equipment
69.97 69.97 Please refer to
Note 25
(Continued)

- 166 -
Percentage of Ownership
Investor Investee Main Businesses
December 31,
2020
December 31,
2019
Remark
Dongguan Hua Gang Meizhou Bailun
Hemodialysis Co., Ltd.
(Meizhou Bailun)
Hemodialysis and
examination
- 51.00 Note 9
Guang Jou Shing Shian
Medical Management
Consulting Co., Ltd. (Guangjou Shing Shian)
Medical consulting 100.00 100.00 Note 10
Huaying Shenzhen Xiamen Hua Chen Da
Logistics Co., Ltd. ( Xiamen Hua Chen Da)
Warehousing and logistics 70.00 70.00
KS Corp. KSA Energy Corporation
(KSA Corp.)
Battery manufacturing,
renewable energy self-use power generation
equipment business
100.00 100.00 Note 4
KSB Energy Corporation (KSB Corp.)
Battery manufacturing, renewable energy self-use
power generation
equipment business
100.00 100.00 Note 4
Wahlee Green Energy
(WL Green Corp.)
Battery manufacturing,
renewable energy self-use
power generation equipment industry
51.00 51.00 Note 4
KSC Energy Corporation (KSC Corp.)
Solar power generation business
100.00 - Note 11
KSD Energy Corporation
(KSD Corp.)
Solar power generation
business
100.00 - Note 12
WT Industrial P.T. Wah Tech Indonesia
(WT Indonesia)
Trading business of
industrial materials
66.00 66.00 Please refer to
Note 25
QuanShun Logistics Co., Ltd. (Quanshun Logistics)
Chuancheng Logistics Co., Ltd. (Chuancheng
Logistics)
Freight forwarders and leasing business
100.00 - Please refer to Note 26
(Concluded)
Note 1: In July 2019, Okayama Solar Ltd. has been liquidated.
Note 2: The ownership percentage in WL Indonesia increased to 70% due to the subscription of the
Company for additional new shares of WL Indonesia at a percentage different from its existing
shareholding proportion in June 2020. As the transaction did not change the control of the Group
over WL Indonesia, the Group processed the equity transaction by reducing capital surplus by
$846 thousand.
Note 3: In May 2020, Meidi H.K. has been liquidated.
Note 4: The Group acquired KS Corp. and its subsidiaries at May 1, 2019 and obtained 51% ownership,
refer to Note 25. In addition, WL Green Corp. is in the process of liquidation.
Note 5: In September 2019, the Company invested $7,755 thousand (PHP12,750 thousand) in WL
Philippines Corp. which was established in Philippines.
Note 6: In October 2019, the Company invested $7,747 thousand (PHP12,700 thousand) in WL
Philippines Inc. which was established in Philippines.
Note 7: In July 2020, the Company invested $30,000 thousand in WH Energy which was established in
Taiwan.
Note 8: Shanghai Yikang sold some of its equity shares of Shanghai Yadi to unrelated party in February
2019. The ownership percentage in Shanghai Yadi decreased to 70% due to the subscription of
Shanghai Yikang for additional new shares of Shanghai Yadi at a percentage different from its
existing shareholding proportion in June 2019. As the above transaction did not change the control
of the Group over Shanghai Yadi, the Group processed the equity transaction by reducing
unappropriated earnings by $8,049 thousand.

- 167 -
Note 9: In June 2019, Dongguan Hua Gang invested $2,228 thousand (RMB510 thousand) in Meizhou
Bailun which was established in China.
Note 10: In September 2019, Dongguan Hua Gang invested $4,368 thousand (RMB1,000 thousand) in
Guangjou Shing Shian which was established in China.
Note 11: In June 2020, KS Corp. invested $1,000 thousand in KSC Corp. which was established in Taiwan.
Note 12: In November 2020, KS Corp. invested in KSD Corp. which was established in Taiwan. As of
December 31, 2020, the investment amount was $67,000 thousand.
13. INVESTMENTS ACCOUNTED FOR USING THE EQUITY METHOD
December 31
2020 2019
Investments in associates
Material associates
Chang Wah Electromaterials Inc. $ 2,080,267 $ 1,799,523
Associates that are not individually material 2,741,815 2,755,507
4,822,082 4,555,030
Investments in joint ventures
Joint ventures that are not individually material 4,000 -
$ 4,826,082 $ 4,555,030
Refer to Tables 6 and 7 for the main business and location of the investments accounted for using the equity
method.
a. Material associates
Proportion of
Ownership and Voting Rights
December 31
Name of Associate 2020 2019
Chang Wah Electromaterials Inc. 30.98% 30.98%
Fair values (Level 1) of investments in associates with available published price quotation are
summarized as follows:
December 31
Name of Associate 2020 2019
Chang Wah Electromaterials Inc. $ 6,065,702 $ 3,532,554
The summarized financial information below represents amounts shown in the financial statements of
Chang Wah Electromaterials Inc. prepared for the equity accounting purpose.

- 168 -
December 31
2020 2019
Current assets $ 11,117,986 $ 10,022,351
Noncurrent assets 12,201,685 7,993,130
Current liabilities (6,282,083) (5,883,765)
Noncurrent liabilities (8,122,048) (4,084,782)
Equity 8,915,540 8,046,934
Non-controlling interests (2,418,385) (2,455,979)
$ 6,497,155 $ 5,590,955
Percentage of ownership held by the Group (%) 30.98 30.98
Equity attributable to the Group $ 2,012,840 $ 1,732,096
Goodwill 67,427 67,427
Carrying amount $ 2,080,267 $ 1,799,523
For the Year Ended December 31
2020 2019
Operating revenue $ 16,424,018 $ 15,464,381
Net profit for the year $ 1,362,120 $ 1,405,855
Other comprehensive income for the year 744,564 101,575
Total comprehensive income for the year $ 2,106,684 $ 1,507,430
Cash dividends received $ 249,302 $ 237,483
As of December 31, 2020 and 2019, the Company’s dividends receivable from Chang Wah
Electromaterials Inc. were $51,455 thousand and $81,140 thousand, respectively.
b. Aggregate information of associates that are not individually material
For the Year Ended December 31
2020 2019
The Group’s share of
Net profit for the year $ 271,096 $ 190,198
Other comprehensive income (loss) for the year 19,293 (65,782)
Total comprehensive income for the year $ 290,389 $ 124,416
c. Fluctuation in investment in associates and joint ventures
1) The Company purchased 156 thousand shares of Wah Hong Industrial Corp. from the open market in
the amount of $3,005 thousand. The shareholdings in Wah Hong Industrial Corp. had increased from
26.11% to 26.67%.
2) Shanghai Yikang sold all of its equity shares of Shanghai Chang Wah Electromaterials Inc. to Chang
Wah Electromaterials Inc. in June 2020 for $82,897 thousand (RMB19,729 thousand) and recognized
loss on disposal of investment under the equity method for $4,688 thousand.

- 169 -
3) Huaying Shenzhen subscribed for additional new shares of Jianyinrong Logistics at existing
shareholding proportion in the amount of $5,391 thousand (RMB1,180 thousand) in January 2019.
4) Huaying Shenzhen subscribed for additional new shares of Xiamen Jiashengyuan at existing
shareholding proportion in the amount of $1,919 thousand (RMB420 thousand) in January 2019.
5) The Company signed a joint venture agreement with a Japanese company in December 2020 to jointly
establish ORC Electrical Machinery Co., Ltd (ORC Co.). According to the joint venture agreement,
the Company invested $4,000 thousand to obtain 40% of the equity, and the two parties jointly led
the operating activities of ORC Co.
14. PROPERTY, PLANT AND EQUIPMENT
For the year ended December 31, 2020
Freehold
Land Buildings
Power
Generation
Equipment
Other
Equipment
Property
under
Construction Total
Cost
Balance at January 1, 2020 $ 895,247 $ 1,042,511 $ 1,786,703 $ 818,826 $ 244,465 $ 4,787,752 Acquisitions through business
combinations
-
-
-
4,275
-
4,275
Additions - 1,574 28,516 91,151 230,358 351,599 Disposals (151,085 ) - (10,556 ) (25,217 ) (3,009 ) (189,867 )
Reclassified - - 168,622 - (168,622 ) -
Effect of foreign currency exchange differences
68
(68 )
395
5,156
-
5,551
Balance at December 31, 2020 $ 744,230 $ 1,044,017 $ 1,973,680 $ 894,191 $ 303,192 $ 4,959,310
Accumulated depreciation
Balance at January 1, 2020 $ - $ 295,986 $ 122,637 $ 568,635 $ - $ 987,258
Acquisitions through business
combinations
-
-
-
2,280
-
2,280 Depreciation expense - 29,123 96,441 78,188 - 203,752
Disposals - - (10,556 ) (10,103 ) - (20,659 )
Effect of foreign currency exchange differences
-
1,427
-
(326 )
-
1,101
Balance at December 31, 2020 $ - $ 326,536 $ 208,522 $ 638,674 $ - $ 1,173,732
Carrying amount at December 31, 2020 $ 744,230 $ 717,481 $ 1,765,158 $ 255,517 $ 303,192 $ 3,785,578
For the year ended December 31, 2019
Freehold
Land Buildings
Power
Generation
Equipment
Other
Equipment
Property
under
Construction Total
Cost
Balance at January 1, 2019 $ 741,916 $ 1,034,978 $ 261,451 $ 761,244 $ 23,080 $ 2,822,669
Acquisitions through business combinations
151,085
-
1,199,144
7,479
204,475
1,562,183
Additions 2,868 27,456 42,491 84,668 305,165 462,648
Disposals - (185 ) - (31,646 ) - (31,831 )
Reclassified
-
-
- 291,335
-
(291,335 )
-
Effect of foreign currency exchange
differences
(622 )
(19,738 )
(7,718 )
(2,919 )
3,080
(27,917 )
Balance at December 31, 2019 $ 895,247 $ 1,042,511 $ 1,786,703 $ 818,826 $ 244,465 $ 4,787,752
(Continued)

- 170 -
Freehold
Land Buildings
Power
Generation
Equipment
Other
Equipment
Property
under
Construction Total
Accumulated depreciation
Balance at January 1, 2019 $ - $ 271,835 $ 25,181 $ 524,798 $ - $ 821,814 Acquisitions through business
combinations
-
-
39,845
1,537
-
41,382
Depreciation expense - 29,908 58,221 73,620 - 161,749 Disposals - (185 ) - (29,462 ) - (29,647 )
Effect of foreign currency exchange
differences
-
(5,572 )
(610 )
(1,858 )
-
(8,040 )
Balance at December 31, 2019 $ - $ 295,986 $ 122,637 $ 568,635 $ - $ 987,258
Carrying amount at December 31, 2019 $ 895,247 $ 746,525 $ 1,664,066 $ 250,191 $ 244,465 $ 3,800,494
(Concluded)
a. Reconciliation of the additions to property, plant and equipment and the cash paid stated in the statements
of cash flows is as follows:
For the Year Ended December 31
2020 2019
Additions to property, plant and equipment $ 351,599 $ 462,648
Capitalization of interest (12,644) (2,304)
Increase (decrease) in prepayments for equipment 18,957 (12,694)
Decrease (increase) in payables for equipment 17,206 (17,151)
Increase in provisions (27,115) -
Cash paid $ 348,003 $ 430,499
b. Property, plant and equipment are depreciated on a straight-line basis over the following estimated useful
lives:
Buildings
Office 20-63 years
Office interior decoration 5-11 years
Power generation equipment 7-20 years
Others 2-15 years
c. Refer to Note 30 for the carrying amount of property, plant and equipment pledged as collateral for
borrowings.
15. LEASE ARRANGEMENTS
a. Right-of-use assets
For the year ended December 31, 2020
Land Buildings
Other
Equipment Total
Balance at January 1, 2020 $ 3,317 $ 135,470 $ 9,059 $ 147,846 Additions 28,884 524,091 2,771 555,746 Depreciation expense (2,029) (74,617) (3,352) (79,998)
(Continued)

- 171 -
Land Buildings
Other
Equipment Total
Effects of foreign currency
exchange differences $ 44
$ 607 $ - $ 651 Balance at December 31, 2020 $ 30,216 $ 585,551 $ 8,478 $ 624,245
(Concluded)
For the year ended December 31, 2019
Land Buildings
Other
Equipment Total
Balance at January 1, 2019 $ - $ - $ - $ - Adjustments on initial application
of IFRS 16 3,649
129,964 - 133,613 Balance at January 1, 2019
(adjusted) 3,649
129,964 - 133,613 Acquisitions through business
combinations -
35,563 2,471 38,034 Additions - 28,725 8,737 37,462 Depreciation expense (200) (50,416) (2,139) (52,755) Lease modification - (5,506) - (5,506) Effects of foreign currency
exchange differences (132)
(2,860) (10) (3,002) Balance at December 31, 2019 $ 3,317 $ 135,470 $ 9,059 $ 147,846
b. Lease liabilities
December 31
2020 2019
Carrying amount
Current $ 64,747 $ 32,649
Noncurrent $ 566,902 $ 109,532
Range of discount rate (%) for lease liabilities was as follows:
December 31
2020 2019
Land 1.85 -
Buildings 1.50-4.80 1.80-4.80
Other equipment 0.98-4.80 1.80-4.80
c. Material leasing activities and terms
The Group leases abovementioned subjects for the use of office and warehouse, for installation of power
generation equipment, and transportation equipment with lease terms of 1 to 20 years, which will expire
from February 2021 to December 2043. The Group does not have bargain purchase options to acquire the
leasehold subjects at the end of the lease terms.

- 172 -
d. Other lease information
For the Year Ended December 31
2020 2019
Expenses relating to short-term leases $ 107,978 $ 126,200
Expenses relating to low-value asset leases $ 4,757 $ 3,843
Expenses relating to variable lease payments not included in the
measurement of lease liabilities
$ 6,897 $ 15,372
Total cash outflow for leases $ 197,727 $ 204,023
The Group’s leases of certain subjects qualify as short-term or low-value asset leases, and the Group has
elected to apply the recognition exemption and thus, did not recognize right-of-use assets and lease
liabilities for these leases.
16. BORROWINGS
a. Short-term borrowings
December 31
2020 2019
Secured bank loans (Note 30) $ 709,245 $ 1,046,567
Unsecured bank loans 6,691,691 5,720,686
Others (Note 29) - 23,000
$ 7,400,936 $ 6,790,253
Annual interest rate (%) 0.50-3.70 0.43-3.92
b. Short-term bills payable
December 31,
2020
Short-term bills payable China Bills Finance Corporation $ 30,000 Mega Bills Finance Corporation 30,000 60,000
Less: Discount on short-term bills payable 83 $ 59,917
Annual interest rate (%) 1.64-1.79
c. Long-term borrowings December 31
2020 2019
Unsecured borrowings
Syndicated bank loans (Note 1) $ 1,799,823 $ 1,799,438
Less: Syndicated loan fee 4,320 5,760
1,795,503 1,793,678
(Continued)

- 173 -
December 31
2020 2019
Bank loans (Note 2) $ 1,240,707 $ 1,265,830
3,036,210 3,059,508
Secured borrowings (Note 30)
Syndicated bank loans (Note 3) 1,080,081 998,755
Less: Syndicated loan fee 11,822 7,513
1,068,259 991,242
Bank loans 540,149 706,625
Others 919 3,090
1,609,327 1,700,957
Less: Current portions 538,534 250,456 $ 4,107,003 $ 4,510,009
Annual interest rate (%)
Syndicated bank loans 0.66-1.85 0.66-1.90
Bank loans 0.87-2.07 0.94-3.16
Others 3.00 3.00
Expiration period
Syndicated bank loans 2023.01-2024.10 2023.01-2024.10
Bank loans 2021.02-2037.06 2020.06-2037.06
Others 2021.08 2021.08
(Concluded)
Note 1: The Company signed a syndicated loan agreement with eleven banks led by Bank of Taiwan in
December 2018. The main contents of the syndicated loan agreement are as follows:
1) The total amount of syndicated bank loans is $3.6 billion, which is a medium-term cyclical
loan and commercial paper issued with insurance quotation. The term of the loan is 5 years
from the initial drawdown date (January 2019). Fractional reserve and debt recycling is
available within the total amount of syndicated loans.
2) Pursuant to the bank loan agreement, the Group should maintain certain financial ratios
which should be calculated based on audited annual consolidated financial statements. The
Group had met the requirement as of December 31, 2020 and 2019.
Note 2: Pursuant to certain bank loan agreements, the Group should maintain certain financial ratios
which should be calculated based on audited annual and unreviewed semiannual consolidated
financial statements. The Group had met the requirement as of December 31, 2020 and 2019.
Note 3: The subsidiaries KS Corp., KSA Corp. and KSB Corp. signed a syndicated loan agreement with
five banks led by Bank SinoPac in September 2019. The main contents of the syndicated loan
agreement are as follows:
1) The total amount of syndicated bank loans is $4 billion, divided into credit limit A, credit
limit B and credit limit C, which are non-revolving credit.
a) The total amount of credit limit A is $2.628 billion, which has to be fully paid off 36
months after the initial drawdown date.
b) The total amount of credit limit B is $2.628 billion, the first repayment will be made 6

- 174 -
months after the initial drawdown date and subsequent repayment will be made every 3
months, for a total of 19 periods. The repaid amount for period 1 through period 19 is
34% of the principal and the repaid amount for period 19 is 66% of the principal.
Application for extension is acceptable.
c) The total amount of credit limit C is $1.715 billion, the first repayment will be made 3
months after the initial drawdown date and subsequent repayment will be made every
three months, for a total of 20 periods. The repaid amount for period 1 through period
20 is 36% of the principal and the repaid amount for period 20 is 64% of the principal.
Application for extension is acceptable.
2) Pursuant to bank loan agreements, each individual borrower should maintain certain
financial ratios which should be calculated based on audited annual and unreviewed
semiannual standalone financial statements. Each individual borrower had met the
requirement as of December 31, 2020 and 2019.
17. NOTES PAYABLE AND ACCOUNTS PAYABLE
Notes payable and accounts payable (including related parties) are mainly related to operating activities.
Trading conditions are negotiated separately. The Group has formulated a financial risk management policy,
in order to ensure all payables are paid within the pre-agreed credit period; therefore, no interest is required.
18. OTHER PAYABLES
December 31
2020 2019
Payable for salaries or bonuses $ 673,642 $ 524,065
Payable for employees’ compensation and remuneration to directors 237,733 222,010
Payable for commission 28,960 18,366
Payable for freight fee 26,010 22,970
Payable for insurance premium 22,861 18,042
Payable for business tax 40,832 83,861
Payable for equipment 6,871 24,077
Others 186,904 204,837
$ 1,223,813 $ 1,118,228
19. RETIREMENT BENEFIT PLANS
a. Defined contribution plans
The Company adopted a pension plan under the Labor Pension Act (LPA), which is a state-managed
defined contribution plan. Under the LPA, the Company makes monthly contributions to employees’
individual pension accounts at 6% of monthly salaries and wages.
Subsidiaries are required by local regulations to make contributions to central provident fund and
retirement insurance, which are also considered defined contribution plans.

- 175 -
b. Defined benefit plans
The defined benefit plan adopted by the Company in accordance with the Labor Standards Act is operated
by the government of the ROC. Pension benefits are calculated on the basis of the length of service and
average monthly salaries of the 6 months before retirement. The Company contributes amounts equal to
8% of total monthly salaries and wages to a pension fund administered by the pension fund monitoring
committee. Pension contributions are deposited in the Bank of Taiwan in the committee’s name. Before
the end of each year, the Company assesses the balance in the pension fund. If the amount of the balance
in the pension fund is inadequate to pay retirement benefits for employees who conform to retirement
requirements in the next year, the Company is required to fund the difference in one appropriation that
should be made before the end of March of the next year. The pension fund is managed by the Bureau of
Labor Funds, Ministry of Labor (the “Bureau”); the Company has no right to influence the investment
policy and strategy.
The subsidiaries Raycong H.K. and WT Industrial both have pension plans covering eligible employees,
which is also considered defined benefit plan.
The amounts included in the consolidated balance sheets in respect of the Group’s defined benefit plans
were as follows: December 31
2020 2019
Present value of defined benefit obligation $ 414,688 $ 431,598
Fair value of plan assets (99,848) (110,930)
Net defined benefit liability $ 314,840 $ 320,668
Movements in net defined benefit liability were as follows:
Present Value
of the Defined
Benefit
Obligation
Fair Value of
the Plan Assets
Net Defined
Benefit
Liabilities
Balance at January 1, 2019 $ 456,907 $ (117,671) $ 339,236 Service cost
Current service cost 5,309 - 5,309 Past service cost (566) - (566)
Net interest expense (income) 3,241 (915) 2,326 Recognized in profit or loss 7,984 (915) 7,069 Remeasurement
Return on plan assets (excluding amounts
included in net interest) - (4,255)
(4,255) Actuarial loss - changes in financial
assumptions 3,650 -
3,650 Actuarial gain - changes in demographic
assumptions (12) -
(12) Actuarial gain - experience adjustments (8,758) - (8,758)
Recognized in other comprehensive income (5,120) (4,255) (9,375) Contributions from the employer - (12,093) (12,093) (Continued)

- 176 -
Present Value
of the Defined
Benefit
Obligation
Fair Value of
the Plan Assets
Net Defined
Benefit
Liabilities
Benefits paid $ (28,202) $ 24,004 $ (4,198) Exchange differences on foreign plans 29 - 29 Balance at December 31, 2019 431,598 (110,930) 320,668 Service cost
Current service cost 2,370 - 2,370 Past service cost (42) - (42)
Net interest expense (income) 2,623 (741) 1,882 Recognized in profit or loss 4,951 (741) 4,210 Remeasurement
Return on plan assets (excluding amounts
included in net interest) - (3,873)
(3,873) Actuarial loss - changes in financial
assumptions 11,720 -
11,720 Actuarial gain - experience adjustments (3,377) - (3,377)
Recognized in other comprehensive income 8,343 (3,873) 4,470 Contributions from the employer - (11,508) (11,508) Benefits paid (29,446) 27,204 (2,242) Exchange differences on foreign plans (758) - (758) Balance at December 31, 2020 $ 414,688 $ (99,848) $ 314,840
(Concluded)
Through the defined benefit plans under the Labor Standards Act, the Company is exposed to the
following risks:
1) Investment risk
The plan assets are invested in domestic and foreign equity and debt securities, bank deposits, etc.
The investment is conducted at the discretion of the Bureau or under the mandated management.
However, in accordance with relevant regulations, the return generated by plan assets should not be
below the interest rate for a 2-year time deposit with local banks.
2) Interest risk
A decrease in the government bond interest rate will increase the present value of the defined benefit
obligation; however, this will be partially offset by an increase in the return on the plan’s debt
investments.
3) Salary risk
The present value of the defined benefit obligation is calculated by reference to the future salaries of
plan participants. As such, an increase in the salaries of the plan participants will increase the present
value of the defined benefit obligation.

- 177 -
The actuarial valuations of the present value of the defined benefit obligation were carried out by qualified
actuaries. The significant assumptions used for the purposes of the actuarial valuations were as follows:
December 31
2020 2019
Discount rate (%) 0.30 0.65
Expected rate of salary increase (%) 2.00 2.00
If possible reasonable changes in each of the significant actuarial assumptions will occur and all other
assumptions will remain constant, the present value of the defined benefit obligation would increase
(decrease) as follows:
December 31
2020 2019
Discount rate(s)
0.25% increase $ (8,425) $ (9,008)
0.25% decrease $ 8,711 $ 9,319
Expected rate(s) of salary increase
0.25% increase $ 8,542 $ 9,170
0.25% decrease $ (8,307) $ (8,913)
The sensitivity analysis presented above may not be representative of the actual change in the present
value of the defined benefit obligation as it is unlikely that the change in assumptions would occur in
isolation of one another as some of the assumptions may be correlated.
December 31
2020 2019
The expected contributions to the plan for the next year $ 26,354 $ 27,009
The average duration of the defined benefit obligation 8 years 8 years
20. EQUITY
a. Share capital
December 31
2020 2019
Number of authorized shares (in thousands) 500,000 500,000
Amount of authorized shares $ 5,000,000 $ 5,000,000
Number of issued and fully paid shares (in thousands) 231,390 231,390
Amount of issued and fully paid shares $ 2,313,901 $ 2,313,901
Fully paid ordinary shares, which have a par value of $10, carry one vote per share and carry a right to
dividends. Based on the Company’s articles of incorporation (the “Articles”), part of authorized shares
can be issued as preferred shares.

- 178 -
b. Capital surplus
December 31
2020 2019
May be used to offset a deficit, distributed
as cash dividends, or transferred to share capital (Note)
Issuance of share capital $ 1,160,519 $ 1,160,519
Difference between consideration paid and the carrying amount
of the subsidiaries’ net assets during actual acquisition - 29
May be used only to offset a deficit
Donations 11,867 11,867
Expired share options 22,374 22,374
Share of changes in capital surplus of associates 21,755 22,572
May not be used for any purpose
Share of changes in capital surplus of associates 115,210 100,704
$ 1,331,725 $ 1,318,065
Note: Such capital surplus may be used to offset a deficit; in addition, when the Company has no deficit,
such capital surplus may be distributed as cash dividends or transferred to share capital (limited
to a certain percentage of the Company’s capital surplus and to once a year).
c. Retained earnings and dividends policy
Under the dividends policy as set forth in the Articles, where the Company made a profit in a fiscal year,
the profit shall be first utilized for paying taxes, offsetting losses of previous years, setting aside as a legal
reserve 10% of the remaining profit, except when the accumulated amount of such legal reserve equals
to the Company’s total issued capital, setting aside or reversing a special reserve in accordance with the
laws and regulations, and then any remaining profit together with any undistributed retained earnings
shall be used by the Company’s board of directors as the basis for proposing a distribution plan, which
should be resolved in the shareholders’ meeting for the distribution of dividends and bonuses to
shareholders. The common share dividends will be distributed after the distribution of preferred share
dividends based on the Articles.
The dividend policy of the Company is based on the current and future development plans, investment
environment, capital requirements and competition in the domestic and foreign markets, as well as the
benefits of shareholders, etc. The dividends to shareholders shall be not less than 10% of the distributable
earnings each year, but if the distributable earnings is less than 1% of the Company’s paid-in capital, the
Company should not make appropriation for dividends. The dividends to shareholders can be paid in cash
or/and issued shares, but cash dividends shall be not less than 50% of the total dividends.
Legal reserve may be used to offset deficit. If the Company has no deficit and the legal reserve has
exceeded 25% of the Company’s paid-in capital, the excess may be transferred to capital or distributed
in cash.
Items referred to under Rule No. 1010012865 and Rule No. 1010047490 issued by the FSC and in the
directive titled “Questions and Answers for Special Reserves Appropriated Following Adoption of
IFRSs” should be appropriated to or reversed from a special reserve by the Company. On the first-time
adoption of IFRSs, the Company appropriated to the special reserve $72,302 thousand.

- 179 -
The appropriations of earnings for 2019 and 2018 had been approved in the shareholders’ meetings in
May 2020 and 2019, respectively; the amounts were as follows:
Appropriation of Earnings Dividends Per Share (NT$)
For the Year Ended
December 31
For the Year Ended
December 31
2019 2018 2019 2018
Legal reserve $ 143,424 $ 134,596
Special reserve 300,740 601,187
Cash dividends to shareholders 763,587 740,448 $ 3.3 $ 3.2
$ 1,207,751 $ 1,476,231
The appropriations of earnings for 2020 had been proposed by the Company’s board of directors on
March 26, 2021. The appropriations and dividends per share were as follows:
Appropriation
of Earnings
Dividends Per
Share (NT$)
Legal reserve $ 183,957
Special reserve $ (343,469)
Cash dividends to shareholders $ 925,561 $ 4.0
The Company’s board of directors also proposed to transfer the amount of $46,278 thousand from capital
surplus to share capital, issue share dividend equivalent to $0.2 per share, and increase capital by 4,628
thousand new ordinary shares.
The appropriations of earnings for 2020 and capital surplus transferred to share capital are subject to the
resolution in the shareholders’ meeting to be held on May 28, 2021.
d. Other equity items
1) Exchange differences on translating the financial statements of foreign operations
For the Year Ended December 31
2020 2019
Balance at January 1 $ (607,512) $ (355,909)
Recognized for the year
Exchange differences on translating the financial
statements of foreign operations 15,159 (202,505)
Share from associates accounted for using the equity
method 9,920 (93,657)
Income tax (4,571) 45,714
Reclassification adjustment
Disposal of foreign operations 3,371 (1,155)
Balance at December 31 $ (583,633) $ (607,512)

- 180 -
2) Unrealized gain on financial assets at FVTOCI
For the Year Ended December 31
2020 2019
Balance at January 1 $ (372,575) $ (323,438)
Recognized for the year
Unrealized gain (loss) - equity instruments 110,390 (114,290)
Share from associates accounted for using the equity
method 235,449
72,404
Income tax 6,911 11,672
Cumulative unrealized loss (gain) of equity instruments
transferred to retained earnings due to disposal
Equity instruments of the Group (18,567) 4,652
Share from associates accounted for using the equity
method (14,593)
(23,575)
Balance at December 31 $ (52,985) $ (372,575)
e. Non-Controlling interests
For the Year Ended December 31
2020 2019
Balance at January 1 $ 1,839,706 $ 1,343,281
Other comprehensive income (loss) during the year
Net profit for the year 186,996 143,259
Exchange differences on translating the financial statements of
foreign operations (1,904) (36,608)
Adjustments relating to changes in capital surplus of associates
accounted for using the equity method - 7,323
Non-controlling interests arising from subsidiaries’ capital
increase 11,729 16,736
Non-controlling interests arising from acquisition of subsidiaries
(Note 25) - 386,043
Cash dividends distributed to non-controlling interests (3,196) (20,328)
Capital refund from subsidiaries (2,880) -
Balance at December 31 $ 2,030,451 $ 1,839,706
21. REVENUE
For the Year Ended December 31
2020 2019
Revenue from contracts with customers
Revenue from sale of goods $ 58,183,071 $ 53,969,523
Other operating revenue 897,849 712,306
$ 59,080,920 $ 54,681,829

- 181 -
a. Contract balances
December 31,
2020
December 31,
2019
January 1,
2019
Notes receivable (including related parties) $ 2,406,695 $ 1,988,198 $ 1,823,042
Net accounts receivable (including related
parties)
15,225,203 13,587,121 13,331,880
$ 17,631,898 $ 15,575,319 $ 15,154,922
Contract liabilities
Sale of goods $ 345,351 $ 289,480 $ 151,748
The changes in the balance of contract liabilities primarily result from the timing difference between the
date the Group fulfills its performance obligation and the date the customer’s payment is received. There
are no significant changes for the years ended December 31, 2020 and 2019, except the increase in
contract liabilities of $30,449 thousand due to the acquisition of subsidiaries in 2019.
Revenue in the reporting period recognized from the beginning contract liabilities is as follows:
For the Year Ended December 31
2020 2019
Sale of goods $ 286,976 $ 151,748
b. Disaggregation of revenue
Refer to Note 34 for information about the disaggregation of revenue.
22. NET PROFIT
The details of net profit were as follows:
a. Other income (Note 29)
For the Year Ended December 31
2020 2019
Rental income $ 25,068 $ 21,213
Dividends 16,696 12,714
Consulting service income 38,551 16,963
Government grants 31,625 50,497
Others 39,797 48,571
$ 151,737 $ 149,958
b. Other gains and losses
For the Year Ended December 31
2020 2019
Fair value changes of financial instruments designated as at
FVTPL $ (6,464) $ (4,814)
(Continued)

- 182 -
For the Year Ended December 31
2020 2019
Net foreign exchange loss $ (31,107) $ (5,502)
Gains on disposals of property, plants and equipment 24,182 1,189
Others (38,060) (20,362)
$ (51,449) $ (29,489)
(Concluded)
c. Financial costs
For the Year Ended December 31
2020 2019
Interest on bank loans $ 197,174 $ 269,138
Syndicated loan fee amortization 3,050 3,417
Interest on lease liabilities 11,203 3,775
Less: amount included in cost of qualifying assets 6,778 2,304
$ 204,649 $ 274,026
Capitalized rate (%) 1.85 1.90
d. Depreciation and amortization
For the Year Ended December 31
2020 2019
Property, plant and equipment $ 203,752 $ 161,749
Right-of-use assets 79,998 52,755
Intangible assets 33,750 26,781
Other noncurrent assets 7,323 5,034
Less: amount included in cost of qualifying assets 5,866 -
$ 318,957 $ 246,319
An analysis of depreciation by function
Operating costs $ 166,101 $ 92,986
Operating expenses 111,783 121,518
$ 277,884 $ 214,504
An analysis of amortization by function
Operating costs $ 9,700 $ 4,145
Operating expenses 31,373 27,670
$ 41,073 $ 31,815

- 183 -
e. Employee benefits expense
For the Year Ended December 31
2020 2019
Short-term employee benefits $ 1,566,685 $ 1,406,989
Post-employment benefits
Defined contribution plans 39,632 54,178
Defined benefit plans (Note 19) 4,210 7,069
43,842 61,247
$ 1,610,527 $ 1,468,236
An analysis of employee benefits expense by function
Operating costs $ 87,960 $ 58,611
Operating expenses 1,522,567 1,409,625
$ 1,610,527 $ 1,468,236
f. Compensation of employees and remuneration of directors
The Company accrued compensation of employees and remuneration of directors at the rates between
9% and 13% and no higher than 2%, respectively, of net profit before income tax, compensation of
employees, and remuneration of directors. The compensation of employees and remuneration of directors
for the years ended December 31, 2020 and 2019 which have been approved by the Company’s board of
directors on March 26, 2021 and March 25, 2020, were as follows:
For the Year Ended December 31 2020 2019
Withdrawal
Rate (%)
Amount
Withdrawal
Rate (%)
Amount
Compensation of employees paid in cash 9 $ 210,798 11 $ 200,997
Remuneration of directors paid in cash 1.15 26,935 1.15 21,013
If there is a change in the proposed amounts after the annual consolidated financial statements were
authorized for issue, the differences are recorded as a change in the accounting estimate.
There was no difference between the actual amounts of compensation of employees and remuneration of
directors paid and the amounts recognized in the consolidated financial statements for the years ended
December 31, 2019 and 2018.
Information on the compensation of employees and remuneration of directors resolved by the Company’s
board of directors in 2020 and 2019 is available at the Market Observation Post System website of the
Taiwan Stock Exchange.

- 184 -
23. INCOME TAX
a. The major components of income tax expense recognized in profit or loss
For the Year Ended December 31
2020 2019 Current tax
In respect of the current year $ 494,473 $ 385,625 Income tax on unappropriated earnings 11,325 13,869 Adjustments for prior years 391 7,702
506,189 407,196 Deferred tax
In respect of the current year 83,330 (113) $ 589,519 $ 407,083
The reconciliation of accounting profit and income tax expenses is as follows:
For the Year Ended December 31
2020 2019
Profit before tax $ 2,635,635 $ 1,966,164
Income tax expense calculated at the statutory rate $ 573,250 $ 418,251
Nondeductible expenses in determining taxable income 6,972 5,219
Domestic investment income (113,398) (103,673)
Deferred tax effect of earnings of subsidiaries 99,715 64,196
Other adjustments 6,912 (4,849)
Income tax on unappropriated earnings 11,325 13,869
Adjustments for prior years 391 7,702
Nondeductible withholding tax 4,352 6,368
$ 589,519 $ 407,083
The corporate income tax rate is 20%, the applicable tax rate used by subsidiaries in China is 25%, the
applicable tax rate used by subsidiaries in Singapore is 17%, the applicable tax rate used by subsidiaries
in Thailand is 20%, and tax rates used by other entities in the Group operating in other jurisdictions are
based on the tax laws in those jurisdictions.
As the status of appropriations of earnings for 2021 is uncertain, the potential income tax consequences
of the 2020 unappropriated earnings are not reliably determinable.
b. Income tax benefit recognized directly in equity - only for the year ended December 31, 2019
Amount
Deferred tax benefit
Disposal parts of subsidiaries’ equity $ 2,012

- 185 -
c. Income tax benefit recognized in other comprehensive income
For the Year Ended December 31
2020 2019
Deferred tax benefit
In respect of the current year
Unrealized loss on financial assets at FVTOCI $ 6,911 $ 11,672
Remeasurement on defined benefit plan 893 (1,875)
Translation of foreign operations (4,571) 45,714
$ 3,233 $ 55,511
d. Current tax assets and liabilities
December 31
2020 2019
Current tax assets $ 114 $ -
Income tax payable $ 272,968 $ 221,112
e. Deferred tax assets and liabilities
The movements of deferred tax assets and liabilities were as follows:
For the year ended December 31, 2020
Opening
Balance
Recognized in
Profit or Loss
Recognized in
Other
Comprehensive
Income
Exchange
Differences Closing Balance
Deferred Tax Assets
Temporary differences
Provision for loss on inventories $ 42,769 $ (7,995 ) $ - $ 557 $ 35,331 Unpaid bonuses 67,470 20,544 - 368 88,382
Refund liabilities 32,164 2,627 - - 34,791 Unrealized consulting expenses 27,248 237 - 369 27,854
Defined benefit plans 62,456 (3,347 ) 893 - 60,002
Foreign operations loss and exchange differences
36,511 (4,655 ) 3,987 - 35,843
Others 57,031 4,109 1,929 (234 ) 62,835
325,649 11,520 6,809 1,060 345,038 Loss carryforwards - 93 - - 93
$ 325,649 $ 11,613 $ 6,809 $ 1,060 $ 345,131
Deferred Tax Liabilities
Temporary differences Foreign operations income and exchange
differences
$ 1,046,988 $ 95,044 $ 3,576 $ - $ 1,145,608
Others 9,845 (101 ) - - 9,744
$ 1,056,833 $ 94,943 $ 3,576 $ - $ 1,155,352

- 186 -
For the year ended December 31, 2019
Opening
Balance
Recognized in
Profit or Loss
Recognized in
Other
Comprehensive
Income
Recognized in
Retained
Earnings
Business
Combination
Exchange
Differences Closing Balance
Deferred Tax Assets
Temporary differences
Provision for loss on inventories $ 38,100 $ 5,401 $ - $ - $ 112 $ (844 ) $ 42,769
Unpaid bonuses 54,485 13,635 - - - (650 ) 67,470
Refund liabilities 26,159 6,005 - - - - 32,164
Unrealized consulting expenses 27,580 702 - - - (1,034 ) 27,248
Defined benefit plans 66,667 (2,301 ) (1,875 ) - - (35 ) 62,456
Foreign operations loss and
exchange differences
29,405 (2,147 ) 9,253
-
- - 36,511
Others 31,595 24,913 - - 1,439 (916 ) 57,031
$ 273,991 $ 46,208 $ 7,378 $ - $ 1,551 $ (3,479 ) $ 325,649
Deferred Tax Liabilities
Temporary differences
Foreign operations income and
exchange differences
$ 1,046,986 $ 50,147 $ (48,133 )
$ (2,012 )
$ - $ - $ 1,046,988
Others 12,493 (4,052 ) - - 1,404 - 9,845
$ 1,059,479 $ 46,095 $ (48,133 ) $ (2,012 ) $ 1,404 $ - $ 1,056,833
f. Deductible temporary differences for which no deferred tax assets have been recognized in the
consolidated balance sheets
December 31
2020 2019
Evaluation loss of foreign investments $ 116,383 $ 116,383
g. Information about unused loss carryforwards
As of December 31, 2020, the loss carryforwards comprise of:
NT$ Expiry Year
$ 467 2030
h. The aggregate amount of temporary differences associated with investments for which deferred tax
liabilities have not been recognized
As of December 31, 2020 and 2019, the taxable temporary differences associated with investments in
subsidiaries for which no deferred tax liabilities have been recognized were $1,173,920 thousand and
$803,232 thousand.
i. Income tax assessments
The income tax returns of the Company and the domestic subsidiaries through 2018 have been assessed
by the tax authorities.
Shanghai Yikang and Dongguan Hua Gang had completed the filing of their tax returns through 2019
with the tax authorities.
24. EARNINGS PER SHARE (EPS)
Earnings and weighted average number of shares outstanding used in the computation of EPS were as follows:
a. Net profit for the year attributable to the owners of the Company

- 187 -
For the Year Ended December 31
2020 2019
Earnings used in the computation to basic/diluted EPS $ 1,859,120 $ 1,415,822
b. Weighted average number of shares outstanding (in thousands)
For the Year Ended December 31
2020 2019
Weighted average number of shares outstanding used in
computation of basic EPS
231,390 231,390
Effect of potentially dilutive shares
Employees’ compensation 6,768 7,503
Weighted average number of shares outstanding used in
computation of diluted EPS
238,158 238,893
The Company offers to settle the employees’ compensation in cash or shares; thus, the Company assumes the
entire amount of the compensation will be settled in shares and the resulting potential shares were included
in the weighted average number of shares outstanding used in the computation of diluted EPS, as the effect
is dilutive. Such dilutive effect of the potential shares is included in the computation of diluted EPS until the
shareholders resolve the number of shares to be distributed to employees at their meeting in the following
year.
25. BUSINESS COMBINATIONS
a. Subsidiaries acquired
Principal
Activity
Date of
Acquisition
Proportion of
Voting Equity
Interests
Acquired (%)
Consideration
Transferred -
Cash
KS Corp. Battery
manufacturing
and renewable
energy self-use
power
generation
equipment
business
May 1, 2019 51 $ 468,384
Shanghai Lihuang Medical devices
and equipment
June 30, 2019 70 $ 14,518
WT Indonesia Trading business
of industrial
materials
October 31, 2019 66 $ 2,020
The Group acquired above subsidiaries in 2019 to expand the Group’s operation.

- 188 -
b. Assets acquired and liabilities assumed at the date of acquisition
KS Corp.
Shanghai
Lihuang WT Indonesia
Current assets
Cash and cash equivalents $ 67,714 $ 6,980 $ 8,967
Financial assets at FVTPL 7,648 - -
Accounts receivable 32,420 158 45,530
Other receivables 2,585 150 4,484
Current tax assets 28 - -
Inventories 11,891 3,761 -
Prepayments for purchases 28,774 - -
Other current assets 29,989 69 340
Noncurrent assets
Investments under the equity method 79,989 - -
Property, plant and equipment 1,520,801 - -
Right-of-use assets 36,588 1,446 -
Other intangible assets 138,062 20,574 -
Other financial assets - noncurrent 79,607 - -
Deferred tax assets 1,404 - 147
Refundable deposits 21,301 - 47
Current liabilities
Short-term borrowings (160,510) - -
Contract liabilities - current (29,514) (935) -
Notes and accounts payable (115,060) (10,008) (51,679)
Other payables (2,347) - (653)
Current tax liabilities (10,892) - (7)
Other current liabilities (505) - -
Noncurrent liabilities
Long-term borrowings (932,345) - -
Lease liabilities - noncurrent (36,588) (1,446) -
Deferred tax liabilities (1,404) - -
$ 769,636 $ 20,749 $ 7,176
c. Goodwill recognized on acquisitions
KS Corp.
Shanghai
Lihuang WT Indonesia
Consideration transferred $ 468,384 $ 14,518 $ 2,020
Plus: Fair value of the equity held by the
Group on the date of acquisition 5,136 - 2,444
Plus: Non-controlling interests 377,101 6,231 2,712
Less: Fair value of identifiable net assets
acquired (769,636) (20,749) (7,176)
Goodwill recognized on acquisitions $ 80,985 $ - $ -
The goodwill from acquisitions mainly represents the control premium. In addition, the consideration
paid for acquisitions effectively included amounts attributed to revenue growth and future market
expansions. These benefits are not recognized separately from goodwill because they do not meet the
recognition criteria for identifiable intangible assets.

- 189 -
d. Non-controlling interests
The non-controlling interests of KS Corp., Shanghai Lihuang and WT Indonesia were measured at their
proportionate share of recognized identifiable net assets.
e. Net cash outflow (inflow) on acquisition of subsidiaries
KS Corp.
Shanghai
Lihuang WT Indonesia
Consideration paid in cash $ 468,384 $ 14,518 $ 2,020
Less: Cash and cash equivalent acquired (67,714) (6,980) (8,967)
$ 400,670 $ 7,538 $ (6,947)
f. Impact of acquisitions on the results of the Group
The financial results of the acquirees since the acquisition dates to December 31, 2019 were as follows:
KS Corp.
Shanghai
Lihuang WT Indonesia
Revenue $ 154,231 $ 4,104 $ 21,380
Net profit (loss) $ 25,725 $ (1,185) $ (585)
Had these acquisitions of subsidiaries been in effect at the beginning of the annual reporting period, the
Group’s pro-forma revenue and pro-forma net profit would have been $54,917,757 thousand and
$1,540,832 thousand, respectively, for the year ended December 31, 2019. This pro-forma information is
for illustrative purposes only and is not necessarily an indication of the revenue and results of operations
of the Group that actually would have been achieved had the acquisition been completed at the beginning
of the annual reporting period, nor is it intended to be a projection of future results.
26. ACQUISITION OF A SUBSIDIARY THAT DOES NOT CONSTITUTE A BUSINESS
In order to obtain a logistics transportation business license, the Group acquired 100% of the equity shares of
Chuancheng Logistics Co., Ltd. at a consideration of $12,947 thousand in cash. In accordance with IFRS 3,
the Group evaluated and concluded that the acquired shares of Chuancheng Logistics Co., Ltd. do not
constitute a business; therefore, the share purchase transaction is accounted for as acquisition of a group of
assets.
The information relating to the assets acquired and liabilities assumed and the relevant net cash outflow at
the date of acquisition:
a. Acquisition of assets
Amount
Current assets
Cash and cash equivalent $ 9,947
Other current assets 28
Noncurrent assets
Property, plant and equipment 1,995
Other intangible assets 977
$ 12,947

- 190 -
b. Net cash outflow on acquisition of subsidiaries
Amount
Consideration paid in cash $ 12,947
Less: Cash and cash equivalent acquired (9,947)
$ 3,000
27. CAPITAL MANAGEMENT
The Group manages its capital to ensure it will be able to continue as a going concern while maximizing the
return to shareholders through the optimization of the debt and equity balance.
The capital structure of the Group consists of net debt and equity.
The key management personnel of the Group periodically reviews the cost of capital and the risk associated
with each class of capital. Based on recommendations of the key management personnel, in order to balance
the overall capital structure, the Group may adjust the amount of dividends paid to shareholders, the number
of new shares issued or repurchased, and/or the amount of new debt issued or existing debt redeemed.
The Group is not subject to any externally imposed capital requirements, except those discussed in Note 16.
28. FINANCIAL INSTRUMENTS
a. Fair values of financial instruments not measured at fair value
The management of the Group considered the carrying amount of financial assets and financial liabilities
that are not measured at fair value as approximate amount of their fair value.
b. Fair value of financial instruments measured at fair value on a recurring basis
1) Fair value hierarchy
December 31, 2020
Level 1 Level 2 Level 3 Total
Financial assets at FVTPL
Mutual funds $ 72,066 $ - $ - $ 72,066
Structured deposits - 139,576 - 139,576
Foreign exchange options
contracts - 23 - 23
$ 72,066 $ 139,599 $ - $ 211,665
(Continued)

- 191 -
Level 1 Level 2 Level 3 Total
Financial assets at FVTOCI
Investments in equity
instruments
Domestic listed shares $ 154,071 $ 75,491 $ - $ 229,562
Unlisted shares - - 504,180 504,180
Foreign listed shares 19,956 - - 19,956
$ 174,027 $ 75,491 $ 504,180 $ 753,698
Financial liabilities at FVTPL
Foreign exchange forward
contracts $ - $ 280 $ - $ 280
(Concluded)
December 31, 2019
Level 1 Level 2 Level 3 Total
Financial assets at FVTPL
Mutual funds $ 72,611 $ - $ - $ 72,611
Structured deposits - 99,007 - 99,007
Foreign exchange options
contracts - 1,123 - 1,123
$ 72,611 $ 100,130 $ - $ 172,741
Financial assets at FVTOCI
Investments in equity
instruments
Domestic listed shares $ 99,708 $ - $ - $ 99,708
Unlisted shares - - 511,494 511,494
Foreign listed shares 30,679 - - 30,679
$ 130,387 $ - $ 511,494 $ 641,881
Financial liabilities at FVTPL
Foreign exchange forward
contracts $ - $ 1,372 $ - $ 1,372
There were no transfers between Level 1 and Level 2 for the years ended December 31, 2020 and
2019.

- 192 -
2) Reconciliation of Level 3 fair value measurements of financial assets
For the Year Ended December 31
2020 2019
Balance at January 1 $ 511,494 $ 569,293
Disposal (1,288) -
Recognized in other comprehensive income (6,026) (57,799)
Balance at December 31 $ 504,180 $ 511,494
3) Valuation techniques and inputs applied for Level 2 fair value measurement
Financial Instruments Valuation Techniques and Inputs
Structured deposits Based on the financial product information provided by financial
institutions, the evaluation method is based on the rate of
return of the deposit principal and its linked targets.
Derivative financial assets The estimated future cash flows are based on the observable
forward exchange rate at the end of the year and the exchange
rate stipulated in the contract, and are discounted separately at
rates that reflects the credit risk of each counterparty.
Emerging market shares The fair value is assessed by reference to the transaction price
supported by observable market prices.
4) Valuation techniques and inputs applied for Level 3 fair value measurement
The fair value of the unlisted shares held by the Group is measured by using the market approach
based on the price-book ratio of the comparable companies or by the latest net value of the investees.
c. Categories of financial instruments
December 31
2020 2019
Financial assets
FVTPL
Mandatorily classified at FVTPL $ 211,665 $ 172,741
FVTOCI
Equity instruments 753,698 641,881
Measured at amortized cost (Note 1) 21,912,133 19,119,808
Financial liabilities
FVTPL
Held for trading 280 1,372
Measured at amortized cost (Note 2) 20,879,466 18,902,823
Note 1: Including cash and cash equivalents, notes receivable (including related parties), accounts
receivable (including related parties), other receivables (including related parties) and other
financial assets, etc.
Note 2: Including short-term borrowings, short-term bills payable, notes payable (including related

- 193 -
parties), accounts payable (including related parties), other payables, long-term borrowings
(including current portion) and guarantee deposits received, etc.
d. Financial risk management objectives and policies
The Group’s Corporate Treasury function provides services to the business, coordinates access to
domestic and international financial markets, monitors and manages the financial risks relating to the
operations of the Group through internal risk reports which analyze exposures by degree and magnitude
of risks. These risks include market risk, credit risk and liquidity risk.
1) Market risk
The Group’s activities expose it primarily to the financial risks as follows:
a) Foreign currency risk
The Group had foreign currency trades, which exposed the Group to foreign currency risk.
The carrying amounts of the Group’s foreign currency denominated monetary assets and
monetary liabilities (including those eliminated on consolidation) at the end of the reporting
period are set out in Note 32.
Sensitivity analysis
The Group was mainly exposed to the USD.
The sensitivity rate used when reporting foreign currency risk internally to key management
personnel is 1%. The sensitivity analysis included only the outstanding foreign currency
denominated monetary items at the balance sheet date. Had the functional currency weakened
(strengthened) by 1% against the USD, the pre-tax profit for the years ended December 31, 2020
and 2019 would have been higher (lower) by $3,837 thousand and $6,252 thousand, respectively.
b) Interest rate risk
The Group was exposed to interest rate risk because the Group borrowed funds at both fixed and
floating interest rates. The risk is managed by the Group by maintaining an appropriate mix of
fixed and floating rate borrowings.
The carrying amounts of the Group’s financial assets and financial liabilities with exposure to
interest rates at the end of the reporting period were as follows:
December 31
2020 2019
Fair value interest rate risk
Financial assets $ 1,025,233 $ 1,127,532
Financial liabilities 6,096,367 4,701,852
Cash flow interest rate risk
Financial assets 2,929,897 1,941,525
Financial liabilities 6,641,672 6,991,047

- 194 -
Sensitivity analysis
The sensitivity analysis below shows the Group’s exposure to interest rates for non-derivative
instruments at the end of the reporting period. For floating rate assets and liabilities, the analysis
was prepared assuming the amount of the assets and liabilities outstanding at the end of the
reporting period was outstanding for the whole year.
If interest rates had been 1% higher/lower and all other variables were held constant, the Group’s
pre-tax profit for the years ended December 31, 2020 and 2019 would have been lower/higher by
$37,118 thousand and $50,495 thousand, respectively, which was mainly attributable to the
Group’s exposure to interest rates on its variable-rate bank deposits and borrowings.
c) Other price risk
The Group was exposed to equity price risk through its investments in equity securities and mutual
funds. The Group manages this exposure by maintaining a portfolio of investments with different
risks. The Group’s equity price risk was mainly concentrated on equity instruments of unlisted
shares.
Sensitivity analysis
The sensitivity analysis below shows the exposure to equity price risk at the end of the reporting
period.
If equity prices had been 1% higher/lower, pre-tax profit for the years ended December 31, 2020
and 2019 would have been higher/lower by $721 thousand and $726 thousand, as a result of the
changes in fair value of financial assets at FVTPL, and the pre-tax other comprehensive income
for the years ended December 31, 2020 and 2019 would have been higher/lower by $7,537
thousand and $6,419 thousand, as a result of the changes in fair value of financial assets at
FVTOCI.
2) Credit risk
Credit risk refers to the risk that counterparty will default on its contractual obligations resulting in
financial loss to the Group. At the end of the reporting period, the Group’s maximum exposure to
credit risk could be equal to the total of the following:
a) The carrying amount of the respective recognized financial assets as stated in the consolidated
balance sheets; and
b) The amount of contingent liabilities in relation to financial guarantees provided by the Group.
The Group adopted a policy of only dealing with creditworthy counterparties and uses other publicly
available financial information and its own trading records to rate its major customers. The Group’s
exposure and the credit ratings of its counterparties are continuously monitored and credit exposure
is controlled by setting credit limits of counterparties annually.
The concentration of credit risk was limited due to the fact that the customer base was large and
unrelated.
3) Liquidity risk
The Group manages liquidity risk by monitoring and maintaining a level of cash and cash equivalents
deemed adequate to finance the Group’s operations and mitigate the effects of fluctuations in cash
flows. In addition, management monitors the utilization of bank borrowings and ensures compliance
with loan covenants.

- 195 -
Liquidity risk tables for non-derivative financial liabilities
The following tables detail the Group’s remaining contractual maturities for its non-derivative
financial liabilities with agreed-upon repayment periods. The tables had been drawn up based on the
undiscounted cash flows of financial liabilities from the earliest date on which the Group can be
required to pay. The tables included both interest and principal cash flows. Specifically, liabilities
with a repayment on demand clause were included in the earliest time band regardless of the
probability of the counterparties choosing to exercise their rights. The maturity dates for other non-
derivative financial liabilities were based on the agreed-upon repayment dates.
To the extent that interest flows are at floating rates, the undiscounted amount was derived from the
interest rate at the end of the year.
Less than
1 Year 1-5 Years 5-10 Years 10-20 Years Total
December 31, 2020
Non-interest bearing liabilities $ 8,772,860 $ 1,616 $ - $ - $ 8,774,476
Variable interest rate liabilities 4,816,721 988,769 600,451 385,440 6,791,381
Lease liabilities 84,622 253,293 170,577 233,857 742,349
Fixed interest rate liabilities 3,715,747 1,818,464 - - 5,534,211
Financial guarantee contracts 1,160,995 - - - 1,160,995
$ 18,550,945 $ 3,062,142 $ 771,028 $ 619,297 $ 23,003,412
December 31, 2019
Non-interest bearing liabilities $ 7,351,686 $ 419 $ - $ - $ 7,352,105
Variable interest rate liabilities 4,641,911 2,270,688 234,972 216,833 7,364,404
Lease liabilities 37,408 94,547 11,077 7,749 150,781
Fixed interest rate liabilities 2,611,089 2,071,983 - - 4,683,072
Financial guarantee contracts 777,098 - - - 777,098
$ 15,419,192 $ 4,437,637 $ 246,049 $ 224,582 $ 20,327,460
The amounts included above for financial guarantee contracts were the maximum amounts the Group
could be required to settle under the arrangement with an option to demand the full guaranteed amount
if that amount is claimed by the counterparty of the financial guarantee contract. Based on
expectations at the end of the year, the Group considers that it is more likely than not that no amount
will be payable under the arrangement.
The amounts included above for variable interest rate non-derivative financial liabilities were subject
to change if changes in variable interest rates differ from those estimates of interest rates at the end
of the year.
e. Transfers of financial assets
1) Recognition of notes receivable that had been transferred
The Group discounted commercial acceptance bills to banks and transferred a portion of commercial
acceptance bills in China to some of its suppliers in order to settle the accounts payable to these banks
or suppliers. If these commercial acceptance bills are not recoverable at maturity, banks or suppliers
have the right to request the Group to pay the unsettled balance. As the Group has not transferred the
significant risks and rewards relating to these commercial acceptance bills, it continues to recognize
the full carrying amounts of these commercial acceptance bills and treats these commercial
acceptance bills that have been transferred as collateral.

- 196 -
December 31
2020 2019
Discounted to banks $ 709,245 $ 1,046,567
Endorsement transfer to suppliers $ 413,991 $ 203,259
2) Derecognition of notes receivable that had been transferred
The Group transferred a portion of its banker’s acceptance bills in China to some of its suppliers in
order to settle the accounts payable to these suppliers. As the Group has transferred substantially all
risks and rewards relating to these bills receivable, it derecognized the full carrying amount of the
bills receivable and the associated accounts payable. However, if the derecognized bills receivable
are not paid at maturity, the suppliers have the right to request the Group to pay the unsettled balance;
therefore, the Group still has continuing involvement in these bills receivable.
The maximum exposure to loss from the Group’s continuing involvement in the derecognized bills
receivable is equal to the face amounts of the transferred but unsettled bills receivable, and as of
December 31, 2020 and 2019, the face amount of these unsettled bills receivable was $390,423
thousand and $39,687 thousand, respectively. The unsettled bills receivable will be due in 1-7 months.
Taking into consideration the credit risk of these derecognized bills receivable, the Group estimates
that the fair value of its continuing involvement is not significant.
During the years ended December 31, 2020 and 2019, the Group did not recognize any gains or losses
upon the transfer of the banker’s acceptance bills. No gains or losses were recognized from the
continuing involvement, both during the period or cumulatively.
29. RELATED PARTY TRANSACTIONS
Transactions between the Group and related parties were disclosed as follows:
a. Name of related parties and relation
Related Parties Relation with the Group
Chang Wah Electromaterials Inc. Associate
Nagase Wahlee Plastics Corp. Associate
Wah Hong Industrial Corp. Associate
ORC Technology Corp. Associate
Shanghai Hua Chang Trading Co., Ltd. Associate
Xiamen JianYuan Rung Logistic Co., Ltd. Associate
WL Green Corp. Associate (became a subsidiary
since May 2019)
Eco Energy Corporation Associate
Open sky Technology Corp. Associate (adopt equity method for
subsidiaries)
Welo-tech Corp. Associate (adopt equity method for
subsidiaries)
Shanghai Chang Wah Electromaterials Inc. Associate’s subsidiary
Chang Wah International Trade (Shenzhen) Co., Ltd. Associate’s subsidiary
Chang Wah Technology Co. Ltd. Associate’s subsidiary
SIP Chang Hong Optoelectronics Ltd. Associate’s subsidiary
(Continued)

- 197 -
Related Parties Relation with the Group
Sun Hong Optronics Ltd. Associate’s subsidiary
Qingdao Changhong Optoelectronics Ltd. Associate’s subsidiary
Xiamen G&H Electronics Co., Ltd. Associate’s subsidiary
Ningpo Changhong Optoelectronics Ltd. Associate’s subsidiary
Wah Ma Chemical Sdn. Bhd. Associate’s subsidiary
PT Wah Hong Indonesia Associate’s subsidiary
Suzhou Shanji Photoelectric Co., Ltd. Associate’s subsidiary (since April
2019)
Bao Guang Investment Co., Ltd. Key management personnel
(Director of the Company)
Daily Polymer Corp. Other related party
Raycon Industries Inc. Other related party
Asahi Kasei Wah Lee Hi-tech Corp. Other related party
JingYi Technology Co. Other related party
Forcera Materials Co., Ltd. Other related party
Taigene Biotechnology Co., Ltd. Other related party
Minima Co., Ltd. Other related party
Sin Hao Co., Ltd. Other related party
Eleocom Co., Ltd. Other related party (has been
incorporated since April 2020)
(Concluded)
b. Operating transactions
1) Sales of goods
For the Year Ended December 31
Related Party Category 2020 2019
Associates and their subsidiaries $ 401,212 $ 489,260
Other related parties 24,902 17,811
$ 426,114 $ 507,071
The selling prices and collection terms of sales to related parties were similar to third parties.
2) Purchase of goods
For the Year Ended December 31
Related Party Category 2020 2019
Associates and their subsidiaries $ 576,889 $ 398,884
Other related parties 1,348,756 1,258,097
$ 1,925,645 $ 1,656,981
The prices of purchases from related parties were made under arm’s length terms and there were no
similar transactions with third parties for comparison; payment terms were similar to third parties.

- 198 -
3) Commission expense
For the Year Ended December 31
Related Party Category 2020 2019
Associates $ 608 $ -
Other related parties 154 241
$ 762 $ 241
4) Receivables from related parties
December 31
2020 2019
Notes receivable - related parties
Associates $ 6,925 $ 15,538
Accounts receivable - related parties
Associates and their subsidiaries $ 110,179 $ 98,237
Other related parties 4,269 7,178
114,448 105,415
Less: Allowance for losses 1,006 295
$ 113,442 $ 105,120
Other receivables - related parties
Associates and their subsidiaries
Chang Wah Electromaterials Inc. $ 51,455 $ 81,140
Others 7,998 2,077
Other related parties 299 354
$ 59,752 $ 83,571
The outstanding accounts receivable from related parties are unsecured.
5) Payables to related parties
December 31
2020 2019
Notes payable - related parties
Associates $ 1,261 $ 201
Accounts payable - related parties
Associates and their subsidiaries $ 127,555 $ 108,081
Other related parties 250,449 246,629
$ 378,004 $ 354,710
(Continued)

- 199 -
December 31
2020 2019
Other payables
Associates and their subsidiaries $ 7,686 $ 5
Other related parties 667 329
$ 8,353 $ 334
(Concluded)
The outstanding payables to related parties are unsecured and will be paid in cash.
6) Contract liabilities
December 31
Related Party Category 2020 2019
Associates $ 27,872 $ -
c. Loans from related parties (under short-term borrowings)
December 31
Related Party Category/Name 2020 2019
Associates Eco Energy Corporation $ - $ 23,000
Interest expense
For The Year Ended December 31
Related Party Category/Name 2020 2019
Associates
Eco Energy Corporation $ (78) $ 1,290
The loans from related parties are unsecured and the interest rate was 1.75%.
The overestimated interest expense of $149 thousand in 2019 was reversed and adjusted to interest
expense in 2020.
d. Acquisition of property, plant and equipment
For The Year Ended December 31
Related Party Category 2020 2019
Associates $ 114,606 $ 68,762
e. Disposals of property, plant and equipment
Proceeds Gain on Disposal
For the Year Ended
December 31
For the Year Ended
December 31
2020 2019 2020 2019
Associates $ 9,181 $ 57 $ 1,208 $ 57

- 200 -
f. Disposals of investment under the equity method - only for the year ended December 31, 2020
Related Party Category/Name Line Item
Number of
Shares
Underlying
Assets Proceeds Loss on Disposal
Associates
Chang Wah Electromaterials Inc.
Investment under
the equity
method
1,225,000 Share interest of
Shanghai Chang
Wah
Electromaterials
Inc.
$ 82,897 $ (4,688 )
g. Other income
For the Year Ended December 31
Related Party Category/Name 2020 2019
Associated and their subsidiaries
Wah Hong Industrial Corp. $ 25,059 $ 7,230
Others 8,173 10,106
33,232 17,336
Other related parties 3,425 3,408
Key management personnel 24 24
$ 36,681 $ 20,768
Other income included rental income, consulting service income and endorsement income.
h. Lease arrangements
For the Year Ended December 31
Related Party Category/Name 2020 2019
Lease expense
Associated $ 35 $ -
Other related parties 279 331
$ 314 $ 331
i. Endorsements and guarantees
December 31
Related Party Category 2020 2019
Associates and their subsidiaries
Amount endorsed $ 1,183,456 $ 1,281,922
Amount utilized $ 770,572 $ 737,411
Other related parties
Amount endorsed $ 25,194 $ 25,194
Amount utilized $ - $ -
j. Compensation of key management personnel
The amounts of the remuneration of directors and other members of key management personnel were as
follows:

- 201 -
For the Year Ended December 31
2020 2019
Short-term employee benefits $ 128,143 $ 126,146
Post-employment benefits 909 1,169
$ 129,052 $ 127,315
The remuneration of directors and other key management was determined by the remuneration committee
based on the performance of individuals and market trends.
30. ASSETS PLEDGED AS COLLATERAL
The Group provided the following assets as collaterals for part of borrowings and performance guarantee.
December 31
2020 2019
Notes receivable $ 1,123,236 $ 1,249,826
Other financial assets - current 1,300 1,345
Other financial assets - noncurrent 89,330 79,673
Property, plant and equipment
Freehold land 457,022 608,107
Buildings 410,439 426,129
Power generation equipment 1,460,394 1,338,092
Other 1,260 4,694
$ 3,452,981 $ 3,707,866
In addition to the above assets as collateral, the Group also provided the shares of some subsidiaries as
collaterals for borrowings.
31. SIGNIFICANT CONTINGENT LIABILITIES AND UNRECOGNIZED COMMITMENTS
In addition to those disclosed in other notes, significant commitments and contingencies of the Group as of
December 31, 2020 were as follows:
a. The Group’s unused letters of credit for purchase of merchandise were $557,592 thousand.
b. The unrecognized commitments for acquisition of property, plant and equipment were $209,168
thousand.
c. Company A filed a lawsuit with the Taipei District Court against KS Corp. for failing to fulfill its
obligation of placing orders under a purchase agreement and demanded a compensation of $50,363
thousand. In October 2020, a judgment entered in the first instance was announced that Company A won
the case; KS Corp. filed an appeal. The Group believed that the plaintiff's demand is unfounded and did
not record related compensation loss due to the uncertainty of the final trial.
d. Company B filed a letter to KS Corp. in November 2020 to terminate a lease agreement, requested KS
Corp. to pay a default penalty of $41,704 thousand and confiscate the guarantee deposit. KS Corp., based
on the advice from legal counsel, believed that there were unavoidable reasons for it to waive the default
penalty. Therefore, KS Corp. derecognized the aforementioned guarantee deposit and related construction
in progress and recorded losses, but no loss related to default penalty was recognized. In addition KS
Corp. has filed a lawsuit against the request of company B.

- 202 -
32. SIGNIFICANT ASSETS AND LIABILITIES DENOMINATED IN FOREIGN CURRENCY
The significant assets and liabilities denominated in foreign currencies were as follows:
Foreign
Currency
Amount Exchange Rate
Carrying
Amount
December 31, 2020
Monetary financial assets
USD $ 216,737 28.48 (USD:NTD) $ 6,172,663
USD 33,776 7.7539 (USD:HKD) 961,941
USD 22,747 6.5295 (USD:RMB) 647,823
USD 2,191 25,657.66 (USD:VND) 62,406
USD 1,011 29.8 (USD:THB) 28,790
Nonmonetary financial assets Investments accounted for using
the equity method
USD 11,806 28.48 (USD:NTD) 336,226
RMB 175,480 4.3617 (RMB:NTD) 765,397
RMB 1,293,025 1.1875 (RMB:HKD) 5,638,929
JPY 466,818 0.2763 (JPY:NTD) 128,982
HKD 1,751,208 3.6730 (HKD:NTD) 6,432,186
THB 186,628 0.9556 (THB:NTD) 178,342
PHP 23,780 0.5861 (PHP:NTD) 13,937
Monetary financial liabilities
USD 211,176 28.48 (USD:NTD) 6,014,305
USD 16,090 7.7539 (USD:HKD) 458,256
USD 26,858 6.5295 (USD:RMB) 764,904
USD 7,511 25,657.66 (USD:VND) 213,921
USD 1,355 29.8 (USD:THB) 38,580
December 31, 2019
Monetary financial assets
USD 174,296 29.98 (USD:NTD) 5,225,386
USD 30,100 7.7890 (USD:HKD) 902,400
USD 34,298 6.9646 (USD:RMB) 1,028,265
USD 883 25,623.93 (USD:VND) 26,461
USD 656 29.69 (USD:THB) 19,679
Nonmonetary financial assets
Investments accounted for using
the equity method
USD 10,627 29.98 (USD:NTD) 318,587
RMB 163,033 4.3046 (RMB:NTD) 701,794
RMB 1,134,151 1.118 (RMB:HKD) 4,882,096
JPY 424,092 0.2760 (JPY:NTD) 117,049
(Continued)

- 203 -
Foreign
Currency
Amount Exchange Rate
Carrying
Amount
HKD $ 1,467,739 3.849 (HKD:NTD) $ 5,649,326
THB 169,240 1.0098 (THB:NTD) 170,898
PHP 25,450 0.6091 (PHP:NTD) 15,502
Monetary financial liabilities
USD 163,626 29.98 (USD:NTD) 4,905,498
USD 12,193 7.7890 (USD:HKD) 365,545
USD 37,769 6.9646 (USD:RMB) 1,132,316
USD 4,195 25,623.93 (USD:VND) 125,773
USD 1,595 29.69 (USD:THB) 47,816
(Concluded)
For the years ended December 31, 2020 and 2019, realized and unrealized net foreign exchange losses were
$31,107 thousand and $5,502thousand, respectively. It is impractical to disclose net foreign exchange gains
(losses) by each significant foreign currency due to the variety of the foreign currency transactions and
functional currencies of the Group’s entities.
33. ADDITIONAL DISCLOSURES
a. Information about significant transactions and investees:
1) Financing provided to others: Table 1
2) Endorsements/guarantees provided: Table 2
3) Marketable securities held (excluding investments in subsidiaries and associates): Table 3
4) Marketable securities acquired or disposed of at costs or prices of at least NT$300 million or 20% of
the paid-in capital: None
5) Acquisition of individual real estate at costs of at least NT$300 million or 20% of the paid-in capital:
None
6) Disposal of individual real estate at prices of at least NT$300 million or 20% of the paid-in capital:
None
7) Total purchases from or sales to related parties amounting to at least NT$100 million or 20% of the
paid-in capital: Table 4
8) Receivables from related parties amounting to at least NT$100 million or 20% of the paid-in capital:
Table 5
9) Trading in derivative instruments: Note 7, in addition, the Group incurred a net loss of $9,066
thousand on derivative instruments transactions for the year ended December 31, 2020.
10) Intercompany relationships and significant intercompany transactions: Table 9
11) Information on investees: Table 6

- 204 -
b. Information on investments in mainland China
1) Information on any investee company in mainland China, showing the name, principal business
activities, paid-in capital, method of investment, inward and outward remittance of funds, ownership
percentage, net income of investees, investment income or loss, carrying amount of the investment at
the end of the period, repatriations of investment income, and limit on the amount of investment in
the mainland China area: Table 7
2) Any of the following significant transactions with investee companies in mainland China, either
directly or indirectly through a third area, and their prices, payment terms, and unrealized gains or
losses:
a) The amount and percentage of purchases and the balance and percentage of the related payables
at the end of the period: Table 8
b) The amount and percentage of sales and the balance and percentage of the related receivables at
the end of the period: Table 8
c) The amount of property transactions and the amount of the resultant gains or losses: None
d) The balance of negotiable instrument endorsements or guarantees or pledges of collateral at the
end of the period and the purposes: Table 2
e) The highest balance, the end of period balance, the interest rate range, and total current period
interest with respect to financing of funds: Table 1
f) Other transactions that have a material effect on the profit or loss for the year or on the financial
position, such as the rendering or receipt of services.
The Company’s other significant transactions with investee companies in mainland China as of
and for the year ended December 31, 2020 were as follow:
Counterparties Line Item Amount
Shanghai Yikang Other income $ 29,158
Shanghai Yikang Commission expense 111,499
Shanghai Yikang Other receivables 107,472
Shanghai Yikang Other payables 26,915
Shanghai Hua Chang Trading Co., Ltd. Other income 369
Shanghai Yadi Other receivables 2,022
Shanghai Yadi Other income 2,059
c. Information of major shareholders: list all shareholders with ownership of 5% or greater showing the
name of the shareholder, the number of shares owned, and percentage of ownership of each shareholder:
Table 10
34. SEGMENT INFORMATION
Information reported to the chief operating decision maker for the purposes of resource allocation and
assessment of segment performance is distinguished by operating area and categories of merchandise and
service. The Group’s reportable segments were as follows:

- 205 -
Wah Lee Industrial Corporation (“Wah Lee”) is mainly engaged in the import/export and agency business
of composite materials, engineering plastic, printed circuit board, semiconductor, and computer related
manufacturing materials and equipment.
Raycong H.K. and its subsidiary Dongguan Hua Gang (“Raycong”) are mainly engaged in the trade of
engineering plastic, composite materials and equipment.
Shanghai Yikang is mainly engaged in trade of manufacturing materials and import/export business.
Others - Other subsidiaries which were below the quantitative threshold were not listed as reportable
segments. Please refer to Note 12 for details.
Segment revenue and results
a. The following is an analysis of the Group’s revenue and results from operations by reportable segment:
Wah Lee Raycong
Shanghai
Yikang Others
Adjustment
and
Elimination Total
For the year ended December 31, 2020
Revenue from external customers $ 30,162,503 $ 12,929,949 $ 12,626,605 $ 3,361,863 $ - $ 59,080,920 Inter-segment revenue 3,073,988 63,123 206,832 200,102 (3,544,045 ) -
Segment revenue $ 33,236,491 $ 12,993,072 $ 12,833,437 $ 3,561,965 $ (3,544,045 ) $ 59,080,920
Segment income $ 640,341 $ 535,813 $ 629,162 $ 222,259 $ 80,340 $ 2,107,915
Interest income 709 2,261 46,104 2,944 - 52,018 Other income 189,594 13,449 44,430 9,307 (105,043 ) 151,737
Other gains and losses (49,813 ) 9,463 (17,844 ) (8,981 ) 15,726 (51,449 )
Financial costs (79,298 ) (48,207 ) (37,670 ) (40,584 ) 1,110 (204,649 ) Profit before income tax 701,533 512,779 664,182 184,945 (7,867 ) 2,055,572
Income tax expense (245,349 ) (125,229 ) (171,269 ) (46,932 ) (740 ) (589,519 )
Net profit after tax $ 456,184 $ 387,550 $ 492,913 $ 138,013 $ (8,607 ) 1,466,053
Share of profit or loss of associates
under the equity method 580,063
Consolidated net profit $ 2,046,116
December 31, 2019
Identifiable assets $ 14,045,546 $ 6,738,647 $ 8,596,468 $ 5,416,032 $ (979,615 ) $ 33,817,078 Goodwill 111,809
Investment accounted for using the
equity method 4,826,082
Total assets $ 38,754,969
For the year ended
December 31, 2019
Revenue from external customers $ 26,044,832 $ 11,973,415 $ 13,414,743 $ 3,248,839 $ - $ 54,681,829 Inter-segment revenue 3,180,968 63,282 175,391 162,624 (3,582,265 ) -
Segment income $ 29,225,800 $ 12,036,697 $ 13,590,134 $ 3,411,463 $ (3,582,265 ) $ 54,681,829
Segment income $ 479,573 $ 364,892 $ 484,643 $ 158,811 $ 86,516 $ 1,574,435
Interest revenue 1,274 1,685 6,460 5,460 - 14,879 Other income 183,140 8,462 63,403 10,393 (115,440 ) 149,958
Other gains and losses (1,119 ) (18,463 ) (21,735 ) 4,122 7,706 (29,489 )
Financial costs (128,708 ) (82,720 ) (27,761 ) (35,278 ) 441 (274,026 ) Profit before income tax 534,160 273,856 505,010 143,508 (20,777 ) 1,435,757
Income tax expense (189,416 ) (62,251 ) (130,616 ) (24,766 ) (34 ) (407,083 )
Net profit after tax $ 344,744 $ 211,605 $ 374,394 $ 118,742 $ (20,811 ) 1,028,674
(Continued)

- 206 -
Wah Lee Raycong
Shanghai
Yikang Others
Adjustment
and
Elimination Total
Share of profit or loss of associates
under the equity method $ 530,407
Consolidated net profit $ 1,559,081
December 31, 2019
Identifiable assets $ 12,563,868 $ 6,115,190 $ 7,995,336 $ 4,573,669 $ (1,504,887 ) $ 29,743,176
Goodwill 112,668 Investment accounted for using the
equity method 4,555,030
Total assets $ 34,410,874
(Concluded)
Segment profit represented the profit before tax earned by each segment without share of profits of
associates. This was the measure reported to the chief operating decision maker for the purpose of
resource allocation and assessment of segment performance. For the purpose of monitoring segment
performance and allocating resources between segments, all assets are allocated to reportable segments
other than interests in associates accounted for using the equity method.
b. Revenue from major products and services
The following is an analysis of the Group’s revenue from continuing customers from its major products
and services.
For the Year Ended December 31
2020 2019
IT industry $ 20,224,937 $ 18,842,403
FPD industry 16,249,182 15,103,754
Semiconductor industry 12,129,747 10,717,080
PCB industry 6,369,176 5,359,587
Opto-electronics 1,640,036 2,078,534
Others 2,467,842 2,580,471
$ 59,080,920 $ 54,681,829
c. Geographical information
The Group’s revenue from external customers by location of customers and information about its
noncurrent assets by location of assets are detailed below.
Revenue from
External Customers
For the Year Ended Noncurrent Assets
December 31 December 31
2020 2019 2020 2019
Taiwan $ 17,279,050 $ 14,823,120 $ 3,687,029 $ 3,186,812
China 32,094,120 30,554,546 438,468 437,545
Others 9,707,750 9,304,163 564,645 608,663
$ 59,080,920 $ 54,681,829 $ 4,690,142 $ 4,233,020
Noncurrent assets exclude investments under the equity method, financial assets, deferred tax assets, and

- 207 -
goodwill.
d. Information about major customers
No single customer contributed 10% or more of the Group’s revenue for the years ended December 31,
2020 and 2019.

- 208 -
TABLE 1
WAH LEE INDUSTRIAL CORPORATION AND SUBSIDIARIES
FINANCING PROVIDED TO OTHERS
FOR THE YEAR ENDED DECEMBER 31, 2020
(In Thousands of New Taiwan Dollars)
No. Financing Company Counterparty
Financial
Statement
Account
Related Party Maximum Balance
for the Year Ending Balance
(Note 1)
Actual Amount
Drawn
(Notes 1 and 3)
Interest
Rate (%)
Nature of
Financing
Business
Transaction
Amount
Reasons for
Short-Term
Financing
Allowance for
Impairment Loss
Collateral Financing Limit
for Each
Borrower (Note 3)
Aggregate
Financing
Limit (Note 2)
Note
Item Value
1 Shanghai Yikang Shanghai Yadi Other receivables - related
parties
Yes $ 64,863 $ - $ - - short-term financing
$ - Operating capital
$ - - $ - $ 1,328,820 $ 1,328,820
2 Shenzhen Huaying Xiamen Hua Chen Da
Other receivables - related
parties
Yes 17,515 8,723 6,979 4.77 short-term financing
- Operating capital
- - - 62,360 62,360
3 Dongguan Hua Gang Guangjou Shing Shain
Other receivables - related
parties
Yes 39,408 39,255 - - short-term financing
- Operating capital
- - - 699,145 699,145
3 Dongguan Hua Gang Meizhou Bailun Other receivables
- related
parties
Yes 19,891 - - - short-term
financing
- Operating
capital
- - - 699,145 699,145
4 KS Corp. KSA Energy Other receivables
- related
parties
Yes 30,000 30,000 10,000 2.00 short-term
financing
- Operating
capital
- - - 208,883 208,883
Note 1: RMB is converted by spot exchange CNY1=NT$4.3617.
Note 2: Individual and aggregate financing limit should not exceed 30% of the lender’s equity.
Note 3: It was eliminated on consolidation.

- 209 -
TABLE 2
WAH LEE INDUSTRIAL CORPORATION AND SUBSIDIARIES
ENDORSEMENTS/GUARANTEES PROVIDED
FOR THE YEAR ENDED DECEMBER 31, 2020
(In Thousands of New Taiwan Dollars)
No. Endorsement/Guarantee
Provider
Endorsee/Guarantee
Limit on
Endorsement/
Guarantee Given on
Benefit of Each Party
(Notes 1-8)
Maximum Amount
Endorsed/
Guaranteed During
the Year
Outstanding
Endorsement/
Guarantee at The
End of the Period
(Note 8)
Actual Borrowing
Amount (Note 8)
Amount of
Endorsement/
Guarantee
Collateralized by
Properties
Ratio of
Accumulated
Endorsement/
Guarantee to
Net Equity per
Latest Financial
Statements (%)
Maximum
Endorsement/
Guarantee Amount
Allowable
(Notes 1-8)
Guarantee Provided
by Parent Company Guarantee Provided
by Subsidiary
Guarantee Provided
to Subsidiaries in
Mainland China Note
Name Relationship
0 The Company Nagase Wahlee Plastics
Corp.
Shareholder of an investee
provides
endorsements/guarantees
to the company in
proportion to the shareholding percentage
$ 2,575,602 $ 970,000 $ 480,000 $ 307,229 $ - 3.73 $ 12,878,009 N N N
0 The Company Asahi Kasei Wah Lee Hi-
tech Corp.
Shareholder of an investee
provides
endorsements/guarantees
to the company in
proportion to the
shareholding percentage
2,575,602 50,388 25,194 - - 0.20 12,878,009 N N N
0 The Company Shanghai Yikang Subsidiary of the Company 2,575,602 197,583 190,816 106,277 - 1.48 12,878,009 Y N Y
0 The Company Dongguan Hua Gang Subsidiary of the Company 3,863,403 368,318 256,320 256,320 - 1.99 12,878,009 Y N Y
0 The Company Raycong H.K., Shanghai
Yikang and Dongguan
Hua Gang
Subsidiary of the Company 2,575,602 120,000 120,000 71,830 - 0.93 12,878,009 Y N Y
0 The Company Shanghai Hua Chang
Trading Co., Ltd.
Shareholder of an investee
provides
endorsements/guarantees to the company in
proportion to the
shareholding percentage
2,575,602 1,494,350 703,456 463,343 - 5.46 12,878,009 N N Y
0 The Company WL Singapore Subsidiary of the Company 3,863,403 677,040 432,896 294,186 - 3.36 12,878,009 Y N N
0 The Company Sakuragawa Solar Ltd. Subsidiary of the Company 2,575,602 178,414 174,621 90,748 - 1.36 12,878,009 Y N N
0 The Company Miyazaki Solar Ltd. Subsidiary of the Company 2,575,602 322,104 315,258 249,958 - 2.45 12,878,009 Y N N
0 The Company WL Indonesia Subsidiary of the Company 2,575,602 187,550 88,288 - - 0.69 12,878,009 Y N N
0 The Company WL Vietnam Subsidiary of the Company 3,863,403 490,050 230,688 155,840 - 1.79 12,878,009 Y N N 0 The Company WT Industrial Subsidiary of the Company 2,575,602 986,272 447,221 55,279 - 3.47 12,878,009 Y N N
0 The Company Wah Lee Philippines Inc. Subsidiary of the Company 2,575,602 58,980 56,960 - - 0.44 12,878,009 Y N N
0 The Company KS Corp. Subsidiary of the Company 2,575,602 179,626 179,626 179,626 179,626 1.39 12,878,009 Y N N
1 Shanghai Yikang Shanghai Chang Wah
Electromaterials Inc.
Shareholder of an investee
provides
endorsements/guarantees
to the company in proportion to the
shareholding percentage
- 51,879 - - - - - N N Y
1 Shanghai Yikang Shanghai Yadi Subsidiary of the Company 885,880 122,128 122,128 29,996 - 2.76 2,214,700 Y N Y
2 KS Corp. KSA Corp. Subsidiary of the Company 176,094 1,382 1,382 1,353 - 0.20 352,188 Y N N
2 KS Corp. KSB Corp. The Company is required to
provide guarantees or
endorsements for the
construction project based on the construction
contract
1,760,940 100,000 100,000 28,891 10,000 14.36 2,817,504 Y N N
2 KS Corp. KSA Corp. The Company is required to
provide guarantees or
endorsements for the
construction project
based on the construction
contract
1,760,940 400,000 400,000 125,172 25,000 57.45 2,817,504 Y N N
(Continued)

- 210 -
No. Endorsement/Guarantee
Provider
Endorsee/Guarantee
Limit on
Endorsement/
Guarantee Given on
Benefit of Each Party
(Notes 1-8)
Maximum Amount
Endorsed/
Guaranteed During
the Year
Outstanding
Endorsement/
Guarantee at The
End of the Period
(Note 8)
Actual Borrowing
Amount (Note 8)
Amount of
Endorsement/
Guarantee
Collateralized by
Properties
Ratio of
Accumulated
Endorsement/
Guarantee to
Net Equity per
Latest Financial
Statements (%)
Maximum
Endorsement/
Guarantee Amount
Allowable
(Notes 1-8)
Guarantee Provided
by Parent Company
Guarantee Provided
by Subsidiary
Guarantee Provided
to Subsidiaries in
Mainland China
Note Name Relationship
3 KSA Corp. KSB Corp. The Company is required to
provide guarantees or
endorsements for the
construction project based on the construction
contract
$ 6,130,000 $ 100,000 $ 100,000 $ 28,891 $ - 145.60 $ 9,195,000 N N N
3 KSA Corp. KS Corp. The Company is required to
provide guarantees or
endorsements for the
construction project
based on the construction contract
6,130,000 1,800,000 1,800,000 926,018 - 2,620.89 9,195,000 N Y N
4 KSB Corp. KSA Corp. The Company is required to
provide guarantees or
endorsements for the
construction project
based on the construction
contract
2,226,000 400,000 400,000 125,172 - 3,162.81 4,452,000 N N N
4 KSB Corp. KS Corp. The Company is required to provide guarantees or
endorsements for the
construction project
based on the construction
contract
2,226,000 1,800,000 1,800,000 926,018 - 14,232.62 4,452,000 N Y N
5 Dongguan Hua Gang Guang Jou Shing Shian Subsidiary of the Company 699,145 177,035 177,035 87,593 - 7.60 1,165,241 Y N Y
6 Raycong H.K. Xiamen Hua Chen Da Subsidiary of the Company 1,286,437 30,020 28,480 5,683 - 0.44 3,216,093 Y N Y
(Concluded)
Note 1: The limit on endorsement/guarantee given on behalf of each party shall not exceed 20% of the equity of the Company. If the Company directly or indirectly holds 100% of the equity of the endorsee or guarantee, the limit on
endorsement/guarantee given on behalf of each party shall not exceed 30% of the equity of the Company. The maximum total amount of endorsement/guarantee shall not exceed 100% of the equity of the Company.
Note 2: The limit on endorsement/guarantee given on behalf of each party shall not exceed 20% of the equity of Shanghai Yikang. If the Company directly or indirectly holds 100% of the equity of the endorsee or guarantee, the limit
on endorsement/guarantee given on behalf of each party shall not exceed 30% of the equity of Shanghai Yikang. The maximum total amount of endorsement/guarantee shall not exceed 50% of the equity of Shanghai Yikang.
Note 3: The limit on endorsement/guarantee given on behalf of each party shall not exceed 30% of the equity of Dongguan Hua Gang. The maximum total amount of endorsement/guarantee shall not exceed 50% of the equity of
Dongguan Hua Gang.
Note 4: The limit on endorsement/guarantee given on behalf of each party shall not exceed 20% of the equity of Raycong H.K. The maximum total amount of endorsement/guarantee shall not exceed 50% of the equity of Raycong H.K.
Note 5: The limit on endorsement/guarantee given to each party, based on the construction project, shall not exceed 500% of the paid-in capital of KS Corp.; the maximum total amount of endorsement/guarantee shall not exceed 800%
of the paid-in capital of KS Corp. The limit on endorsement/guarantee given to each party, not based on construction project, shall not exceed 50% of the paid-in capital of KS Corp. The total amount of endorsement/guarantee
shall not exceed 100% of the paid-in capital of KS Corp.
Note 6: The limit on endorsement/guarantee given to each party, based on the construction project, shall not exceed 10,000% of the paid-in capital of KSA Corp.; the maximum total amount of endorsement/guarantee shall not exceed
15,000% of the paid-in capital of KSA Corp.
Note 7: The limit on endorsement/guarantee given to each party, based on the construction project, shall not exceed 20,000% of the paid-in capital of KSB Corp.; the maximum total amount of endorsement/guarantee shall not exceed
40,000% of the paid-in capital of KSB Corp.
Note 8: USD is converted by spot exchange USD$1=NT$28.48; JPY is converted by spot exchange JPY1=NT$0.2763; RMB is converted by spot exchange RMB1=NT$4.3617; THB is converted by spot exchange THB1=NT$0.9556.

- 211 -
TABLE 3
WAH LEE INDUSTRIAL CORPORATION AND SUBSIDIARIES
MARKETABLE SECURITIES HELD
DECEMBER 31, 2020
(In Thousands of New Taiwan Dollars)
Holding Company Name Type and Name of Marketable
Securities
Relationship with The
Holding Company Financial Statement Account
December 31, 2020
Note Number of
Shares Carrying Value
Percentage
of
Ownership
(%)
Fair Value
The Company Stock
Chang Wah Technology Co.
Ltd.
Associate’s subsidiary Financial assets at FVTOCI -
current 2,000,000 $ 119,600 - $ 119,600
Daily Polymer Corp. The Company is the director of the
company
Financial assets at FVTOCI -
noncurrent
2,154,410 $ 34,471 3.02 $ 34,471
Wah Yuen Technology Holding
Limited
- Financial assets at FVTOCI -
noncurrent
1,968,180 77,513 0.75 77,513
JingYi Technology Co. The Company is the director of the
company
Financial assets at FVTOCI -
noncurrent
2,066,432 55,014 16.94 55,014
High Power Optoelectronics
Inc.
- Financial assets at FVTOCI -
noncurrent
67,991 - 0.12 -
Asahi Kasei Wah Lee Hi-tech
Corp.
The Company is the director of the
company
Financial assets at FVTOCI -
noncurrent
9,497 85,891 19.38 85,891
Forcera Materials Co., Ltd. The Company is the director of the
company
Financial assets at FVTOCI -
noncurrent
2,102,476 56,581 8.83 56,581
Univision Technology Holdings - Financial assets at FVTOCI -
noncurrent
38,794,190 - 9.10 -
Minima Technology Co., Ltd. The Company is the director of the
company
Financial assets at FVTOCI -
noncurrent
3,600,000 82,160 9.27 82,160
TaiGene Biotechnology Co.,
Ltd.
The Company is the supervisor of
the company
Financial assets at FVTOCI -
noncurrent
2,300,000 11,037 6.57 11,037
Shilian Fine Chemicals Co.,
Ltd.
- Financial assets at FVTOCI -
noncurrent
11,871,585 81,890 4.57 81,890
CDIB Capital Group. - Financial assets at FVTOCI -
noncurrent
5,000,000 54,094 2.86 54,094
Darco Water Technologies Ltd. - Financial assets at FVTOCI -
noncurrent
7,649,782 19,956 8.15 19,956
Eleocom Co., Ltd. The Company is the director of the
company
Financial assets at FVTOCI -
noncurrent
1,500,000 - 10.71 -
Tien Li Offshore Wind
Technology Co., Ltd.
The Company is the director of the
company
Financial assets at FVTOCI -
noncurrent
828,572 75,491
1.51 75,491
$ 634,098 $ 634,098
(Continued)

- 212 -
Holding Company Name Type and Name of Marketable
Securities
Relationship with The
Holding Company Financial Statement Account
December 31, 2020
Note Number of
Shares Carrying Value
Percentage
of
Ownership
(%)
Fair Value
SHC Holding Ltd. Guangzhou Yonguang
Optoelectronics Co., Ltd.
- Financial assets at FVTOCI -
noncurrent
- $ - 12.82 $ -
Wah Lee Holding Ltd. Mutual funds
JPMorgan Funds- Multi-
Revenue Fund-A (acc) - USD
- Financial assets at FVTPL -
current
7,737 $ 45,265 - $ 45,265
JPMorgan Funds-Income Fund
A (dist) - USD
- Financial assets at FVTPL -
current
28,629 26,801
- 26,801
$ 72,066 $ 72,066
(Concluded)

- 213 -
TABLE 4
WAH LEE INDUSTRIAL CORPORATION AND SUBSIDIARIES
TOTAL PURCHASES FROM OR SALES TO RELATED PARTIES AMOUNTING TO AT LEAST NT$100 MILLION OR 20% OF THE PAID-IN CAPITAL
FOR THE YEAR ENDED DECEMBER 31, 2020
(In Thousands of New Taiwan Dollars)
Buyer Related Party Relationship
Transaction Details Abnormal Transaction Notes/Accounts Receivable (Payable)
Note Purchase/
Sale Amount % of Total Payment Terms
Unit Price Payment Terms Ending Balance % of Total
The Company Raycong H.K. Subsidiary Sales $ (834,028 ) (3 ) 30 to 90 days after
monthly closing
Normal trade terms The terms with
related parties are
not significantly different from
those with third
parties
$ 196,628 3
Shanghai Yi Kang Subsidiary Sales (1,091,538 ) (3 ) 30 to 120 days after
monthly closing
Normal trade terms The terms with
related parties are
not significantly different from
those with third
parties
220,188 3
Dongguan Huagang Subsidiary Sales (757,187 ) (2 ) 30 to 120 days after
monthly closing
Normal trade terms The terms with
related parties are
not significantly different from
those with third
parties
190,401 3
WL Vietnam Subsidiary Sales (104,275 ) - 90 days after monthly
closing
Normal trade terms The terms with
related parties are
not significantly different from
those with third
parties
30,827 -
Nagase Wahlee Plastics. Associates accounted for using the
equity method
Purchase 122,831 1 60 to 90 days after
monthly closing
Normal trade terms The terms with
related parties are
not significantly different from
those with third
parties
(5,288 ) -
Asahi Kasei Wah Lee Hi-tech Corp. Substantial related party Purchase 1,205,245 4 105 days after monthly
closing
No comparable
transactions with third
party
The terms with
related parties are
not significantly different from
those with third parties
(226,047 ) (6 )
Chang Wah Electromaterials Inc. Associates accounted for using the
equity method
Sales (255,686 ) (1 ) 90 days after monthly
closing
Normal trade terms The terms with
related parties are not significantly
different from
those with third parties
67,565 1
Raycong H.K. Dongguan Hua Gang Subsidiary Sales (671,140 ) (19 ) 30 to 180 days after monthly closing
Normal trade terms The terms with related parties are
not significantly
different from those with third
parties
77,962 9
Shanghai Yikang Shanghai Hua Chang Associate’s subsidiary accounted for
using the equity method
Purchase 193,496 2 30 days after monthly
closing
No comparable
transactions with third
party
The terms with
related parties are
not significantly different from
those with third
parties
(35,982 ) (2 )
(Continued)

- 214 -
Buyer Related Party Relationship
Transaction Details Abnormal Transaction Notes/Accounts Receivable (Payable)
Note Purchase/
Sale Amount % of Total Payment Terms
Unit Price Payment Terms Ending Balance % of Total
Shanghai Yikang The Company Parent company Sales $ (119,910 ) (1 ) 120 days after monthly
closing
No comparable
transactions with third party
The terms with
related parties are not significantly
different from
those with third parties
$ 25,955 -
WL Indonesia WT Indonesia Associates Sales (109,217 ) (100 ) 60 days after monthly closing
No comparable transactions with third
party
The terms with related parties are
not significantly
different from those with third
parties
31,290 100
Note: It was eliminated on consolidation.

- 215 -
TABLE 5
WAH LEE INDUSTRIAL CORPORATION AND SUBSIDIARIES
RECEIVABLES FROM RELATED PARTIES AMOUNTING TO AT LEAST NT$100 MILLION OR 20% OF THE PAID-IN CAPITAL
DECEMBER 31, 2020
(In Thousands of New Taiwan Dollars)
Company Name Related Party Relationship Ending Balance
(Notes 1 and 2)
Turnover
Rate
Overdue Amount Received in
Subsequent Period
Allowance for
Impairment Loss Amount Actions Taken
The Company Shanghai Yikang Subsidiary $ 327,660 2.01 $ - - $ 161,033 $ -
Raycong H.K. Subsidiary 250,646 3.62 - - 98,242 -
Dongguan Hua Gang Subsidiary 192,763 5.20 - - 175,344 -
Chang Wah Electromaterials Inc. Associate accounted for using the
equity method
119,020 1.86 - - 67,565 -
Note 1: Including trade receivables and other receivables. Other receivables are mainly service revenue and dividends collected from related parties.
Note 2: Receivables from subsidiary were eliminated on consolidation.

- 216 -
TABLE 6
WAH LEE INDUSTRIAL CORPORATION AND SUBSIDIARIES
INFORMATION ON INVESTEES
FOR THE YEAR ENDED DECEMBER 31, 2020
(In Thousands of New Taiwan Dollars)
Company Name Investee Company Location Main Businesses and Products Original Investment Amount Number of
Shares %
Carrying Amount
(Note 2)
Net Income (Loss) of
the Investee
Share of Profit (Loss)
(Notes 1 and 2) Note
December 31, 2020 December 31, 2019
The Company Wah Lee Holding Ltd. BVI International investment business $ 430,666 $ 430,666 13,070,000 100.00 $ 4,184,973 $ 430,779 $ 430,436 Subsidiary
The Company Raycong H.K. Hong Kong Trading business of engineering plastic,
composite materials and equipment
304,113 304,113 56,000,000 53.69 3,453,779 741,376 397,670 Subsidiary
The Company Chang Wah Electromaterials Inc. Taiwan Agency of IC packaging material and
equipment
449,349 449,349 197,902,180 30.98 2,080,267 997,299 308,967 Associate
The Company Nagase Wahlee Plastics Corp. Taiwan Trading business of synthetic resin
product and related material, agency
of domestic and international
products distribution quotation and
bidding business
20,810 20,810 4,000,000 40.00 728,537 279,524 111,793 Associate
The Company Wah Hong Industrial Corp. Taiwan Manufacturing of LCD material, BMC
(bulk molding compound) material
and molded product
942,926 939,921 26,118,978 26.67 1,023,436 215,794 57,502 Associate
The Company ORC Technology Corp. Taiwan Trading business and service of
exposure machine and parts
6,000 6,000 600,000 35.00 170,408 73,647 25,777 Associate
The Company WL Japan Japan Trading business of synthetic resin,
industrial plastic, glass fiber, non-
ferrous metal, molding machine,
electromechanical parts, office
automation equipment, optical
mechanical equipment, battery and
industrial electrical equipment and
parts
21,490 21,490 1,500 83.33 4,966 (69 ) (58 ) Subsidiary
The Company WL Korea South Korea Trading business of synthetic resin,
industrial plastic, glass fiber, non-
ferrous metal, molding machine,
electromechanical parts, office
automation equipment, optical
mechanical equipment, battery and
industrial electrical equipment and
parts
18,856 18,856 147,000 100.00 698 1,848 1,848 Subsidiary
The Company Sakuragawa Solar Ltd. Japan Solar power generation business 46,008 46,008 - 99.99 86,576 7,662 7,662 Subsidiary
The Company Miyazaki Solar Ltd. Japan Solar power generation business 82,103 82,103 - 99.99 37,440 4,279 4,279 Subsidiary
The Company WL Indonesia Indonesia Trading business of industrial materials 48,262 14,840 1,610,000 70.00 37,145 (7,868 ) (5,200 ) Subsidiary
The Company Meidi H.K. Hong Kong International investment business - 17,753 - - - - - Subsidiary
The Company WL Vietnam Vietnam Trading business of industrial materials 16,293 16,293 - 100.00 36,133 9,402 9,402 Subsidiary
The Company QuanShun Logistics Co., Ltd. Taiwan Freight forwarders and leasing business 95,000 95,000 9,500,000 63.33 122,470 25,214 15,969 Subsidiary
The Company WL Green Corp. Taiwan Battery manufacturing and
renewable energy self-use power
generation equipment business
2,000 5,000 200,000 25.00 1,164 (185 ) (46 ) Subsidiary
The Company WT Industrial Thailand Trading business of industrial materials 200,000 200,000 7,650 51.00 197,605 52,415 19,027 Subsidiary
The Company Eco Energy Corporation Taiwan Battery manufacturing and
renewable energy self-use power
generation equipment business
80,000 80,000 8,000,000 20.00 97,878 14,115 2,855 Associate
(Continued)

- 217 -
Company Name Investee Company Location Main Businesses and Products Original Investment Amount Number of
Shares %
Carrying Amount
(Note 2)
Net Income (Loss) of
the Investee
Share of Profit (Loss)
(Notes 1 and 2) Note
December 31, 2020 December 31, 2019
The Company KS Corp. Taiwan Battery manufacturing and renewable
energy self-use power generation
equipment business
$ 468,384 $ 468,384 17,962,577 51.00 $ 500,767 $ 26,464 $ 16,133 Subsidiary
The Company WL Philippines Corp. Philippines Trading business of industrial materials 7,755 7,755 127,495 99.99 7,464 (8 ) (8 ) Subsidiary
The Company WL Philippines Inc. Philippines Trading business of industrial materials 7,747 7,747 126,997 99.99 6,473 (973 ) (973 ) Subsidiary
The Company WH Energy Taiwan Solar power generation business 30,000 - 3,000,000 100.00 29,901 (99 ) (99 ) Subsidiary
The Company ORC Co. Taiwan Trading business of industrial materials 4,000 - 400,000 40.00 4,000 - - Joint
Venture QuanShun Logistics Co., Ltd. Chuancheng Logistics Co., Ltd. Taiwan Freight forwarders and leasing business 12,947 - 25,000 100.00 12,248 (570 ) (700 ) Subsidiary
KS Corp. KSA Corp. Taiwan Solar power generation business 55,000 25,000 6,130,000 100.00 68,679 6,668 6,668 Subsidiary
KS Corp. KSB Corp. Taiwan Solar power generation business 10,000 10,000 1,113,000 100.00 12,647 1,391 1,391 Subsidiary
KS Corp. WL Green Corp. Taiwan Solar power generation business 4,320 10,200 432,000 51.00 2,374 (185 ) (94 ) Subsidiary
KS Corp. Eco Energy Corporation Taiwan Battery manufacturing and renewable
energy self-use power generation
equipment business
80,000 80,000 8,000,000 20.00 97,878 14,115 2,855 Associate
KS Corp. KSC Corp. Taiwan Solar power generation business 1,000 - 100,000 100.00 917 (83 ) (83 ) Subsidiary
KS Corp. KSD Corp. Taiwan Solar power generation business 67,000 - 6,700,000 100.00 66,807 (193 ) (193 ) Subsidiary
Wah Lee Holding Ltd. SHC Holding Ltd. Mauritius International investment business 43,892 43,892 1,290,000 100.00 763,090 53,095 53,095 Subsidiary
Wah Lee Holding Ltd. WL Singapore Singapore Agency of semiconductor materials and
equipment
51,639 51,639 1,600,000 100.00 347,788 34,963 34,963 Subsidiary
Wah Lee Holding Ltd. Raycong H.K. Hong Kong Trading business of engineering plastic,
composite materials and equipment
943,164 943,164 48,296,655 46.31 2,978,553 741,376 343,309 Subsidiary
Wah Lee Holding Ltd. Regent King H.K. Hong Kong Trading business of engineering plastic,
composite materials and equipment
39 39 - 100.00 2,307 1,065 1,065 Subsidiary
WT Industrial WT Indonesia Indonesia Trading business of industrial materials 3,953 3,953 18,150 66.00 1,883 (3,225 ) (2,128 ) Subsidiary
WL Singapore Gishine Tech Singapore Research and development of
environmental protection and
cleaning technology
- - - 49.00 - - - Associate
(Concluded)
Note 1: The share of profit (loss) recognized for the year ended December 31, 2020 included eliminated unrealized gains or losses and amortization of investment premium.
Note 2: The share of profit (loss) of subsidiaries are eliminated on consolidation.
Note 3: Please refer to Table 7 for information on investments in mainland China.

- 218 -
TABLE 7
WAH LEE INDUSTRIAL CORPORATION AND SUBSIDIARIES
INFORMATION ON INVESTMENTS IN MAINLAND CHINA
FOR THE YEAR ENDED DECEMBER 31, 2020
(In Thousands of New Taiwan Dollars)
Investee Company Main Businesses and Products Paid-in Capital Method of
Investment
Accumulated
Outward
Remittance for
Investment from
Taiwan as of
January 1, 2020
Remittance of Funds Accumulated
Outward
Remittance for
Investment from
Taiwan as of
December 31, 2020
Net Income (Loss)
of the Investee
%
Ownership
of Direct or
Indirect
Investment
Investment
Gain (Loss)
(Note 1)
Carrying Amount
as of December 31,
2020
Accumulated
Repatriation of
Investment Income
as of December 31,
2020
Note Outward Inward
Dongguan Hua Gang Sales of industrial materials $ 1,137,186 Invested through the third region,
Raycong H.K.
$ - $ - $ - $ - $ 317,691 100.00 $ 317,691 $ 2,325,413 $ -
Shanghai Yikang Processing and selling of chemical
material for release of wax;
international trading; trading agent and warehousing business
within enterprises in the bonded
area
990,731 Invested through the
third region,
Raycong H.K.
340,629 - - 340,629 503,201 70.00 352,241 3,118,401 -
Shenzhen Huaying Sales of industrial materials 24,084 Invested through the
third region,
Raycong H.K.
- - - - 8,597 100.00 8,597 207,867 -
Shanghai Wah Chang Trading Co.,
Ltd.
International trading and trading
consulting; trading agent and
commercial simple processing within enterprises in the bonded
area
68,352 Invested through the
third region, SHC
Holding Ltd.
43,714 - - 43,714 212,717 30.00 63,816 611,292 -
Shanghai Chang Wah Electromaterials Inc.
Agency of IC packaging material and equipment
113,920 Invested through Chinese
corporation,
Shanghai Yikang
- - - - 24,255 - 7,428 - -
Shanghai Yadi Import and export of goods and
technology
13,085 Invested through
Chinese
corporation, Shanghai Yikang
- - - - (6,355 ) 49.00 (3,114 ) 18,362 -
Shanghai Lihuang Medical devices and equipment 14,525 Invested through
Chinese corporation,
Shanghai Yikang
- - - - 919 48.98 (1,492 ) 6,759 -
Meizhou Bailun Hemodialysis and examination - Invested through Chinese
corporation,
Dongguan Hua Gang
- - - - (562 ) - (287 ) - -
Guangjou Shing Shian Wholesale of medical supplies 21,809 Invested through
Chinese
corporation,
Dongguan Hua
Gang
- - - - 12,216 100.00 12,216 44,333 -
Xiamen Hua Chen Da Warehouse logistics 13,085 Invested through
Chinese
corporation, Shenzhen Huaying
- - - - (239 ) 70.00 (167 ) 7,491 -
Xiamen Jian Yuan Rong Logistics
Ltd.
Warehouse logistics 34,894 Invested through
Chinese corporation,
Shenzhen Huaying
- - - - (3,047 ) 30.00 (910 ) 9,396 -
Xiamen Jia Cheng Yuan Trading and Development Co. Ltd.
Warehouse logistics 8,723 Invested through Chinese
corporation,
Shenzhen Huaying
- - - - (53 ) 30.00 (20 ) 2,990 -
(Continued)

- 219 -
Investee Company
Accumulated Outward Remittance
for Investment in Mainland China
as of
December 31, 2020 (Note 3)
Investment Amount Authorized by
Investment Commission, MOEA
(Note 2)
Upper Limit on the Amount of
Investment Stipulated by
Investment Commission, MOEA
(Note 3) The Company $ 384,343 $ 2,480,528 $ -
Note 1: The disclosures of investment gains and losses this period are based on the following:
1. Dongguan Hua Gang and Shanghai Yikang: audited by the Company’s CPA.
2. Others are based on unaudited financial statements.
Note 2: The difference of $2,096,185 thousand between accumulated outward remittance for investment in mainland China and investment amount authorized by investment commission, MOEA is due to investment of $1,338,686
thousand (USD8,488 thousand and HKD267,000 thousand) through Raycong H.K., investment of $111,175 thousand (USD3,572 thousand) through Wah Yuen Technology Holding Limited, transferred capital from retained
earnings of $434,385 thousand (USD13,790 thousand) of Shanghai Yikang, investment of $14,500 thousand (USD500 thousand) through SHC Holding Ltd., investment without significant influence of $162,978 thousand and
the invested amount of $34,461 thousand which had already been liquidated but not yet revoked.
Note 3: Under the “Principles Governing the Review of Investments or Technical Cooperation in Mainland China” issued by the Investment Commission on August 29, 2008, the Company had obtained the certificate issued by the
Industrial Bureau of the Ministry of Economic Affairs in accordance with the business scope of the operating headquarters; thus, the amount that can be invested in companies located in mainland China is unlimited.
(Concluded)

- 220 -
TABLE 8
WAH LEE INDUSTRIAL CORPORATION AND SUBSIDIARIES
SIGNIFICANT TRANSACTIONS WITH INVESTEE COMPANIES IN MAINLAND CHINA, EITHER DIRECTLY OR INDIRECTLY THROUGH A THIRD AREA, AND THEIR PRICES, PAYMENT TERMS, AND
UNREALIZED GAINS OR LOSSES
FOR THE YEAR ENDED DECEMBER 31, 2020
(In Thousands of New Taiwan Dollars)
Company Name Investee Company Transaction Type
Purchase/Sale
Price
Transaction Details Notes/Trade Receivable
(Payable) Unrealized (Gain)
Loss Note
Amount % Payment Terms
Comparison with
Normal
Transactions
Ending Balance %
The Company Shanghai Yikang Sales $ 1,091,538 3 Normal trade terms 30 to 120 days after
monthly closing
The terms with
related parties are
not significantly
different from
those with third
parties
$ 220,188 3 $ 554 Note
Shanghai Yikang Purchase (119,910 ) - Normal trade terms 120 days after monthly
closing
The terms with
related parties are
not significantly
different from
those with third
parties
(25,955 ) (1) - Note
Dongguan Hua Gang Sales 757,187 2 Normal trade terms 30 to 120 days after
monthly closing
The terms with
related parties are
not significantly
different from
those with third
parties
190,401 3 436 Note
Shanghai Yadi Sales 27,571 - Normal trade terms 90 days after monthly
closing
The terms with
related parties are
not significantly
different from
those with third
parties
6,392 - - Note
Shanghai Lihuang Sales 10,675 - Normal trade terms 90 days after monthly
closing
The terms with
related parties are
not significantly
different from
those with third
parties
3,190 - - Note
Raycong H.K. Dongguan Hua Gang Sales 671,140 19 Normal trade terms 30 to 180 days after
monthly closing
The terms with
related parties are
not significantly
different from
those with third
parties
77,962 9 5,069 Note
Note: It was eliminated on consolidation.

- 221 -
TABLE 9
WAH LEE INDUSTRIAL CORPORATION AND SUBSIDIARIES
INTERCOMPANY RELATIONSHIPS AND SIGNIFICANT INTERCOMPANY TRANSACTIONS
FOR THE YEAR ENDED DECEMBER 31, 2020
(In Thousands of New Taiwan Dollars)
No. Investee Company Counterparty Relationship
Transaction Details
Financial Statement
Accounts Amount Payment Terms
% of Total
Sales or
Assets
0 The Company Shanghai Yikang Parent to subsidiary Operating revenue $ 1,091,538 According to the contract 2.00
0 The Company Shanghai Yikang Parent to subsidiary Trade receivables 220,188 According to the contract 1.00
0 The Company Shanghai Yikang Parent to subsidiary Other income 29,158 According to the contract -
0 The Company Shanghai Yikang Parent to subsidiary Other receivables 107,472 According to the contract -
0 The Company Raycong H.K. Parent to subsidiary Operating revenue 834,028 According to the contract 1.00
0 The Company Raycong H.K. Parent to subsidiary Trade receivables 196,628 According to the contract 1.00
0 The Company Raycong H.K. Parent to subsidiary Other income 38,766 According to the contract -
0 The Company Raycong H.K. Parent to subsidiary Other receivables 54,018 According to the contract -
0 The Company Dongguan Hua Gang Parent to subsidiary Operating revenue 757,187 According to the contract 1.00
0 The Company Dongguan Hua Gang Parent to subsidiary Trade receivables 190,401 According to the contract -
0 The Company Dongguan Hua Gang Parent to subsidiary Other receivables 2,362 According to the contract -
0 The Company WT Industrial Parent to subsidiary Operating revenue 93,963 According to the contract -
0 The Company WT Industrial Parent to subsidiary Trade receivables 10,427 According to the contract -
0 The Company WT Industrial Parent to subsidiary Other income 13,278 According to the contract -
0 The Company WT Industrial Parent to subsidiary Other receivables 11,958 According to the contract -
0 The Company WL Vietnam Parent to subsidiary Operating revenue 104,275 According to the contract -
0 The Company WL Vietnam Parent to subsidiary Trade receivables 30,827 According to the contract -
0 The Company WL Vietnam Parent to subsidiary Other income 1,108 According to the contract -
0 The Company WL Vietnam Parent to subsidiary Other receivables 316 According to the contract -
0 The Company KS Corp. Parent to subsidiary Operating revenue 70,919 According to the contract -
0 The Company KS Corp. Parent to subsidiary Trade receivables 24,454 According to the contract -
0 The Company KS Corp. Parent to subsidiary Other income 5,955 According to the contract -
0 The Company KS Corp. Parent to subsidiary Other receivables 1,187 According to the contract -
0 The Company KS Corp. Parent to subsidiary Contract liabilities 77,113 According to the contract -
0 The Company WL Singapore Parent to subsidiary Operating revenue 62,988 According to the contract -
0 The Company WL Singapore Parent to subsidiary Trade receivables 13,930 According to the contract -
0 The Company WL Singapore Parent to subsidiary Other income 6,572 According to the contract -
0 The Company WL Singapore Parent to subsidiary Other receivables 13,483 According to the contract -
0 The Company Shanghai Yadi Parent to subsidiary Operating revenue 27,571 According to the contract -
0 The Company Shanghai Yadi Parent to subsidiary Trade receivables 6,392 According to the contract -
0 The Company Shanghai Yadi Parent to subsidiary Other income 2,059 According to the contract -
0 The Company Shanghai Yadi Parent to subsidiary Other receivables 2,022 According to the contract -
0 The Company Quan Shun Logistics
Co., Ltd.
Parent to subsidiary Other income 17,947 According to the contract -
0 The Company Quan Shun Logistics
Co., Ltd.
Parent to subsidiary Other receivables 5,798 According to the contract -
0 The Company Shanghai Lihuang Parent to subsidiary Operating revenue 10,675 According to the contract -
0 The Company Shanghai Lihuang Parent to subsidiary Trade receivables 3,190 According to the contract -
(Continued)

- 222 -
No. Investee Company Counterparty Relationship
Transaction Details
Financial Statement
Accounts Amount Payment Terms
% of Total
Sales or
Assets
0 The Company KSA Corp. Parent to subsidiary Operating revenue $ 17,128 According to the contract -
0 The Company KSA Corp. Parent to subsidiary Trade receivables 23,903 According to the contract -
0 The Company KSA Corp. Parent to subsidiary Contract liabilities 9,473 According to the contract -
1 Shanghai Yikang The Company Subsidiary to parent Operating revenue 119,910 According to the contract -
1 Shanghai Yikang The Company Subsidiary to parent Trade receivables 25,955 According to the contract -
1 Shanghai Yikang Dongguan Hua Gang Subsidiary to subsidiary Operating revenue 69,761 According to the contract -
1 Shanghai Yikang Dongguan Hua Gang Subsidiary to subsidiary Trade receivables 7,335 According to the contract -
1 Shanghai Yikang Raycong H.K. Subsidiary to parent Operating revenue 12,050 According to the contract -
1 Shanghai Yikang Raycong H.K. Subsidiary to parent Trade receivables 3,133 According to the contract -
2 Raycong H.K. Dongguan Hua Gang Parent to subsidiaries Operating revenue 671,140 According to the contract 1.00
2 Raycong H.K. Dongguan Hua Gang Parent to subsidiaries Trade receivables 77,962 According to the contract -
3 Dongguan Hua Gang Shanghai Yikang Subsidiary to subsidiary Operating revenue 47,536 According to the contract -
3 Dongguan Hua Gang Shanghai Yikang Subsidiary to subsidiary Trade receivables 11,381 According to the contract -
3 Dongguan Hua Gang Shanghai Yikang Subsidiary to subsidiary Other income 27 According to the contract -
3 Dongguan Hua Gang Shanghai Yikang Subsidiary to subsidiary Other receivables 28 According to the contract -
4 QuanShun Logistics Co., Ltd. The Company Subsidiary to parent Operating revenue 82,090 According to the contract -
4 QuanShun Logistics Co., Ltd. The Company Subsidiary to parent Trade receivables 24,293 According to the contract -
4 QuanShun Logistics Co., Ltd. The Company Subsidiary to parent Other receivables 6 According to the contract -
5 Shenzhen Huaying Dongguan Hua Gang Subsidiary to subsidiary Operating revenue 56,396 According to the contract -
5 Shenzhen Huaying Dongguan Hua Gang Subsidiary to subsidiary Trade receivables 10,744 According to the contract -
5 Shenzhen Huaying Xiamen Hua Chen Da Parent to subsidiary Other receivables 8,723 According to the contract -
5 Shenzhen Huaying Xiamen Hua Chen Da Parent to subsidiary Interest revenue 227 According to the contract -
6 WL Indonesia WT Indonesia Subsidiary to subsidiary Operating revenue 109,217 According to the contract -
6 WL Indonesia WT Indonesia Subsidiary to subsidiary Trade receivables 31,390 According to the contract -
7 KS Corp. KSA Corp. Parent to subsidiary Other receivables 17,628 According to the contract -
7 KS Corp. KSA Corp. Parent to subsidiary Operating revenue 3,762 According to the contract -
7 KS Corp. KSA Corp. Parent to subsidiary Interest revenue 153 According to the contract -
(Concluded)

- 223 -
TABLE 10
WAH LEE INDUSTRIAL CORPORATION
INFORMATION OF MAJOR SHAREHOLDERS
DECEMBER 31, 2020
Name of Major Shareholder
Shares
Number of Shares Percentage of
Ownership (%)
Kang Tai Investment Co., Ltd. 16,374,155 7.07
Fu Shih Investment Co., Ltd. 13,188,583 5.69
Note: The information of major shareholders presented in this table is provided by the Taiwan Depository &
Clearing Corporation based on the number of ordinary shares held by shareholders with ownership of 5%
or greater, that have been issued without physical registration by the Company as of the last business day
for the current quarter.
- 224 -
VI. 2020 certified parent-only Financial Statements
INDEPENDENT AUDITORS’ REPORT
The Board of Directors and Shareholders
Wah Lee Industrial Corporation
Opinion
We have audited the accompanying parent company only financial statements of Wah Lee Industrial Corporation
(the “Company”), which comprise the balance sheets as of December 31, 2020 and 2019, and the statements of
comprehensive income, changes in equity and cash flows for the years then ended, and the notes to the financial
statements, including a summary of significant accounting policies.
In our opinion, based on our audits and the reports of other auditors (refer to Other Matter paragraph), the
accompanying parent company only financial statements present fairly, in all material respects, the financial
position of the Company as of December 31, 2020 and 2019, and its financial performance and its cash flows for
the years then ended in accordance with the Regulations Governing the Preparation of Financial Reports by
Securities Issuers.
Basis for Opinion
We conducted our audit of the parent company only financial statements for the year ended December 31, 2020
in accordance with the Regulations Governing Auditing and Attestation of Financial Statements by Certified
Public Accountants and auditing standards generally accepted in the Republic of China. We conducted our audit
of the parent company only financial statements for the year ended December 31, 2019 in accordance with the
Regulations Governing Auditing and Attestation of Financial Statements by Certified Public Accountants, Rule
No. 1090360805 issued by the Financial Supervisory Commission of the Republic of China on February 25, 2020,
and auditing standards generally accepted in the Republic of China. Our responsibilities under those standards are
further described in the Auditors’ Responsibilities for the Audit of the Parent Company Only Financial Statements
section of our report. We are independent of the Company in accordance with The Norm of Professional Ethics
for Certified Public Accountant of the Republic of China, and we have fulfilled our other ethical responsibilities
in accordance with these requirements. We believe that the audit evidence we have obtained is sufficient and
appropriate to provide a basis for our opinion.
Key Audit Matters
Key audit matters are those matters that, in our professional judgment, were of most significance in our audit of
the parent company only financial statements for the year ended December 31, 2020. These matters were
addressed in the context of our audit of the parent company only financial statements as a whole, and in forming
our opinion thereon, and we do not provide a separate opinion on these matters.
The key audit matter identified in the Company’s parent company only financial statements for the year ended
December 31, 2020 is discussed as follows:

- 225 -
Occurrence of revenue from specific customers
The operating revenue of the Company for the year ended December 31, 2020 was NT$33,236,491 thousand, of
which the revenue and gross profit from specific customers show significant growth over the past year. In addition,
based on the ROC GAAS, revenue recognition is presumed to have a significant risk. Therefore, we considered
the occurrence of revenue from specific customers as a key audit matter.
Refer to Note 4 to the parent company only financial statements for the related accounting policy on revenue
recognition.
The main audit procedures that we performed to address the occurrence of the revenue from specific customers
were as follows:
1. We understood and tested the design and operating effectiveness of the internal controls relevant to shipment
and revenue recognition.
2. We verified, on a sampling basis, the occurrence of recorded revenue from specific customers against
supporting documents, including shipping and collection documents, and we checked whether the payer is
the same as the buyer.
Other Matter
The financial statements of certain investees accounted for using the equity method in the Company’s parent
company only financial statements for the years ended December 31, 2020 and 2019 were audited by other
independent auditors; accordingly, our opinion insofar as it relates to the amounts and information disclosed, is
based solely on the reports of other independent auditors.
The carrying values of the investments accounted for using the equity method as of December 31, 2020 and 2019
were NT$728,537 thousand and NT$675,514 thousand, respectively, both representing 3% of total parent
company only assets; and the amounts of the share of profit of associates for the years ended December 31, 2020
and 2019 were NT$111,793 thousand and NT$69,036 thousand, representing 5% and 4% of parent company only
profit before income tax, respectively.
Responsibilities of Management and Those Charged with Governance for the Parent Company Only
Financial Statements
Management is responsible for the preparation and fair presentation of the parent company only financial
statements in accordance with the Regulations Governing the Preparation of Financial Reports by Securities
Issuers, and for such internal control as management determines is necessary to enable the preparation of parent
company only financial statements that are free from material misstatement, whether due to fraud or error.
In preparing the parent company only financial statements, management is responsible for assessing the
Company’s ability to continue as a going concern, disclosing, as applicable, matters related to going concern and
using the going concern basis of accounting unless management either intends to liquidate the Company or to
cease operations, or has no realistic alternative but to do so.
Those charged with governance, including the audit committee, are responsible for overseeing the Company’s
financial reporting process.

- 226 -
Auditors’ Responsibilities for the Audit of the Parent Company Only Financial Statements
Our objectives are to obtain reasonable assurance about whether the parent company only financial statements as
a whole are free from material misstatement, whether due to fraud or error, and to issue an auditors’ report that
includes our opinion. Reasonable assurance is a high level of assurance, but is not a guarantee that an audit
conducted in accordance with the auditing standards generally accepted in the Republic of China will always
detect a material misstatement when it exists. Misstatements can arise from fraud or error and are considered
material if, individually or in the aggregate, they could reasonably be expected to influence the economic decisions
of users taken on the basis of these parent company only financial statements.
As part of an audit in accordance with the auditing standards generally accepted in the Republic of China, we
exercise professional judgment and maintain professional skepticism throughout the audit. We also:
1. Identify and assess the risks of material misstatement of the parent company only financial statements,
whether due to fraud or error, design and perform audit procedures responsive to those risks, and obtain audit
evidence that is sufficient and appropriate to provide a basis for our opinion. The risk of not detecting a
material misstatement resulting from fraud is higher than for one resulting from error, as fraud may involve
collusion, forgery, intentional omissions, misrepresentations, or the override of internal control.
2. Obtain an understanding of internal control relevant to the audit in order to design audit procedures that are
appropriate in the circumstances, but not for the purpose of expressing an opinion on the effectiveness of the
Company’s internal control.
3. Evaluate the appropriateness of accounting policies used and the reasonableness of accounting estimates and
related disclosures made by management.
4. Conclude on the appropriateness of management’s use of the going concern basis of accounting and, based
on the audit evidence obtained, whether a material uncertainty exists related to events or conditions that may
cast significant doubt on the Company’s ability to continue as a going concern. If we conclude that a material
uncertainty exists, we are required to draw attention in our auditors’ report to the related disclosures in the
parent company only financial statements or, if such disclosures are inadequate, to modify our opinion. Our
conclusions are based on the audit evidence obtained up to the date of our auditors’ report. However, future
events or conditions may cause the Company to cease to continue as a going concern.
5. Evaluate the overall presentation, structure and content of the parent company only financial statements,
including the disclosures, and whether the consolidated financial statements represent the underlying
transactions and events in a manner that achieves fair presentation.
6. Obtain sufficient and appropriate audit evidence regarding the financial information of entities or business
activities within the Company to express an opinion on the parent company only financial statements. We are
responsible for the direction, supervision, and performance of the audit. We remain solely responsible for our
audit opinion.
We communicate with those charged with governance regarding, among other matters, the planned scope and
timing of the audit and significant audit findings, including any significant deficiencies in internal control that we
identify during our audit.
We also provide those charged with governance with a statement that we have complied with relevant ethical
requirements regarding independence, and to communicate with them all relationships and other matters that may
reasonably be thought to bear on our independence, and where applicable, related safeguards.
From the matters communicated with those charged with governance, we determine those matters that were of
most significance in the audit of the parent company only financial statements for the year ended December 31,
2020 and are therefore the key audit matters. We describe these matters in our auditors’ report unless law or
regulation precludes public disclosure about the matter or when, in extremely rare circumstances, we determine
that a matter should not be communicated in our report because the adverse consequences of doing so would

- 227 -
reasonably be expected to outweigh the public interest benefits of such communication.
The engagement partners on the audits resulting in this independent auditors’ report are Chiu-Yen Wu and Chen-
Li Chen.
Deloitte & Touche
Taipei, Taiwan
Republic of China
March 26, 2021
Notice to Readers
The accompanying parent company only financial statements are intended only to present the parent company
only financial position, financial performance and cash flows in accordance with accounting principles and
practices generally accepted in the Republic of China and not those of any other jurisdictions. The standards,
procedures and practices to audit such parent company only financial statements are those generally applied in
the Republic of China.
For the convenience of readers, the independent auditors’ report and the accompanying parent company only
financial statements have been translated into English from the original Chinese version prepared and used in
the Republic of China. If there is any conflict between the English version and the original Chinese version or
any difference in the interpretation of the two versions, the Chinese-language independent auditors’ report and
parent company only financial statements shall prevail.

- 228 -
WAH LEE INDUSTRIAL CORPORATION
PARENT COMPANY ONLY BALANCE SHEETS
(In Thousands of New Taiwan Dollars)
December 31, 2020 December 31, 2019
ASSETS Amount % Amount %
CURRENT ASSETS
Cash and cash equivalents (Note 6) $ 1,194,704 4 $ 792,785 3
Financial assets at fair value through other comprehensive income - current (Notes 4 and 7) 119,600 - 68,900 -
Notes receivable (Notes 4 and 8) 131,614 1 155,804 1
Accounts receivable, net (Notes 4, 5 and 8) 6,534,683 24 5,494,610 23
Accounts receivable - related parties (Notes 4, 5, 8 and 25) 800,694 3 1,014,996 4
Other receivables 42,422 - 26,171 -
Other receivables - related parties (Note 25) 253,266 1 406,900 2
Merchandise (Notes 4, 5 and 9) 1,824,901 7 1,831,530 8
Prepayments for purchases (Note 25) 1,004,155 4 690,345 3
Other current assets 12,136 - 14,113 -
Total current assets 11,918,175 44 10,496,154 44
NONCURRENT ASSETS
Financial assets at fair value through other comprehensive income - noncurrent (Notes 4 and 7) 634,098 2 572,981 2
Investments accounted for using the equity method (Notes 4, 10 and 26) 12,812,080 48 11,532,750 48
Property, plant and equipment (Notes 4, 11 and 26) 711,059 3 748,692 3
Right-of-use assets (Notes 4 and 12) 21,427 - 27,335 -
Investment properties (Notes 4, 13 and 26) 436,599 2 417,208 2
Other intangible assets 23,619 - 24,539 -
Deferred tax assets (Notes 4 and 21) 236,455 1 227,274 1
Prepayments for equipment - - 109 -
Refundable deposits 54,114 - 49,576 -
Prepayments for investments 10,000 - - -
Total noncurrent assets 14,939,451 56 13,600,464 56
TOTAL $ 26,857,626 100 $ 24,096,618 100
LIABILITIES AND EQUITY
CURRENT LIABILITIES
Short-term borrowings (Note 14) $ 4,013,494 15 $ 3,316,962 14
Contract liabilities - current (Notes 20 and 25) 305,104 1 259,153 1
Notes payable (Note 15) 29,219 - 323,906 1
Notes payable - related parties (Notes 15 and 25) 938 - 201 -
Accounts payables (Note 15) 3,602,416 13 2,873,629 12
Accounts payables - related parties (Notes 15 and 25) 271,663 1 274,755 1
Other payables (Notes 16 and 25) 771,384 3 687,301 3
Current tax liabilities (Note 21) 82,325 - 93,596 -
Lease liabilities - current (Notes 4 and 12) 8,043 - 7,314 -
Current portion of long-term borrowings (Note 14) 433,577 2 32,486 -
Refund liabilities - current 173,956 1 155,819 1
Other current liabilities 15,358 - 11,401 -
Total current liabilities 9,707,477 36 8,036,523 33
NONCURRENT LIABILITIES
Long-term borrowings (Note 14) 2,785,247 11 3,217,425 13
Provision for employee benefits - noncurrent 14,760 - 14,760 -
Deferred tax liabilities (Notes 4 and 21) 1,155,352 4 1,056,833 5
Lease liabilities - noncurrent (Notes 4 and 12) 13,663 - 20,154 -
Net defined benefit liabilities - noncurrent (Notes 4 and 7) 300,009 1 303,006 1
Guarantee deposits received 3,109 - 3,020 -
Total noncurrent liabilities 4,272,140 16 4,615,198 19
Total liabilities 13,979,617 52 12,651,721 52
EQUITY (Note 19)
Share Capital 2,313,901 8 2,313,901 10
Capital surplus 1,331,725 5 1,318,065 5
Retained earnings
Legal reserve 2,228,083 8 2,084,659 9
Special reserve 980,087 4 679,347 3
Unappropriated earnings 6,660,831 25 6,029,012 25
Total retained earnings 9,869,001 37 8,793,018 37
Other equity (636,618)
(2
) (980,087)
(4
)
Total equity 12,878,009 48 11,444,897 48
TOTAL $ 26,857,626 100 $ 24,096,618 100
The accompanying notes are an integral part of the parent company only financial statements.
(With Deloitte & Touche auditors’ report dated March 26, 2021)

- 229 -
WAH LEE INDUSTRIAL CORPORATION
PARENT COMPANY ONLY STATEMENTS OF COMPREHENSIVE INCOME
(In Thousands of New Taiwan Dollars, Except Earnings Per Share)
For the Year Ended December 31
2020 2019
Amount % Amount %
OPERATING REVENUE (Notes 4, 19 and 25) $ 33,236,491 100 $ 29,225,800 100
OPERATING COSTS (Notes 9, 20 and 25) 30,967,419 93 27,249,269 93
GROSS PROFIT 2,269,072 7 1,976,531 7
UNREALIZED GAIN ON TRANSACTIONS WITH
ASSOCIATES AND JOINT VENTURES (2,234) - (22,361) -
REALIZED GAIN ON TRANSACTIONS WITH
ASSOCIATES AND JOINT VENTURES 22,361 - 28,199 -
REALIZED GROSS PROFIT 2,289,199 7 1,982,369 7
OPERATING EXPENSES (Notes 8, 20 and 25)
Selling and marketing expenses 1,265,698 4 1,166,533 4
General and administrative expenses 344,463 1 335,182 1
Expected credit loss 38,697 - 1,081 -
Total operating expenses 1,648,858 5 1,502,796 5
PROFIT FROM OPERATIONS 640,341 2 479,573 2
NON-OPERATING INCOME AND EXPENSES
(Notes 20 and 25)
Interest income 709 - 1,274 -
Other income 189,594 1 183,140 1
Other gains and losses (49,813) - (1,119) -
Finance costs (79,298) - (128,708) (1)
Share of profit of subsidiaries, associates and joint
ventures 1,402,936 4 1,071,078 4
Total non-operating income and expenses 1,464,128 5 1,125,665 4
PROFIT BEFORE INCOME TAX 2,104,469 7 1,605,238 6
INCOME TAX EXPENSE (Notes 4 and 21) 245,349 1 189,416 1
NET PROFIT FOR THE YEAR 1,859,120 6 1,415,822 5
(Continued)

- 230 -
WAH LEE INDUSTRIAL CORPORATION
PARENT COMPANY ONLY STATEMENTS OF COMPREHENSIVE INCOME
(In Thousands of New Taiwan Dollars, Except Earnings Per Share)
For the Year Ended December 31
2020 2019
Amount % Amount %
OTHER COMPREHENSIVE INCOME (Notes 18 and
21)
Items that will not be reclassified subsequently to
profit or loss:
Remeasurement of defined benefit plans $ (4,470) - $ 9,375 -
Unrealized gain (loss) on investments in equity
instruments designated as at fair value through
other comprehensive income 110,390 - (114,290) -
Share of other comprehensive income of
subsidiaries and associates accounted for using
the equity method 236,698 1 72,454 -
Income tax relating to items that will not be
reclassified subsequently to profit or loss 7,804 - 9,797 -
Items that may be reclassified subsequently to profit
or loss:
Share of other comprehensive gain (loss) of
subsidiaries and associates accounted for using
the equity method 28,450 - (297,317) (1)
Income tax relating to items that may be
reclassified subsequently to profit or loss (4,571) - 45,714 -
Other comprehensive income (loss) for the year,
net of income tax 374,301 1 (274,267) (1)
TOTAL COMPREHENSIVE INCOME FOR THE
YEAR $ 2,233,421 7 $ 1,141,555 4
EARNINGS PER SHARE (Note 22)
Basic $ 8.03 $ 6.12
Diluted $ 7.81 $ 5.93
The accompanying notes are an integral part of the parent company only financial statements.
(With Deloitte & Touche auditors’ report dated March 26, 2021) (Concluded)

- 231 -
WAH LEE INDUSTRIAL CORPORATION PARENT COMPANY ONLY STATEMENTS OF CHANGES IN EQUITY FOR THE YEARS ENDED DECEMBER 31, 2020 AND 2019 (In Thousands of New Taiwan Dollars)
Other Equity
Retained Earnings
Exchange Differences on Translation of the Financial Statements of
Unrealized Gain/(Loss) on
Financial Assets at Fair
Value Through Other
Share Capital Capital Surplus Legal Reserve Special Reserve Unappropriated
Earnings Foreign
Operations Comprehensive
Income Subtotal Total Equity BALANCE AT JANUARY 1, 2019 $ 2,313,901 $ 1,331,880 $ 1,950,063 $ 78,160 $ 6,070,997 $ (355,909) $ (323,438) $ (679,347) $ 11,065,654 Appropriation of 2018 earnings
Legal reserve - - 134,596 - (134,596) - - - - Special reserve - - - 601,187 (601,187) - - - - Cash dividends distributed by the Company - - - - (740,448) - - - (740,448)
- - 134,596 601,187 (1,476,231) - - - (740,448) Changes in percentage of ownership interests in subsidiaries - - - - (8,049) - - - (8,049) Changes in capital surplus from investments in associates accounted for using
the equity method - (13,815) - - - - - - (13,815) Net profit for the year ended December 31, 2019 - - - - 1,415,822 - - - 1,415,822 Other comprehensive income (loss) for the year ended December 31, 2019, net
of income tax - - - - 7,550 (251,603) (30,214) (281,817) (274,267) Total comprehensive income (loss) for the year ended December 31, 2019 - - - - 1,423,372 (251,603) (30,214) (281,817) 1,141,555 Disposals of investments in equity instruments designated as at fair value
through other comprehensive income (Notes 7 and 18) - - - - (4,652) - 4,652 4,652 - Associates disposed the investments in equity instruments designated as at fair
value through other comprehensive income (Note 18) - - - - 23,575 - (23,575) (23,575) - BALANCE AT DECEMBER 31, 2019 2,313,901 1,318,065 2,084,659 679,347 6,029,012 (607,512) (372,575) (980,087) 11,444,897 Appropriation of 2019 earnings
Legal reserve - - 143,424 - (143,424) - - - - Special reserve - - - 300,740 (300,740) - - - - Cash dividends distributed by the Company - - - - (763,587) - - - (763,587)
- - 143,424 300,740 (1,207,751) - - - (763,587) Changes in percentage of ownership interests in subsidiaries - (846) - - - - - - (846) Changes in capital surplus from investments in associates accounted for using
the equity method - 14,506 - - (50,382) - - - (35,876) Net profit for the year ended December 31, 2020 - - - - 1,859,120 - - - 1,859,120 Other comprehensive income (loss) for the year ended December 31, 2020, net
of income tax - - - - (2,328) 23,879 352,750 376,629 374,301 Total comprehensive income for the year ended December 31, 2020 - - - - 1,856,792 23,879 352,750 376,629 2,233,421 Disposals of investments in equity instruments designated as at fair value
through other comprehensive income (Notes 7 and 18) - - - - 18,567 - (18,567) (18,567) - Associates disposed the investments in equity instruments designated as at fair
value through other comprehensive income (Note 18) - - - - 14,593 - (14,593) (14,593) - BALANCE AT DECEMBER 31, 2020 $ 2,313,901 $ 1,331,725 $ 2,228,083 $ 980,087 $ 6,660,831 $ (583,633) $ (52,985) $ (636,618) $ 12,878,009
The accompanying notes are an integral part of the parent company only financial statements. (With Deloitte & Touche auditors’ report dated March 26, 2021)

- 232 -
WAH LEE INDUSTRIAL CORPORATION
PARENT COMPANY ONLY STATEMENTS OF CASH FLOWS
(In Thousands of New Taiwan Dollars)
For the Years Ended December 31
2020 2019
CASH FLOWS FROM OPERATING ACTIVITIES
Income before income tax $ 2,104,469 $ 1,605,238
Adjustments for:
Depreciation expense 58,658 57,015
Amortization expense 6,770 4,868
Expected credit loss 38,697 1,081
Finance costs 79,298 128,708
Interest income (709) (1,274)
Dividend income (16,696) (12,714)
Share of profit of subsidiaries and associates accounted for using the
equity method
(1,402,936) (1,071,078)
Loss (gain) on disposal of investment for using the equity method 3,371 (1,155)
Impairment loss on non-financial assets 3,785 77,316
Unrealized gain on transactions with subsidiaries 2,234 22,361
Realized gain on transactions with subsidiaries (22,361) (28,199)
Net loss (gain) on foreign currency exchange 37,629 (63,486)
Others (2,375) (1,804)
Changes in operating assets and liabilities
Notes receivable 24,190 74,622
Accounts receivable (1,078,059) 76,560
Accounts receivable - related parties 213,591 58,969
Other receivables (16,251) 3,408
Other receivables - related parties 113,216 (39,199)
Inventories 2,844 119,231
Prepayments for purchases (313,810) (319,171)
Other current assets 1,977 12,217
Contract liabilities 45,951 199,934
Notes payable (294,687) (187,559)
Notes payable - related parties 737 (1,347)
Accounts payable 728,787 (673,060)
Accounts payable - related parties (3,092) (79,034)
Other payables 93,135 13,574
Refund liabilities 18,137 25,023
Other current liabilities 3,957 (3,470)
Net defined benefit liabilities (7,467) (11,507)
Cash generated from (used in) operations 422,990 (13,932)
Interest received 709 1,274
Dividends received 493,329 383,463
Interest paid (86,910) (123,865)
Income tax paid (164,049) (181,129)
Net cash generated from operating activities 666,069 65,811
(Continued)

- 233 -
WAH LEE INDUSTRIAL CORPORATION
PARENT COMPANY ONLY STATEMENTS OF CASH FLOWS
(In Thousands of New Taiwan Dollars)
For the Years Ended December 31
2020 2019
CASH FLOWS FROM INVESTING ACTIVITIES
Purchase of financial assets at fair value through other comprehensive
income
$ (50,000) $ -
Proceeds from disposal of financial assets at fair value through other
comprehensive income
47,285 4,782
Proceeds from the capital reduction of financial assets at fair value
through other comprehensive income
1,288 -
Purchase of investments accounted for using the equity method (37,005) (483,886)
Proceeds from the capital reduction of investments accounted for
using equity method
3,000 70,804
Payments for property, plant and equipment (47,420) (31,754)
Proceeds from disposal of property, plant and equipment 17,194 1,737
Decrease (increase) in refundable deposits (4,538) 192
Increase in other intangible assets (5,850) (13,403)
Prepayments for investments (10,000) -
Net cash used in investing activities (86,046) (451,528)
CASH FLOWS FROM FINANCING ACTIVITIES
Increase in short-term borrowings 658,903 336,239
Decrease in short-term bills payable - (100,000)
Proceeds from long-term borrowings 8,000,385 6,892,239
Repayment of long-term borrowings (8,032,912) (6,131,946)
Increase in guarantee deposits received 89 -
Repayment of the principal portion of lease liabilities (7,560) (5,269)
Cash dividends (763,587) (740,448)
Acquisition of additional interests in subsidiaries (33,422) -
Net cash generated from (used in) financing activities (178,104) 250,815
NET INCREASE (DECREASE) IN CASH AND CASH
EQUIVALENTS
401,919 (134,902)
CASH AT THE BEGINNING OF THE YEAR 792,785 927,687
CASH AT THE END OF THE YEAR $ 1,194,704 $ 792,785
The accompanying notes are an integral part of the parent company only financial statements.
(With Deloitte & Touche auditors’ report dated March 26, 2021) (Concluded)

- 234 -
WAH LEE INDUSTRIAL CORPORATION
NOTES TO PARENT COMPANY ONLY FINANCIAL STATEMENTS
FOR THE YEARS ENDED DECEMBER 31, 2020 AND 2019
(In Thousands of New Taiwan Dollars, Unless Stated Otherwise)
1. ORGANIZATION
Wah Lee Industrial Corporation (the “Company”) was incorporated in October 1968, and is mainly engaged
in the import/export and agency business of composite materials, engineering plastic, printed circuit board,
semiconductor, and computer related manufacturing materials and equipment.
The Company’s shares have been listed and traded on the Taiwan Stock Exchange since July 22, 2002.
The parent company only financial statements are presented in the Company’s functional currency, the New
Taiwan dollar.
2. APPROVAL OF FINANCIAL STATEMENTS
The parent company only financial statements were approved and authorized for issue by the Company’s
board of directors on March 26, 2021.
3. APPLICATION OF NEW, AMENDED AND REVISED STANDARDS AND INTERPRETATIONS
a. Initial application of the International Financial Reporting Standards (IFRS), International Accounting
Standards (IAS), IFRIC Interpretations (IFRIC), and SIC Interpretations (SIC) (collectively, the “IFRSs”)
endorsed and issued into effect by the Financial Supervisory Commission (FSC)
The initial application of the IFRSs endorsed and issued into effect by the FSC did not have a material
impact on the Company’s accounting policies.
b. The IFRSs endorsed by the FSC for application starting from 2021
New IFRSs
Effective Date
Announced by IASB
Amendments to IFRS 4 “Extension of the Temporary Exemption from
Applying IFRS 9”
Effective immediately upon
promulgation by the IASB
Amendments to IFRS 9, IAS 39, IFRS 7, IFRS 4 and IFRS 16
“Interest Rate Benchmark Reform - Phase 2”
January 1, 2021
As of the date the parent company only financial statements were authorized for issue, the Company
assessed that the application of standards and interpretations will not have a material impact on the
Company’s financial position and financial performance.

- 235 -
c. New IFRSs in issue but not yet endorsed and issued into effect by the FSC
New IFRSs
Effective Date
Announced by IASB (Note 1)
“Annual Improvements to IFRS Standards 2018-2020” January 1, 2022 (Note 2)
Amendments to IFRS 3 “Reference to the Conceptual Framework” January 1, 2022 (Note 3)
Amendments to IFRS 10 and IAS 28 “Sale or Contribution of Assets
between an Investor and its Associate or Joint Venture”
To be determined by IASB
Amendments to IAS 1 “Classification of Liabilities as Current or
Noncurrent”
January 1, 2023
Amendments to IAS 1 “Disclosure of Accounting Policies” January 1, 2023 (Note 6)
Amendments to IAS 8 “Definition of Accounting Estimates” January 1, 2023 (Note 7)
Amendments to IAS 16 “Property, Plant and Equipment - Proceeds
before Intended Use”
January 1, 2022 (Note 4)
Amendments to IAS 37 “Onerous Contracts - Cost of Fulfilling a
Contract”
January 1, 2022 (Note 5)
Note 1: Unless stated otherwise, the above New IFRSs are effective for annual reporting periods
beginning on or after their respective effective dates.
Note 2: The amendments to IFRS 9 will be applied prospectively to modifications and exchanges of
financial liabilities that occur on or after the annual reporting periods beginning on or after
January 1, 2022.
Note 3: The amendments are applicable to business combinations for which the acquisition date is on
or after the beginning of the annual reporting period beginning on or after January 1, 2022.
Note 4: The amendments are applicable to property, plant and equipment that are brought to the location
and condition necessary for them to be capable of operating in the manner intended by
management on or after January 1, 2021.
Note 5: The amendments are applicable to contracts for which the entity has not yet fulfilled all its
obligations on January 1, 2022.
Note 6: The amendments will be applied prospectively for annual reporting periods beginning on or
after January 1, 2023.
Note 7: The amendments are applicable to changes in accounting estimates and changes in accounting
policies that occur on or after the beginning of the annual reporting period beginning on or after
January 1, 2023.
As of the date the parent company only financial statements were authorized for issue, the Company is
continuously assessing the possible impact that the application of standards and interpretations will have
on the Company’s financial position and financial performance and will disclose the relevant impact
when the assessment is completed.
4. SUMMARY OF SIGNIFICANT ACCOUNTING POLICIES
a. Statement of compliance
The parent company only financial statements have been prepared in accordance with the Regulations
Governing the Preparation of Financial Reports by Securities Issuers.

- 236 -
b. Basis of preparation
The parent company only financial statements have been prepared on the historical cost basis except for
financial instruments which are measured at fair value, and net defined benefit liabilities which are
measured at the present value of the defined benefit obligation less the fair value of plan assets.
The fair value measurements, which are grouped into Levels 1 to 3 based on the degree to which the fair
value measurement inputs are observable and based on the significance of the inputs to the fair value
measurement in its entirety, are described as follows:
1) Level 1 inputs are quoted prices (unadjusted) in active markets for identical assets or liabilities;
2) Level 2 inputs are inputs other than quoted prices included within Level 1 that are observable for the
asset or liability, either directly (i.e., as prices) or indirectly (i.e., derived from prices); and
3) Level 3 inputs are unobservable inputs for the asset or liability.
The subsidiaries and associates or joint venture are incorporated in the parent company only financial
statements under the equity method. To make net profit for the year, other comprehensive income and
equity in the parent company only financial statements equal to those attributed to owners of the Company
on the consolidated financial statements, the effect of the differences between parent company only basis
and the consolidated basis are adjusted in the parent company only investments accounted for using equity
method, the related share of the profit or loss, the related share of other comprehensive income of
subsidiaries and associates and related equity.
c. Classification of current and noncurrent assets and liabilities
Current assets include:
1) Assets held primarily for the purpose of trading;
2) Assets expected to be realized within 12 months after the reporting period; and
3) Cash unless the asset is restricted from being exchanged or used to settle a liability for at least 12
months after the reporting period.
Current liabilities include:
1) Liabilities held primarily for the purpose of trading;
2) Liabilities due to be settled within 12 months after the reporting period; and
3) Liabilities for which the Company does not have an unconditional right to defer settlement for at least
12 months after the reporting period.
Assets and liabilities that are not classified as current are classified as noncurrent.
d. Foreign currencies
In preparing the parent company only financial statements, transactions in currencies other than the
Company’s functional currency (i.e., foreign currencies) are recognized at the rates of exchange
prevailing at the dates of the transactions.
At the end of each reporting period, monetary items denominated in foreign currencies are retranslated at
the rates prevailing at that date. Exchange differences on monetary items arising from settlement or
translation are recognized in profit or loss in the year in which they arise.

- 237 -
Non-monetary items measured at fair value that are denominated in foreign currencies are retranslated at
the rates prevailing at the date when the fair value was determined. Exchange differences arising from
the retranslation of non-monetary items are included in profit or loss for the period except for exchange
differences arising from the retranslation of non-monetary items in respect of which gains and losses are
recognized directly in other comprehensive income, in which cases, the exchange differences are also
recognized directly in other comprehensive income.
Non-monetary items that are measured at historical cost in a foreign currency are translated using the
exchange rate at the date of the transaction, and not retranslated subsequently.
For the purpose of presenting the consolidated financial statements, the assets and liabilities of the
Company’s foreign operations (including subsidiaries and associates in other countries that use currencies
which are different from the currency of the Company) are translated into the New Taiwan dollar at the
exchange rates prevailing at the end of the reporting period. Income and expense items are translated at
the average exchange rates for the period. The resulting currency translation differences are recognized
in other comprehensive income and accumulated in equity attributed to the owners of the Company and
non-controlling interests as appropriate.
e. Merchandise
Merchandise is stated at the lower of cost or net realizable value; comparison of cost and net realizable
value and recognition of write-downs are made by item. The net realizable value is the estimated selling
price of merchandise less all estimated costs necessary to make the sale. Inventories are recorded at
weighted-average cost on the balance sheet date.
f. Investments in subsidiaries
Investments in subsidiaries are accounted for using the equity method.
Subsidiaries are the entities controlled by the Company.
Under the equity method, the investment in subsidiaries is initially recognized at cost and adjusted
thereafter to recognize the Company’s share of profit or loss and other comprehensive income of the
subsidiaries. The Company also recognizes the changes in the Company’s share of equity of subsidiaries.
Any excess of the cost of acquisition over the Company’s share of the net fair value of the identifiable
assets and liabilities of a subsidiary recognized at the date of acquisition is recognized as goodwill, which
is included within the carrying amount of the investment and is not amortized. Any excess of the
Company’s share of the net fair value of the identifiable assets and liabilities over the cost of acquisition,
after reassessment, is recognized immediately in profit or loss.
When the Company’s share of loss of a subsidiary exceeds its interest in that subsidiary (which includes
any carrying amount of the investment accounted for using the equity method and long-term interests
that, in substance, form part of the Company’s net investment in the subsidiary), the Company continues
recognizing its share of further loss, if any.
The Company assesses its investment for any impairment by comparing the carrying amount with the
estimated recoverable amount as assessed based on the investee’s financial statements as a whole.
Impairment loss is recognized when the carrying amount exceeds the recoverable amount. If the
recoverable amount of the investment subsequently increases, the Company recognizes a reversal of the
impairment loss; the adjusted post-reversal carrying amount should not exceed the carrying amount that
would have been recognized (net of amortization or depreciation) had no impairment loss been recognized
in prior years. An impairment loss recognized on goodwill cannot be reversed in a subsequent period.

- 238 -
Profit or loss resulting from downstream transactions is eliminated in full only in the parent company
only financial statements. Profit and loss resulting from upstream transactions and transactions between
subsidiaries is recognized only in the parent company only financial statements and only to the extent of
interests in the subsidiaries that are not related to the Company.
g. Investments in associates and joint ventures
An associate is an entity over which the Company has significant influence and which is neither a
subsidiary nor an interest in a joint venture. A joint venture is a joint arrangement whereby the Company
and other parties that have joint control of the arrangement have rights to the net assets of the arrangement.
The Company uses the equity method to account for its investments in associates and joint ventures.
Under the equity method, investments in an associate and a joint venture are initially recognized at cost
and adjusted thereafter to recognize the Company’s share of the profit or loss and other comprehensive
income of the associate and joint venture. The Company also recognizes the changes in the Company’s
share of equity of associates.
Any excess of the cost of acquisition over the Company’s share of the net fair value of the identifiable
assets and liabilities of an associate and a joint venture at the date of acquisition is recognized as goodwill,
which is included within the carrying amount of the investment and is not amortized. Any excess of the
Company’s share of the net fair value of the identifiable assets and liabilities over the cost of acquisition,
after reassessment, is recognized immediately in profit or loss.
When the Company subscribes for additional new shares of an associate and a joint venture at a
percentage different from its existing ownership percentage, the resulting carrying amount of the
investment differs from the amount of the Company’s proportionate interest in the associate. The
Company records such a difference as an adjustment to investments with the corresponding amount
charged or credited to capital surplus - changes in capital surplus from investments in associates and joint
venture accounted for using the equity method. If the Company’s ownership interest is reduced due to its
additional subscription of the new shares of the associate and joint venture, the proportionate amount of
the gains or losses previously recognized in other comprehensive income in relation to that associate and
joint venture is reclassified to profit or loss on the same basis as would be required had the investee
directly disposed of the related assets or liabilities. When the adjustment should be debited to capital
surplus, but the capital surplus recognized from investments accounted for using the equity method is
insufficient, the shortage is debited to retained earnings.
The entire carrying amount of an investment (including goodwill) is tested for impairment as a single
asset by comparing its recoverable amount with its carrying amount. Any impairment loss recognized is
not allocated to any asset, including goodwill, that forms part of the carrying amount of the investment.
Any reversal of that impairment loss is recognized to the extent that the recoverable amount of the
investment subsequently increases.
When the Company transacts with its associate and joint venture, profits and losses resulting from the
transactions with the associate and joint venture are recognized in the Company’s parent company only
financial statements only to the extent of interests in the associate and joint venture that are not related to
the Company.
h. Property, plant, and equipment
Property, plant and equipment are measured at cost less accumulated depreciation and accumulated
impairment loss.
Property, plant and equipment in the course of construction are measured at cost less any recognized
impairment loss. Cost includes professional fees and borrowing costs eligible for capitalization. Such
assets are depreciated and classified to the appropriate categories of property, plant and equipment when

- 239 -
completed and ready for their intended use.
Freehold land is not depreciated.
Depreciation of property, plant, and equipment is recognized using the straight-line method. Each
significant part is depreciated separately. The estimated useful lives, residual values and depreciation
methods are reviewed at the end of each reporting period, with the effects of any changes in the estimates
accounted for on a prospective basis.
On derecognition of an item of property, plant and equipment, the difference between the sales proceeds
and the carrying amount of the asset is recognized in profit or loss.
i. Investment properties
Investment properties are properties held to earn rentals and/or for capital appreciation.
Investment properties are measured initially at cost, including transaction costs. Subsequent to initial
recognition, investment properties are measured at cost less accumulated depreciation. Depreciation is
recognized using the straight-line method.
On derecognition of an investment property, the difference between the net disposal proceeds and the
carrying amount of the asset is included in profit or loss.
j. Impairment of property, plant and equipment and investment properties
At the end of each reporting period, the Company reviews the carrying amounts of its property, plant and
equipment and investment properties to determine whether there is any indication that those assets have
suffered any impairment loss. If any such indication exists, the recoverable amount of the asset is
estimated in order to determine the extent of the impairment loss. When it is not possible to estimate the
recoverable amount of an individual asset, the Company estimates the recoverable amount of the cash-
generating unit to which the asset belongs. Corporate assets are allocated to the individual cash-generating
unit on a reasonable and consistent basis of allocation.
The recoverable amount is the higher of fair value less costs to sell and value in use. If the recoverable
amount of an asset or cash-generating unit is estimated to be less than its carrying amount, the carrying
amount of the asset or cash-generating unit is reduced to its recoverable amount, with the resulting
impairment loss recognized in profit or loss.
When an impairment loss is subsequently reversed, the carrying amount of the asset or cash-generating
unit is increased to the revised estimate of its recoverable amount, but only to the extent of the carrying
amount that would have been determined had no impairment loss been recognized on the asset or cash-
generating unit in prior years. A reversal of an impairment loss is recognized in profit or loss.
k. Financial instruments
Financial assets and financial liabilities are recognized when the Company becomes a party to the
contractual provisions of the instruments.
Financial assets and financial liabilities are initially measured at fair value. Transaction costs that are
directly attributable to the acquisition or issuance of financial assets and financial liabilities (other than
financial assets and financial liabilities at fair value through profit or loss (FVTPL)) are added to or
deducted from the fair value of the financial assets or financial liabilities, as appropriate, on initial
recognition.

- 240 -
1) Financial assets
All regular way purchases or sales of financial assets are recognized and derecognized on a trade date
basis.
a) Measurement category
Financial assets are classified into the following categories: financial assets at amortized cost, and
investments in equity instruments at fair value through other comprehensive income (FVTOCI).
i Financial assets at amortized cost
25.
26. Financial assets that meet the following conditions are subsequently measured at
amortized cost:
27.
i) The financial asset is held within a business model whose objective is to hold financial
assets in order to collect contractual cash flows; and
ii) The contractual terms of the financial asset give rise on specified dates to cash flows that
are solely payments of principal and interest on the principal amount outstanding.
28.
29. Subsequent to initial recognition, financial assets at amortized cost, including cash,
notes and accounts receivable, other receivables, other financial assets, and refundable
deposits, are measured at amortized cost, which equals the gross carrying amount determined
using the effective interest method less any impairment loss. Exchange differences are
recognized in profit or loss.
30.
31. Interest income is calculated by applying the effective interest rate to the gross
carrying amount of a financial asset.
32.
ii Investments in equity instruments at FVTOCI
33.
34. On initial recognition, the Company may make an irrevocable election to designate
investments in equity instruments as at FVTOCI. Designation as at FVTOCI is not permitted
if the equity investment is held for trading or if it is contingent consideration recognized by
an acquirer in a business combination.
35.
36. Investments in equity instruments at FVTOCI are subsequently measured at fair value
with gains and losses arising from changes in fair value recognized in other comprehensive
income and accumulated in other equity. The cumulative gain or loss will not be reclassified
to profit or loss on disposal of the equity investments, instead, it will be transferred to retained
earnings.
37.
38. Dividends on these investments in equity instruments are recognized in profit or loss
when the Company’s right to receive the dividends is established, unless the dividends clearly
represent a recovery of part of the cost of the investment.
b) Impairment of financial assets
The Company recognizes a loss allowance for expected credit losses on financial assets at
amortized cost (including accounts receivable).
The Company always recognizes lifetime expected credit losses (ECLs) for accounts receivable.
For all other financial instruments, the Company recognizes lifetime ECLs when there has been
a significant increase in credit risk since initial recognition. If, on the other hand, the credit risk
on the financial instruments has not increased significantly since initial recognition, the Company

- 241 -
measures the loss allowance for that financial instruments at an amount equal to 12-month ECLs.
Expected credit losses reflect the weighted average of credit losses with the respective risks of
default occurring as the weights. Lifetime ECLs represent the expected credit losses that will
result from all possible default events over the expected life of a financial instrument. In contrast,
12-month ECLs represent the portion of lifetime ECLs that is expected to result from default
events on a financial instrument that are possible within 12 months after the reporting date.
For internal credit risk management purposes, the Company determines that the following
situations indicate that a financial asset is in default without taking into account any collateral
held by the Company:
i Internal or external information shows that the debtor is unlikely to pay its creditors.
ii When a financial asset is more than 180 days past due unless the Company has reasonable
and corroborative information to support a more lagged default criterion.
The Company recognizes an impairment gain or loss in profit or loss for all financial instruments
with a corresponding adjustment to their carrying amount through a loss allowance account.
c) Derecognition of financial assets
The Company derecognizes a financial asset only when the contractual rights to the cash flows
from the asset expire or when it transfers the financial asset and substantially all the risks and
rewards of ownership of the asset to another party.
On derecognition of a financial asset at amortized cost in its entirety, the difference between the
asset’s carrying amount and the sum of the consideration received and receivable is recognized
in profit or loss. On derecognition of an investment in an equity instrument at FVTOCI, the
cumulative gain or loss which had been recognized in other comprehensive income is transferred
directly to retained earnings, without recycling through profit or loss.
2) Equity instruments
Debt and equity instruments issued by the Company are classified as either financial liabilities or as
equity in accordance with the substance of the contractual arrangements and the definitions of a
financial liability and an equity instrument.
Equity instruments issued by the Company are recognized at the proceeds received, net of direct issue
costs.
The repurchase of the Company’s own equity instruments is recognized in and deducted directly from
equity. No gain or loss is recognized in profit or loss on the purchase, sale, issuance or cancellation
of the Company’s own equity instruments.
3) Financial liabilities
a) Subsequent measurement
The Company’s financial liabilities are measured at amortized cost using the effective interest
method.
- 242 -
b) Derecognition of financial liabilities
The difference between the carrying amount of the financial liability derecognized and the
consideration paid, including any non-cash assets transferred or liabilities assumed, is recognized
in profit or loss.
l. Revenue recognition
The Company identifies contracts with customers, allocates the transaction price to the performance
obligations and recognizes revenue when performance obligations are satisfied.
1) Revenue from sale of goods
Revenue from sale of goods comes from sales of composite materials, engineering plastic and
semiconductor. Sales of goods are recognized as revenue when the goods are shipped or delivered to
the customer’s specific location because it is the time when the customer has full discretion over the
manner of distribution and price to sell the goods, has the primary responsibility for sales to future
customers and bears the risks of obsolescence. Accounts receivable are recognized concurrently.
2) Revenue from rendering of services
Commission revenue comes from providing intermediary or agency service to client in the transfer
of merchandise to clients’ customers. The Company recognizes revenue as control of the goods is
transferred to the customer, and the Company has no further obligations to the customer. Other
revenue from rendering of services is recognized as the Company fulfills the obligation.
m. Leasing
At the inception of a contract, the Company assesses whether the contract is, or contains, a lease.
1) The Company as lessor
Leases are classified as finance leases whenever the terms of a lease transfer substantially all the risks
and rewards of ownership to the lessee. All other leases are classified as operating leases.
Lease payments (less any lease incentives payable) from operating leases are recognized as income
on a straight-line basis over the terms of the relevant leases. Initial direct costs incurred in obtaining
operating leases are added to the carrying amounts of the underlying assets and recognized as
expenses on a straight-line basis over the lease terms.
When a lease includes both land and building elements, the Company assesses the classification of
each element separately as a finance or an operating lease based on the assessment as to whether
substantially all the risks and rewards incidental to ownership of each element have been transferred
to the lessee. The lease payments are allocated to the land and the building elements in proportion to
the relative fair values of the leasehold interests in the land element and building element of the lease
at the inception of the contract. If the allocation of the lease payments can be made reliably, each
element is accounted for separately in accordance with its lease classification. When the lease
payments cannot be allocated reliably to the land and building elements, the entire lease is generally
classified as a finance lease unless it is clear that both elements are operating leases; in which case,
the entire lease is classified as an operating lease.
2) The Company as a lessee
The Company recognizes right-of-use assets and lease liabilities for all leases at the commencement
date of a lease, except for short-term leases and low-value asset leases accounted for applying a
recognition exemption where lease payments are recognized as expenses on a straight-line basis over
- 243 -
the lease terms.
Right-of-use assets are initially measured at cost, which comprises the initial measurement of lease
liabilities adjusted for lease payments made at or before the commencement date. Right-of-use assets
are subsequently measured at cost less accumulated depreciation and impairment losses and adjusted
for any remeasurement of the lease liabilities. Right-of-use assets are presented on a separate line in
the parent company only balance sheets.
Right-of-use assets are depreciated using the straight-line method from the commencement dates to
the end of the lease terms.
Lease liabilities are initially measured at the present value of the lease payments, which comprise
fixed payments. The lease payments are discounted using the interest rate implicit in a lease. If that
rate cannot be readily determined, the Company uses its incremental borrowing rate. Subsequently,
lease liabilities are measured at amortized cost using the effective interest method, with interest
expense recognized over the lease terms. When there is a change in a lease term, the Company
remeasures the lease liabilities with a corresponding adjustment to the right-of-use-assets. However,
if the carrying amount of the right-of-use assets is reduced to zero, any remaining amount of the
remeasurement is recognized in profit or loss. Lease liabilities are presented on a separate line in the
parent company only balance sheets.
n. Employee benefits
1) Short-term employee benefits
Liabilities recognized in respect of short-term employee benefits are measured at the undiscounted
amount of the benefits expected to be paid in exchange for the related services.
2) Retirement benefits
Payments to defined contribution retirement benefit plans are recognized as expenses when
employees have rendered services entitling them to the contributions.
Defined benefit costs (including service cost, net interest and remeasurement) under the defined
benefit retirement benefit plans are determined using the projected unit credit method. Service cost
(including current service cost) and net interest on the net defined benefit liabilities (assets) are
recognized as employee benefits expenses in the period in which they occur. Remeasurement,
comprising actuarial gains and losses and the return on plan assets (excluding interest), is recognized
in other comprehensive income in the period in which it occurs. Remeasurement recognized in other
comprehensive income is reflected immediately in retained earnings and will not be reclassified to
profit or loss.
Net defined benefit liabilities represent the actual deficit in the Company’s defined benefit plans.
o. Taxation
Income tax expense represents the sum of the tax currently payable and deferred tax.
1) Current tax
Income tax payable (refundable) is based on taxable profit (loss) for the year determined according
to the applicable tax laws of tax jurisdiction.
According to the Income Tax Act of the ROC, an additional tax on unappropriated earnings is
provided for in the year the shareholders approve to retain the earnings.
- 244 -
Adjustments of prior years’ tax liabilities are added to or deducted from the current year’s tax
provision.
2) Deferred tax
Deferred tax is recognized on temporary differences between the carrying amounts of assets and
liabilities and the corresponding tax bases used in the computation of taxable profit.
Deferred tax liabilities are generally recognized for all taxable temporary differences. Deferred tax
assets are generally recognized for all deductible temporary differences to the extent that it is probable
that taxable profits will be available against which those deductible temporary differences can be
utilized.
Deferred tax liabilities are recognized for taxable temporary differences associated with investments
in subsidiaries, except where the Company is able to control the reversal of the temporary difference
and it is probable that the temporary difference will not reverse in the foreseeable future. Deferred
tax assets arising from deductible temporary differences associated with such investments and
interests are only recognized to the extent that it is probable that there will be sufficient taxable profits
against which to utilize the benefits of the temporary differences and they are expected to reverse in
the foreseeable future.
The carrying amount of deferred tax assets is reviewed at the end of each reporting period and reduced
to the extent that it is no longer probable that sufficient taxable profits will be available to allow all
or part of the assets to be recovered. A previously unrecognized deferred tax asset is also reviewed at
the end of each reporting period and recognized to the extent that it has become probable that future
taxable profit will allow the deferred tax asset to be recovered.
Deferred tax liabilities and assets are measured at the tax rates that are expected to apply in the period
in which the liabilities are settled or the assets are realized, based on tax rates and tax laws that have
been enacted or substantively enacted by the end of the reporting period. The measurement of deferred
tax liabilities and assets reflects the tax consequences that would follow from the manner in which
the Company expects, at the end of the reporting period, to recover or settle the carrying amount of
its assets and liabilities.
3) Current and deferred taxes for the year
Current and deferred taxes are recognized in profit or loss, except when they relate to items that are
recognized in other comprehensive income or directly in equity, in which case, the current and
deferred taxes are also recognized in other comprehensive income or directly in equity, respectively.
5. CRITICAL ACCOUNTING JUDGMENTS AND KEY SOURCES OF ESTIMATION
UNCERTAINTY
In the application of the Company’s accounting policies, management is required to make judgments,
estimations and assumptions about the carrying amounts of assets and liabilities that are not readily apparent
from other sources. The estimates and associated assumptions are based on historical experience and other
factors that are considered relevant. Actual results may differ from these estimates.
The Company considers the economic implications of the COVID-19 when making its critical accounting
estimates. The estimates and underlying assumptions are reviewed on an ongoing basis. Revisions to
accounting estimates are recognized in the year in which the estimates are revised if the revisions affect only
that year or in the year of the revisions and future years if the revisions affect both current and future years.

- 245 -
Key sources of estimation uncertainty
a. Estimated impairment of accounts receivable
The provision for impairment of accounts receivable is based on assumptions about risk of default and
expected loss rates. The Company uses judgment in making these assumptions and in selecting the inputs
to the impairment calculation, based on the Company’s historical experience, existing market conditions
as well as forward looking estimates as of the end of each reporting period. For details of the key
assumptions and inputs used, see Note 8. Where the actual future cash inflows are less than expected, a
material impairment loss may arise.
b. Impairment of inventories
The net realizable value of inventories is the estimated selling price in the ordinary course of business
less the estimated costs necessary to make the sale. The estimation of net realizable value is based on
current market conditions and historical experience with product sales of a similar nature. Changes in
market conditions may have a material impact on the estimation of the net realizable value.
6. CASH AND CASH EQUIVALENTS
December 31
2020 2019
Cash on hand $ 538 $ 577
Demand deposits 1,192,420 790,423
Checking accounts 1,746 1,785
$ 1,194,704 $ 792,785
The Company interacts with a variety of financial institutions with sound credit ratings to disperse credit risk,
hence, there was no expected credit loss.
7. FINANCIAL ASSETS AT FAIR VALUE THROUGH OTHER COMPREHENSIVE INCOME
December 31
2020 2019
Current
Domestic investments in equity instruments
Listed shares $ 119,600 $ 68,900
Noncurrent
Domestic investments in equity instruments
Listed shares $ 109,962 $ 30,808
Unlisted shares 426,667 419,792
536,629 450,600
(Continued)

- 246 -
December 31
2020 2019
Foreign investments in equity instruments
Listed shares $ 19,956 $ 30,679
Unlisted shares 77,513 91,702
97,469 122,381
$ 634,098 $ 572,981
(Concluded)
These investments in equity instruments are held for medium to long-term strategic purposes. Accordingly,
the management elected to designate these investments in equity instruments as at FVTOCI as they consider
that recognizing short-term fluctuations in these investments’ fair value in profit or loss would not be
consistent with the Company’s strategy of holding these investments for long-term purposes.
In 2020 and 2019, the Company sold some equity shares in order to manage credit concentration risk. The
sold shares had fair values of $47,285 thousand and $4,782 thousand, respectively, and their related unrealized
valuation gain of $26,285 thousand and loss of $4,652 thousand, respectively, were transferred from other
equity to retained earnings.
In 2020, Telelynx Inc. has been liquidated, and the Company received the capital reduction of $1,288
thousand and transferred the unrealized valuation loss of $7,718 thousand from other equity to retained
earnings.
Dividends of $16,696 thousand and $12,714 thousand, respectively, recognized in 2020 and 2019 were all
related to the investments held at December 31, 2020 and 2019, respectively.
8. NOTES RECEIVABLE AND ACCOUNTS RECEIVABLE, NET
December 31
2020 2019
Notes receivable
Notes receivable - operating $ 131,614 $ 155,804
Accounts receivables - unrelated parties
At amortized cost
Gross carrying amount $ 6,577,457 $ 5,502,832
Less: Allowance for impairment loss 42,774 8,222
$ 6,534,683 $ 5,494,610
Accounts receivables - related parties
At amortized cost
Gross carrying amount $ 801,700 $ 1,015,291
Less: Allowance for impairment loss 1,006 295
$ 800,694 $ 1,014,996
The main credit period of sales of goods was 60-90 days. No interest was charged on receivables. In order to
minimize credit risk, the management of the Company has delegated a team responsible for determining
credit limits, credit approvals and other monitoring procedures to ensure that follow-up action is taken to
recover overdue debts. In addition, the Company reviews the recoverable amount of each individual trade
debt at the end of the reporting period to ensure that adequate allowance is made for possible irrecoverable

- 247 -
amounts. In this regard, the management believes the Company’s credit risk was significantly reduced.
The Company measures the loss allowance for accounts receivable at an amount equal to lifetime ECLs. The
expected credit losses on receivables are estimated using a provision matrix by reference to the past default
experience of the customer, the customer’s current financial position, economic condition of the industry. As
the Company’s historical credit loss experience does not show significantly different loss patterns for
different customer segments, the provision for loss allowance based on past due status is not further
distinguished according to the Company’s different customer base.
The Company writes off receivables when there is evidence indicating that the debtor is in severe financial
difficulty and there is no realistic prospect of recovery, e.g., when the debtor has been placed under
liquidation. For receivables that have been written off, the Company continues to engage in enforcement
activity to attempt to recover the receivables due. Where recoveries are made, these are recognized in profit
or loss.
The following table details the loss allowance of receivables as of December 31, 2020 based on the
Company’s provision matrix.
Customers without Signs of Default Customers
Not Past Due
Past Due
1-60 Days
Past Du
61-180 Days
Past Due
Over 181 days
With Signs of
Default Total
Expected credit loss rate (%) 0.1 1-5 10-35 50 100
Gross carrying amount $ 7,143,434 $ 293,031 $ 17,925 $ 52,895 $ 3,486 $ 7,510,771
Loss allowance (Lifetime ECL) (7,648 ) (3,470 ) (2,729 ) (26,447 ) (3,486 ) (43,780 )
Amortized cost $ 7,135,786 $ 289,561 $ 15,196 $ 26,448 $ - $ 7,466,991
The following table details the loss allowance of accounts receivable as of December 31, 2019 based on the
Company’s different customer industry categories.
Customers without Signs of Default Customers
Flat Panel
Display
Information
Technology PCB/Mobo Semiconductor Green Energy Other
With Signs of
Default Total
Expected credit loss rate (%) 0.0016 0.0016 0.0016 0.0022 0.0016 0.0290 100
Gross carrying amount $ 1,500,958 $ 470,954 $ 525,042 $ 1,356,460 $ 92,013 $ 2,565,799 $ 6,897 $ 6,518,123
Loss allowance (Lifetime ECL) (24 ) (8 ) (8 ) (30 ) (2 ) (1,548 ) (6,897 ) (8,517 )
Amortized cost $ 1,500,934 $ 470,946 $ 525,034 $ 1,356,430 $ 92,011 $ 2,564,251 $ - $ 6,509,606
The aging of notes and accounts receivable for the year ended December 31, 2019 based on the past due days
from invoice date was as follows:
December 31,
2019
Up to 90 days $ 5,402,451
91-150 days 854,199
151-180 days 81,489
Over 181 days 335,788 $ 6,673,927

- 248 -
The movements of the loss allowance of notes receivable and accounts receivable were as follows:
For the Year Ended December 31
2020 2019
Balance at January 1 $ 8,517 $ 7,436
Impairment losses recognized 38,697 1,081
Amounts written off (3,434) -
Balance at December 31 $ 43,780 $ 8,517
9. MERCHANDISE
The costs of inventories recognized in cost of goods sold for the years ended December 31, 2020 and 2019
were $30,963,508 thousand and $27,244,873 thousand respectively, which included the following items:
For the Year Ended December 31
2020 2019
Write-downs of inventories $ 3,785 $ 77,316
Others 581 (1,010)
$ 4,366 $ 76,306
10. INVESTMENTS ACCOUNTED FOR USING THE EQUITY METHOD
December 31
2020 2019
Investments in subsidiaries $ 8,707,554 $ 7,724,827
Investments in associates 4,100,526 3,807,923
Investment in joint ventures 4,000 -
$ 12,812,080 $ 11,532,750
See table 6 and 7 for the information on investment accounted for using the equity method for the nature of
activities and country of incorporation of the associate.
a. Investments in subsidiaries
December 31
2020 2019
Unlisted Company Book Value
Percentage of
Ownership Book Value
Percentage of
Ownership
Wah Lee Holding Ltd. $ 4,184,973 100.00 $ 3,733,888 100.00
Raycong Industrial (H.K.) Ltd.
(Raycong H.K.) 3,453,779 53.69
3,023,029 53.69
Wah Lee Japan Corp. (WL
Japan) 4,966 83.33
5,018 83.33
Wah Lee Korea Ltd (WL
Korea) 698 100.00
(1,248) 100.00
Okayama Solar Ltd. - - - -
(Continued)

- 249 -
December 31
2020 2019
Unlisted Company Book Value
Percentage of
Ownership Book Value
Percentage of
Ownership
Sakuragawa Solar Ltd. $ 86,576 99.99 $ 78,867 99.99
Miyazaki Solar Ltd. 37,440 99.99 33,164 99.99
PT. Wah Lee Indonesia (WL
Indonesia) 37,145 70.00
11,758 60.00
Medi H.K. - - - 80.00
Wha Lee Vietnam Co., Ltd.
(WL Vietnam) 36,133 100.00
28,312 100.00
QuanShun Logistics Co., Ltd.
(QuanShun Logistics) 122,470 63.33
106,501 63.33
Wah Tech Industrial Co., Ltd.
(WT Industrial) 197,605 51.00
197,866 51.00
Kingstone Energy Technology
Corporation (KS Corp.) 500,767 51.00
487,960 51.00
Wahlee Green Energy
Corporation (WL Green
Corp.) 1,164 25.00
4,210 25.00
Wah Heng Energy Technology
Corp. (WH Energy) 29,901 100.00
- -
Wah Lee Philippines
International Corp. (WL
Philippines Corp.) 7,464 99.99
7,755 99.99
Wah Lee Philippines Inc. (WL
Philippines Inc.) 6,473 99.99
7,747 99.99
$ 8,707,554 $ 7,724,827
(Concluded)
Note 1: Okayama Solar Ltd. returned cash capital of $70,804 thousand in February 2019, and has been
liquidated in July 2019.
Note 2: The ownership percentage in WL Indonesia increased to 70% due to the subscription of the
Company for $33,422 thousand for additional new shares of WL Indonesia at a percentage
different from its existing shareholding proportion in June 2020. As the transaction did not
change the control of the Company over WL Indonesia, the Company processed the equity
transaction by reducing capital surplus by $846 thousand.
Note 3: In May 2020, Meidi H.K. has been liquidated.
Note 4: To expand the Company’s operations, the Company acquired KS Corp. for $468,384 thousand
in May 2019 and obtained 51% ownership; refer to Note 25 to the consolidated financial
statements for 2020.
Note 5: WL Green Corp. had been incorporated by resolution in the shareholders’ meeting held in
November 2019, and had returned cash capital of $3,000 thousand. It is in the process of
liquidation as of the date the parent company only financial statements were authorized for issue.
Note 6: In July 2020, the Company invested $30,000 thousand in WH Energy which was established in
Taiwan.

- 250 -
Note 7: In September 2019, the Company invested $7,755 thousand (PHP12,750 thousand) in WL
Philippines Corp. which was established in Philippines.
Note 8: In October 2019, the Company invested $7,747 thousand (PHP12,700 thousand) in WL
Philippines Inc. which was established in Philippines.
Note 9: Refer to Note 26 for information relating to investments in subsidiaries pledged as collateral for
borrowings.
b. Investments accounted for using the equity method
December 31
2020 2019
Investments in associates
Material associates
Chang Wah Electromaterials Inc. $ 2,080,267 $ 1,799,523
Associates that are not individually material 2,020,259 2,008,400
$ 4,100,526 $ 3,807,923
1) Material associates
Proportion of
Ownership and Voting Rights
December 31
Name of Associate 2020 2019
Chang Wah Electromaterials Inc. 30.98% 30.98%
Fair values (Level 1) of investments in associates with available published price quotation are
summarized as follows:
December 31
Name of Associate 2020 2019
Chang Wah Electromaterials Inc. $ 6,065,702 $ 3,532,554
The summarized financial information below represents amounts shown in the financial statements
of Chang Wah Electromaterials Inc. prepared for the equity accounting purpose.
December 31
2020 2019
Current assets $ 11,117,986 $ 10,022,351
Noncurrent assets 12,201,685 7,993,130
Current liabilities (6,282,083) (5,883,765)
Noncurrent liabilities (8,122,048) (4,084,782)
Equity 8,915,540 8,046,934
Non-controlling interests (2,418,385) (2,455,979)
$ 6,497,155 $ 5,590,955
(Continued)

- 251 -
December 31
2020 2019
Percentage of ownership held by the Company (%) 30.98 30.98
Equity attributable to the Company $ 2,012,840 $ 1,732,096
Goodwill 67,427 67,427
Carrying amount $ 2,080,267 $ 1,799,523
(Concluded)
For the Year Ended December 31
2020 2019
Operating revenue $ 16,424,018 $ 15,464,381
Net profit for the year $ 1,362,120 $ 1,405,855
Other comprehensive income for the year 744,564 101,575
Total comprehensive income for the year $ 2,106,684 $ 1,507,430
Cash dividends received $ 249,357 $ 237,483
As of December 31, 2020 and 2019, the Company’s dividends receivable from Chang Wah
Electromaterials Inc. were $51,455 thousand and $81,140 thousand, respectively.
2) Aggregate information of associates that are not individually material
For the Year Ended December 31
2020 2019
The Company share of
Net profit for the year $ 197,927 $ 150,577
Other comprehensive loss for the year 14,121 (40,735)
Total comprehensive income for the year $ 212,048 $ 109,842
3) The Company purchased 156 thousand shares of Wah Hong Industrial Corp. from the open market in
the amount of $3,005 thousand. The shareholdings in Wah Hong Industrial Corp. had increased from
26.11% to 26.67%.
c. Investment in joint ventures - only as of December 31, 2020
Amount
Individual non-significant joint ventures $ 4,000
The Company signed a joint venture agreement with a Japanese company in December 2020 to jointly
establish ORC Electrical Machinery Co., Ltd. (ORC Co.). According to the joint venture agreement, the
Company invested $4,000 thousand to obtain 40% of the equity, and the two parties jointly led the
operating activities of ORC Co.

- 252 -
11. PROPERTY, PLANT AND EQUIPMENT
For the year ended December 31, 2020
Freehold Land Buildings
Power
Generation
Equipment
Other
Equipment Total
Cost
Balance at January 1,
2020
$ 429,363 $ 298,869 $ 500,727 $ 49,595 $ 1,278,554
Additions - 1,575 45,954 - 47,529
Reclassified (16,020) (11,769) - - (27,789)
Disposals - - (19,978) (549) (20,527)
Balance at December 31,
2020
$ 413,343 $ 288,675 $ 526,703 $ 49,046 $ 1,277,767
Accumulated depreciation
Balance at January 1,
2020
$ - $ 136,349 $ 348,982 $ 44,531 $ 529,862
Depreciation expense - 5,392 40,521 1,526 47,439
Reclassified - (4,885) - - (4,885)
Disposals - - (5,159) (549) (5,708)
Balance at December 31,
2020
$ - $ 136,856 $ 384,344 $ 45,508 $ 566,708
Carrying amount at
December 31, 2020
$ 413,343 $ 151,819 $ 142,359 $ 3,538 $ 711,059
For the year ended December 31, 2019
Freehold Land Buildings
Power
Generation
Equipment
Other
Equipment Total
Cost
Balance at January 1,
2019
$ 429,363 $ 298,371 $ 479,481 $ 51,726 $ 1,258,941
Additions - 498 42,792 2,755 46,045
Disposals - - (21,546) (4,886) (26,432)
Balance at December 31,
2019
$ 429,363 $ 298,869 $ 500,727 $ 49,595 $ 1,278,554
Accumulated depreciation
Balance at January 1,
2019
$ - $ 130,290 $ 329,852 $ 48,004 $ 508,146
Depreciation expense - 6,059 40,676 1,413 48,148
Disposals - - (21,546) (4,886) (26,432)
Balance at December 31,
2019
$ - $ 136,349 $ 348,982 $ 44,531 $ 529,862
Carrying amount at
December 31, 2019
$ 429,363 $ 162,520 $ 151,745 $ 5,064 $ 748,692

- 253 -
a. Reconciliation of the additions to property, plant and equipment and the cash paid stated in the statements
of cash flows is as follows:
For the Year Ended December 31
2020 2019
Additions to property, plant and equipment $ 47,529 $ 46,045
Decrease in prepayments for equipment (109) (14,291)
Cash paid $ 47,420 $ 31,754
b. Property, plant and equipment are depreciated on a straight-line basis over the following estimated useful
lives:
Buildings
Office 41-61 years
Office interior decoration 5-6 years
Power generation equipment
Cylinder 5-9 years
Warehouse 8 years
Other 4-15 years
Others 6-11 years
c. Refer to Note 26 for the carrying amount of property, plant and equipment pledged as collateral for
borrowings.
12. LEASE ARRANGEMENTS
a. Right-of-use assets
For the year ended December 31, 2020
Buildings
Transportation
Equipment Total
Cost
Balance at January 1, 2020 $ 27,307 $ 4,022 $ 31,329 Additions - 1,798 1,798 Balance at December 31, 2020 $ 27,307 $ 5,820 $ 33,127
Accumulated depreciation Balance at January 1, 2020 $ 3,568 $ 426 $ 3,994 Depreciation expense 6,116 1,590 7,706 Balance at December 31, 2020 $ 9,684 $ 2,016 $ 11,700 Carrying amount at December 31, 2020 $ 17,623 $ 3,804 $ 21,427

- 254 -
For the year ended December 31, 2019
Buildings
Transportation
Equipment Total
Cost
Balance at January 1, 2019 $ - $ - $ - Adjustments on initial application of IFRS 16 6,981 - 6,981 Balance at January 1, 2019 (adjusted) 6,981 - 6,981 Additions 27,307 4,022 31,329 Lease modification (6,981) - (6,981) Balance at December 31, 2019 $ 27,307 $ 4,022 $ 31,329
Accumulated depreciation Balance at January 1, 2019 $ - $ - $ - Depreciation expense 5,043 426 5,469 Lease modification (1,475) - (1,475) Balance at December 31, 2019 $ 3,568 $ 426 $ 3,994 Carrying amount at December 31, 2019 $ 23,739 $ 3,596 $ 27,335
b. Lease liabilities
December 31
2020 2019
Carrying amount
Current $ 8,043 $ 7,314
Noncurrent $ 13,663 $ 20,154
Range of discount rate (%) for lease liabilities was as follows:
December 31
2020 2019
Buildings 1.80 1.80
Transportation equipment 0.98-1.80 1.80
c. Material leasing activities and terms
The Company leases abovementioned subjects for the use of warehouse and transportation equipment
with remaining lease terms of 2 to 4 years, which will expire before or in June 2024. The Company does
not have bargain purchase options to acquire the leasehold subjects at the end of the lease terms.
d. Other lease information
For the Year Ended December 31
2020 2019
Expenses relating to short-term leases $ 55,007 $ 52,931
Expenses relating to low-value asset leases $ 1,877 $ 911
Total cash outflow for leases $ 64,873 $ 59,443

- 255 -
The Company’s leases of certain subjects qualify as short-term or low-value asset leases, and the
Company has elected to apply the recognition exemption and thus, did not recognize right-of-use assets
and lease liabilities for these leases.
13. INVESTMENT PROPERTY
For the year ended December 31, 2020
Land Buildings Total
Cost
Balance at January 1, 2020 $ 252,392 $ 173,307 $ 425,699
Reclassified 16,020 11,769 27,789
Balance at December 31, 2020 $ 268,412 $ 185,076 $ 453,488
Accumulated depreciation
Balance at January 1, 2020 $ - $ 8,491 $ 8,491
Depreciation expense - 3,513 3,513
Reclassified - 4,885 4,885
Balance at December 31, 2020 $ - $ 16,889 $ 16,889
Carrying amount at December 31, 2020 $ 268,412 $ 168,187 $ 436,599
For the year ended December 31, 2019
Land Buildings Total
Cost
Balance at January 1, 2019 and December 31,
2019 $ 252,392 $ 173,307 $ 425,699
Accumulated depreciation
Balance at January 1, 2019 $ - $ 5,093 $ 5,093
Depreciation expense - 3,398 3,398
Balance at December 31, 2019 $ - $ 8,491 $ 8,491
Carrying amount at December 31, 2019 $ 252,392 $ 164,816 $ 417,208
The abovementioned investment properties are units of land and buildings located in Hsinchu County and
leased under operating leases to subsidiaries with lease terms which will expire from June 2021 to June 2025.
Lessees do not have bargain purchase options to acquire the leasehold subjects at the end of the lease terms.

- 256 -
The maturity analysis of lease payments receivable under non-cancellable operating leases of investment
properties was as follows:
December 31
2020 2019
Within 1 year $ 8,384 $ 7,818
More than 1 year but not more than 5 years 3,004 -
$ 11,388 $ 7,818
All of the Company’s investment properties are held under freehold interests, buildings are depreciated using
the straight-line method over their estimated useful life of 51 years; for the carrying amount of investment
properties pledged as collateral for borrowing, refer to Note 26.
The fair value of the Company’s investment properties was around $500 million as of December 31, 2020
and 2019. The fair value of the land and buildings was not valued by independent valuer; the Company’s
management determined the fair value with reference to the replacement cost of similar properties in the
vicinity of the Company’s investment properties.
14. BORROWINGS
a. Short-term borrowings
December 31
2020 2019
Unsecured borrowings $ 4,013,494 $ 3,316,962
Annual interest rate (%) 0.50-2.67 0.50-2.78
b. Long-term borrowings
December 31
2020 2019
Unsecured borrowings
Syndicated bank loans (Note 1) $ 1,799,823 $ 1,799,438
Less: Syndicated loan fee 4,320 5,760
1,795,503 1,793,678
Bank loans (Note 2) 900,000 900,000
2,695,503 2,693,678 Secured borrowings (Note 26)
Bank loans 523,321 556,233
3,218,824 3,249,911
Less: Current portion 433,577 32,486 $ 2,785,247 $ 3,217,425
Annual interest rate (%)
Syndicated bank loans 0.66 0.66
Bank loans 0.87-1.43 0.94-1.68
(Continued)

- 257 -
December 31
2020 2019
Expiration period
Syndicated bank loans 2024.01 2024.01
Bank loans 2021.02-2037.06 2021.03-2037.06
(Concluded)
Note 1: The Company signed a syndicated loan agreement with eleven banks led by Bank of Taiwan in
December 2018. The main contents of the syndicated loan agreement are as follows:
1) The total amount of syndicated bank loans is $3.6 billion, which is a medium-term cyclical
loan and commercial paper issued with insurance quotation. The term of the loan is 5 years
from the initial drawdown date (January 2019). Fractional reserve and debt recycling is
available within the total amount of syndicated loans.
2) Pursuant to the bank loan agreement, the Company should maintain certain financial ratios
which should be calculated based on audited annual consolidated financial statements. The
Company had met the requirement as of December 31, 2020 and 2019.
Note 2: Pursuant to certain bank loan agreements, the Company should maintain certain financial ratios
which should be calculated based on audited annual and unreviewed semiannual consolidated
financial statements. The Company had met the requirement as of December 31, 2020 and 2019.
15. NOTES PAYABLE AND ACCOUNTS PAYABLE
Notes payable and accounts payable (including related parties) are mainly related to operating activities.
Trading conditions are negotiated separately. The Company has formulated a financial risk management
policy, in order to ensure all payables are paid within the pre-agreed credit period; therefore, no interest is
required.
16. OTHER PAYABLES
December 31
2020 2019
Payable for salaries or bonuses $ 378,312 $ 306,455
Payable for employees’ compensation and remuneration to directors 237,733 222,010
Payable for commission 53,074 48,406
Payable for freight fee 20,036 18,173
Payable for insurance premium 19,287 17,325
Others 62,942 74,932
$ 771,384 $ 687,301

- 258 -
17. RETIREMENT BENEFIT PLANS
a. Defined contribution plans
The Company adopted a pension plan under the Labor Pension Act (LPA), which is a state-managed
defined contribution plan. Under the LPA, the Company makes monthly contributions to employees’
individual pension accounts at 6% of monthly salaries and wages.
b. Defined benefit plans
The defined benefit plan adopted by the Company in accordance with the Labor Standards Act is operated
by the government of the ROC. Pension benefits are calculated on the basis of the length of service and
average monthly salaries of the 6 months before retirement. The Company contributes amounts equal to
8% of total monthly salaries and wages to a pension fund administered by the pension fund monitoring
committee. Pension contributions are deposited in the Bank of Taiwan in the committee’s name. Before
the end of each year, the Company assesses the balance in the pension fund. If the amount of the balance
in the pension fund is inadequate to pay retirement benefits for employees who conform to retirement
requirements in the next year, the Company is required to fund the difference in one appropriation that
should be made before the end of March of the next year. The pension fund is managed by the Bureau of
Labor Funds, Ministry of Labor (the “Bureau”); the Company has no right to influence the investment
policy and strategy.
The amounts included in the parent company only balance sheets in respect of the Company’s defined
benefit plans were as follows:
December 31
2020 2019
Present value of defined benefit obligation $ 399,857 $ 413,936
Fair value of plan assets (99,848) (110,930)
Net defined benefit liability $ 300,009 $ 303,006
Movements in net defined benefit liability were as follows:
Present Value
of the Defined
Benefit
Obligation
Fair Value of
the Plan Assets
Net Defined
Benefit
Liabilities
Balance at January 1, 2019 $ 441,559 $ (117,671) $ 323,888 Service cost
Current service cost 2,722 - 2,722 Past service cost (566) - (566)
Net interest expense (income) 3,241 (915) 2,326 Recognized in profit or loss 5,397 (915) 4,482 Remeasurement
Return on plan assets (excluding amounts
included in net interest) - (4,255)
(4,255) Actuarial loss - changes in financial
assumptions 3,650 -
3,650
(Continued)

- 259 -
Present Value
of the Defined
Benefit
Obligation
Fair Value of
the Plan Assets
Net Defined
Benefit
Liabilities
Actuarial gain - changes in demographic
assumptions $ (12) $ -
$ (12) Actuarial gain - experience adjustments (8,758) - (8,758)
Recognized in other comprehensive income (5,120) (4,255) (9,375) Contributions from the employer - (12,093) (12,093) Benefits paid (27,900) 24,004 (3,896) Balance at December 31, 2019 413,936 (110,930) 303,006 Service cost
Current service cost 2,201 - 2,201 Past service cost (42) - (42)
Net interest expense (income) 2,623 (741) 1,882 Recognized in profit or loss 4,782 (741) 4,041 Remeasurement
Return on plan assets (excluding amounts
included in net interest) - (3,873)
(3,873) Actuarial loss - changes in financial
assumptions 11,720 -
11,720 Actuarial gain - experience adjustments (3,377) - (3,377)
Recognized in other comprehensive income 8,343 (3,873) 4,470 Contributions from the employer - (11,508) (11,508) Benefits paid (27,204) 27,204 - Balance at December 31, 2020 $ 399,857 $ (99,848) $ 300,009
(Concluded)
Through the defined benefit plans under the Labor Standards Act, the Company is exposed to the
following risks:
1) Investment risk
The plan assets are invested in domestic and foreign equity and debt securities, bank deposits, etc.
The investment is conducted at the discretion of the Bureau or under the mandated management.
However, in accordance with relevant regulations, the return generated by plan assets should not be
below the interest rate for a 2-year time deposit with local banks.
2) Interest risk
A decrease in the government bond interest rate will increase the present value of the defined benefit
obligation; however, this will be partially offset by an increase in the return on the plan’s debt
investments.

- 260 -
3) Salary risk
The present value of the defined benefit obligation is calculated by reference to the future salaries of
plan participants. As such, an increase in the salaries of the plan participants will increase the present
value of the defined benefit obligation.
The actuarial valuations of the present value of the defined benefit obligation were carried out by qualified
actuaries. The significant assumptions used for the purposes of the actuarial valuations were as follows:
December 31
2020 2019
Discount rate (%) 0.30 0.65
Expected rate of salary increase (%) 2.00 2.00
If possible reasonable changes in each of the significant actuarial assumptions will occur and all other
assumptions will remain constant, the present value of the defined benefit obligation would increase
(decrease) as follows:
December 31
2020 2019
Discount rate(s)
0.25% increase $ (8,425) $ (9,008)
0.25% decrease $ 8,711 $ 9,319
Expected rate(s) of salary increase
0.25% increase $ 8,542 $ 9,170
0.25% decrease $ (8,307) $ (8,913)
The sensitivity analysis presented above may not be representative of the actual change in the present
value of the defined benefit obligation as it is unlikely that the change in assumptions would occur in
isolation of one another as some of the assumptions may be correlated.
December 31
2020 2019
The expected contributions to the plan for the next year $ 26,354 $ 27,009
The average duration of the defined benefit obligation 8 years 8 years
18. EQUITY
a. Share Capital
December 31
2020 2019
Number of shares authorized (in thousands) 500,000 500,000
Amount of authorized shares $ 5,000,000 $ 5,000,000
(Continued)

- 261 -
December 31
2020 2019
Number of issued and fully paid shares (in thousands) 231,390 231,390
Amounts of issued and fully paid shares $ 2,313,901 $ 2,313,901
(Concluded)
Fully paid ordinary shares, which have a par value of $10, carry one vote per share and carry a right to
dividends. Based on the Company’s articles of incorporation (the “Articles”), part of authorized shares
can be issued as preferred shares.
b. Capital surplus
December 31
2020 2019
May be used to offset a deficit, distributed
as cash dividends, or transferred to share capital (Note)
Issuance of share capital $ 1,160,519 $ 1,160,519
Difference between consideration paid and the carrying amount
of the subsidiaries’ net assets during actual acquisition - 29
May be used only to offset a deficit
Donations 11,867 11,867
Expired share options 22,374 22,374
Share of changes in capital surplus of associates 21,755 22,572
May not be used for any purpose
Share of changes in capital surplus of associates 115,210 100,704
$ 1,331,725 $ 1,318,065
Note: Such capital surplus may be used to offset a deficit; in addition, when the Company has no deficit,
such capital surplus may be distributed as cash dividends or transferred to share capital (limited
to a certain percentage of the Company’s capital surplus and to once a year).
c. Retained earnings and dividends policy
Under the dividends policy as set forth in the Articles, where the Company made a profit in a fiscal year,
the profit shall be first utilized for paying taxes, offsetting losses of previous years, setting aside as a legal
reserve 10% of the remaining profit, except when the accumulated amount of such legal reserve equals
to the Company’s total issued capital, setting aside or reversing a special reserve in accordance with the
laws and regulations, and then any remaining profit together with any undistributed retained earnings
shall be used by the Company’s board of directors as the basis for proposing a distribution plan, which
should be resolved in the shareholders’ meeting for the distribution of dividends and bonuses to
shareholders. The common share dividends will be distributed after the distribution of preferred share
dividends based on the Articles.

- 262 -
The dividend policy of the Company is based on the current and future development plans, investment
environment, capital requirements and competition in the domestic and foreign markets, as well as the
benefits of shareholders, etc. The dividends to shareholders shall be not less than 10% of the distributable
earnings each year, but if the distributable earnings is less than 1% of the Company’s paid-in capital, the
Company should not make appropriation for dividends. The dividends to shareholders can be paid in cash
or/and issued shares, but cash dividends shall be not less than 50% of the total dividends.
Legal reserve may be used to offset deficit. If the Company has no deficit and the legal reserve has
exceeded 25% of the Company’s paid-in capital, the excess may be transferred to capital or distributed
in cash.
Items referred to under Rule No. 1010012865 and Rule No. 1010047490 issued by the FSC and in the
directive titled “Questions and Answers for Special Reserves Appropriated Following Adoption of
IFRSs” should be appropriated to or reversed from a special reserve by the Company. On the first-time
adoption of IFRSs, the Company appropriated to the special reserve $72,302 thousand.
The appropriations of earnings for 2019 and 2018 had been approved in the shareholders’ meetings in
May 2020 and 2019, respectively; the amounts were as follows:
Appropriation of Earnings
Dividends Per Share
(NT$)
For the Year Ended
December 31
For the Year Ended
December 31
2019 2018 2019 2018
Legal reserve $ 143,424 $ 134,596
Special reserve 300,740 601,187
Cash dividends to shareholders 763,587 740,448 $ 3.3 $ 3.2
$ 1,207,751 $ 1,476,231
The appropriations of earnings for 2020 had been proposed by the Company’s board of directors on
March 26, 2021. The appropriations and dividends per share were as follows:
Appropriation
of Earnings
Dividends Per
Share (NT$)
Legal reserve $ 183,957 Special reserve $ (343,469) Cash dividends to shareholders $ 925,561 $ 4.0
The Company’s board of directors also proposed to transfer the amount of $46,278 thousand from capital
surplus to share capital, issue share dividend equivalent to $0.2 per share, and increase capital by 4,628
thousand new ordinary shares.
The appropriations of earnings for 2020 and capital surplus transferred to share capital are subject to the
resolution in the shareholders’ meeting to be held on May 28, 2021.

- 263 -
d. Other equity items
1) Exchange differences on translating the financial statements of foreign operations
For the Year Ended December 31
2020 2019
Balance at January 1 $ (607,512) $ (355,909)
Recognized for the year
Share from associates accounted for using the equity
method 25,079 (296,162)
Income tax (4,571) 45,714
Reclassification adjustment
Disposal of foreign operations 3,371 (1,155)
Balance at December 31 $ (583,633) $ (607,512)
2) Unrealized gain on financial assets at FVTOCI
For the Year Ended December 31
2020 2019
Balance at January 1 $ (372,575) $ (323,438)
Recognized for the year
Unrealized gain (loss) - equity instruments 110,390 (114,290)
Share from associates accounted for using the equity
method 235,449
72,404
Income tax 6,911 11,672
Cumulative unrealized loss (gain) of equity instruments
transferred to retained earnings due to disposal
Equity instruments of the Company (18,567) 4,652
Share from associates accounted for using the equity
method (14,593)
(23,575)
Balance at December 31 $ (52,985) $ (372,575)
39. 19. REVENUE
For the Year Ended December 31
2020 2019
Revenue from contracts with customers
Revenue from sale of goods $ 33,183,310 $ 29,167,524
Other operating revenue 53,181 58,276
$ 33,236,491 $ 29,225,800

- 264 -
Contract balances
December 31,
2020
December 31,
2019
January 1,
2019
Notes receivable $ 131,614 $ 155,804 $ 230,426
Accounts receivable, net (including related
parties)
7,335,377 6,509,606 6,646,216
$ 7,466,991 $ 6,665,410 $ 6,876,642
Contract liabilities
Sale of goods $ 305,104 $ 259,153 $ 59,219
The changes in the balance of contract liabilities primarily result from the timing difference between the date
the Company fulfills its performance obligation and the date the customer’s payment is received. There are
no significant changes for the years ended December 31, 2020 and 2019.
Revenue in the reporting period recognized from the beginning contract liabilities is as follows:
For the Year Ended December 31
2020 2019
Sale of goods $ 257,919 $ 59,219
20. NET PROFIT
The details of net profit were as follows:
a. Other income (Note 25)
For the Year Ended December 31
2020 2019
Rental income $ 39,300 $ 34,084
Dividends 16,696 12,714
Consulting service income 118,243 110,241
Others 15,355 26,101
$ 189,594 $ 183,140
b. Other gains and losses
For the Year Ended December 31
2020 2019
Foreign exchange gain (loss), net $ (33,407) $ 10,475
Others (16,406) (11,594)
$ (49,813) $ (1,119)

- 265 -
c. Financial costs
For the Year Ended December 31
2020 2019
Interest on bank loans $ 77,429 $ 125,496
Syndicated loan fee amortization 1,440 2,880
Interest on lease liabilities 429 332
$ 79,298 $ 128,708
d. Depreciation and amortization
For the Year Ended December 31
2020 2019
Property, plant and equipment $ 47,439 $ 48,148
Right-of-use assets 7,706 5,469
Investment property 3,513 3,398
Intangible assets 6,770 4,868
$ 65,428 $ 61,883
An analysis of depreciation by function
Operating costs $ 632 $ 390
Operating expenses 54,513 53,227
Non-operating income and expenses 3,513 3,398
$ 58,658 $ 57,015
An analysis of amortization by function
Operating expenses $ 6,770 $ 4,868
e. Employee benefits expense
For the Year Ended December 31
2020 2019
Short-term employee benefits $ 881,204 $ 817,007
Post-employment benefits (Note 17)
Defined contribution plans 18,239 18,073
Defined benefit plans 4,041 4,482
22,280 22,555
$ 903,484 $ 839,562
f. Compensation of employees and remuneration of directors
The Company accrued compensation of employees and remuneration of directors at the rates between
9% and 13% and no higher than 2%, respectively, of net profit before income tax, compensation of
employees, and remuneration of directors. The compensation of employees and remuneration of directors
for the years ended December 31, 2020 and 2019 which have been approved by the Company’s board of
directors on March 26, 2021 and March 25, 2020, were as follows:

- 266 -
For the Year Ended December 31 2020 2019
Withdrawal
Rate (%)
Amount
Withdrawal
Rate (%)
Amount
Compensation of employees paid in cash 9 $ 210,798 11 $ 200,997
Remuneration of directors paid in cash 1.15 26,935 1.15 21,013
If there is a change in the proposed amounts after the annual parent company only financial statements
were authorized for issue, the differences are recorded as a change in the accounting estimate.
There was no difference between the actual amounts of compensation of employees and remuneration of
directors paid and the amounts recognized in the parent company only financial statements for the years
ended December 31, 2019 and 2018.
Information on the compensation of employees and remuneration of directors resolved by the Company’s
board of directors in 2020 and 2019 is available at the Market Observation Post System website of the
Taiwan Stock Exchange.
21. INCOME TAX
a. The major components of income tax expense recognized in profit or loss
For the Year Ended December 31
2020 2019 Current tax
In respect of the current year $ 145,955 $ 147,304
Income tax on unappropriated earnings 11,325 13,829
Adjustments for prior years (4,502) 4,769
152,778 165,902
Deferred tax
In respect of the current year 92,571 23,514
$ 245,349 $ 189,416
The reconciliation of accounting profit and income tax expenses is as follows:
For the Year Ended December 31
2020 2019
Profit before tax $ 2,104,469 $ 1,605,238
Income tax expense calculated at the statutory rate 20% $ 420,894 $ 321,048
Nondeductible expenses in determining taxable income 199 24
Domestic investment income (111,110) (104,313)
No recognize the taxable temporary differences associated with
investments in subsidiaries (74,138) (50,703)
Income tax on unappropriated earnings 11,325 13,829
Adjustments for prior years (4,502) 4,769
Nondeductible withholding tax 2,681 4,762
$ 245,349 $ 189,416

- 267 -
As the status of appropriations of earnings for 2021 is uncertain, the potential income tax consequences
of the 2020 unappropriated earnings are not reliably determinable.
b. Income tax benefit recognized directly in equity - only for the year ended December 31, 2019
Amount
Deferred tax benefit
Disposal parts of subsidiaries’ equity $ 2,012
c. Income tax benefit recognized in other comprehensive income
For the Year Ended December 31
2020 2019
Deferred tax benefit
In respect of the current year
Unrealized loss on financial assets at FVTOCI $ 6,911 $ 11,672
Remeasurement on defined benefit plan 893 (1,875)
Translation of foreign operations (4,571) 45,714
$ 3,233 $ 55,511
d. Current tax liabilities
December 31
2020 2019
Income tax payable $ 82,325 $ 93,596
e. Deferred tax assets and liabilities
The movements of deferred tax assets and liabilities were as follows:
For the year ended December 31, 2020
Opening
Balance
Recognized in
Profit or Loss
Recognized in
Retained
Earnings
Recognized in
Other
Comprehensive
Income Closing Balance
Deferred Tax Assets
Temporary differences
Provision for loss on inventories $ 23,724 $ (3,302 ) $ - $ - $ 20,422
Unpaid bonuses 50,398 14,034 - - 64,432 Refund liabilities 31,164 3,627 - - 34,791
Defined benefit obligations 60,601 (1,492 ) - 893 60,002
Foreign operations loss and exchange differences
36,511 (4,655 )
- 3,987 35,843
Others 24,876 (5,840 ) - 1,929 20,965
$ 227,274 $ 2,372 $ - $ 6,809 $ 236,455
(Continued)
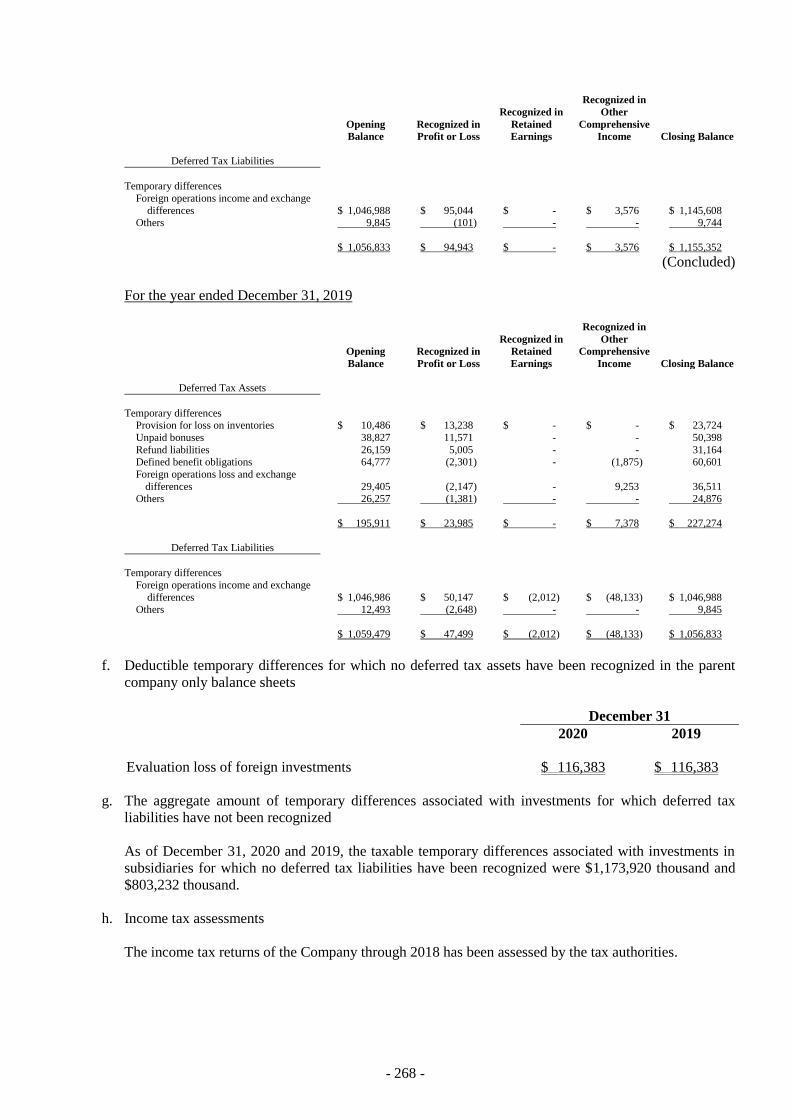
- 268 -
Opening
Balance
Recognized in
Profit or Loss
Recognized in
Retained
Earnings
Recognized in
Other
Comprehensive
Income Closing Balance
Deferred Tax Liabilities
Temporary differences
Foreign operations income and exchange
differences
$ 1,046,988 $ 95,044
$ - $ 3,576 $ 1,145,608 Others 9,845 (101 ) - - 9,744
$ 1,056,833 $ 94,943 $ - $ 3,576 $ 1,155,352
(Concluded)
For the year ended December 31, 2019
Opening
Balance
Recognized in
Profit or Loss
Recognized in
Retained
Earnings
Recognized in
Other
Comprehensive
Income Closing Balance
Deferred Tax Assets
Temporary differences Provision for loss on inventories $ 10,486 $ 13,238 $ - $ - $ 23,724
Unpaid bonuses 38,827 11,571 - - 50,398
Refund liabilities 26,159 5,005 - - 31,164 Defined benefit obligations 64,777 (2,301 ) - (1,875 ) 60,601
Foreign operations loss and exchange
differences
29,405 (2,147 )
- 9,253 36,511 Others 26,257 (1,381 ) - - 24,876
$ 195,911 $ 23,985 $ - $ 7,378 $ 227,274
Deferred Tax Liabilities
Temporary differences
Foreign operations income and exchange
differences
$ 1,046,986 $ 50,147
$ (2,012 ) $ (48,133 ) $ 1,046,988 Others 12,493 (2,648 ) - - 9,845
$ 1,059,479 $ 47,499 $ (2,012 ) $ (48,133 ) $ 1,056,833
f. Deductible temporary differences for which no deferred tax assets have been recognized in the parent
company only balance sheets
December 31
2020 2019
Evaluation loss of foreign investments $ 116,383 $ 116,383
g. The aggregate amount of temporary differences associated with investments for which deferred tax
liabilities have not been recognized
As of December 31, 2020 and 2019, the taxable temporary differences associated with investments in
subsidiaries for which no deferred tax liabilities have been recognized were $1,173,920 thousand and
$803,232 thousand.
h. Income tax assessments
The income tax returns of the Company through 2018 has been assessed by the tax authorities.

- 269 -
22. EARNINGS PER SHARE (EPS)
Earnings and weighted average number of shares outstanding used in the computation of EPS were as follows:
a. Net profit for the year attributable to the owners of the Company
For the Year Ended December 31
2020 2019
Earnings used in the computation to basic/diluted EPS $ 1,859,120 $ 1,415,822
b. Weighted average number of shares outstanding (in thousands)
For the Year Ended December 31
2020 2019
Weighted average number of shares outstanding used in
computation of basic EPS
231,390 231,390
Effect of potentially dilutive shares
Employees’ compensation 6,768 7,503
Weighted average number of shares outstanding used in
computation of diluted EPS
238,158 238,893
The Company offers to settle the employees’ compensation in cash or shares; thus, the Company assumes the
entire amount of the compensation will be settled in shares and the resulting potential shares were included
in the weighted average number of shares outstanding used in the computation of diluted EPS, as the effect
is dilutive. Such dilutive effect of the potential shares is included in the computation of diluted EPS until the
shareholders resolve the number of shares to be distributed to employees at their meeting in the following
year.
23. CAPITAL MANAGEMENT
The Company manages its capital to ensure it will be able to continue as a going concern while maximizing
the return to shareholders through the optimization of the debt and equity balance.
The capital structure of the Company consists of net debt and equity.
The key management personnel of the Company periodically reviews the cost of capital and the risk
associated with each class of capital. Based on recommendations of the key management personnel, in order
to balance the overall capital structure, the Company may adjust the amount of dividends paid to shareholders,
the number of new shares issued or repurchased, and/or the amount of new debt issued or existing debt
redeemed.
The Company is not subject to any externally imposed capital requirements, except those discussed in Note
14.

- 270 -
24. FINANCIAL INSTRUMENTS
a. Fair values of financial instruments not measured at fair value
The management of the Company considered the carrying amount of financial assets and financial
liabilities that are not measured at fair value as approximate amount of their fair value.
b. Fair value of financial instruments measured at fair value on a recurring basis
1) Fair value hierarchy
December 31, 2020
Level 1 Level 2 Level 3 Total
Financial assets at FVTOCI
Investments in equity
instruments
Domestic listed shares $ 154,071 $ 75,491 $ - $ 229,562
Unlisted shares - - 504,180 504,180
Foreign listed shares 19,956 - - 19,956
$ 174,027 $ 75,491 $ 504,180 $ 753,698
December 31, 2019
Level 1 Level 2 Level 3 Total
Financial assets at FVTOCI
Investments in equity
instruments
Domestic listed shares $ 99,708 $ - $ - $ 99,708
Unlisted shares - - 511,494 511,494
Foreign listed shares 30,679 - - 30,679
$ 130,387 $ - $ 511,494 $ 641,881
There were no transfers between Level 1 and Level 2 for the years ended December 31, 2020 and
2019.
2) Reconciliation of Level 3 fair value measurements of financial assets
For the Year Ended December 31
2020 2019
Balance at January 1 $ 511,494 $ 569,293
Disposal (1,288) -
Recognized in other comprehensive income (6,026) (57,799)
Balance at December 31 $ 504,180 $ 511,494
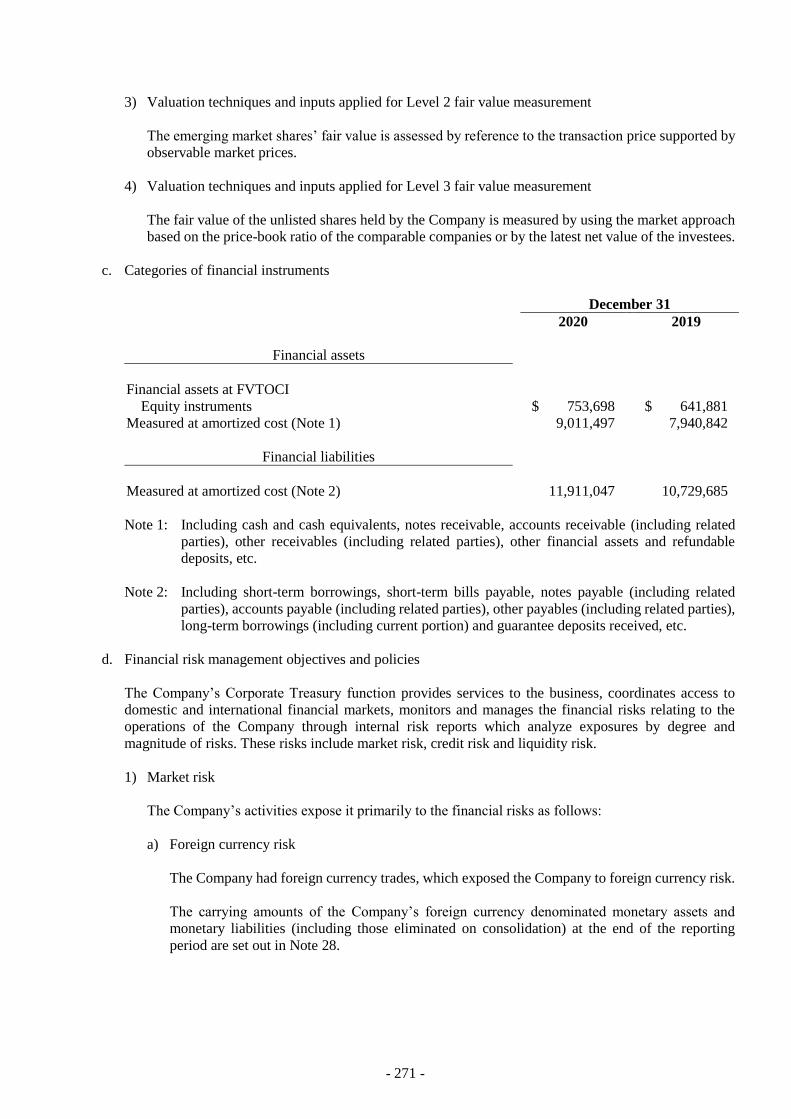
- 271 -
3) Valuation techniques and inputs applied for Level 2 fair value measurement
The emerging market shares’ fair value is assessed by reference to the transaction price supported by
observable market prices.
4) Valuation techniques and inputs applied for Level 3 fair value measurement
The fair value of the unlisted shares held by the Company is measured by using the market approach
based on the price-book ratio of the comparable companies or by the latest net value of the investees.
c. Categories of financial instruments
December 31
2020 2019
Financial assets
Financial assets at FVTOCI
Equity instruments $ 753,698 $ 641,881
Measured at amortized cost (Note 1) 9,011,497 7,940,842
Financial liabilities
Measured at amortized cost (Note 2) 11,911,047 10,729,685
Note 1: Including cash and cash equivalents, notes receivable, accounts receivable (including related
parties), other receivables (including related parties), other financial assets and refundable
deposits, etc.
Note 2: Including short-term borrowings, short-term bills payable, notes payable (including related
parties), accounts payable (including related parties), other payables (including related parties),
long-term borrowings (including current portion) and guarantee deposits received, etc.
d. Financial risk management objectives and policies
The Company’s Corporate Treasury function provides services to the business, coordinates access to
domestic and international financial markets, monitors and manages the financial risks relating to the
operations of the Company through internal risk reports which analyze exposures by degree and
magnitude of risks. These risks include market risk, credit risk and liquidity risk.
1) Market risk
The Company’s activities expose it primarily to the financial risks as follows:
a) Foreign currency risk
The Company had foreign currency trades, which exposed the Company to foreign currency risk.
The carrying amounts of the Company’s foreign currency denominated monetary assets and
monetary liabilities (including those eliminated on consolidation) at the end of the reporting
period are set out in Note 28.

- 272 -
Sensitivity analysis
The Company was mainly exposed to the USD.
The sensitivity rate used when reporting foreign currency risk internally to key management
personnel is 1%. The sensitivity analysis included only the outstanding foreign currency
denominated monetary items at the balance sheet date. Had the functional currency weakened
(strengthened) by 1% against the USD, the pre-tax profit for the years ended December 31, 2020
and 2019 would have been higher (lower) by $1,362 thousand and $2,722 thousand, respectively.
b) Interest rate risk
The Company was exposed to interest rate risk because the Company borrowed funds at both
fixed and floating interest rates. The risk is managed by the Company by maintaining an
appropriate mix of fixed and floating rate borrowings.
The carrying amounts of the Company’s financial assets and financial liabilities with exposure to
interest rates at the end of the reporting period were as follows:
December 31
2020 2019
Fair value interest rate risk
Financial liabilities $ 3,871,566 $ 2,848,992
Cash flow interest rate risk
Financial assets 1,192,420 790,423
Financial liabilities 3,382,458 3,745,349
Sensitivity analysis
The sensitivity analysis below shows the Company’s exposure to interest rates for non-derivative
instruments at the end of the reporting period. For floating rate assets and liabilities, the analysis
was prepared assuming the amount of the assets and liabilities outstanding at the end of the
reporting period was outstanding for the whole year.
If interest rates had been 1% higher/lower and all other variables were held constant, the
Company’s pre-tax profit for the years ended December 31, 2020 and 2019 would have been
lower/higher by $21,900 thousand and $29,549 thousand, respectively, which was mainly
attributable to the Company’s exposure to interest rates on its variable-rate bank deposits and
borrowings.
c) Other price risk
The Company was exposed to equity price risk through its investments in equity securities and
mutual funds. The Company manages this exposure by maintaining a portfolio of investments
with different risks. The Company’s equity price risk was mainly concentrated on equity
instruments of unlisted shares.
Sensitivity analysis
The sensitivity analysis below shows the exposure to equity price risk had been 1% higher/lower,
pre-tax other comprehensive income for the years ended December 31, 2020 and 2019 would
have been higher/lower by $7,537 thousand and $6,419 thousand, as a result of the changes in
fair value of financial assets at FVTOCI.
2) Credit risk

- 273 -
Credit risk refers to the risk that counterparty will default on its contractual obligations resulting in
financial loss to the Company. At the end of the reporting period, the Company’s maximum exposure
to credit risk could be equal to the total of the following:
a) The carrying amount of the respective recognized financial assets as stated in the parent company
only balance sheets; and
b) The amount of contingent liabilities in relation to financial guarantees provided by the Company.
The Company adopted a policy of only dealing with creditworthy counterparties and uses other
publicly available financial information and its own trading records to rate its major customers. The
Company’s exposure and the credit ratings of its counterparties are continuously monitored and credit
exposure is controlled by setting credit limits of counterparties annually.
The concentration of credit risk was limited due to the fact that the customer base was large and
unrelated.
3) Liquidity risk
The Company manages liquidity risk by monitoring and maintaining a level of cash and cash
equivalents deemed adequate to finance the Company’s operations and mitigate the effects of
fluctuations in cash flows. In addition, management monitors the utilization of bank borrowings and
ensures compliance with loan covenants.
Liquidity risk tables for non-derivative financial liabilities
The following tables detail the Company’s remaining contractual maturities for its non-derivative
financial liabilities with agreed-upon repayment periods. The tables had been drawn up based on the
undiscounted cash flows of financial liabilities from the earliest date on which the Company can be
required to pay. The tables included both interest and principal cash flows. Specifically, liabilities
with a repayment on demand clause were included in the earliest time band regardless of the
probability of the counterparties choosing to exercise their rights. The maturity dates for other non-
derivative financial liabilities were based on the agreed-upon repayment dates.
To the extent that interest flows are at floating rates, the undiscounted amount was derived from the
interest rate at the end of the year.
Less than
1 Year 1-5 Years 5-10 Years 10-20 Years Total
December 31, 2020
Non-interest bearing liabilities $ 4,675,620 $ 3,109 $ - $ - $ 4,678,729
Variable interest rate liabilities 2,902,529 163,362 204,203 171,651 3,441,745
Lease liabilities 8,344 13,911 - - 22,255
Fixed interest rate liabilities 2,079,165 1,818,464 - - 3,897,629
Financial guarantee contracts 2,230,636 - - - 2,230,636
$ 11,896,294 $ 1,998,846 $ 204,203 $ 171,651 $ 14,270,994
(Continued)

- 274 -
Less than
1 Year 1-5 Years 5-10 Years 10-20 Years Total
December 31, 2019
Non-interest bearing liabilities $ 4,159,792 $ 3,020 $ - $ - $ 4,162,812
Variable interest rate liabilities 2,549,414 868,960 210,865 216,617 3,845,856
Lease liabilities 7,736 20,685 - - 28,421
Fixed interest rate liabilities 859,095 2,071,005 - - 2,930,100
Financial guarantee contracts 2,108,189 - - - 2,108,189
$ 9,684,226 $ 2,963,670 $ 210,865 $ 216,617 $ 13,075,378
(Concluded)
The amounts included above for financial guarantee contracts were the maximum amounts the
Company could be required to settle under the arrangement with an option to demand the full
guaranteed amount if that amount is claimed by the counterparty of the financial guarantee contract.
Based on expectations at the end of the year, the Company considers that it is more likely than not
that no amount will be payable under the arrangement.
The amounts included above for variable interest rate non-derivative financial liabilities were subject
to change if changes in variable interest rates differ from those estimates of interest rates at the end
of the year.
25. RELATED PARTY TRANSACTIONS
The transactions between the Company and related parties were disclosed as follows:
a. Name of related parties and relation
Related Parties Relation with the Company
Raycong Industrial (Hong Kong) Limited Subsidiary
Shanghai Yikang Chemicals & Industries Co. Ltd. Subsidiary
Dongguan Huagang International Trading Co. Ltd. Subsidiary
Quanshun Logistic Co. Ltd. Subsidiary
Lihouang Medical Devices (Shanghai) Co. Ltd. Subsidiary
Xiamen Hua Chen Da Logistic Co. Ltd. Subsidiary
WL Indonesia Subsidiary
WL Vietnam Subsidiary
WT Industrial Subsidiary
Wah Lee Tech (Singapore) Pte. Ltd. Subsidiary
Regent King International Limited Subsidiary
Shanghai Yadi International Trading Co. Ltd. Subsidiary
Kingstone Energy Technology Corporation Subsidiary
KSA Energy Corporation Subsidiary
Wah Lee Green Energy Corporation Subsidiary (associate company
before May 2019)
Chang Wah Electromaterials Inc. Associate
Nagase Wahlee Plastics Corp. Associate
Wah Hong Industrial Corp. Associate
ORC Technology Corp. Associate
Shanghai Hua Chang Trading Co. Ltd. Associate
Eco Energy Corporation Associate
Chang Wah Technology Co. Ltd. Associate’s subsidiary
(Continued)

- 275 -
Related Parties Relation with the Company
SIP Chang Hong Optoelectronics Ltd. Associate’s subsidiary
Sun Hong Optronics Ltd. Associate’s subsidiary
Xiamen G&H Electronics Co., Ltd. Associate’s subsidiary
Ningpo Changhong Optoelectronics Ltd. Associate’s subsidiary
Qingdao Changhong Optoelectronics Ltd. Associate’s subsidiary
Wah Ma Chemical Sdn. Bhd. Associate’s subsidiary
PT. Wah Hong Indonesia Associate’s subsidiary
Suzhou Shanji Photoelectric Co., Ltd. Associate’s subsidiary (since April
2019)
Bao Guang Investment Co. Ltd. Key management personnel
(Director of the company)
Daily Polymer Corp. Other related party
Asahi Kasei Wah Lee Hi-tech Corp. Other related party
JingYi Technology Co. Other related party
Forcera Materials Co. Ltd. Other related party
Eleocom Co., Ltd. Other related party (has been
incorporated since April 2020)
Taigene Biotechnology Co., Ltd. Other related party
Minima Co., Ltd. Other related party
Sin Hao Co., Ltd. Other related party
Raycon Industries Inc. Other related party
(Concluded)
b. Operating transactions
1) Sales of goods
For the Year Ended December 31
Related Party Category 2020 2019
Subsidiaries $ 3,069,435 $ 3,178,821
Associates and their subsidiaries 328,342 292,729
Other related parties 15,580 17,811
$ 3,413,357 $ 3,489,361
The selling prices and collection terms of sales to related parties were similar to third parties.
2) Purchase of goods
For the Year Ended December 31
Related Party Category 2020 2019
Subsidiaries $ 26,525 $ 28,447
Associates and their subsidiaries 149,208 135,543
Other related parties 1,339,653 1,250,312
$ 1,515,386 $ 1,414,302
The prices of purchases from related parties were made under arm’s length terms and there were no
similar transactions with third parties for comparison; payment terms were similar to third parties.

- 276 -
3) Commission revenue (Included in operating revenue)
For the Year Ended December 31
Related Party Category/Name 2020 2019
Commission revenue
Subsidiaries $ 4,271 $ 1,682
Associates and their subsidiaries - 1,155
$ 4,271 $ 2,837
4) Commission Expense
For the Year Ended December 31
Related Party Category/Name 2020 2019
Commission expense
Subsidiaries
Shanghai Yikang $ 111,499 $ 111,541
Others 2,655 4,270
Associates and their subsidiaries 608 -
Other related parties 154 241
$ 114,916 $ 116,052
Freight Fee
Subsidiaries
Quan Shun Logistice Co., Ltd. $ 47,683 $ 45,110
Others - 51
$ 47,683 $ 45,161
5) Receivables from related parties
December 31
2020 2019
Accounts receivable - related parties
Subsidiaries
Shanghai Yikang $ 220,188 $ 645,560
Others 500,152 281,335
720,340 926,895
Associates and their subsidiaries 77,950 82,012
Other related parties 3,410 6,384
801,700 1,015,291
Less: Allowance for losses 1,006 295
$ 800,694 $ 1,014,996
(Continued)

- 277 -
December 31
2020 2019
Other receivables - related parties
Subsidiaries
Raycong Industrial (HK) $ 54,018 $ 133,734
Shanghai Yikang 107,472 113,173
Others 37,146 76,422
198,636 323,329
Associates and their subsidiaries
Chang Wah Electromaterials Inc. 51,455 81,140
Others 2,876 2,077
54,331 83,217
Other related parties 299 354
$ 253,266 $ 406,900
(Concluded)
The outstanding accounts receivable from related parties are unsecured.
6) Payables to related parties
December 31
2020 2019
Notes payable - related parties
Associates $ 938 $ 201
Accounts payable - related parties
Subsidiaries $ 6,244 $ 1,366
Associates 14,970 27,986
Other related parties 250,449 245,403
$ 271,663 $ 274,755
Other payables
Subsidiaries $ 52,338 $ 54,602
Associates’ subsidiaries - 5
Other related parties 667 329
$ 53,005 $ 54,936
The outstanding payables to related parties are unsecured and will be paid in cash.

- 278 -
7) Prepayments for purchases
December 31
Related Party Category 2020 2019
Associates $ 60,573 $ 68,762
8) Contract liabilities
December 31
Related Party Category 2020 2019
Subsidiaries
KS Corp. $ 77,113 $ 106,748
Others 9,473 4,217
86,586 110,965
Associates 27,872 -
$ 114,458 $ 110,965
c. Disposals of property, plant and equipment
Proceeds Gain on Disposal
For the Year Ended
December 31
For the Year Ended
December 31
Related Party Category 2020 2019 2020 2019
Subsidiaries $ 7,047 $ - $ 1,035 $ -
Associates 9,181 57 1,208 57
$ 16,228 $ 57 $ 2,243 $ 57
d. Other income
For the Year Ended December 31
Related Party Category/Name 2020 2019
Subsidiaries
Raycong Industrial (HK) $ 38,766 $ 41,116
Shanghai Yikang 29,158 38,303
Quan Shun Logistice Co., Ltd. 17,947 18,216
Others 19,146 17,856
105,017 115,491
Associated and their subsidiaries
Wah Hong Industrial Corp. 25,059 7,230
Others 8,173 10,106
33,232 17,336
Other related parties 3,425 3,408
Key management personnel 24 24
$ 141,698 $ 136,259
Other income included rental income, consulting service income and endorsement income.

- 279 -
e. Lease agreements
For the Year Ended December 31
Related Party Category 2020 2019
Lease expense
Subsidiaries
Chuan Shun Logistic Co., Ltd. $ 28,145 $ 32,843
Others 31 88
28,176 32,931
Other related parties 279 331
$ 28,455 $ 33,262
f. Endorsements and guarantees
December 31
Related Party Category 2020 2019
Subsidiaries
Amount endorsed $ 2,492,694 $ 2,611,392
Amount utilized $ 1,460,064 $ 1,417,319
Associates
Amount endorsed $ 1,183,456 $ 1,230,506
Amount utilized $ 770,572 $ 690,870
Other related parties
Amount endorsed $ 25,194 $ 25,194
Amount utilized $ - $ -
g. Compensation of key management personnel
The amounts of the remuneration of directors and other members of key management personnel were as
follows:
For the Year Ended December 31
2020 2019
Short-term employee benefits $ 93,192 $ 107,380
Post-employment benefits 411 1,017
$ 93,603 $ 108,397
The remuneration of directors and other key management was determined by the remuneration committee
based on the performance of individuals and market trends.
26. ASSETS PLEDGED AS COLLATERAL
The Company provided the following assets as collaterals for part of borrowings and performance guarantee.
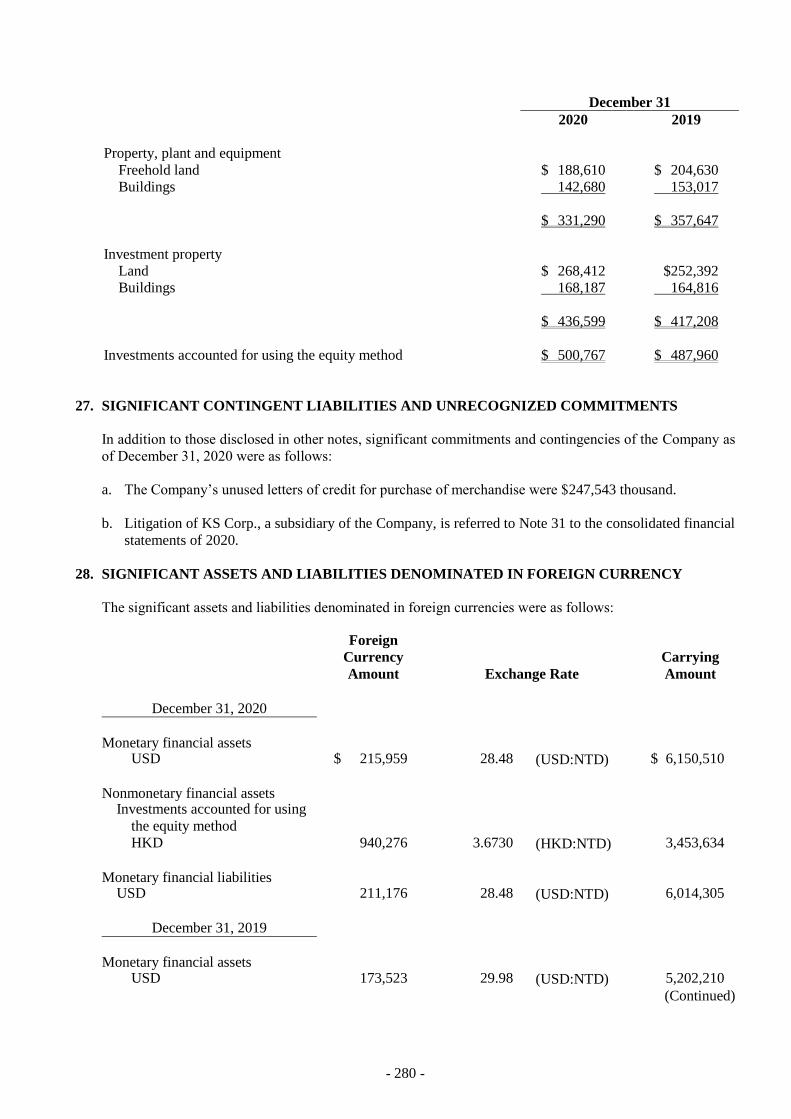
- 280 -
December 31
2020 2019
Property, plant and equipment
Freehold land $ 188,610 $ 204,630
Buildings 142,680 153,017
$ 331,290 $ 357,647
Investment property
Land $ 268,412 $252,392
Buildings 168,187 164,816
$ 436,599 $ 417,208
Investments accounted for using the equity method $ 500,767 $ 487,960
27. SIGNIFICANT CONTINGENT LIABILITIES AND UNRECOGNIZED COMMITMENTS
In addition to those disclosed in other notes, significant commitments and contingencies of the Company as
of December 31, 2020 were as follows:
a. The Company’s unused letters of credit for purchase of merchandise were $247,543 thousand.
b. Litigation of KS Corp., a subsidiary of the Company, is referred to Note 31 to the consolidated financial
statements of 2020.
28. SIGNIFICANT ASSETS AND LIABILITIES DENOMINATED IN FOREIGN CURRENCY
The significant assets and liabilities denominated in foreign currencies were as follows:
Foreign
Currency
Amount Exchange Rate
Carrying
Amount
December 31, 2020
Monetary financial assets
USD $ 215,959 28.48 (USD:NTD) $ 6,150,510
Nonmonetary financial assets Investments accounted for using
the equity method
HKD 940,276 3.6730 (HKD:NTD) 3,453,634
Monetary financial liabilities
USD 211,176 28.48 (USD:NTD) 6,014,305
December 31, 2019
Monetary financial assets
USD 173,523 29.98 (USD:NTD) 5,202,210
(Continued)

- 281 -
Foreign
Currency
Amount Exchange Rate
Carrying
Amount
Nonmonetary financial assets
Investments accounted for using
the equity method
HKD $ 788,073 3.849 (HKD:NTD) $ 3,033,293
Monetary financial liabilities
USD 164,444 29.98 (USD:NTD) 4,930,035
(Concluded)
For the years ended December 31, 2020 and 2019, realized and unrealized net foreign exchange were net loss
$33,407 and net gain $10,475, respectively. It is impractical to disclose net foreign exchange gains (losses)
by each significant foreign currency due to the variety of the foreign currency transactions and functional
currencies of the Company’s entities.
29. ADDITIONAL DISCLOSURES
a. Information about significant transactions and investees:
1) Financing provided to others: Table 1
2) Endorsements/guarantees provided: Table 2
3) Marketable securities held (excluding investments in subsidiaries and associates): Table 3
4) Marketable securities acquired or disposed of at costs or prices of at least NT$300 million or 20% of
the paid-in capital: None
5) Acquisition of individual real estate at costs of at least NT$300 million or 20% of the paid-in capital:
None
6) Disposal of individual real estate at prices of at least NT$300 million or 20% of the paid-in capital:
None
7) Total purchases from or sales to related parties amounting to at least NT$100 million or 20% of the
paid-in capital: Table 4
8) Receivables from related parties amounting to at least NT$100 million or 20% of the paid-in capital:
Table 5
9) Trading in derivative instruments: None
10) Information on investees: Table 6
b. Information on investments in mainland China
1) Information on any investee company in mainland China, showing the name, principal business
activities, paid-in capital, method of investment, inward and outward remittance of funds, ownership
percentage, net income of investees, investment income or loss, carrying amount of the investment at
the end of the period, repatriations of investment income, and limit on the amount of investment in
the mainland China area: Table 7

- 282 -
2) Any of the following significant transactions with investee companies in mainland China, either
directly or indirectly through a third area, and their prices, payment terms, and unrealized gains or
losses:
a) The amount and percentage of purchases and the balance and percentage of the related payables
at the end of the period: Table 8
b) The amount and percentage of sales and the balance and percentage of the related receivables at
the end of the period: Table 8
c) The amount of property transactions and the amount of the resultant gains or losses: None
d) The balance of negotiable instrument endorsements or guarantees or pledges of collateral at the
end of the period and the purposes: Table 2
e) The highest balance, the end of period balance, the interest rate range, and total current period
interest with respect to financing of funds: Table 1
f) Other transactions that have a material effect on the profit or loss for the year or on the financial
position, such as the rendering or receipt of services.
The Company’s other significant transactions with investee companies in mainland China as of
and for the year ended December 31, 2020 were as follow:
Counterparties Line Item Amount
Shanghai Yikang Other income $ 29,158
Shanghai Yikang Commission expense 111,499
Shanghai Yikang Other receivables 107,472
Shanghai Yikang Other payables 26,915
Shanghai Hua Chang Trading Co., Ltd. Other income 367
Shanghai Yadi Other receivables 2,022
Shanghai Yadi Other income 2,059
c. Information of major shareholders: List all shareholders with ownership of 5% or greater showing the
name of the shareholder, the number of shares owned, and percentage of ownership of each shareholder:
Table 9.
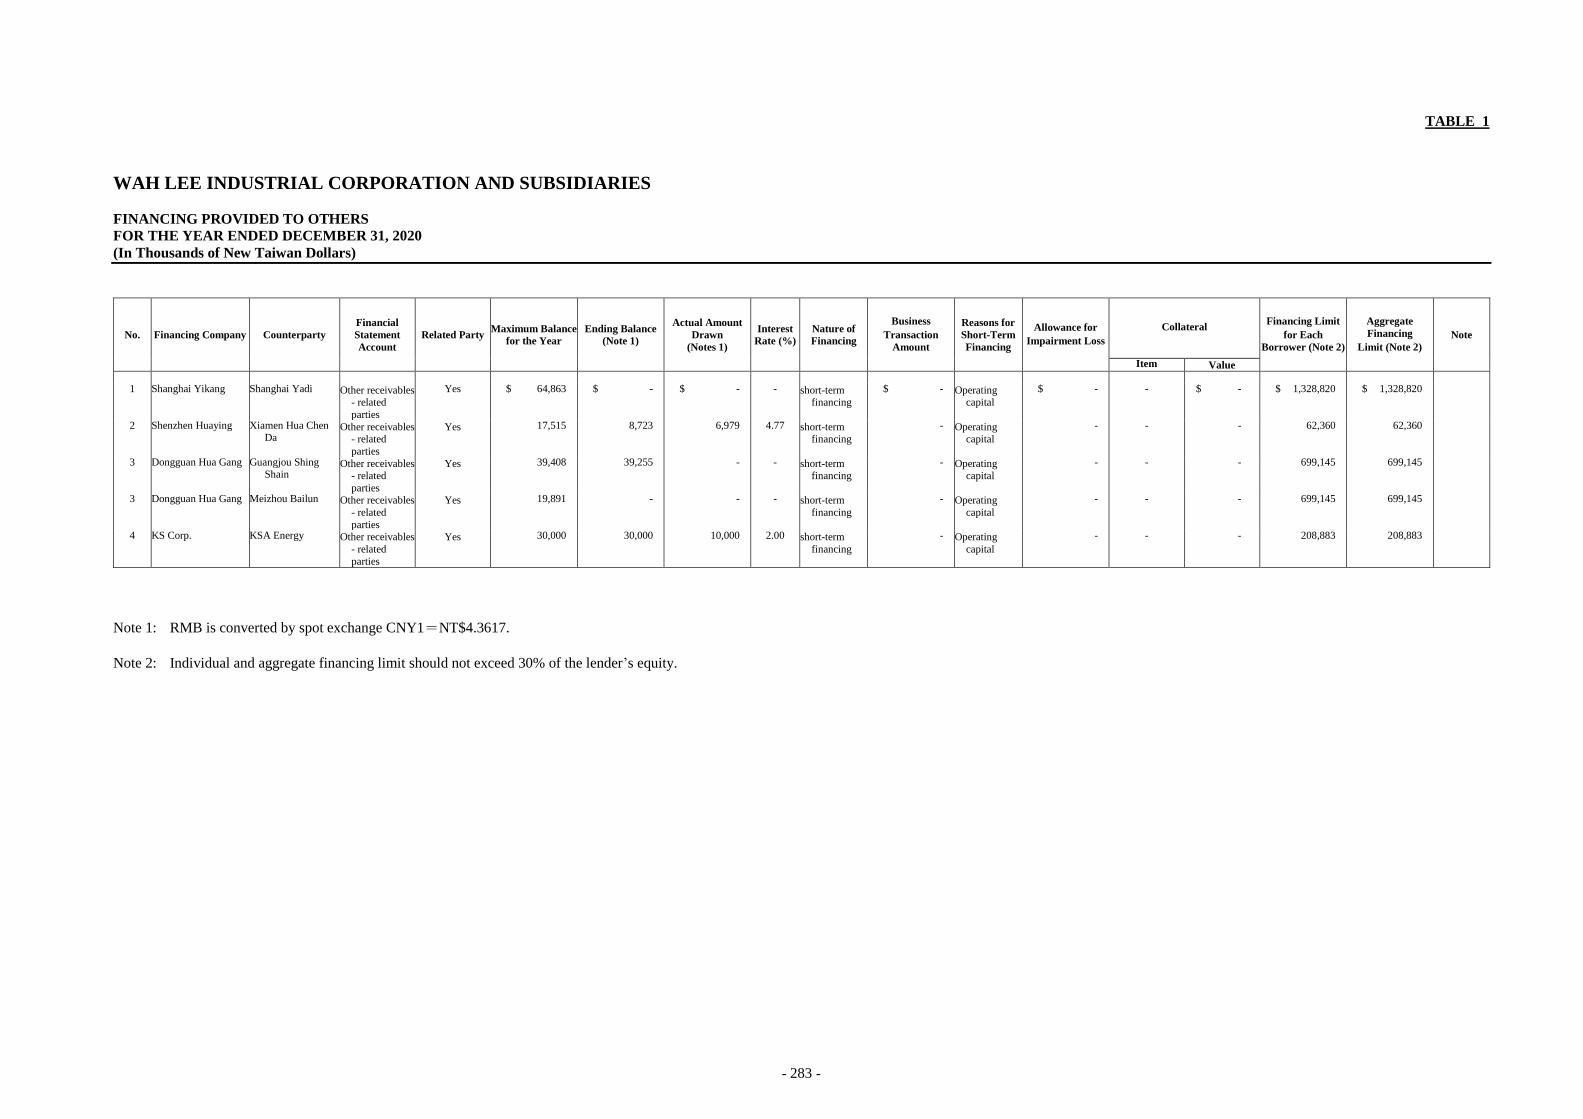
- 283 -
TABLE 1
WAH LEE INDUSTRIAL CORPORATION AND SUBSIDIARIES
FINANCING PROVIDED TO OTHERS
FOR THE YEAR ENDED DECEMBER 31, 2020
(In Thousands of New Taiwan Dollars)
No. Financing Company Counterparty
Financial
Statement
Account
Related Party Maximum Balance
for the Year Ending Balance
(Note 1)
Actual Amount
Drawn
(Notes 1)
Interest
Rate (%)
Nature of
Financing
Business
Transaction
Amount
Reasons for
Short-Term
Financing
Allowance for
Impairment Loss
Collateral Financing Limit
for Each
Borrower (Note 2)
Aggregate
Financing
Limit (Note 2)
Note
Item Value
1 Shanghai Yikang Shanghai Yadi Other receivables - related
parties
Yes $ 64,863 $ - $ - - short-term financing
$ - Operating capital
$ - - $ - $ 1,328,820 $ 1,328,820
2 Shenzhen Huaying Xiamen Hua Chen Da
Other receivables - related
parties
Yes 17,515 8,723 6,979 4.77 short-term financing
- Operating capital
- - - 62,360 62,360
3 Dongguan Hua Gang Guangjou Shing Shain
Other receivables - related
parties
Yes 39,408 39,255 - - short-term financing
- Operating capital
- - - 699,145 699,145
3 Dongguan Hua Gang Meizhou Bailun Other receivables
- related
parties
Yes 19,891 - - - short-term
financing
- Operating
capital
- - - 699,145 699,145
4 KS Corp. KSA Energy Other receivables
- related
parties
Yes 30,000 30,000 10,000 2.00 short-term
financing
- Operating
capital
- - - 208,883 208,883
Note 1: RMB is converted by spot exchange CNY1=NT$4.3617.
Note 2: Individual and aggregate financing limit should not exceed 30% of the lender’s equity.

- 284 -
TABLE 2
WAH LEE INDUSTRIAL CORPORATION AND SUBSIDIARIES
ENDORSEMENTS/GUARANTEES PROVIDED
FOR THE YEAR ENDED DECEMBER 31, 2020
(In Thousands of New Taiwan Dollars)
No. Endorsement/Guarantee
Provider
Endorsee/Guarantee
Limit on
Endorsement/
Guarantee Given on
Benefit of Each Party
(Notes 1-8)
Maximum Amount
Endorsed/
Guaranteed During
the Year
Outstanding
Endorsement/
Guarantee at The
End of the Period
(Note 8)
Actual Borrowing
Amount (Note 8)
Amount of
Endorsement/
Guarantee
Collateralized by
Properties
Ratio of
Accumulated
Endorsement/
Guarantee to
Net Equity per
Latest Financial
Statements (%)
Maximum
Endorsement/
Guarantee Amount
Allowable
(Notes 1-8)
Guarantee Provided
by Parent Company Guarantee Provided
by Subsidiary
Guarantee Provided
to Subsidiaries in
Mainland China Note
Name Relationship
0 The Company Nagase Wahlee Plastics
Corp.
Shareholder of an investee
provides
endorsements/guarantees
to the company in
proportion to the shareholding percentage
$ 2,575,602 $ 970,000 $ 480,000 $ 307,229 $ - 3.73 $ 12,878,009 N N N
0 The Company Asahi Kasei Wah Lee Hi-
tech Corp.
Shareholder of an investee
provides
endorsements/guarantees
to the company in
proportion to the
shareholding percentage
2,575,602 50,388 25,194 - - 0.20 12,878,009 N N N
0 The Company Shanghai Yikang Subsidiary of the Company 2,575,602 197,583 190,816 106,277 - 1.48 12,878,009 Y N Y
0 The Company Dongguan Hua Gang Subsidiary of the Company 3,863,403 368,318 256,320 256,320 - 1.99 12,878,009 Y N Y
0 The Company Raycong H.K., Shanghai
Yikang and Dongguan
Hua Gang
Subsidiary of the Company 2,575,602 120,000 120,000 71,830 - 0.93 12,878,009 Y N Y
0 The Company Shanghai Hua Chang
Trading Co., Ltd.
Shareholder of an investee
provides
endorsements/guarantees to the company in
proportion to the
shareholding percentage
2,575,602 1,494,350 703,456 463,343 - 5.46 12,878,009 N N Y
0 The Company WL Singapore Subsidiary of the Company 3,863,403 677,040 432,896 294,186 - 3.36 12,878,009 Y N N
0 The Company Sakuragawa Solar Ltd. Subsidiary of the Company 2,575,602 178,414 174,621 90,748 - 1.36 12,878,009 Y N N
0 The Company Miyazaki Solar Ltd. Subsidiary of the Company 2,575,602 322,104 315,258 249,958 - 2.45 12,878,009 Y N N
0 The Company WL Indonesia Subsidiary of the Company 2,575,602 187,550 88,288 - - 0.69 12,878,009 Y N N
0 The Company WL Vietnam Subsidiary of the Company 3,863,403 490,050 230,688 155,840 - 1.79 12,878,009 Y N N 0 The Company WT Industrial Subsidiary of the Company 2,575,602 986,272 447,221 55,279 - 3.47 12,878,009 Y N N
0 The Company Wah Lee Philippines Inc. Subsidiary of the Company 2,575,602 58,980 56,960 - - 0.44 12,878,009 Y N N
0 The Company KS Corp. Subsidiary of the Company 2,575,602 179,626 179,626 179,626 179,626 1.39 12,878,009 Y N N
1 Shanghai Yikang Shanghai Chang Wah
Electromaterials Inc.
Shareholder of an investee
provides
endorsements/guarantees
to the company in proportion to the
shareholding percentage
- 51,879 - - - - - N N Y
1 Shanghai Yikang Shanghai Yadi Subsidiary of the Company 885,880 122,128 122,128 29,996 - 2.76 2,214,700 Y N Y
2 KS Corp. KSA Corp. Subsidiary of the Company 176,094 1,382 1,382 1,353 - 0.20 352,188 Y N N
2 KS Corp. KSB Corp. The Company is required to
provide guarantees or
endorsements for the
construction project based on the construction
contract
1,760,940 100,000 100,000 28,891 10,000 14.36 2,817,504 Y N N
2 KS Corp. KSA Corp. The Company is required to
provide guarantees or
endorsements for the
construction project
based on the construction
contract
1,760,940 400,000 400,000 125,172 25,000 57.45 2,817,504 Y N N
(Continued)

- 285 -
No. Endorsement/Guarantee
Provider
Endorsee/Guarantee
Limit on
Endorsement/
Guarantee Given on
Benefit of Each Party
(Notes 1-8)
Maximum Amount
Endorsed/
Guaranteed During
the Year
Outstanding
Endorsement/
Guarantee at The
End of the Period
(Note 8)
Actual Borrowing
Amount (Note 8)
Amount of
Endorsement/
Guarantee
Collateralized by
Properties
Ratio of
Accumulated
Endorsement/
Guarantee to
Net Equity per
Latest Financial
Statements (%)
Maximum
Endorsement/
Guarantee Amount
Allowable
(Notes 1-8)
Guarantee Provided
by Parent Company
Guarantee Provided
by Subsidiary
Guarantee Provided
to Subsidiaries in
Mainland China
Note Name Relationship
3 KSA Corp. KSB Corp. The Company is required to
provide guarantees or
endorsements for the
construction project based on the construction
contract
$ 6,130,000 $ 100,000 $ 100,000 $ 28,891 $ - 145.60 $ 9,195,000 N N N
3 KSA Corp. KS Corp. The Company is required to
provide guarantees or
endorsements for the
construction project
based on the construction contract
6,130,000 1,800,000 1,800,000 926,018 - 2,620.89 9,195,000 N Y N
4 KSB Corp. KSA Corp. The Company is required to
provide guarantees or
endorsements for the
construction project
based on the construction
contract
2,226,000 400,000 400,000 125,172 - 3,162.81 4,452,000 N N N
4 KSB Corp. KS Corp. The Company is required to provide guarantees or
endorsements for the
construction project
based on the construction
contract
2,226,000 1,800,000 1,800,000 926,018 - 14,232.62 4,452,000 N Y N
5 Dongguan Hua Gang Guang Jou Shing Shian Subsidiary of the Company 699,145 177,035 177,035 87,593 - 7.60 1,165,241 Y N Y
6 Raycong H.K. Xiamen Hua Chen Da Subsidiary of the Company 1,286,437 30,020 28,480 5,683 - 0.44 3,216,093 Y N Y
(Concluded)
Note 1: The limit on endorsement/guarantee given on behalf of each party shall not exceed 20% of the equity of the Company. If the Company directly or indirectly holds 100% of the equity of the endorsee or guarantee, the limit on
endorsement/guarantee given on behalf of each party shall not exceed 30% of the equity of the Company. The maximum total amount of endorsement/guarantee shall not exceed 100% of the equity of the Company.
Note 2: The limit on endorsement/guarantee given on behalf of each party shall not exceed 20% of the equity of Shanghai Yikang. If the Company directly or indirectly holds 100% of the equity of the endorsee or guarantee, the limit
on endorsement/guarantee given on behalf of each party shall not exceed 30% of the equity of Shanghai Yikang. The maximum total amount of endorsement/guarantee shall not exceed 50% of the equity of Shanghai Yikang.
Note 3: The limit on endorsement/guarantee given on behalf of each party shall not exceed 30% of the equity of Dongguan Hua Gang. The maximum total amount of endorsement/guarantee shall not exceed 50% of the equity of
Dongguan Hua Gang.
Note 4: The limit on endorsement/guarantee given on behalf of each party shall not exceed 20% of the equity of Raycong H.K. The maximum total amount of endorsement/guarantee shall not exceed 50% of the equity of Raycong H.K.
Note 5: The limit on endorsement/guarantee given to each party, based on the construction project, shall not exceed 500% of the paid-in capital of KS Corp.; the maximum total amount of endorsement/guarantee shall not exceed 800%
of the paid-in capital of KS Corp. The limit on endorsement/guarantee given to each party, not based on construction project, shall not exceed 50% of the paid-in capital of KS Corp. The total amount of endorsement/guarantee
shall not exceed 100% of the paid-in capital of KS Corp.
Note 6: The limit on endorsement/guarantee given to each party, based on the construction project, shall not exceed 10,000% of the paid-in capital of KSA Corp.; the maximum total amount of endorsement/guarantee shall not exceed
15,000% of the paid-in capital of KSA Corp.
Note 7: The limit on endorsement/guarantee given to each party, based on the construction project, shall not exceed 20,000% of the paid-in capital of KSB Corp.; the maximum total amount of endorsement/guarantee shall not exceed
40,000% of the paid-in capital of KSB Corp.
Note 8: USD is converted by spot exchange USD$1=NT$28.48; JPY is converted by spot exchange JPY1=NT$0.2763; RMB is converted by spot exchange RMB1=NT$4.3617; THB is converted by spot exchange THB1=NT$0.9556.

- 286 -
TABLE 3
WAH LEE INDUSTRIAL CORPORATION AND SUBSIDIARIES
MARKETABLE SECURITIES HELD
DECEMBER 31, 2020
(In Thousands of New Taiwan Dollars)
Holding Company Name Type and Name of Marketable
Securities
Relationship with The
Holding Company Financial Statement Account
December 31, 2020
Note Number of
Shares Carrying Value
Percentage
of
Ownership
(%)
Fair Value
The Company Stock
Chang Wah Technology Co.
Ltd.
Associate’s subsidiary Financial assets at FVTOCI -
current 2,000,000 $ 119,600 - $ 119,600
Daily Polymer Corp. The Company is the director of the
company
Financial assets at FVTOCI -
noncurrent
2,154,410 $ 34,471 3.02 $ 34,471
Wah Yuen Technology Holding
Limited
- Financial assets at FVTOCI -
noncurrent
1,968,180 77,513 0.75 77,513
JingYi Technology Co. The Company is the director of the
company
Financial assets at FVTOCI -
noncurrent
2,066,432 55,014 16.94 55,014
High Power Optoelectronics
Inc.
- Financial assets at FVTOCI -
noncurrent
67,991 - 0.12 -
Asahi Kasei Wah Lee Hi-tech
Corp.
The Company is the director of the
company
Financial assets at FVTOCI -
noncurrent
9,497 85,891 19.38 85,891
Forcera Materials Co., Ltd. The Company is the director of the
company
Financial assets at FVTOCI -
noncurrent
2,102,476 56,581 8.83 56,581
Univision Technology Holdings - Financial assets at FVTOCI -
noncurrent
38,794,190 - 9.10 -
Minima Technology Co., Ltd. The Company is the director of the
company
Financial assets at FVTOCI -
noncurrent
3,600,000 82,160 9.27 82,160
TaiGene Biotechnology Co.,
Ltd.
The Company is the supervisor of
the company
Financial assets at FVTOCI -
noncurrent
2,300,000 11,037 6.57 11,037
Shilian Fine Chemicals Co.,
Ltd.
- Financial assets at FVTOCI -
noncurrent
11,871,585 81,890 4.57 81,890
CDIB Capital Group. - Financial assets at FVTOCI -
noncurrent
5,000,000 54,094 2.86 54,094
Darco Water Technologies Ltd. - Financial assets at FVTOCI -
noncurrent
7,649,782 19,956 8.15 19,956
Eleocom Co., Ltd. The Company is the director of the
company
Financial assets at FVTOCI -
noncurrent
1,500,000 - 10.71 -
Tien Li Offshore Wind
Technology Co., Ltd.
The Company is the director of the
company
Financial assets at FVTOCI -
noncurrent
828,572 75,491
1.51 75,491
$ 634,098 $ 634,098
(Continued)

- 287 -
Holding Company Name Type and Name of Marketable
Securities
Relationship with The
Holding Company Financial Statement Account
December 31, 2020
Note Number of
Shares Carrying Value
Percentage
of
Ownership
(%)
Fair Value
SHC Holding Ltd. Guangzhou Yonguang
Optoelectronics Co., Ltd.
- Financial assets at FVTOCI -
noncurrent
- $ - 12.82 $ -
Wah Lee Holding Ltd. Mutual funds
JPMorgan Funds- Multi-
Revenue Fund-A (acc) - USD
- Financial assets at FVTPL -
current
7,737 $ 45,265 - $ 45,265
JPMorgan Funds-Income Fund
A (dist) - USD
- Financial assets at FVTPL -
current
28,629 26,801
- 26,801
$ 72,066 $ 72,066
(Concluded)

- 288 -
TABLE 4
WAH LEE INDUSTRIAL CORPORATION AND SUBSIDIARIES
TOTAL PURCHASES FROM OR SALES TO RELATED PARTIES AMOUNTING TO AT LEAST NT$100 MILLION OR 20% OF THE PAID-IN CAPITAL
FOR THE YEAR ENDED DECEMBER 31, 2020
(In Thousands of New Taiwan Dollars)
Buyer Related Party Relationship
Transaction Details Abnormal Transaction Notes/Accounts Receivable (Payable)
Note Purchase/
Sale Amount % of Total Payment Terms
Unit Price Payment Terms Ending Balance % of Total
The Company Raycong H.K. Subsidiary Sales $ (834,028 ) (3 ) 30 to 90 days after
monthly closing
Normal trade terms The terms with
related parties are
not significantly different from
those with third
parties
$ 196,628 3
Shanghai Yi Kang Subsidiary Sales (1,091,538 ) (3 ) 30 to 120 days after
monthly closing
Normal trade terms The terms with
related parties are
not significantly different from
those with third
parties
220,188 3
Dongguan Huagang Subsidiary Sales (757,187 ) (2 ) 30 to 120 days after
monthly closing
Normal trade terms The terms with
related parties are
not significantly different from
those with third
parties
190,401 3
WL Vietnam Subsidiary Sales (104,275 ) - 90 days after monthly
closing
Normal trade terms The terms with
related parties are
not significantly different from
those with third
parties
30,827 -
Nagase Wahlee Plastics. Associates accounted for using the
equity method
Purchase 122,831 1 60 to 90 days after
monthly closing
Normal trade terms The terms with
related parties are
not significantly different from
those with third
parties
(5,288 ) -
Asahi Kasei Wah Lee Hi-tech Corp. Substantial related party Purchase 1,205,245 4 105 days after monthly
closing
No comparable
transactions with third
party
The terms with
related parties are
not significantly different from
those with third parties
(226,047 ) (6 )
Chang Wah Electromaterials Inc. Associates accounted for using the
equity method
Sales (255,686 ) (1 ) 90 days after monthly
closing
Normal trade terms The terms with
related parties are not significantly
different from
those with third parties
67,565 1
Raycong H.K. Dongguan Hua Gang Subsidiary Sales (671,140 ) (19 ) 30 to 180 days after monthly closing
Normal trade terms The terms with related parties are
not significantly
different from those with third
parties
77,962 9
Shanghai Yikang Shanghai Hua Chang Associate’s subsidiary accounted for
using the equity method
Purchase 193,496 2 30 days after monthly
closing
No comparable
transactions with third
party
The terms with
related parties are
not significantly different from
those with third
parties
(35,982 ) (2 )
(Continued)

- 289 -
Buyer Related Party Relationship
Transaction Details Abnormal Transaction Notes/Accounts Receivable (Payable)
Note Purchase/
Sale Amount % of Total Payment Terms
Unit Price Payment Terms Ending Balance % of Total
Shanghai Yikang The Company Parent company Sales $ (119,910 ) (1 ) 120 days after monthly closing
No comparable transactions with third
party
The terms with related parties are
not significantly
different from those with third
parties
$ 25,955 -
WL Indonesia WT Indonesia Associates Sales (109,217 ) (100 ) 60 days after monthly
closing
No comparable
transactions with third
party
The terms with
related parties are
not significantly different from
those with third
parties
31,290 100
(Concluded)

- 290 -
TABLE 5
WAH LEE INDUSTRIAL CORPORATION AND SUBSIDIARIES
RECEIVABLES FROM RELATED PARTIES AMOUNTING TO AT LEAST NT$100 MILLION OR 20% OF THE PAID-IN CAPITAL
DECEMBER 31, 2020
(In Thousands of New Taiwan Dollars)
Company Name Related Party Relationship Ending Balance
(Note)
Turnover
Rate
Overdue Amount Received in
Subsequent Period
Allowance for
Impairment Loss Amount Actions Taken
The Company Shanghai Yikang Subsidiary $ 327,660 2.01 $ - - $ 161,033 $ -
Raycong H.K. Subsidiary 250,646 3.62 - - 98,242 -
Dongguan Hua Gang Subsidiary 192,763 5.20 - - 175,344 -
Chang Wah Electromaterials Inc. Associate accounted for using the
equity method
119,020 1.86 - - 67,565 -
Note: Including trade receivables and other receivables. Other receivables are mainly service revenue and dividends collected from related parties.

- 291 -
TABLE 6
WAH LEE INDUSTRIAL CORPORATION AND SUBSIDIARIES
INFORMATION ON INVESTEES
FOR THE YEAR ENDED DECEMBER 31, 2020
(In Thousands of New Taiwan Dollars)
Company Name Investee Company Location Main Businesses and Products Original Investment Amount Number of
Shares % Carrying Amount
Net Income (Loss) of
the Investee
Share of Profit (Loss)
(Note 1) Note
December 31, 2020 December 31, 2019
The Company Wah Lee Holding Ltd. BVI International investment business $ 430,666 $ 430,666 13,070,000 100.00 $ 4,184,973 $ 430,779 $ 430,436 Subsidiary
The Company Raycong H.K. Hong Kong Trading business of engineering plastic,
composite materials and equipment
304,113 304,113 56,000,000 53.69 3,453,779 741,376 397,670 Subsidiary
The Company Chang Wah Electromaterials Inc. Taiwan Agency of IC packaging material and
equipment
449,349 449,349 197,902,180 30.98 2,080,267 997,299 308,967 Associate
The Company Nagase Wahlee Plastics Corp. Taiwan Trading business of synthetic resin
product and related material, agency
of domestic and international
products distribution quotation and
bidding business
20,810 20,810 4,000,000 40.00 728,537 279,524 111,793 Associate
The Company Wah Hong Industrial Corp. Taiwan Manufacturing of LCD material, BMC
(bulk molding compound) material
and molded product
942,926 939,921 26,118,978 26.67 1,023,436 215,794 57,502 Associate
The Company ORC Technology Corp. Taiwan Trading business and service of
exposure machine and parts
6,000 6,000 600,000 35.00 170,408 73,647 25,777 Associate
The Company WL Japan Japan Trading business of synthetic resin,
industrial plastic, glass fiber, non-
ferrous metal, molding machine,
electromechanical parts, office
automation equipment, optical
mechanical equipment, battery and
industrial electrical equipment and
parts
21,490 21,490 1,500 83.33 4,966 (69 ) (58 ) Subsidiary
The Company WL Korea South Korea Trading business of synthetic resin,
industrial plastic, glass fiber, non-
ferrous metal, molding machine,
electromechanical parts, office
automation equipment, optical
mechanical equipment, battery and
industrial electrical equipment and
parts
18,856 18,856 147,000 100.00 698 1,848 1,848 Subsidiary
The Company Sakuragawa Solar Ltd. Japan Solar power generation business 46,008 46,008 - 99.99 86,576 7,662 7,662 Subsidiary
The Company Miyazaki Solar Ltd. Japan Solar power generation business 82,103 82,103 - 99.99 37,440 4,279 4,279 Subsidiary
The Company WL Indonesia Indonesia Trading business of industrial materials 48,262 14,840 1,610,000 70.00 37,145 (7,868 ) (5,200 ) Subsidiary
The Company Meidi H.K. Hong Kong International investment business - 17,753 - - - - - Subsidiary
The Company WL Vietnam Vietnam Trading business of industrial materials 16,293 16,293 - 100.00 36,133 9,402 9,402 Subsidiary
The Company QuanShun Logistics Co., Ltd. Taiwan Freight forwarders and leasing business 95,000 95,000 9,500,000 63.33 122,470 25,214 15,969 Subsidiary
The Company WL Green Corp. Taiwan Battery manufacturing and
renewable energy self-use power
generation equipment business
2,000 5,000 200,000 25.00 1,164 (185 ) (46 ) Subsidiary
The Company WT Industrial Thailand Trading business of industrial materials 200,000 200,000 7,650 51.00 197,605 52,415 19,027 Subsidiary
The Company Eco Energy Corporation Taiwan Battery manufacturing and
renewable energy self-use power
generation equipment business
80,000 80,000 8,000,000 20.00 97,878 14,115 2,855 Associate
(Continued)

- 292 -
Company Name Investee Company Location Main Businesses and Products Original Investment Amount Number of
Shares % Carrying Amount
Net Income (Loss) of
the Investee
Share of Profit (Loss)
(Note 1) Note
December 31, 2020 December 31, 2019
The Company KS Corp. Taiwan Battery manufacturing and renewable
energy self-use power generation
equipment business
$ 468,384 $ 468,384 17,962,577 51.00 $ 500,767 $ 26,464 $ 16,133 Subsidiary
The Company WL Philippines Corp. Philippines Trading business of industrial materials 7,755 7,755 127,495 99.99 7,464 (8 ) (8 ) Subsidiary
The Company WL Philippines Inc. Philippines Trading business of industrial materials 7,747 7,747 126,997 99.99 6,473 (973 ) (973 ) Subsidiary
The Company WH Energy Taiwan Solar power generation business 30,000 - 3,000,000 100.00 29,901 (99 ) (99 ) Subsidiary
The Company ORC Co. Taiwan Trading business of industrial materials 4,000 - 400,000 40.00 4,000 - - Joint
Venture QuanShun Logistics Co., Ltd. Chuancheng Logistics Co., Ltd. Taiwan Freight forwarders and leasing business 12,947 - 25,000 100.00 12,248 (570 ) (700 ) Subsidiary
KS Corp. KSA Corp. Taiwan Solar power generation business 55,000 25,000 6,130,000 100.00 68,679 6,668 6,668 Subsidiary
KS Corp. KSB Corp. Taiwan Solar power generation business 10,000 10,000 1,113,000 100.00 12,647 1,391 1,391 Subsidiary
KS Corp. WL Green Corp. Taiwan Solar power generation business 4,320 10,200 432,000 51.00 2,374 (185 ) (94 ) Subsidiary
KS Corp. Eco Energy Corporation Taiwan Battery manufacturing and renewable
energy self-use power generation
equipment business
80,000 80,000 8,000,000 20.00 97,878 14,115 2,855 Associate
KS Corp. KSC Corp. Taiwan Solar power generation business 1,000 - 100,000 100.00 917 (83 ) (83 ) Subsidiary
KS Corp. KSD Corp. Taiwan Solar power generation business 67,000 - 6,700,000 100.00 66,807 (193 ) (193 ) Subsidiary
Wah Lee Holding Ltd. SHC Holding Ltd. Mauritius International investment business 43,892 43,892 1,290,000 100.00 763,090 53,095 53,095 Subsidiary
Wah Lee Holding Ltd. WL Singapore Singapore Agency of semiconductor materials and
equipment
51,639 51,639 1,600,000 100.00 347,788 34,963 34,963 Subsidiary
Wah Lee Holding Ltd. Raycong H.K. Hong Kong Trading business of engineering plastic,
composite materials and equipment
943,164 943,164 48,296,655 46.31 2,978,553 741,376 343,309 Subsidiary
Wah Lee Holding Ltd. Regent King H.K. Hong Kong Trading business of engineering plastic,
composite materials and equipment
39 39 - 100.00 2,307 1,065 1,065 Subsidiary
WT Industrial WT Indonesia Indonesia Trading business of industrial materials 3,953 3,953 18,150 66.00 1,883 (3,225 ) (2,128 ) Subsidiary
WL Singapore Gishine Tech Singapore Research and development of
environmental protection and
cleaning technology
- - - 49.00 - - - Associate
(Concluded)
Note 1: The share of profit (loss) recognized for the year ended December 31, 2020 included eliminated unrealized gains or losses and amortization of investment premium.
Note 2: Please refer to Table 7 for information on investments in mainland China.

- 293 -
TABLE 7
WAH LEE INDUSTRIAL CORPORATION AND SUBSIDIARIES
INFORMATION ON INVESTMENTS IN MAINLAND CHINA
FOR THE YEAR ENDED DECEMBER 31, 2020
(In Thousands of New Taiwan Dollars)
Investee Company Main Businesses and Products Paid-in Capital Method of
Investment
Accumulated
Outward
Remittance for
Investment from
Taiwan as of
January 1, 2020
Remittance of Funds Accumulated
Outward
Remittance for
Investment from
Taiwan as of
December 31, 2020
Net Income (Loss)
of the Investee
%
Ownership
of Direct or
Indirect
Investment
Investment
Gain (Loss)
(Note 1)
Carrying Amount
as of December 31,
2020
Accumulated
Repatriation of
Investment Income
as of December 31,
2020
Note Outward Inward
Dongguan Hua Gang Sales of industrial materials $ 1,137,186 Invested through the third region,
Raycong H.K.
$ - $ - $ - $ - $ 317,691 100.00 $ 317,691 $ 2,325,413 $ -
Shanghai Yikang Processing and selling of chemical
material for release of wax;
international trading; trading agent and warehousing business
within enterprises in the bonded
area
990,731 Invested through the
third region,
Raycong H.K.
340,629 - - 340,629 503,201 70.00 352,241 3,118,401 -
Shenzhen Huaying Sales of industrial materials 24,084 Invested through the
third region,
Raycong H.K.
- - - - 8,597 100.00 8,597 207,867 -
Shanghai Wah Chang Trading Co.,
Ltd.
International trading and trading
consulting; trading agent and
commercial simple processing within enterprises in the bonded
area
68,352 Invested through the
third region, SHC
Holding Ltd.
43,714 - - 43,714 212,717 30.00 63,816 611,292 -
Shanghai Chang Wah Electromaterials Inc.
Agency of IC packaging material and equipment
113,920 Invested through Chinese
corporation,
Shanghai Yikang
- - - - 24,255 - 7,428 - -
Shanghai Yadi Import and export of goods and
technology
13,085 Invested through
Chinese
corporation, Shanghai Yikang
- - - - (6,355 ) 49.00 (3,114 ) 18,362 -
Shanghai Lihuang Medical devices and equipment 14,525 Invested through
Chinese corporation,
Shanghai Yikang
- - - - 919 48.98 (1,492 ) 6,759 -
Meizhou Bailun Hemodialysis and examination - Invested through Chinese
corporation,
Dongguan Hua Gang
- - - - (562 ) - (287 ) - -
Guangjou Shing Shian Wholesale of medical supplies 21,809 Invested through
Chinese
corporation,
Dongguan Hua
Gang
- - - - 12,216 100.00 12,216 44,333 -
Xiamen Hua Chen Da Warehouse logistics 13,085 Invested through
Chinese
corporation, Shenzhen Huaying
- - - - (239 ) 70.00 (167 ) 7,491 -
Xiamen Jian Yuan Rong Logistics
Ltd.
Warehouse logistics 34,894 Invested through
Chinese corporation,
Shenzhen Huaying
- - - - (3,047 ) 30.00 (910 ) 9,396 -
Xiamen Jia Cheng Yuan Trading and Development Co. Ltd.
Warehouse logistics 8,723 Invested through Chinese
corporation,
Shenzhen Huaying
- - - - (53 ) 30.00 (20 ) 2,990 -
(Continued)

- 294 -
Investee Company
Accumulated Outward Remittance
for Investment in Mainland China
as of
December 31, 2020 (Note 3)
Investment Amount Authorized by
Investment Commission, MOEA
(Note 2)
Upper Limit on the Amount of
Investment Stipulated by
Investment Commission, MOEA
(Note 3) The Company $ 384,343 $ 2,480,528 $ -
Note 1: The disclosures of investment gains and losses this period are based on the following:
1. Dongguan Hua Gang and Shanghai Yikang: audited by the Company’s CPA.
2. Others are based on unaudited financial statements.
Note 2: The difference of $2,096,185 thousand between accumulated outward remittance for investment in mainland China and investment amount authorized by investment commission, MOEA is due to investment of $1,338,686
thousand (USD8,488 thousand and HKD267,000 thousand) through Raycong H.K., investment of $111,175 thousand (USD3,572 thousand) through Wah Yuen Technology Holding Limited, transferred capital from retained
earnings of $434,385 thousand (USD13,790 thousand) of Shanghai Yikang, investment of $14,500 thousand (USD500 thousand) through SHC Holding Ltd., investment without significant influence of $162,978 thousand and
the invested amount of $34,461 thousand which had already been liquidated but not yet revoked.
Note 3: Under the “Principles Governing the Review of Investments or Technical Cooperation in Mainland China” issued by the Investment Commission on August 29, 2008, the Company had obtained the certificate issued by the
Industrial Bureau of the Ministry of Economic Affairs in accordance with the business scope of the operating headquarters; thus, the amount that can be invested in companies located in mainland China is unlimited.
(Concluded)

- 295 -
TABLE 8
WAH LEE INDUSTRIAL CORPORATION AND SUBSIDIARIES
SIGNIFICANT TRANSACTIONS WITH INVESTEE COMPANIES IN MAINLAND CHINA, EITHER DIRECTLY OR INDIRECTLY THROUGH A THIRD AREA, AND THEIR PRICES, PAYMENT TERMS, AND
UNREALIZED GAINS OR LOSSES
FOR THE YEAR ENDED DECEMBER 31, 2020
(In Thousands of New Taiwan Dollars)
Company Name Investee Company Transaction Type
Purchase/Sale
Price
Transaction Details Notes/Trade Receivable
(Payable) Unrealized (Gain)
Loss Note
Amount % Payment Terms
Comparison with
Normal
Transactions
Ending Balance %
The Company Shanghai Yikang Sales $ 1,091,538 3 Normal trade terms 30 to 120 days after
monthly closing
The terms with
related parties are
not significantly
different from
those with third
parties
$ 220,188 3 $ 554
Shanghai Yikang Purchase (119,910 ) - Normal trade terms 120 days after monthly
closing
The terms with
related parties are
not significantly
different from
those with third
parties
(25,955 ) (1) -
Dongguan Hua Gang Sales 757,187 2 Normal trade terms 30 to 120 days after
monthly closing
The terms with
related parties are
not significantly
different from
those with third
parties
190,401 3 436
Shanghai Yadi Sales 27,571 - Normal trade terms 90 days after monthly
closing
The terms with
related parties are
not significantly
different from
those with third
parties
6,392 - -
Shanghai Lihuang Sales 10,675 - Normal trade terms 90 days after monthly
closing
The terms with
related parties are
not significantly
different from
those with third
parties
3,190 - -
Raycong H.K. Dongguan Hua Gang Sales 671,140 19 Normal trade terms 30 to 180 days after
monthly closing
The terms with
related parties are
not significantly
different from
those with third
parties
77,962 9 5,069

- 296 -
TABLE 9
WAH LEE INDUSTRIAL CORPORATION
INFORMATION OF MAJOR SHAREHOLDERS
DECEMBER 31, 2020
Name of Major Shareholder
Shares
Number of Shares Percentage of
Ownership (%)
Kang Tai Investment Co., Ltd. 16,374,155 7.07
Fu Shih Investment Co., Ltd. 13,188,583 5.69
Note: The information of major shareholders presented in this table is provided by the Taiwan Depository &
Clearing Corporation based on the number of ordinary shares held by shareholders with ownership of 5%
or greater, that have been issued without physical registration by the Company as of the last business day
for the current quarter.

- 297 -
THE CONTENTS OF STATEMENTS OF MAJOR ACCOUNTING ITEMS
ITEM STATEMENT INDEX
MAJOR ACCOUNTING ITEMS IN ASSETS, LIABILITIES
AND EQUITY
STATEMENT OF CASH 1
STATEMENT OF FINANCIAL ASSETS AT FAIR VALUE
THROUGH OTHER COMPREHENSIVE INCOME -
CURRENT
Table 3
STATEMENT OF NOTES RECEIVABLE 2
STATEMENT OF ACCOUNTS RECEIVABLE 3
STATEMENT OF OTHER RECEIVABLES 4
STATEMENT OF INVENTORIES 5
STATEMENT OF FINANCIAL ASSETS AT FAIR VALUE
THROUGH OTHER COMPREHENSIVE INCOME - NON
CURRENT
6
STATEMENT OF CHANGES IN INVESTMENTS
ACCOUNTED FOR USING THE EQUITY METHOD
7
STATEMENT OF CHANGES IN PROPERTY, PLANT AND
EQUIPMENT
Note 11
STATEMENT OF CHANGES IN ACCUMULATED
DEPRECIATION OF PROPERTY, PLANT AND
EQUIPMENT
Note 11
STATEMENT OF CHANGES IN RIGHT-OF-USE ASSETS Note 12
STATEMENT OF CHANGES IN ACCUMULATED
DEPRECIATION OF RIGHT-OF-USE ASSETS
Note 12
STATEMENT OF CHANGES IN INVESTMENT PROPERTY Note 13
STATEMENT OF CHANGES IN ACCUMULATED
DEPRECIATION OF INVESTMENT PROPERTY
Note 13
STATEMENT OF DEFERRED TAX ASSETS Note 21
STATEMENT OF SHORT-TERM BORROWINGS 8
STATEMENT OF CONTRACT LIABILITIES 9
STATEMENT OF NOTES PAYABLE 10
STATEMENT OF ACCOUNTS PAYABLE 11
STATEMENT OF OTHER PAYABLES Note 16
STATEMENT OF LONG-TERM BORROWINGS 12
STATEMENT OF LEASE LIABILITIES Note 12
STATEMENT OF DEFERRED TAX LIABILITIES Note 21
MAJOR ACCOUNTING ITEMS IN PROFIT OR LOSS
STATEMENT OF OPERATING REVENUES 13
STATEMENT OF OPERATING COSTS 14
STATEMENT OF OPERATING EXPENSES 15
STATEMENT OF OTHER GAINS AND LOSSES Note 20
STATEMENT OF EMPLOYEE BENEFIT, DEPRECIATION
AND AMORTIZATION BY FUNCTION
16
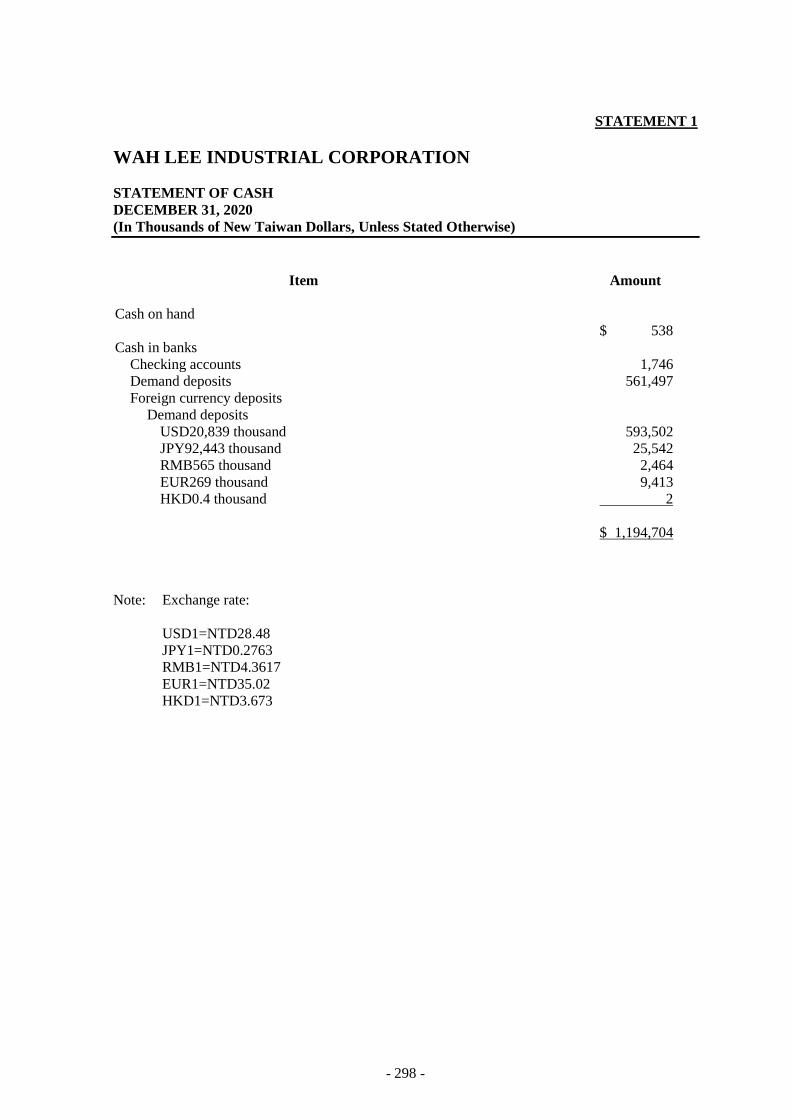
- 298 -
STATEMENT 1
WAH LEE INDUSTRIAL CORPORATION
STATEMENT OF CASH
DECEMBER 31, 2020
(In Thousands of New Taiwan Dollars, Unless Stated Otherwise)
Item Amount
Cash on hand
$ 538
Cash in banks
Checking accounts 1,746
Demand deposits 561,497
Foreign currency deposits
Demand deposits
USD20,839 thousand 593,502
JPY92,443 thousand 25,542
RMB565 thousand 2,464
EUR269 thousand 9,413
HKD0.4 thousand 2
$ 1,194,704
Note: Exchange rate:
USD1=NTD28.48
JPY1=NTD0.2763
RMB1=NTD4.3617
EUR1=NTD35.02
HKD1=NTD3.673

- 299 -
STATEMENT 2
WAH LEE INDUSTRIAL CORPORATION
STATEMENT OF NOTES RECEIVABLE
DECEMBER 31, 2020
(In Thousands of New Taiwan Dollars)
Client Name Amount
Unrelated parties
Thermostic Industrial Co., Ltd. $ 9,017
Others (Note) 122,597
$ 131,614
Note: The amount of individual client included in others did not exceed 5% of the account balance.

- 300 -
STATEMENT 3
WAH LEE INDUSTRIAL CORPORATION
STATEMENT OF ACCOUNTS RECEIVABLE
DECEMBER 31, 2020
(In Thousands of New Taiwan Dollars)
Client Name Amount
Related parties (Note) $ 801,700
Less: Allowance for impairment loss 1,006
800,694
Unrelated parties
Innolux Corp. 507,745
Others (Note) 6,069,712
6,577,457
Less: Allowance for impairment loss 42,774
6,534,683
$ 7,335,377
Note: The amount of individual client included in others did not exceed 5% of the account balance.

- 301 -
STATEMENT 4
WAH LEE INDUSTRIAL CORPORATION
STATEMENT OF OTHER RECEIVABLES
DECEMBER 31, 2020
(In Thousands of New Taiwan Dollars)
Client Name Amount
Related parties
Consulting service income $ 185,122
Dividends receivable 52,255
Others (Note) 15,889
253,266
Non-related parties (Note)
Tax refund receivable 15,534
Others (Note) 26,888
42,422
$ 295,688
Note: The amount of individual item included in others did not exceed 5% of the account balance.

- 302 -
STATEMENT 5
WAH LEE INDUSTRIAL CORPORATION
STATEMENT OF INVENTORIES
DECEMBER 31, 2020
(In Thousands of New Taiwan Dollars)
Amount
Item Carrying Amount
Net Realizable
Value
Merchandise $ 1,824,901 $ 2,062,067

- 303 -
STATEMENT 6
WAH LEE INDUSTRIAL CORPORATION
STATEMENT OF FINANCIAL ASSETS AT FAIR VALUE THROUGH OTHER COMPREHENSIVE INCOME - NONCURRENT
FOR THE YEAR ENDED DECEMBER 31, 2020
(In Thousands of New Taiwan Dollar)
Balance, January 1, 2020 Additions in Investment Decrease in Investment Balance, December 31, 2020
Investees Shares Amount Shares Amount Shares Amount Shares Amount Collateral
Stock
Daily Polymer Corp. 2,154,410 $ 30,808 - $ 3,663 - $ - 2,154,410 $ 34,471 None
Wah Yuen Technology Holding Limited 1,968,180 91,702 - - - 14,189 1,968,180 77,513 None
Jing Yi Technology Co., 2,066,432 43,409 - 11,605 - - 2,066,432 55,014 None
High Power Optoelectronics Inc. 67,991 - - - - - 67,991 - None
Asahi Kasei Wah Lee Hi-tech Corp. 9,497 81,100 - 4,791 - - 9,497 85,891 None
Forcera Materials Co., Ltd. 2,102,476 45,008 - 11,573 - - 2,102,476 56,581 None
Univision Technology Holdings 38,794,190 - - - - - 38,794,190 - None
Telelynx Inc. 266,811 898 - - 266,811 898 - - None
Taigene Biotechnology Co., Ltd. 2,300,000 10,597 - 440 - - 2,300,000 11,037 None
Shilian Fine Chemicals Co., Ltd. 11,871,585 107,110 - - - 25,220 11,871,585 81,890 None
CDIB Capital Group. 5,000,000 46,934 - 7,160 - - 5,000,000 54,094 None
Darco Water Technologies Ltd. 7,649,782 30,679 - - - 10,723 7,649,782 19,956 None
Eleocom Co., Ltd. 1,500,000 - - - - - 1,500,000 - None
Minima Technology Co., Ltd. 3,600,000 84,736 - - - 2,576 3,600,000 82,160 None
Tien Li Offshore Wind Technology Co.,
Ltd.
- -
1,428,572 96,491
600,000 21,000
828,572 75,491
None
$ 572,981 $ 135,723 $ 74,606 $ 634,098

- 304 -
STATEMENT 7
WAH LEE INDUSTRIAL CORPORATION
STATEMENT OF CHANGES IN INVESTMENTS ACCOUNTED FOR USING THE EQUITY METHOD
FOR THE YEAR ENDED DECEMBER 31, 2020
(In Thousands of New Taiwan Dollar, Except Unit Price)
Balance, December 31, 2020 Market Value or Net Assets Value
Balance, January 1, 2020 Additions in Investment (Note 1) Decrease in Investment (Note 1) % of (Note 2)
Name Shares Amount Shares Amount Shares Amount Shares Ownership Amount Unit Price Total Amount Collateral
Wah Lee Holding Ltd. 13,070,000 $ 3,733,888 - $ 451,085 - $ - 13,070,000 100.00 $ 4,184,973 $ 320.20 $ 4,186,005 None
Raycong H.K. 56,000,000 3,023,029 - 430,750 - - 56,000,000 53.69 3,453,779 61.67 3,453,634 None
Chang Wah Electromaterials Inc. 19,790,218 1,799,523 178,111,962 559,488 - 278,744 197,902,180 30.98 2,080,267 30.65 6,065,702 None
Nagase Wahlee Plastics Corp. 4,000,000 675,514 - 117,023 - 64,000 4,000,000 40.00 728,537 182.13 728,537 None
Wah Hong Industrial Corp. 25,962,978 987,991 156,000 69,967 - 34,522 26,118,978 26.67 1,023,436 35.40 924,612 None
ORC Technology Corp. 600,000 249,632 - 25,776 - 105,000 600,000 35.00 170,408 284.01 170,408 None
WL Japan 1,500 5,018 - 6 - 58 1,500 83.33 4,966 3,310.54 4,966 None
WL Korea 147,000 (1,248 ) - 1,946 - - 147,000 100.00 698 4.75 698 None
Sakuragawa Solar Ltd. - 78,867 - 7,709 - - - 99.99 86,576 - 86,576 None
Miyazaki Solar Ltd. - 33,164 - 4,279 - 3 - 99.99 37,440 - 37,440 None
WL Indonesia 486,000 11,758 1,124,000 33,422 - 8,035 1,610,000 70.00 37,145 23.07 37,145 None
WL Vietnam - 28,312 - 9,402 - 1,581 - 100.00 36,133 - 36,133 None
Meidi H.K. 143 - - - 143 - - - - - - None
QuanShun Logistics Co., Ltd. 9,500,000 106,501 - 15,969 - - 9,500,000 63.33 122,470 12.89 122,470 None
WL Green Corp. 500,000 4,210 - - 300,000 3,046 200,000 25.00 1,164 2.33 1,164 None
WT Industrial 7,650 197,866 - 19,026 - 19,287 7,650 51.00 197,605 25,830.70 197,605 None
Eco Energy Corporation 8,000,000 95,263 2,855 - 240 8,000,000 20.00 97,878 12.23 97,878 None
KS Corp. 16,632,000 487,960 1,330,577 16,133 - 3,326 17,962,577 51.00 500,767 27.88 500,767 Note 3
WL Philippines Corp. 127,495 7,755 - - - 291 127,495 99.99 7,464 58.54 7,464 None
WL Philippines Inc. 126,997 7,747 - - - 1,274 126,997 99.99 6,473 50.97 6,473 None
Wah Heng Energy Technology - - 3,000,000 30,000 - 99 3,000,000 100.00 29,901 9.97 29,901 None
ORC Electrical Machinery Co., Ltd. - - 400,000 4,000 - - 400,000 40.00 4,000 10.00 4,000 None
$ 11,532,750 $ 1,798,836 $ 519,506 $ 12,812,080 $ 16,699,578
Note 1: Changes in this year include new investments, cash and stock dividends received, capital reduction, adjustments to changes in the shareholding ratio of the investee company, the share of profits and losses and other comprehensive
gains and losses of subsidiaries and affiliates recognized by the equity method, and the unrealized profit and loss adjustment of downstream transactions.
Note 2: The market price is the closing price of the stock on the balance sheet date; the net equity value is calculated based on the financial statements of each invested company and the Company’s shareholding ratio.
Note 3: The Company pledged 17,962,577 shares of KS Corp. to the bank as a guarantee for the syndicated loan of KS Corp.

- 305 -
STATEMENT 8
WAH LEE INDUSTRIAL CORPORATION
STATEMENT OF SHORT-TERM BORROWINGS
DECEMBER 31, 2020
(In Thousands of New Taiwan Dollars)
Type/Bank Name Contract Period Interest Rate (%)
Balance,
December 31, 2020 Loan Commitments Collateral
Unsecured Borrowings
HSBC Bank 2020.09-2021.04 0.90 $ 415,496 $ 786,000 None
Land Bank of Taiwan 2020.10-2021.03 0.55-0.77 521,524 800,000 None
Mizuho Bank 2020.10-2021.03 0.90 580,875 1,067,800 None
Mega Bank 2020.10-2021.03 0.70-0.90 308,945 500,000 None
Sumitomo Mitsui Banking Corporation 2020.07-2021.06 0.92-0.94 174,536 562,000 None
CTBC Bank 2020.09-2021.05 0.81-0.97 245,887 500,000 None
The Shanghai Commercial & Savings Bank, Ltd. 2020.10-2021.03 0.77 225,727 562,000 None
Hua Nan Bank 2020.10-2021.03 0.88-0.90 139,235 900,000 None
MUFG 2020.11-2021.03 0.88 160,944 500,000 None
First Commercial Bank 2020.10-2021.03 0.80-0.92 296,332 500,000 None
Bank of Taiwan 2020.02-2021.02 2.67 354,650 500,000 None
Bank of Panshin 2020.10-2021.01 0.93 9,126 100,000 None
Taiwan Business Bank 2020.12-2021.03 0.76 97,336 129,260 None
United Overseas Bank 2020.02-2021.01 0.83 193,040 281,000 None
Cathay United Bank 2020.11-2021.01 0.88 60,754 200,000 None
Fubon Bank 2020.10-2021.03 0.50-0.97 67,297 100,000 None
Taishin Bank 2020.10-2021.03 0.85-0.89 37,166 100,000 None
E. SUN Commercial Bank 2020.11-2021.03 0.82 124,624 300,000 None
$ 4,013,494

- 306 -
STATEMENT 9
WAH LEE INDUSTRIAL CORPORATION
STATEMENT OF CONTRACT LIABILITIES
DECEMBER 31, 2020
(In Thousands of New Taiwan Dollars)
Customer Name Amount
Related parities
KS Corp. $ 77,113
Eco Energy Corporation 27,872
Others (Note) 9,473
114,458
Unrelated parties
Sahara Presentation Systems Ltd. 50,652
Clevertouch B.V. 44,657
United Microelectronics Corporation 27,720
Taiwan Semiconductor Manufacturing Company 27,561
Others (Note) 40,056
190,646
$ 305,104
Note: The amount of individual vendor included in others did not exceed 5% of the account balance.

- 307 -
STATEMENT 10
WAH LEE INDUSTRIAL CORPORATION
STATEMENT OF NOTES PAYABLE
DECEMBER 31, 2020
(In Thousands of New Taiwan Dollars)
Vendor Name Amount
Related parities
Others (Note) $ 938
Non - related parties
Shinkong Synthetic Fibers Corp. 16,014
E-MAX Precision Technology Co., Ltd. 6,180
Gheng Yang Transportation Co., Ltd. 1,890
Nan Ya Plastics Corporation 1,797
Others (Note) 3,338
29,219
$ 30,157
Note: The amount of individual vendor included in others did not exceed 5% of the account balance.

- 308 -
STATEMENT 11
WAH LEE INDUSTRIAL CORPORATION
STATEMENT OF ACCOUNTS PAYABLE
DECEMBER 31, 2020
(In Thousands of New Taiwan Dollars)
Vendor Name Amount
Related parties
Asahi Kasei Wah Lee Hi-tech Corp. $ 226,047
Others (Note) 45,616
271,663
Non-related parties
JSR Corp. 637,963
Mitsubishi Chemical Taiwan Co., Ltd. 531,755
Chi Mei Corporation 274,863
Clean Technology Co., Ltd. 274,179
Fitipower Integrated Technology Inc. 202,003
Others (Note) 1,681,653
3,602,416
$ 3,874,079
Note: The amount of individual vendor included in others did not exceed 5% of the account balance.

- 309 -
STATEMENT 12
WAH LEE INDUSTRIAL CORPORATION
STATEMENT OF LONG-TERM BORROWINGS
FOR THE YEAR ENDED DECEMBER 31, 2020
(In Thousands of New Taiwan Dollars)
Balance, December 31, 2020
Bank Name Contract Period and Repayment Terms Interest Rate (%) Current Noncurrent Total Collateral
Syndicated Bank Loans
China Bills Finance Corporation Circulate until January 2024 0.66 $ - $ 1,799,823 $ 1,799,823 None
Less: Syndicated loan free - 4,320 4,320
- 1,795,503 1,795,503
Unsecured Borrowing
HSBC Bank Repayable in June 2021 0.87 200,000 - 200,000 None
Fubon Bank Repayable in March 2021 0.98 200,000 - 200,000 None
MUFG Bank Repayable in August 2022 0.98 - 200,000 200,000 None
Mizuho Bank Repayable in August 2022 0.98 - 300,000 300,000 None
400,000 500,000 900,000
Collate raised Borrowing
Land Bank of Taiwan Repayable monthly to June 2037 1.43 33,577 489,744 523,321 Land and Buildings
$ 433,577 $ 2,785,247 $ 3,218,824
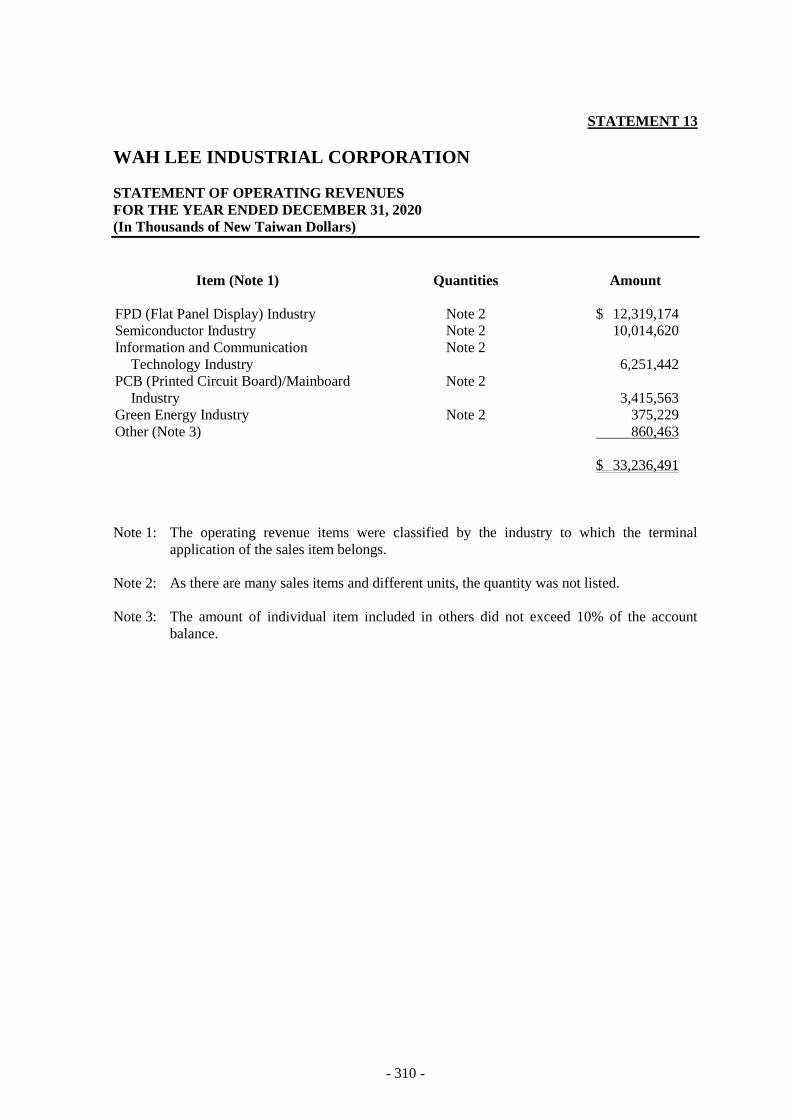
- 310 -
STATEMENT 13
WAH LEE INDUSTRIAL CORPORATION
STATEMENT OF OPERATING REVENUES
FOR THE YEAR ENDED DECEMBER 31, 2020
(In Thousands of New Taiwan Dollars)
Item (Note 1) Quantities Amount
FPD (Flat Panel Display) Industry Note 2 $ 12,319,174
Semiconductor Industry Note 2 10,014,620
Information and Communication
Technology Industry
Note 2
6,251,442
PCB (Printed Circuit Board)/Mainboard
Industry
Note 2
3,415,563
Green Energy Industry Note 2 375,229
Other (Note 3) 860,463
$ 33,236,491
Note 1: The operating revenue items were classified by the industry to which the terminal
application of the sales item belongs.
Note 2: As there are many sales items and different units, the quantity was not listed.
Note 3: The amount of individual item included in others did not exceed 10% of the account
balance.

- 311 -
STATEMENT 14
WAH LEE INDUSTRIAL CORPORATION
STATEMENT OF OPERATING COSTS
FOR THE YEAR ENDED DECEMBER 31, 2020
(In Thousands of New Taiwan Dollars)
Item Amount
Cost of goods sold
Inventories, beginning of year $ 1,831,530
Add: Purchases 30,974,309
Less: Transfer to operating expenses (17,824 )
Transfer to other loss (187 )
Write-down of inventories (3,785 )
Inventories, end of year (1,824,901 )
30,959,142
Write-down of inventories 3,785
Others 581
Cost of goods sold 30,963,508
Other operating costs 3,911
$ 30,967,419

- 312 -
STATEMENT 15
WAH LEE INDUSTRIAL CORPORATION
STATEMENT OF OPERATING EXPENSES
FOR THE YEAR ENDED DECEMBER 31, 2020
(In Thousands of New Taiwan Dollars)
Item
Marketing
Expense
General and
Administrative
Expense Total
Employee benefits $ 675,966 $ 227,518 $ 903,484
Commission expense 172,771 - 172,771
Import/export expense 103,839 - 103,839
Freight Fee 89,858 136 89,994
Depreciation 38,181 23,102 61,283
Rent expense 55,465 1,419 56,884
Miscellaneous purchase 3,231 47,759 50,990
Service fees 16,861 11,546 28,407
Others 109,526 32,983 142,509
$ 1,265,698 $ 344,463 1,610,161
Expected credit loss 38,697
$ 1,648,858

- 313 -
STATEMENT 16
WAH LEE INDUSTRIAL CORPORATION
STATEMENT OF EMPLOYEE BENEFIT, DEPRECIATION AND AMORTIZATION BY FUNCTION
FOR THE YEARS ENDED DECEMBER 31, 2020 AND 2019
(In Thousands of New Taiwan Dollars)
For the Year Ended December 31
2020 2019
Operating
Cost
Operating
Expense
Non-
operating
Expenses Total
Operating
Cost
Operating
Expense
Non-
operating
Expenses Total
Employee benefit
Salaries $ - $ 777,655 $ - $ 777,655 $ - $ 721,953 $ - $ 721,953 Labor and health
insurance
- 39,764 - 39,764 - 40,866 - 40,866
Pension - 22,280 - 22,280 - 22,555 - 22,555 Remuneration of directors - 26,935 - 26,935 - 21,013 - 21,013
Others - 36,850 - 36,850 - 33,175 - 33,175
$ - $ 903,484 $ - $ 903,484 $ - $ 839,562 $ - $ 839,562
$ 632 $ 54,513 $ 3,513 $ 58,658 $ 390 $ 53,227 $ 3,398 $ 57,015 Depreciation
- 6,770 - 6,770 - 4,868 - 4,868
Amortization
Note 1: The average number of the Company’s employees was 419 and 426, including 5 non-employee directors
in 2020 and 2019, respectively.
Note 2: The average employee benefits and salaries of the Company were as follows:
a. The average employee benefits for the years ended December 31, 2020 and 2019 were $2,117
thousand and $1,944 thousand, respectively.
b. The average salaries for the years ended December 31, 2020 and 2019 were $1,878 thousand and
$1,715 thousand, respectively.
c. The average salaries increased by 10% year-on-year.
d. The Company has set up an audit committee without supervisors.
e. The Company’s salary and remuneration policies (including directors, executive officers and
employees) are as follows:
1) Directors
The salaries and remuneration of directors are determined and proposed by the remuneration
committee in accordance with the following policies, and submitted to the board of directors for
resolution.
a) Remuneration of directors
According to the Company’s Articles, where the Company made a profit in a fiscal year, the
compensation of employees and remuneration of directors shall be accrued at the rates between
9% and 13% and no higher than 2%, respectively.
(Continued)

- 314 -
b) Traffic allowance
According to the Company’s remuneration and compensation policy, 1) the traffic allowance
for attending the board of directors’ meeting is paid $10 thousand once per person; 2) directors
who do not attend the board of directors’ meeting in person are not allowed to be paid the
traffic allowance; 3) the adjustment for traffic allowance shall be proposed by the remuneration
committee and submitted to the board of directors for approval.
c) Other compensation
According to the Company’s Articles, the compensation of directors for participating in the
Company’s daily operations is determined and proposed by the remuneration committee based
on their participation and contribution to the Company, and submitted to the board of directors
for approval.
2) Executive officers
The salaries and remuneration of executive officers are determined and proposed by the
remuneration committee in accordance with the following policies, and submitted to the board of
directors for resolution.
a) The salary and remuneration policy for executive officers should be competitive in the market.
The overall compensation includes fixed salary, incentive bonus, welfare, and other indirect
compensation.
b) The salary and remuneration policy for executive officers should meet the Company’s business
strategies, and the remuneration of executive officers should be highly correlated with the
Company’s performance indicators.
3) Employees
a) The salary and remuneration of employees include fixed salary, bonuses, compensation, stock
options, share dividend, retirement benefit, various allowances, and other incentives and
rewards, etc.
b) The salary and remuneration are determined based on each employee’s job responsibilities and
the Company’s policies.
According to the Company’s Articles, where the Company made a profit in a fiscal year, the
compensation of employees shall be accrued at the rates between 9% and 13%. The compensation
paid to each employee is determined based on each employee’s job responsibilities, individual
performance and the overall level of the contribution to the Company.
(Concluded)

- 315 -
WAH LEE INDUSTRIAL CORP.
Chairman: Ray-Ching Chang