2020 Annual Report - TEB
376
2020 Annual Report
-
Upload
khangminh22 -
Category
Documents
-
view
1 -
download
0
Transcript of 2020 Annual Report - TEB

2020 Annual Report

1
CONTENTS SECTION 1 - PRESENTATION .............................................................................................................................................................. 2
AGENDA OF THE ORDINARY GENERAL ASSEMBLY MEETING ON 26 MARCH 2021 ............................................................................... 2 STATEMENT OF RESPONSIBILITY FOR THE 2020 ANNUAL REPORT OF TÜRK EKONOMİ BANKASI A.Ş. .................................................. 3 GENERAL INFORMATION ...................................................................................................................................................................... 4 SHAREHOLDING STRUCTURE OF TÜRK EKONOMİ BANKASI A.Ş. (“TEB”) .............................................................................................. 5 AMENDMENTS TO THE ARTICLES OF ASSOCIATION .............................................................................................................................. 5 SIGNIFICANT EVENTS OCCURRING AFTER THE END OF THE ACTIVITY YEAR ......................................................................................... 6 MESSAGE FROM THE CHAIRMAN ......................................................................................................................................................... 8 CEO’S ASSESSMENT............................................................................................................................................................................. 10 TÜRK EKONOMİ BANK’S PERFORMANCE IN 2020 ............................................................................................................................... 13 IN GENERAL ......................................................................................................................................................................................... 13 TEB’S POSITION IN THE INDUSTRY ...................................................................................................................................................... 13 AWARDS.............................................................................................................................................................................................. 14 CORPORATE BANKING GROUP ............................................................................................................................................................ 15 SME BANKING GROUP ........................................................................................................................................................................ 18 ASSET AND LIABILITY MANAGEMENT & THE TREASURY GROUP ........................................................................................................ 25 NEW PRODUCTS AND SERVICES .......................................................................................................................................................... 28 RETAIL AND PRIVATE BANKING GROUP .............................................................................................................................................. 28 SECURITIES SERVICES .......................................................................................................................................................................... 28 TEB PORTFÖY YÖNETİMİ A.Ş. .............................................................................................................................................................. 31 TEB YATIRIM MENKUL DEĞERLER A.Ş. ................................................................................................................................................ 32 TEB ARF TEKNOLOJİ A.Ş....................................................................................................................................................................... 34
SECTION 2 - INFORMATION ABOUT MANAGEMENT AND CORPORATE GOVERNANCE PRACTICES ..................................................... 35 BOARD OF DIRECTORS ........................................................................................................................................................................ 36 EXECUTIVE MANAGEMENT ................................................................................................................................................................. 42 INFORMATION ON TRANSACTIONS CONDUCTED WITH RELATED PARTIES ........................................................................................ 52 ACTIVITIES FOR WHICH SUPPORT SERVICES ARE RECEIVED AND SUPPLIERS ...................................................................................... 53 PERFORMANCE BONUSES AND SALES PREMIUMS .............................................................................................................................. 62 FINANCIAL RIGHTS PROVIDED TO THE MEMBERS OF THE GOVERNING BODY AND SENIOR EXECUTIVES .......................................... 63 REMARKS ON INDEPENDENT AND PUBLIC AUDITS ............................................................................................................................. 64 INFORMATION ABOUT LAWSUITS FILED AGAINST THE BANK THAT MAY POTENTIALLY AFFECT THE COMPANY’S FINANCIAL POSITION AND OPERATIONS AND ABOUT THEIR POSSIBLE OUTCOMES........................................................................... 64 ADMINISTRATIVE OR JUDICIAL SANCTIONS IMPOSED AGAINST THE COMPANY AND THE BOARD OF DIRECTORS MEMBERS ON ACCOUNT OF BREACH OF LEGISLATION ...................................................................................................................... 64 CHANGES IN EQUITY STAKE HELD IN SUBSIDIARIES ............................................................................................................................ 64 INFORMATION ABOUT DEALINGS WITH THE CONTROLLING COMPANY ............................................................................................ 64 PROFIT DISTRIBUTION PROPOSAL ....................................................................................................................................................... 69
SECTION 3 - ASSESSMENT OF FINANCIAL POSITION AND RISK MANAGEMENT ................................................................................. 71 THE AUDIT COMMITTEE’S ASSESSMENT OF INTERNAL CONTROL, INTERNAL AUDIT AND RISK MANAGEMENT SYSTEMS AND ACTIVITIES DURING THE REPORTING PERIOD .............................................................................................................. 71 EVALUATION OF FINANCIAL STATUS, PROFITABILITY AND SOLVENCY ................................................................................................ 72 RISK MANAGEMENT POLICIES ACCORDING TO VARIOUS TYPES OF RISKS .......................................................................................... 73 CREDIT RATINGS ASSIGNED BY RATING AGENCIES AND INFORMATION ON THEIR CONTENTS .......................................................... 75 DONATIONS ........................................................................................................................................................................................ 76 FIVE-YEAR SUMMARY OF FINANCIAL INFORMATION INCLUDING THE REPORTING PERIOD ............................................................... 79 BRANCHES ........................................................................................................................................................................................... 80 CONVENIENCE TRANSLATION INTO ENGLISH OF INDEPENDENT AUDITOR’S REPORT ON THE BOARD OF DIRECTOS’ ANNUAL REPORT ORIGINALLY ISSUED IN TURKISH ............................................................................................................................. 94
SECTION 4- UNCONSOLIDATED FINANCIAL STATEMENTS ................................................................................................................. 96 PUBLICLY ANNOUNCED UNCONSOLIDATED FINANCIAL STATEMENTS AND RELATED DISCLOSURES FOR THE PERIOD FROM 1 JANUARY TO 31 DECEMBER 2020.......................................................................................................................................... 96
SECTION 5- CONSOLIDATED FINANCIAL STATEMENTS .................................................................................................................... 234 PUBLICLY ANNOUNCED CONSOLIDATED FINANCIAL STATEMENTS AND RELATED DISCLOSURES FOR THE PERIOD FROM 1 JANUARY TO 31 DECEMBER 2020........................................................................................................................................ 234

2
SECTION 1 - PRESENTATION
AGENDA OF THE ORDINARY GENERAL ASSEMBLY MEETING ON 26 MARCH 2021
1- Opening and formation of the Presidential Board,
2- Granting authorization to the Presidential Board for signing the meeting minutes,
3- Reading, discussion and approval of the Board of Directors’ Activity Report for the year 2020,
4- Reading, discussion and approval of the 2020 financial statements,
5- Pass a decision regarding the approval of appointments made to the vacated seats on the Board of Directors pursuant to Article 363 of the Turkish Commercial Code (TCC),
6- Release of the Board Members from their transactions in 2020,
7- Discussion and approval of the Board of Director’s proposal on the dividend distribution or passing resolution on approval of the amended version or disapproval of the same,
8- Reading of the annual audit report prepared by the Independent Audit Firm, and passing resolution on the appointment of the Independent Audit Firm and the Group auditor proposed by the Board of Directors for the independent audit of our Bank for the year 2021,
9- Determination of number and term of office of the Board Members and election of the same,
10- Determination of benefit such as fees and remunerations to be paid to the Board of Directors,
11- Authorize the Board of Directors for a period of fifteen months in order to issue capital market instruments having the nature of a debt instrument,
12- Passing resolution on granting authorization to the members of the Board of Directors to carry out the commercial transactions set forth in Articles 395 - 396 of the Turkish Commercial Code.
TÜRK EKONOMİ BANKASI A.Ş. BOARD OF DIRECTORS Yavuz CANEVİ Dr. Akın AKBAYGİL
Chairman of the Board of Directors Deputy Chairman of the Board of Directors

STATEMENT OF RESPONSIBILITY FOR ANNUAL REPORT 2020 OF TÜRK EKONOMİ BANKASI A.Ş.
We have reviewed the annual report of Türk Ekonomi Bank A.Ş. prepared for the period 01.01.2020 - 31.12.2020 in accordance with the Capital Markets Board of Turkey Communiqué (no. II-14.1) on Principles of Financial Reporting in Capital Markets and the Regulation on Principles and Procedures Concerning the Preparation and Publishing of Annual Report by Banks published by the Banking Regulation and Supervision Agency (BRSA), and we hereby represent that, within the frame of our duty and responsibility at the Bank and to the best of our knowledge, the year-end Annual Report: »Does not contain any misrepresentations about material events, nor does it omit any information which might be misleading as of the date of the relevant declaration, »Presents a true and fair view of the progress and performance of the business, and the Bank’s financial condition, as well as major risks and volatilities facing the Bank.
Yavuz CANEVİ Chairman of the
Board of Directors
Nicolas de Baudinet de Courcelles
Member of the Board of Directors and Chairman of the Audit
Committee
Ayşe AŞARDAĞ Member of the Board of Directors
and Deputy Chairman of the Audit Committee
Ümit LEBLEBİCİ Chief Executive Officer
M. Aşkın DOLAŞTIR Assistant General Manager
Responsible of Financial Reporting
Hatice ERTUĞRAL Regulatory Reporting
Senior Manager

4
GENERAL INFORMATION
Reporting Period: 01.01.2020-31.12.2020 Title of the Bank: Türk Ekonomi Bankası A.Ş. Headquarters: TEB Kampüs C ve D Blok Saray Mah. Sokullu Cad. No: 7A-7B Ümraniye 34768
İstanbul, Turkey Telephone: +90 216 635 35 35 Fax: +90 216 636 36 36 Web site: www.teb.com.tr E-mail: [email protected] Trade Registration Number: 189356 Central Registry Number (Mersis): 0876004342000105

5
SHAREHOLDING STRUCTURE OF TÜRK EKONOMİ BANKASI A.Ş. (“TEB”)
The distribution of the Bank’s TL 2.204.390.000,00 paid-in capital as of 31 December 2020
Shareholder’s Name/Title Within TL 2.204.390.000,00 Capital;
Amount Share
TEB HOLDİNG A.Ş. 1.212.414.500,002 55,0000% BNPP YATIRIMLAR HOLDİNG A.Ş. 518.42.498,520 23,5141% BNP PARIBAS FORTIS YATIRIMLAR HOLDİNG A.Ş. 467.879.148,835 21,2249% BNP PARIBAS SA 5.253.352,000 0,2383% KOCAELİ TİCARET ODASI (KOCAELİ CHAMBER OF COMMERCE) 500.500,643 0,0227% TOTAL 2.204.390.000,000 100,00% There have been no changes in the ownership or capital structure in 2020. Information on the Bank’s Qualified Shareholders
Shareholder’s Name/Title Within TL 2.204.390.000,00 Capital;
Amount Share
TEB HOLDİNG A.Ş. 1.212.414.500,002 55,0000% BNPP YATIRIMLAR HOLDİNG A.Ş. 518.342.498,520 23,5141% BNP PARIBAS FORTIS YATIRIMLAR HOLDİNG A.Ş. 467.879.148,835 21,2249% (*) The table names the direct shareholders.
TEB Holding A.Ş. is a member of the Çolakoğlu Group and BNP Paribas Group of Companies. A total of 50% of the shares in TEB Holding A.Ş. are controlled by BNP Paribas Fortis Yatırımlar Holding A.Ş., while the other 50% of the shares are controlled by the Çolakoğlu Group. BNP Paribas Fortis Yatırımlar Holding A.Ş. is controlled by BNP Paribas Fortis NV/SA, which holds 100% of the shares in BNP Paribas Fortis Yatırımlar Holding A.Ş. On the other hand, BNP Paribas S.A. controls BNPP Yatırımlar Holding A.Ş. by 100% of the shares.
Explanations Regarding the Shares Owned by the Bank's Chairman and Board Members, General Manager and Assistant General Managers
There are no Bank shares owned by the Bank's Chairman and Board Members, General Manager or Assistant General Managers.
AMENDMENTS TO THE ARTICLES OF ASSOCIATION
There were no amendments to the articles of association in 2020.

6
SIGNIFICANT EVENTS OCCURRING AFTER THE END OF THE ACTIVITY YEAR
A bond with a 242 days maturity, an ISIN code of TRFTEBK22116 and a nominal value of TL 400.912.472 issued on 11 June 2020, matured on 8 February 2021 and has been redeemed.
A bond with a 360 days maturity, an ISIN code of TRFTEBK62112 and a nominal value of TL 309.430.583 issued on 12 June 2020, its 7th and 8th coupon payments were made on 8 January 2021 and 8 February 2021, respectively.
A bond with a 248 days maturity, an ISIN code of TRFTEBK22124 and a nominal value of TL 319.771.469 issued on 12 June 2020, matured on 15 February 2021 and has been redeemed.
A bond with a 250 days maturity, an ISIN code of TRFTEBK22132 and a nominal value of TL 47.732.365 issued on 17 June 2020, matured on 22 February 2021 and has been redeemed.
A bond with a 300 days maturity, an ISIN code of TRFTEBK42114 and a nominal value of TL 266.182.279 issued on 26 June 2020, its 7th and 8th coupon payments were made on 22 January 2021 and 22 February 2021, respectively.
A bond with a 372 days maturity, an ISIN code of TRSTEBK72114 and a nominal value of TL 29.771.028 issued on 2 July 2020, its 6th and 7th coupon payments were made on 4 January 2021 and 4 February 2021, respectively.
A bond with a 279 days maturity, an ISIN code of TRFTEBK42122 and a nominal value of TL 77.366.417 issued on 10 July 2020, its 6th and 7th coupon payments were made on 12 January 2021 and 12 February 2021, respectively.
A bond with a 384 days maturity, an ISIN code of TRSTEBK72122 and a nominal value of TL 20.470.186 issued on 10 July 2020, its 6th and 7th coupon payments were made on 18 January 2021 and 19 February 2021, respectively.
A bond with a 279 days maturity, an ISIN code of TRFTEBK42130 and a nominal value of TL 142.234.581 issued on 17 July 2020, its 6th and 7th coupon payments were made on 19 January 2021 and 19 February 2021, respectively.
A bond with a 377 days maturity, an ISIN code of TRSTEBK72130 and a nominal value of TL 14.562.000 issued on 17 July 2020, its 6th and 7th coupon payments were made on 7 January 2021 and 5 February 2021, respectively.
A bond with a 210 days maturity, an ISIN code of TRFTEBK32156 and a nominal value of TL 4.860.096 issued on 14 August 2020, its 5th and 6th coupon payments were made on 11 January 2021 and 10 February 2021, respectively.
A loan agreement with a 367 days maturity for the amount of USD 58.000.000 was signed with the European Development Bank for Reconstruction and Development (EBRD) on 15 January 2021.
The application for the issuance of structured debt instruments up to an amount of TL 1.000.000.000 (one billion Turkish liras) by our Bank to be sold to domestic qualified investors was approved by the CMB decision dated 21 January 2021 no. 4/67.
On 4 February 2021, the international rating agency Fitch Ratings confirmed the Bank’s Long-Term FC Issuer Default Rating as B+ and Long-Term LC Issuer Default Rating as BB- with a Negative Outlook, while affirming its Short-Term FC and LC Issuer Default Rating as B, viability rating as b+, bank support rating as 4, and national long-term rating as AA (tur), assigning it a stable outlook.
A bond with a 210 days maturity, an ISIN code of TRFTEBK22157 and a nominal value of TL 105.695.955, issued on 28 July 2020 matured on 23 February 2021 and has been redeemed.
The sales of the bonds with a 91 days maturity and a nominal value of TL 486.940.253 issued to be sold to qualified investors within the debt instruments limit to be issued up to TL 23,0 billion by being offered to the public or not, which was approved by the CMB at its meeting no. 25/522 held on 16 April 2020, was completed; the asset clearance took place on 26 February 2021.

7
TEB: PAST AND PRESENT
TEB started out as Kocaeli Halk Bankası T.A.Ş. in 1927 a small local bank based in İzmit. Acquired by the Çolakoğlu Group in 1982, TEB’s name was changed to Türk Ekonomi Bankası A.Ş. the same year, and its headquarters were relocated to İstanbul.
Having focused its attentions on the foreign trade finance and investment banking business lines in the 1980s, TEB undertook an initial public offering in February 2000 after which its shares began trading on Borsa Istanbul’s national market and was simultaneously quoted on the London Stock Exchange’s depository receipt market.
On 10 February 2005, TEB entered into a partnership agreement with BNP Paribas, a leading Europe-based international financial services group whose members had operations in 71 countries as of end-2020.
By joining forces with the BNP Paribas Group, one of the most respected names in international markets, TEB further expanded the scope of its global vision.
In 2009 the BNP Paribas Group acquired majority stakes in Fortis Bank Belgium and Fortis Bank Luxembourg, as a result of which purchases the group also became the biggest shareholder in Fortis Bank’s Turkish subsidiary.
Subsequently the BNP Paribas Group, which now indirectly controlled a majority stake in TEB and the Çolakoğlu Group reached an agreement under which it was decided to merge Fortis Bank Turkey into TEB. This merger formally took place on 14 February 2011.
As a result of this merger, TEB Holding now controls a majority (55%) stake in TEB while the Çolakoğlu Group and BNP Paribas each control an equal (50%) stake in TEB Holding.
At a time when TEB’s publicly-traded shares were listed on Borsa İstanbul National Market, on 14 November 2014, BNP Paribas Fortis Yatırımlar Holding A.Ş., acting on behalf of
shareholders controlling a sufficient majority in TEB, applied to exercise their squeeze-out rights as provided for under current capital market regulations. With the completion of the delisting process on 25 June 2015, the shares in TEB A.Ş. were delisted from the stock exchange and TEB A.Ş. was excluded from the scope of Capital Market Law as a share issuer. Following an application from TEB, which is listed on the London Stock Exchange, depositary receipts were also closed to processing and delisted as of 31 March 2015. Furthermore, the depositary receipt program was terminated on 6 June 2015.
TEB carries out its activities drawing on the added value derived from the BNP Paribas Group’s worldwide organization, superior know-how and experience.
Within this scope, TEB provides its customers with a complete array of corporate, small-business, treasury, capital market, retail and private banking financial products and services as well as an extensive line-up of investment, factoring and portfolio management products and services through its subsidiaries and group companies.
As of year-end 2020 TEB was at the service of 6,8 million customers with,
• 8.850 employees, • 455 branches, • 1.660 ATMs, • on online branch at www.teb.com.tr, • a call center on 0850 200 0 666.
TEB gives its customers access to BNP Paribas’ global vision and operational capabilities. A synergetic collaboration with BNP Paribas also makes it possible for the Bank to keep a close and constant watch on developments taking place in global markets as they unfold.

8
MESSAGE FROM THE CHAIRMAN
Esteemed stakeholders,
2020 has been a tough year for the global economy because of the Covid-19 pandemic that took all the countries in its tight grip. In the reporting period, global economic activity came to a standstill because of the lockdowns and restrictions implemented against the pandemic.
Uncertainties in the financial markets lessened upon “phase one” trade deal reached between the US and China, and the world economy made an optimistic start to 2020.
From December 2019, however, the Covid-19 virus outbreak at first affected China and the Asian countries, before spreading to Europe and the US. Central banks of developed countries implemented expansionary monetary policies in an effort to alleviate the economic impacts of the pandemic and announced additional incentives. The US Federal Reserve System (the Fed) implemented two urgent subsequent rate cuts in March, pulling the policy rate down to almost zero. The US announced a comprehensive financial relief package of USD 2,2 trillion against the pandemic.
The European Central Bank (ECB) kept the policy rate at zero in the same period and introduced the Pandemic Emergency Purchase Program (PEPP). Declared as EUR 750 billion in March, the program was raised to EUR 1,35 trillion in June and EUR 1,85 trillion in December. The ECB also stated that the purchase program would continue until it judges that the corona crisis phase is over.
The risk appetite diminished as the volatility and uncertainties in financial markets increased, and the currencies of developing countries depreciated in the face of those of developed countries. In the same timeframe, fund flows to emerging countries declined and demand for developed countries‘government bonds increased due to a search for a safe harbor. Fund flows to emerging countries are anticipated to restart as and when uncertainties ease and financial markets recapture stability in 2021.
In the World Economic Outlook report released in January 2021, the International Monetary Fund (IMF) estimates 3,5% contraction for global economy in 2020, while projecting 5,5% growth in 2021. The same report forecasts 6% growth for Turkey in 2021.
Turkey made a strong start to the first quarter of 2020 with a 4,5% growth driven by increased exports and production, but was forced to implement lockdowns and restrictions upon the emergence of the Covid-19 pandemic in our country from March. The Central Bank of the Republic of Turkey (CBRT) held an urgent meeting in March, at which the policy rate was decreased and liquidity measures were announced in an effort to support the markets against the pandemic. Lending rates declined thanks to credit support schemes, and credit growth momentum accelerated.
In the same period, the government announced a financial relief package of TL 100 billion in a bid to support the real sector and protect employment. Production has increased again with the loosening of quarantine conditions since June, and the Turkish economy captured a 6,7% growth performance in the third quarter of the year.
In 2020, our export and tourism revenues decreased significantly due to the reasons associated with the epidemic,
and the current account balance continued to post a deficit. In the first half of the year, inflation continued to decline, before readopting an uptrend upon reflection of pandemic-driven unit cost increases and the developments in exchange rates upon consumer prices. In response, the CBRT increased its policy rate once again towards the end of the year in an attempt to take inflation under control and secure price stability.
On the basis of the whole year, production has recovered quickly and reached its pre-pandemic levels. In 2020, it is estimated that the Turkish economy will be able to achieve a growth near zero despite the pandemic. In the year ahead, vaccination campaigns against Covid-19 and its results will be monitored. In 2021, a fast growth could be achieved owing to the strong base effect and on the back of efficient monetary and fiscal policies.
Esteemed stakeholders,
In this second part of my message, I would like to share my opinions regarding TEB’s strategic position and its achievements in 2020.
In our 93rd year in operation
Established under the name Kocaeli Halk Bankası on 6 June 1927 at the initiative of 83 local tradesmen and businesses, our Bank completed its 93rd year in operation with a successful performance. Having adeptly managed the challenges handed by the Covid-19 pandemic, our Bank focused on protecting the health of all its stakeholders with a particular focus on our employees, and crowned its development and growth with a sustainable performance.
A member of the BNP Paribas Group, which is Europe’s largest and one of the world’s largest banking and financial services structures, TEB is a national bank having an equally global service ambition and capability.
Distinguished in the market with the degree it has incarnated innovation and with high added-value products and services offered to customers, TEB registered 30,46% growth in terms of assets, bringing its total assets to TL 140 billion and lending volume to TL 82,9 billion in 2020.
While our loans-to-assets ratio was 59%, our NPL ratio that stood at 4,22% is a solid outcome of our sound lending policies and prudent risk approach.
With respect to our financial and operational performance, I would like to specifically mention that our subsidiaries all produced successful outputs in 2020. They continued to enrich the portfolio of products and services made available to our customers under the TEB roof with their rich product and service line-ups, to build on cross- and complementary-selling of services, and finally, to contribute to our added-value generation power.
TEB makes a differentiation with its responsible approach as much as with its products.
TEB, beyond being a bank, is a responsible corporate citizen focused on producing extensive positive impact within the society. An emphatic supporter of the entire entrepreneurship universe with a special focus on the SMEs and women entrepreneurs, TEB gets involved also in initiatives related to

9
fintechs, entrepreneurship and start‐ups. On another note, TEB also carries out extensive and exemplary activities for increasing financial literacy and awareness among the general public.
We are convinced that TEB will reach broader populations over the years, and continue to fulfill its financial and social missions simultaneously through its products, services, solutions and supports.
We are moving forward with confidence.
The TEB brandname is associated with trust and consistency for its stakeholders. No matter what the market conditions may be, TEB will remain as a safe harbor and strong business partner for all its retail and corporate customers and will be their choice in the construction of the financial future.
TEB enjoys power and prestige in global financial circles. Successfully representing its sector on all platforms, our Bank will keep constantly boosting its cooperation with global financing resources and providing the real sector with the funding necessary for the sustainable development journey of the Turkish economy.
In keeping with the immense responsibility upon it, TEB will continue to work, produce, give back and make a difference also in the future, rising upon its solid foundations. In this process, our institutional priority will be to ameliorate the value
proposition offered to our customers. Alongside, it is our ultimate and unchanged target to continually build on our reputation and shareholder value as an output.
Before I wrap up my message, I would like to present TEB’s 2020 operational results and financial statements for our esteemed stakeholders' review.
I would like to thank the TEB management team and all our employees who contributed to our performance in 2020 for their committed and hard work, and I would like to express our gratitude on behalf of our Board of Directors and myself to our valuable shareholders for their invaluable and unwavering support.
Yours sincerely,
YAVUZ CANEVİ Chairman of the Board of Directors

10
CEO’S ASSESSMENT
Esteemed Stakeholders,
In March 2020, the Covid-19 pandemic invaded our lives as a phenomenon that will have lingering effects in the medium- and long-term ahead of us. The manner and location of its origination still researched and debated, the coronavirus spread across the Earth in a short period of time, forcing a radical and rapid transformation of the lives of billions of people, as well as production and consumption patterns.
As the World Health Organization declared it a pandemic on March 11th, the Republic of Turkey Ministry of Health also announced the first case in our country and initiated the transition to restrictions.
Our country succeeded in managing that process with swift and correct measures. The foundations of this success were laid by our robust healthcare infrastructure and capacity, and our healthcare industry workers who self-sacrificingly worked by waving aside the virus that threatens their very own lives, putting their non-stop effort into fighting the pandemic at the expense of staying away from their families for months.
Taking this opportunity, we would like to express our deepest gratitude to the invaluable healthcare workers to whom we entrust our lives if need be, to the members of the service and banking industries, and the valued members of the TEB family.
At TEB, we have given priority to protecting the health of our employees and customers from the very beginning of the process and took the necessary actions to ensure continuity of our operations. As we fulfilled the duty falling upon us to implement the financial measures adopted across the country and to channel the financing support to our fellow citizens, we targeted to contribute to the national economy, to stand by our customers and to achieve sustainable growth through our activities.
The Turkish economy, which had its robustness tested and confirmed a number of times in the past 20 years, successfully passed the resiliency test given by the pandemic as well.
While priority was given to keeping the wheels of the economy turning during the pandemic, support was extended to economic actors and households through a series of measures, incentives and implementations put into implementation swiftly.
I would like to gladly express that the Turkish banking sector preserved its robust structure in this process, and reinforced its support to the economy in all respects.
After making a hopeful start to 2020 like the whole world and our country, our Bank undersigned significant achievements in the first two months of the year, before turning its attention to a prevention/protection strategy prioritizing the health of its stakeholders in general and its employees and customers in particular, from March onwards.
Stating that we have displayed great courage and extraordinary efforts as a team in the fight against the pandemic, I would like to share my observations.
In this period when we tried our crisis management competencies, our Covid-19 Crisis Management team worked
night and day to implement the measures fully, and extended the necessary support to our employees uninterruptedly.
As we planned our working formats carefully with an agile approach, we successfully put into life the necessary coordination and actions for fully and immediately implementing the measures announced by regulatory authorities. As TEB, we were able to offer uninterrupted service on the basis of rotating working scheme and in the light of scientific data.
Our Bank managed its 2020 activities within the frame of a participative, agile and flexible strategic management.
As we optimized the maturity risk through expanded consumer loans and balanced housing loans in the recent period, we have also vested our SME portfolio in a healthier structure through new customer acquisition while continuing to expand it. In the corporate banking business line, the fast growth on the TL lending side and our being one of the banks that come to mind first in foreign trade have made the perfect elements of our clockwork strategy.
The contribution of our participative management and strong team has played a big part in reflecting the potential presented by the markets in our performance. According to our financial results for the year ended 31 December 2020, our Bank’s total assets augmented by 30% to TL 140 billion in the 12 months to end-2020, while we booked TL 1,177 million in net profit. Loans, which represent the most important indicator of the support we provide to the economy and our customers, accounted for 59% of our total assets.
Giving priority to risk management and asset quality as always, our Bank’s total lending amounted to TL 82.9 billion in the last quarter of the year, with total deposits worth TL 93.8 billion, up by a remarkable 30%. We maintained our consistent growth on the back of our solid capital structure also in the last quarter of 2020, and increased our profitability sustainably. While our Bank’s shareholder’ equity was worth TL 11.4 billion, capital adequacy ratio was 18.51%, well above the target ratio of 12%.
At TEB, we molded our approach to product and service pricing by prioritizing assets and liabilities management in 2020; we continued to offer non-stop service to our customers in all lines of business in keeping with our “full support at all times” concept amid extraordinary regulatory requirements such as assets ratio and required reserves.
Segment leadership and market-maker position handed to us by our Marifetli Account product, along with the success we achieved in salary payments, played a big part in the broad-based customer portfolio we have created. In 2020 that saw our credit portfolio expand by 20%, our Bank established itself as one that is capable of strongly managing its liquidity.
Thanks to the disciplined stance and our strategy to decrease the concentration of risk exposure with corporate companies and in the SME segment, we were able to end 2020 with a healthy portfolio composition and growth.
On the other hand, our Bank considered all demands that it deemed to be rational and productive as a prerequisite of long-term cooperation and strategic partnership approach and kept standing by its customers solidly and determinedly, making available restructuring and additional supports.

11
The Covid‐19 pandemic squeezed the transformation that would normally take several years for the humankind within just several months. While hygiene, mask and social distancing became the motto of life in this process, isolation shaped our lifecycles as the primary form of protection. In this timeframe, we all experienced the power and importance of digitalization first‐hand.
This process provided us with the opportunity to try our digital banking capabilities, power and service delivery capacity we recently introduced and that largely reshaped our service delivery platform. During 2020 when we concentrated on digital services, our customers made use of non‐branch channels at a ratio of 80%.
Our digital banking application CEPTETEB has made us all proud by claiming the “Best Retail Banking Digital Platform” award in the Global Finance Best Digital Bank 2020 in the Western Europe program.
CEPTETEB İŞTE, our mobile application launched by early 2020 making day‐to‐day business life easier for SMEs and businesses, on the other hand, quickly endorsed its success garnering awards on numerous international platforms including one in the Mobile category at the “Innovation in Digital Banking Awards” organized by The Banker magazine.
We are tackling, designing and launching our Digital Banking products and services to offer solutions with high value propositions to the entire range of our customers from individual to retail and from SME to Private Banking. This approach is a constant contributor to our Bank’s promoter score as a financial services provider and also to customer satisfaction to which we attach great importance.
Enabling leanness, speed and practicability, digitalization will shape the future competition, in other words, the new normal. With this thought in mind, we will keep using digitalization as a leverage in the products and services we offer, and enhancing customer satisfaction by creating differentiation in competition.
Entrepreneurship and the start‐up ecosystem is another platform that our Bank deems important.
While the Start‐Up House we opened in 2013 that goes beyond our own sector to inspire numerous economic actors of our country, the activities and initiatives in this area also increased rapidly. We consider entrepreneurship and start‐ups among the driving forces of the new normal, we value the collaborations we establish in the area of entrepreneurship, and we also regard entrepreneurship an important peg for Turkey’s growth.
In addition, we support growing women’s employment, and empowering women in business through their involvement in the economy at a greater extent.
We regard our human capital as the permanent guarantee of our existence.
Named among the Top Employers in Europe and in Turkey also in 2020 by the Top Employers Institute, our Bank undersigned a remarkable success by earning the Top Employer Turkey and Top Employer Europe certifications for eight years in a row.
Our performance management based on objective criteria, our transparent career committees, local and international career opportunities offered to our employees, our talent management programs preparing the future leadership, and our uninterrupted training and development activities serve as the telling indicators of the importance and value we attach to our human capital.
As we contribute to the national economy and sustainable growth with our products and services in keeping with our understanding of being a “Good Bank”, we, at TEB, undertake initiatives that bear a positive impact for the society and set examples for other organizations, which add value to all our stakeholders that consist of our employees, customers, shareholders and our society.
The value we produce for our customers within our service cycle, our contribution to the Turkish economy, our direct and indirect presence in the employment front, and our contribution to the society that we belong to all point at the outputs of being a great bank. Other significant aspects in this context are being ethical, achieving full legal and regulatory compliance, being an honest actor of the sector and transparency.
In brief, being a great bank is being able to head towards the same targets with our stakeholders, producing, and giving back. In the period ahead, TEB will continue to uncompromisingly and determinedly do whatever is necessary to be a great bank.
We have solid faith in the future of Turkey.
I would like to take this opportunity to thank first our employees who made the 2020 performance of TEB possible and all our stakeholders for their valuable support.
Yours sincerely,
Ümit Leblebici CEO

12
AN OVERVIEW OF THE ECONOMY AND THE SECTOR IN 2020
Having ended 2019 with a growth rate of 0,9%, the Turkish economy made a strong start to 2020, but the economic activity slowed down as the Covid-19 outbreak acquired a global dimension.
From March 2020, the epidemic began showing its effect also in our country and lockdown and isolation measures were implemented in April and May. The negative effects of the pandemic took their toll on the economy, along with social life. Having registered 4,5% growth in the first quarter of 2020, the Turkish economy shrank by 9,9% on an annual basis in the second quarter due to lockdown conditions and the closures imposed on the services industry.
With the help of the loosened lockdown measures in the summertime, coupled with the contribution of expansionary monetary and fiscal policies implemented in the same timeframe, the economy recovered quickly, and ranked among the fastest-growing economies with a 6,7% growth rate in the third quarter of the year.
2020 has been a tough year for the financial markets.
Global risk appetite lessened in connection with the Covid-19 pandemic, and fund flows to emerging countries declined. In this period of high uncertainty, the demand for the assets of the developed countries increased. Having gone below 300 bps at the end of 2019 due to the volatility in international markets, our country risk premium went above 600 bps during the pandemic. In the same timeframe, Turkish lira depreciated in the face of the currencies of developed countries, and the USD/TL rate surged from 5,90 at year-end 2019 to 7,42 at year-end 2020.
With the aim of restraining the negative effects of the pandemic upon the economy, comprehensive steps were taken both in monetary and fiscal policies. The Central Bank of the Republic of Turkey (CBRT) gradually decreased the policy rate from 12% at year-end 2019 to 8,25% in May, and declared relief packages to provide the real sector and the banking sector with the appropriate liquidity conditions.
With the flexibility provided in lending conditions, consumer TL loan rates and commercial loan rates went down to 8,45% and 8,15% respectively.
In the second half of the year, inflation escalated more rapidly than anticipated due to the developments in exchange rates and increased unit costs in connection with the pandemic, and went up to 14,6% at the end of 2020.
In an attempt to take under control inflation projections and to re-establish price stability, the CBRT increased the benchmark rate against the uptrend in inflation, and increased the policy rate which was 8,25% to 17% as at year-end 2020.
Export and tourism revenues slumped in the first half of the year due to reasons linked to the pandemic, and the current account balance began to post a high deficit. In the second half of the year, domestic demand remained strong with the increased lending momentum, and the annual current account deficit went up to USD 36,7 billion as at year-end. While portfolio outflows amounted to USD 5,5 billion on an annual basis, FX reserves dwindled by USD 31,9 billion. With the inception of normalization, exports and tourism revenues are anticipated to recuperate in the year ahead, and to contribute to FX reserves.
The budget deficit augmented in 2020 as a result of the financial measures implemented against the pandemic.
As a result of the deferment of tax payments, increased social security expenses and steps taken to protect employment, budget deficit amounted to TL 172,7 billion in 2020.
The Turkish economy is estimated to achieve limited growth in 2020 despite the pandemic.
Through vaccination campaigns, the negative circumstances stemming from the Covid-19 pandemic are targeted to be precluded in 2021. Services and tourism industries, which were the hardest-hit sectors by the pandemic, are anticipated to attain a fast recuperation in the year ahead. However, the slow pace of recovery in the European Union countries poses a risk upon our exports. Our country risk premium is anticipated to decline and investments are expected to pick up as and when uncertainties are alleviated and financial markets recapture stability in the period ahead.
Turkish Banking Sector Key Indicators December 2020 December 2019 Assets TL 6,108 trillion TL 4,492 trillion Loans TL 3,618 trillion TL 2,740 trillion Marketable Securities TL 1,023 billion TL 661 billion Deposits TL 3,625 trillion TL 2,688 trillion

13
TÜRK EKONOMİ BANK’S PERFORMANCE IN 2020
IN GENERAL
Presented below is a summary of TEB’s shares of the banking industry’s basic indicators as of 31 December 2019 and 31 December 2020 together with information about changes in those shares. Looking at the highlights of the Bank’s performance in 2020 as compared with that of 2019 we observe that: • Total assets increased by 30,46% in 2020. • Shareholders’ equity reached TL 11,410 million. • Total deposits accounted for a 67% share of the Bank’s balance-sheet. • Total credits, which is the most significant indicator of the Bank’s support for its customers and the economy, has been TL 82,9 billion
in 2020 which represents 59,2% of total assets. • Loan-to-deposit ratio has been realized as 88,44%, capital adequacy as 18,51% and return on equity as 11,61%.
TEB’S POSITION IN THE INDUSTRY
(TL million) 31.12.2020 TEB Industry TEB’s share (%)
Total Assets 140.048 6.107.832 2,29 Total Live Credits 78.882 3.618.480 2,18 Total Deposits 93.773 3.625.266 2,59 Number of Branches 455 11.189 4,07 Number of Employees 8.850 203.224 4,35
Source (for industry figures): BRSA’s December 2020 monthly bulletin

14
AWARDS
In 2020, TEB’s activities have been recognized and rewarded as always both in Turkey and abroad.
AWARD CATEGORY / RANKING PRODUCT / SERVICE
RETAIL BANKING
Global Finance “Best Digital Bank 2020”
Banks operating in Western Europe / Best Retail Banking Digital Platform CEPTETEB
PSM Awards 2020 Digital Transformation Category/ Silver PSM Mall IQ Location Based Targeting Integration
Golden Spider (Altın Örümcek) Most Accessible Mobile Application CEPTETEB
Contact Center World Best in Customer Service / Gold TEB Call Center
Contact Center World Best Sales Campaign / Gold TEB Call Center
Contact Center World Best Contact Center Sales Professional / Gold TEB Call Center
IDC (International Data Corporation) Digital Transformation Awards Digital Trailblazer/Best Digital Trailblazer Project TEB Customer Experience Platform
PRIVATE BANKING
International Finance Awards 2020 Most Innovative Private Banking Private Banking
World Finance 2020 Best Private Bank Turkey Private Banking
Euromoney 2020 Best Private Banking Services Overall in Turkey Private Banking
Euromoney 2020 Best Next Generation Programs in Turkey Private Banking
Euromoney 2020 Best Capital Markets and Advisory in Turkey Private Banking
Euromoney 2020 Best Impact Investing in Turkey Private Banking
Euromoney 2020 Best Data Management and Security in Turkey Private Banking
Euromoney 2020 Best Innovative Technology Adoption in Turkey Private Banking
CORPORATE BANKING
Asian Banking & Finance Awards Best Cash Management Bank in Turkey Cash Management
Stevie International Business Awards Covid-19 Most Valuable Corporate Response / Silver Stevie Cash Management
SME BANKING Global Business Excellence Awards 2020 Best Application Award CEPTETEB İŞTE
Global Finance, The Innovators 2020 Best Innovation Award CEPTETEB İŞTE
Best Business Awards 2020 Best Innovation Award CEPTETEB İŞTE The Asian Banker, - Financial Technology Innovation Awards Best Mobile Banking Technology Implementation CEPTETEB İŞTE
The Banker, Innovation in Digital Banking 2020 Mobile Category Winner CEPTETEB İŞTE
IFC, Global SME Finance Competition Innovative Product of the Year / Honorable Mention CEPTETEB İŞTE
BNPP Rising Up Best Project CEPTETEB İŞTE
HUMAN RESOURCES Top Employers Turkey 2021 / Top Employer Europe 2021
Top Employers Turkey and Top Employers Europe Certificates Human Resources Practices

15
CORPORATE BANKING GROUP
In the ever-changing and intense competitive environment of financial markets in 2020, TEB Corporate Banking Group succeeded in maximizing customer satisfaction by fulfilling its customers’ diverse needs through the right channels.
TEB offers high value-added products and services to medium- and large-scale domestic and international companies, conglomerates and holding companies with an annual turnover of TL 125 million and above.
The Bank is also supported by the synergy created with the global network of its partner BNP Paribas in the Corporate Banking business line.
The products and services offered within the scope of Corporate Banking activities are as follows:
• Trade finance • Working capital and investment loans • Cash management and risk management products • Standard and derivative treasury products • Corporate investment banking products • Commodity finance • Project finance
TEB has tailored its privileged and high-quality services delivered through a total of 14 corporate branches, 7 of which are in Istanbul, in line with its long-term customer relations approach. The Bank provides its services through its foreign trade centers staffed with experienced specialists and an organization specifically designed for multinational companies.
TEB further reinforces its effectiveness in Corporate Banking in the ever-changing and intense competitive environment of financial markets. In 2020, the Bank succeeded in maximizing customer satisfaction by fulfilling its customers’ diverse needs through the right channels.
In a fast transforming world with new technological developments, customer expectations and requirements are changing at the same speed. TEB Corporate Banking Group is focused on sustaining customer experience and product quality at the highest level in accordance with changing customer expectations and needs.
TEB continued its activities within its transformation projects in 2020 with the aim of providing a fast service for its customers’ daily transactions offering expertise services best suited to customers’ needs. In line with its goal of being “the first bank that comes to mind of customers” in the corporate banking business line, TEB plans to continue its activities towards development of new products and services.
Multinationals Desk TEB is the first bank in Turkey to set up a Multinationals Desk.
Since 2006, TEB has been servicing multinationals as well as Turkish firms with international operations, by providing significant advantages and convenience. In these services, TEB benefits from its own extensive network of domestic branches in Turkey as well as the cooperation it has developed with BNP Paribas, which operates with 198.000 employees in 71 countries with the slogan "One Bank for Corporates", and has more than 23 million customers and more than 7.000 branches.
TEB delivers the service quality and standard that global partners of multinationals receive from BNP Paribas at the maximum extent allowed by the local regulatory framework.
The Multinationals Desk that operates under the Corporate Banking Division provides services with its specialized personnel in the headquarters and corporate branches. TEB seeks to be the main bank with which all multinationals with operations in Turkey prefer to work as almost 1.300 multinationals from 45 countries already do.
GLOBAL TRADE SOLUTIONS AND FINANCIAL INSTITUTIONS
Global service competence in international trade TEB is a distinctive and specialized bank in foreign trade. The global service network of BNP Paribas further strengthens this characteristic.
Among the world’s top three banks in foreign trade finance business, BNP Paribas ranks first in Europe.
BNP Paribas’ operations in 71 countries and Trade Centers active at more than 100 locations in over 60 countries sharpen TEB’s competitive edge in trade finance business. Thanks to its capability of delivering global services, the Bank provides tailored solutions such as foreign trade legal framework consultancy and preparation of letter of credit documentation.TEB maintains correspondent relationships with more than 1.000 banks located all over the world, TEB constantly seeks to expand this network in line with its customers’ needs. In addition to its strong correspondent network, TEB also enjoys the possibility to offer its customers maturity options in foreign trade transactions according to their needs using the network of BNP Paribas covering 71 countries.
Favorable terms in foreign trade transactions Through its correspondent network, TEB facilitates money transfer services for its customers that require transferring money in local currencies of different countries owing to their investments in such countries.
Facilitating cross-border money transfer in 135 different currencies to more than 180 countries, TEB also offers cash transfer services to customers who want to make bulk payments at competitive costs through its wide correspondent network.
TEB Foreign Trade Centers Located in İstanbul, Bursa and İzmir, TEB Trade Center network providing foreign trade finance and foreign trade consultancy products and services is the first of its kind in the Turkish banking industry.
Trade finance solutions suited to customers’ needs are tailored via benefitting from TEB’s and BNP Paribas’ trade finance expertise and extensive correspondent networks.
Strong position in export finance TEB is one of Turkey’s pioneering and competent banks in trade finance. TEB’s strong position in export finance is verified by sectoral data. Retail loans excluded, loans used to finance exports comprise 17% of Bank’s performing loans portfolio.
TEB has 4,8% market share in export loans, which puts the Bank in the 7th place.

16
According to data for the third quarter of 2020, TEB mediated 6,6% of counter-guarantees provided to Turkey from overseas in terms of the number of transactions and 5,5% of export letters of credit in terms of volume.
Every TEB Trade Center employs a team whose members have expertise in “structured trade and commodity finance”. This team devises financing solutions that are specifically tailored according to the goods involved and customer cash flows. In this way, firms can be offered tailored products that go beyond the sector’s conventional financing methods.
TEB was the first bank to offer structured commodity financing credit in Turkey. The Bank has provided credit facilities by accepting product certificates as collateral issued against commodities being held in the first licensed warehouse in Turkey. In July 2017, the necessary infrastructure for borrowing against electronic product certificate (ELUS) has been finalized, and customers’ demands for financing began to be fulfilled.
Another solution TEB offers to exporters is rediscount credit opportunities the Central Bank of Turkey allocates to Turkish exporters.
Experience shared through foreign trade training programs TEB provides its customers with specialized consultancy services related to their foreign trade and investment activities. In addition, TEB also works with sectoral and regional exporters’ associations, chambers of commerce and industry, organized industrial zone directorates and similar organizations to provide practical foreign trade training and seminars on foreign trade issues that are designed to meet the particular needs of firms in different parts of the country.
LARGE CORPORATES
Service delivered on the basis of a broad and high-quality product range At TEB, large corporates relationship management is conducted by a team of Global Relationship Managers at the Headquarters within the Corporate Banking service network. This structure is the extension of the model implemented by BNP Paribas International Retail Banking organization in various countries.
Relationship management with large companies includes large corporate companies which have been established and grown in Turkey, and differentiated themselves in terms of revenue, geography and diversity of financial transactions.
Global Relationship Managers are equipped for and in charge with handling the coordination of services to meet these companies’ strategic needs such as debt and equity capital markets, financial markets, project financing, mergers and acquisitions.
CASH MANAGEMENT
Innovative products admired by stakeholders Along with BNP Paribas, TEB provides special cash management solutions to global customers requiring a single global solution for all their subsidiaries around the world involving efficiency and control in their collection and payment processes.
In 2020, the Bank continued to offer service to multinational companies with a number of specific products that provide efficiency and control in their national and international payment and collection processes associated with their operations in Turkey.
TEB Cash Management will carry on with its efforts to be recognized as the first bank that comes to mind for cash management, and will continue to offer products and services for its international customers which are fully integrated with BNP Paribas’ global cash management system in the years ahead.
Practical and advantageous cash management solutions In partnership with BNP Paribas, TEB develops cash management implementations for its global customers requiring a single global solution for their operations that may be scattered all around the world.
In 2020, customers were presented many specially-designed products and solutions allowing them to achieve greater efficiency and control in the conduct of national and international payment and collection processes related to their existing or planned operations in Turkey. TEB will continue to deliver products and services that are fully integrated into BNP Paribas’ global cash management system to its multinational customers in the years to come.
CUSTOMER SUPPORT THROUGH VARIOUS CHANNELS ENABLED BY STRONG SYNERGY
TEB Corporate Banking has adopted a customer-oriented approach in the product and service processes it offers to its customers. Within this framework, the Bank focuses on the strategy of “creating value for all stakeholders” in line with the culture of generating cross-business.
Despite the negative impacts of the Covid-19 pandemic in 2020, TEB continued to provide end-to-end solutions to corporates at all business lines, including their whole ecosystem with a holistic approach offering TEB Group’s range of financial and non-financial products and services.
TEB Corporate Banking continued to create value for its customers, including the ones who need investment banking products and services, by taking advantage of strong international network and product line of BNP Paribas Group. In order to achieve this goal, TEB provided the following services:
• support for commercial and investment activities • local and international resources for the funding of foreign
trade activities • financial advisory • M&A advisory • project finance facilities • public offerings.
In addition, Corporate Banking conducts cross-selling and business development activities together with the Bank’s other business lines, in order to create value for corporates in all areas of their interests such as agricultural banking, consumer finance, housing finance projects, payment systems with card and POS services, solutions for dealers, corporate finance and salary agreements.
Domestic and international product and service diversity TEB’s domestic and international product and service variety stands out in its services provided through its affiliates as well:
• TEB Arval offers its international experience to the fleet management sector as a solution partner for Corporate Banking customers’ fleet management activities and provides fleet rental services to more than one million vehicles worldwide,

17
• BNP Paribas Leasing Solutions provides financial solutions to Corporate Banking customers for their investments in equipment and real estate,
• TEB Faktoring provides services in domestic and international factoring industry with an experience of more than 20 years and it has been awarded as the Best Export Factoring Company for the 7th time by the world’s largest factoring chain Factors Chain International.
• TEB Investment carries out mediating activities for its customers’ public offerings, debt instruments, domestic and international transactions and provides investment consultancy services,
• TEB Portfolio provides alternative fund management services for its Corporate Banking customers and many funds, in which it is the founder and director,
• BNP Paribas Cardif Pension offers a range of advantageous fast and high-quality services to its customers in meeting their group pension and insurance needs”.
BUSINESS DEVELOPMENT ACTIVITIES
With the contribution of stakeholder relations… Within the context of business development activities, TEB takes major steps to develop its Corporate Banking customer base. In line with these collaborations with major non-governmental organizations, industry and trade exchanges have been realized.
Taking customer focus and customer satisfaction into consideration, TEB conducted joint business development activities with TEB Start-up Banking portfolio of start-up firms to provide support for corporate banking customers’ Industry 4.0 and digital transformation processes. A number of successful projects were carried on to improve service quality and efficiency with cooperation developed with BNP Paribas and business partnerships experienced in their fields.
During 2020 that was a rough year on a global scale, the Bank offered need-based business solutions adding value to customers to help corporate companies to come through this process with minimal impact. In cooperation with the Ministry of Treasury and Finance, the Bank continued to provide various support and incentive packages to corporate customers which were targeted at reducing the financing costs of R&D and environmental investments.
PUBLIC BANKING
Cooperation with public agencies and local administrations focused on value generation The Public Banking Department was established under Corporate Banking in 2017 in order to expand the scope of business with the public sector and to increase cooperation areas.
With the establishment of the department, it is intended to meet public sector’s needs in foreign trade, structured trade finance, cash management, and alternative funding facilities
with BNP Paribas’ industry expertise and support for longer term and lower-cost funding.
The Public Banking Department carries on with its efforts to provide low-cost funding and other banking products to Public Economic Enterprises and Local Administrations.
In 2020, TEB Public Banking continued to make efforts to develop relationships with new public institutions, as well as to make alternative funding facilities such as bond issuances more accessible for public institutions in accordance with their medium and long term strategies, primarily through capital markets.
In this context, priority was given to Sustainable Financing facilities, and environmentally-sensitive financing deals were supported.
MARKETING AND BUSINESS MANAGEMENT ACTIVITIES
Projects generating versatile value Marketing and business management activities are carried out in parallel with the Corporate Banking sales and marketing strategies that were formulated.
These activities include oversight of action plans devised, conducting transformation projects backing strategy and goals and detailed analyses in improvement areas, and management and reporting of improvement projects for identified processes.
In addition, training programs are planned and executed in coordination with the Human Resources Department, which are designed to contribute to the development of the Bank’s employees, and to equip them with the knowledge and competencies that will help achieve the strategy and goals.
In addition to strategy and project management coordination, budget management and financial performance of Corporate Banking are monitored and reported, and in this context, support is provided for data supply in relation to sales, marketing and analysis activities of branches and related teams.
Activities are carried out under the Corporate Banking organization to achieve full compliance particularly with the national and international legislation for prevention of laundering proceeds from crime and with the TEB and BNP Paribas Group procedures. To this end, implementations, examinations and training activities are managed in coordination with branches and related teams.
TEB Corporate Banking also carries out sustainability initiatives in line with its “positive impact” target, taking into consideration its environmental and social responsibilities. In this context, projects targeted at offering innovative and sustainability-focused products and services continue at an increasing pace.

18
SME BANKING GROUP
TEB carries out its SME Banking activities under its “consultant banking” approach. The Bank’s unchanging goal in this business line is to deliver “the best customer experience”.
TEB SME Banking Group supports its SME customers with non-financial products and services, alongside financial products. Offering service with the objective of delivering “the best customer experience” constitutes the main theme of SME Banking customer services and service model.
As an innovative bank, TEB constantly improves the products and services it offers to SMEs within the scope of SME Banking activities and assists them with diverse solutions introduced in various areas such as growth and competition that represent the biggest challenges for SMEs.
Support to the SMEs during the pandemic Automation and digital transformation that gained speed in the wake of the pandemic shaped the models of doing business in the banking sector and customer demands and expectations, and digital channels gained further ground in customer interactions. In this context, TEB SME Banking also made it a priority to satisfy customer expectations and to deliver the best SME Banking experience to the SMEs by increasing its automation and digital transformation of banking processes.
TEB SME Banking is structured to cover various areas with the aim of offering customized service to its customers of varying scales with differing product and service requirements.
Accordingly, the Bank operates in the areas of Start-up, Gold and Municipal Banking segments, as well as SME and Agricultural Banking. Customers are offered information, training and partnership support also in non-financial matters.
In 2020, the banking sector in Turkey was reshaped due to the pandemic after the first quarter of the year, as was the case in the rest of the world. During the pandemic, TEB continued to expand its SME lending and to stand by the SMEs that serve as the driving engine of the national economy.
Taking into consideration the impacts of the pandemic and altered customer expectations, the Bank redesigned its products and processes in order to provide faster and solution-oriented service to its SME customers at its branches.
During the pandemic that persists globally, TEB launched support packages facilitating loan repayments of its SME customers. In this scope, the Bank assessed demands for deferment of loan repayments by customers with disrupted cash flows and having difficulties in repayment of credits with a sense of responsibility, formulated new repayment plans compatible with their cash flows, and fulfilled additional credit demands.
Having sustained its support to the SMEs by participating in all KGF (Credit Guarantee Fund) and KOSGEB (Small and Medium Enterprises Development Organization of Turkey) supported projects in this period, TEB provided guidance to its customers currently, or are targeting to become, engaged in exports via its expert Foreign Trade team organized in its regions.
CEPTETEB İŞTE CROWNED ITS FIRST YEAR WITH AWARDS.
CEPTETEB İŞTE is a comprehensive digital commercial banking platform by TEB, which allows SME, corporate and business
customers to perform many financial transactions quickly and easily.
CEPTETEB İŞTE was deemed worthy of awards by a number of international organizations in 2020.
Some of the capabilities CEPTETEB İŞTE offers include transacting without having to make a branch visit, real-time and easy follow-up of the financial status, time-saving enabled by a fast and practical interface, monitoring the current status of financial products, and real-time management and monitoring of POS devices.
Ever since its launch for use by customers, CEPTETEB İŞTE continues to be enriched with new functions in line with customer needs. Loan applications, POS demands, commercial credit card and cheque book demands began to be accepted via the app with the aim of offering new digital experiences to customers.
START-UP BANKING
Solid support to start-ups in cooperation with TİM Start-up House, the first one of which TEB had opened in Ataşehir, İstanbul in 2013 with the aim of reaching start-ups all over the country, supporting technology start-ups and winning their innovative business ideas for the economy, brings service also to Anatolia within the frame of the cooperation with the Turkish Exporters Assembly (TİM).
Turkey’s most comprehensive start-up network, TİM-TEB Start-up House moved to Kolektif House in the Maslak area in January 2020, where the start-up ecosystem is concentrated. Aiming to support the technology firms and start-ups in Ankara, a new Start-up House was opened in February 2020 at METU CoZone, established at the Middle East Technical University (METU) Technopolis with the aim of bringing together the start-up ecosystem in Ankara.
As of year-end 2020, TİM-TEB Start-up House expanded its coverage to 7 cities, namely İstanbul, Ankara, İzmir, Gaziantep, Denizli, Bursa, and Mersin.
Aiming to grow Turkey’s start-up ecosystem TEB aims to grow Turkey’s start-up ecosystem through the accelerator and growth-driven original programs of TİM-TEB Start-up Houses intended to ensure sustainability and rapid growth of technology companies. In this context, support was extended to over 1.000 start-ups during 2020 within the scope of the programs executed in 7 cities.
TEB stands by young entrepreneurs with TÜBİTAK BiGG Program. For six years, TEB has been extending support within the scope of TÜBİTAK’s Young Enterprise (BiGG) Program to conceivers of innovative technology business ideas, at every stage from the realization of business ideas including advisory, technical mentoring and office support to the publicity of the project, from finding customers to presentation to investors.
During 2020, TEB helped 18 start-ups with technological business ideas to receive grants worth TL 200.000 and to become incorporated within the scope of TÜBİTAK BiGG Program. TEB’s contribution to the grants made available to date under the TÜBİTAK BiGG Program amounted to TL 14,8 million for a total of 89 technological business ideas.

19
Having renewed its TÜBİTAK accreditation in the third quarter of 2020, TEB qualified as an implementation institution for two more years. The Bank will keep supporting start-ups in all respects including how to transform their business ideas into a business and how to market their projects.
Start Up 2 Corporate Program continues with corporate companies. Market reach and network supports needed by start-ups are provided by TİM-TEB Start-up House in the broadest extent. In 2020, TEB continued to reach Exporter Unions affiliated to TİM and to enable participation of start-ups targeting a given country in the Trade Delegations organized by TİM. In addition, start-ups were brought together with TİM-member companies, and SMEs and corporate companies covered in TEB’s customer portfolio.
Allowing organizations to closely monitor technological trends and reach new technological products/services via the Startup 2 Corporate Program, TEB also aims for start-ups to reach their target customers. Within this scope, nearly 100 technology companies were brought together with the directors of a large number of different organizations during 2020.
AGRICULTURAL BANKING
TEB continues with its efforts to drive the development of the agricultural industry and to fulfill the financial needs of producers. Since 2007, TEB Agricultural Banking has been making available its Agricultural Banking products based on the circumstances and dynamics of agricultural production for use by producers. TEB Agricultural Banking provides agricultural input financing and funding for their investment projects to farmer and producer organizations (unions, cooperatives and chambers) and agricultural establishments of any scale.
New partnerships in the industry under TEB Harman Kart that transforms labor into abundance Having given particular weight to partnerships with the industry’s leading institutions for producers fulfilling their agricultural input needs under TEB Harman Kart (Harvest Card), TEB expanded its member merchant network, and added new partnerships to existing ones in areas such as fuel oil, fertilizers, seeds, fodder, and pesticides.
With TEB Harman Kart, producers are able to purchase from member merchants interest-free up to six months, fulfill their input needs for their agricultural production, pay for their agricultural electricity and irrigation bills, and repay these items at the harvest period.
Consentrated on digitalization during the pandemic. TEB redesigned its processes to allow completion of transactions without a branch visit in an effort to support the increased operating capital needs of farmers that carried on with their production through the pandemic.
In this context, producers who do not have a Harman Kart (Harvest Card) can apply for one by simply texting. All producers needing Agricultural Loan can apply for it with a single text message, without going to a branch, and can satisfy their urgent cash needs within seconds.
Advantages for the entire agricultural industry under the Contracted Production Loan TEB’s partnerships in the agricultural industry further expand with Contracted Production Loan agreements. TEB Agricultural Banking offers financial solutions to the parent company collecting the produce and to thousands of producers working under contracted production model alike from cultivation to the delivery of the produce to the consumers.
Events were suspended during the pandemic. During the pandemic, TEB was compelled to suspend its regular participation in annual trade fairs and festivals. The Bank is looking forward to reuniting with the producers in days of abundance in the period ahead, when it will be offering its new products and services.
GOLD BANKING
TEB continues to create value in Turkish jewelry industry with its expertise in gold and jewelry, with its accessibility and experience through innovative products which make a difference in that industry.
Providing solutions for the needs of customers in jewelry industry for more than 20 years, TEB has been supporting this industry with a market share of 12% in gold credits based on BRSA’s December data.
TEB Gold Banking offers its customers service with a range of products including Current Gold Deposit Accounts and Type B Gold Fund
MUNICIPALITY BANKING
Number of municipalities and their subsidiaries that TEB partnered up with reached 650 TEB Municipality Banking continued to be one of the most significant players in this area in 2020 with its products and services developed specifically for the needs of local administration. With Municipality Banking approach, the Bank provided municipalities easy access to financing and contributed to more rapid infrastructural investments.
Providing the first online/real time collection service within the scope of its cash management solutions, TEB offered a faster and easier service for citizens to make their payments to municipalities.

20
RETAIL AND PRIVATE BANKING GROUP
During the pandemic-dominated 2020, TEB Retail and Private Banking Group uninterruptedly delivered its innovative products and services to its customers giving the foreground to its customers’ health.
In 2020, TEB also fortified the value propositions offered through digital channels.
As a result of the efforts spent, digital banking applications were developed rapidly, which enabled significant expansions in services provided digitally.
Amid the special conditions that tainted 2020, TEB supported its customers also with credit card and retail loan debt deferment and restructuring options.
In 2020, TEB Retail Banking carried out its activities with its customer-focused approach to service and increased new customer acquisition. New products and services were designed throughout the year, and marketing activities were executed with an analytical approach, thus responding to quickly evolving customer needs. TEB is focused on continuously improving customer experience while keeping pace with the transforming technology and customer needs.
Priorities in 2020 TEB identified its priorities in the retail banking segment as follows:
• Improve customer experience in all aspects, • Offer digital transformation solutions, • Grow with general purpose loans, Marifetli Account and
new customers, • Increase the number of active customers in all segments
The Bank is focused on upgrading efficiency and customer satisfaction by optimizing digital services in order to deliver a seamless banking experience to its customers.
To be the most recommended bank TEB targets to deliver positive experiences that make a difference in the sector within its service cycle.
In its journey for achieving this target, TEB carries out its activities with the goal to “be the most recommended bank”; to this end, the Bank constantly measures customer experience.
In 2020, the Bank employed the NPS (Net Promoter Score) methodology to measure the customers’ experience with TEB and the level of their recommending the Bank. The survey results are regularly analyzed by the “voice of customer” business units and necessary enhancements are made in improvement areas within customer experience.
As a result of technological upgrades carried out in 2020, TEB incorporated digital channel alternatives within NPS measurement. This development served to receive easy and fast feedbacks from customers.
Based on its competence to contact the customers through their most preferred channels and to be accessible thereon, TEB integrated digital channels with its satisfaction system.
Digital transformation gained great importance in the reporting period due to the transformed customer behaviors instigated by the pandemic.
A long-time investor in digital transformation, TEB continues with developments and improvements on its digital and branch channels. The highlights of these initiatives are presented below:
• Digital customer acquisition • Increased cash withdrawal limits from ATMs • Increased number of turbo video devices and upgrades on
the devices • Efforts for prioritization of contacts at the call center • Communications for referring customers to use digital
channels • Capability to transfer pensions from another bank through
digital channels
Aiming to further enhance customer experience, TEB also keeps investing in CRM, big data, analytics and real-time interaction technologies for gaining a better insight into customer needs and responding to expectations with correctly-timed personalized offers.
Retail and Affluent (Yıldız) Banking
A solution- and customer-oriented approach TEB’s approach to retail banking is a solution- and customer-oriented one. The Bank aims to reach its customers through a higher number of channels, and give its customers effortless, fast and reliable access to all banking transactions digitally, as well as through physical channels.
During 2020, the Bank carried out effective, continuous and multi-channel communication activities in credit and deposit products and this contributed to new customer gains.
Digitalization for superior customer experience During the pandemic, TEB carried out a multi-dimensional and intensive activity in retail loans, and stood by its customers suffering from disrupted cash flows by granting them deferment on their consumer credit balances. By enabling fulfillment of customer demands digitally, the Bank not only made it easier for its customers to make their deferments, but also quickly responded to all possible customer demands.
Having set its priority during the pandemic as protecting customers’ health, TEB quickly improved its alternative distribution channels, and took care to satisfy credit demands through non-branch channels. Owing to the upgrades made to digital channels and the call center in 2020, the share of credit generation on digital channels went up to 44% at TEB.
One of the most preferred banks in consumer credit The Bank secured effective portfolio management aimed at the right target audience on the back of analytical studies conducted, as well as upgraded loan products and processes. Analytical CRM models helped increase campaign efficiencies significantly.
“Marifetli Account”, an account changing savings habits “Marifetli Account”, which has changed Turkey’s savings habits, is a savings account with a daily term and provides account holders the flexibility of depositing or withdrawing cash at any time.
As savers turned to Marifetli Account at a higher extent amid the varying interest rate environment of 2020, the balance in these accounts expanded by 21%. Marifetli Account offered

21
advantageous interest rates to savers throughout the year with its attractive campaigns.
Global Youth (Genç) Account which is a sub product of Marifetli Account offers a lower limit of 100 TL/EUR/USD/GBP to encourage youngsters’ savings. By this account, youngsters earn income on savings of lower amounts and gain awareness on savings at an earlier age.
Growth enabled by salary account customers TEB mediates salary payments of numerous large corporate and public sector institutions with the target of being “the most preferred bank” in salary payments. Supporting the expansion in the Retail Banking business line, salary account customers constituted 21% of newly acquired customers in 2020.
In 2020, special packages offered to customers with salary accounts are enriched with favorable credit terms, deposit rates and discount campaigns for a range of products.
Custom-tailored retention programs are developed for those customers whose salary agreements ended enabled customers loyalty in long run.
71% rise in the number of pension account customers The number of TEB’s pension account customers grew by 71% in 2020. The Bank offered promotional campaigns to customers transferring their pension accounts to TEB, thereby ensuring new customer acquisition and customer satisfaction.
Advantageous credit rates and special customer programs were made available to existing and newly acquired pension account customers, under which they were provided with advantages in various aspects from credit cards to supermarket and healthcare expenses.
Partnerships to support new customer acquisition In 2020 TEB partnered up with management of apartments and building complexes and carried out activities for school payments and transferring parent accounts to TEB in line with the goal of increasing the number of new customers,.
TEB Affluent (Yıldız) Banking
TEB renewed its Affluent Banking propositions to its customers in the medium-upper income group in the second quarter of 2020. Presenting the renewed financial and non-financial privileges with holistic banking approach, TEB strengthened customer loyalty and digital penetration. During 2020, the number of TEB Affluent Banking customers grew by 24% and the ratio of digitally active Affluent customers by 40%.
In May 2020, TEB launched CEPTETEB Affluent, an exclusive mobile app experience for Affluent Customers.
As part of the efforts to facilitate access to financial products during the pandemic, the one-time instruction for using Mobile Approval that is required to bear a wet signature began to be accepted with digital signature. Another novelty brought by TEB Affluent (Yıldız) Banking has been Affluent (Yıldız) Privileges introduced within the scope of CEPTETEB Affluent introduced in June 2020.
TEB Accessible Banking Since 2014, TEB has been working to make its branches and other service outlets capable of offering service under “Accessible Banking”- concept. With its initiatives, the Bank has been eliminating the barriers to accessing banking services, and
letting its customers with disabilities to easily perform their banking transactions.
TEB offers service to its visually-impaired customers out of 170 branches, via 1.652 ATMs and 46.000 POS devices, and to its orthopedically-handicapped customers out of 299 branches and via 678 ATMs. The Bank offers prioritized service to its customers with disabilities through its other channels as well.
A broad product range in bancassurance TEB works in a synergetic collaboration with BNP Paribas Cardif A.Ş. and Zurich Sigorta in the area of bancassurance. Offering life and non-life insurance and private pension products to its customers, TEB boasts a wide product range covering life, personal accident, agricultural, gold, engineering, unemployment, health, liability and pension plans.
During 2020, TEB Bancassurance continued to offer service both through the Bank’s branches and alternative distribution channels in order to respond to its customers’ needs for insurance and private pension products.
TEB Bancassurance is also focused on developing and improving its business processes. The Bank established an information structure which enables viewing and printing the policies purchased via internet and mobile banking, and to search past policies.
TEB also started selling the “Complementary Health Insurance” product, which is targeted at eliminating customers’ health concerns in the face of the pandemic conditions.
TEB Family Academy expands the habit of saving up across the society TEB Family Academy has been systematically working since 2012, to expand the habit of saving up across the society and to help raise a financially literate generation.
Focused on the youth, women and first-time income-earners, TEB Family Academy Financial Literacy Trainings are open to everyone and free-of-charge. Participants in the Academy’s training programs receive basic financial literacy information under the headings of saving up, budget management, correct use of loans and cards, and investing.
Through its partnerships to date, TEB has touched the lives of 20 million people in total from different segments of the society.
More than 6.500 students took part in the face-to-face training within the scope of TEB’s Digital Financial Literacy Program ongoing since 2018, whereas online training sessions have been instrumental in reaching more than 250 thousand youngsters.
To determine and regularly measure the level of countrywide financial literacy, TEB has been preparing a Financial Literacy and Access Index since 2013.
Private Banking
TEB has been offering private banking and wealth management services since 1989. TEB Private Banking operates out of 11 Private Banking Centers and 4 in-branch corners located in Turkey and the Turkish Republic of Northern Cyprus.
Combining BNP Paribas’ global know-how and experiences with an innovation concept, TEB Private Banking services its customers with a rich product portfolio.

22
CEPTETEB application is designed with content and visuals differentiated according to the needs of Private Banking customers.
Using the Mobile Approval function, which is a first in the sector, Private Banking customers can approve their transaction orders via CEPTETEB without a wet signature.
As part of the improvements made during 2020, the Financial Analysis Report that lets Private Banking customers analyze their past and current portfolios at the Bank is launched on CEPTETEB Internet Banking and Mobile Banking App. In addition, TEB Private Banking customers can now access the daily Investment Strategy Report and Stock Report via the mobile app.
TEB Private Banking rendered uninterrupted service to its customers amid the pandemic conditions in 2020. Customers reached TEB Private Banking Customer Representatives and performed their transactions by calling from their registered phone numbers. They were kept informed about the markets and developments through regular teleconferences within the scope of Investment Consultancy services offered by TEB Investment.
TEB Private Banking offers customers investment consultancy service via its experts at specialty branches within the scope of Investment Consultancy model created by TEB Investment. TEB Investment consultants offer portfolio management model alternatives created in line with investor profiles and according to different risk levels.
In light of the developments in international markets, TEB Private Banking increased its synergy with TEB Investment and TEB Asset Management and expanded its product range with new funds, alternative products and services in 2020.
Digital Banking
In 2020, TEB continued to introduce the sector with the fast-developing new technologies and to make life easier for its customers with its innovative approach.
During 2020, 83,6% of TEB customers used non-branch channels.
Loans for which applications were made via digital channels accounted for 61% of total sales, while the share of deposit accounts opened via digital channels rose to 63%.
TEB offers its customers “Fast Track” at IGA, TAV and SAW airports, free-of-charge cash withdrawal abroad and departure fee payments through CEPTETEB mobile banking application.
In 2020, TEB continued to invest in technologies that will create added value for customers. Investments continued in relation to the TEB FX platform which is made available for use by individual and corporate customers via TEB’s Digital Banking Platform CEPTETEB, and the service-provision hours of TEB FX were extended to 24 hours on business days.
In the reporting period, TEB carried out the necessary digitalization efforts to let its customers execute a higher number of transactions with less or no contact. In this context, the customers are provided with the capabilities to deposit cash using 2D (QR) code without touching the ATM screens, and access all their account statements and contracts via the mobile app.
The preliminary work has been completed on the Easy Address Project launched in 2020, which will allow customers to use mobile phone numbers and identification information instead of IBAN in money transfers.
ATM Having one of the youngest networks of ATMs in the industry, TEB offers 7/24 services whether the user is a customer or not.
TEB's ATM market share in 2020 was 3,14%. Providing services with their new user-friendly front-end, 99% of the TEB ATMs allow for cash depositing and have conversion feature (all cash deposited can be used in all withdrawal transactions).
It is possible to withdraw foreign currency from 86% of TEB ATMs.
Nearly 65 million transactions are realized through 1.660 ATMs annually.
TEB’s Global ATM agreement enables the use of TEB cards for cash withdrawals at BNP Paribas ATMs in various countries as well as other banks’ ATMs free of charge. This service is being offered in 6 continents at around 50.000 ATMs.
In addition to those, channels are being set up for customers to perform their cash or other banking transactions through new ATM sharing collaborations.
With the partnership ‘3 Banks Single ATM’ established with two leading banks in the sector, number of ATMS in TEB ATM network reached 7.712.
Open Banking operations TEB carried on with its operations within the scope of Open Banking, which is recognized as the new station of the financial system after digital banking, with the API program and Fintech Partnership Programs in 2020.
Within the scope of the API Program, the Bank’s API set was expanded and began to be used via the Telepati Chatbot. In addition, the infrastructure has been finalized which enables information sharing with third parties, subject to customer approval, under the Open Banking communiqué published by the end of the year.
Many innovative projects within the scope of the strategy to get TEB ready for the future were introduced to internal units within the scope of Fintech partnerships, and integration phase was started for partnerships with which an agreement was reached and which presented their value propositions.
Payment Systems
TEB continued its efforts in 2020 to facilitate payments of individual and corporate customers and develop new payment alternatives. TEB carries out activities to help customers perform their shopping transactions more easily, quickly and securely.
While security of card payments was further increased, additional product features were also enriched. TEB made available payment alternatives that will help merchants grow their turnovers.
TEB keeps on increasing its POS solutions and packages offered for each segment through acceptance of all popular cards via

23
single bank and account, the Bank aimed to make the merchants’ lives easier and add value to their businesses.
In the context of responding to sector-specific needs, the Bank expanded its service spheres by offering solutions and packages catering to customer needs and expectations, such as TEB Milyem POS for jewelers, Harman Card and Harman POS for the needs for farmers and Professionals Packages.
TEB has led the sector through campaigns, which include opportunities intended for end-users and device variety. In 2020, TEB has become one of the several banks to develop its proprietary POS application in the area of Android POS with its internal IT resources. With respect to pioneering initiatives in the payments front, the Bank’s development efforts are in progress for 2D (QR Payment) and Soft POS (using mobile phones as POS devices).
In 2020, the number of banks with joint POS deals reached seven and the number of brands & models collaborated for cash registers reached 18.
TEB extends support to member merchants with turnover and transaction analyses and company-tailored reports, as well as POS payment services. The Bank generated added value by fulfilling needs specific to each business.
As part of its digitalization efforts, TEB kept working towards making life easier for its POS customers and,
• Further enhanced POS capabilities available on CEPTETEB İŞTE. While the Bank lets member merchants effortlessly perform their day-to-day banking transactions with the rich set of functions and ease-of-use, it also made available tools for easy monitoring of all transactions associated with POS;
• Expanded its product/service network through special POS infrastructure for payment institutions, accepting POS applications through digital channels, dynamic currency converter (DCC), second end-of-day, and sub-dealership system.
As of 2020 year-end;
• TEB was offering service at 112.400 locations on the basis of direct POS agreements. The Bank offers member merchants shopping opportunities with installment and Bonus point redemption capability with 40.000 POS devices incorporating Bonus feature,
• TEB supports payment organizations, the new players in the sector. Carrying on with virtual POS efforts with a number of payment institutions, the Bank possesses a comprehensive and reliable infrastructure regarding the recognition and management of sub-businesses. Approximately 70 thousand additional businesses are being served within the scope of this working model.
• With nearly 55.000 agreements in the PRD (Payment Recorder Device) market, TEB has 3,58% share in the PRD-cash register POS market.
• With 66.000 contactless POS/PRDs, the Bank strongly supports contactless payments particularly through solutions and communication campaigns at chain stores.
• POS agreements were made with large corporate customers and global chain stores.
Microbusiness Banking
TEB Microbusiness Banking collaborates with chambers of artisans that play an important role in their respective sectors.
The Bank offers various facilities to trade associations and chamber/association member businesses ranging from free money transfer to reduced loan rates.
TEB launched CEPTETEB İŞTE, the new digital banking application designed for businesses to use banking products and services in a simple and easy manner in line with the Bank’s “your business is always with you” approach.
CEPTETEB İŞTE provides member merchants with a structure to view their instant turnovers and the trend for the last 7 days, take out an installment loan, pay installments, control and monitor all their cash flows. TEB offers a broad product range to tradesmen and microbusinesses with the Patron Card.
The Bank’s Patron Card product provides tradesmen and small enterprises with the opportunity to quickly access credit facilities with a single card through alternative distribution channels. TEB customers can access their full limits in commercial installment loans, seasonal loans, overdraft accounts and company credit cards over a single card with the TEB Patron Card and can meet their commercial loan needs with terms of up to 36 months from TEB ATMs and the TEB Corporate Internet branch on a 24/7 basis.
The Patron Card offers businesses operating in the tourism sector seasonal loan payment options. They are able to make their loan repayments in May-October period in two installments in line with their cash flows.
Women Banking
Increasing women’s participation in the business world and strengthening their presence in every area is crucial in terms of the added value contributed to the economy.
Women-owned businesses are faced with problems in their incorporation and growth phases, particularly in terms of creating collateral and obtaining loans. For the solution of these problems, women need to be involved in the economy with their identity as producers at a higher extent.
TEB is focused on satisfying the women business owners’ needs in business life with an integrated approach to service and to be “the women’s consultant bank”.
In its efforts designed in line with this goal, the Bank concentrates on extending the support women business owners need in financial and non-financial matters for sustainable economic growth. During 2020, the amount of TEB’s lending to women-owned businesses increased by nearly 10%.
TEB generates many high-quality solutions to provide the information that women business owners will need to grow their businesses.
Coaching and mentoring support to women business owners from TEB Through Women Banking support programs, TEB fulfills the women business owners’ need for mentoring and coaching. These activities are conducted within the scope of TEB Star Cluster and TEB Growth Academy.
With these training programs, women entrepreneurs receive learning and coaching service, and are supported in taking steps for growing their businesses with the systematic method and perspective provided by the training.

24
Branch Service Model
TEB has espoused a working system integrated with technology within the scope of digital transformation process. The Bank also produces solutions for its customers preferring to be serviced by branches, as well as non-branch channels. A product of the R&D efforts of TEB’s IT Department, the Turbo® devices can handle nearly 85% of the transactions executed at the counters. Located in TEB branches, Turbo® devices allow performance of not only transactions involving a physical exchange such as cash withdrawal/deposit, payments, credit card delivery, etc. but also those requiring a wet signature, such as taking out a loan.
As of 2020 year-end, Turbo® devices are being used actively at 80 TEB branches in 28 cities. Customers who use the Turbo®
device for performing their transactions choose to use it also on their next visit to the branch, and to handle their transactions themselves rather than seeking online support with increased use.
On the other hand, TEB branch employees working on the sales side can now digitally perform customer transactions faster and more practically using their tablets.
Adapting advancing technology to its operational processes, TEB constantly builds on its business models and service channels based on its “customer-oriented” banking approach.

25
ASSET AND LIABILITY MANAGEMENT & THE TREASURY GROUP
TEB is one of the first banks in Turkey to develop an “Asset and Liability Management” approach.
TEB Asset and Liability Management and Treasury Group has managed interest rate, liquidity and structural exchange rate risks with the aim of maintaining a sustainable profit for the Bank.
The Group has adopted a management style based on sound, prudent and long-term strategies with its competent and experienced staff and the know-how developed in cooperation with the BNP Paribas Group.
In 2020, the Asset-Liability Management and Treasury Group contributed to its subsidiaries to work efficiently in within the boundaries set by compliance.
New regulatory framework governing asset and liability management Despite the economic and political risks in 2020, the Asset and Liability Management and Treasury Group significantly contributed to the Bank’s profitability through proactive hedging strategies in interest rate risk management.
The Group continued to take actions to secure funding diversity and funding maturity extension with the aim of reaching solid and consistent liquidity targets.
Thanks to these actions it achieved to keep the liquidity ratios within limits, and the Bank was able to reach the targets set by the additional required reserves linked to credit growth and asset ratio introduced by the regulatory authorities during the reporting period.
Close watch of global and local markets The Group monitors the local and international markets closely to foresee the potential volatility in the market and so as to mitigate the structural risks in interest rate, FX and liquidity positions in the Bank’s balance sheet. The expertise that is required to be able effectively manage those risks is another strength of the Asset-Liability Management and Treasury Group.
The Group is in constant communication with all the business lines to ensure that the balance sheet is composed of assets and liabilities with the right cost structure and in line with the competition faced from the market.
The Asset-Liability Management and Treasury Group plays an important role in modeling interest and liquidity risks accurately, measuring the realizations and the decision-making
processes of the Bank through reports prepared for matters under the Group’s responsibility.
Efforts to diversify funding sources In 2020, the Asset-Liability Management and Treasury Group aimed at creating a stronger and more consistent liquidity for the Bank by securing a broad base of deposits. To this end, the Bank focused on Marifetli Account and a substantial growth has been recorded in that product.
In line with TEB’s targets in digital banking, the Asset-Liability Management and Treasury Group maintained its supportive stance for the pricing made through the CEPTETEB channel.
For diversifying funding sources, the Group also initiated working on a cash flow based funding product towards securing long term funding from international markets.
Upon transition to the asset ratio practice, TEB bond issues were increased significantly, thereby creating long-term liabilities and securing product diversity.
Asset-Liability Management and Treasury Group incorporated TL REF, which is anticipated to replace TL Libor, in its product range, and played an active part in TL REF-linked loans and TL REF-linked interest rate swaps (Overnight Index Swap-OIS).
Collaboration of experience with BNP Paribas in the field of effective liquidity and risk management Information flow between specialist teams to adapt BNP Paribas’ know-how in modeling analyses to the requirements of Turkey by the Asset-Liability Management and Treasury Group continued efficiently in 2020.
Competitive pricing of export loans and corporate loans have been enabled by the low-cost funding provided by BNP Paribas.
Additionally, work was carried out to adapt the liquidity and risk management policies implemented by the BNP Paribas Group to the Bank, and experiences were shared for a more efficient liquidity and risk management.
Specific activities were performed for intraday liquidity management and experiences were shared to effectively manage liquidity under stressful situations.

26
CORPORATE INVESTMENT BANKING GROUP
TEB Corporate Investment Banking Group operates since 2011. The Group provides Turkish companies targeting strategic business opportunities at home or abroad with consultancy support that will cater to such pursuits, and supports this service with loans and capital market transactions.
The Corporate Investment Banking Group targets to deliver customized international solutions with high added value to customers in a fast and effective manner. To this end, international gains are achieved with the support derived from BNP Paribas’ financial strength competency in global products.
The Group carries on with its customer-oriented activities in the fields of Global Markets, Financial Institutions, Large Corporate Groups, Large Corporate Groups Finance and Corporate Finance and Strategic Business Management.
In 2020, TEB Corporate Investment Banking Group successfully sustained its development despite the competition and toughening market conditions.
In borrowing and international market transactions realized by the targeted clients, BNP Paribas’ wide range of products and geographical network has been efficiently utilized.
In a year when corporate firms and financial institutions were inclined to diversify their resources, the Corporate Investment Banking Group continued to offer international debt instruments to its customers and brought them together with international investors.
Global Markets continued its operations in changing and developing global markets in a strong and sustainable growth trend in 2020.
Using domestic and foreign markets effectively, TEB carried on solution generating tailored solutions with its staff experienced in managing currency, interest and commodity risks in a wide range of instruments such as spot, swap, options and structured derivative products.
TEB focused on new generation digital solutions to carry customer experience to the highest level and TEB FX platform was launched. With this platform, Retail, Private, SME and Corporate Banking customers are provided the opportunity to perform transactions in more than 40 pairs of currency at market exchange rates as well as accessing market and economy news, setting up alarms and placing orders thus making use of market opportunities rapidly.
Solutions tailored for large corporate clients The Large Corporate Groups Department offers various structured products and funding alternatives to the pioneering companies in Turkey by making use of the BNP Paribas’ wide global network.
The Department manages all kinds of banking transactions of Turkey’s leading large corporate groups, and develops banking solutions that are compatible with TEB’s customers and those of BNP Paribas alike. The Department extends the necessary support for the creation of favorable financing conditions (bonds, public offering, project finance, acquisition finance and sector-specific financing solutions etc.).Developing high-level
relationship management with its customers, the Large Corporate Groups Department targets to provide the products and service with the highest added value available at TEB and BNP Paribas at the highest extent possible.
The Department also aims to strengthen its customers’ cash flows by producing different financing solutions, while at the same time setting policies to be positioned as the cash flow bank of these groups and ensuring efficient management of these policies.
TEB has also pioneered the financial markets in terms of sustainability, with the intermediary service it provided for a Sustainability Linked Loan of a corporate firm in Turkey.
The Corporate Finance Department provided consultancy services in big infrastructure projects in 2020, helped private capital funds in Turkey with their business ideas thanks to the rich client portfolio of TEB and intermediated strategic investments.
TEB owns a structure that meets all the customer needs in Investment Banking. The Corporate Investment Banking Group is a structure that combines TEB’s power in the local market with BNP Paribas’ financial strength, position in global finance markets, expertise and experience in capital markets, structured finance and consulting.
Capable of single-handedly responding to a corporation’s all requirements in these areas; the Corporate Investment Banking is integrated into TEB’s client portfolio and BNP Paribas’ product range. This allows the Group to benefit from both the growing network of TEB clients and the strong product specialists at BNP Paribas.
Syndicated loan was rolled over successfully. In 2020, TEB renewed its syndicated loan, and secured funding equivalent to USD 335 million in total from international markets.
The syndication deal contributed to refreshed trust in Turkey’s solid banking system by international markets, and served as a re-endorsement of the strong structure of the financial system.
The syndicated loan with a 367-day maturity TEB signed on 30 October 2020 is for the amount of EUR 250 million and USD 41,5 million. The all-in cost of the facility that will be used towards the general financing of foreign trade is set as Euribor+2,25% for the Euro tranche and as Libor+2,50% for the USD tranche.
Money transfer services at low-cost TEB offers money transfer service to its customers requiring transfers in the local currency of different countries due to having investments in these countries via its correspondents.
Enjoying the capability to transfer money in 135 currencies to more than 180 countries, TEB provides money transfer service at competitive special costs to its customers carrying out bulk transfers, thanks to its strong correspondent network.

27
TEB SECURITIES SERVICES
TEB Securities Services offers service under Corporate Investment Banking (CIB). The department offers solutions for capital markets related operations and new products to foreign financial institutions, foreign custodians, institutional investors and issuers of capital market instruments, with a consultancy approach.
Having completed its 13th year in the industry in 2020, TEB Securities Services started to operate within TEB in 2007, and has since been providing local custody and settlement services in cooperation with BNP Paribas Securities Services, which is Europe’s largest custodian bank, that were originally established by BNP Paribas in Turkey back in the 1990s.
The department also offers post-trade services for its customers’ needs pertaining to capital market instruments, which may arise subsequent to their investment and financing decisions. In addition, TEB Securities Services also provides TL correspondent bank service to non-Group banks and financial institutions.
TEB Securities Services provides the following services;
• Settlement and custody services for equities, debt instruments and other capital market instruments,
• Turkish Lira correspondent banking transactions service, • Account operator service for omnibus accounts for
International Central Securities Depositories in Turkish market,
• Collateral and cash management services for derivatives, • Securities borrowing/ lending transactions, • Outsourcing services for brokers, • Escrow and collateral management services, • Debt instrument, certificate and warrant issue-related
operations and payment services, • Account operating services for issuers’ central registry
agency accounts, • Individual custody, collective portfolio custody and
funding services for portfolio management companies.
Sustaining its successful performance as in the previous years, Securities Services Department won new clients and carried on managing the transactions of clients successfully in 2020.
Having the global perspective with a pioneering and client-focused approach TEB remains the choice of clients seeking more than a custodian bank for post-trade services in capital markets.
The department consistently ranked first in the surveys conducted by the market’s leading institutions in 2020, which polled customers’ opinions and scores:
• Global Custodian - Agent Banks in Emerging Markets (ABEM 2020)
• Global Investor Magazine - Sub Custody 2020 • Global Finance Magazine - Country Award Best Sub-
Custodian Bank 2020
TEB Securities Services monitors all the developments realized by regulatory bodies, namely Capital Markets Board of Turkey (CMB), Takas Istanbul (Istanbul Clearing, Settlement and
Custody Bank Inc.), Borsa Istanbul (BIST), Merkezi Kayıt Istanbul (MKK - Central Securities Depository of Turkey) and the Banking Regulation and Supervision Agency (BRSA) from legal,
technological and operational aspects. The department provides solutions to client needs on the securities services business with investments in new products and technology.
Making use of these developments as an opportunity to cooperate with clients and developing joint projects with them, the department stands out from the competition with its investments aimed at achieving operational excellence with priority given to helping its clients expand their businesses.
As a pioneering post-trade services provider, the objective of the department is to implement innovative solutions that will contribute to the development of the capital markets and the Bank.
To achieve this objective, collaborations continue with BIST, Takas Istanbul, MKK and Turkish Capital Markets Association (TSPB).
Significant developments occurred in the Turkish capital markets in 2020, and new product and cooperation development efforts continued throughout the year.
In 2019, long-awaited omnibus account structure for International Central Securities Depositories (ICSD) was launched. With this change, omnibus account structure which allows beneficiaries abroad to monitor and manage all their capital market instruments in an collective manner has been added to account types held under MKK.
Omnibus account structure is compatible with working principles of ICSDs. Using the account system adopted by these institutions all around the world for our country’s capital market instruments will help increase the use of Turkish capital market instruments in international transactions as collateral and facilitate integration of domestic markets with international markets.
Within the frame of the approval obtained, domestic government bonds owned by non-resident institutions and funds can be included in omnibus accounts held at MKK. Since the central counterparty (CCP) services started to be provided in the BIST Equity Market, TEB Securities Services conducted comprehensive evaluations with Takas İstanbul and the clients on the impacts of these changes on markets and services provided. Following these developments, TEB started preparations towards being a General Clearing Member in the BIST Equity Market.
TEB continues its efforts to support development and growth of this market by becoming the leading bank providing this new service.
The department also works in close collaboration with other TEB affiliates active in capital markets. In particular, the services related to BIST Futures and Options Market offered in partnership with TEB Investment has brought considerable success with increasing transaction volumes and addition of new customers.
TEB Securities Services Department continued to provide collective portfolio custody and fund services for portfolio management companies in 2020.

28
NEW PRODUCTS AND SERVICES
CORPORATE BANKING GROUP
In 2020, TEB Cash Management developed integrations with the Association of Public Notaries regarding second-hand car sales, and with TURMOB/LUCA for salary payments, and introduced e-Waybill and Easy Address definition products.
SME BANKING GROUP
Taking into consideration the pandemic conditions and transformed customer expectations, the SME Banking Group redesigned its products and processes in an effort to provide faster and solution-oriented service to SME customers at branches, and introduced support packages providing easy payment terms for SMEs.
New features aligned with customer needs were added to CEPTETEB İŞTE, the banking app specifically designed for commercial companies and launched in 2019. In this context, the Bank began to accept loan applications, POS demands, commercial credit card and cheque book demands via the app in 2020 in order to deliver new digital experiences to customers.
İstanbul Ataşehir Start-up House, the first hub opened in 2013 by TİM-TEB Start-up House which is Turkey’s most comprehensive start-up network, relocated in 2020 to the new campus, Kolektif House, in Maslak area where the start-up ecosystem is concentrated.
In February 2020, to support the technology firms and start-ups in Ankara, a new Start-up House was opened in METU CoZone established in METU Technopolis with the aim of bringing together the start-up ecosystem in Ankara.
RETAIL AND PRIVATE BANKING GROUP
During 2020, TEB continued to fulfill the needs of its Retail and Private Banking customers with services designed to generate added value.
TEB renewed its Affluent Banking propositions offered to its customers in the upper income group in the second quarter of 2020. In May 2020, CEPTETEB Affluent was launched which is the mobile app exclusive to Affluent Customers, whereas June 2020 marked the introduction of Affluent Privileges within CEPTETEB Affluent. With a dynamic structure that is revised according to current needs and circumstances, TEB Affluent Banking makes its financial products and services accessible by its Affluent Customers through all channels, and its non-financial privileges via CEPTETEB Affluent.
Offering various advantages and discounts to its customers at dozens of brands and restaurants under eight different categories from restaurant and delivery service privileges to dry cleaning, from travel privileges to advantages at supermarkets, TEB Affluent Banking has been an important step in terms of customer satisfaction and digitalization.
TEB’s personal banking assistant that is able to respond to frequently asked questions about banking products and services, and provides the location information for nearest ATMs and branches, TELEPATİ continued to offer service with additional functions. Under the new capabilities, TEB customers can now execute their banking transactions 24/7 after identity authentication and can easily receive the answers to a large set of questions via TELEPATİ.
Having a drastic impact on social life as a whole in 2020, the Covid-19 affected the banking activities and compelled change. In this process, digital transformation has become the key focus area in order to be able to reach larger audiences.
In this context, TEB undertook various developments and improvements on a number of digital channels and its branches in order to make customer experience even more perfect.
Highlights of development and improvement initiatives are given below:
• Digital customer acquisition • Increased cash withdrawal limits from ATMs • Increased number of turbo video devices and upgrades on
the devices • Efforts for prioritization of contacts at the call center • Communications for directing customers to use digital
channels without having to go to branches • Capability to transfer pensions from another bank through
digital channels • Initiatives for customers above the age of 65
SECURITIES SERVICES
TL Correspondent Account Services In 2020, TL correspondent account services provided to non-Group overseas banks and financial institutions was included in the product and service range of TEB Securities Services. The department provides post-transaction services for capital market instruments and TL correspondent bank accounts of its clients set up with the Bank with its team of specialists at the TEB Head Office. The department actively contributes to furthering the Turkish lira correspondent banking transactions offered by TEB, mainly to custody banking customer portfolio.
Account Operator Service for Omnibus Account Structure Holding a general custody license, TEB Securities Services began offering account operator service to Euroclear Bank, one of Europe’s leading banks, from 20 July 2020 subject to the principles defined for International Central Securities Depositories (ICSD) and in accordance with the omnibus account structure regulations. With this breakthrough, TEB further reinforced its image as the pioneering bank in the sector and kept expanding its product array by adding a key account to its portfolio.

29
TEB FINANCIAL AND NON-FINANCIAL SERVICES GROUP
TEB FAKTORİNG A.Ş.
One of the biggest players in its industry, TEB Faktoring A.Ş. (TEB Faktoring) provides export, import and domestic factoring products and services to corporate and commercial customers and SMEs.
In 2020, TEB Faktoring’s business volume was TL 9,95 billion and its total assets were TL 2.623.555 thousand, with a growth of 26%.
Having recovered gradually from the second half of 2019, economy began to be negatively affected by the Covid-19 pandemic that took the whole world in its grip from March 2020 onwards. Yet, the business volume of the factoring sector grew by 14% during 2020.
TEB Faktoring successfully increased its factoring receivables by 21% especially owing to its efficient domestic factoring service to its clients despite the restrictions and lockdowns imposed against the pandemic for the most part of 2020.
TEB Faktoring’s net profit in 2020 amounted TL 29.073 thousand. As of 2020 year end, TEB Faktoring’s return on equity was 16,1%. Return on equity for the industry was 11,3% for 2020.
Maintaining its robust capitalization along with stable growth, TEB Faktoring accordingly raised its paid-in capital from TL 30 million to TL 50 million in December 2020.
While the reduced economic activities resulting from the restrictions imposed in connection with the Covid-19 pandemic led to scarce supply, increased costs and disrupted cash flows that ran in parallel caused a surge in the number of companies faced with payment difficulties; hence, credit repayments were also negatively affected. Notwithstanding, the ratio of bad cheques and non-performing loans declined in 2020 thanks to the measures, relief packages, increased lending by the financial sector, restructuring and temporary maturity extensions in the definition of NPLs introduced in an effort to alleviate those negative effects of the pandemic.
In 2020, the factoring industry’s non-performing loan ratio (NPL) and cost of risk ratio were 3,9% and 1,6%, respectively.
Focusing more on risk management, TEB Faktoring’s NPL ratio and cost of risk ratio were 0,73% and 0,15%, respectively, which are well below the industry average.
As of year-end, the company had 1.681 active customers, 16 branches and 100 employees.
In 2020, TEB Faktoring remained among the leading factoring companies in Turkey and the world in terms of the export factoring business volume according to Factors Chain International (FCI), the world’s biggest factoring chain.
In 2020, TEB Faktoring was rewarded as the most admired company of our country for the third time.
Having adopted an efficient and effective company management principle, TEB Faktoring attaches great importance to digital transformation in order to provide better service to its customers and to achieve success in the difficult conditions created by a fragile economy.
Within this scope, TEB Faktoring initiated many fundamental projects in the recent years.
In our fast changing era, sustainable digital transformation and digital services play a key part in real economy and competition. TEB Faktoring kept improving its digital channels also in 2020 in line with its customer-oriented and innovative vision.
One of the pivotal elements of profitability and enable employment of different channels for reaching customers, efficient risk management, and increasing productivity, automation and rapid service, digitalization projects will be carried on in 2021.
TEB Faktoring caters to customer needs evolving with the advancing technology by offering an effective and lean digital experience and by standing by its customers any time,wherever they may be. Extending increasing support to all its customers with a particular focus on the SMEs, TEB Faktoring has contributed to Turkey’s sustainable economy.
Centering its digitalization efforts around both work processes and customer services, TEB Faktoring has placed TEB Faktoring mobile application in its focal point.
Allowing customers to make their applications digitally, and letting them obtain results and pricing quickly, TEB Faktoring mobile app is planned to be further upgraded in 2021, and to be enriched with additional services that will provide a leaner user experience.
Getting ready for the future together with fintech companies and digital platforms that make up an important component of digital transformation and digital business models, TEB Faktoring will remain one of the players steering the marketplace with its digital products and services in the future, as it has been before.
Carrying on with its contacts along this line in 2020, TEB Faktoring will finalize supplier finance platforms and information bridge projects in particular by early 2021, and will introduce applications that customers can easily reach for obtaining results quickly and having a better user experience.
Management of risks in economy, particularly in the domestic market, is becoming more critical. In today’s economic environment, for healthy growth SMEs will need to focus on exports with more favorable conditions. Their most significant motivation will be to open up to new markets, realize trade with companies in countries they do not know and which they cannot measure their risk while protecting their cash flow and equity. Factoring firms providing all these services will be their biggest supporters by providing factoring guarantee, finance and collection services.
Besides the support it extends to the SMEs, TEB Faktoring offers solutions generating value also to multinationals with the added contribution of BNP Paribas’ global network and synergy. Through Multi-Local, an authentic approach that comes at the top of these solutions, the company offers the service, which the global sister companies of multinationals receive from BNP Paribas Group companies, in Turkey at the maximum extent possible under the local rules and regulations.

30
Drawing from the strong domestic and overseas relationships of TEB and BNP Paribas Group, TEB Faktoring also embraces the Group’s “creating value for all of the stakeholders” strategy. Accordingly, while the company supports its customers with the factoring product, it also carries on with cross-selling and
creating synergy at points that the Group’s assistance and support can be utilized.

31
TEB PORTFÖY YÖNETİMİ A.Ş.
TEB Portföy Yönetimi A.Ş. (TEB Asset Management) has been operating in asset management sector since 1999.
As of year-end 2020, it is the 7th largest asset management company in Turkey, with TL 14,5 billion assets under management and 3,96% market share in the sector.
Authorized by the Capital Markets Board of Turkey (CMB) to engage in asset management and investment advisory activities on 15 June 2015, the Company has an authorization certificate numbered PYŞ/PY.22-YD.11/524.
The main activity of the company is to launch and manage mutual funds subject to the Capital Market Law and the provisions of applicable legislation.
In addition, TEB Asset Management, which also manages private pension funds, provides investment management services to institutional and retail clients in line with their risk profiles as a proxy under portfolio management agreements and investment advisory services to international funds.
On 16 August 2019, TEB Asset Management reached a deal with ING and acquired all shares of ING Portföy Yönetimi. Thanks to the strategic collaboration with ING for the distribution of mutual funds launched by TEB Asset Management and with NN Hayat Emeklilik for the management of pension funds launched by NN Hayat Emeklilik, the company further increased its existing strength in the sector in 2020.
Following the Covid-19 outbreak, TEB Asset Management began working mainly on the basis of remote access. In this context, the company kept all risk and control points under close watch, maintained close contact with its clients and business partners regularly keeping them informed about financial markets and mutual funds, and prioritized liquidity in portfolio investments, by taking necessary precautionary actions to preclude any liquidity problem under an extraordinary circumstance.
Having a wide external distribution channel, TEB Asset Management had:
• a 3,03% market share in the mutual funds market, with a total of TL 4,2 billion of assets,
• a 2,91% market share on the actively-managed mutual funds,
• a total of TL 144 million assets under management in its institutional wealth management and discretionary portfolio management business lines,
• a 5,79% market share in the pension funds market, with a total of TL 9,9 billion assets
• a total of TL 271 million in international investment funds,
as of 2020 year end.
The synergies that TEB Asset Management generates by collaborating with BNP Paribas Asset Management, one of Euro Zone’s leading asset managers, are accelerating the company’s progress in becoming a global force. Thanks to this collaboration, TEB Asset Management entered into strategic partnerships with many other international firms.
TEB Asset Management manages Parvest Turkey Fund, a leading Turkish equities based fund whose assets of TL 216 million are invested in the stocks of companies established in Turkey. TEB Asset Management also manages Japan-based Turkey Equity Mother Fund, whose assets amount to about TL 55 million.
TEB Asset Management provides investment advisory to other international funds which invest in Turkish equities with asset size of TL 45 million. Based on the total assets of equity based international funds that are managed and advised, TEB Asset Management is one of Turkey’s largest asset managers working for international clients.
TEB Asset Management put into life a number of projects in 2020, the foundations of which it had laid within the scope of digitalization.
An agreement was signed within the frame of Robot Advisory service with GAMBIT, Europe’s largest company in its field used by 20 institutions engaged in the finance sector including the BNP Paribas network, covering total assets worth EUR 50 billion, and servicing over 1 million end-users.
With the aim of achieving a more active presence in digital and social network media, and optimizing content management, media planning, agency management, event management and media/press relations, TEB Asset Management made an agreement entailing these services with TEB.
Personnel taking place in TEB Retail Banking sales network were given capital market trainings about capital markets with a special emphasis on TEB Asset Management mutual funds through TEB Fund Academy. In the wake of the Covid-19 pandemic, training programs were shifted to distance learning platforms from June 2020.
TEB Asset Management steers its investors to the right investment alternatives at the right times and capitalizes on cooperation opportunities with the potential to increase its market share together with its domestic and international stakeholders. The company also implements hedging strategies against potential volatilities in markets to protect its clients and itself.

32
TEB YATIRIM MENKUL DEĞERLER A.Ş.
Having started its operations in 1996, TEB Investment conducts the investment services and operations of the TEB Group as a “Broadly Authorized Brokerage House” being an investment house licensed by the Capital Markets Board of Turkey (CMB).
In line with this, TEB Investment currently provides the following investment services:
• Brokerage services (domestic and abroad) • Portfolio intermediation services (domestic) • Investment advisory services • Issuance intermediation services • Custody services (Limited custody services) • Introducing brokerage services.
Backed by 25 years of experience, TEB Investment reaches its clients at home and abroad with an extensive array of products and services through a variety of product and service channels that address the particular needs of different investor profiles. Accordingly, the company provides intermediation services in capital market instruments such as equities and derivatives markets, debt instrument markets and mutual funds, along with corporate finance and research services.
In the field of corporate finance, TEB Investment offers high-quality advisory services in the areas of mergers and acquisitions in integration with intermediation of public offering and debt aimed particularly at fulfilling the financing needs of businesses.
In parallel with the developments in international markets, TEB Investment captured the technological innovations that gained speed especially in recent years in its own IT infrastructure, upon which it has developed major projects and upgraded its digital infrastructure covering both mobile and desktop applications in line with customer demands.
Another important advantage TEB Investment enjoys in the investment houses universe is the research infrastructure at its disposal, which supports its extensive and efficient marketing network. TEB Investment has become an investment house appreciated particularly by investors with a number of awards earned in this area in recent years.
TEB Investment is one of the few companies maintaining a good balance in the delivery of its extensive intermediation and research services to individual and institutional investors, alike.
Specifically in the capital markets, TEB Investment is an investment house of choice by virtue of its competent human resource capable of effectively serving both individual and institutional investors, a team of experienced research experts, ability to combine its local market knowledge with the international experience of its global partner, BNP Paribas, and effective use of technology.
In conducting its activities, TEB Investment also capitalizes on the international experience of, and collaborates with the BNP Paribas Group. A central example of this collaboration has been the research conducted in the area of financing resources entailing different products, addressing clients in the field of corporate finance. In addition to that, there is intense collaboration in institutional intermediary services, access to
international markets, investment advisory in Retail and Private Banking business lines, digitalization and new customer acquisition.
TEB Investment carries out a number of activities with various business lines of TEB and BNP Paribas that increase the synergy within the group. While TEB Investment handles a substantial portion of debt issues for TEB’s subsidiaries and TEB itself, intermediation and corporate finance services are offered to TEB’s corporate customers in debt and equity issues, and commodity hedging and derivatives transactions are intermediated in select products.
Together with the Retail Banking Group, the company acquires new customers digitally and through the branch channel for investing customers’ assets in Borsa İstanbul; similarly, joint marketing activities are carried out with the Bank’s custody department with the purpose of offering brokerage services to foreign institutional investors.
The company collaborates with BNP Paribas in customer acquisition and creation of marketing strategies in the futures and equity markets, and work is undertaken to offer certain global markets’ products covered in the services portfolio of BNP Paribas jointly with TEB Investment to clients.
TEB Investment recognizes that digitalization, which has gained speed due to the trends in technology, is modifying the sector’s structure and business conduct in parallel with the changes in international markets and local regulatory framework. Aware of this fact, the company implemented the strategies it has formulated and concentrated on enriching the customer experience through service diversification in different segments.
In 2020, as the first step of achieving these targets, transformation initiatives were continued in order to create a customer experience that puts effective employment of technology and research in the forefront, and to rebuild TEB Investment into a more efficient company with a higher level of digitalization.
Continuing to work towards offering innovative platforms to its clients in the area of digitalization, TEB Investment will be launching its new investment applications and websites from early 2021. The new platforms that will cover a number of value-added services will bring along many infrastructural innovations which will support investment decisions and speed up service processes in terms of customer experience.
The company constantly reviews and revises its technical and organizational infrastructure as necessary in order to complete its efforts targeted at new services planned to be introduced in the coming period, particularly structured products and digital platforms, and to create added value for all its stakeholders amid the evolving market structure.
On the basis of domestic markets, on the other hand, recent global and local developments fueled household interest in the capital markets from the first quarter of the year, and the number and composition of investors changed significantly.
In the wake of the pandemic that commenced in March 2020, TEB Investment enabled all its employees to carry on with their work seamlessly, securely and without suffering from business

33
interruption through remote access enabled by its technical infrastructure and means. During this period, all customer marketing activities, and contacts with internal and third parties were carried out through remote access. TEB Investment Head Office and branches implemented rotating working system, and the health of employees was monitored closely. In the office environment, equipment and protective materials securing hygiene were distributed to all employees, and necessary measures were taken. Physical and protective health requirements defined by the Group and by the public authority were implemented at a high standard to safeguard employee health. The actualizations that occurred in the Company’s revenues and expenses by reason of Covid-19 did not have a material impact on the Company’s financials.
As a result of all these developments, TEB Investment successfully attained its budgeted targets for 2020 and authored significant achievements in terms of a number of criteria. At 2020 year-end, TEB Investment ranked 20 with a 1,90% share of the market for its trading volume worth TL 248.788 million in Borsa İstanbul Equity Market. TEB Investment ranks 9th in Borsa İstanbul Derivatives Market with a 3,71% market share secured with a trading volume of TL 212.628 million.
With its organizational and systemic infrastructure focused on domestic and international developments and changes, TEB Investment targets to increase its market share particularly through digital channels and investment advisory services, and to sustain its active and pioneering role in the development of our country’s capital markets by offering high-quality and value-added services to investors in the coming year.
Having redefined its vision along this line in 2020, TEB Investment spelled it out as “Our vision is to be named as the place where all investors active in financial markets of Turkey place the highest reliance on, and take support from the suggestions of, and feel standing beside themselves on their way to guide their investments and achieve their goals”. The company will carry on with its operations with the same vision.

34
TEB ARF TEKNOLOJİ A.Ş.
TEB ARF Teknoloji A.Ş. was incorporated in Büdotek Technopark in Dudullu with a capital of TL 50.000 and officially started operations in December 2020. The founding objective of the company is to conduct the software development activities of an R&D nature under a separate legal entity, and derive a competitive advantage by increasing the focus in these areas. TEB ARF’s activities in 2020 were restricted with producing software programs exclusively for Türk Ekonomi Bankası A.Ş.
Having started operations by year-end 2020 and having ended 2020 with a sales volume of TL 1,1 million, TEB ARF will be offering service in relation to software programs and advanced analytics to TEB in 2021.

35
SECTION 2 - INFORMATION ABOUT MANAGEMENT AND CORPORATE GOVERNANCE PRACTICES
HEAD OFFICE ORGANIZATION CHART

36
BOARD OF DIRECTORS
Chairman and Members of the Board of Directors
Name-Surname Title Yavuz Canevi Chairman Dr. Akın Akbaygil Deputy Chairman Jean-Paul Sabet Deputy Chairman Ümit Leblebici Executive Member and CEO Nicolas de Baudinet de Courcelles Board Member and Chairman of the Audit Committee Ayşe Aşardağ Board Member and Deputy Chairman of the Audit Committee Yvan L.A.M. DeCock Board Member and Member of the Audit Committee Sabri Davaz Board Member and Member of the Audit Committee Özden Odabaşı Board Member Xavier Henri Jean Guilmineau Board Member François Andre Jesualdo Benaroya Board Member Hans Wilfried J. Broucke (*) Board Member (*) As of 4 August 2020, Hans Wilfried J. BROUCKE was appointed as the Board Member of our Bank to replace Jacques Roger Jean Marie RININO, who resigned from his position as a Board Member of our Bank. Yavuz Canevi, Chairman March 2015-present TSKB, Board Member 2012-2015 FERB Turkish - French Business Forum, Vice President 2010-2015 FERB Turkish - Holland Business Forum, Board Member 2009-present Global Relations Forum / Auditor 2004-2010 NETAŞ, Board Member 1996-present TEB A.Ş., Chairman of the Board of Directors 1995-2019 İKV, Member of the Board 2001-2013 TEB Holding A.Ş., Board Member 2001-2010 Hedef Alliance A.Ş., Member of the Board 1993-2012 TSKB, Member of the Board 1989-present FNSS Savunma Sistemleri A.Ş., Chairman of the Board 1991-1994 TÜSİAD, Member of the Board 1989-present TÜSİAD, Member of High Advisory Council 1998-2011 TEB N.V. Holland, Chairman of the Board of Directors 1993-2005 Istanbul Stock Exchange, Deputy Chairman and Board Member 1989 2005 EUROTURK BANK Member of the Board 1987-1989 Turk Eximbank Chairman of the Board of Directors 1986-1989 Undersecretary of Treasury and Foreign Trade, Republic of Turkey Prime Ministry 1984-1986 Central Bank of Turkey, Governor 1980-1984 Central Bank of Turkey, Vice Governor 1979-1980 T. Garanti Bankası, Assistant General Manager in Charge of International Relations 1976-1979 Central Bank of Turkey, CEO of Foreign Exchange 1960-1975 Auditor, Ministry of Finance
Georgia State University, USA, Faculty Member 1966-1969 University of Southern California (USC), USA, MA Economics 1956-1960 Ankara University, Faculty of Political Science, Department of Public Finance and Economics

37
Dr. Akın Akbaygil, Deputy Chairman 1988-present TEB A.Ş., Deputy Chairman 1986-present TEB A.Ş., Credit Committee Chairman 2017 -2019 Ekonomi Yatırımlar Ltd. Board Member March 2011-present TEB Holding A.Ş., CEO 2005-present TEB Faktoring A.Ş., Chairman March 2011-March 2017 TEB Holding A.Ş. Board Member – CEO February 2005– March 2017 TEB Mali Yatırımlar A.Ş. Board Member – CEO April 2008 – March 2017 TEB A.Ş., Audit Committee Deputy Chairman March 2013 – March 2016 TEB A.Ş., Independent Board Member 2011-April 2014 TEB N.V., Chairman 1999-2013 Ekonomi Bank IBU Ltd., Deputy Chairman 2011-2012 TEB Yatırım Menkul Değerler A.Ş., Chairman 2011-2011 Fortis Yatırım Menkul Değerler A.Ş., Board Member 1998-2011 TEB N.V., Deputy Chairman October 2003– March 2011 TEB Mali Yatırımlar A.Ş. General Manager 2005-2010 TEB Finansal Kiralama A.Ş., Chairman July 1998– February 2005 TEB Mali Yatırımlar A.Ş. Deputy Chairman 2004-2007 TEB Portföy Yönetimi A.Ş., Chairman 1997-2005 TEB Sigorta A.Ş., Chairman
TEB Faktoring, Board Member 1996-2005 TEB Finansal Kiralama A.Ş., Board Member February 1988– October 2003 TEB A.Ş. Deputy Chairman - CEO 2001-2002 Banks Association of Turkey, Deputy Chairman 1994-2001 Banks Association of Turkey, Board Member April 1988– July 1988 İlkesan Yat. ve Gel. A.Ş., Deputy Chairman March 1986– April 1988 İlkesan Yat. ve Gel. A.Ş., Board Member June 1983– February 1988 TEB A.Ş., Board Member, CEO May 1982– June 1983 TEB A.Ş., Board Member 1965-1982 Akbank T.A.Ş. Director of Foreign Affairs 1969-1973 Istanbul University, Faculty of Economics, Ph.D. 1967-1968 Istanbul University, Faculty of Economics, MBA 1962-1967 Istanbul University, Faculty of Economics, BA
Jean-Paul Sabet, Deputy Chairman January 2013-present Deputy Head of International Retail Banking 2010-2012 BNP Paribas, International Retail Banking, Head of Turkey Zone October 2010 - November 2010 TEB A.Ş., Audit Committee Member June 2010-present BNP Paribas Yatırımlar Holding A.Ş., Chairman February 2011 - present BNP Paribas Fortis Yatırımlar Holding A.Ş., Board Member 2010-present TEB A.Ş., Deputy Chairman of Board of Directors
TEB Holding A.Ş., Board Member BNP Paribas International Retail Banking, Turkey
2010-2015 BNL Banca Nazionale del Lavoro, Italy Board Member October 2014-present Bank Gospodarki Zywnosciowej S.A., Board Member April 2013-present JSC “UkrSibbank”, Board Member, Ukraine 2013-2015 BNP Paribas Polska SA, Chairman of the Audit Committee, Poland August 1988-present LDC, Board Member, France 2006-2009 Banca Nazionale del Lavoro/BNP Paribas Italy, C.O.O. 2004-2006 French Retail Banking Management Committee, Member
Head of BNP Paribas Finance and Strategy Department 1998-2003 KLEPIERRE France, Board Member 1996-1998 Société Centrale D’Investissements, France 1973-1976 H.E.C. Ecole des Hautes Etudes Commerciales

38
Ümit Leblebici, Executive Member and CEO July 2020-present TEB ARF Teknoloji A.Ş., Chairman July 2017-present FERB Board Member May 2014-present Banks Association of Turkey, Deputy Chairman September 2013-present TEB A.Ş., Executive Board Member and CEO February 2013-September 2013 TEB A.Ş., Deputy CEO 2002-2013 TEB A.Ş. Assistant General Manager, ALM and Treasury Group April 2013-September 2013 TEB Yatırım Menkul Değerler A.Ş., Chairman 2012-December 2014 TEB Portföy Yönetimi A.Ş., Chairman 2011-2012 TEB Portföy Yönetimi A.Ş., Board Member 1999-2002 TEB A.Ş. Director, Treasury Group 1997-1999 Ottoman Bank, Treasury Manager March 1997 -July 1997 Ulusal Bank, Treasury Manager 1991-1997 Midland Bank, Treasury Manager 1988-1994 Istanbul University, MBA at Finance Major 1984-1988 Istanbul University, Faculty of Business Administration Nicolas de Baudinet de Courcelles, Member and Chairman of the Audit Committee July 2019-present TEB A.Ş., Chairman of the Audit Committee and Chairman of the Compliance Committee February 2019 -present BNPP Yatırımlar Holding A.Ş., Board Member February 2019 -present BNPP Fortis Yatırımlar Holding A.Ş., Board Member January 2019 -present TEB A.Ş., Board Member 2018 – 2019 TEB ARVAL Araç Filo Kiralama A.Ş., Deputy Chairman December 2018 -present TEB Faktoring A.Ş., Board Member December 2018 -present TEB Yatırım Menkul Değerler A.Ş., Board Member 2013– 2019 BNP PARIBAS Compliance Group Corporate and Investment Banking Financial Security Chairman 1986 - 2012 BNP PARIBAS Compliance Group Corporate and Investment Banking 1981-1984 Sciences Po / Economics and Finance

39
Ayşe Aşardağ, Member and Deputy Chairman of the Audit Committee March 2020-present TEB Sh.A (Kosovo), Deputy Chairman March 2017-present TEB A.Ş., Deputy Chairman of the Audit Committee 2016-present TEB Faktoring A.Ş., Deputy Chairman 2016-2017 TEB ARVAL Araç Filo Kiralama A.Ş., Board Member 2012-2017 Ekonomi Yatırımlar Ltd., Board Member 2012-present TEB Yatırım Menkul Değerler A.Ş., Deputy Chairman
TEB Finansman A.Ş., Deputy Chairman 2011-2016 TEB Faktoring A.Ş., Board Member
The Economy Bank N.V., Board Member 2011-December 2014 TEB Portföy Yönetimi A.Ş., Board Member 2010-present TEB A.Ş., Board Member 2009-2020 TEB Sh.A (Kosovo), Board Member 2003-2013 Ekonomi Bank Offshore Ltd. Board Member 2001-present TEB Holding A.Ş., Budget and Financial Control Coordinator 2010-2011 Fortis Bank A.Ş., Board Member 2009-2010 TEB ARVAL Araç Filo Kiralama A.Ş., Board Member 2008-2009 TEB ARVAL Araç Filo Kiralama A.Ş., Deputy Chairman, Etkin Temizlik Hizmetleri A.Ş. Chairman 2007-2010 TEB Tüketici Finansman A.Ş., Deputy Chairman 2007-2009 TEB Sh.A (Kosovo), Deputy Chairman 2007-2008 TEB Sigorta A.Ş. Chairman
TEB İletişim ve Yayıncılık Hizmetleri A.Ş. Chairman Etkin Personel Taşımacılık Hizmetleri A.Ş. Chairman Etkin Temizlik Hizmetleri A.Ş. Chairman TEB Tüketici Finansman A.Ş. Board Member TEB ARVAL Araç Filo Kiralama A.Ş. Board Member
2007-2010 TEB UCB Konut Danışmanlık A.Ş., Chairman 2004-2010 Ege Turizm ve İnşaat A.Ş., Deputy Chairman 2001-2009 TEB Finansal Kiralama A.Ş.
TEB Faktoring A.Ş. TEB Yatırım Menkul Değerler A.Ş. Auditor
2001-2010 TEB A.Ş., Auditor 2001-2007 TEB Sigorta A.Ş., Board Member
TEB Portföy Yönetimi A.Ş., Auditor 1995-2001 TEB A.Ş., Budget and Financial Control Director 1994-1995 University of Glamorgan, Lecturer in Accounting 1987-1994 Price Waterhouse, Istanbul, London, Audit Unit 1992 Institute of Chartered Accountants in England and Wales, ACA 1982-1987 Boğaziçi University, Faculty of Administrative Sciences, Business Administration Department, BS
Yvan L.A.M. De Cock, Member and Member of the Audit Committee June 2019-present Bank Degroof Petercam, Independent Board Member June 2018-present IFTHEA B.V. / Brussels – CEO 2016-2018 BNP Paribas Fortis, Advisor to the CEO
May 2013-present BNP Paribas Yatırımlar Holding A.Ş., Board Member BNPP Fortis Yatırımlar Holding A.Ş., Board Member
February 2013-present TEB A.Ş., Audit Committee Member December 2012-present TEB A.Ş., Board Member 2011-September 2016 BNP Paribas Fortis, Head of Corporate and Public Banking 2012 - 2019 May BNP Paribas Fortis Factoring Director 2011-2013 TEB Holding A.Ş., Board Member 2011-2017 Fortis Private Equity Belgium Director 2006-2011 CEO Fortis Bank Turkey 2002-2006 CEO Fortis Bank UK 1999-2002 Head of Global Corporate Banking at Fortis Bank 1994-1999 Head of Corporate Banking North Centre Area, Belgium, Générale de Banque 1988-1994 Head of Trade Finance Group, Générale de Banque 1984-1988 Export Finance Manager, Générale de Banque 1982-1984 Legal Adviser, Nat. Delcrederedienst 1978-1982 Lawyer at Winderickx and Associates 1983-1986 HUB-EHSAL, Master of Finance 1974-1977 Katholieke Universiteit Leuven, Master of Law

40
Sabri Davaz, Member and Member of the Audit Committee 2017-2019 TEB Sh.A., Board Member and Chairman of the Audit Committee 2013-present TEB A.Ş., Audit Committee Member 2013-2016 TEB Sh.A., Board Member, Audit Committee Member 2012-present TEB A.Ş., Board Member 2011-present TEB Holding A.Ş., Chief Advisor to the Chairman 2000-2011 BRSA Chief Sworn Bank Auditor
BRSA Vice Chairman BRSA Consultant
1997-1998 Undersecretariat of Treasury, Vice President of the Board of Sworn Bank Auditors 1989-1997 Undersecretariat of Treasury, Sworn Bank Auditor 1985-1989 Undersecretariat of Treasury, Assistant of Sworn Bank Auditor 1998-2000 Boston University, Financial Economics Master 1980-1984 Ankara University, The Faculty of Political Science Hans Wilfried J. Broucke, Yönetim Kurulu Üyesi 2020 Ağustos’tan bu yana TEB A.Ş. Board Member 2017 Ekim’den bu yana Ukrsibbank Ukraine/Head of Corporate Banking 2012-2017 BNP Paribas Bulgaria CEO/Country Head 2010-2012 BNP Paribas Czech Republic/Country Head 2005-2010 BNP Paribas Czech Republic/General Manager 1985-1987 Applied Economics - Catholic University of Louvain – Belgium, Master’s Degree 1983-1985 Economical, Political and Social Sciences - UFSAL - Brussels - Belgium, Bachelor’s Degree Özden Odabaşı, Member March 2017-present TEB A.Ş., Board Member 1998-2016 The Economy Bank N.V., CEO 1997-1998 FB Finansbank Suisse S.A., CEO 1994-1997 Finansbank Holland N.V. 1987-1993 Finansbank A.Ş., Marketing Director/Assistant General Manager 1986-1987 BNP-Akbank A.Ş., Marketing Manager 1984-1986 Citibank N.A. İstanbul, Customer Representative/Marketing Manager 1983-1984 Mobil Oil Türk A.Ş., Internal Control Assistant Manager 1981-1982 Northern Illinois University, MBA 1980-1981 Boğaziçi University, Faculty of Economics and Administrative Sciences, Department of Business
Administration, Master’s Degree 1976-1980 Middle East Technical University, Faculty of Administrative Sciences, Department of Business
Administration, Bachelor’s Degree Xavier Henri Jean Guilmineau, Member December 2018-present BNP Paribas IRB Head of Retail and SME Banking January 2018- December 2018 TEB Arval Deputy Chairman January 2016-present BNP Yatırımlar Holding A.Ş. Board Member
BNP Paribas Fortis Yatırımlar Holding A.Ş. Board Member January 2016- December 2018 TEB Faktoring A.Ş. Board Member
TEB Yatırım Menkul Değerler A.Ş. Board Member December 2015-present TEB A.Ş., Board Member October 2015- December 2015 TEB A.Ş., Advisor 2009-2015 CEO Asia BNP Paribas Cardif 2013-2015 BNP Paribas Cardif, Executive Committee Member 2009-2015 Paris Management Consultant-Taiwan, Chairman of the Board of Directors 2009-2015 Bank of Beijing Cardif Life JV-China, Vice Chairman of Board of Directors 2009-2015 BNP Paribas Cardif TCB Life Insurance JV-Taiwan, Member of the Board of Directors 2009-2015 BNP Paribas Cardif Life Insurance JV-Korea, Member of the Board of Directors 2005-2008 Head of Central and Eastern Europe, BNP Paribas Cardif 2002-2005 Retail Development Manager, Bank of The West (USA) 1998-2002 Head of Mission, General Inspection, BNP Paribas Group 1993-1998 Head of North Agribusiness Center, BNP Paribas France 1996-1997 Lille 1 University, Business Administration, Certificate of Competency, Diploma of Specialized Higher
Education 1989-1993 National School of Engineering in Agriculture and Food Industries, BS Degree in Agricultural and Food
Industries 1987-1990 Nancy 1 University, Technology University Degree in Applied Food and Biological Industries 1983-1986 Nantes Academy, Secondary School Baccalaureate Diploma in Math and Natural Sciences François Andre Jesualdo Benaroya, Member

41
January 2018-present TEB A.Ş., Board Member October 2017-present BNP Paribas -IRB, Head of Central & Eastern Europe/Turkey July 2014-September 2017 BGZ BNP Paribas (Poland), Vice Chairman of the Board November 2011-June 2014 BNP Paribas -IRB, Head of Retail November 2007-October 2011 UKRSIBBANK BNP Paribas Ukrain, Vice Chairman of the Board August 1992-January 1994 Republic of France National Institute of Statistics and Economic Studies / National School of Statistics
and Economic Administration
September 1989-July 1992 Republic of France Ecole Polytechnique/ Engineering

42
EXECUTIVE MANAGEMENT
General Manager, Assistant General Managers and Their Responsibilities in the Bank
Ümit Leblebici Executive Member and CEO Gökhan Mendi Senior Assistant General Manager Retail and Private Banking Group Ali Gökhan Cengiz Assistant General Manager SME Banking Group Mustafa Aşkın Dolaştır Assistant General Manager Financial Control (Affairs) Group Bade Sipahioğlu Işık Assistant General Manager Human Resources Group Gökhan Özdil Assistant General Manager Corporate Credits Group Ali İhsan Arıdaşır Assistant General Manager SME Credits Group Osman Durmuş Assistant General Manager Retail and Micro SME Credits Group Melis Coşan Baban Chief Legal Advisor, Secretary of the Board of
Directors Head of Legal Affairs
Mehmet Ali Cer Assistant General Manager Information Technologies Group
Kubilay Güler Assistant General Manager Banking Operations and Support Services Ömer Abidin Yenidoğan Assistant General Manager Corporate Investment Banking Akil Özçay Assistant General Manager Global Markets Tuğrul Özbakan Assistant General Manager Treasury & ALM Gülümser Özgün Henden Assistant General Manager Corporate Banking Managers of Internal Systems
Hakan Tıraşın Head of Internal Audit Nimet Elif Kocaayan Chief Risk Officer Birol Deper Head of Compliance Group and Internal Control Group, Consumer Relations Coordination Officer Ümit Leblebici, Executive Member and CEO July 2020-present TEB ARF Teknoloji A.Ş., Chairman July 2017-present FERB Board Member May 2014-present Banks Association of Turkey, Deputy Chairman September 2013-present TEB A.Ş., Executive Board Member and CEO February 2013-September 2013 TEB A.Ş., Deputy CEO 2002-2013 TEB A.Ş. Assistant General Manager, ALM and Treasury Group April 2013-September 2013 TEB Yatırım Menkul Değerler A.Ş., Chairman 2012-December 2014 TEB Portföy Yönetimi A.Ş., Chairman 2011-2012 TEB Portföy Yönetimi A.Ş., Board Member 1999-2002 TEB A.Ş. Director, Treasury Group 1997-1999 Osmanlı Bankası, Treasury Manager March 1997 -July 1997 Ulusal Bank, Treasury Manager 1991-1997 Midland Bank, Treasury Manager 1988-1994 Istanbul University, MBA at Finance Major 1984-1988 Istanbul University, Faculty of Business Administration

43
Gökhan Mendi, Senior Assistant General Manager, Retail and Private Banking October 2016-present TEB Yatırım Menkul Değerler A.Ş., Board Member October 2013-present TEB A.Ş., Senior Assistant General Manager, Retail and Private Banking June 2013-present Interbank Card Center (BKM) Board Member May 2012-present Fortis Bank A.Ş., Mensupları Emekli Sandığı Vakfı, Board Member
Fortis Bank Personeli Güvenlik Vakfı, Board Member 2011-2013 TEB A.Ş., Assistant General Manager, Retail and Private Banking 2011-March 2016 TEB Yatırım Menkul Değerler A.Ş., Board Member 2011-2014 TEB Portföy Yönetimi A.Ş., Board Member 2011-2012 TEB Tüketici Finansmanı A.Ş., Deputy Chairman 2007-2011 Fortis Bank A.Ş., Head of Retail Banking & Bancassurance, Board Member 2003-2007 Finansbank, Retail Banking Assistant General Manager,
Finans Sigorta A.Ş., Finans Portföy & Finans Yatırım, Board Member 2001-2003 Finansbank, NL, Consumer Banking, Assistant General Manager 1999-2001 Citibank Inc. Plc. London, Head of Business Development 1998-1999 Citibank N.A., Istanbul, Credit Cards Marketing Director 1996-1998 Citibank N.A., Istanbul, Sales & Marketing Manager 1996-1996 Beiersdorf Chemical, Sales & Marketing Manager 1992-1996 British Petroleum Istanbul, Marketing Services & Product Manager 1991-1992 British Petroleum Istanbul, Marketing Services Manager 1990-1991 British Petroleum Istanbul, Assistant of Engineering Manager 2000-2002 London Business School, Executive MBA 1987-1988 Istanbul University, MBA 1983-1987 Istanbul Technical University, Civil Engineering
Mustafa Aşkın Dolaştır, Assistant General Manager, Financial Control Group December 2020-present TEB ARF Teknoloji A.Ş., Board Member March 2019-present Ekonomi Yatırımlar Ltd., Board Member March 2018-present TEB ARVAL Araç Filo Kiralama A.Ş., Board Member 2016-present BNP Paribas Cardif Emeklilik A.Ş., Board Member 2016-present BNP Paribas Cardif Sigorta A.Ş., Board Member 2016-present BNP Paribas Cardif Hayat Sigorta A.Ş., Board Member 2008-present TEB A.Ş., CFO 2007 February-November TEB Arval/Faktoring/Leasing, CFO 1998-2007 The Economy Bank N.V. Amsterdam, Deputy CEO and Member of the Execution Committee 1994-1998 Finansbank (Holland) N.V., CFO 1992-1994 Commercial Union Hayat Sigorta A.Ş., CFO 1990-1992 Finansbank A.Ş. Istanbul, Group Head, Subsidiaries 1986-1989 Arthur Andersen & Co. Istanbul, Lisbon, London and Cambridge Offices, Senior Auditor 1985-1986 The Central Bank of the Republic of Turkey, Specialist 1984-1985 Istanbul Technical University, Management Engineering Lecturer, Operational Research 1983-1986 Istanbul Technical University, Master Degree in Management Engineering 1979-1983 Istanbul Technical University, Management Engineering
Bade Sipahioğlu Işık, Assistant General Manager, Human Resources Group April 2020-present TEB A.Ş., Assistant General Manager, Human Resources Group 2014-2017 OGER Telecom, Chief Human Resources Officer 2001-2014 Akbank T.A.Ş. Group Head (Human Resources and Organization), Executive Vice President (Human
Resources) 1997-2001 Doğuş Group (Garanti Bank, Humanitas, Ottoman Bank) Vice President (Human Resources and
Organization ) 1996-1997 Intertech İşlem ve Pazarlama, Human Resources Manager 1994-1995 Institut d’Etudes Politiques de Paris, Master’s degree in Business Management and Corporate Social
Development 1990-1994 Marmara University Faculty of Economics and Administrative Sciences, Political Sciences (French)

44
Gökhan Özdil, Assistant General Manager, Corporate Credits Group September 2017-present TEB Faktoring A.Ş., Board Member March 2016-March 2017 TEB Faktoring A.Ş., Board Member 2011-present TEB A.Ş., Assistant General Manager, Corporate Credits Group 2005-2011 Fortis Bank A.Ş., Corporate and Commercial Banking Credits Assistant General Manager 2008-present Fortis Bank A.Ş., Mensupları Emekli Sandığı Vakfı, Executive Vice President
Fortis Bank Personeli Güvenlik Vakfı, Executive Vice President 2007-2008 Fortis Bank A.Ş., Mensupları Emekli Sandığı Vakfı, Board Member; Fortis Bank Personeli Güvenlik
Vakfı, Board Member 2007-2008 Fortis Bank A.Ş., Retail Banking Credits Assistant General Manager 2005-2007 Fortis Bank A.Ş., Credits Group Assistant General Manager 2004-2005 Türk Dış Ticaret Bankası A.Ş., Credits Group Assistant General Manager 1996-2004 Türk Dış Ticaret Bankası A.Ş., Branch Manager 1992-1996 Türk Dış Ticaret Bankası A.Ş., Assistant Branch Manager 1989-1992 Türk Dış Ticaret Bankası A.Ş., Internal Audit Group, Inspector 1987-1989 Türk İş Bankası A.Ş., Head Office 1981-1986 Middle East Technical University, Economics Ali İhsan Arıdaşır, Assistant General Manager - SME Credits Group March 2019-present BNP Paribas Finansal Kiralama A.Ş., Board Member December 2018-present TEB A.Ş., Assistant General Manager - SME Credits Group October 2018 - December 2018 TEB A.Ş., Credits Advisor November 2016 - October 2018 Anadolu Bank A.Ş., Assistant General Manager, Credits Allocation January 2008 - November 2016 TEB A.Ş., Credits Monitoring Director / Credits Director / SME Credits Allocation Director August 2003- December 2007 TEB A.Ş., South Anatolia Commercial Credits and Credits Allocation Supervisor August 2002- August 2003 TEB A.Ş. Gazipaşa Bulvarı Branch Corporate Banking Branch Manager June 2002- August 2002 TEB A.Ş., Commercial Banking Marketing and Product Development Manager June 1996 - June 2002 TEB A.Ş. Adana Branch Commerial Marketing Manager August 1993- May 1996 Pamukbank A.Ş. Corporate Marketing Manager 1987 - 1992 Boğaziçi University Economics and Administrative Sciences Faculty, Department of Economics Osman Durmuş, Assistant General Manager - Retail and Micro SME Credits Group March 2018 - present TEB Yatırım Menkul Değerler A.Ş., Board Member August 2017-present TEB Sh. A. Board Member 2008-present TEB A.Ş., Assistant General Manager, Retail and Small Business Credit Group 1998-2008 HSBC Bank A.Ş./Demirbank T.A.Ş., Head of Retail and Small Business Credit and Risk Group 1997-1998 Yapı Kredi Kart Hizmetleri A.Ş., Head of Credit Cards and Risk 1994-1996 Yapı Kredi Bankası A.Ş., Unit Manager, Retail Banking Accounting Department 1990-1993 Yapı Kredi Bankası A.Ş., Specialist, Retail Banking Accounting Department 1988-1990 Yapı Kredi Bankası A.Ş., Chief Assistant, Accounting Department 1986-1987 Yapı Kredi Bankası A.Ş., Rıhtım Branch, Clerk 1982-1986 Marmara University, Faculty of Press and Media, Journalism and Public Relations Department Melis Coşan Baban, Chief Legal Advisor, Board General Secretary, Assistant General Manager 2008-present TEB A.Ş., Assistant General Manager, Legal Affairs 2005-present TEB A.Ş., Chief Legal Advisor, Board General Secretary 2000-2005 Pekin & Pekin Law Firm, Partner 1998-2000 Pekin & Pekin Law Firm, Senior Lawyer 1993-1998 Postacıoğlu Law Firm, Lawyer 1996-1997 Columbia University, New York, USA, Master of Law (LL.M.) 1989-1995 Istanbul University, Law School, Law Degree

45
Mehmet Ali Cer, Assistant General Manager, Information Technologies Group July 2020-present TEB ARF Teknoloji A.Ş., Deputy Chairman May 2012-present Fortis Bank A.Ş., Mensupları Emekli Sandığı Vakfı, Board Member
Fortis Bank Personeli Güvenlik Vakfı, Board Member 2011-present TEB A.Ş., Assistant General Manager, Information Technologies Group February 2011-November 2011 TEB A.Ş., Infrastructure Management, Group Director 2010-2011 Fortis Bank A.Ş., Information Technologies, Director 2000-2010 TEB A.Ş., Infrastructure Management, Director 1997-2000 Demirbank A.Ş., Software Development, Manager 1995-1997 Metters Industries, Senior Software Engineer 1993-1995 Southern Illinois University, Graduate Assistant 1990-1992 Türkiye Kalkınma Bankası A.Ş., System Analyst 1993-1996 Southern Illinois University, Computer Engineering (Master Degree) 1985-1990 Hacettepe University, Department of Computer Engineering Kubilay Güler, Assistant General Manager, Banking Operations and Support Services 2017-present Bantaş Nakit ve Kıymetli Mal Taşıma ve Güvenlik Hizmetleri A.Ş., Board Member 2014-2016 Interbank Card Center (BKM), Head of Security Committee 2013-2017 Bantaş Nakit ve Kıymetli Mal Taşıma ve Güvenlik Hizmetleri A.Ş., Board Member 2012-present TEB A.Ş., Assistant General Manager, Banking Operations & Support Services 2011-2012 Finansbank A.Ş., Assistant General Manager, Internal Control Unit 2002-2005 The Interbank Card Center (BKM), Chairman of the Security Committee
The Interbank Card Center (BKM), Board Member 1999-2011 Finansbank A.Ş., Assistant General Manager, Operations & Alternative Distribution Channels 1995-1999 Citibank N.A., Assistant General Manager, Operations 1994-1995 AKK (INTERBANK) Manager 1989-1994 Netbank (Marmarabank), Manager, Credit & Marketing Department 1985-1989 İmarbank, Management Trainee, Card Sales & Operations Department 1983-1985 Akbank A.Ş., Exchange Department Specialist 1978-1983 Middle East Technical University, Faculty of Economic & Administrative Science, Public
Administration Ömer Abidin Yenidoğan, Assistant General Manager, Corporate Investment Banking December 2020-present TEB Yatırım Menkul Değerler A.Ş., Board Member October 2014-present TEB A.Ş., Assistant General Manager, Corporate Investment Banking September 2014-present TEB Portföy Yönetimi A.Ş., Advisor to the Board 2003-2014 TEB Portföy Yönetimi, CEO March 2011 - March 2018 TEB Yatırım Menkul Değerler A.Ş., Board Member 2013-2015 TKB BNPP IP JSC & LLC (Saint Petersburg - Russian Federation), Board Member 2010-2014 Corporate Governance Association of Turkey, Board Member 2001-2003 TEB Retail Banking, Marketing Director 2000-2001 TEB Portföy Yönetimi A.Ş., Marketing Assistant General Manager 1997-1999 TEB Yatırım Menkul Değerler A.Ş., International Capital Market Assistant Manager 1995-1996 Citibank Turkey, GCB 1994-1995 University of Nottingham, Financial MBA 1989-1994 Marmara University, BA in Political Sciences (French)

46
Akil Özçay, Assistant General Manager, Global Markets 2015-2020 TEB Yatırım Menkul Değerler A.Ş., Board Member 2012-2013 TEB Yatırım Menkul Değerler A.Ş., Chairman of the Board 2012-2013 TEB Portföy Yönetimi A.Ş., Board Member 2011-present TEB A.Ş., Assistant General Manager, Global Merkets 2011-2012 TEB Portföy Yönetimi A.Ş., Chairman of the Board 2011-2012 TEB Yatırım Menkul Değerler A.Ş., Deputy Chairman 2011-2011 Fortis Portföy Yönetimi A.Ş., Chairman of the Board 2009-2013 TEB Sh.A., Board Member 2008-2011 TEB A.Ş., Chief Advisor to the CEO 2007-2008 CBRT Internal Audit, Chief Audit Executive 2005-2007 Rutgers, The State University of New Jersey, Master 2004-2007 CBRT New York Representative Office, Chief Representative 2001-2004 CBRT Markets Department, General Director 1998-2001 CBRT Markets Department, Assistant General Director 1996-1998 CBRT Open Markets Operations, Manager 1995-1996 CBRT Banking Supervision, Manager 1994-1995 CBRT Markets Department, Foreign Exchange Transactions, Manager 1977-1981 Ankara University, Faculty of Political Sciences Tuğrul Özbakan, Assistant General Manager, ALM & Treasury June 2015-present TEB A.Ş., Assistant General Manager, ALM & Treasury Group 2013-2015 TEB A.Ş., Group Director, ALM & Treasury Group 2008-2013 TEB A.Ş., Director, ALM 2007-2008 TEB Portföy Yönetimi A.Ş., Assistant General Manager, DPM and Fund Management June 2007-July 2007 TEB A.Ş. Financial Markets Director 2005-2006 TEB Portföy Yönetimi A.Ş., Board Member 2005-2006 Varlık Yatırım Ortaklığı A.Ş., Board Member 1996-2006 TEB A.Ş. Director, Financial Markets 2004-2009 Istanbul Marmara University, Ph.D. in EU Economics 1999-2002 Istanbul Bilgi University, Business Administration (MBA) 1991-1995 Stanford University, Palo Alto, USA, BA in Economics Gülümser Özgün Henden, Assistant General Manager, Corporate Banking March 2018 - present BNP Paribas Finansal Kiralama A.Ş., Board Member November 2015-present TEB A.Ş., Assistant General Manager, Corporate Banking 2015-November 2015 TEB A.Ş., Group Director, Corporate Businesses 2011-2014 TEB A.Ş., Sales Director, Corporate Banking 2003-2011 TEB A.Ş., Commercial Banking, Sales, Marketing and Product Development Director 2001-2003 Garanti Bankası A.Ş., Senior Manager, Commercial Banking 2000-2001 Osmanlı Bankası A.Ş., Manager, Corporate Banking 1995-2000 Finansbank A.Ş., Manager 1992-1995 Garanti Bankası A.Ş., MT 1987-1992 Middle East Technical University, Business Administration Hakan Tıraşın, Head of Internal Audit 2006-present TEB A.Ş., Head of Internal Audit 2004-2005 TEB A.Ş., Assistant General Manager, Organization, Banknote Markets and Support Services and
Secretary General 1992-2004 TEB A.Ş., General Secretary 1989-1992 TEB A.Ş., Internal Audit, Inspector 1973-1989 Akbank, Branch Manager and Inspector 1972-1977 Istanbul Academy of Economics and Business Administration

47
Birol Deper, Head of Compliance and Internal Control, Consumer Relations Coordination Officer March 2016-present TEB Sh.A., Board Member April 2015-present Banks Association of Turkey-Risk Center, Board Member September 2013-present TEB A.Ş., Consumer Relations Coordination Officer 2012-present TEB A.Ş., Head of Compliance Group and Internal Control Group 2011-April 2013 TEB Portföy Yönetimi A.Ş., Auditor 2010-2012 TEB A.Ş., Compliance and Regulation Director 2008-2012 TEB A.Ş., Banking Regulation Director 2007-April 2013 TEB Cetelem Tüketici Finansmanı A.Ş., Auditor 2006-2008 TEB A.Ş., Banking Regulation Manager 2001-2006 Banking Regulation and Supervision Agency, Certified Bank Auditor 2007-2010 Galatasaray University Institute of Political Sciences-MBA 1996-2000 Ankara University, Faculty of Political Sciences, Department of Business Administration Nimet Elif Kocaayan, Head of Group Risk Management July 2017-present TEB A.Ş. Head of Group Risk Management July 2017-present TEB Yatırım Menkul Değerler A.Ş., Board Member 2010-2017 TEB A.Ş., Credit Risk Director 2003-2010 TEB A.Ş. Operational Risk-BASEL II and Credit Risk Supervisor/ Credit Risk Manager 2000-2003 TEB A.Ş. Credit Allocation Supervisor 1995-2000 TEB A.Ş. Internal Audit, Inspector /Assistant Inspector 1991-1995 İstanbul University, Faculty of Economics, Department of Economics Ali Gökhan Cengiz, Assistant General Manager, SME Banking March 2019-present TEB A.Ş., Assistant General Manager, SME Banking 2016 - 2019 TEB A.Ş., Group Director, Corporate Banking Sales Management 2004 - 2016 Akbank T.A.Ş. Division Head 2003 – 2004 Dışbank TA.Ş. Branch Manager 2001 - 2003 Citibank A.Ş. Branch Manager 1995 – 2001 Interbank Branch Deputy Manager 1993 Oklahoma City University MBA 1986 - 1989 Hacettepe University, Department of Economics

48
COMMITTEES OF TÜRK EKONOMİ BANKASI A.Ş
Information on Participation of Board Members and Committee Members into Respective Meetings:
As of 31 December 2020 the Board of Directors has accepted 212 resolutions. The Board Members and Committee Members have participated into respective meetings at sufficient levels.
SENIOR EXECUTIVE COMMITTEE
Monitoring and surveillance of TEB and TEB Group’s operational performance on behalf of TEB’s Board of Directors and in accordance with its directions.
Chairman Jean Paul SABET, Vice Chairman of the Board of Directors Deputy Chairman Dr. Akın AKBAYGİL, Vice Chairman of the Board of Directors Members General Manager Committee meets as required. CREDIT COMMITTEE
The Credit Committee is responsible to evaluate and approve loans within its authorization limits. Chairman Dr. Akın AKBAYGİL, Vice Chairman of the Board of Directors Members Özden ODABAŞI, Board Member Nicolas de BAUDINET de COURCELLES, Board Member Hans Wilfried J. BROUCKE, Board Member General Manager Alternate Members Sabri Davaz, Board Member Ayşe Aşardağ, Board Member Committee meets as required.
RISK COMMITTEE
Responsibilities of the Committee: To audit and assess risk policies Chairman Hans Wilfried J. BROUCKE, Board Member Deputy Chairman Dr. Akın AKBAYGİL, Vice Chairman of the Board of Directors Committee meets as required. AUDIT COMMITTEE
Responsibilities of the Committee: • On behalf of the Board of Directors to supervise the
efficiency and adequacy of the Bank’s internal systems, • To supervise compliance with the provisions hereof
concerning internal control and with the internal policies and implementation procedures approved by the Board of Directors and to make proposals to the Board of Directors in relation to measures which it is considered necessary to take,
• Together with the top-level management and the independent auditors, to evaluate the results of independent audit, the annual and quarterly financial statements and related documents and the independent audit report,
• To evaluate the independence of the rating institutions, the independent audit institutions, including those which carry out audits of information systems and the valuation institutions with which the Bank will sign contracts and of their presidents, directors, auditors, managers and employees, in their activities related with the Bank and the sufficiency of the resources that are allocated.
Chairman Nicolas de BAUDINET de COURCELLES, Board Member Deputy Chairman Ayşe AŞARDAĞ, Board Member Members Yvan De COCK, Board Member Sabri DAVAZ, Board Member Committee meets at least every three months.

49
OPERATIONAL RISK COMMITTEE
Responsibilities of the Committee: • To make suggestions for the Operational Risk
Management Policy approved by the Board of Directors, • Based on the results of measurements and management
conducted in accordance with the Operational Risk Management Policy; o To review operations by measuring operational risks
and by making general assessments regarding incidents that take place and potential risks aimed at mitigation, and to pass decisions when necessary,
o To follow up the course and development of audit suggestions,
o To oversee the development of key risk indicators identified by the Group Risk Management and to evaluate new indicators based on risk mitigation measures, risk profile and trends,
o To review and evaluate the risk assessment results of service providers within the scope of the Regulation on Procurement of Support Services by Banks and the Regulation on Information Systems of Banks and Electronic Banking Services.
Chairman Assistant General Manager, Banking Operations and Support Services Deputy Chairman Assistant General Manager, Financial Control Group Members Senior Assistant General Manager, Retail and Private Banking Group Assistant General Manager, SME Banking Group Assistant General Manager, Corporate Credits Group Assistant General Manager, Corporate Investment Banking Assistant General Manager, Information Technologies Group Assistant General Manager, Human Resources Group Chief Legal Advisor, Secretary of the Board of Directors Committee meets as monthly. SELECTION AND COMPENSATION COMMITTEE
Responsibilities of the Committee: • Establishing a compensation policy that is aligned with
the scope and structure of the Bank activities, its strategies, long-term goals and risk management structures, the BRSA’s “Regulation Amending the Regulation on the Banks’ Corporate Governance Principles” and ““Guide on Best Compensation Practices in Banks” published in the Official Gazette issue 27959 dated 9 June 2011 that prevent taking excessive risks and that contribute to effective risk management.
• Determination, monitoring and supervision of remuneration implementations (including salaries, performance bonuses, premiums, awards, fringe benefits and social benefits).
• Annual submission to the Board of Directors the proposals with respect to the evaluation of remuneration policy and implementations under the risk management.
• Determination of the criteria for payments of performance bonuses based on performances of the employees and announcement of such criteria to the employees and regular review of such criteria according to the determined standards and special duties and responsibilities.
• Determination and approval of organizational structure, norms, job descriptions, appointment, promotion, salary
and performance bonuses for Group Director and higher positions.
Chairman Jean Paul SABET, Vice Chairman of the Board of Directors Deputy Chairman Dr. Akın AKBAYGİL, Vice Chairman of the Board of Directors Regular Attendant General Manager Committee meets as required. COMPLIANCE COMMITTEE
Responsibilities of the Committee: • To supervise of compliance policies and practices. • To monitor the changes in legislation.
Chairman Nicolas de BAUDINET de COURCELLES, Board Member Deputy Chairman Dr. Akın AKBAYGİL, Vice Chairman of the Board of Directors Members Sabri DAVAZ, Board Member Yvan L.A.M. DE COCK, Board Member Committee meets as required. CORPORATE GOVERNANCE COMMITTEE
Responsibilities of the Committee: To oversee compliance with corporate governance principles, undertake improvement efforts in this area and submit proposals to the Board of Directors. Chairman Dr. Akın AKBAYGİL, Vice Chairman of the Board of Directors Deputy Chairman Yavuz CANEVİ, Chairman of the Board of Directors Members Hans Wilfried J. BROUCKE, Board Member Nicolas de BAUDINET de COURCELLES, Board Member Yvan L.A.M. DE COCK, Board Member Sabri DAVAZ, Board Member Committee meets as required.

50
ASSETS AND LIABILITIES COMMITTEE Responsibilities of the Committee: • Regarding TEB Group’s Financial Markets activities;
evaluation of industry developments and expectations, determination of strategies, evaluation of markets and the strategies to be adopted and the comparison of risk sizes to be taken,
• To review of financial indicator reports, • To discuss expectations and developments in the domestic
and international markets, • To review of the general presentation of marketing groups, • To review of ALM’s presentation in terms of deposits and
credit structure, • To examine the funding cost and spread improvement for
business segments, • Evaluation of analysis of the Bank’s weekly balance-sheet,
income and expense, profit and loss statement.
Chairman General Manager Deputy Chairman Assistant General Manager, Assets and Liabilities Management and Treasury Members Deputy Head of Corporate Investment Banking Senior Assistant General Manager, Retail and Private Banking Group Senior Assistant General Manager, SME Banking Group and Deputy General Manager Assistant General Manager, Corporate Banking Assistant General Manager, Financial Control Group Assistant General Manager, Fixed Income Assets and Liabilities Management Director Chief Economist Chief Investment Advisor Committee meets bi-weekly or as required.
NEW PRODUCT COMMITTEE Responsibilities of the Committee: Within the scope of the Regulation of New Product, Activity and Organization to make decisions about products, activities and organizations which are defined as “newly”. Chairman Head of Compliance Group and Internal Control Group Deputy Chairman Assistant General Manager of Product Owner Segment Members Data Management Director Core Banking Operations Director Information Security and Quality Director Business Process Director Business Solutions Director Head of Legal Affairs, Secretary of the Board Contracts, Legal Counseling and Projects Director General Accounting Director Group Chief Risk Officer (and/or manager delegated according to the role) Executive Tax Director Customer and Product Safety Director Representative of Compliance Division Customer Rights Coordination Manager Legislation Manager Committee meets when the new products, activities and organizational change for customers are on the agenda.

51
MARKET AND LIQUIDITY RISK COMMITTEE Responsibilities of the Committee: • To monitor market risks and derivative risks, • To review market and customer derivative risk policies and
submit to the Board of Directors, • To examine stress scenarios and if necessary, to make
proposal to the Board of Directors for amendment, • To review market risk limits and recommend to Board of
Directors, • Discussion of necessary topics by Financial Markets, /
Treasury, Financial Affairs and Group Risk Management, • To monitor the liquidity of the Bank; to analyze and follow-
up borrowing capacity and other possible funding sources in order to avoid any default risk,
• To analyze and monitor the interest rate exposure of the Bank,
• To review the limits regarding both interest and liquidity risks and recommend to Board of Directors,
• To prepare guidelines and policies for interest rate and liquidity risks and recommend to Risk Policies Committee,
• Recommendation of interest, liquidity, market and counterparty credit risk measurement methods to the Risk Policy Committee.
Chairman General Manager Deputy Chairman Group Chief Risk Officer Members ALM & Treasury Assistant General Manager Financial Affairs Assistant General Manager Financial Markets Assistant General Manager Financial Markets Trading Director ALM Director Treasury Director Market Risk and Operational Risk Director Capital Markets Mid-Office Director Committee that meets on a monthly basis or as required.

52
INFORMATION ON TRANSACTIONS CONDUCTED WITH RELATED PARTIES
The Bank is involved in various transactions with the risk group to which TEB is included (related parties) and these are carried out for commercial purposes and at market prices. Loan transactions with related-parties and their share in the Bank’s total credit risk as of 31 December 2020 and 31 December 2019 were as follows:
% 31.12.2020 31.12.2019 Share in total cash loans 1,27% 0,72% Share in total non-cash loans 2,18% 1,27% Share in total cash and non-cash loans 1,49% 0,86% Detailed information about the risk group to which TEB is included has been prepared in accordance with the “Communiqué on Financial Statements and Related Explanations and Footnotes Announced to the Public by Banks”
and published in Section 3, of the “Annual Report” and was also included in the financial statements as of 31 December 2020 and Section 5, Article VII.1 of the Independent Audit Report.

53
ACTIVITIES FOR WHICH SUPPORT SERVICES ARE RECEIVED AND SUPPLIERS Company Title Scope of Support
Services Taken Explanation of the Service
IRON MOUNTAIN ARŞİVLEME HİZMETLERİ ANONİM ŞİRKETİ Archiving Archives Service Agreement IBM GLOBAL SERVICES İŞ VE TEKNOLOJİ HİZMETLERİ VE TİCARET LİMİTED ŞİRKETİ
Information Technologies
Emergency Situation Services
SUPERONLINE İLETİŞİM HİZMETLERİ ANONİM ŞİRKETİ Information Technologies
Electronic Communication Service Framework Agreement
CMC İLETİŞİM VE ÇAĞRI MERKEZİ HİZMETLERİ ANONİM ŞİRKETİ
Call Center Outgoing Call and Telemarketing Service
WEBHELP ÇAĞRI MERKEZİ VE MÜŞTERİ HİZMETLERİ A.Ş. Call Center Update Address Search Service WEBHELP ÇAĞRI MERKEZİ VE MÜŞTERİ HİZMETLERİ A.Ş. Call Center Outgoing Call Service PRONET GÜVENLİK HİZMETLERİ A.Ş. Security Alarm Monitoring Centre Subscription Agreement PRONET GÜVENLİK HİZMETLERİ A.Ş. Security Off Site ATM Alarm Systems Leasing and Service
Agreement SECURITAS GÜVENLİK HİZMETLERİ ANONİM ŞİRKETİ Security Private Safety Agreement TEPE SAVUNMA VE GÜVENLİK SİSTEMLERİ SAN. A.Ş. Security Private Safety Agreement E-KART ELEKTRONİK KART SİSTEMLERİ SANAYİ VE TİCARET ANONİM ŞİRKETİ
Credit Card Purchases
Purchasing Credit Card Plastic and Chip Agreement
2M İLETİŞİM HİZMETLERİ SANAYİ TİCARET LİMİTED ŞİRKETİ Operational Support
Point of Sale Credit
ABDULLAH ÖZDEMİR Operational Support
Point of Sale Credit
ADNAN ÖZMEN ORT. Operational Support
Point of Sale Credit
ADO BİLİŞİM LABORATUAR MÜH. VE TES. CİH. İÇ DIŞ TİC. VE SAN. LTD. ŞTİ.
Operational Support
Point of Sale Credit
AFS ÇELİK DAY. TÜK. MAL. MOB. TEKS. İNŞ. TAŞ. TAR. HAY. SAN. VE TİC. LTD. ŞTİ.
Operational Support
Point of Sale Credit
AHMET BEYHAN Operational Support
Point of Sale Credit
AHMET TİMUR ÖNCÜL TAHSİN ÖZKIR ADİ ORTAKLIĞI Operational Support
Point of Sale Credit
AHMET VAKKAS YILDIZ Operational Support
Point of Sale Credit
AKKAŞLAR D.T.M. ELEK. VE ELEK. ÜR. PAZ. İLET. HİZ. İNŞ. SAN. İÇ DIŞ TİC. LTD. ŞTİ.
Operational Support
Point of Sale Credit
AKTİF EĞİ. -ÖĞR. BİL. İLE. TUR. GÜV. AKA. İÇ VE DIŞ TİC. LTD. ŞTİ.
Operational Support
Point of Sale Credit
ALİ DEMİR / BEYAZ EŞYA TİCARETİ Operational Support
Point of Sale Credit
ALTIN ELEKTRİKLİ EV ALETLERİ TİC. SAN. LTD. ŞTİ. Operational Support
Point of Sale Credit
ALTIN MOBİLYA TİCARET VE SANAYİ A.Ş. Operational Support
Point of Sale Credit
ALTINBAŞ DAYANIKLI TÜKETİM MADDELERİ TİC. VE SAN. A.Ş.
Operational Support
Point of Sale Credit
ANLI DAYANIKLI TÜK MALL TİC. LTD. ŞTİ. Operational Support
Point of Sale Credit
ARG ELEKTRONİK NAKLİYE BİLİŞİM TURİZM SANAYİ VE TİCARET LİMİTED ŞİRKET
Operational Support
Point of Sale Credit
ARTI İNŞAAT GIDA TURİZM LTD. ŞTİ. Operational Support
Point of Sale Credit
ARZU AVCI Operational Support
Point of Sale Credit
ASİLLER DAYANIKLI TÜKETİM MALLARI SAN. VE TİC. LTD. ŞTİ.
Operational Support
Point of Sale Credit
AŞKIN ÇINAR Operational Support
Point of Sale Credit
ATALAR TELEKOMÜNİKASYON VE İLETİŞİM GIDA TEKSTİL SAN. VE TİC. LTD. ŞTİ.
Operational Support
Point of Sale Credit
ATİLLA YILMAZ Operational Support
Point of Sale Credit
AY HAN DAY. TÜK. MAL. HALI MOB. VE İNŞ. SAN. TİC. LTD. ŞTİ
Operational Support
Point of Sale Credit
AYKUT MOBİLYA VE DAYANIKLI TÜK. MAL. SAN. TİC. LTD. ŞTİ.
Operational Support
Point of Sale Credit

54
AYSANLAR DAY. TÜK. MAL. EL. EŞ. MOT. OTO. İNŞ. TA. D. GAZSAN. VE TİC. LTD. ŞTİ.
Operational Support
Point of Sale Credit
AYTUR ZÜCCACİYE GİYİM TEKS. DAY. TÜK. MAL. SAN. VE TİC. LTD. ŞTİ.
Operational Support
Point of Sale Credit
BAĞDAT DAYANIKLI TÜK. MALL. İNŞ. GIDA TİC. VE SAN. LTD. ŞTİ.
Operational Support
Point of Sale Credit
BALCI BEYAZ EŞYA MOBİLYA VE MOTORLU ARAÇLAR İNŞAAT TİCARET ANONİM ŞİRK
Operational Support
Point of Sale Credit
BAŞEL DAYANIKLI TÜK. MAL. ELEKT. SAN. VE TİC. LTD. ŞTİ. Operational Support
Point of Sale Credit
BATIKAN HAZAR MIZRAK Operational Support
Point of Sale Credit
BEL EĞİTİM A.Ş. Operational Support
Point of Sale Credit
BEREKET TİCARET Operational Support
Point of Sale Credit
BEYAZ EV İNŞ. MÜH. DAY. TÜK. MAL. TİC. LTD. ŞTİ. Operational Support
Point of Sale Credit
BEYCELİ DAYANIKLI TÜKETİM MALLARI TİC. LTD. ŞTİ. Operational Support
Point of Sale Credit
BIZTECH MAĞAZACILIK HAB. TEK. SAN. VE TİC. A.Ş. TİC. Operational Support
Point of Sale Credit
BİLGE TİCARET DAY. TÜK. MAL. LTD. ŞTİ. Operational Support
Point of Sale Credit
BİSMİL KARDEŞLER OTOM İNŞ NAK TARIM HAYVANCILIK SAN VE TİC. LTD. ŞTİ
Operational Support
Point of Sale Credit
BRD MOTOR İNŞAAT OTOMOTİV GIDA VE TURİZM SANAYİ TİCARET ANONİM ŞİRKETİ
Operational Support
Point of Sale Credit
BULUTOĞLU DAY. TÜK. MAL. NAK. İNŞ. VE GID. SAN. TİC. LTD. ŞTİ.
Operational Support
Point of Sale Credit
BURSA UĞURLU DAYANIKLI TÜK MAM. SAN. TİC. AŞ Operational Support
Point of Sale Credit
BÜNYAMİN ALEMDAR Operational Support
Point of Sale Credit
CANTEKBİL TEKNOLOJİBİLİŞİM ÜRÜN. ELKTİC. LTD. ŞTİ. Operational Support
Point of Sale Credit
CER TİCARET DAYANIKLI TÜKETİM MALLARI PAZARLAMA ANONİM ŞİRKETİ
Operational Support
Point of Sale Credit
CEYLANLAR İNŞAAT NAK. TAAH. TİC. LTD. ŞTİ. Operational Support
Point of Sale Credit
COŞAR MOBİLYA SAN. VE TİC. LTD. ŞTİ. Operational Support
Point of Sale Credit
CYM DAYANIKLI TÜKETİM MALLARI İNŞAAT İTH. İHR. SAN. VE TİC. LTD. ŞTİ.
Operational Support
Point of Sale Credit
ÇETMEN MAĞAZALARI MOBİLYA DAY. TÜKETİM MALLARI OTO. SAN. VE TİC. A.Ş.
Operational Support
Point of Sale Credit
DAF İLETİŞİM SİSTEMLERİ Operational Support
Point of Sale Credit
DATAPARK İÇ VE DIŞ TİC. LTD. ŞTİ. Operational Support
Point of Sale Credit
DEĞER BEYAZ EŞYA GIDA. EĞ. DAN. TAR. ÜR. SAN VE TİC. LTD. ŞTİ.
Operational Support
Point of Sale Credit
DELİKANLI EV GEREÇLERİ SAN VE TİC. LTD. ŞTİ. Operational Support
Point of Sale Credit
DEMİRCAN TELEKOM Operational Support
Point of Sale Credit
DEMİRHAN DAYANIKLI TÜKETİM MALL. MOB. TUR. GIDA SAN VE TİC. LTD. ŞTİ.
Operational Support
Point of Sale Credit
DENİZLİ GÜNNUR OTOMOTİV LTD. ŞTİ. Operational Support
Point of Sale Credit
DERİN DAYANIKLI TÜK. MAL. TURZ. SAN. TİC. LTD. ŞTİ Operational Support
Point of Sale Credit
DOĞAN DAYANIKLI TÜKETİM MALLARI PAZARLAMA TİCARET LİMİTED ŞİRKETİ
Operational Support
Point of Sale Credit
DOĞU VE BATI MOTORLUTAŞITLAR SANAYİTİC. LTD. ŞTİ. Operational Support
Point of Sale Credit
DÜNYA OFİS BİLİŞİM DANIŞ. YAZ. ELEKT. TİC. LTD. ŞTİ. Operational Support
Point of Sale Credit

55
ECS DAYANIKLI TÜKETİM MAL. MOB. HALI TEK. İNŞ. İTH. İHR. SAN. VE TİC. LTD. ŞTİ.
Operational Support
Point of Sale Credit
EGEMEN ELEKTRİKLİ EV ALETLERİ PAZARLAMA ANONİM ŞİRKETİ
Operational Support
Point of Sale Credit
EKON DAYANIKLI TÜKETİM MALLARI İNŞAAT İLETİŞİM OTO. SAN. VE TİC. LTD. ŞTİ.
Operational Support
Point of Sale Credit
ELBİSTAN ELEKTRONİK İNŞ. TAAHHÜT KUYUMCULUK TEKS. SAN VE TİC. LTD. ŞTİ.
Operational Support
Point of Sale Credit
ELMACIOĞLU TÜKETİMMALLARI TİCARETANONİM ŞİRKETİ Operational Support
Point of Sale Credit
EMRE BİLGİSAYAR İLETİŞİM HİZMETLERİTİC. LTD. ŞTİ. Operational Support
Point of Sale Credit
EMRE MOBİLYA DAYANIKLI TÜK MALL GIDAİNŞ S V T LTD. ŞT
Operational Support
Point of Sale Credit
EMSA TEK ELEKT. EŞ. GI. HAYV. İNŞ. TAH. VE DAY. TÜK. MAL. SAN. TİC. LTD. ŞTİ.
Operational Support
Point of Sale Credit
EREM DAYANIKLI TÜKETİM MALLARI VE TİC. LTD. ŞTİ. Operational Support
Point of Sale Credit
EREN EKVATOR DA. TÜ. M. İN. TE. KON. GI. TU. EĞ. HİZ. LTD. ŞTİ.
Operational Support
Point of Sale Credit
ERSİN YILDIZOĞLU Operational Support
Point of Sale Credit
EVRENKENT MÜHENDİSLİK MİMARLIK İNŞAAT DOĞALGAZ MÜŞ. SAN. VE TİC. LTD. ŞTİ.
Operational Support
Point of Sale Credit
FATİH DİNÇ Operational Support
Point of Sale Credit
GALERİ GÜRSES DAYANIKLI VE DAYANIKSIZ TÜKETİM MALLARI TİCARET A.Ş.
Operational Support
Point of Sale Credit
GAZİANTEP MOTOR SAN. VE TİC. LTD. ŞTİ. Operational Support
Point of Sale Credit
GAZİOĞLU MOBİLYA DAYTÜKETİM MAL İNŞTİC. LTD. ŞTİ. Operational Support
Point of Sale Credit
GENÇER DAYANIKLI TÜKMAL PAZ ÖZEL EĞTİNŞ TAH SN LTD. Ş
Operational Support
Point of Sale Credit
GEZERLER DAYANIKLI TÜKETİM MALLARI KIRTASİYE VE İNŞAAT SAN LTD. ŞTİ.
Operational Support
Point of Sale Credit
GÖKSAM İLETİŞİM ELEKTRONİK DAY. TÜK. MLZ. SAN VE TİC. LTD. ŞTİ.
Operational Support
Point of Sale Credit
GÜLER İLETİŞİM İNŞ. TURZ. SAN. TİC. LTD. ŞTİ. Operational Support
Point of Sale Credit
GÜLPA DAYANIKLI TÜKETİM MALLARI KUY. İNŞ. MOB. TİC. VE SAN. LTD. ŞTİ
Operational Support
Point of Sale Credit
GÜNDÜZ BEYAZ EŞYA DAY. TÜK. MAL. TİC. LTD. ŞTİ. Operational Support
Point of Sale Credit
GÜRLEK İLETİŞİM VE BİLİŞİM LİMİTED ŞİRKETİ Operational Support
Point of Sale Credit
GÜROLCAN DAYANIKLI TÜKETİM MALLARI SAN. VE TİC. LTD. ŞTİ
Operational Support
Point of Sale Credit
GÜVEN EVİN DAYANIKLI TÜKETİM MALLARI AKARY. MOB. TAŞ. TİC. VE SAN. LTD. ŞTİ.
Operational Support
Point of Sale Credit
GÜVENEL DAYANIKLI TÜKETİM MALLARI İLETİŞİM BİLİŞİM SAN. VE TİC. LTD. ŞTİ
Operational Support
Point of Sale Credit
HAKAN BEKEN Operational Support
Point of Sale Credit
HALDIZ İNŞ. OTOMOTİV VE TİC. A.Ş. Operational Support
Point of Sale Credit
HALUK HAŞMET PARPUCU Operational Support
Point of Sale Credit
HARUN ELEKTRONİK BEYAZ EŞYA LİMİTED ŞİRKETİ Operational Support
Point of Sale Credit
HASAN ÇİTİL Operational Support
Point of Sale Credit
HULUSİ İLHAN- AK ÇARŞI ALIŞVERİŞ MERKEZİ Operational Support
Point of Sale Credit
IHLAMUR DAYANIKLI TÜKETİM MALLARI SANAYİ TİCARET LİMİTED ŞİRKETİ
Operational Support
Point of Sale Credit
İÇKALE BİLİŞİM DAĞITIM İLET. VE TEL. TUR. İNŞ. İTH. İHR. A.Ş.
Operational Support
Point of Sale Credit

56
İHSAN ORUÇ Operational Support
Point of Sale Credit
İLKER KAYA Operational Support
Point of Sale Credit
İLKER SAKİN/BEKO BAYİİ Operational Support
Point of Sale Credit
İMO DAYANIKLI TÜKETİM MALLARI TİCARET LİMİTED ŞİRKETİ
Operational Support
Point of Sale Credit
İRİS DAYANIKLI TÜKETİM MALLARI TİCARET LİMİTED ŞİRKETİ Operational Support
Point of Sale Credit
İSMAİL SERKAN TARKAN Operational Support
Point of Sale Credit
İZMİR MOTOMARKET SERVİSİ VE TİCARET ANONİM ŞİRKETİ Operational Support
Point of Sale Credit
KAAN ELEKTRONİK VE DAY TÜK MALL PAZ TİC Operational Support
Point of Sale Credit
KABİLLER DAYANIKLI TÜKETİM MALLARI TİC. LTD. ŞTİ. Operational Support
Point of Sale Credit
KADİR SEVİMLİ Operational Support
Point of Sale Credit
KAHYAOĞLU YATIRIM PAZ. VE ÜRETİM A.Ş. Operational Support
Point of Sale Credit
KAMİL DOĞAN Operational Support
Point of Sale Credit
KARABAĞ DAYANIKLI TÜKETİM MAMÜLLERİ TİCARET VE SAN LTD. ŞTİ.
Operational Support
Point of Sale Credit
KARDEŞLER DAYANIKLI TÜK. MAL. PAZ. İNŞ. TAAH. İH. VE İT. TİC. VE SAN. LTD. ŞTİ.
Operational Support
Point of Sale Credit
KARDEŞLER TİCARET-İSMET TAŞKAN Operational Support
Point of Sale Credit
KARGILI MOBİLYA VE İNŞAAT TİC. LTD. ŞTİ. Operational Support
Point of Sale Credit
KAYAOĞLU DAYANIKLI TÜKETİM MAL. MOB. İNŞ. TAAH. SAN. TİC. LTD. ŞTİ.
Operational Support
Point of Sale Credit
KEMAL ŞENGÜL Operational Support
Point of Sale Credit
KESKİNLER EV ALETLERİ TİC. LTD. ŞTİ. Operational Support
Point of Sale Credit
KIVRAK MOTOR OTO VE MAK. TUR. İTH. İHR. İNŞ. TUR. TAŞ. TİC. VE SAN. LTD. ŞTİ.
Operational Support
Point of Sale Credit
KMR DAYANIKLI TÜKETİM MAL. SAĞ. HİZ. GIDA TİC. LTD. ŞTİ.
Operational Support
Point of Sale Credit
KOBİHATTI BİLGİSAYAR VE YAZILIM HİZ SAN VE TİC. LTD. STİ Operational Support
Point of Sale Credit
KOYUNCU DENİZCİLİK RENT A CAR OTO SAT. VE SER. HİZ. TUR. TİC. LTD. ŞTİ
Operational Support
Point of Sale Credit
KUTLU BİLGİ EĞİTİM Operational Support
Point of Sale Credit
KUTLU KUY. İLT. TURZ. TEKS. GID. İNŞ. SN VE TC. LTD. ŞT Operational Support
Point of Sale Credit
KUTUP PAZARLAMA VE TİCARET AŞ Operational Support
Point of Sale Credit
KÜÇÜKLER DAYANIKLI TÜKETİM MAL. TİC. LTD. ŞTİ. Operational Support
Point of Sale Credit
KVK KURUMSAL SATIŞ VE PAZARLAMA ANONİM ŞİRKETİ Operational Support
Point of Sale Credit
MACROCOM BİL. DAY. TÜK. MAL. GIDATEK. TUR. İNŞ. SAN. TİC. LTD. ŞTİ
Operational Support
Point of Sale Credit
MARMARA ATILIM DAYANIKLI TÜK. MAL. PAZ. İTH. İHR. TİC. LTD. ŞTİ.
Operational Support
Point of Sale Credit
MARMARA GIDA GAZ AKARYAKIT İNŞAAT OTOMOTİV TAŞIMA. SAN. VE TİC. LTD. ŞTİ.
Operational Support
Point of Sale Credit
MEHMET ALİ KURT Operational Support
Point of Sale Credit
MEHMET DİRİK DAYANIKLI TÜK MAL GD TEKS SAN VE TİC. LTD. ŞTİ.
Operational Support
Point of Sale Credit
MEHMET EREN Operational Support
Point of Sale Credit

57
MEHMET KONŞUK Operational Support
Point of Sale Credit
MEHMET-EMİN-ERSİN İŞBİLİR ADİ ORTAKLIĞI Operational Support
Point of Sale Credit
MEKTEBİM EĞİTİM KURUMLARI TİCARET ANONİM ŞİRKETİ Operational Support
Point of Sale Credit
MELEK BAŞ Operational Support
Point of Sale Credit
MELEK DİKER Operational Support
Point of Sale Credit
MERAM MİMARLIK MÜHENDİSLİK MOBİLYA LİMİTED ŞİRKETİ
Operational Support
Point of Sale Credit
MERT DAYANIKLI TÜKETİM MALLARI SAN. TİC. LTD. ŞTİ. Operational Support
Point of Sale Credit
METİN GÜNEŞ Operational Support
Point of Sale Credit
MKŞ DAYANIKLI TÜKETİM MALLARI TİCARET LTD. ŞTİ. Operational Support
Point of Sale Credit
MNR BALIKESİR MOTOR PAZARLAMA SEVİS VE TİCARET LİMEDŞİRKETİ
Operational Support
Point of Sale Credit
MNR MOTOR PAZ. SER. VE TİC. LTD. Operational Support
Point of Sale Credit
MUHAMMED EROĞLU - EROĞLU TİCARET Operational Support
Point of Sale Credit
MUSTAFA AKKOÇ MAKİNA SANAYİ VE TİCARET ANONİM ŞİRKETİ
Operational Support
Point of Sale Credit
MVG İLETİŞİM TEKNOLOJİ ÜRÜNLERİ PAZARLAMA ANONİM ŞİRKETİ
Operational Support
Point of Sale Credit
NARMANLAR DAY. TÜK. MAL. İNŞ. AKAR. OTO. TUR. TARIM. HAY. SAN. VE TİC. LTD. ŞTİ.
Operational Support
Point of Sale Credit
NEFES MOBİL İLETİŞİM İNŞAAT TİCARET ANONİM ŞİRKETİ Operational Support
Point of Sale Credit
NİZAMLAR PETROL ÜRÜNLERİ DAY. TÜK. MAL. İNŞ. SAN. VE DIŞ TİC. LTD. ŞTİ.
Operational Support
Point of Sale Credit
ONUR GÜNAY MOB. ELEK. ELEKTRONİK DAY. TÜKETİM MAL. SAN. VE TİC. LTD. ŞTİ.
Operational Support
Point of Sale Credit
ORHAN MEHMET ÇATALYÜREK ORT. Operational Support
Point of Sale Credit
ORPA MOBİLYA OTO. İNŞ. SAN. LTD. ŞTİ. Operational Support
Point of Sale Credit
OSKO DAYANIKLI TÜKETİM MALLARI SAN. VE TİC. LTD. ŞTİ Operational Support
Point of Sale Credit
ÖZ SPOT- KEMAL ÖZ Operational Support
Point of Sale Credit
ÖZANADOLU 2 TELEKOMİNİKASYON İNŞ. TAR. HAY. GID. İTH. İHR. TİC. VE SAN. LTD. ŞT
Operational Support
Point of Sale Credit
ÖZER EV ALETLERİ MOBİLYA DAYANIKLI TÜKETİM MALLARI İNŞAAT TİC. LTD. ŞTİ.
Operational Support
Point of Sale Credit
ÖZLER KARDEŞLER SAN. TİC. LTD. ŞTİ. Operational Support
Point of Sale Credit
ÖZSAĞLAM DAY TÜK MALPAZAR. SAN. VE TİC. LTD. ŞTİ. Operational Support
Point of Sale Credit
PANOMİ MOBİLE PAZARLAMA TİCARET LİMİTED ŞİRKETİ Operational Support
Point of Sale Credit
PARK BERGAMA MAĞAZACILIK SANAYİ VE TİCARET LİMİTED ŞİRKETİ
Operational Support
Point of Sale Credit
PENTA TAŞIT TİC. VE SAN. LTD. ŞTİ. Operational Support
Point of Sale Credit
PINAR İNŞAAT SAN. VE TİC. LTD. ŞTİ. Operational Support
Point of Sale Credit
PLATİN BEYAZ EŞYA TİCARET LİMİTED ŞİRKETİ. Operational Support
Point of Sale Credit
RADİKAL PAZARLAMA VE DIŞ TİCARET LİMİTED ŞİRKETİ Operational Support
Point of Sale Credit
RECAİ BALTAŞ Operational Support
Point of Sale Credit
RECEP ÖZKAN Operational Support
Point of Sale Credit

58
RİDVAN DEMİRTAŞé#DEMİRTAŞ TİCARETé# Operational Support
Point of Sale Credit
RÜZGAR TELEKOM ELEKTRONİK ALET. YAY. YED. PARÇA VE AKS. TİC. SAN. LTD. ŞTİ.
Operational Support
Point of Sale Credit
SAADET HALI DAYANIKLI TÜKETİM MADDELERİ TİCARET SANAYİ ANONİM ŞİRKETİ
Operational Support
Point of Sale Credit
SADEDDİN TİCARET Operational Support
Point of Sale Credit
SADIK KARABACAK Operational Support
Point of Sale Credit
SCS AKSESUAR İLE. TELEK. ELEK. ELEKTRONİK İN. TAAH. İTH. İHR. TİC. LTD. ŞTİ.
Operational Support
Point of Sale Credit
SENETSEPET COM ALIŞVERİŞ MERKZ LTD. ŞTİ Operational Support
Point of Sale Credit
SERAL DAYANIKLI TÜK. MALL. SAN. TİC. LTD. ŞTİ Operational Support
Point of Sale Credit
SERGÜR DAYANIKLI TÜKETİM MALLARI SANAYİ VE TİCARET LİMİTED ŞİRKETİ
Operational Support
Point of Sale Credit
SERHAT ERSAN Operational Support
Point of Sale Credit
SERHATLAR DAYANIKLI TÜKETİM MALLARI SANAYİ VE TİCARET ANONİM ŞİRKETİ
Operational Support
Point of Sale Credit
SERKAN AKSOY Operational Support
Point of Sale Credit
SONER KAV Operational Support
Point of Sale Credit
SOYGÜR DAYANIKLI TÜKETİM VE İLETİŞİM PAZZARLAMA LİMİTED ŞİR
Operational Support
Point of Sale Credit
SPLAZA SAY. TÜK. M. İN. T. SAN. VE TİC. A.Ş. Operational Support
Point of Sale Credit
SUNGURBEY EĞİTİM VE TİC. LTD. ŞTİ. Operational Support
Point of Sale Credit
SÜERLER HAYAT DAYANIKLI TÜKETİMMALLARI GIDA İNŞ. TUR.
Operational Support
Point of Sale Credit
SÜLEYMAN GİRAY Operational Support
Point of Sale Credit
ŞAKALAKOĞLU EĞİTİM HİZMETLERİ TURZM İNŞ. VE NAKL. TİC. LTD. ŞTİ
Operational Support
Point of Sale Credit
ŞANLI MOBİLYA ELEKTRONİK EŞ. EV TEK. ZÜC. VE İN. ŞSAN. TİC. LTD. ŞTİ
Operational Support
Point of Sale Credit
ŞARK-IŞIK HALI MOBİLYA TUR. TAAH. VE TİC. LTD. ŞTİ. Operational Support
Point of Sale Credit
ŞEKERCİLER HALI MOBİLYA TEKS. ELEKT. AV. ZÜC. MUT. DAY. TÜK. MAL. A
Operational Support
Point of Sale Credit
ŞENER BAYDAR Operational Support
Point of Sale Credit
ŞENGÜLLER A.Ş. Operational Support
Point of Sale Credit
ŞENGÜLLER TELEKOMİNİKASYON VE DAY. TÜK. MAMÜL. PAZ. A.Ş.
Operational Support
Point of Sale Credit
TAVİLOĞLU EV ALETLERİ TİCARET VE TURİZM NAKLİYAT LİMİTED ŞİRKETİ
Operational Support
Point of Sale Credit
TEK TELEKOM TİCARET LTD. ŞTİ. Operational Support
Point of Sale Credit
TEKUĞUR DAY. TÜK. MAL. TİC. LTD. ŞTİ. Operational Support
Point of Sale Credit
TİNK EĞİTİM HİMZETLERİ VE DANIŞMANLIK ANONİM ŞİRKETİ
Operational Support
Point of Sale Credit
TOKDEMİR BİLİŞİM TEKNOLOJİLERİ İNŞAAT GIDA İTHALAT İHRACAT SANAYİ VE T
Operational Support
Point of Sale Credit
TUANA DAYANIKLI TÜK. MAL. MOB. İNŞ. GIDASAN. VE TİC. LTD. Ş
Operational Support
Point of Sale Credit
TUNA TİCARET HAKAN KALKAN-CEVDET BALMUMCU ADİ ORTAKLİĞI
Operational Support
Point of Sale Credit
TUNAHAN ELEKT. KUY. TEM. TEKS. VE DERİ SAN. TİC. LTD. ŞTİ.
Operational Support
Point of Sale Credit
TURGUT AKAR HALICILIK TUR. SAN. VE TİCLTD. ŞTİ. Operational Support
Point of Sale Credit

59
TUSE İLETİŞİM Operational Support
Point of Sale Credit
TÜRKANLAR DAYANIKLITÜKE. MALL. PAZAR. TİC. LTD. ŞTİ. Operational Support
Point of Sale Credit
UĞUR KILIÇ MİM. İNŞ. TAA. NAK. ÖZE. EĞİ. SAĞ. VE TUR. SAN. TİC. LTD. ŞTİ.
Operational Support
Point of Sale Credit
UĞURLAR PAZARLAMA TİCARET LTD. ŞTİ. Operational Support
Point of Sale Credit
UŞAK MOBİL MARKET İLETİŞİM ELEKTRONİK SANAYİ VE TİCARET LİMİTED ŞİRKET
Operational Support
Point of Sale Credit
UYAR TİCARET Operational Support
Point of Sale Credit
UYARLAR DAY. TÜK. MALL. SAN. VE TİC. LTD. ŞTİ. Operational Support
Point of Sale Credit
UYGUN TİCARET ŞAKİR UYGUN Operational Support
Point of Sale Credit
UYSAL MÜHENDİSLİK DAY. TÜK. MALLARI VE MOB. PAZ. TİC. LTD. ŞTİ.
Operational Support
Point of Sale Credit
UYSALLAR MOTORLUARAÇLAR SAN VETİC. LTD. ŞTİ. Operational Support
Point of Sale Credit
ÜÇYILMAZ TİCARET ELEKTRİK DAY. TÜK. MALL. TURZ. GID. VE OTOM. SAN. LTD. ŞTİ
Operational Support
Point of Sale Credit
VADULLAH MESUT GENCER-ONURLU İNŞ. İŞLERİ DAY. TÜK. MAL. TRAKTÖR BAYİLİĞİ
Operational Support
Point of Sale Credit
VARDAR DAY. TÜK. MAD. SAR. TUR. İTH. İHR. SAN VE TİC. LTD. ŞTİ.
Operational Support
Point of Sale Credit
VEYİSOĞLU DAYANIKLI TÜKETİM MALLARI İNŞAAT SANAYİ VE TİCARET LTD. ŞTİ.
Operational Support
Point of Sale Credit
VOLKAN CAN Operational Support
Point of Sale Credit
YAKIŞAN DAYANIKLI TÜKETİM MALLARI PAZARLAMA SAN VE TİC. LTD. ŞTİ.
Operational Support
Point of Sale Credit
YALÇIN AKAY - AKAY TİCARET Operational Support
Point of Sale Credit
YAVUZATA DAY. TÜK. MALLARI İNŞ. SAN. VE TİC. LTD. ŞTİ Operational Support
Point of Sale Credit
YAVUZLAR BEYAZ EŞYA DAYANIKLI LTD. ŞTİ. Operational Support
Point of Sale Credit
YETGİNLER DAY. TÜKETTİM. MAM. KUY. OTOMOTİVSAN. VE TİC. LTD.
Operational Support
Point of Sale Credit
YILMAZ ALTUN Operational Support
Point of Sale Credit
YILMAZER EV GEREÇLERİ İTHALAT İHRACAT SAN. VE TİC. A.Ş.
Operational Support
Point of Sale Credit
YUSUF GÜZELSOY Operational Support
Point of Sale Credit
YUSUF KIVILCIM Operational Support
Point of Sale Credit
ZAFER TEKSTİL İNŞAAT SANAYİ VE DAHİLİ TİC. LTD. ŞTİ. Operational Support
Point of Sale Credit
ZENNURE AYDÖNER Operational Support
Point of Sale Credit
ZEYNEP KALKANLI Operational Support
Point of Sale Credit
ZİRVE İNŞAAT İLETİŞİM ELEKTRONİK TUR. GIDA SAN. VE TİC. LTD. ŞTİ.
Operational Support
Point of Sale Credit
AGT HIZLI KURYE HİZMETLERİ ANONİM ŞİRKETİ Operational Services
Commodity Delivery Agreement
AGT HIZLI KURYE HİZMETLERİ ANONİM ŞİRKETİ Operational Services
Courier Services Under Robin Project
ARÇELİK A.Ş. Operational Services
Cash Register POS SLA Area Service
AUSTRIA CARD TURKEY KART OPERASYONLARI A.Ş. Operational Services
Personalization of Cards With Chip and Magnetic Stripes
BANTAŞ NAKİT VE KIYMETLİ MAL TAŞIMA GÜVENL. HİZM. AŞ
Operational Services
Service Procurement Agreement
BANTAŞ NAKİT VE KIYMETLİ MAL TAŞIMA GÜVENL. HİZM. AŞ
Operational Services
Central Bank of the Republic of Turkey (CBRT) Cash Withdrawl Agreement

60
COLLECTÜRK ALACAK YÖNETİMİ VE DANIŞMANLIK ANONİM ŞİRKETİ
Operational Services
Legal Prosecution Collection Search
CREDE DANIŞMANLIK VE DIŞ TİC. A.Ş. Operational Services
Legal Entity Intelligence Automation
DATA MARKET BİLGİ HİZMETLERİ ANONİM ŞİRKETİ Operational Services
Hiring Staff For Information Systems
DATA MARKET BİLGİ HİZMETLERİ ANONİM ŞİRKETİ Operational Services
Service Procurement Agreement
E-KART ELEKTRONİK KART SİSTEMLERİ SANAYİ VE TİCARET ANONİM ŞİRKETİ
Operational Services
Metamorfoz TEB HCE
FU GAYRİMENKUL YATIRIM DANIŞMANLIK A.Ş. Operational Services
Operational Support for Mortgage Processes
GÜZEL SANATLAR ÇEK BASIM LTD. ŞTİ. Operational Services
Cheque Printing Services Agreement
HOBİM ARŞİVLEME VE BASIM HİZMETLERİ ANONİM ŞİRKETİ Operational Services
Purchasing Credit Card Statement Printing and Enveloping Service
HUGIN YAZILIM TEKNOLOJİLERİ ANONİM ŞİRKETİ Operational Services
Payment Registration Equipment Service Agreement
INGENİCO ÖDEME SİSTEM ÇÖZÜMLERİ A.Ş. Operational Services
Service for Remote Installing to POS Devices.
IRON MOUNTAIN ARŞİVLEME HİZMETLERİ ANONİM ŞİRKETİ Operational Services
Scan Data Entry Outsourcing
İNGENİCO ÖDEME SİSTEM ÇÖZÜMLERİ A.Ş. Operational Services
Cash Register Machines - Field Services
İNGENİCO ÖDEME SİSTEM ÇÖZÜMLERİ A.Ş. Operational Services
Practice Development, Technical Support, Update and Maintenance Agreement
İNNOVA BİLİŞİM ÇÖZÜMLERİ A.Ş. Operational Services
Company Operation Center Service Agreement
İPOTEKA GAYRİMENKUL YATIRIM DANIŞMANLIK ANONİM ŞİRKETİ
Operational Services
Service Agreement Regarding Mortgage Processes
İŞ ZEKASI YAZILIM DANIŞMANLIK HİZMETLERİTİCARET A.Ş. Operational Services
Hiring Staff For Information Systems
KARTNET BİLGİSAYAR SANAYİ VE TİCARET ANONİM ŞİRKETİ Operational Services
Capv 2.1 Maintenance and Repairing Services Agreement
KARTNET BİLGİSAYAR SANAYİ VE TİCARET ANONİM ŞİRKETİ Operational Services
POS Network Maintenance Agreement
KEYTORC TEKNOLOJİ HİZMETLERİ VE DANIŞMANLIK ANONİM ŞİRKETİ
Operational Services
Test Consultancy Service Agreement
KONUT KREDİSİ COM TR DANIŞMANLIK A.Ş. Operational Services
Retail Loan Product Marketing
KURYE NET MOTORLU KURYECİLİK VE DAĞITIM HİZMETLERİ A.Ş.
Operational Services
Commodity Distribution
LİNK TERA BİLGİ TEKNOLOJİLERİ A.Ş. Operational Services
Hiring Staff For Information Systems
MİKROSARAY MİKROBİLGİSAYAR PAZ. VE TİC. A.Ş. Operational Services
Cash Register Machines - Field Services
MT BİLGİ TEKNOLOJİLERİ VE DIŞ TİCARET A.Ş. KARBİL YAZILIM VE BİLİŞİM TEKNOLOJİLERİ TİC. A.Ş.
Operational Services
Cash Register POS Agreement
NCR BİLİŞİM SİSTEMLERİ LTD. ŞTİ. Operational Services
ATM Hardware-Software Maintenance and Repairing Services Agreement
NETAS TELEKOMUNIKASYON A. S. Operational Services
Network Maintenance Agreement
PANAROMA BiLİŞİM TEKNOLOJİLERİ SANAYİ VE TİCARET A.Ş.
Operational Services
Cash Register Machines Installation and Service Agreement
PAYCORE ÖDEME HİZMETLERİ TAKAS VE MUTABAKAT SİSTEMLERİ A.Ş.
Operational Services
Printing and Enveloping Agreement
PAYTEN TEKNOLOJİ ANONİM ŞİRKETİ Operational Services
Cyber POS Services
PLANİST BİLİŞİM HİZMETLERİ VE DANIŞMANLIK TİC. LTD. ŞTİ.
Operational Services
Hiring Staff For Information Systems
PLASTİKKART AKILLI KART İLETİŞİM SİSTEMLERİ SAN. VE TİC. A.Ş.
Operational Services
Personalization of Cards with Chip and Magnetic Stripes and Raw Card Supply Outsourcing Agreement
POSTA VE TELGRAF TEŞKİLATI ANONİM ŞİRKETİ. Operational Services
Credit Applications and Repayments from PTT Branches
R2 SERVİS ELEKTRİK ELEKTRONİK VE BİLGİSAYAR TEKNOLOJİLERİ SANAYİ VE TİCARET ANONİM ŞİRKETİ
Operational Services
Cash Register Equipment Service Agreement
RİSK YAZILIM TEKNOLOJİLERİ DAN. EĞ. TİC. LTD. ŞTİ Operational Services
RISKTURK Software, Procurement, Warranty and Maintenance Agreement

61
VERİFONE ELEKTRONİK VE DANIŞMANLIK LTD. ŞTİ. Operational Services
POS Remote Installation Agreement
VERİFONE ELEKTRONİK VE DANIŞMANLIK LTD. ŞTİ. Operational Services
Practice Development, Technical Support, Update and Maintenance Agreement
WEBHELP ÇAĞRI MERKEZİ VE MÜŞTERİ HİZMETLERİ A.Ş. Marketing Outgoing Call, Credit Card Sales and Marketing 32 BİT BİLG. HİZM. SAN. VE TC. LTD. ŞTİ. Software Exchange Rate Broadcasting Development Service
Procurement 32 BİT BİLG. HİZM. SAN. VE TC. LTD. ŞTİ. Software Otass Integration Software Maintenance 360 TRADİNG NETWORKS Software Exchange Trading Platform 3-D BİLİŞİM TEKNOLOJİLERİ DANIŞMANLIK VE TEKNİK SERVİS ANONİM ŞİRKETİ
Software NICE Sound Recording Maintenance Agreement
ARTGE TEKNOLOJİ MÜHENDİSLİK SANAYİ VE TİCARET A.Ş. Software Face Recognition System Project BDH BİLİŞİM DESTEK HİZM. SAN. VE TİC. A. Ş Software Hiring Staff For Information Systems BNP PARIBAS SECURITIES SERVICES Software Acetp Software Agreement ÇÖZÜMEVİ YÖNETİM DANIŞMANLIĞI VE BİLGİSAYAR YAZILIM TİCARET ANONİM ŞİRKETİ
Software Çözümevi Hyperion Application Maintenance
D. T. P. BİLGİ İŞLEM İLETİŞİM VE TİCARET A.Ş. Software E-Archive Integration D. T. P. BİLGİ İŞLEM İLETİŞİM VE TİCARET A.Ş. Software E-Invoice Project EKSİ BİR ARTI BİR YAZILIM DANIŞMANLIK SANAYİ VE TİCARET A.Ş.
Software Cash Management Cost Optimization
FİNANCİAL ENGİNEERİNG ASSOCİATES, INC. Software Finalyse Software Agreement FOREKS BİLGİ İLETİŞİM HİZ. A.Ş. Software Service Facilitation Agreement İNFİNA YAZILIM A.Ş. Software Fund Operations and Collective Custody Agreement İSEMARKET BİLGİSAYAR YAZILIM VE DANIŞMANLIK LİMİTED ŞİRKETİ
Software Secure Login Software Maintenance for the Internet Branch
İŞ ZEKASI YAZILIM DANIŞMANLIK HİZMETLERİ TİCARET ANONİM ŞİRKETİ
Software Real Time Campaign Management Program Agreement
KEY YAZILIM ÇÖZÜMLERİ ANONİM ŞİRKETİ Software Appraisal Software Agreement MATRİKS BİLGİ DAĞITIM HİZ. A.Ş. Software Mobile Practice Development and Maintenance
Agreement METAMORFOZ BİLİŞİM TEKNOLOJİLERİ SANAYİ VE TİCARET ANONİM ŞİRKETİ
Software Smart Watch Application Software and Maintenance (HCE Phone and Smart Watch)
OBSS TEKNOLOJİ ANONİM ŞİRKETİ Software Software ONUSS ORTAK NOKTA ULUSLARARASI HABERLEŞME SİSTEM SERVİS BİLGİSAYAR YAZILIM DANIŞ. VE DIŞ TİC. LTD. ŞTİ.
Software Software
RİSK YAZILIM TEKNOLOJİLERİ DANIŞMANLIK EĞİT. TİC. LTD. Software RISKTURK Software, Procurement, Warranty and Maintenance Agreement
RİSK YAZILIM TEKNOLOJİLERİ DANIŞMANLIK EĞİT. TİC. LTD. Software Software, Market Risk Reporting Module Agreement SESTEK SES VE İLETİŞİM BİLGİSAYAR TEK. SAN. TİC. A.Ş. Software Speech Analytics SİSTAŞ SAYISAL İLETİŞİM SAN. TİC. A.Ş. Software Call Me Licence and Maintenance Services TÜRKKEP KAYITLI ELEKTRONİK POSTA HİZM. SAN. VE TİC. A.Ş.
Software Registered E-Mail Licensing Services
VERİSOFT BİLGİ İŞLEM TİCARET VE SANAYİ ANONİM ŞİRKETİ Software TEB POS Machine Software Implementation On Cash Register Machines Agreement
COMMENCİS TEKNOLOJİ ANONİM ŞİRKETİ Software (Banking) Pozitron Mobile Banking Agreement ECZACIBAŞI BİLİŞİM SAN. VE TİC. A. Ş Software (Banking) Electronic Foreclosure Management System Software
Licence Agreement ECZACIBAŞI BİLİŞİM SAN. VE TİC. A.Ş. Software (Banking) Ebiflow Payment Order System Licence and Service
Agreement ECZACIBAŞI BİLİŞİM SAN. VE TİC. A.Ş. Software (Banking) Mobilink Maintenance Agreement ERETİM BİLGİSAYAR HİZMERLERİ VE DANIŞMANLIK LTD. ŞTİ. Software (Banking) Campaign Management Tool License and
Implementation Agreement ETCBASE YAZILIM VE BİLİŞİM TEKNOLOJİLERİ A.Ş. Software (Banking) Software FİNEKSUS BİLİŞİM ÇÖZÜMLERİ TİCARET A.Ş. Software (Banking) SWIFT Alliance System İNFİNA YAZILIM A.Ş. Software (Banking) Finbase Mail Inflex Module - Maintenance BNP PARIBAS S. A. /FRANCE Software (Other) Software Development, Maintenance and Support
Service DİEBOLD NİXDORF TEKNOLOJİ ANONİM ŞİRKETİ Software (Other) Software Maintenance Agreement GENOM BİLİŞİM TEKNOLOJİLERİ DANIŞMANLIK VE TİC. A.Ş. Software (Other) Human Resources Update and Telephone Support
Service MARO ULUSLARARASI BİLGİ TEKNOLOJİLERİ DANIŞMANLIK GELİŞTİRME DESTEK HİZMETLERİ SANAYİ VE TİCARET ANONİM ŞİRKETİ
Software (Other) Consultancy, Appraisal and Labor Agreement
SİSTAŞ SAYISAL İLETİŞİM SAN TİC. A.Ş. Software (System) GVP Maintenance Agreement SİSTAŞ SAYISAL İLETİŞİM SAN. TİC. A.Ş. SESTEK SES VE İLETİŞİM BİLGİSAYAR TEK. SAN. TİC. A.Ş.
Software (System) Voice-Signature and Voice-Guide Agreement For Call Center
BNP PARIBAS SA / HEAD OFFICE Software (Other) CORTEX

62
PERFORMANCE BONUSES AND SALES PREMIUMS
Annual bonus pool is set on the basis of the profitability of the Bank, the results generated by the activity and achievements and also the (local and/or professional) sector practices. Payment of bonuses will only be considered if the Bank achieves 80% of the budgeted net profit at the end of the financial year.
TL 137,5 million in total has been set aside in the Bank’s 2020 financial statements as provision for performance bonuses and sales premiums. Slated for payment in 2021, the amount splits as TL 124,8 million to be paid depending on the performances of the employees during the year and TL 12,6 million as sales premium in line with the sales realized by sales staff in 2020.
In addition, the deferred bonus amount, i.e. the bonus paid to employees in a later period than the period it is earned, is TL 30 million.

63
FINANCIAL RIGHTS PROVIDED TO THE MEMBERS OF THE GOVERNING BODY AND SENIOR EXECUTIVES
The Remuneration policy of the Bank has been prepared in accordance with Banking Regulation and Supervision Agency (BRSA) “Corporate Governance Principles” and “Guideline on Banks’ Good Remuneration Practices” within the scope of proportionality principle, and in compliance with the content, structure and strategies of the Bank’s activities, its long-term targets, risk management structures and in compliance with the local regulation. Remuneration policy aims to prevent extreme risk taking and evaluates the contributions to the effective risk management. Our Remuneration Policy is intended to encourage TEB to manage risks within the principles and parameters defined and approved by its Board of Directors. The purpose of our Remuneration Policy is also to ensure that TEB can attract and retain competent and expert employees both in business lines and control functions that will help to fulfill its strategic objectives. SECOM (Selection and Compensation Committee) is responsible for the preparation of Remuneration Policy on behalf of the Board of Directors and for ensuring its compliance with local regulations and BNP Paribas Group compensation policies provided that they are not contradictory to the local rules and regulations and TEB Policies as approved by TEB Board of Directors. Analysis and establishment of the rules of the RP will be conducted by SECOM with the involvement of Human Resources (HR), Finance, Risk and Compliance Management. After SECOM’s full review and acceptance, Remuneration Policy will be submitted to the Board of Directors for approval. Remuneration Policy is reviewed annually. The main duties and responsibilities are as follows: • Formation of a written Remuneration Policy which is in
compliance with the BRSA Regulation • Determination, monitoring and supervision of
remuneration implementations (including salaries, performance bonuses, premiums, awards and fringe benefits).
• Approval of the policy for Material Risk Takers that are defined by TEB General Management.
• Annual submission to the BOD the proposals with respect to the assessment of Remuneration Policy and implementations under the risk management.
• Determination of the criteria for the payments of performance bonuses to the employees based on the Bank’s performance, business line’s, and/or function’s performance and their individual performances and announcement of such criteria to the employees and regular review of such criteria according to the determined standards and special duty and responsibilities.
• SECOM considers the risk policy and other policy documents of the Bank in order to ensure the alignment of the Remuneration Policy with the current organization chart, reporting lines and separation of duties.
• Review of remuneration criteria at least once a year to ensure that the Remuneration Policy does not encourage excessive risk taking nor create conflict of interest between management control systems
• Preparation of SECOM organization chart, reporting levels, segregation of duties and remuneration policy in accordance with the risk policy and other polices of the Bank.
At the Ordinary General Assembly Meeting convened on 26 March 2020, a decision was taken not to pay an attendance fee to Board members in consideration of their roles. During the period January-December 2020, any and all rights, interests and remunerations paid to our Board members and senior executives amounted to TL 53.514.910 and travel, accommodation and representation expenses amounted to TL 463.465. Board members may be granted loans within the legally defined limits or may be remunerated depending on various criteria including the Bank’s performance, the positions they hold and the time they allocate.

64
REMARKS ON INDEPENDENT AND PUBLIC AUDITS
In 2020 fiscal year, our Bank and its subsidiaries were externally audited by DRT Bağımsız Denetim ve Serbest Muhasebeci Mali Müşavirlik A.Ş. On the other hand, various audits were conducted at the Bank by regulatory public authorities such as the Banking Regulation and Supervision Agency (BRSA), the Ministry of Treasury and Trade, the Competition Authority and the Central Bank of the Republic of Turkey.
INFORMATION ABOUT LAWSUITS FILED AGAINST THE BANK THAT MAY POTENTIALLY AFFECT THE COMPANY’S FINANCIAL POSITION AND OPERATIONS AND ABOUT THEIR POSSIBLE OUTCOMES
904 lawsuits worth TL 11.650.350 in total were brought against the Bank during 2020. A total of 13.698 lawsuits brought in 2020 and previous years are currently in litigation. A provision of TL 91.771.628 had been set aside for these lawsuits as at 31 December 2020.
ADMINISTRATIVE OR JUDICIAL SANCTIONS IMPOSED AGAINST THE COMPANY AND THE BOARD OF DIRECTORS MEMBERS ON ACCOUNT OF BREACH OF LEGISLATION
Administrative fines imposed against the Bank during the reporting period amounted to TL 12.923.265 There are no administrative or judicial sanctions imposed against the Bank’s Board members.
CHANGES IN EQUITY STAKE HELD IN SUBSIDIARIES
There were no changes in 2020.
INFORMATION ABOUT DEALINGS WITH THE CONTROLLING COMPANY
There were no legal transactions that would benefit the controlling companies, which were steered directly or indirectly by the controlling companies, during 2020. All legal transactions between controlling companies and TEB were carried out in accordance with market practices, the principles of commercial prudence and integrity and the arm’s length principle. The Company did not incur any loss by reason of these transactions and therefore, no compensation was necessary.
In 2020 there were no legal transactions, which were carried out at the direction of the controlling companies so as to benefit the controlling companies’ subsidiaries. All legal transactions between the controlling company’s subsidiaries and our Company were carried out in accordance with market practices, the principles of commercial prudence and integrity and arm’s length principle. The Company did not incur any loss by reason of these transactions and therefore no compensation was necessary.
No measures were taken or avoided to the benefit of our Company’s direct or indirect controlling companies since such measures were not necessary and therefore, no losses to the detriment of the Company arose.
No measures were taken or avoided to the benefit of the controlling company’s subsidiaries since such measures were not necessary and therefore, no losses to the detriment of the Company arose.

65
TEB HUMAN RESOURCES GROUP
TEB is a big family with its 8.850 employees. Happiness of each member of this big family is very valuable and important for TEB. Happy employees will bring happy customers and happy customers will bring sustainable success. Human resources lie at the heart of TEB’s strategy to achieve its business goals.
Our Strategic Priorities
• Positive Management approach • Employees are trusted and their ideas are valued, • Positive aspects are emphasized through constant
feedbacks and achievements are appreciated and recognized,
• Opportunities for continuous development are offered, • A management approach supportive of cooperation is
espoused • Equipping our employees with new competences the
business world requires and retaining them. • Increasing efficiency by digitalizing and effective use of data • Penetrating agility into our DNA • Creating a human resource with a high level of risk
awareness and risk management • Positive impact for a better future
• Exploring the expectations of employees that make TEB’s most important and key stakeholder group, using various methods, enhancing their engagement, and realizing the necessary policies and practices to be the “top employer”,
• Treating all external candidates and company employees equally, protecting their rights, and encouraging diversity and inclusion,
• Creating a dynamic working environment where all employees are offered equal opportunities, continuous learning and development are supported, and innovation and entrepreneurship are encouraged,
• Promoting employee volunteering programs Key Principles
1. Trust, Respect & Transparency: We value each other and adopt a culture based on trust, respect and transparency.
2. Responsibility: We act responsibly towards all our stakeholders
3. Agility: We treat our Bank as our own work place and act with an agile mindset 4. Discipline: We comply with all rules and regulations and take our actions with a disciplined attitude 5. One Bank/ We Culture: We always think and act as One Bank
Positive Management approach
Together we create the Great Place to Work
TEB started its ‘’Great Place to Work’’ journey in 2012 in line with its ‘’Positive Management’’ approach and practices which value its employees. TEB was the first and only bank to make the list of ‘’Great Place to Work-Best Employers of Turkey’’ in 2016.
Top Employers Institute, one of the most prestigious worldwide institutes that rates the HR policies and implementations of companies, has chosen TEB as one of the Top Employers of Europe and Turkey in 2020.
TEB achieved to receive the Top Employer Turkey and Top Employer Europe Certificates for 8 years in a row.
Objective criteria in performance management
The aim of TEB Performance Management System is to keep TEB Group goals and strategies in line with the individual goals and business results, to direct the employees to the right targets and to ensure their development, thereby increasing organizational efficiency. Performance reviews are carried out based on objective criteria taking into consideration the realization of individual business goals employees’ achievement of their competence targets.
Transparent career committees
Career committees at TEB that meet for promotions or mobilities are open to employee representatives who are not in managerial positions so that they can express their opinions.
Local and international career opportunities
TEB offers the future leaders both local and international mobility opportunities with the support of its strategic partner BNP Paribas.
In line with TEB’s objective and transparent communication and equal opportunity principles, all open positions at BNP Paribas and TEB Group are announced in the Bank and group companies and all employees have the opportunity to apply for these positions.
Accordingly, making appointments to manager and higher-level positions from internal resources has been adopted as a main principle. In 2020, 80% of appointments to managerial positions were made from internal resources.
An approach training the Future Leaders through Talent Management Programs
To achieve the outstanding performance at TEB, the main objectives are to increase individual and team performances through continuous improvement of processes and systems, to create a working environment and different career opportunities for employees to drive their ongoing development by helping them build on their performances and competencies, and to raise the leaders of the future in this way.
High-potential and high-performing TEB employees are provided with the opportunity to get together with senior management in various events, where they have a chance to introduce themselves and share their opinions in an open and cordial environment.
The future leaders are provided with personalized learning and development opportunities which will guide their careers.
During 2020, 754 talents benefited from personalized learning and development opportunities.
In addition, TEB offers global talents to take part in BNP Paribas Global Talent Development Programs.
During 2020, 324 TEB employees took part in the 4-week online Mobility Days program, which was organized with the theme “You are the Lead in your Career” in order to encourage internal local and global mobility.
TEB organizes a number of programs and events whereby employees learn and feed from one another. Ongoing since 2011, the TEB Mentoring Program was moved to the digital platform in 2020. 80 mentors participated in the training programs carried out for TEB Mentors in 2020.

66
In order to ensure continuity in the Bank’s management, succession plans for N-1, N-2 and other critical roles were reviewed and revised.
Nonstop training and development activities
With the awareness of ‘’high quality and trained workforce’’ being the most significant differentiating element of the finance industry, TEB carried on supporting employees in their personal and professional development in the most effective way.
In 2020, TEB adapted to the new normal in an agile fashion, and carried on with all of its training programs in the virtual classroom environment.
While TEB carried on with the prescheduled trainings on the digital medium, it also supported employee development by holding webinars about topics linked to the current situation. 49 webinars were organized about period-specific topics, in which 2.681 TEB employees participated.
Competencies required by changing roles
When training and raising the leaders of the future, TEB constantly updates its training and development programs in line with the emerging needs.
The journey that started with TEB Digital Academy launched in 2018 and Let’s Get Digital continued with special certification programs with a higher degree of personalization given the altered dynamics of 2020.
A work environment supporting innovation and entrepreneurship
With its continuous efforts on innovation since 2007, TEB has been cited as an exemplar of innovation by the world-famous research company Gartner in its report “Creating and Expanding a Culture of Innovation” in the finance industry. Having received “Turkey Innovation Champion” award in 2014, TEB was named the “Most Successful Bank in Innovation Management” by the European Financial Management Association (EFMA) for four consecutive years between 2013 through 2016.
High-quality programs taking entrepreneurship further
The objective of the Intrapreneurship Program launched by TEB in 2014 is to create an entrepreneurial culture within the organization and to raise the intrapreneurs who conceive and are able to realize innovative projects that can change the Bank’s future. Through this program, existing ways of doing business are changed, a working environment where employees can develop and implement their projects as entrepreneurs is offered, and employees are supported with training programs, mentorship and coaching.
At the TEB Intrapreneurship Program, which is at its sixth year in 2020, nearly 200 projects were submitted by TEB employees who have an intrapreneur spirit. Moved to the digital environment in 2020, all components of the program such as Hackathon, jury, mentor meetings and accelerators program were carried out digitally. Intrapreneurs selected by TEB Innovation Committee consisting of executive managers were included in the acceleration program and received mentorship, coaching and training support to develop their projects as start-ups.
TEB HOME- Start-up Partnership Program
As a joint working platform with the objective of accelerating innovation, TEB HOME prioritizes innovative projects coming from different channels and builds teams to implement these projects.
Within the scope of the Home Program that employs innovative methods, TEB intrapreneurs are able to test and execute their ideas and projects with the help of start-ups using their competences and carry the agile world of financial technology start-ups into the Bank.
Innovation remains an important part of TEB’s DNA through programs that help TEB employees produce solutions and take initiative to lead change and thus strengthen their entrepreneurial muscles.
Moves by TEB to grow the innovation ecosystem
Since 2007, TEB has been including its customers, students, start-ups, academics and suppliers in its innovation ecosystem, in addition to its employees. While the Bank’s products and services are re-designed through partnerships established, innovation culture is being spread to a much wider population.
TEB Open Innovation Competition
In 2020, 13th TEB Open Innovation Competition has been organized, which is one of the largest reflections of TEB’s innovation practices outside the Bank. The program was conducted fully online for the first time.
In 2019-2020 period, 12.755 applications were submitted to the TEB Open Innovation Competition. 70% of the applications were from university students, 21% were from customers and 9% were from techno start-ups.
Finalists participate to a special innovation and entrepreneurship camp to prepare for the competition. In addition to financial prizes, winners are offered career opportunities at TEB. Until today 12 finalists joined the TEB family.
“My TEB My World””
Through its practices, TEB provides a work environment where young talents can show their potential, develop themselves continuously and create added value. With “My TEB My World” motto, TEB offers TEB employees and youngsters who want to join TEB family a successful, innovative, healthy, pleasant world which provides continuous development opportunities.
TEB Online University Internship Program
In 2020, TEB carried out the Online University Internship Program for university students. Under the program, university students were delivered an online internship experience of 8-12 weeks during which they were able to generate projects together with TEB managers. In addition to project work, students were provided with e-learning opportunities through face-to-face trainings in virtual classrooms and on the digital platform.
TEB Campus Gatherings
TEB Campus Gatherings offer university students opportunities to meet with TEB managers and to get acquainted with the finance world and career opportunities. In 2020, more than 6.000 students were reached through publicity activities, presentations, career festivals, and conversation sessions with managers.
324.641 applications were received and 2.660 job interviews were performed in 2020 in line with the Bank’s goals and strategies. Various selection and placement tools were used to make a selection based on the required competencies and 638 people joined the TEB family.

67
One Day at TEB
Within the frame of this event, university students are invited to the Bank and experience life at TEB first-hand. In 2020, university students were offered the opportunity to get to know the life at TEB on the online platform.
TEB Young Engineers Meeting
710 engineering students took part in the online event which was organized to celebrate 5 December World Engineers Day together with young engineering students. Participating young engineers were given an introduction to the banking sector and the engineering positions in the finance sector.
TEB Innovation and Youth Summit
Innovation gatherings where TEB talents are being brought together around a new theme each year since 2007 will be held online for the first time in 2021. University students that will attend the event will be provided with the chance to listen to inspirational presentations and engage in career conversations with TEB managers throughout the event.
As was the case in earlier editions of the event, awards will be presented also during the online Summit to innovative, creative TEB employees who submit their ideas at the Internal Innovation Competitions and to customers, university students, new graduates and techno start-ups who are placed at TEB Innovation Competition.
TEB is setting up a Digital Incubation Center
Targeting to set up and build on a Digital Talent Pool that will consolidate the Bank’s digital, data and analytical capabilities, TEB developed a specific recruitment and training program (Digital, Data & Agile Academy) as part of the Digital Incubation Center initiatives.
As a first in the sector, it was organized on 5 December the World Engineers Day. The event was held with the participation of 80 students selected from within 1,200 applications, and the participants were offered the chance to stand for the analytical roles at the TEB Digital Incubation Center.
The new address for agility: TEB Agile Studio
IT Agile Studio was established to increase agility at TEB and launch projects more rapidly.
In 2020, development journeys in this area were designed in cooperation with the TEB Agile Studio and TEB Academy, and training programs were initiated.
End-to-End digital HR experience with people-oriented digital applications
TEB puts into life innovative digital HR applications in order to deliver a perfect employee experience.
Targeting to offer digital recruitment processes, learning and development applications, talent management systems and other processes digitally in the most practical manner, TEB
employs applications offered by BNP Paribas to make life easier for its employees, as well as various applications including Chatbot, HR Mobile App, TEB Digital Campus and TEB HR Analytics.
Target of developing Human Resources with a high level of risk awareness and risk management
‘’First Level Control’’ project which has the objective of ensuring employees at all levels to manage risks that are related to their duties and responsibilities effectively has been completed and launched.
TEB is one of the “Most Kind Hearted Companies”
In 2020 TEB runners participated the Istanbul Marathon and Runatolia Marathon for the benefit of Non-Profit Organizations under the roof of Adım Adım organization. For those who do not participate the marathons supported them with their donations.
As a result of its performance at these charity marathons since 2008, TEB has been recognized as one of the “Most Kind Hearted Companies”.
A family who enjoys being together
TEB employees get together at events like “Leaders’ Cafe” where they can listen to senior managers’ knowledge and experiences, “TEB Talks” where experts share their inspiring career and success stories and “Innovation Talks” where most recent technological developments and trends are shared. Held digitally in 2020, these meetings were open to TEB employees from all over Turkey.
Employees can participate in various activities in their areas of interest and get together with colleagues outside work at TEB Band, Turkish Music Choir, TEB Photography Club, TEB Chess Club, TEB Theater and TEB Scuba Diving Club. The activities continued on online platforms in 2020.
TEB Sports Academy
Under the roof of TEB Sports Academy, in-house sports events are organized to keep employees healthy, to enhance team spirit and “we” awareness, to increase the sense of belonging of employees and to create social value within the scope of social responsibility. In the same context, employees are encouraged to participate in outside sports activities and represent the Bank in these organizations.
In the volleyball branch, TEB claimed the championship in the 2019-2020 season in the Corporate Volleyball League and Corporate Games League. After the first quarter of 2020, Sports Academy events were carried on digitally.
One of a kind village in the industry: SAKLIKÖY
At Saklıköy where TEB conducts its training and development activities, employees can also get together with each other and their families to socialize.

68
SUMMARY OF BOARD DIRECTORS’ REPORT PRESENTED TO THE GENERAL ASSEMBLY
Distinguished shareholders, customers and employees,
2020 has been a tough year for the global economy because of the Covid-19 outbreak that took all the countries in its tight grip, and global economic activity came to a standstill because of the lockdowns and restrictions implemented against the pandemic. As vaccination campaigns and medication efforts continue in 2021, fund flows to emerging countries will possibly restart as and when uncertainties are alleviated and financial markets recapture stability. In the World Economic Outlook released in January 2021, the International Monetary Fund (IMF) estimates 3,5% contraction for global economy in 2020, while projecting 5,5% growth in 2021. The same report forecasts 6% growth for Turkey in 2021.
As of 31 December 2020, TEB’s total assets went up by 30% to reach TL 140 billion in the January-December period, while the Bank booked TL 1,2 billion in net profit. Loans, which make up the most important indicator of TEB’s support to the economy and its customers, accounted for 59% of its total assets in 2020.
Giving priority to risk management and asset quality, as always, our bank’s total credits were TL 82,9 billion and deposits were up by 30% and reached TL 93,8 billion. Maintaining its stable growth along with its robust capitalization, TEB’s shareholders’ equity was TL 11,4 billion, while capital adequacy ratio was a strong 18,51%, well above the targeted ratio of 12%.
In 2020, TEB kept focusing on personal loans and growing in this segment. Offering the possibility to defer consumer loan repayments in this period, the Bank stood by its customers suffering from disrupted cash flow, and prioritized the transactions its customers executed through digital channels in this period. Owing to custom-tailored campaigns, as well as the upgrades made to digital channels and the call center throughout the year, the share of credit generation on digital channels went up to 44% at TEB.
As increasing savings remain critical in order for Turkey to capture its growth target and for sustainable development of the society, TEB continued with its efforts aimed at helping spread the habit of saving up across the society and raise a financially literate generation through TEB Family Academy. In addition, TEB continued to offer products and services to encourage and facilitate saving up. The Bank has made it easy to save up through the Marifetli Account, which is offered for customers who are not in the habit of investing and who wish to while also regularizing their cash flows.
In 2020, pandemic-imposed conditions accelerated numerous digital developments envisaged in the financial sector but were anticipated to take a much longer time. A long-time investor in digitalization and technology, TEB stood by its customers by
responding to rising digital demands during the pandemic with its robust infrastructure and innovative applications. Having offered services in this period with two distinct digital channels, namely CEPTETEB for its individual customers and CEPTETEB İŞTE for its commercial customers, TEB allowed rapid and uninterrupted execution of banking transactions. At the same time, TEB continued to service its SME customers via its expert customer representatives and its “Consultant Bank” understanding, and to produce financial solutions. The Bank has integrated its SME service model with modern banking implementations and digital processes.
Within the frame of the transformed ways of doing business and customer communications in particular, TEB took important steps related to its business processes in 2020, with the target of offering better and faster service to its customers also in the Corporate Banking area. In this timeframe, the share of TL loans within total lending by Corporate Banking increased significantly. In addition, the volume of export credits also expanded. TEB Corporate Banking quickly adjusted to the changed working order, and kept responding to customer needs through digital solutions with the support of its robust technology. In this period when cash management products came to the foreground, the instructions management platform serving in the area of banking instructions particularly for Internet banking and mobile banking applications introduced products such as Mobil-Ink and E-signature to the customers. Treasury products providing hedging for corporate customers against currency risk and interest rate risk also continued to be offered.
On 30 October 2020, TEB signed a syndicated loan agreement for EUR 250 million and USD 41,5 million with a maturity of 367 days which was participated by 19 leading banks. This syndicated loan was expected to be used particularly in financing of foreign trade and provide a great contribution to Turkish economy and companies’ growth. All-in-cost of the syndicated loan is Euribor+2,25% and Libor+2,50%, for Euro and USD portions, respectively.
We hereby present the operating results and financial statements of TEB for 2020 fiscal year for your comments and review. We, as the Board of Directors, would like to thank you, our valued shareholders, our team, our customers and our business partners for accompanying and having confidence in us throughout our journey.
Sincerely,
Board of Directors
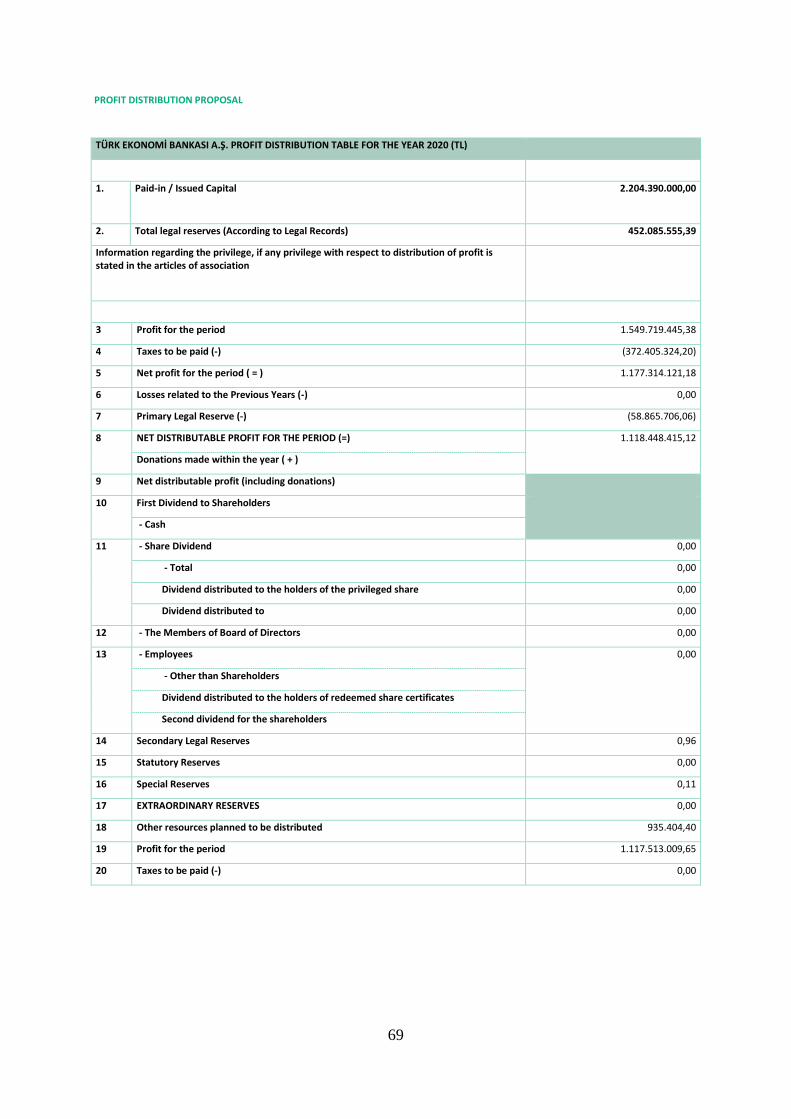
69
PROFIT DISTRIBUTION PROPOSAL
TÜRK EKONOMİ BANKASI A.Ş. PROFIT DISTRIBUTION TABLE FOR THE YEAR 2020 (TL)
1. Paid-in / Issued Capital
2.204.390.000,00
2. Total legal reserves (According to Legal Records) 452.085.555,39
Information regarding the privilege, if any privilege with respect to distribution of profit is stated in the articles of association
3 Profit for the period 1.549.719.445,38
4 Taxes to be paid (-) (372.405.324,20)
5 Net profit for the period ( = ) 1.177.314.121,18
6 Losses related to the Previous Years (-) 0,00
7 Primary Legal Reserve (-) (58.865.706,06)
8 NET DISTRIBUTABLE PROFIT FOR THE PERIOD (=) 1.118.448.415,12
Donations made within the year ( + )
9 Net distributable profit (including donations)
10 First Dividend to Shareholders
- Cash
11 - Share Dividend 0,00
- Total 0,00
Dividend distributed to the holders of the privileged share 0,00
Dividend distributed to 0,00
12 - The Members of Board of Directors 0,00
13 - Employees 0,00
- Other than Shareholders
Dividend distributed to the holders of redeemed share certificates
Second dividend for the shareholders
14 Secondary Legal Reserves 0,96
15 Statutory Reserves 0,00
16 Special Reserves 0,11
17 EXTRAORDINARY RESERVES 0,00
18 Other resources planned to be distributed 935.404,40
19 Profit for the period 1.117.513.009,65
20 Taxes to be paid (-) 0,00

70
DIVIDEND DISTRIBUTION TABLE
GROUP TOTAL DIVIDENDS
TOTAL DIVIDENDS / NET PROFIT FOR THE
PERIOD
DIVIDEND TO THE SHARE WITH A NOMINAL VALUE OF TL 1
CASH (TL) BONUS (TL) RATIO (%) AMOUNT (TL) RATIO (%)
NET
A 0,96 0,00 0,00 0,00 0,00
B 0,00 0,00 0,00 0,00 0,00
TOTAL 0,96 0,00 0,00 0,00 0,00

71
SECTION 3 - ASSESSMENT OF FINANCIAL POSITION AND RISK MANAGEMENT
THE AUDIT COMMITTEE’S ASSESSMENT OF INTERNAL CONTROL, INTERNAL AUDIT AND RISK MANAGEMENT SYSTEMS AND ACTIVITIES DURING THE REPORTING PERIOD
The organization set up for the operation of internal control, internal audit and risk management systems at TEB was structured in accordance with the provisions of the “Regulation on Banks’ Internal Systems and Internal Capital Adequacy Evaluation” published in the Official Gazette dated 11 July 2014.
The mentioned structure is aligned with the scope and nature of the Bank’s operations and possesses the quality and efficiency to respond to changing conditions.
Risk Management, Compliance and Internal Control and the Internal Audit Group report to the Board of Directors; independent of one another, these units worked in coordination and successfully completed their activities in 2020.
The Board of Directors has taken necessary action to approve important strategies and policies regarding control activities and to maintain an efficient internal audit system and risk management system.
The Audit System created encompasses all operations and units of the Bank and its subsidiaries. As at year-end, the Internal Audit Group was formed of 1 Group Head, 4 Assistant Group Heads, 7 Audit Managers, 1 Supervisor Auditor, 10 Senior Auditors, 21 Auditors, 14 Authorized Assistant Auditors, 11 Assistant Auditors, 1 Senior IT Auditor, 1 IT Auditor, 4 IT Assistant Auditors, 1 Data Analysis Assistant Manager, 1 Internal Audit Group Support and Coordination Assistant Manager and 1 Executive Assistant.
The Board of Directors has taken all necessary action to make sure that the Internal Audit Group is able to audit all operations and units of the Bank and its consolidated subsidiaries without any restrictions.
Within the scope of 2020 unconsolidated process and head office audit activities, 119 branches were audited.
In addition to branch audits, inspections were conducted in a total of 34 different areas: 24 at the Head Office, 3 at subsidiaries, 7 in IT. Besides these audits, Management Assessment was carried out, which covered banking and information technology processes.
The Compliance and Internal Control Group covers the Internal Control Division, Legislation Division, Compliance Division and IT Control Division, Subsidiaries Coordination Division and TRNC Compliance Division.
Internal control activities are arranged so as to cover basic control areas. According to the internal control organization, the Branches Control Department, Head Office Control Department, Finance and Treasury Transactions Control Department, Control Design and Support Department and IT and Support Department conduct the controls at branches and head office departments, respectively.
In accordance with Regulation on Internal Systems and Internal Capital Adequacy Assessment Process of Banks and MASAK regulations, regulatory and compliance functions are being conducted by Regulation and Compliance units under Compliance and Internal Control Group.
The activities of the Legislation Division are carried out in accordance with the requirements of applicable legislation and the Group’s guidelines.
The aim of Risk Management system is to define, measure and monitor the Bank’s risk exposure stemming from its operations and to make sure that these risks are controlled through the policies, guidelines and limits established.
Risk Management functions of the Bank and all subsidiaries are gathered under the Group Risk Management. Group Risk Management reports to TEB Group Boards of Directors via the Risk Committee and the Audit Committee at TEB A.Ş. and is responsible for carrying out the general monitoring, warning and recommendation functions on behalf of the Boards of Directors in line with the principles stipulated in this regulation.
In accordance with the Board of Directors resolution 184 dated 29 December 2019, Group Risk Management will be required to not only report to Audit Committee but also to Risk Committee as well.
The Bank’s Group Risk Management is organized in three divisions:
• Credit Risk Management, • Rating Models Development, • Market Risk and Operational Risk Departments and IFRS
Collective Provisions Department and Group Risk Analysis Department
At the Bank’s Board of Directors meeting held on 08 November 2005, a decision was passed to set up an Audit Committee responsible for the entire TEB Group companies in view of the provisions of Article 24 of the Banking Law no. 5411 and it was decided that the said committee should assume the powers of the members of the Senior Risk Committee set up at the Bank under Law no. 4389.
During 2020, the Audit Committee met 53 times. The Committee works committedly to monitor the risks on a consolidated basis across the entire Group, to create control points, to review documented procedures on the basis of activities, to provide the coordination among the Internal Audit Group, Risk Management, Compliance and Internal Control groups, to set up the internal control system of the same scope between the Bank and Group companies and to fulfil other liabilities in accordance with the Banking Regulation.
The Bank closely monitors and implements international best practices, as well as the new regulatory requirements regarding internal audit and risk management systems.

72
EVALUATION OF FINANCIAL STATUS, PROFITABILITY AND SOLVENCY
A review of TEB’s financial statements that are drawn up in accordance with the regulations of the Banking Regulation and Supervision Agency (BRSA) reveals as follows:
TEB’s after-tax profit for 2020 reached to TL 1,18 billion and the Bank posted a RoE of 11,61% in line with its strategies focused on profitability and productivity. Sustaining a consistent growth with its strong capital structure, TEB’s equity was TL 11,4 billion and its capital adequacy ratio was realized as 18,51%, considerably higher than target ratio of 12%.
The Bank increased its asset size by 30,5% to reach TL 140.048 million in 2020 while credits which are the most important indicator of TEB’s contribution to the economy and its customers became TL 82,9 billion constituting 59% of total assets.
While time deposits volume which meets a great portion of the Bank’s funding requirement, total deposits as a percentage of liabilities became 67%. On the other hand, current deposits also increased to reach TL 32,8 billion and had a great contribution to the Bank in terms of funding costs.
On 30 October 2020, TEB signed a syndicated loan facility agreement with the participation of 19 international banks for the purpose of supplying a loan in the amount of EUR 250 million and USD 41,5 million with 367-days maturity. The syndicated loan was expected to be used particularly in financing of foreign trade and provide a great contribution to Turkish economy and companies’ growth. All-in-cost of the syndicated loan is Euribor+2,25% and Libor+2,50%, for Euro and USD portions, respectively.

73
RISK MANAGEMENT POLICIES ACCORDING TO VARIOUS TYPES OF RISKS
Credit Risk
Credit risk is the risk of a contracting party’s defaulting in the performance of its contractual obligations and thus causing the other party to incur a financial loss. The TEB Group is exposed to credit risk basically through trading, trade finance, treasury and leasing activities but credit risk may also arise in other circumstances and due to other reasons.
One of the most prominent characteristics of the Bank is its conservative lending policy and solid asset structure that go hand in hand with a consistent growth strategy.
The authority to extend limits and allocate loans basically lies with the Board of Directors, which has delegated part of this authority to the Credit Committee and the General Manager in line with the principles and procedures set out by the BRSA. In turn, the General Manager has delegated part of his authority to Credit Groups and Business Lines jointly on the basis of rules approved by the Board of Directors.
Loans are extended within the limits defined for each debtor and group of debtors individually. Every customer that performs a transaction on credit must have a credit limit allocated by the relevant authorities and customers are systematically prevented from exceeding those credit risk limits.
Credit decisions are taken after loan proposals are first approved by a credit analyst together with the credit department and the related business line. Credit limits are allocated to borrowers identified as having the ability to generate cash flow, the ability to make repayments with the income generated on their business operations, reliable financial data, strong shareholder’s equity and an administration and shareholding structure made up of people having high morality and business experience.
Concentrations of credit risk arise when a number of customers are engaged in similar business activities, or activities in the same geographical region, or have similar economic features that would cause their ability to fulfill contractual obligations to be similarly affected by changes in economic, political or other conditions. In general, the TEB Group attempts to control credit risk by monitoring credit exposures, limiting transactions with specific counterparties, continually assessing the credibility and creditworthiness of counterparties, diversifying its lending activities to avoid undue concentrations of risks with individuals or groups of customers or industries and by obtaining necessary collateral when appropriate. The credit limits to be allocated are determined in accordance with the related counterparty’s financial structure, certain qualitative criteria and the quality of any collateral to be provided.
Pursuant to the prudent policies the Bank adopts, the maximum credit limit that can be allocated to a customer is kept below legal limits, thus minimizing the risk of loan concentration. Limits set by the Board of Directors are regularly monitored and reported.
After a loan facility is offered, the Credit Monitoring Department monitors the customer’s repayment capability and the sufficiency and adequacy of the collateral. In this way, any problematic loan is identified at an early stage.
The Bank uses an in-house credit rating system, named TEBCORE (TEB Counterparty Risk & Rating Evaluation), which
consists of several rating models for corporate and SME customers engaged in the production, service, construction and precious metal sectors.
The ratings are used for the purposes of credit allocation and delegation, assessing TFRS 9 (Turkish Financial Reporting Standards) collective provisions, credit reporting, portfolio management and stress testing.
The Group Risk Management reports to the Risk Committee, the Audit Committee and the Board of Directors and on a regular basis presenting the Bank’s risk concentrations, a breakdown of the Bank’s loan portfolio by ratings, specific segments of the loan portfolio, large exposures, large non-performing accounts and impairment allowances as well as default and recovery rates.
The credit risks and limits related to financial institutions are determined by the Financial Institutions and Counterparty Risk Committee, which is a sub-committee of the Credit Committee. The limits and exposures set are monitored daily by the Group Risk Management.
Where a loan is granted subject to collateral being given, the Bank's policy is to require the collateral to be perfected before funds are advanced and to avoid currency and maturity mismatches. All collateral should be given in a legally valid manner and should be liquid in nature. In this context, real estate should be of a fast-moving nature.
The Bank classifies overdue (non-performing) loans in view of the current regulatory rules.
Both collective and specific provisions are made with methodologies that are compliant with both TFRS 9 standards and BNP Paribas methodologies.
Interest Rate Risk
Interest rate risk involves possible losses that may be incurred due to fluctuations and volatilities in interest rates depending on maturity mismatches or the structures of interest rate-sensitive products in the balance sheet.
Protection against fluctuations in interest rates is the topmost priority for TEB. Interest rate risk is managed by the Assets and Liabilities Committee (ALCO). Decisions taken by ALCO are executed by the Assets and Liabilities Management Department under the Asset and Liability Management and Treasury Group.
Interest rate risk is determined by measuring the rate of sensitivity of assets, liabilities and off-balance sheet items to interest rates. The Board of Directors has set risk tolerance limits for the net interest income sensitivity and market value of equity sensitivity. TEB runs simulations of interest income according to estimated macroeconomic indicators. Duration, gap and sensitivity analyses are conducted and these calculations are conveyed to ALCO and to Market and Liquidity Risk Committee.
Possible negative effects of interest rate fluctuations on financial position and cash flow are minimized by means of prompt decisions. The management monitors the interest rate movements in the market on a daily basis and can make changes whenever necessary in deposit and loan rates.
When determining short, medium and long- term pricing strategies, TEB’s Assets and Liabilities Committee manages maturity mismatch and adopts the principle of working with positive balance sheet margins as its pricing policy.

74
Market Risk
Market risk involves possible losses a bank may incur as a result of the exposure of its balance sheet and off-balance sheet accounts to interest rate risk, exchange rate risk, commodity risk and equity position risk resulting from fluctuations in the financial markets, in interest rates, exchange rates, commodity or stock prices.
TEB’s Board of Directors ensures that the Group Risk Management and senior management take the necessary steps to properly measure, control and manage the Bank’s exposure to market risk.
The Board of Directors determines market risk limits and periodically revises these limits in accordance with market conditions and the strategies of TEB. All assessments regarding market risks are also evaluated by the Market and Liquidity Risk Committee that meets on a monthly basis. With regard to TEB’s daily transactions, stop-loss and transaction limits, PV01 and VaR limits are applied on the basis of each product. The Board of Directors assigns limits for positions in derivatives and similar contracts. Transactions are carried out within these limits and the limits are monitored and reported daily.
The market risk of the Bank is calculated using a standard method and reported to legal authorities.
The market risk can influence the Value-at- Risk (VaR) figure, which is also calculated using financial models. VaR figure is calculated using historical simulation method on the basis of a 250-business-day data and a one-day holding period in a 99% confidence interval. Daily VaR figures are used for internal reporting and risk monitoring of the Bank. Back testing is periodically performed to validate the accuracy of calculations and the methods used.
The VaR figures calculated by internal models to predict losses in the event of a crisis are also verified by scenario analyses and stress tests and are then reported to senior management and the Board of Directors.
Scenario analyses and stress tests involve the reapplication of past crises to existing portfolios or the observation of likely losses due to interest and foreign exchange shocks.
Liquidity Risk
Liquidity risk is defined as the risk resulting from lack of sufficient cash holdings or cash inflow to fully meet cash obligations in due time, because of imbalanced cash flow.
Liquidity risk also includes the risk of loss that may arise when it is not possible for a bank to adequately close positions at favorable prices and at sufficient amounts or as rapidly as required, or when a bank is unable to exit the positions held, due to inability to enter the market as needed, to shallow market structure in certain products or to obstacles arising in the markets.
TEB’s policies focus on maintaining the quality of its asset structure, so that liquid assets can meet all obligations. Striving to be one of the most liquid banks in the sector is of utmost importance to TEB. The Board of Directors regularly monitors and determines liquidity ratios and the relevant standards for maintaining high liquidity at all times.
TEB has in place an effective management reporting system for timely reporting of the liquidity position to the Board of Directors, senior management and all related units. Cash flow
analyses are carried out for different maturity structures and currency units. Maturity mismatches are monitored and concentrations in funding sources are closely monitored. All related analyses are evaluated in detail by the Market and Liquidity Risk Committee that meets at least once a month.
As a matter of general policy, consistency in maturities and interest rates of assets and liabilities is maintained at all times in line with Assets and Liabilities Management strategies. The difference arising from the return and cost of TL and foreign currency asset-liability items in the balance sheet is constantly managed by targeting positive margin.
With regard to the sources of funding and liquidity, it is observed that while the greater part of the liquidity requirement of TEB is met by deposits bonds issue, syndicated loans and pre-financing products are also used at times to obtain funds in addition to deposits.
Operational Risk
Operational risk refers the probability of loss resulting from:
Inadequate or failing business processes, people, systems, or
Ordinary or extraordinary external events.
Operational risk management principles are set out in the Operational Risk Management Policy approved by the Board of Directors.
Advanced measurement approach tools are used to measure operational risk. It is targeted to measure operational risk through historic data analyses, risk indicators, process analyses, scenario analyses, stress tests and risk self-assessment studies. Risk exposure is constantly monitored to determine whether it is within the Company’s risk appetite and is overseen by the Board of Directors via the Audit Committee. Remedial actions for identified irregularities are assessed and put into life by the Bank’s related management committees.
Counterparty Credit Risk
Counterparty credit risk is defined as the risk of each party arising from contract, that neither can deny liability for.
The Bank aims to manage counterparty credit risk in a manner presenting a true and fair view, using predefined methods.
Implementation procedures regarding counterparty credit risk are defined in the policy document approved by the Board of Directors.
The tasks mentioned below are included in counterparty credit risk management:
• Clearly determine open positions of counterparty credit risk
• Recognize the tools forming the systemic infrastructure in the measurement and management of risk (risk management)
• Define each counterparty, group, country and risk limits • Report open positions and projected size of risk • Reduce risk through framework agreements (ISDA, CSA,
GMRA, etc.), receiving collateral and margin completion within the scope of counterparty credit risk measurement
Strategy, policy and implementation procedures for counterparty credit risk are defined in the policy document approved by the Board of Directors.

75
CREDIT RATINGS ASSIGNED BY RATING AGENCIES AND INFORMATION ON THEIR CONTENTS
The current ratings of the Bank are as follows:
Moody’s Investor Services Baseline Credit Assessment b3 Adjusted Baseline Credit Assessment b1 Long Term Foreign Currency Deposit Rate: B2 Short Term Foreign Currency Deposit Rate: NP Long Term Turkish Lira Deposit Rate B1 Short Term Turkish Lira Deposit Rate: NP Outlook Negative Fitch Ratings: Foreign Currency Commitments Long Term B+ Short Term B Outlook Negative Turkish Lira Commitments Long Term BB- Short Term B Outlook Negative National AA (tur) Outlook Stable Financial Capacity Rating b+

76
DONATIONS
Date Recipient Amount 07.01.2020 Turkish Education Foundation 800,00 09.01.2020 Elif Parla/Elif Parlakay/January 2020 Scholarship 750,00 09.01.2020 Sabri Talh/Sabri Talha Parlakay/January 2020 Scholarship 750,00 09.01.2020 Kerem Mert/Kerem Mert Dalkılıç/January 2020 Scholarship 1.000,00 09.01.2020 Elif Zeyne/Elif Zeynep Dalkılıç/January 2020 Scholarship 1.000,00 09.01.2020 Yiğit Eren/Yiğit Eren Dalkılıç/January 2020 Scholarship 1.000,00 09.01.2020 Ahmet İbre/Ahmet İbre/January 2020 Scholarship 1.000,00 09.01.2020 Müge Şirin/Buse Aras/January 2020 Scholarship 750,00 09.01.2020 Müge Şirin/Nehir Aras/January 2020 Scholarship 500,00 09.01.2020 Tuna Çelik/Tuna Çelik/January 2020 Scholarship 250,00 09.01.2020 Fatoş Kang/İklim Hira Altınok/January 2020 Scholarship 250,00 17.01.2020 Edremit Hilmi Irak Primary School donation of 96 assets 2.000,00 20.01.2020 Turkish Education Foundation 400,00 21.01.2020 Turkish Education Foundation 150,00 21.01.2020 Turkish Education Foundation 100,00 21.01.2020 Turkish Education Foundation 200,00 22.01.2020 Adıyaman Provincial Police Department, donation of 81 assets 2.896,00 22.01.2020 Bağcılar Municipality Support Services Department, donation of 76 assets 1.685,00 22.01.2020 Bağcılar Municipality Support Services Department, donation of 56 assets 1.505,00 30.01.2020 Antalya Contemporary Education and Culture Foundation 200,00 31.01.2020 Turkish Education Foundation 100,00 04.02.2020 Turkish Education Foundation 200,00 06.02.2020 Yakacık Vocational Technical Anatolian High School, donation of 43 assets 835,00 06.02.2020 Turkish Education Foundation 700,00 07.02.2020 Elif Parlakay/February 2020 Scholarship 750,00 07.02.2020 Sabri Talha Parlakay/February 2020 Scholarship 750,00 07.02.2020 Kerem Mert Dalkılıç/February 2020 Scholarship 1.000,00 07.02.2020 Elif Zeynep Dalkılıç/February 2020 Scholarship 1.000,00 07.02.2020 Yiğit Eren Dalkılıç/February 2020 Scholarship 1.000,00 07.02.2020 Ahmet İbre/February 2020 Scholarship 1.000,00 07.02.2020 Buse Aras/February 2020 Scholarship 750,00 07.02.2020 Nehir Aras/February 2020 Scholarship 500,00 07.02.2020 Tuna Çelik/February 2020 Scholarship 250,00 07.02.2020 İklim Hira Altınok/February 2020 Scholarship 250,00
13.02.2020 The Turkish Foundation for Combating Soil Erosion, for Reforestation and the Protection of Natural Habitats
98,00
19.02.2020 Turkish Education Foundation 100,00 20.02.2020 Turkish Education Foundation 250,00 24.02.2020 İKSV Istanbul Foundation for Culture and Arts 20.000,00 25.02.2020 Turkish Education Foundation 50,00 26.02.2020 Turkish Education Foundation 200,00 03.03.2020 Elif Parlakay/March 2020 Scholarship 750,00 03.03.2020 Sabri Talha Parlakay/March 2020 Scholarship 750,00 03.03.2020 Kerem Mert Dalkılıç/March 2020 Scholarship 1.000,00 03.03.2020 Elif Zeynep Dalkılıç/March 2020 Scholarship 1.000,00 03.03.2020 Yiğit Eren Dalkılıç/March 2020 Scholarship 1.000,00 03.03.2020 Ahmet İbre/March 2020 Scholarship 1.000,00 03.03.2020 Buse Aras/March 2020 Scholarship 750,00 03.03.2020 Nehir Aras/March 2020 Scholarship 500,00 03.03.2020 Tuna Çelik/March 2020 Scholarship 250,00 03.03.2020 İklim Hira Altınok/March 2020 Scholarship 250,00 04.03.2020 Turkish Education Foundation 50,00 27.03.2020 Turkish Education Foundation 300,00 03.04.2020 Elif Parlakay/April 2020 Scholarship 750,00 03.04.2020 Sabri Talha Parlakay/April 2020 Scholarship 750,00 03.04.2020 Kerem Mert Dalkılıç/April 2020 Scholarship 1.000,00 03.04.2020 Elif Zeynep Dalkılıç/April 2020 Scholarship 1.000,00 03.04.2020 Yiğit Eren Dalkılıç/April 2020 Scholarship 1.000,00 03.04.2020 Ahmet İbre/April 2020 Scholarship 1.000,00 03.04.2020 Buse Aras/April 2020 Scholarship 750,00 03.04.2020 Nehir Aras/April 2020 Scholarship 500,00 03.04.2020 Tuna Çelik/April 2020 Scholarship 250,00

77
03.04.2020 İklim Hira Altınok/April 2020 Scholarship 250,00 06.04.2020 Ministry of National Education Central Accounting Directorate 3.500.000,00 09.04.2020 Ministry of Family, Labor and Social Services 5.000.000,00 10.04.2020 Akdeniz University Strategy Development Department 100.000,00 13.04.2020 Çağatay Aksu / Scholarship 56.638,00 04.05.2020 Cerrahpaşa University - Device Purchase 84.786,98 07.05.2020 Sabri Talha Parlakay/May 2020 Scholarship 750,00 07.05.2020 Kerem Mert Dalkılıç/May 2020 Scholarship 1.000,00 07.05.2020 Elif Zeynep Dalkılıç/May 2020 Scholarship 1.000,00 07.05.2020 Yiğit Eren Dalkılıç/May 2020 Scholarship 1.000,00 07.05.2020 Ahmet İbre/May 2020 Scholarship 1.000,00 07.05.2020 Buse Aras/May 2020 Scholarship 750,00 07.05.2020 Nehir Aras/May 2020 Scholarship 500,00 07.05.2020 Tuna Çelik/May 2020 Scholarship 250,00 07.05.2020 İklim Hira Altınok/May 2020 Scholarship 250,00 07.05.2020 Elif Parla/Elif Parlakay/May 2020 Scholarship 750,00 20.05.2020 Yedikule Chest Diseases Hospital, donation 36.180,00 20.05.2020 Yedikule Chest Diseases Hospital, donation 28.080,00 27.05.2020 Turkish Education Foundation 100,00 28.05.2020 Haydarpaşa Numune Hospital Video Laryngoscope Device Donation 131.083,23 19.06.2020 Turkish Foundation for Children in Need of Protection 100,00 30.07.2020 Istanbul University Cerrahpaşa Faculty of Medicine-Device Purchase 88.554,75 13.08.2020 Turkish Education Foundation 200,00 25.08.2020 Turkish Education Foundation 200,00 01.09.2020 Turkish Education Foundation 100,00 29.09.2020 Turkish Education Foundation 250,00 29.09.2020 Turkish Education Foundation 400,00 01.10.2020 Turkish Education Foundation 200,00 01.10.2020 Turkish Education Foundation 200,00 02.10.2020 Turkish Education Foundation 750,00 12.10.2020 Elif Parla/Elif Parlakay/September 2020 Scholarship 500,00 12.10.2020 Sabri Talh/Sabri Talha Parlakay/September 2020 Scholarship 1.000,00 12.10.2020 Elif Zeyne/Elif Zeynep Dalkılıç/September 2020 Scholarship 1.000,00 12.10.2020 Yiğit Eren/Yiğit Eren Dalkılıç/September 2020 Scholarship 1.000,00 12.10.2020 Ahmet İbre/Ahmet İbre/September 2020 Scholarship 1.500,00 12.10.2020 Müge Şirin/Buse Aras/September 2020 Scholarship 1.500,00 12.10.2020 Müge Şirin/Nehir Aras/September 2020 Scholarship 1.000,00 12.10.2020 Tuna Çelik/Tuna Çelik/September 2020 Scholarship 500,00 12.10.2020 Fatoş Kang/İklim Hira Altınok/September 2020 Scholarship 500,00 12.10.2020 Yiğit Berk/Yiğit Berk Şenlik/September 2020 Scholarship 1.000,00 12.10.2020 Elif Parla/Elif Parlakay/October 2020 Scholarship 500,00 12.10.2020 Sabri Talh/Sabri Talha Parlakay/October 2020 Scholarship 1.000,00 12.10.2020 Elif Zeyne/Elif Zeynep Dalkılıç/October 2020 Scholarship 1.000,00 12.10.2020 Yiğit Eren/Yiğit Eren Dalkılıç/October 2020 Scholarship 1.000,00 12.10.2020 Ahmet İbre/Ahmet İbre/October 2020 Scholarship 1.500,00 12.10.2020 Müge Şirin/Buse Aras/October 2020 Scholarship 1.500,00 12.10.2020 Müge Şirin/Nehir Aras/October 2020 Scholarship 1.000,00 12.10.2020 Tuna Çelik/Tuna Çelik/October 2020 Scholarship 500,00 12.10.2020 Fatoş Kang/İklim Hira Altınok/October 2020 Scholarship 500,00 12.10.2020 Yiğit Berk/Yiğit Berk Şenlik/October 2020 Scholarship 1.000,00 19.10.2020 Mehmet Zorlu Primary School donation of 4 assets 120,00 19.10.2020 Mimar Sinan Secondary School donation of 55 assets 1.330,00 19.10.2020 Valia. Fuat Güven/Hasibe-Mazhar Gürbüz Primary School donation 1.400,00 19.10.2020 Hüseyin Akif Terzioğlu Primary School donation of 87 assets 3.358,00
19.10.2020 Didim District Governorship, District Directorate of National Education, donation of 42 assets
1.965,00
22.10.2020 Turkish Education Foundation 200,00 22.10.2020 Koç University - Anatolian Scholars Program 181.868,00 23.10.2020 Turkish Education Foundation 250,00 23.10.2020 Turkish Education Foundation 200,00 26.10.2020 Çağatay Aksu/ Scholarship 48.756,00 26.10.2020 Turkish Education Foundation 250,00 26.10.2020 Turkish Education Foundation 100,00 02.11.2020 Elif Parlakay/November 2020 Scholarship 500,00 02.11.2020 Sabri Talha Parlakay/November 2020 Scholarship 1.000,00 02.11.2020 Elif Zeynep Dalkılıç/November 2020 Scholarship 1.000,00 02.11.2020 Yiğit Eren Dalkılıç/November 2020 Scholarship 1.000,00 02.11.2020 Ahmet İbre/November 2020 Scholarship 1.500,00

78
02.11.2020 Buse Aras/November 2020 Scholarship 1.500,00 02.11.2020 Nehir Aras/November 2020 Scholarship 1.000,00 02.11.2020 Tuna Çelik/November 2020 Scholarship 500,00 02.11.2020 İklim Hira Altınok/November 2020 Scholarship 500,00 02.11.2020 Yiğit Berk Şenlik/November 2020 Scholarship 1.000,00 02.11.2020 Turkish Education Foundation 50,00 05.11.2020 General Directorate of Forestry 100.000,00 06.11.2020 Turkish Education Association 50,00
10.11.2020 The Turkish Foundation for Combating Soil Erosion, for Reforestation and the Protection of Natural Habitats
100,00
12.11.2020 Burdur Branch, asset donation 4.001,59 12.11.2020 Burdur Branch, donation 191,66 17.11.2020 Turkish Education Foundation 500,00 18.11.2020 Turkish Education Foundation 100,00 20.11.2020 Turkish Education Foundation 250,00 24.11.2020 Ortahisar District Governorship, Kireçhane Primary School, donation of 162 assets 4.475,97 03.12.2020 Elif Parlakay/December 2020 Scholarship 500,00 03.12.2020 İzmir Metropolitan Municipality One Rent One Home campaign 100.000,00 04.12.2020 Sabri Talha Parlakay/December 2020 Scholarship 1.000,00 04.12.2020 Elif Zeynep Dalkılıç/December 2020 Scholarship 1.000,00 04.12.2020 Yiğit Eren Dalkılıç/December 2020 Scholarship 1.000,00 04.12.2020 Ahmet İbre/December 2020 Scholarship 1.500,00 04.12.2020 Buse Aras/December 2020 Scholarship 1.500,00 04.12.2020 Nehir Aras/December 2020 Scholarship 1.000,00 04.12.2020 Tuna Çelik/December 2020 Scholarship 500,00 04.12.2020 İklim Hira Altınok/December 2020 Scholarship 500,00 04.12.2020 Yiğit Berk Şenlik/December 2020 Scholarship 1.000,00 08.12.2020 Turkish Education Foundation 300,00 08.12.2020 Turkish Education Foundation 100,00
17.12.2020 Eyüpsultan District Governorship, Şehit Öğretmenler Secondary School, donation of 50 assets
875,00
24.12.2020 Turkish Education Foundation 50,00 25.12.2020 Turkish Education Foundation 100,00 28.12.2020 Şehit Numan Şeref Datlı Police Station donation of 10 assets 150,00 28.12.2020 Şehit Numan Şeref Datlı Police Station donation of 10 assets 1.885,21 29.12.2020 Turkish Education Foundation 1.750,00 30.12.2020 Turkish Education Foundation 100,00

79
FIVE-YEAR SUMMARY OF FINANCIAL INFORMATION INCLUDING THE REPORTING PERIOD
(TL thousand) 31.12.2016
2016-2015
Change 31.12.2017
2017-2016
Change 31.12.2018
2018-2017
Change 31.12.2019
2019-2018
Change 31.12.2020
2020- 2019
Change Liquid Assets 15.237.022 35,59% 13.489.109 -11,47% 19.852.854 47,18% 21.336.601 7,47% 29.641.197 38,92% Securities 4.668.068 -0,12% 5.558.278 19,07% 6.699.383 20,53% 11.740.554 75,25% 22.802.391 94,22% Loans 56.363.829 5,92% 63.290.777 12,29% 63.998.823 1,12% 65.577.143 2,47% 78.884.319 20,29% Other Assets 3.458.471 21,93% 3.420.065 -1,11% 6.446.104 88,48% 8.695.870 34,90% 8.720.135 0,28% Total Assets 79.727.390 10,79% 85.758.229 7,56% 96.997.164 13,11% 107.350.168 10,67% 140.048.042 30,46% Demand Deposits 7.628.600 9,27% 9.504.405 24,59% 11.644.855 22,52% 16.786.665 44,16% 32.754.131 95,12% Time Deposits 42.204.058 12,80% 46.072.311 9,17% 52.572.309 14,11% 55.407.662 5,39% 61.019.347 10,13% Funds Borrowed 16.596.691 4,25% 15.186.301 -8,50% 14.671.854 -3,39% 13.412.150 -8,59% 20.490.810 52,78% Other Liabilities 5.498.640 17,41% 5.975.535 8,67% 8.369.638 40,07% 12.023.117 43,65% 14.373.903 19,55% Equity (excl. profit) 6.857.602 12,80% 7.950.838 15,94% 8.736.805 9,89% 8.650.220 -0,99% 10.232.537 18,29% Net Income 941.799 6,73% 1.068.839 13,49% 1.001.703 -6,28% 1.070.354 6,85% 1.777.314 9,99% Total Liabilities 79.727.390 10,79% 85.758.229 7,56% 96.997.164 13,11% 107.350.168 10,67% 140.048.042 30,46% NPL Ratio 3,08% 0,80% 3,02% -0,06% 4,15% 1,13% 5,99% 1,84% 4,22% -1,77% Return on Equity 13,53% -1,15% 13,38% -0,15% 11,18% -2,20% 11,50% 0,32% 11,61% 0,11% Return on Assets 1,24% -0,07% 1,29% 0,05% 1,10% -0,20% 1,05% -0,05% 0,95% -0,10% Capital Adequacy Ratio 14,37% 0,43% 16,12% 1,74% 16,93% 0,81% 16,95% 0,02% 18,51% 1,56%

80
BRANCHES
BRANCH ADDRESS COUNTY PROVINCE TELEPHONE
4. Levent Branch Emniyet Evleri Mahallesi Eski Büyükdere Caddesi No: 11/A Kağıthane 34415 İstanbul KAĞITHANE İSTANBUL +90 850 204 00
49
4. Sanayi Branch 129 Sokak No: 1/E 4. Sanayi Sitesi BORNOVA İZMİR +90 850 204 03 45
A.O.S.B. İzmir Branch M. Kemal Atatürk Bulvarı No: 42 / 19 Çiğli 35620 İzmir ÇİĞLİ İZMİR +90 850 204 00
67
Acıbadem Branch Acıbadem Caddesi No: 164/4 Üsküdar 34660 İstanbul ÜSKÜDAR İSTANBUL +90 850 204 01 83
Adana Atikop Branch
Yeşiloba Mahallesi Turhan Cemal Beriker Bulvarı Adana İş Merkezi A Blok No: 443/E Seyhan 01100 Adana
SEYHAN ADANA +90 850 204 05 35
Adana Branch Turan Cemal Beriker Bulvarı Güleç İşhanı 23 Seyhan 01120 Adana SEYHAN ADANA +90 850 204 00
26
Adana Çarşı Branch Karasoku Mahallesi Kızılay Caddesi No: 14 01010 Seyhan - Adana SEYHAN ADANA +90 850 204 04
45 Adana Çukurova Branch
Çınarlı Mahallesi Atatürk Caddesi No: 15 Seyhan 01120 Adana SEYHAN ADANA +90 850 204 05
24 Adana Mobilyacılar Branch
Güzelevler Mahallesi Mobilyacılar Sitesi Meşe Caddesi No: 18 A Kısım Yüreğir 01310 Adana YÜREĞİR ADANA +90 850 204 02
69 Adana Toros Branch
Beyazevler Mahallesi Bülent Angın Bulvarı No: 128/A Çukurova 01170 Adana ÇUKUROVA ADANA +90 850 204 04
46
Adapazarı Branch Tığcılar Mahallesi Atatürk Bulvarı No: 27 MERKEZ SAKARYA +90 850 204 01 13
Adapazarı Çarşı Branch
Orta Mahalle Soğan Pazarı Caddesi No: 8 Adapazarı 54040 Sakarya ADAPAZARI SAKARYA +90 850 204 05
05
Adıyaman Branch Yenipınar Mahallesi Atatürk Caddesi No: 31 A/A Merkez 02100 Adıyaman MERKEZ ADIYAMAN +90 850 204 02
81 Aegean Corporate Branch Cumhuriyet Bulvarı 66 Kat: 2 KONAK İZMİR +90 850 204 00
68
Afyon Branch Burmalı Mahallesi Cumhuriyet Meydanı No: 7/1 Merkez 03100 Afyonkarahisar MERKEZ AFYONKARAHİSAR +90 850 204 01
16 Afyon Kadınana Branch
Dumlupınar Mahallesi Kadınana Caddesi Davulcuoğlu İş Merkezi No: 5A Merkez 03200 Afyonkarahisar MERKEZ AFYONKARAHİSAR +90 850 204 05
10 Akdeniz Sanayi Branch
Şafak Mahallesi 5009 Sokak Akdeniz Sanayi Sitesi 36. Blok No: 114 Kepez 07224 Antalya KEPEZ ANTALYA +90 850 204 02
04 Akdeniz Üniversitesi Branch
Akdeniz Üniversitesi Dumlupınar Bulvarı Olbia Çarşısı Kampüs Konyaaltı 07058 Antalya KONYAALTI ANTALYA +90 850 204 07
32 Akdeniz Üniversitesi Tıp Fakültesi Branch
Dumlupınar Bulvarı Akdeniz Üniversitesi Tıp Fak. Hastanesi H Blok Giriş Katı Konyaaltı 07070 Antalya KONYAALTI ANTALYA +90 850 204 07
72
Akhisar Branch Şehit Teğmen Ün Caddesi Paşa Mahallesi No: 78 Akhisar 45200 Manisa AKHİSAR MANİSA +90 850 204 02
59
Aksaray Branch Hamidiye Mahallesi 761/Şehit Ali Mutlu Sokak No: 1/1 Merkez 68100 Aksaray MERKEZ AKSARAY +90 850 204 03
54 Aksaray İstanbul Branch
Kemalpaşa Mahallesi Ordu Caddesi No: 66A Kat: 1 Fatih 34134 İstanbul FATİH İSTANBUL +90 850 204 00
72
Aksaz Branch Aksaz Deniz Üs Komutanlığı Aksaz MARMARİS MUĞLA +90 850 204 02 40
Akşehir Branch Meydan Mahallesi İnönü Caddesi No: 64 Akşehir 42550 Konya AKŞEHİR KONYA +90 850 204 02
86
Alanya Branch Atatürk Caddesi 42/A Alanya 07400 Antalya ALANYA ANTALYA +90 850 204 01 08
Alanya Mahmutlar Branch
Mahmutlar Mahallesi Barbaros Caddesi No: 98B/A Alanya 07450 Antalya ALANYA ANTALYA +90 850 204 01
73 Alanya Sanayi Branch
Cumhuriyet Mahallesi Keykubat Bulvarı No: 218 Alanya 07400 Antalya ALANYA ANTALYA +90 850 204 06
04
Alaşehir Branch Soğuksu Mahallesi Sekine Evren Caddesi No: 87 Alaşehir 45600 Manisa ALAŞEHİR MANİSA +90 850 204 06
64
Alemdar Branch Alemdar Caddesi Ömerağa Mahallesi No: 19 İZMİT KOCAELİ +90 850 204 03 48
Aliağa Branch İstiklal Caddesi No: 35/B ALİAĞA İZMİR +90 850 204 02 11
Alibeyköy Branch Alibeyköy Mahallesi Namık Kemal Caddesi 30/A Eyüp 34060 İstanbul EYÜP İSTANBUL +90 850 204 05
61
Alsancak Branch 1382 Sokak 33/A Bodrum Kat Alsancak Konak 35220 İzmir KONAK İZMİR +90 850 204 04
55

81
Altıparmak Branch Cemal Nadir Caddesi No: 47 Kat: 1 Altıparmak OSMANGAZİ BURSA +90 850 204 03 63
Altıyol Branch Söğütlüçeşme Caddesi No: 124/126 A KADIKÖY İSTANBUL +90 850 204 00 87
Altunizade Branch Kısıklı Caddesi No: 19 Altunizade ÜSKÜDAR İSTANBUL +90 850 204 00 95
Amasya Branch Yüzevler Mahallesi Mustafa Kemal Paşa Caddesi No: 76/A-B-1 Merkez 05100 Amasya MERKEZ AMASYA +90 850 204 06
87
Anamur Branch Esentepe Mahallesi Atatürk Bulvarı No: 8/B ANAMUR MERSİN +90 850 204 03 04
Ankara 4. Kolordu Branch
4. Kolordu Komutanlığı Samsun Yolu Üzeri Mamak 06265 Ankara MAMAK ANKARA +90 850 204 02
85
Ankara Branch Mustafa Kemal Mahallesi 2120 Caddesi No: 4 A Çankaya 06530 Ankara ÇANKAYA ANKARA +90 850 204 00
06
Antakya Branch Yavuz Selim Caddesi 5. Mıntıka Zühtiye Ökten Çarşısı No: 1-2 Antakya Merkez 31100 Hatay Merkez HATAY +90 850 204 00
73
Antalya Branch Etiler Mahallesi Adnan Menderes Bulvarı Birlik Apartmanı No: 53/A-B Muratpaşa 07010 Antalya MURATPAŞA ANTALYA +90 850 204 00
25 Antalya Etiler Branch
Etiler Mahallesi 851 Sokak No: 2 Muratpaşa 07010 Antalya MURATPAŞA ANTALYA +90 850 204 01
88 Antalya Muratpaşa Branch
Tahılpazarı Mahallesi Şarampol Caddesi Ömer Melli İş Hanı No: 86A Muratpaşa 07040 Antalya MURATPAŞA ANTALYA +90 850 204 03
87 Antalya Sanayi Branch
Yükseliş Mahallesi Gazi Bulvarı No: 123/1 Kepez 07025 Antalya KEPEZ ANTALYA +90 850 204 05
60 Antalya Toptancı Hali Branch
Güneş Mahallesi Yeni Toptancı Hal Kompleksi B2/1 Blok No: 1 Kepez 07260 Antalya KEPEZ ANTALYA +90 850 204 03
18
Aspendos Corporate Branch
Etiler Mahallesi Adnan Menderes Bulvarı Birlik Apartmanı No: 53/A-B Asma Kat Muratpaşa 07010 Antalya
MURATPAŞA ANTALYA +90 850 204 02 82
Atakum Branch Mimar Sinan Mahallesi 162 Sokak No: 17/F Atakum 55200 Samsun ATAKUM SAMSUN +90 850 204 01
98
Ataşehir Branch Atatürk Mahallesi Ataşehir Bulvarı No: 14/F Özel İşyeri: 1 Ataşehir 34758 İstanbul ATAŞEHİR İSTANBUL +90 850 204 04
35 Atatürk Caddesi Adana Branch
Kurtuluş Mahallesi Atatürk Caddesi Meryem Gizer Apartmanı No: 63/A Seyhan 01130 Adana SEYHAN ADANA +90 850 204 01
17
Atrium Branch Ataköy 7-8-9-10. Kısım Mahallesi Karanfil Sokak Atrium AVM Apt. No: 2/61 Bakırköy 34158 İstanbul BAKIRKÖY İSTANBUL +90 850 204 04
72
Avcılar Branch Mustafa Kemal Paşa Mahallesi Firuzköy Bulvarı No: 115A Avcılar 34320 İstanbul AVCILAR İSTANBUL +90 850 204 00
74 Avcılar Çarşı Branch
Merkez Mahallesi Reşitpaşa Caddesi No: 41 Avcılar 34310 İstanbul AVCILAR İSTANBUL +90 850 204 02
41
Avcılar E-5 Branch Cihangir Mahallesi E-5 Yanyol Caddesi No: 239 Avcılar 34310 İstanbul AVCILAR İSTANBUL +90 850 204 05
97
Aydın Branch Kurtuluş Mahallesi Adnan Menderes Bulvarı No: 40B/B Efeler 09020 Aydın EFELER AYDIN +90 850 204 00
75
Aydın Çarşı Branch Hasan Efendi - Ramazan Paşa Mahallesi Hükümet Bulvarı No: 17/1 Efeler 09110 Aydın EFELER AYDIN +90 850 204 05
12
Ayvalık Branch İsmetpaşa Mahallesi Atatürk Bulvarı Caddesi No: 109 Ayvalık 10400 Balıkesir AYVALIK BALIKESİR +90 850 204 07
14
Bafra Branch Hacınabi Mahallesi Tekel Caddesi No: 40 Bafra 55400 Samsun BAFRA SAMSUN +90 850 204 03
33
Bağcılar Branch İstanbul Caddesi No: 12/B BAĞCILAR İSTANBUL +90 850 204 01 76
Bahçelievler İstanbul Branch İzzettin Çalışlar Caddesi No: 40 BAHÇELİEVLER İSTANBUL +90 850 204 02
34
Bahçeşehir Branch Bahçeşehir 2. Kısım Mahallesi Süzer Bulvarı No: 13 Başakşehir 34488 İstanbul BAŞAKŞEHİR İSTANBUL +90 850 204 00
76
Bakırköy Branch Cevizlik Mahallesi İstanbul Caddesi No: 24 Bakırköy 34142 İstanbul BAKIRKÖY İSTANBUL +90 850 204 00
14 Bakırköy Meydan Branch
Kartaltepe Mahallesi İncirli Caddesi No: 12/14 Bakırköy 34145 İstanbul BAKIRKÖY İSTANBUL +90 850 204 03
93
Balçova Branch Onur Mahallesi Ata Caddesi No: 48/A Balçova 35330 İzmir BALÇOVA İZMİR +90 850 204 02
16
Balgat Branch Ceyhun Atıf Kansu Caddesi No: 80 Balgat ÇANKAYA ANKARA +90 850 204 01 50
Balıkesir Branch Hisariçi Mahallesi Örücüler Caddesi No: 14B Karesi 10010 Balıkesir KARESİ BALIKESİR +90 850 204 00
77 Balıkesir Çarşı Branch
Altıeylül Mahallesi Anafartalar Caddesi No: 25/B Altıeylül 10100 Balıkesir ALTIEYLÜL BALIKESİR +90 850 204 04
98

82
Bandırma Branch İnönü Caddesi No: 68/A BANDIRMA BALIKESİR +90 850 204 03 51
Bankalar Caddesi Branch Bereketzade Mahallesi Bankalar Caddesi No: 28B BEYOĞLU İSTANBUL +90 850 204 02
12
Barkal Branch Şakirpaşa Mahallesi Turhan Cemal Beriker Bulvarı No: 249/A Seyhan 01100 Adana SEYHAN ADANA +90 850 204 01
64
Bartın Branch Kırtepe Mahallesi Hamam Caddesi No: 5 Merkez 74100 Bartın MERKEZ BARTIN +90 850 204 06
77 Başkent Corporate Branch
Simon Bolivar Caddesi No: 17 Kat: 1-2 Çankaya 06680 Ankara ÇANKAYA ANKARA +90 850 204 04
56 Batı Ataşehir Branch
Barbaros Mahallesi Halk Caddesi No: 47/1 Ataşehir 34746 İstanbul ATAŞEHİR İSTANBUL +90 850 204 06
74
Batman Branch Gap Mahallesi Turgut Özal Bulvarı Babil Plaza No: 316 E-F Merkez 72070 Batman MERKEZ BATMAN +90 850 204 03
28
Bayındır Branch Mithatpaşa Mahallesi Fevzi Paşa Caddesi No: 23A Bayındır 35840 İzmir BAYINDIR İZMİR +90 850 204 07
25
Bayramiç Branch Camicedit Mahallesi Atatürk Caddesi No: 22 A Bayramiç 17700 Çanakkale BAYRAMİÇ ÇANAKKALE +90 850 204 07
27 Bayrampaşa Branch
Yenidoğan Mahallesi Abdi İpekçi Caddesi No: 4D Bayrampaşa 34030 İstanbul BAYRAMPAŞA İSTANBUL +90 850 204 00
22
Bayramyeri Branch Saraylar Mahallesi Enverpaşa Caddesi Katrancı İşh. No: 26/1 Merkezefendi 20010 Denizli MERKEZEFENDİ DENİZLİ +90 850 204 00
98
Bebek Branch Cevdet Paşa Caddesi No: 55 Bebek BEŞİKTAŞ İSTANBUL +90 850 204 00 48
Bekirpaşa Branch 28 Haziran Mahallesi Turan Güneş Caddesi No: 301 A İzmit 41060 Kocaeli İZMİT KOCAELİ +90 850 204 03
13
Bergama Branch Ertuğrul Mahallesi Park Otel Sokak No: 10 Bergama 35700 İzmir BERGAMA İZMİR +90 850 204 06
97 Beşevler Sanayi Branch
Üçevler Mahallesi Nilüfer Caddesi 4 Nilüfer 16130 Bursa NİLÜFER BURSA +90 850 204 01
20
Beşiktaş Branch Ortabahçe Caddesi No : 2 BEŞİKTAŞ İSTANBUL +90 850 204 00 78
Beşiktaş Çarşı Branch
Cihannuma Mahallesi Salih Efendi Sokak No: 7 Beşiktaş 34353 İstanbul BEŞİKTAŞ İSTANBUL +90 850 204 05
42 Beşyüzevler Branch
Barbaros Hayrettin Paşa Mahallesi Eski Edirne Asfaltı Caddesi No: 224B Gaziosmanpaşa 34520 İstanbul GAZİOSMANPAŞA İSTANBUL +90 850 204 00
79
Beyazıt Branch Mimar Hayrettin Mahallesi Yeniçeriler Caddesi No: 29 Bayazıt Fatih 34126 İstanbul FATİH İSTANBUL +90 850 204 01
23
Beykent Branch Cumhuriyet Mahallesi Gürpınar Yolu Beylikdüzü San. Sitesi B2 Blok No: 325-326-327-328-355-356 B.Çekmece 34500 İstanbul
BÜYÜKÇEKMECE İSTANBUL +90 850 204 06 37
Beykent Üniversitesi Branch
T.C. Beykent Üniversitesi Ayazağa Kampüsü Ayazağa Mahallesi Hadımkoru Caddesi No: 19A Sarıyer 34485 İstanbul
SARIYER İSTANBUL +90 850 204 06 63
Beylikdüzü Branch Beylikdüzü OSB Mahallesi Açelya Caddesi No: 1/8 Beylikdüzü 34524 İstanbul BEYLİKDÜZÜ İSTANBUL +90 850 204 00
47 Beylikdüzü E-5 Branch
Barbaros Hayrettin Paşa Mahallesi Şehitler Caddesi Beymahall Sit. No: 5 B/1 Esenyurt 34522 İstanbul ESENYURT İSTANBUL +90 850 204 04
07
Beyoğlu Branch Hüseyinağa Mahallesi Hamalbaşı Caddesi No: 6/A Beyoğlu 34435 İstanbul BEYOĞLU İSTANBUL +90 850 204 04
51
Biga Branch İstiklal Mahallesi İstiklar Caddesi No: 106-108 İç Kapı No: 1 Biga 17200 Çanakkale BİGA ÇANAKKALE +90 850 204 02
77
Bodrum Branch Türk Kuyusu Mahallesi Kıbrıs Şehitleri Caddesi No: 65/A-65/B Bodrum 48400 Muğla BODRUM MUĞLA +90 850 204 01
06 Bodrum Gümbet Branch
Merkez Mahallesi Atatürk Bulvarı No: 203/A1-A3 Konacık - Bodrum 48480 Muğla BODRUM MUĞLA +90 850 204 03
14 Boğaziçi Corporate Branch
Büyükdere Caddesi Şarlı İş Merkezi No: 103 K: 3 Mecidiyeköy - Şişli / İstanbul ŞİŞLİ İSTANBUL +90 850 204 04
32
Boğazlıyan Branch Çarşı Mahallesi Mescit Caddesi No: 17 Boğazlıyan 66400 Yozgat BOĞAZLIYAN YOZGAT +90 850 204 07
38
Bolu Branch Aktaş Mahallesi İzzet Baysal Caddesi No: 114 MERKEZ BOLU +90 850 204 01 42
Bornova Branch Manavkuyu Mahallesi Mustafa Kemal Caddesi 132/1A Bayraklı 35535 İzmir BAYRAKLI İZMİR +90 850 204 01
00 Bornova Çarşı Branch
Mustafa Kemal Caddesi No: 11-A/B Bornova 35040 İzmir BORNOVA İZMİR +90 850 204 03
98
Bostancı E5 Branch İçerenköy Mahallesi Değirmen Yolu Caddesi No: 31/1A Ataşehir 34752 İstanbul ATAŞEHİR İSTANBUL +90 850 204 04
31 Bostanlı Branch Bostanlı Mahallesi Cemal Gürsel Caddesi No: 526/B KARŞIYAKA İZMİR +90 850 204 02

83
Karşıyaka 35590 İzmir 31
Bozüyük Branch Yeni Mahalle İsmet İnönü Caddesi No: 67 Bozüyük 11300 BİLECİK BOZÜYÜK BİLECİK +90 850 204 06
86
Buca Branch Kozağaç Mahallesi Uğur Mumcu Caddesi No: 96 Buca 35390 İzmir BUCA İZMİR +90 850 204 06
96
Bucak Branch Oğuzhan Mahallesi Cumhuriyet Caddesi No: 20/A BUCAK BURDUR +90 850 204 03 47
Burdur Branch Özgür Mahallesi Gazi Caddesi No: 79A Merkez 15200 Burdur MERKEZ BURDUR +90 850 204 02
73
Bursa Branch Doğanbey Mahallesi Fevzi Çakmak Caddesi No: 52/B Osmangazi 16220 Bursa OSMANGAZİ BURSA +90 850 204 00
17 Bursa Çekirge Branch
Çekirge Mahallesi Çekirge Caddesi Batıca - Bintaş Apartmanı No: 153 A Osmangazi 16070 Bursa OSMANGAZİ BURSA +90 850 204 04
65 Bursa Cumhuriyet Caddesi Branch
Tuzpazarı Mahallesi Cumhuriyet Caddesi No: 114 Osmangazi 16020 Bursa OSMANGAZİ BURSA +90 850 204 05
87 Bursa Organize Sanayi Branch
Organize San. Bölgesi Ali Osman Sönmez Bulvarı Bankalar Caddesi 16159 Nilüfer/Bursa NİLÜFER BURSA +90 850 204 03
84 Bursa Serbest Bölge Branch
Ata Mahallesi Serbest Bölge Orkide Caddesi No: 13/1 Gemlik 16600 Bursa GEMLİK BURSA +90 850 204 00
65 Büsan Sanayi Sitesi Branch
Fevzi Çakmak Mahallesi KOSGEB Caddesi No: 1/1 Karatay 42050 Konya KARATAY KONYA +90 850 204 01
18 Büyükçekmece Branch
19 Mayıs Mahallesi Nutuk Caddesi No: 48A/1 Büyükçekmece 34500 İstanbul BÜYÜKÇEKMECE İSTANBUL +90 850 204 01
89 Caddebostan Branch
Caddebostan Mahallesi Bağdat Caddesi No: 265A/1 Kadıköy 34728 İstanbul KADIKÖY İSTANBUL +90 850 204 01
10
Çağlayan Branch Çağlayan Mahallesi Kağıthane Caddesi No: 141 C Kağıthane 34403 İstanbul KAĞITHANE İSTANBUL +90 850 204 01
57
Çanakkale Branch Kemalpaşa Mahallesi Değirmenlik Sokak No: 49 /1 Merkez 17010 Çanakkale MERKEZ ÇANAKKALE +90 850 204 01
85 Çankaya Ankara Branch Simon Bolivar Caddesi No: 17 06680 Çankaya - Ankara ÇANKAYA ANKARA +90 850 204 03
82
Çankırı Branch Yunus AVM Buğday Pazarı Mahallesi Çarşamba Pazarı Caddesi No: 4/B116-Z118-Z119 Merkez Çankırı MERKEZ ÇANKIRI +90 850 204 06
73
Çarşamba Branch Dr.Tevfik Türker Caddesi No: 13 ÇARŞAMBA SAMSUN +90 850 204 01 58
Çarşı İzmir Branch 1203/1 Sokak No: 7 Yenişehir Konak İzmir KONAK İZMİR +90 850 204 00 66
Çarşı İzmit Branch Karabaş Mahallesi Leyla Atakan Caddesi No: 27 A/0 İzmit 41040 Kocaeli İZMİT KOCAELİ +90 850 204 04
16
Çekmeköy Branch Madenler Mahallesi Serencebey Caddesi No: 58A Ümraniye 34776 İstanbul ÜMRANİYE İSTANBUL +90 850 204 01
43
Çengelköy Branch Çengelköy Mahallesi Çengelköy Caddesi No: 59 Çengelköy Üsküdar 34680 İstanbul ÜSKÜDAR İSTANBUL +90 850 204 03
41
Çerkezköy Branch Gazi Osman Paşa Mahallesi Atatürk Caddesi No: 5 ÇERKEZKÖY TEKİRDAĞ +90 850 204 02 84
Çeşme Branch İsmet İnönü Mahallesi 2001 Sokak No: 74/A Çeşme 35930 İzmir ÇEŞME İZMİR +90 850 204 02
48
Çetin Emeç Branch Ehlibeyt Mahallesi Ceyhun Atuf Kansu Caddesi No: 126/E ÇANKAYA ANKARA +90 850 204 03
42
Cevizli Branch Orhantepe Mahallesi Üsküdar Caddesi Breeze Tower Apt. No: 155 A Kartal 34865 İstanbul KARTAL İSTANBUL +90 850 204 05
62
Ceyhan Branch Türlübaş Mahallesi Atatürk Caddesi No: 260 Ceyhan 01960 Adana CEYHAN ADANA +90 850 204 06
56 Çiftehavuzlar Branch
Bağdat Caddesi Aziz Kaya İş Merkezi No: 193/A Zemin Kat A Kısım Çiftehavuzlar Kadıköy 34730 İstanbul KADIKÖY İSTANBUL +90 850 204 01
34
Çiğli Branch Şirintepe Mahallesi Anadolu Caddesi No: 778/3A Çiğli 35620 İzmir ÇİĞLİ İZMİR +90 850 204 05
55
Çınar Branch 15 Mayıs Mahallesi Gazi Mustafa Kemal Bulvarı No: 145/B Pamukkale 20150 Denizli PAMUKKALE DENİZLİ +90 850 204 01
99
Çine Branch Hamidabat Mahallesi Mehmet Yavaş Caddesi TN: 20 No: 111/A Çine 09500 Aydın ÇİNE AYDIN +90 850 204 07
35
Çorlu Branch Kazimiye Mahallesi Salih Omurtak Caddesi No: 22/B ÇORLU TEKİRDAĞ +90 850 204 01 09
Çorlu Çarşı Branch Cemaliye Mahallesi Saray Caddesi No: 2 Çorlu 59860 Tekirdağ ÇORLU TEKİRDAĞ +90 850 204 02
89
Çorum Branch Çepni Mahallesi İnönü Caddesi No: 4 Merkez 19040 Çorum MERKEZ ÇORUM +90 850 204 01
44
Çubuk Branch Yıldırım Beyazıt Mahallesi Ankara (1.Kısım) Bulvarı B Blok Özdemirler Apartmanı No: 29 G- H Çubuk 06760 ÇUBUK ANKARA +90 850 204 07
61

84
Ankara Çukurambar Branch
Kızılırmak Mahallesi Ufuk Üniversitesi Caddesi No: 1/A Çankaya 06530 Ankara ÇANKAYA ANKARA +90 850 204 05
17 Çukurova Corporate Branch
Çınarlı Mahallesi Atatürk Caddesi No: 15 Kat: 1 A Kısım 01120 Seyhan - Adana SEYHAN ADANA +90 850 204 03
59
Çumra Branch İzzetbey Mahalle 72444 Sokak No: 3A Daire: 1 Çumra 42500 Konya ÇUMRA KONYA +90 850 204 07
28
Darıca Branch Kazımkarabekir Mahallesi İstasyon Caddesi No: 509/A Darıca 41700 Kocaeli DARICA KOCAELİ +90 850 204 07
22
Davutpaşa Branch Maltepe Mahallesi Davutpaşa Caddesi No: 101 DK: 230-231-232-352 Topkapı Zeytinburnu 34010 İstanbul ZEYTİNBURNU İSTANBUL +90 850 204 00
96 Değirmendere Trabzon Branch
Sanayi Mahallesi Devlet Karayolu Caddesi No: 85A Ortahisar 61030 Trabzon ORTAHİSAR TRABZON +90 850 204 02
42
Demetevler Branch Demetgül Mahallesi 408 Cadde No 11 A Yenimahalle 06200 Ankara YENİMAHALLE ANKARA +90 850 204 06
70 Demirciler Sitesi Branch
Seyitnizam Mahallesi Demirciler Sitesi 2. Cadde No: 81 Zeytinburnu 34015 İstanbul ZEYTİNBURNU İSTANBUL +90 850 204 02
21
Demirtaş Branch Panayır Mahallesi Yeni Yalova Yolu Caddesi No: 455/F OSMANGAZİ BURSA +90 850 204 02 98
Demirtaş Organize Sanayi Branch
Demirtaş Organize Sanayi Bölgesi Mustafa Karaer Caddesi No: 18 Osmangazi 16245 Bursa OSMANGAZİ BURSA +90 850 204 04
57
Denizli Branch Saraylar Mahallesi İzmir Bulvarı TEB Sit. No: 57 Merkezefendi 20010 Denizli MERKEZEFENDİ DENİZLİ +90 850 204 00
19 Denizli Çivril Branch
Çatlar Mahallesi Cumhuriyet Caddesi No: 3 Çivril 20600 Denizli ÇİVRİL DENİZLİ +90 850 204 06
84 Denizli Sanayi Branch
Saraylar Mahallesi Ahi Sinan Caddesi No: 36/A Merkezefendi 20010 Denizli MERKEZEFENDİ DENİZLİ +90 850 204 05
51 Denizli Saraylar Branch
Saraylar Mahallesi 459 Sokak No : 7 / 9 MERKEZ 20100 Denizli MERKEZ DENİZLİ +90 850 204 03
88
Develi Branch İbrahimağa Mahallesi Cumhuriyet Caddesi Belediye İş Merkezi No: 2/1B Develi 38400 Kayseri DEVELİ KAYSERİ +90 850 204 07
63
Didim Branch Efeler Mahallesi Atatürk Bulvarı No: 107 A/A Didim 09270 Aydın DİDİM AYDIN +90 850 204 01
54
Dikmen Branch Ş.Mevlüt Meriç Mahallesi Dikmen Caddesi No: 260/15 06460 Dikmen Çankaya - Ankara ÇANKAYA ANKARA +90 850 204 06
27
Diyarbakır Branch Peyas Mahallesi Urfa Bul. Azizoğlu Sit. A-Blok No: 98 B Kayapınar 21070 Diyarbakır KAYAPINAR DİYARBAKIR +90 850 204 01
28
Diyarbakır Kayapınar Branch
Selahattin Eyyubi Mahallesi Turgut Özal Bulvarı Yıldem Yapı Sitesi B Blok No: 74/A Bağlar 21080 Diyarbakır
BAĞLAR DİYARBAKIR +90 850 204 05 99
Diyarbakır Sur Branch
Bağcılar Mahallesi Urfa Bulvarı Baran Plaza No: 217/1 Bağlar 21050 Diyarbakır BAĞLAR DİYARBAKIR +90 850 204 04
80
Dokuz Eylül Üniversitesi Branch
İnciraltı Mahallesi Mithatpaşa Caddesi Dokuz Eylül Üniversitesi İnciraltı Yerleşkesi No: 1606 2/1/1 Balçova 35330 İzmir
BALÇOVA İZMİR +90 850 204 07 53
Dudullu Branch Necip Fazıl Bulvarı No: 7-9 Ümraniye 34773 İstanbul ÜMRANİYE İSTANBUL +90 850 204 07 21
Düzce Branch Camikebir Mahallesi 659. Bulvar No: 8A Merkez 81010 Düzce MERKEZ DÜZCE +90 850 204 02
87
Edirne Branch Mithatpaşa Mahallesi Talatpaşa Caddesi No: 155 Merkez 22100 Edirne MERKEZ EDİRNE +90 850 204 02
13
Edremit Branch Camivasat Mahallesi Menderes Bulvarı No: 11/2 Edremit 10300 Balıkesir EDREMİT BALIKESİR +90 850 204 01
90 Ege Üniversitesi Branch
Kazım Dirik Mahallesi Üniversite Caddesi No: 9/47A Bornova 35100 İzmir BORNOVA İZMİR +90 850 204 07
54 Ege Üniversitesi Kampüsü Branch
Erzene Mahallesi Ankara Caddesi 172/15 B Bornova 35040 İzmir BORNOVA İZMİR +90 850 204 07
74
Elazığ Branch Hürriyet Caddesi Mehmet Arslan İş Merkezi No: 35/A Merkez 23200 Elazığ MERKEZ ELAZIĞ +90 850 204 01
61 Elazığ Hürriyet Caddesi Branch
Nail Bey Mahallesi Vali Fahribey Caddesi Huzur İş Merkezi No: 1/A Merkez 23100 Elazığ MERKEZ ELAZIĞ +90 850 204 06
02
Elbistan Branch Güneşli Mahallesi Dulkadiroğlu Caddesi No: 100/B Elbistan 46300 Kahramanmaraş ELBİSTAN KAHRAMANMARAŞ +90 850 204 06
85
Eminönü Branch Hobyar Mahallesi Vakıf Hanı Sokak No: 8 Fatih 34112 İstanbul FATİH İSTANBUL +90 850 204 00
29
Emirdağ Branch Yenidoğan Mahallesi Şehit Er Yüksel Yeşildağ Caddesi No: 4/1-2 Emirdağ 03600 Afyonkarahisar EMİRDAĞ AFYONKARAHİSAR +90 850 204 07
55
Erdemli Branch Merkez Mahallesi Alparslan Türkeş Bulvarı No: 561A Erdemli 33730 Mersin ERDEMLİ MERSİN +90 850 204 07
02

85
Erenköy Branch Caddebostan Mahallesi Ethem Efendi Caddesi No: 13/1 Kadıköy 34728 İstanbul KADIKÖY İSTANBUL +90 850 204
0389 Erenler Sanayi Branch Erenler Mahallesi Sakarya Caddesi No: 306/A ERENLER SAKARYA +90 850 204 02
88
Erzincan Branch Atatürk Mahallesi Nerim Tombul Caddesi No: 12/Z2-Z3 Merkez 24002 Erzincan MERKEZ ERZİNCAN +90 850 204 03
16
Erzurum Branch Kazım Karabekir Paşa Mahallesi Orhan Şerifsoy Caddesi Türk Ekonomi Bankası A.Ş. Apt. No: 52 Yakutiye 25100 Erzurum
YAKUTİYE ERZURUM +90 850 204 01 48
Esenler Branch Menderes Mahallesi Atışalanı Caddesi No: 15 Esenler 34225 İstanbul ESENLER İSTANBUL +90 850 204 06
09
Esenyurt Branch İnönü Mahallesi Doğan Araslı Bulvarı No: 124/C ESENYURT İSTANBUL +90 850 204 03 36
Eskişehir Bağlar Branch
Yenibağlar Mahallesi Üniversite Caddesi 106/A Tepebaşı 26170 Eskişehir TEPEBAŞI ESKİŞEHİR +90 850 204 05
67
Eskişehir Branch İstiklal Mahallesi İki Eylül Caddesi No: 2/1 Odunpazarı 26010 Eskişehir ODUNPAZARI ESKİŞEHİR +90 850 204 00
41 Eskişehir İki Eylül Caddesi Branch
İstiklal Mahallesi İki Eylül Caddesi No: 50/B Odunpazarı 26010 ESKİŞEHİR ODUNPAZARI ESKİŞEHİR +90 850 204 04
13
Etiler Branch Etiler Mahallesi Nisbetiye Caddesi No: 97 Kat: 1 Beşiktaş 34337 İstanbul BEŞİKTAŞ İSTANBUL +90 850 204 00
16
Etimesgut Branch İstasyon Mahallesi İstasyon Caddesi Tüzün Sokak No: 8/7 ETİMESGUT ANKARA +90 850 204 02
52
Fatih Branch Ali Kuşçu Mahallesi Macar Kardeşler Caddesi No: 34 Fatih 34083 İstanbul FATİH İSTANBUL +90 850 204 03
35
Fatsa Branch Mustafa Kemal Paşa Mahallesi Reşadiye Caddesi No: 14/A Fatsa 52400 Ordu FATSA ORDU +90 850 204 01
53
Fener Branch Çağlayan Mahallesi Barınaklar Bulvarı A. Atmaca Apt. B Blok No: 3/A-B Muratpaşa 07230 Antalya MURATPAŞA ANTALYA +90 850 204 02
93
Fethiye Branch Cumhuriyet Mahallesi Çarşı Caddesi No: 25 Fethiye 48300 MUĞLA FETHİYE MUĞLA +90 850 204 01
33 Fethiye Likya Branch
Taşyaka Mahallesi İnönü Bulvarı No: 4 4/A 4/B Fethiye 48300 MUĞLA FETHİYE MUĞLA +90 850 204 04
96 Fethiye Seydikemer Branch
Cumhuriyet Mahallesi İnönü Caddesi No: 40 Kemer Fethiye 48300 Muğla FETHİYE MUĞLA +90 850 204 07
09
Fındıkzade Branch Haseki Sultan Mahallesi Kızılelma Caddesi No: 15 Fatih 34096 İstanbul FATİH İSTANBUL +90 850 204 04
30
Florya Branch Şenlik Mahallesi Florya Asfaltı No: 86 Zemin Kat Kısım A Florya Bakırköy 34153 İstanbul BAKIRKÖY İSTANBUL +90 850 204 02
02
Gaziantep Branch İncili Pınar Mahallesi Muammer Aksoy Bulvarı Dünya İş Merkezi 34/2 ŞEHİTKAMİL GAZİANTEP +90 850 204 00
28 Gaziantep İncilipınar Branch
Değirmiçem Mahallesi Gazi Muhtar Paşa Bulvarı No: 13 A Şehitkamil 27090 Gaziantep ŞEHİTKAMİL GAZİANTEP +90 850 204 04
09
Gaziemir Branch Akçay Caddesi No: 169/A GAZİEMİR İZMİR +90 850 204 02 79
Gazimağusa Branch İsmet İnönü Bulvarı No: 43 Sakarya - GAZİMAĞUSA / KKTC +90 392 365 59
20 Gaziosmanpaşa Ankara Branch Uğur Mumcu Caddesi 76/A Gaziosmanpaşa ÇANKAYA ANKARA +90 850 204 01
01 Gaziosmanpaşa İstanbul Branch
Merkez Mahallesi Eyüp Yolu No: 4 Gaziosmanpaşa 34245 İstanbul GAZİOSMANPAŞA İSTANBUL +90 850 204 01
86
Gebze Branch Hacı Halil Mahallesi Zübeyde Hanım Caddesi No: 33/B GEBZE KOCAELİ +90 850 204 00 35
Gebze Çarşı Branch Hacı Halil Mahallesi Cumhuriyet Meydanı No: 3/2 Gebze 41400 Kocaeli GEBZE KOCAELİ +90 850 204 04
11
Gebze E5 Branch Osman Yılmaz Mahallesi İstanbul Caddesi No: 74/A GEBZE KOCAELİ +90 850 204 02 44
Gebze Organize Sanayi Bölgesi Branch
Gebze Organize Sanayi Bölgesi Bankalar ve Çarşı Merkezi 1600 Sokak No: 1601-7 Gebze 41480 Kocaeli GEBZE KOCAELİ +90 850 204 07
34
Gemlik Branch Hamidiye Mahallesi İstiklal Caddesi No: 31 Gemlik 16600 Bursa GEMLİK BURSA +90 850 204 01
93
Geyve Branch Camikebir Mahallesi Elvan Bey Sokak No: 66 A-1 Geyve 54700 Sakarya GEYVE SAKARYA +90 850 204 07
52
Gezgin Branch Emniyettepe Mahallesi Kazım Karabekir Caddesi Rektörlük Apt. No: 2/13/1 Eyüpsultan 34060 İstanbul EYÜPSULTAN İSTANBUL
Gimat Branch Mehmet Emin Erdoğan İş Merkezi Macun Mahallesi Bağdat Caddesi No: 93/25-26-27-28 YENİMAHALLE ANKARA +90 850 204 02
30 Giresun Branch Şeyhkeramettin Mahallesi Gazi Caddesi No: 2 Merkez MERKEZ GİRESUN +90 850 204 02

86
28200 Giresun 70
Girne Branch Bedrettin Demirel Caddesi No: 12/12B Girne KKTC - GİRNE / KKTC +90 392 815 85 10
Girne Bulvarı Branch Girne Bulvarı No: 140 Karşıyaka 35580 İzmir KARŞIYAKA İZMİR +90 850 204 00
86
Göktürk Branch Göktürk Merkez Mahallesi İstanbul Caddesi No: 30-32 Göktürk ? Eyüp 34050 İstanbul EYÜP İSTANBUL +90 850 204 06
99
Gölcük Branch Amiral Sağlam Caddesi No: 12/B GÖLCÜK KOCAELİ +90 850 204 02 17
Gönen Branch Akçaali Mahallesi Atatürk Caddesi No: 27 Gönen 10900 Balıkesir GÖNEN BALIKESİR +90 850 204 06
60 Göztepe İstanbul Branch
Göztepe Mahallesi Tütüncü Mehmet Efendi Caddesi No: 93/A Göztepe Kadıköy 34730 İstanbul KADIKÖY İSTANBUL +90 850 204 01
46
Gündoğdu Branch Kültür Mahallesi Plevne Bulvarı Dr. Rıfat Bey Apartmanı Zemin Kat No: 14A ve 14 /1 Konak 35220 İzmir
KONAK İZMİR +90 850 204 00 69
Güneşli Branch 15 Temmuz Mahallesi Koçman Caddesi No: 36B Bağcılar 34212 İstanbul BAĞCILAR İSTANBUL +90 850 204 00
39 Güneşli Çarşı Branch
Hürriyet Mahallesi Atatürk Caddesi No: 3-5C Bağcılar 34212 İstanbul BAĞCILAR İSTANBUL +90 850 204 04
04 Güngören Sanayi Branch
Sanayi Mahallesi Atatürk Caddesi Real Merter Sit. No: 51 /3/42 Güngören 34165 İstanbul GÜNGÖREN İSTANBUL +90 850 204 04
08
Hadımköy Branch Akçaburgaz 5.Bölge San 1 Bulvarı 109 Hadımköy BÜYÜKÇEKMECE İSTANBUL +90 850 204 01 19
Harbiye Branch Cumhuriyet Caddesi No: 123 B Harbiye Şişli 34373 İstanbul ŞİŞLİ İSTANBUL +90 850 204 03
80
Hasanpaşa Branch Kurbağalıdere Caddesi No: 25 34722 Söğütlüçeşme - Kadıköy - İstanbul KADIKÖY İSTANBUL +90 850 204 05
23
Hatay İzmir Branch İnönü Caddesi No: 229/B Karabağlar 35361 İzmir KARABAĞLAR İZMİR +90 850 204 03 22
Haznedar Bahçelievler Branch
Bahçelievler Mahallesi Naci Kasım Sokak No: 2/1A Bahçelievler 34180 İstanbul BAHÇELİEVLER İSTANBUL +90 850 204 04
34
Heykel Branch Bursa Selçuk Hatun Mahallesi Ressam Şefik Bursalı Caddesi No: 5 Heykel Osmangazi 16010 Bursa OSMANGAZİ BURSA +90 850 204 01
51
Hopa Branch Merkez Kuledibi Mahallesi Cumhuriyet Meydanı No: 1/A Hopa 08600 Artvin HOPA ARTVİN +90 850 204 02
90
Hürriyet Branch Soğukkuyu Mahallesi 1. Hürriyet Caddesi No: 24-26B Osmangazi 16160 Bursa OSMANGAZİ BURSA +90 850 204 02
97
İçerenköy Branch İçerenköy Mahallesi Çayır Caddesi Özce Center İş Merkezi No: 3A/1 Ataşehir 34752 İstanbul ATAŞEHİR İSTANBUL +90 850 204 01
52
Iğdır Branch Bağlar Mahallesi İbrahim Bozyel Caddesi No: 4/A Merkez 76103 Iğdır MERKEZ IĞDIR +90 850 204 06
78 Ihlamurkuyu Branch
Ihlamurkuyu Mahallesi Alemdağ Caddesi No: 249A Ümraniye 34771 İstanbul ÜMRANİYE İSTANBUL +90 850 204 04
68
İkitelli Branch İkitelli OSB Mahallesi Atatürk Bulvarı Dış Kapı No: 52 İç Kapı No: 1 Başakşehir 34490 İstanbul BAŞAKŞEHİR İSTANBUL +90 850 204 00
60
İkitelli Organize Sanayi Branch
İkitelli OSB Mahallesi Bağcılar-Güngören Metro AVM B Blok Sokak Dış Kapı No: 1/B İç Kapı No: 13 Başakşehir 34490 İstanbul
BAŞAKŞEHİR İSTANBUL +90 850 204 04 60
İmes Sanayi Sitesi Branch İmes Sanayi Sitesi C Blok 301/3 Yukarı Dudullu ÜMRANİYE İSTANBUL +90 850 204 00
61
İmsan Branch İkitelli Caddesi İmsan Küçük Sanayi Sitesi E - Blok No : 10 İkitelli Küçükçekmece 34303 İstanbul KÜÇÜKÇEKMECE İSTANBUL +90 850 204 02
28
İnegöl Branch Sinanbey Mahallesi Nuri Doğrul Caddesi No: 19 İnegöl 16400 Bursa İNEGÖL BURSA +90 850 204 02
66 İnönü Caddesi Malatya Branch Şıkşık Mahallesi İnönü Caddesi No: 91/A MERKEZ MALATYA +90 850 204 02
45
İskenderun Branch Çay Mahallesi Atatürk Bulvarı No: 25A İskenderun 31300 Hatay İSKENDERUN HATAY +90 850 204 00
85
Isparta Branch Kutlubey Mahallesi 106 Cadde Halısarayı Apartmanı G Blok Dış Kapı No: 2-G İç Kapı No: 1 MERKEZ ISPARTA +90 850 204 02
43 İstanbul Anatolian Side Corporate Branch
Esentepe Mahallesi Cevizli D-100 Güney Yanyol Caddesi Dumankaya Vizyon D Blok No: 13 D / 76 Kartal 34870 İstanbul
KARTAL İSTANBUL +90 850 204 05 36
İstanbul Corporate Branch
Gayrettepe Mahallesi Yener Sokak No: 1 Kat: 1/A Beşiktaş 34349 İstanbul BEŞİKTAŞ İSTANBUL +90 850 204 00
12 İstanbul Ulus Branch
Nispetiye Mahallesi Ahmet Adnan Saygun Caddesi No: 22D Beşiktaş 34340 İstanbul BEŞİKTAŞ İSTANBUL +90 850 204 02
20

87
İstoç Branch Mahmutbey Mahallesi 17. Yol Sokak No: 132/A İSTOÇ Bağcılar 34218 İstanbul BAĞCILAR İSTANBUL +90 850 204 01
97
İvedik Branch İvedik Organize Sanayi Sit. Melih Gökçek Bulvarı Halk Yapı Koop. No : 17/22 Ostim Yenimahalle 06370 Ankara
YENİMAHALLE ANKARA +90 850 204 01 67
İzmir 1. Sanayi Branch
Mersinli Mahallesi 2822 Sokak No: 63 Konak 35170 İzmir KONAK İZMİR +90 850 204 02
08
İzmir Branch Akdeniz Mahallesi Cumhuriyet Bulvarı No 86/A Konak 35210 İzmir KONAK İZMİR +90 850 204
0040 İzmir Çankaya Branch
Fevzipaşa Bulvarı No: 59 / A-B Çankaya Konak 35210 İzmir KONAK İZMİR +90 850 204 02
00 İzmir Göztepe Branch
Göztepe Mahallesi Mithatpaşa Caddesi No: 984A Konak 35290 İzmir KONAK İZMİR +90 850 204 01
60
İzmit Branch Körfez Mahallesi Ankara Karayolu No: 123/3 MERKEZ (İZMİT) KOCAELİ +90 850 204 00 20
Kadıköy Çarşı Branch
Caferağa Mahallesi Mühürdar Caddesi No: 22 Kadıköy 34710 İstanbul KADIKÖY İSTANBUL +90 850 204 04
52
Kadirli Branch Savrun Mahallesi Atatürk Caddesi No: 46 Kadirli 80760 Osmaniye KADİRLİ OSMANİYE +90 850 204 06
89
Kağıthane Branch Merkez Mahallesi Sadabat Caddesi No: 40 40 A Kağıthane 34406 İstanbul KAĞITHANE İSTANBUL +90 850 204 04
76 Kahramanmaraş Branch
Hayrullah Mahallesi Azerbaycan Bulvarı Ağdaş Plaza Sit. No: 12 A Onikişubat 46040 Kahramanmaraş ONİKİŞUBAT KAHRAMANMARAŞ +90 850 204 00
31 Kahramanmaraş Çarşı Branch
Menderes Mahallesi Trabzon Bulvarı No: 53/D Dulkadiroğlu 46100 Kahramanmaraş DULKADİROĞLU KAHRAMANMARAŞ +90 850 204 04
86
Kalamış Branch Faruk Ayanoğlu Caddesi Barış Apt. 19/1-2 Fenerbahçe KADIKÖY İSTANBUL +90 850 204 00 42
Kalkan Branch Kalkan Mahallesi Milli Egemenlik Caddesi No: 1/1 Kaş 07960 Antalya KAŞ ANTALYA +90 850 204 07
44
Karabağlar Branch Aşık Veysel Mahallesi Yeşillik Caddesi No: 437-441/B Karabağlar 35110 İzmir KARABAĞLAR İZMİR +90 850 204 00
53
Karabük Branch Bayır Mahallesi Menderes Caddesi No: 2/B Merkez 78100 Karabük MERKEZ KARABÜK +90 850 204 02
83
Karacabey Branch Tavşanlı Mahallesi Bursa Caddesi Necmi Akkuş Sitesi No: 31 A/5 Karacabey 16700 Bursa KARACABEY BURSA +90 850 204 02
91 Karadeniz Ereğli Branch
Orhanlar Mahallesi Yalı Caddesi No: 38 Ereğli 67300 Zonguldak EREĞLİ ZONGULDAK +90 850 204 00
88
Karaköy Branch Kemankeş Karamustafapaşa Mahallesi Necatibey Caddesi Hacı Mahmut İş Merkezi No: 72/A Beyoğlu İstanbul
BEYOĞLU İSTANBUL +90 850 204 01 39
Karaman Branch Mansurdede Mahallesi Atatürk Bulvarı No: 24 D-E-F Merkez 70200 Karaman MERKEZ KARAMAN +90 850 204 06
72
Kars Branch Merkez Mahallesi Kazım Paşa Caddesi No: 117 MERKEZ KARS +90 850 204 03 78
Karşıyaka Branch Cemal Gürsel Caddesi No: 200/A Karşıyaka 35600 İzmir KARŞIYAKA İZMİR +90 850 204 03
94
Kartal Çarşı Branch Ankara Caddesi Şimşek Han No: 82 Zemin Kat KARTAL İSTANBUL +90 850 204 01 40
Karya Bodrum Branch
Kıbrıs Şehitleri Caddesi Emniyet Müdürlüğü Yanı Ataman İş Mrk. C Blk. Bodrum 48400 MUĞLA BODRUM MUĞLA +90 850 204 04
19
Kastamonu Branch Cebrail Mahallesi Plevne Caddesi No: 52 A-B Merkez 37200 Kastamonu MERKEZ KASTAMONU +90 850 204 02
68
Kavacık Branch Rüzgarlıbahçe Mahallesi Cumhuriyet Caddesi No: 12 Beykoz 34805 İstanbul BEYKOZ İSTANBUL +90 850 204 01
55
Kaynarca Branch Fevzi Çakmak Mahallesi Tevfik İleri Caddesi No: 111 Pendik 34899 İstanbul PENDİK İSTANBUL +90 850 204 02
78
Kayseri Branch Cumhuriyet Mahallesi Turan Caddesi No: 3 Melikgazi 38110 Kayseri MELİKGAZİ KAYSERİ +90 850 204 00
23 Kayseri Corporate Branch Anbar Mahallesi 14. Cadde No: 20 Asma Kat 38070 MELİKGAZİ KAYSERİ +90 850 204 05
93 Kayseri Eski Sanayi Branch
Sanayi Mahallesi Osman Kavuncu Bulvarı No: 90 Kocasinan 38010 Kayseri KOCASİNAN KAYSERİ +90 850 204 05
72 Kayseri Sanayi Branch Anbar Mahallesi 14. Cadde No: 20 Zemin Kat MELİKGAZİ KAYSERİ +90 850 204 01
70
Kazasker Branch Şemsettin Günaltay Caddesi No: 109/A Erenköy KADIKÖY İSTANBUL +90 850 204 01 11
Keçiören Branch Güçlükaya Mahallesi Kızlar Pınarı Caddesi No: 53/A Keçiören 06310 Ankara KEÇİÖREN ANKARA +90 850 204 03
08 Kemalpaşa Branch Mehmet Akif Ersoy Mahallesi Atatürk Bulvarı No: KEMALPAŞA İZMİR +90 850 204 00

88
51/1A Kemalpaşa 35730 İzmir 51
Kemer Branch Yeni Mahalle Dörtyol Bulvarı No: 25/B KEMER ANTALYA +90 850 204 01 74
Kepez Branch Teomanpaşa Mahallesi Yeşilırmak Caddesi 34/2 Kepez 07260 Antalya KEPEZ ANTALYA +90 850 204 07
04
Keşan Branch Büyük Cami Mahallesi Cumhuriyet Meydanı No: 8 Keşan 22800 Edirne KEŞAN EDİRNE +90 850 204 02
94
Kestel Branch Ahmet Vefik Paşa Mahallesi Gazi Caddesi No: 6/A KESTEL BURSA +90 850 204 03 15
Kıraç Branch Çakmaklı Mahallesi Hadımköy Yolu Caddesi Ufuk Plaza No: 57B Büyükçekmece 34500 İstanbul BÜYÜKÇEKMECE İSTANBUL +90 850 204 06
54
Kırıkkale Branch Yenidoğan Mahallesi Cumhuriyet Caddesi No: 8/A MERKEZ KIRIKKALE +90 850 204 03 79
Kırklareli Branch Karakaş Mahallesi 100. Yıl Caddesi Necdet Şeylan Apt No: 10/Z03 Merkez 39010 Kırklareli MERKEZ KIRKLARELİ +90 850 204 03
39
Kırşehir Branch Medrese Mahallesi M. Kemal Hotamaroğlu Sokak No: 2 Merkez 40200 Kırşehir MERKEZ KIRŞEHİR +90 850 204 06
68
Kızılay Branch Gazi Mustafa Kemal Bulvarı No: 7/A Kızılay Çankaya 06420 Ankara ÇANKAYA ANKARA +90 850 204 01
38
Kızıltoprak Branch Zühtüpaşa Mahallesi Bağdat Caddesi No: 62/3 Kızıltoprak Kadıköy 34724 İstanbul KADIKÖY İSTANBUL +90 850 204 04
89 Kocasinan Kayseri Branch
Sahabiye Mahallesi Ahmet Paşa Caddesi No: 31-B 31-C 31-D 31-E Kocasinan 38010 Kayseri KOCASİNAN KAYSERİ +90 850 204 07
13
Konya Branch Musalla Bağları Mahallesi Ahmet Hilmi Nalçacı Caddesi Cengizhan No: 130/1 Selçuklu 42060 Konya SELÇUKLU KONYA +90 850 204 00
30 Konya Buğday Pazarı Branch
Fevzi Çakmak Mahallesi Adana Çevreyolu Caddesi No: 26B-(1 İşyeri) Karatay 42050 Konya KARATAY KONYA +90 850 204 07
08 Konya Ereğli Branch
Selçuklu Mahallesi Atatürk Caddesi Necip Pala Apt. Sit. No: 44D Ereğli 42310 Konya EREĞLİ KONYA +90 850 204 02
60
Konyaaltı Branch Bahçelievler Mahallesi Konyaaltı Caddesi Sıtkı Göksoy Apt No: 40 / Z1 Muratpaşa 07050 Antalya MURATPAŞA ANTALYA +90 850 204 01
72
Körfez Branch Kuzey Mahallesi Cahit Zarifoğlu Caddesi No: 53/B KÖRFEZ KOCAELİ +90 850 204 03 26
Koşuyolu Branch Koşuyolu Mahallesi Koşuyolu Caddesi No: 72 A Kadıköy 34718 İstanbul KADIKÖY İSTANBUL +90 850 204 05
63
Kozyatağı Branch Sahrayıcedit Mahallesi Atatürk Caddesi No: 67A Kadıköy 34734 İstanbul KADIKÖY İSTANBUL +90 850 204 00
56 Kozyatağı Corporate Branch
Değirmen Sokak Nida Kule No: 18 Kat: 3 Kozyatağı Kadıköy 34710 İstanbul KADIKÖY İSTANBUL +90 850 204 00
18 Küçükbakkalköy Branch
Küçükbakkalköy Mahallesi Serdar Sokak No: 1 D: 3 Ataşehir 34750 İstanbul ATAŞEHİR İSTANBUL +90 850 204 05
58
Küçüksu Branch Saray Mahallesi Küçüksu Caddesi No: 60/1A Ümraniye 34768 İstanbul ÜMRANİYE İSTANBUL +90 850 204 03
77
Kumluca Branch Merkez Mahallesi Gödene Caddesi No: 18 Kumluca 07350 Antalya KUMLUCA ANTALYA +90 850 204 03
31
Kurtköy Branch Şeyhli Mahallesi Ankara Caddesi No: 217 A Pendik 34890 İstanbul PENDİK İSTANBUL +90 850 204 01
87
Kuşadası Branch İsmet İnönü Bulvarı No : 59 09400 Kuşadası - Aydın KUŞADASI AYDIN +90 850 204 04 77
Kütahya Branch Gazi Kemal Mahallesi Cumhuriyet Caddesi No: 77/B Merkez 43050 Kütahya MERKEZ KÜTAHYA +90 850 204 06
43
Kuyubaşı Branch Fahrettin Kerim Gökay Caddesi No: 122/1 Zemin Kat A Kısım Göztepe Kadıköy 34722 İstanbul KADIKÖY İSTANBUL +90 850 204 03
02 Kuyumcukent Branch
29 Ekim Caddesi No: 1 Kuyumcukent Atölye Bloğu Zemin/1. Kat 5. Sokak No: 19 Yenibosna BAHÇELİEVLER İSTANBUL +90 850 204 02
71
Laleli Branch Mimar Kemalettin Mahallesi Mesih Paşa Caddesi No: 54 Daire : 1 Laleli Fatih 34130 İstanbul FATİH İSTANBUL +90 850 204 02
10
Lara Branch Yeşilbahçe Mahallesi Metin Kasapoğlu Caddesi Armada Apt. Sit. No: 44 D Muratpaşa 07160 Antalya MURATPAŞA ANTALYA +90 850 204 01
15
Lefkoşa Branch Ortaköy Mahallesi Kumsal Mevkii Mehmet Akif Caddesi Koçan No: D303 ve D304 - LEFKOŞA / KKTC +90 392 229 20
40 Lefkoşa Kaymaklı Branch
Küçük Kaymaklı Mahallesi Şht. Mustafa Ahmet Ruso Caddesi (Adres No: 3 ve 4) Lefkoşa / KKTC - LEFKOŞA / KKTC +90 392 228 02
55 Levent Çarşı Branch Çarşı Caddesi No: 22 1. Levent BEŞİKTAŞ İSTANBUL +90 850 204 01
12
Lüleburgaz Branch Kocasinan Mahallesi İstanbul Caddesi No: 12/ Z01 Lüleburgaz 39750 Kırklareli LÜLEBURGAZ KIRKLARELİ +90 850 204 02
05
Maçka Branch Harbiye Mahallesi Kadırgalar Caddesi No: 13A Şişli 34367 İstanbul ŞİŞLİ İSTANBUL +90 850 204 00
45

89
Malatya Branch Niyazi Mahallesi Çevre Yolu Sokak (Buhara Bulvarı) Caddesi No: 195 Merkez 44100 MERKEZ MALATYA +90 850 204 00
89 Malatya Çarşı Branch
İzzetiye Mahallesi Şehit Servet Aktaş Caddesi No: 8 Battalgazi 44210 Malatya BATTALGAZİ MALATYA +90 850 204 06
90
Malkara Branch Camiatik Mahallesi Hürriyet Caddesi No: 25/11 Malkara 59300 Tekirdağ MALKARA TEKİRDAĞ +90 850 204 07
30 Maltepe Çarşı İstanbul Branch
Altayçeşme Mahallesi Atatürk Caddesi No: 41/604 Maltepe 34843 İstanbul MALTEPE İSTANBUL +90 850 204 07
73 Maltepe E-5 Branch
Altayçeşme Mahallesi Çam Sokak No: 25A Maltepe 34843 İstanbul MALTEPE İSTANBUL +90 850 204 04
41 Maltepe İstanbul Branch Bağlarbaşı Mahallesi Bağdat Caddesi No: 477 MALTEPE İSTANBUL +90 850 204 01
21
Manavgat Branch Eski Hisar Mahallesi Demokrasi Bulvarı Öğrekçi Plaza No: 73/Z02-Z03 Manavgat 07600 Antalya MANAVGAT ANTALYA +90 850 204 01
07 Manavgat Sanayi Branch
Aşağı Pazarcı Mahallesi Zübeyde Hanım Caddesi No: 19/Z01 Manavgat 07600 Antalya MANAVGAT ANTALYA +90 850 204 04
78
Manavkuyu Branch Adalet Mahallesi Manas Bulvarı No: 20/A Bayraklı 35530 İzmir BAYRAKLI İZMİR +90 850 204 06
25
Manisa Branch 1. Anafartalar Mahallesi Mustafa Kemal Paşa Caddesi No: 40/A Şehzadeler 45020 Manisa ŞEHZADELER MANİSA +90 850 204 01
14 Manisa Sanayi Branch
75. Yıl Mahallesi Bahri Sarıtepe Caddesi No: 53/A Yunusemre 45030 Manisa YUNUSEMRE MANİSA +90 850 204 02
03
Mardin Branch 13 Mart Mahallesi Vali Ozan Caddesi 82/B Artuklu 47200 Mardin ARTUKLU MARDİN +90 850 204 03
27 Marmara Corporate Branch
23 Nisan Mahallesi 75. Yıl Caddesi No: 5A/15 Durmazlar İş Merkezi Nilüfer 16120 Bursa NİLÜFER BURSA +90 850 204 00
58
Marmaris Branch Tepe Mahallesi Ulusal Egemenlik Caddesi No: 24 Marmaris 48700 MUĞLA MARMARİS MUĞLA +90 850 204 01
02
Maslak Branch Reşitpaşa Mahallesi Eski Büyükdere Caddesi No: 14/A Sarıyer 34468 İstanbul SARIYER İSTANBUL +90 850 204 01
29 Maslak Sanayi Branch
Ayazağa Mahallesi Büyükdere Caddesi No: 257/C Sarıyer 34485 İstanbul SARIYER İSTANBUL +90 850 204 04
06 Mecidiyeköy Branch Büyükdere Caddesi 103/1 Mecidiyeköy ŞİŞLİ İSTANBUL +90 850 204 00
64 Mega Center Branch
Kocatepe Mahallesi Yağ İskelesi Caddesi Mega Center C.51 Blok No: 25/A Bayrampaşa 34045 İstanbul BAYRAMPAŞA İSTANBUL +90 850 204 01
80
Menemen Branch Mermerli Mahallesi Mithatpaşa Caddesi No: 55 Menemen 35661 İzmir MENEMEN İZMİR +90 850 204 02
29
Mersin Branch Camişerif Mahallesi İsmet İnönü Bulvarı No: 94A Akdeniz 33010 Mersin AKDENİZ MERSİN +90 850 204 00
38 Mersin Çamlıbel Branch Kültür Mahallesi 103. Cadde No : 62 33100 İçel Mersin MERKEZ MERSİN +90 850 204 03
85 Mersin Çarşı Branch
Camişerif Mahallesi İstiklal Caddesi No: 40/D Akdeniz 33060 Mersin AKDENİZ MERSİN +90 850 204 04
44 Mersin Pozcu Branch
İnönü ( Bahçe ) Mahallesi G.M.K. Bulvarı Emel Sitesi B ve C Blok No: 353 / A 33140 Pozcu -Mersin -İçel MERKEZ MERSİN +90 850 204 05
84
Mersin Toptancılar Sitesi Branch
Mersin Toptancılar Sitesi (Mertoç) Hal Mahallesi Turgut Özal Bulvarı E Blok No: 92 Akdeniz 33020 Mersin
AKDENİZ MERSİN +90 850 204 06 52
Merter Branch Mehmet Nesih Özmen Mahallesi Fatih Caddesi No: 21 A Güngören 34173 İstanbul GÜNGÖREN İSTANBUL +90 850 204 00
32
Merzifon Branch Hocasüleyman Mahallesi Yokuşbaşı Caddesi No: 13 Merzifon 05300 Amasya MERZİFON AMASYA +90 850 204 03
23 Meşrutiyet Caddesi Branch Meşrutiyet Mahallesi Meşrutiyet Caddesi No: 11 B ÇANKAYA ANKARA +90 850 204 01
05 Metropol Mersin Branch
Mesudiye Mahallesi Kuvayi Milliye Caddesi No: 84/B Akdeniz 33060 Mersin AKDENİZ MERSİN +90 850 204 03
52
Mevlana Branch Aziziye Mahallesi Mevlana Caddesi No: 63 D: 1 KARATAY KONYA +90 850 204 02 57
Mezitli Branch Menderes Mahallesi Gazi Mustafa Kemal Bulvarı Doğaner Yapı Koop. Sit. A Blok Apt. No: 709 AA Mezitli 33340 Mersin
MEZİTLİ MERSİN +90 850 204 02 55
Milas Branch Hacıilyas Mahallesi Menteşe Caddesi Özler İş Hanı Karşısı No: 91 Milas 48200 Muğla MİLAS MUĞLA +90 850 204 06
65
Montrö Branch Şair Eşref Bulvarı No: 23/A 35210 Çankaya Konak / İzmir KONAK İZMİR +90 850 204 03
81
Muğla Branch Şeyh Mahallesi İsmet İnönü Caddesi Dış Kapı No: 17 Menteşe 48050 MUĞLA MENTEŞE MUĞLA +90 850 204 02
58 Mut Branch Doğancı Mahallesi Atatürk Bulvarı No: 48/A-B Mut MUT MERSİN +90 850 204 07

90
33600 Mersin 46
Narlıdere Branch Çamtepe Mahallesi Mithatpaşa Caddesi No: 277-279 Narlıdere 35320 İzmir NARLIDERE İZMİR +90 850 204 07
03
Nato Yolu Branch Tuzluçayır Mahallesi Nato Yolu Caddesi 294. Sokak No: 1/A Mamak 06620 Ankara MAMAK ANKARA +90 850 204 07
16
Nazilli Branch Altıntaş Mahallesi 129 Sokak No: 2 NAZİLLİ AYDIN +90 850 204 03 21
Necatibey Branch Kızılay Mahallesi Necatibey Caddesi Günay Apt. No: 25 B Çankaya 06420 Ankara ÇANKAYA ANKARA +90 850 204 01
36
Nevşehir Branch Karasoku Mahallesi Atatürk Caddesi No: 16/B Merkez 50100 Nevşehir MERKEZ NEVŞEHİR +90 850 204 06
94
Niğde Branch Yenice Mahallesi Ayhan Şahenk Bulvarı No: 15/A Merkez 51200 NİĞDE MERKEZ NİĞDE +90 850 204 01
66
Nilüfer Branch İhsaniye Mahallesi İzmir Yolu Caddesi No: 118 A Nilüfer 16130 Bursa NİLÜFER BURSA +90 850 204 01
03 Nuruosmaniye Branch
Alemdar Mahallesi Nuruosmaniye Caddesi No: 12/1 Fatih 34110 İstanbul FATİH İSTANBUL +90 850 204 02
54
Ödemiş Branch Akıncılar Mahallesi Gazi Caddesi No: 32/1 Ödemiş 35750 İzmir ÖDEMİŞ İZMİR +90 850 204 02
49
Ofis Branch Kooperatifler Mahallesi Akkoyunlu Bulvarı No: 19/B Yenişehir 21100 Diyarbakır YENİŞEHİR DİYARBAKIR +90 850 204 03
03
Ordu Branch Şarkiye Mahallesi Süleyman Felek Caddesi No: 93C Altınordu 52000 ORDU ALTINORDU ORDU +90 850 204 01
82
Orhangazi Branch Muradiye Mahallesi Yalova Caddesi No: 38/A Orhangazi 16800 Bursa ORHANGAZİ BURSA +90 850 204 03
69 Ortaklar Caddesi Branch
Büyükdere Caddesi 60/A Mecidiyeköy Şişli 34387 İstanbul ŞİŞLİ İSTANBUL +90 850 204 01
25
Ortaköy Branch Yıldız Mahallesi Çırağan Caddesi No: 97 Ortaköy BEŞİKTAŞ İSTANBUL +90 850 204 01 30
Osmanbey Branch Cumhuriyet Mahallesi Halaskargazi Caddesi No: 103B Şişli 34380 İstanbul ŞİŞLİ İSTANBUL +90 850 204 00
13
Osmaniye Branch Alibeyli Mahallesi Dr. Ahmet Alkan Caddesi No: 17/A Merkez 80010 Osmaniye MERKEZ OSMANİYE +90 850 204 06
42
Ostim Branch Ostim Sanayi Sitesi 100. Yıl Bulvarı No: 9 Yenimahalle 06370 Ankara YENİMAHALLE ANKARA +90 850 204 01
24
Özlüce Branch Altınşehir Mahallesi Ahmet Taner Kışlalı Bulvarı No: 36A/A Nilüfer 16230 Bursa NİLÜFER BURSA +90 850 204 05
79
Pendik Branch Batı Mahallesi Ankara Caddesi No: 102 PENDİK İSTANBUL +90 850 204 01 31
Pendik E-5 Branch Çınardere Mahallesi Gönenli Mehmet Efendi Caddesi No: 85 Pendik 34896 İstanbul PENDİK İSTANBUL +90 850 204 00
37
Perpa Branch Halil Rıfat Paşa Mahallesi Yüzer Havuz Sokak No: 1/922 Şişli 34384 İstanbul ŞİŞLİ İSTANBUL +90 850 204 01
27
Pınarbaşı Branch Ümit Mahallesi Kemalpaşa Caddesi No: 333 B Pınarbaşı Bornova 35060 İzmir BORNOVA İZMİR +90 850 204 00
50
Polatlı Branch Cumhuriyet Mahallesi Ankara Caddesi No: 5 Polatlı 06900 Ankara POLATLI ANKARA +90 850 204 06
57 Polatlı Topçu ve Füze Okulu Komutanlığı Branch
İstiklal Mahallesi Refik Cesur Caddesi No: 1 Polatlı 06900 Ankara POLATLI ANKARA +90 850 204 07
01
Private Banking Center Branch
Nispetiye Caddesi Dilhayat Sokak No: 8 Zemin Kat Etiler BEŞİKTAŞ İSTANBUL +90 850 204 00
70
Rize Branch Yeniköy Mahallesi Tevfik İleri Caddesi No : 18 MERKEZ RİZE +90 850 204 01 95
Rumeli Corporate Branch
Target İş Merkezi E-5 Yan Yolu üzeri Haramidere mevkii K: 5 Beylikdüzü 34520 İstanbul BEYLİKDÜZÜ İSTANBUL +90 850 204 06
36 Sakarya Caddesi Branch
Cumhuriye Mahallesi Sakarya-1 Caddesi No: 37/A Tepebaşı 26130 Eskişehir TEPEBAŞI ESKİŞEHİR +90 850 204 02
27
Salihli Branch Atatürk Mahallesi Belediye Caddesi No: 93-95 SALİHLİ MANİSA +90 850 204 01 92
Samsun Branch Kale Mahallesi Kaptanağa Sokak No: 4/B İlkadım 55030 Samsun MERKEZ SAMSUN +90 850 204 00
90 Samsun Mecidiye Branch
Hançerli Mahallesi Çifte Hamam Caddesi No: 2 İlkadım 55020 Samsun İLKADIM SAMSUN +90 850 204 04
94 Samsun Sanayi Branch
Yenimahalle Mahallesi 28. Sokak No: 23/1 Canik 55080 Samsun CANİK SAMSUN +90 850 204 01
81
Şanlıurfa Branch Atatürk Bulvarı Numune Pasajı No: 16/2-3 Haliliye 63100 Şanlıurfa HALİLİYE ŞANLIURFA +90 850 204 01
35

91
Şanlıurfa Sarayönü Caddesi Branch
Yusufpaşa Mahallesi Sarayönü Caddesi No: 131 Haliliye Şanlıurfa HALİLİYE ŞANLIURFA +90 850 204 04
23
Santral Ümraniye Branch
Atatürk Mahallesi Sütçü imam Caddesi Kardeşler Apartmanı No: 51A Dükkan No: 1-2 Ümraniye 34764 İstanbul
ÜMRANİYE İSTANBUL +90 850 204 04 02
Sarıgazi Branch İnönü Mahallesi Ankara Caddesi No: 63/A Sancaktepe SANCAKTEPE İSTANBUL +90 850 204 03 43
Sarıgöl Branch Cumhuriyet Mahallesi Aşağı Koçaklar Caddesi No: 6/Z01 Sarıgöl 45470 MANİSA SARIGÖL MANİSA +90 850 204 07
23
Sarıyer Branch Sarıyer Merkez Mahallesi Yeni Mahalle Caddesi No: 19 Sarıyer 34450 İstanbul SARIYER İSTANBUL +90 850 204 02
01
Saruhanlı Branch Saruhan Mahallesi Cumhuriyet Meydanı No: 9/2-3 Saruhanlı 45800 Manisa SARUHANLI MANİSA +90 850 204 07
24
Şaşmaz Branch Bahçekapı Mahallesi 2488. Cadde. No: 4-A ETİMESGUT ANKARA +90 850 204 02 39
Sefaköy Branch Kartaltepe Mahallesi Halkalı Caddesi No: 62A/1 Küçükçekmece 34295 İstanbul KÜÇÜKÇEKMECE İSTANBUL +90 850 204 01
22 Şehitkamil Gaziantep Branch
Budak Mahallesi Gazi Muhtarpaşa Bulvarı No: 44/D Şehitkamil 27090 Gaziantep ŞEHİTKAMİL GAZİANTEP +90 850 204 00
97 Şenesenevler Branch
Bostancı Mahallesi Emin Ali Paşa Caddesi No: 116 A/14 Kadıköy 34744 İstanbul KADIKÖY İSTANBUL +90 850 204 04
87
Serik Branch Yeni Mahalle Hürriyet Caddesi No: 6-8 SERİK ANTALYA +90 850 204 03 30
Seyrantepe Branch Seyrantepe Mahallesi İbrahim Karaoğlanoğlu Caddesi No: 111A/1 Kağıthane 34418 İstanbul KAĞITHANE İSTANBUL +90 850 204 06
18
Siirt Branch Bahçelievler Mahallesi Hükümet Bulvarı No: 26 Merkez 56100 Siirt MERKEZ SİİRT +90 850 204 06
71
Silifke Branch Mukaddem Mahallesi İnönü Bulvarı No: 20 A Silifke 33940 Mersin SİLİFKE MERSİN +90 850 204 06
88
Silivri Branch Piri Mehmet Paşa Mahallesi Başkomutan Caddesi No: 4 Silivri 34570 İstanbul SİLİVRİ İSTANBUL +90 850 204 02
61
Sincan Branch Atatürk Mahallesi Ankara Caddesi No: 44/A Sincan 06930 Ankara SİNCAN ANKARA +90 850 204 01
91
Sinop Branch Meydankapı Mahallesi Kıbrıs Caddesi No: 4 Merkez 57000 Sinop MERKEZ SİNOP +90 850 204 06
91
Şirehanı Branch İsmetpaşa Mahallesi İnönü Caddesi No: 217/7 Şahinbey 27010 Gaziantep ŞAHİNBEY GAZİANTEP +90 850 204 03
37
Şirinevler Branch Meriç Sokak Ünal İş Merkezi No: 13/3 Zemin Kat Şirinevler Bahçelievler 34188 İstanbul BAHÇELİEVLER İSTANBUL +90 850 204 02
33
Şirinyalı Branch Şirinyalı Mahallesi İsmet Gökşen Caddesi No: 80/1 Muratpaşa 07160 Antalya MURATPAŞA ANTALYA +90 850 204 04
62
Şirinyer Branch Güven Mahallesi Menderes Caddesi No: 318 Buca 35370 İzmir BUCA İZMİR +90 850 204 02
76
Sirkeci Branch Hobyar Mahallesi Ankara Caddesi Eraysan Ofis Malzemeleri Apt. No: 37/1 Fatih 34112 İstanbul FATİH İSTANBUL +90 850 204 03
91 Şişli Meydan Branch
19 Mayıs Mahallesi Halaskargazi Caddesi No: 212A Şişli 34381 İstanbul ŞİŞLİ İSTANBUL +90 850 204 03
83
Siteler Branch Ulubey Mahallesi Demirhendek Caddesi No: 69 Altındağ 06320 Ankara ALTINDAĞ ANKARA +90 850 204 04
74
Sivas Branch Atatürk Caddesi No: 15 MERKEZ SİVAS +90 850 204 02 47
Soğanlık Branch Atatürk Caddesi No : 119 34880 Soğanlık - Kartal - İstanbul KARTAL İSTANBUL +90 850 204 05
96
Söğütözü Branch Platin Tower Söğütözü Mahallesi Dumlupınar Bulvarı (Eskişehiryolu Üzeri) No: 94/G Çankaya 06510 Ankara ÇANKAYA ANKARA +90 850 204 06
82
Söke Branch Konak Mahallesi Aydın Caddesi No: 19 Söke 09200 Aydın SÖKE AYDIN +90 850 204 06
59
Soma Branch Kurtuluş Mahallesi Fatih Caddesi No: 10 SOMA MANİSA +90 850 204 03 40
Sorgun Branch Çay Mahallesi Cumhuriyet Caddesi No: 71 A Sorgun 66700 YOZGAT SORGUN YOZGAT +90 850 204 07
31 Southeastern Anatolia Corporate Branch
Mücahitler Mahallesi Gazi Muhtarpaşa Bulvarı No: 48 Kat : 6 A Kısım Şehitkamil 27090 Gaziantep ŞEHİTKAMİL GAZİANTEP +90 850 204 03
58
Suadiye Branch Bağdat Caddesi German Apt. 456 Suadiye KADIKÖY İSTANBUL +90 850 204 00 15
Suburcu Branch Çukur Mahallesi Suburcu Caddesi No: 11/A Şahinbey 27400 Gaziantep ŞAHİNBEY GAZİANTEP +90 850 204 01
96 Sultanbeyli Branch Mehmet Akif Mahallesi Fatih Bulvarı No: 244/B SULTANBEYLİ İSTANBUL +90 850 204 01

92
Sultanbeyli 34920 İstanbul 94
Sultangazi Branch Cebeci Mahallesi Eski Edirne Asfaltı No: 748 34270 Sultançifliği 34270 Sultangazi İstanbul SULTANGAZİ İSTANBUL +90 850 204 06
06
Tahtakale Branch Süleymaniye Mahallesi Şahende Sokak Keleşler İş Hanı No: 7A Fatih 34116 İstanbul FATİH İSTANBUL +90 850 204 01
47
Tarsus Branch Şehit Mustafa Mahallesi Atatürk Bulvarı No: 7/A Tarsus 33500 Mersin TARSUS MERSİN +90 850 204 02
37 Tarsus Makam Branch
Şehit Mustafa Mahallesi Atatürk Caddesi 33400 No: 17/A Tarsus - İçel Mersin TARSUS MERSİN +90 850 204 04
66
Tatvan Branch Tuğ Mahallesi Cumhuriyet Caddesi No: 214/Z1 Tatvan 13200 BİTLİS TATVAN BİTLİS +90 850 204 06
81
Tekirdağ Branch Aydoğdu Mahallesi Hükümet Caddesi No: 94 Süleymanpaşa 59200 Tekirdağ SÜLEYMANPAŞA TEKİRDAĞ +90 850 204 02
24
Teksan Branch 75. Yıl (Sultandere) Mahallesi Teksan İdari (Küme Evler) No: 63/2 Odunpazarı 26250 ESKİŞEHİR ODUNPAZARI ESKİŞEHİR +90 850 204 01
84 Thrace Corporate Branch
Nur Yıldız Plaza 15 Temmuz Mahallesi Gülbahar Caddesi No: 7A Kat: 5 Güneşli/Bağcılar 34212 İstanbul BAĞCILAR İSTANBUL +90 850 204 00
55
Tire Branch Cumhuriyet Meydanı No: 05 TİRE İZMİR +90 850 204 02 53
Tokat Branch Kabe-i Mescid Mahallesi Gaziosmanpaşa Bulvarı No: 168/A Merkez 60030 Tokat MERKEZ TOKAT +90 850 204 06
51
Topçular Branch Rami Kışla Caddesi Koçbay İş Merkezi No: 25/B 7-8 Topçular EYÜP İSTANBUL +90 850 204 01
78 Topkapı Maltepe Branch
Maltepe Mahallesi Gümüşsuyu Caddesi No: 53 Dk: 21-22 Zeytinburnu 34010 İstanbul ZEYTİNBURNU İSTANBUL +90 850 204 05
28
Torbalı Branch Tepeköy Mahallesi Ağalar Caddesi No: 16 A-B TORBALI 35860 İzmir TORBALI İZMİR +90 850 204 03
56
Trabzon Branch Kemerkaya Mahallesi Kahramanmaraş Caddesi No: 35A Ortahisar 61030 Trabzon ORTAHİSAR TRABZON +90 850 204 00
91 Trakya Üniversitesi Branch
Kocasinan Mahallesi E5 Karayolu Caddesi No: 76/13 İç Kapı : 2 Merkez 22030 Edirne MERKEZ EDİRNE +90 850 204 07
45
Tunalı Hilmi Branch Remzi Oğuz Mahallesi Tunalı Hilmi Caddesi No: 68/A Kavaklıdere ÇANKAYA ANKARA +90 850 204 03
11 13
Turgutlu Branch Altay Mahallesi Atatürk Bulvarı No: 163 TURGUTLU MANİSA +90 850 204 02 92
Tuzla Branch İçmeler Mahallesi Mazhar Sokak No: 21A Tuzla 34947 İstanbul TUZLA İSTANBUL +90 850 204 02
36 Tuzla Deniz Harp Okulu Branch Tuzla Deniz Harp Okulu Komutanlığı Sosyal Tesisleri TUZLA İSTANBUL +90 850 204 03
20
Tuzla OSB Branch Aydınlı-İstanbul AYOSB Mahallesi 5. Sokak İstanbul Anadolu Yakası OSB Sitesi No: 2 Tuzla 34953 İstanbul TUZLA İSTANBUL +90 850 204 02
18 Tuzla Piyade Okulu Branch Piyade Okulu Komutanlığı TUZLA İSTANBUL +90 850 204 03
50
Üçevler Branch Üçevler Mahallesi Ahıska Caddesi No: 10/1 Nilüfer 16270 Bursa NİLÜFER BURSA +90 850 204 01
62 Ulus Ankara Branch
Anafartalar Mahallesi Sanayi Caddesi No: 15/1-2-3-4-5-6-7 Altındağ 06050 Ankara ALTINDAĞ ANKARA +90 850 204 00
34
Ümitköy Branch Çay Yolu Mahallesi 8. Cadde No : 45 Çankaya 06530 Ankara ÇANKAYA ANKARA +90 850 204 02
26
Ümraniye Branch Alemdağ Caddesi 194/2 ÜMRANİYE İSTANBUL +90 850 204 00 43
Ümraniye Sanayi Branch
Çakmak Mahallesi Alemdağ Caddesi No: 422 Ümraniye 34775 İstanbul ÜMRANİYE İSTANBUL +90 850 204 06
10
Uncalı Branch Uncalı Mahallesi Uncalı Caddesi No: 63 Konyaaltı 07070 Antalya UNCALI ANTALYA +90 850 204 02
75
Ünye Branch Kaledere Mahallesi Akkuş Niksar Caddesi No: 6/A Ünye 52300 Ordu ÜNYE ORDU +90 850 204 06
98
Uşak Branch İslice Mahallesi İsmetpaşa Caddesi No: 67/B Merkez 64100 UŞAK MERKEZ UŞAK +90 850 204 00
92
Uşak Çarşı Branch İslice Mahallesi İslice Sokak No: 12/A Merkez 64200 Uşak MERKEZ UŞAK +90 850 204 05
18
Üsküdar Branch Aziz Mahmut Hüdayi Mahallesi Hakimiyeti Milliye Caddesi No: 50 Kat : 1 Üsküdar 34672 İstanbul ÜSKÜDAR İSTANBUL +90 850 204 01
32
Uzunköprü Branch Muradiye Camii Mahallesi Cumhuriyet Caddesi No: 1-A Uzunköprü 22300 Edirne UZUNKÖPRÜ EDİRNE +90 850 204 06
93
Valikonağı Branch Teşvikiye Mahallesi Valikonağı Caddesi No: 66 Şişli 34365 İstanbul ŞİŞLİ İSTANBUL +90 850 204 02
19
Van Branch Şerefiye Mahallesi M. Fevzi Çakmak Caddesi Lütfü Savur İş Merkezi Sit. No: 14 İpekyolu 65100 Van İPEKYOLU VAN +90 850 204 02
15

93
Van Yüzüncü Yıl Üniversitesi Branch
Yüzüncü Yıl Üniversitesi Bardakçı Mahallesi Zeve Kampüsü Tuşba 65040 Van TUŞBA VAN +90 850 204 07
10
Yalıkavak Branch İnönü Caddesi No: 101/A-E Yalıkavak Bodrum 48990 MUĞLA BODRUM MUĞLA +90 850 204 06
92
Yalova Branch Rüstempaşa Mahallesi Çeşme Sokak No: 2/1 Merkez 77200 Yalova MERKEZ YALOVA +90 850 204 03
10 Yalova İskele Branch
Süleyman Bey Mahallesi Cengiz Koçal Caddesi No: 24/1 Merkez 77200 Yalova MERKEZ YALOVA +90 850 204 05
59 Yeditepe Corporate Branch
Gayrettepe Mahallesi Yener Sokak No: 1 Kat: 1/B Beşiktaş 34349 İstanbul BEŞİKTAŞ İSTANBUL +90 850 204 05
38
Yeni Adana Branch Güzelyalı Mahallesi Turgut Özal Bulvarı No: 90/D Edip Özaltın Sitesi B Blok Altı Çukurova 01170 Adana ÇUKUROVA ADANA +90 850 204 05
73
Yenibosna Branch Yenibosna Merkez Mahallesi Yıldırım Beyazıt Caddesi No: 210A Bahçelievler 34197 İstanbul BAHÇELİEVLER İSTANBUL +90 850 204 03
29 Yeniköy Antalya Branch
Yeniköy Mahallesi Atatürk Caddesi No: 476 Döşemealtı DÖŞEMEALTI ANTALYA +90 850 204 03
53
Yeniköy Branch Yeniköy Mahallesi Köybaşı Caddesi No: 51 Yeniköy Sarıyer 34464 İstanbul SARIYER İSTANBUL +90 850 204 02
51
Yeşilköy Branch İstasyon Caddesi Orhan Gazi Sokak No: 1 Zemin Kat Kısım A Yeşilköy Bakırköy 34801 İstanbul BAKIRKÖY İSTANBUL +90 850 204 00
54
Yıldırım Branch Duaçınarı Mahallesi Ankarayolu Caddesi B Blok Apt. No: 171-173B Yıldırım 16370 Bursa YILDIRIM BURSA +90 850 204 02
80
Yıldız Branch Turan Güneş Bulvarı No: 17 ÇANKAYA ANKARA +90 850 204 01 63
Yıldız Posta Branch Gayrettepe Mahallesi Yener Sokak No: 1 BEŞİKTAŞ İSTANBUL +90 850 204 03 92
Yozgat Branch Medrese Mahallesi Şeyhzade Caddesi No: 11/B Merkez 66100 Yozgat MERKEZ YOZGAT +90 850 204 07
00
Yüreğir Branch Cumhuriyet Mahallesi 770 Sokak No: 11/A Yüreğir 01280 Adana YÜREĞİR ADANA +90 850 204 01
56 Zekeriyaköy Branch
Zekeriyaköy Mahallesi 4. Caddesi Kültür Merkezi Apt. No: 4/1/2 Sarıyer 34450 İstanbul SARIYER İSTANBUL +90 850 204 03
70 Zeytinburnu Branch
Prof. Muammer Aksoy Caddesi No: 85 Zeytinburnu 34020 İstanbul ZEYTİNBURNU İSTANBUL +90 850 204 00
93 Zeytinburnu Bulvar Branch
Gökalp Mahallesi 58. Bulvar Caddesi No: 49-51 Zeytinburnu 34020 İstanbul ZEYTİNBURNU İSTANBUL +90 850 204 05
21
Zonguldak Branch Meşrutiyet Mahallesi Gazipaşa Caddesi No: 31 Merkez 67030 Zonguldak MERKEZ ZONGULDAK +90 850 204 06
34

94
CONVENIENCE TRANSLATION INTO ENGLISH OF INDEPENDENT AUDITOR’S REPORT ON THE BOARD OF DIRECTOS’ ANNUAL REPORT ORIGINALLY ISSUED IN TURKISH

DRT Bağımsız Denetim ve Serbest Muhasebeci Mali Müşavirlik A.Ş. Maslak no1 Plaza Eski Büyükdere Caddesi Maslak Mahallesi No:1 Maslak, Sarıyer 34485 İstanbul, Turkey
Tel : +90 (212) 366 6000 Fax : +90 (212) 366 6010 www.deloitte.com.tr
Mersis No: 0291001097600016 Ticari Sicil No : 304099
(CONVENIENCE TRANSLATION OF
INDEPENDENT AUDITOR’S REPORT ON THE MANAGEMENT’S ANNUAL REPORT
ORIGINALLY ISSUED IN TURKISH)
INDEPENDENT AUDITOR’S REPORT ON THE MANAGEMENT’S ANNUAL REPORT
To the General Assembly of Türk Ekonomi Bankası A.Ş.
1) Opinion
As we have audited the full set consolidated and unconsolidated financial statements of Türk Ekonomi Bankası
A.Ş. (“the Bank”) and its consolidated subsidiaries (“the Group”) for the period between 01/01/2020–31/12/2020,
we have also audited the annual report for the same period.
In our opinion, the consolidated and unconsolidated financial information provided in the Management’s annual
report and the Management’s discussions on the Group’s financial performance, are fairly presented in all
material respects, and are consistent with the full set audited consolidated and unconsolidated financial statements
and the information obtained from our audit.
2) Basis for Opinion
We conducted our audit in accordance with the regulation on “Independent Auditing of Banks” published in the
Official Gazette dated 2 April 2015 with No. 29314 and the Standards on Independent Auditing (“SIA”) which is
a part of Turkish Auditing Standards published by the Public Oversight Accounting and Auditing Standards
Authority (“POA”). Our responsibility is disclosed under Responsibilities of the Independent Auditor on the
Independent Audit of the Annual Report in detail. We declare that we are independent from the Bank in
accordance with the Code of Ethics for Independent Auditors (“Code of Ethics”) issued by POA and ethical
provisions stated in the regulation of audit. We have fulfilled other responsibilities in accordance with these
requirements and the Code of Ethics. We believe that the audit evidence we have obtained is sufficient and
appropriate to provide a basis for our audit opinion.
3) Auditor’s Opinion for the Full Set Consolidated and Unconsolidated Financial Statements
We have presented unqualified opinion for the Bank’s full set consolidated and unconsolidated financial
statements for the period between 01/01/2020–31/12/2020 in our Auditor’s Report dated 5 February 2021.
Deloitte refers to one or more of Deloitte Touche Tohmatsu Limited, a UK private company limited by guarantee (“DTTL”), its network of member firms, and their related entities. DTTL and each of its member firms are legally separate and independent entities. DTTL (also referred to as “Deloitte Global”) does not provide services to clients. Please see www.deloitte.com/about to learn more about our global network of member firms.
© 2021. For information, contact Deloitte Touche Tohmatsu Limited.

4) Management’s Responsibility for the Annual Report
The Bank Management is responsible for the following in accordance with Article 514 and 516 of the Turkish
Commercial Code No. 6102 (“TCC”) and the regulation on “Preparing and Publishing the Annual Report by
Banks” published in the Official Gazette dated 1 November 2006 and No. 26333 (“the Communiqué”):
a) Preparing the annual report within the three months following the reporting date and presenting it to the
General Assembly,
b) Preparing the annual report with the all respects of the Bank’s flow of operations for that year and the Bank’s
financial performance accurately, completely, directly and fairly. In this report, the consolidated financial position
is assessed in accordance with the financial statements. The Bank’s development and risks that the Bank may
probably face are also pointed out in this report. The Board of Director’s evaluation on those matters are also
stated in this report.
c) The annual report also includes the matters stated below:
- The significant events occurred in the Bank’s activities subsequent to the financial year ends,
- The Bank’s research and development activities,
- The compensation paid to key management personnel and members of Board of Directors including financial
benefits such as salaries, bonuses and premiums, allowances, travelling, accommodation and representation
expenses, in cash and kind facilities, insurances and other similar guarantees.
The Board of Directors also considers the secondary regulations prepared by the Banking Regulation and
Supervision Agency and the Ministry of Trade and related institutions while preparing the annual report.
5) Responsibilities of the Independent Auditor on the Independent Audit of the Annual Report
Our aim is to express an opinion and prepare a report about whether the Management’s discussions and
consolidated financial information in the annual report within the scope of the provisions of the TCC and the
Communiqué are fairly presented and consistent with the information obtained from our audit.
We conducted our audit in accordance with the regulation on “Independent Auditing of Banks” published in the
Official Gazette dated 2 April 2015 with No. 29314 and the SIA. Those standards require that we comply with
ethical requirements and plan and perform the audit to obtain reasonable assurance about whether the
Management’s discussions on the Group’s financial performance, are fairly presented in all material respects, and
are consistent with the full set audited consolidated and unconsolidated financial statements and the information
obtained from our audit
The engagement partner on the audit resulting in this independent auditor’s report is Yaman Polat.
DRT BAĞIMSIZ DENETİM VE SERBEST MUHASEBECİ MALİ MÜŞAVİRLİK A.Ş.
Member of DELOITTE TOUCHE TOHMATSU LIMITED
Yaman Polat
Partner
İstanbul, 26 February 2021

96
SECTION 4- UNCONSOLIDATED FINANCIAL STATEMENTS
PUBLICLY ANNOUNCED UNCONSOLIDATED FINANCIAL STATEMENTS AND RELATED DISCLOSURES FOR THE PERIOD FROM 1 JANUARY TO 31 DECEMBER 2020

CONVENIENCE TRANSLATION
OF PUBLICLY ANNOUNCED CONSOLIDATED
FINANCIAL STATEMENTS AND
AUDITOR REPORT
ORIGINALLY ISSUED IN TURKISH
TÜRK EKONOMİ BANKASI A.Ş.
PUBLICLY ANNOUNCED UNCONSOLIDATED
FINANCIAL STATEMENTS AND RELATED DISCLOSURES FOR
THE YEAR FROM 1 JANUARY TO 31 DECEMBER 2020
WITH INDEPENDENT AUDITOR’S REPORT

(CONVENIENCE TRANSLATION OF
INDEPENDENT AUDITOR’S REPORT ORIGINALLY ISSUED IN TURKISH)
INDEPENDENT AUDITOR’S REPORT
To the General Assembly of Türk Ekonomi Bankası AŞ.
A) Report on the Audit of the Financial Statements
1) Opinion
We have audited the financial statements of Türk Ekonomi Bankası AŞ (the “Bank”), which comprise the
balance sheet as at 31 December 2020, and the statement of income, statement of income and expense items
accounted for under shareholders’ equity, statement of changes in shareholders’ equity and statement of
cash flows for the year then ended and, notes to the financial statements, including a summary of significant
accounting policies.
In our opinion, the accompanying financial statements present fairly, in all material respects, the financial
position of the Bank as at 31 December 2020, and its financial performance and its cash flows for the year
then ended in accordance with “the Banking Regulation and Supervision Agency (“BRSA”) Accounting
and Reporting Regulations” including the regulation on “The Procedures and Principles Regarding Banks’
Accounting Practices and Maintaining Documents” published in the Official Gazette dated 1 November
2006 with No.26333, and other regulations on accounting records of banks published by the Banking
Regulation and Supervision Board and circulars and pronouncements published by BRSA and provisions
of Turkish Financial Reporting Standards (TFRS) for the matters not legislated by the aforementioned
regulations.
2) Basis for Opinion
We conducted our audit in accordance with the regulation on “Independent Auditing of Banks” published
in the Official Gazette dated 2 April 2015 with No. 29314 and Standards on Independent Auditing (“SIA”)
which is a part of Turkish Auditing Standards published by the Public Oversight Accounting and Auditing
Standards Authority (“POA”). Our responsibilities under those standards are further described in the
Auditor’s Responsibilities for the Audit of the Financial Statements section of our report. We are
independent of the Bank in accordance with the Code of Ethics for Independent Auditors (“Code of Ethics”)
published by the POA, together with the ethical requirements that are relevant to our audit of the financial
statements, and we have fulfilled our other ethical responsibilities in accordance with these requirements
and the Code of Ethics. We believe that the audit evidence we have obtained is sufficient and appropriate
to provide a basis for our opinion.
3) Key Audit Matters
Key audit matters are those matters that, in our professional judgment, were of most significance in our
audit of the financial statements of the current period. These matters were addressed in the context of our
audit of the financial statements as a whole, and in forming our opinion thereon, and we do not provide a
separate opinion on these matters.

Key Audit Matters How the matter was addressed in the audit
Impairment of loans in accordance with TFRS 9 Financial Instruments Standard (“TFRS 9”) Impairment of loans is a key area of judgment for the management. The Bank has the total loans and receivables amounting to TL 82,932,090 thousands, which comprise 59% of the Bank’s total assets in its unconsolidated financial statements and the total provision for impairment amounting to TL 4,047,771 as at 31 December 2020. As of 1 January 2018, the Bank has started to recognize provisions for impairment in accordance with TFRS 9 and also “Regulation on the Procedures and Principles for Classification of Loans by Banks and Provisions to be set aside” published in the Official Gazette dated 22 June 2016 numbered 29750. In this respect, the method of provisions for impairment as set out in accordance with the related legislation of BRSA as mentioned in the Section 3 Note VIII of Explanation on Accounting Policies has been changed by applying the expected credit loss model under TFRS 9. The expected credit loss estimates are required to be unbiased, probability-weighted and should include supportable information about past events, current conditions, and forecasts of future economic conditions. The Bank exercises significant decisions using judgment, interpretation and assumptions over calculating loan impairments. These judgments, interpretations and assumptions are key in the development of the financial models. In addition, impairment of loans and receivables consist of significant judgments and assumptions regarding with Covid 19 effects. Not fulfilling the requirements of the TFRS 9 is a potential risk for the Bank. Failure in determining the loans and receivables that are impaired and not recording the adequate provision for these impaired loans is the aforementioned risk. Accordingly, impairment of loans and receivables is considered as a key audit matter. Related explanations relating to the impairment of loans and receivables are presented in Section 5 Note I.6.
As part of our audit work, the following procedures
were performed: We assessed and tested the design, implementation
and operating effectiveness of key controls applied by
the Bank with respect to classification of loans and
determination and calculation of impairments. Our
information system experts have also participated to
perform these procedures.
We have assessed and analysed the relevant contract
terms to assess management’s accounting policy and
classification of the instrument for selected samples.
We have performed loan review procedures on
selected samples of loans and receivables considering
effects of Covid 19 with the objective of identifying
whether the loss event had occurred and whether the
provision for impairment has been recognized in a
timely manner within the framework of the provisions
of the relevant legislation.
We have tested relevant inputs and assumption used
by the management in each stage of the expected
credit loss calculation by considering whether the
inputs and assumptions appear reasonable regarding
with Covid 19 effects, the relationship between the
assumptions and whether the assumptions are
interdependent and internally consistent, whether the
assumptions appropriately reflect current market
information and collections, and whether the
asumptions appear reasonable when considered
collectively with other assumptions, including those
for the same accounting estimates and those for other
accounting estimates.
We have tested historical loss data to validate the
completeness and accuracy of key parameters.
We have tested whether the model is applied to
appropriate segments of assets which share credit risk
characteristics and whether the historical loss rates
were incurred under economic conditions
representative of those that may exist during the
assets’ exposure periods.
We tested the application of the model to the relevant
inputs and the mathematical integrity of each stage of
the expected credit loss calculation.

Key Audit Matters How the matter was addressed in the audit
Based on our discussions with the Bank management,
we evaluated whether the key assumptions and other
judgements considering Covid 19 effects underlying
the estimations of impairments were reasonable.
We assessed expected credit losses determined based
on individual assessment per Bank’s policy by means
of supporting data, and evaluated appropriateness via
communications with management considering Covid
19 effects.
Our specialists are involved in all procedures related
to models and assumptions.
We have reviewed disclosures made within the TFRS
9 framework in the financial statements of the Bank
with respect to loans and receivables and related
impairment provisions.
Pension Fund Obligations
Defined benefit pension plan that the Bank provides to
its employees is managed by Fortis Bank AŞ
Mensupları Emekli Sandığı (“Plan”) which is
established by the 20th provisional article of the Social
Security Law numbered 506 (the “Law”).
As disclosed in the Section III Note XVII to the
unconsolidated financial statements, the Plan is
composed of benefits which are subject to transfer to
the Social Security Foundation (“SSF”) as per the
Social Security Law no.5510 provisional article 20, and
other social rights and pension benefits provided by the
Bank that are not transferable to the SSF. The Council
of Ministers has been authorized to determine the
transfer date. Following the transfer, the funds and the
institutions that employ the funds’ members will cover
the non-transferable social rights and pension benefits
provided under the Plan even if it is included in
foundation voucher.
As of 31 December 2020, the Bank’s transferrable
liabilities are calculated by an independent actuary
using the actuarial assumptions regulated by the Law,
and in accordance with the Decision of the Council of
Ministers announced in the Official Gazette dated 15
December 2006 and No.26377. The valuation of the
Plan liabilities requires judgment in determining
appropriate assumptions such as defining the
transferrable social benefits, discount rates, salary
increases, inflation levels, demographic assumptions,
and the impact of changes in the Plan. Management
uses expert opinion of the independent actuary in
Our audit work included the following procedures:
We involved external experts (actuary) in our audit
team to evaluate the assumptions used in the
calculation of the pension obligations and the
appropriateness of the estimates.
It has been tested whether the plan assets meet plan
obligations in accordance with the methods and
assumptions used.
In addition, reconciliations and tests were carried out
through sampling of the accuracy of the data
provided to the Bank’s actuary.
We have assessed whether there is a significant
change in the actuarial assumptions, methods, legal
regulations and legislation used in the calculations
and whether the assumptions are reasonable.

Key Audit Matters How the matter was addressed in the audit
assessing uncertainties related to these underlying
assumptions and estimates.
As described in Section V Note II.8.c2 considering the
subjectivity of key judgments and assumptions, plus the
uncertainty around the transfer date and basis of the
transfer calculation given the fact that the technical
interest rate is prescribed under the Law, we considered
this as a key audit matter.
Information Technologies Audit
The Bank and its finance functions are dependent on the
IT-infrastructure for the continuity of its operations, and
the demand for technology-enabled business services is
rapidly growing in the Bank and its subsidiaries.
Controls over reliability and continuity of the electronic
data processing are within the scope of the information
systems internal controls audit. The reliance on
information systems within the Bank means that the
controls over access rights, continuity of systems,
privacy and integrity of the electronic data are critical
and found to be key area of focus as part of our risk
based scoping.
Procedures within the context of our information
technology audit work:
• We identified and tested the Banks' controls
over information systems as part of our audit
procedures.
• Information generation comprise all layers of
information systems (including applications,
networks, transmission systems and database).
The information systems controls tested are
categorized in the following areas:
• Security management
• Change management
• Operations management
• We selected high-risk areas as, database logging
and change management control activities, to
prevent and detect whether accesses to financial
data had been identified in a timely manner.
• We tested the accesses and logging controls
underlying all applications that have direct or
indirect impacts on financial data generation.
• Automated controls and integration controls are
tested to underly and detect changes and
accesses in the process of financial data
generation.
• We also tested the appropriateness and accuracy
of the information produced by the entity and
information used in controls reports as inputs to
our controls and outputs generated by the IT
components.
• Finally, we understood and tested the controls
over database, network, application and
operating system layers of applications.

4) Responsibilities of Management and Those Charged with Governance for the Financial Statements
Management is responsible for the preparation and fair presentation of the financial statements in
accordance with the BRSA Accounting and Reporting Regulations, and for such internal control as
management determines is necessary to enable the preparation of financial statements that are free from
material misstatement, whether due to fraud or error.
In preparing the financial statements, management is responsible for assessing the Bank’s ability to
continue as a going concern, disclosing, as applicable, matters related to going concern and using the
going concern basis of accounting unless management either intends to liquidate the Bank or to cease
operations, or has no realistic alternative but to do so.
Those charged with governance are responsible for overseeing the Bank’s financial reporting process.
5) Auditor’s Responsibilities for the Audit of the Financial Statements
Responsibilities of independent auditors in an independent audit are as follows:
Our objectives are to obtain reasonable assurance about whether the financial statements as a whole are
free from material misstatement, whether due to fraud or error, and to issue an auditor’s report that
includes our opinion. Reasonable assurance is a high level of assurance, but is not a guarantee that an
audit conducted in accordance with the regulation on “Independent Auditing of Banks” published in the
Official Gazette dated 2 April 2015 with No. 29314 and SIA will always detect a material misstatement
when it exists. Misstatements can arise from fraud or error and are considered material if, individually
or in the aggregate, they could reasonably be expected to influence the economic decisions of users
taken on the basis of these financial statements.
As part of an audit in accordance with the regulation on “Independent Auditing of Banks” published in
the Official Gazette dated 2 April 2015 with No. 29314 and SIA, we exercise professional judgment and
maintain professional skepticism throughout the audit. We also:
• Identify and assess the risks of material misstatement of the financial statements, whether due to
fraud or error, design and perform audit procedures responsive to those risks, and obtain audit
evidence that is sufficient and appropriate to provide a basis for our opinion. (The risk of not
detecting a material misstatement resulting from fraud is higher than for one resulting from error,
as fraud may involve collusion, forgery, intentional omissions, misrepresentations, or the override
of internal control.)
• Obtain an understanding of internal control relevant to the audit in order to design audit procedures
that are appropriate in the circumstances, but not for the purpose of expressing an opinion on the
effectiveness of the Bank’s internal control.
• Evaluate the appropriateness of accounting policies used and the reasonableness of accounting
estimates and related disclosures made by management.

• Conclude on the appropriateness of management’s use of the going concern basis of accounting
and, based on the audit evidence obtained, whether a material uncertainty exists related to events
or conditions that may cast significant doubt on the Bank’s ability to continue as a going concern.
If we conclude that a material uncertainty exists, we are required to draw attention in our auditor’s
report to the related disclosures in the financial statements or, if such disclosures are inadequate, to
modify our opinion. Our conclusions are based on the audit evidence obtained up to the date of our
auditor’s report. However, future events or conditions may cause the Bank to cease to continue as
a going concern.
• Evaluate the overall presentation, structure and content of the financial statements, including the
disclosures, and whether the financial statements represent the underlying transactions and events
in a manner that achieves fair presentation.
We communicate with those charged with governance regarding, among other matters, the planned
scope and timing of the audit and significant audit findings, including any significant deficiencies in
internal control that we identify during our audit.
We also provide those charged with governance with a statement that we have complied with relevant
ethical requirements regarding independence, and to communicate with them all relationships and other
matters that may reasonably be thought to bear on our independence, and where applicable, related
safeguards.
From the matters communicated with those charged with governance, we determine those matters that
were of most significance in the audit of the financial statements of the current period and are therefore
the key audit matters. We describe these matters in our auditor’s report unless law or regulation
precludes public disclosure about the matter or when, in extremely rare circumstances, we determine
that a matter should not be communicated in our report because the adverse consequences of doing so
would reasonably be expected to outweigh the public interest benefits of such communication.

B) Other Responsibilities Arising from Regulatory Requirements
In accordance with paragraph four of the Article 402 of the Turkish Commercial Code No. 6102
(“TCC”), nothing has come to our attention that may cause us to believe that the Bank’s set of accounts
for the period 1 January - 31 December 2020 does not comply with TCC and the provisions of the Bank’s
articles of association in relation to financial reporting.
In accordance with paragraph four of the Article 402 of TCC, the Board of Directors provided us all the
required information and documentation with respect to our audit.
The engagement partner on the audit resulting in this independent auditor’s report is Yaman Polat.
Additional Paragraph for English Translation
The effect of the differences between the accounting principles summarized in Section 3 and the
accounting principles generally accepted in countries in which the accompanying financial statements
are to be distributed and International Financial Reporting Standards (“IFRS”) have not been quantified
and reflected in the accompanying financial statements. The accounting principles used in the
preparation of the accompanying financial statements differ materially from IFRS. Accordingly, the
accompanying financial statements are not intended to present the Bank’s financial position and results
of its operations in accordance with accounting principles generally accepted in such countries of users
of the financial statements and IFRS.
DRT BAĞIMSIZ DENETİM VE SERBEST MUHASEBECİ MALİ MÜŞAVİRLİK A.Ş.
Member of DELOITTE TOUCHE TOHMATSU LIMITED
Yaman Polat, SMMM
Partner
İstanbul, 5 February 2021

Convenience Translation of
Publicly Announced Unconsolidated Financial Statements and Audit Report
Originally Issued in Turkish, See in Note I. of Section Three
UNCONSOLIDATED FINANCIAL REPORT OF TÜRK EKONOMİ BANKASI A.Ş.
AS OF AND FOR THE YEAR ENDED 31 DECEMBER 2020
Address : Saray Mahallesi Sokullu Caddesi No: 7/A – 7/B
Ümraniye 34768 - İstanbul
Telephone : (0 216) 635 35 35
Fax : (0 216) 636 36 36
Website : www.teb.com.tr
E-mail : [email protected]
The unconsolidated financial report for the year-end prepared in accordance with “Communiqué on the Financial
Statements and the Related Policies and Disclosures to be Publicly Announced” as regulated by the Banking
Regulation and Supervision Agency, is consist of the sections listed below:
• General Information about the Bank
• Unconsolidated Financial Statements of the Bank
• Explanations on the Accounting Policies Applied in the Related Period
• Information on Financial Structure and Risk Management of the Bank
• Disclosures and Footnotes on Unconsolidated Financial Statements
• Other Explanations
• Independent Auditor’s Report
The accompanying audited unconsolidated financial statements, related disclosures and footnotes which are
presented in this report are prepared in accordance with the Regulation on Accounting Applications for Banks and
Safeguarding of Documents, Turkish Accounting Standards, Turkish Financial Reporting Standards, the related
statements and guidance, and incompliance with the financial records of our Bank, and unless stated otherwise,
presented in thousands of Turkish Lira (TL).
Information related to responsible personnel for the questions can be raised about financial statements:
Name-Surname/Title : Aslıhan Kaya / External Reporting Senior Manager
Telephone Number : (0216) 635 24 51
Fax Number : (0216) 636 36 36
Yavuz Canevi
Nicolas de Baudinet
de Courcelles Ayşe Aşardağ
Ümit Leblebici
M. Aşkın Dolaştır
Hatice Ertuğral
Chairman of the
Board of the
Directors
Chairman of the
Audit Committee
Vice Chairman of the
Audit Committee
Chief
Executive
Officer
Assistant General
Manager Responsible of
Financial Reporting
Regulatory
Reporting
Senior Manager

INDEX
Page Number
SECTION ONE
General Information
I. History of the Bank, Including its Incorporation Date, Initial Legal Status and Amendments to Legal Status 1
II. Explanation on the Bank’s Capital Structure, Shareholders of the Bank who are in Charge of the Management
and/or Auditing of the Bank Directly or Indirectly, Changes in These Matters (if any), and the Group the Bank Belongs to 1
III. Explanations Regarding the Chairman and the Members of Board of Directors, Audit Committee,
General Manager and Assistants and Shares of the Bank They Possess 2
IV. Information on the Bank’s Qualified Shareholders 3
V. Summary on the Bank’s Functions and Lines of Activity 3
VI. Differences between the Communiqué on Preparation of Financial Statements of Banks and Turkish
Accounting Standards and Short Explanation about the Entities Subject to Full Consolidation or Proportional Consolidation and
Entities which are Deducted from Equity or Entities which are not Included in these Three Methods 3
VII. Current or Likely, Actual or Legal Barriers to Immediate Transfer of Equity or Repayment of Debts between Bank and its Subsidiaries 3
SECTION TWO
Unconsolidated Financial Statements
I. Balance Sheet 5
II. Statement of Off-Balance Sheet Items 7
III. Statement of Profit or Loss 8
IV. Statement of Profit or Loss and Other Comprehensive Income 9
V. Statement of Changes in Shareholders’ Equity 10
VI. Statement of Cash Flows 11
VII. Statement of Profit Distribution 12
SECTION THREE
Accounting Principles
I. Basis of Presentation 13
II. Explanations on Usage Strategy of Financial Assets and Foreign Currency Transactions 14
III. Explanations on Investments in Associates, Subsidiaries and Joint Ventures 14
IV. Explanations on Forward and Option Contracts and Derivative Instruments 14
V. Explanations on Interest Income and Expenses 15
VI. Explanations on Fees and Commission Income and Expenses 16
VII. Explanations on Financial Assets 16
VIII. Explanations on Impairment of Financial Assets 18
IX. Explanations on Offsetting of Financial Assets and Liabilities 21
X. Explanations on Sales and Repurchase Agreements and Lending of Securities 21
XI. Explanations on Assets Held for Sale, Discontinued Operations and Liabilities Related to Those Assets 21
XII. Explanations on Goodwill and Other Intangible Assets 22
XIII. Explanations on Tangible Fixed Assets 23
XIV. Explanations on Leasing Transactions 22
XV. Explanations on Provisions and Contingent Liabilities 23
XVI. Explanations on Contingent Assets 24
XVII. Explanations on Liabilities Regarding Employee Benefits 24
XVIII. Explanations on Taxation 25
XIX. Additional Explanations on Borrowings 25
XX. Explanations on Issued Equity Securities 25
XXI. Explanations on Bill Guarantees and Acceptances 26
XXII. Explanations on Government Incentives 26
XXIII. Explanations on Reporting According to Segmentation 26
XXIV. Explanations on Other Matters 27
XXV. Reclassifications 27
SECTION FOUR
Information on Financial Structure and Risk Management
I. Explanations Related to Components of Shareholders’ Equity 28
II. Explanations Related to Credit Risk 37
III. Explanations Related to Risk Involved in Counter-Cyclical Capital Buffer Calculation 47
IV. Explanations Related to Currency Risk 48
V. Explanations Related to Interest Rate Risk 50
VI. Explanations Related to Share Certificates Position Risk from Banking Book 53
VII. Explanations Related to Liquidity Risk Management and Liquidity Coverage Ratio 53
VIII. Explanations Related to Leverage Ratio 60
IX. Explanations Related to Presentation of Financial Assets and Liabilities at Fair Value 61
X. Explanations Related to Transactions Carried out on Behalf of Other Parties and Fiduciary Assets 62
XI. Explanations Related to Risk Management 63
SECTION FIVE
Explanations and Disclosures on Unconsolidated Financial Statements
I. Explanations and Disclosures Related to the Assets 88
II. Explanations and Disclosures Related to the Liabilities 107
III. Explanations and Disclosures Related to the Off-Balance Sheet Items 117
IV. Explanations and Disclosures Related to the Statement of Income 121
V. Explanations and Disclosures Related to Statement of Changes in Shareholders’ Equity 125
VI. Explanations and Disclosures Related to Statement of Cash Flows 125
VII. Explanations and Disclosures Related to Risk Group of the Bank 127
VIII. Explanations on the Bank’s Domestic Branches, Agencies and Branches Abroad and Off-shore Branches 128
IX. Explanations and Disclosures Related to Subsequent Events 128
SECTION SIX
Other Explanations
I. Other Explanations on Activities of Bank 128
SECTION SEVEN
Independent Auditor’s Report
I. Explanations on the Independent Auditor’s Report 128
II. Other Footnotes and Explanations Prepared by the Independent Auditors 128

TÜRK EKONOMİ BANKASI A.Ş.
NOTES AND EXPLANATIONS TO UNCONSOLIDATED FINANCIAL STATEMENTS
AS OF 31 DECEMBER 2020 (Unless otherwise stated amounts are expressed in thousands of Turkish Lira (“TL”).)
1
SECTION ONE
GENERAL INFORMATION
I. History of the Bank, Including its Incorporation Date, Initial Legal Status and Amendments
to Legal Status
Türk Ekonomi Bankası Anonim Şirketi (“TEB” or “Bank”), which had been a local bank incorporated in Kocaeli
in 1927 under the name of Kocaeli Halk Bankası T.A.Ş., was acquired by the Çolakoğlu Group in 1982. Its title
was changed as Türk Ekonomi Bankası A.Ş. and its headquarters moved to İstanbul. On 10 February 2005, BNP
Paribas took over 50% of shares of TEB Holding A.Ş. Consequently, BNP Paribas became indirect shareholder of
TEB with 42.125% ownership. In 2009 BNP Paribas Group successively acquired 75% of Fortis Bank Belgium
and 66% of Fortis Bank Luxembourg and became the shareholder holding the majority of the shares of Fortis Bank
Turkey. The indirect majority shareholders of TEB which are BNP Paribas and Çolakoğlu Group has agreed on
the merger of TEB and Fortis Bank under the trademark of TEB and following the authorizations obtained from
the regulatory authorities on 14 February 2011 the legal merge of two banks has been performed. The process
regarding the procedure has been summarized below. As a result of the merger of TEB Holding, TEB has a
majority stake of 55% and on the other hand Çolakoğlu Group and BNP Paribas have the share of 50%.
II. Explanation on the Bank’s Capital Structure, Shareholders of the Bank who are in Charge
of the Management and/or Auditing of the Bank Directly or Indirectly, Changes in these
Matters (if any), and the Group the Bank Belongs to
As of 31 December 2020, and 31 December 2019 the shareholders’ structure and their respective ownerships are
summarized as follows:
31 December 2020 31 December 2019
Name of shareholders
Paid in
Capital
%
Paid in
Capital
%
TEB Holding A.Ş. 1,212,415 55.00 1,212,415 55.00
BNPP Yatırımlar Holding A.Ş. 518,342 23.51 518,342 23.51
BNP Paribas Fortis Yatırımlar Holding A.Ş. 467,879 21.23 467,879 21.23
BNP Paribas SA 5,253 0.24 5,253 0.24
Kocaeli Chamber of Commerce 501 0.02 501 0.02
2,204,390 100.00 2,204,390 100.00
As of 31 December 2020, the Bank’s paid-in-capital consists of 2,204,390,000 shares of TL 1.00 (full TL) nominal each.

TÜRK EKONOMİ BANKASI A.Ş.
NOTES AND EXPLANATIONS TO UNCONSOLIDATED FINANCIAL STATEMENTS
AS OF 31 DECEMBER 2020 (Unless otherwise stated amounts are expressed in thousands of Turkish Lira (“TL”).)
2
III. Explanations Regarding the Chairman and the Members of Board of Directors, Audit Committee, General Manager and Assistants and Shares of the Bank They Possess
Name Title Education
Board of Directors;
Yavuz Canevi Chairman of the Board of Directors Master Dr.Akın Akbaygil Deputy Chairman of the Board of Directors PhD Jean Paul Sabet Deputy Chairman of the Board of Directors University
Ayşe Aşardağ Member of the Board of Directors and Vice Chairman of the Audit Committee University François Andre Jesualdo Benaroya Member of the Board of Directors University
Yvan L.A.M De Cock Member of the Board of Directors and Audit Committee University
Sabri Davaz Member of the Board of Directors and Audit Committee Master Xavier Henri Jean Guilmineau Member of the Board of Directors Master
Özden Odabaşı Member of the Board of Directors Master
Hans Wilfried J. Broucke Nicolas de Baudinet de Courcelles
Member of the Board of Directors Member of the Board of Directors and Chairman of the Audit Committee
Master University
Ümit Leblebici General Manager and the Executive Director Master
Assistant General Managers;
Gökhan Mendi Senior Assistant General Manager Responsible from Retail and Private
Banking Group
Master
Melis Coşan Baban Chief Legal Advisor and Secretary of the Board of Directors Master
Mehmet Ali Cer Assistant General Manager Responsible from Information Technologies Master Mustafa Aşkın Dolaştır Assistant General Manager Responsible from Financial Affairs Group Master
Osman Durmuş Assistant General Manager Responsible from Retail and Small Business Credit
Group
University
Kubilay Güler Assistant General Manager Responsible from Banking Operations and Support
Services
University
Gülümser Özgün Henden Assistant General Manager Responsible from Corporate Banking Group University Dr.Tuğrul Özbakan Assistant General Manager Responsible from Asset Liability Management and
Treasury Group
PhD
Akil Özçay Assistant General Manager Responsible from Fixed Income Master Gökhan Özdil Assistant General Manager Responsible from Corporate Loans University
Ömer Abidin Yenidoğan
Ali İhsan Arıdaşır
Ali Gökhan Cengiz
Assistant General Manager Responsible from Corporate Investment Banking
Group Assistant General Manager Responsible from SME Loans
Assistant General Manager Responsible from SME Banking
Master
University
Master
Bade Siphaioğlu Işık Assistant General Manager Responsible from Human Resources Group Master
Group Heads (*);
Nimet Elif Akpınar Head of Group Risk Management University Birol Deper Head of Compliance Group and Internal Control Group, Consumer Relations
Coordination Officer
Master
Internal Audit (*); Hakan Tıraşın Head of Internal Audit Group University
(*) Group Heads and Head of Internal Audit are in Assistant General Manager status.
There are no Bank shares owned by the above stated Chairman and Members of Board of Directors, General
Manager and Assistants.

TÜRK EKONOMİ BANKASI A.Ş.
NOTES AND EXPLANATIONS TO UNCONSOLIDATED FINANCIAL STATEMENTS
AS OF 31 DECEMBER 2020 (Unless otherwise stated amounts are expressed in thousands of Turkish Lira (“TL”).)
3
IV. Information on the Bank’s Qualified Shareholders
Name / Commercial Name
Share
Amount
Share
Ratio
Paid-up
Shares
Unpaid
Shares
TEB Holding A.Ş. 1,212,415 55.00% 1,212,415 -
BNPP Yatırımlar Holding A.Ş. 518,342 23.51% 518,342 -
BNP Paribas Fortis Yatırımlar Holding A.Ş. 467,879 21.23% 467,879 -
TEB Holding A.Ş. is a member of both Çolakoğlu and BNP Paribas groups. 50% of the shares of TEB Holding
A.Ş. are controlled by BNP Paribas, Fortis Yatırımlar Holding A.Ş., while the remaining 50% is controlled by
Çolakoğlu Group. BNP Paribas Fortis Yatırımlar Holding A.Ş. is controlled by Fortis Bank SA/NV whose
shareholders are BNP Paribas Fortis NV/SA by 100% shares, respectively. 100% of the shares of BNPP Yatırımlar
Holding A.Ş. are controlled by BNP Paribas SA.
V. Summary on the Bank’s Functions and Lines of Activity
The Bank’s operating areas include, corporate, commercial, SME, retail and private banking as well as project
finance and custody operations. Besides the ordinary banking operations, the Bank is handling agency functions
through its branches on behalf of TEB Portföy Yönetimi A.Ş., Zurich Sigorta A.Ş. and Cardif Hayat Sigorta A.Ş.
As of 31 December 2020, the Bank has 451 local branches and 4 foreign branches (31 December 2019: 467 local
branches, 4 foreign branches). As of 31 December 2020, the number of employees of the Bank is 8,850
(31 December 2019; 8,954).
VI. Differences between the Communiqué on Preparation of Financial Statements of Banks and
Turkish Accounting Standards and Short Explanation about the Entities Subject to Full
Consolidation or Proportional Consolidation and Entities which are Deducted from Equity
or Entities which are not Included in these Three Methods
There is no difference for the Bank, except for the non-financial subsidiary, between the consolidation process
according to the Turkish Accounting Standards and the Communiqué of the Preparation of Financial Statements
of Banks in Turkey.
The Bank owns 0.1% but the Group owns 33.3% share of Bantaş Nakit ve Kıymetli Mal Taşıma ve Güvenlik
Hizmetleri A.Ş, it is presented as joint venture in financial statements however, and it is carried by cost value since
necessary requirements for consolidation is not met.
TEB ARF Teknoloji A.Ş., a non-financial subsidiary owned 100% and by the Bank, was registered in the Trade
Registry Gazette on 16 July 2020. The Bank presents TEB ARF Teknoloji A.Ş. in the subsidiaries line in its
financial statements.
VII. Current or Likely, Actual or Legal Barriers to Immediate Transfer of Equity or Repayment
of Debts Between Bank and its Subsidiaries
None.

SECTION TWO
UNCONSOLIDATED FINANCIAL STATEMENTS
I. Balance Sheet
II. Statement of Off-Balance Sheet Items
III. Statement of Profit or loss
IV. Statement of Profit or Loss and Other Comprehensive Income
V. Statement of Changes in Shareholders’ Equity
VI. Statement of Cash Flows
VII. Statement of Profit Distribution

TÜRK EKONOMİ BANKASI A.Ş
UNCONSOLIDATED BALANCE SHEET AT 31 DECEMBER 2020 AND 2019 (Unless otherwise stated amounts are expressed in thousands of Turkish Lira (“TL”).)
5
I. BALANCE SHEET (STATEMENT OF FINANCIAL POSITION)
ASSETS
Audited
Current Period
31.12.2020
Audited
Prior Period
31.12.2019
Section 5
Note TL FC Total TL FC Total
I. FINANCIAL ASSETS (Net) 20,245,141 22,528,451 42,773,592 8,076,181 22,007,009 30,083,190
1.1 Cash and Cash Equivalents 11,518,749 18,122,448 29,641,197 2,626,642 18,709,959 21,336,601
1.1.1 Cash and Balances with Central Bank (I-1) 3,431,921 13,519,382 16,951,303 716,053 11,239,917 11,955,970
1.1.2 Banks (I-4) 1,908,213 4,615,206 6,523,419 1,071,174 7,480,991 8,552,165
1.1.3 Money Markets 6,180,886 - 6,180,886 840,263 - 840,263
1.1.4 Expected Loss Provision (-) 2,271 12,140 14,411 848 10,949 11,797
1.2 Financial Assets at Fair Value Through Profit or Loss 511,089 1,119,802 1,630,891 426,084 869,339 1,295,423
1.2.1 Government Debt Securities (I-2) 463,550 984,266 1,447,816 385,317 782,677 1,167,994
1.2.2 Equity Securities 47,539 135,536 183,075 40,767 84,258 125,025
1.2.3 Other Financial Assets - - - - 2,404 2,404
1.3 Financial Assets at Fair Value Through Other Comprehensive Income (I-5) 5,628,391 3,022,986 8,651,377 3,323,142 2,216,475 5,539,617
1.3.1 Government Debt Securities 5,617,510 3,022,986 8,640,496 3,315,247 2,216,475 5,531,722
1.3.2 Equity Securities 10,881 - 10,881 7,895 - 7,895
1.3.3 Other Financial Assets - - - - - -
1.4 Derivative Financial Assets 2,586,912 263,215 2,850,127 1,700,313 211,236 1,911,549
1.4.1 Derivative Financial Assets at Fair Value Through Profit and Loss (I-3) 1,520,531 232,078 1,752,609 1,473,795 196,247 1,670,042
1.4.2 Derivative Financial Assets at Fair Value Through Other Comprehensive Income (I-12) 1,066,381 31,137 1,097,518 226,518 14,989 241,507
II. FINANCIAL ASSETS MEASURED AT AMORTIZED COST (Net) 76,191,309 15,213,133 91,404,442 57,002,218 13,480,439 70,482,657
2.1 Loans (I-6) 69,567,055 13,365,035 82,932,090 56,725,319 12,492,716 69,218,035
2.2 Lease Receivables (I-11) - - - - - -
2.3 Factoring Receivables - - - - - -
2.4 Other Financial Assets Measured at Amortized Cost (I-7) 10,197,854 2,325,087 12,522,941 3,549,987 1,356,631 4,906,618
2.4.1 Government Debt Securities 10,197,854 2,325,087 12,522,941 3,549,987 1,356,631 4,906,618
2.4.2 Other Financial Assets - - - - - -
2.5 Expected Credit Loss (-) 3,573,600 476,989 4,050,589 3,273,088 368,908 3,641,996
III. PROPERTY AND EQUIPMENT HELD FOR SALE PURPOSE AND
RELATED TO DISCONTINUED OPERATIONS (Net) 112,859 - 112,859 131,362 - 131,362
3.1 Held for Sale Purpose (I-17) 112,859 - 112,859 131,362 - 131,362
3.2 Related to Discontinued Operations - - - - - -
IV. EQUITY INVESTMENTS 116,041 - 116,041 115,991 - 115,991
4.1 Investments in Associates (Net) (I-8) - - - - - -
4.1.1 Associates Valued Based on Equity Method - - - - - -
4.1.2 Unconsolidated Associates - - - - - -
4.2 Subsidiaries (Net) (I-9) 116,036 - 116,036 115,986 - 115,986
4.2.1 Unconsolidated Financial Subsidiaries 115,986 - 115,986 115,986 - 115,986
4.2.2 Unconsolidated Non-Financial Subsidiaries 50 - 50 - - -
4.3 Joint Ventures (Net) (I-10) 5 - 5 5 - 5
4.3.1 Joint Ventures Valued Based on Equity Method - - - - - -
4.3.2 Unconsolidated Joint Ventures 5 - 5 5 - 5
V. PROPERTY AND EQUIPMENT (Net) (I-13) 836,192 - 836,192 877,782 - 877,782
VI. INTANGIBLE ASSETS (Net) (I-14) 564,803 - 564,803 555,886 - 555,886
6.1 Goodwill 421,124 - 421,124 421,124 - 421,124
6.2 Other 143,679 - 143,679 134,762 - 134,762
VII. INVESTMENT PROPERTIES (Net) (I-15) - - - - - -
VIII. CURRENT TAX ASSET 19,678 - 19,678 10,958 - 10,958
IX. DEFERRED TAX ASSET (I-16) 632,912 - 632,912 650,094 - 650,094
X. OTHER ASSETS (Net) (I-18) 1,965,145 1,622,378 3,587,523 2,345,923 2,096,325 4,442,248
TOTAL ASSETS
100,684,080 39,363,962 140,048,042 69,766,395 37,583,773 107,350,168
The accompanying notes are an integral part of these unconsolidated financial statements.

TÜRK EKONOMİ BANKASI A.Ş.
UNCONSOLIDATED BALANCE SHEET AT 31 DECEMBER 2020 AND 2019 (Unless otherwise stated amounts are expressed in thousands of Turkish Lira (“TL”).)
6
I. BALANCE SHEET (STATEMENT OF FINANCIAL POSITION)
LIABILITIES
Audited
Current Period
31.12.2020
Audited
Prior Period
31.12.2019
Section
5 Note TL FC Total TL FC Total
I. DEPOSITS (II-1) 49,618,540 44,154,938 93,773,478 34,476,076 37,718,252 72,194,328
II. FUNDS BORROWED (II-3) 412,907 9,334,699 9,747,606 307,801 8,269,181 8,576,982
III. MONEY MARKET FUNDS (II-4) 3,830,785 2,717,468 6,548,253 1,317,498 327,167 1,644,665
IV. SECURITIES ISSUED (Net) (II-3) 4,810,637 - 4,810,637 2,333,877 - 2,333,877
4.1 Bills 4,766,623 - 4,766,623 2,333,877 - 2,333,877
4.2 Asset Backed Securities - - - - - -
4.3 Bonds 44,014 - 44,014 - - -
V. FUNDS - - - - - -
5.1 Borrower Funds - - - - - -
5.2 Other - - - - - -
VI. FINANCIAL ASSETS AT FAIR VALUE THROUGH PROFIT AND LOSS - - - - - -
VII. DERIVATIVE FINANCIAL LIABILITIES 3,135,153 208,026 3,343,179 3,404,041 107,517 3,511,558
7.1 Derivative Financial Liabilities at Fair Value Through Profit and Loss (II-2) 2,067,218 193,125 2,260,343 1,486,334 100,250 1,586,584
7.2 Derivative Financial Liabilities at Fair Value Through Other Comprehensive
Income (II-7) 1,067,935 14,901 1,082,836 1,917,707 7,267 1,924,974
VIII. FACTORING LIABILITIES - - - - - -
IX. LEASE LIABILITIES (Net) (II-6) 547,035 51,922 598,957 614,030 39,677 653,707
X. PROVISIONS (II-8) 746,323 226,726 973,049 657,461 168,521 825,982
10.1 Restructuring Provisions - - - - - -
10.2 Reserve for Employee Benefits 475,253 29,963 505,216 352,885 22,713 375,598
10.3 Insurance Technical Provisions (Net) - - - - - -
10.4 Other Provisions 271,070 196,763 467,833 304,576 145,808 450,384
XI. CURRENT TAX LIABILITY (II-9) 321,406 - 321,406 213,516 - 213,516
XII. DEFERRED TAX LIABILITY - - - - - -
XIII. LIABILITIES FOR PROPERTY AND EQUIPMENT HELD FOR
SALE AND RELATED TO DISCONTINUED OPERATIONS (Net) (I-10) - - - - - -
13.1 Held for Sale - - - - - -
13.2 Held from Discontinued Operations - - - - - -
XIV. SUBORDINATED DEBT INSTRUMENTS (I-11) - 4,194,951 4,194,951 - 3,190,503 3,190,503
14.1 Loans - - - - - -
14.2 Other Debt Instruments - 4,194,951 4,194,951 - 3,190,503 3,190,503
XV. OTHER LIABILITIES 4,070,593 256,082 4,326,675 4,029,751 454,725 4,484,476
XVI. SHAREHOLDERS’ EQUITY (II-12) 11,360,851 49,000 11,409,851 9,705,323 15,251 9,720,574
16.1 Paid-in Capital 2,204,390 - 2,204,390 2,204,390 - 2,204,390
16.2 Capital Reserves 390,297 - 390,297 390,297 - 390,297
16.2.1 Share Premiums 2,565 - 2,565 2,565 - 2,565
16.2.2 Share Cancellation Profits - - - - - -
16.2.3 Other Capital Reserves 387,732 - 387,732 387,732 - 387,732
16.3 Other Accumulated Comprehensive Income or Expense that will not be
Reclassified at Profit and Loss 279,006 - 279,006 312,187 - 312,187
16.4 Other Accumulated Comprehensive Income or Expense that will be Reclassified
at Profit and Loss (363,792) 49,000 (314,792) (884,581) 15,251 (869,330)
16.5 Profit Reserves 7,664,139 - 7,664,139 6,603,179 - 6,603,179
16.5.1 Legal Reserves 452,086 - 452,086 398,568 - 398,568
16.5.2 Status Reserves - - - - - -
16.5.3 Extraordinary Reserves 7,020,021 - 7,020,021 6,194,919 - 6,194,919
16.5.4 Other Profit Reserves 192,032 - 192,032 9,692 - 9,692
16.6 Profit or Loss 1,186,811 - 1,186,811 1,079,851 - 1,079,851
16.6.1 Prior Periods’ Profit / Loss 9,497 - 9,497 9,497 - 9,497
16.6.2 Current Periods’ Profit / Loss 1,177,314 - 1,177,314 1,070,354 - 1,070,354
16.7 Minority Shares (II-13) - - - - - -
TOTAL LIABILITIES 78,854,230 61,193,812 140,048,042 57,059,374 50,290,794 107,350,168
The accompanying notes are an integral part of these unconsolidated financial statements.

TÜRK EKONOMİ BANKASI A.Ş.
UNCONSOLIDATED STATEMENT OF OFF-BALANCE SHEET ITEMS
AS OF 31 DECEMBER 2020 AND 2019 (Unless otherwise stated amounts are expressed in thousands of Turkish Lira (“TL”).)
7
II. STATEMENT OF OFF-BALANCE SHEET ITEMS Audited
Current Period
31.12.2020
Audited
Prior Period
31.12.2019
Section 5
Note
TL
FC
Total
TL
FC
Total
A. OFF BALANCE SHEET COMMITMENTS (I+II+III) 82,223,013 89,376,868 171,599,881 67,739,091 87,362,056 155,101,147
I. GUARANTEES AND WARRANTIES (III-1) 7,481,426 16,764,598 24,246,024 9,130,519 13,244,967 22,375,486
1.1 Letters of Guarantee 6,052,327 8,131,845 14,184,172 6,481,105 7,071,936 13,553,041
1.1.1 Guarantees Subject to State Tender Law 80,715 89,820 170,535 93,314 79,406 172,720
1.1.2 Guarantees Given for Foreign Trade Operations 344,482 545,346 889,828 319,439 417,745 737,184
1.1.3 Other Letters of Guarantee 5,627,130 7,496,679 13,123,809 6,068,352 6,574,785 12,643,137
1.2 Bank Acceptances - 16,573 16,573 - 12,915 12,915
1.2.1 Import Letter of Acceptance - 16,573 16,573 - 12,915 12,915
1.2.2 Other Bank Acceptances - - - - - -
1.3 Letters of Credit - 5,025,525 5,025,525 260 2,623,591 2,623,851
1.3.1 Documentary Letters of Credit - 3,656,589 3,656,589 - 1,119,305 1,119,305
1.3.2 Other Letters of Credit - 1,368,936 1,368,936 260 1,504,286 1,504,546
1.4 Prefinancing Given as Guarantee - - - - - -
1.5 Endorsements - - - - - -
1.5.1 Endorsements to the Central Bank of Turkey - - - - - -
1.5.2 Other Endorsements - - - - - -
1.6 Purchase Guarantees for Securities Issued - - - - - -
1.7 Factoring Guarantees - - - - - -
1.8 Other Guarantees 1,428,395 2,548,277 3,976,672 2,649,033 2,382,926 5,031,959
1.9 Other Collaterals 704 1,042,378 1,043,082 121 1,153,599 1,153,720
II. COMMITMENTS (III-1) 17,188,967 2,831,971 20,020,938 16,821,291 3,460,708 20,281,999
2.1 Irrevocable Commitments 17,188,967 2,831,971 20,020,938 16,821,291 3,460,708 20,281,999
2.1.1 Asset Purchase Commitments 916,964 2,114,054 3,031,018 1,406,402 2,278,420 3,684,822
2.1.2 Deposit Purchase and Sale Commitments - 94,524 94,524 - 759,924 759,924
2.1.3 Share Capital Commitment to Associates and Subsidiaries - - - - - -
2.1.4 Loan Granting Commitments 5,498,822 237,748 5,736,570 5,059,676 174,696 5,234,372
2.1.5 Securities Issuance Brokerage Commitments - - - - - -
2.1.6 Commitments for Reserve Deposit Requirements - - - - - -
2.1.7 Commitments for Cheque Payments 1,741,408 - 1,741,408 1,769,641 - 1,769,641
2.1.8 Tax and Fund Liabilities from Export Commitments 47,494 - 47,494 71,566 - 71,566
2.1.9 Commitments for Credit Card Limits 8,978,512 - 8,978,512 8,506,931 - 8,506,931
2.1.10 Commitments for Credit Cards and Banking Services Promotions 5,767 - 5,767 4,975 - 4,975
2.1.11 Receivables from Short Sale Commitments on Securities - - - - - -
2.1.12 Payables for Short Sale Commitments on Securities - - - - - -
2.1.13 Other Irrevocable Commitments - 385,645 385,645 2,100 247,668 249,768
2.2 Revocable Commitments - - - - - -
2.2.1 Revocable Loan Granting Commitments - - - - - -
2.2.2 Other Revocable Commitments - - - - - -
III. DERIVATIVE FINANCIAL INSTRUMENTS (III-2) 57,552,620 69,780,299 127,332,919 41,787,281 70,656,381 112,443,662
3.1 Derivative Financial Instruments for Hedging Purposes 14,112,081 9,895,360 24,007,441 16,303,838 9,650,297 25,954,135
3.1.1 Fair Value Hedge 1,991,418 4,258,649 6,250,067 - 1,740,184 1,740,184
3.1.2 Cash Flow Hedge 12,120,663 5,636,711 17,757,374 16,303,838 7,910,113 24,213,951
3.1.3 Foreign Net Investment Hedges - - - - - -
3.2 Held for Trading Transactions 43,440,539 59,884,939 103,325,478 25,483,443 61,006,084 86,489,527
3.2.1 Forward Foreign Currency Buy/Sell Transactions 6,698,057 10,100,110 16,798,167 3,905,504 6,836,778 10,742,282
3.2.1.1 Forward Foreign Currency Transactions-Buy 4,420,031 4,234,382 8,654,413 2,186,296 3,210,603 5,396,899
3.2.1.2 Forward Foreign Currency Transactions-Sell 2,278,026 5,865,728 8,143,754 1,719,208 3,626,175 5,345,383
3.2.2. Swap Transactions Related to Foreign Currency and Interest Rates 35,101,585 43,210,657 78,312,242 18,588,736 48,542,952 67,131,688
3.2.2.1 Foreign Currency Swap-Buy 1,723,908 25,735,907 27,459,815 4,003,482 25,326,796 29,330,278
3.2.2.2 Foreign Currency Swap-Sell 20,517,677 10,825,732 31,343,409 12,453,254 16,946,840 29,400,094
3.2.2.3 Interest Rate Swaps-buy 6,430,000 3,324,509 9,754,509 1,066,000 3,134,658 4,200,658
3.2.2.4 Interest Rate Swaps-Sell 6,430,000 3,324,509 9,754,509 1,066,000 3,134,658 4,200,658
3.2.3 Foreign Currency, Interest Rate and Securities Options 1,050,757 3,069,974 4,120,731 2,952,821 5,548,060 8,500,881
3.2.3.1 Foreign Currency Options-Buy 729,259 1,370,067 2,099,326 1,726,935 2,562,617 4,289,552
3.2.3.2 Foreign Currency Options-Sell 321,498 1,699,907 2,021,405 1,225,886 2,985,443 4,211,329
3.2.3.3 Interest Rate Options-Buy - - - - - -
3.2.3.4 Interest Rate Options-Sell - - - - - -
3.2.3.5 Securities Options-Buy - - - - - -
3.2.3.6 Securities Options-Sell - - - - - -
3.2.4 Foreign Currency Futures 590,140 543,771 1,133,911 36,362 35,164 71,526
3.2.4.1 Foreign Currency Futures-Buy 2,957 541,030 543,987 36,362 - 36,362
3.2.4.2 Foreign Currency Futures-Sell 587,183 2,741 589,924 - 35,164 35,164
3.2.5 Interest Rate Futures - - - - - -
3.2.5.1 Interest Rate Futures-Buy - - - - - -
3.2.5.2 Interest rate Futures-Sell - - - - - -
3.2.6 Other - 2,960,427 2,960,427 20 43,130 43,150
B. CUSTODY AND PLEDGES RECEIVED (IV+V+VI) 169,031,491 42,921,176 211,952,667 155,126,352 34,382,041 189,508,393
IV. ITEMS HELD IN CUSTODY 26,642,365 5,778,751 32,421,116 22,692,296 3,362,169 26,054,465
4.1 Customer Fund and Portfolio Balances - - - - - -
4.2 Investment Securities Held in Custody 14,096,812 4,231,162 18,327,974 12,683,121 1,926,086 14,609,207
4.3 Cheques Received for Collection 11,666,295 953,460 12,619,755 9,224,197 917,651 10,141,848
4.4 Commercial Notes Received for Collection 532,953 81,589 614,542 501,378 129,625 631,003
4.5 Other assets Received for Collection 125 512,540 512,665 125 388,807 388,932
4.6 Assets Received for Public Offering - - - - - -
4.7 Other Items under Custody 346,180 - 346,180 283,475 - 283,475
4.8 Custodians - - - - - -
V. PLEDGES RECEIVED 139,190,758 36,757,375 175,948,133 127,978,988 30,359,974 158,338,962
5.1 Marketable Securities 306,697 459,121 765,818 362,798 100,651 463,449
5.2 Guarantee Notes 50,158,510 24,390,412 74,548,922 48,526,817 20,196,846 68,723,663
5.3 Commodity 142,587 108,608 251,195 50,194 - 50,194
5.4 Warranty - - - - - -
5.5 Immovable 77,965,304 8,026,196 85,991,500 69,855,979 7,236,289 77,092,268
5.6 Other Pledged Items 10,617,660 3,773,038 14,390,698 9,183,200 2,826,188 12,009,388
5.7 Pledged Items-Depository - - - - - -
VI. ACCEPTED BILL, GUARANTEES AND WARRANTIES 3,198,368 385,050 3,583,418 4,455,068 659,898 5,114,966
TOTAL OFF BALANCE SHEET COMMITMENTS (A+B) 251,254,504 132,298,044 383,552,548 222,865,443 121,744,097 344,609,540
The accompanying notes are an integral part of these unconsolidated financial statements.

TÜRK EKONOMİ BANKASI A.Ş.
UNCONSOLIDATED STATEMENT OF PROFIT OR LOSS FOR THE YEAR ENDED
31 DECEMBER 2020 AND 2019 (Unless otherwise stated amounts are expressed in thousands of Turkish Lira (“TL”).)
8
III. STATEMENT OF PROFIT OR LOSS
Section 5
Note
Audited Audited
INCOME AND EXPENSE ITEMS Current Period Prior Period
01.01-31.12.2020 01.01-31.12.2019
I. INTEREST INCOME (IV-1) 11,239,492 12,358,965
1.1 Interest Income on Loans 8,673,914 10,605,062
1.2 Interest Income on Reserve Requirements 83,562 108,777
1.3 Interest Income on Banks 165,865 234,267
1.4 Interest Income on Money Market Transactions 145,965 245,284
1.5 Interest Income on Securities Portfolio 2,147,734 1,131,686
1.5.1 Financial Assets at Fair Value Through Profit or Loss 178,384 187,881
1.5.2 Financial Assets at Fair Value Through Other Comprehensive Income 800,174 330,963
1.5.3 Financial Assets Measured at Amortized Cost 1,169,176 612,842
1.6 Financial Lease Income - -
1.7 Other Interest Income 22,452 33,889
II. INTEREST EXPENSE (-) (IV-2) 5,093,416 6,922,720
2.1 Interest Expense on Deposits 3,688,830 5,645,472
2.2 Interest Expense on Funds Borrowed 490,497 517,583
2.3 Interest Expense on Money Market Transactions 238,193 115,205
2.4 Interest Expense on Securities Issued 454,149 514,885
2.5 Interest Expense on Leases 99,037 104,031
2.5 Other Interest Expenses 122,710 25,544
III. NET INTEREST INCOME (I - II) 6,146,076 5,436,245
IV. NET FEES AND COMMISSIONS INCOME/EXPENSE 1,157,227 1,500,669
4.1 Fees and Commissions Received 1,761,110 2,375,008
4.1.1 Non-cash Loans 260,274 285,265
4.1.2 Other (IV-12) 1,500,836 2,089,743
4.2 Fees and Commissions Paid (-) 603,883 874,339
4.2.1 Non-cash Loans 6,628 4,971
4.2.2 Other (IV-12) 597,255 869,368
V. DIVIDEND INCOME (IV-3) 31,334 18,570
VI. TRADING INCOME / LOSS (Net) (IV-4) (1,739,661) (1,010,533)
6.1 Securities Trading Gains / Losses (52,291) 125,374
6.2 Gains / Losses on Derivative Financial Instruments (1,059,395) (911,169)
6.3 Foreign Exchange Gains / Losses (627,975) (224,738)
VII. OTHER OPERATING INCOME (IV-5) 132,885 134,615
VIII. GROSS OPERATING PROFIT (III+IV+V+VI+VII+VIII) 5,727,861 6,079,566
IX. EXPECTED CREDIT LOSS (-) (IV-6) 752,187 1,404,740
X. OTHER PROVISION EXPENSES (-) (IV-6) (22,683) 89,173
XI. PERSONNEL EXPENSE (-) 1,581,779 1,445,655
XII. OTHER OPERATING EXPENSES (-) (IV-7) 1,866,858 1,726,235
XIII. NET OPERATING INCOME/LOSS (VIII-IX-X-XI-XII) 1,549,720 1,413,763
XIV. EXCESS AMOUNT RECORDED AS INCOME AFTER MERGER - -
XV. INCOME/LOSS FROM INVESTMENTS IN SUBSIDIARIES CONSOLIDATED
BASED ON EQUITY METHOD - -
XVI. INCOME/LOSS ON NET MONETARY POSITION - -
XVII. PROFIT/LOSS BEFORE TAX FROM CONTINUED OPERATIONS (XIII+...+XVI) (IV-8) 1,549,720 1,413,763
XVIII. TAX PROVISION FOR CONTINUED OPERATIONS (±) (IV-9) (372,406) (343,409)
18.1 Current Tax Provision (486,856) (525,749)
18.2 Deferred Tax Income Effect(+) (1,314,199) (211,949)
18.3 Deferred Tax Expense Effect(-) 1,428,649 394,289
XIX. CURRENT PERIOD PROFIT/LOSS FROM DISCONTINUED OPERATIONS
(XVII±XVIII) (IV-10) 1,177,314 1,070,354
XX. INCOME FROM DISCONTINUED OPERATIONS - -
20.1 Income from Non-current Assets Held for Sale - -
20.2 Profit from Sales of Associates, Subsidiaries and Joint Ventures - -
20.3 Income from Other Discontinued Operations - -
XXI. EXPENSES FROM DISCONTINUED OPERATIONS (-) - -
21.1 Expenses from Non-current Assets Held for Sale - -
21.2 Loss from Sales of Associates, Subsidiaries and Joint Ventures - -
21.3 Expenses for Other Discontinued Operations - -
XXII. PROFIT/LOSS BEFORE TAX FROM DISCONTINUED OPERATIONS (XX-XXI) (IV-8) - -
XXIII. TAX PROVISION FOR DISCONTINUED OPERATIONS (±) - -
23.1 Current Tax Provision - -
23.2 Deferred Tax Expense Effect(+) - -
23.3 Deferred Tax Income Effect(-) - -
XXIV. CURRENT PERIOD PROFIT/LOSS FROM DISCONTINUED OPERATIONS
(XXII±XXIII) (IV-10) - -
XXV. NET INCOME/LOSS (XIX+XXIV) (IV-11) 1,177,314 1,070,354
25.1 Group’s Profit / Loss 1,177,314 1,070,354
25.2 Minority Interest Profit / Loss (-) - -
Earnings per Share 0.5341 0.4856
The accompanying notes are an integral part of these unconsolidated financial statements.

TÜRK EKONOMİ BANKASI A.Ş.
UNCONSOLIDATED STATEMENT OF PROFIT OR LOSS AND OTHER COMPREHENSIVE INCOME
FOR THE YEAR ENDED 31 DECEMBER 2020 AND 2019 (Unless otherwise stated amounts are expressed in thousands of Turkish Lira (“TL”).)
9
IV. STATEMENT OF PROFIT OR LOSS AND OTHER COMPREHENSIVE INCOME
Audited
Current Period
01.01-31.12.2020
Audited
Prior Period
01.01-31.12.2019
I. CURRENT PERIOD INCOME/LOSS 1,177,314 1,070,354
II. OTHER COMPREHENSIVE INCOME 511,963 (991,941)
2.1 Other Comprehensive Income that will not be Reclassified through Profit or Loss (42,575) 11,567
2.1.1 Gains (losses) on Revaluation of Property, Plant and Equipment - -
2.1.2 Gains (losses) on Revaluation of Intangible Assets - -
2.1.3 Gains (losses) on Remeasurements of Defined Benefit Plans (53,832) 10,775
2.1.4 Other Components of Other Comprehensive Income that will not be Reclassified through Profit or Loss 500 3,061
2.1.5 Taxes Relating to Components of Other Comprehensive Income that will not be Reclassified through Profit or
Loss 10,757 (2,269)
2.2 Other Comprehensive Income that will be Reclassified to Profit or Loss 554,538 (1,003,508)
2.2.1 Exchange Differences on Translation - -
2.2.2 Valuation and/or Reclassification Profit or Loss from Financial Assets at Fair Value Through Other
Comprehensive Income (132,443) 201,250
2.2.3 Income (loss) related with Cash Flow Hedges 829,370 (1,463,373)
2.2.4 Income (loss) related with Hedges of Net Investments in Foreign Operations - -
2.2.5 Other Components of Other Comprehensive Income that will be Reclassified through Other Profit or Loss - -
2.2.6 Taxes Relating to Components of Other Comprehensive Income that will be Reclassified through Profit or Loss (142,389) 258,615
III. TOTAL COMPREHENSIVE INCOME (I+II) 1,689,277 78,413
The accompanying notes are an integral part of these unconsolidated financial statements.

TÜRK EKONOMİ BANKASI A.Ş.
UNCONSOLIDATED STATEMENT OF CHANGES IN SHAREHOLDERS’ EQUITY
FOR THE YEAR FROM 1 JANUARY TO 31 DECEMBER 2020 AND 2019 (Unless otherwise stated amounts are expressed in thousands of Turkish Lira (“TL”).)
10
V. STATEMENT OF CHANGES IN SHAREHOLDERS’ EQUITY
STATEMENT OF CHANGES IN SHAREHOLDERS’ EQUITY
Accumulated Other Comprehensive Income
or Expense Not Reclassified through Profit
or Loss
Accumulated Other Comprehensive
Income or Expense Reclassified through
Profit or Loss
Audited
Paid-in
Capital
Share
Premiums
Share
Cancellation
Profit
Other
Capital
Reserves 1 2 3 4 5 6
Profit
Reserves
Prior Period
Profit or (Loss)
Current
Period Profit
or (Loss)
Total Equity
Except from
Minority Shares
Minority
Shares
Total
Shareholders'
Equity
Prior Period – 01.01-31.12.2019
I. Prior Period End Balance 2,204,390 2,565 - 484,079 266,122 32,702 1,796 - (139,555) 273,733 5,601,476 1,011,200 - 9,738,508 - 9,738,508
II. Corrections According to TAS 8 - - - (96,347) - - - - - - - - - (96,347) - (96,347)
2.1 The Effect of Corrections of Errors - - - - - - - - - - - - - - - -
2.2 The Effects of Changes in Accounting Policy - - - (96,347) - - - - - - - - - (96,347) - (96,347)
III. New Balance (I+II) 2,204,390 2,565 - 387,732 266,122 32,702 1,796 - (139,555) 273,733 5,601,476 1,011,200 - 9,642,161 - 9,642,161
IV. Total Comprehensive Income - - - - - 8,620 2,947 - 156,976 (1,160,484) - - 1,070,354 78,413 - 78,413
V. Capital Increase by Cash - - - - - - - - - - - - - - - -
VI. Capital Increase by Internal Sources - - - - - - - - - - - - - - - -
VII. Paid-in Capital Inflation Adjustment
Difference - - - - - - - - - - - - - - - -
VIII. Convertible Bonds to Shares - - - - - - - - - - - - - - - -
IX. Subordinated Debt Instruments - - - - - - - - - - - - - - - -
X. Increase/Decrease by Other Changes - - - - - - - - - - - - - - - -
XI. Profit Distribution - - - - - - - - - - 1,001,703 (1,001,703) - - - -
11.1 Dividends Paid - - - - - - - - - - - - - - - -
11.2 Transfers to Reserves - - - - - - - - - - 1,001,703 (1,001,703) - - - -
11.3 Other - - - - - - - - - - - - - - - -
Period-End Balance 31.12.2019
(III+IV+V+VI+VII+VIII+IX+X+XI) 2,204,390 2,565 - 387,732 266,122 41,322 4,743 - 17,421 (886,751) 6,603,179 9,497 1,070,354 9,720,574 - 9,720,574
Current Period – 01.01-31.12.2020
I. Prior Period End Balance 2,204,390 2,565 - 387,732 266,122 41,322 4,743 - 17,421 (886,751) 6,603,179 1,079,851 - 9,720,574 - 9,720,574
II. Corrections According to TAS 8 - - - - z - - - - - - - - - - -
2.1 Effects of Corrections - - - - - - - - - - - - - - - -
2.2 Effects of the Changes in Accounting Policies - - - - - - - - - - - - - - - -
III. Adjusted Beginning Balance (I+II) 2,204,390 2,565 - 387,732 266,122 41,322 4,743 - 17,421 (886,751) 6,603,179 1,079,851 - 9,720,574 - 9,720,574
IV. Total Comprehensive Income - - - - - (43,066) 491 - (105,508) 660,046 - - 1,177,314 1,689,277 - 1,689,277
V. Capital Increase by Cash - - - - - - - - - - - - - - - -
VI. Capital Increase by Internal Sources - - - - - - - - - - - - - - - -
VII. Paid-in Capital Inflation Adjustment
Difference - - - - - - - - - - - - - - - -
VIII . Convertible Bonds to Shares - - - - - - - - - - - - - - - -
IX. Subordinated Debt Instruments - - - - - - - - - - - - - - - -
X. Increase/Decrease by Other Changes - - - - - - - - - - - - - - -
XI. Profit Distribution - - - - 9,394 - - - - - 1,060,960 (1,070,354) - - - -
11.1 Dividends Paid - - - - - - - - - - - - - - - -
11.2 Transfers to Reserves - - - - 9,394 - - - - - 1,060,960 (1,070,354) - - - -
11.3 Other - - - - - - - - - - - - - - - -
Period-End Balance 31.12.2020
(III+IV+V+VI+VII+VIII+IX+X+XI) 2,204,390 2,565 - 387,732 275,516 (1,744) 5,234 - (88,087) (226,705) 7,664,139 9,497 1,177,314 11,409,851 - 11,409,851
1. Increase/decrease from tangible assets accumulated revaluation reserve,
2. Accumulated gains / losses on remeasurements of defined benefit plans, 3. Other (Other comprehensive income of associates and joint ventures accounted with equity method that will not be reclassified at profit or loss and other accumulated amounts of other comprehensive income items that will not be reclassified at profit or loss),
4. Foreign currency translation differences,
5. Accumulated revaluation and / or classification gains / losses of financial assets at fair value through other comprehensive income,
6. Other (Cash flow hedge gains / losses, other comprehensive income of associates and joint ventures accounted with equity method that will be reclassified at profit or loss and other accumulated amounts of other comprehensive income items that will be reclassified at profit or loss).
The accompanying notes are an integral part of these unconsolidated financial statements.

TÜRK EKONOMİ BANKASI A.Ş.
UNCONSOLIDATED STATEMENT OF CASH FLOW
FOR THE YEAR FROM 1 JANUARY TO 31 DECEMBER 2020 AND 2019 (Unless otherwise stated amounts are expressed in thousands of Turkish Lira (“TL”).)
11
VI. STATEMENT OF CASH FLOWS Audited Audited
Prior Period
01.01-31.12.2019
Section
5 Note
Current Period
01.01-31.12.2020
A. CASH FLOWS FROM BANKING OPERATIONS
1.1 Operating profit before changes in operating assets and liabilities 4,593,464 5,938,334
1.1.1 Interest received 10,687,114 11,944,525
1.1.2 Interest paid (4,932,080) (7,194,011)
1.1.3 Dividend received 31,334 18,570
1.1.4 Fees and commissions received 1,345,387 2,344,880
1.1.5 Other income 133,185 2,327,241
1.1.6 Collections from previously written off loans 1,610,390 1,077,143
1.1.7 Payments to personnel and service suppliers (1,551,631) (1,427,250)
1.1.8 Taxes paid (342,411) (741,734)
1.1.9 Others (VI-1) (2,387,824) (2,411,030)
1.2 Changes in operating assets and liabilities 7,800,843 (370,128)
1.2.1 Net (increase) in financial asset at fair value through profit or loss (329,359) (676,907)
1.2.2 Net (increase) in due from banks and other financial institutions (83,896) -
1.2.3 Net (increase) in loans (10,570,598) (1,673,378)
1.2.4 Net (increase) in other assets (VI-1) (792,680) (261,210)
1.2.5 Net increase in bank deposits 11,958,916 1,684,589
1.2.6 Net increase in other deposits 5,480,752 4,986,559
1.2.7 Net increase/(decrease) in financial asset at fair value through profit or loss - -
1.2.8 Net increase/(decrease) in funds borrowed 1,206,986 (3,151,430)
1.2.9 Net (increase)/decrease in matured payables - -
1.2.10 Net increase / (decrease) in other liabilities (VI-1) 930,722 (1,278,351)
I. Net cash provided from banking operations 12,394,307 5,568,206
B. CASH FLOWS FROM INVESTING ACTIVITIES
II. Net cash provided from investing activities (9,602,984) (4,425,930)
2.1 Cash paid for purchase of entities under common control, associates and subsidiaries (Joint Vent.) (50) -
2.2 Cash obtained from sale of entities under common control, associates and subsidiaries (Joint Vent.) - -
2.3 Cash paid for purchase of tangible assets (202,037) (277,408)
2.4 Cash obtained from sale of tangible assets 3,907 22,128
2.5 Cash paid for purchase of financial assets at fair value through other comprehensive income (6,171,855) (4,627,548)
2.6 Cash obtained from sale of financial assets at fair value through other comprehensive income 3,620,752 2,281,659
2.7 Cash paid for purchase of financial assets measured at amortized cost (7,591,796) (1,726,438)
2.8 Cash obtained from sale of financial assets measured at amortized cost 823,184 -
2.9 Others (VI-1) (85,089) (98,323)
C. CASH FLOWS FROM FINANCING ACTIVITIES
III. Net cash provided from financing activities 2,189,332 1,677,170
3.1 Cash obtained from funds borrowed and securities issued 14,631,331 15,002,839
3.2 Cash used for repayment of funds borrowed and securities issued (12,196,805) (13,101,686)
3.3 Equity instruments issued - -
3.4 Dividends paid - -
3.5 Payments for financial leases (245,194) (223,983)
3.6 Others - -
IV. Effect of change in foreign exchange rate on cash and cash equivalents (VI-1) 1,432,624 475,011
V. Net increase in cash and cash equivalents 6,413,279 3,294,457
VI. Cash and cash equivalents at beginning of the period 16,328,523 13,034,066
VII. Cash and cash equivalents at end of the period (VI-2) 22,741,802 16,328,523
The accompanying notes are an integral part of these unconsolidated financial statements.

TÜRK EKONOMİ BANKASI A.Ş.
UNCONSOLIDATED STATEMENT OF PROFIT DISTRIBUTION
FOR THE YEAR 31 DECEMBER 2020 AND 2019 (Unless otherwise stated amounts are expressed in thousands of Turkish Lira (“TL”).)
12
VII. STATEMENT OF PROFIT DISTRIBUTION Audited Current
Period
Audited Prior
Period
31.12.2020 31.12.2019(*)
I. DISTRIBUTION OF CURRENT YEAR INCOME
1.1 CURRENT YEAR INCOME 1,549,720 1,413,763
1.2 TAXES AND DUTIES PAYABLE (-) 372,406 343,409
1.2.1 Corporate tax (Income tax) 486,856 525,749
1.2.2 Income withholding tax - -
1.2.3 Other taxes and duties (**) (114,450) (182,340)
A. NET INCOME FOR THE YEAR (1.1-1.2) 1,177,314 1,070,354
1.3 PRIOR YEARS’ LOSSES (-) - -
1.4 FIRST LEGAL RESERVES (-) - 53,518
1.5 OTHER STATUTORY RESERVES (-) - -
B. NET INCOME AVAILABLE FOR DISTRIBUTION [(A-(1.3+1.4+1.5)] 1,177,314 1,016,836
1.6 FIRST DIVIDEND TO SHAREHOLDERS (-) - -
1.6.1 To owners of ordinary shares - -
1.6.2 To owners of preferred shares - -
1.6.3 To owners of preferred shares (preemptive rights) - -
1.6.4 To profit sharing bonds - -
1.6.5 To holders of profit and loss sharing certificates - -
1.7 DIVIDENDS TO PERSONNEL (-) - -
1.8 DIVIDENDS TO BOARD OF DIRECTORS (-) - -
1.9 SECOND DIVIDEND TO SHAREHOLDERS (-) - -
1.9.1 To owners of ordinary shares - -
1.9.2 To owners of preferred shares - -
1.9.3 To owners of preferred shares (preemptive rights) - -
1.9.4 To profit sharing bonds - -
1.9.5 To holders of profit and loss sharing certificates - -
1.10 SECOND LEGAL RESERVES (-) - -
1.11 STATUTORY RESERVES (-) - -
1.12 EXTRAORDINARY RESERVES - 1,016,836
1.13 OTHER RESERVES - -
1.14 SPECIAL FUNDS - -
II. DISTRIBUTION OF RESERVE - -
2.1 DISTRIBUTED RESERVES - -
2.2 SECOND LEGAL RESERVES (-) - -
2.3 DIVIDENDS TO SHAREHOLDERS (-) - -
2.3.1 To owners of ordinary shares - -
2.3.2 To owners of preferred shares - -
2.3.3 To owners of preferred shares (preemptive rights) - -
2.3.4 To profit sharing bonds - -
2.3.5 To holders of profit and loss sharing certificates - -
2.4 DIVIDENDS TO PERSONNEL (-) - -
2.5 DIVIDENDS TO BOARD OF DIRECTORS (-) - -
III. EARNINGS PER SHARE - -
3.1 TO OWNERS OF ORDINARY SHARES 0.5340 0.4613
3.2 TO OWNERS OF ORDINARY SHARES ( % ) 53.40 46.13
3.3 TO OWNERS OF PREFERRED SHARES - -
3.4 TO OWNERS OF PREFERRED SHARES ( % ) - -
IV. DIVIDEND PER SHARE - -
4.1 TO OWNERS OF ORDINARY SHARES - -
4.2 TO OWNERS OF ORDINARY SHARES ( % ) - -
4.3 TO OWNERS OF PREFERRED SHARES - -
4.4 TO OWNERS OF PREFERRED SHARES ( % ) - -
(*) As of 31 December 2020, when the financial statements have been finalized, the General Assembly meeting has not been held.
(**) Other taxes and duties amount is deferred tax income (31 December 2019: Deferred tax income).
The accompanying notes are an integral part of these unconsolidated financial statements.

TÜRK EKONOMİ BANKASI A.Ş.
NOTES AND EXPLANATIONS TO UNCONSOLIDATED FINANCIAL STATEMENTS
AS OF 31 DECEMBER 2020 (Unless otherwise stated amounts are expressed in thousands of Turkish Lira (“TL”).)
13
SECTION THREE
ACCOUNTING PRINCIPLES
I. Basis of Presentation
a. Financial statements and related explanations and preparation of footnotes in compliance with Turkish Accounting Standards (“TAS”) and Regulation on Accounting Applications for Banks and Safeguarding of Documents:
The unconsolidated financial statements are prepared within the scope of the “Regulation on Accounting Applications for Banks and Safeguarding of Documents” related with Banking Act numbered 5411 published in the Official Gazette no.26333 dated 1 November 2006 and in accordance with the regulations, communiqués, interpretations and legislations related to reporting principles on accounting records of Banks published by the Banking Regulation and Supervision Agency (“BRSA”) Financial Reporting Standards (TFRS) put into effect by Public Oversight Accounting and Auditing Standards Authority (“POA”) for those matters not regulated by the aforementioned regulations. The format and content of the publicly announced unconsolidated financial statements and notes to these statements have been prepared in accordance with the “Communiqué on Publicly Announced Financial Statements, Explanations and Notes to These Financial Statements” and “Communiqué On Disclosures About Risk Management To Be Announced To Public By Banks” and amendments to this Communiqué. The Bank maintains its books in Turkish Lira in accordance with the Banking Law, Turkish Commercial Code and Turkish Tax Legislation. The unconsolidated financial statements have been prepared in TL, under the historical cost convention except for the financial assets and liabilities carried at fair value.
The preparation of unconsolidated financial statements in conformity with TFRS requires the use of certain critical
accounting estimates by the Bank management to exercise its judgment on the assets and liabilities of the balance sheet
and contingent issues as of the balance sheet date. These estimates, which include the fair value calculations of financial
instruments and impairments of financial assets are being audited regularly and, when necessary, suitable corrections are
made and the effects of these corrections are reflected to the income statement. Assumptions and estimates that are used in
the preparation of the accompanying financial statements are explained in the following related disclosures.
The new type of coronavirus (COVID-19), first emerging in China, has been classified as a pandemic affecting countries
globally by the World Health Organization on 11 March 2020. COVID-19 has impacts on economic conditions, sectors,
businesses, consumers, as well as asset and commodity prices, liquidity, exchange rates, interest rates, money and capital
markets and many other issues and it still maintains uncertainty about the future stands. While many countries announce
economic and financial programs in order to limit the damage caused by the virus, Turkey also set regulatory fiscal and
monetary actions in motion to support the companies and households in such difficult conditions. Additional regulatory
measures are continued to be announced to tackle adverse impacts on companies and certain sectors. The effects of this global pandemic on the Bank's financial statements are regularly monitored by the Risk Management as
well as the Bank's Management. While preparing the unconsolidated financial statements as of 31 December 2020, the
Bank reflected the possible effects of the COVID-19 outbreak on the estimates and judgements used in the preparation of
the financial statements. Bank Management takes the necessary precautions in order to keep the negative effects under
control and to be affected at the minimum level. The approach preferred for the period of 31 December 2020, will be
revised in the following reporting periods, considering the effect of the pandemic and future expectations.
b. The accounting policies and the valuation principles applied in the preparation of the accompanying financial statements:
The accounting policies and valuation principles used in the preparation of the financial statements are subject to the regulations, communiqués, annotations and circulars issued by BRSA on accounting and financial reporting principles and the TFRS (”BRSA Accounting and Financial Reporting Legislation”) which has been put into force by the POA on issues not regulated by the BRSA determined according to the principles. The accounting policies and the valuation principles applied in the preparation of the accompanying financial statements are explained between Notes II and XXV.

TÜRK EKONOMİ BANKASI A.Ş.
NOTES AND EXPLANATIONS TO UNCONSOLIDATED FINANCIAL STATEMENTS
AS OF 31 DECEMBER 2020 (Unless otherwise stated amounts are expressed in thousands of Turkish Lira (“TL”).)
14
II. Explanations on Usage Strategy of Financial Assets and Foreign Currency Transactions
The Bank aims to develop and promote products for the financial needs of each customer such as SMEs, multinational
companies and small individual investors in line with Banking Legislation. The primary objective of the Bank is to increase
profitability with optimum liquidity and minimum risk while fulfilling customer needs.
The Bank aims at creating an optimum maturity risk and working with a positive margin between cost of resource and
product yield in the process of asset and liability management.
As a component of risk management strategy of the Bank, risk bearing short positions of currency, interest or price
movements is performed only by the Asset-Liability Management and Treasury Group using the limits defined by the
Board of Directors. The Asset-Liability Committee manages the maturity mismatches while deciding the short, medium
and long term strategies as well as adopting the principle of positive balance sheet margin as a pricing policy.
The Board of Directors allows a purchase risk in treasury operations and individual limits are defined by the Board of
Directors for each product.
The Bank’s foreign currency asset and liability balances are valuated with the Bank’s exchange buying rate at the reporting
date and recognized as “Foreign Exchange Gains / Losses” within statement of income.
The Bank’s hedging activities for the currency risk due to foreign currency available for sale equity instruments are
described under the Currency Risk section; and the Bank’s hedging activities from interest rate risk arising from fixed
interest rate deposits and floating interest rate borrowings are described in detail under Interest Rate Risk section.
The Bank’s Asset-Liability Committee approves the trading of various derivative instruments such as currency swaps, forwards and similar derivatives to hedge interest and currency exchange risks in line with the balance sheet structure.
III. Explanations on Investments in Associates, Subsidiaries and Joint Ventures
In accordance with “TAS 27”, investments in associates, subsidiaries and joint ventures are accounted with cost values and
are reflected on the financial statements after deducting the provision for impairment, if any.
The dividends received from investments in associates, subsidiaries and joint ventures are reflected to income statements
at the date of the right to receive dividend.
IV. Explanations on Forward and Option Contracts and Derivative Instruments
The Bank's derivative transactions mainly consist of foreign currency swaps and interest rate swaps, cross currency swaps,
currency options and forward foreign currency purchase and sale contracts.
Pursuant to "TFRS 9 Financial Instruments" ("TFRS 9"), derivative financial instruments of the Bank are classified as
"Derivative financial assets at fair value through profit or loss" or "Derivative financial assets at fair value through other
comprehensive income".
Assets and liabilities arising from derivative transactions are recorded in off-balance sheet through their contractual
amounts. Derivative transactions are measured at fair value after initial recognition. In accordance with the classification
of derivative financial instruments, they are disclosed under "Derivative Financial Assets at Fair Value Through Profit or
Loss” or “Derivative Financial Assets at Fair Value Through Other Comprehensive Income”, in financial statements.
Differences arising from the fair value changes of derivative financial instruments at fair value through profit or loss are
recognized under “Gains / Losses on Derivative Financial Instruments” in “Trading Income / Loss” in the statement of
profit or loss. The fair values of the derivative financial instruments are calculated using quoted market prices or by using
discounted cash flow models.
Derivative financial instruments are booked under off-balance sheet items. Derivative financial instruments where the
underlying asset is money or commodity, are booked based on the amounts to be received / paid at the maturity date.
Derivative financial instruments based on interest rate are booked with the principal amount on which the interest rate is
calculated.
All derivative financial instruments are measured with fair value method. The fair value of the derivative financial
instruments traded in organized markets is the price on the organized market.

TÜRK EKONOMİ BANKASI A.Ş.
NOTES AND EXPLANATIONS TO UNCONSOLIDATED FINANCIAL STATEMENTS
AS OF 31 DECEMBER 2020 (Unless otherwise stated amounts are expressed in thousands of Turkish Lira (“TL”).)
15
IV. Explanations on Forward and Option Contracts and Derivative Instruments (continued)
The cash flows of forward, currency swap, interest rate swap, and cross currency swap, transactions should be determined
firstly in order to measure with fair value method. Expected cash flows due to the floating interest rate for these products
are defined according to market interest rate at the valuation date. Valuation is calculated by discounting the cash flows
with the market interest rate and foreign currencies are converted in to Turkish Lira with exchange rates at the valuation
date.
Derivative financial instruments based on interest rate are measured not only with fair value method but also with amortized
cost. While the fair value of derivatives are reflected in a single valuation account within the balance sheet, the amortized
cost and the difference between the fair value and the amortized cost are reflected separately on the income / expense
accounts.
Black and Scholes Model is used to measure the fair value of options. Options premiums are accrued on the start date of
maturity. The valuation amount is composed of premiums valued at each valuation date. Premium to be paid calculated
within this model is recorded as income, and the premium to be collected as expense.
The Bank has adopted fair value and cash flow hedge accounting. Hedge accounting can be applied in order to prevent
short-term fluctuations in the income statement resulting from differences between valuation methods of assets and
liabilities exposed to interest rate risk and their hedging derivative instruments.
A part of the Bank's fixed income foreign currency securities and Turkish Lira loans are subject to fair value hedge
accounting. The fair value risk of the related financial assets with fixed interest rate is hedged by currency swaps and cross
currency swaps. The Bank is also hedging the cash flow risk arising from financial debts, with interest rate swaps and cross
currency swaps. The hedge effectiveness between the derivative instruments / transactions used for hedging and hedged item, are measured
regularly and the results are documented. In case of ineffectiveness of hedge accounting, the hedge accounting is
terminated.
During period where the relation between hedging instrument and the hedged item is measured;
a) Within the scope fair value hedge accounting, the fair value change of the hedged item is recognized in profit or
loss,
b) Within the scope of cash flow hedge accounting, the fair value change of the hedged item is recognized in other
comprehensive income and the ineffective part of the gain or loss arisen from the hedging instrument is booked
in profit or loss.
In the admission of the accounting policies, TFRS 9 presents the option of postponing the adoption of TFRS 9 hedge
accounting and continuing to apply the hedge accounting provisions of TAS 39. Within this context, the Bank will continue
to apply the hedge accounting provisions of TAS 39.
While the Bank recognizes the fair value changes of the hedged items in the “Other Interest Income” and “Other Interest
Expense” accounts, it recognizes the fair value changes of the hedging instruments related to the same period in the “Gains/
Losses on Derivative Financial Instruments” account.
Additionally, the difference between the fair value and carrying value of the hedged items as of the application date of
hedge accounting is amortized based on their maturities and recognized in “Other Interest Income” and “Other Interest
Expense” accounts.
V. Explanations on Interest Income and Expenses
Interest income and expenses are recorded on accrual basis. As the interest income and expense is accrued, all tax liabilities
are fulfilled.
Financial assets and liabilities for which the future cash payments and collections are known, are discounted by using
effective interest rate.
Accrued but not collected interests and rediscounts of loans, those classified as non-performing (Stage 3) are not reversed
and included in interest income.
The interest amount representing the time value of the future collections of the non-performing loans is recognized under
interest income and fully provisioned. The income effect arising from the discount of the estimates of expected collection
as getting closer to the estimated date of collection, is recorded under interest income.

TÜRK EKONOMİ BANKASI A.Ş.
NOTES AND EXPLANATIONS TO UNCONSOLIDATED FINANCIAL STATEMENTS
AS OF 31 DECEMBER 2020 (Unless otherwise stated amounts are expressed in thousands of Turkish Lira (“TL”).)
16
VI. Explanations on Fees and Commission Income and Expenses
Fees and commissions other than integral part of the effective interest rate of the financial instruments measured at
amortized cost are accounted in accordance with the TFRS 15 Revenue from Contracts with Customers Standard.
Income on banking services which are not related to periodic services are recorded as income when they are collected. In
order to classify the fees and commissions collected from customers as income on banking services or as other non-interest
income, they shouldn’t be related with a credit transaction.
All type of fees and commissions collected from customers regarding cash loans are deferred in commissions on cash loans
account and are recognized as income over the period of the loan by discounting with effective interest rate.
For Bank assurance services provided by the Bank commissions from insurance companies are recorded as income on
accrual basis.
The commissions related with non-cash loans or periodic banking services, are deferred and recorded as income over the
period according to the cut-off principle. Credit fee and commission expenses which are paid to other companies and
institutions regarding financial liabilities and which create operational costs are discounted by effective interest rate and
are recorded as expenses in the relevant period according to the cut-off principle.
VII. Explanations on Financial Assets
The Bank classifies and recognizes its financial assets as “Financial Assets at Fair Value through Profit or Loss”, “Financial
Assets Measured at Fair Value through Other Comprehensive Income” or “Financial Assets Measured at Amortized Cost”.
The financial assets are recognized or derecognized in accordance with the “Recognition and Derecognition” principles
defined in Section 3 related to the classification and measurement of financial instruments of the "TFRS 9 Financial
Instruments" standard published in the Official Gazette No. 29953 dated 19 January 2017 by the Public Oversight
Accounting and Auditing Standards Authority (POA). At initial recognition, financial assets are measured at fair value. In
the case of financial assets are not measured at “fair value through profit or loss”, transaction costs are added or deducted
to/from their fair value.
The Bank recognizes a financial asset in the financial statement when, and only when, the Bank becomes a party to the
contractual provisions of the instrument. All regular way purchases and sales of financial assets are recognized on the the
(“settlement date”). When the Bank first recognizes a financial asset, the business model and the characteristics of
contractual cash flows of the financial asset are considered by management.
Financial Assets at Fair Value through Profit or Loss
Financial assets at fair value through profit or loss are financial assets that are managed by business model other than the
business model that aims to hold to collect and hold & sell the contractual cash flows; acquired for the purpose of generating
profit from short-term fluctuations in price, or regardless of this purpose, the financial assets that are a part of a portfolio
with evidence of short-time profit-taking; and the financial assets, whose terms do not give rise to cash flows that are solely
payments of principal of interest at certain dates. Financial assets at fair value through profit or loss are initially recognized
at fair value and are subsequently measured at fair value. Gain and losses upon their valuation are accounted under the
profit / loss accounts.
Equity securities classified as financial assets at fair value through profit or loss are recognized at fair value.
Accounting policies related to derivative financial instruments at fair value through profit or loss are explained in Section
III. Footnote IV.

TÜRK EKONOMİ BANKASI A.Ş.
NOTES AND EXPLANATIONS TO UNCONSOLIDATED FINANCIAL STATEMENTS
AS OF 31 DECEMBER 2020 (Unless otherwise stated amounts are expressed in thousands of Turkish Lira (“TL”).)
17
VII. Explanations on Financial Assets (continued)
Financial Assets at Fair Value Through Other Comprehensive Income
Financial assets are classified as financial assets at fair value through other comprehensive income where the business
models aim to hold financial assets in order to collect the contractual cash flows and selling assets and the terms of financial
asset give rise to cash flows that are solely payments of principal of interest at certain dates.
Financial assets at fair value through other comprehensive income are recognized at acquisition costs that reflect their fair
value by adding transaction costs. Financial assets at fair value through other comprehensive income are subsequently
measured at their fair value. The interest income of financial assets at fair value through other comprehensive income that
are calculated by effective interest rate method are reflected in the statement of profit or loss. The difference between the
fair value of the financial assets at fair value through other comprehensive income and the amortized cost of the financial
assets, i.e. "Unrealized gains and losses", is not recognized in the statement of profit or loss until the realization of the
financial asset, the sale of the asset, the disposal of the asset or being impaired of the asset are accounted under "Other
Accumulated Comprehensive Income or Expenses that will be reclassified at Profit or Loss" under shareholders' equity.
Accumulated fair value differences under equity are reflected to the income statement when such securities are collected
or disposed.
The Bank may elect at initial recognition to irrevocably designate an equity investment at fair value other comprehensive
income where those investments are hold for purposes other than to generate investments returns. When this election is
used, fair value gains and losses are recognized in other comprehensive income and are not subsequently reclassified to
profit or loss. Dividends continue to be recognized in profit or loss in the financial statements.
All equity instruments classified as financial assets at fair value through other comprehensive income are measured at fair
value. However, in limited circumstances, cost may be an appropriate estimate of fair value. That may be the case if
insufficient more recent information is available to measure fair value, or if there is a wide range of possible fair value
measurements and cost represents the best estimate of fair value within that range.
Financial Assets Measured at Amortized Cost
Financial investments measured at amortised cost:
A financial asset is classified as a financial asset measured at amortized cost when the Bank’s policy within a business
model is to hold the asset to collect contractual cash flows and the terms give rise to cash flows that are solely payments
of principal of interest at certain dates.
Financial asset measured at amortized cost is recognized at cost which represents its fair value at initial recognition by
adding the transaction costs and subsequently measured at “Amortized cost” by using the “Effective interest (IRR) rate
method”. Interest income related to the financial asset measured at amortized cost is recognized in the statement of profit
or loss.
Loans:
Loans are financial assets with fixed or determinable payment terms which are not traded on an active market and measured
at amortized cost is recognized at cost which represents its fair value at initial recognition by adding the transaction costs
and subsequently measured at amortized cost by using the “Effective interest (IRR) rate method”.

TÜRK EKONOMİ BANKASI A.Ş.
NOTES AND EXPLANATIONS TO UNCONSOLIDATED FINANCIAL STATEMENTS
AS OF 31 DECEMBER 2020 (Unless otherwise stated amounts are expressed in thousands of Turkish Lira (“TL”).)
18
VIII. Explanations on Impairment of Financial Assets
As of 1 January 2018, a loss allowance for expected credit losses is provided for all financial assets measured at amortised
cost and financial assets measured at fair value through other comprehensive income, all financial assets, which are not
measured at fair value through profit or loss, loan commitments and financial guarantee contracts in accordance with TFRS
9 principles and the regulation published in the Official Gazette no. 29750 dated 22 June 2016 in connection with
“Procedures and Principals regarding Classification of Loans and Allowances Allocated for Such Loans” which came into
force starting from 1 January 2018. Equity instruments are not subject to impairment assessment as they are measured at
fair value.
Measurement of the expected credit losses reflects:
- Time value of Money
- Reasonable and supportable information on past events, current conditions and forecasts of future economic
conditions at the reporting date
The Bank has changed its credit calculation method with the expected credit loss model as of 1 January 2018. Expected credit losses include an unbiased and probability-weighted amount that is determined by evaluating a range of possible outcomes; reasonable and supportable information that is available without undue cost or effort at the reporting date about past events, current conditions and forecasts of future economic conditions and the time value of money. The financial assets is divided into “3 stage categories” depending on the gradual increase in credit risk observed since their initial recognition:
Stage 1:
For the financial assets at initial recognition or that do not have a significant increase in credit risk since initial recognition. Impairment for credit risk is recorded in the amount of 12 month expected credit losses.
Stage 2:
In the event of a significant increase in credit risk since initial recognition, the financial asset is transferred to Stage 2.
Impairment for credit risk is determined based on the instrument’s lifetime expected credit losses. Following criteria have
been taken into account in classification a financial asset as Stage 2:
- Loans having past due more than 30 days and less than 90 days
- Restructured loans
- Concordatum files
- Significant deterioration in probability of default
In the case of the occurrence of any of the first three items above, it is classified under Stage 2 loans regardless of the
comparison between probabilities of default.
Significant deterioration in probability of default is considered as significant increase in credit risk and the financial asset
is classified under Stage 2 loans. In this regard, it is assumed that the probability of default deteriorates, if the probability
of default exceeds the thresholds defined by the Bank's internal rating based credit rating models.
BRSA had increased the default definition on loans from 90 days to 180 days with the decision dated 17 March 2020 that
would be valid until 31 December 2020. According to the BRSA decision dated 8 December 2020 and numbered 9312 this
date is extended until 30 June 2021. Following the BRSA decision, The Bank regularly reviews probability of default rates
for loans those are overdue between 90-180 days and continued to be followed in Stage 2 and makes the necessary updates.
The effects of these updates are reflected in the financial statements. The regulation change does not include loans those
are overdue more than 90 days before 17 March 2020.
The Bank continued to classify loans with delay of 90 to 180 days as Stage 2, valid from 17 March 2020 until 31 December
2020, in accordance with the BRSA decision dated 17 March 2020 and numbered 8948.
The Bank computed an increased expected credit loss provision or simulated Stage 3 level expected credit loss provision
to Corporate and SME loan customers which are not subject to individual assessment by considering how many times the
customer had delay more than 90 days in total after June 2020. In other segments, the expected credit loss was computed
at Stage 3 level.
Stage 3:
Stage 3 includes financial assets that have objective evidence of impairment at the reporting date. For these assets, lifetime
expected credit losses are recognized.

TÜRK EKONOMİ BANKASI A.Ş.
NOTES AND EXPLANATIONS TO UNCONSOLIDATED FINANCIAL STATEMENTS
AS OF 31 DECEMBER 2020 (Unless otherwise stated amounts are expressed in thousands of Turkish Lira (“TL”).)
19
VIII. Explanations on Impairment of Financial Assets (continued)
Expected Credit Loss Calculation
Expected credit loss calculation refers to the calculation to estimate the loss of the financial instrument in case of default
and it is based on 3 stage impairment model based on the change in credit quality. The Bank uses two different calculations
considering 12 month and lifetime probability of default of the financial instruments.
If there is a significant increase in credit risk between the origination date and the reporting date of the loan, the lifetime
probability of default is used and if there is no significant increase in credit risk the 12 month probability of default is used.
There are mainly 3 loan portfolios as Commercial portfolios, Retail portfolios and Public portfolios.
While the Bank uses the internal credit ratings for commercial portfolios, the internal behavioural scores is used for the
retail portfolios. It is determined significant increase in credit risk by comparing the credit ratings/behavioural scores at the
origination date and reporting date for both portfolios.
Default Definition: Debts having past due more than 90 days; in addition, the fact that an obligor is unlikely to pay its
credit obligations, it should be considered as defaulted regardless of the existence of any past-due amount or of the number
of days past due.
In addition, due to COVID-19, the “more than 90 days delay” condition, which was used in the definition of default for the
classification of loans, began to be applied as "more than 180 days delay" in accordance with the BRSA decision as of 17
March 2020. This implementation will be valid until 30 June 2021. Consistent with the subjected change, provision has
been provided in accordance with the Bank's risk policies.
As of 31 December 2020, considering the possible effects of COVID-19 the data obtained with the principle of best effort
were reflected to the estimates and assumptions used in the calculation of expected credit losses with the best estimation
method. In light of the related information, the Bank has reconsidered its macroeconomic expectations in the expected
credit loss calculation. The Bank has also provided additional provisions through individual assessment for customers
which may be considered as highly effected.
The Bank does not have any financial asset as purchased or originated credit-impaired.
Probability of Default (PD): PD represents the likelihood of default over a specified time period. Based on the historical
data, 1-year PD of a customer is calculated for each portfolio on the basis of credit ratings and behavioural scores. PDs and
LGDs used in the ECL calculation are (point in time, PIT) based on key portfolios and consider both current conditions
and expected cyclical changes. Two types of probability of default are calculated.
- 12-Month PD: as the estimated probability of default occurring within the next 12 months
- Lifetime PD: as the estimated probability of default occurring over the remaining life of the financial instrument
Internal rating systems are used to measure the risk of both commercial and retail portfolios. The internal rating models
used in the commercial portfolio include the customer's financial information and the answers to the qualitative question
set. Behavioural score cards used in the retail portfolio include the behavioural data of the customer and the product in the
Bank, the demographic information of the customer and the behavioural data of the customer in the sector. The probability
of default is calculated based on historical data, current conditions and forward-looking macroeconomic expectations.
Loss Given Default (LGD): If a loan defaults, it represents the economic loss incurred on the loan. It is expressed as a
percentage.
The Bank calculates the recovery rates for each portfolio in a way that include the collateral types and several risk elements
based on historical data, and it is ensured that the time value of money is included into the calculation by discounting of
these recoveries to the reporting date. The collaterals in the calculation are taken into account by considering the credit
conversion factors. The collaterals included in “Communique on Credit Risk Mitigation Techniques” is taken into account
with their rules in the communique. The remaining part is considered as unsecured portfolio and loss given default rate
determined for this portfolio is applied.

TÜRK EKONOMİ BANKASI A.Ş.
NOTES AND EXPLANATIONS TO UNCONSOLIDATED FINANCIAL STATEMENTS
AS OF 31 DECEMBER 2020 (Unless otherwise stated amounts are expressed in thousands of Turkish Lira (“TL”).)
20
VIII. Explanations on Impairment of Financial Assets (Continued)
Expected Credit Loss Calculation (continued)
Exposure at Default (EAD): The EAD represents an estimate of the exposure to credit risk at the time of a potential default
occurring during the life of a financial instrument. The expected default amount is calculated by discounting the principal
and interest repayments for cash loans and income accruals by effective interest method while it refers to the value
calculated through using credit conversion factors for non-cash loans and commitments. It shows the risk of the borrower
at the date of default.
Effective interest rate: the discount factor which reflects the time value of money.
Lifetime ECL is calculated by taking into account the period during which the Bank will be exposed to credit risk. The
maturity information defined for all cash and non-cash loans is used in the calculation of the expected credit loss along
with their maturity and payment plans. The maturity refers to the contractual life of a financial instruments unless there is
the legal right to call it earlier. The maturity analysis and credit risk mitigation processes such as cancellation/revision of
the limits have been developed for the definition of behavioural maturity for loans that do not have maturity information
and revolving loans.
When expected credit losses are estimated, it is considered that three different macroeconomic scenarios as ”Base”,
“Adverse” and “Favourable” and the weighted average of the results of these scenarios is taken into account. Forward-
looking PDs based on the weighted average of these three scenarios are calculated on segment basis. The fundamental
macroeconomic variable in the macroeconomic models is the estimated annual growth rate in gross national product. The
Bank periodically reviews the parameters included in the calculation and updates them when necessary.
Expected Credit Loss Calculation of Stage 1 Loans: It is calculated by considering 12 month (1 year) PDs for the financial
assets measured at amortized cost, which do not reflect a significant increase in credit risk. Therefore, it is a part of the
lifetime expected credit losses. Such expected 12 month PDs are applied on an expected exposure at default, multiplied
with loss given default rate and discounted with the original effective interest rate.
In the case of the current default rate is below a defined threshold without comparison with the origination date, the related
loans are classified under Stage 1 loans by considering their credit qualities. Treasury Bills and CBRT balances are
classified under Stage 1 Loans. In addition, the institutions related to risk group of the Bank and other banks’ placements
are classified under Stage 1 Loans.
Expected Credit Loss Calculation of Stage 2 Loans: It is calculated by considering lifetime PDs for the loans which has
shown a significant increase in credit risk since origination. Such expected lifetime PDs are applied on an expected
exposure at default, multiplied with loss given default rate and discounted with the original effective interest rate.
In determining of the significant increase in credit risk, qualitative and quantitative assessments are performed.
Qualitative assessments:
The loans with a delay on repayment more than 30 days are classified under Stage 2 loans. In addition, the restructured
loans are classified under this stage. Also, all the customers declaring concordatum are classified under this stage.
The Bank periodically reviews the parameters included in the calculation and updates them when necessary.
The Bank continued to classify loans with delay of 90 to 180 days as Stage 2, valid from 17 March 2020 until 31 December
2020, in accordance with the BRSA decision dated 17 March 2020 and numbered 8948.
Increased expected loss provision or simulated Stage 3 expected loan loss provision was allocated to Corporate and SME
loan customers which are not subject to individual assessment by considering how many times the customer had delay
more than 90 days in total after June 2020. In other segments, the expected credit loss provision was allocated as Stage 3
level.

TÜRK EKONOMİ BANKASI A.Ş.
NOTES AND EXPLANATIONS TO UNCONSOLIDATED FINANCIAL STATEMENTS
AS OF 31 DECEMBER 2020 (Unless otherwise stated amounts are expressed in thousands of Turkish Lira (“TL”).)
21
VIII. Explanations on Impairment of Financial Assets (continued)
Expected Credit Loss Calculation (continued)
Quantitative assessments:
“Significant increase in credit risk” is quantitatively based on the comparison the risk of default at the reporting date with
the risk of default at the date of initial recognition. Where the change is above the defined threshold it is considered as
significant increase in the credit risk, meaning that the credit is classified under Stage 2 Loans.
In the case of the internal credit rating of the loan is above a defined threshold, “high risk portfolio”, without comparison
with the origination date, the related loans are classified under Stage 2 loans.
Expected Credit Loss Calculation of Stage 3 Loans: Lifetime expected credit losses are booked for the loans considered as
impaired. When calculating the provisions by discounting the individual cash flow expectations for financial instruments
which are above a defined threshold, loss given default rates are taken into account in case of default for financial
instruments which are below the defined threshold.
IX. Explanations on Offsetting of Financial Assets and Liabilities
Financial assets and liabilities are offset and the net amount is reported in the balance sheet when the Bank has legally
enforceable rights to offset the recognized amounts and to collect/pay related financial assets and liabilities on a net basis,
or there is an intention to realize the asset and settle the liability simultaneously.
X. Explanations on Sales and Repurchase Agreements and Lending of Securities
Treasury bills and government bonds within the scope of repurchase agreements are classified in financial statements as
financial assets carried at amortized costs, financial assets at fair value through profit or loss or financial assets at fair value
through other comprehensive income according to the classification of marketable securities subject to repurchase
agreement, and are valued according to the measurement rules of the relevant category. Funds obtained through repurchase
agreements are booked in a separate liability account, namely funds provided under repurchase agreements under money
market balances. Income and expenses arisen from these transactions are booked in “Interest Income on Marketable
Securities Portfolio” and “Interest Expense on Money Market Borrowings” in income statement.
Securities purchased under repurchase agreements (“reverse repos”) are accounted under “Money Market Placements” in
the balance sheet. The difference between the purchase and resell price of the repurchase agreements is accrued over the
life of repurchase agreements. As of 31 December 2020, the Bank has TL 3,679,810 reverse repo transaction
(31 December 2019: TL 840,263).
As of 31 December 2020, the Bank does not have any marketable securities lending transaction (31 December 2019: None).
XI. Explanations on Assets Held for Sale, Discontinued Operations and Liabilities Related to Those
Assets
Non-current assets held for sale consists of property, plant and equipment acquired for impairment and accounted in
financial statements convenient with “TFRS 5 Assets Held for Sale and Discontinued Operations”.
As of 31 December 2020, assets held for sale and discontinued operations of the Bank are TL 112,859 (31 December
2019: TL 131,362). As per the appraisals performed for the real estates held for sale included “Assets Held for Sale” in the
financial statements, TL 5,330 (31 December 2019: TL 10,598) has been reserved as provision for impairment losses.
As of 31 December 2020, the Bank has no discontinued operations.

TÜRK EKONOMİ BANKASI A.Ş.
NOTES AND EXPLANATIONS TO UNCONSOLIDATED FINANCIAL STATEMENTS
AS OF 31 DECEMBER 2020 (Unless otherwise stated amounts are expressed in thousands of Turkish Lira (“TL”).)
22
XII. Explanations on Goodwill and Other Intangible Assets
Goodwill is measured as the excess of the sum of the consideration transferred, the amount of any non-controlling interests
in the acquiree, and the fair value of the acquirer's previously held equity interest in the acquiree (if any) over the net of
the acquisition-date amounts of the identifiable assets acquired and the liabilities assumed. In the merger transaction where
acquirer and acquiree exchange equity instruments, it is taken into account the fair value of equity shares exchanged and
the difference between such amount and fair value of the acquiree’s identifiable net asset value is accounted as goodwill.
If the initial accounting for a business combination is incomplete by the end of the reporting period in which the
combination occurs, the acquirer shall report in its financial statements provisional amounts for the items for which the
accounting is incomplete. During the measurement period, the acquirer shall retrospectively adjust the provisional amounts
recognized at the acquisition date to reflect new information obtained about facts and circumstances that existed as of the
acquisition date and, if known, would have affected the measurement of the amounts recognized as of that date. During the
measurement period, the acquirer shall also recognize additional assets or liabilities if new information is obtained about
facts and circumstances that existed as of the acquisition date and, if known, would have resulted in the recognition of
those assets and liabilities as of that date. The measurement period shall not exceed one year from the acquisition date.
As explained in footnote 1 of Section 1, under the Banking Regulation and Supervision Agency decision dated 10 February
2011 and the release of decision in Official Newspaper 12 February 2011 dated and numbered as 27844, all rights,
receivables, (assets and liabilities) of Fortis Bank A.Ş. would be transferred to the Bank as stated in Istanbul Commerce
Trade dated 14 February 2011.
Within the framework of TFRS 3 Business Combination, identifiable assets and liabilities acquired at the merger date are
measured at their acquisition date fair value. In this context, the Bank has measured the identifiable assets acquired and the
identifiable liabilities acquired in the date of the merger of Fortis Bank A.Ş. at fair value and presented in the financial
statements as related items. The resulting difference of TL 48,783 is shown in related assets and liability section, the equity
impact is shown under other shareholder’s equity section. The amount of TL 421,124, which is the difference between TL
2,385,482, the fair value of transferred amount and TL 1,964,358, the identifiable net asset value is accounted as goodwill
in the financial statements and the equity impact is shown under other shareholder’s equity section.
Goodwill arising on an acquisition of a business or a merger is carried at cost as established at the date of acquisition of
the business less accumulated impairment losses, if any. For the purposes of impairment testing, goodwill is allocated to
each of the Bank's cash-generating units (or groups of cash-generating units) that is expected to benefit from the synergies
of the combination. A cash-generating unit to which goodwill has been allocated is tested for impairment annually, or more
frequently when there is indication that the unit may be impaired. If the recoverable amount of the cash-generating unit is
less than its carrying amount, the impairment loss is allocated first to reduce the carrying amount of any goodwill allocated
to the unit and then to the other assets of the unit pro rata based on the carrying amount of each asset in the unit. Any
impairment loss for goodwill is recognized directly in profit or loss in the income statement. An impairment loss recognized
for goodwill is not reversed in subsequent periods. On disposal of the relevant cash-generating unit, the attributable amount
of goodwill is included in the determination of the profit or loss on disposal.
Intangible assets are accounted for at restated cost until 31 December 2004 in accordance with inflation accounting and are
amortized with straight-line method, after 31 December 2004 the acquisition cost and any other cost incurred so as to
prepare the intangible asset ready for use less reserve for impairment, if any, and are amortized on a straight-line method.
The cost of assets subject to amortization is restated after deducting the exchange differences, capitalized financial expenses
and revaluation increases, if any, from the cost of the assets.
The other intangible assets of the Bank comprise mainly software. The useful lives of such assets acquired are determined
as 3-5 years by taking into consideration the expected utilization period, technical, technological or any other impairment
and maintenance expenses necessary for the economic use of such assets. Software used are mainly developed within the
Bank by the Bank’s personnel and the related expenses are not capitalized.
There are no anticipated changes in the accounting estimates about the amortization rate and amortization method and
residual values that would have a significant impact in the current and future periods.

TÜRK EKONOMİ BANKASI A.Ş.
NOTES AND EXPLANATIONS TO UNCONSOLIDATED FINANCIAL STATEMENTS
AS OF 31 DECEMBER 2020 (Unless otherwise stated amounts are expressed in thousands of Turkish Lira (“TL”).)
23
XIII. Explanations on Tangible Fixed Assets
Tangible assets of the Bank are accounted for at their restated cost until 31 December 2004 and afterwards, the acquisition
cost and any other cost incurred to prepare the asset ready for use are reflected, less reserve for impairment, if any.
Depreciation rates are defined according to the economic life of the relevant assets.
Depreciation is calculated using the straight line method, without taking residual values into consideration, based on the number of months that the asset is used. No amendment has been made to the depreciation method in the current period. The economic useful lives of the tangible fixed assets are as follows:
Buildings 50 years Furniture, Fixtures and Office Equipment and Others 5-15 years
Gain or loss resulting from disposals of the tangible fixed assets is reflected to the income statement as the difference between the net proceeds and net book value.
Maintenance costs of tangible fixed assets are capitalized if they extend the economic useful life of the related asset. Other
maintenance costs are expensed. Leasehold improvements amount is subject to depreciation during leasing period. This
period is taken into consideration maximum five years. For the branches, this period is considered as three years in parallel
with the Bank's business plans.
The Bank employs independent appraisers in determining the current fair values of its real estate’s when there is any indication of impairment in value of real estates.
XIV. Explanations on Leasing Transactions
“TFRS 16 Leases” was promulgated in the Official Gazette dated 16 April 2018 and numbered 30393, effective from 1
January 2019. This Standard specifies the principles for the leasing, presentation and disclosure of leases. The purpose of
the standard is to provide tenants and lessees with appropriate information and faithful representation. This information is
the basis for evaluating the impact of the leases on the entity's financial position, financial performance and cash flows by
users of financial statements. The Bank has started to apply the related standard for the first time on 1 January 2019 by
reflecting the application effects to the equity accounts.
Lease obligations under the contract in the amount of liabilities on the balance sheet equal to the sum of all cash payments
and offset with the form shown gross interest expense arising from the contract. The right of use arising from the leasing
transactions, at the date of commencement, the present value of the lease payments which have not been paid at that date
is measured. In this measurement, if the interest can be easily determined, the implied interest rate in the lease is used. If
this ratio is not easily determined, the Bank's alternative borrowing interest rate announced by the Asset and Liability
Management Department is used.
Public Oversight Authority (POA) made amendments in TFRS 16 “Leases” standard by publishing the Concessions
Granted in Lease Payments Regarding COVID-19 – “amendments regarding TFRS 16 Leases” on 5 June 2020. With this
amendment, exception is granted to lessee on the subject of not evaluating whether the privileges granted on lessees’ lease
payments due to COVID-19 are changes on leasing or not. The subjected changes did not have a significant impact on the
Bank’s financial position or performance.
With the “TFRS 16 Leases” standard which became effective as of 1 January 2019, the difference between the operating lease and financial lease has been removed and the lease transactions are started to be recognized under “Tangible Assets” as an asset (tenure) and under “Lease Payables” as a liability.
XV. Explanations on Provisions and Contingent Liabilities
Provisions are provided for liabilities of uncertain timing or amount arising from past events have the probability to result
in an expense or loss in the future and when it can be measured reliably.
Provisions are determined by using the Bank’s best expectation of expenses in fulfilling the obligation as of the balance
sheet date, and discounted to present value if material. Provisions and contingent liabilities, excluding specific and general
provisions for loans and other receivables, are recognized in accordance with the Turkish Accounting Standards (TAS 37)
regarding Provisions, Contingent Liabilities and Contingent Assets.

TÜRK EKONOMİ BANKASI A.Ş.
NOTES AND EXPLANATIONS TO UNCONSOLIDATED FINANCIAL STATEMENTS
AS OF 31 DECEMBER 2020 (Unless otherwise stated amounts are expressed in thousands of Turkish Lira (“TL”).)
24
XVI. Explanations on Contingent Assets
Contingent assets usually arise from unplanned or other unexpected events that give rise to the possibility of an inflow of economic benefits to the entity. Contingent assets are not recognized in financial statements since this may result in the recognition of income that may never be realized.
Contingent assets are disclosed in the financial statements’ notes where an inflow of economic benefits is probable. Contingent assets are assessed continually to ensure that developments are appropriately reflected in the financial statements. In case it has become virtually certain that an inflow of economic benefits will arise, the asset and the related income are recognized in the financial statements.
XVII. Explanations on Liabilities Regarding Employee Benefits
In accordance with existing social legislation in Turkey, the Bank is required to make lump-sum termination indemnities
over a 30 day salary to each employee who has completed over 1 year of service, whose employment is terminated due to
retirement or for reasons other than resignation or misconduct, and due to marriage, female employees terminating their
employments within a year as of the date of marriage, or male employees terminating their employments due to their
military service. The Bank is also required to make a payment for the period of notice calculated over each service year of
the employee whose employment is terminated for reasons other than resignation or misconduct. Total benefit is calculated
in accordance with TAS 19 Employee Benefits.
Such benefit plans are unfunded since there is no funding requirement in Turkey. The cost of providing benefits to the
employees for the services rendered by them under the defined benefit plan is determined by independent actuaries annually
using the projected unit credit method.
Employees transferred to the Bank following the business combination defined in “General Information” of the Bank and
Fortis Bank A.Ş. are the members of “Fortis Bank A.Ş. Mensupları Emekli Sandığı” (the “Pension Fund”) which was
established in May 1964 under the Provisional Article 20 of Social Insurance Law No: 506. Technical financial statements
of the Pension Fund are audited by a licensed actuary in accordance with Article 38 of the Insurance Supervisory Law and
the “Actuary Regulations” issued based on the same article. As of 31 December 2020, the Pension Fund has 1,505
employees and 1,191 pensioners (31 December 2019: 1,552 employees and 1,139 pensioners).
Provisional Article 23 (1) of Banking Law No: 5411 (the “Banking Law”) published in the Official Gazette repeated no:
25983 on 1 November 2005 requires the transfer of bank funds to the Social Security Institution (the “SSI”) within 3 years
after the effective date of the Banking Law and the related paragraph also sets out the basis for the related transfer. However,
Article 23 (1) of Banking Law No: 5411 was annulled based on the Constitutional Court’s ruling issued on 22 March 2007
and ruled for the stay of execution as of 31 March 2007. The related Court ruling and its basis were published in the Official
Gazette No: 26731 on 15 December 2007.
Following the publication of the said decree of the Constitutional Court, the Turkish Grand National Assembly (the
“TGNA”) initiated its studies on the development of new regulations in regards to the transfer of bank pension
participations to the SSI and the related articles of the Social Security Law that are set out to determine the basis of fund
transfers and new regulations became effective with its publication in the Official Gazette No: 26870 on 8 May 2008 and
the completion of the transfer within 3 years starting from 1 January 2008. Upon the Council of Ministers’ resolution issued
in the Official Gazette, the transfer period has been extended for 2 years as of 14 March 2011. According to amendment
on the social security and general health insurance law published in the Official Gazette dated 8 March 2012 numbered
6283, mentioned 2-year transfer period has been increased to 4 years. Upon the Council of Ministers’ resolution dated 24
February 2014 issued in the Official Gazette No:28987 on 30 April 2014, mentioned transfer period has been extended for
one more year while it has been extended for one year upon the Council of Ministers’ resolution dated 8 April 2013 issued
in the Official Gazette No:28636 on 3 May 2013. The Council of Ministers has been lastly authorized to determine the
transfer date in accordance with the last amendment in the first paragraph of the 20th provisional article of Law No.5510
implemented by the Law No. 6645 on Amendment of the Occupational Health and Safety Law and Other Laws and Decree
Laws published in the Official Gazette dated 23 April 2015 numbered 29335. According to paragraph (I) of Article 203 of
Law no. 703 which published on the Official Gazette no. 30473 dated 9 July 2018, the phrase, placed in 20th provisional
article of Social Insurance and General Health Insurance Law no.5510, “Council of Ministers” is authorized to determine
the date of transfer to the Social Security Institution has been replaced with “President”.
The technical financial statements of the Pension Fund are prepared by an independent actuary company considering related
regulation and the Fund is not required to provide any provisions for any technical or actual deficit in the financial
statements based on the actuarial report prepared as of 31 December 2020. Since the Bank has no legal rights to carry the
economic benefits arising from repayments of Pension Funds and/or decreases in future contributions at present value; no
asset has been recognized in the balance sheet.

TÜRK EKONOMİ BANKASI A.Ş.
NOTES AND EXPLANATIONS TO UNCONSOLIDATED FINANCIAL STATEMENTS
AS OF 31 DECEMBER 2020 (Unless otherwise stated amounts are expressed in thousands of Turkish Lira (“TL”).)
25
XVII. Explanations on Liabilities Regarding Employee Benefits (Continued)
Since the Bank management anticipates that any potential liability that may be incurred during or after the transfer within
the above-mentioned limits will be likely recoverable, they believe such liabilities will not bring any additional liability to
the Bank.
XVIII. Explanations on Taxation
Corporate tax
According to the Article 32 of the Corporate Tax Law No. 5520, announced in the Official Gazette dated 21 September
2006, the corporate tax rate is 20% in Turkey. However, the corporate income tax rate has been applied as 22% for the 3
years between 2018-2020 regarding to the "Law on Amendment of Certain Tax Laws and Some Other Laws" numbered
7061 and published in the Official Gazette on 5 December 2017.
The tax legislation requires advance tax to be calculated and paid based on earnings generated for each quarter, the amounts
thus calculated and paid are offset from the final tax computed over the earnings of the year. On the other hand, corporate
tax and any related taxes paid to foreign tax offices for the income obtained from foreign branches are taken into account
in the Tax Statement according to Article 22 of the Preventation of Double Taxation Treaty signed between Northern
Cyprus and the Turkish Republic.
50% portion of the gains derived from the sale of immovable (from 5 December 2017) which have been acquired due to
loans under follow-up from the Bank and 75% portion of participation shares, founder's shares, dividend shares and
preemption rights is tax exempt. 75% portion of the capital gains derived from the sale of equity investments and 50%
portion of the immovable properties held for at least two years are exempt from corporate taxation, providing that such
gains are added to paid-in capital or held in a special fund account under liability for 5 years.
Tax returns are required to be filed between the first and twenty-fifth day of the fourth month following the balance sheet
date and paid in one instalment until the end of the related month.
According to the Corporate Tax Law, tax losses can be carried forward for a maximum period of five years following the
year in which the losses are incurred. Tax authorities can inspect tax returns and the related accounting records for a
retrospective maximum period of five years.
Deferred Tax Asset/Liablity
The Bank calculates and reflects deferred tax asset or liability on timing differences which will result in taxable or
deductible amounts in determining taxable profit of future periods.
The deferred tax is calculated using the enacted tax rates that are valid as of the balance sheet date in accordance with the
tax legislation in force. According to the Law, which was approved in the Grand National Assembly on 28 November 2017
and published in the Official Gazette dated 5 December 2017, the rate of Corporate Tax for the years 2018, 2019 and 2020
was increased from 20% to 22%. Therefore, deferred tax assets and liabilities are measured at the tax rate of 22% that are
expected to apply to these periods when the assets is realised or the liability is settled, based on the Law that have been
enacted. For the periods 2021 and after, the reversals of temporary differences are measured by 20%.
Deferred tax liabilities are recognized for all resulting temporary differences whereas deferred tax assets resulting from
temporary differences are recognized to the extent that it is probable that future taxable profit will be available against
which the deferred tax assets can be utilized.
Deferred tax asset is calculated over temporary differences arisen from expected credit loss provision in line with TFRS 9
principles from 1 January 2018.
Deferred tax income balance resulting from netting of deferred tax assets and liabilities should not be used in dividend
distribution and capital increase.
XIX. Additional Explanations on Borrowings
The borrowing costs related to purchase, production, or construction of qualifying assets that require significant time to be
prepared for use and sale are included in the cost of assets until the relevant assets become ready to be used or to be sold.
Financial investment income obtained by temporary placement of undisbursed investment loan in financial investments is
offset against borrowing costs qualified for capitalization.
All other borrowing costs are recorded to the income statement in the period they are incurred.
XX. Explanations on Issued Equity Securities
There is no share issued in 2020.

TÜRK EKONOMİ BANKASI A.Ş.
NOTES AND EXPLANATIONS TO UNCONSOLIDATED FINANCIAL STATEMENTS
AS OF 31 DECEMBER 2020 (Unless otherwise stated amounts are expressed in thousands of Turkish Lira (“TL”).)
26
XXI. Explanations on Bill Guarantees and Acceptances
Acceptances are realized simultaneously with the payment dates of the customers and they are presented as probable
commitments in off-balance sheet accounts.
XXII. Explanations on Government Incentives
There is no government incentive utilized by the Bank.
XXIII. Explanations on Reporting According to Segmentation
The operating segments of the Bank include retail and private banking, SME banking, corporate banking, treasury and
asset-liability management.
Retail and private banking lines of the Bank provide consumer loans, personal financing, housing, workplace and vehicle
loans for customer needs related to general consumption, purchase of durable goods, and real estate. The Bank also provides
account products like Marifetli, Fırsat and CEPTETEB along with the standard time deposit products to enable
advantageous savings in different currencies and maturities. In regard to investment needs for customers, retail and private
banking offers brokerage services for treasury bill transactions, government bonds, Eurobonds, foreign exchange
purchases/sales, a wide-range of investment funds, private pension funds and equity securities transactions. It also provides
practical account, credit deposit account, automatic bill/regular payment options, safe-deposit boxes and insurance services
beside credit and debit cards offering advantages in shopping and banking transactions. These products and services are
provided to customers through widespread physical branches and ATM network and also via a 24/7 call center, internet
and mobile banking.
Corporate banking provides financial solutions and banking services to large-scale local firms, holdings and their group
companies, and multinational companies operating in Turkey. In addition to the bank deposit services provided to corporate
customers, corporate banking also develops tailored solutions and products for standard cash and non-cash loans,
investment loans, cash management services in line with customer needs and demands and foreign trade financing. Foreign
exchange purchase and sale transactions, corporate financing services, derivative products and solutions to manage foreign
exchange and interest rate risk and commodity financing are other services provided by the Bank. The Bank provides these
services and products for its corporate customers via teams, located in its corporate branches and Head Office, who are
specialized in foreign trade, cash management, structured finance and multinational companies. It also benefits from the
global business network and expertise of BNP Paribas Group.
SME banking provides small and medium-sized enterprises with financial solutions and exclusive services for non-
financial matters. The Bank, which specifically designed its services for different segments in the field of SME Banking,
has developed solutions that are tailored to the needs of these segments. In addition to solutions developed for small and
medium-sized enterprises, solutions were developed for agricultural producers, jewellers, female leaders and
entrepreneurship segments and for SME banking, enterprise banking, agriculture banking, gold banking, women’s banking
and entrepreneurship banking. These solutions are provided on a larger scale based on the types of financial problems
encountered by customers, and they are supported in non-financial matters via offering access to information, training and
networks. At this point, the Bank does not only provide financial support to the SMEs but also provides the training and
expertise they need to grow their business, strengthen their competitiveness and use their financing properly.
When determining the short, medium and long-term pricing strategy, Asset-Liability Management and the Treasury Group
also manage the maturity mismatch, by adopting a principle foreseeing to work with a positive balance sheet margin. Spot
and forward TL and foreign exchange purchase-sale transactions, treasury bill, government bond, and Eurobond purchase-
sale transactions, and derivative product purchase/sale transactions are carried out under defined authorizations. The Bank
also carries out activities related to providing medium and long-term funding, enabling funding at a price below the price
reflecting the country risk price, diversifying funding resources, and creating an international investor base in this field.
The Financial Markets Group provides structured financial solutions to hedge foreign exchange/interest rate risks of
customers and provides the most appropriate price for the market instruments offered to customers by monitoring market
conditions.

TÜRK EKONOMİ BANKASI A.Ş.
NOTES AND EXPLANATIONS TO UNCONSOLIDATED FINANCIAL STATEMENTS
AS OF 31 DECEMBER 2020 (Unless otherwise stated amounts are expressed in thousands of Turkish Lira (“TL”).)
27
XXIII. Explanations on Reporting According to Segmentation (continued)
The details of the income statement and the balance sheet which the Bank operates as a business line:
Current Period
Retail and Private
Banking
Corporate
Banking
SME
Banking Other Total
Dividend Income - - - 31,334 31,334
Profit Before Tax 261,391 318,969 88,170 881,190 1,549,720
Tax Provision (-) - - - 372,406 372,406
Net Profit for the Period 261,391 318,969 88,170 508,784 1,177,314
Current Period
Retail and Private
Banking
Corporate
Banking
SME
Banking Other Total
Segment Assets 29,454,535 30,864,545 17,917,969 61,694,952 139,932,001
Investments in Associates, Subsidiaries and Jointly
Controlled Entities - - - 116,041 116,041
Total Assets 29,454,535 30,864,545 17,917,969 61,810,993 140,048,042
Segment Liabilities 57,220,832 28,190,237 8,208,073 35,019,049 128,638,191
Shareholders’ Equity - - - 11,409,851 11,409,851
Total Liabilities 57,220,832 28,190,237 8,208,073 46,428,900 140,048,042
Prior Period (31.12.2019)
Retail and Private
Banking
Corporate
Banking
SME
Banking Other Total
Dividend Income - - - 18,570 18,570
Profit Before Tax 572,390 838,101 (269,219) 272,491 1,413,763
Tax Provision (-) - - - 343,409 343,409
Net Profit for the Period 572,390 838,101 (269,219) (70,918) 1,070,354
Prior Period (31.12.2019)
Retail and Private
Banking
Corporate
Banking
SME
Banking Other Total
Segment Assets 25,750,311 20,792,344 17,290,247 43,401,275 107,234,177
Investments in Associates, Subsidiaries and Jointly
Controlled Entities - - - 115,991 115,991
Total Assets 25,750,311 20,792,344 17,290,247 43,517,266 107,350,168
Segment Liabilities 51,472,544 14,120,899 6,479,553 25,556,598 97,629,594
Shareholders’ Equity - - - 9,720,574 9,720,574
Total Liabilities 51,472,544 14,120,899 6,479,553 35,277,172 107,350,168
XXIV. Explanations on Other Matters
It has been resolved in the Ordinary General Assembly dated 26 March 2020 of the Bank, TL 1,070,354 that constitutes
the 2019 net balance sheet profit shall be transferred to the Extraordinary Reserves after setting aside, in accordance with
the proposal in the resolution of the Board of Directors, TL 53,518 as Legal Reserves, TL 9,394 as Special Reserves, TL
0.87 (full TL) as profit distributed to the holders of the founder jouissance certificates.
XXV. Reclassifications
In order to comply with the presentation of the financial statements dated 31 December 2020, some classifications were
made on the statement of income and statement of cash flows dated 31 December 2019.

TÜRK EKONOMİ BANKASI A.Ş.
NOTES AND EXPLANATIONS TO UNCONSOLIDATED FINANCIAL STATEMENTS
AS OF 31 DECEMBER 2020 (Unless otherwise stated amounts are expressed in thousands of Turkish Lira (“TL”).)
28
SECTION FOUR
INFORMATION ON FINANCIAL STRUCTURE AND RISK MANAGEMENT
I. Explanations Related to Components of Shareholders’ Equity
Total capital and Capital adequacy ratio have been calculated in accordance with the “Regulation on Equity of Banks” and
“Regulation on Measurement and Assessment of Capital Adequacy of Banks” and decision of BRSA dated 23 March 2020
and 3397 numbered, dated 16 April 2020 and 3984 numbered. According to the latest regulation changes;
In calculating the amount subject to credit risk; exchange buying rate which was used for the financial statements dated 31
December 2019 are used for calculating the foreign currency valuation.
In case that the net valuation differences of the securities owned by Banks which are included in the "Securities with Fair
Value through Other Comprehensive Income" portfolio as of 23 March 2020 are negative, these differences are not taken
into account in the amount of equity.
In accordance with the Standard Approach, 0% risk weight is used in the calculation of the amount subject to credit risk
for FX receivables of Banks which are from Republic of Turkey Central Management within the scope of Regulation on
Measurement and Assessment of Capital Adequacy of Banks published on the Official Gazette dated 23 October 2015 and
numbered 29511.
As of 31 December 2020, Bank’s total capital has been calculated as TL 16,429,056 (31 December 2019: TL 14,339,636)
and capital adequacy ratio is 18,51% (31 December 2019: 16.95%). This ratio is well above the minimum ratio required
by the legislation. The credit risk of banking accounts has been calculated by using the “standard approach”, the market
risk of purchase and sale accounts by using the “standard method”, counterparty credit risk of derivative and repo
transactions by using the “fair value method”, credit valuation adjustments of over counter derivative transactions by using
the “standard model” and operational risk by using the “basic indicator approach”.

TÜRK EKONOMİ BANKASI A.Ş.
NOTES AND EXPLANATIONS TO UNCONSOLIDATED FINANCIAL STATEMENTS
AS OF 31 DECEMBER 2020 (Unless otherwise stated amounts are expressed in thousands of Turkish Lira (“TL”).)
29
I. Explanations Related to Components of Shareholders’ Equity (continued)
Information related to the Components of Shareholders' Equity:
Common Equity Tier 1 Capital Current Period
31.12.2020
Amount related to
treatment before
01.01.2014(*)
Paid-in Capital to be Entitled for Compensation after All Creditors 2,404,652
Share Premium 2,565
Reserves 8,293,298
Gains Recognized in Equity as per TAS 63,530
Profit 1,186,811
Current Period Profit 1,177,314
Prior Period Profit 9,497
Bonus Shares from Associates, Subsidiaries and Joint-Ventures not Accounted in Current Period’s Profit 527
Common Equity Tier 1 Capital Before Deductions 11,951,383
Deductions from Common Equity Tier 1 Capital -
Valuation adjustments calculated as per the (I) item of first paragraph of Article 9 of the Regulation on Bank
Capital -
Current and Prior Periods' Losses not Covered by Reserves, and Losses Accounted under Equity according
to TAS 23,436
Leasehold Improvements on Operational Leases 38,025
Goodwill netted off deferred tax liability 421,124 421,124
Other intangible assets netted off deferred tax liabilities except mortgage servicing rights. 131,757 131,757
Deferred tax assets that rely on future profitability excluding those arising from temporary differences (net of
related tax liability) -
Differences are not recognized at the fair value of assets and liabilities subject to hedge of cash flow risk -
Communiqué Related to Principles of the amount credit risk calculated with the Internal Ratings Based
Approach, total expected loss amount exceeds the total provision -
Gains arising from securitization transactions -
Unrealized gains and losses due to changes in own credit risk on fair value of Bank’s liabilities -
Net amount of defined-benefit plan assets -
Direct and indirect investments of the Bank in its own Tier 1 Capital -
Excess amount expressed in the law (Article 56 4th paragraph) -
Investments in the capital of banking, financial and insurance entities that are outside the scope of
regulatory consolidation, net of eligible long positions, where the Bank does not own more than 10% of
the issued share capital (amount above 10% threshold) -
Significant investments in the common stock of banking, financial and insurance entities that are outside
the scope of regulatory consolidation, net of eligible long positions (amount above 10% threshold) of
Tier 1 Capital -
Mortgage servicing rights (amount above 10% threshold) of Tier 1 Capital -
Deferred tax assets arising from temporary differences (amount above 10% threshold, net of related tax
liability) -
Amounts exceeding 15% of Tier 1 Capital according to Regulation on Measurement and Assessment of
Capital Adequacy Ratios of Banks (2nd article temporary second paragraph) -
Investments in the capital of banking, financial and insurance entities that are outside the scope of
regulatory consolidation, net of eligible long positions, where the Bank does not own more than 10% of
the issued common share capital of the entity (amount above 10% threshold) -
Amounts related to mortgage servicing rights -
Excess amount of deferred tax assets from temporary differences -
Other Items Determined by BRSA -
Deductions to be made from common equity due to insufficient Additional Tier I Capital or Tier II Capital -
Total Deductions from Common Equity Tier 1 Capital 614,342
Total Common Equity Tier 1 Capital 11,337,041

TÜRK EKONOMİ BANKASI A.Ş.
NOTES AND EXPLANATIONS TO UNCONSOLIDATED FINANCIAL STATEMENTS
AS OF 31 DECEMBER 2020 (Unless otherwise stated amounts are expressed in thousands of Turkish Lira (“TL”).)
30
I. Explanations Related to Components of Shareholders' Equity (continued)
Information related to the Components of Shareholders’ Equity: (continued)
Current
Period
31.12.2020
Amount related to
treatment before
01.01.2014(*)
ADDITIONAL TIER 1 CAPITAL
Preferred Stock not Included in Common Equity and the Related Share Premiums -
Debt instruments and premiums approved by BRSA -
Debt instruments and premiums approved by BRSA(Temporary Article 4) -
Additional Tier 1 Capital before deductions -
Deductions from Additional Tier 1 Capital
Bank's direct or indirect investment on its own Tier 1 Capital -
Investments in equity instruments issued by banks or financial institutions invested in Bank’s additional Tier I
Capital which are compatible with the article 7 of the regulation -
Total of Net Long Positions of the Investments in Equity Items of Unconsolidated Banks and Financial
Institutions where the Bank Owns 10% or less of the Issued Share Capital Exceeding the 10%
Threshold of Common Equity Tier 1 Capital -
The Total of Net Long Position of the Direct or Indirect Investments in Additional Tier 1 Capital of
Unconsolidated Banks and Financial Institutions where the Bank Owns more than 10% of the Issued
Share Capital -
Other Items Determined by BRSA -
Items to be deducted from Tier I Capital during the Transition Period
Goodwill and other intangible assets and related deferred tax liabilities which will not deducted from Common
Equity Tier 1 capital for the purposes of the first sub-paragraph of the Provisional Article 2 of the Regulation on
Bank Capital (-) - -
Net deferred tax asset/liability which is not deducted from Common Equity Tier 1 capital for the purposes of the
sub-paragraph of the Provisional Article 2 of the Regulation on Bank Capital (-) -
The amount to be deducted from Additional Tier 1 Capital (-) -
Total Deductions from Additional Tier 1 Capital -
Total Additional Tier 1 Capital -
Total Tier 1 Capital (Tier 1 Capital=Common Equity+Additional Tier 1 Capital) 11,337,041
TIER 2 CAPITAL
Bank’s borrowing insturments and related issuancee premium 4,137,063
Bank’s borrowing insturments and related issuancee premium(in the scope of temporary Article 4) -
Provisions (Amounts stated in the first paragraph of the article 8 of the Regulation on the Bank Capital) 959,538
Tier 2 Capital Before Deductions 5,096,601
Deductions from Tier 2 Capital
Bank's direct or indirect investment on its own Tier 2 Capital (-) -
Investments in equity instruments issued by banks and financial institutions invested in Bank’s Tier II Capital
which are compatible with Article 8 of the regulation -
Total of Net Long Positions of the Investments in Equity Items of Unconsolidated Banks and Financial
Institutions where the Bank Owns 10% or less of the Issued Share Capital Exceeding the 10%
Threshold of Common Equity Tier 1 Capital (-) -
The Total of Net Long Position of the Direct or Indirect Investments in Additional Core Capital and
Tier 2 Capital of Unconsolidated Banks and Financial Institutions where the Bank Owns 10% or more of the
Issued Share Capital Exceeding the 10% Threshold of Tier 1 Capital -
Other Items Determined by BRSA (-) -
Total Deductions from Tier 2 Capital -
Total Tier 2 Capital 5,096,601
Total Capital (The sum of Tier 1 and Tier 2 Capital) 16,433,642

TÜRK EKONOMİ BANKASI A.Ş.
NOTES AND EXPLANATIONS TO UNCONSOLIDATED FINANCIAL STATEMENTS
AS OF 31 DECEMBER 2020 (Unless otherwise stated amounts are expressed in thousands of Turkish Lira (“TL”).)
31
I. Explanations Related to Components of Shareholders’ Equity (continued)
Information related to the Components of Shareholders’ Equity: (continued)
Current
Period
31.12.2020
Amount related to
treatment before
01.01.2014(*)
The sum of Tier 1 Capital and Tier 2 Capital (Total Capital)
Loan granted to Customer against the Articles 50 and 51 of the Banking Law 1,046
Net Book Values of Immovables Exceeding 50% of the Equity and of Assets Acquired against Overdue
Receivables and Held for Sale as per the Article 57 of the Banking Law but Retained More Than Five Years (-) -
Other items to be defined by the BRSA (-) 3,540
Items to be deducted from the sum of Tier I and Tier II Capital (“Capital”) during the Transition Period
Portion of the total of net long positions of investments made in Common Equity items of banks and financial
institutions outside the scope of consolidation where the Bank owns 10% or less of the issued common share
capital exceeding 10% of Common Equity of the Bank not to be deducted from the Common Equity, Additional
Tier 1 Capital, Tier 2 Capital as per the 1st clause of the Provisional Article 2 of the Regulation on the Equity of
Banks -
Portion of the total of net long positions of direct or indirect investments made in Additional Tier 1 and Tier 2
Capital items of banks and financial institutions outside the scope of consolidation where the Bank owns 10% or
more of the issued common share capital exceeding 10% of Common Equity of the Bank not to be deducted from
the Additional Tier 1 Capital and Tier 2 Capital as per the 1st clause of the Provisional Article 2 of the
Regulation on the Equity of Banks -
Portion of the total of net long positions of investments made in Common Equity items of banks and financial
institutions outside the scope of consolidation where the Bank owns 10% or more of the issued common share
capital, deferred tax assets based on temporary differences and mortgage servicing rights not deducted from
Common Equity as per the 1st and 2nd Paragraph of the 2nd clause of the Provisional Article 2 of the Regulation
on the Equity of Banks -
TOTAL CAPITAL
Total Capital 16,429,056
Total Risk Weighted Assets 88,762,236
Capital Adequacy Ratios
Common Equity Tier 1 Capital Adequacy Ratio (%) 12.77
Tier 1 Capital Adequacy Ratio (%) 12.77
Capital Adequacy Ratio (%) 18.51
BUFFERS
Total additional Common Equity Tier 1 Capital requirement ratio (a+b+c) (%) 2.50
a) Capital conservation buffer requirement (%) 2.50
b) Bank specific counter-cyclical buffer requirement (%) -
c) Systemic significant bank buffer ratio (%) -
The ratio of Additional Common Equity Tier 1 capital which will be calculated by the first paragraph of the
Article 4 of Regulation on Capital Conservation and Countercyclical Capital buffers to Risk Weighted Assets 4.27
Amounts below the Excess Limits as per the Deduction Principles
Amounts arising from the net long positions of investments made in Total Capital items of banks and financial
institutions where the Bank owns 10% or less of the issued common share capital 182,843
Amounts arising from the net long positions of investments made in Tier 1 Capital items of banks and financial
institutions where the Bank owns 10% or more of the issued common share capital -
Mortgage servicing rights -
Deferred tax assets arising from temporary differences (net of related tax liability) 632,912
Limits related to provisions considered in Tier 2 Calculation
General provisions for standard based receivables (before tenthousandtwentyfive limitation) 1,996,558
Up to 1.25% of total risk-weighted amount of general reserves for receivables where the standard approach
used(**) 959,538
Excess amount of total provision amount to credit risk Amount of the Internal Ratings Based Approach in
accordance with the Communiqué on the Calculation -
Excess amount of total provision amount to 0.6% of risk weighted receivables of credit risk Amount of the
Internal Ratings Based Approach in accordance with the Communiqué on the Calculation -
Debt instruments subjected to Article 4 (to be implemented between 1 January 2018 and 1 January 2022)
Upper limit for Additional Tier 1 Capital subjected to temporary Article 4 -
Amounts Excess the Limits of Additional Tier 1 Capital subjected to temporary Article 4 -
Upper limit for Additional Tier 2 Capital subjected to temporary Article 4 -
Amounts Excess the Limits of Additional Tier 2 Capital subjected to temporary Article 4 -
The positive difference between the expected credit loss provision amount in accordance with TFRS 9
and the total provision amount before the application of TFRS 9 177,147
(*) Amounts in this column represents the amounts of items that are subject to phasing and taken into consideration at the end of transition process. (**) The positive difference between the expected credit loss provision amount in accordance with TFRS 9 and the total provision amount before the application of
TFRS 9 has been deducted.

TÜRK EKONOMİ BANKASI A.Ş.
NOTES AND EXPLANATIONS TO UNCONSOLIDATED FINANCIAL STATEMENTS
AS OF 31 DECEMBER 2020 (Unless otherwise stated amounts are expressed in thousands of Turkish Lira (“TL”).)
32
I. Explanations Related to Components of Shareholders’ Equity (continued)
Information related to the Components of Shareholders’ Equity: (continued)
Common Equity Tier 1 Capital
Prior Period
31.12.2019
Amount related to
treatment before
01.01.2014(*)
Paid-in Capital to be Entitled for Compensation after All Creditors 2,404,652
Share Premium 2,565
Reserves 7,353,433
Gains Recognized in Equity as per TAS 23,065
Profit 1,079,851
Current Period Profit 1,070,354
Prior Period Profit 9,497
Bonus Shares from Associates, Subsidiaries and Joint-Ventures not Accounted in Current Period’s Profit 527
Common Equity Tier 1 Capital Before Deductions 10,864,093
Deductions from Common Equity Tier 1 Capital
Valuation adjustments calculated as per the (I) item of first paragraph of Article 9 of the Regulation on Bank
Capital -
Current and Prior Periods' Losses not Covered by Reserves, and Losses Accounted under Equity according
to TAS 3,475
Leasehold Improvements on Operational Leases 44,877
Goodwill netted off deferred tax liability 421,124 421,124
Other intangible assets netted off deferred tax liabilities except mortgage servicing rights. 124,530 124,530
Deferred tax assets that rely on future profitability excluding those arising from temporary differences (net of
related tax liability) -
Differences are not recognized at the fair value of assets and liabilities subject to hedge of cash flow risk -
Communiqué Related to Principles of the amount credit risk calculated with the Internal Ratings Based
Approach, total expected loss amount exceeds the total provision -
Gains arising from securitization transactions -
Unrealized gains and losses due to changes in own credit risk on fair value of Bank’s liabilities -
Net amount of defined-benefit plan assets -
Direct and indirect investments of the Bank in its own Tier 1 Capital -
Excess amount expressed in the law (Article 56, 4th paragraph) -
Investments in the capital of banking, financial and insurance entities that are outside the scope of
regulatory consolidation, net of eligible long positions, where the Bank does not own more than 10% of
the issued share capital (amount above 10% threshold) -
Significant investments in the common stock of banking, financial and insurance entities that are outside
the scope of regulatory consolidation, net of eligible long positions (amount above 10% threshold) of
Tier 1 Capital -
Mortgage servicing rights (amount above 10% threshold) of Tier 1 Capital -
Deferred tax assets arising from temporary differences (amount above 10% threshold, net of related tax
liability) -
Amounts exceeding 15% of Tier 1 Capital according to Regulation on Measurement and Assessment of
Capital Adequacy Ratios of Banks (2nd article temporary second paragraph) -
Investments in the capital of banking, financial and insurance entities that are outside the scope of
regulatory consolidation, net of eligible long positions, where the Bank does not own more than 10% of
the issued common share capital of the entity (amount above 10% threshold) -
Amounts related to mortgage servicing rights -
Excess amount of deferred tax assets from temporary differences -
Other Items Determined by BRSA -
Deductions to be made from common equity due to insufficient Additional Tier I Capital or Tier II Capital -
Total Deductions from Common Equity Tier 1 Capital 594,006
Total Common Equity Tier 1 Capital 10,270,087

TÜRK EKONOMİ BANKASI A.Ş.
NOTES AND EXPLANATIONS TO UNCONSOLIDATED FINANCIAL STATEMENTS
AS OF 31 DECEMBER 2020 (Unless otherwise stated amounts are expressed in thousands of Turkish Lira (“TL”).)
33
I. Explanations Related to Components of Shareholders’ Equity (continued)
Information related to the Components of Shareholders’ Equity: (continued)
Prior Period
31.12.2019
Amount related
to treatment before
01.01.2014 (*)
ADDITIONAL TIER 1 CAPITAL
Preferred Stock not Included in Common Equity and the Related Share Premiums -
Debt instruments and premiums approved by BRSA -
Debt instruments and premiums approved by BRSA(Temporary Article 4) -
Additional Tier 1 Capital before deductions -
Deductions from Additional Tier 1 Capital -
Bank's direct or indirect investment on its own Tier 1 Capital -
Investments in equity instruments issued by banks or financial institutions invested in Bank’s additional Tier
I Capital which are compatible with the article 7 of the regulation -
Total of Net Long Positions of the Investments in Equity Items of Unconsolidated Banks and Financial
Institutions where the Bank Owns 10% or less of the Issued Share Capital Exceeding the 10%
Threshold of Common Equity Tier 1 Capital -
The Total of Net Long Position of the Direct or Indirect Investments in Additional Tier 1 Capital of
Unconsolidated Banks and Financial Institutions where the Bank Owns more than 10% of the Issued
Share Capital -
Other Items Determined by BRSA -
Items to be deducted from Tier I Capital during the Transition Period -
Goodwill and other intangible assets and related deferred tax liabilities which will not deducted from
Common Equity Tier 1 capital for the purposes of the first sub-paragraph of the Provisional Article 2 of the
Regulation on Bank Capital (-) - -
Net deferred tax asset/liability which is not deducted from Common Equity Tier 1 capital for the purposes of
the sub-paragraph of the Provisional Article 2 of the Regulation on Bank Capital (-) -
The amount to be deducted from Additional Tier 1 Capital (-) -
Total Deductions from Additional Tier 1 Capital -
Total Additional Tier 1 Capital -
Total Tier 1 Capital (Tier 1 Capital=Common Equity+Additional Tier 1 Capital) 10,270,087
TIER 2 CAPITAL
Bank’s borrowing insturments and related issuancee premium 3,145,908
Bank’s borrowing insturments and related issuancee premium(in the scope of temporary Article 4) -
Provisions (Amounts stated in the first paragraph of the article 8 of the Regulation on the Bank Capital) 932,332
Tier 2 Capital Before Deductions 4,078,240
Deductions from Tier 2 Capital
Bank's direct or indirect investment on its own Tier 2 Capital (-) -
Investments in equity instruments issued by banks and financial institutions invested in Bank’s Tier II
Capital which are compatible with Article 8 of the regulation -
Total of Net Long Positions of the Investments in Equity Items of Unconsolidated Banks and Financial
Institutions where the Bank Owns 10% or less of the Issued Share Capital Exceeding the 10%
Threshold of Common Equity Tier 1 Capital (-) -
The Total of Net Long Position of the Direct or Indirect Investments in Additional Core Capital and
Tier 2 Capital of Unconsolidated Banks and Financial Institutions where the Bank Owns 10% or more of
the Issued Share Capital Exceeding the 10% Threshold of Tier 1 Capital (-) -
Other Items Determined by BRSA (-) -
Total Deductions from Tier 2 Capital -
Total Tier 2 Capital 4,078,240
Total Capital (The sum of Tier 1 and Tier 2 Capital) 14,348,327

TÜRK EKONOMİ BANKASI A.Ş.
NOTES AND EXPLANATIONS TO UNCONSOLIDATED FINANCIAL STATEMENTS
AS OF 31 DECEMBER 2020 (Unless otherwise stated amounts are expressed in thousands of Turkish Lira (“TL”).)
34
I. Explanations Related to Components of Shareholders’ Equity (continued)
Information related to the Components of Shareholders’ Equity: (continued)
Prior
Period
31.12.2019
Amount related to
treatment before
01.01.2014 (*)
The sum of Tier 1 Capital and Tier 2 Capital (Total Capital)
Loan granted to Customer against the Articles 50 and 51 of the Banking Law 2,467
Net Book Values of Immovables Exceeding 50% of the Equity and of Assets Acquired against Overdue
Receivables and Held for Sale as per the Article 57 of the Banking Law but Retained More Than Five Years(-) -
Other items to be defined by the BRSA (-) 6,224
Items to be deducted from the sum of Tier I and Tier II Capital (“Capital”) during the Transition Period
Portion of the total of net long positions of investments made in Common Equity items of banks and financial
institutions outside the scope of consolidation where the Bank owns 10% or less of the issued common share
capital exceeding 10% of Common Equity of the Bank not to be deducted from the Common Equity,
Additional Tier 1 Capital, Tier 2 Capital as per the 1st clause of the Provisional Article 2 of the Regulation on
the Equity of Banks -
Portion of the total of net long positions of direct or indirect investments made in Additional Tier 1 and Tier 2
Capital items of banks and financial institutions outside the scope of consolidation where the Bank owns 10%
or more of the issued common share capital exceeding 10% of Common Equity of the Bank not to be deducted
from the Additional Tier 1 Capital and Tier 2 Capital as per the 1st clause of the Provisional Article 2 of the
Regulation on the Equity of Banks -
Portion of the total of net long positions of investments made in Common Equity items of banks and financial
institutions outside the scope of consolidation where the Bank owns 10% or more of the issued common share
capital, deferred tax assets based on temporary differences and mortgage servicing rights not deducted from
Common Equity as per the 1st and 2nd Paragraph of the 2nd clause of the Provisional Article 2 of the
Regulation on the Equity of Banks -
TOTAL CAPITAL
Total Capital 14,339,636
Total Risk Weighted Assets 84,609,081
Capital Adequacy Ratios
Common Equity Tier 1 Capital Adequacy Ratio (%) 12.14
Tier 1 Capital Adequacy Ratio (%) 12.14
Capital Adequacy Ratio (%) 16.95
BUFFERS
Total additional Common Equity Tier 1 Capital requirement ratio (a+b+c) (%) 2.50
a) Capital conservation buffer requirement (%) 2.50
b) Bank specific counter-cyclical buffer requirement (%) -
c) Systemic significant bank buffer ratio (%) -
The ratio of Additional Common Equity Tier 1 capital which will be calculated by the first paragraph of the
Article 4 of Regulation on Capital Conservation and Countercyclical Capital buffers to Risk Weighted Assets 3.63
Amounts below the Excess Limits as per the Deduction Principles
Amounts arising from the net long positions of investments made in Total Capital items of banks and financial
institutions where the Bank owns 10% or less of the issued common share capital 124,855
Amounts arising from the net long positions of investments made in Tier 1 Capital items of banks and financial
institutions where the Bank owns 10% or more of the issued common share capital -
Mortgage servicing rights -
Deferred tax assets arising from temporary differences (net of related tax liability) 650,094
Limits related to provisions considered in Tier 2 Calculation
General provisions for standard based receivables (before tenthousandtwentyfive limitation) 1,503,984
Up to 1.25% of total risk-weighted amount of general reserves for receivables where the standard approach
used(**) 932,332
Excess amount of total provision amount to credit risk Amount of the Internal Ratings Based Approach in
accordance with the Communiqué on the Calculation -
Excess amount of total provision amount to 0.6% of risk weighted receivables of credit risk Amount of the
Internal Ratings Based Approach in accordance with the Communiqué on the Calculation -
Debt instruments subjected to Article 4 (to be implemented between 1 January 2018 and 1 January 2022)
Upper limit for Additional Tier 1 Capital subjected to temporary Article 4 -
Amounts Excess the Limits of Additional Tier 1 Capital subjected to temporary Article 4 -
Upper limit for Additional Tier 2 Capital subjected to temporary Article 4 -
Amounts Excess the Limits of Additional Tier 2 Capital subjected to temporary Article 4 - The positive difference between the expected credit loss provision amount in accordance with TFRS 9
and the total provision amount before the application of TFRS 9 265,721 (*) Amounts in this column represents the amounts of items that are subject to phasing and taken into consideration at the end of transition process.
(**) The positive difference between the expected credit loss provision amount in accordance with TFRS 9 and the total provision amount before
the application of TFRS 9 has been deducted.

TÜRK EKONOMİ BANKASI A.Ş.
NOTES AND EXPLANATIONS TO UNCONSOLIDATED FINANCIAL STATEMENTS
AS OF 31 DECEMBER 2020 (Unless otherwise stated amounts are expressed in thousands of Turkish Lira (“TL”).)
35
I. Explanations Related to Components of Shareholders’ Equity (continued)
Information related to the Components of Shareholders’ Equity: (continued) T T-1 T-2 T-3 T-4
CAPITAL ITEMS
Common Equity Tier 1 Capital 11,337,041 11,343,942 11,084,682 10,582,731 10,270,087
Common Equity Tier 1 Capital where the transition impact of TFRS 9 has not
been applied (a) 11,159,894 11,166,795 10,907,535 10,405,584 10,004,366
Tier 1 Capital 11,337,041 11,343,942 11,084,682 10,582,731 10,270,087
Tier 1 Capital where the transition impact of TFRS 9 has not been applied (b) 11,159,894 11,166,795 10,907,535 10,405,584 10,004,366
Capital 16,429,056 16,472,605 15,644,097 15,063,625 14,339,636
Capital where the transition impact of TFRS 9 has not been applied (c) 16,251,909 16,295,458 15,466,950 14,886,478 14,073,915
TOTAL RISK WEIGHTED ASSETS
Total Risk Weighted Assets 88,762,236 86,658,046 87,260,960 97,225,786 84,609,081
CAPITAL ADEQUENCY RATIOS
Common Equity Tier 1 Capital Adequacy Ratio (%) 12.77 13.09 12.70 10.88 12.14
Common Equity Tier 1 Capital Adequacy Ratio (%) where the transition
impact of TFRS 9 has not been applied (ç) 12.57 12.89 12.50 10.70 11.82
Tier 1 Capital Adequacy Ratio (%) 12.77 13.09 12.70 10.88 12.14
Tier 1 Capital Adequacy Ratio (%) where the transition impact of TFRS 9
has not been applied (ç) 12.57 12.89 12.50 10.70 11.82
Capital Adequacy Ratio (%) 18.51 19.01 17.93 15.49 16.95
Capital Adequacy Ratio (%) where the transition impact of TFRS 9 has not
been applied (ç) 18.31 18.80 17.72 15.31 16.63
LEVERAGE RATIO
Leverage Ratio Total Risk Amount 183,587,494 179,856,846 167,785,998 168,042,884 148,550,077
Leverage Ratio 6.11% 6.20% 6.57% 6.18% 6.91%
FTA not Applied Leverage Ratio (d) 6.01% 6.11% 6.47% 6.08% 6.73%
Basic information for the TFRS 9 transition process
a: Common equity Tier 1 capital if Temporary Article 5 of the Regulation on equities of banks has not applied.
b: Tier 1 capital if Temporary Article 5 of the Regulation on equities of banks has not applied.
c: Total capital if Temporary Article 5 of the Regulation on equities of banks has not applied.
ç: Capital adequacy ratios calculated with capital items if Temporary Article 5 of the Regulation on banks has not applied.
d: The leverage ratio calculated with capital items if Temporary Article 5 of the Regulation on banks has not applied.
Explanations on Reconciliation of Capital Items to Balance Sheet:
Total Capital per Balance Sheet 11,409,851
Hedging Funds (effective portion) 226,705
Deductions Made Under Regulation (602,482)
Transition Impact of TFRS 9 (Temporary 5th Article) 177,147
Gerçeğe uygun değer farkı diğer kapsamlı gelire yansıtılan finansal varlıkların birikmiş
yeniden değerleme ve/veya sınıflandırma kazançları/kayıpları 125,820
Common Equity Tier 1 Capital 11,337,041
Additional Tier 1 Capital -
Tier 1 Capital 11,337,041
General Provisions (Stage 1 and 2) 959,538
Bank's Borrowing Instruments 4,137,063
Deductions Made Under Regulation (4,586)
Total Equity 16,429,056

TÜRK EKONOMİ BANKASI A.Ş.
NOTES AND EXPLANATIONS TO UNCONSOLIDATED FINANCIAL STATEMENTS
AS OF 31 DECEMBER 2020 (Unless otherwise stated amounts are expressed in thousands of Turkish Lira (“TL”).)
36
I. Explanations Related to Components of Shareholders’ Equity (continued)
Information related to debt instruments included in equity calculation
All of the debt instruments included in equity calculation are issued by the Bank.
Issuer TEB TEB TEB TEB
Unique identifier of the debt instrument (e.g. CUSIP, ISIN) XS1895575071 XS2023308278 XS1973559484 XS1845118865
Governing law(s) of the debt instrument Turkey Turkey Turkey Turkey
Regulatory treatment
Subject to 10% deduction as of 1/1/2015 No No No No
Eligible at unconsolidated/consolidated/consolidated and unconsolidated Available Available Available Available
Type of the debt instrument Borrowing
Instrument
Borrowing
Instrument
Borrowing
Instrument
Borrowing
Instrument
Amount recognized in regulatory capital (TL Currency in mil, as of most recent
reporting date) 1,551.5 907.2 544.3 1,134
Par value of debt instrument (TL Currency in mil) 1,551.5 907.2 544.3 1,134
Accounting classification of the debt instrument 34701100 34701100 34701100 34701100
Original date of issuance 05.11.2018 22.07.2019 14.05.2019 27.06.2018
Perpetual or dated Time Time Time Time
Original maturity date 05.11.2028 22.07.2029 14.05.2029 27.06.2028
Issuer call subject to prior supervisory approval Available Available Available Available
Optional call date, contingent call dates and redemption amount 05.11.2023 22.07.2024 14.05.2024 27.06.2023
Subsequent call dates, if applicable - - - -
Coupons / dividends
Fixed or floating dividend/coupon Fixed Floating Floating Floating
Coupon rate and any related index 10.40% 6mEuribor+7.10% 6mEuribor+7.10% 6mEuribor+5.10%
Existence of a dividend stopper None None None None
Fully discretionary, partially discretionary or mandatory Mandatory Mandatory Mandatory Mandatory
Existence of step up or other incentive to redeem None None None None
Noncumulative or cumulative None None None None
Convertible or non-convertible
If convertible, conversion trigger(s) - - - -
If convertible, fully or partially - - - -
If convertible, conversion rate - - - -
If convertible, mandatory or optional conversion - - - -
If convertible, specify instrument type convertible into - - - -
If convertible, specify issuer of instrument it converts into - - - -
Write-down feature
If write-down, write-down trigger(s) - - - -
If write-down, full or partial - - - -
If write-down, permanent or temporary - - - -
If temporary write-down, description of write-up mechanism - - - -
Position in subordination hierarchy in liquidation (specify instrument type
immediately senior to the debt instrument) deposit and
other receivables
deposit and
other receivables
deposit and
other receivables
deposit and
other receivables
Whether conditions which stands in Article of 7 and 8 of Banks’ shareholder equity
law are possessed or not Possess Possess Possess Possess
According to Article 7 and 8 of Banks' shareholders equity law that are not
possessed(*) - - - -
(*) Under Article 8/2 in subsection (ğ) mechanism of write-down or conversion to common shares are stated.

TÜRK EKONOMİ BANKASI A.Ş.
NOTES AND EXPLANATIONS TO UNCONSOLIDATED FINANCIAL STATEMENTS
AS OF 31 DECEMBER 2020 (Unless otherwise stated amounts are expressed in thousands of Turkish Lira (“TL”).)
37
II. Explanations Related to Credit Risk
Credit risk is the risk and financial loss that the Bank is a party in a contract whereby the counterparty fails to meet
its obligation and causes to incur a financial loss.
The credit allocation is performed on a debtor and a debtor group basis within the limits. In the credit allocation
process, many financial and non-financial criteria are taken into account within the framework of the internal rating
procedures of the Bank. These criteria include geographical and sector concentrations. The sector concentrations
for loans are monitored closely. In accordance with the Bank’s loan policy, the rating of the companies, credit
limits and guarantees are considered together, and credit risks incurred are monitored.
The credit risks and limits related to treasury activities, the limits of the correspondent banks that are determined
by their ratings and the control of the maximum acceptable risk level in relation to the equity of the Bank are
monitored daily. Risk limits are determined in connection with these daily transactions, and risk concentration is
monitored systematically concerning off-balance sheet operations.
As prescribed in the Communiqué numbered 29750 dated 22 June 2016 on “Methods and Principles for the
Determination of Loans and Other Receivables to be Reserved for and Allocation of Reserves”, the credit
worthiness of the debtors of the loans and other receivables is monitored regularly. Most of the statements of
accounts for the loans are derived from audited financial statements. The unaudited documents result from the
timing differences between the loan allocation and the audit dates of the financial statements of the companies and
subsequently the audited financial statements are obtained from the companies. Credit limits are determined
according to the audited statement of accounts, and guarantee factors are developed in accordance with the decision
of the credit committee considering the characteristics of the transactions and the financial structures of the
companies.
A restructuring is defined as the privilege due to the borrower's encountered or likely to encountered financial
difficulties. The privileges granted to the borrower assumed to be in financial difficulty are;
- A change in the terms and conditions of the loan or
- Partially or completely refinancing of the loan in favour of the debtor.
In order to be subject to restructuring, the firm must be confronted with the difficulty of payment. The difficulty
should be supported by concrete developments or findings. Each restructuring request is evaluated on transaction
basis by the authorized credit allocation unit according to the activity of the firm, the income generation structure
by the sectoral operation.
Restructuring of the loans supported by Credit Guarantee Fund (“CGF loans”) is evaluated in accordance with the
current legislation. The principles regarding to restructuring of Treasury-Back CGF loans in the scope of
11 October 2018 dated Presidential Decree are taken into account.
Non-required delay time loans that is not classified as Stage III Loans defined in “Regulation on Procedures and
Principles for Classification of Loans And Provisions to be Set Aside” published in the Official Gazette numbered
29750 dated 22 June 2016, amended by the regulation published in the Official Gazette dated 14 December 2016
and numbered 29918, whose principal and interest payment collection delayed more than 30 days are considered
as “past-due loan” in the Accounting Practice; group III, IV and V loans defined in the mentioned communiqué
are considered as “impaired receivables” without considering refinancing or addition of the accrued interest and
quasi-interest principal amount.
The Bank provides specific reserves to Group III, IV and V loans in accordance with “Regulation on Procedures
and Principles for Classification of Loans and Provisions to be Set Aside”.

TÜRK EKONOMİ BANKASI A.Ş.
NOTES AND EXPLANATIONS TO UNCONSOLIDATED FINANCIAL STATEMENTS
AS OF 31 DECEMBER 2020 (Unless otherwise stated amounts are expressed in thousands of Turkish Lira (“TL”).)
38
II. Explanations Related to Credit Risk (continued)
In calculating the amount subject to credit risk; exchange buying rate which was used for the financial statements
dated 31 December 2019 are used for calculating the foreign currency valuation in accordance with BRSA
decisions dated 23 March 2020 and numbered 3391, dated 16 April 2020 and numbered 3984.
In accordance with the Standard Approach, 0% risk weight is used in the calculation of the amount subject to credit risk for FX receivables of Banks which are from Republic of Turkey Central Management within the scope of Regulation on Measurement and Assessment of Capital Adequacy of Banks published on the Official Gazette dated 23 October 2015 and numbered 29511.
Total amount of exposures after offsetting transactions but before applying credit risk mitigations and the average
exposure amounts that are classified in different risk groups and types for the relevant period:
Exposure classifications
Current Period Risk
Amount (*)
Average Risk
Amount (*,**)
Conditional and unconditional receivables from central governments or central banks 35,611,406 30,378,860
Conditional and unconditional receivables from regional or local governments 1,198,712 1,191,770
Conditional and unconditional receivables from administrative units and non-commercial enterprises - -
Conditional and unconditional receivables from multilateral development banks - -
Conditional and unconditional receivables from international organizations - - Conditional and unconditional receivables from banks and brokerage houses 9,619,818 8,412,497
Conditional and unconditional corporate receivables 42,602,286 41,606,407
Conditional and unconditional retail receivables 35,852,357 35,305,146 Conditional and unconditional secured mortgage receivables 10,955,985 11,567,659
Past due receivables 1,277,011 1,611,860
Receivables defined in high risk category by BRSA - - Securities collateralized by mortgages - -
Securitization positions - -
Short-term receivables from banks, stockbrokers and corporate - - Investments of natured collective investment enterprise - -
Other receivables 3,543,873 4,011,263
Investments in equities 167,257 144,178
(*) Risk amounts after conversion rate to credit are given before credit risk mitigation.
(**) Average risk amount is calculated by taking the arithmetic average of balances prepared to the end of the month.
Exposure classifications
Prior Period Risk
Amount (*)
Average Risk
Amount (*,**)
Conditional and unconditional receivables from central governments or central banks 20,808,776 19,889,510
Conditional and unconditional receivables from regional or local governments 1,249,725 1,028,952 Conditional and unconditional receivables from administrative units and non-
commercial enterprises - -
Conditional and unconditional receivables from multilateral development banks - - Conditional and unconditional receivables from international organizations - -
Conditional and unconditional receivables from banks and brokerage houses 12,343,046 8,454,625
Conditional and unconditional corporate receivables 34,548,225 38,019,684 Conditional and unconditional retail receivables 32,532,649 32,161,243
Conditional and unconditional secured mortgage receivables 12,654,892 10,737,238
Past due receivables 1,874,439 1,602,291 Receivables defined in high risk category by BRSA - -
Securities collateralized by mortgages - -
Securitization positions - - Short-term receivables from banks, stockbrokers and corporate - -
Investments of natured collective investment enterprise - -
Other receivables 4,337,763 3,937,051 Investments in equities 132,920 115,964
(*) Risk amounts after conversion rate to credit are given before credit risk mitigation.
(**) Average risk amount is calculated by taking the arithmetic average of balances prepared to the end of the month.

TÜRK EKONOMİ BANKASI A.Ş.
NOTES AND EXPLANATIONS TO UNCONSOLIDATED FINANCIAL STATEMENTS
AS OF 31 DECEMBER 2020 (Unless otherwise stated amounts are expressed in thousands of Turkish Lira (“TL”).)
39
II. Explanations Related to Credit Risk (continued) For the positions of the Bank in terms of forward transactions and other similar contracts, operational limits are set by the Board of Directors and the transactions take place within these limits.
The fulfillment of the benefits and proceeds related to forward transactions can be realized at maturity. However,
in order to minimize the risk, back to back positions of existing risks are entered into the market due to necessity.
Indemnified non-cash loans are subject to the same risk weight as outstanding loans matured but not yet paid.
Since the volume of the restructured loans is not material to the financial statements, no additional follow up
methodology is developed, except as stated in the regulations.
Financial institutions abroad and country risks of the Bank are generally taken for the financial institutions and
countries that are rated at investment level by international rating agencies which do not have the risk of failing to
meet minimum obligations. Therefore, the probable risks are considered to be not material to the financial structure
of the Bank.
The Bank does not have a material credit risk concentration as an active participant in the international banking
market when the financial operations of the other financial institutions are concerned.
As of 31 December 2020, the receivables of the Bank from its top 100 and top 200 cash loan share in total cash
loans are respectively 25.96% and 33.84%. (31 December 2019: 22.56% and 28.45%)
As of 31 December 2020, the receivables of the Bank from its top 100 and top 200 non-cash loan share are 72.30%
and 83.41% respectively in the total non-cash loans. (31 December 2019: 58.35% and 66.46%)
As of 31 December 2020, the share of cash and non-cash receivables of the Bank from its top 100 and top 200
loan customers in total balance sheet and off-balance sheet assets is 10.49% and 14.01% respectively.
(31 December 2019: 8.44% and 10.94%)
As of 31 December 2020, the general loan loss provision related with the credit risk taken by the Bank is TL
1,996,558 (31 December 2019: TL1,503,984).
Credit Rating System
Credit risk is evaluated according to the internal rating system of the Bank, which is linked to the rating scale, and loans are classified from the best rating to the lowest rating according to the probability of default. As of 31 December 2020, Retail, Business and Agricultural Banking loans are excluded from the internal rating system of the Bank and these loans constitute 29.70% of the total cash and non-cash loan portfolio (31 December 2019: 31.05 %). Application and behavioral scorecards are used for the Individual and Business segments, however behavioral scorecard is used for the Agricultural segment.
The risks that are subject to rating models can be allocated as follows:
Category
Description of Category
Share in the
Total %
31.12.2020
Share in the
Total %
31.12.2019
1st Category The borrower has a very strong financial structure 47.06 40.39
2nd Category The borrower has a good financial structure 25.30 25.38
3rd Category The borrower has an intermediate level of financial structure 20.35 24.95
4th Category
The financial structure of the borrower must be closely monitored in
the medium term 7.29 9.28
Total 100.00 100.00

TÜRK EKONOMİ BANKASI A.Ş.
NOTES AND EXPLANATIONS TO UNCONSOLIDATED FINANCIAL STATEMENTS
AS OF 31 DECEMBER 2020 (Unless otherwise stated amounts are expressed in thousands of Turkish Lira (“TL”).)
40
II. Explanations Related to Credit Risk (continued)
Profile of significant exposures in major regions:
Exposure Categories (***)
Conditional
and
unconditional
exposures to
central
governments
or central
banks
Conditional
and
unconditional
exposures to
regional
governments
or local
authorities
Conditional and
unconditional
receivables from
administrative
units and non-
commercial
enterprises
Conditional
and
unconditional
exposures to
multilateral
development
banks
Conditional
and
unconditional
exposures to
international
organizations
Conditional
and
unconditional
exposures to
banks and
brokerage
houses
Conditional
and
unconditional
exposures to
corporates
Conditional
and
unconditional
retail
exposures
Conditional
and
unconditional
exposures
secured by real
estate property
Past due
items
Receivables
in regulatory
high-risk
categories
Exposures
in the
form of
bonds
secured
by
mortgages
Securitization
Positions
Short term
exposures to
banks,
brokerage
houses and
corporates
Exposures in
the form of
collective
investment
undertakings Others
Investments
in equities Total
Current Period
Domestic 70,174 598,426 - - - 1,690,830 30,670,286 24,561,633 5,455,931 1,075,347 - - - - -
1,408,311 167,257
65,698,195
European Union
(EU) Countries - - - - - 376,546 32 7,411 2,445 1,202 - - - - - - - 387,636
OECD Countries(*) - - - - - 29,410 - 769 278 - - - - - - 397 - 30,854
Off-Shore Banking
Regions (****) 389,970 - - - - 8 211,528 104,878 22,704 7,739 - - - - - 432 - 737,259
USA, Canada - - - - - 195,970 - 803 311 27 - - - - - - - 197,111
Other Countries - - - - - 15,929 6,099 2,585 482 27 - - - - - - - 25,122
Associates,
Subsidiaries and
Joint Ventures - - - - - - - - - - - - - - - 116,041 - 116,041
Unallocated
Assets/Liabilities
(**) - 935 - - - 561,081 10,616,055 2,208,847 424,648 90,173 - - - - - 2,889 -
13,904,628
Total 460,144 599,361 - - - 2,869,774 41,504,000 26,886,926 5,906,799 1,174,515 - - - - - 1,528,070 167,257 81,096,846
(*) Includes OECD countries other than EU countries, USA and Canada.
(**) Includes assets and liability items that cannot be allocated on a consistent basis.
(***) Risk amounts after conversion rate to credit are given before Credit Risk Mitigation.
(****) Northern Cyprus Turkish Republic balances are included in Off-Shore Banking Regions.

TÜRK EKONOMİ BANKASI A.Ş.
NOTES AND EXPLANATIONS TO UNCONSOLIDATED FINANCIAL STATEMENTS
AS OF 31 DECEMBER 2020 (Unless otherwise stated amounts are expressed in thousands of Turkish Lira (“TL”).)
41
II. Explanations Related to Credit Risk (continued)
Profile of significant exposures in major regions: (continued)
Exposure Categories (***)
Conditional
and
unconditional
exposures to
central
governments
or central
banks
Conditional
and
unconditional
exposures to
regional
governments
or local
authorities
Conditional and
unconditional
receivables
from
administrative
units and non-
commercial
enterprises
Conditional
and
unconditional
exposures to
multilateral
development
banks
Conditional
and
unconditional
exposures to
international
organizations
Conditional
and
unconditional
exposures to
banks and
brokerage
houses
Conditional
and
unconditional
exposures to
corporates
Conditional
and
unconditional
retail
exposures
Conditional and
unconditional
exposures secured
by real estate
property
Past due
items
Receivabl
es in
regulatory
high-risk
categories
Exposures
in the
form of
bonds
secured by
mortgages
Securitization
Positions
Short term
exposures to
banks,
brokerage
houses and
corporates
Exposures in
the form of
collective
investment
undertakings Others
Investments
in equities Total
Prior Period
Domestic 4,286,981 623,819 - - - 2,277,362 20,711,820 21,919,612 6,477,806 1,685,310 - - - - - 1,520,061 132,920
59,635,691
European Union
(EU) Countries - - - - - 1,376,688 4,079 9,718 4,904 1,752 - - - - - 191 - 1,397,332
OECD Countries(*) - - - - - 148,208 108 529 413 3 - - - - - 540 - 149,801
Off-ShoreBanking
Regions (****) 399,811 - - - - 9 234,520 106,298 43,444 6,187 - - - - - 306 - 790,575
USA, Canada - - - - - 42,234 - 901 345 10 - - - - - - - 43,490
Other Countries - - - - - 14,220 35,750 1,968 799 20 - - - - - - - 52,757
Associates,
Subsidiaries and
Joint Ventures - - - - - - - - - - - - - - - 115,991 - 115,991
Unallocated
Assets/Liabilities
(**) - 1,050 - - - 557,445 12,245,386 2,352,342 490,801 115,221 - - - - - 2,649 -
15,764,894
Total 4,686,792 624,869 - - - 4,416,166 33,231,663 24,391,368 7,018,512 1,808,503 - - - - - 1,639,738 132,920 77,950,531
(*) Includes OECD countries other than EU countries, USA and Canada.
(**) Includes assets and liability items that cannot be allocated on a consistent basis.
(***) Risk amounts after conversion rate to credit are given before credit risk mitigation.
(****) Northern Cyprus Turkish Republic balances are included in Off-Shore Banking Regions.

TÜRK EKONOMİ BANKASI A.Ş.
NOTES AND EXPLANATIONS TO UNCONSOLIDATED FINANCIAL STATEMENTS
AS OF 31 DECEMBER 2020 (Unless otherwise stated amounts are expressed in thousands of Turkish Lira (“TL”).)
42
II. Explanations Related to Credit Risk (continued)
Risk profile by Sectors or Counterparties:
Exposure Categories (**)
Current Period
Conditional
and
unconditional
exposures to
central
governments
or central
banks
Conditional
and
unconditional
exposures to
regional
governments
or local
authorities
Conditional
and
unconditional
receivables
from
administrative
units and non-
commercial
enterprises
Conditional
and
unconditional
exposures to
multilateral
development
banks
Conditional
and
unconditional
exposures to
international
organizations
Conditional
and
unconditional
exposures to
banks and
brokerage
houses
Conditional
and
unconditional
exposures to
corporates
Conditional
and
unconditional
retail
exposures
Conditional
and
unconditional
exposures
secured by
real estate
property
Past due
items
Receivables
in regulatory
high-risk
categories
Exposures
in the form
of bonds
secured by
mortgages
Securitization
Positions
Short term
exposures
to banks,
brokerage
houses and
corporates
Exposures in
the form of
collective
investment
undertakings Others
Investments
in equities TL (*) FC Total
Agriculture - - - - - - 447,234 438,967 158,476 112,583 - - - - - - - 1,089,467 67,793 1,157,260
Farming and Stockbreeding - - - - - - 443,548 431,691 157,781 111,728 - - - - - - - 1,078,011 66,737 1,144,748
Forestry - - - - - - - - - - - - - - - - - - - -
Fishery - - - - - - 3,686 7,276 695 855 - - - - - - - 11,456 1,056 12,512
Manufacturing - - - - - - 24,855,202 4,902,058 1,764,334 330,290 - - - - - 6 - 22,480,233 9,371,657 31,851,890
Mining and Quarrying - - - - - - 1,572,126 202,080 81,468 21,774 - - - - - 3 - 1,631,846 245,605 1,877,451
Production - - - - - - 21,870,372 4,671,776 1,504,491 291,654 - - - - - 3 - 19,767,297 8,570,999 28,338,296
Electricity, Gas and Water - - - - - - 1,412,704 28,202 178,375 16,862 - - - - - - - 1,081,090 555,053 1,636,143
Construction - - - - - - 2,477,190 577,174 262,209 184,251 - - - - - - - 1,914,319 1,586,505 3,500,824
Services 460,144 599,361 - - - 2,869,774 13,549,135 5,097,399 2,431,352 481,209 - - - - - 1,527,418 166,544 19,101,067 8,081,269 27,182,336
Wholesale and Retail Trade - - - - - - 5,745,415 2,529,212 767,050 210,204 - - - - - 78 - 7,539,402 1,712,557 9,251,959
Accommodation and Dining - - - - - - 457,285 389,829 827,844 56,062 - - - - - - - 939,127 791,893 1,731,020
Transportation and Telecom. - - - - - - 1,784,563 1,020,382 345,067 70,347 - - - - - 99 - 2,585,392 635,066 3,220,458
Financial Institutions 460,144 - - - - 2,869,774 1,947,044 52,674 100,912 5,769 - - - - - 1,526,984 166,544 3,902,824 3,227,021 7,129,845 Real Estate and Rental Services - - - - - - 3,004,184 759,125 308,164 101,740 - - - - - 246 - 2,646,475 1,526,984 4,173,459
Self-Employment Services - - - - - - 411,191 305,939 79,234 24,662 - - - - - 3 - 633,765 187,264 821,029
Educational Services - - - - - - 27,088 33,188 2,825 12,394 - - - - - 3 - 75,372 126 75,498
Health and Social Services - 599,361 - - - - 172,365 7,050 256 31 - - - - - 5 - 778,710 358 779,068
Other - - - - - - 175,239 15,871,328 1,290,428 66,182 - - - - - 646 713 17,299,893 104,643 17,404,536
Total 460,144 599,361 - - - 2,869,774 41,504,000 26,886,926 5,906,799 1,174,515 - - - - - 1,528,070 167,257 61,884,979 19,211,867 81,096,846
(*) Foreign Currency indexed credits are shown in TL column.
(**) Risk amounts after conversion rate to credit are given before credit risk mitigation.

TÜRK EKONOMİ BANKASI A.Ş.
NOTES AND EXPLANATIONS TO UNCONSOLIDATED FINANCIAL STATEMENTS
AS OF 31 DECEMBER 2020 (Unless otherwise stated amounts are expressed in thousands of Turkish Lira (“TL”).)
43
II. Explanations Related to Credit Risk (continued)
Risk profile by Sectors or Counterparties: (continued)
Exposure Categories (**)
Prior Period
Conditional
and
unconditional
exposures to
central
governments
or central
banks
Conditional
and
unconditional
exposures to
regional
governments
or local
authorities
Conditional
and
unconditional
receivables
from
administrative
units and non-
commercial
enterprises
Conditional
and
unconditional
exposures to
multilateral
development
banks
Conditional
and
unconditional
exposures to
international
organizations
Conditional
and
unconditional
exposures to
banks and
brokerage
houses
Conditional
and
unconditional
exposures to
corporates
Conditional
and
unconditional
retail
exposures
Conditional
and
unconditional
exposures
secured by real
estate property
Past due
items
Receivables
in regulatory
high-risk
categories
Exposures
in the form
of bonds
secured by
mortgages
Securitization
Positions
Short term
exposures
to banks,
brokerage
houses and
corporates
Exposures in
the form of
collective
investment
undertakings Others
Investments
in equities TL (*) FC Total
Agriculture - - - - - - 374,692 536,218 261,206 150,896 - - - - - - - 1,162,084 160,928 1,323,012
Farming and Stockbreeding - - - - - - 317,205 525,965 258,848 148,777 - - - - - - - 1,090,841 159,954 1,250,795
Forestry - - - - - - - - - - - - - - - - - - - -
Fishery - - - - - - 57,487 10,253 2,358 2,119 - - - - - - - 71,243 974 72,217
Manufacturing - - - - - - 18,252,019 4,977,803 2,163,538 554,389 - - - - - 21 - 15,490,396 10,457,374 25,947,770
Mining and Quarrying - - - - - - 1,473,513 237,677 78,380 33,035 - - - - - - - 1,135,354 687,251 1,822,605
Production - - - - - - 16,016,287 4,707,054 1,913,525 509,667 - - - - - 21 - 13,756,241 9,390,313 23,146,554
Electricity, Gas and Water - - - - - - 762,219 33,072 171,633 11,687 - - - - - - - 598,801 379,810 978,611
Construction - - - - - - 2,118,040 637,414 467,131 284,003 - - - - - - - 2,031,355 1,475,233 3,506,588
Services 4,686,792 624,869 - - - 4,416,166 12,008,560 5,215,221 2,632,510 707,107 - - - - - 1,638,829 131,367 17,247,660 14,813,761 32,061,421
Wholesale and Retail Trade - - - - - - 4,003,922 2,526,552 912,416 340,407 - - - - - 97 - 5,805,138 1,978,256 7,783,394
Accommodation and Dining - - - - - - 733,180 417,832 802,371 68,350 - - - - - - - 818,428 1,203,305 2,021,733
Transportation and Telecom. - - - - - - 1,536,635 978,073 293,854 142,060 - - - - - 115 - 2,266,800 683,937 2,950,737
Financial Institutions 4,686,792 - - - - 4,416,166 1,786,230 59,171 5,201 7,406 - - - - - 1,638,362 131,367 3,810,088 8,920,607 12,730,695 Real Estate and Rental Services - - - - - - 3,438,078 907,814 510,515 114,144 - - - - - 242 - 3,057,345 1,913,448 4,970,793
Self-Employment Services - - - - - - 380,682 279,877 103,933 31,773 - - - - - - - 682,986 113,279 796,265
Educational Services - - - - - - 42,583 38,431 3,213 2,883 - - - - - 8 - 86,556 562 87,118
Health and Social Services - 624,869 - - - - 87,250 7,471 1,007 84 - - - - - 5 - 720,319 367 720,686
Other - - - - - - 478,352 13,024,712 1,494,127 112,108 - - - - - 888 1,553 14,704,848 406,892 15,111,740
Total 4,686,792 624,869 - - - 4,416,166 33,231,663 24,391,368 7,018,512 1,808,503 - - - - - 1,639,738 132,920 50,636,343 27,314,188 77,950,531
(*) Foreign Currency indexed credits are shown in TL column.
(**) Risk amounts after conversion rate to credit are given before credit risk mitigation.

TÜRK EKONOMİ BANKASI A.Ş.
NOTES AND EXPLANATIONS TO UNCONSOLIDATED FINANCIAL STATEMENTS
AS OF 31 DECEMBER 2020 (Unless otherwise stated amounts are expressed in thousands of Turkish Lira (“TL”).)
44
II. Explanations Related to Credit Risk (continued)
Analysis of maturity-bearing exposures according to remaining maturities:
Current Period Term to Maturity
Exposure classifications 1 Month
1-3
Months
3-6
Months
6-12
Months
Over
1 year
Conditional and unconditional exposures to central governments or
central banks 460,144 - - - -
Conditional and unconditional exposures to regional governments or local authorities 2,896 1,917 2,504 73,817 517,264
Conditional and unconditional receivables from administrative units
and non-commercial enterprises - - - - - Conditional and unconditional exposures to multilateral development
banks - - - - -
Conditional and unconditional exposures to international organizations - - - - -
Conditional and unconditional exposures to banks and brokerage houses 1,556,176 82,212 102,568 50,379 99,750
Conditional and unconditional exposures to corporates 4,446,913 4,286,397 7,166,570 6,269,661 8,707,685
Conditional and unconditional retail exposures 4,743,410 932,170 2,272,421 2,793,708 13,924,631 Conditional and unconditional exposures secured by real estate
property 321,818 215,569 504,560 624,601 3,813,992
Past due receivables - - - - - Receivables defined in high risk category by BRSA - - - - -
Exposures in the form of bonds secured by mortgages - - - - -
Securitization Positions - - - - - Short term exposures to banks, brokerage houses and corporates - - - - -
Exposures in the form of collective investment undertakings - - - - -
Other receivables 12,972 - - - - Investment in equities - - - - -
Total 11,544,329 5,518,265 10,048,623 9,812,166 27,063,322
Prior Period Term to Maturity
Exposure classifications 1 Month
1-3
Months
3-6
Months
6-12
Months
Over
1 year
Conditional and unconditional exposures to central governments or
central banks 1,066,414 471,734 149,250 - 2,999,393 Conditional and unconditional exposures to regional governments or
local authorities 454 8,510 5,831 28,694 580,327
Conditional and unconditional receivables from administrative units and non-commercial enterprises - - - - -
Conditional and unconditional exposures to multilateral development
banks - - - - - Conditional and unconditional exposures to international
organizations - - - - -
Conditional and unconditional exposures to banks and brokerage houses 2,521,879 149,760 391,771 354,946 22,467
Conditional and unconditional exposures to corporates 6,709,735 3,041,969 1,774,385 2,099,121 7,070,149
Conditional and unconditional retail exposures 5,901,738 662,123 1,057,436 1,960,244 12,447,543 Conditional and unconditional exposures secured by real estate
property 1,060,771 188,558 418,402 500,288 4,358,543
Past due receivables - - - - - Receivables defined in high risk category by BRSA - - - - -
Exposures in the form of bonds secured by mortgages - - - - -
Securitization Positions - - - - - Short term exposures to banks, brokerage houses and corporates - - - - -
Exposures in the form of collective investment undertakings - - - - -
Other receivables 9,742 - - - - Investment in equities - - - - -
Total 17,270,733 4,522,654 3,797,075 4,943,293 27,478,422

TÜRK EKONOMİ BANKASI A.Ş.
NOTES AND EXPLANATIONS TO UNCONSOLIDATED FINANCIAL STATEMENTS
AS OF 31 DECEMBER 2020 (Unless otherwise stated amounts are expressed in thousands of Turkish Lira (“TL”).)
45
II. Explanations Related to Credit Risk (continued) Information about the risk exposure categories:
The credit rating of Fitch Ratings International Rating Agency is used for all receivables from the central
governments or central banks which are included in the risk classes indicated in Article 6 of the Communiqué on
Measurement and Assessment of Capital Adequacy of the Bank, and the country risk classification announced by
The Organization for Economic Co-operation and Development (OECD) is used for receivables from banks and
intermediary agencies. 20% weight concentration is used for receivables from non-rated banks and intermediary
agencies with a maturity period of three months or less, and 50% weight concentration is used for receivables with
a maturity period of more than three months, and the risk weight used for all receivables is not lower than the risk
concentration corresponding to the OECD credit quality level of the country where the non-rated banks and
intermediary agencies are founded.
Risk ratings per the credit quality levels and the risk weights according to exposure categories announced by Fitch
Ratings International Rating Agency and Organization for Economic Co-operation and Development (OECD)’s
are presented below:
Credit
Quality Level Fitch Ratings Long-
Term Credit Rating
Risk Weight of
Receivables from
Central Government or
Central Banks
Receivables from Banks and Brokerage
Houses
Corporate
Receivables
DTM less than
3 months
DTM higher than
3 months 0 - 20% 50% 100%
1 AAA and AA- 0% 20% 50% 100%
2 A+ and A- 20% 20% 50% 100%
3 BBB+ and BBB- 50% 50% 50% 100%
4 BB+ and BB- 100% 100% 100% 100%
5 B+ and B- 100% 100% 100% 100%
6 CCC+ and below 150% 100% 100% 100%
7 - 150% 150% 100%
Exposures by risk weights:
Current Period
Risk Weights 0% 10% 20% 35% 50% 75% 100% 150% 200% 250% 1250%
Deductions
from Equity
Exposures before
Credit Risk
Mitigation 37,120,331 - 6,848,950 4,781,154 10,296,262 35,844,332 45,768,483 169,194 - - - 595,492
Exposures after
Credit Risk
Mitigation 39,207,308 - 7,127,526 4,781,154 9,805,690 33,271,187 43,175,855 111,039 - - - 595,492
Prior Period
Risk Weights 0% 10% 20% 35% 50% 75% 100% 150% 200% 250% 1250%
Deductions
from Equity
Exposures before
Credit Risk
Mitigation 18,782,383 - 9,722,718
5,619,543 8,772,509 32,503,479
44,694,831 386,973 - - - 599,223
Exposures after
Credit Risk
Mitigation 20,810,311 - 9,894,427
5,619,543 8,792,310 30,117,705
42,886,103 251,802 - - - 599,223

TÜRK EKONOMİ BANKASI A.Ş.
NOTES AND EXPLANATIONS TO UNCONSOLIDATED FINANCIAL STATEMENTS
AS OF 31 DECEMBER 2020 (Unless otherwise stated amounts are expressed in thousands of Turkish Lira (“TL”).)
46
II. Explanations Related to Credit Risk (continued)
Information in terms of major sectors and type of counterparties:
Current Period Credits Provisions
Impaired Receivables (TFRS 9) Expected Credit
Major Sectors / Counterparties
Significant Increase in
Credit Risk (Stage II)
Credit-Impaired
Losses (Stage III)
Loss Provisions
(TFRS 9)
Agriculture 589,157 237,067 178,448
Farming and Stockbreeding 576,288 228,842 172,294
Forestry - 3,634 2,088
Fishery 12,869 4,591 4,066
Manufacturing 1,731,493 674,352 851,836
Mining and Quarrying 189,483 14,968 75,194
Production 1,499,539 635,292 752,434
Electricity, Gas and Water 42,471 24,092 24,208
Services 4,248,425 2,132,357 2,003,325
Wholesale and Retail Trade 3,107,940 1,273,123 1,203,942
Accommodation and Dining 121,449 131,641 133,499
Transportation and Telecom. 293,137 98,481 176,684
Financial Institutions 40,969 9,653 10,883
Real Estate and Rental Services 344,119 384,202 268,913
Professional Services 303,989 137,755 141,206
Educational Services 24,358 32,194 24,886
Health and Social Services 12,464 65,308 43,312
Other 1,383,270 458,106 620,716
Total 7,952,345 3,501,882 3,654,325
Prior Period Credits Provisions
Impaired Receivables (TFRS 9) Expected Credit
Major Sectors / Counterparties
Significant Increase in
Credit Risk (Stage II)
Credit-Impaired
Losses (Stage III)
Loss Provisions
(TFRS 9)
Agriculture 389,856 257,288 165,710
Farming and Stockbreeding 384,108 252,031 162,059
Forestry - 675 612
Fishery 5,748 4,582 3,039
Manufacturing 1,542,620 803,789 626,803
Mining and Quarrying 84,136 13,466 18,190
Production 1,451,604 773,381 602,057
Electricity, Gas and Water 6,880 16,942 6,556
Services 3,064,524 1,857,476 1,449,342
Wholesale and Retail Trade 944,454 1,463,331 938,988
Accommodation and Dining 737,563 122,513 132,793
Transportation and Telecom. 492,117 149,666 137,225
Financial Institutions 212,560 13,413 59,972
Real Estate and Rental Services 553,559 33,710 122,601
Professional Services 60,825 64,569 44,882
Educational Services 17,606 7,229 8,298
Health and Social Services 45,840 3,045 4,583
Other 3,867,382 1,228,353 1,004,843
Total 8,864,382 4,146,906 3,246,698

TÜRK EKONOMİ BANKASI A.Ş.
NOTES AND EXPLANATIONS TO UNCONSOLIDATED FINANCIAL STATEMENTS
AS OF 31 DECEMBER 2020 (Unless otherwise stated amounts are expressed in thousands of Turkish Lira (“TL”).)
47
II. Explanations Related to Credit Risk (continued)
Information about Value Adjustment and Change in Provisions
31.12.2019
Balance
Provision for the
Period
Provision
Reversal
Written off
from Asset
Other
Adjustments(*)
31.12.2020
Balance
Default (Stage III) 2,394,656 680,625 (207,531) (485,853) - 2,381,897
Expected Loss
Provisions (Stage I-II) 1,503,984 980,025 (648,931) - 161,480 1,996,558
(*) Determined according to currency differences, business merger, acquisition and disposition of affiliate company
31.12.2018
Balance
Provision for the
Period
Provision
Reversal
Written off
from Asset
Other
Adjustments(*)
31.12.2019
Balance
Default (Stage III) 1,705,877 1,543,159 (242,873) (613,109) 1,602 2,394,656
Expected Loss
Provisions (Stage I-II) 1,356,383 459,096 (353,802) - 42,307 1,503,984
(*) Determined according to currency differences, business merger, acquisition and disposition of affiliate company.
III. Explanations Related to Risks Involved in Counter-Cyclical Capital Buffer Calculation:
Current Period
Countries where the risk ultimately taken
Private sector loans in
banking accounts
Risk weighted amounts
calculated in
trading accounts Total
Turkey 71,192,511 1,031,487 72,223,998
TRNC 323,446 - 323,446
England 283,621 - 283,621
Egypt 6,098 - 6,098
Germany 4,714 - 4,714
Netherlands 993 - 993
France 954 - 954
Other 9,554 - 9,554 71,821,891 1,031,487 72,853,378
Prior Period
Countries where the risk ultimately taken
Private sector loans in
banking accounts
Risk weighted amounts
calculated in
trading accounts Total
Turkey 63,538,329 613,436 64,151,765
TRNC 370,046 - 370,046
England 343,908 - 343,908
The Ivory Coast 29,622 - 29,622
Germany 6,331 - 6,331
Egypt 6,126 - 6,126
Belgium 1,730 - 1,730
Other 12,613 5 12,618 64,308,705 613,441 64,922,146

TÜRK EKONOMİ BANKASI A.Ş.
NOTES AND EXPLANATIONS TO UNCONSOLIDATED FINANCIAL STATEMENTS
AS OF 31 DECEMBER 2020 (Unless otherwise stated amounts are expressed in thousands of Turkish Lira (“TL”).)
48
IV. Explanations Related to Currency Risk
Foreign currency risk indicates the probability of loss that the Bank is subject to due to the exchange rate movements in the market. While calculating the share capital requirement, all foreign currency assets, liabilities and forward transactions of the Bank are taken into consideration and risk is calculated by using the standard method.
The Board of Directors of the Bank sets limits for the positions, which are followed up daily. Any possible changes in the foreign currency transactions in the Bank’s positions are also monitored.
As an element of the Bank’s risk management strategies, foreign currency liabilities are hedged against exchange rate risk by derivative instruments.
Asset Liability Management and Treasury Department of the Bank is responsible for the management of Turkish Lira or
foreign currency price, liquidity and affordability risks that could occur in the domestic and international markets within the limits set by the Board of Directors. The monitoring of risk and risk related transactions occurring in the money
markets is performed daily and reported to the Bank’s Asset-Liability Committee on a weekly basis.
As of 31 December 2020, the Bank’s balance sheet short position is TL 21,615,848 (31 December 2019: TL 12,304,371
short position) off-balance sheet long position is TL 20,950,439 (31 December 2019: 11,928,995 long position) and as a
result net foreign currency short position is TL 665,409 (31 December 2019: net TL 375,376 short position).
The announced current foreign exchange buying rates of the Bank at 31 December 2020 and the previous five working
days in full TL are as follows:
24.12.2020 25.12.2020 28.12.2020 29.12.2020 30.12.2020 31.12.2020
USD 7.5343 7.5127 7.4187 7.3265 7.3415 7.3883
JPY 0.0727 0.0726 0.0716 0.0707 0.0713 0.0717
EURO 9.1843 9.1429 9.0634 8.975 9.0234 9.072
The simple arithmetic averages of the major current foreign exchange buying rates of the Bank for the thirty days before
31 December 2019 are as follows:
Monthly Average Foreign
Exchange Rate
USD 7.6812
JPY 0.0740
EUR 9.3475
Information on the foreign currency risk of the Bank:
The Bank is exposed to foreign currency risk in large amounts in EURO and USD.
The table below shows the Bank's sensitivity to a 10% change in the USD and EURO rates. The rate of 10% used is the
rate used to report the currency risk to the senior management within the Bank, and this rate represents the possible change
expected by the management in exchange rates. 10% depreciation of USD and EURO against TL affects profit and equity
amounts positively in the case of a short position and negatively in the case of a long position.
Change in FX Rate % Effect on Profit / Loss Effect on Equity (*)
31 December 2020 31 December 2020 USD 10 increase (21,533) 2,403 USD 10 decrease 21,533 (2,403) EURO 10 increase 2,810 2,496 EURO 10 decrease (2,810) (2,496)
Change in FX Rate % Effect on Profit / Loss
Effect on Equity
(*)
31 December 2019 31 December 2019 USD 10 increase 19,299 937 USD 10 decrease (19,299) (937) EURO 10 increase (7,623) 587 EURO 10 decrease 7,623 (587)
(*) The effect on equity does not include the effect of the change in exchange rates on the income statement.
The sensitivity of the Bank to the changes in the exchange rates did not change significantly in the current period. Opening
or closing positions in line with market expectations may increase the sensitivity to changes in the period's exchange rates.

TÜRK EKONOMİ BANKASI A.Ş.
NOTES AND EXPLANATIONS TO UNCONSOLIDATED FINANCIAL STATEMENTS
AS OF 31 DECEMBER 2020 (Unless otherwise stated amounts are expressed in thousands of Turkish Lira (“TL”).)
49
IV. Explanations Related to Currency Risk (continued)
Information on the Bank's currency risk:
The table below shows the Bank’s distribution of balance sheet and derivative foreign exchange transactions taking into
account the options transactions with nominal values as indicated in the BRSA regulation on foreign currency position.
Besides taking into account this position by monitoring legal limits, the Bank also monitors the delta-adjusted position of
the option transactions. As of 31 December 2020, the Bank has net USD short position TL 222,394 and net EUR long
position TL 42,157.
Current Period EUR USD Other FC Total Assets
Cash (Cash in Vault, Foreign Currency Cash, Money in Transit, Cheques Purchased) and Balances with the Central Bank of Turkey(1) 5,575,267 6,192,796 1,748,758 13,516,821
Banks(2) 563,501 2,195,685 1,846,441 4,605,627
Financial Assets at Fair Value Through Profit or Loss 273,495 846,307 - 1,119,802
Money Market Placements - - - -
Financial Assets at Fair Value through Other Comprehensive Income 2,402,125 597,696 23,165 3,022,986
Loans (3) 9,748,810 2,539,105 834,361 13,122,276
Subsidiaries, Associates and Entities Under Common Control - - - -
Financial Assets Measured at Amortized Cost(4) 1,263,472 1,061,092 - 2,324,564
Derivative Financial Assets for Hedging Purposes (5) - - - -
Tangible Assets - - - -
Intangible Assets - - - -
Other Assets (6) 1,450,428 185,001 5,956 1,641,385
Total Assets 21,277,098 13,617,682 4,458,681 39,353,461
Liabilities
Bank Deposits 71 - 15 86
Foreign Currency Deposits (7) 12,698,616 23,869,761 7,586,475 44,154,852
Money Market Borrowings 2,717,468 - - 2,717,468
Funds Provided From Other Financial Institutions 9,056,646 4,472,261 743 13,529,650
Securities Issued - - - -
Miscellaneous Payables - - - -
Derivative Financial Liabilities for Hedging Purposes 14,901 - - 14,901
Other Liabilities (8) 230,137 300,973 21,242 552,352
Total Liabilities 24,717,839 28,642,995 7,608,475 60,969,309
Net Balance Sheet Position (3,440,741) (15,025,313) (3,149,794) (21,615,848)
Net Off-Balance Sheet Position 3,506,359 14,570,186 2,964,614 21,041,159
Financial Derivative Assets (9) 15,993,374 25,685,642 4,743,380 46,422,396
Financial Derivative Liabilities (9) 12,487,015 11,115,456 1,778,766 25,381,237
Non-Cash Loans (10) 8,000,422 7,226,322 1,537,854 16,764,598
Prior Period
Total Assets 19,666,901 14,316,374 3,896,975 37,880,250
Total Liabilities 20,695,152 25,650,183 3,839,286 50,184,621
Net Balance Sheet Position (1,028,251) (11,333,809) 57,689 (12,304,371)
Net Off-Balance Sheet Position 797,511 11,133,800 (2,316) 11,928,995
Financial Derivative Assets (9) 14,804,346 26,844,874 782,678 42,431,898
Financial Derivative Liabilities (9) 14,006,835 15,711,074 784,994 30,502,903
Non-Cash Loans (10) 6,880,451 5,459,747 904,769 13,244,967
(1) Cash (Cash in Vault, Foreign Currency Cash, Money in Transit, Cheques Purchased) and Balances with the Central Bank of Turkey TL 2,561(31 December 2019: TL 1,890) includes the balances of expected credit losses.
(2) The banks include TL 9,579 (31 December 2019: TL 9,059) of expected credit loss provisions. (3) Foreign currency indexed loans amounting to TL 233,707 (31 December 2019: TL 495,451) are included in the loan portfolio. Also, it includes TL 476,466 (31
December 2019: TL 368,603) amounting to expected credit loss. (4) Financial assets at amortized cost includes expected credit loss amounting to TL 523 (31 December 2019: TL 305). (5) TL 31,137 (31 December 2019: TL 14,112) income accruals from derivative financial instruments is deducted from derivative financial assets held for risk
management. (6) TL 213,071 (31 December 2019: TL 184,862) income accruals from derivative financial instruments is deducted from other assets. (7) Precious metal accounts amounting to TL 6,002,054 (31 December 2019: TL 2,349,023) are included in the foreign currency deposits. (8) TL 175,503 (31 December 2019: TL 90,922) expense accruals from derivative financial instruments are deducted from other liabilities. (9) Forward asset and marketable securities purchase-sale commitments of TL 951,630 (31 December 2019: TL 1,395,075) are added to derivative financial assets and
TL 1,071,704 (31 December 2019: TL 883,345) has been added to derivative financial assets.
(10) There is no effect on the net off-balance sheet position.

TÜRK EKONOMİ BANKASI A.Ş.
NOTES AND EXPLANATIONS TO UNCONSOLIDATED FINANCIAL STATEMENTS
AS OF 31 DECEMBER 2020 (Unless otherwise stated amounts are expressed in thousands of Turkish Lira (“TL”).)
50
V. Explanations Related to Interest Rate Risk
Interest rate risk shows the probability of loss related to the changes in interest rates depending on the Bank’s position, and it is managed by the Asset-Liability Committee. The interest rate sensitivity of assets, liabilities and off-balance sheet items related to this risk are measured by using the standard method and included in the market risk for capital adequacy.
The priority of the risk management department is to protect from interest rate volatility. Duration, maturity and sensitivity analysis performed within this context are calculated by the risk management department and reported to the Liquidity Risk and Asset-Liability Committee.
Simulations on interest income are performed in connection with the forecasted economic indicators used in the budget of the Bank.
The Bank management monitors the market interest rates on a daily basis and revises the interest rates of the Bank when necessary.
The Bank carries interest rate risk within the legal and internal limits and manages the interest rate risk in accordance with the bank's risk appetite. Information related to the interest rate sensitivity of assets, liabilities and off-balance sheet items (based on repricing dates):
Up to 1
Month 1-3 Months
3-12
Months 1-5 Years Over 5 Years
Non-interest
Bearing(1) Total
Current Period
Assets
Cash (Cash in Vault, Foreign Currency Cash, Money in
Transit, Cheques Purchased) and Balances with the
Central Bank of Turkey(2) 11,452,134 - - - - 5,495,853 16,947,987
Banks(3) 4,732,084 - - - - 1,780,679 6,512,763
Financial Assets at Fair Value Through Profit and
Loss 297,525 91,886 760,926 201,958 95,521 183,075 1,630,891
Money Market Placements 6,180,886 - - - - (439) 6,180,447
Financial Assets at Fair Value Through Other Comprehensive Income(4) 805,587 113,055 2,319,571 4,656,078 746,205 10,881 8,651,377
Loans(5) 11,310,285 6,681,908 25,261,054 32,741,342 3,435,619 (545,889) 78,884,319
Financial Assets Measured at Amortized Cost(6) 1,012,657 825,220 9,171,693 1,472,121 41,250 (2,818) 12,520,123
Other Assets 338,380 535,384 266,647 672,721 299,267 6,607,736 8,720,135
Total Assets 36,129,538 8,247,453 37,779,891 39,744,220 4,617,862 13,529,078 140,048,042
Liabilities
Bank Deposits 7,424,601 - - - - 43,796 7,468,397
Other Deposits 47,493,350 5,865,710 235,318 367 32,710,336 86,305,081
Money Market Borrowings 6,548,253 - - - - - 6,548,253
Miscellaneous Payables - - - - - - -
Securities Issued 2,160,640 - 2,649,997 - - - 4,810,637
Funds Provided From Other Financial Institutions
Financial Institutions 758,398 594,518 8,303,532 91,158 4,194,951 - 13,942,557
Other Liabilities 227,987 28,532 383,341 1,309,066 244,413 18,779,778 20,973,117
Total Liabilities 64,613,229 6,488,760 11,572,188 1,400,591 4,439,364 51,533,910 140,048,042
Balance Sheet Long Position - 1,758,693 26,207,703 38,343,629 178,498 - 66,488,523
Balance Sheet Short Position (28,483,691) - - - - (38,004,832) (66,488,523)
Off-Balance Sheet Long Position 3,031,120 3,816,103 - - - - 6,847,223
Off-Balance Sheet Short Position - - (796,816) (5,154,568) (487,360) - (6,438,744)
Total Position (25,452,571) 5,574,796 25,410,887 33,189,061 (308,862) (38,004,832) 408,479
(1)The expected loss provisions are presented under the “Non-Interest Bearing” column. (2)Cash and cash equivalents include cash balances (cash in hand, cash in hand, cash in the safe deposit box, purchased checks) and the Central Bank of Turkey's outstanding
loss provisions in the amount of TL 3,316. (3)The banks include TL 10,656 of expected loss provisions.
(4)Receivables from money markets includes the expected losses provisions amounting to TL 439. (5)The revolving loans amounting to TL 6,201,511 are presented under the “Up to 1 Month” column. It includes expected loss provisions amounting to TL 4,047,771. (6)Financial assets at amortized cost include losses amounting to TL 2,818.
The other assets line in the non-interest bearing column consists of tangible assets amounting to TL 836,192 intangible assets amounting to TL 564,803, subsidiaries amounting to TL 116,036 and entities under common control joint venture amounting to TL 5, assets held for sale amounting to TL 112,859 while other liabilities line includes the shareholders’ equity of TL 11,409,851.

TÜRK EKONOMİ BANKASI A.Ş.
NOTES AND EXPLANATIONS TO UNCONSOLIDATED FINANCIAL STATEMENTS
AS OF 31 DECEMBER 2020 (Unless otherwise stated amounts are expressed in thousands of Turkish Lira (“TL”).)
51
V. Explanations Related to Interest Rate Risk (continued)
Information related to the interest rate sensitivity of assets, liabilities and off-balance sheet items (based on
repricing dates): (continued)
Up to 1
Month 1-3 Months
3-12
Months 1-5 Years Over 5 Years
Non-interest
Bearing Total
Prior Period
Assets
Cash (Cash in Vault, Foreign Currency Cash,
Money in Transit, Cheques Purchased) and
Balances with the Central Bank of Turkey 8,951,411 - - - - 3,002,600 11,954,011
Banks 6,057,109 - - - - 2,485,247 8,542,356
Financial Assets at Fair Value Through Profit and
Loss 180,593 132,240 55,307 669,506 132,752 125,025 1,295,423
Money Market Placements 840,263 - - - - (29) 840,234
Financial Assets at Fair Value Through Other Comprehensive Income 1,057,349 529,972 523,340 2,416,056 1,005,005 7,895 5,539,617
Loans (1) 16,882,302 4,579,167 11,359,041 28,333,166 3,917,453 506,014 65,577,143
Financial Assets Measured at Amortized Cost 164,665 796,314 2,075,934 1,699,969 169,736 (1,104) 4,905,514
Other Assets 105,790 7,652 315,615 948,324 94,067 7,224,422 8,695,870
Total Assets 34,239,482 6,045,345 14,329,237 34,067,021 5,319,013 13,350,070 107,350,168
Liabilities
Bank Deposits 362,573 - - - - 23,739 386,312
Other Deposits 49,530,928 4,829,633 677,235 7,293 16,762,927 71,808,016
Money Market Borrowings 1,644,665 - - - - - 1,644,665
Miscellaneous Payables - - - - - - -
Securities Issued 1,692,304 641,573 - - - - 2,333,877
Funds Provided From Other Financial Institutions
FiFinancialInstitutions 1,736,892 2,987,103 5,676,760 100,473 1,266,257 - 11,767,485
Other Liabilities 23,862 117 711,943 2,330,152 86,263 16,257,476 19,409,813
Total Liabilities 54,991,224 8,458,426 7,065,938 2,437,918 1,352,520 33,044,142 107,350,168 Balance Sheet Long Position - - 7,263,299 31,629,103 3,966,493 - 42,858,895
Balance Sheet Short Position (20,751,742) (2,413,081) - - - (19,694,072) (42,858,895)
Off-Balance Sheet Long Position 5,720,979 4,734,356 - - - - 10,455,335
Off-Balance Sheet Short Position - - (4,006,053) (5,678,954) (623,850) - (10,308,857) Total Position (15,030,763) 2,321,275 3,257,246 25,950,149 3,342,643 (19,694,072) 146,478
(1) The expected loss provisions are presented under the “Non-Interest Bearing” column. (2) Cash balances (Cash, Effective Deposit, Money in transit, Notes Payable) and the Central Bank of the Republic of Turkey include balances of expected losses
amounting to TL 1,959. (3) Banks include balance of expected loss provisions amounting to TL 9,809. (4) Money market placements include balance of expected loss provisions amounting to TL 29. (5) The revolving loans amounting to TL 7,177,775 are presented under the “Up to 1 Month” column. It includes expected loss provisions amounting to TL 3,640,892. (6) Financial assets at amortized cost include balance of expected loss provisions of TL 1,104.
The other assets line in the non-interest bearing column consists of tangible assets amounting to TL 877,782 intangible
assets amounting to TL 555,886, subsidiaries amounting to TL 116,036 and entities under common control joint venture
amounting to TL 5, assets held for sale amounting to TL 131,362 while other liabilities line includes the shareholders’
equity of TL 9,720,574.

TÜRK EKONOMİ BANKASI A.Ş.
NOTES AND EXPLANATIONS TO UNCONSOLIDATED FINANCIAL STATEMENTS
AS OF 31 DECEMBER 2020 (Unless otherwise stated amounts are expressed in thousands of Turkish Lira (“TL”).)
52
V. Explanations Related to Interest Rate Risk (continued)
Average interest rates applied to monetary financial instruments: EUR
%
USD
%
YEN
%
TL
%
End of Current Period
Assets
Cash (Cash in Vault, Foreign Currency Cash, Money in Transit, Cheques
Purchased) and Balances with the Central Bank of Turkey - - - 12.00
Banks (0.29) 0.21 (0.26) 17.88
Financial Assets at Fair Value Through Profit and Loss 2.60 2.65 - 10.12
Money Market Placements - - - 17.98
Financial Assets at Fair Value Through Other Comprehensive Income 2.91 3.86 - 12.91
Loans 2.79 3.81 5.37 14.33
Financial Assets Measured at Amortized Cost 2.04 3.51 - 8.26
Liabilities
Bank Deposits - - - 10.65
Other Deposits 0.04 1.25 - 15.12
Money Market Borrowings 0.88 - - 17.02
Miscellaneous Payables - - - -
Securities Issued - - - 9.54
Funds Provided From Other Financial Institutions 2.09 4.91 - 10.69
EUR
%
USD
%
YEN
%
TL
%
End of Prior Period
Assets
Cash (Cash in Vault, Foreign Currency Cash, Money in Transit, Cheques
Purchased) and Balances with the Central Bank of Turkey - - - 10.00
Banks - 1.59 - 11.43
Financial Assets at Fair Value Through Profit and Loss 1.52 4.89 - 8.66
Money Market Placements - - - 11.46
Financial Assets at Fair Value Through Other Comprehensive Income 2.11 4.57 - 13.83
Loans 3.23 4.95 5.28 16.42
Financial Assets Measured at Amortized Cost 2.48 4.51 - 14.63
Liabilities
Bank Deposits - 1.40 - 5.10
Other Deposits 0.16 1.86 0.25 10.26
Money Market Borrowings - - - 11.02
Miscellaneous Payables - - - -
Securities Issued - - - 12.05
Funds Provided From Other Financial Institutions 2.16 5.65 - 12.31
Interest rate risk arising from banking accounts:
a) Significant assumptions and frequency of measurement of interest rate risk, including the nature of
interest rate risk arising from banking accounts and those related to the movement of deposits other
than loan early repayments and time deposits:
Interest rate risk arising from banking accounts is monitored through different scenarios, and the interest
risk exposed by presenting the results to the relevant committees is evaluated from different perspectives.
There is a limit determined by the Board of Directors regarding the risk amount. It is taken care to ensure a
certain harmony between assets and liabilities on the basis of currency, taking into account the market
expectations of the bank.
Early repayment rates of loans were determined by examining historic the reaction of housing loans to
interest movements in the previous periods. By analyzing the movements of demand deposits on the basis
of branches and accounts, it has been determined the duration of demand deposits that remain in the Bank
on account basis. Assumptions accepted in parallel with the results reached are reflected in the above
mentioned products in interest rate sensitivity calculations.

TÜRK EKONOMİ BANKASI A.Ş.
NOTES AND EXPLANATIONS TO UNCONSOLIDATED FINANCIAL STATEMENTS
AS OF 31 DECEMBER 2020 (Unless otherwise stated amounts are expressed in thousands of Turkish Lira (“TL”).)
53
V. Explanations Related to Interest Rate Risk (continued)
Interest rate risk arising from banking accounts: (continued)
b) Economic value differences arising from fluctuations in interest rates in accordance with the “Regulation
on Measurement and Evaluation of Interest Rate Risk Arising from Banking Accounts by Standard Shock
Method”:
Currency
Applied shock
(+/- x base point) Gains/ (Losses) Gains /Equity– (Losses)/ Equity
TL (400) 1,270,671 7.79%
TL 500 (1,422,031) (8.72)%
EURO (200) (83,424) (0.51)%
EURO 200 87,032 0.53%
USD (200) (101,872) (0.62)%
USD 200 101,153 0.62%
Total (For negative shocks) (800) 1,085,376 6.66%
Total (For positive shocks) 900 (1,233,845) (7.57)%
VI. Explanations Related to Certificates Share Position Risk from Banking Book: Equity securities which are not publicly traded in the Bank’s financial statements are booked as their fair value, or otherwise booked as their cost value whereby fair value can not be calculated properly.
The Bank does not have any shares traded in Borsa Istanbul.
VII. Explanations Related to Liquidity Risk and Liquidity Coverage Ratio
a) Information on liquidity risk management, such as the Bank's risk capacity, responsibilities and the structure of
liquidity risk management, Bank’s internal liquidity risk reporting, communication between the Board of Directors
and business lines on liquidity risk strategy, policy and application:
The Asset-Liability Management and Treasury Group is responsible for following up the Bank's current liquidity
position and for complying with liquidity limits approved by the Board of Directors. After evaluating the liquidity
position, the Asset-Liability Management and Treasury Group use authorized products to provide sufficient liquidity
based on liquidity position.
Responsibilities for liquidity management are described in the Liquidity Risk Policy which is audited and approved
by the Board of Directors annually. The various responsibilities have been shared among the appropriate departments
and committees as outlined in duty descriptions. While the Asset-Liability Management and Treasury Group alone is
responsible for managing liquidity and for developing short-term liquidity estimates, the Asset-Liability Management
and Treasury Group works with the Asset-Liability Management Committee to jointly developing/setting short-term
liquidity strategies and middle and long term liquidity estimates. The Asset-Liability Management Committee is
responsible for preparing middle and long term liquidity strategies.
The Risk Management Group monitors daily all set liquidity risk limits, and periodically reports internal and legal
liquidity rates and changes to the Audit Committee and Board of Directors, in addition to providing daily reports to
senior management. Information about the Bank's liquidity structure and policies is provided to the relevant business
lines at an Assets-Liabilities Committee meeting which is held every couple of weeks and at a Liquidity Risk
Committee meeting which is held monthly.
b) Information on the centralization degree of liquidity management and funding strategy, and on operations
between Bank and its partnerships:
The Asset-Liability Management and the Treasury Group manage the Bank's liquidity risk and performs this role only
for the bank. Liquidity gap values are monitored within the limits set by the Board of Directors, and for compliance
with these limits, the necessary debt instruments are used, while considering price and maturity structure. Our
subsidiaries manage their own liquidity and we provide them borrowing facilities within market conditions and legal
limits.

TÜRK EKONOMİ BANKASI A.Ş.
NOTES AND EXPLANATIONS TO UNCONSOLIDATED FINANCIAL STATEMENTS
AS OF 31 DECEMBER 2020 (Unless otherwise stated amounts are expressed in thousands of Turkish Lira (“TL”).)
54
VII. Explanations Related to Liquidity Risk and Liquidity Coverage Ratio (continued)
c) Information about the Bank's funding strategy including policies on funding types and variety of maturities:
While the Bank tries to diversify its funding resources, it also tries to extend its payment terms. Customer deposits
are the bank's main funding resource. Our main strategy for deposit management is to be inclusive while extending
the average maturity. In addition to borrowings from money markets and collecting deposit, the Bank uses
instruments such as long-term syndicated loans, securities issued in TL and foreign currency to diversify funding
resources.
d) Information on liquidity management based on currency which consists of a minimum of 5% of the Bank's total
liabilities:
Excluding TL, USD and EUR, there is no foreign currency which exceeds 5% of total liabilities. For these currencies, liquidity gaps are reported on a monthly basis and the Liquidity Coverage Ratio is calculated daily for Total and Foreign Currency. The Asset-Liability Management and Treasury Group is responsible for taking the necessary steps to keep ratios within the limits determined by the Board of Directors. Trend of these ratios are monitored on a monthly basis by the Liquidity Risk Committee which includes the General Manager, Assistant General Manager responsible from Financial Affairs Group, Group Risk Chief Officer, and the Assistant General Manager in charge of the Asset-Liability Management and Treasury Group. Furthermore, senior management is periodically informed about the relevant ratios.
e) Information on liquidity risk mitigation techniques:
The Bank's main liquidity management strategy is to diversify funding resources and extend the maturity structure.
The Bank's balance sheet liquidity risk is periodically measured by Assets-Liabilities management and closely
monitored with the Treasury. In accordance with market expectations, the Assets-Liabilities Management and
Treasury Group carries out the actions necessary to minimize risk.
Within this framework, the Bank’s liquidity risk is attempted to manage efficiently by long-term structural changes
(such as diversifying funding sources, extending maturity structure etc.) and short and mid-term money market and
derivative transactions.
In the short term, liquidity risk is minimized with FX swaps, interbank borrowings and repurchase agreements, while
cross currency swap transactions are used to minimize these risks in the long term.
f) Explanation on the usage of the stress test:
The aim of the liquidity stress test is to analyse how liquidity squeeze affects bank liquidity. Cash inflows and
outflows which may arise in cases of stress event are analysed based on products with different maturities. Stress
events which may arise as a result of the liquidity squeeze, both in the Bank and in the whole banking system, in
cases of stress event are analysed. Also, situations where the two scenarios might coincide are considered. The
analysis addresses how much of the net cash outflows of different maturities would be covered by the current liquid
stock during all relevant stress events.
g) General information on liquidity emergency and contingency plans:
The extraordinary liquidity situation is evaluated to determine;
- Whether the liquidity problem is specific to the bank or applies to the whole banking system and
- Whether there is a permanent or temporary problem.
Profitability has second degree importance in extraordinary liquidity conditions. In cases of cash shortage or cash
withdrawal, the branches are responsible for informing the Asset-Liability Management and Treasury Group about
withdrawn liabilities. The Asset-Liability Management and Treasury Group takes the necessary actions to cover the
cash outflow which may occur in the accounts and informs the Asset-Liability Committee of any related delays.
In a liquidity crisis, the Asset-Liability Management and Treasury Group, the Asset-Liability Committee, the Liquidity Risk Committee, senior management, and the Board of Directors are responsible for solving the liquidity problem. It is predicted that, in a liquidity crisis, in order to create additional liquidity, written actions (considering the cost) must be taken within current market conditions.

TÜRK EKONOMİ BANKASI A.Ş.
NOTES AND EXPLANATIONS TO UNCONSOLIDATED FINANCIAL STATEMENTS
AS OF 31 DECEMBER 2020 (Unless otherwise stated amounts are expressed in thousands of Turkish Lira (“TL”).)
55
VII. Explanations Related to Liquidity Risk Management and Liquidity Coverage Ratio (continued)
Liquidity Coverage Ratio:
Rate of Percentage to Be
Taken into Account not
Implemented Total
Value(*)
Rate of Percentage to Be
Taken into Account
Implemented Total
Value(*)
Current Period – 31 December 2020 TL+FC FC TL+FC FC
High Quality Liquid Assets
1 High Quality Liquid Assets 36,582,088 15,499,469
Cash Outflows
2 Real Person and Retail Deposits 61,582,931 31,915,012 5,475,939 3,191,501
3 Stable Deposits 13,647,077 - 682,354 - 4 Less Stable Deposits 47,935,854 31,915,012 4,793,585 3,191,501 5 Unsecured Debts Other than Real Person and Retail
Deposits 32,361,702 14,472,515 17,661,127 7,275,184 6 Operational Deposits 117,835 - 29,459 - 7 Non-Operational Deposits 28,298,303 12,070,133 13,713,430 4,872,802 8 Other Unsecured Funding 3,945,564 2,402,382 3,918,238 2,402,382 9 Secured Funding - - - - 10 Other Cash Outflows 1,665,525 2,927,065 1,665,525 2,927,065 11 Outflows Related to Derivative Exposures and
Other Collateral Requirements 1,665,525 2,927,065 1,665,525 2,927,065 12 Outflows Related to Restructured Financial
Instruments - - - - 13 Payment Commitments and Other Off-Balance Sheet
Commitments Granted for Debts to Financial Markets - - - - 14 Other Revocable Off-Balance Sheet
Commitments and Contractual Obligations - - - - 15 Other Irrevocable or Conditionally Revocable
Off-Balance Sheet Obligations 34,747,936 12,938,807 2,767,596 1,288,863
16 Total Cash Outflows 27,570,187 14,682,613
Cash Inflows
17 Secured Receivables - - - - 18 Unsecured Receivables 11,815,328 5,566,219 9,247,037 5,177,146 19 Other cash Inflows 966,659 9,003,399 966,659 9,003,399
20 Total Cash Inflows 12,781,987 14,569,618 10,213,696 14,180,545
Values to which the upper limit is applied
21 Total High Quality Liquid Assets 36,582,088 15,499,469
22 Total Net Cash Outflows 17,356,491 3,670,653
23 Liquidity Coverage Ratio (%) 210.77 422.25
(*) Simple arithmetic average of the last three months data calculated by using weekly simple arithmetic averages.

TÜRK EKONOMİ BANKASI A.Ş.
NOTES AND EXPLANATIONS TO UNCONSOLIDATED FINANCIAL STATEMENTS
AS OF 31 DECEMBER 2020 (Unless otherwise stated amounts are expressed in thousands of Turkish Lira (“TL”).)
56
VII. Explanations Related to Liquidity Risk Management and Liquidity Coverage Ratio (continued)
Liquidity Coverage Ratio: (continued)
Rate of Percentage to Be
Taken into Account not
Implemented Total Value(*)
Rate of Percentage to Be
Taken into Account
Implemented Total Value(*)
Prior Period – 31 December 2019 TL+FC FC TL+FC TL
High Quality Liquid Assets
1 High Quality Liquid Assets 22,314,509 14,243,288
Cash Outflows
2 Real Person and Retail Deposits 52,470,993 25,987,479 4,616,009 2,598,748
3 Stable Deposits 12,621,803 - 631,090 -
4 Less Stable Deposits 39,849,190 25,987,479 3,984,919 2,598,748
5 Unsecured Debts Other than Real Person and Retail
Deposits 21,413,624 11,074,642 11,928,061 5,872,051
6 Operational Deposits 70,441 - 17,610 -
7 Non-Operational Deposits 16,335,675 8,860,962 6,932,951 3,658,371
8 Other Unsecured Funding 5,007,508 2,213,680 4,977,500 2,213,680
9 Secured Funding - - - -
10 Other Cash Outflows 1,576,774 2,328,433 1,576,774 2,328,433
11 Outflows Related to Derivative Exposures and
Other Collateral Requirements 1,576,774 2,328,433 1,576,774 2,328,433
12 Outflows Related to Restructured Financial
Instruments - - - -
13 Payment Commitments and Other Off-Balance Sheet
Commitments Granted for Debts to Financial Markets - - - -
14 Other Revocable Off-Balance Sheet
Commitments and Contractual Obligations - - - -
15 Other Irrevocable or Conditionally Revocable
Off-Balance Sheet Obligations 32,629,677 10,716,211 2,666,309 1,124,445
16 Total Cash Outflows 20,787,153 11,923,677
Cash Inflows
17 Secured Receivables - - - -
18 Unsecured Receivables 12,666,308 5,508,103 9,352,475 4,874,984
19 Other cash Inflows 1,731,364 8,382,892 1,731,364 8,382,892
20 Total Cash Inflows 14,397,672 13,890,995 11,083,839 13,257,876
Values to which the upper limit is applied
21 Total High Quality Liquid Assets 22,314,509 14,243,288
22 Total Net Cash Outflows 9,703,314 2,980,919
23 Liquidity Coverage Ratio (%) 229.97 477.82
(*) Simple arithmetic average of the last three months data calculated by using weekly simple arithmetic averages.

TÜRK EKONOMİ BANKASI A.Ş.
NOTES AND EXPLANATIONS TO UNCONSOLIDATED FINANCIAL STATEMENTS
AS OF 31 DECEMBER 2020 (Unless otherwise stated amounts are expressed in thousands of Turkish Lira (“TL”).)
57
VII. Explanations Related to Liquidity Risk Management and Liquidity Coverage Ratio (continued)
Liquidity Coverage Ratio: (continued)
The amount of high quality liquid assets, distribution of deposits based on segment, maturity types of borrowings and the
share of revolving loans in loan portfolio can be considered as the most important factors affecting Liquidity Coverage
Ratio.
High quality liquid assets in order of their priority consist of the time accounts, bond portfolio, required reserve, cash and
effective deposit. Funding sources consists of corporate customer deposits, real person deposits, borrowings and SME
deposit accounts which are weighted by ratios used in Liquidity Coverage Ratio reporting considering their maturity types.
Due to amount differences between buy and sell transactions, derivative products effect more FC Liquidity Coverage
Ratio rather than the total. Besides, cash outflows due to withdrawal of the collaterals securing derivatives and market
valuation changes on derivative transactions are considered in calculations. There are concentration limits on funding sources approved by Board of Directors. Proportional limits on product type are reported in relation to how much of the funding can be obtained from deposits, group funding, borrowings from banks and repo and other long-term sources. Liquidity management of the subsidiaries subject to consolidation is carried out by the companies themselves. Although there is a consolidated reporting for the Liquidity Coverage Ratio, there is no centralized liquidity management. Finally, there is no significant cash inflow and cash outflow related to the liquidity profile of the Bank, which is included in the calculation of liquidity coverage ratio, but which is not included in the public disclosure template in the second paragraph of the related communiqué. The weeks with lowest and highest liquidity coverage ratio for the last three months calculated by using weekly simple arithmetic averages are presented below:
Current Period Prior Period
TL+FC FC TL+FC FC
Lowest 170.05% 274.27% 153.35% 358.28%
Week 23.10.2020 16.10.2020 04.10.2019 18.10.2019
Highest 267.71% 491.66% 375.55% 610.47%
Week 18.12.2020 11.12.2020 06.12.2019 06.12.2019

TÜRK EKONOMİ BANKASI A.Ş.
NOTES AND EXPLANATIONS TO UNCONSOLIDATED FINANCIAL STATEMENTS
AS OF 31 DECEMBER 2020 (Unless otherwise stated amounts are expressed in thousands of Turkish Lira (“TL”).)
58
VII. Explanations Related to Liquidity Risk Management and Liquidity Coverage Ratio
(continued) Liquidity Coverage Ratio: (continued)
Presentation of assets and liabilities according to their remaining maturities:
Current Period
Demand Up to 1
Month 1-3
Months 3-12
Months 1-5
Years Over
5 Years Undistributed (1) Total
Assets
Cash (Cash in Vault, Foreign Currency
Cash, Money in Transit, Cheques
Purchased) and Balances with the
Central Bank of Turkey(2) 5,499,169 11,452,134 - - - - (3,316) 16,947,987
Banks(3) 2,347,591 4,175,828 - - - - (10,656) 6,512,763
Financial Assets at Fair Value Through
Profit and Loss - 215,364 12,605 676,294 448,032 95,521 183,075 1,630,891
Money Market Placements(4) - 6,180,886 - - - - (439) 6,180,447
Financial Assets at Fair Value Through
Other Comprehensive Income 10,881 118,185 61,238 2,461,895 4,935,096 1,064,082 - 8,651,377
Loans(4) - 10,344,024 6,679,434 25,275,844 33,695,287 3,435,619 (545,889) 78,884,319
Financial Assets Measured at Amortized
Cost(5) - 606,251 511,946 980,114 10,083,934 340,696 (2,818) 12,520,123
Other Assets - 1,254,201 787,405 446,644 743,683 299,267 5,188,935 8,720,135
Total Assets 7,857,641 34,346,873 8,052,628 29,840,791 49,906,032 5,235,185 4,808,892 140,048,042
Liabilities
Bank Deposits 43,796 7,424,601 - - - - - 7,468,397
Other Deposits 32,710,336 47,493,350 5,865,710 235,318 367 - - 86,305,081
Funds Provided from Other Financial
Institutions - 741,423 59,141 8,829,629 117,413 4,194,951 - 13,942,557
Money Market Placements - 6,548,253 - - - - - 6,548,253
Securities Issued - 2,160,640 - 2,649,997 - - - 4,810,637
Miscellaneous Payables - - - - - - - -
Other Liabilities - 5,030,934 781,778 617,866 1,642,131 517,508 12,382,900 20,973,117
Total Liabilities 32,754,132 69,399,201 6,706,629 12,332,810 1,759,911 4,712,459 12,382,900 140,048,042
Liquidity Gap (24,896,491) (35,052,328) 1,345,999 17,507,981 48,146,121 522,726 (7,574,008) -
Net Off-Balance Sheet Position - 223,288 (240,996) 117,535 126,240 (3,144) - 222,923
Financial Derivative Assets - 18,691,080 19,520,863 9,383,245 11,983,043 4,199,690 - 63,777,921
Financial Derivative Liabilities - 18,467,792 19,761,859 9,265,710 11,856,803 4,202,834 - 63,554,998
Non-Cash Loans 6,918,016 1,354,463 2,719,244 6,823,344 6,430,957 - - 24,246,024
Prior Period
Total Assets 5,507,510 33,279,118 5,954,430 12,932,885 37,190,039 5,767,493 6,718,693 107,350,168
Total Liabilities 16,786,666 59,083,886 5,940,873 8,557,061 2,792,617 3,642,509 10,546,556 107,350,168
Liquidity Gap (11,279,156) (25,804,768) 13,557 4,375,824 34,397,422 2,124,984 (3,827,863) -
Net Off-Balance Sheet Position - 217,295 (20,526) 21,127 62,051 1,665 - 281,612
Financial Derivative Assets - 18,322,414 6,162,762 13,378,270 15,125,169 3,374,022 - 56,362,637
Financial Derivative Liabilities - 18,105,119 6,183,288 13,357,143 15,063,118 3,372,357 - 56,081,025
Non-Cash Loans 6,078,123 942,642 2,658,433 5,667,723 7,028,565 - - 22,375,486
(1) The assets which are necessary to provide banking services and could not be liquidated in a short term, such as tangible assets, investments in subsidiaries
and associates, office supply inventory, prepaid expenses and loans under follow-up, are classified as under undistributed.
(2) Cash and cash equivalents include cash balances (cash in hand, cash in hand, cash in the safe deposit box, purchased checks) and the Central Bank of Turkey's
outstanding loss provisions amounting to TL 3,316.
(3) The banks include TL 10,656 of expected loss provisions. (4) Receivables from money markets includes the expected losses provisions amounting to TL 439. (5) The revolving loans amounting to TL 6,201,511 are presented under the “Up to 1 Month” column. It includes expected loss provisions amounting to TL
4,047,771. (6) Financial assets at amortized cost include losses amounting to TL 2,818.

TÜRK EKONOMİ BANKASI A.Ş.
NOTES AND EXPLANATIONS TO UNCONSOLIDATED FINANCIAL STATEMENTS
AS OF 31 DECEMBER 2020 (Unless otherwise stated amounts are expressed in thousands of Turkish Lira (“TL”).)
59
VII. Explanations Related to Liquidity Risk Management and Liquidity Coverage Ratio (continued)
Analysis of financial liabilities by remaining contractual maturities:
Demand
Up to 1
Month
1-3
Months
3-12
Months
1-5
Years
5 Years
and Over
Unallocated
Total
31 December 2020
Money Market Borrowings - 6,568,394 - - - - (20,141) 6,548,253 Other Deposits 32,710,336 47,611,550 5,941,850 241,975 367 - (200,997) 86,305,081
Banks Deposits 43,796 7,433,248 - - - - (8,647) 7,468,397
Funds From Other Financial Institutions - 835,551 71,744 9,569,324
1,129,862 5,581,278 (3,245,202) 13,942,557
Issued Securities - - 4,413,557 739,050 - - (341,970) 4,810,637
Total 32,754,132 62,448,743 10,427,151 10,550,349 1,130,229 5,581,278 (3,816,957) 119,074,925
31 December 2019
Money Market Borrowings - 1,644,941 - - - - (276) 1,644,665
Other Deposits 16,762,927 49,590,016 4,856,525 702,372 8,133 - (111,957) 71,808,016 Banks Deposits 23,739 362,650 - - - - (77) 386,312
Funds from Other Financial
Institutions - 1,058,591 400,531 7,466,273 1,197,495 4,214,894 (2,570,299) 11,767,485 Issued Securities - 1,732,211 659,336 - - - (57,670) 2,333,877
Total 16,786,666 54,388,409 5,916,392 8,168,645 1,205,628 4,214,894 (2,740,279) 87,940,355
Analysis of contractual maturity of the Bank’s derivative financial instruments:
Up to 1 Month
1-3 Months
3-12 Months
1-5 Years
5 Years and
Over
Unallocated
31 December 2020
Derivative financial instruments for
hedging purposes
Fair Value Hedge 1,047,907 4,338,325 - - 863,835 6,250,067 Cash Flow Hedge 710,591 34,994 1,708,688 3,238,883 - 5,693,156
Trading Transactions Forward foreign exchange agreement 3,000,033 2,271,615 2,318,963 553,143 - 8,143,754 Swap money selling agreement 10,028,698 13,815,112 2,175,927 3,527,930 3,329,046 32,876,713 Swap interest agreement - - - - - - Futures monetary agreement - 209,828 380,096 - - 589,924 Money exchange options contract 981,308 566,084 288,360 185,653 - 2,021,405
Total 15,768,537 21,235,958 6,872,034 7,505,609 4,192,881 55,575,019
31 December 2019
Derivative financial instruments for
hedging purposes
Fair Value Hedge - 935,776 - 804,408 - 1,740,184 Cash Flow Hedge 617,006 335,892 4,195,289 6,305,070 107,140 11,560,397
Trading Transactions Forward foreign exchange agreement 1,738,432 1,661,071 1,479,351 466,529 - 5,345,383 Swap money selling agreement 13,932,004 2,992,549 5,848,387 6,105,848 2,806,467 31,685,255 Swap interest agreement 26,051 14,667 105,270 142,349 9,818 298,155 Futures monetary agreement - - - 35,164 - 35,164 Money exchange options contract 1,709,590 1,694,963 743,905 62,871 - 4,211,329
Total 18,023,083 7,634,918 12,372,202 13,922,239 2,923,425 54,875,867

TÜRK EKONOMİ BANKASI A.Ş.
NOTES AND EXPLANATIONS TO UNCONSOLIDATED FINANCIAL STATEMENTS
AS OF 31 DECEMBER 2020 (Unless otherwise stated amounts are expressed in thousands of Turkish Lira (“TL”).)
60
VIII. Explanations Related to Leverage Ratio
a) Information on issues that cause differences between current period and previous period leverage ratios:
There is a decrease in the leverage ratio in line with the increase on-balance sheet risks.
b) Leverage ratio:
Assets on the Balance Sheet
Current
Period(*)
Prior
Period(*)
1 Assets on the Balance Sheet (Excluding Derivative Financial Instruments and Loan
Derivatives, Including Collaterals) 134,762,915 103,210,045
2 (Assets Deducted from Core Capital) (675,833) (580,323)
3 Total Risk Amount for Assets on the Balance Sheet 134,087,082 102,629,722
Derivative Financial Instruments and Credit Derivatives
4 Renewal Cost of Derivative Financial Instruments and Loan Derivatives 1,777,668 438,483
5 Potential Credit Risk Amount of Derivative Financial Instruments and Loan Derivatives 492,002 560,417
6 Total Risk Amount of Derivative Financial Instruments and Loan Derivatives 2,269,670 998,900
Financing Transactions with Securities or Goods Warranties
7 Risk Amount of Financial Transactions with Securities or Goods Warranties (Excluding
Those in the Balance Sheet) 900,450 3,323
8 Risk Amount Arising from Intermediated Transactions - -
9 Total Risk Amount of Financing Transactions with Securities or Goods Warranties 900,450 3,323
Off-the-Balance Sheet Transactions
10 Gross Nominal Amount of the Off-Balance Sheet Transactions 46,024,212 46,734,215
11 (Adjustment Amount Arising from Multiplying by the Credit Conversion Rate) - -
112 Total Risk Amount for Off-Balance Sheet Transactions 46,024,212 46,734,215
Capital and Total Risk
13 Tier 1 Capital 11,154,878 10,224,843
14 Total Risk Amount 183,281,414 150,366,160
Leverage Ratio
15 Leverage Ratio 6.09% 6.80%
(*) The amounts in the table are calculated by using the quarterly average amounts.

TÜRK EKONOMİ BANKASI A.Ş.
NOTES AND EXPLANATIONS TO UNCONSOLIDATED FINANCIAL STATEMENTS
AS OF 31 DECEMBER 2020 (Unless otherwise stated amounts are expressed in thousands of Turkish Lira (“TL”).)
61
IX. Explanations on the Presentation of Financial Assets and Liabilities at Their Fair Values
The table below shows the book value and fair value of financial assets and liabilities that are not shown at the fair value of the Bank's financial statements.
Book Value Fair Value
Current Period Prior Period Current Period Prior Period
Financial Assets 112,749,029 85,404,864 112,447,072 87,155,529
Receivables From Money Markets 6,180,447 840,234 6,180,447 840,234 Banks 6,512,763 8,542,356 6,512,763 8,542,356 Financial Assets at Fair Value Through Other
Comprehensive Income 8,651,377 5,539,617 8,651,377 5,539,617 Financial Assets Valued Over Amortized Cost 12,520,123 4,905,514 12,544,293 5,032,899 Loans 78,884,319 65,577,143 78,558,192 67,200,423
Financial Liabilities 121,695,133 91,123,255 121,946,859 91,289,902
Banks Deposits 7,468,397 386,312 7,468,397 386,312 Other Deposits 86,305,081 71,808,016 86,455,274 71,903,320 Funds Received from Other Financial Institutions (*) 20,490,810 13,412,150 20,592,343 13,483,493 Securities Issued 4,810,637 2,333,877 4,810,637 2,333,877 Miscellaneous Payables 2,620,208 3,182,900 2,620,208 3,182,900
(*) Debts to money markets and subordinated loans are included in the line of funds from other financial institutions.
Investment securities in the current period include financial assets valued at their amortized cost and at fair value through other comprehensive income. The fair value of assets held to maturity assets are determined based on market prices or quoted market prices of other securities subject to redemption in terms of interest, maturity and other similar circumstances, where their prices cannot be determined.
Due to the fact that demand deposits, variable rate placements and overnight deposits are short-term, hence their carrying value reflects their fair value. Estimated fair value of fixed interest deposits and funds provided from other financial institutions, is calculated with the presence of discounted cash flow using the current interest rates used for other debts of similar quality and similar maturity structure; by finding the discounted cash flow using the fair value of loans and the current interest rates used for receivables with similar and similar maturities. As the miscellaneous debts are short term, their carrying value approximately reflects their fair value.
The fair value of financial assets and liabilities are determined as follows:
• First level: Financial assets and liabilities are valued at the stock market prices traded in the active market for the same assets and liabilities.
• Second level: Financial assets and liabilities are valued from the inputs used to find the price of the relevant asset or liability directly or indirectly, which can be observed in the market other than the stock exchange price specified in the first level.
• Third level: Financial assets and liabilities are valued from inputs that are not based on any observable data in the market used to find the fair value of the asset or liability.

TÜRK EKONOMİ BANKASI A.Ş.
NOTES AND EXPLANATIONS TO UNCONSOLIDATED FINANCIAL STATEMENTS
AS OF 31 DECEMBER 2020 (Unless otherwise stated amounts are expressed in thousands of Turkish Lira (“TL”).)
62
IX. Explanations on the Presentation of Financial Assets and Liabilities at Their Fair Values(continued)
The following table contains the analysis of the fair values of the financial instruments carried at fair values, including the
stock market prices, valuation techniques, all model data of which can be measured in the market, or using valuation
techniques whose data cannot be measured in the market:
31 December 2020 Level 1 Level 2 Level 3 Total
Financial Assets 10,065,146 3,008,598 58,651 13,132,395
Financial Assets at Fair Value Through Profit or Loss 1,447,816 1,887,914 47,770 3,383,500
Government Debt Securities 1,447,816 - - 1,447,816
Derivative Financial Assets at Fair Value Through
Profit or Loss - 1,752,609 - 1,752,609
Financial Assets at Fair Value Through Other
Comprehensive Income - 135,305 47,770 183,075
Derivative Financial Assets for Hedging Purposes - 1,097,518 - 1,097,518
Financial Assets at Fair Value Through Other Comprehensive
Income 8,617,330 23,166 10,881 8,651,377
Government Debt Securities 8,617,330 23,166 - 8,640,496
Other Fair Value Differences Financial Assets Reflected to
Other Comprehensive Income - 10,881 10,881
Financial Liabilities - 3,343,179 - 3,343,179
Derivative Financial Liabilities at Fair Value Through Profit
or Loss - 2,260,343 - 2,260,343
Derivative Financial Liabilities for Hedging Purposes - 1,082,836 - 1,082,836
31 December 2019 Level 1 Level 2 Level 3 Total
Financial Assets 6,681,437 2,016,319 48,833 8,746,589
Financial Assets at Fair Value Through Profit or Loss 1,170,398 1,754,129 40,938 2,965,465
Government Debt Securities 1,167,994 - - 1,167,994
Derivative Financial Assets at Fair Value Through
Profit or Loss - 1,670,042 - 1,670,042
Financial Assets at Fair Value Through Other
Comprehensive Income 2,404 84,087 40,938 127,429
Derivative Financial Assets for Hedging Purposes - 241,507 - 241,507
Financial Assets at Fair Value Through Other Comprehensive
Income 5,511,039 20,683 7,895 5,539,617
Government Debt Securities 5,511,039 20,683 - 5,531,722
Other Fair Value Differences Financial Assets Reflected to
Other Comprehensive Income - - 7,895 7,895
Financial Liabilities - 3,511,558 - 3,511,558
Derivative Financial Liabilities at Fair Value Through Profit
or Loss - 1,586,584 - 1,586,584
Derivative Financial Liabilities for Hedging Purposes - 1,924,974 - 1,924,974
There is no transition between levels in the current year.
X. Explanations Related to Transaction Carried Out on Behalf of Other Parties and Fiduciary Assets
The Bank performs buying transactions on behalf of customers, and gives custody, administration and advisory services.
The Bank does not deal with fiduciary transactions.

TÜRK EKONOMİ BANKASI A.Ş.
NOTES AND EXPLANATIONS TO UNCONSOLIDATED FINANCIAL STATEMENTS
AS OF 31 DECEMBER 2020 (Unless otherwise stated amounts are expressed in thousands of Turkish Lira (“TL”).)
63
XI. Explanations Related to Risk Management
Notes and explanations prepared in accordance with “the Communiqué on Disclosures about Risk Management to be
Announced to Public by Banks” published in Official Gazette no. 29511 on 23 October 2015 and became effective as of
31 March 2016 are presented in this section. The notes to be presented within the scope of internal rating based approach
have not been presented due to use of standard approach for the calculation of capital adequacy ratio by the Bank.
1. Risk management approach and Risk Weighted Amounts
1.1 Bank’s risk management approach
The objective of the Risk Management system is to provide that the risks that are derived from the bank’s activities
are defined, measured, monitored and controlled through policies, procedures and limits established.
Risk Management functions of the Bank and all of its subsidiaries have been gathered under the Group Risk
Management. Group Risk Management reports to the Boards of Directors of TEB Group through the Risk Comittee
and Audit Committee within the TEB A.Ş. and is responsible for fulfilling its duties of general supervision, notification
and recommendation on behalf of the Boards of Directors in line with the principles laid down in this Regulation.
With Risk Policies, the Bank aims to,
i) Identify the main risks to which bank is exposed and identified risks are within the controlled range,
ii) Define roles and responsibilities to identify, analyse, measure, monitor, and control the main risks bank faces and
other risks which may arise as a consequence of changes in activity structure and economic conditions,
iii) Identify the volume of transactions which may cause non-controllable risks by considering equity strength or
decrease the activities affected by such risks.
Risk policies and the procedures related there to contain written standards set by the Board of Directors and the “Senior
Management” consisting of General Manager, Assistant General Managers and Chief Risk Officer.
Risk policies and related procedures are prepared in compliance with the Banking Law, external legislation and general
banking practices and presented to the Senior Management / Board of Directors for approval.
It is the principal duty of all managers of the Bank to provide compliance with risk policies containing the criteria
required for each unit.
Risk Management Operations consist of;
i) risk measurement,
ii) monitoring of risks,
iii) control of risk and reporting operations
Risk management operations are conducted by Group Risk Management and personnel.
Group Risk Management applies second order controls for quantifiable risks as part of continuous control system.
Head of Group Risk Management reports to the Board of Directors via Risk Committee and Audit Committee.

TÜRK EKONOMİ BANKASI A.Ş.
NOTES AND EXPLANATIONS TO UNCONSOLIDATED FINANCIAL STATEMENTS
AS OF 31 DECEMBER 2020 (Unless otherwise stated amounts are expressed in thousands of Turkish Lira (“TL”).)
64
XI. Explanations Related to Risk Management (continued)
1. Risk management approach and Risk Weighted Amounts (continued) 1.2 Overview of Risk Weighted Amounts
Risk Weighted Amounts
Minimum capital
Requirement
Current Period Prior Period Current Period
1 Credit Risk (Excluding Counterparty Credit Risk) (CCR) 74,646,643 73,382,817 5,971,732
2 Of which Standardized Approach (SA) 74,646,643 73,382,817 5,971,732
3 Of which Internal Rating-Based (IRB) Approach - - -
4 Counterparty Credit risk 2,116,406 1,203,770 169,312
5 Of which Standardized Approach for Counterparty Credit Risk
(SA-CCR) 2,116,406 1,203,770 169,312
6 Of which Internal Model Method (IMM) - - -
7 Equity positions in banking book under market-based approach - - -
8 Equity Investment in Funds - Look-Through Approach - - -
9 Equity Investment in Funds - Mandate-Based Approach - - -
10 Equity Investment in Funds - 1250% Weighted Risk Approach - - -
11 Settlement Risk - - -
12 Securitization Positions in banking accounts - - -
13 Of which IRB ratings-based approach (RBA) - - -
14 Of which IRB Supervisory Formula Approach (SFA) - - -
15 Of which SA/simplified supervisory formula approach
(SSFA) - - -
16 Market risk 2,451,650 1,649,750 196,132
17 Of which Standardized approach (SA) 2,451,650 1,649,750 196,132
18 Of which Internal model approaches (IMM) - - -
19 Operational Risk 9,547,537 8,372,744 763,803
20 Of which Basic Indicator Approach 9,547,537 8,372,744 763,803
21 Of which Standard Approach - - -
22 Of which Advanced Measurement Approach - - -
23 Amounts Below the Thresholds for Deduction (Subject to a 250%
Risk Weight) - - -
24 Floor Adjustment - - -
25 Total (1+4+7+8+9+10+11+12+16+19+23+24) 88,762,236 84,609,081 7,100,979

TÜRK EKONOMİ BANKASI A.Ş.
NOTES AND EXPLANATIONS TO UNCONSOLIDATED FINANCIAL STATEMENTS
AS OF 31 DECEMBER 2020 (Unless otherwise stated amounts are expressed in thousands of Turkish Lira (“TL”).)
65
XI. Explanations Related to Risk Management (continued)
2. Linkages Between Financial Statements and Regulatory Exposures
2.1 Differences between accounting and regulatory scopes of consolidation and mapping of financial statement categories with regulatory risk categories Carrying value of items
Current Period
Carrying values
as reported in
published financial
statements (*)
Subject to
credit risk
framework
Subject to
counterparty
credit risk
framework
Subject to the
market risk
framework (**)
Not subject to capital
requirements or
subject to deduction
from capital
Assets Cash Values and Central Bank 16,951,303 16,951,303 - - -
Banks 6,523,419 6,526,154 - - -
Receivables From Money Markets 6,180,886 2,501,076 3,679,810 - -
Financial Assets at Fair Value through Profit Loss 1,630,891 183,074 - 1,447,817 -
Financial Assets at Fair Value Through Other Comprehensive Income 8,651,377 8,653,347 - - -
Financial Assets Measured by Amortized Cost 12,522,941 12,522,941 - - -
Part of Derivative Financial Assets at Fair Value Through Profit Loss 1,752,609 - 1,752,609 1,752,609 -
The Fair Value Differences of Derivative Financial Assets Reflected to Other Comprehensive Income 1,097,518 - 1,097,518 1,097,518 -
Frozen Financial Assets - - - - -
Expected Loss Reserves (-) 4,065,000 2,294,073 - - -
Credits 82,932,090 82,932,088 - - -
Factoring Receivables - - - - -
Non-Current Assets Held For Sale and Discontinued Operations (Net) 112,859 112,859 - - -
Affiliates (Net) - - - - -
Subsidiaries (Net) 116,036 116,036 - - -
Joint Ventures (Joint Ventures) (Net) 5 5 - - -
Property, Plant and Equipment (Net) 836,192 798,168 - - 38,025
Intangible Assets (Net) 564,803 - - - 564,803
Investment Properties (Net) - - - - -
Current Tax Asset 19,678 19,678 - - -
Deferred Tax Asset 632,912 632,912 - - -
Other Assets (*) 3,587,523 1,845,163 1,470,105 - 272,255
Total assets 140,048,042 131,500,731 8,000,042 4,297,944 875,083
Liabilities
Deposit 93,773,478 - - - -
Loans received 9,747,606 - - - -
Debts to money markets 6,548,253 - 6,548,253 - -
Issued securities 4,810,637 - - - -
Financial Liabilities with Fair Value Differences Reflected to Profit Loss - - - - -
Derivative Financial Liabilities 3,343,179 - 1,604,879 - -
Factoring Obligations - - - - -
Lease Liablities 598,957 - - - -
Provisions 973,049 - - - -
Current Tax Liability 321,406 - - - -
Deferred Tax Liability - - - - -
Fixed asset payables related to activities held and discontinued for sale (net) - - - - -
Subordinated loans 4,194,951 - - - -
Other Liabilities 4,326,675 - 2,461 - -
Equity 11,409,851 - - - -
Total liabilities 140,048,042 - 8,155,593 - -
(*) Refers to Bank’s unconsolidated financial statement

TÜRK EKONOMİ BANKASI A.Ş.
NOTES AND EXPLANATIONS TO UNCONSOLIDATED FINANCIAL STATEMENTS
AS OF 31 DECEMBER 2020 (Unless otherwise stated amounts are expressed in thousands of Turkish Lira (“TL”).)
66
XI. Explanations Related to Risk Management (continued)
2. Linkages Between Financial Statements and Regulatory Exposures
2.1 Differences between accounting and regulatory scopes of consolidation and mapping of financial statement categories with regulatory risk categories Carrying value of items
Prior Period
Carrying values
as reported in
published financial
statements (*)
Subject to
credit risk
framework
Subject to
counterparty
credit risk
framework
Subject to the
market risk
framework (**)
Not subject to capital
requirements or
subject to deduction
from capital
Assets Cash Values and Central Bank 11,955,970 11,955,970 - - -
Banks 8,552,165 8,553,619 - - -
Receivables From Money Markets 840,263 - 840,263 - -
Financial Assets at Fair Value through Profit Loss 1,295,423 125,026 - 1,170,397 -
Financial Assets at Fair Value Through Other Comprehensive Income 5,539,617 5,539,546 - - -
Financial Assets Measured by Amortized Cost 4,906,618 4,906,618 - - -
Part of Derivative Financial Assets at Fair Value Through Profit Loss 1,670,042 - 1,670,042 1,670,042 -
The Fair Value Differences of Derivative Financial Assets Reflected to Other Comprehensive Income 241,507 - 241,507 241,507 -
Frozen Financial Assets - - - - -
Expected Loss Reserves (-) 3,653,793 2,352,545 - - -
Credits (*) 69,218,035 69,218,035 - - -
Factoring Receivables - - - - -
Non-Current Assets Held For Sale and Discontinued Operations (Net) 131,362 131,362 - - -
Affiliates (Net) - - - - -
Subsidiaries (Net) 115,986 115,986 - - -
Joint Ventures (Joint Ventures) (Net) 5 5 - - -
Property, Plant and Equipment (Net) 877,782 832,905 - - 44,877
Intangible Assets (Net) 555,886 - - - 555,885
Investment Properties (Net) - - - - -
Current Tax Asset 10,958 10,958 - - -
Deferred Tax Asset 650,094 650,094 - - -
Other Assets (*) 4,442,248 2,554,356 1,889,567 531 -
Total assets 107,350,168 102,241,935 4,641,379 3,082,477 600,762
Liabilities
Deposit 72,194,328 - - - -
Loans received 8,576,982 - - - -
Debts to money markets 1,644,665 - 1,644,665 - -
Issued securities 2,333,877 - - - -
Financial Liabilities with Fair Value Differences Reflected to Profit Loss - - - - -
Derivative Financial Liabilities 3,511,558 - 2,571,144 - -
Factoring Obligations - - - - -
Lease Liablities 653,707 - -
Provisions 825,982 - - - -
Current Tax Liability 213,516 - - - -
Deferred Tax Liability - - - - -
Fixed asset payables related to activities held and discontinued for sale (net) - - - - -
Subordinated loans 3,190,503 - - - -
Other Liabilities 4,484,476 - 730,161 - -
Equity 9,720,574 - - - -
Total liabilities 107,350,168 - 4,945,970 - -
(*) Refers to Bank’s unconsolidated financial statements.

TÜRK EKONOMİ BANKASI A.Ş.
NOTES AND EXPLANATIONS TO UNCONSOLIDATED FINANCIAL STATEMENTS
AS OF 31 DECEMBER 2020 (Unless otherwise stated amounts are expressed in thousands of Turkish Lira (“TL”).)
67
XI. Explanations Related to Risk Management (continued)
2. Linkages Between Financial Statements and Regulatory Exposures
2.2 Differences between accounting and regulatory scopes of consolidation and mapping of financial
statement categories with regulatory risk categories
Current Period Total
Items subject
to credit risk
framework
Items subject to
counterparty
credit risk
framework
Items subject to
market risk
framework
1 Asset carrying value amount under scope of
regulatory consolidation 140,048,042 131,500,731 8,000,042 4,297,944
2 Liabilities carrying value amount under regulatory
scope of consolidation 8,155,593 - 8,155,593 -
3 Total net amount under regulatory scope of
consolidation 131,892,449 131,500,730 (155,551) 4,297,944
4 Off-balance sheet amounts 48,120,392 18,120,887 678,183 -
5 Differences in valuations - - - -
6 Differences due to different netting rules, other than those already included in row 2 - - - -
7 Differences due to consideration of provisions - - - -
8 Differences due to prudential filters - - - - 9 Exposure amounts considered for regulatory
purposes 180,012,840 149,621,617 522,632 4,297,944
Prior Period Total
Items subject
to credit risk
framework
Items subject to
counterparty
credit risk
framework
Items subject to
market risk
framework
1 Asset carrying value amount under scope of
regulatory consolidation 107,350,168 102,241,935 4,641,379 3,082,477
2 Liabilities carrying value amount under regulatory
scope of consolidation 4,945,970 - 4,945,970 -
3 Total net amount under regulatory scope of
consolidation 102,404,201 102,241,935 (304,591) 3,082,477
4 Off-balance sheet amounts 96,510,498 17,225,190 567,789 -
5 Differences in valuations - - - - 6 Differences due to different netting rules, other
than those already included in row 2 - - - -
7 Differences due to consideration of provisions - - - - 8 Differences due to prudential filters - - - -
9 Exposure amounts considered for regulatory
purposes 198,914,699 119,467,125 263,198 3,082,477
2.3 Explanations of differences between accounting and regulatory exposure amounts in accordance with
TAS
The market value approach is used to make valuation of the positions in the Bank portfolios. The market
data sources used for valuations are identified, defined in the Market Risk Policy, and reviewed annually.
The relevant action is taken immediately when it is determined that the data does not reflect the market
condition other than annual data source evaluation. Product valuations are checked by using sources such
as Reuters and Bloomberg.

TÜRK EKONOMİ BANKASI A.Ş.
NOTES AND EXPLANATIONS TO UNCONSOLIDATED FINANCIAL STATEMENTS
AS OF 31 DECEMBER 2020 (Unless otherwise stated amounts are expressed in thousands of Turkish Lira (“TL”).)
68
XI. Explanations Related to Risk Management (continued)
3. Credit Risk Disclosure
3.1 General information about credit risk
3.1.1 General qualitative information about credit risk
The objective of the Risk Management system is to provide that the risks that are derived from the bank’s
activities are defined, measured, monitored and controlled through policies, procedures and limits established.
Credit Risk Management reports aim to supply risk level trends and risk expectations for the future. Details
and content vary depending on the requirements of meetings and are presented in graphs and figures for ease
of explanation and taking decisions.
The main report presented to Senior Management is the Credit Risk General Overview report, which is
prepared monthly and discussed by the Risk Policies Committee. This report is also presented to the Board of
Directors, Risk Committee and to the Audit Committee. Additionally, Group Risk Management prepares
reports with special titles less frequently. Most of these reports are presented to the Risk Policies Committee.
These reports may also be used in irregular meetings where emergent subjects are discussed or in meetings
where the attendance of Senior Management is not required.
Credit risk policies are prepared in line with the Banking Law, external regulations, and general banking
practices, and are approved by the Risk Policies Committee, Risk Committee, and Board of Directors.
The Bank’s credit activities are managed according to the General Credit Policy that is approved by the Risk
Policies Committee, Risk Committee and the Board of Directors.
The Risk Appetite declaration is approved by the Board of Directors and audited once a year. The Bank
combines existing risk management tools, processes, principles, and policies, using a consistent approach with
risk appetite declaration, and ensures that risks taken are within the agreed upon limits. In this way, the
consistency of risk practices is improved across the Bank.
The Bank controls the credit risk by monitoring loan receivables, limiting certain transactions with counter
parties, evaluating the creditworthiness of the counter party regularly, diversifying loan types and products
separately based on customer groups and industry to prevent the concentration of deferred payments and
receiving guarantees when appropriate.
3.1.2 Credit quality of assets
Current Period
Gross carrying value in unconsolidated
financial statements prepared as per TAS
Allowances/
impairments Net values
Defaulted exposures Non-defaulted exposures
Loans 3,501,882 79,430,208 4,047,771 78,884,319
Debt Securities - 21,163,437 2,818 21,160,619
Off-balance sheet exposures - 44,266,962 311,330 43,955,632
Total 3,501,882 144,860,607 4,361,919 144,000,570
Prior Period
Gross carrying value in unconsolidated financial
statements prepared as per TAS
Allowances/
Impairments Net values Defaulted exposures Non-defaulted exposures
Loans 4,146,906 65,071,129 3,640,892 65,577,143
Debt Securities - 10,438,340 1,104 10,437,236
Off-balance sheet exposures - 42,657,485 243,480 42,414,005
Total 4,146,906 118,166,954 3,885,476 118,428,384

TÜRK EKONOMİ BANKASI A.Ş.
NOTES AND EXPLANATIONS TO UNCONSOLIDATED FINANCIAL STATEMENTS
AS OF 31 DECEMBER 2020 (Unless otherwise stated amounts are expressed in thousands of Turkish Lira (“TL”).)
69
XI. Explanations Related to Risk Management (continued)
3. Credit Risk Disclosure (continued)
3.1 General information about credit risk (continued)
3.1.3 Changes in stock of defaulted loans and debt securities
(*)The bank wrote off TL 97,496 of its non-performing loans. Additionally, the portion of the Bank's non-performing loan portfolio amounting to TL 424,469 for which a provision of TL 410,516 was provided, was sold in 2020 with a price of TL 35,759 and after following
the completion of the necessary procedures, non-performing loans were written off from the records. (**)Includes collections during the period.
(*) The bank wrote off TL 171,832 of its non-performing loans. The Bank's non-performing loan portfolio amounting to TL 467,640 with
provision TL 450,294 was sold in 2019 with a price of TL 26,363 after the completion of the necessary procedures, non-performing loans were written off from the records.
(**) Includes collections during the period
3.1.4 Additional disclosure related to the credit quality
a) The scope and definitions of “past due” and “impaired” exposures used for accounting purposes and the
differences, if any, between the definition of past due and impaired for accounting purposes
According to the “Communiqué on Methods and Principles for the Determination of Loans and Other
Receivables to be Reserved for and Allocation of Reserves”, non-required delay time loans that is not classified
as Stage III Loans, whose principal and interest payment collection delayed more than 30 days are considered
as “non-performing loan” in the Accounting Practice.
Receivables past due more than 90 days are considered as “impaired receivables”, and they are classified as
group III, IV, and V in accordance with Communiqué. A specific reserve is allocated for such receivables.
b) The extent of past due exposures (more than 90 days) that are not considered to be “impaired” and the
reasons for this
A specific provision is allocated for receivables which are overdue for more than 90 days in accordance with
the Communiqué. According to the BRSA decision dated 17 March 2020, following the number of overdue
days valid in the definition of default was changed from 90 days to 180 days, expected credit losses are
allocated considering the Stage 2 and Stage 3 provision ratios for risks within this range.
c) Description of methods used for determining impairments
Provision amount is determined in accordance with the regulation on “Methods and Principles for the
Determination of Loans and Other Receivables to be Reserved for and Allocation of Reserves”.
d) The definition of the restructured exposure
If the borrower fails to make payment to the Bank due to a temporary lack of liquidity, loans and other
receivables including deferred interest payments may be restructured to provide the borrower with additional
liquidity to enable the Bank to collect its receivables, or a new repayment schedule may be arranged.
1 Defaulted loans and debt securities at end of the 31 December 2019 4,146,906
2 Loans and debt securities that have defaulted since the last reporting period 1,451,572
3 Returned to non-defaulted status -
4 Amounts written off(*) (521,965)
5 Other changes (**) (1,574,631)
6 Defaulted loans and debt securities at end of 31 December 2020 (1+2-3-4-5) 3,501,882
1 Defaulted loans and debt securities at end of the 31 December 2018 2,774,744
2 Loans and debt securities that have defaulted since the last reporting period 3,062,812
3 Returned to non-defaulted status -
4 Amounts written off(*) (639,870)
5 Other changes (**) (1,050,780)
6 Defaulted loans and debt securities at end of 31 December 2019 (1+2-3-4-5) 4,146,906

TÜRK EKONOMİ BANKASI A.Ş.
NOTES AND EXPLANATIONS TO UNCONSOLIDATED FINANCIAL STATEMENTS
AS OF 31 DECEMBER 2020 (Unless otherwise stated amounts are expressed in thousands of Turkish Lira (“TL”).)
70
XI. Explanations Related to Risk Management (continued)
3. Credit Risk Disclosure (continued)
3.1 General information about credit risk (continued)
3.1.4 Additional disclosure related to the credit quality (continued)
e) Breakdown of exposures by geographical areas, industry and residual maturity:
Breakdown of Loans and Receivables by sector:
Current Period
TL (%) FC (%)
Agriculture 16,512,303 25.00 3,051,887 22.83
Farming and Stockbreeding 16,211,517 24.54 3,050,339 22.82
Forestry - - - -
Fishery 300,786 0.46 1,548 0.01
Manufacturing 22,951,706 34.74 6,097,207 45.62
Mining and Quarrying 1,928,121 2.92 179,404 1.34
Production 20,849,286 31.56 5,886,041 44.04
Electricity, Gas and Water 174,299 0.26 31,762 0.24
Construction 1,115,441 1.69 61,756 0.46
Services 19,151,597 28.99 3,356,564 25.11
Wholesale and Retail Trade 5,609,523 8.49 554,172 4.15
Accommodation and Dining 3,349,901 5.07 792,491 5.93
Transportation and Telecom. 2,041,497 3.09 311,508 2.33
Financial Institutions 1,489,840 2.26 98,540 0.74
Real Estate and Rental Services 3,342,800 5.06 530,997 3.97
Self-Employment Services 2,719,581 4.12 1,037,743 7.76
Educational Services 313,805 0.48 17,315 0.13
Health and Social Services 284,650 0.43 13,798 0.10
Other 6,334,126 9.59 797,621 5.98
Total 66,065,173 100.00 13,365,035 100.00
Prior Period
TL (%) FC (%)
Agriculture 1,272,531 2.42 139,879 1.12
Farming and Stockbreeding 1,210,438 2.30 138,905 1.11
Forestry - - - -
Fishery 62,093 0.12 974 0.01
Manufacturing 14,855,656 28.26 5,936,539 47.53
Mining and Quarrying 1,158,785 2.20 203,068 1.63
Production 13,147,577 25.01 5,450,083 43.63
Electricity, Gas and Water 549,294 1.05 283,388 2.27
Construction 1,247,839 2.37 335,191 2.68
Services 13,222,498 25.15 5,735,750 45.91
Wholesale and Retail Trade 5,205,663 9.90 1,005,417 8.05
Accommodation and Dining 805,003 1.53 1,373,359 10.99
Transportation and Telecom. 2,099,437 3.99 336,643 2.69
Financial Institutions 1,936,249 3.68 1,516,889 12.14
Real Estate and Rental Services 1,070,901 2.04 1,402,519 11.23
Self-Employment Services 680,584 1.29 100,360 0.80
Educational Services 82,751 0.16 563 0.00
Health and Social Services 1,341,910 2.55 - -
Other 21,979,889 41.80 345,357 2.76
Total 52,578,413 100.00 12,492,716 100.00
Breakdown of loans and receivables according to remaining maturities is provided in the note VII. of section
four under the “Presentation of assets and liabilities according to their remaining maturities”.

TÜRK EKONOMİ BANKASI A.Ş.
NOTES AND EXPLANATIONS TO UNCONSOLIDATED FINANCIAL STATEMENTS
AS OF 31 DECEMBER 2020 (Unless otherwise stated amounts are expressed in thousands of Turkish Lira (“TL”).)
71
XI. Explanations Related to Risk Management (continued)
3. Credit Risk Disclosure (continued)
3.1 General information about credit risk (continued)
3.1.4 Additional disclosure related to the credit quality (continued)
f) Amounts of impaired exposures on geographical areas and industry basis (according to the definition
used by the Bank for accounting purposes) and write-offs with related allowances.
All of the Bank’s loans under follow-up is in Turkey. Amounts of provision allocated receivables based on
sector are presented in the note II of section 4 under “Information in terms of major sectors and type of
counterparties”.
g) Ageing analysis of accounting past-due exposures
31 December 2020 (*) 1-30 Day 31-60 Day 61-90 Day Total
Loans and Receivables
Commercial Loans 265,565 155,830 438,085 859,480
Consumer Loans 520,416 180,156 256,865 957,437
Credit Cards 77,892 77,145 56,408 211,445
Total 863,873 413,131 751,358 2,028,362
(*) According to the BRSA's decisions, dated 17 March 2020 and numbered 8948 and, dated 8 December 2020 and numbered 9312,
to be effective from 17 March 2020 until 30 June 2021, total amount of loans with delays of 91 to 180 days which are continued to be classified as Stage 2 is TL 626,606 as of 31 December 2020.
31 December 2019 1-30 Day 31-60 Day 61-90 Day Total
Loans and Receivables
Commercial Loans 455,811 357,891 1,093,620 1,907,322
Consumer Loans 482,022 297,618 380,699 1,160,339
Credit Cards 96,362 103,803 73,313 273,478
Total 1,034,195 759,312 1,547,632 3,341,139
h) Breakdown of restructured exposures between impaired and not impaired exposures
Not impaired loans:
Current Period Gross Amount
Significant Increase
in Credit Risk
(Stage II) Net Amount
Commercial Loans 1,585,123 (621,022) 964,101
Consumer Loans 154,605 (32,183) 122,422
Credit Cards 22,188 (1,735) 20,453
Total 1,761,916 (654,940) 1,106,976
Prior Period Gross Amount
Significant Increase
in Credit Risk
(Stage II) Net Amount
Commercial Loans 1,927,889 (393,754) 1,534,135
Consumer Loans 137,661 (14,402) 123,259
Credit Cards 61,116 (3,605) 57,511
Total 2,126,666 (411,761) 1,714,905

TÜRK EKONOMİ BANKASI A.Ş.
NOTES AND EXPLANATIONS TO UNCONSOLIDATED FINANCIAL STATEMENTS
AS OF 31 DECEMBER 2020 (Unless otherwise stated amounts are expressed in thousands of Turkish Lira (“TL”).)
72
XI. Explanations Related to Risk Management (continued)
3. Credit Risk Disclosure (continued)
3.1 General information about credit risk (continued)
3.1.4 Additional disclosure related to the credit quality (continued)
Impaired loans:
Current Period Gross Amount
Default
(Stage III) Net Amount
Commercial Loans 65,682 37,989 27,693
Consumer Loans 27,484 18,913 8,571
Credit Cards 5,953 4,519 1,434
Total 99,119 61,421 37,698
Prior Period Gross Amount
Default
(Stage III) Net Amount
Commercial Loans 47,120 28,442 18,678
Consumer Loans 56,711 34,791 21,920
Credit Cards 11,972 9,355 2,617
Total 115,803 72,588 43,215
3.2 Credit Risk Mitigation
3.2.1 Qualitative disclosure requirements related to credit risk mitigation techniques
a) Core features of policies and processes for which the Bank makes on and off-balance sheet netting
The Bank does not perform on and off balance sheet offsetting to decrease credit risk, and credit derivatives
are not used.
b) Core features of policies and processes for collateral evaluation and management
Financial collaterals are measured at fair value as of reporting date and are included in the risk mitigation process. When allocating the collateral amount to loans provided, the Bank applies credit risk mitigation according to the comprehensive method that includes risk mitigation calculations considering the volatility-adjusted values of financial collaterals. The legal validity of the mortgage is ensured by duly registering the mortgage in a timely manner, and significant changes in market conditions are monitored.
In terms of credit risk mitigation, the Bank uses cash, government and treasury bonds, fund, gold, bank
guarantee, stock and derivatives as main collateral type. Mortgages on residential and commercial real
estate reported under different risk class are other main types of collaterals.
c) Information about market or credit risk concentrations under the credit risk mitigation instruments used
(i.e.by guarantor type, collateral and credit derivative providers).
Guarantor entity’s credit risk value is to be considered in credit risk mitigation process in cases where Bank
credit customers obtained guarantee from other entities.
Bank mostly prefers cash, securities such as government and Treasury bond for collateral which have low
market and credit risk concentration risk.

TÜRK EKONOMİ BANKASI A.Ş.
NOTES AND EXPLANATIONS TO UNCONSOLIDATED FINANCIAL STATEMENTS
AS OF 31 DECEMBER 2020 (Unless otherwise stated amounts are expressed in thousands of Turkish Lira (“TL”).)
73
XI. Explanations Related to Risk Management (continued)
3. Credit Risk Disclosure (continued)
3.2 Credit risk mitigation
3.2.2 Credit risk mitigation techniques – Overview
Current Period
Exposures
unsecured:
carrying
amount
Exposures
secured
by
collateral
Exposures
secured by
collateral,
of which:
secured
amount
Exposures
secured
by
financial
guarantees
Exposures
secured by
financial
guarantees,
of which:
secured amount
Exposures
secured by
credit
derivatives
Exposures
secured by
credit
derivatives
of which:
secured
amount
1 Loans(*) 62,123,854 9,340,977 8,438,686 5,746,115 4,549,485 - -
2 Debt securities(*) 19,865,015 - - - - - - 3 Total 81,988,869 9,340,977 8,438,686 5,746,115 4,549,485 - -
4 Of which defaulted(*) 3,290,277 123,545 87,776 65,615 297 - -
(*) According to BRSA communiqué dated 23/03/2020 and numbered 24049440-045, 31/12/2019 exchange rates are used for credit risk calculations.
Prior Period
Exposures
unsecured:
carrying
amount
Exposures
secured
by
collateral
Exposures
secured by
collateral,
of which:
secured
amount
Exposures
secured
by
financial
guarantees
Exposures
secured by
financial
guarantees,
of which:
secured amount
Exposures
secured by
credit
derivatives
Exposures
secured by
credit
derivatives
of which:
secured
amount
1 Loans 51,501,497 10,623,941 9,464,806 4,740,052 3,794,739 - -
2 Debt securities 10,438,340 - - - - - - 3 Total 61,939,837 10,623,941 9,464,806 4,740,052 3,794,739 - -
4 Of which defaulted 3,816,599 312,828 221,411 17,479 1,122 - -
3.3 Credit risk under standardized approach
3.3.1 Disclosures on banks’ use of credit ratings under the standard approach for credit risk
For portfolios that are risk-weighted under the standardized approach for credit risk, banks must disclose the
following information:
a) Names of the External Credit Assessment Institutions (ECAIs) and Export Credit Agencies (ECAs) used
by the bank, and the reasons for any changes over the reporting period
The Bank uses Fitch Ratings International Rating Agency’s external ratings.
b) The risk classes for which each ECAI or ECA is used
The credit rating of Fitch International Rating is used for all receivables from the central governments or
central banks which are included in the risk classes indicated in Article 6 of the Communiqué on
Measurement and Assessment of Capital Adequacy of the Bank, and the country risk classification
announced by The Organization for Economic Co-operation and Development (OECD) is used for
receivables from banks and intermediary agencies. 20% risk weight on is used for receivables from non-
rated banks and intermediary agencies with a maturity period of three months or less, and 50% risk weight
is used for receivables with a maturity period of more than three months, and the risk weight used for all
receivables is not lower than the risk concentration corresponding to the OECD credit quality level of the
country where the non-rated banks and intermediary agencies are founded.

TÜRK EKONOMİ BANKASI A.Ş.
NOTES AND EXPLANATIONS TO UNCONSOLIDATED FINANCIAL STATEMENTS
AS OF 31 DECEMBER 2020 (Unless otherwise stated amounts are expressed in thousands of Turkish Lira (“TL”).)
74
XI. Explanations Related to Risk Management (continued)
3. Credit Risk Disclosure (continued)
3.3 Credit risk under standardized approach (continued)
3.3.1 Disclosures on banks’ use of credit ratings under the standard approach for credit risk (continued)
c) A description of the process used to apply the issuer credit ratings onto other issuer comparable assets in
the banking book
20% risk weight is used for receivables from non-rated banks and intermediary agencies with a maturity
period of three months or less, and a 50% risk weight is used for receivables with a maturity period of more
than three months. According to the regulation on capital adequacy, corporates where the counterparties
are domestic, the related exposures are included in the calculation of capital adequacy as unrated.
d) The alignment of the alphanumerical scale of each agency used with risk buckets. (except where Agency
(BRSA) publishes a standard mapping with which the bank has to comply)
Risk ratings per the credit quality levels and the risk weights according to exposure categories announced
by Fitch Ratings International Rating Agency and Organization for Economic Co-operation and
Development (OECD)’s are presented below:
Fitch Ratings
Long- Term
Credit Rating
Risk Weight of
Receivables from
Central Government
or Central Banks
Receivables from Banks and Brokerage
Houses
Corporate
Receivables
Credit
DTM less than
3 months
DTM higher than 3
months
Quality
Level
0 - 20% 50% 100%
1 AAA and AA- 0% 20% 50% 100%
2 A+ and A- 20% 20% 50% 100%
3 BBB+ and BBB- 50% 50% 50% 100%
4 BB+ and BB- 100% 100% 100% 100%
5 B+ and B- 100% 100% 100% 100%
6 CCC+ and below 150% 100% 100% 100%
7 - 150% 150% 100%

TÜRK EKONOMİ BANKASI A.Ş.
NOTES AND EXPLANATIONS TO UNCONSOLIDATED FINANCIAL STATEMENTS
AS OF 31 DECEMBER 2020 (Unless otherwise stated amounts are expressed in thousands of Turkish Lira (“TL”).)
75
XI. Explanations Related to Risk Management (continued)
3. Credit Risk Disclosures (continued)
3.3 Credit risk under standardized approach (continued)
3.3.2 Standardized approach – credit risk exposure and Credit Risk Mitigation (CRM) effects
Current Period
Exposures before CCF and
CRM Exposures post-CCF and CRM
Risk Weighted Amounts and
Risk Weighted Amounts density
Asset classes
On-balance
sheet
amount
Off-balance
sheet
amount
On-balance
sheet
amount
Off-balance
sheet
amount
Risk Weighted
amounts
Risk Weighted
amounts
density
1 Exposures to central governments or
central banks 35,081,966 - 37,168,942 - 460,144 1%
2 Exposures to regional governments or
local authorities 1,196,851 3,910 1,195,676 1,851 598,768 50%
3 Exposures to public sector entities - - - - - -
4 Exposures to multilateral development
banks - - - - - -
5 Exposures to international
organizations - - - - - -
6 Exposures to institutions 7,131,564 2,113,171 7,016,925 1,689,485 2,364,609 27%
7 Exposures to corporates 30,929,793 17,725,095 29,078,801 9,418,754 37,816,140 98%
8 Retail exposures 32,868,189 15,383,637 30,423,707 2,836,385 24,942,728 75%
9 Exposures secured by residential
property 4,654,019 334,268 4,654,019 127,135 1,673,404 35%
10 Exposures secured by commercial real
estate 5,703,402 1,117,896 5,450,919 462,159 3,971,642 67%
11 Past-due loans 1,207,798 226,565 1,207,503 65,240 1,123,886 88%
12 Higher-risk categories by the Agency
Board - - - - - -
13 Exposures in the form of covered
bonds - - - - - -
14 Exposures to institutions and
corporates with a short-term credit
assessment - - - - - -
15 Exposures in the form of units or
shares in collective investment
undertakings (CIUs) - - - - - -
16 Other assets 3,540,984 2,723,762 3,540,976 2,889 1,528,065 43%
17 Investments in equities 167,257 - 167,257 - 167,257 100%
18 Total 122,481,823 39,628,304 119,904,725 14,603,898 74,646,643 55%

TÜRK EKONOMİ BANKASI A.Ş.
NOTES AND EXPLANATIONS TO UNCONSOLIDATED FINANCIAL STATEMENTS
AS OF 31 DECEMBER 2020 (Unless otherwise stated amounts are expressed in thousands of Turkish Lira (“TL”).)
76
XI. Explanations Related to Risk Management (continued)
3. Credit Risk Disclosures (continued)
3.3 Credit risk under standardized approach (continued)
3.3.2 Standardized approach – credit risk exposure and Credit Risk Mitigation (CRM) effects
(continued)
Prior Period
Exposures before CCF and
CRM Exposures post-CCF and CRM
Risk Weighted Amounts and
Risk Weighted Amounts density
Asset classes
On-balance
sheet
Amount
Off-balance
sheet
amount
On-balance
sheet
amount
Off-balance
sheet
amount
Risk Weighted
Amounts
Risk Weighted
Amounts
density
1 Exposures to central governments or
central banks 20,795,764 - 22,823,247 445 4,686,792 21%
2 Exposures to regional governments or
local authorities 1,247,638 4,566 1,242,201 2,087 622,150 50%
3 Exposures to public sector entities - - - - - -
4 Exposures to multilateral development
Banks - - - - - -
5 Exposures to international
organizations - - - - - -
6 Exposures to institutions 10,917,720 2,235,018 10,819,861 1,718,566 4,387,903 35%
7 Exposures to corporates 21,700,590 18,703,110 20,454,546 11,499,334 30,921,617 97%
8 Retail exposures 29,340,715 15,428,657 27,088,081 3,014,696 22,568,577 75%
9 Exposures secured by residential
Property 5,473,079 374,142 5,473,079 146,464 1,966,840 35%
10 Exposures secured by commercial real
Estate 6,506,468 1,174,811 6,236,649 512,230 4,765,201 71%
11 Past-due loans 1,794,352 244,545 1,793,224 77,444 1,691,079 90%
12 Higher-risk categories by the Agency
Board - - - - - -
13 Exposures in the form of covered
bonds - - - - - -
14 Exposures to institutions and
corporates with a short-term credit
assessment - - - - - -
15 Exposures in the form of units or
shares in collective investment
undertakings (CIUs) - - - - - -
16 Other assets 4,335,114 4,450,530 4,335,112 2,649 1,639,738 38%
17 Investments in equities 132,920 - 132,920 - 132,920 100%
18 Total 102,244,360 42,615,379 100,398,920 16,973,915 73,382,817 63%

TÜRK EKONOMİ BANKASI A.Ş.
NOTES AND EXPLANATIONS TO UNCONSOLIDATED FINANCIAL STATEMENTS
AS OF 31 DECEMBER 2020 (Unless otherwise stated amounts are expressed in thousands of Turkish Lira (“TL”).)
77
XI. Explanations Related to Risk Management (continued) 3. Credit Risk Disclosures (continued)
3.3 Credit risk under standardized approach (continued)
3.3.3 Standardized approach – exposures by asset classes and risk weights
(*) The amount shown on the line of “Exposures secured by commercial real estate” is “Exposures secured by real estate” and other amounts shown on this column represented exposures subject to 50% risk weight.
Current Period
Asset Classes / Risk Weights 0% 10% 20% 35%
50% secured
by real
estate (*) 75% 100% 150% 200% Other risk
weights
Total credit risk
exposure amount
(after CCF and CRM)
1 Exposures to regional governments or local authorities 36,708,798 - - - - - 460,144 - - - 37,168,942
2 Exposures to regional governments or local authorities - - - - 1,197,519 - 8 - - - 1,197,527 3 Exposures to public sector entities - - - - - - - - - - -
4 Exposures to multilateral development banks - - - - - - - - - - -
5 Exposures to international organizations - - - - - - - - - - - 6 Exposures to banks and financial intermediaries - - 6,679,841 - 1,995,853 - 30,715 1 - - 8,706,410
7 Exposures to corporates - - 127,443 - 1,158,920 - 37,211,192 - - - 38,497,555
8 Retail exposures - - 1,125 - 6,904 33,252,063 - - - - 33,260,092 9 Exposures secured by residential property - - - 4,781,154 - - - - - - 4,781,154
10 Exposures secured by commercial real estate - - - - 3,882,873 - 2,030,205 - - - 5,913,078
11 Past-due loans - - - - 408,750 - 752,955 111,038 - - 1,272,743 12 Higher-risk categories by the Agency Board - - - - - - - - - - -
13 Exposures in the form of covered bonds - - - - - - - - - - -
14 Exposures to institutions and corporates with a short-term credit assessment - - - - - - - - - - -
15 Exposures in the form of units or shares in collective
investment undertakings (CIUs) - - - - - - - - - - - 16 Investments in equities - - - - - - 167,257 - - - 167,257
17 Other assets 1,969,069 - 58,413 - - - 1,516,383 - - - 3,543,865
18 Total 38,677,867 - 6,866,822 4,781,154 8,650,819 33,252,063 42,168,859 111,039 - - 134,508,623

TÜRK EKONOMİ BANKASI A.Ş.
NOTES AND EXPLANATIONS TO UNCONSOLIDATED FINANCIAL STATEMENTS
AS OF 31 DECEMBER 2020 (Unless otherwise stated amounts are expressed in thousands of Turkish Lira (“TL”).)
78
XI. Explanations Related to Risk Management (continued) 3. Credit Risk Disclosures (continued)
3.3 Credit risk under standardized approach (continued)
3.3.3 Standardized approach – exposures by asset classes and risk weights (continued)
Prior Period
Asset Classes / Risk Weights 0% 10% 20% 35%
50% secured
by real
estate (*) 75% 100% 150% 200%
Other risk
weights
Total credit risk
exposure amount
(after CCF and CRM)
1 Exposures to regional governments or local authorities 18,136,900 - - - - - 4,686,792 - - - 22,823,692
2 Exposures to regional governments or local authorities - - - - 1,244,276 - 12 - - - 1,244,288
3 Exposures to public sector entities - - - - - - - - - - -
4 Exposures to multilateral development banks - - - - - - - - - - -
5 Exposures to international organizations - - - - - - - - - - -
6 Exposures to banks and financial intermediaries - - 9,044,671 - 1,838,724 - 1,645,882 9,150 - - 12,538,427
7 Exposures to corporates - - 786,895 - 805,495 - 30,361,490 - - - 31,953,880
8 Retail exposures - - 5,755 - 21,615 30,075,157 250 - - - 30,102,777
9 Exposures secured by residential property - - - 5,619,543 - - - - - - 5,619,543
10 Exposures secured by commercial real estate - - - - 3,967,356 - 2,781,523 - - - 6,748,879
11 Past-due loans - - - - 601,830 - 1,026,186 242,652 - - 1,870,668
12 Higher-risk categories by the Agency Board - - - - - - - - - - -
13 Exposures in the form of covered bonds - - - - - - - - - - -
14 Exposures to institutions and corporates with a short-term credit
assessment - - - - - - - - - - -
15 Exposures in the form of units or shares in collective investment
undertakings (CIUs) - - - - - - - - - - -
16 Investments in equities - - - - - - 132,920 - - - 132,920
17 Other assets 2,660,399 - 47,029 - - - 1,630,333 - - - 4,337,761
18 Total 20,797,299 - 9,884,350 5,619,543 8,479,296 30,075,157 42,265,388 251,802 - - 117,372,835
(*) The amount shown on the line of “Exposures secured by commercial real estate” is “Exposures secured by real estate” and other amounts shown on this column represented exposures subject to 50% risk weight.

TÜRK EKONOMİ BANKASI A.Ş.
NOTES AND EXPLANATIONS TO UNCONSOLIDATED FINANCIAL STATEMENTS
AS OF 31 DECEMBER 2020 (Unless otherwise stated amounts are expressed in thousands of Turkish Lira (“TL”).)
79
XI. Explanations Related to Risk Management (continued) 4. Counterparty Credit Risk
4.1. Qualitative disclosure related to counterparty credit risk
Limit requests of clients demanding derivative transactions are evaluated based on the related line of business in
different credit committees. Limit amounts approved by credit committee are risk weighted limits. In calculation
of risk amount that traced to risk weighted limits is multiplied by ratios based on each factor’s historical movement
that varies according to transaction’s nominal amount, transaction’s maturity, type, currency and purpose. Updates
are generally conducted on a yearly basis except for the times of strict market fluctuations. In other words, if
current tables do not cover risk calculations efficiently in case of strict market volatility, all tables are reviewed
without waiting for annual period.
In table calculations, different time periods are considered while making analyses. If there is a period in data set
with strictly fluctuating period, historical period after this period might be crucial. Also, in historical fluctuations,
similar work meant for a data is organized separately. References provided by BNPP are also considered in the
process. Eventually, all results are discussed firstly among line of business and then in the Market Risk Committee.
Final decision is made by Risk Policy Committee and one of the alternatives is chosen. Approval of the Board of
Directors members is obtained if the Risk Policy Committee members deem necessary.
Customers demanding derivative transactions are separated into two based on the purpose of the transaction.
Decision of allocating the client to a group is given with taking into consideration client’s all transactions. Related
Credit Department decides on the evaluation of client either in trading derivative transaction limit or in hedging
derivative transaction limit.
In principle, all individual customers are evaluated as in trading portfolio, and the Bank works with 100% cash
and cash equivalent collaterals. Commercial and corporate customers are evaluated different for each firm and
based on the decision given, are subject to different collateral conditions. Risks are monitored daily based on the
collateral conditions set with the client, and additional collaterals are demanded when a necessity arises according
to internally set principles.
For derivative transactions made with banks, ISDA, CSA and GMRA agreements are requested from
counterparties in principle, derivative transactions are not made with banks that do not sign these agreements.
Collateral management is made on a daily basis with banks considering agreement conditions so that counterparty
risk is minimized.
All open derivative transactions are evaluated daily by using market data and resulting evaluation amount is
installed to system. As a new transaction is made, risk amount calculated with risk weights is reflected
automatically to the system. In other words, counterparty risk regarding all derivative transactions is monitored on
banking system. Collateral amount required for customer transactions, transaction evaluation amount and risk
weighted nominal amount is monitored daily by considering collateral condition and limit monitoring principles
set up by the Bank.
Simulations of transactions are conducted in order to be able to see the level of capital consumption on transaction
basis. Ratings and Basel II portfolios of derivative customers and banks are audited and updated monthly. These
are considered in the calculation of capital requirement and evaluation of collateral conditions.

TÜRK EKONOMİ BANKASI A.Ş.
NOTES AND EXPLANATIONS TO UNCONSOLIDATED FINANCIAL STATEMENTS
AS OF 31 DECEMBER 2020 (Unless otherwise stated amounts are expressed in thousands of Turkish Lira (“TL”).)
80
XI. Explanations Related to Risk Management (continued) 4. Counterparty Credit Risk (continued)
4.2. Analysis of counterparty credit risk (CCR) exposure by approach
Current Period
Replacement
cost
Potential
future
exposure EEPE(*)
Alpha used
for
computing
regulatory
EAD
EAD post
CRM
Risk Weighted
Amounts
Standardized Approach - CCR (For Derivatives) 1,452,674 498,722 1.4 1,923,504 1,229,934
Internal Model Method (for derivatives, repo
transactions , marketable securities or commodity
lending or borrowing transactions, long settlement
transactions and securities financing transactions) - - - -
Simple Approach for Credit Mitigation (for repo transactions, marketable securities or commodity
lending or borrowing transactions, long settlement
transactions and securities financing transactions) - - Comprehensive Approach for Credit Risk Mitigation
(for repo transactions, marketable securities or
commodity lending or borrowing transactions, long settlement transactions and securities financing
transactions) - -
VaR for repo transactions, marketable securities or commodity lending or borrowing transactions, long
settlement transactions and securities financing
transactions 1,047,632 420,982
Total 1,650,916
(*) Effective Expected Positive Exposure
Prior Period
Replacement
Cost
Potential
future
exposure EEPE(*)
Alpha used
for
computing
regulatory
EAD
EAD post
CRM
Risk
Weighted
Amounts
Standardized Approach - CCR (For Derivatives) 424,504 567,790 1.4 978,777 807,495
Internal Model Method (for derivatives, repo transactions , marketable securities or commodity
lending or borrowing transactions, long settlement
transactions and securities financing transactions) - - - - Simple Approach for Credit Mitigation (for repo
transactions, marketable securities or commodity
lending or borrowing transactions, long settlement transactions and securities financing transactions) - -
Comprehensive Approach for Credit Risk Mitigation
(for repo transactions, marketable securities or commodity lending or borrowing transactions, long
settlement transactions and securities financing
transactions) - - VaR for repo transactions, marketable securities or
commodity lending or borrowing transactions, long
settlement transactions and securities financing transactions 20,589 3,653
Total 811,148
(*)Effective Expected Positive Exposure

TÜRK EKONOMİ BANKASI A.Ş.
NOTES AND EXPLANATIONS TO UNCONSOLIDATED FINANCIAL STATEMENTS
AS OF 31 DECEMBER 2020 (Unless otherwise stated amounts are expressed in thousands of Turkish Lira (“TL”).)
81
XI. Explanations Related to Risk Management (continued) 4. Counterparty Credit Risk (continued)
4.3. Credit valuation adjustment (CVA) capital charge
Current Period EAD post-CRM
Risk Weighted
Amounts
Total portfolios subject to the Advanced CVA capital
charge - -
(i) VaR component (including the 3×multiplier) -
(ii) Stressed VaR component (including the 3×multiplier) -
All portfolios subject to the Standardized CVA capital
charge 1,923,504 465,490
Total subject to the CVA capital charge 1,923,504 465,490
Prior Period EAD post-CRM
Risk
Weighted
Amounts
Total portfolios subject to the Advanced CVA capital
charge - -
(i) VaR component (including the 3×multiplier) -
(ii) Stressed VaR component (including the 3×multiplier) -
All portfolios subject to the Standardized CVA capital
charge 978,777 392,622
Total subject to the CVA capital charge 978,777 392,622

TÜRK EKONOMİ BANKASI A.Ş.
NOTES AND EXPLANATIONS TO UNCONSOLIDATED FINANCIAL STATEMENTS
AS OF 31 DECEMBER 2020 (Unless otherwise stated amounts are expressed in thousands of Turkish Lira (“TL”).)
82
XI. Explanations Related to Risk Management (continued) 4. Counterparty Credit Risk (continued)
4.4. Counterparty credit risk by risk classes and risk weights
Current Period
Risk Weight / Regulatory portfolio 0% 10% 20% 35% 50% 75% 100% 150% Others
Total credit
exposure(*)
Claims from central governments and central banks 529,441 - - - - - - - - 529,441
Claims from regional and local governments - - - - - - - - - -
Claims from administration and non-commercial entity - - - - - - - - - - Claims from multilateral development banks - - - - - - - - - -
Claims from international organizations - - - - - - - - - -
Claims from banks and financial intermediaries - - 254,344 - 1,137,118 - - - - 1,391,462 Corporates - - 6,360 - 17,753 - 1,006,996 - - 1,031,109
Retail portfolios - - - - - 19,124 - - - 19,124 Claims on landed real estate - - - - - - - - - -
Past due loans - - - - - - - - - -
Claims which are determined as high risk by the board of BRSA - - - - - - - - - - Mortgage securities - - - - - - - - - -
Securitization positions - - - - - - - - - -
Claims from corporates, banks and financial intermediaries which have short term credit rating - - - - - - - - - -
Investments which are qualified as collective investment institutions - - - - - - - - - -
Stock investment - - - - - - - - - - Other claims - - - - - - - - - -
Other assets(**) - - - - - - - - - -
Total 529,441 - 260,704 - 1,154,871 19,124 1,006,996 - - 2,971,136
(*) Total credit risk: Amount related to capital adequacy calculation after the counterparty credit risk measurement techniques are applied.
(**) Other assets: The amounts not included in the credit risk of the counterparty reported in the risks table to the Central Counterparty.

TÜRK EKONOMİ BANKASI A.Ş.
NOTES AND EXPLANATIONS TO UNCONSOLIDATED FINANCIAL STATEMENTS
AS OF 31 DECEMBER 2020 (Unless otherwise stated amounts are expressed in thousands of Turkish Lira (“TL”).)
83
XI. Explanations Related to Risk Management (continued) 4. Counterparty Credit Risk (continued)
4.4. Counterparty credit risk by risk classes and risk weights (continued)
Prior Period
Risk Weight/ Regulatory portfolio 0% 10% 20% 35% 50% 75% 100% 150% Others
Total credit
exposure(*)
Claims from central governments and central banks 13,012 - - - - - - - - 13,012
Claims from regional and local governments - - - - - - - - - -
Claims from administration and non-commercial entity - - - - - - - - - - Claims from multilateral development banks - - - - - - - - - -
Claims from international organizations - - - - - - - - - -
Claims from banks and financial intermediaries - - 9,946 - 297,308 - 46,481 - - 353,735 Corporates - - 131 - 15,706 - 574,234 - - 590,071
Retail portfolios - - - - - 42,548 - - - 42,548 Claims on landed real estate - - - - - - - - - -
Past due loans - - - - - - - - - -
Claims which are determined as high risk by the board of BRSA - - - - - - - - - - Mortgage securities - - - - - - - - - -
Securitization positions - - - - - - - - - -
Claims from corporates, banks and financial intermediaries which have short term credit rating - - - - - - - - - -
Investments which are qualified as collective investment institutions - - - - - - - - - -
Stock investment - - - - - - - - - - Other claims - - - - - - - - - -
Other assets(**) - - - - - - - - - -
Total 13,012 - 10,077 - 313,014 42,548 620,715 - - 999,366
(*) Total credit risk: Amount related to capital adequacy calculation after the counterparty credit risk measurement techniques are applied.
(**) Other assets: The amounts not included in the credit risk of the counterparty reported in the risks table to the Central Counterparty.

TÜRK EKONOMİ BANKASI A.Ş.
NOTES AND EXPLANATIONS TO UNCONSOLIDATED FINANCIAL STATEMENTS
AS OF 31 DECEMBER 2020 (Unless otherwise stated amounts are expressed in thousands of Turkish Lira (“TL”).)
84
XI. Explanations Related to Risk Management (continued) 4. Counterparty Credit Risk (continued)
4.5. Composition of collateral for CCR exposure
Collateral used in derivative transactions Collateral used in SFTs
Fair value of collateral received Fair value of posted collateral Fair value of
collateral received
Fair value of
posted collateral Current Period Segregated Unsegregated Segregated Unsegregated
Cash – domestic currency - 1,220 - - - -
Cash – other currencies - 3,711 - - - -
Domestic sovereign debt - 1,055 - - - -
Other sovereign debt - 21,906 - - - -
Government agency debt - - - - - -
Corporate bonds - - - - - -
Equity securities - - - - - -
Other collateral - - - - - -
Total - 27,892 - - - -
Collateral used in derivative transactions Collateral used in SFTs
Fair value of collateral received Fair value of posted collateral Fair value of
collateral received
Fair value of
posted collateral Prior Period Segregated Unsegregated Segregated Unsegregated
Cash – domestic currency - 298 - - - -
Cash – other currencies - 12,916 - - - -
Domestic sovereign debt - 74 - - - -
Other sovereign debt - 229 - - - -
Government agency debt - - - - - -
Corporate bonds - - - - - -
Equity securities - - - - - -
Other collateral - - - - - -
Total - 13,517 - - - -
4.6. Credit derivatives exposures
Current Period
Protection bought Protection sold
Nominal
Single-name credit default swaps - -
Index credit default swaps - -
Total return swaps - -
Credit options - -
Other credit derivatives - -
Total Notionals - - Fair Values
Positive fair value (asset) - -
Negative fair value (liability) - -
Prior Period
Protection bought Protection sold
Nominal - -
Single-name credit default swaps - -
Index credit default swaps - -
Total return swaps - -
Credit options - -
Other credit derivatives - - Total Notionals
Fair Values - -
Positive fair value (asset) - -
Negative fair value (liability) - -
4.7. Exposures to central counterparties
None.

TÜRK EKONOMİ BANKASI A.Ş.
NOTES AND EXPLANATIONS TO UNCONSOLIDATED FINANCIAL STATEMENTS
AS OF 31 DECEMBER 2020 (Unless otherwise stated amounts are expressed in thousands of Turkish Lira (“TL”).)
85
XI. Explanations Related to Risk Management (continued) 5. Securitization Disclosures Since the Bank does not hold securitization position, the notes to be presented according to the ‘Communiqué on
Disclosures about Risk Management to be announced to Public by Banks’ have not been presented.
6. Market Risk Disclosures
The market risk section includes the market risk capital requirements calculated for trading book and banking book
exposures that are subject to a market risk charge. It also includes capital requirements for securitization positions
held in the trading book. However, it excludes the counterparty credit risk capital charges that apply to the same
exposures, which are reported in Section 5 – Counterparty credit risk.
Notes and explanations prepared in accordance with the “Communiqué on Disclosures about Risk Management to
be announced to Public by Banks” published in Official Gazette no. 29511 on 23 October 2015 and became
effective as of 31 March 2016. The notes to be presented on annually basis according to Communiqué have not
been presented due to usage of standard approach for the calculation of market risk by the Bank.
6.1. Qualitative disclosure requirements related to market risk
Interest rate and foreign exchange rate risks, arising from the volatility in the financial markets, of the financial
positions taken by the Bank related to balance sheet and off-balance sheet accounts are measured and while
calculating the capital adequacy and the amount subject to Value at Risk (VAR), as summarized below, is
taken into consideration by the standard method. Beside the standard method, VAR is calculated by using
internal model as supported by scenario analysis and stress tests. VAR is calculated daily by historic simulation.
These results are also reported daily to the management.
For FX position, limits in different breakdowns are determined by Board of Directors and option operations
are considered with delta conjugates.
In regular analysis, net interest income effects originating from interest rates changes are calculated for all
interest rates sensitive products and the results are followed up in limits determined by Board of Directors. The
shocks which are given to interest rates are changes by each currency and in linear scenario analysis, not only
linear but also sudden shocks are evaluated. These analyses may be performed for both current and targeted
financial figures.
According to economic cost approach, changes in market interest rates may affect the Bank’s assets, liabilities
and off balance sheet items values. The Bank’s economic value’s sensitivity to interest rate is an important
issue for stockholders, management and auditors.
Economic value of a product is net present value that is calculated by discounting expected cash flow.
Economic value of the Bank is the net present value of the cash flows that is subtracting expected cash flows
of liabilities from net present value of assets and adding off balance sheet items expected cash flows. Economic
value approach represents value of the Bank’s sensitivity to interest rate fluctuations.
Market value of equity is defined as the difference between the market value of assets and liabilities. The Board
of Directors predefines a limit for market value of equity; shock method is applied to all items to be able to see
equity’s influence on market value. Shocks applied may vary based on currencies.
As Economical Value approach considers effects of interest rate changes on all future cash flows, it enables to
comprehensively understand effects of interest rate changes in the long run.

TÜRK EKONOMİ BANKASI A.Ş.
NOTES AND EXPLANATIONS TO UNCONSOLIDATED FINANCIAL STATEMENTS
AS OF 31 DECEMBER 2020 (Unless otherwise stated amounts are expressed in thousands of Turkish Lira (“TL”).)
86
XI. Explanations Related to Risk Management (continued) 6. Market Risk Disclosures (continued)
6.1. Qualitative disclosure requirements related to market risk (continued)
In addition to these analyses, Group Risk Management, based on current position, conducts stress testing to be
able to predict possible losses as a consequence of exceptional fluctuations. Stress testings are prepared by
BNP Paribas and TEB Group Risk Management measure the sensitivity created as a result of market price
changes based on scenarios. Scenario analysis both on historical and hypothetical basis are conducted.
Scenario analysis is applied both to currency and interest rates to be able to understand the effects on current
portfolio.
Other than scenario analysis, various stress testings are applied to current portfolio; in order to see the effects
of prior events on current position.
Nominal amount limits defined for bond portfolio, VAR (value at risk) limit for trading portfolio, and PV01
limits set for tracking interest rate risk are calculated daily, tracked and reported to the management. Both
interest rate and liquidity gap calculations are made for each item of the balance sheet. For both calculations,
as product based cash flows are formed, repricing, maturity and product based acceptances are also considered.
Monthly reports are prepared for Market and Liquidity Risk Committees. Reports include end of the day
positions, monthly/annual cumulative profit/loss balances and some positions taken in that month.
All Limit and risk positions are represented to Risk Policies Committee, Risk Committee and to The Board of
Directors.
6.2. Standardized Approach
Current Period Risk Weighted Amounts
Outright products
1 Interest rate risk (general and specific) 1,561,156
2 Equity risk (general and specific) -
3 Foreign exchange risk 248,933
4 Commodity risk 588,523
Options
5 Simplified approach -
6 Delta-plus method 53,038
7 Scenario approach -
8 Securitization -
9 Total 2,451,650
Prior Period Risk Weighted Amounts
Outright product 1 Interest rate risk (general and specific) 1,437,126
2 Equity risk (general and specific) -
3 Foreign exchange risk 82,917
4 Commodity risk 107,119
Options
5 Simplified approach
6 Delta-plus method 22,588
7 Scenario approach -
8 Securitization -
9 Total 1,649,750

TÜRK EKONOMİ BANKASI A.Ş.
NOTES AND EXPLANATIONS TO UNCONSOLIDATED FINANCIAL STATEMENTS
AS OF 31 DECEMBER 2020 (Unless otherwise stated amounts are expressed in thousands of Turkish Lira (“TL”).)
87
XI. Explanations Related to Risk Management (continued)
7. Explanations Related to Operational Risk
a) Operational risk has been calculated using the basic indicator approach. Market risk measurements are
performed monthly.
b) In case of Basic Indicator Approach the following:
31.12.2017 31.12.2018 31.12.2019
Total/Number
of positive
gross income
years
Rate (%) Total
Gross Income 4,133,929 5,159,211 5,982,919 5,092,020 15 763,803
Operational Risk Capital
Requirement (Total*12.5) 9,547,537
31.12.2016 31.12.2017 31.12.2018
Total/Number
of positive
gross income
years
Rate (%) Total
Gross Income 4,103,251 4,133,929 5,159,211 4,465,464 15 669,820
Operational Risk Capital
Requirement (Total*12.5) 8,372,744
c) The Bank does not use the standard method.
d) The Bank does not use any alternative approach in standard method.
e) The Bank does not use advanced measurement approach.
8. Explanations Related to Remuneration Policy in Banks
TEB pays net salaries on the last working day of each month, after the required legal deductions are made. In
addition to receiving a monthly salary, all TEB employees are assessed based on meeting their qualitative and
quantitative targets, and the Bank may pay performance-based success and sales premiums or annual
performance bonuses to reward employees’ collective and individual success.
An annual performance bonus is determined based on the Bank’s profitability, the results of Bank activities,
and the realization of targets in line with market practices (local and/or professional). A performance bonus is
only paid when the target realized in a particular year is at least 80%. Employees included in the success and
sales premium scheme are paid success and sales premiums based to the targets realized during the year.
The remuneration policy of the Bank was prepared in line with the BRSA’s “Communiqué on Corporate
Management of Banks” and “Guidance on Good Remuneration Practices in Banks”, and within the scope of
the principle of proportionality, the content, structure, and strategies of the Bank’s activities, long-term targets,
the risk management structure of the Bank and local regulations. These regulations aim to prevent taking
excessive risks and evaluate actual contributions to the risk management.
The remuneration policy supports the Bank in managing risks in line with the principles and parameters
determined and approved by the Board of Directors. The remuneration policy aims to attract and retain expert
employees who will contribute to the Bank reaching its strategic targets in both business line and support
functions.
SECOM (Selection and Compensation Committee) is responsible, on behalf of the Board of Directors, for
ensuring that the remuneration policy is prepared in line with local and BNP Paribas regulations. SECOM
manages the principles of the remuneration policy, taking opinions from the human resources, financial affairs,
risk, compliance, and internal control groups. The remuneration policy is audited and approved by SECOM
and submitted to the Board of Directors. The remuneration policy is reviewed annually.

TÜRK EKONOMİ BANKASI A.Ş.
NOTES AND EXPLANATIONS TO UNCONSOLIDATED FINANCIAL STATEMENTS
AS OF 31 DECEMBER 2020 (Unless otherwise stated amounts are expressed in thousands of Turkish Lira (“TL”).)
88
SECTION FIVE
EXPLANATIONS AND DISCLOSURES ON UNCONSOLIDATED FINANCIAL STATEMENTS
I. Explanations and Disclosures Related to the Assets
1. a) Information on Cash and Balances with the Central Bank of the Republic of Turkey:
Current Period Prior Period
TL FC TL FC
Cash in TL/Foreign Currency 382,963 1,948,389 410,344 2,031,625
Balances with the Central Bank of Turkey 3,048,958 11,382,722 305,709 8,942,832
Other - 188,271 - 265,460
Total 3,431,921 13,519,382 716,053 11,239,917
b) Information related to the account of the Central Bank of the Republic of Turkey:
Current Period Prior Period
TL FC TL FC
Unrestricted Demand Deposit 2,979,546 - 297,130 -
Unrestricted Time Deposit - 4,626,036 - 3,932,318
Restricted Time Deposit 69,412 6,756,686 8,579 5,010,514
Total 3,048,958 11,382,722 305,709 8,942,832
Foreign currency unrestricted deposit amounting to TL 4,626,036 (31 December 2019: TL 3,932,318) foreign currency restricted deposit amounting to TL 6,756,686 (31 December 2019: TL 5,010,514) unrestricted deposit balance amounting to TL 2,979,546 (31 December 2019: TL 297,130), and restricted deposit amounting to TL 69,412 (31 December 2019: TL 8,579) comprises of reserve deposits. As of 31 December 2020, the Turkish lira required reserve ratios are determined to be within the range of 1% - 6% depending on the maturity structure of deposits denominated in Turkish Lira (31 December 2019: 1% - 2%), and the required reserve ratios for foreign currency deposits and other liabilities within the range of 5% - 22% (31 December 2019: 5% - 21%).
2. Information on financial assets at fair value through profit and loss (net):
a.1) Information on financial assets at fair value through profit and loss given as collateral or blocked: None (31
December 2019: None).
a.2) Financial assets at fair value through profit and loss subject to repurchase agreements: None (31 December
2019: None).
Net book value of unrestricted financial assets at fair value through profit and loss is TL 1,447,816
(31 December 2019: TL 1,167,994).
3. Positive differences related to derivative financial assets held-for-trading:
Current Period Prior Period
TL FC TL FC
Forward Transactions 392,758 56,660 144,959 9,474
Swap Transactions 1,091,529 165,479 1,302,918 179,827
Futures Transactions - - - -
Options 36,244 9,939 25,918 6,946
Other - - - -
Total 1,520,531 232,078 1,473,795 196,247

TÜRK EKONOMİ BANKASI A.Ş.
NOTES AND EXPLANATIONS TO UNCONSOLIDATED FINANCIAL STATEMENTS
AS OF 31 DECEMBER 2020 (Unless otherwise stated amounts are expressed in thousands of Turkish Lira (“TL”).)
89
I. Explanations and Disclosures Related to the Assets (continued)
4. Information on banks:
a) Information on banks:
Current Period Prior Period
TL FC TL FC
Banks
Domestic Banks 1,851,274 801,236 1,015,539 185,361
Foreign Banks 56,939 3,813,970 55,635 7,295,630
Foreign Head Offices and Branches - - - -
Total 1,908,213 4,615,206 1,071,174 7,480,991
b) Information on foreign banks account:
Unrestricted Amount Restricted Amount
Current Period Prior Period Current Period Prior Period
EU Countries 1,637,693 5,946,715 - - USA, Canada 1,518,644 211,172 - - OECD Countries (*) 135,873 739,820 - - Coastal Banking Regions 556,267 446,599 - - Other 22,432 6,959 - - Total 3,870,909 7,351,265 - -
(*) OECD countries other than EU countries, USA and Canada.
5. Information on financial assets at fair value through other comprehensive income:
a.1) Information on financial assets at fair value through other comprehensive income given as collateral /
blocked:
Current Period Prior Period
TL FC TL FC
Equity Securities - - - -
Bond, Treasury Bill and Similar
Investment Securities 876,626 272,329 333,201 -
Other - - - -
Total 876,626 272,329 333,201 -
a.2) Information on financial assets at fair value through other comprehensive income subject to repurchase
agreements:
Current Period Prior Period
TL FC TL FC
Government Bonds 869,642 2,567,087 77,088 -
Treasury Bills - - - -
Other Government Debt Securities - - - -
Bank Bonds and Bank Guaranteed Bonds - - - -
Asset Backed Securities - - - -
Other - - - -
Total 869,642 2,567,087 77,088 -
The book value of debt securities and equity securities in unrestricted financial assets at fair value through other
comprehensive income is TL 4,065,693 (31 December 2019: TL 5,129,328)

TÜRK EKONOMİ BANKASI A.Ş.
NOTES AND EXPLANATIONS TO UNCONSOLIDATED FINANCIAL STATEMENTS
AS OF 31 DECEMBER 2020 (Unless otherwise stated amounts are expressed in thousands of Turkish Lira (“TL”).)
90
I. Explanations and Disclosures Related to the Assets (continued)
5. Information on financial assets at fair value through other comprehensive income (continued)
b.1) Information on financial assets at fair value through other comprehensive income:
Current Period Prior Period
Debt Securities 8,640,496 5,531,722
Quoted at Stock Exchange 8,617,330 5,511,108
Unquoted at Stock Exchange 23,166 20,614
Share Certificates 10,881 7,895
Quoted at Stock Exchange - -
Unquoted at Stock Exchange 10,881 7,895
Impairment Provision (-) - -
Total 8,651,377 5,539,617
6. Information on loans:
a) Information on all types of loans and advances given to shareholders and employees of the Bank: Current Period Prior Period
Cash Non-Cash Cash Non-Cash
Direct Loans Granted to Shareholders - 438,193 1,596 182,856
Corporate Shareholders - 438,193 1,596 182,856
Real Person Shareholders - - - -
Indirect Loans Granted to Shareholders - - - -
Loans Granted to Employees 153,482 - 139,703 -
Total 153,482 438,193 141,299 182,856
b) Information on the standard loans and loans under close monitoring and restructured loans under close monitoring:
Cash Loans Standard Loans
Loans under Close Monitoring
Not Under the Scope
of Restructuring
Loans Under Restructuring
Loans with Revised
Contract Terms Refinancing
Non-specialized Loans 71,477,863 6,190,429 92,352 1,669,564
Working Capital Loans 5,389,404 835,979 54,422 796,995
Export Loans 9,300,529 62,917 - 89,456
Import Loans - - - -
Loans Given to Financial Sector 2,655,503 - - -
Consumer Loans 16,922,139 2,915,680 3,912 150,693
Credit Cards 4,540,033 655,741 22,188 -
Other 32,670,255 1,720,112 11,830 632,420
Specialized Loans - - - -
Other Receivables - - - -
Total 71,477,863 6,190,429 92,352 1,669,564
Current Period Prior Period
Standard Loans
Loans Under
Close Monitoring
Standard Loans
Loans Under
Close
Monitoring
12 Month Expected Credit Losses 393,446 - 394,194 -
Significant increase in Credit Risk - 1,360,252 - 894,153
Total 393,446 1,360,252 394,194 894,153
c) Distribution of cash loans by maturity structure:
Standard Loans
Loans under Close Monitoring
Not under the Scope of
Restructuring Restructuring
Short Term Loans 35,701,203 1,564,549 152,657
Medium and Long Term Loans 35,776,660 4,625,880 1,609,259
Total 71,477,863 6,190,429 1,761,916

TÜRK EKONOMİ BANKASI A.Ş.
NOTES AND EXPLANATIONS TO UNCONSOLIDATED FINANCIAL STATEMENTS
AS OF 31 DECEMBER 2020 (Unless otherwise stated amounts are expressed in thousands of Turkish Lira (“TL”).)
91
I. Explanations and Disclosures Related to the Assets (continued)
6. Information on loans: (continued)
d) Information on consumer loans, individual credit cards, personnel loans and credit cards given to personnel:
Current Period
Short Term Medium and
Long Term
Total
Consumer Loans-TL 450,376 18,715,717 19,166,093
Housing Loans 663 4,502,862 4,503,525
Vehicle Loans 6,877 451,829 458,706
General Purpose Loans 442,836 13,761,026 14,203,862
Other - - -
Consumer Loans –Indexed to FC - 15,510 15,510
Housing Loans - 15,510 15,510
Vehicle Loans - - -
General Purpose Loans - - -
Other - - -
Consumer Loans-FC (**) - 19,914 19,914
Housing Loans - 5,349 5,349
Vehicle Loans - 1,909 1,909
General Purpose Loans - 12,656 12,656
Other - - -
Individual Credit Cards-TL 3,497,240 21,003 3,518,243
With Instalments 1,160,176 21,003 1,181,179
Without Instalments 2,337,064 - 2,337,064
Individual Credit Cards-FC 4,898 - 4,898
With Instalments - - -
Without Instalments 4,898 - 4,898
Personnel Loans-TL 10,001 107,618 117,619
Housing Loans - 356 356
Vehicle Loans - - -
General Purpose Loans 10,001 107,262 117,263
Other - - -
Personnel Loans- Indexed to FC - - -
Housing Loans - - -
Vehicle Loans - - -
General Purpose Loans - - -
Other - - -
Personnel Loans-FC - - -
Housing Loans - - -
Vehicle Loans - - -
General Purpose Loans - - -
Other - - -
Personnel Credit Cards-TL 32,257 52 32,309
With Instalments 9,979 52 10,031
Without Instalments 22,278 - 22,278
Personnel Credit Cards-FC 32 - 32
With Instalments - - -
Without Instalments 32 - 32
Overdraft Accounts-TL(Real Persons) (*) 673,283 - 673,283
Overdraft Accounts-FC(Real Persons) 5 - 5
Total 4,668,092 18,879,814 23,547,906
(*) Overdraft accounts include personnel loans amounting to TL 3,522.
(**) Loans granted via branches abroad.

TÜRK EKONOMİ BANKASI A.Ş.
NOTES AND EXPLANATIONS TO UNCONSOLIDATED FINANCIAL STATEMENTS
AS OF 31 DECEMBER 2020 (Unless otherwise stated amounts are expressed in thousands of Turkish Lira (“TL”).)
92
I. Explanations and Disclosures Related to the Assets (continued)
6. Information on loans: (continued)
d) Information on consumer loans, individual credit cards, personnel loans and credit cards given to personnel:
Prior Period
Short Term Medium and
Long Term
Total
Consumer Loans-TL 567,813 15,880,140 16,447,953
Housing Loans 3,287 5,334,276 5,337,563
Vehicle Loans 18,385 422,741 441,126
General Purpose Loans 546,141 10,123,123 10,669,264
Other - - -
Consumer Loans –Indexed to FC - 18,308 18,308
Housing Loans - 18,308 18,308
Vehicle Loans - - -
General Purpose Loans - - -
Other - - -
Consumer Loans-FC (**) - 27,949 27,949
Housing Loans - 6,031 6,031
Vehicle Loans - 3,655 3,655
General Purpose Loans - 18,263 18,263
Other - - -
Individual Credit Cards-TL 3,135,899 54,120 3,190,019
With Instalments 1,012,747 54,120 1,066,867
Without Instalments 2,123,152 - 2,123,152
Individual Credit Cards-FC 11,775 - 11,775
With Instalments - - -
Without Instalments 11,775 - 11,775
Personnel Loans-TL 13,520 89,484 103,004
Housing Loans - 517 517
Vehicle Loans - - -
General Purpose Loans 13,520 88,967 102,487
Other - - -
Personnel Loans- Indexed to FC - - -
Housing Loans - - -
Vehicle Loans - - -
General Purpose Loans - - -
Other - - -
Personnel Loans-FC - - -
Housing Loans - - -
Vehicle Loans - - -
General Purpose Loans - - -
Other - - -
Personnel Credit Cards-TL 31,920 - 31,920
With Instalments 10,293 - 10,293
Without Instalments 21,627 - 21,627
Personnel Credit Cards-FC 393 - 393
With Instalments - - -
Without Instalments 393 - 393
Overdraft Accounts-TL(Real Persons) (*) 608,567 - 608,567
Overdraft Accounts-FC(Real Persons) 4 - 4
Total 4,369,891 16,070,001 20,439,892
(*) Overdraft accounts include personnel loans amounting to TL 4,386.
(**) Loans granted via branches abroad.

TÜRK EKONOMİ BANKASI A.Ş.
NOTES AND EXPLANATIONS TO UNCONSOLIDATED FINANCIAL STATEMENTS
AS OF 31 DECEMBER 2020 (Unless otherwise stated amounts are expressed in thousands of Turkish Lira (“TL”).)
93
I. Explanations and Disclosures Related to the Assets (continued)
6. Information on loans: (continued)
e) Information on commercial loans with instalments and corporate credit cards:
Current Period
Short Term
Medium and
Long Term
Total
Commercial loans with instalment – TL 2,173,068 8,946,399 11,119,467
Business Loans 257 163,797 164,054
Vehicle Loans 61,037 1,257,926 1,318,963
General Purpose Loans 2,111,774 7,524,676 9,636,450
Other - - -
Commercial loans with instalment - Indexed to FC - 148,076 148,076
Business Loans - 6,192 6,192
Vehicle Loans - 23,201 23,201
General Purpose Loans - 118,683 118,683
Other - - -
Commercial loans with instalment – FC - - -
Business Loans - - -
Vehicle Loans - - -
General Purpose Loans - - -
Other - - -
Corporate Credit Cards-TL 1,660,003 917 1,660,920
With Instalments 601,673 917 602,590
Without Instalments 1,058,330 - 1,058,330
Corporate Credit Cards-FC 1,560 - 1,560
With Instalments - - -
Without Instalments 1,560 - 1,560
Overdraft Accounts-TL(Legal Entities) 741,420 - 741,420
Overdraft Accounts-FC(Legal Entities) - - -
Total 4,576,051 9,095,392 13,671,443
Prior Period
Short Term
Medium and
Long Term
Total
Commercial loans with instalment – TL 1,006,177 9,781,970 10,788,147
Business Loans 1,000 170,690 171,690
Vehicle Loans 26,836 682,638 709,474
General Purpose Loans 978,341 8,928,642 9,906,983
Other - - -
Commercial loans with instalment - Indexed to FC - 331,604 331,604
Business Loans - 5,899 5,899
Vehicle Loans - 83,943 83,943
General Purpose Loans - 241,762 241,762
Other - - -
Commercial loans with instalment – FC 478 - 478
Business Loans - - -
Vehicle Loans - - -
General Purpose Loans 478 - 478
Other - - -
Corporate Credit Cards-TL 1,504,191 - 1,504,191
With Instalments 385,150 - 385,150
Without Instalments 1,119,041 - 1,119,041
Corporate Credit Cards-FC 2,439 - 2,439
With Instalments - - -
Without Instalments 2,439 - 2,439
Overdraft Accounts-TL(Legal Entities) 849,525 - 849,525
Overdraft Accounts-FC(Legal Entities) - - -
Total 3,362,810 10,113,574 13,476,384
f) Distribution of loans by users:
Current Period Prior Period
Public 2,048,390 2,096,489
Private 77,381,818 62,974,640
Total 79,430,208 65,071,129

TÜRK EKONOMİ BANKASI A.Ş.
NOTES AND EXPLANATIONS TO UNCONSOLIDATED FINANCIAL STATEMENTS
AS OF 31 DECEMBER 2020 (Unless otherwise stated amounts are expressed in thousands of Turkish Lira (“TL”).)
94
I. Explanations and Disclosures Related to the Assets (continued)
6. Information on loans: (continued)
g) Domestic and foreign loans:
Current Period Prior Period
Domestic Loans 78,937,391 64,523,379
Foreign Loans 492,817 547,750
Total 79,430,208 65,071,129
h) Loans granted to subsidiaries and associates:
Current Period Prior Period
Direct Loans Granted to Subsidiaries and Associates 345,966 277,729
Indirect Loans Granted to Subsidiaries and Associates - -
Total 345,966 277,729
i) Specific or non-performing loan (Stage 3) provisions for loans:
Current Period Prior Period
Loans and Receivables with Limited Collectability 104,606 349,033
Loans and Receivables with Doubtful Collectability 198,193 572,537
Uncollectible Loans and Receivables 1,991,274 1,430,975
Total 2,294,073 2,352,545
j) Information on loans under follow-up (Net):
j.1) Information on loans and other receivables included in loans under follow-up which are restructured or
rescheduled:
Group III Group IV Group V
Loans and Receivables
with Limited
Collectability
Loans and Receivables
with Doubtful
Collectability
Uncollectible
Loans and
Receivables
Current Period
Gross Amounts before Provisions 22,018 24,809 52,292
Restructured Loans 22,018 24,809 52,292
Prior Period
Gross Amounts before Provisions 55,867 41,008 18,928
Restructured Loans 55,867 41,008 18,928
j.2) Movement of loans under follow-up:
Group III Group IV Group V
Loans and Receivables
with Limited
Collectability
Loans and Receivables
with Doubtful
Collectability
Uncollectible
Loans and
Receivables
Prior period end balance 624,321 1,168,994 2,353,591
Additions (+) 962,916 94,269 394,387
Transfers from other Categories of Loans under Follow-up (+) - 1,173,957 1,705,142
Transfers to other Categories of Loans under Follow-up (-) 1,173,957 1,705,142 -
Collections (-) 245,121 412,866 916,644
Write-Offs (-) 4 691 96,801
Sold Portfolio (-)(*) 3 4,792 419,674
Corporate and Commercial Loans - 4,572 171,810
Retail Loans 2 - 137,865
Credit Cards 1 220 109,999
Other - - -
Current period end balance 168,152 313,729 3,020,001
Provision (-) 104,606 198,193 1,991,274
Net Balances on Balance Sheet 63,546 115,536 1,028,727
(*) Past due receivables amounting to TL 424,469 for which TL 410,516 of provision had been allocated, is sold for TL 35,759 during 2020.
After all sales procedures were completed, these past due receivables have been written off from the portfolio.

TÜRK EKONOMİ BANKASI A.Ş.
NOTES AND EXPLANATIONS TO UNCONSOLIDATED FINANCIAL STATEMENTS
AS OF 31 DECEMBER 2020 (Unless otherwise stated amounts are expressed in thousands of Turkish Lira (“TL”).)
95
I. Explanations and Disclosures Related to the Assets (continued)
6. Information on loans (continued) :
j ) Information on loans under follow-up (Net) (continued):
j.3) Information on foreign currency loans under follow-up:
Group III Group IV Group V
Loans and Receivables with
Limited Collectability
Loans and Receivables with
Doubtful Collectability
Uncollectible Loans and
Receivables
31 December 2020
Period End Balance 13,274 82,483 206,622
Provision (-) 7,729 57,368 158,053
Net Balance on Balance Sheet 5,545 25,115 48,569
31 December 2019
Prior Period End Balance 40,984 76,556 153,192
Provision (-) 22,125 42,944 121,969
Net Balance on Balance Sheet 18,859 33,612 31,223
j.4) Information regarding gross and net amounts of loans under follow-up with respect to user groups:
Group III Group IV Group V
Loans and Receivables with
Limited Collectability
Loans and Receivables
with Doubtful Collectability
Uncollectible Loans and
Receivables
Current Period (Net)
Loans to Real Persons and Legal Entities (Gross) 168,152 313,729 3,020,001
Provision (-) 104,606 198,193 1,991,274
Loans to Real Persons and Legal Entities (Net) 63,546 115,536 1,028,727
Banks (Gross) - - -
Provision (-) - - -
Banks (Net) - - -
Other Loans and Receivables (Gross) - - -
Provision (-) - - -
Other Loans and Receivables (Net) - - -
Prior Period (Net)
Loans to Real Persons and Legal Entities (Gross) 624,321 1,168,994 2,353,591
Provision (-) 349,033 572,537 1,430,975
Loans to Real Persons and Legal Entities (Net) 275,288 596,457 922,616
Banks (Gross) - - -
Provision (-) - - -
Banks (Net) - - -
Other Loans and Receivables (Gross) - - -
Provision (-) - - -
Other Loans and Receivables (Net) - - -
j.5) Information on interest accruals, rediscounts and valuation differences calculated for non-performing
loans and their provisions:
Group III Group IV Group V
Loans with Limited
Collectability
Loans with Doubtful
Collectability Uncollectible Loans
Current Period(Net) 2,233 10,665 357,174
Interest Accruals, Rediscounts and Valuation Differences 18,675 40,732 637,700
Provision (-) 16,442 30,067 280,526
Prior Period (Net) 18,822 77,767 229,640
Interest Accruals, Rediscounts and Valuation Differences 76,914 175,092 394,218
Provision (-) 58,092 97,325 164,578

TÜRK EKONOMİ BANKASI A.Ş.
NOTES AND EXPLANATIONS TO UNCONSOLIDATED FINANCIAL STATEMENTS
AS OF 31 DECEMBER 2020 (Unless otherwise stated amounts are expressed in thousands of Turkish Lira (“TL”).)
96
I. Explanations and Disclosures Related to the Assets (continued)
6. Information on loans: (continued)
k) Outline of the liquidation policy for losses and other receivables:
Loans and other receivables, which are deemed not possible to be collected according to the “Regulation on
Classification of Loans and Provisions and Provisions for Reserves” published in the Official Gazette dated 22 June
2016 and numbered 29750, are fulfilled by the requirements of the Tax Procedure Law in line with the decision taken
by the Bank's senior management classified as a loan as a loss.
l) Disclosures regarding the unregistered policy:
The Fifth Group - Loans classified as Loss Loans, with at least one reporting period in this group, and the lifetime
expected credit loss due to the default of the debtor constitutes the Bank's credits to be deducted. Deregistration is
an accounting practice and does not result in the right to waive. Loans deducted from the record do not affect the
legal follow-up of the Bank. Indicators are utilized regarding the absence of reasonable expectations regarding the
recovery of loans. The deregistration is examined on an incident basis with predefined criteria and the following
deregistration indicators are considered:
- The possibility of recovery is limited: Loans with low collateralization, limited collateral capability, limited assets
that provide foreclosure collection, and less than expected cost income for collection are evaluated.
- Financial indicators: Financial indicators evaluating that the entire loan is not capable of recovering are evaluated,
- Long-term follow-up: Those who do not have reasonable collection expectations are evaluated in order to recover
the loans that have been pursuing for a long time.
The following practices for the loans bank monitors, although the loans have ben written-off by the Bank, cannot be
different from its registered loans.
a) The methods applied for legal collection of loans from debtors,
b) Decisions to be subjected to the sale of non-performing loans,
c) Decisions to waive the credit by waiving the loans.
Within the scope of TFRS 9, the deducted amount during the period is TL 97,496 (31 December 2019: TL 171,832)
and its effect on NPL ratio is 0.12%(31 December 2019: 0.23%) . The follow-up conversion rate, after deductions,
is 4.22% (31 December 2019 5.99% ) in the current period frozen loan figures, while the calculated rate including
the loans deducted during the year is 4.34% (31 December 2019 : 6.22%) .
m) Other explanations and disclosures :
Current Period Commercial Consumer Credit Cards Total
Standard Loans 50,015,691 16,922,139 4,540,033 71,477,863
Loans under Close Monitoring 4,204,131 3,070,285 677,929 7,952,345
Loans Under Follow-Up 3,096,177 315,522 90,183 3,501,882
Total 57,315,999 20,307,946 5,308,145 82,932,090
12 Month Expected Credit Loss (Stage I) (-) 176,623 162,525 54,298 393,446
Significant Increase in Credit Risk (Stage II) (-) 1,033,284 263,142 63,826 1,360,252
Default (Stage III) (-) 1,996,399 228,731 68,943 2,294,073
Total 3,206,306 654,398 187,067 4,047,771
Net Credit Balance on the Balance Sheet 54,109,693 19,653,548 5,121,078 78,884,319
Prior Period Commercial Consumer Credit Cards Total
Standard Loans 37,586,208 14,593,587 4,026,952 56,206,747
Loans under Close Monitoring 5,538,399 2,612,198 713,785 8,864,382
Loans Under Follow-Up 3,617,237 398,230 131,439 4,146,906
Total 46,741,844 17,604,015 4,872,176 69,218,035
12 Month Expected Loss Reserves (Stage I) (-) 192,135 144,831 57,228 394,194
Significant Increase in Credit Risk (Stage II) (-) 686,025 161,159 46,969 894,153
Default (Stage III) (-) 2,009,282 250,895 92,368 2,352,545
Total 2,887,442 556,885 196,565 3,640,892
Net Credit Balance on the Balance Sheet 43,854,402 17,047,130 4,675,611 65,577,143

TÜRK EKONOMİ BANKASI A.Ş.
NOTES AND EXPLANATIONS TO UNCONSOLIDATED FINANCIAL STATEMENTS
AS OF 31 DECEMBER 2020 (Unless otherwise stated amounts are expressed in thousands of Turkish Lira (“TL”).)
97
I. Explanations and Disclosures Related to the Assets (continued)
6. Information on loans: (continued)
m) Other explanations and disclosures (continued)
The following is a reclassification of provision for impairment on loans by stage;
Current Period
Commercial
Standard Loans
(Stage 1)
Loans under close
monitoring (Stage 2)
Non- performing
loans (Stage 3) Total
31 December 2019 192,135 686,025 2,009,282 2,887,442
Transfers; - Stage 1 to Stage 2 (8,724) 49,433 - 40,709
- Stage 1 to Stage 3 (1,029) - 34,371 33,342
- Stage 2 to Stage 3 - (70,704) 259,761 189,057 - Stage 2 to Stage 1 2,529 (19,907) - (17,378)
- Stage 3 to Stage 2 - - - -
Transferred within the period 87,699 574,689 141,749 804,137 Collections (110,444) (285,376) (189,132) (584,952)
Sold Portfolio - - (163,411) (163,411)
Write-off - - (96,221) (96,221) Currency differences 14,457 99,124 - 113,581
Prior Period
Total expected credit losses 31 December 2020 176,623 1,033,284 1,996,399 3,206,306
Commercial
Standard Loans
(Stage 1)
Loans under close
monitoring (Stage 2)
Non- performing
loans (Stage 3) Total
31 December 2018 218,413 634,220 760,528 1,613,161 Transfers;
- Stage 1 to Stage 2 (19,564) 104,626 - 85,062
- Stage 1 to Stage 3 (5,387) - 169,762 164,375
- Stage 2 to Stage 3 - (82,960) 378,714 295,754
- Stage 2 to Stage 1 2,817 (17,869) - (15,052)
- Stage 3 to Stage 2 - - - - Transferred within the period 117,210 243,941 1,388,936 1,750,087
Collections (127,005) (224,291) (236,201) (587,497)
Sold Portfolio - - (282,227) (282,227) Write-offs - - (171,832) (171,832)
Currency differences 5,651 28,358 1,602 35,611
Total expected credit losses 31 December 2019 192,135 686,025 2,009,282 2,887,442

TÜRK EKONOMİ BANKASI A.Ş.
NOTES AND EXPLANATIONS TO UNCONSOLIDATED FINANCIAL STATEMENTS
AS OF 31 DECEMBER 2020 (Unless otherwise stated amounts are expressed in thousands of Turkish Lira (“TL”).)
98
I. Explanations and Disclosures Related to the Assets (continued)
6. Information on loans: (continued)
m) Other explanations and disclosures (continued)
Current Period
Consumer
Standard Loans
(Stage 1)
Loans under close
monitoring (Stage 2)
Non- performing
loans (Stage 3) Total
31 December 2019 144,831 161,159 250,895 556,885
Transfers;
- Stage 1 to Stage 2 (9,009) 69,594 - 60,585 - Stage 1 to Stage 3 (1,226) - 27,155 25,929
- Stage 2 to Stage 3 - (16,472) 65,561 49,089
- Stage 2 to Stage 1 4,209 (30,446) - (26,237) - Stage 3 to Stage 2 - - - -
Transferred within the period 72,237 122,632 29,704 224,573
Collections (48,517) (43,325) (18,399) (110,241) Sold Portfolio - - (124,910) (124,910)
Write-offs - - (1,275) (1,275)
Currency differences - - - -
Total expected credit losses 31 December 2020 162,525 263,142 228,731 654,398
Prior Period
Consumer
Standard Loans
(Stage 1)
Loans under close
monitoring (Stage 2)
Non- performing
loans (Stage 3) Total
31 December 2018 85,416 149,047 769,345 1,003,808
Transfers; - Stage 1 to Stage 2 (7,719) 37,698 - 29,979
- Stage 1 to Stage 3 (2,701) - 54,025 51,324
- Stage 2 to Stage 3 - (13,970) 74,977 61,007 - Stage 2 to Stage 1 4,716 (28,485) - (23,769)
- Stage 3 to Stage 2 - - - -
Transferred within the period 91,331 52,767 (555,612) (411,514) Collections (26,212) (35,898) (6,672) (68,782)
Sold Portfolio - - (85,168) (85,168)
Write-offs - - - - Currency differences - - - -
Total expected credit losses 31 December 2019 144,831 161,159 250,895 556,885

TÜRK EKONOMİ BANKASI A.Ş.
NOTES AND EXPLANATIONS TO UNCONSOLIDATED FINANCIAL STATEMENTS
AS OF 31 DECEMBER 2020 (Unless otherwise stated amounts are expressed in thousands of Turkish Lira (“TL”).)
99
I. Explanations and Disclosures Related to the Assets (continued)
6. Information on loans: (continued)
m) Other explanations and disclosures (continued) Current Period
Credit Cards
Standard Loans
(Stage 1)
Loans under close
monitoring (Stage 2)
Non- performing
loans (Stage 3) Total
31 December 2019 57,228 46,969 92,368 196,565
Transfers;
- Stage 1 to Stage 2 (5,373) 35,955 - 30,582 - Stage 1 to Stage 3 (1,144) - 22,014 20,870
- Stage 2 to Stage 3 - (5,174) 32,122 26,948
- Stage 2 to Stage 1 6,441 (16,903) - (10,462) - Stage 3 to Stage 2 - - - -
Transferred within the period 4,183 14,254 22,475 40,912 Collections (7,037) (11,275) - (18,312)
Sold Portfolio - - (100,036) (100,036)
Write-offs - - - - Currency differences - - - -
Total expected credit losses 31 December 2020 54,298 63,826 68,943 187,067
Prior Period
Credit Cards
Standard Loans
(Stage 1)
Loans under close
monitoring (Stage 2)
Non- performing
loans (Stage 3) Total
31 December 2018 51,561 52,947 128,307 232,815 Transfers;
- Stage 1 to Stage 2 (5,389) 27,657 - 22,268
- Stage 1 to Stage 3 (2,850) - 71,316 68,466 - Stage 2 to Stage 3 - (7,962) 67,091 59,129
- Stage 2 to Stage 1 7,383 (17,452) - (10,069)
- Stage 3 to Stage 2 - - - - Transferred within the period 13,240 3,035 (91,447) (75,172)
Collections (6,717) (11,256) - (17,973)
Sold Portfolio - - (82,899) (82,899) Write-offs - - - -
Currency differences - - - -
Total expected credit losses 31 December 2019 57,228 46,969 92,368 196,565

TÜRK EKONOMİ BANKASI A.Ş.
NOTES AND EXPLANATIONS TO UNCONSOLIDATED FINANCIAL STATEMENTS
AS OF 31 DECEMBER 2020 (Unless otherwise stated amounts are expressed in thousands of Turkish Lira (“TL”).)
100
I. Explanations and Disclosures Related to the Assets (continued)
6. Information on loans: (continued)
m) Other explanations and disclosures (continued):
The fair value of collaterals of non- performing loans, capped with the respective outstanding loan balance, at
31 December 2020 is TL 1,902,570 (31 December 2019: TL 2,272,171).
The fair value of the collateral of non-performing loans that do not exceed the risk:
Current Period Prior Period
Mortgage 1,459,066 1,595,390
Vehicle 118,677 161,143
Cash 878 1,068 Other (*) 323,949 514,570
Total 1,902,570 2,272,171
(*) Other amount includes Treasury backed and Portfolio guaranteed CGF guarantee amounting to TL 323,949 (31 December 2019: TL 514,750).
As of 31 December 2020, the fair value of the collaterals of the customers' total principal risk related to the
loans under close monitoring is TL 3,911,887 (31 December 2019: TL 3,406,585).
Fair value of the part of the collaterals of the closely monitored loans that do not exceed the risk:
Current Period Prior Period
Mortgage 3,263,239 2,741,280
Vehicle 282,443 304,501 Cash 230,542 265,836
Other 135,663 94,968
Total 3,911,887 3,406,585
As of 31 December 2020 and 31 December 2019, the details of the commodities and real estates that the bank
has acquired for disposal of credit receivables are as follows:
31 December 2020 Commercial Consumer Total
Residential, commercial or industrial properties 108,709 4,150 112,859
Other - - -
Total 108,709 4,150 112,859
31 December 2019 Commercial Consumer Total
Residential, commercial or industrial properties 123,326 8,036 131,362
Other - - -
Total 123,326 8,036 131,362

TÜRK EKONOMİ BANKASI A.Ş.
NOTES AND EXPLANATIONS TO UNCONSOLIDATED FINANCIAL STATEMENTS
AS OF 31 DECEMBER 2020 (Unless otherwise stated amounts are expressed in thousands of Turkish Lira (“TL”).)
101
I. Explanations and Disclosures Related to the Assets (continued)
7. Information on financial assets measured at amortized cost:
a) a.1) Information on financial assets measured at amortized cost and subject to repurchase agreements:
a.2) Information on financial assets measured at amortized cost and given as collateral / blocked:
Financial assets valued over their amortized cost classified as free warehouse TL 528,072 (31 December
2019: TL 1,328,238).
a.3) Information on held-to-maturity investments given as collateral or blocked:
Current Period Prior Period
Government Bonds 12,522,941 4,906,618
Treasury Bills - -
Other Public Sector Debt Securities - -
Total 12,522,941 4,906,618
a.4) Information government debt securities measured at amortized cost:
Current Period Prior Period
Debt securities 12,522,941 4,906,618
Quoted on a Stock Exchange 12,522,941 4,906,618
Unquoted - -
Impairment Provision (-) - -
Total 12,522,941 4,906,618
a.5) Movement of financial assets measured at amortized cost:
Current Period Prior Period
Beginning Balance 4,906,618 2,792,080
Foreign Currency Differences on Monetary Assets 377,092 -
Purchases During the Year (*)(**) 8,062,415 2,114,538
Disposals Through Sales and Redemptions (823,184) -
Impairment Provision (-) - -
Closing Balance 12,522,941 4,906,618
(*) Includes rediscount amounts. (**) In the current period, the securities portfolio of the Chief Investment Office were transferred to the Asset-Liability Management
and Treasury Group due to the change in the business model of the Bank management. During this transition, securities held as
Financial Assets at Fair Value through Other Comprehensive Income amounting to TL 291,603 were classified as Financial Assets Measured at Amortized Cost. After this reclassification, the valuation difference amounting to TL 20,141 has been reversed from
equity.
Current Period Prior Period
TL FC TL FC
Equity Securities - - - -
Bond, Treasury bill and similar investment securities 2,971,137 1,153,219 1,194,716 405,580
Total 2,971,137 1,153,219 1,194,716 405,580
Current Period Prior Period
TL FC TL FC
Equity Securities - - - -
Bond, Treasury bill and similar investment securities 6,698,645 1,171,868 1,978,084 -
Other - - - -
Total 6,698,645 1,171,868 1,978,084 -

TÜRK EKONOMİ BANKASI A.Ş.
NOTES AND EXPLANATIONS TO UNCONSOLIDATED FINANCIAL STATEMENTS
AS OF 31 DECEMBER 2020 (Unless otherwise stated amounts are expressed in thousands of Turkish Lira (“TL”).)
102
I. Explanations and Disclosures Related to the Assets (continued)
8. Information on associates (Net):
a.1) Information on unconsolidated associates according to Communiqué on Preparing Banks’
Consolidated Financial Statements and related Turkish Accounting Standard: None (31 December
2019: None).
a.2) Information on the unconsolidated associates: None (31 December 2019: None).
a.3) Explanations of consolidated associates: None (31 December 2019: None).
a.4) Information on sector information on consolidated associates: None (31 December 2019: None).
a.5) Consolidated associates which are quoted on the stock exchange: None (31 December 2019: None).
9. Information on subsidiaries (Net):
a) Information on shareholders’ equity of significant subsidiaries:
Subsidiaries do not use internal capital adequacy assessment approach.
TEB Faktoring
A.Ş.
TEB Yatırım
Menkul
Değerler A.Ş.
TEB Portföy
Yönetimi A.Ş.
Paid-in Capital to be Entitled for Compensation after All Creditors 50,000 28,794 6,860
Reserves 100,454 47,846 6,674
Net income for the period and prior period income 40,455 104,065 20,849
Income/ Loss recognized under equity in accordance with TAS - - (122)
Leasehold Improvements on Operational Leases (-) 186 303 58
Goodwill and intangible asset and the related deferred tax liability (-) 3,031 4,162 551
Total Common Equity Tier 1 Capital 187,692 176,240 33,652
General Provision 3,832 - -
Total Equity 191,524 176,240 33,652
b) If there is any unconsolidated subsidiary, total equity amount that is lack of subjection to the reasonable
justifications of non–consolidate and minimum capital requirement: None (31 December 2019: None).
c) Information on the unconsolidated subsidiaries: None (31 December 2019: None).
d) Information on the consolidated subsidiaries:
d.1) Information on the consolidated subsidiaries:
Description
Address (City/ Country)
The Bank’s share percentage-If different voting percentage (%)
Other shareholders’ share
percentage (%) 1 TEB Faktoring A.Ş. İstanbul/Turkey 100.00 - 2 TEB Yatırım Menkul Değerler A.Ş. İstanbul/Turkey 96.62 3.38 3 TEB Portföy Yönetimi A.Ş. İstanbul/Turkey 25.60 29.14
Information on the consolidated subsidiaries with the order as presented in the table above:
Total Assets
Shareholders’ Equity
Total Fixed
Assets
Interest Income
Income on Marketable
Securities Portfolio
Current Period Profit / Loss
Prior Period Profit / Loss (*)
Fair Value
1 2,620,875 190,909 4,355 197,063 - 29,417 39,385 - 2 522,419 180,705 3,630 33,279 - 78,931 31,755 - 3 44,370 34,261 1,890 2,928 98 13,590 4,917 -
(*) These figures are shown per BRSA financial statements as of 31 December 2019.

TÜRK EKONOMİ BANKASI A.Ş.
NOTES AND EXPLANATIONS TO UNCONSOLIDATED FINANCIAL STATEMENTS
AS OF 31 DECEMBER 2020 (Unless otherwise stated amounts are expressed in thousands of Turkish Lira (“TL”).)
103
I. Explanations and Disclosures Related to the Assets (continued)
9. Information on subsidiaries (Net): (continued)
d.2) Information on consolidated subsidiaries:
Current Period Prior Period
Balance at the beginning of the period 115,986 115,986
Movements during the period - - Purchases - - Bonus shares obtained - Share in current year income - - Sales - Revaluation increase - - Provision for impairment - -
Balance at the end of the period 115,986 115,986
Capital commitments - - Share percentage at the end of the period (%) - -
d.3) Sectoral information on the consolidated subsidiaries and the related carrying amounts:
Current Period Prior Period
Banks - - Insurance Companies - - Factoring Companies 43,417 43,417 Leasing Companies - - Finance Companies - - Other Financial Subsidiaries 72,569 72,569
Total 115,986 115,986
d.4) Consolidated subsidiaries quoted on the stock exchange: None (31 December 2019: None).
e) Information on non-financial subsidiaries that are not consolidated:
TEB ARF Teknoloji A.Ş. was established by the Bank with TL 50,000 paid-in capital and 100% ownership; It was registered in the Trade Registry Gazette on 16 July 2020.
10. Explanations on entities under common control (joint ventures):
a) Information on entities under common control (joint ventures):
Entities under common
control (joint ventures)
Share of the
Parent Bank
(%)
Share of the
Group (%)
Current
Asset
Non-current
Asset
Long-term
Receivable Profit Loss
Bantaş Nakit ve Kıymetli Mal Taşıma ve
Güvenlik Hizmetleri A.Ş. 0.1 33.3 113,710 47,576 25,018 215,676
(193,028)
b) Accounting method of the reasonable justification of unconsolidated in Joint Ventures that booked on the
unconsolidated the Parent Bank’s financial statements:
The Bank owns 0.1% but the Group owns 33.3% share of Bantaş Nakit ve Kıymetli Mal Taşıma ve Güvenlik
Hizmetleri A.Ş. and it is presented as joint venture in financial statements however, it is carried by cost value
since necessary requirements for consolidation is not met.
11. Information on financial lease receivables (Net): None (31 December 2019: None).

TÜRK EKONOMİ BANKASI A.Ş.
NOTES AND EXPLANATIONS TO UNCONSOLIDATED FINANCIAL STATEMENTS
AS OF 31 DECEMBER 2020 (Unless otherwise stated amounts are expressed in thousands of Turkish Lira (“TL”).)
104
I. Explanations and Disclosures Related to the Assets (continued)
12. Positive differences related to derivative financial assets for hedging purposes:
Current Period Prior Period
TL FC TL FC
Fair Value Hedge 416,239 31,137 7,024 14,112
Cash Flow Hedge 650,142 - 219,494 877
Foreign Net Investment Hedge - - - -
Total 1,066,381 31,137 226,518 14,989
In case of termination of the fair value hedge accounting, any adjustment to the book value of the hedging instrument calculated using the effective interest method under fair value hedge accounting is amortized through profit or loss to the financial asset price until the maturity of the asset.
According to cash flow hedges terminated by the Bank, accumulated valuation differences amounted TL 18,266
(31 December 2019: TL 20,286) is recorded under equity as of 31 December 2020 and these accumulated
differences are transferred into income statement by considering maturity date of hedged items.
13. Information on tangible assets:
31 December 2019 Purchases Sales Other 31 December 2020
Cost: Real estate 109,711 574 (1,206) 358 109,437
Right of Use 1,017,239 77,631 (85,644) - 1,009,226
Furniture, Furnishings, Office
Machines and Other Securities 879,596 123,832 (13,994) - 989,434
Total cost 2,006,546 202,037 (100,844) 358 2,108,097
31 Decemer 2019 Period Expenses Sales Other 31 December 2020
Accumulated Depreciation: Real estate 51,802 3,556 (417) 56 54,997
Right of Use Depreciation 479,140 145,792 (85,644) - 539,288
Furniture, Furnishings, Office
Machines and Other Securities 597,822 93,271 (13,473) - 677,620
Total Accumulated Depreciation 1,128,764 242,619 (99,534) 56 1,271,905
Net Book Value 877,782 836,192
a) The impairment provision set or cancelled in the current period according to the asset groups not
individually significant but materially affecting the overall financial statements, and the reason and
conditions for this: None.
b) Pledges, mortgages and other restrictions on the tangible fixed assets, expenses arising from the
construction for tangible fixed assets, commitments given for the purchases of tangible fixed assets:
None.

TÜRK EKONOMİ BANKASI A.Ş.
NOTES AND EXPLANATIONS TO UNCONSOLIDATED FINANCIAL STATEMENTS
AS OF 31 DECEMBER 2020 (Unless otherwise stated amounts are expressed in thousands of Turkish Lira (“TL”).)
105
I. Explanations and Disclosures Related to the Assets (continued)
14. Information on intangible assets:
31 December 2019 Purchases Sales Other 31 December 2020
Cost:
Other Intangible Assets 468,333 85,089 (409) - 553,013 Total cost 468,333 85,089 (409) - 553,013
31 December 2019
Depreciation
Expense Sales Other 31 December 2020
Accumulated Depreciation:
Other Intangible Assets 333,571 75,775 (12) - 409,334
Total Accumulated Depreciation 333,571 75,775 (12) - 409,334
Net Book Value 134,762 143,679
a) Disclosures for book value, description and remaining useful life for a specific intangible fixed asset that is
material to the financial statements: None.
b) Disclosure for intangible fixed assets acquired through government grants and accounted for at fair value at
initial recognition: None.
c) The method of subsequent measurement for intangible fixed assets that are acquired through government
incentives and recorded at fair value at the initial recognition: None.
d) Book value of intangible assets that are restricted or pledged in use: None.
e) Amount of purchase commitments for intangible fixed assets: None.
f) Information on revalued intangible assets according to their types: None.
g) Amount of total research and development expenses recorded in income statement within the period if any:
None.
h) Positive or negative consolidation goodwill on entity basis: Not applicable for unconsolidated financial
statements.
i) Information on goodwill:
Following the publication of the BRSA's permission dated February 10, 2011 in the Official Gazette dated
February 12, 2011 and numbered 27844, all rights by the termination of the legal personality of Fortis Bank A.Ş.
The merger of two banks was realized through the transfer of receivables, liabilities and liabilities to the Bank
in the form of ashes. The shareholders of Fortis Bank A.Ş., which was dismissed due to the merger, were given
1.0518 registered TEB shares for each share with a nominal value of TL 1 to be replaced with their existing
shares. Since the enterprises subject to this merger are not controlled by the same person or persons before and
after the business merger, the transaction has been evaluated within the scope of TFRS 3. Fortis Bank A.Ş. The
difference between this value and the fair value of Fortis Bank A.Ş.'s identifiable net assets acquired is recognized
as goodwill, considering the fair value of the equity shares subject to change as a result of the merger as of 14
February 2011. It has been recognized.
j) Beginning and ending balance of the goodwill and movement on goodwill in the current period:
Current Period Prior Period
Beginning period 421,124 421,124
Foreign currency differences - -
Acquisitions - -
Balance at the end of the period 421,124 421,124
15. Information on investment properties: None (31 December 2019: None)

TÜRK EKONOMİ BANKASI A.Ş.
NOTES AND EXPLANATIONS TO UNCONSOLIDATED FINANCIAL STATEMENTS
AS OF 31 DECEMBER 2020 (Unless otherwise stated amounts are expressed in thousands of Turkish Lira (“TL”).)
106
I. Explanations and Disclosures Related to the Assets (continued)
16. Information on deferred tax assets:
a) As of 31 December 2020, deferred tax asset computed on the temporary differences and reflected to the
balance sheet is TL 632,912 (31 December 2019: TL 650,094). There are no tax exemptions or deductions
over which deferred tax asset is computed.
b) Temporary differences over which deferred tax asset is not computed and recorded in the balance sheet in
prior periods: None.
c) Allowance for deferred tax and deferred tax assets from reversal of allowance: None.
d) Movement of deferred tax:
Current Period Prior Period
As of January 1 650,094 187,325
TFRS 16 Transition Effect - 24,083
Deferred Tax Income / (Expense) 114,450 182,340
Deferred Tax Accounted Under Equity (131,632) 256,346
Deferred Tax Asset 632,912 650,094
After net off the net deferred tax asset is presented as deferred tax asset on the balance sheet and net deferred tax
liability presented as deferred tax liability on balance sheet. The deferred tax income of TL 114,450 is stated under
the tax provision in the income statement (31 December 2019: TL 182,340 income). The portion of the deferred
tax that is directly attributable to equity which is presented in the table below has been netted within the relevant
accounts in the statement of shareholders' equity.
Current Period Prior Period
Financial assets fair value through other comprehensive income 26,926 (44,390)
From hedge accounting (169,324) 302,891
Actuarial gains and losses 10,766 (2,155)
Total (131,632) 256,346
17. Information on assets held for sale and discontinued operations:
Current Period Prior Period
Beginning of Period Cost 131,362 109,104
Accumulated Depreciation at the Beginning of the Period (-) - -
Net Book Value 131,362 109,104
Opening Balance 131,362 109,104
Acquired 137,125 149,647
Disposed (-) 160,897 122,922
Impairment (-) (5,269) 4,467
Depreciation Value (-) - -
Period End Cost 112,859 131,362
Period End Accumulated Depreciation (-) - -
Closing Net Book Value 112,859 131,362
18. Information on other assets:
Other assets of the balance sheet amount to TL 3,587,523 (31 December 2019: TL 4,442,248) and do not
exceed 10% of the total balance sheet excluding off-balance sheet commitments.

TÜRK EKONOMİ BANKASI A.Ş.
NOTES AND EXPLANATIONS TO UNCONSOLIDATED FINANCIAL STATEMENTS
AS OF 31 DECEMBER 2020 (Unless otherwise stated amounts are expressed in thousands of Turkish Lira (“TL”).)
107
II. Explanations and Disclosures Related to the Liabilities
1. a) Information on maturity structure of deposits:
a.1) Current period:
7 Day Call Up to 1
Month
1-3
Months
3-6
Months
6 Month-
1 Year
1 Year
and Over
Accumulated
Total Demand Accounts Deposits
Saving Deposits 3,343,473 - 13,247,327 9,248,027 174,061 15,303 31,868 - 26,060,059
Foreign Currency Deposits 18,427,496 - 7,600,065 11,882,963 97,381 92,277 52,616 - 38,152,798
Residents in Turkey 17,203,160 - 7,316,504 11,506,796 67,244 42,090 36,070 - 36,171,864
Residents Abroad 1,224,336 - 283,561 376,167 30,137 50,187 16,546 - 1,980,934
Public Sector Deposits 431,997 - 59,843 136,651 8,020 - - - 636,511
Commercial Deposits 4,493,650 - 3,953,410 5,879,776 158,781 1,448 13,824 - 14,500,889
Other Institutions Deposits 206,580 - 145,091 539,426 61,442 63 168 - 952,770
Precious Metals Deposits 5,807,140 - 31,022 94,004 15,788 50,503 3,597 - 6,002,054
Bank Deposits 43,796 - 7,424,601 - - - - - 7,468,397
Central Bank of Turkey 31 - - - - - - - 31
Domestic Banks 8 - - - - - - - 8
Foreign Banks 43,757 - 7,424,601 - - - - - 7,468,358
Special Financial Institutions - - - - - - - - -
Other - - - - - - - - -
Total 32,754,132 - 32,461,359 27,780,847 515,473 159,594 102,073 - 93,773,478
a.2) Prior period:
7 Day Call Up to 1
Month
1-3
Months
3-6
Months
6 Month-
1 Year
1 Year
and Over
Accumulated
Total Demand Accounts Deposits
Saving Deposits 2,913,675 - 11,685,382 8,760,022 198,974 159,316 142,791 - 23,860,160
Foreign Currency Deposits 8,689,233 - 9,179,868 16,994,157 220,469 75,587 91,126 - 35,250,440
Residents in Turkey 8,125,778 - 8,724,284 16,524,666 196,404 32,768 74,233 - 33,678,133
Residents Abroad 563,455 - 455,584 469,491 24,065 42,819 16,893 - 1,572,307
Public Sector Deposits 424,598 - 73,628 50,872 7,475 - - - 556,573
Commercial Deposits 3,315,957 - 3,921,717 1,904,438 101,496 3,210 55,398 - 9,302,216
Other Institutions Deposits 143,878 - 65,741 266,882 12,458 91 554 - 489,604
Precious Metals Deposits 1,275,586 - 90,788 700,588 38,080 142,511 101,470 - 2,349,023
Bank Deposits 23,739 - 362,573 - - - - - 386,312
Central Bank of Turkey 25 - - - - - - - 25
Domestic Banks 16 - - - - - - - 16
Foreign Banks 23,698 - 358,772 - - - - - 382,470
Special Financial Institutions - - 3,801 - - - - - 3,801
Other - - - - - - - - -
Total 16,786,666 - 25,379,697 28,676,959 578,952 380,715 391,339 - 72,194,328
b) Information on saving deposits under the guarantee of saving deposit insurance:
b.1) Saving deposits exceeding the limit of insurance:
i) Information on saving deposits under the guarantee of saving deposit insurance and exceeding the limit of
saving deposit insurance:
Saving Deposits
Under the Guarantee of
Insurance (*)
Exceeding the Limit of
Insurance (*)
Current Period Prior Period Current Period Prior Period
Saving Deposits 14,783,424 14,607,157 10,931,481 8,731,764
Foreign Currency Saving Deposits 7,067,339 6,075,469 14,081,460 12,928,549
Other Deposits in the Form of Saving Deposits 2,567,019 781,197 2,854,708 1,320,538
Foreign Branches’ Deposits under Foreign Authorities'
Insurance - - - -
Off-shore Banking Regions’ Deposits under Foreign
Authorities' Insurance - - - -
Total 24,417,782 21,463,823 27,867,649 22,980,851
(*) According to the BRSA’s circular no 1584 dated on 23 February 2005, accruals are included in the saving deposit amounts.

TÜRK EKONOMİ BANKASI A.Ş.
NOTES AND EXPLANATIONS TO UNCONSOLIDATED FINANCIAL STATEMENTS
AS OF 31 DECEMBER 2020 (Unless otherwise stated amounts are expressed in thousands of Turkish Lira (“TL”).)
108
II. Explanations and Disclosures Related to the Liabilities (continued)
b) Information on saving deposits under the guarantee of saving deposit insurance: (continued)
b.1) Saving deposits exceeding the limit of insurance: (continued)
ii) Deposits of real persons not under the guarantee of saving deposit insurance:
Current Period Prior Period
Foreign Branches’ Deposits and Other Accounts 639,161 615,203
Deposits of Controlling Shareholders and Their Close Families 1,130,777 3,823,134
Deposits of Chairman and Members of the Board of Directors and Their Close Families 66,845 68,002
Deposits Obtained Through Illegal Acts Defined in the 282nd Article of the 5237 Numbered
Turkish Criminal Code Dated 26 September 2004. - -
Saving Deposits in Banks Established in Turkey Exclusively for Off Shore Banking
Activities - -
2. Information on derivative financial liabilities:
a) Negative differences related to derivative financial liabilities held-for-trading:
Current Period Prior Period
TL FC TL FC
Forward Transactions 71,044 6,778 97,772 25,075
Swap Transactions 1,977,574 179,821 1,362,074 71,890
Futures Transactions - - - -
Options 18,600 6,526 26,488 3,285
Other - - -
Total 2,067,218 193,125 1,486,334 100,250
3. Information on funds borrowed and debt securities issued:
a) Information on banks and other financial institutions:
Current Period Prior Period
TL FC TL FC
Funds Borrowed from Central Bank of Turkey - - - -
From Domestic Banks and Institutions 412,907 34,552 307,801 169,120
From Foreign Banks, Institutions and Funds - 9,300,147 - 8,100,061
Total 412,907 9,334,699 307,801 8,269,181
As of 31 December 2020, the Bank has borrowings from its related parties amounting to TL 3,915,889 (31
December 2019: TL 3,507,164).
b) Maturity analysis of borrowings:
Current Period Prior Period
TL FC TL FC
Short-term 412,907 4,859,037 307,801 4,735,058
Medium and long-term - 4,475,662 - 3,534,123
Total 412,907 9,334,699 307,801 8,269,181
c) Additional explanations regarding the areas where the Bank's obligations are concentrated:
The Bank diversifies its funding sources with customer deposits, loans from abroad, securities issued and borrowings from money markets. Deposits are the most important source of funding of the Bank and do not present any risk concentration with its stable structure spread over a wide base. Loans received mainly consist of funds obtained from various foreign financial institutions with different features and maturity-interest structure. There is no risk concentration in the bank's funding sources.

TÜRK EKONOMİ BANKASI A.Ş.
NOTES AND EXPLANATIONS TO UNCONSOLIDATED FINANCIAL STATEMENTS
AS OF 31 DECEMBER 2020 (Unless otherwise stated amounts are expressed in thousands of Turkish Lira (“TL”).)
109
II. Explanations and Disclosures Related to the Liabilities (continued) 3. Information on funds borrowed and debt securities issued: (continued)
d) Information on Debt Securities Issued:
Current Period Prior Period
TL FC TL FC
Bank Bonds 4,766,623 - 2,333,877 -
Treasury Bills 44,014 - - -
Total 4,810,637 - 2,333,877 -
4. Funds provided through repurchase transactions:
Information on funds provided through repurchase transactions:
Current Period Prior Period
TL FC TL FC
From Domestic Transactions 3,830,785 2,717,468 1,317,498 327,167
Financial Institutions and Organizations 3,830,785 2,717,468 1,317,498 327,167
Other Institutions and Organizations - - - -
Individuals - - - -
From Overseas Transactions - - - -
Financial Institutions and Organizations - - - -
Other Institutions and Organizations - - - -
Individuals - - - -
Total 3,830,785 2,717,468 1,317,498 327,167
5. Other external funding payables which exceed 10% of the balance sheet total (excluding off-balance sheet
commitments) and the breakdown of these which constitute at least 20% of grand total:
Other foreign sources item of the balance sheet is TL 1,699,019 (31 December 2019: TL 1,293,901) and does not exceed
10% of the total balance sheet.
6. Explanation on financial lease obligations (Net):
With the “TFRS 16 Leases” standard which became effective as of 1 January 2019, the difference between the operating
lease and financial lease has been removed and the lease transactions are started to be recognized under “Tangible Fixed
Assets” as an asset (tenure) and under “Liabilities from Leasing” as a liability. Bank has as of 31 December 2020 TL
598,957 (31 December 2019: TL 653,707) Liabilities from Leasing amount.
7. Negative differences table related to derivative financial liabilities for hedging purposes:
Current Period Prior Period
TL FC TL FC
For the protection of fair value risk 84,098 - - - For cash flow hedge purposes 983,837 14,901 1,917,707 7,267 For protection from net investment risk abroad - - - - Total 1,067,935 14,901 1,917,707 7,267
In case of termination of the fair value hedge accounting, any adjustment to the book value of the hedging instrument calculated using the effective interest method under fair value hedge accounting is amortized through profit or loss to the financial asset price until the maturity of the asset. As of 31 December 2020, there are accumulated valuation differences of TL 18,266 (31 December 2019: TL 20,286) under equity as of 31 December 2020. This amount is spread over the remaining terms of the hedged items by the Bank and transferred to the income statement.

TÜRK EKONOMİ BANKASI A.Ş.
NOTES AND EXPLANATIONS TO UNCONSOLIDATED FINANCIAL STATEMENTS
AS OF 31 DECEMBER 2020 (Unless otherwise stated amounts are expressed in thousands of Turkish Lira (“TL”).)
110
II. Explanations and Disclosures Related to the Liabilities (continued) 8. Information on provisions:
a) Foreign exchange provision on the foreign currency indexed loans and financial lease receivables: There are no
provision on the foreign currency indexed loans that is offset from the loans on the balance sheet (31 December 2019: None).
b) The specific provisions provided for unindemnifies non-cash loans or expected credit loss for non-cash loans:
Current Period Prior Period
Stage 1 58,241 55,551
Stage 2 165,265 145,818
Stage 3 87,824 42,111
Total 311,330 243,480
c) Liabilities on unused vacation, bonus, health, employee termination benefits:
As of 31 December 2020, the Bank received TL 13,581(31 December 2019: TL 12,344) allowance,
TL 286,464 (31 December 2019: TL 192,002) and TL 168,071 (31 Decemer 2019: TL 139,152) related to the
premiums to be paid to bank personnel and TL 37,100 (31 December 2019: TL 32,100) reflected the provision of
other personnel expenses to the “Provisions for Employee Rights” account in the financial statements.
c.1) Termination Benefits:
In determining the liability, the Bank makes use of independent actuaries and makes assumptions on issues such
as discount rate, employee turnover rate and future salary increases. These assumptions are reviewed annually:
Movement of employee termination benefits:
Current Period Prior Period
As of January 1 192,002 173,020
Current service cost 18,634 18,702
Interest cost 23,390 28,185
Reductions and payments 2,543 9,047
Actuarial loss / (gain) 64,314 577
Compensations paid (14,419) (37,529)
Total 286,464 192,002
c.2) Retirement Benefits:
The employees who have joined the Bank as a consequence of the merger of TEB and Fortis Bank are members
of the “Pension Fund Foundation” established in accordance with the Social Security Law No.506, Article
No.20.
The liabilities described in the Retirement Fund Section 3 No. XVI “Explanations on Liabilities related to
Rights of Employees” which may arise during the transfer have been calculated by the actuary based on the
principles of the related regulation, whereas the liabilities in connection with other social rights and benefits
which will not be undertaken by the SSI after the transfer have been calculated by the actuary based on TAS
19 principles. The Bank is not required to provide any provisions for any technical or actual deficit in the
financial statements based on the actuarial report prepared as of 31 December 2020 and 31 December 2019.
Since the Bank has no legal rights to carry the economic benefits arising from repayments of Pension Funds
and/or decreases in future contributions at present value; no asset has been recognized in the balance sheet.
31 December 2020 31 December 2019
Discount rate (%) 14.50 12.51
Estimated inflation rate (%) 10.03 6.59
Salary increase rate over inflation rate (%) 1.00 1.00

TÜRK EKONOMİ BANKASI A.Ş.
NOTES AND EXPLANATIONS TO UNCONSOLIDATED FINANCIAL STATEMENTS
AS OF 31 DECEMBER 2020 (Unless otherwise stated amounts are expressed in thousands of Turkish Lira (“TL”).)
111
II. Explanations and Disclosures Related to the Liabilities (continued)
8. Information on provisions: (continued)
c) Liabilities on unused vacation, bonus, health, employee termination benefits: (continued)
c.2) Pension Rights: (continued)
Within the frame of the assumptions determined;
Period Based Pension and Health Obligations: 31 December 2020 31 December 2019
Net Present Value of Transferrable Retirement Liabilities (1,081,794) (919,469)
Net Present Value of Transferrable Retirement and Health Contributions 371,589 355,986
General Administration Expenses (10,818) (9,195)
Present Value of Pension and Medical Benefits Transferable to SSF (1) (721,023) (572,678)
Fair Value of Plan Assets (2) 2,998,581 2,646,999
Asset Surplus over Transferable Benefits ((2)-(1)=(3)) 2,277,558 2,074,321
Non-Transferable Benefits (4) (624,502) (404,727)
Asset Surplus over Total Benefits ((3)-(4) 1,653,056 1,669,594
As of 31 December 2020 and 31 December 2019, the distribution of the fair value of the total assets of the
Pension Fund is as follows:
31 December 2020 31 December 2019
Bank placements 2,804,241 1,119,326
Property, plant and equipment 119,573 114,378
Government bonds and treasury bills, fund and rediscount interest income - 1,278,238
Other 74,767 135,057
Total 2,998,581 2,646,999
Actuarial assumptions used in the calculation of liabilities excluding the period-based liabilities according to
TAS 19 are as follows:
31 December 2020 31 December 2019
Discount rates 14.50% 12.51%
Inflation expectations 10.03% 6.59%
As of 31 December 2020, health inflation is assumed to be above 20% (31 December 2019: 20%). It is assumed
that general wage increase and SSI ceiling increase rates will be the same as inflation. CSO 2001 (31 December
2019: CSO 2001) Female / Male mortality table was used to represent the expected mortality rates both before and
after retirement.
d) Information on other provisions:
Current Period Prior Period
Provision for Non-Cash Loans 311,330 243,480
Provision for Legal Cases 91,772 51,069
Provision for Promotions of Credit Cards and Banking Services 11,935 12,936
Other 52,796 142,899
Total 467,833 450,384

TÜRK EKONOMİ BANKASI A.Ş.
NOTES AND EXPLANATIONS TO UNCONSOLIDATED FINANCIAL STATEMENTS
AS OF 31 DECEMBER 2020 (Unless otherwise stated amounts are expressed in thousands of Turkish Lira (“TL”).)
112
II. Explanations and Disclosures Related to the Liabilities (continued)
8. Information on provisions: (continued)
d) Information on other provisions (continued)
Below is the reconciliation of impairment provisions for non-cash loans;
Current Period
Standard
Qualified Loans
(Stage I)
Loans in Close
Monitoring
(Stage II)
Loans Under
Follow-Up
(Stage III) Total
31 December 2019 55,551 145,818 42,111 243,480
Transfers;
- Stage 1 to Stage 2 (3,464) 22,238 - 18,774
- Stage 1 to Stage 3 (78) - 1,489 1,411
- Stage 2 to Stage 3 - (12,704) 85,543 72,839
- Stage 2 to Stage 1 3,162 (9,071) - (5,909)
- Stage 3 to Stage 2 - - - -
Transferred within the period 15,206 (213) (35,539) (20,546)
Collections (17,063) (21,075) (5,780) (43,918)
Write-offs - - - -
Exchange differences 4,927 40,272 - 45,199
Total Expected Loss Reserve 31 December 2020 58,241 165,265 87,824 311,330
Prior Period
Standard
Qualified Loans
(Stage I)
Loans in Close
Monitoring
(Stage II)
Loans Under
Follow-Up
(Stage III) Total
31 December 2018 50,741 104,222 47,696 202,659
Transfers; - - - -
- Stage 1 to Stage 2 (3,253) 30,060 - 26,807
- Stage 1 to Stage 3 (282) - 6,045 5,763
- Stage 2 to Stage 3 - (3,768) 31,155 27,387
- Stage 2 to Stage 1 2,084 (6,592) - (4,508)
- Stage 3 to Stage 2 - - - -
Transferred within the period 28,313 34,932 (27,256) 35,989
Collections (23,649) (19,738) (15,529) (58,916)
Write-offs - - - -
Exchange differences 1,597 6,702 - 8,299
Total Expected Loss Reserves 31 December 2019 55,551 145,818 42,111 243,480
9. Explanations on taxes payable:
a) Information on tax provision:
As of 31 December 2020, the Bank's corporate tax liability is TL 158,727 (31 December 2019: TL 29,289). As of 31
December 2020, the Bank's debt on total taxes and premiums is TL 321,406 (31 December 2019: TL 213,516).
b) Information on current tax liability:
Current Period Prior Period
Corporate Tax Payable 158,727 29,289
Taxation on Securities 45,038 70,139
Property Tax 1,223 2,569
Banking Insurance Transaction Tax (BITT) 50,699 59,307
Foreign Exchange Transaction Tax 4,556 2,430
Value Added Tax Payable 6,365 5,073
Other (*) 28,268 23,408
Total 294,876 192,215
(*) Others include income taxes deducted from wages amounting to TL 24,127 (31 December 2019: TL 19,419) and stamp taxes payable amounting to TL 1,761 (31 December 2019: TL 1,518).

TÜRK EKONOMİ BANKASI A.Ş.
NOTES AND EXPLANATIONS TO UNCONSOLIDATED FINANCIAL STATEMENTS
AS OF 31 DECEMBER 2020 (Unless otherwise stated amounts are expressed in thousands of Turkish Lira (“TL”).)
113
II. Explanations and Disclosures Related to the Liabilities (continued)
9. Explanations on taxes payable (continued):
c) Information on premiums:
Current Period Prior Period
Social Security Premiums-Employee 11,386 9,114
Social Security Premiums-Employer 12,575 10,133
Bank Social Aid Pension Fund Premium-Employee - -
Bank Social Aid Pension Fund Premium-Employer - -
Pension Fund Membership Fees and Provisions-Employee - -
Pension Fund Membership Fees and Provisions-Employer - -
Unemployment Insurance-Employee 966 775
Unemployment Insurance-Employer 1,603 1,279
Other - -
Total 26,530 21,301
d) Explanations on deferred tax liabilities, if any: the Bank does not have any deferred tax liabilities as of 31
December 2020 (31 December 2019: None).
10. Information on fixed assets payables related to activities held and discontinued for sale: None (31 December
2019: None).
11. Explanations on the number of subordinated loans the Bank used, maturity, interest rate, institution that
the loan was borrowed from, and conversion option, if any:
The Bank was issued Subordinated debt instrument on 5 November 2018, which has two Call Dates; falling on the fifth
anniversary notes and the Interest Payment Date falling thereafter amounting USD210 million with the final maturity of
10 years. The interest rate of the issuance is 10.40% per annum and will be continued at the end of the 5th year with an
annual interest rate of 6 months Libor + 7.32% after the first early redemption date. The “T2 capital” was provided by
BNP Paribas Fortis SA / NV.
The Bank, aligned its Board of Directors’ decision dated 8 May 2012, had issued a debt instrument as T2 Capital
Subordinated debt instrument with a value of USD 65 million on 14 May 2012 and the debt instrument was redeemed on
14 May 2019 with the decision of the Board of Directors and upon the approval of Banking Regulation and Supervision
Agency (BRSA). On 14 May 2019, the Bank issued a subordinated debt securities with amount of 60 million EURO with
the final maturity of 10 years, with no call till the 5th anniversary of the notes. The Notes have two Call Dates, falling on
the fifth anniversary notes and the Interest Payment Date falling thereafter. The interest rate of the issuance is six months
Euribor + 7.10% annually. The “T2 capital” was provided by BNP Paribas Fortis SA / NV.
On 20 July, 2012, the Bank had issued a debt instrument of EUR 100 million as T2 capital and the debt instrument was
redeemed on 22 July 2019 after the decision of the relevant Board of Directors and the approval of the BRSA. On 22 July
2019, the Bank issued a subordinated debt securities with amount of 100 million EURO, with the final maturity of 10
years, with no call till 5th anniversary of the notes. The Notes have two Call Dates, falling on the fifth anniversary notes
and the Interest Payment Date falling thereafter. The interest rate of the issuance is six months Euribor + 7.10% annually.
The “T2 capital” was provided by BNP Paribas Fortis SA / NV.
The Bank issued subordinated debt instrument, which has early redemption right in 27 June 2023, with the final maturity
of 10 years in the amount of EUR125 million in 27 June 2018. The interest rate of the issuance is 6 month Euribor +
5.10% per annum. The “T2 capital” was provided by BNP Paribas Fortis S.A. / N.V.
The above mentioned four subordinated loans are utilized in-line with the “loan capital” definition of BRSA and will
positively affect the capital adequacy ratio of the Bank as well as utilizing long term funding.

TÜRK EKONOMİ BANKASI A.Ş.
NOTES AND EXPLANATIONS TO UNCONSOLIDATED FINANCIAL STATEMENTS
AS OF 31 DECEMBER 2020 (Unless otherwise stated amounts are expressed in thousands of Turkish Lira (“TL”).)
114
II. Explanations and Disclosures Related to the Liabilities (continued)
11. Explanations on the number of subordinated loans the Bank used, maturity, interest rate, institution that
the loan was borrowed from, and conversion option, if any(continued):
Information on subordinated loans:
Current Period Prior Period
TL FC TL FC
Borrowing Tools to be Included in Additional Capital
Calculation - - - -
Subordinated Loans - - - -
Subordinated Debt Instruments - - - -
Debt Instruments to be Included in the Contribution
Capital Calculation - 4,194,951 - 3,190,503
Subordinated Loans - - - -
Subordinated Debt Instruments - 4,194,951 - 3,190,503
Total - 4,194,951 - 3,190,503
Current Period Prior Period
TL FC TL FC
Domestic Banks - - - -
Domestic Other Institutions - - - -
Foreign Banks - 4,194,951 - 3,190,503
Branches and Head Office Abroad - - - -
Total - 4,194,951 - 3,190,503
12. Information on Shareholders’ Equity:
a) Presentation of Paid-in Capital: Current Period Prior Period
Common Stock 2,204,390 2,204,390
Preferred Stock - -
b) Paid-in capital amount, explanation as to whether the registered share capital system is applicable at the Bank if so amount of registered share capital ceiling:
Capital System Paid-in capital Ceiling
Registered Capital System 2,204,390 -
c) Information on share capital increases, their sources and other information on increased capital shares in current period: None.
d) Information on share capital increases from revaluation funds: None.
e) Capital commitments in the last fiscal year and at the end of the following period, the general purpose of these commitments and projected resources required to meet these commitments: None.
f) Indicators of the Bank’s income, profitability and liquidity for the previous periods and possible effects of these
future assumptions on the Bank’s equity due to the uncertainty of these indicators:
The income diversified with various business line and related channels/products/sectors, supported with different
projects result a sustainable and relatively non-volatile profitability. Besides, interest rate, currency rate and liquidity
risk under control are testing with various simulation and these test prevents the risks of effect. The profitability of
the Bank is followed up and estimated by the Bank’s Planning and Performance Management in short and long term.
It is also reported to Asset-Liability Committee and other related organs. As result, current and future negative effect
on equity is not occurred and expected.
g) Information on preferred shares: None.

TÜRK EKONOMİ BANKASI A.Ş.
NOTES AND EXPLANATIONS TO UNCONSOLIDATED FINANCIAL STATEMENTS
AS OF 31 DECEMBER 2020 (Unless otherwise stated amounts are expressed in thousands of Turkish Lira (“TL”).)
115
II. Explanations and Disclosures Related to the Liabilities (continued) 12. Information on Shareholders’ Equity: (continued)
h) Information on marketable securities valuation differences:
Current Period Prior Period
TL FC TL FC
From Associates, Subsidiaries, and Entities Under Common Control
(Joint Vent.) - - - -
Valuation Difference (149,256) 61,169 (3,474) 20,895
Foreign Exchange Difference - - - -
Total (149,256) 61,169 (3,474) 20,895
13. Information on minority interests: None (31 December 2019: None).

TÜRK EKONOMİ BANKASI A.Ş.
NOTES AND EXPLANATIONS TO UNCONSOLIDATED FINANCIAL STATEMENTS
AS OF 31 DECEMBER 2020 (Unless otherwise stated amounts are expressed in thousands of Turkish Lira (“TL”).)
116
III. Explanations and Disclosures Related to the Off-Balance Sheet Items
1. Information on off-balance sheet liabilities:
a) Nature and amount of irrevocable loan commitments:
Current Period Prior Period
Commitments for Credit Card Expenditure Limits 8,978,512 8,506,931
Loan Granting Commitments 5,736,570 5,234,372
Asset Purchase and Sale Commitments 3,031,018 3,684,822
Payment Commitments for Cheques 1,741,408 1,769,641
Time Deposit Purchase and Sale Commitments 94,524 759,924
Tax and Fund Liabilities from Export Commitments 47,494 71,566
Commitments for Promotions Related with Credit Cards and Banking Activities 5,767 4,975
Other Irrevocable Commitments 385,645 249,768
Total 20,020,938 20,281,999
b) Possible losses and commitments related to off-balance sheet items:
The Bank, within the context of banking activities, undertakes certain commitments, consisting of loan
commitments, letters of guarantee, acceptance credits and letters of credit.
b.1) Non-cash loans including guarantees, acceptances, financial guarantee and other letters of credits:
Current Period Prior Period
Letters of credit 5,025,525 2,623,851
Bank acceptances 16,573 12,915
Other commitments 3,976,672 5,031,959
Other contingencies 1,043,082 1,153,720
Total 10,061,852 8,822,445
b.2) Guarantees, surety ships, and similar transactions:
c) c.1) Total amount of non-cash loans:
Current Period Prior Period
Non-cash Loans Given Against Achieving Cash Loans 1,262,302 1,499,838
With Maturity of One Year or Less Than One Year 94,973 130,687
With Maturity of More Than One Year 1,167,329 1,369,151
Other Non-Cash Loans 22,983,722 20,875,648
Total 24,246,024 22,375,486
Current Period Prior Period
Final letters of guarantee 9,864,566 9,855,883
Advance letters of guarantee 2,244,080 1,481,220
Letters of guarantee given to the customs 481,964 429,999
Temporary letters of guarantee 332,396 286,101
Other letters of guarantee 1,261,166 1,499,838
Total 14,184,172 13,553,041

TÜRK EKONOMİ BANKASI A.Ş.
NOTES AND EXPLANATIONS TO UNCONSOLIDATED FINANCIAL STATEMENTS
AS OF 31 DECEMBER 2020 (Unless otherwise stated amounts are expressed in thousands of Turkish Lira (“TL”).)
117
III. Explanations and Disclosures Related to the Off-Balance Sheet Items (continued)
1. Information on off-balance sheet liabilities: (continued)
c.2) Information on sectoral risk breakdown of non-cash loans
c.3) Information on Stage I and Stage II non-cash loans:
Current Period
Stage I Stage II
Non-cash loans TL FC TL FC
Letters of guarantee 5,499,529 7,423,249 552,798 708,596
Bank acceptances - 16,573 - -
Letters of credit - 4,893,122 - 132,403
Endorsements - - - -
Underwriting commitments - - - -
Factoring commitments - - - -
Other commitments and contingencies 1,393,047 3,439,901 36,052 150,754
Total 6,892,576 15,772,845 588,850 991,753
Prior Period
Stage I Stage II
Non-cash loans TL FC TL FC
Letters of guarantee 5,763,889 6,558,086 717,216 513,850
Bank acceptances - 12,695 - 220
Letters of credit 260 2,479,195 - 144,396
Endorsements - - - -
Underwriting commitments - - - -
Factoring commitments - - - -
Other commitments and contingencies 2,600,335 3,358,168 48,819 178,357
Total 8,364,484 12,408,144 766,035 836,823
The Bank provided a reserve for TL 263,951 (31 December 2019: TL 286,647) of non-cash loans not indemnified
which equals to net amounting to TL 87,824 (31 December 2019: TL 42,111)
Current Period Prior Period
TL (%) FC (%) TL (%) FC (%)
Agricultural 20,404 0.27 22,980 0.14 33,515 0.37 30,972 0.23
Farming and raising livestock 18,338 0.25 22,980 0.14 20,044 0.22 30,972 0.23
Forestry, Wood and Paper - - - - - - - -
Fishery 2,066 0.03 - - 13,471 0.15 - -
Manufacturing 2,294,148 30.66 5,969,293 35.61 2,361,726 25.87 6,761,713 51.05
Mining and Quarry 106,832 1.43 295,929 1.77 123,105 1.35 672,430 5.08
Production 2,109,458 28.20 5,560,042 33.17 2,159,522 23.65 5,914,253 44.65
Electricity, Gas and Water 77,858 1.04 113,322 0.68 79,099 0.87 175,030 1.32
Construction 1,322,830 17.68 3,711,776 22.14 1,548,096 16.96 2,273,895 17.17
Services 3,605,121 48.19 5,095,080 30.39 5,132,770 56.22 4,116,286 31.08
Wholesale and Retail Trade 1,585,385 21.19 2,108,405 12.58 1,257,201 13.77 1,112,311 8.40
Hotel, Tourism, Food and
Beverage Services 121,734 1.63 105,933 0.63 133,984 1.47 71,748 0.54
Transportation and Communication 416,936 5.57 511,955 3.05 450,731 4.94 446,030 3.37
Financial Institutions 463,495 6.20 713,275 4.25 979,561 10.73 1,495,269 11.29
Real Estate and Renting 929,698 12.43 1,410,419 8.41 2,197,820 24.07 953,721 7.20
Self- employment Services 73,121 0.98 243,457 1.45 96,719 1.06 35,562 0.27
Education Services 5,517 0.07 336 - 6,349 0.07 178 -
Health and Social Services 9,235 0.12 1,300 0.01 10,405 0.11 1,467 0.01
Other 238,923 3.19 1,965,469 11.72 54,412 0.60 62,101 0.47
Total 7,481,426 100.00 16,764,598 100.00 9,130,519 100.00 13,244,967 100.00

TÜRK EKONOMİ BANKASI A.Ş.
NOTES AND EXPLANATIONS TO UNCONSOLIDATED FINANCIAL STATEMENTS
AS OF 31 DECEMBER 2020 (Unless otherwise stated amounts are expressed in thousands of Turkish Lira (“TL”).)
118
III. Explanations and Disclosures Related to the Off-Balance Sheet Items (continued)
2. Information related to derivative financial instruments:
Derivative transactions according to purposes
Trading Hedging
Current
Period
Prior Period Current
Period
Prior Period
Types of trading transactions
Foreign currency related derivative transactions (I): 80,856,033 78,045,061 - -
Forward transactions 16,798,167 10,742,282 - -
Swap transactions 58,803,224 58,730,372 - -
Futures transactions 1,133,911 71,526 - -
Option transactions 4,120,731 8,500,881 - -
Interest related derivative transactions (II): 19,509,018 8,401,316 - -
Forward rate transactions - -
Interest rate swap transactions 19,509,018 8,401,316 - -
Interest option transactions - - - -
Futures interest transactions - - - -
Marketable securities call-put options (III) - - - -
Other trading derivative transactions (IV) 2,960,427 43,150 - -
A.Total trading derivative transactions (I+II+III+IV) 103,325,478 86,489,527 - -
Types of hedging transactions
Fair value hedges - - 6,250,067 1,740,184
Cash flow hedges - - 17,757,374 24,213,951
Net investment hedges - - - -
B. Total hedging related derivatives - - 24,007,441 25,954,135
Total Derivative Transactions (A+B) 103,325,478 86,489,527 24,007,441 25,954,135
Related to agreements of forward transactions and options; the information based on the type of forward and options transactions are disclosed separately, specified with related amounts, type of agreement, purpose of transaction, nature of risk, strategy of risk management, hedging relationship, possible effects on the Bank’s financial position, timing of cash flows, reasons of unrealized transactions which previously projected to be realized, income and expenses that could not be linked to income statement in the current period because of the agreements: Forward foreign exchange and swap transactions are based on protection from interest and currency fluctuations. According to TAS, they do not qualify as hedging instruments and are remeasured at fair value.
i) Derivative instruments for fair value hedging purposes:
In 2020, the Bank applied fair value hedge accounting in order to avoid the effects of interest rate fluctuations in the market by matching its swap portfolio with its loans and marketable securities. As of 31 December 2020, the nominal value of the derivative instruments for risk management purposes is TL 6,250,067 and the net fair value is TL 363,278.
Current Period Prior Period
Fair Value Fair Value
Nominal Asset Liability Nominal Asset Liability
Cross Currency Swaps 6,250,067 447,376 84,098 1,740,184 21,136 -
Interest Rate Swaps - - - - - -
Total 6,250,067 447,376 84,098 1,740,184 21,136 -

TÜRK EKONOMİ BANKASI A.Ş.
NOTES AND EXPLANATIONS TO UNCONSOLIDATED FINANCIAL STATEMENTS
AS OF 31 DECEMBER 2020 (Unless otherwise stated amounts are expressed in thousands of Turkish Lira (“TL”).)
119
III. Explanations and Disclosures Related to the Off-Balance Sheet Items (continued)
2. Information related to derivative financial instruments: (continued)
ii) Derivative instruments for cash flow hedge purposes:
The Bank has applied cash flow hedge accounting by matching its swap portfolio with total notional amounting to TL 17,757,374 (31 December 2019: TL 24,213,951) and 1-90 days of maturity deposit portfolio together with selected borrowing portfolio. Effective portion of TL 283,380 (31 December 2019: TL 1,112,750 credit) credit accounted for under equity is presented after deducting its deferred tax effect of TL 56,676 (31 December 2019: TL 226,000 debit) debit in the financial statements. In 2020, ineffective portion of TL 18,266 (31 December 2019: TL 20,286 ) income is accounted for under income statement.
Current Period Prior Period
Fair Value Fair Value
Nominal Asset Liability Nominal Asset Liability
Cross Currency Swaps 4,852,334 615,008 471,891 7,611,850 218,639 875,965
Interest Rate Swaps 12,905,040 35,134 526,847 16,602,101 1,732 1,049,009
Total 17,757,374 650,142 998,738 24,213,951 220,371 1,924,974
3. Credit derivatives and risk exposures on credit derivatives: None.
4. Explanations on contingent liabilities and assets:
a.1) The Bank's share in contingent liabilities arising from entities under common control (joint ventures)
together with other venture: None.
a.2) Share of entity under common control (joint ventures) in its own contingent liabilities: None.
a.3) The Bank’s contingent liabilities resulting from liabilities of other ventures in entities under common control (joint ventures): None.
b) Accounting and presentation of contingent assets and liabilities in the financial statements:
b.1) Contingent assets are accounted for, if probability of realization is almost certain. If probability of
realization is high, then it is explained in the footnotes: As of 31 December 2020, there are no contingent
assets that need to be explained (31 December 2019: None).
b.2) A provision is made for contingent liabilities, if realization is probable and the amount can be reliably
determined. If realization is remote or the amount cannot be determined reliably, then it is explained in the
footnotes. The Bank has provided provision amounting to TL 91,772 for various lawsuits filed by various
individuals and institutions with high probability of occurrence and cash outflow. This amount is presented
under “Other Provisions” in the financial statements.
5. Custodian and intermediary services:
The Bank provides trading and safe keeping services in the name and account of third parties, which are presented
in the statement of contingencies and commitments.

TÜRK EKONOMİ BANKASI A.Ş.
NOTES AND EXPLANATIONS TO UNCONSOLIDATED FINANCIAL STATEMENTS
AS OF 31 DECEMBER 2020 (Unless otherwise stated amounts are expressed in thousands of Turkish Lira (“TL”).)
120
III. Explanations and Disclosures Related to the Off-Balance Sheet Items (continued)
6. The information on the Bank’s rating by the international rating introductions (*):
TEB maintained its position as one of the most highly rated banks in Turkey. As of 31 December 2020, TEB’s ratings
were as follows:
Moody’s Investor Services:
Baseline Credit Assessment b3
Adjusted Baseline Credit Assessment b1
Long Term FC Deposits B2
Short Term FC Deposits NP
Long Term TL Deposits B1
Short Term TL Deposits NP
Outlook Negative
Fitch Ratings:
Foreign Currency
Long-term B+
Short-term B
Outlook Negative
Turkish Lira
Long-term BB-
Short-term B
Outlook Negative
National AA (tur)
Outlook Stable
Financial Strength b+
(*) Ratings above are not performed based on the “Communiqué for Authorization and Activities of Rating
Institutions” published by the Capital Markets Board.

TÜRK EKONOMİ BANKASI A.Ş.
NOTES AND EXPLANATIONS TO UNCONSOLIDATED FINANCIAL STATEMENTS
AS OF 31 DECEMBER 2020 (Unless otherwise stated amounts are expressed in thousands of Turkish Lira (“TL”).)
121
IV. Explanations and Disclosures Related to the Statement of Income
1. Explanations on Interest Income
a) Information on interest income on loans:
Current Period Prior Period
TL FC TL FC
Interest income on loans (*)
Short term loans 3,370,179 221,584 4,612,075 356,415
Medium and long term loans 4,697,498 242,614 5,137,129 269,578
Interest on loans under follow-up 142,039 - 229,865 -
Premiums received from Resource Utilization Support Fund - - - -
Total 8,209,716 464,198 9,979,069 625,993
(*) Includes fees and commissions obtained from cash loans amounting to TL 153,388 (31 December 2019: TL 225,870).
b) Information on interest income on banks:
Current Period Prior Period
TL FC TL FC
The Central Bank of Turkey - - - 22,728
Domestic banks 154,030 475 142,459 2,975
Foreign banks 3,470 7,890 15,024 51,081
Branches and head office abroad - - - -
Total 157,500 8,365 157,483 76,784
c) Information on interest income on marketable securities portfolio:
Current Period Prior Period
TL FC TL FC
Financial Assets at Fair Value Through Profit or Loss 135,137 43,247 159,911 27,970
Financial Assets at Fair Value Through Other Comprehensive
Income 708,300 91,874 282,760 48,203
Financial Assets Measured at Amortized Cost 1,078,923 90,253 571,203 41,639
Total 1,922,360 225,374 1,013,874 117,812
d) Interest Income on Subsidiaries and Associates:
Current Period Prior Period
Interest received from Subsidiaries and Associates 18,548 17,214
2. Explanations on Interest Expense
a) Information on interest expense on funds borrowed (*):
Current Period Prior Period
TL FC TL FC
Banks
The Central Bank of Turkey - - - -
Domestic banks 30,758 4,130 43,880 16,087
Foreign banks - 455,609 - 457,616
Branches and head office abroad - - - -
Other financial institutions - - - -
Total 30,758 459,739 43,880 473,703
(*) Includes fees and commission expenses of cash loans amounting to TL 10,870 (31 December 2019: TL 23,055).
b) Information on interest expense on associates and subsidiaries: Current Period Prior Period
Interest expenses to associates and subsidiaries 1,838 2,103

TÜRK EKONOMİ BANKASI A.Ş.
NOTES AND EXPLANATIONS TO UNCONSOLIDATED FINANCIAL STATEMENTS
AS OF 31 DECEMBER 2020 (Unless otherwise stated amounts are expressed in thousands of Turkish Lira (“TL”).)
122
IV. Explanations and Disclosures Related to the Statement of Income (continued)
2. Explanations on Interest Expense (continued)
c) Information on interest expenses on securities issued:
Current Period Prior Period
TL FC TL FC
Interest expense on securities issued 454,149 - 514,885 -
Total 454,149 - 514,885 -
d) Distribution of interest expenses on deposits based on maturity of deposits:
Current Period Time Deposits
Account Name
Demand
Deposits
Up to 1
Month
Up to 3
Months
Up to 6
Months
Up to 1
Year
More than
1 Year
Accumulated
Deposits
Total
TL Bank Deposits - 178,541 - - - - - 178,541 Saving Deposits - 1,219,565 862,589 14,228 4,701 14,788 - 2,115,871
Public Sector Deposits - 2,002 17,514 768 - - - 20,284 Commercial Deposits - 458,972 599,679 20,442 210 4,987 - 1,084,290 Other Deposits - 11,147 141,728 4,119 7 36 - 157,037 7 Days Call Accounts - - - - - - - -
Total - 1,870,227 1,621,510 39,557 4,918 19,811 - 3,556,023
FC Foreign Currency Deposits 9 19,810 103,064 1,179 510 987 - 125,559 Bank Deposits - 285 - - - 5 - 290 7 Days Call Accounts - - - - - - - -
Precious Metal Deposits - 238 2,432 470 2,249 1,569 - 6,958
Total 9 20,333 105,496 1,649 2,759 2,561 - 132,807
Grand Total 9 1,890,560 1,727,006 41,206 7,677 22,372 - 3,688,830
Prior Period Time Deposits
Account Name
Demand
Deposits
Up to 1
Month
Up to 3
Months
Up to 6
Months
Up to 1
Year
More than
1 Year
Accumulated
Deposits
Total
TL Bank Deposits - 39,449 - - - - - 39,449 Saving Deposits 9 1,595,995 1,948,510 137,972 45,953 35,407 - 3,763,846
Public Sector Deposits - 4,463 6,465 2,174 - - - 13,102 Commercial Deposits 235 465,464 530,438 54,558 31,676 46,726 - 1,129,097 Other Deposits - 7,238 158,706 14,990 73,986 4,870 - 259,790 7 Days Call Accounts - - - - - - - -
Total 244 2,112,609 2,644,119 209,694 151,615 87,003 - 5,205,284
FC
Foreign Currency Deposits - 95,599 304,254 5,303 4,492 3,929 - 413,577
Bank Deposits - 8,327 - - - - - 8,327 7 Days Call Accounts - - - - - - - - Precious Metal Deposits 1 682 12,328 1,108 3,037 1,128 - 18,284
Total 1 104,608 316,582 6,411 7,529 5,057 - 440,188
Grand Total 245 2,217,217 2,960,701 216,105 159,144 92,060 - 5,645,472
3. Information on dividend income:
Current
Period
Prior
Period
Financial Assets at Fair Value through Profit or Loss - -
Financial Assets at Fair Value Through Other Comprehensive Income 3,557 1,326
Other 27,777 17,244
Total 31,334 18,570

TÜRK EKONOMİ BANKASI A.Ş.
NOTES AND EXPLANATIONS TO UNCONSOLIDATED FINANCIAL STATEMENTS
AS OF 31 DECEMBER 2020 (Unless otherwise stated amounts are expressed in thousands of Turkish Lira (“TL”).)
123
IV. Explanations and Disclosures Related to the Statement of Income (continued)
4. Information on trading gain / loss: Current Period Prior Period
Gains 61,961,748 34,028,533
Gains on capital market operations 295,308 449,304
Gains on derivative financial instruments (1) 15,988,223 14,068,159
Foreign exchange gains 45,678,217 19,511,070
Losses (-) 63,701,409 35,039,066
Losses on capital market operations 347,599 323,930
Losses on derivative financial instruments (1) 17,047,618 14,979,328
Foreign exchange losses 46,306,192 19,735,808 (1) Includes exchange rate fluctuations of hedging transactions net profit of TL 801,149 (31 December 2019: TL 142,065 profit), derivative financial
instruments exchange rate changes in profit / loss accounts amounting to TL 235,299 (31 December 2019: TL 343,138) net exchange income .
5. Information on other operating income:
Other operating income of the Bank mainly consists of all transaction costs collected from clients and disposal
of assets.
6. Provision expenses of banks for loans and other receivables:
a) Allowance for Expected Credit Losses and Other Provisions:
Current Period Prior Period
Expected Credit Losses 752,187 1,404,740
12-Month Expected Credit Losses (Stage 1) (15,056) 40,818
Significant Increase in Credit Risk (Stage 2) 346,150 64,476
Credit-Impaired (Stage 3) 421,093 1,299,446
Impairment Provisions for Securities - -
Financial Assets at Fair Value Through Profit or Loss - -
Financial Assets at Fair Value Through Other Comprehensive Income - -
Impairment Provision Related to Investments in Associates, Subsidiaries and Joint Ventures - -
Investments in Associates - -
Subsidiaries - -
Joint Ventures - -
Other (22,683) 89,173
Total 729,504 1,493,913
(1) Includes provision reversals amounting to TL 53,259 (31 December 2019: TL 19,708).
7. Information on other operating expenses: Current Period Prior Period
Reserve for employee termination benefits (1) 30,148 18,405
Bank social aid fund deficit provision - -
Impairment expenses of fixed assets 943 -
Depreciation expenses of fixed assets 242,619 224,729
Impairment expenses of intangible assets - -
Impairment expense of goodwill - -
Amortization expenses of intangible assets 75,775 70,560
Impairment for investments accounted with equity method - -
Impairment expenses of assets to be disposed (5,269) 4,467
Depreciation expenses of assets to be disposed - -
Impairment expenses of assets held for sale and discontinued operations - -
Other operating expenses 1,107,432 1,060,140
Leasing Expenses on TFRS 16 Exceptions 32,784 52,448
Maintenance expenses 34,248 36,318
Advertisement expenses 58,856 67,796
Other expenses 981,544 903,578
Loss on sales of assets 6,581 10,778
Other (2) 438,777 355,561
Total 1,897,006 1,744,640 (1) The provision for employment termination benefits is included in the personnel expenses item in the financial statements. (3) Includes other premiums and expenses paid to the Savings Deposit Insurance Fund amounting to TL 191,325 (31 December 2019: TL 142,295) and
other taxes and fees paid in the amount of TL 179,916 (31 December 2019: TL 149,358).

TÜRK EKONOMİ BANKASI A.Ş.
NOTES AND EXPLANATIONS TO UNCONSOLIDATED FINANCIAL STATEMENTS
AS OF 31 DECEMBER 2020 (Unless otherwise stated amounts are expressed in thousands of Turkish Lira (“TL”).)
124
IV. Explanations and Disclosures Related to the Statement of Income (continued)
8. Information on profit loss before continuing and discontinued operations before tax:
a) The portion of the profit before tax amounting to TL 6,146,076 (31 December 2019: TL 5,436,245)
consists of net interest income, while TL 1,157,227 (31 December 2019: TL 1,500,669)consists of net fee
and commission income; total operating expenses amount to TL 3,448,637 (31 December 2019: TL
3,171,890).
b) Explanations on discontinued operations profit loss: None.
9. Information on tax provision for continuing and discontinued operations:
a) As of 31 December 2020, the current tax expense is TL 486,856 (31 December 2019: TL 525,749).
Deferred tax income is TL 114,450 (31 December 2019: TL 182,340) and there is no current and deferred
tax income/expense from discontinued operations (31 December 2019: None).
b) Deferred tax income on temporary differences resulted from continued operations is TL 114,450 (31
December 2019: TL 182,340).
c) Tax reconciliation:
Current Period Prior Period
Profit before tax 1,549,720 1,413,763
Additions 174,565 164,440
Nonallowable expenses 50,178 96,927
Effect of different tax rate 86,615 33,200
Deductions 37,772 34,313
Dividend income (31,532) (18,218)
Other (31,532) (18,218)
Taxable Profit/ (Loss) 1,692,753 1,559,985
Corporate tax rate 22% 22%
Tax calculated 372,406 343,197
Prior year tax correction - 212
Tax charge 372,406 343,409
10. Information on net profit / loss of continuing and discontinued operations:
Net profit of the Bank from the activities carried out as of 31 December 2020 TL 1,177,314
(31 Decembe 2019: TL 1,070,354) as of 31 December 2020 there is no net profit from discontinued
operations (31 December 2019: None).
11. The explanations on net income/loss for the period:
a) The nature and amount of certain income and expense items from ordinary operations is disclosed if the
disclosure for nature, amount and repetition rate of such items is required for the complete understanding
of the Bank's performance for the period: None (31 December 2019: None).
b) Effect of changes in accounting estimates on income statement for the current and, if any, for subsequent
periods: None (31 December 2019: None).
c) Profit/ loss attributable to minority interest: None (31 December 2019: None).

TÜRK EKONOMİ BANKASI A.Ş.
NOTES AND EXPLANATIONS TO UNCONSOLIDATED FINANCIAL STATEMENTS
AS OF 31 DECEMBER 2020 (Unless otherwise stated amounts are expressed in thousands of Turkish Lira (“TL”).)
125
IV. Explanations and Disclosures Related to the Statement of Income (continued)
12. If the other items in the income statement exceed 10% of the income statement total accounts amounting
to at least 20% of these items:
Current Period Prior Period
Other fees and commissions received
Card Fees and Commissions 798,924 1,313,155
Insurance Commissions 262,964 185,916
Prepayment Comissions 76,263 62,993
General Limit Revision Comissions 49,332 45,680
Transfer Commissions 48,859 39,659
Fund Management Fees 47,613 31,072
Settlement Expense Provision, Eft, Swift, Agency Commissions 44,649 44,630
Periodic Service Commissions 28,225 166,434
Other 144,007 200,204
Total 1,500,836 2,089,743
Other fees and commissions paid
Credit Cards Commissions and Fees 418,324 701,669
Commission and Fees Paid to Correspondent Banks 38,071 39,026
Settlement Expense Provision, Eft, Swift Commissions 26,989 20,400
Other 113,871 108,273
Total 597,255 869,368
V. Explanations and Disclosures Related to Statement of Changes in Shareholders' Equity
a) The effect of changes in the fair value of financial assets at fair value through profit or loss is recognized in
the “Marketable Securities Valuation Differences” account under the equity. The relevant amount is
decreased by TL 132,443 in 2020 (31 December 2019: TL 201,250 increased) and change effect to deferred
tax is TL 26,935 (31 December 2019: TL 44,275).
b) Increase in cash flow risk hedging items:
The Bank uses interest rate and cross currency swaps for reducing cash flow risk arising from short term
deposit and borrowing. In this context, the effective portion is accounted for under equity in “Hedging Funds”
account. The related amount in 2020 increased by TL 829,370 (31 December 2019: TL 1,463,373 decreased)
and the effect of this change to deferred tax is TL 169,324 (31 December 2019: TL 302,891).
c) Explanations on profit distribution:
It has been resolved in the Ordinary General Assembly dated 26 March 2019 of the Bank, TL 1,070,354 that
constitutes the 2019 net balance sheet profit shall be transferred to the Extraordinary Reserves after setting
aside, in accordance with the proposal in the resolution of the Board of Directors, TL 53,518 as Legal
Reserves, TL 9,394 as special reserves,TL 0.87 (full TL) as profit distributed to the holders of the founder
jouissance certificates.
Profit appropriation will be resolved in the General Assembly meeting which has not been conducted as of the
date of the accompanying financial statements are authorized for issue.
VI. Explanations and Disclosures Related to Statement of Cash Flows
1. The effects of the other items stated in the cash flow statement and the changes in foreign currency
exchange rates on cash and cash equivalents:
“Other items” amounting to TL 2,387,824 (31 December 2019: TL 2,411,030) in “Operating profit before
changes in operating assets and liabilities” consists of fees and commissions paid and other expenses except for
leasing expenses, reserve for employee termination benefits, depreciation charges and taxes paid.

TÜRK EKONOMİ BANKASI A.Ş.
NOTES AND EXPLANATIONS TO UNCONSOLIDATED FINANCIAL STATEMENTS
AS OF 31 DECEMBER 2020 (Unless otherwise stated amounts are expressed in thousands of Turkish Lira (“TL”).)
126
.
VI. Explanations and Disclosures Related to Statement of Cash Flows (continued)
1. The effects of the other items stated in the cash flow statement and the changes in foreign currency
exchange rates on cash and cash equivalents (continued):
The “net increase in other liabilities” item in the “change in assets and liabilities subject to banking activities”
amounting to TL 930,722 (31 December 2019: TL 1,278,351 decreased) consists of various liabilities, other
foreign sources and changes in money markets. “Net increase in other assets” item amounting to TL 792,80 (31
December 2019: TL 261,210 decreased) consists of changes in blocked reserve requirements, miscellaneous
receivables and other assets.
“Other” item amounting to TL 85,089 (31 December 2019: TL 98,323) included in “Net cash flow from
investment activities” consists of cash outflows for intangible assets received in the current period.
The effect of the change in foreign exchange rate on cash and cash equivalents includes the foreign exchange
rate difference resulting from the conversion of foreign currency cash and cash equivalents to TL at the beginning
and end of the period, and as TL 1,432,624 for the year 2020 (31 December 2019: TL 475,011) It has been
realized.
2. Cash and cash equivalents at beginning and end of periods:
The reconciliation of the components of cash and cash equivalents, accounting policies used to determine these
components, the effect of any change made in accounting principle in the current period, the recorded amounts
of the cash and cash equivalent assets at the balance sheet and the recorded amounts in the cash flow statement:
Beginning of the period Current Period Prior Period
Cash 6,936,877 8,834,731
Cash in TL/Foreign Currency 2,441,969 2,006,466
Central Bank – Unrestricted amount 4,229,448 6,721,963
Other 265,460 106,302
Cash equivalents 9,391,646 4,199,335
Banks 8,551,646 3,917,835
Money market placements 840,000 281,500
Total cash and cash equivalents 16,328,523 13,034,066
End of the period Current Period Prior Period
Cash 10,125,205 6,936,877
Cash in TL/Foreign Currency 2,331,352 2,441,969
Central Bank – Unrestricted amount 7,605,582 4,229,448
Other 188,271 265,460
Cash equivalents 12,616,597 9,391,646
Banks 6,438,597 8,551,646
Money market placements 6,178,000 840,000
Total cash and cash equivalents 22,741,802 16,328,523

TÜRK EKONOMİ BANKASI A.Ş.
NOTES AND EXPLANATIONS TO UNCONSOLIDATED FINANCIAL STATEMENTS
AS OF 31 DECEMBER 2020 (Unless otherwise stated amounts are expressed in thousands of Turkish Lira (“TL”).)
127
VII. Explanations and Disclosures Related to Risk Group of the Bank
1. Volume of related party transactions, income and expense amounts involved and outstanding loan and
deposit balances:
Balance sheet and income/expense items of previous periods are presented as of 31 December 2019.
a) Current Period:
Related Parties
Subsidiaries, associates and
entities under common Control
(Joint Vent.)
Direct and Indirect
Shareholders of the Bank
Other Entities Included
in the Risk group
Cash Non-cash Cash Non-cash Cash Non-cash
Loans
Balance at Beginning of Period 277,729 716 15,616 182,856 248,301 101,145
Balance at End of Period 345,966 778 71,698 438,193 741,973 89,477
Interest and Commission Income 18,548 48 7,595 2,125 15,808 629
Direct and indirect shareholders of the Bank balance above includes TL 71,698 and other entities included in the
risk group balance above includes TL 76,533 placement in “Banks”.
b) Prior Period:
Related Parties
Subsidiaries, associates and
entities under common Control
(Joint Vent.)
Direct and indirect
Shareholders of the Bank
Other Entities Included
in the Risk Group
Cash Non-cash Cash Non-cash Cash Non-cash
Loans
Balance at Beginning of Period 97,952 971 73,228 260,569 281,838 20,136
Balance at end of Period 277,729 716 15,616 182,856 248,301 101,145
Interest and Commission Income 17,214 40 29,774 2,541 10,850 1,140
Direct and indirect shareholders of the Bank balance above includes TL 14,020 and other entities included in the
risk group balance above includes TL 60,244 placement in “Banks”.
c) c.1) Information on related party deposits balances:
Related parties
Subsidiaries, associates and
entities under common control
(Joint Vent.)
Direct and indirect
shareholders of the Bank
Other entities included
in the risk group
Deposits
Current
Period
Prior
Period
Current
period
Prior
period
Current
Period
Prior
Period
Balance at Beginning of Period 16,476 57,033 3,313,150 1,497,789 648,747 1,055,942
Balance at End of Period 31,575 16,476 5,596,710 3,313,150 1,281,302 648,747
Interest on Deposits 1,838 2,103 162,488 90,121 39,047 92,318
c.2) Information on forward and option agreements and other similar agreements made with related parties:
Related Parties
Subsidiaries, associates and
entities under common control
(Joint Vent.)
Direct and indirect
shareholders of the Bank
Other entities included
in the risk group
Current
Period
Prior
Period
Current
Period
Prior
Period
Current
Period
Prior
Period
Financial Assets at Fair Value Through
Profit and Loss
Beginning of Period - 34,685 30,904,435 28,512,967 109,762 1,210,586
End of Period - - 18,396,561 30,904,435 284,453 109,762
Total Profit/loss - 2,376 (1,106,802) 1,403,566 (23,948) (14,335)
Hedging Transactions purposes
Beginning of Period - - 17,648,505 17,581,390 - -
End of Period - - 10,139,721 17,648,505 - -
Total Profit/Loss - - 949,648 (1,209,539) - -
d) As of 31 December 2020, the total amount of remuneration and benefits provided for the senior management

TÜRK EKONOMİ BANKASI A.Ş.
NOTES AND EXPLANATIONS TO UNCONSOLIDATED FINANCIAL STATEMENTS
AS OF 31 DECEMBER 2020 (Unless otherwise stated amounts are expressed in thousands of Turkish Lira (“TL”).)
128
of the Bank is TL 53,515 (31 December 2019: TL 44,125).
VIII. Explanations on the Bank’s Domestic Branches, Agencies and Branches Abroad and Off-
shore Branches
1. Explanations on the Bank’s domestic branches, agencies and branches abroad and off-shore
branches:
Numbers Employees
Domestic branches 451 8,778
Country
Rep-offices abroad - - -
Total Assets Capital
Branches abroad 4 72 Cyprus 1,198,195 20,000
Off-shore branches - - - - -
2. Explanations on Branch and Agency Openings or Closings of the Bank:
The Bank closed 16 branches in 2020, there are no branches opened during the year.
IX. Explanations and Disclosures Related to Subsequent Events
None.
SECTION SIX
OTHER EXPLANATIONS
I. Other Disclosures Related to the Bank's Activity
None.
SECTION SEVEN
INDEPENDENT AUDITOR’S REPORT
I. Explanations on the Independent Auditor’s Report
The unconsolidated financial statements of the Bank were audited by DRT Bağımsız Denetim ve Serbest
Muhasebeci Mali Müşavirlik A.Ş. and the independent auditor’s report dated 5 February 2021 is presented
preceding the financial statements.
II. Other Footnotes and Explanations Prepared by the Independent Auditors
None.

234
SECTION 5- CONSOLIDATED FINANCIAL STATEMENTS
PUBLICLY ANNOUNCED CONSOLIDATED FINANCIAL STATEMENTS AND RELATED DISCLOSURES FOR THE PERIOD FROM 1 JANUARY TO 31 DECEMBER 2020

CONVENIENCE TRANSLATION
OF PUBLICLY ANNOUNCED CONSOLIDATED
FINANCIAL STATEMENTS AND
AUDITOR REPORT
ORIGINALLY ISSUED IN TURKISH
TÜRK EKONOMİ BANKASI
ANONİM ŞİRKETİ AND ITS SUBSIDIARIES
PUBLICLY ANNOUNCED CONSOLIDATED
FINANCIAL STATEMENTS AND RELATED DISCLOSURES FOR
THE YEAR FROM 1 JANUARY TO 31 DECEMBER 2020
WITH INDEPENDENT AUDITOR’S REPORT

(CONVENIENCE TRANSLATION OF
INDEPENDENT AUDITOR’S REPORT ORIGINALLY ISSUED IN TURKISH)
INDEPENDENT AUDITOR’S REPORT
To the General Assembly of Türk Ekonomi Bankası AŞ.
A) Report on the Audit of the Financial Statements
1) Opinion
We have audited the financial statements of Türk Ekonomi Bankası AŞ (the “Bank”) and its
consolidated subsidiaries (“the Group”), which comprise the consolidated balance sheet as at 31
December 2020, and the consolidated statement of income, consolidated statement of income and
expense items accounted for under shareholders’ equity, consolidated statement of changes in
shareholders’ equity and consolidated statement of cash flows for the year then ended and, notes to the
consolidated financial statements, including a summary of significant accounting policies.
In our opinion, the accompanying consolidated financial statements present fairly, in all material
respects, the consolidated financial position of the Group as at 31 December 2020, and its consolidated
financial performance and its consolidated cash flows for the year then ended in accordance with “the
Banking Regulation and Supervision Agency (“BRSA”) Accounting and Reporting Regulations”
including the regulation on “The Procedures and Principles Regarding Banks’ Accounting Practices and
Maintaining Documents” published in the Official Gazette dated 1 November 2006 with No.26333, and
other regulations on accounting records of banks published by the Banking Regulation and Supervision
Board and circulars and pronouncements published by BRSA and provisions of Turkish Financial
Reporting Standards (TFRS) for the matters not legislated by the aforementioned regulations.
2) Basis for Opinion
We conducted our audit in accordance with the regulation on “Independent Auditing of Banks”
published in the Official Gazette dated 2 April 2015 with No. 29314 and Standards on Independent
Auditing (“SIA”) which is a part of Turkish Auditing Standards published by the Public Oversight
Accounting and Auditing Standards Authority (“POA”). Our responsibilities under those standards are
further described in the Auditor’s Responsibilities for the Audit of the Financial Statements section of
our report. We are independent of the Group in accordance with the Code of Ethics for Independent
Auditors (“Code of Ethics”) published by the POA, together with the ethical requirements that are
relevant to our audit of the financial statements, and we have fulfilled our other ethical responsibilities
in accordance with these requirements and the Code of Ethics. We believe that the audit evidence we
have obtained is sufficient and appropriate to provide a basis for our opinion.
3) Key Audit Matters
Key audit matters are those matters that, in our professional judgment, were of most significance in our
audit of the financial statements of the current period. These matters were addressed in the context of
our audit of the financial statements as a whole, and in forming our opinion thereon, and we do not
provide a separate opinion on these matters.

Key Audit Matters How the matter was addressed in the audit
Impairment of loans in accordance with TFRS 9 Financial Instruments Standard (“TFRS 9”) Impairment of loans is a key area of judgment for the management. The Group has the total loans and receivables amounting to TL 85,265,773 thousands, which comprise 60% of the Group’s total assets in its unconsolidated financial statements and the total provision for impairment amounting to TL 4,064,933 as at 31 December 2020. As of 1 January 2018, the Group has started to recognize provisions for impairment in accordance with TFRS 9 and also “Regulation on the Procedures and Principles for Classification of Loans by Banks and Provisions to be set aside” published in the Official Gazette dated 22 June 2016 numbered 29750. In this respect, the method of provisions for impairment as set out in accordance with the related legislation of BRSA as mentioned in the Section 3 Note VIII of Explanation on Accounting Policies has been changed by applying the expected credit loss model under TFRS 9. The expected credit loss estimates are required to be unbiased, probability-weighted and should include supportable information about past events, current conditions, and forecasts of future economic conditions. The Group exercises significant decisions using judgment, interpretation and assumptions over calculating loan impairments. These judgments, interpretations and assumptions are key in the development of the financial models. In addition, impairment of loans and receivables consist of significant judgments and assumptions regarding with Covid 19 effects. fulfilling Not the requirements of the TFRS 9 is a potential risk for the Group. Failure in determining the loans and receivables that are impaired and not recording the adequate provision for these impaired loans is the aforementioned risk. Accordingly, impairment of loans and receivables is considered as a key audit matter. Related explanations relating to the impairment of loans and receivables are presented in Section 5 Note I.6.
As part of our audit work, the following procedures
were performed: We assessed and tested the design, implementation
and operating effectiveness of key controls applied by
the Group with respect to classification of loans and
determination and calculation of impairments. Our
information system experts have also participated to
perform these procedures.
We have assessed and analysed the relevant contract
terms to assess management’s accounting policy and
classification of the instrument for selected samples. We have performed loan review procedures on
selected samples of loans and receivables considering
effects of Covid 19 with the objective of identifying
whether the loss event had occurred and whether the
provision for impairment has been recognized in a
timely manner within the framework of the provisions
of the relevant legislation.
We have tested relevant inputs and assumption used
by the management in each stage of the expected credit
loss calculation by considering whether the inputs and
assumptions appear reasonable regarding with Covid
19 effects, the relationship between the assumptions
and whether the assumptions are interdependent and
internally consistent, whether the assumptions
appropriately reflect current market information and
collections, and whether the assumptions appear
reasonable when considered collectively with other
assumptions, including those for the same accounting
estimates and those for other accounting estimates.
We have tested historical loss data to validate the
completeness and accuracy of key parameters.
We have tested whether the model is applied to
appropriate segments of assets which share credit risk
characteristics and whether the historical loss rates
were incurred under economic conditions
representative of those that may exist during the
assets’ exposure periods.
We tested the application of the model to the relevant
inputs and the mathematical integrity of each stage of
the expected credit loss calculation.
Based on our discussions with the Group management,
we evaluated whether the key assumptions and other

Key Audit Matters How the matter was addressed in the audit
judgements considering Covid 19 effects underlying
the estimations of impairments were reasonable.
We assessed expected credit losses determined based
on individual assessment per Group’s policy by means
of supporting data, and evaluated appropriateness via
communications with management considering Covid
19 effects.
Our specialists are involved in all procedures related
to models and assumptions.
We have reviewed disclosures made within the TFRS
9 framework in the financial statements of the Group
with respect to loans and receivables and related
impairment provisions.
Pension Fund Obligations
Defined benefit pension plan that the Group provides to
its employees is managed by Fortis Bank AŞ Mensupları
Emekli Sandığı (“Plan”) which is established by the 20th
provisional article of the Social Security Law numbered
506 (the “Law”).
As disclosed in the Section III Note XVII to the
consolidated financial statements, the Plan is composed of
benefits which are subject to transfer to the Social Security
Foundation (“SSF”) as per the Social Security Law
no.5510 provisional article 20, and other social rights and
pension benefits provided by the Group that are not
transferable to the SSF. The Council of Ministers has been
authorized to determine the transfer date. Following the
transfer, the funds and the institutions that employ the
funds’ members will cover the non-transferable social
rights and pension benefits provided under the Plan even
if it is included in foundation voucher.
As of 31 December 2020, the Group’s transferrable
liabilities are calculated by an independent actuary using
the actuarial assumptions regulated by the Law, and in
accordance with the Decision of the Council of Ministers
announced in the Official Gazette dated 15 December
2006 and No.26377. The valuation of the Plan liabilities
requires judgment in determining appropriate assumptions
such as defining the transferrable social benefits, discount
rates, salary increases, inflation levels, demographic
assumptions, and the impact of changes in the Plan.
Management uses expert opinion of the independent
actuary in assessing uncertainties related to these
underlying assumptions and estimates.
As described in Section V Note II.8.c2 considering the
subjectivity of key judgments and assumptions, plus the
Our audit work included the following procedures:
We involved external experts (actuary) in our audit
team to evaluate the assumptions used in the
calculation of the pension obligations and the
appropriateness of the estimates.
It has been tested whether the plan assets meet plan
obligations in accordance with the methods and
assumptions used.
In addition, reconciliations and tests were carried out
through sampling of the accuracy of the data provided
to the Group’s actuary.
We have assessed whether there is a significant change
in the actuarial assumptions, methods, legal
regulations and legislation used in the calculations and
whether the assumptions are reasonable.

Key Audit Matters How the matter was addressed in the audit
uncertainty around the transfer date and basis of the
transfer calculation given the fact that the technical
interest rate is prescribed under the Law, we considered
this as a key audit matter.
Information Technologies Audit
The Group and its finance functions are dependent on the
IT-infrastructure for the continuity of its operations, and
the demand for technology-enabled business services is
rapidly growing in the Group and its subsidiaries. Controls
over reliability and continuity of the electronic data
processing are within the scope of the information systems
internal controls audit. The reliance on information
systems within the Group means that the controls over
access rights, continuity of systems, privacy and integrity
of the electronic data are critical and found to be key area
of focus as part of our risk based scoping.
Procedures within the context of our information
technology audit work:
• We identified and tested the Group's controls
over information systems as part of our audit
procedures.
• Information generation comprise all layers of
information systems (including applications,
networks, transmission systems and
database). The information systems controls
tested are categorized in the following areas:
• Security management
• Change management
• Operations management
• We selected high-risk areas as, database
logging and change management control
activities, to prevent and detect whether
accesses to financial data had been identified
in a timely manner.
• We tested the accesses and logging controls
underlying all applications that have direct or
indirect impacts on financial data generation.
• Automated controls and integration controls
are tested to underly and detect changes and
accesses in the process of financial data
generation.
• We also tested the appropriateness and
accuracy of the information produced by the
entity and information used in controls reports
as inputs to our controls and outputs generated
by the IT components.
• Finally, we understood and tested the controls
over database, network, application and
operating system layers of applications.

4) Responsibilities of Management and Those Charged with Governance for the Financial
Statements
Group Management is responsible for the preparation and fair presentation of the financial statements
in accordance with the BRSA Accounting and Reporting Regulations, and for such internal control as
management determines is necessary to enable the preparation of financial statements that are free from
material misstatement, whether due to fraud or error.
In preparing the financial statements, management is responsible for assessing the Group’s ability to
continue as a going concern, disclosing, as applicable, matters related to going concern and using the
going concern basis of accounting unless management either intends to liquidate the Group or to cease
operations, or has no realistic alternative but to do so.
Those charged with governance are responsible for overseeing the Group’s financial reporting process.
5) Auditor’s Responsibilities for the Audit of the Financial Statements
Responsibilities of independent auditors in an independent audit are as follows:
Our objectives are to obtain reasonable assurance about whether the financial statements as a whole are
free from material misstatement, whether due to fraud or error, and to issue an auditor’s report that
includes our opinion. Reasonable assurance is a high level of assurance, but is not a guarantee that an
audit conducted in accordance with the regulation on “Independent Auditing of Banks” published in the
Official Gazette dated 2 April 2015 with No. 29314 and SIA will always detect a material misstatement
when it exists. Misstatements can arise from fraud or error and are considered material if, individually
or in the aggregate, they could reasonably be expected to influence the economic decisions of users
taken on the basis of these financial statements.
As part of an audit in accordance with the regulation on “Independent Auditing of Banks” published in
the Official Gazette dated 2 April 2015 with No. 29314 and SIA, we exercise professional judgment and
maintain professional scepticism throughout the audit. We also:
• Identify and assess the risks of material misstatement of the financial statements, whether due
to fraud or error, design and perform audit procedures responsive to those risks, and obtain audit
evidence that is sufficient and appropriate to provide a basis for our opinion. (The risk of not
detecting a material misstatement resulting from fraud is higher than for one resulting from
error, as fraud may involve collusion, forgery, intentional omissions, misrepresentations, or the
override of internal control.)
• Obtain an understanding of internal control relevant to the audit in order to design audit
procedures that are appropriate in the circumstances, but not for the purpose of expressing an
opinion on the effectiveness of the Group’s internal control.
• Evaluate the appropriateness of accounting policies used and the reasonableness of accounting
estimates and related disclosures made by management.
• Conclude on the appropriateness of management’s use of the going concern basis of accounting
and, based on the audit evidence obtained, whether a material uncertainty exists related to events
or conditions that may cast significant doubt on the Group’s ability to continue as a going
concern. If we conclude that a material uncertainty exists, we are required to draw attention in
our auditor’s report to the related disclosures in the financial statements or, if such disclosures
are inadequate, to modify our opinion. Our conclusions are based on the audit evidence obtained

up to the date of our auditor’s report. However, future events or conditions may cause the Group
to cease to continue as a going concern.
• Evaluate the overall presentation, structure and content of the financial statements, including
the disclosures, and whether the financial statements represent the underlying transactions and
events in a manner that achieves fair presentation.
• Obtain sufficient appropriate audit evidence regarding the financial information of the entities
or business activities within the Group to express an opinion on the consolidated financial
statements. We are responsible for the direction, supervision and performance of the group audit.
We remain solely responsible for our audit opinion.
We communicate with those charged with governance regarding, among other matters, the planned
scope and timing of the audit and significant audit findings, including any significant deficiencies in
internal control that we identify during our audit.
We also provide those charged with governance with a statement that we have complied with relevant
ethical requirements regarding independence, and to communicate with them all relationships and other
matters that may reasonably be thought to bear on our independence, and where applicable, related
safeguards.
From the matters communicated with those charged with governance, we determine those matters that
were of most significance in the audit of the financial statements of the current period and are therefore
the key audit matters. We describe these matters in our auditor’s report unless law or regulation
precludes public disclosure about the matter or when, in extremely rare circumstances, we determine
that a matter should not be communicated in our report because the adverse consequences of doing so
would reasonably be expected to outweigh the public interest benefits of such communication.

B) Other Responsibilities Arising From Regulatory Requirements
In accordance with paragraph four of the Article 402 of the Turkish Commercial Code No. 6102
(“TCC”), nothing has come to our attention that may cause us to believe that the Group’s set of accounts
for the period 1 January - 31 December 2020 does not comply with TCC and the provisions of the Bank’s
articles of association in relation to financial reporting.
In accordance with paragraph four of the Article 402 of TCC, the Board of Directors provided us all the
required information and documentation with respect to our audit.
The engagement partner on the audit resulting in this independent auditor’s report is Yaman Polat.
Additional Paragraph for English Translation
The effect of the differences between the accounting principles summarized in Section 3 and the
accounting principles generally accepted in countries in which the accompanying financial statements
are to be distributed and International Financial Reporting Standards (“IFRS”) have not been quantified
and reflected in the accompanying financial statements. The accounting principles used in the
preparation of the accompanying financial statements differ materially from IFRS. Accordingly, the
accompanying financial statements are not intended to present the Group’s financial position and results
of its operations in accordance with accounting principles generally accepted in such countries of users
of the financial statements and IFRS.
DRT BAĞIMSIZ DENETİM VE SERBEST MUHASEBECİ MALİ MÜŞAVİRLİK A.Ş.
Member of DELOITTE TOUCHE TOHMATSU LIMITED
Yaman Polat, SMMM
Partner
İstanbul, 5 February 2021

CONSOLIDATED FINANCIAL REPORT OF TÜRK EKONOMİ BANKASI A.Ş.
AS OF AND 31 DECEMBER 2020
Address : Saray Mahallesi Sokullu Caddesi No:7/A – 7/B
Ümraniye 34768 - İstanbul
Telephone : (0 216) 635 35 35
Fax : (0 216) 636 36 36
Website : www.teb.com.tr
E-mail : [email protected]
The consolidated financial report for the year-end period, prepared in accordance with “Communiqué on the
Financial Statements and the Related Policies and Disclosures to be Publicly Announced” as regulated by the
Banking Regulation and Supervision Agency, is consist of the sections listed below:
• General Information about the Parent Bank
• Consolidated Financial Statements of the Parent Bank
• Explanations on the Accounting Policies Applied in The Related Period
• Information on Financial Structure and Risk Management of the Group which is under
Consolidation
• Disclosures and Footnotes on Consolidated Financial Statements
• Other explanations
• Independent Auditor’s Audit Report
The subsidiaries, associates and jointly controlled entities, financial statements have been consolidated in this
reporting package are as follows:
Subsidiaries Associates Jointly Controlled Entities
1 TEB Yatırım Menkul Değerler A.Ş. - -
2 TEB Faktoring A.Ş. - -
3 TEB Portföy Yönetimi A.Ş. - -
The accompanying audited consolidated financial statements for the year-end, related disclosures and footnotes
which have been audited and presented in this report are prepared in accordance with the Regulation on Accounting
Applications for Banks and Safeguarding of Documents, Turkish Accounting Standards, Turkish Financial
Reporting Standards, the related statements and guidance, and incompliance with the financial records of the Parent
Bank, and unless stated otherwise, presented in thousands of Turkish Lira (TL).
Information related to responsible personnel for the questions can be raised about financial statements:
Name-Surname/Title: Aslıhan Kaya / External Reporting Senior Manager
Tel No : (0216) 635 24 51
Fax No : (0216) 636 36 36
Yavuz Canevi Nicolas de Baudinet Ayşe Aşardağ
Ümit Leblebici
M. Aşkın Dolaştır
Hatice Ertuğral
Chairman
of the Board of
Directors
de Courcelles
Chairman
of the Audit
Committee
Vice Chairman
of the Audit
Committee
Chief
Executive
Officer
Assistant General
Manager Responsible of
Financial Reporting
Regulatory
Reporting
Senior Manager

INDEX
Page Number
SECTION ONE
General Information
I. History of the Parent Bank, Including its Incorporation Date, Initial Legal Status and Amendments to Legal Status 1
II. Explanation on the Parent Bank’s Capital Structure, Shareholders of the Parent Bank who are in Charge of the Management and/or
Auditing of the Parent Bank Directly or Indirectly, Changes in These Matters (if any), and the Group the Bank’s Belongs to 1
III. Explanations Regarding the Chairman and the Members of Board of Directors, Audit Committee,
General Manager and Assistants and Shares of the Parent Bank They Possess 2
IV. Information on the Parent Bank’s Qualified Shareholders 3
V. Summary on the Parent Bank’s Functions and Lines of Activity 3
VI. Differences between the Communiqué on Preparation of Consolidated Financial Statements of Banks and Turkish Accounting Standards and Short
Explanation about the Entities Subject to Full Consolidation or Proportional Consolidation and Entities which are
Deducted from Equity or Entities which are not Included in these Three Methods 3
VII. Current or Likely, Actual or Legal Barriers to Immediate Transfer of Equity or Repayment of Debts between Parent Bank and its Subsidiaries 3
SECTION TWO
Consolidated Financial Statements
I. Consolidated Balance Sheet 5
II. Consolidated Statement of Off-Balance Sheet Items 7
III. Consolidated Statement of Profit or Loss 8
IV. Consolidated Statement of Profit or Loss and Other Comprehensive Income 9
V. Consolidated Statement of Changes in Shareholders’ Equity 10
VI. Consolidated Statement of Cash Flows 11
VII. Consolidated Statement of Profit Distribution 12
SECTION THREE
Accounting Principles
I. Basis of Presentation 13
II. Explanations on Usage Strategy of Financial Assets and Foreign Currency Transactions 14
III. Information about the Parent Bank and its Consolidated Subsidiaries 14
IV. Explanations on Forward and Option Contracts and Derivative Instruments 15
V. Explanations on Interest Income and Expenses 16
VI. Explanations on Fees and Commission Income and Expenses 16
VII. Explanations on Financial Assets 17
VIII. Explanations on Impairment of Financial Assets 19
IX. Explanations on Offsetting of Financial Assets and Liabilities 22
X. Explanations on Sales and Repurchase Agreements and Lending of Securities 22
XI. Explanations on Assets Held for Sale, Discontinued Operations and Liabilities Related to Those Assets 22
XII. Explanations on Goodwill and Other Intangible Assets 23
XIII. Explanations on Tangible Fixed Assets 24
XIV. Explanations on Leasing Transactions 24
XV. Explanations on Provisions and Contingent Liabilities 24
XVI. Explanations on Contingent Assets 25
XVII. Explanations on Liabilities Regarding Employee Benefits 25
XVIII. Explanations on Taxation 26
XIX. Additional Explanations on Borrowings 26
XX. Explanations on Issued Equity Securities 26
XXI. Explanations on Bill Guarantees and Acceptances 27
XXII. Explanations on Government Incentives 27
XXIII. Explanations on Reporting According to Segmentation 27
XXIV. Explanations on Other Matters 28
XXV. Reclassifications 28
SECTION FOUR
Information on Consolidated Financial Structure and Risk Management of the Group
I. Explanations Related to Components of Consolidated Shareholders’ Equity 29
II. Explanations Related to the Consolidated Credit Risk 38
III. Explanations Related to Risks Involved in Counter-Cyclical Capital Buffer Calculation 48
IV. Explanations Related to the Consolidated Currency Risk 49
V. Explanations Related to Consolidated Interest Rate Risk 51
VI. Explanations Related to Share Certificate Position Risk from Consolidated Banking Book 54
VII. Explanations Related to Consolidated Liquidity Risk and Liquidity Coverage Ratio 54
VIII. Explanations Related to Consolidated Leverage Ratio 60
IX. Explanations Related to Presentation of Financial Assets and Liabilities at Fair Value 61
X. Explanations Related to Transactions Carried out on Behalf of Other Parties and Fiduciary Assets 62
XI. Explanations Related to Consolidated Risk Management 63
SECTION FIVE
Explanations and Disclosures on Consolidated Financial Statements
I. Explanations and Disclosures Related to the Consolidated Assets 88
II. Explanations and Disclosures Related to the Consolidated Liabilities 108
III. Explanations and Disclosures Related to the Consolidated Off-Balance Sheet Items 116
IV. Explanations and Disclosures Related to the Consolidated Statement of Income 121
V. Explanations and Disclosures Related to Consolidated Statement of Changes in Shareholders’ Equity 125
VI. Explanations and Disclosures Related to Statement of Consolidated Cash Flows 126
VII. Explanations and Disclosures Related to Risk Group of the Parent Bank 127
VIII. Explanations on the Parent Bank’s Domestic, Abroad, Off-Shore Branches or Subsidiaries, and Agencies Abroad 128
IX. Explanations on Significant Events and Matters Arising Subsequent to Balance Sheet Date 128
SECTION SIX
Other Explanations
I. Other Explanations on Activities of the Parent Bank 128
SECTION SEVEN
Independent Auditor’s Audit Report
I. Explanations on the Independent Auditor’s Report 128
II. Other Footnotes and Explanations Prepared by Independent Auditors 128

TÜRK EKONOMİ BANKASI A.Ş.
NOTES AND EXPLANATIONS TO CONSOLIDATED FINANCIAL STATEMENTS AS OF
31 DECEMBER 2020 (Unless otherwise stated amounts are expressed in thousands of Turkish Lira (“TL”).)
1
SECTION ONE
GENERAL INFORMATION
I. History of the Parent Bank, Including its Incorporation Date, Initial Legal Status and Amendments
to Legal Status
Türk Ekonomi Bankası Anonim Şirketi (“The Bank” or “TEB”), which had been a local bank incorporated in Kocaeli in 1927 under the name of Kocaeli Halk Bankası T.A.Ş., was acquired by the Çolakoğlu Group in 1982. Its title was changed as Türk Ekonomi Bankası A.Ş. and its headquarters moved to İstanbul. On 10 February 2005, BNP Paribas took over 50% of shares of TEB Holding A.Ş. Consequently, BNP Paribas became indirect shareholder of TEB with 42.125% ownership. In 2009, BNP Paribas Group successively acquired 75% of Fortis Bank Belgium and 66% of Fortis Bank Luxembourg and became the shareholder holding the majority of the shares of Fortis Bank Turkey. The indirect majority shareholders of TEB which are BNP Paribas and Çolakoğlu Group has agreed on the merger of TEB and Fortis Bank under the trademark of TEB and following the authorizations obtained from the regulatory authorities on 14 February 2011 the legal merge of two banks has been performed. The process regarding the procedure has been summarized below. As a result of the merger of TEB Holding, TEB has a majority stake of 55% and on the other hand Çolakoğlu Group and BNP Paribas have the share of 50%.
II. Explanation on the Parent Bank’s Capital Structure, Shareholders of the Parent Bank who are in Charge of the Management and/or Auditing of the Parent Bank Directly or Indirectly, Changes in These Matters (if any), and the Group the Parent Bank’s Belongs to
As of 31 December 2020 and 31 December 2019 the shareholders’ structure and their respective ownerships are summarized as follows:
31 December 2020 31 December 2019
Name of shareholders
Paid in capital
%
Paid in Capital
%
TEB Holding A.Ş. 1,212,415 55.00 1,212,415 55.00 BNPP Yatırımlar Holding A.Ş. 518,342 23.51 518,342 23.51 BNP Paribas Fortis Yatırımlar Holding A.Ş. 467,879 21.23 467,879 21.23 BNP Paribas SA 5,253 0.24 5,253 0.24 Kocaeli Ticaret Odası 501 0.02 501 0.02 2,204,390 100.00 2,204,390 100.00
As of 31 December 2020, the Parent Bank’s paid-in-capital consists of 2,204,390,000 shares of TL 1.00 (full TL) nominal each.

TÜRK EKONOMİ BANKASI A.Ş.
NOTES AND EXPLANATIONS TO CONSOLIDATED FINANCIAL STATEMENTS AS OF
31 DECEMBER 2020 (Unless otherwise stated amounts are expressed in thousands of Turkish Lira (“TL”).)
2
III. Explanations Regarding the Chairman and the Members of Board of Directors, Audit
Committee, General Manager and Assistants and Shares of the Parent Bank They Possess
Name Title Education Board of Directors;
Yavuz Canevi Chairman of the Board of Directors Master
Dr. Akın Akbaygil Deputy Chairman of the Board of Directors PhD
Jean Paul Sabet Deputy Chairman of the Board of Directors University
Ayşe Aşardağ Member of the Board of Directors and Vice Chairman of the Audit Committee University
François Andre Jesualdo Benaroya Member of the Board of Directors University
Yvan L.A.M. De Cock Member of the Board of Directors and Audit Committee University
Sabri Davaz Member of the Board of Directors and Audit Committee Master
Xavier Henri Jean Guilmineau Member of the Board of Directors Master
Özden Odabaşı Member of the Board of Directors Master
Hans Wilfried J. Broucke Member of the Board of Directors Master
Nicolas de Baudinet de Courcelles Member of the Board of Directors and Chairman of the Audit Committee University
Ümit Leblebici Chief Executive Officer and the Executive Member Master
Assistant General Managers;
Gökhan Mendi Senior Assistant General Manager Responsible from Retail and Private Banking
Group
Master
Melis Coşan Baban Chief Legal Advisor and Secretary of the Board of Directors Master
Mehmet Ali Cer Assistant General Manager Responsible from Information Technologies Master
Mustafa Aşkın Dolaştır Assistant General Manager Responsible from Financial Affairs Group Master
Osman Durmuş Assistant General Manager Responsible from Retail and Small Business Credit
Group
University
Kubilay Güler Assistant General Manager Responsible from Banking Operations and Support
Services
University
Gülümser Özgün Henden Assistant General Manager Responsible from Corporate Banking Group University
Dr. Tuğrul Özbakan Assistant General Manager Responsible from Asset Liability Management and
Treasury Group
PhD
Akil Özçay Assistant General Manager Responsible from Fixed Income Master
Gökhan Özdil Assistant General Manager Responsible from Corporate Loans University
Ömer Abidin Yenidoğan Assistant General Manager Responsible from Corporate Investment Banking
Group
Master
Ali İhsan Arıdaşır Assistant General Manager Responsible from SME Loans University
Ali Gökhan Cengiz Assistant General Manager Responsible from SME Banking Master
Bade Sipahioğlu Işık Assistant General Manager Responsible from Human Resources Group Master
Group Heads (*);
Nimet Elif Akpınar Head of Group Risk Management University
Birol Deper Head of Compliance Group and Internal Control Group, Consumer Relations
Coordination Officer
Master
Internal Audit(*);
Hakan Tıraşın Internal Audit Group University
(*) Group Heads and Head of Internal Audit are in Assistant General Manager status.
There are no Bank shares owned by the above stated Chairman and Members of Board of Directors, General Manager and Assistants.

TÜRK EKONOMİ BANKASI A.Ş.
NOTES AND EXPLANATIONS TO CONSOLIDATED FINANCIAL STATEMENTS AS OF
31 DECEMBER 2020 (Unless otherwise stated amounts are expressed in thousands of Turkish Lira (“TL”).)
3
IV. Information on the Parent Bank’s Qualified Shareholders
Name/Commercial Name
Share
Amount
Share
Ratio
Paid up
Shares
Unpaid
Shares
TEB Holding A.Ş. 1,212,415 55.00% 1,212,415 - BNPP Yatırımlar Holding A.Ş. 518,342 23.51% 518,342 - BNP Paribas Fortis Yatırımlar Holding A.Ş. 467,879 21.23% 467,879 -
TEB Holding A.Ş. is a member of both Çolakoğlu and BNP Paribas groups. 50% of the shares of TEB Holding
A.Ş. are controlled by BNP Paribas Fortis Yatırımlar Holding A.Ş., while the remaining 50% is controlled by
Çolakoğlu Group. BNP Paribas Fortis Yatırımlar Holding A.Ş. is controlled by BNP Paribas Fortis NV/SA whose
shareholders are BNP Paribas Fortis NV/SA by 100% shares, respectively. 100% of the shares of BNPP Yatırımlar
Holding A.Ş. are controlled by BNP Paribas SA.
V. Summary on the Parent Bank’s Functions and Lines of Activity
The Parent Bank’s operating areas include, corporate, commercial, SME, retail and private banking as well as
project finance and custody operations. Besides the ordinary banking operations, the Parent Bank is handling
agency functions through its branches on behalf of TEB Portföy Yönetim A.Ş., Zurich Sigorta A.Ş. and Cardif
Hayat Sigorta A.Ş. As of 31 December 2020, the Parent Bank has 451 local branches and 4 foreign branches
(31 December 2019: 467 local branches, 4 foreign branches). As of 31 December 2020, the number of employees
of the Group is 9,129 (31 December 2019: 9,248).
VI. Differences between the Communiqué on Preparation of Consolidated Financial
Statements of Banks and Turkish Accounting Standards and Short Explanation about the
Entities Subject to Full Consolidation or Proportional Consolidation and Entities which are
deducted from Equity or Entities which are not Included in These Three Methods
There is no difference for the Bank, except for the non-financial subsidiary, between the consolidation process
according to the Turkish Accounting Standards and the Communiqué of the Preparation of Financial Statements
of Banks in Turkey.
The Parent Bank owns 0.1% but the Group owns 33.3% share of Bantaş Nakit ve Kıymetli Mal Taşıma ve Güvenlik Hizmetleri A.Ş, it is presented as joint venture in financial statements however, and it is carried by cost value since necessary requirements for consolidation is not met.
TEB ARF Teknoloji A.Ş., a non-financial subsidiary owned 100% and by the Parent Bank, was registered in the
Trade Registry Gazette on 16 July 2020. The Parent Bank presents TEB ARF Teknoloji A.Ş. in the subsidiaries
line in its financial statements.
VII. Current or Likely, Actual or Legal Barriers to Immediate Transfer of Equity or Repayment
of Debts between Parent Bank and its Subsidiaries
None.

SECTION TWO
CONSOLIDATED FINANCIAL STATEMENTS
I. Consolidated Balance Sheet
II. Consolidated Statement of Off-Balance Sheet Items
III. Consolidated Statement of Profit or Loss
IV. Consolidated Statement of Profit or Loss and Other Comprehensive Income
V. Consolidated Statement of Changes in Shareholders’ Equity
VI. Consolidated Statement of Cash Flows
VII. Consolidated Statement of Profit Distribution

TÜRK EKONOMİ BANKASI ANONİM ŞİRKETİ
CONSOLIDATED BALANCE SHEET AT 31 DECEMBER 2020 AND 2019 (Unless otherwise stated amounts are expressed in thousands of Turkish Lira (“TL”).)
5
I. CONSOLIDATED BALANCE SHEET (STATEMENT OF FINANCIAL POSITION)
ASSETS
Audited
Current Period
31.12.2020
Audited
Prior Period
31.12.2019
Section 5
Note TL FC Total TL FC Total
I. FINANCIAL ASSETS (Net) 20,312,342 22,622,956 42,935,298 8,094,017 22,014,859 30,108,876
1.1 Cash and Cash Equivalents 11,584,929 18,216,953 29,801,882 2,642,723 18,717,809 21,360,532
1.1.1 Cash and Balances with Central Bank (I-1) 3,431,921 13,519,382 16,951,303 716,054 11,239,917 11,955,971
1.1.2 Banks (I-4) 1,974,393 4,709,711 6,684,104 1,087,213 7,488,841 8,576,054
1.1.3 Money Markets 6,180,886 - 6,180,886 840,304 - 840,304
1.1.4 Expected Loss Provision (-) 2,271 12,140 14,411 848 10,949 11,797
1.2 Financial Assets at Fair Value Through Profit or Loss 511,090 1,119,802 1,630,892 426,085 869,339 1,295,424
1.2.1 Government Debt Securities (I-2) 463,550 984,266 1,447,816 385,317 782,677 1,167,994
1.2.2 Equity Securities 47,540 135,536 183,076 40,768 84,258 125,026
1.2.3 Other Financial Assets - - - - 2,404 2,404
1.3 Financial Assets at Fair Value Through Other Comprehensive Income (I-5) 5,629,411 3,022,986 8,652,397 3,324,896 2,216,475 5,541,371
1.3.1 Government Debt Securities 5,618,530 3,022,986 8,641,516 3,317,001 2,216,475 5,533,476
1.3.2 Equity Securities 10,881 - 10,881 7,895 - 7,895
1.3.3 Other Financial Assets - - - - - -
1.4 Derivative Financial Assets 2,586,912 263,215 2,850,127 1,700,313 211,236 1,911,549
1.4.1 Derivative Financial Assets at Fair Value Through Profit and Loss (I-3) 1,520,531 232,078 1,752,609 1,473,795 196,247 1,670,042
1.4.2 Derivative Financial Assets at Fair Value Through Other Comprehensive Income (I-12) 1,066,381 31,137 1,097,518 226,518 14,989 241,507
II. FINANCIAL ASSETS MEASURED AT AMORTIZED COST (Net) 77,577,144 16,143,819 93,720,963 58,026,785 14,346,010 72,372,795
2.1 Loans (I-6) 69,418,968 13,342,867 82,761,835 56,568,956 12,490,850 69,059,806
2.2 Lease Receivables (I-11) - - - - - -
2.3 Factoring Receivables (I-18) 1,548,931 955,007 2,503,938 1,209,538 873,720 2,083,258
2.4 Other Financial Assets Measured at Amortized Cost (I-7) 10,197,854 2,325,087 12,522,941 3,549,987 1,356,631 4,906,618
2.4.1 Government Debt Securities 10,197,854 2,325,087 12,522,941 3,549,987 1,356,631 4,906,618
2.4.2 Other Financial Assets - - - - - -
2.5 Expected Credit Loss (-) (I-6,18) 3,588,609 479,142 4,067,751 3,301,696 375,191 3,676,887
III. PROPERTY AND EQUIPMENT HELD FOR SALE PURPOSE AND RELATED
TO DISCONTINUED OPERATIONS (Net) 112,859 - 112,859 131,362 - 131,362
3.1 Held for Sale Purpose (I-17) 112,859 - 112,859 131,362 - 131,362
3.2 Related to Discontinued Operations - - - - - -
IV. EQUITY INVESTMENTS 55 - 55 5 - 5
4.1 Investments in Associates (Net) (I-8) - - - - - -
4.1.1 Associates Valued Based on Equity Method - - - - - -
4.1.2 Unconsolidated Associates - - - - - -
4.2 Subsidiaries (Net) (I-9) 50 - 50 - - -
4.2.1 Unconsolidated Financial Subsidiaries - - - - - -
4.2.2 Unconsolidated Non-Financial Subsidiaries 50 - 50 - - -
4.3 Joint Ventures (Net) (I-10) 5 - 5 5 - 5
4.3.1 Joint Ventures Valued Based on Equity Method - - - - - -
4.3.2 Unconsolidated Joint Ventures 5 - 5 5 - 5
V. PROPERTY AND EQUIPMENT (Net) (I-13) 845,976 91 846,067 884,141 677 884,818
VI. INTANGIBLE ASSETS (Net) (I-14) 572,547 - 572,547 561,432 - 561,432
6.1 Goodwill 421,124 - 421,124 421,124 - 421,124
6.2 Other 151,423 - 151,423 140,308 - 140,308
VII. INVESTMENT PROPERTIES (Net) (I-15) - - - - - -
VIII. CURRENT TAX ASSET 19,678 - 19,678 14,810 - 14,810
IX. DEFERRED TAX ASSET (I-16) 651,589 - 651,589 667,146 - 667,146
X. OTHER ASSETS (Net) (I-19) 2,232,039 1,638,672 3,870,711 2,375,393 2,097,796 4,473,189
TOTAL ASSETS 102,324,229 40,405,538 142,729,767 70,755,091 38,459,342 109,214,433
The accompanying notes are an integral part of these consolidated financial statements.

TÜRK EKONOMİ BANKASI ANONİM ŞİRKETİ
CONSOLIDATED BALANCE SHEET AT 31 DECEMBER 2020 AND 2019 (Unless otherwise stated amounts are expressed in thousands of Turkish Lira (“TL”).)
6
I. CONSOLIDATED BALANCE SHEET (STATEMENT OF FINANCIAL POSITION)
LIABILITIES
Audited
Current Period
31.12.2020
Audited
Prior Period
31.12.2019
Section 5
Note TL FC Total TL FC Total
I. DEPOSITS (II-1) 49,589,731 44,152,172 93,741,903 34,470,683 37,707,169 72,177,852
II. FUNDS BORROWED (II-3) 1,562,891 10,348,393 11,911,284 1,067,418 9,127,278 10,194,696
III. MONEY MARKET FUNDS (II-4) 4,016,659 2,717,468 6,734,127 1,323,300 327,167 1,650,467
IV. SECURITIES ISSUED (Net) (II-3) 4,810,637 - 4,810,637 2,333,877 - 2,333,877
4.1 Bills 4,766,623 - 4,766,623 2,333,877 - 2,333,877
4.2 Asset Backed Securities - - - - - -
4.3 Bonds 44,014 - 44,014 - - -
V. FUNDS - - - - - -
5.1 Borrower Funds - - - - - -
5.2 Other - - - - - -
VI. FINANCIAL ASSETS AT FAIR VALUE THROUGH PROFIT AND
LOSS - - - - - -
VII. DERIVATIVE FINANCIAL LIABILITIES 3,135,153 208,026 3,343,179 3,404,041 107,517 3,511,558
7.1 Derivative Financial Liabilities at Fair Value Through Profit and Loss (II-2) 2,067,218 193,125 2,260,343 1,486,334 100,250 1,586,584
7.2 Derivative Financial Liabilities at Fair Value Through Other
Comprehensive Income (II-7) 1,067,935 14,901 1,082,836 1,917,707 7,267 1,924,974
VIII. FACTORING LIABILITIES (II-14) 91 8,888 8,979 274 538 812
IX. LEASE LIABILITIES (Net) (II-6) 552,899 51,975 604,874 617,693 39,964 657,657
X. PROVISIONS (II-8) 778,091 226,726 1,004,817 678,877 168,521 847,398
10.1 Restructuring Provisions - - - - - -
10.2 Reserve for Employee Benefits 505,168 29,963 535,131 372,735 22,713 395,448
10.3 Insurance Technical Provisions (Net) - - - - - -
10.4 Other Provisions 272,923 196,763 469,686 306,142 145,808 451,950
XI. CURRENT TAX LIABILITY (II-9) 343,527 - 343,527 222,365 - 222,365
XII. DEFERRED TAX LIABILITY - - - - - -
XIII. LIABILITIES FOR PROPERTY AND EQUIPMENT HELD FOR
SALE AND RELATED TO DISCONTINUED OPERATIONS (Net) (II-10) - - - - - -
13.1 Held For Sale - - - - - -
13.2 Held From Discontinued Operations - - - - - -
XIV. SUBORDINATED DEBT INSTRUMENTS (II-11) - 4,194,951 4,194,951 - 3,190,503 3,190,503
14.1 Loans - - - - - -
14.2 Other Debt Instruments - 4,194,951 4,194,951 - 3,190,503 3,190,503
XV. OTHER LIABILITIES 4,079,335 262,481 4,341,816 4,037,263 480,077 4,517,340
XVI. SHAREHOLDERS’ EQUITY (II-12) 11,640,673 49,000 11,689,673 9,894,657 15,251 9,909,908
16.1 Paid-in Capital 2,204,390 - 2,204,390 2,204,390 - 2,204,390
16.2 Capital Reserves 391,754 - 391,754 391,754 - 391,754
16.2.1 Share Premiums 2,565 - 2,565 2,565 - 2,565
16.2.2 Share Cancellation Profits - - - - - -
16.2.3 Other Capital Reserves 389,189 - 389,189 389,189 - 389,189
16.3 Other Accumulated Comprehensive Income or Expense that will not be
Reclassified at Profit and Loss 276,629 - 276,629 310,864 - 310,864
16.4 Other Accumulated Comprehensive Income or Expense that will be
Reclassified at Profit and Loss (363,855) 49,000 (314,855) (884,644) 15,251 (869,393)
16.5 Profit Reserves 7,843,996 - 7,843,996 6,728,424 - 6,728,424
16.5.1 Legal Reserves 490,587 - 490,587 434,338 - 434,338
16.5.2 Status Reserves - - - - - -
16.5.3 Extraordinary Reserves 7,161,377 - 7,161,377 6,284,394 - 6,284,394
16.5.4 Other Profit Reserves 192,032 - 192,032 9,692 - 9,692
16.6 Profit or Loss 1,272,252 - 1,272,252 1,134,463 - 1,134,463
16.6.1 Prior Periods’ Profit / Loss 9,497 - 9,497 9,497 - 9,497
16.6.2 Current Periods’ Profit / Loss 1,262,755 - 1,262,755 1,124,966 - 1,124,966
16.7 Minority Shares (II-13) 15,507 - 15,507 9,406 - 9,406
TOTAL LIABILITIES 80,509,687 62,220,080 142,729,767 58,050,448 51,163,985 109,214,433
The accompanying notes are an integral part of these consolidated financial statements.

TÜRK EKONOMİ BANKASI A.Ş.
CONSOLIDATED STATEMENT OF OFF-BALANCE SHEET ITEMS
AS OF 31 DECEMBER 2020 AND 2019 (Unless otherwise stated amounts are expressed in thousands of Turkish Lira (“TL”).)
7
II. CONSOLIDATED STATEMENT OF OFF-BALANCE SHEET ITEMS
Audited
Current Period
31.12.2020
Audited
Prior Period
31.12.2019
Section 5
Note
TL
FC
Total
TL
FC
Total
A. OFF BALANCE SHEET COMMITMENTS (I+II+III) 82,225,686 89,376,868 171,602,554 67,741,200 87,362,056 155,103,256
I. GUARANTEES AND WARRANTIES (III-1) 7,480,648 16,764,598 24,245,246 9,129,803 13,244,967 22,374,770
1.1 Letters of Guarantee 6,051,549 8,131,845 14,183,394 6,480,389 7,071,936 13,552,325
1.1.1 Guarantees Subject to State Tender Law 80,715 89,820 170,535 93,314 79,406 172,720
1.1.2 Guarantees Given for Foreign Trade Operations 344,482 545,346 889,828 319,439 417,745 737,184
1.1.3 Other Letters of Guarantee 5,626,352 7,496,679 13,123,031 6,067,636 6,574,785 12,642,421
1.2 Bank Acceptances - 16,573 16,573 - 12,915 12,915
1.2.1 Import Letter of Acceptance - 16,573 16,573 - 12,915 12,915
1.2.2 Other Bank Acceptances - - - - - -
1.3 Letters of Credit - 5,025,525 5,025,525 260 2,623,591 2,623,851
1.3.1 Documentary Letters of Credit - 3,656,589 3,656,589 - 1,119,305 1,119,305
1.3.2 Other Letters of Credit - 1,368,936 1,368,936 260 1,504,286 1,504,546
1.4 Prefinancing Given as Guarantee - - - - - -
1.5 Endorsements - - - - - -
1.5.1 Endorsements to the Central Bank of Turkey - - - - - -
1.5.2 Other Endorsements - - - - - -
1.6 Purchase Guarantees for Securities Issued - - - - - -
1.7 Factoring Guarantees - - - - - -
1.8 Other Guarantees 1,428,395 2,548,277 3,976,672 2,649,033 2,382,926 5,031,959
1.9 Other Collaterals 704 1,042,378 1,043,082 121 1,153,599 1,153,720
II. COMMITMENTS (III-1) 17,192,418 2,831,971 20,024,389 16,824,116 3,460,708 20,284,824
2.1 Irrevocable Commitments 17,192,418 2,831,971 20,024,389 16,824,116 3,460,708 20,284,824
2.1.1 Asset Purchase Commitments 916,964 2,114,054 3,031,018 1,406,402 2,278,420 3,684,822
2.1.2 Deposit Purchase and Sale Commitments - 94,524 94,524 - 759,924 759,924
2.1.3 Share Capital Commitment to Associates and Subsidiaries - - - - - -
2.1.4 Loan Granting Commitments 5,498,822 237,748 5,736,570 5,059,676 174,696 5,234,372
2.1.5 Securities Issuance Brokerage Commitments - - - - - -
2.1.6 Commitments for Reserve Deposit Requirements - - - - - -
2.1.7 Commitments for Cheque Payments 1,741,408 - 1,741,408 1,769,641 - 1,769,641
2.1.8 Tax and Fund Liabilities from Export Commitments 47,494 - 47,494 71,566 - 71,566
2.1.9 Commitments for Credit Card Limits 8,978,512 - 8,978,512 8,506,931 - 8,506,931
2.1.10 Commitments for Credit Cards and Banking Services Promotions 5,767 - 5,767 4,975 - 4,975
2.1.11 Receivables from Short Sale Commitments on Securities - - -
2.1.12 Payables for Short Sale Commitments on Securities - - -
2.1.13 Other Irrevocable Commitments 3,451 385,645 389,096 4,925 247,668 252,593
2.2 Revocable Commitments - - - - - -
2.2.1 Revocable Loan Granting Commitments - - - - - -
2.2.2 Other Revocable Commitments - - - - - -
III. DERIVATIVE FINANCIAL INSTRUMENTS (III-2) 57,552,620 69,780,299 127,332,919 41,787,281 70,656,381 112,443,662
3.1 Derivative Financial Instruments for Hedging Purposes 14,112,081 9,895,360 24,007,441 16,303,838 9,650,297 25,954,135
3.1.1 Fair Value Hedge 1,991,418 4,258,649 6,250,067 - 1,740,184 1,740,184
3.1.2 Cash Flow Hedge 12,120,663 5,636,711 17,757,374 16,303,838 7,910,113 24,213,951
3.1.3 Foreign Net Investment Hedges - - - - - -
3.2 Held for Trading Transactions 43,440,539 59,884,939 103,325,478 25,483,443 61,006,084 86,489,527
3.2.1 Forward Foreign Currency Buy/Sell Transactions 6,698,057 10,100,110 16,798,167 3,905,504 6,836,778 10,742,282
3.2.1.1 Forward Foreign Currency Transactions-Buy 4,420,031 4,234,382 8,654,413 2,186,296 3,210,603 5,396,899
3.2.1.2 Forward Foreign Currency Transactions-Sell 2,278,026 5,865,728 8,143,754 1,719,208 3,626,175 5,345,383
3.2.2. Swap Transactions Related to Foreign Currency and Interest Rates 35,101,585 43,210,657 78,312,242 18,588,736 48,542,952 67,131,688
3.2.2.1 Foreign Currency Swap-Buy 1,723,908 25,735,907 27,459,815 4,003,482 25,326,796 29,330,278
3.2.2.2 Foreign Currency Swap-Sell 20,517,677 10,825,732 31,343,409 12,453,254 16,946,840 29,400,094
3.2.2.3 Interest Rate Swaps-buy 6,430,000 3,324,509 9,754,509 1,066,000 3,134,658 4,200,658
3.2.2.4 Interest Rate Swaps-Sell 6,430,000 3,324,509 9,754,509 1,066,000 3,134,658 4,200,658
3.2.3 Foreign Currency, Interest Rate and Securities Options 1,050,757 3,069,974 4,120,731 2,952,821 5,548,060 8,500,881
3.2.3.1 Foreign Currency Options-Buy 729,259 1,370,067 2,099,326 1,726,935 2,562,617 4,289,552
3.2.3.2 Foreign Currency Options-Sell 321,498 1,699,907 2,021,405 1,225,886 2,985,443 4,211,329
3.2.3.3 Interest Rate Options-Buy - - - - - -
3.2.3.4 Interest Rate Options-Sell - - - - - -
3.2.3.5 Securities Options-Buy - - - - - -
3.2.3.6 Securities Options-Sell - - - - - -
3.2.4 Foreign Currency Futures 590,140 543,771 1,133,911 36,362 35,164 71,526
3.2.4.1 Foreign Currency Futures-Buy 2,957 541,030 543,987 36,362 - 36,362
3.2.4.2 Foreign Currency Futures-Sell 587,183 2,741 589,924 - 35,164 35,164
3.2.5 Interest Rate Futures - - - - - -
3.2.5.1 Interest Rate Futures-Buy - - - - - -
3.2.5.2 Interest rate Futures-Sell - - - - - -
3.2.6 Other - 2,960,427 2,960,427 20 43,130 43,150
B. CUSTODY AND PLEDGES RECEIVED (IV+V+VI) 176,730,851 44,287,540 221,018,391 165,611,452 35,349,359 200,960,811
IV. ITEMS HELD IN CUSTODY 33,848,445 5,782,810 39,631,255 32,624,537 3,374,145 35,998,682
4.1 Customer Fund and Portfolio Balances 4,218,738 - 4,218,738 7,318,390 - 7,318,390
4.2 Investment Securities Held In Custody 15,992,767 4,231,162 20,223,929 14,503,776 1,926,086 16,429,862
4.3 Cheques Received for Collection 12,745,727 957,162 13,702,889 10,011,245 929,338 10,940,583
4.4 Commercial Notes Received for Collection 544,908 81,946 626,854 507,526 129,914 637,440
4.5 Other assets Received for Collection 125 512,540 512,665 125 388,807 388,932
4.6 Assets Received for Public Offering - - - - - -
4.7 Other Items under Custody 346,180 - 346,180 283,475 - 283,475
4.8 Custodians - - - - - -
V. PLEDGES RECEIVED 139,684,038 38,119,680 177,803,718 128,531,847 31,315,316 159,847,163
5.1 Marketable Securities 306,697 459,121 765,818 362,798 100,651 463,449
5.2 Guarantee Notes 50,620,121 25,752,717 76,372,838 49,046,126 21,152,188 70,198,314
5.3 Commodity 142,587 108,608 251,195 50,194 - 50,194
5.4 Warranty - - - - - -
5.5 Immovables 77,966,304 8,026,196 85,992,500 69,856,979 7,236,289 77,093,268
5.6 Other Pledged Items 10,648,329 3,773,038 14,421,367 9,215,750 2,826,188 12,041,938
5.7 Pledged Items-Depository - - - - - -
VI. ACCEPTED BILL, GUARANTEES AND WARRANTIES 3,198,368 385,050 3,583,418 4,455,068 659,898 5,114,966
TOTAL OFF BALANCE SHEET COMMITMENTS (A+B) 258,956,537 133,664,408 392,620,945 233,352,652 122,711,415 356,064,067
The accompanying notes are an integral part of these consolidated financial statements.
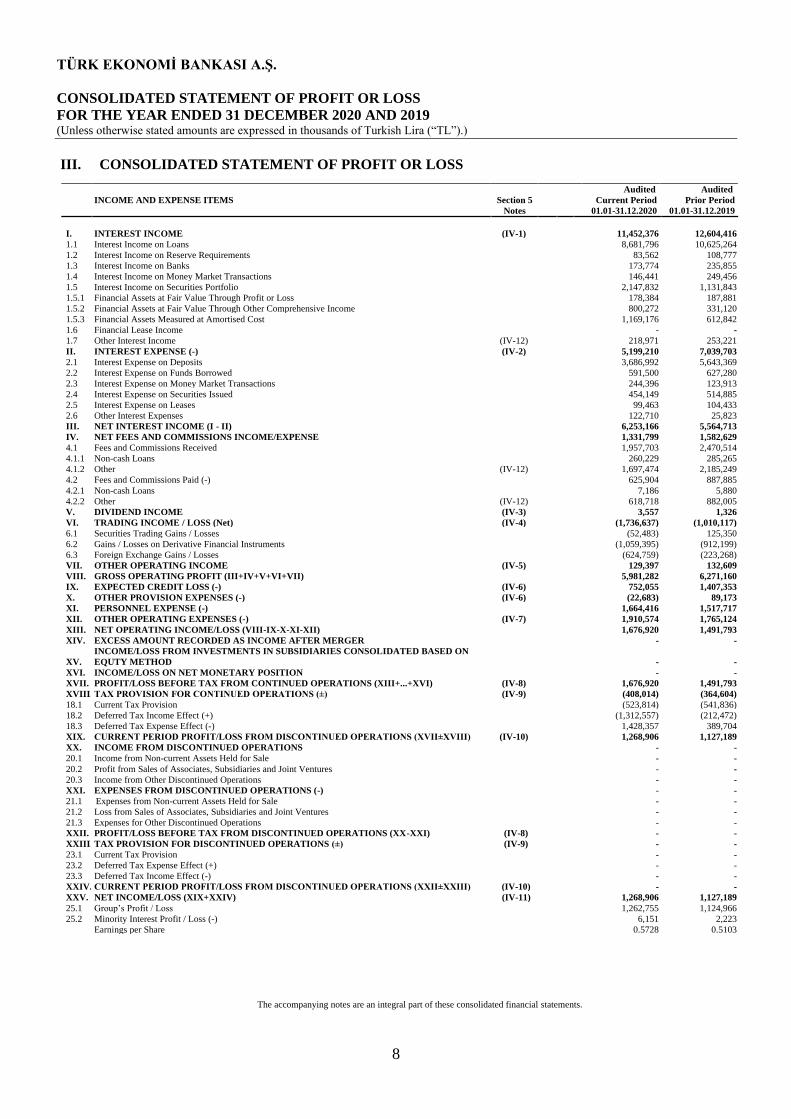
TÜRK EKONOMİ BANKASI A.Ş.
CONSOLIDATED STATEMENT OF PROFIT OR LOSS
FOR THE YEAR ENDED 31 DECEMBER 2020 AND 2019 (Unless otherwise stated amounts are expressed in thousands of Turkish Lira (“TL”).)
8
III. CONSOLIDATED STATEMENT OF PROFIT OR LOSS
Audited Audited
INCOME AND EXPENSE ITEMS Section 5
Notes
Current Period Prior Period
01.01-31.12.2020 01.01-31.12.2019
I. INTEREST INCOME (IV-1) 11,452,376 12,604,416
1.1 Interest Income on Loans 8,681,796 10,625,264
1.2 Interest Income on Reserve Requirements 83,562 108,777
1.3 Interest Income on Banks 173,774 235,855
1.4 Interest Income on Money Market Transactions 146,441 249,456
1.5 Interest Income on Securities Portfolio 2,147,832 1,131,843
1.5.1 Financial Assets at Fair Value Through Profit or Loss 178,384 187,881
1.5.2 Financial Assets at Fair Value Through Other Comprehensive Income 800,272 331,120
1.5.3 Financial Assets Measured at Amortised Cost 1,169,176 612,842
1.6 Financial Lease Income - -
1.7 Other Interest Income (IV-12) 218,971 253,221
II. INTEREST EXPENSE (-) (IV-2) 5,199,210 7,039,703
2.1 Interest Expense on Deposits 3,686,992 5,643,369
2.2 Interest Expense on Funds Borrowed 591,500 627,280
2.3 Interest Expense on Money Market Transactions 244,396 123,913
2.4 Interest Expense on Securities Issued 454,149 514,885
2.5 Interest Expense on Leases 99,463 104,433
2.6 Other Interest Expenses 122,710 25,823
III. NET INTEREST INCOME (I - II) 6,253,166 5,564,713
IV. NET FEES AND COMMISSIONS INCOME/EXPENSE 1,331,799 1,582,629
4.1 Fees and Commissions Received 1,957,703 2,470,514
4.1.1 Non-cash Loans 260,229 285,265
4.1.2 Other (IV-12) 1,697,474 2,185,249
4.2 Fees and Commissions Paid (-) 625,904 887,885
4.2.1 Non-cash Loans 7,186 5,880
4.2.2 Other (IV-12) 618,718 882,005
V. DIVIDEND INCOME (IV-3) 3,557 1,326
VI. TRADING INCOME / LOSS (Net) (IV-4) (1,736,637) (1,010,117)
6.1 Securities Trading Gains / Losses (52,483) 125,350
6.2 Gains / Losses on Derivative Financial Instruments (1,059,395) (912,199)
6.3 Foreign Exchange Gains / Losses (624,759) (223,268)
VII. OTHER OPERATING INCOME (IV-5) 129,397 132,609
VIII. GROSS OPERATING PROFIT (III+IV+V+VI+VII) 5,981,282 6,271,160
IX. EXPECTED CREDIT LOSS (-) (IV-6) 752,055 1,407,353
X. OTHER PROVISION EXPENSES (-) (IV-6) (22,683) 89,173
XI. PERSONNEL EXPENSE (-) 1,664,416 1,517,717
XII. OTHER OPERATING EXPENSES (-) (IV-7) 1,910,574 1,765,124
XIII. NET OPERATING INCOME/LOSS (VIII-IX-X-XI-XII) 1,676,920 1,491,793
XIV. EXCESS AMOUNT RECORDED AS INCOME AFTER MERGER - -
XV.
INCOME/LOSS FROM INVESTMENTS IN SUBSIDIARIES CONSOLIDATED BASED ON
EQUTY METHOD
- -
XVI. INCOME/LOSS ON NET MONETARY POSITION - -
XVII. PROFIT/LOSS BEFORE TAX FROM CONTINUED OPERATIONS (XIII+...+XVI) (IV-8) 1,676,920 1,491,793
XVIII. TAX PROVISION FOR CONTINUED OPERATIONS (±) (IV-9) (408,014) (364,604)
18.1 Current Tax Provision (523,814) (541,836)
18.2 Deferred Tax Income Effect (+) (1,312,557) (212,472)
18.3 Deferred Tax Expense Effect (-) 1,428,357 389,704
XIX. CURRENT PERIOD PROFIT/LOSS FROM DISCONTINUED OPERATIONS (XVII±XVIII) (IV-10) 1,268,906 1,127,189
XX. INCOME FROM DISCONTINUED OPERATIONS - -
20.1 Income from Non-current Assets Held for Sale - -
20.2 Profit from Sales of Associates, Subsidiaries and Joint Ventures - -
20.3 Income from Other Discontinued Operations - -
XXI. EXPENSES FROM DISCONTINUED OPERATIONS (-) - -
21.1 Expenses from Non-current Assets Held for Sale - -
21.2 Loss from Sales of Associates, Subsidiaries and Joint Ventures - -
21.3 Expenses for Other Discontinued Operations - -
XXII. PROFIT/LOSS BEFORE TAX FROM DISCONTINUED OPERATIONS (XX-XXI) (IV-8) - -
XXIII. TAX PROVISION FOR DISCONTINUED OPERATIONS (±) (IV-9) - -
23.1 Current Tax Provision - -
23.2 Deferred Tax Expense Effect (+) - -
23.3 Deferred Tax Income Effect (-) - -
XXIV. CURRENT PERIOD PROFIT/LOSS FROM DISCONTINUED OPERATIONS (XXII±XXIII) (IV-10) - -
XXV. NET INCOME/LOSS (XIX+XXIV) (IV-11) 1,268,906 1,127,189
25.1 Group’s Profit / Loss 1,262,755 1,124,966
25.2 Minority Interest Profit / Loss (-) 6,151 2,223
Earnings per Share 0.5728 0.5103
The accompanying notes are an integral part of these consolidated financial statements.

TÜRK EKONOMİ BANKASI A.Ş.
CONSOLIDATED STATEMENT OF PROFIT OR LOSS AND OTHER COMPREHENSIVE
INCOME FOR THE YEAR ENDED 31 DECEMBER 2020 AND 2019 (Unless otherwise stated amounts are expressed in thousands of Turkish Lira (“TL”).)
9
IV. CONSOLIDATED STATEMENT OF PROFIT OR LOSS AND OTHER COMPREHENSIVE INCOME
Audited
Current Period
01.01-31.12.2020
Audited
Prior Period
01.01-31.12.2019
I. CURRENT PERIOD INCOME/LOSS 1,268,906 1,127,189
II. OTHER COMPREHENSIVE INCOME 510,859 (992,114)
2.1 Other Comprehensive Income that will not be Reclassified through Profit or Loss (43,674) 11,186
2.1.1 Gains (losses) on Revaluation of Property, Plant and Equipment - -
2.1.2 Gains (losses) on Revaluation of Intangible Assets - -
2.1.3 Gains (losses) on Remeasurement of Defined Benefit Plans (55,205) 10,299
2.1.4 Other Components of Other Comprehensive Income that will not be Reclassified through Profit or Loss 500 3,061
2.1.5 Taxes Relating to Components of Other Comprehensive Income that will not be Reclassified through Profit or Loss 11,031 (2,174)
2.2 Other Comprehensive Income that will be Reclassified to Profit or Loss 554,533 (1,003,300)
2.2.1 Exchange Differences on Translation - - 2.2.2 Valuation and/or Reclassification Profit or Loss from Financial Assets at Fair Value through Other Comprehensive
Income (132,449) 201,511
2.2.3 Income (loss) related with Cash Flow Hedges 829,370 (1,463,374)
2.2.4 Income (loss) related with Hedges of Net Investments in Foreign Operations - -
2.2.5 Other Components of Other Comprehensive Income that will be Reclassified through Other Profit or Loss - -
2.2.6 Taxes Relating to Components of Other Comprehensive Income that will be Reclassified through Profit or Loss (142,388) 258,563 III. TOTAL COMPREHENSIVE INCOME (I+II) 1,779,765 135,075
The accompanying notes are an integral part of these consolidated financial statements.

TÜRK EKONOMİ BANKASI A.Ş.
CONSOLIDATED STATEMENT OF CHANGES IN THE SHAREHOLDERS' EQUITY
FOR THE YEAR FROM 1 JANUARY TO 31 DECEMBER 2020 AND 2019 (Unless otherwise stated amounts are expressed in thousands of Turkish Lira (“TL”).)
10
V. STATEMENT OF CHANGES IN SHAREHOLDERS’ EQUITY
STATEMENT OF CHANGES IN SHAREHOLDERS’ EQUITY
Accumulated Other Comprehensive
Income or Expense Not Reclassified
through Profit or Loss
Accumulated Other Comprehensive
Income or Expense Reclassified through
Profit or Loss
Audited
Paid-in
Capital
Share
Premiums
Share
Cancellation
Profit
Other
Capital
Reserves 1 2 3 4 5 6
Profit
Reserves
Prior Period
Profit or (Loss)
Current
Period Profit
or (Loss)
Total Equity
Except from
Minority
Shares
Minority
Shares
Total
Shareholders'
Equity
Prior Period – 01.01-31.12.2019
I. Prior Period End Balance 2,204,390 2,565 - 485,536 266,122 31,706 1,796 - (139,731) 273,733 5,675,707 1,062,214 - 9,864,038 8,589 9,872,627
II. Corrections According to TAS 8 - - - (96,347) - - - - - - - - - (96,347) - (96,347)
2.1 The Effect of Corrections of Errors - - - - - - - - - - - - - - - -
2.2 The Effects of Changes in Accounting Policy - - - (96,347) - - - - - - - - - (96,347) - (96,347)
III. New Balance (I+II) 2,204,390 2,565 - 389,189 266,122 31,706 1,796 - (139,731) 273,733 5,675,707 1,062,214 - 9,767,691 8,589 9,776,280
IV. Total Comprehensive Income - - - - - 8,293 2,947 - 157,088 (1,160,483) - - 1,124,966 132,811 2,264 135,075
V. Capital Increase by Cash - - - - - - - - - - - - - - - -
VI. Capital Increase by Internal Sources - - - - - - - - - - - - - - - -
VII. Paid-in Capital Inflation Adjustment Difference - - - - - - - - - - - - - - - -
VIII. Convertible Bonds to Shares - - - - - - - - - - - - - - - -
IX. Subordinated Debt Instruments - - - - - - - - - - - - - - - -
X. Increase/Decrease by Other Changes - - - - - - - - - - - - - - - -
XI. Profit Distribution - - - - - - - - - - 1,052,717 (1,052,717) - - (1,447) (1,447)
11.1 Dividends Paid - - - - - - - - - - - - - - (1,447) (1,447)
11.2 Transfers to Reserves - - - - - - - - - - 1,052,717 (1,052,717) - - - -
11.3 Other - - - - - - - - - - - - - - - -
Period-End Balance 31.12.2019
(III+IV+V+VI+VII+VIII+IX+X+XI) 2,204,390 2,565 - 389,189 266,122 39,999 4,743 - 17,357 (886,750) 6,728,424 9,497 1,124,966 9,900,502 9,406 9,909,908
Current Period – 01.01-31.12.2020
I. Prior Period End Balance 2,204,390 2,565 - 389,189 266,122 39,999 4,743 - 17,357 -886,750 6,728,424 1,134,463 - 9,900,502 9,406 9,909,908
II. Corrections According to TAS 8
2.1 Effects of Corrections - - - - - - - - - - - - - - - -
2.2 Effects of the Changes in Accounting Policies - - - - - - - - - - - - - - - -
III. Adjusted Beginning Balance (I+II) 2,204,390 2,565 - 389,189 266,122 39,999 4,743 - 17,357 -886,750 6,728,424 1,134,463 - 9,900,502 9,406 9,909,908
IV. Total Comprehensive Income - - - - - -44,119 490 - -105,508 660,046 - - 1,262,755 1,773,664 6,101 1,779,765
V. Capital Increase by Cash - - - - - - - - - - - - - - - -
VI. Capital Increase by Internal Sources - - - - - - - - - - - - - - - -
VII. Paid-in Capital Inflation Adjustment Difference - - - - - - - - - - - - - - - -
VIII. Convertible Bonds to Shares - - - - - - - - - - - - - - - -
IX. Subordinated Debt Instruments - - - - - - - - - - - - - - - -
X. Increase/Decrease by Other Changes - - - - - - - - - - - - - - - -
XI. Profit Distribution - - - - 9,394 - - - - - 1,115,572 -1,124,966 - - - -
11.1 Dividends Paid - - - - - - - - - - - - - - - -
11.2 Transfers to Reserves - - - - 9,394 - - - - - 1,115,572 -1,124,966 - - - -
11.3 Other - - - - - - - - - - - - - - - -
Period-End Balance 31.12.2020
(III+IV+V+VI+VII+VIII+IX+X+XI) 2,204,390 2,565 - 389,189 275,516 (4,120) 5,233 - (88,151) (226,704) 7,843,996 9,497 1,262,755 11,674,166 15,507 11,689,673 1. Increase/decrease from tangible assets accumulated revaluation reserve,
2. Accumulated gains / losses on remeasurements of defined benefit plans,
3. Other (Other comprehensive income of associates and joint ventures accounted with equity method that will not be reclassified at profit or loss and other accumulated amounts of other comprehensive income items that will not be reclassified at profit or loss),
4. Foreign currency translation differences,
5. Accumulated revaluation and / or classification gains / losses of financial assets at fair value through other comprehensive income,
6. Other (Cash flow hedge gains / losses, other comprehensive ıncome of associates and joint ventures accounted with equity method that will be reclassified at profit or loss and other accumulated amounts of other comprehensive income items that will be reclassified at profit or loss).
The accompanying notes are an integral part of these consolidated financial statements.

TÜRK EKONOMİ BANKASI A.Ş.
CONSOLIDATED STATEMENT OF CASH FLOWS
FOR THE YEAR FROM 1 JANUARY TO 31 DECEMBER 2020 AND 2019 (Unless otherwise stated amounts are expressed in thousands of Turkish Lira (“TL”).)
11
VI. CONSOLIDATED STATEMENT OF CASH FLOWS
Audited Current Period
01.01-31.12.2020
Audited
Prior Period
01.01-31.12.2019 Section 5
Notes
A. CASH FLOWS FROM BANKING OPERATIONS
1.1 Operating profit before changes in operating assets and liabilities 4,708,110 6,108,327
1.1.1 Interest received 10,899,819 12,189,963
1.1.2 Interest paid (5,008,327) (7,341,806)
1.1.3 Dividend received 3,557 1,326
1.1.4 Fees and commissions received 1,541,980 2,440,386
1.1.5 Other income 129,697 2,325,852
1.1.6 Collections from previously written off loans 1,610,390 1,077,528
1.1.7 Payments to personnel and service suppliers (1,664,416) (1,497,992)
1.1.8 Taxes paid (365,266) (763,127)
1.1.9 Others (VI-1) (2,439,324) (2,323,803)
1.2 Changes in operating assets and liabilities 7,838,255 (532,007)
1.2.1 Net (increase) / decrease in financial asset at fair value through profit or loss (329,359) (676,908)
1.2.2 Net (increase) / decrease in due from banks and other financial institutions (83,717) 68
1.2.3 Net (increase) in loans (10,977,082) (1,886,668)
1.2.4 Net (increase) in other assets (VI-1) (1,111,815) (251,877)
1.2.5 Net increase in bank deposits 12,138,988 1,647,957
1.2.6 Net increase in other deposits 5,465,653 5,027,115
1.2.7 Net increase / (decrease) in financial asset at fair value through profit or loss - -
1.2.8 Net increase / (decrease) in funds borrowed 1,723,403 (2,934,379)
1.2.9 Net increase / (decrease) in matured payables - -
1.2.10 Net (decrease) / increase in other liabilities 1,012,184 (1,457,315)
I. Net cash provided from banking operations 12,546,365 5,576,320
B. CASH FLOWS FROM INVESTING ACTIVITIES
II. Net cash provided from investing activities (9,615,146) (4,431,612)
2.1 Cash paid for purchase of entities under common control, associates and subsidiaries (Joint Vent.) (50) -
2.2 Cash obtained from sale of entities under common control, associates and subsidiaries (Joint Vent.) - -
2.3 Cash paid for purchase of tangible assets (208,351) (280,432)
2.4 Cash obtained from sale of tangible assets 4,446 22,434
2.5 Cash paid for purchase of financial assets at fair value through other comprehensive income (6,174,641) (4,627,548)
2.6 Cash obtained from sale of financial assets at fair value through other comprehensive income 3,621,407 2,281,659
2.7 Cash paid for purchase of financial assets measured at amortised cost (7,591,794) (1,726,438)
2.8 Cash obtained from sale of financial assets measured at amortised cost 823,184 -
2.9 Others (VI-1) (89,347) (101,287)
C. CASH FLOWS FROM FINANCING ACTIVITIES
III. Net cash provided from financing activities 2,186,190 1,672,581
3.1 Cash obtained from funds borrowed and securities issued 14,631,331 15,002,839
3.2 Cash used for repayment of funds borrowed and securities issued (12,196,805) (13,101,686)
3.3 Equity instruments issued - -
3.4 Dividends paid - (1,447)
3.5 Payments for financial leases (248,336) (227,125)
3.6 Others - -
IV. Effect of change in foreign exchange rate on cash and cash equivalents (VI-1) 1,432,624 475,011
V. Net increase in cash and cash equivalents 6,550,033 3,292,300
VI. Cash and cash equivalents at beginning of the period 16,352,454 13,060,154
VII. Cash and cash equivalents at end of the period (VI-2) 22,902,487 16,352,454
The accompanying notes are an integral part of these consolidated financial statements.

TÜRK EKONOMİ BANKASI A.Ş.
CONSOLIDATED STATEMENT OF PROFIT DISTRIBUTION
FOR THE YEAR 31 DECEMBER 2020 AND 2019 (Unless otherwise stated amounts are expressed in thousands of Turkish Lira (“TL”).)
12
VII. CONSOLIDATED STATEMENT OF PROFIT DISTRIBUTION
Current Audited Period Prior Audited Period
31.12.2020(*) 31.12.2019(*)
I. DISTRIBUTION OF CURRENT YEAR INCOME
1.1 CURRENT YEAR INCOME - -
1.2 TAXES AND DUTIES PAYABLE (-) - -
1.2.1 Corporate tax (Income tax) - -
1.2.2 Income withholding tax - -
1.2.3 Other taxes and duties - -
A. NET INCOME FOR THE YEAR (1.1-1.2) - -
1.3 PRIOR YEARS’ LOSSES (-) - -
1.4 FIRST LEGAL RESERVES (-) - -
1.5 OTHER STATUTORY RESERVES (-) - -
B. NET INCOME AVAILABLE FOR DISTRIBUTION [(A-(1.3+1.4+1.5)] - -
1.6 FIRST DIVIDEND TO SHAREHOLDERS (-) - -
1.6.1 To owners of ordinary shares - -
1.6.2 To owners of preferred shares - -
1.6.3 To owners of preferred shares (pre-emptive rights) - -
1.6.4 To profit sharing bonds - -
1.6.5 To holders of profit and loss sharing certificates - -
1.7 DIVIDENDS TO PERSONNEL (-) - -
1.8 DIVIDENDS TO BOARD OF DIRECTORS (-) - -
1.9 SECOND DIVIDEND TO SHAREHOLDERS (-) - -
1.9.1 To owners of ordinary shares - -
1.9.2 To owners of preferred shares - -
1.9.3 To owners of preferred shares (pre-emptive rights) - -
1.9.4 To profit sharing bonds - -
1.9.5 To holders of profit and loss sharing certificates - -
1.10 SECOND LEGAL RESERVES (-) - -
1.11 STATUTORY RESERVES (-) - -
1.12 EXTRAORDINARY RESERVES - -
1.13 OTHER RESERVES - -
1.14 SPECIAL FUNDS - -
II. DISTRIBUTION OF RESERVES
2.1 DISTRIBUTED RESERVES - -
2.2 SECOND LEGAL RESERVES (-) - -
2.3 DIVIDENDS TO SHAREHOLDERS (-) - -
2.3.1 To owners of ordinary shares - -
2.3.2 To owners of preferred shares - -
2.3.3 To owners of preferred shares (pre-emptive rights) - -
2.3.4 To profit sharing bonds - -
2.3.5 To holders of profit and loss sharing certificates - -
2.4 DIVIDENDS TO PERSONNEL (-) - -
2.5 DIVIDENDS TO BOARD OF DIRECTORS (-) - -
III. EARNINGS PER SHARE
3.1 TO OWNERS OF ORDINARY SHARES - -
3.2 TO OWNERS OF ORDINARY SHARES (%) - -
3.3 TO OWNERS OF PREFERRED SHARES - -
3.4 TO OWNERS OF PREFERRED SHARES (%) - -
IV. DIVIDEND PER SHARE
4.1 TO OWNERS OF ORDINARY SHARES - -
4.2 TO OWNERS OF ORDINARY SHARES (%) - -
4.3 TO OWNERS OF PREFERRED SHARES - -
4.4 TO OWNERS OF PREFERRED SHARES (%) - -
(*) The Bank does not distribute profit on consolidated accounts.
The accompanying notes are an integral part of these consolidated financial statements.

TÜRK EKONOMİ BANKASI ANONİM ŞİRKETİ
NOTES AND EXPLANATIONS TO CONSOLIDATED FINANCIAL STATEMENTS AS OF 31
DECEMBER 2020 (Unless otherwise stated amounts are expressed in thousands of Turkish Lira (“TL”).)
13
SECTION THREE
ACCOUNTING PRINCIPLES
I. Basis of Presentation
a. Financial statements and related explanations and preparation of footnotes in compliance with Turkish Accounting Standards (“TAS") and Regulation on Accounting Applications for Banks and Safeguarding of Documents:
The consolidated financial statements are prepared within the scope of the “Regulation on Accounting Applications for Banks and Safeguarding of Documents” related with Banking Act numbered 5411 published in the Official Gazette no.26333 dated 1 November 2006 and in accordance with the regulations, communiqués, interpretations and legislations related to reporting principles on accounting records of Banks published by the Banking Regulation and Supervision Agency (“BRSA”) and Turkish Financial Reporting Standards (TFRS) put into effect by Public Oversight Accounting and Auditing Standards Authority (“POA”) for those matters not regulated by the aforementioned regulations. The format and content of the publicly announced unconsolidated financial statements and notes to these statements have been prepared in accordance with the “Communiqué on Publicly Announced Financial Statements, Explanations and Notes to These Financial Statements” and “Communiqué On Disclosures About Risk Management To Be Announced To Public By Banks” and amendments to this Communiqué. The Bank maintains its books in Turkish Lira in accordance with the Banking Law, Turkish Commercial Code and Turkish Tax Legislation.
The consolidated financial statements have been prepared in TL, under the historical cost convention except for the financial assets and liabilities carried at fair value.
The preparation of consolidated financial statements in conformity with TFRS requires the use of certain critical
accounting estimates by the Parent Bank management to exercise its judgment on the assets and liabilities of the balance
sheet and contingent issues as of the balance sheet date. These estimates, which include the fair value calculations of
financial instruments and impairments of financial assets are being reviewed regularly and, when necessary, suitable
corrections are made and the effects of these corrections are reflected to the income statement. Assumptions and estimates
that are used in the preparation of the accompanying financial statements are explained in the following related
disclosures.
The new type of coronavirus (COVID-19), first emerging in China, has been classified as a pandemic affecting countries
globally by the World Health Organization on 11 March 2020. COVID-19 has impacts on economic conditions, sectors,
businesses, consumers, as well as asset and commodity prices, liquidity, exchange rates, interest rates, money and capital
markets and many other issues and it still maintains uncertainty about the future stands. While many countries announce
economic and financial programs in order to limit the damage caused by the virus, Turkey also set regulatory fiscal and
monetary actions in motion to support the companies and households in such difficult conditions. Additional regulatory
measures are continued to be announced to tackle adverse impacts on companies and certain sectors.
The effects of this global pandemic on the Bank's financial statements are regularly monitored by the Risk Management
as well as the Bank's Management. While preparing the consolidated financial statements as of 31 December 2020, the
Bank reflected the possible effects of the COVID-19 outbreak on the estimates and judgements used in the preparation of
the financial statements. Bank Management takes the necessary precautions in order to keep the negative effects under
control and to be affected at the minimum level. The approach preferred for the period of 31 December 2020, will be
revised in the following reporting periods, considering the effect of the pandemic and future expectations.
b. The accounting policies and the valuation principles applied in the preparation of the accompanying
financial statements:
The accounting policies and valuation principles used in the preparation of the financial statements are subject to the
regulations, communiqués, annotations and circulars issued by BRSA on accounting and financial reporting principles
and the TFRS (”BRSA Accounting and Financial Reporting Legislation”) which has been put into force by the POA on
issues not regulated by the BRSA determined according to the principles.
The accounting policies and valuation principles applied in the preparation of the current period financial statements are
explained between notes II and XXV.
c. Different accounting policies applied in the preparation of consolidated financial statements:
In case the accounting policies used by the subsidiaries are different from the Parent Bank, the differences are adjusted in
the financial statements considering the materiality criterion.

TÜRK EKONOMİ BANKASI ANONİM ŞİRKETİ
NOTES AND EXPLANATIONS TO CONSOLIDATED FINANCIAL STATEMENTS AS OF 31
DECEMBER 2020 (Unless otherwise stated amounts are expressed in thousands of Turkish Lira (“TL”).)
14
II. Explanations on Usage Strategy of Financial Assets and Foreign Currency Transactions
The Group aims to develop and promote products for the financial needs of each customer such as SMEs, multinational companies and small individual investors in line with Banking Legislation. The primary objective of the Parent Bank is to increase profitability with optimum liquidity and minimum risk while fulfilling customer needs.
The Group aims at creating an optimum maturity risk and working with a positive margin between cost of resource and product yield in the process of asset and liability management.
As a component of risk management strategy of the Group, risk bearing short term positions of currency, interest or price movements is performed only by the Asset-Liability Management and Treasury Group using the limits defined by the Board of Directors. The Asset-Liability Committee of the Parent Bank manages the maturity mismatches while deciding the short, medium and long term strategies as well as adopting the principle of positive balance sheet margin as a pricing policy.
The Board of Directors of the Parent Bank allows a purchase risk in treasury operations and individual limits are defined by the Board of Directors for each product.
The Parent Bank’s foreign currency asset and liability balances are valuated with the Parent Bank’s exchange buying rate at the reporting date and recognized as “Foreign Exchange Gains / Losses” within statement of income.
The Parent Bank’s hedging activities for the currency risk due to foreign currency available for sale equity instruments are described under the Currency Risk section; and the Parent Bank’s hedging activities from interest rate risk arising from fixed interest rate deposits and floating interest rate borrowings are described in detail under Interest Rate Risk section.
The Parent Bank’s Asset-Liability Committee approves the trading of various derivative instruments such as currency
swaps, forwards and similar derivatives to hedge interest and currency exchange risks in line with the Parent Bank’s
balance sheet structure.
III. Information about the Parent Bank and its Consolidated Subsidiaries
The Parent Bank, with no difference in practice between TAS and TFRS, and the subsidiaries are consolidated by using line-by-line consolidation method. Türk Ekonomi Bankası Anonim Şirketi and its financial institutions, TEB Faktoring A.Ş. (TEB Faktoring), TEB Yatırım Menkul Değerler A.Ş. (TEB Yatırım) and TEB Portföy Yönetimi A.Ş. (TEB Portföy) are included in the accompanying consolidated financial statements by line-by-line consolidation method. The Parent Bank and the entities included in the consolidation are referred to as “the Group” in this report. The accompanying consolidated financial statements are prepared in accordance with “Communiqué on Preparation of Consolidated Financial Statements of Banks” published in the Official Gazette dated 8 November 2006 numbered 26340. The financial statements of the subsidiaries, which were prepared in accordance with the prevailing principles and rules regarding financial accounting and reporting standards in their respective country of incorporation and the Turkish Commercial Code and/or communiqués of the Capital Market Board, are duly adjusted in order to present their financial statements in accordance with TAS and TFRS.
Explanations on Consolidation Method and Scope
The commercial names of the entities included in consolidation and the locations of the head offices of these institutions:
Commercial Name Head Office TEB Faktoring Turkey TEB Yatırım Turkey TEB Portföy Turkey
Line-by-line consolidation method is used for all the financial institutions included in the consolidation. It has been publicly announced that the decision regarding the liquidation of “Stichting TEB Diversified Payment Rights" and "TEB Diversified Payment Rights S.A." has been taken on 19 July 2019. "TEB Diversified Payment Rights S.A." liquidation was completed on 23 July 2019. Bank has been notified that the liquidation of "Stichting TEB Diversified Payment Rights S.A." was completed on 7 April 2020.
The financial statements of subsidiaries were prepared as of 31 December 2020 and 31 December 2019. The transactions and balances between the consolidated entities and the Parent Bank are eliminated.

TÜRK EKONOMİ BANKASI ANONİM ŞİRKETİ
NOTES AND EXPLANATIONS TO CONSOLIDATED FINANCIAL STATEMENTS AS OF 31
DECEMBER 2020 (Unless otherwise stated amounts are expressed in thousands of Turkish Lira (“TL”).)
15
IV. Explanations on Forward and Option Contracts and Derivative Instruments
The Parent Bank's derivative transactions mainly consist of foreign currency swaps and interest rate swaps, cross currency
swaps, currency options and forward foreign currency purchase and sale contracts.
Pursuant to "TFRS 9 Financial Instruments" ("TFRS 9"), derivative financial instruments of the Parent Bank are classified
as "Derivative financial assets at fair value through profit or loss" or "Derivative financial assets at fair value through
other comprehensive income".
Assets and liabilities arising from derivative transactions are recorded in off-balance sheet through their contractual
amounts. Derivative transactions are measured at fair value after initial recognition. In accordance with the classification
of derivative financial instruments, they are disclosed under "Derivative Financial Assets at Fair Value Through Profit or
Loss” or “Derivative Financial Assets at Fair Value Through Other Comprehensive Income” in financial statements.
Differences arising from the fair value changes of derivative financial instruments at fair value through profit or loss are
recognized under “Gains / Losses on Derivative Financial Instruments” in “Trading Income / Loss” in the statement of
profit or loss. The fair values of the derivative financial instruments are calculated using quoted market prices or by using
discounted cash flow models.
Derivative financial instruments are booked under off-balance sheet items. Derivative financial instruments where the
underlying asset is money or commodity are booked based on the amounts to be received/paid at the maturity date.
Derivative financial instruments based on interest rate are booked with the principal amount on which the interest rate is
calculated.
All derivative financial instruments are measured with fair value method. The fair value of the derivative financial
instruments traded in organized markets is the price on the organized market.
The cash flows of forward, currency swap, interest rate swap, and cross currency swap transactions should be determined
firstly in order to measure with fair value method. Expected cash flows due to the floating interest rate for these products
are defined according to market interest rate at the valuation date. Valuation is calculated by discounting the cash flows
with the market interest rate and foreign currencies are converted into Turkish Lira with exchange rates at the valuation
date.
Derivative financial instruments based on interest rate are measured not only with fair value method but also with
amortized cost. While the fair value of derivatives are reflected in a single valuation account within the balance sheet, the
amortized cost and the difference between the fair value and the amortized cost are reflected separately on the
income/expense accounts.
Black and Scholes Model is used to measure the fair value of options. Options premiums are accrued on the start date of
maturity. The valuation amount is composed of premiums valued at each valuation date. Premium to be paid calculated
within this model is recorded as income, and the premium to be collected as expense.
The Parent Bank has adopted fair value and cash flow hedge accounting. Hedge accounting can be applied in order to
prevent short-term fluctuations in the income statement resulting from differences between valuation methods of assets
and liabilities exposed to interest rate risk and their hedging derivative instruments.
A part of the Parent Bank's fixed income foreign currency securities and Turkish Lira loans are subject to fair value hedge
accounting. The fair value risk of the related financial assets with fixed interest rate is hedged by currency swaps and
cross currency swaps. The Parent Bank is also hedging the cash flow risk arising from financial debts, with interest rate
swaps and cross currency swaps.
The hedge effectiveness between the derivative instruments/transactions used for hedging and hedged item are measured
regularly, and the results are documented. In case of ineffectiveness of hedge accounting, the hedge accounting is
terminated.
During period where the relation between hedging instrument and the hedged item is measured;
a) Within the scope fair value hedge accounting, the fair value change of the hedged item is recognized in profit
and loss,
b) Within the scope of cash flow hedge accounting, the fair value change of the hedged item is recognized in other
comprehensive income and the ineffective part of the gain or loss arisen from the hedging instrument is booked
in profit or loss.

TÜRK EKONOMİ BANKASI ANONİM ŞİRKETİ
NOTES AND EXPLANATIONS TO CONSOLIDATED FINANCIAL STATEMENTS AS OF 31
DECEMBER 2020 (Unless otherwise stated amounts are expressed in thousands of Turkish Lira (“TL”).)
16
IV. Explanations on Forward and Option Contracts and Derivative Instruments (Continued)
In the admission of the accounting policies, TFRS 9 presents the option of postponing the adoption of TFRS 9 hedge
accounting and continuing to apply the hedge accounting provisions of TAS 39. Within this context, the Parent Bank will
continue to apply the hedge accounting provisions of TAS 39.
While the Parent Bank recognizes the fair value changes of the hedged items in the “Other Interest Income” and “Other
Interest Expense” accounts, it recognizes the fair value changes of the hedging instruments related to the same period in
the “Gains/Losses on Derivative Financial Instruments” account.
Additionally, the difference between the fair value and carrying value of the hedged items as of the application date of
hedge accounting is amortized based on their maturities and recognized in “Other Interest Income” and “Other Interest
Expense” accounts.
V. Explanations on Interest Income and Expenses
Interest income and expenses are recorded on accrual basis. As the interest income and expense is accrued, all tax liabilities
are fulfilled.
Financial assets and liabilities for which the future cash payments and collections are known, are discounted by using
effective interest rate.
Accrued but not collected interests and rediscounts of loans, those classified as non-performing (Stage 3) are not reversed
and included in interest income.
The interest amount representing the time value of the future collections of the non-performing loans is recognized under
interest income and fully provisioned. The income effect arising from the discount of the estimates of expected collection
as getting closer to the estimated date of collection, is recorded under interest income.
VI. Explanations on Fees and Commission Income and Expenses
Fees and commissions other than integral part of the effective interest rate of the financial instruments measured at
amortized cost are accounted in accordance with the TFRS 15 Revenue from Contracts with Customers Standard.
Income on banking services which are not related to periodic services are recorded as income when they are collected. In
order to classify the fees and commissions collected from customers as income on banking services or as other non-interest
income, they shouldn’t be related with a credit transaction.
All type of fees and commissions collected from customers regarding cash loans are deferred in commissions on cash
loans account and are recognized as income over the period of the loan by discounting with effective interest rate.
For Bank assurance services provided by the Parent Bank commissions from insurance companies are recorded as income
on accrual basis.
The commissions related with non-cash loans or periodic banking services are deferred and recorded as income over the
period according to the cut-off principle. Credit fee and commission expenses which are paid to other companies and
institutions regarding financial liabilities and which create operational costs are discounted by effective interest rate and
are recorded as expense in relevant period according to the cut-off principle.

TÜRK EKONOMİ BANKASI ANONİM ŞİRKETİ
NOTES AND EXPLANATIONS TO CONSOLIDATED FINANCIAL STATEMENTS AS OF 31
DECEMBER 2020 (Unless otherwise stated amounts are expressed in thousands of Turkish Lira (“TL”).)
17
VII. Explanations on Financial Assets
The Group classifies and recognizes its financial assets as “Financial Assets at Fair Value Through Profit or Loss”,
“Financial Assets Measured at Fair Value Through Other Comprehensive Income” or “Financial Assets Measured at
Amortized Cost”. The financial assets are recognized or derecognized in accordance with the “Recognition and
Derecognition” principles defined in Section 3 related to the classification and measurement of financial instruments of
"TFRS 9 Financial Instruments" standard published in the Official Gazette No. 29953 dated 19 January 2017 by the Public
Oversight Accounting and Auditing Standards Authority (POA). At initial recognition, financial assets are measured at
fair value. In the case of financial assets are not measured “at fair value through profit or loss”, transaction costs are added
or deducted to/from their fair value.
The Parent Bank recognizes a financial asset in the financial statement when, and only when, the Parent Bank becomes a
party to the contractual provisions of the instrument. All regular way purchases and sales of financial assets are recognized
on the (“settlement date”). When the Parent Bank first recognizes a financial asset, the business model and the
characteristics of contractual cash flows of the financial asset are considered by management.
Financial Assets at Fair Value through Profit or Loss
Financial assets at fair value through profit or loss are financial assets that are managed by business model other than the
business model that aims to hold to collect and hold & sell the contractual cash flows; acquired for the purpose of
generating profit from short-term fluctuations in price, or regardless of this purpose, the financial assets that are a part of
a portfolio with evidence of short-time profit-taking; and the financial assets, whose terms do not give rise to cash flows
that are solely payments of principal of interest at certain dates. Financial assets at fair value through profit or loss are
initially recognized at fair value and are subsequently measured at fair value. Gain and losses upon their valuation are
accounted under the profit / loss accounts.
Equity securities classified as financial assets at fair value through profit or loss are recognized at fair value.
Accounting policies related to derivative financial instruments at fair value through profit or loss are explained in Section
III. Footnote IV.
Financial Assets at Fair Value through Other Comprehensive Income
Financial assets are classified as financial assets at fair value through other comprehensive income where the business
models aim to hold financial assets in order to collect the contractual cash flows and selling assets and the terms of
financial asset give rise to cash flows that are solely payments of principal of interest at certain dates.
Financial assets at fair value through other comprehensive income are recognized at acquisition costs that reflect their fair
value by adding transaction costs. Financial assets at fair value through other comprehensive income are subsequently
measured at their fair value. The interest income of financial assets at fair value through other comprehensive income that
are calculated by effective interest rate method are reflected in the statement of profit or loss. The difference between the
fair value of the financial assets at fair value through other comprehensive income and the amortized cost of the financial
assets, i.e. "Unrealized gains and losses", is not recognized in the statement of profit or loss until the realization of the
financial asset, the sale of the asset, the disposal of the asset or being impaired of the asset are accounted under "Other
Accumulated Comprehensive Income or Expenses that will be reclassified at Profit or Loss" under shareholders' equity.
Accumulated fair value differences under equity are reflected to the income statement when such securities are collected
or disposed.
The Group may elect, at initial recognition, to irrevocably designate an equity investments at fair value other
comprehensive income where those investments are hold for purposes other than to generate investments returns. When
this election is used, fair value gains and losses are recognized in other comprehensive income and are not subsequently
reclassified to profit or loss. Dividends continue to be recognized in profit or loss in the financial statements.

TÜRK EKONOMİ BANKASI ANONİM ŞİRKETİ
NOTES AND EXPLANATIONS TO CONSOLIDATED FINANCIAL STATEMENTS AS OF 31
DECEMBER 2020 (Unless otherwise stated amounts are expressed in thousands of Turkish Lira (“TL”).)
18
VII. Explanations on Financial Assets (Continued)
Financial Assets at Fair Value Through Other Comprehensive Income (continued)
All equity instruments classified as financial assets at fair value through other comprehensive income are measured at fair
value. However, in limited circumstances, cost may be an appropriate estimate of fair value. That may be the case if
insufficient more recent information is available to measure fair value, or if there is a wide range of possible fair value
measurements and cost represents the best estimate of fair value within that range.
Financial Assets Measured at Amortised Cost
Financial investments measured at amortised cost:
A financial asset is classified as a financial asset measured at amortized cost when the Parent Bank’s policy within a
business model is to hold the asset to collect contractual cash flows and the terms give rise to cash flows that are solely
payments of principal of interest at certain dates.
Financial asset measured at amortised cost is recognized at cost which represents its fair value at initial recognition by
adding the transaction costs and subsequently measured at “Amortized cost” by using the “Effective interest (IRR) rate
method”. Interest income related to the financial asset measured at amortized cost is recognized in the statement of profit
or loss. Loans:
Loans are financial assets with fixed or determinable payment terms which are not traded on an active market and
measured at amortised cost is recognized at cost which represents its fair value at initial recognition by adding the
transaction costs and subsequently measured at amortised cost by using the “Effective interest (IRR) rate method”.

TÜRK EKONOMİ BANKASI ANONİM ŞİRKETİ
NOTES AND EXPLANATIONS TO CONSOLIDATED FINANCIAL STATEMENTS AS OF 31
DECEMBER 2020 (Unless otherwise stated amounts are expressed in thousands of Turkish Lira (“TL”).)
19
VIII. Explanations on Impairment of Financial Assets
As of 1 January 2018, a loss allowance for expected credit losses is provided for all financial assets measured at amortised cost and financial assets measured at fair value through other comprehensive income, all financial assets, which are not measured at fair value through profit or loss, loan commitments and financial guarantee contracts in accordance with TFRS 9 principles and the regulation published in the Official Gazette no. 29750 dated 22 June 2016 in connection with “Procedures and Principals regarding Classification of Loans and Allowances Allocated for Such Loans” which came into force starting from 1 January 2018. Equity instruments are not subject to impairment assessment as they are measured at fair value.
Measurement of the expected credit losses reflects:
- Time value of Money
- Reasonable and supportable information on past events, current conditions and forecasts of future economic
conditions at the reporting date
The Parent Bank has changed its credit calculation method with the expected credit loss model as of 1 January 2018.
Expected credit losses include an unbiased and probability-weighted amount that is determined by evaluating a range of
possible outcomes; reasonable and supportable information that is available without undue cost or effort at the reporting
date about past events, current conditions and forecasts of future economic conditions and the time value of money. The
financial assets are divided into “3 stage categories” depending on the gradual increase in credit risk observed since their
initial recognition:
Stage 1:
For the financial assets at initial recognition or that do not have a significant increase in credit risk since initial recognition. Impairment for credit risk is recorded in the amount of 12 month expected credit losses.
Stage 2:
In the event of a significant increase in credit risk since initial recognition, the financial asset is transferred to Stage 2. Impairment for credit risk is determined based on the instrument’s lifetime expected credit losses. Following criterias have been taken into account in classification a financial asset as Stage 2:
- Loans having past due more than 30 days and less than 90 days - Restructured loans - Concordatum files - Significant deterioration in probability of default
In the case of the occurrence of any of the first three items above, it is classified under Stage 2 loans regardless of the comparison between probabilities of default.
Significant deterioration in probability of default is considered as significant increase in credit risk and the financial asset is classified under Stage 2 loans. In this regard, it is assumed that the probability of default deteriorates, if the probability of default exceeds the thresholds defined by the Bank's internal rating based credit rating models.
BRSA had increased the default definition on loans from 90 days to 180 days with the decision dated 17 March 2020 that would be valid until 31 December 2020. According to the BRSA decision dated 8 December 2020 and numbered 9312 this date is extended until 30 June 2021. Following the BRSA decision, The Bank regularly reviews probability of default rates for loans those are overdue between 90-180 days and continued to be followed in Stage 2 and makes the necessary updates. The effects of these updates are reflected in the financial statements. The regulation change does not include loans those are overdue more than 90 days before 17 March 2020.
The Parent Bank continued to classify loans with delay of 90 to 180 days as Stage 2, valid from 17 March 2020 until 31 December 2020, in accordance with the BRSA decision dated 17 March 2020 and numbered 8948.
The Parent Bank computed an increased expected credit loss provision or simulated Stage 3 level expected credit loss
provision to Corporate and SME loan customers which are not subject to individual assessment by considering how many
times the customer had delay more than 90 days in total after June 2020. In other segments, the expected credit loss was
computed at Stage 3 level.
Stage 3:
Stage 3 includes financial assets that have objective evidence of impairment at the reporting date. For these assets, lifetime expected credit losses are recognized.

TÜRK EKONOMİ BANKASI ANONİM ŞİRKETİ
NOTES AND EXPLANATIONS TO CONSOLIDATED FINANCIAL STATEMENTS AS OF 31
DECEMBER 2020 (Unless otherwise stated amounts are expressed in thousands of Turkish Lira (“TL”).)
20
VIII. Explanations on Impairment of Financial Assets (Continued)
Expected Credit Loss Calculation
Expected credit loss calculation refers to the calculation to estimate the loss of the financial instrument in case of default
and it is based on 3 stage impairment model based on the change in credit quality. The Parent Bank uses two different
calculations considering 12 month and lifetime probability of default of the financial instruments.
If there is a significant increase in credit risk between the origination date and the reporting date of the loan, the lifetime
probability of default is used and if there is no significant increase in credit risk the 12 month probability of default is
used.
There are mainly 3 loan portfolios as Commercial portfolios, Retail portfolios and Public portfolios.
While the Bank uses the internal credit ratings for commercial portfolios, the internal behavioural scores is used for the
retail portfolios. It is determined significant increase in credit risk by comparing the credit ratings/behavioural scores at
the origination date and reporting date for both portfolios.
Default Definition: Debts having past due more than 90 days; in addition, the fact that an obligor is unlikely to pay its
credit obligations, it should be considered as defaulted regardless of the existence of any past-due amount or of the number
of days past due.
In addition, due to COVID-19, the “more than 90 days delay” condition, which was used in the definition of default for
the classification of loans, began to be applied as "more than 180 days delay" in accordance with the BRSA decision as
of 17 March 2020. This implementation will be valid until 30 June 2021. Consistent with the subjected change, provision
has been provided in accordance with the Parent Bank's risk policies.
As of 31 December 2020, considering the possible effects of COVID-19 the data obtained with the principle of best effort
were reflected to the estimates and assumptions used in the calculation of expected credit losses with the best estimation
method. In light of the related information, the Bank has reconsidered its macroeconomic expectations in the expected
credit loss calculation. The Bank has also provided additional provisions through individual assessment for customers
which may be considered as highly effected.
The Bank does not have any financial asset as purchased or originated credit-impaired.
Probability of Default (PD): PD represents the likelihood of default over a specified time period. Based on the historical
data, 1-year PD of a customer is calculated for each portfolio on the basis of credit ratings and behavioural scores. PDs
and LGDs used in the ECL calculation are (point in time, PIT) based on key portfolios and consider both current conditions
and expected cyclical changes. Two types of probability of default are calculated.
- 12-Month PD: as the estimated probability of default occurring within the next 12 months
- Lifetime PD: as the estimated probability of default occurring over the remaining life of the financial instrument
Internal rating systems are used to measure the risk of both commercial and retail portfolios. The internal rating models
used in the commercial portfolio include the customer's financial information and the answers to the qualitative question
set. Behavioural score cards used in the retail portfolio include the behavioural data of the customer and the product in
the Bank, the demographic information of the customer and the behavioural data of the customer in the sector. The
probability of default is calculated based on historical data, current conditions and forward-looking macroeconomic
expectations.
Loss Given Default (LGD): If a loan defaults, it represents the economic loss incurred on the loan. It is expressed as a
percentage.
The Bank calculates the recovery rates for each portfolio in a way that include the collateral types and several risk elements
based on historical data, and it is ensured that the time value of money is included into the calculation by discounting of
these recoveries to the reporting date. The collaterals in the calculation are taken into account by considering the credit
conversion factors. The collaterals included in “Communique on Credit Risk Mitigation Techniques” is taken into account
with their rules in the communique. The remaining part is considered as unsecured portfolio and loss given default rate
determined for this portfolio is applied.

TÜRK EKONOMİ BANKASI ANONİM ŞİRKETİ
NOTES AND EXPLANATIONS TO CONSOLIDATED FINANCIAL STATEMENTS AS OF 31
DECEMBER 2020 (Unless otherwise stated amounts are expressed in thousands of Turkish Lira (“TL”).)
21
VIII. Explanations on Impairment of Financial Assets (Continued)
Expected Credit Loss Calculation (continued)
Exposure at Default (EAD): The EAD represents an estimate of the exposure to credit risk at the time of a potential default
occurring during the life of a financial instrument. The expected default amount is calculated by discounting the principal
and interest repayments for cash loans and income accruals by effective interest method while it refers to the value
calculated through using credit conversion factors for non-cash loans and commitments. It shows the risk of the borrower
at the date of default.
Effective interest rate: the discount factor which reflects the time value of money.
Lifetime ECL is calculated by taking into account the period during which the Parent Bank will be exposed to credit risk.
The maturity information defined for all cash and non-cash loans is used in the calculation of the expected credit loss
along with their maturity and payment plans. The maturity refers to the contractual life of a financial instruments unless
there is the legal right to call it earlier. The maturity analysis and credit risk mitigation processes such as
cancellation/revision of the limits have been developed for the definition of behavioural maturity for loans that do not
have maturity information and revolving loans.
When expected credit losses are estimated, it is considered that three different macroeconomic scenarios as “Base”,
“Adverse” and “Favourable” and the weighted average of the results of these scenarios is taken into account. Forward-
looking PDs based on the weighted average of these three scenarios are calculated on segment basis. The fundamental
macroeconomic variable in the macroeconomic models is the estimated annual growth rate in gross national product. The
Bank periodically reviews the parameters included in the calculation and updates them when necessary.
Expected Credit Loss Calculation of Stage 1 Loans: It is calculated by considering 12 month (1 year) PDs for the financial
assets measured at amortized cost, which do not reflect a significant increase in credit risk. Therefore, it is a part of the
lifetime expected credit losses. Such expected 12 month PDs are applied on an expected exposure at default, multiplied
with loss given default rate and discounted with the original effective interest rate.
In the case of the current default rate is below a defined threshold without comparison with the origination date, the related
loans are classified under Stage 1 loans by considering their credit qualities. Treasury Bills, Government Bonds and CBRT
balances are classified under Stage 1 loans. In addition, the institutions related to risk group of the Bank and other banks’
placements are classified under Stage 1 loans.
Expected Credit Loss Calculation of Stage 2 Loans: It is calculated by considering lifetime PDs for the loans which has
shown a significant increase in credit risk since origination. Such expected lifetime PDs are applied on an expected
exposure at default, multiplied with loss given default rate and discounted with the original effective interest rate.
In determining of the significant increase in credit risk, qualitative and quantitative assessments are performed.
Qualitative assessments:
The loans with a delay on repayment more than 30 days are classified under Stage 2 loans. In addition, the restructured
loans are classified under this stage. Also, all the customers declaring concordatum are classified under this stage.
The Parent Bank periodically reviews the parameters included in the calculation and updates them when necessary.
The Parent Bank continued to classify loans with delay of 90 to 180 days as Stage 2, valid from 17 March 2020 until 31
December 2020, in accordance with the BRSA decision dated 17 March 2020 and numbered 8948.
Increased expected loss provision or simulated Stage 3 expected loan loss provision was allocated to Corporate and SME
loan customers which are not subject to individual assessment by considering how many times the customer had delay
more than 90 days in total after June 2020. In other segments, the expected credit loss provision was allocated as Stage 3
level.

TÜRK EKONOMİ BANKASI ANONİM ŞİRKETİ
NOTES AND EXPLANATIONS TO CONSOLIDATED FINANCIAL STATEMENTS AS OF 31
DECEMBER 2020 (Unless otherwise stated amounts are expressed in thousands of Turkish Lira (“TL”).)
22
VIII. Explanations on Impairment of Financial Assets (Continued)
Expected Credit Loss Calculation (continued)
Quantitative assessments:
“Significant increase in credit risk” is quantitatively based on the comparison the risk of default at the reporting date with
the risk of default at the date of initial recognition. Where the change is above the defined threshold it is considered as
significant increase in the credit risk, meaning that the credit is classified under Stage 2 loans.
In the case of the internal credit rating of the loan is above a defined threshold, “high risk portfolio”, without comparison
with the origination date, the related loans are classified under Stage 2 loans.
Expected Credit Loss Calculation of Stage 3 Loans: Lifetime expected credit losses are booked for the loans considered
as impaired. When calculating the provisions by discounting the individual cash flow expectations for financial
instruments which are above a defined threshold, loss given default rates are taken into account in case of default for
financial instruments which are below the defined threshold.
IX. Explanations on Offsetting of Financial Assets and Liabilities
Financial assets and liabilities are offset and the net amount is reported in the balance sheet when the Parent Bank has
legally enforceable rights to offset the recognized amounts and to collect/pay related financial assets and liabilities on a
net basis, or there is an intention to realize the asset and settle the liability simultaneously.
X. Explanations on Sales and Repurchase Agreements and Lending of Securities
Treasury bills and government bonds within the scope of repurchase agreements are classified in financial statements as
financial assets at fair value through profit or loss, financial assets at fair value through other comprehensive income and
financials assets measured at amortized cost according to the classification of marketable securities subject to repurchase
agreement, and are valued according to the measurement rules of the relevant category. Funds obtained through repurchase
agreements are booked in a separate liability account, namely funds provided under repurchase agreements under money
market balances. Income and expenses arisen from these transactions are booked in “Interest Income on Marketable
Securities Portfolio” and “Interest Expense on Money Market Borrowings” in income statement.
Securities purchased under repurchase agreements (“Reverse repos”) are accounted under “Money Market Placements”
in the balance sheet. The difference between the purchase and resell price of the repurchase agreements is accrued over
the life of repurchase agreements. As of 31 December 2020, the Group has TL 3,679,810 reverse repo transaction
(31 December 2019: TL 840,304).
As of 31 December 2020, the Group does not have any marketable securities lending transaction (31 December 2019:
None).
XI. Explanations on Assets Held for Sale, Discontinued Operations and Liabilities Related to Those
Assets
Non-current assets held for sale consists of property, plant and equipment acquired for impairment and accounted in
financial statements convenient with “TFRS 5 Assets Held for Sale and Discontinued Operations”.
As of 31 December 2020, assets held for sale and discontinued operations of the Group are TL 112,859 (31 December
2019: TL 131,362). As per the appraisals performed for the real estates held for sale included “Assets Held for Sale” in
the financial statements, TL 5,330 (31 December 2019: TL 10,598) has been reserved as provision for impairment losses.
As of 31 December 2020, the Group has no discontinued operations.

TÜRK EKONOMİ BANKASI ANONİM ŞİRKETİ
NOTES AND EXPLANATIONS TO CONSOLIDATED FINANCIAL STATEMENTS AS OF 31
DECEMBER 2020 (Unless otherwise stated amounts are expressed in thousands of Turkish Lira (“TL”).)
23
XII. Explanations on Goodwill and Other Intangible Assets
Goodwill is measured as the excess of the sum of the consideration transferred, the amount of any non-controlling interests
in the acquiree, and the fair value of the acquirer's previously held equity interest in the acquiree (if any) over the net of
the acquisition-date amounts of the identifiable assets acquired and the liabilities assumed. In the merger transaction where
acquirer and acquiree exchange equity instruments, it is taken into account the fair value of equity shares exchanged and
the difference between such amount and fair value of the acquiree’s identifiable net asset value is accounted as goodwill.
If the initial accounting for a business combination is incomplete by the end of the reporting period in which the
combination occurs, the acquirer shall report in its financial statements provisional amounts for the items for which the
accounting is incomplete. During the measurement period, the acquirer shall retrospectively adjust the provisional
amounts recognized at the acquisition date to reflect new information obtained about facts and circumstances that existed
as of the acquisition date and, if known, would have affected the measurement of the amounts recognized as of that date.
During the measurement period, the acquirer shall also recognize additional assets or liabilities if new information is
obtained about facts and circumstances that existed as of the acquisition date and, if known, would have resulted in the
recognition of those assets and liabilities as of that date. The measurement period shall not exceed one year from the
acquisition date.
As explained in footnote 1 of Section 1, under the Banking Regulation and Supervision Agency decision dated
10 February 2011 and the release of decision in Official Newspaper 12 February 2011 dated and numbered as 27844, all
rights, receivables, (assets and liabilities) of Fortis Bank A.Ş. would be transferred to the Parent Bank as stated in Istanbul
Commerce Trade dated 14 February 2011.
Within the framework of TFRS 3 Business Combination, identifiable assets and liabilities acquired at the merger date are
measured at their acquisition date fair value. In this context, the Parent Bank has measured the identifiable assets acquired
and the identifiable liabilities acquired in the date of the merger of Fortis Bank A.Ş. at fair value and presented in the
financial statements as related items. The resulting difference of TL 48,783 is shown in related assets and liability section,
the equity impact is shown under other shareholder’s equity section. The amount of TL 421,124, which is the difference
between TL 2,385,482, the fair value of transferred amount and TL 1,964,358, the identifiable net asset value is accounted
as goodwill in the financial statements and the equity impact is shown under other shareholder’s equity section.
Goodwill arising on an acquisition of a business or a merger is carried at cost as established at the date of acquisition of
the business less accumulated impairment losses, if any. For the purposes of impairment testing, goodwill is allocated to
each of the Parent Bank's cash-generating units (or groups of cash-generating units) that is expected to benefit from the
synergies of the combination. A cash-generating unit to which goodwill has been allocated is tested for impairment
annually, or more frequently when there is indication that the unit may be impaired. If the recoverable amount of the cash-
generating unit is less than its carrying amount, the impairment loss is allocated first to reduce the carrying amount of any
goodwill allocated to the unit and then to the other assets of the unit pro rata based on the carrying amount of each asset
in the unit. Any impairment loss for goodwill is recognized directly in profit or loss in the income statement. An
impairment loss recognized for goodwill is not reversed in subsequent periods. On disposal of the relevant cash-generating
unit, the attributable amount of goodwill is included in the determination of the profit or loss on disposal.
Intangible assets are accounted for at restated cost until 31 December 2004 in accordance with inflation accounting and
are amortized with straight-line method, after 31 December 2004 the acquisition cost and any other cost incurred so as to
prepare the intangible asset ready for use less reserve for impairment, if any, and are amortized on a straight-line method.
The cost of assets subject to amortization is restated after deducting the exchange differences, capitalized financial
expenses and revaluation increases, if any, from the cost of the assets.
The other intangible assets of the Group comprise mainly software. The useful lives of such assets acquired are determined
as 3-5 years by taking into consideration the expected utilization period, technical, technological or any other impairment
and maintenance expenses necessary for the economic use of such assets. Software’s used are mainly developed within
the Parent Bank by the Parent Bank’s personnel and the related expenses are not capitalized.
There are no anticipated changes in the accounting estimates about the amortization rate and amortization method and
residual values that would have a significant impact in the current and future periods.

TÜRK EKONOMİ BANKASI ANONİM ŞİRKETİ
NOTES AND EXPLANATIONS TO CONSOLIDATED FINANCIAL STATEMENTS AS OF 31
DECEMBER 2020 (Unless otherwise stated amounts are expressed in thousands of Turkish Lira (“TL”).)
24
XIII. Explanations on Tangible Fixed Assets
Tangible assets of the Group are accounted for at their restated cost until 31 December 2004 and afterwards, the acquisition
cost and any other cost incurred to prepare the asset ready for use are reflected, less reserve for impairment, if any.
Depreciation rates are defined according to the economic life of the relevant assets.
Depreciation is calculated using the straight line method, without taking residual values into consideration based on the
number of months that the asset is used. No amendment has been made to the depreciation method in the current period.
The economic useful lives of the tangible fixed assets are as follows:
Buildings 50 years Furniture, Fixtures and Office Equipment and Others 5-15 years
Gain or loss resulting from disposals of the tangible fixed assets is reflected to the income statement as the difference
between the net proceeds and net book value.
Maintenance costs of tangible fixed assets are capitalized if they extend the economic useful life of the related asset and
other maintenance costs are expensed. Leasehold improvements amount is subject to depreciation during leasing period.
This period is taken into consideration maximum five years. For the branches this period is considered as three years in
parallel with the Parent Bank's business plans.
The Parent Bank employs independent appraisers in determining the current fair values of its real estate’s when there is
any indication of impairment in value of real estates.
XIV. Explanations on Leasing Transactions
“TFRS 16 Leases” was promulgated in the Official Gazette dated 16 April 2018 and numbered 30393, effective from 1 January 2019. This Standard specifies the principles for the leasing, presentation and disclosure of leases. The purpose of the standard is to provide tenants and lessees with appropriate information and faithful representation. This information is the basis for evaluating the impact of the leases on the entity's financial position, financial performance and cash flows by users of financial statements. The Bank has started to apply the related standard for the first time on 1 January 2019 by reflecting the application effects to the equity accounts. Lease obligations under the contract in the amount of liabilities on the balance sheet equal to the sum of all cash payments and offset with the form shown gross interest expense arising from the contract. The right of use arising from the leasing transactions, at the date of commencement, the present value of the lease payments which have not been paid at that date is measured. In this measurement, if the interest can be easily determined, the implied interest rate in the lease is used. If this ratio is not easily determined, the Bank's alternative borrowing interest rate announced by the Asset and Liability Management Department is used.
Public Oversight Authority (POA) made amendments in TFRS 16 “Leases” standard by publishing the Concessions Granted in Lease Payments Regarding COVID-19 – “amendments regarding TFRS 16 Leases” on 5 June 2020. With this amendment, exception is granted to lessee on the subject of not evaluating whether the privileges granted on lessees’ lease payments due to COVID-19 are changes on leasing or not. The subjected changes did not have a significant impact on the Parent Bank’s financial position or performance.
With the “TFRS 16 Leases” standard which became effective as of 1 January 2019, the difference between the operating lease and financial lease has been removed and the lease transactions are started to be recognized under “Tangible Assets” as an asset (tenure) and under “Lease Payables” as a liability.
XV. Explanations on Provisions and Contingent Liabilities
Provisions are provided for liabilities of uncertain timing or amount arising from past events have the probability to result in an expense or loss in the future and when it can be measured reliably.
Provisions are determined by using the Group’s best expectation of expenses in fulfilling the obligation as of the balance sheet date and discounted to present value if material. Provisions and contingent liabilities, excluding specific and general provisions for loans and other receivables, are recognized in accordance with the Turkish Accounting Standards (TAS 37) regarding Provisions, Contingent Liabilities and Contingent Assets.

TÜRK EKONOMİ BANKASI ANONİM ŞİRKETİ
NOTES AND EXPLANATIONS TO CONSOLIDATED FINANCIAL STATEMENTS AS OF 31
DECEMBER 2020 (Unless otherwise stated amounts are expressed in thousands of Turkish Lira (“TL”).)
25
XVI. Explanations on Contingent Assets
Contingent assets usually arise from unplanned or other unexpected events that give rise to the possibility of an inflow of
economic benefits to the entity. Contingent assets are not recognized in financial statements since this may result in the
recognition of income that may never be realized.
Contingent assets are disclosed in the financial statements’ notes where an inflow of economic benefits is probable.
Contingent assets are assessed continually to ensure that developments are appropriately reflected in the financial
statements. In case it has become virtually certain that an inflow of economic benefits will arise, the asset and the related
income are recognized in the financial statements.
XVII. Explanations on Liabilities Regarding Employee Benefits
In accordance with existing social legislation in Turkey, the Parent Bank is required to make lump-sum termination indemnities over a 30 day salary to each employee who has completed over 1 year of service, whose employment is terminated due to retirement or for reasons other than resignation or misconduct, and due to marriage, female employees terminating their employments within a year as of the date of marriage, or male employees terminating their employments due to their military service. The Parent Bank is also required to make a payment for the period of notice calculated over each service year of the employee whose employment is terminated for reasons other than resignation or misconduct. Total benefit is calculated in accordance with TAS 19 Employee Benefits.
Such benefit plans are unfunded since there is no funding requirement in Turkey. The cost of providing benefits to the
employees for the services rendered by them under the defined benefit plan is determined by independent actuaries
annually using the projected unit credit method.
Employees transferred to the Parent Bank following the business combination defined in “General Information” of the
Parent Bank and Fortis Bank A.Ş. are the members of “Fortis Bank A.Ş. Mensupları Emekli Sandığı” (the “Pension
Fund”) which was established in May 1964 under the Provisional Article 20 of Social Insurance Law No. 506. Technical
financial statements of the Pension Fund are reviewed by a licensed actuary in accordance with Article 38 of the Insurance
Supervisory Law and the “Actuary Regulations” issued based on the same article. As of 31 December
2020, the Pension Fund has 1,505 employees and 1,191 pensioners (31 December 2019: 1,552 employees and 1,139
pensioners). 9
Provisional Article 23 (1) of Banking Law No. 5411 (the “Banking Law”) published in the Official Gazette repeated No.
25983 on 1 November 2005 requires the transfer of bank funds to the Social Security Institution (the “SSI”) within 3 years
after the effective date of the Banking Law and the related paragraph also sets out the basis for the related transfer.
However, Article 23 (1) of Banking Law No. 5411 was annulled based on the Constitutional Court’s ruling issued on
22 March 2007 and ruled for the stay of execution as of 31 March 2007. The related Court ruling and its basis were
published in the Official Gazette No. 26731 on 15 December 2007.
Following the publication of the said decree of the Constitutional Court, the Turkish Grand National Assembly (the
“TGNA”) initiated its studies on the development of new regulations in regards to the transfer of bank pension
participations to the SSI and the related articles of the Social Security Law that are set out to determine the basis of fund
transfers and new regulations became effective with its publication in the Official Gazette No: 26870 on 8 May 2008 and
the completion of the transfer within 3 years starting from 1 January 2008. Upon the Council of Ministers’ resolution
issued in the Official Gazette, the transfer period has been extended for 2 years as of 14 March 2011. According to
amendment on the social security and general health insurance law published in the Official Gazette dated 8 March 2012
numbered 6283, mentioned 2-year transfer period has been increased to 4 years. Upon the Council of Ministers’ resolution
dated 24 February 2014 issued in the Official Gazette No:28987 on 30 April 2014, mentioned transfer period has been
extended for one more year while it has been extended for one year upon the Council of Ministers’ resolution dated 8
April 2013 issued in the Official Gazette No:28636 on 3 May 2013. The Council of Ministers has been lastly authorized
to determine the transfer date in accordance with the last amendment in the first paragraph of the 20th provisional article
of Law No.5510 implemented by the Law No. 6645 on Amendment of the Occupational Health and Safety Law and Other
Laws and Decree Laws published in the Official Gazette dated 23 April 2015 numbered 29335. According to paragraph
(I) of Article 203 of Law no. 703 which published on the Official Gazette no. 30473 dated 9 July 2018, the phrase, placed
in 20th provisional article of Social Insurance and General Health Insurance Law no.5510, “Council of Ministers” is
authorized to determine the date of transfer to the Social Security Institution has been replaced with “President”.
The technical financial statements of the Pension Fund are prepared by an independent actuary company considering related regulation and the Fund is not required to provide any provisions for any technical or actual deficit in the financial statements based on the actuarial report prepared as of 31 December 2020. Since the Parent Bank has no legal rights to carry the economic benefits arising from repayments of Pension Funds and/or decreases in future contributions at present value; no asset has been recognized in the balance sheet.
Since the Parent Bank management anticipates that any potential liability that may be incurred during or after the transfer within the above-mentioned limits will be likely recoverable, they believe such liabilities will not bring any additional liability to the Parent Bank.

TÜRK EKONOMİ BANKASI ANONİM ŞİRKETİ
NOTES AND EXPLANATIONS TO CONSOLIDATED FINANCIAL STATEMENTS AS OF 31
DECEMBER 2020 (Unless otherwise stated amounts are expressed in thousands of Turkish Lira (“TL”).)
26
XVIII. Explanations on Taxation
Corporate tax
According to the Article 32 of the Corporate Tax Law No. 5520, announced in the Official Gazette dated 21 June 2006,
the corporate tax rate is 20% in Turkey. However, the corporate income tax rate has been applied as 22% for 3 the years
between 2018-2020 regarding to the "Law on Amendment of Certain Tax Laws and Some Other Laws" numbered 7061
and published in the Official Gazette on 5 December 2017.
The tax legislation requires advance tax to be calculated and paid based on earnings generated for each quarter, the
amounts thus calculated and paid are offset from the final tax computed over the earnings of the year. On the other hand,
corporate tax and any related taxes paid to foreign tax offices for the income obtained from foreign branches are taken
into account in the Tax Statement according to Article 22 of the Preventation of Double Taxation Treaty signed between
Northern Cyprus and the Turkish Republic.
50% portion of the gains derived from the sale of immovable (from 5 December 2017) which have been acquired due to
loans under follow-up from the Bank and 75% portion of participation shares, founder's shares, dividend shares and pre-
emption rights is tax exempt. 75% portion of the capital gains derived from the sale of equity investments and 50% portion
of the immovable properties held for at least two years are exempt from corporate taxation, providing that such gains are
added to paid-in capital or held in a special fund account under liability for 5 years.
Tax returns are required to be filed between the first and twenty-fifth day of the fourth month following the balance sheet
date and paid in one instalment until the end of the related month.
According to the Corporate Tax Law, tax losses can be carried forward for a maximum period of five years following the
year in which the losses are incurred. Tax authorities can inspect tax returns and the related accounting records for a
retrospective maximum period of five years.
Deferred Tax Asset / Liability
The Group calculates and reflects deferred tax asset or liability on timing differences which will result in taxable or
deductible amounts in determining taxable profit of future periods.
The deferred tax is calculated using the enacted tax rates that are valid as of the balance sheet date in accordance with the
tax legislation in force. According to the Law, which was approved in the Grand National Assembly on 28 November
2017 and published in the Official Gazette dated 5 December 2017, the rate of Corporate Tax for the years 2018, 2019
and 2020 was increased from 20% to 22%. Therefore, deferred tax assets and liabilities are measured at the tax rate of
22% that are expected to apply to these periods when the assets is realised or the liability is settled, based on the Law that
have been enacted. For the periods 2021 and after, the reversals of temporary differences are measured by 20%.
Deferred tax liabilities are recognized for all resulting temporary differences whereas deferred tax assets resulting from
temporary differences are recognized to the extent that it is probable that future taxable profit will be available against
which the deferred tax assets can be utilized.
Deferred tax asset is calculated over temporary differences arisen from expected credit loss provision in line with TFRS
9 principles from 1 January 2018.
Deferred tax income balance resulting from netting of deferred tax assets and liabilities should not be used in dividend
distribution and capital increase.
XIX. Additional Explanations on Borrowings
The borrowing costs related to purchase, production, or construction of qualifying assets that require significant time to
be prepared for use and sale are included in the cost of assets until the relevant assets become ready to be used or to be
sold. Financial investment income obtained by temporary placement of undisbursed investment loan in financial
investments is offset against borrowing costs qualified for capitalization.
All other borrowing costs are recorded to the income statement in the period they are incurred.
XX. Explanations on Issued Equity Securities
There is no share issued in the year 2020.

TÜRK EKONOMİ BANKASI ANONİM ŞİRKETİ
NOTES AND EXPLANATIONS TO CONSOLIDATED FINANCIAL STATEMENTS AS OF 31
DECEMBER 2020 (Unless otherwise stated amounts are expressed in thousands of Turkish Lira (“TL”).)
27
XXI. Explanations on Bill Guarantees and Acceptances Acceptances are realized simultaneously with the payment dates of the customers and they are presented as probable commitments in off-balance sheet accounts.
XXII. Explanations on Government Incentives There is no government incentive utilized by the Group.
XXIII. Explanations on Reporting According to Segmentation
The operating segments of the Parent Bank include retail and private banking, SME banking, corporate banking, treasury
and asset-liability management.
Retail and private banking lines of the Parent Bank provide consumer loans, personal financing, housing, workplace and
vehicle loans for customer needs related to general consumption, purchase of durable goods, and real estate. The Parent
Bank also provides account products like Marifetli, Fırsat and CEPTETEB along with the standard time deposit products
to enable advantageous savings in different currencies and maturities. In regard to investment needs for customers, retail
and private banking offers brokerage services for treasury bill transactions, government bonds, Eurobonds, foreign
exchange purchases/sales, a wide-range of investment funds, private pension funds and equity securities transactions. It
also provides practical account, credit deposit account, automatic bill/regular payment options, safe-deposit boxes and
insurance services beside credit and debit cards offering advantages in shopping and banking transactions. These products
and services are provided to customers through widespread physical branches and ATM network and also via a 24/7 call
center, internet and mobile banking.
Corporate banking provides financial solutions and banking services to large-scale local firms, holdings and their group
companies, and multinational companies operating in Turkey. In addition to the bank deposit services provided to
corporate customers, corporate banking also develops tailored solutions and products for standard cash and non-cash
loans, investment loans, cash management services in line with customer needs and demands and foreign trade financing.
Foreign exchange purchase and sale transactions, corporate financing services, derivative products and solutions to
manage foreign exchange and interest rate risk and commodity financing are other services provided by the Parent Bank.
The Bank provides these services and products for its corporate customers via teams, located in its corporate branches
and Head Office, who are specialized in foreign trade, cash management, structured finance and multinational companies.
It also benefits from the global business network and expertise of BNP Paribas Group.
SME banking provides small and medium-sized enterprises with financial solutions and exclusive services for non-
financial matters. The Parent Bank, which specifically designed its services for different segments in the field of SME
Banking, has developed solutions that are tailored to the needs of these segments. In addition to solutions developed for
small and medium-sized enterprises, solutions were developed for agricultural producers, jewellers, female leaders and
entrepreneurship segments and for SME banking, enterprise banking, agriculture banking, gold banking, women’s
banking and entrepreneurship banking. These solutions are provided on a larger scale based on the types of financial
problems encountered by customers, and they are supported in non-financial matters via offering access to information,
training and networks. At this point, the Parent Bank does not only provide financial support to the SMEs but also provides
the training and expertise they need to grow their business, strengthen their competitiveness and use their financing
properly.
When determining the short, medium and long-term pricing strategy, Asset-Liability Management and the Treasury Group
also manage the maturity mismatch, by adopting a principle foreseeing to work with a positive balance sheet margin. Spot
and forward TL and foreign exchange purchase-sale transactions, treasury bill, government bond, and Eurobond purchase-
sale transactions, and derivative product purchase/sale transactions are carried out under defined authorizations. The
Parent Bank also carries out activities related to providing medium and long-term funding, enabling funding at a price
below the price reflecting the country risk price, diversifying funding resources, and creating an international investor
base in this field.
The Financial Markets Group provides structured financial solutions to hedge foreign exchange/interest rate risks of
customers and provides the most appropriate price for the market instruments offered to customers by monitoring market
conditions.

TÜRK EKONOMİ BANKASI ANONİM ŞİRKETİ
NOTES AND EXPLANATIONS TO CONSOLIDATED FINANCIAL STATEMENTS AS OF 31
DECEMBER 2020 (Unless otherwise stated amounts are expressed in thousands of Turkish Lira (“TL”).)
28
XXIII. Explanations on Reporting According to Segmentation (Continued) The details of the income statement and the balance sheet which the Group operates as a business line:
Current Period
Retail and Private
Banking
Corporate
Banking
SME
Banking Other Elimination Total
Dividend Income - - - 32,308 (28,751) 3,557
Profit Before Tax 416,020 394,058 88,170 809,102 (30,430) 1,676,920 Tax Provision (-) - - - 408,098 (84) 408,014
Net Profit for the Period 416,020 394,058 88,170 401,004 (30,346) 1,268,906
Current Period
Retail and Private
Banking
Corporate
Banking
SME
Banking Other Elimination Total
Segment Assets 29,758,990 33,737,144 17,917,969 61,694,952 (379,343) 142,729,712 Investments in Associates, Subsidiaries and
Jointly Controlled Entities - - - 126,652 (126,597) 55
Total Assets 29,758,990 33,737,144 17,917,969 61,821,604 (505,940) 142,729,767
Segment Liabilities 57,562,522 30,630,337 8,208,073 35,019,049 (379,887) 131,040,094 Shareholders’ Equity - - - 11,815,726 (126,053) 11,689,673
Total Liabilities 57,562,522 30,630,337 8,208,073 46,834,775 (505,940) 142,729,767
Prior Period (31.12.2019)
Retail and Private
Banking
Corporate
Banking
SME
Banking Other Elimination Total
Dividend Income - - - 19,502 (18,176) 1,326
Profit before Tax 656,105 911,375 (269,219) 212,779 (19,247) 1,491,793
Tax Provision (-) - - - 364,629 (25) 364,604
Net Profit for The Period 656,105 911,375 (269,219) (151,850) (19,222) 1,127,189
Prior Period (31.12.2019)
Retail and Private
Banking
Corporate
Banking
SME
Banking Other Elimination Total
Segment Assets 25,906,561 22,913,607 17,290,247 43,401,275 (297,262) 109,214,428 Investments in Associates, Subsidiaries
and Jointly Controlled Entities - - - 124,923 (124,918) 5
Total Assets 25,906,561 22,913,607 17,290,247 43,526,198 (422,180) 109,214,433
Segment Liabilities 51,517,147 16,048,947 6,479,553 25,556,598 (297,720) 99,304,525 Shareholders’ Equity - - - 10,034,368 (124,460) 9,909,908
Total Liabilities 51,517,147 16,048,947 6,479,553 35,590,966 (422,180) 109,214,433
XXIV. Explanations on Other Matters
It has been resolved in the Ordinary General Assembly dated 26 March 2020 of the Parent Bank, TL 1,070,354 that
constitutes the 2019 net balance sheet profit shall be transferred to the Extraordinary Reserves after setting aside, in
accordance with the proposal in the resolution of the Board of Directors, TL 53,518 as Legal Reserves, TL 9,394 as
Special Reserves, TL 0.87 (full TL) as profit distributed to the holders of the founder jouissance certificates.
XXV. Reclassifications
In order to comply with the presentation of the financial statements dated 31 December 2020, some classifications were
made on the statement of income and statement of cash flows dated 31 December 2019.

TÜRK EKONOMİ BANKASI ANONİM ŞİRKETİ
NOTES AND EXPLANATIONS TO CONSOLIDATED FINANCIAL STATEMENTS AS OF 31
DECEMBER 2020 (Unless otherwise stated amounts are expressed in thousands of Turkish Lira (“TL”).)
29
SECTION FOUR
INFORMATION ON CONSOLIDATED FINANCIAL STRUCTURE AND RISK
MANAGEMENT
I. Explanations Related to Components of Consolidated Shareholders’ Equity
Total capital and Capital adequacy ratio have been calculated in accordance with the “Regulation on Equity of Banks”
and “Regulation on Measurement and Assessment of Capital Adequacy of Banks” and decision of BRSA dated 23 March
2020 and 3397 numbered, dated 16 April 2020 and 3984 numbered. According to the latest regulation changes;
In calculating the amount subject to credit risk; exchange buying rate which was used for the financial statements dated
31 December 2019 are used for calculating the foreign currency valuation.
In case that the net valuation differences of the securities owned by Banks which are included in the "Securities with Fair
Value through Other Comprehensive Income" portfolio as of 23 March 2020 are negative, these differences are not taken
into account in the amount of equity.
In accordance with the Standard Approach, 0% risk weight is used in the calculation of the amount subject to credit risk
for FX receivables of Banks which are from Republic of Turkey Central Management within the scope of Regulation on
Measurement and Assessment of Capital Adequacy of Banks published on the Official Gazette dated 23 October 2015
and numbered 29511.
As of 31 December 2020, Group’s total capital has been calculated as TL 16,717,321 (31 December 2019: TL 14,538,530)
and Capital Adequacy Ratio is 18.25% (31 December 2019: 16.74%). This ratio is well above the minimum ratio required
by the legislation. The credit risk of banking accounts has been calculated by using the “standard approach”, the market
risk of purchase and sale accounts by using the “standard method”, counterparty credit risk of derivative and repo
transactions by using the “fair value method”, credit valuation adjustments of over the counter derivative transactions by
using the “standard model” and operational risk by using the “basic indicator approach”.

TÜRK EKONOMİ BANKASI ANONİM ŞİRKETİ
NOTES AND EXPLANATIONS TO CONSOLIDATED FINANCIAL STATEMENTS AS OF 31
DECEMBER 2020 (Unless otherwise stated amounts are expressed in thousands of Turkish Lira (“TL”).)
30
I. Explanations Related to Components of Consolidated Shareholders’ (Continued)
Information related to the Components of Consolidated Shareholders' Equity:
Common Equity Tier 1 Capital
Current
Period
31.12.2020
Amount related to
treatment before
01.01.2014(*)
Paid-in Capital to be Entitled for Compensation after All Creditors 2,404,652
Share Premium 2,565
Reserves 8,472,235
Gains Recognized in Equity as per TAS 63,530
Profit 1,272,252
Current Period Profit 1,262,755
Prior Period Profit 9,497
Bonus Shares from Associates, Subsidiaries and Joint-Ventures not Accounted in Current Period’s Profit 527
Minority interest 530 795
Common Equity Tier 1 Capital Before Deductions 12,216,291
Deductions from Common Equity Tier 1 Capital
Valuation adjustments calculated as per the (I) item of first paragraph of Article 9 of the Regulation on Bank -
Current and Prior Periods' Losses not Covered by Reserves, and Losses Accounted under Equity according to TAS 23,436
Leasehold Improvements on Operational Leases 38,571
Goodwill netted off deferred tax liability 421,124 421,124
Other intangible assets netted off deferred tax liabilities except mortgage servicing rights. 139,502 139,502
Deferred tax assets that rely on future profitability excluding those arising from temporary differences (net of related tax liability) -
Differences are not recognized at the fair value of assets and liabilities subject to hedge of cash flow risk -
Communiqué Related to Principles of the amount credit risk calculated with the Internal Ratings Based Approach, total expected loss
amount exceeds the total provision -
Gains arising from securitization transactions -
Unrealized gains and losses due to changes in own credit risk on fair value of Bank’s liabilities -
Net amount of defined-benefit plan assets -
Direct and indirect investments of the Bank in its own Tier 1 Capital -
Excess amount expressed in the law (Article 56 4th paragraph) -
Investments in the capital of banking, financial and insurance entities that are outside the scope of
regulatory consolidation, net of eligible long positions, where the bank does not own more than 10% of
the issued share capital (amount above 10% threshold) -
Significant investments in the common stock of banking, financial and insurance entities that are outside
the scope of regulatory consolidation, net of eligible long positions (amount above 10% threshold) of Tier 1 Capital -
Mortgage servicing rights (amount above 10% threshold) of Tier 1 Capital -
Deferred tax assets arising from temporary differences (amount above 10% threshold, net of related tax liability) -
Amounts exceeding 15% of Tier 1 Capital according to Regulation on Measurement and Assessment of
Capital Adequacy Ratios of Banks (2nd article temporary second paragraph) -
Investments in the capital of banking, financial and insurance entities that are outside the scope of
regulatory consolidation, net of eligible long positions, where the bank does not own more than 10% of
the issued common share capital of the entity (amount above 10% threshold) -
Amounts related to mortgage servicing rights -
Excess amount of deferred tax assets from temporary differences -
Other Items Determined by BRSA -
Deductions to be made from common equity due to insufficient Additional Tier I Capital or Tier II Capital -
Total Deductions from common equity Tier 1 Capital 622,633
Total Common Equity Tier 1 Capital 11,593,658

TÜRK EKONOMİ BANKASI ANONİM ŞİRKETİ
NOTES AND EXPLANATIONS TO CONSOLIDATED FINANCIAL STATEMENTS AS OF 31
DECEMBER 2020 (Unless otherwise stated amounts are expressed in thousands of Turkish Lira (“TL”).)
31
I. Explanations Related to Components of Consolidated Shareholders’ (Continued)
Information related to the Components of Consolidated Shareholders' Equity: (continued)
Current Period
31.12.2020
Amount related to
treatment before
01.01.2014(*)
ADDITIONAL TIER 1 CAPITAL Preferred Stock not Included in Common Equity and the Related Share Premiums -
Debt instruments and premiums approved by BRSA -
Debt instruments and premiums approved by BRSA (Temporary Article 4) -
Third Parties Share in the Additional Tier 1 Capital 114
Third Parties Share in the Additional Tier 1 Capital (in the scope of Temporary Article 3) 114
Additional Tier 1 Capital before deductions 114
Deductions from Additional Tier 1 Capital
Bank’s direct or indirect investment on its own Tier 1 Capital - Investments in equity instruments issued by banks or financial institutions invested in Bank’s additional Tier I Capital which are
compatible with the article 7 of the regulation - Total of Net Long Positions of the Investments in Equity Items of Unconsolidated Banks and Financial Institutions where the
Bank Owns 10% or less of the Issued Share Capital Exceeding the 10% Threshold of Common Equity Tier 1 Capital - The Total of Net Long Position of the Direct or Indirect Investments in Additional Tier 1 Capital of Unconsolidated Banks and
Financial Institutions where the Bank Owns more than 10% of the Issued Share Capital -
Other Items Determined by BRSA -
Items to be deducted from Tier I Capital during the Transition Period Goodwill and other intangible assets and related deferred tax liabilities which will not deducted from Common Equity Tier 1
capital for the purposes of the first sub-paragraph of the Provisional Article 2 of the Regulation on Bank Capital (-) - Net deferred tax asset/liability which is not deducted from Common Equity Tier 1 capital for the purposes of the sub-paragraph of
the Provisional Article 2 of the Regulation on Bank Capital (-) -
The amount to be deducted from Additional Tier 1 Capital (-) -
Total Deductions from Additional Tier 1 Capital -
Total Additional Tier 1 Capital 114
Total Tier 1 Capital (Tier 1 Capital=Common Equity + Additional Tier 1 Capital) 11,593,772
TIER 2 CAPITAL
Bank's borrowing instruments and related issuance premium 4,137,063
Bank's borrowing instruments and related issuance premium (in the scope of temporary Article 4) -
Third parties’ share in the Tier 2 Capital 151
Third parties’ share in the Tier 2 Capital (in the scope of Temporary Article 3) 151
Provisions (Amounts stated in the first paragraph of the article 8 of the Regulation on the Bank Capital) 990,921
Tier 2 Capital Before Deductions 5,128,135
Deductions from Tier 2 Capital
Bank's direct or indirect investment on its own Tier 2 Capital (-) - Investments in equity instruments issued by banks and financial institutions invested in Bank’s Tier II Capital which are
compatible with Article 8 of the regulation - Total of Net Long Positions of the Investments in Equity Items of Unconsolidated Banks and Financial Institutions where the
Bank Owns 10% or less of the Issued Share Capital Exceeding the 10% Threshold of Common Equity Tier 1 Capital (-) - The Total of Net Long Position of the Direct or Indirect Investments in Additional Core Capital and Tier 2 Capital of
Unconsolidated Banks and Financial Institutions where the Bank Owns 10% or more of the Issued Share Capital Exceeding the
10% Threshold of Tier 1 Capital (-) -
Other Items Determined by BRSA (-) -
Total Deductions from Tier 2 Capital -
Total Tier 2 Capital 5,128,135
Total Capital (The sum of Tier 1 and Tier 2 Capital) 16,721,907

TÜRK EKONOMİ BANKASI ANONİM ŞİRKETİ
NOTES AND EXPLANATIONS TO CONSOLIDATED FINANCIAL STATEMENTS AS OF 31
DECEMBER 2020 (Unless otherwise stated amounts are expressed in thousands of Turkish Lira (“TL”).)
32
I. Explanations Related to Components of Consolidated Shareholders’ (Continued)
Information related to the Components of Consolidated Shareholders' Equity: (continued)
Current Period
31.12.2020
Amount related to
treatment before
01.01.2014(*) The sum of Tier 1 Capital and Tier 2 Capital (Total Equity)
Loan granted to Customer against the Articles 50 and 51 of the Banking Law 1,046 Net Book Values of Immovables Exceeding 50% of the Equity and of Assets Acquired against Overdue
Receivables and Held for Sale as per the Article 57 of the Banking Law but Retained More Than Five Years -
Other items to be defined by the BRSA 3,540
Items to be deducted from the sum of Tier I and Tier II Capital (“Capital”) during the Transition Period - Portion of the total of net long positions of investments made in Common Equity items of banks and financial institutions
outside the scope of consolidation where the Bank owns 10% or less of the issued common share capital exceeding 10% of
Common Equity of the Bank not to be deducted from the Common Equity, Additional Tier I Capital, Tier II Capital as per the
1st clause of the Provisional Article 2 of the Regulation on the Equity of Banks. - Portion of the total of net long positions of direct or indirect investments made in Additional Tier I and Tier II Capital items of
banks and financial institutions outside the scope of consolidation where the Bank owns 10% or more of the issued common
share capital exceeding 10% of Common Equity of the Bank not to be deducted from the Additional Tier I Capital and Tier II
Capital as per the 1st clause of the Provisional Article 2 of the Regulation on the Equity of Banks. - Portion of the total of net long positions of investments made in Common Equity items of banks and financial institutions
outside the scope of consolidation where the Bank owns 10% or more of the issued common share capital, deferred tax assets
based on temporary differences and mortgage servicing rights not deducted from Common Equity as per the 1st and 2nd
Paragraph of the 2nd clause of the Provisional Article 2 of the Regulation on the Equity of Banks -
TOTAL CAPITAL
Total Capital 16,717,321
Total Risk Weighted Assets 91,603,777
Capital Adequacy Ratios
Common Equity Tier 1 Capital Adequacy Ratio (%) 12.66
Tier 1 Capital Adequacy Ratio (%) 12.66
Capital Adequacy Ratio (%) 18.25
BUFFERS
Total additional Common Equity Tier 1 Capital requirement ratio (a+b+c) (%) 2.50
a) Capital conservation buffer requirement (%) 2.50
b) Bank specific counter-cyclical buffer requirement (%) -
c) Systemic significant bank buffer ratio (%) - The ratio of Additional Common Equity Tier 1 capital which will be calculated by the first paragraph of the Article 4 of
Regulation on Capital Conservation and Countercyclical Capital buffers to Risk Weighted Assets 4.15
Amounts below the Excess Limits as per the Deduction Principles Amounts arising from the net long positions of investments made in Total Capital items of banks and financial institutions
where the Bank owns 10% or less of the issued common share capital 182,843
Amounts arising from the net long positions of investments made in Tier I Capital items of banks and financial institutions
where the Bank owns 10% or more of the issued common share capital
-
Mortgage servicing rights -
Deferred tax assets arising from temporary differences (net of related tax liability) 651,589
Limits related to provisions considered in Tier II Calculation
General provisions for standard based receivables (before tenthousandtwentyfive limitation) 2,000,390
Up to 1.25% of total risk-weighted amount of general reserves for receivables where the standard approach used (**) 990,921 Excess amount of total provision amount to credit risk Amount of the Internal Ratings Based Approach in accordance with the
Communiqué on the Calculation
- Excess amount of total provision amount to 0,6% of risk weighted receivables of credit risk Amount of the Internal Ratings
Based Approach in accordance with the Communiqué on the Calculation - Debt instruments subjected to Article 4 (to be implemented between 1 January 2018 and 1 January 2022)
Upper limit for Additional Tier I Capital subjected to temporary Article 4 -
Amounts Excess the Limits of Additional Tier I Capital subjected to temporary Article 4
-
Upper limit for Additional Tier II Capital subjected to temporary Article 4 -
Amounts Excess the Limits of Additional Tier II Capital subjected to temporary Article 4
- The positive difference between the expected credit loss provision amount in accordance with TFRS 9
and the total provision amount before the application of TFRS 9 177,147
(*) Amounts in this column represents the amounts of items that are subject to phasing and taken into consideration at the end of transition process.
(**) The positive difference between the expected credit loss provision amount in accordance with TFRS 9 and the total provision amount before the application of TFRS 9
has been deducted.

TÜRK EKONOMİ BANKASI ANONİM ŞİRKETİ
NOTES AND EXPLANATIONS TO CONSOLIDATED FINANCIAL STATEMENTS AS OF 31
DECEMBER 2020 (Unless otherwise stated amounts are expressed in thousands of Turkish Lira (“TL”).)
33
I. Explanations Related to Components of Consolidated Shareholders’ Equity (Continued)
Information related to the Components of Consolidated Shareholders' Equity: (continued)
Prior
Period
Amount Related
to treatment before
Common Equity Tier 1 Capital 31.12.2019 01.01.2014(*)
Paid-in Capital to be Entitled for Compensation after All Creditors 2,404,652
Share Premium 2,565
Reserves 7,478,812
Gains Recognized in Equity as per TAS 23,065
Profit 1,134,463
Current Period Profit 1,124,966
Prior Period Profit 9,497
Bonus Shares from Associates, Subsidiaries and Joint-Ventures not Accounted in Current Period’s Profit 527
Minority interest 309 464
Common Equity Tier 1 Capital Before Deductions 11,044,393
Deductions from Common Equity Tier 1 Capital
Valuation adjustments calculated as per the (I) item of first paragraph of Article 9 of the Regulation on Bank -
Current and Prior Periods' Losses not Covered by Reserves, and Losses Accounted under Equity according to TAS 3,536
Leasehold Improvements on Operational Leases 45,335 Goodwill netted off deferred tax liability 421,124 421,124
Other intangible assets netted off deferred tax liabilities except mortgage servicing rights. 130,077 130,077
Deferred tax assets that rely on future profitability excluding those arising from temporary differences (net of related tax liability) -
Differences are not recognized at the fair value of assets and liabilities subject to hedge of cash flow risk - Communiqué Related to Principles of the amount credit risk calculated with the Internal Ratings Based Approach, total expected loss
amount exceeds the total provision -
Gains arising from securitization transactions -
Unrealized gains and losses due to changes in own credit risk on fair value of Bank’s liabilities -
Net amount of defined-benefit plan assets -
Direct and indirect investments of the Bank in its own Tier 1 Capital -
Excess amount expressed in the law (Article 56 4th paragraph) - Investments in the capital of banking, financial and insurance entities that are outside the scope of
regulatory consolidation, net of eligible long positions, where the bank does not own more than 10% of
the issued share capital (amount above 10% threshold) - Significant investments in the common stock of banking, financial and insurance entities that are outside
the scope of regulatory consolidation, net of eligible long positions (amount above 10% threshold) of Tier 1 Capital -
Mortgage servicing rights (amount above 10% threshold) of Tier 1 Capital -
Deferred tax assets arising from temporary differences (amount above 10% threshold, net of related tax liability) - Amounts exceeding 15% of Tier 1 Capital according to Regulation on Measurement and Assessment of
Capital Adequacy Ratios of Banks (2nd article temporary second paragraph) - Investments in the capital of banking, financial and insurance entities that are outside the scope of
regulatory consolidation, net of eligible long positions, where the bank does not own more than 10% of
the issued common share capital of the entity (amount above 10% threshold) -
Amounts related to mortgage servicing rights -
Excess amount of deferred tax assets from temporary differences -
Other Items Determined by BRSA -
Deductions to be made from common equity due to insufficient Additional Tier I Capital or Tier II Capital -
Total Deductions from common equity Tier 1 Capital 600,072
Total Common Equity Tier 1 Capital 10,444,321

TÜRK EKONOMİ BANKASI ANONİM ŞİRKETİ
NOTES AND EXPLANATIONS TO CONSOLIDATED FINANCIAL STATEMENTS AS OF 31
DECEMBER 2020 (Unless otherwise stated amounts are expressed in thousands of Turkish Lira (“TL”).)
34
I. Explanations Related to Components of Consolidated Shareholders’ Equity (Continued) Information related to the Components of Consolidated Shareholders' Equity: (continued)
Prior Period
31.12.2019
Amount related
to treatment before
01.01.2014(*) ADDITIONAL TIER 1 CAPITAL
Preferred Stock not Included in Common Equity and the Related Share Premiums -
Debt instruments and premiums approved by BRSA -
Debt instruments and premiums approved by BRSA (Temporary Article 4) -
Third Parties Share in the Additional Tier 1 Capital 67
Third Parties Share in the Additional Tier 1 Capital (in the scope of Temporary Article 3) 67
Additional Tier 1 Capital before deductions 67
Deductions from Additional Tier 1 Capital
Bank’s direct or indirect investment on its own Tier 1 Capital - Investments in equity instruments issued by banks or financial institutions invested in Bank’s additional Tier I Capital which are
compatible with the article 7 of the regulation - Total of Net Long Positions of the Investments in Equity Items of Unconsolidated Banks and Financial Institutions where the
Bank Owns 10% or less of the Issued Share Capital Exceeding the 10% Threshold of Common Equity Tier 1 Capital - The Total of Net Long Position of the Direct or Indirect Investments in Additional Tier 1 Capital of Unconsolidated Banks and
Financial Institutions where the Bank Owns more than 10% of the Issued Share Capital -
Other Items Determined by BRSA -
Items to be deducted from Tier I Capital during the Transition Period - Goodwill and other intangible assets and related deferred tax liabilities which will not deducted from Common Equity Tier 1
capital for the purposes of the first sub-paragraph of the Provisional Article 2 of the Regulation on Bank Capital (-) - Net deferred tax asset/liability which is not deducted from Common Equity Tier 1 capital for the purposes of the sub-paragraph of
the Provisional Article 2 of the Regulation on Bank Capital (-) -
The amount to be deducted from Additional Tier 1 Capital (-) -
Total Deductions from Additional Tier 1 Capital -
Total Additional Tier 1 Capital 67
Total Tier 1 Capital (Tier 1 Capital=Common Equity + Additional Tier 1 Capital) 10,444,388
TIER 2 CAPITAL
Bank's borrowing instruments and related issuance premium 3,145,908
Bank's borrowing instruments and related issuance premium (in the scope of temporary Article 4) -
Third parties’ share in the Tier 2 Capital 88
Third parties’ share in the Tier 2 Capital (in the scope of Temporary Article 3) 88
Provisions (Amounts stated in the first paragraph of the article 8 of the Regulation on the Bank Capital) 956,837
Tier 2 Capital Before Deductions 4,102,833
Deductions from Tier 2 Capital
Bank's direct or indirect investment on its own Tier 2 Capital (-) - Investments in equity instruments issued by banks and financial institutions invested in Bank’s Tier II Capital which are
compatible with Article 8 of the regulation - Total of Net Long Positions of the Investments in Equity Items of Unconsolidated Banks and Financial Institutions where the
Bank Owns 10% or less of the Issued Share Capital Exceeding the 10% Threshold of Common Equity Tier 1 Capital (-) - The Total of Net Long Position of the Direct or Indirect Investments in Additional Core Capital and Tier 2 Capital of
Unconsolidated Banks and Financial Institutions where the Bank Owns 10% or more of the Issued Share Capital Exceeding the
10% Threshold of Tier 1 Capital (-) -
Other Items Determined by BRSA (-) -
Total Deductions from Tier 2 Capital -
Total Tier 2 Capital 4,102,833
Total Capital (The sum of Tier 1 and Tier 2 Capital) 14,547,221

TÜRK EKONOMİ BANKASI ANONİM ŞİRKETİ
NOTES AND EXPLANATIONS TO CONSOLIDATED FINANCIAL STATEMENTS AS OF 31
DECEMBER 2020 (Unless otherwise stated amounts are expressed in thousands of Turkish Lira (“TL”).)
35
I. Explanations Related to Components of Consolidated Shareholders’ Equity (Continued) Information related to the Components of Consolidated Shareholders' Equity: (continued)
Prior Period
31.12.2019
Amount related
to treatment before
01.01.2014(*) The sum of Tier 1 Capital and Tier 2 Capital (Total Equity)
Loan granted to Customer against the Articles 50 and 51 of the Banking Law 2,467 Net Book Values of Immovables Exceeding 50% of the Equity and of Assets Acquired against Overdue
Receivables and Held for Sale as per the Article 57 of the Banking Law but Retained More Than Five Years -
Other items to be defined by the BRSA 6,224 Items to be deducted from the sum of Tier I and Tier II Capital (“Capital”) during the Transition Period -
Portion of the total of net long positions of investments made in Common Equity items of banks and financial
institutions outside the scope of consolidation where the Bank owns 10% or less of the issued common share capital exceeding 10% of Common Equity of the Bank not to be deducted from the Common Equity,
Additional Tier I Capital, Tier II Capital as per the 1st clause of the Provisional Article 2 of the Regulation on
the Equity of Banks. - Portion of the total of net long positions of direct or indirect investments made in Additional Tier I and Tier II
Capital items of banks and financial institutions outside the scope of consolidation where the Bank owns 10%
or more of the issued common share capital exceeding 10% of Common Equity of the Bank not to be deducted from the Additional Tier I Capital and Tier II Capital as per the 1st clause of the Provisional Article 2 of the
Regulation on the Equity of Banks. -
Portion of the total of net long positions of investments made in Common Equity items of banks and financial institutions outside the scope of consolidation where the Bank owns 10% or more of the issued common share
capital, deferred tax assets based on temporary differences and mortgage servicing rights not deducted from
Common Equity as per the 1st and 2nd Paragraph of the 2nd clause of the Provisional Article 2 of the Regulation on the Equity of Banks -
TOTAL CAPITAL
Total Capital 14,538,530 Total Risk Weighted Assets 86,848,849
Capital Adequacy Ratios
Common Equity Tier 1 Capital Adequacy Ratio (%) 12.03
Tier 1 Capital Adequacy Ratio (%) 12.03 Capital Adequacy Ratio (%) 16.74
BUFFERS
Total additional Common Equity Tier 1 Capital requirement ratio (a+b+c) (%) 2.50 a) Capital conservation buffer requirement (%) 2.50
b) Bank specific counter-cyclical buffer requirement (%) -
c) Systemic significant bank buffer ratio (%) - The ratio of Additional Common Equity Tier 1 capital which will be calculated by the first paragraph of the
Article 4 of Regulation on Capital Conservation and Countercyclical Capital buffers to Risk Weighted Assets
(%) 3.52 Amounts below the Excess Limits as per the Deduction Principles
Amounts arising from the net long positions of investments made in Tier I Capital items of banks and financial
institutions where the Bank owns 10% or more of the issued common share capital 124,855 Mortgage servicing rights -
Deferred tax assets arising from temporary differences (net of related tax liability) -
Limits related to provisions considered in Tier II Calculation 667,146 General provisions for standard based receivables (before tenthousandtwentyfive limitation)
Up to 1.25% of total risk-weighted amount of general reserves for receivables where the standard approach used
(**) 1,507,423
Excess amount of total provision amount to credit risk Amount of the Internal Ratings Based Approach in
accordance with the Communiqué on the Calculation 956,837
Excess amount of total provision amount to 0,6% of risk weighted receivables of credit risk Amount of the Internal Ratings Based Approach in accordance with the Communiqué on the Calculation -
Debt instruments subjected to Article 4 (to be implemented between 1 January 2018 and 1 January 2022) -
Upper limit for Additional Tier I Capital subjected to temporary Article 4
Amounts Excess the Limits of Additional Tier I Capital subjected to temporary Article 4 -
Upper limit for Additional Tier II Capital subjected to temporary Article 4 -
Amounts Excess the Limits of Additional Tier II Capital subjected to temporary Article 4 - The positive difference between the expected credit loss provision amount in accordance with TFRS 9
and the total provision amount before the application of TFRS 9 - The ratio of Additional Common Equity Tier 1 capital which will be calculated by the first paragraph of the Article 4 of Regulation on Capital Conservation and Countercyclical Capital buffers to Risk Weighted Assets
(%) 265,721
(*) Amounts in this column represents the amounts of items that are subject to phasing and taken into consideration at the end of transition process. (**) The positive difference between the expected credit loss provision amount in accordance with TFRS 9 and the total provision amount before the application of TFRS
9 has been deducted.

TÜRK EKONOMİ BANKASI ANONİM ŞİRKETİ
NOTES AND EXPLANATIONS TO CONSOLIDATED FINANCIAL STATEMENTS AS OF 31
DECEMBER 2020 (Unless otherwise stated amounts are expressed in thousands of Turkish Lira (“TL”).)
36
I. Explanations Related to Components of Consolidated Shareholders’ Equity (Continued)
Information related to the Components of Consolidated Shareholders' Equity: (continued)
T T-1 T-2 T-3 T-4
CAPITAL ITEMS
Common Equity Tier 1 Capital 11,593,658 11,563,600 11,278,641 10,751,132 10,444,321
Common Equity Tier 1 Capital where the transition impact of TFRS 9 has not been applied (a) 11,416,511 11,386,453 11,101,494 10,573,985 10,178,600
Tier 1 Capital 11,593,772 11,563,674 11,278,711 10,751,193 10,444,388
Tier 1 Capital where the transition impact of TFRS 9 has not been applied (b) 11,416,625 11,386,527 11,101,564 10,574,046 10,178,667
Capital 16,717,321 16,717,156 15,858,763 15,256,150 14,538,530
Capital where the transition impact of TFRS 9 has not been applied (c) 16,540,174 16,540,009 15,681,616 15,079,003 14,272,809
TOTAL RISK WEIGHTED ASSETS
Total Risk Weighted Assets 91,603,777 88,968,214 89,255,953 99,483,130 86,848,849
CAPITAL ADEQUENCY RATIOS
Common Equity Tier 1 Capital Adequacy Ratio (%) 12.66 13.00 12.64 10.81 12.03
Common Equity Tier 1 Capital Adequacy Ratio (%) where the transition impact of TFRS 9 has
not been applied (ç) 12.46 12.80 12.44 10.63 11.72
Tier 1 Capital Adequacy Ratio (%) 12.66 13.00 12.64 10.81 12.03
Tier 1 Capital Adequacy Ratio (%) where the transition impact of TFRS 9 has not been applied
(ç) 12.46 12.80 12.44 10.63 11.72
Capital Adequacy Ratio (%) 18.25 18.79 17.77 15.34 16.74
Capital Adequacy Ratio (%) where the transition impact of TFRS 9 has not been applied (ç) 18.06 18.59 17.57 15.16 16.43
LEVERAGE RATIO
Leverage Ratio Total Risk Amount 186,259,132 182,140,647 167,749,013 169,502,593 150,407,442
Leverage Ratio 6.16% 6.25% 6.69% 6.23% 6.94%
FTA not Applied Leverage Ratio (d) 6.06% 6.15% 6.58% 6.12% 6.77%
Basic information for the TFRS 9 transition process a: Common equity Tier 1 capital if temporary Article 5 of the Regulation on equities of banks has not applied.
b: Tier 1 capital if temporary Article 5 of the Regulation on equities of banks has not applied. c: Total capital if temporary Article 5 of the Regulation on equities of banks has not applied. ç: Capital adequacy ratios calculated with capital items if Temporary Article 5 of the Regulation on banks has not applied. d: The leverage ratio calculated with capital items if Temporary Article 5 of the Regulation on banks has not applied.
Explanations on Reconciliation of Capital Items to Balance Sheet:
Total Capital per Balance Sheet 11,689,673
Hedging Funds (effective portion) 226,704
Deductions Made Under Regulation (625,750)
Transition Impact of TFRS 9 (Temporary 5th Article) 177,147
Accumulated revaluation and / or classification on gains / losses of financial assets with fair value through
comprehensive income 125,884
Common Equity Tier 1 Capital 11,593,658
Additional Tier 1 Capital 114
Tier 1 Capital 11,593,772
General Provisions (Stage 1 and 2) 990,921
Bank's Borrowing Instruments 4,137,063
Deductions Made Under Regulation (4,586)
Share of Third Parties in Capital 151
Total Equity 16,717,321

TÜRK EKONOMİ BANKASI ANONİM ŞİRKETİ
NOTES AND EXPLANATIONS TO CONSOLIDATED FINANCIAL STATEMENTS AS OF 31
DECEMBER 2020 (Unless otherwise stated amounts are expressed in thousands of Turkish Lira (“TL”).)
37
I. Explanations Related to Components of Consolidated Shareholders’ Equity (Continued)
Information related to debt instruments included in equity calculation:
All of the debt securities included in the equity calculation are issued by the Parent Bank.
Issuer TEB TEB TEB TEB
Unique identifier of the debt instrument (e.g. CUSIP, ISIN) XS1895575071 XS2023308278 XS1973559484 XS1845118865
Governing law(s) of the instrument Türkiye Türkiye Türkiye Türkiye
Regulatory treatment Subject to 10% deduction as of 1/1/2015 No No No No
Eligible at consolidated /unconsolidated/ consolidated and unconsolidated Available Available Available Available
Type of the debt instrument
Borrowing
Instrument
Borrowing
Instrument
Borrowing
Instrument
Borrowing
Instrument
Amount recognized in regulatory capital (TL Currency in mil, as of most recent
reporting date) 1,551.5 907.2 544.3 1,134
Par value of instrument (TL Currency in mil) 1,551.5 907.2 544.3 1,134
Accounting classification of the debt instrument 34701100 34701100 34701100 34701100
Original date of issuance 05.11.2018 22.07.2019 14.05.2019 27.06.2018
Perpetual or dated Time Time Time Time
Original maturity date 05.11.2028 22.07.2029 14.05.2029 27.06.2028
Issuer call subject to prior supervisory approval Available Available Available Available
Optional call date, contingent call dates and redemption amount 05.11.2023 22.07.2024 14.05.2024 27.06.2023
Subsequent call dates, if applicable - - - -
Coupons/dividends Fixed or floating dividend/coupon Fixed Floating Floating Floating
Coupon rate and any related index 10.40% 6mEuribor+7.10% 6mEuribor+7.10% 6mEuribor+5.10%
Existence of a dividend stopper None None None None
Fully discretionary, partially discretionary or mandatory Mandatory Mandatory Mandatory Mandatory
Existence of step up or other incentive to redeem None None None None
Noncumulative or cumulative None None None None
Convertible or non-convertible If convertible, conversion trigger (s) - - - -
If convertible, fully or partially - - - -
If convertible, conversion rate - - - -
If convertible, mandatory or optional conversion - - - -
If convertible, specify instrument type convertible into - - - -
If convertible, specify issuer of instrument it converts into - - - -
Write-down feature If write-down, write-down trigger(s) - - - -
If write-down, full or partial - - - -
If write-down, permanent or temporary - - - -
If temporary write-down, description of write-up mechanism - - - -
Position in subordination hierarchy in liquidation (specify instrument type immediately
senior to instrument)
Deposit and
other receivables
Deposit and
other receivables
Deposit and
other receivables
Deposit and
other receivables
Whether conditions which stands in Article of 7 and 8 of Banks’ shareholder equity law
are possessed or not Possess Possess Possess Possess
According to Article 7 and 8 of Banks' shareholders equity law that are not possessed (*) - - - -
(*) Under article 8/2 in subsection (ğ) mechanism of write-down or conversion to common shares are stated.

TÜRK EKONOMİ BANKASI ANONİM ŞİRKETİ
NOTES AND EXPLANATIONS TO CONSOLIDATED FINANCIAL STATEMENTS AS OF 31
DECEMBER 2020 (Unless otherwise stated amounts are expressed in thousands of Turkish Lira (“TL”).)
38
II. Explanations Related to the Consolidated Credit Risk
Credit risk is the risk and financial loss that the Parent Bank is a party in a contract whereby the counterparty fails to meet
its obligation and causes to incur a financial loss.
The credit allocation is performed on a debtor and a debtor group basis within the limits. In the credit allocation process,
many financial and non-financial criteria are taken into account within the framework of the internal rating procedures of
the Parent Bank. These criteria include geographical and sector concentrations. The sector concentrations for loans are
monitored closely. In accordance with the Parent Bank’s loan policy, the rating of the companies, credit limits and
guarantees are considered together, and credit risks incurred are monitored.
The credit risks and limits related to treasury activities, the limits of the correspondent banks that are determined by their
ratings and the control of the maximum acceptable risk level in relation to the equity of the Parent Bank are monitored
daily. Risk limits are determined in connection with these daily transactions, and risk concentration is monitored
systematically concerning off-balance sheet operations.
As prescribed in the Communiqué numbered 29750 dated 22 June 2016 on “Methods and Principles for the Determination
of Loans and Other Receivables to be Reserved for and Allocation of Reserves”, the credit worthiness of the debtors of
the loans and other receivables is monitored regularly. Most of the statements of accounts for the loans are derived from
audited financial statements. The unaudited documents result from the timing differences between the loan allocation and
the audit dates of the financial statements of the companies and subsequently the audited financial statements are obtained
from the companies. Credit limits are determined according to the audited statement of accounts, and guarantee factors
are developed in accordance with the decision of the credit committee considering the characteristics of the transactions
and the financial structures of the companies.
A restructuring is defined as the privilege due to the borrower's encountered or likely to encountered financial difficulties.
The privileges granted to the borrower assumed to be in financial difficulty are;
- A change in the terms and conditions of the loan or
- Partially or completely refinancing of the loan in favour of the debtor.
In order to be subject to restructuring, the firm must be confronted with the difficulty of payment. The difficulty should
be supported by concrete developments or findings. Each restructuring request is evaluated on transaction basis by the
authorized credit allocation unit according to the activity of the firm, the income generation structure by the sectoral
operation.
Restructuring of the loans supported by Credit Guarantee Fund (“CGF loans”) is evaluated in accordance with the
current legislation. The principles regarding to restructuring of Treasury-Back CGF loans in the scope of
11 October 2018 dated Presidential Decree are taken into account.
Non-required delay time loans that is not classified as Stage III Loans defined in “Regulation on Procedures and Principles
for Classification of Loans And Provisions to be Set Aside” published in the Official Gazette numbered 29750 dated 22
June 2016, amended by the regulation published in the Official Gazette dated 14 December 2016 and numbered 29918,
whose principal and interest payment collection delayed more than 30 days are considered as “past-due loan” in the
Accounting Practice; group III, IV and V loans defined in the mentioned communiqué are considered as “impaired
receivables” without considering refinancing or addition of the accrued interest and quasi-interest principal amount.
The Parent bank provides specific reserves to Group III, IV and V loans in accordance with “Regulation on Procedures
and Principles for Classification of Loans and Provisions to be Set Aside”.

TÜRK EKONOMİ BANKASI ANONİM ŞİRKETİ
NOTES AND EXPLANATIONS TO CONSOLIDATED FINANCIAL STATEMENTS AS OF 31
DECEMBER 2020 (Unless otherwise stated amounts are expressed in thousands of Turkish Lira (“TL”).)
39
II. Explanations Related to the Consolidated Credit Risk (Continued)
In calculating the amount subject to credit risk; exchange buying rate which was used for the financial statements dated
31 December 2019 are used for calculating the foreign currency valuation in accordance with BRSA decisions dated 23
March 2020 and numbered 3391, dated 16 April 2020 and numbered 3984.
In accordance with the Standard Approach, 0% risk weight is used in the calculation of the amount subject to credit risk for FX receivables of Banks which are from Republic of Turkey Central Management within the scope of Regulation on Measurement and Assessment of Capital Adequacy of Banks published on the Official Gazette dated 23 October 2015 and numbered 29511. Total amount of exposures after offsetting transactions but before applying credit risk mitigations and the average
exposure amounts that are classified in different risk groups and types for the relevant period:
Exposure classifications
Current
Period Risk
Amount (*)
Average Risk
Amount
(*,**)
Conditional and unconditional receivables from central governments or central banks 35,631,103 29,775,440 Conditional and unconditional receivables from regional or local governments 1,198,712 1,205,215
Conditional and unconditional receivables from administrative units and
non-commercial enterprises - - Conditional and unconditional receivables from multilateral development banks - -
Conditional and unconditional receivables from international organizations - -
Conditional and unconditional receivables from banks and brokerage houses 9,417,384 9,460,631 Conditional and unconditional corporate receivables 44,684,444 41,969,955
Conditional and unconditional retail receivables 36,184,067 35,242,205
Conditional and unconditional secured mortgage receivables 10,955,985 11,894,801 Past due receivables 1,281,949 1,620,673
Receivables in high risk category defined by BRSA - -
Securities collateralised by mortgages - - Securitisation positions - -
Short-term receivables from banks, stockbrokers and corporate - -
Investments of natured collective investment enterprise - - Other receivables 3,720,404 4,028,443
Investments in equities 167,257 145,104
(*) Risk amounts after conversion rate to credit are given before credit risk mitigation.
(**) Average risk amount is calculated by taking the arithmetic average of balances on quarterly prepared to the end of the month.
Exposure classifications
Prior Period
Risk Amount (*)
Average Risk
Amount (*,**)
Conditional and unconditional receivables from central governments or central banks 20,831,054 20,547,036
Conditional and unconditional receivables from regional or local governments 1,249,725 1,058,763
Conditional and unconditional receivables from administrative units and non-commercial enterprises - - Conditional and unconditional receivables from multilateral development banks - -
Conditional and unconditional receivables from international organizations - -
Conditional and unconditional receivables from banks and brokerage houses 12,087,705 8,920,736 Conditional and unconditional corporate receivables 36,384,925 39,232,786
Conditional and unconditional retail receivables 32,868,263 32,188,225
Conditional and unconditional secured mortgage receivables 12,654,892 10,925,747
Past due receivables 1,874,933 1,576,011
Receivables in high risk category defined by BRSA - - Securities collateralised by mortgages - -
Securitisation positions - -
Short-term receivables from banks, stockbrokers and corporate - - Investments of natured collective investment enterprise - -
Other receivables 4,259,299 3,713,329
Investments in equities 132,920 114,471
(*) Risk amounts after conversion rate to credit are given before credit risk mitigation.
(**) Average risk amount is calculated by taking the arithmetic average of balances on quarterly prepared to the end of the month.

TÜRK EKONOMİ BANKASI ANONİM ŞİRKETİ
NOTES AND EXPLANATIONS TO CONSOLIDATED FINANCIAL STATEMENTS AS OF 31
DECEMBER 2020 (Unless otherwise stated amounts are expressed in thousands of Turkish Lira (“TL”).)
40
II. Explanations Related to the Consolidated Credit Risk (Continued)
For the positions of the Parent Bank in terms of forward transactions and other similar contracts, operational limits are set by the Board of Directors and the transactions take place within these limits. The fulfilment of the benefits and proceeds related to forward transactions can be realized at maturity. However, in order to minimize the risk, back to back positions of existing risks are entered into the market due to necessity. Indemnified non-cash loans are subject to the same risk weight as outstanding loans matured but not yet paid. Since the volume of the restructured loans is not material to the financial statements of the Parent Bank, no additional follow up methodology is developed, except as stated in the regulations. Financial institutions abroad and country risks of the Parent Bank are generally taken for the financial institutions and countries that are rated at investment level by international rating agencies which do not have the risk of failing to meet minimum obligations. Therefore, the probable risks are considered to be not material to the financial structure of the Parent Bank. The Group does not have a material credit risk concentration as an active participant in the international banking market when the financial operations of the other financial institutions are concerned. As of 31 December 2020, the receivables of the Group from its top 100 and top 200 cash loan customers share in total cash loans respectively 25.70% and 33.52% (31 December 2019: 20.93% and 26.44%). As of 31 December 2020, the receivables of the Group from its top 100 and top 200 non-cash loan customers share of 72.30% and 83.41% respectively in the total non-cash loans (31 December 2019: 58.36% and 66.46%).
As of 31 December 2020, the share of cash and non-cash receivables of the Group from its top 100 and top 200 loan
customers in total balance sheet and off-balance sheet assets is 10.33% and 13.80% respectively
(31 December 2018: 8.31% and 10.77%).
As of 31 December 2020, the general loan loss provision related with the credit risk taken by the Group is TL 2,000,390 (31 December 2019: TL 1,507,423).
Credit Rating System
Credit risk is evaluated according to the internal rating system of the Parent Bank, which is linked to the rating scale, and loans are classified from the best rating to the lowest rating according to the probability of default. As of 31 December 2020 Retail, Business and Agricultural Banking loans are excluded from the internal rating system of the Parent Bank and these loans constitute 29.70% of the total cash and non-cash loan portfolio (31 December 2019: 31.05%). Application and behavioral scorecards are used for the Individual and Business segments, however behavioral scorecard is used for the Agricultural segment.
The risks that are subject to rating models can be allocated as follows:
Category Description of Category
Share in the
Total %
31.12.2020
Share in the
Total %
31.12.2019
1stCategory The borrower has a very strong financial structure 47.06 40.39
2ndCategory The borrower has a good financial structure 25.30 25.38
3rd Category The borrower has an intermediate level of financial structure 20.35 24.95
4th Category The financial structure of the borrower must be closely monitored in the
medium term 7.29 9.28
Total 100.00 100.00

TÜRK EKONOMİ BANKASI ANONİM ŞİRKETİ
NOTES AND EXPLANATIONS TO CONSOLIDATED FINANCIAL STATEMENTS AS OF 31 DECEMBER 2020 (Unless otherwise stated amounts are expressed in thousands of Turkish Lira (“TL”).)
41
II. Explanations Related to the Consolidated Credit Risk (Continued)
Profile of significant exposures in major regions:
Exposure Categories (***)
Conditional
and
unconditional
exposures to
central
governments or
central banks
Conditional
and
unconditional
exposures to
regional
governments or
local
authorities
Conditional
and
unconditional
receivables
from
administrative
units and non-
commercial
enterprises
Conditional
and
unconditional
exposures to
multilateral
development
banks
Conditional
and
unconditional
exposures to
international
organisations
Conditional
and
unconditional
exposures to
banks and
brokerage
houses
Conditional
and
unconditional
exposures to
corporates
Conditional
and
unconditional
retail
exposures
Conditional and
unconditional
exposures secured
by real estate
property
Past due
items
Receivables
defined in
high-risk
categories
Exposures
in the
form of
bonds
secured
by
mortgages
Securitization
Positions
Short term
exposures to
banks,
brokerage
houses and
corporates
Exposures in
the form of
collective
investment
undertakings Others
Investments
in equities Total
Current Period Domestic 70,174 598,426 - - - 1,687,114 32,089,110 24,799,232 5,455,931 1,080,285 - - - - - 1,700,831 167,257 67,648,360
European Union
(EU)
Countries - - - - - 378,459 297,664 18,590 2,445 1,202 - - - - - - - 698,360
OECD Countries (*) - - - - - 29,410 355,299 770 278 - - - - - - 397 - 386,154
Off-Shore Banking
Regions (****) 389,970 - - - - 8 211,528 104,878 22,704 7,739 - - - - - 432 - 737,259
USA, Canada - - - - - 195,970 380 803 311 27 - - - - - - - 197,491
Other Countries - - - - - 15,929 16,122 2,588 482 27 - - - - - - - 35,148
Associates,
Subsidiaries
and Joint –
Ventures - - - - - - - - - - - - - - - 55 - 55
Unallocated Assets
/Liabilities (**) - 935 - - - 561,081 10,616,055 2,208,847 424,648 90,173 - - - - - 2,889 - 13,904,628
Total 460,144 599,361 - - - 2,867,971 43,586,158 27,135,708 5,906,799 1,179,453 - - - - - 1,704,604 167,257 83,607,455
(*) Includes OECD countries other than EU countries, USA and Canada.
(**) Includes assets and liability items that cannot be allocated on a consistent basis.
(***) Risk amounts after conversion rate to credit are given before Credit Risk Mitigation.
(****) Northern Cyprus Turkish Republic balances are included in Off-Shore Banking Regions.

TÜRK EKONOMİ BANKASI ANONİM ŞİRKETİ
NOTES AND EXPLANATIONS TO CONSOLIDATED FINANCIAL STATEMENTS AS OF 31 DECEMBER 2020 (Unless otherwise stated amounts are expressed in thousands of Turkish Lira (“TL”).)
42
II. Explanations Related to the Consolidated Credit Risk (Continued)
Profile of significant exposures in major regions: (continued)
Exposure Categories (***)
Conditional
and
unconditional
exposures to
central
governments
or central
banks
Conditional
and
unconditional
exposures to
regional
governments
or local
authorities
Conditional
and
unconditional
receivables
from
administrative
units and non-
commercial
enterprises
Conditional
and
unconditional
exposures to
multilateral
development
banks
Conditional
and
unconditional
exposures to
international
organisations
Conditional
and
unconditional
exposures to
banks and
brokerage
houses
Conditional
and
unconditional
exposures to
corporates
Conditional
and
unconditional
retail
exposures
Conditional
and
unconditional
exposures
secured by
real estate
property
Past due
items
Receivables
defined in
high-risk
categories
Exposures
in the
form of
bonds
secured
by
mortgages
Securitization
Positions
Short
term
exposures
to banks,
brokerage
houses
and
corporates
Exposures
in the form
of collective
investment
undertakings Others
Investments
in equities Total
Prior Period Domestic 4,286,981 623,819 - - - 2,224,321 21,812,533 22,158,625 6,477,806 1,685,806 - - - - - 1,557,582 132,920 60,960,393
European Union (EU)
Countries - - - - - 1,379,647 260,448 11,080 4,904 1,752 - - - - - 191 - 1,658,022
OECD Countries (*) - - - - - 148,208 472,147 11,862 413 3 - - - - - 540 - 633,173
Off-Shore Banking
Regions (****) 399,811 - - - - 9 234,520 106,298 43,444 6,187 - - - - - 306 - 790,575
USA, Canada - - - - - 42,234 1,112 901 345 10 - - - - - - - 44,602
Other Countries - - - - - 14,220 42,219 1,968 799 20 - - - - - - - 59,226
Associates, Subsidiaries
and Joint –
Ventures - - - - - - - - - - - - - - - 5 - 5
Unallocated
Assets/Liabilities
(**) - 1,050 - - - 557,445 12,245,386 2,352,342 490,801 115,221 - - - - - 2,649 - 15,764,894
Total 4,686,792 624,869 - - - 4,366,084 35,068,365 24,643,076 7,018,512 1,808,999 - - - - - 1,561,273 132,920 79,910,890
(*) Includes OECD countries other than EU countries, USA and Canada.
(**) Includes assets and liability items that cannot be allocated on a consistent basis.
(***) Risk amounts after conversion rate to credit are given before Credit Risk Mitigation.
(****) Northern Cyprus Turkish Republic balances are included in Off-Shore Banking Regions.

TÜRK EKONOMİ BANKASI ANONİM ŞİRKETİ
NOTES AND EXPLANATIONS TO CONSOLIDATED FINANCIAL STATEMENTS AS OF 31 DECEMBER 2020 (Unless otherwise stated amounts are expressed in thousands of Turkish Lira (“TL”).)
43
II. Explanations Related to the Consolidated Credit Risk (Continued)
Risk profile by Sectors or Counterparties:
Exposure Categories (**)
Current Period
Conditional
and
unconditional
exposures to
central
governments
or central
banks
Conditional
and
unconditional
exposures to
regional
governments
or local
authorities
Conditional
and
unconditional
receivables
from
administrativ
e units and
non-
commercial
enterprises
Conditional
and
unconditional
exposures to
multilateral
development
banks
Conditional
and
unconditiona
l exposures
to
international
organisations
Conditional
and
uncondition
al
exposures
to banks
and
brokerage
houses
Conditional
and
unconditional
exposures to
corporates
Conditional
and
unconditiona
l retail
exposures
Conditional
and
uncondition
al exposures
secured by
real estate
property
Past due
items
Receivables
defined in
high-risk
categories
Exposure
s in the
form of
bonds
secured
by
mortgage
s
Securitization
Positions
Short term
exposures to
banks,
brokerage
houses and
corporates
Exposures
in the form
of collective
investment
undertakings Others
Investments in
equities TL (*) FC Total
Agriculture - - - - - - 497,239 444,468 158,475 112,604 - - - - - - - 1,139,886 72,900 1,212,786
Farming and Stockbreeding - - - - - - 468,762 435,107 157,781 111,728 - - - - - - - 1,103,087 70,291 1,173,378
Forestry - - - - - - 10,728 1,134 - 21 - - - - - - - 10,330 1,553 11,883
Fishery - - - - - - 17,749 8,227 694 855 - - - - - - - 26,469 1,056 27,525
Manufacturing - - - - - -
26,159,429 4,969,726 1,764,334 334,923 - - - - - 5 - 23,207,924 10,020,493 33,228,417
Mining and Quarrying - - - - - - 1,617,044 202,706 81,468 21,774 - - - - - 2 - 1,677,373 245,621 1,922,994
Production - - - - - -
23,048,009 4,738,652 1,504,491 296,287 - - - - - 3 - 20,367,623 9,219,819 29,587,442
Electricity, Gas and Water - - - - - - 1,494,376 28,368 178,375 16,862 - - - - - - - 1,162,928 555,053 1,717,981
Construction - - - - - - 2,584,007 588,306 262,209 184,284 - - - - - - - 2,032,301 1,586,505 3,618,806
Services 460,144 599,361 - - - 2,867,971
14,055,115 5,157,305 2,431,353 481,460 - - - - - 1,655,242 166,544 19,738,285 8,136,210 27,874,495
Wholesale and Retail Trade - - - - - - 5,932,918 2,574,752 767,050 210,394 - - - - - 86 - 7,728,307 1,756,893 9,485,200
Accommodation and Dining - - - - - - 461,759 390,331 827,844 56,062 - - - - - - - 944,103 791,893 1,735,996
Transportation and Telecom. - - - - - - 1,843,637 1,030,270 345,067 70,356 - - - - - 98 - 2,654,362 635,066 3,289,428
Financial Institutions 460,144 - - - - 2,867,971 2,175,190 52,674 100,912 5,769 - - - - - 1,654,801 166,544 4,246,379 3,237,626 7,484,005
Real Estate and Rental Services - - - - - - 3,004,183 759,126 308,164 101,740 - - - - - 246 - 2,646,475 1,526,984 4,173,459
Self-Employment Services - - - - - - 417,367 308,107 79,234 24,713 - - - - - 3 - 642,160 187,264 829,424
Educational Services - - - - - - 27,262 33,188 2,825 12,394 - - - - - 4 - 75,547 126 75,673
Health and Social Services - 599,361 - - - - 192,799 8,857 257 32 - - - - - 4 - 800,952 358 801,310
Other - - - - - - 290,368
15,975,903 1,290,428 66,182 - - - - - 49,357 713 17,566,582 106,369 17,672,951
Total 460,144 599,361 - - - 2,867,971
43,586,158
27,135,708 5,906,799 1,179,453 - - - - - 1,704,604 167,257 63,684,978 19,922,477 83,607,455
(*) Foreign Currency indexed credits are shown in TL column.
(**) Risk amounts after conversion rate to credit are given before credit risk mitigation.

TÜRK EKONOMİ BANKASI ANONİM ŞİRKETİ
NOTES AND EXPLANATIONS TO CONSOLIDATED FINANCIAL STATEMENTS AS OF 31 DECEMBER 2020 (Unless otherwise stated amounts are expressed in thousands of Turkish Lira (“TL”).)
44
II. Explanations Related to the Consolidated Credit Risk (Continued)
Risk profile by Sectors or Counterparties: (continued)
Exposure Categories (**)
Prior Period
Conditional and
unconditional exposures to
central
governments or central banks
Conditional
and
unconditional
exposures to regional
governments or
local authorities
Conditional and
unconditional
receivables
from administrative
units and non-
commercial enterprises
Conditional and
unconditional exposures to
multilateral
development banks
Conditional
and unconditional
exposures to
international organisations
Conditional
and
unconditional exposures
to banks and
brokerage houses
Conditional and
unconditional
exposures to corporates
Conditional and
unconditional
retail exposures
Conditional
and
unconditional exposures
secured by
real estate property
Past due items
Receivables
defined in
high-risk categories
Exposures
in the
form of bonds
secured
by mortgages
Securitization Positions
Short term
exposures to banks,
brokerage
houses and corporates
Exposures in the form of
collective
investment undertakings Others
Investments in equities TL (*) FC Total
Agriculture - - - - - - 427,463 557,360 261,206 150,933 - - - - - - - 1,228,565 168,397 1,396,962
Farming and Stockbreeding - - - - - - 333,334 530,953 258,848 148,814 - - - - - - - 1,104,526 167,423 1,271,949
Forestry - - - - - - 5,198 1,692 - - - - - - - - - 6,890 - 6,890
Fishery - - - - - - 88,931 24,715 2,358 2,119 - - - - - - - 117,149 974 118,123 Manufacturing - - - - - - 19,361,260 5,064,386 2,163,538 554,391 - - - - - 21 - 16,017,555 11,126,041 27,143,596
Mining and Quarrying - - - - - - 1,487,525 241,823 78,380 33,035 - - - - - - - 1,153,507 687,256 1,840,763
Production - - - - - - 17,111,026 4,786,024 1,913,525 509,669 - - - - - 21 - 14,261,290 10,058,975 24,320,265 Electricity, Gas and Water - - - - - - 762,709 36,539 171,633 11,687 - - - - - - - 602,758 379,810 982,568
Construction - - - - - - 2,180,534 654,684 467,131 284,104 - - - - - - - 2,111,220 1,475,233 3,586,453
Services 4,686,792 624,869 - - - 4,366,084 12,496,846 5,270,188 2,632,510 707,254 - - - - - 1,529,902 131,367 17,444,596 15,001,216 32,445,812 Wholesale and Retail Trade - - - - - 4,275,803 2,568,497 912,416 340,554 - - - - - 105 - 5,940,172 2,157,203 8,097,375
Accommodation and Dining - - - - - - 738,886 418,165 802,371 68,350 - - - - - - - 824,467 1,203,305 2,027,772
Transportation and Telecom. - - - - - - 1,556,697 985,641 293,854 142,060 - - - - - 114 - 2,294,429 683,937 2,978,366
Financial Institutions 4,686,792 - - - - 4,366,084 1,942,761 59,171 5,201 7,406 - - - - - 1,529,428 131,367 3,801,896 8,926,314 12,728,210 Real Estate and Rental Services - - - - - - 3,438,078 907,814 510,515 114,144 - - - - - 242 - 3,057,345 1,913,448 4,970,793
Self-Employment Services - - - - - - 407,088 283,114 103,933 31,773 - - - - - - - 709,828 116,080 825,908
Educational Services - - - - - - 42,612 38,430 3,213 2,883 - - - - - 9 - 86,585 562 87,147 Health and Social Services - 624,869 - - - - 94,921 9,356 1,007 84 - - - - - 4 - 729,874 367 730,241
Other - - - - - - 602,262 13,096,458 1,494,127 112,317 - - - - - 31,350 1,553 14,926,640 411,427 15,338,067
Total 4,686,792 624,869 - - - 4,366,084 35,068,365 24,643,076 7,018,512 1,808,999 - - - - - 1,561,273 132,920 51,728,576 28,182,314 79,910,890
(*) Foreign Currency indexed credits are shown in TL column.
(**) Risk amounts after conversion rate to credit are given before credit risk mitigation.

TÜRK EKONOMİ BANKASI ANONİM ŞİRKETİ
NOTES AND EXPLANATIONS TO CONSOLIDATED FINANCIAL STATEMENTS AS OF 31
DECEMBER 2020 (Unless otherwise stated amounts are expressed in thousands of Turkish Lira (“TL”).)
45
II. Explanations Related to the Consolidated Credit Risk (Continued)
Analysis of maturity-bearing exposures according to remaining maturities:
Current Period Term to Maturity
Risks Categories 1 Month 1–3 Months 3–6 Months 6–12 Months Over 1 year
Conditional and unconditional exposures to central governments or central banks 460,144 - - - -
Conditional and unconditional exposures to regional
governments or local authorities 2,896 1,917 2,504 73,817 517,264 Conditional and unconditional receivables from administrative
units and non-commercial enterprises - - - - -
Conditional and unconditional exposures to multilateral
development banks - - - - -
Conditional and unconditional exposures to international
organisations - - - - - Conditional and unconditional exposures to banks and
brokerage houses 1,554,373 82,212 102,568 50,379 99,750
Conditional and unconditional exposures to corporates 5,296,566 5,136,347 7,447,256 6,371,529 8,707,685 Conditional and unconditional retail exposures 4,876,390 1,006,538 2,305,036 2,802,528 13,924,631
Conditional and unconditional exposures secured by real estate
property 321,818 215,569 504,560 624,601 3,813,992 Past due receivables - - - - -
Receivables defined in high-risk category defined by BRSA - - - - -
Exposures in the form of bonds secured by mortgages - - - - - Securitization Positions - - - - -
Short term exposures to banks, brokerage houses and corporate - - - - -
Exposures in the form of collective investment undertakings - - - - - Others 283,140 1,014 2,222 - 3
Investments in equities - - - - -
Total 12,795,327 6,443,597 10,364,146 9,922,854 27,063,325
Prior Period Term to Maturity
Exposure Categories 1 Month 1–3 Months 3–6 Months 6–12 Months Over 1 year
Conditional and unconditional exposures to central governments or central banks 1,066,414 471,734 149,250 - 2,999,393
Conditional and unconditional exposures to regional
governments or local authorities 454 8,510 5,831 28,694 580,327 Conditional and unconditional receivables from administrative
units and non-commercial enterprises - - - - - Conditional and unconditional exposures to multilateral
development banks - - - - -
Conditional and unconditional exposures to international organisations - - - - -
Conditional and unconditional exposures to banks and
brokerage houses 2,471,798 149,760 391,771 354,946 22,467 Conditional and unconditional exposures to corporates 7,668,070 3,655,245 1,962,289 2,173,624 7,072,832
Conditional and unconditional retail exposures 6,010,266 740,655 1,108,243 1,974,087 12,447,543
Conditional and unconditional exposures secured by real estate property 1,060,771 188,558 418,402 500,288 4,358,543
Past due receivables - - - - -
Receivables defined in high-risk category defined by BRSA - - - - - Exposures in the form of bonds secured by mortgages - - - - -
Securitization Positions - - - - -
Short term exposures to banks, brokerage houses and corporate - - - - - Exposures in the form of collective investment undertakings - - - - -
Others 30,905 452 5,862 - 14
Investments in equities - - - - -
Total 18,308,678 5,214,914 4,041,648 5,031,639 27,481,119

TÜRK EKONOMİ BANKASI ANONİM ŞİRKETİ
NOTES AND EXPLANATIONS TO CONSOLIDATED FINANCIAL STATEMENTS AS OF 31
DECEMBER 2020 (Unless otherwise stated amounts are expressed in thousands of Turkish Lira (“TL”).)
46
II. Explanations Related to the Consolidated Credit Risk (Continued)
Information about the risk exposure categories
The credit rating of Fitch Ratings International Rating agency is used for all receivables from the central governments
or central banks which are included in the risk classes indicated in Article 6 of the Communiqué on Measurement and
Assessment of Capital Adequacy of the Bank, and the country risk classification announced by The Organisation for
Economic Co-operation and Development (OECD) is used for receivables from banks and intermediary agencies.
20% risk weight is used for receivables from non-rated banks and intermediary agencies with a maturity period of
three months or less, and 50% risk weight is used for receivables with a maturity period of more than three months,
and the risk weight used for all receivables is not lower than the risk concentration corresponding to the OECD credit
quality level of the country where the non-rated banks and intermediary agencies are founded.
Risk ratings per the credit quality levels and the risk weights according to exposure categories announced by Fitch
Ratings International Rating Agency and Organization for Economic Co-operation and Development (OECD)’s are
presented below:
Fitch Ratings Long- Term
Credit Rating
Risk Weight of Receivables from
Central Government or Central
Banks
Receivables from Banks and Brokerage Houses
Corporate
Receivables
Credit Quality
Level DTM less than 3 months DTM higher than 3 months
0 - 20% 50% 100%
1 AAA ila AA- 0% 20% 50% 100%
2 A+ ila A- 20% 20% 50% 100%
3 BBB+ ila BBB- 50% 50% 50% 100%
4 BB+ ila BB- 100% 100% 100% 100%
5 B+ ila B- 100% 100% 100% 100%
6 CCC+ and below 150% 100% 100% 100%
7 - 150% 150% 100%
Exposures by risk weights:
Current Period
Risk Weights 0% 10% 20% 35% 50% 75% 100% 150% 200% 250% 1250%
Deductions
from
Equity Exposures before
Credit
Risk Mitigation 37,140,028 -
6,517,571
4,781,153 10,425,207 36,176,042 48,032,110 169,194 - - - 603,783 Exposures after
Credit
Risk Mitigation 39,227,005 -
6,796,136
4,781,153 9,934,635 33,602,902 45,439,479 111,039 - - - 603,783
Prior Period
Risk Weights
0% 10% 20% 35% 50% 75% 100% 150% 200% 250% 1250%
Deductions
from
Equity
Exposures before
Credit
Risk Mitigation
18,804,661 -
9,461,115
5,619,542 8,780,553 32,839,093 46,451,779 386,973 - - - 605,226
Exposures after
Credit
Risk Mitigation
20,832,591 -
9,632,820
5,619,542 8,800,354 30,453,319 44,643,049 251,802 - - - 605,226

TÜRK EKONOMİ BANKASI ANONİM ŞİRKETİ
NOTES AND EXPLANATIONS TO CONSOLIDATED FINANCIAL STATEMENTS AS OF 31
DECEMBER 2020 (Unless otherwise stated amounts are expressed in thousands of Turkish Lira (“TL”).)
47
II. Explanations Related to the Consolidated Credit Risk (Continued) Information in terms of major sectors and type of counterparties:
Current Period Credits Provisions
Major Sectors / Counterparties
Impaired Receivables (TFRS 9)) Expected
Credit Loss
Provision
(TFRS9)
Significant
Increase in Credit
Risk (Stage II)
Impaired
(Stage III)
Agriculture 589,157 237,067 178,448
Farming and Stockbreeding 576,288 228,842 172,294 Forestry 12,869 4,591 4,066
Fishery - 3,634 2,088
Manufacturing 1,731,493 674,352 851,836 Mining and Quarrying 42,471 24,092 24,208
Production 1,499,539 635,292 752,434
Electricity, Gas and Water 189,483 14,968 75,194 Services 4,248,425 2,132,357 2,003,325
Wholesale and Retail Trade 3,107,940 1,273,123 1,203,942
Accommodation and Dining 121,449 131,641 133,499 Transportation and Telecom. 303,989 137,755 141,206
Financial Institutions 24,358 32,194 24,886
Real Estate and Rental Services 293,137 98,481 176,684 Professional Services 40,969 9,653 10,883
Educational Services 344,119 384,202 268,913
Health and Social Services 12,464 65,308 43,312 Other 1,383,270 458,106 620,716
Total 7,952,345 3,501,882 3,654,325
Credits Provisions
Prior Period
Major Sectors /
Counterparties
Impaired Receivables (TFRS 9) Expected
Credit Loss
Provision
(TFRS9)
Significant
Increase in Credit
Risk (Stage II)
Impaired
(Stage III)
Agriculture 389,856 257,288 165,710
Farming and Stockbreeding 384,108 252,031 162,059 Forestry - 675 612
Fishery 5,748 4,582 3,039
Manufacturing 1,542,620 803,789 626,803 Mining and Quarrying 84,136 13,466 18,190
Production 1,451,604 773,381 602,057
Electricity, Gas and Water 6,880 16,942 6,556 Services 3,064,524 1,857,476 1,449,342
Wholesale and Retail Trade 944,454 1,463,331 938,988
Accommodation and Dining 737,563 122,513 132,793 Transportation and Telecom. 492,117 149,666 137,225
Financial Institutions 212,560 13,413 59,972
Real Estate and Rental Services 553,559 33,710 122,601 Professional Services 60,825 64,569 44,882
Educational Services 17,606 7,229 8,298
Health and Social Services 45,840 3,045 4,583 Other 3,867,382 1,228,353 1,004,843
Total 8,864,382 4,146,906 3,246,698

TÜRK EKONOMİ BANKASI ANONİM ŞİRKETİ
NOTES AND EXPLANATIONS TO CONSOLIDATED FINANCIAL STATEMENTS AS OF 31
DECEMBER 2020 (Unless otherwise stated amounts are expressed in thousands of Turkish Lira (“TL”).)
48
II. Explanations Related to the Consolidated Credit Risk (Continued)
Information about Value Adjustment and Change in Provisions
31.12.2019
Balance
Provision
for Period
Provision
Reversals
Written off
from Asset
Other
Adjustments(*)
31.12.2020
Balance
Default (Stage III) 2,394,656 700,392 (207,531) (505,620) - 2,381,897
Expected Credit Loss
(Stage I - II) 1,507,423 983,725 (652,238) - 161,480 2,000,390
(*) Determined according to currency differences, business merger, acquisition and disposition of affiliate company
31.12.2018
Balance
Provision
for Period
Provision
Reversals
Write off
from Asset
Other
Adjustments (*)
31.12.2019
Balance
Default (Stage III) 1,765,133 1,515,456 (242,873) (644,662) 1,602 2,394,656
Expected Credit Loss
(Stage I -II) 1,358,020 462,527 (355,431) - 42,307 1,507,423
(*) Determined according to currency differences, business merger, acquisition and disposition of affiliate company
III. Explanations Related to Risks Involved in Counter-Cyclical Capital Buffer Calculation
Current Period
Countries where the risk ultimately taken
Private sector loan
in banking loans
Risk weighted amount
calculated in trading
accounts Total
Turkey 72,282,903 1,031,487
73,314,390
Italy 945,166 - 945,166
Switzerland 332,306 - 332,306
TRNC 323,446 - 323,446
England 321,166 - 321,166
Spain 50,318 - 50,318
Bulgaria 37,782 - 37,782
Denmark 19,492 - 19,492
Egypt 6,098 - 6,098
Other 15,624 - 15,624
74,334,301 1,031,487
75,365,788 Prior Period
Countries where the risk ultimately taken
Private sector loan
in banking loans
Risk weighted amount
calculated in trading
accounts Total
Turkey 64,800,085 613,436
65,413,521
Switzerland 445,348 - 445,348
TRNC 370,046 - 370,046
England 365,118 - 365,118
Italy 89,660 - 89,660
Israel 39,412 - 39,412
Portugal 37,055 - 37,055
Spain 36,353 - 36,353
The Ivory Coast 29,622 - 29,622
Other 106,447 5 106,452
66,319,146 613,441
66,932,587

TÜRK EKONOMİ BANKASI ANONİM ŞİRKETİ
NOTES AND EXPLANATIONS TO CONSOLIDATED FINANCIAL STATEMENTS AS OF 31
DECEMBER 2020 (Unless otherwise stated amounts are expressed in thousands of Turkish Lira (“TL”).)
49
IV. Explanations Related to the Consolidated Currency Risk
Foreign currency risk indicates the probability of loss that the Group is subject to due to the exchange rate movements in the market. While calculating the share capital requirement, all foreign currency assets, liabilities and forward transactions of the Group are taken into consideration and risk is calculated by using the standard method. The Board of Directors of the Parent Bank sets limits for the positions, which are followed up daily. Any possible changes in the foreign currency transactions in the Parent Bank’s positions are also monitored. As an element of the Group’s risk management strategies, foreign currency liabilities are hedged against exchange rate risk by derivative instruments. Asset Liability Management and Treasury Department of the Parent Bank is responsible for the management of Turkish Lira or foreign currency price, liquidity and affordability risks that could occur in the domestic and international markets within the limits set by the Board of Directors. The monitoring of risk and risk related transactions occurring in the money markets is performed daily and reported to the Parent Bank’s Asset-Liability Committee on a weekly basis. As of 31 December 2020, the Group’s balance sheet short position is TL 21,600,540 (31 December 2019: TL
12,301,993 short position) off-balance sheet long position is TL 20,950,439 (31 December 2019: TL 11,928,995
long position) and as a result net foreign currency short position is TL 650,101 (31 December 2019: net TL 372,997
short position).
The announced current foreign exchange buying rates of the Parent Bank at 31 December 2020 and the previous
five working days in full TL are as follows:
24.12.2020 25.12.2020 28.12.2020 29.12.2020 30.12.2020 31.12.2020
USD 7.5343 7.5127 7.4187 7.3265 7.3415 7.3883
JPY 0.0727 0.0726 0.0716 0.0707 0.0713 0.0717
EUR 9.1843 9.1429 9.0634 8.975 9.0234 9.072
The simple arithmetic averages of the major current foreign exchange buying rates of the Parent Bank for the thirty days before
31 December 2020 are as follows:
Monthly Average
Foreign Exchange Rate
USD 7.6812 JPY 0.0740
EUR 9.3475
Information on the foreign currency risk of the Parent Bank:
The Parent Bank is exposed to foreign exchange risk in EURO and USD.
The following table details the Parent Bank's sensitivity to a 10% change in USD and EUR exchange rates. The 10% rate used is the rate that the currency risk is reported to the senior management in the Parent Bank, this rate represents the possible change expected by the management in exchange rates. 10% depreciation of USD and EURO against TL affects profit and equity amounts positively in the case of a short position and negatively in the case of a long position.
Change in exchange rate (%) Effect on Profit/Loss Effect on Equity (*)
31 December 2020 31December 2020 USD 10 increase (21,533) 2,403
USD 10 decrease 21,533 (2,403)
EUR 10 increase 2,810 2,496 EUR 10 decrease (2,810) (2,496)
Change in exchange rate (%) Effect on Profit/Loss Effect on Equity (*)
31 December 2019 31 December 2019
USD 10 increase 19,299 937
USD 10 decrease (19,299) (937) EUR 10 increase (7,623) 587
EUR 10 decrease 7,623 (587)
(*) The effect on the equity does not include the effect of the change in exchange rates on the income statement.
The sensitivity of the Parent Bank to changes in the exchange rates did not change significantly in the current period. Opening
or closing positions in line with market expectations may increase the sensitivity to changes in the period’s exchange rates.

TÜRK EKONOMİ BANKASI ANONİM ŞİRKETİ
NOTES AND EXPLANATIONS TO CONSOLIDATED FINANCIAL STATEMENTS AS OF 31
DECEMBER 2020 (Unless otherwise stated amounts are expressed in thousands of Turkish Lira (“TL”).)
50
I
IV. Explanations Related to the Consolidated Currency Risk (Continued)
Information on the foreign currency risk of the Parent Bank:
The table below shows the Group’s distribution of balance sheet and derivative foreign exchange transactions taking into account the options transactions with nominal values as indicated in the BRSA regulation on foreign currency position. Besides taking into account this position by monitoring legal limits, the Group also monitors the delta-adjusted position of the option transactions. As of 31 December 2020, the Parent Bank has net USD short position TL 222,394 and net EUR long position TL 42,157.
Current Period EUR USD Other FC Total
Assets Cash (Cash in Vault, Foreign Currency Cash, Money in Transit, Cheques Purchased) and Balances with the Central Bank of Turkey(1) 5,575,267 6,192,796 1,748,758 13,516,821
Banks (2) 629,416 2,213,893 1,856,823 4,700,132
Financial Assets at Fair Value Through Profit or Loss 273,495 846,307 - 1,119,802
Money Market Placements - - - -
Financial Assets at Fair Value through Other Comprehensive Income 2,402,125 597,696 23,165 3,022,986
Loans (3) 9,729,893 2,535,854 834,361 13,100,108
Subsidiaries, Associates and Entities Under Common Control - - - -
Held-to-Maturity Investments(4) 1,263,472 1,061,092 - 2,324,564
Derivative Financial Assets for Hedging Purposes(5) - - - -
Tangible Assets 91 - - 91
Intangible Assets - - - -
Other Assets (6) 2,318,224 233,157 59,152 2,610,533
Total Assets 22,191,983 13,680,795 4,522,259 40,395,037
Liabilities
Bank Deposits 71 - 15 86
Foreign Currency Deposits (7) 12,697,235 23,868,480 7,586,371 44,152,086
Money Market Borrowings 2,717,468 - - 2,717,468
Funds Provided from Other Financial Institutions 9,952,799 4,529,136 61,409 14,543,344
Securities Issued - - - -
Miscellaneous Payables - - - -
Derivative Financial Liabilities for Hedging Purposes 14,901 - - 14,901
Other Liabilities (8) 239,379 304,248 24,065 567,692
Total Liabilities 25,621,853 28,701,864 7,671,860 61,995,577
Net Balance Sheet Position (3,429,870) (15,021,069) (3,149,601) (21,600,540)
Net Off-Balance Sheet Position 3,506,359 14,570,186 2,964,614 21,041,159
Financial Derivative Assets(9) 15,993,374 25,685,642 4,743,380 46,422,396
Financial Derivative Liabilities(9) 12,487,015 11,115,456 1,778,766 25,381,237
Non-Cash Loans (10) 8,000,422 7,226,322 1,537,854 16,764,598 Prior Period
Total Assets 20,444,208 14,393,861 3,917,750 38,755,819
Total Liabilities 21,469,848 25,727,978 3,859,986 51,057,812
Net Balance Sheet Position (1,025,640) (11,334,117) 57,764 (12,301,993)
Net Off-Balance Sheet Position 797,511 11,133,800 (2,316) 11,928,995
Financial Derivative Assets (9) 14,804,346 26,844,874 782,678 42,431,898
Financial Derivative Liabilities (9) 14,006,835 15,711,074 784,994 30,502,903
Non-Cash Loans (10) 6,880,451 5,459,747 904,769 13,244,967
(1) Cash (Cash in Vault, Foreign Currency Cash, Money in Transit, Cheques Purchased) and Balances with the Central Bank of Turkey includes the balances of expected credit losses amounting to TL 2,561 (31 December 2019: TL 1,890)
(2) The banks include TL 9,579 of expected credit loss provisions. (31 December 2019: TL 9,059) (3) Foreign currency indexed loans amounting to TL 233,707 TL (31 December 2019: TL 495,451) are included in the loan portfolio. As of 31
December 2020, there is no (31 December 2019: TL None) foreign currency indexed factoring receivables. Also, it includes TL 476,466 (31 December 2019: TL 368,603) amounting to expected credit loss.
(4) Financial assets at amortized cost includes expected credit loss amounting to TL 523 (31 December 2019:TL 305) (5) TL 31,137 (31 December 2019: TL 14,112) income accruals from derivative financial instruments is deducted from derivative financial assets
held for risk management. (6) TL 213,071 (31 December 2019: TL 184,862) income accruals from derivative financial instruments is deducted from other assets. Other assets
line includes factoring receivables amounting to TL 955,007 and factoring receivables expected credit loss amounting to TL 2,153. (7) Precious metal accounts amounting to TL 6,002,054 (31 December 2019: TL 2,349,023) are included in the foreign currency deposits. (8) TL 175,503 (31 December 2019: TL 90,922) expense accruals from derivative financial instruments are deducted from other liabilities. (9) Forward asset and marketable securities purchase-sale commitments of TL 951,630 (31 December 2019: TL 1,395,075) are added to derivative
financial assets and TL 1,071,704 (31 December 2019: TL 883,345) has been added to derivative financial assets. (10) There is no effect on the net off-balance sheet position.

TÜRK EKONOMİ BANKASI ANONİM ŞİRKETİ
NOTES AND EXPLANATIONS TO CONSOLIDATED FINANCIAL STATEMENTS AS OF 31
DECEMBER 2020 (Unless otherwise stated amounts are expressed in thousands of Turkish Lira (“TL”).)
51
V. Explanations Related to Consolidated Interest Rate Risk
Interest rate risk shows the probability of loss related to the changes in interest rates depending on the Parent Bank’s
position, and it is managed by the Asset-Liability Committee. The interest rate sensitivity of assets, liabilities and
off-balance sheet items related to this risk are measured by using the standard method and included in the market
risk for capital adequacy.
The priority of the risk management department is to protect from interest rate volatility. Duration, maturity and sensitivity analysis performed within this context are calculated by the risk management department and reported to the Liquidity Risk and Asset-Liability Committee.
Simulations on interest income are performed in connection with the forecasted macroeconomic indicators used in
the budget of the Group.
The Group management monitors the market interest rates on a daily basis and revises the interest rates of the Bank when necessary.
The Group carries interest rate risk within the legal and internal limits and manages the interest rate risk in accordance with the bank's risk appetite.
Information related to the interest rate sensitivity of assets, liabilities and off-balance sheet items (based on
repricing dates): Up to 1
Month
1-3
Months
3-12
Months
1-5
Years
Over
5 Years
Non-interest
Bearing(1)
Total
Current Period
Assets
Cash (Cash in Vault, Foreign Currency Cash,
Money in Transit, Cheques Purchased) and
Balances with the Central Bank of Turkey(2) 11,452,134 - - - - 5,495,853 16,947,987
Banks(3) 4,796,899 - - - - 1,876,549 6,673,448
Financial Assets at Fair Value Through Profit or
Loss 297,525 91,886 760,926 201,959 95,521 183,075 1,630,892
Money Market Placements(4) 6,180,886 - - - - (439) 6,180,447
Financial Assets at Fair Value Through Other
Comprehensive Income 805,587 113,055 2,319,571 4,657,098 746,205 10,881 8,652,397
Loans(5) 11,140,029 6,681,908 25,261,054 32,741,342 3,435,619 (545,888) 78,714,064
Financial Assets Measured at Amortized Cost(6) 1,012,657 825,220 9,171,693 1,472,121 41,250 (2,818) 12,520,123
Other Assets(7) 1,678,659 1,506,874 696,926 672,721 299,267 6,555,962 11,410,409
Total Assets 37,364,376 9,218,943 38,210,170 39,745,241 4,617,862 13,573,175 142,729,767
Liabilities
Bank Deposits 7,424,601 - - - - 43,796 7,468,397
Other Deposits 47,468,264 5,865,710 235,318 367 - 32,703,847 86,273,506
Money Market Borrowings 6,734,127 - - - - - 6,734,127
Miscellaneous Payables - - - - - - -
Securities Issued 2,160,640 - 2,649,997 - - - 4,810,637
Funds Provided from Other Financial
Institutions 1,827,122 1,289,465 8,703,539 91,158 4,194,951 - 16,106,235
Other Liabilities 227,987 28,532 383,341 1,309,066 244,413 19,143,526 21,336,865
Total Liabilities 65,842,741 7,183,707 11,972,195 1,400,591 4,439,364 51,891,169 142,729,767
Balance Sheet Long Position - 2,035,236 26,237,975 38,344,650 178,498 - 66,796,359
Balance Sheet Short Position (28,478,365) - - - - (38,317,994) (66,796,359)
Off-Balance Sheet Long Position 3,031,120 3,816,103 - - - - 6,847,223
Off-Balance Sheet Short Position - - (796,816) (5,154,568) (487,360) - (6,438,744)
Total Position (25,447,245) 5,851,339 25,441,159 33,190,082 (308,862) (38,317,994) 408,479
(1) The expected loss provisions are presented under the “Non-Interest Bearing” column. (2) Cash balances (Cash, Effective Deposit, Money in transit, Notes Payable) and the Central Bank of the Republic of Turkey include balances of
expected losses amounting to TL 3,316. (3) Banks include balance of expected loss provisions amounting to TL 10,656. (4) Money market placements include balance of expected loss provisions amounting to TL 439. (5) The revolving loans amounting to TL 6,201,511 are presented under the “Up to 1 Month” column. It includes expected loss provisions amounting
to TL 4,047,711. (6) Financial assets at amortized cost include balance of expected loss provisions of TL 2,818. (7) Includes factoring receivables amounting to TL 2,503,938 and factoring receivables expected loss provisions amounting to TL 17,162.
The other assets line in the non-interest bearing column consists of tangible assets amounting to TL 846,067, intangible assets
amounting to TL 572,547, assets held for resale amounting to TL 112,859, subsidiaries amounting to TL 50 and non-financial
jointly controlled entities under common control joint venture amounting to TL 5 and the other liabilities line includes the
shareholders’ equity of TL 11,689,673.

TÜRK EKONOMİ BANKASI ANONİM ŞİRKETİ
NOTES AND EXPLANATIONS TO CONSOLIDATED FINANCIAL STATEMENTS AS OF 31
DECEMBER 2020 (Unless otherwise stated amounts are expressed in thousands of Turkish Lira (“TL”).)
52
V. Explanations Related to Consolidated Interest Rate Risk (Continued) Information related to the interest rate sensitivity of assets, liabilities and off-balance sheet items (based on
repricing dates) : (continued)
Up to 1
Month
1-3
Months
3-12
Months
1-5
Years
Over
5 Years
Non-interest
Bearing
Total
Prior Period
Assets
Cash (Cash in Vault, Foreign Currency Cash,
Money in Transit, Cheques Purchased) and
Balances with the Central Bank of Turkey 8,951,411 - - - - 3,002,601 11,954,012
Banks(3) 6,072,870 - - - - 2,493,375 8,566,245
Financial Assets at Fair Value Through Profit or
Loss 180,593 132,240 55,307 669,507 132,752 125,025 1,295,424
Money Market Placements(4) 840,304 - - - - (29) 840,275
Financial Assets at Fair Value Through
Other Comprehensive Income 1,057,349 530,691 523,340 2,417,091 1,005,005 7,895 5,541,371
Loans(5) 16,724,073 4,579,167 11,359,041 28,333,166 3,917,453 506,014 65,418,914
Financial Assets Measured at Amortized Cost(6) 164,665 796,314 2,075,934 1,699,969 169,736 (1,104) 4,905,514
Other Assets(2) 1,148,017 689,675 657,912 951,007 94,067 7,152,000 10,692,678
Total Assets 35,139,282 6,728,087 14,671,534 34,070,740 5,319,013 13,285,777 109,214,433
Liabilities
Bank Deposits 362,573 - - - - 23,739 386,312
Other Deposits 49,529,000 4,829,633 677,235 7,293 - 16,748,379 71,791,540
Money Market Borrowings 1,650,467 - - - - - 1,650,467
Miscellaneous Payables - - - - - - -
Securities Issued 1,692,304 641,573 - - - - 2,333,877
Funds Provided from Other Financial
Institutions 2,448,096 3,560,585 6,009,788 100,473 1,266,257 - 13,385,199
Other Liabilities 23,862 117 711,943 2,330,152 86,263 16,514,701 19,667,038
Total Liabilities 55,706,302 9,031,908 7,398,966 2,437,918 1,352,520 33,286,819 109,214,433
Balance Sheet Long Position - - 7,272,568 31,632,822 3,966,493 - 42,871,883
Balance Sheet Short Position (20,567,020) (2,303,821) - - - (20,001,042) (42,871,883)
Off-Balance Sheet Long Position 5,720,979 4,734,356 - - - - 10,455,335
Off-Balance Sheet Short Position - - (4,006,053)
(5,678,954) (623,850) - (10,308,857)
Total Position (14,846,041) 2,430,535 3,266,515 25,953,868 3,342,643 (20,001,042) 146,478
(1) The expected loss provisions are presented under the “Non-Interest Bearing” column. (2) Cash balances (Cash, Effective Deposit, Money in transit, Notes Payable) and the Central Bank of the Republic of Turkey include balances of
expected losses amounting to TL 1,959. (3) Banks include balance of expected loss provisions amounting to TL 9,809. (4) Money market placements include balance of expected loss provisions amounting to TL 29. (5) The revolving loans amounting to TL 7,177,755 are presented under the “Up to 1 Month” column. It includes expected loss provisions amounting
to TL 3,640,892. (6) Financial assets at amortized cost include balance of expected loss provisions of TL 1,104. (7) Includes factoring receivables amounting to TL 2,083,258 and factoring receivables expected loss provisions amounting to TL 34,891.
The other assets line in the non-interest bearing column consists of tangible assets amounting to TL 884,818,
intangible assets amounting to TL 561,432, assets held for resale amounting to TL 131,362, entities under common
control joint venture amounting to TL 5 and the other liabilities line includes the shareholders’ equity of TL
9,909,908.

TÜRK EKONOMİ BANKASI ANONİM ŞİRKETİ
NOTES AND EXPLANATIONS TO CONSOLIDATED FINANCIAL STATEMENTS AS OF 31
DECEMBER 2020 (Unless otherwise stated amounts are expressed in thousands of Turkish Lira (“TL”).)
53
V. Explanations Related to Consolidated Interest Rate Risk (Continued)
Average interest rates applied to monetary financial instruments:
EUR USD YEN TL
% % % %
Current Period Assets
Cash (Cash in Vault, Foreign Currency Cash, Money in Transit, Cheques
Purchased) and Balances with the Central Bank of Turkey - - - 12.00
Banks (0.25) 0.21 (0.26) 17.79
Financial Assets at Fair Value Through Profit or Loss 2.60 2.65 - 10.12
Money Market Placements - - - 17.98
Financial Assets at Fair Value Through Other Comprehensive Income 2.91 3.86 - 12.91
Loans (*) 2.65 3.79 5.37 14.43
Financial Assets Measured at Amortized Cost 2.04 3.51 - 8.26
Liabilities
Bank Deposits - - - 10.65
Other Deposits 0.04 1.25 - 15.12
Money Market Borrowings 0.88 - - 17.06
Miscellaneous Payables - - - -
Securities Issued - - - 9.54
Funds Provided from Other Financial Institutions 1.93 4.88 - 11.62 (*) Includes factoring receivables.
EUR USD YEN TL
% % % %
Prior Period Assets Cash (Cash in Vault, Foreign Currency Cash, Money in Transit, Cheques
Purchased) and Balances with the Central Bank of Turkey - - - 10.00
Banks - 1.59 - 11.42
Financial Assets at Fair Value Through Profit or Loss 1.52 4.89 - 8.66
Money Market Placements - - - 11.46
Financial Assets at Fair Value Through Other Comprehensive Income 2.11 4.57 - 13.83
Loans (*) 3.08 4.95 5.28 16.42
Financial Assets Measured at Amortized Cost 2.48 4.51 - 14.63
Liabilities
Bank Deposits - 1.40 - 5.10
Other Deposits 0.16 1.86 0.25 10.26
Money Market Borrowings - - - 11.02
Miscellaneous Payables - - - -
Securities Issued - - - 12.05
Funds Provided from Other Financial Institutions 1.99 5.61 - 17.62
(*) Includes factoring receivables.
Interest rate risk on banking accounts:
a) Significant assumptions and frequency of measurement of interest rate risk, including the nature of interest rate
risk arising from banking accounts and those related to the movement of deposits other than loan early repayments
and time deposits:
Interest rate risk arising from banking accounts is monitored through different scenarios, and the interest risk
exposed by presenting the results to the relevant committees is evaluated from different perspectives. There is a
limit determined by the Board of Directors regarding the risk amount. It is taken care to ensure a certain harmony
between assets and liabilities on the basis of currency, taking into account the market expectations of the bank.
Early repayment rates of loans were determined by examining the historic reaction of housing loans to interest
movements in the previous periods. By analyzing the movements of demand deposits on the basis of branches and
accounts, it has been determined the duration of demand deposits that remain in the Bank on account basis.
Assumptions accepted in parallel with the results reached are reflected in the above mentioned products in interest
rate sensitivity calculations.

TÜRK EKONOMİ BANKASI ANONİM ŞİRKETİ
NOTES AND EXPLANATIONS TO CONSOLIDATED FINANCIAL STATEMENTS AS OF 31
DECEMBER 2020 (Unless otherwise stated amounts are expressed in thousands of Turkish Lira (“TL”).)
54
V. Explanations Related to Consolidated Interest Rate Risk (Continued)
Interest rate risk on banking accounts: (continued)
b) Economic value differences arising from fluctuations in interest rates in accordance with the “Regulation on
Measurement and Evaluation of Interest Rate Risk Arising from Banking Accounts by Standard Shock Method”:
Type of Currency
Shock Applied
(+/- x basis point)
Gains/
(Losses)
Gains/Equity–
(Losses)/Equity
TL (400) 1,270,671 6.17%
TL 500 (1,422,031) (6.87)%
EURO (200) (83,424) 0.24%
EURO 200 87,032 (0.19)%
USD (200) (101,872) 0.23%
USD 200 101,153 (0.15)%
Total (of negative shocks) (800) 1,085,376 6.65%
Total (of positive shocks) 900 (1,233,845) (7.20)%
VI. Explanations Related to Share Certificates Position Risk from Consolidated Banking Book
Equity securities which are not publicly traded in the Bank’s financial statements are booked as their fair value, or otherwise booked as their cost value whereby fair value can not be calculated properly. The Parent Bank has no stocks traded in Borsa Istanbul.
VII. Explanations Related to Consolidated Liquidity Risk and Liquidity Coverage Ratio
a) Information on liquidity risk management, such as the Parent Bank's risk capacity, responsibilities and the structure
of liquidity risk management, Parent Bank’s internal liquidity risk reporting, communication between the Board
of Directors and business lines on liquidity risk strategy, policy and application:
The Asset-Liability Management and Treasury Group is responsible for following up the Parent Bank's current
liquidity position and for complying with liquidity limits approved by the Board of Directors. After evaluating the
liquidity position, the Asset-Liability Management and Treasury Group use authorized products to provide sufficient
liquidity based on liquidity position.
Responsibilities for liquidity management are described in the Liquidity Risk Policy which is reviewed and approved
by the Board of Directors annually. The various responsibilities have been shared among the appropriate departments
and committees as outlined in duty descriptions. While the Asset-Liability Management and Treasury Group alone is
responsible for managing liquidity and for developing short-term liquidity estimates, the Asset-Liability Management
and Treasury Group works with the Asset-Liability Management Committee to jointly developing/setting short-term
liquidity strategies and middle and long term liquidity estimates. The Asset-Liability Management Committee is
responsible for preparing middle and long term liquidity strategies.
The Risk Management Group monitors daily all set liquidity risk limits, and periodically reports internal and legal
liquidity rates and changes to the Risk Committee, Audit Committee and Board of Directors, in addition to providing
daily reports to senior management. Information about the Parent Bank's liquidity structure and policies is provided
to the relevant business lines at an Assets-Liabilities Committee meeting which is held every couple of weeks and at
a Liquidity Risk Committee meeting which is held monthly.
b) Information on the centralization degree of liquidity management and funding strategy, and on operations between
Parent Bank and its partnerships:
The Asset-Liability Management and the Treasury Group manage the Parent Bank's liquidity risk and performs this
role only for the bank. Liquidity gap values are monitored within the limits set by the Board of Directors, and for
compliance with these limits, the necessary debt instruments are used, while considering price and maturity structure.
Our subsidiaries manage their own liquidity and we provide them borrowing facilities within market conditions and
legal limits.

TÜRK EKONOMİ BANKASI ANONİM ŞİRKETİ
NOTES AND EXPLANATIONS TO CONSOLIDATED FINANCIAL STATEMENTS AS OF 31
DECEMBER 2020 (Unless otherwise stated amounts are expressed in thousands of Turkish Lira (“TL”).)
55
VII. Explanations Related to Consolidated Liquidity Risk and Liquidity Coverage Ratio (Continued)
c) Information about the Parent Bank's funding strategy including policies on funding types and variety of maturities:
While the Parent Bank tries to diversify its funding resources, it also tries to extend its payment terms. Customer
deposits are the bank's main funding resource. Our main strategy for deposit management is to be inclusive while
extending the average maturity. In addition to borrowings from money markets and collecting deposit, the Parent Bank
uses instruments such as long-term syndicated loans, securities issued in TL and foreign currency to diversify funding
resources.
d) Information on liquidity management based on currency which consists of a minimum of 5% of the Parent Bank's
total liabilities:
Excluding TL, USD and EUR, there is no foreign currency which exceeds 5% of total liabilities. For these currencies,
liquidity gaps are reported on a monthly basis and the Liquidity Coverage Ratio is calculated daily for Total and
Foreign Currency. The Asset-Liability Management and Treasury Group is responsible for taking the necessary steps
to keep ratios within the limits determined by the Board of Directors. Trend of these ratios are monitored on a monthly
basis by the Liquidity Risk Committee which includes the General Manager, Assistant General Manager responsible
from Financial Affairs Group, Group Risk Chief Officer, and the Assistant General Manager in charge of the Asset-
Liability Management and Treasury Group. Furthermore, senior management is periodically informed about the
relevant ratios.
e) Information on liquidity risk mitigation techniques:
The Parent Bank's main liquidity management strategy is to diversify funding resources and extend the maturity
structure. The Parent Bank's balance sheet liquidity risk is periodically measured by Assets-Liabilities management
and closely monitored with the Treasury. In accordance with market expectations, the Assets-Liabilities Management
and Treasury Group carries out the actions necessary to minimize risk.
Within this framework, the Parent Bank’s liquidity risk is attempted to manage efficiently by long-term structural
changes (such as diversifying funding sources, extending maturity structure etc.) and short and mid-term money
market and derivative transactions.
In the short term, liquidity risk is minimized with FX swaps, interbank borrowings and repurchase agreements, while
cross currency swap transactions are used to minimize these risks in the long term.
f) Explanation on the usage of the stress test:
The aim of the liquidity stress test is to analyse how liquidity squeeze affects bank liquidity. Cash inflows and outflows
which may arise in cases of stress event are analysed based on products with different maturities. Stress events which
may arise as a result of the liquidity squeeze, both in the Parent Bank and in the whole banking system, in cases of
stress event are analysed. Also, situations where the two scenarios might coincide are considered. The analysis
addresses how much of the net cash outflows of different maturities would be covered by the current liquid stock
during all relevant stress events.
g) General information on liquidity emergency and contingency plans:
The extraordinary liquidity situation is evaluated to determine;
- Whether the liquidity problem is specific to the Parent bank or applies to the whole banking system and
- Whether there is a permanent or temporary problem.
Profitability has second degree importance in extraordinary liquidity conditions. In cases of cash shortage or cash
withdrawal, the branches are responsible for informing the Asset-Liability Management and Treasury Group about
withdrawn liabilities. The Asset-Liability Management and Treasury Group takes the necessary actions to cover the
cash outflow which may occur in the accounts and informs the Asset-Liability Committee of any related delays.
In a liquidity crisis, the Asset-Liability Management and Treasury Group, the Asset-Liability Committee, the Liquidity
Risk Committee, senior management, and the Board of Directors are responsible for solving the liquidity problem. It
is predicted that, in a liquidity crisis, in order to create additional liquidity, written actions (considering the cost) must
be taken within current market conditions.

TÜRK EKONOMİ BANKASI ANONİM ŞİRKETİ
NOTES AND EXPLANATIONS TO CONSOLIDATED FINANCIAL STATEMENTS AS OF 31
DECEMBER 2020 (Unless otherwise stated amounts are expressed in thousands of Turkish Lira (“TL”).)
56
VII. Explanations Related to Consolidated Liquidity Risk and Liquidity Coverage Ratio (Continued)
Liquidity Coverage Ratio:
Rate of Percentage to Be Taken into Account
not Implemented Total Value(*)
Rate of Percentage to Be Taken into
Account Implemented Total Value(*)
Current Period – 31 December 2020 TL+FC FC TL+FC FC
High Quality Liquid Assets
1 High Quality Liquid Assets 36,616,220 15,499,469
Cash Outflows
2 Real Person and Retail Deposits 61,582,931 31,915,012 5,475,939 3,191,501
3 Stable Deposits 13,647,077 - 682,354 -
4 Less Stable Deposits 47,935,854 31,915,012 4,793,585 3,191,501
5 Unsecured Debts Other than Real Person and Retail
Deposits 33,093,749 14,777,629 17,888,232 7,359,701
6 Operational Deposits 787,661 293,937 196,915 73,484
7 Non-operational Deposits 28,302,592 12,070,372 13,715,146 4,872,897
8 Other Unsecured Funding 4,003,496 2,413,320 3,976,171 2,413,320
9 Secured Funding 120,457 -
10 Other Cash Outflows 1,665,525 2,927,065 1,665,525 2,927,065
11 Outflows Related to Derivative Exposures and 1,665,525 2,927,065 1,665,525 2,927,065
12 Other Collateral Requirements - - - -
13 Outflows Related to Restructured Financial Instruments - - - -
14 Payment Commitments and Other Off-Balance Sheet
Commitments Granted for Debts to Financial Market - - - -
15 Other Revocable Off-Balance Sheet 34,907,829 12,938,807 2,830,475 1,288,863
16 Total Cash Outflows 27,980,628 14,767,130
Cash Inflows
17 Secured Liabilities - - - -
18 Unsecured Liabilities 12,262,838 5,715,266 9,531,260 5,304,699
19 Other Cash Inflows 966,659 9,003,399 966,659 9,003,399
20 Total Cash Inflows 13,229,497 14,718,665 10,497,919 14,308,098
Values to Which the Upper Limit is
Applied
21 Total High Quality Liquid Assets 36,616,220 15,499,469
22 Total Net Cash Outflows 17,482,709 3,691,783
23 Liquidity Coverage Ratio (%) 209.44 419.84
(*) Simple arithmetic average of the last three months data calculated by using monthly simple arithmetic averages.

TÜRK EKONOMİ BANKASI ANONİM ŞİRKETİ
NOTES AND EXPLANATIONS TO CONSOLIDATED FINANCIAL STATEMENTS AS OF 31
DECEMBER 2020 (Unless otherwise stated amounts are expressed in thousands of Turkish Lira (“TL”).)
57
VII. Explanations Related to Consolidated Liquidity Risk and Liquidity Coverage Ratio (Continued)
Liquidity Coverage Ratio: (continued)
Rate of Percentage to Be Taken into Account
not Implemented Total Value(*)
Rate of Percentage to Be Taken into Account
Implemented Total Value(*)
Prior Period – 31 December 2019 TL+FC FC TL+FC FC
High Quality Liquid Assets
1 High Quality Liquid Assets 21,836,422 13,917,929
Cash Outflows 2 Real Person and Retail Deposits 51,313,467 25,406,593 4,514,492 2,540,659
3 Stable Deposits 12,337,090 - 616,854 -
4 Less Stable Deposits 38,976,377 25,406,593 3,897,638 2,540,659
5 Unsecured Debts Other than Real Person and Retail
Deposits 21,297,924 11,014,451 11,767,184 5,804,238
6 Operational Deposits 435,470 187,907 108,867 46,977
7 Non-operational Deposits 15,944,770 8,635,837 6,769,930 3,566,554
8 Other Unsecured Funding 4,917,684 2,190,707 4,888,387 2,190,707
9 Secured Funding 11,458 -
10 Other Cash Outflows 1,540,455 2,290,197 1,540,455 2,290,197
11 Outflows Related to Derivative Exposures and 1,540,455 2,290,197 1,540,455 2,290,197
12 Other Collateral Requirements - - - -
13 Outflows Related to Restructured Financial Instruments - - - -
14 Payment Commitments and Other Off-Balance Sheet
Commitments Granted for Debts to Financial Market - - - -
15 Other Revocable Off-Balance Sheet 32,014,818 10,476,671 2,646,516 1,098,773
16 Total Cash Outflows 20,480,105 11,733,867
Cash Inflows 17 Secured Liabilities - - - -
18 Unsecured Liabilities 12,640,333 5,416,414 9,256,464 4,759,747
19 Other Cash Inflows 1,691,512 8,203,937 1,691,512 8,203,938
20 Total Cash Inflows 14,331,845 13,620,351 10,947,976 12,963,685
Values to Which the Upper Limit is Applied
21 Total High Quality Liquid Assets 21,836,422 13,917,929
22 Total Net Cash Outflows 9,532,129 2,933,467
23 Liquidity Coverage Ratio (%) 229.08 474.45
(*) Simple arithmetic average of the last three months data calculated by using monthly simple arithmetic averages
The amount of high quality liquid assets, distribution of deposits based on segment, maturity types of borrowings and the
share of revolving loans in loan portfolio can be considered as the most important factors affecting Liquidity Coverage
Ratio.
High quality liquid assets in order to their priority consist of the time accounts, bond portfolio, required reserve, cash and
effective deposit. Funding sources consists of corporate customer deposits, real person deposits, borrowings and SME
deposit accounts which are weighted by ratios used in Liquidity Coverage Ratio reporting considering their maturity types.
Due to amount differences between buy and sell transactions, derivative products effect more FC Liquidity Coverage
Ratio rather than the total. Besides, cash outflows due to withdrawal of the collaterals securing derivatives and market
valuation changes on derivative transactions are considered in calculations.
There are concentration limits on funding sources approved by Board of Directors of the Parent Bank. Proportional limits
on product type are reported in relation to how much of the funding can be obtained from deposits, group funding,
borrowings from banks and repo and other long-term sources.
Liquidity management of the subsidiaries subject to consolidation is carried out by the companies themselves. Although
there is a consolidated reporting for the Liquidity Coverage Ratio, there is no centralized liquidity management. Finally,
there is no significant cash inflow and cash outflow related to the liquidity profile of the Parent Bank, which is included
in the calculation of liquidity coverage ratio, but which is not included in the public disclosure template in the second
paragraph of the related communiqué.

TÜRK EKONOMİ BANKASI ANONİM ŞİRKETİ
NOTES AND EXPLANATIONS TO CONSOLIDATED FINANCIAL STATEMENTS AS OF 31
DECEMBER 2020 (Unless otherwise stated amounts are expressed in thousands of Turkish Lira (“TL”).)
58
VII. Explanations Related to Consolidated Liquidity Risk and Liquidity Coverage Ratio (Continued)
Liquidity Coverage Ratio: (continued)
Consolidated Liquidity Coverage Ratio for the last three months are presented below:
Current Period
TL+FC FC
October 2020 191.54% 351.74%
November 2020 219.37% 487.73% December 2020 256.32% 519.02%
Prior Period
TL+FC FC
October 2019 166.14% 452.52%
November 2019 319.48% 566.39% December 2019 176.08% 373.90%
Presentation of assets and liabilities according to their remaining maturities:
Current Period
Demand
Up to 1
Month
1-3
Months
3-12
Months
1-5
Years
Over
5 Years Undistributed (1) Total
Assets
Cash (Cash in Vault, Foreign
Currency Cash, Money in
Transit, Cheques Purchased)
and Balances with the
Central Bank of Turkey (2) 5,499,169 11,452,134 - - - - (3,316) 16,947,987
Banks (3) 2,443,461 4,240,643 - - - - (10,656) 6,673,448 Financial Assets at Fair Value
Through Profit and Loss - 215,364 12,605 676,294 448,032 95,521 183,076 1,630,892
Money Market Placements - 6,180,886 - - - - (439) 6,180,447
Financial Assets at Fair Value Through
Other Comprehensive Income 10,881 118,185 61,238 2,461,895 4,936,116 1,064,082 - 8,652,397
Loans (4) - 10,173,769 6,679,434 25,275,844 33,695,287 3,435,619 (545,889) 78,714,064
Financial Assets Measured at Amortized
Cost (5) - 606,251 511,946 980,114 10,083,934 340,696 (2,818) 12,520,123
Other Assets (6) - 2,608,271 1,759,909 879,145 743,686 299,267 5,120,131 11,410,409
Total Assets 7,953,511 35,595,503 9,025,132 30,273,292 49,907,055 5,235,185 4,740,089 142,729,767
Liabilities
Bank Deposits 43,796 7,424,601 - - - - - 7,468,397
Other Deposits 32,703,847 47,468,264 5,865,710 235,318 367 - - 86,273,506 Funds Provided from Other
Financial Institutions - 1,810,147 754,088 9,229,636 117,413 4,194,951 - 16,106,235
Money Market Borrowings - 6,734,127 - - - - - 6,734,127
Securities Issued - 2,160,640 - 2,649,997 - - - 4,810,637
Miscellaneous Payables - - - - - - - -
Other Liabilities 11,423 5,048,034 788,655 646,869 1,644,121 517,508 12,680,255 21,336,865
Total Liabilities 32,759,066 70,645,813 7,408,453 12,761,820 1,761,901 4,712,459 12,680,255 142,729,767
Liquidity Gap (24,805,555) (35,050,310) 1,616,679 17,511,472 48,145,154 522,726 (7,940,166) -
Net Off-Balance Sheet Position - 223,288 (240,996) 117,535 126,240 (3,144) - 222,923
Financial Derivative Assets - 18,691,080 19,520,863 9,383,245 11,983,043 4,199,690 - 63,777,921
Financial Derivative Liabilities - 18,467,792 19,761,859 9,265,710 11,856,803 4,202,834 - 63,554,998
Non-Cash Loans 6,917,238 1,354,463 2,719,244 6,823,344 6,430,957 - - 24,245,246
Prior Period
Total Assets 5,515,639 34,182,163 6,637,624 13,281,044 37,193,771 5,767,493 6,636,699 109,214,433
Total Liabilities 16,794,047 59,807,324 6,517,914 8,903,793 2,793,702 3,642,509 10,755,144 109,214,433
Liquidity Gap (11,278,408) (25,625,161) 119,710 4,377,251 34,400,069 2,124,984 (4,118,445) -
Net Off-Balance Sheet Position - 217,295 (20,526) 21,127 62,051 1,665 - 281,612
Financial Derivative Assets - 18,322,414 6,162,762 13,378,270 15,125,169 3,374,022 - 56,362,637
Financial Derivative Liabilities - 18,105,119 6,183,288 13,357,143 15,063,118 3,372,357 - 56,081,025
Non-Cash Loans 6,077,407 942,642 2,658,433 5,667,723 7,028,565 - - 22,374,770
(1) Active accounts with fixed assets, associates and subsidiaries, fixed assets, prepaid expenses and non-performing loans, which are required for the continuation of
banking activities and which do not have the chance to convert to cash in a short time, are recorded here. The expected loss provisions are also shown here. (2) Cash and cash equivalents (Cash in Vault, Foreign Currency, Cash, Money in Transit, Cheques Purchased) and the Central Bank of Turkey includes expected credit
loss amounting to TL 3,316.
(3) Banks include balance of expected loss provisions amounting to TL 10,656.
(4) The revolving loans amounting to TL 6,201,511 are presented under the “Up to 1 Month” column. It includes expected loss provisions amounting to TL 4,047,771.
(5) Financial assets at amortized cost include balance of expected loss provisions of TL 2,818.
(6) Includes factoring receivables amounting to TL 2,503,938 and factoring receivables expected loss provisions amounting to TL 17,162.

TÜRK EKONOMİ BANKASI ANONİM ŞİRKETİ
NOTES AND EXPLANATIONS TO CONSOLIDATED FINANCIAL STATEMENTS AS OF 31
DECEMBER 2020 (Unless otherwise stated amounts are expressed in thousands of Turkish Lira (“TL”).)
59
VII. Explanations Related to Consolidated Liquidity Risk and Liquidity Coverage Ratio (Continued)
Analysis of financial liabilities by remaining contractual maturities:
Analysis of contractual expiry by maturity of the Group’s derivative financial instruments:
Up to 1
Month
1-3
Month
3-12
Month
1-5
Year
5 Year and
Over Total
31 December 2020
Derivative Financial Instruments for Hedging Purposes
Fair Value Hedge 1,047,907 4,338,325 - - 863,835 6,250,067
Cash Flow Hedge 710,591 34,994 1,708,688 3,238,883 - 5,693,156
Trading Transactions Foreign Exchange Forward
Contracts-Sell 3,000,033 2,271,615 2,318,963 553,143 - 8,143,754
Currency Swaps-Sell 10,028,698 13,815,112 2,175,927 3,527,930 3,329,046 32,876,713
Interest Rate Swaps-Sell - - - - - -
Foreign Currency Futures-Sell - 209,828 380,096 - - 589,924
Foreign Currency Options-Sell 981,308 566,084 288,360 185,653 - 2,021,405
Total 15,768,537 21,235,958 6,872,034 7,505,609 4,192,881 55,575,019
31 December 2019
Derivative Financial Instruments for Hedging Purposes
Fair Value Hedge - 935,776 - 804,408 - 1,740,184
Cash Flow Hedge 617,006 335,892 4,195,289 6,305,070 107,140 11,560,397
Trading Transactions Foreign Exchange Forward
Contracts-Sell 1,738,432 1,661,071 1,479,351 466,529 - 5,345,383
Currency Swaps-Sell 13,932,004 2,992,549 5,848,387 6,105,848 2,806,467 31,685,255
Interest Rate Swaps-Sell 26,051 14,667 105,270 142,349 9,818 298,155
Foreign Currency Futures-Sell - - - 35,164 - 35,164
Foreign Currency Options-Sell 1,709,590 1,694,963 743,905 62,871 - 4,211,329
Total 18,023,083 7,634,918 12,372,202 13,922,239 2,923,425 54,875,867
Cash disposal of derivative instruments is shown in the table above.
Demand Up to 1
Month
1-3
Months
3-12
Months
1-5
Years 5 Years and
Over
Adjustments
Total
31 December 2020
Money Market Borrowings - 6,754,268 - - - - (20,141) 6,734,127
Other Deposit 32,703,847 47,586,464 5,941,850 241,975 367 - (200,997) 86,273,506
Bank Deposit 43,796 7,433,248 - - - - (8,647) 7,468,397 Funds Provided from Other Financial
Institutions - 1,904,275 766,691 9,969,331 1,129,862 5,581,278 (3,245,202) 16,106,235
Money Market Borrowings - - 4,413,557 739,050 - - (341,970) 4,810,637
Total 32,747,643 63,678,255 11,122,098 10,950,356 1,130,229 5,581,278 (3,816,957) 121,392,902
31 December 2019
Money Market Borrowings - 1,650,743 - - - - (276) 1,650,467
Other Deposit 16,748,379 49,588,088 4,856,525 702,372 8,133 - (111,957) 71,791,540
Bank Deposit 23,739 362,650 - - - - (77) 386,312 Funds Provided from Other Financial
Institutions - 1,769,795 974,013 7,799,301 1,197,495 4,214,894 (2,570,299) 13,385,199
Money Market Borrowings - 1,732,211 659,336 - - - (57,670) 2,333,877
Total 16,772,118 55,103,487 6,489,874 8,501,673 1,205,628 4,214,894 (2,740,279) 89,547,395

TÜRK EKONOMİ BANKASI ANONİM ŞİRKETİ
NOTES AND EXPLANATIONS TO CONSOLIDATED FINANCIAL STATEMENTS AS OF 31
DECEMBER 2020 (Unless otherwise stated amounts are expressed in thousands of Turkish Lira (“TL”).)
60
VIII. Explanations Related to Consolidated Leverage Ratio
a) Information on issues that cause differences between current period and previous period leverage ratios:
There is a decrease in the leverage ratio in line with the increase on-balance sheet risks.
b) Summary comparison table of the total risk amount and the total asset amount in the financial statements prepared
as per TAS:
Current
Period(*)
Prior
Period(**)
1 Total Asset Amount in the Consolidated Financial Statements Prepared as per TAS(*) 140,377,909 106,140,378
2 The Difference between the Total Asset Amount in the Consolidated Financial Statements
Prepared as per TAS and the Asset Amount in the Consolidated Financial statements
Prepared as per the Communiqué on the Preparation of the Consolidated Financial Statements of
Banks - -
3 The Difference between the Derivative Financial Instruments and the Loan Derivatives Amount in the Consolidated Financial Statements Prepared as per the Communiqué on
the Preparation of the Consolidated Financial Statements of Banks and the Risk
Amounts 492,002
560,417 4 The Difference between the Financial Transactions with Securities or Goods Warranty
Amounts in the Consolidated Financial Statements Prepared as per the Communiqué on
the Preparation of the Consolidated Financial Statements of Banks and the Risk Amounts 900,450
3,323
5 The Difference between the Off-balance Sheet Transactions Amount in the
Consolidated Financial Statements Prepared as per the Communiqué on the Preparation of the Consolidated Financial Statements of Banks and the Risk Amounts 46,027,051
46,736,319
6 Other Differences between the Amount in the Consolidated Financial Statements Prepared
as per the Communiqué on the Preparation of the Consolidated Financial Statements of Banks and the Risk Amounts (1,943,151)
(1,383,371)
7 Total risk amount 185,854,261 152,057,066
(*) Consolidated financial statements prepared as per the sixth paragraph of Article 5 of the Communiqué on the Preparation of the Consolidated Financial
Statements of Banks.
(**) The amounts in the table are calculated by using the quarterly average amounts.
c) Leverage Ratio:
Assets on the Balance Sheet
Current
Period(*)
Prior
Period(*)
1 Assets on the Balance Sheet (Excluding Derivative Financial Instruments and Loan Derivatives, Including Collaterals) 137,340,711 104,904,660
2 (Assets Deducted from Core Capital) (683,621) (586,136)
3 Total Risk Amount for Assets on the Balance Sheet 136,657,090 104,318,524
Derivative Financial Instruments and Credit Derivatives 4 Renewal Cost of Derivative Financial Instruments and Credit Derivatives 1,777,668 438,483
5 Potential Credit Risk Amount of Derivative Financial Instruments and Credit Derivatives 492,002 560,417
6 Total Risk Amount of Derivative Financial Instruments and Credit Derivatives 2,269,670 998,900
Financing Transactions with Securities or Goods Warranties 7 Risk Amount of Financial Transactions with Securities or Goods Warranties (Excluding Those in
the Balance Sheet) 900,450 3,323
8 Risk Amount Arising from Intermediated Transactions - - 9 Total Risk Amount of Financing Transactions with Securities or Goods Warranties 900,450 3,323
Off-Balance Sheet Transactions
10 Gross Nominal Amount of the Off-balance Sheet Transactions 46,027,051 46,736,319
11 (Adjustment Amount Arising from Multiplying by the Credit Conversion Rate) - - 12 Total Risk Amount for Off-balance Sheet Transactions 46,027,051 46,736,319
Capital and Total Risk
13 Tier 1 Capital 11,397,559 10,392,276
14 Total Risk Amount 185,854,261 152,057,066
Leverage Ratio 15 Leverage Ratio 6.13% 6.83%
(*) The amounts in the table are calculated by using the quarterly average amounts.

TÜRK EKONOMİ BANKASI ANONİM ŞİRKETİ
NOTES AND EXPLANATIONS TO CONSOLIDATED FINANCIAL STATEMENTS AS OF 31
DECEMBER 2020 (Unless otherwise stated amounts are expressed in thousands of Turkish Lira (“TL”).)
61
I
IX. Explanations Related to Presentation of Financial Assets and Liabilities at Fair Value
The table below shows the book value and the fair value of financial assets and liabilities that are not shown at the fair
value of the Group’s financial statements.
Book Value Fair Value
Current Period Prior Period Current Period Prior Period
Financial Assets 115,227,255 87,320,686 114,925,298 89,071,351
Receivables from Money Market 6,180,447 840,275 6,180,447 840,275
Banks 6,673,448 8,566,245 6,673,448 8,566,245 Financial Assets at Fair Value Through Other Comprehensive
Income 8,652,397 5,541,371 8,652,397 5,541,371
Financial Assets measured at amortized cost 12,520,123 4,905,514 12,544,293 5,032,899 Loans (**) 81,200,840 67,467,281 80,874,713 69,090,561
Financial Liabilities 124,022,089 92,731,107 124,273,815 92,897,754
Bank Deposit 7,468,397 386,312 7,468,397 386,312 Other Deposit 86,273,506 71,791,540 86,423,699 71,886,844
Funds Borrowed from Other Financial Institutions(*) 22,840,362 15,035,666 22,941,895 15,107,009 Marketable Securities Issued 4,810,637 2,333,877 4,810,637 2,333,877
Sundry Creditors 2,629,187 3,183,712 2,629,187 3,183,712
(*) Funds provided under repo transactions and subordinated loans are included in funds borrowed from other financial institutions.
(**) Factoring receivables are included in loans.
Investment securities in the current period include financial assets valued at their amortized cost and at fair value through other comprehensive income. The fair value of assets held to maturity assets are determined based on market prices or quoted market prices of other securities subject to redemption in terms of interest, maturity and other similar circumstances, where their prices cannot be determined.
Due to the fact that demand deposits, variable rate placements and overnight deposits are short-term, hence their carrying value reflects their fair value. Estimated fair value of fixed interest deposits and funds provided from other financial institutions is calculated with the presence of discounted cash flow using the current interest rates used for other debts of similar quality and similar maturity structure, by finding the discounted cash flow using the fair value of loans and the current interest rates used for receivables with similar and similar maturities. As the miscellaneous debts are short term, their carrying value approximately reflects their fair value.
The fair value of financial assets and liabilities are determined as follows:
• First level: Financial assets and liabilities are valued at the stock market prices traded in the active market for the same assets and liabilities.
• Second level: Financial assets and liabilities are valued from the inputs used to find the price of the relevant asset or liability directly or indirectly, which can be observed in the market other than the stock exchange price specified in the first level.
• Third level: Financial assets and liabilities are valued from inputs that are not based on any observable data in the market used to find the fair value of the asset or liability.

TÜRK EKONOMİ BANKASI ANONİM ŞİRKETİ
NOTES AND EXPLANATIONS TO CONSOLIDATED FINANCIAL STATEMENTS AS OF 31
DECEMBER 2020 (Unless otherwise stated amounts are expressed in thousands of Turkish Lira (“TL”).)
62
IX. Explanations Related to Presentation of Financial Assets and Liabilities at Fair Value
(Continued)
The following table contains the analysis of the fair values of the financial instruments carried at fair values, including
the stock market prices, valuation techniques, all model data of which can be measured in the market, or using valuation
techniques whose data cannot be measured in the market:
31 December 2020 Level 1 Level 2 Level 3 Total
Financial Assets 10,066,166 3,008,598 58,652 13,133,416
Financial assets at Fair value through profit and loss 1,447,816 1,887,914 47,771 3,383,501
Public sector debt securities 1,447,816 - - 1,447,816
Financial assets at Fair value through profit or loss - 1,752,609 - 1,752,609
Other Financial assets at Fair value through
profit or loss - 135,305 47,771 183,076
Derivative financial assets for hedging purposes - 1,097,518 - 1,097,518 Financial Assets at Fair Value Through Other Comprehensive Income 8,618,350 23,166 10,881 8,652,397
Public sector debt securities 8,618,350 23,166 - 8,641,516
Other Financial Assets at Fair Value Through Other Comprehensive Income - - 10,881 10,881
Financial Liabilities - 3,343,179 - 3,343,179
Derivative financial liabilities at Fair value through profit or loss - 2,260,343 - 2,260,343
Derivative financial liabilities for hedging purposes - 1,082,836 - 1,082,836
31 December 2019 Level 1 Level 2 Level 3 Total
Financial Assets 6,683,191 2,016,319 48,834 8,748,344
Financial assets at fair value through profit and loss 1,170,398 1,754,129 40,939 2,965,466 Public sector debt securities 1,167,994 - - 1,167,994
Financial assets at Fair value through profit or loss - 1,670,042 - 1,670,042
Other Financial assets at Fair value through profit or loss 2,404 84,087 40,939 127,430
Derivative financial assets for hedging purposes - 241,507 - 241,507
Financial Assets at Fair Value Through Other Comprehensive Income 5,512,793 20,683 7,895 5,541,371 Public sector debt securities 5,512,793 20,683 - 5,533,476
Other Financial Assets at Fair Value Through Other
Comprehensive Income - - 7,895 7,895
Financial Liabilities - 3,511,558 - 3,511,558
Derivative financial liabilities at Fair value through profit or loss - 1,586,584 - 1,586,584 Derivative financial liabilities for hedging purposes - 1,924,974 - 1,924,974
There is no transition between the levels in the current year.
X. Explanations Related to Transactions Carried out on Behalf of Other Parties and Fiduciary Assets
The Group performs trading transactions on behalf of customers, and gives custody, administration and consultancy
services.
The Group does not deal with fiduciary transactions.

TÜRK EKONOMİ BANKASI ANONİM ŞİRKETİ
NOTES AND EXPLANATIONS TO CONSOLIDATED FINANCIAL STATEMENTS AS OF 31
DECEMBER 2020 (Unless otherwise stated amounts are expressed in thousands of Turkish Lira (“TL”).)
63
XI. Explanations Related to Consolidated Risk Management
Notes and explanations prepared in accordance with “the Communiqué on Disclosures about Risk Management to be
Announced to Public by Banks” published in Official Gazette no. 29511 on 23 October 2015 and became effective as of
31 March 2016 are presented in this section. The notes to be presented within the scope of internal rating based approach
have not been presented due to use of standard approach for the calculation of capital adequacy ratio by the Bank.
1. Risk management approach and overview of Risk Weighted Assets
1.1. The Parent Bank’s risk management approach
The objective of the Risk Management system is to provide that the risks that are derived from the bank’s activities
are defined, measured, monitored and controlled through policies, procedures and limits established.
Risk Management functions of the Parent Bank and all of its subsidiaries have been gathered under the Group Risk
Management. Group Risk Management reports to the Boards of Directors of TEB Group through the Risk Committee
and Audit Committee within the TEB A.Ş. and is responsible for fulfilling its duties of general supervision, notification
and recommendation on behalf of the Boards of Directors in line with the principles laid down in this Regulation.
With Risk Policies, the Parent Bank aims to,
i) Identify the main risks to which the Parent Bank is exposed and identified risks within the control range;
ii) Define roles and responsibilities to identify, analyse, measure, monitor, and control the main risks bank faces
and other risks which may arise as a consequence of changes in activity structure and economic conditions,
iii) Identify the volume of transactions which may cause non-controllable risks by considering equity strength or
decrease the activities affected by such risks.
Risk policies and the procedures related there to contain written standards set by the Board of Directors and the “Senior
Management” consisting of General Manager, Assistant General Managers and Chief Risk Officer.
Risk policies and related procedures are prepared in compliance with the Banking Law, external legislation and general
banking practices and presented to the Senior Management / Board of Directors for approval.
It is the principal duty of all managers of the Parent Bank to provide compliance with risk policies containing the
criteria required for each unit.
Risk Management Operations consist of;
i) risk measurement,
ii) monitoring of risks,
iii) control of risk and reporting operations
Risk management operations are conducted by Group Risk Management and personnel.
Group Risk Management applies second order controls for quantifiable risks as part of continuous control system.
Head of Group Risk Management reports to the Board of Directors via Risk Committee and Audit Committee.

TÜRK EKONOMİ BANKASI ANONİM ŞİRKETİ
NOTES AND EXPLANATIONS TO CONSOLIDATED FINANCIAL STATEMENTS AS OF 31
DECEMBER 2020 (Unless otherwise stated amounts are expressed in thousands of Turkish Lira (“TL”).)
64
XI. Explanations Related to Consolidated Risk Management (Continued)
1. Risk management approach and overview of Risk Weighted Assets
1.2. Overview of Risk Weighted Amounts
Risk Weighted Amounts
Minimum capital
requirement
Current Period Prior Period Current Period
1 Credit Risk (Excluding Counterparty Credit Risk) (CCR) 77,157,249 75,343,174 6,172,580
2 Of which Standardized Approach (SA) 77,157,249 75,343,174 6,172,580
3 Of which Internal Rating-based (IRB) Approach - - -
4 Counterparty Credit Risk 2,116,406 1,203,770 169,312
5 Of which Standardized Approach for Counterparty Credit Risk (SA-CCR) 2,116,406 1,203,770 169,312
6 Of which Internal Model Method (IMM) - - -
7 Equity positions in banking accounts under market-based approach - - -
8 Equity investments in funds – Look-through Approach - - -
9 Equity investments in funds – Mandate-based Approach - - -
10 Equity investments in funds – 1250% Weighted Risk Approach - - -
11 Settlement Risk - - -
12 Securitization Positions in banking accounts. - - -
13 Of which IRB Ratings-based Approach (RBA) - - -
14 Of which IRB Supervisory Formula Approach (SFA) - - -
15 Of which SA/Simplified Supervisory Formula Approach (SSFA) - - -
16 Market Risk 2,435,660 1,637,917 194,853
17 Standardized Approach (SA) 2,435,660 1,637,917 194,853
18 Internal Model Approaches (IMM) -
19 Operational Risk 9,894,462 8,663,988 791,557
20 Of which Basic Indicator Approach 9,894,462 8,663,988 791,557
21 Of which Standard Approach - - -
22 Of which Advanced Measurement Approach - - -
23 Amounts below the Thresholds for Deduction (Subject to a 250% Risk Weight) - - -
24 Floor Adjustment - - -
25 Total (1+4+7+8+9+10+11+12+16+19+23+24) 91,603,777 86,848,849 7,328,302

TÜRK EKONOMİ BANKASI ANONİM ŞİRKETİ
NOTES AND EXPLANATIONS TO CONSOLIDATED FINANCIAL STATEMENTS AS OF 31 DECEMBER 2020 (Unless otherwise stated amounts are expressed in thousands of Turkish Lira (“TL”).)
65
XI. Explanations Related to Consolidated Risk Management (Continued)
2. Linkages Between Financial Statements and Regulatory Exposures
2.3. Differences between accounting and regulatory scopes of consolidation and mapping of financial statement categories with regulatory risk categories
Carrying values of items in accordance with TAS
Current Period
Carrying values under
scope of regulatory
consolidation
Subject to credit
risk framework
Subject to
counterparty
credit risk
framework
Subject to the
market risk
framework
Not subject to capital
requirements or subject to
deduction from capital
Assets
Cash and balances at central bank 16,951,303 16,951,303 - - -
Banks 6,684,104 6,686,839 - - -
Receivables from money markets 6,180,886 2,501,076 3,679,810 - -
Financial assets at fair value through profit or loss 1,630,892 183,074 - 1,447,817 -
Financial assets at fair value through other comprehensive income 8,652,397 8,654,367 - - -
Financial assets measured at amortized cost 12,522,941 12,522,941 - - -
Derivative financial assets at fair value through profit and loss 1,752,609 - 1,752,609 1,752,609 -
Derivative financial assets at fair value through other comprehensive income 1,097,518 - 1,097,518 1,097,518 -
Non-performing financial assets - - - - -
Expected credit loss (-) 4,082,162 2,307,403 - - -
Loans and receivables 82,761,835 82,761,835 - - -
Factoring receivables 2,503,938 2,503,938 - - -
Non-current assets and disposal groups classified as held for sale (net) 112,859 112,859 - - -
Investments in associates (net) - - - - -
Investments in subsidiaries (net) 50 50 - - -
Investments in joint ventures (net) 5 5 - - -
Tangible assets (net) 846,067 808,043 - - 38,025
Intangible assets (net) 572,547 - - - 572,547
Investment properties (net) - - - - -
Tax assets 19,678 19,678 - - -
Deferred tax assets 651,589 651,589 - - -
Other assets 3,870,711 2,128,351 1,470,105 272,255
Total assets 142,729,767 134,178,545 8,000,042 4,297,944 882,827
Liabilities
Deposits 93,741,903 - - - -
Loans 11,911,284 - - - -
Debt to money markets loans 6,734,127 - 6,734,127 - -
Debt securities in issue 4,810,637 - - - -
Financial liabilities at fair value through profit or loss - - - - -
Derivative financial liabilities 3,343,179 - 1,604,879 - -
Factoring debts 8,979 - - - -
Lease Liablities 604,874 - - - -
Provisions 1,004,817 - - - -
Tax liability 343,527 - - - -
Deferred tax liability - - - - -
Liabilities included in disposal groups classified as held for sale (net) - - - - -
Subordinated debts 4,194,951 - - - -
Other liability 4,341,816 - 2,462 - -
Equity 11,689,673 - - - -
Total liabilities 142,729,767 - 8,341,468 - -

TÜRK EKONOMİ BANKASI ANONİM ŞİRKETİ
NOTES AND EXPLANATIONS TO CONSOLIDATED FINANCIAL STATEMENTS AS OF 31 DECEMBER 2020 (Unless otherwise stated amounts are expressed in thousands of Turkish Lira (“TL”).)
66
XI. Explanations Related to Consolidated Risk Management (Continued)
2. Linkages Between Financial Statements and Regulatory Exposures (continued)
2.3. Differences between accounting and regulatory scopes of consolidation and mapping of financial statement categories with regulatory risk categories
(continued)
Carrying values of items in accordance with TAS
Prior Period
Carrying values under
scope of regulatory
consolidation
Subject to credit risk
framework
Subject to
counterparty
credit risk
framework
Subject to
the market
risk
framework
Not subject to capital
requirements or subject to
deduction from capital
Assets Cash and balances at central bank 11,955,971 11,955,971 - - -
Banks 8,576,054 8,577,508 - - -
Receivables from money markets 840,304 - 840,304 - -
Financial assets at fair value through profit or loss 1,295,424 125,026 - 1,170,397 -
Financial assets at fair value through other comprehensive income 5,541,371 5,541,300 - - -
Financial assets measured at amortized cost 4,906,618 4,906,618 - - -
Derivative financial assets at fair value through profit and loss 1,670,042 - 1,670,042 1,670,042 -
Derivative financial assets at fair value through other comprehensive income 241,507 - 241,507 241,507 -
Non-performing financial assets - - - - -
Expected Credit Loss (-) 3,688,684 2,352,545 - - -
Loans and receivables 69,059,806 69,059,806 - - -
Factoring receivables 2,083,258 2,083,259 - - -
Non-current assets and disposal groups classified as held for sale (net) 131,362 131,362 - - -
Investments in associates (net) - - - - -
Investments in subsidiaries (net) - - - - -
Investments in joint ventures (net) 5 5 - - -
Tangible assets (net) 884,818 839,941 - - 44,877
Intangible assets (net) 561,432 - - - 561,431
Investment properties (net) - - - - -
Tax assets 14,810 14,810 - - -
Deferred tax assets 667,146 667,146 - - -
Other assets 4,473,189 2,585,297 1,889,567 531 -
Total Assets 109,214,433 104,135,504 4,641,420 3,082,477 606,308
Liabilities
Deposits 72,177,852 - - - -
Loans 10,194,696 - - - -
Debt to money markets loans 1,650,467 - 1,650,467 - -
Debt securities in issue 2,333,877 - - - -
Financial liabilities at fair value through profit or loss - - - - -
Derivative financial liabilities 3,511,558 - 2,571,144 - -
Factoring debts 812 - - - -
Lease Liablities 657,657 - - - -
Provisions 847,398 - - - -
Tax liability 222,365 - - - -
Deferred tax liability - - - - -
Liabilities included in disposal groups classified as held for sale (net) - - - - -
Subordinated debts 3,190,503 - - - -
Other liability 4,517,340 - 730,162 - -
Equity 9,909,908 - - - -
Prior Period 109,214,433 - 4,951,773 - -

TÜRK EKONOMİ BANKASI ANONİM ŞİRKETİ
NOTES AND EXPLANATIONS TO CONSOLIDATED FINANCIAL STATEMENTS AS OF 31
DECEMBER 2020 (Unless otherwise stated amounts are expressed in thousands of Turkish Lira (“TL”).)
67
XI. Explanations Related to Consolidated Risk Management (Continued)
2. Linkages Between Financial Statements and Regulatory Exposures (continued)
2.4. Differences between accounting and regulatory scopes of consolidation and mapping of financial statement
categories with regulatory risk categories
Current Period Total
Items subject
to credit risk
framework
Items subject to
counterparty credit
risk framework
Items subject
to market risk
framework
1 Asset carrying value amount under scope of
regulatory consolidation 142,729,767 134,178,545 8,000,042 4,297,944
2 Liabilities carrying value amount under regulatory scope
of consolidation 8,341,467 - 8,341,468 - 3 Total net amount under regulatory scope of
consolidation 134,388,300 134,178,545 (341,426) 4,297,944
4 Off-balance sheet amounts 48,123,065 18,120,887 678,183 - 5 Differences in valuations - - - -
6 Differences due to different netting rules (other than
those already included in row 2) - - - - 7 Differences due to consideration of provisions - - - -
8 Differences due to prudential filters - - - -
9 Exposure amounts considered for regulatory purposes - 152,299,432 336,757 4,297,944
Prior Period Total
Items
subject to
credit risk
framework
Items subject to
counterparty credit
risk framework
Items subject
to market risk
framework
1 Asset carrying value amount under scope of regulatory
consolidation 109,214,433 104,135,504 4,641,420 3,082,477
2 Liabilities carrying value amount under regulatory scope of
consolidation 4,951,773 - 4,951,773 -
3 Total net amount under regulatory scope of
consolidation 104,262,660 104,135,504 (310,353) 3,082,477
4 Off-balance sheet amounts 96,512,608 17,225,190 567,789 -
5 Differences in valuations - - - - 6 Differences due to different netting rules (other than those
already included in row 2) - - - -
7 Differences due to consideration of provisions - - - - 8 Differences due to prudential filters - - - -
9 Exposure amounts considered for regulatory purposes - 121,360,694 257,436 3,082,477
2.5. Explanations of differences between accounting and regulatory exposure amounts in accordance with TAS
The market value approach is used to make valuation of the positions in the Bank portfolios. The market data sources
used for valuations are identified, defined in the Market Risk Policy, and reviewed annually. The relevant action is taken
immediately when it is determined that the data does not reflect the market condition other than annual data source
evaluation. Product valuations are checked by using sources such as Reuters and Bloomberg.

TÜRK EKONOMİ BANKASI ANONİM ŞİRKETİ
NOTES AND EXPLANATIONS TO CONSOLIDATED FINANCIAL STATEMENTS AS OF 31
DECEMBER 2020 (Unless otherwise stated amounts are expressed in thousands of Turkish Lira (“TL”).)
68
XI. Explanations Related to Consolidated Risk Management (Continued)
3. Consolidated Credit Risk Disclosure
3.1. General information about
3.1.1. General qualitative information about credit risk
The objective of the Risk Management system is to provide that the risks that are derived from the Parent Bank’s activities
are defined, measured, monitored and controlled through policies, procedures and limits established.
Credit Risk Management reports aim to supply risk level trends and present risk expectations for the future. Details and
content vary depending on the requirements of meetings and are presented in graphs and figures for ease of explanation
and taking decisions.
The main report presented to senior management is the Credit Risk General Overview report, which is prepared monthly
and discussed by the Risk Policies Committee. This report is also presented to the Board of Directors, Risk Committee
and to the Audit Committee. Additionally, Group Risk Management prepares reports with special titles less frequently.
Most of these reports is presented to the Risk Policies Committee. These reports may also be used in irregular meetings
where emergent subjects are discussed or in meetings where the attendance of Senior Management is not required.
Credit risk policies are prepared in line with the Banking Law, external regulations, and general banking practices, and
are approved by the Risk Policies Committee, Risk Committee, and Board of Directors.
The Parent Bank’s credit activities are managed according to the General Credit Policy that is approved by the Risk
Policies Committee and the Board of Directors.
The Risk Appetite Declaration is approved by the Board of Directors and audited once a year. The Parent Bank combines
risk appetite with existing risk management tools, processes, principles, and policies, using a consistent approach with
risk appetite declaration, and ensures that risks taken are within the agreed upon limits. In this way, the consistency of risk
practices is improved across the bank.
The Parent Bank controls the credit risk by monitoring loan receivables, limiting certain transactions with counter parties,
evaluating the creditworthiness of the counter party regularly, diversifying loan types and products separately based on
customer groups and industry to prevent the concentration of deferred payments and receiving guarantees when
appropriate.
3.1.2. Credit quality of assets
Current Period
Gross carrying value in consolidated financial
statements prepared as per TAS
Allowances/
impairments Net Values
Defaulted
exposures
Non-defaulted
Exposures
Loans 3,520,150 81,745,623 4,064,933 81,200,840
Debt Securities - 21,164,457 2,818 21,161,639
Off-balance sheet exposures - 44,269,635 311,330 43,958,305
Total 3,520,150 147,179,715 4,379,081 146,320,784
Prior Period
Gross carrying value in consolidated financial
statements prepared as per TAS
Allowances/
Impairments Net Values
Defaulted
exposures
Non-defaulted
Exposures
Loans 4,178,852 66,964,212 3,675,783 67,467,281
Debt Securities - 10,440,094 1,104 10,438,990
Off-balance sheet exposures - 42,657,485 243,480 42,414,005
Total 4,178,852 120,061,791 3,920,367 120,320,276

TÜRK EKONOMİ BANKASI ANONİM ŞİRKETİ
NOTES AND EXPLANATIONS TO CONSOLIDATED FINANCIAL STATEMENTS AS OF 31
DECEMBER 2020 (Unless otherwise stated amounts are expressed in thousands of Turkish Lira (“TL”).)
69
XI. Explanations Related to Consolidated Risk Management (Continued)
3. Consolidated Credit Risk Disclosure (continued)
3.1. General information about credit risk (continued)
3.1.3. Changes in stock of defaulted loans and debt securities
1 Defaulted loans and debt securities at end of the 31 December 2019 4,178,852
2 Loans and debt securities that have defaulted since the last reporting period 1,460,100
3 Returned to non-defaulted status - 4 Amounts written off(*) (541,732)
5 Other changes (**) (1,577,070)
6 Defaulted loans and debt securities at end of 31 December 2020 (1+2-3-4±5) 3,520,150
(*) The Group wrote off TL 117,263 of its non-performing loans. Additionally, the portion of the Group's non-performing loan portfolio amounting
to TL 424,469 for which a provision of TL 410,516 was provided, was sold in 2020 with a price of TL 35,759 and following the completion of
the necessary procedures, non-performing loans were written off from the records. (**) Includes collections during the period
1 Defaulted loans and debt securities at end of the 31 December 2018 2,839,438
2 Loans and debt securities that have defaulted since the last reporting period 3,077,505 3 Returned to non-defaulted status -
4 Amounts written off(*) (671,808)
5 Other changes (**) (1,066,283) 6 Defaulted loans and debt securities at end of 31 December 2019 (1+2-3-4±5) 4,178,852
(*) The Group wrote off TL 171,832 of its non-performing loans. Additionally, the portion of the Group's non-performing loan portfolio amounting
to TL 499,598 for which a provision of TL 482,232 was provided, was sold in 2019 with a price of TL 26,748, and following the completion of the necessary procedures, non-performing loans were written off from the records.
(**) Includes collections during the period
3.1.4. Additional disclosure related to the credit quality of assets
a) The scope and definitions of “past due” and “impaired” exposures used for accounting purposes and the differences,
if any, between the definition of “past due” and “impaired” for accounting and regulatory purposes
According to the “Communiqué on Methods and Principles for the Determination of Loans and Other Receivables to
be Reserved for and Allocation of Reserves” non-required delay time loans that is not classified as Stage III Loans,
whose principal and interest payment collection delayed more than 30 days are considered as “non-performing loan”
in the Accounting Practice.
Receivables past due more than 90 days are considered as “impaired receivables”, and they are classified as group III,
IV, and V in accordance with Communiqué. A specific reserve is allocated for such receivables.
b) The extent of past-due exposures (more than 90 days) that are not considered to be impaired and the reasons for
this
A specific provision is allocated for receivables which are overdue for more than 90 days in accordance with the
Communiqué. According to the BRSA decision dated 17 March 2020, following the number of overdue days valid in
the definition of default was changed from 90 days to 180 days, expected credit losses are allocated considering the
Stage 2 and Stage 3 provision ratios for risks within this range.
c) Description of methods used for determining impairments
Provision amount is determined in accordance with the regulation on “Methods and Principles for the Determination
of Loans and Other Receivables to be Reserved for and Allocation of Reserves.”
d) The definition of the restructured exposure
If the borrower fails to make payment to the Bank due to a temporary lack of liquidity, loans and other receivables
including deferred interest payments may be restructured to provide the borrower with additional liquidity to enable
the Bank to collect its receivables, or a new repayment schedule may be arranged.

TÜRK EKONOMİ BANKASI ANONİM ŞİRKETİ
NOTES AND EXPLANATIONS TO CONSOLIDATED FINANCIAL STATEMENTS AS OF 31
DECEMBER 2020 (Unless otherwise stated amounts are expressed in thousands of Turkish Lira (“TL”).)
70
XI. Explanations Related to Consolidated Risk Management (Continued) 3. Consolidated Credit Risk Disclosure (continued)
3.1. General information about credit risk (continued)
3.1.4. Additional disclosure related to the credit quality (continued)
e) Breakdown of exposures by geographical areas, industry and residual maturity:
Breakdown of Loans and Receivables by Sector:
Current Period
TL (%) FC (%)
Agriculture 16,531,288 24.40 3,056,724 21.35
Farming and Stockbreeding 16,229,235 23.95 3,055,176 21.34
Forestry - - - -
Fishery 302,053 0.45 1,548 0.01
Manufacturing 23,878,026 35.23 7,041,241 49.18
Mining and Quarrying 2,047,083 3.02 222,809 1.56
Production 21,575,159 31.83 6,786,670 47.40
Electricity, Gas and Water 255,784 0.38 31,762 0.22
Construction 1,115,441 1.65 61,756 0.43
Services 19,621,551 28.96 3,360,663 23.47
Wholesale and Retail Trade 5,707,923 8.43 555,967 3.88
Accommodation and Dining 3,355,043 4.95 792,491 5.53
Transportation and Telecom. 2,113,713 3.12 311,508 2.18
Financial Institutions 1,717,987 2.53 98,540 0.69
Real Estate and Rental Services 3,372,261 4.98 533,301 3.72
Self-Employment Services 2,745,172 4.05 1,037,743 7.25
Educational Services 313,979 0.46 17,315 0.12
Health and Social Services 295,473 0.44 13,798 0.10
Other 6,627,278 9.76 797,621 5.57
Total 67,773,584 100.00 14,318,005 100.00
Prior Period
TL (%) FC (%)
Agriculture 1,288,428 2.39 147,348 1.11
Farming and Stockbreeding 1,225,188 2.27 146,374 1.10
Forestry - - - -
Fishery 63,240 0.12 974 0.01
Manufacturing 15,598,012 28.95 6,793,853 50.85
Mining and Quarrying 1,255,496 2.33 227,125 1.70
Production 13,792,783 25.60 6,283,340 47.03
Electricity, Gas and Water 549,733 1.02 283,388 2.12
Construction 1,247,839 2.32 335,191 2.51
Services 13,567,730 25.18 5,738,551 42.95
Wholesale and Retail Trade 5,260,936 9.77 1,008,218 7.55
Accommodation and Dining 811,205 1.51 1,373,359 10.28
Transportation and Telecom. 2,129,291 3.95 336,643 2.52
Financial Institutions 2,092,780 3.88 1,516,889 11.35
Real Estate and Rental Services 1,115,571 2.07 1,402,519 10.50
Self-Employment Services 732,174 1.36 100,360 0.75
Educational Services 82,780 0.15 563 -
Health and Social Services 1,342,993 2.49 - -
Other 22,181,133 41.16 345,357 2.58
Total 53,883,142 100.00 13,360,300 100.00
Breakdown of loans and receivables according to remaining maturities is provided in the note VI. of section four under
the “Presentation of assets and liabilities according to their remaining maturities”.

TÜRK EKONOMİ BANKASI ANONİM ŞİRKETİ
NOTES AND EXPLANATIONS TO CONSOLIDATED FINANCIAL STATEMENTS AS OF 31
DECEMBER 2020 (Unless otherwise stated amounts are expressed in thousands of Turkish Lira (“TL”).)
71
XI. Explanations Related to Consolidated Risk Management (Continued)
3. Consolidated Credit Risk Disclosure (continued)
3.1. General information about credit risk (continued)
3.1.4. Additional disclosure related to the credit quality (continued)
f) Amounts of impaired exposures on geographical areas and industry basis (according to the definition used by the
Bank for accounting purposes) and write-offs with related allowances.
All of the Parent Bank’s loans under follow-up is in Turkey. Amounts of provision allocated receivables based on
sector are presented in the note II of section 4 under “Information in terms of major sectors and type of counterparties”
g) Ageing analysis of accounting past-due exposures
31 December 2020 (*) 1-30 Days 31-60 Days 61-90 Days Total
Loans and Receivables
Commercial Loans 265,923 157,612 440,170 863,705
Consumer Loans 520,416 180,156 256,865 957,437
Credit Cards 77,892 77,145 56,408 211,445
Total 864,231 414,913 753,443 2,032,587
(*) According to the BRSA's decisions, dated 17 March 2020 and numbered 8948 and, dated 8 December 2020 and numbered 9312, to be effective from 17 March 2020 until 30 June 2021, total amount of loans with delays of 91 to 180 days which are continued to be classified as Stage 2 is TL
626,606 as of 31 December 2020.
31 December 2019 1-30 Days 31-60 Days 61-90 Days Total
Loans and Receivables
Commercial Loans 457,066 358,633 1,094,415 1,910,114
Consumer Loans 482,022 297,618 380,699 1,160,339
Credit Cards 96,362 103,803 73,313 273,478
Toplam 1,035,450 760,054 1,548,427 3,343,931
h) Breakdown of restructured exposures between impaired and not impaired exposures:
Not impaired loans:
Current Period Gross Amount
Significant
Increase in Credit
Risk (Stage II)
Net
Amount
Commercial Loans 1,585,123 (621,022) 964,101
Consumer Loans 154,605 (32,183) 122,422
Credit Cards 22,188 (1,735) 20,453
Total 1,761,916 (654,940) 1,106,976
Prior Period Gross Amount
Significant
Increase in Credit
Risk (Stage II)
Net
Amount
Commercial Loans 1,927,889 (393,754) 1,534,135
Consumer Loans 137,661 (14,402) 123,259
Credit Cards 61,116 (3,605) 57,511
Total 2,126,666 (411,761) 1,714,905

TÜRK EKONOMİ BANKASI ANONİM ŞİRKETİ
NOTES AND EXPLANATIONS TO CONSOLIDATED FINANCIAL STATEMENTS AS OF 31
DECEMBER 2020 (Unless otherwise stated amounts are expressed in thousands of Turkish Lira (“TL”).)
72
XI. Explanations Related to Consolidated Risk Management (Continued)
3. Consolidated Credit Risk Disclosure (continued)
3.1. General information about credit risk (continued)
3.1.4 Additional disclosure related to the credit quality (continued)
Impaired loans:
Current Period Gross Amount
Default
(Stage III) Net Amount
Commercial Loans 65,682 37,989 27,693
Consumer Loans 27,484 18,913 8,571
Credit Cards 5,953 4,519 1,434
Total 99,119 61,421 37,698
Prior Period
Gross
Amount
Default
(Stage III) Net Amount
Commercial Loans 47,120 28,442 18,678
Consumer Loans 56,711 34,791 21,920
Credit Cards 11,972 9,355 2,617
Total 115,803 72,588 43,215
3.2. Credit Risk Mitigation
3.2.1 Qualitative disclosure requirements related to credit risk mitigation techniques
a) Core features of policies and processes for which the Parent Bank makes on and off-balance sheet netting
The Parent Bank does not perform on and off balance sheet offsetting to decrease credit risk, and credit derivatives are
not used.
b) Core features of policies and processes for collateral evaluation and management.
Financial collaterals are measured at fair value as of reporting date and are included in the risk mitigation process.
When allocating the collateral amount to loans provided, the Parent Bank applies credit risk mitigation according to
the comprehensive method that includes risk mitigation calculations considering the volatility-adjusted values of
financial collaterals. The legal validity of the mortgage is ensured by duly registering the mortgage in a timely manner,
and significant changes in market conditions are monitored.
In terms of credit risk mitigation, the Parent Bank uses cash, government and treasury bonds, fund, gold, bank
guarantee, stock and derivatives as main collateral type. Mortgages on residential and commercial real estate reported
under different risk class are other main types of collaterals.
c) Information about market or credit risk concentrations under the credit risk mitigation instruments used (i.e. by
guarantor type, collateral and credit derivative providers).
Guarantor entity’s credit risk value is to be considered in credit risk mitigation process in cases where Parent bank
credit customers obtained guarantee from other entities.
The Parent Bank mostly prefers cash, securities such as government and Treasury bond for collateral which have low
market and credit risk concentration risk.

TÜRK EKONOMİ BANKASI ANONİM ŞİRKETİ
NOTES AND EXPLANATIONS TO CONSOLIDATED FINANCIAL STATEMENTS AS OF 31
DECEMBER 2020 (Unless otherwise stated amounts are expressed in thousands of Turkish Lira (“TL”).)
73
XI. Explanations Related to Consolidated Risk Management (Continued)
3. Consolidated Credit Risk Disclosure (continued)
3.2 Credit Risk Mitigation (continued)
3.2.2. Credit risk mitigation techniques – Overview
Current period
Exposures
unsecured:
carrying
amount
Exposures
secured by
collateral
Exposures
secured by
collateral,
of which:
secured
amount
Exposures
Secured by
financial
guarantees
Exposures
secured by
financial
guarantees, of
which secured
amount
Exposures
secured by
credit
derivatives
Exposures
secured by
credit
derivatives
of which:
secured
amount
1 Loans(*) 64,184,085 9,340,977 8,438,686 5,746,115 4,549,485 - -
2 Debt Securities(*) 19,866,035 - - - - - - 3 Total 84,050,120 9,340,977 8,438,686 5,746,115 4,549,485 - -
4 Of which defaulted(*) 3,308,545 123,545 87,776 65,615 297 - -
(*) According to BRSA communiqué dated 23/03/2020 and numbered 24049440-045, 31/12/2019 exchange rates are used for credit risk calculations.
Prior period
Exposures
unsecured:
carrying
amount
Exposures
secured by
collateral
Exposures
secured by
collateral,
of which:
secured
amount
Exposures
Secured by
financial
guarantees
Exposures
secured by
financial
guarantees, of
which secured
amount
Exposures
secured by
credit
derivatives
Exposures
secured by
credit
derivatives
of which:
secured
amount
1 Loans 53,395,074 10,623,941 9,464,806 4,740,052 3,794,739 - - 2 Debt Securities 10,440,094 - - - - - -
3 Total 63,835,168 10,623,941 9,464,806 4,740,052 3,794,739 - -
4 Of which defaulted 3,848,545 312,828 221,411 17,479 1,122 - -
3.3. Credit risk under standardized approach
3.3.1. Disclosures on banks’ use of credit ratings under the standard approach for credit risk
For portfolios that are risk-weighted under the standardized approach for credit risk, banks must disclose the
following information:
a) Names of the External Credit Assessment Institutions (ECAIs) and Export Credit Agencies (ECAs) used by the
bank, and the reasons for any changes over the reporting period

TÜRK EKONOMİ BANKASI ANONİM ŞİRKETİ
NOTES AND EXPLANATIONS TO CONSOLIDATED FINANCIAL STATEMENTS AS OF 31
DECEMBER 2020 (Unless otherwise stated amounts are expressed in thousands of Turkish Lira (“TL”).)
74
XI. Explanations Related to Consolidated Risk Management (Continued)
3. Consolidated Credit Risk Disclosure (continued)
3.3 Credit risk under standardized approach (continued)
3.3.1. Disclosures on banks’ use of credit ratings under the standard approach for credit risk (continued)
The Parent Bank uses Fitch Ratings International Rating Agency’s external ratings.
b) The risk classes for which each ECAI or ECA is used
The credit rating of Fitch International Rating is used for all receivables from the central governments or central banks
which are included in the risk classes indicated in Article 6 of the Communiqué on Measurement and Assessment Capital
Adequacy, and the country risk classification announced by The Organisation for Economic Co-operation and
Development (OECD) is used for receivables from banks and intermediary agencies. 20% risk weight is used for
receivables from non-rated banks and intermediary agencies with a maturity period of three months or less, and 50%
risk weight is used for receivables with a maturity period of more than three months, and the risk weight used for all
receivables is not lower than the risk concentration corresponding to the OECD credit quality level of the country where
the non-rated banks and intermediary agencies are founded.
c) A description of the process used to apply the issuer to issue credit ratings onto other issuer assets in the banking
book
20% risk weight is used for receivables from non-rated banks and intermediary agencies with a maturity period of three
months or less, and a 50% risk weight is used for receivables with a maturity period of more than three months.
According to the regulation on capital adequacy, corporates where the counterparties are domestic, the related exposures
are included in the calculation of capital adequacy as unrated.
d) The alignment of the alphanumerical scale of each agency used with risk buckets. (except where Agency (BRSA)
publishes a standard mapping with which the bank has to comply)
Risk ratings per the credit quality levels and the risk weights according to exposure categories announced by Fitch
Ratings International Rating Agency and Organization for Economic Co-operation and Development (OECD)’s are
presented below:
Receivables from Banks and Brokerage Houses
Credit
Quality
Level
Fitch Ratings
Long- Term Credit
Rating
Risk Weight of
Receivables from
Central Government
or Central Banks
DTM less than 3
months
DTM higher than 3
months Corporate Receivables
0 - 20% 50% 100% 1 AAA to AA- 0% 20% 50% 100%
2 A+ to A- 20% 20% 50% 100%
3 BBB+ to BBB- 50% 50% 50% 100% 4 BB+ to BB- 100% 100% 100% 100%
5 B+ to B- 100% 100% 100% 100%
6 CCC+ and below 150% 100% 100% 100% 7 - 150% 150% 100%

TÜRK EKONOMİ BANKASI ANONİM ŞİRKETİ
NOTES AND EXPLANATIONS TO CONSOLIDATED FINANCIAL STATEMENTS AS OF 31
DECEMBER 2020 (Unless otherwise stated amounts are expressed in thousands of Turkish Lira (“TL”).)
75
XI. Explanations Related to Consolidated Risk Management (Continued)
3. Consolidated Credit Risk Disclosures (continued)
3.3. Credit risk under standardized approach (continued)
3.3.2. Standardized approach – credit risk exposure and Credit Risk Mitigation (CRM) effects
Current Period Exposures before CCF and CRM Exposures post-CCF and CRM
Risk weighted Amounts
and Risk weighted amounts
density
Asset classes
On-
balance
sheet
amount
Off-
balance sheet
amount
On-balance
sheet
amount
Off-balance
sheet
amount
Risk weighted
amounts
Risk
weighted
amounts
density
1 Exposures to central governments or
central banks 35,101,663 - 37,188,639 - 460,144 1%
2 Exposures to regional governments or
local authorities 1,196,851 3,910 1,195,677 1,851 598,769 50%
3 Exposures to public sector entities - - - - - -
4 Exposures to multilateral development
banks - - - - - -
5 Exposures to international
organisations - - - - - -
6 Exposures to institutions 6,929,130 2,113,171 6,814,490 1,689,485 2,362,807 28%
7 Exposures to corporates 33,011,949 17,725,095 31,160,953 9,418,754 39,898,295 98%
8 Retail exposures 33,199,900 15,383,637 30,755,418 2,836,385 25,191,510 75%
9 Exposures secured by residential
property 4,654,019 334,268 4,654,018 127,135 1,673,404 35%
10 Exposures secured by commercial real
estate 5,703,402 1,117,896 5,450,919 462,159 3,971,642 67%
11 Past-due loans 1,212,736 226,565 1,212,440 65,240 1,128,824 88%
12 Higher-risk categories by the Agency
Board - - - - - -
13 Exposures in the form of covered
bonds - - - - - -
14 Exposures to institutions and
corporates with a short-term credit
assessment - - - - - -
15 Exposures in the form of units or
shares in collective investment
undertakings (CIUs) - - - - - -
16 Other assets 3,717,515 2,723,763 3,717,505 2,889 1,704,597 46%
17 Investments in equities 167,257 - 167,257 - 167,257 100%
18 Total 124,894,422 39,628,305 122,317,316 14,603,898 77,157,249 56%

TÜRK EKONOMİ BANKASI ANONİM ŞİRKETİ
NOTES AND EXPLANATIONS TO CONSOLIDATED FINANCIAL STATEMENTS AS OF 31
DECEMBER 2020 (Unless otherwise stated amounts are expressed in thousands of Turkish Lira (“TL”).)
76
XI. Explanations Related to Consolidated Risk Management (Continued)
3. Consolidated Credit Risk Disclosures (continued)
3.3. Credit risk under standardized approach (continued)
3.3.2. Standardized approach – credit risk exposure and Credit Risk Mitigation (CRM) effects
(continued)
Prior Period
Exposures before CCF and
CRM Exposures post-CCF and CRM
Risk weighted Amounts
and Risk weighted
amounts density
Asset classes
On-
balance
sheet
amount
Off-
balance sheet
amount
On-balance
sheet
amount Asset classes
On-
balance
sheet
amount
Off-
balance
sheet
amount
1 Exposures to central governments or
central banks 20,818,042 - 22,845,527 445 4,686,792 21%
2 Exposures to regional governments or local authorities 1,247,638 4,566 1,242,201 2,087 622,151 50%
3 Exposures to public sector entities - - - - - -
4 Exposures to multilateral development banks - - - - - -
5 Exposures to international
organisations - - - - - - 6 Exposures to institutions 10,662,379 2,235,018 10,564,521 1,718,566 4,337,822 35%
7 Exposures to corporates 23,537,290 18,703,110 22,291,247 11,499,331 32,758,317 97% 8 Retail exposures 29,676,329 15,428,657 27,423,695 3,014,692 22,820,285 75%
9 Exposures secured by residential
property 5,473,079 374,142 5,473,079 146,463 1,966,840 35% 10 Exposures secured by commercial real
estate 6,506,468 1,174,811 6,236,649 512,230 4,765,201 71%
11 Past-due loans 1,794,846 244,545 1,793,718 77,444 1,691,573 90% 12 Higher-risk categories by the Agency
Board - - - - - -
13 Exposures in the form of covered bonds - - - - - -
14 Exposures to institutions and
corporates with a short-term credit assessment - - - - - -
15 Exposures in the form of units or
shares in collective investment undertakings (CIUs) - - - - - -
16 Other assets 4,256,650 4,450,531 4,256,647 2,649 1,561,273 37%
17 Investments in equities 132,920 - 132,920 - 132,920 100%
18 Total 104,105,641 42,615,380 102,260,204 16,973,907 75,343,174 63%

TÜRK EKONOMİ BANKASI ANONİM ŞİRKETİ
NOTES AND EXPLANATIONS TO CONSOLIDATED FINANCIAL STATEMENTS AS OF 31 DECEMBER 2020 (Unless otherwise stated amounts are expressed in thousands of Turkish Lira (“TL”).)
77
XI. Explanations Related to Consolidated Risk Management (Continued)
3. Consolidated Credit Risk Disclosures (continued)
3.3. Credit risk under standardized approach (continued)
3.3.3. Receivables by risk classes and risk weights
Current Period
Asset Classes / Risk Weights 0% 10% 20% 35%
50%
secured
by real estate (*) 75% 100% 150% 200% Others
Total credit risk
exposure amount
(after CCF and
CRM)
1 Exposures to regional governments or local authorities 36,728,495 - - - - - 460,144 - - - 37,188,639 2 Exposures to regional governments or local authorities - - - - 1,197,519 - 9 - - - 1,197,528
3 Exposures to public sector entities - - - - - - - - - -
4 Exposures to multilateral development banks - - - - - - - - - - 5 Exposures to international organisations - - - - - - - - - -
6 Exposures to banks and financial intermediaries - - 6,348,462 - 2,124,798 - 30,714 1 - - 8,503,975
7 Exposures to corporates - - 127,440 - 1,158,920 - 39,293,347 - - - 40,579,707 8 Retail exposures - - 1,121 - 6,904 33,583,778 - - - - 33,591,803
9 Exposures secured by residential property - - - 4,781,153 - - - - - - 4,781,153
10 Exposures secured by commercial real estate - - - - 3,882,873 - 2,030,205 - - - 5,913,078 11 Past-due loans - - - - 408,750 - 757,892 111,038 - - 1,277,680
12 Higher-risk categories by the Agency Board - - - - - - - - - -
13 Exposures in the form of covered bonds - - - - - - - - - - 14 Exposures to institutions and corporates with a short-term
credit assessment - - - - - - - - - -
15 Exposures in the form of units or shares in collective investment undertakings (CIUs) - - - - - - - - - -
16 Investments in equities - - - - - - 167,257 - - - 167,257
17 Other assets 1,969,069 - 58,410 - - - 1,692,915 - - - 3,720,394
18 Total 38,697,564 - 6,535,433 4,781,153 8,779,764 33,583,778 44,432,483 111,039 - - 136,921,214
(*) The amount shown on the line of “Exposures secured by commercial real estate” is “Exposures secured by real estate” and other amounts shown on this column represented exposures subject to 50% risk weight.

TÜRK EKONOMİ BANKASI ANONİM ŞİRKETİ
NOTES AND EXPLANATIONS TO CONSOLIDATED FINANCIAL STATEMENTS AS OF 31 DECEMBER 2020 (Unless otherwise stated amounts are expressed in thousands of Turkish Lira (“TL”).)
78
XI. Explanations Related to Consolidated Risk Management (Continued)
3. Consolidated Credit Risk Disclosures (continued)
3.3. Credit risk under standardized approach (continued)
3.3.3. Receivables by risk classes and risk weights (continued)
Prior Period
Asset Classes / Risk Weights 0% 10% 20% 35%
50%
secured
by real estate (*) 75% 100% 150% 200% Others
Total credit risk
exposure amount
(after CCF and
CRM)
1 Exposures to regional governments or local authorities 18,159,180 - - - - - 4,686,792 - - - 22,845,972
2 Exposures to regional governments or local authorities - - - - 1,244,275 - 13 - - - 1,244,288
3 Exposures to public sector entities - - - - - - - - - - -
4 Exposures to multilateral development banks - - - - - - - - - - -
5 Exposures to international organisations - - - - - - - - - - -
6 Exposures to banks and financial intermediaries - - 8,783,070 - 1,846,769 - 1,644,098 9,150 - - 12,283,087
7 Exposures to corporates - - 786,893 - 805,495 - 32,198,190 - - - 33,790,578
8 Retail exposures - - 5,753 - 21,615 30,410,771 248 - - - 30,438,387
9 Exposures secured by residential property - - - 5,619,542 - - - - - - 5,619,542
10 Exposures secured by commercial real estate - - - - 3,967,356 - 2,781,523 - - - 6,748,879
11 Past-due loans - - - - 601,830 - 1,026,680 242,652 - - 1,871,162
12 Higher-risk categories by the Agency Board - - - - - - - - - - -
13 Exposures in the form of covered bonds - - - - - - - - - - -
14 Exposures to institutions and corporates with a short-term credit
assessment - - - - - - - - - - -
15 Exposures in the form of units or shares in collective investment
undertakings (CIUs) - - - - - - - - - - -
16 Investments in equities - - - - - - 132,920 - - - 132,920
17 Other assets 2,660,399 - 47,027 - - - 1,551,870 - - - 4,259,296
18 Total 20,819,579 - 9,622,743 5,619,542 8,487,340 30,410,771 44,022,334 251,802 - - 119,234,111
(*) The amount shown on the line of “Exposures secured by commercial real estate” is “Exposures secured by real estate” and other amounts shown on this column represented exposures subject to 50% risk weight.

TÜRK EKONOMİ BANKASI ANONİM ŞİRKETİ
NOTES AND EXPLANATIONS TO CONSOLIDATED FINANCIAL STATEMENTS AS OF 31
DECEMBER 2020 (Unless otherwise stated amounts are expressed in thousands of Turkish Lira (“TL”).)
79
XI. Explanations Related to Consolidated Risk Management (Continued) 4. Counterparty Credit Risk
4.1. Qualitative disclosure related to counterparty credit risk
Limit requests of clients demanding derivative transactions are evaluated based on the related line of business in
different credit committees. Limit amounts approved by credit committee are risk weighted limits. In calculation of
risk amount that traced to risk weighted limits is multiplied by ratios based on each factor’s historical movement and
that varies according to transaction’s nominal amount, transaction’s maturity, type, currency and purpose. Updates
are generally conducted on a yearly basis except for the times of strict market fluctuations. In other words, if current
tables do not cover risk calculations efficiently in case of strict market volatility, all tables are reviewed without
waiting for annual period.
In table calculations, different time periods are considered while making analyses. If there is a period in data set with
strictly fluctuating period, historical period after this period might be crucial. Also, in historical fluctuations, similar
work meant for a data is organized separately. References provided by BNPP are also considered in the process.
Eventually, all results are discussed firstly among line of business and then in the Market Risk Committee. Final
decision is made by Risk Policy Committee and one of the alternatives is chosen. Approval of the Board of Directors
members is obtained if the Risk Policy Committee members deem necessary.
Customers demanding derivative transactions are separated into two based on the purpose of the transaction. Decision
of allocating the client to a group is given with taking into consideration client’s all transactions. Related Credit
Department decides on the evaluation of client either in trading derivative transaction limit or in hedging derivative
transaction limit.
In principle, all individual customers are evaluated as in trading portfolio, and The Bank works with 100% cash and
cash equivalent collaterals. Commercial and corporate customers are evaluated different for each firm and based on
the decision given, are subject to different collateral conditions. Risks are monitored daily based on the collateral
conditions set with the client, and additional collaterals are demanded when a necessity arises according to internally
set principles.
For derivative transactions made with banks, ISDA, CSA and GMRA agreements are requested from counterparties
in principle, derivative transactions are not made with banks that do not sign these agreements. Collateral management
is made on a daily basis with banks considering agreement conditions so that counterparty risk is minimized.
All open derivative transactions are evaluated daily by using market data and resulting evaluation amount is installed
to system. As a new transaction is made, risk amount calculated with risk weights is reflected automatically to the
system. In other words, counterparty risk regarding all derivative transactions is monitored on banking system.
Collateral amount required for customer transactions, transaction evaluation amount and risk weighted nominal
amount is monitored daily by considering collateral condition and limit monitoring principles set up by the Bank.
Simulations of transactions are conducted in order to be able to see the level of capital consumption on transaction
basis. Ratings and Basel II portfolios of derivative customers and banks are reviewed and updated monthly. These are
considered in the calculation of capital requirement and evaluation of collateral conditions.

TÜRK EKONOMİ BANKASI ANONİM ŞİRKETİ
NOTES AND EXPLANATIONS TO CONSOLIDATED FINANCIAL STATEMENTS AS OF 31
DECEMBER 2020 (Unless otherwise stated amounts are expressed in thousands of Turkish Lira (“TL”).)
80
XI. Explanations Related to Consolidated Risk Management (Continued) 4. Counterparty Credit Risk (continued)
4.2. Analysis of counterparty credit risk (CCR) exposure by approach
Current Period
Replacem
ent
cost
Potential
future
exposure EEPE(*)
Alpha used for
Computing
regulatory
Exposure at
Default
Exposure
at Default
post
Credit Risk
Mitigation
Risk
Weighted
Assets
Standardized Approach - CCR (For Derivatives) 1,452,674 498,722 1.4 1,923,504 1,229,934
Internal Model Method (for derivatives, repo
transactions, marketable securities or commodity
lending or borrowing transactions, long settlement
transactions and securities financing transactions) - - - -
Simple Approach for Credit Mitigation (for repo transactions, marketable securities or commodity
lending or borrowing transactions, long settlement
transactions and securities financing transactions) - - Comprehensive Approach for Credit Risk Mitigation
(for repo transactions, marketable securities or
commodity lending or borrowing transactions, long settlement transactions and securities financing
transactions) - -
VaR for repo transactions, marketable securities or commodity lending or borrowing transactions, long
settlement transactions and securities financing
transactions 1,047,631 420,982
Total 1,650,916
(*) Effective Expected Positive Exposure
Prior Period
Replacem
ent
cost
Potential
future
exposure EEPE(*)
Alpha used for
Computing
regulatory
Exposure at
Default
Exposure at
Default post
Credit Risk
Mitigation
Risk
Weighted
Assets
Standardized Approach - CCR (For Derivatives) 424,504 567,790 1.4 978,777 807,495 Internal Model Method (for derivatives, repo
transactions, marketable securities or commodity
lending or borrowing transactions, long settlement transactions and securities financing transactions) - - - -
Simple Approach for Credit Mitigation (for repo
transactions, marketable securities or commodity lending or borrowing transactions, long settlement
transactions and securities financing transactions) - -
Comprehensive Approach for Credit Risk Mitigation (for repo transactions, marketable securities or
commodity lending or borrowing transactions, long
settlement transactions and securities financing
transactions) - -
VaR for repo transactions, marketable securities or
commodity lending or borrowing transactions, long settlement transactions and securities financing
transactions 20,589 3,653
Total 811,148
(*) Effective Expected Positive Exposure

TÜRK EKONOMİ BANKASI ANONİM ŞİRKETİ
NOTES AND EXPLANATIONS TO CONSOLIDATED FINANCIAL STATEMENTS AS OF 31
DECEMBER 2020 (Unless otherwise stated amounts are expressed in thousands of Turkish Lira (“TL”).)
81
XI. Explanations Related to Consolidated Risk Management (Continued)
4. Counterparty Credit Risk (continued)
4.3. Credit valuation adjustment (CVA) capital charge
Current Period
Exposure at Default
post-Credit Risk
Mitigation
Risk Weighted
Assets
Total portfolios subject to the Advanced CVA capital charge - - (i) Value at Risk component (including the 3*multiplier) -
(ii) Stressed Value at Risk component (including the 3*multiplier) -
All portfolios subject to the Standardized CVA capital charge 1,923,504 465,490
Total subject to the CVA capital charge 1,923,504 465,490
Prior Period
Exposure at Default
post-Credit Risk
Mitigation
Risk Weighted
Assets
Total portfolios subject to the Advanced CVA capital charge - -
(i) Value at Risk component (including the 3*multiplier) -
(ii) Stressed Value at Risk component (including the 3*multiplier) - All portfolios subject to the Standardized CVA capital charge 978,777 392,622
Total subject to the CVA capital charge 978,777 392,622

TÜRK EKONOMİ BANKASI ANONİM ŞİRKETİ
NOTES AND EXPLANATIONS TO CONSOLIDATED FINANCIAL STATEMENTS AS OF 31 DECEMBER 2020 (Unless otherwise stated amounts are expressed in thousands of Turkish Lira (“TL”).)
82
XI. Explanations Related to Consolidated Risk Management (Continued) 4. Counterparty Credit Risk (continued)
4.4 CCR exposures by regulatory portfolio and risk weights
Current Period
Risk Weight/ Regulatory portfolio 0% 10% 20% 35% 50% 75% 100% 150% Others
Total credit
exposure (*)
Claims from central governments and central banks 529,441 - - - - - - - - 529,441
Claims from regional and local governments - - - - - - - - - - Claims from administration and non-commercial entity - - - - - - - - - -
Claims from multilateral development banks - - - - - - - - - -
Claims from international organizations - - - - - - - - - - Claims from banks and financial intermediaries - - 254,344 - 1,137,118 - - - - 1,391,462
Corporates - - 6,359 - 17,753 - 1,006,996 - - 1,031,108
Retail portfolios - - - - - 19,124 - - - 19,124 Claims on landed real estate - - - - - - - - - -
Past due loans - - - - - - - - - -
Claims which are determined as high risk by the board of BRSA - - - - - - - - - -
Mortgage securities - - - - - - - - - -
Securitization positions - - - - - - - - - -
Claims from corporates, banks and financial intermediaries which have short term credit rating - - - - - - - - - -
Investments which are qualified as collective investment
institutions - - - - - - - - - - Stock investment - - - - - - - - - -
Other claims - - - - - - - - - -
Other assets (**) - - - - - - - - - -
Total 529,441 - 260,703 - 1,154,871 19,124 1,006,996 - - 2,971,135
(*) Total credit risk: Amount related to capital adequacy calculation after the counterparty credit risk measurement techniques are applied.
(**) Other assets: The amounts not included in the credit risk of the counterparty reported in the risks table to the Central Counterparty.

TÜRK EKONOMİ BANKASI ANONİM ŞİRKETİ
NOTES AND EXPLANATIONS TO CONSOLIDATED FINANCIAL STATEMENTS AS OF 31 DECEMBER 2020 (Unless otherwise stated amounts are expressed in thousands of Turkish Lira (“TL”).)
83
XI. Explanations Related to Consolidated Risk Management (Continued) 4. Counterparty Credit Risk (continued)
4.4 CCR exposures by regulatory portfolio and risk weights (continued)
Prior Period
Risk Weight/ Regulatory portfolio 0% 10% 20% 35% 50% 75% 100% 150% Others
Total credit
exposure (*)
Claims from central governments and central banks 13,012 - - - - - - - - 13,012
Claims from regional and local governments - - - - - - - - - -
Claims from administration and non-commercial entity - - - - - - - - - -
Claims from multilateral development banks - - - - - - - - - -
Claims from international organizations - - - - - - - - - -
Claims from banks and financial intermediaries - - 9,946 - 297,308 - 46,481 - - 353,735
Corporates - - 131 - 15,706 - 574,234 - - 590,071
Retail portfolios - - - - - 42,548 - - - 42,548
Claims on landed real estate - - - - - - - - - -
Past due loans - - - - - - - - - -
Claims which are determined as high risk by the board of BRSA - - - - - - - - - -
Mortgage securities - - - - - - - - - -
Securitization positions - - - - - - - - - -
Claims from corporates, banks and financial intermediaries which have short
term credit rating
- - - - - - - - - -
Investments which are qualified as collective investment institutions - - - - - - - - - -
Stock investment - - - - - - - - - -
Other claims - - - - - - - - - -
Other assets (**) - - - - - - - - - -
Total 13,012 - 10,077 - 313,014 42,548 620,715 - - 999,366
(*) Total credit risk: Amount related to capital adequacy calculation after the counterparty credit risk measurement techniques are applied.
(**) Other assets: The amounts not included in the credit risk of the counterparty reported in the risks table to the Central Counterparty.

TÜRK EKONOMİ BANKASI ANONİM ŞİRKETİ
NOTES AND EXPLANATIONS TO CONSOLIDATED FINANCIAL STATEMENTS AS OF
31 DECEMBER 2020 (Unless otherwise stated amounts are expressed in thousands of Turkish Lira (“TL”).)
84
XI. Explanations Related to Consolidated Risk Management (Continued)
4. Counterparty Credit Risk (continued)
4.5. Composition of collateral for counterparty credit risk exposure
Collateral used in derivative
transactions
Collateral used in other
transactions
Fair value of collateral
received
Fair value of posted
collateral
Fair
value of
collateral
received
Fair
value of
posted
collateral Current Period Segregated Unsegregated Segregated Unsegregated
Cash – domestic currency - 1,220 - - - - Cash – other currencies - 3,711 - - - -
Domestic sovereign debt - 1,055 - - - -
Other sovereign debt - 21,906 - - - - Government agency debt - - - - - -
Corporate bonds - - - - - -
Equity securities - - - - - - Other collateral - - - - - -
Total - 27,892 - - - -
Collateral used in derivative
transactions
Collateral used in other
transactions
Fair value of collateral
received
Fair value of posted
collateral
Fair
value of
collateral
received
Fair
value of
posted
collateral Prior Period Segregated Unsegregated Segregated Unsegregated
Cash – domestic currency - 298 - - - - Cash – other currencies - 12,916 - - - -
Domestic sovereign debt - 74 - - - -
Other sovereign debt - 229 - - - - Government agency debt - - - - - -
Corporate bonds - - - - - -
Equity securities - - - - - - Other collateral - - - - - -
Total - 13,517 - - - -
4.6. Credit derivatives exposures
Current Period Prior Period
Protection bought Protection sold Protection bought Protection sold
Nominal Single-name credit default swaps - - - -
Index credit default swaps - - - -
Total return swaps - - - - Credit options - - - -
Other credit derivatives - - - -
Total Nationals - - - -
Fair Values
Positive fair value (asset) - - - -
Negative fair value (liability) - - - -
4.7. Exposures to central counterparties
None.

TÜRK EKONOMİ BANKASI ANONİM ŞİRKETİ
NOTES AND EXPLANATIONS TO CONSOLIDATED FINANCIAL STATEMENTS AS OF
31 DECEMBER 2020 (Unless otherwise stated amounts are expressed in thousands of Turkish Lira (“TL”).)
85
XI. Explanations Related to Consolidated Risk Management (Continued)
5. Securitization Disclosures
Since the Parent Bank does not hold securitization position, the notes to be presented according to the
‘Communiqué on Disclosures about Risk Management to be announced to Public by Banks’ have not been
presented.
6. Market Risk Disclosures
The market risk section includes the market risk capital requirements calculated for trading book and banking book
exposures that are subject to a market risk charge. It also includes capital requirements for securitisation positions
held in the trading book. However, it excludes the counterparty credit risk capital charges that apply to the same
exposures, which are reported in Section 5 – Counterparty credit risk.
Notes and explanations prepared in accordance with “the Communiqué on Disclosures about Risk Management to
be announced to Public by Banks” published in Official Gazette no. 29511 on 23 October 2015 and became
effective as of 31 March 2016. The notes to be presented on annually basis according to Communiqué have not
been presented due to usage of standard approach for the calculation of market risk by the Group.
6.1. Qualitative disclosure requirements related to market risk
Interest rate and foreign exchange rate risks, arising from the volatility in the financial markets, of the financial
positions taken by the Parent Bank related to balance sheet and off-balance sheet accounts are measured and
while calculating the capital adequacy and the amount subject to Value at Risk (VAR), as summarized below, is
taken into consideration by the standard method. Beside the standard method, VAR is calculated by using internal
model as supported by scenario analysis and stress tests. VAR is calculated daily by historic simulation. These
results are also reported daily to the management.
For FX position, limits in different breakdowns are determined by Board of Directors and option operations are
considered with delta conjugates.
In regular analysis, net interest income effects originating from interest rates changes are calculated for all
interest rates sensitive products and the results are followed up in limits determined by Board of Directors. The
shocks which are given to interest rates are changes by each currency and not only linear but also sudden shocks
are evaluated. These analyses may be performed for both current and targeted financial figures.
According to economic cost approach, changes in market interest rates may affect the Parent Bank’s assets,
liabilities and off balance sheet items values. The Parent Bank’s economic value’s sensitivity to interest rate is
an important issue for stockholders, management and auditors.
Economic value of a product is net present value that is calculated by discounting expected cash flow.
Economic value of the Parent Bank is the net present value of the cash flows that is subtracting expected cash
flows of liabilities from net present value of assets and adding off balance sheet items expected cash flows.
Economic value approach represents value of the Bank’s sensitivity to interest rate fluctuations.
Market value of equity is defined as the difference between the market value of assets and liabilities. The Board
of Directors predefines a limit for market value of equity; shock method is applied to all items to be able to see
equity’s influence on market value. Shocks applied may vary based on currencies.
As Economical Value approach considers effects of interest rate changes on all future cash flows, it enables to
comprehensively understand effects of interest rate changes in the long run.
In addition to these analyses, Group Risk Management, based on current position, conducts stress testing to be
able to predict possible losses as a consequence of exceptional fluctuations. Stress testings prepared by BNP
Paribas and TEB Group Risk Management measure the sensitivity created as a result of market price changes
based on scenarios. Scenario analysis both on historical and hypothetical basis are conducted.

TÜRK EKONOMİ BANKASI ANONİM ŞİRKETİ
NOTES AND EXPLANATIONS TO CONSOLIDATED FINANCIAL STATEMENTS AS OF
31 DECEMBER 2020 (Unless otherwise stated amounts are expressed in thousands of Turkish Lira (“TL”).)
86
XI. Explanations Related to Consolidated Risk Management (Continued) 6. Market Risk Disclosures (continued)
6.1. Qualitative disclosure requirements related to market risk (continued)
Scenario analysis is applied both to currency and interest rates to be able to understand the effects on current
portfolio.
Other than scenario analysis, various stress testings are applied to current portfolio; in order to see the effects
of prior events on current position.
Nominal amount limits defined for bond portfolio, VAR (value at risk) limit for trading portfolio, and PV01
limits set for tracking interest rate risk are calculated daily, tracked and reported to the management. Both
interest rate and liquidity gap calculations are made for each item of the balance sheet. For both calculations,
as product based cash flows are formed, repricing, maturity and product based acceptances are also considered.
Monthly reports are prepared for Market and Liquidity Risk Committees. Reports include end of the day
positions, monthly/annual cumulative profit/loss balances and some positions taken in that month.
All Limit and risk positions are represented to Risk Policies Committee, Risk Committee and to The Board of
Directors.
6.2. Standardized Approach
Current Period Risk Weighted Amounts
Outright products 1 Interest rate risk (general and specific) 1,561,156
2 Equity risk (general and specific) -
3 Foreign exchange risk 232,944
4 Commodity risk 588,523
Options
5 Simplified approach -
6 Delta-plus method 53,037
7 Scenario approach -
8 Securitization -
9 Total 2,435,660
Prior Period Risk Weighted Amounts
Outright products 1 Interest rate risk (general and specific) 1,437,126
2 Equity risk (general and specific)) -
3 Foreign exchange risk 71,084
4 Commodity risk 107,119
Options
5 Simplified approach -
6 Delta-plus method 22,588
7 Scenario approach -
8 Securitization -
9 Total 1,637,917

TÜRK EKONOMİ BANKASI ANONİM ŞİRKETİ
NOTES AND EXPLANATIONS TO CONSOLIDATED FINANCIAL STATEMENTS AS OF
31 DECEMBER 2020 (Unless otherwise stated amounts are expressed in thousands of Turkish Lira (“TL”).)
87
XI. Explanations Related to Consolidated Risk Management (Continued)
7. Explanations Related to the Consolidated Operational Risk
a) Operational risk has been calculated using the basic indicator approach. Market risk measurements are performed
monthly.
b) In case of Basic Indicator Approach the following:
31.12.2017
31.12.2018
31.12.2019
Total/Positive
Year Rate
(%)
Total
Gross Income 4,275,468 5,363,915 6,191,758 5,277,046 15 791,557
Operational Risk Capital Requirement
(Total*12,5) 9,894,462
31.12.2016
31.12.2017
31.12.2018
Total/Positive
Year Rate
(%)
Total
Gross Income 4,222,997 4,275,468 5,363,915 4,620,793 15 693,119
Operational Risk Capital Requirement
(Total*12,5) 8,663,988
c) The Group does not use the standard method.
d) The Group does not use any alternative approach in standard method.
e) The Group does not use advanced measurement approach.
8. Explanations Related to Remuneration Policy in Banks
TEB pays net salaries on the last working day of each month, after the required legal deductions are made. In
addition to receiving a monthly salary, all TEB employees are assessed based on meeting their qualitative and
quantitative targets, and the Bank may pay performance-based success and sales premiums or annual performance
bonuses to reward employees’ collective and individual success.
An annual performance bonus is determined based on the Bank’s profitability, the results of Bank activities, and
the realization of targets in line with market practices (local and/or professional). A performance bonus is only
paid when the target realized in a particular year is at least 80%. Employees included in the success and sales
premium scheme are paid success and sales premiums based to the targets realized during the year.
The remuneration policy of the Bank was prepared in line with the BRSA’s “Communiqué on Corporate
Management of Banks” and “Guidance on Good Remuneration Practices” in Banks, and within the scope of the
principle of proportionality, the content, structure, and strategies of the Bank’s activities, long-term targets, and
the risk management structure of the Bank and local regulations. These regulations aim to prevent taking excessive
risks and evaluate actual contributions to risk management.
The remuneration policy supports the Bank in managing risks in line with the principles and parameters determined
and approved by the Board of Directors. The remuneration policy aims to attract and retain expert employees who
will contribute to the Bank reaching its strategic targets in both business line and support functions.
SECOM (Selection and Compensation Committee) is responsible, on behalf of the Board of Directors, for ensuring
that the remuneration policy is prepared in line with local and BNP Paribas regulations. SECOM manages the
principles of the remuneration policy, taking opinions from the human resources, financial affairs, risk,
compliance, and internal control groups. The remuneration policy is reviewed and approved by SECOM and
submitted to the Board of Directors. The remuneration policy is reviewed annually.

TÜRK EKONOMİ BANKASI ANONİM ŞİRKETİ
NOTES AND EXPLANATIONS TO CONSOLIDATED FINANCIAL STATEMENTS AS OF
31 DECEMBER 2020 (Unless otherwise stated amounts are expressed in thousands of Turkish Lira (“TL”).)
88
SECTION FIVE
EXPLANATIONS AND DISCLOSURES ON CONSOLIDATED
FINANCIAL STATEMENTS
I. Explanations and Disclosures Related to the Consolidated Assets
1. a) Information on Cash and Balances with the Central Bank of the Republic of Turkey:
Current Period Prior Period
TL FC TL FC
Cash in TL/Foreign Currency 382,963 1,948,389 410,345 2,031,625
Balances with the Central Bank of Turkey 3,048,958 11,382,722 305,709 8,942,832
Other - 188,271 - 265,460
Total 3,431,921 13,519,382 716,054 11,239,917
b) Information related to the account of the Central Bank of the Republic of Turkey:
Current Period Prior Period
TL FC TL FC
Unrestricted Demand Deposit 2,979,546 - 297,130 -
Unrestricted Time Deposit - 4,626,036 - 3,932,318
Restricted Time Deposit 69,412 6,756,686 8,579 5,010,514
Total 3,048,958 11,382,722 305,709 8,942,832
Foreign currency unrestricted deposit amounting to TL 4,626,036 (31 December 2019: TL 3,932,318), foreign currency restricted deposit amounting to TL 6,756,686 (31 December 2019: TL 5,010,514), unrestricted deposit balance amounting to TL 2,979,546 (31 December 2019: TL 297,130), and restricted deposit amounting to TL 69,412 (31 December 2019: TL 8,579 ) comprises of reserve deposits. As of 31 December 2020, the Turkish lira required reserve ratios are determined to be within the range of 1%-6% depending on the maturity structure of deposits denominated in Turkish Lira (31 December 2019: 1%-2%), and the required reserve ratios for foreign currency deposits and other liabilities within the range of 5%-22% (31 December 2019: 5%-21%).
2. Information on financial assets at fair value through profit or loss (net):
a.1) Information on financial assets at fair value through profit or loss given as collateral / blocked: None
(31 December 2019: None).
a.2) Financial assets at fair value through profit or loss subject to repurchase agreements: None
(31 December 2019: None).
Net book value of unrestricted financial assets at fair value through profit or loss is TL 1,447,816 (31
December 2019: 1,167,994 TL).
3. Positive differences related to derivative financial assets held-for-trading:
Current Period Prior Period
TL FC TL FC
Forward Transactions 392,758 56,660 144,959 9,474
Swap Transactions 1,091,529 165,479 1,302,918 179,827
Futures Transactions - - - - Options 36,244 9,939 25,918 6,946
Other - - - -
Total 1,520,531 232,078 1,473,795 196,247

TÜRK EKONOMİ BANKASI ANONİM ŞİRKETİ
NOTES AND EXPLANATIONS TO CONSOLIDATED FINANCIAL STATEMENTS AS OF
31 DECEMBER 2020 (Unless otherwise stated amounts are expressed in thousands of Turkish Lira (“TL”).)
89
I. Explanations and Disclosures Related to the Consolidated Assets (Continued)
4. Information on banks:
Current Period Prior Period
TL FC TL FC
Banks Domestic Banks 1,917,454 801,216 1,031,578 185,445
Foreign Banks 56,939 3,908,495 55,635 7,303,396
Foreign Head Offices and Branches - - - -
Total 1,974,393 4,709,711 1,087,213 7,488,841
b) Information on foreign banks account:
Unrestricted
Amount Restricted Amount
Unrestricted
Amount Restricted Amount
Current Period Current Period Prior Period Prior Period
EU Countries 1,732,218 - 5,954,481 -
USA and Canada 1,518,644 - 211,172 - OECD Countries(*) 135,873 - 739,820 -
Off-Shore Banking Regions 556,267 - 446,599 -
Other 22,432 - 6,959 -
Total 3,965,434 - 7,359,031 -
5. Information on financial assets at fair value through other comprehensive income:
a.1) Information on financial assets at fair value through other comprehensive income given as collateral
/ blocked:
Current Period Prior Period
TL FC TL FC
Equity Securities - - - -
Bond, Treasury Bill and Similar Investment Securities 876,626 272,329 333,201 -
Other - - - -
Total 876,626 272,329 333,201 -
a.2) Information on financial assets at fair value through other comprehensive income subject to
repurchase agreements:
Current Period Prior Period
TL FC TL FC
Government Bonds 869,642 2,567,087 77,088 -
Treasury Bills - - - - Other Government Debt Securities - - - -
Bank Bonds and Bank Guaranteed Bonds - - - - Asset Backed Securities - - - -
Other - - - -
Total 869,642 2,567,087 77,088 -
The book value of debt securities and equity securities in unrestricted financial assets at fair value through other
comprehensive income is TL 4,066,713 (31 December 2019: TL 5,131,082).
b.1) Information on financial assets at fair value through other comprehensive income:
Current Period Prior Period
Debt Securities 8,641,516 5,533,476
Quoted on a Stock Exchange 8,618,350 5,512,862 Unquoted 23,166 20,614
Equity Securities 10,881 7,895
Quoted on a Stock Exchange - - Unquoted 10,881 7,895
Impairment Provision (-) - -
Total 8,652,397 5,541,371

TÜRK EKONOMİ BANKASI ANONİM ŞİRKETİ
NOTES AND EXPLANATIONS TO CONSOLIDATED FINANCIAL STATEMENTS AS OF
31 DECEMBER 2020 (Unless otherwise stated amounts are expressed in thousands of Turkish Lira (“TL”).)
90
I. Explanations and Disclosures Related to the Consolidated Assets (Continued)
6. Information on loans:
a) Information on all types of loans and advances given to shareholders and employees of the Parent Bank:
Current Period Prior Period
Cash
Loans
Non-Cash
Loans
Cash
Loans
Non-Cash
Loans
Direct Loans Granted to Shareholders - 438,193 1,596 182,856
Corporate Shareholders - 438,193 1,596 182,856
Real Person Shareholders - - - -
Indirect Loans Granted to Shareholders - - - -
Loans Granted to Employees 153,482 - 139,703 -
Total 153,482 438,193 141,299 182,856
b) Information on the standard loans, loans under close monitoring and restructured loans under close
monitoring:
Cash Loans Standard Loans
Loans Under Close Monitoring
Not Under the Scope of
Restructuring
Loans Under Restructuring
Loans with Revised
Contract Terms Refinancing
Non-specialized loans 71,307,608 6,190,429 92,352 1,669,564
Working Capital Loans 5,389,404 835,979 54,422 796,995
Export Loans 9,300,529 62,917 - 89,456
Import Loans - - - -
Loans Given to Financial Sector 2,655,503 - - -
Consumer Loans 16,922,139 2,915,680 3,912 150,693
Credit Cards 4,540,033 655,741 22,188 -
Other 32,500,000 1,720,112 11,830 632,420 Specialized Loans - - - -
Other Receivables - - - -
Total 71,307,608 6,190,429 92,352 1,669,564
Current Period Prior Period
Standard Loans
Loans Under Close
Monitoring Standard Loans
Loans Under Close
Monitoring
12 Month Expected Credit Loss 393,446 - 394,194 - Significant increase in Credit Risk - 1,360,252 - 894,153
Total 393,446 1,360,252 394,194 894,153
c) Distribution of cash loans by maturity structure:
Standard Loans
Loans Under Close Monitoring
Loans not subject to
Restructuring
Restructured
Short-term loans 35,530,948 1,564,549 152,657
Medium and long-term loans 35,776,660 4,625,880 1,609,259
Total 71,307,608 6,190,429 1,761,916

TÜRK EKONOMİ BANKASI ANONİM ŞİRKETİ
NOTES AND EXPLANATIONS TO CONSOLIDATED FINANCIAL STATEMENTS AS OF
31 DECEMBER 2020 (Unless otherwise stated amounts are expressed in thousands of Turkish Lira (“TL”).)
91
I. Explanations and Disclosures Related to the Consolidated Assets (Continued)
6. Information on loans: (continued)
d) Information on consumer loans, individual credit cards, personnel loans and credit cards given to personnel:
Current Period
Short Term
Medium and
Long Term
Total
Consumer Loans-TL 450,376 18,715,717 19,166,093
Housing Loans 663 4,502,862 4,503,525
Vehicle Loans 6,877 451,829 458,706
General Purpose Loans 442,836 13,761,026 14,203,862
Other - - -
Consumer Loans –Indexed to FC - 15,510 15,510
Housing Loans - 15,510 15,510
Vehicle Loans - - -
General Purpose Loans - - -
Other - - -
Consumer Loans-FC (**) - 19,914 19,914
Housing Loans - 5,349 5,349
Vehicle Loans - 1,909 1,909
General Purpose Loans - 12,656 12,656
Other - - -
Individual Credit Cards-TL 3,497,240 21,003 3,518,243
With Instalments 1,160,176 21,003 1,181,179
Without Instalments 2,337,064 - 2,337,064
Individual Credit Cards-FC 4,898 - 4,898
With Instalments - - -
Without Instalments 4,898 - 4,898
Personnel Loans-TL 10,001 107,618 117,619
Housing Loans - 356 356
Vehicle Loans - - -
General Purpose Loans 10,001 107,262 117,263
Other - - -
Personnel Loans- Indexed to FC - - -
Housing Loans - - -
Vehicle Loans - - -
General Purpose Loans - - -
Other - - -
Personnel Loans-FC - - -
Housing Loans - - -
Vehicle Loans - - -
General Purpose Loans - - -
Other - - -
Personnel Credit Cards-TL 32,257 52 32,309
With Instalments 9,979 52 10,031
Without Instalments 22,278 - 22,278
Personnel Credit Cards-FC 32 - 32
With Instalments - - -
Without Instalments 32 - 32
Overdraft Accounts-TL(Real Persons) (*) 673,283 - 673,283
Overdraft Accounts-FC(Real Persons) 5 - 5
Total 4,668,092 18,879,814 23,547,906
(*) Overdraft accounts include personnel loans amounting to TL 3,522.
(**) Loans granted via branches abroad.

TÜRK EKONOMİ BANKASI ANONİM ŞİRKETİ
NOTES AND EXPLANATIONS TO CONSOLIDATED FINANCIAL STATEMENTS AS OF
31 DECEMBER 2020 (Unless otherwise stated amounts are expressed in thousands of Turkish Lira (“TL”).)
92
I. Explanations and Disclosures Related to the Consolidated Assets (continued)
6. Information on loans: (continued)
d) Information on consumer loans, individual credit cards, personnel loans and credit cards given to personnel:
(continued)
Prior Period
Short Term
Medium and
Long Term
Total
Consumer Loans-TL 567,813 15,880,140 16,447,953
Housing Loans 3,287 5,334,276 5,337,563
Vehicle Loans 18,385 422,741 441,126
General Purpose Loans 546,141 10,123,123 10,669,264
Other - - -
Consumer Loans –Indexed to FC - 18,308 18,308
Housing Loans - 18,308 18,308
Vehicle Loans - - -
General Purpose Loans - - -
Other - - -
Consumer Loans-FC (**) - 27,949 27,949
Housing Loans - 6,031 6,031
Vehicle Loans - 3,655 3,655
General Purpose Loans - 18,263 18,263
Other - - -
Individual Credit Cards-TL 3,135,899 54,120 3,190,019
With Instalments 1,012,747 54,120 1,066,867
Without Instalments 2,123,152 - 2,123,152
Individual Credit Cards-FC 11,775 - 11,775
With Instalments - - -
Without Instalments 11,775 - 11,775
Personnel Loans-TL 13,520 89,484 103,004
Housing Loans - 517 517
Vehicle Loans - - -
General Purpose Loans 13,520 88,967 102,487
Other - - -
Personnel Loans- Indexed to FC - - -
Housing Loans - - -
Vehicle Loans - - -
General Purpose Loans - - -
Other - - -
Personnel Loans-FC - - -
Housing Loans - - -
Vehicle Loans - - -
General Purpose Loans - - -
Other - - -
Personnel Credit Cards-TL 31,920 - 31,920
With Instalments 10,293 - 10,293
Without Instalments 21,627 - 21,627
Personnel Credit Cards-FC 393 - 393
With Instalments - - -
Without Instalments 393 - 393
Overdraft Accounts-TL(Real Persons) (*) 608,567 - 608,567
Overdraft Accounts-FC(Real Persons) 4 - 4
Total 4,369,891 16,070,001 20,439,892
(*) Overdraft accounts include personnel loans amounting to TL 4,386.
(**) Loans granted via branches abroad.

TÜRK EKONOMİ BANKASI ANONİM ŞİRKETİ
NOTES AND EXPLANATIONS TO CONSOLIDATED FINANCIAL STATEMENTS AS OF
31 DECEMBER 2020 (Unless otherwise stated amounts are expressed in thousands of Turkish Lira (“TL”).)
93
I. Explanations and Disclosures Related to the Consolidated Assets (Continued)
6. Information on loans: (continued)
e) Information on commercial loans with instalments and corporate credit cards:
Current Period Short Term
Medium and Long
Term Total
Commercial Loans with Instalment -TL 2,173,068 8,946,399 11,119,467
Business Loans 257 163,797 164,054
Vehicle Loans 61,037 1,257,926 1,318,963 General Purpose Loans 2,111,774 7,524,676 9,636,450
Other - - -
Commercial Loans with Instalment - Indexed to FC - 148,076 148,076
Business Loans - 6,192 6,192
Vehicle Loans - 23,201 23,201
General Purpose Loans - 118,683 118,683 Other - - -
Commercial Loans with Instalment - FC - - -
Business Loans - - - Vehicle Loans - - -
General Purpose Loans - - -
Other - - - Corporate Credit Cards-TL 1,660,003 917 1,660,920
With Instalments 601,673 917 602,590
Without Instalments 1,058,330 - 1,058,330 Corporate Credit Cards-FC 1,560 - 1,560
With Instalments - - -
Without Instalments 1,560 - 1,560 Overdraft Accounts-TL(Legal Entities) 741,420 - 741,420
Overdraft Accounts-FC(Legal Entities) - - -
Total 4,576,051 9,095,392 13,671,443
Prior Period Short Term
Medium and Long
Term Total
Commercial Loans with Instalment -TL 1,006,177 9,781,970 10,788,147
Business Loans 1,000 170,690 171,690 Vehicle Loans 26,836 682,638 709,474
General Purpose Loans 978,341 8,928,642 9,906,983
Other - - - Commercial Loans with Instalment - Indexed to FC - 331,604 331,604
Business Loans - 5,899 5,899 Vehicle Loans - 83,943 83,943
General Purpose Loans - 241,762 241,762
Other - - - Commercial Loans with Instalment - FC 478 - 478
Business Loans - - -
Vehicle Loans - - - General Purpose Loans 478 - 478
Other - - -
Corporate Credit Cards-TL 1,504,191 - 1,504,191
With Instalments 385,150 - 385,150
Without Instalments 1,119,041 - 1,119,041
Corporate Credit Cards-FC 2,439 - 2,439
With Instalments - - -
Without Instalments 2,439 - 2,439
Overdraft Accounts-TL(Legal Entities) 849,525 - 849,525
Overdraft Accounts-FC(Legal Entities) - - -
Total 3,362,810 10,113,574 13,476,384

TÜRK EKONOMİ BANKASI ANONİM ŞİRKETİ
NOTES AND EXPLANATIONS TO CONSOLIDATED FINANCIAL STATEMENTS AS OF
31 DECEMBER 2020 (Unless otherwise stated amounts are expressed in thousands of Turkish Lira (“TL”).)
94
I. Explanations and Disclosures Related to the Consolidated Assets (Continued)
6. Information on loans: (continued)
f) Distribution of loans by users:
Current Period Prior Period
Public 2,048,390 2,096,489
Private 77,211,563 62,816,411
Total 79,259,953 64,912,900
g) Domestic and foreign loans:
Current Period Prior Period
Domestic Loans 78,767,136 64,365,150
Foreign Loans 492,817 547,750
Total 79,259,953 64,912,900
h) Loans granted to subsidiaries and associates:
Eliminated in consolidated financial statements.
i) Specific or non-performing loan (Stage 3) provisions for loans:
Current Period Prior Period
Loans and Receivables with Limited Collectability 104,606 349,033
Loans and Receivables with Doubtful Collectability 198,193 572,537
Uncollectible Loans and Receivables 1,991,274 1,430,975
Total 2,294,073 2,352,545
j) Information on loans under follow-up (Net):
j.1) Information on loans and other receivables included in loans under follow-up which are restructured or
rescheduled: Group III Group IV Group V
Loans and Receivables
with Limited Collectability Loans and Receivables with
Doubtful Collectability
Uncollectable
Loans and Receivables
Current Period
Gross Amounts before Provisions 22,018 24,809 52,292
Restructured Loans 22,018 24,809 52,292 Prior Period
Gross Amounts before Provisions 55,867 41,008 18,928
Restructured Loans 55,867 41,008 18,928
j.2) Movement of loans under follow-up:
Prior Period Group III Group IV Group V
Loans and
Receivables with
Limited Collectability
Loans and
Receivables with
Doubtful
Collectability
Uncollectable
Loans and
Receivables Prior Period End Balance 624,321 1,168,994 2,353,591
Additions (+) 962,916 94,269 394,387 Transfers from Other Categories of Loans under Follow-up
(+) - 1,173,957 1,705,142
Transfers to Other Categories of Loans under Follow-up (-) 1,173,957 1,705,142 -
Collections (-) 245,121 412,866 916,644
Write-offs (-) 4 691 96,801
Sold Portfolio (-) (*) 3 4,792 419,674
Corporate and Commercial Loans - 4,572 171,810 Retail Loans 2 - 137,865
Credit Cards 1 220 109,999
Other - - -
Current Period End Balance 168,152 313,729 3,020,001
Provision (-) 104,606 198,193 1,991,274
Net Balances on Balance Sheet 63,546 115,536 1,028,727
(*) Past due receivables amounting to TL 424,469 for which TL 410,516 of provision had been allocated, is sold for
TL 35,759 during 2020. After all sales procedures were completed, these past due receivables have been written off from the
portfolio.
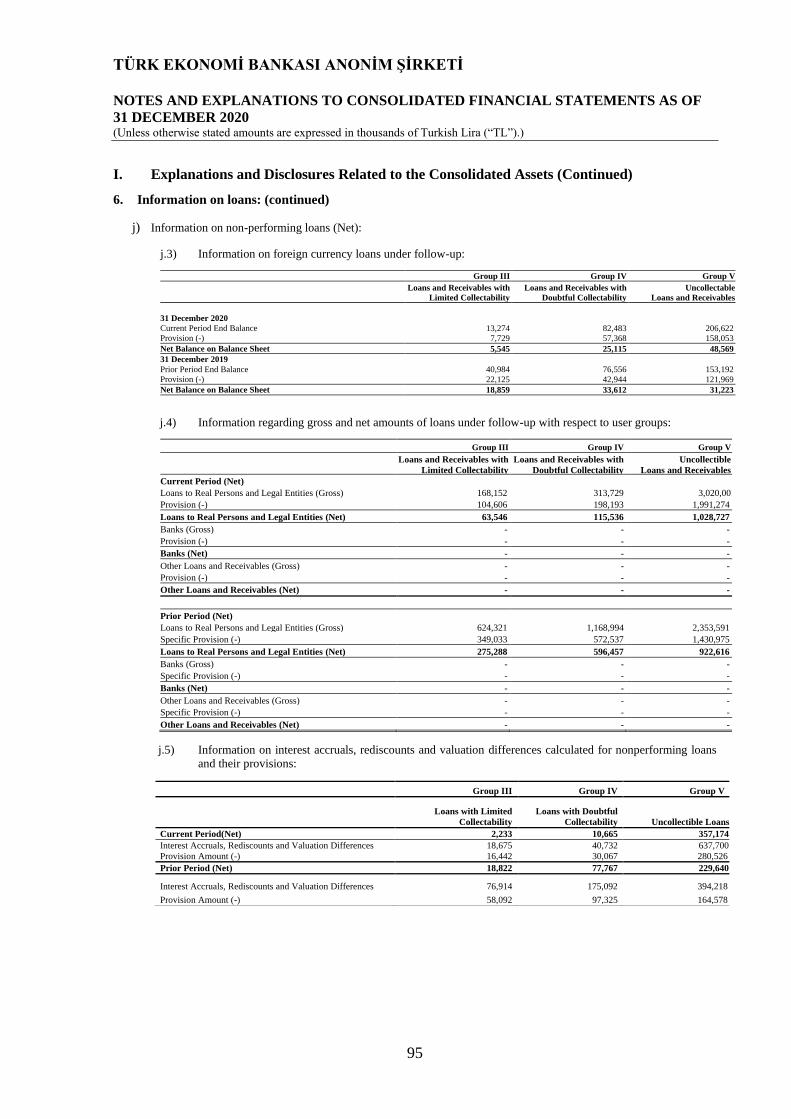
TÜRK EKONOMİ BANKASI ANONİM ŞİRKETİ
NOTES AND EXPLANATIONS TO CONSOLIDATED FINANCIAL STATEMENTS AS OF
31 DECEMBER 2020 (Unless otherwise stated amounts are expressed in thousands of Turkish Lira (“TL”).)
95
I. Explanations and Disclosures Related to the Consolidated Assets (Continued)
6. Information on loans: (continued)
j) Information on non-performing loans (Net):
j.3) Information on foreign currency loans under follow-up:
Group III Group IV Group V
Loans and Receivables with
Limited Collectability
Loans and Receivables with
Doubtful Collectability
Uncollectable
Loans and Receivables
31 December 2020
Current Period End Balance 13,274 82,483 206,622 Provision (-) 7,729 57,368 158,053
Net Balance on Balance Sheet 5,545 25,115 48,569
31 December 2019
Prior Period End Balance 40,984 76,556 153,192
Provision (-) 22,125 42,944 121,969
Net Balance on Balance Sheet 18,859 33,612 31,223
j.4) Information regarding gross and net amounts of loans under follow-up with respect to user groups:
Group III Group IV Group V
Loans and Receivables with
Limited Collectability
Loans and Receivables with
Doubtful Collectability
Uncollectible
Loans and Receivables
Current Period (Net)
Loans to Real Persons and Legal Entities (Gross) 168,152 313,729 3,020,001
Provision (-) 104,606 198,193 1,991,274
Loans to Real Persons and Legal Entities (Net) 63,546 115,536 1,028,727
Banks (Gross) - - -
Provision (-) - - -
Banks (Net) - - -
Other Loans and Receivables (Gross) - - -
Provision (-) - - -
Other Loans and Receivables (Net) - - -
Prior Period (Net)
Loans to Real Persons and Legal Entities (Gross) 624,321 1,168,994 2,353,591
Specific Provision (-) 349,033 572,537 1,430,975
Loans to Real Persons and Legal Entities (Net) 275,288 596,457 922,616
Banks (Gross) - - -
Specific Provision (-) - - -
Banks (Net) - - -
Other Loans and Receivables (Gross) - - -
Specific Provision (-) - - -
Other Loans and Receivables (Net) - - -
j.5) Information on interest accruals, rediscounts and valuation differences calculated for nonperforming loans
and their provisions:
Group III Group IV Group V
Loans with Limited
Collectability
Loans with Doubtful
Collectability Uncollectible Loans
Current Period(Net) 2,233 10,665 357,174
Interest Accruals, Rediscounts and Valuation Differences 18,675 40,732 637,700
Provision Amount (-) 16,442 30,067 280,526
Prior Period (Net) 18,822 77,767 229,640
Interest Accruals, Rediscounts and Valuation Differences 76,914 175,092 394,218
Provision Amount (-) 58,092 97,325 164,578

TÜRK EKONOMİ BANKASI ANONİM ŞİRKETİ
NOTES AND EXPLANATIONS TO CONSOLIDATED FINANCIAL STATEMENTS AS OF
31 DECEMBER 2020 (Unless otherwise stated amounts are expressed in thousands of Turkish Lira (“TL”).)
96
I. Explanations and Disclosures Related to the Consolidated Assets (continued)
6. Information on loans: (continued)
k) Outline of the liquidation policy for losses and other receivables:
Loans and other receivables, which are deemed not possible to be collected according to the “Regulation on Classification of
Loans and Provisions and Provisions for Reserves” published in the Official Gazette dated 22 June 2016 and numbered
29750, are fulfilled by the requirements of the Tax Procedure Law in line with the decision taken by the Bank's senior
management classified as a loan as a loss.
l) Disclosures regarding the unregistered policy:
The Fifth Group - Loans classified as Loss Loans, with at least one reporting period in this group, and the lifetime expected
credit loss due to the default of the debtor constitutes the Bank's credits to be deducted. Deregistration is an accounting
practice and does not result in the right to waive. Loans deducted from the record do not affect the legal follow-up of the
Bank. Indicators are utilized regarding the absence of reasonable expectations regarding the recovery of loans. The
deregistration is examined on an incident basis with predefined criteria and the following deregistration indicators are
considered:
- The possibility of recovery is limited: Loans with low collateralization, limited collateral capability, limited assets that
provide foreclosure collection, and less than expected cost income for collection are evaluated,
- Financial indicators: Financial indicators evaluating that the entire loan is not capable of recovering are evaluated,
- Long-term follow-up: Those who do not have reasonable collection expectations are evaluated in order to recover the loans
that have been pursuing for a long time.
The following practices for the loans bank monitors, although the loans have been written-off by the Bank, cannot be different
from its registered loans.
a) The methods applied for legal collection of loans from debtors,
b) Decisions to be subjected to the sale of non-performing loans,
c) Decisions to waive the the credit by waiving the loans.
Within the scope of TFRS 9, the deducted amount during the period is TL 97,496 (31 December 2019: TL 171,832) and its
effect on NPL ratio is 0.12% (31 December 2019: 0.23%) . The follow-up conversion rate, after deductions, is 4.22% (31
December 2019 5.99% ) in the current period frozen loan figures, while the calculated rate including the loans deducted
during the year is 4.34% (31 December 2019: 6.22%) .
m) Other explanations and disclosures:
Current Period Commercial Consumer
Credit
Cards Other Total
Standard Loans 49,845,436 16,922,139 4,540,033 - 71,307,608
Close Monitoring Loans 4,204,131 3,070,285 677,929 - 7,952,345
Loans Under Follow-Up 3,096,177 315,522 90,183 - 3,501,882
Total 57,145,744 20,307,946 5,308,145 - 82,761,835
12 month expected credit loss (Stage I)(-) 176,623 162,525 54,298 - 393,446
Significant increase in credit risk (Stage II)(-) 1,033,284 263,142 63,826 - 1,360,252
Default (Stage III)(-) 1,996,399 228,731 68,943 - 2,294,073
Total 3,206,306 654,398 187,067 - 4,047,771
Net credit balance on balance sheet 53,939,438 19,653,548 5,121,078 - 78,714,064
Prior Period Commercial Consumer
Credit
Cards Other Total
Standard Loans 37,427,979 14,593,587 4,026,952 - 56,048,518
Close Monitoring Loans 5,538,399 2,612,198 713,785 - 8,864,382
Loans Under Follow-Up 3,617,237 398,230 131,439 - 4,146,906
Total 46,583,615 17,604,015 4,872,176 - 69,059,806
12 month expected credit loss (Stage I)(-) 192,135 144,831 57,228 - 394,194 Significant increase in credit risk (Stage II)(-) 686,025 161,159 46,969 - 894,153
Default (Stage III)(-) 2,009,282 250,895 92,368 - 2,352,545
Total 2,887,442 556,885 196,565 - 3,640,892
Net credit balance on balance sheet 43,696,173 17,047,130 4,675,611 - 65,418,914

TÜRK EKONOMİ BANKASI ANONİM ŞİRKETİ
NOTES AND EXPLANATIONS TO CONSOLIDATED FINANCIAL STATEMENTS AS OF
31 DECEMBER 2020 (Unless otherwise stated amounts are expressed in thousands of Turkish Lira (“TL”).)
97
I. Explanations and Disclosures Related to the Consolidated Assets (Continued)
6. Information on loans: (continued)
m) Other explanations and disclosures: (continued)
The following is a reclassification of provision for impairment on loans by stage;
Current Period
Commercial
Standard Loans
(Stage 1)
Loans under close
monitoring (Stage 2)
Non-performing
loans (Stage 3) Total
31 December 2019 192,135 686,025 2,009,282 2,887,442
Transfers;
- Stage 1 to Stage 2 (8,724) 49,433 - 40,709 - Stage 1 to Stage 3 (1,029) - 34,371 33,342
- Stage 2 to Stage 3 - (70,704) 259,761 189,057
- Stage 2 to Stage 1 2,529 (19,907) - (17,378) - Stage 3 to Stage 2 - - - -
Transferred within the period 87,699 574,689 141,749 804,137
Collections (110,444) (285,376) (189,132) (584,952) Sold Portfolio - - (163,411) (163,411)
Write-offs - - (96,221) (96,221)
Currency differences 14,457 99,124 - 113,581
Total expected credit losses 31 December 2020 176,623 1,033,284 1,996,399 3,206,306
Prior Period
Commercial
Standard Loans
(Stage 1)
Loans under close
monitoring (Stage 2)
Non-performing
loans (Stage 3) Total
31 December 2018 218,413 634,220 760,528 1,613,161
Transfers;
- Stage 1 to Stage 2 (19,564) 104,626 - 85,062 - Stage 1 to Stage 3 (5,387) - 169,762 164,375
- Stage 2 to Stage 3 - (82,960) 378,714 295,754
- Stage 2 to Stage 1 2,817 (17,869) - (15,052) - Stage 3 to Stage 2 - - - -
Transferred within the period 117,210 243,941 1,388,936 1,750,087
Collections (127,005) (224,291) (236,201) (587,497) Sold Portfolio - - (282,227) (282,227)
Write-offs - - (171,832) (171,832) Currency differences 5,651 28,358 1,602 35,611
Total expected credit losses 31 December 2019 192,135 686,025 2,009,282 2,887,442

TÜRK EKONOMİ BANKASI ANONİM ŞİRKETİ
NOTES AND EXPLANATIONS TO CONSOLIDATED FINANCIAL STATEMENTS AS OF
31 DECEMBER 2020 (Unless otherwise stated amounts are expressed in thousands of Turkish Lira (“TL”).)
98
I. Explanations and Disclosures Related to the Consolidated Assets (Continued)
6. Information on loans: (continued)
m) Other explanations and disclosures: (continued)
Current Period
Consumer
Standard Loans
(Stage 1)
Loans under close
monitoring (Stage 2)
Non-performing
loans (Stage 3) Total
31 December 2019 144,831 161,159 250,895 556,885
Transfers; - Stage 1 to Stage 2 (9,009) 69,594 - 60,585
- Stage 1 to Stage 3 (1,226) - 27,155 25,929
- Stage 2 to Stage 3 - (16,472) 65,561 49,089 - Stage 2 to Stage 1 4,209 (30,446) - (26,237)
- Stage 3 to Stage 2 - - - -
Transferred within the period 72,237 122,632 29,704 224,573 Collections (48,517) (43,325) (18,399) (110,241)
Sold Portfolio - - (124,910) (124,910) Write-offs - - (1,275) (1,275)
Currency differences - - - -
Total expected credit losses 31 December
2020 162,525 263,142 228,731 654,398
Prior Period
Consumer
Standard Loans
(Stage 1)
Loans under close
monitoring (Stage 2)
Non-performing
loans (Stage 3) Total
31 December 2018 85,416 149,047 769,345 1,003,808
Transfers; - Stage 1 to Stage 2 (7,719) 37,698 - 29,979
- Stage 1 to Stage 3 (2,701) - 54,025 51,324 - Stage 2 to Stage 3 - (13,970) 74,977 61,007
- Stage 2 to Stage 1 4,716 (28,485) - (23,769)
- Stage 3 to Stage 2 - - - - Transferred within the period 91,331 52,767 (555,612) (411,514)
Collections (26,212) (35,898) (6,672) (68,782)
Sold Portfolio - - (85,168) (85,168) Write-offs - - - -
Currency differences - - - -
Total expected credit losses 31 December
2019
144,831 161,159 250,895 556,885

TÜRK EKONOMİ BANKASI ANONİM ŞİRKETİ
NOTES AND EXPLANATIONS TO CONSOLIDATED FINANCIAL STATEMENTS AS OF
31 DECEMBER 2020 (Unless otherwise stated amounts are expressed in thousands of Turkish Lira (“TL”).)
99
I. Explanations and Disclosures Related to the Consolidated Assets (Continued)
6. Information on loans: (continued)
m) Other explanations and disclosures: (continued)
Current Period
Credit Cards
Standard
Loans
(Stage 1)
Loans under close
monitoring (Stage 2)
Non-performing
loans (Stage 3) Total
31 December 2019 57,228 46,969 92,368 196,565
Transfers; - Stage 1 to Stage 2 (5,373) 35,955 - 30,582
- Stage 1 to Stage 3 (1,144) - 22,014 20,870 - Stage 2 to Stage 3 - (5,174) 32,122 26,948
- Stage 2 to Stage 1 6,441 (16,903) - (10,462)
- Stage 3 to Stage 2 - - - - Transferred within the period 4,183 14,254 22,475 40,912
Collections (7,037) (11,275) - (18,312)
Sold Portfolio - - (100,036) (100,036) Write-offs - - - -
Currency differences - - - -
Total expected credit losses 31 December 2020 54,298 63,826 68,943 187,067
Prior Period
Credit Cards
Standard Loans
(Stage 1)
Loans under close
monitoring (Stage 2)
Non-performing
loans (Stage 3) Total
31 December 2018 51,561 52,947 128,307 232,815 Transfers;
- Stage 1 to Stage 2 (5,389) 27,657 - 22,268
- Stage 1 to Stage 3 (2,850) - 71,316 68,466 - Stage 2 to Stage 3 - (7,962) 67,091 59,129
- Stage 2 to Stage 1 7,383 (17,452) - (10,069)
- Stage 3 to Stage 2 - - - - Transferred within the period 13,240 3,035 (91,447) (75,172)
Collections (6,717) (11,256) - (17,973)
Sold Portfolio - - (82,899) (82,899) Write-offs - - - -
Currency differences - - - -
Total expected credit losses 31 December 2019 57,228 46,969 92,368 196,565
(*) TL 424,469 of the Parent Bank's non-performing loan portfolio for which TL 410,516 of provision held were sold for TL
35,759 in 2020. After completing all necessary procedures, sales fees have been collected and the related non-performing
loans excluded from the records. TL 96,221 of the Parent Bank’s non-performing loans is written off.
(**)TL 467,640 of the Parent Bank's non-performing loan portfolio for which TL 450,294 of provision held were sold for TL
26,363 in 2019. After completing all necessary procedures, sales fees have been collected and the related non-performing
loans excluded from the records. TL 171,832 of the Parent Bank’s non-performing loans is written off.

TÜRK EKONOMİ BANKASI ANONİM ŞİRKETİ
NOTES AND EXPLANATIONS TO CONSOLIDATED FINANCIAL STATEMENTS AS OF
31 DECEMBER 2020 (Unless otherwise stated amounts are expressed in thousands of Turkish Lira (“TL”).)
100
I. Explanations and Disclosures Related to the Consolidated Assets (Continued)
6. Information on loans: (continued)
m) Other explanations and disclosures: (continued)
The fair value of collaterals of non- performing loans, capped with the respective outstanding loan balance,
at 31 December 2020 is TL 1,902,570 (31 December 2019: TL 2,272,171).
The fair value of the collateral of non-performing loans that do not exceed the risk:
Current Period Prior Period
Mortgage 1,459,066 1,595,390
Vehicle 118,677 161,143 Cash 878 1,068
Other(*) 323,949 514,570
Total 1,902,570 2,272,171
(*) Other amount includes Treasury backed and Portfolio guaranteed CGF guarantee amounting to TL 323,949 (31 December 2019: TL 514,750).
As of 31 December 2020, the fair value of the collaterals of the customers' total principal risk related to the
loans under close monitoring is TL 3,911,887 (31 December 2019: TL 3,406,585).
Fair value of the part of the collaterals of the closely monitored loans that do not exceed the risk:
Current Period Prior Period
Mortgage 3,263,239 2,741,280
Vehicle 282,443 304,501
Cash, Government Bonds 230,542 265,836
Other 135,663 94,968
Total 3,911,887 3,406,585
As of 31 December 2020 and 31 December 2019, the details of the commodities and real estates that the
bank has acquired for disposal of credit receivables are as follows:
31 December 2020 Commercial Consumer Total
Residential, commercial or industrial property 108,709 4,150 112,859
Other - - -
Total 108,709 4,150 112,859
31 December 2019 Commercial Consumer Total
Residential, commercial or industrial property 123,326 8,036 131,362
Other - - -
Total 123,326 8,036 131,362
7. Information on financial assets measured at amortized cost:
a) a.1) Information on financial assets measured at amortised cost and subject to repurchase agreements:
Current Period Prior Period
TL FC TL FC
Equity Securities - - - -
Bond, Treasury bill and similar investment securities 2,971,137 1,153,219 1,194,716 405,580
Total 2,971,137 1,153,219 1,194,716 405,580

TÜRK EKONOMİ BANKASI ANONİM ŞİRKETİ
NOTES AND EXPLANATIONS TO CONSOLIDATED FINANCIAL STATEMENTS AS OF
31 DECEMBER 2020 (Unless otherwise stated amounts are expressed in thousands of Turkish Lira (“TL”).)
101
I. Explanations and Disclosures Related to the Consolidated Assets (Continued)
7. Information on financial assets measured at amortized cost: (continued)
a.2) Information on financial assets measured at amortized cost and given as collateral / blocked:
Financial assets valued over their amortized cost classified as free warehouse TL 528,072 (31 December 2019: TL
1,328,238).
a.3) Information on held-to-maturity investments given as collateral or blocked:
Current Period Prior Period
Government Bonds 12,522,941 4,906,618 Treasury Bills - -
Other Public Sector Debt Securities - -
Total 12,522,941 4,906,618
a.4) Information on government debt securities measured at amortized cost:
Current Period Prior Period
Debt securities 12,522,941 4,906,618
Quoted on a Stock Exchange 12,522,941 4,906,618
Unquoted - - Impairment Provision (-) - -
Total 12,522,941 4,906,618
a.5) Movement of financial assets measured at amortized cost:
Current Period Prior Period
Beginning Balance 4,906,618 2,792,080
Foreign Currency Differences on Monetary Assets 377,092 -
Purchases during the Year (*)(**) 8,062,415 2,114,538
Disposals Through Sales and Redemptions (823,184) -
Impairment Provision (-) - -
Closing Balance 12,522,941 4,906,618
(*) Includes rediscount amounts.
(**) In the current period, the securities portfolio of the Chief Investment Office were transferred to the Asset-Liability
Management and Treasury Group due to the change in the business model of the Parent Bank management. During this
transition, securities held as Financial Assets at Fair Value through Other Comprehensive Income amounting to TL
291,603 were classified as Financial Assets Measured at Amortized Cost. After this reclassification, the valuation
difference amounting to TL 20,141 has been reversed from equity.
8. Information on associates (Net):
a.1) Information on consolidated associates according to Communiqué on Preparing Banks’ Consolidated Financial Statements and related Turkish Accounting Standard: None (31 December 2019: None).
a.2) Information on the unconsolidated associates: None (31 December 2019: None).
a.3) Information on the consolidated associates: None (31 December 2019: None).
a.4) Information on sector information on consolidated associates: None (31 December 2019: None).
a.5) Consolidated associates which are quoted on the stock exchange: None (31 December 2019: None).
Current Period Prior Period
TL FC TL FC
Equity Securities - - - - Bond, Treasury bill and similar investment securities 6,698,645 1,171,868 1,978,084 -
Other - - - -
Total 6,698,645 1,171,868 1,978,084 -

TÜRK EKONOMİ BANKASI ANONİM ŞİRKETİ
NOTES AND EXPLANATIONS TO CONSOLIDATED FINANCIAL STATEMENTS AS OF
31 DECEMBER 2020 (Unless otherwise stated amounts are expressed in thousands of Turkish Lira (“TL”).)
102
I. Explanations and Disclosures Related to the Consolidated Assets (Continued)
9. Information on subsidiaries (Net):
a) Information on shareholders’ equity of significant subsidiaries:
TEB Faktoring A.Ş.
TEB Yatırım
Menkul
Değerler A.Ş.
TEB Portföy
Yönetimi A.Ş.
Paid-in Capital to be Entitled for Compensation after All Creditors 50,000 28,794 6,860
Reserves 100,454 47,846 6,674
Net income for the period and prior period income 40,455 104,065 20,849
Income/ Loss recognized under equity in accordance with TAS - - (122)
Leasehold Improvements on Operational Leases (-) 186 303 58
Goodwill and intangible asset and the related deferred tax liability (-) 3,031 4,162 551
Total Common Equity Tier 1 Capital 187,692 176,240 33,652
General Provision 3,832 - - Total Equity 191,524 176,240 33,652
The Parent Bank has no capital requirements arising from its subsidiaries included in the Consolidated Capital
Adequacy Standard Ratio.
b) If there is any unconsolidated subsidiary, total equity amount that is lack of subjection to the reasonable
justifications of non–consolidate and minimum capital requirements: None (31 December 2019: None).
c) Information on the unconsolidated subsidiaries: None (31 December 2019: None).
d) Information on the consolidated subsidiaries:
d.1) Information on the consolidated subsidiaries:
Address
(City/Country) Group’s share percentage-If different voting
percentage (%)
Other
shareholders’ share percentage (%)
1 TEB Faktoring A.Ş. İstanbul/Türkiye 100.00 - 2 TEB Yatırım Menkul Değerler A.Ş. İstanbul/Türkiye 100.00 - 3 TEB Portföy Yönetimi A.Ş. İstanbul/Türkiye 54.74 45.26
Information on the consolidated subsidiaries with the order as presented in the table above:
Total Assets
Shareholders’
Equity
Total Fixed
Assets
Interest Income
Income on Marketable
Securities Portfolio
Current
Period Profit/Loss
Prior Period Profit/Loss (*)
Fair Value
1 2,620,875 190,909 4,355 197,063 - 29,417 39,385 - 2 522,419 180,705 3,630 33,279 - 78,931 31,755 - 3 44,370 34,261 1,890 2,928 98 13,590 4,917 -
(*) These figures are shown per BRSA financial statements as of 31 December 2019.
d.2) Information on consolidated subsidiaries:
Current Period Prior Period
Balance at the Beginning of the Period 124,918 124,424 Movements during the Period 1,679 494
Purchases - - Bonus Shares Obtained - - Share in Current Year Income - - Sales - - Revaluation Increase / (Decrease) 1,679 494 Impairment Provisions -
Balance at the End of the Period 126,597 124,918
Capital Commitments - - Share Percentage at the End of the Period (%) - -

TÜRK EKONOMİ BANKASI ANONİM ŞİRKETİ
NOTES AND EXPLANATIONS TO CONSOLIDATED FINANCIAL STATEMENTS AS OF
31 DECEMBER 2020 (Unless otherwise stated amounts are expressed in thousands of Turkish Lira (“TL”).)
103
I. Explanations and Disclosures Related to the Consolidated Assets (Continued)
9. Information on subsidiaries (Net): (continued)
d) Information on the consolidated subsidiaries: (continued)
d.3) Sectoral information on the consolidated subsidiaries and the related carrying amounts:
Current Period Prior Period
Banks - - Insurance Companies - - Factoring Companies/TEB Faktoring A.Ş. 43,417 43,417 Leasing Companies - - Finance Companies - - Other Financial Subsidiaries 83,180 81,501
Toplam 126,597 124,918
The carrying amounts of the subsidiaries above have been eliminated in the consolidated financial statements.
d.4) Consolidated subsidiaries quoted on the stock exchange: None (31 December 2019: None).
e) Information on the non-financial subsidiaries that are not consolidated:
TEB ARF Teknoloji A.Ş. was established by the Bank with TL 50,000 paid-in capital and 100% ownership; It was registered in the Trade Registry Gazette on 16 July 2020.
10. Information on entities under common control (joint ventures):
a) Information on entities under common control (joint ventures):
Entities under common
control (joint ventures)
Share of the
Parent
Bank (%)
Share of the
Group (%)
Current
Asset
Non-current
Asset
Long-term
Receivable Profit Loss
Bantaş Nakit ve Kıymetli Mal Taşıma ve Güvenlik Hizmetleri A.Ş. 0.1 33.3 113,710 47,576 25,018 215,676 (193,028)
b) Accounting method of the reasonable justification of unconsolidated in Joint Ventures that booked on the unconsolidated parent bank’s financial statements.
The Parent Bank owns 0.1% but the Group owns 33.3% share of Bantaş Nakit ve Kıymetli Mal Taşıma ve Güvenlik Hizmetleri A.Ş., it is presented as joint venture in financial statements however, and it is carried by cost value since necessary requirements for consolidation is not met.
11. Information on financial lease receivables (Net): None (31 December 2019: None). 12. Positive differences related to derivative financial assets for hedging purposes
Current Period Prior Period
TL FC TL FC
Fair Value Hedge 416,239 31,137 7,024 14,112
Cash Flow Hedge 650,142 - 219,494 877 Foreign Net Investment Hedge - - - -
Total 1,066,381 31,137 226,518 14,989
In case of termination of the fair value hedge accounting, any adjustment to the book value of the hedging instrument calculated using the effective interest method under fair value hedge accounting is amortized through profit or loss to the financial asset price until the maturity of the asset.
According to cash flow hedges terminated by the Parent Bank, accumulated valuation differences amounted TL
18,266 (31 December 2019: TL 20,286) is recorded under equity as of 31 December 2020 and these accumulated
differences are transferred into income statement by considering maturity date of hedged items.

TÜRK EKONOMİ BANKASI ANONİM ŞİRKETİ
NOTES AND EXPLANATIONS TO CONSOLIDATED FINANCIAL STATEMENTS AS OF
31 DECEMBER 2020 (Unless otherwise stated amounts are expressed in thousands of Turkish Lira (“TL”).)
104
I. Explanations and Disclosures Related to the Consolidated Assets (Continued)
13. Information on tangible assets:
31 December
2019 Additions Disposals Other
31 December
2020
Cost:
Real Estate 109,711 574 (1,206) 358 109,437
Right of Use 1,023,597 82,741 (86,381) - 1,019,957 Furniture, Furnishings, Office Machines and Other
Securities 892,816 126,072 (14,094) - 1,004,794
Total Cost 2,026,124 209,387 (101,681) 358 2,134,188
31 December
2019
Period
Charge
Disposals Other
31 December
2020
Accumulated Depreciation: Real Estate 51,802 3,556 (417) 55 54,996
Right of Use Depreciation 481,778 148,762 (86,148) - 544,392
Furniture, Furnishing and Office Machines and Other Securities 607,726 94,564 (13,557) - 688,733
Total Accumulated Depreciation 1,141,306 246,882 (100,122) 55 1,288,121
Net Book Value 884,818 846,067
a) The impairment provision set or cancelled in the current period according to the asset groups not
individually significant but materially affecting the overall financial statements, and the reason and
conditions for this: None.
b) Pledges, mortgages and other restrictions on the tangible fixed assets, expenses arising from the construction for tangible fixed assets, commitments given for the purchases of tangible fixed assets: None.

TÜRK EKONOMİ BANKASI ANONİM ŞİRKETİ
NOTES AND EXPLANATIONS TO CONSOLIDATED FINANCIAL STATEMENTS AS OF
31 DECEMBER 2020 (Unless otherwise stated amounts are expressed in thousands of Turkish Lira (“TL”).)
105
I. Explanations and Disclosures Related to the Consolidated Assets (Continued) 14. Information on intangible assets:
31 December 2019 Additions Disposals Other 31 December 2020
Cost:
Other intangible assets 486,748 89,035 (99) - 575,684 Total Cost 486,748 89,035 (99) - 575,684
31 December 2019 Additions Disposals Other 31 December 2020
Accumulated Depreciation:
Other intangible assets 346,440 77,833 (12) - 424,261 Total Accumulated Depreciation 346,440 77,833 (12) - 424,261
Net Book Value 140,308 151,423
a) Disclosures for book value, description and remaining useful life for a specific intangible fixed asset that is
material to the financial statements: None.
b) Disclosure for intangible fixed assets acquired through government grants and accounted for at fair value at initial
recognition: None.
c) The method of subsequent measurement for intangible fixed assets that are acquired through government
incentives and recorded at fair value at the initial recognition: None.
d) The book value of intangible fixed assets that are pledged or restricted for use: None.
e) Amount of purchase commitments for intangible fixed assets: None.
f) Information on revalued intangible assets according to their types: None.
g) Amount of total research and development expenses recorded in income statement within the period if any: None.
h) Positive or negative consolidation goodwill on entity basis: None.
i) Information on goodwill:
Following the publication of the BRSA's permission dated February 10, 2011 in the Official Gazette dated February
12, 2011 and numbered 27844, all rights by the termination of the legal personality of Fortis Bank A.Ş. The merger of
two banks was realized through the transfer of receivables, liabilities and liabilities to the Bank in the form of ashes.
The shareholders of Fortis Bank A.Ş., which was dismissed due to the merger, were given 1.0518 registered TEB
shares for each share with a nominal value of 1 TL to be replaced with their existing shares. Since the enterprises
subject to this merger are not controlled by the same person or persons before and after the business merger, the
transaction has been evaluated within the scope of TFRS 3. Fortis Bank A.Ş. The difference between this value and
the fair value of Fortis Bank A.Ş.'s identifiable net assets acquired is recognized as goodwill, considering the fair value
of the equity shares subject to change as a result of the merger as of 14 February 2011. It has been recognized.
j) Beginning and ending balance of the goodwill and movements on goodwill in the current period:
Current Period Prior Period
Beginning balance 421,124 421,124 Foreign currency differences - -
Acquisitions - -
End Balance 421,124 421,124
15. Information on investment property: None (31 December 2019: None).

TÜRK EKONOMİ BANKASI ANONİM ŞİRKETİ
NOTES AND EXPLANATIONS TO CONSOLIDATED FINANCIAL STATEMENTS AS OF
31 DECEMBER 2020 (Unless otherwise stated amounts are expressed in thousands of Turkish Lira (“TL”).)
106
I. Explanations and Disclosures Related to the Consolidated Assets (Continued) 16. Information on deferred tax asset:
a) As of 31 December 2020, deferred tax asset computed on the temporary differences and reflected to the
balance sheet is TL 651,589 (31 December 2019: TL 667,146). There are no tax exemptions or deductions
over which deferred tax asset is computed.
b) Temporary differences over which deferred tax asset is not computed and recorded in the balance sheet in
prior periods: None.
c) Allowance for deferred tax and deferred tax assets from reversal of allowance: None.
d) Movement of deferred tax:
Current Period Prior Period
As of January 1 667,146 208,699
TFRS 16 transition - 24,083 Deferred Tax Income / (Expense) 115,800 177,232
Deferred Tax Accounted for Under Equity (131,357) 256,389
Merger Effect - 743
Deferred Tax Asset 651,589 667,146
After net off the net deferred tax asset is presented as deferred tax asset on the balance sheet and net deferred tax
liability presented as deferred tax liability on balance sheet. The deferred tax charge of TL 115,800 is stated
under the tax provision in the income statement (31 December 2019: TL 177,232 deferred tax expense). The
portion of the deferred tax that is directly attributable to equity which is presented in the table below has been
netted within the relevant accounts in the statement of shareholders' equity.
Current Period Prior Period
Financial Assets at Fair Value through Other Comprehensive Income 26,926 (44,443)
Cash Flow Hedge (169,324) 302,891
Actuarial Profit or Loss 11,041 (2,059)
Total (131,357) 256,389
17. Information on assets for sale fixed and discontinued operations:
Current Period Prior Period
Beginning of Period Cost 131,362 109,104
Beginning of Period Accumulated Depreciation (-) - -
Net Book Value 131,362 109,104
Opening Balance 131,362 109,104 Acquired 137,125 149,647
Disposed (-) 160,897 122,922
Impairment (-) (5,269) 4,467 Depreciation Value (-) - -
End of Period Cost 112,859 131,362
End of Period Accumulated Depreciation (-) - -
Closing Net Book Value 112,859 131,362

TÜRK EKONOMİ BANKASI ANONİM ŞİRKETİ
NOTES AND EXPLANATIONS TO CONSOLIDATED FINANCIAL STATEMENTS AS OF
31 DECEMBER 2020 (Unless otherwise stated amounts are expressed in thousands of Turkish Lira (“TL”).)
107
I. Explanations and Disclosures Related to the Consolidated Assets (continued)
18. Information on factoring receivables of Group:
a) Maturity analysis explanation:
Current Period Prior Period
TL FC TL FC
Short Term(*) 1,548,931 955,007 1,207,988 873,720
Mid and Long Term - - 1,550 -
Stage 1 Provision (-) 1,861 115 1,334 146 Stage 2 Provision (-) 1,856 - 1,959 -
Stage 3 Provision (-) 11,293 2,037 25,315 6,137
Total 1,533,921 952,855 1,180,930 867,437
(*)Incudes factoring receivables which is impaired amounting to TL 18,268 (31 December 2019: TL 31,946).
b) Other explanations and disclosures:
Current Period Commercial Consumer Total
Standard Loans 2,327,472 - 2,327,472
Close Monitoring Loans 158,198 - 158,198
Loans Under Follow-Up 18,268 - 18,268
Total 2,503,938 - 2,503,938
12 month expected credit loss (Stage I)(-) 1,976 - 1,976
Significant increase in credit risk (Stage II)(-) 1,856 - 1,856
Default (Stage III)(-) 13,330 - 13,330
Total allowance for impairment 17,162 - 17,162
Net credit balance on balance sheet 2,486,776 - 2,486,776
c) Aging analysis of accounting past-due exposures:
31 December 2020 1-30 Days 31-60 Days 61-90 Days Total
Commercial Loans 358 1,782 2,085 4,225
Consumer Loans - - - -
Credit Cards - - - -
Total 358 1,782 2,085 4,225
19. Information on other asset
Other Assets item of the balance sheet amounting to TL 3,870,711 (31 December 2019: TL 4,473,189) does not
exceed 10% of the total amount of balance sheet except for off-balance sheet commitments.

TÜRK EKONOMİ BANKASI ANONİM ŞİRKETİ
NOTES AND EXPLANATIONS TO CONSOLIDATED FINANCIAL STATEMENTS AS OF
31 DECEMBER 2020 (Unless otherwise stated amounts are expressed in thousands of Turkish Lira (“TL”).)
108
II. Explanations and Disclosures Related to the Consolidated Liabilities 1. a) Information on maturity structure of deposits:
a.1) Current period:
Demand 7 Day Call
Accounts Up to 1 Month
1-3 Months
3-6 Months
6 Month - 1 Year
1 Year and Over
Accumulated Deposits
Total
Saving Deposits 3,343,473 - 13,247,327 9,248,027 174,061 15,303 31,868 - 26,060,059
Foreign Currency Deposits 18,424,730 - 7,600,065 11,882,963 97,381 92,277 52,616 - 38,150,032
Residents in Turkey 17,200,394 - 7,316,504 11,506,796 67,244 42,090 36,070 - 36,169,098
Residents Abroad 1,224,336 - 283,561 376,167 30,137 50,187 16,546 - 1,980,934
Public Sector Deposits 431,997 - 59,843 136,651 8,020 0 0 - 636,511
Commercial Deposits 4,489,927 - 3,928,324 5,879,776 158,781 1,448 13,824 - 14,472,080
Other Institutions Deposits 206,580 - 145,091 539,426 61,442 63 168 - 952,770
Precious Metals Deposits 5,807,140 - 31,022 94,004 15,788 50,503 3,597 - 6,002,054
Bank Deposits 43,796 - 7,424,601 - - - - - 7,468,397
Central Bank of Turkey 31 - - - - - - - 31
Domestic Banks 8 - - - - - - - 8
Foreign Banks 43,757 - 7,424,601 - - - - - 7,468,358 Special Financial
Institutions - - - - - - - - -
Other - - - - - - - - -
Total 32,747,643 - 32,436,273 27,780,847 515,473 159,594 102,073 - 93,741,903
a.2) Prior period:
Demand 7 Day Call
Accounts Up to 1 Month
1-3 Months
3-6 Months
6 Month- 1 Year
1 Year and Over
Accumulated Deposits
Total
Saving Deposits 2,913,675 - 11,685,382 8,760,022 198,974 159,316 142,791 - 23,860,160
Foreign Currency Deposits 8,678,150 - 9,179,868 16,994,157 220,469 75,587 91,126 - 35,239,357
Residents in Turkey 8,114,695 - 8,724,284 16,524,666 196,404 32,768 74,233 - 33,667,050
Residents Abroad 563,455 - 455,584 469,491 24,065 42,819 16,893 - 1,572,307
Public Sector Deposits 424,598 - 73,628 50,872 7,475 - - - 556,573
Commercial Deposits 3,312,492 - 3,919,789 1,904,438 101,496 3,210 55,398 - 9,296,823
Other Institutions Deposits 143,878 - 65,741 266,882 12,458 91 554 - 489,604
Precious Metals Deposits 1,275,586 - 90,788 700,588 38,080 142,511 101,470 - 2,349,023
Bank Deposits 23,739 - 362,573 - - - - - 386,312
Central Bank of Turkey 25 - - - - - - - 25
Domestic Banks 16 - - - - - - - 16
Foreign Banks 23,698 - 358,772 - - - - - 382,470 Special Financial
Institutions - - 3,801 - - - - - 3,801
Other - - - - - - - - -
Total 16,772,118 - 25,377,769 28,676,959 578,952 380,715 391,339 - 72,177,852
b) Information on saving deposits under the guarantee of saving deposit insurance:
b.1) Saving deposits exceeding the limit of insurance:
i) Information on saving deposits under the guarantee of saving deposit insurance and exceeding the limit of saving deposit insurance:
Saving Deposits Under the Guarantee of Insurance(*)
Exceeding the Limit of Insurance(*)
Current Period Prior Period Current Period Prior Period
Saving Deposits 14,783,424 14,607,157 10,931,481 8,731,764
Foreign Currency Saving Deposits 7,067,339 6,075,469 14,081,460 12,928,549
Other Deposits in the Form of Saving Deposits 2,567,019 781,197 2,854,708 1,320,538
Foreign Branches’ Deposits under Foreign Authorities'
Insurance - - - -
Off-shore Banking Regions’ Deposits under Foreign
Authorities' Insurance - - - -
Total 24,417,782 21,463,823 27,867,649 22,980,851
(*) According to the BRSA’s circular no 1584 dated on 23 February 2005, accruals are included in the saving deposit amounts

TÜRK EKONOMİ BANKASI ANONİM ŞİRKETİ
NOTES AND EXPLANATIONS TO CONSOLIDATED FINANCIAL STATEMENTS AS OF
31 DECEMBER 2020 (Unless otherwise stated amounts are expressed in thousands of Turkish Lira (“TL”).)
109
II. Explanations and Disclosures Related to the Consolidated Liabilities (Continued)
b) Information on saving deposits under the guarantee of saving deposit insurance: (continued)
b.1) Saving deposits exceeding the limit of insurance: (continued)
ii) Deposit of real persons not under the guarantee of saving deposit insurance:
Current Period Prior Period
Foreign Branches’ Deposits and Other Accounts 639,161 615,203
Deposits of Controlling Shareholders and Their Close Families 1,130,777 3,823,134
Deposits of Chairman and Members of the Board of Directors and Their
Close Families 66,845 68,002
Deposits Obtained through Illegal Acts Defined in the 282nd Article of the 5237 Numbered
Turkish Criminal Code Dated September 26, 2004. - -
Saving Deposits in Banks Established in Turkey exclusively for Off-shore
Banking Activities - -
2. Information on derivative financial liabilities:
a) Negative differences related to derivative financial liabilities held-for-trading:
Current Period Prior Period
TL FC TL FC
Forward Transactions 71,044 6,778 97,772 25,075
Swap Transactions 1,977,574 179,821 1,362,074 71,890
Futures Transactions - - - -
Options 18,600 6,526 26,488 3,285
Other - - - -
Total 2,067,218 193,125 1,486,334 100,250
3. Information on funds borrowed and debt securities issued:
a) Information on banks and other financial institutions:
Current Period Prior Period
TL FC TL FC
Funds Borrowed from Central Bank of Turkey - - - -
From Domestic Banks and Institutions 1,338,253 34,399 633,010 169,116
From Foreign Banks, Institutions and Funds 224,638 10,313,994 434,408 8,958,162
Total 1,562,891 10,348,393 1,067,418 9,127,278
As of 31 December 2020, the Group has borrowings from its related parties amounting to TL 5,013,477 (31 December
2019: TL 4,774,508).
b) Maturity analysis of borrowings:
Current Period Prior Period
TL FC TL FC
Short-term 1,562,891 5,872,731 1,057,415 5,593,155
Medium and long-term - 4,475,662 10,003 3,534,123
Total 1,562,891 10,348,393 1,067,418 9,127,278
c) Additional explanations regarding the areas where the Parent Bank's obligations are concentrated:
The Parent Bank diversifies its funding sources with customer deposits, loans from abroad, securities issued and borrowings from money markets. Deposits are the most important source of funding of the Parent Bank and do not present any risk concentration with its stable structure spread over a wide base. Loans received mainly consist of funds obtained from various foreign financial institutions with different features and maturity-interest structure. There is no risk concentration in the bank's funding sources.

TÜRK EKONOMİ BANKASI ANONİM ŞİRKETİ
NOTES AND EXPLANATIONS TO CONSOLIDATED FINANCIAL STATEMENTS AS OF
31 DECEMBER 2020 (Unless otherwise stated amounts are expressed in thousands of Turkish Lira (“TL”).)
110
II. Explanations and Disclosures Related to the Consolidated Liabilities (Continued)
3. Information on funds borrowed and debt securities issued: (continued)
d) Explanations on debt securities issued:
Current Period Prior Period
TL FC TL FC
Bank Bonds 4,766,623 - 2,333,877 - Treasury Bills 44,014 - - -
Total 4,810,637 - 2,333,877 -
4. Funds provided through repurchase transactions:
Information on funds provided through repurchase transactions:
Current Period Prior Period
TL FC TL FC
Domestic Transactions 4,016,659 2,717,468 1,323,300 327,167
Financial Institutions and Organizations 3,830,785 2,717,468 1,323,300 327,167
Other Institutions and Organizations 185,874 - - -
Individuals - - - - Foreign Transactions - - - -
Financial Institutions and Organizations - - - -
Other Institutions and Organizations - - - - Individuals - - - -
Total 4,016,659 2,717,468 1,323,300 327,167
5. Other external funding payables which exceed 10% of the balance sheet total (excluding off-balance
sheet commitments) and the breakdown of these which constitute at least 20% of grand total
Other external funding payables amounting to TL 1,699,019 (31 December 2019: TL 1,293,901) do not exceed 10% of the total balance sheet.
6. Explanations on financial lease obligations (Net):
With the “TFRS 16 Leases” standard which became effective as of 1 January 2019, the difference between the
operating lease and financial lease has been removed and the lease transactions are started to be recognized
under “Tangible Fixed Assets” as an asset (tenure) and under “Liabilities from Leasing” as a liability. Parent
Bank has as of 31 December 2020, TL 604,874 (31 December 2019: TL 657,657) Liabilities from Leasing
amount.
7. Negative differences table of derivative financial liabilities for hedging purposes:
Current Period Prior Period
TL FC TL FC
Fair Value Hedge 84,098 - - - Cash Flow Hedge 983,837 14,901 1,917,707 7,267 Foreign Net Investment Hedge - - - - Total 1,067,935 14,901 1,917,707 7,267
In case of termination of the fair value hedge accounting, any adjustment to the book value of the hedging instrument calculated using the effective interest method under fair value hedge accounting is amortized through profit or loss to the financial asset price until the maturity of the asset.
As of 31 December 2020, there are accumulated valuation differences of TL 18,266 (31 December 2019: TL
20,286) under equity as of 31 December 2020. This amount is spread over the remaining terms of the hedged
items by the Parent Bank and transferred to the income statement.

TÜRK EKONOMİ BANKASI ANONİM ŞİRKETİ
NOTES AND EXPLANATIONS TO CONSOLIDATED FINANCIAL STATEMENTS AS OF
31 DECEMBER 2020 (Unless otherwise stated amounts are expressed in thousands of Turkish Lira (“TL”).)
111
II. Explanations and Disclosures Related to the Consolidated Liabilities (Continued)
8. Information on provisions:
a) Foreign exchange provision on the foreign currency indexed loans and financial lease receivables: There are no provision on the foreign currency indexed loans that is offset from the loans on the balance sheet (31 December 2019: None).
b) The specific provisions provided for unidentified non-cash loans or expected credit loss for non-cash loans:
Current Period Prior Period
Stage 1 58,241 55,551
Stage 2 165,265 145,818
Stage 3 87,824 42,111
Total 311,330 243,480
c) Liabilities on unused vacation, bonus, health, employee termination benefits
As of 31 December 2020, the Parent Bank received TL 15,249 (31 December 2019: TL 14,195) allowance, TL 297,059 (31 December 2019: TL 200,712) and TL 185,723 (31 December 2019: TL 148,441) related to the premiums to be paid to bank personnel, and TL 37,100 (31 December 2019: TL 32,100) reflected the provision of other personnel expenses the “Provisions of Employee Rights” account in the financial statements.
c.1) Termination Benefits:
In determining the liability, the Parent Bank makes use of independent actuaries and makes assumptions
on issues such as discount rate, employee turnover rate and future salary increases. These assumptions are
reviewed annually.
31 December 2020 31 December 2019
Discount Rate (%) 14.50 12.51 Expected Inflation Rate (%) 10.03 6.59 Salary Increase Rate above Inflation Rate (%) 1.00 1.00
Movement of employee termination benefits:
Current Period Prior Period
As of January 1 200,712 179,934
Service cost 19,392 19,523
Interest cost 24,358 29,231
Settlement cost 2,742 9,413
Actuarial loss / (gain) 65,687 1,054
Benefits paid (15,831) (38,443)
Total 297,060 200,712
c.2) Retirement Benefits:
The employees who have joined the Bank as a consequence of the merger of the Parent Bank and Fortis
Bank are members of the “Pension Fund Foundation” established in accordance with the Social Security
Law No.506, Article No.20.
The liabilities described in the Retirement Fund Section 3 No. XVI “Explanations on Liabilities related to
Rights of Employees” which may arise during the transfer have been calculated by the actuary based on the
principles of the related regulation, whereas the liabilities in connection with other social rights and benefits
which will not be undertaken by the SSI after the transfer have been calculated by the actuary based on
TAS 19 principles. The Parent Bank is not required to provide any provisions for any technical or actual
deficit in the financial statements based on the actuarial report prepared as of 31 December 2020 and 31
December 2019. Since the Bank has no legal rights to carry the economic benefits arising from repayments
of Pension Funds and/or decreases in future contributions at present value; no asset has been recognized in
the balance sheet.

TÜRK EKONOMİ BANKASI ANONİM ŞİRKETİ
NOTES AND EXPLANATIONS TO CONSOLIDATED FINANCIAL STATEMENTS AS OF
31 DECEMBER 2020 (Unless otherwise stated amounts are expressed in thousands of Turkish Lira (“TL”).)
112
II. Explanations and Disclosures Related to the Consolidated Liabilities (Continued)
8. Information on provisions: (continued)
c) Liabilities on unused vacation, bonus, health, employee termination benefits: (continued)
c.2) Pension Rights: (continued)
Within the frame of the assumptions determined;
Period Based Pension and Health Obligations:
31 December
2020
31 December
2019
Net Present Value of Transferrable Retirement Liabilities (1,081,794) (919,469)
Net Present Value of Transferrable Retirement and Health Contributions 371,589 355,986
General Administration Expenses (10,818) (9,195)
Present Value of Pension and Medical Benefits Transferable to SSF (1) (721,023) (572,678)
Fair Value of Plan Assets (2) 2,998,581 2,646,999
Asset Surplus over Transferable Benefits ((2)-(1)=(3)) 2,277,558 2,074,321
Non-Transferable Benefits (4) (624,502) (404,727)
Asset Surplus over Total Benefits ((3)-(4) 1,653,056 1,669,594
As of 31 December 2020 and 31 December 2019, the distribution of the fair value of the total assets of the Pension Fund is as follows:
31 December 2020 31 December 2019
Bank placements 2,804,241 1,119,326
Government bonds and treasury bills, fund and rediscount interest income 119,573 114,378
Tangible assets - 1,278,238
Other 74,767 135,057
Toplam 2,998,581 2,646,999
Actuarial assumptions used in the calculation of liabilities excluding the period-based liabilities according to TAS 19 are as follows :
31 December 2020 31 December 2019
Discount Rate 14.50% 12.51%
Expected Inflation Rate 10.03% 6.59%
As of 31 December 2020, health inflation is assumed to be above than 20% (31 December 2019: 20%). It is assumed
that general wage increase and SSI ceiling increase rates will be the same as inflation. CSO 2001 (31 December 2019:
CSO 2001) Female / Male mortality table was used to represent the expected mortality rates both before and after
retirement.
d) Information on other provisions
Current Period Prior Period
Provision for Non-cash Loans 311,330 243,480
Provision for Legal Cases 93,625 52,635
Provision for Promotions of Credit Cards and Banking Services 11,935 12,936
Other 52,796 142,899
Total 469,686 451,950

TÜRK EKONOMİ BANKASI ANONİM ŞİRKETİ
NOTES AND EXPLANATIONS TO CONSOLIDATED FINANCIAL STATEMENTS AS OF
31 DECEMBER 2020 (Unless otherwise stated amounts are expressed in thousands of Turkish Lira (“TL”).)
113
I. Explanations and Disclosures Related to the Consolidated Liabilities (Continued)
8. Information on provisions: (continued)
d) Information on other provisions: (continued)
The following table is represented reconciliation on the provision for impairment of non-cash loans;
Standard Loans
(Stage 1)
Loans under close
monitoring (Stage 2)
Non-performing
loans (Stage 3) Total
31 December 2019 55,551 145,818 42,111 243,480 Transfers; - - - -
- Stage 1 to Stage 2 (3,464) 22,238 - 18,774
- Stage 1 to Stage 3 (78) - 1,489 1,411
- Stage 2 to Stage 3 - (12,704) 85,543 72,839
- Stage 2 to Stage 1 3,162 (9,071) - (5,909)
- Stage 3 to Stage 2 - - - - Transferred within the period 15,206 (213) (35,539) (20,546)
Collections (17,063) (21,075) (5,780) (43,918)
Currency differences 4,927 40,272 - 45,199
Total expected credit losses 31 December 2020 58,241 165,265 87,824 311,330
Standard Loans
(Stage 1)
Loans under close
monitoring (Stage 2)
Non-performing
loans (Stage 3) Total
31 December 2018 50,741 104,222 47,696 202,659
Transfers; - - - -
- Stage 1 to Stage 2 (3,253) 30,060 - 26,807 - Stage 1 to Stage 3 (282) - 6,045 5,763
- Stage 2 to Stage 3 - (3,768) 31,155 27,387
- Stage 2 to Stage 1 2,084 (6,592) - (4,508) - Stage 3 to Stage 2 - - - -
Transferred within the period 28,313 34,932 (27,256) 35,989
Collections (23,649) (19,738) (15,529) (58,916) Currency differences 1,597 6,702 - 8,299
Total expected credit losses 31 December 2019 55,551 145,818 42,111 243,480
9. Explanations on taxes payable:
a) Information on tax provision:
As of 31 December 2020, the Group’s corporate tax provision is TL 171,984 (31 December 2019: TL
32,155). As of 31 December 2020, the Group’s debt on total taxes and premiums is TL 343,527.
(31 December 2019: TL 222,365)
b) Information on current tax liability:
Current Period Prior Period
Corporate Tax Payable 171,984 32,155
Taxation on Securities 45,038 70,139
Property Tax 1,223 2,569
Banking Insurance Transaction Tax (BITT) 53,917 61,088
Foreign Exchange Transaction Tax 4,556 2,430
Value Added Tax Payable 6,695 5,310
Other (*) 32,586 26,299
Total 315,999 199,990
(*) Others include income taxes deducted from wages amounting to TL 25,404 (31 December 2019: TL 20,576) and stamp taxes payable amounting to TL 1,784 (31 December 2019: TL 1,535).

TÜRK EKONOMİ BANKASI ANONİM ŞİRKETİ
NOTES AND EXPLANATIONS TO CONSOLIDATED FINANCIAL STATEMENTS AS OF
31 DECEMBER 2020 (Unless otherwise stated amounts are expressed in thousands of Turkish Lira (“TL”).)
114
II. Explanations and Disclosures Related to the Consolidated Liabilities (Continued)
9. Explanations on taxes payable: (continued)
c) Information on Premiums:
Current Period Prior Period
Social Security Premiums-Employee 11,813 9,572
Social Security Premiums-Employer 13,052 10,641
Bank Social Aid Pension Fund Premium-Employee - -
Bank Social Aid Pension Fund Premium-Employer - -
Pension Fund Membership Fees and Provisions-Employee - -
Pension Fund Membership Fees and Provisions-Employer - -
Unemployment Insurance-Employee 997 809
Unemployment Insurance-Employer 1,666 1,347
Other - 6
Total 27,528 22,375
d) Explanations on deferred tax liabilities, if any: The Group does not have any deferred tax liability of the
Group as of 31 December 2020 (31 December 2019: None).
10. Information on fixed assets payables related to activities held and discounted for sale : None
(31 December 2019: None).
11. Explanations on the number of subordinated loans the Parent Bank used, maturity, interest rate,
institution that the loan was borrowed from, and conversion option, if any:
The Parent Bank was issued Subordinated debt instrument on 5 November 2018, which has two Call Dates; falling
on the fifth anniversary notes and the Interest Payment Date falling thereafter amounting USD210 million with
the final maturity of 10 years. The interest rate of the issuance is 10.40% per annum and will be continued at the
end of the 5th year with an annual interest rate of 6 months Libor + 7.32% after the first early redemption date.
The “T2 capital” was provided by BNP Paribas Fortis SA / NV.
The Parent Bank, aligned its Board of Directors’ decision dated 8 May 2012, had issued a debt instrument as T2
Capital Subordinated debt instrument with a value of USD 65 million on 14 May 2012 and the debt instrument
was redeemed on 14 May 2019 with the decision of the Board of Directors and upon the approval of Banking
Regulation and Supervision Agency (BRSA). On 14 May 2019, the Parent Bank issued a subordinated debt
securities with amount of 60 million EURO with the final maturity of 10 years, with no call till the 5th anniversary
of the notes. The Notes have two Call Dates, falling on the fifth anniversary notes and the Interest Payment Date
falling thereafter. The interest rate of the issuance is six months Euribor + 7.10% annually. The “T2 capital” was
provided by BNP Paribas Fortis SA / NV.
On 20 July 2012, the Parent Bank had issued a debt instrument of EUR 100 million as T2 capital and the debt
instrument was redeemed on 22 July 2019 after the decision of the relevant Board of Directors and the approval
of the BRSA. On 22 July 2019, the Parent Bank issued a subordinated debt securities with amount of 100 million
EURO, with the final maturity of 10 years, with no call till 5 th anniversary of the notes. The Notes have two Call
Dates, falling on the fifth anniversary notes and the Interest Payment Date falling thereafter. The interest rate of
the issuance is six months Euribor + 7.10% annually. The “T2 capital” was provided by BNP Paribas Fortis SA /
NV.
The Parent Bank issued subordinated debt instrument, which has early redemption right in 27 June 2023, with the
final maturity of 10 years in the amount of EUR125 million in 27 June 2018. The interest rate of the issuance is 6
month Euribor + 5.10% per annum. The “T2 capital” was provided by BNP Paribas Fortis SA / NV.
The above mentioned four subordinated loans are utilized in-line with the “loan capital” definition of BRSA and
will positively affect the capital adequacy ratio of the Parent Bank as well as utilizing long term funding.

TÜRK EKONOMİ BANKASI ANONİM ŞİRKETİ
NOTES AND EXPLANATIONS TO CONSOLIDATED FINANCIAL STATEMENTS AS OF
31 DECEMBER 2020 (Unless otherwise stated amounts are expressed in thousands of Turkish Lira (“TL”).)
115
II. Explanations and Disclosures Related to the Consolidated Liabilities (Continued)
11. Explanations on the number of subordinated loans the Parent Bank used, maturity, interest rate,
institution that the loan was borrowed from, and conversion option, if any: (continued)
Information on subordinated loans:
Current Period Prior Period
TL FC TL FC
Debt Instruments to be Included in the Additional Capital Calculation - - - -
Subordinated loans - - - -
Subordinated Debt Instruments - - - -
Debt Instrument to be Included in the Contribution Capital Calculation - 4,194,951 - 3,190,503
Subordinated Loans - - - -
Subordinated Debt Instruments - 4,194,951 - 3,190,503
Total - 4,194,951 - 3,190,503
Current Period Prior Period
TL FC TL FC
From Domestic Banks - - - -
From Other Domestic Institutions - - - -
From Foreign Banks - 4,194,951 - 3,190,503
From Other Foreign Institutions - - - -
Total - 4,194,951 - 3,190,503
12. Information on Shareholders’ Equity:
a) Presentation of Paid-in capital:
Current Period Prior Period
Common Stock 2,204,390 2,204,390
Preferred Stock - -
b) Paid-in capital amount, explanation as to whether the registered share capital system is applicable at
bank if so amount of registered share capital ceiling:
Capital System Paid-in capital Ceiling
Registered Capital System 2,204,390 -
c) Information on share capital increases and their sources and other information on increased capital
shares in current period: None
d) Information on share capital increases from revaluation funds: None.
e) Capital commitments in the last fiscal year and at the end of the following period, the general purpose
of these commitments and projected resources required to meet these commitments: None.
f) Indicators of the Parent Bank’s income, profitability and liquidity for the previous periods and possible
effects of these future assumptions on the Parent Bank’s equity due to the uncertainty of these
indicators:
The income diversified with various business line and related channels/products/sectors, supported with
different projects result a sustainable and relatively non-volatile profitability. Besides, interest rate,
currency rate and liquidity risk under control are testing with various simulation and these tests prevents
the risks of effect. The profitability of the Parent Bank is followed up and estimated by the Parent Bank’s
Planning and Performance Management in short and long term. It is also reported to Asset-Liability
Committee and other related organs. As result, current and future negative effect on equity is not occurred
and expected.
g) Information on preferred shares: None.
h) Information on marketable securities valuation differences: Current Period Prior Period
TL FC TL FC
From Associates, Subsidiaries, and Entities Under
Common Control (Joint Vent.) - - - -
Valuation Difference (149,198) 61,169 (3,538) 20,895
Foreign Exchange Difference (122) - - -
Total (149,320) 61,169 (3,538) 20,895

TÜRK EKONOMİ BANKASI ANONİM ŞİRKETİ
NOTES AND EXPLANATIONS TO CONSOLIDATED FINANCIAL STATEMENTS AS OF
31 DECEMBER 2020 (Unless otherwise stated amounts are expressed in thousands of Turkish Lira (“TL”).)
116
II. Explanations and Disclosures Related to the Consolidated Liabilities (Continued)
13. Information on minority interest: As of 31 December 2020, part of the group equity that belongs to
minority shares is TL 15,507 (31 December 2019: TL 9,406).
14. Information on factoring liabilities: As of 31 December 2020, group has factoring debt of TL 8,979
(31 December 2019: TL 812).
III. Explanations and Disclosures Related to the Consolidated Off-Balance Sheet Items
1. Information on off-balance sheet liabilities:
a) Nature and amount of irrevocable loan commitments:
Current Period Prior Period
Commitments for Credit Card Expenditure Limits 8,978,512 8,506,931 Loan Granting Commitments 5,736,570 5,234,372
Payment Commitment for Cheques 1,741,408 1,769,641
Asset Purchase and Sale Commitments 3,031,018 3,684,822 Time Deposits Purchase and Sale Commitments 94,524 759,924
Tax and Fund Liabilities from Export Commitments 47,494 71,566
Commitments for Promotions Related with Credit Cards and Banking Activities 5,767 4,975 Other Irrevocable Commitments 389,096 252,593
Total 20,024,389 20,284,824
b) Possible losses and commitments related to off-balance sheet items:
The Group, within the context of banking activities, undertakes certain commitments, consisting of loan
commitments, letters of guarantee, acceptance credits and letters of credit.
b.1) Non-cash loans including guarantees, acceptances, financial guarantee and other letters of credits:
Current Period Prior Period
Letters of Credit 5,025,525 2,623,851
Bank Acceptances 16,573 12,915 Other Commitments 3,976,672 5,031,959
Other Contingencies 1,043,082 1,153,720
Total 10,061,852 8,822,445
b.2) Guarantees, surety ships, and similar transactions:
Current Period Prior Period
Guarantee Letters 9,864,566 9,855,883
Advance Guarantee Letters 2,244,080 1,481,220 Guarantee Letters Given for Customs 481,964 429,999
Temporary Guarantee Letters 332,396 286,101
Other Guarantee Letters 1,260,388 1,499,122
Total 14,183,394 13,552,325
b) c.1) Total amount of non-cash loans:
Current Period Prior Period
Non-Cash Loans Given Against Achieving Cash Loans 1,262,302 1,499,838
With Maturity of One Year or Less Than One Year 94,973 130,687
With Maturity of More Than One Year 1,167,329 1,369,151 Other Non-Cash Loans 22,982,944 20,874,932
Total 24,245,246 22,374,770

TÜRK EKONOMİ BANKASI ANONİM ŞİRKETİ
NOTES AND EXPLANATIONS TO CONSOLIDATED FINANCIAL STATEMENTS AS OF
31 DECEMBER 2020 (Unless otherwise stated amounts are expressed in thousands of Turkish Lira (“TL”).)
117
III. Explanations and Disclosures Related to the Consolidated Off-Balance Sheet Items
(Continued)
1. Information on off-balance sheet liabilities: (continued)
c.2) Information on sectoral risk breakdown of non-cash loans:
Current Period Prior Period
TL (%) FC (%) TL (%) FC (%)
Agricultural 20,404 0.28 22,980 0.14 33,515 0.37 30,972 0.23
Farming and raising livestock 18,338 0.25 22,980 0.14 20,044 0.22 30,972 0.23
Forestry - - - - - - - - Fishery 2,066 0.03 - - 13,471 0.15 - -
Manufacturing 2,294,148 30.67 5,969,293 35.62 2,361,726 25.87 6,761,713 51.05
Mining and Quarry 106,832 1.43 295,929 1.77 123,105 1.35 672,430 5.08 Production 2,109,458 28.20 5,560,042 33.17 2,159,522 23.65 5,914,253 44.65
Electricity, Gas and Water 77,858 1.04 113,322 0.68 79,099 0.87 175,030 1.32
Construction 1,322,830 17.68 3,711,776 22.14 1,548,096 16.96 2,273,895 17.17 Services 3,605,121 48.19 5,095,080 30.38 5,132,770 56.22 4,116,286 31.08
Wholesale and Retail Trade 1,585,385 21.19 2,108,405 12.58 1,257,201 13.77 1,112,311 8.40
Hotel and Restaurant Services 121,734 1.63 105,933 0.63 133,984 1.47 71,748 0.54 Transportation and Communication 416,936 5.57 511,955 3.05 450,731 4.94 446,030 3.37
Financial Institutions 463,495 6.20 713,275 4.25 979,561 10.73 1,495,269 11.29
Real Estate and Renting 929,698 12.43 1,410,419 8.41 2,197,820 24.07 953,721 7.20 Self- employment Services 73,121 0.98 243,457 1.45 96,719 1.06 35,562 0.27
Education Services 5,517 0.07 336 - 6,349 0.07 178 -
Health and Social Services 9,235 0.12 1,300 0.01 10,405 0.11 1,467 0.01 Other 238,145 3.18 1,965,469 11.72 53,696 0.58 62,101 0.47
Total 7,480,648 100.00 16,764,598 100.00 9,129,803 100.00 13,244,967 100.00
c.3) Information on Stage 1 and Stage 2 non-cash loans:
Current Period Stage I Stage II
Non-cash loans TL FC TL FC
Letters of guarantee 5,498,751 7,423,249 552,798 708,596
Bank acceptances - 16,573 - - Letters of credit - 4,893,122 - 132,403
Endorsements - - - -
Underwriting commitments. - - - - Factoring commitments - - - -
Other commitments and contingencies 1,393,047 3,439,901 36,052 150,754
Total 6,891,798 15,772,845 588,850 991,753
The Group provided a reserve for TL 263,951 (31 December 2019: TL 286,647) of non-cash loans not
indemnified which equals to amounting to TL 87,824 (31 December 2019: TL 42,111).
Prior Period Stage I Stage II
Non-cash loans TL FC TL FC
Letters of guarantee 5,763,173 6,558,086 717,216 513,850 Bank acceptances - 12,695 - 220
Letters of credit 260 2,479,195 - 144,396
Endorsements - - - - Underwriting commitments. - - - -
Factoring commitments - - - -
Other commitments and contingencies 2,600,335 3,358,168 48,819 178,357
Total 8,363,768 12,408,144 766,035 836,823

TÜRK EKONOMİ BANKASI ANONİM ŞİRKETİ
NOTES AND EXPLANATIONS TO CONSOLIDATED FINANCIAL STATEMENTS AS OF
31 DECEMBER 2020 (Unless otherwise stated amounts are expressed in thousands of Turkish Lira (“TL”).)
118
III. Explanations and Disclosures Related to the Consolidated Off-Balance Sheet Items
(Continued)
2. Information related to derivative financial instruments:
Derivative transactions according to purposes
Trading Hedging
Current Period Prior Period Current Period Prior Period
Types of trading transactions Foreign currency related derivative transactions (I): 80,856,033 78,045,061 - -
Forward transactions 16,798,167 10,742,282 - -
Swap transactions 58,803,224 58,730,372 - - Futures transactions 1,133,911 71,526 - -
Option transactions 4,120,731 8,500,881 - -
Interest related derivative transactions (II): 19,509,018 8,401,316 - - Forward rate transactions - - - -
Interest rate swap transactions 19,509,018 8,401,316 - - Interest option transactions - - - -
Futures interest transactions - - - -
Marketable securities call-put options (III) - - - - Other trading derivative transactions (IV) 2,960,427 43,150 - -
A. Total trading derivative transactions (I+II+III+IV) 103,325,478 86,489,527 - -
Types of hedging transactions Fair value hedges - - 6,250,067 1,740,184
Cash flow hedges - - 17,757,374 24,213,951
Net investment hedges - - - - B. Total hedging related derivatives - - 24,007,441 25,954,135
Total Derivative Transactions (A+B) 103,325,478 86,489,527 24,007,441 25,954,135
Related to agreements of forward transactions and options; the information based on the type of forward and
options transactions are disclosed separately, specified with related amounts, type of agreement, purpose of
transaction, nature of risk, strategy of risk management, hedging relationship, possible effects on the bank’s
financial position, timing of cash flows, reasons of unrealized transactions which previously projected to be
realized, income and expenses that could not be linked to income statement in the current period because of
the agreements:
Forward foreign exchange and swap transactions are based on protection from interest and currency
fluctuations. According to TAS, they do not qualify as hedging instruments and are remeasured at fair value
by the Parent Bank.
i) Derivative instruments for fair value hedging purposes:
In 2020, the Parent Bank applied fair value hedge accounting in order to avoid the effects of interest rate fluctuations in the market by matching its swap portfolio with its loans and marketable securities. As of 31 December 2020, the nominal value of the derivative instruments for risk management purposes is TL 6,250,067 and the net fair value is TL 363,278.
Current Period Prior Period
Fair Value Fair Value
Nominal Asset Liability Nominal Asset Liability
Cross Currency Swaps 6,250,067 447,376 84,098 1,740,184 21,136 -
Interest Rate Swaps - - - - - -
Total 6,250,067 447,376 84,098 1,740,184 21,136 -

TÜRK EKONOMİ BANKASI ANONİM ŞİRKETİ
NOTES AND EXPLANATIONS TO CONSOLIDATED FINANCIAL STATEMENTS AS OF
31 DECEMBER 2020 (Unless otherwise stated amounts are expressed in thousands of Turkish Lira (“TL”).)
119
III. Explanations and Disclosures Related to the Consolidated Off-Balance Sheet Items
(Continued)
2. Information related to derivative financial instruments: (continued) ii) Derivative instruments for cash flow hedge purposes:
The Parent Bank has applied cash flow hedge accounting by matching its swap portfolio with total notional
amounting to TL 17,757,374 (31 December 2019: TL 24,213,951) and 1-90 days of maturity deposit portfolio
together with selected borrowing portfolio. Effective portion of TL 283,380 (31 December 2019: TL 1,112,750
credit) credit accounted for under equity is presented after deducting its deferred tax effect of TL 56,676
(31 December 2019: TL 226,000 debit) debit in the financial statements. In 2020, ineffective portion of TL 18,266
(31 December 2019: TL 20,286) income is accounted for under income statement.
Current Period Prior Period
Fair Value
Fair Value
Nominal Asset Liability Nominal Asset Liability
Cross Currency Swaps 4,852,334 615,008 471,891 7,611,850 218,639 875,965
Interest Rate Swaps 12,905,040 35,134 526,847 16,602,101 1,732 1,049,009
Total 17,757,374 650,142 998,738 24,213,951 220,371 1,924,974
3. Credit derivatives and risk exposures on credit derivatives: None. 4. Explanations on contingent liabilities and assets
a) a.1) The Group's share in contingent liabilities arising from entities under common control (joint ventures) together with other venturer: None.
a.2) Share of entity under common control (joint ventures) in its own contingent liabilities: None.
a.3) The Group’s contingent liabilities resulting from liabilities of other venturers in entities under
common control (joint ventures): None.
b) Accounting and presentation of contingent assets and liabilities in the financial statements:
b.1) Contingent assets are accounted for, if probability of realization is almost certain. If probability of realization is high, then it is explained in the footnotes: As of 31 December 2020, there are no contingent assets that need to be explained (31 December 2019: None).
b.2) A provision is made for contingent liabilities, if realization is probable and the amount can
be reliably determined. If realization is remote or the amount cannot be determined reliably, then it is explained in the footnotes. The Bank and financial institution subject to consolidation have provided provision amounting to TL 93,625 for various lawsuits filed by various individuals and institutions with high probability of occurrence and cash outflow. This amount is presented under index “Other Provisions” in the financial statements.
5. Custodian and intermediary services:
The Group provides trading and safe keeping services in the name and account of third parties, which are
presented in the statement of contingencies and commitments.
Investment fund participation certificates held in custody which belong to the customers and the portfolio are accounted for with their nominal values. As of 31 December 2020, the total nominal value and number of certificates are TL 4,218,738 and 4,218,738 (31 December 2019: TL 7,318,390 and 7,318,390) and the total fair value is TL 4,310,479 (31 December 2019: TL 4,864,848).

TÜRK EKONOMİ BANKASI ANONİM ŞİRKETİ
NOTES AND EXPLANATIONS TO CONSOLIDATED FINANCIAL STATEMENTS AS OF
31 DECEMBER 2020 (Unless otherwise stated amounts are expressed in thousands of Turkish Lira (“TL”).)
120
III. Explanations and Disclosures Related to the Consolidated Off-Balance Sheet Items
(Continued)
6. The information on the banks’ rating by the international rating introductions (*):
TEB maintained its position as one of the most highly rated banks in Turkey. As of 31 December 2020, TEB’s
ratings were as follows:
Moody’s Investor Services:
Baseline Credit Assessment b3
Adjusted Baseline Credit Assessment b1
Long Term FC Deposits B2
Short Term FC Deposits NP
Long Term TL Deposits B1
Short Term TL Deposits NP
Outlook Negative
Fitch Ratings:
Foreign Currency
Long-term B+
Short-term B
Outlook Negative
Turkish Lira
Long-term BB-
Short-term B
Outlook Negative
National AA (tur)
Outlook Stable
Financial Strength b+
(*) Ratings above are not performed based on the “Communiqué for Authorization and Activities of Rating Institutions”
published by the Capital Markets Board.

TÜRK EKONOMİ BANKASI ANONİM ŞİRKETİ
NOTES AND EXPLANATIONS TO CONSOLIDATED FINANCIAL STATEMENTS AS OF
31 DECEMBER 2020 (Unless otherwise stated amounts are expressed in thousands of Turkish Lira (“TL”).)
121
IV. Explanations and Disclosures Related to the Consolidated Statement of Income
1. Explanations on Interest Income
a) Information on interest income on loans:
Current Period Prior Period
TL FC TL FC
Interest income on loans (*)
Short Term Loans 3,378,061 221,584 4,632,277 356,415 Medium and Long Term Loans 4,697,498 242,614 5,137,129 269,578
Interest on Loans under Follow-Up 142,039 - 229,865 -
Premiums Received from Resource Utilization Support Fund - - - -
Total 8,217,598 464,198 9,999,271 625,993
(*) Includes fees and commissions obtained from cash loans amounting to TL 153,388 (31 December 2019: TL
225,870)
b) Information on interest income on banks:
Current Period Prior Period
TL FC TL FC
The Central Bank of Turkey - - - 22,728
Domestic Banks 161,918 496 143,925 3,097 Foreign Banks 3,470 7,890 15,024 51,081
Branches and Head Office Abroad - - - -
Total 165,388 8,386 158,949 76,906
c) Information on interest income on marketable securities portfolio:
Current Period Prior Period
TL FC TL FC
Financial Assets Valued at Fair Value Through Profit or Loss 135,137 43,247 159,911 27,970 Financial Assets at Fair Value Through Other
Comprehensive Income 708,398 91,874 282,917 48,203 Financial Assets at Amortized Cost 1,078,923 90,253 571,203 41,639
Total 1,922,458 225,374 1,014,031 117,812
d) Information on interest income on associates and subsidiaries:
These amounts are eliminated in the consolidated financial statements.
2. Explanations on Interest Expense
a) Information on interest expense on funds borrowed (*): Current Period Prior Period
TL FC TL FC
Banks
The Central Bank of the Republic of Turkey - - - - Domestic Banks 81,025 4,145 81,387 16,117
Foreign Banks 50,835 455,495 70,102 459,674
Branches and Head Office Abroad - - - - Other Financial Institutions - - - -
Total 131,860 459,640 151,489 475,791
(*) Includes fees and commission expenses related to cash loans amounting to TL 10,870 (31 December 2019: TL 23,055).
b) Information on interest expense on associates and subsidiaries:
These amounts are eliminated in the consolidated financial statements.

TÜRK EKONOMİ BANKASI ANONİM ŞİRKETİ
NOTES AND EXPLANATIONS TO CONSOLIDATED FINANCIAL STATEMENTS AS OF
31 DECEMBER 2020 (Unless otherwise stated amounts are expressed in thousands of Turkish Lira (“TL”).)
122
IV Explanations and Disclosures Related to the Consolidated Statement of Income (Continued) 2. Explanations on Interest Expense (continued)
c) Information on interest expense on securities issued:
Current Period Prior Period
TL FC TL FC
Interest expense on securities issued 454,149 - 514,885 -
Total 454,149 - 514,885 -
d) Distribution of interest expense on deposits based on maturity of deposits:
Current Period: Time Deposits Account Name Demand
Deposits Up to 1 Month
Up to 3 Months
Up to 6 Months
Up to 1 Year
More than 1
Year Accumulate
d Deposits
Total
TL
Bank Deposits - 178,541 - - - - - 178,541
Saving Deposits - 1,219,565 862,589 14,228 4,701 14,788 - 2,115,871
Public Sector Deposits - 2,002 17,514 768 - - - 20,284
Commercial Deposits - 457,318 599,495 20,442 210 4,987 - 1,082,452
Other Deposits - 11,147 141,728 4,119 7 36 - 157,037
7 Days Call Accounts - - - - - - - -
Total - 1,868,573 1,621,326 39,557 4,918 19,811 - 3,554,185
FC Foreign Currency Deposits 9 19,810 103,064 1,179 510 987 - 125,559
Bank Deposits - 285 - - - 5 - 290
7 Days Call Accounts - - - - - - - -
Precious Metal Deposits - 238 2,432 470 2,249 1,569 - 6,958
Total 9 20,333 105,496 1,649 2,759 2,561 - 132,807
Grand Total 9 1,888,906 1,726,822 41,206 7,677 22,372 - 3,686,992
Prior Period:
Time Deposits
Account Name Demand
Deposits Up to 1 Month
Up to 3 Months
Up to 6 Months
Up to 1 Year
More than 1 Year
Accumulated Deposits
Total
TL
Bank Deposits - 39,449 - - - - - 39,449
Saving Deposits 9 1,595,995 1,948,510 137,972 45,953 35,407 - 3,763,846
Public Sector Deposits - 4,463 6,465 2,174 - - - 13,102
Commercial Deposits 235 463,361 530,438 54,558 31,676 46,726 - 1,126,994
Other Deposits - 7,238 158,706 14,990 73,986 4,870 - 259,790
7 Days Call Accounts - - - - - - - -
Total 244 2,110,506 2,644,119 209,694 151,615 87,003 - 5,203,181
FC Foreign Currency Deposits - 95,599 304,254 5,303 4,492 3,929 - 413,577
Bank Deposits - 8,327 - - - - - 8,327
7 Days Call Accounts - - - - - - - -
Precious Metal Deposits 1 682 12,328 1,108 3,037 1,128 - 18,284
Total 1 104,608 316,582 6,411 7,529 5,057 - 440,188
Grand Total 245 2,215,114 2,960,701 216,105 159,144 92,060 - 5,643,369
3. Information on dividend income:
Current Period Prior Period
Financial assets at fair value through profit and loss - - Financial assets at fair value through other comprehensive income 3,557 1,326 Other - -
Total 3,557 1,326

TÜRK EKONOMİ BANKASI ANONİM ŞİRKETİ
NOTES AND EXPLANATIONS TO CONSOLIDATED FINANCIAL STATEMENTS AS OF
31 DECEMBER 2020 (Unless otherwise stated amounts are expressed in thousands of Turkish Lira (“TL”).)
123
IV. Explanations and Disclosures Related to the Consolidated Statement of Income (Continued)
4. Information on trading gain/loss (Net):
Current Period Prior Period
Gains 61,968,025 34,035,854
Gains on capital market operations 295,308 449,304
Gains on derivative financial instruments (1) 15,988,223 14,066,366 Foreign exchange gains 45,684,494 19,520,184 Losses (-) 63,704,662 35,045,971
Losses on capital market operations 347,791 323,954 Losses on derivative financial instruments (1) 17,047,618 14,978,565
Foreign exchange losses 46,309,253 19,743,452
(1) Includes exchange rate fluctuations of hedging transactions net profit of TL 801,149 (31 December 2019: TL 142,065 profit), derivative financial instruments exchange rate changes in profit / loss accounts amounting to TL 235,299 (31 December 2019: TL 343,138) net exchange income.
5. Information on other operating income:
Other operating income of the Group mainly consists of all transaction costs collected from clients and
disposal of assets.
6. Provision expenses of banks for loans and other receivables:
a) Expected Credit Losses and Other Provisions:
Current Period Prior Period
Expected Credit Losses 752,055 1,407,353
12-Month Expected Credit Losses (Stage 1) (14,561) 41,424
Significant Increase in Credit Risk (Stage 2) 346,048 65,672
Credit-Impaired (Stage 3) 420,568 1,300,257
Impairment Losses on Securities - -
Financial Assets Measured at Fair Value through Profit or Loss - -
Financial Assets Measured at Fair Value through Other Comprehensive Income - -
Impairment Losses on Associates, Subsidiaries and Joint Ventures - -
Associates - -
Subsidiaries - -
Joint Ventures - -
Others(1) (22,683) 89,173
Total 729,372 1,496,526
(1) Includes the remaining provision amounting to TL 53,259 (31 December 2019: TL 19,708).
7. Information on other operating expenses:
Current Period Prior Period
Reserve for employee termination benefits (1) 30,661 19,725
Bank social aid fund deficit provision - -
Impairment expenses of fixed assets 943 -
Depreciation expenses of fixed assets 246,882 228,698
Impairment expenses of intangible assets - -
Impairment expense of goodwill - -
Depreciation expenses of intangible assets 77,833 72,141
Impairment for investments accounted with equity method
Impairment expenses of assets to be disposed (5,269) 4,467
Depreciation expenses of assets to be disposed - -
Impairment expenses of assets held for sale and discontinued operations - -
Other operating expenses 1,125,161 1,093,597
Rent expenses related to TFRS16 Exceptions (2) 36,525 55,262
Maintenance expenses 37,604 38,525
Advertisement expenses 59,954 68,282
Other expenses 991,078 931,528
Loss on sales of assets 6,581 10,778
Other (3) 458,443 355,443
Total 1,941,235 1,784,849 (1) The provision for employment termination benefits is included in the personnel expenses item in the financial
statements. (2) Includes other premiums and expenses paid to the Savings Deposit Insurance Fund amounting to TL 191,325 (31
December 2019: TL 142,295) and other taxes and fees paid in the amount of TL 179,916 (31 December 2019: TL 149,358).

TÜRK EKONOMİ BANKASI ANONİM ŞİRKETİ
NOTES AND EXPLANATIONS TO CONSOLIDATED FINANCIAL STATEMENTS AS OF
31 DECEMBER 2020 (Unless otherwise stated amounts are expressed in thousands of Turkish Lira (“TL”).)
124
IV. Explanations and Disclosures Related to the Consolidated Statement of Income (Continued)
8. Information of the profit/loss on continued and discontinued operations before tax:
a) The portion of the profit before tax amounting to TL 6,253,166 (31 December 2019: TL 5,564,713)
consists of net interest income, while TL 1,331,799 (31 December 2019: TL 1,582,629) consists of net
fee and commission income; total operating expenses amount to TL 3,574,990 (31 December 2019: TL
3,282,841).
b) Explanations on discontinued operations profit loss: None.
9. Information on tax provision for continued and discontinued operations:
a) As of 31 December 2020, the current tax expense is TL 523,814 (31 December 2019: TL 541,836)
Deferred tax income is TL 115,800 (31 December 2019: TL 177,232), and there is no current and
deferred tax income/expense from discontinued operations. (31 December 2019: None).
b) Deferred tax income on temporary differences resulted from continued operations is TL 115,800 (31
December 2019: TL 177,232).
c) Tax reconciliation:
Current Period Prior Period
Profit Before Taxes 1,676,920 1,491,793
Additions 182,091 164,948
Nonallowable Expenses 52,398 97,622
The Effect of Different Tax Rates 86,615 33,200
Other 43,078 34,126
Deductions (3,834) (974)
Dividend Income (3,834) (974)
Taxable Profit/Loss 1,855,177 1,655,767
Corporation Tax Rate 22% 22%
Calculated Tax 408,139 364,269
Prior Year Tax Correction (125) 335
Tax Charge 408,014 364,604
10. Information on net profit/loss on continued and discontinued operations before tax:
Net profit of the Group from the activities carried out as of 31 December 2020 TL 1,268,906
(31 December 2019: TL 1,127,189), as of 31 December 2020 there is no net profit from discontinued
operations (31 December 2019: None). 11. The explanations on net income/loss for the period:
a) The nature and amount of certain income and expense items from ordinary operations is disclosed if the
disclosure for nature, amount and repetition rate of such items is required for the complete
understanding of the Bank's performance for the period: None (31 December 2019: None).
b) Effect of changes in accounting estimates on income statement for the current and, if any, for subsequent
periods: None (31 December 2019: None).
c) Profit/loss attributable to minority interest:
Current Period Prior Period
Minority interest profit/loss 6,151 2,223

TÜRK EKONOMİ BANKASI ANONİM ŞİRKETİ
NOTES AND EXPLANATIONS TO CONSOLIDATED FINANCIAL STATEMENTS AS OF
31 DECEMBER 2020 (Unless otherwise stated amounts are expressed in thousands of Turkish Lira (“TL”).)
125
IV. Explanations and Disclosures Related to the Consolidated Statement of Income (Continued)
12. If the other items in the income statement exceed 10% of the income statement total accounts
amounting to at least 20% of these items:
Current Period Prior Period
Other Interest Income
Interest Received from Factoring Transactions 196,519 219,332
Other 22,452 33,889
Total 218,971 253,221
Current Period Prior Period
Other Fees and Commissions Received
Credit Card Fee and Commissions 798,924 1,313,155
Insurance Commissions 262,964 185,916
Brokerage Commissions 170,741 60,045
Funds Management Fees 85,505 53,785
Early Closing Commissions 76,263 62,993
General Limit Revision Commissions 49,332 45,680
Transfer Commissions 48,859 39,659
Settlement Expense Provision, Eft, Swift, Agency Commissions 35,178 48,769
Periodic Service Commission 28,225 166,434
Consultancy Commission 9,535 7,685
Other 131,948 201,128
Total 1,697,474 2,185,249
Other Fees and Commissions Given
Credit Cards Commissions and Fees 418,324 701,669
Commissions and Fees Paid to Correspondent Banks 62,254 58,762
Settlement Expense Provision, Eft, Swift, Agency Commissions 33,471 25,813
Other 104,669 95,761
Total 618,718 882,005
V. Explanations and Disclosures Related to Consolidated Statement of Changes in
Shareholders' Equity
a) The effect of changes in the fair value of financial assets at fair value through profit or loss is recognized
in the “Marketable Securities Valuation Differences” account under the equity. The relevant amount is
decreased by TL 132,450 (31 December 2019: TL 201,511 increased) and change effect to deferred tax
is TL 27,057 (31 December 2019: TL 44,328 ).
b) Increase in cash flow risk hedging items:
The Parent bank uses interest rate and cross currency swaps for reducing cash flow risk arising from
short term deposit and borrowing. In this context, the effective portion is accounted for under equity in
“Hedging Funds” account. The related amount in 2020 decreased by TL 829,371 (31 December 2019:
TL 1,463,374 decreased) and the effect of this change to deferred tax is TL 169,324 (31 December 2019:
TL 302,891).
c) Explanations on profit distribution:
It has been resolved in the Ordinary General Assembly dated 26 March 2019 of the Parent Bank, TL
1,070,354 that constitutes the 2019 net balance sheet profit shall be transferred to the Extraordinary
Reserves after setting aside, in accordance with the proposal in the resolution of the Board of Directors,
TL 53,518 as Legal Reserves, TL 9,394 as special reserves,TL 0.87 (full TL) as profit distributed to
the holders of the founder jouissance certificates.
Profit appropriation will be resolved in the General Assembly meeting which has not been conducted as of the
date of the accompanying financial statements are authorized for issue.

TÜRK EKONOMİ BANKASI ANONİM ŞİRKETİ
NOTES AND EXPLANATIONS TO CONSOLIDATED FINANCIAL STATEMENTS AS OF
31 DECEMBER 2020 (Unless otherwise stated amounts are expressed in thousands of Turkish Lira (“TL”).)
126
VI. Explanations and Disclosures Related to Statement of Consolidated Cash Flows
1. The effect of other items in the Statement of Cash Flows and the change in the exchange rate on cash and
cash equivalents:
“Other items” amounting to TL 2,439,324 (31 December 2019: TL 2,324,255) in “Operating profit before changes
in operating assets and liabilities” consists of fees and commissions paid and other expenses except for leasing
expenses, reserve for employee termination benefits, depreciation charges and taxes paid.
The “net increase in other liabilities” item in the “change in assets and liabilities subject to banking activities
“amounting to TL 1,012,184 (31 December 2019: TL 1,457,315 increased) consists of various liabilities, other
foreign sources and changes in money markets. “Net decrease in other assets” item amounting to TL 1,111,815
(31 December 2019: TL 251,877 increased) consists of changes in blocked reserve requirements, miscellaneous
receivables and other assets.
“Other” item amounting to TL 89,347 (31 December 2019: TL 101,287) in “Net cash provided from investment
activities” consists of cash outflows for intangible assets received in the current period.
The effect of change in foreign exchange rate on cash and cash equivalents includes the foreign exchange rate
difference resulting from the conversion of foreign currency cash and cash equivalents to TL the beginning and
end of the period and as TL 1,432,624 for the year 2020 (31 December 2019: TL 475,011 ). It has been realized.
2. Cash and cash equivalents at beginning and end of periods:
The reconciliation of the components of cash and cash equivalents, accounting policies used to determine these
components, the effect of any change made in accounting principle in the current period, the recorded amounts of
the cash and cash equivalent assets at the balance sheet and the recorded amounts in the cash flow statement:
Beginning of the period Current Period Prior Period
Cash 6,936,878 8,834,731
Cash in TL/Foreign Currency 2,441,970 2,006,466
Central Bank – Unrestricted amount 4,229,448 6,721,963
Other 265,460 106,302
Cash equivalents 9,415,576 4,225,423
Banks 8,575,535 3,943,831
Money market placements 840,041 281,592
Total cash and cash equivalents 16,352,454 13,060,154
End of the period Current Period Prior Period
Cash 10,125,205 6,936,878
Cash in TL/Foreign Currency 2,331,352 2,441,970
Central Bank – Unrestricted amount 7,605,582 4,229,448
Other 188,271 265,460
Cash equivalents 12,777,282 9,415,576
Banks 6,599,282 8,575,535
Money market placements 6,178,000 840,041
Total cash and cash equivalents 22,902,487 16,352,454

TÜRK EKONOMİ BANKASI ANONİM ŞİRKETİ
NOTES AND EXPLANATIONS TO CONSOLIDATED FINANCIAL STATEMENTS AS OF
31 DECEMBER 2020 (Unless otherwise stated amounts are expressed in thousands of Turkish Lira (“TL”).)
127
VII. Explanations and Disclosures Related to Risk Group of the Parent Bank
1. Volume of related party transactions, income and expense amounts involved and outstanding loan
and deposit balances:
Balance sheet items and income/expense items of previous periods are presented as of 31 December 2019.
a) Current Period:
Related Parties
Subsidiaries, Associates and
Entities under Common
Control (Joint Vent.)
Direct and Indirect
Shareholders of the Parent Bank
Other Entities Included
in the Risk Group
Cash Non-cash Cash Non-cash Cash Non-cash
Loans and Other Receivables
Balance at Beginning of Period - - 19,196 182,856 393,152 101,145
Balance at End of Period - - 161,422 438,193 810,094 89,477
Interest and Commission Income - 4 7,596 2,125 16,452 629
Direct and indirect shareholders of the Group balance above includes TL 161,422 and other entities
included in the risk group balance above includes TL 76,533 placement in “Banks”.
b) Prior Period:
Related Parties
Subsidiaries, Associates
and Entities under Common
Control (Joint Vent.)
Direct and Indirect
Shareholders of the Parent Bank
Other Entities Included
in the Risk Group
Cash Non-cash Cash Non-cash Cash
Non-
cash
Loans and Other Receivables
Balance at Beginning of period - - 75,725 260,569 423,513 20,136
Balance at End of Period - - 19,196 182,856 393,152 101,145
Interest and Commission Income - - 29,774 2,541 12,627 1,140
Direct and indirect shareholders of the Group balance above includes TL 17,600 and other entities included
in the risk group balance above includes TL 63,260 placement in “Banks”.
c) c.1) Information on related party deposits balances:
Related parties
Subsidiaries, Associates
and Entities under Common
Control (Joint Vent.)
Direct and Indirect
Shareholders of the Parent Bank
Other Entities Included
in the Risk Group
Deposits
Current
Period
Prior
Period
Current
Period
Prior
Period
Current
Period
Prior
Period
Balance at Beginning of Period - - 3,313,150 1,497,789 648,747
1,055,9
42
Balance at End of Period 1 - 5,596,710 3,313,150 1,281,302 648,747
Interest on Deposits - - 162,488 90,121 39,047 92,318
c.2) Information on forward and option agreements and other similar agreements made with related parties:
Related Parties
Subsidiaries, Associates and
Entities under Common
Control (Joint Vent.)
Direct and Indirect
Shareholders of the Parent
Bank
Other Entities Included
in the Risk Group
Current
Period Prior
Period Current Period
Prior Period
Current Period
Prior
Period Financial Assets at Fair Value Through Profit or Loss
Beginning of Period - - 29,930,097 28,512,967 913,846 1,210,586
End of Period - - 18,396,561 29,930,097 284,453 913,846
Total Profit/Loss - - (1,106,802) 1,403,566 (23,948) (14,335)
Hedging Transactions Purposes
Beginning of Period - - 17,648,505 17,581,390 - -
End of Period - - 10,139,721 17,648,505 - -
Total Profit/Loss - - 949,648 (1,209,539) - -
d) As of 31 December 2020, the total amount of remuneration and fees provided for the senior management of the Group is TL 62,363 (31 December 2019: TL 55,385).

TÜRK EKONOMİ BANKASI ANONİM ŞİRKETİ
NOTES AND EXPLANATIONS TO CONSOLIDATED FINANCIAL STATEMENTS AS OF 31
DECEMBER 2020 (Unless otherwise stated amounts are expressed in thousands of Turkish Lira (“TL”).)
128
VIII. Explanations on the Parent Bank’s Domestic, Abroad, Off-Shore Branches or Subsidiaries, and
Agencies Abroad
1. Explanations on the Parent Bank’s domestic branches, agencies and branches abroad and off-shore
branches:
Numbers Employees
Domestic branches 451 8,778
Country
Rep-offices abroad -
Total Assets Capital
Branches abroad 4 72 Cyprus 1,198,195 20,000
Off-shore branches - - -
2. Explanations on Branch and Agency Openings or Closings of the Parent Bank:
In the year 2020, the Parent Bank closed 16 branches, there are no branches opened during the year.
IX. Explanations on Significant Events and Matters Arising Subsequent to Balance Sheet Date
None.
SECTION SIX
OTHER EXPLANATIONS
I. Other Explanations on Activities of the Parent Bank
None.
SECTION SEVEN
INDEPENDENT AUDITOR’S REPORT
I. Explanations on the Independent Auditor’s Report
The consolidated financial statements of the Group were audited by DRT Bağımsız Denetim ve Serbest Muhasebeci Mali
Müşavirlik A.Ş. and the independent auditor’s audit report dated 5 February 2021 is presented preceding the consolidated
financial statements.
II. Other Footnotes and Explanations Prepared by Independent Auditors
None.

teb.com.tr