2020 ANNUAL REPORT - Trafigura
108
TRAFIGURA GROUP PTE. LTD. 2020 ANNUAL REPORT
-
Upload
khangminh22 -
Category
Documents
-
view
3 -
download
0
Transcript of 2020 ANNUAL REPORT - Trafigura

TRAFIGURA GROUP PTE. LTD.
2020ANNUAL REPORT

Financial and business highlights1
Group revenue
$147.0bn
147.02020
171.52019
180.72018
Combined volume of commodities traded2
365.3mmt
365.32020
372.12019
371.12018
Gross profit
$6.8bn
6.82020
2.92019
2.42018
Total assets
$57.0bn
57.02020
54.22019
53.82018
Oil and Petroleum Products revenue as a percentage of Group revenue
57%
572020
652019
692018
Oil and Petroleum Products total volume traded
267.7mmt
267.72020
274.92019
275.22018
Gross profit margin
4.6%
4.62020
1.72019
1.32018
Total non-current assets
$11.1bn
11.12020
10.82019
8.82018
2020
2019
2018
43
35
Metals and Minerals revenue as a percentage of Group revenue
43%
31
20.92020
19.92019
Non-ferrous concentrates and refined metals total volume traded
20.9mmt
18.52018
1.62020
0.92019
Net profit
$1.6bn
0.92018
7.82020
6.82019
Total Group equity
$7.8bn
6.32018
76.72020
77.32019
Bulk minerals total volume traded
76.7mmt
77.42018
6.02020
2.12019
EBITDA3
$6.0bn
1.72018
8,6192020
5,1062019
Average number of employees over the year4
8,619
4,3162018
Trafigura Group Pte. Ltd. and the companies which it directly or indirectly owns investments in are separate and distinct entities. In this publication, the collective expressions ‘Trafigura’, ‘Trafigura Group’, ‘the Company’ and ‘the Group’ may be used for convenience where reference is made in general to those companies. Likewise, the words ‘we’, ‘us’, ‘our’ and ‘ourselves’ are used in some places to refer to the companies of the Trafigura Group in general. These expressions are also used where no useful purpose is served by identifying any particular company or companies.
1. Trafigura’s financial year ran from 1 October 2019 to 30 September 2020. Figures for this period include the new IFRS 16 reporting requirements.
2. Million metric tonnes.
3. EBITDA (earnings before interest, tax, depreciation and amortisation) is operating profit excluding the share in results of equity-accounted investees, depreciation and amortisation, gains/losses on divestments of subsidiaries, equity-accounted investees and other investments, impairment losses and other non-operating income and expenses.
4. Total employee numbers are calculated as an average over the financial year and comprise employees of consolidated Trafigura Group businesses, operations and offices. For the first time in FY2020, this includes 3,921 Nyrstar employees, following the consolidation of Nyrstar into the Trafigura Group in July 2019. MATSA, Puma Energy, Porto Sudeste and [Impala] Simba employees are excluded as these assets are not consolidated in the Trafigura Group financial accounts.

Global trade brings the world closer together.
It expands the wealth of nations, forges common interests and builds mutual trust.
Trafigura makes trade happen. And we make it our mission to do that responsibly. We deploy infrastructure, skills and our global network to move physical commodities from places they are plentiful to where they are most needed.
We have been connecting our customers to the global economy for over a quarter of a century. We grow prosperity by advancing trade.
Find out more www.trafigura.com
Overview
02 Trafigura at a glance03 What we do
Report of the Board of Directors
04 Statement from the Executive Chairman and Chief Executive Officer
06 Financial review12 Marketplace review14 Performance review
14 Oil and Petroleum Products Trading
18 Metals and Minerals Trading
22 Bulk Trading24 Shipping and
Chartering26 Industrial and
financial assets
Risk management and funding model
30 How Trafigura manages risk
34 Finance to meet diverse business needs
Corporate governance
36 Board of Directors and Committees
Financial statements
38 Contents for the Financial statements
Contents
2020RESPONSIBILITY
REPORTTRAFIGURA GROUP PTE. LTD.
For further information visit: www.trafigura.com/responsibility
The 2020 Annual Report is complemented by our 2020 Responsibility Report. The Responsibility Report reflects on Trafigura’s progress in implementing responsible business practices and presents our performance in managing our social and environmental impacts.

North America
10Offices
1,622Employees
Europe
20Offices
2,036Employees
Middle East
3Offices
38Employees
Africa
10Offices
311Employees
Latin America
29Offices
2,334Employees
Asia & Australia
16Offices
2,278Employees
At a glance
Oil and Petroleum Products
267.7mmt
(Total volume traded)
Metals and Minerals
97.6mmt
(Total volume traded)
Shipping and Chartering
4,225 fixtures
(Shipping and Chartering fixtures)
Trading and logistics1
Industrial and financial assets
Trafigura is one of the world's largest traders by volume of oil and petroleum products, with a global presence and comprehensive coverage of all major markets.
As a leading metals and minerals trader, we negotiate offtake and supply agreements with miners and smelters globally.
Our Shipping and Chartering desk is closely integrated into Trafigura’s business model, providing freight services to commodity trading teams internally and trading freight externally in the professional market.
Impala Terminals is a multimodal logistics provider focused on export-driven emerging markets. It owns and operates ports, port terminals, warehouses and transport assets.
Trafigura Mining Group manages mining operations, develops projects and conducts technical audits of existing and potential partner projects.
Galena Asset Management provides investors with specialised alternative investment solutions through its investments in real assets and private equity funds.
Nyrstar is a global multi-metals mining and smelting business, with a market-leading position in zinc and lead.
www.trafigura.com/locations1. Figures as at 30 September 2020
Trafigura's core business is the physical trading of oil and petroleum products and metals and minerals, and their transportation across the globe. Our assets and investments complement and enhance these activities. We have 8,619 employees across 48 countries.
Overview2

Transformed commodities
SourceWe negotiate
offtake agreements with oil producers,
refiners, mining companies
and smelters. We own mines
and smelters and invest in logistics
that improve market access for
our suppliers.
We invest in renewable power
generation, storage capacity and alternative technologies.
BlendWe blend physical commodities to regional, market
and customer specifications in strategically
located terminals and warehouses
around the world.
StoreWe store
petroleum products at
owned and third-party tankage.
We store metals and minerals at
Impala Terminals and third-party-owned facilities.
DeliverWe operate
efficient, safe and high-
quality logistics.
We move commodities
by barge, truck, rail, pipeline and vessel in support
of our core trading activities and for
third parties.
We supply renewable power
to electricity grids and our own
operational facilities.
Renewable
Natural resources
Non-renewable
Processors
Value creation
What we do
We connect counterparties, build capacity and develop physical commodity markets reliably, efficiently and responsibly. We are adding value to the global trade in natural resources with exceptional service and performance across the supply chain.
By reducing costs
• Global network
• Market knowledge
• Low financing cost
• Operational efficiency
• Economies of scale
• Infrastructure investment
• Supply chain optimisation
By managing risks
• Hedged financial risks
• Political and liability risk insurance
• Integrated systems and processes
• Regulatory compliance
• Governance and responsibility
By limiting emissions
• Transition-enabling metals
• Reduced carbon intensity
• Reduced carbon footprint
• Solar, wind and storage infrastructure
• Alternative technologies
• Renewable energy supply
• Developing low-carbon markets
By transforming commodities
In space In time In form
Power
Trafigura Annual Report 2020 3

Changing market dynamicsTrafigura Group’s core strategy is to advance trade efficiently and responsibly, using its global scale, cross-commodity reach and in-depth market knowledge to connect producers and consumers of energy and industrial raw materials around the world. Our success this year was a reflection of this core strategy, as well as the investments we have made over several years in recruiting and developing talent and in establishing world-class trading infrastructure, IT and risk control systems. The teamwork across our global office network ensured that we were quick to understand the rapidly changing and highly variable market dynamics across the commodity spectrum as the virus spread, and to deploy work from home procedures rapidly and smoothly. Our platform could react to price signals by shifting large volumes of commodities between geographical regions to where they were needed most or into storage when supply outstripped demand – the fundamental function of physical commodities traders in volatile conditions. We were on hand to provide support to our counterparties, helping minimise the impact of COVID-19 and volatile market conditions on their operations. This strong focus on customer service and flexibility further strengthened our long-term relationships.Margins were boosted by understanding the rapidly changing market environment and by commercialising arbitrage opportunities, resulting in a gross trading margin for the Group of 4.6 percent, a significant step-up when compared to 1.7 percent in FY2019 and 1.3 percent the year before. Consolidation was evident across the trade commodity sector, as competitors refocused business models and smaller players suffered from a reduction in credit availability. Our metals volumes grew in both relative and absolute terms. In oil, monthly volumes reflected the volatile market conditions and, despite peak volumes in April, were broadly flat overall compared to the previous year, while our global bunker fuel footprint expanded with the successful start of our fast-growing joint venture, TFG Marine.
I am pleased to present Trafigura Group’s 2020 Annual Report, covering our performance and progress in what by any standard was a challenging and volatile year for the global economy and for commodity markets, as a result of the COVID-19 pandemic. It was a year in which commodity supply chains were significantly disrupted, not only by the virus and by government measures to curb it, but also by changing trade policies and geopolitics. Amidst unprecedented market conditions, our expertise in physical commodity trading, risk management and logistics was called upon to an exceptional degree. I am proud to say that our people around the world rose to the challenge, working professionally with resourcefulness, discipline and in difficult circumstances to address our customers’ supply issues, deliver reliable service and maintain operational performance. I am also pleased to report that our Foundation, employees and businesses supported a range of community and charitable initiatives to help those most affected by the pandemic. I would like to thank every individual who contributed to these collaborative efforts, from our commercial staff to our support and operational employees. Our financial result, including a net profit for the year of USD1,599 million, reflects an excellent performance from our core trading divisions, Oil and Petroleum Products, and Metals and Minerals, both of which delivered record gross profit and EBITDA. At the same time, our industrial assets were adversely impacted by COVID-19 and the consequent economic downturn. Despite further improvements in our health, safety and environmental performance this year, I am saddened to report the death of an Impala Terminals employee in Colombia, and two further fatalities at our MATSA mining joint venture in Spain. These incidents underline the work still needed to achieve the excellence in health and safety to which we aspire.
Jeremy WeirExecutive Chairman and Chief Executive Officer
Statement from the Executive Chairman and Chief Executive Officer
A strong result in a volatile year
In an extraordinary period for global commodity markets, Trafigura Group delivered exceptional customer service and a strong overall commercial and financial performance.
4 Statement from the Executive Chairman and Chief Executive Officer
Financial discipline Our commercial performance was robust, however, we were not immune to the economic downturn. Our industrial assets in all regions suffered from the contraction in demand and restrictions in the movement of goods and people caused by the pandemic. The Group took a conservative approach to assessing the value of its fixed assets and maintained a disciplined approach to investment. The fuel distribution and retailing business, Puma Energy, made a loss during the year and its equity value was adjusted downwards on our balance sheet. The Nyrstar zinc and lead smelting business, of which Trafigura took control in 2019, is in the midst of a turnaround, but made a loss. The value of the Colombian port and logistics venture operated by our Impala Terminals subsidiary was also impaired.This financial year, I am pleased to say that our total capital expenditure – principally focused on maintaining and upgrading Nyrstar’s smelting assets after years of under investment – was largely offset by realisations from asset disposals via our profitable sale of equity stakes in shipowners Scorpio Tankers and Frontline.
Transparency and governanceWe believe that transparency, responsibility and good governance are vital in building trust, in securing long-term relationships with our stakeholders and in developing and growing our business. Our efforts over recent years to drive greater transparency within the commodities trading sector have contributed to improved international reporting standards, such as those developed by the Extractive Industries Transparency Initiative (EITI), including new sector transparency guidelines launched in 2020. As a Board Member of EITI, Trafigura is committed to uphold industry-leading standards in reporting transparently, engaging constructively and encouraging greater participation.Similarly, we are progressing various initiatives to improve the transparency of global supply chains and to ensure responsible sourcing, in particular of the metals and minerals we supply, in line with increasing demands from customers, consumers, financiers and regulators. Our Responsible Sourcing programme has been embedded into the business over the past several years. Through it, we aim to identify key risks, engage suppliers, customers and financiers in risk mitigation efforts and provide assurance to key stakeholders that the ores and concentrates we supply are produced in accordance with global standards, including applicable OECD guidelines. Managing compliance remains a priority. Following the significant steps taken in 2019, including eliminating the practice of using intermediaries for business origination and development across our global operations, we continued to extend and rigorously enforce our robust compliance programme in 2020. This has resulted in systemised processes and significantly strengthened controls related to vessel screening, counterparty due diligence, and the closer oversight of higher-risk third party service providers.
Positioned for a changing worldThe world that emerges from the COVID-19 pandemic will differ in important aspects. Efforts to reduce carbon emissions in order to address the problem of climate change, already gathering pace before the pandemic, will accelerate further. Renewable energy will supply an ever-increasing share of the world’s power supply, and electric and hydrogen-fuelled vehicles will account for an expanding proportion of the global automobile fleet. New technologies and new environmental regulations will likely result in market disruptions, but also provide business opportunities. At the end of 2020, Trafigura is in an excellent position to navigate and benefit from these trends. As a leading trader in non-ferrous metals, we have significant and growing exposure to a sector where demand – for copper, cobalt, aluminium, nickel and other products – is set to expand substantially as a result of electrification and renewable energy technologies. As a leading trader in oil and gas, and metals and minerals, we are playing our part in the energy transition. Whilst oil will remain important and required for many years and we will continue to build market share, we are providing cleaner fuels and alternative energy sources and investing in new technologies such as storage systems and hydrogen.This year, we set out to enhance these activities by establishing a third trading division focused on power and renewables. We believe that an electricity market that is growing and experiencing significant disruption offers opportunity to apply our commercial and risk-control skills, and I fully expect this new division to take its place alongside energy and metals as a core Trafigura business over the next few years.As a major charterer and supplier of shipping and as an operator of industrial assets, we are also conscious of the need to reduce the carbon emissions for which we are responsible. This year, we have set ambitious but realistic targets to curb greenhouse gas emissions from our own operations in the next three years. We are also setting out a path to reduce emissions indirectly attributable to our activities over time. The details of these targets and our other environmental, social and governance ambitions, initiatives and performance will be published in our 2020 Responsibility Report.For Trafigura Group, this was a year that proved and improved the strength of our business. We emerge from it with a stronger balance sheet, an improving asset portfolio and an enhanced and increasingly diversified trading platform that we believe is well placed to adapt to and to assist the accelerated global transition to a lower-carbon world.These are all reasons to be excited about the prospects for Trafigura Group, not merely to prosper from renewed growth in the global economy following the travails of 2020, but also to play a key role in building a better future.
Trafigura Annual Report 2020 5

Financial review
Remarkable trading performance drives record profit
Strong margins and cash-flow generation enabled Trafigura to significantly strengthen its balance sheet, leading to a material reduction of its leverage metrics in the 2020 financial year.
Christophe SalmonGroup Chief Financial Officer
The 2020 financial year saw the best business performance in Trafigura Group’s 27 year history. The company generated record gross profit, EBITDA and cash flow, while profit for the year, at USD1,599 million, was surpassed only by the result in 2013, which included various exceptional, non-cash items.Profit for the year was 84 percent higher than the figure of USD868 million achieved in FY2019. Gross profit, at USD6,795 million, was approximately 2.4 times the FY2019 level (2.0 times on a like-for-like basis). EBITDA at USD6,064 million was 2.8 times last year’s total of USD2,129 million (2.3 times on a like-for-like basis). Our overall trading margin was 4.6 percent, likewise a significant multiple of the margins achieved in recent years and nearly three times the level in FY2019.These figures reflect an outstanding performance by both core trading divisions, Oil and Petroleum Products and Metals and Minerals, in the volatile markets, which were mainly created by the COVID-19 pandemic. The strong profit for the year came despite losses and substantial value impairments in relation to some of our industrial assets as a result of the economic downturn caused by the virus. Strong earnings and cash flows enabled us to significantly strengthen our balance sheet during the year, with total Group equity rising 14 percent to a record USD7,790 million as at 30 September 2020, from USD6,805 million a year earlier. The valuation of our fixed assets led to significant impairments, which has contributed to improving the solidity and resilience of our balance sheet.Our financial leverage was sharply reduced, with the ratio of adjusted debt to net equity falling to 0.35x from 0.78x a year earlier, substantially below our medium-term target of 1x. All this was achieved despite a five percent increase in total assets to USD57 billion, mainly driven by the growth in commodity inventories in support of our trading activity during the year and the implementation of IFRS 16.
Gross profit
$6.8bn
6.8
2.9
2020
2019
1 EBITDA (earnings before interest, tax, depreciation and amortisation) is operating profit excluding the share in results of equity-accounted investees, depreciation and amortisation, gains/losses on divestments of subsidiaries, equity-accounted investees and other investments, impairment losses and other non-operating income and expenses.
2020
2019
Gross profit margin
4.6%
4.6
1.7
EBITDA1
$6.0bn
6.0
2.1
2020
2019
Total assets
$57.0bn
57.02020
54.22019
Net profit
$1.6bn
1.62020
0.92019
Adjusted debt
0.35x
0.35x2020
0.78x2019
Group equity
$7.8bn
7.8
6.8
2020
2019
Group revenue
$147.0bn
147.02020
171.52019
6 Financial review | Remarkable trading performance drives record profit

I am pleased to report that we maintained a disciplined approach to capital expenditure during the year, with net cash used in investing activities standing at USD264 million, well within our stated USD500 million envelope for the year. The increase in “acquisition of property, plant and equipment” compared to 2019 relates to Nyrstar's maintenance capital expenditures of USD252 million (Nyrstar was consolidated into the Trafigura Group in July 2019). This additional expenditure was largely offset by a USD374 million cash inflow from the profitable disposal of our non-core shareholdings in shipowners Frontline and Scorpio Tankers.As a result of our performance and our transparent approach to communication with financial stakeholders, we maintained access to abundant funding throughout the year. We were able to refinance all of the Group’s committed unsecured syndicated lines at similar levels. We accessed the debt capital markets with a bond issue in September 2020, showing that Trafigura continues to benefit from a flight to quality in commodity finance in the face of difficulties encountered by some smaller players during the year. We also continued to diversify our sources of funding – for example arranging a “low-carbon aluminium” financing facility at preferential rates.
Oil and Petroleum Products Revenue by geography (%) Metals and Minerals Revenue by geography (%)
2020
2019 2019
2020
2020 2019
Middle East 3% 3%
Africa 3% 4%
Asia & Australia 35% 29%
Europe 25% 31%
Latin America 9% 9%
North America 25% 24%
2020 2019
Middle East 8% 8%
Africa 4% 3%
Asia & Australia 55% 56%
Europe 13% 13%
Latin America 1% 2%
North America 19% 18%
IFRS 16 reportingLike-for-like comparisons between FY2020 and FY2019 results are complicated by the fact that FY2020 results incorporate for the first time the new IFRS 16 reporting requirement on lease arrangements (see Note 4, page 64). All the FY2020 figures in this statement, unless otherwise indicated, include the effect of IFRS 16, the detail of which is set out in the consolidated financial statements. The comparable FY2019 figures are presented as reported in the 2019 Annual Report. The net impact of this reporting requirement resulted in a reduction in the profit for the period (after taxes) of USD26 million compared to what it would have been in the absence of IFRS 16, as well as an increase in gross profit of USD997 million and an increase in EBITDA of USD1,194 million. In addition, the requirement resulted in an increase of USD2,258 million in our total assets and a corresponding increase in total group equity and liabilities.
Trafigura Annual Report 2020 7

IncomeBoth our Oil and Petroleum Products and our Metals and Minerals businesses contributed to the marked increase in gross profit in FY2020, benefitting from extraordinary volatility and the emergence of contango forward price curves during the year. Gross profit in Oil and Petroleum Products was USD5,259.0 million (FY2019: USD1,681.4 million) or 75 percent of the Group total. Metals and Minerals brought in gross profit of USD1,535.4 million (FY2019: USD1,188.4 million) equal to 25 percent of the Group total.The Oil and Petroleum Products division benefited in particular from the unprecedented market volatility, with April 2020 entering the record books as the most volatile month in history for the oil market. Our Oil and Petroleum Products traders were able to take advantage of the elevated volatility while deploying our deep understanding of physical oil flows along with our world-class risk management systems to adapt to the spread of the COVID-19 pandemic in the first half of the calendar year. Metals and Minerals, meanwhile, maintained the trend of the last few years, steadily growing their customer base and expanding their market share of a consolidating non-ferrous metals market. Once again, Trafigura benefits from the contribution of these two divisions, Metals and Mining and Oil and Petroleum Products, serving markets with distinct and largely uncorrelated business cycles. Total Group revenue in FY2020 was USD146,994 million, 14 percent less than the USD171,474 million recorded for the previous year. While our overall trading volumes remained relatively flat compared to 2019, generally lower commodity prices led to a net reduction in revenue. The total volume of commodities traded dropped marginally by 1.8 percent to 365.3 million metric tonnes, from 372.1 million metric tonnes in FY2019. Oil and Petroleum Products volumes reduced by three percent to 267.7 million metric tonnes, representing an average daily volume of 5.6 million barrels in a market that suffered a slump in demand as a result of the COVID-19 pandemic. Metals and Minerals volumes remained consistent with FY2019 at 97.6 million metric tonnes.
Sep. 2
008
Sep. 2
009
Sep. 2
010
Sep. 2
011
Sep. 2
012
Sep. 2
013
Sep. 2
014
Sep. 2
015
Sep. 2
016
Sep. 2
017
Sep. 2
018
Sep. 2
019
Sep. 2
020
Contango/(Backwardation) (USD/bbl) Trafigura gross profit margin
Maintaining profitability through the oil price cycle
Source: Company information and public market data. Contango/(Backwardation) graph is calculated by subtracting CO1 (Generic 1st ‘CO’ Brent Future) from CO6 (Generic 6th ‘CO’ Brent Future)
(8)(6)(4)
(2)0
246
81012
14
-3.0%
-2.0%
-1.0%
0.0%
1.0%
2.0%
3.0%
4.0%
5.0%
General and administrative expenses rose to USD2,155 million from USD1,049 million, mainly due to the implementation of IFRS16. Net financing costs were somewhat lower than in FY2019 at USD658 million as a result of the softening of interest rates this year. Income tax was USD292 million, compared to USD124 million in FY2019. Impairments, meanwhile, jumped to a multiple of their levels last year, partly reflecting the economic impact of the pandemic on our industrial assets, including our holding in Puma Energy. The three impairment lines of the statement of income contributed a loss of USD1,568 million, compared to just USD104 million in FY2019. The largest adjustments occurred in relation to our Impala Terminals businesses in Colombia, our holding in Indian refiner Nayara Energy and our stake in Puma Energy. An itemised list of these impairments and losses can be found in Note 11 on page 69.
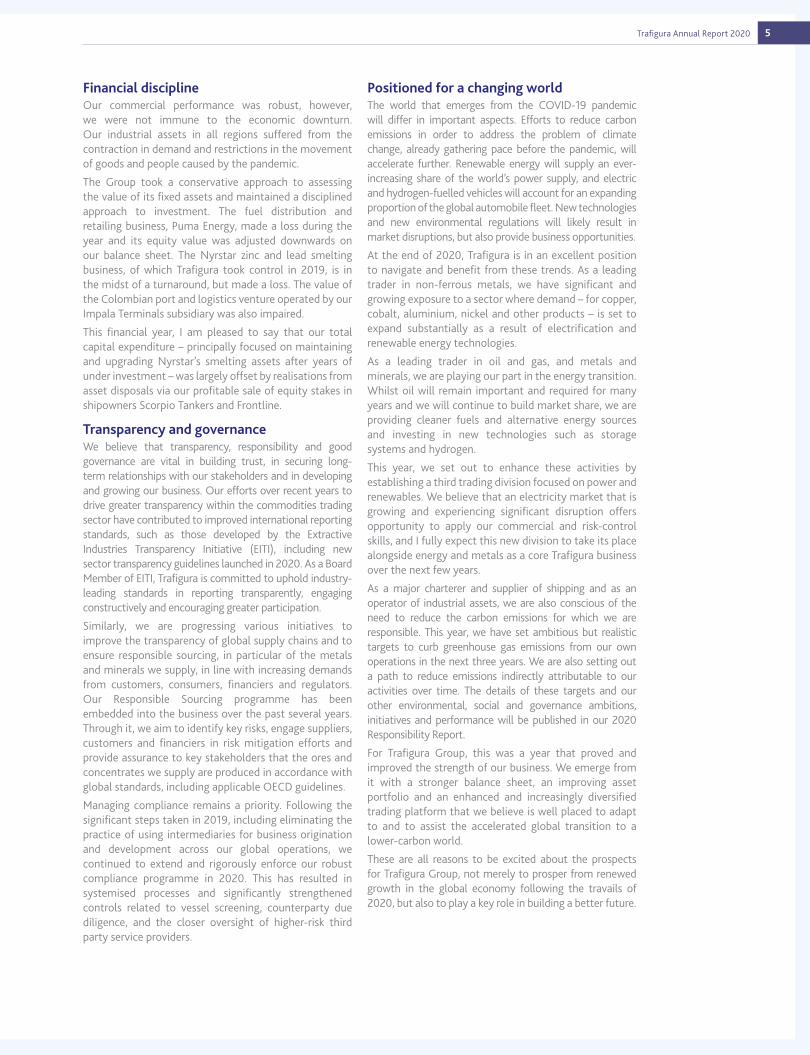
Balance sheetTotal assets amounted to USD56,985 million as at 30 September 2020. Non-current assets were little changed at USD11,116 million compared to USD10,777 million, despite the implementation of IFRS 16 which requires booking leasing arrangements as “right of use” assets, leading to a new non-current asset of USD2,092 million as at 30 September 2020. The current assets grew by six percent to USD45,867 million from USD43,372 million and within that number inventories rose by 50 percent to USD20,178 million. Inventories significantly rose due to an increase in volumes (51 percent for each of Oil and Petroleum Products and Metals and Minerals divisions) and movements in average prices (Brent price decreased by 34 percent and refined copper increased by 15 percent over the year). The oil contango market structure and the increase in metals prices were key drivers in the overall increase. It is worth noting that the oil inventories of 138 million barrels represent less than two days of world consumption of circa 100 million barrels per day. In accordance with Trafigura policy, 100 percent of these stocks are hedged or pre-sold.
Financial review | Remarkable trading performance drives record profit8

Cash flowThe powerful performance of our trading divisions generated exceptionally strong cash flows, with operating cash flow before working capital changes of USD6,118 million, three times the figure of USD1,993 million for FY2019. Trafigura believes this operating cash flow metric is the most reliable measure of its financial performance, since the level of working capital is predominantly driven by prevailing commodity prices and price variations are financed under the Group’s self-liquidating finance lines. The growth of inventories necessitated a significant increase in working capital, meaning that net cash used in operating activities was USD658 million, compared with a net release of USD4,270 million in FY2019. This increase in working capital needs is partially matched by an increase in the use of short-term bank lines. Investing activities resulted in a net cash use of USD265 million, compared to a net use of USD285 million in FY2019. The normal, ongoing maintenance capital expenditures of Nyrstar’s plants and equipment represented USD252 million and was the principal item of the Group's capital expenditure during the year. The net cash from financing activities was a net inflow of USD413 million, compared to a net use of USD3,074 million in FY2019. The overall balance of cash and cash equivalents as at 30 September 2020 was USD5,757 million, compared to USD6,267 million a year earlier.
Liquidity and financingTrafigura maintained wide access to liquidity throughout the year with credit lines of USD61 billion from a network of around 135 financial institutions. The majority of our day-to-day trading activity is financed through uncommitted, self-liquidating trade finance facilities, while we use corporate credit facilities to finance other short-term liquidity requirements, such as margin calls.This funding model gives us the necessary flexibility to cope with periods of enhanced price volatility as utilisation of the trade finance facilities increases or decreases to reflect the volumes traded and underlying prices. Trafigura also maintains an active programme of issuance on debt capital markets to secure longer-term finance in support of our investments.During the course of the 2020 financial year, the Group completed a number of important transactions in the syndicated bank loans market, securitisation markets (notably through innovative financing solutions) and bond markets (public and private). Trafigura Group demonstrated its strong access to committed sources of funding across the globe despite unprecedented volatility throughout the period as a result of the COVID-19 pandemic. It was a strong vote of confidence in the quality of the credit and in the strength of the company’s business. The Group also benefitted from a flight to quality in turbulent times for banks active in the commodity trading sector.
In October 2019, Trafigura refinanced its Asian Revolving Credit Facility (RCF) and Term Loan Facilities (TLF) at USD1,505 million-equivalent with the support of 27 banks. The transaction comprised a 365-day US dollar revolving credit facility, a one-year Chinese yuan renminbi term loan facility and a three-year US dollar term loan facility. This facility was upsized by USD130 million-equivalent post-closing via the accordion feature.In February 2020, Trafigura completed the second phase of its USD450 million Inventory Securitisation Programme launched in November 2017. This was achieved mainly by adding the US as an eligible jurisdiction, following an amendment process with the six financial institutions participating in the platform. This improvement allowed programme utilisation to reach record levels and paves the way for the implementation of the next phase: seeking committed term financing in the asset-backed securitisation markets.In March 2020, Trafigura simultaneously refinanced two core credit facilities and issued notes with long-dated maturities. The company refinanced its flagship 365-day European multi-currency syndicated RCF at USD1,895 million. The facility initially launched at USD1,500 million and closed substantially oversubscribed, allowing the facility to be upsized. In addition, the company decided to exercise the second extension option available on the three-year tranche of its 2018 ERCF, thereby extending the facility by 365 days and maintaining a three-year tenor. Those tranches were subsequently upsized by USD135 million in aggregate via the accordion feature.In a separate transaction, Trafigura returned for the fifth time to the Japanese domestic syndicated bank loan market and raised JPY76.8 billion (USD720 million equivalent at spot rate) via a JPY denominated term loan. In addition to the three-year tranche, which Trafigura has refinanced every two years since 2012, Trafigura introduced an inaugural five-year tranche. Twenty Japanese financial institutions supported the Samurai Loan, demonstrating the continued interest of domestic lenders in Trafigura’s credit. Five new institutions joined the syndicate, while the majority of existing lenders continued to participate and increased their amount invested.In March 2020, Trafigura Funding SA, a dedicated funding vehicle of the company, issued USD203 million of notes in the US Private Placement (USPP) market with tenors of five, seven and ten years. For its fifth issuance in the USPP market, Trafigura achieved its tightest ever all-in financing level. Proceeds were used to refinance USD51.5 million of maturing USPP notes and to support the refinancing of Trafigura’s EUR550 million bond repaid in April 2020.
Key financing milestones in FY2020:Oct. 19 Asian RCF Refinancing (post accordion) USD1,635 million
Mar. 20 European RCF Refinancing (post accordion) USD1,965 million
Japanese Samurai Loan Refinancing JPY76,800 million
US Private Placement USD203 million
May. 20 Non-traditional Receivables Securitisation Programme USD295 million
Sep. 20 USD Senior Bond USD400 million
Low Carbon Aluminium Financing Platform USD500 million
Trafigura Annual Report 2020 9

In May 2020, Trafigura put in place an innovative securitisation programme to finance its receivables currently not eligible for its current Trafigura Securitisation Finance (TSF) securitisation programme. This USD295 million programme is enhanced by an insurance policy and syndicated with three financial institutions. As per the other securitisation programmes, the main purpose is to ultimately syndicate this product with institutional investors in order to continue the diversification of funding sources. In September 2020, Trafigura Funding S.A. successfully returned to the international debt capital markets with an issuance of a USD400 million senior bond. The bond was priced at 5.875 percent, 50 basis points tighter than the Initial Price Talk thanks to very strong support from institutional investors and private banks. This issuance was marked by the quality of the order book reflected by the range and geographical diversity of investors participating in the transaction, with approximately 90 investors distributed across Asia and Europe. The various public and private debt market transactions have allowed the Group to extend its debt maturity profile. In September 2020, Trafigura established a “low-carbon aluminium” financing platform of USD500 million, with two financial institutions supporting the design and structuring of this instrument. This is further proof that Trafigura is at the forefront of financial innovation. As the first financing of its kind for Trafigura and for the wider market, the facility was designed to meet growing demand from downstream manufacturers for low-carbon aluminium and to support upstream producers in accelerating their transition to low-carbon technologies. The platform enables Trafigura to access financing at a preferential interest rate and, in turn, to pay a premium to low carbon aluminium producers. It follows Trafigura’s establishment of a low carbon aluminium-trading desk in FY2019, the first commodity trader to do so. Through this facility, Trafigura is committed to facilitating the transition towards a sustainable aluminium supply chain.After the financial year-end, in October 2020, Trafigura refinanced its Asian RCF and TLF at USD1.6 billion-equivalent, with 24 banks participating in the transaction. The new facilities comprised of a 365-day USD revolving credit facility (USD730 million), a 1-year CNH term loan facility (c. USD590 million equivalent) and a 3-year USD term loan facility (USD278 million). The new facilities were used to refinance the maturing 3-year term loan tranche from 2017 and the maturing 1-year USD and 1-year CNH tranches from 2019, as well as for general corporate purposes. The syndication of the Asian RCF was supported by Trafigura’s strong business and financial performance during this period and its partnership-driven approach with its financing partners, which resulted in a closing amount above last year’s level. Moreover, the record level reached under the CNH tranche has confirmed Trafigura’s front-rank position among commodity traders in the offshore Renminbi centres and demonstrated the benefit of our financial diversification strategy.
Public ratingsTrafigura does not hold a public credit rating and does not seek to obtain one. There are a number of reasons for this, including the fact that Trafigura’s strategy has always been to obtain funding from stakeholders that understand its business model, rather than making investment decisions on the basis of a credit rating. In addition, holding a credit rating could cause Trafigura to take more short-term focused decisions in order to maintain a particular credit rating level. This would conflict with the Group’s focus on long-term value creation and maintenance of a strong balance sheet. Trafigura has been highly successful in securing funding without a public credit rating. Financial discipline is inherent to the company’s business and finance model due to its reliance on debt markets for capital and liquidity. Trafigura’s significant expansion of its sources of financing over the years has been achieved on the basis of the Group maintaining an acceptable and sustainable credit standing, consistent with an investment grade profile. The Group’s financial discipline is reinforced by the financial covenants provided to unsecured lenders and is underlined by the strong support we receive from our banking group and investors.
Value at riskThe Value at Risk (VaR) metric is one of the various risk management tools that Trafigura uses to monitor and limit its market risk exposure.Trafigura uses an integrated VaR model which captures risk, including commodity prices, interest rates, equity prices and currency rates (see further details in Note 35). During 2020, the average 95 percent one-day VaR for derivative positions was USD26.4 million (2019: USD11.6 million), which represented less than one percent of Group equity.
(USD million)26
.4
6.8
7.8
2017 2016 2019
11.6
2020
0.32%
0.11% 0.13%0.18%
■ average 1-day VaR 95 percent–– as % of shareholders’ equity
0
10
20
30
40
50
60
70
0.0
0.1
0.2
0.3
0.4
0.5
0.6
0.7
0.8
0.9
1.0
%
10 Financial review | Remarkable trading performance drives record profit

Shareholder structureTrafigura is owned by its management and circa 850 of its senior employees, who are focused on the long- term success of the business, promoting management depth and stability, and encouraging prudent risk management. The decision as to which employees may become shareholders is discretionary based on individual performance, seniority and expected future contribution to the Group. Trafigura has significantly built up its shareholders’ equity since its inception in 1993 and the Group retains profits to further increase its capital base. Any discretionary buy-backs are subject to sufficient liquidity being available and to the company remaining compliant with financial covenants.
Leverage and adjusted debtAs a physical trading group, Trafigura relies on a specific funding model. As a result, it is not appropriate to apply the same financial analysis framework as for typical industrial companies. For Trafigura, banks and investors have historically considered financial leverage after excluding some specific balance sheet items (e.g. inventories securitisation programmes), resulting in the use of adjusted debt as an overall leverage metric. Adjusted debt corresponds to the company’s total non-current and current debt less cash, fully hedged readily marketable inventories (including purchased and pre-paid inventories which are being released), debt related to the Group’s receivables securitisation programmes and the non-recourse portion of loans from third parties. This metric is a better measure of the Group’s financial leverage than a simple gross debt metric. In particular, the following adjustments are made: • The receivables securitisation programmes are taken
out on the basis that they are entirely distinct legal entities from Trafigura with no recourse to the Group and are only consolidated into the financial statements in accordance with the Group’s accounting rules.
• Cash and short-term deposits are deducted from debt. • Pre-sold or hedged stock, including purchased and pre-
paid inventories which are being released, are deducted from debt. This reflects the great liquidity of the stock and the ease at which it could be converted to cash. As noted above, Trafigura’s policy is to have 100 percent of stock hedged or pre-sold at all times.
• Non-recourse invoice discounting or specific portion of loans (for example, non-recourse portions of bank lines used to extend prepayments to counterparties) are deducted from debt.
As at 30 September 2020, the ratio of adjusted debt to Group equity stood at 0.35x, down from 0.78x at 30 September 2019. This reduction principally reflected the exceptionally strong retained earnings during the year. Whilst the ratio of adjusted debt to Group equity was particularly strong this year, our intention is to maintain this ratio to a level of 1x. Any upwards fluctuation of this ratio to 1x in the future should not be considered as a sign of Trafigura relaxing its disciplined effort to maintain a solid credit standing.
The Company’s adjusted debt to equity ratio at the end of the reporting period is calculated as follows:
TaxationTrafigura operates in a multitude of jurisdictions and adheres to applicable local and international tax law, including legislation on transfer pricing, in the countries in which it operates. The Group’s tax policy is to pay appropriate tax according to work carried out in each jurisdiction, as determined by a functional analysis of operations using standard measures wherever possible, underpinned by reports prepared to fulfil local transfer pricing requirements. The Group’s effective tax rate – the average rate at which consolidated pre-tax profits are taxed – varies from year to year according to circumstances, and in FY2020 it was 15.4 percent (or USD292 million) compared to 12.5 percent (or USD124 million) in FY2019.
OutlookTrafigura’s FY2020 financial performance has demonstrated the Group’s ability to thrive in the most extreme market conditions and the most difficult working environments. Even when the most acute effects of COVID-19 start to recede, volatility will continue to prevail in the oil market for the foreseeable future and is also likely to increase in metals as the supply-demand balance tightens for commodities such as copper. With both of our trading divisions having deepened their customer base and demonstrated their dedication to customer service, we are confident that profits can continue on a somewhat higher plane than the average of the last five years. The Group is well positioned to operate profitably under a more normalised geopolitical, health and economic environment. In addition, the strengthening of our balance sheet during the year has made our company even more resilient to face the vicissitudes of the post-COVID-19 recovery. Our disciplined and focused approach to capital expenditure reinforces this. Equally important, is a stronger balance sheet, coupled with the already diversified nature of our business, has created a platform for a new chapter of growth in the company’s history, focused on a concerted push into the power and renewables markets and investment in the accelerating energy transition.
2020 2019USD’M USD’M
Non-current loans and borrowings 7,070.1 8,492.1 Current loans and borrowings 25,783.5 22,455.5
Total debt 32,853.6 30,947.6
AdjustmentsCash and cash equivalents 5,757.0 6,267.2 Deposits 466.0 374.2 Inventories (including purchased and pre-paid inventories) 20,921.8 14,137.2 Receivables securitisation debt 2,750.6 4,422.1 Non-recourse debt 198.4 437.2
Adjusted total debt 2,759.9 5,309.7
Group equity 7,789.9 6,804.7
Adjusted debt to Group equity ratio at the end of the period 0.35 0.78
Trafigura Annual Report 2020 11

Marketplace review
2020: COVID-19, commodities and change
Saad Rahim Chief Economist
The past year has been unlike any other in modern economic history. It began positively, with a strong growth trend supported by a cessation in the trade war that had plagued the global economy for much of the previous 18 months. The US Federal Reserve, the People’s Bank of China and the European Central Bank were all cutting rates, creating accommodative monetary conditions for growth. Major sentiment and momentum indicators were picking up steam and equity markets were rallying strongly after a summer lull in 2019. Commodity prices followed suit. At the start of our financial year in
early October 2019, Brent was at its second-lowest level of the year at USD56 per barrel, before moving upwards in a nearly straight line to touch USD72 per barrel in early January 2020. Copper did the same, touching USD5,600 per tonne in early October before moving upwards more or less continuously to USD6,300 per tonne in early January 2020. Zinc and aluminium also largely followed the same trajectory. Indeed, from the start of our financial year to early January 2020, most classes of risk assets had moved up by anywhere between five percent (non-USD FX) and nearly 30 percent (Brent).But that was before COVID-19 and the unprecedented hard stop it inflicted on global economic activity. Whereas previous economic slowdowns or periods of turbulence were caused by weaker demand leading to a contraction of economic activity, in 2020 it was the inverse: a forced halt in economic activity implemented in quick succession across the world’s major markets led to a shortfall in demand. Global air travel, which accounts for approximately 10 percent of global oil demand, fell to practically zero for a period of time, and by November 2020 had still only recovered to circa 40 percent of previous levels. US gasoline demand, which typically represents a further 10 percent of global oil demand, halved and remains over one million barrels per day below previous years’ average levels. The reduction in global trade and manufacturing impacted gasoil demand. However, the fact that construction was deemed strategic, and therefore escaped the brunt of lockdowns, helped mitigate a steeper decline in demand for this fuel.Normally, a reduction in demand of even a fraction of this magnitude would have elicited a rapid cut in production by OPEC members and associated producers. In 2020, however, disagreements among the OPEC+ group’s members led to a temporary abandonment of quotas in lieu of an all-out battle for market share. The timing of the decision to do so coincided with the start of China’s recovery from the impact of COVID-19, but before full realisation that the rest of the world would soon be in a situation similar to what China had just been through. The subsequent OPEC+ decision to reverse the March decision to raise output and instead cut output a month later was too little too late, and caused close to one billion barrels of excess inventories to accumulate over a very short period of time.
US Gasoline Demand
5,000
6,000
7,000
8,000
9,000
10,000
11,000
Nov
. 20
Oct
. 20
Sep.
20
Aug.
20
Jul.
20Ju
n. 2
0
May
. 20
Apr.
20M
ar. 2
0Fe
b. 2
0
Jan.
20
Dec.
19
Nov
19O
ct. 1
9Se
p. 19
Aug.
19Ju
l. 19
Jun.
19
May
. 19
Apr.
19
Mar
. 19
Feb.
19Ja
n. 19
Dec.
18
Source: US Department of Energy
Total Output Implied DemandUnits: 1000 barrels per day (or kbd)
12 Marketplace review | 2020: COVID-19, commodities and change

early signs of growth. However, European runs remain significantly lower versus 2019, and the US has proven the real global laggard, pointing to a tricky road ahead for the market. Looking ahead, there are significant uncertainties that remain to be resolved for the market. The widespread deployment of an effective virus vaccine will go a long way towards helping demand and economic activity recover to previous levels, but there are long-term questions around the amount of debt that countries have taken on while dealing with the crisis. For the US, that could mean the start of a weaker US dollar cycle, which in turn should boost global growth and commodity prices, but the market will need to absorb an unprecedented amount of new debt without sending rates to levels that would hamper growth. Longer term, two long-standing and inter-related challenges remain: the accelerating energy transition and reversing the systemic and enduring under-investment in the value chain needed to make the energy transition happen. Governments over the world are adopting more ambitious emissions reduction targets, hastening the build out of renewable power generation, expanding electrical grids, and encouraging electric vehicle adoption. The energy transition will require significantly more copper, nickel and other metals, and so far investment in these areas has been lagging behind future projected needs.
As a result of producers ramping supply to never-before-seen levels at the same time that an unprecedented reduction in demand was unfolding, crude oil prices suffered significant losses. Indeed, a combination of production levels that were just beginning to come off, a massive drop in demand, and a lack of available physical storage at Cushing, the critical physical delivery point for WTI oil, briefly resulted in negative WTI price for the first time in history. That was the situation for oil in April. But for over a month by that point, other parts of global markets were already moving higher. Much of this was due to the fact that although China was the first to experience the COVID-19 outbreak, it was also the quickest to react and the quickest to recover. The initial stringent lockdown measures in China allowed for a quick restart of activity only a couple of weeks after the end of Chinese New Year, which is normally a slow period for China in any case. This rebound was more of a supply-led one, as increased liquidity and credit meant that investment and manufacturing started back up quickly. End-use consumer demand was slower to recover initially, but picked up steam mid-year. With manufacturing, construction, investment and consumption all back on track, China is the only major economy that will record year-on-year growth for the calendar year as a whole. Metals prices have certainly benefited strongly as a result of China’s recovery, with copper rising to a two-year high and looking set to continue rising as construction, infrastructure, electrification and the roll out of 5G technology all contribute to strong demand growth. Zinc and aluminium prices have also hit multi-year highs as the global auto sector has remained an area of consumption strength, albeit after an initial drop-off during the height of the pandemic. Nickel has not quite hit the highs of 2019, but is benefitting from the increasing adoption of electric vehicles globally, and again looks set to see demand growth into the future.Oil prices continue to be impacted and are down approximately 40 percent compared with their 2020 peak, while almost every other asset class has exceeded their year-to-date highs and in many cases reached multi-year highs. Since April, the market has seen a multi-speed recovery. China not only rebounded quickly, it is now seeing material growth over 2019’s refinery runs; India’s rebound took much longer, but it too is seeing some
4,000
4,500
5,000
5,500
6,000
6,500
7,000
7,500
8,000
20202019201820172016
Copper price data 2015 - 2020Trade closeUnits: USD per tonne
-30-25-20-15-10
-505
1015
Oct
. 20
Sep.
20
Aug.
20
Jul.
20
Jun.
20
May
20
Apr.
20
Mar
. 20
Feb.
20
Jan.
20
Dec
. 19
Nov
. 19
Oct
. 19
Sep.
19
Aug.
19
Jul.
19
Jun.
19
May
19
Apr.
19
Mar
. 19
Feb.
19
Jan.
19
Dec
. 18
Nov
. 18
Oct
. 18
Fixed Asset InvestmentRetail Sales
Industrial Production
Source: China National Bureau of Statistics
China Recovery Indicator ChinaStated in percent change year-on-year
How the world deals with the overlapping issues of the COVID-19 pandemic, debt, climate change and resource investment will drive the market for the next year and beyond.
Trafigura Annual Report 2020 13

Performance review
Oil and Petroleum Products Trading
In a highly challenging and volatile market, Trafigura had its strongest trading year on record and further secured its position as one of the world’s leading independent traders of crude oil, refined products and natural gas in 2020.
Ben LuckockCo-Heads of Oil Trading
Jose Maria Larocca Hadi Hallouche
Market overview2020 was a year like no other for the oil markets. The start of Trafigura’s financial year, in October 2019, saw prices continue to drop sharply as supply recovered following the attacks on Saudi Arabia in September 2019. Following a truce in the US-China trade war and further unrest in the Middle East, macro conditions began to pick up again, but then came the biggest demand shock of all time. The emergence of COVID-19 split OPEC+ (OPEC plus Russia and other affiliated producers) in early March and saw prices drop by around 25 percent in two days from the mid USD40s to the mid USD30s range. Prices then drifted further down to the USD20 mark at the close of the first half of our financial year at the end of March, as more and more areas went into lockdown or quarantine.Despite having fallen 70 percent from their peak in January 2020, oil prices were in for an even bigger shock in April. As markets headed into the expiry of the May WTI contract, it became apparent that there was simply not enough available storage capacity at the main physical delivery point for WTI, in Cushing, Oklahoma. This led to a first for oil markets: negative prices for one of the major marker contracts. And once prices went negative, they continued to fall, so that a contract that had opened the day at USD17.73 per barrel closed at USD-37.63, a drop of over USD55, the largest swing ever witnessed in either dollar or percentage terms. However, the negative prices allowed physical traders such as Trafigura to create and implement solutions that rapidly alleviated the bottleneck at Cushing, eventually restoring order to the market.Following that shock, prices began to recover strongly, helped by OPEC+ cuts and the gradual removal of lockdown restrictions. The demand recovery in China in particular has been very strong, helping pull up other parts of Asia. Europe recovered well, but the US remains weak, particularly with regard to jet and gasoline demand. Both regions are now experiencing a second wave of lockdowns. 2021 is likely to bring more refinery expansions in emerging markets and a recovery in both OPEC and non-OPEC supply, but demand remains a problem that is unlikely to be resolved until a COVID-19 vaccine is widely made available.
Oil and Petroleum Products volumes traded (mmt) 2020 2019
Biodiesel 0.5 0.6
Bitumen 0.8 0.4
Condensates 1.9 1.5
Crude oil 127.5 136.3
Fuel oil 27.0 28.3
Gasoline 21.6 25.3
Liquefied natural gas (LNG)2 12.9 10.2
Liquefied petroleum gas (LPG) 5.9 6.3
Middle distillates 40.0 35.4
Naphtha 12.0 14.7
Natural gas2 17.4 16.0
Total 267.7 274.9
57%
Contribution to global revenue(2019: 65 percent)
267.7mmt
Total volume traded(2019: 274.9mmt1)
1 Trading volumes have been restated to be in accordance with recognised revenue line in the income statement.
2 Million metric tonnes of oil equivalent.
14 Performance review | Oil and Petroleum Products Trading

Crude oilIn the global crude market, 2020 was a truly extraordinary year in which the economic shock and unprecedented demand destruction caused by the COVID-19 pandemic coincided with a battle for market share between key producers. The result was significant over-supply, a major build-up of stocks and a precipitous fall in prices – with WTI crude prices briefly in negative territory – followed by a gradual, though only partial, recovery to levels just above USD40 per barrel by the end of September 2020. With the price curve showing a steep contango for much of the year, 2020 was a favourable environment for trading and the Trafigura crude team delivered a strong profit for the year. The team has been significantly strengthened over the past three years with a focus on global alignment and coordination, backed by superior market intelligence. These changes have enabled our traders to move oil quickly around the world this year – notably from the US and Europe to Asia – in response to price signals, and to deliver seamless customer service despite the difficult working conditions created by the pandemic. Key to our performance, as in 2019, was our strength in the US, where we maintained our position as the leading crude exporter, thanks in part to our access to the Cactus II pipeline from the Texas shale fields to the coast. We were also able to win increased business by providing producers access to our established relationships, global logistics network and with working capital by way of pre-payment finance. The team managed the fall in demand and the subsequent resumption well, backing their judgment by taking substantial long-term tankage positions in Asia, the US and Europe. We expect this significantly expanded infrastructure position, and the term contracts it has helped us win, to continue to play in our favour during 2021.
www.trafigura.com/ products-and-services/oil-and-petroleum-products
Trafigura performanceExtremely volatile conditions and market distortion throughout much of FY2020 created increased demand for the services of a large physical trading house like Trafigura in helping to manage the disruptions resulting from imbalances in supply and demand. Accordingly, our Oil and Petroleum Products Trading division had a very strong year. Three themes emerge from the division’s performance in 2020. First, we benefitted greatly from an intense focus on our customers’ rapidly changing needs, ensuring that we could always be relied on for consistent and efficient service and execution, based on our global presence and real-time insights on market developments. This enabled us to deepen existing business relationships and establish significant new ones, while investing in an expansion of our global storage infrastructure.Second, we continued to see a flight to quality and financial strength in the trading marketplace as some of the weaker counterparties were not able to fulfil contracts or provide customers with much-needed support during the first wave of the COVID-19 pandemic. This led to increased demand for larger merchant companies with strong financial backing, including Trafigura.Third, we saw continued benefit from a renewal of our oil trading teams over the last few years. What was a relatively young and untried group two years ago has matured into a cohesive and highly collaborative trading division, which is well placed to operate effectively in volatile and fast-moving markets. The year was also marked by the quality and intensity of communications and information-sharing between different trading desks.Looking ahead, we expect volatility and market distortion to continue, while demand will be slow to recover from the effects of COVID-19. Therefore, our focus will be on long-term collaboration and maintaining our reliable service to help us to continue to build market share.
Terminal in Corpus Christi, Texas, US.
Trafigura Annual Report 2020 15

GasolineThe gasoline trading team entered the 2020 financial year prepared for higher volatility arising in part from the IMO 2020 rule change on sulphur in shipping fuel. But the advent of the COVID-19 pandemic in March caused wholly unexpected and unprecedented shifts in supply and demand, with structural arbitrage reversing as traditional importing countries started to export. The magnitude and speed of the changes caught many market participants by surprise. Trafigura reacted quickly, capitalising on its front-line position in physical trading to understand how refinery run cuts were affecting demand. Volumes handled decreased slightly, while profitability matched the already strong level achieved in 2019. Successful coordination and risk management in such a fast-changing market while traders, operators and Deals Desk professionals worked remotely was itself a significant achievement, bolstered by the close co-operation with other trading desks that is a hallmark of Trafigura’s operating culture. The book’s most important strategic move was to take on significant additional storage in order to take advantage from the contango price curve, notably in Asia. In 2021, we expect the gasoline market to remain extremely volatile, with many refiners under severe margin pressure and some facing inevitable closure. For Trafigura’s gasoline team, continuing to optimise activity between regions and with other trading desks will be crucial to understanding the resulting shifts in supply.
Naphtha and CondensatesNormally a by-product that refiners try to produce less of, naphtha experienced great dislocations throughout the year, becoming one of the best performing hydrocarbons in 2020. Global supply was seriously impacted by lower refinery runs, while consumption was driven by strong demand for plastics, especially in medical equipment and consumer goods packaging, and a rapid recovery in China. The condensates market broadly tracked the fall in demand and over-supply experienced by crude.Trafigura’s trading team was prepared for a volatile market at the start of our financial year, with a strategy to diversify risk. Therefore, it was able to react quickly to the unexpected events of March and April, consolidating its leading position in this market. Volume handled showed a small decrease in response to the reduced size of the market, but profitability was stronger than in 2019. This is a testament to strong teamwork and coordination, as well as a relentless and flexible focus on the needs of customers, all of whom were affected by the pandemic in different ways. The outlook for 2021 is uncertain. We see continuing problems on the supply side for naphtha, with refinery margins under severe strain, while demand for petrochemicals is expected to be impacted by the weakness of the global economy. The net effect is likely to be continued volatility, and we will stay nimble and responsive to fast-changing trends.
Fuel oil and Middle distillates2020 was a tale of two halves in the global gasoil and fuel oil (GOFO) business. The start of the year was characterised by strong gasoil prices and very weak fuel oil prices as the market adjusted for lower sulphur bunker specifications required by the IMO 2020 rule change. The second half was dominated by the impact of the COVID-19 pandemic. Quarantines impacted jet demand which forced refiners to manage their jet yield into the diesel pool, significantly weakening gasoil. In addition, OPEC cuts of heavy crude supplies and refinery run cuts drastically reduced the supply of heavy sulphur fuel oil. The subsequent oversupply of finished grade products across the barrel as demand collapsed saw the market trade to levels not seen since 2008, and was only resolved through floating storage and subsequent refinery run cuts. The Trafigura GOFO team managed risk and exposure, and ensured minimal disruption in performance for trading counterparties, whether in lifting term commitments, supplying customers, or operational execution on the water. The desk significantly increased its global storage capacity, both on land and via floating tanker solutions, to manage the oversupply and provide customers with additional flexibility. The team registered record volume and a strong profit. A key priority, alongside managing the IMO transition, was the launch of a new bunkering business, TFG Marine (see page 29), which places the company at the cutting edge of the change in end-user specifications. The desk also launched a broader push into biodiesel trading to enhance our capabilities in renewables and to integrate biodiesel into the existing traded portfolio. We expect these business lines to continue to drive growth of the trading book over the next 12 months.
Atlacomulco Terminal, Mexico.
16 Performance review | Oil and Petroleum Products Trading

BiodieselTrafigura broadened its focus on trading biodiesel in 2020. We remained active in the US and started to build new business lines in Asia and Europe, as consumers and regulators continued to call for increased penetration of renewable fuels in the energy mix. The US market gained a measure of stability with the adoption of the blender tax credit until the end of 2022. Despite this tax credit, the price relationship between fossil fuels and biofuels eliminates the opportunity for discretionary blending. As such, US market demand is effectively capped by the US Renewable Fuel Standard volumetric requirements. With abundant domestic production capacity, US production margins remain slim. Trafigura maintains key business relationships with the major independent US producers for well over 100 million gallons per year (380 million litres) of biodiesel production. In Europe, we are adopting an arbitrage and breakbulk model, leveraging existing Trafigura and Puma Energy infrastructure, logistics and relationships to penetrate a market in which we have not been active for several years. With new hires joining the team, we expect the biofuel business to become an increasingly important element of our gas oil and fuel oil book in 2021.
Liquefied petroleum gas The COVID-19 pandemic made for a volatile year in the liquefied petroleum gas (LPG) market on both demand and supply sides. Commercial and auto gas consumption were negatively affected, but petrochemical cracking and household consumption increased. At the same time, fluctuating refinery runs and a drop in crude production greatly affected the availability of LPG worldwide. This created volatility in prices with a steep drop in flat price in April and May, and a subsequent recovery from June onwards. In 2020, the Trafigura LPG book went through an important transformation, creating a structure that enabled the trading of volatility via large positions in all pricing centres and optimising between them. Volumes remained flat at close to six million metric tonnes and profitability also remained comparable to 2019 figures.The outlook for 2021 is complex, with possible refinery closures likely to continue to weigh on supply. One theme we will be pursuing actively in the coming year is the environmental sustainability of LPG, for example, as a substitute for wood in domestic cooking.
Liquefied natural gas (LNG) and Natural gasSubstantial LNG supply overhang remained a key theme as we entered the financial year. Coupled with significant demand destruction in early 2020 caused by COVID-19, we saw record low prices, large scale cancellation of US cargoes and a subsequent fall of LNG production from 2019 levels despite production capacity actually increasing.In this challenging environment, Trafigura demonstrated the benefits of having a fully integrated LNG and natural gas team. Close coordination between regional gas traders, physical LNG traders and charterers ensured that information was shared instantaneously to enable a prompt and effective response to volatile markets. In LNG, we went from strength to strength, growing volumes, delivering to new markets and sustaining profitability. Relationships are at the heart of our business and we were able to work with our key counterparties to rebalance deliveries and take account of the changed situation, strengthening trust between us and our end-users. The vast majority of our US LNG output flowed to Europe, benefitting our growing European natural gas operation. Coupled with favourable spreads, this enabled us to build out storage positions and expand into new countries in Eastern Europe. In the Americas, it was a year of building up our Texas business and increasing the volume of gas traded in Mexico and Argentina. We expect the LNG market to remain structurally oversupplied for at least another year, but the lack of final investment decisions on new projects, as a result of weak prices and COVID-19 uncertainty, is likely to result in a substantial tightening of both the LNG and US gas markets from 2022/23. Gas remains the critical transition fuel to achieve the decarbonisation goals adopted in the Paris Agreement; therefore, we expect the pace of activity and the number of participants in these markets to increase over the coming years.
The Marlin Amethyst, our first vessel to be fueled with our new biofuel at the Port of Amsterdam.
Trafigura Annual Report 2020 17

20.9mmt
Total volume traded(2019: 19.9mmt)
Amin Zahir Head of Metals and Minerals
Non-ferrous concentrates and refined metals traded (mmt)
2020 2019
Non-ferrous metal concentrates 11.0 10.6
Non-ferrous refined metals 9.9 9.3
Total 20.9 19.9
Performance review
Metals and Minerals Trading
Trafigura is one of the world's largest traders of non-ferrous concentrates and refined metals and bulk minerals. Despite the challenging global conditions experienced throughout 2020, the division had one of its most profitable years on record.
Market overviewThe global non-ferrous market in 2020 was dominated and defined by the impact of COVID-19. Put simply, it came down to a trade-off between both primary and secondary supply disruptions and demand destruction. The supply and demand for each metal was largely determined by geography. For instance, due to mine disruption in South America, copper and, to a lesser extent, zinc faced greater losses in production than in consumption, as demand was more resilient than for other metals. Aluminium, on the other hand, faced only minor supply disruptions, almost exclusively in the scrap
www.trafigura.com/products-
and-services/metals-and-minerals
market, but suffered a collapse in demand owing to its larger exposure to the automotive and aerospace sectors. Looking ahead to 2021, while the general expectation is that COVID-19 disruptions will be significantly less, other risks to supply, such as industrial action, remain very real.Crucial in defining the future supply-demand profile of each metal will be the extent of governmental economic stimulus packages focused on infrastructure and the electric vehicle revolution. Although COVID-19 has materially impacted near-term balances of non-ferrous metals, the outlook from 2025 onwards is bullish for the whole sector.
Trafigura performance During 2020, the Non-ferrous Metals and Minerals department recorded its most successful performance. It was also the first full year after restructuring the department into four books: copper; zinc and lead; nickel and cobalt; and aluminium – in each case handling both refined metals and concentrates. Merging refined metals and concentrates trading, which had previously been managed separately, proved successful, enabling the four book heads to define clear and consistent strategies for each metal and to extract more value from the interplay between concentrates and metal. Maintaining a consistent presence in all markets contributed to strong performance, particularly our large presence in the China domestic market. Combined with a renewed commitment to research and analysis, this restructure has placed us in a unique position to anticipate key market trends. During the year, we saw past investments and strategic decisions bear fruit, notably making continued strides in improving our internal systems for operational control. Trafigura's proprietary 'Titan' trading platform provides an advanced system of checks and controls, monitoring every link in our global operations chain. Our systems also helped to facilitate the successful integration of Nyrstar.
Non-ferrous concentrates and refined metals
43%
Contribution to global revenue*
(2019: 35%)
*Metals and Minerals revenue as percentage of Group revenue includes bulk minerals.
18 Performance review | Metals and Minerals Trading

The year also saw the establishment of a non-ferrous metals business development unit, which integrated well with the trading books and added significant value in deal origination. Our colleagues in Structured and Corporate Finance and Treasury surpassed themselves in growing our ability to provide financing solutions to support our customers, counterparties and stakeholders. This, together with our financial strength and liquidity, means we are well positioned to take advantage of new market opportunities in the coming year.The most important component, as always, is the support from our customers, clients, suppliers and stakeholders. They recognise that our revenues are produced not at the expense of counterparties but from managing and optimising large flows in markets and geographies through long-term relationships that have been developed over the past 25 years. We are optimistic that we build on the success of this year in 2021 and we expect to see continued progress from the Metals and Minerals department.
CopperLike many other globally traded commodities, copper experienced significant demand destruction in 2020, but this was coupled with significant disruption on the supply side, notably in terms of scrap supply and primary production in Latin America. Once demand returned after the initial shock, a tight supply-demand balance became evident in the latter part of the year, supported by copper-friendly government economic stimulus policies. As a result, prices quickly rallied in May in what became a V-shaped recovery.
Trafigura’s newly integrated copper desk, with trading of concentrates,
refined metal and derivatives united in one department, had an exceptional
year, growing volumes and market share and recording a substantial profit. Integration
created an enhanced dialogue between individual teams, better understanding of the constantly changing environment and an improved capacity to service customers and seize trading opportunities. The trading of ancillary metals, by-products of our copper concentrates business, was also a beneficiary of the integration and experienced growth throughout the year. Such benefits helped us overcome the challenges of working remotely for several months. They also enabled us to support our customers in challenging market conditions, in the process building market share and securing long-term flows. We put in place many financing deals to support our customers in the early stages of the pandemic when copper prices were weak, creating long-term commercial relationships with producers of copper and gold that will contribute to the book’s forward flows. The end result was substantial new business that is noteworthy given the maturity of our presence in the copper market.Looking forward, we see a bright future for copper as a result of growing demand for electricity and government policies aimed at economic recovery and combatting climate change. The latter include incentives for the purchase of electric vehicles and Europe’s Green Deal support package for clean energy. Global investment in power grids is also increasing – a trend we expect to continue in the future. This will likely result in a significant copper supply gap that will drive prices higher to incentivise new production. We believe our integrated team will be well positioned to trade in this market and effectively service our growing customer base.
Copper cathode and concentrates being prepared for export, Ndola, Zambia.
Trafigura Annual Report 2020 19

Zinc and lead (refined and concentrates)In zinc concentrates, the global market swung from surplus supply in 2019 to a deficit, while the lead concentrates market had a more balanced position in 2020. The COVID-19 pandemic, from February, significantly constrained mine and transport capacity globally, in particular in Latin America, reducing global mine production by 8-12 percent. This in turn led to a market deficit for zinc concentrates and a more balanced-to-tight market for lead concentrates, as evidenced by the fall in treatment charges from January/February to September.As the world adapts to the COVID-19 pandemic, mine disruptions are expected to significantly reduce with the global market returning to a more stable trajectory of mine supply.On the refined metal demand side, lockdowns across the globe, with varying timelines and severities, resulted in supply bottlenecks and demand destruction across all sectors and regions, causing significant disruptions for both the zinc and lead markets. In terms of supply, constraints in the lead scrap supply chain resulted in losses of lead metal output, with a number of secondary smelters closing for a period of time. In zinc, while metal production disruptions were limited, especially compared to mine disruptions, demand was heavily impacted and particularly hard-hit by weakness in the automotive sector. As a consequence, both lead and zinc metal markets experienced sizable surpluses, with exchange stocks increasing throughout the second quarter of 2020. Since June, there has been a significant rebound in demand for both metals, primarily led by China, with a strong recovery across most sectors in the third quarter. Europe has also recovered well and we see continued pick-up across all markets into the fourth quarter. We remain positive about demand for both metals on a forward-looking basis, with continued support from both construction and automotive industries through 2021 and beyond.From the performance point of view, the lead and zinc trading desks were well positioned to adapt to this market change. Looking forward, we will continue to focus on developing strong customer relationships and keep consolidating the synergies between the global trading book, mining assets and the Nyrstar smelting business.
Alumina and aluminiumThe COVID-19 pandemic led to severe demand destruction for aluminium across the world as the automotive and aerospace industries that account for a large share of consumption suffered disproportionately from the economic shock. One bright spot was the packaging market, as sales of pharmaceutical products and beverage cans thrived. Demand improved in China in the second half of the financial year but remained weak elsewhere, causing the Chinese import arbitrage for aluminium metal to open for the first time in several years. Aluminium supply remained largely uninterrupted by the crisis, which caused a large global surplus of metal. However, aluminium prices recovered from lows reached in the second quarter with strong capital inflow from investors seeking an inflation hedge. Meanwhile, the alumina market has remained stable over the course of the pandemic. Alumina prices returned to lower more long-term average prices and production capacity resumed to more normal levels following the supply problems of 2018-2019.Overall, Trafigura’s trading volumes increased again this year and we were able to further strengthen our position as the largest global independent alumina and aluminium trader. The team’s customer-centric approach forged further long-term customer relationships, which significantly enhanced our trading volumes.The outlook for 2021 is very much framed by the recovery from the virus. Demand is expected to return slowly to pre-pandemic levels. Despite this, higher aluminium prices mean supply growth will continue. This disconnect between strong futures markets and weak fundamentals will fuel the growing supply overhang. We believe we can continue this year’s growth by further building sales that add value to our customers and by supporting our supply sources in a difficult market environment.Decarbonisation of the industry is becoming a vital issue for the aluminium market. Many customers in the automotive, construction and packaging sectors are increasingly focused on delivering sustainable and low-carbon products to their consumers. In 2020, we became the first commodity trading company to establish a low-carbon aluminium trading desk and a low-carbon aluminium financing platform of up to USD500 million. Natixis and Rabobank supported Trafigura in the design and structuring of this innovative instrument. Our future objectives are to secure long-term low-carbon aluminium supply for our customers, to support the efforts of our business partners as they invest in decarbonisation and ultimately to create efficient linkages between suppliers and end-users.
Zinc at Nyrstar's smelter in Pelt, Belgium.
Find out more about this initiative here: www.trafigura.com/responsibility/case-studies/
20 Performance review | Metals and Minerals Trading

NickelNickel demand held up well in 2020 despite COVID-19, marginally contracting by 2.4 percent. Record high stainless steel consumption in China in the second half of 2020, as well as the growing requirement for nickel in batteries, have partially offset a sharp demand drop in other sectors and regions. At the same time, global nickel supply continued to rise as a result of a significant increase of nickel pig-iron (NPI) production in Indonesia, which exceeded the supply cuts in the rest of the world, tipping the market into a surplus.Trafigura’s nickel team helped counterparties maintain their operations during the crisis by expanding the range of services we offer them in order to counteract extremely volatile demand. We also maintained our strong position across all regions while significantly increasing our nickel concentrates volumes through long-term offtake agreements. We increased trading in NPI out of Indonesia and nickel sulphate in China and the rest of Asia, and traded record volumes in India. Looking ahead, we maintain a positive outlook on the metal fundamentals, particularly owing to the growing electrification of transport as a result of green stimulus policies being implemented around the world. While we expect small surpluses in the next two years due to a continued increase of NPI production in Indonesia, the growing uptake of nickel for electric vehicles will still require additional high-grade supply from new projects in the longer term, which in most cases require prices substantially above the current levels to become economically feasible.
CobaltCobalt market fundamentals remained robust throughout 2020, as COVID-related supply disruptions outweighed the negative impact of the pandemic on metal consumption. In 2020, we saw a continued drop in artisanal supply from the Democratic Republic of the Congo (DRC) as well as pandemic-related supply cuts from nickel operations producing cobalt as a by-product. In addition to the growing demand for EV batteries, cobalt consumption was supported by the shift to 5G that continues to gain pace in China and the subsequent increase in average cobalt loadings in smartphone batteries, which negates the impact of the recent drop in phone sales.Trafigura continued to support its trading partners over the course of the year. The impact of COVID-19 on producers, particularly in the DRC, resulted in significant operational disruption and reduction in volumes. That disruption extended to the Mutoshi Pilot Project – an artisanal small-scale mining formalisation project in the DRC operated by concession holder Chemaf and supported by the NGO Pact and Trafigura. Owing to risks related to COVID-19, the project was suspended in March.Over the course of the year, Trafigura maintained its market share by trading steady volumes of cobalt hydroxide and continuing to service its customers in spite of supply and logistics interruptions, while maintaining a strong commitment to the enhancement of responsible sourcing standards for cobalt. The company has played an active role in industry forums on such matters and has continued to support the World Economic Forum’s Global Battery Alliance (GBA) – both financially and via Trafigura’s participation on the GBA’s Executive Board and Steering Committee.In 2021, we expect the cobalt deficit to widen, as demand trends continue to gain momentum, indicating a need for additional supply.
The Terrafame Talvivaara nickel mine in Sotkamo in Finland.
Trafigura Annual Report 2020 21

Ken Loughnan Head of Bulk Trading 76.7mmt
Total volume traded(2019: 77.3mmt)
CoalThe year in the thermal and coking coal markets was characterised by an abrupt contraction in demand as industrial activity was impacted by COVID-19 and prices fell sharply. This was subsequently followed by a corresponding correction in supply. The main thermal coal indices of API2, API4 and Newcastle traded towards lows not seen since 2015, and in the case of Indonesian indices, to levels not seen since they were first created. For much of the year, thermal coal continued to be priced out of the generation stack by cheap gas wherever utilities could make the switch. Coking coal prices were down by an average of about 15 percent year on year.
Bulk minerals
Performance review
Bulk Trading
Our iron ore business had another strong year in 2020. However, the coal market continued to face a number of challenges.
Bulk minerals volumes traded (mmt)2020 2019
Coal 56.9 59.4
Iron ore 19.8 17.9
Total 76.7 77.3
Global seaborne thermal and coking coal trade in 2020 was between 10 and 15 percent lower than in 2019. Every trade flow was impacted by COVID-19. The Atlantic thermal market was particularly affected, with flows into the Pacific closed completely as US, Colombia and South African exports fell. In addition, China continued to ration import demand for thermal and coking coal through the application of their quota system, which frustrated imports and placed further weight on seaborne prices, despite the arbitrage favouring imports at record highs.Pre-pandemic, our objectives for the year were to consolidate Trafigura’s position as a reliable liquidity provider to our producers and customers across all the products we trade in (thermal, coking coal and coke), and to continue to develop growth markets in South East Asia, India and South America. However, after COVID-19 hit, our focus switched to mitigating the impact of the disruption caused by the pandemic on our suppliers and customers by readapting our cargo flows to meet fluctuating regional demand.Overall, trading volumes were stable across all coal types traded. Thermal coal volume and profitability were in line with last financial year. Coking coal and coke volumes traded were in line with the previous year but profitability was impacted by a sharp fall in liquidity in destination markets resulting from reduced steel industry demand. Notably, having a global network with local representation across all major markets was very important during a period when international travel was not possible.Coal continues to be replaced in the generation stack by renewables as the energy transition accelerates. For 2021, our priority is to continue to service our existing markets and customer base. Permanent mine closures in certain markets provide a supportive environment in the short to medium term.
"Industrial activity was impacted by
COVID-19 and prices
fell sharply."
22 Performance review | Bulk Trading

Iron ore The COVID-19 pandemic significantly affected the iron ore market’s supply-demand structure as well as the direction and volatility of prices. Seaborne demand remained inelastic owing to the difficulty of abruptly ramping industry processes up and down. Early containment of the coronavirus supported recovery in China, which remains the global clearing market with a 70 percent share of demand. At the same time, mining production was marginally disrupted due to the coronavirus and by adverse weather in some producing regions. As a result, the iron ore price grew steadily, surpassing the previous year’s surge following the tragic Brumandinho dam rupture in Brazil in January 2019. Trafigura’s physical iron ore trading team had a strong year in terms of volume and profitability. Our supply chain for Brazilian iron ore through the Porto Sudeste export terminal continued to gain a reputation for reliability and consistency, and we concluded new term sales agreements with several European steel mills. In addition, a number of term contracts were signed with mills in China, complementing the regular spot business. Regions that have been a key focus for growth include Southeast Asia, where new steel-making capacity is being commissioned, and Europe, where we have gained
market share by converting spot sales into long-term contracts. Also important to the book’s development has been the expansion of the portfolio beyond our captive volumes from Porto Sudeste to include origins. These now include Australia, Brazil, Canada, India, Mauritania, Mexico, South Africa and Sweden. Looking ahead, we expect steel production to rise outside of China, making the iron ore market less singularly dependent on Chinese demand. The fundamental outlook for iron ore is a fine balance between supply and demand. Our priority is to work on expanding the seaborne trade and increasing Porto Sudeste’s market share in supplying Asian and European steel mills.
Vessels loading iron ore at Porto Sudeste export facility, Brazil.
Trafigura Annual Report 2020 23

Performance review
Shipping and Chartering
Trafigura Maritime Logistics arranges shipping and freight services for Trafigura’s commodity trading teams and for third-party clients. It operates as a service provider, securing competitive and reliable freight for in-house oil, metals and minerals traders. The Wet and Dry Freight desks also function as profit centres in their own right.
Wet freightThe last 12 months may well be recorded as the most volatile year in the tanker industry’s history. We witnessed the attack on the Abqaiq terminal in Saudi Arabia, US sanctions against the Chinese shipping company Cosco's fleet, and COVID-19 and accompanying sharp moves in oil prices, culminating in a crisis over tanker crew changes. For tanker owners, this created unprecedented volatilty, with super-contango in the oil market pushing tanker earnings to an all-time high throughout calendar Q2 and down again to operating expense levels by end of the third quarter.
4,225Shipping and Chartering fixtures(2019: 4,173)
2020 Wet and Dry Freight activityWet Dry
Number of fixtures13,098
(2019: 3,001)1,127
(2019: 1,172)Average number of vessels under time-charter2
160-180 (2019: 100-120)
40-45(2019: 45-50)
1. Approximately 70% of our wet cargo programme is on third-party owned ships
2. A vessel on hire for more than three months (excludes gas carriers)
The Trafigura wet freight team delivered a robust performance and increased profitability compared to 2019, making this our best year on record. At the start of the financial year, we were expecting significant fuel price disruption because of the incoming IMO 2020 sulphur cap regulations, as well as stronger market fundamentals due to the continuing increase in US exports and an ageing tanker fleet profile. This led the team to build a long freight position across all segments with a blend of shorter and longer period deals. Owing to the optionality and length within our freight book, we were able to respond effectively to the exceptional events that took place throughout the year. Over the course of the year, our fleet increased by almost 70 percent; at the peak, we controlled more than 220 owned and time-chartered vessels (excluding LNG carriers). Cargo volumes increased marginally compared to 2019.One of the biggest challenges faced was to operate a large fleet with more than 80 percent of the team working from home due to COVID-19 related lockdowns. Furthermore, the crew change crisis – with thousands of seafarers from across the globe stranded on ships, continuing to work but unable to be relieved – added a new layer of complications and difficult conditions for crews. On Trafigura-owned and bareboat vessels, we implemented an additional hardship payment for crewmembers who, due to COVID-19 regulations, had to spend overtime on-board. We consider the maritime crews as the unsung heroes of 2020, and it is very much thanks to their hard work and perseverance that global oil trade continued to function throughout this challenging period.We are currently witnessing a rapidly changing industry with more oil and trading companies coming into the market, willing to pay considerable premiums to access time-charters. The increase in bidding activity is pricing time-charter rates to levels in excess of spot and forward freight market curves. With companies seeking to cover more and more of their cargo base via internal time-charters, the number of available cargoes in the spot market is expected to be reduced, thus resulting in a drop in earnings.
Andrea OliviHead of Wet Freight Shipping
Alan CummingHead of Dry Freight Shipping
"We consider the maritime crews as the unsung heroes
of 2020, and it is very much thanks to their hard work and perseverance
that global oil trade continued
to function throughout this
challenging period."
24 Performance review | Shipping and Chartering

We believe that the fundamentals for the next six to 12 months are not encouraging, mainly as a result of demand destruction for oil and continued OPEC+ production cuts. Furthermore, we anticipate that more tankers will come out of floating storage, putting more pressure on the supply side. We expect to redeliver more than half of our current time-chartered fleet by the end of 2020 calendar year. We also anticipate becoming more active in the spot market, which we believe will offer a cheaper solution to ship our cargoes. A priority for next year is to continue improving the ways we manage and reduce CO2 emissions.
Dry freightThe dry freight market in 2020 was defined by two significant events: IMO 2020 and COVID-19. IMO 2020 regulations caused some initial disruption, with fuel prices rising steeply from November to January. However, prices levelled sooner than had been anticipated. The COVID-19 pandemic, on the other hand, had a significant impact on the market as cargo volumes dropped sharply and disrupted traditional trade patterns. Thermal coal trades experienced the greatest impact. Annual volumes declined by over 100 million metric tonnes year-on-year through demand destruction and subsequent mine closures. However this drastic loss of cargo was partly offset by record soya bean volumes flowing from Brazil to China. While cargo volumes dropped globally, inefficient trading through increased ballasting, crew change delays and record congestion in China maintained vessel demand and offset the full impact.
Trafigura Suezmax vessel the Marlin Shikoku
sailing through the Bophorous Strait.
www.trafigura.com/products-and-services/shipping-and-chartering
"The dry freight market throughout 2020 was defined by two significant events: IMO 2020 and COVID-19."
In terms of prices, volatility remained a key characteristic of the market throughout the year, as was witnessed with the Cape market starting the financial year at USD24,402 per day, falling to a low of USD1,992 in May and subsequently climbing to a high of USD33,760 in July. The last three months of the financial year saw a broad recovery in the dry freight complex.Trafigura’s dry freight volumes and fixtures, unsurprisingly, fell year-on-year. However, profit increased by nine percent, yielding a record year for the desk in what were chaotic market circumstances. Apart from the difficulties created by the disruption to normal working practices, both to ours and our counterparties, the biggest challenges were uncertainty over national regulations relating to COVID-19 and the immense hardship experienced by seafarers who could not leave vessels because of travel restrictions.In the next 12 months, we expect the market balance to depend heavily on how the coal market evolves. Freight rates and volumes are certain to be volatile, and while the overall freight market is likely to remain depressed, continued inefficient trading of the fleet will cause temporary spikes in demand. Our focus will be on increasing cargo volumes while further improving our operational efficiency and how we measure, report and reduce CO2 emissions produced through our activities. For further details on our sustainable shipping initiatives, see our 2020 Responsibility Report.
Trafigura Annual Report 2020 25

Trafigura Mining GroupTrafigura Mining Group has invested in a portfolio of mines in Africa, Latin America, North America and Europe, ranging from wholly-owned facilities to joint ventures and minority investments. The Mining Group generates equity value for Trafigura Group and traded volumes for our metals trading books, and provides advisory and support services to the rest of the Group.Globally, this was a challenging year for the majority of our mining assets. The COVID-19 crisis had a far-reaching impact – both directly, where mines were explicitly ordered to suspend operations, and indirectly, by creating difficulties in logistics or in moving people. Separately, MATSA, our Spanish 50:50 copper joint venture with Mubadala, regrettably suffered two fatal accidents, its worst safety performance on record. Production on site was also heavily impacted by a regional forest fire in August which forced the temporary suspension of activities and evacuation of the area. The accidents have prompted a comprehensive and wide-ranging reevaluation of safety culture at the site and an employee consultation process is ongoing. Despite these challenges, MATSA remains our flagship operation with copper equivalent production approaching 100,000 metric tonnes per annum, a production rate similar to last year. The site continues to benefit from a high-quality, long-life mineral reserve and an ever-increasing mineral resource thanks to successful exploration campaigns. The Catalina Huanca mine in Peru was the worst affected by COVID-19; it was forced to suspend operations twice during the year. Otherwise, it operated efficiently each time mining was allowed to resume, with management reopening operations quickly and safely. Catalina Huanca is currently transitioning to a new, large-scale mining method known as sub-level open-stoping, which is similar to the technique in use at MATSA and will significantly and safely reduce operating costs.The Castellanos zinc and lead mine, a joint venture between Trafigura and Cuban parastatal Geominera, had a very difficult year. COVID-related restrictions relating to the movement of people into and out of the site impacted efficiency and created bottlenecks in the supply of spare parts and in maintenance operations. The site still managed to process 1.1 million tonnes of ore, against the original design capacity of one million tonnes.
Nyrstar's Myra-Falls mine in British Columbia, Canada.
Performance review
Industrial and financial assets
In 2020, strategic investments and alliances with carefully selected counterparties continued to further extend the scope of our activities and service offer.
The Ipe iron ore mine in Brazil’s Minas Gerais province performed well and benefitted from higher iron ore prices. The life of the operation has been extended from the original planned closure date of 2021 to 2024, thanks to the ingenuity of our local staff. Meanwhile, construction on our Tico Tico project, the long-term extension of Ipe, is expected to start in 2021. The Mining Group has continued to manage the Canadian mine belonging to Nyrstar Group, which was absorbed into Trafigura in July 2019, two months before the start of this financial year. We placed the Langlois mine in Quebec in December 2019 under care and maintenance in line with the mine closure plan, and are ramping up the Myra Falls mine in British Columbia, working on structural and organisational improvements. Trafigura Mining Group continues to focus on implementing and improving high operational standards across our portfolio in areas such as safety, maintenance, human resources, geology and mining, budgeting, community relations and environmental and project management.
26 Performance review | Industrial and financial assets

Galena Asset ManagementGalena Asset Management, Trafigura’s wholly owned investment subsidiary, operates a number of funds investing in mining and related assets and offers third-party investors the opportunity to invest alongside Trafigura on an equal basis.During 2020, Galena's investments benefitted from strategic decisions put in place to meet the ongoing challenges arising from the global pandemic and its impact on logistical chains.
Galena Private Equity Resources FundThis fund was launched in 2012, became fully invested in 2017 and holds positions in three assets: Finnish nickel, zinc and cobalt producer Terrafame; Utah-based bituminous coal producer Wolverine Fuels; and the Mawson West copper mine in the Democratic Republic of the Congo. In January 2020, Galena Asset Management assisted Wolverine Fuels in refinancing their debt to provide additional comfort in terms of cash flows. Continued support from Trafigura was crucial, in the form of a new USD100 million revolving credit facility.
TerrafameTerrafame currently represents Galena Asset Management’s single largest investment. The company performed well in 2020, continuing to deliver strong growth on all fronts, with improved production, higher net sales and stronger profitability. The company has reached an agreement with Galena Asset Management and its other investors on funding arrangements and further financing to ensure the continued development of its operations during the uncertain market conditions and to finalise the implementation of the nickel sulphate project. Output from the latter will help meet growing demand for the use of nickel sulphate in electric vehicles batteries.
Galena Multistrategy FundThis fund, established with an initial allocation of USD45 million in November 2018 to invest in liquid, commodity-related strategies across multiple asset classes, performed relatively well in a complicated global commodity and macro environment. This year has been particularly challenging across asset classes as correlations broke normal patterns and volatilities remained high.
Upstream opportunitiesThe recent price dislocation in the oil market has dramatically increased the M&A activity in the upstream sector. Galena Asset Management will select the most attractive opportunities from a risk adjusted perspective and that can be optimised in terms of production efficiency.
RenewablesIn line with Trafigura’s investment programme in the renewables sector, Galena Asset Management will work with Trafigura to provide investment opportunities in this arena for external investors.
Impala TerminalsImpala Terminals owns and operates a variety of port, logistical, storage and transportation assets that support Trafigura’s commodity trading business in the Americas, Europe, the Middle East and Africa. These assets are held separately from those included in Trafigura’s joint venture with IFM Investors formed in 2018. Impala Terminals reported a robust performance across the majority of its operations, despite the overall global decrease in the flow of goods and recurrent supply-chain challenges caused by the COVID-19 pandemic.Throughout the year, Impala Terminals invested significantly in training, protective equipment and additional on-site operational measures to ensure the continued safe working conditions for its staff, contractors and customers. Regrettably, despite the existence and application of these preventative measures, a crewmember on one of Impala Terminals’ Colombian fluvial operations contracted COVID-19 in May 2020 and subsequently passed away in July 2020.Impala Terminals’ African assets in Zambia and the Democratic Republic of the Congo (DRC) had a busy year with business expanding briskly, including the growth of traditional copper export flows and newer import volumes, principally chemicals for use in the growing African mining industry. Impala established new office and storage space in the Ndola and Kolwezi warehouses in Zambia and the DRC, respectively. Furthermore, it increased regular bi-directional rail services to ports in Angola, South Africa and Tanzania. In 2021, Impala will continue to focus on growing volumes and its import business.In Colombia, where Impala Terminals operates an inland port at Barrancabermeja and a barging operation from the Atlantic ports of Barranquilla and Cartagena, the government has pledged to dredge the Magdalena River by mid-2021, which will enable deeper draughts and increased volumes of cargo. Despite the current limited barge payload, due to river depth, Impala Terminals was still able to transport over 1.3 million metric tonnes of oil, dry and product cargoes from Barrancabermeja port in 2020. From 2021, now that Barrancabermeja is registered as an international port, Impala Terminals' Colombian operations will be able to export coffee beans by container. In Chile, Impala’s four sites, in Coquimbo, Arica, Antofagasta and Copiapo, expanded steadily throughout 2020. Storage capacity grew to 200,000 metric tonnes to support Trafigura’s concentrates trading business and Chilean and Bolivian exports from mining companies. In 2020, Impala serviced more than 700,000 metric tonnes of concentrates, 400,000 metric tonnes of which was exports from and deliveries to local smelters on behalf of Trafigura. The Trafigura-funded terminal at the Codelco-owned port of Barquito is expected to come on line in the first quarter of 2021 and the facility will be managed by Impala Terminals. It will also seek to expand capacity in the north of the country to cater for Trafigura’s growing business in the region. In Bolivia, operations were hampered by a six-week closure as a result of government measures to contain the spread of COVID-19. Since this time, operations have resumed as normal.
"Our African assets had a busy year with business expanding briskly."
Trafigura Annual Report 2020 27

Nyrstar smelting and refining facility in Port Pirie, Australia.
"A key priority under new ownership was to restore stable production."
Meanwhile, at the Burnside terminal in the US state of Louisiana, the drop in the volume of US coal exports and a challenging alumina market caused a 40 percent fall in throughput volumes compared to 2019, prompting significant cost cuts. Looking forward, Burnside plans to diversify its offering by entering new product cargo markets and will seek to transform part of the site into a photovoltaic solar farm.In Dubai, Impala Terminals Middle East upgraded and expanded its facility and diversified cargoes handled. The impact of the COVID-19 pandemic was minimised due to the diversity of services provided and goods handled and the strategic location of the port. Impala Terminals continues to manage the challenges associated with climate change and the transition to a low-carbon economy. It will continue to measure and manage its emissions, in line with Trafigura Group's climate change strategy.
Nyrstar Trafigura became 98-percent shareholder of leading zinc and lead processing business Nyrstar in July 2019 after a financial restructuring, and the company was fully integrated into the Trafigura balance sheet at the end of that month.In its first year consolidated into the Trafigura Group, Nyrstar made solid progress through operational improvements and an investment programme to restore production stability. However, the Division showed a net loss of USD146 million, reflecting the ongoing recovery from financial difficulties of recent years. Given the distressed situation of Nyrstar before the acquisition date of 31 July 2019, prior result figures are not comparable to the current year performance.
A key priority for Nyrstar under new ownership was to restore stable production which had been seriously impacted by the company's prior financial difficulties. Capital investment during the year amounted to USD280 million, with a similar figure planned for FY2021. This has enabled Nyrstar to replace important plant and equipment after years of under-investment, and to undertake improvement projects that will generate operational cost savings and efficiency improvements. All of the company’s European smelters maintained production despite the market disruptions resulting from the global pandemic. The Port Pirie smelter in South Australia raised production to its design rate and is on course to reach availability targets in 2021. However, overall output and financial targets for the year were not achieved owing to production interruptions as a result of equipment failures.Highlights from the year include: • A new, streamlined corporate office in Budel, Netherlands,
close to one of its major operations with a significant reduction in head office costs;
• Successful completion of integration with Trafigura’s commercial teams in purchasing feedstocks and marketing refined metal, leading to better plant utilisation and more consistent performance for customers;
• Significant logistical efficiencies, including a shift from road to rail transport in Belgium and the use of containers to move product between Port Pirie and the company’s other Australian smelter in Hobart, Tasmania;
• The development of a number of solar and wind powered renewable energy projects across a number of Nyrstar sites;
• A renewed focus on safety and environmental performance, including reduced emissions and improving water quality. Nyrstar has committed to reducing lead in air from the Port Pirie smelter by 20 percent;
• Development of a culture of teamwork and collaboration, enabling Nyrstar to get the most out of its expert and experienced employees as well as new senior management recruits.
Overall, thanks to strong financial backing from Trafigura, Nyrstar is on a much stronger footing going into 2021, with enhanced confidence in the future and strengthened relations with customers as a result of more consistent delivery performance.
28 Performance review | Industrial and financial assets

TFG Marine TFG Marine is a new joint venture company that Trafigura established in 2020 with two of the world’s largest shipowners, Frontline Ltd and Golden Ocean Holdings Ltd, to build a strong position in the global bunker fuel market, through the procurement and supply of marine fuels for its shareholders and affiliated entities as well as third parties.In its first eight months of operation, the company, 75-percent-owned by Trafigura, grew rapidly, building on its established market position in West and South Africa to add operations in Asia, the Americas and north-west Europe. The latter includes bunkering operations in the English Channel, and in the major Amsterdam-Rotterdam-Antwerp hub. TFG Marine has also developed its procurement business, purchasing approximately 250,000 metric tonnes of fuel per month in over 250 bunkering ports globally.Another key highlight of the year was obtaining a bunkering licence in Singapore in May. The city-state accounts for close to 20 percent of the world’s bunker market. TFG Marine has already established a strong position and plans to grow volumes significantly during FY 2021. By the end of September 2020, less than eight months after inception, TFG Marine was operating in 12 physical bunkering locations supplying 540,000 metric tonnes of marine fuel per month, or 6.5 million metric tonnes per year globally, equating to approximately 300 trades per month. The joint venture was able to add significant volumes by bringing in two further exclusive purchasers of bunker fuel, Norway-based Avance Gas, one of the world’s leading VLGC shipowners, and Flex LNG, a carrier based in Bermuda and listed on the Oslo Stock Exchange.
South Africa
West Africa
Pacific Coast
PanamaSingapore
Mauritius
English Channel
Caribbean
US Gulf Coast
ARA
South West AtlanticSouth West Pacific
UAE
Mediterranean South Korea
China
Target regionsCurrent operations
TFG Marine's global operations
In the new financial year, further bunkering operations are planned in the US Gulf Coast, the Mediterranean, South Africa, the Middle East, China and South Korea. Further growth of the procurement business, both in terms of volumes and extending the customer base, remains a focus over the coming year. TFG Marine is committed to the transition to lower carbon fuels. From Q1 2021, it is intended that its rapidly expanding business will allow it to offer a range of advanced marine biofuels for sale to customers in the ports of Amsterdam, Rotterdam and Flushing.
TFG Marine bunkering operation at the Port of Singapore.
Trafigura Annual Report 2020 29

Risk management
How Trafigura manages risk
Trafigura operates in dynamic markets that involve a wide range of risks, whether financial, political, operational, social or environmental.A rigorous and conservative approach to risk management is therefore an integral element and central focus of Trafigura's business.
Trafigura has developed rigorous risk management and governance systems to address the full range of risks to which it is exposed. These systems apply multiple lines of oversight to ensure compliance with all applicable laws and regulations, and a high standard of ethical behaviour by all employees at all times. The Group actively manages and mitigates, wherever possible, the identifiable or foreseeable risks inherent to its activity – for example, systematically hedging exposure to flat prices and extensively using insurance and financial tools such as letters of credit.The diversification of our business, trading a wide range of commodities with varying and uncorrelated market dynamics across a large number of countries and geographical regions, is an important factor in reducing the Group’s overall exposure to any individual market, price, political or other risk. Unlike many financial assets, physical commodity markets provide many opportunities for risk diversification. The premium paid for copper in China, for example, has little to do with the pricing relationship in LPG between the US and Europe.By extending our trading capabilities, we are diversifying the business, resulting in lower overall exposure and higher risk-adjusted performance.
Compliance and responsible conduct Trafigura's Code of Business Conduct, Corporate Responsibility Policy and Business Principles set out the high standards of responsible and ethical behaviour required of every employee, individually and collectively. Every employee receives a copy of the Code and applicable key policies, which includes mandatory training as a condition of employment.In 2020, 556 new-start office-based employees were trained on the Code. Anti-money laundering training, and anti-bribery and corruption training were also delivered, to 1,201 and 1,079 employees respectively*.
Compliance Committee and Head of ComplianceTrafigura’s Chief Compliance Officer oversees the implementation and development of the Group’s compliance programme. He reports to the Chief Operating Officer and the Trafigura Compliance Committee. The Compliance Department operates in partnership with the front office to ensure that our controls are relevant and effective. The Department works to continually improve its practices in an environment of evolving technology, regulations and stakeholder expectations. Our compliance training programme continues to expand, ensuring employee awareness of key external and internal requirements.Further details on our compliance practices can be found in the Responsibility section of our website and in our 2020 Responsibility Report.
Board of Directors and Management CommitteeThe Management Committee and the Board of Directors directly oversee the trading divisions and operating companies. Trafigura has a flat corporate governance structure featuring short and direct channels of communication and control (see separate section on Governance on page 36).The Board of Directors has principal oversight responsibility, sets the risk management framework, determines the overall risk appetite of the business, and ensures that the appropriate structures and processes are in place to handle each category of risk in an appropriate manner.The Management Committee is responsible for the day-to-day management of the Group's operations and investment portfolio and provides direct oversight of the Board's risk management strategy.Further lines of oversight consist of a series of corporate functions that support the Management Committee in establishing policies and processes for managing different categories of risk, as well as providing analysis, advice and implementation support.
Market and price risksMarket Risk Management Committee and Chief Risk OfficerTrafigura systematically hedges all index price exposure incurred as a result of its trading activities within a framework set by the Board of Directors and implemented by the Market Risk Management Committee and the Chief Risk Officer (CRO).The CRO reports directly to the Chief Operating Officer and chairs the Market Risk Management Committee, which includes company directors and senior traders. The Committee meets at least weekly to manage overall exposures, assess the impact of changing market dynamics and limit risk exposures and concentrations.Trafigura’s ongoing programme of investment in risk management systems includes a reporting system that automatically notifies the risk management and trading teams whenever a book nears its risk limits.
CODE OF BUSINESS CONDUCT
www.trafigura.com/brochure/
trafigura-code-of-business-conduct
ADVANCINGRESPONSIBLE TRADE
CORPORATE RESPONSIBILITY POLICY
www.trafigura.com/brochure/
trafigura-corporate-responsibility-policy *Excluding Nyrstar.
30 Risk management and funding model

Operational and ESG risksHSEC Steering Committee and Corporate Affairs The HSEC Steering Committee is co-chaired by a member of the Board of Directors and the Head of Corporate Affairs and comprises senior representatives from across the Group.It is mandated by the Board to promote best practice, oversee the management of health, safety, environment, and community (HSEC) risks and ensure that Trafigura’s Corporate Responsibility Policy and Business Principles are implemented consistently across the organisation.
Control risksAudit Committee and Internal Controls TeamThe Internal Controls Department supports management across the Group to continually assess risks and controls for the governance, trading, IT and support processes. Results of these activities are reported to the Audit Committee accompanied by action plans to strengthen controls and further mitigate risks where required. Internal Controls also manages the annual framework cycle activities as part of the process undertaken by external auditors to validate the existence of the Trafigura Internal Control System every year.Additionally, the team performs site reviews to assess how local management manages risk and to identify opportunities for improvement, and advises on process design for new IT applications.
OUR BUSINESS PRINCIPLES
We believe a safe and healthy work environment is a basic human right recognised in national and international law including United Nations’ and International Labour Organisation’s conventions. Trafigura is committed in its operations and activities to compliance with relevant national and international health and safety laws.
1. We will provide a safe and healthy workplace for all employees, contractors and visitors.
2. We will identify hazards, risks and unsafe conditions and behaviours. Where these cannot be eliminated, they will be appropriately mitigated.
3. We will maintain appropriate health and safety management systems that:a. Identify, evaluate and mitigate work-related risk to as lower level
as reasonably practicable;b. Require the reporting and investigation of work-related accidents,
incidents, illnesses and near-misses; keeping records; determining root-cause and contributing factors; and taking remedial measures to prevent their recurrence;
c. Enable robust management and reporting on health and safety management performance;
d. Require that the planning, design and operation of all our facilities or operations explicitly address and include health and safety standards, procedures and processes;
e. Empower all workers to stop work or any operation if they consider the health and safety risks or hazards faced to be unacceptable;
f. Provide employees and visitors with appropriate personal protective equipment (PPE) at no cost to the individual and ensure users are trained in its use;
g. Make potable water, sanitary facilities and first aid facilities available in the workplace where practicable to do so;
h. Provide measures to prepare for and effectively respond to crises, emergencies and incidents;
i. Evaluate progress, periodically assess performance and act on the results of these assessments; and
j. Ensure that competent staff and sufficient resources are provided to implement these principles.
Our goal is ‘zero harm’. The health and safety of our employees, suppliers, contractors and business partners is paramount. We are committed to building a safety culture across the business in which the value of safety is embedded at every level of the workforce.
THINK HEALTHLOOK AFTER YOURSELF AND THOSE AROUND YOU
TAKE CARE
HEALTH AND SAFETY
BE VIGILANT
THINK SAFETYOUR EMPLOYEES AND PARTNERS DESERVE THE BEST IN SAFETY STANDARDS
10.11.2016
www.trafigura.com/brochure/trafigura-hsec-
business-principles
The CRO works proactively with trading teams to analyse changing market conditions and ensures that hedging strategies are focused on current market dynamics. Rigorous methodologies for managing market risk are used across the company. The CRO’s risk team employs advanced statistical models that capture the non-normal dynamics which are an important feature of commodity markets.The risk team focuses on aggregate risk, paying particular attention to term-structure and intra-commodity spreads. Risk concentrations are continuously reviewed in the context of changing market dynamics. The CRO manages strategic hedging activity dynamically to reduce risk concentrations and limit company-wide exposure.
Finance and credit risksFinance Committee and Finance DepartmentThe Finance Department supports the activities of the whole Group and is involved at the earliest stage of transactions and projects. Overseen by the Finance Committee, it is responsible for assessment of financial risk and has the capacity to veto any transaction.Within Finance, the Credit Department’s key role is to safeguard the balance sheet. It performs fundamental credit analysis, assessing credit risk associated with the Group’s counterparts, setting internal limits, monitoring exposures and overseeing documentation.
Industrial and financial assets
Trading activities
Corporate Committees (Corporate functions)
Market Risk Management Committee
CRO
HSEC Steering Committee
Corporate Affairs
Compliance Committee
Compliance
Accounting Steering
Committee
Tax and Accounting
Finance Committee
Audit Committee
Finance
IT Steering Committee
ITInternal Controls,
Accounting and Legal
Human Resources
Committee
Human Resources
Management Committee
Board of Directors
Operations
Deals Desk
Oil and Petroleum Products
Operations
Deals Desk
Shipping and Chartering (Wet freight) Shipping and Chartering (Dry freight)
Metals and Minerals
Deals Desk
Power and Renewables
Impala Terminals Mining Group Galena Asset Management Nyrstar TFG Marine
Overview of Trafigura’s risk management system
Trafigura Annual Report 2020 31

Finance, liquidity
and credit
Compliance, internal
controls and sanctions
Legal, taxation and
regulationChanges in taxation
arrangements in various territories.
Collateral effects of changes in financial regulatory frameworks.
• Trafigura’s policy is to hedge all index price exposure related to physical transactions on a deal-by-deal basis.
• All stock is at all times either pre-sold or the index price is hedged.
• Despite such hedging, Trafigura remains exposed to basis risk, i.e., the risk of changes in the difference between the price of the commodity being hedged and the hedging instrument. The Group carefully monitors its hedging positions on a daily basis to avoid excessive basis risk resulting from these imperfect correlations.
• The majority of sales and purchases are denominated in US dollars. Exposure to other currencies is hedged and financing raised in currencies other than US dollars is generally swapped into US dollars.
• Our policy is to borrow short-term working capital at floating rates, with any rate changes passed through to our customers, and to fix rates for medium- and long-term financing via the swaps market.
• Freight costs are hedged by our Shipping and Chartering Desk via Forward Freight Agreements and bunker costs.
• Trafigura relies on a deep pool of financing from banks and investors for working capital to support its business, consisting of three pillars: (i) Trade finance, (ii) securitisation and (iii) unsecured committed revolving credit facilities.
• For longer-term capital needs, we raise funds on public bond markets or through private placements with institutional investors. We follow a strict policy of matching the maturity of our assets and liabilities with longer-term assets supported by longer-term borrowings.
• We take a conservative approach to managing our funding liquidity, with more than one-third of committed facilities unutilised at all times under normal market conditions, and immediately available cash of at least USD500 million always on hand.
• Our transactional financing base allows the underlying assets to be entirely marked-to-market, matching liquidity needs for any related margin calls.
• Trafigura’s Compliance Department oversees Group activities in partnership with front office functions to ensure that we operate appropriately and that our controls are relevant and robust. It focuses on promoting a sound compliance culture across the organisation in which everyone recognises their personal responsibility for meeting our compliance objectives. The team adopts a risk-based approach, allocating energy and resources to the issues that matter most to our core business and our stakeholders.
• The Department’s activities include counterparty due diligence (KYC); anti-money laundering; sanctions and trade restrictions; anti-bribery and corruption and financial market conduct.
• The Group ensures that all obligations with regard to international sanctions are respected across all our business activities and that we fulfil the undertakings on sanctions that we give as part of our credit facilities. This is a key focus for the trading desks with support from the Compliance Department, as well as Legal and Finance departments.
• Trafigura is focused on managing legal, taxation and regulatory risks across the multiple jurisdictions in which it operates. The Group adheres to all applicable local and international tax laws, including legislation on transfer pricing.
• We continue to follow the ongoing discussions surrounding the Organisation for Economic Co-operation and Development (OECD) Base Erosion and Profit Shifting (BEPS) Pillar One and Pillar Two blueprints. Once a concrete and final direction is determined, we will respond accordingly.
• We are also following closely the discussions about potential new forms of regulation that may be imposed on commodities trading firms. We have made representations to the appropriate authorities about the risks and unnecessary costs of introducing position limits in commodity derivatives markets and of imposing regulatory capital requirements on commodity trading firms.
Risk Management System
Markets and pricesVolatility in commodity prices, spreads, interest
and exchange rates.
Fluctuations in the supply of, or demand for, commodities
that we trade.
MITIGATION AND ACTIONS
KEY RISKS
32 Risk management and funding model

Counterparty, country
and credit
Digital infrastructure/
cyber-security
Operational and
Environmental, Social and Corporate
Governance (ESG)
KEY RISKS
• Trafigura invests in state-of-the-art systems to protect the integrity of its IT architecture and processes against the threat of fraud or other potential damage from cyber-attack.
• Trafigura uses internal credit limits established by the Credit Department to reduce counterparty and credit risk. The Group prides itself on having had an extremely low incidence of credit losses throughout its history.
• Trafigura reduces political risk in relation to countries below a certain risk rating as gauged by Dun & Bradstreet by purchasing political risk insurance.
• Credit limits reflect Trafigura’s own appetite for risk and are based on a credit analysis of the client as well as the size of the relevant transaction when compared to Trafigura’s balance sheet.
• In light of lower commodity prices in 2020, we paid particular attention to screening our portfolio of prepayment agreements with producers for credit risk.
• Exposures in excess of a credit limit are covered through the insurance or bank markets.
• Our Corporate Responsibility Policy and Business Principles articulate the leadership team’s priorities and commitments for social and environmental governance. At the operational level, they outline what is expected from everyone in the Group, its divisions and operating companies.
• Each division and operating company is required to supplement the Policy and Principles with relevant, sector-specific standards and procedures to manage the impacts of their operations.
• The HSEC Steering Committee requires all divisions and operating companies to maintain a material risk register describing the key issues they need to manage and mitigate.
• All HSEC incidents are recorded and categorised for severity on Safeguard, the Group’s HSEC data management system.
• Incidents registered as levels 3, 4 or 5, involving significant spills or single or multiple fatalities, as well as high-potential near misses are investigated and the results and remedial actions are presented to the HSEC Steering Committee.
• We engage actively with leading industry forums, including the UN Global Compact, the EITI, the World Economic Forum Global Battery Alliance, OECD and Responsible Minerals Initiative.
MITIGATION AND ACTIONS
Trafigura Annual Report 2020 33

Funding model
Finance to meet diverse business needs
Our funding strategy matches sources of funding to financing requirements. We have developed diverse financing strategies that maximise scalability, flexibility and business resilience.
Continued access to capital
Trafigura’s activities require substantial amounts of capital. We source, store, blend and deliver commodities around the globe. We invest in terminals, logistics and physical infrastructure to improve the efficiency of our trading operations.Our diversified funding model allows us to continue to operate effectively and
successfully in all market conditions. Its scalability and structure protects the business from market shocks and provides flexibility and the ability to capitalise on opportunities as they arise.We have put in place a global programme of flexible, short-term facilities to finance our day-to-day operations and a programme of longer-term, corporate
facilities to finance our asset acquisition and other corporate requirements.Available funding exceeds our everyday requirements. This provides headroom for unusual market conditions. We also maintain substantial cash balances to ensure that we will always meet day-to-day capital commitments, even in unexpected circumstances.
Our approach to funding
Diversification improves competitiveness and access to capitalWe diversify both the sources and the structure of our financing to minimise risk and maximise operational effectiveness.We raise funds in a variety of markets in the US, Europe and Asia-Pacific. We have lending arrangements in place with 135 banks around the world. We are therefore not constrained by credit restrictions for specific financial institutions, sectors or regions.We raise capital with a range of repayment schedules, from very short-term facilities to maturities greater than 10 years. This spreads our exposure across the yield curve.
Match-funded, collateralised lending reduces credit riskAs a matter of policy, we match the type of financing to the business requirement. We have established a three-pillar funding structure to put this into practice.We use short-term financing for trading. These loans are secured against the underlying physical commodities. Lines are marked-to-market each week so the level of financing tracks the value of the underlying collateral as prices change. We raise longer-term debt to finance fixed assets and investments.
Transparency promotes stabilityAs a private company relying on debt to finance its operations, Trafigura’s performance is closely scrutinised by a large group of banks and investors worldwide. We comply with the financial covenants attached to our syndicated bank facilities. Members of the finance team regularly meet with our lenders representatives. These meetings often include operationally focused personnel (from Credit, Compliance and Trading Desks) who provide additional insight into our business model. As an issuer of publicly listed debt, we also meet the transparency requirements of our bond investors. Our interim and full-year reports are published online. We hold regular calls and presentations to update investors and to respond to specific queries directly.
Our three-pillar funding structure
1. Transactional facilitiesAll transaction-based lending is fully collateralised. We fund day-to-day trading mostly through one-to-one (i.e. bilateral) agreements with individual banks and borrowing bases with syndicates of banks. Most transactions start with a bank issuing a letter of credit ("LC") on behalf of Trafigura in favour of a commodity supplier to secure due payment. The bank takes security over the physical commodity being purchased. When payment is due, Trafigura draws on a transactional loan to pay the supplier, such loan being secured against the commodity. The loan is marked-to-market weekly until maturity so that the amount being financed always corresponds to the value of the underlying commodity.
Once the commodity is sold to the end-buyer, a receivable is created and assigned to the bank until the cash settlement is used to repay the secured loan. Alternatively, the loan can be repaid earlier if the receivable is sold to one of the trade receivables securitisation programmes sponsored by Trafigura.
2. Securitisation programmeTrafigura manages two trade receivables securitisation programmes through separately capitalised special purpose vehicles: TSF and Argonaut. The programmes further diversify Trafigura’s funding sources and, thanks to TSF's investment-grade ratings from Moody’s and S&P are cost-effective financing mechanisms. Most trades are financed on a trade-by-trade basis with transactional secured loans, but Trafigura
can fund an eligible receivable once an invoice has been issued by selling it to a programme. Securitising our receivables accelerates the rotation of existing credit lines, since transactional secured loans can be repaid faster with the programmes' proceeds.
3. Corporate credit facilitiesTrafigura invests in fixed assets to support its trading activity. We finance these with long-term debt adhering to our policy of matching assets with liabilities. We issue debt securities and negotiate lending facilities in diverse markets. Funding sources include bonds, perpetual bonds, revolving credit facilities, private placements and term loans.
Public credit ratings
Trafigura does not hold a public rating and does not seek to obtain one. The Group focuses on strengthening its balance sheet through long-term value creation.We obtain our funding from stakeholders who understand our business model
in detail and whose investment decisions are not driven by ratings. We have significantly expanded our sources of financing over the years by maintaining a sustainable credit standing that is consistent with an investment-grade profile.
Likewise, the absence of a rating means that Trafigura’s business and investment decisions are not taken on the basis of maintaining a particular rating level, something which becomes particularly important at times of high market volatility.
Trafigura funding model
Transactional facilities
Corporate Credit facilities
Securitisation programme
34 Risk management and funding model

Purchase and sale
agreements
Taking
delivery from supplier
Transportation
Pricing and delivery to customer
Customer payment
Transaction component
Day 1 Purchase and sale agreements
Day 5 Taking delivery
Days 6>19 Transportation
Day 20 Pricing and delivery
Day 50 Customer payment
Brent crude oil price $60 $59 $55 $55 $60
Dubai crude oil price $59 $59 $55 $55 $58
Physical trade •Trafigura agrees to purchase 1 million barrels @ Brent minus $1/barrel, based on Brent price at delivery date
•Trafigura asks a bank to issue an LC for $59 million to the benefit of the supplier, against sight of an acceptable contract, in order to guarantee payment to the supplier, using a transactional credit facility
•Trafigura agrees to sell 1 million barrels @ Dubai plus $2/barrel, based on Dubai price at delivery
•Transaction costs (interest cost, insurance, transport, storage, control, inspection, taxes, etc.) expected at $0.5 million
•Trafigura is invoiced $58 million by the supplier ($59-$1) x 1 million
•Trafigura asks bank to pay 95%* of cargo value (95% x $58 = $55 million) to supplier (and cancel letter of credit) against security over title of the cargo, using transactional credit facility
•Trafigura draws the difference ($58-$55 = $3 million) from the RCF
* percentage financed, depends on each transaction, usually 90-100%
•Trafigura invoices $57 million to customer ($55+$2) x 1 million
•Trafigura sells the receivable (if eligible) to its receivables securitisation programme at face value, receiving payment of $57 million
•Trafigura repays $55 million of the transactional credit facility
•Trafigura uses remaining $2 million ($57-$55) to repay the RCF and build up cash
•Trafigura pays $0.5 million transaction costs (interest cost, insurance, transport, storage, control, inspection, taxes, etc.) using cash
•Securitisation programme receives payment of $57 million from customer and repays funding
Hedging purchase leg •Trafigura purchases 1 million barrels equiv. of Brent futures @ $60/barrel
•Trafigura pays initial margin of $1 million using the RCF
•Trafigura sells 1 million barrels equiv. of Brent futures @ $59/barrel, paying net amount of $1 million using the RCF ($59-$60) x 1 million
•Trafigura recovers $1 million initial margin and repays the RCF
Hedging sale leg •Trafigura sells 1 million barrels equiv. of Dubai futures @ $59/barrel
•Trafigura pays initial margin of $1 million using the RCF
•Trafigura receives payment of $4 million (margin call) and repays the RCF ($59-$55) x 1 million
•Trafigura purchases 1 million barrels equiv. of Dubai futures @ $55/barrel
•No further margin call since price stable
•Trafigura recovers $1 million initial margin going to cash
Transactional credit facility utilisation 59 55 55 – –
Letter of credit utilisation 59 Cancelled – – –
Drawn amount – 55 55 Repaid –
RCF utilisation 2 5 1 – –
Drawn amount 1+1=2 2+3+1-1=5 5-4=1 Repaid –
Securitisation utilisation – – – 57 –
Drawn amount – – – 57 Repaid
Cash position – – – 1.5 1.5
Outstanding cash – – – 1-0.5+1=1.5 1.5
Trade financing exampleto explain funding mechanism
Trafigura Annual Report 2020 35

Corporate governance
Board of Directors and Committees
Trafigura is owned by its management and senior employees. This alignment of employee and shareholder interest promotes sustainable financial performance with management depth and stability.
Board of DirectorsThe principal oversight body for the Group is the Board of Directors, which has overall responsibility for the strategic direction and management of the Group, including commercial and financing strategy and stakeholder relations. Members of the Board of Directors are listed on the opposite page. The Directors with executive responsibilities are also members of the Management Committee and subsidiary committees as outlined below. Management of the Group is characterised by short reporting lines, flat structures, clear delineation and segregation of responsibilities, and personal accountability. Employee remuneration is linked to Group performance and individual contribution. The Group’s circa 850 senior employees, in their capacity as shareholders, have a personal commitment to its long-term success, promoting management depth and stability and encouraging prudent risk management.
Two sub-committees sit within the Board of Directors: the Audit Committee and the Nomination and Remuneration Committee.The Audit Committee assists the Board of Directors in fulfilling its oversight responsibilities for the financial reporting process, the system of internal control, the audit process, and the company's process for monitoring compliance with laws and regulations and the Code of Business Conduct. The Nomination and Remuneration Committee assists and advises the Board of Directors on matters relating to the appointment and remuneration of the Executive Directors, the Management Committee and other senior employees of the Trafigura Group.
Management CommitteeThe nine-strong Management Committee sits below the Board of Directors and includes Trafigura’s three Executive Directors. The Management Committee is responsible for the execution of Trafigura’s business strategy, including management of the day-to-day trading, commercial and operational functions as well as its investment portfolio. The Management Committee is supported by the following corporate functions and committees: • Finance Committee • Audit Committee • Nomination and Remuneration Committee • Accounting Steering Committee • IT Steering Committee • Market Risk Management Committee • Compliance Committee • HSEC Steering Committee • Human Resources Committee
www.trafigura. com/about-
us/leadership
Corporate Committees (Corporate functions)
Market Risk Management Committee
HSEC Steering Committee
Compliance Committee
Accounting Steering
Committee
Finance Committee
IT Steering Committee
Human Resources Committee
Management Committee
Board of Directors
Nomination and Remuneration CommitteeAudit Committee
Corporate governance overview
36 Corporate governance

Leadership
Mike WainwrightExecutive Director and Chief Operating Officer
Mike Wainwright was appointed Chief Operating Officer and Trafigura Management Board member in January 2008. His principal
focus is the management of the middle and back office support teams for the
trading division, including IT strategy and infrastructure. He also has direct responsibility
for the Group’s profit and loss.
Jose Maria LaroccaExecutive Director and Co-Head of Oil Trading
Jose Maria Larocca was appointed to the Trafigura Management Board and Head of the Oil and Petroleum Products Trading division in March 2007. He was one of the company’s
earliest employees, joining Trafigura in London in 1994 on the Oil Deals Desk before taking
a series of commercial roles, including as a trader of naphtha and gasoline.
Pierre LorinetDirector
Pierre Lorinet is the former Group Chief Financial Officer and Managing
Director of the Asia-Pacific region. In 2015, he became a Non-Executive
Director on the Board.
Mark IrwinDirector
Mark Irwin, a UK Chartered Accountant, joined Trafigura as
financial controller in 1994 and has been on the Board since 2004.
Andrew Vickerman Director
Andrew Vickerman has held a Non-Executive Board position with
Trafigura since October 2010 and chairs the Nomination and Remuneration
Committee and co-chairs the HSEC Steering Committee.
Sipko Schat Director
Sipko Schat joined the Board of Directors in January 2016 and
chairs the Audit Committee. Prior to joining Trafigura, Sipko worked in
the Rabobank Group for over 25 years.
Christophe SalmonGroup Chief Financial Officer
Jesus FernandezHead of Mergers and Acquisitions
Ben Luckock Co-Head of Oil Trading
Julien RollandHead of Bulk Minerals, and
Power and Renewables Trading
Amin ZahirHead of Metals and Minerals Trading
Hadi HalloucheCo-Head of Oil Trading
Management CommitteeBoard of Directors
Jeremy WeirExecutive Chairman and Chief Executive Officer
Jeremy Weir was appointed CEO of Trafigura in March 2014 and Executive Chairman in March 2018, after a career spanning nearly
three decades in commodity and commodity derivative markets. Jeremy joined the Trafigura Group in 2001 as Head of Metals Derivatives, Structured Products and Risk Management.
Trafigura Annual Report 2020 37

38 Financial statements

Financial statementsContents
Report of the auditor 40A. Consolidated statement of income 48B. Consolidated statement of other comprehensive income 48C. Consolidated statement of financial position 49D. Consolidated statement of changes in equity 50E. Consolidated statement of cash flows 51F. Notes to the consolidated financial statements 52
39Trafigura Annual Report 2020

Report of the auditor to the Shareholders and the Board of Directors of Trafigura Group Pte. Ltd. Singapore
Report on the audit of the consolidated financial statements
PricewaterhouseCoopers SA, avenue Giuseppe-Motta 50, case postale, CH-1211 Genève 2, Switzerland Téléphone: +41 58 792 91 00, Téléfax: +41 58 792 91 10, www.pwc.ch
PricewaterhouseCoopers SA is a member of the global PricewaterhouseCoopers network of firms, each of which is a separate and independent legal entity.
Our audit approach
OverviewOverall Group materiality: USD 62'000'000We performed full scope audit work at 6 components, audited specific balances at 44 components and performed specified procedures at 6 components. Our audit scope addressed approximately 78% of the Group's revenue and 79% of the Group's total assets.As key audit matters the following areas of focus have been identified: • Valuation of FPOR11 instruments linked
to equity accounted investment in Porto Sudeste in Brazil
• Impairment testing of the equity accounted investment in Puma Energy Holdings Pte. Ltd.
• Impairment testing of the logistics network assets in Colombia
OpinionWe have audited the consolidated financial statements of Trafigura Group Pte. Ltd. and its subsidiaries (collectively, the “Group”), which comprise the consolidated statement of income and consolidated statement of other comprehensive income for the year ended 30 September 2020, the consolidated statement of financial position as at 30 September 2020, the consolidated statement of changes in equity and consolidated statement of cash flows for year then ended and notes to the consolidated financial statements, including a summary of significant accounting policies.In our opinion, the accompanying consolidated financial statements give a true and fair view of the consolidated financial position of the Group as at 30 September 2020 and its consolidated financial performance and its consolidated cash flows for the year then ended in accordance with the International Financial Reporting Standards (IFRS) as issued by the International Accounting Standards Board (IASB).
Basis for opinionWe conducted our audit in accordance with International Standards on Auditing (ISAs). Our responsibilities under those provisions and standards are further described in the “Auditor’s responsibilities for the audit of the consolidated financial statements” section of our report.We are independent of the Group in accordance with the provisions of the International Code of Ethics for Professional Accountants (including International Independence Standards) of the International Ethics Standards Board for Accountants (IESBA Code), and we have fulfilled our other ethical responsibilities in accordance with these requirements. We believe that the audit evidence we have obtained is sufficient and appropriate to provide a basis for our opinion.
Financial statements40

Context of our auditTrafigura Group Pte. Ltd. is one of the world’s largest independent commodity trading and logistics companies. The Group trades operationally across different geographical locations around the world within two primary segments, Oil and Petroleum Products and Metals and Minerals, both of which are supported by the related shipping and chartering activities. The Metals and Minerals segment also encompasses mining, logistics and smelting businesses. The Group also invests in terminals, storage warehouses, mines and other commodity-related assets, either directly or through equity stakes in joint ventures and associate companies over which they may have significant influence.The Group's business is focused on commodity trade flows, including the transporting, storing and blending of a diverse portfolio of commodities to exploit natural arbitrage opportunities. To ensure the accurate capture of all the transactions for financial reporting, the Group relies on complex front-office trade and risk management systems with varying levels of integration, supported by manual reconciliations. The high volume of transactions and complexity of the systems heightens the risk of inaccurate or incomplete recording of transactions within the system. Minor errors, which repeat, could have a material impact on the consolidated financial statements.As a part of designing our audit, we determined materiality and assessed the risks of material misstatement in the consolidated financial statements. In particular, we considered where management made subjective judgements, especially in respect of significant accounting estimates that involved making assumptions and considering the impact of future events that are inherently uncertain. In Note 3.26 Use of estimates and judgements of the financial statements, the Group describes the areas of key judgements made in applying accounting policies and the key sources of estimation uncertainty. Given the significant estimation uncertainty and the higher inherent risks of material misstatement, certain of these areas were also considered by us to be key audit matters and are described in more detail in the section ‘Key audit matters’ of this report. We also addressed risk of management override of controls, including among other matters, consideration of whether there was evidence of bias that represented a risk of material misstatement due to fraud. Furthermore, we evaluated and tested the design and operating effectiveness of the Group’s controls over the accounting and financial reporting aspects within its trading operations, including the use of data analytics to assist in the testing of revenue (trade to cash) to identify nonstandard and more risky transactions.
MaterialityThe scope of our audit was influenced by our application of materiality. Our audit opinion aims to provide reasonable assurance that the consolidated financial statements are free from material misstatement. Misstatements may arise due to fraud or error. They are considered material if, individually or in aggregate, they could reasonably be expected to influence the economic decisions of users taken on the basis of the consolidated financial statements.Based on our professional judgement, we determined certain quantitative thresholds for materiality, including the overall Group materiality for the consolidated financial statements as a whole as set out in the table below. These, together with qualitative considerations, helped us to determine the scope of our audit and the nature, timing and extent of our audit procedures and to evaluate the effect of misstatements, both individually and in aggregate, on the consolidated financial statements as a whole.
Overall Group materiality USD 62'000'000How we determined it 5% of the three-year average profit before taxRationale for the materiality benchmark applied
In our view, the materiality benchmark applied above is the measure against which the performance of the Group is most commonly assessed and is a generally accepted benchmark.
We used a three-year average to allow for the volatility in earnings normally encountered in the commodity trading markets.
We agreed with the Audit Committee that we would report to them misstatements above USD 3'100'000 identified during our audit as well as any misstatements below that amount which, in our view, warranted reporting for qualitative reasons.
Trafigura Annual Report 2020 41

Audit scopeWe tailored the scope of our audit in order to perform sufficient work to enable us to provide an opinion on the consolidated financial statements as a whole, taking into account the structure of the Group, the accounting processes and controls, and the industry in which the Group operates.The Group financial statements are a consolidation of 422 legal entities that are accounted for in 648 financial ledgers, which we have defined as “components” for audit scoping purposes.We identified 6 components that, in our view, required an audit of their financial information due to their size or risk characteristics. For these 6 components, the audit work was performed either centrally by the Group audit team in Switzerland or the Netherlands or by another PwC network firm at one of the Group’s global service centres located in Mumbai, India or Montevideo, Uruguay under the direct guidance of the Group audit team. Additionally, we identified 50 components, that in our view, required either an audit of specific balances or specified procedures to be performed due to the significant or higher risk areas and to achieve appropriate coverage over material amounts.Of the 50 components, there were only 6 components where the work was not performed directly by ourselves or through our direct supervision at the Group’s global services centres. Of these 6 components, we specified procedures in instructions for 4 components to a non-PwC network audit firm to report to us, and we reviewed the results of their work with them for our audit. We determined the level of our involvement in the audit work performed by the component auditors for these 6 components to be able to conclude whether sufficient appropriate audit evidence had been obtained as a basis for our opinion on the consolidated financial statements as a whole.We ensured that the audit teams both at Group and at the component levels included the appropriate skills and competencies necessary for the audit of the Group’s consolidated financial statements, including specialists in the areas of information technology, valuation and taxes. The Group audit team was in regular communication during the year with the local teams to discuss the audit approach, progress of the audit and observations or findings, if any. To facilitate our direct review, local PwC teams in India and Uruguay documented their audit work directly in the Group audit team’s files. The Group audit team also performed further audit procedures over Group functions (including those relating to taxation, equity-based remuneration, valuation of certain non-current assets, litigation, consolidation and financial reporting disclosures). We also performed procedures focused on responding to the risk of fraud and non-compliance with laws and regulations.
Key audit mattersKey audit matters are those matters that, in our professional judgement, were of most significance in our audit of the consolidated financial statements of the current period. These matters were addressed in the context of our audit of the consolidated financial statements as a whole, and in forming our opinion thereon, and we do not provide a separate opinion on these matters.
Financial statements42

Valuation of FPOR11 instruments linked to equity accounted investment in Porto Sudeste, Brazil Refer to “Use of estimates and judgements” in Note 3.26, Note 12 and Note 20
Key audit matter How our audit addressed the key audit matterThe Group holds a 49.63% interest in a joint venture that owns and operates an iron ore port facility in Brazil (Porto Sudeste). Linked to this investment, the Group holds listed debt securities (FPOR11) totalling USD 221 million which are accounted for at fair value through profit and loss. The performance and resulting value of these debt instruments is dependent on the future throughput results of the port. As there is limited liquidity of these debt securities, the fair value is based on a Level 3 valuation using the key assumptions of the port’s business plan. A further discount of 33% to the net present value of the relevant cash flows is also applied due to lack of marketability, which was increased from the 10% discount in prior year.During the year, the Group recorded a fair value loss of USD 125 million on the FPOR11 instruments as disclosed in Note 12. The reduction in the value was primarily driven by an increase in discount factor from 10% as at 30 September 2019 to 33% as at 30 September 2020, reflecting the longer time expected to market such instruments in the current market conditions. Furthermore, the level 3 valuation was revised to reflect lower and more conservative throughput volumes and price projections due to tight iron ore supply conditions in Brazil and uncertain business environment that has been intensified by the COVID-19 pandemic.The revised cash flow projections have also triggered the need to perform an impairment assessment for the Group’s equity investment in Porto Sudeste. Based on the assessment performed, management determined no impairment is required of the carrying value of the investment totalling USD 82 million.The estimates and judgments used in determining the fair value of the debt instruments and related impairment assessments are significant and are considered a key audit matter.
We obtained the valuation models (both at port level and equity investment level) and met with management to gain an overview of the market and operational factors and key assumptions supporting the Group’s FPOR11 valuation and related impairment assessment. With the assistance of our internal valuation specialists, we performed the following procedures: • Gained an understanding of the process for collecting the inputs
into the valuation models and checked the appropriateness of the inputs and significant assumptions, including the throughput volumes, discount rate, iron ore prices, port fees and the marketability discount.
• Re-performed the valuation calculations; benchmarked the valuation model with generally accepted valuation techniques; compared historical estimates used by management to actual results.
• Re-performed certain calculations supporting the sensitivity analysis prepared by management for the forecasted assumptions over the volumes, discount rate and marketability discount; we performed our own independent calculations where applicable.
• Assessed the appropriateness of disclosures included in the financial statements, including key assumptions used and inherent sensitivities of the financial results to these assumptions.
The procedures performed over the port valuation were used to determine the appropriateness of the fair value calculation of FPOR11 instruments.Based on the work performed, we were able to conclude that the significant judgements and estimates used in the valuation models were reasonable and appropriate.
Trafigura Annual Report 2020 43

Impairment testing of the equity accounted investment in Puma Energy Holdings Pte. Ltd. Refer to “Use of estimates and judgements” in Note 3.26, Note 11 and Note 17
Key audit matter How our audit addressed the key audit matterThe Group holds a 55.55% interest in Puma Energy Holdings Pte. Ltd. (Puma), which is valued at USD 1,122 million at 30 September 2020.In 2020, the financial performance of Puma continued to be negatively affected by ongoing uncertainty and various restrictions across its key markets, particularly aviation, that have been imposed by the COVID-19 pandemic. This triggered a need for an impairment test which resulted in the Group recognising a USD 191 million impairment loss in the consolidated statement of income in addition to the USD 326 million loss recorded in the consolidated statement of income and the USD 83 million in consolidated statement of other comprehensive income for Group’s share of Puma’s losses in accordance with IAS 28 Investments in Associates and Joint Ventures. The significance of the estimates and judgments used in making this impairment assessment are considered a key audit matter.
We obtained the valuation models and met with management to gain an overview of the market, operational factors and key assumptions supporting the Group’s impairment assessment. We issued instructions to the non-PwC network audit firm to report to us on financial information supporting the Group’s recording of its share of Puma’s losses and the forecasted cash flows used in the impairment valuation model. We performed a detailed review of the work performed by the non-PwC network audit firm. With the assistance of our internal valuation specialists, we performed the following procedures: • Checked the appropriateness of the inputs and significant
assumptions including the discount rate, terminal growth rate, terminal value calculations and market multiples.
• Re-performed certain valuation calculations, benchmarked the valuation model with generally accepted valuation techniques and compared current year budget estimates used by management to actual results.
• Performed an independent sensitivity analysis calculation for the terminal growth rate, discount rate and market multiples to assess their relationships and impact on the model.
• Assessed the appropriateness of disclosures included in the financial statements.
Based on the work performed, we were able to conclude that the significant judgements and estimates used in the valuation model were reasonable and appropriate.
Financial statements44

Impairment testing of the logistics network assets in Colombia Refer to “Use of estimates and judgements” in Note 3.26 and Note 11
Key audit matter How our audit addressed the key audit matterThe Group has constructed a river port to transport wet and dry bulk cargoes along the Magdalena River, one of Colombia’s main waterways. The carrying value of the total multimodal project, which represents one cash-generating unit, was USD 491 million at 30 September 2020. The potential profitability is hindered by the Colombian government’s delays of its planned dredging of the Magdalena River. The depth of the Magdalena River determines the ease of navigability and how much each barge convoy can load. The dredging project continues to be delayed until a new contractor is mandated to complete the project. This delay, in combination with adverse market conditions seen with the COVID-19 pandemic, triggered a need for an impairment test which resulted in USD 392 million impairment loss being recognised. In making this impairment assessment, management assumed that the river improvement project will be completed by 2026. The significance of this and other estimates and judgments used in making this impairment assessment are considered a key audit matter.
We obtained the valuation models and met with management to gain an overview of the market, operational factors being impacted by the delays in dredging and the key assumptions supporting the Group’s impairment assessment. With the assistance of our internal valuation specialists, we performed the following procedures: • Checked the appropriateness of the inputs and significant
assumptions including the cash flow projections and their length, tariffs, costs and expenses, discount rate as well as the impact of the expected timing for finalisation of the river improvement project.
• Re-performed certain valuation calculations, benchmarked the valuation model with generally accepted valuation techniques, and compared current year budget estimates used by management to actual results.
• Performed an independent sensitivity analysis calculation for timing of the completion of the dredging project, projected cash flows and discount rate to assess their relationships and impact on the model.
• Assessed the appropriateness of disclosures included in the financial statements.
Based on the work performed, we were able to conclude that the significant judgements and estimates used in the valuation model were reasonable and appropriate.
Trafigura Annual Report 2020 45

Other information in the annual reportThe Board of Directors is responsible for the other information in the annual report. The other information comprises all information included in the annual report but does not include the consolidated financial statements of Trafigura Group Pte. Ltd. and our auditor’s reports thereon.Our opinion on the consolidated financial statements does not cover the other information in the annual report and we do not express any form of assurance conclusion thereon.In connection with our audit of the consolidated financial statements, our responsibility is to read the other information in the annual report and, in doing so, consider whether the other information is materially inconsistent with the consolidated financial statements or our knowledge obtained in the audit, or otherwise appears to be materially misstated. If, based on the work we have performed, we conclude that there is a material misstatement of this other information, we are required to report that fact. We have nothing to report in this regard.
Responsibilities of the Board of Directors for the consolidated financial statementsThe Board of Directors is responsible for the preparation of the consolidated financial statements that give a true and fair view in accordance with IFRS as issued by the IASB, and for such internal control as the Board of Directors determines is necessary to enable the preparation of consolidated financial statements that are free from material misstatement, whether due to fraud or error.In preparing the consolidated financial statements, the Board of Directors is responsible for assessing the Group’s ability to continue as a going concern, disclosing, as applicable, matters related to going concern and using the going concern basis of accounting unless the Board of Directors either intends to liquidate the Group or to cease operations, or has no realistic alternative but to do so.
Financial statements46

Auditor’s responsibilities for the audit of the consolidated financial statementsOur objectives are to obtain reasonable assurance about whether the consolidated financial statements as a whole are free from material misstatement, whether due to fraud or error, and to issue an auditor’s report that includes our opinion. Reasonable assurance is a high level of assurance but is not a guarantee that an audit conducted in accordance with ISAs will always detect a material misstatement when it exists. Misstatements can arise from fraud or error and are considered material if, individually or in the aggregate, they could reasonably be expected to influence the economic decisions of users taken on the basis of these consolidated financial statements.As part of an audit in accordance with ISAs, we exercise professional judgment and maintain professional scepticism throughout the audit. We also: • Identify and assess the risks of material misstatement of the
consolidated financial statements, whether due to fraud or error, design and perform audit procedures responsive to those risks, and obtain audit evidence that is sufficient and appropriate to provide a basis for our opinion. The risk of not detecting a material misstatement resulting from fraud is higher than for one resulting from error, as fraud may involve collusion, forgery, intentional omissions, misrepresentations, or the override of internal control.
• Obtain an understanding of internal control relevant to the audit in order to design audit procedures that are appropriate in the circumstances, but not for the purpose of expressing an opinion on the effectiveness of the Group’s internal control.
• Evaluate the appropriateness of accounting policies used and the reasonableness of accounting estimates and related disclosures made.
• Conclude on the appropriateness of the Board of Directors’ use of the going concern basis of accounting and, based on the audit evidence obtained, whether a material uncertainty exists related to events or conditions that may cast significant doubt on the Group’s ability to continue as a going concern. If we conclude that a material uncertainty exists, we are required to draw attention in our auditor’s report to the related disclosures in the consolidated financial statements or, if such disclosures are inadequate, to modify our opinion. Our conclusions are based on the audit evidence obtained up to the date of our auditor’s report. However, future events or conditions may cause the Group to cease to continue as a going concern.
• Evaluate the overall presentation, structure and content of the consolidated financial statements, including the disclosures, and whether the consolidated financial statements represent the underlying transactions and events in a manner that achieves fair presentation.
• Obtain sufficient appropriate audit evidence regarding the financial information of the entities or business activities within the Group to express an opinion on the consolidated financial statements. We are responsible for the direction, supervision and performance of the Group audit. We remain solely responsible for our audit opinion.
We communicate with the Board of Directors or its relevant committee regarding, among other matters, the planned scope and timing of the audit and significant audit findings, including any significant deficiencies in internal control that we identify during our audit.We also provide the Board of Directors or its relevant committee with a statement that we have complied with relevant ethical requirements regarding independence, and communicate with them all relationships and other matters that may reasonably be thought to bear on our independence, and where applicable, actions taken to eliminate threats or safeguards applied.From the matters communicated with the Board of Directors or its relevant committee, we determine those matters that were of most significance in the audit of the consolidated financial statements of the current period and are therefore the key audit matters. We describe these matters in our auditor’s report unless law or regulation precludes public disclosure about the matter or when, in extremely rare circumstances, we determine that a matter should not be communicated in our report because the adverse consequences of doing so would reasonably be expected to outweigh the public interest benefits of such communication.
PricewaterhouseCoopers SA
/s/ TRAVIS RANDOLPH /s/ EWA ANSELM-JEDLINSKATravis Randolph Ewa Anselm-Jedlinska
Geneva, Switzerland7 December 2020
Enclosure: • Consolidated financial statements (consolidated statement of
income, consolidated statement of other comprehensive income, consolidated statement of financial position, consolidated statement of changes in equity, consolidated statement of cash flows and notes)
Trafigura Annual Report 2020 47

A. Consolidated statement of income
Note 2020 2019USD’M USD’M
Revenue 8 146,994.3 171,474.1 Cost of sales* (140,199.8) (168,604.3)
Gross profit** 5 6,794.5 2,869.8
General and administrative expenses * 9/10 (2,155.1) (1,049.1)Impairments of PP&E and intangible fixed assets* 11 (648.6) (49.0)Impairments of financial assets and prepayments 11 (395.1) (20.6)Impairments of equity-accounted investees 11 (524.2) (34.6)Other income/(expenses) – net* 12 (196.2) (68.0)
Results from operating activities 2,875.3 1,648.5
Finance income* 500.1 700.4 Finance expense* (1,158.1) (1,404.5)
Net financing costs (658.0) (704.1)
Share of profit/(loss) of equity-accounted investees 17 (327.0) 47.7
Profit before tax 1,890.3 992.1
Income tax expense* 13 (291.5) (124.3)
Profit for the period 1,598.8 867.8
Profit attributable toOwners of the Company* 1,699.2 871.7 Non-controlling interests 28 (100.4) (3.9)
Profit for the period 1,598.8 867.8
* These line items are impacted due to the initial application of IFRS16 for which comparison figures are not restated. Refer to Note 4.1 for the impact of IFRS16.
** Gross profit for 2019 has been adjusted due to changes in expenses reclassification and presentation.
See accompanying Notes.
B. Consolidated statement of other comprehensive incomeNote 2020 2019
USD’M USD’M
Profit for the period 1,598.8 867.8
Other comprehensive incomeItems that are or may be reclassified to profit or loss:Gain/(loss) on cash flow hedges 27 46.7 (101.8)Effect from hyperinflation adjustment 38 12.8 –Tax on other comprehensive income 13 18.3 10.7 Exchange gain/(loss) on translation of foreign operations* 37.8 (63.1)Share of comprehensive income/(loss) from associates (146.4) 24.4
Items that will not be reclassified to profit or loss:Net change in fair value through other comprehensive income, net of tax 20 (34.3) (6.9)Defined benefit plan actuarial gains/ (losses), net of tax 12.1 (1.5)
Other comprehensive income for the period, net of tax (53.0) (138.2)
Total comprehensive income for the period 1,545.8 729.6
Total comprehensive income attributable to:Owners of the Company* 1,646.2 733.5 Non-controlling interests (100.4) (3.9)
Total comprehensive income for the period 1,545.8 729.6
* These line items are impacted due to the initial application of IFRS16 for which comparison figures are not restated. Refer to Note 4.1 for the impact of IFRS16.
See accompanying Notes.
Financial statements48
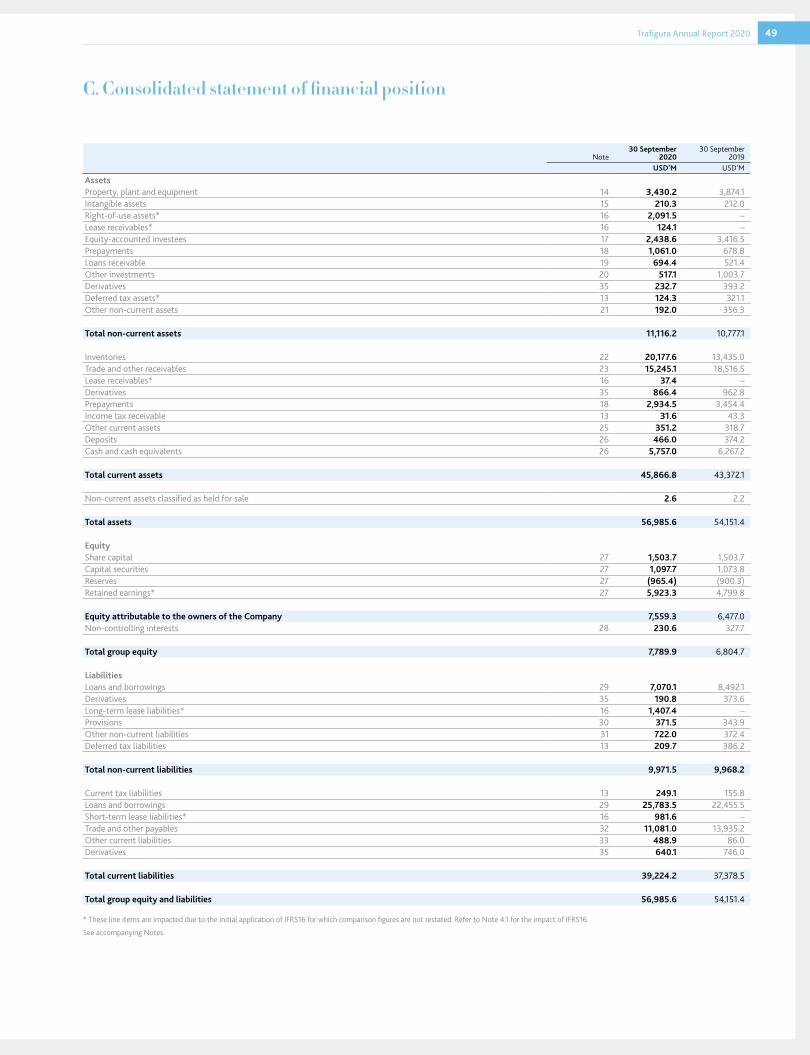
C. Consolidated statement of financial position
Note 30 September
2020 30 September
2019 USD’M USD’M
AssetsProperty, plant and equipment 14 3,430.2 3,874.1Intangible assets 15 210.3 212.0Right-of-use assets* 16 2,091.5 –Lease receivables* 16 124.1 –Equity-accounted investees 17 2,438.6 3,416.5 Prepayments 18 1,061.0 678.8 Loans receivable 19 694.4 521.4 Other investments 20 517.1 1,003.7 Derivatives 35 232.7 393.2 Deferred tax assets* 13 124.3 321.1Other non-current assets 21 192.0 356.3
Total non-current assets 11,116.2 10,777.1
Inventories 22 20,177.6 13,435.0 Trade and other receivables 23 15,245.1 18,516.5 Lease receivables* 16 37.4 –Derivatives 35 866.4 962.8 Prepayments 18 2,934.5 3,454.4 Income tax receivable 13 31.6 43.3 Other current assets 25 351.2 318.7 Deposits 26 466.0 374.2 Cash and cash equivalents 26 5,757.0 6,267.2
Total current assets 45,866.8 43,372.1
Non-current assets classified as held for sale 2.6 2.2
Total assets 56,985.6 54,151.4
Equity Share capital 27 1,503.7 1,503.7 Capital securities 27 1,097.7 1,073.8 Reserves 27 (965.4) (900.3)Retained earnings* 27 5,923.3 4,799.8
Equity attributable to the owners of the Company 7,559.3 6,477.0 Non-controlling interests 28 230.6 327.7
Total group equity 7,789.9 6,804.7
LiabilitiesLoans and borrowings 29 7,070.1 8,492.1 Derivatives 35 190.8 373.6 Long-term lease liabilities* 16 1,407.4 –Provisions 30 371.5 343.9 Other non-current liabilities 31 722.0 372.4 Deferred tax liabilities 13 209.7 386.2
Total non-current liabilities 9,971.5 9,968.2
Current tax liabilities 13 249.1 155.8 Loans and borrowings 29 25,783.5 22,455.5 Short-term lease liabilities* 16 981.6 –Trade and other payables 32 11,081.0 13,935.2 Other current liabilities 33 488.9 86.0 Derivatives 35 640.1 746.0
Total current liabilities 39,224.2 37,378.5
Total group equity and liabilities 56,985.6 54,151.4
* These line items are impacted due to the initial application of IFRS16 for which comparison figures are not restated. Refer to Note 4.1 for the impact of IFRS16.
See accompanying Notes.
Trafigura Annual Report 2020 49

D. Consolidated statement of changes in equity
Equity attributable to the owners of the Company
USD’000 Note Share capital
Currency translation
reserveRevaluation
reserve
Cash flow hedge
reserveCapital
securitiesRetained earnings
Profit for the year Total
Non-controlling
interestsTotal
Group equity
Balance at 1 October 2019 1,503,722 (770,723) (29,018) (100,566) 1,073,792 3,928,066 871,731 6,477,004 327,684 6,804,688 Profit for the period – – – – – – 1,699,139 1,699,139 (100,368) 1,598,771Other comprehensive income – (51,917) (34,311) 21,124 – 12,143 – (52,961) – (52,961)
Total comprehensive income for the period – (51,917) (34,311) 21,124 – 12,143 1,699,139 1,646,178 (100,368) 1,545,810
Profit appropriation – – – – – 871,731 (871,731) – – – Shares issued – – – – – – – – 188 188 Dividend 26 – – – – – (585,987) – (585,987) – (585,987)Acquisition of non-controlling interest in subsidiary – – – – – (8,027) – (8,027) (607) (8,634)Share-based payments 35 – – – – – 130,291 – 130,291 – 130,291 Capital securities (currency translation) 26 – – – – 20,273 (20,273) – – – – Capital securities dividend 26 – – – – – (80,687) – (80,687) – (80,687)Share of other changes in equity of associates – – – – – 312 – 312 – 312 Capital contribution from the minority shareholders – – – – – – – – 3,745 3,745 Other – – – – 3,627 (23,367) – (19,740) – (19,740)
Balance at 30 September 2020 1,503,722 (822,640) (63,329) (79,442) 1,097,692 4,224,202 1,699,139 7,559,344 230,642 7,789,986
Equity attributable to the owners of the Company
USD’000 Note Share capital
Currency translation
reserveRevaluation
reserve
Cash flow hedge
reserveCapital
SecuritiesRetained earnings
Profit forthe year Total
Non-controlling
interestsTotal
Group equity
Balance at 1 October 2018 1,503,722 (694,794) (22,432) (48,080) 953,555 3,380,170 849,217 5,921,358 328,698 6,250,056 Profit for the period – – – – – – 871,731 871,731 (3,934) 867,797 Other comprehensive income – (75,929) (6,890) (52,486) – (2,936) – (138,241) 4 (138,237)
Total comprehensive income for the period – (75,929) (6,890) (52,486) – (2,936) 871,731 733,490 (3,930) 729,560
Profit appropriation – – – – – 849,217 (849,217) – – – Dividend 26 – – – – – (336,721) – (336,721) (6,767) (343,488)Recycling revaluation reserve to retained earnings FVOCI instruments 19 – – 304 – – (304) – – – – Share–based payments 35 – – – – – 108,252 – 108,252 – 108,252 Capital securities issued 26 – – – – 270,363 – – 270,363 – 270,363 Repayment of capital securities 26 – – – – (147,995) – – (147,995) – (147,995)Capital securities (currency translation) 26 – – – – (2,639) 2,639 – – – – Capital securities dividend 26 – – – – – (63,301) – (63,301) – (63,301)Divestment of subsidiary – – – – – 1,198 – 1,198 34 1,232 Share of other changes in equity of associates – – – – – (10,148) – (10,148) – (10,148)Capital contribution from the minority shareholders – – – – – – – – 9,649 9,649 Other – – – – 508 – – 508 – 508
Balance at 30 September 2019 1,503,722 (770,723) (29,018) (100,566) 1,073,792 3,928,066 871,731 6,477,004 327,684 6,804,688
See accompanying Notes.
Financial statements50

E. Consolidated statement of cash flows
Note 2020 2019USD’M USD’M
Cash flows from operating activitiesProfit before tax* 1,890.3 992.1
Adjustments for:Depreciation* 10 1,319.2 149.6 Amortisation of intangible assets 10 50.1 51.2 Provisions 30 53.6 (22.6)(Gain)/loss on fair value through profit and loss instruments 12 128.1 114.0 Impairment losses on financial assets and prepayments 11 395.1 20.6Impairment losses on non-financial fixed assets 11 648.6 49.0Impairment losses on equity-accounted investees 11 524.2 34.6 Net finance costs* 658.0 704.1 Share of (profit)/loss of equity-accounted investees 17 327.0 (47.7)(Gain)/loss on sale of non-financial fixed assets* 12 (5.7) 4.2 (Gain)/loss on sale of equity accounted investees 12 (1.7) 36.0 (Gain)/loss on sale of other investments 12 – (1.8)(Gain)/loss on divestments of subsidiaries 12 0.8 (198.5)Revaluation gain 12 – (0.2)Equity-settled share-based payment transactions 35 130.3 108.3
Operating cashflow before working capital changes 6,118.1 1,992.9
Changes in:Inventories (6,744.1) 2,090.5 Trade and other receivables and derivatives 3,546.4 1,989.5 Prepayments 179.7 (958.2)Trade and other payables and derivatives (2,876.3) 31.0
Cash generated from/(used in) operating activities 223.7 5,145.7
Interest paid* (1,154.1) (1,397.2)Interest received* 475.2 704.8 Dividends (paid)/received 4.9 – Tax (paid)/received (207.8) (183.1)
Net cash from/(used in) operating activities (658.1) 4,270.2
Cash flows from investing activitiesAcquisition of property, plant and equipment 14 (427.8) (224.4)Proceeds from sale of property, plant and equipment 14 95.1 14.7 Acquisition of intangible assets 15 (60.2) (44.2)Proceeds from sale of intangible assets 0.1 – Acquisition of equity accounted investees 17 (72.3) (85.6)Disposal of equity accounted investees 28.8 1.1 Proceeds from loans receivable and advances 18/19 (132.1) (250.9)Repayment of loans receivable and advances 18/19 2.1 3.7 Acquisition of other investments 20 (71.2) (168.9)Disposal of other investments 20 373.8 39.1 Acquisition of subsidiaries, net of cash acquired 6 – 183.4 Disposal of subsidiaries, net of cash disposed of 7 (0.8) 246.9
Net cash from/(used in) investing activities (264.5) (285.1)
Cash flows from financing activitiesProceeds from the issue of capital securities 27 0.5 – Payment of capital securities dividend 27 (73.2) (60.9)Dividend and payments in relation to the share redemption by the direct parent company 27 (586.0) (336.7)Repayment of capital securities 27 – (148.0)Proceeds from capital contributions to subsidiaries by non-controlling interests 28 3.7 10.8 Acquisition of non-controlling interest (8.6) –Dividend non-controlling interest – (5.4)Increase in long-term loans and borrowings 29 1,699.9 1,213.9 (Decrease) in long-term loans and borrowings 29 (1,906.6) (327.4)Payment of lease liabilities (instalment)* 16/29 (999.0) (12.3)Net increase/(decrease) in short-term bank financing 29 2,281.7 (3,407.7)
Net cash from/(used in) financing activities 412.5 (3,073.7)
Net increase/(decrease) in cash and cash equivalents (510.2) 911.4
Cash and cash equivalents at 1 October 6,267.2 5,355.8 Cash and cash equivalents at 30 September 26 5,757.0 6,267.2
* These line items are impacted due to the initial application of IFRS16 for which comparison figures are not restated. Refer to Note 4.1 for the impact of IFRS16.
See accompanying Notes.
Trafigura Annual Report 2020 51

1. Corporate informationThe principal business activities of Trafigura Group Pte. Ltd. (the ‘Company’) and together with its subsidiaries (the ‘Group’) are trading in crude and petroleum products, non-ferrous concentrates, refined metals and bulk commodities such as coal and iron ore. The Group also invests in assets, including through investments in associates, which have strong synergies with its core trading activities. These include storage terminals, service stations, metal warehouses, industrial facilities and mines.The Company is incorporated in Singapore and its principal business office is at 10 Collyer Quay, Ocean Financial Centre, #29-00, Singapore, 049315.The Company’s immediate holding company is Trafigura Beheer B.V., a company incorporated in the Netherlands. Trafigura Beheer B.V. is ultimately controlled by Farringford Foundation, which is established under the laws of Panama.The consolidated financial statements for the year ended 30 September 2020 were authorised for issue by the Board of Directors on 7 December 2020.
2. Basis of preparationThe Company’s consolidated financial statements have been prepared in accordance with International Financial Reporting Standards (IFRS) as issued by the International Accounting Standards Board (IASB).The consolidated financial statements have been prepared under the historical cost convention except for inventories, derivatives and certain other financial instruments that have been measured at fair value. The consolidated financial statements have been prepared on a going concern basis.
2.1 Functional and presentation currencyThe Group’s presentation currency is the US dollar (USD) and all values are rounded to the nearest tenth of a million (USD’M 0.1) except when otherwise indicated. The US dollar is the functional currency of most of the Group’s principal operating subsidiaries. Most of the markets in which the Group is involved are USD denominated.
3. Significant accounting policiesThe consolidated financial statements have been prepared in compliance with IFRS. The accounting policies are consistent with those from previous financial years except for the adoption of IFRS 16 Leases as from 1 October 2019, and the expense classification and presentation including comparative numbers in the statement of income.
3.1 Going concernFollowing the outbreak of the COVID-19 pandemic, the Group has seen increased uncertainties and further market volatility. It is still difficult to say how effective governmental measures will be in preventing the further spread of the virus. Volatile market conditions in the financial year 2020 had a positive effect on the Group's trading results which were at the same time offset with impairments on the industrial assets due to COVID-19 and the consequent economic downturn. In the event of a prolonged pandemic, there may be an additional effect on the financial performance of the Group. The Group has taken measures to ensure that its employees and partners continue to be safe while interacting together. Measures have been taken to minimise the impact of the pandemic and to continue operations in the Group’s businesses. Business continues to function well and largely uninterrupted. Parts of it are already returning
to some kind of normality. The Group continues to provide access to vital materials for modern life. The Group is showing that this can be done responsibly and efficiently in challenging circumstances.The Group has sufficient cash and headroom in its credit facilities. Given the evolving nature of COVID-19, uncertainties will remain and the Group is unable to reasonably estimate the future impact. However, the financial situation of the Group is currently healthy, and it does not believe that the impact of the COVID-19 virus will have a material adverse effect on its financial condition or liquidity. Therefore, based on the Group’s current cash balance and expected yearly cash outflow, the Group expects that it will be able to meet its financial obligations and therefore continues to adopt a going concern assumption as the basis for preparing its annual consolidated financial statements.
3.2 Basis of consolidationThe consolidated financial statements include the assets, liabilities and results of operations of all subsidiaries and branch offices, which the Company, either directly or indirectly, controls. Control is achieved when the Group is exposed, or has rights, to variable returns from its involvement with the investee and has the ability to affect those returns through its power over the investee. When the Group has less than a majority of the voting or similar rights of an investee, the Group considers all relevant facts and circumstances in assessing whether it has power over an investee.Subsidiaries are consolidated from the date on which control is obtained by the Company and cease to be consolidated from the date on which control is transferred to a person or entity outside of the control of the Company. All intra-group assets and liabilities, equity, income, expenses and cash flows relating to transactions between members of the Group are eliminated in full on consolidation.Changes in the Company’s interests in subsidiaries that do not result in a loss of control are accounted for as equity transactions with any difference between the amount by which the non-controlling interests are adjusted and the fair value of the consideration paid or received being recognised directly in equity and attributed to equity holders of the Company.If the Group loses control, the Group derecognises the assets and liabilities of the subsidiary, any non-controlling interests and the other components of equity related to the subsidiary. The parent’s share of components previously recognised in other comprehensive income (OCI) is reclassified to profit and loss or retained earnings, as would be required if the Group had directly disposed of the related assets or liabilities. Any surplus or deficit arising on the loss of control is recognised in the statement of income. If the Group retains any interest in the previous subsidiary, then such interest is measured at fair value at the date that control is lost. Subsequently it is accounted for as an equity-accounted investee or as an equity investment depending on the level of influence retained.Non-controlling interests in subsidiaries are identified separately from the Company’s equity and are initially measured either at fair value or at the non-controlling interests’ proportionate share of the fair value of the acquiree’s identifiable net assets. Subsequent to acquisition, the carrying amount of non-controlling interests is the amount of those interests at initial recognition plus the non-controlling interests’ share of subsequent changes in equity. Total comprehensive income is attributed to non-controlling interests even if this results in the non-controlling interests having a deficit balance.
F. Notes to consolidated financial statements
Financial statements52

3.3 Investments in equity-accounted investeesAssociates and joint ventures (together Associates) in which the Group exercises significant influence or joint control are accounted for using the equity method. Significant influence is the power to participate in the financial and operating policy decisions of the investee but not control these policies. Joint control is established by contractual agreement and requires unanimous consent for strategic financial and operating decisions. The considerations made in determining significant influence or joint control are similar to those necessary to determine control over subsidiaries.Under the equity method, the investment in an Associate is initially recognised at cost. The carrying amount of the investment is adjusted to recognise changes in the Group’s share in the net assets of the Associate since acquisition date. Goodwill relating to the Associate is included in the carrying amount of the investment and is neither amortised nor individually tested for impairment. The statement of income reflects the Group’s share of the results of operations of the Associate. Any change in OCI of those investees is presented as part of the Group’s OCI. In addition, when there has been a change recognised directly in the equity of the Associate, the Group recognises its share of any changes, when applicable, in the statement of changes in equity.Unrealised gains and losses resulting from transactions between the Group and the Associate are eliminated to the extent of the interest in the Associate, unless the sale or contribution of assets constitute a business in which case the gains and losses are recognised in full. The aggregate of the Group’s share of profit or loss of equity-accounted investees is shown on the face of the statement of income and represents profit or loss after tax and non-controlling interests in the subsidiaries of the Associate.The Group determines at each reporting date whether there is any objective evidence that the investment in the Associate is impaired. The financial statements of the Associates are prepared for the same reporting period as the Group, unless otherwise indicated.Changes in the Group’s interest in Associates are accounted for as a gain or loss on disposal with any differences between the amount by which the carrying amount of the Associate is adjusted and the fair value of the consideration received being recognised directly in the statement of income.
3.4 Business combinationsThe Company accounts for its business combinations under the acquisition method at the acquisition date, which is the date on which control is transferred to the Group. The cost of an acquisition is measured as the aggregate of the consideration transferred, which is measured at acquisition date fair value, and the amount of any non-controlling interests in the acquiree. Transaction costs, other than those associated with the issue of debt or equity securities, that the Group incurs in connection with a business combination are expensed as incurred.If a business combination is achieved in stages, any previously held equity interest is remeasured at its acquisition date fair value and any resulting gain or loss is recognised in the statement of income except when measured at fair value through OCI. The remeasured stake is then considered in the determination of goodwill.
If the consideration transferred for a business combination exceeds the fair values attributable to the Group’s share of the identifiable net assets, the difference is treated as goodwill, which is not amortised but is reviewed annually for impairment or when there is an indication of impairment. If a business combination results in negative goodwill, the Group reassesses whether it has correctly identified and measured all assets acquired and all liabilities assumed. If the negative goodwill remains after the reassessment, it is recognised as a gain in the statement of income.Any contingent consideration payable is measured at fair value at the acquisition date. If the contingent consideration is classified as equity, then it is not remeasured and settlement is accounted for within equity. Otherwise, subsequent changes in the fair value of the contingent consideration are recognised in the statement of income.
3.5 Fair value measurementThe Group measures financial instruments, such as derivatives and certain non-derivative financial assets, at fair value at each balance sheet date. Also, fair values of financial instruments measured at amortised cost are disclosed in Note 35.10.Fair value is the price that would be received to sell an asset or paid to transfer a liability in an orderly transaction between market participants at the measurement date. The fair value measurement is based on the presumption that the transaction to sell the asset or transfer the liability takes place either: • In the principal market for the asset or liability, or • In the absence of a principal market, in the most advantageous
market for the asset or liability.The principal or the most advantageous market must be accessible by the Group.The fair value of an asset or a liability is measured using the assumptions that market participants would use when pricing the asset or liability, assuming that market participants act in their economic best interest.A fair value measurement of a non-financial asset takes into account a market participant's ability to generate economic benefits by using the asset in its highest and best use or by selling it to another market participant that would use the asset in its highest and best use.The Group uses valuation techniques that are appropriate in the circumstances and for which sufficient data are available to measure fair value, maximising the use of relevant observable inputs and minimising the use of unobservable inputs.All assets and liabilities for which fair value is measured or disclosed in the financial statements are categorised within the fair value hierarchy, described as follows, based on the lowest level input that is significant to the fair value measurement as a whole:Level 1 — Quoted (unadjusted) market prices in active markets for identical assets or liabilities.Level 2 — Valuation techniques for which the lowest level input that is significant to the fair value measurement is directly or indirectly observable.Level 3 — Valuation techniques for which the lowest level input that is significant to the fair value measurement is unobservable.
Trafigura Annual Report 2020 53

For assets and liabilities that are recognised in the financial statements on a recurring basis, the Group determines whether transfers have occurred between levels in the hierarchy by reassessing categorisation (based on the lowest level input that is significant to the fair value measurement as a whole) at the end of each reporting period.For the purpose of fair value disclosures, the Group has determined classes of assets and liabilities on the basis of the nature, characteristics and risks of the asset or liability and the level of the fair value hierarchy as explained above.
3.6 Foreign currency3.6.1 Foreign currency transactions
Subsidiaries, joint ventures and equity-accounted investees record transactions in the functional currency of the economic environment in which they operate. Transactions in currencies other than the functional currency of the subsidiary, joint ventures and equity investees are recorded at the rates of exchange prevailing at the date of the transaction.Monetary assets and liabilities in currencies other than the functional currency are translated at the rates of exchange prevailing at the balance sheet date and gains and losses are reported in the statement of income.3.6.2 Foreign operations
The assets and liabilities of foreign operations, including goodwill and fair value adjustments arising on acquisition, are translated to USD at exchange rates at the reporting date. The income and expenses of foreign operations, excluding foreign operations in hyperinflationary economies, are translated to USD at the average rate for the year that is considered as the best estimate of transaction dates. The resulting exchange differences are recorded in equity through other comprehensive income and are included in the statement of income upon sale or liquidation of the underlying foreign operation.Group entities, with a functional currency being the currency of a hyperinflationary economy, first restate their financial statements in accordance with IAS 29, Financial Reporting in Hyperinflationary Economies (refer to ‘Reporting in hyperinflationary economies’ below). The related income, costs and balance sheet amounts are translated at the foreign exchange rate ruling at the balance sheet date.3.6.3 Reporting in hyperinflationary economies
When the economy of a country in which the Group operates is deemed hyperinflationary and the functional currency of a Group entity is the currency of that hyperinflationary economy, the financial statements of such Group entities are adjusted so that they are stated in terms of the measuring unit current at the end of the reporting period. This involves restatement of income and expenses to reflect changes in the general price index from the start of the reporting period and restatement of non-monetary items in the statement of financial position to reflect current purchasing power as at the period end using a general price index from the date when they were first recognised. Comparative amounts are not adjusted. Any differences arising were recorded in equity on adoption.The only hyperinflationary economy applicable to the Group is Argentina. The financial statements of the subsidiaries in this country are first adjusted for the effect of inflation with any gain or loss on the net monetary position recorded in the related functional lines in the statement of income and then translated into USD. Refer to Note 38.
3.7 Financial instrumentsFinancial assets are classified in the following measurement categories: • Fair value through other comprehensive income; • Fair value through profit or loss; • Amortised cost.
The classification depends on the Group’s business model for managing the financial assets and the contractual terms of the cash flows. For investments in debt instruments, this will depend on the business model in which the investment is held. For investments in equity instruments, this will depend on whether the Group has made an irrevocable election at the time of initial recognition to account for the equity investment at fair value through other comprehensive income.Subsequent measurement of debt instruments depends on the Group's business model for managing the asset and the cash flow characteristics of the asset.The Group reclassifies debt investments only when its business model for managing these assets changes. Reclassification takes place on the first day of the financial year following the financial year in which the business model changes.At initial recognition, the Group measures a financial asset at its fair value plus, in the case of a financial asset not at fair value through profit or loss, transaction costs that are directly attributable to the acquisition of the financial asset. Transaction costs of financial assets carried at fair value through profit or loss are expensed in profit or loss as incurred.Purchases or sales of financial assets that require delivery of assets within a time frame established by regulation or convention in the market place (regular way trades) are recognised on the trade date, i.e. the date that the Group commits to purchase or sell the asset.The Group derecognises a financial asset when the contractual rights to the cash flows from the asset expire, or it transfers the rights to receive the contractual cash flows in a transaction in which substantially all the risks and rewards of ownership of the financial asset are transferred. Any interest in such transferred financial assets that is created or retained by the Group is recognised as a separate asset or liability.3.7.1 Financial assets at fair value through other comprehensive income
Financial assets that are held for collection of contractual cash flows and for selling the financial assets, where the assets’ cash flows represent solely payments of principal and interest, are measured at fair value through other comprehensive income. Movements in the carrying amount are taken through other comprehensive income, except for the recognition of impairment losses, interest revenue and foreign exchange gains and losses, which are recognised in profit or loss. When the financial asset is derecognised, the cumulative gain or loss previously recognised in other comprehensive income is reclassified from equity to profit or loss and recognised in other gains and losses. Interest income from these financial assets is included in finance income using the effective interest rate (EIR) method.
F. Notes to consolidated financial statements
Financial statements54

Where Group management has elected to present fair value gains and losses on equity investments in other comprehensive income, there is no subsequent reclassification of fair value gains and losses to the statement of income. Dividends from such investments continue to be recognised in the statement of income as other income when the Group’s right to receive payments is established. There are no impairment requirements for equity investments measured at fair value through other comprehensive income.3.7.2 Financial assets at fair value through profit or loss
The Group classifies the following financial assets at fair value through profit or loss: • Equity investments that are held for trading; • Equity investments for which the entity has not elected to recognise
fair value gains and losses through other comprehensive income; • Debt investments that do not qualify for measurement at
amortised cost; • Debt investments that do not qualify for measurement at fair value
through other comprehensive income; • Debt investments that have been designated at fair value through
profit or loss.Financial assets at fair value through profit or loss are carried in the statement of financial position at fair value with net changes in fair value presented as other income and expenses in the statement of income. Interests, dividends and gain or loss on foreign exchange on financial assets at fair value through profit or loss are included separately in finance income or expense, or other income and expense, respectively.Trade and other receivables, and trade and other payables related to commodity contracts including provisional pricing features are measured at fair value through profit or loss applying a Level 2 valuation. The related net changes in fair value are presented under cost of sales.3.7.3 Amortised cost
The Group classifies its financial assets as at amortised cost only if both of the following criteria are met: • The asset is held within a business model with the objective of
collecting the contractual cash flows; • The contractual terms give rise on specified dates to cash flows
that are solely payments of principal and interest on the principal outstanding.
Financial assets at amortised cost include loans receivable, trade and other receivables, and other financial assets that are held with the objective of collecting contractual cash flows. After initial measurement at fair value, the financial assets are measured at amortised cost using the EIR method, less impairment.Amortised cost is calculated by taking into account any discount or premium on acquisition and fees or costs that are an integral part of the EIR. The EIR amortisation is included in finance income in the statement of profit or loss. The losses arising from impairment are recognised in the statement of income in other income and expense.
The Group enters into prepayment agreements where purchases of commodities are prepaid. When the prepayment agreement can be settled in cash or another financial asset, it is classified at amortised cost in line with IFRS 9. When settlement of the prepayment agreement solely occurs by having the commodities physically delivered, these agreements are not classified as financial instruments as they do not meet the definition of a financial asset. For the clauses in the contracts which might result in cash settlement instead of physical delivery, the objective of the contract and the economic reality of such clauses determine the classification. Interest received on prepayment agreements is presented in finance income in the statement of income.3.7.4 Offsetting
Financial assets and liabilities are offset and the net amount presented in the statement of financial position if, and only if, the Group has a legal right to offset the amounts and intends either to settle on a net basis or to realise the asset and settle the liability simultaneously.3.7.5 Non-derivative financial liabilities
The Group measures non-derivative financial liabilities at amortised cost. The non-derivative financial liabilities are recognised initially at fair value less any directly attributable transaction costs. Subsequent to initial recognition, the financial liabilities are measured at amortised cost using the effective interest method.The Group derecognises a financial liability when its contractual obligations are discharged, cancelled or expired.
3.8 Derivative financial instruments, including hedge accountingDerivative instruments, which include physical contracts to sell or purchase commodities that do not meet the own use exemption, are initially recognised at fair value when the Group becomes a party to the contractual provisions of the instrument and are subsequently remeasured to fair value at the end of each reporting period. Any attributable transaction costs are recognised in the statement of income as incurred.The Group utilises derivative financial instruments (shown separately in the statement of financial position) to hedge its primary market risk exposures, primarily risks related to commodity price movements, and to a lesser extent, exposure to foreign currency exchange rates and interest rate movements. Commodity derivative contracts may be utilised to hedge against commodity price risk for fixed-priced physical purchase and sales contracts, including inventory. Commodity swaps, options and futures are used to manage price and timing risks in conformity with the Group’s risk management policies.Generally, the Group does not apply hedge accounting, but in some instances it may elect to apply hedge accounting. Those derivatives qualifying and designated as hedges are either (i) a fair value hedge of the change in fair value of a recognised asset or liability or an unrecognised firm commitment, or (ii) a cash flow hedge of the change in cash flows to be received or paid relating to a recognised asset or liability or a highly probable transaction.
Trafigura Annual Report 2020 55

The Group elects to apply fair value hedge accounting to hedge certain risk components of non-financial hedged items. When applicable, the Group designates derivative hedging instruments as fair value hedges in relationship to the hedged item. The hedged item may be individual risk components that are separately identifiable and reliably measurable. The hedged item is accounted for at fair value through profit and loss and reflected in the statement of financial position as either a recognised asset or liability or an unrecognised firm commitment. Each of the identified risk components of the hedged item will be revalued at each period with its corresponding benchmark accounted for at fair value and recognised through profit and loss, and reflected on the statement of financial position as either a recognised asset or liability or an unrecognised firm commitment. The Group documents at the inception of the hedging transaction the economic relationship between hedging instruments and hedged items, including whether the hedging instrument is expected to offset changes in cash flows of hedged items.A change in the fair value of derivatives designated as a fair value hedge is reflected together with the change in the fair value of the hedged item in the statement of income. A change in the fair value of derivatives designated as a cash flow hedge is initially recognised as a cash flow hedge reserve in OCI. The deferred amount is then released to the statement of income in the same periods during which the hedged transaction affects the statement of income.When a hedging instrument expires, or is sold or terminated, or when a hedge no longer meets the criteria for hedge accounting, any cumulative deferred gain or loss and deferred costs of hedging in equity are reclassified to the statement of income when the underlying hedged item is realised in the statement of income.If the hedge ratio for risk management purposes is no longer optimal but the risk management objective remains unchanged and the hedge continues to qualify for hedge accounting, the hedge relationship will be re-calibrated by adjusting either the volume of the hedging instrument or the volume of the hedged item so that the hedge ratio aligns with the ratio used for risk management purposes. Any hedge ineffectiveness is calculated and accounted for at the time of the hedge relationship re-calibration.3.8.1 Current versus non-current classification
Derivative instruments that are not designated as effective hedging instruments are classified as current or non-current, or separated into current and non-current portions based on an assessment of the facts and circumstances (i.e., the underlying contractual cash flows). Where the Group will hold a derivative as an economic hedge (and does not apply hedge accounting) for a period beyond 12 months after the reporting date, the derivative is classified as non-current (or separated into current and non-current portions).
3.9 Cash and cash equivalentsFor the purpose of the statement of cash flows, cash and cash equivalents consist of all cash on hand and short-term highly liquid investments such as deposits with original maturities of three months or less.
3.10 Property, plant and equipment3.10.1 Recognition and measurement
Property, plant and equipment are measured at cost less accumulated depreciation and accumulated impairment losses. The initial cost of an asset comprises its purchase price or construction cost, any costs directly attributable to bringing the asset into operation, the initial estimate of any decommissioning obligation, if any, and, for qualifying assets, borrowing costs. The purchase price or construction cost is the aggregate amount paid and the fair value of any other consideration given to acquire the asset.When parts of an item of property, plant and equipment have different useful lives, they are accounted for as separate items (major components). The costs of major repairs and maintenance (dry-docking or turnarounds) are capitalised and depreciated over their useful life.Gains or losses on disposal of an item of property, plant and equipment are recorded in the statement of income in other income and expense.The carrying amount of property, plant and equipment is reviewed for impairment whenever events or changes in circumstances indicate the carrying amount may not be recoverable.Assets in the course of construction are capitalised as separate components of property, plant and equipment, included within other fixed assets. Upon completion, the cost of construction is transferred to the appropriate category.3.10.2 Mineral properties and mine development costs
The costs of acquiring mineral reserves and mineral resources are capitalised in the statement of financial position as incurred. Capitalised costs representing mine development costs include costs incurred to bring the mining assets to a condition of being capable of operating as intended by management. Mineral reserves and in some instances mineral resources and capitalised mine development costs are depreciated from the commencement of production using, generally, the unit of production basis. They are written off if the property is abandoned.3.10.3 Exploration and evaluation assets
Exploration and evaluation expenditure relates to costs incurred in the exploration and evaluation of potential mineral reserves and resources, and includes costs such as exploratory drilling and sample testing, and the costs of pre-feasibility studies. Exploration and evaluation expenditure for each area of interest, other than that acquired from the purchase of another mining company, is capitalised as an asset provided that one of the following conditions is met: • Such costs are expected to be recouped in full through successful
development and exploration of the area of interest or alternatively, by its sale; or
• Capitalised exploration and evaluation assets are transferred to mine development assets once the work completed to date supports the future development of the property and such development receives appropriate approvals.
F. Notes to consolidated financial statements
Financial statements56

Acquired mineral rights comprise identifiable exploration and evaluation assets including mineral reserves and mineral resources, which are acquired as part of a business combination and are recognised at fair value at the date of acquisition. The acquired mineral rights are reclassified as “mineral properties and mine development costs” from commencement of development and depreciated on a unit of production basis, when commercial production commences.3.10.4 Subsequent costs
Subsequent expenditure is capitalised only when it is probable that the future economic benefits associated with the expenditure will flow to the Group.3.10.5 Major cyclical maintenance expenditure
Group entities recognise in the carrying amount of an item of plant and equipment, the incremental cost of replacing a component part of such an item when that cost is incurred. If it is probable that the future economic benefits embodied within the item will flow to the Group entity, the cost incurred is significant in relation to the asset and the cost of the item can be measured reliably. Accordingly, major overhaul expenditure is capitalised and depreciated over the period in which benefits are expected to arise (typically three to four years). Any remaining book value of a maintenance component of property, plant and equipment to which the major maintenance is applied, is derecognised at that point in time. All other repairs and maintenance are charged to the statement of income during the financial period in which the costs are incurred.3.10.6 Depreciation
Items of property, plant and equipment are depreciated on a straight-line basis over the estimated useful lives of each component. They are depreciated from the date that they are installed and are ready for use. Land and assets under construction are not depreciated.Depreciation of assets held under finance leases is calculated over the shorter of the lease term or the estimated useful life of the asset.The estimated useful lives for the current and comparative years of significant items of property, plant and equipment are as follows: • Buildings 20-50 years • Machinery and equipment 3-50 years • Barges and vessels 10-20 years • Other fixed assets 1-10 years
Unit of production basis
For mining properties and development assets and certain mining equipment, the economic benefits from the asset are consumed in a pattern which is linked to the production level. Such assets are depreciated on a unit-of-production basis. However, assets within mining operations for which production is not expected to fluctuate significantly from one year to another or which have a physical life shorter than the related mine are depreciated on a straight-line basis as noted above.
In applying the unit-of-production method, depreciation is normally calculated using the quantity of material extracted from the mine in the period as a percentage of the total quantity of material to be extracted in current and future periods based on proved and probable reserves and, for some mines, other mineral resources. Such non-reserve material may be included in depreciation calculations in circumstances where there is a high degree of confidence in its economic extraction.Where parts of an item of property, plant and equipment have different useful lives, they are accounted for as separate items of property, plant and equipment.Critical spare parts purchased for particular items of plant are capitalised and depreciated on the same basis as the plant to which they relate.Depreciation methods, useful lives and residual values are reviewed at each reporting date and adjusted if appropriate.3.10.7 Borrowing costs
Borrowing costs directly attributable to the acquisition, construction or production of qualifying assets, i.e., assets that necessarily take a substantial period of time to get ready for their intended use or sale, are calculated using the EIR method and are capitalised as part of the cost of those assets. The capitalisation of such borrowing costs ceases when the assets are substantially ready for their intended use or sale. Investment income earned on the temporary investment of specific borrowings pending their expenditure on qualifying assets is deducted from the borrowing costs capitalised.All other borrowing costs are expensed in the period in which they are incurred. Borrowing costs consist of interest and other costs that an entity incurs directly in connection with the borrowing of funds.3.11 Intangible assets and goodwill3.11.1 Goodwill
Goodwill that arises on the acquisition of subsidiaries is presented with intangible assets. For the measurement of goodwill at initial recognition refer to Note 3.4.Goodwill is measured at cost less accumulated impairment losses. For the purpose of impairment testing, goodwill acquired in a business combination is, from the acquisition date, allocated to each of the Group’s cash-generating units (CGUs) or group of CGUs that are expected to benefit from the combination, irrespective of whether other assets or liabilities of the acquiree are assigned to those units.Where goodwill has been allocated to a CGU and part of the operation within that unit is disposed of, the goodwill associated with the disposed operation is included in the carrying amount of the operation when determining the gain and loss on disposal. Goodwill disposed in these circumstances is measured based on the relative values of the disposed operation and the portion of the cash-generating unit retained.In respect of equity-accounted investees, the carrying amount of goodwill is included in the carrying amount of the investment, and any impairment loss is allocated to the carrying amount of the equity-accounted investee as a whole.
Trafigura Annual Report 2020 57

3.11.2 Licences and other intangible assets
Licences and other intangible assets, including software development costs, are stated at cost, less accumulated amortisation and accumulated impairment losses. Licences are amortised over the term of the licence, generally not exceeding 10 years.An intangible asset acquired as part of a business combination is measured at fair value at the date of acquisition and is recognised separately from goodwill if the asset is separable or arises from contractual or other legal rights.Intangible assets with finite lives are amortised over their useful economic life and assessed for impairment whenever there is an indication that the intangible asset may be impaired. The amortisation period and the amortisation method for an intangible asset with a finite useful life are reviewed at least at each reporting date. Changes in the expected useful life or the expected pattern of consumption of future economic benefits embodied in the asset are accounted for by changing the amortisation period or method, as appropriate, and treated as changes in the accounting estimates.Gains or losses on disposal of intangible assets are recorded in the statement of income in other income and expense.
3.12 Leases3.12.1 Leases prior to 1 October 2019
Until 30 September 2019, the Group classified its leases as operating or finance leases based upon whether the lease arrangement transferred substantially all the risks and rewards of ownership in accordance with IAS 17.When the Group is the lessee
As a lessee, for finance leases, an asset and a liability were recognised at an amount equal to the lower of the fair value of the leased asset or the present value of the minimum lease payments during the lease term. Such assets were amortised on a straight-line basis over the shorter of the lease term or the estimated useful life of the asset taking into account the residual value, with depreciation included in depreciation expense. Leases that did not qualify as finance leases were classified as operating leases, and the related payments (net of incentives received from the lessor) were expensed on a straight-line basis over the lease term.When the Group is the lessor
The Group operates as a (intermediate) lessor in time-charter arrangements. For operating leases, the Group recognised chartering income on a straight-line basis over the lease term. For finance leases, the underlying asset was derecognised and the Group recognised a finance lease receivable at the amount of its net investment.3.12.2 Leases from 1 October 2019
When the Group is the lessee
As a lessee, from 1 October 2019 onwards, with the adoption of IFRS 16, at inception of a contract the Group assesses whether a contract is, or contains, a lease. A contract is, or contains, a lease if the contract conveys the right to control the use of an identified asset for a period of time in exchange for consideration. To assess whether a contract conveys the right to control the use of an identified asset, the Group assesses whether:
• The contract involves the use (explicitly or implicitly) of an identified asset;
• The Group has the right to obtain substantially all of the economic benefits throughout the period of use;
• The Group has the right to direct the use of the asset.This policy is applied to all lease contracts except for short-term leases and leases of low-value assets as from 1 October 2019 onwards. If a contract is, or contains a lease, the Group accounts a lease component separately from non-lease components. As a lessee, the Group allocates the consideration in the contract based on the relative stand-alone price of components, and the aggregate stand-alone price of the non-lease components (if applicable). For all leases, the Group recognises a right-of-use asset (ROU) and a corresponding liability at the date at which the leased asset is available for use. Assets and liabilities arising from a lease are initially measured on a present value basis. The lease payments are discounted using the interest rate implicit in the lease. If that rate cannot be determined, the lessee’s incremental borrowing rate is used, being the rate of interest that the lessee would have to pay to borrow over a similar term, and with a similar security, the funds necessary to obtain an asset of a similar value to the right-of-use asset in a similar economic environment. Generally, the Group uses its incremental borrowing rate as the discount rate. The incremental borrowing rate is determined using recent third-party financing received adjusted for both changes in financing conditions since third-party financing was received and for terms specific to leases.In determining the lease term, management considers all facts and circumstances that create an economic incentive to exercise an extension option, or not exercise a termination option. Extension options (or periods after termination options) are only included in the lease term if the lease is reasonably certain to be extended (or not terminated). Lease payments included in the measurement of the lease liability include the following: • Fixed payments (including in-substance fixed payments), less any
lease incentives receivables; • Variable lease payments that are based on an index or a rate; • Amounts expected to be payable by the lessee under residual value
guarantees; • The exercise price of a purchase option if the lessee is reasonably
certain to exercise that option; • Payments of penalties for terminating the lease, if the lease term
reflects the lessee exercising that option.The ROU asset is initially measured at cost, which comprises the initial amount of the lease liability adjusted for any lease payments made at or before the commencement date, any initial direct costs, and an estimate of costs to dismantle and remove the underlying asset or to restore the underlying asset or the site on which it is located less any lease incentives received.Subsequent to initial recognition, the lease liability is measured at amortised cost using the effective interest method, and the ROU asset is depreciated on a straight-line basis, from the commencement date to the earlier of the end of the useful life of the right-of-use asset, or the end of the lease term.
F. Notes to consolidated financial statements
Financial statements58

The lease liability is remeasured when: • There is a change in future lease payments arising from changes in
an index or rate; • There is a change in the Group’s assessment of whether it will
exercise an extension option; or • There are modifications in the scope or the consideration of the
lease that were not part of the original term.The lease liability is remeasured with a corresponding adjustment to the ROU asset, or is recorded in profit or loss if the carrying amount of the ROU asset has been reduced to zero.When the Group is the (intermediate) lessor
The accounting policy applicable to the Group as a lessor in the comparative period were the same under IAS 17 except for subleases, when the Group acts as an intermediate lessor.Subleases
When the Group acts as an intermediate lessor, it accounts for its interest in the head lease and the sub-lease separately. The classification of the sub-lease is assessed with reference to the ROU asset of the head lease, and not the underlying asset. If a head lease is a short-term lease, and the exemption below has been applied, the sub–lease is classified as an operating lease. If the sub-lease is classified as a finance lease, the Group derecognises the ROU asset and instead recognises a finance lease receivable at the amount of its net investment, which is the present value of all remaining lease payments. Any difference between the ROU asset and the finance lease receivable is recognised in profit or loss, when the finance lease receivable is recognised. Lease liability relating to the head lease is retained in the statement of financial position, which represents the lease payments owed to the head lessor.For any arrangements that contain lease and non-lease components, as an intermediate lessor, the Group allocates the consideration in the contract based on a relative stand-alone selling basis.Subsequent to initial recognition, the Group, as intermediate lessor, accrues interest income on the net investment. The receipts under the lease are allocated between the receivable and the finance income to produce a constant rate of return on the net investment. The Company, as a lessor, assesses the risk with respect to leased assets as limited and not material. Lease agreements do not impose any covenants, but leased assets may not be used as security for borrowing purposes. Any allowances for expected credit losses are recognised against finance lease receivables as required by IFRS 9, if applicable.
3.13 InventoriesTrading-related inventories are measured at fair value less costs to sell. Fair value movements are included in cost of sales.Inventories of non-trading related products, including work-in-progress, are measured at the lower of cost or net realisable value. Costs comprise all costs of purchases and other costs incurred.
3.14 Impairment of financial instruments and prepayments3.14.1 Non-derivative financial assets
The Group assesses the expected credit losses associated with its debt instruments, prepayments and trade receivables carried at amortised cost and fair value through other comprehensive income. The impairment provisions for financial assets and prepayments are disclosed in Notes 18, 19 and 20 are based on assumptions about risk of default and expected loss rates. The Group uses judgement in making these assumptions and selecting the inputs to the impairment calculation. This judgement is based on the Group’s past history, existing market conditions as well as forward looking estimates at the end of each reporting period.3.14.2 Trade receivables
The Group applies the simplified approach to providing for expected credit losses, which permits the use of the lifetime expected loss provision for all trade receivables. In calculating the expected credit loss rates for trade receivables, the Group considers historical loss rates for each category of counterparties, and adjusts for forward-looking macroeconomic data. Refer to Note 23 for the loss provision on trade receivables.3.14.3 Loans receivable and prepayments
Over the term of the loans and the prepayments, the Group manages its credit risk by appropriately providing for expected credit losses on a timely basis. The Group classifies its loans receivable and prepayments in categories that reflect their credit risk as follows:
Category Group definition of categoryBasis for recognition of expected credit loss provision
Performing Customers have a low risk of default and a strong capacity to meet contractual cash flows
12 month expected losses. Where the expected lifetime of an asset is less than 12 months, expected losses are measured at its expected lifetime.
Underperforming A significant increase in credit risk is noted (see definition below)
Lifetime expected losses
Non-performing The loan meets the definition of default (see below)
Lifetime expected losses
Write-off Based on observable data the interest and/or principal will not be collected
Asset is written off through profit or loss to extent of expected loss
A significant increase in credit risk is presumed if interest and/ or principal repayments are 30 days past due or if there are other indicators of a significant increase in the probability of default. A default is defined when a counterparty structurally fails to perform under a financial contract with a Trafigura Group company and such failure is not expected to be cured shortly.
Trafigura Annual Report 2020 59
The Group assesses the expected credit loss of these loans and prepayments individually based on the discounted product of probability of default (PD), exposure at default (EAD) and loss given default (LGD) as defined below: • PD represents the likelihood of a borrower defaulting on its
financial obligation, either over the next 12 months or over the remaining lifetime of the obligation.
• EAD is based on the amounts the Group expects to be owed at the time of default. For most cases, this represents the carrying amount of the financial asset.
• LGD represents the Group’s expectation of the extent of loss on a defaulted exposure. LGD varies by type of counterparty, seniority of claim and available collateral or other credit support. LGD is expressed as a percentage loss per unit of exposure at the time of default.
The ECL is determined by projecting PD, EAD and LGD for each future month and for each exposure. These three components are multiplied together and discounted at the original effective interest rate of the loan and the prepayment. The PD and LGD are developed by utilising historical default studies and publicly available data.Refer to Note 18 for the loss provision on prepayments and Note 19 for the loss provision on loans receivable.3.14.4 Write-off
The Group reduces the gross carrying amount of a financial asset when there is no reasonable expectation of recovering a financial asset in its entirety or a portion thereof. A write off constitutes a derecognition event.
3.15 Accrued turnoverAccrued turnover relates to sales made before the end of the year that have not been invoiced at the balance sheet date. Reasons for such delays include the need to determine final pricing, quantity and quality analysis. All are typical of the industry in which the Group operates.
3.16 Employee benefits3.16.1 Post-employment benefits
Pensions and other post-employment benefits, wages, salaries, bonuses, social security contributions, paid annual leave and sick leave are accrued in the period in which the associated services are rendered by employees of the Group. The cost of providing benefits under the defined benefit plans is determined separately for each plan using the projected unit credit method. Unvested past service costs are recognised as an expense on a straight-line basis over the average period until the benefits become vested. Past service costs are recognised immediately if the benefits have already vested immediately following the introduction of, or changes to, a pension plan.When a settlement (eliminating all obligations for benefits already accrued) or a curtailment (reducing future obligations as a result of a material reduction in the scheme membership or a reduction in future entitlement) occurs, the obligation and related plan assets are remeasured using current actuarial assumptions and the resultant gain or loss is recognised in profit or loss during the period in which the settlement or curtailment occurs.
The interest element of the defined benefit cost represents the change in present value of scheme obligations resulting from the passage of time, and is determined by applying the discount rate to the opening present value of the benefit obligation, taking into account material changes in the obligation during the year. The expected return on plan assets is based on an assessment made at the beginning of the year of long-term market returns on plan assets, adjusted for the effect on the fair value of plan assets of contributions received and benefits paid during the year. Actuarial gains and losses are recognised in full within other comprehensive income in the year in which they occur.The defined benefit pension plan surplus or deficit in the statement of financial position comprises the total for each plan at the present value of the defined benefit obligation (using a discount rate based on high-quality corporate bonds), less the fair value of plan assets out of which the obligations are to be settled directly. Fair value is based on market price information and, in the case of quoted securities, is the published bid price. Contributions to defined contribution schemes are recognised in profit or loss in the period in which they become payable.3.16.2 Employee share incentive plan and employee share trust
Employees of the Group receive remuneration in the form of shares of the immediate holding company Trafigura Beheer B.V. as consideration for services rendered. This is considered an equity settled share scheme as the Company neither has a present legal nor constructive obligation to settle in cash, nor has a past practice or stated policy of settling in cash.The cost of the equity-settled transactions is measured at fair value at the grant date taking into account the terms and conditions upon which the shares were granted. This fair value is expensed over the vesting period with a corresponding credit to equity. For shares that immediately vest, the fair value is expensed in the accounting period corresponding to the date of grant.3.17 Provisions
The Group recognises provisions for liabilities and onerous contracts that have been incurred as of the balance sheet date and can be reliably estimated. A provision is recognised when (i) the Group has a present obligation (legal or constructive) as a result of a particular event; (ii) it is probable that an outflow of resources embodying economic benefits will be required to settle the obligation; and (iii) an estimate can be made of the amount of the obligation.Provisions for claims, disputes and legal proceedings are recorded if it is probable that the Group will be liable in a proceeding, for the estimated amount at which the liability can be settled. If no reliable estimate can be made, a disclosure will be made for claims, disputes or legal proceedings, for which the amount to be settled is expected to be significant.3.17.1 Restoration, rehabilitation and decommissioning
Restoration, rehabilitation and decommissioning costs arising from the installation of plant and other site preparation work, discounted to their net present value, are provided for and capitalised at the time such an obligation arises. The costs are charged to the statement of income over the life of the operation through depreciation of the asset and the unwinding of the discount on the provision.
F. Notes to consolidated financial statements
Financial statements60

3.17.2 Onerous contracts
A provision for onerous contracts is recognised when the expected benefits to be derived by the Group from a contract are lower than the unavoidable cost of meeting its obligations under the contract. The provision is measured at the present value of the lower of the expected cost of terminating the contract and the expected net cost of continuing with the contract. Before a provision is established, the Group recognises any impairment loss on the assets associated with that contract.
3.18 Accrued costs of sales and expensesThe accrued cost of sales and expenses relate to purchases and expenses made before the year end that have not been invoiced at the balance sheet date. Reasons for such delays include the need to determine final pricing, quantity and quality analysis. All are typical of the industry in which the Group operates.3.19 Revenue recognitionRevenue is derived principally from the sale of goods and in some instances the goods are sold on Cost and Freight (CFR) or Cost, Insurance and Freight (CIF) Incoterms. When goods are sold on a CFR or CIF basis, the Group is responsible for providing these services (shipping and insurance) to the customer, sometimes after the date at which the Group has lost control of the goods. Revenue is recognised when the performance obligations have been satisfied, which is once control of the goods and/or services has transferred from the Group to the buyer.Revenue is measured based on consideration specified in the contract with a customer and excludes amounts collected on behalf of third parties. The same recognition and presentation principles apply to revenues arising from physical settlement of forward sale contracts that do not meet the own use exemption. Revenue related to the sale of goods is recognised when the product is delivered to the destination specified by the customer, which is typically the vessel on which it is shipped, the destination port or the customer’s premises, and the buyer has gained control through their ability to direct the use of and obtain substantially all the benefits from the asset. Where the sale of goods is connected with an agreement to repurchase goods at a later date, revenue is recognised when the repurchase terms are at prevailing market prices, the goods repurchased are readily available in the market, and the buyer gained control of the goods originally sold to them. Should it be determined that control has not transferred or the buyer does not have the ability to benefit substantially from ownership of the asset, revenue is not recognised and any proceeds received are accounted for as a financing arrangement.For certain commodities, the sales price is determined on a provisional basis at the date of sale as the final selling price is subject to movements in market prices up to the date of final pricing, normally ranging from 30 to 90 days after initial booking (provisionally priced sales). Revenue on provisionally priced sales is recognised based on the estimated fair value of the total consideration receivable. The revenue adjustment mechanism embedded within provisionally priced sales arrangements has the character of a commodity derivative. Accordingly, the fair value of the final sales price adjustment is re-estimated continuously. In all cases, fair value is estimated by reference to forward market prices.Revenue related to the provision of shipping-and-insurance-related activities is recognised over time as the service is rendered.
3.20 Cost of salesCost of sales includes the purchase price of the products sold, as well as the costs of purchasing, storing and transporting the products. It also includes the changes in mark-to-market valuation of inventories, all derivatives and forward contracts.
3.21 Selling, general and administrative expensesSelling, general and administrative expenses include the Group’s corporate offices, rent and facility costs, staff costs, depreciation and certain other general and administrative expenses. As the Group chooses to present the gross profit as the result from the trading activities, these costs are not attributed to cost of sales.
3.22 Finance income and finance expenseInterest income and interest expense are recognised on a time-proportion basis using the EIR method.
3.23 Corporate taxesIncome tax expense comprises current and deferred tax. Current and deferred tax are recognised in the statement of income except to the extent that it relates to a business combination, or items recognised directly in equity or in other comprehensive income.3.23.1 Current income tax
Current income tax is the expected tax payable or receivable on the taxable income or loss for the year, using tax rates enacted or substantively enacted at the reporting date, and any adjustment to tax payable in respect of previous years. The charge for taxation includes Singaporean and foreign corporate income taxation. Due to the different statutory rates applicable and non-deductible expenses, the Group effective tax charge differs from the statutory tax rate applicable in Singapore.3.23.2 Deferred tax
Deferred tax is recognised in respect of temporary differences between the carrying amounts of assets and liabilities for financial reporting purposes, and the amounts used for taxation purposes. The measurement of deferred tax reflects the tax consequences that would follow the manner in which the Group expects, at the end of the reporting period, to recover or settle the carrying amount of its assets and liabilities.Deferred tax is measured at the tax rates that are expected to be applied to temporary differences when they reverse, using tax rates enacted or substantively enacted at the reporting date.Deferred tax assets and liabilities are offset if there is a legally enforceable right to offset current tax liabilities and assets, and they relate to taxes levied by the same tax authority on the same taxable entity, or on different tax entities, but they intend to settle current tax liabilities and assets on a net basis, or their tax assets and liabilities will be realised simultaneously.A deferred tax asset is recognised for unused tax losses, tax credits and deductible temporary differences to the extent that it is probable that future taxable profits will be available against which they can be utilised. Deferred tax assets are reviewed at each reporting date and are reduced to the extent that it is no longer probable that the related tax benefit will be realised.
Trafigura Annual Report 2020 61

3.23.3 Tax exposure
In determining the amount of current and deferred tax the Group takes into account the impact of uncertain tax positions and whether additional taxes and interest may be due. The Group believes that its accruals for tax liabilities are adequate for all open tax years based on its assessment of many factors, including interpretations of tax law and prior experience. This assessment relies on estimates and assumptions and may involve a series of judgements about future events. New information may become available that causes the Group to change its judgement regarding the adequacy of existing tax liabilities; such changes to tax liabilities will impact the tax expense in the period that such a determination is made.
3.24 Assets held for saleNon-current assets and disposal groups are classified as held for sale if their carrying amounts will be recovered principally through a sales transaction rather than through continuing use. For this to be the case, the asset or disposal group must be available for immediate sale in its present condition subject only to terms that are usual and customary for the sale of such assets or disposal groups, and its sale must be highly probable. All assets and liabilities of a subsidiary classified as a disposal group are reclassified as held for sale regardless of whether the Group retains a non-controlling interest in its former subsidiary after the sale.Non-current assets and disposal groups (other than financial assets) classified as held for sale are measured at the lower of their carrying amounts and fair values less costs to sell. Property, plant and equipment and intangible assets classified as held for sale are not depreciated or amortised.
3.25 SegmentsThe Group’s operating segments are established on the basis of the components of the Group that are evaluated regularly by the chief operating decision maker (CODM) in deciding how to allocate resources and in assessing performance.
3.26 Use of estimates and judgementsThe preparation of the Group's financial statements in compliance with IFRS requires management to make judgements, estimates and assumptions that affect the reported amounts of assets and liabilities and the disclosure of contingent assets and liabilities at the date of the consolidated financial statements, and the reported amounts of revenues and expenses during the reporting period.The estimates and associated assumptions are based on historical experience and various other factors that are believed to be reasonable under the circumstances, and are used to judge the carrying amount of assets and liabilities that are not readily apparent from other sources. Actual outcomes could differ from those estimates. Existing circumstances and assumptions about future developments, however, may change due to market changes or circumstances arising beyond the control of the Group. Such changes are reflected in the assumptions when they occur.The Group has identified the following areas as being critical to understanding its financial position as they require management to make complex and/or subjective judgements and estimates about matters that are inherently uncertain.
3.26.1 Valuation of financial assets, including derivative and level 3 instruments
Derivative instruments are carried at fair value and the Group evaluates the quality and reliability of the assumptions and data used to measure fair value in the three hierarchy levels, Levels 1, 2 and 3, as prescribed by IFRS 13. Fair values are determined in the following ways: externally verified via comparison to quoted market prices in active markets (Level 1); by using models with externally verifiable inputs (Level 2); or by using alternative procedures such as comparison to comparable instruments and/or using models with unobservable market inputs requiring the Group to make market-based assumptions (Level 3). For more details refer to Note 35. For assets and liabilities that are recognised in the financial statements on a recurring basis, the Group determines whether transfers have occurred between Levels in the hierarchy by re-assessing categorisation (based on the lowest level input that is significant to the fair value measurement as a whole) at the end of each reporting period.3.26.2 Discount rates
In absence of interest rates implicit in the lease contracts, the Group applies the incremental borrowing rate (IBR) as the discount rate to determine the lease liabilities. The IBR is an approximation of the rate that a lessee would pay to attract the required funding to purchase the asset over a similar term, with similar security and in a similar economic environment. The IBR is determined as the sum of a reference rate, a financing spread adjustment and a lease specific adjustment. A single IBR may be applied to a portfolio of leases, which are similar in nature and lease term. Refer to Note 16.3.26.3 Impairments
Investments in Associates and other investments, loans receivables, prepayments, property, plant and equipment and intangible assets are reviewed for impairment whenever events or changes in circumstances indicate that the carrying amount may not be fully recoverable or at least annually for goodwill. If an asset’s recoverable amount is less than the asset’s carrying amount, an impairment loss is recognised. Loans and receivables are evaluated based on collectability. Future cash flow estimates which are used to calculate the asset’s fair value are based on expectations about future operations, primarily comprising estimates about production and sales volumes, commodity prices, operating, rehabilitation and restoration costs and capital expenditures. Changes in such estimates could impact recoverable values of these assets. Estimates are reviewed regularly by management. For more details refer to Note 11.3.26.4 Provisions
The amount recognised as a provision, including tax, legal, restoration and rehabilitation, contractual and other exposures or obligations, is the best estimate of the consideration required to settle the related liability, including any related interest charges, taking into account the risks and uncertainties surrounding the obligation. The Group assesses its liabilities and contingencies based upon the best information available, relevant tax laws and other appropriate requirements. For more details refer to Notes 30 and 33.
F. Notes to consolidated financial statements
Financial statements62

3.26.5 Restoration, rehabilitation and decommissioning costs
A provision for future restoration, rehabilitation and decommissioning costs requires estimates and assumptions to be made around the relevant regulatory framework, the magnitude of the possible disturbance and the timing, extent and costs of the required closure and rehabilitation activities. To the extent that the actual future costs differ from these estimates, adjustments will be recorded and the statement of income could be impacted. The provisions including the estimates and assumptions contained therein are reviewed regularly by management. For more details refer to Note 30.3.26.6 Taxation
Deferred tax assets are recognised only to the extent it is considered probable that those assets will be recoverable. This involves an assessment of when those deferred tax assets are likely to reverse, and a judgement as to whether or not there will be sufficient taxable profits available to offset the tax assets when they do reverse. These judgements are subject to risk and uncertainty and hence, to the extent assumptions regarding future profitability change, there can be an increase or decrease in the amounts recognised in the statement of income in the period in which the change occurs. The recoverability of deferred tax assets, including the estimates and assumptions contained therein, are reviewed regularly by management. For more details refer to Note 13.3.26.7 Determination of control of subsidiaries and joint arrangements
Judgement is required to determine whether the Group controls an entity, and consequently, whether it needs to consolidate that entity into the consolidated financial statements. Specifically, the Group assesses whether it has the power over the relevant activities of the entity, exposure to its variable returns or the ability to use power to impact returns of the entity.The Group has certain investments in companies, which are not consolidated and whose results are accounted for in the Group’s consolidated financial statements based on their equity share ownership. The most significant of the Group’s investments are the 55.5 percent investment in Puma Energy Holdings Pte. Ltd. (Puma), the 50 percent investment in TM Mining Ventures S.L. (MATSA), and the 50 percent investment in Impala Terminals Holding S.à r.l. (Simba).Judgement is also required in determining the classification of a joint arrangement between a joint venture or a joint operation through an evaluation of the rights and obligations arising from the arrangement. The impact of the decision regarding the existence of control, and classification of joint arrangements, significantly impacts the accuracy, completeness and presentation of the financial statements and, potentially, the debt covenant ratios which are included in the Group’s debt financing agreements.
4. Adoption of new and revised standards4.1 IFRS 16 – LeasesThe Group has initially adopted IFRS 16 as from 1 October 2019. IFRS 16 provides a comprehensive model for the identification of lease arrangements and their treatment (on-balance sheet) in the financial statements of both lessees and lessors. The Group applied the modified retrospective approach and therefore the cumulative effect of initially applying IFRS 16 is recognised at the date of initial application, with no restatement of comparative information.4.1.1 Transition
The Group elected not to apply the practical expedient to grandfather the assessment of which transactions are considered to be leases and therefore assessed whether existing contracts were/or contained a lease in accordance with IFRS 16, at the date of initial application (1 October 2019). On initial application of IFRS 16, the Group has elected to apply the following practical expedients permitted by the standard: • To apply a single discount rate on a portfolio of leases with reasonably
similar characteristics; • Reliance on previous assessments on whether leases are onerous as
an alternative to performing an impairment review; • To account for leases with a remaining lease term of less than
12 months as at 1 October 2019 as short-term leases; • To account for contracts for which the underlying asset has a low value
(on acquisition) as low-value leases; • To exclude initial direct costs for the measurement of the ROU assets
at the date of initial application; and • The use of hindsight in determining the lease term where the contract
contains options to extend or terminate the lease.The Group has elected not to recognise ROU assets and lease liabilities for short-term leases with a lease term of 12 months or less (which do not include a purchase option) and leases of low value assets (i.e., acquisition costs of USD10,000 when new). Instead, expenses related to both short-term leases and low-value leases are recognised as incurred.For all leases previously classified as operating leases on 1 October 2019, the Group has applied the following transition provisions:i) On a lease-by-lease basis, the Group chose to measure its ROU
assets at an amount equal to lease liabilities, adjusted by the amount of any prepaid or accrued lease payments relating to that lease recognised in the statement of financial position immediately before the date of initial application (i.e., 1 October 2019).
ii) Recognised its lease liabilities by discounting the remaining lease payments as at 1 October 2019 using the incremental borrowing rate for a portfolio of leases with reasonably similar characteristics.
Trafigura Annual Report 2020 63

4.1.2 Impact on transition
On 1 October 2019, the date of initial application of IFRS 16, the Group recognised ROU assets and lease liabilities of USD2.8 billion. Further, due to the chartering relet-arrangements the Group recognised lease receivables of USD197 million, with a corresponding reduction of the ROU assets. The Group discounted lease payments using its incremental borrowing rate at 1 October 2019. The weighted average incremental borrowing rate applied is 4.6%.An explanation of the differences between the commitments previously disclosed in the Group’s financial statements as at 30 September 2019 and the lease liabilities recognised in the statement of financial position as at 1 October 2019 are as follows:
1 October 2019
USD’M
Operating lease commitments as at 30 September 2019 4,372.8
Adjustments 25.2 Contracts assessed as service arrangements (1,167.4)Contracts assessed as low value –Contracts assessed as short term (223.4)
Undiscounted lease commitments as at 30 September 2019 3,007.1
Effect of discounting, using the incremental borrowing rate at 1 October 2019 (290.4)Adjustments related to reasonably certain renewal options 43.1 Adjustments related to variable payments based on an index 5.0
Lease liabilities as at 1 October 2019 2,764.9
Of which are:Current 843.7 Non-current 1,921.2
The initial value of the ROU assets is determined as follows:1 October
2019USD’M
Amount equal to lease liability as at 1 October 2019 2,764.9
Adjusted for:Reclassification to lease receivables (197.3)
Right-of-use assets as at 1 October 2019 2,567.6
The impact on the statement of financial position at 1 October 2019 is as follows:
30 September 2019
IFRS 16 impact
1 October 2019
USD’M USD’M USD’M
Right-of-use assets – 2,567.6 2,567.6 Lease receivables – 197.3 197.3 Total assets 54,151.4 2,764.9 56,916.3
Total group equity 6,804.7 – 6,804.7 Long-term lease liabilities – 1,921.2 1,921.2 Short-term lease liabilities – 843.7 843.7 Total group equity and liabilities 54,151.4 2,764.9 56,916.3
4.1.3 Impact on financial year ending 30 September 2020
The impact on the income statements for the financial year ending 30 September 2020 is as follows:
2020 Excluding
IFRS 16 impact
2020 Including
USD’M USD’M USD’M
Revenue 146,994.3 – 146,994.3 Cost of sales (141,197.0) 997.2 (140,199.8)
Gross profit 5,797.3 997.2 6,794.5
General and administrative expenses (1,239.5) (915.6) (2,155.1)Impairments of PP&E and intangible fixed assets (544.9) (103.7) (648.6)Impairments of financial assets and prepayments (395.1) – (395.1)Impairments of equity-accounted investees (524.2) – (524.2)Other income/(expenses) – net (294.7) 98.5 (196.2)
Results from operating activities 2,798.9 76.4 2,875.3
Finance income 492.2 7.9 500.1 Finance expense (1,043.1) (115.0) (1,158.1)
Net financing costs (550.9) (107.1) (658.0)
Share of profit/(loss) of equity-accounted investees (327.0) – (327.0)
Profit before tax 1,921.0 (30.7) 1,890.3
Income tax expense (296.0) 4.5 (291.5)
Profit for the period 1,625.0 (26.2) 1,598.8
The impact on the statement of financial position at 30 September 2020 is as follows:
30 September 2020 Excluding
IFRS 16 impact
1 October 2020 Including
USD’M USD’M USD’M
Right-of-use assets – 2,091.5 2,091.5 Long-term lease receivables – 124.1 124.1 Deferred tax assets 119.8 4.5 124.3 Short-term lease receivables – 37.4 37.4 Total assets 54,728.1 2,257.5 56,985.6
Total group equity 7,816.1 (26.2) 7,789.9 Long-term lease liabilities – 1,407.4 1,407.4 Short-term lease liabilities – 981.6 981.6 Provisions 475.2 (103.7) 371.5Trade and other payables 11,082.7 (1.6) 11,081.1Total group equity and liabilities 54,728.1 2,257.5 56,985.6
F. Notes to consolidated financial statements
Financial statements64
4.2 IFRIC 23 – Uncertainty over income tax treatmentThe interpretation addresses the accounting for income taxes when tax treatments involve uncertainty that affects the application of IAS 12 Income Taxes. Due to its global reach, including operating in high-risk jurisdictions, the Group is subject to enhanced complexity and uncertainty, which may lead to uncertain tax treatments and the corresponding recognition and measurement of current and deferred taxes. The judgements and estimates made to separately recognise and measure the effect of each uncertain tax treatment are re-assessed whenever circumstances change or when there is new information that affects those judgments. The Group has re-assessed its global tax exposure and the key estimates taken in determining the positions recorded to adopt IFRIC 23. As of 1 October 2019, the global tax exposure has been determined by referencing to the uncertainty that the tax authority may not accept the Group’s proposed treatment of tax positions. The adoption of the interpretation had no material impact on the Group.
4.3 Other standardsSeveral other amendments to existing standards apply for the first time in 2019, but do not have an impact on the consolidated financial statements of the Group.
4.4 New standards and interpretations not yet adoptedCertain new accounting standards and interpretations have been published that are not mandatory for 30 September 2020 reporting periods and have not been early adopted by the group: • Definition of Material – amendments to IAS 1 and IAS 8; • Definition of a Business – amendments to IFRS 3; • Interest Rate Benchmark Reform – amendments to IFRS 9, IAS 39
and IFRS 7; and • Revised Conceptual Framework for Financial Reporting.
4.4.1 Interest Rate Benchmark ReformThe amendments made to IFRS 7 Financial Instruments: Disclosures, IFRS 9 Financial Instruments and IAS 39 Financial Instruments: Recognition and Measurement provide certain reliefs in relation to interest rate benchmark reforms.The amendments provide temporary relief from applying specific hedge accounting requirements to hedging relationships directly affected by inter-bank offered rate (IBOR) reform. The reliefs have the effect that IBOR reform should not generally cause hedge accounting to terminate. However, any hedge ineffectiveness continues to be recorded in the income statement. The reliefs will cease to apply when the uncertainty arising from interest rate benchmark reform is no longer present.
5. Operating segmentsThe Group’s operating businesses are organised and managed separately according to the nature of the products, with each segment representing a strategic unit that offers different products and serves different markets.Segment results that are reported to the Group’s Chief Executive Officer (CEO), being the chief operating decision maker, include items directly attributable to a segment as well as those that can be allocated on a reasonable basis. • The Oil and Petroleum Products segment is engaged in the sourcing,
provision and storage of oil, at all stages from crude to finished products such as naphtha and gasoline. This includes the blending required to make gasoline in the various grades suitable for the different specifications relevant in different countries. The Oil and Petroleum Products segment also includes related freight activities.
• The Metals and Minerals segment trades copper, lead, zinc, aluminium, iron ore and coal in all forms including ores, concentrates and refined metals. There is involvement in all the various stages from mining through smelting to the finished metal. This segment also includes the Mining Group and Nyrstar and Impala activities. In addition to trading activities, the activities performed in this segment include the blending of metal concentrates, iron ore, coal and alumina, the smelting of zinc and lead concentrates, and warehousing and transportation. The Metals and Minerals segment also includes related freight activities.
• All other segments include holding companies, securitisation programmes, group financing facilities and some smaller operating companies.
Information regarding the results of each reportable segment is included below. Performance is measured based on segment gross profit, as included in the internal management reports that are reviewed by the Group’s CEO. Segment gross profit is used to measure performance as management believes that such information is the most relevant in evaluating the results of certain segments relative to other entities that operate within these industries.The accounting policies of the operating segments are the same as those described in the summary of significant accounting policies. The Group accounts for inter-segment sales and transfers where applicable as if the sales or transfers were to third parties.
Trafigura Annual Report 2020 65

Reconciliations of reportable segment revenues, results, assets and liabilities, and other material items are as follows:
F. Notes to consolidated financial statements
Oil and Petroleum
Metals and Minerals
Corporate and Other Total
2020 USD’M USD’M USD’M USD’M
Sales revenue from external customers 82,107.1 63,043.9 – 145,151.0 Service revenue from external customers 1,573.4 269.9 – 1,843.3
Revenue 83,680.5 63,313.8 – 146,994.3 Cost of sales (78,421.5) (61,778.4) – (140,199.8)
Gross profit 5,259.0 1,535.4 – 6,794.5
General and administrative expenses (2,155.1)Impairments of PP&E and intangible fixed assets* (648.6)Impairments of financial assets and prepayments (395.1)Impairments of equity-accounted investees (524.2)Other income/(expenses) – net (196.2)Finance income 500.1 Finance expense (1,158.1)Share of profit from equity-accounted investees (327.0)Income tax expense (291.5)
Profit for the year 1,598.8
Oil and Petroleum
Metals and Minerals
All other segments Total
30 September 2020 USD’M USD’M USD’M USD’MSegment assets and liabilitiesEquity-accounted investees 1,239.9 1,167.9 30.8 2,438.6 Other non-current assets 3,201.1 4,810.3 666.2 8,677.6 Non-current assets classified as held for sale 0.2 2.4 – 2.6 Total assets 21,308.7 29,472.8 6,204.0 56,985.5 Total liabilities 15,444.3 22,568.4 11,182.9 49,195.6
Other segment informationCapital expenditure 116.6 309.6 64.3 490.5 Depreciation of right-of-use assets* 927.1 72.0 19.6 1,018.6 Depreciation and amortisation of PP&E and intangible fixed assets 29.8 266.0 54.8 350.7 Impairments of PP&E and intangible fixed assets* 131.2 516.0 1.5 648.6 Impairments of financial assets and prepayments 337.0 53.5 4.5 395.1 Impairment of equity-accounted investees 524.2 – – 524.2
Oil and Petroleum
Metals and Minerals
Corporate and Other Total
2019 USD’M USD’M USD’M USD’M
Sales revenue from external customers 111,333.3 59,084.1 – 170,417.4 Service revenue from external customers 841.5 215.2 – 1,056.7
Revenue 112,174.8 59,299.3 – 171,474.1 Cost of sales (110,493.4) (58,110.9) – (168,604.3)
Gross profit 1,681.4 1,188.4 – 2,869.8
General and administrative expenses (1,049.1)Impairments of PP&E and intangible fixed assets* (49.0)Impairments of financial assets and prepayments (20.6)Impairments of equity-accounted investees (34.6)Other income/(expenses) – net (68.0)Finance income 700.4 Finance expense (1,404.5)Share of profit from equity-accounted investees 47.7 Income tax expense (124.3)
Profit for the year 867.8
Oil and Petroleum
Metals and Minerals
Corporate and Other Total
30 September 2019 USD’M USD’M USD’M USD’MSegment assets and liabilitiesEquity-accounted investees 2,196.4 1,188.6 31.5 3,416.5 Other non-current assets 1,792.4 4,157.1 1,411.1 7,360.6 Non-current assets classified as held for sale – 2.2 – 2.2 Total assets 23,596.5 21,991.4 8,563.5 54,151.4 Total liabilities 18,020.0 15,802.2 13,524.5 47,346.7
Other segment informationCapital expenditure 128.1 97.5 46.4 272.0 Depreciation of right-of-use assets – – – –Depreciation and amortisation of PP&E and intangible fixed assets 31.9 101.5 67.4 200.8 Impairments of PP&E and intangible fixed assets 4.8 44.2 – 49.0 Impairments of financial assets and prepayments 1.1 19.6 – 20.7 Impairment of equity-accounted investees 0.3 34.3 – 34.6
Financial statements66

Geographical informationThe following table sets out information about the geographical location of the Group’s revenue from external customers:
Oil & Petroleum
Metals and Minerals Total
2020 USD’M USD’M USD’MRevenue from external customersEurope 20,846.6 8,041.4 28,888.0 Asia 28,228.6 34,525.5 62,754.2 North America 20,813.5 11,887.2 32,700.7 Latin America 7,728.7 948.7 8,677.5 Africa 2,752.2 2,520.0 5,272.2 Australia 693.2 399.6 1,092.8 Middle East 2,617.6 4,991.3 7,608.9
Total revenue from external customers 83,680.4 63,313.7 146,994.3
Oil & Petroleum
Metals and Minerals Total
2019 USD’M USD’M USD’MRevenue from external customersEurope 35,258.4 7,543.0 42,801.4 Asia 30,893.7 33,814.1 64,707.8 North America 26,609.8 10,717.5 37,327.3 Latin America 10,566.0 1,080.5 11,646.5 Africa 4,533.1 1,541.9 6,075.0 Australia 837.0 141.2 978.2 Middle East 3,476.8 4,461.1 7,937.9
Total 112,174.8 59,299.3 171,474.1
6. Acquisitions of subsidiaries and non-controlling interests6.1 Financial year 2020There were no significant acquisitions of subsidiaries and non-controlling interest during the financial year ended 30 September 2020.
6.2 Financial year 2019Acquisition of Nyrstar
On 31 July 2019, as part of the rescue restructuring of the Nyrstar group, the Group acquired 98 percent of the voting shares of NN2 NewCo Limited (NN2, together with its subsidiaries, Nyrstar), a non-listed company incorporated in the United Kingdom. NN2 is the holding company of the operating business of Nyrstar, a global multi-metals business. The acquisition of the 98 percent shareholding agreed between Nyrstar’s creditors was sanctioned by two English schemes of arrangement and confirmed by the US courts, and gave effect to: • Reinstatement of financing facilities with Nyrstar’s financial creditors; • Completion of a new money facility; • Issuance of bond instruments by Trafigura (refer to purchase
consideration below); and • An in-principle agreement with the State of South Australia on the key
terms of the restructuring of the Port Pirie Perpetual Securities.The Group acquired the operating assets of Nyrstar as part of the restructuring of Nyrstar with its creditors with a view to avoiding Nyrstar's insolvency.
Simultaneously with the acquisition of the 98 percent stake, the Group granted the 2 percent minority shareholder, Nyrstar N.V. (of which the Group continues to hold 24.4%), with a put option through which the remaining 2 percent can be sold to Trafigura at a strike price of EUR20.0 million. The option has not been exercised as at the date of these financial statements, but remains exercisable until three years after the acquisition date. The transaction is accounted for on the basis that the underlying shares subject to the non-controlling interest (NCI) put option have been acquired.Assets acquired and liabilities assumed
After finalisation of the acquisition accounting in 2020, the fair values of the identifiable assets and liabilities of Nyrstar as at the date of acquisition were:
Fair value recognised on acquisition
USD’MAssetsProperty, plant and equipment 1,885.3 Intangible assets 4.7 Equity-accounted investees 0.2 Other investments 25.9 Derivatives 8.6 Deferred tax assets 100.8 Other non-current assets 132.7 Total non-current assets 2,158.2
Inventories 792.6 Trade and other receivables 131.7 Derivatives 32.3 Prepayments 27.1 Income tax receivable 1.9 Other current assets 4.9 Cash and cash equivalents 180.2 Total current assets 1,170.7 Total assets 3,328.9
LiabilitiesLoans and borrowings (849.8)Derivatives (31.9)Provisions (308.5)Deferred tax liabilities (152.3)Other non-current liabilities (19.1)Total non-current liabilities (1,361.6)
Current tax liabilities (63.2)Loans and borrowings (351.7)Trade and other payables (620.6)Other current liabilities (450.0)Total current liabilities (1,485.5)Total liabilities (2,847.1)
Total identifiable net assets at fair value at acquisition 481.8
Goodwill arising on acquisition 64.3 Consideration transferred 546.1
Trafigura Annual Report 2020 67

The net assets recognised in the 30 September 2019 financial statements were based on a provisional assessment of their fair value predominantly while the Group sought an independent valuation of fixed assets and the Group continued to evaluate certain deferred tax positions. The valuation had not been completed by the date the 2019 financial statements were approved for issue by the Board of Directors.The main restatements in financial year 2020 to the provisional assessment of the identifiable assets acquired at acquisition result from: • At acquisition the Nyrstar Group had unused tax losses in Switzerland
which were not valued as there was no expectation for the Nyrstar Group to generate sufficient taxable profits to offset against these losses before expiry. During financial year 2020, the Trafigura Group executed an internal reorganisation through which the operation of Nyrstar’s purchase and sales requirements of raw material and refined product was integrated into Trafigura’s trading operations. As a result of this integration, part of the unused tax losses were transferred to Trafigura where these losses could be recovered against Trafigura’s global trading income. As a result, an additional deferred tax asset amounting to USD87.9 million was recognised per acquisition date;
• The finalisation of the fixed assets valuation during financial year 2020 resulting in a downward adjustment to the acquired property, plant and equipment value by USD74.1 million.
The 2019 comparative information was restated to reflect the above and other adjustments to the provisional amounts. As a result, there was a decrease in the property, plant and equipment value of USD74.1 million, an increase in net deferred tax assets of USD43.9 million, reflecting the recognition of the additional deferred tax asset offset by the tax implications of other changes to the provisional amounts, and a net increase in other net identifiable assets by USD7.9 million. There was also a corresponding increase in goodwill of USD22.3 million, resulting in USD64.3 million of total goodwill arising on the acquisition. The impact on the depreciation charge for the period from acquisition to 30 September 2019 resulting from the changes in the valuation of property, plant and equipment was not material. The goodwill of USD64.3 million comprises the value of expected synergies arising from the acquisition, which is not separately recognised.Purchase consideration
The Group has issued various instruments to the former Nyrstar noteholders and convertible bondholders as part of the rescue restructuring, under which those Nyrstar noteholders and convertible bondholders exchanged their Nyrstar debt for Trafigura instruments and, which are considered part of the consideration transferred. Purchase consideration USD'M Fair value of issued perpetual securities 270.4 Fair value of issued senior notes 84.2 Fair value of issued commodity-linked Zinc Instrument 154.4 Incentive payments made to former bondholders 14.9
Purchase consideration 523.9
Fair value non-controlling interest put option 22.2
Consideration for 100% equity 546.1
The USD14.9 million incentive payments relate to EUR13.5 million of fees paid to the former Nyrstar noteholders and convertible bondholders who signed up to the lock up agreement before the end of the early bird period. These fees are considered as part of the consideration. The early bird payments were open to all bondholders.The Group has reported a financial liability related to the put option equal to the net present value of the redemption amount (i.e., the present value exercise price of EUR20.0 million, equivalent to the USD22.2 million included in the above table). By recognising a liability for the put option over the shares held by the minority shareholder of Nyrstar, no non-controlling interest is recognised by the Group.Analyses of cash flows on acquisition
The debt restructuring, including the issuance of new debt instruments by Trafigura, was executed without transfer of cash. The cash flows generated upon acquisition are detailed in the below table. Cash flows on acquisition USD'M
Transaction costs of the acquisition (included in cash flows from operating activites) (21.1)Net cash acquired with the Nyrstar Group (included in cash flows from investing activities) 180.2 Transaction costs attributable to the issuance of the debt instruments (included in cash flows from financing activites) (2.0)
Net cash flow on acquisition 157.1
The Group’s transaction costs related to the acquisition of USD21.1 million were expensed and included in other expenses. Transaction costs related to the issuance of the debt instruments of USD2.0 million are capitalised as debt issuance costs and amortised over the maturity of the debt instruments.
7. Deconsolidation of subsidiaries7.1 Financial year 2020There were no significant deconsolidations of subsidiaries and non-controlling interest during the financial year ended 30 September 2020.
7.2 Financial year 2019Sale of WFV27 to Frontline Ltd.
On 23 August 2019, Trafigura Maritime Logistics Pte. Ltd. (TML), a wholly owned subsidiary of the Group, entered into a Sale and Purchase Agreement (SPA) to sell shares in its wholly owned subsidiary White Flag Ventures XXVII Pte. Ltd. (WFV27) to Frontline Ltd. (Frontline). During 2019, and prior to 23 August 2019, WFV27 had taken delivery of 10 Suezmax tankers under lease agreements in the form of long-term bareboat charter agreements (BBC), which were signed during calendar year 2017. All vessels are fitted with exhaust gas cleaning systems. WFV27 subsequently sub-chartered the vessels to TML under long-term time charter (TC) agreements. The primary purpose of WFV27 is to act as charterer and disponent owner under the BBC, and to ensure all services are rendered to enable chartering the vessels out on a TC basis to the principal (TML). WFV27 does not perform any other relevant activities.In the sale and purchase agreement, it was agreed that Frontline acquires all the shares in WFV27 with the legal transfer taking place subsequently at 16 March 2020. The consideration received by TML in exchange for these shares amounts to 16,035,856 ordinary shares in Frontline, listed on the New York Stock Exchange and the Oslo Stock Exchange.
F. Notes to consolidated financial statements
Financial statements68

The USD97.3 million gain resulting from this divestment has been recorded in other income and expense (refer to Note 12). The effect of the divestment and deconsolidation of WFV27 on the Group’s consolidated financial statements is as follows:
2019USD’M
Fair value of the consideration received 125.7
Non-current assets 16.9Net working capital 8.8Transaction costs 2.7
Gain resulting from divestment 97.3
Sale of entities to Scorpio Tankers Inc.
On 24 September 2019, Trafigura Maritime Logistics Pte. Ltd. (TML), a wholly owned subsidiary of the Group, entered into a sale and purchase agreement to sell shares in its directly owned subsidiaries White Flag Ventures XXV Pte. Ltd., White Flag Ventures XXVI Pte. Ltd. and White Flag Ventures XXIX Pte. Ltd., which have leasehold interests (as lessee under long-term bareboat charter agreements) in 15 Medium Range product tankers and four Long Range coated Aframax (LR2) product tankers, to Scorpio Tankers Inc. Closing of the transaction occurred on 26 September 2019.The consideration received by TML in exchange for these shares in the above listed White Flag entities amount to 4,572,873 ordinary Scorpio shares, listed on the New York Stock Exchange. The fair value of these shares as per signing of the sale and purchase agreement amounted to USD128.4 million. Additionally, the Group purchased 1,206,896 shares of Scorpio for a total consideration of USD35.0 million resulting in a 9.9 percent stake in Scorpio.The USD103.5 million gain resulting from this divestment has been recorded in other income and expense (refer to Note 12). The effect of the divestment and deconsolidation of the entities on the Group’s consolidated financial statements is as follows:
2019USD’M
Fair value of the consideration received 128.4
Non-current assets 21.8Net working capital (1.3)Transaction costs 4.4
Gain resulting from divestment 103.5
8. Revenue2020 2019
USD’M USD’M
Sales of goods 145,151.0 170,417.4 Rendering of services 1,843.3 1,056.7
Total 146,994.3 171,474.1
9. General and administrative expenses2020 2019
USD’M USD’M
Depreciation and amortisation 1,136.2 172.0 Staff costs 773.0 613.7 General and other 245.9 263.4
Total 2,155.1 1,049.1
Refer to Note 10 for a breakdown of depreciation and amortisation. Refer to Note 36 for a breakdown of the staff costs. The category General and other mainly comprises of office, IT, and travelling costs. The expenses increased due the adoption of IFRS16 and the full-year consolidation of Nyrstar.
10. Depreciation and amortisation2020 2019
USD’M USD’M
Depreciation of right-of-use assets 1,018.7 –Depreciation of property, plant and equipment 300.6 149.6 Amortisation of intangible fixed assets 50.0 51.2
Total 1,369.3 200.8
Reported under cost of sales 233.1 28.8 Reported under general and administrative expenses 1,136.2 172.0
Total 1,369.3 200.8
Depreciation and amortisation partially increased as a result of the depreciation on right-of-use assets, and the full year consolidation of Nyrstar. Depreciation related to Nyrstar amounted to USD233.1 million (including USD40.0 million depreciation on right-of-use assets) compared to USD28.8 million in 2019.Refer to Note 4.1 for details on the adoption of IFRS 16.
11. Impairments2020 2019
USD’M USD’M
Impairments of property, plant and equipment 544.9 49.0 Impairments of right-of-use assets 103.7 –
Impairments of fixed assets 648.6 49.0
Impairments of financial assets 246.4 2.7 Impairments of prepayments 148.7 17.9
Impairments of financial assets and prepayments 395.1 20.6
Impairments of equity-accounted investees 524.2 34.6
Impairments of equity-accounted investees 524.2 34.6
Impairments 1,567.9 104.2
Investments in Associates and other investments, property, plant and equipment and intangible assets are reviewed for impairment whenever events or changes in circumstances indicate that the carrying amount may not be fully recoverable or at least annually for goodwill. If an asset's recoverable amount is less than the asset's carrying amount, an impairment loss is recognised. Loans and receivables are evaluated based on collectability.
Trafigura Annual Report 2020 69

Future cash flow estimates which are used to calculate the asset's fair value are based on expectations about future operations primarily comprising estimates about production and sales volumes, commodity prices, operating, rehabilitation and restoration costs and capital expenditures. Changes in such estimates could impact recoverable values of these assets. Estimates are reviewed regularly by management.Value-in-use is determined as the amount of estimated risk-adjusted discounted future cash flows. For this purpose, assets are grouped into Cash-Generating Units (CGUs) based on separately identifiable and largely independent cash flows. The most recent approved financial budgets and (five-year) business plans are the basis for the future cash flow estimates. The valuation model uses the most recent volume and revenue estimates, relevant costs assumptions based on past experience, and where possible market forecasts of commodity prices. This methodology inherently includes elements of judgement and estimations in relation to projected sales volumes and unit margins. Deterioration or improvement in the volume and pricing outlook may result in additional impairments or reversals. Cash flow estimates are risk adjusted and discounted to reflect local conditions as appropriate.As a result of the periodic assessment, the following significant impairment charges and fair value adjustments were recorded:
11.1 Financial year 2020Non-financial assets – Property, plant and equipment
The Group is developing a multimodal supply chain operation in Colombia. The project includes an inland port at Barrancabermeja and fluvial equipment providing multimodal logistics services linking the industrial heartland to the Caribbean ports of Cartagena and Barranquilla via the Magdalena River. These activities will benefit from Colombia’s effort to restore long-term navigability of the Magdalena River. However, there is a delay in the dredging and dyking programme as the government is replacing the original construction company which was initially awarded the concession with another. In combination with the COVID-19 pandemic, this resulted in a trigger to perform an impairment test.To assess a potential impairment, the Colombian project was combined into one CGU as the specific assets do not have independent associated cash flows. The value-in-use calculation includes all aspects of the Colombia multimodal project, and assumes that the Colombian government will award the construction contract at the start of 2021 and that construction will therefore start at the beginning of 2022 increasing the river to a maximum depth by 2026, and a resulting gradual ramp-up of expected revenues and relevant costs. Based on the projections until 2044, which correspond to the current end of the port concession and do not include the expected extension, the estimated recoverable amount is USD491 million. As a result, the Colombian assets were impaired by USD392 million. Further delay in the restoration of the navigability of the Magdalena River may result in additional impairment. The operation specific discount rate in the valuation was 8.5 percent (2019: 7.9 percent).The sensitivity analyses on the valuations show that an increase/decrease in the discount rate of +/-0.5 percentage has an impact on the recoverable amount of minus USD30 million/plus USD32 million. A change in the EBITDA of 10 percent causes a change of USD61 million to the recoverable amount.
Lower coal prices, a decline in US coal production and related export demand, together with an acceleration of coal-fired power plants coming offline, have resulted in a trigger to perform an impairment test for the Burnside logistics export terminal on the Mississippi river in Louisiana, US. The identifiable assets were combined into one CGU with independent cash flows to assess the potential impairment. The value-in-use calculation includes projections over the period 2021 up to and including 2025, and results in an estimated recoverable amount of USD94 million. Consequently, the related operational fixed assets were impaired by USD72 million. The valuation remains sensitive to volumes handled and (further) deterioration in the volume outlook may result in additional impairment. The operation specific discount rate in the valuation was 7.0 percent (2019: 7.5 percent).The sensitivity analyses on the valuations show that an increase/decrease in the discount rate of +/-0.5 percentage points has an impact on the recoverable amount of minus USD9 million/plus USD10 million. A change in the EBITDA of 10 percent causes a change of USD12 million to the recoverable amount.The remaining impairments on property, plant and equipment (USD80 million) are individually lower than USD35 million each.Non-financial assets – Right of use assets
The Group has certain ROU assets located in Corpus Christi, Texas, that enable the transportation, storing, processing and vessel loading of crude oil and crude oil products. The global decrease in demand for crude oil (products) as a result of COVID-19 resulted in a trigger to perform an impairment test.To assess a potential impairment, these ROU assets were determined to be a single CGU. A value-in-use calculation was performed to determine the recoverable amount of the CGU relative to the carrying value of the ROU assets. The value-in-use is calculated based upon the discounted cash flows associated with the CGU using management projections and a discount rate specific to the projected cash flows. Based on the projected discounted cash flows, the recoverable amount was determined to be less than the carrying amount of the ROU assets by USD103.7 million, which was recorded as impairment. The operation specific discount rate in the valuation was 3.0 percent. The sensitivity analysis on the valuations show that an increase/decrease in the discount rate of +/-0.5 percentage points has an impact on the recoverable amount of minus USD3.4 million/plus USD3.5 million. A change in the EBITDA of 10 percent causes a change of USD47.9 million to the recoverable amount.Financial assets and prepayments
Other non-current loans receivables include various loans that are granted to counterparties which the Group trades with. This line also includes the debt agreement with the Angolan Ministry of Finance, which relates to compensation for iron ore investments made by the Group following the liquidation of a consolidated Angolan subsidiary in 2016. In 2019, the original debt agreement was renegotiated with a new redemption schedule in place. Due to the current economic situation in Angola, with collapsing oil prices and COVID-19, it has not been possible for the Angolan Ministry of Finance to honour all of its obligations. Currently, the Group is negotiating the terms of the debt agreement again with the Angolan Ministry of Finance.
F. Notes to consolidated financial statements
Financial statements70
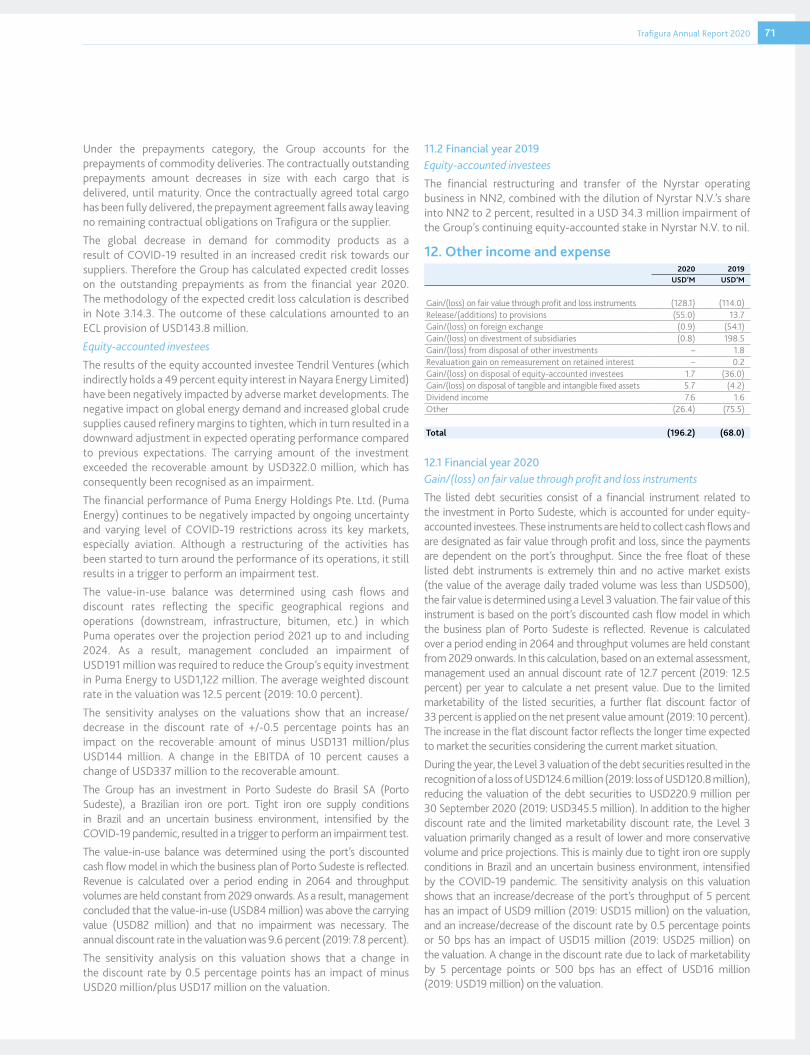
Under the prepayments category, the Group accounts for the prepayments of commodity deliveries. The contractually outstanding prepayments amount decreases in size with each cargo that is delivered, until maturity. Once the contractually agreed total cargo has been fully delivered, the prepayment agreement falls away leaving no remaining contractual obligations on Trafigura or the supplier. The global decrease in demand for commodity products as a result of COVID-19 resulted in an increased credit risk towards our suppliers. Therefore the Group has calculated expected credit losses on the outstanding prepayments as from the financial year 2020. The methodology of the expected credit loss calculation is described in Note 3.14.3. The outcome of these calculations amounted to an ECL provision of USD143.8 million.Equity-accounted investees
The results of the equity accounted investee Tendril Ventures (which indirectly holds a 49 percent equity interest in Nayara Energy Limited) have been negatively impacted by adverse market developments. The negative impact on global energy demand and increased global crude supplies caused refinery margins to tighten, which in turn resulted in a downward adjustment in expected operating performance compared to previous expectations. The carrying amount of the investment exceeded the recoverable amount by USD322.0 million, which has consequently been recognised as an impairment.The financial performance of Puma Energy Holdings Pte. Ltd. (Puma Energy) continues to be negatively impacted by ongoing uncertainty and varying level of COVID-19 restrictions across its key markets, especially aviation. Although a restructuring of the activities has been started to turn around the performance of its operations, it still results in a trigger to perform an impairment test.The value-in-use balance was determined using cash flows and discount rates reflecting the specific geographical regions and operations (downstream, infrastructure, bitumen, etc.) in which Puma operates over the projection period 2021 up to and including 2024. As a result, management concluded an impairment of USD191 million was required to reduce the Group’s equity investment in Puma Energy to USD1,122 million. The average weighted discount rate in the valuation was 12.5 percent (2019: 10.0 percent).The sensitivity analyses on the valuations show that an increase/decrease in the discount rate of +/-0.5 percentage points has an impact on the recoverable amount of minus USD131 million/plus USD144 million. A change in the EBITDA of 10 percent causes a change of USD337 million to the recoverable amount.The Group has an investment in Porto Sudeste do Brasil SA (Porto Sudeste), a Brazilian iron ore port. Tight iron ore supply conditions in Brazil and an uncertain business environment, intensified by the COVID-19 pandemic, resulted in a trigger to perform an impairment test.The value-in-use balance was determined using the port’s discounted cash flow model in which the business plan of Porto Sudeste is reflected. Revenue is calculated over a period ending in 2064 and throughput volumes are held constant from 2029 onwards. As a result, management concluded that the value-in-use (USD84 million) was above the carrying value (USD82 million) and that no impairment was necessary. The annual discount rate in the valuation was 9.6 percent (2019: 7.8 percent).The sensitivity analysis on this valuation shows that a change in the discount rate by 0.5 percentage points has an impact of minus USD20 million/plus USD17 million on the valuation.
11.2 Financial year 2019Equity-accounted investees
The financial restructuring and transfer of the Nyrstar operating business in NN2, combined with the dilution of Nyrstar N.V.’s share into NN2 to 2 percent, resulted in a USD 34.3 million impairment of the Group’s continuing equity-accounted stake in Nyrstar N.V. to nil.
12. Other income and expense2020 2019
USD’M USD’M
Gain/(loss) on fair value through profit and loss instruments (128.1) (114.0)Release/(additions) to provisions (55.0) 13.7 Gain/(loss) on foreign exchange (0.9) (54.1)Gain/(loss) on divestment of subsidiaries (0.8) 198.5 Gain/(loss) from disposal of other investments – 1.8 Revaluation gain on remeasurement on retained interest – 0.2 Gain/(loss) on disposal of equity-accounted investees 1.7 (36.0)Gain/(loss) on disposal of tangible and intangible fixed assets 5.7 (4.2)Dividend income 7.6 1.6 Other (26.4) (75.5)
Total (196.2) (68.0)
12.1 Financial year 2020Gain/(loss) on fair value through profit and loss instruments
The listed debt securities consist of a financial instrument related to the investment in Porto Sudeste, which is accounted for under equity-accounted investees. These instruments are held to collect cash flows and are designated as fair value through profit and loss, since the payments are dependent on the port’s throughput. Since the free float of these listed debt instruments is extremely thin and no active market exists (the value of the average daily traded volume was less than USD500), the fair value is determined using a Level 3 valuation. The fair value of this instrument is based on the port’s discounted cash flow model in which the business plan of Porto Sudeste is reflected. Revenue is calculated over a period ending in 2064 and throughput volumes are held constant from 2029 onwards. In this calculation, based on an external assessment, management used an annual discount rate of 12.7 percent (2019: 12.5 percent) per year to calculate a net present value. Due to the limited marketability of the listed securities, a further flat discount factor of 33 percent is applied on the net present value amount (2019: 10 percent). The increase in the flat discount factor reflects the longer time expected to market the securities considering the current market situation.During the year, the Level 3 valuation of the debt securities resulted in the recognition of a loss of USD124.6 million (2019: loss of USD120.8 million), reducing the valuation of the debt securities to USD220.9 million per 30 September 2020 (2019: USD345.5 million). In addition to the higher discount rate and the limited marketability discount rate, the Level 3 valuation primarily changed as a result of lower and more conservative volume and price projections. This is mainly due to tight iron ore supply conditions in Brazil and an uncertain business environment, intensified by the COVID-19 pandemic. The sensitivity analysis on this valuation shows that an increase/decrease of the port’s throughput of 5 percent has an impact of USD9 million (2019: USD15 million) on the valuation, and an increase/decrease of the discount rate by 0.5 percentage points or 50 bps has an impact of USD15 million (2019: USD25 million) on the valuation. A change in the discount rate due to lack of marketability by 5 percentage points or 500 bps has an effect of USD16 million (2019: USD19 million) on the valuation.
Trafigura Annual Report 2020 71

The remaining impact of USD3.5 million includes the positive result on the sale of Scorpio Tankers Inc. and Frontline Ltd. shares of USD8.1 million.Release/additions to provisions
Refer to Note 30 for more details on provisions.
12.2 Financial year 2019Gain on divestment of subsidiaries
In August 2019, the Group entered into a sale agreement with Frontline for the sale of 10 Suezmax tankers through one of its subsidiaries. In September 2019, the Group also sold through its subsidiaries 15 Medium Range tankers and four LR2 product tankers to Scorpio Shipping Inc. The gain on these transactions amounted USD200.8 million, which is included in gain on divestment of subsidiaries.Other
Other includes the transaction costs related to the acquisition of NN2, and other components.
13. Income tax13.1 Tax expenseIncome tax expense recognised in the statement of income consists of the following:
2020 2019USD’M USD’M
Current income tax expense 270.5 110.1 Adjustments in relation to current income tax of previous year (12.7) (3.4)Deferred tax expense/(income) 24.3 17.4 Withholding tax in the current year 9.4 0.2
Total 291.5 124.3
13.2 Tax recognised in other comprehensive incomeThe tax credit/ charge) relating to components of other comprehensive income is as follows:
2020 2019USD’M USD’M
Tax (expense)/ income on cash flow hedges 18.3 10.7
Total 18.3 10.7
13.3 Reconciliation of effective tax rateThe Group's operations are subject to income taxes in various foreign jurisdictions. The statutory income tax rate vary between 10 percent and 35 percent, which results in a difference between the weighted average statutory income tax rate and Singapore's statutory tax rate of 17 percent (2019: 17 percent).The change to the weighted average statutory income tax rate is a consequence of a change in the mix of profits and losses generated in the various countries in which the Group operates. The change to the effective tax rate is a consequence of a change in the mix of taxable profits and losses generated in the various countries in which the Group operates.
The reconciliation between tax expense and the result of accounting profit multiplied by the Group’s statutory income tax rate for the years ended 30 September 2020 and 2019 is as follows:
2020 2019USD’M % USD’M %
Profit before tax 1,890.3 – 992.1 –Income tax expense at statutory blended tax rate 249.9 13.2% 193.8 19.5%
Tax effect of adjustments to arrive at the effective income tax rate:Effect of unused tax losses, not recognised as deferred tax assets 85.2 39.7 Non-taxable income or subject to specific tax holidays (251.7) (160.2)Non-deductible expenses 202.0 38.7 Foreign exchange 6.8 17.7 Adjustments in relation to income tax of previous year (12.7) (3.4)Tax rate changes 2.5 (2.2)Withholding tax 9.5 0.2
Effective tax rate 291.5 15.4% 124.3 12.5%
F. Notes to consolidated financial statements
Financial statements72
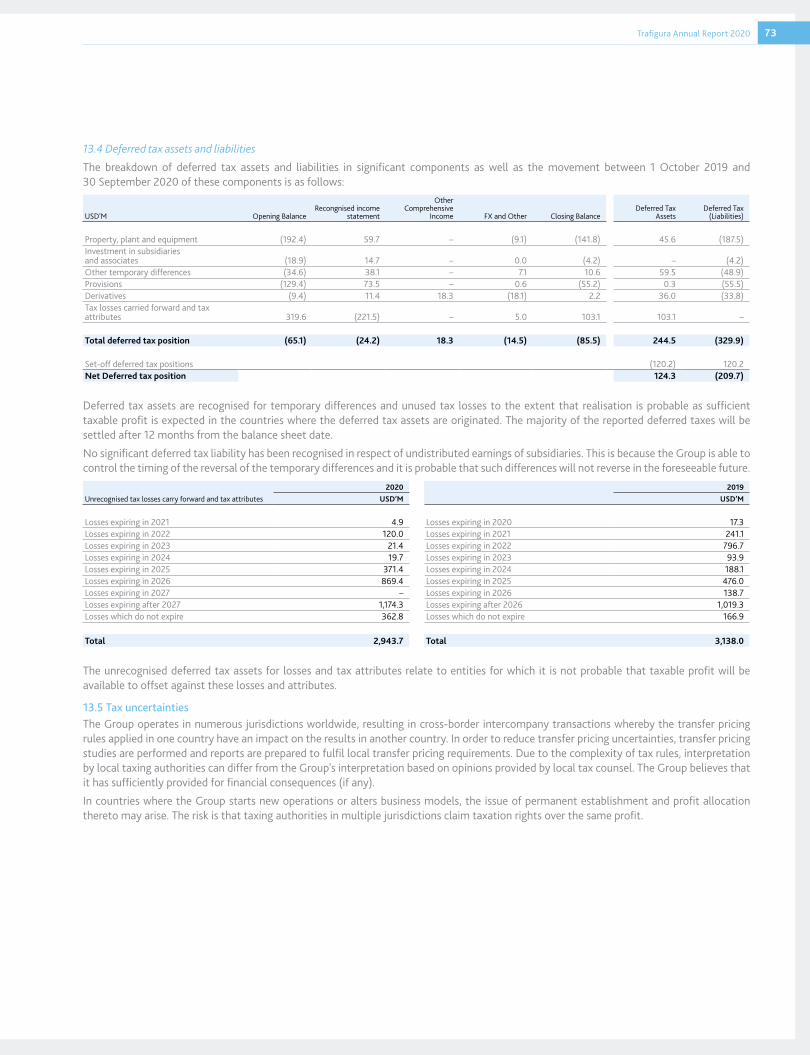
13.4 Deferred tax assets and liabilities
The breakdown of deferred tax assets and liabilities in significant components as well as the movement between 1 October 2019 and 30 September 2020 of these components is as follows:
USD'M Opening BalanceRecongnised income
statement
Other Comprehensive
Income FX and Other Closing BalanceDeferred Tax
AssetsDeferred Tax
(Liabilities)
Property, plant and equipment (192.4) 59.7 – (9.1) (141.8) 45.6 (187.5)Investment in subsidiaries and associates (18.9) 14.7 – 0.0 (4.2) – (4.2)Other temporary differences (34.6) 38.1 – 7.1 10.6 59.5 (48.9)Provisions (129.4) 73.5 – 0.6 (55.2) 0.3 (55.5)Derivatives (9.4) 11.4 18.3 (18.1) 2.2 36.0 (33.8)Tax losses carried forward and tax attributes 319.6 (221.5) – 5.0 103.1 103.1 –
Total deferred tax position (65.1) (24.2) 18.3 (14.5) (85.5) 244.5 (329.9)
Set-off deferred tax positions (120.2) 120.2 Net Deferred tax position 124.3 (209.7)
Deferred tax assets are recognised for temporary differences and unused tax losses to the extent that realisation is probable as sufficient taxable profit is expected in the countries where the deferred tax assets are originated. The majority of the reported deferred taxes will be settled after 12 months from the balance sheet date.No significant deferred tax liability has been recognised in respect of undistributed earnings of subsidiaries. This is because the Group is able to control the timing of the reversal of the temporary differences and it is probable that such differences will not reverse in the foreseeable future.
2020 2019Unrecognised tax losses carry forward and tax attributes USD’M USD’M
Losses expiring in 2021 4.9 Losses expiring in 2020 17.3 Losses expiring in 2022 120.0 Losses expiring in 2021 241.1 Losses expiring in 2023 21.4 Losses expiring in 2022 796.7 Losses expiring in 2024 19.7 Losses expiring in 2023 93.9 Losses expiring in 2025 371.4 Losses expiring in 2024 188.1 Losses expiring in 2026 869.4 Losses expiring in 2025 476.0 Losses expiring in 2027 – Losses expiring in 2026 138.7 Losses expiring after 2027 1,174.3 Losses expiring after 2026 1,019.3 Losses which do not expire 362.8 Losses which do not expire 166.9
Total 2,943.7 Total 3,138.0
The unrecognised deferred tax assets for losses and tax attributes relate to entities for which it is not probable that taxable profit will be available to offset against these losses and attributes.
13.5 Tax uncertaintiesThe Group operates in numerous jurisdictions worldwide, resulting in cross-border intercompany transactions whereby the transfer pricing rules applied in one country have an impact on the results in another country. In order to reduce transfer pricing uncertainties, transfer pricing studies are performed and reports are prepared to fulfil local transfer pricing requirements. Due to the complexity of tax rules, interpretation by local taxing authorities can differ from the Group's interpretation based on opinions provided by local tax counsel. The Group believes that it has sufficiently provided for financial consequences (if any).In countries where the Group starts new operations or alters business models, the issue of permanent establishment and profit allocation thereto may arise. The risk is that taxing authorities in multiple jurisdictions claim taxation rights over the same profit.
Trafigura Annual Report 2020 73

14. Property, plant and equipment
USD’M Land and buildings
Machinery and equipment
Barges and vessels
Mine property and development
Other fixed assets Total
CostBalance at 1 October 2019 1,231.1 2,206.5 629.7 37.1 838.6 4,943.0
Additions 17.9 58.6 58.0 20.7 275.1 430.3 Reclassifications 35.4 84.6 12.1 6.3 (183.7) (45.3)Effect of movements in exchange rates, including hyperinflation adjustment 2.2 78.9 – (2.4) 10.9 89.6 Disposals (5.9) (47.3) (116.9) – (40.3) (210.4)Divestment of subsidiaries – – – – (53.2) (53.2)
Balance at 30 September 2020 1,280.7 2,381.3 582.9 61.7 847.4 5,154.0
Depreciation and impairment lossesBalance at 1 October 2019 301.9 334.7 173.0 1.8 257.5 1,068.9
Depreciation for the period 48.8 172.4 33.9 10.2 35.3 300.6 Impairment losses 134.2 249.5 121.0 – 24.6 529.3 Reclassifications – (2.9) (2.6) (6.5) (1.5) (13.5)Effect of movements in exchange rates, including hyperinflation adjustment (8.1) 3.2 – – (1.4) (6.3)Disposals (3.6) (46.6) (53.7) – (20.1) (124.0)Divestment of subsidiaries – – – – (31.2) (31.2)
Balance at 30 September 2020 473.2 710.3 271.6 5.5 263.2 1,723.8
Net book value at 30 September 2020 807.5 1,671.0 311.3 56.2 584.2 3,430.2
USD’M Land and buildings
Machinery and equipment
Barges and vessels
Mine property and development
Other fixed assets Total
CostBalance at 1 October 2018 883.8 712.3 611.3 – 611.6 2,819.0
Additions 10.0 58.9 28.8 4.8 125.3 227.8 Business combination remeasurements 245.2 1,455.7 – 24.1 160.3 1,885.3 Reclassifications 98.9 8.3 27.6 8.5 (33.5) 109.8 Effect of movements in exchange rates, including hyperinflation adjustment 10.0 (16.3) – (0.3) (5.5) (12.1)Disposals (19.3) (12.4) – – (18.5) (50.2)Divestment of subsidiaries 2.5 – (38.0) – (1.1) (36.6)
Balance at 30 September 2019 1,231.1 2,206.5 629.7 37.1 838.6 4,943.0
Depreciation and impairment lossesBalance at 1 October 2018 256.5 279.3 141.9 – 241.2 918.9
Depreciation for the period 42.8 48.9 35.5 1.8 20.6 149.6 Impairment losses 6.6 12.5 – – 9.5 28.6 Reclassifications 7.2 (0.7) (4.4) – – 2.1 Effect of movements in exchange rates, including hyperinflation adjustment (4.3) (0.7) – – 0.1 (4.9)Disposals (7.6) (4.6) – – (13.3) (25.5)Divestment of subsidiaries 0.7 – – – (0.6) 0.1
Balance at 30 September 2019 301.9 334.7 173.0 1.8 257.5 1,068.9
Net book value at 30 September 2019 929.2 1,871.8 456.7 35.3 581.1 3,874.1
F. Notes to consolidated financial statements
Financial statements74

14.1 Financial year 2020The total addition for the year amounted to USD430.3 million, which mainly relates to investments in the Nyrstar industrial facilities of USD279.1 million (which was primarily maintenance expenditure) and in vessels of USD58.0 million, and in various smaller individual projects. Disposals amounted to USD86.3 million, mainly related to the sale of vessels that were subsequently leased back.Included in the Other fixed assets category are assets under construction, which relates to assets not yet in use, and some Nyrstar related assets. Net book value as at 30 September 2020 amounted to USD449.0 million (30 September 2019: USD340.6 million). Once the assets under construction come into operation they are reclassified to the appropriate asset category and from that point they are depreciated.Certain items of property, plant and equipment are pledged as collateral for an amount of USD250.1 million (30 September 2019: USD342.8 million).Depreciation is included in depreciation and amortisation. Impairment charges are separately disclosed in the income statement.Reference is made to Note 11 for details on impairments.During the financial year ended 30 September 2020, the Group capitalised borrowing cost of a total amount of USD nil under other fixed assets (30 September 2019: USD6.0 million).
14.2 Financial year 2019The total additions during financial year 2019 amounted to USD227.8 million. The main investments during 2019 relate to ongoing investments in Nyrstar’s smelters and equipment of USD46.4 million, the purchase of scrubbers and shipping equipment of USD28.0 million, construction in progress of a splitter unit in Mexico of USD31.5 million, construction in progress of a new storage facility in Mexico of USD18.1 million, and construction in progress of a new terminal facility in North America of USD12.0 million. The remaining investments relate to various smaller projects.
The acquisitions through business combinations totalling USD1,959.4 million are related to the acquisition of NN2, as disclosed in Note 6. Reclassifications include an amount of USD65.5 million related to assets that were previously presented as non-current assets held for sale.Reference is made to Note 11 for details on impairments.The net disposals for the year amounted to USD23.7 million and mainly relate to the sale of a mine in Peru (USD14.9 million). The USD36.6 million in divestments of subsidiaries is mainly related to the Frontline and Scorpio transactions as disclosed in Note 7.The majority of the of the balance in the Other fixed asset category relates to assets under construction which are assets not yet in use. Assets under construction at 30 September 2019 amounted to USD340.6 million. The main projects currently in progress relate to the construction of a power plant in Ghana (USD99.5 million) and the construction of a splitter unit in Mexico (USD118.3 million). In addition, the Other fixed asset category includes small equipment, computer hardware, office equipment and refurbishments.The net book value of property, plant and equipment acquired under finance leases at 30 September 2019 was USD13.2 million.Certain items of property, plant and equipment are pledged as collateral for an amount of USD342.8 million.Depreciation expenses are included in general and administrative expenses. Impairment charges are included in other income and expense.During the financial year ended 30 September 2019, the Group capitalised borrowing cost of a total amount of USD6.0 million under other fixed assets.
Trafigura Annual Report 2020 75

15. Intangible fixed assets
USD’M Goodwill Licences Other
intangible assets Total
CostBalance at 1 October 2019 70.2 27.7 450.2 548.1
Additions – – 60.2 60.2 Reclassifications – – 1.2 1.2 Effect of movements in exchange rates, including hyperinflation adjustment – (2.1) 0.1 (2.0)Disposals – – (0.1) (0.1)Divestment of subsidiaries – – – –
Balance at 30 September 2020 70.2 25.6 511.6 607.4
Amortisation and impairment lossesBalance at 1 October 2019 – 20.4 315.7 336.1
Amortisation for the period – 0.2 49.9 50.1 Impairment 5.9 5.0 2.4 13.3 Effect of movements in exchange rates, including hyperinflation adjustment – (2.1) (0.3) (2.4)Reclassifications – – 0.1 0.1 Disposals – – (0.1) (0.1)Divestment of subsidiaries – – – –
Balance at 30 September 2020 5.9 23.5 367.7 397.1
Net book value at 30 September 2020 64.3 2.1 143.9 210.3
USD’M Goodwill Licences Other
intangible assets Total
CostBalance at 1 October 2018 8.1 32.0 407.3 447.4
Additions – – 44.2 44.2 Acquired through business combination 64.3 – 4.7 69.0 Reclassifications (2.2) – 1.8 (0.4)Effect of movements in exchange rates, including hyperinflation adjustment – (3.1) 0.8 (2.3)Disposals – (1.2) (3.1) (4.3)Divestment of subsidiaries – – (5.5) (5.5)
Balance at 30 September 2019 70.2 27.7 450.2 548.1
Amortisation and impairment lossesBalance at 1 October 2018 2.2 2.0 269.8 274.0
Amortisation for the period – 0.2 51.0 51.2 Impairment – 19.4 1.0 20.4 Effect of movements in exchange rates, including hyperinflation adjustment – – (0.4) (0.4)Reclassifications (2.2) – 1.9 (0.3)Disposals – (1.2) (3.1) (4.3)Divestment of subsidiaries – – (4.5) (4.5)
Balance at 30 September 2019 – 20.4 315.7 336.1
Net book value at 30 September 2019 70.2 7.3 134.5 212.0
Goodwill is the only intangible asset with an indefinite life. All other intangible assets are amortised as follows: • Licence fees paid are amortised evenly over their respective periods, for which the licences have been granted, generally not exceeding 10 years; • Other intangible assets are amortised evenly over their estimated useful economic life. Other intangibles mainly consist of software of
USD141.3 million (2019: USD120.5 million) which is amortised over five years, and payments made under exclusivity contracts with clients for petroleum fuels and lubricants which are amortised over the contractual period.
Amortisation expenses is included in depreciation and amortisation. Impairment charges are separately disclosed in the income statement. Intangible assets with finite lives are tested for impairment when impairment indicators exist. For the purpose of impairment testing, goodwill is allocated to the CGUs or groups of CGUs.
F. Notes to consolidated financial statements
Financial statements76

15.1 Impairment test on goodwillThe goodwill balance of USD64.3 million originates from the acquisition of the Nyrstar Group as disclosed in Note 6. The group performs a goodwill impairment test on an annual basis. For the 2020 reporting period, the recoverable amount of the CGUs was determined based on value-in-use calculations using real-term cash flow projections from approved financial budgets and consumption/production plans covering a five-year period. For impairment, the carrying amount of goodwill is allocated to three CGUs. The below table includes the allocation of the goodwill carrying amount and the pre-tax discount rate applied to the real-term cash flow projections.
Cash generating unit (CGU)Goodwill
USD’MPre-tax
discount rate
Nyrstar – Europe 48.0 7.7%Nyrstar – Australia 14.1 8.1%Nyrstar – United States of America 2.2 7.9%
64.3
As the recoverable amount significantly exceeded the recorded goodwill for all CGUs, no impairment has been recognised.Key assumptions used in value in use calculations and sensitivity to changes in assumption
The calculation of value-in-use for all of the above CGUs is sensitive to a number of assumptions, including the following: • Discount rates; • Foreign exchange rates; • Physical forward prices for (precious) metals; • Treatment charges.
Discount rates − discount rates represent the current market assessment of the risks specific to each CGU, taking into consideration individual risks of the underlying assets that have not been incorporated in the cash flow estimates. The discount rate calculation is based on the specific circumstances of the Group and the Nyrstar operations and is derived from its weighted average cost of capital (WACC). The WACC takes into account both debt and equity. The cost of equity is derived from the expected return on investment by the Group’s investors. The cost of debt is based on the interest-bearing borrowings the Group is obliged to service. Nyrstar-specific risk is incorporated by applying individual beta factors. The beta factors are evaluated annually based on publicly available market data. An increase in the pre-tax discount rate by 0.5 percent would reduce the recoverable amounts by USD128.9 million for Europe, USD86.4 million for Australia and USD31.6 million for the US, and in all CGUs still provide for significant headroom.Foreign exchange rates / Physical forward prices for (precious) metals / Treatment charges (TCs) − estimates are obtained from internal research, as well as from external data. The sensitivity of the recoverable amount when prices of (precious) metals, benchmark TCs or foreign exchange rates increase or decrease on average by 5 percent is as follows:
Metal prices +5% Metal prices -/- 5%
Fx rates +5%
Fx rates -/- 5%
Benchmark TCs +5%
Benchmark TCs -/- 5%
Cash generating unit (CGU) USD'm USD'm USD'm USD'm USD'm USD'm
Nyrstar – Europe 244.0 (243.9) (348.6) 348.9 219.1 (219.0)Nyrstar – Australia 253.5 (253.5) (307.3) 307.4 108.1 (108.1)Nyrstar – United States of America 106.8 (106.8) 3.6 (3.9) 16.7 (16.7)
604.3 (604.2) (652.3) 652.4 343.9 (343.8)
Trafigura Annual Report 2020 77

16. LeasesThe Group leases various assets, including land and buildings and plant and equipment. Leases are negotiated on an individual basis and contain a wide range of different terms and conditions, including termination and renewal rights. The Group, as a lessor, only has finance leases.The lease agreements do not impose any covenants, but leased assets may not be used as security for borrowing purposes.
16.1 Right-of-use assetsUSD'M 30 September 2020 1 October 2019
Freight 1,382.7 1,366.2 Storage rentals 92.7 158.3 Office rent 85.7 106.6 Other 530.4 936.6
Total 2,091.5 2,567.6
USD'M Freight Storage rentals Office rent Other Total
Balance at 1 October 2019 1,366.2 158.3 106.6 936.6 2,567.6 Additions/ remeasurements 642.5 22.1 3.2 16.4 684.2 Disposals (21.7) (1.5) (5.6) – (28.8)Impairment – (9.6) – (94.2) (103.8)Depreciation (604.6) (92.8) (20.4) (300.9) (1,018.7)Effect of movement in exchange rate – 1.3 2.3 0.8 4.4 Other 0.3 14.9 (0.4) (28.3) (13.5)
Balance at 30 September 2020 1,382.7 92.7 85.7 530.4 2,091.4
The Other category mainly includes assets located in Corpus Christi, Texas, that enable the transportation, storing, processing and vessel loading of crude oil and crude oil products.
16.2 Lease receivablesThe following table sets out a maturity analysis of lease receivables at 30 September 2020, showing the undiscounted lease payments to be received:
2020USD'M
Less than one year 43.7 Later than one year and less than five years 132.6 Later than five years –
Total undiscounted lease receivables as at 30 September 2020 176.3
Unearned finance income (14.8)Lease receivables included in the statement of financial position 161.5
Of which are:Current 37.4 Non-current 124.1
The lease payments are evenly distributed over the remaining period.
F. Notes to consolidated financial statements
Financial statements78

16.3 Lease liabilitiesThe following table sets out a maturity analysis of the lease liabilities at 30 September 2020, indicating the undiscounted lease amounts to be paid:
2020USD'M
Less than one year 1,065.0 Later than one year and less than five years 1,216.4 Later than five years 367.0
Total undiscounted lease payable as at 30 September 2020 2,648.4
Future finance costs (259.4)Lease liabilities included in the statement of financial position 2,389.0
Of which are:Current 981.6 Non-current 1,407.4
USD'M Freight Storage rentals Office rent Other Total
Balance at 1 October 2019 1,563.5 158.3 106.6 936.6 2,764.9 Interest 73.1 6.1 4.8 30.7 114.7 Additions/ remeasurements 648.3 22.1 3.2 16.3 689.9 Disposals (21.7) (1.5) (5.6) – (28.8)Payments (707.4) (96.7) (22.0) (313.1) (1,139.2)Effect of movement in exchange rate – 1.4 2.4 0.9 4.7 Other (0.7) 14.0 (0.1) (30.5) (17.3)
Balance at 30 September 2020 1,555.1 103.7 89.3 640.9 2,389.0
Current 596.1 84.9 17.1 283.5 981.6 Non-current 959.9 18.8 71.4 357.4 1,407.5
Balance at 30 September 2020 1,556.0 103.7 88.5 640.9 2,389.1
16.4 Amounts relating to leases recognised for the reporting periodThe following amounts are recognised in profit and loss:
2020USD'M
Depreciation on ROU assets 1,018.7 Interest expense on lease liabilities 114.7 Impairments of right-of-use assets 103.7 Expenses relating to short-term leases 102.8 (Income) from subleasing ROU assets (7.9)Gain or losses on sale and leaseback 9.5 Foreign exchange/ other 1.6
Net (income)/ expenses related to leases 1,343.1
Reference is made to Note 4.1.3 for the impact of the adoption of IFRS 16 on the income statement.At 30 September 2020, the Group is committed to USD 201 million of short-term lease payments.The following amounts are recognised with regard to lease liabilities and lease receivables together in the cash flow statement:
2020USD'M
Cash outflow for leases – included in net cash from/(used in) operating activities (107.1)Cash outflow for leases – included in net cash from/(used in) financing activities (993.0)
Total (1,100.1)
Trafigura Annual Report 2020 79

17. Equity-accounted investees2020 2019
USD’M USD’M
Opening balance 3,416.5 3,361.2 Acquisition through business combination – 0.2 Effect of movements in exchange rates (121.7) (37.7)Additions 94.5 85.6 Fair value of retained interest in deconsolidated subsidiaries – 0.2 Disposals (27.1) (0.7)Impairments (524.2) (34.6)Share of net profit/(loss) (327.0) 47.7 Dividends received (4.9) (18.6)Other (67.5) 13.2
Total 2,438.6 3,416.5
17.1 Financial year 2020The effect of movements in exchange rates of USD121.7 million includes a negative foreign currency translation impact from Puma Energy Holdings Pte. Ltd. (Puma Energy) of USD83.0 million and a negative foreign currency translation impact of USD22.9 million from Tendril Ventures Pte. Ltd. (Tendril Ventures), which indirectly holds shares in Nayara Energy Limited. This foreign exchange movement is included in the other comprehensive income line share of comprehensive income/ (loss) from associates.Puma Energy agreed to a shareholding restructuring transaction with Trafigura and Cochan Holdings. Cochan Holdings reduced its stake in Puma Energy from 15 percent to less than 5 percent, by selling shares in Puma Energy to Trafigura. Hereafter, Puma Energy bought back and cancelled these shares. Puma Energy funded the re-purchase with a subordinated shareholder loan from Trafigura with an initial tenor of seven years. The parties completed the transaction in June 2020. As a result of this transaction, Trafigura’s shareholding in Puma Energy increased to 55.5 percent.Based on agreement between the shareholders, the power to direct the relevant activities of Puma Energy lies solely with its Board of Directors, and shareholders’ rights are only protective in nature. Trafigura appoints three out of eight directors, and decisions by Puma Energy’s Board of Directors are taken by simple majority. Trafigura therefore does not have the majority of decision-making power in the Board of Directors. The transaction did not alter the existing shareholder agreement. Therefore, the increase in Trafigura’s shareholding did not result in Trafigura gaining control over Puma Energy. Consequently, the equity investment in Puma Energy will continue to be accounted for under the equity method.During 2020, the additions to equity-accounted investees amounted to USD94.5 million. In the financial year, the Group participated for its share in an equity contribution in Tendril Ventures resulting in an additional investment of USD44.3 million. Other main additions relate to a new investment in a natural gas and power company focusing on the Italian market of USD11.4 million and an investment in Bluewater Texas Terminals of USD22.6 million.
The share of net loss from investments amounts to USD327.0 million. This is predominantly the result of losses in Puma Energy (USD326.1 million) and Porto Sudeste do Brasil (USD46.6 million), partly offset by profits from MATSA, Guangxi Jinchuan and Impala Terminals Group Sarl (previously Simba) of USD37.8 million. The carrying value of the equity investment in Puma Energy amounted to USD1,122 million as at 30 September 2020.During the financial year 2020 there have been negative market developments in the economic environment in which some of our equity-accounted investees operate. This has resulted in impairments on our investments in Puma Energy Holding Pte Ltd and Tendrill Ventures (Nayara). Details of the impairment analysis are disclosed in Note 11. Other reductions predominately include the negative movements on cash flow hedges of equity-accounted investees, including USD23 million relating to Puma Energy.
17.2 Financial year 2019The additions to equity-accounted investees amounted to USD85.6 million, consisting mainly of additional investments in Tendril Ventures Pte. Ltd. (Tendril Ventures), which indirectly holds shares in Nayara Energy Limited, of USD41.5 million, and an additional capital contribution in Porto Sudeste do Brasil (Porto Sudeste) of USD8.5 million.The effect of movements in exchange rates of USD37.7 million includes a negative foreign currency translation impact from Puma of USD128.6 million, partly offset by a positive foreign currency translation impact of USD99.8 million from Tendril Ventures. This foreign exchange movement is included in the other comprehensive income line exchange gain/ (loss) on translation of foreign operations.Reference is made to Note 9 for details on impairments.The Group’s share of results in its equity-accounted investees for the year amounted to a gain of USD47.7 million. This result includes the positive share in the income of TM Mining Ventures, S.L. (MATSA), Porto Sudeste, Guangxi Jinchuan Non-ferrous Metals Co. Ltd. (Guangxi Jinchuan), Empresa Minera del Caribe S.A. (Emincar) and Impala Terminals Holding S.à r.l. (Simba) of USD143.9 million and losses in Puma and Tendril Ventures of USD97.9 million. The Group’s share of results of Porto Sudeste was a profit of USD71 million, which arose mainly from a reduction in value of Porto Sudeste’s listed debt securities (which resulted in a gain in Porto Sudeste's statement of income) as a result of considering a longer ramp-up period for the port’s throughput volume, which is mainly the result of tight iron ore supply conditions in Brazil. The USD71 million was more than offset by a loss of USD120.8 million from the decrease in value of the listed port securities, which the Group holds as a further investment in Porto Sudeste.Other predominately includes the positive movements on cash flow hedges of equity-accounted investees. In 2019, the Group received dividends of USD18.6 million from its investments in equity-accounted investees (2018: USD50.4 million). The full amount relates to dividends from MATSA.
F. Notes to consolidated financial statements
Financial statements80
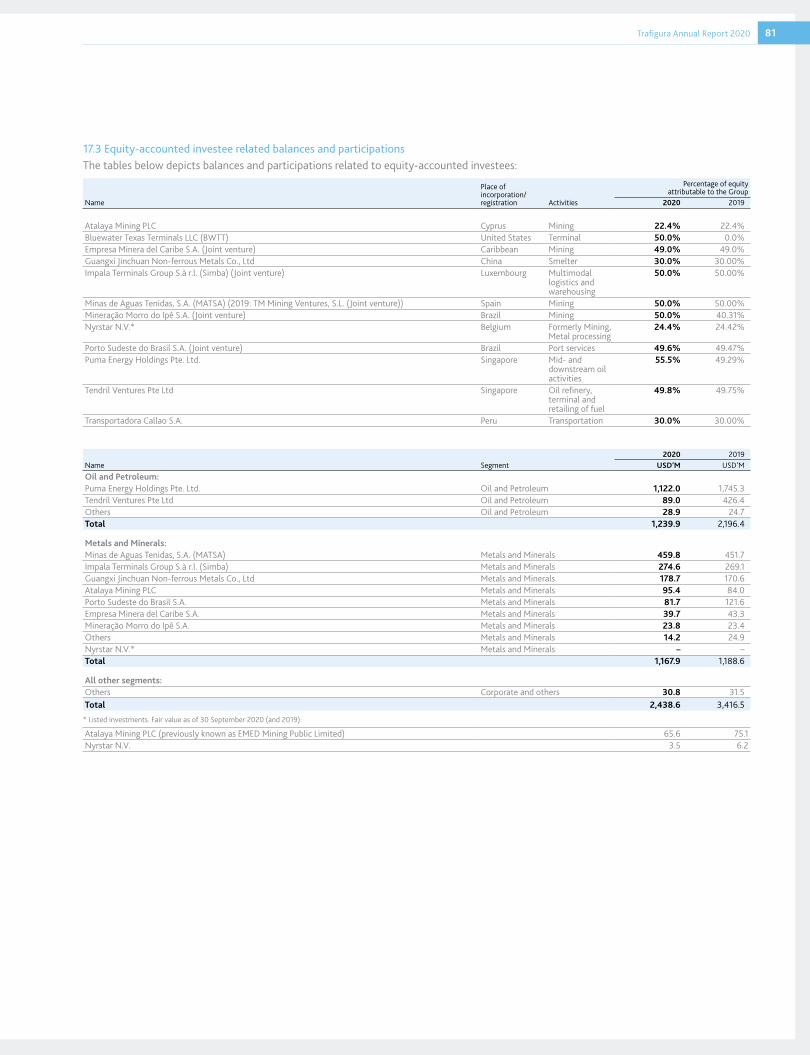
17.3 Equity-accounted investee related balances and participationsThe tables below depicts balances and participations related to equity-accounted investees:
Name
Place of incorporation/ registration Activities
Percentage of equity attributable to the Group
2020 2019
Atalaya Mining PLC Cyprus Mining 22.4% 22.4%Bluewater Texas Terminals LLC (BWTT) United States Terminal 50.0% 0.0%Empresa Minera del Caribe S.A. (Joint venture) Caribbean Mining 49.0% 49.0%Guangxi Jinchuan Non-ferrous Metals Co., Ltd China Smelter 30.0% 30.00%Impala Terminals Group S.à r.l. (Simba) (Joint venture) Luxembourg Multimodal
logistics and warehousing
50.0% 50.00%
Minas de Aguas Tenidas, S.A. (MATSA) (2019: TM Mining Ventures, S.L. (Joint venture)) Spain Mining 50.0% 50.00%Mineração Morro do Ipê S.A. (Joint venture) Brazil Mining 50.0% 40.31%Nyrstar N.V.* Belgium Formerly Mining,
Metal processing24.4% 24.42%
Porto Sudeste do Brasil S.A. (Joint venture) Brazil Port services 49.6% 49.47%Puma Energy Holdings Pte. Ltd. Singapore Mid- and
downstream oil activities
55.5% 49.29%
Tendril Ventures Pte Ltd Singapore Oil refinery, terminal and retailing of fuel
49.8% 49.75%
Transportadora Callao S.A. Peru Transportation 30.0% 30.00%
Name Segment2020 2019
USD’M USD’MOil and Petroleum:Puma Energy Holdings Pte. Ltd. Oil and Petroleum 1,122.0 1,745.3 Tendril Ventures Pte Ltd Oil and Petroleum 89.0 426.4 Others Oil and Petroleum 28.9 24.7 Total 1,239.9 2,196.4
Metals and Minerals:Minas de Aguas Tenidas, S.A. (MATSA) Metals and Minerals 459.8 451.7 Impala Terminals Group S.à r.l. (Simba) Metals and Minerals 274.6 269.1 Guangxi Jinchuan Non-ferrous Metals Co., Ltd Metals and Minerals 178.7 170.6 Atalaya Mining PLC Metals and Minerals 95.4 84.0 Porto Sudeste do Brasil S.A. Metals and Minerals 81.7 121.6 Empresa Minera del Caribe S.A. Metals and Minerals 39.7 43.3 Mineração Morro do Ipê S.A. Metals and Minerals 23.8 23.4 Others Metals and Minerals 14.2 24.9 Nyrstar N.V.* Metals and Minerals – –Total 1,167.9 1,188.6
All other segments:Others Corporate and others 30.8 31.5 Total 2,438.6 3,416.5
* Listed investments. Fair value as of 30 September 2020 (and 2019):
Atalaya Mining PLC (previously known as EMED Mining Public Limited) 65.6 75.1 Nyrstar N.V. 3.5 6.2
Trafigura Annual Report 2020 81

18. Prepayments2020 2019
USD’M USD’M
Current 2,934.7 3,454.4 Non-current 1,060.8 678.8
Total 3,995.5 4,133.2
Prepayments relate to prepayments of commodity deliveries and are split into non-current prepayments (due > 1 year) and current prepayments (due < 1 year). A significant portion of the non-current prepayments, as well as current prepayments, are either financed on a non-recourse basis or insured.Under the prepayments category, the Group accounts for the prepayments of commodity deliveries. Out of the total current prepayments balance, an amount of USD0.7 billion (30 September 2019: USD0.7 billion) relates to prepayments which are made for specifically identified cargos.The contractually outstanding prepayments amount decreases in size with each cargo that is delivered, until maturity. Once the contractually agreed total cargo has been fully delivered, the prepayment agreement falls away leaving no remaining contractual obligations on Trafigura or the supplier.
The Group monitors the commodity prices in relation to the prepayment contracts and manages the credit risk together with its financial assets as described in Note 35. A portion of the long-term prepayments, as well as short-term prepayments, is on a limited recourse basis. Interest on the prepayments is added to the prepayment balance.The global decrease in demand for commodity products as a result of COVID-19 resulted in an increased credit risk towards our suppliers. Therefore the Group has calculated expected credit losses on the outstanding prepayments as from the financial year 2020. The methodology of the expected credit loss calculation is similar to the methodology used in the expected credit loss calculations on loans receivable.Based upon the individual analysis of the prepayments, the Group recorded expected credit losses on these prepayments amounting to USD143.8 million (30 September 2019: nil). The following table explains the movements of the expected credit loss between the beginning and the end of the year and the gross carrying amounts of the prepayments by credit risk category.
F. Notes to consolidated financial statements
Only the individually significant associates Puma Energy Holdings Pte. Ltd., Minas de Aguas Tenidas, S.A. (MATSA) and Impala Terminals Group S.à r.l. (Simba) are shown separate from the other associates.
Puma Energy Holdings Pte. Ltd. Minas de Aguas Tenidas, S.A. (MATSA) Impala Terminals Group S.à r.l.2020 2019 2020 2019 2020 2019
USD’M USD’M USD’M USD’M USD’M USD’M
Non-current asset assets 3,409.7 4,022.1 1,472.4 1,517.0 506.6 309.1 Current assets 2,257.5 2,856.0 120.1 171.2 178.6 134.9 Non-current liabilities 2,751.6 2,863.0 386.3 463.0 222.6 22.0 Current liabilities 3,296.0 3,023.9 286.5 321.8 120.9 98.5 Revenue 12,980.1 17,335.8 496.6 544.4 477.4 312.7 Profit/(loss) for the year (691.2) (499.1) 14.6 29.9 17.6 41.9 Dividends paid – – – (62.5) – –Other comprehensive income (228.7) (224.6) 1.6 2.2 (6.4) (0.1)Total comprehensive income (919.8) (723.7) 16.2 32.1 11.2 41.8
Net assets (380.4) 991.3 919.7 903.4 341.7 323.6 Trafigura's ownership interest 55.5% 49.3% 50.0% 50.0% 50.0% 50.0%Fair value adjustment as a result of partial sale and other adjustments 1,333.3 1,256.7 (0.0) (0.0) 103.9 107.3 Carrying value 1,122.0 1,745.3 459.8 451.7 274.7 269.1
Other associates2020 2019
USD’M USD’MAssets 4,048.9 4,616.4 Liabilities 3,552.9 3,868.2 Revenue 1,420.6 2,557.8 Profit for the year (excluding 2019 Nyrstar results, see below) (57.9) 76.8
The Group's share in profit for 2019 amounted to USD76.8 million, as disclosed in the table above, excludes the losses of Nyrstar N.V. The continuing investment in Nyrstar N.V. has been fully impaired, therefore the valuation of the equity-accounted investee is nil. Since the valuation of the equity-accounted investee cannot be reduced below nil, the Group’s share in the Nyrstar N.V. loss is not included in the share of profit/ (loss) from equity-accounted investees in the statement of income. As from 2020, the profit and loss of Nyrstar N.V. has been included under other associates (nil impact).The amount of corporate guarantees in favour of associates and joint ventures as at 30 September 2020 was USD124.7 million (30 September 2019: USD130.5 million).
Financial statements82

2020
PerformingUnder
performing Total12-months ECL Life time ECL
Prepayments USD’M USD’M USD’MExpected credit loss (ECL) provision Opening balance – 1 October – – –Transfer to under-performing – – –ECL on prepayments recognised during the period 40.3 103.5 143.8 ECL on prepayments derecognised during the period – – –Changes in PD/LGD/EAD – – –
Closing balance 30 September 40.3 103.5 143.8
Carrying amount 30 SeptemberCurrent 1,553.9 1,380.8 2,934.7 Non-current 688.9 371.9 1,060.8
Total 2,242.8 1,752.7 3,995.5
19. Loans and other receivables2020 2019
USD’M USD’M
Loans to associates and related parties 453.2 287.1 Other non-current loans receivable 241.2 234.3
Total 694.4 521.4
Loans to associates and related parties includes a loan receivable from Puma Energy Holding Pte. Ltd. of USD390 million, which relates to the funding of a buy back and subsequent cancelation of shares by Puma Energy Holding Pte Ltd from one of its shareholders. Furthermore, this line includes a loan to a Galena investment fund of USD38.7 million, which relates to their investment in a Canadian mine.Other non-current loans receivables include various loans which are granted to counterparties that the Group trades with. This line also includes the debt agreement with the Angolan Ministry of Finance, which relates to compensation for iron ore investments made by the Group following the liquidation of a consolidated Angolan subsidiary in 2016. In 2019, the original debt agreement was renegotiated, with a new redemption schedule in place. Due to the current economic situation in Angola, with collapsing oil prices and COVID-19, it has not been possible for the Angolan Ministry of Finance to honour all of its obligations. Currently, the Group is negotiating the terms of the debt agreement again with the Angolan Ministry of Finance.Based upon the individual analysis of these loans, the recorded expected credit losses on these loans amounts to USD121.9 million (30 September 2019: USD7.1 million). The following table explains the movements of the expected credit loss between the beginning and the end of the year and the gross carrying amounts of the loan receivables by credit risk category.
2020 2019Performing Under performing Total Performing Under performing Total
12-months ECL Life time ECL 12-months ECL Life time ECLLoan Receivables USD’M USD’M USD’M USD’M USD’M USD’MExpected credit loss (ECL) provisionOpening balance – 1 October 2.6 4.5 7.1 2.0 2.6 4.6 Transfer to under-performing (2.6) 2.6 – – – –New loans originated during the period 4.2 3.3 7.5 0.9 – 0.9 Changes in PD/LGD/EAD 0.3 107.0 107.3 (0.3) 1.9 1.6
Closing balance 30 September 4.6 117.4 121.9 2.6 4.5 7.1
Carrying amount 30 SeptemberCurrent (Note 23) 302.8 – 302.8 430.9 93.8 524.7 Non-current (Note 19) 393.9 300.5 694.4 341.2 180.2 521.4
Total 696.7 300.5 997.2 772.1 274.0 1,046.1
Trafigura Annual Report 2020 83

20. Other investmentsInvestments included in the balance sheets per 30 September 2020 and 2019 can be broken down as follows:
2020 2019USD’M USD’M
Listed equity securities – fair value through OCI 3.9 28.8 Listed equity securities – fair value through profit or loss 25.3 342.1 Listed debt securities – fair value through profit or loss 220.9 345.5 Unlisted equity investments – fair value through profit or loss 34.3 53.9 Unlisted equity investments – fair value through OCI 232.7 233.4
Total 517.1 1,003.7
The Group’s long-term investments consist of listed equity securities, listed debt securities and unlisted equity securities. The listed equity securities have no fixed maturity or coupon rate. The fair values of listed equity investments are based on quoted market prices, while the fair value of the unlisted equity securities is determined based on a Level 3 valuation as prepared by management.The decrease in the listed equity securities (fair value through profit or loss) is primarily resulting from the sale of the Scorpio Tankers Inc. and Frontline Ltd. shares.The decrease in listed debt securities (fair value through profit or loss) mainly results from the financial instruments related to the investment in Porto Sudeste do Brasil SA. For more details refer to Note 12.
21. Other non-current assets2020 2019
USD’M USD’M
Non-financial hedged items 76.9 216.5 Restricted cash 68.0 106.9Others 47.1 32.9
Total 192.0 356.3
For further information on the non-financial hedged items, refer to Note 35.8. The restricted cash balance mainly represents amounts placed on deposit to cover certain reclamation costs for Nyrstar mining operations.
22. Inventories2020 2019
Carrying amount USD’M USD’M
Storage inventories 13,670.1 8,344.3 Floating inventories 6,103.6 4,893.1 Work-in-progress inventories 391.2 185.0 Supplies 12.7 12.6
Total 20,177.6 13,435.0
As at 30 September 2020 (and 30 September 2019), the entire inventory has either been pre-sold or hedged. Part of the inventory has been pledged for securitisation purposes. Refer to Note 24.2.Work-in-progress inventories fully relate to inventories being processed in the Nyrstar smelters.
23. Trade and other receivables2020 2019
USD’M USD’M
Trade debtors 6,286.7 7,946.9 Provision for bad and doubtful debts (47.8) (50.6)Accrued turnover 5,539.8 6,702.2 Broker balances 1,571.4 1,147.5 Other debtors 309.0 390.3 Loans to third parties 294.9 523.6 Loans to related parties 7.9 1.1 Other taxes 438.0 406.3 Related parties 845.2 1,449.2
Total 15,245.1 18,516.5
All financial instruments included in trade and other receivables are held to collect the contractual cash flows, except for those subject to certain dedicated financing facilities, which would be held for collection of contractual cash flows and for selling the financial asset. Furthermore, the cash flows that the Group receives on these instruments are solely payments of principal and interest except for trade and other receivables related to contracts including provisional pricing features.The Group entered into a number of dedicated financing facilities, which finance a portion of its receivables. Part of these facilities meet the criteria of derecognition of the receivables according to IFRS.As per 30 September 2020 an amount of USD2,513.3 million (30 September 2019: USD2,083.1 million) of trade debtors has been discounted. Of this amount, USD2,318.9 million (30 September 2019: USD1,733.0 million) has been derecognised, as the Group has transferred substantially all the risks and rewards of ownership of the financial asset with non-recourse. The remaining part of discounted receivables which does not meet the criteria for derecognition amounting to USD194.4 million (30 September 2019: USD350.1 million), continues to be recognised as trade debtors. For the received amount of cash of these items the Group has recognised a liability under current loans and borrowings.
F. Notes to consolidated financial statements
Financial statements84

Of USD6,286.7 million trade debtors (30 September 2019: USD7,946.9 million), USD1,950.1 million had been sold on a non-recourse basis under the securitisation programme (30 September 2019: USD3,588.3 million). Of the USD845.5 million receivables on related parties (30 September 2019: USD1,449.2 million), USD309.6 million had been sold on a non-recourse basis under the securitisation programme (30 September 2019: USD940.3 million). For more details refer to Note 24.As at 30 September 2020, 7.3 percent (30 September 2019: 6.4 percent) of receivables were between 1-60 days overdue, and 8.5 percent (30 September 2019: 8.9 percent) were greater than 60 days overdue. Trafigura applied the simplified method in assessing expected credit losses. The accounts receivables have been divided in aging buckets and based on an analysis on historical defaults and recovery rates, and considering forward looking information, a percentage for expected credit losses has been determined. Trafigura manages to limit credit losses by renegotiating contracts in the case of a default. From the above analysis, an expected credit loss as at 30 September 2020 of USD6.0 million (30 September 2019: USD3.9 million) has been taken into account. The loss allowance provision at 30 September 2020 amounts to USD40.7 million (30 September 2019: USD50.6 million). The provision mostly relates to demurrage claims and commercial disputes with our clients. Accrued turnover represents receivable balances for sales which have not yet been invoiced. They have similar risks and characteristics as trade debtors. Trade debtors and accrued turnover have similar cash flow characteristics and are therefore considered to be a homogeneous group of financial assets.Total trade and other receivables related to contracts including provisional pricing features amount to USD6.5 billion.
24. Securitisation programmesThe Group operates various securitisation programmes. Trafigura Securitisation Finance PLC (TSF) and Argonaut Receivables Company S.A. (Argo) enable the Group to sell eligible receivables. An inventory securitisation programme, through Trafigura Commodities Funding Pte. Ltd. (TCF) and Trafigura Global Commodities Funding Pte. Ltd. (TGCF), enables Trafigura to sell and repurchase eligible inventories. Those securitisation vehicles are consolidated and consequently the securitised receivables and inventories are included within the consolidated trade debtor and inventory balances.
24.1 Receivables securitisationsOver time the external funding of TSF has increased significantly in size, mostly through Variable Funding Notes (VFN) purchased by bank sponsored conduits, while incorporating a longer term committed funding element, in the form of Medium Term Notes (MTN).Argo was launched in May 2020 and is funded through short-term VFN only.
The available external funding of the receivables securitisation programmes consists of:
2020 2019Interest rate Maturity USD’M USD’M
TSF AAA MTN Libor + 0.85% 2020 – June – 235.0 TSF AAA MTN 2.47% 2020 – June – 230.0 TSF BBB MTN Libor + 1.70% 2020 – June – 35.0 TSF AAA MTN Libor + 0.73% 2021 – September 185.0 185.0 TSF AAA MTN 3.73% 2021 – September 280.0 280.0 TSF BBB MTN 4.33% 2021 – September 35.0 35.0 TSF AAA VFN See Note Various throughout the year 2,519.9 3,097.2 TSF BBB VFN See Note Various throughout the year 189.5 232.9 Argonaut Receivables Securitisation 2021 – April 225.0 –TSF senior subordinated debt 2023 – March 91.6 103.5
Total 3,526.0 4,433.6
As at 30 September 2020, the maximum available amount of external funding was USD3,526.0 million (30 September 2019: USD4,433.6 million) for the receivable securitisation programme.The rate of interest applied to the TSF AAA VFN is principally determined by the demand for commercial paper issued by 10 bank-sponsored conduits. The Group benchmarks the rate provided against 1-week Libor. In the case of the rate of interest applicable to the TSF BBB VFN, the rate of interest is principally determined by the liquidity of the interbank market. The maturity of the TSF AAA and BBB VFNs have been staggered to diversify the maturity profile of the notes. This aims to mitigate the liquidity wall risk associated with a single maturity date for a significant funding amount.
24.2 Inventory securitisation2020 2019
Interest rate Maturity USD’M USD’M
TCF VFN See Note 2019 – November – 410.0 TCF MLF See Note 2019 – November – 40.0 TCF/ TGCF VFN See Note 2020 – November 410.0 –TCF/ TGCF MLF See Note 2020 – November 40.0 –
Total 450.0 450.0
As at 30 September 2020, the maximum available amount of external funding was USD450.0 million (30 September 2019: USD450.0 million) for the inventory securitisation programme. The rate of interest applied to the VFN and MLF under the inventories securitisation is defined in the facility documentation.
Trafigura Annual Report 2020 85

25. Other current assets 2020 2019
USD’M USD’M
Non-financial hedged items 64.5 120.1 Prepaid expenses 278.1 197.0 Other 8.6 1.6
Total 351.2 318.7
The non-financial hedged items balance fully relates to the current part of the non-financial hedged items (for more details refer to Note 34.8). Prepaid expenses relate to prepayments other than those made for physical commodities.
26. Cash and cash equivalents and deposits26.1 Cash and cash equivalentsCash at bank earns interest at floating rates based on daily bank deposit rates. Short-term deposits are made for varying periods between one day and three months depending on the immediate cash requirements of the Group and earn interest at the respective short-term deposit rates. The fair value of cash and cash equivalents approximates the carrying value.An amount of USD43.4 million (30 September 2019: USD40.9 million) of cash at bank is restricted, including restrictions that require the funds to be used for a specified purpose and restrictions that limit the purpose for which the funds can be used, unless fixed asset construction invoices are presented to the banks.
2020 2019USD’M USD’M
Cash at bank and in hand 5,405.8 5,476.3 Short-term deposits 351.2 790.9
Cash and cash equivalents 5,757.0 6,267.2
As at 30 September 2020, the Group had USD9.0 billion (30 September 2019: USD9.2 billion) of committed unsecured syndicated loans, of which USD3.8 billion (30 September 2019: USD2.3 billion) remained unutilised. The Group had USD3.3 billion (30 September 2019: USD3.2 billion) of immediately (same day) available cash in liquidity funds. Therefore, the Group had immediate access to available liquidity balances from liquidity funds and corporate facilities in excess of USD7.1 billion (30 September 2019: USD5.5 billion).
26.2 DepositsShort-term deposits made for periods longer than three months are separately shown in the statement of financial position and earn interest at the respective short-term deposit rates.
27. Capital and reserves27.1 Share capitalAs at 30 September 2020, the Company has 25,000,000 ordinary shares outstanding and a capital of USD1,504 million. During the financial year ended 30 September 2020 no changes took place in the outstanding share capital.The holders of ordinary shares are entitled to receive dividends as and when declared by the Company. All ordinary shares carry one vote per share without restriction. The ordinary shares have no par value.
27.2 Capital securitiesAs part of the financing of the Company and its subsidiaries, the Company has two capital securities instruments with a total carrying value of USD1,097.7 million as at 30 September 2020 (2019: USD1,073.8 million). These two capital securities have a par value of USD800 million and EUR262.5 million respectively (2019: USD800 and EUR262.5 million respectively).These two capital securities are perpetual in respect of which there is no fixed redemption date. The distribution on the capital securities is payable semi-annually in arrears every six months from the date of issue. The Company may elect to defer (in whole but not in part) any distribution in respect of these capital securities by providing no more than 30 or less than 5 business days’ notice, unless a compulsory interest payment event has occurred, including amongst others the occurrence of a dividend payment in respect of subordinated obligations of the Company. Any interest deferred shall constitute arrears of interest and shall bear interest.In the event of a winding-up, the rights and claims of the holders in respect of the capital securities shall rank ahead of claims in respect of the Company’s shareholders, but shall be subordinated in right of payment to the claims of all present and future senior obligations, except for obligations of the Company that are expressed to rank pari passu with, or junior to, its obligations under the capital securities.The USD800 million capital security was originally issued on 21 March 2017 for USD600 million, and the issuance was re-opened for an additional amount of USD200 million on 21 November 2017. The USD800 million capital security is listed on the Singapore Stock Exchange. The distribution on the capital security is 6.875 percent per annum until the distribution payment date in March 2022. The capital security may be redeemed at the Company’s option in whole, but not in part, in the period starting 90 calendar days before, and ending of, the distribution payment date in March 2022 or any distribution date thereafter upon giving not less than 30 nor more than 60 days’ notice to the holders. The early redemption amount payable by the Company shall be the principal amount of the capital security, together with any interest accrued to the date fixed for redemption, all arrears of interest and all additional interest amounts.The EUR262.5 million capital security was issued on 31 July 2019 and is listed on the Singapore Stock Exchange. The distribution on the capital security is 7.5 percent per annum until the distribution payment date in July 2024. The capital security may be redeemed at the Company’s option in whole, but not in part, in the period starting 90 calendar days before, and ending of, the distribution payment date in July 2024 or any distribution date thereafter upon giving not less than 30 nor more than 60 days’ notice to the holders. The early redemption amount payable by the Company shall be the principal amount of the capital security, together with any interest accrued to the date fixed for redemption, all arrears of interest and all additional interest amounts.
F. Notes to consolidated financial statements
Financial statements86

27.3 Currency translation reserveThe currency translation reserve comprises all foreign currency differences arising from the translation of the financial statements of foreign operations, as well as from the translation of liabilities that hedge the Company’s net investment in a foreign operation. The currency translation reserve as per 30 September 2020 includes a negative reserve of USD725.8 million related to the equity investment in Puma Energy Holdings Pte. Ltd.For the impact of hyperinflation accounting, refer to Note 37.
27.4 Revaluation reserveThe revaluation reserve comprises the fair value measurements movements of the equity investments which are accounted for at fair value through other comprehensive income. On realisation of these gains or losses (for example, the sale of an equity instrument), the cumulative amounts of this reserve are transferred to retained earnings. Included in the revaluation reserve is a loss of USD63.3 million (30 September 2019: USD29.0 million loss) related to the mark-to-market valuation of equity investments.
27.5 Cash flow hedge reserveThe Group has elected not to apply the cost of hedging option. A change in the fair value of derivatives designated as a cash flow hedge is initially recognised as a cash flow hedge reserve in OCI. The deferred amount is then released to the statement of income in the same period during which the hedged transaction affects the statement of income.Included in the cash flow hedge reserve is a loss of USD79.4 million (30 September 2019: USD100.6 million loss) related to the effective portion of the changes in fair value of cash flow hedges, net of tax. These cash flow hedges relate to hedging of interest and currency exposure on corporate loans and hedging of price exposure on future purchases and sales of commodities. The losses on hedging derivatives currently shown in the cash flow hedge reserve will be offset by decreased purchase/ finance costs and increased sales values in the period the hedged transactions are recognised. Over time, the overall net impact of the hedged items and hedging instruments together on the statement of income and OCI will be minimal.The cash flow hedge reserves as at 30 September 2020 includes a negative reserve of USD57.6 million relating to the Group’s share in the cash flow hedge reserves of equity-accounted investees (30 September 2019: USD13.4 million negative).
27.6 DividendsThe value of the dividends declared on the ordinary shares amount to USD585.9 million (2019: USD336.7 million), representing USD23.4 per share (2019: USD13.5 per share). Dividend payments are mostly made in relation to the share redemption by the direct parent company.
28. Material partly owned subsidiariesFinancial information of subsidiaries that have material non-controlling interest is provided below. The information is based on amounts before intercompany eliminations.The Company has control over DTS Holdings Pte. Ltd. with a 50 percent equity interest (2019: 50 percent). DTS Holdings Pte. Ltd. is a business venture between the Group and Cochan Singapore Pte. Ltd. and is the main holding company of the DT Group. The DT Group’s activities span trading, shipping, infrastructure, asset management and logistics.The summarised statement of income is as follows:
2020 2019USD’M USD’M
Revenue 16.7 103.2 Cost of sales (4.3) (80.9)General and administrative expenses (8.0) (10.6)Other income/(expense) (220.9) (2.5)Net financing income 9.1 (12.9)
Profit before tax (207.4) (3.7)
Tax (expense)/ income – 0.2
Profit for the period (207.4) (3.5)Attributable to non-controlling interest (103.7) (1.8)
During 2020, DTS Holdings Pte. Ltd. paid a dividend of USD nil (2019: USD6.8 million).The summarised statement of financial position as at 30 September is as follows:
2020 2019USD’M USD’M
Total non-current assets 156.8 294.0 Total current assets 355.2 458.9 Total current liabilities (83.2) (116.7)
Total equity 428.8 636.2
Attributable toNon-controlling interests 214.3 318.0 Owners of the Company 214.5 318.2
Trafigura Annual Report 2020 87
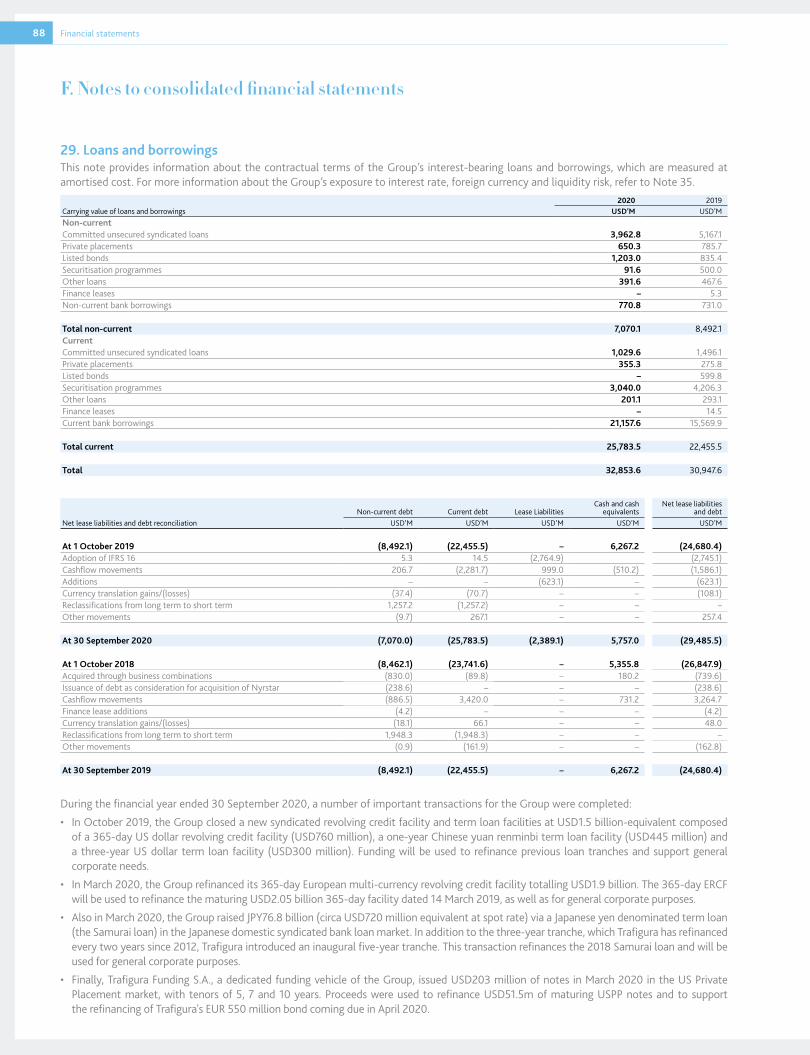
29. Loans and borrowingsThis note provides information about the contractual terms of the Group’s interest-bearing loans and borrowings, which are measured at amortised cost. For more information about the Group’s exposure to interest rate, foreign currency and liquidity risk, refer to Note 35.
2020 2019Carrying value of loans and borrowings USD’M USD’MNon-currentCommitted unsecured syndicated loans 3,962.8 5,167.1 Private placements 650.3 785.7 Listed bonds 1,203.0 835.4 Securitisation programmes 91.6 500.0 Other loans 391.6 467.6 Finance leases – 5.3 Non-current bank borrowings 770.8 731.0
Total non-current 7,070.1 8,492.1 CurrentCommitted unsecured syndicated loans 1,029.6 1,496.1 Private placements 355.3 275.8 Listed bonds – 599.8 Securitisation programmes 3,040.0 4,206.3 Other loans 201.1 293.1 Finance leases – 14.5 Current bank borrowings 21,157.6 15,569.9
Total current 25,783.5 22,455.5
Total 32,853.6 30,947.6
Non-current debt Current debt Lease LiabilitiesCash and cash
equivalentsNet lease liabilities
and debtNet lease liabilities and debt reconciliation USD’M USD’M USD’M USD’M USD’M
At 1 October 2019 (8,492.1) (22,455.5) – 6,267.2 (24,680.4)Adoption of IFRS 16 5.3 14.5 (2,764.9) (2,745.1)Cashflow movements 206.7 (2,281.7) 999.0 (510.2) (1,586.1)Additions – – (623.1) – (623.1)Currency translation gains/(losses) (37.4) (70.7) – – (108.1)Reclassifications from long term to short term 1,257.2 (1,257.2) – – –Other movements (9.7) 267.1 – – 257.4
At 30 September 2020 (7,070.0) (25,783.5) (2,389.1) 5,757.0 (29,485.5)
At 1 October 2018 (8,462.1) (23,741.6) – 5,355.8 (26,847.9)Acquired through business combinations (830.0) (89.8) – 180.2 (739.6)Issuance of debt as consideration for acquisition of Nyrstar (238.6) – – – (238.6)Cashflow movements (886.5) 3,420.0 – 731.2 3,264.7 Finance lease additions (4.2) – – – (4.2)Currency translation gains/(losses) (18.1) 66.1 – – 48.0 Reclassifications from long term to short term 1,948.3 (1,948.3) – – –Other movements (0.9) (161.9) – – (162.8)
At 30 September 2019 (8,492.1) (22,455.5) – 6,267.2 (24,680.4)
During the financial year ended 30 September 2020, a number of important transactions for the Group were completed: • In October 2019, the Group closed a new syndicated revolving credit facility and term loan facilities at USD1.5 billion-equivalent composed
of a 365-day US dollar revolving credit facility (USD760 million), a one-year Chinese yuan renminbi term loan facility (USD445 million) and a three-year US dollar term loan facility (USD300 million). Funding will be used to refinance previous loan tranches and support general corporate needs.
• In March 2020, the Group refinanced its 365-day European multi-currency revolving credit facility totalling USD1.9 billion. The 365-day ERCF will be used to refinance the maturing USD2.05 billion 365-day facility dated 14 March 2019, as well as for general corporate purposes.
• Also in March 2020, the Group raised JPY76.8 billion (circa USD720 million equivalent at spot rate) via a Japanese yen denominated term loan (the Samurai loan) in the Japanese domestic syndicated bank loan market. In addition to the three-year tranche, which Trafigura has refinanced every two years since 2012, Trafigura introduced an inaugural five-year tranche. This transaction refinances the 2018 Samurai loan and will be used for general corporate purposes.
• Finally, Trafigura Funding S.A., a dedicated funding vehicle of the Group, issued USD203 million of notes in March 2020 in the US Private Placement market, with tenors of 5, 7 and 10 years. Proceeds were used to refinance USD51.5m of maturing USPP notes and to support the refinancing of Trafigura's EUR 550 million bond coming due in April 2020.
F. Notes to consolidated financial statements
Financial statements88

The Group was in compliance with all its corporate and financial covenants as at 30 September 2020.
29.1 Terms and debt repayment scheduleThe terms and conditions of the outstanding debt (excluding short-term bank borrowings) per 30 September 2020 are as follows:
Principal Interest rate Maturity Floating/fixed rate debt< 1 year 1–5 years > 5 years TotalUSD’M USD’M USD’M USD’M
Committed unsecured syndicated loansCNH 4,052.8 Libor + 1.00% 2020 – October Floating 594.6 – – 594.6 USD 760.0 Libor + 0.65% 2020 – October Floating – – – – USD 435.0 Libor + 1.10% 2020 – October Floating 435.0 – – 435.0 USD 1,965.0 Libor + 0.55% 2021 – March Floating – – – – USD 875.0 Libor + 0.80% 2022 – March Floating – 700.0 – 700.0 USD 520.0 Libor + 1.10% 2021 – October Floating – 520.0 – 520.0 USD 300.0 Libor + 1.10% 2022 – October Floating – 300.0 – 300.0 JPY 67,800.0 Libor + 0.90% 2023 – March Floating – 642.5 – 642.5 USD 2,740.0 Libor + 0.80% 2023 – March Floating – 1,715.0 – 1,715.0 JPY 9,000.0 Libor + 1% 2025 – March Floating – 85.3 – 85.3
1,029.6 3,962.8 – 4,992.3 Private placementUSD 98.0 7.11% 2021 – April Fixed 98.0 – – 98.0 CNY 500.0 6.50% 2021 – April Fixed 73.7 – – 73.7 CNY 500.0 6.50% 2021 – May Fixed 73.6 – – 73.6 CNY 700.0 6.20% 2021 – September Fixed 103.2 – – 103.2 CNY 540.0 5.49% 2022 – May Fixed – 79.6 – 79.6 USD 57.5 5.53% 2023 – March Fixed – 57.5 – 57.5 USD 53.0 5.55% 2023 – May Fixed – 53.0 – 53.0 USD 35.0 4.01% 2025 – March Fixed – 35.0 – 35.0 USD 67.0 5.72% 2025 – May Fixed – 67.0 – 67.0 USD 83.0 4.17% 2027 – March Fixed – – 83.0 83.0 USD 20.0 5.86% 2028 – May Fixed – – 20.0 20.0 USD 85.0 4.60% 2030 – March Fixed – – 85.0 85.0 USD 200.0 6.33% 2036 – July Fixed 6.7 31.4 138.8 176.9
355.3 323.5 326.8 1,005.6 Listed bondsUSD 444.4 5.25% 2023 – March Fixed – 441.7 – 441.7 CHF 165.0 2.25% 2023 – May Fixed – 179.0 – 179.0 CHF 55.0 3.25% 2024 – September Fixed – 59.7 – 59.7 USD 186.4 0.00% 2026 – July Fixed – – 122.5 122.5 USD 400.0 5.875% 2025 – September Fixed – 400.0 – 400.0
– 1,080.4 122.5 1,203.0 Securitisation programmesUSD 410.0 Libor + 1.0% 2020 – November Floating 372.5 – – 372.5 USD 40.0 Libor + 0.5% 2020 – November Floating 8.4 – – 8.4 USD 225.0 Libor + 1.0% 2021 – April Floating 225.0 – – 225.0 USD 280.0 3.73% 2021 – September Fixed 280.0 – – 280.0 USD 185.0 Libor + 0.73% 2021 – September Floating 185.0 – – 185.0 USD 35.0 4.33% 2021 – September Fixed 35.0 – – 35.0 USD 91.6 Libor + 4.25% 2023 – March Floating – 91.6 – 91.6 USD 2,709.4 Various Various Floating 1,934.1 – – 1,934.1
3,040.0 91.6 – 3,131.6
Other Loans 201.1 327.4 64.2 592.7
Total 4,625.8 5,785.7 513.6 10,925.2
For non-current assets pledged under loans and borrowings agreements, refer to Note 14.
Trafigura Annual Report 2020 89
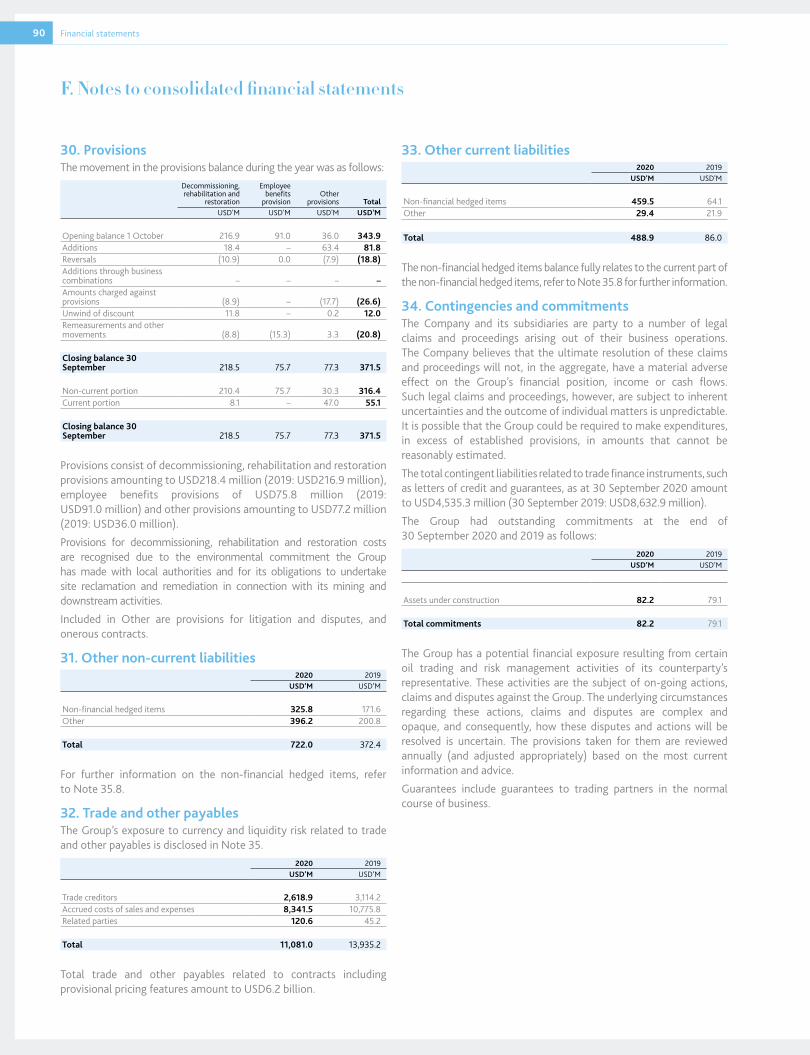
F. Notes to consolidated financial statements
30. ProvisionsThe movement in the provisions balance during the year was as follows:
Decommissioning, rehabilitation and
restoration
Employee benefits
provisionOther
provisions TotalUSD'M USD'M USD'M USD'M
Opening balance 1 October 216.9 91.0 36.0 343.9 Additions 18.4 – 63.4 81.8 Reversals (10.9) 0.0 (7.9) (18.8)Additions through business combinations – – – –Amounts charged against provisions (8.9) – (17.7) (26.6)Unwind of discount 11.8 – 0.2 12.0 Remeasurements and other movements (8.8) (15.3) 3.3 (20.8)
Closing balance 30 September 218.5 75.7 77.3 371.5
Non-current portion 210.4 75.7 30.3 316.4 Current portion 8.1 – 47.0 55.1
Closing balance 30 September 218.5 75.7 77.3 371.5
Provisions consist of decommissioning, rehabilitation and restoration provisions amounting to USD218.4 million (2019: USD216.9 million), employee benefits provisions of USD75.8 million (2019: USD91.0 million) and other provisions amounting to USD77.2 million (2019: USD36.0 million).Provisions for decommissioning, rehabilitation and restoration costs are recognised due to the environmental commitment the Group has made with local authorities and for its obligations to undertake site reclamation and remediation in connection with its mining and downstream activities.Included in Other are provisions for litigation and disputes, and onerous contracts.
31. Other non-current liabilities2020 2019
USD’M USD’M
Non-financial hedged items 325.8 171.6 Other 396.2 200.8
Total 722.0 372.4
For further information on the non-financial hedged items, refer to Note 35.8.
32. Trade and other payablesThe Group’s exposure to currency and liquidity risk related to trade and other payables is disclosed in Note 35.
2020 2019USD’M USD’M
Trade creditors 2,618.9 3,114.2 Accrued costs of sales and expenses 8,341.5 10,775.8 Related parties 120.6 45.2
Total 11,081.0 13,935.2
Total trade and other payables related to contracts including provisional pricing features amount to USD6.2 billion.
33. Other current liabilities2020 2019
USD'M USD'M
Non-financial hedged items 459.5 64.1 Other 29.4 21.9
Total 488.9 86.0
The non-financial hedged items balance fully relates to the current part of the non-financial hedged items, refer to Note 35.8 for further information.
34. Contingencies and commitmentsThe Company and its subsidiaries are party to a number of legal claims and proceedings arising out of their business operations. The Company believes that the ultimate resolution of these claims and proceedings will not, in the aggregate, have a material adverse effect on the Group’s financial position, income or cash flows. Such legal claims and proceedings, however, are subject to inherent uncertainties and the outcome of individual matters is unpredictable. It is possible that the Group could be required to make expenditures, in excess of established provisions, in amounts that cannot be reasonably estimated.The total contingent liabilities related to trade finance instruments, such as letters of credit and guarantees, as at 30 September 2020 amount to USD4,535.3 million (30 September 2019: USD8,632.9 million).The Group had outstanding commitments at the end of 30 September 2020 and 2019 as follows:
2020 2019USD’M USD’M
Assets under construction 82.2 79.1
Total commitments 82.2 79.1
The Group has a potential financial exposure resulting from certain oil trading and risk management activities of its counterparty’s representative. These activities are the subject of on-going actions, claims and disputes against the Group. The underlying circumstances regarding these actions, claims and disputes are complex and opaque, and consequently, how these disputes and actions will be resolved is uncertain. The provisions taken for them are reviewed annually (and adjusted appropriately) based on the most current information and advice.Guarantees include guarantees to trading partners in the normal course of business.
Financial statements90

35. Financial instruments35.1 Financial risk managementThe Group is exposed to a number of different financial risks arising from normal business exposures and its use of financial instruments, including market risks relating to commodity prices, foreign currency exchange rates, interest rates and equity prices, credit risk and liquidity risk.Prudently managing these risks is an integral element of the Group's business and has been institutionalised since the Group’s foundation. Risk management guidelines are established at senior management level. The various risks the Group is exposed to are managed through a combination of internal procedures, such as strict control mechanisms and policies, and external third parties, such as the derivative, insurance and bank markets. As a rule, the Group actively manages and lays off where possible a large majority of the risks inherent to its activity. The Group's conservative risk management process is designed to: • Provide full and accurate awareness of risks throughout the Group; • Professionally evaluate and monitor these risks through a range of
risk metrics; • Limit risks via a dynamic limit setting framework; • Manage risks using a wide range of hedging instruments and
strategies; and • Ensure a constant dialogue between trading desks, risk managers
and senior management.The three main components of the Group's risk management process are the Chief Risk Officer (CRO), the Market Risk Management Committee and the trading teams.The CRO is independent of the revenue-producing units and reports to the Chief Operating Officer and the Management Committee. The CRO has primary responsibility for assessing and monitoring the Group's market risks. The CRO’s team liaises directly with the trading teams to analyse new opportunities and ensure that risk assessments adapt to changing market conditions. The CRO’s team also ensures that the Group's risk management capabilities incorporate ongoing advances in technology and risk management modelling capabilities.The Market Risk Management Committee, which is comprised of members of the Management Committee and the CRO, is responsible for applying the Group's risk management capabilities towards improving the overall performance of the Group. In 2020, the Market Risk Management Committee met at least weekly to discuss and set risk and concentration limits, review changing market conditions and analyse new market risks and opportunities.The Group's trading teams provide deep expertise in hedging and risk management in the specific markets that each team operates in. While the trading teams have front line responsibility for managing the risks arising from their activities, the Group's process ensures a strong culture of escalation and accountability, with well-defined limits, automatic notifications of limit overages and regular dialogue with the CRO and Market Risk Management Committee.
35.2 Market riskMarket risk is the risk of loss in the value of the Group's positions due to changes in market prices. The Group holds positions primarily to ensure the Group's ability to meet physical supply commitments to the Group's customers, to hedge exposures arising from these commitments, and to support the Group's investment activities. The Group's positions change due to changing customer requirements and investment opportunities. The value of the Group's positions is accounted for at fair value and therefore fluctuates on a daily basis due to changes in market prices. Categories of market risk the Group is exposed to include: • Commodity price risk results from exposures to changes in spot
prices, forward prices and volatilities of commodities, such as crude oil, petroleum products, natural gas, base metals, coal and iron ore.
• Currency rate risk results from exposures to changes in spot prices, forward prices and volatilities of currency rates.
• Interest rate risk results from exposures to changes in the level, slope and curvature of yield curves, the volatilities of interest rates and credit spreads.
• Equity price risk results from exposures to changes in prices and volatilities of individual equities and equity indices.
The Group hedges a large majority of price risks arising from its activities. When there is a difference in the characteristics of available hedging instruments and the corresponding commodity price exposures, the Group remains exposed to a residual price risk referred to as basis risk. Dynamically managing the basis risk that arises from the Group's activities requires specialist skills and is a core focus of the Group's trading and risk management teams.Value at Risk
Value at Risk (VaR) is a statistical estimate of the potential loss in value of the Group's positions and unsold in-transit material due to adverse market movements. The Group calculates VaR over a one-day time horizon with a 95 percent confidence level. The Group uses an integrated VaR model which captures risks including commodity prices, interest rates, equity prices and currency rates. The Group's integrated VaR model facilitates comparison of VaR across portfolios comprised of a range of different risk exposures.As of 30 September 2020, the Group's one-day market risk VaR was USD10.3 million (30 September 2019: USD24.1 million). Average market risk VaR (1 day 95 percent) during the period was USD26.4 million, compared to USD11.6 million in the previous full financial year. The Group's Management Committee has set a target of maintaining VaR (one-day 95 percent) below 1 percent of Group equity.The Group is aware of the inherent limitations to VaR and therefore uses a variety of risk measures and risk management techniques to create a robust risk management process. Limitations of VaR include: • VaR does not estimate potential losses over longer-time horizons
where the aggregate moves may be extreme. • VaR does not take account of the liquidity of different risk positions
and therefore does not estimate the losses that might arise if the Group liquidated large positions over a short period of time.
• VaR is based on statistical analysis of historical market data. If this historical data is not reflective of futures market prices movements, VaR may not provide accurate predictions of future possible losses.
Trafigura Annual Report 2020 91

The Group's VaR calculation covers its trading businesses in the crude oil, refined oil products, petrochemical, natural gas, metals, concentrates, coal, iron ore and freight markets, and assesses the open-priced positions which are those subject to price risk, including inventories of these commodities. The Group's VaR model is based on historical simulations, with full valuation of more than 5,000 market risk factors.VaR is calculated based on simultaneously shocking these risk factors. More recent historical price data is more heavily weighted in these simulations, which enables the VaR model to adapt to more recent market conditions and improves the accuracy of the Group's estimates of potential losses.The Group's VaR model utilises advanced statistical techniques that incorporate the non-normal price dynamics that are an important feature of commodity markets. The Group's VaR model is continuously and automatically calibrated and back-tested to ensure that its out-of-sample performance adheres to well-defined targets. In addition, the Group's VaR model is regularly updated to ensure it reflects the current observed dynamics of the markets the Group is active in.The Group has made a significant, ongoing investment in risk management systems, including a reporting system which automatically distributes customised risk reports throughout the Group on a daily basis. These reports provide up-to-date information on each team’s risk using industry standard measures such as 95 percent and 99 percent VaR and performance indicators such as Sharpe ratios.All trading books have well-defined VaR risk limits. Management and the trading teams are automatically notified whenever a book nears its risk limit, as well as whenever a VaR limit breach occurs. In addition, the Group's Deals Desk management team is automatically notified whenever statistically anomalous changes occur in the profit and loss of any deal.For senior management, the daily reports provide a comprehensive view of the Group's risk, classified according to various risk factors. These reports emphasise the risk diversification created by the Group’s varied activities and highlight any excessive risk concentrations.
35.3 Credit riskCredit risk is the risk of financial loss to the Group if a customer or counterparty to a financial instrument or physical contract fails to meet its contractual obligations, and arises principally from the Group’s receivables from customers, and investment in debt and equity securities.The Group has a formalised credit process with credit officers in the key locations around the world. Strict credit limits are set up for each counterparty on the basis of detailed financial and business analysis. These limits are constantly monitored and revised in light of counterparty or market developments and the amount of exposure relative to the size of the Group’s statement of financial position. The Group makes extensive use of the banking and insurance markets to cover any counterparty or country risks that are in excess of its credit limits.
The risk-management-monitoring and decision-making functions are centralised and make extensive use of the Group’s integrated bespoke IT system. The Group conducts transactions with the following major types of counterparties: • Physical commodity counterparties spread across the vertical
chains for both oil and bulk, e.g. producers, refiners/smelters and end-users. Sales to investment grade and non-investment grade counterparties are made on open terms up to internally approved credit limits. Exposures above such limits are subject to payment guarantees.
• Payment guarantee counterparties, i.e., prime financial institutions from which the Group obtains payment guarantees.
• Hedge counterparties, which comprise a number of prime financial institutions and physical participants in the relevant markets. There is no significant concentration of risk with any single counterparty or group of counterparties. Collateral is obtained from counterparties when the Group’s exposure to them exceeds approved credit limits. It is the Group’s policy to have ISDA Master Agreements or ISDA-based Long-Form Confirmation Agreements in place with all hedging counterparties.
The Group trades in all major geographic regions. Where appropriate, guarantees, insurance and letters of credit are used to reduce payment or performance risk. The Group has gross credit exposure in locations across the world with a concentration in emerging markets. Most of this exposure is transferred to third parties, while the Group retains between 10 percent to 20 percent on average of the individual exposures.The Group’s maximum exposure to credit risk, without considering netting agreements or without taking into account of any collateral held or other credit enhancements, is equal to the carrying value of its financial assets as indicated in the statement of financial position plus the guarantees to third parties and associates.The Group has amounts and guarantees outstanding related to countries that are impacted by sanctions currently imposed by the United States and European Union. The Group analysed the sanctions and exposures and concluded that these do not materially impact the Group’s positions.35.3.1 Concentration of credit risk
Concentrations of credit risk exist when changes in economic, industry or geographical factors similarly affect the Group's counterparties, whose aggregate credit exposure is significant in relation to the Group's total credit exposure. The carrying amount of financial assets represents the maximum credit exposure. The Group determines concentrations of credit risk by monitoring the country profile of its third-party trade receivables on an on-going basis.The Group has a diverse customer base, with no customer representing more than 3.5 percent of its revenues over the 12-month period ended 30 September 2020 (2019: 4.5 percent).For details on the aging of trade and other receivables at the reporting date that were not impaired, refer to Note 23.
F. Notes to consolidated financial statements
Financial statements92

35.3.2 Financial assets that are not past due
Trade and other receivables that are not past due are creditworthy debtors with good payment records with the Group. Cash and cash equivalents and derivatives that are not past due are placed with or entered into with reputable financial institutions or companies with high credit ratings and no history of default. The credit quality of trade and other receivables is assessed based on a strict credit policy. The Group has monitored customer credit risk, by grouping trade and other receivables based on their characteristics.Based on the Group’s monitoring of customer credit risk, the Group believes that, except as indicated above, no material expected credit loss allowance is necessary in respect of trade receivables not past due.35.3.3 Impairments of financial assets
Information regarding impairment of financial assets is disclosed in Note 11 (Impairment) and Note 23 (Trade and other receivables).35.3.4 Guarantees
The Group’s policy is to provide financial guarantees only to wholly owned subsidiaries and trading partners in the normal course of business. As part of the Group’s ordinary physical commodity trading activities, Trafigura Group Pte. Ltd. may act as guarantor by way of issuing guarantees accepting responsibility for subsidiaries’ contractual obligations.35.4 Liquidity riskLiquidity risk is the risk that the Group is unable to meet its payment obligations when due, or that it is unable, on an on-going basis, to borrow funds in the market on an unsecured or secured basis at an acceptable price to fund actual or proposed commitments.The Group’s approach to managing liquidity is to ensure, as far as possible, that it will always have sufficient cash and cash equivalents and ready sources of committed funding available to meet anticipated and unanticipated funding needs. Sound financial management with a focus on liquidity has been instrumental to the Group’s success. The Group has demonstrated the ability to raise the appropriate types of financing to match the needs of the business and to tap various investor bases (e.g., syndicated loan markets, trade finance markets, bond markets, private placement markets and securisation), maturities and geographies.The Group manages its treasury and liquidity risks, maintaining a strong liquidity position, through the following: • Targeting immediately available cash on hand of a minimum
amount of USD500 million under normal conditions (higher in the case of extreme volatility);
• Maintaining transactional lines which allow the Group to mark-to-market financings to the value of the underlying physical assets. Mark-to-market financing is performed weekly (or intra-weekly in the case of extreme volatility) and provides an additional source of liquidity that is not available to competitors, which are financed purely from revolving credit facilities and/or capital markets securities;
• Committed unsecured credit facilities; • Maintaining headroom under transactional trade finance lines and
committed revolving credit facilities; and • Reasonable distribution of profit (in order to generate retained
earnings) and subordination of repurchased equity.
The maturity analysis of the Group’s financial liabilities based on the contractual terms is as follows:
0-1 years 1-5 years > 5 years TotalUSD’M USD’M USD’M USD’M
30 September 2020Financial liabilitiesCurrent and non-current loans and borrowings 25,783.5 6,556.5 513.6 32,853.6 Trade and other payables 11,081.0 – – 11,081.0 Expected interest payments on committed lines until maturity 366.1 538.4 152.0 1,056.5 Derivative financial liabilities 640.1 162.6 28.2 830.9
Total financial liabilities 37,870.7 7,257.5 693.8 45,822.0
0-1 years 1-5 years > 5 years TotalUSD’M USD’M USD’M USD’M
30 September 2019Financial liabilitiesCurrent and non-current loans and borrowings 22,455.5 8,094.5 397.6 30,947.6 Trade and other payables 13,935.2 – – 13,935.2 Expected interest payments on committed lines until maturity 367.0 441.9 144.5 953.4 Derivative financial liabilities 746.0 346.6 27.0 1,119.6
Total financial liabilities 37,503.7 8,883.0 569.1 46,955.8
35.5 Interest rate riskThe Group is not exposed to significant interest rate risk since the maturity of its short-term funding ranges from a few weeks to a few months and each commercial transaction considers current interest rate levels. Interest rate risk of the Group is mainly applicable on the long-term funding of the Group, although a majority of debt, whether long-term or short-term, is at floating rate.From time to time, the Group enters into interest rate derivative transactions to lock-in current interest rate levels: for instance, interest rate swaps that provide a method of reducing the Group’s exposure to floating interest rates arising from its corporate funding programmes. To realise the desired matching of derivative results with the hedged interest rate payments, cash flow hedge accounting is applied and the derivatives are designated as hedging instruments. The derivatives are carried on balance and their effectiveness is tested on a quarterly basis.
Trafigura Annual Report 2020 93

35.6 Currency riskThe Group has few exposures to foreign currency risk on its trading activities and those that do exist are hedged out. The Group does not use financial instruments to hedge the translation risk related to equity and earnings of foreign subsidiaries and non-consolidated companies.The Group uses cross-currency swaps to hedge currency risk on the principal and related payments of foreign currency denominated loans and bonds for which cash flow hedge accounting is applied. The hedge relationship is expected to be highly effective due to the matching of critical terms between the underlying hedged item and the associated hedge instrument.The periods when the cash flows are expected to occur are similar to the periods when the cash flows on the foreign currency denominated loans and bonds occur as indicated in Notes 27 and 35.4. Ineffectiveness may arise (i) if the underlying interest reference rate is divergent to the underlying reference rate in the Group’s debt agreements; (ii) to the extent that the hedging instrument is already in the money or out of the money at the point of designation (compared to the hypothetical derivative that must be created on market); (iii) when the timing of the hedging instrument goes beyond the hedged item and it is not considered highly probable that the hedged item will be refinanced beyond its current maturity date; or (iv) if the hedging instrument is for an amount greater than the hedged item.
35.7 Cash flow hedge accountingIn some instances the Group has elected to apply cash flow hedge accounting to certain highly probable cash flows. These cash flows relate to the following hedged items: • Forecasted purchases and sales of LNG; • Sales of mining production; • Purchases of electricity that is needed for the refinery process; • Operating expenditure, interest payments and other forecasted
purchases and sales.The designated hedge derivatives are accounted for at fair value, with the fair value movements being deferred through other comprehensive income where they are deemed to be entered in an effective hedge relationship with cash flows that are yet to be reflected in the statement of income. Any fair value movements that are not considered to be an effective hedge are recognised directly through the statement of income.Ineffectiveness will occur due to time spread between the hedged item and the hedging instrument as well as due to the basis risk. The effectiveness of the economic relationship between the hedging instruments and the hedged item has been assessed at the inception of the hedge accounting designation and is reassessed at least on an annual basis. The hedge ratio is determined by the ratio which provides a strong relationship between movements in the fair value of the hedged item and hedging instruments at the inception of the hedge accounting relationship.
The overview of the cash flow hedges is as follows:2020
USD'M2019
USD'M2020
USD'M2019
USD'MMaturity Equivalent Notionals Fair values
Cross-currency/interest swaps hedging interest payments 0-4 years USD'M 2,094.7 2,453.8 (20.9) (80.4)Gas and fx futures/swaps hedging future purchases and sales of LNG 0-4 years various 604.3 937.9 (51.5) (94.6)Fx swaps hedging future non-USD loan transaction and opex payments 0-4 years USD'M 2,089.1 1,245.7 77.2 (31.2)LME futures hedging future sales and mining production 0-2 years DMT 261,661.4 15,225.0 (8.0) (1.2)Electricity swaps hedging future purchase of electricity 0-10 years AUD'M 592.1 594.0 (70.6) (11.4)Oil related instruments hedging future purchases, sales and cost < 1 year USD'M 25.5 – 1.0 –
Total (72.8) (218.9)
2020
Ineffectiveness recognised
through statement of income
Gain/(loss) on cash flow hedges
through other comprehensive
income
Cross-currency/interest swaps hedging interest payments 3.5 (33.3)Gas and fx futures/swaps hedging future purchases and sales of LNG 0.3 35.1 Fx swaps hedging future non-USD loan transaction and opex payments 14.2 78.0 LME futures hedging future sales and mining production 1.7 18.8 Electricity swaps hedging future purchase of electricity (0.1) (52.7)Oil related instruments hedging future purchases, sales and cost 0.1 1.0
Total 19.6 46.7
Cash flow on hedge reserve on equity-accounted investees (43.7)Tax on cash flow hedge reserve 18.1
Cash flow hedge reserve movement in statement of changes in equity 21.1
F. Notes to consolidated financial statements
Financial statements94

35.8 Fair value hedge accountingIn some instances, the Group elects to apply fair value hedge accounting to certain physical forward contracts described in the table below (the hedged items) and the corresponding paper hedge positions (the hedging instruments). Under the strict rules of hedge accounting, the Group is required to match each paper hedge position with the corresponding physical contract position. The intention is that a movement in fair value of a physical contract is accounted against the corresponding (and opposite) movement in fair value of the related paper hedges: both movements (increase and decrease) are recorded in the statement of income (specifically to the line cost of sales), leading to a neutral result. It is important to note that the fair value of the physical contracts does not include any trading margin, premium or any form of potential profit of the physical contracts.The Group has elected to apply fair value hedge accounting to non-financial hedged items or certain risk components of non-financial hedged items. These non-financial hedged items relate to firm commitments with respect to tolling agreements, a transportation agreement, and offtake agreements amongst others described below.
Tolling agreementsTransportation agreements Offtake agreements
Nature of forward contract (=hedged item)
Convert crude to refined products
Transport crude from Permian Basin to Gulf Coast
Offtake LNG in the US
Main counterparty of forward contract
Buckeye Texas Processing LLC and Magellan Processing LP
Cactus II Pipeline LLC
Cheniere Marketing LLC and Freeport LNG Marketing LLC
Maturity of forward contract
Ranging from 2020 to 2023
Ranging from 2020 to 2024
Ranging from 2020 to 2033
Trading strategy Process crude into refined products
Transport crude from Permian Basin to Gulf Coast
Purchase LNG in the US, transport, transform back into natural gas, and sell natural gas in Europe
Nature of paper hedge (=hedging instrument)
Hedging spread exposure (crude vs refined products) with futures and swaps
Hedging spread exposure (Permian Basin crude vs Gulf Coast crude) with futures and swaps
Hedging spread exposure (LNG in the US vs natural gas in Europe) with futures and swaps
35.8.1 Hedged items
The Group’s tolling agreements represent non-financial hedged items, which the Group has entered into for fractionation services to convert crude feedstock into various crude refined products. The derivative hedging instruments (hedges consisting of futures and swaps) are entered into to hedge the spread exposures, referred to as the hedged risk, between the purchase of crude feedstock and the sale of crude refined products.The Group’s transportation agreement represents a non-financial hedged item, which the Group has entered into for the transportation of crude oil from the Permian Basin of Texas to the Gulf Coast. The derivative hedging instruments (hedges consisting of futures and swaps) are entered into to hedge the spread exposures, referred to as the hedged risk, between the purchase of inland crude oil barrels and the sale of those barrels on the Gulf coast.
The Group’s offtake agreements represent a non-financial hedged item, which the Group has entered into for the purchase of liquefied natural gas (LNG) from the United States with a number of counterparties. The derivative hedging instruments (hedges consisting of futures and swaps) are entered into to hedge the spread exposures, referred to as the hedged risk, between purchasing LNG from the US and selling LNG to its expected destination markets.The Group’s storage and bareboat charter agreements represent non-financial hedged items, which the Group has entered into for the purpose of storing and transporting oil. The derivative hedging instruments are entered to hedge the time spread and freight exposure on the different contracts.35.8.2 Hedging instruments
When applicable, the Group designates derivative hedging instruments as fair value hedges in relationship to the associated hedged items: • The maturity profile of the hedging instrument used for hedging
the designated risk components associated with the tolling agreements varies from one month to four years.
• The maturity profile of the hedging instruments used for hedging the designated risk components associated with the transportation agreement varies from one month to five years.
• The maturity profile of the hedging instruments used for the hedging of the offtake agreement varies from one month to five years.
• The maturity profile of the hedging instruments used for hedging the storage and bareboat charter agreements varies from one month to three years.
The designated hedge derivatives are accounted for at fair value through profit and loss. The identified hedged items are accounted for at fair value and recognised in cost of sales within the statement of income. The fair value is reflected in the statement of financial position as either a recognised asset or liability. The fair value is determined using benchmarks best representing the designated hedged item. Specifically in the case of LNG, the fair value of the hedged item also considers unobservable inputs.35.8.3 Economic relationship
IFRS 9 requires the existence of an economic relationship between the hedged item and the hedging instrument. At designation and at the start of each reporting period, critical terms of both hedged items and hedge instruments in a hedge relationship are reviewed to ascertain the expectation that the value of the hedging instrument and the value of the hedged item would move into opposite directions as a result of the common underlying and therefore meeting the risk management objective of the hedge relationship.
Trafigura Annual Report 2020 95

35.8.4 Hedge effectiveness assessment
At each reporting date or on significant changes in circumstances a quantitative hedge effectiveness assessment is performed. The fair values of both hedged items and hedging instruments are measured and the net difference of the changes is the hedge ineffectiveness amount. The hedge ineffectiveness amount is analysed by its various sources (for example: basis differences, location differences, timing differences, quantity or notional amount differences, currency basis and forward points, credit risk or other risks) where applicable. Specific factors that may impact ineffectiveness are the mismatch in the designated hedge period and the maturity period of the hedging instrument and a differential of the various benchmarks for the pricing of the hedging instruments and the hedged items. In the case of LNG, the hedged item designated includes foreign currency exposure. However, the foreign currency hedges have not been designated into the hedge relationship, giving rise to additional, unintentional ineffectiveness. The fair value of the foreign exchange hedges that have not been designated can be seen in the table below. The fair value adjustments on the non-financial hedged items are presented in the balance sheet under the following categories:
30 September 2020 30 September 2019USD’M USD’M USD’M USD’MOther
non-current assets
(Note 21)
Other current
assets (Note 25)
Other current
assets (Note 21)
Other current
assets (Note 25)
Non-financial hedged items – Tolling agreements 76.9 61.8 145.6 102.0 Non-financial hedged items – Transportation agreements – – – –Non-financial hedged items – LNG contracts – 0.7 68.5 –Non-financial hedged items – Bareboat charter agreements – 2.0 2.4 18.1 Non-financial hedged items – Storage agreements – – – –
Closing balance of the hedged item 76.9 64.5 216.5 120.1
30 September 2020 30 September 2019USD’M USD’M USD’M USD’MOther
non-current liabilities (Note 31)
Other current
liabilities (Note 33)
Other non-current
liabilities (Note 31)
Other current
liabilities (Note 33)
Non-financial hedged items – Tolling agreements – – – –Non-financial hedged items – Transportation agreements 163.2 270.3 148.8 37.6 Non-financial hedged items – LNG contracts 159.1 151.4 22.8 26.5 Non-financial hedged items – Bareboat charter agreements 1.0 28.7 – –Non-financial hedged items – Storage agreements 2.5 9.1 – –
Closing balance of the hedged item 325.7 459.5 171.6 64.1
Net balance of the hedged item (+ = asset/ - = liability) (643.8) 100.9
The following table summarises the movements in the non-financial hedged items and the related derivatives recognised in the statement of income:
30 September 2020
30 September 2019
Fair value hedge accounting USD’M USD’M
Opening balances of the derivatives marked as hedges (170.0) (1,897.9)
Fair value movement included in the hedge relationship 760.7 1,281.4 Hedges for which hedge relationship matured (27.1) 330.3 Hedges not designated in hedge relationship (92.5) 116.2
Closing balance of the derivatives marked as hedges 471.1 (170.0)
Opening balance of the hedged item 100.9 1,749.5
Fair value movement included in the hedge relationship (684.8) (1,333.3)Release of fair value adjustment due to matured hedge relationship (60.0) (315.3)
Closing balance of the hedged item (643.9) 100.9
Lifetime to date net gain/(loss) (172.8) (69.1)Year to date net gain/(loss) (103.7) 79.3 Ineffectiveness year-to-date 75.9 (51.9)
35.9 Capital managementThe Group's policy is to maintain a strong capital base so as to maintain investor, creditor and market confidence and to sustain future development of the business.The Company’s immediate parent, Trafigura Beheer B.V., is exclusively owned by its employees. This shareholding arrangement leads to an alignment of the long-term interests of the Group and its management team. By virtue of having its own capital at risk, senior management is incentivised to take a long-term view of the Group's overall performance and to protect its capital.The Group's capital management is aimed at ensuring that the Group meets financial covenants attached to the interest-bearing loans and borrowings that define capital structure requirements. Breaches in meeting the financial covenants would permit the lenders to immediately call loans and borrowings. There have been no breaches in the financial covenants of any loans and borrowing in the current period.The Group monitors its capital adequacy using an adjusted debt -to-equity ratio, which is adjusted total debt divided by the Group's equity. For this purpose, the adjusted debt metric represents the Group's total non-current and current debt less cash, deposits, readily marketable inventories (including purchased and pre-paid inventories which are being released), debt related to the Group's receivables securitisation programme and the non-recourse portion of loans from third parties.
F. Notes to consolidated financial statements
Financial statements96

The Company’s long-term average target adjusted debt-to-equity ratio is 1.0x. The Company’s adjusted net debt-to-equity ratio at the end of the reporting period was as follows:
30 September 2020
30 September 2019
USD’M USD’M
Non-current loans and borrowings 7,070.1 8,492.1 Current loans and borrowings 25,783.5 22,455.5
Total debt 32,853.6 30,947.6
AdjustmentsCash and cash equivalents 5,757.0 6,267.2 Deposits 466.0 374.2 Inventories (including purchased and pre-paid inventories) 20,921.8 14,137.2 Receivables securitisation debt 2,750.6 4,422.1 Non-recourse debt 198.4 437.2
Adjusted total debt 2,759.9 5,309.7
Group equity 7,789.9 6,804.7
Adjusted debt to Group equity ratio at the end of the period 0.35 0.78
35.10 Fair value35.10.1 Fair values versus carrying amounts
The fair values of inventories, financial assets and liabilities, together with the carrying amounts shown in the statement of financial position, are as follows:
30 September 2020Carrying value Fair value
USD’M USD’MAssetsListed equity securities – Fair value through OCI 3.9 3.9 Listed equity securities – Fair value through profit or loss 25.3 25.3 Listed debt securities – Fair value through profit or loss 220.9 220.9 Unlisted equity investments – Fair value through profit or loss 34.3 34.3 Unlisted equity investments – Fair value through OCI 232.7 232.7 Loans receivable (*) 694.4 730.0 Inventories 20,177.6 20,177.6 Trade and other receivables (*) 15,245.1 15,251.2 Non-financial hedged items 141.4 141.4 Derivatives 1,099.1 1,099.1 Deposits (*) 466.0 466.0 Cash and cash equivalents (*) 5,757.0 5,757.0
Total financial assets and inventories 44,097.7 44,139.4
LiabilitiesLoans and borrowingsFloating rate borrowings (*) 30,330.0 30,330.0 Fixed-rate borrowings 2,523.6 2,585.1 Trade and other payables (*) 11,081.0 11,081.0 Non-financial hedged items 785.2 785.2 Derivatives 830.9 830.9
Total financial liabilities 45,550.7 45,612.1
30 September 2019Carrying value Fair value
USD’M USD’MAssetsListed equity securities – Fair value through OCI 28.8 28.8 Listed equity securities – Fair value through profit or loss 342.1 342.1 Listed debt securities – Fair value through profit or loss 345.5 345.5 Unlisted equity investments – Fair value through profit or loss 53.9 53.9 Unlisted equity investments – Fair value through OCI 233.4 233.4 Loans receivable (*) 521.4 552.8 Inventories 13,435.0 13,435.0 Trade and other receivables (*) 18,516.5 18,527.5 Non-financial hedged items 336.6 336.6 Derivatives 1,356.0 1,356.0 Deposits (*) 374.2 374.2 Cash and cash equivalents (*) 6,267.2 6,267.2
Total financial assets and inventories 41,810.6 41,853.0
LiabilitiesLoans and borrowingsFloating rate borrowings (*) 27,886.1 27,886.1 Fixed-rate borrowings 3,041.7 3,110.9 Finance lease and purchase contract (*) 19.8 19.8 Trade and other payables (*) 13,935.2 13,935.2 Non-financial hedged items 235.7 235.7 Derivatives 1,119.6 1,119.6
Total financial liabilities 46,238.1 46,307.3 * Management has determined that these carrying amounts reasonably approximate their fair values
because these are mostly short-term in nature and are re-priced regularly.
Increases in fair value of derivatives are predominantly caused by physical forward contracts. The gains booked on these contracts are offset by similar losses on associated cash settled hedge derivatives, meaning no net profit has been taken on these forward physical contracts.Offsetting of financial assets and liabilities
In accordance with IAS 32, the Group reports financial assets and liabilities on a net basis in the consolidated statement of financial position only if there is a legally enforceable right to set off the recognised amounts and there is intention to settle on a net basis, or to realise the asset and settle the liability simultaneously. The financial assets and liabilities subject to offsetting, enforceable master netting and similar agreements as at 30 September 2020 and 2019 were as follows:
2020
Amounts eligible for set off under netting agreements
Amounts not subject
to netting agreements
Net amounts presented
in the statement
of financial position
Gross amount
Amounts offset
Net amount
USD’M USD’M USD’M USD’M USD’M
Related parties 921.9 (76.7) 845.2 – 845.2 Derivative assets 2,590.4 (2,111.6) 478.8 620.3 1,099.1
Related parties (197.3) 76.7 (120.6) – (120.6)Derivative liabilities (2,382.7) 2,111.6 (271.1) (559.8) (830.9)
Trafigura Annual Report 2020 97

2019
Amounts eligible for set off under netting agreements
Amounts not subject
to netting agreements
Net amounts presented
in the statement
of financial position
Gross amount
Amounts offset
Net amount
USD’M USD’M USD’M USD’M USD’M
Related parties 1,526.7 (77.5) 1,449.2 – 1,449.2 Derivative assets 1,836.7 (1,156.7) 680.0 676.0 1,356.0
Related parties (122.7) 77.5 (45.2) – (45.2)Derivative liabilities (1,617.8) 1,156.7 (461.1) (658.5) (1,119.6)
For the financial assets and liabilities subject to enforceable master netting or similar arrangements above, each agreement between the Group and the counterparty allows for net settlement of the relevant financial assets and liabilities when both elect to settle on a net basis. In the absence of such an election, financial assets and liabilities may be settled on a gross basis, however, each party to the master netting or similar agreement will have the option to settle all such amounts on a net basis in the event of default of the other party.35.10.2 Fair value hierarchy
The table below analyses financial instruments and other assets and liabilities carried at fair value, by valuation method. The different levels have been defined as follows: • Level 1: quoted prices (unadjusted) in active markets for identical
assets or liabilities. • Level 2: inputs other than quoted prices included within Level 1
that are observable for the asset or liability, either directly (i.e., as prices) or indirectly (i.e., derived from prices).
• Level 3: inputs for the asset or liability that are not based on observable market data (unobservable inputs).
Regarding financial instruments: Level 1 classifications primarily include futures with a maturity of less than one year. Level 2 classifications primarily include swaps and physical forward transactions which derive their fair value primarily from exchange quotes and readily observable broker quotes. Level 3 classifications primarily include physical forward transactions which derive their fair value predominately from calculations that use broker quotes and applicable market-based estimates surrounding location, quality and credit differentials. In circumstances where Trafigura cannot verify fair value with observable market inputs (Level 3 fair values), it is possible that a different valuation model could produce a materially different estimate of fair value.It is Trafigura’s policy to hedge significant market risk. Therefore sensitivity to fair value movements is limited. Trafigura manages its market risk using Value at Risk (VaR), as disclosed in Note 35.2.
Level 1 Level 2 Level 3 Total Other financial assets and inventories USD’M USD’M USD’M USD’M 30 September 2020Listed equity securities – Fair value through OCI 3.9 – – 3.9 Listed equity securities – Fair value through profit or loss 25.3 – – 25.3 Listed debt securities – Fair value through profit or loss – – 220.9 220.9 Unlisted equity investments – Fair value through profit or loss – – 34.3 34.3 Unlisted equity investments – Fair value through OCI – – 232.7 232.7 Futures – – – –OTC derivatives – 202.3 1.0 203.4 Physical forwards – 6.5 414.7 421.1 Cross-currency swaps – 7.3 – 7.3 Interest rate swaps – 21.2 – 21.2 Non-financial hedged items – 140.7 0.7 141.4 Other financial derivatives – 446.0 – 446.0 Inventories – 20,177.6 – 20,177.6 Total 29.2 21,001.7 904.3 21,935.2
Level 1 Level 2 Level 3 Total
Other financial liabilities USD’M USD’M USD’M USD’M 30 September 2020Futures 61.3 – – 61.3 OTC derivatives – 144.4 99.3 243.7 Physical forwards – 4.6 309.6 314.2 Cross-currency swaps – 8.6 – 8.6 Interest rate swaps – 36.3 – 36.3 Non-financial hedged items – 474.7 310.4 785.2 Other financial derivatives – 166.8 – 166.8 Fixed-rate borrowings – 2,523.6 – 2,523.6 Total 61.3 3,359.1 719.3 4,139.7 Net other financial assets/(liabilities) (32.1) 17,642.5 185.0 17,795.5
Level 1 Level 2 Level 3 Total
Other financial assets and inventories USD’M USD’M USD’M USD’M 30 September 2019Listed equity securities – Fair value through OCI 28.8 – – 28.8 Listed equity securities – Fair value through profit or loss 342.1 – – 342.1 Listed debt securities – Fair value through profit or loss – – 345.5 345.5 Unlisted equity investments – Fair value through profit or loss – – 53.9 53.9 Unlisted equity investments – Fair value through OCI – – 233.4 233.4 Futures 11.3 – – 11.3 OTC derivatives – 154.4 41.6 196.0 Physical forwards – 18.3 435.9 454.2 Cross-currency swaps – 5.7 – 5.7 Interest rate swaps – 62.5 – 62.5 Non-financial hedged items – 268.1 68.5 336.6 Other financial derivatives – 626.3 – 626.3 Inventories 13,435.0 – 13,435.0 Total 382.2 14,570.3 1,178.8 16,131.3
Level 1 Level 2 Level 3 Total
Other financial liabilities USD’M USD’M USD’M USD’M 30 September 2019Futures 1.5 – – 1.5 OTC derivatives – 235.7 49.7 285.4Physical forwards – 11.5 378.1 389.6 Cross-currency swaps – 80.0 – 80.0 Interest rate swaps – 7.9 – 7.9 Non-financial hedged items – 186.4 49.3 235.7 Other financial derivatives – 355.1 – 355.1 Fixed-rate borrowings – 3,041.7 – 3,041.7 Total 1.5 3,918.3 477.1 4,396.9 Net other financial assets/ (liabilities) 380.7 10,652.0 701.8 11,734.4
F. Notes to consolidated financial statements
Financial statements98
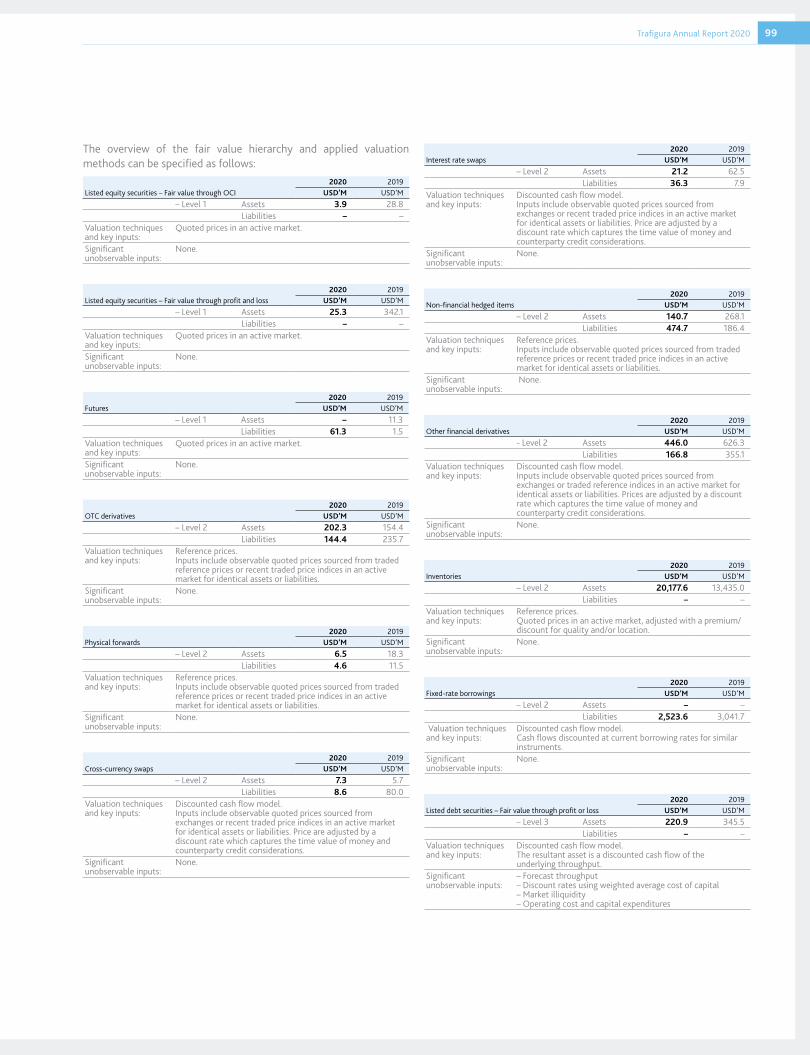
The overview of the fair value hierarchy and applied valuation methods can be specified as follows:
2020 2019Listed equity securities – Fair value through OCI USD’M USD’M
– Level 1 Assets 3.9 28.8Liabilities – –
Valuation techniques and key inputs:
Quoted prices in an active market.
Significant unobservable inputs:
None.
2020 2019Listed equity securities – Fair value through profit and loss USD’M USD’M
– Level 1 Assets 25.3 342.1Liabilities – –
Valuation techniques and key inputs:
Quoted prices in an active market.
Significant unobservable inputs:
None.
2020 2019Futures USD’M USD’M
– Level 1 Assets – 11.3Liabilities 61.3 1.5
Valuation techniques and key inputs:
Quoted prices in an active market.
Significant unobservable inputs:
None.
2020 2019OTC derivatives USD’M USD’M
– Level 2 Assets 202.3 154.4Liabilities 144.4 235.7
Valuation techniques and key inputs:
Reference prices. Inputs include observable quoted prices sourced from traded reference prices or recent traded price indices in an active market for identical assets or liabilities.
Significant unobservable inputs:
None.
2020 2019Physical forwards USD’M USD’M
– Level 2 Assets 6.5 18.3Liabilities 4.6 11.5
Valuation techniques and key inputs:
Reference prices. Inputs include observable quoted prices sourced from traded reference prices or recent traded price indices in an active market for identical assets or liabilities.
Significant unobservable inputs:
None.
2020 2019Cross-currency swaps USD’M USD’M
– Level 2 Assets 7.3 5.7Liabilities 8.6 80.0
Valuation techniques and key inputs:
Discounted cash flow model.Inputs include observable quoted prices sourced from exchanges or recent traded price indices in an active market for identical assets or liabilities. Price are adjusted by a discount rate which captures the time value of money and counterparty credit considerations.
Significant unobservable inputs:
None.
2020 2019Interest rate swaps USD’M USD’M
– Level 2 Assets 21.2 62.5Liabilities 36.3 7.9
Valuation techniques and key inputs:
Discounted cash flow model.Inputs include observable quoted prices sourced from exchanges or recent traded price indices in an active market for identical assets or liabilities. Price are adjusted by a discount rate which captures the time value of money and counterparty credit considerations.
Significant unobservable inputs:
None.
2020 2019Non-financial hedged items USD’M USD’M
– Level 2 Assets 140.7 268.1Liabilities 474.7 186.4
Valuation techniques and key inputs:
Reference prices.Inputs include observable quoted prices sourced from traded reference prices or recent traded price indices in an active market for identical assets or liabilities.
Significant unobservable inputs:
None.
2020 2019Other financial derivatives USD’M USD’M
- Level 2 Assets 446.0 626.3Liabilities 166.8 355.1
Valuation techniques and key inputs:
Discounted cash flow model. Inputs include observable quoted prices sourced from exchanges or traded reference indices in an active market for identical assets or liabilities. Prices are adjusted by a discount rate which captures the time value of money and counterparty credit considerations.
Significant unobservable inputs:
None.
2020 2019Inventories USD’M USD’M
– Level 2 Assets 20,177.6 13,435.0Liabilities – –
Valuation techniques and key inputs:
Reference prices.Quoted prices in an active market, adjusted with a premium/discount for quality and/or location.
Significant unobservable inputs:
None.
2020 2019Fixed-rate borrowings USD’M USD’M
– Level 2 Assets – –Liabilities 2,523.6 3,041.7
Valuation techniques and key inputs:
Discounted cash flow model. Cash flows discounted at current borrowing rates for similar instruments.
Significant unobservable inputs:
None.
2020 2019Listed debt securities – Fair value through profit or loss USD’M USD’M
– Level 3 Assets 220.9 345.5Liabilities – –
Valuation techniques and key inputs:
Discounted cash flow model. The resultant asset is a discounted cash flow of the underlying throughput.
Significant unobservable inputs:
– Forecast throughput – Discount rates using weighted average cost of capital – Market illiquidity – Operating cost and capital expenditures
Trafigura Annual Report 2020 99

2020 2019Unlisted equity investments – Fair value through profit or loss USD’M USD’M
– Level 3 Assets 34.3 53.9 Liabilities – –
Valuation techniques and key inputs:
Valuations obtained from the asset managers of the funds.
Significant unobservable inputs:
– Market illiquidity
2020 2019Unlisted equity investments – Fair value through OCI USD’M USD’M
– Level 3 Assets 232.7 233.4Liabilities – –
Valuation techniques and key inputs:
Valuations obtained from the asset managers of the funds.
Significant unobservable inputs:
– Market illiquidity
2020 2019OTC derivatives USD’M USD’M
– Level 3 Assets 1.0 41.6Liabilities 99.3 49.7
Valuation techniques and key inputs:
Discounted valuation of cashflows generated based on unobservable inputs.
Significant unobservable inputs:
Total load consumption forecast, scaling factor.
2020 2019Physical forwards USD’M USD’M
– Level 3 Assets 414.7 435.9Liabilities 309.6 378.1
Valuation techniques and key inputs:
Internal valuation model Key input is the definition of the observable risk position which forms the basis for the valuation of these physical forwards.
Significant unobservable inputs:
The definition of the observable risk position.
2020 2019Non-financial hedged items USD’M USD’M
– Level 3 Assets 0.7 68.5Liabilities 310.4 49.3
Valuation techniques and key inputs:
Internal valuation model.Key input is the market liquefaction fee curve that is defined using observable quoted prices sourced from traded reference prices or recent traded price indices in an active market for identical assets or liabilities.
Significant unobservable inputs:
Market liquefaction fee curve Liquefaction ratio
The movements in the Level 3 hierarchy can be summarised as follows:
USD’M
Physical forwards/
DerivativesEquity/ Debt
securitiesFirm
commitments Total
1 October 2019 49.7 632.8 19.2 701.7 Total gain/(loss) recognised in statement of income (3.5) (133.3) (469.9) (606.7)Total gain/(loss) recognised in OCI (63.8) (31.9) – (95.8)Invested – 31.2 – 31.2 Disposals – (10.9) – (10.9)Total realised 24.5 – 140.9 165.4
30 September 2020 6.9 487.9 (309.8) 185.0
USD’M
Physical forwards/
DerivativesEquity/Debt
securitiesNon-financial hedged items Total
1 October 2018 65.9 661.1 646.5 1,373.5Total gain/(loss) recognised in statement of income 15.8 (130.0) (679.6) (793.8)Total gain/(loss) recognised in OCI – (2.4) – (2.4)Invested – 112.0 – 112.0 Disposals – (7.9) – (7.9)Total realised (32.0) – 52.3 20.3
30 September 2019 49.7 632.8 19.2 701.7
There have been no transfers between fair value hierarchy levels in the financial year ended 30 September 2020. Materially all Level 3 physical forwards are settled in the next year. See Note 20 for equity/ debt securities.
36. Employee benefits36.1 Equity participation planThe immediate parent of the Company, Trafigura Beheer B.V., has an equity participation plan (EPP) that is open to employees of the Group. Shares issued to employees are preference shares of Trafigura Beheer B.V., which give rights to economic benefits with limited voting rights. The controlling shareholders of the Group, represented by the Board of Directors of Trafigura Control Holdings Pte. Ltd., a parent company of Trafigura Beheer B.V., in consultation with the Board of Directors of the Company, decide on the share awards to be issued to employees. Annual remuneration (which includes the equity participation awards) is subject to review by the remuneration committee of the Group.The value of the shares is based on the net asset value of an ordinary share as set out in the Articles of Association of Trafigura Beheer B.V., which management believe is a fair approximation of the fair value. Shares awarded under the EPP may vest immediately or over a period of several years.Employees do not have the right to freely sell shares that have vested unless Trafigura Control Holdings Pte. Ltd. has granted approval and has refrained from its right to nominate a prospective purchaser and make a purchase offer. Upon termination of employment, employees must transfer all of their shares at the direction of Trafigura Control Holdings Pte. Ltd. or hold the shares subject to further directions of Trafigura Control Holdings Pte. Ltd.
F. Notes to consolidated financial statements
Financial statements100

Neither Trafigura Beheer B.V. nor the Group have a legal or constructive obligation to settle the shares held by employees in cash. If employment is ceased prior to the end of the vesting period, the shares will be forfeited unless otherwise determined by Trafigura Control Holdings Pte. Ltd.The Group’s EPP is classified as an equity-settled plan in the Group’s financial statements; the fair value of the shares granted, determined at the grant date, is recorded in the statement of income rateably over the vesting period of the shares.During 2020, 92,596 immediately vesting shares were granted to employees representing a value of USD50.4 million (2019: 14,647 shares representing a value of USD30.8 million) and 163,938 shares were granted with a vesting period of one to five years representing a value of USD89.4 million (2019: 70,639 shares representing a value of USD148.8 million).Compensation in respect of share-based payments recognised in staff costs for the financial year ended 30 September 2020 amounted to USD130.2 million (2019: USD108.3 million).Unrecognised staff costs in respect of rateably vesting shares expected to be recognised from 2021 to 2024 amount to USD151.7 million at 30 September 2020 (2019: USD150.8 million for the period from 2020 to 2023).36.2 Staff costs
2020 2019USD’M USD’M
Salaries and bonuses 585.5 457.1 Social security costs 41.4 35.6 Pension costs 15.9 12.7 Share-based payments 130.2 108.3
Reported under general and administrative expenses 773.0 613.7
Reported under cost of sales 520.6 79.4
Staff costs 1,293.6 693.1
The staff costs increase is due to the full-year consolidation of Nyrstar.The average number of employees split geographically is depicted below:
2020
Oil & Petroleum
Metals & Minerals
Corporate and other Total
FTE FTE FTE FTE
North, Central and South America 1,054 2,635 291 3,980 Europe and Africa 223 1,853 255 2,331 Asia, Middle East and Australia 279 1,578 451 2,308
Total 1,556 6,066 997 8,619
2019
Oil & Petroleum
Metals & Minerals
Corporate and other Total
FTE FTE FTE FTE
North, Central and South America 965 1,490 286 2,741 Europe and Africa 204 664 254 1,122 Asia, Middle East and Australia 269 550 424 1,243
Total 1,438 2,704 964 5,106
The 2020 increase in staff costs is primarily due to the full-year consolidation of Nyrstar.
37. Related partiesIn the normal course of business, the Group enters into various transactions with related parties, including fixed-price commitments to sell and to purchase commodities, forward sale and purchase contracts, agency agreements and management service agreements. Outstanding balances at period end are unsecured and settlement occurs in cash. There have been no guarantees provided or received for any related-party receivables or payables.All transactions between the Company and its subsidiaries are eliminated on consolidation along with any unrealised profits and losses between its subsidiaries, associates and joint ventures.
37.1 Transactions with key management personnel37.1.1 Key management personnel compensation
In addition to their salaries, the Group also provides non-cash benefits to directors and executive officers. Executive officers also participate in the Group’s share participation programme (refer to Note 35). Compensation of key management personnel, including all members of the Board of Directors and the Management Committee, comprised of the following:
2020 2019USD’M USD’M
Short-term employee benefits 11.4 5.0 Post-employment benefits 0.5 0.5 Share-based payments 23.5 27.9
Total 35.4 33.4
37.1.2 Key management personnel and director transactions
As at 30 September 2020, loans receivable from the members of the Board of Directors and the Management Committee total USD20.8 million (2019: USD19.0 million). Interest is charged on the loans at approximately Libor + 1.5 percent and the loans are repayable within the one to three year bracket.
Trafigura Annual Report 2020 101

37.2 Other related-party transactions
Related-party receivables/(payables)2020 2019
USD’M USD’M
Trafigura Beheer B.V. 11.7 (8.3)Puma Energy Holdings Pte. Ltd. 1,451.8 1,369.0 Farringford N.V. 47.6 78.4 Beheer Malta Ltd. (10.5) (9.2)Ecore B.V. 1.0 1.1 Empresa Minera del Caribe S.A. (Emincar) 253.9 258.1 Jinchuan Group Co. Ltd. 223.4 187.3 Minas de Aguas Teñidas, S.A.U ( MATSA) (74.3) (28.4)Impala Terminals Group S.à r.l. (previously known as Simba Holding S.à r.l.) (3.1) 3.4 Nayara Energy Limited 184.5 276.5 Trafigura Control Holdings Pte. Ltd. 0.9 –Others (139.3) 121.3
Total 1,947.6 2,249.2
2020 2019USD’M USD’M
Sales 7,333.7 10,097.8 Purchases 3,035.2 3,417.7 Interest income 77.8 93.4 Cost recharges 12.1 38.5
Transactions between related parties are made on commercial terms.The nature of the relationships and the nature of transactions entered into with related parties are detailed in the table below:Party Nature of relationship Nature of transaction
Beheer Malta Ltd. Parent company Buy back of prefence shares
Ecore B.V. Cousin group Cost recharges, trading and hedging
Empresa Minera del Caribe S.A. (Emincar)
Equity-accounted investee Financing and trading agreement
Farringford N.V. Parent company Loans and cost rechargesImpala Terminals Group S.à r.l. (previously known as Simba Holding S.à r.l.)
Equity-accounted investee Multimodal logistic services
Jinchuan Group Co. Ltd. Equity-accounted investee Trading agreementMinas de Aguas Teñidas, S.A.U (MATSA)
Equity-accounted investee Financing and trading agreement
Nayara Energy Limited Equity-accounted investee Financing and trading agreement
Porto Sudeste do Brasil S.A.
Equity-accounted investee Loans and cost recharges
Puma Energy Holdings Pte. Ltd.
Equity-accounted investee Financing and trading agreement
Trafigura Beheer B.V. Parent company Loans and cost rechargesTrafigura Control Holding SARL
Parent company Buy back of prefence shares
Trafigura Control Holdings Pte. Ltd.
Parent company Buy back of prefence shares
38. Hyperinflationary economiesWith effect from 1 July 2018, the Argentine economy is considered to be hyperinflationary in accordance with the criteria in IAS 29, Financial reporting in hyperinflationary economies. Accordingly, the financial statements include restatements for changes in the general purchasing power of the Argentine peso. These restatements are made for all Group entities that have the Argentine peso as functional currency.On the application of IAS 29 the Group used a conversion coefficient derived from official wholesale price and consumer price indices published by the National Institute of Statistics and Censuses (INDEC, in its Spanish acronym). The index rates and corresponding conversion coefficients applied are as follows:
YearIndex,
% (December 2010=100)Conversion coefficient
30 September 2014 182.0 564.430 September 2015 205.6 499.530 September 2016 288.6 355.830 September 2017 347.8 295.230 September 2018 488.7 210.130 September 2019 751.6 136.630 September 2020 1,026.9 100.0
Monetary assets and liabilities are not restated because they are already expressed in terms of the monetary unit current as at 30 September 2020. Non-monetary assets and liabilities (items which are not already expressed in terms of the monetary unit as at 30 September 2020) are restated by applying the above index.The impact of 12.8 million has been recorded in other comprehensive income. The pre-tax loss for the year of USD3.6 million is included in finance income (2019: USD84.7 million).
39. Subsequent eventsThere are no significant subsequent events, which require disclosure.
F. Notes to consolidated financial statements
Financial statements102

40. Consolidated subsidiaries and associatesFor entities where legal shareholding is less than 50 percent, the Group has consolidated based on the definition of control under IFRS. Certain entities with a percentage of effective economic interest below 50 percent are held through intermediate holding companies controlled by the Group.
Principal consolidated operating subsidiaries Location
% Owned % Owned2020 2019
Boyaca Navigation Inc. Panama 100.0% 100.0%C.I. Trafigura Petroleum Colombia S.A.S Colombia 100.0% 100.0%Catalina Huanca Sociedad Minera S.A.C. Peru 100.0% 100.0%DT Trading Ltd. Bahamas 50.0% 50.0%DTS Commercial Pte. Ltd. Singapore 50.0% 50.0%DTS Refining Pte. Ltd. Singapore 50.0% 50.0%DTS Shipping Ventures Pte. Ltd. Singapore 50.0% 50.0%Edenfield Procurement DMCC United Arab
Emirates100.0% 100.0%
Fangchenggang Guo Tong Import and Export Co. Ltd.
China 100.0% 100.0%
Galena Asset Management B.V. The Netherlands 100.0% 100.0%Galena Asset Management SA Switzerland 100.0% 100.0%Iberian Minerals Corp. Switzerland 100.0% 100.0%Impala Holdings Limited Malta 100.0% 100.0%Impala Middle East General Warehousing L.L.C.
United Arab Emirates
100.0% 100.0%
Impala Terminals Barrancabermeja S.A. Colombia 100.0% 100.0%Impala Terminals Burnside LLC United States 100.0% 100.0%Impala Terminals Colombia S.A.S Colombia 100.0% 100.0%Impala Terminals DRC SARL The Democratic
Republic of Congo100.0% 100.0%
Impala Terminals Middle East FZE United Arab Emirates
100.0% 100.0%
Impala Terminals UK Limited United Kingdom 100.0% 100.0%Impala Warehousing and Logistics (Shanghai) Co., Ltd
China 100.0% 100.0%
IWL (Luxembourg) S.à r.l. Luxembourg 100.0% 100.0%IWL Capital LLC Marshall Islands 100.0% 100.0%IWL Holding B.V. The Netherlands 100.0% 100.0%IWL Holdings (Luxembourg) S.à r.l. Luxembourg 100.0% 100.0%IWL River Inc. Panama 100.0% 100.0%LYKOS India Private Limited India 100.0% 100.0%NGL Equipments, S.A. de C.V. Mexico 100.0% 100.0%Ningbo Trans-Coal Trading Co., Ltd. China 100.0% 100.0%Petromining S.A. Argentina 100.0% 100.0%Seal Sands Gas Transportation Limited United Kingdom 100.0% 100.0%TCPU LLC (Formerly TCPU Inc.) United States 100.0% 100.0%Teesside Gasport Limited United Kingdom 100.0% 100.0%Trafigura Argentina S.A. Argentina 100.0% 100.0%Cortes Holding S.a.r.l. (Formerly Cortes Holding B.V.)
Luxembourg 100.0% 100.0%
Trafigura Canada General Partnership Canada 100.0% 100.0%Trafigura Chile Limitada Chile 100.0% 100.0%C.I. Trafigura Coal Colombia S.A.S. (Formerly Trafigura Coal Colombia S.A.S.)
Colombia 100.0% 100.0%
Trafigura Derivatives Limited United Kingdom 100.0% 100.0%Trafigura Energy Colombia S.A.S. Colombia 100.0% 100.0%Trafigura Eurasia LLC Russian Federation 100.0% 100.0%Trafigura Funding S.A. Luxembourg 100.0% 100.0%Trafigura Holding GmbH Switzerland 100.0% 100.0%Trafigura Holdings Limited Malta 100.0% 100.0%Trafigura Holdings Pte. Ltd. Singapore 100.0% 100.0%Trafigura India Private Limited India 100.0% 100.0%Trafigura Investment (China) Co., Ltd. China 100.0% 100.0%Trafigura Limited United Kingdom 100.0% 100.0%Trafigura Maritime Logistics Pte. Ltd. Singapore 100.0% 100.0%Trafigura Maritime Ventures Limited Malta 100.0% 100.0%Trafigura Marketing Inc. United States 100.0% 100.0%Trafigura Marketing Ltd. Canada 100.0% 100.0%Trafigura Metales Basicos S.A.C. Peru 100.0% 100.0%Trafigura Mexico, S.A. de C.V. Mexico 100.0% 100.0%
Principal consolidated operating subsidiaries Location
% Owned % Owned2020 2019
Trafigura Mongolia LLC Mongolia 100.0% 100.0%Trafigura Nat Gas Limited Malta 100.0% 100.0%Trafigura Overseas Projects Pte. Ltd. Singapore 100.0% 100.0%Trafigura PE Holding Limited Malta 100.0% 100.0%Trafigura Peru S.A.C. Peru 100.0% 100.0%Trafigura Pte. Ltd. Singapore 100.0% 100.0%Trafigura Services Pte. Ltd. Singapore 100.0% 100.0%Trafigura Services South Africa (Pty) Ltd. South Africa 100.0% 100.0%Trafigura Services Australia Pty Ltd Australia 100.0% 100.0%Trafigura Terminals (Perth) Pty Ltd Australia 100.0% 100.0%TPTE Holding Limited (Formerly TPTE Holding B.V.)
Malta 100.0% 100.0%
Trafigura Trading (Europe) Sàrl Switzerland 100.0% 100.0%Trafigura Trading LLC United States 100.0% 100.0%Trafigura Trading (UK) Limited United Kingdom 100.0% -Trafigura Trading Yangshan Co., Ltd. China 100.0% 100.0%Trafigura Ukraine LLC Ukraine 100.0% 100.0%Trafigura US Inc. United States 100.0% 100.0%Trafigura Ventures IX B.V. The Netherlands 100.0% 100.0%Trafigura Ventures Trading Ltd. Mauritius 100.0% 100.0%Trafigura Ventures V B.V. The Netherlands 100.0% 100.0%Trafigura Ventures VIII B.V. The Netherlands 100.0% 100.0%Urion Holdings (Malta) Limited Malta 100.0% 100.0%Urion Mining International B.V. The Netherlands 100.0% 100.0%Cloudbreak Investments S.à r.l. Luxembourg 100.0% 100.0%Cortes Investments S.à r.l. Luxembourg 100.0% 100.0%Nyrstar Holdings PLC Malta 100.0% 100.0%Pash Kita Limited United Kingdom 85.0% 85.0%Shipstern Holdings S.à r.l. Luxembourg 100.0% 100.0%Trafigura Asia Trading Pte. Ltd. Singapore 100.0% 100.0%Trafigura Holdings S.à r.l. Luxembourg 100.0% 100.0%Trafigura Smelting Investments Limited Malta 100.0% 100.0%Impala Terminals Group 2 S.à r.l. Luxembourg 50.0% 50.0%Impala Terminals Group S.à r.l. Luxembourg 50.0% 50.0%Nyrstar Hobart Pty Ltd Australia 98.5% 98.5%Nyrstar Port Pirie Pty Ltd Australia 98.5% 98.5%Nyrstar Belgium NV Belgium 98.5% 98.5%Breakwater Resources Ltd Canada 100.0% 98.5%Nyrstar Canada (Holdings) Ltd Canada 100.0% 98.5%Nyrstar Myra Falls Ltd Canada 100.0% 98.5%Nyrstar France SAS France 98.5% 98.5%Nyrstar Budel BV The Netherlands 98.5% 98.5%Nyrstar Netherlands (Holdings) BV The Netherlands 98.5% 98.5%Nyrstar Finance International AG Switzerland 98.5% 98.5%Nyrstar Sales & Marketing AG Switzerland 98.5% 98.5%Nyrstar Clarksville Inc United States 98.5% 98.5%Nyrstar Tennessee Mines – Gordonsville LLC
United States 98.5% 98.5%
Nyrstar Tennessee Mines – Strawberry Plains LLC
United States 98.5% 98.5%
NN2 Newco Limited United Kingdom 98.5% 98.5%Nyrstar Holdings & Financing Ltd Malta 98.5% –
41. Board of DirectorsThe Board of Directors
Mark Irwin José LaroccaPierre Lorinet Sipko SchatAndrew Vickerman Mike WainwrightJeremy Weir
Singapore, 7 December 2020.
Trafigura Annual Report 2020 103

Designed and produced by Group Charlescannon SARL Geneva, Switzerland. Photography by AGVision, Charlescannon, Edwin Koo, Fotoflite (Jon Wheeler), Foto-Io Istanbul (Mehmet Yapici), Gareth Bentley, Hill & Knowlton Strategies, Jonathan Glynn Smith, Knighstrom Productions, Vivian Deray.
Trafigura Group Pte. Ltd. and the companies in which it directly or indirectly owns investments in are separate and distinct entities. In this publication, the collective expressions ‘Trafigura’, ‘Trafigura Group’, ‘the Company’ and ‘the Group’ may be used for convenience where reference is made in general to those companies. Likewise, the words ‘we’, ‘us’, ‘our’ and ‘ourselves’ are used in some places to refer to the companies of the Trafigura Group in general. These expressions are also used where no useful purpose is served by identifying any particular company or companies.
Printed by Pureprint on Vision Superior which is FSC certified.Pureprint is certified to ISO 14001 environmental management system, is registered to EMAS the Eco Management Audit Scheme, is a Carbon Neutral Company and has been awarded the Queen’s Award for Enterprise: Sustainable Development.


Trafigura Group Pte. Ltd.
10 Collyer Quay #29-00 Ocean Financial Centre Singapore 049315 Email: [email protected]
www.trafigura.com TJ/0359.1e