BP Annual Report and Form 20F Financial Statements
122
Financial statements 178 Statement of directors’ responsibilities 179 Consolidated financial statements of the BP group Independent auditor’s reports 179 Group income statement 182 Group statement of comprehensive income 183 Group statement of changes in equity 183 Group balance sheet 184 Group cash flow statement 185 186 Notes on financial statements 1. Significant accounting policies 186 2. Significant event – Gulf of Mexico oil spill 194 3. Business combinations 198 4. Non-current assets held for sale 199 5. Disposals and impairment 201 6. Segmental analysis 203 7. Interest and other income 208 8. Production and similar taxes 208 9. Depreciation, depletion and amortization 208 10. Impairment review of goodwill 208 11. Distribution and administration expenses 210 12. Currency exchange gains and losses 210 13. Research and development 210 14. Operating leases 211 15. Exploration for and evaluation of oil and natural gas resources 211 16. Auditor’s remuneration 212 17. Finance costs 212 18. Taxation 212 19. Dividends 214 20. Earnings per ordinary share 215 21. Property, plant and equipment 216 22. Goodwill 217 23. Intangible assets 217 24. Investments in jointly controlled entities 218 25. Investments in associates 219 26. Financial instruments and financial risk factors 220 27. Other investments 225 28. Inventories 226 29. Trade and other receivables 226 30. Cash and cash equivalents 226 31. Valuation and qualifying accounts 227 32. Trade and other payables 227 33. Derivative financial instruments 228 34. Finance debt 233 35. Capital disclosures and analysis of changes in net debt 234 36. Provisions 235 37. Pensions and other post- retirement benefits 239 38. Called-up share capital 245 39. Capital and reserves 246 40. Share-based payments 249 41. Employee costs and numbers 251 42. Remuneration of directors and senior management 252 43. Contingent liabilities 253 44. Capital commitments 254 45. Subsidiaries, jointly controlled entities and associates 255 46. Condensed consolidated information on certain US subsidiaries 256 263 Supplementary information on oil and natural gas (unaudited) Oil and natural gas exploration and production activities 264 Movements in estimated net proved reserves 270 Standardized measure of discounted future net cash flows and changes therein relating to proved oil and gas reserves 282 Operational and statistical information 285 PC1 Parent company financial statements of BP p.l.c. Independent auditor’s report to the members of BP p.l.c. PC1 Company balance sheet PC2 Company cash flow statement PC3 Company statement of total recognized gains and losses PC3 Notes on financial statements PC4 1. Accounting policies PC4 2. Taxation PC5 3. Fixed assets – investments PC5 4. Debtors PC6 5. Creditors PC6 6. Pensions PC7 7. Called-up share capital PC9 8. Capital and reserves PC10 9. Cash flow PC10 10. Contingent liabilities PC11 11. Share-based payments PC11 12. Auditor’s remuneration PC11 13. Directors’ remuneration PC11 Financial statements 177 BP Annual Report and Form 20-F 2012 Financial statements
-
Upload
independent -
Category
Documents
-
view
0 -
download
0
Transcript of BP Annual Report and Form 20F Financial Statements
Financialstatements
178 Statement of directors’ responsibilities
179 Consolidated financial statements of the BP groupIndependent auditor’s reports 179
Group income statement 182
Group statement of comprehensiveincome 183
Group statement of changes inequity 183
Group balance sheet 184
Group cash flow statement 185
186 Notes on financial statements1. Significant accounting policies 186
2. Significant event – Gulf ofMexico oil spill 194
3. Business combinations 198
4. Non-current assets held forsale 199
5. Disposals and impairment 201
6. Segmental analysis 203
7. Interest and other income 208
8. Production and similar taxes 208
9. Depreciation, depletion andamortization 208
10. Impairment review of goodwill 208
11. Distribution andadministration expenses 210
12. Currency exchange gains andlosses 210
13. Research and development 210
14. Operating leases 211
15. Exploration for and evaluationof oil and natural gasresources 211
16. Auditor’s remuneration 212
17. Finance costs 212
18. Taxation 212
19. Dividends 214
20. Earnings per ordinary share 215
21. Property, plant andequipment 216
22. Goodwill 217
23. Intangible assets 217
24. Investments in jointlycontrolled entities 218
25. Investments in associates 219
26. Financial instruments andfinancial risk factors 220
27. Other investments 225
28. Inventories 226
29. Trade and other receivables 226
30. Cash and cash equivalents 226
31. Valuation and qualifyingaccounts 227
32. Trade and other payables 227
33. Derivative financialinstruments 228
34. Finance debt 233
35. Capital disclosures andanalysis of changes in netdebt 234
36. Provisions 235
37. Pensions and other post-retirement benefits 239
38. Called-up share capital 245
39. Capital and reserves 246
40. Share-based payments 249
41. Employee costs andnumbers 251
42. Remuneration of directorsand senior management 252
43. Contingent liabilities 253
44. Capital commitments 254
45. Subsidiaries, jointly controlledentities and associates 255
46. Condensed consolidatedinformation on certain USsubsidiaries 256
263 Supplementary information on oil and natural gas(unaudited)Oil and natural gas exploration andproduction activities 264
Movements in estimated netproved reserves 270
Standardized measure of discountedfuture net cash flows and changestherein relating to proved oil and gasreserves 282
Operational and statisticalinformation 285
PC1 Parent company financial statements of BP p.l.c.Independent auditor’s report to themembers of BP p.l.c. PC1
Company balance sheet PC2
Company cash flow statement PC3
Company statement of totalrecognized gains and losses PC3
Notes on financial statements PC4
1. Accounting policies PC4
2. Taxation PC5
3. Fixed assets – investments PC5
4. Debtors PC6
5. Creditors PC6
6. Pensions PC7
7. Called-up share capital PC9
8. Capital and reserves PC10
9. Cash flow PC10
10. Contingent liabilities PC11
11. Share-based payments PC11
12. Auditor’s remuneration PC11
13. Directors’ remuneration PC11
Financial statements 177BP Annual Report and Form 20-F 2012
Financial statements
Statement of directors’ responsibilities
The directors are responsible for preparing the Annual Report and the financial statements in accordance with applicable law and regulations.
The directors are required by the UK Companies Act 2006 to prepare financial statements for each financial year that give a true and fair view of thefinancial position of the group and the parent company and the financial performance and cash flows of the group and parent company for that period.Under that law they are required to prepare the consolidated financial statements in accordance with International Financial Reporting Standards (IFRS)as adopted by the European Union (EU) and applicable law and have elected to prepare the parent company financial statements in accordance withapplicable United Kingdom law and United Kingdom accounting standards (United Kingdom generally accepted accounting practice). In preparing theconsolidated financial statements the directors have also elected to comply with IFRSs as issued by the International Accounting Standards Board(IASB). In preparing those financial statements, the directors are required to:
• select suitable accounting policies and then apply them consistently.• make judgements and estimates that are reasonable and prudent.• present information, including accounting policies, in a manner that provides relevant, reliable, comparable and understandable information.• provide additional disclosure when compliance with the specific requirements of IFRS is insufficient to enable users to understand the impact of
particular transactions, other events and conditions on the group’s financial position and financial performance.• state that applicable accounting standards have been followed, subject to any material departures disclosed and explained in the parent company
financial statements.• prepare the financial statements on the going concern basis unless it is inappropriate to presume that the company will continue in business.
The directors are responsible for keeping proper accounting records that disclose with reasonable accuracy at any time the financial position of thegroup and company and enable them to ensure that the consolidated financial statements comply with the Companies Act 2006 and Article 4 of the IASRegulation and the parent company financial statements comply with the Companies Act 2006. They are also responsible for safeguarding the assets ofthe group and company and hence for taking reasonable steps for the prevention and detection of fraud and other irregularities.
The directors draw attention to Notes 2, 36 and 43 on the consolidated financial statements which describe the uncertainties surrounding the amountsand timings of liabilities arising from the Gulf of Mexico oil spill.
The group’s business activities, performance, position and risks are set out in this report. The financial position of the group, its cash flows, liquidityposition and borrowing facilities are detailed in the appropriate sections on pages 90-93 and elsewhere in the notes on the consolidated financialstatements. The report also includes details of the group’s risk mitigation and management. Information on the Gulf of Mexico oil spill and BP’sresponse is included on pages 59-62 and elsewhere in this report, including Safety on pages 46-50. The group has considerable financial resources, andthe directors believe that the group is well placed to manage its business risks successfully. After making enquiries, the directors have a reasonableexpectation that the company and the group have adequate resources to continue in operational existence for the foreseeable future. Accordingly, theycontinue to adopt the going concern basis in preparing the annual report and accounts.
Having made the requisite enquiries, so far as the directors are aware, there is no relevant audit information (as defined by Section 418(3) of theCompanies Act 2006) of which the company’s auditors are unaware, and the directors have taken all the steps they ought to have taken to makethemselves aware of any relevant audit information and to establish that the company’s auditors are aware of that information.
The directors confirm that to the best of their knowledge:
• the consolidated financial statements, prepared in accordance with IFRS as issued by the IASB, IFRS as adopted by the EU and in accordance withthe provisions of the Companies Act 2006, give a true and fair view of the assets, liabilities, financial position and profit or loss of the group;
• the parent company financial statements, prepared in accordance with United Kingdom generally accepted accounting practice, give a true and fairview of the assets, liabilities, financial position, performance and cash flows of the company; and
• the management report, which is incorporated in the directors’ report, includes a fair review of the development and performance of the business andthe position of the group, together with a description of the principal risks and uncertainties.
This page does not form part of BP’s Annual Report on Form 20-F as filed with the SEC.
178 Financial statementsBP Annual Report and Form 20-F 2012
Consolidated financial statements of the BP group
Independent auditor’s report on the Annual Report and Accounts to the members of BP p.l.c.We have audited the consolidated financial statements of BP p.l.c. for the year ended 31 December 2012 which comprise the group income statement,the group statement of comprehensive income, the group statement of changes in equity, the group balance sheet, the group cash flow statement andthe related notes 1-45. The financial reporting framework that has been applied in their preparation is applicable law and International Financial ReportingStandards (IFRS) as adopted by the European Union.
This report is made solely to the company’s members, as a body, in accordance with Chapter 3 of Part 16 of the Companies Act 2006. Our audit workhas been undertaken so that we might state to the company’s members those matters we are required to state to them in an auditor’s report and for noother purpose. To the fullest extent permitted by law, we do not accept or assume responsibility to anyone other than the company and the company’smembers as a body, for our audit work, for this report, or for the opinions we have formed.
Respective responsibilities of directors and auditorAs explained more fully in the Statement of directors’ responsibilities set out on page 178, the directors are responsible for the preparation of theconsolidated financial statements and for being satisfied that they give a true and fair view. Our responsibility is to audit and express an opinion on theconsolidated financial statements in accordance with applicable law and International Standards on Auditing (UK and Ireland). Those standards require usto comply with the Auditing Practices Board’s Ethical Standards for Auditors.
Scope of the audit of the financial statementsAn audit involves obtaining evidence about the amounts and disclosures in the financial statements sufficient to give reasonable assurance that thefinancial statements are free from material misstatement, whether caused by fraud or error. This includes an assessment of: whether the accountingpolicies are appropriate to the group’s circumstances and have been consistently applied and adequately disclosed; the reasonableness of significantaccounting estimates made by the directors; and the overall presentation of the financial statements. In addition, we read all the financial and non-financial information in the annual report to identify material inconsistencies with the audited financial statements. If we become aware of any apparentmaterial misstatements or inconsistencies we consider the implications for our report.
Opinion on financial statementsIn our opinion the consolidated financial statements:• give a true and fair view of the state of the group’s affairs as at 31 December 2012 and of its profit for the year then ended;• have been properly prepared in accordance with IFRS as adopted by the European Union; and• have been prepared in accordance with the requirements of the Companies Act 2006 and Article 4 of the IAS Regulation.
Separate opinion in relation to IFRS as issued by the International Accounting Standards BoardAs explained in Note 1 to the consolidated financial statements, the group in addition to applying IFRS as adopted by the European Union, has alsoapplied IFRS as issued by the International Accounting Standards Board (IASB). In our opinion the consolidated financial statements comply with IFRS asissued by the IASB.
Emphasis of matter – significant uncertainty over provisions and contingencies related to the Gulf of Mexico oil spillIn forming our opinion we have considered the adequacy of the disclosures made in Notes 2, 36 and 43 to the financial statements concerning theprovisions, future expenditures for which reliable estimates cannot be made and other contingencies related to the Gulf of Mexico oil spill significantevent. The total amounts that will ultimately be paid by BP in relation to all obligations relating to the incident are subject to significant uncertainty andthe ultimate exposure and cost to BP will be dependent on many factors. Furthermore, significant uncertainty exists in relation to the amount of claimsthat will become payable by BP, the amount of fines that will ultimately be levied on BP (including any determination of BP’s culpability based on anyfindings of negligence, gross negligence or wilful misconduct), the outcome of litigation and arbitration proceedings, and any costs arising from anylonger-term environmental consequences of the oil spill, which will also impact upon the ultimate cost for BP. Our opinion is not qualified in respect ofthese matters.
Opinion on other matter prescribed by the Companies Act 2006In our opinion the information given in the Directors’ Report for the financial year for which the consolidated financial statements are prepared isconsistent with the consolidated financial statements.
Matters on which we are required to report by exceptionWe have nothing to report in respect of the following:Under the Companies Act 2006 we are required to report to you if, in our opinion:
• certain disclosures of directors’ remuneration specified by law are not made; or• we have not received all the information and explanations we require for our audit.Under the Listing Rules we are required to review:• the directors’ statement, set out on page 178, in relation to going concern;• the part of the Governance and Risk section of the Annual report relating to the company’s compliance with the nine provisions of the UK Corporate
Governance Code specified for our review; and• certain elements of the report to shareholders by the Board on directors’ remuneration.
Other matterWe have reported separately on the parent company financial statements of BP p.l.c. for the year ended 31 December 2012 and on the information inthe Directors’ Remuneration Report that is described as having been audited.
Ernst & Young LLPAllister Wilson (Senior Statutory Auditor)for and on behalf of Ernst & Young LLP, Statutory AuditorLondon6 March 2013
1. The maintenance and integrity of the BP p.l.c. website are the responsibility of the directors; the work carried out by the auditors does notinvolve consideration of these matters and, accordingly, the auditors accept no responsibility for any changes that may have occurred to thefinancial statements since they were initially presented on the website.
2. Legislation in the United Kingdom governing the preparation and dissemination of financial statements may differ from legislation in otherjurisdictions.
This page does not form part of BP’s Annual Report on Form 20-F as filed with the SEC.
Financial statements 179BP Annual Report and Form 20-F 2012
Financial statements
Consolidated financial statements of the BP group
Report of Independent Registered Public Accounting Firm on the Annual Report on Form 20-F
The Board of Directors and Shareholders of BP p.l.c.
We have audited the accompanying group balance sheets of BP p.l.c. as at 31 December 2012 and 2011, and the related group income statement,group statement of comprehensive income, group statement of changes in equity and group cash flow statement for each of the three years in theperiod ended 31 December 2012. These financial statements are the responsibility of the Company’s management. Our responsibility is to express anopinion on these financial statements based on our audits.
We conducted our audits in accordance with the standards of the Public Company Accounting Oversight Board (United States). Those standards requirethat we plan and perform the audit to obtain reasonable assurance about whether the financial statements are free of material misstatement. An auditincludes examining, on a test basis, evidence supporting the amounts and disclosures in the financial statements. An audit also includes assessing theaccounting principles used and significant estimates made by management, as well as evaluating the overall financial statement presentation. Webelieve that our audits provide a reasonable basis for our opinion.
In our opinion, the financial statements referred to above present fairly, in all material respects, the group financial position of BP p.l.c. at 31 December2012 and 2011, and the group results of its operations and its cash flows for each of the three years in the period ended 31 December 2012, inaccordance with International Financial Reporting Standards as adopted by the European Union and International Financial Reporting Standards as issuedby the International Accounting Standards Board.
In forming our opinion we have considered the adequacy of the disclosures made in Notes 2, 36 and 43 to the financial statements concerning theprovisions, future expenditures for which reliable estimates cannot be made and other contingencies related to the Gulf of Mexico oil spill significantevent. The total amounts that will ultimately be paid by BP in relation to all obligations relating to the incident are subject to significant uncertainty andthe ultimate exposure and cost to BP will be dependent on many factors. Furthermore, significant uncertainty exists in relation to the amount of claimsthat will become payable by BP, the amount of fines that will ultimately be levied on BP (including any determination of BP’s culpability based on anyfindings of negligence, gross negligence or wilful misconduct), the outcome of litigation and arbitration proceedings, and any costs arising from anylonger-term environmental consequences of the oil spill, which will also impact upon the ultimate cost for BP. Our opinion is not qualified in respect ofthese matters.
We also have audited, in accordance with the standards of the Public Company Accounting Oversight Board (United States), BP p.l.c.‘s internal controlover financial reporting as at 31 December 2012, based on criteria established in Internal Control: Revised Guidance for Directors on the Combined Codeas issued by the Institute of Chartered Accountants in England and Wales (the Turnbull guidance) and our report dated 6 March 2013 expressed anunqualified opinion thereon.
/s/ Ernst & Young LLP
Ernst & Young LLPLondon, United Kingdom6 March 2013
1. The maintenance and integrity of the BP p.l.c. website are the responsibility of the directors; the work carried out by the auditors does notinvolve consideration of these matters and, accordingly, the auditors accept no responsibility for any changes that may have occurred to thefinancial statements since they were initially presented on the website.
2. Legislation in the United Kingdom governing the preparation and dissemination of financial statements may differ from legislation in otherjurisdictions.
180 Financial statementsBP Annual Report and Form 20-F 2012

Consolidated financial statements of the BP group
Report of Independent Registered Public Accounting Firm on the Annual Report on Form 20-F
The Board of Directors and Shareholders of BP p.l.c.
We have audited BP p.l.c.’s internal control over financial reporting as at 31 December 2012, based on criteria established in Internal Control: RevisedGuidance for Directors on the Combined Code as issued by the Institute of Chartered Accountants in England and Wales (the Turnbull guidance). BPp.l.c.’s management is responsible for maintaining effective internal control over financial reporting, and for its assessment of the effectiveness ofinternal control over financial reporting included in the accompanying Management’s report on internal control on page 149. Our responsibility is toexpress an opinion on the company’s internal control over financial reporting based on our audit.
We conducted our audit in accordance with the standards of the Public Company Accounting Oversight Board (United States). Those standards requirethat we plan and perform the audit to obtain reasonable assurance about whether effective internal control over financial reporting was maintained in allmaterial respects. Our audit included obtaining an understanding of internal control over financial reporting, assessing the risk that a material weaknessexists, testing and evaluating the design and operating effectiveness of internal control based on the assessed risk, and performing such otherprocedures as we considered necessary in the circumstances. We believe that our audit provides a reasonable basis for our opinion.
A company’s internal control over financial reporting is a process designed to provide reasonable assurance regarding the reliability of financial reportingand the preparation of financial statements for external purposes in accordance with generally accepted accounting principles. A company’s internalcontrol over financial reporting includes those policies and procedures that (1) pertain to the maintenance of records that, in reasonable detail, accuratelyand fairly reflect the transactions and dispositions of the assets of the company; (2) provide reasonable assurance that transactions are recorded asnecessary to permit preparation of financial statements in accordance with generally accepted accounting principles, and that receipts and expendituresof the company are being made only in accordance with authorizations of management and directors of the company; and (3) provide reasonableassurance regarding prevention or timely detection of unauthorized acquisition, use or disposition of the company’s assets that could have a materialeffect on the financial statements.
Because of its inherent limitations, internal control over financial reporting may not prevent or detect misstatements. Also, projections of any evaluationof effectiveness to future periods are subject to the risk that controls may become inadequate because of changes in conditions, or that the degree ofcompliance with the policies or procedures may deteriorate.
In our opinion, BP p.l.c. maintained, in all material respects, effective internal control over financial reporting as at 31 December 2012, based on theTurnbull guidance.
We also have audited, in accordance with the standards of the Public Company Accounting Oversight Board (United States), the group balance sheetsof BP p.l.c. as at 31 December 2012 and 2011, and the related group income statement, group statement of comprehensive income, group statementof changes in equity and group cash flow statement for each of the three years in the period ended 31 December 2012, and our report dated 6 March2013 expressed an unqualified opinion thereon.
/s/ Ernst & Young LLP
Ernst & Young LLPLondon, United Kingdom6 March 2013
Consent of independent registered public accounting firm
We consent to the incorporation by reference of our reports dated 6 March 2013, with respect to the group financial statements of BP p.l.c., and theeffectiveness of internal control over financial reporting of BP p.l.c., included in this Annual Report and Form 20-F for the year ended 31 December 2012in the following Registration Statements:
Registration Statements on Form F-3 (File No. 333-179953, File No. 333-157906) of BP Capital Markets p.l.c. and BP p.l.c.; andRegistration Statements on Form S-8 (File Nos. 333-149778, 333-79399, 333-67206, 333-103924, 333-123482, 333-123483, 333-131583, 333-146868, 333-146870, 333-146873, 333-131584, 333-132619, 333-173136, 333-177423, 333-179406, 333-186463 and 333-186462) of BP p.l.c.
/s/ Ernst & Young LLP
Ernst & Young LLPLondon, United Kingdom6 March 2013
1. The maintenance and integrity of the BP p.l.c. website are the responsibility of the directors; the work carried out by the auditors does notinvolve consideration of these matters and, accordingly, the auditors accept no responsibility for any changes that may have occurred to thefinancial statements since they were initially presented on the website.
2. Legislation in the United Kingdom governing the preparation and dissemination of financial statements may differ from legislation in otherjurisdictions.
Financial statements 181BP Annual Report and Form 20-F 2012
Financial statements
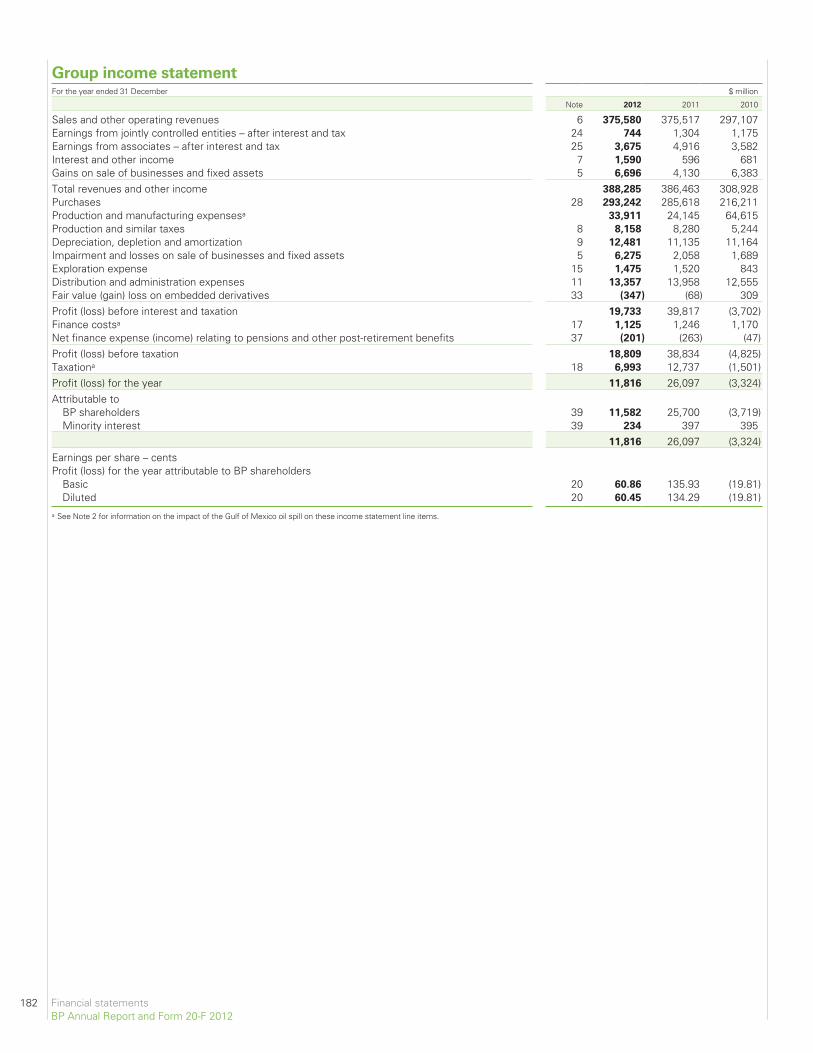
Group income statementFor the year ended 31 December $ million
Note 2012 2011 2010
Sales and other operating revenues 6 375,580 375,517 297,107Earnings from jointly controlled entities – after interest and tax 24 744 1,304 1,175Earnings from associates – after interest and tax 25 3,675 4,916 3,582Interest and other income 7 1,590 596 681Gains on sale of businesses and fixed assets 5 6,696 4,130 6,383Total revenues and other income 388,285 386,463 308,928Purchases 28 293,242 285,618 216,211Production and manufacturing expensesa 33,911 24,145 64,615Production and similar taxes 8 8,158 8,280 5,244Depreciation, depletion and amortization 9 12,481 11,135 11,164Impairment and losses on sale of businesses and fixed assets 5 6,275 2,058 1,689Exploration expense 15 1,475 1,520 843Distribution and administration expenses 11 13,357 13,958 12,555Fair value (gain) loss on embedded derivatives 33 (347) (68) 309Profit (loss) before interest and taxation 19,733 39,817 (3,702)Finance costsa 17 1,125 1,246 1,170Net finance expense (income) relating to pensions and other post-retirement benefits 37 (201) (263) (47)Profit (loss) before taxation 18,809 38,834 (4,825)Taxationa 18 6,993 12,737 (1,501)Profit (loss) for the year 11,816 26,097 (3,324)Attributable to
BP shareholders 39 11,582 25,700 (3,719)Minority interest 39 234 397 395
11,816 26,097 (3,324)Earnings per share – centsProfit (loss) for the year attributable to BP shareholders
Basic 20 60.86 135.93 (19.81)Diluted 20 60.45 134.29 (19.81)
a See Note 2 for information on the impact of the Gulf of Mexico oil spill on these income statement line items.
182 Financial statementsBP Annual Report and Form 20-F 2012
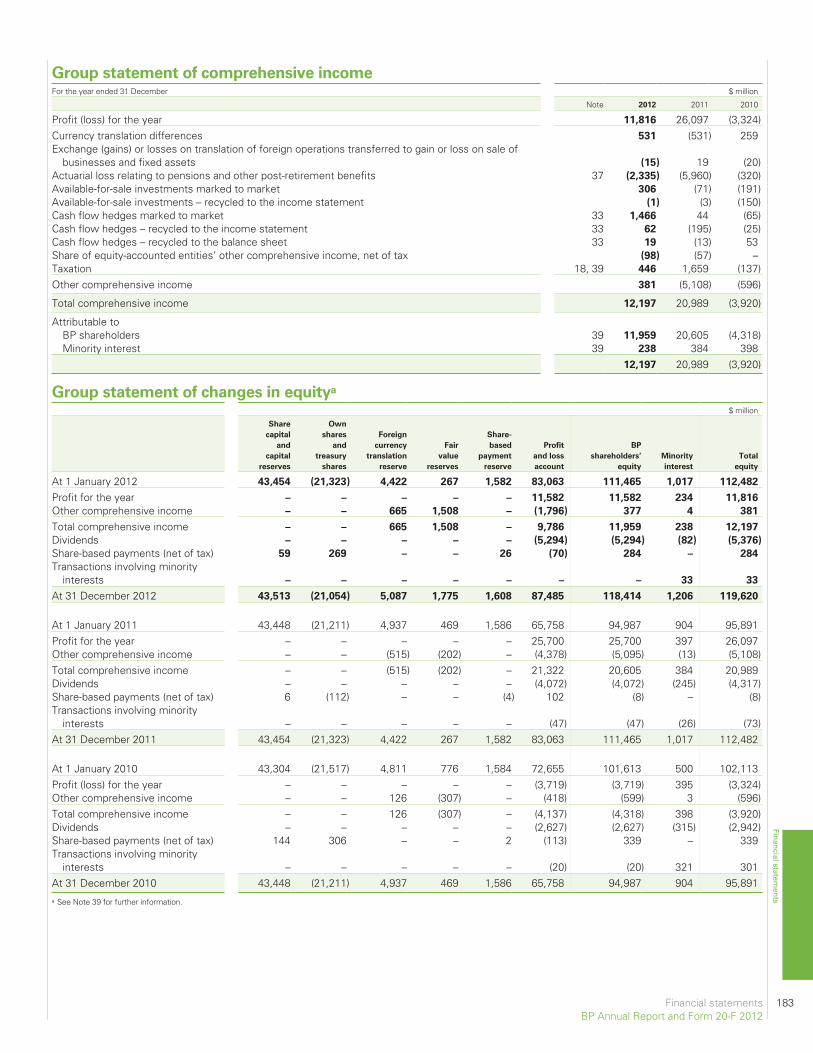
Group statement of comprehensive incomeFor the year ended 31 December $ million
Note 2012 2011 2010
Profit (loss) for the year 11,816 26,097 (3,324)Currency translation differences 531 (531) 259Exchange (gains) or losses on translation of foreign operations transferred to gain or loss on sale of
businesses and fixed assets (15) 19 (20)Actuarial loss relating to pensions and other post-retirement benefits 37 (2,335) (5,960) (320)Available-for-sale investments marked to market 306 (71) (191)Available-for-sale investments – recycled to the income statement (1) (3) (150)Cash flow hedges marked to market 33 1,466 44 (65)Cash flow hedges – recycled to the income statement 33 62 (195) (25)Cash flow hedges – recycled to the balance sheet 33 19 (13) 53Share of equity-accounted entities’ other comprehensive income, net of tax (98) (57) –Taxation 18, 39 446 1,659 (137)Other comprehensive income 381 (5,108) (596)
Total comprehensive income 12,197 20,989 (3,920)
Attributable toBP shareholders 39 11,959 20,605 (4,318)Minority interest 39 238 384 398
12,197 20,989 (3,920)
Group statement of changes in equitya
$ million
Share
capital
and
capital
reserves
Own
shares
and
treasury
shares
Foreign
currency
translation
reserve
Fair
value
reserves
Share-
based
payment
reserve
Profit
and loss
account
BP
shareholders’
equity
Minority
interest
Total
equity
At 1 January 2012 43,454 (21,323) 4,422 267 1,582 83,063 111,465 1,017 112,482
Profit for the year – – – – – 11,582 11,582 234 11,816
Other comprehensive income – – 665 1,508 – (1,796) 377 4 381
Total comprehensive income – – 665 1,508 – 9,786 11,959 238 12,197
Dividends – – – – – (5,294) (5,294) (82) (5,376)
Share-based payments (net of tax) 59 269 – – 26 (70) 284 – 284
Transactions involving minorityinterests – – – – – – – 33 33
At 31 December 2012 43,513 (21,054) 5,087 1,775 1,608 87,485 118,414 1,206 119,620
At 1 January 2011 43,448 (21,211) 4,937 469 1,586 65,758 94,987 904 95,891Profit for the year – – – – – 25,700 25,700 397 26,097Other comprehensive income – – (515) (202) – (4,378) (5,095) (13) (5,108)Total comprehensive income – – (515) (202) – 21,322 20,605 384 20,989Dividends – – – – – (4,072) (4,072) (245) (4,317)Share-based payments (net of tax) 6 (112) – – (4) 102 (8) – (8)Transactions involving minority
interests – – – – – (47) (47) (26) (73)At 31 December 2011 43,454 (21,323) 4,422 267 1,582 83,063 111,465 1,017 112,482
At 1 January 2010 43,304 (21,517) 4,811 776 1,584 72,655 101,613 500 102,113Profit (loss) for the year – – – – – (3,719) (3,719) 395 (3,324)Other comprehensive income – – 126 (307) – (418) (599) 3 (596)Total comprehensive income – – 126 (307) – (4,137) (4,318) 398 (3,920)Dividends – – – – – (2,627) (2,627) (315) (2,942)Share-based payments (net of tax) 144 306 – – 2 (113) 339 – 339Transactions involving minority
interests – – – – – (20) (20) 321 301At 31 December 2010 43,448 (21,211) 4,937 469 1,586 65,758 94,987 904 95,891a See Note 39 for further information.
Financial statements 183BP Annual Report and Form 20-F 2012
Financial statements
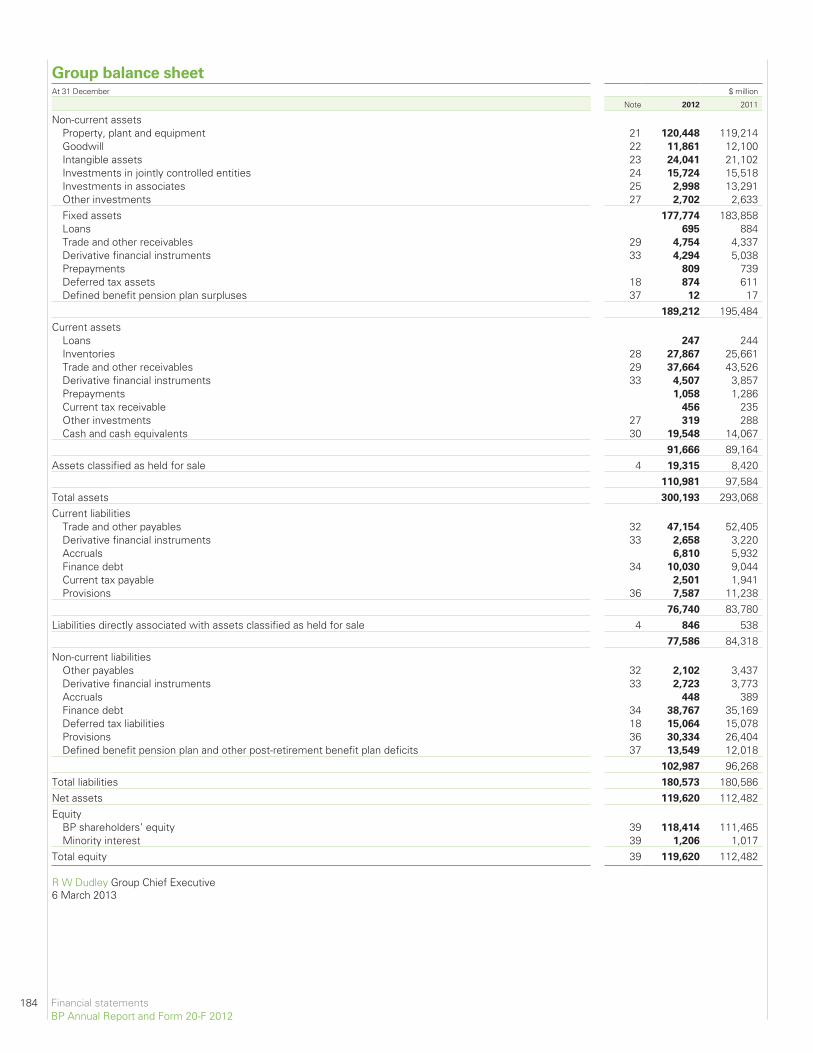
Group balance sheetAt 31 December $ million
Note 2012 2011
Non-current assetsProperty, plant and equipment 21 120,448 119,214Goodwill 22 11,861 12,100Intangible assets 23 24,041 21,102Investments in jointly controlled entities 24 15,724 15,518Investments in associates 25 2,998 13,291Other investments 27 2,702 2,633Fixed assets 177,774 183,858Loans 695 884Trade and other receivables 29 4,754 4,337Derivative financial instruments 33 4,294 5,038Prepayments 809 739Deferred tax assets 18 874 611Defined benefit pension plan surpluses 37 12 17
189,212 195,484Current assets
Loans 247 244Inventories 28 27,867 25,661Trade and other receivables 29 37,664 43,526Derivative financial instruments 33 4,507 3,857Prepayments 1,058 1,286Current tax receivable 456 235Other investments 27 319 288Cash and cash equivalents 30 19,548 14,067
91,666 89,164Assets classified as held for sale 4 19,315 8,420
110,981 97,584Total assets 300,193 293,068Current liabilities
Trade and other payables 32 47,154 52,405Derivative financial instruments 33 2,658 3,220Accruals 6,810 5,932Finance debt 34 10,030 9,044Current tax payable 2,501 1,941Provisions 36 7,587 11,238
76,740 83,780Liabilities directly associated with assets classified as held for sale 4 846 538
77,586 84,318Non-current liabilities
Other payables 32 2,102 3,437Derivative financial instruments 33 2,723 3,773Accruals 448 389Finance debt 34 38,767 35,169Deferred tax liabilities 18 15,064 15,078Provisions 36 30,334 26,404Defined benefit pension plan and other post-retirement benefit plan deficits 37 13,549 12,018
102,987 96,268Total liabilities 180,573 180,586Net assets 119,620 112,482Equity
BP shareholders’ equity 39 118,414 111,465Minority interest 39 1,206 1,017
Total equity 39 119,620 112,482
R W Dudley Group Chief Executive6 March 2013
184 Financial statementsBP Annual Report and Form 20-F 2012
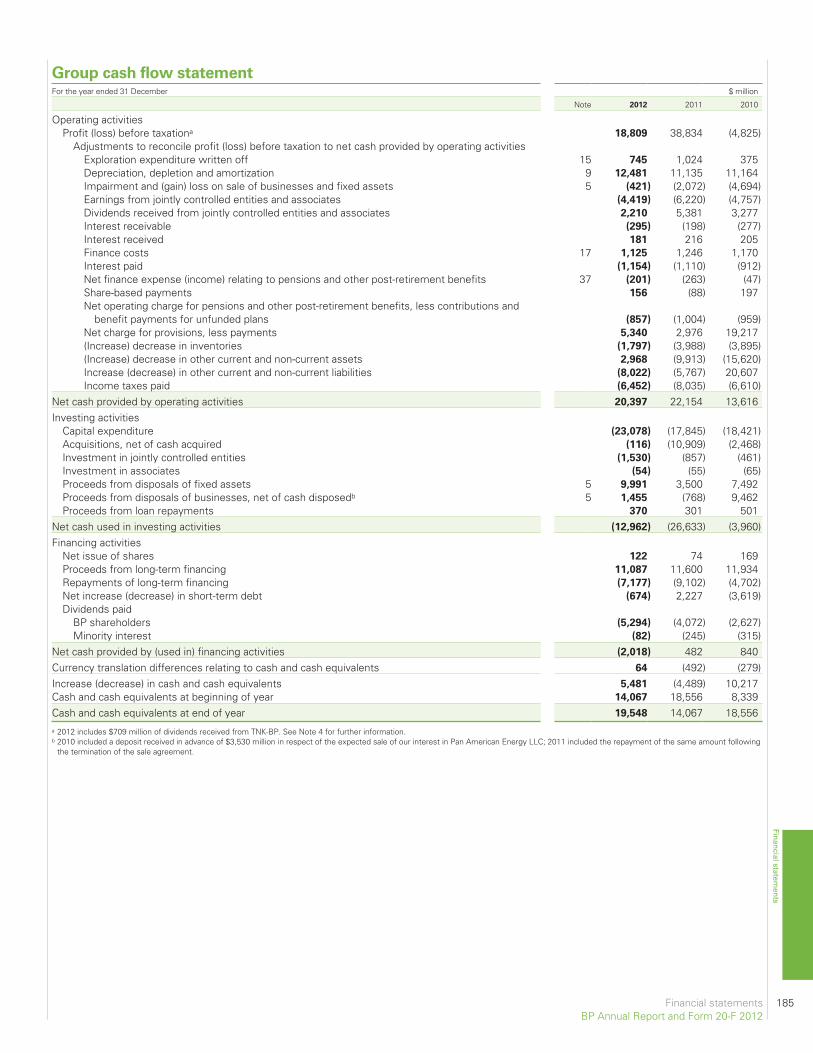
Group cash flow statementFor the year ended 31 December $ million
Note 2012 2011 2010
Operating activitiesProfit (loss) before taxationa 18,809 38,834 (4,825)
Adjustments to reconcile profit (loss) before taxation to net cash provided by operating activitiesExploration expenditure written off 15 745 1,024 375Depreciation, depletion and amortization 9 12,481 11,135 11,164Impairment and (gain) loss on sale of businesses and fixed assets 5 (421) (2,072) (4,694)Earnings from jointly controlled entities and associates (4,419) (6,220) (4,757)Dividends received from jointly controlled entities and associates 2,210 5,381 3,277Interest receivable (295) (198) (277)Interest received 181 216 205Finance costs 17 1,125 1,246 1,170Interest paid (1,154) (1,110) (912)Net finance expense (income) relating to pensions and other post-retirement benefits 37 (201) (263) (47)Share-based payments 156 (88) 197Net operating charge for pensions and other post-retirement benefits, less contributions and
benefit payments for unfunded plans (857) (1,004) (959)Net charge for provisions, less payments 5,340 2,976 19,217(Increase) decrease in inventories (1,797) (3,988) (3,895)(Increase) decrease in other current and non-current assets 2,968 (9,913) (15,620)Increase (decrease) in other current and non-current liabilities (8,022) (5,767) 20,607Income taxes paid (6,452) (8,035) (6,610)
Net cash provided by operating activities 20,397 22,154 13,616Investing activities
Capital expenditure (23,078) (17,845) (18,421)Acquisitions, net of cash acquired (116) (10,909) (2,468)Investment in jointly controlled entities (1,530) (857) (461)Investment in associates (54) (55) (65)Proceeds from disposals of fixed assets 5 9,991 3,500 7,492Proceeds from disposals of businesses, net of cash disposedb 5 1,455 (768) 9,462Proceeds from loan repayments 370 301 501
Net cash used in investing activities (12,962) (26,633) (3,960)Financing activities
Net issue of shares 122 74 169Proceeds from long-term financing 11,087 11,600 11,934Repayments of long-term financing (7,177) (9,102) (4,702)Net increase (decrease) in short-term debt (674) 2,227 (3,619)Dividends paid
BP shareholders (5,294) (4,072) (2,627)Minority interest (82) (245) (315)
Net cash provided by (used in) financing activities (2,018) 482 840Currency translation differences relating to cash and cash equivalents 64 (492) (279)Increase (decrease) in cash and cash equivalents 5,481 (4,489) 10,217Cash and cash equivalents at beginning of year 14,067 18,556 8,339Cash and cash equivalents at end of year 19,548 14,067 18,556a 2012 includes $709 million of dividends received from TNK-BP. See Note 4 for further information.b 2010 included a deposit received in advance of $3,530 million in respect of the expected sale of our interest in Pan American Energy LLC; 2011 included the repayment of the same amount following
the termination of the sale agreement.
Financial statements 185BP Annual Report and Form 20-F 2012
Financial statements
Notes on financial statements
1. Significant accounting policiesAuthorization of financial statements and statement of compliance with
International Financial Reporting Standards
The consolidated financial statements of the BP group for the year ended31 December 2012 were approved and signed by the group chiefexecutive on 6 March 2013 having been duly authorized to do so by theboard of directors. BP p.l.c. is a public limited company incorporated anddomiciled in England and Wales. The consolidated financial statementshave been prepared in accordance with International Financial ReportingStandards (IFRS) as issued by the International Accounting StandardsBoard (IASB), IFRS as adopted by the European Union (EU) and inaccordance with the provisions of the UK Companies Act 2006. IFRS asadopted by the EU differs in certain respects from IFRS as issued by theIASB, however, the differences have no impact on the group’sconsolidated financial statements for the years presented. The significantaccounting policies of the group are set out below.
Basis of preparation
The consolidated financial statements have been prepared in accordancewith IFRS and IFRS Interpretations Committee (IFRIC) interpretationsissued and effective for the year ended 31 December 2012. The standardsand interpretations adopted in the year are described further on page 192.
The accounting policies that follow have been consistently applied to allyears presented.
Subsequent to releasing our unaudited fourth quarter and full year 2012results announcement dated 5 February 2013, an adjustment of $0.8billion has been made to provisions relating to the Gulf of Mexico oil spillas at 31 December 2012, with a corresponding adjustment to thereimbursement asset. There was no impact on profit or loss for the year.For further information see Note 36. In addition, an adjustment has beenmade to correct a $4.7 billion understatement of revenue and purchasesfor the year ended 31 December 2012. There was no impact on profit orloss for the year.
The consolidated financial statements are presented in US dollars and allvalues are rounded to the nearest million dollars ($ million), except whereotherwise indicated.
For further information regarding the key judgements and estimates madeby management in applying the group’s accounting policies, refer toCritical accounting policies on pages 171-174, which forms part of thesefinancial statements.
Basis of consolidation
The group financial statements consolidate the financial statements ofBP p.l.c. and the entities it controls (its subsidiaries) drawn up to31 December each year. Control comprises the power to govern thefinancial and operating policies of the investee so as to obtain benefit fromits activities and is achieved through direct and indirect ownership of votingrights; currently exercisable or convertible potential voting rights; or by wayof contractual agreement. Subsidiaries are consolidated from the date oftheir acquisition, being the date on which the group obtains control, andcontinue to be consolidated until the date that such control ceases. Thefinancial statements of subsidiaries are prepared for the same reporting yearas the parent company, using consistent accounting policies. Intercompanybalances and transactions, including unrealized profits arising fromintragroup transactions, have been eliminated. Unrealized losses areeliminated unless the transaction provides evidence of an impairment of theasset transferred. Minority interests represent the equity in subsidiaries thatis not attributable, directly or indirectly, to the group.
Segmental reporting
The group’s operating segments are established on the basis of thosecomponents of the group that are evaluated regularly by the chiefoperating decision maker in deciding how to allocate resources and inassessing performance. With effect from 1 January 2012, the formerExploration and Production segment was separated to form two newoperating segments, Upstream and TNK-BP, reflecting the way in whichour investment in TNK-BP is managed. In addition, we began reporting theRefining and Marketing segment as Downstream.
On 22 October 2012, BP announced that it had signed heads of terms fora proposed transaction to sell its 50% share in TNK-BP to Rosneft.Following this agreement, BP’s investment in TNK-BP met the criteria tobe classified as held for sale. See Note 4 for further information.
During 2010 a separate organization was created within the group to dealwith the ongoing response to the Gulf of Mexico oil spill. This organizationreports directly to the group chief executive officer and its costs areexcluded from the results of the operating segments. Under IFRS itscosts are therefore presented as a reconciling item between the sum ofthe results of the reportable segments and the group results.
The accounting policies of the operating segments are the same as thegroup’s accounting policies described in this note, except that IFRSrequires that the measure of profit or loss disclosed for each operatingsegment is the measure that is provided regularly to the chief operatingdecision maker. For BP, this measure of profit or loss is replacement costprofit before interest and tax which reflects the replacement cost ofsupplies by excluding from profit inventory holding gains and losses.Replacement cost profit for the group is not a recognized measure undergenerally accepted accounting practice (GAAP). For further informationsee Note 6.
Interests in joint ventures
A joint venture is a contractual arrangement whereby two or more parties(venturers) undertake an economic activity that is subject to joint control.Joint control exists only when the strategic financial and operatingdecisions relating to the activity require the unanimous consent of theventurers. A jointly controlled entity is a joint venture that involves theestablishment of a company, partnership or other entity to engage ineconomic activity that the group jointly controls with its fellow venturers.
The results, assets and liabilities of a jointly controlled entity areincorporated in these financial statements using the equity method ofaccounting. Under the equity method, the investment in a jointlycontrolled entity is carried in the balance sheet at cost, plus post-acquisition changes in the group’s share of net assets of the jointlycontrolled entity, less distributions received and less any impairment invalue of the investment. Loans advanced to jointly controlled entities thathave the characteristics of equity financing are also included in theinvestment on the group balance sheet. The group income statementreflects the group’s share of the results after tax of the jointly controlledentity.
Financial statements of jointly controlled entities are prepared for thesame reporting year as the group. Where necessary, adjustments aremade to those financial statements to bring the accounting policies usedinto line with those of the group.
Unrealized gains on transactions between the group and its jointlycontrolled entities are eliminated to the extent of the group’s interest inthe jointly controlled entities. Unrealized losses are also eliminated unlessthe transaction provides evidence of an impairment of the assettransferred.
The group assesses investments in jointly controlled entities forimpairment whenever events or changes in circumstances indicate thatthe carrying value may not be recoverable. If any such indication ofimpairment exists, the carrying amount of the investment is comparedwith its recoverable amount, being the higher of its fair value less costs tosell and value in use. Where the carrying amount exceeds the recoverableamount, the investment is written down to its recoverable amount.
The group ceases to use the equity method of accounting on the datefrom which it no longer has joint control or significant influence over thejoint venture or associate respectively, or when the interest becomesclassified as an asset held for sale.
Certain of the group’s activities, particularly in the Upstream segment, areconducted through joint ventures where the venturers have a directownership interest in, and jointly control, the assets of the venture. BPrecognizes, on a line-by-line basis in the consolidated financial statements,its share of the assets, liabilities and expenses of these jointly controlledassets incurred jointly with the other partners, along with the group’sincome from the sale of its share of the output and any liabilities andexpenses that the group has incurred in relation to the venture.
186 Financial statementsBP Annual Report and Form 20-F 2012
1. Significant accounting policies continuedInterests in associates
An associate is an entity over which the group is in a position to exercisesignificant influence through participation in the financial and operatingpolicy decisions of the investee, but which is not a subsidiary or a jointlycontrolled entity. The results, assets and liabilities of an associate areincorporated in these financial statements using the equity method ofaccounting as described above for jointly controlled entities.
Foreign currency translation
The functional currency is the currency of the primary economicenvironment in which an entity operates and is normally the currency inwhich the entity primarily generates and expends cash.
In individual subsidiaries, jointly controlled entities and associates,transactions in foreign currencies are initially recorded in the functionalcurrency by applying the rate of exchange ruling at the date of thetransaction. Monetary assets and liabilities denominated in foreigncurrencies are retranslated into the functional currency at the rate ofexchange ruling at the balance sheet date. Any resulting exchangedifferences are included in the income statement. Non-monetary assetsand liabilities, other than those measured at fair value, are not retranslatedsubsequent to initial recognition.
In the consolidated financial statements, the assets and liabilities of non-USdollar functional currency subsidiaries, jointly controlled entities andassociates, including related goodwill, are translated into US dollars at therate of exchange ruling at the balance sheet date. The results and cashflows of non-US dollar functional currency subsidiaries, jointly controlledentities and associates are translated into US dollars using average rates ofexchange. Exchange adjustments arising when the opening net assets andthe profits for the year retained by non-US dollar functional currencysubsidiaries, jointly controlled entities and associates are translated into USdollars are taken to a separate component of equity and reported in thestatement of comprehensive income. Exchange gains and losses arising onlong-term intragroup foreign currency borrowings used to finance thegroup’s non-US dollar investments are also taken to other comprehensiveincome. On disposal or partial disposal of a non-US dollar functional currencysubsidiary, jointly controlled entity or associate, the deferred cumulativeamount of exchange gains and losses recognized in equity relating to thatparticular non-US dollar operation is reclassified to the income statement.
Business combinations and goodwill
A business combination is a transaction or other event in which anacquirer obtains control of one or more businesses. A business is anintegrated set of activities and assets that is capable of being conductedand managed for the purpose of providing a return in the form ofdividends or lower costs or other economic benefits directly to investorsor other owners or participants. A business consists of inputs andprocesses applied to those inputs that have the ability to create outputs.
Business combinations are accounted for using the acquisition method.The identifiable assets acquired and liabilities assumed are measured attheir fair values at the acquisition date. The cost of an acquisition ismeasured as the aggregate of the consideration transferred, measured atacquisition-date fair value, and the amount of any minority interest in theacquiree. Minority interests are stated either at fair value or at theproportionate share of the recognized amounts of the acquiree’sidentifiable net assets. Acquisition costs incurred are expensed andincluded in distribution and administration expenses.
Goodwill is initially measured as the excess of the aggregate of theconsideration transferred, the amount recognized for any minority interestand the acquisition-date fair values of any previously held interest in theacquiree over the fair value of the identifiable assets acquired andliabilities assumed at the acquisition date.
At the acquisition date, any goodwill acquired is allocated to each of thecash-generating units, or groups of cash-generating units, expected tobenefit from the combination’s synergies.
Following initial recognition, goodwill is measured at cost less anyaccumulated impairment losses. Goodwill is reviewed for impairmentannually or more frequently if events or changes in circumstances indicate
that the carrying value may be impaired. Impairment is determined byassessing the recoverable amount of the cash-generating unit to whichthe goodwill relates. Where the recoverable amount of the cash-generating unit is less than the carrying amount, an impairment loss isrecognized. An impairment loss recognized for goodwill is not reversed ina subsequent period.
Goodwill arising on business combinations prior to 1 January 2003 isstated at the previous carrying amount, less subsequent impairments,under UK generally accepted accounting practice.
Goodwill may also arise upon investments in jointly controlled entities andassociates, being the surplus of the cost of investment over the group’sshare of the net fair value of the identifiable assets and liabilities. Suchgoodwill is recorded within investments in jointly controlled entities andassociates, and any impairment of the investment is included within thegroup’s share of earnings from jointly controlled entities and associates.
Non-current assets held for sale
Non-current assets and disposal groups classified as held for sale aremeasured at the lower of carrying amount and fair value less costs to sell.
Non-current assets and disposal groups are classified as held for sale iftheir carrying amounts will be recovered through a sale transaction ratherthan through continuing use. This condition is regarded as met only whenthe sale is highly probable and the asset or disposal group is available forimmediate sale in its present condition subject only to terms that are usualand customary for sales of such assets. Management must be committedto the sale, which should be expected to qualify for recognition as acompleted sale within one year from the date of classification as held forsale.
Property, plant and equipment and intangible assets are not depreciatedonce classified as held for sale. The group ceases to use the equitymethod of accounting from the date on which an interest in a jointlycontrolled entity or an interest in an associate becomes held for sale. If anon-current asset or disposal group has been classified as held for sale,but subsequently ceases to meet the criteria to be classified as held forsale, the group ceases to classify the asset or disposal group as held forsale. Non-current assets and disposal groups that cease to be classified asheld for sale are measured at the lower of the carrying amount before theasset or disposal group was classified as held for sale (adjusted for anydepreciation, amortization or revaluation that would have been recognizedhad the asset or disposal group not been classified as held for sale) and itsrecoverable amount at the date of the subsequent decision not to sell.Except for any interests in equity-accounted entities that cease to beclassified as held for sale, any adjustment to the carrying amount isrecognized in profit or loss in the period in which the asset ceases to beclassified as held for sale. When an interest in an equity-accounted entityceases to be classified as held for sale, it is accounted for using the equitymethod as from the date of its classification as held for sale and thefinancial statements for the periods since classification as held for sale areamended accordingly.
Intangible assets
Intangible assets, other than goodwill, include expenditure on theexploration for and evaluation of oil and natural gas resources, computersoftware, patents, licences and trademarks and are stated at the amountinitially recognized, less accumulated amortization and accumulatedimpairment losses. For information on accounting for expenditures on theexploration for and evaluation of oil and gas resources, see the accountingpolicy for oil and natural gas exploration, appraisal and developmentexpenditure below.
Intangible assets acquired separately from a business are carried initially atcost. The initial cost is the aggregate amount paid and the fair value of anyother consideration given to acquire the asset. An intangible assetacquired as part of a business combination is measured at fair value at thedate of acquisition and is recognized separately from goodwill if the assetis separable or arises from contractual or other legal rights.
Intangible assets with a finite life are amortized on a straight-line basisover their expected useful lives. For patents, licences and trademarks,expected useful life is the shorter of the duration of the legal agreementand economic useful life, and can range from three to 15 years. Computersoftware costs generally have a useful life of three to five years.
Financial statements 187BP Annual Report and Form 20-F 2012
Financial statements
1. Significant accounting policies continuedThe expected useful lives of assets are reviewed on an annual basis and,if necessary, changes in useful lives are accounted for prospectively.
The carrying value of intangible assets is reviewed for impairmentwhenever events or changes in circumstances indicate the carrying valuemay not be recoverable.
Oil and natural gas exploration, appraisal and development expenditure
Oil and natural gas exploration, appraisal and development expenditure isaccounted for using the principles of the successful efforts method ofaccounting.
Licence and property acquisition costsExploration licence and leasehold property acquisition costs are capitalizedwithin intangible assets and are reviewed at each reporting date toconfirm that there is no indication that the carrying amount exceeds therecoverable amount. This review includes confirming that explorationdrilling is still under way or firmly planned or that it has been determined,or work is under way to determine, that the discovery is economicallyviable based on a range of technical and commercial considerations andsufficient progress is being made on establishing development plans andtiming. If no future activity is planned, the remaining balance of the licenceand property acquisition costs is written off. Lower value licences arepooled and amortized on a straight-line basis over the estimated period ofexploration. Upon recognition of proved reserves and internal approval fordevelopment, the relevant expenditure is transferred to property, plantand equipment.
Exploration and appraisal expenditureGeological and geophysical exploration costs are charged against incomeas incurred. Costs directly associated with an exploration well are initiallycapitalized as an intangible asset until the drilling of the well is completeand the results have been evaluated. These costs include employeeremuneration, materials and fuel used, rig costs and payments made tocontractors. If potentially commercial quantities of hydrocarbons are notfound, the exploration well is written off as a dry hole. If hydrocarbons arefound and, subject to further appraisal activity, are likely to be capable ofcommercial development, the costs continue to be carried as an asset.
Costs directly associated with appraisal activity, undertaken to determinethe size, characteristics and commercial potential of a reservoir followingthe initial discovery of hydrocarbons, including the costs of appraisal wellswhere hydrocarbons were not found, are initially capitalized as anintangible asset.
All such carried costs are subject to technical, commercial andmanagement review at least once a year to confirm the continued intentto develop or otherwise extract value from the discovery. When this is nolonger the case, the costs are written off. When proved reserves of oil andnatural gas are determined and development is approved by management,the relevant expenditure is transferred to property, plant and equipment.
Development expenditureExpenditure on the construction, installation and completion ofinfrastructure facilities such as platforms, pipelines and the drilling ofdevelopment wells, including service and unsuccessful development ordelineation wells, is capitalized within property, plant and equipment andis depreciated from the commencement of production as described belowin the accounting policy for property, plant and equipment.
Property, plant and equipment
Property, plant and equipment is stated at cost, less accumulateddepreciation and accumulated impairment losses. The initial cost of anasset comprises its purchase price or construction cost, any costs directlyattributable to bringing the asset into the location and condition necessaryfor it to be capable of operating in the manner intended by management,the initial estimate of any decommissioning obligation, if any, and, forqualifying assets, borrowing costs. The purchase price or constructioncost is the aggregate amount paid and the fair value of any otherconsideration given to acquire the asset. The capitalized value of a financelease is also included within property, plant and equipment. Exchanges ofassets are measured at fair value unless the exchange transaction lackscommercial substance or the fair value of neither the asset received northe asset given up is reliably measurable. The cost of the acquired asset ismeasured at the fair value of the asset given up, unless the fair value of
the asset received is more clearly evident. Where fair value is not used,the cost of the acquired asset is measured at the carrying amount of theasset given up. The gain or loss on derecognition of the asset given up isrecognized in profit or loss.
Expenditure on major maintenance refits or repairs comprises the cost ofreplacement assets or parts of assets, inspection costs and overhaulcosts. Where an asset or part of an asset that was separately depreciatedis replaced and it is probable that future economic benefits associatedwith the item will flow to the group, the expenditure is capitalized and thecarrying amount of the replaced asset is derecognized. Inspection costsassociated with major maintenance programmes are capitalized andamortized over the period to the next inspection. Overhaul costs for majormaintenance programmes, and all other maintenance costs are expensedas incurred.
Oil and natural gas properties, including related pipelines, are depreciatedusing a unit-of-production method. The cost of producing wells isamortized over proved developed reserves. Licence acquisition, commonfacilities and future decommissioning costs are amortized over totalproved reserves. The unit-of-production rate for the amortization ofcommon facilities costs takes into account expenditures incurred to date,together with the future capital expenditure expected to be incurred inrelation to these common facilities.
Other property, plant and equipment is depreciated on a straight line basisover its expected useful life. The typical useful lives of the group’s otherproperty, plant and equipment are as follows:
Land improvements 15 to 25 yearsBuildings 20 to 50 yearsRefineries 20 to 30 yearsPetrochemicals plants 20 to 30 yearsPipelines 10 to 50 yearsService stations 15 yearsOffice equipment 3 to 7 yearsFixtures and fittings 5 to 15 years
The expected useful lives of property, plant and equipment are reviewedon an annual basis and, if necessary, changes in useful lives areaccounted for prospectively.
The carrying amount of property, plant and equipment is reviewed forimpairment whenever events or changes in circumstances indicate thecarrying value may not be recoverable.
An item of property, plant and equipment is derecognized upon disposalor when no future economic benefits are expected to arise from thecontinued use of the asset. Any gain or loss arising on derecognition ofthe asset (calculated as the difference between the net disposal proceedsand the carrying amount of the item) is included in the income statementin the period in which the item is derecognized.
Impairment of intangible assets and property, plant and equipment
The group assesses assets or groups of assets for impairment wheneverevents or changes in circumstances indicate that the carrying amount ofan asset may not be recoverable, for example, changes in the group’sbusiness plans, changes in commodity prices leading to sustainedunprofitable performance, low plant utilization, evidence of physicaldamage or, for oil and gas assets, significant downward revisions ofestimated volumes or increases in estimated future developmentexpenditure. If any such indication of impairment exists, the group makesan estimate of the asset’s recoverable amount. Individual assets aregrouped for impairment assessment purposes at the lowest level at whichthere are identifiable cash flows that are largely independent of the cashflows of other groups of assets. An asset group’s recoverable amount isthe higher of its fair value less costs to sell and its value in use. Where thecarrying amount of an asset group exceeds its recoverable amount, theasset group is considered impaired and is written down to its recoverableamount. In assessing value in use, the estimated future cash flows areadjusted for the risks specific to the asset group and are discounted totheir present value using a pre-tax discount rate that reflects currentmarket assessments of the time value of money.
An assessment is made at each reporting date as to whether there is anyindication that previously recognized impairment losses may no longerexist or may have decreased. If such an indication exists, the recoverable
188 Financial statementsBP Annual Report and Form 20-F 2012
1. Significant accounting policies continuedamount is estimated. A previously recognized impairment loss is reversedonly if there has been a change in the estimates used to determine theasset’s recoverable amount since the last impairment loss wasrecognized. If that is the case, the carrying amount of the asset isincreased to its recoverable amount. That increased amount cannotexceed the carrying amount that would have been determined, net ofdepreciation, had no impairment loss been recognized for the asset inprior years. Such reversal is recognized in profit or loss. After such areversal, the depreciation charge is adjusted in future periods to allocatethe asset’s revised carrying amount, less any residual value, on asystematic basis over its remaining useful life.
Financial assets
Financial assets are classified as loans and receivables; available-for-salefinancial assets; financial assets at fair value through profit or loss; or asderivatives designated as hedging instruments in an effective hedge, asappropriate. Financial assets include cash and cash equivalents, tradereceivables, other receivables, loans, other investments, and derivativefinancial instruments. The group determines the classification of itsfinancial assets at initial recognition. Financial assets are recognizedinitially at fair value, normally being the transaction price plus, in the caseof financial assets not at fair value through profit or loss, directlyattributable transaction costs.
The subsequent measurement of financial assets depends on theirclassification, as follows:
Loans and receivablesLoans and receivables are non-derivative financial assets with fixed ordeterminable payments that are not quoted in an active market. Suchassets are carried at amortized cost using the effective interest method ifthe time value of money is significant. Gains and losses are recognized inincome when the loans and receivables are derecognized or impaired, aswell as through the amortization process. This category of financial assetsincludes trade and other receivables.
Available-for-sale financial assetsAvailable-for-sale financial assets are those non-derivative financial assetsthat are not classified as loans and receivables or financial assets at fairvalue through profit or loss. After initial recognition, available-for-salefinancial assets are measured at fair value, with gains or losses recognizedwithin other comprehensive income. Accumulated changes in fair valueare recorded as a separate component of equity until the investment isderecognized or impaired.
The fair value of quoted investments is determined by reference to bidprices at the close of business on the balance sheet date. Where there isno active market, fair value is determined using valuation techniques.Where fair value cannot be reliably measured, assets are carried at cost.
Financial assets at fair value through profit or lossFinancial assets at fair value through profit or loss are carried on thebalance sheet at fair value with gains or losses recognized in the incomestatement. Derivatives, other than those designated as effective hedginginstruments, are classified as held for trading and are included in thiscategory.
Derivatives designated as hedging instruments in an effective hedgeSuch derivatives are carried on the balance sheet at fair value. Thetreatment of gains and losses arising from revaluation is described belowin the accounting policy for derivative financial instruments and hedgingactivities.
Impairment of financial assets
The group assesses at each balance sheet date whether a financial assetor group of financial assets is impaired.
Loans and receivablesIf there is objective evidence that an impairment loss on loans andreceivables carried at amortized cost has been incurred, the amount of theloss is measured as the difference between the asset’s carrying amountand the present value of estimated future cash flows discounted at thefinancial asset’s original effective interest rate. The carrying amount of theasset is reduced, with the amount of the loss recognized in the incomestatement.
Available-for-sale financial assetsIf an available-for-sale financial asset is impaired, the cumulative losspreviously recognized in equity is transferred to the income statement.Any subsequent recovery in the fair value of the asset is recognized withinother comprehensive income.
If there is objective evidence that an impairment loss on an unquotedequity instrument that is carried at cost has been incurred, the amount ofthe loss is measured as the difference between the asset’s carryingamount and the present value of estimated future cash flows discountedat the current market rate of return for a similar financial asset.
Inventories
Inventories, other than inventory held for trading purposes, are stated atthe lower of cost and net realizable value. Cost is determined by the first-in first-out method and comprises direct purchase costs, cost ofproduction, transportation and manufacturing expenses. Net realizablevalue is determined by reference to prices existing at the balance sheetdate.
Inventories held for trading purposes are stated at fair value less costs tosell and any changes in fair value are recognized in the income statement.
Supplies are valued at cost to the group mainly using the average methodor net realizable value, whichever is the lower.
Financial liabilities
Financial liabilities are classified as financial liabilities at fair value throughprofit or loss; derivatives designated as hedging instruments in aneffective hedge; or as financial liabilities measured at amortized cost, asappropriate. Financial liabilities include trade and other payables, accruals,most items of finance debt and derivative financial instruments. The groupdetermines the classification of its financial liabilities at initial recognition.The measurement of financial liabilities depends on their classification, asfollows:
Financial liabilities at fair value through profit or lossFinancial liabilities at fair value through profit or loss are carried on thebalance sheet at fair value with gains or losses recognized in the incomestatement. Derivatives, other than those designated as effective hedginginstruments, are classified as held for trading and are included in thiscategory.
Derivatives designated as hedging instruments in an effective hedgeSuch derivatives are carried on the balance sheet at fair value. Thetreatment of gains and losses arising from revaluation is described belowin the accounting policy for derivative financial instruments and hedgingactivities.
Financial liabilities measured at amortized costAll other financial liabilities are initially recognized at fair value. For interest-bearing loans and borrowings this is the fair value of the proceedsreceived net of issue costs associated with the borrowing.
After initial recognition, other financial liabilities are subsequentlymeasured at amortized cost using the effective interest method.Amortized cost is calculated by taking into account any issue costs, andany discount or premium on settlement. Gains and losses arising on therepurchase, settlement or cancellation of liabilities are recognizedrespectively in interest and other income and finance costs.
This category of financial liabilities includes trade and other payables andfinance debt.
Leases
Finance leases, which transfer to the group substantially all the risks andbenefits incidental to ownership of the leased item, are capitalized at thecommencement of the lease term at the fair value of the leased item or, iflower, at the present value of the minimum lease payments. Financecharges are allocated to each period so as to achieve a constant rate ofinterest on the remaining balance of the liability and are charged directlyagainst income.
Capitalized leased assets are depreciated over the shorter of theestimated useful life of the asset or the lease term. Operating leasepayments are recognized as an expense in the income statement on astraight-line basis over the lease term. For both finance and operatingleases, contingent rents are recognized in the income statement in theperiod in which they are incurred.
Financial statements 189BP Annual Report and Form 20-F 2012
Financial statements
1. Significant accounting policies continuedDerivative financial instruments and hedging activities
The group uses derivative financial instruments to manage certainexposures to fluctuations in foreign currency exchange rates, interestrates and commodity prices as well as for trading purposes. Suchderivative financial instruments are initially recognized at fair value on thedate on which a derivative contract is entered into and are subsequentlyremeasured at fair value. Derivatives relating to unquoted equityinstruments are carried at cost where it is not possible to reliably measuretheir fair value subsequent to initial recognition. Derivatives are carried asassets when the fair value is positive and as liabilities when the fair valueis negative.
Contracts to buy or sell a non-financial item that can be settled net in cashor another financial instrument, or by exchanging financial instruments asif the contracts were financial instruments, with the exception of contractsthat were entered into and continue to be held for the purpose of thereceipt or delivery of a non-financial item in accordance with the group’sexpected purchase, sale or usage requirements, are accounted for asfinancial instruments. Contracts to buy or sell equity investments,including investments in associates, are also financial instruments.
Gains or losses arising from changes in the fair value of derivatives thatare not designated as effective hedging instruments are recognized in theincome statement.
For the purpose of hedge accounting, hedges are classified as:
• Fair value hedges when hedging exposure to changes in the fair valueof a recognized asset or liability.
• Cash flow hedges when hedging exposure to variability in cash flowsthat is either attributable to a particular risk associated with a recognizedasset or liability or a highly probable forecast transaction.
Hedge relationships are formally designated and documented at inception,together with the risk management objective and strategy for undertakingthe hedge. The documentation includes identification of the hedginginstrument, the hedged item or transaction, the nature of the risk beinghedged, and how the entity will assess the hedging instrumenteffectiveness in offsetting the exposure to changes in the hedged item’sfair value or cash flows attributable to the hedged item. Such hedges areexpected at inception to be highly effective in achieving offsettingchanges in fair value or cash flows. Hedges meeting the criteria for hedgeaccounting are accounted for as follows:
Fair value hedgesThe change in fair value of a hedging derivative is recognized in profit orloss. The change in the fair value of the hedged item attributable to therisk being hedged is recorded as part of the carrying value of the hedgeditem and is also recognized in profit or loss.
The group applies fair value hedge accounting for hedging fixed interestrate risk on borrowings. The gain or loss relating to the effective portion ofthe interest rate swap is recognized in the income statement withinfinance costs, offsetting the amortization of the interest on the underlyingborrowings.
If the criteria for hedge accounting are no longer met, or if the grouprevokes the designation, the adjustment to the carrying amount of ahedged item for which the effective interest method is used is amortizedto profit or loss over the period to maturity.
Cash flow hedgesFor cash flow hedges, the effective portion of the gain or loss on thehedging instrument is recognized within other comprehensive income,while the ineffective portion is recognized in profit or loss. Amounts takento other comprehensive income are transferred to the income statementwhen the hedged transaction affects profit or loss. The gain or lossrelating to the effective portion of interest rate swaps hedging variablerate borrowings is recognized in the income statement within financecosts.
Where the hedged item is the cost of a non-financial asset or liability, suchas a forecast transaction for the purchase of property, plant andequipment, the amounts recognized within other comprehensive incomeare transferred to the initial carrying amount of the non-financial asset orliability. Where the hedged item is an equity investment, such as an
investment in an associate, the amounts recognized in othercomprehensive income remain in the separate component of equity untilthe investment is sold or impaired.
If the hedging instrument expires or is sold, terminated or exercisedwithout replacement or rollover, or if its designation as a hedge isrevoked, amounts previously recognized within other comprehensiveincome remain in equity until the forecast transaction occurs and aretransferred to the income statement or to the initial carrying amount of anon-financial asset or liability as above. If a forecast transaction is nolonger expected to occur, amounts previously recognized in equity arereclassified to the income statement.
Embedded derivativesDerivatives embedded in other financial instruments or other hostcontracts are treated as separate derivatives when their risks andcharacteristics are not closely related to those of the host contract.Contracts are assessed for embedded derivatives when the groupbecomes a party to them, including at the date of a business combination.Embedded derivatives are measured at fair value at each balance sheetdate. Any gains or losses arising from changes in fair value are takendirectly to the income statement.
Provisions, contingencies and reimbursement assets
Provisions are recognized when the group has a present obligation (legalor constructive) as a result of a past event, it is probable that an outflow ofresources embodying economic benefits will be required to settle theobligation and a reliable estimate can be made of the amount of theobligation. Where appropriate, the future cash flow estimates are adjustedto reflect risks specific to the liability.
If the effect of the time value of money is material, provisions aredetermined by discounting the expected future cash flows at a pre-taxrisk-free rate that reflects current market assessments of the time valueof money. Where discounting is used, the increase in the provision due tothe passage of time is recognized within finance costs. Provisions are splitbetween amounts expected to be settled within 12 months of the balancesheet date (current) and amounts expected to be settled later (non-current). Contingent liabilities are possible obligations whose existencewill only be confirmed by future events not wholly within the control ofthe group, or present obligations where it is not probable that an outflowof resources will be required or the amount of the obligation cannot bemeasured with sufficient reliability.
Contingent liabilities are not recognized in the financial statements but aredisclosed unless the possibility of an outflow of economic resources isconsidered remote.
Where the group makes contributions into a separately administered fundfor restoration, environmental or other obligations, which it does notcontrol, and the group’s right to the assets in the fund is restricted, theobligation to contribute to the fund is recognized as a liability where it isprobable that such additional contributions will be made. The grouprecognizes a reimbursement asset separately, being the lower of theamount of the associated restoration, environmental or other provisionand the group’s share of the fair value of the net assets of the fundavailable to contributors.
DecommissioningLiabilities for decommissioning costs are recognized when the group hasan obligation to plug and abandon a well, dismantle and remove a facilityor an item of plant and to restore the site on which it is located, and whena reliable estimate of that liability can be made. Where an obligation existsfor a new facility or item of plant, such as oil and natural gas production ortransportation facilities, this liability will be recognized on construction orinstallation. Similarly, where an obligation exists for a well, this liability isrecognized when it is drilled. An obligation for decommissioning may alsocrystallize during the period of operation of a well, facility or item of plantthrough a change in legislation or through a decision to terminateoperations. The amount recognized is the present value of the estimatedfuture expenditure determined in accordance with local conditions andrequirements.
A corresponding intangible asset (in the case of an exploration or appraisalwell) or item of property, plant and equipment of an amount equivalent tothe provision is also recognized. The item of property, plant andequipment is subsequently depreciated as part of the asset.
190 Financial statementsBP Annual Report and Form 20-F 2012
1. Significant accounting policies continuedOther than the unwinding of discount on the provision, any change in thepresent value of the estimated expenditure is reflected as an adjustmentto the provision and the corresponding asset. Such changes includeforeign exchange gains and losses arising on the retranslation of theliability into the functional currency of the reporting entity, when it isknown that the liability will be settled in a foreign currency.
Environmental expenditures and liabilitiesEnvironmental expenditures that relate to current or future revenues areexpensed or capitalized as appropriate. Expenditures that relate to anexisting condition caused by past operations that do not contribute tocurrent or future earnings are expensed.
Liabilities for environmental costs are recognized when a clean-up isprobable and the associated costs can be reliably estimated. Generally,the timing of recognition of these provisions coincides with thecommitment to a formal plan of action or, if earlier, on divestment or onclosure of inactive sites.
The amount recognized is the best estimate of the expenditure required.Where the liability will not be settled for a number of years, the amountrecognized is the present value of the estimated future expenditure.
Employee benefits
Wages, salaries, bonuses, social security contributions, paid annual leaveand sick leave are accrued in the period in which the associated servicesare rendered by employees of the group. Deferred bonus arrangementsthat have a vesting date more than 12 months after the period end arevalued on an actuarial basis using the projected unit credit method andamortized on a straight-line basis over the service period until the awardvests. The accounting policies for share-based payments and for pensionsand other post-retirement benefits are described below.
Share-based payments
Equity-settled transactionsThe cost of equity-settled transactions with employees is measured byreference to the fair value at the date at which equity instruments aregranted and is recognized as an expense over the vesting period, whichends on the date on which the relevant employees become fully entitledto the award. Fair value is determined by using an appropriate valuationmodel. In valuing equity-settled transactions, no account is taken of anyvesting conditions, other than conditions linked to the price of the sharesof the company (market conditions). Non-vesting conditions, such as thecondition that employees contribute to a savings-related plan, are takeninto account in the grant-date fair value, and failure to meet a non-vestingcondition is treated as a cancellation, where this is within the control ofthe employee.
No expense is recognized for awards that do not ultimately vest, exceptfor awards where vesting is conditional upon a market condition, whichare treated as vesting irrespective of whether or not the market conditionis satisfied, provided that all other performance conditions are satisfied.
At each balance sheet date before vesting, the cumulative expense iscalculated, representing the extent to which the vesting period hasexpired and management’s best estimate of the achievement orotherwise of non-market conditions and the number of equity instrumentsthat will ultimately vest or, in the case of an instrument subject to amarket condition, be treated as vesting as described above. Themovement in cumulative expense since the previous balance sheet dateis recognized in the income statement, with a corresponding entry inequity.
When the terms of an equity-settled award are modified or a new award isdesignated as replacing a cancelled or settled award, the cost based onthe original award terms continues to be recognized over the originalvesting period. In addition, an expense is recognized over the remainderof the new vesting period for the incremental fair value of anymodification, based on the difference between the fair value of the originalaward and the fair value of the modified award, both as measured on thedate of the modification. No reduction is recognized if this difference isnegative.
When an equity-settled award is cancelled, it is treated as if it had vestedon the date of cancellation and any cost not yet recognized in the incomestatement for the award is expensed immediately.
Cash-settled transactionsThe cost of cash-settled transactions is measured at fair value at eachbalance sheet date and recognized as an expense over the vesting period,with a corresponding liability for the cumulative expense recognized onthe balance sheet.
Pensions and other post-retirement benefits
The cost of providing benefits under the defined benefit plans isdetermined separately for each plan using the projected unit creditmethod, which attributes entitlement to benefits to the current period (todetermine current service cost) and to the current and prior periods (todetermine the present value of the defined benefit obligation). Pastservice costs are recognized immediately when the company becomescommitted to a change in pension plan design. When a settlement(eliminating all obligations for benefits already accrued) or a curtailment(reducing future obligations as a result of a material reduction in the planmembership or a reduction in future entitlement) occurs, the obligationand related plan assets are remeasured using current actuarialassumptions and the resultant gain or loss is recognized in the incomestatement during the period in which the settlement or curtailmentoccurs.
The interest element of the defined benefit cost represents the change inpresent value of plan obligations resulting from the passage of time, and isdetermined by applying the discount rate to the opening present value ofthe benefit obligation, taking into account material changes in theobligation during the year. The expected return on plan assets is based onan assessment made at the beginning of the year of long-term marketreturns on plan assets, adjusted for the forecasts of contributions receivedand benefits paid during the year. The difference between the expectedreturn on plan assets and the interest cost is recognized in the incomestatement as other finance income or expense.
Actuarial gains and losses are recognized in full within other comprehensiveincome in the year in which they occur.
The defined benefit pension plan surplus or deficit in the balance sheetcomprises the total for each plan of the present value of the definedbenefit obligation (using a discount rate based on high quality corporatebonds), less the fair value of plan assets out of which the obligations areto be settled directly. Fair value is based on market price information and,in the case of quoted securities, is the published bid price.
Contributions to defined contribution plans are recognized in the incomestatement in the period in which they become payable.
Corporate taxes
Income tax expense represents the sum of current tax and deferred tax.Interest and penalties relating to tax are also included in income taxexpense.
Income tax is recognized in the income statement, except to the extentthat it relates to items recognized in other comprehensive income ordirectly in equity, in which case the related tax is recognized in othercomprehensive income or directly in equity.
Current tax is based on the taxable profit for the period. Taxable profitdiffers from net profit as reported in the income statement because it isdetermined in accordance with the rules established by the applicabletaxation authorities. It therefore excludes items of income or expense thatare taxable or deductible in other periods as well as items that are nevertaxable or deductible. The group’s liability for current tax is calculatedusing tax rates and laws that have been enacted or substantively enactedby the balance sheet date.
Deferred tax is provided, using the liability method, on all temporarydifferences at the balance sheet date between the tax bases of assetsand liabilities and their carrying amounts for financial reporting purposes.
Deferred tax liabilities are recognized for all taxable temporary differencesexcept:
• Where the deferred tax liability arises on the initial recognition ofgoodwill; or
Financial statements 191BP Annual Report and Form 20-F 2012
Financial statements
1. Significant accounting policies continued• Where the deferred tax liability arises on the initial recognition of an
asset or liability in a transaction that is not a business combination and,at the time of the transaction, affects neither accounting profit nortaxable profit or loss; or
• In respect of taxable temporary differences associated withinvestments in subsidiaries, jointly controlled entities and associates,where the group is able to control the timing of the reversal of thetemporary differences and it is probable that the temporary differenceswill not reverse in the foreseeable future.
Deferred tax assets are recognized for all deductible temporarydifferences, carry-forward of unused tax credits and unused tax losses, tothe extent that it is probable that taxable profit will be available againstwhich the deductible temporary differences and the carry-forward ofunused tax credits and unused tax losses can be utilized:
• Except where the deferred tax asset relating to the deductibletemporary difference arises from the initial recognition of an asset orliability in a transaction that is not a business combination and, at thetime of the transaction, affects neither accounting profit nor taxableprofit or loss.
• In respect of deductible temporary differences associated withinvestments in subsidiaries, jointly controlled entities and associates,deferred tax assets are recognized only to the extent that it is probablethat the temporary differences will reverse in the foreseeable future andtaxable profit will be available against which the temporary differencescan be utilized.
The carrying amount of deferred tax assets is reviewed at each balancesheet date and reduced to the extent that it is no longer probable thatsufficient taxable profit will be available to allow all or part of the deferredtax asset to be utilized.
Deferred tax assets and liabilities are measured at the tax rates that areexpected to apply in the period when the asset is realized or the liability issettled, based on tax rates (and tax laws) that have been enacted orsubstantively enacted at the balance sheet date. Deferred tax assets andliabilities are not discounted.
Deferred tax assets and liabilities are offset only when there is a legallyenforceable right to set off current tax assets against current tax liabilitiesand when the deferred tax assets and liabilities relate to income taxeslevied by the same taxation authority on either the same taxable entity ordifferent taxable entities where there is an intention to settle the currenttax assets and liabilities on a net basis or to realize the assets and settlethe liabilities simultaneously.
Customs duties and sales taxes
Customs duties and sales taxes which are passed on to customers areexcluded from revenues and expenses. Assets and liabilities arerecognized net of the amount of customs duties or sales tax except:
• Where the customs duty or sales tax incurred on a purchase of goodsand services is not recoverable from the taxation authority, in whichcase the customs duty or sales tax is recognized as part of the cost ofacquisition of the asset.
• Receivables and payables are stated with the amount of customs dutyor sales tax included.
The net amount of sales tax recoverable from, or payable to, the taxationauthority is included within receivables or payables in the balance sheet.
Own equity instruments
The group’s holdings in its own equity instruments, including ordinaryshares held by Employee Share Ownership Plans (ESOPs), are classifiedas ‘treasury shares’, or ‘own shares’ for the ESOPs, and are shown asdeductions from shareholders’ equity at cost. Consideration received forthe sale of such shares is also recognized in equity, with any differencebetween the proceeds from sale and the original cost being taken to theprofit and loss account reserve. No gain or loss is recognized in theincome statement on the purchase, sale, issue or cancellation of equityshares.
Revenue
Revenue arising from the sale of goods is recognized when the significantrisks and rewards of ownership have passed to the buyer, which is
typically at the point that title passes, and the revenue can be reliablymeasured.
Revenue is measured at the fair value of the consideration received orreceivable and represents amounts receivable for goods provided in thenormal course of business, net of discounts, customs duties and salestaxes.
Physical exchanges are reported net, as are sales and purchases madewith a common counterparty, as part of an arrangement similar to aphysical exchange. Similarly, where the group acts as agent on behalf of athird party to procure or market energy commodities, any associated feeincome is recognized but no purchase or sale is recorded. Additionally,where forward sale and purchase contracts for oil, natural gas or powerhave been determined to be for trading purposes, the associated salesand purchases are reported net within sales and other operating revenueswhether or not physical delivery has occurred.
Generally, revenues from the production of oil and natural gas propertiesin which the group has an interest with joint venture partners arerecognized on the basis of the group’s working interest in those properties(the entitlement method). Differences between the production sold andthe group’s share of production are not significant.
Interest income is recognized as the interest accrues (using the effectiveinterest rate that is the rate that exactly discounts estimated future cashreceipts through the expected life of the financial instrument to the netcarrying amount of the financial asset).
Dividend income from investments is recognized when the shareholders’right to receive the payment is established.
Research
Research costs are expensed as incurred.
Finance costs
Finance costs directly attributable to the acquisition, construction orproduction of qualifying assets, which are assets that necessarily take asubstantial period of time to get ready for their intended use, are added tothe cost of those assets, until such time as the assets are substantiallyready for their intended use. All other finance costs are recognized in theincome statement in the period in which they are incurred.
Use of estimates
The preparation of financial statements requires management to makeestimates and assumptions that affect the reported amounts of assetsand liabilities as well as the disclosure of contingent assets and liabilitiesat the balance sheet date and the reported amounts of revenues andexpenses during the reporting period. Actual outcomes could differ fromthose estimates.
Impact of new International Financial Reporting Standards
Adopted for 2012There are no new or amended standards or interpretations adopted witheffect from 1 January 2012 that have a significant impact on the financialstatements.
Not yet adoptedThe following pronouncements from the IASB will become effective forfuture financial reporting periods and have not yet been adopted by thegroup.
Interests in other entities and related disclosures
In May 2011, the IASB issued three new standards relating to interests inother entities and related disclosures. The new standards are IFRS 10‘Consolidated Financial Statements’, IFRS 11 ‘Joint Arrangements’ andIFRS 12 ‘Disclosure of Interests in Other Entities’. In addition, the IASBissued amendments to IAS 27 ‘Consolidated and Separate FinancialStatements’ (renamed IAS 27 ‘Separate Financial Statements’) and IAS 28‘Investments in Associates’ (renamed IAS 28 ‘Investments in Associatesand Joint Ventures’).
IFRS 10 introduces a single consolidation model that identifies control asthe basis for consolidation. The new model applies to all types of entities,including structured entities. Under the new model, an investor controlsan investee when it is exposed, or has rights, to variable returns from itsinvolvement with the investee and has the ability to affect those returnsthrough its power over the investee.
192 Financial statementsBP Annual Report and Form 20-F 2012
1. Significant accounting policies continuedIFRS 11 establishes a principle that applies to the accounting for all jointarrangements, whereby parties to the arrangement account for theirunderlying contractual rights and obligations relating to the jointarrangement. IFRS 11 identifies two types of joint arrangements. A ‘jointventure’ is a joint arrangement whereby the parties that have joint controlof the arrangement have rights to the net assets of the arrangement. A‘joint operation’ is a joint arrangement whereby the parties that have jointcontrol of the arrangement have rights to the assets, and obligations forthe liabilities, relating to the arrangement. Investments in joint ventureswill be accounted for using the equity method. Investments in jointoperations will be accounted for by recognizing the group’s assets,liabilities, revenue and expenses relating to the joint operation.
IFRS 12 combines all the disclosure requirements for an entity’s interestsin subsidiaries, joint arrangements, associates and structured entities intoone comprehensive disclosure standard.
These new and amended standards are effective for annual periodsbeginning on or after 1 January 2013 and BP will adopt them from thisdate. The evaluation of the effect of adoption of these standards is largelycomplete. The main impact of this suite of new standards is that certain ofthe group’s existing jointly controlled entities, which are currently equityaccounted, will fall under the definition of a joint operation under IFRS 11and thus we will recognize the group’s assets, liabilities, revenue andexpenses relating to these arrangements. Whilst the effect on the group’sreported income and net assets as a result of the new requirements is notexpected to be material, the change is expected to materially impactcertain of the component lines of the balance sheet and incomestatement. On the balance sheet, we expect a reduction in investments injointly controlled entities of approximately $7 billion, which will bereplaced with the recognition (on the relevant line items, principallyintangible assets and property, plant and equipment) of our share of theassets and liabilities relating to these arrangements. In the incomestatement, we expect a reduction in earnings from jointly controlledentities of approximately $0.5 billion, which will be replaced with therecognition (on the relevant line items) of our share of the revenue andexpenses relating to these arrangements.
This new suite of standards was adopted by the EU in December 2012.
Other new standards not yet adopted
In June 2011, the IASB issued an amended version of IAS 19 ‘EmployeeBenefits’, which brings in various changes relating to the recognition andmeasurement of post-retirement defined benefit expense and terminationbenefits, and to the disclosures for all employee benefits. The mainimpact for BP will be that the expense for defined benefit pension andother post-retirement benefit plans will include a net interest income orexpense, which will be calculated by applying the discount rate used formeasuring the obligation and applying that to the net defined benefit assetor liability. This means that the expected return on assets credited to profitor loss (currently calculated based on the expected long-term return onpension assets) will now be based on a lower corporate bond rate, thesame rate that is used to discount the pension liability. The amended IAS19 is effective for annual periods beginning on or after 1 January 2013 andBP will adopt this amended standard from that date. The evaluation of theeffect of adoption of the amended standard is largely complete. Under theamended IAS 19, net finance expense (income) relating to pensions andother post-retirement benefits and profit before tax would have beenapproximately $0.8 billion and $0.7 billion lower for 2012 and 2011respectively, with corresponding pre-tax increases in other comprehensiveincome. There is no impact on cash flows or on the balance sheet at31 December 2012.
In May 2011, the IASB issued a new standard, IFRS 13 ‘Fair ValueMeasurement’. The new standard defines fair value, sets out a frameworkfor measuring fair value and contains the required disclosures about fairvalue measurements. IFRS 13 does not require fair value measurementsin addition to those already required or permitted by other standards,rather it prescribes how fair value should be measured if another standardrequires it. Fair value is defined as the price that would be received to sellan asset or paid to transfer a liability in an orderly transaction betweenmarket participants at the measurement date i.e. it is an exit price. IFRS13 is effective for annual periods beginning on or after 1 January 2013 andBP will adopt it from this date. For BP, no significant impact is expected asa result of the adoption of IFRS 13.
In December 2011, the IASB issued amendments to IFRS 7 ‘Disclosures –Offsetting Financial Assets and Financial Liabilities’ and amendments toIAS 32 ‘Offsetting Financial Assets and Financial Liabilities’. Theseamendments introduce new presentation and disclosure requirementsabout the effects of offsetting financial assets and financial liabilities andrelated arrangements on an entity’s financial position. The amendments toIFRS 7 are effective for annual periods beginning on or after 1 January2013, with the amendments to IAS 32 effective for annual periodsbeginning on or after 1 January 2014. BP will adopt these amendmentswith effect from 1 January 2013 and 1 January 2014 respectively. As aresult of the amendments to IFRS 7, the notes to BP’s 2013 financialstatements will disclose additional information on gross and net financialinstruments balances. The evaluation of the effect of adoption of theamendments to IAS 32 is not expected to result in any significant changesto the offsetting of financial assets and liabilities.
In June 2011, the IASB issued amendments to IAS 1 ‘Presentation ofFinancial Statements’ on the presentation of other comprehensive income(OCI). The amendments require that those items of OCI that might bereclassified to profit or loss at a future date be presented separately fromthose items that will never be reclassified to profit or loss. Theseamendments to IAS 1 are effective for annual periods beginning on orafter 1 July 2012. BP will adopt the amendments with effect from1 January 2013. The adoption of the amended standard will have apresentational impact on the group’s statement of comprehensiveincome, with no effect on the reported income or net assets of the group.
As part of the IASB’s project to replace IAS 39 ‘Financial Instruments:Recognition and Measurement’, in November 2009 the IASB issued thefirst phase of IFRS 9 ‘Financial Instruments’, dealing with the classificationand measurement of financial assets. In October 2010, the IASB updatedIFRS 9 by incorporating the requirements for the accounting for financialliabilities. The remaining phases of IFRS 9 (covering impairment andhedge accounting) are still to be completed. In December 2011, the IASBdecided that IFRS 9 will be effective for annual periods beginning on orafter 1 January 2015, rather than 1 January 2013 as originally indicated. BPhas not yet decided the date of adoption for the group and has not yetcompleted its evaluation of the effect of adoption.
With the exception of IFRS 9, the EU has now adopted all of the above-mentioned other new standards that have been issued but not yetadopted by the group.
There are no other standards and interpretations in issue but not yetadopted that the directors anticipate will have a material effect on thereported income or net assets of the group.
Financial statements 193BP Annual Report and Form 20-F 2012
Financial statements
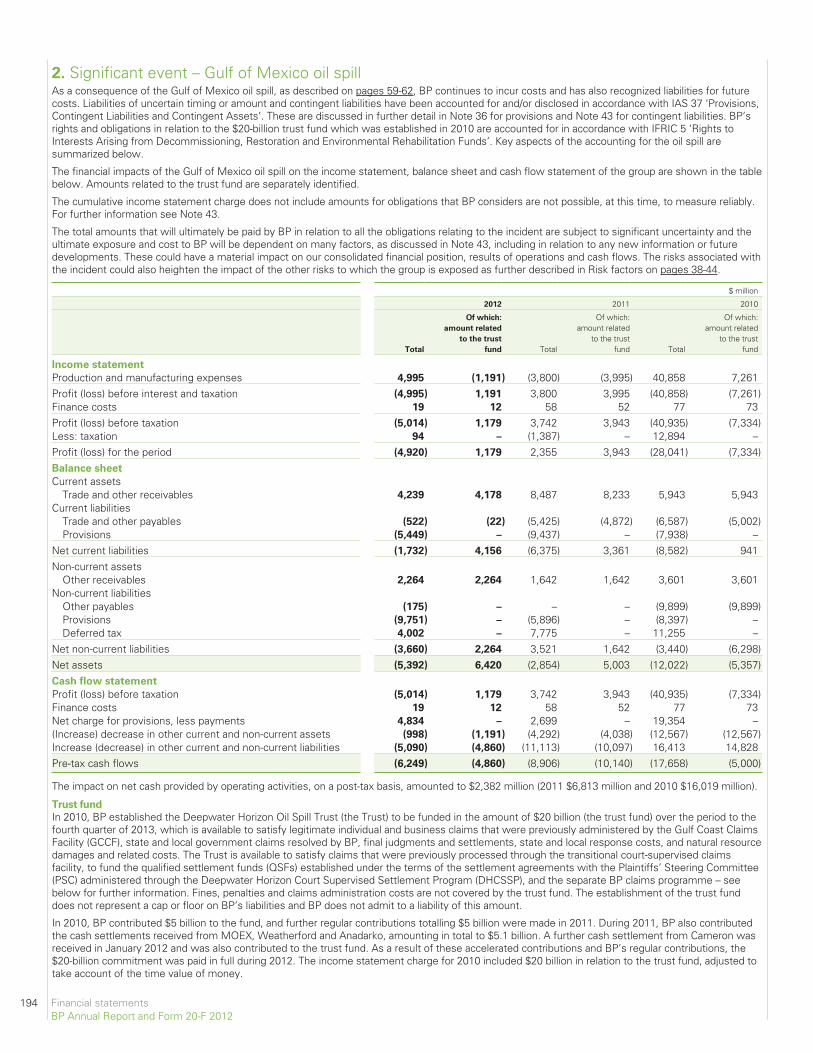
2. Significant event – Gulf of Mexico oil spillAs a consequence of the Gulf of Mexico oil spill, as described on pages 59-62, BP continues to incur costs and has also recognized liabilities for futurecosts. Liabilities of uncertain timing or amount and contingent liabilities have been accounted for and/or disclosed in accordance with IAS 37 ‘Provisions,Contingent Liabilities and Contingent Assets’. These are discussed in further detail in Note 36 for provisions and Note 43 for contingent liabilities. BP’srights and obligations in relation to the $20-billion trust fund which was established in 2010 are accounted for in accordance with IFRIC 5 ‘Rights toInterests Arising from Decommissioning, Restoration and Environmental Rehabilitation Funds’. Key aspects of the accounting for the oil spill aresummarized below.
The financial impacts of the Gulf of Mexico oil spill on the income statement, balance sheet and cash flow statement of the group are shown in the tablebelow. Amounts related to the trust fund are separately identified.
The cumulative income statement charge does not include amounts for obligations that BP considers are not possible, at this time, to measure reliably.For further information see Note 43.
The total amounts that will ultimately be paid by BP in relation to all the obligations relating to the incident are subject to significant uncertainty and theultimate exposure and cost to BP will be dependent on many factors, as discussed in Note 43, including in relation to any new information or futuredevelopments. These could have a material impact on our consolidated financial position, results of operations and cash flows. The risks associated withthe incident could also heighten the impact of the other risks to which the group is exposed as further described in Risk factors on pages 38-44.
$ million
2012 2011 2010
Total
Of which:
amount related
to the trust
fund Total
Of which:amount related
to the trustfund Total
Of which:amount related
to the trustfund
Income statement
Production and manufacturing expenses 4,995 (1,191) (3,800) (3,995) 40,858 7,261Profit (loss) before interest and taxation (4,995) 1,191 3,800 3,995 (40,858) (7,261)Finance costs 19 12 58 52 77 73Profit (loss) before taxation (5,014) 1,179 3,742 3,943 (40,935) (7,334)Less: taxation 94 – (1,387) – 12,894 –Profit (loss) for the period (4,920) 1,179 2,355 3,943 (28,041) (7,334)Balance sheet
Current assetsTrade and other receivables 4,239 4,178 8,487 8,233 5,943 5,943
Current liabilitiesTrade and other payables (522) (22) (5,425) (4,872) (6,587) (5,002)Provisions (5,449) – (9,437) – (7,938) –
Net current liabilities (1,732) 4,156 (6,375) 3,361 (8,582) 941Non-current assets
Other receivables 2,264 2,264 1,642 1,642 3,601 3,601Non-current liabilities
Other payables (175) – – – (9,899) (9,899)Provisions (9,751) – (5,896) – (8,397) –Deferred tax 4,002 – 7,775 – 11,255 –
Net non-current liabilities (3,660) 2,264 3,521 1,642 (3,440) (6,298)Net assets (5,392) 6,420 (2,854) 5,003 (12,022) (5,357)Cash flow statement
Profit (loss) before taxation (5,014) 1,179 3,742 3,943 (40,935) (7,334)Finance costs 19 12 58 52 77 73Net charge for provisions, less payments 4,834 – 2,699 – 19,354 –(Increase) decrease in other current and non-current assets (998) (1,191) (4,292) (4,038) (12,567) (12,567)Increase (decrease) in other current and non-current liabilities (5,090) (4,860) (11,113) (10,097) 16,413 14,828Pre-tax cash flows (6,249) (4,860) (8,906) (10,140) (17,658) (5,000)
The impact on net cash provided by operating activities, on a post-tax basis, amounted to $2,382 million (2011 $6,813 million and 2010 $16,019 million).
Trust fund
In 2010, BP established the Deepwater Horizon Oil Spill Trust (the Trust) to be funded in the amount of $20 billion (the trust fund) over the period to thefourth quarter of 2013, which is available to satisfy legitimate individual and business claims that were previously administered by the Gulf Coast ClaimsFacility (GCCF), state and local government claims resolved by BP, final judgments and settlements, state and local response costs, and natural resourcedamages and related costs. The Trust is available to satisfy claims that were previously processed through the transitional court-supervised claimsfacility, to fund the qualified settlement funds (QSFs) established under the terms of the settlement agreements with the Plaintiffs’ Steering Committee(PSC) administered through the Deepwater Horizon Court Supervised Settlement Program (DHCSSP), and the separate BP claims programme – seebelow for further information. Fines, penalties and claims administration costs are not covered by the trust fund. The establishment of the trust funddoes not represent a cap or floor on BP’s liabilities and BP does not admit to a liability of this amount.
In 2010, BP contributed $5 billion to the fund, and further regular contributions totalling $5 billion were made in 2011. During 2011, BP also contributedthe cash settlements received from MOEX, Weatherford and Anadarko, amounting in total to $5.1 billion. A further cash settlement from Cameron wasreceived in January 2012 and was also contributed to the trust fund. As a result of these accelerated contributions and BP’s regular contributions, the$20-billion commitment was paid in full during 2012. The income statement charge for 2010 included $20 billion in relation to the trust fund, adjusted totake account of the time value of money.
194 Financial statementsBP Annual Report and Form 20-F 2012
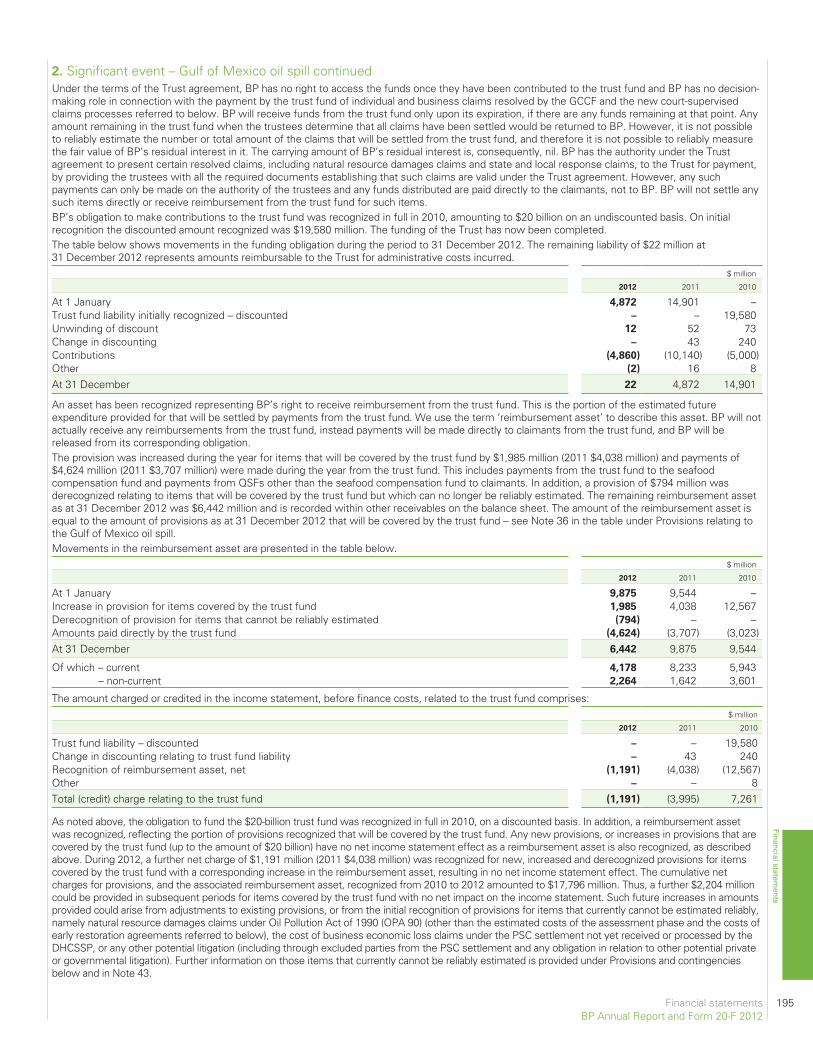
2. Significant event – Gulf of Mexico oil spill continuedUnder the terms of the Trust agreement, BP has no right to access the funds once they have been contributed to the trust fund and BP has no decision-making role in connection with the payment by the trust fund of individual and business claims resolved by the GCCF and the new court-supervisedclaims processes referred to below. BP will receive funds from the trust fund only upon its expiration, if there are any funds remaining at that point. Anyamount remaining in the trust fund when the trustees determine that all claims have been settled would be returned to BP. However, it is not possibleto reliably estimate the number or total amount of the claims that will be settled from the trust fund, and therefore it is not possible to reliably measurethe fair value of BP’s residual interest in it. The carrying amount of BP’s residual interest is, consequently, nil. BP has the authority under the Trustagreement to present certain resolved claims, including natural resource damages claims and state and local response claims, to the Trust for payment,by providing the trustees with all the required documents establishing that such claims are valid under the Trust agreement. However, any suchpayments can only be made on the authority of the trustees and any funds distributed are paid directly to the claimants, not to BP. BP will not settle anysuch items directly or receive reimbursement from the trust fund for such items.BP’s obligation to make contributions to the trust fund was recognized in full in 2010, amounting to $20 billion on an undiscounted basis. On initialrecognition the discounted amount recognized was $19,580 million. The funding of the Trust has now been completed.The table below shows movements in the funding obligation during the period to 31 December 2012. The remaining liability of $22 million at31 December 2012 represents amounts reimbursable to the Trust for administrative costs incurred.
$ million
2012 2011 2010
At 1 January 4,872 14,901 –Trust fund liability initially recognized – discounted – – 19,580Unwinding of discount 12 52 73Change in discounting – 43 240Contributions (4,860) (10,140) (5,000)Other (2) 16 8At 31 December 22 4,872 14,901
An asset has been recognized representing BP’s right to receive reimbursement from the trust fund. This is the portion of the estimated futureexpenditure provided for that will be settled by payments from the trust fund. We use the term ‘reimbursement asset’ to describe this asset. BP will notactually receive any reimbursements from the trust fund, instead payments will be made directly to claimants from the trust fund, and BP will bereleased from its corresponding obligation.The provision was increased during the year for items that will be covered by the trust fund by $1,985 million (2011 $4,038 million) and payments of$4,624 million (2011 $3,707 million) were made during the year from the trust fund. This includes payments from the trust fund to the seafoodcompensation fund and payments from QSFs other than the seafood compensation fund to claimants. In addition, a provision of $794 million wasderecognized relating to items that will be covered by the trust fund but which can no longer be reliably estimated. The remaining reimbursement assetas at 31 December 2012 was $6,442 million and is recorded within other receivables on the balance sheet. The amount of the reimbursement asset isequal to the amount of provisions as at 31 December 2012 that will be covered by the trust fund – see Note 36 in the table under Provisions relating tothe Gulf of Mexico oil spill.Movements in the reimbursement asset are presented in the table below.
$ million
2012 2011 2010
At 1 January 9,875 9,544 –Increase in provision for items covered by the trust fund 1,985 4,038 12,567Derecognition of provision for items that cannot be reliably estimated (794) – –Amounts paid directly by the trust fund (4,624) (3,707) (3,023)At 31 December 6,442 9,875 9,544
Of which – current 4,178 8,233 5,943– non-current 2,264 1,642 3,601
The amount charged or credited in the income statement, before finance costs, related to the trust fund comprises:$ million
2012 2011 2010
Trust fund liability – discounted – – 19,580Change in discounting relating to trust fund liability – 43 240Recognition of reimbursement asset, net (1,191) (4,038) (12,567)Other – – 8Total (credit) charge relating to the trust fund (1,191) (3,995) 7,261
As noted above, the obligation to fund the $20-billion trust fund was recognized in full in 2010, on a discounted basis. In addition, a reimbursement assetwas recognized, reflecting the portion of provisions recognized that will be covered by the trust fund. Any new provisions, or increases in provisions that arecovered by the trust fund (up to the amount of $20 billion) have no net income statement effect as a reimbursement asset is also recognized, as describedabove. During 2012, a further net charge of $1,191 million (2011 $4,038 million) was recognized for new, increased and derecognized provisions for itemscovered by the trust fund with a corresponding increase in the reimbursement asset, resulting in no net income statement effect. The cumulative netcharges for provisions, and the associated reimbursement asset, recognized from 2010 to 2012 amounted to $17,796 million. Thus, a further $2,204 millioncould be provided in subsequent periods for items covered by the trust fund with no net impact on the income statement. Such future increases in amountsprovided could arise from adjustments to existing provisions, or from the initial recognition of provisions for items that currently cannot be estimated reliably,namely natural resource damages claims under Oil Pollution Act of 1990 (OPA 90) (other than the estimated costs of the assessment phase and the costs ofearly restoration agreements referred to below), the cost of business economic loss claims under the PSC settlement not yet received or processed by theDHCSSP, or any other potential litigation (including through excluded parties from the PSC settlement and any obligation in relation to other potential privateor governmental litigation). Further information on those items that currently cannot be reliably estimated is provided under Provisions and contingenciesbelow and in Note 43.
Financial statements 195BP Annual Report and Form 20-F 2012
Financial statements
2. Significant event – Gulf of Mexico oil spill continuedThe $20-billion trust fund may not be sufficient to satisfy all claims under OPA 90 or otherwise that will ultimately be paid.
The Trust agreement does not require BP to make further contributions to the trust fund in excess of the agreed $20 billion should this be insufficient tocover all claims administered by the GCCF and the new court-supervised claims processes, or to settle other items that are covered by the trust fund, asdescribed above. Should the $20-billion trust fund not be sufficient, BP would commence settling legitimate claims and other costs by making paymentsdirectly to claimants or directly to the QSFs, as appropriate. In this case, increases in estimated future expenditure above $20 billion would berecognized as provisions with a corresponding charge in the income statement. The provisions would be utilized and derecognized at the point that BPmade the payments. Under the terms of the Economic and Property Damages Settlement Agreement, several QSFs were established during 2012.These QSFs each relate to specific elements of the agreement, have and will be funded through payments from the Trust, and are available to makepayments to claimants in accordance with those elements of the agreement.
As at 31 December 2012, the cash balances in the Trust and the QSFs amounted to $10,471 million, including $1,847 million remaining in the seafoodcompensation fund yet to be distributed. Under the terms of the Economic and Property Damage Settlement, the QSFs are subject to certain minimumbalances that shall be maintained in the respective funds.
The Economic and Property Damages Settlement with the PSC provides for a transition from the GCCF to the DHCSSP. A transitional claims facility foreconomic and property damages claims commenced operation in March 2012. The transitional claims facility ceased processing new claims in June2012. The DHCSSP began processing new claims from claimants under the Economic and Property Damages Settlement. In addition, a separate BPclaims programme began processing claims from claimants not in the Economic and Property Damages Settlement Class as determined by theEconomic and Property Damages Settlement Agreement or who have requested to opt out of that settlement. Moreover, upon the effective date of theMedical Benefits Class Action Settlement (that is, after any appeals of the final approval of that settlement are exhausted), a separate court-supervisedsettlement programme will begin paying medical claims and implementing other aspects of the medical benefits settlement, such as the PeriodicMedical Consultation Program. In addition, some payments to projects under the Gulf Region Health Outreach Program portion of the Medical BenefitsClass Action Settlement have already been made.
BP pledged certain Gulf of Mexico assets, through an overriding royalty interest, as collateral for the obligation to fund the Trust pursuant to anagreement entered into in September 2010. As noted above, in November 2012 BP met its $20-billion funding obligation to the Trust. Upon completionof the funding obligation, the overriding royalty interest provided as collateral terminated pursuant to its terms.
Provisions and contingencies
At 31 December 2012, BP has recorded certain provisions and disclosed certain contingent liabilities as a consequence of the Gulf of Mexico oil spill.These are described below under Oil Pollution Act of 1990 and Other items.
Oil Pollution Act of 1990 (OPA 90)The claims against BP under OPA 90 fall into three categories: (i) claims by individuals and businesses for removal costs, damage to real or personalproperty, lost profits or impairment of earning capacity and loss of subsistence use of natural resources (“Individual and Business Claims”); (ii) claims bystate and local government entities for removal costs, physical damage to real or personal property, loss of government revenue and increased publicservices costs (“State and Local Claims”); and (iii) claims by the United States, a State trustee, an Indian tribe trustee, or a foreign trustee for naturalresource damages (“Natural Resource Damages claims”). In addition, BP faces civil litigation in which claims for liability under OPA 90 along with othercauses of actions, including personal injury claims, are asserted by individuals, businesses and government entities.
Provisions have been recorded for Individual and Business Claims and State and Local Claims, except as noted below. A provision has also beenrecorded for claims administration costs, natural resource damage assessment costs and costs relating to early natural resource damages restorationagreements. BP considers that it is not possible to measure reliably any obligation in relation to natural resource damage claims (other than theestimated costs of the assessment phase and the costs relating to early restoration agreements), the cost of business economic loss claims under thePSC settlement not yet received or processed by the DHCSSP, or any other potential litigation (including through excluded parties from the PSCsettlement and any obligation in relation to other potential private or governmental litigation), fines, or penalties, other than as described above. Theseitems are therefore disclosed as contingent liabilities – see Note 43 for further information.
Significant uncertainties exist in relation to the amount of claims that are to be paid and will become payable through the claims process establishedpursuant to the PSC settlement. There is significant uncertainty in relation to the amounts that ultimately will be paid in relation to current claims, andthe number, type and amounts payable for claims not yet reported. In addition, there is further uncertainty in relation to interpretations of the claimsadministrator regarding the protocols under the Economic and Property Damages Settlement and judicial interpretation of these protocols, and theoutcomes of any further litigation including in relation to potential opt-outs from the settlement or otherwise. See Note 36 for further information.
The $20-billion trust fund described above is available to satisfy the OPA 90 claims and litigation referred to above. BP’s rights and obligations in relationto the trust fund have been recognized and $20 billion, adjusted to take account of the time value of money, was charged to the income statement in2010.
Other itemsProvisions at 31 December 2012 also include amounts in relation to completing the oil spill response, BP’s commitment to a 10-year researchprogramme in the Gulf of Mexico, the discounted cost of the agreement with the US government to settle all federal criminal charges, estimatedpenalties for liability under Clean Water Act Section 311 and estimated legal fees. These are not covered by the trust fund.
The provision does not reflect any amounts in relation to fines and penalties except for those relating to the Clean Water Act, as it is not possible toestimate reliably either the amount or timing of such additional items. BP also considers that it is not possible to measure reliably any obligation inrelation to litigation other than as included within the settlement with the PSC as set forth in Note 36 and the settlement with the US government forfederal criminal charges. These items are therefore disclosed as contingent liabilities. Further information on provisions is provided below and in Note36. Further information on contingent liabilities is provided in Note 43.
Provision movementsA provision has been recognized for estimated future expenditure relating to the incident, for items that can be measured reliably at this time, inaccordance with BP’s accounting policy for provisions, as set out in Note 1.
196 Financial statementsBP Annual Report and Form 20-F 2012
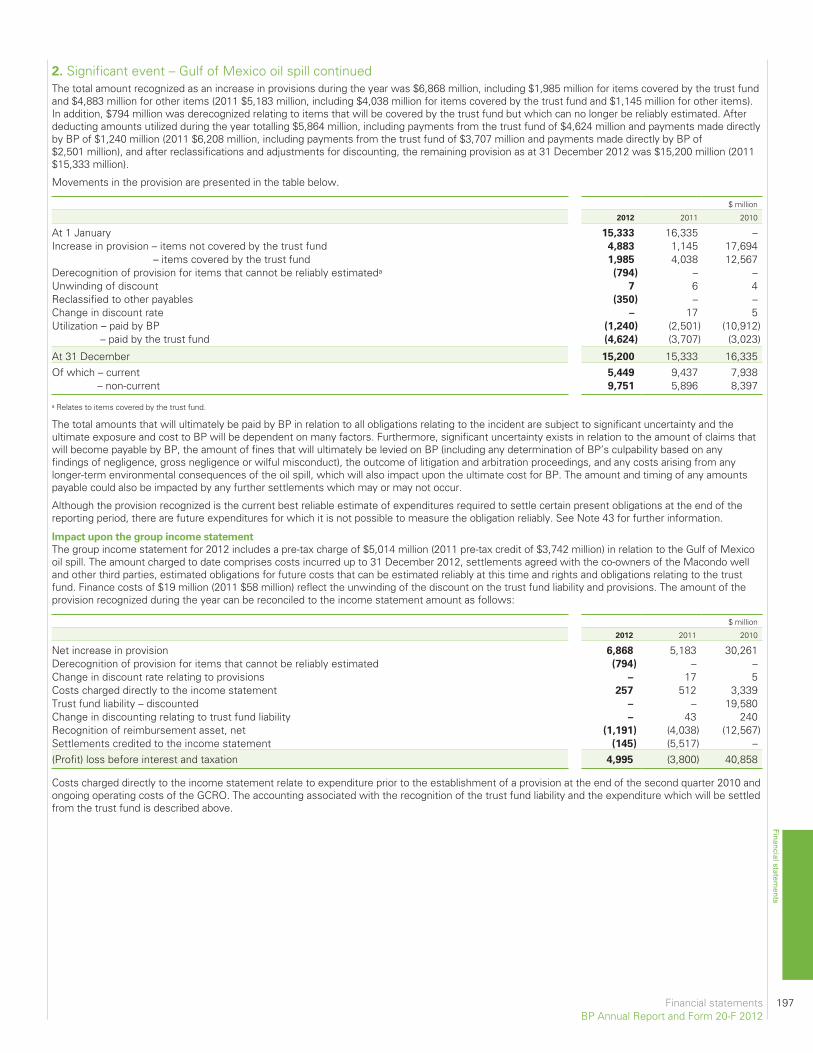
The total amount recognized as an increase in provisions during the year was $6,868 million, including $1,985 million for items covered by the trust fundand $4,883 million for other items (2011 $5,183 million, including $4,038 million for items covered by the trust fund and $1,145 million for other items).In addition, $794 million was derecognized relating to items that will be covered by the trust fund but which can no longer be reliably estimated. Afterdeducting amounts utilized during the year totalling $5,864 million, including payments from the trust fund of $4,624 million and payments made directlyby BP of $1,240 million (2011 $6,208 million, including payments from the trust fund of $3,707 million and payments made directly by BP of$2,501 million), and after reclassifications and adjustments for discounting, the remaining provision as at 31 December 2012 was $15,200 million (2011$15,333 million).
Movements in the provision are presented in the table below.
$ million
2012 2011 2010
At 1 January 15,333 16,335 –Increase in provision – items not covered by the trust fund 4,883 1,145 17,694
– items covered by the trust fund 1,985 4,038 12,567Derecognition of provision for items that cannot be reliably estimateda (794) – –Unwinding of discount 7 6 4Reclassified to other payables (350) – –Change in discount rate – 17 5Utilization – paid by BP (1,240) (2,501) (10,912)
– paid by the trust fund (4,624) (3,707) (3,023)
At 31 December 15,200 15,333 16,335Of which – current 5,449 9,437 7,938
– non-current 9,751 5,896 8,397
a Relates to items covered by the trust fund.
The total amounts that will ultimately be paid by BP in relation to all obligations relating to the incident are subject to significant uncertainty and theultimate exposure and cost to BP will be dependent on many factors. Furthermore, significant uncertainty exists in relation to the amount of claims thatwill become payable by BP, the amount of fines that will ultimately be levied on BP (including any determination of BP’s culpability based on anyfindings of negligence, gross negligence or wilful misconduct), the outcome of litigation and arbitration proceedings, and any costs arising from anylonger-term environmental consequences of the oil spill, which will also impact upon the ultimate cost for BP. The amount and timing of any amountspayable could also be impacted by any further settlements which may or may not occur.
Although the provision recognized is the current best reliable estimate of expenditures required to settle certain present obligations at the end of thereporting period, there are future expenditures for which it is not possible to measure the obligation reliably. See Note 43 for further information.
Impact upon the group income statement
The group income statement for 2012 includes a pre-tax charge of $5,014 million (2011 pre-tax credit of $3,742 million) in relation to the Gulf of Mexicooil spill. The amount charged to date comprises costs incurred up to 31 December 2012, settlements agreed with the co-owners of the Macondo welland other third parties, estimated obligations for future costs that can be estimated reliably at this time and rights and obligations relating to the trustfund. Finance costs of $19 million (2011 $58 million) reflect the unwinding of the discount on the trust fund liability and provisions. The amount of theprovision recognized during the year can be reconciled to the income statement amount as follows:
$ million
2012 2011 2010
Net increase in provision 6,868 5,183 30,261Derecognition of provision for items that cannot be reliably estimated (794) – –Change in discount rate relating to provisions – 17 5Costs charged directly to the income statement 257 512 3,339Trust fund liability – discounted – – 19,580Change in discounting relating to trust fund liability – 43 240Recognition of reimbursement asset, net (1,191) (4,038) (12,567)Settlements credited to the income statement (145) (5,517) –(Profit) loss before interest and taxation 4,995 (3,800) 40,858
Costs charged directly to the income statement relate to expenditure prior to the establishment of a provision at the end of the second quarter 2010 andongoing operating costs of the GCRO. The accounting associated with the recognition of the trust fund liability and the expenditure which will be settledfrom the trust fund is described above.
Financial statements 197BP Annual Report and Form 20-F 2012
Financial statements
2. Significant event – Gulf of Mexico oil spill continued
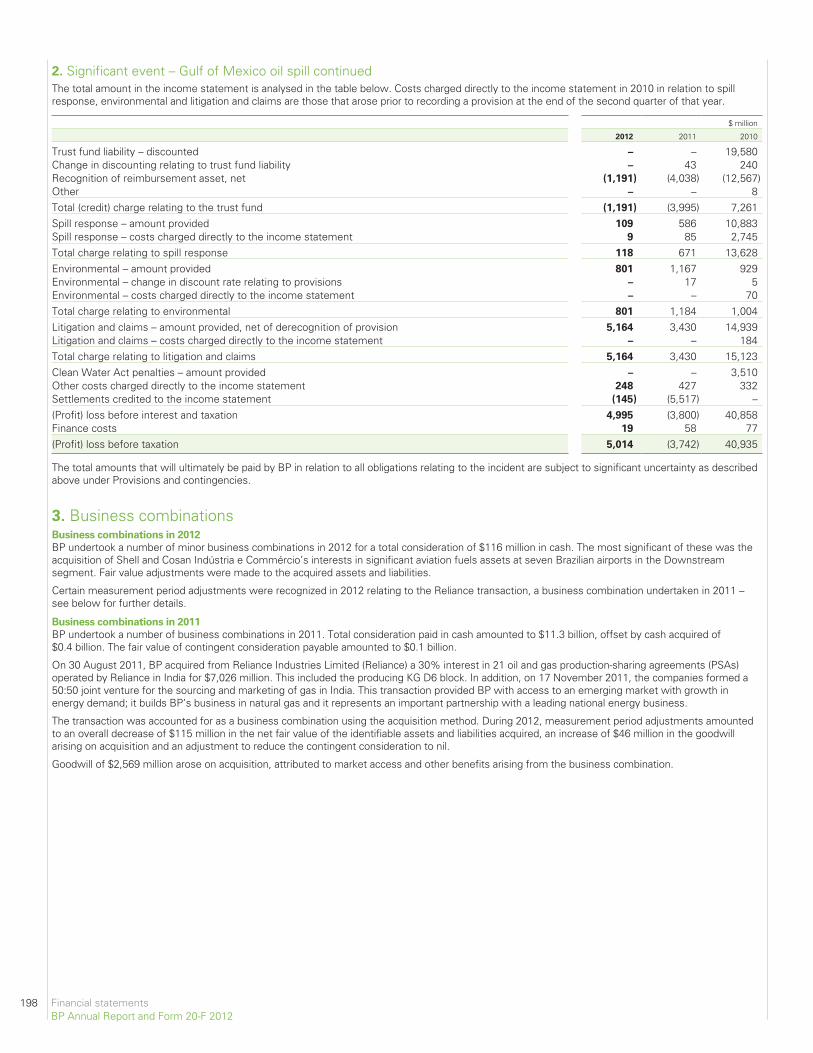
2. Significant event – Gulf of Mexico oil spill continuedThe total amount in the income statement is analysed in the table below. Costs charged directly to the income statement in 2010 in relation to spillresponse, environmental and litigation and claims are those that arose prior to recording a provision at the end of the second quarter of that year.
$ million
2012 2011 2010
Trust fund liability – discounted – – 19,580Change in discounting relating to trust fund liability – 43 240Recognition of reimbursement asset, net (1,191) (4,038) (12,567)Other – – 8Total (credit) charge relating to the trust fund (1,191) (3,995) 7,261Spill response – amount provided 109 586 10,883Spill response – costs charged directly to the income statement 9 85 2,745Total charge relating to spill response 118 671 13,628Environmental – amount provided 801 1,167 929Environmental – change in discount rate relating to provisions – 17 5Environmental – costs charged directly to the income statement – – 70Total charge relating to environmental 801 1,184 1,004Litigation and claims – amount provided, net of derecognition of provision 5,164 3,430 14,939Litigation and claims – costs charged directly to the income statement – – 184Total charge relating to litigation and claims 5,164 3,430 15,123Clean Water Act penalties – amount provided – – 3,510Other costs charged directly to the income statement 248 427 332Settlements credited to the income statement (145) (5,517) –(Profit) loss before interest and taxation 4,995 (3,800) 40,858Finance costs 19 58 77(Profit) loss before taxation 5,014 (3,742) 40,935
The total amounts that will ultimately be paid by BP in relation to all obligations relating to the incident are subject to significant uncertainty as describedabove under Provisions and contingencies.
3. Business combinationsBusiness combinations in 2012
BP undertook a number of minor business combinations in 2012 for a total consideration of $116 million in cash. The most significant of these was theacquisition of Shell and Cosan Indústria e Commércio’s interests in significant aviation fuels assets at seven Brazilian airports in the Downstreamsegment. Fair value adjustments were made to the acquired assets and liabilities.
Certain measurement period adjustments were recognized in 2012 relating to the Reliance transaction, a business combination undertaken in 2011 –see below for further details.
Business combinations in 2011
BP undertook a number of business combinations in 2011. Total consideration paid in cash amounted to $11.3 billion, offset by cash acquired of$0.4 billion. The fair value of contingent consideration payable amounted to $0.1 billion.
On 30 August 2011, BP acquired from Reliance Industries Limited (Reliance) a 30% interest in 21 oil and gas production-sharing agreements (PSAs)operated by Reliance in India for $7,026 million. This included the producing KG D6 block. In addition, on 17 November 2011, the companies formed a50:50 joint venture for the sourcing and marketing of gas in India. This transaction provided BP with access to an emerging market with growth inenergy demand; it builds BP’s business in natural gas and it represents an important partnership with a leading national energy business.
The transaction was accounted for as a business combination using the acquisition method. During 2012, measurement period adjustments amountedto an overall decrease of $115 million in the net fair value of the identifiable assets and liabilities acquired, an increase of $46 million in the goodwillarising on acquisition and an adjustment to reduce the contingent consideration to nil.
Goodwill of $2,569 million arose on acquisition, attributed to market access and other benefits arising from the business combination.
198 Financial statementsBP Annual Report and Form 20-F 2012
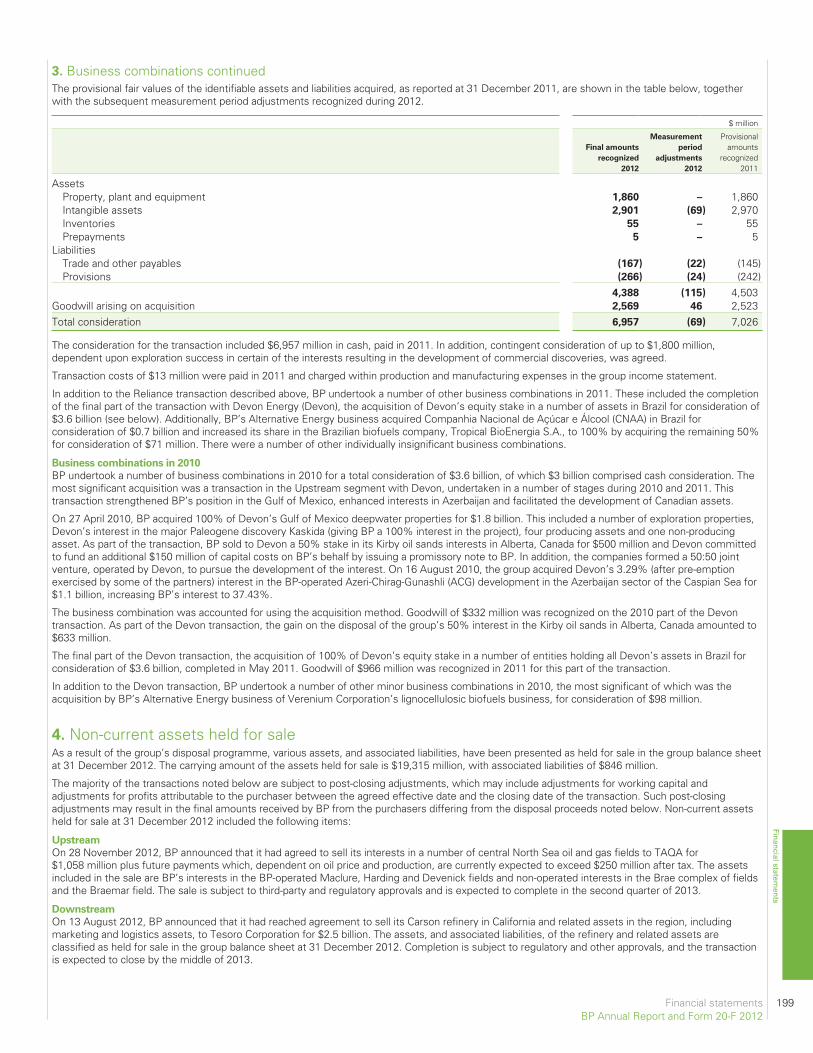
The provisional fair values of the identifiable assets and liabilities acquired, as reported at 31 December 2011, are shown in the table below, togetherwith the subsequent measurement period adjustments recognized during 2012.
$ million
Final amounts
recognized
2012
Measurement
period
adjustments
2012
Provisionalamounts
recognized2011
AssetsProperty, plant and equipment 1,860 – 1,860Intangible assets 2,901 (69) 2,970Inventories 55 – 55Prepayments 5 – 5
LiabilitiesTrade and other payables (167) (22) (145)Provisions (266) (24) (242)
4,388 (115) 4,503Goodwill arising on acquisition 2,569 46 2,523Total consideration 6,957 (69) 7,026
The consideration for the transaction included $6,957 million in cash, paid in 2011. In addition, contingent consideration of up to $1,800 million,dependent upon exploration success in certain of the interests resulting in the development of commercial discoveries, was agreed.
Transaction costs of $13 million were paid in 2011 and charged within production and manufacturing expenses in the group income statement.
In addition to the Reliance transaction described above, BP undertook a number of other business combinations in 2011. These included the completionof the final part of the transaction with Devon Energy (Devon), the acquisition of Devon’s equity stake in a number of assets in Brazil for consideration of$3.6 billion (see below). Additionally, BP’s Alternative Energy business acquired Companhia Nacional de Açúcar e Álcool (CNAA) in Brazil forconsideration of $0.7 billion and increased its share in the Brazilian biofuels company, Tropical BioEnergia S.A., to 100% by acquiring the remaining 50%for consideration of $71 million. There were a number of other individually insignificant business combinations.
Business combinations in 2010
BP undertook a number of business combinations in 2010 for a total consideration of $3.6 billion, of which $3 billion comprised cash consideration. Themost significant acquisition was a transaction in the Upstream segment with Devon, undertaken in a number of stages during 2010 and 2011. Thistransaction strengthened BP’s position in the Gulf of Mexico, enhanced interests in Azerbaijan and facilitated the development of Canadian assets.
On 27 April 2010, BP acquired 100% of Devon’s Gulf of Mexico deepwater properties for $1.8 billion. This included a number of exploration properties,Devon’s interest in the major Paleogene discovery Kaskida (giving BP a 100% interest in the project), four producing assets and one non-producingasset. As part of the transaction, BP sold to Devon a 50% stake in its Kirby oil sands interests in Alberta, Canada for $500 million and Devon committedto fund an additional $150 million of capital costs on BP’s behalf by issuing a promissory note to BP. In addition, the companies formed a 50:50 jointventure, operated by Devon, to pursue the development of the interest. On 16 August 2010, the group acquired Devon’s 3.29% (after pre-emptionexercised by some of the partners) interest in the BP-operated Azeri-Chirag-Gunashli (ACG) development in the Azerbaijan sector of the Caspian Sea for$1.1 billion, increasing BP’s interest to 37.43%.
The business combination was accounted for using the acquisition method. Goodwill of $332 million was recognized on the 2010 part of the Devontransaction. As part of the Devon transaction, the gain on the disposal of the group’s 50% interest in the Kirby oil sands in Alberta, Canada amounted to$633 million.
The final part of the Devon transaction, the acquisition of 100% of Devon’s equity stake in a number of entities holding all Devon’s assets in Brazil forconsideration of $3.6 billion, completed in May 2011. Goodwill of $966 million was recognized in 2011 for this part of the transaction.
In addition to the Devon transaction, BP undertook a number of other minor business combinations in 2010, the most significant of which was theacquisition by BP’s Alternative Energy business of Verenium Corporation’s lignocellulosic biofuels business, for consideration of $98 million.
4. Non-current assets held for saleAs a result of the group’s disposal programme, various assets, and associated liabilities, have been presented as held for sale in the group balance sheetat 31 December 2012. The carrying amount of the assets held for sale is $19,315 million, with associated liabilities of $846 million.
The majority of the transactions noted below are subject to post-closing adjustments, which may include adjustments for working capital andadjustments for profits attributable to the purchaser between the agreed effective date and the closing date of the transaction. Such post-closingadjustments may result in the final amounts received by BP from the purchasers differing from the disposal proceeds noted below. Non-current assetsheld for sale at 31 December 2012 included the following items:
Upstream
On 28 November 2012, BP announced that it had agreed to sell its interests in a number of central North Sea oil and gas fields to TAQA for$1,058 million plus future payments which, dependent on oil price and production, are currently expected to exceed $250 million after tax. The assetsincluded in the sale are BP’s interests in the BP-operated Maclure, Harding and Devenick fields and non-operated interests in the Brae complex of fieldsand the Braemar field. The sale is subject to third-party and regulatory approvals and is expected to complete in the second quarter of 2013.
Downstream
On 13 August 2012, BP announced that it had reached agreement to sell its Carson refinery in California and related assets in the region, includingmarketing and logistics assets, to Tesoro Corporation for $2.5 billion. The assets, and associated liabilities, of the refinery and related assets areclassified as held for sale in the group balance sheet at 31 December 2012. Completion is subject to regulatory and other approvals, and the transactionis expected to close by the middle of 2013.
Financial statements 199BP Annual Report and Form 20-F 2012
Financial statements
3. Business combinations continued
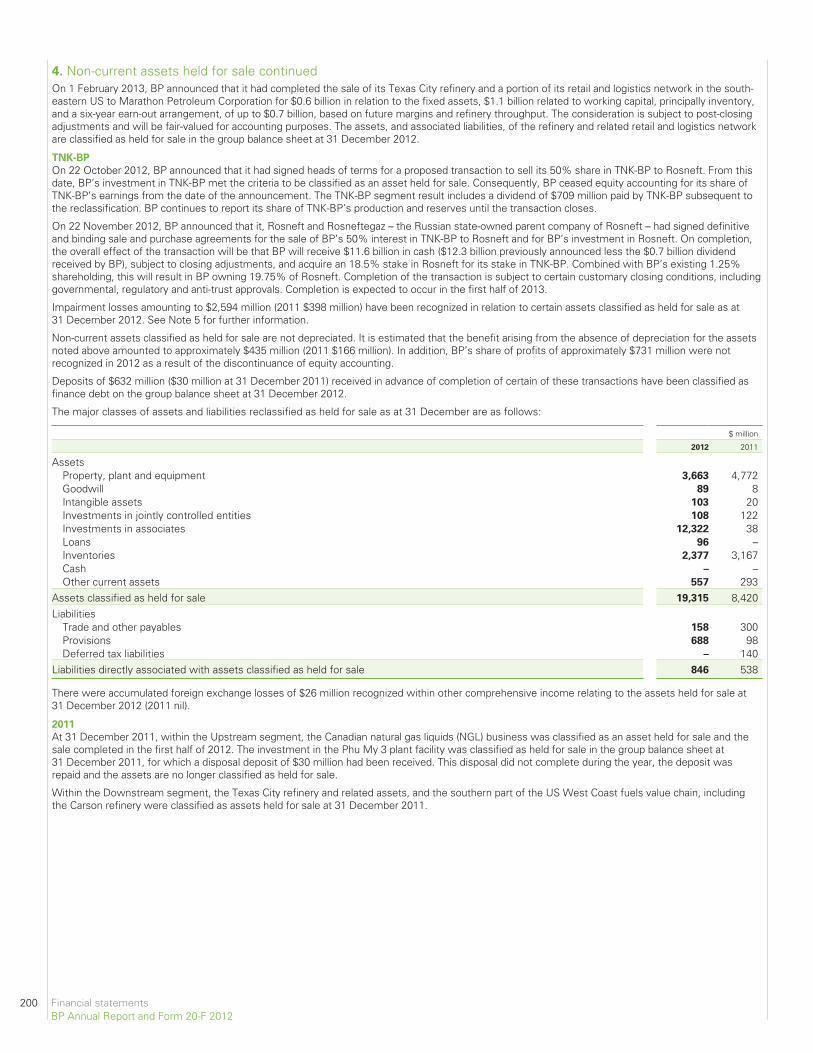
4. Non-current assets held for sale continuedOn 1 February 2013, BP announced that it had completed the sale of its Texas City refinery and a portion of its retail and logistics network in the south-eastern US to Marathon Petroleum Corporation for $0.6 billion in relation to the fixed assets, $1.1 billion related to working capital, principally inventory,and a six-year earn-out arrangement, of up to $0.7 billion, based on future margins and refinery throughput. The consideration is subject to post-closingadjustments and will be fair-valued for accounting purposes. The assets, and associated liabilities, of the refinery and related retail and logistics networkare classified as held for sale in the group balance sheet at 31 December 2012.
TNK-BP
On 22 October 2012, BP announced that it had signed heads of terms for a proposed transaction to sell its 50% share in TNK-BP to Rosneft. From thisdate, BP’s investment in TNK-BP met the criteria to be classified as an asset held for sale. Consequently, BP ceased equity accounting for its share ofTNK-BP’s earnings from the date of the announcement. The TNK-BP segment result includes a dividend of $709 million paid by TNK-BP subsequent tothe reclassification. BP continues to report its share of TNK-BP’s production and reserves until the transaction closes.
On 22 November 2012, BP announced that it, Rosneft and Rosneftegaz – the Russian state-owned parent company of Rosneft – had signed definitiveand binding sale and purchase agreements for the sale of BP’s 50% interest in TNK-BP to Rosneft and for BP’s investment in Rosneft. On completion,the overall effect of the transaction will be that BP will receive $11.6 billion in cash ($12.3 billion previously announced less the $0.7 billion dividendreceived by BP), subject to closing adjustments, and acquire an 18.5% stake in Rosneft for its stake in TNK-BP. Combined with BP’s existing 1.25%shareholding, this will result in BP owning 19.75% of Rosneft. Completion of the transaction is subject to certain customary closing conditions, includinggovernmental, regulatory and anti-trust approvals. Completion is expected to occur in the first half of 2013.
Impairment losses amounting to $2,594 million (2011 $398 million) have been recognized in relation to certain assets classified as held for sale as at31 December 2012. See Note 5 for further information.
Non-current assets classified as held for sale are not depreciated. It is estimated that the benefit arising from the absence of depreciation for the assetsnoted above amounted to approximately $435 million (2011 $166 million). In addition, BP’s share of profits of approximately $731 million were notrecognized in 2012 as a result of the discontinuance of equity accounting.
Deposits of $632 million ($30 million at 31 December 2011) received in advance of completion of certain of these transactions have been classified asfinance debt on the group balance sheet at 31 December 2012.
The major classes of assets and liabilities reclassified as held for sale as at 31 December are as follows:
$ million
2012 2011
AssetsProperty, plant and equipment 3,663 4,772Goodwill 89 8Intangible assets 103 20Investments in jointly controlled entities 108 122Investments in associates 12,322 38Loans 96 –Inventories 2,377 3,167Cash – –Other current assets 557 293
Assets classified as held for sale 19,315 8,420Liabilities
Trade and other payables 158 300Provisions 688 98Deferred tax liabilities – 140
Liabilities directly associated with assets classified as held for sale 846 538
There were accumulated foreign exchange losses of $26 million recognized within other comprehensive income relating to the assets held for sale at31 December 2012 (2011 nil).
2011
At 31 December 2011, within the Upstream segment, the Canadian natural gas liquids (NGL) business was classified as an asset held for sale and thesale completed in the first half of 2012. The investment in the Phu My 3 plant facility was classified as held for sale in the group balance sheet at31 December 2011, for which a disposal deposit of $30 million had been received. This disposal did not complete during the year, the deposit wasrepaid and the assets are no longer classified as held for sale.
Within the Downstream segment, the Texas City refinery and related assets, and the southern part of the US West Coast fuels value chain, includingthe Carson refinery were classified as assets held for sale at 31 December 2011.
200 Financial statementsBP Annual Report and Form 20-F 2012
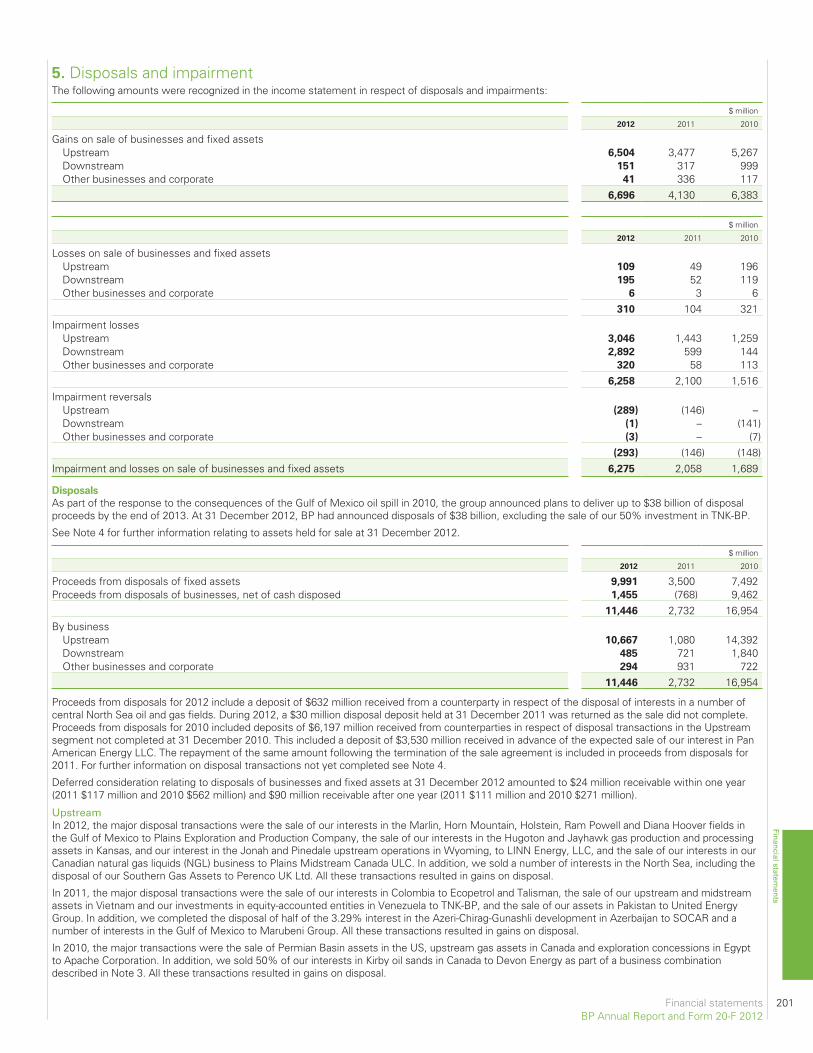
5. Disposals and impairmentThe following amounts were recognized in the income statement in respect of disposals and impairments:
$ million
2012 2011 2010
Gains on sale of businesses and fixed assetsUpstream 6,504 3,477 5,267Downstream 151 317 999Other businesses and corporate 41 336 117
6,696 4,130 6,383
$ million
2012 2011 2010
Losses on sale of businesses and fixed assetsUpstream 109 49 196Downstream 195 52 119Other businesses and corporate 6 3 6
310 104 321Impairment losses
Upstream 3,046 1,443 1,259Downstream 2,892 599 144Other businesses and corporate 320 58 113
6,258 2,100 1,516Impairment reversals
Upstream (289) (146) –Downstream (1) – (141)Other businesses and corporate (3) – (7)
(293) (146) (148)Impairment and losses on sale of businesses and fixed assets 6,275 2,058 1,689
Disposals
As part of the response to the consequences of the Gulf of Mexico oil spill in 2010, the group announced plans to deliver up to $38 billion of disposalproceeds by the end of 2013. At 31 December 2012, BP had announced disposals of $38 billion, excluding the sale of our 50% investment in TNK-BP.
See Note 4 for further information relating to assets held for sale at 31 December 2012.
$ million
2012 2011 2010
Proceeds from disposals of fixed assets 9,991 3,500 7,492Proceeds from disposals of businesses, net of cash disposed 1,455 (768) 9,462
11,446 2,732 16,954By business
Upstream 10,667 1,080 14,392Downstream 485 721 1,840Other businesses and corporate 294 931 722
11,446 2,732 16,954
Proceeds from disposals for 2012 include a deposit of $632 million received from a counterparty in respect of the disposal of interests in a number ofcentral North Sea oil and gas fields. During 2012, a $30 million disposal deposit held at 31 December 2011 was returned as the sale did not complete.Proceeds from disposals for 2010 included deposits of $6,197 million received from counterparties in respect of disposal transactions in the Upstreamsegment not completed at 31 December 2010. This included a deposit of $3,530 million received in advance of the expected sale of our interest in PanAmerican Energy LLC. The repayment of the same amount following the termination of the sale agreement is included in proceeds from disposals for2011. For further information on disposal transactions not yet completed see Note 4.
Deferred consideration relating to disposals of businesses and fixed assets at 31 December 2012 amounted to $24 million receivable within one year(2011 $117 million and 2010 $562 million) and $90 million receivable after one year (2011 $111 million and 2010 $271 million).
UpstreamIn 2012, the major disposal transactions were the sale of our interests in the Marlin, Horn Mountain, Holstein, Ram Powell and Diana Hoover fields inthe Gulf of Mexico to Plains Exploration and Production Company, the sale of our interests in the Hugoton and Jayhawk gas production and processingassets in Kansas, and our interest in the Jonah and Pinedale upstream operations in Wyoming, to LINN Energy, LLC, and the sale of our interests in ourCanadian natural gas liquids (NGL) business to Plains Midstream Canada ULC. In addition, we sold a number of interests in the North Sea, including thedisposal of our Southern Gas Assets to Perenco UK Ltd. All these transactions resulted in gains on disposal.
In 2011, the major disposal transactions were the sale of our interests in Colombia to Ecopetrol and Talisman, the sale of our upstream and midstreamassets in Vietnam and our investments in equity-accounted entities in Venezuela to TNK-BP, and the sale of our assets in Pakistan to United EnergyGroup. In addition, we completed the disposal of half of the 3.29% interest in the Azeri-Chirag-Gunashli development in Azerbaijan to SOCAR and anumber of interests in the Gulf of Mexico to Marubeni Group. All these transactions resulted in gains on disposal.
In 2010, the major transactions were the sale of Permian Basin assets in the US, upstream gas assets in Canada and exploration concessions in Egyptto Apache Corporation. In addition, we sold 50% of our interests in Kirby oil sands in Canada to Devon Energy as part of a business combinationdescribed in Note 3. All these transactions resulted in gains on disposal.
Financial statements 201BP Annual Report and Form 20-F 2012
Financial statements
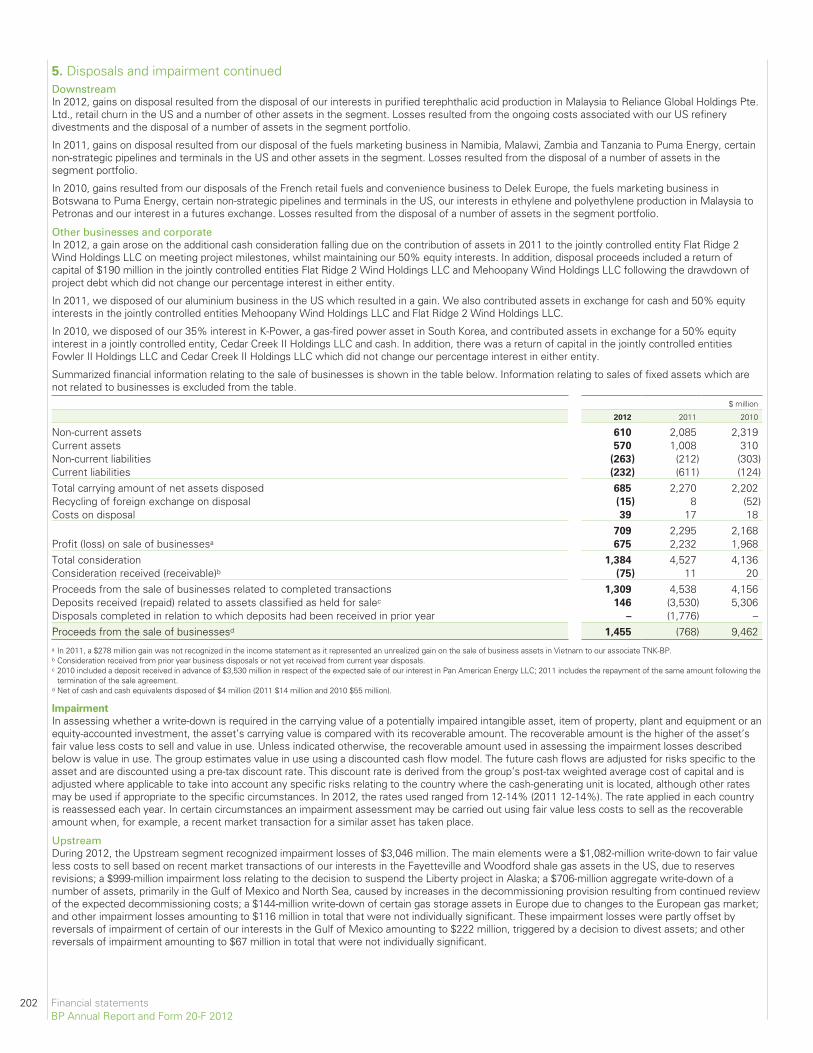
5. Disposals and impairment continuedDownstreamIn 2012, gains on disposal resulted from the disposal of our interests in purified terephthalic acid production in Malaysia to Reliance Global Holdings Pte.Ltd., retail churn in the US and a number of other assets in the segment. Losses resulted from the ongoing costs associated with our US refinerydivestments and the disposal of a number of assets in the segment portfolio.
In 2011, gains on disposal resulted from our disposal of the fuels marketing business in Namibia, Malawi, Zambia and Tanzania to Puma Energy, certainnon-strategic pipelines and terminals in the US and other assets in the segment. Losses resulted from the disposal of a number of assets in thesegment portfolio.
In 2010, gains resulted from our disposals of the French retail fuels and convenience business to Delek Europe, the fuels marketing business inBotswana to Puma Energy, certain non-strategic pipelines and terminals in the US, our interests in ethylene and polyethylene production in Malaysia toPetronas and our interest in a futures exchange. Losses resulted from the disposal of a number of assets in the segment portfolio.
Other businesses and corporateIn 2012, a gain arose on the additional cash consideration falling due on the contribution of assets in 2011 to the jointly controlled entity Flat Ridge 2Wind Holdings LLC on meeting project milestones, whilst maintaining our 50% equity interests. In addition, disposal proceeds included a return ofcapital of $190 million in the jointly controlled entities Flat Ridge 2 Wind Holdings LLC and Mehoopany Wind Holdings LLC following the drawdown ofproject debt which did not change our percentage interest in either entity.
In 2011, we disposed of our aluminium business in the US which resulted in a gain. We also contributed assets in exchange for cash and 50% equityinterests in the jointly controlled entities Mehoopany Wind Holdings LLC and Flat Ridge 2 Wind Holdings LLC.
In 2010, we disposed of our 35% interest in K-Power, a gas-fired power asset in South Korea, and contributed assets in exchange for a 50% equityinterest in a jointly controlled entity, Cedar Creek II Holdings LLC and cash. In addition, there was a return of capital in the jointly controlled entitiesFowler II Holdings LLC and Cedar Creek II Holdings LLC which did not change our percentage interest in either entity.
Summarized financial information relating to the sale of businesses is shown in the table below. Information relating to sales of fixed assets which arenot related to businesses is excluded from the table.
$ million
2012 2011 2010
Non-current assets 610 2,085 2,319Current assets 570 1,008 310Non-current liabilities (263) (212) (303)Current liabilities (232) (611) (124)Total carrying amount of net assets disposed 685 2,270 2,202Recycling of foreign exchange on disposal (15) 8 (52)Costs on disposal 39 17 18
709 2,295 2,168Profit (loss) on sale of businessesa 675 2,232 1,968Total consideration 1,384 4,527 4,136Consideration received (receivable)b (75) 11 20Proceeds from the sale of businesses related to completed transactions 1,309 4,538 4,156Deposits received (repaid) related to assets classified as held for salec 146 (3,530) 5,306Disposals completed in relation to which deposits had been received in prior year – (1,776) –Proceeds from the sale of businessesd 1,455 (768) 9,462a In 2011, a $278 million gain was not recognized in the income statement as it represented an unrealized gain on the sale of business assets in Vietnam to our associate TNK-BP.b Consideration received from prior year business disposals or not yet received from current year disposals.c 2010 included a deposit received in advance of $3,530 million in respect of the expected sale of our interest in Pan American Energy LLC; 2011 includes the repayment of the same amount following the
termination of the sale agreement.d Net of cash and cash equivalents disposed of $4 million (2011 $14 million and 2010 $55 million).
Impairment
In assessing whether a write-down is required in the carrying value of a potentially impaired intangible asset, item of property, plant and equipment or anequity-accounted investment, the asset’s carrying value is compared with its recoverable amount. The recoverable amount is the higher of the asset’sfair value less costs to sell and value in use. Unless indicated otherwise, the recoverable amount used in assessing the impairment losses describedbelow is value in use. The group estimates value in use using a discounted cash flow model. The future cash flows are adjusted for risks specific to theasset and are discounted using a pre-tax discount rate. This discount rate is derived from the group’s post-tax weighted average cost of capital and isadjusted where applicable to take into account any specific risks relating to the country where the cash-generating unit is located, although other ratesmay be used if appropriate to the specific circumstances. In 2012, the rates used ranged from 12-14% (2011 12-14%). The rate applied in each countryis reassessed each year. In certain circumstances an impairment assessment may be carried out using fair value less costs to sell as the recoverableamount when, for example, a recent market transaction for a similar asset has taken place.
UpstreamDuring 2012, the Upstream segment recognized impairment losses of $3,046 million. The main elements were a $1,082-million write-down to fair valueless costs to sell based on recent market transactions of our interests in the Fayetteville and Woodford shale gas assets in the US, due to reservesrevisions; a $999-million impairment loss relating to the decision to suspend the Liberty project in Alaska; a $706-million aggregate write-down of anumber of assets, primarily in the Gulf of Mexico and North Sea, caused by increases in the decommissioning provision resulting from continued reviewof the expected decommissioning costs; a $144-million write-down of certain gas storage assets in Europe due to changes to the European gas market;and other impairment losses amounting to $116 million in total that were not individually significant. These impairment losses were partly offset byreversals of impairment of certain of our interests in the Gulf of Mexico amounting to $222 million, triggered by a decision to divest assets; and otherreversals of impairment amounting to $67 million in total that were not individually significant.
202 Financial statementsBP Annual Report and Form 20-F 2012
During 2011, the Upstream segment recognized impairment losses of $1,443 million. The main elements were a $555-million impairment loss relatingto a number of our interests in the Gulf of Mexico, caused by an increase in the decommissioning provision as a result of further assessments of theregulations relating to idle infrastructure and a decrease in our assumption of the discount rate for provisions; the $393-million write-down of our interestin the Fayetteville shale gas asset in the US, triggered by a decrease in value by reference to a sale transaction by a partner of its interest in the sameasset; and the $153-million write-down of our interest in the proposed Denali gas pipeline in Alaska, resulting from a decision not to proceed with theproject. There were several other impairment losses amounting to $342 million in total that were not individually significant. These impairment losseswere partly offset by reversals of impairment of certain of our interests in the Gulf of Mexico and Egypt amounting to $146 million in total, triggered byan increase in our assumption of long-term oil prices.
During 2010, the Upstream segment recognized impairment losses of $1,259 million. The main elements were the $501-million write-down of assets inthe Gulf of Mexico, triggered by an increase in the decommissioning provision as a result of new regulations in the US relating to idle infrastructure;impairments of oil and gas properties in the Gulf of Mexico and onshore North America of $310 million and $80 million respectively, as a result ofdecisions to dispose of assets at a price lower than the assets’ carrying values; a $341-million write-down of accumulated costs in Sakhalin, Russia,triggered by a change in the outlook on the future recoverability of the investment; and several other individually insignificant impairment lossesamounting to $27 million in total.
DownstreamDuring 2012, the Downstream segment recognized impairment losses of $2,892 million, largely related to assets held for sale for which sales prices hadbeen agreed, see Note 4 for further information. This impairment loss included $1,552 million relating to the Texas City refinery and associated assetsand $1,042 million relating to the Carson refinery and associated assets.
During 2011, the Downstream segment recognized impairment losses of $599 million. Impairment losses of $398 million related to assets classified asheld for sale. Other impairment losses were also recognized relating to retail churn in Europe and other minor asset disposals amounting to $201 millionin total.
During 2010, the Downstream segment recognized impairment losses amounting to $144 million relating to retail churn in Europe and other minor assetdisposals. These losses were largely offset by the reversal of a previously recognized impairment loss of $141 million relating to the investment in ourjointly controlled entity China American Petrochemical Company resulting from a change in market conditions.
Other businesses and corporateDuring 2012, 2011 and 2010, Other businesses and corporate recognized impairment losses totalling $318 million, $58 million and $113 millionrespectively related to various assets in the Alternative Energy business. The amount for 2012 includes $258 million in respect of the decision not toproceed with an investment in a biofuels production facility under development in the US.
6. Segmental analysisThe group’s organizational structure reflects the various activities in which BP is engaged. In 2012, BP had three reportable segments: Upstream,Downstream and TNK-BP. BP’s activities in low-carbon energy are managed through our Alternative Energy business, which is reported in Otherbusinesses and corporate.
Upstream’s activities include oil and natural gas exploration, field development and production; midstream transportation, storage and processing; andthe marketing and trading of natural gas, including liquefied natural gas (LNG), together with power and natural gas liquids (NGLs). The segment isorganized into three functional divisions – Exploration, Developments and Production – integrated through a Strategy and Integration organization.
Downstream’s activities include the refining, manufacturing, marketing, transportation, and supply and trading of crude oil, petroleum, petrochemicalsproducts and related services to wholesale and retail customers.
From 1 January 2012, the group’s investment in TNK-BP is reported as a separate operating segment, rather than within the Upstream segment,reflecting the way in which the investment is managed. On 22 October 2012, BP announced that it had signed heads of terms for a proposedtransaction to sell its 50% share in TNK-BP to Rosneft. Following this agreement, BP’s investment in TNK-BP met the criteria to be classified as held forsale and the transaction is expected to complete in the first half of 2013. See Note 4 for further information.
Other businesses and corporate comprises the Alternative Energy business, Shipping, Treasury (which in the segmental analysis includes all of thegroup’s cash, cash equivalents and associated interest income), and corporate activities worldwide. It also included the group’s aluminium business untilits disposal during 2011. The Alternative Energy business is an operating segment that has been aggregated with the other activities within Otherbusinesses and corporate as it does not meet the materiality thresholds for separate segment reporting.
In 2010, following the Gulf of Mexico incident, we established the Gulf Coast Restoration Organization (GCRO) and equipped it with dedicatedresources and capabilities to manage all aspects of our response to the incident. This organization reports directly to the group chief executive and isoverseen by a board committee, however it is not an operating segment.
The accounting policies of the operating segments are the same as the group’s accounting policies described in Note 1. However, IFRS requires thatthe measure of profit or loss disclosed for each operating segment is the measure that is provided regularly to the chief operating decision maker for thepurposes of performance assessment and resource allocation. For BP, this measure of profit or loss is replacement cost profit or loss before interestand tax which reflects the replacement cost of supplies by excluding from profit or loss inventory holding gains and lossesa. Replacement cost profit orloss for the group is not a recognized measure under IFRS.
Sales between segments are made at prices that approximate market prices, taking into account the volumes involved. Segment revenues andsegment results include transactions between business segments. These transactions and any unrealized profits and losses are eliminated onconsolidation, unless unrealized losses provide evidence of an impairment of the asset transferred. Sales to external customers by region are based onthe location of the seller. The UK region includes the UK-based international activities of Downstream.a Inventory holding gains and losses represent the difference between the cost of sales calculated using the average cost to BP of supplies acquired during the period and the cost of sales calculated on
the first-in first-out (FIFO) method after adjusting for any changes in provisions where the net realizable value of the inventory is lower than its cost. Under the FIFO method, which we use for IFRSreporting, the cost of inventory charged to the income statement is based on its historic cost of purchase, or manufacture, rather than its replacement cost. In volatile energy markets, this can have asignificant distorting effect on reported income. The amounts disclosed represent the difference between the charge (to the income statement) for inventory on a FIFO basis (after adjusting for anyrelated movements in net realizable value provisions) and the charge that would have arisen if an average cost of supplies was used for the period. For this purpose, the average cost of supplies duringthe period is principally calculated on a monthly basis by dividing the total cost of inventory acquired in the period by the number of barrels acquired. The amounts disclosed are not separately reflected inthe financial statements as a gain or loss. No adjustment is made in respect of the cost of inventories held as part of a trading position and certain other temporary inventory positions.
Financial statements 203BP Annual Report and Form 20-F 2012
Financial statements
5. Disposals and impairment continued
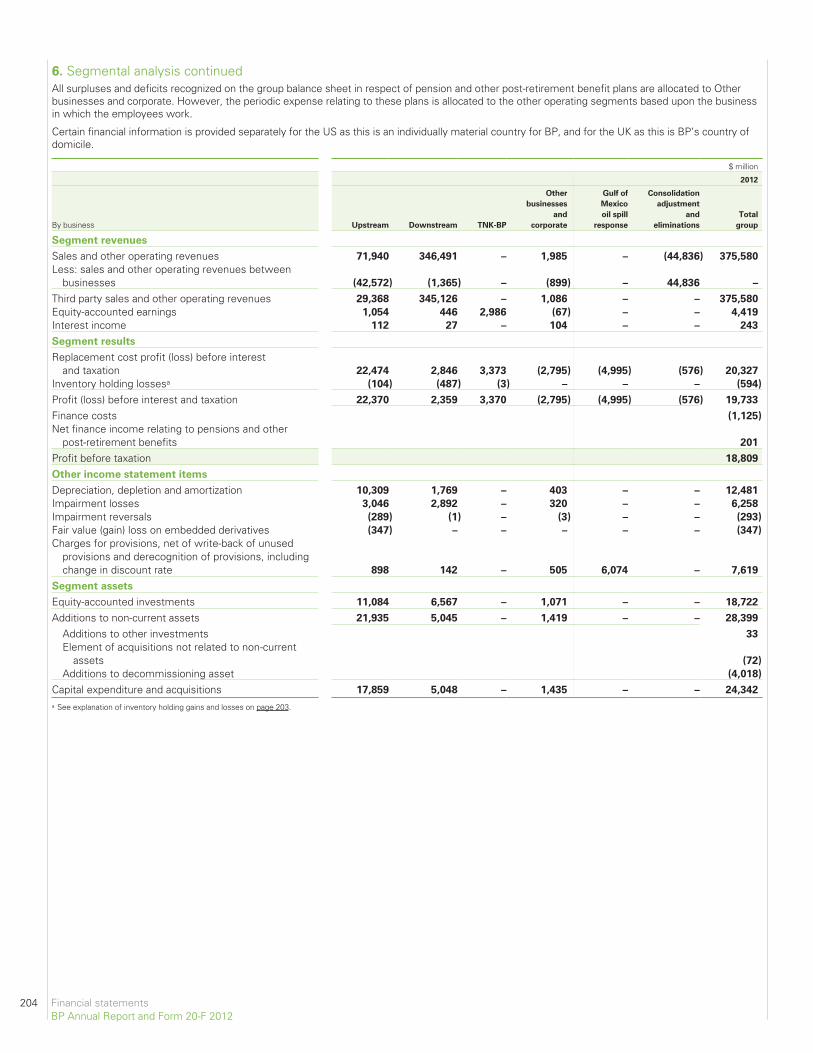
6. Segmental analysis continuedAll surpluses and deficits recognized on the group balance sheet in respect of pension and other post-retirement benefit plans are allocated to Otherbusinesses and corporate. However, the periodic expense relating to these plans is allocated to the other operating segments based upon the businessin which the employees work.
Certain financial information is provided separately for the US as this is an individually material country for BP, and for the UK as this is BP’s country ofdomicile.
$ million
2012
By business Upstream Downstream TNK-BP
Other
businesses
and
corporate
Gulf of
Mexico
oil spill
response
Consolidation
adjustment
and
eliminations
Total
group
Segment revenues
Sales and other operating revenues 71,940 346,491 – 1,985 – (44,836) 375,580
Less: sales and other operating revenues betweenbusinesses (42,572) (1,365) – (899) – 44,836 –
Third party sales and other operating revenues 29,368 345,126 – 1,086 – – 375,580
Equity-accounted earnings 1,054 446 2,986 (67) – – 4,419
Interest income 112 27 – 104 – – 243
Segment results
Replacement cost profit (loss) before interestand taxation 22,474 2,846 3,373 (2,795) (4,995) (576) 20,327
Inventory holding lossesa (104) (487) (3) – – – (594)
Profit (loss) before interest and taxation 22,370 2,359 3,370 (2,795) (4,995) (576) 19,733
Finance costs (1,125)
Net finance income relating to pensions and otherpost-retirement benefits 201
Profit before taxation 18,809
Other income statement items
Depreciation, depletion and amortization 10,309 1,769 – 403 – – 12,481
Impairment losses 3,046 2,892 – 320 – – 6,258
Impairment reversals (289) (1) – (3) – – (293)
Fair value (gain) loss on embedded derivatives (347) – – – – – (347)
Charges for provisions, net of write-back of unusedprovisions and derecognition of provisions, includingchange in discount rate 898 142 – 505 6,074 – 7,619
Segment assets
Equity-accounted investments 11,084 6,567 – 1,071 – – 18,722
Additions to non-current assets 21,935 5,045 – 1,419 – – 28,399
Additions to other investments 33
Element of acquisitions not related to non-currentassets (72)
Additions to decommissioning asset (4,018)
Capital expenditure and acquisitions 17,859 5,048 – 1,435 – – 24,342
a See explanation of inventory holding gains and losses on page 203.
204 Financial statementsBP Annual Report and Form 20-F 2012
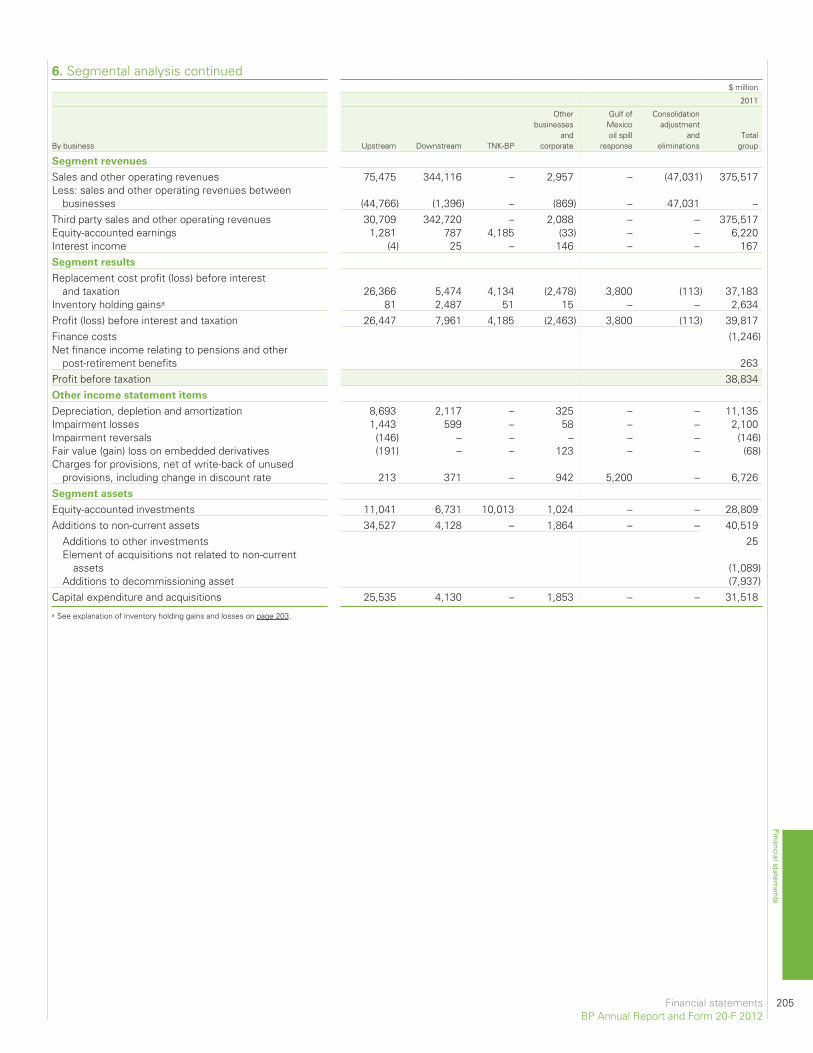
6. Segmental analysis continued$ million
2011
By business Upstream Downstream TNK-BP
Otherbusinesses
andcorporate
Gulf ofMexicooil spill
response
Consolidationadjustment
andeliminations
Totalgroup
Segment revenues
Sales and other operating revenues 75,475 344,116 – 2,957 – (47,031) 375,517Less: sales and other operating revenues between
businesses (44,766) (1,396) – (869) – 47,031 –Third party sales and other operating revenues 30,709 342,720 – 2,088 – – 375,517Equity-accounted earnings 1,281 787 4,185 (33) – – 6,220Interest income (4) 25 – 146 – – 167Segment results
Replacement cost profit (loss) before interestand taxation 26,366 5,474 4,134 (2,478) 3,800 (113) 37,183
Inventory holding gainsa 81 2,487 51 15 – – 2,634Profit (loss) before interest and taxation 26,447 7,961 4,185 (2,463) 3,800 (113) 39,817Finance costs (1,246)Net finance income relating to pensions and other
post-retirement benefits 263Profit before taxation 38,834Other income statement items
Depreciation, depletion and amortization 8,693 2,117 – 325 – – 11,135Impairment losses 1,443 599 – 58 – – 2,100Impairment reversals (146) – – – – – (146)Fair value (gain) loss on embedded derivatives (191) – – 123 – – (68)Charges for provisions, net of write-back of unused
provisions, including change in discount rate 213 371 – 942 5,200 – 6,726Segment assets
Equity-accounted investments 11,041 6,731 10,013 1,024 – – 28,809Additions to non-current assets 34,527 4,128 – 1,864 – – 40,519
Additions to other investments 25Element of acquisitions not related to non-current
assets (1,089)Additions to decommissioning asset (7,937)
Capital expenditure and acquisitions 25,535 4,130 – 1,853 – – 31,518a See explanation of inventory holding gains and losses on page 203.
Financial statements 205BP Annual Report and Form 20-F 2012
Financial statements
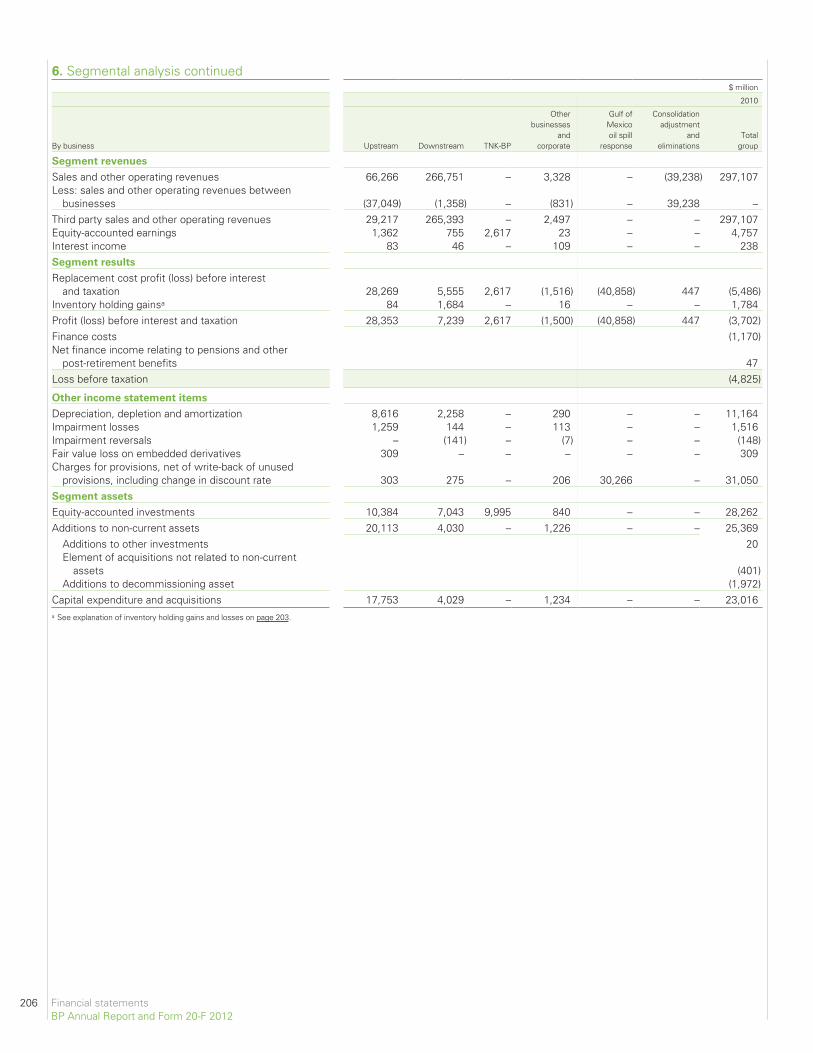
6. Segmental analysis continued$ million
2010
By business Upstream Downstream TNK-BP
Otherbusinesses
andcorporate
Gulf ofMexicooil spill
response
Consolidationadjustment
andeliminations
Totalgroup
Segment revenues
Sales and other operating revenues 66,266 266,751 – 3,328 – (39,238) 297,107Less: sales and other operating revenues between
businesses (37,049) (1,358) – (831) – 39,238 –Third party sales and other operating revenues 29,217 265,393 – 2,497 – – 297,107Equity-accounted earnings 1,362 755 2,617 23 – – 4,757Interest income 83 46 – 109 – – 238Segment results
Replacement cost profit (loss) before interestand taxation 28,269 5,555 2,617 (1,516) (40,858) 447 (5,486)
Inventory holding gainsa 84 1,684 – 16 – – 1,784Profit (loss) before interest and taxation 28,353 7,239 2,617 (1,500) (40,858) 447 (3,702)Finance costs (1,170)Net finance income relating to pensions and other
post-retirement benefits 47Loss before taxation (4,825)
Other income statement items
Depreciation, depletion and amortization 8,616 2,258 – 290 – – 11,164Impairment losses 1,259 144 – 113 – – 1,516Impairment reversals – (141) – (7) – – (148)Fair value loss on embedded derivatives 309 – – – – – 309Charges for provisions, net of write-back of unused
provisions, including change in discount rate 303 275 – 206 30,266 – 31,050Segment assets
Equity-accounted investments 10,384 7,043 9,995 840 – – 28,262Additions to non-current assets 20,113 4,030 – 1,226 – – 25,369
Additions to other investments 20Element of acquisitions not related to non-current
assets (401)Additions to decommissioning asset (1,972)
Capital expenditure and acquisitions 17,753 4,029 – 1,234 – – 23,016a See explanation of inventory holding gains and losses on page 203.
206 Financial statementsBP Annual Report and Form 20-F 2012
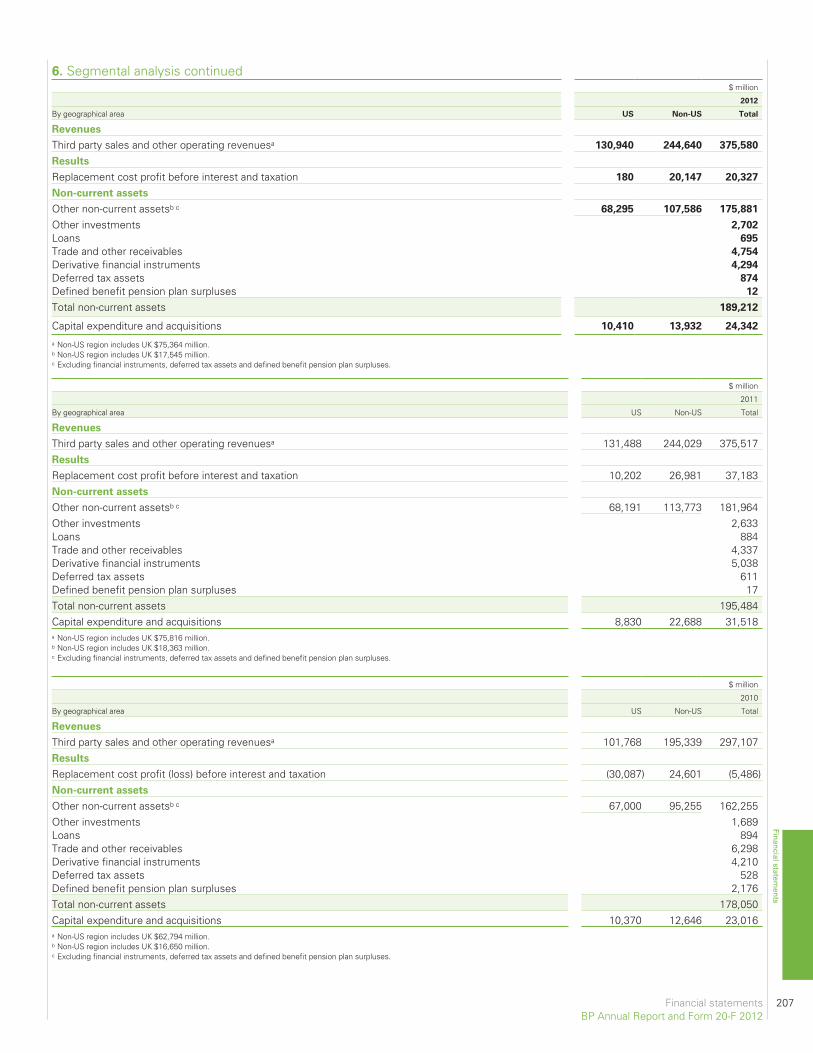
$ million
2012
By geographical area US Non-US Total
Revenues
Third party sales and other operating revenuesa 130,940 244,640 375,580
Results
Replacement cost profit before interest and taxation 180 20,147 20,327
Non-current assets
Other non-current assetsb c 68,295 107,586 175,881
Other investments 2,702
Loans 695
Trade and other receivables 4,754
Derivative financial instruments 4,294
Deferred tax assets 874
Defined benefit pension plan surpluses 12
Total non-current assets 189,212
Capital expenditure and acquisitions 10,410 13,932 24,342
a Non-US region includes UK $75,364 million.b Non-US region includes UK $17,545 million.c Excluding financial instruments, deferred tax assets and defined benefit pension plan surpluses.
$ million
2011
By geographical area US Non-US Total
Revenues
Third party sales and other operating revenuesa 131,488 244,029 375,517Results
Replacement cost profit before interest and taxation 10,202 26,981 37,183Non-current assets
Other non-current assetsb c 68,191 113,773 181,964Other investments 2,633Loans 884Trade and other receivables 4,337Derivative financial instruments 5,038Deferred tax assets 611Defined benefit pension plan surpluses 17Total non-current assets 195,484Capital expenditure and acquisitions 8,830 22,688 31,518a Non-US region includes UK $75,816 million.b Non-US region includes UK $18,363 million.c Excluding financial instruments, deferred tax assets and defined benefit pension plan surpluses.
$ million
2010
By geographical area US Non-US Total
Revenues
Third party sales and other operating revenuesa 101,768 195,339 297,107Results
Replacement cost profit (loss) before interest and taxation (30,087) 24,601 (5,486)Non-current assets
Other non-current assetsb c 67,000 95,255 162,255Other investments 1,689Loans 894Trade and other receivables 6,298Derivative financial instruments 4,210Deferred tax assets 528Defined benefit pension plan surpluses 2,176Total non-current assets 178,050Capital expenditure and acquisitions 10,370 12,646 23,016a Non-US region includes UK $62,794 million.b Non-US region includes UK $16,650 million.c Excluding financial instruments, deferred tax assets and defined benefit pension plan surpluses.
Financial statements 207BP Annual Report and Form 20-F 2012
Financial statements
6. Segmental analysis continued
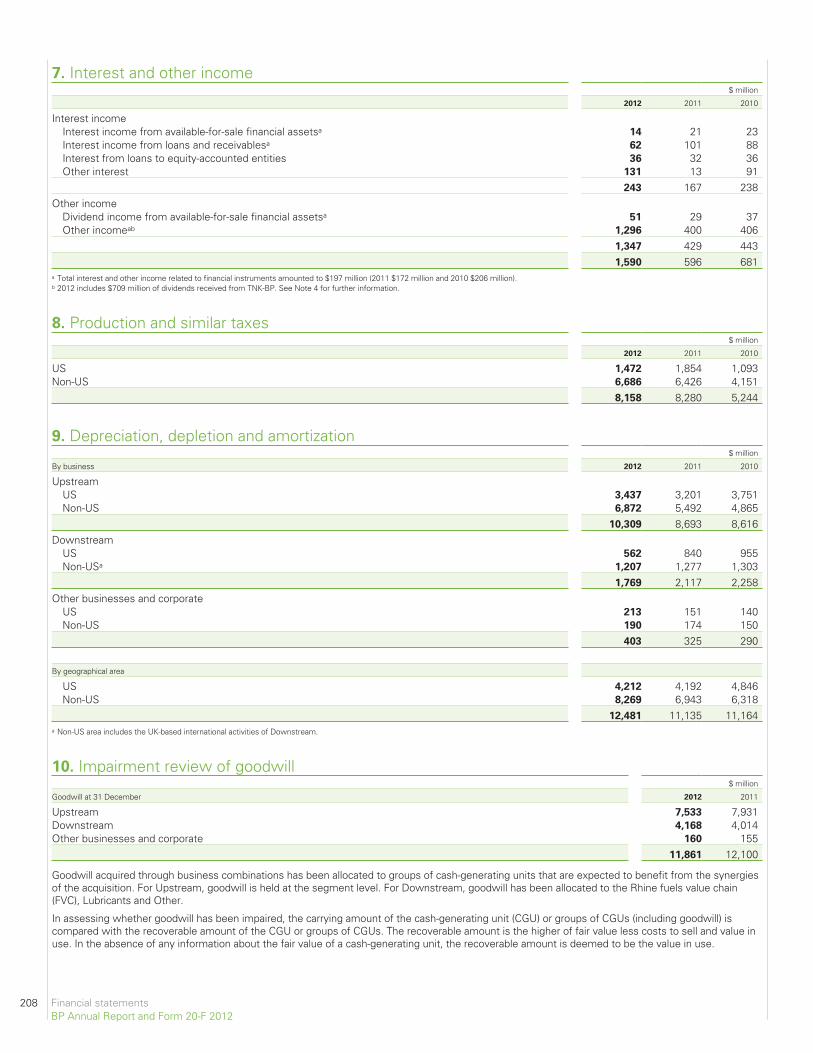
7. Interest and other income$ million
2012 2011 2010
Interest incomeInterest income from available-for-sale financial assetsa 14 21 23Interest income from loans and receivablesa 62 101 88Interest from loans to equity-accounted entities 36 32 36Other interest 131 13 91
243 167 238Other income
Dividend income from available-for-sale financial assetsa 51 29 37Other incomeab 1,296 400 406
1,347 429 4431,590 596 681
a Total interest and other income related to financial instruments amounted to $197 million (2011 $172 million and 2010 $206 million).b 2012 includes $709 million of dividends received from TNK-BP. See Note 4 for further information.
8. Production and similar taxes$ million
2012 2011 2010
US 1,472 1,854 1,093Non-US 6,686 6,426 4,151
8,158 8,280 5,244
9. Depreciation, depletion and amortization$ million
By business 2012 2011 2010
UpstreamUS 3,437 3,201 3,751Non-US 6,872 5,492 4,865
10,309 8,693 8,616Downstream
US 562 840 955Non-USa 1,207 1,277 1,303
1,769 2,117 2,258Other businesses and corporate
US 213 151 140Non-US 190 174 150
403 325 290
By geographical area
US 4,212 4,192 4,846Non-US 8,269 6,943 6,318
12,481 11,135 11,164a Non-US area includes the UK-based international activities of Downstream.
10. Impairment review of goodwill$ million
Goodwill at 31 December 2012 2011
Upstream 7,533 7,931Downstream 4,168 4,014Other businesses and corporate 160 155
11,861 12,100
Goodwill acquired through business combinations has been allocated to groups of cash-generating units that are expected to benefit from the synergiesof the acquisition. For Upstream, goodwill is held at the segment level. For Downstream, goodwill has been allocated to the Rhine fuels value chain(FVC), Lubricants and Other.
In assessing whether goodwill has been impaired, the carrying amount of the cash-generating unit (CGU) or groups of CGUs (including goodwill) iscompared with the recoverable amount of the CGU or groups of CGUs. The recoverable amount is the higher of fair value less costs to sell and value inuse. In the absence of any information about the fair value of a cash-generating unit, the recoverable amount is deemed to be the value in use.
208 Financial statementsBP Annual Report and Form 20-F 2012
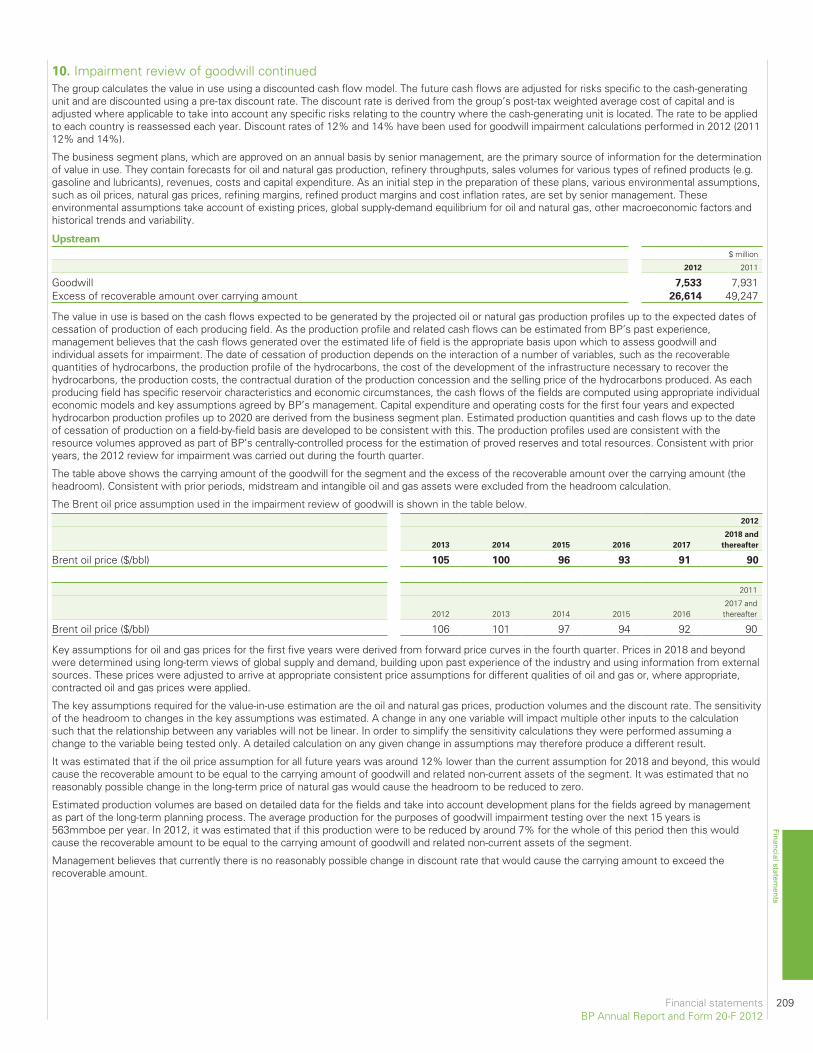
The group calculates the value in use using a discounted cash flow model. The future cash flows are adjusted for risks specific to the cash-generatingunit and are discounted using a pre-tax discount rate. The discount rate is derived from the group’s post-tax weighted average cost of capital and isadjusted where applicable to take into account any specific risks relating to the country where the cash-generating unit is located. The rate to be appliedto each country is reassessed each year. Discount rates of 12% and 14% have been used for goodwill impairment calculations performed in 2012 (201112% and 14%).
The business segment plans, which are approved on an annual basis by senior management, are the primary source of information for the determinationof value in use. They contain forecasts for oil and natural gas production, refinery throughputs, sales volumes for various types of refined products (e.g.gasoline and lubricants), revenues, costs and capital expenditure. As an initial step in the preparation of these plans, various environmental assumptions,such as oil prices, natural gas prices, refining margins, refined product margins and cost inflation rates, are set by senior management. Theseenvironmental assumptions take account of existing prices, global supply-demand equilibrium for oil and natural gas, other macroeconomic factors andhistorical trends and variability.
Upstream
$ million
2012 2011
Goodwill 7,533 7,931Excess of recoverable amount over carrying amount 26,614 49,247
The value in use is based on the cash flows expected to be generated by the projected oil or natural gas production profiles up to the expected dates ofcessation of production of each producing field. As the production profile and related cash flows can be estimated from BP’s past experience,management believes that the cash flows generated over the estimated life of field is the appropriate basis upon which to assess goodwill andindividual assets for impairment. The date of cessation of production depends on the interaction of a number of variables, such as the recoverablequantities of hydrocarbons, the production profile of the hydrocarbons, the cost of the development of the infrastructure necessary to recover thehydrocarbons, the production costs, the contractual duration of the production concession and the selling price of the hydrocarbons produced. As eachproducing field has specific reservoir characteristics and economic circumstances, the cash flows of the fields are computed using appropriate individualeconomic models and key assumptions agreed by BP’s management. Capital expenditure and operating costs for the first four years and expectedhydrocarbon production profiles up to 2020 are derived from the business segment plan. Estimated production quantities and cash flows up to the dateof cessation of production on a field-by-field basis are developed to be consistent with this. The production profiles used are consistent with theresource volumes approved as part of BP’s centrally-controlled process for the estimation of proved reserves and total resources. Consistent with prioryears, the 2012 review for impairment was carried out during the fourth quarter.
The table above shows the carrying amount of the goodwill for the segment and the excess of the recoverable amount over the carrying amount (theheadroom). Consistent with prior periods, midstream and intangible oil and gas assets were excluded from the headroom calculation.
The Brent oil price assumption used in the impairment review of goodwill is shown in the table below.2012
2013 2014 2015 2016 2017
2018 and
thereafter
Brent oil price ($/bbl) 105 100 96 93 91 90
2011
2012 2013 2014 2015 20162017 andthereafter
Brent oil price ($/bbl) 106 101 97 94 92 90
Key assumptions for oil and gas prices for the first five years were derived from forward price curves in the fourth quarter. Prices in 2018 and beyondwere determined using long-term views of global supply and demand, building upon past experience of the industry and using information from externalsources. These prices were adjusted to arrive at appropriate consistent price assumptions for different qualities of oil and gas or, where appropriate,contracted oil and gas prices were applied.
The key assumptions required for the value-in-use estimation are the oil and natural gas prices, production volumes and the discount rate. The sensitivityof the headroom to changes in the key assumptions was estimated. A change in any one variable will impact multiple other inputs to the calculationsuch that the relationship between any variables will not be linear. In order to simplify the sensitivity calculations they were performed assuming achange to the variable being tested only. A detailed calculation on any given change in assumptions may therefore produce a different result.
It was estimated that if the oil price assumption for all future years was around 12% lower than the current assumption for 2018 and beyond, this wouldcause the recoverable amount to be equal to the carrying amount of goodwill and related non-current assets of the segment. It was estimated that noreasonably possible change in the long-term price of natural gas would cause the headroom to be reduced to zero.
Estimated production volumes are based on detailed data for the fields and take into account development plans for the fields agreed by managementas part of the long-term planning process. The average production for the purposes of goodwill impairment testing over the next 15 years is563mmboe per year. In 2012, it was estimated that if this production were to be reduced by around 7% for the whole of this period then this wouldcause the recoverable amount to be equal to the carrying amount of goodwill and related non-current assets of the segment.
Management believes that currently there is no reasonably possible change in discount rate that would cause the carrying amount to exceed therecoverable amount.
Financial statements 209BP Annual Report and Form 20-F 2012
Financial statements
10. Impairment review of goodwill continued
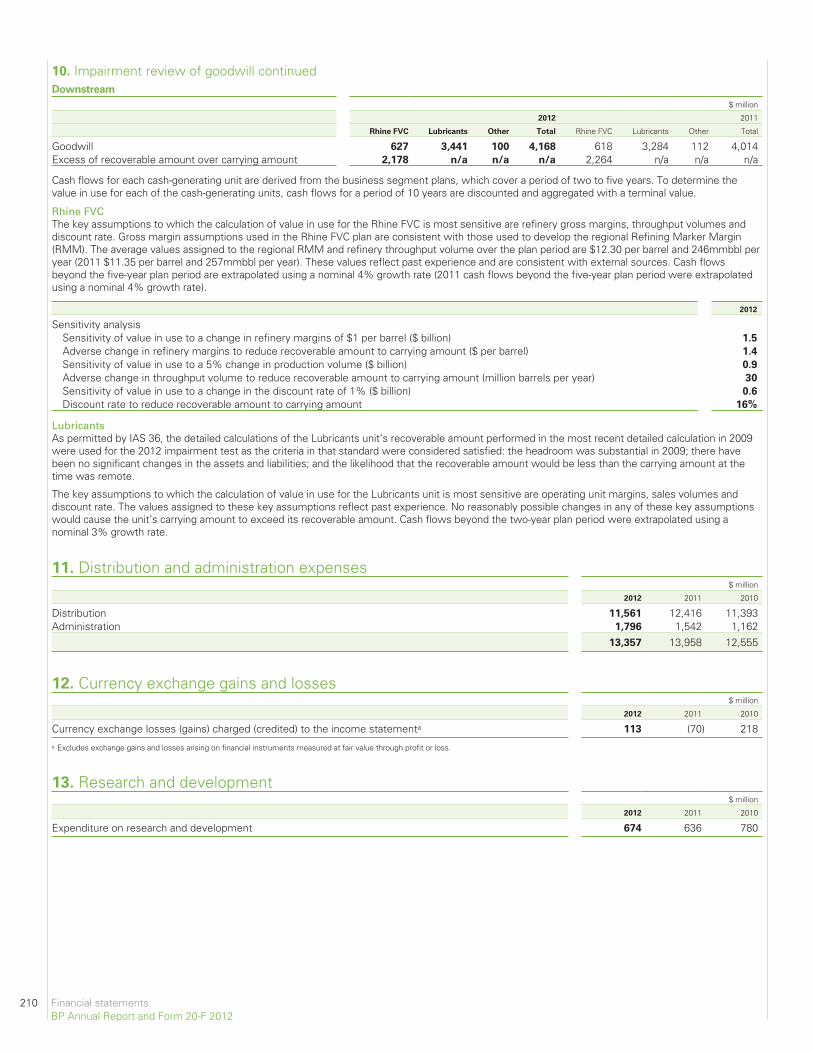
10. Impairment review of goodwill continuedDownstream
$ million
2012 2011
Rhine FVC Lubricants Other Total Rhine FVC Lubricants Other Total
Goodwill 627 3,441 100 4,168 618 3,284 112 4,014Excess of recoverable amount over carrying amount 2,178 n/a n/a n/a 2,264 n/a n/a n/a
Cash flows for each cash-generating unit are derived from the business segment plans, which cover a period of two to five years. To determine thevalue in use for each of the cash-generating units, cash flows for a period of 10 years are discounted and aggregated with a terminal value.
Rhine FVCThe key assumptions to which the calculation of value in use for the Rhine FVC is most sensitive are refinery gross margins, throughput volumes anddiscount rate. Gross margin assumptions used in the Rhine FVC plan are consistent with those used to develop the regional Refining Marker Margin(RMM). The average values assigned to the regional RMM and refinery throughput volume over the plan period are $12.30 per barrel and 246mmbbl peryear (2011 $11.35 per barrel and 257mmbbl per year). These values reflect past experience and are consistent with external sources. Cash flowsbeyond the five-year plan period are extrapolated using a nominal 4% growth rate (2011 cash flows beyond the five-year plan period were extrapolatedusing a nominal 4% growth rate).
2012
Sensitivity analysisSensitivity of value in use to a change in refinery margins of $1 per barrel ($ billion) 1.5
Adverse change in refinery margins to reduce recoverable amount to carrying amount ($ per barrel) 1.4
Sensitivity of value in use to a 5% change in production volume ($ billion) 0.9
Adverse change in throughput volume to reduce recoverable amount to carrying amount (million barrels per year) 30
Sensitivity of value in use to a change in the discount rate of 1% ($ billion) 0.6
Discount rate to reduce recoverable amount to carrying amount 16%
LubricantsAs permitted by IAS 36, the detailed calculations of the Lubricants unit’s recoverable amount performed in the most recent detailed calculation in 2009were used for the 2012 impairment test as the criteria in that standard were considered satisfied: the headroom was substantial in 2009; there havebeen no significant changes in the assets and liabilities; and the likelihood that the recoverable amount would be less than the carrying amount at thetime was remote.
The key assumptions to which the calculation of value in use for the Lubricants unit is most sensitive are operating unit margins, sales volumes anddiscount rate. The values assigned to these key assumptions reflect past experience. No reasonably possible changes in any of these key assumptionswould cause the unit’s carrying amount to exceed its recoverable amount. Cash flows beyond the two-year plan period were extrapolated using anominal 3% growth rate.
11. Distribution and administration expenses$ million
2012 2011 2010
Distribution 11,561 12,416 11,393Administration 1,796 1,542 1,162
13,357 13,958 12,555
12. Currency exchange gains and losses$ million
2012 2011 2010
Currency exchange losses (gains) charged (credited) to the income statementa 113 (70) 218a Excludes exchange gains and losses arising on financial instruments measured at fair value through profit or loss.
13. Research and development$ million
2012 2011 2010
Expenditure on research and development 674 636 780
210 Financial statementsBP Annual Report and Form 20-F 2012
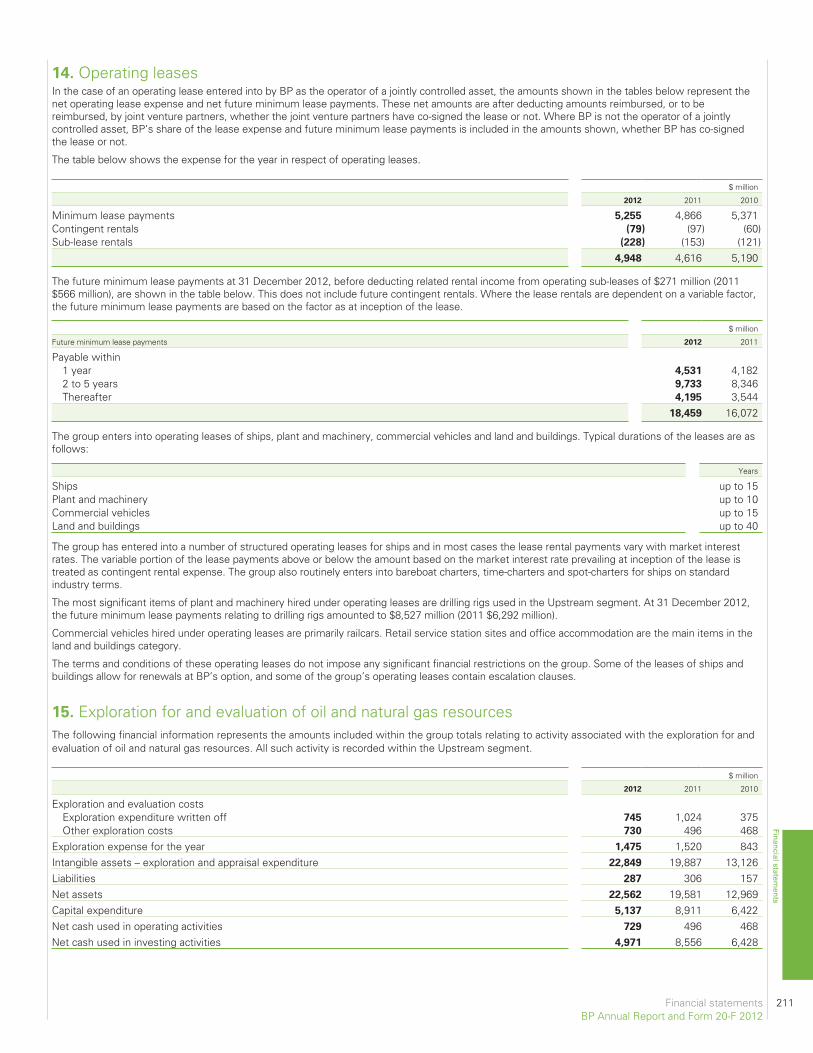
14. Operating leasesIn the case of an operating lease entered into by BP as the operator of a jointly controlled asset, the amounts shown in the tables below represent thenet operating lease expense and net future minimum lease payments. These net amounts are after deducting amounts reimbursed, or to bereimbursed, by joint venture partners, whether the joint venture partners have co-signed the lease or not. Where BP is not the operator of a jointlycontrolled asset, BP’s share of the lease expense and future minimum lease payments is included in the amounts shown, whether BP has co-signedthe lease or not.
The table below shows the expense for the year in respect of operating leases.
$ million
2012 2011 2010
Minimum lease payments 5,255 4,866 5,371Contingent rentals (79) (97) (60)Sub-lease rentals (228) (153) (121)
4,948 4,616 5,190
The future minimum lease payments at 31 December 2012, before deducting related rental income from operating sub-leases of $271 million (2011$566 million), are shown in the table below. This does not include future contingent rentals. Where the lease rentals are dependent on a variable factor,the future minimum lease payments are based on the factor as at inception of the lease.
$ million
Future minimum lease payments 2012 2011
Payable within1 year 4,531 4,1822 to 5 years 9,733 8,346Thereafter 4,195 3,544
18,459 16,072
The group enters into operating leases of ships, plant and machinery, commercial vehicles and land and buildings. Typical durations of the leases are asfollows:
Years
Ships up to 15Plant and machinery up to 10Commercial vehicles up to 15Land and buildings up to 40
The group has entered into a number of structured operating leases for ships and in most cases the lease rental payments vary with market interestrates. The variable portion of the lease payments above or below the amount based on the market interest rate prevailing at inception of the lease istreated as contingent rental expense. The group also routinely enters into bareboat charters, time-charters and spot-charters for ships on standardindustry terms.
The most significant items of plant and machinery hired under operating leases are drilling rigs used in the Upstream segment. At 31 December 2012,the future minimum lease payments relating to drilling rigs amounted to $8,527 million (2011 $6,292 million).
Commercial vehicles hired under operating leases are primarily railcars. Retail service station sites and office accommodation are the main items in theland and buildings category.
The terms and conditions of these operating leases do not impose any significant financial restrictions on the group. Some of the leases of ships andbuildings allow for renewals at BP’s option, and some of the group’s operating leases contain escalation clauses.
15. Exploration for and evaluation of oil and natural gas resourcesThe following financial information represents the amounts included within the group totals relating to activity associated with the exploration for andevaluation of oil and natural gas resources. All such activity is recorded within the Upstream segment.
$ million
2012 2011 2010
Exploration and evaluation costsExploration expenditure written off 745 1,024 375Other exploration costs 730 496 468
Exploration expense for the year 1,475 1,520 843Intangible assets – exploration and appraisal expenditure 22,849 19,887 13,126Liabilities 287 306 157Net assets 22,562 19,581 12,969Capital expenditure 5,137 8,911 6,422Net cash used in operating activities 729 496 468Net cash used in investing activities 4,971 8,556 6,428
Financial statements 211BP Annual Report and Form 20-F 2012
Financial statements
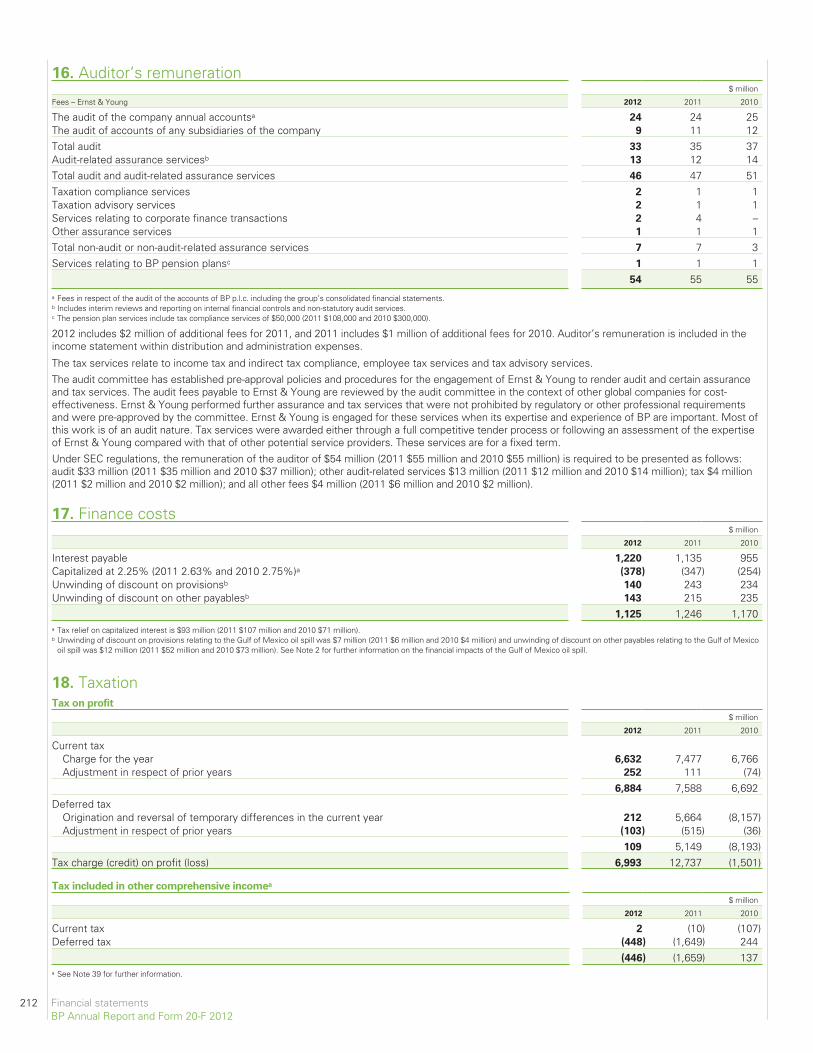
16. Auditor’s remuneration$ million
Fees – Ernst & Young 2012 2011 2010
The audit of the company annual accountsa 24 24 25The audit of accounts of any subsidiaries of the company 9 11 12Total audit 33 35 37Audit-related assurance servicesb 13 12 14Total audit and audit-related assurance services 46 47 51Taxation compliance services 2 1 1Taxation advisory services 2 1 1Services relating to corporate finance transactions 2 4 –Other assurance services 1 1 1Total non-audit or non-audit-related assurance services 7 7 3Services relating to BP pension plansc 1 1 1
54 55 55a Fees in respect of the audit of the accounts of BP p.l.c. including the group’s consolidated financial statements.b Includes interim reviews and reporting on internal financial controls and non-statutory audit services.c The pension plan services include tax compliance services of $50,000 (2011 $108,000 and 2010 $300,000).
2012 includes $2 million of additional fees for 2011, and 2011 includes $1 million of additional fees for 2010. Auditor’s remuneration is included in theincome statement within distribution and administration expenses.
The tax services relate to income tax and indirect tax compliance, employee tax services and tax advisory services.
The audit committee has established pre-approval policies and procedures for the engagement of Ernst & Young to render audit and certain assuranceand tax services. The audit fees payable to Ernst & Young are reviewed by the audit committee in the context of other global companies for cost-effectiveness. Ernst & Young performed further assurance and tax services that were not prohibited by regulatory or other professional requirementsand were pre-approved by the committee. Ernst & Young is engaged for these services when its expertise and experience of BP are important. Most ofthis work is of an audit nature. Tax services were awarded either through a full competitive tender process or following an assessment of the expertiseof Ernst & Young compared with that of other potential service providers. These services are for a fixed term.
Under SEC regulations, the remuneration of the auditor of $54 million (2011 $55 million and 2010 $55 million) is required to be presented as follows:audit $33 million (2011 $35 million and 2010 $37 million); other audit-related services $13 million (2011 $12 million and 2010 $14 million); tax $4 million(2011 $2 million and 2010 $2 million); and all other fees $4 million (2011 $6 million and 2010 $2 million).
17. Finance costs$ million
2012 2011 2010
Interest payable 1,220 1,135 955Capitalized at 2.25% (2011 2.63% and 2010 2.75%)a (378) (347) (254)Unwinding of discount on provisionsb 140 243 234Unwinding of discount on other payablesb 143 215 235
1,125 1,246 1,170a Tax relief on capitalized interest is $93 million (2011 $107 million and 2010 $71 million).b Unwinding of discount on provisions relating to the Gulf of Mexico oil spill was $7 million (2011 $6 million and 2010 $4 million) and unwinding of discount on other payables relating to the Gulf of Mexico
oil spill was $12 million (2011 $52 million and 2010 $73 million). See Note 2 for further information on the financial impacts of the Gulf of Mexico oil spill.
18. TaxationTax on profit
$ million
2012 2011 2010
Current taxCharge for the year 6,632 7,477 6,766Adjustment in respect of prior years 252 111 (74)
6,884 7,588 6,692Deferred tax
Origination and reversal of temporary differences in the current year 212 5,664 (8,157)Adjustment in respect of prior years (103) (515) (36)
109 5,149 (8,193)Tax charge (credit) on profit (loss) 6,993 12,737 (1,501)
Tax included in other comprehensive incomea
$ million
2012 2011 2010
Current tax 2 (10) (107)Deferred tax (448) (1,649) 244
(446) (1,659) 137a See Note 39 for further information.
212 Financial statementsBP Annual Report and Form 20-F 2012
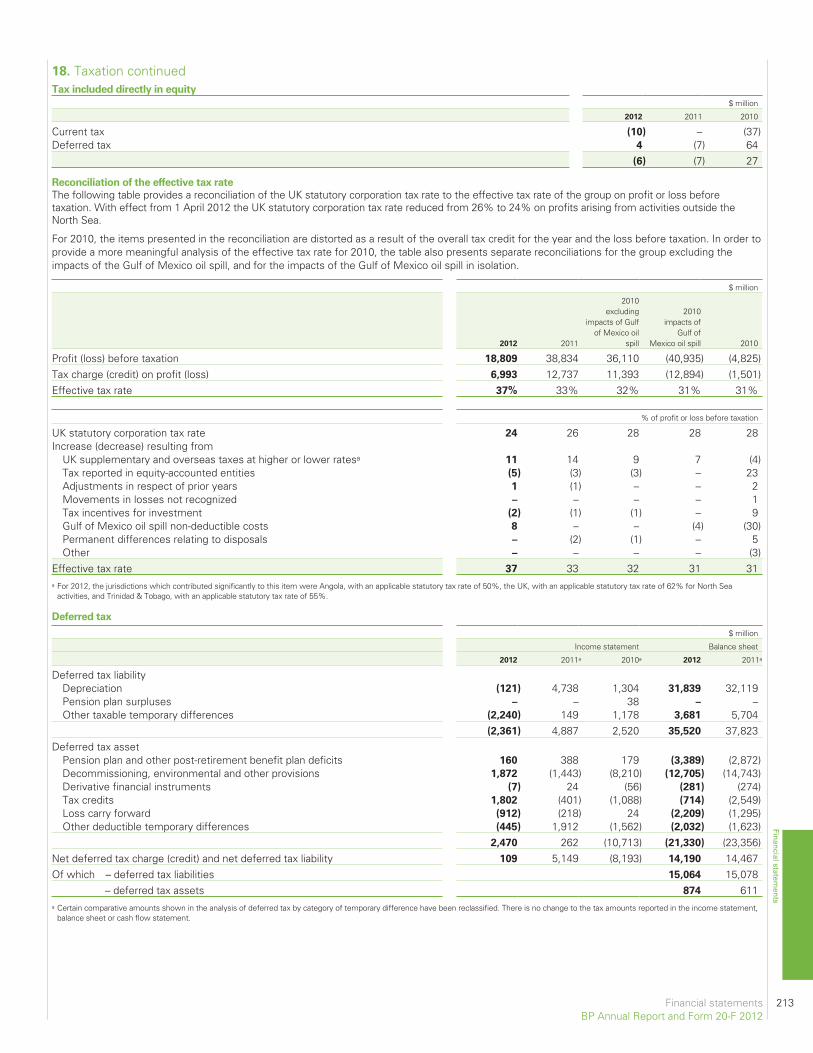
Tax included directly in equity
$ million
2012 2011 2010
Current tax (10) – (37)Deferred tax 4 (7) 64
(6) (7) 27
Reconciliation of the effective tax rate
The following table provides a reconciliation of the UK statutory corporation tax rate to the effective tax rate of the group on profit or loss beforetaxation. With effect from 1 April 2012 the UK statutory corporation tax rate reduced from 26% to 24% on profits arising from activities outside theNorth Sea.
For 2010, the items presented in the reconciliation are distorted as a result of the overall tax credit for the year and the loss before taxation. In order toprovide a more meaningful analysis of the effective tax rate for 2010, the table also presents separate reconciliations for the group excluding theimpacts of the Gulf of Mexico oil spill, and for the impacts of the Gulf of Mexico oil spill in isolation.
$ million
2012 2011
2010excluding
impacts of Gulfof Mexico oil
spill
2010impacts of
Gulf ofMexico oil spill 2010
Profit (loss) before taxation 18,809 38,834 36,110 (40,935) (4,825)Tax charge (credit) on profit (loss) 6,993 12,737 11,393 (12,894) (1,501)Effective tax rate 37% 33% 32% 31% 31%
% of profit or loss before taxation
UK statutory corporation tax rate 24 26 28 28 28Increase (decrease) resulting from
UK supplementary and overseas taxes at higher or lower ratesa 11 14 9 7 (4)Tax reported in equity-accounted entities (5) (3) (3) – 23Adjustments in respect of prior years 1 (1) – – 2Movements in losses not recognized – – – – 1Tax incentives for investment (2) (1) (1) – 9Gulf of Mexico oil spill non-deductible costs 8 – – (4) (30)Permanent differences relating to disposals – (2) (1) – 5Other – – – – (3)
Effective tax rate 37 33 32 31 31a For 2012, the jurisdictions which contributed significantly to this item were Angola, with an applicable statutory tax rate of 50%, the UK, with an applicable statutory tax rate of 62% for North Sea
activities, and Trinidad & Tobago, with an applicable statutory tax rate of 55%.
Deferred tax
$ million
Income statement Balance sheet
2012 2011a 2010a 2012 2011a
Deferred tax liabilityDepreciation (121) 4,738 1,304 31,839 32,119Pension plan surpluses – – 38 – –Other taxable temporary differences (2,240) 149 1,178 3,681 5,704
(2,361) 4,887 2,520 35,520 37,823Deferred tax asset
Pension plan and other post-retirement benefit plan deficits 160 388 179 (3,389) (2,872)Decommissioning, environmental and other provisions 1,872 (1,443) (8,210) (12,705) (14,743)Derivative financial instruments (7) 24 (56) (281) (274)Tax credits 1,802 (401) (1,088) (714) (2,549)Loss carry forward (912) (218) 24 (2,209) (1,295)Other deductible temporary differences (445) 1,912 (1,562) (2,032) (1,623)
2,470 262 (10,713) (21,330) (23,356)Net deferred tax charge (credit) and net deferred tax liability 109 5,149 (8,193) 14,190 14,467Of which – deferred tax liabilities 15,064 15,078
– deferred tax assets 874 611a Certain comparative amounts shown in the analysis of deferred tax by category of temporary difference have been reclassified. There is no change to the tax amounts reported in the income statement,
balance sheet or cash flow statement.
Financial statements 213BP Annual Report and Form 20-F 2012
Financial statements
18. Taxation continued
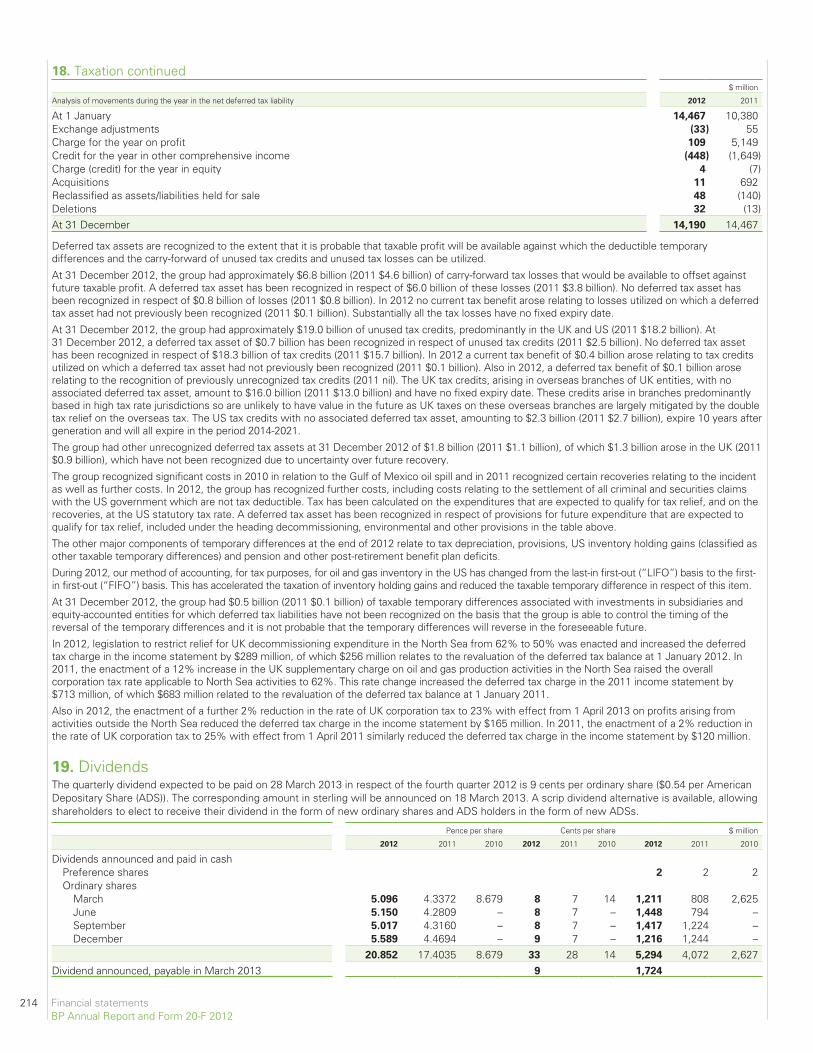
18. Taxation continued$ million
Analysis of movements during the year in the net deferred tax liability 2012 2011
At 1 January 14,467 10,380Exchange adjustments (33) 55Charge for the year on profit 109 5,149Credit for the year in other comprehensive income (448) (1,649)Charge (credit) for the year in equity 4 (7)Acquisitions 11 692Reclassified as assets/liabilities held for sale 48 (140)Deletions 32 (13)At 31 December 14,190 14,467
Deferred tax assets are recognized to the extent that it is probable that taxable profit will be available against which the deductible temporarydifferences and the carry-forward of unused tax credits and unused tax losses can be utilized.
At 31 December 2012, the group had approximately $6.8 billion (2011 $4.6 billion) of carry-forward tax losses that would be available to offset againstfuture taxable profit. A deferred tax asset has been recognized in respect of $6.0 billion of these losses (2011 $3.8 billion). No deferred tax asset hasbeen recognized in respect of $0.8 billion of losses (2011 $0.8 billion). In 2012 no current tax benefit arose relating to losses utilized on which a deferredtax asset had not previously been recognized (2011 $0.1 billion). Substantially all the tax losses have no fixed expiry date.
At 31 December 2012, the group had approximately $19.0 billion of unused tax credits, predominantly in the UK and US (2011 $18.2 billion). At31 December 2012, a deferred tax asset of $0.7 billion has been recognized in respect of unused tax credits (2011 $2.5 billion). No deferred tax assethas been recognized in respect of $18.3 billion of tax credits (2011 $15.7 billion). In 2012 a current tax benefit of $0.4 billion arose relating to tax creditsutilized on which a deferred tax asset had not previously been recognized (2011 $0.1 billion). Also in 2012, a deferred tax benefit of $0.1 billion aroserelating to the recognition of previously unrecognized tax credits (2011 nil). The UK tax credits, arising in overseas branches of UK entities, with noassociated deferred tax asset, amount to $16.0 billion (2011 $13.0 billion) and have no fixed expiry date. These credits arise in branches predominantlybased in high tax rate jurisdictions so are unlikely to have value in the future as UK taxes on these overseas branches are largely mitigated by the doubletax relief on the overseas tax. The US tax credits with no associated deferred tax asset, amounting to $2.3 billion (2011 $2.7 billion), expire 10 years aftergeneration and will all expire in the period 2014-2021.
The group had other unrecognized deferred tax assets at 31 December 2012 of $1.8 billion (2011 $1.1 billion), of which $1.3 billion arose in the UK (2011$0.9 billion), which have not been recognized due to uncertainty over future recovery.
The group recognized significant costs in 2010 in relation to the Gulf of Mexico oil spill and in 2011 recognized certain recoveries relating to the incidentas well as further costs. In 2012, the group has recognized further costs, including costs relating to the settlement of all criminal and securities claimswith the US government which are not tax deductible. Tax has been calculated on the expenditures that are expected to qualify for tax relief, and on therecoveries, at the US statutory tax rate. A deferred tax asset has been recognized in respect of provisions for future expenditure that are expected toqualify for tax relief, included under the heading decommissioning, environmental and other provisions in the table above.
The other major components of temporary differences at the end of 2012 relate to tax depreciation, provisions, US inventory holding gains (classified asother taxable temporary differences) and pension and other post-retirement benefit plan deficits.
During 2012, our method of accounting, for tax purposes, for oil and gas inventory in the US has changed from the last-in first-out (“LIFO”) basis to the first-in first-out (“FIFO”) basis. This has accelerated the taxation of inventory holding gains and reduced the taxable temporary difference in respect of this item.
At 31 December 2012, the group had $0.5 billion (2011 $0.1 billion) of taxable temporary differences associated with investments in subsidiaries andequity-accounted entities for which deferred tax liabilities have not been recognized on the basis that the group is able to control the timing of thereversal of the temporary differences and it is not probable that the temporary differences will reverse in the foreseeable future.
In 2012, legislation to restrict relief for UK decommissioning expenditure in the North Sea from 62% to 50% was enacted and increased the deferredtax charge in the income statement by $289 million, of which $256 million relates to the revaluation of the deferred tax balance at 1 January 2012. In2011, the enactment of a 12% increase in the UK supplementary charge on oil and gas production activities in the North Sea raised the overallcorporation tax rate applicable to North Sea activities to 62%. This rate change increased the deferred tax charge in the 2011 income statement by$713 million, of which $683 million related to the revaluation of the deferred tax balance at 1 January 2011.
Also in 2012, the enactment of a further 2% reduction in the rate of UK corporation tax to 23% with effect from 1 April 2013 on profits arising fromactivities outside the North Sea reduced the deferred tax charge in the income statement by $165 million. In 2011, the enactment of a 2% reduction inthe rate of UK corporation tax to 25% with effect from 1 April 2011 similarly reduced the deferred tax charge in the income statement by $120 million.
19. DividendsThe quarterly dividend expected to be paid on 28 March 2013 in respect of the fourth quarter 2012 is 9 cents per ordinary share ($0.54 per AmericanDepositary Share (ADS)). The corresponding amount in sterling will be announced on 18 March 2013. A scrip dividend alternative is available, allowingshareholders to elect to receive their dividend in the form of new ordinary shares and ADS holders in the form of new ADSs.
Pence per share Cents per share $ million
2012 2011 2010 2012 2011 2010 2012 2011 2010
Dividends announced and paid in cashPreference shares 2 2 2Ordinary shares
March 5.096 4.3372 8.679 8 7 14 1,211 808 2,625June 5.150 4.2809 – 8 7 – 1,448 794 –September 5.017 4.3160 – 8 7 – 1,417 1,224 –December 5.589 4.4694 – 9 7 – 1,216 1,244 –
20.852 17.4035 8.679 33 28 14 5,294 4,072 2,627Dividend announced, payable in March 2013 9 1,724
214 Financial statementsBP Annual Report and Form 20-F 2012
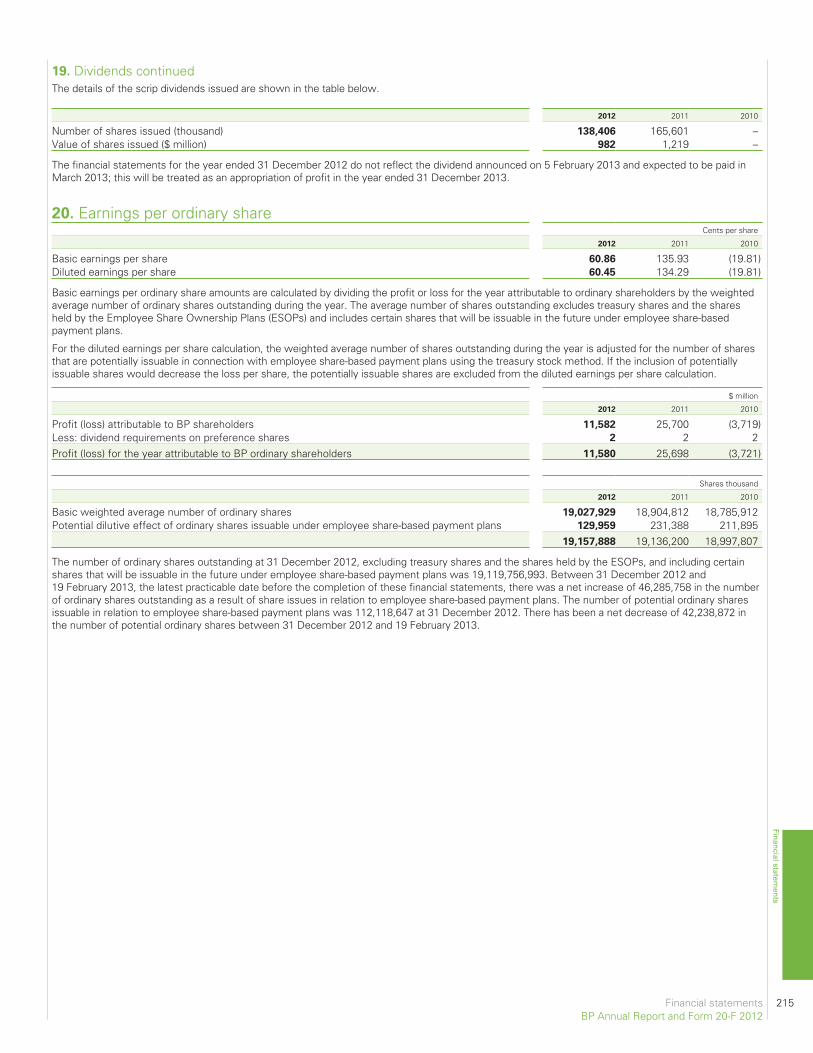
The details of the scrip dividends issued are shown in the table below.
2012 2011 2010
Number of shares issued (thousand) 138,406 165,601 –Value of shares issued ($ million) 982 1,219 –
The financial statements for the year ended 31 December 2012 do not reflect the dividend announced on 5 February 2013 and expected to be paid inMarch 2013; this will be treated as an appropriation of profit in the year ended 31 December 2013.
20. Earnings per ordinary shareCents per share
2012 2011 2010
Basic earnings per share 60.86 135.93 (19.81)Diluted earnings per share 60.45 134.29 (19.81)
Basic earnings per ordinary share amounts are calculated by dividing the profit or loss for the year attributable to ordinary shareholders by the weightedaverage number of ordinary shares outstanding during the year. The average number of shares outstanding excludes treasury shares and the sharesheld by the Employee Share Ownership Plans (ESOPs) and includes certain shares that will be issuable in the future under employee share-basedpayment plans.
For the diluted earnings per share calculation, the weighted average number of shares outstanding during the year is adjusted for the number of sharesthat are potentially issuable in connection with employee share-based payment plans using the treasury stock method. If the inclusion of potentiallyissuable shares would decrease the loss per share, the potentially issuable shares are excluded from the diluted earnings per share calculation.
$ million
2012 2011 2010
Profit (loss) attributable to BP shareholders 11,582 25,700 (3,719)Less: dividend requirements on preference shares 2 2 2Profit (loss) for the year attributable to BP ordinary shareholders 11,580 25,698 (3,721)
Shares thousand
2012 2011 2010
Basic weighted average number of ordinary shares 19,027,929 18,904,812 18,785,912Potential dilutive effect of ordinary shares issuable under employee share-based payment plans 129,959 231,388 211,895
19,157,888 19,136,200 18,997,807
The number of ordinary shares outstanding at 31 December 2012, excluding treasury shares and the shares held by the ESOPs, and including certainshares that will be issuable in the future under employee share-based payment plans was 19,119,756,993. Between 31 December 2012 and19 February 2013, the latest practicable date before the completion of these financial statements, there was a net increase of 46,285,758 in the numberof ordinary shares outstanding as a result of share issues in relation to employee share-based payment plans. The number of potential ordinary sharesissuable in relation to employee share-based payment plans was 112,118,647 at 31 December 2012. There has been a net decrease of 42,238,872 inthe number of potential ordinary shares between 31 December 2012 and 19 February 2013.
Financial statements 215BP Annual Report and Form 20-F 2012
Financial statements
19. Dividends continued
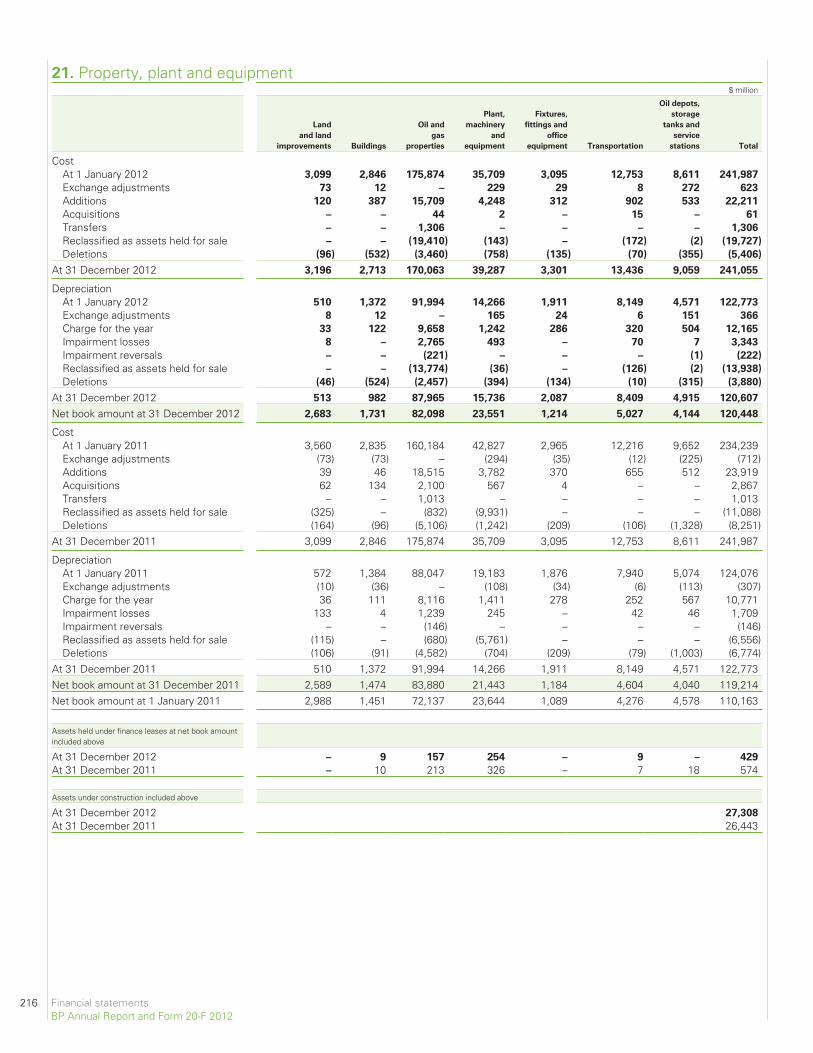
21. Property, plant and equipment$ million
Land
and land
improvements Buildings
Oil and
gas
properties
Plant,
machinery
and
equipment
Fixtures,
fittings and
office
equipment Transportation
Oil depots,
storage
tanks and
service
stations Total
CostAt 1 January 2012 3,099 2,846 175,874 35,709 3,095 12,753 8,611 241,987
Exchange adjustments 73 12 – 229 29 8 272 623
Additions 120 387 15,709 4,248 312 902 533 22,211
Acquisitions – – 44 2 – 15 – 61
Transfers – – 1,306 – – – – 1,306
Reclassified as assets held for sale – – (19,410) (143) – (172) (2) (19,727)
Deletions (96) (532) (3,460) (758) (135) (70) (355) (5,406)
At 31 December 2012 3,196 2,713 170,063 39,287 3,301 13,436 9,059 241,055
DepreciationAt 1 January 2012 510 1,372 91,994 14,266 1,911 8,149 4,571 122,773
Exchange adjustments 8 12 – 165 24 6 151 366
Charge for the year 33 122 9,658 1,242 286 320 504 12,165
Impairment losses 8 – 2,765 493 – 70 7 3,343
Impairment reversals – – (221) – – – (1) (222)
Reclassified as assets held for sale – – (13,774) (36) – (126) (2) (13,938)
Deletions (46) (524) (2,457) (394) (134) (10) (315) (3,880)
At 31 December 2012 513 982 87,965 15,736 2,087 8,409 4,915 120,607
Net book amount at 31 December 2012 2,683 1,731 82,098 23,551 1,214 5,027 4,144 120,448
CostAt 1 January 2011 3,560 2,835 160,184 42,827 2,965 12,216 9,652 234,239Exchange adjustments (73) (73) – (294) (35) (12) (225) (712)Additions 39 46 18,515 3,782 370 655 512 23,919Acquisitions 62 134 2,100 567 4 – – 2,867Transfers – – 1,013 – – – – 1,013Reclassified as assets held for sale (325) – (832) (9,931) – – – (11,088)Deletions (164) (96) (5,106) (1,242) (209) (106) (1,328) (8,251)
At 31 December 2011 3,099 2,846 175,874 35,709 3,095 12,753 8,611 241,987
DepreciationAt 1 January 2011 572 1,384 88,047 19,183 1,876 7,940 5,074 124,076Exchange adjustments (10) (36) – (108) (34) (6) (113) (307)Charge for the year 36 111 8,116 1,411 278 252 567 10,771Impairment losses 133 4 1,239 245 – 42 46 1,709Impairment reversals – – (146) – – – – (146)Reclassified as assets held for sale (115) – (680) (5,761) – – – (6,556)Deletions (106) (91) (4,582) (704) (209) (79) (1,003) (6,774)
At 31 December 2011 510 1,372 91,994 14,266 1,911 8,149 4,571 122,773Net book amount at 31 December 2011 2,589 1,474 83,880 21,443 1,184 4,604 4,040 119,214Net book amount at 1 January 2011 2,988 1,451 72,137 23,644 1,089 4,276 4,578 110,163
Assets held under finance leases at net book amountincluded above
At 31 December 2012 – 9 157 254 – 9 – 429
At 31 December 2011 – 10 213 326 – 7 18 574
Assets under construction included above
At 31 December 2012 27,308
At 31 December 2011 26,443
216 Financial statementsBP Annual Report and Form 20-F 2012
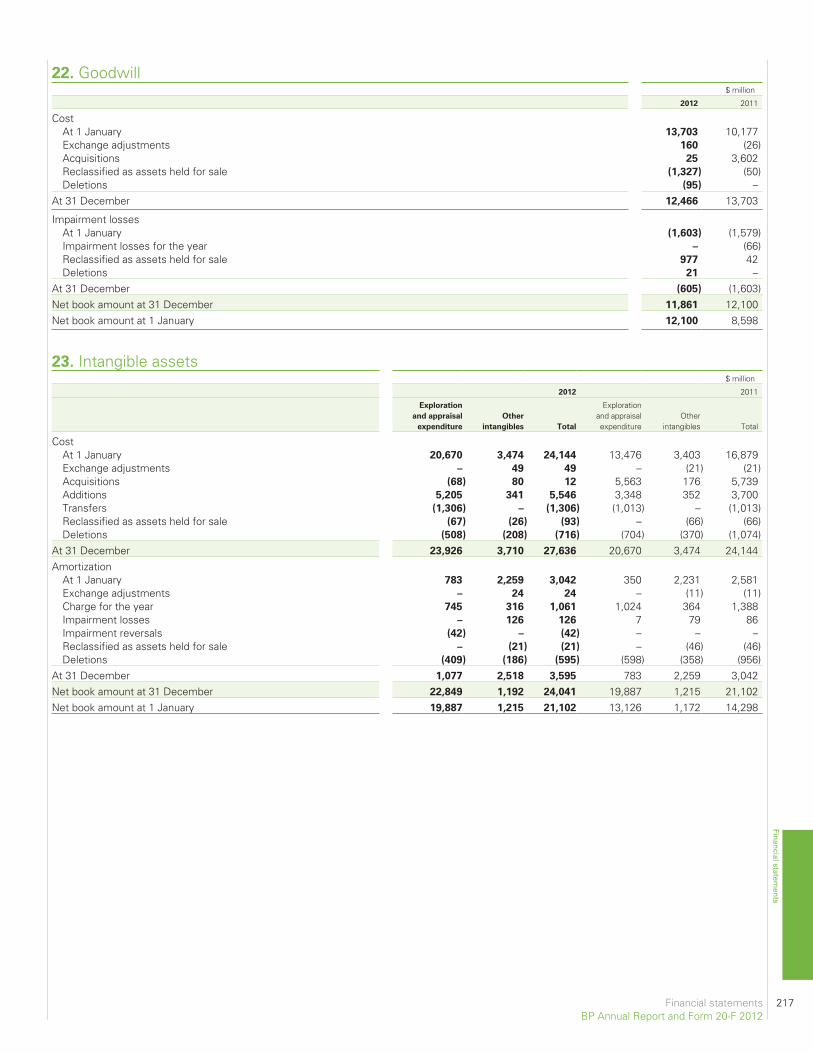
22. Goodwill$ million
2012 2011
CostAt 1 January 13,703 10,177Exchange adjustments 160 (26)Acquisitions 25 3,602Reclassified as assets held for sale (1,327) (50)Deletions (95) –
At 31 December 12,466 13,703
Impairment lossesAt 1 January (1,603) (1,579)Impairment losses for the year – (66)Reclassified as assets held for sale 977 42Deletions 21 –
At 31 December (605) (1,603)Net book amount at 31 December 11,861 12,100Net book amount at 1 January 12,100 8,598
23. Intangible assets$ million
2012 2011
Exploration
and appraisal
expenditure
Other
intangibles Total
Explorationand appraisalexpenditure
Otherintangibles Total
CostAt 1 January 20,670 3,474 24,144 13,476 3,403 16,879Exchange adjustments – 49 49 – (21) (21)Acquisitions (68) 80 12 5,563 176 5,739Additions 5,205 341 5,546 3,348 352 3,700Transfers (1,306) – (1,306) (1,013) – (1,013)Reclassified as assets held for sale (67) (26) (93) – (66) (66)Deletions (508) (208) (716) (704) (370) (1,074)
At 31 December 23,926 3,710 27,636 20,670 3,474 24,144Amortization
At 1 January 783 2,259 3,042 350 2,231 2,581Exchange adjustments – 24 24 – (11) (11)Charge for the year 745 316 1,061 1,024 364 1,388Impairment losses – 126 126 7 79 86Impairment reversals (42) – (42) – – –Reclassified as assets held for sale – (21) (21) – (46) (46)Deletions (409) (186) (595) (598) (358) (956)
At 31 December 1,077 2,518 3,595 783 2,259 3,042Net book amount at 31 December 22,849 1,192 24,041 19,887 1,215 21,102Net book amount at 1 January 19,887 1,215 21,102 13,126 1,172 14,298
Financial statements 217BP Annual Report and Form 20-F 2012
Financial statements
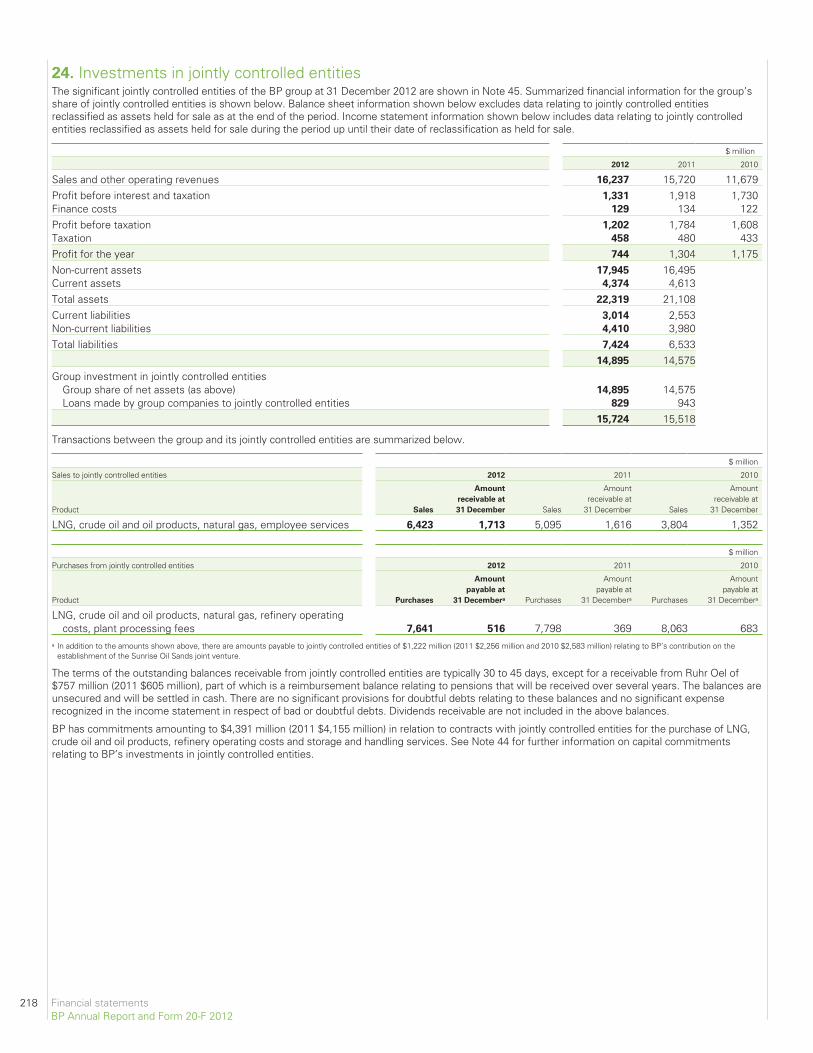
24. Investments in jointly controlled entitiesThe significant jointly controlled entities of the BP group at 31 December 2012 are shown in Note 45. Summarized financial information for the group’sshare of jointly controlled entities is shown below. Balance sheet information shown below excludes data relating to jointly controlled entitiesreclassified as assets held for sale as at the end of the period. Income statement information shown below includes data relating to jointly controlledentities reclassified as assets held for sale during the period up until their date of reclassification as held for sale.
$ million
2012 2011 2010
Sales and other operating revenues 16,237 15,720 11,679Profit before interest and taxation 1,331 1,918 1,730Finance costs 129 134 122Profit before taxation 1,202 1,784 1,608Taxation 458 480 433Profit for the year 744 1,304 1,175Non-current assets 17,945 16,495Current assets 4,374 4,613Total assets 22,319 21,108Current liabilities 3,014 2,553Non-current liabilities 4,410 3,980Total liabilities 7,424 6,533
14,895 14,575Group investment in jointly controlled entities
Group share of net assets (as above) 14,895 14,575Loans made by group companies to jointly controlled entities 829 943
15,724 15,518
Transactions between the group and its jointly controlled entities are summarized below.
$ million
Sales to jointly controlled entities 2012 2011 2010
Product Sales
Amount
receivable at
31 December Sales
Amountreceivable at
31 December Sales
Amountreceivable at
31 December
LNG, crude oil and oil products, natural gas, employee services 6,423 1,713 5,095 1,616 3,804 1,352
$ million
Purchases from jointly controlled entities 2012 2011 2010
Product Purchases
Amount
payable at
31 Decembera Purchases
Amountpayable at
31 Decembera Purchases
Amountpayable at
31 Decembera
LNG, crude oil and oil products, natural gas, refinery operatingcosts, plant processing fees 7,641 516 7,798 369 8,063 683
a In addition to the amounts shown above, there are amounts payable to jointly controlled entities of $1,222 million (2011 $2,256 million and 2010 $2,583 million) relating to BP’s contribution on theestablishment of the Sunrise Oil Sands joint venture.
The terms of the outstanding balances receivable from jointly controlled entities are typically 30 to 45 days, except for a receivable from Ruhr Oel of$757 million (2011 $605 million), part of which is a reimbursement balance relating to pensions that will be received over several years. The balances areunsecured and will be settled in cash. There are no significant provisions for doubtful debts relating to these balances and no significant expenserecognized in the income statement in respect of bad or doubtful debts. Dividends receivable are not included in the above balances.
BP has commitments amounting to $4,391 million (2011 $4,155 million) in relation to contracts with jointly controlled entities for the purchase of LNG,crude oil and oil products, refinery operating costs and storage and handling services. See Note 44 for further information on capital commitmentsrelating to BP’s investments in jointly controlled entities.
218 Financial statementsBP Annual Report and Form 20-F 2012
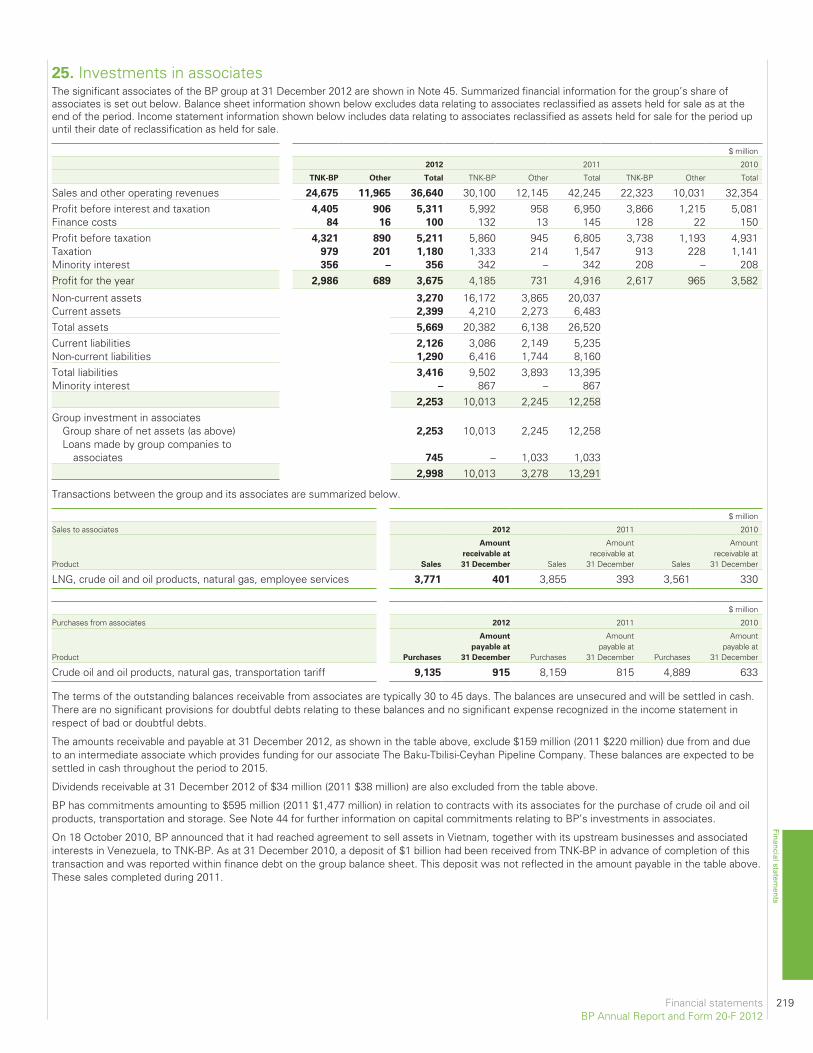
25. Investments in associatesThe significant associates of the BP group at 31 December 2012 are shown in Note 45. Summarized financial information for the group’s share ofassociates is set out below. Balance sheet information shown below excludes data relating to associates reclassified as assets held for sale as at theend of the period. Income statement information shown below includes data relating to associates reclassified as assets held for sale for the period upuntil their date of reclassification as held for sale.
$ million
2012 2011 2010
TNK-BP Other Total TNK-BP Other Total TNK-BP Other Total
Sales and other operating revenues 24,675 11,965 36,640 30,100 12,145 42,245 22,323 10,031 32,354Profit before interest and taxation 4,405 906 5,311 5,992 958 6,950 3,866 1,215 5,081Finance costs 84 16 100 132 13 145 128 22 150Profit before taxation 4,321 890 5,211 5,860 945 6,805 3,738 1,193 4,931Taxation 979 201 1,180 1,333 214 1,547 913 228 1,141Minority interest 356 – 356 342 – 342 208 – 208Profit for the year 2,986 689 3,675 4,185 731 4,916 2,617 965 3,582
Non-current assets 3,270 16,172 3,865 20,037Current assets 2,399 4,210 2,273 6,483Total assets 5,669 20,382 6,138 26,520Current liabilities 2,126 3,086 2,149 5,235Non-current liabilities 1,290 6,416 1,744 8,160Total liabilities 3,416 9,502 3,893 13,395Minority interest – 867 – 867
2,253 10,013 2,245 12,258Group investment in associates
Group share of net assets (as above) 2,253 10,013 2,245 12,258Loans made by group companies to
associates 745 – 1,033 1,0332,998 10,013 3,278 13,291
Transactions between the group and its associates are summarized below.
$ million
Sales to associates 2012 2011 2010
Product Sales
Amount
receivable at
31 December Sales
Amountreceivable at
31 December Sales
Amountreceivable at
31 December
LNG, crude oil and oil products, natural gas, employee services 3,771 401 3,855 393 3,561 330
$ million
Purchases from associates 2012 2011 2010
Product Purchases
Amount
payable at
31 December Purchases
Amountpayable at
31 December Purchases
Amountpayable at
31 December
Crude oil and oil products, natural gas, transportation tariff 9,135 915 8,159 815 4,889 633
The terms of the outstanding balances receivable from associates are typically 30 to 45 days. The balances are unsecured and will be settled in cash.There are no significant provisions for doubtful debts relating to these balances and no significant expense recognized in the income statement inrespect of bad or doubtful debts.
The amounts receivable and payable at 31 December 2012, as shown in the table above, exclude $159 million (2011 $220 million) due from and dueto an intermediate associate which provides funding for our associate The Baku-Tbilisi-Ceyhan Pipeline Company. These balances are expected to besettled in cash throughout the period to 2015.
Dividends receivable at 31 December 2012 of $34 million (2011 $38 million) are also excluded from the table above.
BP has commitments amounting to $595 million (2011 $1,477 million) in relation to contracts with its associates for the purchase of crude oil and oilproducts, transportation and storage. See Note 44 for further information on capital commitments relating to BP’s investments in associates.
On 18 October 2010, BP announced that it had reached agreement to sell assets in Vietnam, together with its upstream businesses and associatedinterests in Venezuela, to TNK-BP. As at 31 December 2010, a deposit of $1 billion had been received from TNK-BP in advance of completion of thistransaction and was reported within finance debt on the group balance sheet. This deposit was not reflected in the amount payable in the table above.These sales completed during 2011.
Financial statements 219BP Annual Report and Form 20-F 2012
Financial statements
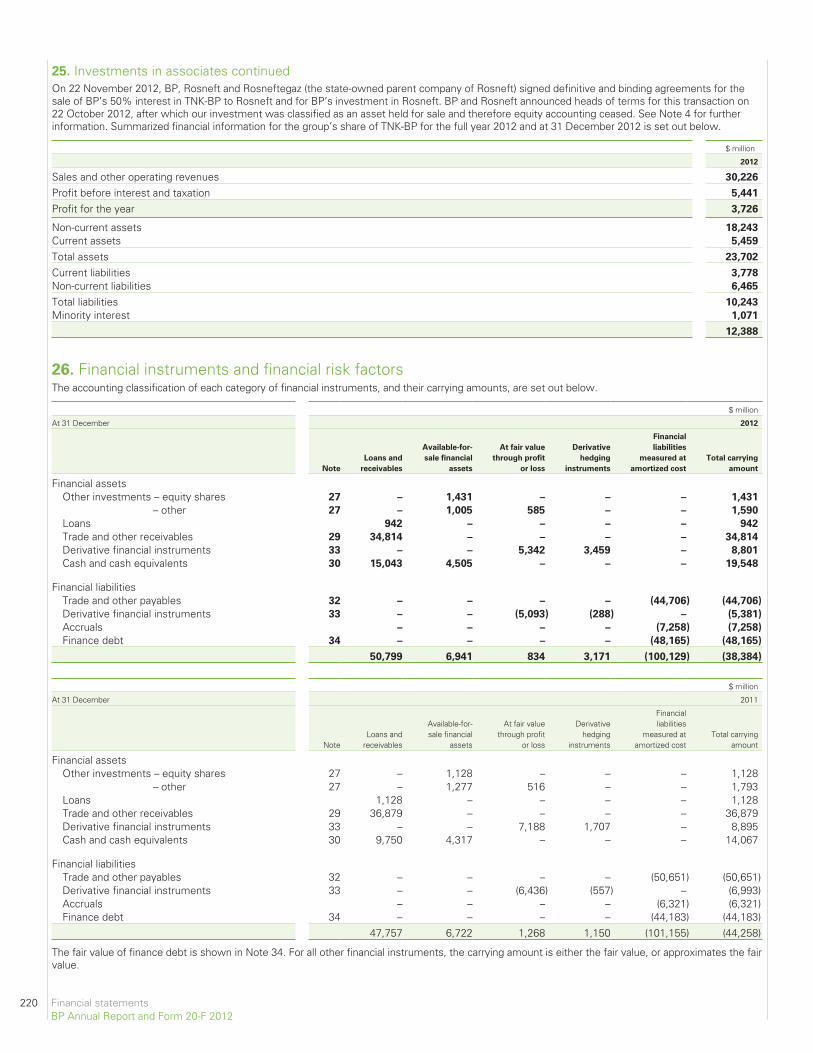
25. Investments in associates continuedOn 22 November 2012, BP, Rosneft and Rosneftegaz (the state-owned parent company of Rosneft) signed definitive and binding agreements for thesale of BP’s 50% interest in TNK-BP to Rosneft and for BP’s investment in Rosneft. BP and Rosneft announced heads of terms for this transaction on22 October 2012, after which our investment was classified as an asset held for sale and therefore equity accounting ceased. See Note 4 for furtherinformation. Summarized financial information for the group’s share of TNK-BP for the full year 2012 and at 31 December 2012 is set out below.
$ million
2012
Sales and other operating revenues 30,226
Profit before interest and taxation 5,441
Profit for the year 3,726
Non-current assets 18,243
Current assets 5,459
Total assets 23,702
Current liabilities 3,778
Non-current liabilities 6,465
Total liabilities 10,243
Minority interest 1,071
12,388
26. Financial instruments and financial risk factorsThe accounting classification of each category of financial instruments, and their carrying amounts, are set out below.
$ million
At 31 December 2012
Note
Loans and
receivables
Available-for-
sale financial
assets
At fair value
through profit
or loss
Derivative
hedging
instruments
Financial
liabilities
measured at
amortized cost
Total carrying
amount
Financial assetsOther investments – equity shares 27 – 1,431 – – – 1,431
– other 27 – 1,005 585 – – 1,590
Loans 942 – – – – 942
Trade and other receivables 29 34,814 – – – – 34,814
Derivative financial instruments 33 – – 5,342 3,459 – 8,801
Cash and cash equivalents 30 15,043 4,505 – – – 19,548
Financial liabilitiesTrade and other payables 32 – – – – (44,706) (44,706)
Derivative financial instruments 33 – – (5,093) (288) – (5,381)
Accruals – – – – (7,258) (7,258)
Finance debt 34 – – – – (48,165) (48,165)
50,799 6,941 834 3,171 (100,129) (38,384)
$ million
At 31 December 2011
NoteLoans and
receivables
Available-for-sale financial
assets
At fair valuethrough profit
or loss
Derivativehedging
instruments
Financialliabilities
measured atamortized cost
Total carryingamount
Financial assetsOther investments – equity shares 27 – 1,128 – – – 1,128
– other 27 – 1,277 516 – – 1,793Loans 1,128 – – – – 1,128Trade and other receivables 29 36,879 – – – – 36,879Derivative financial instruments 33 – – 7,188 1,707 – 8,895Cash and cash equivalents 30 9,750 4,317 – – – 14,067
Financial liabilitiesTrade and other payables 32 – – – – (50,651) (50,651)Derivative financial instruments 33 – – (6,436) (557) – (6,993)Accruals – – – – (6,321) (6,321)Finance debt 34 – – – – (44,183) (44,183)
47,757 6,722 1,268 1,150 (101,155) (44,258)
The fair value of finance debt is shown in Note 34. For all other financial instruments, the carrying amount is either the fair value, or approximates the fairvalue.
220 Financial statementsBP Annual Report and Form 20-F 2012
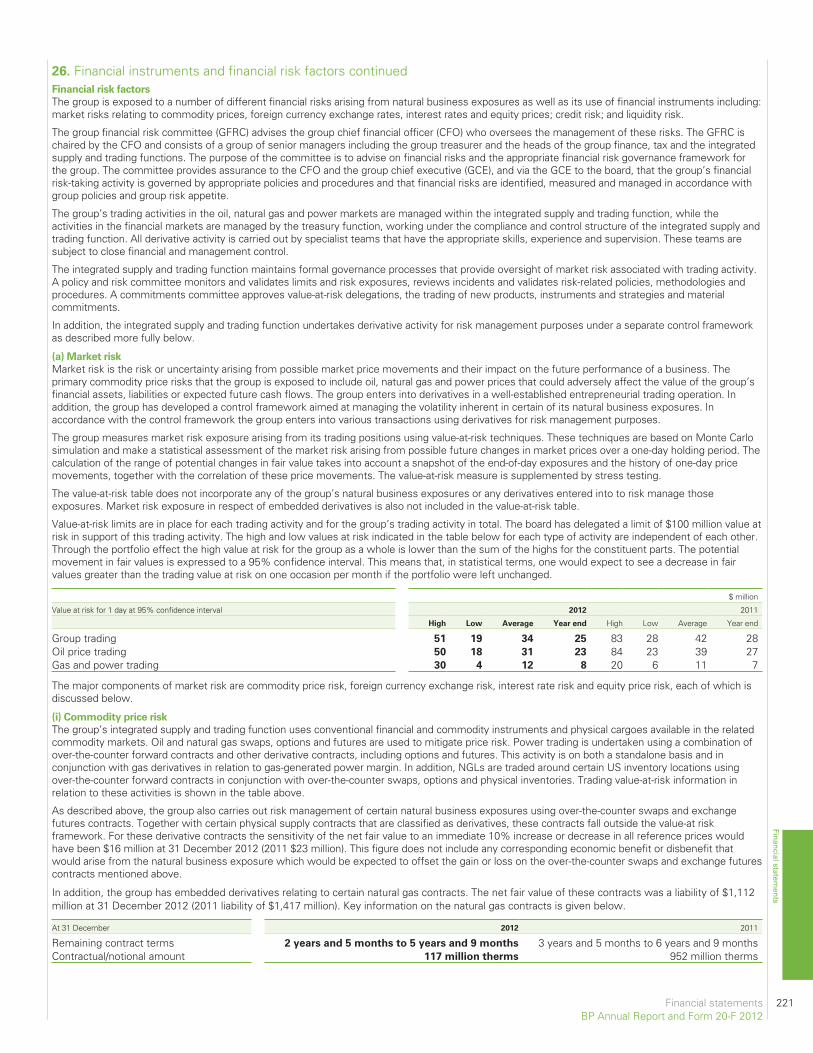
Financial risk factors
The group is exposed to a number of different financial risks arising from natural business exposures as well as its use of financial instruments including:market risks relating to commodity prices, foreign currency exchange rates, interest rates and equity prices; credit risk; and liquidity risk.
The group financial risk committee (GFRC) advises the group chief financial officer (CFO) who oversees the management of these risks. The GFRC ischaired by the CFO and consists of a group of senior managers including the group treasurer and the heads of the group finance, tax and the integratedsupply and trading functions. The purpose of the committee is to advise on financial risks and the appropriate financial risk governance framework forthe group. The committee provides assurance to the CFO and the group chief executive (GCE), and via the GCE to the board, that the group’s financialrisk-taking activity is governed by appropriate policies and procedures and that financial risks are identified, measured and managed in accordance withgroup policies and group risk appetite.
The group’s trading activities in the oil, natural gas and power markets are managed within the integrated supply and trading function, while theactivities in the financial markets are managed by the treasury function, working under the compliance and control structure of the integrated supply andtrading function. All derivative activity is carried out by specialist teams that have the appropriate skills, experience and supervision. These teams aresubject to close financial and management control.
The integrated supply and trading function maintains formal governance processes that provide oversight of market risk associated with trading activity.A policy and risk committee monitors and validates limits and risk exposures, reviews incidents and validates risk-related policies, methodologies andprocedures. A commitments committee approves value-at-risk delegations, the trading of new products, instruments and strategies and materialcommitments.
In addition, the integrated supply and trading function undertakes derivative activity for risk management purposes under a separate control frameworkas described more fully below.
(a) Market risk
Market risk is the risk or uncertainty arising from possible market price movements and their impact on the future performance of a business. Theprimary commodity price risks that the group is exposed to include oil, natural gas and power prices that could adversely affect the value of the group’sfinancial assets, liabilities or expected future cash flows. The group enters into derivatives in a well-established entrepreneurial trading operation. Inaddition, the group has developed a control framework aimed at managing the volatility inherent in certain of its natural business exposures. Inaccordance with the control framework the group enters into various transactions using derivatives for risk management purposes.
The group measures market risk exposure arising from its trading positions using value-at-risk techniques. These techniques are based on Monte Carlosimulation and make a statistical assessment of the market risk arising from possible future changes in market prices over a one-day holding period. Thecalculation of the range of potential changes in fair value takes into account a snapshot of the end-of-day exposures and the history of one-day pricemovements, together with the correlation of these price movements. The value-at-risk measure is supplemented by stress testing.
The value-at-risk table does not incorporate any of the group’s natural business exposures or any derivatives entered into to risk manage thoseexposures. Market risk exposure in respect of embedded derivatives is also not included in the value-at-risk table.
Value-at-risk limits are in place for each trading activity and for the group’s trading activity in total. The board has delegated a limit of $100 million value atrisk in support of this trading activity. The high and low values at risk indicated in the table below for each type of activity are independent of each other.Through the portfolio effect the high value at risk for the group as a whole is lower than the sum of the highs for the constituent parts. The potentialmovement in fair values is expressed to a 95% confidence interval. This means that, in statistical terms, one would expect to see a decrease in fairvalues greater than the trading value at risk on one occasion per month if the portfolio were left unchanged.
$ million
Value at risk for 1 day at 95% confidence interval 2012 2011
High Low Average Year end High Low Average Year end
Group trading 51 19 34 25 83 28 42 28Oil price trading 50 18 31 23 84 23 39 27Gas and power trading 30 4 12 8 20 6 11 7
The major components of market risk are commodity price risk, foreign currency exchange risk, interest rate risk and equity price risk, each of which isdiscussed below.
(i) Commodity price risk
The group’s integrated supply and trading function uses conventional financial and commodity instruments and physical cargoes available in the relatedcommodity markets. Oil and natural gas swaps, options and futures are used to mitigate price risk. Power trading is undertaken using a combination ofover-the-counter forward contracts and other derivative contracts, including options and futures. This activity is on both a standalone basis and inconjunction with gas derivatives in relation to gas-generated power margin. In addition, NGLs are traded around certain US inventory locations usingover-the-counter forward contracts in conjunction with over-the-counter swaps, options and physical inventories. Trading value-at-risk information inrelation to these activities is shown in the table above.
As described above, the group also carries out risk management of certain natural business exposures using over-the-counter swaps and exchangefutures contracts. Together with certain physical supply contracts that are classified as derivatives, these contracts fall outside the value-at riskframework. For these derivative contracts the sensitivity of the net fair value to an immediate 10% increase or decrease in all reference prices wouldhave been $16 million at 31 December 2012 (2011 $23 million). This figure does not include any corresponding economic benefit or disbenefit thatwould arise from the natural business exposure which would be expected to offset the gain or loss on the over-the-counter swaps and exchange futurescontracts mentioned above.
In addition, the group has embedded derivatives relating to certain natural gas contracts. The net fair value of these contracts was a liability of $1,112million at 31 December 2012 (2011 liability of $1,417 million). Key information on the natural gas contracts is given below.
At 31 December 2012 2011
Remaining contract terms 2 years and 5 months to 5 years and 9 months 3 years and 5 months to 6 years and 9 monthsContractual/notional amount 117 million therms 952 million therms
Financial statements 221BP Annual Report and Form 20-F 2012
Financial statements
26. Financial instruments and financial risk factors continued
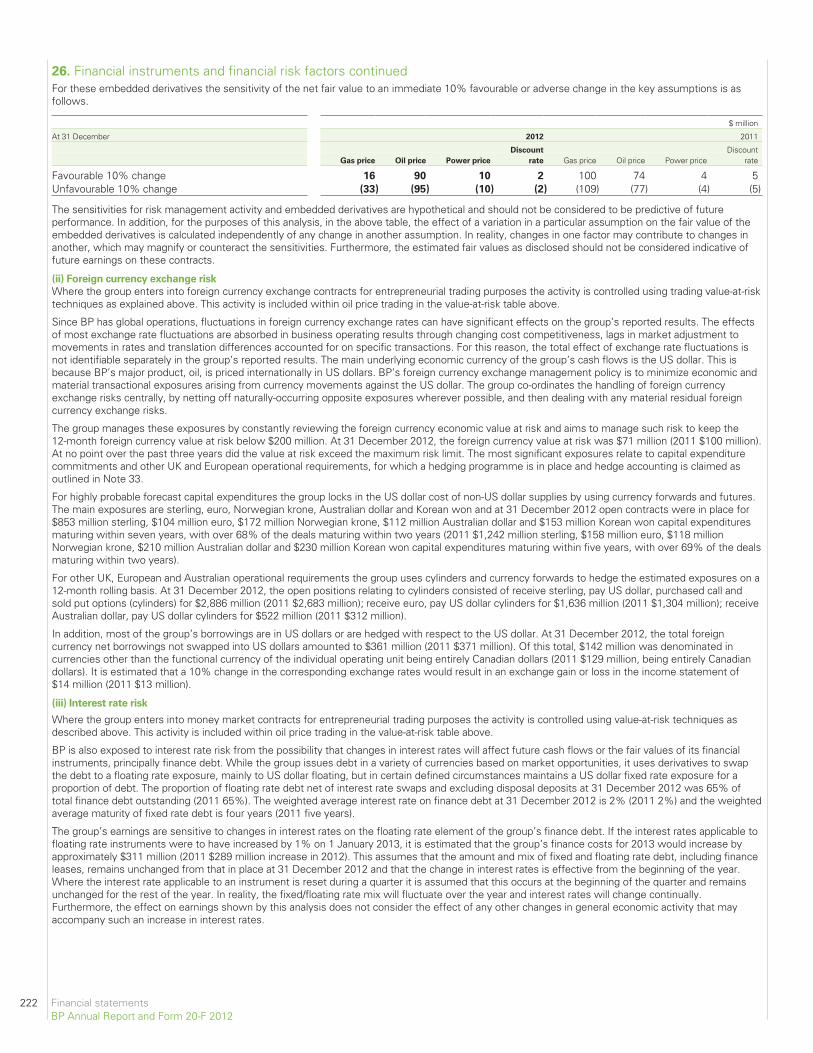
26. Financial instruments and financial risk factors continuedFor these embedded derivatives the sensitivity of the net fair value to an immediate 10% favourable or adverse change in the key assumptions is asfollows.
$ million
At 31 December 2012 2011
Discount DiscountGas price Oil price Power price rate Gas price Oil price Power price rate
Favourable 10% change 16 90 10 2 100 74 4 5Unfavourable 10% change (33) (95) (10) (2) (109) (77) (4) (5)
The sensitivities for risk management activity and embedded derivatives are hypothetical and should not be considered to be predictive of futureperformance. In addition, for the purposes of this analysis, in the above table, the effect of a variation in a particular assumption on the fair value of theembedded derivatives is calculated independently of any change in another assumption. In reality, changes in one factor may contribute to changes inanother, which may magnify or counteract the sensitivities. Furthermore, the estimated fair values as disclosed should not be considered indicative offuture earnings on these contracts.
(ii) Foreign currency exchange risk
Where the group enters into foreign currency exchange contracts for entrepreneurial trading purposes the activity is controlled using trading value-at-risktechniques as explained above. This activity is included within oil price trading in the value-at-risk table above.
Since BP has global operations, fluctuations in foreign currency exchange rates can have significant effects on the group’s reported results. The effectsof most exchange rate fluctuations are absorbed in business operating results through changing cost competitiveness, lags in market adjustment tomovements in rates and translation differences accounted for on specific transactions. For this reason, the total effect of exchange rate fluctuations isnot identifiable separately in the group’s reported results. The main underlying economic currency of the group’s cash flows is the US dollar. This isbecause BP’s major product, oil, is priced internationally in US dollars. BP’s foreign currency exchange management policy is to minimize economic andmaterial transactional exposures arising from currency movements against the US dollar. The group co-ordinates the handling of foreign currencyexchange risks centrally, by netting off naturally-occurring opposite exposures wherever possible, and then dealing with any material residual foreigncurrency exchange risks.
The group manages these exposures by constantly reviewing the foreign currency economic value at risk and aims to manage such risk to keep the12-month foreign currency value at risk below $200 million. At 31 December 2012, the foreign currency value at risk was $71 million (2011 $100 million).At no point over the past three years did the value at risk exceed the maximum risk limit. The most significant exposures relate to capital expenditurecommitments and other UK and European operational requirements, for which a hedging programme is in place and hedge accounting is claimed asoutlined in Note 33.
For highly probable forecast capital expenditures the group locks in the US dollar cost of non-US dollar supplies by using currency forwards and futures.The main exposures are sterling, euro, Norwegian krone, Australian dollar and Korean won and at 31 December 2012 open contracts were in place for$853 million sterling, $104 million euro, $172 million Norwegian krone, $112 million Australian dollar and $153 million Korean won capital expendituresmaturing within seven years, with over 68% of the deals maturing within two years (2011 $1,242 million sterling, $158 million euro, $118 millionNorwegian krone, $210 million Australian dollar and $230 million Korean won capital expenditures maturing within five years, with over 69% of the dealsmaturing within two years).
For other UK, European and Australian operational requirements the group uses cylinders and currency forwards to hedge the estimated exposures on a12-month rolling basis. At 31 December 2012, the open positions relating to cylinders consisted of receive sterling, pay US dollar, purchased call andsold put options (cylinders) for $2,886 million (2011 $2,683 million); receive euro, pay US dollar cylinders for $1,636 million (2011 $1,304 million); receiveAustralian dollar, pay US dollar cylinders for $522 million (2011 $312 million).
In addition, most of the group’s borrowings are in US dollars or are hedged with respect to the US dollar. At 31 December 2012, the total foreigncurrency net borrowings not swapped into US dollars amounted to $361 million (2011 $371 million). Of this total, $142 million was denominated incurrencies other than the functional currency of the individual operating unit being entirely Canadian dollars (2011 $129 million, being entirely Canadiandollars). It is estimated that a 10% change in the corresponding exchange rates would result in an exchange gain or loss in the income statement of$14 million (2011 $13 million).
(iii) Interest rate risk
Where the group enters into money market contracts for entrepreneurial trading purposes the activity is controlled using value-at-risk techniques asdescribed above. This activity is included within oil price trading in the value-at-risk table above.
BP is also exposed to interest rate risk from the possibility that changes in interest rates will affect future cash flows or the fair values of its financialinstruments, principally finance debt. While the group issues debt in a variety of currencies based on market opportunities, it uses derivatives to swapthe debt to a floating rate exposure, mainly to US dollar floating, but in certain defined circumstances maintains a US dollar fixed rate exposure for aproportion of debt. The proportion of floating rate debt net of interest rate swaps and excluding disposal deposits at 31 December 2012 was 65% oftotal finance debt outstanding (2011 65%). The weighted average interest rate on finance debt at 31 December 2012 is 2% (2011 2%) and the weightedaverage maturity of fixed rate debt is four years (2011 five years).
The group’s earnings are sensitive to changes in interest rates on the floating rate element of the group’s finance debt. If the interest rates applicable tofloating rate instruments were to have increased by 1% on 1 January 2013, it is estimated that the group’s finance costs for 2013 would increase byapproximately $311 million (2011 $289 million increase in 2012). This assumes that the amount and mix of fixed and floating rate debt, including financeleases, remains unchanged from that in place at 31 December 2012 and that the change in interest rates is effective from the beginning of the year.Where the interest rate applicable to an instrument is reset during a quarter it is assumed that this occurs at the beginning of the quarter and remainsunchanged for the rest of the year. In reality, the fixed/floating rate mix will fluctuate over the year and interest rates will change continually.Furthermore, the effect on earnings shown by this analysis does not consider the effect of any other changes in general economic activity that mayaccompany such an increase in interest rates.
222 Financial statementsBP Annual Report and Form 20-F 2012
(iv) Equity price risk
The group holds equity investments, typically made for strategic purposes, that are classified as non-current available-for-sale financial assets and aremeasured initially at fair value with changes in fair value recognized in other comprehensive income. Accumulated fair value changes are recycled to theincome statement on disposal, or when the investment is impaired. No impairment losses have been recognized in the years presented relating to listednon-current available-for-sale investments. For further information see Note 27. In addition, at 31 December 2012, the group was a party to certainequity price derivatives described in further detail below.
At 31 December 2012, it is estimated that an increase of 10% in quoted equity prices would result in an immediate credit to other comprehensiveincome of $1,502 million (2011 $87 million credit to other comprehensive income), while a decrease of 10% in quoted equity prices would result in animmediate charge to other comprehensive income of $1,502 million (2011 $87 million charge to other comprehensive income). At 31 December 2012,82% (2011 77%) of the carrying amount of non-current available-for-sale equity financial assets represented the group’s 1.25% stake in Rosneft, thusthe group’s exposure is concentrated on changes in the share price of this equity in particular. As described in Note 33, the agreements for the purchaseof 5.66% and 9.80% shareholdings in Rosneft are derivative financial instruments, whose fair value is impacted by the Rosneft share price, and areaccounted for as cash flow hedges, with changes in fair value recognized in other comprehensive income to the extent the hedge is effective. See Note4 for further information.
(b) Credit risk
Credit risk is the risk that a customer or counterparty to a financial instrument will fail to perform or fail to pay amounts due causing financial loss to thegroup and arises from cash and cash equivalents, derivative financial instruments and deposits with financial institutions and principally from creditexposures to customers relating to outstanding receivables.
The group has a credit policy, approved by the CFO, that is designed to ensure that consistent processes are in place throughout the group to measureand control credit risk. Credit risk is considered as part of the risk-reward balance of doing business. On entering into any business contract the extent towhich the arrangement exposes the group to credit risk is considered. Key requirements of the policy include segregation of credit approval authoritiesfrom any sales, marketing or trading teams authorized to incur credit risk; the establishment of credit systems and processes to ensure that allcounterparty exposure is rated and that all counterparty exposure and limits can be monitored and reported; and the timely identification and reporting ofany non-approved credit exposures and credit losses. While each segment of the group is typically responsible for its own credit risk management andreporting consistent with group policy, the treasury function holds group-wide credit risk authority and oversight responsibility for exposure to banks andfinancial institutions.
The global credit environment remained challenging in 2012, suffering not only from continuing economic and political uncertainties but also from keyevent risks, causing the group to further heighten awareness, discussion and co-ordination of the material credit risks arising from its activities.
Before trading with a new counterparty can start, its creditworthiness is assessed and a credit rating is allocated that indicates the probability of default,along with a credit exposure limit. The assessment process takes into account all available qualitative and quantitative information about thecounterparty and the group, if any, to which the counterparty belongs. The counterparty’s business activities, financial resources and business riskmanagement processes are taken into account in the assessment, to the extent that this information is publicly available or otherwise disclosed to BPby the counterparty, together with external credit ratings. Creditworthiness continues to be evaluated after transactions have been initiated and awatchlist of higher-risk counterparties is maintained.
The group does not aim to remove credit risk but expects to experience a certain level of credit losses. The group attempts to mitigate credit risk byentering into contracts that permit netting and allow for termination of the contract on the occurrence of certain events of default. Depending on thecreditworthiness of the counterparty, the group may require collateral or other credit enhancements such as cash deposits, letters of credit, trade creditinsurance, liens, third-party guarantees and other forms of credit mitigation. Trade receivables and payables, and derivative assets and liabilities, arepresented on a net basis where unconditional netting arrangements are in place with counterparties and where there is an intent to settle amounts dueon a net basis. The maximum credit exposure associated with financial assets is equal to the carrying amount. Collateral received and recognized in thebalance sheet at the year end was $334 million (2011 $273 million) and collateral held off balance sheet was $148 million (2011 $6 million). As at31 December 2012, the group had in place other credit enhancements designed to mitigate approximately $11.5 billion of credit risk (2011 $8.6 billion).Credit exposure exists in relation to guarantees issued by group companies under which amounts outstanding at 31 December 2012 were $237 million(2011 $415 million) in respect of liabilities of jointly controlled entities and associates and $713 million (2011 $1,430 million) in respect of liabilities ofother third parties.
Notwithstanding the processes described above, significant unexpected credit losses can occasionally occur. Exposure to unexpected losses increaseswith concentrations of credit risk that exist when a number of counterparties are involved in similar activities or operate in the same industry sector orgeographical area, which may result in their ability to meet contractual obligations being impacted by changes in economic, political or other conditions.The group’s principal customers, suppliers and financial institutions with which it conducts business are located throughout the world. In addition, theserisks are managed by maintaining a group watchlist and aggregating multi-segment exposures to ensure that a material credit risk is not missed.
Reports are regularly prepared and presented to the GFRC that cover the group’s overall credit exposure and expected loss trends, exposure bysegment, and overall quality of the portfolio. The reports also include details of the largest counterparties by exposure level and expected loss, anddetails of counterparties on the group watchlist.
For the contracts comprising derivative financial instruments in an asset position at 31 December 2012, excluding the contracts with Rosneft accountedfor as derivatives, it is estimated that over 72% (2011 over 76%) of the unmitigated credit exposure is to counterparties of investment grade creditquality.
For cash and cash equivalents, the treasury function dynamically manages bank deposit limits to ensure cash is well-diversified and to reduceconcentration risks. At 31 December 2012, over 98% of the cash and cash equivalents balance was deposited with financial institutions rated at least A-by Standard & Poor’s and A3 by Moody’s. Direct cash and cash equivalent exposures to Greek, Italian, Irish, Portuguese and Spanish financialinstitutions totalled less than 0.6% of total cash and cash equivalents.
Financial statements 223BP Annual Report and Form 20-F 2012
Financial statements
26. Financial instruments and financial risk factors continued
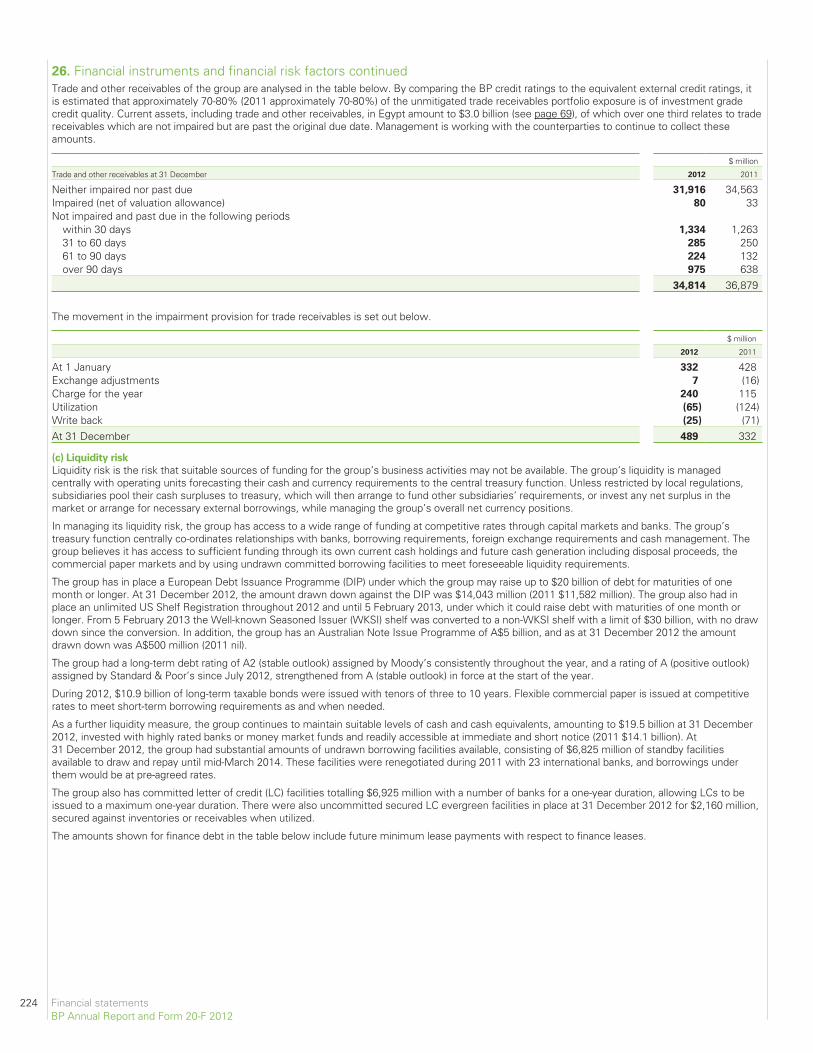
26. Financial instruments and financial risk factors continuedTrade and other receivables of the group are analysed in the table below. By comparing the BP credit ratings to the equivalent external credit ratings, itis estimated that approximately 70-80% (2011 approximately 70-80%) of the unmitigated trade receivables portfolio exposure is of investment gradecredit quality. Current assets, including trade and other receivables, in Egypt amount to $3.0 billion (see page 69), of which over one third relates to tradereceivables which are not impaired but are past the original due date. Management is working with the counterparties to continue to collect theseamounts.
$ million
Trade and other receivables at 31 December 2012 2011
Neither impaired nor past due 31,916 34,563Impaired (net of valuation allowance) 80 33Not impaired and past due in the following periods
within 30 days 1,334 1,26331 to 60 days 285 25061 to 90 days 224 132over 90 days 975 638
34,814 36,879
The movement in the impairment provision for trade receivables is set out below.
$ million
2012 2011
At 1 January 332 428Exchange adjustments 7 (16)Charge for the year 240 115Utilization (65) (124)Write back (25) (71)At 31 December 489 332
(c) Liquidity risk
Liquidity risk is the risk that suitable sources of funding for the group’s business activities may not be available. The group’s liquidity is managedcentrally with operating units forecasting their cash and currency requirements to the central treasury function. Unless restricted by local regulations,subsidiaries pool their cash surpluses to treasury, which will then arrange to fund other subsidiaries’ requirements, or invest any net surplus in themarket or arrange for necessary external borrowings, while managing the group’s overall net currency positions.
In managing its liquidity risk, the group has access to a wide range of funding at competitive rates through capital markets and banks. The group’streasury function centrally co-ordinates relationships with banks, borrowing requirements, foreign exchange requirements and cash management. Thegroup believes it has access to sufficient funding through its own current cash holdings and future cash generation including disposal proceeds, thecommercial paper markets and by using undrawn committed borrowing facilities to meet foreseeable liquidity requirements.
The group has in place a European Debt Issuance Programme (DIP) under which the group may raise up to $20 billion of debt for maturities of onemonth or longer. At 31 December 2012, the amount drawn down against the DIP was $14,043 million (2011 $11,582 million). The group also had inplace an unlimited US Shelf Registration throughout 2012 and until 5 February 2013, under which it could raise debt with maturities of one month orlonger. From 5 February 2013 the Well-known Seasoned Issuer (WKSI) shelf was converted to a non-WKSI shelf with a limit of $30 billion, with no drawdown since the conversion. In addition, the group has an Australian Note Issue Programme of A$5 billion, and as at 31 December 2012 the amountdrawn down was A$500 million (2011 nil).
The group had a long-term debt rating of A2 (stable outlook) assigned by Moody’s consistently throughout the year, and a rating of A (positive outlook)assigned by Standard & Poor’s since July 2012, strengthened from A (stable outlook) in force at the start of the year.
During 2012, $10.9 billion of long-term taxable bonds were issued with tenors of three to 10 years. Flexible commercial paper is issued at competitiverates to meet short-term borrowing requirements as and when needed.
As a further liquidity measure, the group continues to maintain suitable levels of cash and cash equivalents, amounting to $19.5 billion at 31 December2012, invested with highly rated banks or money market funds and readily accessible at immediate and short notice (2011 $14.1 billion). At31 December 2012, the group had substantial amounts of undrawn borrowing facilities available, consisting of $6,825 million of standby facilitiesavailable to draw and repay until mid-March 2014. These facilities were renegotiated during 2011 with 23 international banks, and borrowings underthem would be at pre-agreed rates.
The group also has committed letter of credit (LC) facilities totalling $6,925 million with a number of banks for a one-year duration, allowing LCs to beissued to a maximum one-year duration. There were also uncommitted secured LC evergreen facilities in place at 31 December 2012 for $2,160 million,secured against inventories or receivables when utilized.
The amounts shown for finance debt in the table below include future minimum lease payments with respect to finance leases.
224 Financial statementsBP Annual Report and Form 20-F 2012
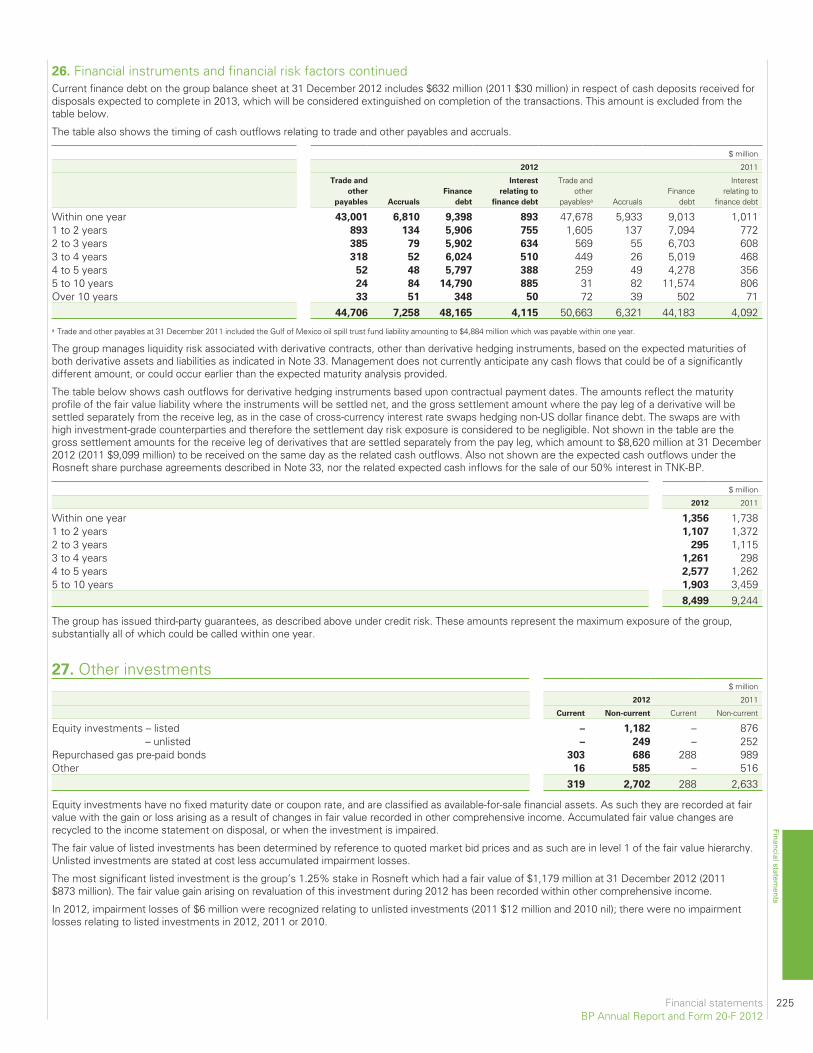
Current finance debt on the group balance sheet at 31 December 2012 includes $632 million (2011 $30 million) in respect of cash deposits received fordisposals expected to complete in 2013, which will be considered extinguished on completion of the transactions. This amount is excluded from thetable below.
The table also shows the timing of cash outflows relating to trade and other payables and accruals.
$ million
2012 2011
Trade and
other
payables Accruals
Finance
debt
Interest
relating to
finance debt
Trade andother
payablesa AccrualsFinance
debt
Interestrelating to
finance debt
Within one year 43,001 6,810 9,398 893 47,678 5,933 9,013 1,0111 to 2 years 893 134 5,906 755 1,605 137 7,094 7722 to 3 years 385 79 5,902 634 569 55 6,703 6083 to 4 years 318 52 6,024 510 449 26 5,019 4684 to 5 years 52 48 5,797 388 259 49 4,278 3565 to 10 years 24 84 14,790 885 31 82 11,574 806Over 10 years 33 51 348 50 72 39 502 71
44,706 7,258 48,165 4,115 50,663 6,321 44,183 4,092a Trade and other payables at 31 December 2011 included the Gulf of Mexico oil spill trust fund liability amounting to $4,884 million which was payable within one year.
The group manages liquidity risk associated with derivative contracts, other than derivative hedging instruments, based on the expected maturities ofboth derivative assets and liabilities as indicated in Note 33. Management does not currently anticipate any cash flows that could be of a significantlydifferent amount, or could occur earlier than the expected maturity analysis provided.
The table below shows cash outflows for derivative hedging instruments based upon contractual payment dates. The amounts reflect the maturityprofile of the fair value liability where the instruments will be settled net, and the gross settlement amount where the pay leg of a derivative will besettled separately from the receive leg, as in the case of cross-currency interest rate swaps hedging non-US dollar finance debt. The swaps are withhigh investment-grade counterparties and therefore the settlement day risk exposure is considered to be negligible. Not shown in the table are thegross settlement amounts for the receive leg of derivatives that are settled separately from the pay leg, which amount to $8,620 million at 31 December2012 (2011 $9,099 million) to be received on the same day as the related cash outflows. Also not shown are the expected cash outflows under theRosneft share purchase agreements described in Note 33, nor the related expected cash inflows for the sale of our 50% interest in TNK-BP.
$ million
2012 2011
Within one year 1,356 1,7381 to 2 years 1,107 1,3722 to 3 years 295 1,1153 to 4 years 1,261 2984 to 5 years 2,577 1,2625 to 10 years 1,903 3,459
8,499 9,244
The group has issued third-party guarantees, as described above under credit risk. These amounts represent the maximum exposure of the group,substantially all of which could be called within one year.
27. Other investments$ million
2012 2011
Current Non-current Current Non-current
Equity investments – listed – 1,182 – 876– unlisted – 249 – 252
Repurchased gas pre-paid bonds 303 686 288 989Other 16 585 – 516
319 2,702 288 2,633
Equity investments have no fixed maturity date or coupon rate, and are classified as available-for-sale financial assets. As such they are recorded at fairvalue with the gain or loss arising as a result of changes in fair value recorded in other comprehensive income. Accumulated fair value changes arerecycled to the income statement on disposal, or when the investment is impaired.
The fair value of listed investments has been determined by reference to quoted market bid prices and as such are in level 1 of the fair value hierarchy.Unlisted investments are stated at cost less accumulated impairment losses.
The most significant listed investment is the group’s 1.25% stake in Rosneft which had a fair value of $1,179 million at 31 December 2012 (2011$873 million). The fair value gain arising on revaluation of this investment during 2012 has been recorded within other comprehensive income.
In 2012, impairment losses of $6 million were recognized relating to unlisted investments (2011 $12 million and 2010 nil); there were no impairmentlosses relating to listed investments in 2012, 2011 or 2010.
Financial statements 225BP Annual Report and Form 20-F 2012
Financial statements
26. Financial instruments and financial risk factors continued
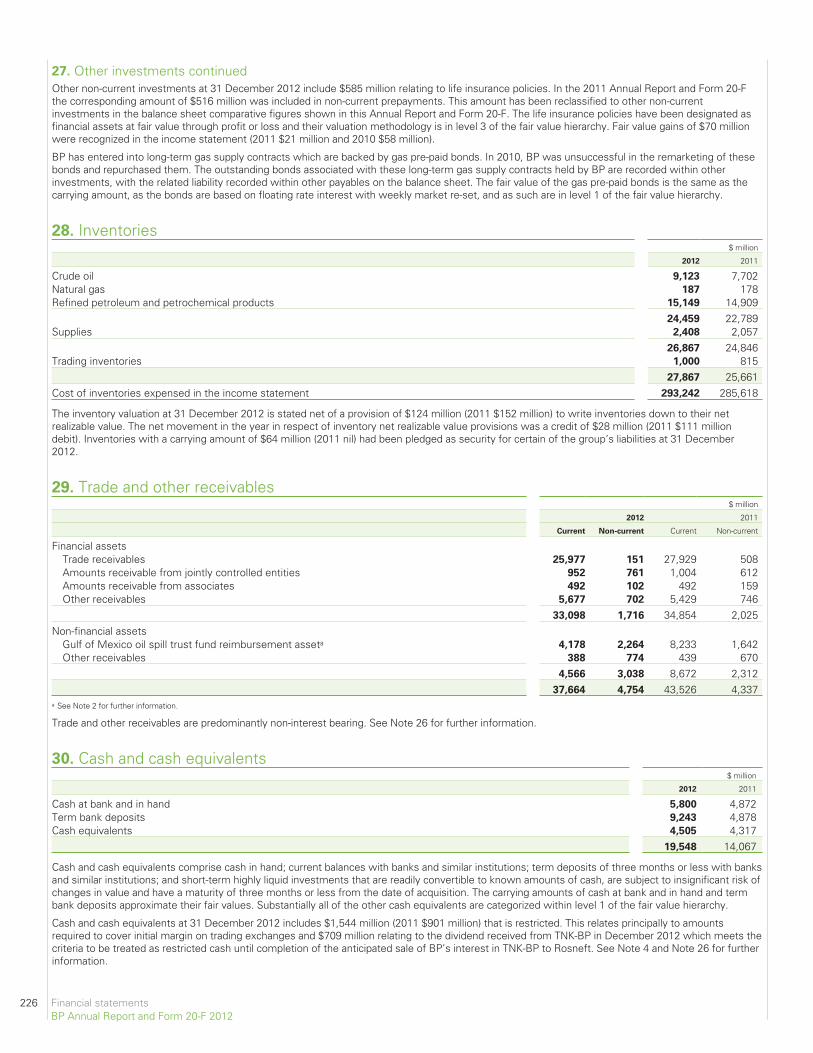
27. Other investments continuedOther non-current investments at 31 December 2012 include $585 million relating to life insurance policies. In the 2011 Annual Report and Form 20-Fthe corresponding amount of $516 million was included in non-current prepayments. This amount has been reclassified to other non-currentinvestments in the balance sheet comparative figures shown in this Annual Report and Form 20-F. The life insurance policies have been designated asfinancial assets at fair value through profit or loss and their valuation methodology is in level 3 of the fair value hierarchy. Fair value gains of $70 millionwere recognized in the income statement (2011 $21 million and 2010 $58 million).
BP has entered into long-term gas supply contracts which are backed by gas pre-paid bonds. In 2010, BP was unsuccessful in the remarketing of thesebonds and repurchased them. The outstanding bonds associated with these long-term gas supply contracts held by BP are recorded within otherinvestments, with the related liability recorded within other payables on the balance sheet. The fair value of the gas pre-paid bonds is the same as thecarrying amount, as the bonds are based on floating rate interest with weekly market re-set, and as such are in level 1 of the fair value hierarchy.
28. Inventories$ million
2012 2011
Crude oil 9,123 7,702Natural gas 187 178Refined petroleum and petrochemical products 15,149 14,909
24,459 22,789Supplies 2,408 2,057
26,867 24,846Trading inventories 1,000 815
27,867 25,661Cost of inventories expensed in the income statement 293,242 285,618
The inventory valuation at 31 December 2012 is stated net of a provision of $124 million (2011 $152 million) to write inventories down to their netrealizable value. The net movement in the year in respect of inventory net realizable value provisions was a credit of $28 million (2011 $111 milliondebit). Inventories with a carrying amount of $64 million (2011 nil) had been pledged as security for certain of the group’s liabilities at 31 December2012.
29. Trade and other receivables$ million
2012 2011
Current Non-current Current Non-current
Financial assetsTrade receivables 25,977 151 27,929 508Amounts receivable from jointly controlled entities 952 761 1,004 612Amounts receivable from associates 492 102 492 159Other receivables 5,677 702 5,429 746
33,098 1,716 34,854 2,025Non-financial assets
Gulf of Mexico oil spill trust fund reimbursement asseta 4,178 2,264 8,233 1,642Other receivables 388 774 439 670
4,566 3,038 8,672 2,31237,664 4,754 43,526 4,337
a See Note 2 for further information.
Trade and other receivables are predominantly non-interest bearing. See Note 26 for further information.
30. Cash and cash equivalents$ million
2012 2011
Cash at bank and in hand 5,800 4,872Term bank deposits 9,243 4,878Cash equivalents 4,505 4,317
19,548 14,067
Cash and cash equivalents comprise cash in hand; current balances with banks and similar institutions; term deposits of three months or less with banksand similar institutions; and short-term highly liquid investments that are readily convertible to known amounts of cash, are subject to insignificant risk ofchanges in value and have a maturity of three months or less from the date of acquisition. The carrying amounts of cash at bank and in hand and termbank deposits approximate their fair values. Substantially all of the other cash equivalents are categorized within level 1 of the fair value hierarchy.
Cash and cash equivalents at 31 December 2012 includes $1,544 million (2011 $901 million) that is restricted. This relates principally to amountsrequired to cover initial margin on trading exchanges and $709 million relating to the dividend received from TNK-BP in December 2012 which meets thecriteria to be treated as restricted cash until completion of the anticipated sale of BP’s interest in TNK-BP to Rosneft. See Note 4 and Note 26 for furtherinformation.
226 Financial statementsBP Annual Report and Form 20-F 2012
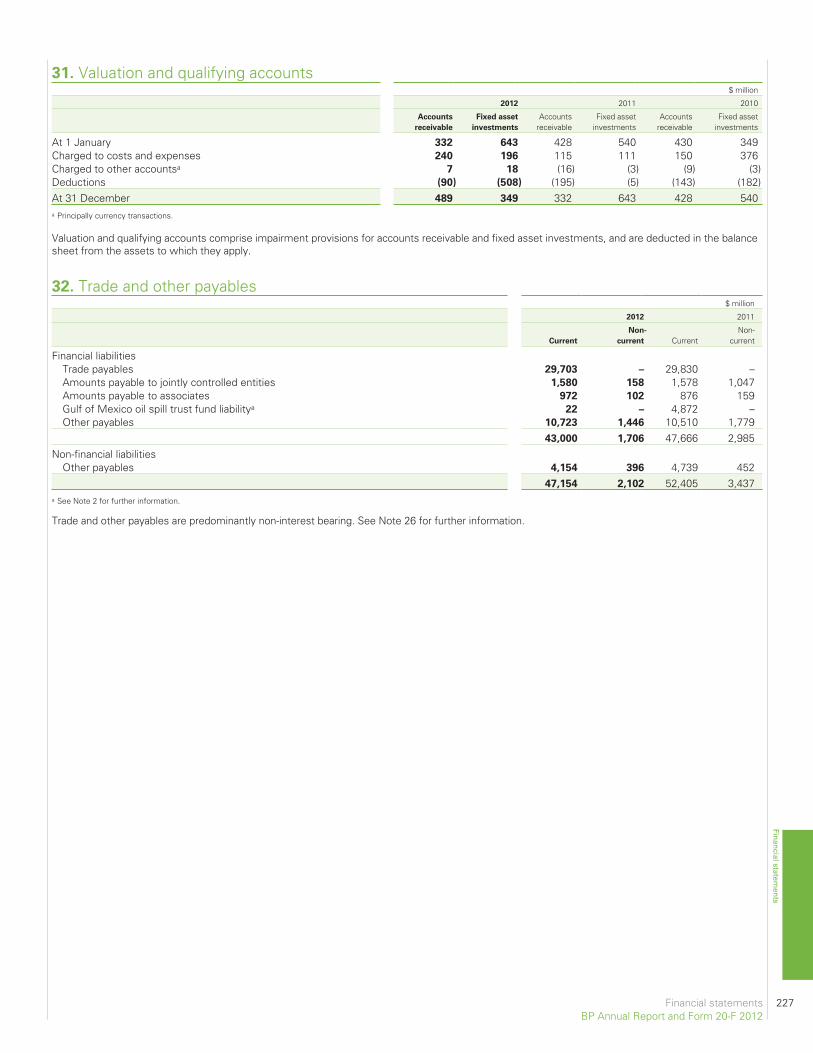
31. Valuation and qualifying accounts$ million
2012 2011 2010
Accounts
receivable
Fixed asset
investments
Accountsreceivable
Fixed assetinvestments
Accountsreceivable
Fixed assetinvestments
At 1 January 332 643 428 540 430 349Charged to costs and expenses 240 196 115 111 150 376Charged to other accountsa 7 18 (16) (3) (9) (3)Deductions (90) (508) (195) (5) (143) (182)At 31 December 489 349 332 643 428 540a Principally currency transactions.
Valuation and qualifying accounts comprise impairment provisions for accounts receivable and fixed asset investments, and are deducted in the balancesheet from the assets to which they apply.
32. Trade and other payables$ million
2012 2011
Current
Non-
current CurrentNon-
current
Financial liabilitiesTrade payables 29,703 – 29,830 –Amounts payable to jointly controlled entities 1,580 158 1,578 1,047Amounts payable to associates 972 102 876 159Gulf of Mexico oil spill trust fund liabilitya 22 – 4,872 –Other payables 10,723 1,446 10,510 1,779
43,000 1,706 47,666 2,985Non-financial liabilities
Other payables 4,154 396 4,739 45247,154 2,102 52,405 3,437
a See Note 2 for further information.
Trade and other payables are predominantly non-interest bearing. See Note 26 for further information.
Financial statements 227BP Annual Report and Form 20-F 2012
Financial statements
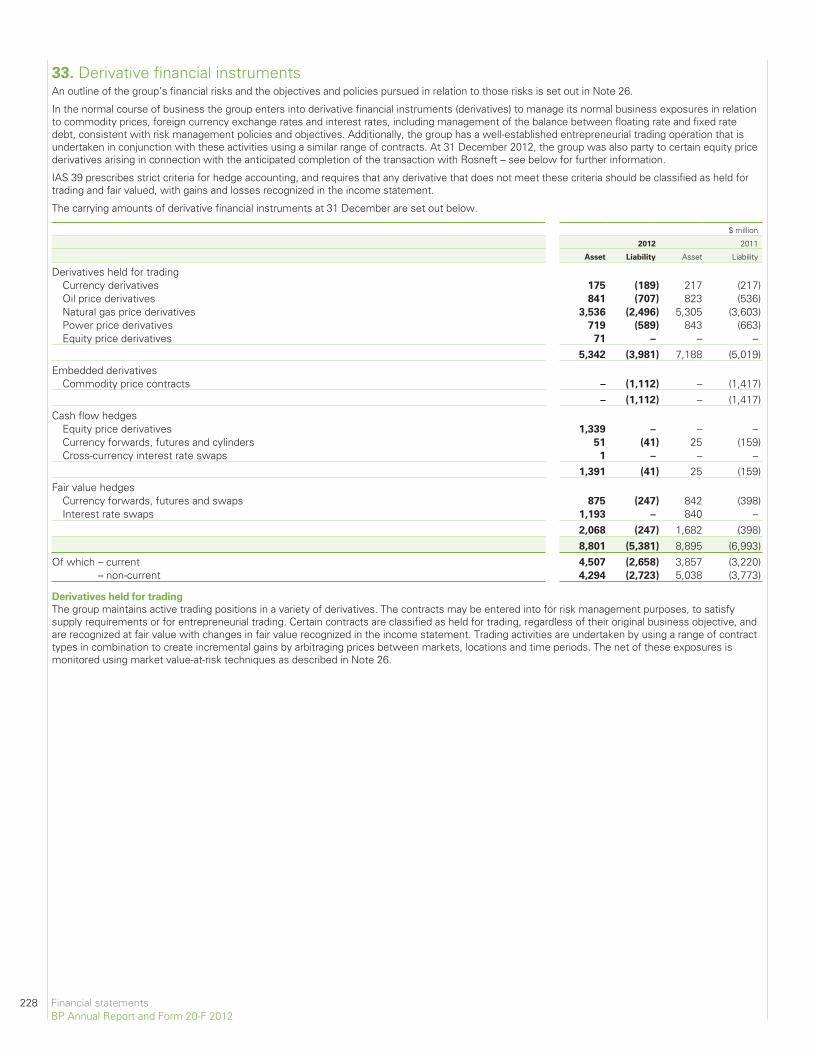
33. Derivative financial instrumentsAn outline of the group’s financial risks and the objectives and policies pursued in relation to those risks is set out in Note 26.
In the normal course of business the group enters into derivative financial instruments (derivatives) to manage its normal business exposures in relationto commodity prices, foreign currency exchange rates and interest rates, including management of the balance between floating rate and fixed ratedebt, consistent with risk management policies and objectives. Additionally, the group has a well-established entrepreneurial trading operation that isundertaken in conjunction with these activities using a similar range of contracts. At 31 December 2012, the group was also party to certain equity pricederivatives arising in connection with the anticipated completion of the transaction with Rosneft – see below for further information.
IAS 39 prescribes strict criteria for hedge accounting, and requires that any derivative that does not meet these criteria should be classified as held fortrading and fair valued, with gains and losses recognized in the income statement.
The carrying amounts of derivative financial instruments at 31 December are set out below.
$ million
2012 2011
Asset Liability Asset Liability
Derivatives held for tradingCurrency derivatives 175 (189) 217 (217)Oil price derivatives 841 (707) 823 (536)Natural gas price derivatives 3,536 (2,496) 5,305 (3,603)Power price derivatives 719 (589) 843 (663)Equity price derivatives 71 – – –
5,342 (3,981) 7,188 (5,019)Embedded derivatives
Commodity price contracts – (1,112) – (1,417)– (1,112) – (1,417)
Cash flow hedgesEquity price derivatives 1,339 – – –Currency forwards, futures and cylinders 51 (41) 25 (159)Cross-currency interest rate swaps 1 – – –
1,391 (41) 25 (159)Fair value hedges
Currency forwards, futures and swaps 875 (247) 842 (398)Interest rate swaps 1,193 – 840 –
2,068 (247) 1,682 (398)8,801 (5,381) 8,895 (6,993)
Of which – current 4,507 (2,658) 3,857 (3,220)– non-current 4,294 (2,723) 5,038 (3,773)
Derivatives held for trading
The group maintains active trading positions in a variety of derivatives. The contracts may be entered into for risk management purposes, to satisfysupply requirements or for entrepreneurial trading. Certain contracts are classified as held for trading, regardless of their original business objective, andare recognized at fair value with changes in fair value recognized in the income statement. Trading activities are undertaken by using a range of contracttypes in combination to create incremental gains by arbitraging prices between markets, locations and time periods. The net of these exposures ismonitored using market value-at-risk techniques as described in Note 26.
228 Financial statementsBP Annual Report and Form 20-F 2012
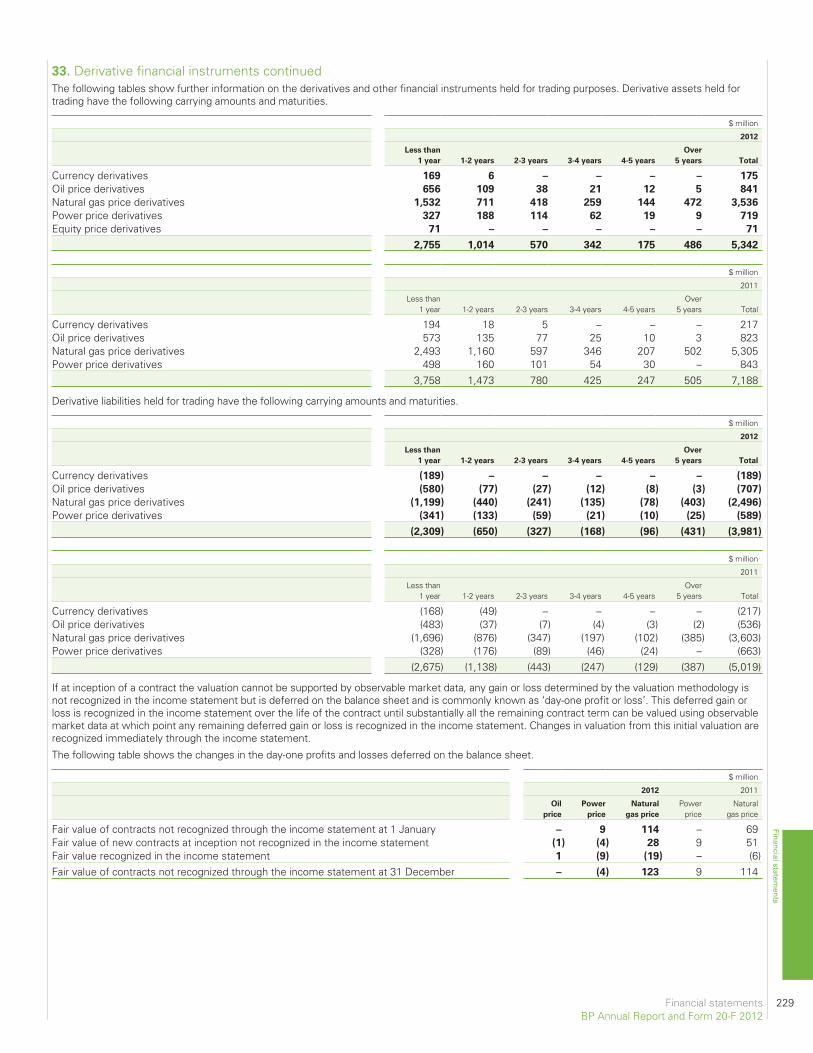
The following tables show further information on the derivatives and other financial instruments held for trading purposes. Derivative assets held fortrading have the following carrying amounts and maturities.
$ million
2012
Less than
1 year 1-2 years 2-3 years 3-4 years 4-5 years
Over
5 years Total
Currency derivatives 169 6 – – – – 175
Oil price derivatives 656 109 38 21 12 5 841
Natural gas price derivatives 1,532 711 418 259 144 472 3,536
Power price derivatives 327 188 114 62 19 9 719
Equity price derivatives 71 – – – – – 71
2,755 1,014 570 342 175 486 5,342
$ million
2011
Less than1 year 1-2 years 2-3 years 3-4 years 4-5 years
Over5 years Total
Currency derivatives 194 18 5 – – – 217Oil price derivatives 573 135 77 25 10 3 823Natural gas price derivatives 2,493 1,160 597 346 207 502 5,305Power price derivatives 498 160 101 54 30 – 843
3,758 1,473 780 425 247 505 7,188
Derivative liabilities held for trading have the following carrying amounts and maturities.
$ million
2012
Less than
1 year 1-2 years 2-3 years 3-4 years 4-5 years
Over
5 years Total
Currency derivatives (189) – – – – – (189)
Oil price derivatives (580) (77) (27) (12) (8) (3) (707)
Natural gas price derivatives (1,199) (440) (241) (135) (78) (403) (2,496)
Power price derivatives (341) (133) (59) (21) (10) (25) (589)
(2,309) (650) (327) (168) (96) (431) (3,981)
$ million
2011
Less than1 year 1-2 years 2-3 years 3-4 years 4-5 years
Over5 years Total
Currency derivatives (168) (49) – – – – (217)Oil price derivatives (483) (37) (7) (4) (3) (2) (536)Natural gas price derivatives (1,696) (876) (347) (197) (102) (385) (3,603)Power price derivatives (328) (176) (89) (46) (24) – (663)
(2,675) (1,138) (443) (247) (129) (387) (5,019)
If at inception of a contract the valuation cannot be supported by observable market data, any gain or loss determined by the valuation methodology isnot recognized in the income statement but is deferred on the balance sheet and is commonly known as ‘day-one profit or loss’. This deferred gain orloss is recognized in the income statement over the life of the contract until substantially all the remaining contract term can be valued using observablemarket data at which point any remaining deferred gain or loss is recognized in the income statement. Changes in valuation from this initial valuation arerecognized immediately through the income statement.
The following table shows the changes in the day-one profits and losses deferred on the balance sheet.
$ million
2012 2011
Oil
price
Power
price
Natural
gas price
Powerprice
Naturalgas price
Fair value of contracts not recognized through the income statement at 1 January – 9 114 – 69Fair value of new contracts at inception not recognized in the income statement (1) (4) 28 9 51Fair value recognized in the income statement 1 (9) (19) – (6)Fair value of contracts not recognized through the income statement at 31 December – (4) 123 9 114
Financial statements 229BP Annual Report and Form 20-F 2012
Financial statements
33. Derivative financial instruments continued
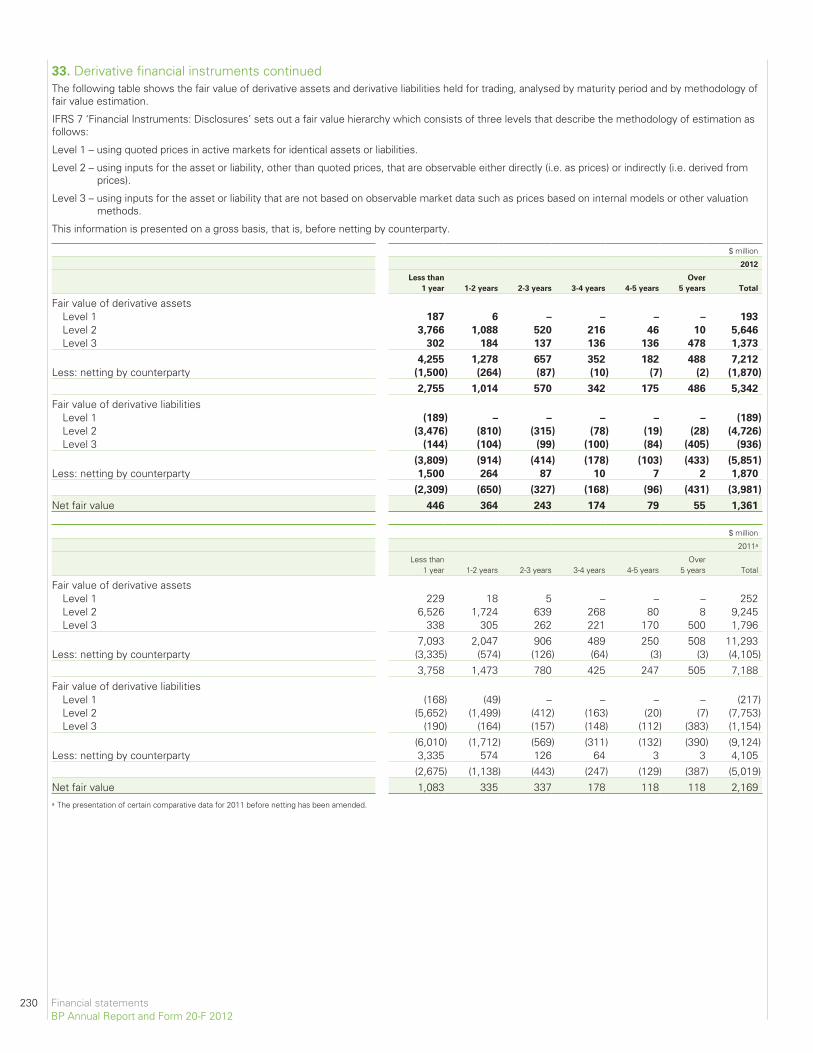
33. Derivative financial instruments continuedThe following table shows the fair value of derivative assets and derivative liabilities held for trading, analysed by maturity period and by methodology offair value estimation.
IFRS 7 ‘Financial Instruments: Disclosures’ sets out a fair value hierarchy which consists of three levels that describe the methodology of estimation asfollows:
Level 1 – using quoted prices in active markets for identical assets or liabilities.
Level 2 – using inputs for the asset or liability, other than quoted prices, that are observable either directly (i.e. as prices) or indirectly (i.e. derived fromprices).
Level 3 – using inputs for the asset or liability that are not based on observable market data such as prices based on internal models or other valuationmethods.
This information is presented on a gross basis, that is, before netting by counterparty.
$ million
2012
Less than
1 year 1-2 years 2-3 years 3-4 years 4-5 years
Over
5 years Total
Fair value of derivative assetsLevel 1 187 6 – – – – 193
Level 2 3,766 1,088 520 216 46 10 5,646
Level 3 302 184 137 136 136 478 1,373
4,255 1,278 657 352 182 488 7,212
Less: netting by counterparty (1,500) (264) (87) (10) (7) (2) (1,870)
2,755 1,014 570 342 175 486 5,342
Fair value of derivative liabilitiesLevel 1 (189) – – – – – (189)
Level 2 (3,476) (810) (315) (78) (19) (28) (4,726)
Level 3 (144) (104) (99) (100) (84) (405) (936)
(3,809) (914) (414) (178) (103) (433) (5,851)
Less: netting by counterparty 1,500 264 87 10 7 2 1,870
(2,309) (650) (327) (168) (96) (431) (3,981)
Net fair value 446 364 243 174 79 55 1,361
$ million
2011a
Less than1 year 1-2 years 2-3 years 3-4 years 4-5 years
Over5 years Total
Fair value of derivative assetsLevel 1 229 18 5 – – – 252Level 2 6,526 1,724 639 268 80 8 9,245Level 3 338 305 262 221 170 500 1,796
7,093 2,047 906 489 250 508 11,293Less: netting by counterparty (3,335) (574) (126) (64) (3) (3) (4,105)
3,758 1,473 780 425 247 505 7,188Fair value of derivative liabilities
Level 1 (168) (49) – – – – (217)Level 2 (5,652) (1,499) (412) (163) (20) (7) (7,753)Level 3 (190) (164) (157) (148) (112) (383) (1,154)
(6,010) (1,712) (569) (311) (132) (390) (9,124)Less: netting by counterparty 3,335 574 126 64 3 3 4,105
(2,675) (1,138) (443) (247) (129) (387) (5,019)Net fair value 1,083 335 337 178 118 118 2,169a The presentation of certain comparative data for 2011 before netting has been amended.
230 Financial statementsBP Annual Report and Form 20-F 2012
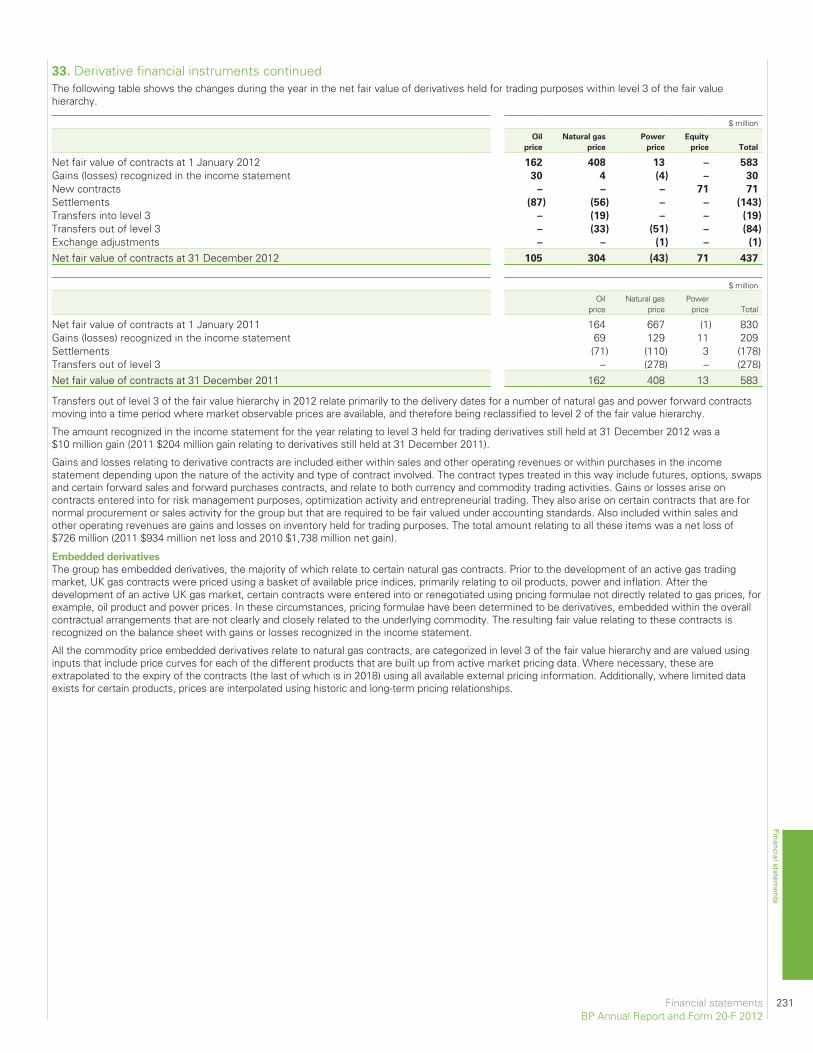
The following table shows the changes during the year in the net fair value of derivatives held for trading purposes within level 3 of the fair valuehierarchy.
$ million
Oil
price
Natural gas
price
Power
price
Equity
price Total
Net fair value of contracts at 1 January 2012 162 408 13 – 583
Gains (losses) recognized in the income statement 30 4 (4) – 30
New contracts – – – 71 71
Settlements (87) (56) – – (143)
Transfers into level 3 – (19) – – (19)
Transfers out of level 3 – (33) (51) – (84)
Exchange adjustments – – (1) – (1)
Net fair value of contracts at 31 December 2012 105 304 (43) 71 437
$ million
Oilprice
Natural gasprice
Powerprice Total
Net fair value of contracts at 1 January 2011 164 667 (1) 830Gains (losses) recognized in the income statement 69 129 11 209Settlements (71) (110) 3 (178)Transfers out of level 3 – (278) – (278)Net fair value of contracts at 31 December 2011 162 408 13 583
Transfers out of level 3 of the fair value hierarchy in 2012 relate primarily to the delivery dates for a number of natural gas and power forward contractsmoving into a time period where market observable prices are available, and therefore being reclassified to level 2 of the fair value hierarchy.
The amount recognized in the income statement for the year relating to level 3 held for trading derivatives still held at 31 December 2012 was a$10 million gain (2011 $204 million gain relating to derivatives still held at 31 December 2011).
Gains and losses relating to derivative contracts are included either within sales and other operating revenues or within purchases in the incomestatement depending upon the nature of the activity and type of contract involved. The contract types treated in this way include futures, options, swapsand certain forward sales and forward purchases contracts, and relate to both currency and commodity trading activities. Gains or losses arise oncontracts entered into for risk management purposes, optimization activity and entrepreneurial trading. They also arise on certain contracts that are fornormal procurement or sales activity for the group but that are required to be fair valued under accounting standards. Also included within sales andother operating revenues are gains and losses on inventory held for trading purposes. The total amount relating to all these items was a net loss of$726 million (2011 $934 million net loss and 2010 $1,738 million net gain).
Embedded derivatives
The group has embedded derivatives, the majority of which relate to certain natural gas contracts. Prior to the development of an active gas tradingmarket, UK gas contracts were priced using a basket of available price indices, primarily relating to oil products, power and inflation. After thedevelopment of an active UK gas market, certain contracts were entered into or renegotiated using pricing formulae not directly related to gas prices, forexample, oil product and power prices. In these circumstances, pricing formulae have been determined to be derivatives, embedded within the overallcontractual arrangements that are not clearly and closely related to the underlying commodity. The resulting fair value relating to these contracts isrecognized on the balance sheet with gains or losses recognized in the income statement.
All the commodity price embedded derivatives relate to natural gas contracts, are categorized in level 3 of the fair value hierarchy and are valued usinginputs that include price curves for each of the different products that are built up from active market pricing data. Where necessary, these areextrapolated to the expiry of the contracts (the last of which is in 2018) using all available external pricing information. Additionally, where limited dataexists for certain products, prices are interpolated using historic and long-term pricing relationships.
Financial statements 231BP Annual Report and Form 20-F 2012
Financial statements
33. Derivative financial instruments continued
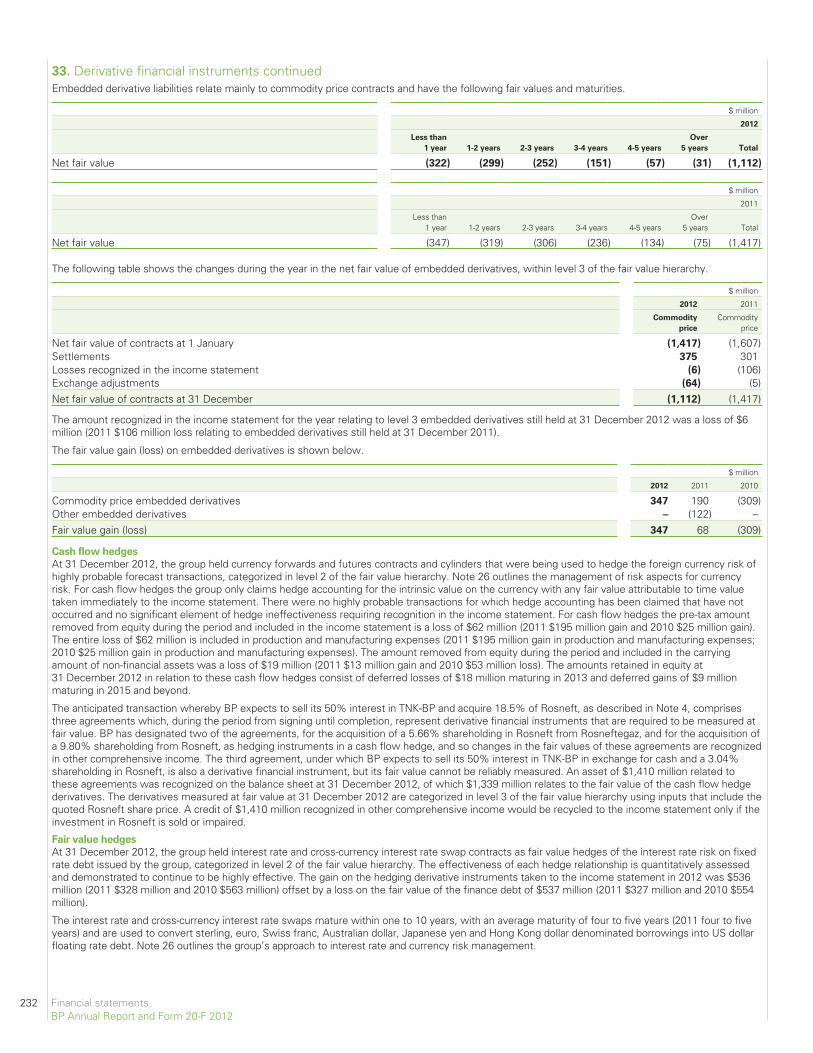
33. Derivative financial instruments continuedEmbedded derivative liabilities relate mainly to commodity price contracts and have the following fair values and maturities.
$ million
2012
Less than
1 year 1-2 years 2-3 years 3-4 years 4-5 years
Over
5 years Total
Net fair value (322) (299) (252) (151) (57) (31) (1,112)
$ million
2011
Less than1 year 1-2 years 2-3 years 3-4 years 4-5 years
Over5 years Total
Net fair value (347) (319) (306) (236) (134) (75) (1,417)
The following table shows the changes during the year in the net fair value of embedded derivatives, within level 3 of the fair value hierarchy.
$ million
2012 2011
Commodity
price
Commodityprice
Net fair value of contracts at 1 January (1,417) (1,607)Settlements 375 301Losses recognized in the income statement (6) (106)Exchange adjustments (64) (5)Net fair value of contracts at 31 December (1,112) (1,417)
The amount recognized in the income statement for the year relating to level 3 embedded derivatives still held at 31 December 2012 was a loss of $6million (2011 $106 million loss relating to embedded derivatives still held at 31 December 2011).
The fair value gain (loss) on embedded derivatives is shown below.
$ million
2012 2011 2010
Commodity price embedded derivatives 347 190 (309)Other embedded derivatives – (122) –Fair value gain (loss) 347 68 (309)
Cash flow hedges
At 31 December 2012, the group held currency forwards and futures contracts and cylinders that were being used to hedge the foreign currency risk ofhighly probable forecast transactions, categorized in level 2 of the fair value hierarchy. Note 26 outlines the management of risk aspects for currencyrisk. For cash flow hedges the group only claims hedge accounting for the intrinsic value on the currency with any fair value attributable to time valuetaken immediately to the income statement. There were no highly probable transactions for which hedge accounting has been claimed that have notoccurred and no significant element of hedge ineffectiveness requiring recognition in the income statement. For cash flow hedges the pre-tax amountremoved from equity during the period and included in the income statement is a loss of $62 million (2011 $195 million gain and 2010 $25 million gain).The entire loss of $62 million is included in production and manufacturing expenses (2011 $195 million gain in production and manufacturing expenses;2010 $25 million gain in production and manufacturing expenses). The amount removed from equity during the period and included in the carryingamount of non-financial assets was a loss of $19 million (2011 $13 million gain and 2010 $53 million loss). The amounts retained in equity at31 December 2012 in relation to these cash flow hedges consist of deferred losses of $18 million maturing in 2013 and deferred gains of $9 millionmaturing in 2015 and beyond.
The anticipated transaction whereby BP expects to sell its 50% interest in TNK-BP and acquire 18.5% of Rosneft, as described in Note 4, comprisesthree agreements which, during the period from signing until completion, represent derivative financial instruments that are required to be measured atfair value. BP has designated two of the agreements, for the acquisition of a 5.66% shareholding in Rosneft from Rosneftegaz, and for the acquisition ofa 9.80% shareholding from Rosneft, as hedging instruments in a cash flow hedge, and so changes in the fair values of these agreements are recognizedin other comprehensive income. The third agreement, under which BP expects to sell its 50% interest in TNK-BP in exchange for cash and a 3.04%shareholding in Rosneft, is also a derivative financial instrument, but its fair value cannot be reliably measured. An asset of $1,410 million related tothese agreements was recognized on the balance sheet at 31 December 2012, of which $1,339 million relates to the fair value of the cash flow hedgederivatives. The derivatives measured at fair value at 31 December 2012 are categorized in level 3 of the fair value hierarchy using inputs that include thequoted Rosneft share price. A credit of $1,410 million recognized in other comprehensive income would be recycled to the income statement only if theinvestment in Rosneft is sold or impaired.
Fair value hedges
At 31 December 2012, the group held interest rate and cross-currency interest rate swap contracts as fair value hedges of the interest rate risk on fixedrate debt issued by the group, categorized in level 2 of the fair value hierarchy. The effectiveness of each hedge relationship is quantitatively assessedand demonstrated to continue to be highly effective. The gain on the hedging derivative instruments taken to the income statement in 2012 was $536million (2011 $328 million and 2010 $563 million) offset by a loss on the fair value of the finance debt of $537 million (2011 $327 million and 2010 $554million).
The interest rate and cross-currency interest rate swaps mature within one to 10 years, with an average maturity of four to five years (2011 four to fiveyears) and are used to convert sterling, euro, Swiss franc, Australian dollar, Japanese yen and Hong Kong dollar denominated borrowings into US dollarfloating rate debt. Note 26 outlines the group’s approach to interest rate and currency risk management.
232 Financial statementsBP Annual Report and Form 20-F 2012
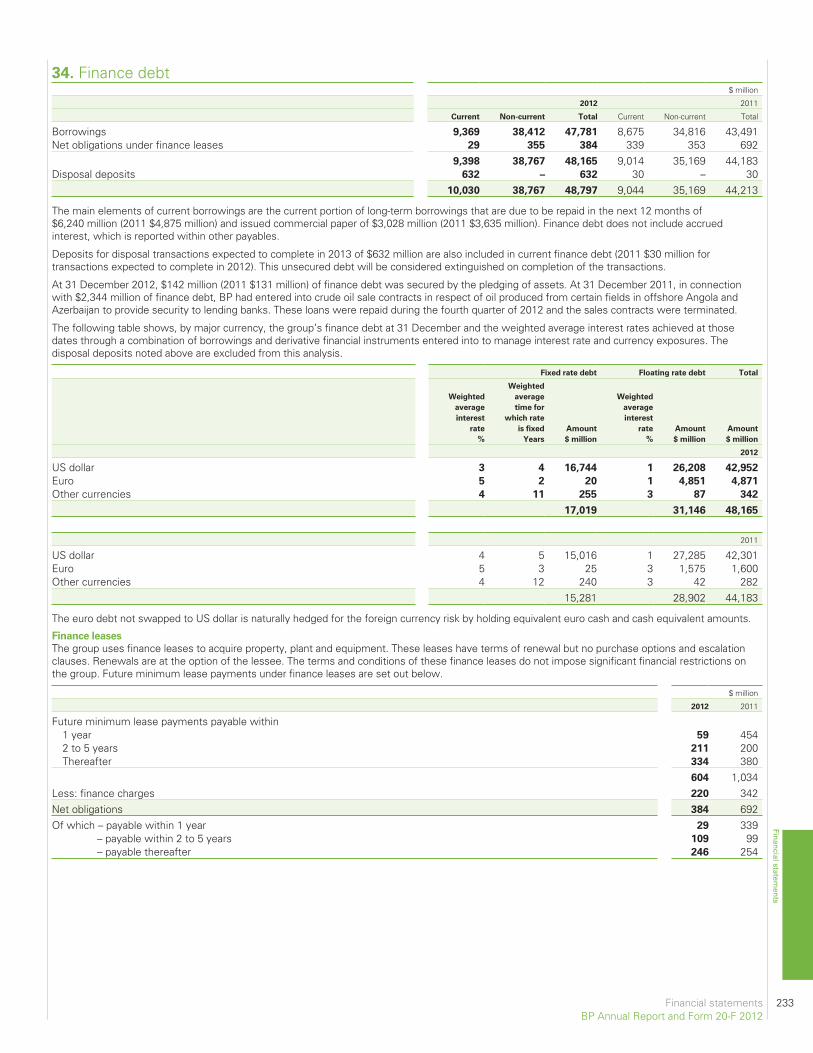
34. Finance debt$ million
2012 2011
Current Non-current Total Current Non-current Total
Borrowings 9,369 38,412 47,781 8,675 34,816 43,491Net obligations under finance leases 29 355 384 339 353 692
9,398 38,767 48,165 9,014 35,169 44,183Disposal deposits 632 – 632 30 – 30
10,030 38,767 48,797 9,044 35,169 44,213
The main elements of current borrowings are the current portion of long-term borrowings that are due to be repaid in the next 12 months of$6,240 million (2011 $4,875 million) and issued commercial paper of $3,028 million (2011 $3,635 million). Finance debt does not include accruedinterest, which is reported within other payables.
Deposits for disposal transactions expected to complete in 2013 of $632 million are also included in current finance debt (2011 $30 million fortransactions expected to complete in 2012). This unsecured debt will be considered extinguished on completion of the transactions.
At 31 December 2012, $142 million (2011 $131 million) of finance debt was secured by the pledging of assets. At 31 December 2011, in connectionwith $2,344 million of finance debt, BP had entered into crude oil sale contracts in respect of oil produced from certain fields in offshore Angola andAzerbaijan to provide security to lending banks. These loans were repaid during the fourth quarter of 2012 and the sales contracts were terminated.
The following table shows, by major currency, the group’s finance debt at 31 December and the weighted average interest rates achieved at thosedates through a combination of borrowings and derivative financial instruments entered into to manage interest rate and currency exposures. Thedisposal deposits noted above are excluded from this analysis.
Fixed rate debt Floating rate debt Total
Weighted
average
interest
rate
%
Weighted
average
time for
which rate
is fixed
Years
Amount
$ million
Weighted
average
interest
rate
%
Amount
$ million
Amount
$ million
2012
US dollar 3 4 16,744 1 26,208 42,952
Euro 5 2 20 1 4,851 4,871
Other currencies 4 11 255 3 87 342
17,019 31,146 48,165
2011
US dollar 4 5 15,016 1 27,285 42,301Euro 5 3 25 3 1,575 1,600Other currencies 4 12 240 3 42 282
15,281 28,902 44,183
The euro debt not swapped to US dollar is naturally hedged for the foreign currency risk by holding equivalent euro cash and cash equivalent amounts.
Finance leases
The group uses finance leases to acquire property, plant and equipment. These leases have terms of renewal but no purchase options and escalationclauses. Renewals are at the option of the lessee. The terms and conditions of these finance leases do not impose significant financial restrictions onthe group. Future minimum lease payments under finance leases are set out below.
$ million
2012 2011
Future minimum lease payments payable within1 year 59 4542 to 5 years 211 200Thereafter 334 380
604 1,034Less: finance charges 220 342Net obligations 384 692Of which – payable within 1 year 29 339
– payable within 2 to 5 years 109 99– payable thereafter 246 254
Financial statements 233BP Annual Report and Form 20-F 2012
Financial statements
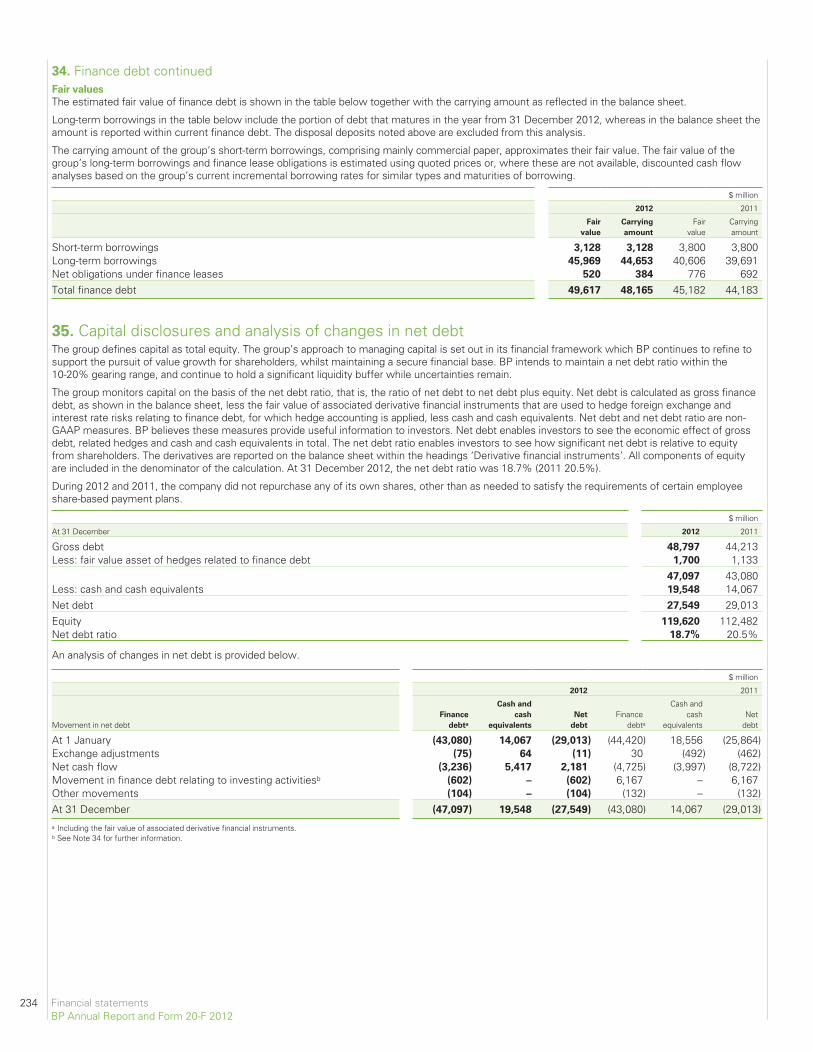
34. Finance debt continuedFair values
The estimated fair value of finance debt is shown in the table below together with the carrying amount as reflected in the balance sheet.
Long-term borrowings in the table below include the portion of debt that matures in the year from 31 December 2012, whereas in the balance sheet theamount is reported within current finance debt. The disposal deposits noted above are excluded from this analysis.
The carrying amount of the group’s short-term borrowings, comprising mainly commercial paper, approximates their fair value. The fair value of thegroup’s long-term borrowings and finance lease obligations is estimated using quoted prices or, where these are not available, discounted cash flowanalyses based on the group’s current incremental borrowing rates for similar types and maturities of borrowing.
$ million
2012 2011
Fair
value
Carrying
amount
Fairvalue
Carryingamount
Short-term borrowings 3,128 3,128 3,800 3,800Long-term borrowings 45,969 44,653 40,606 39,691Net obligations under finance leases 520 384 776 692Total finance debt 49,617 48,165 45,182 44,183
35. Capital disclosures and analysis of changes in net debtThe group defines capital as total equity. The group’s approach to managing capital is set out in its financial framework which BP continues to refine tosupport the pursuit of value growth for shareholders, whilst maintaining a secure financial base. BP intends to maintain a net debt ratio within the10-20% gearing range, and continue to hold a significant liquidity buffer while uncertainties remain.
The group monitors capital on the basis of the net debt ratio, that is, the ratio of net debt to net debt plus equity. Net debt is calculated as gross financedebt, as shown in the balance sheet, less the fair value of associated derivative financial instruments that are used to hedge foreign exchange andinterest rate risks relating to finance debt, for which hedge accounting is applied, less cash and cash equivalents. Net debt and net debt ratio are non-GAAP measures. BP believes these measures provide useful information to investors. Net debt enables investors to see the economic effect of grossdebt, related hedges and cash and cash equivalents in total. The net debt ratio enables investors to see how significant net debt is relative to equityfrom shareholders. The derivatives are reported on the balance sheet within the headings ‘Derivative financial instruments’. All components of equityare included in the denominator of the calculation. At 31 December 2012, the net debt ratio was 18.7% (2011 20.5%).
During 2012 and 2011, the company did not repurchase any of its own shares, other than as needed to satisfy the requirements of certain employeeshare-based payment plans.
$ million
At 31 December 2012 2011
Gross debt 48,797 44,213Less: fair value asset of hedges related to finance debt 1,700 1,133
47,097 43,080Less: cash and cash equivalents 19,548 14,067Net debt 27,549 29,013Equity 119,620 112,482Net debt ratio 18.7% 20.5%
An analysis of changes in net debt is provided below.
$ million
2012 2011
Movement in net debtFinance
debta
Cash and
cash
equivalents
Net
debt
Financedebta
Cash andcash
equivalentsNet
debt
At 1 January (43,080) 14,067 (29,013) (44,420) 18,556 (25,864)Exchange adjustments (75) 64 (11) 30 (492) (462)Net cash flow (3,236) 5,417 2,181 (4,725) (3,997) (8,722)Movement in finance debt relating to investing activitiesb (602) – (602) 6,167 – 6,167Other movements (104) – (104) (132) – (132)At 31 December (47,097) 19,548 (27,549) (43,080) 14,067 (29,013)a Including the fair value of associated derivative financial instruments.b See Note 34 for further information.
234 Financial statementsBP Annual Report and Form 20-F 2012
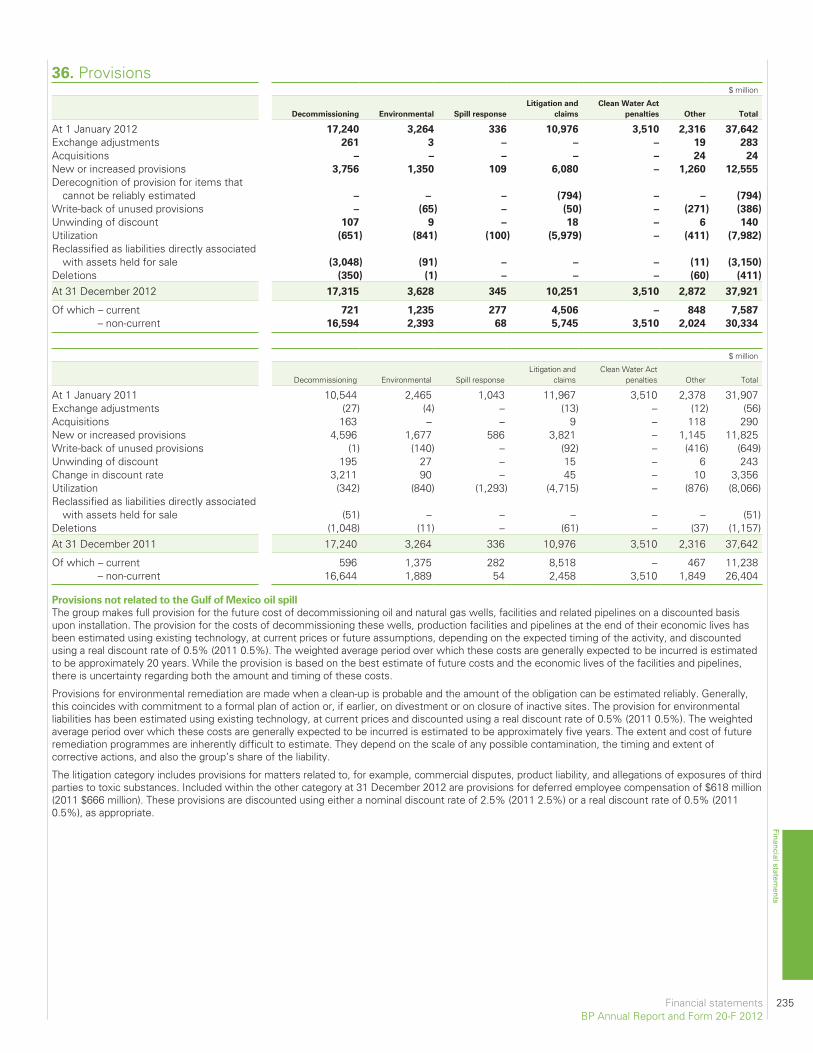
36. Provisions$ million
Decommissioning Environmental Spill response
Litigation and
claims
Clean Water Act
penalties Other Total
At 1 January 2012 17,240 3,264 336 10,976 3,510 2,316 37,642
Exchange adjustments 261 3 – – – 19 283
Acquisitions – – – – – 24 24
New or increased provisions 3,756 1,350 109 6,080 – 1,260 12,555
Derecognition of provision for items thatcannot be reliably estimated – – – (794) – – (794)
Write-back of unused provisions – (65) – (50) – (271) (386)
Unwinding of discount 107 9 – 18 – 6 140
Utilization (651) (841) (100) (5,979) – (411) (7,982)
Reclassified as liabilities directly associatedwith assets held for sale (3,048) (91) – – – (11) (3,150)
Deletions (350) (1) – – – (60) (411)
At 31 December 2012 17,315 3,628 345 10,251 3,510 2,872 37,921
Of which – current 721 1,235 277 4,506 – 848 7,587
– non-current 16,594 2,393 68 5,745 3,510 2,024 30,334
$ million
Decommissioning Environmental Spill responseLitigation and
claimsClean Water Act
penalties Other Total
At 1 January 2011 10,544 2,465 1,043 11,967 3,510 2,378 31,907Exchange adjustments (27) (4) – (13) – (12) (56)Acquisitions 163 – – 9 – 118 290New or increased provisions 4,596 1,677 586 3,821 – 1,145 11,825Write-back of unused provisions (1) (140) – (92) – (416) (649)Unwinding of discount 195 27 – 15 – 6 243Change in discount rate 3,211 90 – 45 – 10 3,356Utilization (342) (840) (1,293) (4,715) – (876) (8,066)Reclassified as liabilities directly associated
with assets held for sale (51) – – – – – (51)Deletions (1,048) (11) – (61) – (37) (1,157)At 31 December 2011 17,240 3,264 336 10,976 3,510 2,316 37,642
Of which – current 596 1,375 282 8,518 – 467 11,238– non-current 16,644 1,889 54 2,458 3,510 1,849 26,404
Provisions not related to the Gulf of Mexico oil spill
The group makes full provision for the future cost of decommissioning oil and natural gas wells, facilities and related pipelines on a discounted basisupon installation. The provision for the costs of decommissioning these wells, production facilities and pipelines at the end of their economic lives hasbeen estimated using existing technology, at current prices or future assumptions, depending on the expected timing of the activity, and discountedusing a real discount rate of 0.5% (2011 0.5%). The weighted average period over which these costs are generally expected to be incurred is estimatedto be approximately 20 years. While the provision is based on the best estimate of future costs and the economic lives of the facilities and pipelines,there is uncertainty regarding both the amount and timing of these costs.
Provisions for environmental remediation are made when a clean-up is probable and the amount of the obligation can be estimated reliably. Generally,this coincides with commitment to a formal plan of action or, if earlier, on divestment or on closure of inactive sites. The provision for environmentalliabilities has been estimated using existing technology, at current prices and discounted using a real discount rate of 0.5% (2011 0.5%). The weightedaverage period over which these costs are generally expected to be incurred is estimated to be approximately five years. The extent and cost of futureremediation programmes are inherently difficult to estimate. They depend on the scale of any possible contamination, the timing and extent ofcorrective actions, and also the group’s share of the liability.
The litigation category includes provisions for matters related to, for example, commercial disputes, product liability, and allegations of exposures of thirdparties to toxic substances. Included within the other category at 31 December 2012 are provisions for deferred employee compensation of $618 million(2011 $666 million). These provisions are discounted using either a nominal discount rate of 2.5% (2011 2.5%) or a real discount rate of 0.5% (20110.5%), as appropriate.
Financial statements 235BP Annual Report and Form 20-F 2012
Financial statements
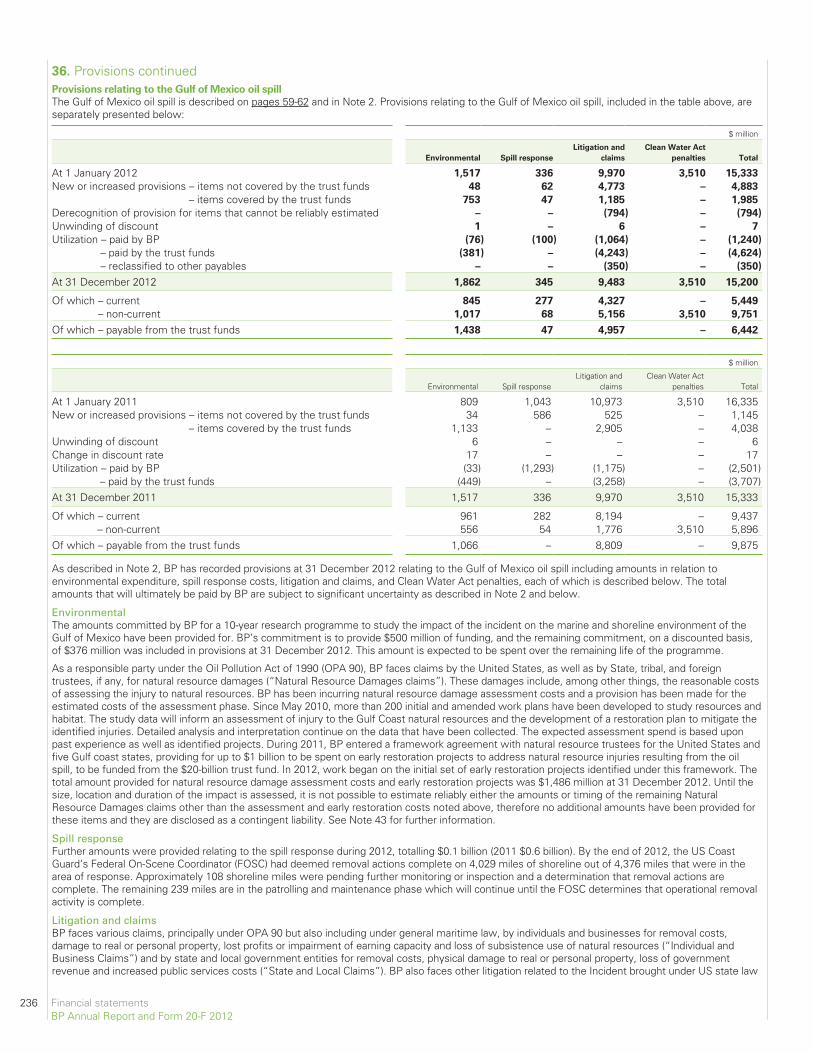
36. Provisions continuedProvisions relating to the Gulf of Mexico oil spill
The Gulf of Mexico oil spill is described on pages 59-62 and in Note 2. Provisions relating to the Gulf of Mexico oil spill, included in the table above, areseparately presented below:
$ million
Environmental Spill response
Litigation and
claims
Clean Water Act
penalties Total
At 1 January 2012 1,517 336 9,970 3,510 15,333
New or increased provisions – items not covered by the trust funds 48 62 4,773 – 4,883
– items covered by the trust funds 753 47 1,185 – 1,985
Derecognition of provision for items that cannot be reliably estimated – – (794) – (794)
Unwinding of discount 1 – 6 – 7
Utilization – paid by BP (76) (100) (1,064) – (1,240)
– paid by the trust funds (381) – (4,243) – (4,624)
– reclassified to other payables – – (350) – (350)
At 31 December 2012 1,862 345 9,483 3,510 15,200
Of which – current 845 277 4,327 – 5,449
– non-current 1,017 68 5,156 3,510 9,751
Of which – payable from the trust funds 1,438 47 4,957 – 6,442
$ million
Environmental Spill responseLitigation and
claimsClean Water Act
penalties Total
At 1 January 2011 809 1,043 10,973 3,510 16,335New or increased provisions – items not covered by the trust funds 34 586 525 – 1,145
– items covered by the trust funds 1,133 – 2,905 – 4,038Unwinding of discount 6 – – – 6Change in discount rate 17 – – – 17Utilization – paid by BP (33) (1,293) (1,175) – (2,501)
– paid by the trust funds (449) – (3,258) – (3,707)At 31 December 2011 1,517 336 9,970 3,510 15,333
Of which – current 961 282 8,194 – 9,437– non-current 556 54 1,776 3,510 5,896
Of which – payable from the trust funds 1,066 – 8,809 – 9,875
As described in Note 2, BP has recorded provisions at 31 December 2012 relating to the Gulf of Mexico oil spill including amounts in relation toenvironmental expenditure, spill response costs, litigation and claims, and Clean Water Act penalties, each of which is described below. The totalamounts that will ultimately be paid by BP are subject to significant uncertainty as described in Note 2 and below.
EnvironmentalThe amounts committed by BP for a 10-year research programme to study the impact of the incident on the marine and shoreline environment of theGulf of Mexico have been provided for. BP’s commitment is to provide $500 million of funding, and the remaining commitment, on a discounted basis,of $376 million was included in provisions at 31 December 2012. This amount is expected to be spent over the remaining life of the programme.
As a responsible party under the Oil Pollution Act of 1990 (OPA 90), BP faces claims by the United States, as well as by State, tribal, and foreigntrustees, if any, for natural resource damages (“Natural Resource Damages claims”). These damages include, among other things, the reasonable costsof assessing the injury to natural resources. BP has been incurring natural resource damage assessment costs and a provision has been made for theestimated costs of the assessment phase. Since May 2010, more than 200 initial and amended work plans have been developed to study resources andhabitat. The study data will inform an assessment of injury to the Gulf Coast natural resources and the development of a restoration plan to mitigate theidentified injuries. Detailed analysis and interpretation continue on the data that have been collected. The expected assessment spend is based uponpast experience as well as identified projects. During 2011, BP entered a framework agreement with natural resource trustees for the United States andfive Gulf coast states, providing for up to $1 billion to be spent on early restoration projects to address natural resource injuries resulting from the oilspill, to be funded from the $20-billion trust fund. In 2012, work began on the initial set of early restoration projects identified under this framework. Thetotal amount provided for natural resource damage assessment costs and early restoration projects was $1,486 million at 31 December 2012. Until thesize, location and duration of the impact is assessed, it is not possible to estimate reliably either the amounts or timing of the remaining NaturalResource Damages claims other than the assessment and early restoration costs noted above, therefore no additional amounts have been provided forthese items and they are disclosed as a contingent liability. See Note 43 for further information.
Spill responseFurther amounts were provided relating to the spill response during 2012, totalling $0.1 billion (2011 $0.6 billion). By the end of 2012, the US CoastGuard’s Federal On-Scene Coordinator (FOSC) had deemed removal actions complete on 4,029 miles of shoreline out of 4,376 miles that were in thearea of response. Approximately 108 shoreline miles were pending further monitoring or inspection and a determination that removal actions arecomplete. The remaining 239 miles are in the patrolling and maintenance phase which will continue until the FOSC determines that operational removalactivity is complete.
Litigation and claimsBP faces various claims, principally under OPA 90 but also including under general maritime law, by individuals and businesses for removal costs,damage to real or personal property, lost profits or impairment of earning capacity and loss of subsistence use of natural resources (“Individual andBusiness Claims”) and by state and local government entities for removal costs, physical damage to real or personal property, loss of governmentrevenue and increased public services costs (“State and Local Claims”). BP also faces other litigation related to the Incident brought under US state law
236 Financial statementsBP Annual Report and Form 20-F 2012
and the laws of certain non-US jurisdictions, as well as claims by private parties under US federal securities laws and other state and federal statutes.See Legal proceedings on pages 162-171 for further information.
The litigation and claims provision includes amounts that can be estimated reliably for the future cost of settling Individual and Business Claims, andState and Local Claims under OPA 90, including certain amounts as set forth below related to the settlements with the PSC, the cost of the agreementwith the US government to resolve all federal criminal claims, and claims administration costs and legal fees. During 2012, a provision was recognized inthe amount of $525 million in respect of the cost of the agreement with the US Securities and Exchange Commission (SEC) to resolve all of the USgovernment’s federal securities claims against the company (the SEC settlement). The remaining obligation for the SEC settlement at 31 December2012 has been reclassified to other payables (as discussed below).
BP announced on 3 March 2012 that a proposed settlement had been reached with the Plaintiffs’ Steering Committee (PSC), subject to final writtenagreement and court approvals, to resolve the substantial majority of legitimate economic loss and property damage claims and exposure-based medicalclaims (Individual and Business claims) stemming from the Deepwater Horizon accident and oil spill. The PSC acts on behalf of the individual andbusiness plaintiffs in the multi-district litigation proceedings pending in New Orleans (MDL 2179). The proposed settlement was an adjusting event afterthe 2011 reporting period and BP’s estimate at that time of the cost of the settlement of $7.8 billion was therefore reflected in the 2011 financialstatements. On 18 April 2012, BP announced that it had reached definitive and fully documented settlement agreements with the PSC consistent withthe terms of that settlement. In November 2012, the court held a fairness hearing with respect to the Economic and Property Damages SettlementAgreement and Medical Benefits Settlement Agreement and subsequently granted final approval to the Economic and Property Damages Settlementon 21 December 2012 and to the medical benefits settlement on 11 January 2013. See Legal proceedings on pages 162-171 for further information.
Under the terms of the PSC settlement agreement, several qualified settlement funds (QSFs) were established during the year. These QSFs, which arefunded through the Trust, each relate to specific elements of the agreement and are available to make payments to claimants in accordance with thoseelements of the agreement.
The total amount allocated to the seafood industry under the PSC settlement is fixed at $2.3 billion and thus amounts contributed from the Trust to theseafood compensation fund extinguish BP’s liability, so the provision and related reimbursement asset are derecognized, irrespective of whetheramounts have been paid out of the fund to claimants. Utilization of the provision in 2012 included $2,230 million contributed to the seafoodcompensation fund. Additionally, a further $67 million was paid to seafood industry claimants through the transition claims process. At 31 December2012, $1,847 million remained in the seafood compensation fund for which the related provision and reimbursement asset had been derecognized.
As at 31 December 2011, the provision for items covered by the settlement with the PSC for Individual and Business claims was $7.8 billion. During 2012,BP increased its estimate of the cost of claims administration by $280 million and also increased the provision by a further $400 million as described below.
Business economic loss claims received by the Deepwater Horizon Court Supervised Settlement Program (DHCSSP) to date are being paid at asignificantly higher average amount than previously assumed by BP in formulating the original estimate of the cost. Further, BP’s initial estimate ofaggregate liability under the settlement agreements was premised on BP’s interpretation of certain protocols established in the Economic and PropertyDamages Settlement Agreement. As part of its monitoring of payments made by the DHCSSP, BP identified multiple claim determinations thatappeared to result from an interpretation of the settlement agreement by the claims administrator that BP believes was incorrect. This interpretationproduced a higher number and value of awards than the interpretation BP assumed in making the initial estimate. Pursuant to the mechanisms in thesettlement agreement, the claims administrator sought clarification from the court on this matter and on 30 January 2013, the court initially upheld theclaims administrator’s interpretation of the agreement.
In its unaudited fourth quarter and full year 2012 results announcement dated 5 February 2013 (the ‘preliminary announcement’), BP stated that if theinitial trend of higher average payments than assumed by BP in its original estimate of the cost continued, then it was likely that BP’s provision for theseclaims would be increased significantly. Management’s initial assessment of the ruling regarding the interpretation of the settlement agreement led toan increase in the estimated cost of the settlement with the PSC of $400 million, bringing the total estimated cost to $8.5 billion. This estimate wasbased upon management’s initial assessment of the ruling’s impact on claims already submitted to and processed by the DHCSSP. At that time, BPwas seeking reversal of the court’s decision in relation to this matter, and management concluded that it was not possible to estimate reliably theimpact of the interpretation on any future claims not yet received or processed by the DHCSSP.
On 6 February 2013, the court reconsidered and vacated its ruling of 30 January 2013 and stayed the processing of certain types of business economicloss claims. The court lifted the stay on 28 February 2013. On 5 March 2013, the court affirmed the claims administrator’s interpretation of theagreement and rejected BP’s position as it relates to business economic loss claims. BP strongly disagrees with the ruling of 5 March 2013 and thecurrent implementation of the agreement by the claims administrator. BP intends to pursue all available legal options including rights of appeal, tochallenge this ruling. Other business economic loss claims continue to be paid at a higher average amount than previously assumed by BP indetermining its initial estimate of the total cost. Management has continued to analyse the claims in the period since 5 February 2013 to gain a betterunderstanding of whether or not the number and average value of claims received and processed to date are predictive of future claims (and so wouldallow management to estimate the total cost reliably). Management has concluded, based upon this analysis, that it is not possible to determinewhether the claims experience to date is, or is not, an appropriate basis for estimating the total cost. Therefore, given the inherent uncertainty thatexists as BP pursues all available legal options to challenge the recent ruling, and the higher number of claims received and higher average claimspayments than previously assumed by BP, which may or may not continue, management has concluded that no reliable estimate can be made of anybusiness economic loss claims not yet received or processed by the DHCSSP.
Therefore, the provision for business economic loss claims at 31 December 2012 included in these financial statements now includes only theestimated cost of claims already received and processed by the DHCSSP. As a consequence, an amount of $0.8 billion previously provided for futureclaims not yet received or processed by the DHCSSP, has been derecognized, with a corresponding reduction in the reimbursement asset and thereforeno net impact on the income statement, as no reliable estimate can be made for this liability. It is therefore disclosed as a contingent liability in Note 43.A provision will be re-established when a reliable estimate can be made of the liability as explained more fully below.
BP’s current estimate of the total cost of those elements of the PSC settlement that can be estimated reliably, which excludes any future businesseconomic loss claims not yet received or processed by the DHCSSP, is $7.7 billion.
If BP is successful in its challenge to the court’s ruling, the total estimated cost of the settlement agreement will, nevertheless, be significantly higher thanthe current estimate of $7.7 billion because business economic loss claims not yet received or processed are not reflected in the current estimate and theaverage payments per claim determined so far are higher than anticipated. If BP is not successful in its challenge to the court’s ruling, a further significantincrease to the total estimated cost of the settlement will be required but BP will continue to challenge the current interpretation and implementation of thesettlement agreement by the claims administrator using all legal avenues available, including rights of appeal. However, there can be no certainty as to howthe dispute will ultimately be resolved or determined. To the extent that there are insufficient funds available in the Trust fund, payments under the PSCsettlement will be made by BP directly and charged to the income statement.
Financial statements 237BP Annual Report and Form 20-F 2012
Financial statements
36. Provisions continued
36. Provisions continuedSignificant uncertainties exist in relation to the amount of claims that are to be paid and will become payable through the claims process. There issignificant uncertainty in relation to the amounts that ultimately will be paid in relation to current claims, and the number, type and amounts payable forclaims not yet reported. In addition, there is further uncertainty in relation to interpretations of the claims administrator regarding the protocols under thesettlement agreement and judicial interpretation of these protocols, and the outcomes of any further litigation including in relation to potential opt-outsfrom the settlement or otherwise. The PSC settlement is uncapped except for economic loss claims related to the Gulf seafood industry.While BP has determined its current best estimate of the cost of those aspects of the settlement with the PSC that can be measured reliably, it ispossible that the actual cost of those items could be significantly higher than this estimate due to the uncertainties noted above. In addition, theprovision will be re-established for remaining business economic loss claims as more information becomes available, the interpretation of the protocolsis clarified and the claims process matures, enabling BP to estimate reliably the cost of these claims. BP will continue to analyse claims data and re-evaluate the assumptions underlying the provision.The provision recognized for litigation and claims includes an estimate for State and Local government claims. Although the provision recognized is BP’scurrent reliable best estimate of the amount required to settle these obligations, significant uncertainty exists in relation to the outcome of any litigationproceedings and the amount of claims that will become payable by BP. In January 2013, the States of Alabama, Mississippi and Florida formallypresented their claims to BP under OPA 90 for alleged losses including economic and property damage as a result of the Gulf of Mexico oil spill (seeNote 43 for further information).BP reached an agreement in November 2012 with the US government, subject to court approval, to resolve all criminal claims arising from the incidentunder which BP will pay $4 billion in instalments over a period of five years. A provision of $3.85 billion has been recognized, representing the discountedcost of the agreement. This settlement was approved by the court in January 2013 and is not covered by the Trust. In addition, BP reached a settlementwith the US Securities and Exchange Commission (SEC), which was approved by the court in December 2012, resolving all of the US government’ssecurities claims against the company, under which BP has agreed to a civil penalty of $525 million, payable in three instalments over a period of three years.On 10 December 2012, a federal judge issued a final judgment regarding the SEC’s claims and the terms of the settlement. During 2012, a provision wasrecognized in the amount of $525 million in respect of the cost of the SEC settlement. The remaining obligation of $350 million for the SEC settlement at31 December 2012, which is not covered by the trust fund, has been reclassified to other payables.BP also faces other litigation for which no reliable estimate of the cost can currently be made. Therefore no amounts have been provided for theseitems. See Note 43 for further information.
Clean Water Act penaltiesA provision has been made for the estimated penalties for strict liability under Section 311 of the Clean Water Act. Such penalties are subject to astatutory maximum calculated as the product of a per-barrel maximum penalty rate and the number of barrels of oil spilled. Uncertainties currently existin relation to both the penalty rate that will ultimately be imposed and the volume of oil spilled.A charge for potential Clean Water Act Section 311 penalties was first included in BP’s second-quarter 2010 interim financial statements. At the timethat charge was taken, the latest estimate from the intra-agency Flow Rate Technical Group created by the National Incident Commander in charge ofthe spill response was between 35,000 and 60,000 barrels per day. The mid-point of that range, 47,500 barrels per day, was used for the purposes ofcalculating the charge. For the purposes of calculating the amount of the oil flow that was discharged into the Gulf of Mexico, the amount of oil that hadbeen or was projected to be captured in vessels on the surface was subtracted from the total estimated flow up until when the well was capped on15 July 2010. The result of this calculation was an estimate that approximately 3.2 million barrels of oil had been discharged into the Gulf. This estimateof 3.2 million barrels was calculated using a total flow of 47,500 barrels per day multiplied by the 85 days from 22 April 2010 through 15 July 2010 lessan estimate of the amount captured on the surface (approximately 850,000 barrels).This estimated discharge volume was then multiplied by $1,100 per barrel – the maximum amount the statute allows in the absence of gross negligence orwilful misconduct – for the purposes of estimating a potential penalty. This resulted in a provision of $3,510 million for potential penalties under Section 311.The actual penalty a court may impose could be lower than $1,100 per barrel if it were determined that such a lower penalty was appropriate based onthe factors a court is directed to consider in assessing a penalty. In particular, in determining the amount of a civil penalty, Section 311 directs a court toconsider a number of enumerated factors, including “the seriousness of the violation or violations, the economic benefit to the violator, if any, resultingfrom the violation, the degree of culpability involved, any other penalty for the same incident, any history of prior violations, the nature, extent, anddegree of success of any efforts of the violator to minimize or mitigate the effects of the discharge, the economic impact of the penalty on the violator,and any other matters as justice may require.” Civil penalties above $1,100 per barrel up to a statutory maximum of $4,300 per barrel of oil dischargedwould only be imposed if alleged gross negligence or wilful misconduct were proven. BP intends to argue for a penalty lower than $1,100 per barrelbased on several of these factors. However, the $1,100 per-barrel rate has been utilized for the purposes of calculating the provision after consideringand weighing all possible outcomes and in light of: (i) the company’s conclusion that it did not act with gross negligence or engage in wilful misconduct;and (ii) the uncertainty as to whether a court would assess a penalty below the $1,100 statutory maximum.On 2 August 2010, the United States Department of Energy and the Flow Rate Technical Group had issued an estimate that 4.9 million barrels of oil hadflowed from the Macondo well, and 4.05 million barrels had been discharged into the Gulf (the difference being the amount of oil captured by vessels onthe surface as part of BP’s well containment efforts).
It was and remains BP’s view, based on the analysis of available data by its experts, that the 2 August 2010 Government estimate is not reliable. BPbelieves that the 2 August 2010 discharge estimate is overstated by at least 20%. If the flow rate were 20% lower than the 2 August 2010 estimate,then the amount of oil that flowed from the Macondo well would be approximately 3.9 million barrels and the amount discharged into the Gulf would beapproximately 3.1 million barrels (using a current estimate of barrels captured by vessels on the surface of 810,000 in line with the stipulation enteredwith the US government – see Legal Proceedings on pages 162-171), which is not materially different from the amount we used for our originalestimate at the end of the second quarter 2010.For the purposes of calculating a provision for fines and penalties under Section 311 of the Clean Water Act, BP has continued to use an estimate of3.2 million barrels of oil discharged to the Gulf of Mexico and a penalty of $1,100 per barrel, as its current best estimate, as defined in paragraphs 36-40of IAS 37 ‘Provisions, Contingent Liabilities and Contingent Assets’, of the amounts which may be used in calculating the penalty under Section 311 ofthe Clean Water Act and as a result, the provision at the end of the year was $3,510 million.The amount and timing of the amount to be paid ultimately will depend upon what is determined by the court in the federal multi-district litigationproceedings in New Orleans (MDL 2179) to be the volume of oil spilled and the penalty rate that is imposed or upon any settlement, if one were to bereached. It is not currently practicable to estimate the timing of expending these costs and the provision has been included within non-current liabilitieson the balance sheet. Save in relation to the amounts described in this note, and in Note 2, no other amounts have been provided as at 31 December2012 in relation to other potential fines and penalties because it is not possible to measure the obligation reliably. Fines and penalties are not covered bythe trust fund.
238 Financial statementsBP Annual Report and Form 20-F 2012
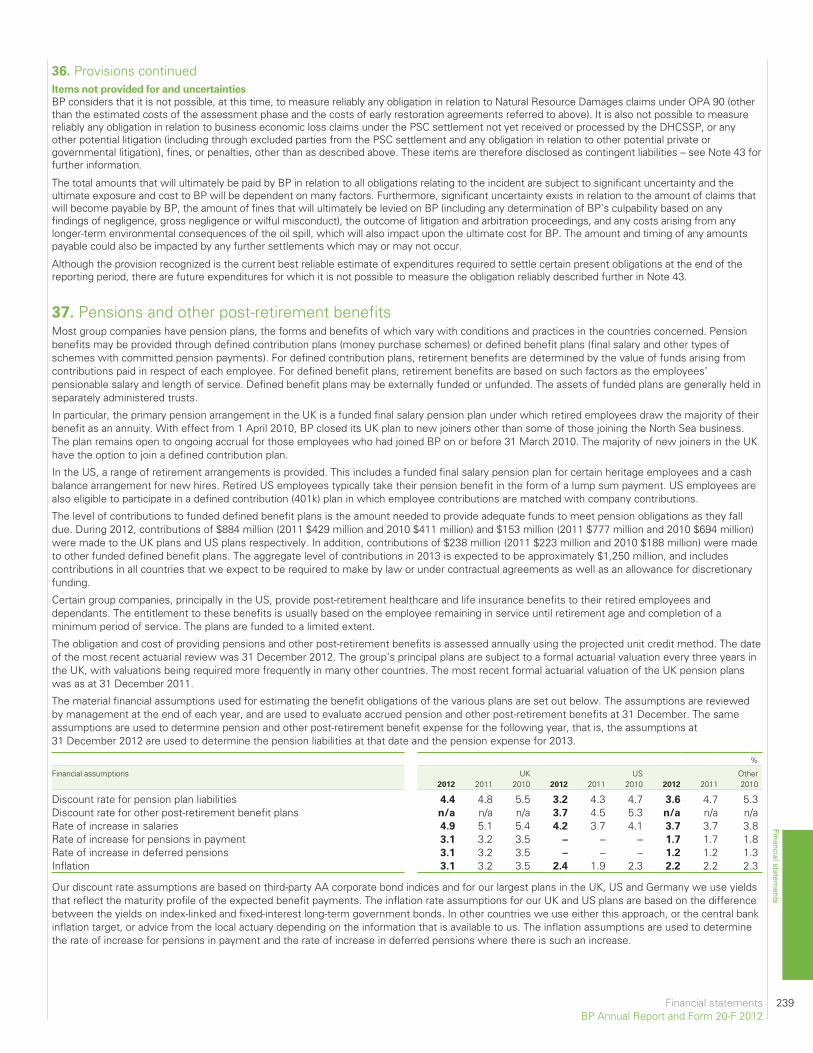
Items not provided for and uncertainties
BP considers that it is not possible, at this time, to measure reliably any obligation in relation to Natural Resource Damages claims under OPA 90 (otherthan the estimated costs of the assessment phase and the costs of early restoration agreements referred to above). It is also not possible to measurereliably any obligation in relation to business economic loss claims under the PSC settlement not yet received or processed by the DHCSSP, or anyother potential litigation (including through excluded parties from the PSC settlement and any obligation in relation to other potential private orgovernmental litigation), fines, or penalties, other than as described above. These items are therefore disclosed as contingent liabilities – see Note 43 forfurther information.
The total amounts that will ultimately be paid by BP in relation to all obligations relating to the incident are subject to significant uncertainty and theultimate exposure and cost to BP will be dependent on many factors. Furthermore, significant uncertainty exists in relation to the amount of claims thatwill become payable by BP, the amount of fines that will ultimately be levied on BP (including any determination of BP’s culpability based on anyfindings of negligence, gross negligence or wilful misconduct), the outcome of litigation and arbitration proceedings, and any costs arising from anylonger-term environmental consequences of the oil spill, which will also impact upon the ultimate cost for BP. The amount and timing of any amountspayable could also be impacted by any further settlements which may or may not occur.
Although the provision recognized is the current best reliable estimate of expenditures required to settle certain present obligations at the end of thereporting period, there are future expenditures for which it is not possible to measure the obligation reliably described further in Note 43.
37. Pensions and other post-retirement benefitsMost group companies have pension plans, the forms and benefits of which vary with conditions and practices in the countries concerned. Pensionbenefits may be provided through defined contribution plans (money purchase schemes) or defined benefit plans (final salary and other types ofschemes with committed pension payments). For defined contribution plans, retirement benefits are determined by the value of funds arising fromcontributions paid in respect of each employee. For defined benefit plans, retirement benefits are based on such factors as the employees’pensionable salary and length of service. Defined benefit plans may be externally funded or unfunded. The assets of funded plans are generally held inseparately administered trusts.
In particular, the primary pension arrangement in the UK is a funded final salary pension plan under which retired employees draw the majority of theirbenefit as an annuity. With effect from 1 April 2010, BP closed its UK plan to new joiners other than some of those joining the North Sea business.The plan remains open to ongoing accrual for those employees who had joined BP on or before 31 March 2010. The majority of new joiners in the UKhave the option to join a defined contribution plan.
In the US, a range of retirement arrangements is provided. This includes a funded final salary pension plan for certain heritage employees and a cashbalance arrangement for new hires. Retired US employees typically take their pension benefit in the form of a lump sum payment. US employees arealso eligible to participate in a defined contribution (401k) plan in which employee contributions are matched with company contributions.
The level of contributions to funded defined benefit plans is the amount needed to provide adequate funds to meet pension obligations as they falldue. During 2012, contributions of $884 million (2011 $429 million and 2010 $411 million) and $153 million (2011 $777 million and 2010 $694 million)were made to the UK plans and US plans respectively. In addition, contributions of $238 million (2011 $223 million and 2010 $188 million) were madeto other funded defined benefit plans. The aggregate level of contributions in 2013 is expected to be approximately $1,250 million, and includescontributions in all countries that we expect to be required to make by law or under contractual agreements as well as an allowance for discretionaryfunding.
Certain group companies, principally in the US, provide post-retirement healthcare and life insurance benefits to their retired employees anddependants. The entitlement to these benefits is usually based on the employee remaining in service until retirement age and completion of aminimum period of service. The plans are funded to a limited extent.
The obligation and cost of providing pensions and other post-retirement benefits is assessed annually using the projected unit credit method. The dateof the most recent actuarial review was 31 December 2012. The group’s principal plans are subject to a formal actuarial valuation every three years inthe UK, with valuations being required more frequently in many other countries. The most recent formal actuarial valuation of the UK pension planswas as at 31 December 2011.
The material financial assumptions used for estimating the benefit obligations of the various plans are set out below. The assumptions are reviewedby management at the end of each year, and are used to evaluate accrued pension and other post-retirement benefits at 31 December. The sameassumptions are used to determine pension and other post-retirement benefit expense for the following year, that is, the assumptions at31 December 2012 are used to determine the pension liabilities at that date and the pension expense for 2013.
%
Financial assumptions2012 2011
UK2010 2012 2011
US2010 2012 2011
Other2010
Discount rate for pension plan liabilities 4.4 4.8 5.5 3.2 4.3 4.7 3.6 4.7 5.3Discount rate for other post-retirement benefit plans n/a n/a n/a 3.7 4.5 5.3 n/a n/a n/aRate of increase in salaries 4.9 5.1 5.4 4.2 3.7 4.1 3.7 3.7 3.8Rate of increase for pensions in payment 3.1 3.2 3.5 – – – 1.7 1.7 1.8Rate of increase in deferred pensions 3.1 3.2 3.5 – – – 1.2 1.2 1.3Inflation 3.1 3.2 3.5 2.4 1.9 2.3 2.2 2.2 2.3
Our discount rate assumptions are based on third-party AA corporate bond indices and for our largest plans in the UK, US and Germany we use yieldsthat reflect the maturity profile of the expected benefit payments. The inflation rate assumptions for our UK and US plans are based on the differencebetween the yields on index-linked and fixed-interest long-term government bonds. In other countries we use either this approach, or the central bankinflation target, or advice from the local actuary depending on the information that is available to us. The inflation assumptions are used to determinethe rate of increase for pensions in payment and the rate of increase in deferred pensions where there is such an increase.
Financial statements 239BP Annual Report and Form 20-F 2012
Financial statements
36. Provisions continued
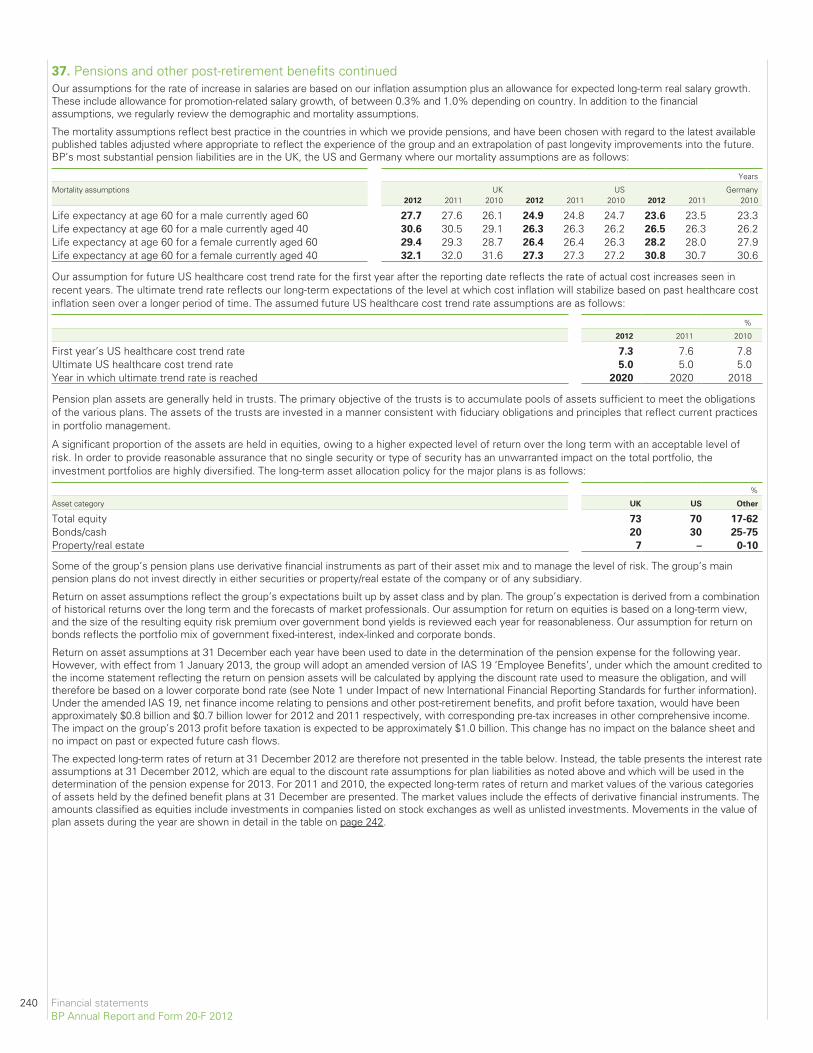
37. Pensions and other post-retirement benefits continuedOur assumptions for the rate of increase in salaries are based on our inflation assumption plus an allowance for expected long-term real salary growth.These include allowance for promotion-related salary growth, of between 0.3% and 1.0% depending on country. In addition to the financialassumptions, we regularly review the demographic and mortality assumptions.
The mortality assumptions reflect best practice in the countries in which we provide pensions, and have been chosen with regard to the latest availablepublished tables adjusted where appropriate to reflect the experience of the group and an extrapolation of past longevity improvements into the future.BP’s most substantial pension liabilities are in the UK, the US and Germany where our mortality assumptions are as follows:
Years
Mortality assumptions2012 2011
UK2010 2012 2011
US2010 2012 2011
Germany2010
Life expectancy at age 60 for a male currently aged 60 27.7 27.6 26.1 24.9 24.8 24.7 23.6 23.5 23.3Life expectancy at age 60 for a male currently aged 40 30.6 30.5 29.1 26.3 26.3 26.2 26.5 26.3 26.2Life expectancy at age 60 for a female currently aged 60 29.4 29.3 28.7 26.4 26.4 26.3 28.2 28.0 27.9Life expectancy at age 60 for a female currently aged 40 32.1 32.0 31.6 27.3 27.3 27.2 30.8 30.7 30.6
Our assumption for future US healthcare cost trend rate for the first year after the reporting date reflects the rate of actual cost increases seen inrecent years. The ultimate trend rate reflects our long-term expectations of the level at which cost inflation will stabilize based on past healthcare costinflation seen over a longer period of time. The assumed future US healthcare cost trend rate assumptions are as follows:
%
2012 2011 2010
First year’s US healthcare cost trend rate 7.3 7.6 7.8Ultimate US healthcare cost trend rate 5.0 5.0 5.0Year in which ultimate trend rate is reached 2020 2020 2018
Pension plan assets are generally held in trusts. The primary objective of the trusts is to accumulate pools of assets sufficient to meet the obligationsof the various plans. The assets of the trusts are invested in a manner consistent with fiduciary obligations and principles that reflect current practicesin portfolio management.
A significant proportion of the assets are held in equities, owing to a higher expected level of return over the long term with an acceptable level ofrisk. In order to provide reasonable assurance that no single security or type of security has an unwarranted impact on the total portfolio, theinvestment portfolios are highly diversified. The long-term asset allocation policy for the major plans is as follows:
%
Asset category UK US Other
Total equity 73 70 17-62
Bonds/cash 20 30 25-75
Property/real estate 7 – 0-10
Some of the group’s pension plans use derivative financial instruments as part of their asset mix and to manage the level of risk. The group’s mainpension plans do not invest directly in either securities or property/real estate of the company or of any subsidiary.
Return on asset assumptions reflect the group’s expectations built up by asset class and by plan. The group’s expectation is derived from a combinationof historical returns over the long term and the forecasts of market professionals. Our assumption for return on equities is based on a long-term view,and the size of the resulting equity risk premium over government bond yields is reviewed each year for reasonableness. Our assumption for return onbonds reflects the portfolio mix of government fixed-interest, index-linked and corporate bonds.
Return on asset assumptions at 31 December each year have been used to date in the determination of the pension expense for the following year.However, with effect from 1 January 2013, the group will adopt an amended version of IAS 19 ‘Employee Benefits’, under which the amount credited tothe income statement reflecting the return on pension assets will be calculated by applying the discount rate used to measure the obligation, and willtherefore be based on a lower corporate bond rate (see Note 1 under Impact of new International Financial Reporting Standards for further information).Under the amended IAS 19, net finance income relating to pensions and other post-retirement benefits, and profit before taxation, would have beenapproximately $0.8 billion and $0.7 billion lower for 2012 and 2011 respectively, with corresponding pre-tax increases in other comprehensive income.The impact on the group’s 2013 profit before taxation is expected to be approximately $1.0 billion. This change has no impact on the balance sheet andno impact on past or expected future cash flows.
The expected long-term rates of return at 31 December 2012 are therefore not presented in the table below. Instead, the table presents the interest rateassumptions at 31 December 2012, which are equal to the discount rate assumptions for plan liabilities as noted above and which will be used in thedetermination of the pension expense for 2013. For 2011 and 2010, the expected long-term rates of return and market values of the various categoriesof assets held by the defined benefit plans at 31 December are presented. The market values include the effects of derivative financial instruments. Theamounts classified as equities include investments in companies listed on stock exchanges as well as unlisted investments. Movements in the value ofplan assets during the year are shown in detail in the table on page 242.
240 Financial statementsBP Annual Report and Form 20-F 2012
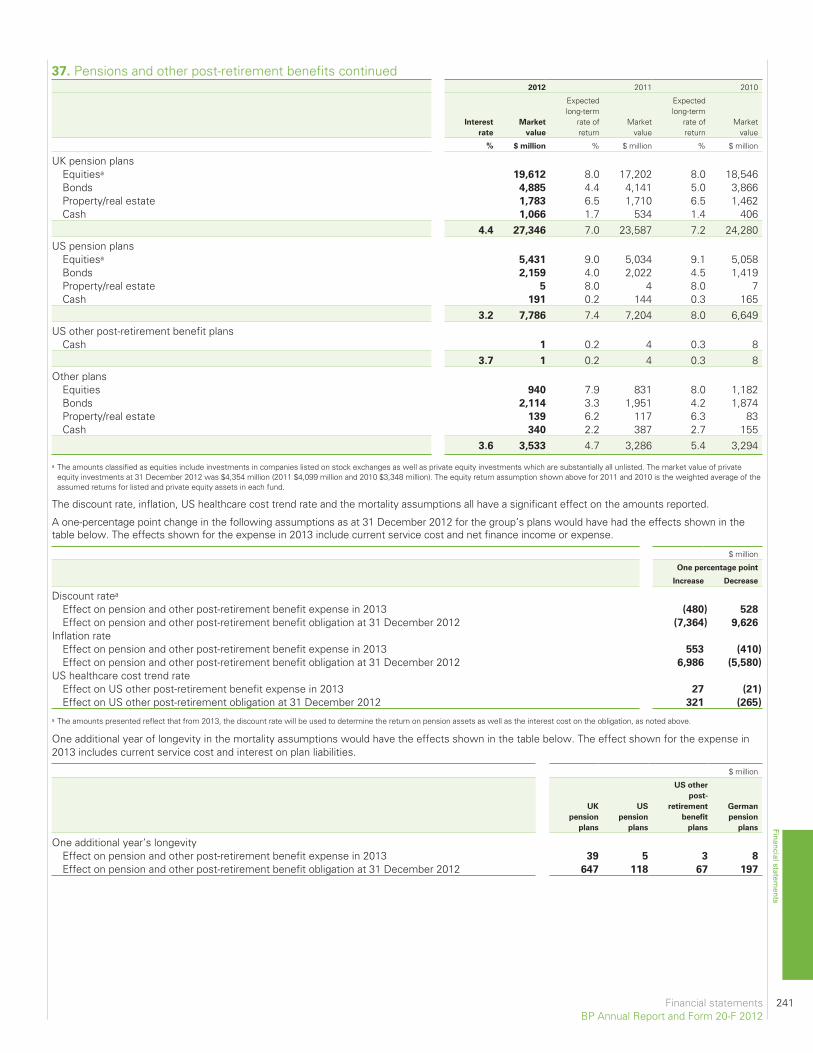
2012 2011 2010
Interest
rate
Market
value
Expectedlong-term
rate ofreturn
Marketvalue
Expectedlong-term
rate ofreturn
Marketvalue
% $ million % $ million % $ million
UK pension plansEquitiesa 19,612 8.0 17,202 8.0 18,546Bonds 4,885 4.4 4,141 5.0 3,866Property/real estate 1,783 6.5 1,710 6.5 1,462Cash 1,066 1.7 534 1.4 406
4.4 27,346 7.0 23,587 7.2 24,280US pension plans
Equitiesa 5,431 9.0 5,034 9.1 5,058Bonds 2,159 4.0 2,022 4.5 1,419Property/real estate 5 8.0 4 8.0 7Cash 191 0.2 144 0.3 165
3.2 7,786 7.4 7,204 8.0 6,649US other post-retirement benefit plans
Cash 1 0.2 4 0.3 83.7 1 0.2 4 0.3 8
Other plansEquities 940 7.9 831 8.0 1,182Bonds 2,114 3.3 1,951 4.2 1,874Property/real estate 139 6.2 117 6.3 83Cash 340 2.2 387 2.7 155
3.6 3,533 4.7 3,286 5.4 3,294
a The amounts classified as equities include investments in companies listed on stock exchanges as well as private equity investments which are substantially all unlisted. The market value of privateequity investments at 31 December 2012 was $4,354 million (2011 $4,099 million and 2010 $3,348 million). The equity return assumption shown above for 2011 and 2010 is the weighted average of theassumed returns for listed and private equity assets in each fund.
The discount rate, inflation, US healthcare cost trend rate and the mortality assumptions all have a significant effect on the amounts reported.
A one-percentage point change in the following assumptions as at 31 December 2012 for the group’s plans would have had the effects shown in thetable below. The effects shown for the expense in 2013 include current service cost and net finance income or expense.
$ million
One percentage point
Increase Decrease
Discount ratea
Effect on pension and other post-retirement benefit expense in 2013 (480) 528
Effect on pension and other post-retirement benefit obligation at 31 December 2012 (7,364) 9,626
Inflation rateEffect on pension and other post-retirement benefit expense in 2013 553 (410)
Effect on pension and other post-retirement benefit obligation at 31 December 2012 6,986 (5,580)
US healthcare cost trend rateEffect on US other post-retirement benefit expense in 2013 27 (21)
Effect on US other post-retirement obligation at 31 December 2012 321 (265)
a The amounts presented reflect that from 2013, the discount rate will be used to determine the return on pension assets as well as the interest cost on the obligation, as noted above.
One additional year of longevity in the mortality assumptions would have the effects shown in the table below. The effect shown for the expense in2013 includes current service cost and interest on plan liabilities.
$ million
UK
pension
plans
US
pension
plans
US other
post-
retirement
benefit
plans
German
pension
plans
One additional year’s longevityEffect on pension and other post-retirement benefit expense in 2013 39 5 3 8
Effect on pension and other post-retirement benefit obligation at 31 December 2012 647 118 67 197
Financial statements 241BP Annual Report and Form 20-F 2012
Financial statements
37. Pensions and other post-retirement benefits continued
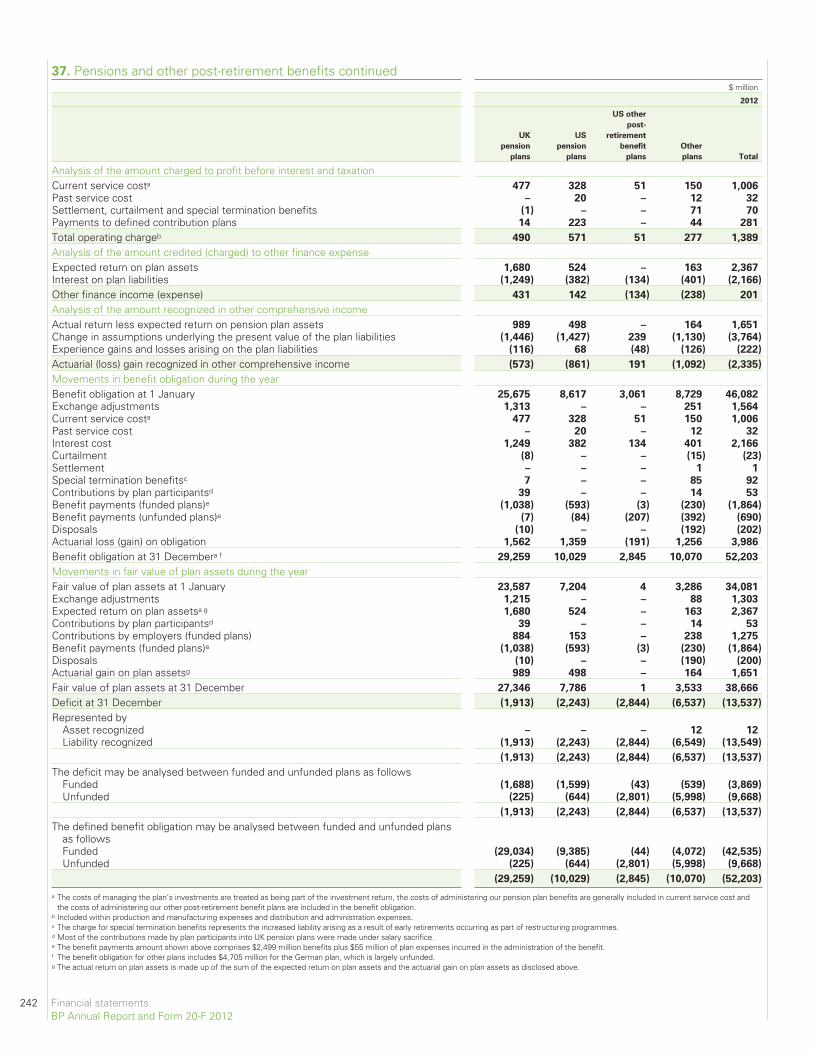
37. Pensions and other post-retirement benefits continued$ million
2012
UK
pension
plans
US
pension
plans
US other
post-
retirement
benefit
plans
Other
plans Total
Analysis of the amount charged to profit before interest and taxationCurrent service costa 477 328 51 150 1,006
Past service cost – 20 – 12 32
Settlement, curtailment and special termination benefits (1) – – 71 70
Payments to defined contribution plans 14 223 – 44 281
Total operating chargeb 490 571 51 277 1,389
Analysis of the amount credited (charged) to other finance expenseExpected return on plan assets 1,680 524 – 163 2,367
Interest on plan liabilities (1,249) (382) (134) (401) (2,166)
Other finance income (expense) 431 142 (134) (238) 201
Analysis of the amount recognized in other comprehensive incomeActual return less expected return on pension plan assets 989 498 – 164 1,651
Change in assumptions underlying the present value of the plan liabilities (1,446) (1,427) 239 (1,130) (3,764)
Experience gains and losses arising on the plan liabilities (116) 68 (48) (126) (222)
Actuarial (loss) gain recognized in other comprehensive income (573) (861) 191 (1,092) (2,335)
Movements in benefit obligation during the yearBenefit obligation at 1 January 25,675 8,617 3,061 8,729 46,082
Exchange adjustments 1,313 – – 251 1,564
Current service costa 477 328 51 150 1,006
Past service cost – 20 – 12 32
Interest cost 1,249 382 134 401 2,166
Curtailment (8) – – (15) (23)
Settlement – – – 1 1
Special termination benefitsc 7 – – 85 92
Contributions by plan participantsd 39 – – 14 53
Benefit payments (funded plans)e (1,038) (593) (3) (230) (1,864)
Benefit payments (unfunded plans)e (7) (84) (207) (392) (690)
Disposals (10) – – (192) (202)
Actuarial loss (gain) on obligation 1,562 1,359 (191) 1,256 3,986
Benefit obligation at 31 Decembera f 29,259 10,029 2,845 10,070 52,203
Movements in fair value of plan assets during the yearFair value of plan assets at 1 January 23,587 7,204 4 3,286 34,081
Exchange adjustments 1,215 – – 88 1,303
Expected return on plan assetsa g 1,680 524 – 163 2,367
Contributions by plan participantsd 39 – – 14 53
Contributions by employers (funded plans) 884 153 – 238 1,275
Benefit payments (funded plans)e (1,038) (593) (3) (230) (1,864)
Disposals (10) – – (190) (200)
Actuarial gain on plan assetsg 989 498 – 164 1,651
Fair value of plan assets at 31 December 27,346 7,786 1 3,533 38,666
Deficit at 31 December (1,913) (2,243) (2,844) (6,537) (13,537)
Represented byAsset recognized – – – 12 12
Liability recognized (1,913) (2,243) (2,844) (6,549) (13,549)
(1,913) (2,243) (2,844) (6,537) (13,537)
The deficit may be analysed between funded and unfunded plans as followsFunded (1,688) (1,599) (43) (539) (3,869)
Unfunded (225) (644) (2,801) (5,998) (9,668)
(1,913) (2,243) (2,844) (6,537) (13,537)
The defined benefit obligation may be analysed between funded and unfunded plansas followsFunded (29,034) (9,385) (44) (4,072) (42,535)
Unfunded (225) (644) (2,801) (5,998) (9,668)
(29,259) (10,029) (2,845) (10,070) (52,203)
a The costs of managing the plan’s investments are treated as being part of the investment return, the costs of administering our pension plan benefits are generally included in current service cost andthe costs of administering our other post-retirement benefit plans are included in the benefit obligation.
b Included within production and manufacturing expenses and distribution and administration expenses.c The charge for special termination benefits represents the increased liability arising as a result of early retirements occurring as part of restructuring programmes.d Most of the contributions made by plan participants into UK pension plans were made under salary sacrifice.e The benefit payments amount shown above comprises $2,499 million benefits plus $55 million of plan expenses incurred in the administration of the benefit.f The benefit obligation for other plans includes $4,705 million for the German plan, which is largely unfunded.g The actual return on plan assets is made up of the sum of the expected return on plan assets and the actuarial gain on plan assets as disclosed above.
242 Financial statementsBP Annual Report and Form 20-F 2012
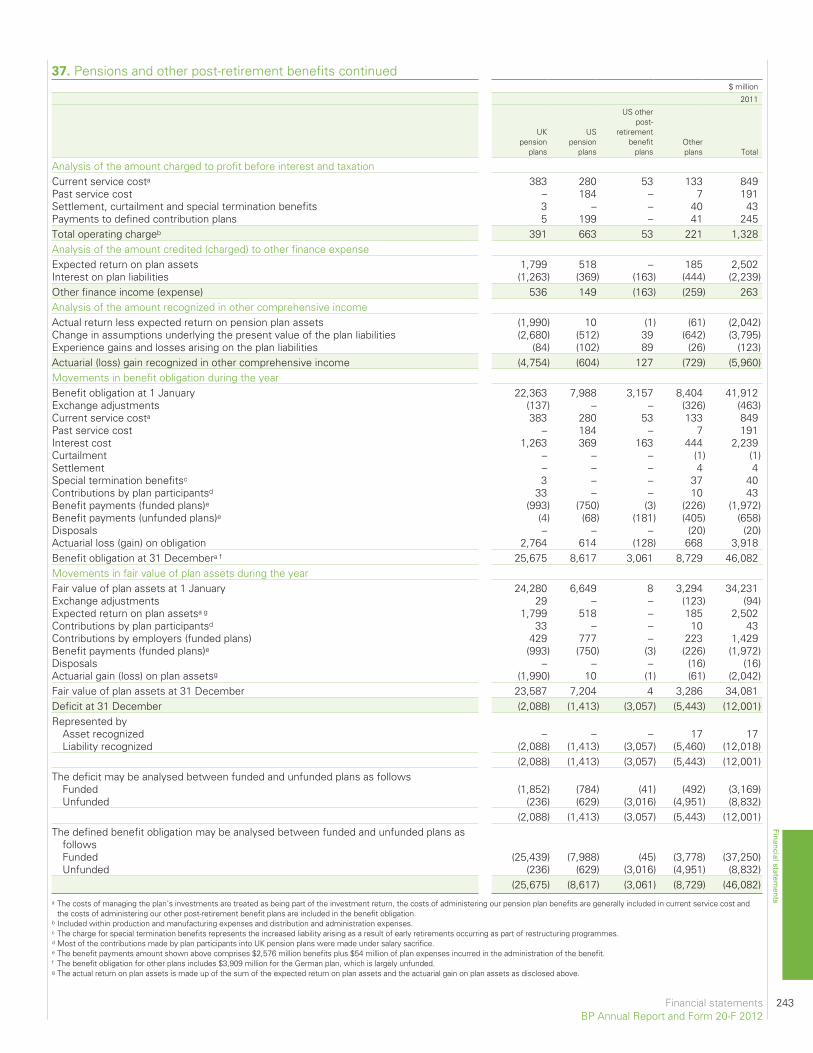
$ million
2011
UKpension
plans
USpension
plans
US otherpost-
retirementbenefit
plansOtherplans Total
Analysis of the amount charged to profit before interest and taxationCurrent service costa 383 280 53 133 849Past service cost – 184 – 7 191Settlement, curtailment and special termination benefits 3 – – 40 43Payments to defined contribution plans 5 199 – 41 245Total operating chargeb 391 663 53 221 1,328Analysis of the amount credited (charged) to other finance expenseExpected return on plan assets 1,799 518 – 185 2,502Interest on plan liabilities (1,263) (369) (163) (444) (2,239)Other finance income (expense) 536 149 (163) (259) 263Analysis of the amount recognized in other comprehensive incomeActual return less expected return on pension plan assets (1,990) 10 (1) (61) (2,042)Change in assumptions underlying the present value of the plan liabilities (2,680) (512) 39 (642) (3,795)Experience gains and losses arising on the plan liabilities (84) (102) 89 (26) (123)Actuarial (loss) gain recognized in other comprehensive income (4,754) (604) 127 (729) (5,960)Movements in benefit obligation during the yearBenefit obligation at 1 January 22,363 7,988 3,157 8,404 41,912Exchange adjustments (137) – – (326) (463)Current service costa 383 280 53 133 849Past service cost – 184 – 7 191Interest cost 1,263 369 163 444 2,239Curtailment – – – (1) (1)Settlement – – – 4 4Special termination benefitsc 3 – – 37 40Contributions by plan participantsd 33 – – 10 43Benefit payments (funded plans)e (993) (750) (3) (226) (1,972)Benefit payments (unfunded plans)e (4) (68) (181) (405) (658)Disposals – – – (20) (20)Actuarial loss (gain) on obligation 2,764 614 (128) 668 3,918Benefit obligation at 31 Decembera f 25,675 8,617 3,061 8,729 46,082Movements in fair value of plan assets during the yearFair value of plan assets at 1 January 24,280 6,649 8 3,294 34,231Exchange adjustments 29 – – (123) (94)Expected return on plan assetsa g 1,799 518 – 185 2,502Contributions by plan participantsd 33 – – 10 43Contributions by employers (funded plans) 429 777 – 223 1,429Benefit payments (funded plans)e (993) (750) (3) (226) (1,972)Disposals – – – (16) (16)Actuarial gain (loss) on plan assetsg (1,990) 10 (1) (61) (2,042)Fair value of plan assets at 31 December 23,587 7,204 4 3,286 34,081Deficit at 31 December (2,088) (1,413) (3,057) (5,443) (12,001)Represented by
Asset recognized – – – 17 17Liability recognized (2,088) (1,413) (3,057) (5,460) (12,018)
(2,088) (1,413) (3,057) (5,443) (12,001)The deficit may be analysed between funded and unfunded plans as follows
Funded (1,852) (784) (41) (492) (3,169)Unfunded (236) (629) (3,016) (4,951) (8,832)
(2,088) (1,413) (3,057) (5,443) (12,001)The defined benefit obligation may be analysed between funded and unfunded plans as
followsFunded (25,439) (7,988) (45) (3,778) (37,250)Unfunded (236) (629) (3,016) (4,951) (8,832)
(25,675) (8,617) (3,061) (8,729) (46,082)a The costs of managing the plan’s investments are treated as being part of the investment return, the costs of administering our pension plan benefits are generally included in current service cost and
the costs of administering our other post-retirement benefit plans are included in the benefit obligation.b Included within production and manufacturing expenses and distribution and administration expenses.c The charge for special termination benefits represents the increased liability arising as a result of early retirements occurring as part of restructuring programmes.d Most of the contributions made by plan participants into UK pension plans were made under salary sacrifice.e The benefit payments amount shown above comprises $2,576 million benefits plus $54 million of plan expenses incurred in the administration of the benefit.f The benefit obligation for other plans includes $3,909 million for the German plan, which is largely unfunded.g The actual return on plan assets is made up of the sum of the expected return on plan assets and the actuarial gain on plan assets as disclosed above.
Financial statements 243BP Annual Report and Form 20-F 2012
Financial statements
37. Pensions and other post-retirement benefits continued

37. Pensions and other post-retirement benefits continued$ million
2010
UKpension
plans
USpension
plans
US otherpost-
retirementbenefit
plansOtherplans Total
Analysis of the amount charged to profit before interest and taxationCurrent service costa 393 241 48 120 802Past service cost – – – 3 3Settlement, curtailment and special termination benefits 24 – – 161 185Payments to defined contribution plans 1 187 – 35 223Total operating chargeb 418 428 48 319 1,213Analysis of the amount credited (charged) to other finance expenseExpected return on plan assets 1,580 465 1 178 2,224Interest on plan liabilities (1,183) (396) (169) (429) (2,177)Other finance income (expense) 397 69 (168) (251) 47Analysis of the amount recognized in other comprehensive incomeActual return less expected return on pension plan assets 1,577 425 (1) 36 2,037Change in assumptions underlying the present value of the plan liabilities (1,144) (498) (132) (489) (2,263)Experience gains and losses arising on the plan liabilities 12 (167) (8) 69 (94)Actuarial (loss) gain recognized in other comprehensive income 445 (240) (141) (384) (320)a The costs of managing the plan’s investments are treated as being part of the investment return, the costs of administering our pension plan benefits are generally included in current service cost and
the costs of administering our other post-retirement benefit plans are included in the benefit obligation.b Included within production and manufacturing expenses and distribution and administration expenses.
At 31 December 2012, reimbursement balances due from or to other companies in respect of pensions amounted to $732 million reimbursementassets (2011 $546 million) and $15 million reimbursement liabilities (2011 $13 million). These balances are not included as part of the pension surplusesand deficits, but are reflected within other receivables and other payables in the group balance sheet.
$ million
2012 2011 2010 2009 2008
History of surplus (deficit) and of experience gains and lossesBenefit obligation at 31 December 52,203 46,082 41,912 40,073 34,847Fair value of plan assets at 31 December 38,666 34,081 34,231 31,453 26,154Deficit (13,537) (12,001) (7,681) (8,620) (8,693)Experience losses on plan liabilities (222) (123) (94) (421) (178)Actual return less expected return on pension plan assets 1,651 (2,042) 2,037 2,549 (10,253)Actual return on plan assets 4,018 460 4,261 4,528 (7,331)Actuarial loss recognized in other comprehensive income (2,335) (5,960) (320) (682) (8,430)Cumulative amount recognized in other comprehensive income (12,237) (9,902) (3,942) (3,622) (2,940)
Estimated future benefit payments
The expected benefit payments, which reflect expected future service, as appropriate, but exclude plan expenses, up until 2022 are as follows:$ million
UK
pension
plans
US
pension
plans
US
other post-
retirement
benefit
plans
Other
plans Total
2013 1,115 813 167 560 2,655
2014 1,163 829 169 568 2,729
2015 1,211 847 171 567 2,796
2016 1,268 851 173 561 2,853
2017 1,276 849 173 554 2,852
2018-2022 7,059 4,003 851 2,659 14,572
244 Financial statementsBP Annual Report and Form 20-F 2012
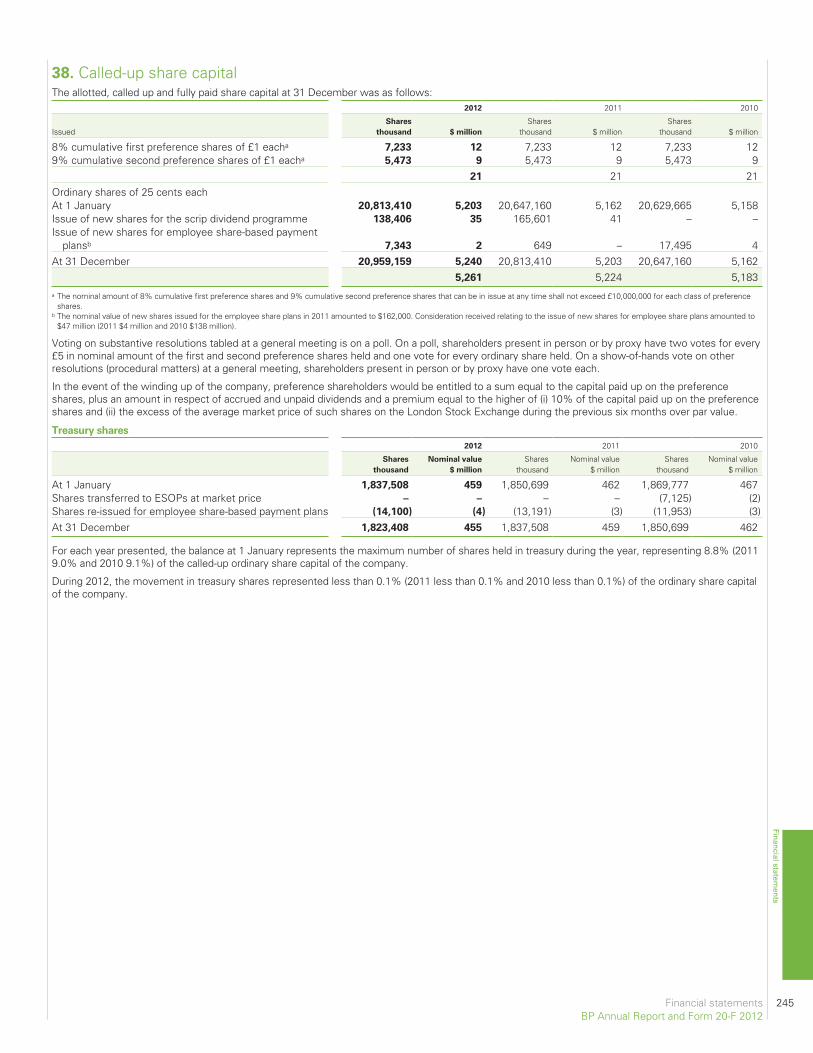
38. Called-up share capitalThe allotted, called up and fully paid share capital at 31 December was as follows:
2012 2011 2010
IssuedShares
thousand $ million
Sharesthousand $ million
Sharesthousand $ million
8% cumulative first preference shares of £1 eacha 7,233 12 7,233 12 7,233 129% cumulative second preference shares of £1 eacha 5,473 9 5,473 9 5,473 9
21 21 21Ordinary shares of 25 cents eachAt 1 January 20,813,410 5,203 20,647,160 5,162 20,629,665 5,158Issue of new shares for the scrip dividend programme 138,406 35 165,601 41 – –Issue of new shares for employee share-based payment
plansb 7,343 2 649 – 17,495 4At 31 December 20,959,159 5,240 20,813,410 5,203 20,647,160 5,162
5,261 5,224 5,183a The nominal amount of 8% cumulative first preference shares and 9% cumulative second preference shares that can be in issue at any time shall not exceed £10,000,000 for each class of preference
shares.b The nominal value of new shares issued for the employee share plans in 2011 amounted to $162,000. Consideration received relating to the issue of new shares for employee share plans amounted to
$47 million (2011 $4 million and 2010 $138 million).
Voting on substantive resolutions tabled at a general meeting is on a poll. On a poll, shareholders present in person or by proxy have two votes for every£5 in nominal amount of the first and second preference shares held and one vote for every ordinary share held. On a show-of-hands vote on otherresolutions (procedural matters) at a general meeting, shareholders present in person or by proxy have one vote each.
In the event of the winding up of the company, preference shareholders would be entitled to a sum equal to the capital paid up on the preferenceshares, plus an amount in respect of accrued and unpaid dividends and a premium equal to the higher of (i) 10% of the capital paid up on the preferenceshares and (ii) the excess of the average market price of such shares on the London Stock Exchange during the previous six months over par value.
Treasury shares
2012 2011 2010
Shares
thousand
Nominal value
$ million
Sharesthousand
Nominal value$ million
Sharesthousand
Nominal value$ million
At 1 January 1,837,508 459 1,850,699 462 1,869,777 467Shares transferred to ESOPs at market price – – – – (7,125) (2)Shares re-issued for employee share-based payment plans (14,100) (4) (13,191) (3) (11,953) (3)At 31 December 1,823,408 455 1,837,508 459 1,850,699 462
For each year presented, the balance at 1 January represents the maximum number of shares held in treasury during the year, representing 8.8% (20119.0% and 2010 9.1%) of the called-up ordinary share capital of the company.
During 2012, the movement in treasury shares represented less than 0.1% (2011 less than 0.1% and 2010 less than 0.1%) of the ordinary share capitalof the company.
Financial statements 245BP Annual Report and Form 20-F 2012
Financial statements
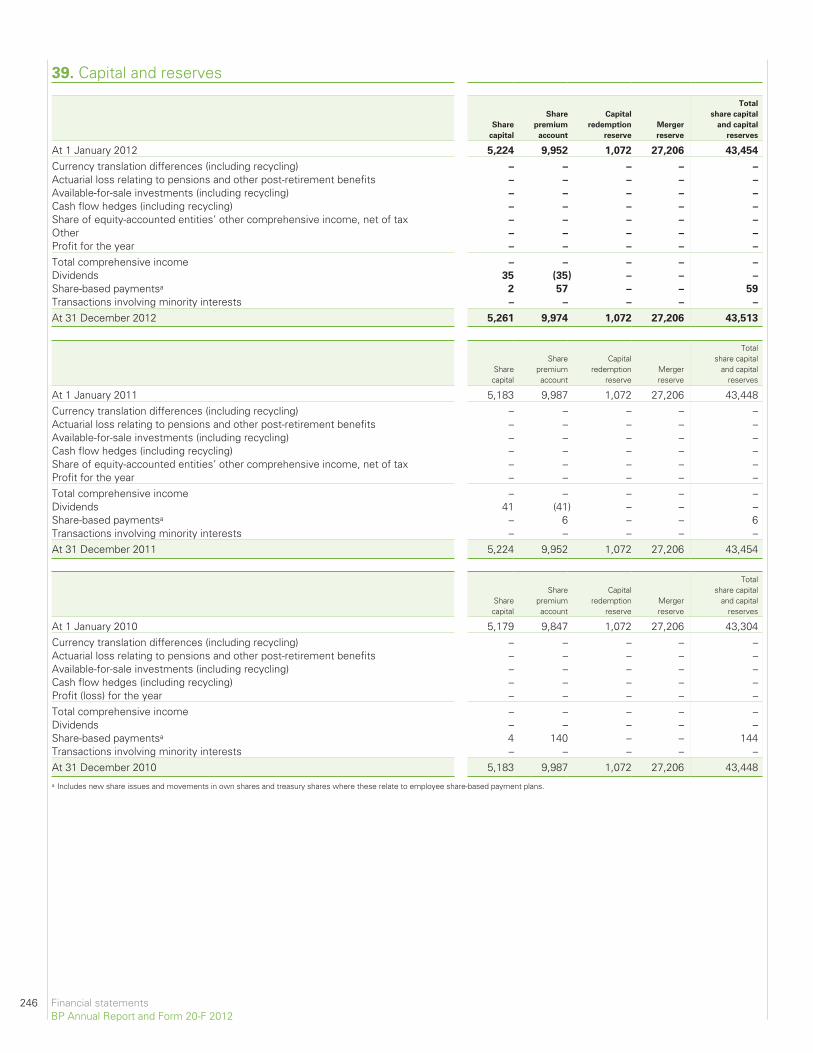
39. Capital and reserves
Share
capital
Share
premium
account
Capital
redemption
reserve
Merger
reserve
Total
share capital
and capital
reserves
At 1 January 2012 5,224 9,952 1,072 27,206 43,454
Currency translation differences (including recycling) – – – – –
Actuarial loss relating to pensions and other post-retirement benefits – – – – –
Available-for-sale investments (including recycling) – – – – –
Cash flow hedges (including recycling) – – – – –
Share of equity-accounted entities’ other comprehensive income, net of tax – – – – –
Other – – – – –
Profit for the year – – – – –
Total comprehensive income – – – – –
Dividends 35 (35) – – –
Share-based paymentsa 2 57 – – 59
Transactions involving minority interests – – – – –
At 31 December 2012 5,261 9,974 1,072 27,206 43,513
Sharecapital
Sharepremiumaccount
Capitalredemption
reserveMergerreserve
Totalshare capital
and capitalreserves
At 1 January 2011 5,183 9,987 1,072 27,206 43,448Currency translation differences (including recycling) – – – – –Actuarial loss relating to pensions and other post-retirement benefits – – – – –Available-for-sale investments (including recycling) – – – – –Cash flow hedges (including recycling) – – – – –Share of equity-accounted entities’ other comprehensive income, net of tax – – – – –Profit for the year – – – – –Total comprehensive income – – – – –Dividends 41 (41) – – –Share-based paymentsa – 6 – – 6Transactions involving minority interests – – – – –At 31 December 2011 5,224 9,952 1,072 27,206 43,454
Sharecapital
Sharepremiumaccount
Capitalredemption
reserveMergerreserve
Totalshare capital
and capitalreserves
At 1 January 2010 5,179 9,847 1,072 27,206 43,304Currency translation differences (including recycling) – – – – –Actuarial loss relating to pensions and other post-retirement benefits – – – – –Available-for-sale investments (including recycling) – – – – –Cash flow hedges (including recycling) – – – – –Profit (loss) for the year – – – – –Total comprehensive income – – – – –Dividends – – – – –Share-based paymentsa 4 140 – – 144Transactions involving minority interests – – – – –At 31 December 2010 5,183 9,987 1,072 27,206 43,448a Includes new share issues and movements in own shares and treasury shares where these relate to employee share-based payment plans.
246 Financial statementsBP Annual Report and Form 20-F 2012
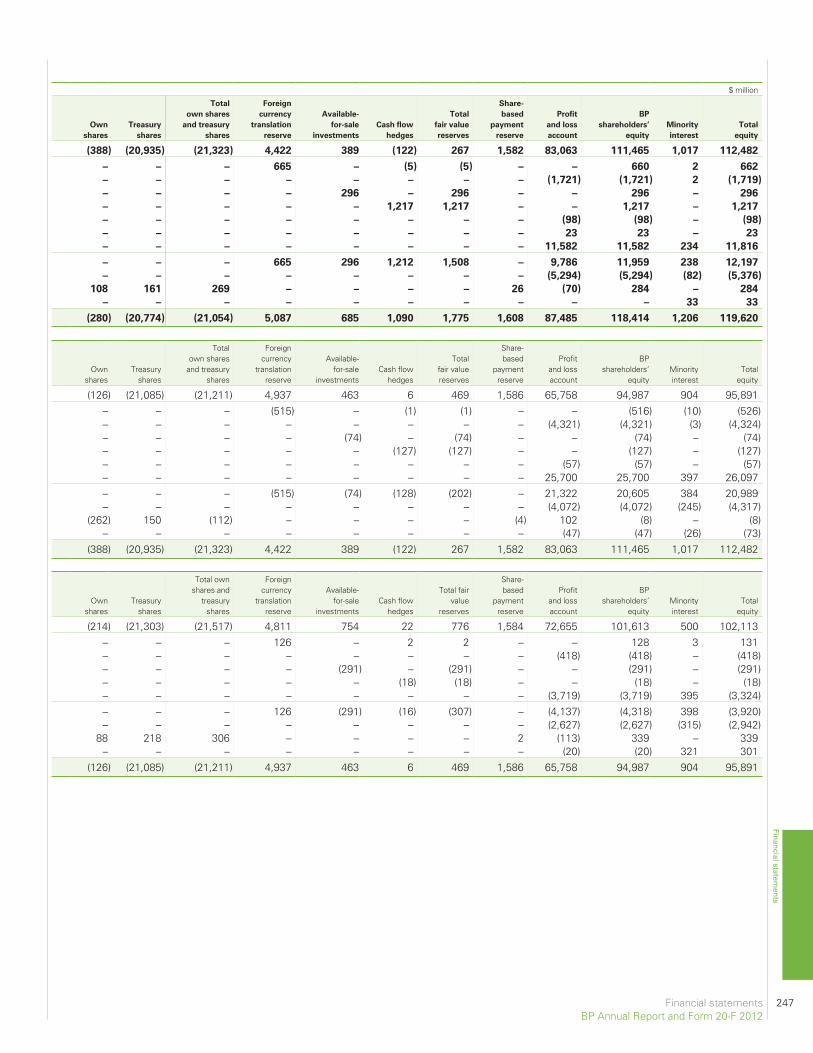
$ million
Own
shares
Treasury
shares
Total
own shares
and treasury
shares
Foreign
currency
translation
reserve
Available-
for-sale
investments
Cash flow
hedges
Total
fair value
reserves
Share-
based
payment
reserve
Profit
and loss
account
BP
shareholders’
equity
Minority
interest
Total
equity
(388) (20,935) (21,323) 4,422 389 (122) 267 1,582 83,063 111,465 1,017 112,482
– – – 665 – (5) (5) – – 660 2 662
– – – – – – – – (1,721) (1,721) 2 (1,719)
– – – – 296 – 296 – – 296 – 296
– – – – – 1,217 1,217 – – 1,217 – 1,217
– – – – – – – – (98) (98) – (98)
– – – – – – – – 23 23 – 23
– – – – – – – – 11,582 11,582 234 11,816
– – – 665 296 1,212 1,508 – 9,786 11,959 238 12,197
– – – – – – – – (5,294) (5,294) (82) (5,376)
108 161 269 – – – – 26 (70) 284 – 284
– – – – – – – – – – 33 33
(280) (20,774) (21,054) 5,087 685 1,090 1,775 1,608 87,485 118,414 1,206 119,620
Ownshares
Treasuryshares
Totalown shares
and treasuryshares
Foreigncurrency
translationreserve
Available-for-sale
investmentsCash flow
hedges
Totalfair valuereserves
Share-based
paymentreserve
Profitand lossaccount
BPshareholders’
equityMinorityinterest
Totalequity
(126) (21,085) (21,211) 4,937 463 6 469 1,586 65,758 94,987 904 95,891– – – (515) – (1) (1) – – (516) (10) (526)– – – – – – – – (4,321) (4,321) (3) (4,324)– – – – (74) – (74) – – (74) – (74)– – – – – (127) (127) – – (127) – (127)– – – – – – – – (57) (57) – (57)– – – – – – – – 25,700 25,700 397 26,097– – – (515) (74) (128) (202) – 21,322 20,605 384 20,989– – – – – – – – (4,072) (4,072) (245) (4,317)
(262) 150 (112) – – – – (4) 102 (8) – (8)– – – – – – – – (47) (47) (26) (73)
(388) (20,935) (21,323) 4,422 389 (122) 267 1,582 83,063 111,465 1,017 112,482
Ownshares
Treasuryshares
Total ownshares and
treasuryshares
Foreigncurrency
translationreserve
Available-for-sale
investmentsCash flow
hedges
Total fairvalue
reserves
Share-based
paymentreserve
Profitand lossaccount
BPshareholders’
equityMinorityinterest
Totalequity
(214) (21,303) (21,517) 4,811 754 22 776 1,584 72,655 101,613 500 102,113– – – 126 – 2 2 – – 128 3 131– – – – – – – – (418) (418) – (418)– – – – (291) – (291) – – (291) – (291)– – – – – (18) (18) – – (18) – (18)– – – – – – – – (3,719) (3,719) 395 (3,324)– – – 126 (291) (16) (307) – (4,137) (4,318) 398 (3,920)– – – – – – – – (2,627) (2,627) (315) (2,942)
88 218 306 – – – – 2 (113) 339 – 339– – – – – – – – (20) (20) 321 301
(126) (21,085) (21,211) 4,937 463 6 469 1,586 65,758 94,987 904 95,891
Financial statements 247BP Annual Report and Form 20-F 2012
Financial statements

39. Capital and reserves continuedShare capital
The balance on the share capital account represents the aggregate nominal value of all ordinary and preference shares in issue, including treasuryshares.
Share premium account
The balance on the share premium account represents the amounts received in excess of the nominal value of the ordinary and preference shares.
Capital redemption reserve
The balance on the capital redemption reserve represents the aggregate nominal value of all the ordinary shares repurchased and cancelled.
Merger reserve
The balance on the merger reserve represents the fair value of the consideration given in excess of the nominal value of the ordinary shares issued in anacquisition made by the issue of shares.
Own shares
Own shares represent BP shares held in Employee Share Ownership Plans (ESOPs) to meet the future requirements of the employee share-basedpayment plans. The ESOPs have waived their rights to dividends on shares held for future awards and are funded by the group. Until such time as thecompany’s own shares held by the ESOPs vest unconditionally to employees, the amount paid for those shares is shown as a reduction in shareholders’equity. Assets and liabilities of the ESOPs are recognized as assets and liabilities of the group.
At 31 December 2012, the ESOPs held 22,428,179 shares (2011 27,784,503 shares and 2010 11,477,253 shares) for potential future awards, which hada market value of $154 million (2011 $197 million and 2010 $82 million). At 31 December 2012, a further 18,673,926 ordinary share equivalents(2011 21,420,000 ordinary share equivalents) were held by the group in the form of ADSs to meet the requirements of employee share-based paymentplans in the US.
Treasury shares
Treasury shares represent BP shares repurchased and available for re-issue.
Foreign currency translation reserve
The foreign currency translation reserve records exchange differences arising from the translation of the financial statements of foreign operations.Upon disposal of foreign operations, the related accumulated exchange differences are recycled to the income statement.
Available-for-sale investments
This reserve records the changes in fair value of available-for-sale investments. On disposal or impairment of the investments, the cumulative changesin fair value are recycled to the income statement.
Cash flow hedges
This reserve records the portion of the gain or loss on a hedging instrument in a cash flow hedge that is determined to be an effective hedge. For furtherinformation see Note 1.
Share-based payment reserve
This reserve represents cumulative amounts charged to profit in respect of employee share-based payment plans where the scheme has not yet beensettled by means of an award of shares to an individual.
Profit and loss account
The balance held on this reserve is the accumulated retained profits of the group.
248 Financial statementsBP Annual Report and Form 20-F 2012
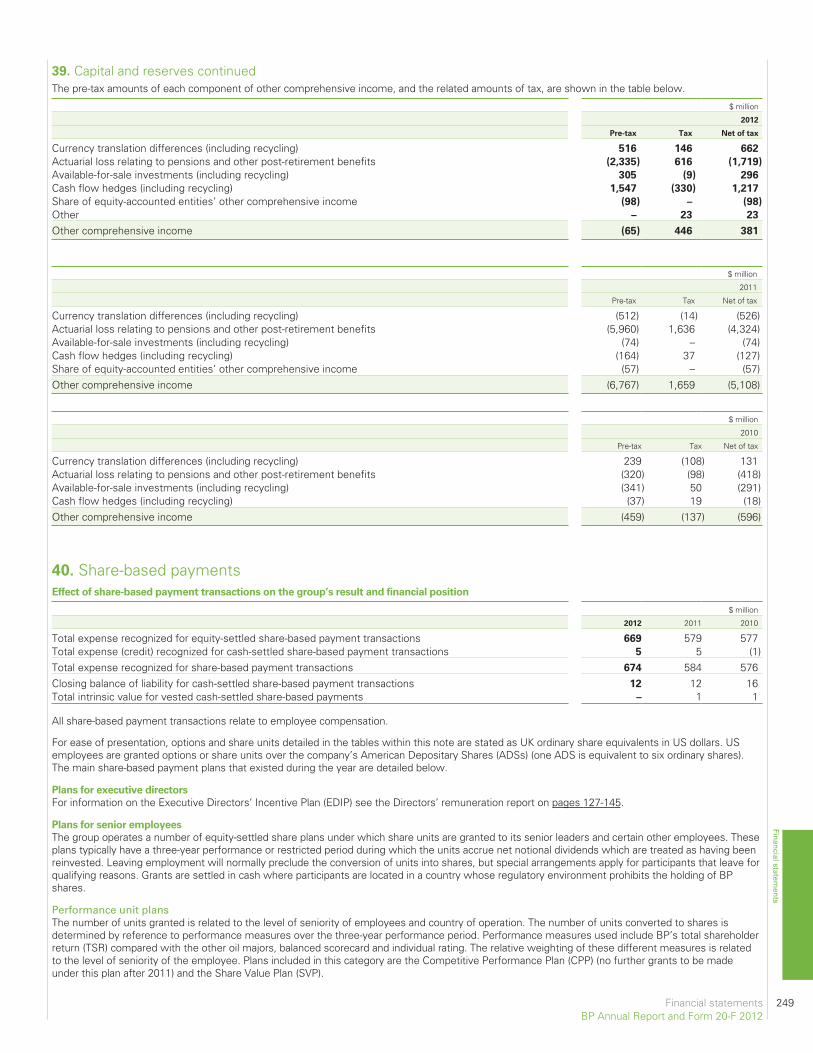
The pre-tax amounts of each component of other comprehensive income, and the related amounts of tax, are shown in the table below.
$ million
2012
Pre-tax Tax Net of tax
Currency translation differences (including recycling) 516 146 662
Actuarial loss relating to pensions and other post-retirement benefits (2,335) 616 (1,719)
Available-for-sale investments (including recycling) 305 (9) 296
Cash flow hedges (including recycling) 1,547 (330) 1,217
Share of equity-accounted entities’ other comprehensive income (98) – (98)
Other – 23 23
Other comprehensive income (65) 446 381
$ million
2011
Pre-tax Tax Net of tax
Currency translation differences (including recycling) (512) (14) (526)Actuarial loss relating to pensions and other post-retirement benefits (5,960) 1,636 (4,324)Available-for-sale investments (including recycling) (74) – (74)Cash flow hedges (including recycling) (164) 37 (127)Share of equity-accounted entities’ other comprehensive income (57) – (57)Other comprehensive income (6,767) 1,659 (5,108)
$ million
2010
Pre-tax Tax Net of tax
Currency translation differences (including recycling) 239 (108) 131Actuarial loss relating to pensions and other post-retirement benefits (320) (98) (418)Available-for-sale investments (including recycling) (341) 50 (291)Cash flow hedges (including recycling) (37) 19 (18)Other comprehensive income (459) (137) (596)
40. Share-based paymentsEffect of share-based payment transactions on the group’s result and financial position
$ million
2012 2011 2010
Total expense recognized for equity-settled share-based payment transactions 669 579 577Total expense (credit) recognized for cash-settled share-based payment transactions 5 5 (1)Total expense recognized for share-based payment transactions 674 584 576Closing balance of liability for cash-settled share-based payment transactions 12 12 16Total intrinsic value for vested cash-settled share-based payments – 1 1
All share-based payment transactions relate to employee compensation.
For ease of presentation, options and share units detailed in the tables within this note are stated as UK ordinary share equivalents in US dollars. USemployees are granted options or share units over the company’s American Depositary Shares (ADSs) (one ADS is equivalent to six ordinary shares).The main share-based payment plans that existed during the year are detailed below.
Plans for executive directors
For information on the Executive Directors’ Incentive Plan (EDIP) see the Directors’ remuneration report on pages 127-145.
Plans for senior employees
The group operates a number of equity-settled share plans under which share units are granted to its senior leaders and certain other employees. Theseplans typically have a three-year performance or restricted period during which the units accrue net notional dividends which are treated as having beenreinvested. Leaving employment will normally preclude the conversion of units into shares, but special arrangements apply for participants that leave forqualifying reasons. Grants are settled in cash where participants are located in a country whose regulatory environment prohibits the holding of BPshares.
Performance unit plansThe number of units granted is related to the level of seniority of employees and country of operation. The number of units converted to shares isdetermined by reference to performance measures over the three-year performance period. Performance measures used include BP’s total shareholderreturn (TSR) compared with the other oil majors, balanced scorecard and individual rating. The relative weighting of these different measures is relatedto the level of seniority of the employee. Plans included in this category are the Competitive Performance Plan (CPP) (no further grants to be madeunder this plan after 2011) and the Share Value Plan (SVP).
Financial statements 249BP Annual Report and Form 20-F 2012
Financial statements
39. Capital and reserves continued
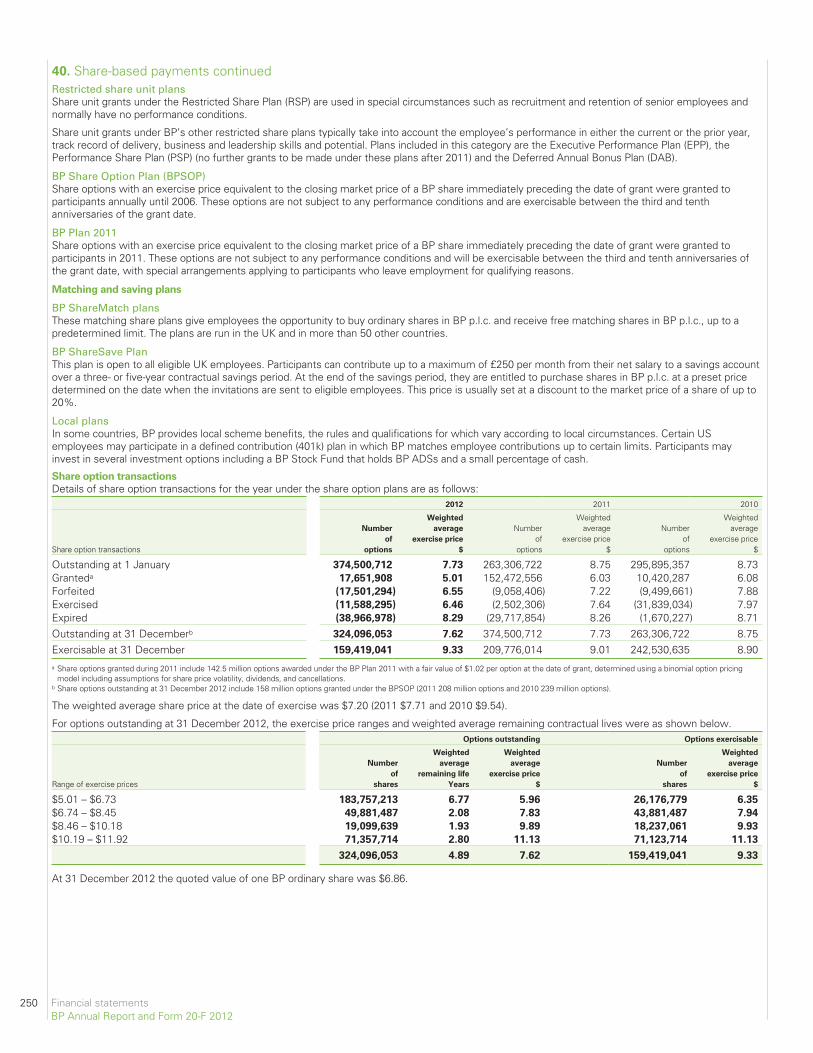
40. Share-based payments continuedRestricted share unit plansShare unit grants under the Restricted Share Plan (RSP) are used in special circumstances such as recruitment and retention of senior employees andnormally have no performance conditions.
Share unit grants under BP’s other restricted share plans typically take into account the employee’s performance in either the current or the prior year,track record of delivery, business and leadership skills and potential. Plans included in this category are the Executive Performance Plan (EPP), thePerformance Share Plan (PSP) (no further grants to be made under these plans after 2011) and the Deferred Annual Bonus Plan (DAB).
BP Share Option Plan (BPSOP)Share options with an exercise price equivalent to the closing market price of a BP share immediately preceding the date of grant were granted toparticipants annually until 2006. These options are not subject to any performance conditions and are exercisable between the third and tenthanniversaries of the grant date.
BP Plan 2011Share options with an exercise price equivalent to the closing market price of a BP share immediately preceding the date of grant were granted toparticipants in 2011. These options are not subject to any performance conditions and will be exercisable between the third and tenth anniversaries ofthe grant date, with special arrangements applying to participants who leave employment for qualifying reasons.
Matching and saving plans
BP ShareMatch plansThese matching share plans give employees the opportunity to buy ordinary shares in BP p.l.c. and receive free matching shares in BP p.l.c., up to apredetermined limit. The plans are run in the UK and in more than 50 other countries.
BP ShareSave PlanThis plan is open to all eligible UK employees. Participants can contribute up to a maximum of £250 per month from their net salary to a savings accountover a three- or five-year contractual savings period. At the end of the savings period, they are entitled to purchase shares in BP p.l.c. at a preset pricedetermined on the date when the invitations are sent to eligible employees. This price is usually set at a discount to the market price of a share of up to20%.
Local plansIn some countries, BP provides local scheme benefits, the rules and qualifications for which vary according to local circumstances. Certain USemployees may participate in a defined contribution (401k) plan in which BP matches employee contributions up to certain limits. Participants mayinvest in several investment options including a BP Stock Fund that holds BP ADSs and a small percentage of cash.
Share option transactions
Details of share option transactions for the year under the share option plans are as follows:2012 2011 2010
Share option transactions
Number
of
options
Weighted
average
exercise price
$
Numberof
options
Weightedaverage
exercise price$
Numberof
options
Weightedaverage
exercise price$
Outstanding at 1 January 374,500,712 7.73 263,306,722 8.75 295,895,357 8.73Granteda 17,651,908 5.01 152,472,556 6.03 10,420,287 6.08Forfeited (17,501,294) 6.55 (9,058,406) 7.22 (9,499,661) 7.88Exercised (11,588,295) 6.46 (2,502,306) 7.64 (31,839,034) 7.97Expired (38,966,978) 8.29 (29,717,854) 8.26 (1,670,227) 8.71Outstanding at 31 Decemberb 324,096,053 7.62 374,500,712 7.73 263,306,722 8.75Exercisable at 31 December 159,419,041 9.33 209,776,014 9.01 242,530,635 8.90a Share options granted during 2011 include 142.5 million options awarded under the BP Plan 2011 with a fair value of $1.02 per option at the date of grant, determined using a binomial option pricing
model including assumptions for share price volatility, dividends, and cancellations.b Share options outstanding at 31 December 2012 include 158 million options granted under the BPSOP (2011 208 million options and 2010 239 million options).
The weighted average share price at the date of exercise was $7.20 (2011 $7.71 and 2010 $9.54).
For options outstanding at 31 December 2012, the exercise price ranges and weighted average remaining contractual lives were as shown below.Options outstanding Options exercisable
Range of exercise prices
Number
of
shares
Weighted
average
remaining life
Years
Weighted
average
exercise price
$
Number
of
shares
Weighted
average
exercise price
$
$5.01 – $6.73 183,757,213 6.77 5.96 26,176,779 6.35
$6.74 – $8.45 49,881,487 2.08 7.83 43,881,487 7.94
$8.46 – $10.18 19,099,639 1.93 9.89 18,237,061 9.93
$10.19 – $11.92 71,357,714 2.80 11.13 71,123,714 11.13
324,096,053 4.89 7.62 159,419,041 9.33
At 31 December 2012 the quoted value of one BP ordinary share was $6.86.
250 Financial statementsBP Annual Report and Form 20-F 2012
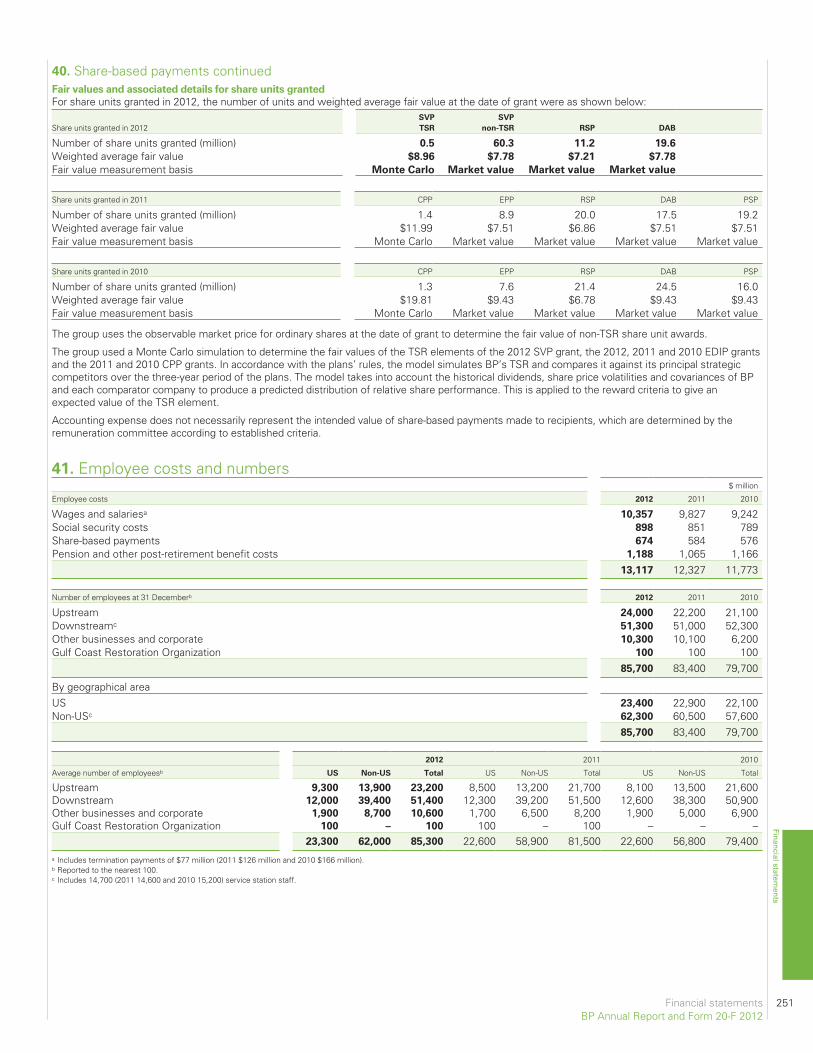
Fair values and associated details for share units granted
For share units granted in 2012, the number of units and weighted average fair value at the date of grant were as shown below:
Share units granted in 2012SVP
TSR
SVP
non-TSR RSP DAB
Number of share units granted (million) 0.5 60.3 11.2 19.6
Weighted average fair value $8.96 $7.78 $7.21 $7.78
Fair value measurement basis Monte Carlo Market value Market value Market value
Share units granted in 2011 CPP EPP RSP DAB PSP
Number of share units granted (million) 1.4 8.9 20.0 17.5 19.2Weighted average fair value $11.99 $7.51 $6.86 $7.51 $7.51Fair value measurement basis Monte Carlo Market value Market value Market value Market value
Share units granted in 2010 CPP EPP RSP DAB PSP
Number of share units granted (million) 1.3 7.6 21.4 24.5 16.0Weighted average fair value $19.81 $9.43 $6.78 $9.43 $9.43Fair value measurement basis Monte Carlo Market value Market value Market value Market value
The group uses the observable market price for ordinary shares at the date of grant to determine the fair value of non-TSR share unit awards.
The group used a Monte Carlo simulation to determine the fair values of the TSR elements of the 2012 SVP grant, the 2012, 2011 and 2010 EDIP grantsand the 2011 and 2010 CPP grants. In accordance with the plans’ rules, the model simulates BP’s TSR and compares it against its principal strategiccompetitors over the three-year period of the plans. The model takes into account the historical dividends, share price volatilities and covariances of BPand each comparator company to produce a predicted distribution of relative share performance. This is applied to the reward criteria to give anexpected value of the TSR element.
Accounting expense does not necessarily represent the intended value of share-based payments made to recipients, which are determined by theremuneration committee according to established criteria.
41. Employee costs and numbers$ million
Employee costs 2012 2011 2010
Wages and salariesa 10,357 9,827 9,242Social security costs 898 851 789Share-based payments 674 584 576Pension and other post-retirement benefit costs 1,188 1,065 1,166
13,117 12,327 11,773
Number of employees at 31 Decemberb 2012 2011 2010
Upstream 24,000 22,200 21,100Downstreamc 51,300 51,000 52,300Other businesses and corporate 10,300 10,100 6,200Gulf Coast Restoration Organization 100 100 100
85,700 83,400 79,700
By geographical areaUS 23,400 22,900 22,100Non-USc 62,300 60,500 57,600
85,700 83,400 79,700
2012 2011 2010
Average number of employeesb US Non-US Total US Non-US Total US Non-US Total
Upstream 9,300 13,900 23,200 8,500 13,200 21,700 8,100 13,500 21,600Downstream 12,000 39,400 51,400 12,300 39,200 51,500 12,600 38,300 50,900Other businesses and corporate 1,900 8,700 10,600 1,700 6,500 8,200 1,900 5,000 6,900Gulf Coast Restoration Organization 100 – 100 100 – 100 – – –
23,300 62,000 85,300 22,600 58,900 81,500 22,600 56,800 79,400a Includes termination payments of $77 million (2011 $126 million and 2010 $166 million).b Reported to the nearest 100.c Includes 14,700 (2011 14,600 and 2010 15,200) service station staff.
Financial statements 251BP Annual Report and Form 20-F 2012
Financial statements
40. Share-based payments continued
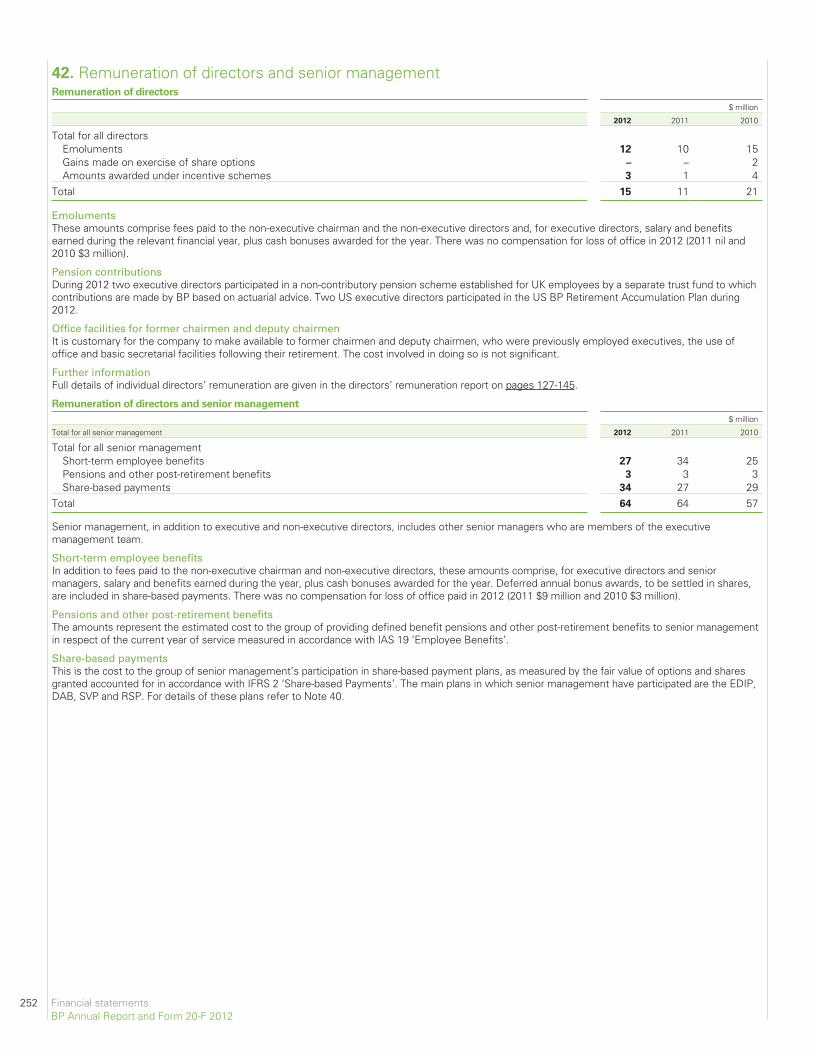
42. Remuneration of directors and senior managementRemuneration of directors
$ million
2012 2011 2010
Total for all directorsEmoluments 12 10 15Gains made on exercise of share options – – 2Amounts awarded under incentive schemes 3 1 4
Total 15 11 21
EmolumentsThese amounts comprise fees paid to the non-executive chairman and the non-executive directors and, for executive directors, salary and benefitsearned during the relevant financial year, plus cash bonuses awarded for the year. There was no compensation for loss of office in 2012 (2011 nil and2010 $3 million).
Pension contributionsDuring 2012 two executive directors participated in a non-contributory pension scheme established for UK employees by a separate trust fund to whichcontributions are made by BP based on actuarial advice. Two US executive directors participated in the US BP Retirement Accumulation Plan during2012.
Office facilities for former chairmen and deputy chairmenIt is customary for the company to make available to former chairmen and deputy chairmen, who were previously employed executives, the use ofoffice and basic secretarial facilities following their retirement. The cost involved in doing so is not significant.
Further informationFull details of individual directors’ remuneration are given in the directors’ remuneration report on pages 127-145.
Remuneration of directors and senior management
$ million
Total for all senior management 2012 2011 2010
Total for all senior managementShort-term employee benefits 27 34 25Pensions and other post-retirement benefits 3 3 3Share-based payments 34 27 29
Total 64 64 57
Senior management, in addition to executive and non-executive directors, includes other senior managers who are members of the executivemanagement team.
Short-term employee benefitsIn addition to fees paid to the non-executive chairman and non-executive directors, these amounts comprise, for executive directors and seniormanagers, salary and benefits earned during the year, plus cash bonuses awarded for the year. Deferred annual bonus awards, to be settled in shares,are included in share-based payments. There was no compensation for loss of office paid in 2012 (2011 $9 million and 2010 $3 million).
Pensions and other post-retirement benefitsThe amounts represent the estimated cost to the group of providing defined benefit pensions and other post-retirement benefits to senior managementin respect of the current year of service measured in accordance with IAS 19 ‘Employee Benefits’.
Share-based paymentsThis is the cost to the group of senior management’s participation in share-based payment plans, as measured by the fair value of options and sharesgranted accounted for in accordance with IFRS 2 ‘Share-based Payments’. The main plans in which senior management have participated are the EDIP,DAB, SVP and RSP. For details of these plans refer to Note 40.
252 Financial statementsBP Annual Report and Form 20-F 2012
43. Contingent liabilitiesContingent liabilities relating to the Gulf of Mexico oil spill
As a consequence of the Gulf of Mexico oil spill, as described on pages 59-62, BP has incurred costs during the year and recognized provisions forcertain future costs. Further information is provided in Note 2 and Note 36.
BP has provided for its best estimate of amounts expected to be paid from the $20-billion trust fund. This includes certain amounts expected to be paidpursuant to the Oil Pollution Act of 1990 (OPA 90) as described in Note 36. It is not possible, at this time, to measure reliably other obligations arisingfrom the accident that are under the terms of the trust fund, namely any obligation in relation to Natural Resource Damages claims (except for theestimated costs of the assessment phase and the costs relating to early restoration agreements as described in Note 36), claims asserted in civillitigation including any further litigation through excluded parties from the PSC settlement, the cost of business economic loss claims under the PSCsettlement not yet received or processed by the Deepwater Horizon Court Supervised Settlement Program (DHCSSP), any further obligation that mayarise from state and local government presentment claims under OPA 90 and any obligation in relation to other potential private or governmentallitigation, nor is it practicable to estimate their magnitude or possible timing of payment. Therefore, no amounts have been provided for theseobligations as at 31 December 2012. The $20-billion trust fund may not be sufficient to satisfy all claims under OPA 90 or otherwise that will ultimatelybe paid.
Natural resource damages resulting from the oil spill are currently being assessed (see Note 36 for further information). BP and the federal and statetrustees are collecting extensive data in order to assess the extent of damage to wildlife, shoreline, near shore and deepwater habitats, and recreationaluses, among other things. The study data will inform an assessment of injury to the Gulf Coast natural resources and the development of a restorationplan to mitigate the identified injuries. Detailed analysis and interpretation continue on the data that have been collected. Any early restoration projectsundertaken pursuant to the $1-billion framework agreement could mitigate the total damages resulting from the incident. Accordingly, until the size,location and duration of the impact is assessed, it is not possible to estimate reliably either the amounts or timing of the remaining Natural ResourceDamages claims, therefore no amounts have been provided as at 31 December 2012.
As set out more fully in Note 36, business economic loss claims received by the DHCSSP to date are being paid at a significantly higher average amountthan previously assumed by BP. Further, BP has identified multiple business economic loss claim determinations under the PSC settlement thatappeared to result from an interpretation of the Economic and Property Damages Settlement Agreement by the claims administrator that BP believeswas incorrect. This interpretation produced a higher number and value of awards than the interpretation BP assumed in making the initial estimate of thecost of the settlement. Pursuant to the mechanisms in the settlement agreement, the claims administrator sought clarification from the court on thismatter and on 30 January 2013, the court initially upheld the claims administrator’s interpretation of the agreement. On 6 February 2013, the courtreconsidered and vacated this ruling and stayed the processing of certain types of claims. The court lifted the stay on 28 February 2013. On 5 March2013, the court affirmed the claims administrator’s interpretation of the agreement and rejected BP’s position as it relates to business economic lossclaims. BP strongly disagrees with the ruling of 5 March 2013 and the current implementation of the agreement by the claims administrator. BP intendsto pursue all available legal options, including rights of appeal, to challenge this ruling. Management has concluded that it is not possible to determinewhether the claims experience to date is, or is not, an appropriate basis for estimating the total cost. Therefore given the inherent uncertainty that existsas BP pursues all available legal options to challenge the ruling, including rights of appeal to challenge the decision, and the higher number of claimsreceived and higher average claims payments than previously assumed by BP, which may or may not continue, management has concluded that noreliable estimate can be made of any business economic loss claims not yet received or processed by the DHCSSP. Therefore the potential cost of suchclaims is not provided for and is disclosed as a contingent liability. See Note 36 for further information.
In January 2013, the States of Alabama, Mississippi and Florida formally presented their claims to BP under OPA 90 for alleged losses includingeconomic and property damage as a result of the Gulf of Mexico oil spill. BP is evaluating these claims. The State of Louisiana has also asserted similarclaims. The amounts claimed, certain of which include punitive damages or other multipliers, are very substantial. However BP considers themethodologies used to calculate these claims to be seriously flawed, not supported by the legislation and to substantially overstate the claims. Claimshave also been presented by various local governments which are substantial in aggregate and more claims are expected to be presented. The amountsalleged in the presentments for State and Local government claims total over $34 billion. BP will defend vigorously against these claims if adjudicated attrial.
BP is named as a defendant in approximately 750 civil lawsuits brought by individuals, businesses, insurers and government entities in US federal andstate courts, as well as certain foreign jurisdictions, resulting from the Deepwater Horizon accident, the Gulf of Mexico oil spill, and the spill responseefforts. Further actions are likely to be brought. Among other claims, these lawsuits assert claims for personal injury or wrongful death in connectionwith the accident and the spill response, commercial and economic injury, damage to real and personal property, breach of contract and violations ofstatutes, including, but not limited, to alleged violations of US securities and environmental statutes. Until further fact and expert disclosures occur,court rulings clarify the issues in dispute, liability and damage trial activity nears or progresses, or other actions such as further possible settlementsoccur, it is not possible given these uncertainties to arrive at a range of outcomes or a reliable estimate of the liabilities that may accrue to BP inconnection with or as a result of these claims. Therefore no amounts have been provided for these items as at 31 December 2012. See Legalproceedings on pages 162-171 for further information.
For those items not covered by the trust fund it is not possible to measure reliably any obligation in relation to other litigation or potential fines andpenalties except, subject to certain assumptions detailed in Note 36, for those relating to the Clean Water Act. There are a number of federal and stateenvironmental and other provisions of law, other than the Clean Water Act, under which one or more governmental agencies could seek civil fines andpenalties from BP. For example, a complaint filed by the United States sought to reserve the ability to seek penalties and other relief under a number ofother laws. Given the large number of claims that may be asserted, it is not possible at this time to determine whether and to what extent any suchclaims would be successful or what penalties or fines would be assessed. Therefore no amounts have been provided for these items.
Under the settlement agreements with Anadarko and MOEX, and with Cameron International, the designer and manufacturer of the Deepwater Horizonblowout preventer, with M-I L.L.C. (M-I), the mud contractor, and with Weatherford, the designer and manufacturer of the float collar used on theMacondo well, BP has agreed to indemnify Anadarko, MOEX, Cameron, M-I and Weatherford for certain claims arising from the accident. It is thereforepossible that BP may face claims under these indemnities, but it is not currently possible to reliably measure any obligation in relation to such claims andtherefore no amount has been provided as at 31 December 2012.
The magnitude and timing of possible obligations in relation to the Gulf of Mexico oil spill are subject to a very high degree of uncertainty as describedfurther in Risk factors on pages 38-44. Furthermore, for those items for which a provision has been recorded, as noted in Note 36, significant uncertaintyalso exists in relation to the ultimate exposure and cost to BP. Any such possible obligations are therefore contingent liabilities and, at present, it is notpracticable to estimate their magnitude or possible timing of payment. Furthermore, other material unanticipated obligations may arise in future inrelation to the incident.
Financial statements 253BP Annual Report and Form 20-F 2012
Financial statements
43. Contingent liabilities continuedOther contingent liabilities
There were contingent liabilities at 31 December 2012 in respect of guarantees and indemnities entered into as part of the ordinary course of thegroup‘s business. No material losses are likely to arise from such contingent liabilities. Further information is included in Note 26.
Lawsuits arising out of the Exxon Valdez oil spill in Prince William Sound, Alaska, in March 1989 were filed against Exxon (now ExxonMobil), AlyeskaPipeline Service Company (Alyeska), which operates the oil terminal at Valdez, and the other oil companies that own Alyeska. Alyeska initially respondedto the spill until the response was taken over by Exxon. BP owns a 46.9% interest (reduced during 2001 from 50% by a sale of 3.1% to Phillips) inAlyeska through a subsidiary of BP America Inc. and briefly indirectly owned a further 20% interest in Alyeska following BP‘s combination with AtlanticRichfield Company (Atlantic Richfield). Alyeska and its owners have settled all the claims against them under these lawsuits. Exxon has indicated that itmay file a claim for contribution against Alyeska for a portion of the costs and damages that Exxon has incurred. BP will defend any such claimsvigorously. It is not possible to estimate any financial effect.
In the normal course of the group‘s business, legal proceedings are pending or may be brought against BP group entities arising out of current and pastoperations, including matters related to commercial disputes, product liability, antitrust, premises-liability claims, general environmental claims andallegations of exposures of third parties to toxic substances, such as lead pigment in paint, asbestos and other chemicals. BP believes that the impact ofthese legal proceedings on the group‘s results of operations, liquidity or financial position will not be material.
With respect to lead pigment in paint in particular, Atlantic Richfield, a subsidiary of BP, has been named as a co-defendant in numerous lawsuitsbrought in the US alleging injury to persons and property. Although it is not possible to predict the outcome of the legal proceedings, Atlantic Richfieldbelieves it has valid defences that render the incurrence of a liability remote; however, the amounts claimed and the costs of implementing theremedies sought in the various cases could be substantial. The majority of the lawsuits have been abandoned or dismissed against Atlantic Richfield. Nolawsuit against Atlantic Richfield has been settled nor has Atlantic Richfield been subject to a final adverse judgment in any proceeding. AtlanticRichfield intends to defend such actions vigorously.
The group files income tax returns in many jurisdictions throughout the world. Various tax authorities are currently examining the group‘s income taxreturns. Tax returns contain matters that could be subject to differing interpretations of applicable tax laws and regulations and the resolution of taxpositions through negotiations with relevant tax authorities, or through litigation, can take several years to complete. While it is difficult to predict theultimate outcome in some cases, the group does not anticipate that there will be any material impact upon the group‘s results of operations, financialposition or liquidity.
The group is subject to numerous national and local environmental laws and regulations concerning its products, operations and other activities. Theselaws and regulations may require the group to take future action to remediate the effects on the environment of prior disposal or release of chemicals orpetroleum substances by the group or other parties. Such contingencies may exist for various sites including refineries, chemical plants, oil fields,service stations, terminals and waste disposal sites. In addition, the group may have obligations relating to prior asset sales or closed facilities. Theultimate requirement for remediation and its cost are inherently difficult to estimate. However, the estimated cost of known environmental obligationshas been provided in these accounts in accordance with the group‘s accounting policies. While the amounts of future costs could be significant andcould be material to the group‘s results of operations in the period in which they are recognized, it is not practical to estimate the amounts involved. BPdoes not expect these costs to have a material effect on the group‘s financial position or liquidity.
The group also has obligations to decommission oil and natural gas production facilities and related pipelines. Provision is made for the estimated costsof these activities, however there is uncertainty regarding both the amount and timing of these costs, given the long-term nature of these obligations.BP believes that the impact of any reasonably foreseeable changes to these provisions on the group‘s results of operations, financial position or liquiditywill not be material.
The group generally restricts its purchase of insurance to situations where this is required for legal or contractual reasons. This is because externalinsurance is not considered an economic means of financing losses for the group. Losses will therefore be borne as they arise rather than being spreadover time through insurance premiums with attendant transaction costs. The position is reviewed periodically.
44. Capital commitmentsAuthorized future capital expenditure for property, plant and equipment by group companies for which contracts had been signed at 31 December 2012amounted to $14,068 million (2011 $12,517 million). In addition, at 31 December 2012, the group had contracts in place for future capital expenditurerelating to investments in jointly controlled entities of $275 million (2011 $296 million) and investments in associates of nil (2011 $36 million). BP’s shareof capital commitments of jointly controlled entities amounted to $825 million (2011 $1,244 million). The group has also signed definitive and bindingsale and purchase agreements for the sale of BP’s 50% interest in TNK-BP to Rosneft and for BP’s further investment in Rosneft, as described inNote 4.
254 Financial statementsBP Annual Report and Form 20-F 2012
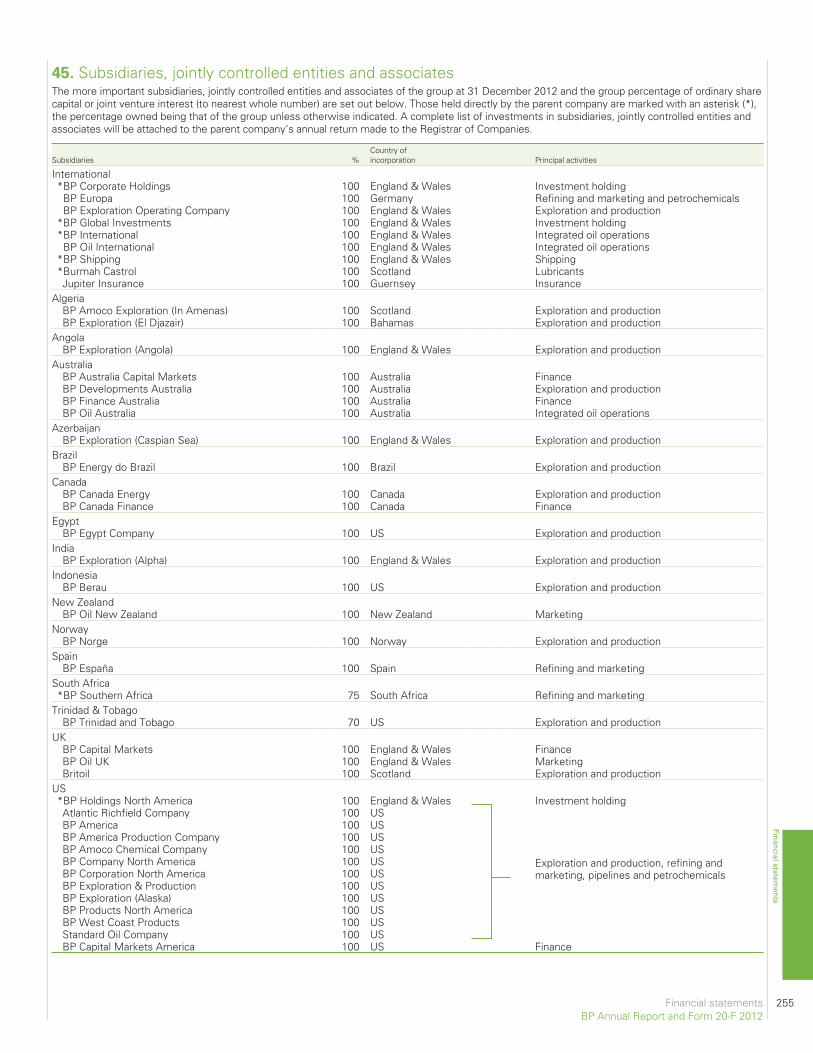
45. Subsidiaries, jointly controlled entities and associatesThe more important subsidiaries, jointly controlled entities and associates of the group at 31 December 2012 and the group percentage of ordinary sharecapital or joint venture interest (to nearest whole number) are set out below. Those held directly by the parent company are marked with an asterisk (*),the percentage owned being that of the group unless otherwise indicated. A complete list of investments in subsidiaries, jointly controlled entities andassociates will be attached to the parent company’s annual return made to the Registrar of Companies.
Subsidiaries %Country ofincorporation Principal activities
International*BP Corporate Holdings 100 England & Wales Investment holding
BP Europa 100 Germany Refining and marketing and petrochemicalsBP Exploration Operating Company 100 England & Wales Exploration and production
*BP Global Investments 100 England & Wales Investment holding*BP International 100 England & Wales Integrated oil operations
BP Oil International 100 England & Wales Integrated oil operations*BP Shipping 100 England & Wales Shipping*Burmah Castrol 100 Scotland LubricantsJupiter Insurance 100 Guernsey Insurance
AlgeriaBP Amoco Exploration (In Amenas) 100 Scotland Exploration and productionBP Exploration (El Djazair) 100 Bahamas Exploration and production
AngolaBP Exploration (Angola) 100 England & Wales Exploration and production
AustraliaBP Australia Capital Markets 100 Australia FinanceBP Developments Australia 100 Australia Exploration and productionBP Finance Australia 100 Australia FinanceBP Oil Australia 100 Australia Integrated oil operations
AzerbaijanBP Exploration (Caspian Sea) 100 England & Wales Exploration and production
BrazilBP Energy do Brazil 100 Brazil Exploration and production
CanadaBP Canada Energy 100 Canada Exploration and productionBP Canada Finance 100 Canada Finance
EgyptBP Egypt Company 100 US Exploration and production
IndiaBP Exploration (Alpha) 100 England & Wales Exploration and production
IndonesiaBP Berau 100 US Exploration and production
New ZealandBP Oil New Zealand 100 New Zealand Marketing
NorwayBP Norge 100 Norway Exploration and production
SpainBP España 100 Spain Refining and marketing
South Africa*BP Southern Africa 75 South Africa Refining and marketing
Trinidad & TobagoBP Trinidad and Tobago 70 US Exploration and production
UKBP Capital Markets 100 England & Wales FinanceBP Oil UK 100 England & Wales MarketingBritoil 100 Scotland Exploration and production
US*BP Holdings North America 100 England & Wales Investment holdingAtlantic Richfield Company 100 USBP America 100 US
Exploration and production, refining andmarketing, pipelines and petrochemicals
BP America Production Company 100 USBP Amoco Chemical Company 100 USBP Company North America 100 USBP Corporation North America 100 USBP Exploration & Production 100 USBP Exploration (Alaska) 100 USBP Products North America 100 USBP West Coast Products 100 USStandard Oil Company 100 USBP Capital Markets America 100 US Finance
Financial statements 255BP Annual Report and Form 20-F 2012
Financial statements
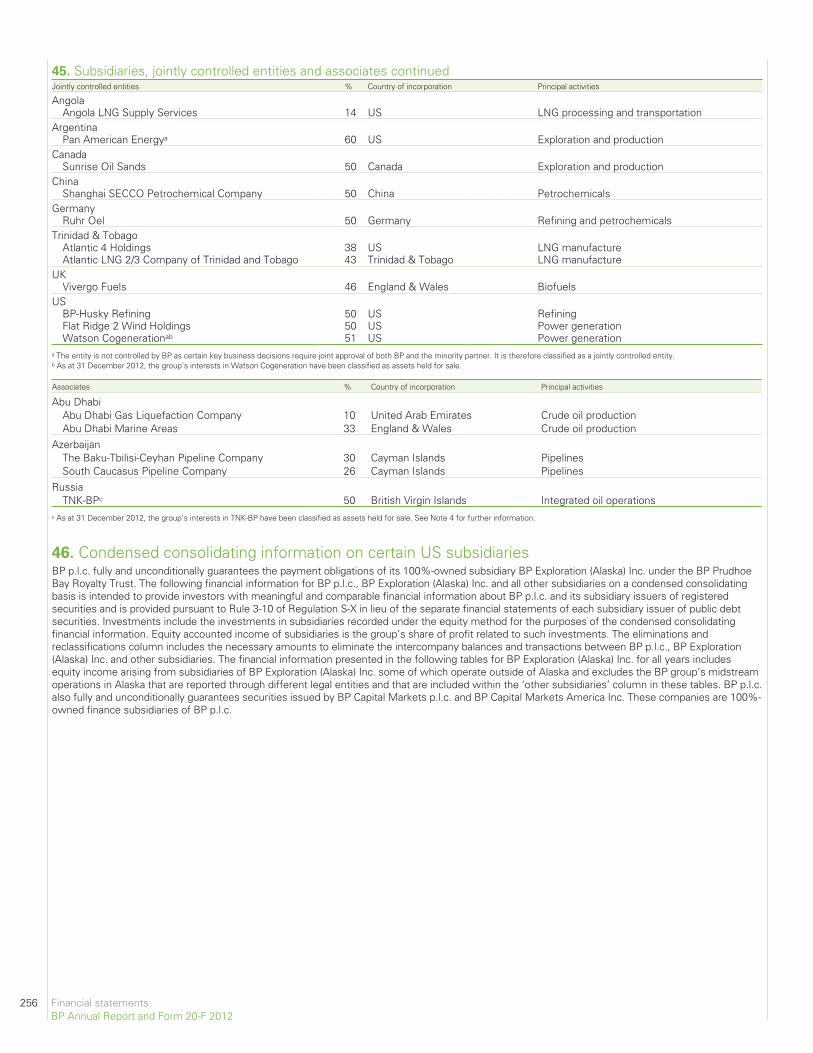
45. Subsidiaries, jointly controlled entities and associates continuedJointly controlled entities % Country of incorporation Principal activities
AngolaAngola LNG Supply Services 14 US LNG processing and transportation
ArgentinaPan American Energya 60 US Exploration and production
CanadaSunrise Oil Sands 50 Canada Exploration and production
ChinaShanghai SECCO Petrochemical Company 50 China Petrochemicals
GermanyRuhr Oel 50 Germany Refining and petrochemicals
Trinidad & TobagoAtlantic 4 Holdings 38 US LNG manufactureAtlantic LNG 2/3 Company of Trinidad and Tobago 43 Trinidad & Tobago LNG manufacture
UKVivergo Fuels 46 England & Wales Biofuels
USBP-Husky Refining 50 US RefiningFlat Ridge 2 Wind Holdings 50 US Power generationWatson Cogenerationab 51 US Power generation
a The entity is not controlled by BP as certain key business decisions require joint approval of both BP and the minority partner. It is therefore classified as a jointly controlled entity.b As at 31 December 2012, the group’s interests in Watson Cogeneration have been classified as assets held for sale.
Associates % Country of incorporation Principal activities
Abu DhabiAbu Dhabi Gas Liquefaction Company 10 United Arab Emirates Crude oil productionAbu Dhabi Marine Areas 33 England & Wales Crude oil production
AzerbaijanThe Baku-Tbilisi-Ceyhan Pipeline Company 30 Cayman Islands PipelinesSouth Caucasus Pipeline Company 26 Cayman Islands Pipelines
RussiaTNK-BPc 50 British Virgin Islands Integrated oil operations
c As at 31 December 2012, the group’s interests in TNK-BP have been classified as assets held for sale. See Note 4 for further information.
46. Condensed consolidating information on certain US subsidiariesBP p.l.c. fully and unconditionally guarantees the payment obligations of its 100%-owned subsidiary BP Exploration (Alaska) Inc. under the BP PrudhoeBay Royalty Trust. The following financial information for BP p.l.c., BP Exploration (Alaska) Inc. and all other subsidiaries on a condensed consolidatingbasis is intended to provide investors with meaningful and comparable financial information about BP p.l.c. and its subsidiary issuers of registeredsecurities and is provided pursuant to Rule 3-10 of Regulation S-X in lieu of the separate financial statements of each subsidiary issuer of public debtsecurities. Investments include the investments in subsidiaries recorded under the equity method for the purposes of the condensed consolidatingfinancial information. Equity accounted income of subsidiaries is the group’s share of profit related to such investments. The eliminations andreclassifications column includes the necessary amounts to eliminate the intercompany balances and transactions between BP p.l.c., BP Exploration(Alaska) Inc. and other subsidiaries. The financial information presented in the following tables for BP Exploration (Alaska) Inc. for all years includesequity income arising from subsidiaries of BP Exploration (Alaska) Inc. some of which operate outside of Alaska and excludes the BP group’s midstreamoperations in Alaska that are reported through different legal entities and that are included within the ‘other subsidiaries’ column in these tables. BP p.l.c.also fully and unconditionally guarantees securities issued by BP Capital Markets p.l.c. and BP Capital Markets America Inc. These companies are 100%-owned finance subsidiaries of BP p.l.c.
256 Financial statementsBP Annual Report and Form 20-F 2012
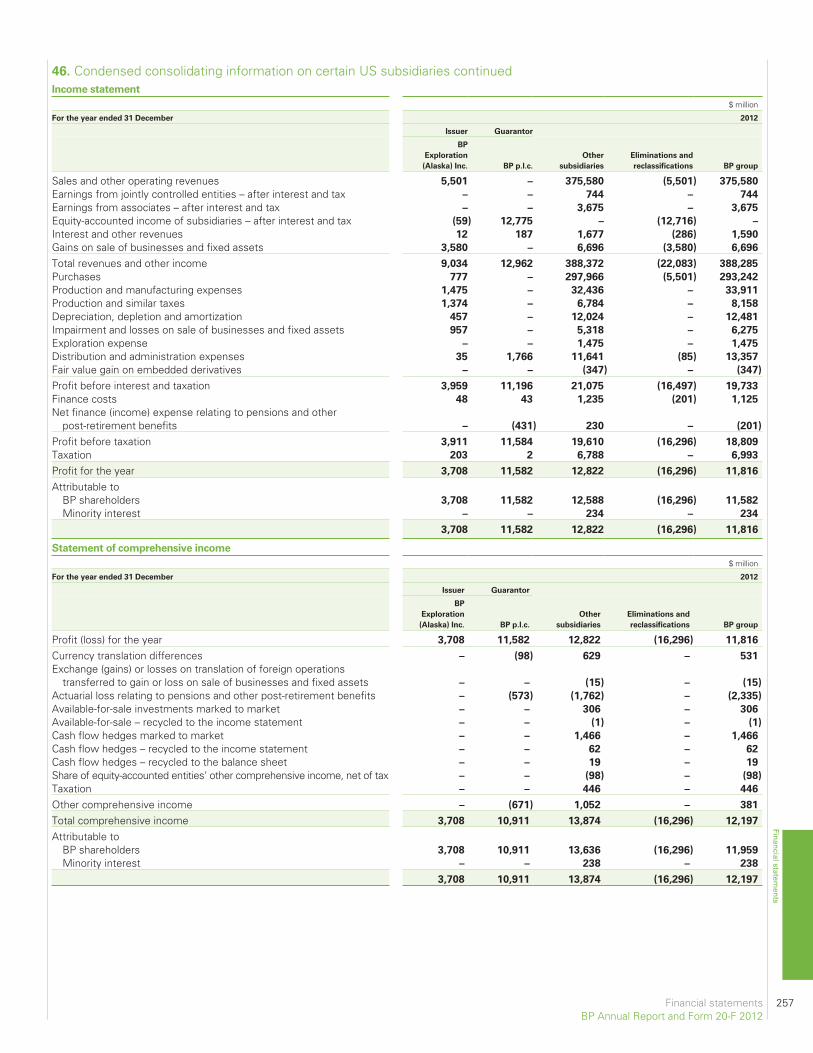
Income statement
$ million
For the year ended 31 December 2012
Issuer Guarantor
BP
Exploration
(Alaska) Inc. BP p.l.c.
Other
subsidiaries
Eliminations and
reclassifications BP group
Sales and other operating revenues 5,501 – 375,580 (5,501) 375,580
Earnings from jointly controlled entities – after interest and tax – – 744 – 744
Earnings from associates – after interest and tax – – 3,675 – 3,675
Equity-accounted income of subsidiaries – after interest and tax (59) 12,775 – (12,716) –
Interest and other revenues 12 187 1,677 (286) 1,590
Gains on sale of businesses and fixed assets 3,580 – 6,696 (3,580) 6,696
Total revenues and other income 9,034 12,962 388,372 (22,083) 388,285
Purchases 777 – 297,966 (5,501) 293,242
Production and manufacturing expenses 1,475 – 32,436 – 33,911
Production and similar taxes 1,374 – 6,784 – 8,158
Depreciation, depletion and amortization 457 – 12,024 – 12,481
Impairment and losses on sale of businesses and fixed assets 957 – 5,318 – 6,275
Exploration expense – – 1,475 – 1,475
Distribution and administration expenses 35 1,766 11,641 (85) 13,357
Fair value gain on embedded derivatives – – (347) – (347)
Profit before interest and taxation 3,959 11,196 21,075 (16,497) 19,733
Finance costs 48 43 1,235 (201) 1,125
Net finance (income) expense relating to pensions and otherpost-retirement benefits – (431) 230 – (201)
Profit before taxation 3,911 11,584 19,610 (16,296) 18,809
Taxation 203 2 6,788 – 6,993
Profit for the year 3,708 11,582 12,822 (16,296) 11,816
Attributable toBP shareholders 3,708 11,582 12,588 (16,296) 11,582
Minority interest – – 234 – 234
3,708 11,582 12,822 (16,296) 11,816
Statement of comprehensive income
$ million
For the year ended 31 December 2012
Issuer Guarantor
BP
Exploration
(Alaska) Inc. BP p.l.c.
Other
subsidiaries
Eliminations and
reclassifications BP group
Profit (loss) for the year 3,708 11,582 12,822 (16,296) 11,816
Currency translation differences – (98) 629 – 531
Exchange (gains) or losses on translation of foreign operationstransferred to gain or loss on sale of businesses and fixed assets – – (15) – (15)
Actuarial loss relating to pensions and other post-retirement benefits – (573) (1,762) – (2,335)
Available-for-sale investments marked to market – – 306 – 306
Available-for-sale – recycled to the income statement – – (1) – (1)
Cash flow hedges marked to market – – 1,466 – 1,466
Cash flow hedges – recycled to the income statement – – 62 – 62
Cash flow hedges – recycled to the balance sheet – – 19 – 19
Share of equity-accounted entities’ other comprehensive income, net of tax – – (98) – (98)
Taxation – – 446 – 446
Other comprehensive income – (671) 1,052 – 381
Total comprehensive income 3,708 10,911 13,874 (16,296) 12,197
Attributable toBP shareholders 3,708 10,911 13,636 (16,296) 11,959
Minority interest – – 238 – 238
3,708 10,911 13,874 (16,296) 12,197
Financial statements 257BP Annual Report and Form 20-F 2012
Financial statements
46. Condensed consolidating information on certain US subsidiaries continued
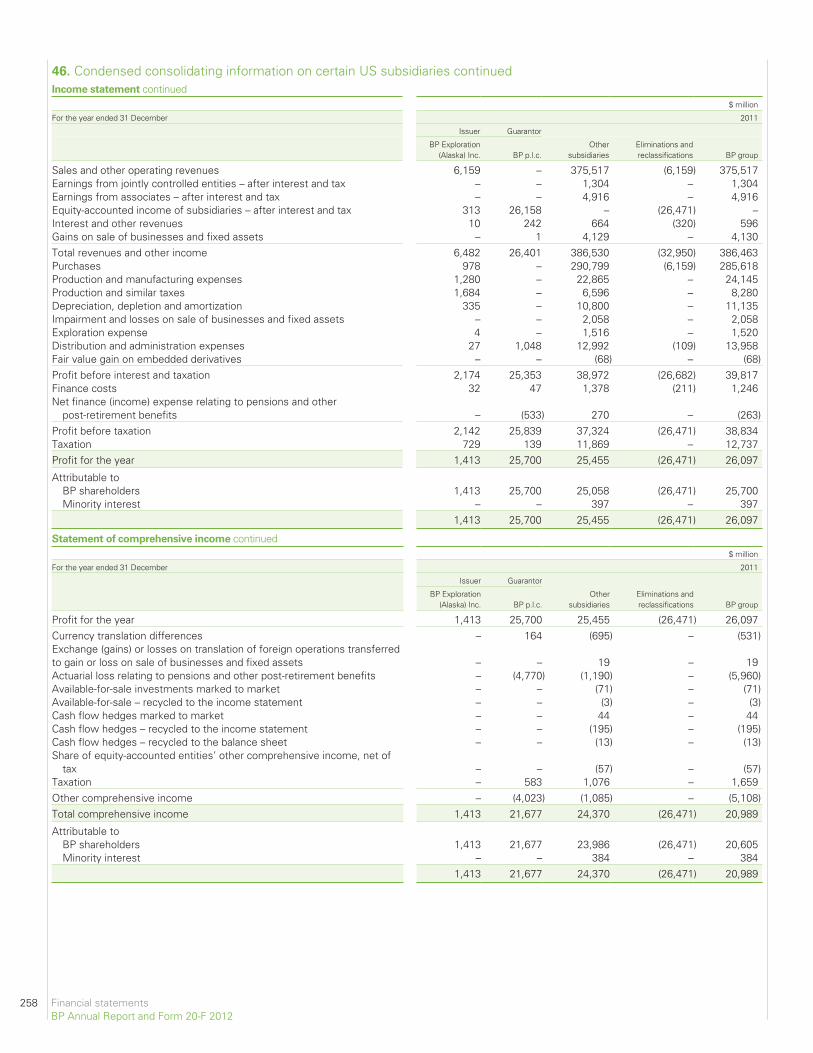
46. Condensed consolidating information on certain US subsidiaries continuedIncome statement continued
$ million
For the year ended 31 December 2011
Issuer Guarantor
BP Exploration(Alaska) Inc. BP p.l.c.
Othersubsidiaries
Eliminations andreclassifications BP group
Sales and other operating revenues 6,159 – 375,517 (6,159) 375,517Earnings from jointly controlled entities – after interest and tax – – 1,304 – 1,304Earnings from associates – after interest and tax – – 4,916 – 4,916Equity-accounted income of subsidiaries – after interest and tax 313 26,158 – (26,471) –Interest and other revenues 10 242 664 (320) 596Gains on sale of businesses and fixed assets – 1 4,129 – 4,130Total revenues and other income 6,482 26,401 386,530 (32,950) 386,463Purchases 978 – 290,799 (6,159) 285,618Production and manufacturing expenses 1,280 – 22,865 – 24,145Production and similar taxes 1,684 – 6,596 – 8,280Depreciation, depletion and amortization 335 – 10,800 – 11,135Impairment and losses on sale of businesses and fixed assets – – 2,058 – 2,058Exploration expense 4 – 1,516 – 1,520Distribution and administration expenses 27 1,048 12,992 (109) 13,958Fair value gain on embedded derivatives – – (68) – (68)Profit before interest and taxation 2,174 25,353 38,972 (26,682) 39,817Finance costs 32 47 1,378 (211) 1,246Net finance (income) expense relating to pensions and other
post-retirement benefits – (533) 270 – (263)Profit before taxation 2,142 25,839 37,324 (26,471) 38,834Taxation 729 139 11,869 – 12,737Profit for the year 1,413 25,700 25,455 (26,471) 26,097
Attributable toBP shareholders 1,413 25,700 25,058 (26,471) 25,700Minority interest – – 397 – 397
1,413 25,700 25,455 (26,471) 26,097
Statement of comprehensive income continued$ million
For the year ended 31 December 2011
Issuer Guarantor
BP Exploration(Alaska) Inc. BP p.l.c.
Othersubsidiaries
Eliminations andreclassifications BP group
Profit for the year 1,413 25,700 25,455 (26,471) 26,097Currency translation differences – 164 (695) – (531)Exchange (gains) or losses on translation of foreign operations transferredto gain or loss on sale of businesses and fixed assets – – 19 – 19Actuarial loss relating to pensions and other post-retirement benefits – (4,770) (1,190) – (5,960)Available-for-sale investments marked to market – – (71) – (71)Available-for-sale – recycled to the income statement – – (3) – (3)Cash flow hedges marked to market – – 44 – 44Cash flow hedges – recycled to the income statement – – (195) – (195)Cash flow hedges – recycled to the balance sheet – – (13) – (13)Share of equity-accounted entities’ other comprehensive income, net of
tax – – (57) – (57)Taxation – 583 1,076 – 1,659Other comprehensive income – (4,023) (1,085) – (5,108)Total comprehensive income 1,413 21,677 24,370 (26,471) 20,989
Attributable toBP shareholders 1,413 21,677 23,986 (26,471) 20,605Minority interest – – 384 – 384
1,413 21,677 24,370 (26,471) 20,989
258 Financial statementsBP Annual Report and Form 20-F 2012

Income statement continued$ million
For the year ended 31 December 2010
Issuer Guarantor
BP Exploration(Alaska) Inc. BP p.l.c.
Othersubsidiaries
Eliminations andreclassifications BP group
Sales and other operating revenues 4,793 – 297,107 (4,793) 297,107Earnings from jointly controlled entities – after interest and tax – – 1,175 – 1,175Earnings from associates – after interest and tax – – 3,582 – 3,582Equity-accounted income of subsidiaries – after interest and tax 620 (3,567) – 2,947 –Interest and other revenues – 188 714 (221) 681Gains on sale of businesses and fixed assets – 260 6,376 (253) 6,383Total revenues and other income 5,413 (3,119) 308,954 (2,320) 308,928Purchases 637 – 220,367 (4,793) 216,211Production and manufacturing expenses 966 – 63,649 – 64,615Production and similar taxes 998 – 4,246 – 5,244Depreciation, depletion and amortization 351 – 10,813 – 11,164Impairment and losses on sale of businesses and fixed assets 1,524 – 1,689 (1,524) 1,689Exploration expense – – 843 – 843Distribution and administration expenses 16 673 11,975 (109) 12,555Fair value loss on embedded derivatives – – 309 – 309Profit (loss) before interest and taxation 921 (3,792) (4,937) 4,106 (3,702)Finance costs 2 31 1,249 (112) 1,170Net finance (income) expense relating to pensions and other
post-retirement benefits 4 (388) 337 – (47)Profit (loss) before taxation 915 (3,435) (6,523) 4,218 (4,825)Taxation 143 31 (1,675) – (1,501)Profit (loss) for the year 772 (3,466) (4,848) 4,218 (3,324)
Attributable toBP shareholders 772 (3,466) (5,243) 4,218 (3,719)Minority interest – – 395 – 395
772 (3,466) (4,848) 4,218 (3,324)
Statement of comprehensive income continued$ million
For the year ended 31 December 2010
Issuer Guarantor
BP Exploration(Alaska) Inc. BP p.l.c.
Othersubsidiaries
Eliminations andreclassifications BP group
Profit (loss) for the year 772 (3,466) (4,848) 4,218 (3,324)Currency translation differences – (45) 304 – 259Exchange (gains) or losses on translation of foreign operations transferredto gain or loss on sale of businesses and fixed assets – – (20) – (20)Actuarial loss relating to pensions and other post-retirement benefits – 457 (777) – (320)Available-for-sale investments marked to market – – (191) – (191)Available-for-sale – recycled to the income statement – – (150) – (150)Cash flow hedges marked to market – – (65) – (65)Cash flow hedges – recycled to the income statement – – (25) – (25)Cash flow hedges – recycled to the balance sheet – – 53 – 53Share of equity-accounted entities’ other comprehensive income, net of
tax – – – – –Taxation – (123) (14) – (137)Other comprehensive income – 289 (885) – (596)Total comprehensive income 772 (3,177) (5,733) 4,218 (3,920)
Attributable toBP shareholders 772 (3,177) (6,131) 4,218 (4,318)Minority interest – – 398 – 398
772 (3,177) (5,733) 4,218 (3,920)
Financial statements 259BP Annual Report and Form 20-F 2012
Financial statements
46. Condensed consolidating information on certain US subsidiaries continued
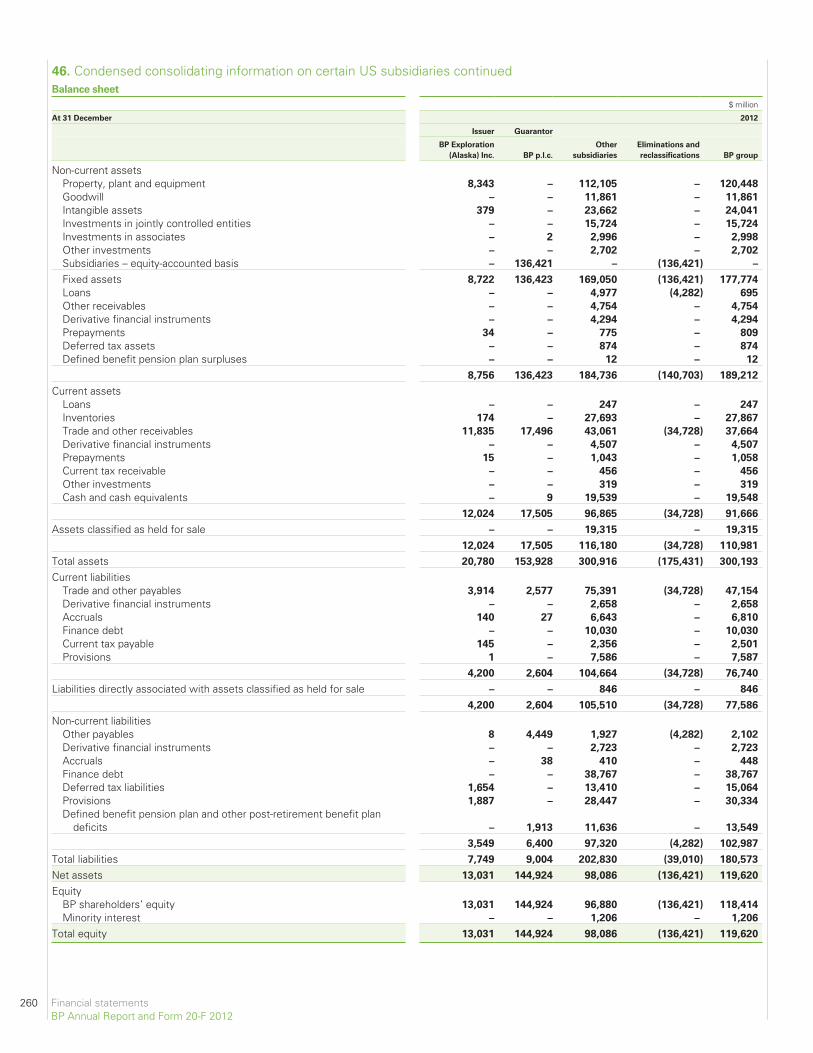
46. Condensed consolidating information on certain US subsidiaries continuedBalance sheet
$ million
At 31 December 2012
Issuer Guarantor
BP Exploration
(Alaska) Inc. BP p.l.c.
Other
subsidiaries
Eliminations and
reclassifications BP group
Non-current assetsProperty, plant and equipment 8,343 – 112,105 – 120,448
Goodwill – – 11,861 – 11,861
Intangible assets 379 – 23,662 – 24,041
Investments in jointly controlled entities – – 15,724 – 15,724
Investments in associates – 2 2,996 – 2,998
Other investments – – 2,702 – 2,702
Subsidiaries – equity-accounted basis – 136,421 – (136,421) –
Fixed assets 8,722 136,423 169,050 (136,421) 177,774
Loans – – 4,977 (4,282) 695
Other receivables – – 4,754 – 4,754
Derivative financial instruments – – 4,294 – 4,294
Prepayments 34 – 775 – 809
Deferred tax assets – – 874 – 874
Defined benefit pension plan surpluses – – 12 – 12
8,756 136,423 184,736 (140,703) 189,212
Current assetsLoans – – 247 – 247
Inventories 174 – 27,693 – 27,867
Trade and other receivables 11,835 17,496 43,061 (34,728) 37,664
Derivative financial instruments – – 4,507 – 4,507
Prepayments 15 – 1,043 – 1,058
Current tax receivable – – 456 – 456
Other investments – – 319 – 319
Cash and cash equivalents – 9 19,539 – 19,548
12,024 17,505 96,865 (34,728) 91,666
Assets classified as held for sale – – 19,315 – 19,315
12,024 17,505 116,180 (34,728) 110,981
Total assets 20,780 153,928 300,916 (175,431) 300,193
Current liabilitiesTrade and other payables 3,914 2,577 75,391 (34,728) 47,154
Derivative financial instruments – – 2,658 – 2,658
Accruals 140 27 6,643 – 6,810
Finance debt – – 10,030 – 10,030
Current tax payable 145 – 2,356 – 2,501
Provisions 1 – 7,586 – 7,587
4,200 2,604 104,664 (34,728) 76,740
Liabilities directly associated with assets classified as held for sale – – 846 – 846
4,200 2,604 105,510 (34,728) 77,586
Non-current liabilitiesOther payables 8 4,449 1,927 (4,282) 2,102
Derivative financial instruments – – 2,723 – 2,723
Accruals – 38 410 – 448
Finance debt – – 38,767 – 38,767
Deferred tax liabilities 1,654 – 13,410 – 15,064
Provisions 1,887 – 28,447 – 30,334
Defined benefit pension plan and other post-retirement benefit plandeficits – 1,913 11,636 – 13,549
3,549 6,400 97,320 (4,282) 102,987
Total liabilities 7,749 9,004 202,830 (39,010) 180,573
Net assets 13,031 144,924 98,086 (136,421) 119,620
EquityBP shareholders’ equity 13,031 144,924 96,880 (136,421) 118,414
Minority interest – – 1,206 – 1,206
Total equity 13,031 144,924 98,086 (136,421) 119,620
260 Financial statementsBP Annual Report and Form 20-F 2012
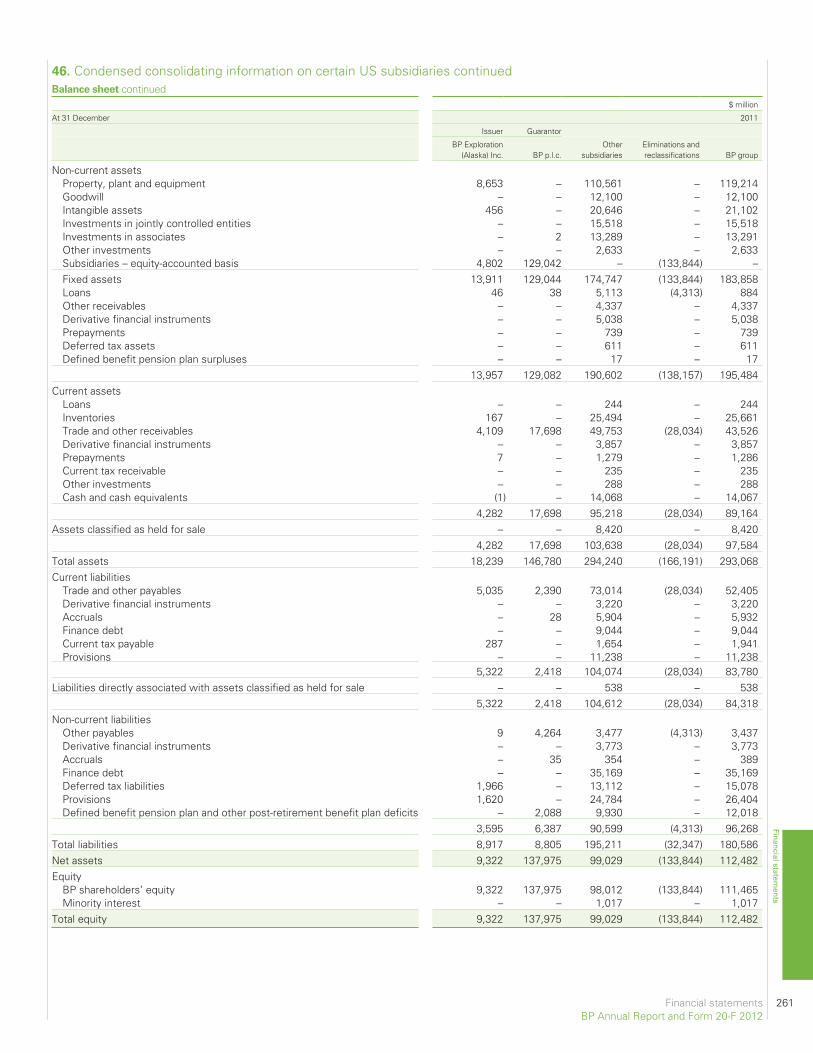
Balance sheet continued$ million
At 31 December 2011
Issuer Guarantor
BP Exploration(Alaska) Inc. BP p.l.c.
Othersubsidiaries
Eliminations andreclassifications BP group
Non-current assetsProperty, plant and equipment 8,653 – 110,561 – 119,214Goodwill – – 12,100 – 12,100Intangible assets 456 – 20,646 – 21,102Investments in jointly controlled entities – – 15,518 – 15,518Investments in associates – 2 13,289 – 13,291Other investments – – 2,633 – 2,633Subsidiaries – equity-accounted basis 4,802 129,042 – (133,844) –Fixed assets 13,911 129,044 174,747 (133,844) 183,858Loans 46 38 5,113 (4,313) 884Other receivables – – 4,337 – 4,337Derivative financial instruments – – 5,038 – 5,038Prepayments – – 739 – 739Deferred tax assets – – 611 – 611Defined benefit pension plan surpluses – – 17 – 17
13,957 129,082 190,602 (138,157) 195,484Current assets
Loans – – 244 – 244Inventories 167 – 25,494 – 25,661Trade and other receivables 4,109 17,698 49,753 (28,034) 43,526Derivative financial instruments – – 3,857 – 3,857Prepayments 7 – 1,279 – 1,286Current tax receivable – – 235 – 235Other investments – – 288 – 288Cash and cash equivalents (1) – 14,068 – 14,067
4,282 17,698 95,218 (28,034) 89,164Assets classified as held for sale – – 8,420 – 8,420
4,282 17,698 103,638 (28,034) 97,584Total assets 18,239 146,780 294,240 (166,191) 293,068Current liabilities
Trade and other payables 5,035 2,390 73,014 (28,034) 52,405Derivative financial instruments – – 3,220 – 3,220Accruals – 28 5,904 – 5,932Finance debt – – 9,044 – 9,044Current tax payable 287 – 1,654 – 1,941Provisions – – 11,238 – 11,238
5,322 2,418 104,074 (28,034) 83,780Liabilities directly associated with assets classified as held for sale – – 538 – 538
5,322 2,418 104,612 (28,034) 84,318Non-current liabilities
Other payables 9 4,264 3,477 (4,313) 3,437Derivative financial instruments – – 3,773 – 3,773Accruals – 35 354 – 389Finance debt – – 35,169 – 35,169Deferred tax liabilities 1,966 – 13,112 – 15,078Provisions 1,620 – 24,784 – 26,404Defined benefit pension plan and other post-retirement benefit plan deficits – 2,088 9,930 – 12,018
3,595 6,387 90,599 (4,313) 96,268Total liabilities 8,917 8,805 195,211 (32,347) 180,586Net assets 9,322 137,975 99,029 (133,844) 112,482Equity
BP shareholders’ equity 9,322 137,975 98,012 (133,844) 111,465Minority interest – – 1,017 – 1,017
Total equity 9,322 137,975 99,029 (133,844) 112,482
Financial statements 261BP Annual Report and Form 20-F 2012
Financial statements
46. Condensed consolidating information on certain US subsidiaries continued
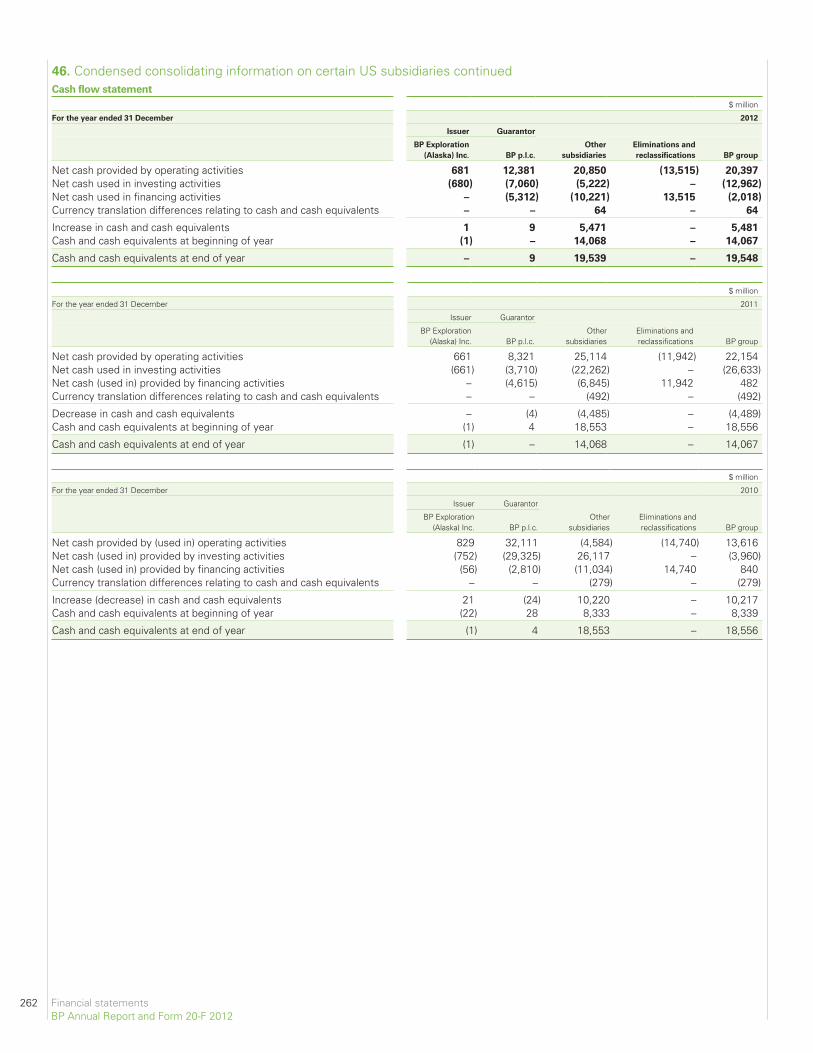
46. Condensed consolidating information on certain US subsidiaries continuedCash flow statement
$ million
For the year ended 31 December 2012
Issuer Guarantor
BP Exploration
(Alaska) Inc. BP p.l.c.
Other
subsidiaries
Eliminations and
reclassifications BP group
Net cash provided by operating activities 681 12,381 20,850 (13,515) 20,397
Net cash used in investing activities (680) (7,060) (5,222) – (12,962)
Net cash used in financing activities – (5,312) (10,221) 13,515 (2,018)
Currency translation differences relating to cash and cash equivalents – – 64 – 64
Increase in cash and cash equivalents 1 9 5,471 – 5,481
Cash and cash equivalents at beginning of year (1) – 14,068 – 14,067
Cash and cash equivalents at end of year – 9 19,539 – 19,548
$ million
For the year ended 31 December 2011
Issuer Guarantor
BP Exploration(Alaska) Inc. BP p.l.c.
Othersubsidiaries
Eliminations andreclassifications BP group
Net cash provided by operating activities 661 8,321 25,114 (11,942) 22,154Net cash used in investing activities (661) (3,710) (22,262) – (26,633)Net cash (used in) provided by financing activities – (4,615) (6,845) 11,942 482Currency translation differences relating to cash and cash equivalents – – (492) – (492)
Decrease in cash and cash equivalents – (4) (4,485) – (4,489)Cash and cash equivalents at beginning of year (1) 4 18,553 – 18,556
Cash and cash equivalents at end of year (1) – 14,068 – 14,067
$ million
For the year ended 31 December 2010
Issuer Guarantor
BP Exploration(Alaska) Inc. BP p.l.c.
Othersubsidiaries
Eliminations andreclassifications BP group
Net cash provided by (used in) operating activities 829 32,111 (4,584) (14,740) 13,616Net cash (used in) provided by investing activities (752) (29,325) 26,117 – (3,960)Net cash (used in) provided by financing activities (56) (2,810) (11,034) 14,740 840Currency translation differences relating to cash and cash equivalents – – (279) – (279)
Increase (decrease) in cash and cash equivalents 21 (24) 10,220 – 10,217Cash and cash equivalents at beginning of year (22) 28 8,333 – 8,339
Cash and cash equivalents at end of year (1) 4 18,553 – 18,556
262 Financial statementsBP Annual Report and Form 20-F 2012
Supplementary information on oil and natural gas (unaudited)The regional analysis presented below is on a continent basis, with separate disclosure for countries that contain 15% or more of the total provedreserves (for subsidiaries plus equity-accounted entities), in accordance with SEC and FASB requirements.
Oil and gas reserves – certain definitions
Unless the context indicates otherwise, the following terms have the meanings shown below:
Proved oil and gas reservesProved oil and gas reserves are those quantities of oil and gas, which, by analysis of geoscience and engineering data, can be estimated with reasonablecertainty to be economically producible – from a given date forward, from known reservoirs, and under existing economic conditions, operatingmethods, and government regulations – prior to the time at which contracts providing the right to operate expire, unless evidence indicates that renewalis reasonably certain, regardless of whether deterministic or probabilistic methods are used for the estimation. The project to extract the hydrocarbonsmust have commenced or the operator must be reasonably certain that it will commence the project within a reasonable time.
(i) The area of the reservoir considered as proved includes:(A) The area identified by drilling and limited by fluid contacts, if any; and(B) Adjacent undrilled portions of the reservoir that can, with reasonable certainty, be judged to be continuous with it and to contain
economically producible oil or gas on the basis of available geoscience and engineering data.(ii) In the absence of data on fluid contacts, proved quantities in a reservoir are limited by the lowest known hydrocarbons (LKH) as seen in a
well penetration unless geoscience, engineering, or performance data and reliable technology establishes a lower contact with reasonablecertainty.
(iii) Where direct observation from well penetrations has defined a highest known oil (HKO) elevation and the potential exists for an associatedgas cap, proved oil reserves may be assigned in the structurally higher portions of the reservoir only if geoscience, engineering, orperformance data and reliable technology establish the higher contact with reasonable certainty.
(iv) Reserves which can be produced economically through application of improved recovery techniques (including, but not limited to, fluidinjection) are included in the proved classification when:(A) Successful testing by a pilot project in an area of the reservoir with properties no more favourable than in the reservoir as a whole, the
operation of an installed programme in the reservoir or an analogous reservoir, or other evidence using reliable technology establishesthe reasonable certainty of the engineering analysis on which the project or programme was based; and
(B) The project has been approved for development by all necessary parties and entities, including governmental entities.(v) Existing economic conditions include prices and costs at which economic producibility from a reservoir is to be determined. The price shall
be the average price during the 12-month period prior to the ending date of the period covered by the report, determined as an unweightedarithmetic average of the first-day-of-the-month price for each month within such period, unless prices are defined by contractualarrangements, excluding escalations based upon future conditions.
Undeveloped oil and gas reservesUndeveloped oil and gas reserves are reserves of any category that are expected to be recovered from new wells on undrilled acreage, or from existingwells where a relatively major expenditure is required for recompletion.
(i) Reserves on undrilled acreage shall be limited to those directly offsetting development spacing areas that are reasonably certain ofproduction when drilled, unless evidence using reliable technology exists that establishes reasonable certainty of economic producibility atgreater distances.
(ii) Undrilled locations can be classified as having undeveloped reserves only if a development plan has been adopted indicating that they arescheduled to be drilled within five years, unless the specific circumstances justify a longer time.
(iii) Under no circumstances shall estimates for undeveloped reserves be attributable to any acreage for which an application of fluid injection orother improved recovery technique is contemplated, unless such techniques have been proved effective by actual projects in the samereservoir or an analogous reservoir, or by other evidence using reliable technology establishing reasonable certainty.
Developed oil and gas reservesDeveloped oil and gas reserves are reserves of any category that can be expected to be recovered:
(i) Through existing wells with existing equipment and operating methods or in which the cost of the required equipment is relatively minorcompared with the cost of a new well; and
(ii) Through installed extraction equipment and infrastructure operational at the time of the reserves estimate if the extraction is by means notinvolving a well.
For details on BP’s proved reserves and production compliance and governance processes, see pages 84-86.
Supplementary information on oil and natural gas (unaudited) 263BP Annual Report and Form 20-F 2012
Financial statements
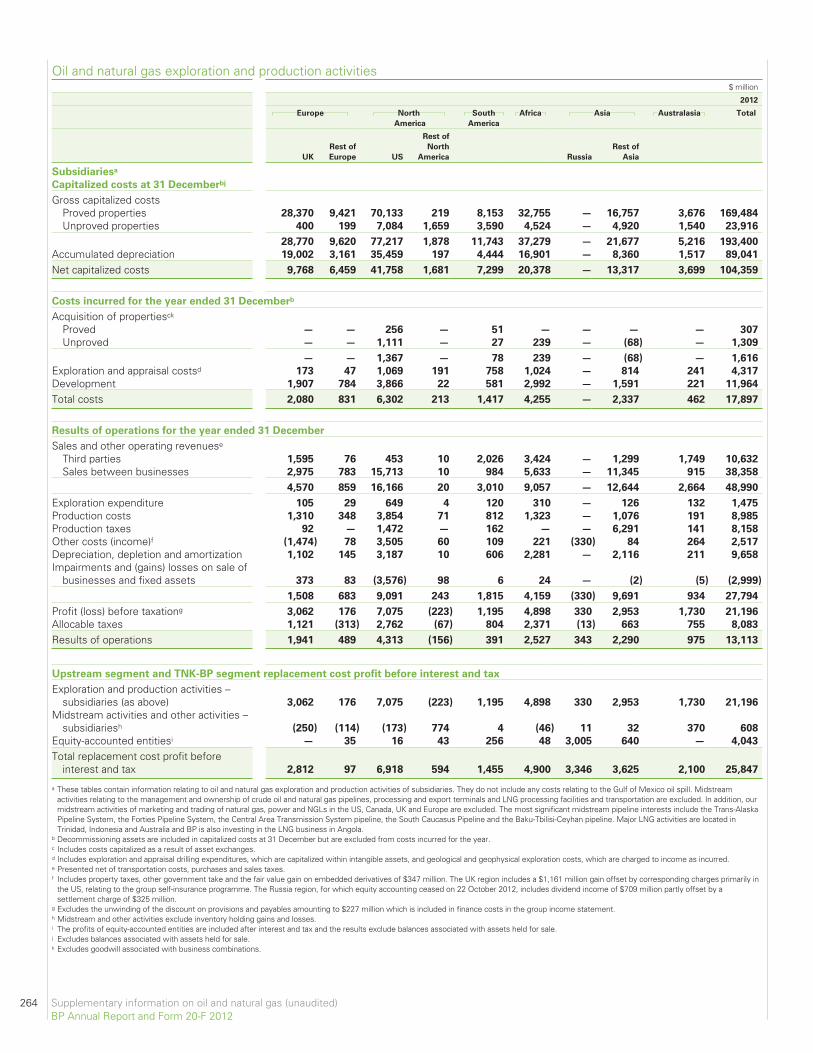
Oil and natural gas exploration and production activities$ million
2012
Europe North
America
South
America
Africa Asia Australasia Total
UK
Rest of
Europe US
Rest of
North
America Russia
Rest of
Asia
Subsidiariesa
Capitalized costs at 31 Decemberbj
Gross capitalized costsProved properties 28,370 9,421 70,133 219 8,153 32,755 — 16,757 3,676 169,484
Unproved properties 400 199 7,084 1,659 3,590 4,524 — 4,920 1,540 23,916
28,770 9,620 77,217 1,878 11,743 37,279 — 21,677 5,216 193,400
Accumulated depreciation 19,002 3,161 35,459 197 4,444 16,901 — 8,360 1,517 89,041
Net capitalized costs 9,768 6,459 41,758 1,681 7,299 20,378 — 13,317 3,699 104,359
Costs incurred for the year ended 31 Decemberb
Acquisition of propertiesck
Proved — — 256 — 51 — — — — 307
Unproved — — 1,111 — 27 239 — (68) — 1,309
— — 1,367 — 78 239 — (68) — 1,616
Exploration and appraisal costsd 173 47 1,069 191 758 1,024 — 814 241 4,317
Development 1,907 784 3,866 22 581 2,992 — 1,591 221 11,964
Total costs 2,080 831 6,302 213 1,417 4,255 — 2,337 462 17,897
Results of operations for the year ended 31 December
Sales and other operating revenuese
Third parties 1,595 76 453 10 2,026 3,424 — 1,299 1,749 10,632
Sales between businesses 2,975 783 15,713 10 984 5,633 — 11,345 915 38,358
4,570 859 16,166 20 3,010 9,057 — 12,644 2,664 48,990
Exploration expenditure 105 29 649 4 120 310 — 126 132 1,475
Production costs 1,310 348 3,854 71 812 1,323 — 1,076 191 8,985
Production taxes 92 — 1,472 — 162 — — 6,291 141 8,158
Other costs (income)f (1,474) 78 3,505 60 109 221 (330) 84 264 2,517
Depreciation, depletion and amortization 1,102 145 3,187 10 606 2,281 — 2,116 211 9,658
Impairments and (gains) losses on sale ofbusinesses and fixed assets 373 83 (3,576) 98 6 24 — (2) (5) (2,999)
1,508 683 9,091 243 1,815 4,159 (330) 9,691 934 27,794
Profit (loss) before taxationg 3,062 176 7,075 (223) 1,195 4,898 330 2,953 1,730 21,196
Allocable taxes 1,121 (313) 2,762 (67) 804 2,371 (13) 663 755 8,083
Results of operations 1,941 489 4,313 (156) 391 2,527 343 2,290 975 13,113
Upstream segment and TNK-BP segment replacement cost profit before interest and tax
Exploration and production activities –subsidiaries (as above) 3,062 176 7,075 (223) 1,195 4,898 330 2,953 1,730 21,196
Midstream activities and other activities –subsidiariesh (250) (114) (173) 774 4 (46) 11 32 370 608
Equity-accounted entitiesi — 35 16 43 256 48 3,005 640 — 4,043
Total replacement cost profit beforeinterest and tax 2,812 97 6,918 594 1,455 4,900 3,346 3,625 2,100 25,847
a These tables contain information relating to oil and natural gas exploration and production activities of subsidiaries. They do not include any costs relating to the Gulf of Mexico oil spill. Midstreamactivities relating to the management and ownership of crude oil and natural gas pipelines, processing and export terminals and LNG processing facilities and transportation are excluded. In addition, ourmidstream activities of marketing and trading of natural gas, power and NGLs in the US, Canada, UK and Europe are excluded. The most significant midstream pipeline interests include the Trans-AlaskaPipeline System, the Forties Pipeline System, the Central Area Transmission System pipeline, the South Caucasus Pipeline and the Baku-Tbilisi-Ceyhan pipeline. Major LNG activities are located inTrinidad, Indonesia and Australia and BP is also investing in the LNG business in Angola.
b Decommissioning assets are included in capitalized costs at 31 December but are excluded from costs incurred for the year.c Includes costs capitalized as a result of asset exchanges.d Includes exploration and appraisal drilling expenditures, which are capitalized within intangible assets, and geological and geophysical exploration costs, which are charged to income as incurred.e Presented net of transportation costs, purchases and sales taxes.f Includes property taxes, other government take and the fair value gain on embedded derivatives of $347 million. The UK region includes a $1,161 million gain offset by corresponding charges primarily in
the US, relating to the group self-insurance programme. The Russia region, for which equity accounting ceased on 22 October 2012, includes dividend income of $709 million partly offset by asettlement charge of $325 million.
g Excludes the unwinding of the discount on provisions and payables amounting to $227 million which is included in finance costs in the group income statement.h Midstream and other activities exclude inventory holding gains and losses.i The profits of equity-accounted entities are included after interest and tax and the results exclude balances associated with assets held for sale.j Excludes balances associated with assets held for sale.k Excludes goodwill associated with business combinations.
264 Supplementary information on oil and natural gas (unaudited)BP Annual Report and Form 20-F 2012
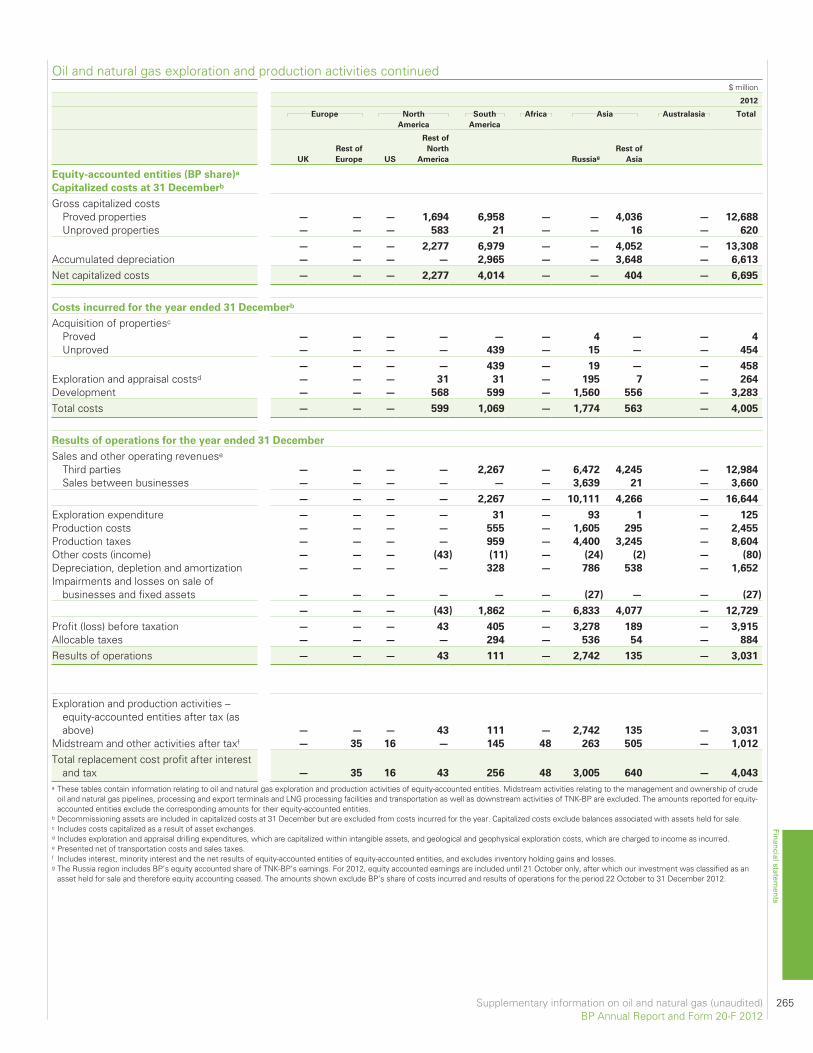
$ million
2012
Europe North
America
South
America
Africa Asia Australasia Total
UK
Rest of
Europe US
Rest of
North
America Russiag
Rest of
Asia
Equity-accounted entities (BP share)a
Capitalized costs at 31 Decemberb
Gross capitalized costsProved properties — — — 1,694 6,958 — — 4,036 — 12,688
Unproved properties — — — 583 21 — — 16 — 620
— — — 2,277 6,979 — — 4,052 — 13,308
Accumulated depreciation — — — — 2,965 — — 3,648 — 6,613
Net capitalized costs — — — 2,277 4,014 — — 404 — 6,695
Costs incurred for the year ended 31 Decemberb
Acquisition of propertiesc
Proved — — — — — — 4 — — 4
Unproved — — — — 439 — 15 — — 454
— — — — 439 — 19 — — 458
Exploration and appraisal costsd — — — 31 31 — 195 7 — 264
Development — — — 568 599 — 1,560 556 — 3,283
Total costs — — — 599 1,069 — 1,774 563 — 4,005
Results of operations for the year ended 31 December
Sales and other operating revenuese
Third parties — — — — 2,267 — 6,472 4,245 — 12,984
Sales between businesses — — — — — — 3,639 21 — 3,660
— — — — 2,267 — 10,111 4,266 — 16,644
Exploration expenditure — — — — 31 — 93 1 — 125
Production costs — — — — 555 — 1,605 295 — 2,455
Production taxes — — — — 959 — 4,400 3,245 — 8,604
Other costs (income) — — — (43) (11) — (24) (2) — (80)
Depreciation, depletion and amortization — — — — 328 — 786 538 — 1,652
Impairments and losses on sale ofbusinesses and fixed assets — — — — — — (27) — — (27)
— — — (43) 1,862 — 6,833 4,077 — 12,729
Profit (loss) before taxation — — — 43 405 — 3,278 189 — 3,915
Allocable taxes — — — — 294 — 536 54 — 884
Results of operations — — — 43 111 — 2,742 135 — 3,031
Exploration and production activities –equity-accounted entities after tax (asabove) — — — 43 111 — 2,742 135 — 3,031
Midstream and other activities after taxf — 35 16 — 145 48 263 505 — 1,012
Total replacement cost profit after interestand tax — 35 16 43 256 48 3,005 640 — 4,043
a These tables contain information relating to oil and natural gas exploration and production activities of equity-accounted entities. Midstream activities relating to the management and ownership of crudeoil and natural gas pipelines, processing and export terminals and LNG processing facilities and transportation as well as downstream activities of TNK-BP are excluded. The amounts reported for equity-accounted entities exclude the corresponding amounts for their equity-accounted entities.
b Decommissioning assets are included in capitalized costs at 31 December but are excluded from costs incurred for the year. Capitalized costs exclude balances associated with assets held for sale.c Includes costs capitalized as a result of asset exchanges.d Includes exploration and appraisal drilling expenditures, which are capitalized within intangible assets, and geological and geophysical exploration costs, which are charged to income as incurred.e Presented net of transportation costs and sales taxes.f Includes interest, minority interest and the net results of equity-accounted entities of equity-accounted entities, and excludes inventory holding gains and losses.g The Russia region includes BP’s equity accounted share of TNK-BP’s earnings. For 2012, equity accounted earnings are included until 21 October only, after which our investment was classified as an
asset held for sale and therefore equity accounting ceased. The amounts shown exclude BP’s share of costs incurred and results of operations for the period 22 October to 31 December 2012.
Supplementary information on oil and natural gas (unaudited) 265BP Annual Report and Form 20-F 2012
Financial statements
Oil and natural gas exploration and production activities continued
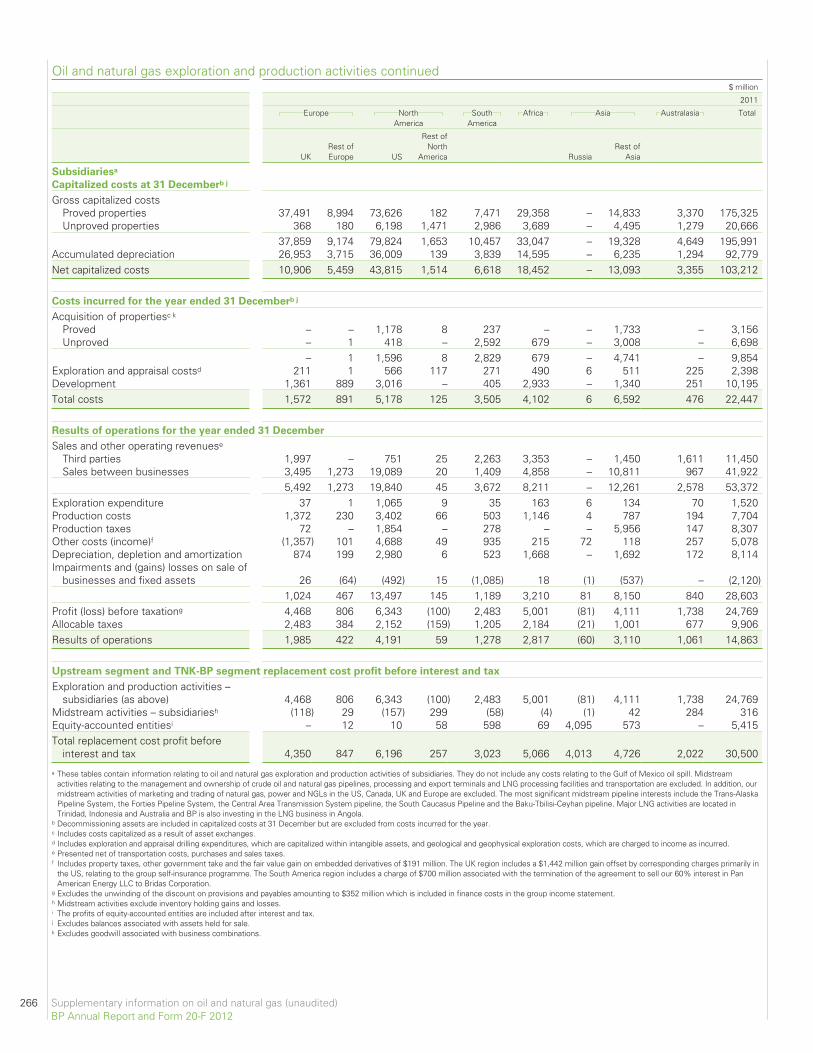
Oil and natural gas exploration and production activities continued$ million
2011
Europe NorthAmerica
SouthAmerica
Africa Asia Australasia Total
UKRest ofEurope US
Rest ofNorth
America RussiaRest of
Asia
Subsidiariesa
Capitalized costs at 31 Decemberb j
Gross capitalized costsProved properties 37,491 8,994 73,626 182 7,471 29,358 – 14,833 3,370 175,325Unproved properties 368 180 6,198 1,471 2,986 3,689 – 4,495 1,279 20,666
37,859 9,174 79,824 1,653 10,457 33,047 – 19,328 4,649 195,991Accumulated depreciation 26,953 3,715 36,009 139 3,839 14,595 – 6,235 1,294 92,779Net capitalized costs 10,906 5,459 43,815 1,514 6,618 18,452 – 13,093 3,355 103,212
Costs incurred for the year ended 31 Decemberb j
Acquisition of propertiesc k
Proved – – 1,178 8 237 – – 1,733 – 3,156Unproved – 1 418 – 2,592 679 – 3,008 – 6,698
– 1 1,596 8 2,829 679 – 4,741 – 9,854Exploration and appraisal costsd 211 1 566 117 271 490 6 511 225 2,398Development 1,361 889 3,016 – 405 2,933 – 1,340 251 10,195Total costs 1,572 891 5,178 125 3,505 4,102 6 6,592 476 22,447
Results of operations for the year ended 31 December
Sales and other operating revenuese
Third parties 1,997 – 751 25 2,263 3,353 – 1,450 1,611 11,450Sales between businesses 3,495 1,273 19,089 20 1,409 4,858 – 10,811 967 41,922
5,492 1,273 19,840 45 3,672 8,211 – 12,261 2,578 53,372Exploration expenditure 37 1 1,065 9 35 163 6 134 70 1,520Production costs 1,372 230 3,402 66 503 1,146 4 787 194 7,704Production taxes 72 – 1,854 – 278 – – 5,956 147 8,307Other costs (income)f (1,357) 101 4,688 49 935 215 72 118 257 5,078Depreciation, depletion and amortization 874 199 2,980 6 523 1,668 – 1,692 172 8,114Impairments and (gains) losses on sale of
businesses and fixed assets 26 (64) (492) 15 (1,085) 18 (1) (537) – (2,120)1,024 467 13,497 145 1,189 3,210 81 8,150 840 28,603
Profit (loss) before taxationg 4,468 806 6,343 (100) 2,483 5,001 (81) 4,111 1,738 24,769Allocable taxes 2,483 384 2,152 (159) 1,205 2,184 (21) 1,001 677 9,906Results of operations 1,985 422 4,191 59 1,278 2,817 (60) 3,110 1,061 14,863
Upstream segment and TNK-BP segment replacement cost profit before interest and tax
Exploration and production activities –subsidiaries (as above) 4,468 806 6,343 (100) 2,483 5,001 (81) 4,111 1,738 24,769
Midstream activities – subsidiariesh (118) 29 (157) 299 (58) (4) (1) 42 284 316Equity-accounted entitiesi – 12 10 58 598 69 4,095 573 – 5,415Total replacement cost profit before
interest and tax 4,350 847 6,196 257 3,023 5,066 4,013 4,726 2,022 30,500
a These tables contain information relating to oil and natural gas exploration and production activities of subsidiaries. They do not include any costs relating to the Gulf of Mexico oil spill. Midstreamactivities relating to the management and ownership of crude oil and natural gas pipelines, processing and export terminals and LNG processing facilities and transportation are excluded. In addition, ourmidstream activities of marketing and trading of natural gas, power and NGLs in the US, Canada, UK and Europe are excluded. The most significant midstream pipeline interests include the Trans-AlaskaPipeline System, the Forties Pipeline System, the Central Area Transmission System pipeline, the South Caucasus Pipeline and the Baku-Tbilisi-Ceyhan pipeline. Major LNG activities are located inTrinidad, Indonesia and Australia and BP is also investing in the LNG business in Angola.
b Decommissioning assets are included in capitalized costs at 31 December but are excluded from costs incurred for the year.c Includes costs capitalized as a result of asset exchanges.d Includes exploration and appraisal drilling expenditures, which are capitalized within intangible assets, and geological and geophysical exploration costs, which are charged to income as incurred.e Presented net of transportation costs, purchases and sales taxes.f Includes property taxes, other government take and the fair value gain on embedded derivatives of $191 million. The UK region includes a $1,442 million gain offset by corresponding charges primarily in
the US, relating to the group self-insurance programme. The South America region includes a charge of $700 million associated with the termination of the agreement to sell our 60% interest in PanAmerican Energy LLC to Bridas Corporation.
g Excludes the unwinding of the discount on provisions and payables amounting to $352 million which is included in finance costs in the group income statement.h Midstream activities exclude inventory holding gains and losses.i The profits of equity-accounted entities are included after interest and tax.j Excludes balances associated with assets held for sale.k Excludes goodwill associated with business combinations.
266 Supplementary information on oil and natural gas (unaudited)BP Annual Report and Form 20-F 2012
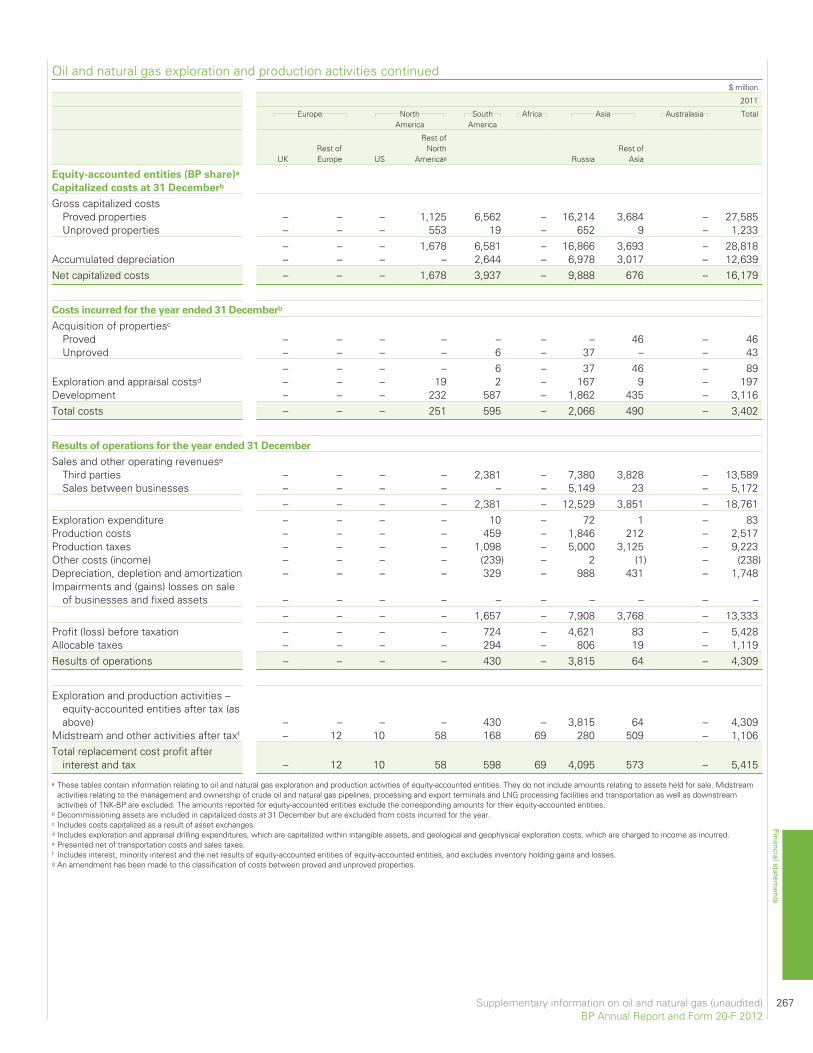
$ million
2011
Europe NorthAmerica
SouthAmerica
Africa Asia Australasia Total
UKRest ofEurope US
Rest ofNorth
Americag RussiaRest of
Asia
Equity-accounted entities (BP share)a
Capitalized costs at 31 Decemberb
Gross capitalized costsProved properties – – – 1,125 6,562 – 16,214 3,684 – 27,585Unproved properties – – – 553 19 – 652 9 – 1,233
– – – 1,678 6,581 – 16,866 3,693 – 28,818Accumulated depreciation – – – – 2,644 – 6,978 3,017 – 12,639Net capitalized costs – – – 1,678 3,937 – 9,888 676 – 16,179
Costs incurred for the year ended 31 Decemberb
Acquisition of propertiesc
Proved – – – – – – – 46 – 46Unproved – – – – 6 – 37 – – 43
– – – – 6 – 37 46 – 89Exploration and appraisal costsd – – – 19 2 – 167 9 – 197Development – – – 232 587 – 1,862 435 – 3,116Total costs – – – 251 595 – 2,066 490 – 3,402
Results of operations for the year ended 31 December
Sales and other operating revenuese
Third parties – – – – 2,381 – 7,380 3,828 – 13,589Sales between businesses – – – – – – 5,149 23 – 5,172
– – – – 2,381 – 12,529 3,851 – 18,761Exploration expenditure – – – – 10 – 72 1 – 83Production costs – – – – 459 – 1,846 212 – 2,517Production taxes – – – – 1,098 – 5,000 3,125 – 9,223Other costs (income) – – – – (239) – 2 (1) – (238)Depreciation, depletion and amortization – – – – 329 – 988 431 – 1,748Impairments and (gains) losses on sale
of businesses and fixed assets – – – – – – – – – –– – – – 1,657 – 7,908 3,768 – 13,333
Profit (loss) before taxation – – – – 724 – 4,621 83 – 5,428Allocable taxes – – – – 294 – 806 19 – 1,119Results of operations – – – – 430 – 3,815 64 – 4,309
Exploration and production activities –equity-accounted entities after tax (asabove) – – – – 430 – 3,815 64 – 4,309
Midstream and other activities after taxf – 12 10 58 168 69 280 509 – 1,106Total replacement cost profit after
interest and tax – 12 10 58 598 69 4,095 573 – 5,415
a These tables contain information relating to oil and natural gas exploration and production activities of equity-accounted entities. They do not include amounts relating to assets held for sale. Midstreamactivities relating to the management and ownership of crude oil and natural gas pipelines, processing and export terminals and LNG processing facilities and transportation as well as downstreamactivities of TNK-BP are excluded. The amounts reported for equity-accounted entities exclude the corresponding amounts for their equity-accounted entities.
b Decommissioning assets are included in capitalized costs at 31 December but are excluded from costs incurred for the year.c Includes costs capitalized as a result of asset exchanges.d Includes exploration and appraisal drilling expenditures, which are capitalized within intangible assets, and geological and geophysical exploration costs, which are charged to income as incurred.e Presented net of transportation costs and sales taxes.f Includes interest, minority interest and the net results of equity-accounted entities of equity-accounted entities, and excludes inventory holding gains and losses.g An amendment has been made to the classification of costs between proved and unproved properties.
Supplementary information on oil and natural gas (unaudited) 267BP Annual Report and Form 20-F 2012
Financial statements
Oil and natural gas exploration and production activities continued
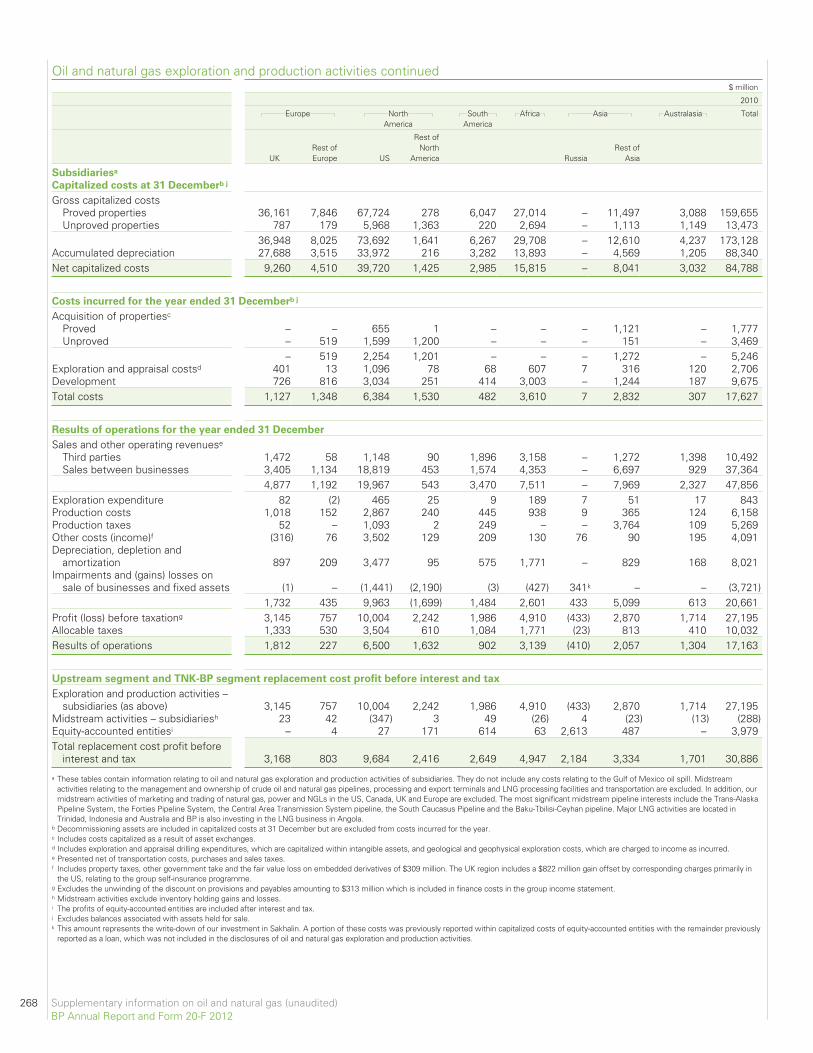
Oil and natural gas exploration and production activities continued$ million
2010
Europe NorthAmerica
SouthAmerica
Africa Asia Australasia Total
UKRest ofEurope US
Rest ofNorth
America RussiaRest of
Asia
Subsidiariesa
Capitalized costs at 31 Decemberb j
Gross capitalized costsProved properties 36,161 7,846 67,724 278 6,047 27,014 – 11,497 3,088 159,655Unproved properties 787 179 5,968 1,363 220 2,694 – 1,113 1,149 13,473
36,948 8,025 73,692 1,641 6,267 29,708 – 12,610 4,237 173,128Accumulated depreciation 27,688 3,515 33,972 216 3,282 13,893 – 4,569 1,205 88,340Net capitalized costs 9,260 4,510 39,720 1,425 2,985 15,815 – 8,041 3,032 84,788
Costs incurred for the year ended 31 Decemberb j
Acquisition of propertiesc
Proved – – 655 1 – – – 1,121 – 1,777Unproved – 519 1,599 1,200 – – – 151 – 3,469
– 519 2,254 1,201 – – – 1,272 – 5,246Exploration and appraisal costsd 401 13 1,096 78 68 607 7 316 120 2,706Development 726 816 3,034 251 414 3,003 – 1,244 187 9,675Total costs 1,127 1,348 6,384 1,530 482 3,610 7 2,832 307 17,627
Results of operations for the year ended 31 December
Sales and other operating revenuese
Third parties 1,472 58 1,148 90 1,896 3,158 – 1,272 1,398 10,492Sales between businesses 3,405 1,134 18,819 453 1,574 4,353 – 6,697 929 37,364
4,877 1,192 19,967 543 3,470 7,511 – 7,969 2,327 47,856Exploration expenditure 82 (2) 465 25 9 189 7 51 17 843Production costs 1,018 152 2,867 240 445 938 9 365 124 6,158Production taxes 52 – 1,093 2 249 – – 3,764 109 5,269Other costs (income)f (316) 76 3,502 129 209 130 76 90 195 4,091Depreciation, depletion and
amortization 897 209 3,477 95 575 1,771 – 829 168 8,021Impairments and (gains) losses on
sale of businesses and fixed assets (1) – (1,441) (2,190) (3) (427) 341k – – (3,721)1,732 435 9,963 (1,699) 1,484 2,601 433 5,099 613 20,661
Profit (loss) before taxationg 3,145 757 10,004 2,242 1,986 4,910 (433) 2,870 1,714 27,195Allocable taxes 1,333 530 3,504 610 1,084 1,771 (23) 813 410 10,032Results of operations 1,812 227 6,500 1,632 902 3,139 (410) 2,057 1,304 17,163
Upstream segment and TNK-BP segment replacement cost profit before interest and tax
Exploration and production activities –subsidiaries (as above) 3,145 757 10,004 2,242 1,986 4,910 (433) 2,870 1,714 27,195
Midstream activities – subsidiariesh 23 42 (347) 3 49 (26) 4 (23) (13) (288)Equity-accounted entitiesi – 4 27 171 614 63 2,613 487 – 3,979Total replacement cost profit before
interest and tax 3,168 803 9,684 2,416 2,649 4,947 2,184 3,334 1,701 30,886
a These tables contain information relating to oil and natural gas exploration and production activities of subsidiaries. They do not include any costs relating to the Gulf of Mexico oil spill. Midstreamactivities relating to the management and ownership of crude oil and natural gas pipelines, processing and export terminals and LNG processing facilities and transportation are excluded. In addition, ourmidstream activities of marketing and trading of natural gas, power and NGLs in the US, Canada, UK and Europe are excluded. The most significant midstream pipeline interests include the Trans-AlaskaPipeline System, the Forties Pipeline System, the Central Area Transmission System pipeline, the South Caucasus Pipeline and the Baku-Tbilisi-Ceyhan pipeline. Major LNG activities are located inTrinidad, Indonesia and Australia and BP is also investing in the LNG business in Angola.
b Decommissioning assets are included in capitalized costs at 31 December but are excluded from costs incurred for the year.c Includes costs capitalized as a result of asset exchanges.d Includes exploration and appraisal drilling expenditures, which are capitalized within intangible assets, and geological and geophysical exploration costs, which are charged to income as incurred.e Presented net of transportation costs, purchases and sales taxes.f Includes property taxes, other government take and the fair value loss on embedded derivatives of $309 million. The UK region includes a $822 million gain offset by corresponding charges primarily in
the US, relating to the group self-insurance programme.g Excludes the unwinding of the discount on provisions and payables amounting to $313 million which is included in finance costs in the group income statement.h Midstream activities exclude inventory holding gains and losses.i The profits of equity-accounted entities are included after interest and tax.j Excludes balances associated with assets held for sale.k This amount represents the write-down of our investment in Sakhalin. A portion of these costs was previously reported within capitalized costs of equity-accounted entities with the remainder previously
reported as a loan, which was not included in the disclosures of oil and natural gas exploration and production activities.
268 Supplementary information on oil and natural gas (unaudited)BP Annual Report and Form 20-F 2012

$ million
2010
Europe NorthAmerica
SouthAmerica
Africa Asia Australasia Total
UKRest ofEurope US
Rest ofNorth
Americag RussiaRest of
Asia
Equity-accounted entities (BP share)a
Capitalized costs at 31 Decemberb
Gross capitalized costsProved properties – – – 893 5,778 – 14,486 3,192 – 24,349Unproved properties – – – 533 163 – 652 – – 1,348
– – – 1,426 5,941 – 15,138 3,192 – 25,697Accumulated depreciation – – – – 2,250 – 6,300 2,674 – 11,224Net capitalized costs – – – 1,426 3,691 – 8,838 518 – 14,473
Costs incurred for the year ended 31 Decemberb
Acquisition of propertiesc
Proved – – – – – – – – – –Unproved – – – – 9 – 66 – – 75
– – – – 9 – 66 – – 75Exploration and appraisal costsd – – – 28 2 – 94 – – 124Development – – – 21 549 – 1,416 355 – 2,341Total costs – – – 49 560 – 1,576 355 – 2,540
Results of operations for the year ended 31 December
Sales and other operating revenuese
Third parties – – – – 2,268 – 5,610 2,557 – 10,435Sales between businesses – – – – – – 3,432 19 – 3,451
– – – – 2,268 – 9,042 2,576 – 13,886Exploration expenditure – – – – 22 – 40 – – 62Production costs – – – – 316 – 1,602 184 – 2,102Production taxes – – – – 911 – 3,567 2,029 – 6,507Other costs (income) – – – 67 75 – 3 (2) – 143Depreciation, depletion and amortization – – – – 269 – 954 363 – 1,586Impairments and losses on sale of
businesses and fixed assets – – – – – – 43 – – 43– – – 67 1,593 – 6,209 2,574 – 10,443
Profit (loss) before taxation – – – (67) 675 – 2,833 2 – 3,443Allocable taxes – – – – 260 – 475 33 – 768Results of operations – – – (67) 415 – 2,358 (31) – 2,675
Exploration and production activities –equity-accounted entities after tax(as above) – – – (67) 415 – 2,358 (31) – 2,675
Midstream and other activities after taxf – 4 27 238 199 63 255 518 – 1,304Total replacement cost profit after
interest and tax – 4 27 171 614 63 2,613 487 – 3,979
a These tables contain information relating to oil and natural gas exploration and production activities of equity-accounted entities. They do not include amounts relating to assets held for sale. Midstreamactivities relating to the management and ownership of crude oil and natural gas pipelines, processing and export terminals and LNG processing facilities and transportation as well as downstreamactivities of TNK-BP are excluded. The amounts reported for equity-accounted entities exclude the corresponding amounts for their equity-accounted entities.
b Decommissioning assets are included in capitalized costs at 31 December but are excluded from costs incurred for the year.c Includes costs capitalized as a result of asset exchanges.d Includes exploration and appraisal drilling expenditures, which are capitalized within intangible assets, and geological and geophysical exploration costs, which are charged to income as incurred.e Presented net of transportation costs and sales taxes.f Includes interest, minority interest and the net results of equity-accounted entities of equity-accounted entities.g An amendment has been made to the classification of costs between proved and unproved properties.
Supplementary information on oil and natural gas (unaudited) 269BP Annual Report and Form 20-F 2012
Financial statements
Oil and natural gas exploration and production activities continued
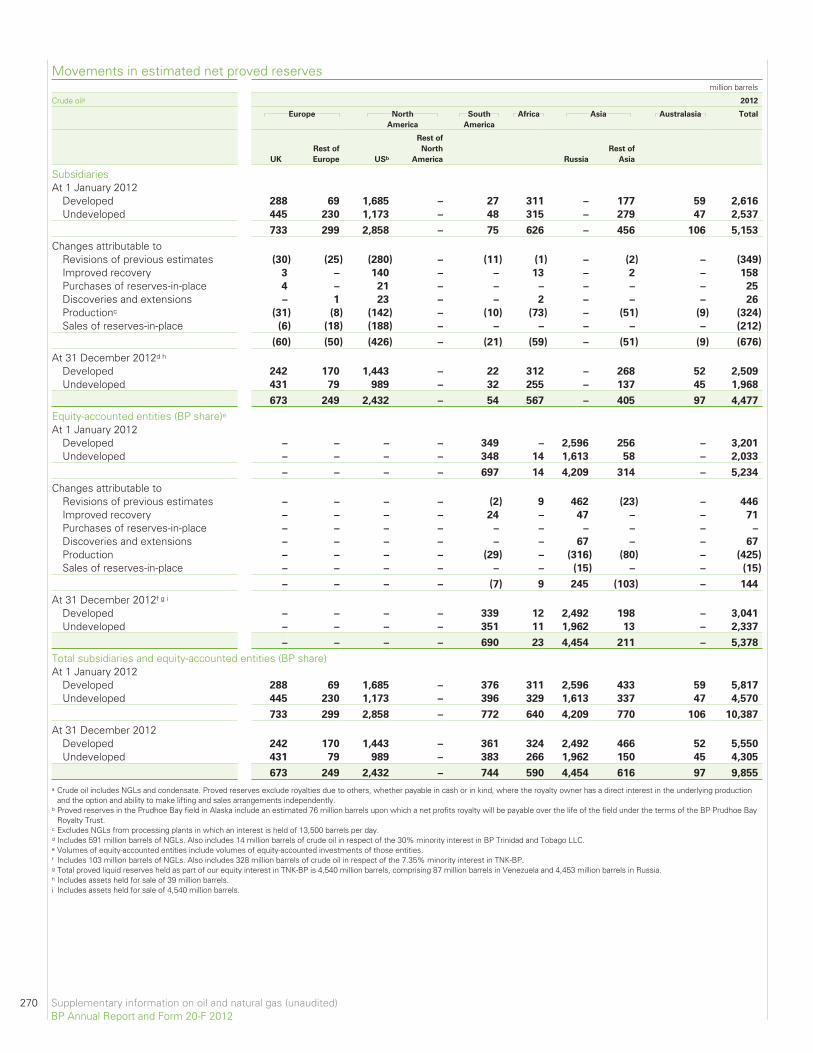
Movements in estimated net proved reservesmillion barrels
Crude oila 2012
Europe North
America
South
America
Africa Asia Australasia Total
UK
Rest of
Europe USb
Rest of
North
America Russia
Rest of
Asia
SubsidiariesAt 1 January 2012
Developed 288 69 1,685 – 27 311 – 177 59 2,616
Undeveloped 445 230 1,173 – 48 315 – 279 47 2,537
733 299 2,858 – 75 626 – 456 106 5,153
Changes attributable toRevisions of previous estimates (30) (25) (280) – (11) (1) – (2) – (349)
Improved recovery 3 – 140 – – 13 – 2 – 158
Purchases of reserves-in-place 4 – 21 – – – – – – 25
Discoveries and extensions – 1 23 – – 2 – – – 26
Productionc (31) (8) (142) – (10) (73) – (51) (9) (324)
Sales of reserves-in-place (6) (18) (188) – – – – – – (212)
(60) (50) (426) – (21) (59) – (51) (9) (676)
At 31 December 2012d h
Developed 242 170 1,443 – 22 312 – 268 52 2,509
Undeveloped 431 79 989 – 32 255 – 137 45 1,968
673 249 2,432 – 54 567 – 405 97 4,477
Equity-accounted entities (BP share)eAt 1 January 2012
Developed – – – – 349 – 2,596 256 – 3,201
Undeveloped – – – – 348 14 1,613 58 – 2,033
– – – – 697 14 4,209 314 – 5,234
Changes attributable toRevisions of previous estimates – – – – (2) 9 462 (23) – 446
Improved recovery – – – – 24 – 47 – – 71
Purchases of reserves-in-place – – – – – – – – – –
Discoveries and extensions – – – – – – 67 – – 67
Production – – – – (29) – (316) (80) – (425)
Sales of reserves-in-place – – – – – – (15) – – (15)
– – – – (7) 9 245 (103) – 144
At 31 December 2012f g i
Developed – – – – 339 12 2,492 198 – 3,041
Undeveloped – – – – 351 11 1,962 13 – 2,337
– – – – 690 23 4,454 211 – 5,378
Total subsidiaries and equity-accounted entities (BP share)At 1 January 2012
Developed 288 69 1,685 – 376 311 2,596 433 59 5,817
Undeveloped 445 230 1,173 – 396 329 1,613 337 47 4,570
733 299 2,858 – 772 640 4,209 770 106 10,387
At 31 December 2012Developed 242 170 1,443 – 361 324 2,492 466 52 5,550
Undeveloped 431 79 989 – 383 266 1,962 150 45 4,305
673 249 2,432 – 744 590 4,454 616 97 9,855
a Crude oil includes NGLs and condensate. Proved reserves exclude royalties due to others, whether payable in cash or in kind, where the royalty owner has a direct interest in the underlying productionand the option and ability to make lifting and sales arrangements independently.
b Proved reserves in the Prudhoe Bay field in Alaska include an estimated 76 million barrels upon which a net profits royalty will be payable over the life of the field under the terms of the BP Prudhoe BayRoyalty Trust.
c Excludes NGLs from processing plants in which an interest is held of 13,500 barrels per day.d Includes 591 million barrels of NGLs. Also includes 14 million barrels of crude oil in respect of the 30% minority interest in BP Trinidad and Tobago LLC.e Volumes of equity-accounted entities include volumes of equity-accounted investments of those entities.f Includes 103 million barrels of NGLs. Also includes 328 million barrels of crude oil in respect of the 7.35% minority interest in TNK-BP.g Total proved liquid reserves held as part of our equity interest in TNK-BP is 4,540 million barrels, comprising 87 million barrels in Venezuela and 4,453 million barrels in Russia.h Includes assets held for sale of 39 million barrels.i Includes assets held for sale of 4,540 million barrels.
270 Supplementary information on oil and natural gas (unaudited)BP Annual Report and Form 20-F 2012
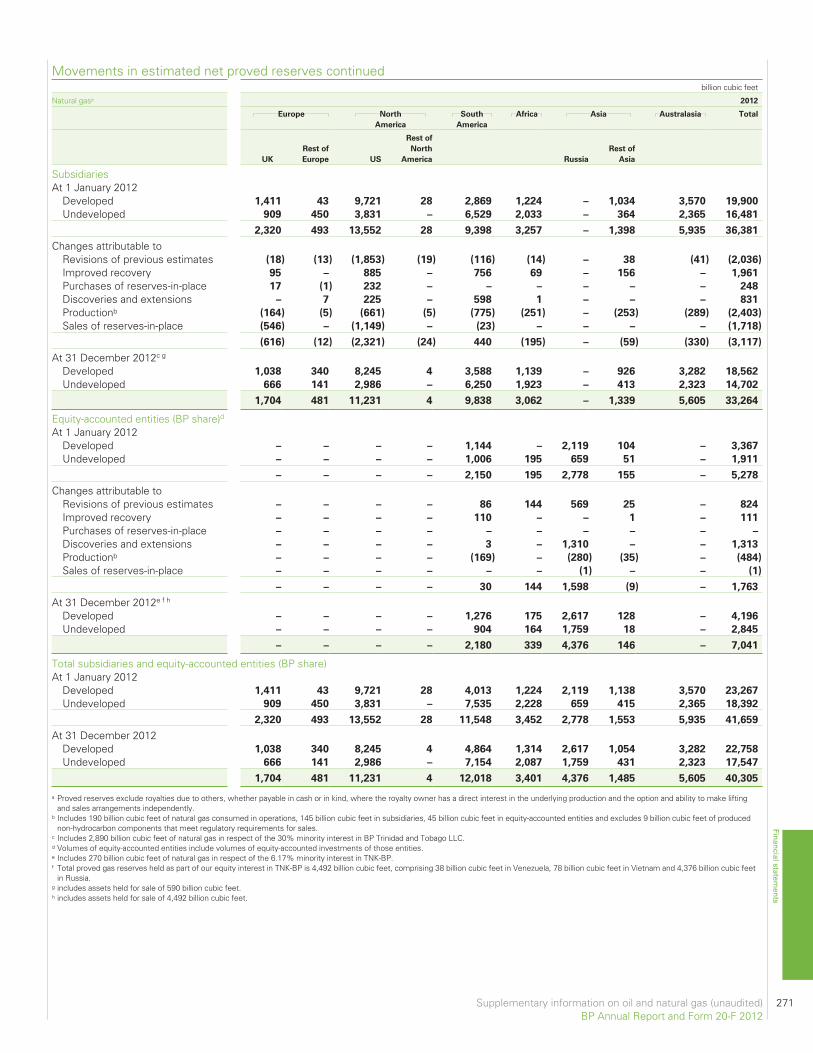
billion cubic feet
Natural gasa 2012
Europe North
America
South
America
Africa Asia Australasia Total
UK
Rest of
Europe US
Rest of
North
America Russia
Rest of
Asia
SubsidiariesAt 1 January 2012
Developed 1,411 43 9,721 28 2,869 1,224 – 1,034 3,570 19,900
Undeveloped 909 450 3,831 – 6,529 2,033 – 364 2,365 16,481
2,320 493 13,552 28 9,398 3,257 – 1,398 5,935 36,381
Changes attributable toRevisions of previous estimates (18) (13) (1,853) (19) (116) (14) – 38 (41) (2,036)
Improved recovery 95 – 885 – 756 69 – 156 – 1,961
Purchases of reserves-in-place 17 (1) 232 – – – – – – 248
Discoveries and extensions – 7 225 – 598 1 – – – 831
Productionb (164) (5) (661) (5) (775) (251) – (253) (289) (2,403)
Sales of reserves-in-place (546) – (1,149) – (23) – – – – (1,718)
(616) (12) (2,321) (24) 440 (195) – (59) (330) (3,117)
At 31 December 2012c g
Developed 1,038 340 8,245 4 3,588 1,139 – 926 3,282 18,562
Undeveloped 666 141 2,986 – 6,250 1,923 – 413 2,323 14,702
1,704 481 11,231 4 9,838 3,062 – 1,339 5,605 33,264
Equity-accounted entities (BP share)d
At 1 January 2012Developed – – – – 1,144 – 2,119 104 – 3,367
Undeveloped – – – – 1,006 195 659 51 – 1,911
– – – – 2,150 195 2,778 155 – 5,278
Changes attributable toRevisions of previous estimates – – – – 86 144 569 25 – 824
Improved recovery – – – – 110 – – 1 – 111
Purchases of reserves-in-place – – – – – – – – – –
Discoveries and extensions – – – – 3 – 1,310 – – 1,313
Productionb – – – – (169) – (280) (35) – (484)
Sales of reserves-in-place – – – – – – (1) – – (1)
– – – – 30 144 1,598 (9) – 1,763
At 31 December 2012e f h
Developed – – – – 1,276 175 2,617 128 – 4,196
Undeveloped – – – – 904 164 1,759 18 – 2,845
– – – – 2,180 339 4,376 146 – 7,041
Total subsidiaries and equity-accounted entities (BP share)At 1 January 2012
Developed 1,411 43 9,721 28 4,013 1,224 2,119 1,138 3,570 23,267
Undeveloped 909 450 3,831 – 7,535 2,228 659 415 2,365 18,392
2,320 493 13,552 28 11,548 3,452 2,778 1,553 5,935 41,659
At 31 December 2012Developed 1,038 340 8,245 4 4,864 1,314 2,617 1,054 3,282 22,758
Undeveloped 666 141 2,986 – 7,154 2,087 1,759 431 2,323 17,547
1,704 481 11,231 4 12,018 3,401 4,376 1,485 5,605 40,305
a Proved reserves exclude royalties due to others, whether payable in cash or in kind, where the royalty owner has a direct interest in the underlying production and the option and ability to make liftingand sales arrangements independently.
b Includes 190 billion cubic feet of natural gas consumed in operations, 145 billion cubic feet in subsidiaries, 45 billion cubic feet in equity-accounted entities and excludes 9 billion cubic feet of producednon-hydrocarbon components that meet regulatory requirements for sales.
c Includes 2,890 billion cubic feet of natural gas in respect of the 30% minority interest in BP Trinidad and Tobago LLC.d Volumes of equity-accounted entities include volumes of equity-accounted investments of those entities.e Includes 270 billion cubic feet of natural gas in respect of the 6.17% minority interest in TNK-BP.f Total proved gas reserves held as part of our equity interest in TNK-BP is 4,492 billion cubic feet, comprising 38 billion cubic feet in Venezuela, 78 billion cubic feet in Vietnam and 4,376 billion cubic feet
in Russia.g includes assets held for sale of 590 billion cubic feet.h includes assets held for sale of 4,492 billion cubic feet.
Supplementary information on oil and natural gas (unaudited) 271BP Annual Report and Form 20-F 2012
Financial statements
Movements in estimated net proved reserves continued
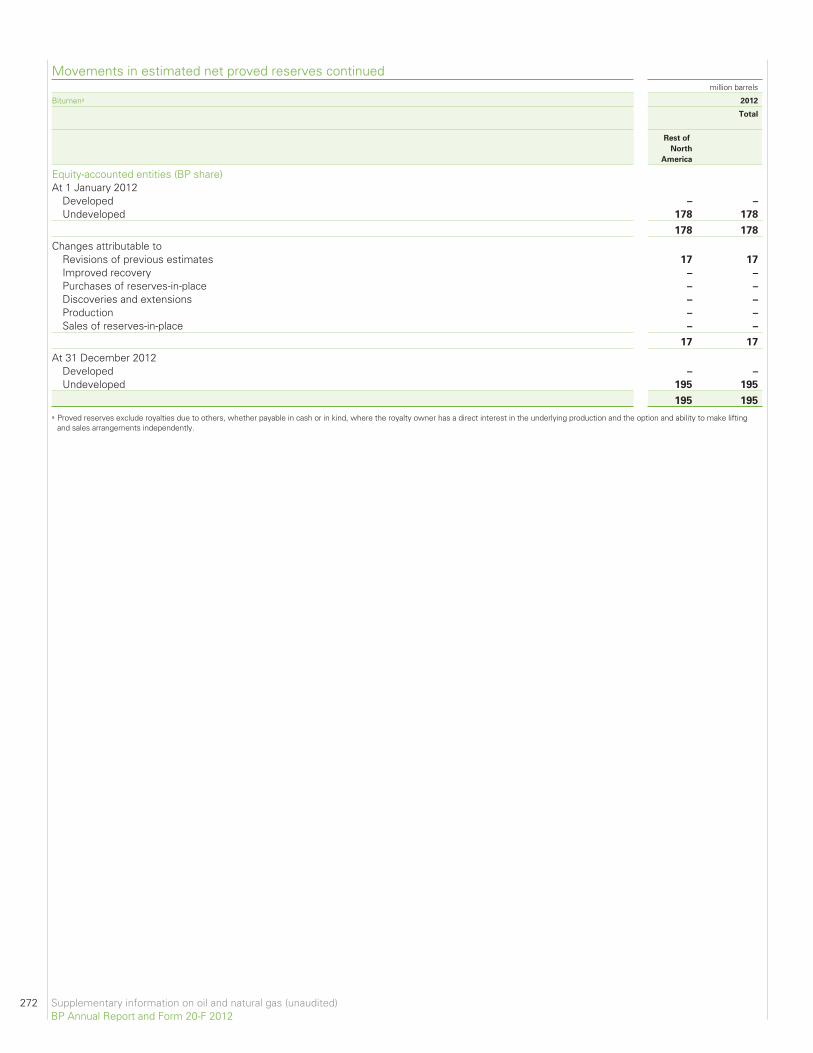
Movements in estimated net proved reserves continuedmillion barrels
Bitumena 2012
Total
Rest of
North
America
Equity-accounted entities (BP share)At 1 January 2012
Developed – –
Undeveloped 178 178
178 178
Changes attributable toRevisions of previous estimates 17 17
Improved recovery – –
Purchases of reserves-in-place – –
Discoveries and extensions – –
Production – –
Sales of reserves-in-place – –
17 17
At 31 December 2012Developed – –
Undeveloped 195 195
195 195
a Proved reserves exclude royalties due to others, whether payable in cash or in kind, where the royalty owner has a direct interest in the underlying production and the option and ability to make liftingand sales arrangements independently.
272 Supplementary information on oil and natural gas (unaudited)BP Annual Report and Form 20-F 2012
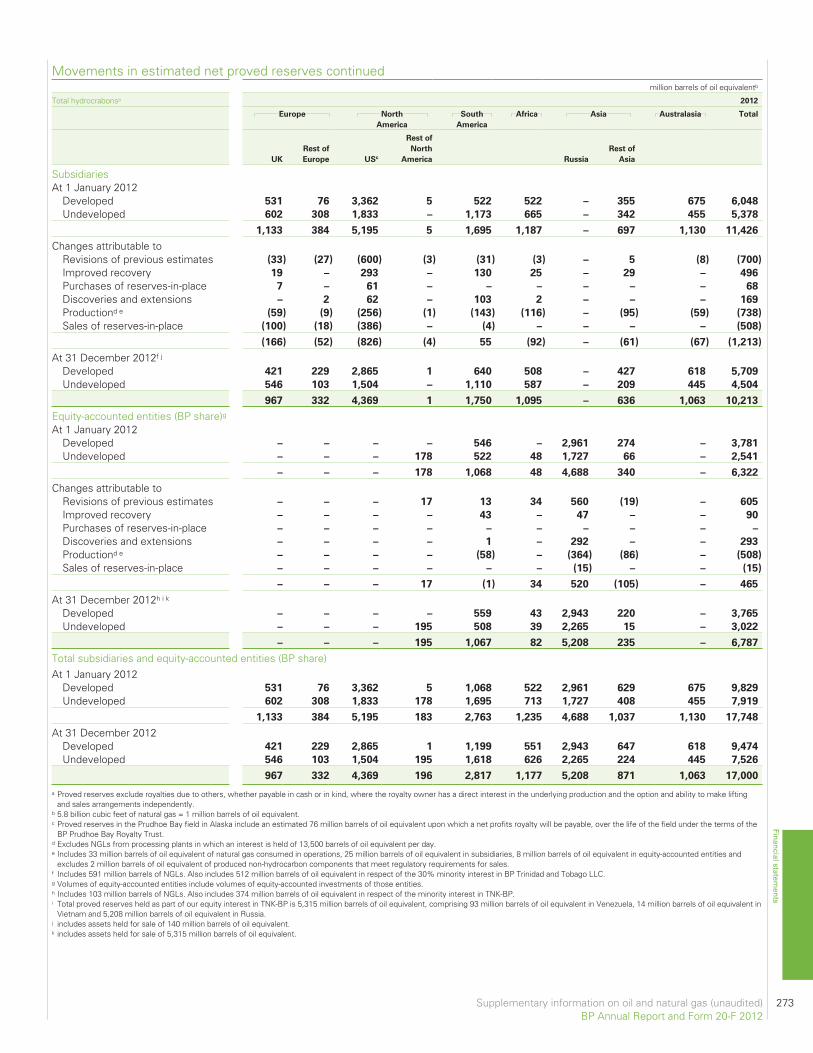
million barrels of oil equivalentb
Total hydrocrabonsa 2012
Europe North
America
South
America
Africa Asia Australasia Total
UK
Rest of
Europe USc
Rest of
North
America Russia
Rest of
Asia
SubsidiariesAt 1 January 2012
Developed 531 76 3,362 5 522 522 – 355 675 6,048
Undeveloped 602 308 1,833 – 1,173 665 – 342 455 5,378
1,133 384 5,195 5 1,695 1,187 – 697 1,130 11,426
Changes attributable toRevisions of previous estimates (33) (27) (600) (3) (31) (3) – 5 (8) (700)
Improved recovery 19 – 293 – 130 25 – 29 – 496
Purchases of reserves-in-place 7 – 61 – – – – – – 68
Discoveries and extensions – 2 62 – 103 2 – – – 169
Productiond e (59) (9) (256) (1) (143) (116) – (95) (59) (738)
Sales of reserves-in-place (100) (18) (386) – (4) – – – – (508)
(166) (52) (826) (4) 55 (92) – (61) (67) (1,213)
At 31 December 2012f j
Developed 421 229 2,865 1 640 508 – 427 618 5,709
Undeveloped 546 103 1,504 – 1,110 587 – 209 445 4,504
967 332 4,369 1 1,750 1,095 – 636 1,063 10,213
Equity-accounted entities (BP share)gAt 1 January 2012
Developed – – – – 546 – 2,961 274 – 3,781
Undeveloped – – – 178 522 48 1,727 66 – 2,541
– – – 178 1,068 48 4,688 340 – 6,322
Changes attributable toRevisions of previous estimates – – – 17 13 34 560 (19) – 605
Improved recovery – – – – 43 – 47 – – 90
Purchases of reserves-in-place – – – – – – – – – –
Discoveries and extensions – – – – 1 – 292 – – 293
Productiond e – – – – (58) – (364) (86) – (508)
Sales of reserves-in-place – – – – – – (15) – – (15)
– – – 17 (1) 34 520 (105) – 465
At 31 December 2012h i k
Developed – – – – 559 43 2,943 220 – 3,765
Undeveloped – – – 195 508 39 2,265 15 – 3,022
– – – 195 1,067 82 5,208 235 – 6,787
Total subsidiaries and equity-accounted entities (BP share)At 1 January 2012
Developed 531 76 3,362 5 1,068 522 2,961 629 675 9,829
Undeveloped 602 308 1,833 178 1,695 713 1,727 408 455 7,919
1,133 384 5,195 183 2,763 1,235 4,688 1,037 1,130 17,748
At 31 December 2012Developed 421 229 2,865 1 1,199 551 2,943 647 618 9,474
Undeveloped 546 103 1,504 195 1,618 626 2,265 224 445 7,526
967 332 4,369 196 2,817 1,177 5,208 871 1,063 17,000
a Proved reserves exclude royalties due to others, whether payable in cash or in kind, where the royalty owner has a direct interest in the underlying production and the option and ability to make liftingand sales arrangements independently.
b 5.8 billion cubic feet of natural gas = 1 million barrels of oil equivalent.c Proved reserves in the Prudhoe Bay field in Alaska include an estimated 76 million barrels of oil equivalent upon which a net profits royalty will be payable, over the life of the field under the terms of the
BP Prudhoe Bay Royalty Trust.d Excludes NGLs from processing plants in which an interest is held of 13,500 barrels of oil equivalent per day.e Includes 33 million barrels of oil equivalent of natural gas consumed in operations, 25 million barrels of oil equivalent in subsidiaries, 8 million barrels of oil equivalent in equity-accounted entities and
excludes 2 million barrels of oil equivalent of produced non-hydrocarbon components that meet regulatory requirements for sales.f Includes 591 million barrels of NGLs. Also includes 512 million barrels of oil equivalent in respect of the 30% minority interest in BP Trinidad and Tobago LLC.g Volumes of equity-accounted entities include volumes of equity-accounted investments of those entities.h Includes 103 million barrels of NGLs. Also includes 374 million barrels of oil equivalent in respect of the minority interest in TNK-BP.i Total proved reserves held as part of our equity interest in TNK-BP is 5,315 million barrels of oil equivalent, comprising 93 million barrels of oil equivalent in Venezuela, 14 million barrels of oil equivalent in
Vietnam and 5,208 million barrels of oil equivalent in Russia.j includes assets held for sale of 140 million barrels of oil equivalent.k includes assets held for sale of 5,315 million barrels of oil equivalent.
Supplementary information on oil and natural gas (unaudited) 273BP Annual Report and Form 20-F 2012
Financial statements
Movements in estimated net proved reserves continued
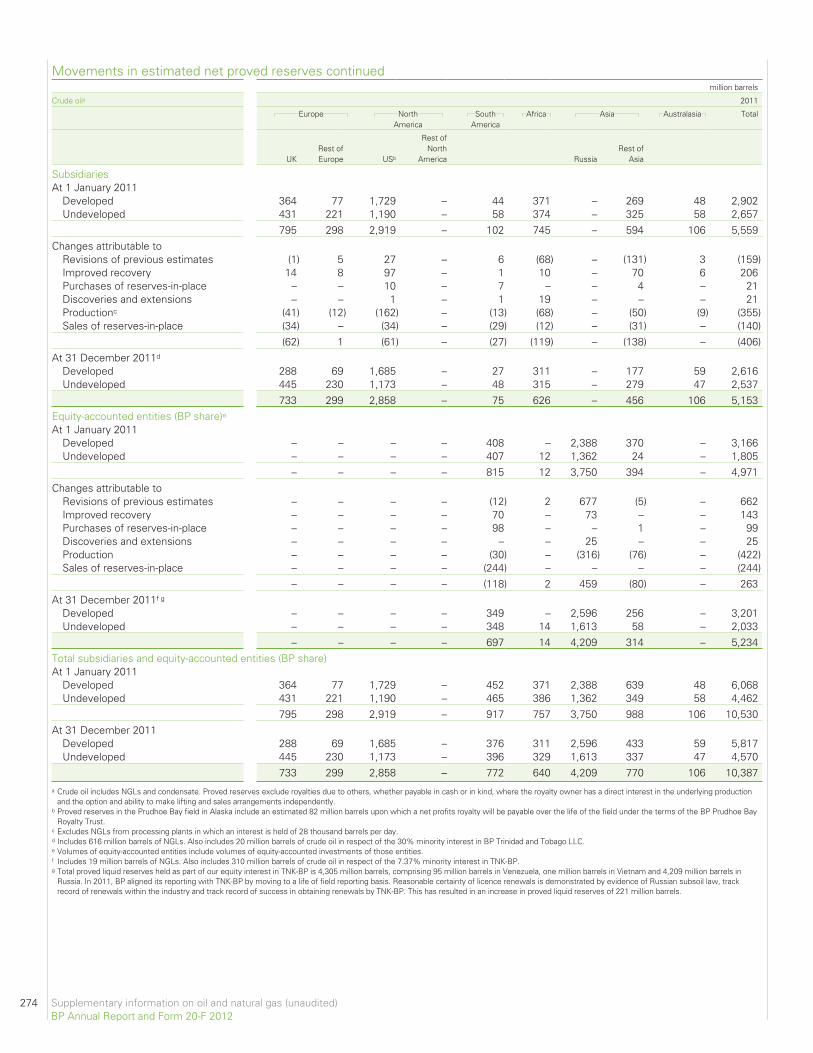
Movements in estimated net proved reserves continuedmillion barrels
Crude oila 2011
Europe NorthAmerica
SouthAmerica
Africa Asia Australasia Total
UKRest ofEurope USb
Rest ofNorth
America RussiaRest of
Asia
SubsidiariesAt 1 January 2011
Developed 364 77 1,729 – 44 371 – 269 48 2,902Undeveloped 431 221 1,190 – 58 374 – 325 58 2,657
795 298 2,919 – 102 745 – 594 106 5,559Changes attributable to
Revisions of previous estimates (1) 5 27 – 6 (68) – (131) 3 (159)Improved recovery 14 8 97 – 1 10 – 70 6 206Purchases of reserves-in-place – – 10 – 7 – – 4 – 21Discoveries and extensions – – 1 – 1 19 – – – 21Productionc (41) (12) (162) – (13) (68) – (50) (9) (355)Sales of reserves-in-place (34) – (34) – (29) (12) – (31) – (140)
(62) 1 (61) – (27) (119) – (138) – (406)At 31 December 2011d
Developed 288 69 1,685 – 27 311 – 177 59 2,616Undeveloped 445 230 1,173 – 48 315 – 279 47 2,537
733 299 2,858 – 75 626 – 456 106 5,153Equity-accounted entities (BP share)eAt 1 January 2011
Developed – – – – 408 – 2,388 370 – 3,166Undeveloped – – – – 407 12 1,362 24 – 1,805
– – – – 815 12 3,750 394 – 4,971Changes attributable to
Revisions of previous estimates – – – – (12) 2 677 (5) – 662Improved recovery – – – – 70 – 73 – – 143Purchases of reserves-in-place – – – – 98 – – 1 – 99Discoveries and extensions – – – – – – 25 – – 25Production – – – – (30) – (316) (76) – (422)Sales of reserves-in-place – – – – (244) – – – – (244)
– – – – (118) 2 459 (80) – 263At 31 December 2011f g
Developed – – – – 349 – 2,596 256 – 3,201Undeveloped – – – – 348 14 1,613 58 – 2,033
– – – – 697 14 4,209 314 – 5,234Total subsidiaries and equity-accounted entities (BP share)At 1 January 2011
Developed 364 77 1,729 – 452 371 2,388 639 48 6,068Undeveloped 431 221 1,190 – 465 386 1,362 349 58 4,462
795 298 2,919 – 917 757 3,750 988 106 10,530At 31 December 2011
Developed 288 69 1,685 – 376 311 2,596 433 59 5,817Undeveloped 445 230 1,173 – 396 329 1,613 337 47 4,570
733 299 2,858 – 772 640 4,209 770 106 10,387a Crude oil includes NGLs and condensate. Proved reserves exclude royalties due to others, whether payable in cash or in kind, where the royalty owner has a direct interest in the underlying production
and the option and ability to make lifting and sales arrangements independently.b Proved reserves in the Prudhoe Bay field in Alaska include an estimated 82 million barrels upon which a net profits royalty will be payable over the life of the field under the terms of the BP Prudhoe Bay
Royalty Trust.c Excludes NGLs from processing plants in which an interest is held of 28 thousand barrels per day.d Includes 616 million barrels of NGLs. Also includes 20 million barrels of crude oil in respect of the 30% minority interest in BP Trinidad and Tobago LLC.e Volumes of equity-accounted entities include volumes of equity-accounted investments of those entities.f Includes 19 million barrels of NGLs. Also includes 310 million barrels of crude oil in respect of the 7.37% minority interest in TNK-BP.g Total proved liquid reserves held as part of our equity interest in TNK-BP is 4,305 million barrels, comprising 95 million barrels in Venezuela, one million barrels in Vietnam and 4,209 million barrels in
Russia. In 2011, BP aligned its reporting with TNK-BP by moving to a life of field reporting basis. Reasonable certainty of licence renewals is demonstrated by evidence of Russian subsoil law, trackrecord of renewals within the industry and track record of success in obtaining renewals by TNK-BP. This has resulted in an increase in proved liquid reserves of 221 million barrels.
274 Supplementary information on oil and natural gas (unaudited)BP Annual Report and Form 20-F 2012
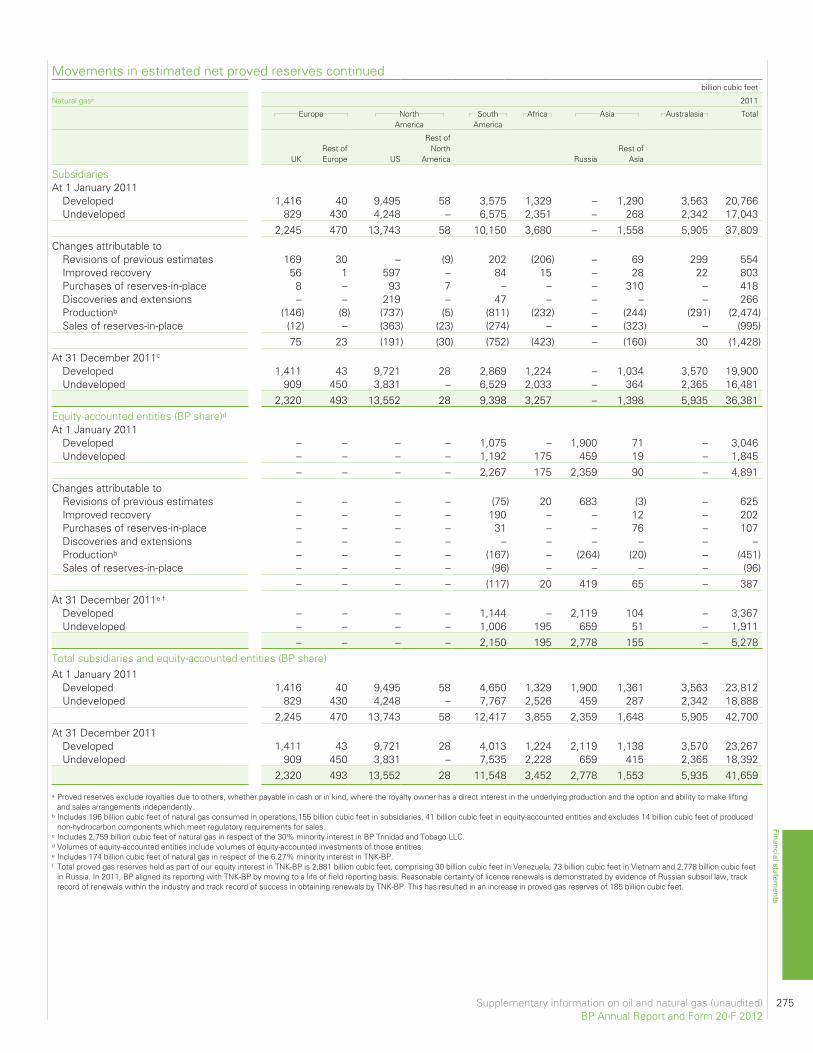
billion cubic feet
Natural gasa 2011
Europe NorthAmerica
SouthAmerica
Africa Asia Australasia Total
UKRest ofEurope US
Rest ofNorth
America RussiaRest of
Asia
SubsidiariesAt 1 January 2011
Developed 1,416 40 9,495 58 3,575 1,329 – 1,290 3,563 20,766Undeveloped 829 430 4,248 – 6,575 2,351 – 268 2,342 17,043
2,245 470 13,743 58 10,150 3,680 – 1,558 5,905 37,809Changes attributable to
Revisions of previous estimates 169 30 – (9) 202 (206) – 69 299 554Improved recovery 56 1 597 – 84 15 – 28 22 803Purchases of reserves-in-place 8 – 93 7 – – – 310 – 418Discoveries and extensions – – 219 – 47 – – – – 266Productionb (146) (8) (737) (5) (811) (232) – (244) (291) (2,474)Sales of reserves-in-place (12) – (363) (23) (274) – – (323) – (995)
75 23 (191) (30) (752) (423) – (160) 30 (1,428)At 31 December 2011c
Developed 1,411 43 9,721 28 2,869 1,224 – 1,034 3,570 19,900Undeveloped 909 450 3,831 – 6,529 2,033 – 364 2,365 16,481
2,320 493 13,552 28 9,398 3,257 – 1,398 5,935 36,381Equity-accounted entities (BP share)dAt 1 January 2011
Developed – – – – 1,075 – 1,900 71 – 3,046Undeveloped – – – – 1,192 175 459 19 – 1,845
– – – – 2,267 175 2,359 90 – 4,891Changes attributable to
Revisions of previous estimates – – – – (75) 20 683 (3) – 625Improved recovery – – – – 190 – – 12 – 202Purchases of reserves-in-place – – – – 31 – – 76 – 107Discoveries and extensions – – – – – – – – – –Productionb – – – – (167) – (264) (20) – (451)Sales of reserves-in-place – – – – (96) – – – – (96)
– – – – (117) 20 419 65 – 387At 31 December 2011e f
Developed – – – – 1,144 – 2,119 104 – 3,367Undeveloped – – – – 1,006 195 659 51 – 1,911
– – – – 2,150 195 2,778 155 – 5,278Total subsidiaries and equity-accounted entities (BP share)At 1 January 2011
Developed 1,416 40 9,495 58 4,650 1,329 1,900 1,361 3,563 23,812Undeveloped 829 430 4,248 – 7,767 2,526 459 287 2,342 18,888
2,245 470 13,743 58 12,417 3,855 2,359 1,648 5,905 42,700At 31 December 2011
Developed 1,411 43 9,721 28 4,013 1,224 2,119 1,138 3,570 23,267Undeveloped 909 450 3,831 – 7,535 2,228 659 415 2,365 18,392
2,320 493 13,552 28 11,548 3,452 2,778 1,553 5,935 41,659
a Proved reserves exclude royalties due to others, whether payable in cash or in kind, where the royalty owner has a direct interest in the underlying production and the option and ability to make liftingand sales arrangements independently.
b Includes 196 billion cubic feet of natural gas consumed in operations,155 billion cubic feet in subsidiaries, 41 billion cubic feet in equity-accounted entities and excludes 14 billion cubic feet of producednon-hydrocarbon components which meet regulatory requirements for sales.
c Includes 2,759 billion cubic feet of natural gas in respect of the 30% minority interest in BP Trinidad and Tobago LLC.d Volumes of equity-accounted entities include volumes of equity-accounted investments of those entities.e Includes 174 billion cubic feet of natural gas in respect of the 6.27% minority interest in TNK-BP.f Total proved gas reserves held as part of our equity interest in TNK-BP is 2,881 billion cubic feet, comprising 30 billion cubic feet in Venezuela, 73 billion cubic feet in Vietnam and 2,778 billion cubic feet
in Russia. In 2011, BP aligned its reporting with TNK-BP by moving to a life of field reporting basis. Reasonable certainty of licence renewals is demonstrated by evidence of Russian subsoil law, trackrecord of renewals within the industry and track record of success in obtaining renewals by TNK-BP. This has resulted in an increase in proved gas reserves of 185 billion cubic feet.
Supplementary information on oil and natural gas (unaudited) 275BP Annual Report and Form 20-F 2012
Financial statements
Movements in estimated net proved reserves continued
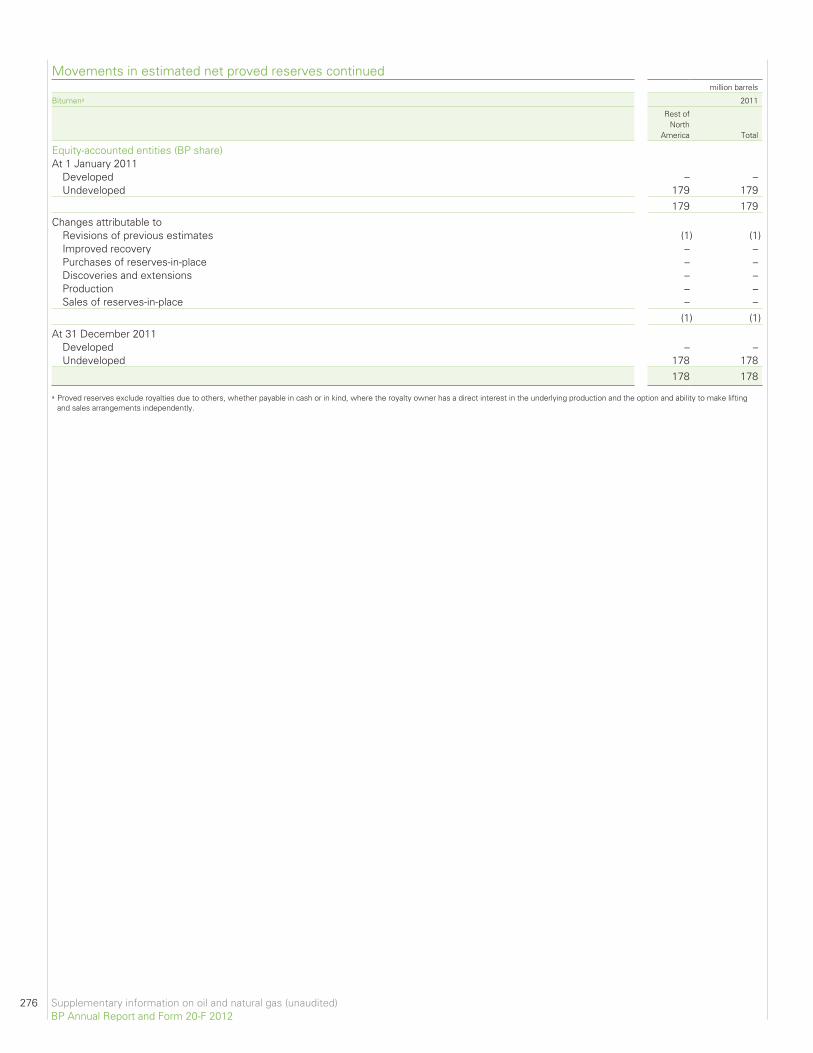
Movements in estimated net proved reserves continuedmillion barrels
Bitumena 2011
Rest ofNorth
America Total
Equity-accounted entities (BP share)At 1 January 2011
Developed – –Undeveloped 179 179
179 179Changes attributable to
Revisions of previous estimates (1) (1)Improved recovery – –Purchases of reserves-in-place – –Discoveries and extensions – –Production – –Sales of reserves-in-place – –
(1) (1)At 31 December 2011
Developed – –Undeveloped 178 178
178 178
a Proved reserves exclude royalties due to others, whether payable in cash or in kind, where the royalty owner has a direct interest in the underlying production and the option and ability to make liftingand sales arrangements independently.
276 Supplementary information on oil and natural gas (unaudited)BP Annual Report and Form 20-F 2012
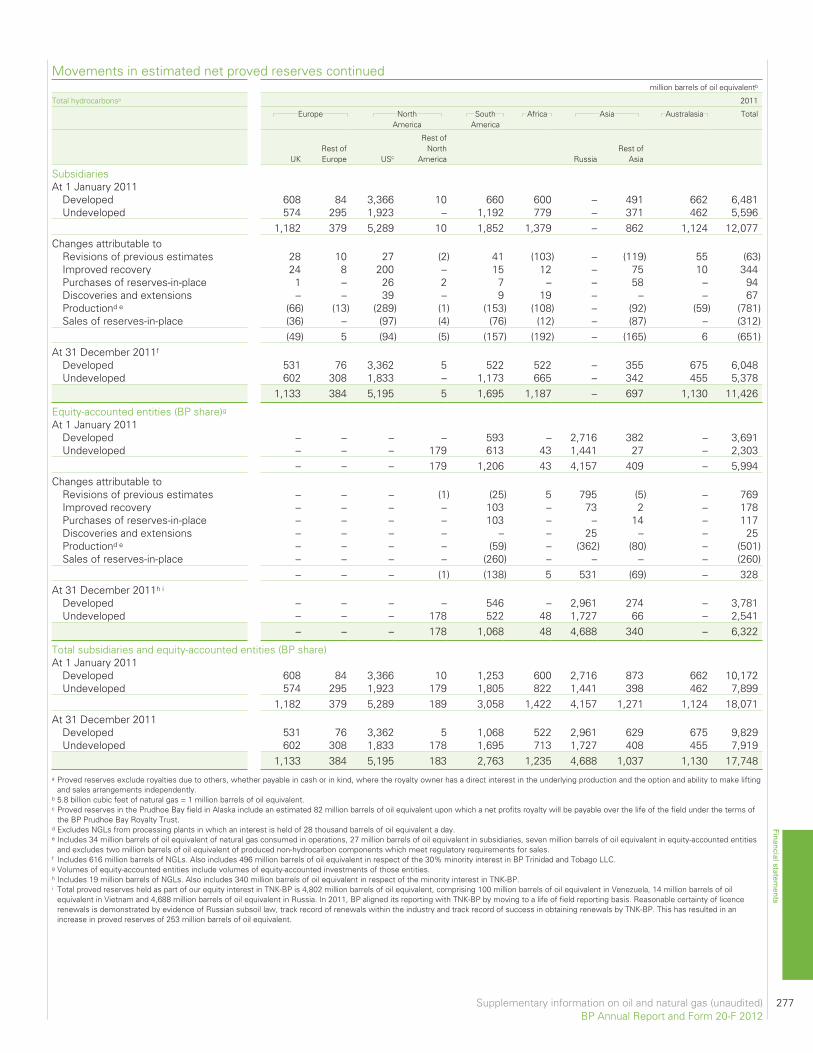
million barrels of oil equivalentb
Total hydrocarbonsa 2011
Europe NorthAmerica
SouthAmerica
Africa Asia Australasia Total
UKRest ofEurope USc
Rest ofNorth
America RussiaRest of
Asia
SubsidiariesAt 1 January 2011
Developed 608 84 3,366 10 660 600 – 491 662 6,481Undeveloped 574 295 1,923 – 1,192 779 – 371 462 5,596
1,182 379 5,289 10 1,852 1,379 – 862 1,124 12,077Changes attributable to
Revisions of previous estimates 28 10 27 (2) 41 (103) – (119) 55 (63)Improved recovery 24 8 200 – 15 12 – 75 10 344Purchases of reserves-in-place 1 – 26 2 7 – – 58 – 94Discoveries and extensions – – 39 – 9 19 – – – 67Productiond e (66) (13) (289) (1) (153) (108) – (92) (59) (781)Sales of reserves-in-place (36) – (97) (4) (76) (12) – (87) – (312)
(49) 5 (94) (5) (157) (192) – (165) 6 (651)At 31 December 2011f
Developed 531 76 3,362 5 522 522 – 355 675 6,048Undeveloped 602 308 1,833 – 1,173 665 – 342 455 5,378
1,133 384 5,195 5 1,695 1,187 – 697 1,130 11,426
Equity-accounted entities (BP share)gAt 1 January 2011
Developed – – – – 593 – 2,716 382 – 3,691Undeveloped – – – 179 613 43 1,441 27 – 2,303
– – – 179 1,206 43 4,157 409 – 5,994Changes attributable to
Revisions of previous estimates – – – (1) (25) 5 795 (5) – 769Improved recovery – – – – 103 – 73 2 – 178Purchases of reserves-in-place – – – – 103 – – 14 – 117Discoveries and extensions – – – – – – 25 – – 25Productiond e – – – – (59) – (362) (80) – (501)Sales of reserves-in-place – – – – (260) – – – – (260)
– – – (1) (138) 5 531 (69) – 328At 31 December 2011h i
Developed – – – – 546 – 2,961 274 – 3,781Undeveloped – – – 178 522 48 1,727 66 – 2,541
– – – 178 1,068 48 4,688 340 – 6,322
Total subsidiaries and equity-accounted entities (BP share)At 1 January 2011
Developed 608 84 3,366 10 1,253 600 2,716 873 662 10,172Undeveloped 574 295 1,923 179 1,805 822 1,441 398 462 7,899
1,182 379 5,289 189 3,058 1,422 4,157 1,271 1,124 18,071At 31 December 2011
Developed 531 76 3,362 5 1,068 522 2,961 629 675 9,829Undeveloped 602 308 1,833 178 1,695 713 1,727 408 455 7,919
1,133 384 5,195 183 2,763 1,235 4,688 1,037 1,130 17,748a Proved reserves exclude royalties due to others, whether payable in cash or in kind, where the royalty owner has a direct interest in the underlying production and the option and ability to make lifting
and sales arrangements independently.b 5.8 billion cubic feet of natural gas = 1 million barrels of oil equivalent.c Proved reserves in the Prudhoe Bay field in Alaska include an estimated 82 million barrels of oil equivalent upon which a net profits royalty will be payable over the life of the field under the terms of
the BP Prudhoe Bay Royalty Trust.d Excludes NGLs from processing plants in which an interest is held of 28 thousand barrels of oil equivalent a day.e Includes 34 million barrels of oil equivalent of natural gas consumed in operations, 27 million barrels of oil equivalent in subsidiaries, seven million barrels of oil equivalent in equity-accounted entities
and excludes two million barrels of oil equivalent of produced non-hydrocarbon components which meet regulatory requirements for sales.f Includes 616 million barrels of NGLs. Also includes 496 million barrels of oil equivalent in respect of the 30% minority interest in BP Trinidad and Tobago LLC.g Volumes of equity-accounted entities include volumes of equity-accounted investments of those entities.h Includes 19 million barrels of NGLs. Also includes 340 million barrels of oil equivalent in respect of the minority interest in TNK-BP.i Total proved reserves held as part of our equity interest in TNK-BP is 4,802 million barrels of oil equivalent, comprising 100 million barrels of oil equivalent in Venezuela, 14 million barrels of oil
equivalent in Vietnam and 4,688 million barrels of oil equivalent in Russia. In 2011, BP aligned its reporting with TNK-BP by moving to a life of field reporting basis. Reasonable certainty of licencerenewals is demonstrated by evidence of Russian subsoil law, track record of renewals within the industry and track record of success in obtaining renewals by TNK-BP. This has resulted in anincrease in proved reserves of 253 million barrels of oil equivalent.
Supplementary information on oil and natural gas (unaudited) 277BP Annual Report and Form 20-F 2012
Financial statements
Movements in estimated net proved reserves continued
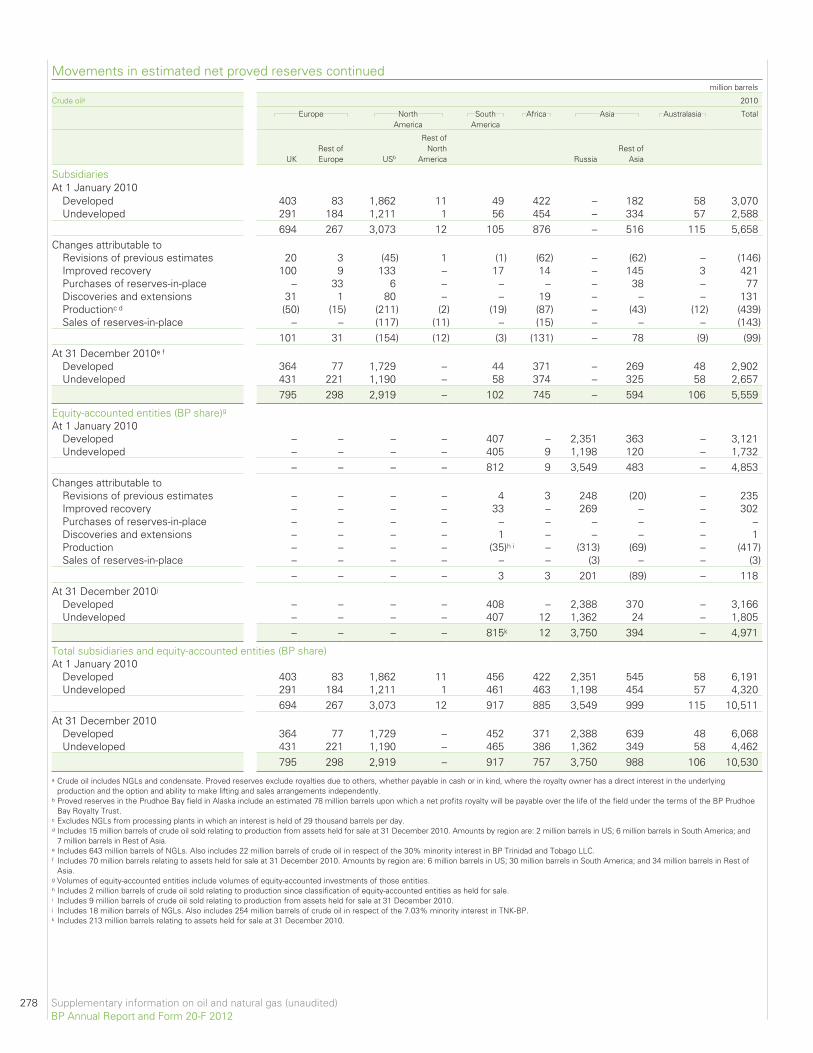
Movements in estimated net proved reserves continuedmillion barrels
Crude oila 2010
Europe NorthAmerica
SouthAmerica
Africa Asia Australasia Total
UKRest ofEurope USb
Rest ofNorth
America RussiaRest of
Asia
SubsidiariesAt 1 January 2010
Developed 403 83 1,862 11 49 422 – 182 58 3,070Undeveloped 291 184 1,211 1 56 454 – 334 57 2,588
694 267 3,073 12 105 876 – 516 115 5,658Changes attributable to
Revisions of previous estimates 20 3 (45) 1 (1) (62) – (62) – (146)Improved recovery 100 9 133 – 17 14 – 145 3 421Purchases of reserves-in-place – 33 6 – – – – 38 – 77Discoveries and extensions 31 1 80 – – 19 – – – 131Productionc d (50) (15) (211) (2) (19) (87) – (43) (12) (439)Sales of reserves-in-place – – (117) (11) – (15) – – – (143)
101 31 (154) (12) (3) (131) – 78 (9) (99)At 31 December 2010e f
Developed 364 77 1,729 – 44 371 – 269 48 2,902Undeveloped 431 221 1,190 – 58 374 – 325 58 2,657
795 298 2,919 – 102 745 – 594 106 5,559
Equity-accounted entities (BP share)g
At 1 January 2010Developed – – – – 407 – 2,351 363 – 3,121Undeveloped – – – – 405 9 1,198 120 – 1,732
– – – – 812 9 3,549 483 – 4,853Changes attributable to
Revisions of previous estimates – – – – 4 3 248 (20) – 235Improved recovery – – – – 33 – 269 – – 302Purchases of reserves-in-place – – – – – – – – – –Discoveries and extensions – – – – 1 – – – – 1Production – – – – (35)h i – (313) (69) – (417)Sales of reserves-in-place – – – – – – (3) – – (3)
– – – – 3 3 201 (89) – 118At 31 December 2010j
Developed – – – – 408 – 2,388 370 – 3,166Undeveloped – – – – 407 12 1,362 24 – 1,805
– – – – 815k 12 3,750 394 – 4,971
Total subsidiaries and equity-accounted entities (BP share)At 1 January 2010
Developed 403 83 1,862 11 456 422 2,351 545 58 6,191Undeveloped 291 184 1,211 1 461 463 1,198 454 57 4,320
694 267 3,073 12 917 885 3,549 999 115 10,511At 31 December 2010
Developed 364 77 1,729 – 452 371 2,388 639 48 6,068Undeveloped 431 221 1,190 – 465 386 1,362 349 58 4,462
795 298 2,919 – 917 757 3,750 988 106 10,530a Crude oil includes NGLs and condensate. Proved reserves exclude royalties due to others, whether payable in cash or in kind, where the royalty owner has a direct interest in the underlying
production and the option and ability to make lifting and sales arrangements independently.b Proved reserves in the Prudhoe Bay field in Alaska include an estimated 78 million barrels upon which a net profits royalty will be payable over the life of the field under the terms of the BP Prudhoe
Bay Royalty Trust.c Excludes NGLs from processing plants in which an interest is held of 29 thousand barrels per day.d Includes 15 million barrels of crude oil sold relating to production from assets held for sale at 31 December 2010. Amounts by region are: 2 million barrels in US; 6 million barrels in South America; and
7 million barrels in Rest of Asia.e Includes 643 million barrels of NGLs. Also includes 22 million barrels of crude oil in respect of the 30% minority interest in BP Trinidad and Tobago LLC.f Includes 70 million barrels relating to assets held for sale at 31 December 2010. Amounts by region are: 6 million barrels in US; 30 million barrels in South America; and 34 million barrels in Rest of
Asia.g Volumes of equity-accounted entities include volumes of equity-accounted investments of those entities.h Includes 2 million barrels of crude oil sold relating to production since classification of equity-accounted entities as held for sale.i Includes 9 million barrels of crude oil sold relating to production from assets held for sale at 31 December 2010.j Includes 18 million barrels of NGLs. Also includes 254 million barrels of crude oil in respect of the 7.03% minority interest in TNK-BP.k Includes 213 million barrels relating to assets held for sale at 31 December 2010.
278 Supplementary information on oil and natural gas (unaudited)BP Annual Report and Form 20-F 2012
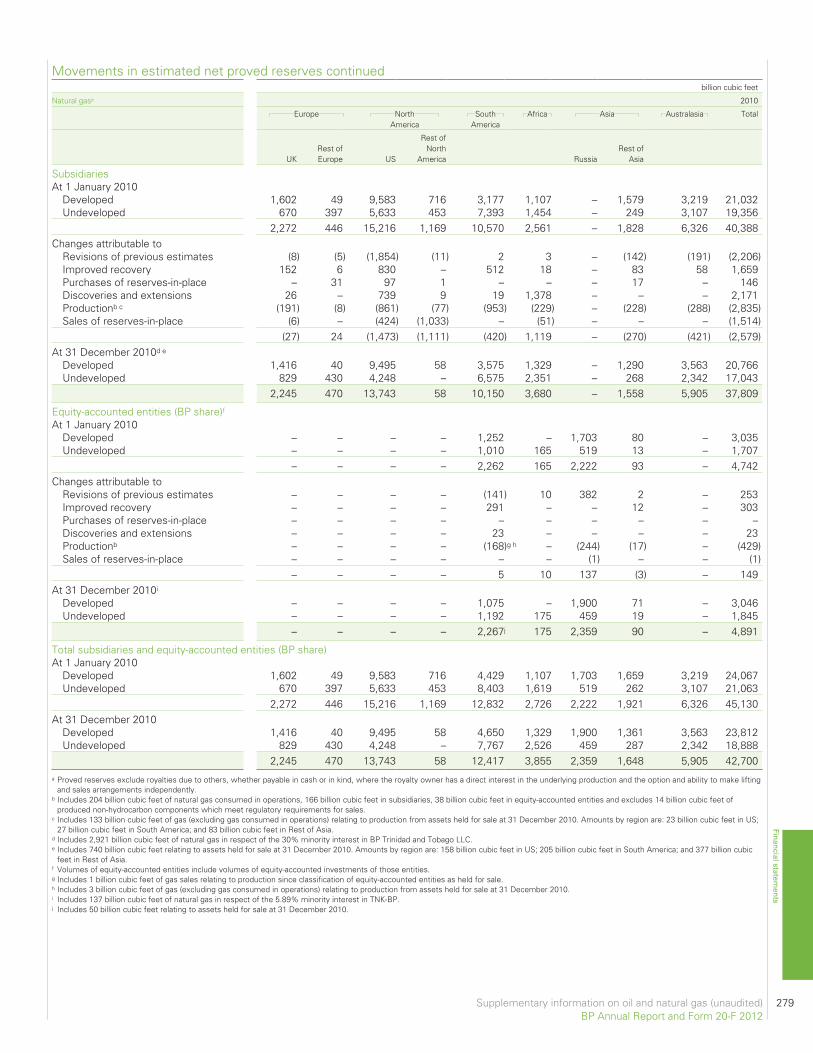
billion cubic feet
Natural gasa 2010
Europe NorthAmerica
SouthAmerica
Africa Asia Australasia Total
UKRest ofEurope US
Rest ofNorth
America RussiaRest of
Asia
SubsidiariesAt 1 January 2010
Developed 1,602 49 9,583 716 3,177 1,107 – 1,579 3,219 21,032Undeveloped 670 397 5,633 453 7,393 1,454 – 249 3,107 19,356
2,272 446 15,216 1,169 10,570 2,561 – 1,828 6,326 40,388Changes attributable to
Revisions of previous estimates (8) (5) (1,854) (11) 2 3 – (142) (191) (2,206)Improved recovery 152 6 830 – 512 18 – 83 58 1,659Purchases of reserves-in-place – 31 97 1 – – – 17 – 146Discoveries and extensions 26 – 739 9 19 1,378 – – – 2,171Productionb c (191) (8) (861) (77) (953) (229) – (228) (288) (2,835)Sales of reserves-in-place (6) – (424) (1,033) – (51) – – – (1,514)
(27) 24 (1,473) (1,111) (420) 1,119 – (270) (421) (2,579)At 31 December 2010d e
Developed 1,416 40 9,495 58 3,575 1,329 – 1,290 3,563 20,766Undeveloped 829 430 4,248 – 6,575 2,351 – 268 2,342 17,043
2,245 470 13,743 58 10,150 3,680 – 1,558 5,905 37,809
Equity-accounted entities (BP share)fAt 1 January 2010
Developed – – – – 1,252 – 1,703 80 – 3,035Undeveloped – – – – 1,010 165 519 13 – 1,707
– – – – 2,262 165 2,222 93 – 4,742Changes attributable to
Revisions of previous estimates – – – – (141) 10 382 2 – 253Improved recovery – – – – 291 – – 12 – 303Purchases of reserves-in-place – – – – – – – – – –Discoveries and extensions – – – – 23 – – – – 23Productionb – – – – (168)g h – (244) (17) – (429)Sales of reserves-in-place – – – – – – (1) – – (1)
– – – – 5 10 137 (3) – 149At 31 December 2010i
Developed – – – – 1,075 – 1,900 71 – 3,046Undeveloped – – – – 1,192 175 459 19 – 1,845
– – – – 2,267j 175 2,359 90 – 4,891
Total subsidiaries and equity-accounted entities (BP share)At 1 January 2010
Developed 1,602 49 9,583 716 4,429 1,107 1,703 1,659 3,219 24,067Undeveloped 670 397 5,633 453 8,403 1,619 519 262 3,107 21,063
2,272 446 15,216 1,169 12,832 2,726 2,222 1,921 6,326 45,130At 31 December 2010
Developed 1,416 40 9,495 58 4,650 1,329 1,900 1,361 3,563 23,812Undeveloped 829 430 4,248 – 7,767 2,526 459 287 2,342 18,888
2,245 470 13,743 58 12,417 3,855 2,359 1,648 5,905 42,700a Proved reserves exclude royalties due to others, whether payable in cash or in kind, where the royalty owner has a direct interest in the underlying production and the option and ability to make lifting
and sales arrangements independently.b Includes 204 billion cubic feet of natural gas consumed in operations, 166 billion cubic feet in subsidiaries, 38 billion cubic feet in equity-accounted entities and excludes 14 billion cubic feet of
produced non-hydrocarbon components which meet regulatory requirements for sales.c Includes 133 billion cubic feet of gas (excluding gas consumed in operations) relating to production from assets held for sale at 31 December 2010. Amounts by region are: 23 billion cubic feet in US;
27 billion cubic feet in South America; and 83 billion cubic feet in Rest of Asia.d Includes 2,921 billion cubic feet of natural gas in respect of the 30% minority interest in BP Trinidad and Tobago LLC.e Includes 740 billion cubic feet relating to assets held for sale at 31 December 2010. Amounts by region are: 158 billion cubic feet in US; 205 billion cubic feet in South America; and 377 billion cubic
feet in Rest of Asia.f Volumes of equity-accounted entities include volumes of equity-accounted investments of those entities.g Includes 1 billion cubic feet of gas sales relating to production since classification of equity-accounted entities as held for sale.h Includes 3 billion cubic feet of gas (excluding gas consumed in operations) relating to production from assets held for sale at 31 December 2010.i Includes 137 billion cubic feet of natural gas in respect of the 5.89% minority interest in TNK-BP.j Includes 50 billion cubic feet relating to assets held for sale at 31 December 2010.
Supplementary information on oil and natural gas (unaudited) 279BP Annual Report and Form 20-F 2012
Financial statements
Movements in estimated net proved reserves continued
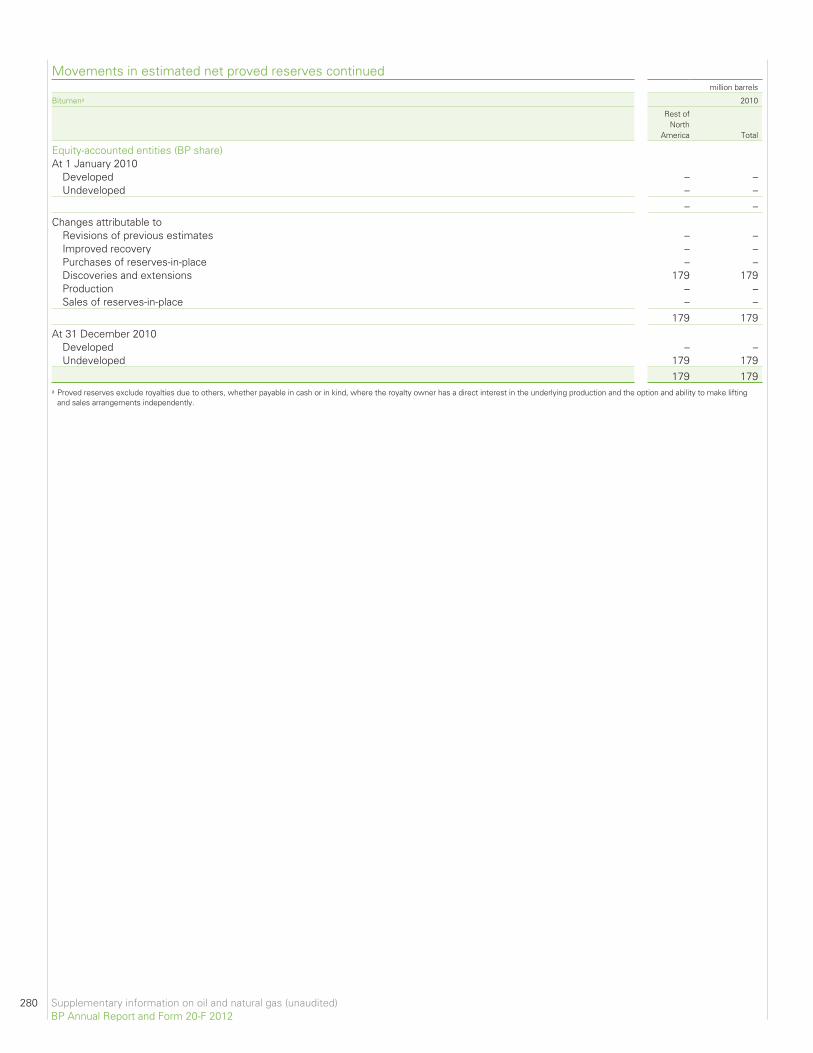
Movements in estimated net proved reserves continuedmillion barrels
Bitumena 2010
Rest ofNorth
America Total
Equity-accounted entities (BP share)At 1 January 2010
Developed – –Undeveloped – –
– –Changes attributable to
Revisions of previous estimates – –Improved recovery – –Purchases of reserves-in-place – –Discoveries and extensions 179 179Production – –Sales of reserves-in-place – –
179 179At 31 December 2010
Developed – –Undeveloped 179 179
179 179a Proved reserves exclude royalties due to others, whether payable in cash or in kind, where the royalty owner has a direct interest in the underlying production and the option and ability to make lifting
and sales arrangements independently.
280 Supplementary information on oil and natural gas (unaudited)BP Annual Report and Form 20-F 2012
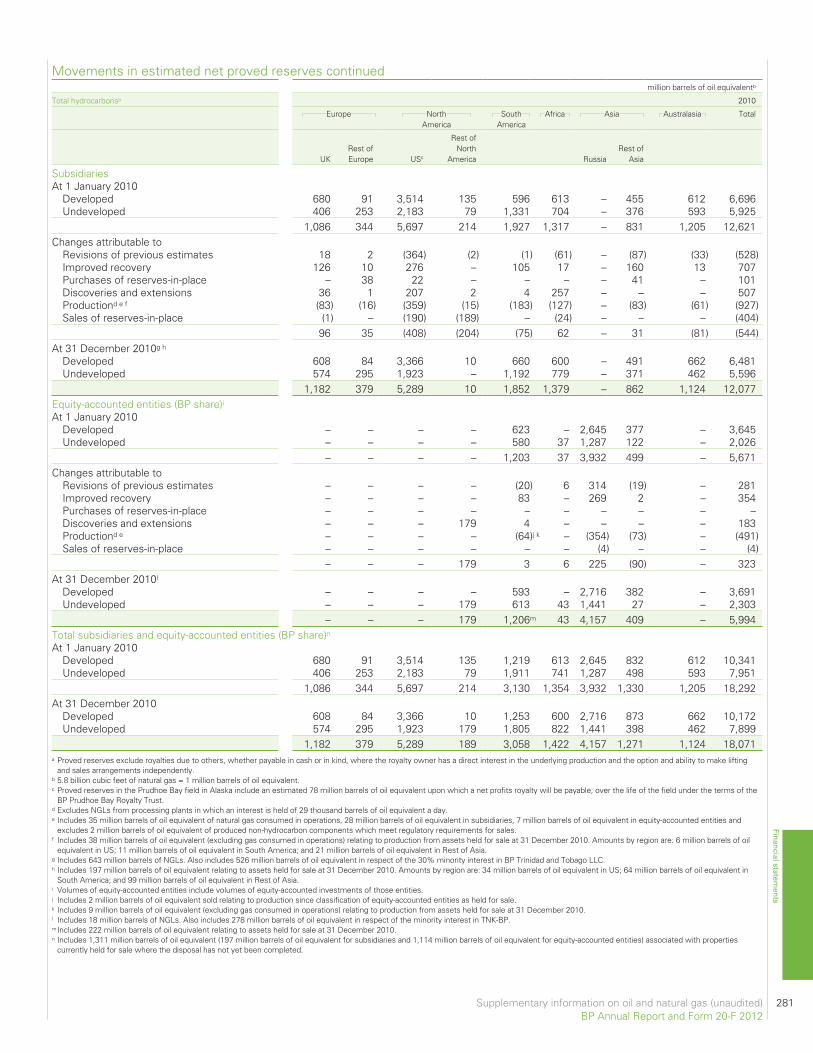
million barrels of oil equivalentb
Total hydrocarbonsa 2010
Europe NorthAmerica
SouthAmerica
Africa Asia Australasia Total
UKRest ofEurope USc
Rest ofNorth
America RussiaRest of
Asia
SubsidiariesAt 1 January 2010
Developed 680 91 3,514 135 596 613 – 455 612 6,696Undeveloped 406 253 2,183 79 1,331 704 – 376 593 5,925
1,086 344 5,697 214 1,927 1,317 – 831 1,205 12,621Changes attributable to
Revisions of previous estimates 18 2 (364) (2) (1) (61) – (87) (33) (528)Improved recovery 126 10 276 – 105 17 – 160 13 707Purchases of reserves-in-place – 38 22 – – – – 41 – 101Discoveries and extensions 36 1 207 2 4 257 – – – 507Productiond e f (83) (16) (359) (15) (183) (127) – (83) (61) (927)Sales of reserves-in-place (1) – (190) (189) – (24) – – – (404)
96 35 (408) (204) (75) 62 – 31 (81) (544)At 31 December 2010g h
Developed 608 84 3,366 10 660 600 – 491 662 6,481Undeveloped 574 295 1,923 – 1,192 779 – 371 462 5,596
1,182 379 5,289 10 1,852 1,379 – 862 1,124 12,077Equity-accounted entities (BP share)iAt 1 January 2010
Developed – – – – 623 – 2,645 377 – 3,645Undeveloped – – – – 580 37 1,287 122 – 2,026
– – – – 1,203 37 3,932 499 – 5,671Changes attributable to
Revisions of previous estimates – – – – (20) 6 314 (19) – 281Improved recovery – – – – 83 – 269 2 – 354Purchases of reserves-in-place – – – – – – – – – –Discoveries and extensions – – – 179 4 – – – – 183Productiond e – – – – (64)j k – (354) (73) – (491)Sales of reserves-in-place – – – – – – (4) – – (4)
– – – 179 3 6 225 (90) – 323At 31 December 2010l
Developed – – – – 593 – 2,716 382 – 3,691Undeveloped – – – 179 613 43 1,441 27 – 2,303
– – – 179 1,206m 43 4,157 409 – 5,994Total subsidiaries and equity-accounted entities (BP share)nAt 1 January 2010
Developed 680 91 3,514 135 1,219 613 2,645 832 612 10,341Undeveloped 406 253 2,183 79 1,911 741 1,287 498 593 7,951
1,086 344 5,697 214 3,130 1,354 3,932 1,330 1,205 18,292At 31 December 2010
Developed 608 84 3,366 10 1,253 600 2,716 873 662 10,172Undeveloped 574 295 1,923 179 1,805 822 1,441 398 462 7,899
1,182 379 5,289 189 3,058 1,422 4,157 1,271 1,124 18,071a Proved reserves exclude royalties due to others, whether payable in cash or in kind, where the royalty owner has a direct interest in the underlying production and the option and ability to make lifting
and sales arrangements independently.b 5.8 billion cubic feet of natural gas = 1 million barrels of oil equivalent.c Proved reserves in the Prudhoe Bay field in Alaska include an estimated 78 million barrels of oil equivalent upon which a net profits royalty will be payable, over the life of the field under the terms of the
BP Prudhoe Bay Royalty Trust.d Excludes NGLs from processing plants in which an interest is held of 29 thousand barrels of oil equivalent a day.e Includes 35 million barrels of oil equivalent of natural gas consumed in operations, 28 million barrels of oil equivalent in subsidiaries, 7 million barrels of oil equivalent in equity-accounted entities and
excludes 2 million barrels of oil equivalent of produced non-hydrocarbon components which meet regulatory requirements for sales.f Includes 38 million barrels of oil equivalent (excluding gas consumed in operations) relating to production from assets held for sale at 31 December 2010. Amounts by region are: 6 million barrels of oil
equivalent in US; 11 million barrels of oil equivalent in South America; and 21 million barrels of oil equivalent in Rest of Asia.g Includes 643 million barrels of NGLs. Also includes 526 million barrels of oil equivalent in respect of the 30% minority interest in BP Trinidad and Tobago LLC.h Includes 197 million barrels of oil equivalent relating to assets held for sale at 31 December 2010. Amounts by region are: 34 million barrels of oil equivalent in US; 64 million barrels of oil equivalent in
South America; and 99 million barrels of oil equivalent in Rest of Asia.i Volumes of equity-accounted entities include volumes of equity-accounted investments of those entities.j Includes 2 million barrels of oil equivalent sold relating to production since classification of equity-accounted entities as held for sale.k Includes 9 million barrels of oil equivalent (excluding gas consumed in operations) relating to production from assets held for sale at 31 December 2010.l Includes 18 million barrels of NGLs. Also includes 278 million barrels of oil equivalent in respect of the minority interest in TNK-BP.mIncludes 222 million barrels of oil equivalent relating to assets held for sale at 31 December 2010.n Includes 1,311 million barrels of oil equivalent (197 million barrels of oil equivalent for subsidiaries and 1,114 million barrels of oil equivalent for equity-accounted entities) associated with properties
currently held for sale where the disposal has not yet been completed.
Supplementary information on oil and natural gas (unaudited) 281BP Annual Report and Form 20-F 2012
Financial statements
Movements in estimated net proved reserves continued
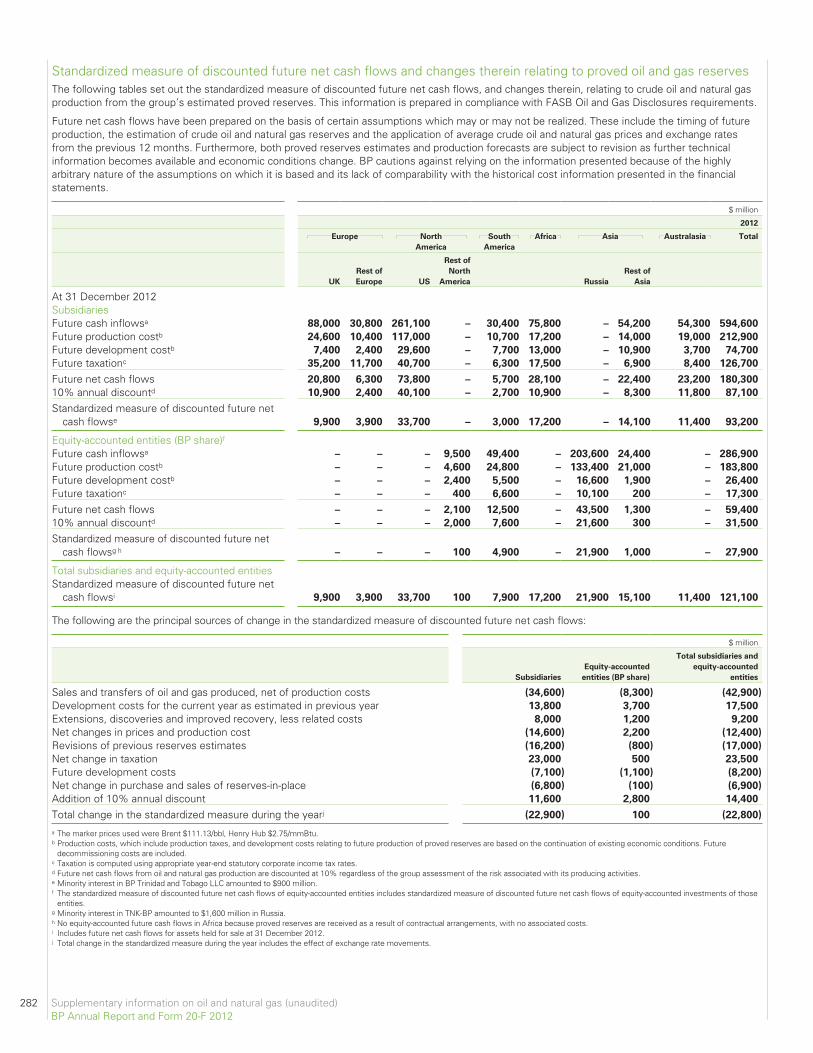
Standardized measure of discounted future net cash flows and changes therein relating to proved oil and gas reservesThe following tables set out the standardized measure of discounted future net cash flows, and changes therein, relating to crude oil and natural gasproduction from the group’s estimated proved reserves. This information is prepared in compliance with FASB Oil and Gas Disclosures requirements.
Future net cash flows have been prepared on the basis of certain assumptions which may or may not be realized. These include the timing of futureproduction, the estimation of crude oil and natural gas reserves and the application of average crude oil and natural gas prices and exchange ratesfrom the previous 12 months. Furthermore, both proved reserves estimates and production forecasts are subject to revision as further technicalinformation becomes available and economic conditions change. BP cautions against relying on the information presented because of the highlyarbitrary nature of the assumptions on which it is based and its lack of comparability with the historical cost information presented in the financialstatements.
$ million
2012
Europe North
America
South
America
Africa Asia Australasia Total
UK
Rest of
Europe US
Rest of
North
America Russia
Rest of
Asia
At 31 December 2012SubsidiariesFuture cash inflowsa 88,000 30,800 261,100 – 30,400 75,800 – 54,200 54,300 594,600
Future production costb 24,600 10,400 117,000 – 10,700 17,200 – 14,000 19,000 212,900
Future development costb 7,400 2,400 29,600 – 7,700 13,000 – 10,900 3,700 74,700
Future taxationc 35,200 11,700 40,700 – 6,300 17,500 – 6,900 8,400 126,700
Future net cash flows 20,800 6,300 73,800 – 5,700 28,100 – 22,400 23,200 180,300
10% annual discountd 10,900 2,400 40,100 – 2,700 10,900 – 8,300 11,800 87,100
Standardized measure of discounted future netcash flowse 9,900 3,900 33,700 – 3,000 17,200 – 14,100 11,400 93,200
Equity-accounted entities (BP share)fFuture cash inflowsa – – – 9,500 49,400 – 203,600 24,400 – 286,900
Future production costb – – – 4,600 24,800 – 133,400 21,000 – 183,800
Future development costb – – – 2,400 5,500 – 16,600 1,900 – 26,400
Future taxationc – – – 400 6,600 – 10,100 200 – 17,300
Future net cash flows – – – 2,100 12,500 – 43,500 1,300 – 59,400
10% annual discountd – – – 2,000 7,600 – 21,600 300 – 31,500
Standardized measure of discounted future netcash flowsg h – – – 100 4,900 – 21,900 1,000 – 27,900
Total subsidiaries and equity-accounted entitiesStandardized measure of discounted future net
cash flowsi 9,900 3,900 33,700 100 7,900 17,200 21,900 15,100 11,400 121,100
The following are the principal sources of change in the standardized measure of discounted future net cash flows:
$ million
Subsidiaries
Equity-accounted
entities (BP share)
Total subsidiaries and
equity-accounted
entities
Sales and transfers of oil and gas produced, net of production costs (34,600) (8,300) (42,900)
Development costs for the current year as estimated in previous year 13,800 3,700 17,500
Extensions, discoveries and improved recovery, less related costs 8,000 1,200 9,200
Net changes in prices and production cost (14,600) 2,200 (12,400)
Revisions of previous reserves estimates (16,200) (800) (17,000)
Net change in taxation 23,000 500 23,500
Future development costs (7,100) (1,100) (8,200)
Net change in purchase and sales of reserves-in-place (6,800) (100) (6,900)
Addition of 10% annual discount 11,600 2,800 14,400
Total change in the standardized measure during the yearj (22,900) 100 (22,800)
a The marker prices used were Brent $111.13/bbl, Henry Hub $2.75/mmBtu.b Production costs, which include production taxes, and development costs relating to future production of proved reserves are based on the continuation of existing economic conditions. Future
decommissioning costs are included.c Taxation is computed using appropriate year-end statutory corporate income tax rates.d Future net cash flows from oil and natural gas production are discounted at 10% regardless of the group assessment of the risk associated with its producing activities.e Minority interest in BP Trinidad and Tobago LLC amounted to $900 million.f The standardized measure of discounted future net cash flows of equity-accounted entities includes standardized measure of discounted future net cash flows of equity-accounted investments of those
entities.g Minority interest in TNK-BP amounted to $1,600 million in Russia.h No equity-accounted future cash flows in Africa because proved reserves are received as a result of contractual arrangements, with no associated costs.i Includes future net cash flows for assets held for sale at 31 December 2012.j Total change in the standardized measure during the year includes the effect of exchange rate movements.
282 Supplementary information on oil and natural gas (unaudited)BP Annual Report and Form 20-F 2012
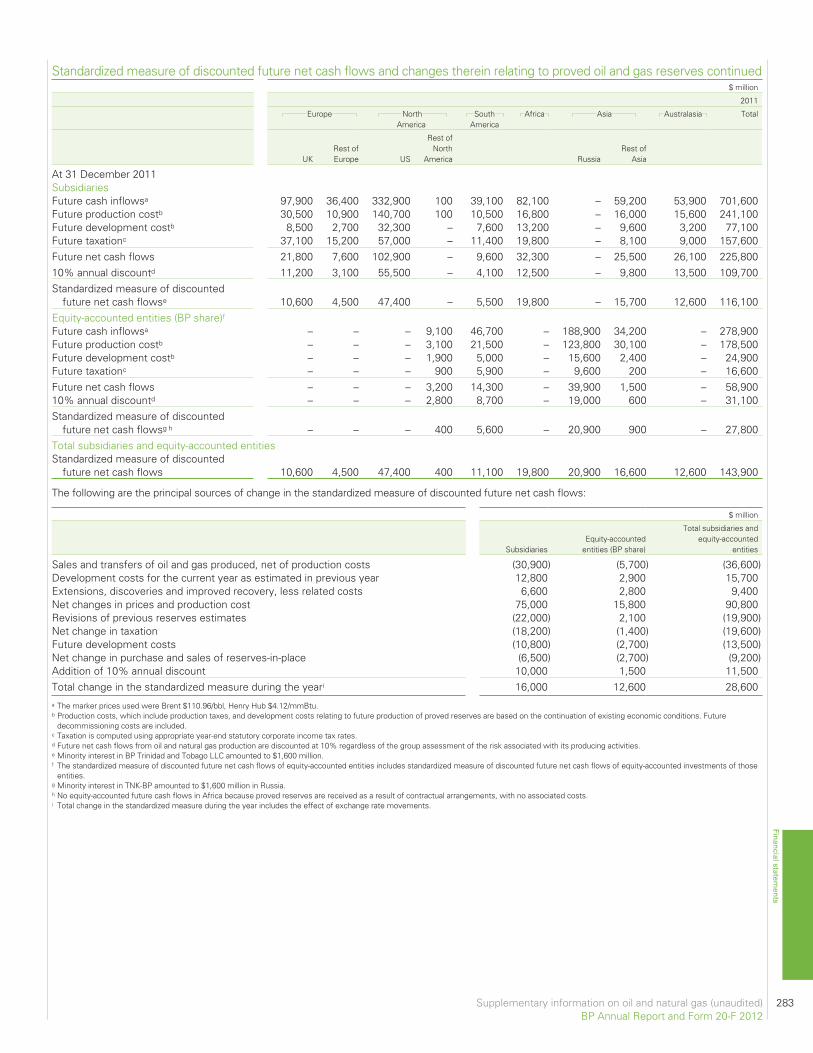
$ million
2011
Europe NorthAmerica
SouthAmerica
Africa Asia Australasia Total
UKRest ofEurope US
Rest ofNorth
America RussiaRest of
Asia
At 31 December 2011SubsidiariesFuture cash inflowsa 97,900 36,400 332,900 100 39,100 82,100 – 59,200 53,900 701,600Future production costb 30,500 10,900 140,700 100 10,500 16,800 – 16,000 15,600 241,100Future development costb 8,500 2,700 32,300 – 7,600 13,200 – 9,600 3,200 77,100Future taxationc 37,100 15,200 57,000 – 11,400 19,800 – 8,100 9,000 157,600Future net cash flows 21,800 7,600 102,900 – 9,600 32,300 – 25,500 26,100 225,80010% annual discountd 11,200 3,100 55,500 – 4,100 12,500 – 9,800 13,500 109,700Standardized measure of discounted
future net cash flowse 10,600 4,500 47,400 – 5,500 19,800 – 15,700 12,600 116,100Equity-accounted entities (BP share)fFuture cash inflowsa – – – 9,100 46,700 – 188,900 34,200 – 278,900Future production costb – – – 3,100 21,500 – 123,800 30,100 – 178,500Future development costb – – – 1,900 5,000 – 15,600 2,400 – 24,900Future taxationc – – – 900 5,900 – 9,600 200 – 16,600Future net cash flows – – – 3,200 14,300 – 39,900 1,500 – 58,90010% annual discountd – – – 2,800 8,700 – 19,000 600 – 31,100Standardized measure of discounted
future net cash flowsg h – – – 400 5,600 – 20,900 900 – 27,800Total subsidiaries and equity-accounted entitiesStandardized measure of discounted
future net cash flows 10,600 4,500 47,400 400 11,100 19,800 20,900 16,600 12,600 143,900
The following are the principal sources of change in the standardized measure of discounted future net cash flows:
$ million
SubsidiariesEquity-accounted
entities (BP share)
Total subsidiaries andequity-accounted
entities
Sales and transfers of oil and gas produced, net of production costs (30,900) (5,700) (36,600)Development costs for the current year as estimated in previous year 12,800 2,900 15,700Extensions, discoveries and improved recovery, less related costs 6,600 2,800 9,400Net changes in prices and production cost 75,000 15,800 90,800Revisions of previous reserves estimates (22,000) 2,100 (19,900)Net change in taxation (18,200) (1,400) (19,600)Future development costs (10,800) (2,700) (13,500)Net change in purchase and sales of reserves-in-place (6,500) (2,700) (9,200)Addition of 10% annual discount 10,000 1,500 11,500Total change in the standardized measure during the yeari 16,000 12,600 28,600a The marker prices used were Brent $110.96/bbl, Henry Hub $4.12/mmBtu.b Production costs, which include production taxes, and development costs relating to future production of proved reserves are based on the continuation of existing economic conditions. Future
decommissioning costs are included.c Taxation is computed using appropriate year-end statutory corporate income tax rates.d Future net cash flows from oil and natural gas production are discounted at 10% regardless of the group assessment of the risk associated with its producing activities.e Minority interest in BP Trinidad and Tobago LLC amounted to $1,600 million.f The standardized measure of discounted future net cash flows of equity-accounted entities includes standardized measure of discounted future net cash flows of equity-accounted investments of those
entities.g Minority interest in TNK-BP amounted to $1,600 million in Russia.h No equity-accounted future cash flows in Africa because proved reserves are received as a result of contractual arrangements, with no associated costs.i Total change in the standardized measure during the year includes the effect of exchange rate movements.
Supplementary information on oil and natural gas (unaudited) 283BP Annual Report and Form 20-F 2012
Financial statements
Standardized measure of discounted future net cash flows and changes therein relating to proved oil and gas reserves continued
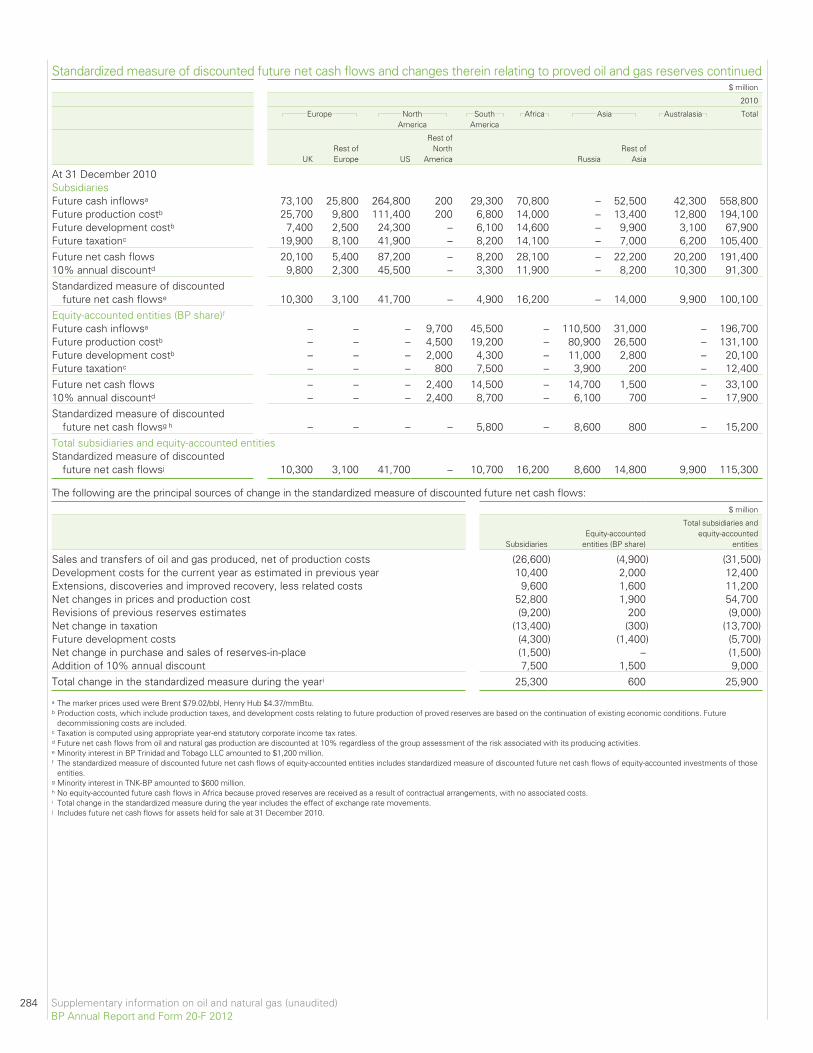
Standardized measure of discounted future net cash flows and changes therein relating to proved oil and gas reserves continued$ million
2010
Europe NorthAmerica
SouthAmerica
Africa Asia Australasia Total
UKRest ofEurope US
Rest ofNorth
America RussiaRest of
Asia
At 31 December 2010SubsidiariesFuture cash inflowsa 73,100 25,800 264,800 200 29,300 70,800 – 52,500 42,300 558,800Future production costb 25,700 9,800 111,400 200 6,800 14,000 – 13,400 12,800 194,100Future development costb 7,400 2,500 24,300 – 6,100 14,600 – 9,900 3,100 67,900Future taxationc 19,900 8,100 41,900 – 8,200 14,100 – 7,000 6,200 105,400Future net cash flows 20,100 5,400 87,200 – 8,200 28,100 – 22,200 20,200 191,40010% annual discountd 9,800 2,300 45,500 – 3,300 11,900 – 8,200 10,300 91,300Standardized measure of discounted
future net cash flowse 10,300 3,100 41,700 – 4,900 16,200 – 14,000 9,900 100,100Equity-accounted entities (BP share)fFuture cash inflowsa – – – 9,700 45,500 – 110,500 31,000 – 196,700Future production costb – – – 4,500 19,200 – 80,900 26,500 – 131,100Future development costb – – – 2,000 4,300 – 11,000 2,800 – 20,100Future taxationc – – – 800 7,500 – 3,900 200 – 12,400Future net cash flows – – – 2,400 14,500 – 14,700 1,500 – 33,10010% annual discountd – – – 2,400 8,700 – 6,100 700 – 17,900Standardized measure of discounted
future net cash flowsg h – – – – 5,800 – 8,600 800 – 15,200Total subsidiaries and equity-accounted entitiesStandardized measure of discounted
future net cash flowsj 10,300 3,100 41,700 – 10,700 16,200 8,600 14,800 9,900 115,300
The following are the principal sources of change in the standardized measure of discounted future net cash flows:$ million
SubsidiariesEquity-accounted
entities (BP share)
Total subsidiaries andequity-accounted
entities
Sales and transfers of oil and gas produced, net of production costs (26,600) (4,900) (31,500)Development costs for the current year as estimated in previous year 10,400 2,000 12,400Extensions, discoveries and improved recovery, less related costs 9,600 1,600 11,200Net changes in prices and production cost 52,800 1,900 54,700Revisions of previous reserves estimates (9,200) 200 (9,000)Net change in taxation (13,400) (300) (13,700)Future development costs (4,300) (1,400) (5,700)Net change in purchase and sales of reserves-in-place (1,500) – (1,500)Addition of 10% annual discount 7,500 1,500 9,000Total change in the standardized measure during the yeari 25,300 600 25,900
a The marker prices used were Brent $79.02/bbl, Henry Hub $4.37/mmBtu.b Production costs, which include production taxes, and development costs relating to future production of proved reserves are based on the continuation of existing economic conditions. Future
decommissioning costs are included.c Taxation is computed using appropriate year-end statutory corporate income tax rates.d Future net cash flows from oil and natural gas production are discounted at 10% regardless of the group assessment of the risk associated with its producing activities.e Minority interest in BP Trinidad and Tobago LLC amounted to $1,200 million.f The standardized measure of discounted future net cash flows of equity-accounted entities includes standardized measure of discounted future net cash flows of equity-accounted investments of those
entities.g Minority interest in TNK-BP amounted to $600 million.h No equity-accounted future cash flows in Africa because proved reserves are received as a result of contractual arrangements, with no associated costs.i Total change in the standardized measure during the year includes the effect of exchange rate movements.j Includes future net cash flows for assets held for sale at 31 December 2010.
284 Supplementary information on oil and natural gas (unaudited)BP Annual Report and Form 20-F 2012
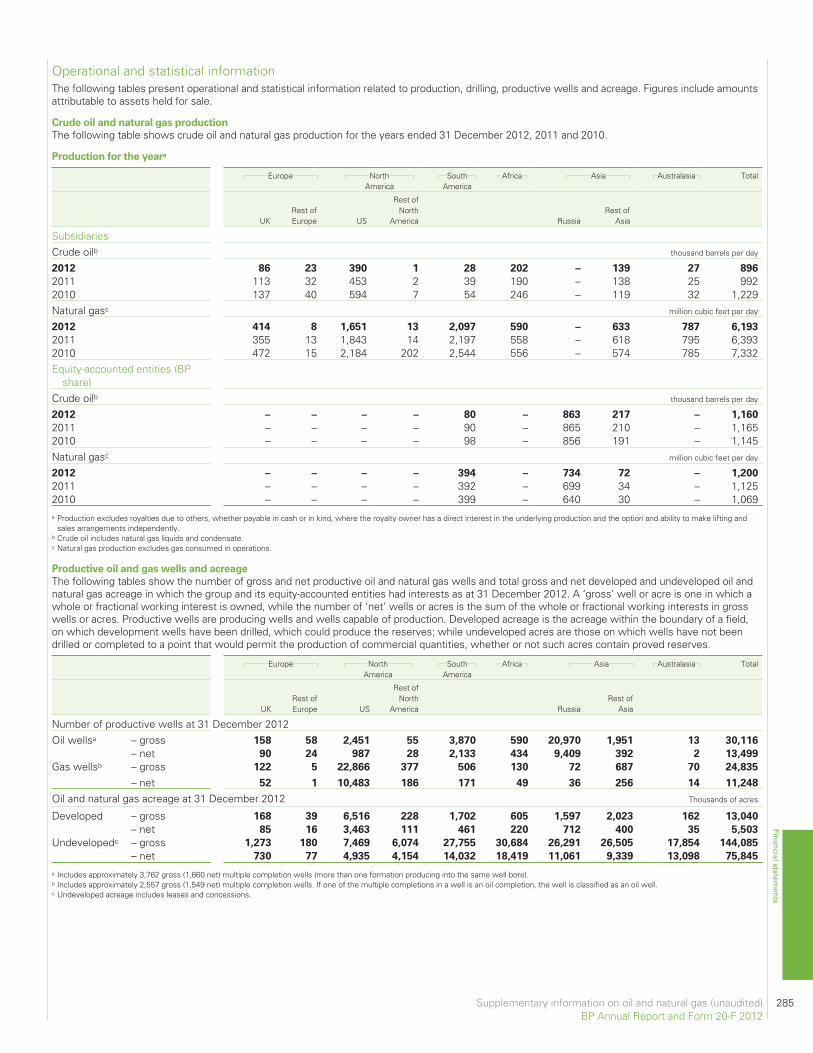
The following tables present operational and statistical information related to production, drilling, productive wells and acreage. Figures include amountsattributable to assets held for sale.
Crude oil and natural gas production
The following table shows crude oil and natural gas production for the years ended 31 December 2012, 2011 and 2010.
Production for the yeara
Europe NorthAmerica
SouthAmerica
Africa Asia Australasia Total
UKRest ofEurope US
Rest ofNorth
America RussiaRest of
Asia
SubsidiariesCrude oilb thousand barrels per day
2012 86 23 390 1 28 202 – 139 27 896
2011 113 32 453 2 39 190 – 138 25 9922010 137 40 594 7 54 246 – 119 32 1,229Natural gasc million cubic feet per day
2012 414 8 1,651 13 2,097 590 – 633 787 6,193
2011 355 13 1,843 14 2,197 558 – 618 795 6,3932010 472 15 2,184 202 2,544 556 – 574 785 7,332Equity-accounted entities (BP
share)Crude oilb thousand barrels per day
2012 – – – – 80 – 863 217 – 1,160
2011 – – – – 90 – 865 210 – 1,1652010 – – – – 98 – 856 191 – 1,145Natural gasc million cubic feet per day
2012 – – – – 394 – 734 72 – 1,200
2011 – – – – 392 – 699 34 – 1,1252010 – – – – 399 – 640 30 – 1,069a Production excludes royalties due to others, whether payable in cash or in kind, where the royalty owner has a direct interest in the underlying production and the option and ability to make lifting and
sales arrangements independently.b Crude oil includes natural gas liquids and condensate.c Natural gas production excludes gas consumed in operations.
Productive oil and gas wells and acreage
The following tables show the number of gross and net productive oil and natural gas wells and total gross and net developed and undeveloped oil andnatural gas acreage in which the group and its equity-accounted entities had interests as at 31 December 2012. A ‘gross’ well or acre is one in which awhole or fractional working interest is owned, while the number of ‘net’ wells or acres is the sum of the whole or fractional working interests in grosswells or acres. Productive wells are producing wells and wells capable of production. Developed acreage is the acreage within the boundary of a field,on which development wells have been drilled, which could produce the reserves; while undeveloped acres are those on which wells have not beendrilled or completed to a point that would permit the production of commercial quantities, whether or not such acres contain proved reserves.
Europe NorthAmerica
SouthAmerica
Africa Asia Australasia Total
UKRest ofEurope US
Rest ofNorth
America RussiaRest of
Asia
Number of productive wells at 31 December 2012Oil wellsa – gross 158 58 2,451 55 3,870 590 20,970 1,951 13 30,116
– net 90 24 987 28 2,133 434 9,409 392 2 13,499
Gas wellsb – gross 122 5 22,866 377 506 130 72 687 70 24,835
– net 52 1 10,483 186 171 49 36 256 14 11,248
Oil and natural gas acreage at 31 December 2012 Thousands of acres
Developed – gross 168 39 6,516 228 1,702 605 1,597 2,023 162 13,040
– net 85 16 3,463 111 461 220 712 400 35 5,503
Undevelopedc – gross 1,273 180 7,469 6,074 27,755 30,684 26,291 26,505 17,854 144,085
– net 730 77 4,935 4,154 14,032 18,419 11,061 9,339 13,098 75,845
a Includes approximately 3,762 gross (1,660 net) multiple completion wells (more than one formation producing into the same well bore).b Includes approximately 2,557 gross (1,549 net) multiple completion wells. If one of the multiple completions in a well is an oil completion, the well is classified as an oil well.c Undeveloped acreage includes leases and concessions.
Supplementary information on oil and natural gas (unaudited) 285BP Annual Report and Form 20-F 2012
Financial statements
Operational and statistical information
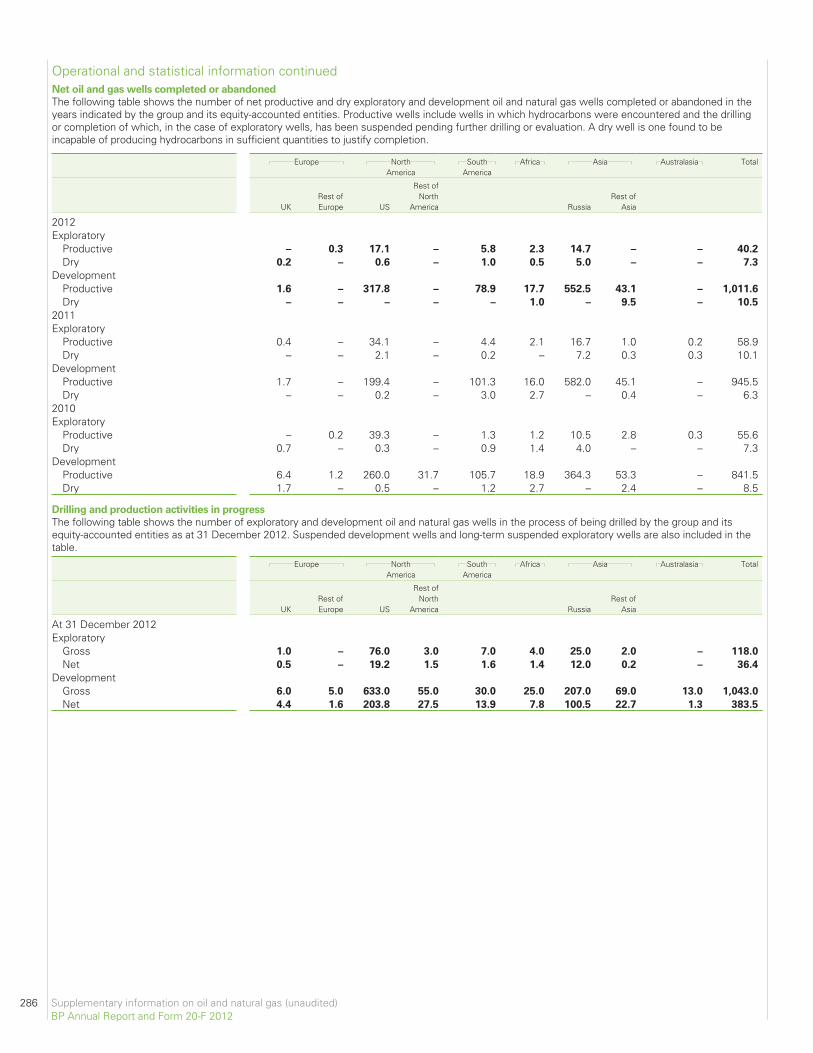
Operational and statistical information continuedNet oil and gas wells completed or abandoned
The following table shows the number of net productive and dry exploratory and development oil and natural gas wells completed or abandoned in theyears indicated by the group and its equity-accounted entities. Productive wells include wells in which hydrocarbons were encountered and the drillingor completion of which, in the case of exploratory wells, has been suspended pending further drilling or evaluation. A dry well is one found to beincapable of producing hydrocarbons in sufficient quantities to justify completion.
Europe NorthAmerica
SouthAmerica
Africa Asia Australasia Total
UKRest ofEurope US
Rest ofNorth
America RussiaRest of
Asia
2012Exploratory
Productive – 0.3 17.1 – 5.8 2.3 14.7 – – 40.2
Dry 0.2 – 0.6 – 1.0 0.5 5.0 – – 7.3
DevelopmentProductive 1.6 – 317.8 – 78.9 17.7 552.5 43.1 – 1,011.6
Dry – – – – – 1.0 – 9.5 – 10.5
2011Exploratory
Productive 0.4 – 34.1 – 4.4 2.1 16.7 1.0 0.2 58.9Dry – – 2.1 – 0.2 – 7.2 0.3 0.3 10.1
DevelopmentProductive 1.7 – 199.4 – 101.3 16.0 582.0 45.1 – 945.5Dry – – 0.2 – 3.0 2.7 – 0.4 – 6.3
2010Exploratory
Productive – 0.2 39.3 – 1.3 1.2 10.5 2.8 0.3 55.6Dry 0.7 – 0.3 – 0.9 1.4 4.0 – – 7.3
DevelopmentProductive 6.4 1.2 260.0 31.7 105.7 18.9 364.3 53.3 – 841.5Dry 1.7 – 0.5 – 1.2 2.7 – 2.4 – 8.5
Drilling and production activities in progress
The following table shows the number of exploratory and development oil and natural gas wells in the process of being drilled by the group and itsequity-accounted entities as at 31 December 2012. Suspended development wells and long-term suspended exploratory wells are also included in thetable.
Europe NorthAmerica
SouthAmerica
Africa Asia Australasia Total
UKRest ofEurope US
Rest ofNorth
America RussiaRest of
Asia
At 31 December 2012Exploratory
Gross 1.0 – 76.0 3.0 7.0 4.0 25.0 2.0 – 118.0
Net 0.5 – 19.2 1.5 1.6 1.4 12.0 0.2 – 36.4
DevelopmentGross 6.0 5.0 633.0 55.0 30.0 25.0 207.0 69.0 13.0 1,043.0
Net 4.4 1.6 203.8 27.5 13.9 7.8 100.5 22.7 1.3 383.5
286 Supplementary information on oil and natural gas (unaudited)BP Annual Report and Form 20-F 2012

SignaturesThe registrant hereby certifies that it meets all of the requirements for filing on Form 20-F and that it has duly caused and authorized the undersigned tosign this annual report on its behalf.
BP p.l.c.(Registrant)
/s/ David J Jackson
Company Secretary6 March 2013
Financial statements 287BP Annual Report and Form 20-F 2012
Financial statements
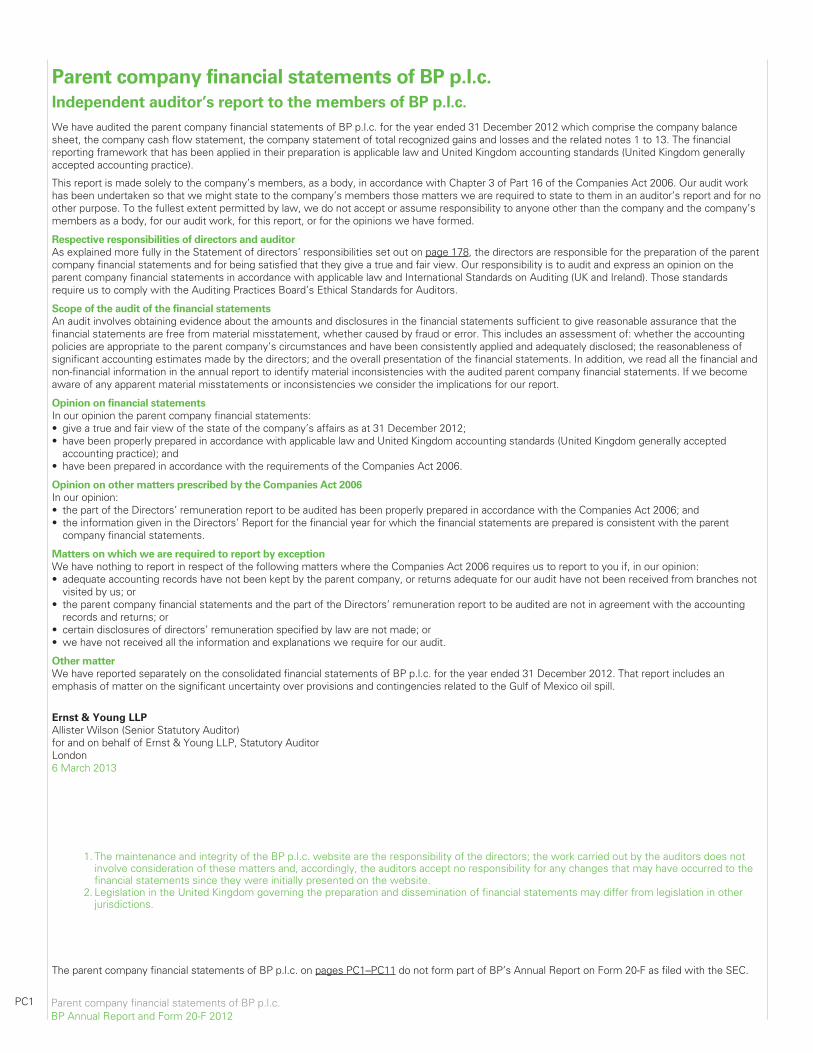
Parent company financial statements of BP p.l.c.
Independent auditor’s report to the members of BP p.l.c.
We have audited the parent company financial statements of BP p.l.c. for the year ended 31 December 2012 which comprise the company balancesheet, the company cash flow statement, the company statement of total recognized gains and losses and the related notes 1 to 13. The financialreporting framework that has been applied in their preparation is applicable law and United Kingdom accounting standards (United Kingdom generallyaccepted accounting practice).
This report is made solely to the company’s members, as a body, in accordance with Chapter 3 of Part 16 of the Companies Act 2006. Our audit workhas been undertaken so that we might state to the company’s members those matters we are required to state to them in an auditor’s report and for noother purpose. To the fullest extent permitted by law, we do not accept or assume responsibility to anyone other than the company and the company’smembers as a body, for our audit work, for this report, or for the opinions we have formed.
Respective responsibilities of directors and auditor
As explained more fully in the Statement of directors’ responsibilities set out on page 178, the directors are responsible for the preparation of the parentcompany financial statements and for being satisfied that they give a true and fair view. Our responsibility is to audit and express an opinion on theparent company financial statements in accordance with applicable law and International Standards on Auditing (UK and Ireland). Those standardsrequire us to comply with the Auditing Practices Board’s Ethical Standards for Auditors.
Scope of the audit of the financial statements
An audit involves obtaining evidence about the amounts and disclosures in the financial statements sufficient to give reasonable assurance that thefinancial statements are free from material misstatement, whether caused by fraud or error. This includes an assessment of: whether the accountingpolicies are appropriate to the parent company’s circumstances and have been consistently applied and adequately disclosed; the reasonableness ofsignificant accounting estimates made by the directors; and the overall presentation of the financial statements. In addition, we read all the financial andnon-financial information in the annual report to identify material inconsistencies with the audited parent company financial statements. If we becomeaware of any apparent material misstatements or inconsistencies we consider the implications for our report.
Opinion on financial statements
In our opinion the parent company financial statements:• give a true and fair view of the state of the company’s affairs as at 31 December 2012;• have been properly prepared in accordance with applicable law and United Kingdom accounting standards (United Kingdom generally accepted
accounting practice); and• have been prepared in accordance with the requirements of the Companies Act 2006.
Opinion on other matters prescribed by the Companies Act 2006
In our opinion:• the part of the Directors’ remuneration report to be audited has been properly prepared in accordance with the Companies Act 2006; and• the information given in the Directors’ Report for the financial year for which the financial statements are prepared is consistent with the parent
company financial statements.
Matters on which we are required to report by exception
We have nothing to report in respect of the following matters where the Companies Act 2006 requires us to report to you if, in our opinion:• adequate accounting records have not been kept by the parent company, or returns adequate for our audit have not been received from branches not
visited by us; or• the parent company financial statements and the part of the Directors’ remuneration report to be audited are not in agreement with the accounting
records and returns; or• certain disclosures of directors’ remuneration specified by law are not made; or• we have not received all the information and explanations we require for our audit.
Other matter
We have reported separately on the consolidated financial statements of BP p.l.c. for the year ended 31 December 2012. That report includes anemphasis of matter on the significant uncertainty over provisions and contingencies related to the Gulf of Mexico oil spill.
Ernst & Young LLP
Allister Wilson (Senior Statutory Auditor)for and on behalf of Ernst & Young LLP, Statutory AuditorLondon6 March 2013
1. The maintenance and integrity of the BP p.l.c. website are the responsibility of the directors; the work carried out by the auditors does notinvolve consideration of these matters and, accordingly, the auditors accept no responsibility for any changes that may have occurred to thefinancial statements since they were initially presented on the website.
2. Legislation in the United Kingdom governing the preparation and dissemination of financial statements may differ from legislation in otherjurisdictions.
The parent company financial statements of BP p.l.c. on pages PC1–PC11 do not form part of BP’s Annual Report on Form 20-F as filed with the SEC.
PC1 Parent company financial statements of BP p.l.c.BP Annual Report and Form 20-F 2012
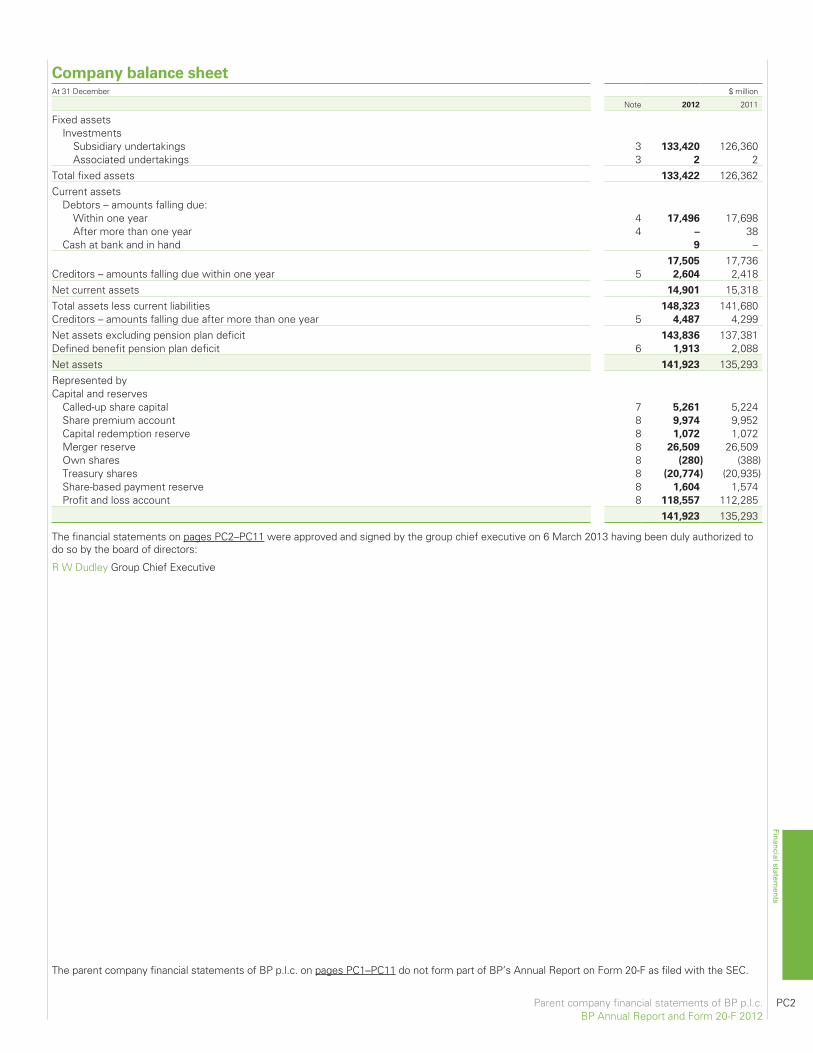
Company balance sheetAt 31 December $ million
Note 2012 2011
Fixed assetsInvestments
Subsidiary undertakings 3 133,420 126,360Associated undertakings 3 2 2
Total fixed assets 133,422 126,362Current assets
Debtors – amounts falling due:Within one year 4 17,496 17,698After more than one year 4 – 38
Cash at bank and in hand 9 –17,505 17,736
Creditors – amounts falling due within one year 5 2,604 2,418Net current assets 14,901 15,318Total assets less current liabilities 148,323 141,680Creditors – amounts falling due after more than one year 5 4,487 4,299Net assets excluding pension plan deficit 143,836 137,381Defined benefit pension plan deficit 6 1,913 2,088Net assets 141,923 135,293Represented byCapital and reserves
Called-up share capital 7 5,261 5,224Share premium account 8 9,974 9,952Capital redemption reserve 8 1,072 1,072Merger reserve 8 26,509 26,509Own shares 8 (280) (388)Treasury shares 8 (20,774) (20,935)Share-based payment reserve 8 1,604 1,574Profit and loss account 8 118,557 112,285
141,923 135,293
The financial statements on pages PC2–PC11 were approved and signed by the group chief executive on 6 March 2013 having been duly authorized todo so by the board of directors:
R W Dudley Group Chief Executive
Parent company financial statements of BP p.l.c. PC2BP Annual Report and Form 20-F 2012
Financial statements
The parent company financial statements of BP p.l.c. on pages PC1–PC11 do not form part of BP’s Annual Report on Form 20-F as filed with the SEC.
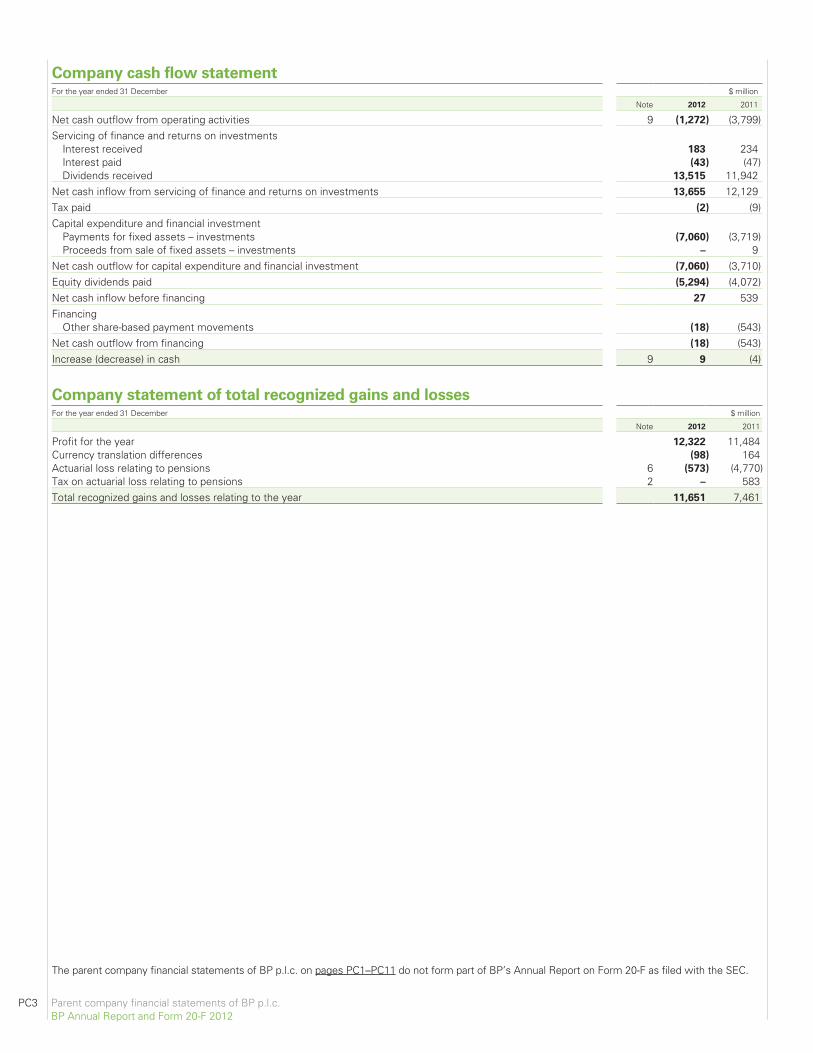
Company cash flow statementFor the year ended 31 December $ million
Note 2012 2011
Net cash outflow from operating activities 9 (1,272) (3,799)Servicing of finance and returns on investments
Interest received 183 234Interest paid (43) (47)Dividends received 13,515 11,942
Net cash inflow from servicing of finance and returns on investments 13,655 12,129Tax paid (2) (9)Capital expenditure and financial investment
Payments for fixed assets – investments (7,060) (3,719)Proceeds from sale of fixed assets – investments – 9
Net cash outflow for capital expenditure and financial investment (7,060) (3,710)Equity dividends paid (5,294) (4,072)Net cash inflow before financing 27 539Financing
Other share-based payment movements (18) (543)Net cash outflow from financing (18) (543)Increase (decrease) in cash 9 9 (4)
Company statement of total recognized gains and lossesFor the year ended 31 December $ million
Note 2012 2011
Profit for the year 12,322 11,484Currency translation differences (98) 164Actuarial loss relating to pensions 6 (573) (4,770)Tax on actuarial loss relating to pensions 2 – 583Total recognized gains and losses relating to the year 11,651 7,461
The parent company financial statements of BP p.l.c. on pages PC1–PC11 do not form part of BP’s Annual Report on Form 20-F as filed with the SEC.
PC3 Parent company financial statements of BP p.l.c.BP Annual Report and Form 20-F 2012
Notes on financial statements
1. Accounting policiesAccounting standards
These accounts are prepared on a going concern basis and in accordancewith the Companies Act 2006 and applicable UK accounting standards.
Accounting convention
The financial statements are prepared under the historical costconvention.
Foreign currency transactions
Functional currency is the currency of the primary economic environmentin which an entity operates and is normally the currency in which theentity primarily generates and expends cash. Transactions in foreigncurrencies are initially recorded in the functional currency by applying therate of exchange ruling at the date of the transaction. Monetary assetsand liabilities denominated in foreign currencies are retranslated into thefunctional currency at the rate of exchange ruling at the balance sheetdate. Any resulting exchange differences are included in profit for theyear. Exchange adjustments arising when the opening net assets and theprofits for the year retained by non-US dollar functional currency branchesare translated into US dollars are taken to a separate component of equityand reported in the statement of total recognized gains and losses.
Investments
Investments in subsidiaries and associated undertakings are recorded atcost. The company assesses investments for impairment wheneverevents or changes in circumstances indicate that the carrying value of aninvestment may not be recoverable. If any such indication of impairmentexists, the company makes an estimate of its recoverable amount. Wherethe carrying amount of an investment exceeds its recoverable amount,the investment is considered impaired and is written down to itsrecoverable amount.
Share-based payments
Equity-settled transactionsThe cost of equity-settled transactions with employees of the companyand other members of the group is measured by reference to the fairvalue at the date at which equity instruments are granted and isrecognized as an expense over the vesting period, which ends on the dateon which the relevant employees become fully entitled to the award. Fairvalue is determined by using an appropriate valuation model. In valuingequity-settled transactions, no account is taken of any vesting conditions,other than conditions linked to the price of the shares of the company(market conditions). Non-vesting conditions, such as the condition thatemployees contribute to a savings-related plan, are taken into account inthe grant-date fair value, and failure to meet a non-vesting condition istreated as a cancellation, where this is within the control of the employee.
No expense is recognized for awards that do not ultimately vest, exceptfor awards where vesting is conditional upon a market condition, whichare treated as vesting irrespective of whether or not the market conditionis satisfied, provided that all other performance conditions are satisfied.
At each balance sheet date before vesting, the cumulative expense iscalculated, representing the extent to which the vesting period has expiredand management’s best estimate of the achievement or otherwise of non-market conditions and the number of equity instruments that will ultimatelyvest or, in the case of an instrument subject to a market condition, betreated as vesting as described above. The movement in cumulativeexpense since the previous balance sheet date is recognized in the incomestatement, with a corresponding entry in equity.
When the terms of an equity-settled award are modified or a new award isdesignated as replacing a cancelled or settled award, the cost based on theoriginal award terms continues to be recognized over the original vestingperiod. In addition, an expense is recognized over the remainder of the newvesting period for the incremental fair value of any modification, based onthe difference between the fair value of the original award and the fair valueof the modified award, both as measured on the date of the modification.No reduction is recognized if this difference is negative.
When an equity-settled award is cancelled, it is treated as if it had vestedon the date of cancellation and any cost not yet recognized in the incomestatement for the award is expensed immediately.
Cash-settled transactionsThe cost of cash-settled transactions is measured at fair value andrecognized as an expense over the vesting period, with a correspondingliability recognized on the balance sheet.
Pensions
The cost of providing benefits under the defined benefit plans isdetermined separately for each plan using the projected unit creditmethod, which attributes entitlement to benefits to the current period (todetermine current service cost) and to the current and prior periods (todetermine the present value of the defined benefit obligation). Pastservice costs are recognized immediately when the company becomescommitted to a change in pension plan design. When a settlement(eliminating all obligations for benefits already accrued) or a curtailment(reducing future obligations as a result of a material reduction in thescheme membership or a reduction in future entitlement) occurs, theobligation and related plan assets are remeasured using current actuarialassumptions and the resultant gain or loss is recognized in the incomestatement during the period in which the settlement or curtailmentoccurs.
The interest element of the defined benefit cost represents the change inpresent value of scheme obligations resulting from the passage of time, andis determined by applying the discount rate to the opening present value ofthe benefit obligation, taking into account material changes in the obligationduring the year. The expected return on plan assets is based on anassessment made at the beginning of the year of long-term market returnson plan assets, adjusted for the effect on the fair value of plan assets ofcontributions received and benefits paid during the year. The differencebetween the expected return on plan assets and the interest cost isrecognized in the income statement as other finance income or expense.
Actuarial gains and losses are recognized in full within the statement oftotal recognized gains and losses in the period in which they occur.
The defined benefit pension plan surplus or deficit in the balance sheetcomprises the total for each plan of the present value of the definedbenefit obligation (using a discount rate based on high quality corporatebonds), less the fair value of plan assets out of which the obligations areto be settled directly. Fair value is based on market price information and,in the case of quoted securities, is the published bid price. The surplus ordeficit, net of taxation thereon, is presented separately above the total fornet assets on the face of the balance sheet.
The BP Pension Fund is operated in a way that does not allow theindividual participating employing companies in the pension fund toidentify their share of the underlying assets and liabilities of the fund, andhence the company recognizes the full defined benefit pension plansurplus or deficit in its balance sheet.
Deferred taxation
Deferred tax is recognized in respect of all timing differences that haveoriginated but not reversed at the balance sheet date where transactionsor events have occurred at that date that will result in an obligation to paymore, or a right to pay less, tax in the future.
Deferred tax assets are recognized only to the extent that it is consideredmore likely than not that there will be suitable taxable profits from whichthe underlying timing differences can be deducted.
Deferred tax is measured on an undiscounted basis at the tax rates thatare expected to apply in the periods in which timing differences reverse,based on tax rates and laws enacted or substantively enacted at thebalance sheet date.
Use of estimates
The preparation of accounts in conformity with generally acceptedaccounting practice requires management to make estimates andassumptions that affect the reported amounts of assets and liabilities atthe date of the accounts and the reported amounts of revenues andexpenses during the reporting period. Actual outcomes could differ fromthese estimates.
The parent company financial statements of BP p.l.c. on pages PC1–PC11 do not form part of BP’s Annual Report on Form 20-F as filed with the SEC.
Financial statements
Parent company financial statements of BP p.l.c. PC4BP Annual Report and Form 20-F 2012
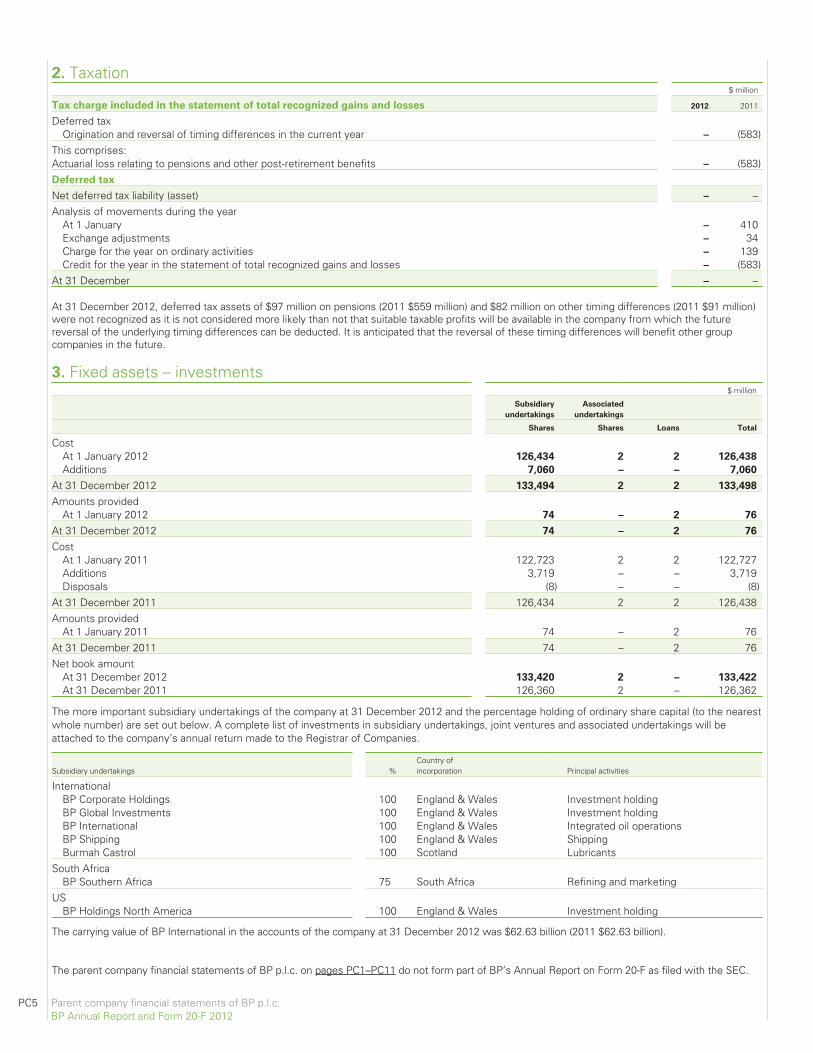
2. Taxation$ million
Tax charge included in the statement of total recognized gains and losses 2012 2011
Deferred taxOrigination and reversal of timing differences in the current year – (583)
This comprises:Actuarial loss relating to pensions and other post-retirement benefits – (583)Deferred tax
Net deferred tax liability (asset) – –Analysis of movements during the year
At 1 January – 410Exchange adjustments – 34Charge for the year on ordinary activities – 139Credit for the year in the statement of total recognized gains and losses – (583)
At 31 December – –
At 31 December 2012, deferred tax assets of $97 million on pensions (2011 $559 million) and $82 million on other timing differences (2011 $91 million)were not recognized as it is not considered more likely than not that suitable taxable profits will be available in the company from which the futurereversal of the underlying timing differences can be deducted. It is anticipated that the reversal of these timing differences will benefit other groupcompanies in the future.
3. Fixed assets – investments$ million
Subsidiary
undertakings
Associated
undertakings
Shares Shares Loans Total
CostAt 1 January 2012 126,434 2 2 126,438
Additions 7,060 – – 7,060
At 31 December 2012 133,494 2 2 133,498
Amounts providedAt 1 January 2012 74 – 2 76
At 31 December 2012 74 – 2 76
CostAt 1 January 2011 122,723 2 2 122,727Additions 3,719 – – 3,719Disposals (8) – – (8)
At 31 December 2011 126,434 2 2 126,438Amounts provided
At 1 January 2011 74 – 2 76At 31 December 2011 74 – 2 76Net book amount
At 31 December 2012 133,420 2 – 133,422
At 31 December 2011 126,360 2 – 126,362
The more important subsidiary undertakings of the company at 31 December 2012 and the percentage holding of ordinary share capital (to the nearestwhole number) are set out below. A complete list of investments in subsidiary undertakings, joint ventures and associated undertakings will beattached to the company’s annual return made to the Registrar of Companies.
Subsidiary undertakings %Country ofincorporation Principal activities
InternationalBP Corporate Holdings 100 England & Wales Investment holdingBP Global Investments 100 England & Wales Investment holdingBP International 100 England & Wales Integrated oil operationsBP Shipping 100 England & Wales ShippingBurmah Castrol 100 Scotland Lubricants
South AfricaBP Southern Africa 75 South Africa Refining and marketing
USBP Holdings North America 100 England & Wales Investment holding
The carrying value of BP International in the accounts of the company at 31 December 2012 was $62.63 billion (2011 $62.63 billion).
The parent company financial statements of BP p.l.c. on pages PC1–PC11 do not form part of BP’s Annual Report on Form 20-F as filed with the SEC.
PC5 Parent company financial statements of BP p.l.c.BP Annual Report and Form 20-F 2012
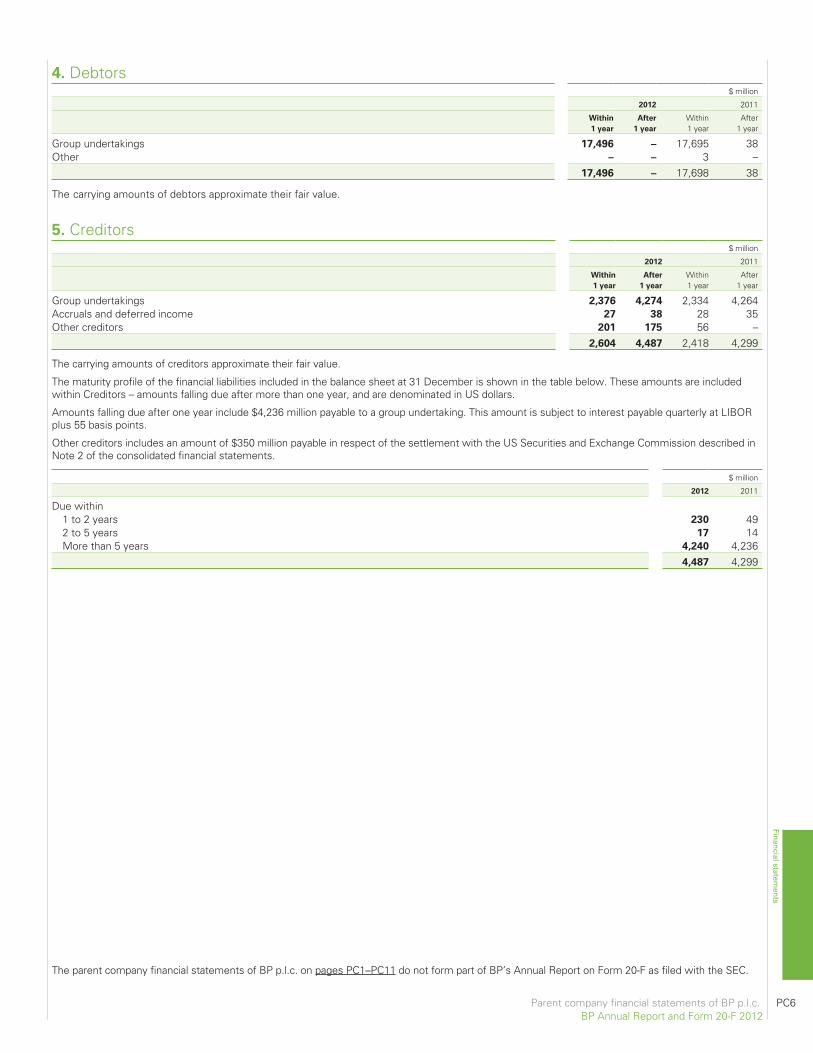
4. Debtors$ million
2012 2011
Within
1 year
After
1 year
Within1 year
After1 year
Group undertakings 17,496 – 17,695 38Other – – 3 –
17,496 – 17,698 38
The carrying amounts of debtors approximate their fair value.
5. Creditors$ million
2012 2011
Within
1 year
After
1 year
Within1 year
After1 year
Group undertakings 2,376 4,274 2,334 4,264Accruals and deferred income 27 38 28 35Other creditors 201 175 56 –
2,604 4,487 2,418 4,299
The carrying amounts of creditors approximate their fair value.
The maturity profile of the financial liabilities included in the balance sheet at 31 December is shown in the table below. These amounts are includedwithin Creditors – amounts falling due after more than one year, and are denominated in US dollars.
Amounts falling due after one year include $4,236 million payable to a group undertaking. This amount is subject to interest payable quarterly at LIBORplus 55 basis points.
Other creditors includes an amount of $350 million payable in respect of the settlement with the US Securities and Exchange Commission described inNote 2 of the consolidated financial statements.
$ million
2012 2011
Due within1 to 2 years 230 492 to 5 years 17 14More than 5 years 4,240 4,236
4,487 4,299
Parent company financial statements of BP p.l.c. PC6BP Annual Report and Form 20-F 2012
Financial statements
The parent company financial statements of BP p.l.c. on pages PC1–PC11 do not form part of BP’s Annual Report on Form 20-F as filed with the SEC.
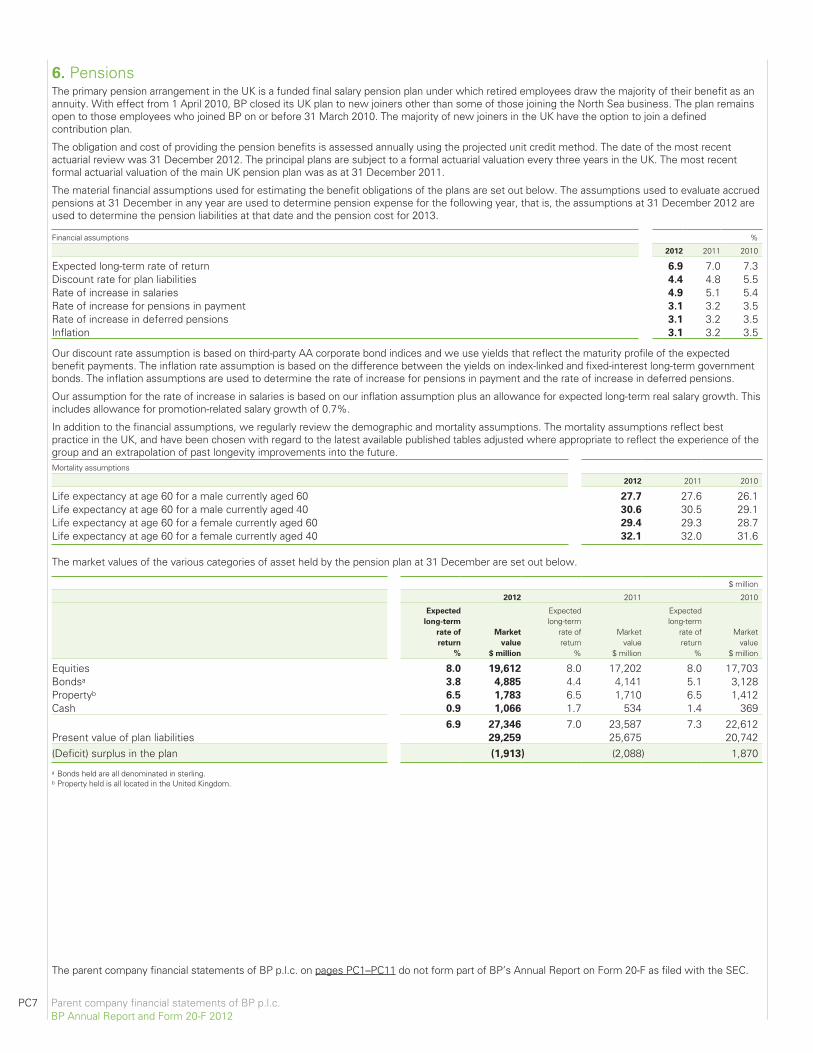
6. PensionsThe primary pension arrangement in the UK is a funded final salary pension plan under which retired employees draw the majority of their benefit as anannuity. With effect from 1 April 2010, BP closed its UK plan to new joiners other than some of those joining the North Sea business. The plan remainsopen to those employees who joined BP on or before 31 March 2010. The majority of new joiners in the UK have the option to join a definedcontribution plan.
The obligation and cost of providing the pension benefits is assessed annually using the projected unit credit method. The date of the most recentactuarial review was 31 December 2012. The principal plans are subject to a formal actuarial valuation every three years in the UK. The most recentformal actuarial valuation of the main UK pension plan was as at 31 December 2011.
The material financial assumptions used for estimating the benefit obligations of the plans are set out below. The assumptions used to evaluate accruedpensions at 31 December in any year are used to determine pension expense for the following year, that is, the assumptions at 31 December 2012 areused to determine the pension liabilities at that date and the pension cost for 2013.
Financial assumptions %
2012 2011 2010
Expected long-term rate of return 6.9 7.0 7.3Discount rate for plan liabilities 4.4 4.8 5.5Rate of increase in salaries 4.9 5.1 5.4Rate of increase for pensions in payment 3.1 3.2 3.5Rate of increase in deferred pensions 3.1 3.2 3.5Inflation 3.1 3.2 3.5
Our discount rate assumption is based on third-party AA corporate bond indices and we use yields that reflect the maturity profile of the expectedbenefit payments. The inflation rate assumption is based on the difference between the yields on index-linked and fixed-interest long-term governmentbonds. The inflation assumptions are used to determine the rate of increase for pensions in payment and the rate of increase in deferred pensions.
Our assumption for the rate of increase in salaries is based on our inflation assumption plus an allowance for expected long-term real salary growth. Thisincludes allowance for promotion-related salary growth of 0.7%.
In addition to the financial assumptions, we regularly review the demographic and mortality assumptions. The mortality assumptions reflect bestpractice in the UK, and have been chosen with regard to the latest available published tables adjusted where appropriate to reflect the experience of thegroup and an extrapolation of past longevity improvements into the future.Mortality assumptions
2012 2011 2010
Life expectancy at age 60 for a male currently aged 60 27.7 27.6 26.1Life expectancy at age 60 for a male currently aged 40 30.6 30.5 29.1Life expectancy at age 60 for a female currently aged 60 29.4 29.3 28.7Life expectancy at age 60 for a female currently aged 40 32.1 32.0 31.6
The market values of the various categories of asset held by the pension plan at 31 December are set out below.
$ million
2012 2011 2010
Expected
long-term
rate of
return
%
Market
value
$ million
Expectedlong-term
rate ofreturn
%
Marketvalue
$ million
Expectedlong-term
rate ofreturn
%
Marketvalue
$ million
Equities 8.0 19,612 8.0 17,202 8.0 17,703Bondsa 3.8 4,885 4.4 4,141 5.1 3,128Propertyb 6.5 1,783 6.5 1,710 6.5 1,412Cash 0.9 1,066 1.7 534 1.4 369
6.9 27,346 7.0 23,587 7.3 22,612Present value of plan liabilities 29,259 25,675 20,742(Deficit) surplus in the plan (1,913) (2,088) 1,870
a Bonds held are all denominated in sterling.b Property held is all located in the United Kingdom.
PC7 Parent company financial statements of BP p.l.c.BP Annual Report and Form 20-F 2012
The parent company financial statements of BP p.l.c. on pages PC1–PC11 do not form part of BP’s Annual Report on Form 20-F as filed with the SEC.
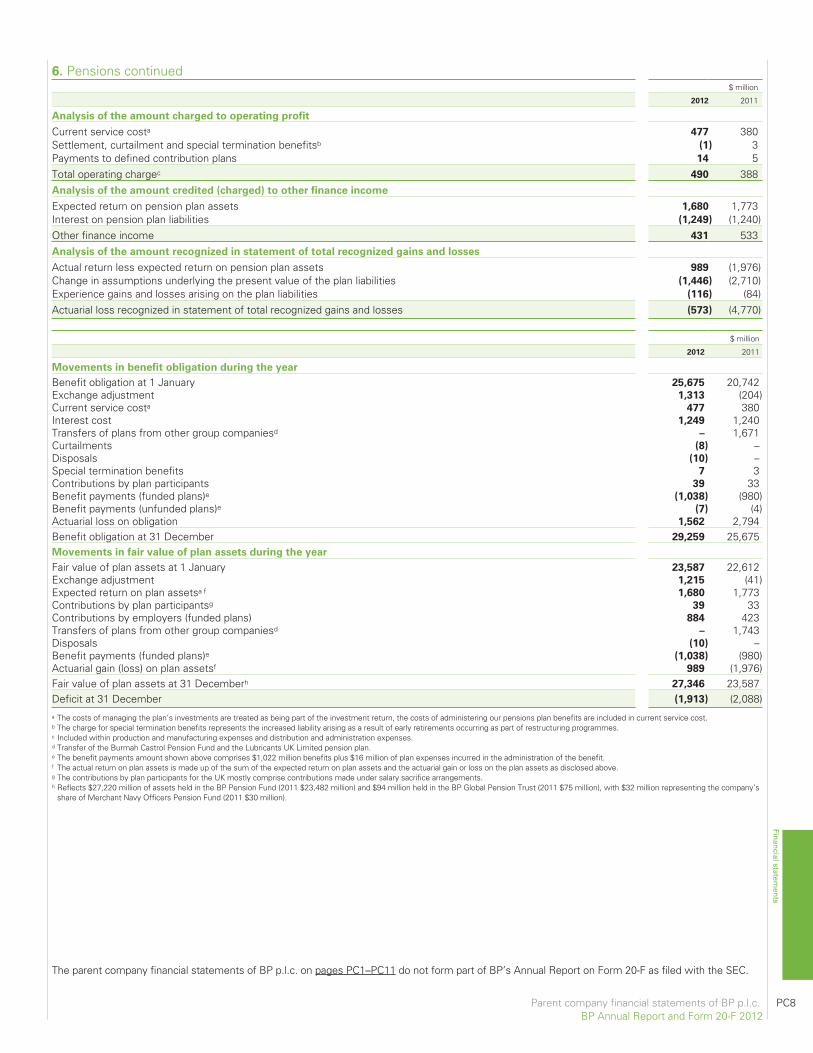
$ million
2012 2011
Analysis of the amount charged to operating profit
Current service costa 477 380Settlement, curtailment and special termination benefitsb (1) 3Payments to defined contribution plans 14 5Total operating chargec 490 388Analysis of the amount credited (charged) to other finance income
Expected return on pension plan assets 1,680 1,773Interest on pension plan liabilities (1,249) (1,240)Other finance income 431 533Analysis of the amount recognized in statement of total recognized gains and losses
Actual return less expected return on pension plan assets 989 (1,976)Change in assumptions underlying the present value of the plan liabilities (1,446) (2,710)Experience gains and losses arising on the plan liabilities (116) (84)Actuarial loss recognized in statement of total recognized gains and losses (573) (4,770)
$ million
2012 2011
Movements in benefit obligation during the year
Benefit obligation at 1 January 25,675 20,742Exchange adjustment 1,313 (204)Current service costa 477 380Interest cost 1,249 1,240Transfers of plans from other group companiesd – 1,671Curtailments (8) –Disposals (10) –Special termination benefits 7 3Contributions by plan participants 39 33Benefit payments (funded plans)e (1,038) (980)Benefit payments (unfunded plans)e (7) (4)Actuarial loss on obligation 1,562 2,794Benefit obligation at 31 December 29,259 25,675Movements in fair value of plan assets during the year
Fair value of plan assets at 1 January 23,587 22,612Exchange adjustment 1,215 (41)Expected return on plan assetsa f 1,680 1,773Contributions by plan participantsg 39 33Contributions by employers (funded plans) 884 423Transfers of plans from other group companiesd – 1,743Disposals (10) –Benefit payments (funded plans)e (1,038) (980)Actuarial gain (loss) on plan assetsf 989 (1,976)Fair value of plan assets at 31 Decemberh 27,346 23,587Deficit at 31 December (1,913) (2,088)a The costs of managing the plan’s investments are treated as being part of the investment return, the costs of administering our pensions plan benefits are included in current service cost.b The charge for special termination benefits represents the increased liability arising as a result of early retirements occurring as part of restructuring programmes.c Included within production and manufacturing expenses and distribution and administration expenses.d Transfer of the Burmah Castrol Pension Fund and the Lubricants UK Limited pension plan.e The benefit payments amount shown above comprises $1,022 million benefits plus $16 million of plan expenses incurred in the administration of the benefit.f The actual return on plan assets is made up of the sum of the expected return on plan assets and the actuarial gain or loss on the plan assets as disclosed above.g The contributions by plan participants for the UK mostly comprise contributions made under salary sacrifice arrangements.h Reflects $27,220 million of assets held in the BP Pension Fund (2011 $23,482 million) and $94 million held in the BP Global Pension Trust (2011 $75 million), with $32 million representing the company’s
share of Merchant Navy Officers Pension Fund (2011 $30 million).
Parent company financial statements of BP p.l.c. PC8BP Annual Report and Form 20-F 2012
Financial statements
6. Pensions continued
The parent company financial statements of BP p.l.c. on pages PC1–PC11 do not form part of BP’s Annual Report on Form 20-F as filed with the SEC.
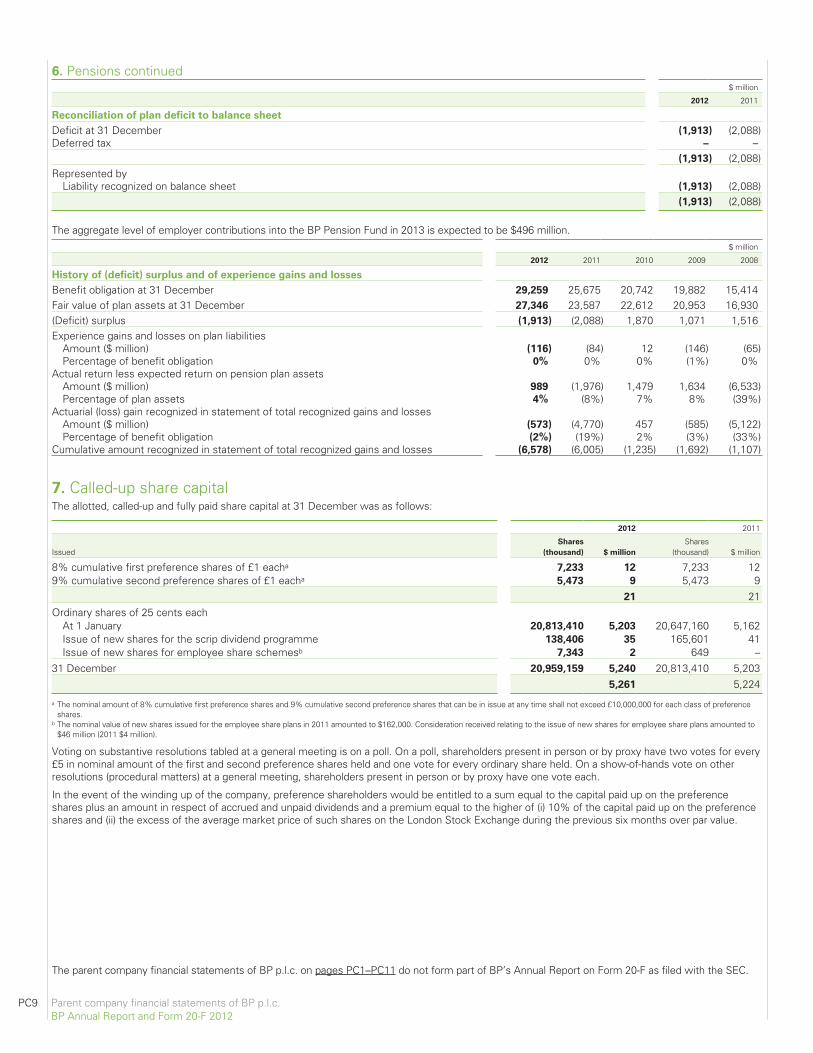
6. Pensions continued$ million
2012 2011
Reconciliation of plan deficit to balance sheet
Deficit at 31 December (1,913) (2,088)Deferred tax – –
(1,913) (2,088)Represented by
Liability recognized on balance sheet (1,913) (2,088)(1,913) (2,088)
The aggregate level of employer contributions into the BP Pension Fund in 2013 is expected to be $496 million.$ million
2012 2011 2010 2009 2008
History of (deficit) surplus and of experience gains and losses
Benefit obligation at 31 December 29,259 25,675 20,742 19,882 15,414Fair value of plan assets at 31 December 27,346 23,587 22,612 20,953 16,930(Deficit) surplus (1,913) (2,088) 1,870 1,071 1,516Experience gains and losses on plan liabilities
Amount ($ million) (116) (84) 12 (146) (65)Percentage of benefit obligation 0% 0% 0% (1%) 0%
Actual return less expected return on pension plan assetsAmount ($ million) 989 (1,976) 1,479 1,634 (6,533)Percentage of plan assets 4% (8%) 7% 8% (39%)
Actuarial (loss) gain recognized in statement of total recognized gains and lossesAmount ($ million) (573) (4,770) 457 (585) (5,122)Percentage of benefit obligation (2%) (19%) 2% (3%) (33%)
Cumulative amount recognized in statement of total recognized gains and losses (6,578) (6,005) (1,235) (1,692) (1,107)
7. Called-up share capitalThe allotted, called-up and fully paid share capital at 31 December was as follows:
2012 2011
IssuedShares
(thousand) $ million
Shares(thousand) $ million
8% cumulative first preference shares of £1 eacha 7,233 12 7,233 129% cumulative second preference shares of £1 eacha 5,473 9 5,473 9
21 21Ordinary shares of 25 cents each
At 1 January 20,813,410 5,203 20,647,160 5,162Issue of new shares for the scrip dividend programme 138,406 35 165,601 41Issue of new shares for employee share schemesb 7,343 2 649 –
31 December 20,959,159 5,240 20,813,410 5,2035,261 5,224
a The nominal amount of 8% cumulative first preference shares and 9% cumulative second preference shares that can be in issue at any time shall not exceed £10,000,000 for each class of preferenceshares.
b The nominal value of new shares issued for the employee share plans in 2011 amounted to $162,000. Consideration received relating to the issue of new shares for employee share plans amounted to$46 million (2011 $4 million).
Voting on substantive resolutions tabled at a general meeting is on a poll. On a poll, shareholders present in person or by proxy have two votes for every£5 in nominal amount of the first and second preference shares held and one vote for every ordinary share held. On a show-of-hands vote on otherresolutions (procedural matters) at a general meeting, shareholders present in person or by proxy have one vote each.
In the event of the winding up of the company, preference shareholders would be entitled to a sum equal to the capital paid up on the preferenceshares plus an amount in respect of accrued and unpaid dividends and a premium equal to the higher of (i) 10% of the capital paid up on the preferenceshares and (ii) the excess of the average market price of such shares on the London Stock Exchange during the previous six months over par value.
PC9 Parent company financial statements of BP p.l.c.BP Annual Report and Form 20-F 2012
The parent company financial statements of BP p.l.c. on pages PC1–PC11 do not form part of BP’s Annual Report on Form 20-F as filed with the SEC.
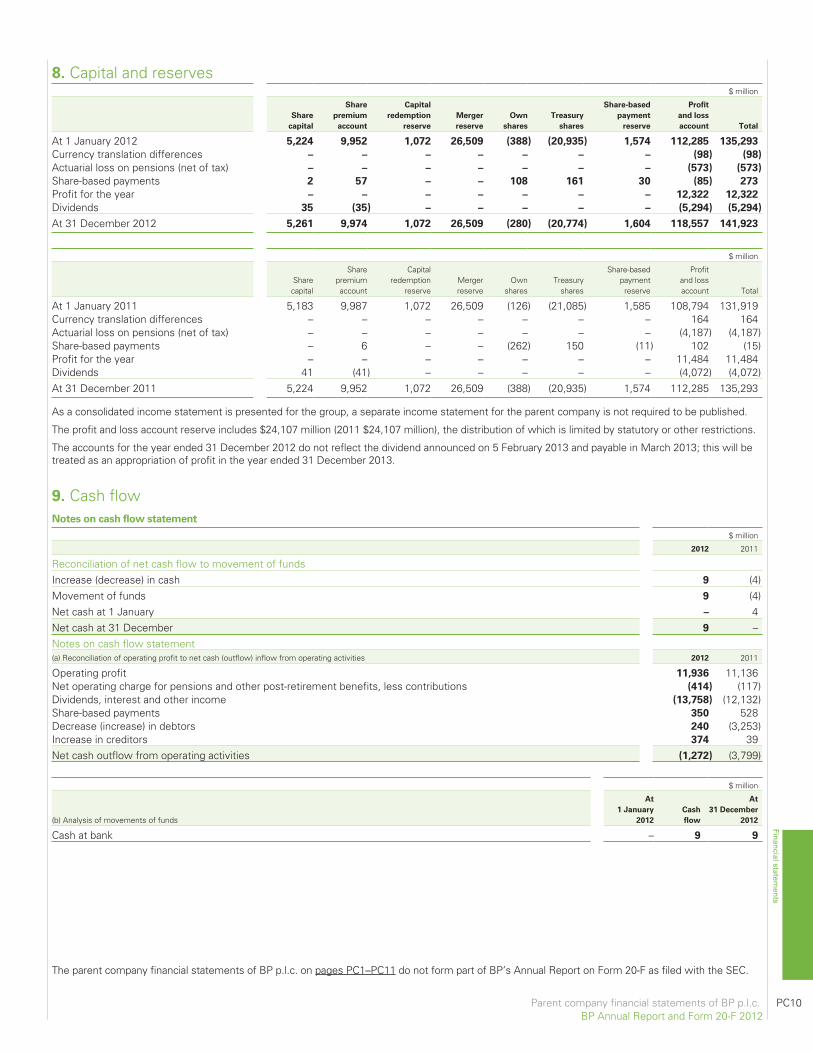
8. Capital and reserves$ million
Share
capital
Share
premium
account
Capital
redemption
reserve
Merger
reserve
Own
shares
Treasury
shares
Share-based
payment
reserve
Profit
and loss
account Total
At 1 January 2012 5,224 9,952 1,072 26,509 (388) (20,935) 1,574 112,285 135,293
Currency translation differences – – – – – – – (98) (98)
Actuarial loss on pensions (net of tax) – – – – – – – (573) (573)
Share-based payments 2 57 – – 108 161 30 (85) 273
Profit for the year – – – – – – – 12,322 12,322
Dividends 35 (35) – – – – – (5,294) (5,294)
At 31 December 2012 5,261 9,974 1,072 26,509 (280) (20,774) 1,604 118,557 141,923
$ million
Sharecapital
Sharepremiumaccount
Capitalredemption
reserveMergerreserve
Ownshares
Treasuryshares
Share-basedpayment
reserve
Profitand lossaccount Total
At 1 January 2011 5,183 9,987 1,072 26,509 (126) (21,085) 1,585 108,794 131,919Currency translation differences – – – – – – – 164 164Actuarial loss on pensions (net of tax) – – – – – – – (4,187) (4,187)Share-based payments – 6 – – (262) 150 (11) 102 (15)Profit for the year – – – – – – – 11,484 11,484Dividends 41 (41) – – – – – (4,072) (4,072)At 31 December 2011 5,224 9,952 1,072 26,509 (388) (20,935) 1,574 112,285 135,293
As a consolidated income statement is presented for the group, a separate income statement for the parent company is not required to be published.
The profit and loss account reserve includes $24,107 million (2011 $24,107 million), the distribution of which is limited by statutory or other restrictions.
The accounts for the year ended 31 December 2012 do not reflect the dividend announced on 5 February 2013 and payable in March 2013; this will betreated as an appropriation of profit in the year ended 31 December 2013.
9. Cash flowNotes on cash flow statement
$ million
2012 2011
Reconciliation of net cash flow to movement of fundsIncrease (decrease) in cash 9 (4)Movement of funds 9 (4)Net cash at 1 January – 4Net cash at 31 December 9 –Notes on cash flow statement(a) Reconciliation of operating profit to net cash (outflow) inflow from operating activities 2012 2011
Operating profit 11,936 11,136Net operating charge for pensions and other post-retirement benefits, less contributions (414) (117)Dividends, interest and other income (13,758) (12,132)Share-based payments 350 528Decrease (increase) in debtors 240 (3,253)Increase in creditors 374 39Net cash outflow from operating activities (1,272) (3,799)
$ million
(b) Analysis of movements of funds
At
1 January
2012
Cash
flow
At
31 December
2012
Cash at bank – 9 9
Parent company financial statements of BP p.l.c. PC10BP Annual Report and Form 20-F 2012
Financial statements
The parent company financial statements of BP p.l.c. on pages PC1–PC11 do not form part of BP’s Annual Report on Form 20-F as filed with the SEC.
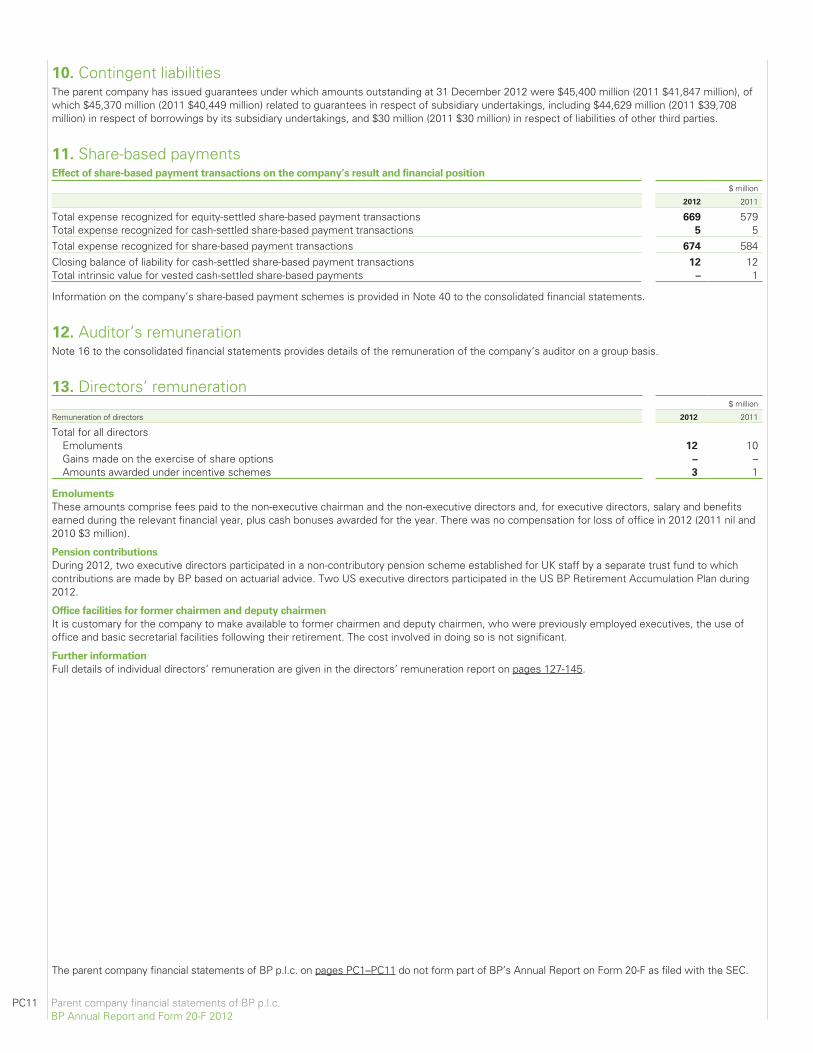
10. Contingent liabilitiesThe parent company has issued guarantees under which amounts outstanding at 31 December 2012 were $45,400 million (2011 $41,847 million), ofwhich $45,370 million (2011 $40,449 million) related to guarantees in respect of subsidiary undertakings, including $44,629 million (2011 $39,708million) in respect of borrowings by its subsidiary undertakings, and $30 million (2011 $30 million) in respect of liabilities of other third parties.
11. Share-based paymentsEffect of share-based payment transactions on the company’s result and financial position
$ million
2012 2011
Total expense recognized for equity-settled share-based payment transactions 669 579Total expense recognized for cash-settled share-based payment transactions 5 5Total expense recognized for share-based payment transactions 674 584Closing balance of liability for cash-settled share-based payment transactions 12 12Total intrinsic value for vested cash-settled share-based payments – 1
Information on the company’s share-based payment schemes is provided in Note 40 to the consolidated financial statements.
12. Auditor’s remunerationNote 16 to the consolidated financial statements provides details of the remuneration of the company’s auditor on a group basis.
13. Directors’ remuneration$ million
Remuneration of directors 2012 2011
Total for all directorsEmoluments 12 10Gains made on the exercise of share options – –Amounts awarded under incentive schemes 3 1
Emoluments
These amounts comprise fees paid to the non-executive chairman and the non-executive directors and, for executive directors, salary and benefitsearned during the relevant financial year, plus cash bonuses awarded for the year. There was no compensation for loss of office in 2012 (2011 nil and2010 $3 million).
Pension contributions
During 2012, two executive directors participated in a non-contributory pension scheme established for UK staff by a separate trust fund to whichcontributions are made by BP based on actuarial advice. Two US executive directors participated in the US BP Retirement Accumulation Plan during2012.
Office facilities for former chairmen and deputy chairmen
It is customary for the company to make available to former chairmen and deputy chairmen, who were previously employed executives, the use ofoffice and basic secretarial facilities following their retirement. The cost involved in doing so is not significant.
Further information
Full details of individual directors’ remuneration are given in the directors’ remuneration report on pages 127-145.
PC11 Parent company financial statements of BP p.l.c.BP Annual Report and Form 20-F 2012
The parent company financial statements of BP p.l.c. on pages PC1–PC11 do not form part of BP’s Annual Report on Form 20-F as filed with the SEC.