Interim Report Nordea Direct First Quarter 2021
30
Interim Report 1 st quarter 2021 Nordea Direct Bank Nordea Direct Bank ASA is part of the Nordea Group. Nordea build strong and close relationships through our engage- ment with customers and society. Whenever people strive to reach their goals and realise their dreams, we are there to provide relevant financial solutions. We are one of the largest banks in the Nordic region and among the ten largest fi- nancial groups in Europe in terms of total market capitalisation with around 10 million customers. The Nordea share is listed on the Nasdaq Helsinki, Nasdaq Copenhagen and Nasdaq Stockholm exchanges. Read more about us on Nordea.com.
-
Upload
khangminh22 -
Category
Documents
-
view
0 -
download
0
Transcript of Interim Report Nordea Direct First Quarter 2021

Interim Report 1st quarter 2021
Nordea Direct Bank
Nordea Direct Bank ASA is part of the Nordea Group. Nordea build strong and close relationships through our engage-ment with customers and society. Whenever people strive to reach their goals and realise their dreams, we are there to provide relevant financial solutions. We are one of the largest banks in the Nordic region and among the ten largest fi-nancial groups in Europe in terms of total market capitalisation with around 10 million customers. The Nordea share is
listed on the Nasdaq Helsinki, Nasdaq Copenhagen and Nasdaq Stockholm exchanges.
Read more about us on Nordea.com.
Nordea Direct Bank – Interim Report, 1st quarter 2021 2
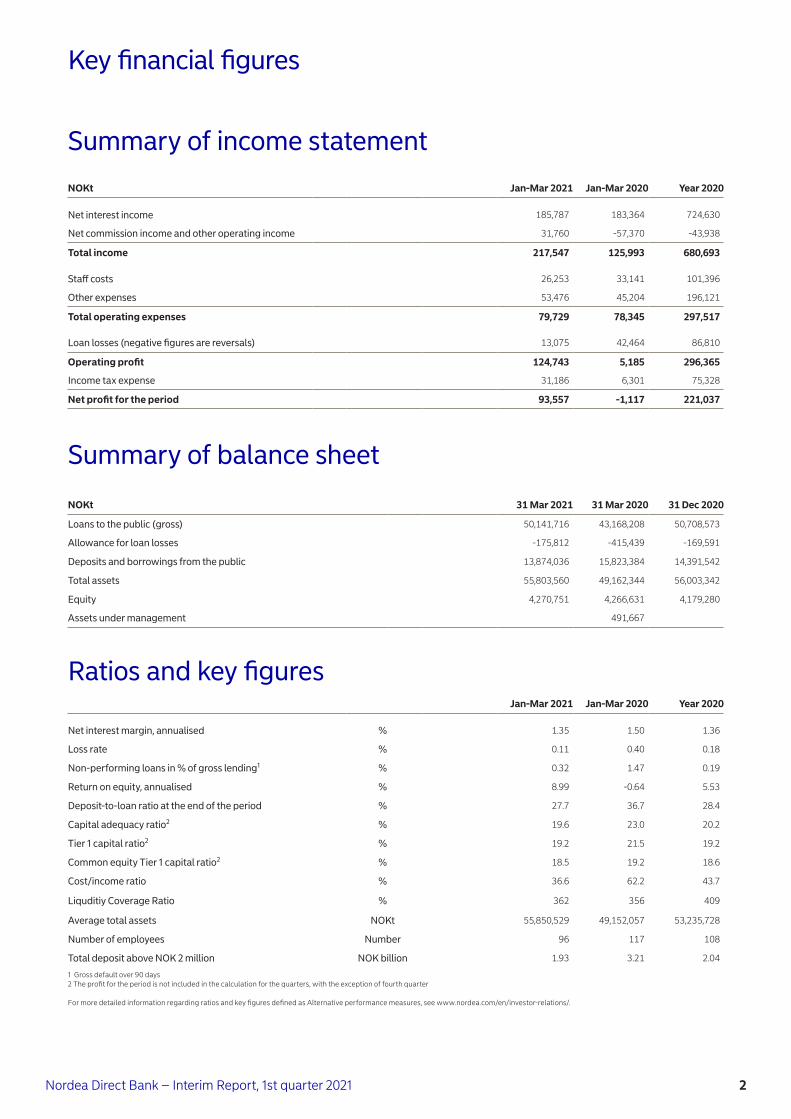
Jan-Mar 2021 Jan-Mar 2020 Year 2020
Net interest margin, annualised % 1.35 1.50 1.36
Loss rate % 0.11 0.40 0.18
Non-performing loans in % of gross lending1 % 0.32 1.47 0.19
Return on equity, annualised % 8.99 -0.64 5.53
Deposit-to-loan ratio at the end of the period % 27.7 36.7 28.4
Capital adequacy ratio2 % 19.6 23.0 20.2
Tier 1 capital ratio2 % 19.2 21.5 19.2
Common equity Tier 1 capital ratio2 % 18.5 19.2 18.6
Cost/income ratio % 36.6 62.2 43.7
Liquditiy Coverage Ratio % 362 356 409
Average total assets NOKt 55,850,529 49,152,057 53,235,728
Number of employees Number 96 117 108
Total deposit above NOK 2 million NOK billion 1.93 3.21 2.04
Ratios and key figures
1 Gross default over 90 days 2 The profit for the period is not included in the calculation for the quarters, with the exception of fourth quarter
For more detailed information regarding ratios and key figures defined as Alternative performance measures, see www.nordea.com/en/investor-relations/.
Key financial figures
Summary of income statement
NOKt Jan-Mar 2021 Jan-Mar 2020 Year 2020
Net interest income 185,787 183,364 724,630
Net commission income and other operating income 31,760 -57,370 -43,938
Total income 217,547 125,993 680,693
Staff costs 26,253 33,141 101,396
Other expenses 53,476 45,204 196,121
Total operating expenses 79,729 78,345 297,517
Loan losses (negative figures are reversals) 13,075 42,464 86,810
Operating profit 124,743 5,185 296,365
Income tax expense 31,186 6,301 75,328
Net profit for the period 93,557 -1,117 221,037
Summary of balance sheet
NOKt 31 Mar 2021 31 Mar 2020 31 Dec 2020
Loans to the public (gross) 50,141,716 43,168,208 50,708,573
Allowance for loan losses -175,812 -415,439 -169,591
Deposits and borrowings from the public 13,874,036 15,823,384 14,391,542
Total assets 55,803,560 49,162,344 56,003,342
Equity 4,270,751 4,266,631 4,179,280
Assets under management 491,667

3Nordea Direct Bank –Interim Report, 1st quarter 2021 3
Introduction(Previous year comparable figures for the company are shown in brackets)
Nordea Direct Bank ASA is a wholly owned subsidi-ary of Nordea Bank Abp. The bank was established in 2007 and has administrative offices in Oslo and Førde.
The merger between Nordea Direct Bank and Nordea Bank Abp is ongoing and the target comple-tion date is to be determined. Completion is subject to regulatory approval.
Income statementOperating profit was NOK 124.7m (NOK 5.2m). The increase was driven by financial instruments and one time bookings on the Total Income, as well as impro-ved write-down and losses due to the sale of an un-secured lending portfolio at the end of 2020.
Total income amounted to NOK 217.5m (NOK 126.0 m).
Net interest income amounted to NOK 185.8m (NOK 183.4m). The improvement was driven by portfolio growth.
Net commission income and other income amounted to NOK 31.8m (negative NOK 57.4m). The increase was primarily driven by gains on financial instru-ments and a one-time booking related to a portfolio of pre-paid cards. The one-time booking is regarding the closing of pre-paid cards issued by Gjensidige Bank ASA (now Nordea Direct Bank ASA) for a third party. The pre-paid cards have expired already be-fore the acquisition of Gjensidige Bank ASA by Nordea Bank Abp and the board decided to write-off the balance of these cards, in close dialogue with the third party and after taking all necessary steps to pay out customer dues.
Net interest margin1 was 1.35% (1.50%). The de-crease was driven by the change in portfolio compo-sition.
Operating expenses were NOK 79.7m (NOK 78.3m).
The cost/income ratio was 36.6% (62.2%), driven by the improvement in the total Income.
Total write-downs and losses amounted to NOK 13.1m (NOK 42.5m). The improvement is driven by the sale of an unsecured lending portfolio at the end of 2020 as well as tightening of credit rules.
Write-downs and losses were 0.11% (0.40%) of ave-rage gross lending. The decrease was driven by lower write-downs and losses following the delinqu-ent portfolio sale, as well as change in portfolio com-position.
Gross lending in default over 90 days decreased to NOK 162.1m (NOK 632.4m). The decrease was driven by the sale of the delinquent portfolio at the end of 2020. Gross loans in default over 90 days were 0.32% (1.47%) of total gross lending.
The weighted average loan-to-value ratio2 was esti-mated to be 61.2% (60.7%) for the mortgage portfo-lio.
Lending, deposits and investments growthGross lending increased by 16.2% and amounted to NOK 50,141.7m (NOK 43,168.2m) as of 31 March 2021The growth is primarily driven by the bank ente-ring an agreement with The Confederation of Unions for Professionals (UNIO), the second biggest labour union in Norway. Deposits decreased by 12,3%, reaching NOK 13,874.0m (NOK 15,823.4m).
Capital positionAs of 31 March 2021, the Nordea Direct Bank Group had a capital adequacy ratio of 19.6% (23.0%). The total capital held by the bank was NOK 4,268.0m (NOK 4,546.2m), of which NOK 4,023.1m (NOK 3,800.8m) was common equity Tier 1 capital. The common equity Tier 1 capital ratio was 18.5% (19.2%).
RatingNordea Direct Bank ASA and its subsidiary Nordea Direct Boligkreditt AS had a long-term and short-term counterparty credit rating of AA-/A-1+. The co-vered bonds portfolio issued by Nordea Direct Boligkreditt AS had a long-term rating of AAA.
Nordea Direct Boligkreditt AS will hold the amount of over-collateralisation required to maintain the cur-rent rating for Nordea Direct Boligkreditt AS`s co-vered bond program.
1 The net interest margin is calculated as net interest income as a percentage of average total assets, annualised.
Nordea Direct Bank ASA
2 The loan-to-value ratio estimate is calculated on the basis of the exposure on the reporting date and the property valuation, including any higher priority pledge(s), at the time the loan was approved.

Nordea Direct Bank – Interim Report, 1st quarter 2021 4
Debt securities issuedNet issues of debt securities, including subordinated loan capital, amounted to NOK 19.308.0m (NOK 23,034.8m) as of 31 March 2021. The total face value of the securities issued by the bank was NOK 19,187.5m.
Repayments through ordinary maturity and buy back of bonds from investors were NOK 1,770.0m in the period.
LiquidityAs of 31 March 2021, the Nordea Direct Bank Group had net liquid assets of NOK 8,685.9m, divided bet-ween NOK 918.1m in bank deposits and NOK 7,767.8m in debt securities. Of the latter assets NOK 3,165.5m were investments in covered bonds from Nordea Direct Boligkreditt AS (eliminated in the con-solidated accounts). The net liquid assets were at an adequate level that covers the bond debt that is due in the next 17 months.
Covid-19 MeasuresAfter the outbreak of Covid-19 during the first quar-ter of 2020, the bank has taken steps to ensure conti-nuity of its operations. There were no major disrup-tions in the services towards customers. The staff
was able to work remotely to a great extent and the vendors were able to provide services according to agreements in place. In order to meet the needs of the customers in these unusual times, the bank gran-ted up to 6-month interest only payments to a limi-ted number of customers and decreased lending rates on its portfolio. It also tightened criteria for granting loans to customer groups assumed to be particularly exposed in case of an economic down-turn. These measures were in line with the Norwegian banking market.
Norges Bank offered extraordinary F-loans in order to provide liquidity to the banking system in the con-text of the Covid-19 situation. On April 16th 2020, Nordea Direct Bank ASA was granted a F-loan amounting to NOK 500.0m and a maturity of 12 months.
In the coming period, the bank will monitor the over-all economic situation created by the outbreak of Covid-19 and will take the necessary steps to conti-nue its strong current operations.
Events after the balance sheet dateNo significant events have occurred after the end of the quarter.
Nordea Direct Bank ASA
Oslo, 10 May 2021
Mona Eek-Jensen Per Kumle Hans-Jacob Starheim Board member Board member Employee representative
Krister G. Aanesen Chief Executive Officer
Randi Marjamaa Sjur Loen Marte Kopperstad Chairman Board member Board member

5Nordea Direct Bank –Interim Report, 1st quarter 2021 5
NOKt Note Jan-Mar 2021 Jan-Mar 2020 Year 2020
Interest income etc, amortised cost 282,078 382,484 1,256,686
Interest income etc, fair value 5,679 22,150 53,016
Interest costs etc. 101,970 221,271 585,072
Net interest income 185,787 183,364 724,630
Dividends from investments in shares and funds 33 5,379
Fee and commission income 7,125 9,534 34,027
Fee and commission expense 11,466 11,683 60,198
Net gains on financial instruments at fair value 7,454 -55,210 -24,211
Other operating income 28,615 -11 1,065
Net commission income and other operating income 31,760 -57,370 -43,938
Total income 217,547 125,993 680,693
Staff costs 26,253 33,141 101,396
Depreciation 3,138 4,205 15,690
Other operating expenses 50,338 40,999 180,431
Total operating expenses 79,729 78,345 297,517
Profit / (loss) before loan losses 137,818 47,649 383,175
Loan losses 4 13,075 42,464 86,810
Operating profit 124,743 5,185 296,365
Income tax expense 31,186 6,301 75,328
Net profit for the period 93,557 -1,117 221,037
Basic/diluted earnings per share, NOK 106.8 -1.3 252.3
Income statementNordea Direct Bank Group
NOKt Jan-Mar 2021 Jan-Mar 2020 Year 2020
Net profit for the period 93,557 -1,117 221,037
Components of other comprehensive income
Items that are not reclassified subsequently to profit or loss
Actuarial gains/ (loss) on pensions -3,253
Tax on items that are not reclassified to profit or loss 813
Items that may be reclassified subsequently to profit or loss
Tax on items that may be reclassified to profit or loss
Total components of other comprehensive income -2,440
Total comprehensive income for the period 93,557 -1,117 218,598
Statement of comprehensive incomeNordea Direct Bank Group

Nordea Direct Bank – Interim Report, 1st quarter 2021 6
Balance sheetNordea Direct Bank Group
NOKt Note 31 Mar 2021 31 Mar 2020 31 Dec 2020
Assets
Cash and balances with central banks 55,443 68,156 58,553
Loans to credit institutions 6 862,697 468,043 350,899
Loans to the public 2,4 49,965,904 42,752,768 50,538,982
Interest-bearing securities 8 4,602,227 5,332,041 4,679,830
Derivatives 8 118,740 251,567 199,324
Shares (and other securities with variable yield) 9,745 11,934 10,620
Intangible assets 9,633 21,947 12,629
Deferred tax assets 20,439 11,809 20,090
Fixed assets 1,250 2,042 1,393
Other assets -1,765 -2,738 1,586
Advance payments and accrued income 159,246 244,774 129,436
Total assets 55,803,560 49,162,344 56,003,342
Liabilities and equity
Liabilities to credit institutions 6 17,893,000 5,456,000 15,831,000
Deposits and borrowings from the public 2 13,874,036 15,823,384 14,391,542
Debt securities in issue 3,6,8 19,108,075 22,734,936 20,959,345
Derivatives 8 23,489 40,794 32,029
Current tax liabilities 74,721 21,826 79,050
Other liabilities 133,766 211,595 156,149
Accrued expenses and prepaid income 194,829 279,453 144,066
Retirement benefit obligations 30,925 27,815 30,925
Subordinated loan capital 3 199,969 299,910 199,956
Total liabilities 51,532,809 44,895,713 51,824,063
Equity
Share capital 667,512 667,512 667,512
Share premium reserve 1,814,374 1,814,374 1,814,374
Perpetual Tier 1 capital 9 144,896 445,530 144,884
Other paid-in equity 2,647 2,647 2,647
Retained earnings 1,547,765 1,337,684 1,549,862
Net profit for the period 93,557 -1,117
Total equity 4,270,751 4,266,631 4,179,280
Total liabilities and equity 55,803,560 49,162,344 56,003,342

7Nordea Direct Bank –Interim Report, 1st quarter 2021 7
Statement of changes in equityNordea Direct Bank Group
NOKtShare
capital
Share premium
reserve
Perpetual Tier 1
capital
Other paid-in equity
Otherequity
Totalequity
Balance at 1 Jan 2021 667,512 1,814,374 144,884 2,647 1,549,862 4,179,280
Net profit for the period 1,058 92,499 93,557
Other comprehensive income, net of tax
Total comprehensive income 1,058 92,499 93,557
Capital expansion
Share-based payment transactions settled in equity -1,040 -1,040
AT1 capital
Paid interest on AT 1 capital -1,047 -1,047
Balance at 31 Mar 2021 667,512 1,814,374 144,896 2,647 1,641,322 4,270,751
NOKtShare
capital
Share premium
reserve
Perpetual Tier 1
capital
Other paid-in equity
Otherequity
Totalequity
Balance at 1 Jan 2020 666,020 1,115,866 445,441 2,647 1,342,153 3,572,127
Net profit for the period 9,372 211,666 221,037
Other comprehensive income, net of tax -2,440 -2,440
Total comprehensive income 9,372 209,226 218,598
Capital expansion 1,492 698,508 700,000
Share-based payment transactions settled in equity -1,517 -1,517
AT1 capital -298,200
Paid interest on AT 1 capital -11,728 -11,728
Balance at 31 Dec 2020 667,512 1,814,374 144,884 2,647 1,549,862 4,179,280
NOKtShare
capital
Share premium
reserve
Perpetual Tier 1
capital
Other paid-in equity
Otherequity
Totalequity
Balance at 1 Jan 2020 666,020 1,115,866 445,441 2,647 1,342,153 3,572,127
Net profit for the period 4,469 -5,585 -1,117
Other comprehensive income, net of tax
Total comprehensive income 4,469 -5,585 -1,117
Capital expansion 1,492 698,508 700,000
Share-based payment transactions settled in equity
AT1 capital
Paid interest on AT 1 capital -4,380 -4,380
Balance at 31 Mar 2020 667,512 1,814,374 445,530 2,647 1,336,568 4,266,631
Number of shares at end of period 876,000
Nordea Direct Bank – Interim Report, 1st quarter 2021 8
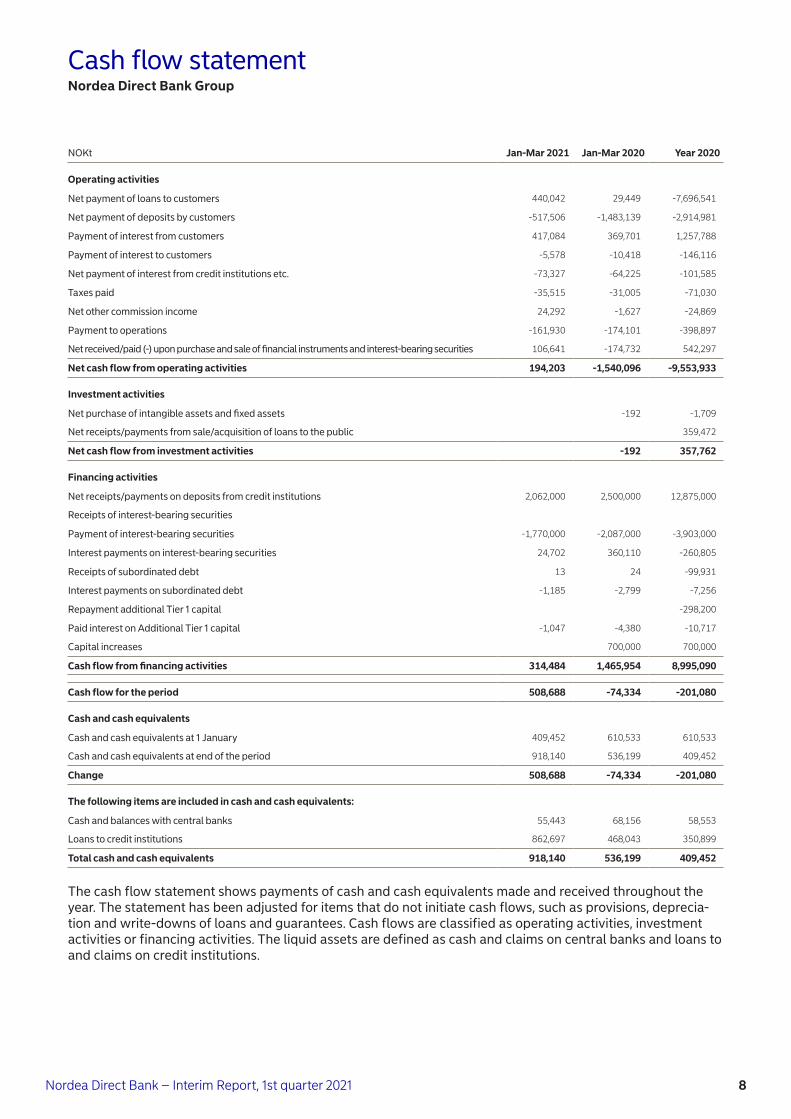
NOKt Jan-Mar 2021 Jan-Mar 2020 Year 2020
Operating activities
Net payment of loans to customers 440,042 29,449 -7,696,541
Net payment of deposits by customers -517,506 -1,483,139 -2,914,981
Payment of interest from customers 417,084 369,701 1,257,788
Payment of interest to customers -5,578 -10,418 -146,116
Net payment of interest from credit institutions etc. -73,327 -64,225 -101,585
Taxes paid -35,515 -31,005 -71,030
Net other commission income 24,292 -1,627 -24,869
Payment to operations -161,930 -174,101 -398,897
Net received/paid (-) upon purchase and sale of financial instruments and interest-bearing securities 106,641 -174,732 542,297
Net cash flow from operating activities 194,203 -1,540,096 -9,553,933
Investment activities
Net purchase of intangible assets and fixed assets -192 -1,709
Net receipts/payments from sale/acquisition of loans to the public 359,472
Net cash flow from investment activities -192 357,762
Financing activities
Net receipts/payments on deposits from credit institutions 2,062,000 2,500,000 12,875,000
Receipts of interest-bearing securities
Payment of interest-bearing securities -1,770,000 -2,087,000 -3,903,000
Interest payments on interest-bearing securities 24,702 360,110 -260,805
Receipts of subordinated debt 13 24 -99,931
Interest payments on subordinated debt -1,185 -2,799 -7,256
Repayment additional Tier 1 capital -298,200
Paid interest on Additional Tier 1 capital -1,047 -4,380 -10,717
Capital increases 700,000 700,000
Cash flow from financing activities 314,484 1,465,954 8,995,090
Cash flow for the period 508,688 -74,334 -201,080
Cash and cash equivalents
Cash and cash equivalents at 1 January 409,452 610,533 610,533
Cash and cash equivalents at end of the period 918,140 536,199 409,452
Change 508,688 -74,334 -201,080
The following items are included in cash and cash equivalents:
Cash and balances with central banks 55,443 68,156 58,553
Loans to credit institutions 862,697 468,043 350,899
Total cash and cash equivalents 918,140 536,199 409,452
Cash flow statementNordea Direct Bank Group
The cash flow statement shows payments of cash and cash equivalents made and received throughout the year. The statement has been adjusted for items that do not initiate cash flows, such as provisions, deprecia-tion and write-downs of loans and guarantees. Cash flows are classified as operating activities, investment activities or financing activities. The liquid assets are defined as cash and claims on central banks and loans to and claims on credit institutions.
9Nordea Direct Bank –Interim Report, 1st quarter 2021 9
Notes to the financial statementsNordea Direct Bank Group
Note 1 Accounting policiesThe consolidated financial statements as of the first quarter of 2021, concluded on 31 March 2021, com-prise Nordea Direct Bank ASA and its subsidiary Nordea Direct Boligkreditt AS. With the exception of the changes described below, the accounting poli-cies applied in the interim report is the same as those used in the annual report for 2020.
The consolidated financial statements as of the first quarter of 2021 have been prepared in accordance with IFRS and IAS 34 Interim Financial Reporting. The interim report does not include all the informa-tion required in a complete annual report and should be read in conjunction with the annual report for 2020.
Changes in accounting policiesAs a main rule, all income and expenses shall be shown in the income statement. The exception to this rule is the effect of changes to accounting principles. In the event of fundamental accounting reforms/ changes in accounting policies, figures for previous years must be recalculated to enable comparison. If items in the financial statement are reclassified, comparative figures must be calculated for the pre-vous periods and reported in the financial statments.
Changes in significant accounting policies in the
current period A number of new standards, changes to standards and interpretations have been issued for financial years beginning after 1 January 2021. They have not been applied when preparing these consolidated fi-nancial statements. Nordea Direct Bank ASA does not plan early implementation of these standards.
Based on our preliminary assessments and on the basis of current operations amendments to stan-dards and interpretation statements will not have a material effect
Other amendments to IFRSOther amendments to IFRS are not assessed to have any significant impact on Nordea Direct Bank ASAs financial statements, capital adequacy or large ex-posures in the period of initial application.
Preparation of the interim accounts involves using assessments, estimates and assumptions that affect the use of accounting policies and recognised amounts for assets and liabilities, revenues and ex-penses. The actual results may deviate from these estimates. The most material assessments relating to the use of the company’s accounting policies and the key sources of uncertainty in the estimates are the same when preparing the interim accounts as in the annual accounts for 2020.
All amounts are shown in NOK thousands (NOKt) un-less otherwise indicated. Due to rounding off diffe-rences, figures and percentages may not add up exactly to the totals indicated.
A complete audit of the interim report has not been carried out.

Nordea Direct Bank – Interim Report, 1st quarter 2021 10
Covid 19 Macro scenarios Nordea Direct uses Macro scenarios covering unem-ployment and house prices in the collective provision models. The macro variables are assumed to cor-relate to loan losses and changes to the macro fore-cast will impact Probability of Default (PD) and Loss Given Default (LGD) in the model through correlation factors. These correlation factors are based on stud-ies by published by Norges Bank: http://www.norg-es-bank.no/Publisert/Signerte-publikasjoner/Penger-og-Kreditt/Penger-og-Kreditt-12007/Faktorer-bak-bankenes-problemlan/.
The macro variables are also used by Nordea for their collective provision model and Nordea Direct aligned the values in its model with Nordea's. The updated scenarios reflect the economic impact from Covid 19. Scenarios are developed by Nordea
Enterprise Wide Risk Management, but leverages government and other sources including a reference point to the ECB scenarios.
The table below summarises the Macro scenarios used in Nordea Direct collective provision model for Q1 2021. The change applies to all Nordea Direct col-lective provision models (Unsecured Loans, Mortgage Loans and Credit Cards).
Until end of 2020, the household lending rate was used as a third variable in the model. After the an-nual validation process that was implemented during the first quarter of 2021, this variable was removed from the model.
Note 1 Accounting policies (cont.)
2021 2022 2023
Unemployment rate
Alternative A (best case) 4.9% 4.2% 3.9%
Base case 5.1% 4.6% 4.1%
Alternative B (worst case) 6.3% 6.2% 5.6%
Housing prices
Alternative A (best case) 6.5% 3.3% 1.7%
Base case 1.7% 0.8% 1.2%
Alternative B (worst case) -9.7% -9.3% 3.2%
Scenario weighting Q1 2021
Alternative A (best case) 5%
Base case 50%
Alternative B (worst case) 45%

11Nordea Direct Bank –Interim Report, 1st quarter 2021 11
Note 3 Liabilities on the issue of securitiesNominal value Carrying amount
NOKt 31 Mar 2021 31 Mar 2020 31 Dec 2020 31 Mar 2021 31 Mar 2020 31 Dec 2020
Liabilities opened for the issue of securities
Bond debt 1 13,687,500 15,976,500 15,457,500 13,698,113 16,007,026 15,484,240
Subordinated loan capital 200,000 300,000 200,000 199,969 299,910 199,956
- Own non-amortised certificates/bonds -303,000 -303,197
Total liabilities at amortised cost 13,887,500 15,973,500 15,657,500 13,898,082 16,003,739 15,684,196
Liabilities opened for the issue of securities
Bond debt 5,300,000 6,800,000 5,300,000 5,409,962 7,031,107 5,475,105
Total liabilities included in fair value hedge 5,300,000 6,800,000 5,300,000 5,409,962 7,031,107 5,475,105
Total liabilities 19,187,500 22,773,500 20,957,500 19,308,044 23,034,846 21,159,301
1 Minus covered bonds held by Nordea Direct Bank ASA issued by Nordea Direct Bank Boligkreditt AS with a nominal at NOK 5,754.1m (1,670.0m) as of 31 March 2020. The cover pool market value was NOK 1,681.0m (2,146.0m).
Note 2 Segment informationNOKt 31 Mar 2021 31 Dec 2020 30 Sep 2020 30 Jun 2020 31 Mar 2020 31 Dec 2019 30 Sep 2019 30 Jun 2019
Deposit by sector and industry
Retail market 12,267,106 12,665,871 12,954,894 13,508,089 12,809,973 13,306,516 14,011,422 14,327,489
Other 1,606,930 1,725,671 2,225,113 2,392,324 3,013,411 4,000,008 5,208,129 6,356,140
Total deposits 13,874,036 14,391,542 15,180,007 15,900,413 15,823,384 17,306,523 19,219,551 20,683,630
Loans to customers divided by sector and industry
Private individuals 50,141,716 50,708,573 50,447,984 47,696,120 43,168,208 43,203,811 51,300,415 49,667,800
Commercial business 2,233,483 2,342,381
Gross loans 50,141,716 50,708,573 50,447,984 47,696,120 43,168,208 43,203,811 53,533,898 52,010,181
Maturity
Remaining maturity (nominal value) 31 Mar 2021 31 Mar 2020 31 Dec 2020
2020 1,816,000
2021 3,941,000 5,711,000 5,711,000
2022 7,446,500 7,446,500 7,446,500
2023 5,950,000 5,950,000 5,950,000
2025 1,350,000 1,350,000 1,350,000
2027 500,000 500,000 500,000
Total 19,187,500 22,773,500 20,957,500
The maturity of subordinated loan capital is presented at first call date in the above table.
New issues in 2021
Repayments in 2021 1,770,000

Nordea Direct Bank – Interim Report, 1st quarter 2021 12
Write-downs and losses on loans
NOKt 31 Mar 2021 31 Mar 2020 31 Dec 2020
Write-downs and losses for the period
+/- Change in group write-downs for the period (ECL) 6,221 29,632 -216,217
+ Write-off during the period 6,823 12,517 301,719
- Payments on previously written-off accounts 31 315 1,308
Write-downs and losses for the period 13,075 42,464 86,810
Loss allowance
Loss allowance at the start of the period 169,591 385,807 385,807
+/- Change in loss allowance for the period 6,221 29,632 -216,217
Loss allowance at the end of the period 175,812 415,439 169,591
Defaulted loans
Gross default over 90 days 162,102 632,421 94,866
Note 4 Write-downs and losses on loans
Credit quality by risk group
31 Mar 2021NOKt
Stage 112-month ECL
Stage 2lifetime ECL
Stage 3lifetime ECL Total
Loans to and claims on customers
Low 47,228,703 39,772 17,851 47,286,326
Medium 1,023,015 648,205 12,128 1,683,348
High 282,536 828,487 48,229 1,159,251
Not classified 3,492 432 237 4,160
Impaired and written down 165,139 165,139
Adjustment 1 -156,510 -156,510
Total 48,381,236 1,516,896 243,583 50,141,716
Loss allowance 55,238 57,524 63,050 175,812
Total net 48,325,998 1,459,373 180,533 49,965,904

13Nordea Direct Bank –Interim Report, 1st quarter 2021 13
Note 4 Write-downs and losses on loans (cont.)
31 Mar 2020NOKt
Stage 112-month ECL
Stage 2lifetime ECL
Stage 3lifetime ECL Total
Loans to and claims on customers
Low 39,575,305 3,766 13,537 39,592,608
Medium 1,304,618 364,082 13,680 1,682,380
High 409,189 930,493 57,941 1,397,623
Not classified 3,445 312 1 3,758
Impaired and written down 641,142 641,142
Adjustment 1 -149,304 -149,304
Total 41,143,253 1,298,654 726,300 43,168,208
Loss allowance 43,374 45,506 326,560 415,439
Total net 41,099,879 1,253,148 399,741 42,752,768
31 Dec 2020NOKt
Stage 112-month ECL
Stage 2lifetime ECL
Stage 3lifetime ECL Total
Loans to and claims on customers
Low 47,809,339 2,791 15,486 47,827,617
Medium 1,249,473 373,506 9,578 1,632,557
High 414,461 698,657 57,493 1,170,611
Not classified 2,299 347 1 2,646
Impaired and written down 97,866 97,866
Adjustment 1 -22,724 -22,724
Total 49,452,848 1,075,302 180,423 50,708,573
Loss allowance 68,382 51,175 50,034 169,591
Total net 49,384,466 1,024,127 130,389 50,538,982
1Market value adjustment for fixed interest loans and overaft facilities balance with credit balance.
Loans to and claims on customers by past due status
31 Mar 2021 31 Mar 2020 31 Dec 2020
NOKtGross carrying
amountLoss
allowanceGross carrying
amountLoss
allowanceGross carrying
amountLoss
allowance
0-29 days 49,873,998 107,791 42,369,449 78,801 50,447,842 100,323
30-59 days 77,635 15,391 117,421 20,218 122,768 28,125
60-89 days 27,980 8,075 48,916 11,544 43,098 10,408
90+ days 162,102 44,555 632,421 304,876 94,866 30,736
Total 50,141,716 175,812 43,168,208 415,439 50,708,573 169,591

Nordea Direct Bank – Interim Report, 1st quarter 2021 14
Note 4 Write-downs and losses on loans (cont.)
Loss allowance
NOKtStage 1
12-month ECLStage 2
lifetime ECLStage 3
lifetime ECLTotal
allowance
Loss allowance as at 1 Jan 2021 68,382 51,175 50,034 169,591
Transfer to stage 1 3,120 -6,115 -1,214 -4,209
Transfer to stage 2 -19,767 32,644 -1,171 11,707
Transfer to stage 3 -790 -15,340 22,518 6,387
New Finanicial assets originated during the period 12,084 450 1,441 13,975
Financial assets that have been derecognised -4,120 -3,549 -2,318 -9,986
Changes in balance with no transfer between stages -3,671 -1,741 -6,242 -11,653
Loss allowance as at 31 Mar 2021 55,238 57,524 63,050 175,812
NOKtStage 1
12-month ECLStage 2
lifetime ECLStage 3
lifetime ECLTotal
allowance
Loss allowance as at 1 Jan 2020 31,998 47,456 306,354 385,808
Transfer to stage 1 2,843 -8,674 -973 -6,803
Transfer to stage 2 -2,791 19,373 -131 16,451
Transfer to stage 3 -391 -16,375 24,253 7,487
New Finanicial assets originated during the period 3,308 1,973 102 5,384
Financial assets that have been derecognised -771 -1,510 -7,206 -9,487
Changes in balance with no transfer between stages 9,178 3,263 4,160 16,601
Loss allowance as at 31 Mar 2020 43,374 45,506 326,560 415,440
NOKtStage 1
12-month ECLStage 2
lifetime ECLStage 3
lifetime ECLTotal
allowance
Loss allowance as at 1 Jan 2020 31,998 47,456 306,354 385,807
Transfer to stage 1 2,945 -8,311 -1,630 -6,996
Transfer to stage 2 -2,440 24,238 -831 20,967
Transfer to stage 3 -1,421 -1,953 22,078 18,705
New Finanicial assets originated during the period 26,861 11,730 7,170 45,761
Financial assets that have been derecognised -5,482 -7,755 -21,785 -35,022
Management judgement due to Covid-19, payment reliefs 13,103 13,103
Additional Management judgement due to Covid-19 17,025 17,025
Portfolio sale -1,685 -18,997 -257,485 -278,168
Changes in balance with no transfer between stages 582 -8,335 -3,837 -11,591
Loss allowance as at 31 Dec 2020 68,382 51,175 50,034 169,591
The following tables reconcile the opening and closing balances for accumulated loan loss allowance on fi-nancial Instruments.
Reconciling items includes the following: -Changes in allowance due to the origination of new financial instruments during the period. -Changes in allowance due to the derecognition of financial instruments during the period. -Transfers between stages due to changes in credit risk. This includes the difference in loan loss allowance ba-lance from one period to another. -Changes in balance with no transfer between stages are related to financial instruments that did not move between stages but had changes in balances and hence resulting in changes in loan loss allowance.
Balances shown are loan loss allowance balances as of end of period except for “financial assets that have been derecognised” which are as of the beginning of period.

15Nordea Direct Bank –Interim Report, 1st quarter 2021 15
NOKt 31 Mar 2021 31 Mar 2020 31 Dec 2020
Stage 1 55,238 43,374 68,382
Stage 2 57,524 45,506 51,175
Stage 3 63,050 326,560 50,034
Total 175,812 415,440 169,591
Stage 1 31.4% 10.4% 40.3%
Stage 2 32.7% 11.0% 30.2%
Stage 3 35.9% 78.6% 29.5%
Total 100.0% 100.0% 100.0%
Note 4 Write-downs and losses on loans (cont.)
Loans to and claims on customers
NOKtStage 1
12-month ECLStage 2
lifetime ECLStage 3
lifetime ECL Total
Gross carrying amount as at 1 Jan 2021 49,452,848 1,075,302 180,423 50,708,573
Transfer to stage 1 300,043 -285,068 -14,975
Transfer to stage 2 -872,203 884,922 -12,719
Transfer to stage 3 -22,365 -78,742 101,107
New financial assets originated 4,513,356 49,137 3,378 4,565,870
Financial assets that have been derecognised -4,099,655 -102,268 -10,493 -4,212,416
Change in balances due to payments -757,002 -26,385 -8,713 -792,100
Other Changes1 -133,786 5,574 -128,212
Gross carrying amount as at 31 Mar 2021 48,381,236 1,516,896 243,583 50,141,716
Loss allowance as at 31 Mar 2021 55,238 57,524 63,050 175,812
1Market value adjustment for fixed interest loans and overaft facilities balance with credit balance.
The following tables reconcile the opening and closing balances on gross carrying amount.
Reconciling items includes the following: - Transfers between stages due to changes in credit risk. - Changes due to the origination of new financial instruments during the period. - Changes due to the derecognition of loans during the period, including down-payment of loans, write-offs and sale of assets.
Balances shown are as of end of period except for “financial assets that have been derecognised” which are as of beginning of period and "down-payments" which are computed as the difference of the beginning of pe-riod and closing period balances.

Nordea Direct Bank – Interim Report, 1st quarter 2021 16
Note 4 Write-downs and losses on loans (cont.)
Loans to and claims on customers
NOKtStage 1
12-month ECLStage 2
lifetime ECLStage 3
lifetime ECL Total
Gross carrying amount as at 1 Jan 2020 41,121,650 1,407,959 674,202 43,203,811
Transfer to stage 1 491,523 -485,276 -6,246
Transfer to stage 2 -460,694 463,156 -2,462
Transfer to stage 3 -9,314 -73,984 83,297
New financial assets originated 2,578,140 88,510 1,446 2,668,095
Financial assets that have been derecognised -1,972,586 -74,705 -18,219 -2,065,511
Change in balances due to payments -435,145 -27,006 -38,866 -501,016
Other Changes1 -170,320 33,148 -137,171
Gross carrying amount as at 31 Mar 2020 41,143,253 1,298,654 726,300 43,168,208
Loss allowance as at 31 Mar 2020 43,374 45,506 326,560 415,439
NOKtStage 1
12-month ECLStage 2
lifetime ECLStage 3
lifetime ECL Total
Gross carrying amount as at 1 Jan 2020 41,121,650 1,407,959 674,202 43,203,811
Transfer to stage 1 495,937 -484,115 -11,822
Transfer to stage 2 -370,191 378,874 -8,683
Transfer to stage 3 -60,643 -29,170 89,813
New financial assets originated 21,632,175 338,142 19,300 21,989,617
Financial assets that have been derecognised -11,688,632 -375,755 -58,342 -12,122,729
Change in balances due to payments -1,564,932 -69,610 -8,202 -1,642,744
Portfolio sale -67,784 -85,763 -496,781 -650,328
Other Changes1 -44,731 -5,261 -19,061 -69,053
Gross carrying amount as at 31 Dec 2020 49,452,848 1,075,302 180,423 50,708,573
Loss allowance as at 31 Dec 2020 68,382 51,175 50,034 169,591
1Market value adjustment for fixed interest loans and overaft facilities balance with credit balance.
NOKt 31 Mar 2021 31 Mar 2020 31 Dec 2020
Stage 1 48,381,236 41,143,253 49,452,848
Stage 2 1,516,896 1,298,654 1,075,302
Stage 3 243,583 726,300 180,423
Total 50,141,716 43,168,208 50,708,573
Stage 1 96.5% 95.3% 97.5%
Stage 2 3.0% 3.0% 2.1%
Stage 3 0.5% 1.7% 0.4%
Total 100.0% 100.0% 100.0%

17Nordea Direct Bank –Interim Report, 1st quarter 2021 17
Note 5 Capital adequacyNOKt 31 Mar 2021 31 Mar 2020 31 Dec 2020
Primary capital
Share capital and share premium 2,481,886 2,481,886 2,481,886
Other equity 1,643,969 1,339,215 1,552,509
Total equity (exclusive perpetual Tier 1 capital) 4,125,855 3,821,101 4,034,395
Deduction
Profit not included in the calculation of net primary capital -93,557
Goodwill and other intangible assets -9,633 -21,947 -12,629
Value adjustments due to the requirement for prudent valuation -4,754 -5,636 -4,922
Increase
IFRS 9 transitional arrangements for credit loss provisioning 5,195 7,273 7,273
Common equity Tier 1 capital 4,023,105 3,800,790 4,024,117
Perpetual Tier 1 capital 144,896 445,530 144,884
Tier 1 capital 4,168,001 4,246,320 4,169,002
Supplementary capital
Subordinated loan capital 99,969 299,910 199,956
Net primary capital 4,267,970 4,546,230 4,368,958
Credit risk:
Of which:
Central governments or central banks 4,088 2,362 4,018
Institutions 18,473 19,787 13,816
Enterprises
Mass market positions 192,849 210,428 195,144
Positions secured by mortgage 1,352,617 1,124,792 1,346,268
Overdue positions 24,979 53,491 25,378
Covered bonds 24,316 30,137 24,907
Shares in securities fund
Equity positions 780 955 850
Other positions 4,695 8,346 4,895
Total minimum requirement credit risk 1,622,797 1,450,297 1,615,276
Operational risk 108,871 118,677 108,871
CVA-risk 6,366 11,108 9,372
Minimum requirement for net primary capital 1,738,033 1,580,081 1,733,518
Basis of calculation of balance sheet items not included in trading portfolio 19,612,309 17,500,787 19,735,335
Basis of calculation of off-balance sheet items not included in trading portfolio 672,648 627,921 455,615
Risk-weighted assets (calculation basis for capital adequacy ratio) 21,725,415 19,751,016 21,668,977

Nordea Direct Bank – Interim Report, 1st quarter 2021 18
Note 5 Capital adequacy (cont.) NOKt 31 Mar 2021 31 Mar 2020 31 Dec 2020
Buffer requirements
Systemic risk buffer 651,762 592,530 650,069
Conservation buffer 543,135 493,775 541,724
Countercyclical buffer 217,254 197,510 216,690
Total buffer requirement for common equity Tier 1 capital 1,412,152 1,283,816 1,408,484
Pillar 2 requirement 1.7% for common equity Tier 1 capital set by the Financial Supervisory Authority of Norway 369,332 335,767 368,373
Available common equity Tier 1 capital net min.requirement 1,263,978 1,292,411 1,272,157
Capital adequacy
Capital adequacy ratio 19.6% 23.0% 20.2%
Tier 1 capital ratio 19.2% 21.5% 19.2%
Common equity Tier 1 capital ratio 18.5% 19.2% 18.6%
Leverage ratio 7.2% 8.3% 7.3%
For credit risk the standard method is used, while basis method is used for oparational risk. The FinancialSupervisory Authority of Norway has set a Pillar 2 reguirement on additional 1.7% of risk-weighted assets for Nordea Direct Bank Group, covered by Common equity Tier 1 capital. Total regulatory requirement for common equity Tier 1 capital was 12.7% end of Q1 2021.
New standard IFRS 9 guidelines for credit loss provisioning were implemented 1.1.2018. The bank used transi-tional arrangements for IFRS 9. The new rules for loss provisions increased the bank's loss and provision with NOK 13.9m. Equity was reduced by NOK 10.4m adjusted for tax. In accordance with transitional arrangements, the effect of increased of loss and provision will be phased in over five years.
NOKt 31 Mar 2021 31 Mar 2020 31 Dec 2020
Numbers without use of transitional arrangements:
Common equity Tier 1 capital 4,017,911 3,793,517 4,016,845
Tier 1 capital 4,162,806 4,239,047 4,161,729
Net primary capital 4,262,775 4,538,958 4,361,685
Common equity Tier 1 capital ratio 18.5% 19.2% 18.5%
Tier 1 capital ratio 19.2% 21.5% 19.2%
Capital adequacy ratio 19.6% 23.0% 20.1%

19Nordea Direct Bank –Interim Report, 1st quarter 2021 19
Nordea Direct Bank ASA is a directly owned subsidi-ary of Nordea Bank Abp. Nordea Direct Boligkreditt AS is a wholly owned subsidiary of Nordea Direct Bank ASA. All transactions and agreements with rela-ted parties are carried out in accordance with the arm’s length principle.
Nordea Direct Boligkreditt AS purchases services such as customer support and loan management, as well as day-to-day management and administrative services, from Nordea Direct Bank ASA.
Nordea Direct Boligkreditt AS has access to strong credit facilities with Nordea Direct Bank ASA. This en-sures that the Company can pay interest and principal to the covered bonds owners, and finance the trans-ferring of loans and the cover pool.
Further information about the credit agreements: a) long-term credit facility of up to NOK 1,000.0m. Expiry date 31 December 2022. b) short-term credit facility of up to NOK 20,000.0m. Expiry date 30 November 2021. c) Credit facility agreement that enables Nordea Direct Boligkreditt AS to borrow money in order to repay its outstanding bond debt. The credit facility shall be sufficient to cover the total repayment of the outstanding bonds over the next 12 months. As of 31 March 2021, the credit limit of the agreement was NOK 5,000.0m.
All transactions between the parent company Nordea Direct Bank ASA and the subsidiary Nordea Direct Boligkreditt AS have been eliminated in the consolidated financial statements.
The list below shows the transactions with related parties that are recognised in the income statementJan-Mar 2021
NOKtNordea Direct
Boligkreditt ASNordea Bank
AbpOther Nordea
companies
Net interest income 16,113 55,919
Other operating income 3,074 1,051
Other operating expenses -240 -520
Jan-Mar 2020
NOKtNordea Direct
Boligkreditt ASNordea Bank
AbpOther Nordea
companies
Net interest income 21,499 -12,886
Other operating income 2,703 3,035
Other operating expenses -229 -1,955
Jan-Dec 2020
NOKtNordea Direct
Boligkreditt ASNordea Bank
AbpOther Nordea
companies
Net interest income 47,274 74,197
Other operating income 10,648 6,773
Other operating expenses -950 -10,971
Note 6 Transactions with related parties

Nordea Direct Bank – Interim Report, 1st quarter 2021 20
Note 6 Transactions with related parties (cont.)
The list below shows assets / liabilities with / to related parties31 Mar 2021
NOKtNordea Direct
Boligkreditt ASNordea Bank
AbpOther Nordea
companies
Deposit 622,669 783,448
Loans to credit institutions 10,577,451 1,732
Interest-bearing securities 3,165,532 235,977
Deposits by credit institutions 17,410,323
Other liabilities 5,900
31 Mar 2020
NOKtNordea Direct
Boligkreditt ASNordea Bank
AbpOther Nordea
companies
Deposit 657,386 377,908
Loans to credit institutions 2,819,579 12,852 1,007
Interest-bearing securities 1,677,901 329,211
Deposits by credit institutions 5,471,897
Other liabilities
31 Dec 2020
NOKtNordea Direct
Boligkreditt ASNordea Bank
AbpOther Nordea
companies
Deposit 449,027 282,683
Loans to credit institutions 5,280,351 2,904
Interest-bearing securities 1,393,903 664,882
Deposits by credit institutions 15,345,487
Other liabilities 5,900

21Nordea Direct Bank –Interim Report, 1st quarter 2021 21
Fair value Financial assets and liabilities measured at fair value are carried at the amount each asset/liability can be settled for in an orderly transaction between market participants on the measurement date.
Different valuation techniques and methods are used to estimate fair value, depending on the type of finan-cial instruments and the extent to which they are tra-ded in active markets. Instruments are classified in their entirety in one of three valuation levels in a hie-rarchy on the basis of the lowest level input that is sig-nificant to the fair value measurement in its entirety.
Prices quoted in active markets are considered to be the best estimate of an asset/liability’s fair value. When quoted prices in active markets are not availa-ble, the fair value of financial assets/ liabilities will preferably be estimated on the basis of valuation techniques based on observable market data. When neither quoted prices in active markets nor observa-ble market data are available, the fair value of finan-cial assets/liabilities is estimated based on valuation techniques that are based on non-observable market data.
Quoted prices in active markets Quoted prices in active markets are considered the best estimate of an asset/liability’s fair value. A finan-cial asset/liability is considered valued based on quo-ted prices in active markets if fair value is estimated based on easily and regularly available prices and these prices represent actual and regularly occurring transactions at arm’s length principle. Financial as-sets/liabilities valued based on quoted prices in active markets are classified as level one in the valuation hi-erarchy.
Valuation based on observable market data When quoted prices in active markets are not availa-ble, the fair value of financial assets/ liabilities is pre-ferably estimated on the basis of valuation techni-ques based on observable market data. A financial asset/liability is considered valued based on ob-servable market data if fair value is estimated with reference to prices that are not quoted, but are ob-servable either directly (as prices) or indirectly (deri-ved from prices). Financial assets/liabilities valued based on observable market data are classified as level two in the valuation hierarchy.
Valuation based on non-observable market data When neither quoted prices in active markets nor observable market data is available, the fair value of financial assets/liabilities is estimated based on valu-ation techniques which are based on non-observable market data. A financial asset/liability is considered valued based on non-observable market data if fair value is estimated without being based on quoted prices in active markets or observable market data. Financial assets/liabilities valued based on non-ob-servable market data are classified as level three in the valuation hierarchy.
Sensitivity financial assets level threeThe sensitivity analysis for financial assets that are valued on the basis of non-observable market data shows the effect on profits of realistic and plausi-ble market outcomes. General market downturns or a worsening of the outlook can affect expecta-tions of future cash flows or the applied multiples, which in turn will lead to a reduction in value. A fall in value of 10% is deemed to be a realistic and plausible market outcome for shares and similar in-terests, as well as bonds and other securities with a fixed return that are included in level three of the valuation hierarchy.
Note 8 Fair value of financial instruments
Note 7 Contingent liabilities and securityNOKt 31 Mar 2021 31 Mar 2020 31 Dec 2020
Guarantees
Loan commitment 6,830,289 4,861,800 4,100,304
Unutilised credit facility 19,861 3,619,122 3,547,703
Total contingent liabilities 6,850,150 8,480,922 7,648,007
Securities provided as collateral for loans from/credit facility with Norges Bank 1,740,621 848,827 2,090,485
Total securities provided 1,740,621 848,827 2,090,485

Nordea Direct Bank – Interim Report, 1st quarter 2021 22
Note 8 Fair value of financial instruments (cont.)31 Mar 2021 31 Mar 2020 31 Dec 2020
NOKt Carrying amount
Fair value
Carrying amount
Fair value
Carrying amount
Fair value
Assets
Cash to and receivables from central banks 55,443 55,443 68,156 68,156 58,553 58,553
Cash to and receivables from central banks 55,443 55,443 68,156 68,156 58,553 58,553
Loans to and receivables from credit institutions, amortised cost 862,697 862,697 468,043 468,043 350,899 350,899
Loans to and receivables from credit institutions 862,697 862,697 468,043 468,043 350,899 350,899
Loans to and receivables from customers, amortised cost 49,965,904 49,988,452 42,752,768 42,775,765 50,538,982 50,564,229
Loans to and receivables from customers 49,965,904 49,988,452 42,752,768 42,775,765 50,538,982 50,564,229
Interest-bearing securities, fair value 4,602,227 4,602,227 5,332,041 5,332,041 4,679,830 4,679,830
Interest-bearing securities 4,602,227 4,602,227 5,332,041 5,332,041 4,679,830 4,679,830
Derivatives, fair value 118,740 118,740 251,567 251,567 199,324 199,324
Derivatives 118,740 118,740 251,567 251,567 199,324 199,324
Shares available for sale 9,745 9,745 11,934 11,934 10,620 10,620
Shares 9,745 9,745 11,934 11,934 10,620 10,620
Other financial assets, amortised cost 103,240 103,240 144,708 144,708 71,900 71,900
Total other financial assets 103,240 103,240 144,708 144,708 71,900 71,900
Total financial assets 55,717,997 55,740,544 49,029,217 49,052,214 55,910,109 55,935,355
Liabilities
Liability to credit institutions, amortised cost 17,893,000 17,893,000 5,456,000 5,456,000 15,831,000 15,831,000
Liability to credit institutions 17,893,000 17,893,000 5,456,000 5,456,000 15,831,000 15,831,000
Deposits and liabilities to customers, amortised cost 13,874,036 13,874,903 15,823,384 15,826,741 14,391,542 14,393,732
Deposits and liabilities to customers 13,874,036 13,874,903 15,823,384 15,826,741 14,391,542 14,393,732
Liability incurred through the issue of securities, amortised cost 13,698,113 13,784,955 15,703,829 16,007,505 15,484,240 15,571,313
Liability incurred through the issue of securities, fair value hedge 5,409,962 5,464,359 7,031,107 6,617,017 5,475,105 5,523,411
Liability incurred through the issue of securities 19,108,075 19,249,314 22,734,936 22,624,522 20,959,345 21,094,724
Derivatives, fair value 23,489 23,489 40,794 40,794 32,029 32,029
Derivatives 23,489 23,489 40,794 40,794 32,029 32,029
Subordinated loan capital, amortised cost 199,969 202,020 299,910 293,701 199,956 202,038
Subordinated loan capital 199,969 202,020 299,910 293,701 199,956 202,038
Other financial liabilities, amortised cost 130,957 130,957 224,187 224,187 90,111 90,111
Other financial liabilities 130,957 130,957 224,187 224,187 90,111 90,111
Total financial liabilities 51,229,526 51,373,683 44,579,211 44,465,945 51,503,983 51,643,634
Off-balance sheet obligations and guarantees
Guarantees
Mortgage assets 1 1,740,621 1,740,621 848,827 848,827 2,090,485 2,090,485
1 Securities provided as collateral for loans from/credit facility with Norges Bank.

23Nordea Direct Bank –Interim Report, 1st quarter 2021 23
31 Mar 2021
NOKt Level 1 Level 2 Level 3 Total
Interest-bearing securities, fair value 4,602,227 4,602,227
Shares 9,745 9,745
Derivatives, fair value 118,740 118,740
Total financial assets, fair value 4,602,227 118,740 9,745 4,730,712
Loans to and receivables from customers, amortised cost 49,988,452 49,988,452
Total financial assets, amortised cost 49,988,452 49,988,452
Derivatives, fair value 23,489 23,489
Total financial liabilities, fair value 23,489 23,489
Deposits and liabilities to customers, amortised cost 13,874,903 13,874,903
Liability incurred through the issue of securities, amortised cost 13,784,955 13,784,955
Subordinated loan capital, amortised cost 202,020 202,020
Total financial liabilities, amortised cost 13,986,975 13,874,903 27,861,877
Liability incurred through the issue of securities, fair value hedge 5,464,359 5,464,359
Total financial liabilities, fair value hedge 5,464,359 5,464,359
There were no major moves between levels 1 and 2 in 2021.
31 Mar 2020
NOKt Level 1 Level 2 Level 3 Total
Interest-bearing securities, fair value 5,332,041 5,332,041
Shares 11,934 11,934
Derivatives, fair value 251,567 251,567
Total financial assets, fair value 5,332,041 251,567 11,934 5,595,542
Loans to and receivables from customers, amortised cost 42,775,765 42,775,765
Total financial assets, amortised cost 42,775,765 42,775,765
Derivatives, fair value 40,794 40,794
Total financial liabilities, fair value 40,794 40,794
Deposits and liabilities to customers, amortised cost 15,826,741 15,826,741
Liability incurred through the issue of securities, amortised cost 16,007,505 16,007,505
Subordinated loan capital, amortised cost 293,701 293,701
Total financial liabilities, amortised cost 16,301,206 15,826,741 32,127,947
Liability incurred through the issue of securities, fair value hedge 6,617,017 6,617,017
Total financial liabilities, fair value hedge 6,617,017 6,617,017
There were no major moves between levels 1 and 2 in 2020.
Note 8 Fair value of financial instruments (cont.)

Nordea Direct Bank – Interim Report, 1st quarter 2021 24
Note 8 Fair value of financial instruments (cont.)31 Dec 2020
NOKt Level 1 Level 2 Level 3 Total
Interest-bearing securities, fair value 4,679,830 4,679,830
Shares 10,620 10,620
Derivatives, fair value 199,324 199,324
Total financial assets, fair value 4,679,830 199,324 10,620 4,889,775
Loans to and receivables from customers, amortised cost 50,564,229 50,564,229
Total financial assets, amortised cost 50,564,229 50,564,229
Derivatives, fair value 32,029 32,029
Total financial liabilities, fair value 32,029 32,029
Deposits and liabilities to customers, amortised cost 14,393,732 14,393,732
Liability incurred through the issue of securities, amortised cost 15,571,313 15,571,313
Subordinated loan capital, amortised cost 202,038 202,038
Total financial liabilities, amortised cost 15,773,350 14,393,732 30,167,083
Liability incurred through the issue of securities, fair value hedge 5,523,411 5,523,411
Total financial liabilities, fair value hedge 5,523,411 5,523,411
There were no major moves between levels 1 and 2 in 2020.
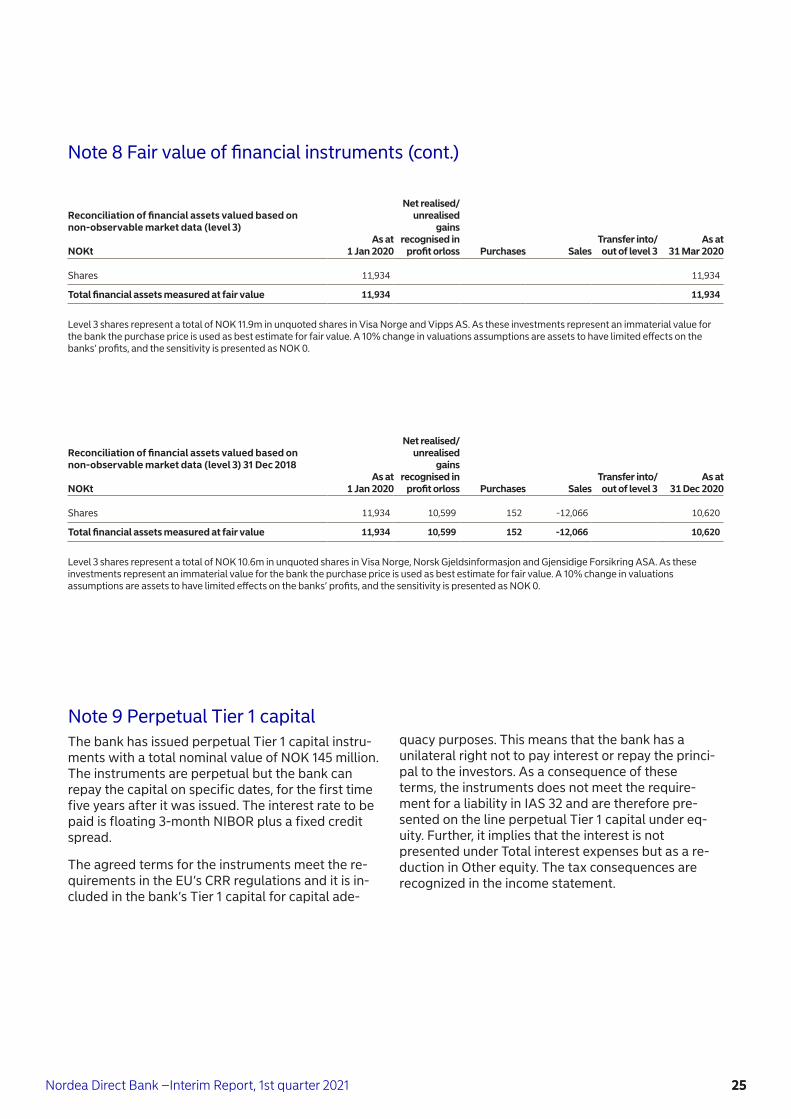
Reconciliation of financial assets valued based on non-observable market data (level 3) NOKt
As at 1 Jan 2021
Net realised/unrealised
gains recognised in
profit orloss Purchases SalesTransfer into/out of level 3
As at 31 Mar 2021
Shares 10,620 -875 9,745
Total financial assets measured at fair value 10,620 -875 9,745
Level 3 shares represent a total of NOK 9.7m in unquoted shares in Visa Norge, Norsk Gjeldsinformasjon and Gjensidige Forsikring ASA. As these investments represent an immaterial value for the bank the purchase price is used as best estimate for fair value. A 10% change in valuations assumptions are assets to have limited effects on the banks’ profits, and the sensitivity is presented as NOK 0.
25Nordea Direct Bank –Interim Report, 1st quarter 2021 25
Note 9 Perpetual Tier 1 capitalThe bank has issued perpetual Tier 1 capital instru-ments with a total nominal value of NOK 145 million. The instruments are perpetual but the bank can repay the capital on specific dates, for the first time five years after it was issued. The interest rate to be paid is floating 3-month NIBOR plus a fixed credit spread.
The agreed terms for the instruments meet the re-quirements in the EU’s CRR regulations and it is in-cluded in the bank’s Tier 1 capital for capital ade-
quacy purposes. This means that the bank has a unilateral right not to pay interest or repay the princi-pal to the investors. As a consequence of these terms, the instruments does not meet the require-ment for a liability in IAS 32 and are therefore pre-sented on the line perpetual Tier 1 capital under eq-uity. Further, it implies that the interest is not presented under Total interest expenses but as a re-duction in Other equity. The tax consequences are recognized in the income statement.
Note 8 Fair value of financial instruments (cont.)
Reconciliation of financial assets valued based on non-observable market data (level 3) NOKt
As at 1 Jan 2020
Net realised/unrealised
gains recognised in
profit orloss Purchases SalesTransfer into/out of level 3
As at 31 Mar 2020
Shares 11,934 11,934
Total financial assets measured at fair value 11,934 11,934
Reconciliation of financial assets valued based on non-observable market data (level 3) 31 Dec 2018 NOKt
As at 1 Jan 2020
Net realised/unrealised
gains recognised in
profit orloss Purchases SalesTransfer into/out of level 3
As at 31 Dec 2020
Shares 11,934 10,599 152 -12,066 10,620
Total financial assets measured at fair value 11,934 10,599 152 -12,066 10,620
Level 3 shares represent a total of NOK 11.9m in unquoted shares in Visa Norge and Vipps AS. As these investments represent an immaterial value for the bank the purchase price is used as best estimate for fair value. A 10% change in valuations assumptions are assets to have limited effects on the banks’ profits, and the sensitivity is presented as NOK 0.
Level 3 shares represent a total of NOK 10.6m in unquoted shares in Visa Norge, Norsk Gjeldsinformasjon and Gjensidige Forsikring ASA. As these investments represent an immaterial value for the bank the purchase price is used as best estimate for fair value. A 10% change in valuations assumptions are assets to have limited effects on the banks’ profits, and the sensitivity is presented as NOK 0.

Nordea Direct Bank – Interim Report, 1st quarter 2021 26
Q1 Q4 Q3 Q2 Q1 Q4 Q3 Q2NOKt 2021 2020 2020 2020 2020 2019 2019 2019
Interest income etc, amortised cost 282,078 285,058 287,234 301,909 382,484 428,967 501,409 469,797
Interest income etc, fair value 5,679 6,890 7,235 16,741 22,150 22,125 20,652 18,940
Interest costs etc. 101,970 99,581 95,366 168,853 221,271 231,060 238,215 215,551
Net interest income 185,787 192,367 199,102 149,797 183,364 220,032 283,845 273,186
Dividends from investments in shares and funds 33 5,379 1,053
Fee and commission income 7,125 7,293 8,927 8,272 9,534 15,112 30,865 38,536
Fee and commission expense 11,466 25,207 11,772 11,535 11,683 27,372 50,623 52,577
Net gains on financial instruments at fair value 7,454 6,684 3,047 21,268 -55,210 -1,847 1,252 3,610
Other operating income 28,615 744 10 322 -11 74 528 88
Total income 217,547 187,260 199,315 168,124 125,993 206,000 265,868 263,898
Staff costs 26,253 24,212 24,660 19,384 33,141 38,616 40,808 35,675
Depreciation 3,138 3,627 3,866 3,992 4,205 5,170 6,917 7,187
Other operating costs 50,338 52,161 44,214 43,057 40,999 62,184 68,900 62,019
Total operating expenses 79,729 80,000 72,740 66,432 78,345 105,971 116,625 104,881
Profit / (loss) before loan losses 137,818 107,260 126,574 101,692 47,649 100,030 149,242 159,017
Loan losses 13,075 -40,365 -22,532 107,243 42,464 60,698 54,148 54,282
Operating profit 124,743 147,625 149,107 -5,552 5,185 39,332 95,095 104,734
Quarterly earnings performanceNordea Direct Bank Group

27Nordea Direct Bank –Interim Report, 1st quarter 2021 27
NOKt Jan-Mar 2021 Jan-Mar 2020 Year 2020
Interest income etc, amortised cost 201,572 255,541 900,471
Interest income etc, fair value 9,215 34,496 77,409
Interest costs etc. 72,807 140,529 397,378
Net interest income 137,980 149,509 580,503
Dividends from investments in shares and funds 33 5,379
Fee and commission income 6,577 8,969 31,840
Fee and commission expense 11,466 11,683 60,198
Net gains on financial instruments at fair value 7,456 -52,643 -21,889
Other operating income 31,689 2,691 11,714
Net commission income and other operating income 34,288 -52,666 -33,154
Total income 172,268 96,842 547,348
Staff costs 25,669 32,544 99,682
Depreciation 3,138 4,205 15,690
Other operating expenses 46,591 37,197 175,197
Total operating expenses 75,398 73,946 290,569
Profit / (loss) before loan losses 96,870 22,897 256,779
Loan losses 12,349 42,917 87,060
Operating profit 84,521 -20,021 169,719
Income tax expense 21,130 43,666
Net profit for the period 63,391 -20,021 126,053
Basic/diluted earnings per share, NOK 72.4 -22.9 143.9
Income statementNordea Direct Bank ASA
NOKt Jan-Mar 2021 Jan-Mar 2020 Year 2020
Profit/ (loss) for the period 63,391 -20,021 126,053
Components of other comprehensive income
Items that are not reclassified subsequently to profit or loss
Actuarial gains/ (loss) on pensions -3,253
Tax on items that are not reclassified to profit or loss 813
Unrealised gain/(loss) on loans to customers, fair value over other comprehensive income 4,944
Items that may be reclassified subsequently to profit or loss
Tax on items that may be reclassified to profit or loss -1,236
Total components of other comprehensive income 1,268
Total comprehensive income for the period 63,391 -20,021 127,321
Statement of comprehensive incomeNordea Direct Bank ASA

Nordea Direct Bank – Interim Report, 1st quarter 2021 28
NOKt 31 Mar 2021 31 Mar 2020 31 Dec 2020
Assets
Cash and balances with central banks 55,443 68,156 58,553
Loans to credit institutions 11,430,363 3,272,069 5,625,219
Loans to the public 22,995,395 22,825,965 28,716,816
Interest-bearing securities 7,577,814 6,819,947 5,883,707
Derivatives 76,255 175,710 143,239
Shares (and other securities with variable yield) 9,745 11,934 10,620
Ownership interest in group companies 1,220,030 1,220,030 1,220,030
Intangible assets 9,633 21,947 12,629
Deferred tax assets 19,495 11,566 19,146
Fixed assets 1,250 2,042 1,393
Other assets -1,765 -2,738 1,586
Advance payments and accrued income 135,419 206,998 110,762
Total assets 43,529,077 34,633,626 41,803,701
Liabilities and equity
Liabilities to credit institutions 18,515,669 6,113,386 16,280,027
Deposits and borrowings from the public 13,874,036 15,823,384 14,391,542
Debt securities in issue 7,116,127 8,366,571 7,181,081
Derivatives 20,534 36,981 28,910
Current tax liabilities 44,065 11,282 46,688
Other liabilities 133,486 211,548 156,076
Accrued expenses and prepaid income 158,452 204,984 114,059
Retirement benefit obligations 30,925 27,815 30,925
Subordinated loan capital 199,969 299,910 199,956
Total liabilities 40,093,262 31,095,860 38,429,265
Equity
Share capital 667,512 667,512 667,512
Share premium reserve 1,814,374 1,814,374 1,814,374
Perpetual Tier 1 capital 144,896 445,530 144,884
Other paid-in equity 2,657 2,657 2,657
Retained earnings 742,985 627,714 745,009
Net profit for the period 63,391 -20,021
Total equity 3,435,815 3,537,766 3,374,436
Total liabilities and equity 43,529,077 34,633,626 41,803,701
Balance sheetNordea Direct Bank ASA

29Nordea Direct Bank –Interim Report, 1st quarter 2021 29
Statement of changes in equityNordea Direct Bank ASA
NOKtShare
capital
Share premium
reserve
Perpetual Tier 1
capital
Other paid-in equity
Otherequity
Totalequity
Balance at 1 Jan 2021 667,512 1,814,374 144,884 2,657 745,009 3,374,436
Net profit for the period 1,058 62,333 63,391
Other comprehensive income, net of tax
Total comprehensive income 1,058 62,333 63,391
Capital expansion
Share-based payment transactions settled in equity -966 -966
AT1 capital
Paid interest on AT 1 capital -1,047 -1,047
Balance at 31 Mar 2021 667,512 1,814,374 144,896 2,657 806,376 3,435,815
NOKtShare
capital
Share premium
reserve
Perpetual Tier 1
capital
Other paid-in equity
Otherequity
Totalequity
Balance at 1 Jan 2020 666,020 1,115,866 445,441 2,657 632,183 2,862,167
Net profit for the period 9,372 116,681 126,053
Other comprehensive income, net of tax -2,440 -2,440
Total comprehensive income 9,372 114,242 123,614
Capital expansion 1,492 698,508 700,000
Share-based payment transactions settled in equity -1,416 -1,416
AT1 capital -298,200 -298,200
Paid interest on AT 1 capital -11,728 -11,728
Balance at 31 Dec 2020 667,512 1,814,374 144,884 2,657 745,009 3,374,436
NOKtShare
capital
Share premium
reserve
Perpetual Tier 1
capital
Other paid-in equity
Otherequity
Totalequity
Balance at 1 Jan 2020 666,020 1,115,866 445,441 2,657 632,183 2,862,167
Net profit for the period 4,469 -24,489 -20,021
Other comprehensive income, net of tax
Total comprehensive income 4,469 -24,489 -20,021
Capital expansion 1,492 698,508 700,000
Share-based payment transactions settled in equity
AT1 capital
Paid interest on AT 1 capital -4,380 -4,380
Balance at 31 Mar 2020 667,512 1,814,374 445,530 2,657 607,694 3,537,766
Number of shares at end of period 876,000

Nordea Direct Bank – Interim Report, 1st quarter 2021
Nordea Direct Bank ASA Essendropsgt. 7 P.O. Box 1166 Sentrum 0107 Oslo , Norway Phone +47 915 03100
30