FINANCIAL RATIOS AS A TOOL TO EVALUATE NORDEA ...
42
TALLINN UNIVERSITY OF TECHNOLOGY School of Business and Governance Department of Economics and Finance Sindy Fouad Tutah FINANCIAL RATIOS AS A TOOL TO EVALUATE NORDEA BANK ABP PERFORMANCE Bachelor’s thesis Programme International Business Administration, specialization Finance & Accounting Supervisor: Kalle Ahi, MA Co-Supervisor: Merle Küttim, MA Tallinn 2020
-
Upload
khangminh22 -
Category
Documents
-
view
0 -
download
0
Transcript of FINANCIAL RATIOS AS A TOOL TO EVALUATE NORDEA ...
TALLINN UNIVERSITY OF TECHNOLOGY
School of Business and Governance
Department of Economics and Finance
Sindy Fouad Tutah
FINANCIAL RATIOS AS A TOOL TO EVALUATE NORDEA
BANK ABP PERFORMANCE Bachelor’s thesis
Programme International Business Administration, specialization Finance & Accounting
Supervisor: Kalle Ahi, MA
Co-Supervisor: Merle Küttim, MA
Tallinn 2020
I hereby declare that I have compiled the thesis independently
and all works, important standpoints and data by other authors
have been properly referenced and the same thesis
has not been previously presented for grading.
The document length is 9.265 words from the introduction to the end of the conclusion.
Sindy Tutah ………………………………………………………………
(signature, date)
Student code: 166405TVTB
Student email address: [email protected]
Supervisor: Kalle Ahi, MA:
The thesis conforms to the requirements in force
…………………………………
(signature, date)
Co-supervisor: Merle Küttim, MA:
The thesis conforms to the requirements in force
…………………..……………
(signature, date)
Chairman of the Defence Committee:
To be added only for graduation theses/ Permitted to the defence:
……………………………………………………………………..……
(name, signature, date)
3
TABLE OF CONTENTS
ABSTRACT .................................................................................................................................... 4
INTRODUCTION ........................................................................................................................... 5
1. THEORETICAL BACKGROUND ......................................................................................... 8
1.1. Performance evaluation of financial institutions .............................................................. 8
1.2. Methodology of financial ratios applied to banks .......................................................... 11
2. METHODS AND DATA ....................................................................................................... 16
2.1. Methodology and models ................................................................................................ 16
2.2. Data gathering and analysis ............................................................................................ 19
2.3. Nordea Bank Abp ........................................................................................................... 20
2.4. Danske Bank A/S ............................................................................................................ 22
3. RATIO COMPARISON ANALYSIS .................................................................................... 24
3.1. Financial performance ratios of Nordea Abp.................................................................. 24
3.2. Compare the ratios to Danske Bank A/S ........................................................................ 31
3.3. Discussion of the results ................................................................................................. 34
CONCLUSION ............................................................................................................................. 36
REFERENCES .............................................................................................................................. 38
APPENDIX ................................................................................................................................... 42
Appendix 1. Non-exclusive licence ........................................................................................... 42
4
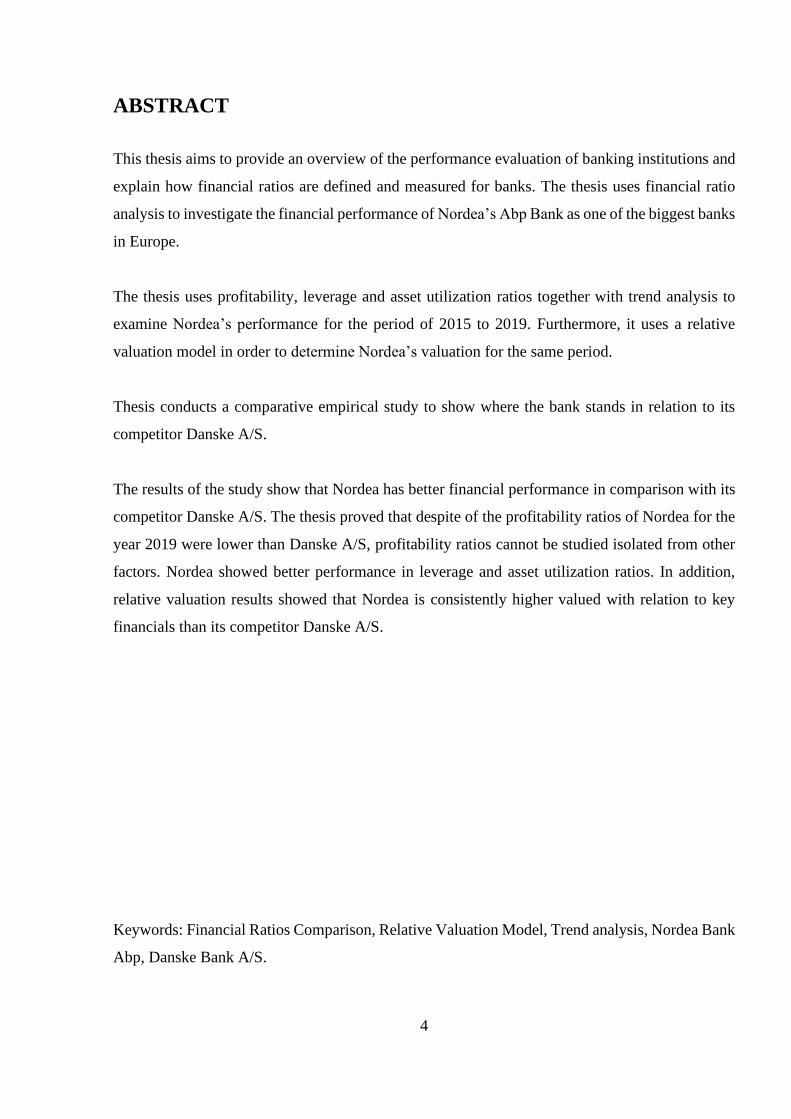
ABSTRACT
This thesis aims to provide an overview of the performance evaluation of banking institutions and
explain how financial ratios are defined and measured for banks. The thesis uses financial ratio
analysis to investigate the financial performance of Nordea’s Abp Bank as one of the biggest banks
in Europe.
The thesis uses profitability, leverage and asset utilization ratios together with trend analysis to
examine Nordea’s performance for the period of 2015 to 2019. Furthermore, it uses a relative
valuation model in order to determine Nordea’s valuation for the same period.
Thesis conducts a comparative empirical study to show where the bank stands in relation to its
competitor Danske A/S.
The results of the study show that Nordea has better financial performance in comparison with its
competitor Danske A/S. The thesis proved that despite of the profitability ratios of Nordea for the
year 2019 were lower than Danske A/S, profitability ratios cannot be studied isolated from other
factors. Nordea showed better performance in leverage and asset utilization ratios. In addition,
relative valuation results showed that Nordea is consistently higher valued with relation to key
financials than its competitor Danske A/S.
Keywords: Financial Ratios Comparison, Relative Valuation Model, Trend analysis, Nordea Bank
Abp, Danske Bank A/S.
5
INTRODUCTION
Nordea Bank Abp is headquartered in Helsinki. It is the biggest bank in Finland in terms of total
assets. In 2019, Nordea Abp struggled with a money-laundering scandal that has also hit Danske
Bank A/S. Nordea Abp deepened in suspicious money flows to about 700 million euros from So-
viet states to the west. Danske Bank A/S is one of the main competitors of Nordea Bank Abp and
is also under investigation because of suspicious transactions for $230 billion from the Estonian
unit. Although both banks allocated many of their resources to the anti-money laundering work,
they still allowed money in questionable funds to be transmitted through their accounts (Milne
2019). This raises the question if recent events have also influenced the financial performance of
both banks. This thesis investigates the performance of banks by applying financial ratio analysis.
There are no universal correct values for assessing financial performance. Only the income state-
ment or balance sheet cannot be used for evaluating and planning purposes. Instead, there are
certain techniques to yield important insights that reveal much about the financial performance of
Nordea Abp. The author uses financial and valuation ratios and compares the results with Danske
bank.
Although some financial analytics documented the role of ratios in analyzing the financial health
of firms, this thesis provides further and valuable insights that include the banking industry. It is a
tool to evaluate a universal bank. The thesis discusses important financial formulas in detail that
could be used to evaluate the financial performance for a universal bank and investigate the value
of it in the bank industry.
This thesis evaluates the financial performance of Nordea Abp Bank, based on the profitability,
leverage, asset utilization and valuation ratios. In addition, the author uses the trend analysis for
the years of 2015-2019, in order to make assessments of Nordea’s financial health in comparison
with Danske with Danske Bank A/S and explore the most significant changes in ratios during the
mentioned period.
The aim of the thesis is to investigate the financial performance of Nordea Bank Abp during the
years of 2015-2019 and compare it to Danske Bank A/S.
6
The thesis uses financial ratios as a tool to observe and monitor the financial performance of the
mentioned banks. The author uses price to earnings (P/E) and price to book (P/B) ratios to compare
Nordea Bank Abp with Danske A/S during the time of 2015 to 2019.
The thesis hypothesis is formulated as follows: Nordea Abp Bank has better financial performance
as compared to Danske A/S Bank based on financial ratios. This thesis states the following re-
search tasks to prove the hypothesis successfully:
1. Provide an overview of the performance evaluation of banking/financial institutions.
2. Explain how financial ratios are defined and measured for banks.
3. Conduct a comparative empirical study to show where the Nordea Abp Bank stands in
relation to its competitor.
The study is done by using online sources, books, and academic articles. The thesis is based on
using both the primary and secondary sources. The author uses original sources such as using the
annual reports and financial statements of the compared banks. The secondary sources to be used
are from industry reports, academic articles, and books. The variety of sources is important to
provide a full picture and knowledge that helps the author to evaluate the financial performance of
Nordea Bank Abp.
This thesis is divided into three chapters. In the first chapter, the author highlights the specific
character of financial institutions in evaluating their performance. In this regard, the notion of the
banking industry is clarified. It is also important to justify the methodology and why using the
chosen ratios was best for performance evaluation.
In the second chapter, justify the data, where it originates and how it is analyzed. The methodology
of valuation clarified as well as the chosen model and options of financial ratios in order to deter-
mine the performance of Nordea.
Moreover, in the second chapter, the author focuses on Nordea Bank and Danske Bank as two of
the biggest banks in Europe. She gives a background information about both banks, then provides
an overview about the recent changes in the structure of the bank.

7
The third chapter comprises of the ratio comparison analysis, where the author uses financial ratios
to analyse and compare Nordea’s financial health for a period of 5 years. In this subchapter, the
trend analysis is used. In the second subchapter the author compares results with Danske followed
by discussion and results as third subchapter.
8
1. THEORETICAL BACKGROUND
1.1. Performance evaluation of financial institutions
Financial analysis can be one of the most important tools to determine the stability and financial
performance of any business. Typically, financial analysts use the available financial information
of firms in order to learn and understand how to make better financial decisions. They work in
detail with interpreting the financial ratios.
It is wise to start with the short overview of the financial statements in order to give a brief back-
ground on how the performance evaluation is performed in general for financial institutions. In
this regard, financial statements can be defined as the formal records prepared by managers of the
company to present financial activities. They are considered as written records and one can go
back to them when there is a need to verify the financial performance by numbers for any reason,
either internal or external reasons. For example, financial statements can be used to ensure accu-
racy, investing, financing or tax reasons. The financial statement consists of several statements
which are: balance sheet, income statement, and cash flow statement. (Murphy 2019)
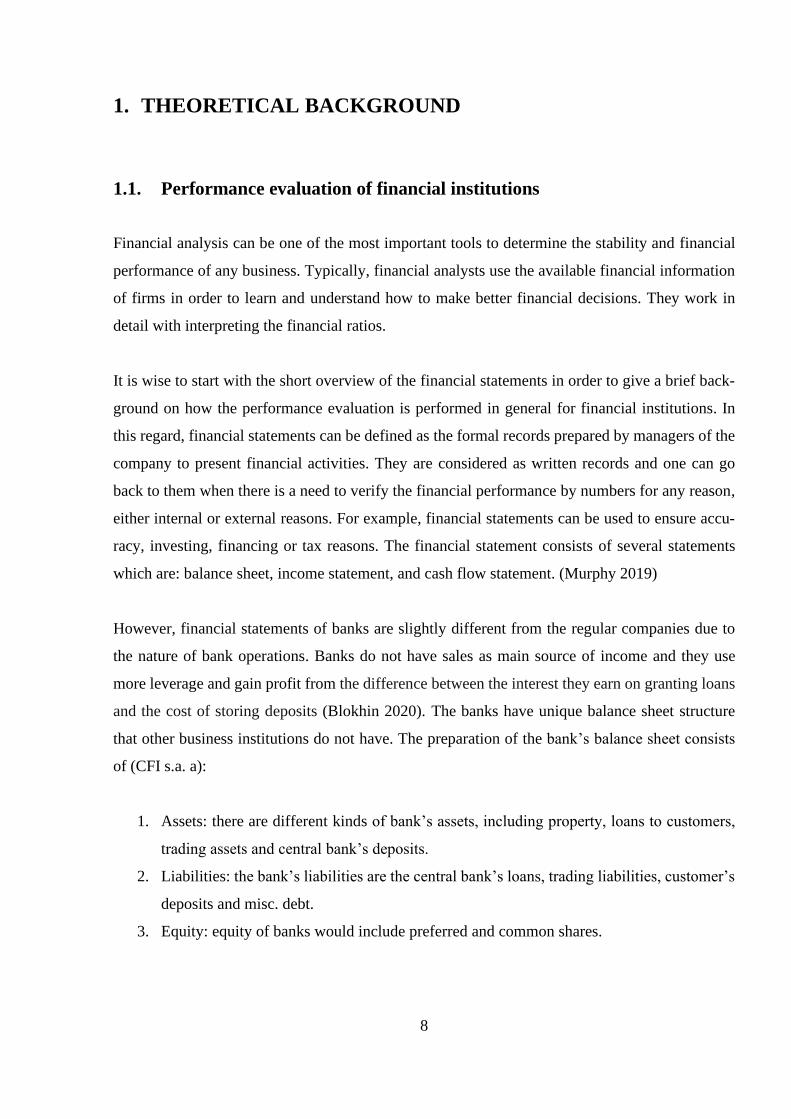
However, financial statements of banks are slightly different from the regular companies due to
the nature of bank operations. Banks do not have sales as main source of income and they use
more leverage and gain profit from the difference between the interest they earn on granting loans
and the cost of storing deposits (Blokhin 2020). The banks have unique balance sheet structure
that other business institutions do not have. The preparation of the bank’s balance sheet consists
of (CFI s.a. a):
1. Assets: there are different kinds of bank’s assets, including property, loans to customers,
trading assets and central bank’s deposits.
2. Liabilities: the bank’s liabilities are the central bank’s loans, trading liabilities, customer’s
deposits and misc. debt.
3. Equity: equity of banks would include preferred and common shares.
9
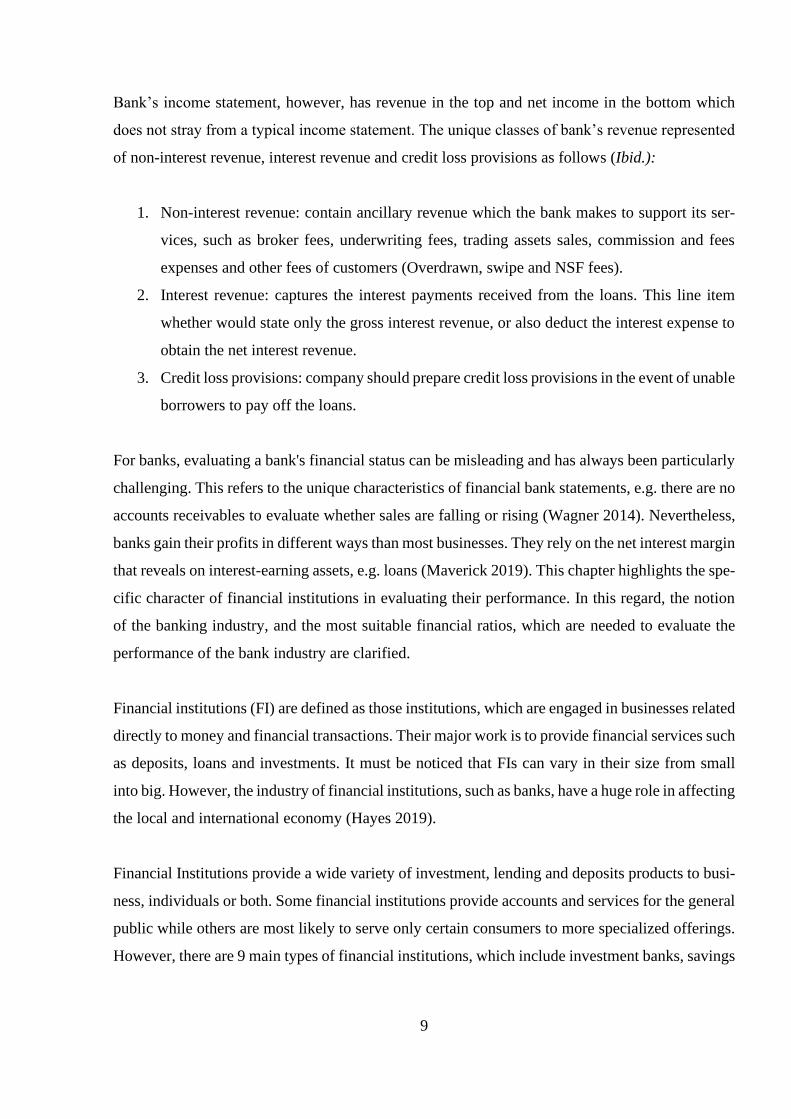
Bank’s income statement, however, has revenue in the top and net income in the bottom which
does not stray from a typical income statement. The unique classes of bank’s revenue represented
of non-interest revenue, interest revenue and credit loss provisions as follows (Ibid.):
1. Non-interest revenue: contain ancillary revenue which the bank makes to support its ser-
vices, such as broker fees, underwriting fees, trading assets sales, commission and fees
expenses and other fees of customers (Overdrawn, swipe and NSF fees).
2. Interest revenue: captures the interest payments received from the loans. This line item
whether would state only the gross interest revenue, or also deduct the interest expense to
obtain the net interest revenue.
3. Credit loss provisions: company should prepare credit loss provisions in the event of unable
borrowers to pay off the loans.
For banks, evaluating a bank's financial status can be misleading and has always been particularly
challenging. This refers to the unique characteristics of financial bank statements, e.g. there are no
accounts receivables to evaluate whether sales are falling or rising (Wagner 2014). Nevertheless,
banks gain their profits in different ways than most businesses. They rely on the net interest margin
that reveals on interest-earning assets, e.g. loans (Maverick 2019). This chapter highlights the spe-
cific character of financial institutions in evaluating their performance. In this regard, the notion
of the banking industry, and the most suitable financial ratios, which are needed to evaluate the
performance of the bank industry are clarified.
Financial institutions (FI) are defined as those institutions, which are engaged in businesses related
directly to money and financial transactions. Their major work is to provide financial services such
as deposits, loans and investments. It must be noticed that FIs can vary in their size from small
into big. However, the industry of financial institutions, such as banks, have a huge role in affecting
the local and international economy (Hayes 2019).
Financial Institutions provide a wide variety of investment, lending and deposits products to busi-
ness, individuals or both. Some financial institutions provide accounts and services for the general
public while others are most likely to serve only certain consumers to more specialized offerings.
However, there are 9 main types of financial institutions, which include investment banks, savings
10
and loan associations, internet banks, credit unions, brokerage firms, mortgage companies, retail
and commercial banks, central banks and insurance companies. (Horton 2020)
The financial institutions are regulated by the act of financial institutions, which is an ‘offshoot’
of the Banking Act. The legislation includes organisations of different scope and size, and activi-
ties contain factoring, administering and issuing means of payments, commitments and guarantees,
foreign exchange, as well as services of money transmission. The financial institution is forbidden
to have from the public deposits or other reliable funds to fund its activities. Its activities can
include the following (FinanceMalta 2014):
• Lending such as mortgage credits, factoring with or without recourse, personal credits and
financing of commercial transactions;
• Commitments and guarantees, money broking, risk capital, financial leasing, payment services
and electronic money issuing;
• Issues of underwriting share and such issues;
• Administering and issuing means of payment such as travellers’ checks, bankers’ drafts and
credit cards;
• Trading for the account of customers or for own account in foreign exchange, financial options
and futures, instruments of the exchange and interest rate, instruments of the transferable and
instruments of the money market.
Financial institutions are for profit institutions, where their work is mainly aimed to gain profit.
Therefore, their performance is measured by financial indicators. Mainly it is measured by the
three most important metrics that contribute to improving the performance of these institutions.
First, revenue, i.e. cash flow, expenses, i.e. all the costs incurred during the institution operations.
Second, operating profit obtained by subtracting expenses from revenue to have all net money
earned from operations after taxes and interests.
Characterization of the performance of an entity may need a correct definition of inputs and out-
puts, associated with its activities. The definition of what are inputs and outputs and how they
could be measured in financial institutions is challenging and has faced some disagreement for a
long time. For example, banks can deal with non-monetary services or as a mediator between
savers and borrowers (Wirnkar, Tanko 2008, 7).
11
Several studies have focused on microeconomic and macroeconomic factors that affect the finan-
cial institution performance. However, in terms of the bank industry, the case is complicated. Many
cases showed that banks are not that much affected by macroeconomic factors. For example, in-
flation does not have any significant effect on the rate of profitability of many banks around the
world, such as in Turkey and Tunisia. However, studies showed banks are affected mostly by
microeconomic and industry-specific factors, e.g. competition in the market (Helhel 2015, 148).
1.2. Methodology of financial ratios applied to banks
Banks are different from standard companies. Typically, companies make their money from the
production of goods or services (Petersons, Nielsen 2010). However, banks are unique. They make
money from the interest that they receive from loans and from the provision of financial services.
Banks provide services such as checking accounts, savings accounts, credit cards, interest of
checking deposits, ATMs, check debit cards, automatic payment and deposit, online banking,
money transfers, traveller’s checks, overdraft protection and safe deposit boxes (Oklahoma state
department of education 2016).
For many reasons, whether internal or external, banks at a certain point need to look closely at
their financial structure of the company in order to assess its performance and compare it with
competitors. This can be done by financial ratios. Financial ratios show the historical data of the
relationships between financial statement units in order to identify the strengths and weaknesses
of the institution. In this regard, financial ratios also estimate banks possible financial performance
in the future. Thus, financial ratios display essential information related to debts, performance and
future development possibilities. (Basu 2019)
For banks, ratios are divided into categories to evaluate the performance. Financial ratios can be
classified as ratios for profitability, ratios for efficiency, ratios for financial strength, and other
specific ratios. (CFI s.a. b)
According to Maverick (2019), the analysts of banks use financial ratios to evaluate the bank in-
dustry, such as net interest margin, return on assets (ROA) ratio, loan to assets ratio. It has always
12
been challenging to analyse banks since banks operate and generate profit in a fundamentally dif-
ferent way from most other businesses.
Financial ratios are a relative magnitude of numerical values taken from an enterprise's financial
statements to evaluate the overall financial condition to perform quantitative analysis and measure
profitability, leverage, liquidity, efficiency, and valuation. Many of the financial ratios can be pre-
sented in percentages by multiplying decimals by 100%.
The ratio analysis techniques are also trend analysis and industry comparison. Industry comparison
used to compare different companies within an industry and evaluate the comparative perfor-
mance. (Tarawneh 2006)
Profitability ratios examine the ability of the financial institution management to generate profits.
increase in total revenue on the total costs during a certain period. The common ratios applied to
financial institutions are Return on assets (ROA), Return on equity (ROE) and Net Interest Margin
(Carlson 2019; CFI s.a. b).
While leverage ratios are used to determine a capital structure, obligations and the company's abil-
ity to clear these obligations. Company's financial aptitude is measured by the creditors, board of
directors, investors and others by using leverage ratios. At a certain point in time, every business
needs finance from financial institutions and investors to expand but in order to generate earnings,
these debts and loans must be controlled. Return on investment (ROI) should be greater than the
interest rate which paid on loans and debt. ROI > Interest means that the wealth of shareholder is
increased, while ROI < Interest means that the wealth of shareholder is depleted. (Borad 2019)
The current ratio is the most common liquidity ratio and is the current assets to current liabilities
ratio. This ratio examines the ability of the company to pay short-term bills. Greater than one ratio
is usually a minimum as anything lower than one means that the company's liabilities are more
than its assets. Higher ratio means that the safety cushion is high, that increases flexibility as some
of the receivable balances and inventory items cannot easily be convertible to cash. (Basu 2019)
13
The efficiency ratios are also called asset utilization ratios. They show how much the financial
institution is able to generate profits from its assets. High number of ratios shows between perfor-
mance for a firm. However, it is wise to compare results of ratios with competitors in the market,
as some industries have higher ratio numbers than others. This is due to the fact that some indus-
tries have very huge assets that take longer to be turned into profits. (Ibid.)
For listed banks, it is also possible to evaluate the performance of a bank by using valuation ratios.
It is a way to value banks by comparing them with other banks. The best examples of using a
relative valuation approach to determine the value of property occur in the real estate field (Jacob-
son 2018). This method considers the effect of property value features, meaning the value property
procedure that compares a similar property, which has similar utility. The relative valuation shall
be made based on the conditions of the financing terms, sales, market conditions, physical charac-
teristics and location. (Office of the Federal Register 2018)
The ratio comparison approach is based on replacement value or book values, it assumes that a
new investment approximately should sell the same price ratio to as an existing investment of
salient economic variable with an observable ratio. However, it is possible to use in this approach
alternative numbers for earnings as the denominator for this ratio comparison such as book value,
sales revenue, subscribers, advertising lines, monthly rents or cash flow. (Jacobson 2018)
For banks, however, P/E ratios are widely used by analysts and investors to find the relative value
of a bank’s shares by comparing it across a bank's peers. It can also be used to gauge performance
over years or in comparing the aggregate markets with each other or over time. Price-to-earnings
(P/E) ratio is useful for valuing companies that determine its current share price as compared to its
per-share earnings. P/E ratio, also known as the earnings multiple or the price multiple (Hayes
2019).
A bank´s price to book (P/B) ratio is calculated by dividing its stock price by the bank’s book
value per share (BVPS). Low P/B ratios could mean undervalued stocks. P/B ratio could be useful
for conducting a thorough stock value analysis (Staff 2019).
Here is a list of the financial ratio’s main categories that can be used for the analysis of banks with
brief description (Table 1).
14
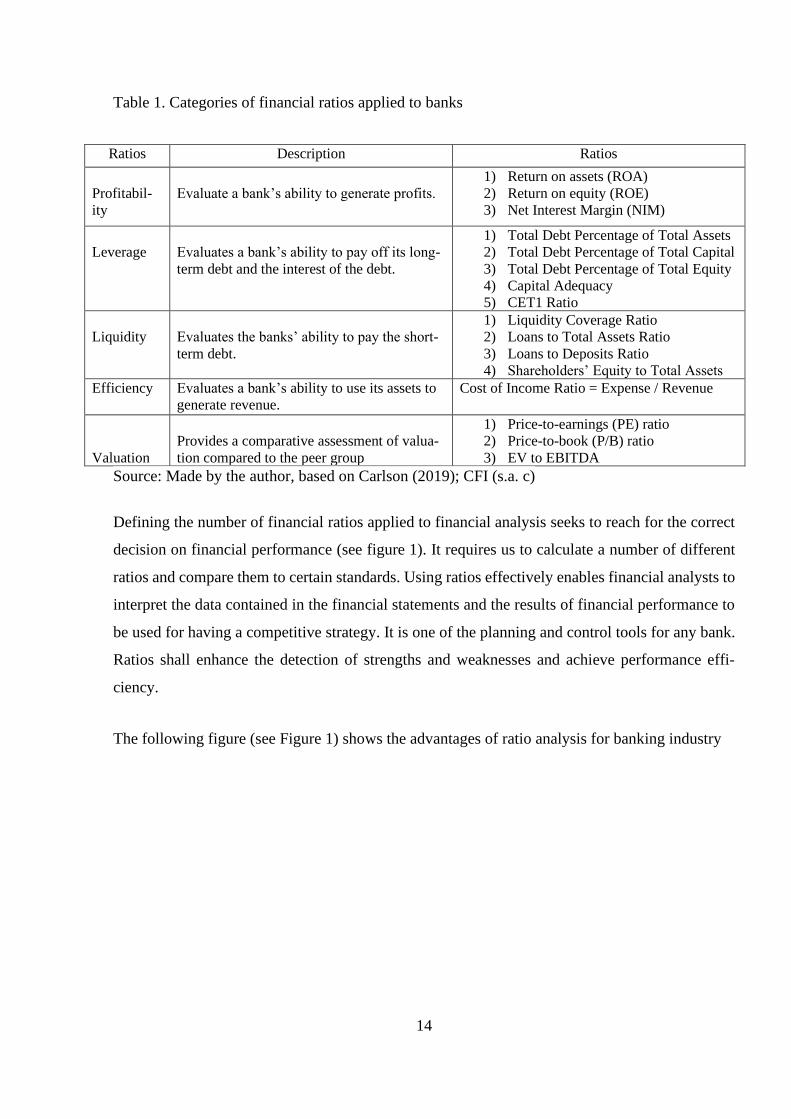
Table 1. Categories of financial ratios applied to banks
Ratios Description Ratios
Profitabil-
ity
Evaluate a bank’s ability to generate profits.
1) Return on assets (ROA)
2) Return on equity (ROE)
3) Net Interest Margin (NIM)
Leverage
Evaluates a bank’s ability to pay off its long-
term debt and the interest of the debt.
1) Total Debt Percentage of Total Assets
2) Total Debt Percentage of Total Capital
3) Total Debt Percentage of Total Equity
4) Capital Adequacy
5) CET1 Ratio
Liquidity
Evaluates the banks’ ability to pay the short-
term debt.
1) Liquidity Coverage Ratio
2) Loans to Total Assets Ratio
3) Loans to Deposits Ratio
4) Shareholders’ Equity to Total Assets
Efficiency Evaluates a bank’s ability to use its assets to
generate revenue.
Cost of Income Ratio = Expense / Revenue
Valuation
Provides a comparative assessment of valua-
tion compared to the peer group
1) Price-to-earnings (PE) ratio
2) Price-to-book (P/B) ratio
3) EV to EBITDA
Source: Made by the author, based on Carlson (2019); CFI (s.a. c)
Defining the number of financial ratios applied to financial analysis seeks to reach for the correct
decision on financial performance (see figure 1). It requires us to calculate a number of different
ratios and compare them to certain standards. Using ratios effectively enables financial analysts to
interpret the data contained in the financial statements and the results of financial performance to
be used for having a competitive strategy. It is one of the planning and control tools for any bank.
Ratios shall enhance the detection of strengths and weaknesses and achieve performance effi-
ciency.
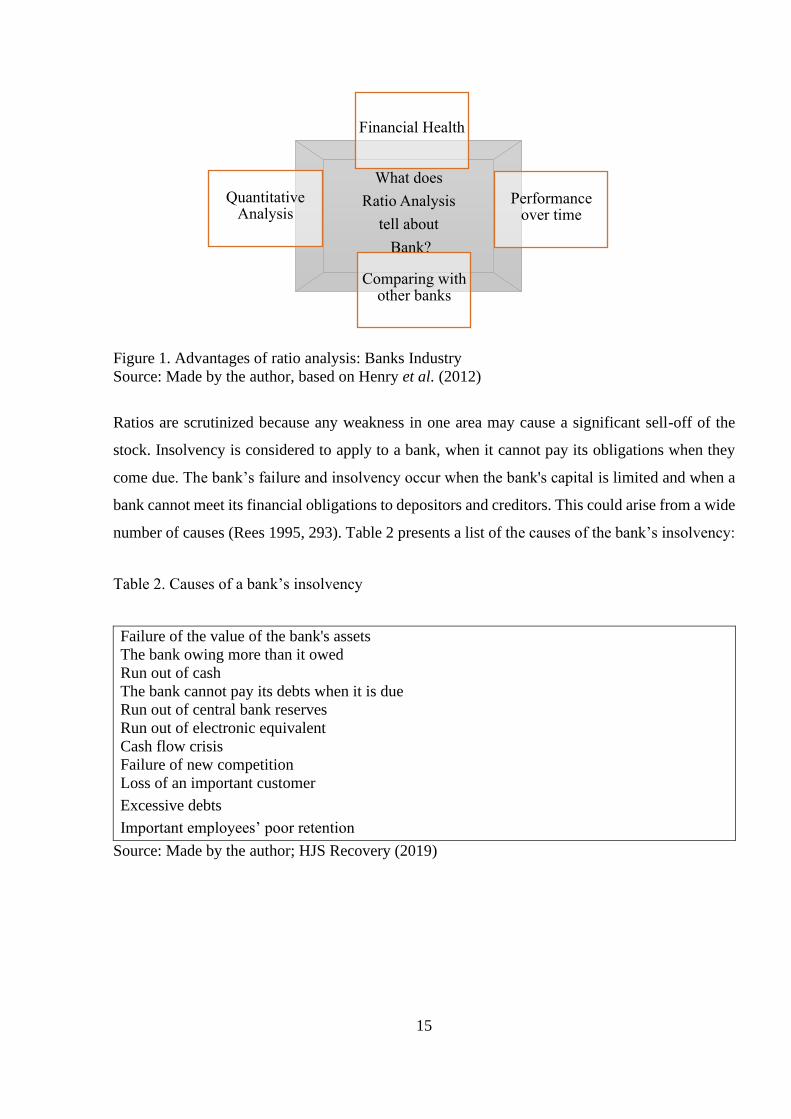
The following figure (see Figure 1) shows the advantages of ratio analysis for banking industry
15
Figure 1. Advantages of ratio analysis: Banks Industry
Source: Made by the author, based on Henry et al. (2012)
Ratios are scrutinized because any weakness in one area may cause a significant sell-off of the
stock. Insolvency is considered to apply to a bank, when it cannot pay its obligations when they
come due. The bank’s failure and insolvency occur when the bank's capital is limited and when a
bank cannot meet its financial obligations to depositors and creditors. This could arise from a wide
number of causes (Rees 1995, 293). Table 2 presents a list of the causes of the bank’s insolvency:
Table 2. Causes of a bank’s insolvency
Failure of the value of the bank's assets
The bank owing more than it owed
Run out of cash
The bank cannot pay its debts when it is due
Run out of central bank reserves
Run out of electronic equivalent
Cash flow crisis
Failure of new competition
• Loss of an important customer
• Excessive debts
Important employees’ poor retention
Source: Made by the author; HJS Recovery (2019)
What does
Ratio Analysis
tell about
Bank?
Financial Health
Performance over time
Comparing with other banks
Quantitative Analysis
16
2. METHODS AND DATA
2.1. Methodology and models
The processes of globalization, technological progress, liberalization and financial markets dereg-
ulation have significantly changed the operating environment of banks. These changes established
the necessary prerequisites for management and performance evaluation on the market and en-
hanced market competition. The profit-earning pressure for banks, the credit markets crisis, in-
creasing requirements, acquisitions and mergers leads to change the view of the further banking
development as a whole. Performance management became a priority direction and the urgent
issue of modern banking development (Buriak 2014).
Among the huge set of measures used by practitioners and academics alike to evaluate a bank’s
performance, a distinction could be made between market-based, economic and traditional
measures of performance. Market-based measures characterise the capital markets way of valuing
the company’s activity, compared with its economic value or estimated accounting. The most used
metrics include total share return, price-earnings ratio, price-to-book value and credit default swap.
While economic measures consider the aim at assessing and development of shareholder value
creation of any given fiscal year, the results generated from its economic assets. Economic
measures mainly focus on efficiency with high levels of data requirements. An additional measure
similar applied in other industries is traditional performance. From an assessment perspective, the
most widely used are return on equity, cost-to-income or return on assets ratio. (ECB 2010)
This chapter provides information related to methods used to reach for the evaluation of perfor-
mance of Nordea Bank. The chapter aims to describe the structure of the thesis and justify the
models and sections. The purpose is to gain better understanding on the process of the thesis. It
answers the question of why the thesis used the specific financial ratios and methods of analysis.
As the thesis focuses on the financial performance of Nordea Bank, author uses financial ratio
analysis to investigate the profitability, leverage and asset utilization together with the valuation
ratios, because these ratios are found to be most appropriate for bank evaluation (Petersons, Niel-
sen 2010).

17
Following discussion presents the ratios with respective formulas which are applied to evaluate
the performance of Nordea Bank.
First of all, profitability ratios, which are one of the most important factors to evaluate the perfor-
mance of Nordea Bank and compare it to Danske Bank. It is a method to evaluate the ability to
generate profits and how well Nordea gains profits. In this regard, author used the following ratios
to achieve the profitably: (Maverick 2019)
Net Margin (NM) Indicates the availability of company’s convert revenue into profits for share-
holders.
𝑁𝑒𝑡 𝑀𝑎𝑟𝑔𝑖𝑛 = (𝑇𝑜𝑡𝑎𝑙 𝑅𝑒𝑣𝑒𝑛𝑢𝑒 − 𝑇𝑜𝑡𝑎𝑙 𝐸𝑥𝑝𝑒𝑛𝑠𝑒)
𝑇𝑜𝑡𝑎𝑙 𝑅𝑒𝑣𝑒𝑛𝑢𝑒 (1)
Net Interest Margin (NIM) is a measure of the difference between the interest income generated
by banks and the amount of interest paid to their lenders (e.g. depositors), relative to the amount
of their total assets. Since the interest earned is a primary source of revenue for a bank, this metric
is a good indicator of a bank's overall profitability.
Net Interest Margin = 𝐼𝑛𝑡𝑒𝑟𝑒𝑠𝑡 𝐼𝑛𝑐𝑜𝑚𝑒 − 𝐼𝑛𝑡𝑒𝑟𝑒𝑠𝑡 𝐸𝑥𝑝𝑒𝑛𝑠𝑒
𝑇𝑜𝑡𝑎𝑙 𝐴𝑠𝑠𝑒𝑡 (2)
Return on assets (ROA) is also another good method to evaluate the financial profit of banks rel-
ative to its total assets
𝑅𝑒𝑡𝑢𝑟𝑛 𝑜𝑛 𝐴𝑠𝑠𝑒𝑡𝑠 = 𝑁𝑒𝑡 𝐼𝑛𝑐𝑜𝑚𝑒
𝑇𝑜𝑡𝑎𝑙 𝐴𝑠𝑠𝑒𝑡𝑠 (3)
Return on equity (ROE) is especially important to bank shareholders and when a result of a bank
is intended to be compared with another bank, as it helps in eliminating the size differences. Thus,
it is an effective measure to analyze how each bank is performing based on the equity capital
available to it.
𝑅𝑒𝑡𝑢𝑟𝑛 𝑜𝑛 𝐸𝑞𝑢𝑖𝑡𝑦 = 𝑁𝑒𝑡 𝐼𝑛𝑐𝑜𝑚𝑒
𝐸𝑞𝑢𝑖𝑡𝑦 (4)
18
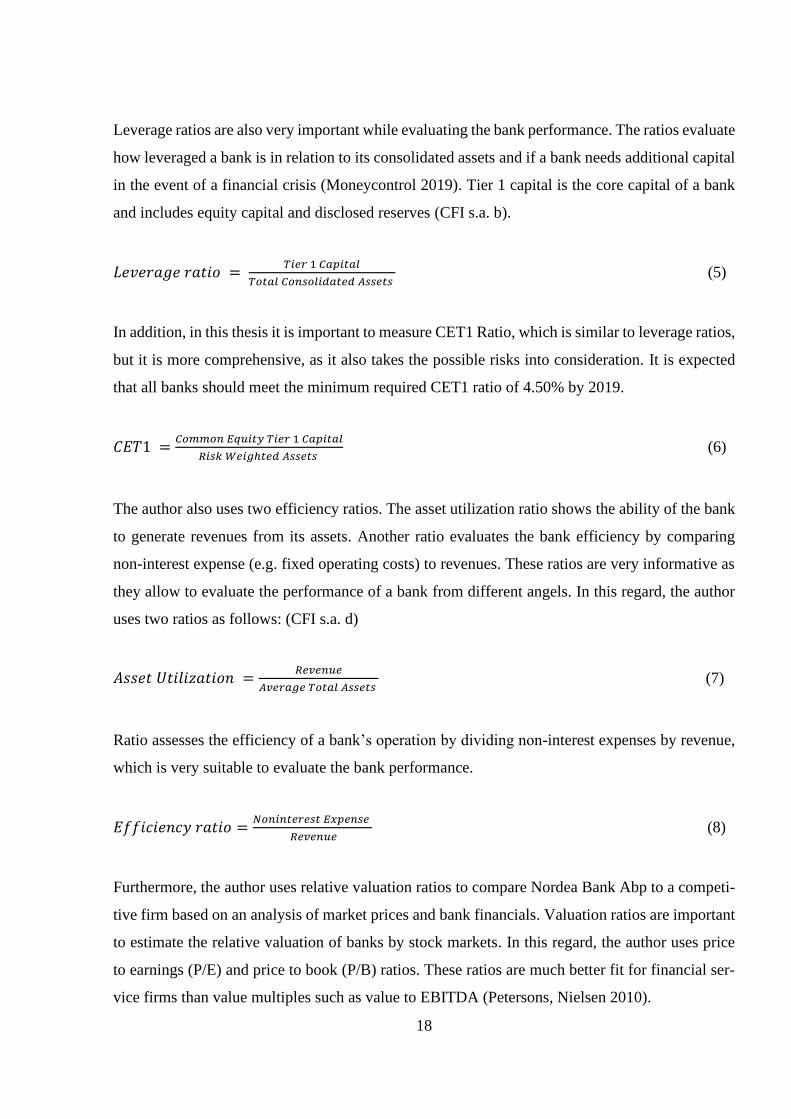
Leverage ratios are also very important while evaluating the bank performance. The ratios evaluate
how leveraged a bank is in relation to its consolidated assets and if a bank needs additional capital
in the event of a financial crisis (Moneycontrol 2019). Tier 1 capital is the core capital of a bank
and includes equity capital and disclosed reserves (CFI s.a. b).
𝐿𝑒𝑣𝑒𝑟𝑎𝑔𝑒 𝑟𝑎𝑡𝑖𝑜 = 𝑇𝑖𝑒𝑟 1 𝐶𝑎𝑝𝑖𝑡𝑎𝑙
𝑇𝑜𝑡𝑎𝑙 𝐶𝑜𝑛𝑠𝑜𝑙𝑖𝑑𝑎𝑡𝑒𝑑 𝐴𝑠𝑠𝑒𝑡𝑠 (5)
In addition, in this thesis it is important to measure CET1 Ratio, which is similar to leverage ratios,
but it is more comprehensive, as it also takes the possible risks into consideration. It is expected
that all banks should meet the minimum required CET1 ratio of 4.50% by 2019.
𝐶𝐸𝑇1 =𝐶𝑜𝑚𝑚𝑜𝑛 𝐸𝑞𝑢𝑖𝑡𝑦 𝑇𝑖𝑒𝑟 1 𝐶𝑎𝑝𝑖𝑡𝑎𝑙
𝑅𝑖𝑠𝑘 𝑊𝑒𝑖𝑔ℎ𝑡𝑒𝑑 𝐴𝑠𝑠𝑒𝑡𝑠 (6)
The author also uses two efficiency ratios. The asset utilization ratio shows the ability of the bank
to generate revenues from its assets. Another ratio evaluates the bank efficiency by comparing
non-interest expense (e.g. fixed operating costs) to revenues. These ratios are very informative as
they allow to evaluate the performance of a bank from different angels. In this regard, the author
uses two ratios as follows: (CFI s.a. d)
𝐴𝑠𝑠𝑒𝑡 𝑈𝑡𝑖𝑙𝑖𝑧𝑎𝑡𝑖𝑜𝑛 =𝑅𝑒𝑣𝑒𝑛𝑢𝑒
𝐴𝑣𝑒𝑟𝑎𝑔𝑒 𝑇𝑜𝑡𝑎𝑙 𝐴𝑠𝑠𝑒𝑡𝑠 (7)
Ratio assesses the efficiency of a bank’s operation by dividing non-interest expenses by revenue,
which is very suitable to evaluate the bank performance.
𝐸𝑓𝑓𝑖𝑐𝑖𝑒𝑛𝑐𝑦 𝑟𝑎𝑡𝑖𝑜 =𝑁𝑜𝑛𝑖𝑛𝑡𝑒𝑟𝑒𝑠𝑡 𝐸𝑥𝑝𝑒𝑛𝑠𝑒
𝑅𝑒𝑣𝑒𝑛𝑢𝑒 (8)
Furthermore, the author uses relative valuation ratios to compare Nordea Bank Abp to a competi-
tive firm based on an analysis of market prices and bank financials. Valuation ratios are important
to estimate the relative valuation of banks by stock markets. In this regard, the author uses price
to earnings (P/E) and price to book (P/B) ratios. These ratios are much better fit for financial ser-
vice firms than value multiples such as value to EBITDA (Petersons, Nielsen 2010).
19
Price to book ratio indicates the price that has to be paid compared to the shareholder equity.
𝑃/𝐵 𝑅𝑎𝑡𝑖𝑜 =𝑀𝑎𝑟𝑘𝑒𝑡 𝑃𝑟𝑖𝑐𝑒 𝑝𝑒𝑟 𝑆ℎ𝑎𝑟𝑒
𝐵𝑜𝑜𝑘 𝑉𝑎𝑙𝑢𝑒 𝑝𝑒𝑟 𝑆ℎ𝑎𝑟𝑒 (9)
Price to earnings ratio indicates the valuation of the bank share by markets in relation to current
profits.
𝑃/𝐸 𝑅𝑎𝑡𝑖𝑜 =𝑀𝑎𝑟𝑘𝑒𝑡 𝑣𝑎𝑙𝑢𝑒 𝑝𝑒𝑟 𝑆ℎ𝑎𝑟𝑒
𝐸𝑎𝑟𝑛𝑖𝑛𝑔𝑠 𝑝𝑒𝑟 𝑠ℎ𝑎𝑟𝑒 (10)
High value of price to earnings ratio may indicate good growth prospects of the bank or possible
price bubble. Application of value ratios assumes a proper peer group for comparison.
2.2. Data gathering and analysis
Information for the empirical study is collected from the information, which is available for public
use. Thesis uses two approaches toward financial analysis in order to compare the results of ratios
used in this thesis. First, the thesis uses a cross-sectional analysis approach in order to compare
results with Danske Bank A/S. This model is important, because it allows for comparison between
a particular company to its industry peer over a focused time period (Chen 2019). Furthermore, it
is an important model that would help the author to find out the result of the hypothesis.
Furthermore, the author uses trend analysis to gain an overview of the most significant changes in
the financial performance of Nordea Bank for a 5 years period. It is important to follow the finan-
cial performance of Nordea for a long enough period, in order to have a more comprehensive view
of its performance and to be able to recognize any patterns in it.
Trend analysis gains a greater insight into Nordea’s performance over time based on the results of
ratios in each year. A common approach of trend analysis for several years is to use the oldest year
as the base year.
20
This thesis investigates Nordea’s financial statement between 2015 and 2019. The analysis in-
cludes its competitor bank: Danske A/S Bank. Income statement data for Nordea Abp Bank and
Danske A/S Bank can be found in appendix 1 and 2, respectively.
2.3. Nordea Bank Abp
Nordea Abp Bank branch is one of the strongest banks in Europe. It is a universal bank leading
commercial and investment bank located in Finland (Nordea s.a. a). Since 1998, Nordea Bank
Finland Abp (NBF) has been with the Nordea Group that was formed by merger between Nord-
banken and Merita. NBF conducts banking operations in Finland, the banking operations as part
of Nordea Group. (Nordea Bank AB s.a.)
Nordea signed the principles for responsible banking in 2019 to hold the bank’s commitment to-
ward principles of a sustainable economy and become a truly main focus of banking Nordic union.
Nordea is one of other 30 founding principal responsible banks, developed by the United nation
environment program finance initiative assigned in New York at the climate week (Nordea s.a. b)
The bank introduced its services in twenty countries, sixteen countries are out of the Nordics and
these four countries – Finland, Sweden, Norway and Denmark-. Based on market capitalisation
the bank is one of the best ten financial services institutions in the European countries. Nordea
bank also holds an AA rating that just a few banks in Europe hold. (Nordea s.a. c)
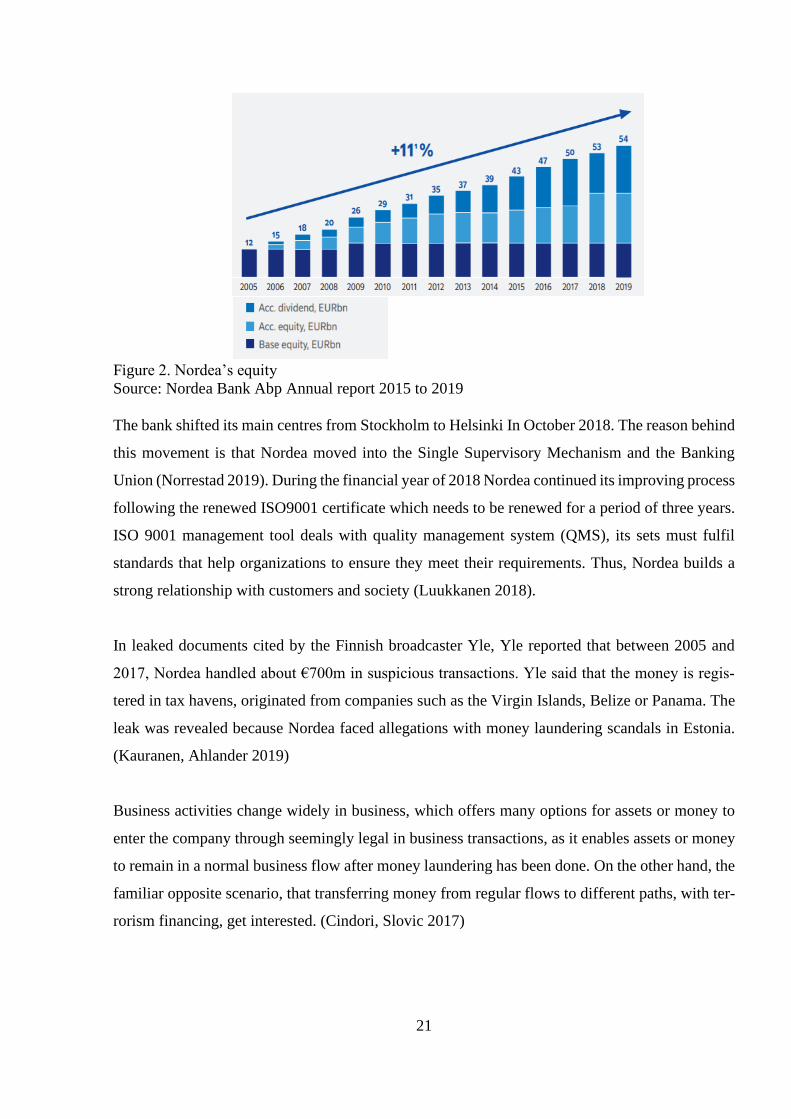
In 2019, the total assets were EUR 554.8 billion and the bank's total operating income was EUR
8.6 billion (Ibid.). On 20 June 2019, the bank was ranked as one of the most sustainable banks in
the world. Furthermore, on 28 November of 2019, the bank classed as the best corporate bank
between the Nordics countries’ banks (see figure 2). (Nordea Bank Abp Annual report 2015 to
2019)
Figure below (see Figure 2) shows that Nordea’s Equity is strong and has a resistant growth.
21
Figure 2. Nordea’s equity
Source: Nordea Bank Abp Annual report 2015 to 2019
The bank shifted its main centres from Stockholm to Helsinki In October 2018. The reason behind
this movement is that Nordea moved into the Single Supervisory Mechanism and the Banking
Union (Norrestad 2019). During the financial year of 2018 Nordea continued its improving process
following the renewed ISO9001 certificate which needs to be renewed for a period of three years.
ISO 9001 management tool deals with quality management system (QMS), its sets must fulfil
standards that help organizations to ensure they meet their requirements. Thus, Nordea builds a
strong relationship with customers and society (Luukkanen 2018).
In leaked documents cited by the Finnish broadcaster Yle, Yle reported that between 2005 and
2017, Nordea handled about €700m in suspicious transactions. Yle said that the money is regis-
tered in tax havens, originated from companies such as the Virgin Islands, Belize or Panama. The
leak was revealed because Nordea faced allegations with money laundering scandals in Estonia.
(Kauranen, Ahlander 2019)
Business activities change widely in business, which offers many options for assets or money to
enter the company through seemingly legal in business transactions, as it enables assets or money
to remain in a normal business flow after money laundering has been done. On the other hand, the
familiar opposite scenario, that transferring money from regular flows to different paths, with ter-
rorism financing, get interested. (Cindori, Slovic 2017)
22
2.4. Danske Bank A/S
Danske Bank is considered as one of the strongest competitors to Nordea. In 2019 it delivered a
net profit of DKK 15.1 billion, return on equity of 9.5% and growth of 3%. Danske started to
simplify their product range, accelerating their digitization efforts in the most important areas to
their customers, improved cost discipline, and defined clear quantitative objectives for their sus-
tainability strategy and societal impact. These were just a few steps of the transformation journey
Danske will take to become a better bank over next year with a strong market position. (Danske
Bank A/S 2020)
Danske Bank acquired in financial companies’ space after the deregulation of globalization in the
90s. Danske Bank devises more rewarding strategies but relatively risky. This means not only
entering new markets but also expanding into new business segments such as pension, leasing,
mortgage finance, asset management and insurance. The reason why having this strategy was the
desire to decrease the net interest margin (NIM) to ensure the stability of receiving more interest
than it pays and making Danske Bank the largest bank in Scandinavia. (Kouassi-Zessia, Zikoh
Jean Luc 2009)
The world today is more exposed to media and news than ever. Information can be gathered in-
stantly about the latest news from around the world using many different sources of news. Danske
Bank investigated in a money laundering scandal more than 200 million euros in five countries,
the suspicious payments flowed in its Estonian branch from Russia. (Kauranen, Ahlander 2019)
In 2018, the largest money-laundering scandal arose in Europe for Danske Bank, the scandal hap-
pened in its Estonian branch, viewed in terms of monetary. Money- laundering concerns also the
financial market, where shareholders and investors connect the new events which they have been
instantly informed to their personal interest. When information about the company is released, this
will cause the stock market fluctuations. The information arrived from an anonymous whistle-
blower at the department of Danish justice showed that the money-laundering had been gained for
Russian accounts and believed that Danske Bank accepted more than 7 billion DKK within over
1700 transactions. (Berglund 2019)

23
The Danske Bank scandal was one of the most topics that was discussed in 2018. The issues related
to the scandal appeared in Sweden alone 50 times in television and radio, 1528 times on online
news sources, and 400 times in newspapers (Berglund, Ekelund 2019). The realisation is that even
the safest Banks in Europe have been caught up in a money-laundering scandal which can affect
their financial performance. Money laundering can be performed in different ways, involving reg-
ular business operations. The effect of a money-laundering scandal on banks varies, causing the
change in their financial performance and effects on the bank's reputation.
24
3. RATIO COMPARISON ANALYSIS
3.1. Financial performance ratios of Nordea Abp
In this chapter, the author analyses the financial and valuation ratios of Nordea for the period of 5
years. Trend analysis for financial ratios is also conducted as a method to show the ups and downs
of Nordea throughout the investigated years. Financial ratios are used to show profitably, leverage,
asset utilization, and valuation ratios. Author uses ratios that are shown to be the best methods for
finding out financial performance of banks.
Second, the author compares the results of financial ratios of Nordea with Danske as to evaluate
the financial performance of Nordea. Comparing Nordea with its most competitive bank in the
market shall give a clearer picture to the value of Nordea and its financial performance as overall.
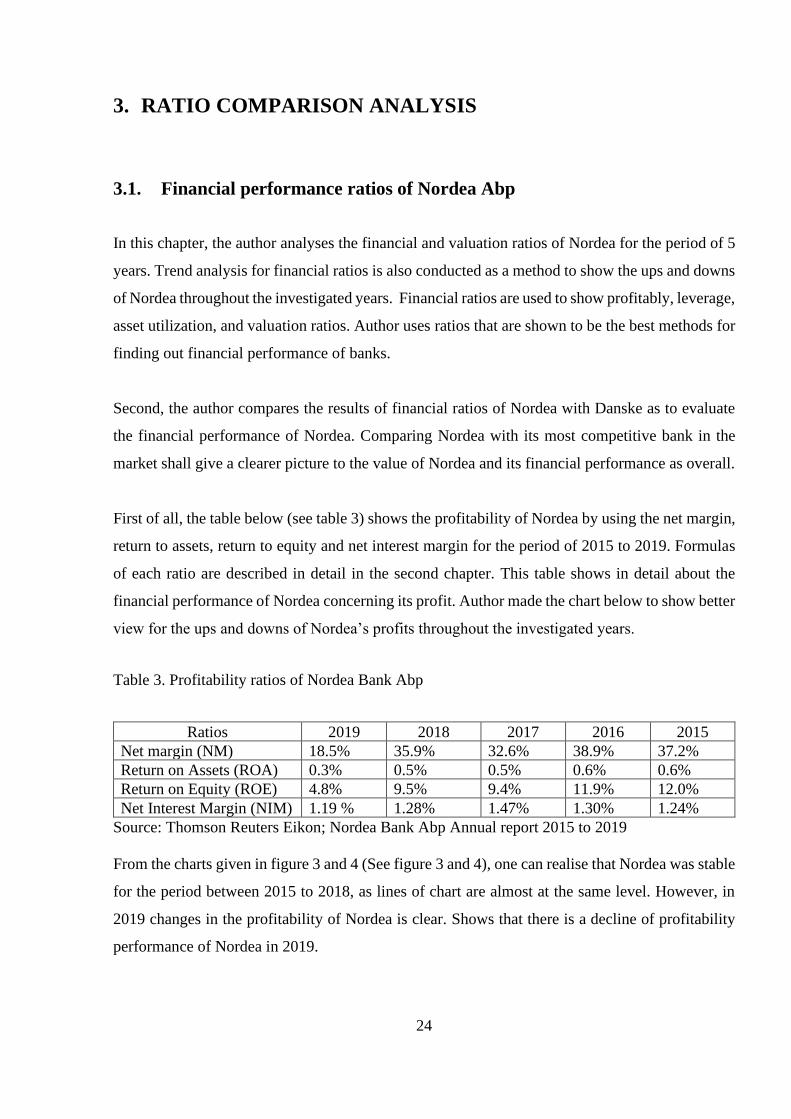
First of all, the table below (see table 3) shows the profitability of Nordea by using the net margin,
return to assets, return to equity and net interest margin for the period of 2015 to 2019. Formulas
of each ratio are described in detail in the second chapter. This table shows in detail about the
financial performance of Nordea concerning its profit. Author made the chart below to show better
view for the ups and downs of Nordea’s profits throughout the investigated years.
Table 3. Profitability ratios of Nordea Bank Abp
Ratios 2019 2018 2017 2016 2015
Net margin (NM) 18.5% 35.9% 32.6% 38.9% 37.2%
Return on Assets (ROA) 0.3% 0.5% 0.5% 0.6% 0.6%
Return on Equity (ROE) 4.8% 9.5% 9.4% 11.9% 12.0%
Net Interest Margin (NIM) 1.19 % 1.28% 1.47% 1.30% 1.24%
Source: Thomson Reuters Eikon; Nordea Bank Abp Annual report 2015 to 2019
From the charts given in figure 3 and 4 (See figure 3 and 4), one can realise that Nordea was stable
for the period between 2015 to 2018, as lines of chart are almost at the same level. However, in
2019 changes in the profitability of Nordea is clear. Shows that there is a decline of profitability
performance of Nordea in 2019.
25
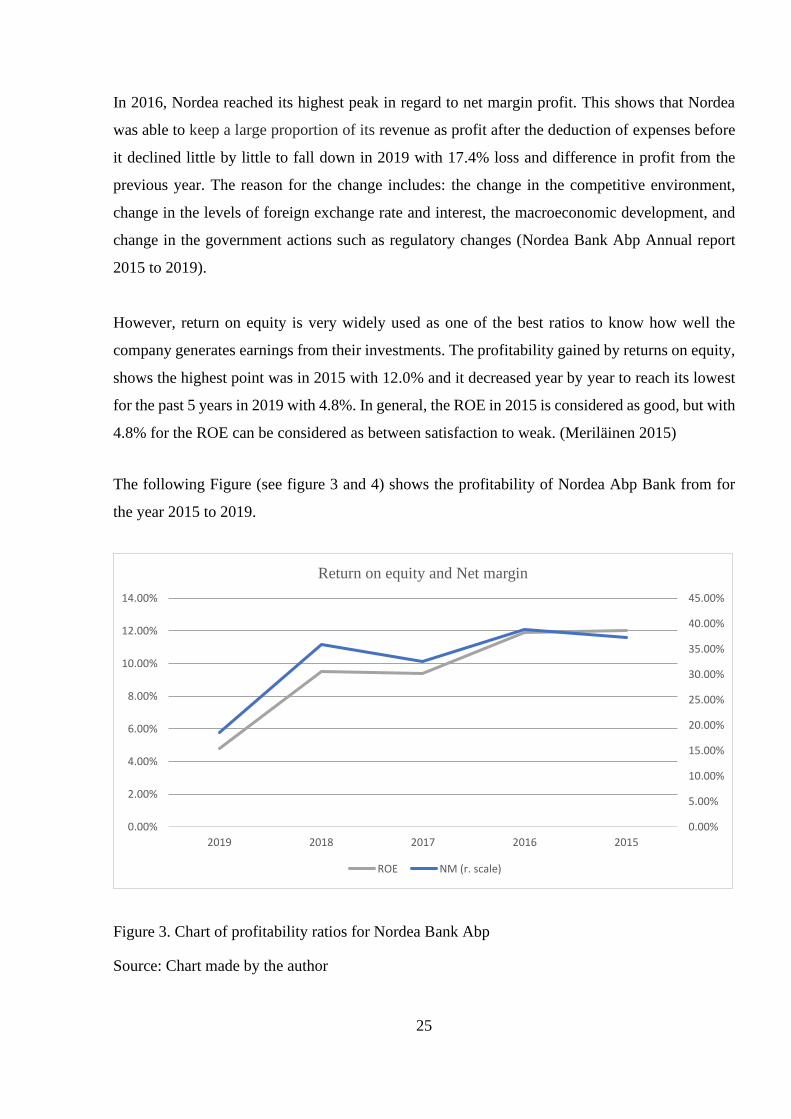
In 2016, Nordea reached its highest peak in regard to net margin profit. This shows that Nordea
was able to keep a large proportion of its revenue as profit after the deduction of expenses before
it declined little by little to fall down in 2019 with 17.4% loss and difference in profit from the
previous year. The reason for the change includes: the change in the competitive environment,
change in the levels of foreign exchange rate and interest, the macroeconomic development, and
change in the government actions such as regulatory changes (Nordea Bank Abp Annual report
2015 to 2019).
However, return on equity is very widely used as one of the best ratios to know how well the
company generates earnings from their investments. The profitability gained by returns on equity,
shows the highest point was in 2015 with 12.0% and it decreased year by year to reach its lowest
for the past 5 years in 2019 with 4.8%. In general, the ROE in 2015 is considered as good, but with
4.8% for the ROE can be considered as between satisfaction to weak. (Meriläinen 2015)
The following Figure (see figure 3 and 4) shows the profitability of Nordea Abp Bank from for
the year 2015 to 2019.
Figure 3. Chart of profitability ratios for Nordea Bank Abp
Source: Chart made by the author
0.00%
5.00%
10.00%
15.00%
20.00%
25.00%
30.00%
35.00%
40.00%
45.00%
2019 2018 2017 2016 2015
0.00%
2.00%
4.00%
6.00%
8.00%
10.00%
12.00%
14.00%
Return on equity and Net margin
ROE NM (r. scale)
26
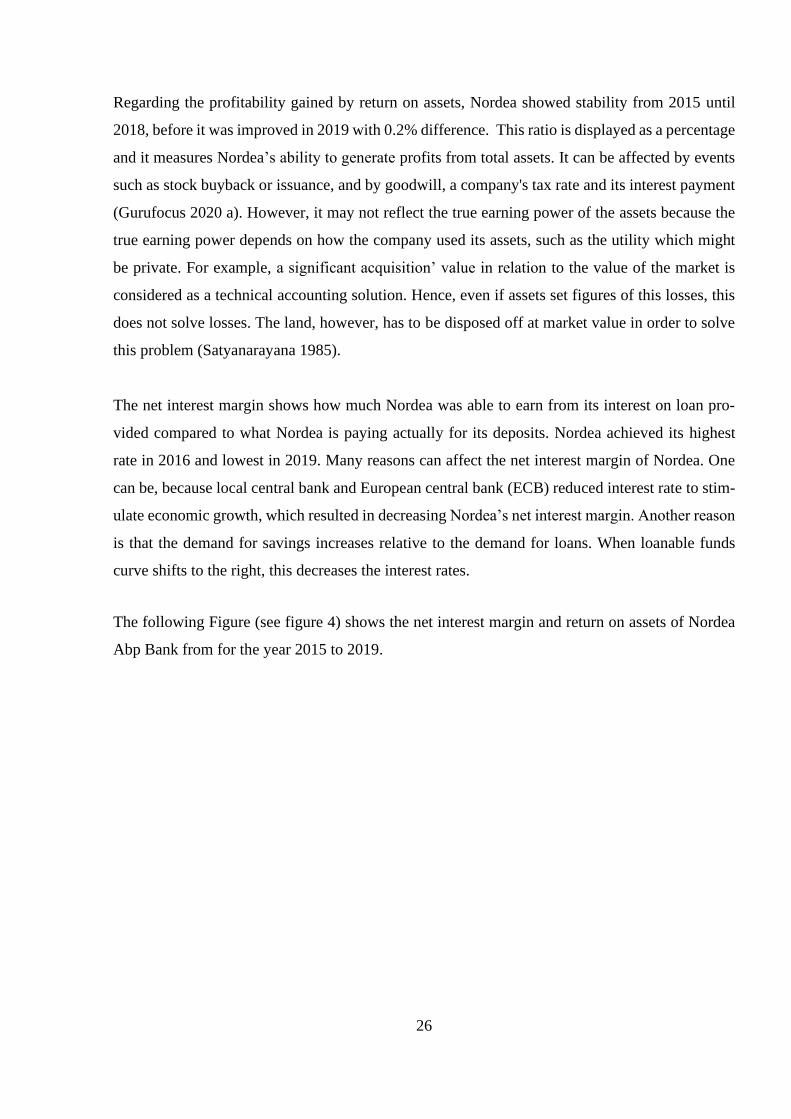
Regarding the profitability gained by return on assets, Nordea showed stability from 2015 until
2018, before it was improved in 2019 with 0.2% difference. This ratio is displayed as a percentage
and it measures Nordea’s ability to generate profits from total assets. It can be affected by events
such as stock buyback or issuance, and by goodwill, a company's tax rate and its interest payment
(Gurufocus 2020 a). However, it may not reflect the true earning power of the assets because the
true earning power depends on how the company used its assets, such as the utility which might
be private. For example, a significant acquisition’ value in relation to the value of the market is
considered as a technical accounting solution. Hence, even if assets set figures of this losses, this
does not solve losses. The land, however, has to be disposed off at market value in order to solve
this problem (Satyanarayana 1985).
The net interest margin shows how much Nordea was able to earn from its interest on loan pro-
vided compared to what Nordea is paying actually for its deposits. Nordea achieved its highest
rate in 2016 and lowest in 2019. Many reasons can affect the net interest margin of Nordea. One
can be, because local central bank and European central bank (ECB) reduced interest rate to stim-
ulate economic growth, which resulted in decreasing Nordea’s net interest margin. Another reason
is that the demand for savings increases relative to the demand for loans. When loanable funds
curve shifts to the right, this decreases the interest rates.
The following Figure (see figure 4) shows the net interest margin and return on assets of Nordea
Abp Bank from for the year 2015 to 2019.
27
Figure 4. Chart of profitability ratios for Nordea Bank Abp
Source: Chart made by the author
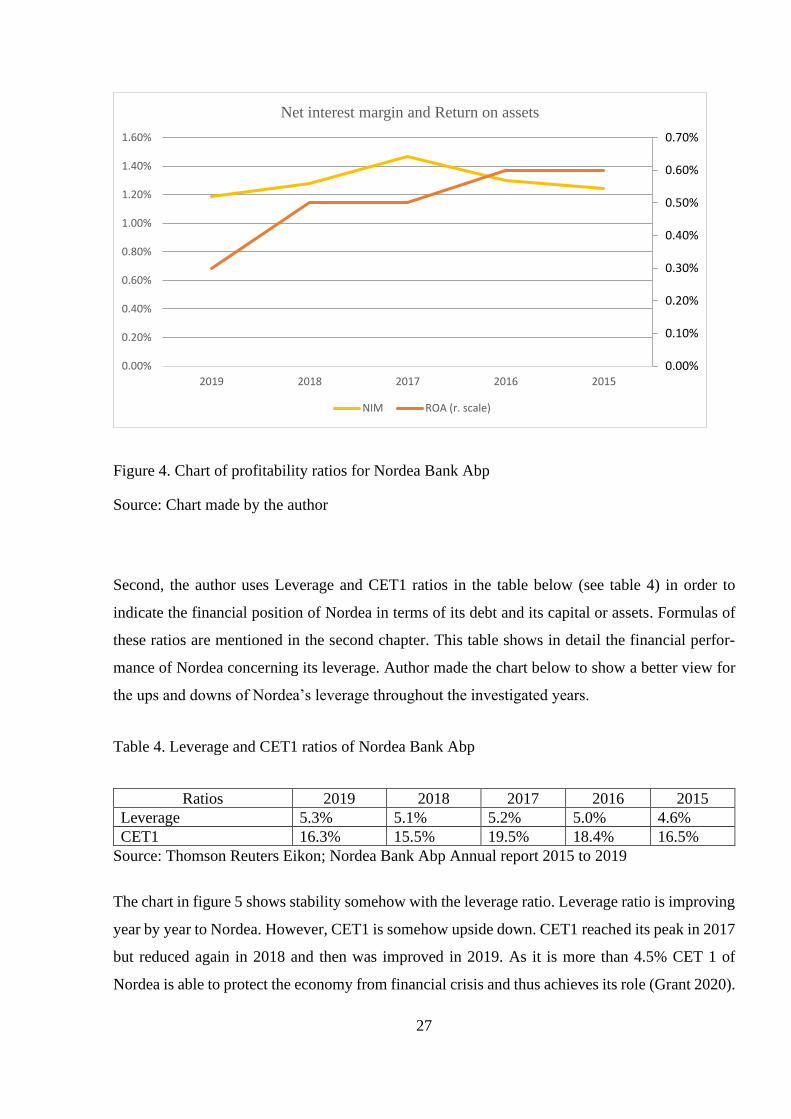
Second, the author uses Leverage and CET1 ratios in the table below (see table 4) in order to
indicate the financial position of Nordea in terms of its debt and its capital or assets. Formulas of
these ratios are mentioned in the second chapter. This table shows in detail the financial perfor-
mance of Nordea concerning its leverage. Author made the chart below to show a better view for
the ups and downs of Nordea’s leverage throughout the investigated years.
Table 4. Leverage and CET1 ratios of Nordea Bank Abp
Ratios 2019 2018 2017 2016 2015
Leverage 5.3% 5.1% 5.2% 5.0% 4.6%
CET1 16.3% 15.5% 19.5% 18.4% 16.5%
Source: Thomson Reuters Eikon; Nordea Bank Abp Annual report 2015 to 2019
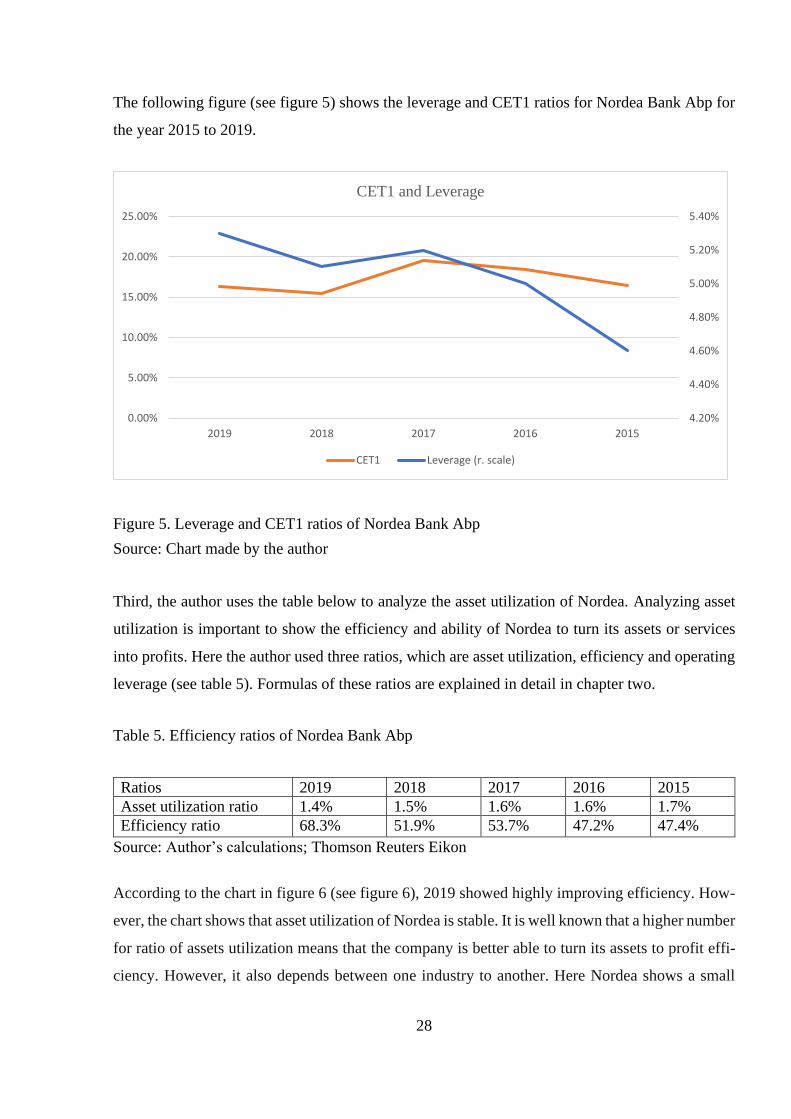
The chart in figure 5 shows stability somehow with the leverage ratio. Leverage ratio is improving
year by year to Nordea. However, CET1 is somehow upside down. CET1 reached its peak in 2017
but reduced again in 2018 and then was improved in 2019. As it is more than 4.5% CET 1 of
Nordea is able to protect the economy from financial crisis and thus achieves its role (Grant 2020).
0.00%
0.10%
0.20%
0.30%
0.40%
0.50%
0.60%
0.70%
2019 2018 2017 2016 2015
0.00%
0.20%
0.40%
0.60%
0.80%
1.00%
1.20%
1.40%
1.60%
Net interest margin and Return on assets
NIM ROA (r. scale)
28
The following figure (see figure 5) shows the leverage and CET1 ratios for Nordea Bank Abp for
the year 2015 to 2019.
Figure 5. Leverage and CET1 ratios of Nordea Bank Abp
Source: Chart made by the author
Third, the author uses the table below to analyze the asset utilization of Nordea. Analyzing asset
utilization is important to show the efficiency and ability of Nordea to turn its assets or services
into profits. Here the author used three ratios, which are asset utilization, efficiency and operating
leverage (see table 5). Formulas of these ratios are explained in detail in chapter two.
Table 5. Efficiency ratios of Nordea Bank Abp
Ratios 2019 2018 2017 2016 2015
Asset utilization ratio 1.4% 1.5% 1.6% 1.6% 1.7%
Efficiency ratio 68.3% 51.9% 53.7% 47.2% 47.4%
Source: Author’s calculations; Thomson Reuters Eikon
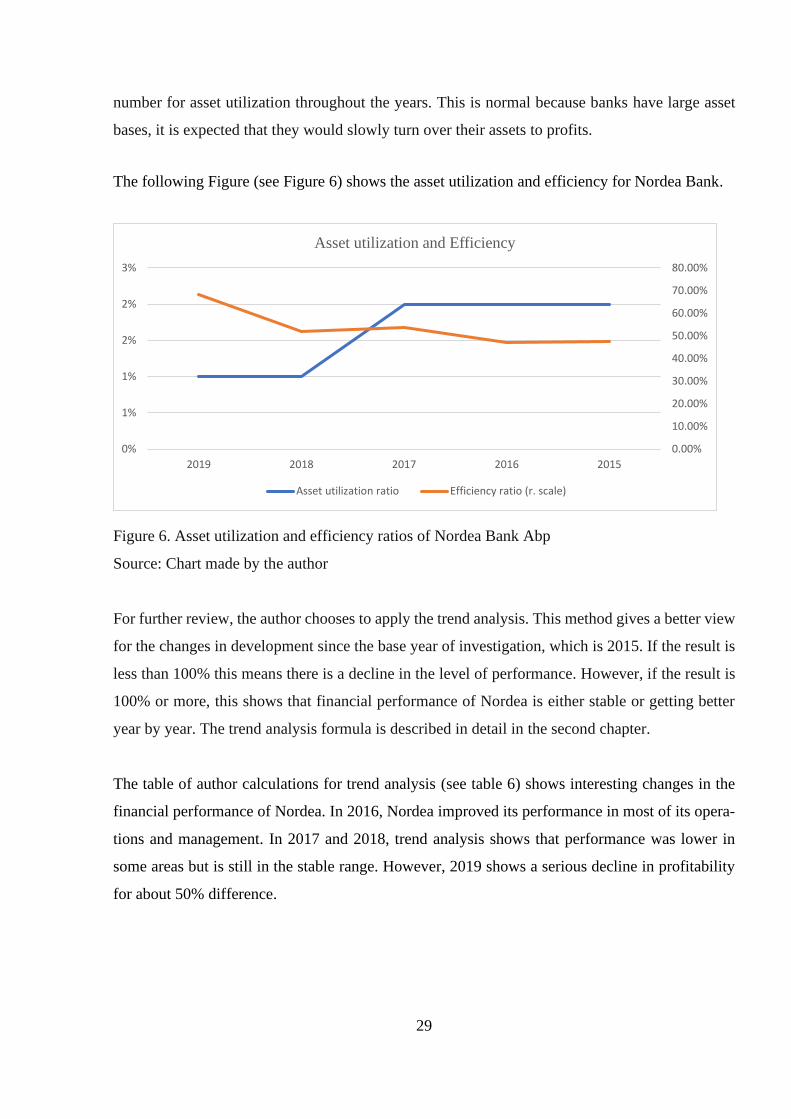
According to the chart in figure 6 (see figure 6), 2019 showed highly improving efficiency. How-
ever, the chart shows that asset utilization of Nordea is stable. It is well known that a higher number
for ratio of assets utilization means that the company is better able to turn its assets to profit effi-
ciency. However, it also depends between one industry to another. Here Nordea shows a small
4.20%
4.40%
4.60%
4.80%
5.00%
5.20%
5.40%
0.00%
5.00%
10.00%
15.00%
20.00%
25.00%
2019 2018 2017 2016 2015
CET1 and Leverage
CET1 Leverage (r. scale)
29
number for asset utilization throughout the years. This is normal because banks have large asset
bases, it is expected that they would slowly turn over their assets to profits.
The following Figure (see Figure 6) shows the asset utilization and efficiency for Nordea Bank.
Figure 6. Asset utilization and efficiency ratios of Nordea Bank Abp
Source: Chart made by the author
For further review, the author chooses to apply the trend analysis. This method gives a better view
for the changes in development since the base year of investigation, which is 2015. If the result is
less than 100% this means there is a decline in the level of performance. However, if the result is
100% or more, this shows that financial performance of Nordea is either stable or getting better
year by year. The trend analysis formula is described in detail in the second chapter.
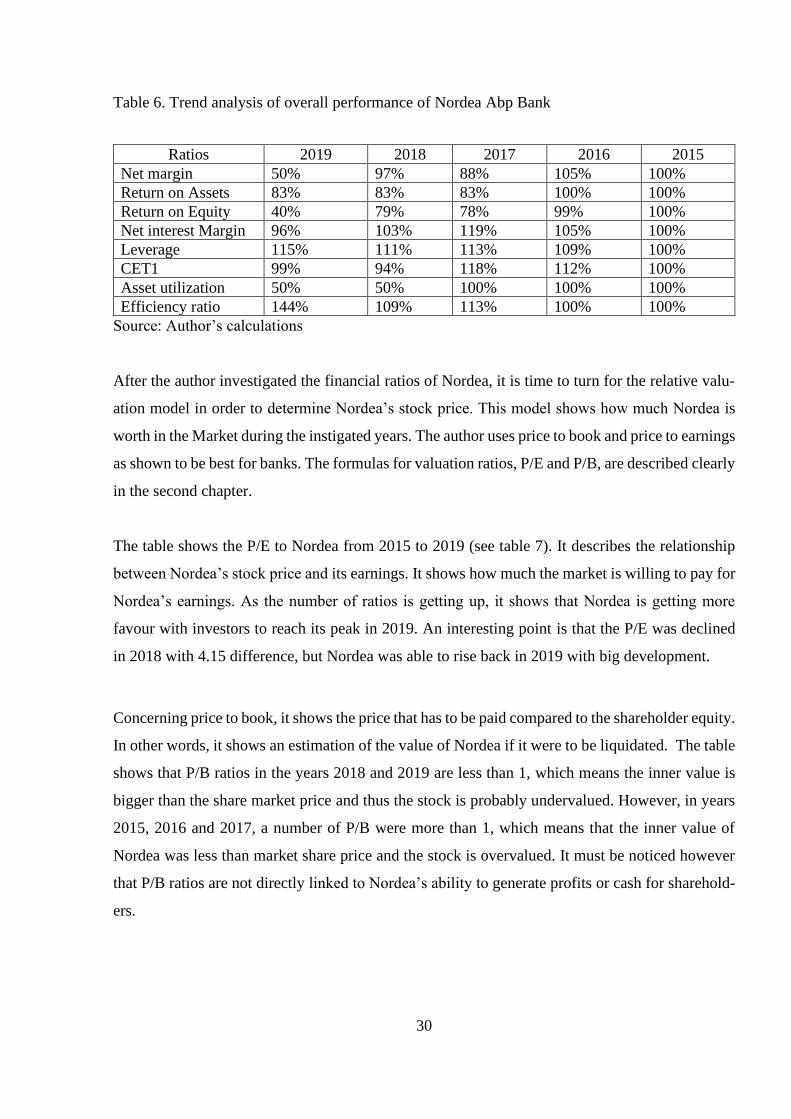
The table of author calculations for trend analysis (see table 6) shows interesting changes in the
financial performance of Nordea. In 2016, Nordea improved its performance in most of its opera-
tions and management. In 2017 and 2018, trend analysis shows that performance was lower in
some areas but is still in the stable range. However, 2019 shows a serious decline in profitability
for about 50% difference.
0.00%
10.00%
20.00%
30.00%
40.00%
50.00%
60.00%
70.00%
80.00%
2019 2018 2017 2016 2015
0%
1%
1%
2%
2%
3%
Asset utilization and Efficiency
Asset utilization ratio Efficiency ratio (r. scale)
30
Table 6. Trend analysis of overall performance of Nordea Abp Bank
Ratios 2019 2018 2017 2016 2015
Net margin 50% 97% 88% 105% 100%
Return on Assets 83% 83% 83% 100% 100%
Return on Equity 40% 79% 78% 99% 100%
Net interest Margin 96% 103% 119% 105% 100%
Leverage 115% 111% 113% 109% 100%
CET1 99% 94% 118% 112% 100%
Asset utilization 50% 50% 100% 100% 100%
Efficiency ratio 144% 109% 113% 100% 100%
Source: Author’s calculations
After the author investigated the financial ratios of Nordea, it is time to turn for the relative valu-
ation model in order to determine Nordea’s stock price. This model shows how much Nordea is
worth in the Market during the instigated years. The author uses price to book and price to earnings
as shown to be best for banks. The formulas for valuation ratios, P/E and P/B, are described clearly
in the second chapter.
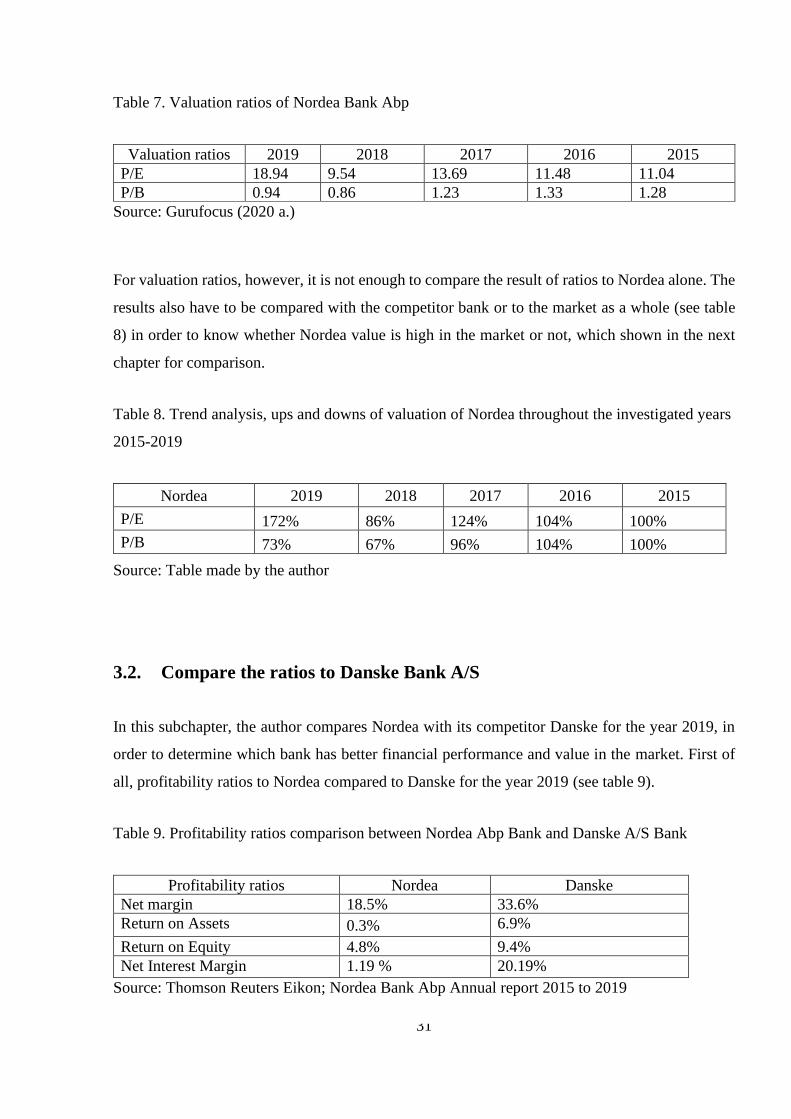
The table shows the P/E to Nordea from 2015 to 2019 (see table 7). It describes the relationship
between Nordea’s stock price and its earnings. It shows how much the market is willing to pay for
Nordea’s earnings. As the number of ratios is getting up, it shows that Nordea is getting more
favour with investors to reach its peak in 2019. An interesting point is that the P/E was declined
in 2018 with 4.15 difference, but Nordea was able to rise back in 2019 with big development.
Concerning price to book, it shows the price that has to be paid compared to the shareholder equity.
In other words, it shows an estimation of the value of Nordea if it were to be liquidated. The table
shows that P/B ratios in the years 2018 and 2019 are less than 1, which means the inner value is
bigger than the share market price and thus the stock is probably undervalued. However, in years
2015, 2016 and 2017, a number of P/B were more than 1, which means that the inner value of
Nordea was less than market share price and the stock is overvalued. It must be noticed however
that P/B ratios are not directly linked to Nordea’s ability to generate profits or cash for sharehold-
ers.
31
Table 7. Valuation ratios of Nordea Bank Abp
Valuation ratios 2019 2018 2017 2016 2015
P/E 18.94 9.54 13.69 11.48 11.04
P/B 0.94 0.86 1.23 1.33 1.28
Source: Gurufocus (2020 a.)
For valuation ratios, however, it is not enough to compare the result of ratios to Nordea alone. The
results also have to be compared with the competitor bank or to the market as a whole (see table
8) in order to know whether Nordea value is high in the market or not, which shown in the next
chapter for comparison.
Table 8. Trend analysis, ups and downs of valuation of Nordea throughout the investigated years
2015-2019
Nordea 2019 2018 2017 2016 2015
P/E 172% 86% 124% 104% 100%
P/B 73% 67% 96% 104% 100%
Source: Table made by the author
3.2. Compare the ratios to Danske Bank A/S
In this subchapter, the author compares Nordea with its competitor Danske for the year 2019, in
order to determine which bank has better financial performance and value in the market. First of
all, profitability ratios to Nordea compared to Danske for the year 2019 (see table 9).
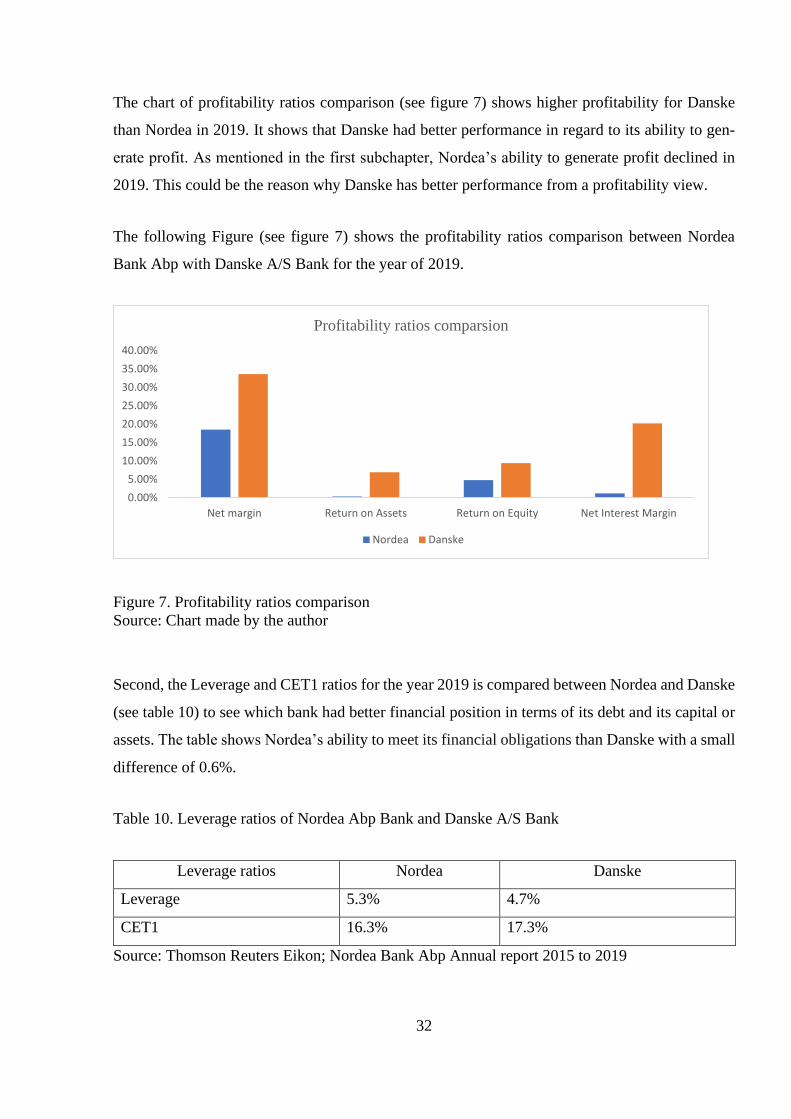
Table 9. Profitability ratios comparison between Nordea Abp Bank and Danske A/S Bank
Profitability ratios Nordea Danske
Net margin 18.5% 33.6%
Return on Assets 0.3% 6.9%
Return on Equity 4.8% 9.4%
Net Interest Margin 1.19 % 20.19%
Source: Thomson Reuters Eikon; Nordea Bank Abp Annual report 2015 to 2019
32
The chart of profitability ratios comparison (see figure 7) shows higher profitability for Danske
than Nordea in 2019. It shows that Danske had better performance in regard to its ability to gen-
erate profit. As mentioned in the first subchapter, Nordea’s ability to generate profit declined in
2019. This could be the reason why Danske has better performance from a profitability view.
The following Figure (see figure 7) shows the profitability ratios comparison between Nordea
Bank Abp with Danske A/S Bank for the year of 2019.
Figure 7. Profitability ratios comparison
Source: Chart made by the author
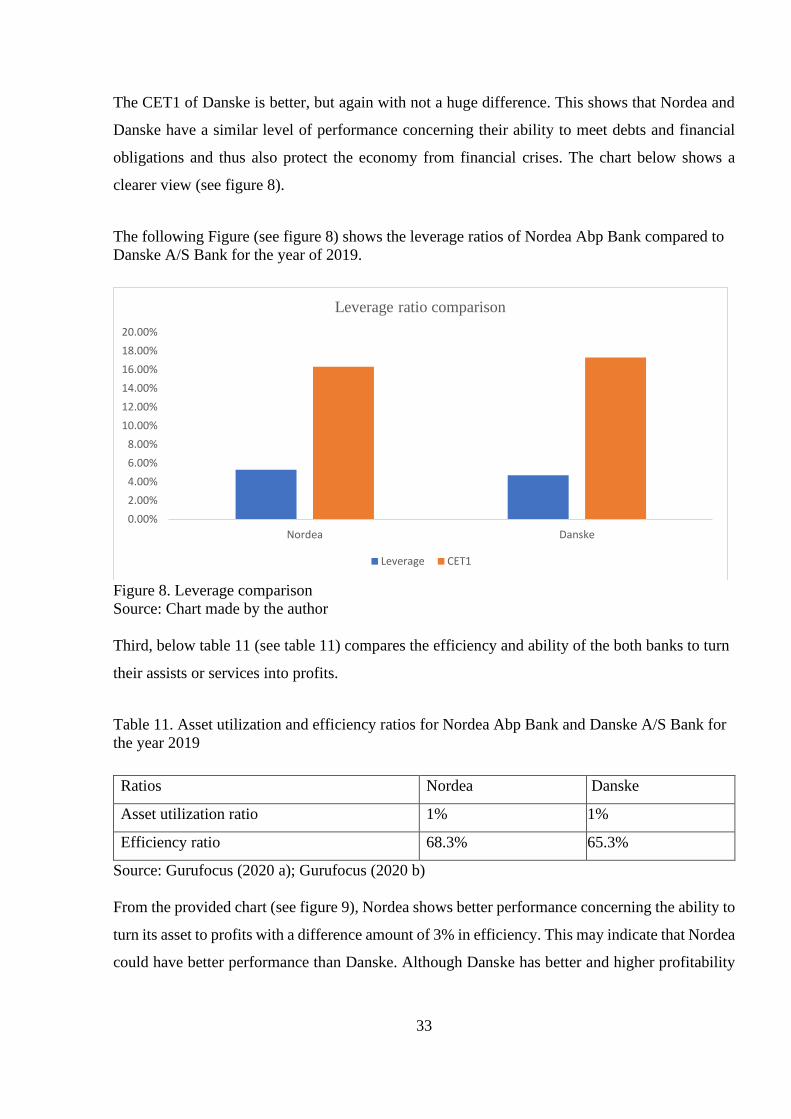
Second, the Leverage and CET1 ratios for the year 2019 is compared between Nordea and Danske
(see table 10) to see which bank had better financial position in terms of its debt and its capital or
assets. The table shows Nordea’s ability to meet its financial obligations than Danske with a small
difference of 0.6%.
Table 10. Leverage ratios of Nordea Abp Bank and Danske A/S Bank
Leverage ratios Nordea Danske
Leverage 5.3% 4.7%
CET1 16.3% 17.3%
Source: Thomson Reuters Eikon; Nordea Bank Abp Annual report 2015 to 2019
0.00%
5.00%
10.00%
15.00%
20.00%
25.00%
30.00%
35.00%
40.00%
Net margin Return on Assets Return on Equity Net Interest Margin
Profitability ratios comparsion
Nordea Danske
33
The CET1 of Danske is better, but again with not a huge difference. This shows that Nordea and
Danske have a similar level of performance concerning their ability to meet debts and financial
obligations and thus also protect the economy from financial crises. The chart below shows a
clearer view (see figure 8).
The following Figure (see figure 8) shows the leverage ratios of Nordea Abp Bank compared to
Danske A/S Bank for the year of 2019.
Figure 8. Leverage comparison
Source: Chart made by the author
Third, below table 11 (see table 11) compares the efficiency and ability of the both banks to turn
their assists or services into profits.
Table 11. Asset utilization and efficiency ratios for Nordea Abp Bank and Danske A/S Bank for
the year 2019
Ratios Nordea Danske
Asset utilization ratio 1% 1%
Efficiency ratio 68.3% 65.3%
Source: Gurufocus (2020 a); Gurufocus (2020 b)
From the provided chart (see figure 9), Nordea shows better performance concerning the ability to
turn its asset to profits with a difference amount of 3% in efficiency. This may indicate that Nordea
could have better performance than Danske. Although Danske has better and higher profitability
0.00%
2.00%
4.00%
6.00%
8.00%
10.00%
12.00%
14.00%
16.00%
18.00%
20.00%
Nordea Danske
Leverage ratio comparison
Leverage CET1
34
ratios, Nordea has little bit more efficiency in accordance with its assets. Asset Utilization ratios
are more specific to indicate the financial health of any company, especially for investors.
Concerning each bank value in the market, the table below (see table 12) shows the comparison
between Nordea and Danske to understand whether the value ratios for Nordea in the previous
subchapter were high or low in the market.
Table 12. Price to earnings and price to book ratios for Nordea Bank Abp and Danske Bank A/S
Bank Nordea Danske
P/E 18.94 14.62
P/B 0.94 0.55
Source: Gurufocus (2020 a); Gurufocus (2020 b)
In accordance with the chart below (see figure 10), Nordea shows higher stock price and worth in
the market than Danske. P/E shows that investors are willing to pay more for one euro of surplus
in Nordea bank than Danske with a 4.2% difference. Furthermore, P/B shows that investors find
Nordea a relatively safer investment than Danske with a difference 0.39%.
3.3. Discussion of the results
The financial ratios analysis to Nordea showed that Nordea’s performance was strong in 2016.
The decline in performance was gradually after 2016 until 2019 but still better than the base year
of 2015. Profitability ratios of Nordea were lowest in 2019. When the author compared profitabil-
ity ratios of Nordea with Danske, results showed that Danske had better performance in regards
with profitability with a big difference from Nordea.
The decline in profitability in 2019 for Nordea, led the author to search beyond the reasons. It is
written in the news that Nordea reviewed its targets in 2019. In this year, Nordea was pinched by
Anti-Money-Laundering compliance costs (Broughton 2019). In 2019, Nordea invested in regu-
latory and systems infrastructure, digital and compliance platforms, and operations to the Nordic
markets in order to have better future developments (Arvopaperi 2019).
35
On the other hand, Nordea shows better performance in efficiency in 2019. Since the base year,
2015, Nordea was able to improve its leverage that shows its well management to meet its financial
obligations as well as be able to protect the economy from crises.
Furthermore, Nordea was able to improve its asset utilizations that shows its better management
year by year. In 2019, Nordea has well ability to turn its assists to profits. Although the ratio of
asset utilization amounted to 0.02%, this does not mean that Nordea had difficulty turning assets
to profits, because when compared to the banking industry, the number is reasonable and not much
different from Danske, which amounted to 0.03%. Based on efficiency ratios, Nordea showed
better performance in 2019 with 20.9% increase than the base year.
When results of leverage and assist utilization were compared with Danske, Nordea showed better
results for the year 2019. It is worth mentioning here that leverage and assists utilization ratios are
more specific than profitability ratios. They are very important for investors.
The results can also explain why Nordea had a better valuation in the market than Danske with a
small difference. The small difference can also imply that Danske is a real competitor to Nordea,
but Nordea still has better performance than Danske. Despite this fact, Nordea still needs to work
in future to improve its profitability performance. It is also expected that the performance is going
to be improved due to the fact that Nordea had several changes in its priorities in 2019, which shall
show development in the next few years.
36
CONCLUSION
The evaluation of the bank financial performance is more complicated and can be misleading in
comparison with any other firm. Banks are evaluated according to their profitability, leverage,
asset utilization and valuation in the stock market. They get profits and been valued by different
factors than any other firms. They are financial institutions, where they get most of their profits by
interests. Therefore, formulas used to banks are not the same as any other business, but there are
selected formulas can be applied to banks, which are more suitable to banks unique operations.
It is also necessary to observe the financial ratios used for a bank from different aspects. For
example, track the ups and downs of financial ratios to a period of time and search for the reasons
that were beyond any drop happened. This trend analysis is important to show whether bank is
developing or going back in its financial performance. It is also a method to highlight the weak
areas for the financial performance of bank in order to develop them in the future.
This thesis aims to investigate the financial performance of Nordea Bank Abp during the years of
2015-2019 and compare it to Danske Bank A/S. Financial ratios of Nordea showed development
in the performance since the base year 2015. Nordea had the best performance in 2016 and its
performance declined gradually in 2017, then 2018 and the lowest was in 2019 in the overall fi-
nancial performance of Nordea.
The reason beyond the decline in the overall performance is referred to the drops in profitability
ratios, although leverage and assets utilization ratios were improving year by year since the base
year, 2015.
As investors are looking more at the ability of bank to meet its liabilities and turn its assets to
profits, Nordea had better valuation year by year. P/E shows that investors are willing to pay more
for one euro of surplus in Nordea bank in 2019 than any other year. Similarly, P/B shows that
investors find Nordea a relatively safer investment in 2019.
In order to know whether financial ratios of Nordea were enough high, results were compared with
Danske as competitor bank. Profitability ratios showed better performance for Danske than
Nordea, while leverage and asset utilization showed better results in favor of Nordea.
37
In this regard, the author decided to accept the hypothesis and confirm that it was successfully
proved. Nordea Abp Bank has better financial performance as compared to Danske A/S Bank
based on financial ratios.
The author referred the reason for approving the hypothesis to the fact that despite of profitability
ratios are important to evaluate a bank performance, these ratios cannot be compared isolated from
other ratios, which are more specific and give more insights to the performance of banks. Asset
utilization ratios and leverage ratios, as well as valuation ratios, showed that Nordea had better
performance than Danske.
This means that Nordea is better welling to manage its operations and that Nordea is better able to
meet its financial obligations, and also better able to turn its assets to profit. Therefore, Nordea
was also better valued in the stock than Danske.
It must be noticed that Nordea and Danske had close valuation ratios and that is why Danske is
considered to be a strong competitor to Nordea. Despite this fact, results showed that Nordea has
better valuation in the market.
Reasons for profitability decline in Nordea may be referred to investments made by Nordea to
change its priority in 2019 and to its long-term plan for 2022. Nordea put better regimes to fight
money laundering, invested more in the Nordic region, as well as its investment in digital trans-
formation for future development.
All these changes can lead also to higher expenses for the year 2019 and thus lower profit than the
previous years. These reasons, on other hands, can also lead investors to trust more the investment
in Nordea than Danske and thus have better valuation ratios. Thus, Nordea Abp Bank stronger
than its competitor Danske A/S in most areas.
Comparing Nordea to its competitor Danske gave a better insight into the financial position of
Nordea in the stock. However, a suggestion for further studies could be to also include in the study
of other banks at the Nordic level, such as SEB and DNB. This could give a better rank to the level
of the financial performance of Nordea.
38
REFERENCES
Arvopaperi (2019). Nordea: Half-Year Financial Report 2019. Retrieved from https://www.ar-
vopaperi.fi/porssitiedotteet/nordea-half-year-financial-report-2019/24fdf78f-a69f-453c-8b30-
2d5e8ac1f5e7, 17 July 2019.
Basu, C. (2019). Four Basic Types of Financial Ratios Used to Measure a Company's Performance. Small Business – Chron.
Berglund, C. Ekelund, B. (2019). Corporate Scandal: The Reputational Impact on the Financial
Performance: An event study of Danske Bank's money laundering scandal.
BLOKHIN, A. (2020). How Do You Analyze a Bank's Financial Statements. Retrieved from
https://www.investopedia.com/ask/answers/042915/how-does-analyzing-banks-financial-state-
ments-differ-companies-other-sectors.asp, 13 March 2020.
Borad, S. B. (2019). Leverage Ratios. Retrieved from https://efinancemanagement.com/invest-
ment-decisions/leverage-ratios.
Broughton, K. (2019). Nordic Banks Pinched by Anti-Money-Laundering Compliance Costs. The
Wall Street Journal.
Buriak, A. (2014). Performance in banking: theory and practice peculiarities. Central European
Journal for Science and Research, Forthcoming.
Carlson, R. (2019). Categories of Financial Ratios: Financial ratios provide an economic portrait
of a business. Retrieved from https://www.thebalancesmb.com/categories-of-financial-ratios-
393217, 2 April 2020.
CFI. (s.a. a). Financial Statements for Banks: How banks differ from typical businesses. Corporate
finance institute (database). [Online] Retrieved from https://corporatefinanceinstitute.com/re-
sources/knowledge/accounting/financial-statements-for-banks/, 1 April 2020.
CFI. (s.a. b). Bank-Specific Ratios. Corporate finance institute (database). [Online] Retrieved
from https://corporatefinanceinstitute.com/resources/knowledge/finance/bank-specific-ratios/, 1
April 2020.
CFI. (s.a. c). Types of Valuation Multiples: The different types of multiples used in analysis.
Corporate finance institute (database). [Online] Retrieved from https://corporatefinanceinsti-
tute.com/resources/knowledge/valuation/types-of-valuation-multiples/, 2 April 2020.
CFI. (s.a. d). Asset Turnover Ratio. Corporate finance institute (database). [Online] Retrieved
from https://corporatefinanceinstitute.com/resources/knowledge/finance/asset-turnover-ratio/, 1
April 2020.
Chen, J. (2019). Cross-Sectional Analysis. Retrieved from https://www.in-
vestopedia.com/terms/c/cross_sectional_analysis.asp, 27 March 2020.
https://corporatefinanceinstitute.com/resources/knowledge/accounting/financial-statements-for-banks/
39
Cindori, S. Slovic, J. (2017). Identifying Money Laundering in Business Operations as a Factor
for Estimating Risk. Economic and Social Development: Book of Proceedings, 138-146.
Danske Bank A/S (2020). Danske Bank has announced its financial results for 2019. Retrieved
from https://www.globenewswire.com/news-release/2020/02/05/1979999/0/en/Danske-Bank-de-
livered-a-net-profit-of-DKK-15-1-billion-for-2019-The-result-was-as-expected-and-affected-by-
non-recurring-items-Return-on-shareholders-equity-of-9-6-New-targets-for-.html, 17 April 2020.
ECB. (2010). Beyond roe-how to measure bank performance. Appendix to the report on EU bank-
ing structures.
FinanceMalta (2014). Financial Institutions. Re-trieved from https://iconfinance-
malta.blob.core.windows.net/libx-128-public/Tags/Banking%20and%20Financial%20Institu-
tions/FM%20Fact%20Sheet%20-%20Financial%20Institutions.pdf, 11 March 2020.
Grant, M. (2020). Common Equity Tier 1. Retrieved from https://www.in-
vestopedia.com/terms/c/common-equity-tier-1-cet1.asp, 30 March 2020.
Gurufocus (2020 a). Nordea Bank Abp PE Ratio. Retrieved from https://www.guru-
focus.com/term/pettm/OTCPK:NBNKF/PE-Ratio/Nordea%20Bank%20Abp, 13 March 2020.
Gurufocus (2020 b). Danske Bank A/S. Retrieved from https://www.gurufocus.com/term/turno-
ver/DNSKF/Asset-Turnover/Danske%20Bank%20A/S, 28 March 2020.
Hayes, A. (2019). Balance Sheet. Retrieved from https://www.investopedia.com/terms/b/balance-
sheet.asp, 28 February 2020.
Helhel, Y. (2015). Evaluating the performance of the commercial banks in Georgia. Research
Journal of Finance and Accounting, 5, 146-156.
Henry, E. Robinson, T. R. Van Greuning, J. H. (2012). Financial analysis techniques. Financial
reporting & analysis, 327-385.
HJS Recovery (2019, February 12). 5 Alarmingly Common Reasons Stable Businesses Become
Insolvent. [Blog post]. Retrieved from https://www.hjsrecovery.co.uk/5-alarmingly-common-rea-
sons-stable-businesses-become-insolvent/, 15 April 2020.
HORTON, M. (2020). What Are the 9 Major Types of Financial Institution. Retrieved from
https://www.investopedia.com/ask/answers/061615/what-are-major-categories-financial-institu-
tions-and-what-are-their-primary-roles.asp, 23 March 2020.
Jacobson, A. (2018). The Ratio Comparison Approach. Retrieved from https://www.ajjacob-
son.us/tracking-portfolio/the-ratio-comparison-approach.html, 13 March 2020.
Kauranen, A., Ahlander , J. (2019). Nordea handled about $790 million in suspicious transactions:
Finnish TV. Retrieved from https://www.reuters.com/article/us-nordea-bnk-moneylaunder-
ing/nordea-handled-about-790-million-in-suspicious-transactions-finnish-tv-idUSKCN1QL11S,
1 April 2020.
40
Kouassi-Zessia, Zikoh Jean Luc M. P. (2009). Strategic valuation of Danske Bank. Copenhagen:
M. Sc. Applied Economics and Finance.
Luukkanen, P. (2018). How Nordea Life Assurance’s evolution allows it to succeed in the life
insurance sector. Retrieved from https://www.worldfinance.com/wealth-management/evolving-
to-succeed-in-the-life-insurance-sector Nordea Life Assurance Finland Ltd.
Maverick J. B. (2019). Key Financial Ratios to Analyze Retail Banks. Retrieved from
https://www.investopedia.com/articles/active-trading/082615/key-financial-ratios-analyze-retail-
banks.asp, 28 March 2020.
Meriläinen, V. (2015). Profitability analysis of the Finnish banking sector in 2010-2014.
Milne, R. (2019). Nordea hit by new money-laundering allegations. The Financial Times Limited
2020. Nordic and Baltic Correspondent.
Moneycontrol (2019). Explainer | Why ‘leverage ratio’ is so important for banks. Retrieved from
https://www.moneycontrol.com/news/business/moneycontrol-research/explainer-why-leverage-
ratio-is-so-important-for-banks-4079521.html, 23 March 2020.
Murphy, C. H. (2019). Financial Statements. Re-trieved from https://www.in-
vestopedia.com/terms/f/financial-statements.asp, 05 March 2020.
Nordea (s.a. a). History. Retrieved from https://www.nordea.com/en/about-nordea/who-we-
are/our-history/, 15 March 2020
Nordea (s.a. b). News and press. Retrieved from https://www.nordea.com/en/press-and-
news/news-and-press-releases/press-releases/2019/09-22-20h00-nordea-co-founder-of-ground-
breaking-unep-fi-and-banking-sector-sustainability-initiative.html, 17 March 2020.
Nordea (s.a. c). Nordea at a glance. https://www.nordea.com/en/about-nordea/who-we-are/nordea-
at-a-glance/, 23 April 2020.
Nordea Bank AB (s.a.). ISSUANCE PROGRAMME FOR WARRANTS AND CERTIFICATES.
NORDEA BANK FINLAND ABP. Nordea.
Nordea Bank Abp Annual report 2015 to 2019. Group annual reports. Retrieved from
https://www.nordea.com/fi/investor-relations/raportteja-ja-esityksia/group-annual-reports/, 20
March 2020.
Norrestad, F. (2019). Total assets of Nordea 2014-2018. Retrieved from https://www.sta-
tista.com/statistics/747381/total-assets-of
nordea/?fbclid=IwAR25fE7l6I10UQ79ljx5EPjmB_UsHgb51PxRY9qc2y-adZHh2Us0kzdPZw8,
13 April 2020.
Office of the Federal Register (2018). Title 12, Banks and Banking, Parts 600-899. IntraWEB,
LLC and Claitor's Law Publishing, P. 132, 135.
Oklahoma State Department of Education (2016). STUDENT MODULE 3.1 FINANCIAL SER-
VICE PROVIDER Retrieved from https://www.jenksps.org/pages/uploaded_files/Mod-
ule_3.1.pdf, 18 March 2020.
41
Petersons, N., Nielsen, M. S. (2010). Valuation of Nordea: Valuation of Nordea with special focus
on Nordea‟s activities in Latvia. (StudentThesis) Copenhagen Business School.
Rees, B. (1995). Financial Analysis. (2nd ed.) University of Strathclyde, England. Prentice Hall
Staff, M. F. (2019). Using the Price-to-Book Ratio to Analyze Stocks. Motley Fool's Knowledge
Center.
Satyanarayana, J. (1985). The Working of the Andhra Pradesh State Road Transport Corporation.
Concept Publishing Company.
Tarawneh, M. (2006). A comparison of financial performance in the banking sector: Some evi-
dence from Omani commercial banks. – International Research Journal of Finance and Econom-
ics, 3, 3, 101-112.
Thomson Reuters Eikon
Wagner, H. (2014). Analyzing a bank's financial statements. Retrieved from http://www.timeless-
investor.com/wp-content/uploads/2016/07/Analyzing-A-Bank-_-Investopedia.pdf, 7 February
2016.
Wirnkar, A. Tanko, M. (2008) CAMELs and Banks Performance Evaluation: The Way Forward.
SSRN Electronic Journal, 7.
42
APPENDIX
Appendix 1. Non-exclusive licence
I Sindy Fouad Tutah
1. Give Tallinn University of Technology a permission (non-exclusive licence) to use free of
charge my creation FINANCIAL RATIOS AS A TOOL TO EVALUATE NORDEA BANK ABP
PERFORMANCE, supervised by Kalle Ahi,
1.1. to reproduce with the purpose of keeping and publishing electronically, including for the pur-
pose of supplementing the digital collection of TalTech library until the copyright expires;
1.2. to make available to the public through the web environment of Tallinn University of Tech-
nology, including through the digital collection of TalTech library until the copyright expires.
2. I am aware that the author will also retain the rights provided in Section 1.
3. I confirm that by granting the non-exclusive licence no infringement is committed to the third
persons’ intellectual property rights or to the rights arising from the personal data protection act
and other legislation.