FINANCIAL RATIOS AND ANALYSIS OF TATA MOTORS
15
2020 EPRA JEBR | EPRA International Journal of Economic and Business Review | www.eprajournals.com 17 Research Paper EPRA International Journal of Economic and Business Review-Peer Reviewed Journal Volume - 8, Issue -10, October 2020 |e-ISSN: 2347 - 9671| p- ISSN: 2349 – 0187 SJIF Impact Factor (2020): 8.107|| ISI Value: 1.433|| Journal DOI URL: https://doi.org/10.36713/epra2012 FINANCIAL RATIOS AND ANALYSIS OF TATA MOTORS ABSTRACT Article DOI URL: https://doi.org/10.36713/epra5462 The paper investigates the financial health of Tata Motors in comparison with the Maruti Suzuki, Ashok Leyland, and SML Isuzu & Force motors for the period 2006-2016 on the aggregate market level data. Debt to total assets is approx. 60-70% which is above the average. Debt to equity ratio is moving between 1.5 to 2.2 which is bad for any company. In the case of the liquidity ratios which are very low relatively to industry. Further, earning per share, price to earning ratio, earning power & market value to book value all these ratios are below and its moving around zero. Overall Tata motors financial ratios indicates that its financial conditions are under performance. KEYWORDS: Tata Motors; Financial Ratios INTRODUCTION FINANCIAL RATIO ANALYSIS • A ratio is an arithmetical relationship between two figures. • Financial ratio analysis is a study of ratios between various items or groups of items in financial statements. Following are the important ratios: 1. LIQUIDITY RATIO • Liquidity refers to the ability of a firm to meet its obligations in the short run, usually one year. • L.R. are generally based on the relationship between current assets and current liabilities. • The important liquidity ratios are: Current ratio &Acid test ratio. Current ratio: The current ratio is an important financial ratio which measures the ability of the firm to meet its current liabilities — current assets get converted into cash in the operational cycle of the firm and provide the funds needed to pay current liabilities. Apparently, the higher the current ratio, the greater the short-term solvency. The current ratio is defined as: Acid-test ratio: The acid-test ratio is also known the quick ratio. It is a fairly stringent measure of liquidity. It is based on those current assets which are highly liquid- inventories are excluded from the numerator of this ratio because inventories are deemed to be the least liquid component of current assets. 1 MD Qamar Azam 1 Department of Economics, Jamia Millia Islamia( Central University), New Delhi-110025 2 MD Abrar Alam 2 Research Analyst, Ex- Assistant Manager, Vision RI Connexion Services, Sonipat, Haryana.
-
Upload
khangminh22 -
Category
Documents
-
view
1 -
download
0
Transcript of FINANCIAL RATIOS AND ANALYSIS OF TATA MOTORS

2020 EPRA JEBR | EPRA International Journal of Economic and Business Review | www.eprajournals.com 17
Research Paper
EPRA International Journal of Economic and Business Review-Peer Reviewed Journal
Volume - 8, Issue -10, October 2020 |e-ISSN: 2347 - 9671| p- ISSN: 2349 – 0187
SJIF Impact Factor (2020): 8.107|| ISI Value: 1.433|| Journal DOI URL: https://doi.org/10.36713/epra2012
FINANCIAL RATIOS AND ANALYSIS OF TATA MOTORS
ABSTRACT Article DOI URL: https://doi.org/10.36713/epra5462
The paper investigates the financial health of Tata Motors in comparison with the Maruti Suzuki, Ashok Leyland, and
SML Isuzu & Force motors for the period 2006-2016 on the aggregate market level data. Debt to total assets is approx.
60-70% which is above the average. Debt to equity ratio is moving between 1.5 to 2.2 which is bad for any company. In
the case of the liquidity ratios which are very low relatively to industry. Further, earning per share, price to earning ratio,
earning power & market value to book value all these ratios are below and its moving around zero. Overall Tata motors
financial ratios indicates that its financial conditions are under performance.
KEYWORDS: Tata Motors; Financial Ratios
INTRODUCTION FINANCIAL RATIO ANALYSIS
• A ratio is an arithmetical relationship between two figures.
• Financial ratio analysis is a study of ratios between various items or groups of items in financial statements.
Following are the important ratios:
1. LIQUIDITY RATIO • Liquidity refers to the ability of a firm to
meet its obligations in the short run, usually one year.
• L.R. are generally based on the relationship between current assets and current liabilities.
• The important liquidity ratios are:
Current ratio &Acid test ratio. Current ratio: The current ratio is an important financial ratio which measures the ability of the firm to meet its current liabilities — current assets get converted into cash in the operational cycle of the firm and provide the funds needed to pay current liabilities. Apparently, the higher the current ratio, the greater the short-term solvency.
The current ratio is defined as:
Acid-test ratio: The acid-test ratio is also known the quick ratio. It is a fairly stringent measure of liquidity. It is based on those current assets which are highly liquid-inventories are excluded from the numerator of this ratio because inventories are deemed to be the least liquid component of current assets.
1MD Qamar Azam
1Department of Economics, Jamia Millia Islamia(
Central University), New Delhi-110025
2MD Abrar Alam
2Research Analyst, Ex- Assistant Manager, Vision RI
Connexion Services, Sonipat, Haryana.
SJIF Impact Factor (2020):8.107||DOI:10.36713/epra2012|Volume–8|Issue-10|October2020| e- ISSN: 2347-9671| p- ISSN: 2349-0187
2020 EPRA JEBR | EPRA International Journal of Economic and Business Review | www.eprajournals.com 18
The acid test ratio is defined as:
Where quick assets are defined as current assets excluding inventories)
2. Leverage ratio Leverage ratio refers to the use of debt finance. While debt capital is a cheaper source of finance, it is also a riskier source of finance. Leverage ratio helps in assessing the risk arising from the use of debt capital. Two types of ratios are commonly used to analyse financial leverage they are as follows:
a. Debt-equity ratio b. Interest coverage ratio
Debt equity ratio The debt equity ratio shows the relative contributions of creditors and owners. It is defined as:
In general, the lower the debt-equity ratio, the higher the degree of protection enjoyed by the creditors.
INTRESET COVERAGE RATIOS The interest coverage ratio is a debt ratio and profitability ratio used to determine how easily a company can pay interest on outstanding debt. The interest coverage ratio may be calculated by dividing a company's earnings before interest and taxes (EBIT) during a given period by the amount a company must pay in interest on its debts during the same period. The method for calculating interest coverage ratio may be represented with the following formula:
INVENTORY TURNOVER RATIO The inventory turnover or stock turnover ratio measures how fast the inventory is moving through the firm and generating sales. The inventory turnover ratio is deemed to reflect the efficiency of inventory management. The higher the ratio, the more efficient the management of inventories and vice versa. However, this may not always be true. A high inventory turnover ratio may be caused by a low level of inventory which may result in frequent stock outs and loss of sales and customer goodwill. It may be calculated as:
ACCOUNT RECEIVABLE TURNOVER RATIO This ratio shows how many times sundry debtors or trade receivables turn over during the year. It is defined as:
The receivables figure used in the denominator of this ratio is generally the receivables figure at the end of the period. However, when sales are highly seasonal or when sales growth is high, the year-end receivables figure is somewhat inappropriate. When sales are highly seasonal, the average of the receivables figure at the end of each month or each season may be used and when sales growth is high the average of the beginning and ending receivables balances may be used.
NO. OF DAYS SALES IN ACCOUNT RECEIVABLES Measures, on average, how many days it takes to
collect an account receivable. It is defined as:
PROFITABILITY RATIOS PROFIT MARGIN RATIOS Profit margin ratio measures a company‟s ability to generate earnings relative to sales, assets and equity. This ratio assesses the ability of a company to generate earnings, profits and cash flows relative to relative to some metric, often the amount of money invested. They highlight how effectively the profitability of a company is being managed.
• Common examples of profitability ratios include return on sales, return on investment, return on equity, return on capital employed (ROCE), cash return on capital invested (CROCI), gross profit margin and net profit margin. All of these ratios indicate how well a company is performing at generating profits or revenues relative to a certain metric.
Profit margin ratio is of two types which as follows:
a. Gross profit margin ratio b. Net profit margin ratio
GROSS PROFIT MARGINS This ratio shows the margin left after meeting manufacturing costs. It measures the efficiency of production as well as pricing. To analyse the factors underlying the variation in gross profit margin, the proportion of various elements of cost (labour, materials and manufacturing overheads) to sales may be studied in detail. It is defined as

SJIF Impact Factor (2020):8.107||DOI:10.36713/epra2012|Volume–8|Issue-10|October2020| e- ISSN: 2347-9671| p- ISSN: 2349-0187
2020 EPRA JEBR | EPRA International Journal of Economic and Business Review | www.eprajournals.com 19
NET PROFIT MARGINS This ratio shows the earnings left for shareholders (both equity and preference) as a percentage of net sales. It measures the overall efficiency of production, administration, selling, financing, pricing, and tax management. It may be calculated as:
5. Valuation ratio Valuation ratios are ratios computed on the basis of parameters in the financial statements of a company and used to estimate the value of a companies. These can be used to easily compare companies and determine which a better investment is. A particular firm‟s valuation ratio can be compared with that of the industry‟s or with other companies to determine its investment attractiveness. It is mainly categorised in to three types which as follows:
a. Yield b. Price-earning ratio c. Market price to book value ratio
Price-earning ratio: It is the most popular financial statistics in stock market. It is commonly referred to as a summary measure which primarily reflects the following factors: growth prospects, risk characteristics, shareholders‟ orientation, cooperate image, and degree of liquidity.
Price-earning ratio may be calculated as follows:
The market price per share may be the price prevailing on a certain day, or preferably the average price over a period of time. The earnings per share is simply the profit after tax divided by the number of outstanding equity shares.
Market price to book value ratio: It is a financial ratio used to compare a company's current market price to its book value. It is also sometimes known as a Market-to-Book ratio. This ratio also gives some idea of whether an investor is paying too much for what would be left if the company went bankrupt immediately. For companies in distress, the book value is usually calculated without the intangible assets that would have no resale value. In such cases, P/B should also be calculated on a "diluted" basis, because stock options may well vest on sale of the company or change of control or firing of management.
Market Value to Book Value Ratio is defined as:
In a very important sense, this ratio reflects the contribution of a firm to the net wealth of the society. When this ratio exceeds 1 it means that the firm has contributed to the creation of net wealth in the society — if this ratio is, say, 2, the firm has created a net wealth of one rupee for every rupee invested in it. When this ratio is equal to 1, it implies that the firm has neither contributed to nor detracted from the net wealth of the society.
TATA MOTORS Tata Motors Limited, a USD 42 billion organisation, is a leading global automobile manufacturer of cars, utility vehicles, buses, trucks and defence vehicles.
Tata Motors is part of the USD 100 billion Tata group founded by Jamsetji Tata in 1868. Sustainability and the spirit of „giving back to society‟ is a core philosophy and good corporate citizenship is strongly embedded in our DNA. Tata Motors is India‟s largest automobile company.
Empirical Analysis:
FINANCIAL RATIOS OF TATA MOTORS
YEAR Mar 07 Mar 08 Mar 09 Mar 10 Mar 11 Mar 12 Mar 13 Mar 14 Mar 15 Mar 16
LQUIDITY RATIO
CURRENT RATIO 1.099 0.796 0.540 0.519 0.577 0.618 0.480 0.359 0.421 0.603
ACID TEST RATIO 0.828 0.610 0.416 0.387 0.373 0.411 0.269 0.153 0.185 0.327
ACCOUNT RECEVABLE TURNOVER 35.601 30.078 19.107 17.924 18.855 20.450 19.780 22.597 31.139 31.585 No. of days sale in ac. Receivable 10.253 12.135 19.102 20.364 19.358 17.849 18.453 16.153 11.722 11.556
Inventory turn over 8.390 9.446 8.099 8.017 8.233 8.803 7.887 6.298 5.684 10.248
LEVERAGE RATIO
DEBT TO EQUITY 1.795 2.336 2.099 2.452 1.708 1.778 1.727 1.593 2.360 1.344

SJIF Impact Factor (2020):8.107||DOI:10.36713/epra2012|Volume–8|Issue-10|October2020| e- ISSN: 2347-9671| p- ISSN: 2349-0187
2020 EPRA JEBR | EPRA International Journal of Economic and Business Review | www.eprajournals.com 20
DEBT TO TOTAL ASSETS 0.642 0.700 0.677 0.710 0.631 0.640 0.633 0.614 0.702 0.573 TOTAL CAPITALIZATION 0.311 0.401 0.394 0.488 0.431 0.393 0.384 0.380 0.497 0.355
COVERAGE RATIO
INTREST COVERAGE RATIO 7.602 7.054 2.505 3.270 2.587 2.100 1.126 0.233 -1.466 1.102
EQUITY RATIO 0.358 0.300 0.323 0.290 0.369 0.360 0.367 0.386 0.298 0.427 NET INCOME TO NET SALES 0.072 0.071 0.040 0.063 0.038 0.023 0.007 0.010 -0.131 0.006
ROE 0.308 0.276 0.100 0.165 0.104 0.063 0.016 0.017 -0.278 0.013
PROFTABILITY RATIO
GROSS PROFIT MARGIN 0.226 0.236 0.185 0.226 0.259 0.267 0.267 0.204 0.240 0.407
NET PROFIT MARGIN 0.072 0.071 0.040 0.063 0.038 0.023 0.007 0.010 -0.131 0.006 RETURN ON INVESTMENT 0.100 0.078 0.026 0.044 0.033 0.023 0.006 0.007 -0.095 0.004
RETURN ON EQUITY 0.279 0.259 0.082 0.151 0.091 0.063 0.016 0.017 -0.319 0.010
EARNING PER SHARE 49.650 52.630 19.780 39.260 6.060 3.900 0.930 1.030 -14.720 0.680 PRICE TO EARNING RATIO 2.711 2.191 1.804 3.809 40.736 69.944 282.462 382.650 -36.965 568.088
EARNING POWER 0.154 0.115 0.044 0.080 0.066 0.047 0.030 0.006 -0.047 0.031
MV/BV 0.020 0.015 0.003 0.010 0.012 0.014 0.014 0.021 0.037 0.017
FINANCIAL RATIOS OF AUTOMOBILE INDUSTRY
AVERAGE RATIO OF 5 AUTOMOBILE COMPANIES
RATIO 2006-07 2007-08 2008-09 2009-10 2010-11 2011-12 2012-13 2013-14 2014-15 2015-16
CR 1.16 1.72 1.07 0.97 1.33 1.19 1.09 1.10 1.03 1.04
QR 0.83 1.42 0.75 0.65 0.93 0.82 0.74 0.68 0.65 0.61
AcRT 16.30 17.49 23.62 29.35 45.30 52.33 48.05 63.67 60.62 47.77
NDSAcRT 44.37 35.80 40.66 33.39 25.72 23.05 25.90 27.70 20.67 18.80
IT 7.48 9.30 7.40 7.95 8.11 8.05 7.77 7.32 8.04 9.34
D-E 2.17 1.99 1.83 1.37 1.17 1.27 1.28 1.14 1.22 0.94
D-TA 0.63 0.57 0.57 0.52 0.49 0.52 0.52 0.49 0.49 0.45
TCR 0.55 0.45 0.65 0.49 0.46 0.44 0.44 0.45 0.46 0.41
ICR 21.14 8.20 25.25 13.11 26.91 141.02 275.45 100.35 171.95 260.98
GPM 23.77% 24.87% 24.11% 27.36% 27.93% 27.00% 26.85% 26.21% 28.35% 33.11%
NPM 7.35% 7.09% 5.54% 10.44% 10.67% 8.35% 8.40% 7.89% 6.71% 10.39%
ROI 119.44% 150.77% 71.12% 82.32% 95.25% 101.37% 100.63% 99.74% 106.45% 117.95%
ROE 24.09% 22.97% 4.33% 16.52% 18.48% 16.75% 16.38% 15.28% 12.20% 20.23%
EPS 27.006 29.756 2.206 24.43 24.84 27.17 37.07 56.046 79.054 108.554
MV/BV 1.05 0.80 0.36 0.55 0.82 0.97 0.87 1.22 2.66 2.26
PER 10.20 7.80 7.14 13.25 22.10 29.84 69.69 134.17 28.07 139.77
EP 0.12 0.13 0.06 0.11 0.13 0.11 0.12 0.12 0.14 0.18

SJIF Impact Factor (2020):8.107||DOI:10.36713/epra2012|Volume–8|Issue-10|October2020| e- ISSN: 2347-9671| p- ISSN: 2349-0187
2020 EPRA JEBR | EPRA International Journal of Economic and Business Review | www.eprajournals.com 21
1. We have calculated the above average ratios considering 5 automobile companies namely:Tata motors, Maruti Suzuki, Ashok Leyland, SML Isuzu & Force motors.
COMPARISON OF TATA MOTORS FINANCIAL RATIOS WITH INDUSTRIES RATIOS 1. CURRENT RATIO: it gives an idea of company‟s ability to pay back its liability.Here Tata motors C.R. is highest in 2006-07 period after that it is decreasing and it is under 1.It indicates that its
liability is greater than its assets. So, it is not in
good financial health.
2. ACID - TEST RATIO: It indicates the
company short term liquidity and measures company‟sability to meet its short-term obligations with most liquid assets. Higher the
acid-test ratio should be for healthy company. In the case of TATA MOTORS, acid test ratio is below 1after 2007.
3. ACCOUNT RECEIVABLE TURN OVER: this ratio measure how many times a company converts its receivables into cash.
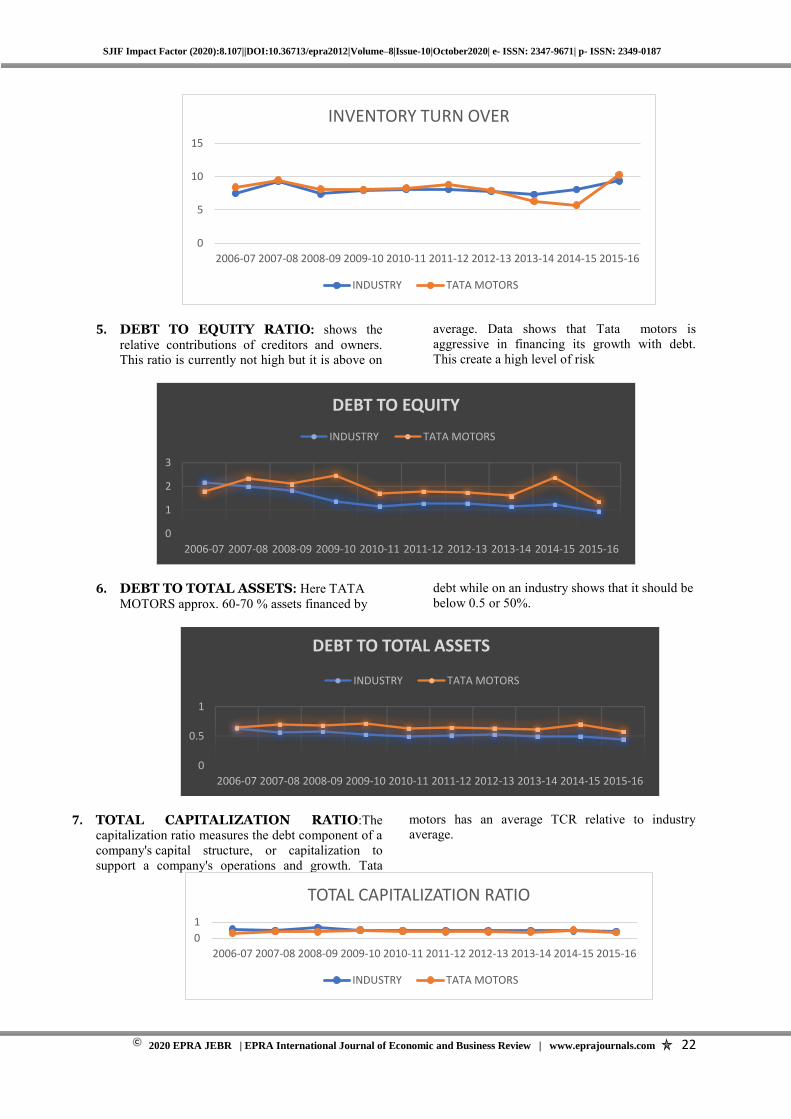
4. INVENTORY TURNOVER RATIO: Indicates the effectiveness of the inventory management
practices of the firm. In this case it is moving with industry.
0
1
2
CURRENT RATIO
INDUSTRY TATA MOTORS
0
0.5
1
1.5
2006-07 2007-08 2008-09 2009-10 2010-11 2011-12 2012-13 2013-14 2014-15 2015-16
ACID-EST RATIO
INDUSTRY TATA MOTORS
0
100
2006-07 2007-08 2008-09 2009-10 2010-11 2011-12 2012-13 2013-14 2014-15 2015-16
AC.RECEVABLE TURN OVER
INDUSTRY TATA MOTORS
SJIF Impact Factor (2020):8.107||DOI:10.36713/epra2012|Volume–8|Issue-10|October2020| e- ISSN: 2347-9671| p- ISSN: 2349-0187
2020 EPRA JEBR | EPRA International Journal of Economic and Business Review | www.eprajournals.com 22
5. DEBT TO EQUITY RATIO: shows the relative contributions of creditors and owners. This ratio is currently not high but it is above on
average. Data shows that Tata motors is aggressive in financing its growth with debt. This create a high level of risk
6. DEBT TO TOTAL ASSETS: Here TATA MOTORS approx. 60-70 % assets financed by
debt while on an industry shows that it should be below 0.5 or 50%.
7. TOTAL CAPITALIZATION RATIO:The capitalization ratio measures the debt component of a company's capital structure, or capitalization to support a company's operations and growth. Tata
motors has an average TCR relative to industry average.
0
5
10
15
2006-07 2007-08 2008-09 2009-10 2010-11 2011-12 2012-13 2013-14 2014-15 2015-16
INVENTORY TURN OVER
INDUSTRY TATA MOTORS
0
1
2
3
2006-07 2007-08 2008-09 2009-10 2010-11 2011-12 2012-13 2013-14 2014-15 2015-16
DEBT TO EQUITY
INDUSTRY TATA MOTORS
0
0.5
1
2006-07 2007-08 2008-09 2009-10 2010-11 2011-12 2012-13 2013-14 2014-15 2015-16
DEBT TO TOTAL ASSETS
INDUSTRY TATA MOTORS
0
1
2006-07 2007-08 2008-09 2009-10 2010-11 2011-12 2012-13 2013-14 2014-15 2015-16
TOTAL CAPITALIZATION RATIO
INDUSTRY TATA MOTORS

SJIF Impact Factor (2020):8.107||DOI:10.36713/epra2012|Volume–8|Issue-10|October2020| e- ISSN: 2347-9671| p- ISSN: 2349-0187
2020 EPRA JEBR | EPRA International Journal of Economic and Business Review | www.eprajournals.com 23
8. PROFITABILITY RATIOS: a. GROSS PROFIT MARGIN:
b. NET PROFIT MARGIN:
c. RETURN ON EQUITY
00.20.40.6
GROSS PROFIT MARGIN
INDUSTRY TATA MOTORS
-0.2
-0.1
0
0.1
0.2
2 0 0 6 -0 7
2 0 0 7 -0 8
2 0 0 8 -0 9
2 0 0 9 -1 0
2 0 1 0 -1 1
2 0 1 1 -1 2
2 0 1 2 -1 3
2 0 1 3 -1 4
2 0 1 4 -1 5
2 0 1 5 -1 6
NET PROFIT MARGIN
INDUSTRY TATA MOTORS
-0.4
-0.2
0
0.2
0.4
2006-07 2007-08 2008-09 2009-10 2010-11 2011-12 2012-13 2013-14 2014-15 2015-16
RETURN ON EQUITY
INDUSTRY TATA MOTORS

SJIF Impact Factor (2020):8.107||DOI:10.36713/epra2012|Volume–8|Issue-10|October2020| e- ISSN: 2347-9671| p- ISSN: 2349-0187
2020 EPRA JEBR | EPRA International Journal of Economic and Business Review | www.eprajournals.com 24
d. RETURN ON INVESTMENT:
e. EARNING PER SHARE:
f. PRICE TO EARNING RATIOS:
-0.2
0
0.2
0.4
0.6
0.8
1
1.2
1.4
1.6
2006-07 2007-08 2008-09 2009-10 2010-11 2011-12 2012-13 2013-14 2014-15 2015-16
RETURN ON INVESTMENT
INDUSTRY TATA MOTORS
-40
-20
0
20
40
60
80
100
120
2006-07 2007-08 2008-09 2009-10 2010-11 2011-12 2012-13 2013-14 2014-15 2015-16
EARNING PER SHARE
INDUSTRY TATA MOTORS
-200
0
200
400
600
2006-072007-082008-092009-102010-112011-122012-132013-142014-152015-16
PE RATIO
INDUSTRY TATA MOTORS
SJIF Impact Factor (2020):8.107||DOI:10.36713/epra2012|Volume–8|Issue-10|October2020| e- ISSN: 2347-9671| p- ISSN: 2349-0187
2020 EPRA JEBR | EPRA International Journal of Economic and Business Review | www.eprajournals.com 25
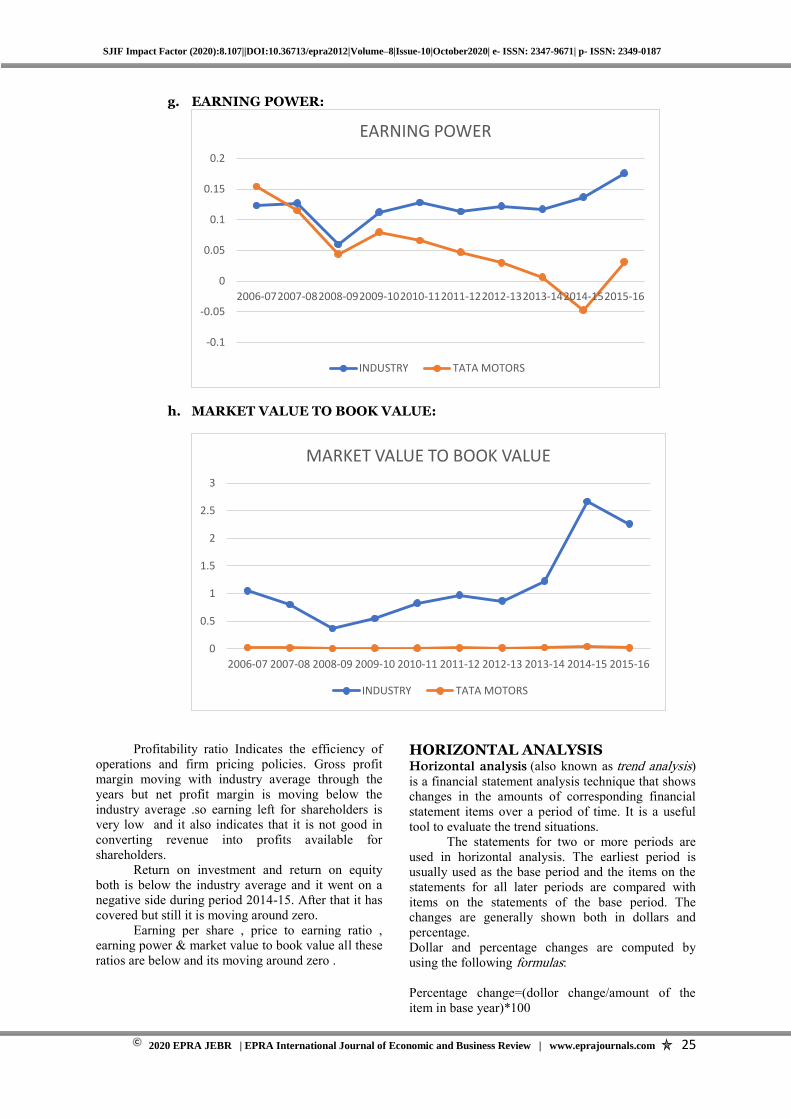
g. EARNING POWER:
h. MARKET VALUE TO BOOK VALUE:
Profitability ratio Indicates the efficiency of operations and firm pricing policies. Gross profit margin moving with industry average through the years but net profit margin is moving below the industry average .so earning left for shareholders is very low and it also indicates that it is not good in converting revenue into profits available for shareholders.
Return on investment and return on equity both is below the industry average and it went on a negative side during period 2014-15. After that it has covered but still it is moving around zero.
Earning per share , price to earning ratio , earning power & market value to book value all these ratios are below and its moving around zero .
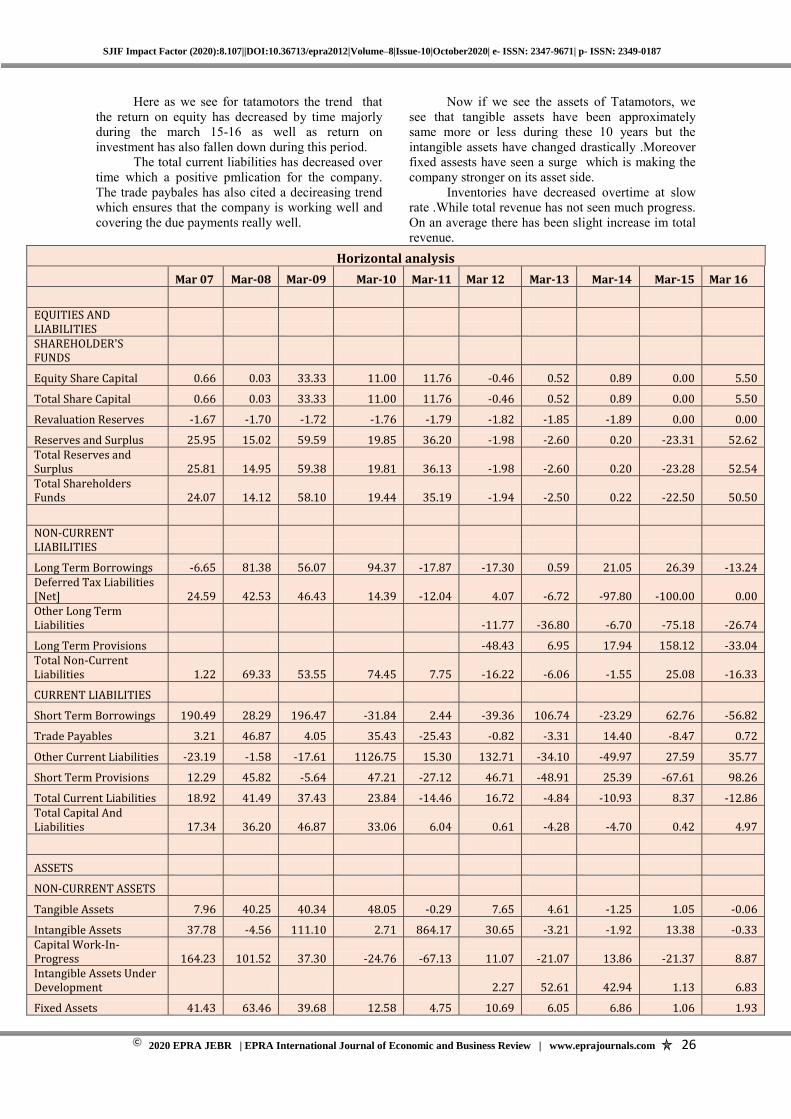
HORIZONTAL ANALYSIS Horizontal analysis (also known as trend analysis) is a financial statement analysis technique that shows changes in the amounts of corresponding financial statement items over a period of time. It is a useful tool to evaluate the trend situations.
The statements for two or more periods are used in horizontal analysis. The earliest period is usually used as the base period and the items on the statements for all later periods are compared with items on the statements of the base period. The changes are generally shown both in dollars and percentage. Dollar and percentage changes are computed by using the following formulas: Percentage change=(dollor change/amount of the item in base year)*100
-0.1
-0.05
0
0.05
0.1
0.15
0.2
2006-072007-082008-092009-102010-112011-122012-132013-142014-152015-16
EARNING POWER
INDUSTRY TATA MOTORS
0
0.5
1
1.5
2
2.5
3
2006-07 2007-08 2008-09 2009-10 2010-11 2011-12 2012-13 2013-14 2014-15 2015-16
MARKET VALUE TO BOOK VALUE
INDUSTRY TATA MOTORS
SJIF Impact Factor (2020):8.107||DOI:10.36713/epra2012|Volume–8|Issue-10|October2020| e- ISSN: 2347-9671| p- ISSN: 2349-0187
2020 EPRA JEBR | EPRA International Journal of Economic and Business Review | www.eprajournals.com 26
Here as we see for tatamotors the trend that the return on equity has decreased by time majorly during the march 15-16 as well as return on investment has also fallen down during this period.
The total current liabilities has decreased over time which a positive pmlication for the company. The trade paybales has also cited a decireasing trend which ensures that the company is working well and covering the due payments really well.
Now if we see the assets of Tatamotors, we see that tangible assets have been approximately same more or less during these 10 years but the intangible assets have changed drastically .Moreover fixed assests have seen a surge which is making the company stronger on its asset side.
Inventories have decreased overtime at slow rate .While total revenue has not seen much progress. On an average there has been slight increase im total revenue.
Horizontal analysis
Mar 07 Mar-08 Mar-09 Mar-10 Mar-11 Mar 12 Mar-13 Mar-14 Mar-15 Mar 16
EQUITIES AND LIABILITIES SHAREHOLDER'S FUNDS
Equity Share Capital 0.66 0.03 33.33 11.00 11.76 -0.46 0.52 0.89 0.00 5.50
Total Share Capital 0.66 0.03 33.33 11.00 11.76 -0.46 0.52 0.89 0.00 5.50
Revaluation Reserves -1.67 -1.70 -1.72 -1.76 -1.79 -1.82 -1.85 -1.89 0.00 0.00
Reserves and Surplus 25.95 15.02 59.59 19.85 36.20 -1.98 -2.60 0.20 -23.31 52.62 Total Reserves and Surplus 25.81 14.95 59.38 19.81 36.13 -1.98 -2.60 0.20 -23.28 52.54 Total Shareholders Funds 24.07 14.12 58.10 19.44 35.19 -1.94 -2.50 0.22 -22.50 50.50
NON-CURRENT LIABILITIES
Long Term Borrowings -6.65 81.38 56.07 94.37 -17.87 -17.30 0.59 21.05 26.39 -13.24 Deferred Tax Liabilities [Net] 24.59 42.53 46.43 14.39 -12.04 4.07 -6.72 -97.80 -100.00 0.00 Other Long Term Liabilities -11.77 -36.80 -6.70 -75.18 -26.74
Long Term Provisions -48.43 6.95 17.94 158.12 -33.04 Total Non-Current Liabilities 1.22 69.33 53.55 74.45 7.75 -16.22 -6.06 -1.55 25.08 -16.33
CURRENT LIABILITIES
Short Term Borrowings 190.49 28.29 196.47 -31.84 2.44 -39.36 106.74 -23.29 62.76 -56.82
Trade Payables 3.21 46.87 4.05 35.43 -25.43 -0.82 -3.31 14.40 -8.47 0.72
Other Current Liabilities -23.19 -1.58 -17.61 1126.75 15.30 132.71 -34.10 -49.97 27.59 35.77
Short Term Provisions 12.29 45.82 -5.64 47.21 -27.12 46.71 -48.91 25.39 -67.61 98.26
Total Current Liabilities 18.92 41.49 37.43 23.84 -14.46 16.72 -4.84 -10.93 8.37 -12.86 Total Capital And Liabilities 17.34 36.20 46.87 33.06 6.04 0.61 -4.28 -4.70 0.42 4.97
ASSETS
NON-CURRENT ASSETS
Tangible Assets 7.96 40.25 40.34 48.05 -0.29 7.65 4.61 -1.25 1.05 -0.06
Intangible Assets 37.78 -4.56 111.10 2.71 864.17 30.65 -3.21 -1.92 13.38 -0.33 Capital Work-In-Progress 164.23 101.52 37.30 -24.76 -67.13 11.07 -21.07 13.86 -21.37 8.87 Intangible Assets Under Development 2.27 52.61 42.94 1.13 6.83
Fixed Assets 41.43 63.46 39.68 12.58 4.75 10.69 6.05 6.86 1.06 1.93

SJIF Impact Factor (2020):8.107||DOI:10.36713/epra2012|Volume–8|Issue-10|October2020| e- ISSN: 2347-9671| p- ISSN: 2349-0187
2020 EPRA JEBR | EPRA International Journal of Economic and Business Review | www.eprajournals.com 27
Non-Current Investments 22.92 98.23 164.10 72.24 0.90 -20.56 1.50 1.02 -7.58 0.05 Deferred Tax Assets [Net] 17.15 125.06 188.06 -30.87 -100.00 0.00 0.00 0.00 0.00 0.00 Long Term Loans And Advances 0.00 0.00 0.00 0.00 0.00 1.70 2.50 -18.37 -17.64 -1.68 Other Non-Current Assets -28.54 -40.04 -66.61 -100.00 0.00 188.23 -6.07 31.31 41.84 -22.13 Total Non-Current Assets 35.17 74.05 82.13 37.79 9.24 -6.18 3.70 2.25 -3.78 0.85 Foreign Currency Monetary Item Translation Difference A/C
CURRENT ASSETS
Current Investments 0.00 2911.93 -31.95 -94.28 -79.95 8485.56
Inventories 24.29 -3.16 -7.93 31.65 32.56 17.91 -2.90 -13.30 24.32 2.08
Trade Receivables 9.28 44.56 37.54 53.80 8.82 4.05 -32.87 -33.08 -8.40 40.73 Cash And Cash Equivalents -26.14 189.96 -52.37 53.55 38.54 -24.21 -74.86 -51.14 317.75 -52.15 Short Term Loans And Advances 3.75 -26.49 7.46 -6.46 -58.48 1.14 -18.15 -20.12 28.65 13.97
OtherCurrentAssets 0.00 0.00 0.00 0.00 0.00 1.39 -8.07 4.60 7.31 116.06
Total Current Assets 4.97 2.39 -6.67 19.05 -4.91 24.98 -26.09 -33.51 27.21 24.88
Total Assets 17.34 36.20 46.87 33.06 6.04 0.61 -4.28 -4.70 0.42 4.97
Profit & Loss account of Tata Motors
0.94 0.94 0.92 0.92 0.91 0.90 0.89 0.88 0.88 0.87
INCOME Revenue From Operations [Gross] 32.35 6.54 -13.84 33.76 33.47 15.64 -16.96 -23.61 4.66 18.16 Less: Excise/Sevice Tax/Other Levies 30.09 -1.58 -33.94 -2.69 46.26 19.99 -7.33 -23.81 -6.93 32.43 Revenue From Operations 32.73 7.89 -10.80 37.85 32.46 15.26 -17.84 -23.59 5.85 16.88 Other Operating Revenues 0.00 0.00 0.00 0.00 0.00 29.23 30.39 -2.94 6.06 4.35 Total Operating Revenues 32.73 7.89 -10.80 37.85 33.12 15.33 -17.57 -23.41 5.85 16.74
Other Income 30.15 -34.13 25.49 32.52 -65.35 35.73 263.75 83.56 -50.92 13.37
Total Revenue 32.63 6.20 -9.90 37.67 29.83 15.51 -14.63 -18.64 0.14 16.57
EXPENSES Cost Of Materials Consumed 34.95 4.64 -13.72 25.34 27.54 25.27 -19.62 -24.78 8.11 9.74 Purchase Of Stock-In Trade 46.10 9.52 36.43 107.00 63.15 -12.62 -8.85 -13.89 14.17 -8.78 Operating And Direct Expenses 30.04 3.67 -4.23 48.80 -89.05 65.86 81.75 0.70 2.04 -2.94 Changes In Inventories Of FG,WIP And Stock-In Trade 36.11 -111.58 488.04 -354.84 -41.61 76.12 -76.98 -358.86 -336.42 -102.61 Employee Benefit Expenses 19.26 12.90 0.44 18.35 24.94 17.32 5.41 1.43 7.43 -2.09

SJIF Impact Factor (2020):8.107||DOI:10.36713/epra2012|Volume–8|Issue-10|October2020| e- ISSN: 2347-9671| p- ISSN: 2349-0187
2020 EPRA JEBR | EPRA International Journal of Economic and Business Review | www.eprajournals.com 28
Finance Costs 32.84 9.17 58.29 84.99 11.03 -11.93 13.88 -3.62 20.50 -8.10 Depreciation And Amortisation Expenses 12.54 11.26 34.07 18.22 31.62 18.08 13.12 13.90 25.74 -5.74 Miscellaneous Expenses Written Off 15.23 -24.31 -20.48 181.47 -100.00 0.00 0.00 0.00 0.00 0.00
Other Expenses 31.98 1.53 6.24 40.17 117.88 24.74 -7.40 -10.22 15.64 -0.48 Less: Amounts Transfer To Capital Accounts 0.00 0.00 0.00 0.00 0.00 10.94 5.14 5.80 10.87 -7.56
Total Expenses 33.42 6.83 -5.04 32.06 33.77 17.24 -12.64 -16.55 8.13 5.37
Profit/Loss Before Exceptional, ExtraOrdinary Items And Tax 25.32 0.10 -60.65 179.11 -17.17 -17.81 -69.31 -182.21 634.86 -114.38
Exceptional Items 0.00 0.00 0.00 0.00 0.00 297.80 -28.88 29.71 -25.21 -10.04
Profit/Loss Before Tax 25.32 0.10 -60.65 179.11 -22.37 -38.95 -86.96 -686.41 287.48 -103.78 Tax Expenses-Continued Operations
Current Tax 31.00 -70.80 -100.00 0.00 0.00 -33.43 -78.41 -374.88 -121.73 -337.06 Less: MAT Credit Entitlement 0.00 0.00 0.00 0.00 0.00 -32.25 -78.56 -1281.47 6.20 -100.00
Deferred Tax 24.67 126.58 -100.62 -23678.40 -36.16 -73.89 -229.72 1406.84 -97.38 -109.31
Other Direct Taxes -63.20 -2.10 114.29 -100.00 0.00 0.00 0.00 0.00 0.00 0.00
Total Tax Expenses 25.80 -17.08 -97.72 4615.68 -34.74 -74.32 -228.42 972.13 -156.18 -110.97 Profit/Loss After Tax And Before ExtraOrdinary Items 25.15 6.03 -50.65 123.73 -19.12 -31.44 -75.70 10.84 -1516.64 -104.94 Profit/Loss From Continuing Operations 25.15 6.04 -49.90 120.36 -19.12 -31.44 -75.70 10.84 -1516.64 -104.94 Profit/Loss For The Period 25.15 6.04 -49.90 120.36 -19.12 -31.44 -75.70 10.84 -1516.64 -104.94
Costs of goods sold 30.75 6.39 -4.79 30.84 27.54 14.04 -17.60 -16.82 1.09 -8.93
gross profit 40.04 13.05 -30.22 68.76 52.18 19.02 -17.47 -41.46 24.41 97.95
VERTICAL ANALYSIS Vertical analysis (also known as common-size analysis) is a popular method of financial statement analysis that shows each item on a statement as a percentage of a base figure within the statement.
To conduct a vertical analysis of balance sheet, the total of assets and the total of liabilities and stockholders‟ equity are generally used as base figures. All individual assets (or groups of assets if condensed form balance sheet is used) are shown as a percentage of total assets. The current liabilities, long term debts and equities are shown as a percentage of the total liabilities and stockholders‟ equity.
In a vertical analysis, the percentage is computed by using the following formula:
Percentage change=
Where base item is total liability
and capital in case of liability and for assets side total assets
The vertical analysis also has the same results as the horizontal. The current liabilities have
decreased slightly over time.While the percentage
of profit has decreased a lot over time. This is a
serious issue for Tata motors. This has been
mainly due the decreasing net sales. Drop in
demand for JLR cars in China and weak Indian
operations seen as reasons for the tepid
quarterly result

SJIF Impact Factor (2020):8.107||DOI:10.36713/epra2012|Volume–8|Issue-10|October2020| e- ISSN: 2347-9671| p- ISSN: 2349-0187
2020 EPRA JEBR | EPRA International Journal of Economic and Business Review | www.eprajournals.com 29
VERTICAL ANALYSIS
Mar 07 Mar-08 Mar-09 Mar-10 Mar-11 Mar 12 Mar-13 Mar-14 Mar-15 Mar 16 EQUITIES AND LIABILITIES SHAREHOLDER'S FUNDS
Equity Share Capital 2.01 1.47 1.34 1.12 1.18 1.16 1.22 1.29 1.29 1.30
Total Share Capital 2.01 1.47 1.34 1.12 1.18 1.16 1.22 1.29 1.29 1.30
Revaluation Reserves 0.14 0.10 0.07 0.05 0.04 0.04 0.04 0.05 0.05 0.04
Reserves and Surplus 33.64 28.41 30.87 27.80 35.71 34.79 35.40 37.22 28.42 41.33 Total Reserves and Surplus 33.77 28.50 30.93 27.85 35.75 34.83 35.44 37.26 28.47 41.37 Total Shareholders Funds 35.78 29.98 32.27 28.97 36.93 36.00 36.67 38.56 29.76 42.67
NON-CURRENT
LIABILITIES Long Term
Borrowings 11.16 14.86 15.79 23.06 17.86 14.68 15.43 19.60 24.67 20.39 Deferred Tax Liabilities [Net] 5.02 5.25 5.24 4.50 3.73 3.86 3.76 0.09 0.00 0.00 Other Long Term Liabilities 0.00 0.00 0.00 0.00 4.10 3.59 2.37 2.32 0.57 0.40
Long Term Provisions 0.00 0.00 0.00 0.00 2.31 1.19 1.32 1.64 4.21 2.69 Total Non-Current Liabilities 16.17 20.11 21.02 27.56 28.01 23.32 22.89 23.65 29.45 23.48
CURRENT LIABILITIES Short Term
Borrowings 9.73 9.16 18.49 9.47 9.15 5.52 11.91 9.59 15.54 6.39
Trade Payables 29.76 32.09 22.73 23.14 16.27 16.04 16.20 19.45 17.73 17.01 Other Current Liabilities 1.46 1.05 0.59 5.45 5.92 13.70 9.43 4.95 6.29 8.14
Short Term Provisions 7.11 7.61 4.89 5.41 3.72 5.42 2.89 3.81 1.23 2.32 Total Current Liabilities 48.05 49.91 46.71 43.47 35.06 40.68 40.44 37.80 40.79 33.86 Total Capital And Liabilities 100.00 100.00 100.00 100.00 100.00 100.00 100.00 100.00 100.00 100.00
ASSETS NON-CURRENT
ASSETS
Tangible Assets 19.56 20.14 19.25 21.42 20.14 21.55 23.55 24.40 24.55 23.37
Intangible Assets 0.65 0.46 0.66 0.51 4.62 6.00 6.07 6.25 7.05 6.70 Capital Work-In-Progress 13.09 19.37 18.11 10.24 3.17 3.50 2.89 3.45 2.70 2.80 Intangible Assets Under Development 0.00 0.00 0.00 0.00 3.84 3.90 6.22 9.33 9.39 9.56
Fixed Assets 33.30 39.97 38.01 32.16 31.77 34.95 38.72 43.42 43.70 42.43 Non-Current Investments 12.90 18.78 33.77 43.71 41.59 32.84 34.82 36.91 33.97 32.38 Deferred Tax Assets [Net] 0.92 1.52 2.98 1.55 0.00 0.00 0.00 0.00 0.00 0.00 Long Term Loans And Advances 0.00 0.00 0.00 0.00 6.33 6.40 6.85 5.87 4.81 4.51 Other Non-Current Assets 0.05 0.02 0.01 0.00 0.06 0.18 0.18 0.25 0.35 0.26
Total Non-Current 47.18 60.29 74.77 77.42 79.75 74.37 80.58 86.45 82.83 79.58
SJIF Impact Factor (2020):8.107||DOI:10.36713/epra2012|Volume–8|Issue-10|October2020| e- ISSN: 2347-9671| p- ISSN: 2349-0187
2020 EPRA JEBR | EPRA International Journal of Economic and Business Review | www.eprajournals.com 30
Assets
Foreign Currency Monetary Item Translation Difference A/C 0.00 0.00 0.00 0.00 0.00 0.47 0.00 0.00 0.00 0.00
CURRENT ASSETS
Current Investments 0.00 0.00 0.00 0.00 0.16 4.75 3.38 0.20 0.04 3.31
Inventories 13.03 9.26 5.81 5.74 7.18 8.42 8.54 7.77 9.62 9.35
Trade Receivables 4.07 4.32 4.05 4.68 4.80 4.97 3.48 2.45 2.23 2.99 Cash And Cash Equivalents 4.31 9.17 2.97 3.43 4.48 3.38 0.89 0.45 1.89 0.86 Short Term Loans And Advances 31.42 16.96 12.41 8.72 3.42 3.43 2.94 2.46 3.15 3.42
OtherCurrentAssets 0.00 0.00 0.00 0.00 0.21 0.21 0.20 0.22 0.23 0.48
Total Current Assets 52.82 39.71 25.23 22.58 20.25 25.15 19.42 13.55 17.17 20.42
Total Assets 100.00 100.00 100.00 100.00 100.00 100.00 100.00 100.00 100.00 100.00
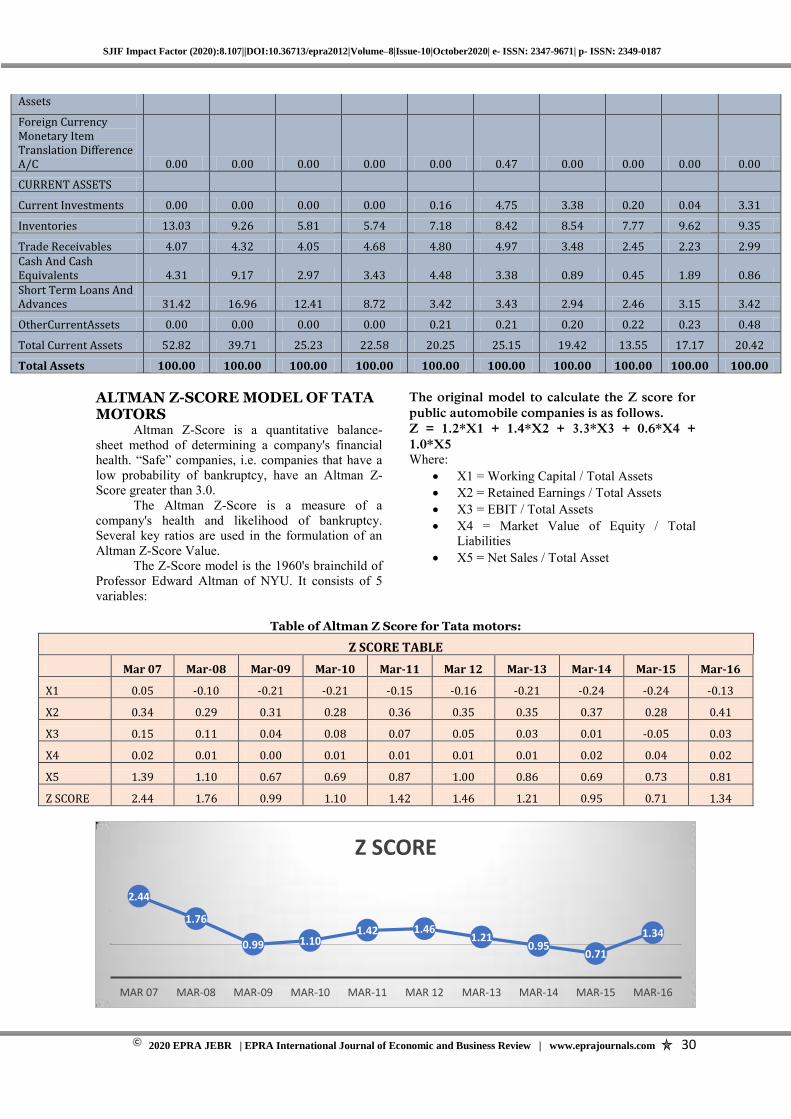
ALTMAN Z-SCORE MODEL OF TATA MOTORS
Altman Z-Score is a quantitative balance-sheet method of determining a company's financial health. “Safe” companies, i.e. companies that have a low probability of bankruptcy, have an Altman Z-Score greater than 3.0.
The Altman Z-Score is a measure of a company's health and likelihood of bankruptcy. Several key ratios are used in the formulation of an Altman Z-Score Value.
The Z-Score model is the 1960's brainchild of Professor Edward Altman of NYU. It consists of 5 variables:
The original model to calculate the Z score for
public automobile companies is as follows.
Z = 1.2*X1 + 1.4*X2 + 3.3*X3 + 0.6*X4 +
1.0*X5 Where:
X1 = Working Capital / Total Assets
X2 = Retained Earnings / Total Assets
X3 = EBIT / Total Assets
X4 = Market Value of Equity / Total Liabilities
X5 = Net Sales / Total Asset
Table of Altman Z Score for Tata motors:
Z SCORE TABLE
Mar 07 Mar-08 Mar-09 Mar-10 Mar-11 Mar 12 Mar-13 Mar-14 Mar-15 Mar-16
X1 0.05 -0.10 -0.21 -0.21 -0.15 -0.16 -0.21 -0.24 -0.24 -0.13
X2 0.34 0.29 0.31 0.28 0.36 0.35 0.35 0.37 0.28 0.41
X3 0.15 0.11 0.04 0.08 0.07 0.05 0.03 0.01 -0.05 0.03
X4 0.02 0.01 0.00 0.01 0.01 0.01 0.01 0.02 0.04 0.02
X5 1.39 1.10 0.67 0.69 0.87 1.00 0.86 0.69 0.73 0.81
Z SCORE 2.44 1.76 0.99 1.10 1.42 1.46 1.21 0.95 0.71 1.34
2.44
1.76
0.99 1.10 1.42 1.46
1.21 0.95
0.71
1.34
MAR 07 MAR-08 MAR-09 MAR-10 MAR-11 MAR 12 MAR-13 MAR-14 MAR-15 MAR-16
Z SCORE
SJIF Impact Factor (2020):8.107||DOI:10.36713/epra2012|Volume–8|Issue-10|October2020| e- ISSN: 2347-9671| p- ISSN: 2349-0187
2020 EPRA JEBR | EPRA International Journal of Economic and Business Review | www.eprajournals.com 31
Here its X1 (Working capital/total assets) ratios shows negative except only in 2006-07. it means major part of its working capital is financed by debt. Proper credit policy or collection of overdue on time would increase this ratio.
The company is able to maintain it's retained earnings. According to the result of X2, the company is able to generate and retain its profit out of its total assets.
X3 indicates the company's ability to generate profit out of its total assets. But the company has shown a decline trend from 2008-2009.
X4 shows the company's market value to overcome its liabilities. The ideal number is 1. Tata Motors X2 ratio is above 1. it showed an increasing trend and after that a sudden dip with market in period 2008-09 maked.
Analyzing X5 ratio, Tata Motors was not able to utilize its fixed assets fully after 2008-2009 to 20015-16.
When Z is 3.0 or more, the firm is most likely safe based on the financial data. However, be careful to double check as fraud, economic downturns and other factors could cause unexpected reversals.
When Z is 2.7 to 3.0, the company is probably safe from bankruptcy, but this is in the grey area and caution should be taken.
When Z is 1.8 to 2.7,. This is the lower portion of the grey area and a dramatic turnaround of the company is needed.
If a company is generating lower than 1.8, serious studies must be performed to ensure the company can survive.
CONCLUSION Overall Z score of Tata motors is lies between
0.71 to 2.44, lowest in 2015. Company needs serious studies. We can say that its main reason is company's working capital to total assets is negative during the periods. Its all profitability ratios are under the average and negative during the years. Debt to total assets is approx. 60-70% which is above the average. Debt to equity ratio is moving between 1.5 to 2.2 which is bad for any company. In the case of the liquidity ratios which are very low relatively to industry. On an average tata motors financial ratios indicates that its financial conditions are under performance.
REFERENCES
1. Money control 2. The financial express 3. Wikipedia 4. http://www.tatamotors.com