High voltage induction motors Technical catalog for IEC motors
Upload
khangminh22Category
view
0download
0
ˆ200GNal5oj%DyCqQTŠ200GNal5oj%DyCqQT
762654 FS 1TATA MOTORS LTDFORM 20-F
31-Jul-2014 13:45 ESTHTMHKG
RR Donnelley ProFile HKR narrr0dc 5*ESS 0C
RRWIN-XENP13811.5.15
fs_pg001
Page 1 of 1
As filed with the Securities and Exchange Commission on July 31, 2014
UNITED STATES SECURITIES AND EXCHANGE COMMISSION
WASHINGTON, D.C. 20549
FORM 20-F
OR
For the Fiscal year ended March 31, 2014
OR
For the transition period from to
Date of event requiring this shell company report
Commission file number: 001-32294
TATA MOTORS LIMITED (Exact name of Registrant as specified in its charter)
Not applicable (Translation of Registrant’s name into English)
H.K. Sethna Tel.: +91 22 6665 7219
Facsimile: +91 22 6665 7260 Email:[email protected]
Address: Bombay House
24, Homi Mody Street Mumbai 400 001, India
(Name, Telephone, Facsimile number, Email and Address of company contact person)
� REGISTRATION STATEMENT PURSUANT TO SECTION 12(b) OR 12(g) OF THE SECURITIES EXCHANGE ACT OF 1934
⌧ ANNUAL REPORT PURSUANT TO SECTION 13 OR 15(d) OF THE SECURITIES EXCHANGE ACT OF 1934
� TRANSITION REPORT PURSUANT TO SECTION 13 OR 15(d) OF THE SECURITIES EXCHANGE ACT OF 1934
� SHELL COMPANY REPORT PURSUANT TO SECTION 13 OR 15(d) OF THE SECURITIES EXCHANGE ACT OF 1934
Republic of India
Bombay House 24, Homi Mody Street Mumbai 400 001, India
(Jurisdiction of incorporation or organization) (Address of principal executive offices)

ˆ200GNal5oj%Vh5qQYŠ200GNal5oj%Vh5qQY
762654 FS 2TATA MOTORS LTDFORM 20-F
31-Jul-2014 17:26 ESTHTMHKG
RR Donnelley ProFile HKR arumr0dc 2*ESS 0C
WCRFBU-MWE-XN0511.5.15
Page 1 of 1
Securities registered or to be registered pursuant to Section 12(b) of the Act:
Securities registered or to be registered pursuant to Section 12(g) of the Act:
None (Title of Class)
Securities for which there is a reporting obligation pursuant to Section 15(d) of the Act:
None (Title of Class)
Indicate the number of outstanding shares of each of the issuer’s classes of capital or common stock as of the close of the period covered by the annual report. — 2,736,713,122 Ordinary Shares and 481,966,945 ‘A’ Ordinary Shares, including 581,630,185 Ordinary Shares represented by 116,321,835 American Depositary Shares (ADS) outstanding as of March 31, 2014. (Each ADS now represents five Ordinary Shares).
Indicate by check mark if the registrant is a well-known seasoned issuer, as defined in Rule 405 of the Securities Act. ⌧ Yes � No
If this report is an annual or transition report, indicate by check mark if the registrant is not required to file reports pursuant to Section 13 or 15(d) of the Securities Exchange Act of 1934. � Yes ⌧ No
Indicate by check mark whether the registrant: (1) has filed all reports required to be filed by Section 13 or 15(d) of the Securities Exchange Act of 1934 during the preceding 12 months (or for such shorter period that the registrant was required to file such reports), and (2) has been subject to such filing requirements for the past 90 days. ⌧ Yes � No
Indicate by check mark whether the registrant has submitted electronically and posted on its corporate Web site, if any, every Interactive Data File required to be submitted and posted pursuant to Rule 405 of Regulation S-T (§232.405 of this chapter) during the preceding 12 months (or for such shorter period that the registrant was required to submit and post such files). � Yes � No
Indicate by check mark whether the registrant is a large accelerated filer, an accelerated filer, or a non-accelerated filer. See definition of “accelerated filer and large accelerated filer” in Rule 12b-2 of the Exchange Act. (Check one):
Large accelerated filer ⌧ Accelerated filer � Non-accelerated filer �
Indicate by check mark which basis of accounting the registrant has used to prepare the financial statements included in this filing.
If “Other” has been checked in response to the previous question, indicate by check mark which financial statement item the registrant has elected to follow. Item 17 � Item 18 �
If this is an annual report, indicate by check mark whether the registrant is a shell company (as defined in Rule 12b-2 of the Exchange Act). � Yes ⌧ No
Title of each class Name of each exchange on which registered Ordinary Shares, par value Rs.2 per share * The New York Stock Exchange, Inc
U.S. GAAP �
International Financial Reporting Standards as issued by the International Accounting Standards Board ⌧
Other �
* Not for trading, but only in connection with listed American Depositary Shares, each representing five shares of common stock.

ˆ200GNal5ojnvYKSQsŠ200GNal5ojnvYKSQs
762654 ROM 1TATA MOTORS LTDFORM 20-F
25-Jul-2014 12:43 ESTHTMHKG
RR Donnelley ProFile HKR dommj0dc 2*ESS 0C
LANFBU-MWE-XN2111.5.15
Page 1 of 1
In this annual report on Form 20-F:
i
• References to “we”, “our” and “us” are to Tata Motors Limited and its consolidated subsidiaries, except as the context
otherwise requires;
• References to “dollar”, “US dollar” and “US$” are to the lawful currency of the United States of America; references to “rupees” and “Rs.” are to the lawful currency of India; references to “JPY” are to the lawful currency of Japan; references to “GBP” are to the lawful currency of the United Kingdom; references to “Euro” are to the lawful currency of States of European union; references to “Russian Ruble” are to the lawful currency of Russia; and references to “RMB” and “Chinese Renminbi” are to the lawful currency of China;
• References to “US GAAP” are to accounting principles generally accepted in the United States; references to “Indian
GAAP” are to accounting principles generally accepted in India; and references to “IFRS” are to International Financial Reporting Standards and its interpretations as issued by International Accounting Standards Board;
• References to an “ADS” are to an American Depositary Share, each of which represents five of our Ordinary Shares of
Rs.2/- each, and references to an “ADR” are to an American Depositary Receipt evidencing one or more ADSs;
• References to “Share” and “Ordinary Share” are to the Ordinary Shares and the ‘A’ Ordinary Shares unless otherwise
specifically mentioned to the contrary;
• References to light commercial vehicles, or LCVs, refer to vehicles that have gross vehicle weight, or GVW, of up to 7.5 metric tons while references to medium and heavy commercial vehicles, or M&HCVs refer to vehicles that have GVW, of over 7.5 metric tons; SCVs refer to Small commercial vehicles with GVW of upto 2 metric tons; ICVs refer to Intermediate commercial vehicles with GVW between 7.5 metric tons and 16 metric tons
• References to passenger cars are to vehicles that have a seating capacity of up to five persons, including the driver that are further classified into the following market segments: Micro — length of up to 3,200 mm; Mini — length of between 3,200 mm and 3,600 mm; Compact — length of between 3,600 mm and 4,000 mm; Super Compact — length of between 4,000 mm and 4,250 mm; Mid-size — length of between 4,250 mm and 4,500mm; Executive — length of between 4,500mm and 4,700 mm; Premium — length of between 4,700 mm and 5,000mm; Luxury — length of above 5,000 mm; Coupe — Roadster- 2 Doors; 2/4 Seater, retractable/firm roof; and Exotics — price greater than Rs.10 million;
• References to utility vehicles, or UVs, and multi-purpose vehicles, or MPVs and Vans, are to vehicles that have a seating
capacity of five to ten persons, including the driver;
• References to premium cars and sports utility vehicles, or SUVs, are to a defined list of premium competitor cars and SUVs
for our Jaguar Land Rover business;
• Unless otherwise stated, comparative and empirical Indian industry data in this annual report have been derived from
published reports of the Society of Indian Automobile Manufacturers, or SIAM; while international industry data have been derived from published reports of IHS Global Insight;
• References to a particular “Fiscal” year, such as “Fiscal 2012”, are to our Fiscal year ended on March 31 of that year; • Figures in tables may not add up to totals due to rounding;
• “Millimeters” or “mm” are equal to 1/1000 of a meter. A meter is equal to approximately 39.37 inches and a millimeter is
equal to approximately 0.039 inch;
• “Kilograms” or “kg” are each equal to approximately 2.2 pounds, and “metric tons” or “tons” are equal to 1,000
kilograms or approximately 2,200 pounds; • “Liters” are equivalent to 61.02 cubic inches of volume, or approximately 1.057 U.S. quarts of liquid measure; and • “Revenues” refers to Total Revenue net of excise duty unless stated otherwise. • “Companies Act” refers to the Indian Companies Act, 2013 except where it states otherwise.

ˆ200GNal5ojlT9&Vw}Š200GNal5ojlT9&Vw}
762654 ROM 2TATA MOTORS LTDFORM 20-F
25-Jul-2014 00:23 ESTHTMHKG
RR Donnelley ProFile HKR pf_rend 1*ESS 0C
hkrdoc211.5.15
Page 1 of 1
Special Note Regarding Forward-looking Statements All statements contained in this annual report that are not statements of historical fact constitute “forward-looking statements”.
Generally, these statements can be identified by the use of forward-looking terms such as “anticipate”, “believe”, “can”, “could”, “estimate”, “expect”, “intend”, “may”, “plan”, “seek”, “will” and “would” or similar words. However, these words are not the exclusive means of identifying forward-looking statements. All statements regarding our expected financial condition and results of operations, business, plans and prospects are forward-looking statements. These forward-looking statements include statements as to our business strategy, our revenue and profitability, planned projects and other matters discussed in this annual report regarding matters that are not historical fact. These forward-looking statements and any other projections contained in this annual report (whether made by us or any third party) involve known and unknown risks, uncertainties and other factors that may cause our actual results, performance or achievements to be materially different from any future results, performance or achievements expressed or implied by these forward-looking statements or other projections. Although we are an SEC-reporting company and will have ongoing disclosure obligations under U.S. federal securities laws, we are not undertaking to publicly update or revise any statements in this annual report, whether as a result of new information, future events or otherwise.
The risks and factors that could cause our actual results, performances and achievements to be materially different from the forward-looking statements set out in Item 3.D and elsewhere in this annual report include, among others:
ii
• general political, social and economic conditions, and the competitive environment in India, the United States, the United
Kingdom and the rest of Europe and other markets in which we operate and sell our products; • fluctuations in the currency exchange rate against the functional currency of the respective consolidated entities; • accidents and natural disasters;
• terms on which we finance our working capital and capital and product development expenditures and investment
requirements; • implementation of new projects, including mergers and acquisitions, planned by management; • contractual arrangements with suppliers;
• government policies including those specifically regarding the automotive industry, including industrial licensing,
environmental regulations, safety regulations, import restrictions and duties, excise duties, sales taxes, value added taxes, product range restrictions, diesel and gasoline prices and road network enhancement projects;
• significant movements in the prices of key inputs such as steel, aluminum, rubber and plastics; and • other factors beyond our control.

ˆ200GNal5ojlZfz2wOŠ200GNal5ojlZfz2wO
762654 ROM 3TATA MOTORS LTDFORM 20-F
25-Jul-2014 00:28 ESTHTMHKG
RR Donnelley ProFile HKR pf_rendSTART PAGE
2*ESS 0C
HKRPRFRS0311.5.15
Page 1 of 1
TABLE OF CONTENTS
iii
Part I
Item 1. Identity of Directors, Senior Management and Advisers 1 Item 2. Offer Statistics and Expected Timetable 1 Item 3. Key Information 1 A. Selected Financial Data 1 B. Capitalization and Indebtedness 3 C. Reasons for the Offer and Use of Proceeds 3 D. Risk Factors 3 Item 4. Information on the Company 14 A. History and Development of the Company 14 B. Business Overview 19 C. Organizational Structure 42 D. Property, Plants and Equipment 45 Item 4A. Unresolved Staff Comments 50 Item 5. Operating and Financial Review and Prospects 50 A. Operating Results 50 B. Liquidity and Capital Resources 64 C. Research and Development, Patents and Licenses, etc. 75 D. Trend Information 75 E. Off-balance Sheet Arrangements 76 F. Tabular Disclosure of Contractual Obligations 76 Item 6. Directors, Senior Management and Employees 76 A. Directors and Senior Management 76 B. Compensation 80 C. Board Practices 81 D. Employees 84 E. Share Ownership 86 Item 7. Major Shareholders and Related Party Transactions 86 A. Major Shareholders 86 B. Related Party Transactions 88 C. Interests of Experts and Counsel 89 Item 8. Financial Information 89 A. Consolidated Statements and Other Financial Information 89 B. Significant Changes 90 Item 9. The Offer and Listing 90 A. Offer and Listing Details 90 B. Plan of Distribution 90 C. Markets 91 D. Selling Shareholders 93 E. Dilution 93 F. Expenses of the Issue 93 Item 10. Additional Information 93 A. Share Capital 93 B. Memorandum and Articles of Association 94 C. Material Contracts 101 D. Exchange Controls 101 E. Taxation 104 F. Dividends and Paying Agents 108 G. Statement by Experts 108 H. Documents on Display 108 I. Subsidiary Information 108 Item 11. Quantitative and Qualitative Disclosures about Market Risk 108 Item 12. Description of Securities Other than Equity Securities 108

ˆ200GNal5ojlZhVmwJŠ200GNal5ojlZhVmwJ
762654 ROM 4TATA MOTORS LTDFORM 20-F
25-Jul-2014 00:28 ESTHTMHKG
RR Donnelley ProFile HKR pf_rend 2*ESS 0C
HKRPRFRS0311.5.15
Page 1 of 1
iv
Part II
Item 13. Defaults, Dividend Arrearages and Delinquencies 109 Item 14. Material Modifications to the Rights of Security Holders and Use of Proceeds 109 Item 15. Controls and Procedures 109 Item 16A. Audit Committee Financial Expert 110 Item 16B. Code of Ethics 110 Item 16C. Principal Accountant Fees and Services 111 Item 16D. Exemptions from the Listing Standards for Audit Committees 111 Item 16E. Purchases of Equity Securities by the Issuer and Affiliated Purchasers 111 Item 16F. Change in Registrant’s Certifying Accountant 111 Item 16G. Corporate Governance 112
Part III
Item 17. Financial Statements 112 Item 18. Financial Statements 112 Item 19. Exhibits 113
ˆ200GNal5oj%H4CnwkŠ200GNal5oj%H4Cnwk
762654 TX 1TATA MOTORS LTDFORM 20-F
31-Jul-2014 14:31 ESTHTMHKG
RR Donnelley ProFile HKR venkp1dc 11*ESS 0C
NERFBU-MWE-XN0111.5.15
Page 1 of 1
PART I
Not applicable.
Not applicable.
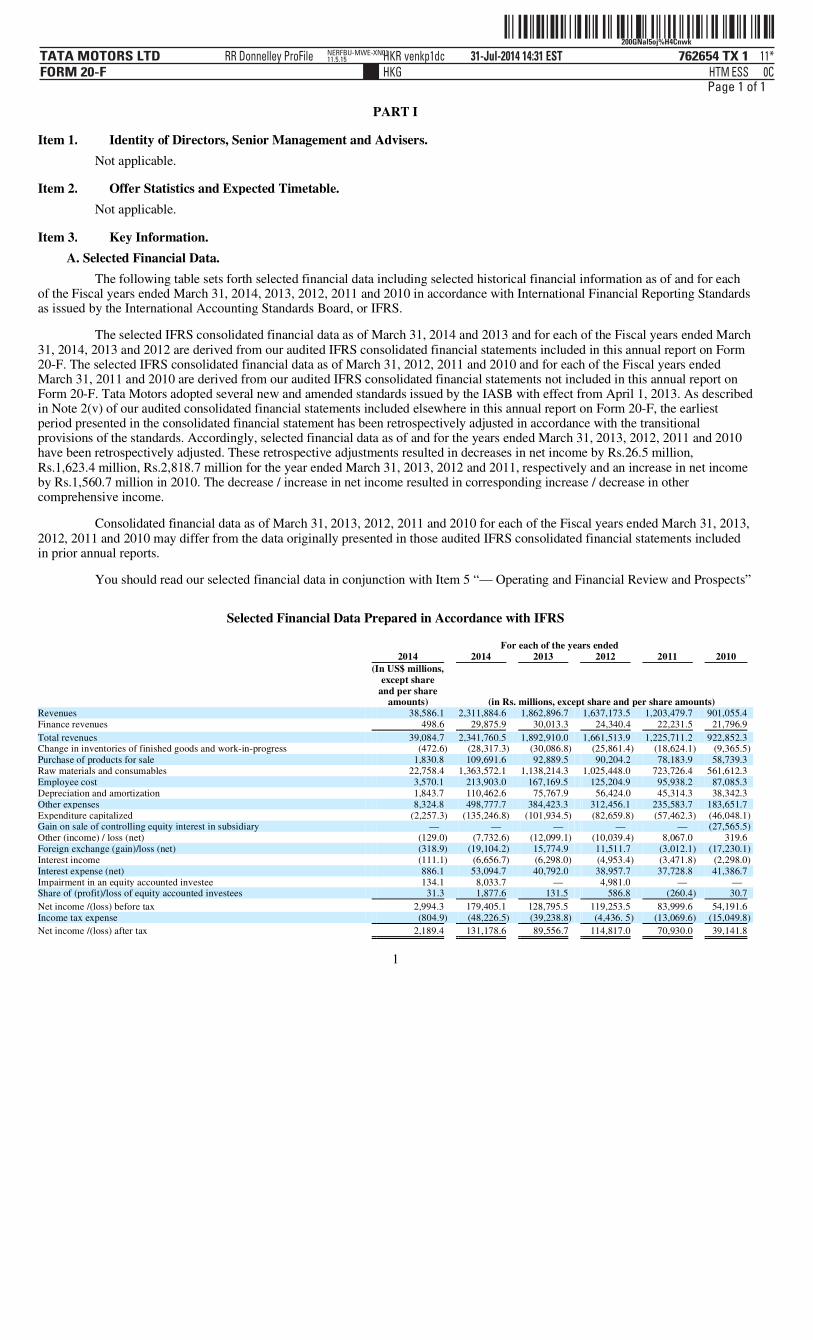
A. Selected Financial Data. The following table sets forth selected financial data including selected historical financial information as of and for each
of the Fiscal years ended March 31, 2014, 2013, 2012, 2011 and 2010 in accordance with International Financial Reporting Standards as issued by the International Accounting Standards Board, or IFRS.
The selected IFRS consolidated financial data as of March 31, 2014 and 2013 and for each of the Fiscal years ended March 31, 2014, 2013 and 2012 are derived from our audited IFRS consolidated financial statements included in this annual report on Form 20-F. The selected IFRS consolidated financial data as of March 31, 2012, 2011 and 2010 and for each of the Fiscal years ended March 31, 2011 and 2010 are derived from our audited IFRS consolidated financial statements not included in this annual report on Form 20-F. Tata Motors adopted several new and amended standards issued by the IASB with effect from April 1, 2013. As described in Note 2(v) of our audited consolidated financial statements included elsewhere in this annual report on Form 20-F, the earliest period presented in the consolidated financial statement has been retrospectively adjusted in accordance with the transitional provisions of the standards. Accordingly, selected financial data as of and for the years ended March 31, 2013, 2012, 2011 and 2010 have been retrospectively adjusted. These retrospective adjustments resulted in decreases in net income by Rs.26.5 million, Rs.1,623.4 million, Rs.2,818.7 million for the year ended March 31, 2013, 2012 and 2011, respectively and an increase in net income by Rs.1,560.7 million in 2010. The decrease / increase in net income resulted in corresponding increase / decrease in other comprehensive income.
Consolidated financial data as of March 31, 2013, 2012, 2011 and 2010 for each of the Fiscal years ended March 31, 2013, 2012, 2011 and 2010 may differ from the data originally presented in those audited IFRS consolidated financial statements included in prior annual reports.
You should read our selected financial data in conjunction with Item 5 “— Operating and Financial Review and Prospects”
Selected Financial Data Prepared in Accordance with IFRS
1
Item 1. Identity of Directors, Senior Management and Advisers.
Item 2. Offer Statistics and Expected Timetable.
Item 3. Key Information.
For each of the years ended 2014 2014 2013 2012 2011 2010
(In US$ millions,
except share and per share
amounts)
(in Rs. millions, except share and per share amounts) Revenues 38,586.1 2,311,884.6 1,862,896.7 1,637,173.5 1,203,479.7 901,055.4 Finance revenues 498.6 29,875.9 30,013.3 24,340.4 22,231.5 21,796.9
Total revenues 39,084.7 2,341,760.5 1,892,910.0 1,661,513.9 1,225,711.2 922,852.3 Change in inventories of finished goods and work-in-progress (472.6) (28,317.3) (30,086.8) (25,861.4) (18,624.1) (9,365.5) Purchase of products for sale 1,830.8 109,691.6 92,889.5 90,204.2 78,183.9 58,739.3 Raw materials and consumables 22,758.4 1,363,572.1 1,138,214.3 1,025,448.0 723,726.4 561,612.3 Employee cost 3,570.1 213,903.0 167,169.5 125,204.9 95,938.2 87,085.3 Depreciation and amortization 1,843.7 110,462.6 75,767.9 56,424.0 45,314.3 38,342.3 Other expenses 8,324.8 498,777.7 384,423.3 312,456.1 235,583.7 183,651.7 Expenditure capitalized (2,257.3) (135,246.8) (101,934.5) (82,659.8) (57,462.3) (46,048.1) Gain on sale of controlling equity interest in subsidiary — — — — — (27,565.5) Other (income) / loss (net) (129.0) (7,732.6) (12,099.1) (10,039.4) 8,067.0 319.6 Foreign exchange (gain)/loss (net) (318.9) (19,104.2) 15,774.9 11,511.7 (3,012.1) (17,230.1) Interest income (111.1) (6,656.7) (6,298.0) (4,953.4) (3,471.8) (2,298.0) Interest expense (net) 886.1 53,094.7 40,792.0 38,957.7 37,728.8 41,386.7 Impairment in an equity accounted investee 134.1 8,033.7 — 4,981.0 — — Share of (profit)/loss of equity accounted investees 31.3 1,877.6 131.5 586.8 (260.4) 30.7
Net income /(loss) before tax 2,994.3 179,405.1 128,795.5 119,253.5 83,999.6 54,191.6 Income tax expense (804.9) (48,226.5) (39,238.8) (4,436. 5) (13,069.6) (15,049.8)
Net income /(loss) after tax 2,189.4 131,178.6 89,556.7 114,817.0 70,930.0 39,141.8
ˆ200GNal5oj$&#THQHŠ 200GNal5oj$&#THQH
762654 TX 2TATA MOTORS LTDFORM 20-F
31-Jul-2014 11:32 ESTHTMHKG
RR Donnelley ProFile HKR palap0dc 7*ESS 0C
HKGFBU-MWE-XN0311.5.15
Page 1 of 1
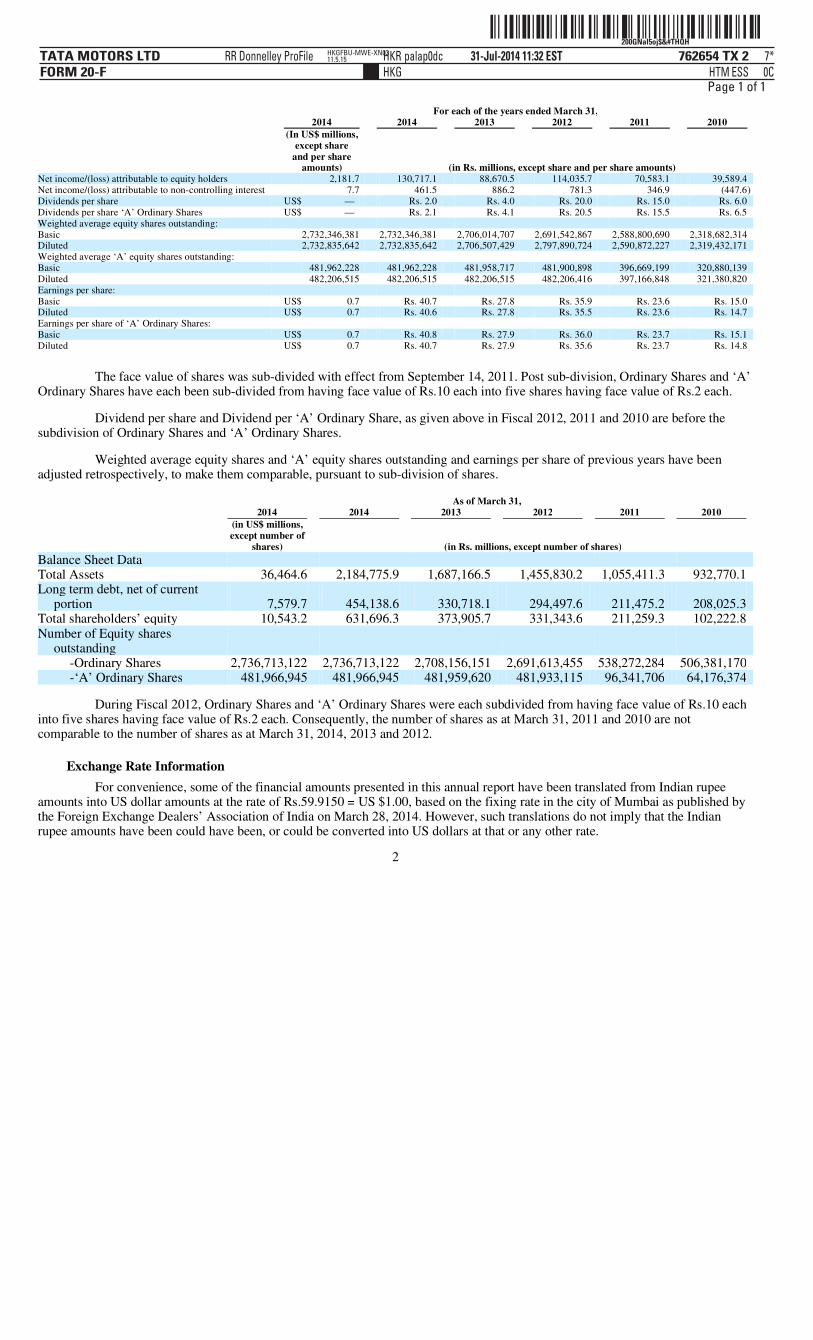
The face value of shares was sub-divided with effect from September 14, 2011. Post sub-division, Ordinary Shares and ‘A’ Ordinary Shares have each been sub-divided from having face value of Rs.10 each into five shares having face value of Rs.2 each.
Dividend per share and Dividend per ‘A’ Ordinary Share, as given above in Fiscal 2012, 2011 and 2010 are before the subdivision of Ordinary Shares and ‘A’ Ordinary Shares.
Weighted average equity shares and ‘A’ equity shares outstanding and earnings per share of previous years have been adjusted retrospectively, to make them comparable, pursuant to sub-division of shares.
During Fiscal 2012, Ordinary Shares and ‘A’ Ordinary Shares were each subdivided from having face value of Rs.10 each into five shares having face value of Rs.2 each. Consequently, the number of shares as at March 31, 2011 and 2010 are not comparable to the number of shares as at March 31, 2014, 2013 and 2012.
Exchange Rate Information For convenience, some of the financial amounts presented in this annual report have been translated from Indian rupee
amounts into US dollar amounts at the rate of Rs.59.9150 = US $1.00, based on the fixing rate in the city of Mumbai as published by the Foreign Exchange Dealers’ Association of India on March 28, 2014. However, such translations do not imply that the Indian rupee amounts have been could have been, or could be converted into US dollars at that or any other rate.
2
For each of the years ended March 31, 2014 2014 2013 2012 2011 2010
(In US$ millions,
except share and per share
amounts)
(in Rs. millions, except share and per share amounts) Net income/(loss) attributable to equity holders 2,181.7 130,717.1 88,670.5 114,035.7 70,583.1 39,589.4 Net income/(loss) attributable to non-controlling interest 7.7 461.5 886.2 781.3 346.9 (447.6) Dividends per share US$ — Rs. 2.0 Rs. 4.0 Rs. 20.0 Rs. 15.0 Rs. 6.0 Dividends per share ‘A’ Ordinary Shares US$ — Rs. 2.1 Rs. 4.1 Rs. 20.5 Rs. 15.5 Rs. 6.5 Weighted average equity shares outstanding: Basic 2,732,346,381 2,732,346,381 2,706,014,707 2,691,542,867 2,588,800,690 2,318,682,314 Diluted 2,732,835,642 2,732,835,642 2,706,507,429 2,797,890,724 2,590,872,227 2,319,432,171 Weighted average ‘A’ equity shares outstanding: Basic 481,962,228 481,962,228 481,958,717 481,900,898 396,669,199 320,880,139 Diluted 482,206,515 482,206,515 482,206,515 482,206,416 397,166,848 321,380,820 Earnings per share: Basic US$ 0.7 Rs. 40.7 Rs. 27.8 Rs. 35.9 Rs. 23.6 Rs. 15.0 Diluted US$ 0.7 Rs. 40.6 Rs. 27.8 Rs. 35.5 Rs. 23.6 Rs. 14.7 Earnings per share of ‘A’ Ordinary Shares: Basic US$ 0.7 Rs. 40.8 Rs. 27.9 Rs. 36.0 Rs. 23.7 Rs. 15.1 Diluted US$ 0.7 Rs. 40.7 Rs. 27.9 Rs. 35.6 Rs. 23.7 Rs. 14.8
As of March 31, 2014 2014 2013 2012 2011 2010
(in US$ millions, except number of
shares)
(in Rs. millions, except number of shares)
Balance Sheet Data
Total Assets 36,464.6 2,184,775.9 1,687,166.5 1,455,830.2 1,055,411.3 932,770.1 Long term debt, net of current
portion 7,579.7 454,138.6 330,718.1 294,497.6 211,475.2 208,025.3 Total shareholders’ equity 10,543.2 631,696.3 373,905.7 331,343.6 211,259.3 102,222.8 Number of Equity shares
outstanding
-Ordinary Shares 2,736,713,122 2,736,713,122 2,708,156,151 2,691,613,455 538,272,284 506,381,170 -‘A’ Ordinary Shares 481,966,945 481,966,945 481,959,620 481,933,115 96,341,706 64,176,374
ˆ200GNal5oj$%bGKwrŠ200GNal5oj$%bGKwr
762654 TX 3TATA MOTORS LTDFORM 20-F
31-Jul-2014 10:31 ESTHTMHKG
RR Donnelley ProFile HKR kupsu0dc 4*ESS 0C
RRWIN-XENP14311.5.15
Page 1 of 1
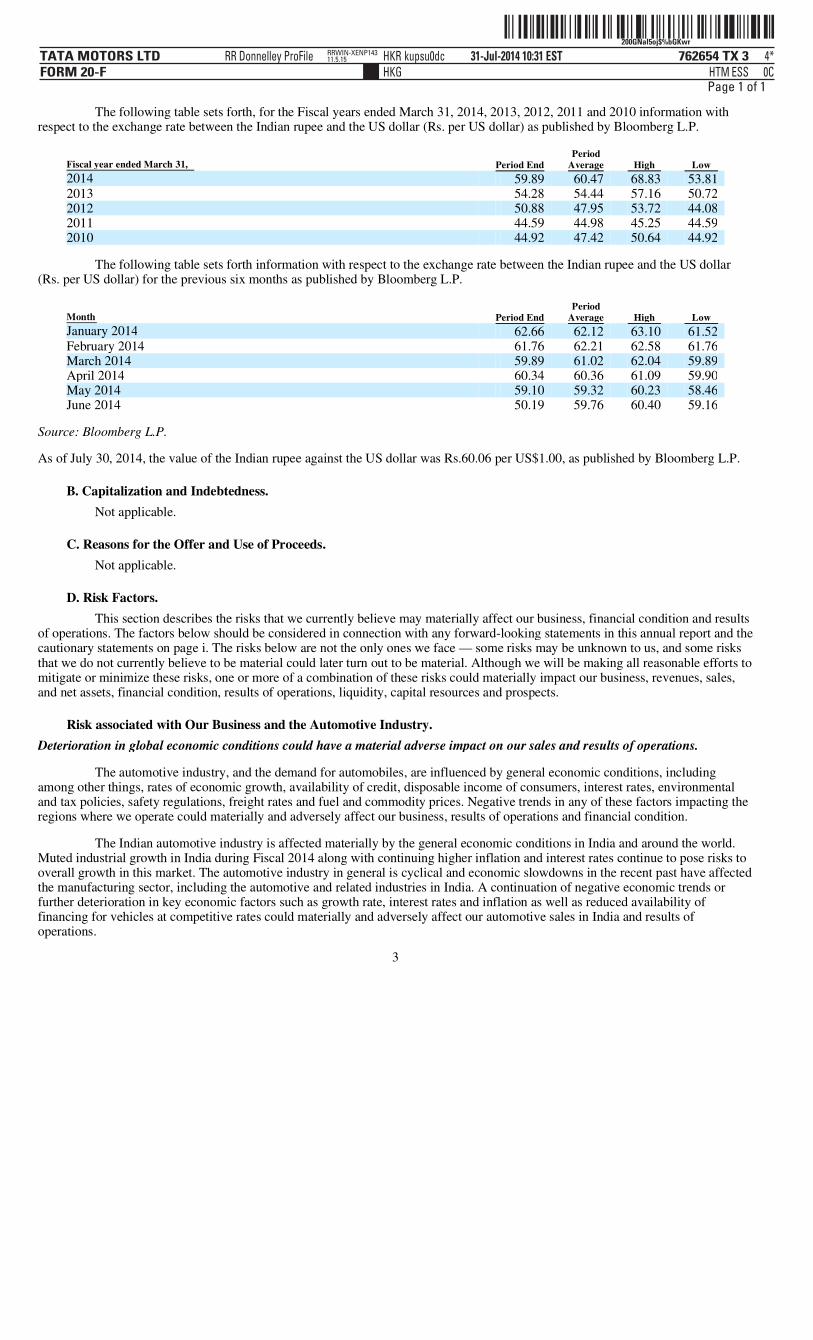
The following table sets forth, for the Fiscal years ended March 31, 2014, 2013, 2012, 2011 and 2010 information with respect to the exchange rate between the Indian rupee and the US dollar (Rs. per US dollar) as published by Bloomberg L.P.
The following table sets forth information with respect to the exchange rate between the Indian rupee and the US dollar (Rs. per US dollar) for the previous six months as published by Bloomberg L.P.
Source: Bloomberg L.P.
As of July 30, 2014, the value of the Indian rupee against the US dollar was Rs.60.06 per US$1.00, as published by Bloomberg L.P.
B. Capitalization and Indebtedness. Not applicable.
C. Reasons for the Offer and Use of Proceeds. Not applicable.
D. Risk Factors. This section describes the risks that we currently believe may materially affect our business, financial condition and results
of operations. The factors below should be considered in connection with any forward-looking statements in this annual report and the cautionary statements on page i. The risks below are not the only ones we face — some risks may be unknown to us, and some risks that we do not currently believe to be material could later turn out to be material. Although we will be making all reasonable efforts to mitigate or minimize these risks, one or more of a combination of these risks could materially impact our business, revenues, sales, and net assets, financial condition, results of operations, liquidity, capital resources and prospects.
Risk associated with Our Business and the Automotive Industry. Deterioration in global economic conditions could have a material adverse impact on our sales and results of operations.
The automotive industry, and the demand for automobiles, are influenced by general economic conditions, including among other things, rates of economic growth, availability of credit, disposable income of consumers, interest rates, environmental and tax policies, safety regulations, freight rates and fuel and commodity prices. Negative trends in any of these factors impacting the regions where we operate could materially and adversely affect our business, results of operations and financial condition.
The Indian automotive industry is affected materially by the general economic conditions in India and around the world. Muted industrial growth in India during Fiscal 2014 along with continuing higher inflation and interest rates continue to pose risks to overall growth in this market. The automotive industry in general is cyclical and economic slowdowns in the recent past have affected the manufacturing sector, including the automotive and related industries in India. A continuation of negative economic trends or further deterioration in key economic factors such as growth rate, interest rates and inflation as well as reduced availability of financing for vehicles at competitive rates could materially and adversely affect our automotive sales in India and results of operations.
3
Fiscal year ended March 31, Period End Period
Average High Low
2014 59.89 60.47 68.83 53.81 2013 54.28 54.44 57.16 50.72 2012 50.88 47.95 53.72 44.08 2011 44.59 44.98 45.25 44.59 2010 44.92 47.42 50.64 44.92
Month Period End Period
Average High Low
January 2014 62.66 62.12 63.10 61.52 February 2014 61.76 62.21 62.58 61.76 March 2014 59.89 61.02 62.04 59.89 April 2014 60.34 60.36 61.09 59.90 May 2014 59.10 59.32 60.23 58.46 June 2014 50.19 59.76 60.40 59.16

ˆ200GNal5ojrYc#9Q‹Š200GNal5ojrYc#9Q
762654 TX 4TATA MOTORS LTDFORM 20-F
27-Jul-2014 10:52 ESTHTMHKG
RR Donnelley ProFile HKR kumbh2dc 2*ESS 0C
RRWIN-XENP13811.5.14
Page 1 of 1
Our Jaguar Land Rover business has significant operations in the United Kingdom, North America, continental Europe and China, as well as sales operations in many major countries across the globe. The global economic downturn significantly impacted the global automotive markets, particularly in the United States and Europe, including the United Kingdom, where our Jaguar Land Rover operations have significant sales exposure. During Fiscal 2014, the automotive market in the United Kingdom and Europe continued to experience challenges. Confidence in financial markets and general consumer confidence have been further eroded by recent political tensions in North Africa, the Middle East and Ukraine, and concerns of an economic slowdown in China. Our strategy with respect to our Jaguar Land Rover operations, which includes new product launches and expansion in growing markets such as China, India, Russia and Brazil, may not be sufficient to mitigate the decrease in demand for our products in established markets and this could have a significant adverse impact on our financial performance. If industry demand softens because of lower or negative economic growth in key markets, including China, or other factors, our results of operations and financial condition could be materially and adversely affected.
Restrictive covenants in our financing agreements may limit our operations and financial flexibility and materially and adversely impact our financial condition, results of operations and prospects.
Some of our financing agreements and debt arrangements set limits on and/or require us to obtain lender consent before, among other things, pledging assets as security. In addition, certain financial covenants may limit our ability to borrow additional funds or to incur additional liens. In the past, we have been able to obtain required lender consent for such activities. However, there can be no assurance that we will be able to obtain such consents in the future. If our liquidity needs or growth plans require such consents and such consents are not obtained, we may be forced to forego or alter our plans, which could materially and adversely affect our results of operations and financial condition.
In the event we breach these covenants, the outstanding amounts due under such financing agreements could become due and payable immediately and/or result in increased costs. A default under one of these financing agreements may also result in cross-defaults under other financing agreements and result in the outstanding amounts under such other financing agreements becoming due and payable immediately. Defaults under one or more of our financing agreements could have a material adverse effect on our results of operations and financial condition.
In Fiscal 2013, we were in breach of two financial covenants relating to our ratio of total outstanding liability to tangible net worth and the other relating to our debt service coverage ratio in bank guarantees relating to our 2009 non-convertible Indian rupee debentures, which could potentially result in increased costs under these guarantees. We have requested and obtained waivers of our obligations to pay additional costs as a consequence of such breaches. In Fiscal 2014, we are in breach of one financial covenant relating to our ratio of total outstanding liability to tangible net worth, which has also been waived by the lenders and has not resulted in any default or penalties. As per the terms of the bank guarantee agreement, a breach of one covenant is not an event of default and also does not require us to pay increased costs for these guarantees. However, we cannot assure you that we will succeed in obtaining consents or waivers in the future from our lenders or guarantors, or that our lenders and guarantors will not impose additional operating and financial restrictions on us, or otherwise seek to modify the terms of our existing loan agreements in ways that are materially adverse to us. See “Item 5. Operating and Financial Review and Prospects — B. Liquidity and Capital Resources — Loan Covenants.”
Exchange rate and interest rate fluctuations could materially and adversely affect our financial condition and results of operations.
Our operations are subject to risks arising from fluctuations in exchange rates with reference to countries in which we operate. We import capital equipment, raw materials and components from, manufacture vehicles in, and sell vehicles into, various countries, and therefore our revenues and costs have significant exposure to the relative movements of the GBP, the US dollar, the Euro, the Chinese Renminbi, the Japanese Yen and the Indian rupee. In particular, the Indian rupee declined significantly relative to the US dollar during Fiscal 2014. As of August 28, 2013, the value of the Indian rupee against the US dollar was Rs. 68.80 = US$1.00, following a depreciation of approximately 28.2%, as compared to Rs.53.65 = US $1.00 on May 1, 2013, based on the exchange rate for Indian rupees in the City of New York for cable transfers payable in foreign currencies as certified by the Federal Reserve Bank of New York for customs purposes. The noon buying rate for the Indian rupee from the Federal Reserve Bank of New York, expressed in rupees per US$1.00, was Rs. 59.89 on March 28, 2014.
Moreover, we have outstanding foreign currency denominated debt and are sensitive to fluctuations in foreign currency exchange rates. We have experienced and expect to continue to experience foreign exchange losses and gains on obligations denominated in foreign currencies in respect of our borrowings and foreign currency assets and liabilities due to currency fluctuations.
We also have interest-bearing assets (including cash balances) and interest bearing liabilities, which bear interest at variable rates. We are therefore exposed to changes in interest rates in the various markets in which we borrow.
4

ˆ200GNal5ojlTS=9w)Š200GNal5ojlTS=9w)
762654 TX 5TATA MOTORS LTDFORM 20-F
25-Jul-2014 00:24 ESTHTMHKG
RR Donnelley ProFile HKR pf_rend 1*ESS 0C
hkrdoc211.5.15
Page 1 of 1
Although we engage in managing our interest and foreign exchange exposure through use of financial hedging instruments such as forward contracts, swap agreements and option contracts, higher interest rates and a weakening of the Indian rupee against major foreign currencies significantly increase our cost of borrowing, which could have a material adverse effect on our financial condition, results of operations and liquidity.
Financial instability in other countries could disrupt our business and cause the trading price of our Shares and ADSs to decrease.
The Indian automotive market and the Indian economy are influenced by economic and market conditions in other countries. Although economic conditions are different in each country, investors’ reactions to economic developments in one country can have adverse effects on the securities of companies and the economy as a whole, in other countries, including India. A loss of investor confidence in the financial systems of other emerging markets may cause volatility in Indian financial markets and indirectly, in the Indian economy in general. Any worldwide financial instability could also have a negative impact on the Indian economy, including the movement of exchange rates and interest rates in India. In the event the recovery of global economy is slower than expected, or if there is any significant financial disruption, this could have a material adverse effect on our cost of funding, loan portfolio, business, prospects, results of operations, financial condition and the trading price of our Shares and ADSs.
Intensifying competition could materially and adversely affect our sales and results of operations.
The global automotive industry is highly competitive and competition is likely to further intensify in view of the continuing globalization and consolidation in the worldwide automotive industry. Competition is especially likely to increase in the premium automotive categories as each market participant intensifies its efforts to retain its position in established markets while also expanding in emerging markets, such as China, India, Russia, Brazil and parts of Asia. The factors affecting competition include product quality and features, innovation and time to introduce new products, ability to control costs, pricing, reliability, safety, fuel economy, environmental impact and perception thereof, customer service and financing terms. There can be no assurance that we will be able to compete successfully in the global automotive industry in the future.
We also face strong competition in the Indian market from domestic as well as foreign automobile manufacturers. Improving infrastructure and robust growth prospects compared to other mature markets have attracted a number of international companies to India either through joint ventures with local partners or through independently owned operations in India. International competitors bring with them decades of international experience, global scale, advanced technology and significant financial resources. Consequently, domestic competition is likely to further intensify in the future. There can be no assurance that we will be able to implement our future strategies in a way that will mitigate the effects of increased competition in the Indian automotive industry.
Our future success depends on our ability to satisfy changing customer demands by offering innovative products in a timely manner and maintaining such products’ competitiveness and quality.
Our competitors may gain significant advantages if they are able to offer products satisfying customer needs earlier than we are able to and this could adversely impact our sales and results of operations. Unanticipated delays or cost overruns in implementing new product launches, expansion plans or capacity enhancements could materially and adversely impact our financial condition and results of operations.
Customer preferences especially in many of the developed markets seem to be moving in favor of more fuel efficient and environmentally friendly vehicles. Furthermore, in many countries there has been significant pressure on the automotive industry to reduce carbon dioxide emissions. In many markets these preferences are driven by increased government regulations, rising fuel prices and customers’ environmental considerations. Our operations may be significantly impacted if we experience delays in developing fuel efficient products that reflect changing customer preferences, especially in the premium automotive category. In addition, a deterioration in the quality of our vehicles could force us to incur substantial costs and damage our reputation. There can be no assurance that the market acceptance of our future products will meet our sales expectations, in which case we may be unable to realize the intended economic benefits of our investments and our financial condition and results of operations may be materially and adversely affected.
We are subject to risks associated with product liability, warranty and recall.
We are subject to risks and costs associated with product liability, warranties and recalls, should we supply defective products, parts, or related after-sales services, including by generating negative publicity, which may have a material adverse effect on our business, results of operations and financial condition. Such events could also require us to expend considerable resources in correcting these problems and could significantly reduce demand for our products. We may also be subject to class actions or other large scale product liability or other lawsuits in various jurisdictions where we have a significant presence.
5

ˆ200GNal5ojqkJT8w/Š200GNal5ojqkJT8w/
762654 TX 6TATA MOTORS LTDFORM 20-F
26-Jul-2014 08:46 ESTHTMHKG
RR Donnelley ProFile HKR khanz0dc 2*ESS 0C
LANFBU-MWE-XN1911.5.15
Page 1 of 1
We are subject to risk associated with the automobile financing business.
In India, we are subject to risks associated with our automobile financing business. In Fiscal 2014, the market share of our automobile financing business, which supports sales of our vehicles, declined to 30.0% from 33.1% in Fiscal 2013. Any default by our customers or inability to repay installments as due, could materially and adversely affect our business, financial condition, results of operations and cash flows. In addition, any downgrade in our credit ratings may increase our borrowing costs and restrict our access to the debt markets. Over time, and particularly in the event of any credit rating downgrade, market volatility, market disruption, regulatory changes or otherwise, we may need to reduce the amount of financing receivables we originate, which could severely disrupt our ability to support the sale of our vehicles.
The sale of our commercial and passenger vehicles is heavily dependent on fund availability for our customers. Rising delinquencies and early defaults has contributed to a reduction in automobile financing, which has had an adverse effect on fund availability for potential customers. This reduction in available financing may continue in the future and have a material adverse effect on our business, financial conditions and results of operations.
Jaguar Land Rover has consumer finance arrangements in place with local providers in a number of key markets. Any reduction in the supply of available consumer financing for purchase of new vehicles could create additional pressures to increase marketing incentives in order to maintain demand for our vehicles, which could materially and adversely affect our sales and net income. Furthermore, Jaguar Land Rover also offers residual value guarantees on the leases of certain vehicles in some markets. Any significant declines in used car valuations could materially and adversely affect our sales and results of operations.
Underperformance of our distribution channels and supply chains may adversely affect our sales and results of operations.
Our products are sold and serviced through a network of authorized dealers and service centers across our domestic market, and a network of distributors and local dealers in international markets. We monitor the performance of our dealers and distributors and provide them with support to enable them to perform to our expectations. There can be no assurance, however, that our expectations will be met. Any under-performance by our dealers or distributors could materially and adversely affect our sales and results of operations.
We rely on third parties to supply us with the raw materials, parts and components used in the manufacture of our products. Furthermore, for some of these parts and components, we are dependent on a single source. Our ability to procure supplies in a cost effective and timely manner is subject to various factors, some of which are not within our control. While we manage our supply chain as part of our vendor management process, any significant problems with our supply chain in the future could severely disrupt our business and materially reduce our sales and net income.
Natural disasters and man-made accidents, adverse economic conditions, decline in automobile demand, and lack of access to sufficient financing arrangements, among others, could have a negative financial impact on our suppliers and distributors in turn impairing timely availability of components to us or increasing the costs of such components. Similarly, impairments to the financial condition of our distributors may adversely impact our performance in some markets. In addition, if one or more of the other global automotive manufacturers were to become insolvent, this would severely disrupt our supply chains and may further materially reduce our sales and net income.
In respect of our Jaguar Land Rover operations, as part of a separation agreement from Ford, we have entered into supply agreements with Ford and certain other third parties for critical components. Any disruption of such services could have a material adverse effect on our business, financial condition and results of operations.
Increases in input prices may have a material adverse effect on our results of operations. In Fiscal 2014 and Fiscal 2013, the consumption of raw materials, components and aggregates and purchase of products for
sale constituted approximately 61.7% and 63.4% respectively, of our total revenues. Prices of commodity items used in manufacturing automobiles, including steel, aluminum, copper, zinc, rubber, platinum, palladium and rhodium have become increasingly volatile in recent years. Further price movements would closely depend on the evolving economic scenarios across the globe. While we continue to pursue cost reduction initiatives, an increase in price of input materials could severely impact our profitability to the extent such increase cannot be absorbed by the market through price increases and/or could have a negative impact on the demand. In addition, because of intense price competition and our high level of fixed costs, we may not be able to adequately address changes in commodity prices even if they are foreseeable. Increases in fuel costs also pose a significant challenge to automobile manufacturers worldwide, including us, especially in the commercial and premium vehicle segments where increased fuel prices have an impact on demand.
6

ˆ200GNal5ojlTWcYwKŠ200GNal5ojlTWcYwK
762654 TX 7TATA MOTORS LTDFORM 20-F
25-Jul-2014 00:24 ESTHTMHKG
RR Donnelley ProFile HKR pf_rend 1*ESS 0C
hkrdoc211.5.15
Page 1 of 1
Deterioration in the performance of any of our subsidiaries, joint ventures and affiliates may adversely affect our results of operations.
We have made and may continue to make capital commitments to our subsidiaries, joint ventures and affiliates, and if the business or operations of any of these subsidiaries, joint ventures and affiliates deteriorates, the value of our investments may decline substantially.
The significant reliance of Jaguar Land Rover on key mature markets increases the risk of negative impact of reduced customer demand in those countries.
Jaguar Land Rover, which contributes a large portion of our revenues, generates a significant portion of its sales in the United Kingdom, North American and continental European markets where the automotive industry was severely impacted during the global economic downturn in Fiscal 2009. Even though sales of passenger cars in certain of these markets were aided by government-sponsored car-scrap incentives, these incentives primarily benefited the compact and micro-compact car segments and had virtually no slowing effect on the sales declines in the premium car or all-terrain vehicle segments in which we operate. Although demand in these markets has recovered, any decline in demand for our vehicles in these major markets may in the future significantly impair our business, financial condition and results of operations. In addition, our strategy, which includes new product launches and further expansion into growing markets, such as China, India, Russia and Brazil, may not be sufficient to mitigate a decrease in demand for our products in mature markets in the future, which could have a material adverse effect on our financial performance.
We are subject to risks associated with growing our business through mergers and acquisitions.
We believe that our acquisitions provide us opportunities to grow significantly in the global automobile markets by offering premium brands and products. Our acquisitions have provided us with access to technology and additional capabilities while also offering potential synergies. However, the scale, scope and nature of the integration required in connection with our acquisitions present significant challenges, and we may be unable to integrate the relevant subsidiaries, divisions and facilities effectively within our expected schedule. An acquisition may not meet our expectations and the realization of the anticipated benefits may be blocked, delayed or reduced as a result of numerous factors, some of which are outside our control.
We will continue to evaluate growth opportunities through suitable mergers and acquisitions in the future. Growth through mergers and acquisitions involves business risks, including unforeseen contingent risks or latent business liabilities that may only become apparent after the merger or acquisition is completed. The key success factors will be seamless integration and effective management of the merged/acquired entity, retention of key personnel, and generating cash flow from synergies in engineering and sourcing, joint sales and marketing efforts, and management of a larger business. If any of these factors fails to materialize or if we are unable to manage any of the associated risks successfully, our business, financial condition and results of operations could be materially and adversely affected.
Our business is seasonal in nature and a substantial decrease in our sales during certain quarters could have a material adverse impact on our financial performance.
The sales volumes and prices for our vehicles are influenced by the cyclicality and seasonality of demand for these products. The automotive industry has been cyclical in the past and we expect this cyclicality to continue.
In the Indian market, demand for our vehicles generally peaks between January and March, although there is a decrease in demand in February just before release of the Indian fiscal budget. Demand is usually lean from April to July and picks up again in the festival season from September onwards, with a decline in December due to year-end.
Our Jaguar Land Rover business is impacted by the bi-annual registration of vehicles in the United Kingdom where the vehicle registration number changes every six months, which in turn has an impact on the resale value of vehicles. This leads to an increase in sales during the period when the aforementioned change occurs. Other markets such as the United States are influenced by introduction of new model year products which typically occurs in the autumn of each year. The automotive market in China tends to reflect higher demand for vehicles around the Chinese New Year. Demand in the western European automotive markets tends to be reduced during the summer and winter holidays. Furthermore, our cash flows are impacted by temporary shutdowns of three of our manufacturing plants in the United Kingdom during the summer and winter holiday seasons. The resulting sales and cash flow profile is reflected in our results of operations on a quarterly basis.
7
ˆ200GNal5ojlTYu#w:Š200GNal5ojlTYu#w:
762654 TX 8TATA MOTORS LTDFORM 20-F
25-Jul-2014 00:24 ESTHTMHKG
RR Donnelley ProFile HKR pf_rend 1*ESS 0C
hkrdoc211.5.15
Page 1 of 1
We rely on licensing arrangements with Tata Sons Limited to use the “Tata” brand. Any improper use of the associated trademarks by our licensor or any other third parties could materially and adversely affect our business, financial condition and results of operations.
Our rights to our trade names and trademarks are a crucial factor in marketing our products. Establishment of the “Tata” word mark and logo mark in and outside India is material to our operations. We have licensed the use of the “Tata” brand from Tata Sons Limited, or Tata Sons. If Tata Sons, or any of their subsidiaries or affiliated entities, or any third party uses the trade name “Tata” in ways that adversely affect such trade name or trademark, our reputation could suffer damage, which in turn could have a material adverse effect on our business, financial condition and results of operations.
Inability to protect or preserve our intellectual property could materially and adversely affect our business, financial condition and results of operations.
We own or otherwise have rights in respect of a number of patents relating to the products we manufacture, which have been obtained over a period of years. In connection with the design and engineering of new vehicles and the enhancement of existing models, we seek to regularly develop new technical designs for use in our vehicles. We also use technical designs which are the intellectual property of third parties with such third parties’ consent. These patents and trademarks have been of value in the growth of our business and may continue to be of value in the future. Although we do not regard any of our businesses as being dependent upon any single patent or related group of patents, an inability to protect this intellectual property generally, or the illegal breach of some or a large group of our intellectual property rights, would have a materially adverse effect on our business, financial condition and results of operations. We may also be affected by restrictions on the use of intellectual property rights held by third parties and we may be held legally liable for the infringement of the intellectual property rights of others in our products.
We may be adversely affected by labor unrest.
All of our permanent employees, other than officers and managers, in India and most of our permanent employees in South Korea, Spain and the United Kingdom, including certain officers and managers, in relation to our automotive business, are members of labor unions and are covered by our wage agreements, where applicable with those labor unions.
In general, we consider our labor relations with all of our employees to be good. However, in the future we may be subject to labor unrest, which may delay or disrupt our operations in the affected regions, including the acquisition of raw materials and parts, the manufacture, sales and distribution of products and the provision of services. If work stoppages or lock-outs at our facilities or at the facilities of our major vendors occur or continue for a long period of time, our business, financial condition and results of operations may be materially and adversely affected.
Our business and prospects could suffer if we lose one or more key personnel or if we are unable to attract and retain our employees.
Our business and future growth depend largely on the skills of our workforce, including executives and officers, and automotive designers and engineers. The loss of the services of one or more of our personnel could impair our ability to implement our business strategy. In view of intense competition, any inability to continue to attract, retain and motivate our workforce could materially and adversely affect our business, financial condition, results of operations and prospects.
Future pension obligations may prove more costly than currently anticipated and the market value of assets in our pension plans could decline.
We provide post retirement and pension benefits to our employees, including defined benefit plans. Our pension liabilities are generally funded. However, lower returns on pension fund assets, changes in market conditions, interest rates or inflation rates, and adverse changes in other critical actuarial assumptions, may impact our pension liabilities or assets and consequently increase funding requirements, which could materially decrease our net income and cash flows.
Any inability to manage our growing international business may materially and adversely affect our financial condition and results of operations.
Our growth strategy relies on the expansion of our operations by introducing certain automotive products in markets outside India, including Europe, China, Russia, Brazil, the United States, Africa and other parts of Asia. The costs associated with entering and establishing ourselves in new markets, and expanding such operations, may be higher than expected, and we may face significant competition in those regions. In addition, our international business is subject to many actual and potential risks and challenges, including language barriers, cultural differences and other difficulties in staffing and managing overseas operations, inherent difficulties and delays in contract enforcement and the collection of receivables under the legal systems of some foreign countries, the risk of non-tariff barriers, other restrictions on foreign trade or investment sanctions, and the burdens of complying with a wide variety of foreign laws, rules and regulations. If we are unable to manage risks related to our expansion and growth in other parts of the world, our business, results of operations and financial condition could be materially and adversely affected.
8

ˆ200GNal5oj%Ty@jwwŠ200GNal5oj%Ty@jww
762654 TX 9TATA MOTORS LTDFORM 20-F
31-Jul-2014 17:14 ESTHTMHKG
RR Donnelley ProFile HKR arumr0dc 5*ESS 0C
WCRFBU-MWE-XN0511.5.15
Page 1 of 1
We have a limited number of manufacturing, design, engineering and other facilities and any disruption in the operations of those facilities could materially and adversely affect our business, financial condition and results of operations.
We have manufacturing facilities and design and engineering centers located in India, the United Kingdom, China, South Korea, Spain, Thailand and South Africa, and have established a presence in Indonesia. We could experience disruptions to our manufacturing, design and engineering capabilities for a variety of reasons, including, among others, extreme weather, fire, theft, system failures, natural catastrophes, mechanical or equipment failures and similar events. Any such disruptions could affect our ability to design, manufacture and sell our products and, if any of these events were to occur, there can be no assurance that we would be able to shift our design, engineering or manufacturing operations to alternate sites in a timely manner or at all. Any such disruption could materially and adversely affect our business, financial condition and results of operations.
We are exposed to operational risks, including risks in connection with our use of information technology.
Operational risk is the risk of loss resulting from inadequate or failed internal systems and processes, whether resulting from internal or external events. Such risks could stem from inadequacy or failures of controls within internal procedures, violations of internal policies by employees, disruptions or malfunctioning of information technology systems such as computer networks and telecommunication systems, other mechanical or equipment failures, human error, natural disasters or malicious acts by third parties. Any unauthorized access to or misuse of data on our information technology systems, human errors or technological or process failures of any kind could severely disrupt our operations, including our manufacturing, design and engineering processes, and could have a material adverse effect on our financial condition and results of operations.
Any failures or weaknesses in our internal controls could materially and adversely affect our financial condition and results of operations.
As discussed in Item 15, “Controls and Procedures,” upon an evaluation of the effectiveness of the design and operation of our internal controls. We concluded that there was a material weakness such that our internal controls over financial reporting were not effective as at March 31, 2014. The existence of this material weakness, if not adequately remediated, could materially and adversely affect our ability to report accurately our financial condition and results of operations in a reliable manner. Although we have instituted remedial measures to address the material weakness identified and continually review and evaluate our internal control systems to allow management to report on the sufficiency of our internal controls, we cannot assure you that we will not discover additional weaknesses in our internal controls over financial reporting. Any such additional weaknesses or failure to adequately remediate any existing weakness could materially and adversely affect our financial condition or results of operations.
Our insurance coverage may not be adequate to protect us against all potential losses to which we may be subject, and this may have a material adverse effect on our business, financial condition and results of operations.
While we believe that the insurance coverage that we maintain is reasonably adequate to cover all normal risks associated with the operation of our business, there can be no assurance that our insurance coverage will be sufficient, that any claim under our insurance policies will be honored fully or timely, or that our insurance premiums will not increase substantially. Accordingly, to the extent that we suffer loss or damage that is not covered by insurance or which exceeds our insurance coverage, or are required to pay higher insurance premiums, our business, financial condition and results of operations may be materially and adversely affected.
Political and Regulatory Risks. India’s obligations under the World Trade Organization Agreement.
India’s obligations under its World Trade Organization agreement could reduce the present level of tariffs on imports of components and vehicles. Reductions of import tariffs could result in increased competition, which in turn could materially and adversely affect our sales and results of operations.
Compliance with new and current laws, regulations and government policies regarding increased fuel economy, reduced greenhouse gas and other emissions, vehicle safety and taxes may significantly increase our costs and materially decrease our net income.
As an automobile company, we are subject to extensive governmental regulations regarding vehicle emission levels, noise and safety, and the levels of pollutants generated by our production facilities. These regulations are likely to become more stringent and compliance costs may significantly impact our future results of operations. In particular, the United States and Europe have stringent regulations relating to vehicular emissions. The proposed tightening of vehicle emissions regulations by the European Union will require significant costs for compliance. In addition, a number of further legislative and regulatory measures to address greenhouse emissions, including national laws and the Kyoto Protocol, are in various phases of discussions and implementation.
In order to comply with current and future safety and environmental norms, we may have to incur additional costs to: (i) operate and maintain our production facilities; (ii) install new emissions controls or reduction technologies; (iii) purchase or otherwise obtain allowances to emit greenhouse gases; (iv) administer and manage our greenhouse gas emissions program, and (v) invest in research and development to upgrade products and manufacturing facilities. These costs may be difficult to pass through to consumers. If we are unable to develop commercially viable technologies or otherwise unable to attain compliance within the time frames set by the new standards, we could face significant civil penalties or be forced to restrict product offerings drastically. Moreover, safety and environmental standards may at times impose conflicting imperatives, which pose engineering challenges and would, among other things, increase our costs. While we are pursuing the development and implementation of various technologies in order to meet the required standards in the various countries in which we sell our vehicles, the costs for compliance with these required standards could be significant to our operations and may materially and adversely impact our business, financial condition and results of operations.
9

ˆ200GNal5oj!Q6epQ_Š200GNal5oj!Q6epQ_
762654 TX 10TATA MOTORS LTDFORM 20-F
30-Jul-2014 06:13 ESTHTMHKG
RR Donnelley ProFile HKR subrv6dc 4*ESS 0C
ACXFBU-MWE-XN0611.5.15
Page 1 of 1
Imposition of any additional taxes and levies designed to limit the use of automobiles could significantly reduce the demand for our products as well as our sales and net income. Changes in corporate and other taxation policies as well as changes in export and other incentives given by the various governments could also materially and adversely affect our financial condition and results of operations. For example, we benefit from excise duty exemptions for manufacturing facilities in the State of Uttarakhand and other incentives such as subsidies or loans from states where we have manufacturing operations. The Government of India had proposed a comprehensive national goods and services tax, or GST, regime that will combine taxes and levies by the central and state governments into one unified rate structure. While both the Government of India and other state governments of India have publicly announced that all committed incentives will be protected following the implementation of the GST, given the limited availability of information in the public domain concerning the GST, we are unable to provide any assurance as to this or any other aspect of the tax regime following implementation of the GST. The implementation of this rationalized tax structure may be affected by any disagreement between certain state governments, which could create uncertainty. The timeline of the proposed transition is uncertain as at the date hereof.
The Proposed Direct Tax Code, or DTC, aims to replace the existing Income Tax Act, 1961 and other direct tax laws, with a view to simplify and rationalize the tax provisions into one unified code. The various proposals included in DTC are subject to review by the new government and as such impact if any, is not quantifiable at this stage.
Regulations in the areas of investments, taxes and levies may also have an impact on Indian securities, including our Shares and ADSs. In this regard it is important to note that DTC would likely have a significant impact on the current tax regime, including in respect of our Shares and ADSs. For more information, see Item 4.B “— Business Overview — Government Regulations — Indian Taxes — Goods and Services Tax” of this annual report.
We may be adversely impacted by political instability, wars, terrorism, multinational conflicts, natural disasters, fuel shortages/prices, epidemics and labor strikes.
Our products are exported to a number of geographical markets and we plan to further expand our international operations in the future. Consequently, we are subject to various risks associated with conducting our business outside our domestic markets and our operations may be subject to political instability in those markets, wars, terrorism, regional and/or multinational conflicts, natural disasters, fuel shortages, epidemics and labor strikes. In addition, conducting business internationally, especially in emerging markets, exposes us to additional risks, including adverse changes in economic and government policies, unpredictable shifts in regulation, inconsistent application of existing laws and regulations, unclear regulatory and taxation systems and divergent commercial and employment practices and procedures. Any significant or prolonged disruption or delay in our operations related to these risks could materially and adversely impact our business, financial condition and results of operations.
Compliance with new and changing corporate governance and public disclosure requirements adds uncertainty to our compliance policies and increases our costs of compliance.
We are subject to a complex and changing regime of laws, rules, regulations and standards relating to accounting, corporate governance and public disclosure, including the Sarbanes-Oxley Act of 2002 and Securities and Exchange Commission, or SEC, regulations, Securities and Exchange Board of India, or SEBI, regulations, New York Stock Exchange, or NYSE, listing rules and Indian stock market listing regulations. New or changed laws, rules, regulations and standards may lack specificity and are subject to varying interpretations. Their application in practice may evolve over time as new guidance is provided by regulatory and governing bodies. This could result in continuing uncertainty regarding compliance matters and higher costs of compliance as a result of ongoing revisions to such governance standards. We are committed to maintaining high standards of corporate governance and public disclosure. However, our efforts to comply with evolving laws, rules, regulations and standards in this regard have resulted in, and are likely to continue to result in, increased general and administrative expenses and a diversion of management resources and time.
In addition, new laws, rules, regulations and standards regarding corporate governance may make it more difficult for us to obtain director and officer liability insurance, including under the recently enacted provisions of the Indian Companies Act, 2013. Further, our Board members, Executive Directors and our Chief Financial Officer could face an increased risk of personal liability in connection with the performance of their duties. As a result, we may face difficulties attracting and retaining qualified Board members and senior management. If we fail to comply with new or changed laws, rules, regulations or differing standards, our business and reputation may be harmed.
10

ˆ200GNal5ojnvWRMwWŠ200GNal5ojnvWRMwW
762654 TX 11TATA MOTORS LTDFORM 20-F
25-Jul-2014 12:43 ESTHTMHKG
RR Donnelley ProFile HKR balan2dc 2*ESS 0C
LANFBU-MWE-XN1611.5.15
Page 1 of 1
Compliance with the SEC’s new rule for disclosures on “conflict minerals” may be time consuming and costly and could adversely affect our reputation.
Under the Dodd-Frank Wall Street Reform and Consumer Protection Act of 2010, the SEC has adopted a new rule that applies to companies that use certain minerals and metals, known as conflict minerals, in their products, including certain products manufactured for them by third parties. The new rule requires companies that use conflict minerals in the production of their products to conduct due diligence as to whether or not such minerals originate from the Democratic Republic of Congo and adjoining countries and requires companies to file certain information with the SEC about the use of these minerals. The deadline for the first conflict minerals report was June 2, 2014, and we filed our first conflict minerals report on May 30, 2014. We expect to incur additional costs to comply with the new due diligence and disclosure requirements. In addition, depending on our findings or our inability to make reliable findings about the source of any possible conflict minerals that may be used in any products manufactured for us by third parties, our reputation could be harmed.
If an initial decision rendered by the Administrative Law Judge, or the ALJ, in administrative proceedings brought by the SEC against the PRC-based network firms of the Big Four accounting firms, including the independent registered public accounting firm of Chery Jaguar Landrover Automotive Co., Limited, becomes final, we could become unable to timely file future financial statements in compliance with the requirements of the U.S. Securities Exchange Act of 1934, as amended.
In December 2012, the SEC instituted administrative proceedings against the PRC-based network firms of the Big Four accounting firms, including the independent registered public accounting firm of Chery Jaguar Land Rover Automotive Co., Limited, our joint venture with Chery Automobile Co., Ltd. to manufacture cars in China, alleging that these firms had violated U.S. securities laws and the SEC’s rules and regulations thereunder by failing to provide to the SEC the audit work papers of these firms with respect to certain PRC-based companies that are publicly traded in the United States. On January 22, 2014, the ALJ presiding over the matter rendered an initial decision that each of the firms had violated the SEC’s rules of practice by failing to produce audit workpapers to the SEC. The initial decision censured each of the firms and barred them from practicing before the SEC for a period of six months. The ALJ’s initial decision has been appealed by these firms. The ALJ’s decision does not take effect unless and until it is endorsed by the SEC. Any SEC endorsement or other determination could be appealed by the accounting firms through the U.S. federal courts. While we cannot predict the outcome of the SEC’s review or that of any subsequent appeal process, if the accounting firms are ultimately temporarily denied the ability to practice before the SEC, our ability to file our financial statements in compliance with SEC requirements could be impacted. A determination that we have not timely filed financial statements in compliance with SEC requirements could ultimately lead to the delisting of our ADSs from the New York Stock Exchange or the termination of the registration of our ADSs under the Securities Exchange Act of 1934, as amended, or both, which would substantially reduce or effectively terminate the trading of our ADSs in the United States.
Risks associated with Investments in an Indian Company. Political changes in the Government of India could delay and/or affect the further liberalization of the Indian economy and adversely affect economic conditions in India generally and our business in particular.
Our business could be significantly influenced by economic policies adopted by the Government of India. Since 1991, successive governments have pursued policies of economic liberalization and financial sector reforms.
The Government of India has at various times announced its general intention to continue India’s current economic and financial liberalization and deregulation policies. However, protests against such policies, which have occurred in the past, could slow the pace of liberalization and deregulation. The rate of economic liberalization could change, and specific laws and policies affecting foreign investment, currency exchange rates and other matters affecting investment in India could change as well. While we expect any new government to continue the liberalization of India’s economic and financial sectors and deregulation policies, there can be no assurance that such policies will be continued.
The Government of India has traditionally exercised and continues to exercise influence over many aspects of the economy. Our business and the market price and liquidity of our ADSs and Shares may be affected by interest rates, changes in policy, taxation, social and civil unrest and other political, economic or other developments in or affecting India.
A change in the Government of India’s economic liberalization and deregulation policies could disrupt business and economic conditions in India generally, and specifically those of our Company, as a substantial portion of our assets are located in India, and could have a material adverse effect on our financial condition and results of operations.
11
ˆ200GNal5ojlTd@ew%Š200GNal5ojlTd@ew%
762654 TX 12TATA MOTORS LTDFORM 20-F
25-Jul-2014 00:24 ESTHTMHKG
RR Donnelley ProFile HKR pf_rend 1*ESS 0C
hkrdoc211.5.15
Page 1 of 1
Terrorist attacks, civil disturbances, regional conflicts and other acts of violence, particularly in India, may disrupt or otherwise adversely affect the markets in which we operate, our business and our profitability.
India has from time to time experienced social and civil unrest and hostilities, including terrorist attacks and riots and armed conflict with neighboring countries. Events of this nature in the future could influence the Indian economy and could have a material adverse effect on the market for securities of Indian companies, including our ADSs and Shares, and on the market for our vehicles.
Rights of shareholders under Indian law may be more limited than under the laws of other jurisdictions.
Our Articles of Association, which include regulations applicable to our Board of Directors, and Indian law, govern our corporate affairs. Legal principles relating to these matters and the validity of corporate procedures, directors’ fiduciary duties and liabilities, and shareholders’ rights may differ from those that would apply to a company incorporated in another jurisdiction. Shareholders’ rights under Indian law may not be as extensive as shareholders’ rights under the laws of other countries or jurisdictions, including the United States. You may also have more difficulty in asserting your rights as a shareholder of our Company than you would as a shareholder of a corporation organized in another jurisdiction.
The market value of your investment may fluctuate due to the volatility of the Indian securities market.
The Indian stock exchanges have, in the past, experienced substantial fluctuations in the prices of their listed securities. The Indian stock exchanges, including the Bombay Stock Exchange Limited, or BSE, have experienced problems that, if they continue or recur, could affect the market price and liquidity of the securities of Indian companies, including our Shares. These problems in the past included temporary exchange closures, broker defaults, settlement delays and strikes by brokers. In addition, the governing bodies of the Indian stock exchanges have from time to time imposed restrictions on trading in certain securities, limitations on price movements and margin requirements. Furthermore, from time to time disputes have occurred between listed companies and stock exchanges and other regulatory bodies, which in some cases may have had a negative effect on market sentiment.
There may be a differing level of regulation and monitoring of the Indian securities markets and the activities of investors, brokers and other participants, than in the United States. SEBI received statutory powers in 1992 to assist it in carrying out its responsibility for improving disclosure and other regulatory standards for the Indian securities markets. Subsequently, SEBI has prescribed regulations and guidelines in relation to disclosure requirements, insider dealing and other matters relevant to the Indian securities market. There may, however, be less publicly available information about Indian companies than is regularly made available by public companies in the United States.
Investors may have difficulty enforcing judgments against us or our management.
We are a limited liability company incorporated under the laws of India. The majority of our directors and Executive Officers named in this annual report are residents of India and a substantial portion of our assets and the assets of these directors and Executive Officers are located in India. As a result, investors may find it difficult to (i) effect service of process upon us or these directors and Executive Officers in jurisdictions outside of India, (ii) enforce court judgments obtained outside of India, including those based upon the civil liability provisions of the U.S. federal securities laws, against us or these directors and Executive Officers, (iii) enforce, in an Indian court, court judgments obtained outside of India, including those based upon the civil liability provisions of the U.S. federal securities laws, against us or these directors and Executive Officers, and (iv) obtain expeditious adjudication of an original action in an Indian court to enforce liabilities, including those based upon the civil liability provisions of the U.S. federal securities laws, against us or these directors and Executive Officers.
India is not a party to any international treaty in relation to the recognition or enforcement of foreign judgments. Recognition and enforcement of foreign judgments is provided under Section 13 of the Code of Civil Procedure, or the Civil Procedure Code.
Section 13 and Section 44A of the Civil Procedure Code provide that a foreign judgment shall be conclusive as to any matter thereby directly adjudicated upon except (i) where it has not been pronounced by a court of competent jurisdiction, (ii) where it has not been given on the merits of the case, (iii) where it appears on the face of the proceedings to be founded on an incorrect view of international law or a refusal to recognize the law of India in cases where Indian law is applicable, (iv) where the proceedings in which the judgment was obtained were opposed to natural justice, (v) where it has been obtained by fraud or (vi) where it sustains a claim founded on a breach of any law in force in India.
Section 44A of the Civil Procedure Code provides that where a foreign judgment has been rendered by a superior court in any country or territory outside India which the Government has by notification declared to be a reciprocating territory, it may be enforced in India by proceedings in execution as if the judgment had been rendered by the relevant court in India. However, Section 44A of the Civil Procedure Code is applicable only to monetary decrees not being in the nature of any amounts payable in respect of taxes or other charges of a like nature or in respect of a fine or other penalty.
12
ˆ200GNal5ojlTfYGwBŠ200GNal5ojlTfYGwB
762654 TX 13TATA MOTORS LTDFORM 20-F
25-Jul-2014 00:24 ESTHTMHKG
RR Donnelley ProFile HKR pf_rend 1*ESS 0C
hkrdoc211.5.15
Page 1 of 1
The United States has not been declared by the Government of India to be a reciprocating territory for the purpose of Section 44A of the Civil Procedure Code. Accordingly, a judgment of a court in the United States may be enforced only by a suit upon the judgment and not by proceedings in execution. The suit must be brought in India within three years from the date of the judgment in the same manner as any other suit filed to enforce a civil liability in India. It is unlikely that a court in India would award damages on the same basis as a foreign court if an action is brought in India. Furthermore, it is unlikely that an Indian court would enforce foreign judgments if it viewed the amount of damages awarded as excessive or inconsistent with public policy. A party seeking to enforce a foreign judgment in India is required to obtain approval from RBI, the central bank of India, to execute such a judgment or to repatriate outside India any amount recovered.
Risks associated with our Shares and ADSs. Fluctuations in the exchange rate between the Indian rupee and the US dollar may have a material adverse effect on the market value of our ADSs and Shares, independent of our operating results.
Fluctuations in the exchange rate between the Indian rupee and the US dollar will affect, among others things, the US dollar equivalents of the price of the Shares in Indian rupees as quoted on the Indian stock exchanges and, as a result, may affect the market price of the ADSs. Such fluctuations will also affect the US dollar equivalent of any cash dividends in Indian rupees received on the Shares represented by the ADSs and the dollar equivalent of the proceeds in Indian rupee of a sale of Shares in India.
The exchange rate between the Indian rupee and the US dollar has changed materially in the last two decades and may materially fluctuate in the future. As of August 28, 2013, the value of the Indian rupee against the US dollar was Rs. 68.80 = US$1.00, following a depreciation of approximately 28.2%, as compared to Rs.53.65 = US $1.00 on May 1, 2013, based on the exchange rate for Indian rupees in the City of New York for cable transfers payable in foreign currencies as certified by the Federal Reserve Bank of New York for customs purposes. The noon buying rate for the Indian rupee from the Federal Reserve Bank of New York, expressed in rupees per US$1.00, was Rs. 59.89 on March 28, 2014.
Holders of ADSs have fewer rights than shareholders and must act through the depositary to exercise those rights.
Although holders of ADSs have a right to receive any dividends declared in respect of Shares underlying the ADSs, they cannot exercise voting or other direct rights as a shareholder with respect to the Shares underlying the ADSs evidenced by ADRs. Citibank, N.A. as depositary is the registered shareholder of the deposited Shares underlying our ADSs, and therefore only Citibank, N.A. can exercise the rights of shareholders in connection with the deposited Shares. Only if requested by us, will the depositary notify holders of ADSs of upcoming votes and arrange to deliver our voting materials to holders of ADSs. The depositary will try, in so far as practicable, subject to Indian laws and the provisions of our Articles of Association, to vote or have its agents vote the deposited securities as instructed by the holders of ADSs. If the depositary receives voting instructions in time from a holder of ADSs which fail to specify the manner in which the depositary is to vote the Shares underlying such holder’s ADSs, such holder will be deemed to have instructed the depositary to vote in favor of the items set forth in such voting instructions. If the depositary has not received timely instructions from a holder of ADSs, the holder shall be deemed to have instructed the depositary to give a discretionary proxy to a person designated by us, subject to the conditions set forth in the Amended and Restated Deposit Agreement (as amended). If requested by us, the depositary is required to represent all shares underlying ADSs, regardless whether timely instructions have been received from the holders of such ADSs, for the sole purpose of establishing a quorum at a meeting of shareholders. In addition, in your capacity as an ADS holder, you will not be able to bring a derivative action, examine our accounting books and records, or exercise appraisal rights. Registered holders of our Shares withdrawn from the depositary arrangements will be entitled to vote and exercise other direct shareholder rights in accordance with Indian law. However, a holder may not know about a meeting sufficiently in advance to withdraw the underlying shares in time. Furthermore, a holder of ADSs may not receive voting materials, if we do not instruct the depositary to distribute such materials, or may not receive such voting materials in time to instruct the depositary to vote.
Moreover, pursuant to Indian regulations, we are required to offer our shareholders preemptive rights to subscribe for a proportionate number of shares to maintain their existing ownership percentages prior to the issue of new shares. These rights may be waived by a resolution passed by at least 75% of our shareholders present and voting at a general meeting. Holders of ADSs may be unable to exercise preemptive rights for subscribing to these new Shares unless a registration statement under the Securities Act is effective or an exemption from the registration requirements is available to us. Our decision to file a registration statement would be based on the costs, timing, potential liabilities and the perceived benefits associated with any such registration statement and we do not commit that we would file such a registration statement. If any issue of securities is made to our shareholders in the future, such securities may also be issued to the depositary, which may sell such securities in the Indian securities market for the benefit of the holders of ADSs. There can be no assurance as to the value, if any, the depositary would receive upon the sale of these rights/securities. To the extent that holders of ADSs are unable to exercise preemptive rights, their proportionate interest in the Company would be reduced.
13

ˆ200GNal5ojqkNfmQ~Š200GNal5ojqkNfmQ~
762654 TX 14TATA MOTORS LTDFORM 20-F
26-Jul-2014 08:47 ESTHTMHKG
RR Donnelley ProFile HKR khanz0dc 3*ESS 0C
LANFBU-MWE-XN1911.5.15
Page 1 of 1
Indian Government regulation of foreign ownership could materially reduce the price of the ADSs.
Foreign ownership of Indian securities is regulated and is partially restricted. In addition, there are restrictions on the deposit of Shares into our ADS facilities. ADSs issued by companies in certain emerging markets, including India, may trade at a discount to the underlying equity shares, in part because of the restrictions on foreign ownership of the underlying equity shares and in part because ADSs are sometimes perceived to offer less liquidity than underlying shares that can be traded freely in local markets by both local and international investors. See Item 10.D “— Exchange Controls”. The ADSs could trade at a discount to the market price of the underlying shares.
A. History and Development of the Company. We were incorporated on September 1, 1945 as a public limited liability company under the Indian Companies Act VII of
1913 as Tata Locomotive and Engineering Company Limited. Our name was changed to Tata Engineering and Locomotive Company Limited on September 24, 1960, and to Tata Motors Limited on July 29, 2003. Tata Motors Limited is incorporated and domiciled in India. We commenced operations as a steam locomotive manufacturer. This business was discontinued in 1971. Since 1954, we have been manufacturing automotive vehicles. The automotive vehicle business commenced with the manufacture of commercial vehicles under financial and technical collaboration with Daimler-Benz AG (now Daimler AG) of Germany. This agreement ended in 1969. We produced only commercial vehicles until 1991, when we started producing passenger vehicles as well. Together with our consolidated subsidiaries we form the Tata Motors Group. Please see Item 4.C “— Organizational Structure” for details of our subsidiaries and affiliates.
In September 2004, we became the first company from India’s engineering sector to be listed on the New York Stock Exchange.
We offer a broad portfolio of automotive products, ranging from sub-1 ton to 49 ton GVW, trucks (including pickup trucks) to small, medium, and large buses and coaches to passenger cars, including the world’s most affordable car — the Tata Nano, premium luxury cars and SUVs. We rank as the eighth largest truck manufacturer globally in the 6 ton plus category according to Automotive World, as measured by volume of vehicles produced in 2013. The fall in the ranking from fifth to eighth with respect to size of truck manufacturing is attributable to, among other factors, slowdown in the Indian economy and the consequent reduction in sales of the M&HCV vehicles.
We have a substantial presence in India and also have global operations in connection with production and sale of Jaguar and Land Rover premium brand passenger vehicles. We are the largest automobile manufacturer by revenue in India, the largest commercial vehicle manufacturer in terms of revenue in India and among the top four passenger vehicle manufacturers in terms of units sold in India during Fiscal 2014. We estimate that over 8 million vehicles produced by us are being operated in India as of the date hereof.
We operate six principal automotive manufacturing facilities in India: at Jamshedpur in the state of Jharkhand, at Pune in the state of Maharashtra, at Lucknow in the state of Uttar Pradesh, at Pantnagar in the state of Uttarakhand, Sanand in the state of Gujarat and at Dharwad in the state of Karnataka. We also operate three principal automotive manufacturing facilities in the United Kingdom through our Jaguar Land Rover business: at Solihull in the West Midlands, Castle Bromwich in the West Midlands and at Halewood in Liverpool and have two advanced design and engineering facilities located at Whitley and Gaydon.
We have expanded our international operations through mergers and acquisitions and in India we have made strategic alliances involving non-Indian companies:
14
Item 4. Information on the Company.
• In 2004, we acquired the Daewoo Commercial Vehicles Company (renamed as Tata Daewoo Commercial Vehicle Company Limited, or TDCV), which is South Korea’s second largest truck maker in terms of revenue. Together with TDCV we have developed our next generation trucks called the ‘Prima’ range of trucks (earlier referred to as the World Truck).
• In Fiscal 2005, we acquired a 21% equity interest in Hispano Carrocera S.A. (renamed as Tata Hispano Motors Carrocera S.A.), or Hispano, a Spanish bus and coach manufacturer. During Fiscal 2010, we acquired the remaining 79% of the remaining equity interests in Hispano. However, despite investments by Tata Motors since 2005, the impact of the 2008 global economic recession and the resultant shrinkage in demand in the segment in which Tata Hispano operates resulted in accumulated losses of over Euro 60 million in the past five years. Due to the reduction in the size of the market year after year the industry was left with idle capacities making it very difficult to operate. Considering the untenable nature of the business and no or low visibility of a turnaround in the market, as well as the absence of any potential acquirers of the business, we decided to wind down operations in place of investing more over the next five years.
ˆ200GNal5oj@5cmJwrŠ200GNal5oj@5cmJwr
762654 TX 15TATA MOTORS LTDFORM 20-F
30-Jul-2014 12:08 ESTHTMHKG
RR Donnelley ProFile HKR kanns4dc 4*ESS 0C
ACXFBU-MWE-XN1211.5.15
Page 1 of 1
15
• We have a joint venture agreement with Fiat Group Automobiles S.p.A., Italy, or Fiat Group, located at Ranjangaon in Maharashtra to manufacture passenger cars, engines and transmissions for the Indian and overseas markets. Established in April 2008, the plant currently manufactures Fiat Linea, Fiat Punto, Tata Manza, Tata Indica and Tata Indica Vista vehicles as well as components for such vehicles, such as engines and transmissions. During May 2012, both the joint-venture partners decided to re-align their Indian joint-venture. Accordingly, in March 2013, we and Fiat Group have signed a Restructuring Framework Agreement, or RFA. As per the revised agreement –
a) Joint venture shall manufacture and assemble Fiat products, Tata products and any new products (including for
third parties) in accordance with the terms and conditions settled in the RFA. The current third party orders shall continue as per current terms.
b) The distribution company, owned by Fiat Group shall be responsible for distribution of the Fiat vehicles and
parts from April 1, 2013.
• In May 2006, we entered into a joint venture agreement with Brazil-based Marcopolo S.A., or Marcopolo, to manufacture and assemble fully-built buses and coaches in India, wherein we have a 51% ownership, with the remainder held by Marcopolo. The joint venture, Tata Marcopolo Motors Limited, or Tata Marco Polo, commenced production during Fiscal 2008.
• In December 2006, we entered into a joint venture agreement with Thonburi Automotive Assembly Plant Co. Ltd Thailand, or Thonburi, to manufacture pickup trucks in Thailand. As of March 31, 2014, we own 94.36% of the joint venture, while Thonburi Group owns the remaining 5.64%. The joint venture, which began vehicle production in March 2008, enabled us to access the Thailand market, which is a major market for pickup trucks, as well as other potential markets in the ASEAN region.
• We are also expanding our export operations for certain products. Our vehicles are being marketed in several countries in Europe, Africa, the Middle East, South East Asia and South Asia. During Fiscal 2008, Tata Motors (SA) Proprietary Ltd, or TMSA, a joint venture company in which we hold a 60% equity interest with the remaining 40% equity interest being held by Tata Africa Holdings (SA) (Pty.) Ltd, was formed for the manufacture and assembly operations of our LCVs and M&HCVs in South Africa. We have set up an assembly plant in South Africa at Rosslyn and commenced operations in July 2011.
• In June 2008, we acquired the Jaguar Land Rover business from Ford Motor Company. Jaguar Land Rover is a global automotive business, which designs, manufactures and sells Jaguar luxury sedans and sports cars and Land Rover premium all-terrain vehicles as well as related parts, accessories and merchandise. The Jaguar Land Rover business has internationally recognized brands, a product portfolio of award winning luxury performance cars and premium all-terrain vehicles, brand specific global distribution networks and research and development capabilities. We acquired three major manufacturing facilities located in Halewood, Solihull and Castle Bromwich and two advanced design and engineering facilities located at Whitley and Gaydon, all in the United Kingdom, together with national sales companies in several countries.
• In October 2010, we acquired an 80% equity interest in Trilix Srl., Turin (Italy), a design and engineering company, in line with our objective to enhance our styling/design capabilities to meet global standards. Trilix offers design and engineering services in the automotive sector, including styling, architecture, packaging, surfacing, macro- and micro-feasibility studies and detailed engineering development. Trilix continues to implement a strategic growth policy and in March 2013 moved to a new facility as part of its ongoing implementation of this growth policy.
• In December 2011, PT Tata Motors Indonesia was established as our subsidiary, with the objective and purpose of conducting business activities of import, assembly and wholesale distribution of vehicles in Indonesia and to neighboring countries. In February 2013, PT Tata Motors Distribusi Indonesia was established as subsidiary of PT Tata Motors Indonesia, with the objective and purpose of conducting business activities of import and wholesale distribution of vehicles in Indonesia.
• Jaguar Land Rover has committed to a joint venture with Chery Automobile Co. Ltd to build a factory in Changshu, China to supply the local market beginning in Fiscal 2015. The joint venture is expected to invest a total of RMB 10.9 billion into the manufacturing plant, R&D center and engine production facility. JLR is committed to invest RMB 3.5 billion of equity capital in the joint venture company, representing a 50% of the share capital and voting rights of the joint venture company.
• In December 2013, Jaguar Land Rover signed an agreement to invest GBP 240 million into a production facility in Rio de Janeiro in Brazil. We expect the construction of the vehicle manufacturing facility will commence in 2014 and the first vehicles are expected to come off the assembly line in 2016. We expect the new plant will have a capacity to build 24,000 vehicles annually for Brazil.

ˆ200GNal5ojqk$1fQHŠ200GNal5ojqk$1fQH
762654 TX 16TATA MOTORS LTDFORM 20-F
26-Jul-2014 08:49 ESTHTMHKG
RR Donnelley ProFile HKR khanz0dc 3*ESS 0C
LANFBU-MWE-XN1911.5.15
Page 1 of 1
We produce a wide range of automotive products, including:
Jaguar has an established presence in the premium car segment. Jaguar currently produces four car lines, including the Jaguar XK sports car (coupe and convertible), the Jaguar F-TYPE (coupe and convertible), the Jaguar XF sedan and the Jaguar XJ sedan. The 2013 Model Year Jaguar XF range includes for the first time an all-wheel drive version of the new V6 gasoline engine for the United States and European markets and a 2.0-liter gasoline version for the United States and Chinese markets. The 2013 Model Year for Jaguar XJ includes an all-wheel drive version and a 3.0-liter V6 gasoline version for the United States and European markets and a 2.0-liter gasoline version for the Chinese market. In September 2012, the Jaguar F-TYPE was at the Paris Motorshow, a two-seat sports car that was inspired by the 2011 C-X16 concept car. The Jaguar F-TYPE has an all-aluminum architecture and combines technological features such as all-aluminum double wishbone suspension and stop/start fuel economy measures with the power of Jaguar’s latest 3.0-liter V6 and 5.0-liter V8 engines. The Jaguar F-TYPE convertible was made available to retail customers from April 2013 in select markets and the coupe went on sale from April 2014 onwards. The C-X17 concept car was created as a design study to introduce Jaguar’s all-new advanced aluminium architecture. We believe that this modular, scalable architecture will allow Jaguar to grow its product portfolio and target high-growth areas of the premium market, beginning with a new mid-sized sedan in 2015. We believe that the C-X17 concept car is one example of the diverse range of vehicles that could be produced using the new architecture.
16
• Passenger Cars. Our range of Tata branded passenger cars include the Nano (Micro segment), the Indica (Compact segment), the Vista (Compact segment) the Indigo eCS (mid-sized segment) and the Manza (mid-sized) in the sedan category. We have expanded our car lines with several variants and fuel options to suit various customer preferences. In June 2013, we announced the Horizonext, a customer-focused strategy for our passenger vehicles business, and unveiled eight newly upgraded and enhanced products across the five brands. In Fiscal 2014, we introduced new products including the E-max range of CNG vehicles (for Tata Indica, Tata Indigo eCS and Tata Nano) and the Nano Twist with electric power steering. During the Delhi Auto Expo 2014, Tata Motors showcased two new products, the Bolt hatchback and the Zest sedan, which are anticipated to be launched later this year.
• Utility Vehicles. We manufacture a range of Tata branded utility vehicles, including the Sumo and the Safari, (SUVs), the Xenon XT (the lifestyle pickup), the Tata Aria (a crossover vehicle), and the Venture (a multipurpose utility vehicle, or MPV). Under the Safari brand, we offer two variants, the Dicor which is equipped with a 2.2L VTT DICOR engine, and the Safari Storme is powered by 2.2L VariCOR engine. Under the Sumo brand we offer the Sumo Gold, which features a BS4 3.0L diesel CR4 engine. The new Tata Aria launched in April 2014 has the 2.2L VARICOR engine which delivers an ultra-smooth ride. Land Rover produces six car lines under the brands of Range Rover and Land Rover, and provides us with market share in the premium all-terrain vehicles segment. Range Rover is the premium range consisting of Range Rover, Range Rover Sport and Range Rover Evoque, and the Land Rover brand comprises the Defender, Discovery 4 and Freelander 2 vehicles. The Freelander 2 was significantly enhanced for the 2013 model year with the introduction of a turbocharged 2.0-liter gasoline engine, offering superior performance to the 3.2-liter engine it replaces while also reducing CO emissions. At the 2013 New York International Auto Show, Land Rover introduced the new 2014 Model Year Range Rover Sport built on a weight saving aluminum architecture. The Range Rover Sport’s new aluminum architecture achieves a weight saving of up to 420kg, and when combined with a TDV6 engine, allows for improved agility and performance, with 15% CO reduction and 24% improved fuel economy. The new Range Rover Sport is the fastest, most agile and most responsive Land Rover produced to date. The new Range Rover Sport was awarded “SUV of the Year” by Top Gear magazine in the United Kingdom in 2013, the Middle East Edition of EVO in 2013 and Car and Driver in China in 2014. The all new Range Rover was launched in the third quarter of Fiscal 2013 on the same lightweight aluminum architecture. A diesel hybrid Range Rover is currently being developed for introduction later in 2014.
• Light Commercial Vehicles. We manufacture a variety of Light Commercial Vehicles (LCVs), including pickup trucks, and small commercial vehicles (SCVs) with a GVW (including payload) of between 1.2 tons and 7.5 tons. This also includes the Tata Ace, India’s first indigenously developed mini-truck with a 0.75 ton payload with different fuel options, the Super Ace with a 1-ton payload, the Ace Zip with a 0.6 ton payload, the Magic and Magic Iris, both passenger variants for commercial transportation developed on the Tata Ace platform, and the Winger. At the Delhi Auto Expo 2014, we unveiled the Ultra Narrow Cab and the Iris Electric. In Fiscal 2014 we marked our entry into two major markets – Australia and Indonesia with the Xenon and the SCV range of vehicles respectively. In Fiscal 2014 our new launches included the Ace and Magic Facelift, the Ace DICOR with common rail engine, and a new Ace Zip to tap the vast small three wheeler market. Additionally, the Company’s pickup truck, the Tata Xenon received an award for LCV Cargo vehicle of the year 2013. In Fiscal 2014, the Company launched new features and designs across the SFC (semi-forward control) range, and also introduced mechanical suspended seats in the HEx2 (high power and extra features) range of ICV trucks. Besides this, the Company has introduced the new-generation Ultra LCV / ICV range of trucks which commenced sales in July 2013.
2
2

ˆ200GNal5ojlTldww[Š200GNal5ojlTldww[
762654 TX 17TATA MOTORS LTDFORM 20-F
25-Jul-2014 00:24 ESTHTMHKG
RR Donnelley ProFile HKR pf_rend 1*ESS 0C
hkrdoc211.5.15
Page 1 of 1
Our Commercial Vehicles business, in year 2011, initiated ‘Project Neev’ – a growth program for rural India designed to promote self-employment. Through a rigorous skill building exercise, local, unemployed rural youth have been enrolled and trained to work from homes as promoters of our commercial vehicles. Project Neev is currently operational in nine states of India and has engagement in 307 districts, 2,437 sub-districts, covering more than 350,000 villages. The rural penetration drive initiated through Project Neev has additionally deployed an approximately 5,000 strong dedicated rural team and 604 dedicated rural outlets in towns and villages with populations of less than 50,000. More than 50,000 small commercial vehicles have been sold since the commencement of this program, which we attribute to a 19% increase in volumes. Project Neev currently completed its third wave of expansion, and we anticipate that it will operate in all major states across the country within the next couple of years. This programme has been appreciated and recognized in various forums such as Rural Marketing Association of India Flame Awards for excellence in the field of rural marketing.
Another initiative pioneered by our Commercial Vehicles business is ‘TATA-OK’. TATA-OK seeks to promote our commercial vehicles through capturing new customer segments, for example economical and used vehicle buyers, promoting the sale of new vehicles through the exchange of used commercial vehicles at our dealerships, increasing the resale value of our commercial vehicles products, and developing deeper customer engagement and thereby promoting brand loyalty. TATA-OK has completed three years of operation, including a pilot year, with more than 15,000 transactions across all customer segments through 150 affiliated retailers across all regions.
On March 23, 2014, the Company organized the T1 Prima Truck Racing Championship at the BIC Greater Noida – Buddh International F1 Circuit.
The championship featured 12 purpose-built Tata 4038.S Prima trucks The 12 trucks were divided among six teams, with participation from experienced international drivers. The Prima Truck Racing Championship was organized by the Federation of Motor Sports Clubs of India (FMSCI) and was conducted according to British Truck Racing Association (BTRA) guidelines. The event showcased the performance of our trucks as well as highlighted the contributions that truck drivers make to their communities.
In Fiscal 2014, we expanded the ‘Tata Alert’ service across all national highways. ‘Tata Alert’ provides breakdown assistance across all national highways in India by promising to respond to the breakdown site within 4 hours of notification and to return the vehicle to the road within 48 hours. This was coupled with the introduction of new services such as the ‘Tata On-site’ service and parts support through the use of “Container Workshops”. These workshops are an onsite service support system where a container is deployed onsite and houses the repair equipment while the repairs are done in the open. In addition, we introduced the ‘on-demand AMC (Annual maintenance contracts)’ service, which provides customized AMC support for significant customers such as large fleet owners. ‘Triple Benefit Insurance’ products were also introduced for both the cargo and Construck ranges (providing coverage for zero depreciation, loss of revenue, and replacement for total loss in case of accident). In January 2013, to further strengthen the core proposition of lowest total cost of ownership we introduced warranty of 4 years/4 lakh (400,000) kms on drivelines for our entire range of heavy trucks with 25 tons and higher GVW and extended the same to our 16T GVW truck range effective from March 2014 onwards.
17
• Medium and Heavy Commercial Vehicles We manufacture a variety of Medium and Heavy Commercial Vehicles (M&HCVs), which includes trucks, tractors, buses, tippers, and multi-axled vehicles with GVW (including payload) of between 8 tons and 49 tons. In addition, through TDCV we manufacture a range of trucks ranging from 215 horsepower to 560 horsepower, including dump trucks, tractor-trailers, mixers and cargo vehicles. During Fiscal 2010, we unveiled a new range of trucks, referred to as the ‘Tata Prima’ line, to our customers in India and South Korea, and have partially extended the offering by providing various products off the ‘Prima’ line. We also expect to gradually export these ‘Prima’ products to other countries such as South Africa, Russia, the other South Asian Association for Regional Cooperation (SAARC) countries, the Middle East and various countries in Africa. We showcased at the Delhi Auto Expo 2012, the Tata LPT 3723, India’s first 5-axle rigid truck, the Tata Paradiso G7 Multi-axle Coach, jointly developed by Tata Motors and Tata Marcopolo Motors Limited, and the Tata Starbus Fuel Cell Concept (Hydrogen). In September 2012, Tata Motors Limited launched six new heavy trucks and a telematics and fleet management service, Tata FleetMan. Targeted at commercial vehicle fleet owners and large consigners of goods, the service offers advanced telematics solutions, which provides our customers with tools for improving productivity and profitability. The ‘Tata Prima’ line has now been further extended with the launch of two new engine capacities of 380HP and 230HP. In the 380HP range, two new models have been launched – the Prima 4938 tractor and the Prima 3138K tipper. The new 230HP LX range has two new products – the Prima 4923 and the Prima 4023 tractors. The LX range was further expanded with the launch of 8 more products in Fiscal 2014 – Prima 2523T LX, Prima 3123T LX, Prima 4028.S LX (Single reduction and Hub reduction), Prima 4928.S LX (Single reduction and Hub reduction), Prima 4923.S LX, and Prima LX series of Tippers were launched – 2523K, 3123K, 2528K & 3128K. Our Construck range has been further supplemented with the launch of the Tata LPK 3118 tipper.

ˆ200GNal5oj$=GaXw_Š 200GNal5oj$=GaXw_
762654 TX 18TATA MOTORS LTDFORM 20-F
31-Jul-2014 04:21 ESTHTMHKG
RR Donnelley ProFile HKR khanz0dc 2*ESS 0C
ACXFBU-MWE-XN1111.5.15
Page 1 of 1
For M&HCV buses, several marketing and brand building initiatives have been undertaken. In order to cultivate safe practices in school bus riders, promote the brand image and build connections with school bus riders and stakeholders such as children, parents and school authorities, the ‘Dream it to Win it’ school bus campaign was organized across 2,070 schools in 11 cities across India, in Fiscal 2013. Owing to positive responses received for the campaign, in Fiscal 2014 this campaign was further extended to 1,967 schools across 22 Indian cities. Through this event, students from different regions were educated on safety while travelling in school buses. Another major initiative undertaken was the ‘Good Citizen Program.’ This is an interactive training session which has been designed, with the objective of promoting education and awareness of safety in school bus travel to school bus staff and. Since its inception the program has aimed at creating a sense of involvement among participants, increasing awareness about their duties and responsibilities, for example maintaining personal hygiene, general etiquette and behavior and taking necessary measures in case of accidents.
In February 2013, in the SIAM International Bus & Utility Vehicles Show, at Greater Noida, we showcased two new applications from our line-up of buses for the MCV market for intercity transportation and staff transportation: a 45-seater front-engine luxury air-conditioned intercity coach and a luxury non-air-conditioned 41-seater staff bus. Other new vehicles on display included the Divo Coach, Semi Deluxe Starbus Ultra Contract Bus, the all new Starbus Ultra intended for use as school transportation and an ambulance based on the Tata Venture platform. The new MCV buses are fully built offerings catering to both air-conditioned and non-air-conditioned contract and intercity applications. The world-class body has been built to meet international standards by Tata Motors Marcopolo Limited, on the Tata LPO 1618 and LPO 1512 chassis.
At the Delhi Auto Expo 2014, we unveiled Starbus Urban Parallel Hybrid Bus and the Starbus Urban Articulated Bus. The Starbus Urban Parallel Hybrid bus is intended for urban transportation and offers improved mileage with lower emissions relative to the conventional Starbus buses. The Starbus Urban Articulated Bus is targeted at bus rapid transit systems. With its two sections, it offers a carrying capacity of up to 70 passengers alongside the maneuverability needed for city transportation.
We believe that the foundation of our growth over the last five decades has been a deep understanding of economic conditions and customer needs, and the ability to translate this understanding into desirable products though research and development. Our Engineering Research Centre, or ERC, established in 1966, has enabled us to successfully design, develop and produce our own range of vehicles. As a consequence of the acquisition of Jaguar Land Rover, we now have state-of-the-art engineering and design facilities. We believe the ERC along with the capabilities of our Jaguar Land Rover business will enhance our product engineering capability and facilitate rapid introduction of new products. Furthermore, we have a wholly-owned subsidiary, Tata Motors European Technical Centre PLC, or TMETC, in the United Kingdom, which is engaged in automobile research and engineering.
Please see Item 4.B “— Business Overview — Our Strategy — Capital and Product Development Expenditures” and Item 5.B “Operating and Financial Review and Prospect — Liquidity and Capital Resources — Capital Expenditures” for details on the Company’s principal capital expenditures.
Through our other subsidiary and associate companies, we are engaged in providing engineering and automotive solutions, construction equipment manufacturing, automotive vehicle components manufacturing and supply chain activities, machine tools and factory automation solutions, high-precision tooling and plastic and electronic components for automotive and computer applications, and automotive retailing and service operations.
Tata Technologies Limited, or TTL, our 72.32% owned subsidiary, is engaged in providing specialized engineering and design services, product lifecycle management, or PLM, and product-centric IT services to leading global manufacturers. TTL’s customers are among the world’s premier automotive, aerospace and consumer durables manufacturers. TTL had 17 subsidiary companies and one joint venture as at March 31, 2014.
TML Distribution Company Limited, or TDCL, our wholly-owned subsidiary, was incorporated on March 28, 2008. TDCL provides distribution and logistics support for distribution of our products throughout India. TDCL commenced its operations in Fiscal 2009.
Our wholly-owned subsidiary, Tata Motors Finance Limited, or TMFL, was incorporated on June 1, 2006, with the objective of becoming a preferred financing provider for our dealer’s customers by capturing customer spending over the vehicle life-cycle relating to vehicles sold by us. TMFL commenced operations on September 1, 2006. In India, TMFL is registered with the RBI as a Systemically Important Non-Deposit Taking Non-Banking Financial Company and is classified as an Asset Finance Company under the RBI’s regulations on Non-Banking Financial Companies.
Our wholly-owned subsidiary, Tata Motors Insurance Broking and Advisory Services Limited (TMIBASL) is a licensed Direct General Insurance Broker for the Indian market with plans to branch out globally to avail better opportunities. It commenced business in Fiscal 2008 and provides end-to-end insurance solutions in retail segment with special focus on the automobile sector. TMIBASL offers services to various original equipment manufacturers (OEMs) in the passenger vehicle, commercial and construction equipment segments, including Tata Motors.
18
ˆ200GNal5ojw%ujiQ=Š200GNal5ojw%ujiQ=
762654 TX 19TATA MOTORS LTDFORM 20-F
29-Jul-2014 06:24 ESTHTMHKG
RR Donnelley ProFile HKR thanm0dc 3*ESS 0C
HKGFBU-MWE-XN0111.5.15
Page 1 of 1
As of March 31, 2014, our operations included 70 consolidated subsidiaries, 2 joint operations, 3 joint ventures and 18 equity method affiliates, in respect of which we exercise significant influence.
As of March 31, 2014, we had approximately 68,889 permanent employees, including approximately 39,323 permanent employees at our consolidated subsidiaries and joint operations.
Tata Incorporated serves as our authorized United States representative. The address of Tata Incorporated is 3 Park Avenue, 27 Floor, New York, NY 10016, United States of America.
Our Registered Office is located at Bombay House, 24, Homi Mody Street, Mumbai 400 001, India. Our telephone number is +91-22-6665-8282 and our website address is www.tatamotors.com. Our website does not constitute a part of this annual report.
B. Business Overview. We primarily operate in the automotive segment. Our automotive segment operations include all activities relating to the
development, design, manufacture, assembly and sale of vehicles including financing thereof, as well as sale of related parts and accessories. The acquisition of the Jaguar Land Rover business has enabled us to enter the premium car market in developed markets such as the United Kingdom, the United States and Europe as well as in growing markets like China, Russia and Brazil, where we were not present earlier. Going forward, we expect to focus on profitable growth opportunities in our global automotive business, through new products and market expansion. Within our automotive operations we continue to focus on integration and synergy through sharing of resources, platforms, facilities for product development and manufacturing, sourcing strategy and mutual sharing of best practices.
Our business segments are (i) automotive operations and (ii) all other operations. Our automotive operations include all activities relating to development, design, manufacture, assembly and sale of vehicles including financing thereof, as well as sale of related parts and accessories. We provide financing for vehicles sold by dealers in India. The vehicle financing is intended to drive sale of vehicles by providing financing to the dealers’ customers and as such is an integral part of automotive business. Our automotive operations segment is further divided into Tata and other brand vehicles (including spares and financing thereof) and Jaguar Land Rover.
19
th

ˆ200GNal5ojrRmn#w8Š200GNal5ojrRmn#w8
762654 TX 20TATA MOTORS LTDFORM 20-F
27-Jul-2014 07:13 ESTHTMHKG
RR Donnelley ProFile HKR peetp0dc 4*ESS 0C
WCRFBU-MWE-XN0311.5.15
Page 1 of 1
Our other operations business segment includes information technology, or IT services and machine tools and factory automation solutions.
Our Strategy We believe that we have established a strong position in the Indian automobile industry by launching new products,
investing in research and development, strengthening our financial position and expanding our manufacturing and distribution network. We have pursued the strategy of increasing our presence in the global automotive markets and enhancing our product range and capability through strategic acquisitions/alliances. Our goal is to position ourselves as a major international automotive company by offering products across various markets by combining our engineering and other strengths as well as through strategic acquisitions. Our strategy to achieve these goals consists of the following elements:
Continued focus on new product development: In Fiscal 2014, we launched 89 new products or variants of our existing vehicle lines. We offer an extensive range of commercial vehicles (for both goods and passenger transport) as well as passenger vehicles. We have plans to expand the range of our product base further supported by our strong brand recognition in India, our understanding of local consumer preferences, in-house engineering capabilities and extensive distribution network. With growing competition, changing technologies and evolving customer expectations, we understand the importance of bringing new platforms to address market gaps and further enhance our existing range of vehicles to ensure customer satisfaction. Our capital expenditures totaled Rs.272,832 million, Rs.212,078 million and Rs.148,255 million during Fiscal 2014, 2013 and 2012, respectively and we currently plan to invest approximately Rs.380 billion in Fiscal 2015 in new products & technologies.
Jaguar Land Rover has aimed to enhance its technological strengths through in-house R&D activities, including the development of two new engineering and design centres which centralize Jaguar Land Rover’s capabilities in product design and engineering. Furthermore, Jaguar Land Rover participates in advanced research consortia that bring together leading manufacturers, suppliers or academic specialists in the United Kingdom and are supported by funding from the UK Government’s Technology Strategy Board. Examples of such efforts are the Evoque_e program, which aims to design and develop hybrid and electric vehicle powertrain systems, and the VARCITY project, which aims to develop the supply chains for vehicle body architectures using carbon fiber technology, among other goals.
Leveraging our capabilities: We believe that our in-house research and development capabilities, including those of our subsidiaries Jaguar Land Rover and TDCV and our joint ventures with Marcopolo of Brazil in India, with Thonburi in Thailand and Tata Africa Holdings (SA) (Pty.), Ltd in South Africa, Trilix Srl., Turin (Italy), and TMETC in the United Kingdom will enable us to expand our product range and extend our geographical reach. We continually strive to achieve synergy wherever possible with our subsidiaries and joint ventures.
In Fiscal 2012, we showcased at the Delhi Auto Expo 2012: (i) the Tata Ultra, a new LCV and ICV range platform, allowing flexibility of multiple wheel bases and multiple payload points, (ii) the Tata LPT 3723, India’s first 5-axle rigid truck (launched in September 2012) and the Tata Paradiso G7 multi-axle coach, jointly developed by Tata Motors and Marcopolo and (iii) our alternate fuel technology capability through the following concept vehicles - the Tata Starbus Fuel Cell (hydrogen) and the Tata Magic Iris CNG.
Our product portfolio of Tata brand vehicles which includes the Nano, Indica, Indica Vista, Indigo, Indigo Manza, Sumo, Sumo Grande, Safari, Safari Storme, Aria and Venture, enables us to compete in various passenger vehicle market segments. We also offer alternative fuel vehicles under the Nano and Indigo brands.
We have continued modernizing our facilities to meet demand for our vehicles. Our Jamshedpur plant, which manufactures our entire range of M&HCVs, including the Tata Prima, both for civilian and defense applications, was our first, set up in 1945 to manufacture steam locomotives. It led the Company’s foray into commercial vehicles in 1954. The Jamshedpur plant has been modernized through the decades, with a particularly intense scale in the last 10 years. In Fiscal 2013, the Jamshedpur plant produced its two millionth truck.
Jaguar Land Rover aims to invest substantially to develop new products in new and existing segments by introducing new powertrains and technologies that satisfy both customer preferences and regulatory requirements. Complementing this, Jaguar Land Rover invests in manufacturing capacity in the United Kingdom and internationally to meet customer demand. In line with other premium automotive manufacturers Jaguar Land Rover aims to maintain an allocation of 10 to 12% of revenue on capital expenditure. However, in Fiscal 2015 and 2016, we anticipate that Jaguar Land Rover will make higher capital spending in order to take advantage of the growth opportunities. For Fiscal 2015, capital expenditure at our Jaguar Land Rover business are expected to be approximately GBP 3.5 billion to GBP 3.7 billion (allocated approximately 40% for R&D and 60% for expenditure on tangible fixed assets such as facilities, tools and equipment as well as investment in our China joint venture).
20
ˆ200GNal5ojlTsWMw[Š200GNal5ojlTsWMw[
762654 TX 21TATA MOTORS LTDFORM 20-F
25-Jul-2014 00:24 ESTHTMHKG
RR Donnelley ProFile HKR pf_rend 1*ESS 0C
hkrdoc211.5.15
Page 1 of 1
In Fiscal 2015, Jaguar Land Rover will also start full production at its Engine Manufacturing Centre at Wolverhampton, UK. Our aim is that the plant will manufacture a family of premium, technologically advanced engines, “Ingenium”. These will be entirely designed and built in-house for exclusive use. We expect that the Jaguar XE, debuting in 2015, will be the first vehicle equipped with these four-cylinder engines. Jaguar Land Rover’s state-of-the-art Engine Manufacturing Centre is the first new facility that it has built from the ground up. Situated at Wolverhampton in the heart of the UK, we believe that it is ideally located between the Jaguar Land Rover’s three other manufacturing sites at Halewood, Castle Bromwich and Solihull. We expect that the plant will employ almost 1,400 people by the time it reaches full capacity and the first phase of recruitment commenced in January 2014. Representing an investment of more than GBP 500 million, we believe that the plant will manufacture Jaguar Land Rover’s most advanced engines ever.
Continuing focus on high quality and enhancing customer satisfaction: One of our principal goals is to achieve international quality standards for our products and services. We have established a procedure for ensuring quality control of outsourced components. Products purchased from approved sources undergo a supplier quality improvement process. We also have a program for assisting vendors from whom we purchase raw materials or components to maintain quality. Each vendor is reviewed on a quarterly basis on parameters of quality, cost and delivery and preference is given to vendors with TS 16949 certification. We are pursuing various quality improvement programs, both internally and at our suppliers’ operations, in an effort to enhance customer satisfaction and reduce our future warranty costs. We have also established a procedure for ensuring quality control of outsourced components, and products purchased from approved sources undergo a supplier quality improvement process. Reliability and other quality targets are built into our new product introduction process. Assurance of quality is further driven by the design team, which interacts with downstream functions like process-planning, manufacturing and supplier management to ensure quality in design processes and manufacturing. Through close coordination supported by our IT systems, we monitor quality performance in the field and implement corrections on an ongoing basis to improve the performance of our products thereby improving customer satisfaction. In India, we improved our Customer Service Index, or CSI, score to 799 in 2013 from 796 in 2012. We maintained the 6 ranking in the 2013 J.D. Power India Customer Service Index survey. We continue to focus on high quality customer satisfaction. We believe our extensive sales and service network has also enabled us to provide quality and timely customer service. We are encouraging focused initiatives at both sales and service touch points to enhance customer experience and strive to be best in class.
Jaguar and Land Rover collectively received over 195 awards from leading international motoring writers, magazines and commentators in 2013, reflecting the strength of its design capabilities and distinctive model line-up. The Jaguar XF is Jaguar’s best-selling model across the world by volume and has received more than 100 international awards since its launch, including being named “Best Executive Car” by What Car? Magazine for four consecutive years. The Jaguar XJ has received more than 20 international awards since its launch, including “Best Luxury Car” from China’s Auto News in 2010, “Annual Limousine King” from Quattroroute (Italy), “Luxury Car of the Year” from Top Gear (UK), Automobile Magazine’s “2011 Design of the Year” and “Best Executive Sedan” at the Bloomberg Awards in the United States. The Jaguar F-TYPE has been voted the winner of a prestigious Golden Steering Wheel award by readers of the respected German newspapers Bild am Sonntag and Auto Bild. The F-TYPE competed in the “coupé and cabriolet” category, finishing ahead of the Porsche Cayman and BMW 4 Series Coupé. Range Rover achieved the Highest Automotive Performance, Execution and Layout (APEAL) score of any model in the J.D. Power 2013 APEAL survey – the first time a model outside of the large premium car segment has ranked highest among all models in the industry. The New Range Rover Sport was awarded “SUV of the Year” by Top Gear magazine in the United Kingdom in 2013, the Middle East Edition of EVO in 2013 and Car and Driver in China in 2014.
Products and environmental performance: Our strategy is to invest in products and technologies that position our products ahead of expected stricter environmental regulations and ensure that we benefit from a shift in consumer awareness of the environmental impact of the vehicles they drive. We are the largest investor in automotive research and development in the United Kingdom as measured by GBP. We also believe that we are the leader in development of automotive green-technology in the United Kingdom. Our environmental vehicle strategy focuses on new propulsion technology, weight reduction and reducing parasitic losses through the driveline.
We have developed diesel hybrid versions of the Range Rover and Range Rover Sport, without compromising the vehicles’ off road ability or load space. We are currently conducting trials of an electric Defender, as part of our research into the electrification of premium sedan and all terrain vehicles.
We believe that we are a global leader in the use of aluminum and other lightweight materials to reduce vehicle weight and improve fuel and CO efficiency, and we believe we are ahead of many of our competitors in the implementation of aluminum construction. We offer five aluminum monocoque vehicles: the Jaguar F TYPE, the Range Rover, the Range Rover Sport, the Jaguar XJ and Jaguar XK. We plan to deploy our core competency in aluminum construction across more models in our range.
21
th
2

ˆ200GNal5ojlTt#$wdŠ200GNal5ojlTt#$wd
762654 TX 22TATA MOTORS LTDFORM 20-F
25-Jul-2014 00:24 ESTHTMHKG
RR Donnelley ProFile HKR pf_rend 1*ESS 0C
hkrdoc211.5.15
Page 1 of 1
We are also developing more efficient powertrains and other technologies. This includes smaller and more efficient diesel and gasoline engines, stop start and hybrid engines, starting with a diesel hybrid engine available in the Range Rover and Range Rover Sport this year and the introduction of our own four cylinder engines from beginning in 2015.
Our current product line up is the most efficient it has ever been, in terms of fuel efficient and CO emissions. The most efficient version of the Range Rover Evoque emits less than 130 g/km. The all aluminum Jaguar XJ 3.0 V6 twin turbo diesel has CO emissions of 159 g/km. The new 3.0 liter TDV6 Range Rover offers similar performance to the previous 4.4 liter TDV8 Range Rover while fuel consumption and CO emissions have been reduced (now 196 g/km). The new “downsized” 2.0 liter turbocharged gasoline engine options in the Range Rover Evoque, the 2013 Model Year Freelander, and the Jaguar XF and XJ will also offer improved fuel efficiency. In the case of the latest Freelander Si4, fuel consumption and CO emissions have been reduced over the outgoing 3.2 liter Freelander Si6. Equipped with stop start and an 8 speed automatic transmission, the XF 2.2 liter diesel, already the most fuel efficient Jaguar to date was further improved for 2014 Model Year with CO emissions cut to 129 g/km. In 2014 we will intend to launch our first hybrid electric vehicles in the Range Rover and Range Rover Sport 3.0L TDV6 Hybrid with emissions of 169 g/km.
We are also taking measures to reduce emissions, waste and the use of natural resources from all of our operations. We recognize the need to use resources responsibly, produce less waste and reduce our carbon footprint. We have reduced our energy use per vehicle by 23% from 2007 levels. We have implemented life cycle techniques so that we can evaluate and reduce our environmental footprint throughout the value chain. We have been certified to the international environmental management standard, ISO 14001, since 1998. As part of our integrated CO management strategy, we have one of the largest voluntary CO offset programs. Through CO offset schemes, we offset all our own manufacturing CO emissions and have provided customer programs to enable our customers to offset the emissions from vehicle use.
Mitigating cyclicality: The automobile industry is impacted by cyclicality. To mitigate the impact of cyclicality, we plan to continually strengthen our operations through gaining market share across different segments, and offering a wide range of products in diverse geographies. We also plan to continue to strengthen our business operations other than vehicle sales, such as financing of our vehicles, spare part sales, service and maintenance contracts, sales of aggregates for non-vehicle businesses, reconditioning of aggregates and sale of castings, production aids and tooling / fixtures, to reduce the impact of cyclicality of the automotive industry.
Expanding our international business: Our international expansion strategy involves entering new markets where we have an opportunity to grow and introducing new products to existing markets in order to grow our presence in such markets. Our international business strategy has already resulted in the growth of our international operations in select markets and chosen segments over the last five years. In recent years, we have grown our market share across various African markets such as Kenya, Nigeria, Tanzania, Congo and Senegal, and have also introduced certain products in Australia.
We have also expaned our range through acquisitions and joint ventures. Our acquisition of Jaguar Land Rover has expanded our geographical presence significantly. Through Jaguar Land Rover we now offer products in the premium performance car and premium all-terrain vehicle segments with globally recognized brands and we have diversified our business across markets and product segments. We will continue to build upon the internationally recognized brands of Jaguar Land Rover. TDCV continues to be the largest exporter of heavy commercial vehicles from South Korea. We have established a joint venture along with Thonburi in Thailand to manufacture pickup trucks and any other product lines that would be suitable for the market, going forward. During Fiscal 2008, we established a joint venture company to undertake manufacture and assembly operations in South Africa, which has been one of our largest export markets from India in terms of unit volume. The joint venture company, Tata Motors (SA) Proprietary Limited, commenced operations in July 2011. Currently, Tata Motors (SA) Proprietary Limited, caters to the domestic South African market and up to March 2014, it had produced and sold over 2,000 chassis.
Reducing operating costs: We believe that our scale of operations provides us with a significant advantage in reducing costs and we plan to continue to sustain and enhance this cost advantage.
Our ability to leverage our technological capabilities and our manufacturing facilities among our commercial vehicle and passenger vehicle businesses enables us to reduce cost. For example, the diesel engine used in our Indica was modified to engineer a new variant for use in the Ace platform, which helped to reduce the project cost. Similarly, platform sharing for the manufacture of pickup trucks and UVs enables us to reduce capital investment that would otherwise be required, while allowing us to improve the utilization levels at our manufacturing facilities. Where it is advantageous for us to do so, we intend to add our existing low cost engineering and sourcing capability to vehicles manufactured under the Jaguar and Land Rover brands.
Our vendor relationships also contribute to our cost reductions. For example, we believe that the vendor rationalization program that we are undertaking will provide economies of scale to our vendors which would benefit our cost programs. We are also undertaking various internal and external benchmarking exercises that would enable us to improve the cost effectiveness of our components, systems and sub-systems.
22
2
2
2
2
2
2 2
2 2

ˆ200GNal5ojqlhp$Q$Š200GNal5ojqlhp$Q$
762654 TX 23TATA MOTORS LTDFORM 20-F
26-Jul-2014 08:52 ESTHTMHKG
RR Donnelley ProFile HKR khanz0dc 2*ESS 0C
LANFBU-MWE-XN1911.5.15
Page 1 of 1
We have intensified efforts to review and realign our cost structure through a number of measures such as reduction of manpower costs and rationalization of other fixed costs. Our Jaguar Land Rover business has undertaken several cost control and cost management initiatives such as increased sourcing of materials from low cost countries, reduction in number of suppliers, rationalization of marketing setup, reduction of manpower costs through increased employee flexibility between sites and several other initiatives. Further, our Jaguar Land Rover business is exploring opportunities through reduction in number of platforms, reduction in engineering costs, increased use of off-shoring and several other initiatives.
Enhancing capabilities through the adoption of superior processes: Tata Sons and the entities promoted by Tata Sons, including us, aim at improving quality of life through leadership in various sectors of national economic significance. In pursuit of this goal, Tata Sons and the Tata Sons promoted entities have institutionalized an approach, called the Tata Business Excellence Model, or TBEM, which has been formulated along the lines of the Malcolm Baldridge National Quality Award to enable us to improve performance and attain higher levels of efficiency in our businesses and in discharging our social responsibility. The model aims to nurture core values and concepts embodied in various focus areas such as leadership, strategic planning, customers, markets and human resources, and to translate them to operational performance. Our adoption and implementation of this model seeks to ensure that our business is conducted through superior processes.
We have deployed a balance score card, or BSC, management system, developed by Dr. Robert Kaplan and Dr. David Norton of the Harvard Business School for measurement based management and feedback. We have also deployed a new product introduction, or NPI, process for systematic product development and a PLM system for effective product data management across our organization. On the human resources front, we have adopted various processes to enhance the skills and competencies of our employees. We have also enhanced our performance management system, with appropriate mechanisms to recognize talent and sustain our leadership base. We believe these will enhance our way of doing business, given the dynamic and demanding global business environment.
Expanding customer financing activities: With financing increasingly being a critical factor in vehicle purchases and the rising aspirations of consumers in India, we intend to expand our vehicle financing activities to enhance our vehicle sales. Further, in a scenario where there is a lack of sufficient finance availability for vehicle sales in the Indian market, as was witnessed during the financial crisis, our finance business is expected to play a significant role in filling the gap created when financing from other banks and non-banking financial companies dries up. In addition to improving our competitiveness in customer attraction and retention, we believe that expansion of our financing business would also contribute towards moderating the impact on our financial results from the cyclical nature of vehicle sales.
Continuing to invest in technology and technical skills: We believe we are one of the most technologically advanced indigenous vehicle manufacturers in India. Over the years, we have enhanced our technological strengths through extensive in-house research and development activities. Further, our research and development facilities at our subsidiaries, like TMETC, TDCV, TTL, and Trilix, together with the two advanced engineering and design centers of Jaguar Land Rover, have increased our capabilities in product design and engineering. In our Jaguar Land Rover business, we are committed to continue to invest in new technologies to develop products that meet the opportunities of the premium segment, including developing sustainable technologies to improve fuel economy and reduce CO emissions. We consider technological leadership to be a significant factor in continued success, and therefore intend to continue to devote significant resources to upgrade our technological base.
Maintaining financial strength: Our cash flow from operating activities in Fiscal 2014 and 2013 was Rs.371,432 million and Rs. 225,549 million, respectively. The improved position in our operating cash flows is primarily due to an increase in volumes at our Jaguar Land Rover business, implementation of cost reduction programs, and prudent working capital management. We have established processes for project evaluation and capital investment decisions with an objective to enhance our long term profitability.
Leveraging brand equity: We believe customers associate the Tata name with reliability, trust and ethical value, and our brand name is gaining significant international recognition due to the international growth strategies of various Tata companies. The Tata brand is used and its benefits are leveraged by Tata companies to their mutual advantage. We recognize the need for enhancing our brand recognition in highly competitive markets in which we compete with internationally recognized brands. We, along with Tata Sons and other Tata companies, will continue to promote the Tata brand and leverage its use in India, as well as in various international markets where we plan to increase our presence. Supported by the corporate level “Tata” brand, we believe our product brands like Indica, Indigo, Sumo, Safari, Aria, Venture Nano, Prima, Ace, Magic along with Daewoo, Jaguar, Range Rover and Land Rover are highly regarded, and will be nurtured and promoted. At the same time, we will continue to build new brands such as the newly launched Ultra range of LCVs to further enhance our brand equity.
23
2

ˆ200GNal5ojo8HkaQÄŠ200GNal5ojo8HkaQ˜
762654 TX 24TATA MOTORS LTDFORM 20-F
25-Jul-2014 14:02 ESTHTMHKG
RR Donnelley ProFile HKR ganeg0dc 2*ESS 0C
SWRFBU-MWE-XN0411.5.14
Page 1 of 1
Automotive Operations We sold 1,020,546, 1,192,742, and 1,270,211 vehicles in Fiscal 2014, 2013 and 2012 respectively, consisting of 588,657
units of Tata and other brand vehicles and 431,889 units of Jaguar Land Rover vehicles in Fiscal 2014. In terms of units sold our largest market is India where we sold 527,378 and 756,444 units during Fiscal 2014 and 2013, (constituting 51.7% and 63.4% of total sales in Fiscal 2014 and Fiscal 2013, respectively) followed by China where we sold 103,910 units and 79,458 units in Fiscal 2014 and Fiscal 2013 respectively (constituting 10.2% and 6.7% of total sales). A geographical breakdown of our revenues is set forth in Item 5.A “— Operating Results — Geographical breakdown”.
Our total sales (including international business sales and Jaguar Land Rover sales) in Fiscal 2014, 2013 and 2012 are set forth in the table below:
Revenues from our automotive operations were Rs.2,329,582 million, Rs.1,881,621 million and Rs.1,651,564 million in Fiscal 2014, 2013 and 2012, respectively. Tata and other brand vehicles (including spares and financing thereof) constituted 18.7% of our total automotive revenues before inter-segment elimination in Fiscal 2014, while Jaguar Land Rover constituted 81.3%.
Tata and other brand vehicles (including spares and financing thereof) We sold 588,657, 820,686, and 955,961 units of Tata and other brand vehicles in Fiscal 2014, 2013 and 2012, respectively.
Of the 588,657 units sold in Fiscal 2014, 527,378 units were sold in India while 61,279 units were sold outside of India, compared to 756,444 units and 64,242 units respectively, in Fiscal 2013. Our share of the Indian four-wheeler automotive vehicle market (i.e. automobile vehicles other than two and three wheeler categories) decreased from 22.1% in Fiscal 2013 to 16.6% in Fiscal 2014. We maintained our leadership position in the commercial vehicle segment in the industry, which was characterized by increased competition during the year. The passenger vehicle market also continued to be subject to intense competition. A principal reason for the decline in volume of sales of Tata and other brand vehicles is the lack of fund availability for potential customers. High default rates in loans alongside early delinquencies has led financiers to tighten lending norms, such as lowering the loan-to-value ratio on new financings while focusing on collection of existing loans.
The following table sets forth our total sales of Tata and other brand vehicles:
The following table sets forth our market share in various categories in the Indian market-based on wholesale volumes:
24
Category Fiscal 2014 Fiscal 2013 Fiscal 2012 Units % Units % Units % Passenger Cars 204,075 20.0% 237,023 19.9% 353,709 27.9% Utility Vehicles 383,871 37.6% 361,822 30.3% 316,589 24.9% Light Commercial Vehicles 296,873 29.1% 428,708 35.9% 365,677 28.8% Medium and Heavy Commercial Vehicles 135,727 13.3% 165,189 13.9% 234,236 18.4% Total 1,020,546 100.0% 1,192,742 100.0% 1,270,211 100.0%
Category Fiscal 2014 Fiscal 2013 Fiscal 2012 Units % Units % Units %
Passenger Cars 123,431 21.0% 179,257 21.9% 299,719 31.4% Utility Vehicles 32,626 5.5% 47,532 5.8% 56,329 5.9% Light Commercial Vehicles 296,873 50.4% 428,708 52.2% 365,677 38.2% Medium and Heavy Commercial Vehicles 135,727 23.1% 165,189 20.1% 234,236 24.5% Total 588,657 100.0% 820,686 100.0% 955,961 100.0%
Category Fiscal 2014 Fiscal 2013 Fiscal 2012
Passenger Cars* 6.1% 9.6% 13.6% Utility Vehicles** 5.0% 7.1% 10.9% Light Commercial Vehicles*** 53.7% 62.2% 60.2% Medium and Heavy Commercial Vehicles 54.9% 53.3% 59.3%
Total Four-Wheel Vehicles 16.6% 22.1% 25.1%
* Passenger cars market shares include sales of Fiat vehicles distributed by us and Jaguar Land Rover vehicles sold in India. ** UV market share includes the market share for Vans V1 segment (i.e. Tata Venture) and excludes Vans V2 segment (i.e. Tata
Ace Magic), *** LCV market shares include the market shares for Vans V2 segment (i.e. Tata Ace Magic) in accordance with SIAM’s
classification of passenger vehicles.

ˆ200GNal5oj$%C6JwLŠ200GNal5oj$%C6JwL
762654 TX 25TATA MOTORS LTDFORM 20-F
31-Jul-2014 10:24 ESTHTMHKG
RR Donnelley ProFile HKR kupsu0dc 6*ESS 0C
RRWIN-XENP14311.5.15
Page 1 of 1
Our performance in various categories of the Indian market is described below:
India’s GDP growth continues to remain weak, at 4.9% in Fiscal 2014 according to advance estimates after growing at 4.5% in Fiscal 2013. Industrial activity continues to remain weak. The Index of Industrial production (IIP) declined by 0.1% during Fiscal 2014. The stagnation in the industrial activity was broad-based. While mining output declined by 1.1%, manufacturing output declined by 0.7% during the same period. Fiscal 2014 witnessed a decline in investments in new projects in line with a slowdown in overall growth. On the back of tight monetary policy, limited fiscal spending, rising inflation and slowing investments, over the previous year, Fiscal 2014 saw many of the same challenges continuing into the year. Fiscal 2014 was marked by efforts of the Government of India to contain the fiscal deficit, and expenditure on infrastructure and other key sectors suffered. With the continued high interest rates and inflation, households were forced to spend more on essentials and reduce discretionary spending, leading to deferral of purchasing decisions. The consistent stagnation of the industrial growth mainly in the areas of mining and quarrying, manufacturing and infrastructure adversely impacted the domestic auto industry.
Passenger cars: The passenger vehicle industry recorded a negative growth of 4.7% for the first time in the last five years in Fiscal 2014. The last such instance was during the economic slowdown of Fiscal 2009, when it remained close to flat at a negative growth of 0.5%. The decline in sales volumes is seen across segments, with the sedan segment witnessing the largest decline. The Hatchbacks and UV segments are historically the volume drivers. The high growth in UV segment last year, with the onset of Softroaders, did not witness similar growth in Fiscal 2014. Further, tightening of credit norms, higher interest rate, and a rise in fuel prices have contributed to low consumer confidence and has resulted in deferral of purchasing decision.
The Government of India has deregulated gasoline prices in the recent past and continued to subsidize diesel prices. This has resulted in preference of diesel vehicles. During the year, the Government of India started correcting the diesel prices in measured manner with a view to minimize government subsidy. This has resulted to lowering of gap between diesel prices and gasoline prices to some extent. Hence share of gasoline vehicles in overall industry has gone up, especially in hatchbacks and sedans. The hatchback segment, which is the largest volume segment in the industry declined in Fiscal 2014. Hyundai launched the Grand i-10 in the hatchback segment this year, which received an overwhelming response in the market. Maruti Suzuki launched its new hatchback Celerio with an automated manual transmission at the Delhi Auto Expo 2014. Nissan launched its budget brand Datsun in India. The first vehicle launched under the Datsun brand is the ‘Datsun Go’ hatchback.
The sedan segment (or the A3 segment according to SIAM) has grown by around 7% in Fiscal 2014 as compared to Fiscal 2013 due to new launches such as Honda Amaze, New Honda City, Hyundai Xcent, New Elantra, and New Skoda Octavia. The sub 4-m compact sedans continue to remain in demand.
Increase in marketing initiatives and network actions continued in the face of weak industry trends. Our performance within the industry was also impacted unfavorably. During Fiscal 2014, we recorded sales of 117,767 vehicles in the domestic market; a decline of 32.2% over last year. The overall market share of passenger cars was lower at 6.1% as compared to 9.6% during the last fiscal year. The negative growth of industry, competition from new models and declining preference for diesel vehicles, severely affected our market share.
We continued our focus on branding Nano as a smart city car. In Fiscal 2014, we sold 23,400 Nano cars, compared with 48,122 in Fiscal 2013. The Nano Awesome Campaign was launched during Fiscal 2014 along the same lines. The Nano Twist with electric power steering was launched in January 2014 and is aimed at appealing to younger customers.
Consequent to the signing of the Restructuring Framework Agreement, as agreed therein, the distribution agreement between TML, FIAL and FGA for the distribution of the Fiat vehicles in India was terminated with effect from April 1, 2013 and the distribution of the Fiat vehicles was taken over by Fiat Group Automobiles India Private Limited (FGAIPL), a wholly-owned subsidiary of FGA, Italy.
Since the commencement of distribution of Jaguar and Land Rover vehicles through our exclusive dealerships in India in June 2009, the brands have witnessed an impressive growth in the Indian market. The sales volumes in Fiscal 2014 have grown approximately 12.5% to 2,805 vehicles compared to Fiscal 2013 despite the adverse impact of more than 17% depreciation in the value of rupee versus GBP. Aided by start of local manufacturing in India, the sales of Jaguar XF grew by 119% in Fiscal 2014. We expect that continued efforts towards dealership network expansion and local manufacturing of Jaguar Land Rover products will enable us to further penetrate the premium/luxury automotive passenger car market in India.
25

ˆ200GNal5oj!VtdWw/Š200GNal5oj!VtdWw/
762654 TX 26TATA MOTORS LTDFORM 20-F
30-Jul-2014 06:40 ESTHTMHKG
RR Donnelley ProFile HKR palap0dc 4*ESS 0C
RRWIN-XENP14111.5.15
Page 1 of 1
Utility Vehicles: The utility vehicle segment, which had grown more than 50% last year has declined this year. The soft roader segment
continued to grow with new launches by competition like Ecosport, Terrano and Enjoy. The offroader segment has declined, mainly after an increase in the excise duty on SUVs in February 2013. Our share in the overall UV segment has declined mainly due to lack of presence in the growing compact SUV and softroader segment. The subsequent reduction in the excise duty has not resulted in a substantial improvement in the UV segment.
Commercial Vehicles: The commercial vehicles market in India in Fiscal 2014 recorded a decline of 22.4%. Limited government spending on
developmental activity, weak industrial activity, low freight/cargo availability, rising diesel prices and weak consumer demand, have contributed to this decline. We registered a decrease in sales in Fiscal 2014, by 29.5% to 378,028 units.
Light Commercial Vehicles (including pickups): Our range of LCVs includes SCVs, pickup trucks, trucks and commercial passenger carriers with a GVW (including
payload) of between 1.2 tons and 7.5 tons. The LCV market segment declined by 21.2% in Fiscal 2014 to 498,483 units from 632,450 units in Fiscal 2013. The decline in LCV market segment is particularly significant when compared to its growth rate of 17.9% in Fiscal 2013. Our sales in the LCV segment declined by 31.9% to 268,041 units from 393,726 units in Fiscal 2014.
Medium and Heavy Commercial Vehicles: Our M&HCVs have a wide range of applications and are generally configured as trucks, tippers, buses, tankers, tractors or
concrete mixers. We sold 109,987 units during Fiscal 2014, resulting in a market share of 54.9%.
M&HCV truck sales have been declining for most of Fiscal 2013 and Fiscal 2014, due to a weak economic environment in India, bans on mining, fleet underutilization (estimated at above 40%), rising diesel prices, unchanged freight rates and sharp fall in resale prices. But a partial lifting of the mining bans, the excise duty cut, the increase in the freight rates in January and February have revived sales in the last few months of Fiscal 2014. A complete ban on iron ore mining in the states of Karnataka in Fiscal 2011 and Goa in Fiscal 2012 had been put in place by the Supreme Court of India to suppress illegal mining where the licenses of many mines were cancelled. A small percentage of mines in these areas have resumed mining in the recent past upon receiving clearances from the authorities.
Tata and other brand vehicles — Sales and Distribution: Our sales and distribution network in India as of March 2014 comprises approximately 2,420 sales contact points for our
passenger and commercial vehicle business. In line with our growth strategy, we formed a 100% owned subsidiary, TDCL, in March 2008, to act as a dedicated distribution and logistics management company to support the sales and distribution operations of our vehicles in India. We believe this has improved the efficiency of our selling and distribution operations and processes.
TDCL provides distribution and logistics support for vehicles manufactured at our facilities and has set up stocking points at some of our plants and at different places throughout India. TDCL helps us improve planning, inventory management, transport management and timely delivery. We have completed the initial rollout of a new customer relations management system, or CRM, at all of our dealerships and offices across the country and have been certified by Oracle as the largest Siebel deployment in the automotive market. The combined CRM initiative supports users both within our Company and among our distributors in India and abroad.
Through our vehicle financing division and wholly owned subsidiary, TMFL we also provide financing services to purchasers of our vehicles through our independent dealers, who act as our agents for financing transactions, and through our branch network. TMFL, disbursed Rs.87,676 million and Rs.111,800 million during Fiscal 2014 and 2013, respectively. During Fiscal 2014 and 2013, approximately 32% and 33%, respectively, of our vehicle unit sales in India were made by the dealers through financing arrangements where our captive vehicle financing divisions provided the support. Total vehicle finance receivables outstanding as at March 31, 2014 and 2013 amounted to Rs.185,275 million and Rs.198,219 million respectively.
We market our commercial and passenger vehicles in several countries in Africa, Middle East, South East Asia, South Asia, Australia and Russia/ Commonwealth of Independent States (CIS) countries. We have a network of distributors in all such chosen countries where we export our vehicles. Such distributors have created a network of dealers and branch offices and facilities for sales and after-sales servicing of our products in their respective markets. We have also stationed overseas resident sales and service representatives in various countries to oversee our operations in the respective territories. We use a network of service centers on highways and a toll-free customer assistance center to provide 24-hour on-road maintenance (including replacement of parts) to vehicle owners.
26

ˆ200GNal5oj!VwGPQdŠ200GNal5oj!VwGPQd
762654 TX 27TATA MOTORS LTDFORM 20-F
30-Jul-2014 06:41 ESTHTMHKG
RR Donnelley ProFile HKR palap0dc 2*ESS 0C
RRWIN-XENP14111.5.15
Page 1 of 1
In Fiscal 2013, we introduced Tata FleetMan. Targeted at commercial vehicle fleet owners and large consigners of goods, the service offers advanced telematics solutions, which we anticipate will help in increasing productivity and profitability. The Tata FleetMan has been designed to address what we understand to be pressing concerns of the commercial vehicle fleet owner.
Through advanced telematics solutions like fuel management, driver management and remote diagnostics, Tata FleetMan combines information technology and telecommunications equipment and software, with Tata Motors Limited expertise in automobile technology, providing features like real time fleet tracking, SMS alerts, geo-fencing and trip management.
We believe that the reach of our sales, service and maintenance network provides us with a significant advantage over our competitors.
Tata and other brand vehicles — Competition: We face competition from various domestic and foreign automotive manufacturers in the Indian automotive market.
Improving infrastructure and robust growth prospects compared to other mature markets have attracted a number of international companies to India who have either formed joint ventures with local partners or have established independently owned operations in India. Global competitors bring with them decades of international experience, global scale, advanced technology and significant financial resources, and as a result, competition is likely to further intensify in the future. We have designed our products to suit the requirements of the Indian market based on specific customer needs such as safety, driving comfort, fuel efficiency and durability. We believe that our vehicles are suited to the general conditions of Indian roads and the local climate. The vehicles have also been designed to comply with applicable environmental regulations currently in effect. We also offer a wide range of optional configurations to meet the specific needs of our customers. We intend to develop and are developing products to strengthen our product portfolio in order to meet the increasing customer expectation of owning world class products.
Tata and other brand vehicles — Seasonality: Demand for our vehicles in the Indian market is subject to seasonal variations. Demand generally peaks between January
and March, although there is a decrease in demand in February just before release of the Government of India’s fiscal budget. Demand is usually lean from April to July and picks up again in the festival season from September onwards, with a decline in December due to model year change.
Tata and other brand vehicles — Exports: We are expanding our export operations, which have been ongoing since 1961. We market our commercial and passenger
vehicles in several countries in Europe, Africa, the Middle East, South East Asia and South Asia and have recently commenced exports of certain products to Australia. Our exports of vehicles manufactured in India decreased by 2.5% in Fiscal 2014 to 46,983 units from 48,196 units in Fiscal 2013 impacted by external environment influences in Europe, the Middle East and South Asia.
In Fiscal 2014, our top five export destinations from India accounted for approximately 73% and 88% of our exports of commercial vehicles and passenger vehicle units, respectively. We are strengthening our position in the geographic areas we are currently operating in and exploring possibilities of entering new markets with similar market characteristics to the Indian market.
Tata Daewoo Commercial Vehicle Co. Ltd., Korea: TDCV recorded a 5.1% increase in its overall vehicle sales to 10,594 units in Fiscal 2014 from 10,080 units in Fiscal 2013. In the South Korean market, TDCV’s unit sales in the M&HCV category in Fiscal 2014 increased by 21.9% to 6,584 units as compared to 5,400 units in Fiscal 2013, mainly due to strong performance of the Company as well as the gradual recovery in the economy. However, TDCV’s export performance in Fiscal 2014 decreased by 14.3% to 4,010 units compared to 4,680 units in Fiscal 2013, due to adverse economic conditions in its major export markets.
Jaguar Land Rover The strengths of the Jaguar Land Rover business include its internationally recognized brands, strong product portfolio of
award winning luxury performance cars and premium all-terrain vehicles, global distribution network, strong research and development capabilities, and a strong management team. Our total sales of Jaguar Land Rover in Fiscal 2014, 2013 and 2012 are set forth in the table below:
27
Fiscal 2014 Fiscal 2013 Fiscal 2012 Units % Units % Units %
Jaguar 80,644 18.7% 57,766 15.5% 53,990 17.2% Land Rover 351,245 81.3% 314,290 84.5% 260,260 82.8% Total 431,889 100.0% 372,056 100.0% 314,250 100.0%
ˆ200GNal5ojlT$6zweŠ200GNal5ojlT$6zwe
762654 TX 28TATA MOTORS LTDFORM 20-F
25-Jul-2014 00:24 ESTHTMHKG
RR Donnelley ProFile HKR pf_rend 1*ESS 0C
hkrdoc211.5.15
Page 1 of 1
Jaguar: Jaguar designs, develops and manufactures a range of premium cars and sports cars recognized for their design,
performance and quality. Jaguar’s range of products comprises the XF and XJ sedans, the F-TYPE two seater sports car and the XK coupe and convertible.
Land Rover: Land Rover designs, develops and manufactures premium all-terrain vehicles that aim to differentiate themselves from the
competition by their capability, design, durability, versatility and refinement. Land Rover’s range of products comprises the Defender, Discovery, Freelander 2, Range Rover (including the new Range Rover), Range Rover Evoque and Range Rover Sport (including the new Range Rover Sport).
28
• The XF, launched in 2008, is a premium executive car that merges sports car styling with the sophistication of a luxury sedan. The 2013 model year XF range also included for the first time an all-wheel drive version of the new V6 gasoline engine for the US and European markets and a 2.0 liter gasoline version for the US and Chinese markets which helped to grow the volume of sales for Jaguar in FY 2014.
• The XJ is Jaguar’s largest luxury sedan vehicle, powered by a range of supercharged and naturally aspirated 5.0-liter V8 gasoline engine and a 3.0-liter diesel engine. Using Jaguar’s aerospace inspired aluminum body architecture, the new XJ’s lightweight aluminum body provides improved agility, and fuel and CO efficiency. The 2013 Model Year also included an all-wheel drive version and a 3.0 liter V6 gasoline version for the US and European markets excluding the United Kingdom and a 2.0 liter gasoline version for the Chinese market.
• The F-TYPE, a two seat sports car, inspired by the 2011 C-X16 concept cars, with an all-aluminum structure and enhanced technology with the power of Jaguar’s latest 3.0 liter V6 and 5.0 liter V8 engines, was available for retail customers from April 2013 onwards and since then, has received numerous awards and appreciation by the auto media. In November 2013, Jaguar unveiled the F-TYPE coupe which went on sale in April 2014.
• In March 2013, Jaguar unveiled two new additions to its R performance range, the XJR sedan and the XKR-S GT. The 550PS XJR - Jaguar’s new flagship sports sedan - combines a supercar performance and assertive looks with the luxury features already associated with the XJ range. The XKR-S GT is the road-going but track-ready version of the XK coupe.
• At the Frankfurt Motor Show in September 2013, Jaguar revealed its first ever crossover concept vehicle, the Jaguar C X17, based on a new modular and scalable aluminum architecture, which is adaptable to different vehicle designs and may be used in different models. JLR has also announced the new Jaguar XE, a mid-sized sedan which will be built on this new modular architecture. We anticipate that this will allow Jaguar to grow its product portfolio and target high growth areas of the premium market.
• The Defender is one of Land Rover’s most capable SUVs, and targets extreme all-terrain capabilities and payload /
towing capability.
• The Freelander 2 is a vehicle intended for active lifestyles, matching style with technological features and off-road capability. The Freelander 2 offering was enhanced for the 2013 model year with the introduction of a turbocharged 2.0-liter gasoline engine, giving superior performance as compared to the 3.2-liter engine it replaces, while also reducing CO emissions.
• The Land Rover Discovery Sport replaces the Freelander 2 in the Land Rover product range and is expected to be
available for retail sales in 2015.
• The Range Rover is the flagship product under the Land Rover brand. The new all-aluminum version was launched in the third quarter of Fiscal 2013. The new Range Rover won Top Gear magazine’s “Luxury Car of the Year” in 2012 and was awarded the maximum 5-star safety rating by Euro NCAP in 2012. The new “Discovery Vision” Concept car was unveiled at New York International Auto Show in April 2014 to an enthusiastic response amongst auto media and journalists.
• The Range Rover Evoque is the smallest, lightest and most fuel-efficient Range Rover to date, available in 5-door and coupe body styles and in both front-wheel drive and all-wheel drive derivatives. Since its launch in September 2011, consumer demand has been consistent across the globe and the car has been a major success for JLR. The volumes have grown to 120,911 units in Fiscal 2014 as compared to 116,291 units in Fiscal 2013.
• The Range Rover Sport aims to combine the performance of a sports tourer with the versatility of a Land Rover. At the 2013 New York International Auto Show, Land Rover debuted the 2014 model year Range Rover Sport built on a weight saving aluminum architecture that is capable of reducing the weight of the All New Range Rover Sport by up to 420 kg. 2014 model year Range Rover Sport is the fastest, most agile and most responsive Land Rover ever.
2
2
ˆ200GNal5ojo92TewaŠ200GNal5ojo92Tewa
762654 TX 29TATA MOTORS LTDFORM 20-F
25-Jul-2014 14:03 ESTHTMHKG
RR Donnelley ProFile HKR ganeg0dc 2*ESS 0C
SWRFBU-MWE-XN0411.5.14
Page 1 of 1
Jaguar Land Rover’s performance in key geographical markets on retail basis United States In Fiscal 2014, industrial activity in the United States increased and the unemployment rate fell. Consumer spending
recovered with rising asset prices and consumer confidence. However, consumer spending patterns were disrupted by weather patterns between December and March as well as the shutdown of the U.S. Federal Government.
In Fiscal 2014, total passenger car sales expanded by 6.2%. Alongside a strong expansion of business in Canada, total Jaguar Land Rover sales in North America grew 20.2%. United States retail volumes in Fiscal 2014 for the combined brands totaled 75,671 units. Jaguar retail volumes in Fiscal 2014 grew by 49% compared to Fiscal 2013, leading to an increase in market share. Land Rover retail volumes in Fiscal 2014 increased by 13% compared to Fiscal 2013.
United Kingdom In Fiscal 2014 labor market conditions in the United Kingdom improved as the employment rate increased. Rising
consumer and business confidence helped to underpin stronger retail sales and investment spending, while the recovery in house prices helped to improve household wealth. UK vehicle sales increased 12.5% compared to the previous year.
UK retail volumes in Fiscal 2014 for the combined brands totaled 76,721 units. Jaguar retail volumes in Fiscal 2014 increased by 10% compared to Fiscal 2013, broadly maintaining market share. Land Rover retail volumes in Fiscal 2014 increased by 5% compared to Fiscal 2013, increasing market share.
Europe (excluding Russia) The European economy continues to struggle, with austerity measures in place in a number of countries. The economic
situation continues to create uncertainty around Eurozone stability, the Euro and borrowing costs. Credit continues to be difficult to obtain for customers and the outlook remains volatile.
European retail volumes in Fiscal 2014 for the combined Jaguar Land Rover brands totaled 82,854 units, representing a 2.3% increase compared to Fiscal 2013. Jaguar retail volume in Fiscal 2014 grew by 5%, and Land Rover retail volume in Fiscal 2014 increased by 1.8% compared to Fiscal 2013.
China The Chinese economy continued to grow in Fiscal 2014, however GDP growth is likely to slow in the future.
The joint venture established to manufacture cars in China with Chery Automobile Co., Limited, or Chery Automobile, a Chinese automotive manufacturer, was approved by the National Development and Reform Commission of the People’s Republic of China in October 2012 and GBP 71 million was invested in Fiscal 2013. Jaguar Land Rover and Chery Automobile intend to accelerate plans to build a joint venture manufacturing plant in Changshu, near Shanghai, as part of a 10.9 billion RMB investment that will also include a new research and development center and engine production facility. The project includes the creation of a new partnership brand to assemble models tailored specifically for the Chinese market, including the marketing and distribution. The two companies plan to complete the Changshu facility in Jiangsu province during 2014. Construction of a new engine plant for production of fuel efficient engines is also contemplated in the joint venture partnership agreement.
Chinese retail volumes in Fiscal 2014 reached 103,077 for the combined brands units up from 77,075 units in Fiscal 2013. Jaguar volumes more than doubled to 19,891, while Land Rover sales reached 83,186.
Asia Pacific (excluding China) The Asia Pacific region main markets are Japan, Australia and New Zealand. These regions were less affected by the
economic crisis compared to the United States, the United Kingdom and Europe, and recovered more favorably during Fiscal 2014, partly due to increased trade with China and other growth economies.
The Asia Pacific retail volumes in Fiscal 2014 for the combined brands totaled 22,795 units. Jaguar retail volume in Fiscal 2014 increased by 30% compared to Fiscal 2013. Land Rover retail volume in Fiscal 2014 increased by 27% compared to Fiscal 2013.
29

ˆ200GNal5ojlV0BFwQŠ200GNal5ojlV0BFwQ
762654 TX 30TATA MOTORS LTDFORM 20-F
25-Jul-2014 00:24 ESTHTMHKG
RR Donnelley ProFile HKR pf_rend 1*ESS 0C
hkrdoc211.5.15
Page 1 of 1
Other markets The major constituents of the other markets category are Russia, South Africa and Brazil, along with the rest of Africa and
South America. These economies were not affected as significantly by the 2008 global economic crisis as more developed economies and have had continued GDP growth in recent years, partially due to increased commodity and oil prices.
The other markets retail volumes in Fiscal 2014 for the combined Jaguar and Land Rover brands totaled 73,193 units, reflecting an increase of 15% from Fiscal 2013. Jaguar retail volumes in Fiscal 2014 increased 27% from 6,402 units in Fiscal 2013 to 8,135 in Fiscal 2014, while Land Rover retail volume increased 14% from 57,087 units in Fiscal 2013 to 65,058 in Fiscal 2014.
Jaguar Land Rover — Sales & Distribution: We market Jaguar Land Rover products in 170 markets, through a global network of 18 national sales companies, or NSCs,
84 importers, 53 export partners and 2,518 franchise sales dealers, of which 784 are joint Jaguar and Land Rover dealers.
Jaguar Land Rover has established robust business processes and systems to ensure that its production plans meet anticipated retail sales demand and to enable the active management of its inventory of finished vehicles and dealer inventory throughout its network. Jaguar Land Rover has robust arrangements in place with: Black Horse (part of the Lloyds Bank Group) in the UK, FGA Capital (a joint venture between Fiat Auto and Credit Agricole) in Europe and Chase Auto Finance in the USA for the provision of dealer and consumer financial services products. Jaguar Land Rover has similar arrangements with local automobile financial services providers in other key markets. Jaguar Land Rover’s financing partners offer its customers a range of consumer financing options.
Sales locations for Jaguar Land Rover vehicles are operated as independent franchises. Jaguar Land Rover is represented in its key markets through national sales companies as well as third party importers. Jaguar Land Rover has regional offices in certain select countries that manage customer relationships, vehicle supplies and provide marketing and sales support to their regional importer markets. The remaining importer markets are managed from the United Kingdom.
Jaguar Land Rover products are sold through our dealerships to retail customers. Jaguar Land Rover products are also sold to fleet customers, including daily rental car companies, commercial fleet customers, leasing companies, and governments. As a consequence, Jaguar Land Rover has a diversified customer base, which reduces its independence on any single customer or group of customers.
Jaguar Land Rover — Competition: Jaguar Land Rover operates in a globally competitive environment and face competition from established premium and
other vehicle manufacturers who aspire to move into the premium performance car and premium SUV markets, some of which are much larger than we are. Jaguar vehicles compete primarily against other European brands such as Audi, BMW and Mercedes Benz. Land Rover and Range Rover vehicles compete largely against SUVs manufactured by Audi, BMW, Infiniti, Lexus, Mercedes Benz, Porsche and Volkswagen. The Land Rover Defender competes with vehicles manufactured by Isuzu, Nissan and Toyota.
Jaguar Land Rover — Seasonality: Jaguar Land Rover sales volume is impacted by the bi-annual registration of vehicles in the United Kingdom where the
vehicle registration number changes every six months, which in turn has an impact on the resale value of the vehicles. This leads to a concentration of sales during the periods when the change occurs. Seasonality in most other markets is driven by introduction of new model year derivatives, for example in the US market. Additionally in the US market there is some seasonality around the purchase of vehicles in northern states where the purchase of Jaguar vehicles is concentrated in the spring /summer months, and the purchase of 4x4 vehicles is concentrated in the autumn/winter months. In China there is an increase in vehicle purchases during the fourth Fiscal quarter, which includes the Chinese New Year holiday. Furthermore, western European markets tend to be impacted by summer and winter holidays. The resulting sales profile influences operating results on a quarter to quarter basis.
Research and Development: Over the years, we have devoted significant resources towards our research and development activities. Our research and
development activities focus on product development, environmental technologies and vehicle safety. Our ERC, established in 1966, is one of the few in-house automotive research and development centers in India recognized by the Government of India. ERC is integrated with all of the Tata Motors global automotive product design and development centers in South Korea, Italy and the United Kingdom. In addition to this, we leverage key competencies through various engineering service suppliers and design teams of our suppliers.
30

ˆ200GNal5ojlV1lxw]Š200GNal5ojlV1lxw]
762654 TX 31TATA MOTORS LTDFORM 20-F
25-Jul-2014 00:24 ESTHTMHKG
RR Donnelley ProFile HKR pf_rend 1*ESS 0C
hkrdoc211.5.15
Page 1 of 1
We have a crash test facility for passive safety development towards meeting regulatory and consumer group test requirements and evaluating occupant safety, which includes a full vehicle crash test facility, a sled test facility for simulating the crash environment on subsystems, a pedestrian safety testing facility, a high strain rate machine and a pendulum impact test facility for goods carrier vehicles. This facility is also supported by computer-aided engineering infrastructure to simulate tests in a digital environment. Our safety development facilities also incorporate other equipment that we believe will help improve the safety and design of our vehicles as well as assist in the compliance with regulatory requirements, including transient dynamometer test beds, a mileage accumulation chassis dynamometer and emission labs engine development, a hemi-anechoic chamber testing facility for developing vehicles with lower noise and vibration levels, an engine emission and performance development facility, an eight poster test facility that helps to assess structural durability of M&HCVs, and a new passenger car infotainment system and dedicated labcar testing facility. In addition, we are installing a new engine noise test facility and transmission control unit which we expect will aid in powertrain development. Other key facilities include an environmental testing facility, heavy duty dynamometers and aggregate endurance test rigs.
Our product design and development centers are equipped with hardware, software and other information technology infrastructure, which we believe is conducive to creating a digital product development and virtual testing and validation environment, which we expect to reduce product development cycle-time and to increase ability to create multiple design options. These centers are growing with increased vehicle development programs targeted at improving the breadth and depth of technology. Our product development infrastructure also include prototype development systems, testing cycle simulators and styling studios. We have made investments in our product development infrastructure which we expect to enhance our product development capabilities especially with respect to computer-aided design, computer-aided manufacturing, computer-aided engineering, knowledge-based engineering, product life cycle management, manufacturing planning and specific engineering review processes, such as production of digital mockups. Our product lifecycle management system provides vital processes, including manufacturing feasibility studies, for product development. In order to track and fix various issues arising in vehicle design and development processes, we have institutionalized ‘issue tracking’ systems at various points in the product development cycle which we believe will manage issues that arise in the product development cycle effectively.
In addition, our research and development activities focus on developing vehicles running on alternative fuels, including CNG, liquefied petroleum gas, bio-diesel and compressed air and electric cars. We are continuing to develop green-technology vehicles and are presently developing an electric vehicle on the Indica Vista platform. We are also pursuing alternative fuel options such as ethanol blending for development of vehicles fueled by hydrogen.
We are also pursuing various initiatives, such as the introduction of premium lightweight architecture, to enable our business to comply with the existing and evolving emissions legislation in the developed world, which we believe will be a key enabler of both reduction in CO and further efficiencies in manufacturing and engineering.
Initiatives in the area of vehicle electronics such as engine management systems, in-vehicle network architecture and multiplexed wiring were deployed in our range of vehicles. Technologies such as electronic stability programs, automated and automatic transmission systems, telematics for communication and tracking, anti-lock braking systems intelligent transportation systems are in the process of various phases of deployment on our future range of vehicles. Likewise, various new technologies and systems that would improve safety, performance and emissions of our product range are being implemented in our passenger cars and commercial vehicles.
We are developing an enterprise level vehicle diagnostics system for achieving faster diagnostics of complex electronics in our vehicles in order to provide prompt service to customers. Furthermore, our initiative in telematics has spanned into a fleet management, driver information and navigation system – Tata FleetMan, as well as a vehicle tracking system using Global Navigation Satellite Systems, or GNSS.
We established a wholly-owned subsidiary, TMETC, in 2006, to augment the abilities of our ERC with an objective to obtain access to leading technologies to support our product development activities. In October 2010, we also acquired a design house in Italy, Trilix Srl, that has been working with us on many of our projects and which is now a part of the Tata Motors design organization.
Our Jaguar Land Rover research and development operations currently consist of a single engineering team, operating within co-managed engineering facilities, sharing premium technologies, power train designs and vehicle architecture. In our Jaguar Land Rover products, we are pursuing several initiatives including alternative energy technologies to meet the targeted reduction in CO emissions in the next five years. Over recent years, we believe that Jaguar Land Rover has made significant progress in reducing its development cycle times. The ERC in India and Jaguar Land Rover engineering and development operations in the United Kingdom, have identified areas to leverage their facilities and resources to enhance the product development process and achieve economies of scale.
31
2
2

ˆ200GNal5ojlV3FbwQŠ200GNal5ojlV3FbwQ
762654 TX 32TATA MOTORS LTDFORM 20-F
25-Jul-2014 00:24 ESTHTMHKG
RR Donnelley ProFile HKR pf_rend 1*ESS 0C
hkrdoc211.5.15
Page 1 of 1
We endeavor to absorb the best of technologies for our product range to meet the requirements of a globally competitive market. All of our vehicles and engines are compliant with the prevalent regulatory norms in the respective countries in which they are sold. Our strategy to invest and develop our development capabilities has helped us in attaining significant achievements such as the design and development of India’s first indigenously developed compact car, the segment creating mini- truck – the ‘Tata Ace’ and the world’s most affordable family car — the Tata Nano. In collaboration with our subsidiary TDCV, we developed the “World Truck”, now referred to as ‘Prima’, a sophisticated and contemporary M&HCV range with performance standards similar to those in developed markets, which we launched in India and in South Korea during Fiscal 2010. In Fiscal 2011, we launched the Tata Aria, India’s first premium crossover and the Tata Venture, a multipurpose van in India. In Fiscal 2013, we launched the Indigo Manza Club Class, the Vista D90, and the Safari Storme in the passenger cars segment and launched the Xenon Pickup, the Tata LPT 3723, and the Prima tipper and tractor variants in the commercial vehicle segment. In Fiscal 2014, we launched the Vista Tech, Nano CNG emax, Nano Twist and updated the current range of products like Indica, Indigo, Sumo, Aria, and Nano in the passenger cars segment and launched the Ultra Truck 912 and 812 with different wheel base, Prima 4928 6x4 and 4028 4x2, 3138 for domestic and 3338 for SA etc. in the commercial vehicle segment.
Intellectual Property We create, own, and maintain a wide array of intellectual property assets throughout the world that are among our most
valuable assets. Our intellectual property assets include patents, trademarks, copyrights designs, trade secrets and other intellectual property rights. Patents relate to our innovations and products; trademarks secured relate to our brands and products; copyrights are secured for creative content; and designs are secured for aesthetic features of products/components. We proactively and aggressively seek to protect our intellectual property in India and other countries.
We own a number of patents and have applied for new patents which are pending for grant in India as well as in other countries. We have also filed a number of patent applications outside India under the Patent Cooperation Treaty, which we expect will be effective in other countries going forward. We also obtain new patents as part of our ongoing research and development activities.
We own registrations for a number of trademarks and have pending applications for registration of these in India as well as other countries. The registrations mainly include trademarks for our vehicle models and other promotional initiatives. We use the Tata brand, which has been licensed to us by Tata Sons. We believe that establishment of the Tata word mark and logo mark in India and around the world is material to our operations. As part of our acquisition of TDCV, we have rights to the perpetual and exclusive use of the “Daewoo” brand and trademarks in South Korea and overseas markets for the product range of TDCV.
As part of the acquisition of our Jaguar Land Rover business, ownership (or co-ownership, as applicable) of core intellectual property associated with Jaguar Land Rover was transferred to us. Additionally, perpetual royalty free licenses to use other essential intellectual property have been granted to us for use in Jaguar and Land Rover vehicles. Jaguar and Land Rover own registered designs, to protect the design of their vehicles in several countries.
In varying degrees, all our intellectual property is important to us. In particular, the Tata brand is integral to the conduct of our business, a loss of which could lead to dilution of our brand image and have a material adverse effect on our business.
License(s) On February 22, 2013, RBI released the final guidelines on granting new banking licenses in line with the Indian
government’s aim to allow more companies to participate in the banking sector. The Tata Group had previously applied to the RBI for a banking license on July 1, 2013. On November 26, 2013, Tata Group withdrew its application upon concluding that the current financial services operating model best supports the current needs of the Tata Group’s domestic and overseas strategy.
Components and Raw Materials The principal materials and components required by us for use in Tata and other brand vehicles are steel sheets (for in-
house stampings) and plates; iron and steel castings and forgings; items such as alloy wheels, tires, fuel injection systems, batteries, electrical wiring systems, electronic information systems and displays; interior systems such as seats, cockpits, doors, plastic finishers and plastic functional parts, glass and consumables (paints, oils, thinner, welding consumables, chemicals, adhesives and sealants) and fuels. We also require aggregates like axles, engines, gear boxes and cams for our vehicles, which are manufactured in-house or by our subsidiaries, affiliates, joint ventures / operations and strategic suppliers. We have long term purchase agreements for some critical components such as transmissions and engines. We have established contracts with some commodity suppliers to cover our own as well as our suppliers’ requirements in order to moderate the effect of volatility in commodity prices. We have also undertaken special initiatives to reduce material consumption through value engineering and value analysis techniques.
We have reorganized the sourcing department in India under four divisions, namely, Purchasing, Supplier Quality, Supply Chain and Production and Planning Management or PPM. The reorganization was done with a view to establish and define responsibility and accountability in the sourcing department. Purchasing oversees the commercial aspects of product sourcing; Supplier Quality is primarily responsible for maintaining the quality of supplies that we purchase; Supply Chain oversees the logistics of the supply and delivery of parts for our vendors while PPM oversees execution of new projects.
32

ˆ200GNal5ojlV4pCwrŠ200GNal5ojlV4pCwr
762654 TX 33TATA MOTORS LTDFORM 20-F
25-Jul-2014 00:24 ESTHTMHKG
RR Donnelley ProFile HKR pf_rend 1*ESS 0C
hkrdoc211.5.15
Page 1 of 1
As part of our strategy to become a low-cost vehicle manufacturer, we have undertaken various initiatives to reduce our fixed and variable costs. In India we started an e-sourcing initiative in 2002, pursuant to which we procure some supplies through reverse auctions. We also use external agencies as third party logistic providers. This has resulted in space and cost savings. Our initiatives to leverage information technology in supply chain activities have resulted in improved efficiency through real time information exchange and processing with our suppliers.
We have an established supplier quality sixteen step process in order to ensure quality of outsourced components. We formalized the component development process using AIAG guidelines. We also have a program for assisting vendors from whom we purchase raw materials or components to maintain quality. Preference is given to vendors with TS 16949 certification. We also maintain a stringent quality assurance program that includes random testing of production samples, frequent re-calibration of production equipment and analysis of post-production vehicle performance, as well as an ongoing dialogue with workers to reduce production defects.
We are also exploring opportunities for increasing the global sourcing of parts and components from low cost countries, and have in place a vendor management program that includes vendor base rationalization, vendor quality improvement and vendor satisfaction surveys. We have begun to include our supply chain in our initiatives on social accountability and environment management activities, including supply chain carbon footprint measurement and knowledge sharing on various environmental aspects.
The principal materials and components required by us for use in our Jaguar and Land Rover vehicles are steel and aluminum in sheet (for in-house stamping) or externally pre-stamped form, aluminum castings and extrusions, iron and steel castings and forgings and items such as alloy wheels, tires, fuel injection systems, batteries, electrical wiring systems, electronic information systems and displays, leather trimmed interior systems such as seats, cockpits, doors, plastic finishers and plastic functional parts, glass and consumables (paints, oils, thinner, welding consumables, chemicals, adhesives and sealants) and fuels. We also require certain highly functional components such as axles, engines and gear boxes for our vehicles, which are mainly manufactured by strategic suppliers. We have long term purchase agreements with our key suppliers. The components and raw materials in our cars include steel, aluminum, copper, platinum and other commodities. We have established contracts with certain commodity suppliers to cover our own and our suppliers’ requirements to mitigate the effect of such high volatility in commodity prices. Special initiatives were also undertaken to reduce material consumption through value engineering and value analysis techniques.
The Jaguar Land Rover business works with a range of strategic suppliers to meet our requirements for parts and components. The Jaguar Land Rover business has established quality control programs to ensure that externally purchased raw materials and components are monitored and meet our quality standards. Such programs include site engineers who regularly interface with suppliers and carry out visits to supplier sites and ensure that the relevant quality standards are being met. Site engineers are also supported by persons in other functions, such as program engineers who interface with new model teams as well as resident engineers located at our Jaguar Land Rover plants, who provide the link between the site engineers and the Jaguar Land Rover plants. We have in the past worked, and expect to continue to work, with our suppliers to optimize our procurements, including by sourcing certain raw materials and component requirements from low cost countries.
Suppliers We have an extensive supply chain for procuring various components. We also outsource many manufacturing processes
and activities to various suppliers. In such cases, we provide training to external suppliers who design and manufacture the required tools and fixtures.
Our associate company Tata AutoComp Systems Ltd., or TACO, manufactures automotive components and encourages the entry of internationally acclaimed automotive component manufacturers into India by setting up joint ventures with them.
Our other suppliers include some of the large Indian automotive supplier groups with multiple product offerings, such as the Anand Group, the Sona Group, and the TVS Group, as well as large multinational suppliers, such as Bosch, Continental, Delphi and Denso, Johnson Controls Limited for seats, Yazaki AutoComp Limited for wiring harnesses. We continue to work with our suppliers for our Jaguar Land Rover business to optimize procurements and enhance our supplier base, including the sourcing of certain of our raw material and component requirements from low cost countries. In addition, the co-development of various components, such as engines, axles and transmissions is also being evaluated, which we believe may lead to the development of a low-cost supplier base for Jaguar Land Rover.
In India, we have established vendor parks in the vicinity of our manufacturing operations and vendor clusters have been formed at our facilities at Pantnagar (Uttarakhand) and Sanand (Gujarat). This initiative is aimed at ensuring flow of component supplies on a real-time basis, thereby reducing logistics and inventory costs as well as reducing uncertainties in the long distance supply chain. Efforts are being taken to replicate the model at new upcoming locations as well as a few existing plant locations.
33
ˆ200GNal5ojrRZ&2w8Š200GNal5ojrRZ&2w8
762654 TX 34TATA MOTORS LTDFORM 20-F
27-Jul-2014 07:08 ESTHTMHKG
RR Donnelley ProFile HKR kupsu0dc 2*ESS 0C
RRWIN-XENP13911.5.14
Page 1 of 1
As part of our pursuit of continued improvement in procurement, we have integrated our system for electronic interchange of data with our suppliers with the Enterprise Resource Planning. This has facilitated real time information exchange and processing, which enables us to manage our supply chain more effectively.
We have established processes to encourage improvements via knowledge sharing among our vendors through an initiative called Vendor Council consisting of our senior executives and representatives of major suppliers. The Vendor Council also helps in addressing common concerns through joint deliberations. The Vendor Council works on four critical aspects of engagement between us and the suppliers (i.e., quality, efficiency, relationship and new technology development).
We import some components that are either not available in the domestic market or when equivalent domestically-available components do not meet our quality standards. We also import products to take advantage of lower prices in foreign markets, such as special steels, wheel rims and power steering assemblies.
Ford has been and continues to be a major supplier of parts and services to Jaguar Land Rover. In connection with our acquisition of Jaguar Land Rover in June 2008, long term agreements were entered with Ford for technology sharing and joint development providing technical support across a range of technologies focused mainly around power train engineering such that we may continue to operate according to our existing business plan. Supply agreements, ranging in duration from seven to nine years, were entered into with Ford for (i) the long term supply of engines developed by Ford, (ii) engines developed by us but manufactured by Ford and (iii) engines from Ford-PSA co-operation.
Based on learning from the global financial crisis and its cascading effect on the financial health of our suppliers, we have commenced efforts to assess supplier financial risk.
Suppliers are appraised based on or long term requirements through a number of platforms such as Vendor Council meetings, council regional chapter meetings, national vendor meets and location-specific vendor meets.
Capital and Product Development Expenditures Our capital expenditure totaled Rs.272,832 million, Rs.212,078 million and Rs.148,255 million during Fiscal 2014, 2013
and 2012, respectively. Our capital expenditure during the past three Fiscal years related primarily to new product development and capacity expansion for new and existing products to meet market demand as well as investments towards improving quality, reliability and productivity that are each aimed at increasing operational efficiency.
We intend to continue to invest in our business units in general, and in research and product development in particular, over the next several years in order to improve our existing product range, develop new products and platforms and to build and expand our portfolio in the passenger vehicle and commercial vehicle categories. We believe this would strengthen our position in the Indian automotive market and help us to grow our market share internationally.
As part of this future growth strategy, we plan to make investments in product development, capital expenditure in capacity enhancement, plant renewal and modernization and to pursue other growth opportunities. Our subsidiaries also have their individual growth plans and related capital expenditure plans. These expenditures are expected to be funded largely through cash generated from operations, existing investible surplus in the form of cash and cash equivalents, investment securities and other external financing sources.
Other Operations In addition to our automotive operations, we are also involved in other business activities, including information
technology services. Net revenues, before inter-segment elimination, from these activities totaled Rs.24,989 million, Rs.22,179 million and Rs.18,905 million in Fiscal 2014, 2013 and 2012, respectively, representing nearly 1.1%, 1.2% and 1.1% of our total revenues before inter-segment elimination in the corresponding Fiscal periods.
Information Technology Services: As of March 31, 2014, we owned a 72.32% equity interest in our subsidiary, TTL. TTL, founded in 1994 and a part of Tata
Motors Group, is a global leader in Engineering Services Outsourcing, and product development IT services solutions for PLM and Enterprise Resource Management, or ERM, to the world’s leading automotive, aerospace and consumer durables manufacturers and their suppliers. TTL’s services include product design, analysis and production engineering, knowledge-based engineering, PLM, ERM and CRM systems. TTL also distributes implements and supports PLM products from leading solution providers in the world such as Dassault Systems and Autodesk.
TTL has its international headquarters in Singapore, with regional headquarters in the United States (Novi, Michigan), India (Pune) and the United Kingdom (Coventry). In Fiscal 2014, TTL acquired Cambric Corporation, a premier engineering services organization, to achieve greater domain expertise and presence in the industrial equipment sector. TTL has a combined global workforce of around 7,020 professionals serving clients worldwide from facilities in the North America, Europe, and Asia Pacific regions. TTL responds to customers’ needs through its subsidiary companies and through its six offshore development centers in India, Thailand and Romania. TTL had 17 functional subsidiary companies and one joint venture as of March 31, 2014.
34

ˆ200GNal5ojwu2DCQNŠ200GNal5ojwu2DCQN
762654 TX 35TATA MOTORS LTDFORM 20-F
29-Jul-2014 03:49 ESTHTMHKG
RR Donnelley ProFile HKR selvs1dc 6*ESS 0C
NERFBU-MWE-XN0111.5.15
Page 1 of 1
The consolidated revenues of TTL in Fiscal 2014 were Rs.23,724 million (including sales to Tata Motors Group) reflecting a growth of 16.7% against Rs.20,324 million in the previous year with traction in the automotive and aerospace markets. TTL recorded profit after tax of Rs.2,642 million in Fiscal 2014, reflecting a decrease of 12.2% over Rs.3,008 million in Fiscal 2013.
Government Regulations Indian Automotive Sector Automotive Mission Plan, 2006-2016 The automotive mission plan, or Plan 2006, promulgated by the Ministry of Heavy Industries and Public Enterprises of the
Government of India in December 2006, consists of recommendations to the task force of the Development Council on Automobile and Allied Industries constituted by the Government of India, in relation to the preparation of the mission plan for the Indian automotive industry. Plan 2006 recommends that a negative list of items, such as no duty concession for import of used or re-manufactured vehicles, or treatment of remanufactured automotive products as old products, should be negotiated for free trade agreements or regional trade agreements, on a case-by-case basis with other countries. It recommends the adoption of appropriate tariff policies to attract more investment into the automobile industry, the improvement of power infrastructure to facilitate faster growth of the automotive sector both domestically and internationally, policy initiatives such as encouragement of collaboration between the automotive industry and research and academic institutions, tax concessions and incentives to enhance competitiveness in manufacturing and promotion of research and technology development. For the promotion of exports in the automotive components sector, among other things, it recommends the creation of special automotive component parks in special economic zones and the creation of virtual special economic zones, which would enjoy certain exemptions on sales tax, excise and customs duty. Strengthening the inspection and certification system by encouraging public-private partnerships and rationalization of the motor vehicles regulations, are also among the major recommendations of the plan.
A committee set up under the chairmanship of the Secretary of the Ministry of Heavy Industries and Public Enterprises consisting of all stakeholders including representatives of the Ministry of Finance, and of other interested parties relating to road transport, the environment, commerce, industrial policy and promotion, labor, shipping, railways, human resource development, science and technology, new and renewable energy, petroleum and natural gas and the automotive industry, will monitor the implementation and progress of Plan 2006.
Plan 2006 is being reviewed by Ministry of Heavy Industries and Public Enterprises of the Government of India.
The Auto Policy, 2002 The Auto Policy was introduced by the Department of Heavy Industry, Ministry of Heavy Industries and Public
Enterprises of the Government of India in March 2002, with the aims, among others, of promoting a globally competitive automotive industry that would emerge as a global source for automotive components, establishing an international hub for manufacturing small, affordable passenger cars, ensuring a balanced transition to open trade at a minimal risk to the Indian economy and local industry, encouraging modernization of the industry and facilitating indigenous design, research and development, as well as developing domestic safety and environment standards on par with international standards.
Emission Norms in India In 1992, the Government of India issued emission and safety standards, which were further tightened in April 1996, under
the Indian Motor Vehicle Act. Currently Bharat Stage IV norms (equivalent to Euro IV norms) are in force for four wheelers in 13 cities and Bharat Stage III norms (equivalent to Euro III norms) are in effect in the rest of India. Our vehicles comply with these norms. As required by the draft Notification on the Gazetted Statutory Rule numbered G.S.R 278 E, Bharat Stage IV norms will be extended in 20 additional cities. The next change in emission regulations remains to be discussed by the Government of India.
Auto Fuel Vision & Policy 2025 The Ministry of Petroleum and Natural Gas constituted an expert committee under the Chairmanship of Shri Saumitra
Chaudhuri, Member Planning Commission on December 19, 2012. Its objective was to recommend auto fuel quality applicable through model year 2025. The committee in its draft report has recommended Bharat Stage IV compliant fuel across the country by 2017. Bharat Stage V compliant fuel with 10ppm sulphur will be made available from 2020 onwards. The draft report proposes nationwide Bharat Stage V emission norms for new 4 wheelers from model year 2020 and for all 4 wheelers from model year 2021. It also recommends Bharat Stage VI emissions norms from 2024 onwards. In April 2014, the expert committee submitted its recommendations to the Ministry of Petroleum and Natural Gas.
35

ˆ200GNal5ojnv463QŠ200GNal5ojnv463Q´
762654 TX 36TATA MOTORS LTDFORM 20-F
25-Jul-2014 12:35 ESTHTMHKG
RR Donnelley ProFile HKR dommj0dc 2*ESS 0C
LANFBU-MWE-XN2111.5.15
Page 1 of 1
Central Motors Vehicles Rules, 1989 Chapter V of the Central Motor Vehicle Rules, 1989, or the CMV rules, lays down provisions relating to construction and
maintenance of motor vehicles. Among specifications pertaining to dimensions, gears, indicators, reflectors, lights, horns, safety belts and others. The CMV rules govern emission standards for vehicles operating on compressed natural gas or CNG, gasoline, liquefied petroleum gas and diesel.
In addition, pursuant to the CMV rules, every manufacturer must submit the prototype of every vehicle to be manufactured by it for testing by the Vehicle Research and Development Establishment of the Ministry of Defense of the Government of India, or Automotive Research Association of India, Pune, or the Central Machinery Testing and Training Institute, Budni (MP), or the Indian Institute of Petroleum, Dehradun, or the Central Institute of Road Transport, Pune, or the International Center for Automotive Technology, Manesar or such other agencies as may be specified by the central government for granting a certificate by that agency as to the compliance of provisions of the Motor Vehicles Act, 1988 and these rules.
In case of CNG fitments by vehicle manufacturers on new gasoline vehicles, each model manufactured must be of a type approved pursuant to the prevailing mass emission norms as applicable for the category of new vehicle in respect of the place of its use.
The CMV Rules also require the manufacturers to comply with notifications in the Official Gazette, issued by Government of India to use such parts, components or assemblies in manufacture of such vehicle, of such standards as may be specified or the relevant standards as specified by the Bureau of Indian Standards.
Emission and Safety in India In 1992, the Government of India issued emission and safety standards, which were further tightened in April 1996 under
the Indian Motor Vehicle Act.
We are also working towards meeting all applicable regulations which we believe are likely to come into effect in various markets in the near future. Our vehicle exports to Europe comply with Euro V norms, and we believe our vehicles also comply with the various safety regulations in effect in the other international markets where we operate.
The Indian automobile industry is progressively harmonizing its safety regulations with international standards in order to facilitate sustained growth of the Indian automobile industry as well as to encourage export of automobiles from India.
India has been a signatory to the 1998 UNECE Agreement on Global Technical Regulations since April 22, 2006 and has voted in favor of all eleven Global Technical Regulations. We work closely with the Government of India to participate in WP 29 World Forum Harmonization activities.
India has a well-established regulatory framework administered by the Indian Ministry of Road Transport and Highways. The Ministry issues notifications under the CMV Rules and the Motor Vehicles Act. Vehicles manufactured in India must comply with applicable Indian standards and automotive industry standards. In January 2002, the Indian Ministry of Road Transport and Highways has finalized plans on implementing automobile safety standards. The plans are based on traffic conditions, traffic density, driving habits and road user behavior in India and is generally aimed at increasing safety requirements for vehicles under consideration for Indian markets.
The Essential Commodities Act, 1955 The Essential Commodities Act, 1955, as amended by the Essential Commodities (Amendment and Validation) Act, 2009,
or the Essential Commodities Act, authorizes the Government of India, if it finds it necessary or expedient to do so, to provide for regulating or prohibiting the production, supply, distribution, trade and commerce in the specified commodities under the Essential Commodities Act, in order to maintain or increase supplies of any essential commodity or to secure their equitable distribution and availability at fair prices, or to secure any essential commodity for the defense of India or the efficient conduct of military operations. The definition of “essential commodity” under the Essential Commodities Act includes “component parts and accessories of automobiles”.
Environmental Regulations Manufacturing units or plants must ensure compliance with environmental legislation, such as the Water (Prevention and
Control of Pollution) Act, 1974, the Air (Prevention and Control of Pollution) Act, 1981, the Environment Protection Act, 1986 and the Hazardous Wastes (Management and Handling) Rules, 1989. The basic purpose of these statutes is to control, abate and prevent pollution. In order to achieve these objectives, Pollution Control Boards, or PCBs, which are vested with diverse powers to deal with water and air pollution, have been set up in each state. The PCBs are responsible for setting the standards for maintenance of clean air and water, directing the installation of pollution control devices in industries and undertaking inspection to ensure that units or plants are functioning in compliance with the standards prescribed. These authorities also have the power of search, seizure and investigation.
36

ˆ200GNal5ojlVBvtwUŠ200GNal5ojlVBvtwU
762654 TX 37TATA MOTORS LTDFORM 20-F
25-Jul-2014 00:24 ESTHTMHKG
RR Donnelley ProFile HKR pf_rend 1*ESS 0C
hkrdoc211.5.15
Page 1 of 1
Our manufacturing plants have received or are in the process of obtaining the Government of India’s environmental clearances required for our operations. We are fully committed to our role as a responsible corporate citizen with respect to reducing environmental pollution. We treat effluents at our plants and have made significant investments towards lowering the emissions from our products.
In addition, the Ministry of Environment and Forests conducts environment impact assessments. The Ministry receives proposals for expansion, modernization and establishment of projects and the impact of such projects on the environment are assessed by the Ministry, before it grants clearances for the proposed projects.
Regulation of Imports and Exports Quantitative restrictions on imports into India were removed with effect from April 1, 2001, pursuant to India’s World
Trade Organization obligations, and imports of capital goods and automotive components were placed under the open general license category.
Automobiles and automotive components may, generally, be imported into India without a license from the Government of India subject to their meeting Indian standards and regulations, as specified by designated testing agencies. As a general matter, cars, UVs and SUVs in completely built up, or CBU, condition may be imported at 60% basic customs duty. However, cars with cost, insurance and freight value of more than US$40,000 or with engine capacities more than 3000 cc for diesel variants and 2500 cc for gasoline variants, may be imported at an 100% basic customs duty. Commercial vehicles may be imported at a basic customs duty of 10% and components may be imported at basic customs duty ranging from at 10% to 7.5% (for engine component).
The FDI Policy Automatic approval for foreign equity investments up to 100% is allowed in the automobile manufacturing sector under the
FDI Policy.
Indian Taxes See Item 10.E “— Taxation” for additional information relating to our taxation.
Excise Duty: The Government of India imposes excise duty on cars and other motor vehicles and their chassis, which rates vary from
time to time and across vehicle categories reflecting the policies of the Government of India. The chart below sets forth a summary of historical changes and the current rates of excise duty.
37
Change of Tax Rate
Excise Duty (per vehicle or chassis)
Smallcars*
Cars other than small
cars**
Motor vehicles for morethan 13 persons
Chassis fitted with engines
for vehicles ofmore than 13
persons Trucks
Chassis with engines fitted for
trucks
Safari, SUVs and
UVs
March 2008
12%
22% or 22% +
Rs. 15,000* 12% 12% + Rs.
10,000 14% 14% + Rs.
10,000
20% + Rs.20,000
December 2008 8% - 8%
8% + Rs. 10,000 10%
10%+ Rs. 10,000 -
March 2009 - - - - 8%
8% + Rs. 10,000 -
July 2009 - - - - - -
20% + Rs.15,000
February 2010 10% - 10%
10% + Rs. 10,000 10%
10% + Rs.10,000
22% + Rs.15,000
March 2012 12%
24% or 27%* 12% 15% 12% 15% 27%
May 2012 - - - - - 14% -March 2013
- - - - - 13%
27% or 30%
February 2014 (valid until June 30, 2014) 8%
20% or 24%* 8% 10% 8% 9% 24%

ˆ200GNal5oj!M7YLw?Š200GNal5oj!M7YLw?
762654 TX 38TATA MOTORS LTDFORM 20-F
30-Jul-2014 06:06 ESTHTMHKG
RR Donnelley ProFile HKR subrv6dc 3*ESS 0C
ACXFBU-MWE-XN0611.5.15
Page 1 of 1
All vehicles / chassis are subjected to Automobile Cess assessed at 0.125%, Education Cess assessed at 2% and Secondary and Higher Education Cess assessed at 1% in addition to the excise duty indicated above. Certain passenger vehicles are also subject to National Calamity Contingent Duty, or NCCD, assessed at 1%.
Value Added Tax: The Value Added Tax, or VAT, has been implemented throughout India. VAT enables set-off from sales tax paid on inputs
by traders and manufacturers against the sales tax collected by them on behalf of the Government of India, thereby eliminating the cascading effect of taxation. Two main brackets of 5% and 12.5%, along with special brackets of 0%, 1%, 3%, 4%, 13.5%, 14% 14.5%, 15%, 20% and 23% have been announced for various categories of goods and commodities sold in the country and certain states have also introduced additional VAT of 1% to 3% on specified commodities, including automobiles. In some of the states, surcharge of 5% to 10% on VAT has been introduced on automobiles. Since its implementation, VAT has had a positive impact on our business. Prior to the implementation of VAT, a major portion of sales tax paid on purchases formed part of our total cost of materials. The implementation of VAT has resulted in savings on the sales tax component, as VAT paid on inputs may generally be set-off against tax paid on outputs.
In addition to VAT, a Central Sales Tax, however, continues to exist, although it is proposed to be abolished in a phased manner. In the Indian Union Budget 2008-09, the Central Sales Tax rate was reduced to 2% which remained unchanged in Fiscal 2014.
Goods and Services Tax: The Government of India is proposing to reform the indirect tax system in India with a comprehensive national goods and
services tax, or GST, covering the manufacture, sale and consumption of goods and services. The date of introduction of GST is not yet known. The proposed GST regime will combine taxes and levies by the central and state governments into one unified rate structure. The Government of India has publicly expressed the view that following the implementation of the GST, indirect tax on domestically manufactured goods is expected to decrease along with prices on such goods.
We have benefitted and continue to benefit from excise duty exemptions for manufacturing facilities in the state of Uttarakhand and other incentives such as subsidies or loans from other states where we have manufacturing operations. While both the Government of India and other state governments of India have publicly announced that all committed incentives will be protected following the implementation of the GST. Given the limited availability of information in the public domain concerning the GST, we are unable to provide any assurance as to the effect of this or any other aspect of the tax regime following implementation of the GST.
Proposed Direct Tax Code: The Proposed Direct Tax Code, or DTC, aims to replace the existing Income Tax Act, 1961 and other direct tax laws, with
a view to simplify and rationalize the tax provisions into one unified code. The various proposals included in DTC are subject to review by the new government and as such impact if any, is not quantifiable at this stage.
Insurance Coverage: The Indian insurance industry is predominantly state-owned and insurance tariffs are regulated by the Indian Insurance
Regulatory and Development Authority. We have insurance coverage which we consider reasonably sufficient to cover all normal risks associated with our operations (including business interruptions) and which we believe are in accordance with industry standards in India. We have obtained coverage for product liability for some of our vehicle models in several countries to which we export vehicles. TDCV has insurance coverage as is required and applicable to cover all normal risks in accordance with industry standards in South Korea, including product liability. We have also taken insurance coverage on Directors and Officers liability to minimize risks associated with international litigations for us and our subsidiaries.
38
* Small cars - cars with length not exceeding 4,000mm and an engine capacity not exceeding 1,500 cc for cars with diesel engines and not exceeding 1,200 cc for cars with gasoline engines. The higher rate is applicable if engine capacity exceeds 1,500 cc.
** Cars other than small cars - motor vehicles for transport of more than 13 persons, trucks, jeeps, SUVs and UVs and chassis fitted with such engines.
(-) indicates no change during the relevant year.

ˆ200GNal5ojnw@=jw,Š 200GNal5ojnw@=jw,
762654 TX 39TATA MOTORS LTDFORM 20-F
25-Jul-2014 12:56 ESTHTMHKG
RR Donnelley ProFile HKR dommj0dc 4*ESS 0C
LANFBU-MWE-XN2111.5.15
Page 1 of 1
Jaguar Land Rover has global insurance coverage which we consider to be reasonably sufficient to cover normal risks associated with our operations and insurance risks (including property, business interruption, marine and product/general liability) and which we believe is in accordance with commercial industry standards and statutory requirements.
Economic Stimulus Package and Incentives: In January 2009, the Government of India announced an economic stimulus package targeting the automotive industry.
Public sector banks were encouraged to fund the automotive sector along with providing a line of credit to non-bank financial companies, specifically aimed at commercial vehicles. The states were to be provided a onetime assistance to purchase 15,000 buses for their urban transport systems.
There was a 4% cut in the central value added tax rate, or Cenvat, on cars and trucks and a 2% cut in Cenvat rate on motor vehicles for transport of more than 13 persons, including the driver. Further, in February 2009, the Cenvat rate was reduced from 10% to 8% for Trucks and buses and service tax was also reduced from 12% to 10%. The Government of India has also provided for an accelerated tax depreciation of 50% for commercial vehicles purchased between January 1 and September 30, 2009. The Cenvat rate was restored to 10% since April 1, 2010 and was further revised to 12% with effect from March 16, 2012. The Government of India has made changes in Excise duty in February 2014 which will be in effect until December 31, 2014 as follows: The Cenvat on small cars, trucks and buses reduced to 8% in February, 2014 whereas Cenvat on cars other than small cars has been reduced to 20% or 24% from 24% or 27%. The Cenvat on UVs have been reduced from 27% or 30% to 24%. The Cenvat for chassis which was increased from 12% to 14% in the budget for the Indian fiscal year 2012-2013, has since been revised to 13% in the budget for the Indian fiscal year 2013-2014 and further reduced to 9% in February 2014.
In the United Kingdom, the Bank of England base (interest) rate has been maintained at an historic low of 0.5% in order to provide monetary/economic stimulus to the UK economy. However a recent improvement in UK GDP growth, improving labour market conditions and a return to inflation levels close to the long term target (2%) is placing pressure on the Bank of England to begin raising interest rates towards the end of the year, although rate rises are likely to be small and gradual.
The European Central Bank has progressively reduced its interest rates since July 2011 prompted by the developing sovereign debt crisis of peripheral Eurozone economies and more recently, in May 2014, the main refinancing rate was cut to a historical low of 0.15% to address persistent low growth across the European Union.
The US Federal Reserve began tapering off its quantitative easing programme in December 2013, signifying a return to growth for the United States economy. However since then the expected reduction in unemployment and strong economic growth has failed to materialise as anticipated. Base interest rates in the United States have been maintained at historically low levels of 0.25% and they are likely to remain low whilst employment and GDP remain lower than anticipated.
The Government of India has launched a National Electric Mobility Mission plan 2020, or NEMMP, to encourage reliable, affordable and efficient electric vehicles that meet consumer performance and price expectations. Through collaboration between the government and industry for promotion and development of indigenous manufacturing capabilities, required infrastructure, consumer awareness and technology, the NEMMP aims to help India to emerge as a leader in the electric vehicle market in the world by 2020 and contribute towards national fuel security.
Furthermore, the Ministry of Road Transport & Highways and the Bureau of Energy Efficiency in India finalized labeling regulations for the M1 category of vehicles, which includes all passenger vehicles i.e cars, UVs, SUVs, Vans etc, upto less than or equal to 10 seats.
The Government of India’s plan to encourage India’s transition to hybrid / electric mobility consists of the following initiatives:
39
a) Demand Side: Mandate use of electric vehicles in areas such as public transportation and government fleets in order
to create initial demand for OEMs and provide incentives for the sales of electric vehicles to consumers.
b) Supply Side: Link incentives to localization of the production of key components of electric vehicle in a phased
manner.
c) Research & Development: Fund research and development, or R&D, programs along with OEMs / component
suppliers to develop optimal solutions for India at low cost.
d) Infrastructure support: Roll out pilot programs to support hybrid/electric vehicles and test their effectiveness and
make modest investments to build public charging infrastructure to support electric vehicles (especially for buses).

ˆ200GNal5ojlVHVrwaŠ200GNal5ojlVHVrwa
762654 TX 40TATA MOTORS LTDFORM 20-F
25-Jul-2014 00:24 ESTHTMHKG
RR Donnelley ProFile HKR pf_rend 1*ESS 0C
hkrdoc211.5.15
Page 1 of 1
Environmental, Fiscal and Other Governmental regulations around the world: Our Jaguar Land Rover business has significant operations in the United States and Europe, which have stringent
regulations relating to vehicular emissions. The proposed tightening of vehicle emissions regulations by the European Union will require significant costs of compliance for Jaguar Land Rover. While we are pursuing various technologies in order to meet the required standards in the various countries in which we operate, the costs of compliance with these required standards can be significant to our operations and may adversely impact our results of operations.
Greenhouse gas / CO / fuel economy legislation: Legislation is now in place limiting the manufacturer fleet average greenhouse gas emissions in Europe for passenger cars starting January 2012. Similarly, the U.S. federal government imposes greenhouse gas emissions standards that apply to 2012-2016 model year vehicles and issued regulations in 2012 for tightened fuel economy and emissions standards for model years 2017-2025. In addition, many other markets either have or will shortly define similar greenhouse gas emissions standards such as Canada, Mexico, China, Japan, South Korea, Switzerland, Brazil, Saudi Arabia, Turkey, Taiwan and Australia. In Europe, implementation of LCV CO standards would impact the Defender and a small number of commercial Freelander and Discovery vehicles. In India, fuel efficiency labeling legislation is being finalized by the Ministry of Road Transport and Highways and the Bureau of Energy Efficiency, under the Ministry of Power. This matter is also being discussed under the Auto Policy committee in order to create a framework for implementation in 2025.
In Europe, monetary fines are imposed as penalties for non-compliance with emissions standards. In the United States, non-compliance with the fuel economy standards require by the National Highway Traffic Safety Administration CAFE standards may result in monetary fines. Failure to comply with the Environmental Protection Agency standards on greenhouse gas emissions may result in market exclusion.
California has developed a zero emissions vehicle regulation mandating increased penetration of electric and plug in hybrid electric vehicles beginning with model year 2012 and the Advanced Clean Car package of regulations which tightened previous standards on emissions and evaporative emissions beginning with model year 2017, that are more stringent than the requirements of the U.S. federal greenhouse gas standards.
Jaguar Land Rover undertakes technology deployment plans directed to achieving these standards. These plans include the use of lightweight materials, including aluminum, which will contribute to the manufacture of lighter vehicles with improved fuel-efficiency, reducing parasitic losses through the driveline and improvements in aerodynamics. They also include the development and installation of smaller engines in our existing vehicles and other drive train efficiency improvements, including the introduction of eight-speed transmissions in the majority of our vehicles, and nine speed transmissions available in the Land Rover Evoque . We also plan to expand the introduction of smaller vehicles, which commenced with the introduction of the Range Rover Evoque, the most fuel-efficient vehicle in the Land Rover line-up. The technology deployment plans include the research, development and deployment of hybrid and plug-in hybrid electric vehicles initially in Europe and the United States, both of which require significant investment.
Additionally, local excise tax initiatives are also a key consideration in ensuring our products meet customer needs for environmental footprint and cost of ownership concerns.
Non-greenhouse gas emissions legislation: Existing European Union 5, or EU5 regulations and planned EU6 regulations in Europe, and existing Low Emission Vehicle 2, or LEV2 regulations and planned LEV3 regulations in California, place ever stricter limits on particulate emissions, oxides of nitrogen and hydrocarbons for passenger and light duty trucks. These regulations require ever increasing levels of technology in engine control systems, on-board diagnostics and after treatment systems that increase the base costs of our power trains. The stringency of such evaporative emissions regulations also require more advanced materials and joints solutions to eliminate fuel evaporative losses, all for much longer warranted periods (up to 150,000 miles in the United States). While Europe and California lead the implementation of these emissions programs, other nations and states tend to follow with adoption of these regulations within a short period thereafter.
To comply with the current and future environmental laws, rules, regulations and standards, we may have to incur substantial capital expenditure and research and development expenditure, to upgrade products and manufacturing facilities, which would have an impact on our cost of production and results of operation.
Imposition of any additional taxes and levies by the Government of India designed to limit the use of automobiles could adversely affect the demand for our products and our results of operations.
Vehicle safety: Vehicles sold in Europe are subject to vehicle safety regulations established by the European Union or by individual member states. In 2009, the European Union enacted a new regulation to establish a simplified framework for vehicle safety, repealing more than 50 existing directives and replacing them with a single regulation aimed at incorporating relevant United Nations standards. Further new regulations on advanced safety systems are to be introduced. The European Commission plans to require (i) new model cars from 2011 to have electronic stability control systems; (ii) to introduce regulations relating to low-rolling resistance tires in 2013; and (iii) to require tire pressure monitoring systems starting in 2012. From April 2009, the criteria for whole vehicle type approval were extended to cover all new road vehicles, to be phased in over five years depending on vehicle category. The extension clarifies the criteria applicable to small commercial vehicles.
40
2
2
ˆ200GNal5ojlVJ#Ww"Š200GNal5ojlVJ#Ww"
762654 TX 41TATA MOTORS LTDFORM 20-F
25-Jul-2014 00:24 ESTHTMHKG
RR Donnelley ProFile HKR pf_rend 1*ESS 0C
hkrdoc211.5.15
Page 1 of 1
In the United States, the National Highway Traffic Safety Administration, or NHTSA, issues federal motor vehicle safety standards covering a wide range of vehicle components and systems such as airbags, seatbelts, brakes, windshields, tires, steering columns, displays, lights, door locks, side impact protection and fuel systems. We are required to test new vehicles and equipment and ensure their compliance with these standards before selling them in the United States. We are also required to recall vehicles found to have defects that present an unreasonable risk to safety or which do not conform to the required Federal Motor Vehicle Safety Standards, and to repair them without charge to the owner. The financial cost and impact on consumer confidence of such recalls can be significant depending on the repair required and the number of vehicles affected. We have no pending investigations relating to alleged safety defects or potential compliance issues before NHTSA.
These standards add to the cost and complexity of designing and producing vehicles and equipment. In recent years NHTSA has mandated, among other things:
Furthermore, the Cameron Gulbransen Kids Transportation Safety Act of 2007, or Kids and Cars Safety Act, passed into law in 2008, and requires NHTSA to enact regulations related to rearward visibility which were implemented in 2014 and begin to take effect starting in model year 2016. The act also requires manufacturers to install brake-to-shift interlocks in vehicles with automatic transmissions. NHTSA has proposed regulations requiring brake – throttle override systems, for the installation of event data recorders in vehicles and for approaching vehicle audible systems. The costs to meet these regulatory requirements may be significant.
Many other countries have vehicle regulatory requirements which differ from those in the United States. The differing requirements among various countries creates complexity and increases costs such that the development of a common product that meets the country regulatory requirements of all countries is not possible. Global Technical Regulations, developed under the auspices of the United Nations, continue to have an increasing impact on automotive safety activities, as indicated by EU legislation. In 2008, Global Technical Regulations on electronic stability control, head restraints and pedestrian protection, were adopted by the UN World Forum for the Harmonization of Vehicle Regulations, and are now in different stages of national implementation. While global harmonization is fundamentally supported by the automobile industry in order to reduce complexity, national implementation may still introduce subtle differences into the system.
At present, India is a signatory of the 1998 UNECE Agreement on Global Technical Regulations, which makes the global technical regulations alternate standards to national regulations. The transition of finalized global technical regulations into national standards remains in progress.
Export Promotion Capital Goods: Since Fiscal 1997, we have benefited from participation in the Export Promotion Capital Goods Scheme, or the EPCG Scheme, which permits us to import capital equipment under a special license at a substantially reduced customs duty. Our participation in this scheme is subject to us fulfilling an obligation to export goods manufactured or produced by the use of capital equipment imported under the EPCG Scheme to the value of a multiple of the cost plus insurance and freight value of these imports or customs duty saved over a period of 6, 8 and 12 years from the date of obtaining the special license. We currently hold 95 licenses which require us to export our products of a value of approximately Rs.74.47 billion between the years 2002 to 2020, and we carefully monitor our progress in meeting our incremental milestones. After fulfilling some of the export obligations as per provisions of Foreign Trade Policy, as on March 31, 2014 we have remaining obligations to export products of a value of approximately Rs.5.98 billion by March 2020. In the event that the export obligation under the EPCG Scheme is not fulfilled, we would have to pay the differential between the reduced and normal duty on the goods imported along with interest. In view of our past record of exceeding our export milestones, and our current plans with respect to our export markets, we do not currently foresee any impediments to meeting our export obligation in the required time frame.
41
• a system for collecting information relating to vehicle performance and customer complaints, and foreign recalls to
assist in the early identification of potential vehicle defects as required by the Transportation Recall Enhancement, Accountability, and Documentation Act;
• enhanced requirements for frontal and side impact, including a lateral pole impact; and • enhanced requirements for vehicle roof strength and rollover safety requirements.
ˆ200GNal5oj%LN5SQlŠ200GNal5oj%LN5SQl
762654 TX 42TATA MOTORS LTDFORM 20-F
31-Jul-2014 15:16 ESTHTMHKG
RR Donnelley ProFile HKR ramam2dc 10*ESS 0C
NERFBU-MWE-XN0111.5.15
Page 1 of 1
Legal Proceedings In the normal course of business, we face claims and assertions by various parties. We assess such claims and assertions
and monitor the legal environment on an ongoing basis, with the assistance of external legal counsel where appropriate. We record a liability for any claims where a potential loss is probable and capable of being estimated and disclose such matters in our financial statements, if material. For potential losses which are considered reasonably possible, but not probable, we provide disclosure in the financial statements, but do not record a liability in our financial statements unless the loss becomes probable. Should any new developments arise, such as a change in law or rulings against us, we may need to make provisions in our financial statements, which could adversely impact our reported financial condition and results of operations. Furthermore, if significant claims are determined against us and we are required to pay all or a portion of the disputed amounts, there could be a material adverse effect on our business and profitability. Certain claims that are above Rs.200 million in value are described in Note 34 to our consolidated financial statements included in this annual report. Certain claims that are below Rs.200 million in value pertain to indirect taxes, labor and other civil cases. There are other claims against us which pertain to motor accident claims in India (involving vehicles that were damaged in accidents while being transferred from our manufacturing plants to regional sales offices), product liability claims and consumer complaints. Some of these cases relate to replacement of parts of vehicles and/or compensation for deficiency in services provided by us or our dealers.
In June 2011, the newly elected State Government of West Bengal (referred to as the “State Government”), enacted legislation to cancel our land lease agreement entered into for the purpose of establishing a manufacturing facility for automobiles at Singur. We subsequently challenged the legal validity of the legislation. In June 2012, the Calcutta High Court (referred to as the “High Court”), ruled against the validity of the legislation and restored our rights under the land lease agreement. The State Government has appealed to the Supreme Court of India. Proceedings at the Supreme Court are continuing as of the date of this annual report, and a hearing has been scheduled for August 5, 2014. We expect that the High Court’s judgment, which we believe to be based on an established position of law, will be upheld.
In South Korea, our union employees had filed a lawsuit to include some elements of non-ordinary salary and bonus as part of ordinary wages. The district court ruled in favor of the union employees on January 2013 and ordered TDCV to pay the employees KRW 17.2 billion and interest, up to the period of lawsuit. We have recorded a provision of KRW 43.6 billion (Rs.2,124 million) (through March 31, 2013) in Fiscal 2013 in respect of this lawsuit. TDCV has filed an appeal against the order which is still pending. In December 2013, in a case involving an unaffiliated company the Supreme Court of South Korea laid down guidelines and principles of determining the elements which could be considered as part of ordinary wage and the principles to be considered for determining the applicability of such claims on a retrospective basis. The Labor Union has formally withdrawn its claim in respect of five elements out of total 12 elements which were part of the original claim. Accordingly, TDCV reversed provision of KRW 13.4 billion (Rs.748 million) in Fiscal 2014 for such five items and recorded a provision of KRW 45.8 billion (Rs.2,565 million) up to March 31, 2014 in respect of this lawsuit. On April 18, 2014, the High Court ordered mediation, to which the Union did not concur. At present this matter is pending before the High Court.
We believe that none of the contingencies, would have a material adverse effect on our financial condition, results of operations or cash flows.
C. Organizational Structure. I. Tata Sons- Promoter and its Promoted Entities
Tata Sons holds equity interests in promoted companies engaged in a wide range of businesses. The various companies promoted by Tata Sons, including our company, are based substantially in India and had combined revenues of approximately US$103 billion in Fiscal 2014. The businesses of Tata Sons promoted entities can be categorized under seven business sectors, namely, engineering, materials, energy, chemicals, consumer products, services, communications and information systems.
Tata Sons promoted entities have their origins in the trading business founded by the founder Mr. Jamsetji Tata in 1868, which was developed and expanded in furtherance of his ideals by his two sons, Sir Dorabji Tata and Sir Ratan Tata, following their father’s death in 1904. The family interests subsequently vested largely in the Sir Ratan Tata Trust, the Sir Dorabji Tata Trust and other related trusts. These trusts established for philanthropic and charitable purposes and together own a significant percentage of the share capital of Tata Sons Limited.
Over the years, the operations of Tata Sons promoted entities had expanded to encompass a number of major industrial and commercial enterprises including Indian Hotels Company Limited (1902), Tata Steel Limited, or Tata Steel (1907), which became the sixth largest steel maker in the world after it acquired Corus, Tata Power Company Limited (1910), Tata Chemicals Limited, or Tata chemicals (1939), which is the world’s second largest manufacturer of soda ash and Tata Motors Limited (1945), which is the seventh largest manufacturer of buses and the eight largest manufacturer of trucks in the world and which acquired Jaguar Land Rover in 2008. Tata Motors Limited made India’s first indigenously developed car, the Indica, in 1998, and introduced the world’s lowest-cost car, the Tata Nano in Fiscal 2010. Other Tata entities include Voltas Limited (1954), and Tata Global Beverages Ltd, or Tata Tea Limited (1962), which is the second largest branded tea company in the world, along with its UK-based subsidiary Tetley.
42

ˆ200GNal5ojnvezkQ5Š200GNal5ojnvezkQ5
762654 TX 43TATA MOTORS LTDFORM 20-F
25-Jul-2014 12:45 ESTHTMHKG
RR Donnelley ProFile HKR megar0dc 2*ESS 0C
RRWIN-XENP14311.5.14
Page 1 of 1
Tata Consultancy Services Limited, or TCS, a subsidiary of Tata Sons which started its operations in the 1960s as a division of Tata Sons and later converted to a listed public company, is leading software service provider and exporter and the first Indian software firm to exceed sales of US$4 billion. TCS has delivery centers around the globe including in the United States, the United Kingdom, Hungary, Brazil, Uruguay and China, as well as India.
Tata Sons promoted entities promoted India’s first airline, Tata Airlines, which later became Air India (India’s national carrier), as well as India’s largest general insurance company, New India Assurance Company Limited, both of which were subsequently taken over by the government as part of the Government of India’s nationalization program. In 1999, entities promoted by Tata Sons also invested in several telephone and telecommunication ventures, including acquiring a significant portion of the Government of India’s equity stake in the then state owned Videsh Sanchar Nigam Limited (VSNL), which was subsequently renamed, Tata Communications Limited and is one of the world’s largest wholesale voice carriers. Tata Sons promoted companies are building multinational businesses that aspire to achieve growth through excellence and innovation, while balancing the interests of shareholders, employees and society.
We have for many years been a licensed user of the “Tata” brand owned by Tata Sons, and thus have both gained from the use of the Tata brand and common brand equity as well as helped to grow and sustain its brand equity. Tata Sons instituted a corporate identity program to re-position the brand to compete in a global environment. A substantial ongoing investment and recurring expenditure is undertaken by Tata Sons planned to develop and promote a strong, well-recognized and common brand equity, which is intended to represent for the consumer a high level of quality, service and reliability associated with products and services offered by the Tata Sons promoted entities.
Each of the Tata Sons promoted entities which have subscribed to the Tata Brand Equity & Business Promotion Scheme pays a subscription fee to use the “Tata” business name and trademarks and participate in and gain from the Tata brand equity as well as avail themselves of various services including legal, human resources, economics and statistics, corporate communications, public affairs services. We believe that our company benefits from the use of and association with the “Tata” brand identity and accordingly, Tata Motors Limited and certain of our subsidiaries have subscribed to the Tata Brand Equity & Business Promotion Agreement and agreed to pay an annual subscription fee to Tata Sons which is in the range of 0.15%-0.25% of the annual net income (defined as net revenues exclusive of excise duties and other governmental taxes and non-operating income), subject to a ceiling of 5% of annual profit before tax (defined as profit after interest and depreciation but before income tax). In some of the past years, Tata Sons has lowered the absolute amount of subscription fee, considering its outlay for activities related to brand promotion and protection in those years. In Fiscal 2012, 2013 and 2014 Tata Motors Limited on a standalone basis paid an amount less than 0.25% of its annual net income as per Indian GAAP. Pursuant to our licensing agreement with Tata Sons, we have also undertaken certain obligations for the promotion and protection of the Tata brand identity licensed to us under the agreement. The agreement can be terminated by written agreement between the parties, by Tata Sons upon our breach of the agreement and our failure to remedy the same, or by Tata Sons upon providing six months’ notice for reasons to be recorded in writing. The agreement can also be terminated by Tata Sons upon the occurrence of certain specified events, including liquidation.
The Tata Sons promoted entities have sought to continue to follow the ideals, values and principles of ethics, integrity and fair business practices espoused by the founder of Tata Sons, Mr. Jamsetji Tata, and his successors. To further protect and enhance the Tata brand equity, these values and principles have been articulated in the Tata Code of Conduct, which has been adopted by Tata promoted entities. The Tata Trust have also made significant contributions towards national causes through promotion of public institutions in the field of science, such as the Indian Institute of Science and the Tata Institute of Fundamental Research and in the field of social services through the Tata Institute of Social Sciences, the Tata Memorial Hospital and the National Center for the Performing Arts and more recently the Tata Medical Center at Kolkata for cancer patients set up by the Tata Trusts and supported by Tata Sons and promoted companies. The Tata Trust is one among the largest charitable foundations in India.
Some of the Tata Sons promoted entities hold shares in other companies promoted by Tata Sons. Similarly, some of our directors hold directorships on the boards of Tata Sons and/or other Tata Sons promoted entities. However, there are no voting agreements, material supply or purchase agreements or any other relationships or agreements that have the effect of binding us with other Tata Sons promoted entities at management, financial or operational levels. With the exception of Tata Steel, which under our Articles of Association has the right to appoint one director on our Board, Tata Sons or its subsidiaries do not have any special contractual or other power to appoint our directors or management. They have only the voting power of their shareholdings in our Company. Except as set forth in the tables below under the heading “Subsidiaries and Affiliates” and except for approximately a 15.38% equity interest in Tata Services Ltd, a 12.47% equity interest in Tata International Limited, a 9.55% equity interest in Tata Industries Limited and a 6.67% equity interest in Tata Projects Ltd, our shareholdings in other Tata Sons promoted entities are generally insignificant as a percentage of their respective outstanding shares or in terms of the amount of our investment or the market value of our shares of those companies.
43
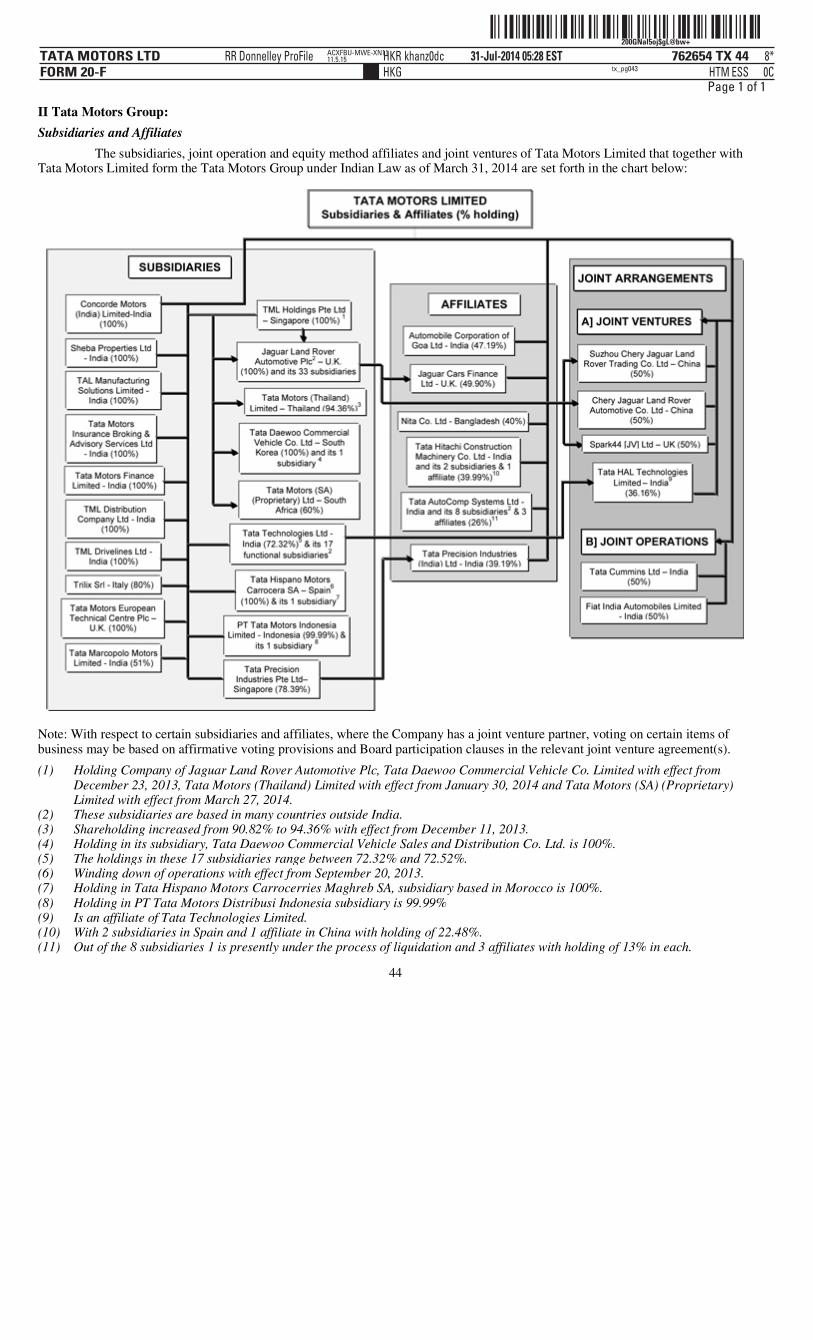
ˆ200GNal5oj$gL@bw+Š 200GNal5oj$gL@bw+
762654 TX 44TATA MOTORS LTDFORM 20-F
31-Jul-2014 05:28 ESTHTMHKG
RR Donnelley ProFile HKR khanz0dc 8*ESS 0C
ACXFBU-MWE-XN1111.5.15
tx_pg043
Page 1 of 1
II Tata Motors Group: Subsidiaries and Affiliates
The subsidiaries, joint operation and equity method affiliates and joint ventures of Tata Motors Limited that together with Tata Motors Limited form the Tata Motors Group under Indian Law as of March 31, 2014 are set forth in the chart below:
Note: With respect to certain subsidiaries and affiliates, where the Company has a joint venture partner, voting on certain items of business may be based on affirmative voting provisions and Board participation clauses in the relevant joint venture agreement(s).
44
(1) Holding Company of Jaguar Land Rover Automotive Plc, Tata Daewoo Commercial Vehicle Co. Limited with effect from December 23, 2013, Tata Motors (Thailand) Limited with effect from January 30, 2014 and Tata Motors (SA) (Proprietary) Limited with effect from March 27, 2014.
(2) These subsidiaries are based in many countries outside India. (3) Shareholding increased from 90.82% to 94.36% with effect from December 11, 2013. (4) Holding in its subsidiary, Tata Daewoo Commercial Vehicle Sales and Distribution Co. Ltd. is 100%. (5) The holdings in these 17 subsidiaries range between 72.32% and 72.52%. (6) Winding down of operations with effect from September 20, 2013. (7) Holding in Tata Hispano Motors Carrocerries Maghreb SA, subsidiary based in Morocco is 100%. (8) Holding in PT Tata Motors Distribusi Indonesia subsidiary is 99.99% (9) Is an affiliate of Tata Technologies Limited. (10) With 2 subsidiaries in Spain and 1 affiliate in China with holding of 22.48%. (11) Out of the 8 subsidiaries 1 is presently under the process of liquidation and 3 affiliates with holding of 13% in each.

ˆ200GNal5ojnvVG4QFŠ200GNal5ojnvVG4QF
762654 TX 45TATA MOTORS LTDFORM 20-F
25-Jul-2014 12:43 ESTHTMHKG
RR Donnelley ProFile HKR subrn1dc 3*ESS 0C
RRWIN-XENP14111.5.14
Page 1 of 1
D. Property, Plants and Equipment. Facilities: We operate six principal automotive manufacturing facilities in India. The first facility was established in 1945
at Jamshedpur in the State of Jharkhand in eastern India. We commenced construction of the second facility in 1966 (with production commencing in 1976) at Pune, in the State of Maharashtra in western India, the third facility in 1985 (with production commencing in 1992) at Lucknow, in the State of Uttar Pradesh in northern India, the fourth at Pantnagar in the State of Uttarakhand, India, which commenced operations in Fiscal 2008, the fifth at Sanand in Gujarat in western India for manufacturing of the Nano, which commenced operations in June 2010, and the sixth plant for manufacturing Tata Marcopolo buses under our joint venture with Marcopolo and LCVs at Dharwad in Karnataka (which buses are also produced at Lucknow). The Jamshedpur, Pune, Sanand, Pantnagar and Lucknow manufacturing facilities have been accredited with ISO/TS 16949:2000(E) certification.
The manufacturing facilities of TDCV are based in Gunsan, South Korea. TDCV has received the ISO/TS 16949 certification, an international quality systems specification given by SGS UK Ltd., an International Automotive Task Force, or IATF, accredited certification body. It is the first South Korean automobile original equipment manufacturer to be awarded an ISO/TS 16949 certification.
Fiat India Automobiles Limited, our joint arrangement with Fiat Group, has its manufacturing facility located in Ranjangaon, Maharashtra. The plant is used for manufacturing Tata and Fiat branded cars and engines, and transmissions for use by both partners.
Tata Motors (Thailand) Limited is our joint venture with Thonburi, and has a manufacturing facility located in Samutprakarn province, Thailand. The facility is used for the manufacture and assembly of pickup trucks.
Following our acquisition of Jaguar Land Rover, we currently operate three principal automotive manufacturing facilities in the United Kingdom at Solihull, Castle Bromwich, and Halewood and have two product development facilities in the United Kingdom at Gaydon and Whitley. Most of these facilities are owned as freehold estates or are held through long-term leaseholds, generally with nominal rents. A new advanced engine facility is being established at Wolverhampton in the United Kingdom’s Midlands area to manufacture low-emission engines.
Jaguar Land Rover and Chery Automobile intend to accelerate plans to build a joint venture manufacturing plant for the Chery Jaguar Land Rover Automotive Co. Limited joint venture in Changshu, near Shanghai, as part of a RMB 10.9 billion investment that will also include a new research and development center and engine production facility. The two companies plan to complete the Changshu facility in Jiangsu province in 2014. Construction of a new engine plant for production of fuel efficient engines is also contemplated under the joint venture agreement.
Jaguar Land Rover’s new Engine Manufacturing Centre in the UK is essential to support the Company’s long-term strategic growth plans and will be the home for a new generation of technologically advanced, lightweight 4-cylinder low emission diesel and gasoline engines. Reinforcing Jaguar Land Rover’s commitment to manufacturing and innovation in the United Kingdom, we expect to increase investment in the facility to in excess of GBP 500 million from GBP 355 million. This is anticipated to almost double the number of highly skilled engineering and manufacturing jobs at the plant, taking the total number of people who will be employed at the site to almost 1,400. The facility is the first in the Jaguar Land Rover’s history to be entirely designed and specified by Jaguar Land Rover. With an area of almost 100,000 square meters, the plant is intended to include an engine testing center alongside the manufacturing and assembly halls. The facility will endeavor to meet the highest standards of sustainable production and will feature a variety of energy efficiency technologies. The new Engine Manufacturing Centre is expected to open later this year with the first engines expected to be produced in 2015.
TMSA, our joint venture with Tata Africa Holdings (SA) (Pty.) Limited for the manufacture and assembly operations of our LCVs and M&HCVs in South Africa, owns and operates a manufacturing facility located in Rosslyn, South Africa.
Description of environmental issues that may affect the Company’s utilization of facilities: Tata Motors Limited: As with other participants in the automobile industry around the world, we are exposed to regulatory risks related to
climate change. The design and development of fuel efficient vehicles and vehicles running on alternative renewable energy have become a priority as a result of fossil fuel scarcity escalating price and growing awareness about energy efficiency among customers.
We have adopted the Tata Group Climate Change Policy which addresses key climate change issues related to products, processes and services. We are committed to reduction of greenhouse gases emissions throughout the lifecycle of our products and development of fuel efficient and low greenhouse gas emitting vehicles, as an integral part of our product development and manufacturing strategy.
45
ˆ200GNal5ojlVSenwQŠ200GNal5ojlVSenwQ
762654 TX 46TATA MOTORS LTDFORM 20-F
25-Jul-2014 00:24 ESTHTMHKG
RR Donnelley ProFile HKR pf_rend 1*ESS 0C
hkrdoc211.5.15
Page 1 of 1
Considering the climate change risk, we are actively involved in partnerships with technology providers to embrace energy efficient technologies not only for products but also for processes and are also participating actively in various national committees in India, which are working on formulating policies and regulations for improvement of the environment, including through reduction of greenhouse gases.
India, as a party to the United Nations Framework Convention on Climate Change, 1992 and its Kyoto Protocol, 1997, has been committed to addressing the global problem on the basis of the principle of “common but differentiated responsibilities and respective capabilities” of the member parties. At present, there are no legally binding targets for greenhouse gas reductions for India as it is a developing country. There are, however, opportunities for minimizing energy consumption through elimination of energy losses during manufacturing, thereby reducing manufacturing costs and increasing productivity.
In order to manage regulatory and general risks of climate change, we are increasingly investing in the design and development of fuel efficient and alternative energy vehicles, in addition to implementing new advanced technologies to increase efficiency of our internal combustion engines. We have manufactured CNG versions of buses, LCVs, and the ACE Xenon, as well as an LPG version of the Indica passenger vehicle.
In September 2010, Tata Motors Limited presented CNG-Electric hybrid low-floor Starbuses to the Delhi Transport Corporation. This was the first time in India that hybrid buses would be used for public transportation. The Tata hybrid Starbus offers substantial improvements in fuel economy compared to a conventional bus. The usage of this technology leads to lower emissions thereby contributing to cleaner air and a greener, more environment-friendly commercial passenger transportation application. Furthermore, we have developed a fuel cell powered bus which will undergo road trials shortly.
Moreover, we are using refrigerants such as R134A in our products in order to minimize our contribution towards greenhouse gas emissions. We also ensure that no refrigerant is released to atmosphere during any service, repair and maintenance of the air-conditioning systems of our vehicles by first recovering the refrigerant charge before the system is serviced and recharged. In addition, since 2009, we have voluntarily disclosed fuel efficiency information for our passenger vehicles in India in accordance with a decision by SIAM. We are also continually in the process of developing products to meet the current and future emission norms in India and other countries. For example, we offer products which meet the Bharat Stage III and Bharat Stage IV norms in India and Euro V norms in International markets.
We also strive to increase the proportion of energy sourced from renewables. As one of our prime objectives, we have endeavored to incorporate environmentally sound practices in our processes, products and services. Our manufacturing facilities at Pune, Jamshedpur, Lucknow, Sanand, Dharwad and Pantnagar in India, each have an Environmental Management System in place and have achieved ISO-14001 certification. We have been implementing various Environment Management Programs on energy conservation such as reduction in electricity and fuel consumption with resulting reductions in greenhouse gas emissions. We are actively working towards a shift to gas fuels to meet process heat requirements.
Jaguar Land Rover: Our production facilities are subject to a wide range of environmental, health and safety requirements. These requirements
address, among other things, air emissions, wastewater discharges, accidental releases into the environment, human exposure to hazardous materials, the storage, treatment, transportation and disposal of wastes and hazardous materials, the investigation and clean- up of contamination, process safety and the maintenance of safe conditions in the workplace. Many of our operations require permits and controls to monitor or prevent pollution. We have incurred, and will continue to incur, substantial ongoing capital and operating expenditures to ensure compliance with current and future environmental, health and safety laws and regulations or their more stringent enforcement. Other environmental, health and safety laws and regulations could impose restrictions or onerous conditions on the availability or the use of raw materials the Company needs for our manufacturing process.
Our manufacturing process results in the emission of greenhouse gases such as carbon dioxide. The EU Emissions Trading Scheme, an EU-wide system in which allowances to emit greenhouse gases are issued and traded, is anticipated to cover more industrial facilities and become progressively more stringent over time, including by reducing the number of allowances that will be allocated free of cost to manufacturing facilities. In addition, a number of further legislative and regulatory measures to address greenhouse gas emissions, including national laws and the Kyoto Protocol, 1997 are in various phases of discussion or implementation. These measures could result in increased costs to: (i) operate and maintain our production facilities; (ii) install new emissions controls; (iii) purchase or otherwise obtain allowances to emit greenhouse gases; and (iv) administer and manage the Company’s greenhouse gas emissions program.
46
ˆ200GNal5oj$=l=!wGŠ200GNal5oj$=l=!wG
762654 TX 47TATA MOTORS LTDFORM 20-F
31-Jul-2014 04:26 ESTHTMHKG
RR Donnelley ProFile HKR khanz0dc 2*ESS 0C
ACXFBU-MWE-XN1111.5.15
Page 1 of 1
Many of our sites have an extended history of industrial activity. We may be required to investigate and remediate contamination at those sites, as well as properties at which we formerly conducted operations, regardless of whether the Company caused the contamination or whether the activity causing the contamination was legal at the time it occurred. In connection with contaminated properties, as well as our operations generally, the Company also could be subject to claims by government authorities, individuals and other third parties seeking damages for alleged personal injury or property damage resulting from hazardous substance contamination or exposure caused by our operations, facilities or products. We could be required to establish or substantially increase financial reserves for such obligations or liabilities and, if we fail to accurately predict the amount or timing of such costs, the related impact on our business, financial condition or results of operations could be material.
We have a good health and safety record. We maintain our plants and facilities with a view to meeting these regulatory requirements and have also put in place a compliance reporting and monitoring process which is intended to help us to mitigate risk.
Production Capacity: The following table shows our production capacity as of March 31, 2014 and production levels by plant and product type
in Fiscal 2014 and 2013:
Properties: We produce vehicles and related components and carry out other businesses through various manufacturing facilities. In
addition to our manufacturing facilities, our properties include sales offices and other sales facilities in major cities, repair service facilities and research and development facilities.
47
Fiscal Year ended March 31, Production
Capacity Production (Units)
2014 2013
Tata Motors Plants in India*
Medium and Heavy Commercial Vehicles, Light Commercial Vehicles, Utility Vehicles, Passenger Cars, 1,625,000 513,442 773,238
Jaguar Land Rover**
Utility Vehicles, Passenger Cars 514,000 439,120 385,787 Other Subsidiary companies plants (excluding Jaguar Land Rover)***
Medium & Heavy Commercial Vehicles, Buses & bus body and Pick-up trucks 58,750 22,162 28,272
Joint operations**** (Passenger Cars) 100,000 30,702 23,968
* This refers to estimated production capacity on a double shift basis for all plants (except Uttarakhand plant for which capacity is on three shift basis) for manufacture of vehicles and replacement parts.
** Production capacity is on three shift basis. *** The plants are located in South Korea, Morocco, South Africa and Thailand. Production capacity of plants at Morocco are on
single shift basis **** Excludes Production of Engines / Powertrains
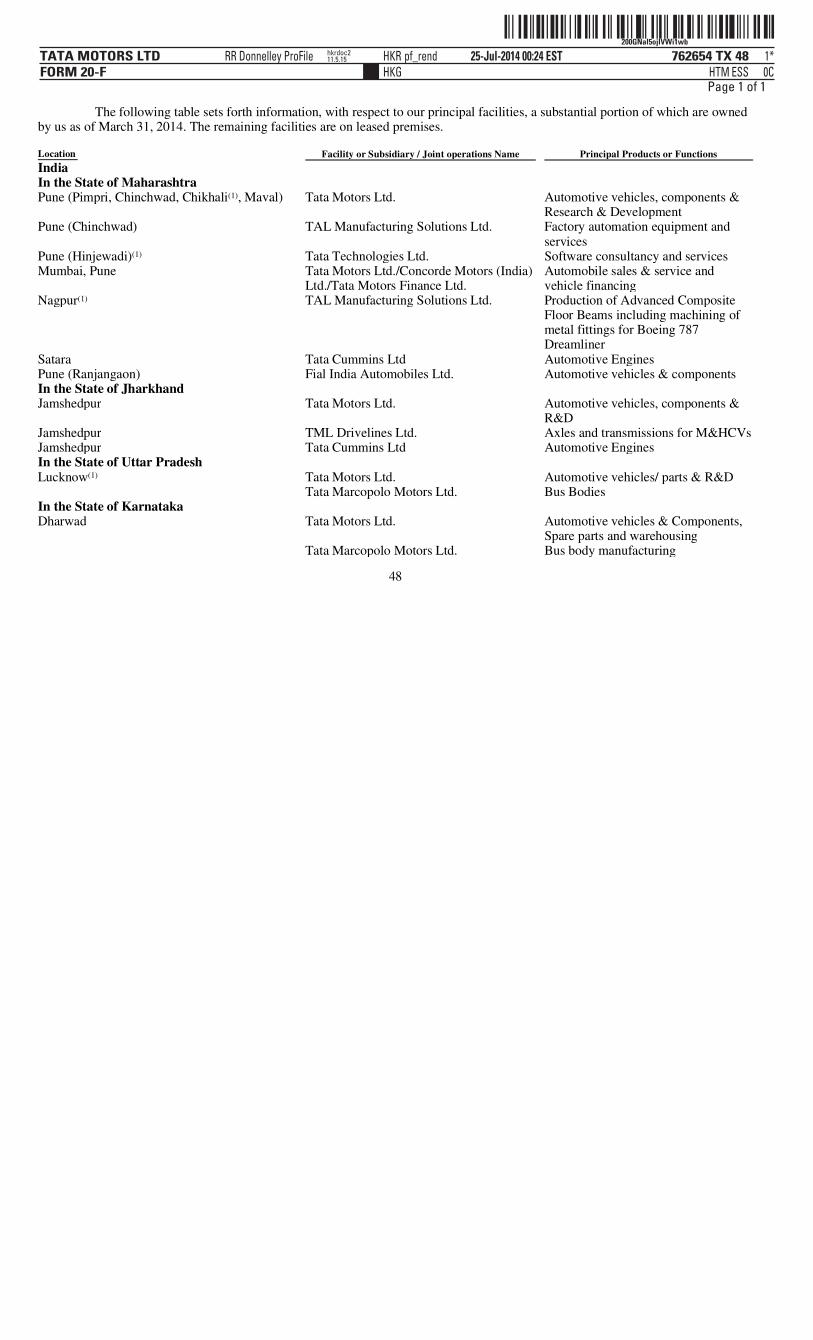
ˆ200GNal5ojlVWi1wbŠ200GNal5ojlVWi1wb
762654 TX 48TATA MOTORS LTDFORM 20-F
25-Jul-2014 00:24 ESTHTMHKG
RR Donnelley ProFile HKR pf_rend 1*ESS 0C
hkrdoc211.5.15
Page 1 of 1
The following table sets forth information, with respect to our principal facilities, a substantial portion of which are owned by us as of March 31, 2014. The remaining facilities are on leased premises.
48
Location Facility or Subsidiary / Joint operations Name Principal Products or Functions India
In the State of Maharashtra
Pune (Pimpri, Chinchwad, Chikhali , Maval)
Tata Motors Ltd.
Automotive vehicles, components & Research & Development
Pune (Chinchwad)
TAL Manufacturing Solutions Ltd.
Factory automation equipment and services
Pune (Hinjewadi) Tata Technologies Ltd. Software consultancy and servicesMumbai, Pune
Tata Motors Ltd./Concorde Motors (India) Ltd./Tata Motors Finance Ltd.
Automobile sales & service and vehicle financing
Nagpur
TAL Manufacturing Solutions Ltd.
Production of Advanced Composite Floor Beams including machining of metal fittings for Boeing 787 Dreamliner
Satara Tata Cummins Ltd Automotive EnginesPune (Ranjangaon) Fial India Automobiles Ltd. Automotive vehicles & componentsIn the State of Jharkhand
Jamshedpur
Tata Motors Ltd.
Automotive vehicles, components & R&D
Jamshedpur TML Drivelines Ltd. Axles and transmissions for M&HCVsJamshedpur Tata Cummins Ltd Automotive EnginesIn the State of Uttar Pradesh
Lucknow Tata Motors Ltd. Automotive vehicles/ parts & R&D Tata Marcopolo Motors Ltd. Bus Bodies
In the State of Karnataka
Dharwad
Tata Motors Ltd.
Automotive vehicles & Components, Spare parts and warehousing
Tata Marcopolo Motors Ltd. Bus body manufacturing
(1)
(1)
(1)
(1)
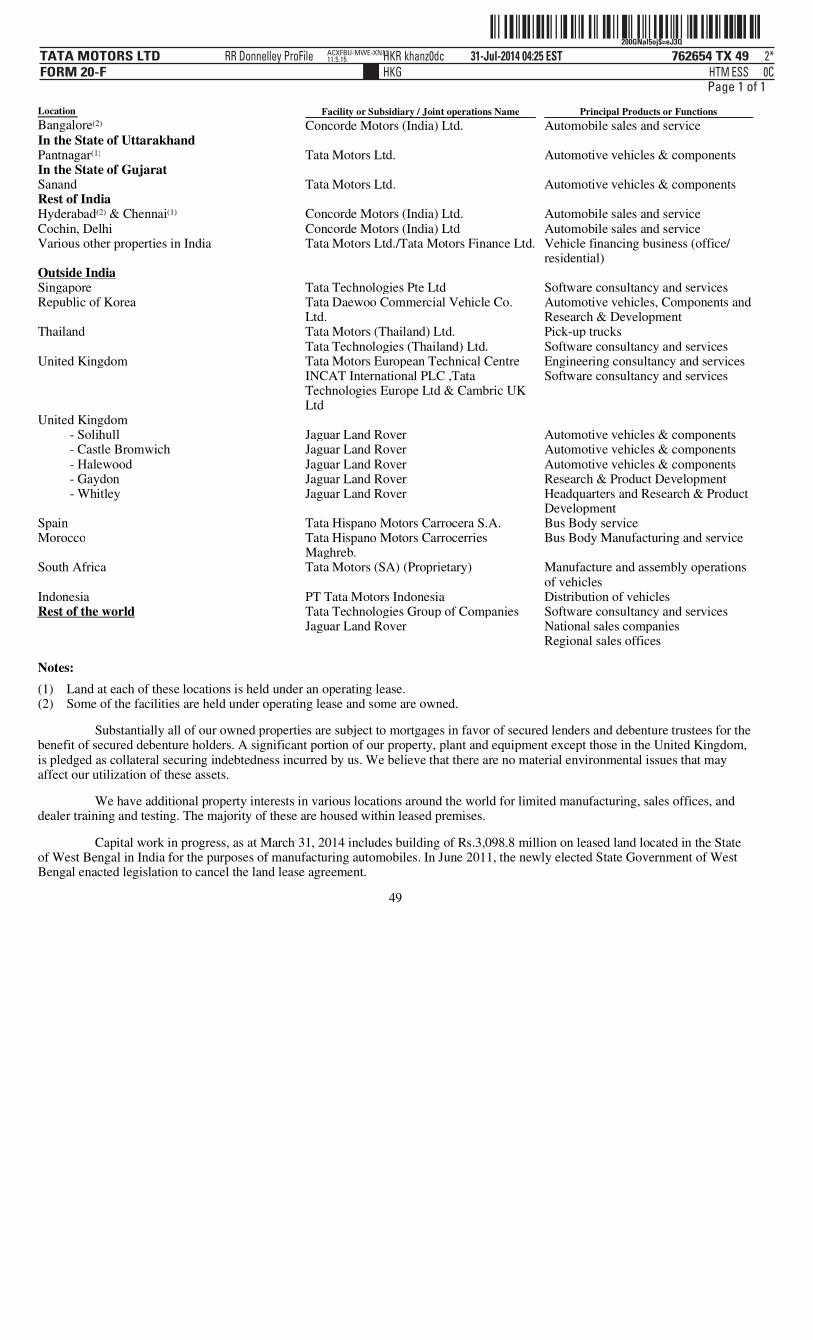
ˆ200GNal5oj$=eJ3QÉŠ 200GNal5oj$=eJ3Q
762654 TX 49TATA MOTORS LTDFORM 20-F
31-Jul-2014 04:25 ESTHTMHKG
RR Donnelley ProFile HKR khanz0dc 2*ESS 0C
ACXFBU-MWE-XN1111.5.15
Page 1 of 1
Notes:
Substantially all of our owned properties are subject to mortgages in favor of secured lenders and debenture trustees for the benefit of secured debenture holders. A significant portion of our property, plant and equipment except those in the United Kingdom, is pledged as collateral securing indebtedness incurred by us. We believe that there are no material environmental issues that may affect our utilization of these assets.
We have additional property interests in various locations around the world for limited manufacturing, sales offices, and dealer training and testing. The majority of these are housed within leased premises.
Capital work in progress, as at March 31, 2014 includes building of Rs.3,098.8 million on leased land located in the State of West Bengal in India for the purposes of manufacturing automobiles. In June 2011, the newly elected State Government of West Bengal enacted legislation to cancel the land lease agreement.
49
Location Facility or Subsidiary / Joint operations Name Principal Products or Functions Bangalore Concorde Motors (India) Ltd. Automobile sales and serviceIn the State of Uttarakhand
Pantnagar Tata Motors Ltd. Automotive vehicles & componentsIn the State of Gujarat
Sanand Tata Motors Ltd. Automotive vehicles & componentsRest of India Hyderabad & Chennai Concorde Motors (India) Ltd. Automobile sales and serviceCochin, Delhi Concorde Motors (India) Ltd Automobile sales and serviceVarious other properties in India
Tata Motors Ltd./Tata Motors Finance Ltd.
Vehicle financing business (office/ residential)
Outside India
Singapore Tata Technologies Pte Ltd Software consultancy and servicesRepublic of Korea
Tata Daewoo Commercial Vehicle Co. Ltd.
Automotive vehicles, Components and Research & Development
Thailand Tata Motors (Thailand) Ltd. Pick-up trucks Tata Technologies (Thailand) Ltd. Software consultancy and services
United Kingdom Tata Motors European Technical Centre Engineering consultancy and services
INCAT International PLC ,Tata Technologies Europe Ltd & Cambric UK Ltd
Software consultancy and services
United Kingdom
- Solihull Jaguar Land Rover Automotive vehicles & components- Castle Bromwich Jaguar Land Rover Automotive vehicles & components- Halewood Jaguar Land Rover Automotive vehicles & components- Gaydon Jaguar Land Rover Research & Product Development- Whitley
Jaguar Land Rover
Headquarters and Research & Product Development
Spain Tata Hispano Motors Carrocera S.A. Bus Body serviceMorocco
Tata Hispano Motors Carrocerries Maghreb.
Bus Body Manufacturing and service
South Africa
Tata Motors (SA) (Proprietary)
Manufacture and assembly operations of vehicles
Indonesia PT Tata Motors Indonesia Distribution of vehiclesRest of the world Tata Technologies Group of Companies Software consultancy and services
Jaguar Land Rover National sales companies Regional sales offices
(1) Land at each of these locations is held under an operating lease. (2) Some of the facilities are held under operating lease and some are owned.
(2)
(1)
(2) (1)

ˆ200GNal5oj%LBBhQ%Š200GNal5oj%LBBhQ%
762654 TX 50TATA MOTORS LTDFORM 20-F
31-Jul-2014 15:02 ESTHTMHKG
RR Donnelley ProFile HKR kotts0dc 6*ESS 0C
LANFBU-MWE-XN2011.5.15
Page 1 of 1
The Company challenged the legal validity of the legislation. In June 2012, the Calcutta High Court ruled against the validity of the legislation and restored the Company’s rights under the land lease agreement. The State Government has filed an appeal in the Supreme Court of India. As of the date of the authorization of the financial statements, the Supreme Court has not concluded on the State Government appeal.
The Company reasonably expects that the High Courts’ judgment, based on established law, will be upheld by the Supreme Court. Based on the management’s assessment, no adjustments to the carrying amount of buildings is considered necessary. For further details regarding the current legal proceedings with respect to the leased land please refer to Item 4.B “— Business Overview — Legal Proceedings” of this annual report.
We consider all of our principal manufacturing facilities and other significant properties to be in good condition and adequate to meet the needs of our operations.
None.
You should read the following discussion of our financial condition and results of operations together with our consolidated financial statements prepared in conformity with IFRS and information included in this annual report. This discussion and analysis contains forward-looking statements that involve risks, uncertainties and assumptions. Our actual results may differ materially from those anticipated in these forward-looking statements as a result of various factors including, but not limited to, those set forth in Item 3.D and elsewhere in this annual report.
A. Operating Results. All financial information discussed in this section is derived from our financial statements included in this annual report on
Form 20-F, which has been prepared in accordance with International Financial Reporting Standards as issued by International Accounting Standards Board.
Overview In Fiscal 2014, our total revenue (net of excise duties) including finance revenues increased by 23.7% to Rs.2,341,761
million from Rs.1,892,910 million in Fiscal 2013. We recorded a net income (attributable to shareholders of the Company) of Rs.130,717 million in Fiscal 2014, representing an increase of 47.4% or Rs.42,046 million over net income in Fiscal 2013 of Rs.88,671 million.
Automotive operations Automotive operations are our most significant segment, accounting for 99.5%, 99.4% and 99.4% of our total revenues in
Fiscal 2014, 2013, and 2012, respectively. In Fiscal 2014, revenue from automotive operations before inter-segment eliminations was Rs.2,329,582 million as compared to Rs.1,881,621 million in Fiscal 2013 and Rs.1,651,564 million in Fiscal 2012.
Our automotive operations include:
Our automotive operations segment is further divided into Tata and other brand vehicles including financing thereof and the Jaguar Land Rover. In Fiscal 2014, Jaguar Land Rover contributed 81.3% (72.5% in Fiscal 2013) of our total automotive revenue (before intra segment elimination) and the remaining 18.7% (27.5% or Fiscal 2013) was contributed by Tata and other brand vehicles.
Tata and other brands vehicles (including spares and financing thereof) India is the major market for Tata and other brand vehicles (including financing thereof). During Fiscal 2014, there was
continued deterioration in the macroeconomic factors leading to volume contraction and competitive pressures across all major products.
50
Item 4A. Unresolved Staff Comments.
Item 5. Operating and Financial Review and Prospects.
• All activities relating to the development, design, manufacture, assembly and sale of vehicles as well as related spare
parts and accessories; • Distribution and service of vehicles; and • Financing of our vehicles in certain markets.

ˆ200GNal5oj!V!2ZQJŠ200GNal5oj!V!2ZQJ
762654 TX 51TATA MOTORS LTDFORM 20-F
30-Jul-2014 06:43 ESTHTMHKG
RR Donnelley ProFile HKR palap0dc 8*ESS 0C
RRWIN-XENP14111.5.15
Page 1 of 1
During Fiscal 2014, the Indian economy recorded a GDP growth of 4.7%, compared to 4.5% in Fiscal 2013 (based on data from the Ministry of Statistics and Programme Implementation). The Index of Industrial production (IIP) declined by 0.1% during Fiscal 2014. The stagnation in the industrial activity was broad-based. While mining output registered a decline of 1.1%, manufacturing output declined by 0.7% during the same period. Fiscal 2014 witnessed a decline in investments in new projects in line with slowdown in overall growth. The stagnation of industrial growth particularly in mining and quarrying, manufacturing and infrastructure, adversely impacted the domestic auto industry. Fiscal 2014 was also marked by efforts by the Government of India to contain the fiscal deficit. As a result, the domestic auto industry witnessed decline as expenditure on infrastructure and other key sectors suffered. With the continued high interest rates and inflation, households were forced to spend more on essentials and reduced discretionary spending, leading to deferrals of purchase decisions.
The demand in certain product category was also affected due to the lack of financing for potential customers in Fiscal 2014. Further, high default rates in loans alongside early delinquencies has led financiers to tighten lending norms, such as lowering the loan-to-value ratio on new financings while focusing on collection of existing loans.
Consequently, sales in the Indian automobile industry posted a decline of 9.3% in Fiscal 2014, as compared to 1.1% growth in Fiscal 2013. Sales of commercial vehicles declined by 22.4% (last year growth of 1.7%) and passenger vehicles declined by 4.7%, compared to an increase Fiscal 2013 of 0.9%. The sales in the M&HCV category fell by 25.2% in Fiscal 2014 continuing a 23.3% decline in Fiscal 2013, due to ban on mining, significant deacceleration in investment in infrastructure and slowing economy growth. Further, the contraction of the LCV segment by 21.2% to 498,483 units from 632,450 units in Fiscal 2013 has significantly impacted the volume which had been a growth driver in the past, growing by 17.9% in Fiscal 2013. The fall in the LCV segment has been led by a decline of sales in the SCV segment. Sales of our commercial vehicles in India decreased by 29.5% to 378,028 units in Fiscal 2014 from 536,491 units in Fiscal 2013. However, over the last few months, there have been some signs of revival and sales volumes have stabilized which was facilitated by steps taken by the Government of India to revive the economy, such as 4% reduction in excise duty for a limited period upto December 31, 2014 and a partial lifting of mining bans. There has been slight increase in freight rates, indicating that the economy may be nearing the end of the down-cycle.
The passenger vehicle industry in India recorded a negative growth of 4.7% for the first time in the last five years in Fiscal 2014. The decline in sales volumes was seen across segments, with the sedan segment witnessing the largest decline. The Hatchbacks and UV segment are historically the volume drivers. The high growth in UV segment last year, with the onset of soft roaders did not witness similar growth in Fiscal 2014. Our passenger vehicle (including UV) sales in India decreased to 149,350 units in Fiscal 2014 from 219,953 units in Fiscal 2013 (32.1%). We sold 23,400 Nano cars in Fiscal 2014, a decrease of 51.4% over 48,122 units in Fiscal 2013. In the UV category, we sold 31,583 units in Fiscal 2014, representing a decrease of 31.9% from 46,366 units in Fiscal 2013. The premium and luxury vehicles segment however has seen a growth in an otherwise declining year. We sold 2,805 units of Jaguar and Land Rover in Fiscal 2014 as compared to 2,494 units in Fiscal 2013 in India.
Our overall sales in international markets decreased by 4.6% to 61,279 units in Fiscal 2014, as compared to 64,242 units in Fiscal 2013. Our exports of vehicles manufactured in India decreased marginally by 2.5% in Fiscal 2014 to 46,983 units from 48,196 units in Fiscal 2013. For Tata Motors, traditionally strong markets in South Asia, such as Bangladesh, also were affected by internal conflict and unrest.
TDCV, our subsidiary company engaged in design, development and manufacturing of M&HCVs, recorded a 5.1% increase in its overall vehicle sales to 10,594 units in Fiscal 2014, from 10,080 units in Fiscal 2013. TDCV exported 4,010 units in Fiscal 2014, compared to 4,680 units in Fiscal 2013, a fall of 14.3%. However, in the South Korean market, TDCV’s sales have increased by 22% from 5,400 units in Fiscal 2013 to 6,584 units in Fiscal 2014, primarily attributable to growth in the South Korean economy and improved market share of TDCV in local market.
Our overall vehicle sales decreased by 28.3% to 588,657 units in Fiscal 2014 from 820,686 units in Fiscal 2013, resulting in a revenue (before inter-segment elimination) decrease of 15.8% to Rs.435,012 million in Fiscal 2014, compared to Rs.516,867 million in Fiscal 2013.
Revenue from our vehicle financing operations decreased marginally by 0.5% to Rs.29,876 million in Fiscal 2014 as compared to Rs.30,013 million in Fiscal 2013.
There was a decrease in spares and after sales activity by 9.6% to Rs.40,798 million in Fiscal 2014, compared to Rs.45,119 million in Fiscal 2013. In terms of earnings before other income, interest and tax before inter-segment eliminations from Tata and other brand vehicles and financing thereof, there was a loss of Rs.20,630 million in Fiscal 2014 as compared to a profit of Rs.13,554 million in Fiscal 2013. The losses were mainly attributable to a significant reduction in volumes and competitive pressure on pricing. Also as a result of increase delinquency rate on vehicle financing, we provided Rs.24,139 million in Fiscal 2014 as compared to Rs.9,428 million in Fiscal 2013. Further, there was an increase in depreciation expense as a result of additions to plant / facility in recent years, and in amortization expense in respect of new products launched. While we have stepped up the cost reduction programs, in the short term, the level of fixed costs continued to have negative impact on earnings.
51

ˆ200GNal5oj!W6HoQ7Š200GNal5oj!W6HoQ7
762654 TX 52TATA MOTORS LTDFORM 20-F
30-Jul-2014 06:44 ESTHTMHKG
RR Donnelley ProFile HKR palap0dc 10*ESS 0C
RRWIN-XENP14111.5.15
Page 1 of 1
Jaguar Land Rover Jaguar Land Rover had another successful year of continued growth in all markets, particularly 33.7% year on year growth
in China retail sales. Jaguar Land Rover also significantly improved sales in more developed economies, where, despite uncertain trading conditions, it has increased volumes in all major markets. The volume growth has been driven by the all-new Range Rover and the launch of new Range Rover Sport and Jaguar F-TYPE. More established models have also been performing well, including in particular derivatives such as the XF Sportbrake and all-wheel drive and smaller engine options.
Retail volumes in Fiscal 2014 were 434,311 units, an increase of 15.9% compared to the prior year. Retail volumes were 80,522 units for Jaguar and 353,789 units for Land Rover, growth of 37.3% and 11.9%, respectively. Retail volumes have grown across all markets, led by China up 34% from last year, to record retail sales of 103,077. North America and Asia Pacific regions also performed strongly, up 20.2% and 27.7% to 75,671 and 22,795 respectively while UK and Europe were up 6.2% and 2.3% to 76,721 and 82,854 units respectively.
Wholesale volumes in Fiscal 2014 were 431,889 units, an increase of 16.1% over Fiscal 2013. Wholesale volumes for Jaguar in Fiscal 2014 were 80,644 units, representing an increase of 37.3% as compared to 57,766 units sold in Fiscal 2013. Wholesale volumes for Land Rover in Fiscal 2014 were 351,245 units, representing an increase of 11.8% over sales of 314,290 units in Fiscal 2013.
Revenues (before inter-segment eliminations) for Jaguar Land Rover were Rs.1,894,590 million in Fiscal 2014, compared to Rs.1,365,620 million in Fiscal 2013, representing a 38.7% increase over Fiscal 2013. The increase was primarily driven by demand for both brands as well as a strong product and market mix, supported by favorable exchange rates. The revenues were also positively impacted by translation gain, of approximately Rs.218,417 million.
In Fiscal 2014, the Jaguar Land Rover business reported earnings before other income, interest and tax before inter-segment eliminations of Rs.228,027 million, as compared to Rs.150,653 million in Fiscal 2013, representing an increase of 51.3% over Fiscal 2013. The improvement in profitability was mainly attributable to increases in volumes across all markets, introduction of the Jaguar F-TYPE and smaller powertrain derivative of XF and XJ and XF Sportbrake, the New Range Rover, the New Range Rover Sport and Range Rover Evoque. Further, the performance was also supported by the positive impact of the continuing strength of the US dollar against the GBP and the Euro, improving its revenues against the backdrop of a largely GBP and Euro cost base. The reported earnings before other income, interest and tax also have an element of foreign currency translation gain of GBP to rupees of Rs.27,064 million.
Other Operations Our other operations business segment mainly includes information technology services, machine tools and factory
automation solutions. Our revenue from other operations before inter-segment eliminations was Rs.24,989 million in Fiscal 2014, an increase of 12.7% from Rs.22,179 million in Fiscal 2013. Revenues from other operations represented 1.1%, 1.2% and 1.1% of our total revenues, before inter-segment eliminations, in Fiscal 2014, 2013 and 2012, respectively. Earnings before other income, interest and tax before inter-segment eliminations, were Rs.2,634 million in Fiscal 2014 and Rs.3,294 million and Rs.2,443 million in Fiscal 2013 and 2012, respectively.
Geographical breakdown We have pursued a strategy of increasing exports of Tata and other brand vehicles to new and existing markets. Improved
market sentiment and a strong portfolio of Jaguar Land Rover products during Fiscal 2014, have enabled us to increase our share in international markets. Further, Jaguar Land Rover also experienced a change in market mix, in particular the continued strengthening of business in China, which is our second largest single market in terms of volumes, after India. The performance of our subsidiary in South Korea, TDCV, and TTL contributed to our revenue from international markets. TDCV’s major export markets are Algeria, Russia, Vietnam, South Africa and countries in the Middle East. The proportion of our net sales earned from markets outside of India has increased significantly to 84.4% and 76.1% in Fiscal 2014 and Fiscal 2013, respectively. The increase was also a consequence of reduction in domestic sales in India.
The following table sets forth our revenue from our key geographical markets:
52
Fiscal 2014 Fiscal 2013 Fiscal 2012 Revenue Rs. in million Percentage Rs. in million Percentage Rs. in million Percentage
India 364,591 15.6% 453,276 23.9% 549,174 33.1% China 656,138 28.0% 446,508 23.6% 296,923 17.9% United Kingdom 290,162 12.4% 224,604 11.9% 179,866 10.8% United States of America 266,436 11.4% 189,007 10.0% 157,855 9.5% Rest of Europe 292,378 12.4% 221,035 11.7% 190,056 11.4% Rest of the World 472,056 20.2% 358,480 18.9% 287,640 17.3%
Total 2,341,761 1,892,910 1,661,514
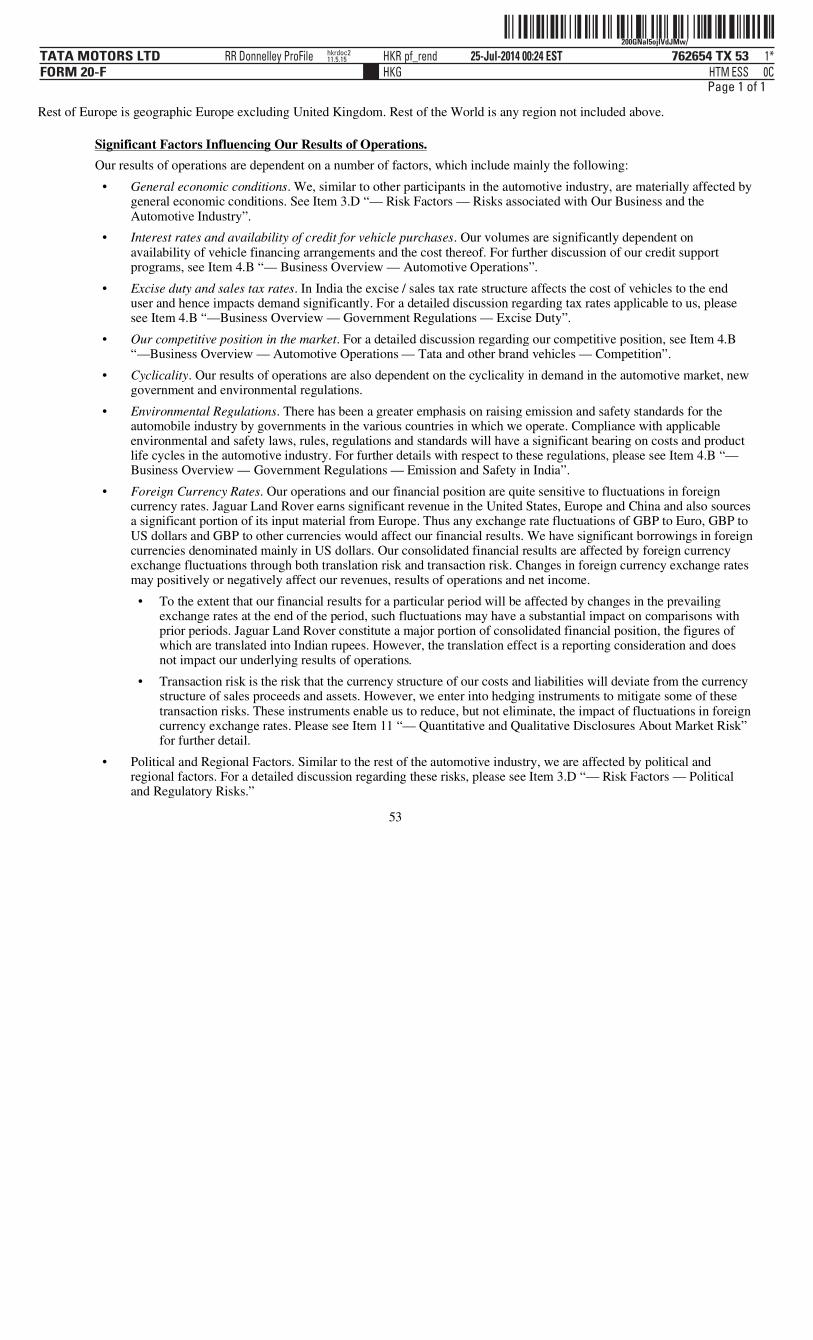
ˆ200GNal5ojlVdJMw/Š200GNal5ojlVdJMw/
762654 TX 53TATA MOTORS LTDFORM 20-F
25-Jul-2014 00:24 ESTHTMHKG
RR Donnelley ProFile HKR pf_rend 1*ESS 0C
hkrdoc211.5.15
Page 1 of 1
Rest of Europe is geographic Europe excluding United Kingdom. Rest of the World is any region not included above.
Significant Factors Influencing Our Results of Operations. Our results of operations are dependent on a number of factors, which include mainly the following:
53
• General economic conditions. We, similar to other participants in the automotive industry, are materially affected by
general economic conditions. See Item 3.D “— Risk Factors — Risks associated with Our Business and the Automotive Industry”.
• Interest rates and availability of credit for vehicle purchases. Our volumes are significantly dependent on
availability of vehicle financing arrangements and the cost thereof. For further discussion of our credit support programs, see Item 4.B “— Business Overview — Automotive Operations”.
• Excise duty and sales tax rates. In India the excise / sales tax rate structure affects the cost of vehicles to the end
user and hence impacts demand significantly. For a detailed discussion regarding tax rates applicable to us, please see Item 4.B “—Business Overview — Government Regulations — Excise Duty”.
• Our competitive position in the market. For a detailed discussion regarding our competitive position, see Item 4.B
“—Business Overview — Automotive Operations — Tata and other brand vehicles — Competition”.
• Cyclicality. Our results of operations are also dependent on the cyclicality in demand in the automotive market, new
government and environmental regulations.
• Environmental Regulations. There has been a greater emphasis on raising emission and safety standards for the automobile industry by governments in the various countries in which we operate. Compliance with applicable environmental and safety laws, rules, regulations and standards will have a significant bearing on costs and product life cycles in the automotive industry. For further details with respect to these regulations, please see Item 4.B “—Business Overview — Government Regulations — Emission and Safety in India”.
• Foreign Currency Rates. Our operations and our financial position are quite sensitive to fluctuations in foreign currency rates. Jaguar Land Rover earns significant revenue in the United States, Europe and China and also sources a significant portion of its input material from Europe. Thus any exchange rate fluctuations of GBP to Euro, GBP to US dollars and GBP to other currencies would affect our financial results. We have significant borrowings in foreign currencies denominated mainly in US dollars. Our consolidated financial results are affected by foreign currency exchange fluctuations through both translation risk and transaction risk. Changes in foreign currency exchange rates may positively or negatively affect our revenues, results of operations and net income.
• To the extent that our financial results for a particular period will be affected by changes in the prevailing exchange rates at the end of the period, such fluctuations may have a substantial impact on comparisons with prior periods. Jaguar Land Rover constitute a major portion of consolidated financial position, the figures of which are translated into Indian rupees. However, the translation effect is a reporting consideration and does not impact our underlying results of operations.
• Transaction risk is the risk that the currency structure of our costs and liabilities will deviate from the currency structure of sales proceeds and assets. However, we enter into hedging instruments to mitigate some of these transaction risks. These instruments enable us to reduce, but not eliminate, the impact of fluctuations in foreign currency exchange rates. Please see Item 11 “— Quantitative and Qualitative Disclosures About Market Risk” for further detail.
• Political and Regional Factors. Similar to the rest of the automotive industry, we are affected by political and
regional factors. For a detailed discussion regarding these risks, please see Item 3.D “— Risk Factors — Political and Regulatory Risks.”
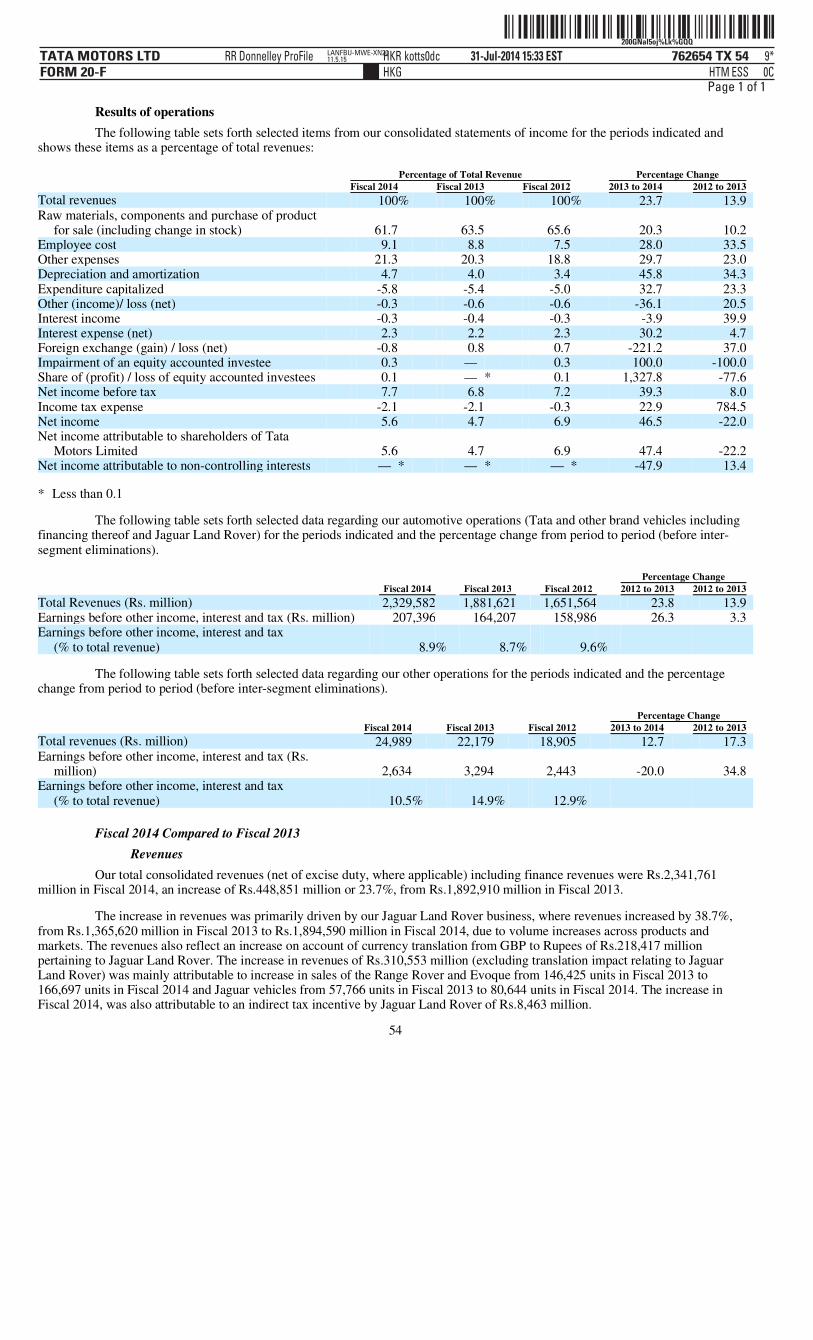
ˆ200GNal5oj%Lk%GQQŠ200GNal5oj%Lk%GQQ
762654 TX 54TATA MOTORS LTDFORM 20-F
31-Jul-2014 15:33 ESTHTMHKG
RR Donnelley ProFile HKR kotts0dc 9*ESS 0C
LANFBU-MWE-XN2011.5.15
Page 1 of 1
Results of operations The following table sets forth selected items from our consolidated statements of income for the periods indicated and
shows these items as a percentage of total revenues:
The following table sets forth selected data regarding our automotive operations (Tata and other brand vehicles including financing thereof and Jaguar Land Rover) for the periods indicated and the percentage change from period to period (before inter-segment eliminations).
The following table sets forth selected data regarding our other operations for the periods indicated and the percentage change from period to period (before inter-segment eliminations).
Fiscal 2014 Compared to Fiscal 2013 Revenues
Our total consolidated revenues (net of excise duty, where applicable) including finance revenues were Rs.2,341,761 million in Fiscal 2014, an increase of Rs.448,851 million or 23.7%, from Rs.1,892,910 million in Fiscal 2013.
The increase in revenues was primarily driven by our Jaguar Land Rover business, where revenues increased by 38.7%, from Rs.1,365,620 million in Fiscal 2013 to Rs.1,894,590 million in Fiscal 2014, due to volume increases across products and markets. The revenues also reflect an increase on account of currency translation from GBP to Rupees of Rs.218,417 million pertaining to Jaguar Land Rover. The increase in revenues of Rs.310,553 million (excluding translation impact relating to Jaguar Land Rover) was mainly attributable to increase in sales of the Range Rover and Evoque from 146,425 units in Fiscal 2013 to 166,697 units in Fiscal 2014 and Jaguar vehicles from 57,766 units in Fiscal 2013 to 80,644 units in Fiscal 2014. The increase in Fiscal 2014, was also attributable to an indirect tax incentive by Jaguar Land Rover of Rs.8,463 million.
54
Percentage of Total Revenue Percentage Change Fiscal 2014 Fiscal 2013 Fiscal 2012 2013 to 2014 2012 to 2013
Total revenues 100% 100% 100% 23.7 13.9 Raw materials, components and purchase of product
for sale (including change in stock) 61.7 63.5 65.6 20.3 10.2 Employee cost 9.1 8.8 7.5 28.0 33.5 Other expenses 21.3 20.3 18.8 29.7 23.0 Depreciation and amortization 4.7 4.0 3.4 45.8 34.3 Expenditure capitalized -5.8 -5.4 -5.0 32.7 23.3 Other (income)/ loss (net) -0.3 -0.6 -0.6 -36.1 20.5 Interest income -0.3 -0.4 -0.3 -3.9 39.9 Interest expense (net) 2.3 2.2 2.3 30.2 4.7 Foreign exchange (gain) / loss (net) -0.8 0.8 0.7 -221.2 37.0 Impairment of an equity accounted investee 0.3 — 0.3 100.0 -100.0 Share of (profit) / loss of equity accounted investees 0.1 — * 0.1 1,327.8 -77.6 Net income before tax 7.7 6.8 7.2 39.3 8.0 Income tax expense -2.1 -2.1 -0.3 22.9 784.5 Net income 5.6 4.7 6.9 46.5 -22.0 Net income attributable to shareholders of Tata
Motors Limited 5.6 4.7 6.9 47.4 -22.2 Net income attributable to non-controlling interests — * — * — * -47.9 13.4
* Less than 0.1
Percentage Change Fiscal 2014 Fiscal 2013 Fiscal 2012 2012 to 2013 2012 to 2013
Total Revenues (Rs. million) 2,329,582 1,881,621 1,651,564 23.8 13.9 Earnings before other income, interest and tax (Rs. million) 207,396 164,207 158,986 26.3 3.3 Earnings before other income, interest and tax
(% to total revenue) 8.9% 8.7% 9.6%
Percentage Change Fiscal 2014 Fiscal 2013 Fiscal 2012 2013 to 2014 2012 to 2013 Total revenues (Rs. million) 24,989 22,179 18,905 12.7 17.3 Earnings before other income, interest and tax (Rs.
million) 2,634 3,294 2,443 -20.0 34.8 Earnings before other income, interest and tax
(% to total revenue) 10.5% 14.9% 12.9%
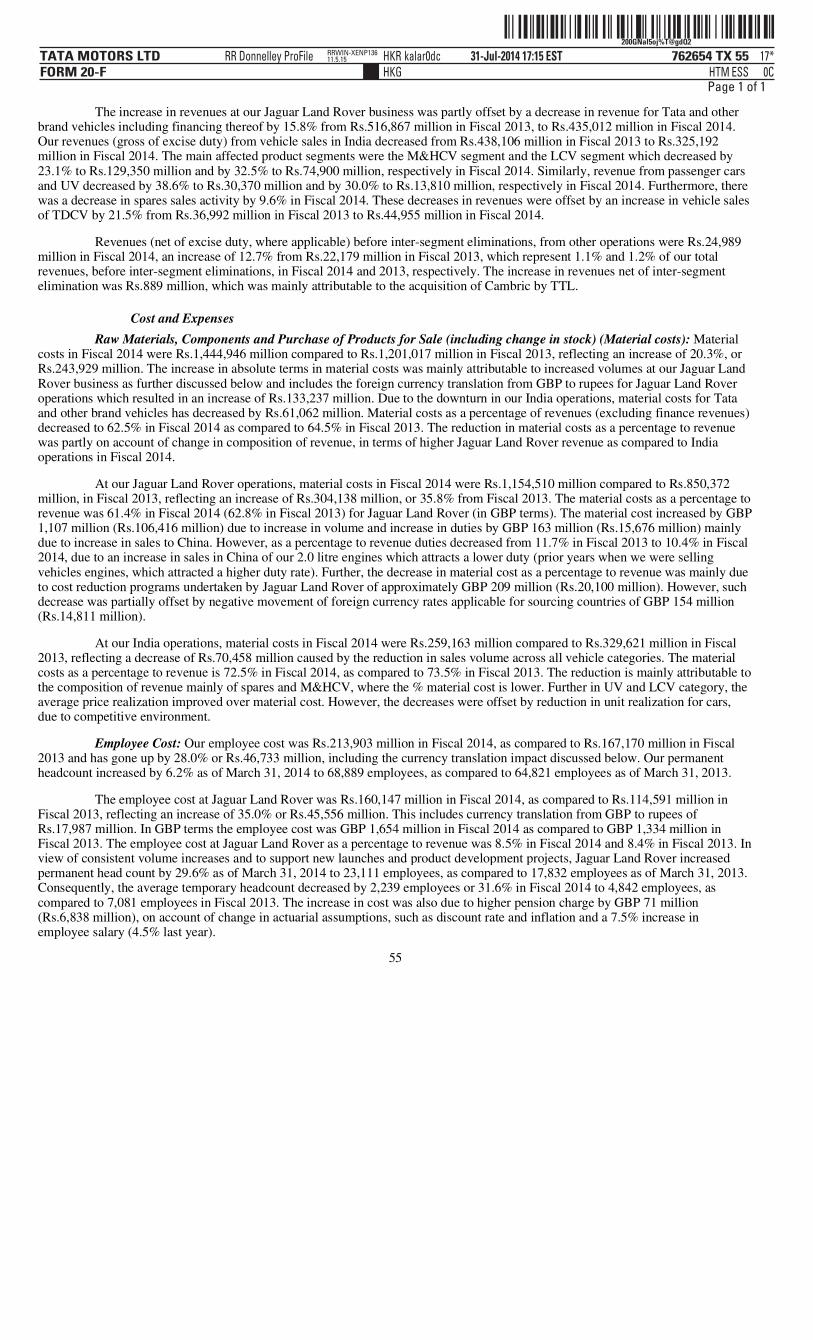
ˆ200GNal5oj%T@gdQ2Š200GNal5oj%T@gdQ2
762654 TX 55TATA MOTORS LTDFORM 20-F
31-Jul-2014 17:15 ESTHTMHKG
RR Donnelley ProFile HKR kalar0dc 17*ESS 0C
RRWIN-XENP13611.5.15
Page 1 of 1
The increase in revenues at our Jaguar Land Rover business was partly offset by a decrease in revenue for Tata and other brand vehicles including financing thereof by 15.8% from Rs.516,867 million in Fiscal 2013, to Rs.435,012 million in Fiscal 2014. Our revenues (gross of excise duty) from vehicle sales in India decreased from Rs.438,106 million in Fiscal 2013 to Rs.325,192 million in Fiscal 2014. The main affected product segments were the M&HCV segment and the LCV segment which decreased by 23.1% to Rs.129,350 million and by 32.5% to Rs.74,900 million, respectively in Fiscal 2014. Similarly, revenue from passenger cars and UV decreased by 38.6% to Rs.30,370 million and by 30.0% to Rs.13,810 million, respectively in Fiscal 2014. Furthermore, there was a decrease in spares sales activity by 9.6% in Fiscal 2014. These decreases in revenues were offset by an increase in vehicle sales of TDCV by 21.5% from Rs.36,992 million in Fiscal 2013 to Rs.44,955 million in Fiscal 2014.
Revenues (net of excise duty, where applicable) before inter-segment eliminations, from other operations were Rs.24,989 million in Fiscal 2014, an increase of 12.7% from Rs.22,179 million in Fiscal 2013, which represent 1.1% and 1.2% of our total revenues, before inter-segment eliminations, in Fiscal 2014 and 2013, respectively. The increase in revenues net of inter-segment elimination was Rs.889 million, which was mainly attributable to the acquisition of Cambric by TTL.
Cost and Expenses Raw Materials, Components and Purchase of Products for Sale (including change in stock) (Material costs): Material
costs in Fiscal 2014 were Rs.1,444,946 million compared to Rs.1,201,017 million in Fiscal 2013, reflecting an increase of 20.3%, or Rs.243,929 million. The increase in absolute terms in material costs was mainly attributable to increased volumes at our Jaguar Land Rover business as further discussed below and includes the foreign currency translation from GBP to rupees for Jaguar Land Rover operations which resulted in an increase of Rs.133,237 million. Due to the downturn in our India operations, material costs for Tata and other brand vehicles has decreased by Rs.61,062 million. Material costs as a percentage of revenues (excluding finance revenues) decreased to 62.5% in Fiscal 2014 as compared to 64.5% in Fiscal 2013. The reduction in material costs as a percentage to revenue was partly on account of change in composition of revenue, in terms of higher Jaguar Land Rover revenue as compared to India operations in Fiscal 2014.
At our Jaguar Land Rover operations, material costs in Fiscal 2014 were Rs.1,154,510 million compared to Rs.850,372 million, in Fiscal 2013, reflecting an increase of Rs.304,138 million, or 35.8% from Fiscal 2013. The material costs as a percentage to revenue was 61.4% in Fiscal 2014 (62.8% in Fiscal 2013) for Jaguar Land Rover (in GBP terms). The material cost increased by GBP 1,107 million (Rs.106,416 million) due to increase in volume and increase in duties by GBP 163 million (Rs.15,676 million) mainly due to increase in sales to China. However, as a percentage to revenue duties decreased from 11.7% in Fiscal 2013 to 10.4% in Fiscal 2014, due to an increase in sales in China of our 2.0 litre engines which attracts a lower duty (prior years when we were selling vehicles engines, which attracted a higher duty rate). Further, the decrease in material cost as a percentage to revenue was mainly due to cost reduction programs undertaken by Jaguar Land Rover of approximately GBP 209 million (Rs.20,100 million). However, such decrease was partially offset by negative movement of foreign currency rates applicable for sourcing countries of GBP 154 million (Rs.14,811 million).
At our India operations, material costs in Fiscal 2014 were Rs.259,163 million compared to Rs.329,621 million in Fiscal 2013, reflecting a decrease of Rs.70,458 million caused by the reduction in sales volume across all vehicle categories. The material costs as a percentage to revenue is 72.5% in Fiscal 2014, as compared to 73.5% in Fiscal 2013. The reduction is mainly attributable to the composition of revenue mainly of spares and M&HCV, where the % material cost is lower. Further in UV and LCV category, the average price realization improved over material cost. However, the decreases were offset by reduction in unit realization for cars, due to competitive environment.
Employee Cost: Our employee cost was Rs.213,903 million in Fiscal 2014, as compared to Rs.167,170 million in Fiscal 2013 and has gone up by 28.0% or Rs.46,733 million, including the currency translation impact discussed below. Our permanent headcount increased by 6.2% as of March 31, 2014 to 68,889 employees, as compared to 64,821 employees as of March 31, 2013.
The employee cost at Jaguar Land Rover was Rs.160,147 million in Fiscal 2014, as compared to Rs.114,591 million in Fiscal 2013, reflecting an increase of 35.0% or Rs.45,556 million. This includes currency translation from GBP to rupees of Rs.17,987 million. In GBP terms the employee cost was GBP 1,654 million in Fiscal 2014 as compared to GBP 1,334 million in Fiscal 2013. The employee cost at Jaguar Land Rover as a percentage to revenue was 8.5% in Fiscal 2014 and 8.4% in Fiscal 2013. In view of consistent volume increases and to support new launches and product development projects, Jaguar Land Rover increased permanent head count by 29.6% as of March 31, 2014 to 23,111 employees, as compared to 17,832 employees as of March 31, 2013. Consequently, the average temporary headcount decreased by 2,239 employees or 31.6% in Fiscal 2014 to 4,842 employees, as compared to 7,081 employees in Fiscal 2013. The increase in cost was also due to higher pension charge by GBP 71 million (Rs.6,838 million), on account of change in actuarial assumptions, such as discount rate and inflation and a 7.5% increase in employee salary (4.5% last year).
55

ˆ200GNal5oj%M0PVQ2Š200GNal5oj%M0PVQ2
762654 TX 56TATA MOTORS LTDFORM 20-F
31-Jul-2014 15:42 ESTHTMHKG
RR Donnelley ProFile HKR adran0dc 10*ESS 0C
ACXFBU-MWE-XN0211.5.15
Page 1 of 1
The employee cost at TDCV was Rs.5,771 million in Fiscal 2014, as compared to Rs.6,916 million in Fiscal 2013. In Fiscal 2013, TDCV recorded a provision of Rs.2,124 million, stemming from the lawsuit filed by the union employees demanding inclusion of some elements of non-ordinary salary and bonus as part of ordinary wages, which has been decided by the District Court against TDCV. TDCV has filed an appeal against the order which is still pending. On a comparable basis, the increase of Rs.979 million in Fiscal 2014 represents normal annual increments and currency translation of Rs.709 million.
For our India operations (Tata brand vehicles) the employee cost was Rs.33,672 million in Fiscal 2014, reflecting an increase of 2.5% or Rs.792 million. The permanent headcount decreased marginally by 0.5% as at March 31, 2014 to 38,434 employees, as compared to 38,627 employees as at March 31, 2013. To address the challenges posed by the business downturn, the Company has introduced an organization wide cost optimization program, and incurred Rs.535 million towards employee early separation scheme. Remaining increase mainly represented normal annual increments.
During Fiscal 2014, we have closed the manufacturing operations at Tata Hispano Motors Carrocera S.A. and accordingly paid EURO 12.4 million (Rs.1,006 million) as employee separation cost. The closure has been trigerred by continuous under performance mainly attributable to challenging market conditions in which Hispano operates.
Other Expenses: Other expenses increased by 29.7% to Rs.498,778 million in Fiscal 2014 from Rs.384,423 million in Fiscal 2013. This increase mainly reflects an effect of volumes at Jaguar Land Rover and currency translation of GBP to rupees of Rs.43,558 million pertaining to Jaguar Land Rover. As a percentage of total revenues, these expenses represented 21.3% in Fiscal 2014, as compared to 20.3% in Fiscal 2013. The major components of expenses are as follows:
Further, based on our assessment of non-recoverability of overdues in trade and other receivables, we have recorded a provision of Rs.2,691 million in Fiscal 2014, an increase of Rs.1,549 million.
56
Year ended March 31, Increase/ (Decrease) 2014 2013
(Rs. in millions)
Freight and transportation expenses 75,439 55,930 19,509 Works operation and other Expenses 186,067 143,924 42,143 Publicity 81,425 66,556 14,869 Allowance for trade and other receivables, and finance receivables 26,830 10,570 16,260 Warranty and product liability expenses 57,957 42,029 15,928
i) The increase in freight and transportation expenses corresponds to an increase in volumes at our Jaguar Land Rover operations, predominantly on account of increased China sales.
ii) Our works operation and other expenses represented 7.9% and 7.6% of total revenue in Fiscal 2014 and 2013, respectively. These mainly relate to volume related expenses at Jaguar Land Rover.
iii) Publicity expenses were 3.5% of our revenues in Fiscal 2014 (same as Fiscal 2013). In addition to routine product and brand campaigns, we incurred expenses relating to new product introduction campaigns, namely new Range Rover, new Range Rover Sport, Range Rover Evoque, Jaguar F-TYPE and smaller powertrain derivative XF and XJ and XF Sportbrake and the Prima LX series of trucks, Vista tech and Sumo Gold in India.
iv) The allowances for trade and other receivables, and finance receivables mainly relates to India operations. The increase mainly relates to provision for impairment of vehicle loans. Consistent deterioration in the economic environment in India severely affected fleet owners and transporters. Due to overcapacity and slowing industrial activity, freight rates stagnated. As a result, the increased diesel prices and other cost could not be fully recovered by the transporters. Both large and small fleet operators suffered due to lack of cargos, reduced trips and waiting periods. The situation was further accentuated on account of delays in payments by customers, which affected the cash flow and economics of small fleet operators who generally avail financing. Consequently, the rate of defaults increased during the year. The number of vehicles repossessed have also increased leading to pressure on downward realization of resale of these vehicles. As per the policy followed by us of recognizing allowances for finance receivables upon event of default, we have made provision of Rs.24,139 million in Fiscal 2014.
v) Warranty and product liability expenses represented 2.5% and 2.2% of our revenues in Fiscal 2014 and Fiscal 2013, respectively. The warranty expenses at Jaguar Land Rover represented 2.84% of the revenue as compared to 2.80% last year, whereas for Tata Motors Indian operations these represent 0.99% of revenue as compared to 0.78% last year. The increase cost for Tata Motors Indian operations represented increase in warranty period from two years to four years for certain M&HCV models, resulting in an increase in warranty accrual from Rs.116 million in Fiscal 2013 to Rs.438 million in Fiscal 2014. Please refer to Item 5.A “Critical Accounting Policies” of this annual report for further details.

ˆ200GNal5oj%LsgaQ9Š200GNal5oj%LsgaQ9
762654 TX 57TATA MOTORS LTDFORM 20-F
31-Jul-2014 15:36 ESTHTMHKG
RR Donnelley ProFile HKR adran0dc 10*ESS 0C
ACXFBU-MWE-XN0211.5.15
Page 1 of 1
Expenditure capitalized: These represent employee costs, stores and other manufacturing supplies and other works expenses incurred towards product development projects and also include costs attributable to internally constructed capital items. Considering the nature of our industry, we have to continually invest in the development of new products and also address safety, emission and other regulatory norms. The increase reflects expenditure on new products and other major product development plans, including for example, with respect to the new Range Rover, the Range Rover Sport, Jaguar F-Type future LCVs, World Truck and passenger car models. The expenditure capitalized in Fiscal 2014 was Rs.135,247 million as compared to Rs.101,935 million in Fiscal 2013. The increase inclues currency translation impact from GBP to rupees of Rs.13,374 million pertaining to Jaguar Land Rover.
Depreciation and Amortization: Our depreciation and amortization expenses increased by Rs.34,695 million or 45.8%, the breakdown of which is as follows:
The increase on account of currency translation from GBP to rupees is Rs.9,864 million pertaining to Jaguar Land Rover. The increase in depreciation expenses was on account of asset addition in Fiscal 2014 and plant and equipment and toolings (mainly towards capacity and new products) and the full effect of asset additions in the previous year. The amortization expense mainly relate to product development cost capitalized and new products introduced during Fiscal 2013 and Fiscal 2014, primarily, the new Range Rover, the new Range Rover Sport, Evoque and Jaguar F-TYPE and represented 2.5% and 1.9% of revenue for the Fiscal 2014 and Fiscal 2013, respectively.
Other income (net): There was a net gain of Rs.7,733 million in Fiscal 2014, as compared to Rs.12,099 million in Fiscal 2013, representing a decrease of 36.1% or Rs.4,366 million.
For further details refer Note 30 to our consolidated financial statements included elsewhere in this annual report.
Interest expense (net): Our interest expense (net of interest capitalized) increased by 30.2% to Rs.53,095 million in Fiscal 2014, compared to Rs.40,792 million in Fiscal 2013. As a percentage of total revenues, interest expense represented 2.3% in Fiscal 2014 compared to 2.2% in Fiscal 2013. The interest expense (net) for Jaguar Land Rover was GBP 138 million (Rs. 13,272 million) in Fiscal 2014 as compared to GBP 65 million (Rs.5,608 million) in Fiscal 2013. The increase of Rs.12,303 million was due to prepayment of Senior Notes of GBP 53 million (Rs.5,097 million). This also includes a currency translation of Rs.2,317 million from GBP to rupees.
Foreign exchange (gain)/loss (net): We was a net foreign exchange gain of Rs.19,104 million in Fiscal 2014, compared to loss of Rs.15,775 million in Fiscal 2013. This was primarily attributable to Jaguar Land Rover
Impairment in respect of equity accounted investees: In Fiscal 2014, we recognized an impairment loss of Rs.8,034 million in respect of its investment in an associate. The associate is engaged in the business of manufacture and sale of construction equipment. The operation has been severely affected due to the current economic slowdown and increased competition from new entrants. The recoverable amount is determined based on value in use.
57
Fiscal 2014 Fiscal 2013
Depreciation 52,426 39,651 Amortization 58,037 36,117 Total 110,463 75,768
i. In Fiscal 2013, we recorded a gain of Rs.3,933 million on account of the fair value of prepayment option to the
holders of Senior Notes. During the Fiscal 2014, the Company refunded these notes before maturity and consequently recognized a loss of Rs.4,792 million towards reversal of previously recognized gain.
ii. As compared to gain of Rs.802 million in Fiscal 2013, there was a loss on fair value of conversion option relating to
convertible foreign currency notes of Rs.838 million in Fiscal 2014. The notes have been fully converted in Fiscal 2014.
iii. In Fiscal 2014, there was a gain on a sale of available for sale investments of Rs.1,102 million as compared to loss
of Rs.275 million in Fiscal 2013.
i. Jaguar Land Rover recorded an exchange gain of Rs.25,244 million in Fiscal 2014 as compared to loss of Rs.12,680 million in Fiscal 2013. There was a gain of Rs.10,771 million on cash flow hedges in Fiscal 2014 as compared to a loss of Rs.5,047 million in Fiscal 2013. We incurred a net exchange gain on Senior Notes of Rs.8,367 million in Fiscal 2014, as compared to Rs.3,405 million in Fiscal 2013. The gain was mainly due to depreciation of USD as compared to GBP.
ii. For India operations, due to depreciation of the Indian rupee against all major currencies, we incurred exchange
losses. There was a net exchange loss of Rs.4,841 million in Fiscal 2014 as compared to Rs.5,467 million in Fiscal 2013, attributable to foreign currency denominated borrowings.

ˆ200GNal5oj%Mqr&w~Š 200GNal5oj%Mqr&w~
762654 TX 58TATA MOTORS LTDFORM 20-F
31-Jul-2014 16:21 ESTHTMHKG
RR Donnelley ProFile HKR balan2dc 11*ESS 0C
LANFBU-MWE-XN1711.5.15
Page 1 of 1
Income Taxes: Our income tax expense was Rs.48,227 million in Fiscal 2014 as compared to Rs.39,239 million in Fiscal 2013, representing 26.9% as compared to 30.5% of net income before tax, respectively. The reasons for major reconciliation items are given below:
For further details refer to Note 17 to our consolidated financial statements included elsewhere in this annual report.
Share of profit of equity accounted investees and Non-controlling Interests in Consolidated Subsidiaries, net of tax: In Fiscal 2014, our share of profit of equity accounted investees reflected a loss of Rs.1,878 million, as compared Rs.132 million in Fiscal 2013.
In Fiscal 2014, our share of non-controlling interest reflected a gain of Rs.462 million, as compared to Rs.886 million in Fiscal 2013, primarily due to reduced profitability of one of our subsidiary.
Net Income Our consolidated net income in Fiscal 2014 excluding share of non-controlling interests increased by 47.4% to Rs.130,717
million from Rs.88,671 million in Fiscal 2013. Net income as a percentage of total revenues also increased to 5.6% in Fiscal 2014 from 4.7% in Fiscal 2013. This increase was mainly the result of the following factors:
Which was offset by
58
i. Considering the statutory tax rates applicable for each company in the group, the effective tax rate has decreased from 23.7% in Fiscal 2013 to 19.9% in Fiscal 2014. The net increase in tax expense by Rs.5,280 million is represented by a gross increase in tax expense of Rs.11,970 million due to increase in income offset by decrease in statutory tax rate of Rs.6,690 million.
ii. We recognized net credit of Rs.5,300 million representing reduction in statutory tax rates applicable to a subsidiary
in the UK. We had recognized a net debit of Rs.1,548 million during Fiscal 2013 due to changes in tax rates in our Indian operations.
iii. We recognized net credit of Rs.3,257 million in respect of utilization /credit of unrecognized tax losses, unabsorbed
depreciation and other tax benefits as compared to Rs.518 million in Fiscal 2013.
iv. Income tax expenses on undistributed earnings of subsidiaries has increased by Rs.7,383 million mainly due to
dividends paid in Fiscal 2015 out of profits of Fiscal 2014 declared by Jaguar Land Rover and increase in profits in our overseas subsidiary companies.
v. The relevant Indian tax regulations mandate the companies to pay tax on book profits, known as Minimum Alternate Tax or MAT. MAT may be carried forward and set-off against future income tax liabilities computed under normal tax provisions within a period of ten years. We had recognized deferred tax assets representing MAT paid in prior years for Tata Motors Limited on standalone basis. In the course of assessment of recoverability of MAT paid, we have written off previously recognized tax credit of Rs.7,318 million in view of future taxable profit, considering continued economic slowdown in India.
vi. The tax on share of profit / loss of equity accounting investees was Rs.537 million in Fiscal 2014 as compared to a
credit of Rs.34 million in Fiscal 2013.
• The operations of an associate engaged in the business of industrial equipment continued to be impacted by adverse
economic conditions and competitive pressure. Our share of loss for the Fiscal 2014 was Rs.1,354 million as compared to Rs.703 million in Fiscal 2013.
• Fiscal 2013 includes a gain of Rs.1,101 million, representing our share of profit in one of the equity accounted
investees, which recorded gain on divestment of certain joint venture investments.
• Jaguar Land Rover performance in terms of volume and profitability contributed significantly. The earnings before other income, interest and tax for Jaguar Land Rover was Rs.228,026 million in Fiscal 2014 as compared to Rs.150,653 million in Fiscal 2013; amounting to 12.0% of sales as compared to 11.0% for Fiscal 2013. The net income also include an element of currency translation of Rs.22,566 million from GBP to rupees.
• Revenues from the domestic market (India), which were significantly affected by volume contractions, decreased by 19.6% to Rs.364,591 million in Fiscal 2014 from Rs.453,276 million in Fiscal 2013. This resulted in negative earnings before other income, interest and tax of Rs.20,631 million in Fiscal 2014 for Tata and other brand vehicles including financing thereof, as compared to positive earning of Rs.13,554 million in Fiscal 2013.

ˆ200GNal5oj$=iv1Q2Š200GNal5oj$=iv1Q2
762654 TX 59TATA MOTORS LTDFORM 20-F
31-Jul-2014 04:25 ESTHTMHKG
RR Donnelley ProFile HKR peetp0dc 10*ESS 0C
WCRFBU-MWE-XN0511.5.15
Page 1 of 1
Fiscal 2013 Compared to Fiscal 2012 Revenues
Our total consolidated revenues (net of excise duty, where applicable) including finance revenues were Rs.1,892,910 million in Fiscal 2013, an increase of Rs.231,396 million or 13.9%, from Rs.1,661,514 million in Fiscal 2012.
The increase in revenues was primarily driven by our Jaguar Land Rover where revenues increased by 30.7%, from Rs.1,044,533 million in Fiscal 2012 to Rs.1,365,620 million in Fiscal 2013. The increase in revenues was primarily a result of volume increases across products and markets. The revenues also reflect an increase on account of currency translation from GBP to rupees of Rs.140,655 million. Rs.150,630 million, or 14.4% of the aggregate increase in revenues of Rs.180,432 million (excluding translation impact) was mainly attributable to an increase in sales of the Range Rover Evoque from 59,948 units in Fiscal 2012 to 115,529 units in Fiscal 2013.
The increase in revenues at our Jaguar Land Rover was partly offset by a decrease in revenue for Tata and other brand vehicles including financing thereof by 14.9% from Rs.607,709 million in Fiscal 2012, to Rs.516,867 million in Fiscal 2013. The decrease was mainly due to lower growth in some markets and competition. In particular, the decrease in revenues resulted from a significant reduction in the vehicle sales volumes in several vehicle categories, including M&HCV in India, which decreased from Rs.246,079 million to Rs.168,363 million and passenger cars, which decreased by 37.8% from Rs.81,330 million to Rs.50,551 million.
The above decrease in revenues was offset by:
Revenues (net of excise duty, where applicable) before inter-segment eliminations, from other operations were Rs.22,179 million in Fiscal 2013, an increase of 17.3% from Rs.18,905 million in Fiscal 2012. The increase in revenues from other operations was mainly attributable to traction in the automotive and aerospace markets. Revenues from other operations represented 1.2% and 1.1% of our total revenues, before inter-segment eliminations, in Fiscal 2013 and 2012, respectively.
Cost and Expenses Raw Materials, components and Purchase of Products for Sale (including change in stock) (Material costs): Material
costs in Fiscal 2013 were Rs.1,201,017 million compared to Rs.1,089,791 million in Fiscal 2012, reflecting an increase of 10.2%, or Rs.111,226 million, from Fiscal 2012. The increase in material costs was mainly attributable to an increase volumes at our Jaguar Land Rover as further discussed below. The increase was also partially attributable to the effect of currency translation from GBP to Indian rupees, which resulted in an increase of Rs.88,851 million. This was partly offset by decrease at our India operations, due to reduction in volumes. Material costs as a percentage of revenues (excluding finance revenues) decreased to 64.5% in Fiscal 2013 as compared to 66.6% in Fiscal 2012.
At our Jaguar Land Rover operations, material costs in Fiscal 2013 were Rs.850,372 million compared to Rs.671,043 million in Fiscal 2012, reflecting an increase of Rs.179,329 million from Fiscal 2012 (net of translation increase of Rs.90,478 million). The material cost as a percentage of revenues decreased to 62.8% in Fiscal 2013, as compared to 64.6% in Fiscal 2012. The material cost increased by GBP 896 million (Rs.77,081 million) due to increase in volume and increase in duties by GBP 213 million (Rs.18,314 million) mainly due to increase in sales to China. As a percentage to revenue duties decreased from 12.1% in Fiscal 2012 to 11.7% in Fiscal 2013. Further, the decrease in material cost as a percentage to revenue was mainly due to cost reduction programs undertaken by Jaguar land Rover of approximately GBP 117 million (Rs.10,060 million) and positive movement of foreign currency rates applicable for sourcing countries of GBP 185 million (Rs.15,907 million).
59
• A decrease in other income, mainly due to the loss on the fair value of prepayment option and loss on conversion
option; and • Impairment loss of Rs.8,034 million in respect of investment in an associate.
• an increase in finance revenue by 23.3% from Fiscal 2012, which resulted from increased volume of financing. • an increase in spares sales activity by 10.2% from Fiscal 2012.
• an increase in vehicle sales in LCV category, in India by 17.6% from Rs.95,805 million in Fiscal 2012 to
Rs.112,631 million in Fiscal 2013, which was largely supported by demand for small commercial vehicles driven by certain niche segments and our market penetration.
• an increase in vehicle sales of TDCV by 24.1% from Rs.29,808 million in Fiscal 2012 to Rs.36,992 million in Fiscal 2013, primarily as a result of improvement in some of the Company’s traditional export markets like Algeria, Russia, Laos, South Africa, and Vietnam. TDCV has also commenced introducing its products in some new markets like Indonesia, Ecuador, and Ghana with a view to diversify its market.
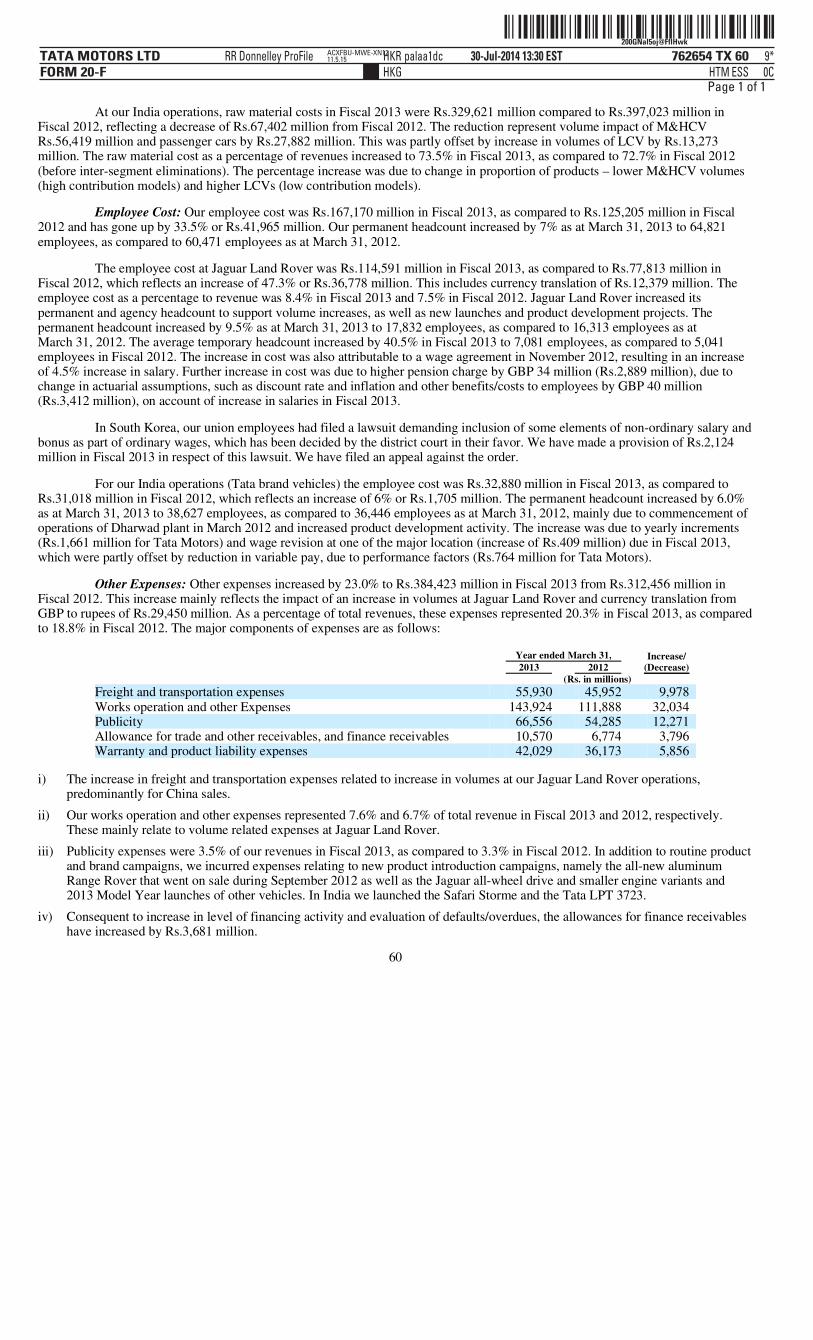
ˆ200GNal5oj@FflHwkŠ200GNal5oj@FflHwk
762654 TX 60TATA MOTORS LTDFORM 20-F
30-Jul-2014 13:30 ESTHTMHKG
RR Donnelley ProFile HKR palaa1dc 9*ESS 0C
ACXFBU-MWE-XN1211.5.15
Page 1 of 1
At our India operations, raw material costs in Fiscal 2013 were Rs.329,621 million compared to Rs.397,023 million in Fiscal 2012, reflecting a decrease of Rs.67,402 million from Fiscal 2012. The reduction represent volume impact of M&HCV Rs.56,419 million and passenger cars by Rs.27,882 million. This was partly offset by increase in volumes of LCV by Rs.13,273 million. The raw material cost as a percentage of revenues increased to 73.5% in Fiscal 2013, as compared to 72.7% in Fiscal 2012 (before inter-segment eliminations). The percentage increase was due to change in proportion of products – lower M&HCV volumes (high contribution models) and higher LCVs (low contribution models).
Employee Cost: Our employee cost was Rs.167,170 million in Fiscal 2013, as compared to Rs.125,205 million in Fiscal 2012 and has gone up by 33.5% or Rs.41,965 million. Our permanent headcount increased by 7% as at March 31, 2013 to 64,821 employees, as compared to 60,471 employees as at March 31, 2012.
The employee cost at Jaguar Land Rover was Rs.114,591 million in Fiscal 2013, as compared to Rs.77,813 million in Fiscal 2012, which reflects an increase of 47.3% or Rs.36,778 million. This includes currency translation of Rs.12,379 million. The employee cost as a percentage to revenue was 8.4% in Fiscal 2013 and 7.5% in Fiscal 2012. Jaguar Land Rover increased its permanent and agency headcount to support volume increases, as well as new launches and product development projects. The permanent headcount increased by 9.5% as at March 31, 2013 to 17,832 employees, as compared to 16,313 employees as at March 31, 2012. The average temporary headcount increased by 40.5% in Fiscal 2013 to 7,081 employees, as compared to 5,041 employees in Fiscal 2012. The increase in cost was also attributable to a wage agreement in November 2012, resulting in an increase of 4.5% increase in salary. Further increase in cost was due to higher pension charge by GBP 34 million (Rs.2,889 million), due to change in actuarial assumptions, such as discount rate and inflation and other benefits/costs to employees by GBP 40 million (Rs.3,412 million), on account of increase in salaries in Fiscal 2013.
In South Korea, our union employees had filed a lawsuit demanding inclusion of some elements of non-ordinary salary and bonus as part of ordinary wages, which has been decided by the district court in their favor. We have made a provision of Rs.2,124 million in Fiscal 2013 in respect of this lawsuit. We have filed an appeal against the order.
For our India operations (Tata brand vehicles) the employee cost was Rs.32,880 million in Fiscal 2013, as compared to Rs.31,018 million in Fiscal 2012, which reflects an increase of 6% or Rs.1,705 million. The permanent headcount increased by 6.0% as at March 31, 2013 to 38,627 employees, as compared to 36,446 employees as at March 31, 2012, mainly due to commencement of operations of Dharwad plant in March 2012 and increased product development activity. The increase was due to yearly increments (Rs.1,661 million for Tata Motors) and wage revision at one of the major location (increase of Rs.409 million) due in Fiscal 2013, which were partly offset by reduction in variable pay, due to performance factors (Rs.764 million for Tata Motors).
Other Expenses: Other expenses increased by 23.0% to Rs.384,423 million in Fiscal 2013 from Rs.312,456 million in Fiscal 2012. This increase mainly reflects the impact of an increase in volumes at Jaguar Land Rover and currency translation from GBP to rupees of Rs.29,450 million. As a percentage of total revenues, these expenses represented 20.3% in Fiscal 2013, as compared to 18.8% in Fiscal 2012. The major components of expenses are as follows:
60
Year ended March 31, Increase/ (Decrease) 2013 2012
(Rs. in millions) Freight and transportation expenses 55,930 45,952 9,978 Works operation and other Expenses 143,924 111,888 32,034 Publicity 66,556 54,285 12,271 Allowance for trade and other receivables, and finance receivables 10,570 6,774 3,796 Warranty and product liability expenses 42,029 36,173 5,856
i) The increase in freight and transportation expenses related to increase in volumes at our Jaguar Land Rover operations, predominantly for China sales.
ii) Our works operation and other expenses represented 7.6% and 6.7% of total revenue in Fiscal 2013 and 2012, respectively. These mainly relate to volume related expenses at Jaguar Land Rover.
iii) Publicity expenses were 3.5% of our revenues in Fiscal 2013, as compared to 3.3% in Fiscal 2012. In addition to routine product and brand campaigns, we incurred expenses relating to new product introduction campaigns, namely the all-new aluminum Range Rover that went on sale during September 2012 as well as the Jaguar all-wheel drive and smaller engine variants and 2013 Model Year launches of other vehicles. In India we launched the Safari Storme and the Tata LPT 3723.
iv) Consequent to increase in level of financing activity and evaluation of defaults/overdues, the allowances for finance receivables have increased by Rs.3,681 million.

ˆ200GNal5oj@FVGuw8Š200GNal5oj@FVGuw8
762654 TX 61TATA MOTORS LTDFORM 20-F
30-Jul-2014 13:28 ESTHTMHKG
RR Donnelley ProFile HKR ramam2dc 5*ESS 0C
NERFBU-MWE-XN0111.5.15
Page 1 of 1
Expenditure capitalized: These represent employee costs, stores and other manufacturing supplies and other works expenses incurred towards product development projects and also include costs attributable to internally constructed capital items. Considering the nature of our industry, we have to continually invest in the development of new products and also address safety, emission and other regulatory norms. The increase reflects expenditure on new products and other major product development plans, including for example, with respect to the new Range Rover, the Range Rover Sport, future LCVs, World Truck and passenger car models.
Depreciation and Amortization: Our depreciation and amortization expenses increased by Rs.19,344 million to Rs.75,768 million in Fiscal 2013, compared to Rs.56,424 million in Fiscal 2012. The increase on account of currency translation is Rs.5,401 million. The increase in depreciation expenses from Rs.33,288 million in Fiscal 2012 to Rs.39,651 million in Fiscal 2013, is on account of asset addition in Fiscal 2013 and plant and equipment (mainly towards capacity and new products) installed in Fiscal 2012 (production facility for Evoque at Halewood and plant at Dharwad), the full effect of which is reflected in the current year. The increase in amortization of product development cost from Rs.23,136 million in Fiscal 2012 to Rs.36,117 million in Fiscal 2013, reflects amortization cost of products capitalized and introduced during Fiscal 2012 and Fiscal 2013, primarily, the Range Rover Evoque and Safari Storme.
Other income (net): There was a net gain of Rs.12,099 million in Fiscal 2013, as compared to Rs.10,039 million in Fiscal 2012 an increase of Rs.2,060 million.
For further details refer Note 30 to our consolidated financial statements included elsewhere in this annual report.
Interest expense (net): Our interest expense (net of interest capitalized) increased by 4.7% to Rs.40,792 million in Fiscal 2013, compared to Rs.38,958 million in Fiscal 2012. As a percentage of total revenues, interest expense represented 2.2% in Fiscal 2013 compared to 2.3% in Fiscal 2012. The gross interest expense increased by 15.1% to Rs.54,152 million in Fiscal 2013, compared to Rs.47,045 million in Fiscal 2012. Consequent to increase in financing activity and the rate change, interest expense increased by Rs.3,765 million.
Foreign exchange (gain)/loss (net): We had a net foreign exchange loss of Rs.15,775 million in Fiscal 2013, compared to Rs.11,512 million in Fiscal 2012. This was primarily due to the following factors:
Income Taxes: Our income tax expense was Rs.39,239 million in Fiscal 2013, compared to Rs.4,437 million in Fiscal 2012. The main reason are
61
v) Warranty and product liability expenses represented 2.2% of our revenues both in Fiscal 2013 and Fiscal 2012. Please refer Item 5.A “Critical Accounting Policies” of this annual report for further details.
i. There was a gain of Rs.3,933 million on fair value of prepayment option on Senior Notes.
ii. As compared to Fiscal 2012 there was reduction in gain on fair value of conversion option relating to convertible
foreign currency notes by Rs.1,631 million in Fiscal 2013.
i. Jaguar Land Rover incurred an exchange loss of Rs.12,680 million in Fiscal 2013 as compared to Rs.759 million in Fiscal 2012. There was a loss of Rs.5,047 million on cash flow hedges in Fiscal 2013 as compared to a gain of Rs.1,615 million in Fiscal 2012. We incurred a net exchange loss on Senior Notes of Rs.3,405 million in Fiscal 2013, as compared to Rs.924 million in Fiscal 2012.
ii. For India operations, due to depreciation of the Indian rupee against all major currencies, we incurred exchange losses on foreign currency payments and borrowings. There was a net exchange loss of Rs.5,467 million in Fiscal 2013 as compared to Rs.9,672 million in Fiscal 2012. The reduction of Rs.4,205 million, attributable to repayment of foreign currency denominated borrowings (Zero Coupon Convertible Alternative Reference Securities and Foreign Currency Convertible Notes).
i. In Fiscal 2012, we recognized all previously unrecognized unused tax losses and other temporary differences
pertaining to Jaguar Land Rover operations resulting in tax credit of Rs.29,528 million.
ii. During Fiscal 2013, we recognized Rs.4,133 million tax expense on distribution of dividend from an overseas
subsidiary and there was increase of Rs.1,113 million in tax provision on undistributed earnings of subsidiaries / associates (due to increase in subsidiary companies profits of Jaguar Land Rover, mainly China).
iii. There was an increase of Rs.1,538 million towards additional tax liability on the rate change and Rs.2,498 million
due to the increase in income.

ˆ200GNal5oj@FMRRwSŠ200GNal5oj@FMRRwS
762654 TX 62TATA MOTORS LTDFORM 20-F
30-Jul-2014 13:26 ESTHTMHKG
RR Donnelley ProFile HKR ramam2dc 6*ESS 0C
NERFBU-MWE-XN0111.5.15
Page 1 of 1
For further details refer to Note 17 to our consolidated financial statements included elsewhere in this annual report.
Share of profit of equity accounted investees and Non-controlling Interests in Consolidated Subsidiaries, net of tax: In Fiscal 2013, our share of profit of equity accounted investees reflected a loss of Rs.132 million, as compared to Rs.587 million in Fiscal 2012. In Fiscal 2013,
In Fiscal 2013, our share of non-controlling interest reflected a gain of Rs.886 million, as compared to Rs.781 million in Fiscal 2012, primarily due to increased profitability of our subsidiaries, mainly Tata Technologies Ltd.
Net Income Our consolidated net income in Fiscal 2013 excluding share of non-controlling interests decreased by 22.2% to Rs.88,671
million from Rs.114,036 million in Fiscal 2012. Net income as a percentage of total revenues also decreased to 4.7% in Fiscal 2013 from 6.9% in Fiscal 2012. This decrease was the result of the following factors:
Which was offset by
Recent Accounting Pronouncements Please refer to Note 2 (v) to our consolidated financial statements included elsewhere in this annual report for adopted and
yet to be adopted accounting pronouncements as of March 31, 2014.
Critical Accounting Policies The preparation of financial statements in conformity with IFRS requires management to make judgments, estimates and
assumptions that affect the application of accounting policies and the reported amounts of assets, liabilities, income, expenses and disclosures of contingent assets and liabilities at the date of these financial statements and the reported amounts of revenues and expenses for the years presented. The actual results may differ from these estimates.
Estimates and underlying assumptions are reviewed on an ongoing basis and at each balance sheet date. Revisions to accounting estimates are recognized in the period in which the estimate is revised and future periods affected.
In particular, information about significant areas of estimation uncertainty and critical judgments in applying accounting policies that have the most significant effect on the amounts recognized in the financial statements are included in the following notes:
Impairment of Goodwill Cash generating units to which goodwill is allocated are tested for impairment annually at each balance sheet date, or more
frequently when there is an indication that the unit may be impaired. If the recoverable amount of the cash generating unit is less than the carrying amount of the unit, the impairment loss is allocated first to reduce the carrying amount of any goodwill allocated to that unit and then to the other assets of the unit pro rata on the basis of carrying amount of each asset in the unit. Goodwill impairment loss recognized is not reversed in subsequent period. Please refer to Note 14 to our consolidated financial statements included elsewhere in this annual report for assumptions used for goodwill impairment.
62
• our share of profits increased by Rs.1,101 million in one of equity accounted investees, which recorded gain on
divestment of certain joint ventures investment. • loss of Rs.816 million in the joint venture with Chery Automobiles (mainly start-up cost).
• Revenues from the domestic market (India) decreased by 17.5% to Rs.453,276 million in Fiscal 2013 from Rs.549,174 million in Fiscal 2012, resulting in earnings before other income, interest and tax of Rs.13,554 million in Fiscal 2013 for Tata and other brand vehicles including financing thereof, as compared to Rs.42,228 million in Fiscal 2012; and
• foreign exchange loss. • higher income tax expense.
• Revenues from market outside India increased by 29.4% to Rs.1,439,634 million in Fiscal 2013 from Rs.1,112,340 million in Fiscal 2012, mainly attributable to our Jaguar Land Rover. The earnings before other income, interest and tax for Jaguar Land Rover was Rs.150,653 million in Fiscal 2013 as compared to Rs.116,759 million in Fiscal 2012; and
• increase in other income, mainly due to gain on the fair value of prepayment option.

ˆ200GNal5ojqoFMkQfŠ200GNal5ojqoFMkQf
762654 TX 63TATA MOTORS LTDFORM 20-F
26-Jul-2014 09:10 ESTHTMHKG
RR Donnelley ProFile HKR balan2dc 2*ESS 0C
RRWIN-XENP14011.5.14
Page 1 of 1
Impairment of property, plant and equipment and intangible assets At each balance sheet date, the Company assesses whether there is any indication that any property, plant and equipment
and intangible assets with finite lives may be impaired. If any such impairment exists the recoverable amount of an asset is estimated to determine the extent of impairment, if any. Where it is not possible to estimate the recoverable amount of an individual asset, the Company estimates the recoverable amount of the cash-generating unit to which the asset belongs.
Intangible assets with indefinite useful lives and intangible assets not yet available for use are tested for impairment annually at each balance sheet date, or earlier, if there is an indication that the asset may be impaired.
Recoverable amount is the higher of fair value less costs to sell and value in use. In assessing value in use, the estimated future cash flows are discounted to their present value using a pre-tax discount rate that reflects current market assessments of the time value of money and the risks specific to the asset for which the estimates of future cash flows have not been adjusted.
If the recoverable amount of an asset (or cash-generating unit) is estimated to be less than its carrying amount, the carrying amount of the asset (or cash-generating unit) is reduced to its recoverable amount. An impairment loss is recognized immediately in the income statement.
Impairment of equity accounted investees In Fiscal 2014 and Fiscal 2012, the Company had recognized an impairment loss of Rs.8,034 million and Rs.4,981 million
respectively, in respect of its investment in an associate on account of economic slowdown and increased competition from new entrants. The associate is engaged in the business of manufacture and sale of construction equipment. The recoverable amount of the investment is determined based on value in use.
Product Warranty Vehicle warranties are provided for a specified period of time. Our vehicle warranty obligations vary depending upon the
type of the product, geographical location of its sale and other factors.
The estimated liability for vehicle warranties is recorded when products are sold. These estimates are established using historical information on the nature, frequency, and average cost of warranty claims and our estimates regarding possible future incidence based on actions on product failures.
Changes in warranty liability as a result of changes in estimated future warranty costs and any additional costs in excess of estimated costs, can materially affect our net income. Determination of warranty liability is based on the estimated frequency and amount of future claims, which are inherently uncertain. Our policy is to continuously monitor warranty liabilities to determine the adequacy of our estimate of such liabilities. Actual claims incurred in the future may differ from our original estimates, which may materially affect warranty expense.
Employee Benefits Employee benefit costs and obligations are dependent on assumptions used in calculating such amounts. These
assumptions include salary increase, discount rates, health care cost trend rates, benefits earned, interest cost, expected return on plan assets, mortality rates and other factors.
While we believe that the assumptions used are appropriate, differences in actual experience or changes in assumptions may affect our employee benefit costs and obligations.
Recoverability/recognition of deferred tax assets Deferred tax assets and liabilities are recognized for the future tax consequences of temporary differences between the
carrying values of assets and liabilities and their respective tax bases, and unutilized business loss and depreciation carry-forwards and tax credits. Such deferred tax assets and liabilities are computed separately for each taxable entity and for each taxable jurisdiction. Deferred tax assets are recognized to the extent that it is probable that future taxable income will be available against which the deductible temporary differences, unused tax losses, depreciation carry-forwards and unused tax credits could be utilized.
Conversion options valuation Fair value of conversion option in foreign currency convertible notes/convertible alternative reference securities is
determined using various option valuation models such as Black Scholes Merton model, Cox Ross Rubinstein Model and Monte Carlo Simulation. Management uses its best judgment in estimating the fair value of its financial instruments. However, there are inherent limitations in any valuation technique. Changes in fair valuation of conversion option could have material impact on the results of the Company. However, there are no direct cash flow consequences.
63

ˆ200GNal5oj%MXCiw-Š200GNal5oj%MXCiw-
762654 TX 64TATA MOTORS LTDFORM 20-F
31-Jul-2014 16:09 ESTHTMHKG
RR Donnelley ProFile HKR varsu0dc 6*ESS 0C
RRWIN-XENP14311.5.15
Page 1 of 1
Financial instruments and fair valuation of prepayment options in Senior Notes Fair valuation of prepayment options and other financial instruments requires judgment around the valuations.
Property, plant and equipment Capital work in progress, as at March 31, 2014 includes building of Rs.3,098.8 million on leased land located in the State
of West Bengal in India for the purposes of manufacturing automobiles. In June 2011, the newly elected State Government of West Bengal (referred to as the “State Government”) enacted legislation to cancel the land lease agreement.
The Company challenged the legal validity of the legislation. In June 2012, the Calcutta High Court (referred to as the “High Court”) ruled against the validity of the legislation and restored the Company’s rights under the land lease agreement. The State Government filed an appeal in the Supreme Court of India. As of the date of the authorization of the financial statements, the Supreme Court has not concluded on the State Government appeal.
The Company reasonably expects that the High Courts’ judgment, based on established law, will be upheld by the Supreme Court. Based on the management’s assessment, no adjustments to the carrying amount of buildings is considered necessary. For further details regarding the current legal proceedings with respect to the leased land please refer to Item 4.B “— Business Overview — Legal Proceedings” of this annual report.
B. Liquidity and Capital Resources. We finance our capital expenditures and research and development investments through cash generated from operations,
cash and cash equivalents, debt and equity funding. We also raise funds through sale of investments including divestment in stakes of subsidiaries on a selective basis.
Our business segments are (i) automotive operations and (ii) all other operations. We provide financing for vehicles sold by dealers in India. Our automotive operations segment is further divided into Tata and other brand vehicles (including financing thereof) and Jaguar Land Rover. Further, given the nature of our industry and competition, we are required to make significant investments in product development on an ongoing basis.
Principal Sources of Funding Liquidity Our funding requirements are met through a mixture of equity, convertible or non-convertible debt securities and other
long-term/short-term borrowings. We access funds from debt markets through commercial paper programs, convertible and non–convertible debentures, and other debt instruments. We continually monitor funding options available in the debt and equity capital markets with a view to maintaining financial flexibility.
See Note 36 to our audited consolidated financial statements included elsewhere in this annual report for additional disclosures on financial instruments related to liquidity, foreign exchange and interest rate exposures and use of derivatives for risk management purposes.
The following table sets forth our short-term and long-term debt position:
During Fiscal 2014 and 2013, the effective weighted average interest rate on our long-term debt was 8.2% and 8.9% per annum, respectively.
The following table sets forth a summary of the maturity profile for our outstanding long-term debt obligations as of March 31, 2014.
64
Fiscal 2014 Fiscal 2013 (Rs. in millions)
Total short-term debt (excluding current portion of long-term debt) 100,465 117,378 Total current portion of long-term debt 65,496 117,519 Long-term debt net of current portion 454,139 330,718
Total Debt 620,100 565,615
Payments Due by Period* Rs. in millions
Within one year 99,838 After one year and up to two years 108,082 After two year and up to five years** 250,009 After five year and up to ten years** 220,965 Total 678,894

ˆ200GNal5oj%PbmdwjŠ200GNal5oj%Pbmdwj
762654 TX 65TATA MOTORS LTDFORM 20-F
31-Jul-2014 16:42 ESTHTMHKG
RR Donnelley ProFile HKR kalar0dc 13*ESS 0C
RRWIN-XENP13611.5.15
Page 1 of 1
The following table sets forth our total liquid assets – namely cash and cash equivalents, short term deposits and investments in mutual funds:
These resources enable us to cater to business needs in the event of changes in credit market conditions. Of the above liquid assets, Jaguar Land Rover has Rs.344,228 million and Rs.233,631 million as of March 31, 2014 and as of March 31, 2013, respectively.
We expect to invest in property, plant and equipment and product development of approximately Rs.380 billion during Fiscal 2015.
We will continue to invest in new products and technologies to meet consumer and regulatory requirements. We are currently enhancing the production capacities and building a new engine facility in the United Kingdom. We are investing in new manufacturing facility through joint venture with Chery Automobile in China and assembly footprint in Brazil. These investments would enable us to pursue further growth opportunities and address competitive positioning. We expect to meet most of our investments out of operating cash flows and cash liquidity available to us. In order to meet the balance requirements, we may be require to raise funds through additional loan and by accessing capital markets from time to time, as deemed necessary.
In view of the continuing prolonged economic downturn, the operating margins for Tata Motors Limited on a standalone basis are expected to remain under pressure. With the ongoing need for investments in products and technologies, we were free cash flow negative in Fiscal 2014, and expect to be free cash flow negative in Fiscal 2015. We expect that with the improvement in macro-economic conditions and business performance, through other steps like raising funds at subsidiary levels, review of non-core investments etc, and through appropriate actions for raising additional long term resources at Tata Motors Limited on a standalone basis, the funding gap would be appropriately addressed.
The following table provides information for credit rating of Tata Motors short-term borrowing and long-term borrowing from rating agencies Credit Analysis and Research Ltd Ratings (CARE), Information and Credit Rating Agency of India Ltd (ICRA), CRISIL Ltd ( CRISIL),Standard & Poor’s Ratings Group (S&P) and Moody’s Investor Services (Moody’s). A credit rating is not a recommendation to buy, sell or hold securities. A credit rating may be subject to withdrawal or revision at any time. Each rating should be evaluated separately of any other rating:
We believe that we have sufficient liquidity available to meet our planned capital requirements. However, our sources of funding could be adversely affected by an economic slowdown, as was witnessed in Fiscal 2009, or other macroeconomic factors in India and abroad, such as in the United Kingdom, the United States, Europe and China, which are beyond our control. A decrease in the demand for our vehicles could affect our ability to obtain funds from external sources on acceptable terms or in a timely manner.
Our cash is located at various subsidiaries within the Tata Motors Group. There may also be legal, contractual or economic restrictions on the ability of subsidiaries to transfer funds to us in the form of cash dividends, loans, or advances. Brazil, Russia, South Africa and other locations have regulatory restrictions disincentives or costs on pooling or transferring of cash. However such restrictions have not had and are not estimated to have significant impact on our ability to meet our cash obligations.
Certain debt issued at Jaguar Land Rover are subject to customary covenants and events of default which include amongst other things restrictions or limitations on the amount of cash which can be transferred outside the Jaguar Land Rover Group of companies in the form of dividends, loans or investments. These are referred to as Restricted Payments in the loan documentation. In general, the amount of cash which can be transferred outside the Jaguar Land Rover group is limited to 50% of its cumulative Consolidated Net Income (as defined in the relevant documentation) from January 2011. As of March 31, 2014, the estimated amount that is available for dividend payments, other distributions and restricted payments outside the Jaguar Land Rover Group of companies is approximately GBP 1,812 million.
Long term funding In order to refinance our acquisition related borrowings and for supporting long term funding needs, we continued to raise
funds during Fiscal 2013 and Fiscal 2014. We had in the past issued convertible notes, which were convertible into equity or repayable on maturity. Details of major funding during Fiscal 2010 through Fiscal 2014 are provided below.
65
* Including interest ** Jaguar Land Rover has only Senior Notes as long-term debt obligations as of March 31, 2014 of Rs.183,400 million.
Fiscal 2014 Fiscal 2013 (Rs. in millions)
Total cash and cash equivalents 159,922 116,910 Total short term deposits 125,150 68,957 Total mutual funds investments 95,016 75,327
Total liquid assets 380,088 261,194
CARE ICRA CRISIL S&P Moody’s
Long- term borrowings AA+ AA AA BB Ba3 Short-term borrowings — A1+ A1+ — —

ˆ200GNal5ojrYfh2wWŠ200GNal5ojrYfh2wW
762654 TX 66TATA MOTORS LTDFORM 20-F
27-Jul-2014 10:53 ESTHTMHKG
RR Donnelley ProFile HKR varsu0dc 3*ESS 0C
ACXFBU-MWE-XN0711.5.14
Page 1 of 1
In May 2009, we issued secured non-convertible credit enhanced Indian rupee debentures in four tranches, having tenors up to seven years, aggregating Rs.42,000 million on a private placement basis. Proceeds were used to prepay part of the short-term bridge loan taken for the acquisition of the Jaguar Land Rover business. As on March 31, 2014 an amount of Rs.12,500 million is outstanding.
In October 2009, we issued 29,904,306 new equity shares in the form of Global Depositary Shares, or GDSs, at a price of US$12.54 per GDS, aggregating US$375 million (Rs.17,941.9 million), and 4% foreign currency convertible notes due 2014, or FCCN, aggregating US$375 million (Rs.17,941.9 million at time of issue). The holders of the FCCN had an option, subject to the terms and conditions of the issue, to convert these notes into Ordinary Shares, GDSs or ADSs. We utilized the proceeds from the GDS and FCCN to repay the outstanding bridge loan taken for the acquisition of the Jaguar Land Rover business. During Fiscal 2011, 2,576 FCCN were converted into 19,423,734 Ordinary Shares/ADSs. There was no conversion of FCCN during Fiscal 2012. During Fiscal 2013, 433 FCCN were converted into 16,519,201 Ordinary Shares/ADSs. During Fiscal 2014, 741 FCCN were converted into 28,549,566 Ordinary Shares/ADSs. As of March 31, 2014, no FCCN remained outstanding.
In March 2010, we raised funds through further divestments of investments, in the amount of Rs.21,202 million.
In October 2010, we raised funds totaling Rs.33,510 million through an issue of 32,165,000 ‘A’ Ordinary Shares at a price of Rs.764/- per share (face value of Rs.10 each) and 8,320,300 Ordinary Shares at a price of Rs.1,074/- per share (face value of Rs.10 each) to qualified institutional buyers, under a qualified institutional placement or QIP. This financing strategy enabled us to reduce risks by further de-leveraging.
In May 2011, Jaguar Land Rover issued GBP 1,000 million equivalent senior notes, or Senior Notes. The Senior Notes included GBP 500 million Senior Notes due 2018 at a coupon of 8.125% per annum, US$ 410 million Senior Notes due 2018 at a coupon of 7.75% per annum and US$ 410 million Senior Notes due 2021 at a coupon of 8.125% per annum. The 2018 Senior Notes were callable in May 2014 and hence Jaguar Land Rover successfully redeemed them in full through a tender/deposit with the agent in March 2014. The redemption was completed in March 2014. The Senior Notes are non-callable for life.
In September 2011, we raised syndicated foreign currency term loans of US$ 500 million in two tranches with tenors between four to seven years. The proceeds were used to finance general capital expenditure and investments in its overseas subsidiaries in accordance with guidelines on External Commercial Borrowings, or ECB, issued by the RBI.
In March 2012, Jaguar Land Rover issued GBP 500 million Senior Notes due 2020 at a coupon of 8.25% per annum. The proceeds have / or will be used for general corporate purposes. The notes are callable at a premium for the present value of future interest rates, if called before a specified date and thereafter are callable at fixed premiums.
During Fiscal 2013, we issued rated, listed, unsecured non-convertible debentures of Rs.21,000 million with maturities between 2 to 7 years.
In January 2013, Jaguar Land Rover issued US$ 500 million Senior Notes due 2023 at a coupon of 5.625% per annum. The proceeds have been and will be used for general corporate purposes, including, to support ongoing growth and capital spending plans. The notes are callable at a premium for the present value of future interest rates, if called before a specified date and thereafter are callable at fixed premiums.
In May 2013, TML Holdings Pte Ltd. has issued S$ 350 million, 4.25% Senior Notes due 2018. During Fiscal 2014, TML Holdings Pte Ltd further raised equivalent US$ 600 million (US$ 460 million and SG$ 176.8 million) syndicated loan facility with equivalent US$ 300 million (US$ 250 million and SG$62.8 million) maturing in November 2017 and equivalent US$ 300 million (US$ 210 million and SG$114 million) in November 2019. This fund has been utilized for the general corporate purposes of Tata Motors Limited’s Indian operations on a standalone basis.
In December 2013 and January 2014, Jaguar Land Rover issued US$ 700 million Senior Notes due 2018 at a coupon of 4.125% per annum and GBP 400 million Senior Notes due 2022 at a coupon of 5% respectively. The proceeds have been utilized to refinance the GBP 500 million Senior Notes due 2018 at a coupon of 8.125% per annum and US$ 410 million Senior Notes due 2018 at a coupon of 7.75% per annum, which were callable in May 2014.
During Fiscal 2014, the Company issued rated, listed, unsecured, non-convertible debentures of Rs.11,000 millions, the proceeds have been utilized for general corporate purposes.
Jaguar Land Rover as borrower had entered into a committed revolving credit facility for three and five years under a facility agreement in December 2011 with a syndicate of banks. In July 2013, Jaguar Land Rover amended and restated the facility to GBP 1,250 million at better pricing and terms and conditions, which has since been upsized to GBP 1,290 million. As at March 2014, the facility is fully undrawn. The facility has two tranches, a three year tranche of GBP 323 million (maturing in 2016) and a five year tranche of GBP 967 million (maturing in 2018). Jaguar Land Rover is subject to certain customary financial and other covenants under this facility.
66

ˆ200GNal5oj!LMDeQwŠ200GNal5oj!LMDeQw
762654 TX 67TATA MOTORS LTDFORM 20-F
30-Jul-2014 05:59 ESTHTMHKG
RR Donnelley ProFile HKR murub0dc 4*ESS 0C
SERFBU-MWE-XN0211.5.15
Page 1 of 1
In Fiscal 2014, TMFL continued its efforts and focus on raising non-convertible debentures (NCDs) and commercial papers (CPs) and raised Rs.59,050 million and Rs.20,900 million respectively. Bank borrowings through secured and unsecured term loans, continued to remain as the major source of funds for long term borrowing. Further, during the year, TMFL issued unsecured perpetual NCDs worth Rs.750 million towards Tier 1 Capital and unsecured long term NCDs worth Rs.1,551 million as Tier 2 capital to enhance its Capital Adequacy ratio.
We plan to refinance and raise long term funding through borrowings or equity issuances, on the basis of review of business plans, operating results and covenant requirements of our existing borrowings.
Short term funding We fund our short-term working capital requirements with cash generated from operations, overdraft facilities with banks,
short and medium term borrowings from lending institutions, banks and commercial paper. The maturities of these short and medium term borrowings and debentures are generally matched to particular cash flow requirements. We had short-term borrowings of Rs.100,465 million and Rs.117,378 million as of March 31, 2014 and 2013, respectively. We had unused short-term credit facilities of Rs.250,392 million and Rs. 204,498 million as of March 31, 2014 and 2013, respectively.
In April 2012, we received approvals from our Board to increase our working capital limits for our India operations to Rs.140,000 million from Rs.120,000 million. The working capital limits are secured by hypothecation of existing current assets of the Company including stock of raw material, stock in process, semi-finished goods, stores and spares not relating to plant and machinery (consumable stores and spares), bills receivables and book debts including vehicle finance receivable and all other moveable current assets except cash and bank balances, loans and advances of the Company both present and future. The working capital limits are renewed annually.
Loan Covenants Some of our financing agreements and debt arrangements set limits on and/or require prior lender consent for, among other
things, undertaking new projects, issuing new securities, change in management, mergers, sale of undertakings and investment in subsidiaries. In addition, certain negative covenants may limit our ability to borrow additional funds or to incur additional liens, and/or provide for increased costs in case of breach. Certain of our financing arrangements also include financial covenants to maintain certain debt-to-equity ratios, debt-to-earnings ratios, liquidity ratios, capital expenditure ratios and debt coverage ratios.
We monitor compliance with our financial covenants on an ongoing basis. We also review our refinancing strategy and continue to plan for deployment of long term funds to address any potential non-compliance.
In May 2009, we issued, on a private placement basis, an aggregate amount of Rs.42,000 million in secured non- convertible credit enhanced Indian rupee debentures in four tranches, having tenors up to seven years. Proceeds were used to prepay part of the short-term bridge loan taken for the acquisition of the Jaguar Land Rover. As of March 31 2014, principal amount of Rs.12,500 million was outstanding, which is due for repayment in Fiscal 2016.
This credit enhancement of the debentures is in the form of bank guarantee and requires compliance with certain financial covenants with reference to Tata Motors Limited on standalone basis under Indian GAAP and further provide for an increase in costs upon certain specified breaches of the covenants. In Fiscal 2013, we were in breach of two financial covenants relating to our ratio of total outstanding liability to tangible net worth and the other our debt service coverage ratio. We have requested and obtained waivers of our obligations to pay additional costs amounting to Rs.450.6 million as a consequence of such breaches.
In Fiscal 2014, we did not comply with one covenant relating to our ratio of total outstanding liability to tangible net worth, which has also been waived by the lenders and has not resulted in any default or penalties. As per the terms of the bank guarantee agreement, a breach of one covenant is not an event of default and also does not require us to pay increased costs for these guarantees. Considering the continuing weak economic and business environment in India, we expect that we will be unable to comply with this covenant in Fiscal 2015. Such non-compliance with loan covenants has not triggered any cross-default provisions under any of our financing documents. Except for the above one covenant discussed in this section, we expect to comply with most of our financial covenants during the 12-month period following the date of this annual report. We believe that the above non-compliance will not affect our ability to raise fund in the future, but may possibly increase the cost of the borrowings and/or offering and credit enhancements.
67
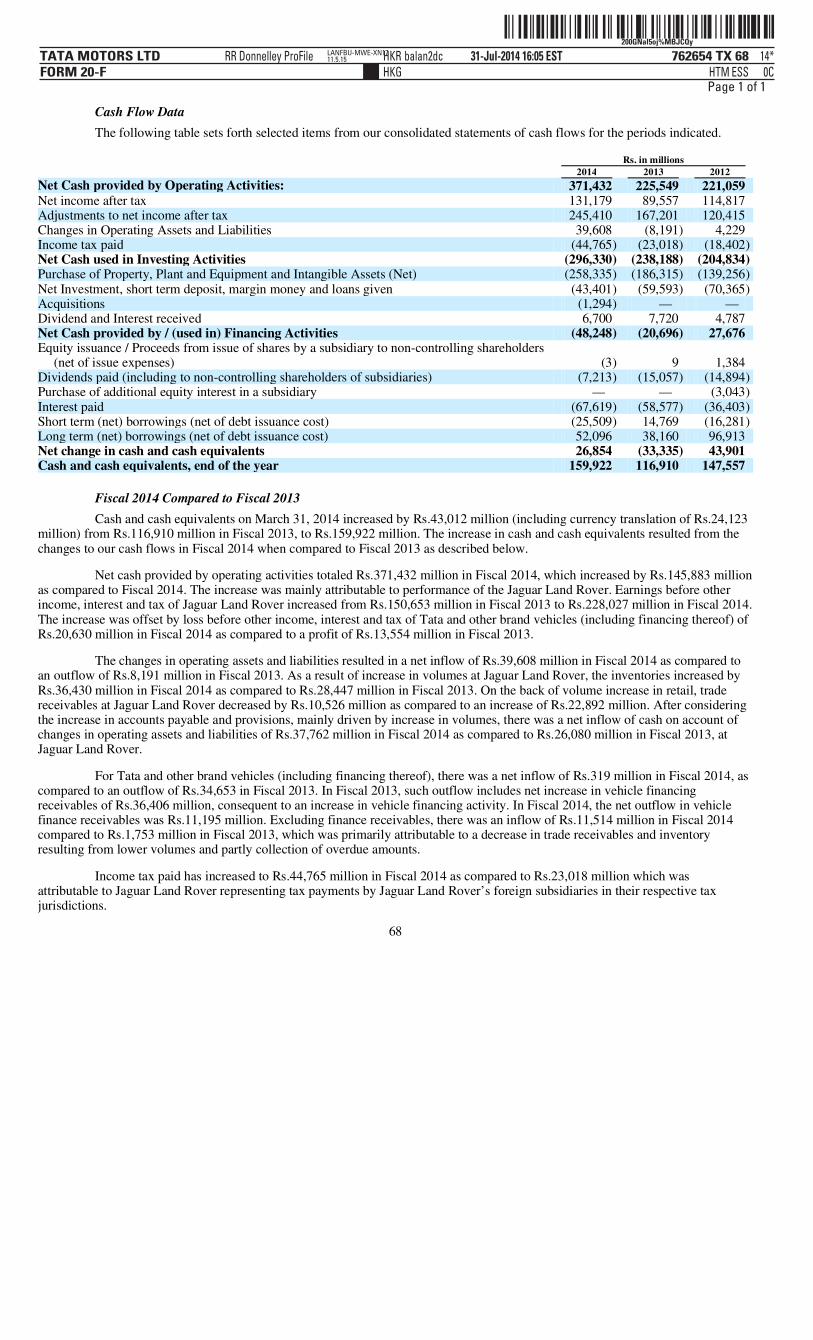
ˆ200GNal5oj%MBJCQyŠ200GNal5oj%MBJCQy
762654 TX 68TATA MOTORS LTDFORM 20-F
31-Jul-2014 16:05 ESTHTMHKG
RR Donnelley ProFile HKR balan2dc 14*ESS 0C
LANFBU-MWE-XN1711.5.15
Page 1 of 1
Cash Flow Data The following table sets forth selected items from our consolidated statements of cash flows for the periods indicated.
Fiscal 2014 Compared to Fiscal 2013 Cash and cash equivalents on March 31, 2014 increased by Rs.43,012 million (including currency translation of Rs.24,123
million) from Rs.116,910 million in Fiscal 2013, to Rs.159,922 million. The increase in cash and cash equivalents resulted from the changes to our cash flows in Fiscal 2014 when compared to Fiscal 2013 as described below.
Net cash provided by operating activities totaled Rs.371,432 million in Fiscal 2014, which increased by Rs.145,883 million as compared to Fiscal 2014. The increase was mainly attributable to performance of the Jaguar Land Rover. Earnings before other income, interest and tax of Jaguar Land Rover increased from Rs.150,653 million in Fiscal 2013 to Rs.228,027 million in Fiscal 2014. The increase was offset by loss before other income, interest and tax of Tata and other brand vehicles (including financing thereof) of Rs.20,630 million in Fiscal 2014 as compared to a profit of Rs.13,554 million in Fiscal 2013.
The changes in operating assets and liabilities resulted in a net inflow of Rs.39,608 million in Fiscal 2014 as compared to an outflow of Rs.8,191 million in Fiscal 2013. As a result of increase in volumes at Jaguar Land Rover, the inventories increased by Rs.36,430 million in Fiscal 2014 as compared to Rs.28,447 million in Fiscal 2013. On the back of volume increase in retail, trade receivables at Jaguar Land Rover decreased by Rs.10,526 million as compared to an increase of Rs.22,892 million. After considering the increase in accounts payable and provisions, mainly driven by increase in volumes, there was a net inflow of cash on account of changes in operating assets and liabilities of Rs.37,762 million in Fiscal 2014 as compared to Rs.26,080 million in Fiscal 2013, at Jaguar Land Rover.
For Tata and other brand vehicles (including financing thereof), there was a net inflow of Rs.319 million in Fiscal 2014, as compared to an outflow of Rs.34,653 in Fiscal 2013. In Fiscal 2013, such outflow includes net increase in vehicle financing receivables of Rs.36,406 million, consequent to an increase in vehicle financing activity. In Fiscal 2014, the net outflow in vehicle finance receivables was Rs.11,195 million. Excluding finance receivables, there was an inflow of Rs.11,514 million in Fiscal 2014 compared to Rs.1,753 million in Fiscal 2013, which was primarily attributable to a decrease in trade receivables and inventory resulting from lower volumes and partly collection of overdue amounts.
Income tax paid has increased to Rs.44,765 million in Fiscal 2014 as compared to Rs.23,018 million which was attributable to Jaguar Land Rover representing tax payments by Jaguar Land Rover’s foreign subsidiaries in their respective tax jurisdictions.
68
Rs. in millions 2014 2013 2012
Net Cash provided by Operating Activities: 371,432 225,549 221,059 Net income after tax 131,179 89,557 114,817 Adjustments to net income after tax 245,410 167,201 120,415 Changes in Operating Assets and Liabilities 39,608 (8,191) 4,229 Income tax paid (44,765) (23,018) (18,402) Net Cash used in Investing Activities (296,330) (238,188) (204,834) Purchase of Property, Plant and Equipment and Intangible Assets (Net) (258,335) (186,315) (139,256) Net Investment, short term deposit, margin money and loans given (43,401) (59,593) (70,365) Acquisitions (1,294) — — Dividend and Interest received 6,700 7,720 4,787 Net Cash provided by / (used in) Financing Activities (48,248) (20,696) 27,676 Equity issuance / Proceeds from issue of shares by a subsidiary to non-controlling shareholders
(net of issue expenses) (3) 9 1,384 Dividends paid (including to non-controlling shareholders of subsidiaries) (7,213) (15,057) (14,894) Purchase of additional equity interest in a subsidiary — — (3,043) Interest paid (67,619) (58,577) (36,403) Short term (net) borrowings (net of debt issuance cost) (25,509) 14,769 (16,281) Long term (net) borrowings (net of debt issuance cost) 52,096 38,160 96,913 Net change in cash and cash equivalents 26,854 (33,335) 43,901 Cash and cash equivalents, end of the year 159,922 116,910 147,557

ˆ200GNal5oj%Nv47QsŠ200GNal5oj%Nv47Qs
762654 TX 69TATA MOTORS LTDFORM 20-F
31-Jul-2014 16:36 ESTHTMHKG
RR Donnelley ProFile HKR kotts0dc 17*ESS 0C
LANFBU-MWE-XN2011.5.15
Page 1 of 1
Net cash used in investing activities totaled Rs.296,330 million in Fiscal 2014 as compared to Rs.238,188 million for Fiscal 2013, (increase Rs.58,142 million in Fiscal 2014) mainly due to investment in property, plant and equipment by Jaguar Land Rover and product development projects both at our Jaguar Land Rover and India operations. In Fiscal 2014, payments for capital expenditure at our Jaguar Land Rover increased by Rs.67,940 million to Rs.225,398 million from Rs.157,458 million in Fiscal 2013. The increases in the capital expenditure are intended to support continued growth in sales volumes at our Jaguar Land Rover and setting up of new engine manufacturing facilities at the UK. The following table sets forth a summary of our cash flow on property plant and equipment and intangible assets for the periods indicated.
Our net investment in short-term deposit margin moneys and loans resulted in an outflow of Rs.43,401 million in Fiscal 2014 as compared to Rs.59,953 million in Fiscal 2013, which mainly related to investment of surplus cash in bank deposits mainly by Jaguar Land Rover of Rs.45,080 million. Jaguar Land Rover invested Rs.9,008 million in the joint venture Chery Jaguar Land Rover Automotive Company Limited.
Net cash used in financing activities totaled Rs.48,248 million in Fiscal 2014, as compared to Rs.20,696 million in Fiscal 2013, mainly due to increased short term borrowings, which was partly offset by lower dividend payment.
For Tata and other brand vehicles, the short term debt decreased by Rs.10,878 million and long term debt (net) increased by Rs.46,441 million, which includes debts raised by TML Holdings Pte Ltd (TMLHS) of Rs.38,827 million in Fiscal 2014. The funds raised by TMLHS have been utilized for the general corporate purposes of Tata Motors Limited on standalone basis. This includes an increase in debt (short term + long term) of Rs.2,005 million in Fiscal 2014 at TMFL, as compared to net increase of Rs.55,710 million in Fiscal 2013, due to an increase in financing activity in last year. In Fiscal 2013, there was repayment of Convertible Alternative Reference Securities of Rs.35,374 million.
For Jaguar Land Rover, the short term debt (net) decreased by Rs.15,128 million due to repayment of loans in some of the overseas subsidiary and long term debt (net) increased by Rs.7,913 million in Fiscal 2014.
Interest paid is Rs.67,619 million in Fiscal 2014 as compared to Rs.58,577 million in Fiscal 2013. For Jaguar Land Rover interest paid is Rs.23,725 million in Fiscal 2014 as compared to Rs.13,723 million in Fiscal 2013, due to prepayment charges on Senior Notes. For Tata and other brand vehicles, the interest paid was Rs.43,157 million in Fiscal 2014 as compared to Rs.44,719 million in Fiscal 2013.
We paid dividend (including to non-controlling shareholders of subsidiaries) of Rs.7,213 million in Fiscal 2014 as compared to Rs.15,057 million in Fiscal 2013. The reduction was attributable to decrease in profits of Tata Motors Limited on a standalone basis.
Fiscal 2013 Compared to Fiscal 2012 Cash and cash equivalents on March 31, 2013 decreased by Rs.29,042 million from March 31, 2012, to Rs.116,910
million. The decrease in cash and cash equivalents resulted from the changes to our cash flows in Fiscal 2013 when compared to Fiscal 2012 as described below.
Net cash provided by operating activities totaled Rs.225,549 million in Fiscal 2013. Cash inflows from operating activities increased by Rs.4,549 million in Fiscal 2013 from Rs.221,059 million in Fiscal 2012. The increase in net cash from operations were consequent to higher sales volumes in the Jaguar Land Rover, which were partially offset by reduced sales volumes for Tata and other brand vehicles. Earnings before other income, interest and tax of Jaguar Land Rover increased from Rs.116,759 million in Fiscal 2012 to Rs.150,653 million in Fiscal 2013, whereas earnings before other income, interest and tax of Tata and other brand vehicles (including financing thereof) decreased to Rs.13,554 million in Fiscal 2013 as compared to Rs.42,228 million in Fiscal 2012.
The changes in operating assets and liabilities resulted in an outflow of Rs.8,191 million in Fiscal 2013 as compared to inflow of Rs.4,229 million in Fiscal 2012. As a result of an increase in volumes at Jaguar Land Rover, the trade receivables and inventories increased by Rs.51,339 million in Fiscal 2013 as compared to Rs.34,032 million in Fiscal 2012. After considering the increase in accounts payable and provisions, there was a net inflow of cash on account of changes in operating assets and liabilities of Rs.26,080 million in Fiscal 2013 as compared to Rs.42,915 million in Fiscal 2012 for Jaguar Land Rover.
For Tata and other brand vehicles, the net change in operating assets and liabilities represented an outflow of Rs.34,653 million in Fiscal 2013 as compared to Rs.38,687 million in Fiscal 2012. Such outflow includes net increase in vehicle financing receivables of Rs.36,406 million in Fiscal 2013 as compared to Rs.30,660 million in Fiscal 2012, as a result of an increase in financing volumes.
69
Rs. in millions 2014 2013
Tata and other brand vehicles 32,237 28,857 Jaguar Land Rover 225,398 157,458

ˆ200GNal5oj%McklQRŠ200GNal5oj%McklQR
762654 TX 70TATA MOTORS LTDFORM 20-F
31-Jul-2014 16:12 ESTHTMHKG
RR Donnelley ProFile HKR balan2dc 6*ESS 0C
RRWIN-XENP14111.5.15
Page 1 of 1
Net cash used in investing activities totaled Rs.238,188 million in Fiscal 2013. Cash outflows from investing activities increased by Rs.33,354 million in Fiscal 2013 from Rs.204,834 in Fiscal 2012, mainly due to investment in property, plant and equipment and product development projects at our Jaguar Land Rover. In Fiscal 2013, payments for capital expenditure at our Jaguar Land Rover increased by Rs.49,844 million to Rs.157,458 million from Rs.107,614 million in Fiscal 2012. The increases in the capital expenditure are intended to support continued growth in sales volumes at our Jaguar Land Rover during Fiscal 2013. The following table sets forth a summary of our cash flow on property plant and equipment and intangible assets for the periods indicated.
Our net investment in short-term deposit margin moneys and loans resulted in an outflow of Rs.59,593 million in Fiscal 2013 as compared to Rs.70,365 million in Fiscal 2012. This outflow mainly related to surplus cash investments in bank deposits by Jaguar Land Rover of Rs.66,637 million.
Net cash used in financing activities totaled Rs.20,696 million in Fiscal 2013, as compared to cash inflow of Rs.27,676 million in Fiscal 2012, mainly due to increased interest paid in Fiscal 2013, resulting from increased borrowing levels. For Tata and other brand vehicles, the short term debt increased by Rs.12,539 million and long term debt increased by Rs.13,583 million in Fiscal 2013, as compared to net reduction of Rs.6,836 million in short term debt and increase of Rs.15,657 million in long term debt in Fiscal 2012. For Jaguar Land Rover, the short term debt increased by Rs.2,383 million and long term debt increased by Rs.25,375 million in Fiscal 2013, as compared to net reduction of Rs.9,266 million in short term debt and increase of Rs.81,324 million in long term debt in Fiscal 2012.
We paid dividend (including to non-controlling shareholders of subsidiaries) of Rs.15,057 million in Fiscal 2013 as compared to Rs.14,894 million in Fiscal 2012.
Balance Sheet Data Please refer the consolidated balance sheet in the enclosed financial statements. We have discussed below major items and
variations.
Our total assets were Rs.2,184,776 million and Rs.1,687,167 million as of March 31, 2014 and 2013, respectively. The increase by 29.5% in assets as of March 31, 2014 was partly attributable to foreign currency translation into Indian rupees.
Our total current assets have increased by Rs.222,102 million to Rs.953,709 million as of March 31, 2014 or 30.4%, as compared to Rs.731,607 million as of March 31, 2013.
Cash and cash equivalents were Rs.159,922 million as of March 31, 2014, compared to Rs.116,910 million as of March 31, 2013, an increase of 36.8%. Of the increase, Rs.24,123 million is due to currency translations from GBP to rupees. We hold cash and cash equivalent principally in Indian rupees, GBP, and Chinese Renminbi. Out of cash and cash equivalents as at March 31, 2014, Jaguar Land Rover holds Rs.137,707 million, which is surplus cash deposits for future use. As of March 31, 2014, we had short term deposits of Rs.125,150 million as compared to Rs.68,957 million as at March 31, 2013, an increase of 81.5%. The increase in cash and cash equivalents and deposits was primarily attributable to performance of our Jaguar Land Rover operations and currency translation of Rs.20,899 million from GBP to rupees.
As of March 31, 2014, we had finance receivables including non-current portion (net of allowances for credit losses) of Rs.185,275 million as compared to Rs.198,219 million as of March 31, 2013, a decrease of Rs.12,944 million or 6.5% due to reduction in financing activity done in Fiscal 2014. Further, the increase in allowances for our vehicle financing activity due to defaults and overdues have decreased the net finance receivables. The gross finance receivables was Rs.216,863 million as compared to Rs.212,754 million as of March 31, 2013. The vehicle financing is integral to our automotive operations in India. For further detail see “— B. Liquidity and Capital Resources — Tata and other brand vehicles — vehicle financing”.
70
Rs. in millions 2013 2012
Tata and other brand vehicles 28,857 31,642 Jaguar Land Rover 157,458 107,614

ˆ200GNal5oj$a%KrQJŠ200GNal5oj$a%KrQJ
762654 TX 71TATA MOTORS LTDFORM 20-F
31-Jul-2014 04:40 ESTHTMHKG
RR Donnelley ProFile HKR annal0dc 9*ESS 0C
LANFBU-MWE-XN2311.5.15
Page 1 of 1
Trade receivables (net of allowance for doubtful receivables) were Rs.109,645 million as of March 31, 2014, representing an increase of Rs.3,854 million or 3.6% over March 31, 2013. The increase is net of Rs.14,497 million due to currency translation from GBP to rupees. The past dues for more than six months (gross) have increased from Rs.7,980 million as at March 31, 2013 to Rs.9,519 million or 19.3% as of March 31, 2014 and these mainly represent dues from government-owned transport undertaking and passenger vehicle dealers, for which we are pursuing recovery. The trade receivables for Tata and other brand vehicles have decreased by 2.9% to Rs.26,709 million as of March 31, 2014 from Rs.27,475 million as at March 31, 2013. The trade receivables of our Jaguar Land Rover increased from Rs.76,116 million as at March 31, 2013 to Rs.82,753 million as of March 31, 2014, as a result of the growth in revenue by 22.9% (GBP terms) and currency translation.
As of March 31, 2014, inventories were at Rs.272,736 million compared to Rs.210,496 million as of March 31, 2013, an increase of 29.6%. The increase in finished goods inventory was Rs.55,611 million as of March 31, 2014 to Rs. 217,687 million as compared to Rs.162,076 million as of March 31, 2013. The increase is mainly attributable to currency translation of Rs.37,899 million from GBP to rupees. In terms of number of days to sales, finished goods represented 34 inventory days in Fiscal 2014 sales as compared to 31 inventory days in Fiscal 2013. The increase in finished goods mainly relates to the increase in volumes, mainly at our Jaguar Land Rover.
Our investments (current and non-current investments) have increased to Rs.101,877 million as of March 31, 2014 from Rs.81,473 million as of March 31, 2013, representing an increase of Rs.20,404 million, or 25.0%. This includes Rs.15,257 towards currency translation. Our investments mainly comprise mutual fund investments of Rs.95,016 million as of March 31, 2014 as compared to Rs.75,327 million as of March 31, 2013. Of such investments Jaguar Land Rover were Rs.87,093 million as of March 31, 2014 as compared to Rs.67,485 million as of March 31, 2013, an increase of 29.0%.
Our other assets (current and non- current) increased marginally by 0.3% to Rs.68,144 million as of March 31, 2014 from Rs.67,929 million as of March 31, 2013. The increase mainly is attributable to prepaid expenses which were Rs.11,692 million as of March 31, 2014 as compared with Rs.6,421 million as of March 31, 2013 and currency translation of Rs.6,812 million from GBP to rupees.
Our other financial assets (current and non-current) have increased to Rs.96,418 million as of March 31, 2014 from Rs.39,189 million as of March 31, 2013. The increase also include Rs.15,076 million towards impact of currency translation. Derivative financial instruments increased by Rs.70,796 million from Rs.8,763 million as of March 31, 2013 to Rs.79,559 million as of March 31, 2014, representing options and other hedging arrangements; mainly related to Jaguar Land Rover predominantly due to an increase in the volume of USD forward foreign exchange contracts enacted coupled with the weakening of the US Dollar compared to GBP (fallen 9% from March 31, 2013 to March 31, 2014) and therefore increasing the fair value of these derivative contracts. Margin money held as security for securitization of finance receivables has decreased by 35.1% from Rs.2,096 million as of March 31, 2013 to Rs.1,361 million as of March 31, 2014, due to release of cash collaterals on completion / expiry of securitized pools.
The income tax assets (both current and non-current) were Rs.11,979 million as of March 31, 2014 as compared to Rs.10,210 million as of March 31, 2013, an increase 17.3%. The increase includes Rs.316 million towards currency translation from GBP to rupees.
The property, plant and equipment (net of depreciation) of Rs.494,610 million as of March 31, 2014, increased by 35.5% or Rs.129,630 million during Fiscal 2014 from Rs.364,980 million as of March 31, 2013. The increase mainly relates to Jaguar Land Rover towards investment in Plant and Machinery and toolings to support the growing demand for vehicles and also includes impact of currency translation of Rs.55,493 million from GBP to rupees.
In Fiscal 2014, we have acquired 100% equity interest in Cambric Holdings Inc, for a consideration of Rs.1,631 million and recognized Rs.1,154 million as goodwill.
The intangible assets were Rs.492,184 million as of March 31, 2014, an increase of 40.0% from Rs.351,667 million as of March 31, 2013, which mainly include product development projects and brands and other intangible assets, an increase by Rs.140,517 million during Fiscal 2014. The increase includes Rs.73,933 million towards impact of currency translation from GBP to rupees. As of March 31, 2014, there were product development project in process amounting to Rs.229,684 million. We are engaged in automotive business and our products include commercial vehicles in the entire range (LCV to M&HCV), passenger cars, and cars or SUV in the premium segment. Considering the nature of industry and competition, we continuously introduce new products and variants to meet the customers’ needs.
Our carrying value of investments in equity accounted investees is Rs.20,237 million as of March 31, 2014, as compared to Rs.20,830 million as of March 31, 2013, an decrease of 2.8% which includes Rs.2,426 million towards currency translation. In Fiscal 2014, we had recorded impairment loss of Rs.8,034 million in respect of an associate engaged in manufacturing and sale of construction equipment. Further, in Fiscal 2014, we have additionally invested Rs.9,008 million in Chery Jaguar Land Rover Automotive Company Limited.
71

ˆ200GNal5oj@KXxdw:Š200GNal5oj@KXxdw:
762654 TX 72TATA MOTORS LTDFORM 20-F
30-Jul-2014 13:55 ESTHTMHKG
RR Donnelley ProFile HKR venkp1dc 6*ESS 0C
ACXFBU-MWE-XN1411.5.15
Page 1 of 1
A deferred tax liability (net) of Rs.11,658 million was recorded in the income statement. Rs.13,606 million was recorded in other comprehensive income, which mainly include derivative financial instruments of Rs.18,286 million and Rs.2,541 million (credit) (including translation) towards post-retirement benefits. The net deferred tax asset of Rs.3,879 million as of March 31,2014 as compared to Rs.29,149 million as of March 31, 2013.
Accounts payable (including acceptances) were Rs.595,818 million as of March 31, 2014, as compared to Rs.461,245 million as of March 31, 2013, an increase of Rs. 134,573 million or 29.2%, reflecting increase in operations at Jaguar Land Rover and currency translation impact of Rs.83,361 million from GBP to rupees.
Other financial liabilities (current and non-current) were Rs.44,097 million as of March 31, 2014 (Rs.60,514 million as of March 31, 2013), a reduction of Rs.16,417 million, net of currency translation impact of Rs.5,613 million, mainly include liability towards vehicles sold under repurchase arrangement, derivative instruments, deferred payment liabilities, interest accrued but not due on loans, lease liabilities etc. We have derivative financial instruments representing options and other hedging arrangements; mainly relate to Jaguar Land Rover, which has decreased from Rs.34,385 million as of March 31, 2013 to Rs.11,922 million as of March 31, 2014. We have sold vehicles in certain markets under agreed repurchase arrangements for which we have liability of Rs.18,277 million as of March 31, 2014 (Rs.15,014 million as of March 31, 2013).
The provisions (current and non-current) as of March 2014 and 2013 were Rs.112,524 million and Rs.80,931 million, respectively, representing an increase of Rs.31,593 million. The provision for warranty increased by Rs.26,699 million mainly on account of volume growth at Jaguar Land Rover and currency translation impact of Rs.17,013 million from GBP to rupees.
Other liabilities (current and non-current) have increased by Rs.20,140 million or 18.1% to Rs.131,283 million as of March 31, 2014, as compared to Rs.111,144 million as of March 31, 2013. The increase related to an additional employee benefit obligations totaling Rs.67,711 million incurred during this period as compared to Rs.55,195 million in March 31, 2013, mainly pertaining to the Jaguar Land Rover pension plan, consequent to changes in actuarial factors, mainly discount rate. The increase also reflect the impact of currency translation of Rs.20,011 million from GBP to rupees.
Our total debt was Rs.620,099 million as of March 31, 2014, as compared to Rs.565,616 million as of March 31, 2013, an increase of Rs.54,483 million or 9.6% in Fiscal 2014 which includes Rs.31,837 million towards currency translation from GBP to rupees. Short-term debt including the current portion of long-term debt decreased by Rs.68,936 million or 29.3% to Rs.165,961 million as of March 31, 2014, as compared to Rs.234,897 million as of March 31, 2013. Our long-term debt, excluding the current portion, increased by Rs.123,421 million or 37.3% to Rs.454,139 million as of March 31, 2013 (Rs.330,718 million as of March 31, 2013). Long-term debt including the current portion increased by Rs.71,398 million or 15.9% to Rs.519,635 million. During Fiscal 2014, we issued rated, listed, unsecured non-convertible debentures of Rs.11,000 million as a step to raise long term resources and optimize the loan maturity profile and Jaguar Land Rover issued USD 700 million Senior Notes due 2018 at a coupon of 4.125% per annum and GBP 400 million Senior Notes due 2022 at a coupon of 5.0% per annum. The net proceeds of these notes were utilized to refinance existing debt of GBP 750 milion equivalent Senior Notes issued in May 2011. Further, during Fiscal 2014, we have issued SGD 350 million 4.25% Senior Notes, due 2018 and equivalent USD 600 million loan through TMLHS. Fixed deposits from public and shareholders (unsecured) were paid, whereas loan from banks/financial institution (short term + long term) increased by Rs.24,770 million. There was a net decrease in collateralized debt obligation by Rs.5,407 million as of March 31, 2014, mainly due to a decrease in securitized finance receivables.
Total shareholders’ equity was Rs.631,696 million and Rs.373,906 million as of March 31, 2014 and 2013, respectively.
Our reserves increased from Rs. 197,577 million as of March 31, 2013 to Rs.308,089 million as of March 31, 2014. We paid a dividend of Rs.7,220 million in Fiscal 2014.
Our other components of equity reflected a gain of Rs.125,609 million as of March 31, 2014 against a loss of Rs.12,660 million as of March 31, 2013. We have accounted for an actuarial gains/loss (net) reduction of Rs.13,385 million in respect of pension obligations. This was offset by gain of Rs.71,000 million on cash flow hedges (net), recorded in comprehensive income and currency translation credit of Rs.66,790 million and gain on available for sale investments (net) of Rs.480 million.
The ratio of net debt to shareholders’ equity (total debt less cash and cash equivalents and liquid marketable securities divided by total shareholders’ equity) under IFRS decreased from 1.0 as of March 31, 2013 to 0.6 as of March 31, 2014. Details of the calculation of this ratio are set forth in Exhibit 7.1 to this annual report.
72
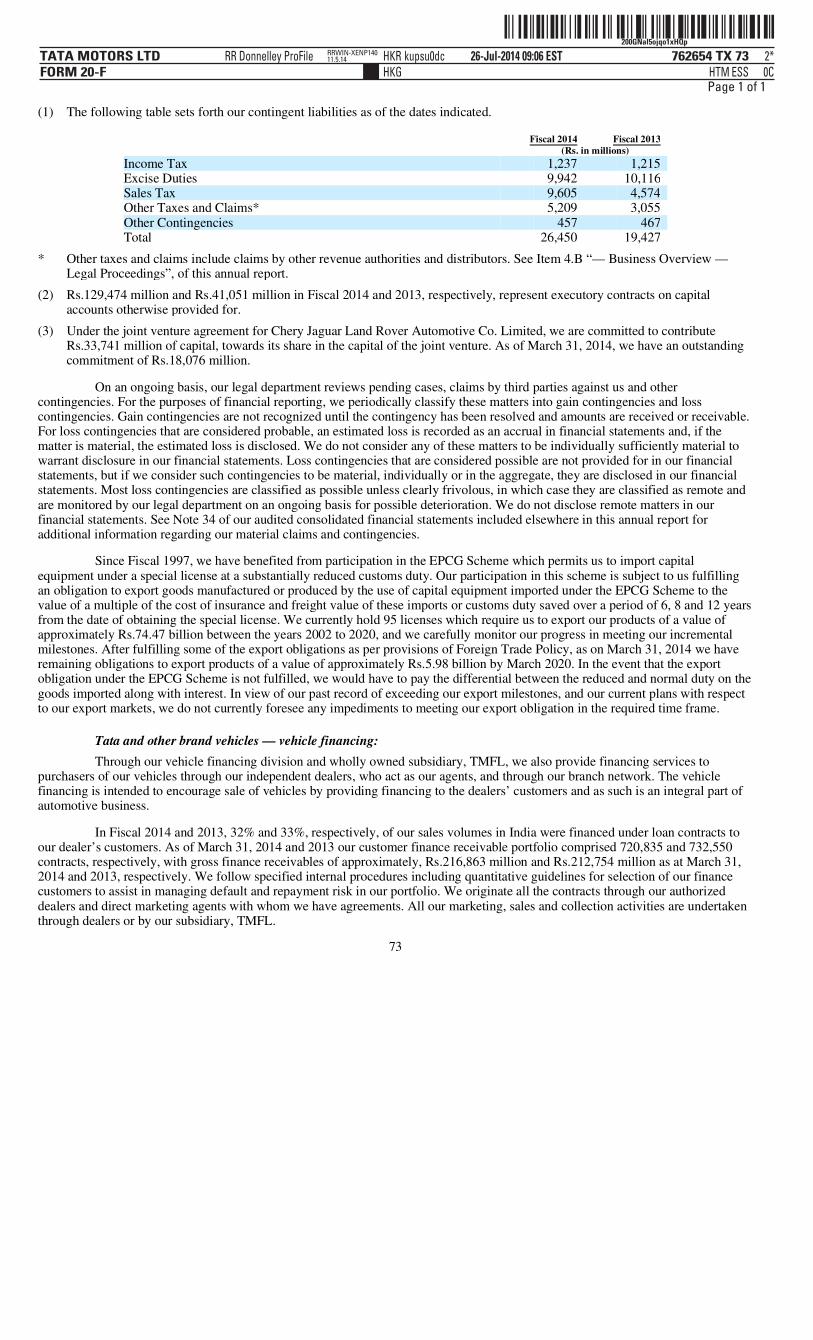
ˆ200GNal5ojqo1xHQpŠ200GNal5ojqo1xHQp
762654 TX 73TATA MOTORS LTDFORM 20-F
26-Jul-2014 09:06 ESTHTMHKG
RR Donnelley ProFile HKR kupsu0dc 2*ESS 0C
RRWIN-XENP14011.5.14
Page 1 of 1
On an ongoing basis, our legal department reviews pending cases, claims by third parties against us and other contingencies. For the purposes of financial reporting, we periodically classify these matters into gain contingencies and loss contingencies. Gain contingencies are not recognized until the contingency has been resolved and amounts are received or receivable. For loss contingencies that are considered probable, an estimated loss is recorded as an accrual in financial statements and, if the matter is material, the estimated loss is disclosed. We do not consider any of these matters to be individually sufficiently material to warrant disclosure in our financial statements. Loss contingencies that are considered possible are not provided for in our financial statements, but if we consider such contingencies to be material, individually or in the aggregate, they are disclosed in our financial statements. Most loss contingencies are classified as possible unless clearly frivolous, in which case they are classified as remote and are monitored by our legal department on an ongoing basis for possible deterioration. We do not disclose remote matters in our financial statements. See Note 34 of our audited consolidated financial statements included elsewhere in this annual report for additional information regarding our material claims and contingencies.
Since Fiscal 1997, we have benefited from participation in the EPCG Scheme which permits us to import capital equipment under a special license at a substantially reduced customs duty. Our participation in this scheme is subject to us fulfilling an obligation to export goods manufactured or produced by the use of capital equipment imported under the EPCG Scheme to the value of a multiple of the cost of insurance and freight value of these imports or customs duty saved over a period of 6, 8 and 12 years from the date of obtaining the special license. We currently hold 95 licenses which require us to export our products of a value of approximately Rs.74.47 billion between the years 2002 to 2020, and we carefully monitor our progress in meeting our incremental milestones. After fulfilling some of the export obligations as per provisions of Foreign Trade Policy, as on March 31, 2014 we have remaining obligations to export products of a value of approximately Rs.5.98 billion by March 2020. In the event that the export obligation under the EPCG Scheme is not fulfilled, we would have to pay the differential between the reduced and normal duty on the goods imported along with interest. In view of our past record of exceeding our export milestones, and our current plans with respect to our export markets, we do not currently foresee any impediments to meeting our export obligation in the required time frame.
Tata and other brand vehicles — vehicle financing: Through our vehicle financing division and wholly owned subsidiary, TMFL, we also provide financing services to
purchasers of our vehicles through our independent dealers, who act as our agents, and through our branch network. The vehicle financing is intended to encourage sale of vehicles by providing financing to the dealers’ customers and as such is an integral part of automotive business.
In Fiscal 2014 and 2013, 32% and 33%, respectively, of our sales volumes in India were financed under loan contracts to our dealer’s customers. As of March 31, 2014 and 2013 our customer finance receivable portfolio comprised 720,835 and 732,550 contracts, respectively, with gross finance receivables of approximately, Rs.216,863 million and Rs.212,754 million as at March 31, 2014 and 2013, respectively. We follow specified internal procedures including quantitative guidelines for selection of our finance customers to assist in managing default and repayment risk in our portfolio. We originate all the contracts through our authorized dealers and direct marketing agents with whom we have agreements. All our marketing, sales and collection activities are undertaken through dealers or by our subsidiary, TMFL.
73
(1) The following table sets forth our contingent liabilities as of the dates indicated.
Fiscal 2014 Fiscal 2013 (Rs. in millions)
Income Tax 1,237 1,215 Excise Duties 9,942 10,116 Sales Tax 9,605 4,574 Other Taxes and Claims* 5,209 3,055 Other Contingencies 457 467 Total 26,450 19,427
* Other taxes and claims include claims by other revenue authorities and distributors. See Item 4.B “— Business Overview — Legal Proceedings”, of this annual report.
(2) Rs.129,474 million and Rs.41,051 million in Fiscal 2014 and 2013, respectively, represent executory contracts on capital accounts otherwise provided for.
(3) Under the joint venture agreement for Chery Jaguar Land Rover Automotive Co. Limited, we are committed to contribute Rs.33,741 million of capital, towards its share in the capital of the joint venture. As of March 31, 2014, we have an outstanding commitment of Rs.18,076 million.
ˆ200GNal5ojqoC1CQeŠ200GNal5ojqoC1CQe
762654 TX 74TATA MOTORS LTDFORM 20-F
26-Jul-2014 09:08 ESTHTMHKG
RR Donnelley ProFile HKR kupsu0dc 2*ESS 0C
RRWIN-XENP14011.5.14
Page 1 of 1
We securitize or sell our finance receivables on the basis of evaluation of market conditions and funding requirements. The constitution of these pools is based on criteria that are decided by credit rating agencies and/or based on the advice that we receive as to the marketability of a pool. We undertake these securitizations of our receivables in either or both of the following forms:
We act as collection agent on behalf of the investors, representatives, special purpose vehicles or banks, in whose favor the receivables have been assigned, for the purpose of collecting receivables from the purchasers on the terms and conditions contained in the applicable deeds of securitization, in respect of which pass-through certificates are issued to investors in case of special purpose vehicles, or SPVs. We also secure the payments to be made by the purchasers of amounts constituting the receivables under the loan agreements to the extent specified by rating agencies by any one or all of the following methods:
For further details refer Note 36(b) to our consolidated financial statements included elsewhere in this annual report.
Capital Expenditure Capital expenditure totaled Rs.272,832 million, Rs.212,078 million and Rs.148,255 million during Fiscal 2014, 2013 and
2012, respectively. Our automotive operations accounted for a majority of this capital expenditure.
Our capital expenditures, during the past three years in India related mostly to (i) capacity expansion and new production facilities, (ii) the introduction of new products such as the Tata Nano, World Truck, Tata 407 Pickup, Tata Super ACE, Tata ACE EX, Tata Magic, Winger and Sumo Grande, (iii) the development of planned future products and technologies, (iv) quality and reliability improvements aimed at operating cost reductions and (v) modernization.
Capital expenditure in the Jaguar Land Rover mainly included expenditure for the launch on the New Range Rover Sport and Jaguar F-TYPE, product development costs on various future products, expenditure for capacity expansion at Solihull which includes a new assembly hall and expenditure on construction of the new engine plant at Wolverhampton, UK. Jaguar Land Rover has also entered into a joint venture agreement with Chery Automobiles to build a factory in China to manufacture vehicles and engines. The construction of the plant in China for the joint venture with Chery Automobiles is progressing according to plan.
For details on our product development projects, please refer Note 15 to our consolidated financial statements included elsewhere in this annual report.
Tata Motors continues to focus on development of new products for the Indian market and other international market it serves. The Jaguar Land Rover continues to make investments in new technologies through its research and development activities to develop products that meet the requirements of the premium segment including developing sustainable technologies to improve fuel economy and reduce CO emissions. Please refer to Item 4.B “— Business Overview — Government Regulations” of this annual report for further details.
We intend to continue to invest in our business units and research and development over the next several years, including capital expenditures for our ongoing projects, new projects, product development programs, mergers, acquisitions and strategic alliances to build and expand our presence in the passenger vehicle and commercial vehicle categories.
74
• assignment of the receivables due from purchasers under loan agreements; and • securitization of receivables due from purchasers by means of private placement.
• by furnishing to the investors collateral, in respect of the obligations of the purchasers and the undertakings to be
provided by us;
• by furnishing, in favor of the investors, 10.88% to 21.20% of the gross receivables as cash collateral in case of previous year securitization, for securitizations done during Fiscal 2014 the range lies between 13.84% to 14.5% of the gross receivables either by way of a fixed deposit or bank guarantee to secure the obligations of the purchasers and our obligations as the collection agent, based on the quality of receivables and rating assigned to the individual pool of receivables by the rating agency(ies); and
• by way of over-collateralization or by investing in subordinate pass-through certificates to secure the obligations of
the purchasers.
2

ˆ200GNal5ojlaqRQQvŠ200GNal5ojlaqRQQv
762654 TX 75TATA MOTORS LTDFORM 20-F
25-Jul-2014 00:32 ESTHTMHKG
RR Donnelley ProFile HKR pf_rend 2*ESS 0C
HKRPRFRS1011.5.15
Page 1 of 1
Some of our recently launched and anticipated new products are as follows:
Heavy Trucks: In March 2014 we extended the Tata Prima advantage with the launch of 10 new heavy duty trucks from the Prima LX range of Heavy Commercial Vehicles. Six new models of the Prima LX in the cargo segment — and four new models in tippers segment. In November 2014, four new features were added to Tata FleetMan. These features aim to enhance economy, safety and communication security of fleet operations besides as well as make Tata FleetMan accessible on the mobile platform. The four new features are — Tata FleetMan Mobile Application, idling management, monitoring of sudden acceleration and harsh braking and 256 bit encryption of all Tata FleetMan data communication. Our Construck range has been further supplemented with the launch of the Tata LPK 3118 tipper.
Buses: At the Delhi Auto Expo 2014, we unveiled the Starbus Urban Parallel Hybrid Bus and the Starbus Urban Articulated Bus. The Starbus Urban Parallel Hybrid Bus is meant for urban transportation and offers improved mileage with lower emissions relative to conventional Starbus models.
Light Commercial Vehicles: In Fiscal 2014, we launched the Ace & Magic Facelift, Ace DICOR with common rail engine, and a new Ace Zip to tap into small three wheeler market.
Passenger Cars: In June 2013, we had announced Horizonext, customer-focused strategy for our passenger vehicles business, and also unveiled 8 newly upgraded and enhanced products, across 5 brands. We launched new enhanced versions of Tata Indigo eCS, Tata Sumo Gold, Tata Nano, Tata Indica and the Explorer edition of Tata Storme. We also introduced a various new products including the E-max range of CNG vehicles (for Tata Indica, Tata Indigo e CS and Tata Nano) and the recently launched Tata Nano Twist with Electric Power Steering. We launched the new Vista VX Tech top-of-the-line limited edition variant in February 2014. During the Delhi Auto Expo 2014, Tata Motors showcased two new products, the Bolt hatchback and the Zest Sedan, which are expected to be launched later this year. The Zest and Bolt will be powered by the segment-first, turbocharged intercooled multi-point fuel-injected (MPFi) gasoline engine, the Revotron 1.2T.
Utility vehicles: In April 2014, we launched the new Aria with a new engine. We also launched the new Movus in May 2014, which is an entry level UV which is relatively fuel efficient and easy to maintain.
Jaguar F-Type: The new Jaguar F-TYPE convertible went on sale in Fiscal 2014. This latest Jaguar sports car has been engineered for improved performance and responsive handling through features like supercharged V6 and V8 engines, lightweight body construction and advanced driving technologies.
New Range Rover Sport: Showcased at the New York International Show 2013, the new Range Rover Sport is the fastest, most agile and most responsive Land Rover to date. Developed alongside the new Range Rover, it offers the brand’s best-ever on-road dynamics together with all-terrain capability. Exploiting Land Rover’s lightweight suspension design and dynamic chassis technologies, the Sport’s all-new, aluminum architecture achieves a weight saving of up to 420kg against the equivalent outgoing model. This is designed to enable the vehicle to blend agile handling with comfort, and to offer a mix of sporting luxury and a dynamic, connected driving experience, along with a reduction of CO to 194g/km.
New Range Rover: The all new Range Rover, which was launched in September 2012, has been developed from the ground up to provide a luxurious driving experience. Its elegant styling is a fresh interpretation of the car’s iconic design cues and while instantly recognizable as a Range Rover, the new vehicle takes a significant step forward with what we believe is a bold evolution of the characteristic design.
Please see Item 4.A “Information on the Company — History and Development of the Company” for more information on some of our recently launched and anticipated new products.
We engaged in additional financing activities during Fiscal 2013 and 2014 as described above in the introduction to this Item 5.B. “— Liquidity and Capital Resources”.
C. Research and Development, Patents and Licenses, etc. Please see Item 4.B “— Business Overview” of this annual report for the information required by this item.
D. Trend Information. Please see Item 5.A “— Operating Results” of this annual report for the information required by this item.
75
2

ˆ200GNal5ojuxi!mQ{Š200GNal5ojuxi!mQ{
762654 TX 76TATA MOTORS LTDFORM 20-F
28-Jul-2014 13:37 ESTHTMHKG
RR Donnelley ProFile HKR balan2dc 4*ESS 0C
LANFBU-MWE-XN1411.5.15
Page 1 of 1
E. Off-balance Sheet Arrangements None
F. Tabular Disclosure of Contractual Obligations
A. Directors and Senior Management. Board of Directors.
Under our Articles of Association, the number of our directors cannot be less than three or more than fifteen. At present, our board comprises ten directors.
Article 127 of our Articles of Association provide that the Board of Directors of Tata Steel, which, with its subsidiary, owns, as of June 30, 2014, 5.40% of our Ordinary Shares and none of ‘A’ Ordinary Shares, has the right to nominate one director, the “Steel Director” to the Board. Mr. Cyrus P. Mistry was appointed as a nominee director of Tata Steel with effect from May 29, 2013.
In addition, our Articles of Association provide that (a) our debenture holders have the right to nominate one director; a Debenture Director, if the trust deeds relating to outstanding debentures require the holders to nominate a director; and (b) financial institutions in India, have the right to nominate two directors, the “Financial Institutions Directors”, to the Board pursuant to the terms of the loan agreements. Currently, there is no Debenture Director or Financial Institutions Director on the Board. Our directors are not required to hold any of our Shares by way of qualification.
As of June 30, 2014, our directors and senior management, in their sole and joint names, beneficially held an aggregate of 19,500 Ordinary Shares (approximately 0.0007% of our issued share capital) and 2,930 ‘A’ Ordinary Shares (approximately 0.0006% of our issued share capital).
Mr. Karl Slym served as the Managing Director since September 13, 2012. He led all operations of the Company in India and in international markets. Mr. Slym ceased to be the Managing Director of the Company upon his demise on January 26, 2014. The position of Managing Director is vacant as of the date of this annual report. As an interim measure, a Corporate Steering Committee or CSC, was constituted to provide oversight of strategy and key aspects of the Company’s operations.
Mr. Cyrus P. Mistry chairs the CSC, comprising of Mr Pisharody, Mr Borwankar and other officers of the Company, as well as the New Product Design and Engineering Review meetings.
76
Payment due by period (Rs. in millions)
Type Total Less than 1
year 1 to 3 years 3 to 5 years
More than 5 years
Long Term Debts* 519,635 99,838 213,720 144,372 220,964 Capital Lease 2,412 845 1,154 413 — Operating Lease 17,921 2,974 2,992 1,410 10,546 Capital Commitments 129,474 128,761 689 12 12 Purchase Commitments 119,132 45,099 57,829 16,204 — Other Liabilities 173,883 90,242 19,354 11,221 55,656 Provisions 112,524 46,556 54,801 6,881 4,333
Total 1,074,981 414,315 350,539 180,513 291,511
* Includes interest
Item 6. Directors, Senior Management and Employees.

ˆ200GNal5ojnykydw&Š200GNal5ojnykydw&
762654 TX 77TATA MOTORS LTDFORM 20-F
25-Jul-2014 13:14 ESTHTMHKG
RR Donnelley ProFile HKR kotts0dc 2*ESS 0C
ACXFBU-MWE-XN1511.5.14
Page 1 of 1
The following table provides information about our Directors, Executive Officers and Chief Financial Officer as at June 30, 2014:
Biographies Set forth below is a short biography of each of our directors, senior management and Chief Financial Officer:
Mr. Cyrus P. Mistry (Chairman): Mr. Mistry was appointed as a Director of Tata Motors with effect from May 29, 2012, and as Deputy Chairman of the Company with effect from November 7, 2012. Mr. Mistry took over as Chairman from Mr. Ratan N. Tata on his retirement with effect from December 28, 2012.
Mr. Mistry was earlier Managing Director of the Shapoorji Pallonji group and was also responsible for building the infrastructure development division in the Shapoorji Pallonji group.
Mr. Mistry is a Graduate of Civil Engineering from the Imperial College London (1990) and has an MSc in Management from the London Business School (1997). He was recently bestowed with the Alumni Achievement Award by the London Business School.
77
Name Position
Date of birth/ business
address
Year appointed as director or
Executive Officer or Chief
Financial Officer Expiration of term
Number of Ordinary Shares of
Rs. 2 each
beneficially owned as of
June 30, 2014
Number of ‘A’
Ordinary shares of Rs.2 each
beneficiallyowned as
of June 30, 2014
Cyrus P. Mistry Chairman July 4, 1968 2012 Non-rotational 14,500 NIL Ravi Kant Vice-Chairman June 1, 1944 2000 2014 NIL NIL N.N. Wadia Director February 15, 1944 1998 2019 NIL NIL R.A. Mashelkar Director January 1, 1943 2007 2017 NIL NIL Nasser Munjee Director November 18, 1952 2008 2019 NIL NIL Subodh Bhargava Director March 30, 1942 2008 2017 NIL NIL V K Jairath Director December 27, 1958 2009 2019 250 NIL Ralf Speth Director September 9, 1955 2010 2014 NIL NIL Falguni Nayar Director February 19, 1963 2013 2019 NIL NIL Karl Slym Managing Director February 9, 1962 2012 Not Applicable NIL NIL Ravindra Pisharody
Executive Director (Commercial Vehicles)
November 24, 1955 2012 2015 NIL 50
S B Borwankar
Executive Director (Quality) July 15, 1952 2012 2016 NIL NIL
C. Ramakrishnan Chief Financial Officer June 27, 1955 2007 2015 5,000 2,880
(1) The business address of each of our directors, Executive Officers and Chief Financial Officer, other than as described immediately below, is Bombay House, 24 Homi Mody Street, Mumbai 400 001. The business address of N.N. Wadia is The Wadia Group, C-1, Wadia International Centre (Bombay Dyeing), Pandurang Budhkar Marg, Worli, Mumbai 400 025, India; the business address of R. A. Mashelkar is “Raghunath”, D-4, Varsha Park, Baner, Pune 411045, India; the business address of Nasser Munjee is Development Credit Bank Ltd, Peninsula Business Park, Tower ‘A’ 6 Floor, Senapati Bapat Marg, Lower Parel, Mumbai 400 013, India; the business address of Subhodh Bhargava is Tata Communications Limited, 4 Floor, VSB Bangla Sahib Road, New Delhi - 110001, India; the business address of V K Jairath is 194-B, Kalpataru Horizon, S.K. Ahire Marg, Off Annie Besant Road, Worli, Mumbai 400018, Maharashtra, India; the business address of Ralf Speth is Jaguar Land Rover, Abbey Road, Whitley, Coventry, CV3 4LF, U K; the business address of S. B. Borwankar is Tata Motors Limited, Pune Works, Pimpri, Pune - 411 018; the business address of Falguni Nayar is FSN E-Commerce Ventures Pvt. Ltd., 104, Vasan Udyog Bhavan, Sun Mill Compound, Tulsi Pipe Road, Lower Parel (West), Mumbai-400 013.
(2) Each of our Directors, Executive Officers and Chief Financial Officer beneficially owned less than 1% of our Shares as of June 30, 2014.
(3) Retired as per the Company’s retirement age policy on June 1, 2014. (4) Ceased to be the Managing Director with effect from January 26, 2014. (5) As per the Company policy, employees retire at the age of 60.
(1) (2) (2)
(3)
(4)
(5)
th
th

ˆ200GNal5ojlW9TnwÀŠ200GNal5ojlW9Tnw
762654 TX 78TATA MOTORS LTDFORM 20-F
25-Jul-2014 00:24 ESTHTMHKG
RR Donnelley ProFile HKR pf_rend 1*ESS 0C
hkrdoc211.5.15
Page 1 of 1
On the untimely and tragic demise of (Late) Mr Karl Slym, Managing Director of the Company on January 26, 2014 the CSC, was constituted, as an interim measure in order, to provide greater focus and attention to the management of operations of the Company. Mr. Mistry is the Chairman of the CSC.
Mr. Ravi Kant (Vice-Chairman): Mr. Kant has been with the Company since February 1999, joining as Senior Vice President (Commercial Vehicles), and was inducted on the Board as an Executive Director in July 2000 and became the Managing Director in July 2005. Upon retiring from his executive position on June 1, 2009, Mr. Ravi Kant continued to be on the Company’s Board of Directors as Vice-Chairman.
Prior to joining the Company, he served as Director of Consumers Electronics for Philips India Limited prior to which he served as Senior Executive Director (Marketing) of LML Limited and as Vice President (Sales & Marketing) of Titan Watches Limited.
Mr. Ravi Kant holds a Bachelor of Technology degree in Metallurgical Engineering from the Institute of Technology, Kharagpur and a Master’s degree in Science from the University of Aston, Birmingham, UK.
He retired as the Vice Chairman of the Company on June 1, 2014, as per the Company’s retirement age policy.
Mr. Nusli N. Wadia: Educated in the UK, Mr. Wadia is the Chairman of the Bombay Dyeing & Manufacturing Company Limited and heads the Wadia Group. He is also the Chairman or as a trustee of various charitable institutions and non-profit organizations.
He was appointed as an Independent Director of the Company with effect from December 22, 1998.
Dr. R. A. Mashelkar: Dr. Mashelkar is an eminent chemical engineering scientist retired from the post of Director General from the CSIR and is the President of Indian National Science Academy (INSA), National Innovation Foundation, Institution of Chemical Engineers, UK and Global Research Alliance. The President of India honoured Dr. Mashelkar with the Padmashri (1991), the Padmabhushan (2000) and the Padma Vibhushan (2014). Dr. Mashelkar holds a Ph.D. in Chemical Engineering from the Bombay University.
He was appointed as an Independent Director of the Company with effect from August 28, 2007.
Mr. Nasser Munjee: Mr. Nasser Munjee served with HDFC for over 20 years at various positions including as its Executive Director. He was the Managing Director of Infrastructure Development Finance Co. Limited. (IDFC) up to March 2004. Presently he is the Chairman of Development Credit Bank (DCB) since June 2005 and is also on the Board of various Multinational Companies and Trusts.
Mr. Munjee is a Technical Advisor on the World Bank-Public Private Partnership Infrastructure and Advisory Fund. Mr. Munjee holds a Bachelor’s degree and a Master’s degree from the London School of Economics, UK.
He was appointed as an Independent Director of the Company with effect from June 27, 2008.
Mr. Subodh Bhargava: Mr. Bhargava retired from Eicher Group of Companies as Group Chairman and Chief Executive in March 2000. He was the past President of the Confederation of Indian Industry and the Association of Indian Automobile Manufacturers; and the Vice President of the Tractor Manufacturers Association.
He is currently associated as a Director of several Indian corporates, including Tata Communications Limited and Tata Steel Limited. Mr. Bhargava holds a degree in Mechanical Engineering from the University of Roorkee.
He was appointed as an Independent Director of the Company with effect from June 27, 2008.
Mr. V. K. Jairath: Mr. Jairath served as the Principal Secretary (Industries) of the Government of Maharashtra and has over 25 years of experience in public administration, rural development, poverty alleviation, infrastructure, finance, industry, urban development and environmental management occupying various important positions in the Government of India and the State Government of Maharashtra.
Mr. Jairath holds a Bachelor of Arts Degree in Public Administration and Bachelor of Laws Degree, both from the Punjab University, a Masters in Economics from the University of Manchester, UK and joined Indian Administrative Service in 1982.
78

ˆ200GNal5ojnvgtow-Š200GNal5ojnvgtow-
762654 TX 79TATA MOTORS LTDFORM 20-F
25-Jul-2014 12:45 ESTHTMHKG
RR Donnelley ProFile HKR subrn1dc 2*ESS 0C
RRWIN-XENP14111.5.14
Page 1 of 1
He was appointed as an Independent Director of the Company with effect from March 31, 2009.
Dr. Ralf Speth: Dr. Ralf Speth was appointed to the post of Chief Executive Officer at Jaguar Land Rover on February 18, 2010. He is on the Board of Directors of Jaguar Land Rover Automobile PLC, UK. Dr. Speth earned a degree in Engineering from Rosenheim University, Germany and holds a Doctorate of Engineering in Mechanical Engineering and Business Administration from Warwick University.
Having served BMW for 20 years, Dr. Speth joined Ford Motor Company’s Premier Automotive Group as Director of Production, Quality and Product Planning.
He was appointed as a Director of the Company with effect from November 10, 2010.
Ms. Falguni Nayar: Ms. Falguni Nayar has spent over 19 years with Kotak Mahindra Bank with the last 6 years as Managing Director and CEO of Kotak Investment Bank. She is currently the founder and CEO of Nykaa.com, an online shopping website for beauty and wellness products and also offers an online magazine, expert advice and virtual makeover tools.
She was recognised as the ‘Top Business Woman’ by Business Today in 2009 and 2011 and has received the FICCI Ladies Organisation award for ‘Top Woman Achiever’ in the field of banking in 2008. She holds a B.Com degree from the Mumbai University and a PGDM from IIM, Ahmedabad.
She was appointed as an Independent Director of the Company with effect from May 29, 2013.
Mr. R Pisharody: Mr. Ravindra Pisharody is the Executive Director (Commercial Vehicles) since June 21, 2012 having joined Tata Motors as Vice President Commercial Vehicles (Sales & Marketing), in 2007. He is also on the board of various Tata Motors Group Companies. Before joining the Company, he worked with Castrol Ltd., a subsidiary of BP, and with Philips India, a subsidiary of the Dutch company in various roles. Mr. Pisharody is an alumnus of IIT, Kharagpur and IIM, Kolkata.
Mr. S. B. Borwankar: Mr. Satish Borwankar started his career with Tata Motors in 1974, as a Graduate Engineer Trainee and is currently the Executive Director (Quality) with effect from June 21, 2012. He has worked in various executive positions, for overseeing and implementing product development, manufacturing operations and quality control initiatives of the Commercial Vehicles Business Unit. He has played a significant role in setting up Greenfield projects of the Company. Mr. Borwankar is a Mechanical Engineer from IIT, Kanpur.
(Late) Mr. Karl Slym (Managing Director): Mr. Karl Slym joined Tata Motors as the Managing Director with effect from September 13, 2012. He lead all operations of Tata Motors in India and international markets.
Before joining Tata Motors, Mr. Slym was the Executive Vice President and Board Member, SGMW Motors, China (a General Motors joint venture), prior to which he was President, Managing Director and Board Member of General Motors in India. For over two decades, Mr. Slym had been with Toyota and General Motors in various positions across different regions. Mr. Slym was an alumnus of Stanford University and a Sloan Fellow.
He ceased to be the Managing Director of the Company with effect from January 26, 2014.
Mr. C. Ramakrishnan (Chief Financial Officer): Mr. C. Ramakrishnan started his career with Tata Motors in 1980. As CFO, he is responsible for Finance, Accounts, Taxation, Business Planning, Investor Relations, Treasury, CRM & DMS and IT.
Before becoming CFO of Tata Motors, Mr. Ramakrishnan was with the Tata Sons - Chairman’s Office for 7 years.
He is on the Board of several Tata Companies including Tata Technologies Limited, Tata Cummins Limited, Tata Motors Finance Limited, Jaguar Land Rover Automotive Plc., U.K., Jaguar Land Rover India Limited, Tata Hispano Motors Carrocera, S.A., Tata Motors Thailand Limited, Tata Daewoo Commercial Vehicle Co. Limited, South Korea, Tata Motors (SA) (Proprietary) Limited, Sheba Properties Limited, Fiat India Automobiles Limited and TML Holdings Pte. Limited.
Mr. Ramakrishnan is a Chartered Accountant and a Cost Accountant. Mr. Ramakrishnan was appointed as the Chief Financial Officer of Tata Motors with effect from September 18, 2007.
There is no family relationship between any of our directors, Executive Officers or Chief Financial Officer.
79

ˆ200GNal5oj%Lm7YwhŠ200GNal5oj%Lm7Ywh
762654 TX 80TATA MOTORS LTDFORM 20-F
31-Jul-2014 15:33 ESTHTMHKG
RR Donnelley ProFile HKR adran0dc 16*ESS 0C
ACXFBU-MWE-XN0211.5.15
Page 1 of 1
B. Compensation. The following table provides the annual compensation paid/accrued to our Directors and Executive Officers in Fiscal 2014.
Apart from the above, the Managing and Executive Directors are also eligible to receive special retirement benefits at the discretion of the Board, which include a monthly pension, ex-gratia and medical benefits and in the case of the Managing Director also housing benefits.
The Indian Companies Act, 1956 requires shareholders’ approval by special resolution for remuneration in excess of Rs.4,800,000 per year for each director, if a company on a standalone basis records no profits or inadequate profits, as defined under the Indian Companies Act, 1956 for a given fiscal year.
On May 22, 2014, the Company proposed 3 resolutions on a postal ballot for the approval and ratification of the remuneration paid to Mr. R Pisharody, Mr. Satish Borwankar and Late Mr. Karl Slym (including a statutory death benefits of Rs.24,103,475 for his legal heir) during Fiscal 2014. Furthermore, two of these resolutions also sought approval for remuneration in excess of the statutory limit for Mr. Pisharody and Mr. Borwankar for Fiscal 2015, 2016 and 2017. The resolutions each secured approximately 70% approval of voting shareholders, which falls below the 75% approval required by the Indian Companies Act, 1956.
The remuneration paid during Fiscal 2014 in excess of the statutory limit of Rs. 31,950,227 for Mr. Pisharody, Rs. 22,836,518 for Mr. Borwankar and Rs. 146,399,889 (including a statutory benefit of Rs.24,103,475 for his legal heirs) for Mr. Slym is currently being held by the respective Directors in trust for the Company.
80
Name Position Remuneration
(in Rs.)
Cyrus P. Mistry Chairman 310,000 Ravi Kant Vice Chairman 400,000 N.N. Wadia Director 300,000 S.M. Palia Director 20,000 R A Mashelkar Director 330,000 N Munjee Director 5,935,000 S. Bhargava Director 180,000 V K Jairath Director 400,000 Falguni Nayar Director 340,000 Ralf Speth Director 310,940,000 Karl Slym Managing Director 128,407,000 Ravi Pisharody Executive Director (Commercial Vehicles) 32,371,000 Satish Borwankar Executive Director (Quality) 25,998,000 C. Ramakrishnan Chief Financial Officer 26,951,000
1. Includes salary, allowance, taxable value of perquisites, commission and our contribution to provident fund and superannuation fund for Managing Directors / Chief Financial Officer and sitting fees for Non-Executive Directors. No commission has been paid by the Company for the Fiscal 2014, due to inadequacy of profits.
2. The remuneration of Mr. Ravi Kant, also includes sitting fees paid by TAL Manufacturing Solutions Limited. As per the Company’s Retirement Age Policy he retires as the Vice Chairman and Director of the Company on June 1, 2014.
3. Ceased to be Director as per the Company’s Retirement Age Policy with effect from April 25, 2013. 4. The remuneration of Mr N Munjee also includes remuneration of £50,000 received from JLR Automotive Plc and sitting fees
paid by TMFL. 5. Dr. Ralf Speth’s remuneration mentioned above is paid by Jaguar Land Rover Automotive Plc which includes the value of car
perks, NIC payments and pension accrual. 6. Ceased to be the Managing Director of the Company with effect from January 26, 2014. Excludes benefits of Rs.24,103,475
paid to Mr. Slym’s legal heir. 7. The remuneration includes sitting fees paid by Tata International Limited and Nita Company Limited. 8. The remuneration also includes sitting fees and commission paid by Automobile Corporation of Goa Limited. 9. The remuneration paid includes sitting fees paid by Sheba Properties Limited and Tata Technologies Limited. 10. Rounded to nearest thousands of Indian rupees. For full time Directors, the retirement benefits exclude provision for encashable
leave and gratuity as a separate actuarial valuation is not available.
(1)
(2)
(3)
(4)(10)
(5)(10)
(6)(10)
(7)(10)
(8)(10)
(9)(10)

ˆ200GNal5oju5tXnw†Š200GNal5oju5tXnw
762654 TX 81TATA MOTORS LTDFORM 20-F
28-Jul-2014 08:56 ESTHTMHKG
RR Donnelley ProFile HKR peetp0dc 5*ESS 0C
WCRFBU-MWE-XN0611.5.15
Page 1 of 1
The Company remains committed to pursuing the long-term interests of all stakeholders, including the Company’s shareholders and employees. The Company takes cognizance of the shareholders views; at the same time, it is necessary to balance this with recruiting and retaining an industry-proven management team through the long-term. This involves ensuring that the Company’s leadership and talent base is appropriately remunerated notwithstanding cyclical phases, particularly when the Company has ongoing significant turnaround and growth strategies under execution. The Company is currently considering its options and will move ahead taking into account this commitment to the best and most equitable interest of all stakeholders.
C. Board Practices. The Board size of ten directors is commensurate with our size and consistent with other companies in the industry. The
Board consists of Executive, Non-Executive and Independent Directors. Appointments of new directors are considered by the full Board and our shareholders at each year’s Annual General Meeting.
The roles of the Chairman and the Chief Executive Officer are distinct and separate with appropriate powers being delegated to the Managing Director to perform the day to day activities of the Company. As of the date of this annual report, the CSC is delegated with operational oversight of the Company while the position of Managing Director remains vacant.
The Board, along with its Committees, provide leadership and guidance to our management, in particular with respect to corporate governance, business strategies and growth plans, the identification of risks and their mitigation strategies, entry into new businesses, product launches, demand fulfillment and capital expenditure requirements, and the review of our plans and targets.
The Board has delegated powers to the Committees of the Board through written/stated specific terms of reference/scope and oversees the functioning operations of the Committees through various circulars/minutes circulated to it. The Committees operate as empowered agents of the Board as per their charter/terms of reference.
The Board also undertakes our subsidiaries’ oversight functions through review of their performance against their set targets, advises them on growth plans and where necessary, gives strategic guidelines. While all our subsidiaries have their respective Board of Directors and their management is responsible for their performance, our Board oversees the performance of our subsidiaries on a quarterly basis to have an oversight over the performance and functioning of our subsidiary companies. Our Audit Committee also has a meeting wherein the CEO and the CFO of our subsidiary companies meet annually and make presentations on significant issues in audit, internal control and risk management. The minutes of the meetings of our subsidiary companies are also placed before our Board of Directors and attention is drawn to significant transactions and arrangements entered into by our subsidiary companies.
Please see Item 6.A “— Directors and Senior Management” for details regarding the terms of office for the Board.
Committees The Audit Committee comprises of four independent directors: N. Munjee, Chairman, R. A. Mashelkar, V. K. Jairath, S.
M. Palia (ceased with effect from April 25, 2013) and Falguni Nayar (appointed with effect from May 29, 2013). The scope of the Audit Committee includes:
81
a) Reviewing the quarterly/annual financial statements before submission to the Board, focusing primarily on:
• Overseeing the Company’s financial reporting process and the disclosure of its financial information, including
earnings, press release, to ensure that the financial statements are correct, sufficient and credible;
• Reviewing reports on the Management Discussion and Analysis of financial condition, results of operations
and the Directors’ Responsibility Statement; • Compliance with accounting standards and changes in accounting policies and practices; • Major accounting entries involving estimates based on exercise of judgment by management; • Draft Audit Report, qualifications, if any and significant adjustments arising out of audit; • Analysis of the effects of alternative GAAP methods on the financial statements; • Compliance with listing and other legal requirements concerning financial statements; • Scrutiny of inter corporate loans and investments; and
• Disclosures made under the CEO and CFO certification and related party transactions to the Board and
Shareholders.

ˆ200GNal5ojlWHaPw>Š200GNal5ojlWHaPw>
762654 TX 82TATA MOTORS LTDFORM 20-F
25-Jul-2014 00:24 ESTHTMHKG
RR Donnelley ProFile HKR balaj0ma 1*ESS 0C
hkrdoc211.5.14
Page 1 of 1
The Audit Committee has also adopted policies for the approval of services to be rendered by our independent statutory auditors, based on a procedure for ensuring such auditor’s independence and objectivity, as well as for the oversight of audit work for streamlining the audit process across our subsidiaries.
The Nomination and Remuneration Committee: The Nomination Committee and Remuneration Committees were merged into one Committee with effect from November 8, 2013 comprising of two independent directors, namely N. N. Wadia and S. Bhargava and two Non-Executive Directors, namely Cyrus P. Mistry (appointed with effect from February 14, 2013) and Ravi Kant (Retired on June 1, 2014). The Committee is empowered to:
82
b) Reviewing with the management, external auditor and internal auditor, adequacy of internal control systems and
recommending improvements to the management.
c) Reviewing, with the management, the statement of uses/application of funds raised through an issue (public issue, rights issue, preferential issue, etc.), the statement of funds utilized for purposes other than those stated in the offer document/ prospectus/ notice and the report submitted by the monitoring agency monitoring the utilization of proceeds of a public or rights issue and making appropriate recommendations to the Board to take up steps in this matter.
d) Recommending the appointment/removal of the statutory auditor, cost auditor, fixing audit fees, name of Audit firm and approving non-audit/consulting services provided by the statutory auditors’ firms to the Company and its subsidiaries; evaluating auditors’ performance, qualifications, experience, and independence and pending proceedings relating to professional misconduct, if any. It shall also ensure that the cost auditors are independent, have arm’s length relationship and are also not otherwise disqualified at the time of their appointment or during their tenure.
e) Reviewing the adequacy of internal audit function, coverage and frequency of internal audit, appointment, removal,
performance and terms of remuneration of the chief internal auditor.
f) Discussing with the internal auditor and senior management significant internal audit findings and follow-up
thereon.
g) Reviewing the findings of any internal investigation by the internal auditor into matters involving suspected fraud or
irregularity or a failure of internal control systems of a material nature and report the matter to the Board.
h) Discussing with the external auditor before the audit commences, the nature and scope of audit, as well as conduct
post-audit discussions to ascertain any area of concern.
i) Reviewing the Company’s financial and risk management policies.
j) Establish and review the functioning of the Vigil Mechanism under the Whistle-Blower policy of the Company and
review the functioning of the legal compliance mechanism.
k) Reviewing the financial statements and investments made by subsidiary companies and subsidiary oversight relating
to areas such as adequacy of the internal audit structure and function of the subsidiaries, their status of audit plan and its execution, key internal audit observations, risk management and the control environment.
l) Look into the reasons for any substantial defaults in payment to the depositors, debenture holders, shareholders (in
case of non-payment of declared dividend) and creditors, if any.
m) Reviewing the effectiveness of the system for monitoring compliance with laws and regulations.
n) Approving the appointment of CFO after assessing the qualification, experience and background etc. of the
candidate.
o) Engaging a registered valuer in case valuations are required in respect of any property, stocks, shares, debentures,
securities, goodwill, assets, liabilities or net worth of the Company.
p) Reviewing and suitably reply to the report(s) forwarded by the auditors on the matters where auditors have sufficient
reason to believe that an offence involving fraud, is being or has been committed against the Company by officers or employees of the Company.
q) Reviewing the system of storage, retrieval, display or printout of books of accounts maintained in electronic mode
during the required period under law.
r) Approving all or any subsequent modification of transactions with related parties.
i. Formulate the criteria for determining qualifications, positive attributes and independence of a director.

ˆ200GNal5ojrY28cQfŠ200GNal5ojrY28cQf
762654 TX 83TATA MOTORS LTDFORM 20-F
27-Jul-2014 10:25 ESTHTMHKG
RR Donnelley ProFile HKR varsu0dc 4*ESS 0C
ACXFBU-MWE-XN1411.5.14
Page 1 of 1
We have not issued any stock options to our directors/employees.
Stakeholders Relationship Committee: Pursuant to the Companies Act, 2013, the Investors’ Grievance Committee was renamed as the Stakeholders’ Relationship Committee with effect from November 8, 2013, and is constituted by V. K. Jairath, Ravi Kant (ceased to be a member on June 1, 2014), Falguni Nayar (appointed with effect from May 29, 2013) and (late) Karl Slym (ceased to be a member with effect from January 26, 2014). The Committee oversees redressal of investors’ complaints pertaining to share/debenture transfers, non-receipt of annual reports, interest/dividend payments, issue of duplicate certificates, transmission (with or without legal representation) of shares and debentures, matters pertaining to our Fixed Deposit Program and other miscellaneous complaints. Its scope also includes delegation of powers to our executives or the share transfer agents to process share transfers and other investor-related matters.
The Executive Committee of the Board comprises Cyrus P. Mistry, Chairman, Ravi Kant (ceased to be a member with effect from June 1, 2014), N. N. Wadia, N. Munjee, S. Bhargava, Ravindra Pisharody, Satish Borwankar, and (late) Karl Slym (ceased to be a member with effect from January 26, 2014). This Committee came into effect on July 25, 2006, upon the dissolution of the Finance Committee and the Committee of the Board. The Committee reviews revenue and capital expenditure budgets, long-term business strategies and plans, the organizational structure of the Company, raising of finance, property related issues, review and sale of investments and the allotment of securities within established limits.
The Corporate Steering Committee or CSC comprises Cyrus P. Mistry, Chairman, Ravindra Pisharody, Satish Borwankar, C Ramakrishnan, the Chief Financial Officer as well as the Chief Human Resource Officer, the President (Passenger Vehicle Business Unit) and the Head, Advanced and Product Engineering. The Committee was constituted as an interim measure upon the demise of the late Mr Karl Slym to provide oversight on strategy and key aspects of the Company’s operations.
The Ethics and Compliance Committee sets forth policies relating to the implementation of the Tata Code of Conduct for Prevention of Insider Trading, the recordation of monthly reports and dealings in securities by the “Specified Persons” and make decisions regarding penal action in respect of violations of the applicable regulations/the Code. It also implements appropriate actions in respect of violations of the Tata Code of Conduct. The Ethics and Compliance Committee comprises, V. K. Jairath, Ravi Kant (ceased to be a member with effect from June 1, 2014), Falguni Nayar (appointed with effect from May 29, 2013) and (late) Karl Slym (ceased to be a member with effect from January 26, 2014), C. Ramakrishnan, our Chief Financial Officer, is the Compliance Officer under the Tata Code of Conduct.
The Safety, Health & Environment or SHE Committee was constituted with the objective of reviewing Safety, Health and Environment practices. The Board of Directors at its meeting held on February 14, 2013, constituted a Committee and adopted a Charter for the same. The SHE Committee comprises R. A. Mashelkar, Chairman, V. K. Jairath, (late) Karl Slym (ceased to be a member with effect from January 26, 2014), Ravindra Pisharody and Satish Borwankar as members of this Committee.
Corporate Social Responsibility Committee or CSR Committee was reconstituted on November 8, 2013 in accordance with the provisions of the Companies Act, 2013, comprising of R. A. Mashelkar, Chairman, Falguni Nayar and (late) Karl Slym (ceased to be a member with effect from January 26, 2014) as members of this Committee. Following are the terms of reference of the Committee:
83
ii. Recommend to the Board a policy relating to the remuneration for the directors (including specific remuneration
packages for Executive Directors including pension rights and any compensation payment), key managerial personnel and other employees. While formulating the policy, it shall ensure that –
(a) The level and composition of remuneration is reasonable and sufficient to attract, retain and motivate directors
of the quality required to run the company successfully;
(b) Relationship of remuneration to performance is clear and meets appropriate performance benchmarks; and
(c) Remuneration to directors, key managerial personnel and senior management involves a balance between fixed
and incentive pay reflecting short and long-term performance objectives appropriate to the working of the company and its goals.
iii. Identify persons who are qualified to become directors (including independent directors) and who may be appointed in senior management in accordance with the criteria laid down and recommend to the Board their appointment and removal. Whilst recommending appointment of Executive Directors, a balance between functional and business unit representatives may be considered.
iv. Carry out evaluation of every director’s performance including review of remuneration of CEOs of certain
significant subsidiaries.
v. Take steps to refresh the composition of the Board from time to time.
a) Formulate and recommend to the Board a Corporate Social Responsibility Policy which shall indicate the activities
to be undertaken by the Company as specified in Schedule VII;
b) Recommend the amount of expenditure to be incurred on the activities referred to in clause (a); and
c) Monitor the Corporate Social Responsibility Policy of the Company from time to time.

ˆ200GNal5ojw%vsxwjŠ200GNal5ojw%vsxwj
762654 TX 84TATA MOTORS LTDFORM 20-F
29-Jul-2014 06:25 ESTHTMHKG
RR Donnelley ProFile HKR palap0dc 3*ESS 0C
NERFBU-MWE-XN0111.5.15
Page 1 of 1
Apart from the Committees described above, the Board of Directors also constitutes committee(s) of directors with specific terms of reference as it may deem fit.
D. Employees. We consider our human capital as a critical factor to our success. Under the aegis of Tata Sons and the Tata Sons promoted
entities, we have drawn up a comprehensive human resource strategy which addresses key aspects of human resource development such as:
In line with our human resource strategy, we, in turn, have implemented various initiatives in order to build better organizational capability that we believe will enable us to sustain competitiveness in the global market place. Our human resources focus is to attract talent, retain the better and advance the best.
Some of the initiatives to meet this objective include:
We employed approximately 68,889 permanent employees as of March 31, 2014, including as part of our Jaguar Land Rover business and joint operations. The average number of flexible (temporary, trainee and contractual) employees for the Fiscal 2014 was approximately 35,260 (including joint operations).
84
• Code of conduct and fair business practices.
• A fair and objective performance management system linked to the performance of the businesses which identifies
and differentiates high performers while offering separation avenues for non-performers.
• Creation of a common pool of talented managers across Tata Sons and the Tata Sons promoted entities with a view
to increasing their mobility through inter-company job rotation.
• Evolution of performance based compensation packages to attract and retain talent within Tata Sons and the Tata
Sons promoted entities.
• Development of comprehensive training programs to impart and continuously upgrade the industry/function specific
skills.
• Extensive process mapping exercise to benchmark and align the human resource processes with global best
practices. • Driving a globally benchmarked employee engagement program. • Succession planning through identification of second level of managers for all units, locations, functions.
• Implementation of a “Fast Track Selection Scheme”, which is a system for identifying potential talent in the areas of
general, commercial and operations management and offering them opportunities for growth within the organization.
• Our “Talent Management Scheme” which includes the identification of high performers and high potentials through
various routes such as our Performance Management System and Development Centers. Subsequent to the identification process, we provide them with challenging assignments for faster development.
• Introduction of performance rating based salary review and quality linked variable payment for supervisory category
of employees.
• Restructuring the top level organization and creation of new verticals for greater functional focus and moving
towards creating a matrix organization.
• Implementation of a powerful employer brand to attract talent — “Lead the Future” has become our Employee
Value Proposition statement.
• Driving cultural transformation — we have reframed the mission, vision, values and culture of the organization and
introduced the concept of ACES — Accountability, Customer & Product focus, Excellence and Speed. • Extensive brand building initiatives at university campuses to increase recruiting from premium universities.
• To focus on skill and capability building of our blue collar workforce; common curriculum, infrastructure and
training methods have been developed. Pilot infrastructure has been developed at Pune and Sanand and the same will be introduced at all other manufacturing plants.
• Jaguar Land Rover launched a new “Team Talk Online” portal to its production workers, which provides them with
business updates alongside information on employee benefits, training and development.

ˆ200GNal5ojw%jFFQ}Š200GNal5ojw%jFFQ}
762654 TX 85TATA MOTORS LTDFORM 20-F
29-Jul-2014 06:21 ESTHTMHKG
RR Donnelley ProFile HKR thanm0dc 3*ESS 0C
ACXFBU-MWE-XN1311.5.15
Page 1 of 1
The following table set forth a breakdown of persons employed by our business segments and by geographic location as of March 31, 2014.
Training and Development The Company is committed to the training and development of its employees. There is a focused approach to address all
capability gaps and prepare employees for changes in the external environment, such that it enables meeting the organization’s strategic objectives.
The training and development system addresses development needs of various segments of workforce through the Tata Motors Academy or TMA. Well defined Centres of Excellence or CoEs, like Manufacturing Excellence and Innovation, Commercial, Corporate, Management Development and Global Leadership are a part of TMA. These CoEs address the diverse needs of different categories of employees and functions through mediums like classroom interventions, external programs as well as an in-house learning management system based online platform. TMA offers learning interventions at each level of an employee’s transition in the organization beginning with his/her joining. Employees viewed as having higher potential at senior levels are also selected for Fulbright fellowships for leadership in management.
As a means of ensuring business relevance and value of learning offered, efforts are taken to closely align learning & development with business needs and priorities through a learning governance body called as Learning Advisory Council or LAC. We have a multi-tiered LAC structure which involves senior leaders in different parts of the organization as its members. LACs play a threefold role namely — designing, implementing and reviewing the learning agenda.
Within the technical training set up an innovative Fundamental Skills Training intervention has been launched across the organization. This aims at addressing the key issues of inconsistent quality, poor craftsmanship, high repair & rework and low productivity levels through training of the front line team members on the correct skill required to perform the job. We are now migrating from a trade based training approach to a process based training approach wherein it is more important for the team member to know skills related to his actual work in addition to the general trade based skills which he learns at the training institutes. These skills are very specific and not currently taught at the training institutes.
Union Wage Settlements All employees in India belonging to the operative grades are members of labor unions except at our Sanand and Dharwad
plants. We have generally enjoyed cordial relations with our employees at our factories and offices.
Employee wages are paid in accordance with wage agreements that have varying terms (typically three years) at different locations. The expiration dates of the wage agreements with respect to various locations/subsidiaries are as follows:
85
Segment No. of Employees
Automotive 63,051 Other 5,838 Total 68,889
Location No. of Employees India 43,986 Abroad 24,903 Total 68,889
Location/subsidiaries Wage Agreement valid until Pune CVBU August 31, 2015 Pune PVBU March 31, 2016 Jamshedpur March 31, 2016 Mumbai December 31, 2015 Lucknow March 31, 2014* Pantnagar March 31, 2015 Jaguar Land Rover October 31, 2014
* under negotiation

ˆ200GNal5ojrYk#vwgŠ200GNal5ojrYk#vwg
762654 TX 86TATA MOTORS LTDFORM 20-F
27-Jul-2014 10:56 ESTHTMHKG
RR Donnelley ProFile HKR varsu0dc 6*ESS 0C
ACXFBU-MWE-XN0711.5.14
Page 1 of 1
We strive to maintain cordial industrial relations environment in all our manufacturing units. In October 2013, at the Pantnagar plant there was a disagreement on bonus payment with the Union and as a result the plant operations were shut down for four working days. The issue was resolved through conciliation proceedings with the union. The bonus paid was accepted and as on date there is no dispute pending in this regard.
The variability in wage settlements was built in by introducing vehicles and profit linked payment scheme based on the index of various parameters such as quality, productivity, operating profit and individual’s performance and attendance. As a result, the payment was high, if the Company did well and low if it did not.
Union support in implementation of reforms that impact quality, cost erosion and productivity improvements across all locations is commendable.
In South Korea, our union employees had filed a lawsuit to include some elements of non-ordinary salary and bonus as part of ordinary wages. The district court ruled in favor of the union employees on January 2013 and ordered TDCV to pay the employees KRW 17.2 billion and interest, up to the period of lawsuit. We have recoded a provision of KRW 43.6 billion (Rs.2,124 million) (through March 31, 2013) in Fiscal 2013 in respect of this lawsuit. TDCV has filed an appeal against the order which is still pending. In December 2013, in a case involving an unaffiliated company the Supreme Court of South Korea laid down guidelines and principles of determining the elements which could be considered as part of ordinary wage and the principles to be considered for determining the applicability of such claims on a retrospective basis. The Labor Union has formally withdrawn its claim in respect of five elements out of total twelve elements which were part of the original claim. Accordingly, TDCV reversed provision of KRW 13.4 billion (Rs.748 million) in Fiscal 2014 for such five items and recorded a provision of KRW 45.8 billion (Rs.2,565 million) up to March 31, 2014 in respect of this lawsuit. On April 18, 2014, the High Court ordered mediation, to which the Union did not concur. At present this matter is pending before the High Court.
E. Share Ownership. The information required by this item is set forth in Item 6.A “— Directors, Senior Management and Employees” of this
annual report.
A. Major Shareholders. We are a widely held, listed company with approximately 356,574, shareholders for Ordinary Shares and 43,960
shareholders for ‘A’ Ordinary Shares on record. To our knowledge, as of June 30, 2014, the following persons beneficially owned 1% or more of 2,736,713,122 Ordinary Shares and 481,966,945 ‘A’ Ordinary Shares outstanding at that time:
Ordinary Shares
86
Item 7. Major Shareholders and Related Party Transactions.
Name of Shareholder Holding Percentage
Tata Sons Limited and Subsidiary 702,333,345 25.67 Tata Steel Limited and Subsidiary 147,810,695 5.40 Tata Industries Limited 68,436,485 2.50 Life Insurance Corporation of India 102,169,250 3.73 Europacific Growth Fund 55,477,262 2.03 Citibank N.A. 581,674,545 21.25 ICICI Prudential Life Insurance Company Limited 31,082,892 1.14
(1)

ˆ200GNal5ojo3fp7w^Š200GNal5ojo3fp7w^
762654 TX 87TATA MOTORS LTDFORM 20-F
25-Jul-2014 13:29 ESTHTMHKG
RR Donnelley ProFile HKR kotts0dc 2*ESS 0C
ACXFBU-MWE-XN1511.5.14
Page 1 of 1
‘A’ Ordinary Shares*
From March 31, 2011 to June 30, 2014, the holdings of our largest shareholder, Tata Sons Limited (together with its subsidiaries), have increased from 25.12% to 25.67%. The holdings of Tata Steel Ltd. (together with its subsidiaries) have increased from 4.79% as of March 31, 2011 to 5.40% as of June 30, 2014. The shareholding of Citibank N.A. as depositary for our ADRs and GDRs has increased from 17.29% to 21.25%. The shareholding of Life Insurance Corporation of India Ltd. has decreased from 6.45% to 3.73%.
According to our register of shareholders and register of beneficial shareholders, as of June 30, 2014, there were 70 registered holders of our shares with addresses in the United States, whose shareholdings represented approximately 0.03% of our outstanding Ordinary Shares on that date, excluding any of our shares held by United States residents in the form of depositary shares. Because some of these shares were held by brokers or other nominees, the number of record holders with addresses in the United States may be fewer than the number of beneficial owners in the United States.
The total permitted holding of Foreign Institutional Investors, or FIIs, in the Ordinary Share paid up capital has been increased to 35% by a resolution passed by our shareholders on January 22, 2004 and to 75% of the ‘A’ Ordinary Share paid up Capital approved by the Reserve Bank of India pursuant to their letter dated October 31, 2013. The FII holding as of June 30, 2014 in Ordinary Shares was approximately 27.78% and 67.06% in ‘A’ Ordinary Shares. See Item 10.D “— Exchange Controls” for further details.
None of our shares of common stock entitles the holder to any preferential voting rights.
87
Name of Shareholder Holding Percentage
Mathews Asia Dividend Fund 33,395,515 6.93 HSBC Global Investment Funds A/C HSBC Global Investment Funds Mauritius Limited 27,062,051 5.62 HDFC Trustee Company Limited - HDFC Equity Fund 22,195,750 4.61 HDFC Trustee Company Limited - HDFC Top 200 Fund 19,099,057 3.96 Merrill Lynch Capital Markets Espana S.A.S.V 15,139,005 3.14 Government of Singapore 13,632,495 2.83 Government Pension Fund Global 11,757,569 2.44 Swiss Finance Corporation (Mauritius) Limited 10,342,176 2.15 Skagen Global Verdipapirfond 8,226,456 1.71 SBI Magnum Taxgain Scheme 8,000,000 1.66 HDFC Trustee Company Limited - HDFC Prudence Fund 7,967,427 1.65 Franklin Templeton Investment Funds 7,450,000 1.55 The Master Trust Bank of Japan, Ltd. A/C HSBC Indian Equity Mother Fund 7,361,946 1.53 Pioneer Asset Management S.A. A/C Pioneer Asset Management S.A. on behalf of Pioneer Funds - Emerging Markets Equity 6,945,880 1.44 HDFC Trustee Company Limited - HDFC Tax Saverfund 6,685,418 1.39 D. E. Shaw Oculus Investments Bi-Fi 1 Mauritius Limited 6,500,000 1.35 Goldman Sachs (Singapore) Pte 5,802,961 1.20 Eastspring Investments India Equity Open Limited 5,422,770 1.13 Nomura Singapore Limited 5,305,167 1.10 Nordea Emerging Market Equities Fund 5,205,728 1.08 Morgan Stanley Asia (Singapore) Pte. 5,170,116 1.07 Macquarie Emerging Markets Asian Trading Pte. Ltd. 4,994,000 1.04
Citibank, N.A. as depositary for our ADRs and GDRs, was the holder on record on June 30, 2014 of 581,630,185 Shares and 44,360 Shares respectively on behalf of the beneficial owners of deposited shares.
* The ‘A’ Ordinary Shareholders are entitled to receive a dividend for any financial year at five percentage points more than the aggregate rate of dividend declared on Ordinary Shares for that financial year but are entitled to one vote for every ten ‘A’ Ordinary Shares held as per the terms of its issue and the Articles of Association of the Company.
(1)

ˆ200GNal5ojw%y5Qw†Š200GNal5ojw%y5Qw
762654 TX 88TATA MOTORS LTDFORM 20-F
29-Jul-2014 06:26 ESTHTMHKG
RR Donnelley ProFile HKR palap0dc 4*ESS 0C
NERFBU-MWE-XN0111.5.15
Page 1 of 1
Under the Takeover Regulations of India, in the event of any acquisition of shares or voting rights, which, taken together with shares or voting rights held by the acquirer and by person acting in concert with such acquirer, aggregate to 5% or more of the shares, or any acquisition or disposal of 2% or more shares or voting rights, such person must file a report concerning the shareholding or the voting rights with us and the stock exchanges on which our Shares are traded. Please see Item 9.A “— Offer and Listing Details — Markets” for information with respect to these stock exchanges. Disclosures would be applicable under the Insider Trading Regulations of India with respect to (i) any person who holds more than 5% shares or voting rights and any change in his holdings by 2% or more (ii) any person, who is a director or officer of the company on becoming a director or an officer of the company and any person who is a promoter or part of a promoter group on becoming a promoter or belonging to a promoter group, shall disclose any change in the holdings exceeding Rs.500,000 in value or 25,000 shares or 1% of the total shareholdings or voting rights whichever is lower. The above disclosure under Insider Trading Regulations would be made to us and we would in turn disclose to relevant stock exchanges. Furthermore, under our listing agreement with the stock exchanges where our Shares are listed, we are required to periodically disclose to such stock exchanges the name and percentage of shares held by persons or entities that hold more than 1% of our Shares. For the purposes of the above, reporting and takeover requirements under our listing agreements, shares withdrawn from our ADS/GDS facility will be included as part of a person’s shareholding.
To our knowledge, we are not, directly or indirectly, owned or controlled by any other corporation or by any government or by any other natural or legal persons severally or jointly. We are not aware of any arrangements the operation of which may at a later time result in our change of control.
For details regarding voting rights, please refer to Item 10.B “— Memorandum and Articles of Association — Voting Rights”.
B. Related Party Transactions. Our related parties principally consist of Tata Sons, subsidiaries and joint ventures of Tata Sons, our joint ventures and our
associates and their subsidiaries. We routinely enter into transactions with these related parties in the ordinary course of business. We enter into transactions for sale and purchase of products with our associates and joint ventures.
The following table summarizes related party transactions and balances included in our consolidated financial statements included elsewhere in this annual report for the year ended / as of March 31, 2014:
88
With associates and their
subsidiaries With joint Operations
With jointventures
With Tata Sons Ltd and
its subsidiaries
and joint ventures Notes
(Rs. in millions)
Purchase of products 13,276 21,598 — 497 (Note a) Sale of products 1,829 5,553 33 10,642 Services received 99 2 910 10,858 (Note b) Services rendered 125 58 2,510 929 Bill discounted — — — 16,015 (Note c) Redemption / buyback of investment — — 96 — Purchase of property, plant and equipment — — — 8 Interest Income 3 268 — 4 (Note d) Interest expenses 29 154 — 252 Dividend Income 145 — — 100 Dividend paid — — — 1,409 Amount receivable in respect of Loans and interest
thereon 1 1,733 — 90 (Note d) Amount payable in respect of Loans and interest
thereon 160 — — 289 Bill discounted (in respect of amount payable) — — — 1,360 (Note c) Loans given 269 — — — Loans repaid by related parties — — — 5 Loans taken 335 — — — Loans repaid by us 370 — — 578 Deposit receivable — — — 30

ˆ200GNal5oj$$$prQ5Š 200GNal5oj$$$prQ5
762654 TX 89TATA MOTORS LTDFORM 20-F
31-Jul-2014 10:14 ESTHTMHKG
RR Donnelley ProFile HKR peetp0dc 6*ESS 0C
WCRFBU-MWE-XN0511.5.15
Page 1 of 1
Notes: The details of major items are as follows:
Please refer to Note 39 to our consolidated financial statements included elsewhere in this annual report for further detail.
C. Interests of Experts and Counsel. Not applicable.
A. Consolidated Statements and Other Financial Information. The information required by this item is set forth beginning on page F-1 of this annual report.
Legal or Arbitration Proceedings. The information on legal or arbitration proceedings required by this item is set forth in Item 4.B “— Business Overview —
Legal Proceedings”.
89
a. During Fiscal 2014, we purchased from our associates and joint operations various vehicle components, assemblies, aggregates, etc., totaling Rs.34,874 million. For the period from April 1, 2014 through June 30, 2014, our purchases were Rs.8,919 million from these associates and joint operations. These purchases have been made at fair market price determined in accordance with arm’s length commercial terms.
b.
i)
The services received from Tata Sons Limited include those for which brand subscription fees were paid pursuant to an agreement with them (Refer to Exhibit 4.1), under which the Company and certain of its subsidiaries have agreed to pay an annual subscription fee for participation and gain from promotion and protection of the Tata brand identity. The annual subscription fee is equal to 0.15%-0.25% of annual net income (defined as net revenues exclusive of excise duties and other governmental taxes and non-operating income), subject to a ceiling of 5% of annual profit before tax (defined as profit after interest and depreciation but before income tax) (unconsolidated as per Indian GAAP).
ii)
We also received other business support services from subsidiaries of Tata Sons, in the areas of call center and transaction processing work for the Company and some of its subsidiaries. These services are in the normal course of business and the transaction prices represent fair market price of the consideration, and other terms have been based on the normal commercial terms.
iii)
We received IT related services from one of the subsidiaries of Tata Sons, Tata Consultancy Services Limited, or TCS (a leading IT service provider), for integrated IT service relating to IT infrastructure for the Company, Jaguar Land Rover and other subsidiary companies. The contract was finalized after evaluation of competitive bids from TCS and other IT service provider. These services are in the normal course of business and the transaction prices represent fair market price of the consideration, and other terms have been based on the normal commercial terms.
c. During Fiscal 2014, we have paid discounting charges for invoice discounting facility availed by vendors, with one of the subsidiary of Tata Sons. These services are in the normal course of business and the transaction price (discounting charges) represents fair market price, considering commercial and market terms.
d. As of March 31, 2014, the subordinated loan to a joint operation (including interest) was Rs.1,733 million and represents the largest amount outstanding during Fiscal 2014. The loan is subordinated to other borrowings of the joint operation. The interest in respect of loans was Rs.119 million in Fiscal 2014, and is based on the reference rate of the Reserve Bank of India. As of June 30, 2014, we had a total of Rs.1,760 million of outstanding loans (including interest ) (net of inter company elimination).
Item 8. Financial Information.

ˆ200GNal5ojnx7mzwÆŠ200GNal5ojnx7mzw˘
762654 TX 90TATA MOTORS LTDFORM 20-F
25-Jul-2014 12:59 ESTHTMHKG
RR Donnelley ProFile HKR dommj0dc 3*ESS 0C
LANFBU-MWE-XN2111.5.15
Page 1 of 1
Dividend Policy. Any dividend declared by Tata Motors is based on the profits available for distribution as reported in the unconsolidated
statutory financial statements of Tata Motors prepared in accordance with Indian GAAP. Further, Indian law mandates that dividends be declared out of distributable profits only after the transfer of a specified percentage of net income computed in accordance with current regulations to a general reserve. Based on the net income available for appropriation, dividends are recommended by the Board of Directors for approval by the shareholders at our Annual General Meeting. Further, the Board of Directors may also pay an interim dividend at its discretion. Since Fiscal year 1956, we have had an uninterrupted dividend distribution except for the Fiscal years 2001 and 2002. We returned to dividend distribution in Fiscal 2003. Considering the Company’s financial performance, we declared dividends (excluding dividend tax) totaling Rs.6,485 million, Rs.12,807 million and Rs.12,742 million for Fiscal 2014, 2013 and 2012 to our shareholders.
B. Significant Changes. Other than as set forth in this annual report, no significant change has occurred with respect to us since the date of our
audited consolidated IFRS financial statements included elsewhere in this annual report.
A. Offer and Listing Details. There has been no SEC-registered offering of our Shares in the United States.
The details on our share and ADS price history are included in Item 9.C “— Markets”.
B. Plan of Distribution. Not applicable.
90
Item 9. The Offer and Listing.

ˆ200GNal5ojlbCvBQxŠ200GNal5ojlbCvBQx
762654 TX 91TATA MOTORS LTDFORM 20-F
25-Jul-2014 00:33 ESTHTMHKG
RR Donnelley ProFile HKR pf_rend 2*ESS 0C
HKRPRFRS1011.5.15
Page 1 of 1
C. Markets.
91
NSE BSE NYSE
Closing Price per Ordinary Share
Closing Price per Ordinary Share Closing Price per ADS
Period High
Period Low
Period High
Period Low
Period High
Period Low
(Rs. Per Share)
Avg. Daily Trading Volume
(in ‘000) (Rs. Per Share)
Avg. Daily Trading Volume
(in ‘000) (US$ Per ADS)
Avg. Daily Trading Volume
(in ‘000) Fiscal 2014 416.95 255.20 7227.83 417.05 255.30 820.41 35.41 22.25 495.69 2013 333.70 205.10 10,275.70 333.40 204.85 1,321.40 30.74 18.94 562.27 2012 1,298.70 139.60 9,367.10 1,295.05 139.65 1,459.06 28.87 14.89 833.79 2011 1,365.15 673.45 3,667.12 1,365.60 673.70 693.39 36.00 15.65 849.69 2010 826.45 180.00 4,987.09 827.40 179.85 1,388.76 18.77 5.36 580.72 2009 691.55 126.20 1,734.36 690.45 126.45 502.91 17.15 3.14 466.25 Fiscal 2014 1st Quarter 317.05 255.20 8109.06 316.90 255.30 869.55 28.67 22.71 558.77 2nd Quarter 349.60 278.80 8029.33 349.20 278.70 950.28 27.67 22.25 486.56 3rd Quarter 399.90 335.65 7013.72 399.85 335.50 905.39 32.72 27.30 482.00 4th Quarter 416.95 336.40 5755.81 417.05 336.60 557.76 35.41 26.74 453.61 Fiscal 2013 1st Quarter 319.25 221.65 11,691.75 319.35 221.55 1,733.27 30.28 20.07 735.90 2nd Quarter 277.85 205.10 10,026.14 277.65 204.85 1,378.32 25.68 18.94 493.38 3rd Quarter 312.65 247.65 9,859.39 312.40 247.70 1,125.91 28.72 23.88 402.16 4th Quarter 333.70 269.15 9,499.97 333.40 269.30 1,037.39 30.74 24.41 617.75 Fiscal 2012 1st Quarter 1,298.70 931.00 2,111.76 1,295.05 930.25 349.93 28.58 21.10 927.20 2nd Quarter 1,068.10 139.60 5,594.62 1,063.95 139.65 874.00 24.05 14.89 978.63 3rd Quarter 206.80 147.70 15,312.45 206.20 147.25 2,549.26 21.34 15.00 719.66 4th Quarter 290.45 183.95 14,535.50 289.40 183.80 2,087.37 28.87 18.11 705.00 Fiscal 2011 1st Quarter 872.60 673.45 4,858.74 872.85 673.70 924.54 20.60 15.65 508.24 2nd Quarter 1,106.45 750.95 3,569.12 1,106.65 750.90 798.15 25.52 17.16 654.94 3rd Quarter 1,365.15 1,102.95 3,263.50 1,365.60 1,104.90 511.13 36.00 25.59 1,062.97 4th Quarter 1,308.45 1,054.40 2,982.49 1,306.45 1,058.25 536.80 30.06 23.93 1,177.51 Month March 2014 412.90 379.70 5019.14 412.90 380.10 415.06 35.41 32.48 366.17 February 2014 416.95 336.40 7499.63 417.05 336.60 776.00 35.05 26.74 615.29 January 2014 386.10 348.25 4987.88 385.30 347.80 507.76 31.33 27.25 394.78 December 2013 399.90 360.45 6340.33 399.85 360.60 732.49 32.28 29.50 417.64 November 2013 399.20 360.00 6978.14 399.25 360.05 954.56 32.72 28.46 480.40 October 2013 390.45 335.65 7721.00 390.85 335.50 1031.46 32.32 27.30 542.16 September 2013 349.60 297.35 7459.98 349.20 297.25 1011.19 27.67 22.31 475.01 August 2013 319.10 278.80 10196.20 319.30 278.70 1003.89 25.58 22.25 591.23 July 2013 299.90 284.05 6640.17 299.85 284.15 850.69 25.25 23.41 392.39 June 2013 314.05 270.30 8749.01 313.8 269.50 1014.97 27.53 22.71 524.80 May 2013 317.05 285.60 7235.69 316.90 285.30 788.35 28.67 25.60 498.68 April 2013 300.00 255.20 8473.50 299.45 255.30 817.51 27.54 23.62 649.73 March 2013 309.40 269.15 10,126.55 309.25 269.30 969.18 28.49 24.41 585.69 February 2013 306.75 281.65 8,655.31 306.90 285.00 922.75 29.12 26.73 615.07 January 2013 333.70 293.45 9,716.85 333.40 293.55 1,193.42 30.74 26.99 650.71 December 2012 312.65 271.55 9,747.96 312.40 271.30 1,386.00 28.72 25.02 355.23 November 2012 283.95 258.75 12,527.20 284.10 258.85 1,122.87 25.73 23.88 455.28 October 2012 280.55 247.65 7,424.74 280.35 247.70 881.09 26.81 24.13 393.74 September 2012 277.85 228.70 10,366.80 277.65 228.70 1,294.80 25.68 20.72 565.94 August 2012 248.10 220.95 10,182.98 247.90 220.90 1,398.22 22.13 19.88 472.21 July 2012 246.50 205.10 9,566.73 246.40 204.85 1,435.24 22.42 18.94 450.93 June 2012 248.20 221.65 13,774.30 248.10 221.55 2225.67 22.25 20.07 571.70 May 2012 308.40 233.00 12,891.74 308.30 233.20 1700.60 29.88 20.79 906.59 April 2012 319.25 275.60 8,185.10 319.35 275.75 1252.18 30.28 27.00 720.56 March 2012 290.45 267.00 11,261.60 289.40 266.00 1517.36 28.87 26.22 582.59 February 2012 287.85 246.45 16,624.52 286.40 246.10 2568.69 28.14 24.98 769.89 January 2012 243.75 183.95 15,910.29 243.60 183.80 2219.83 24.08 18.11 775.77
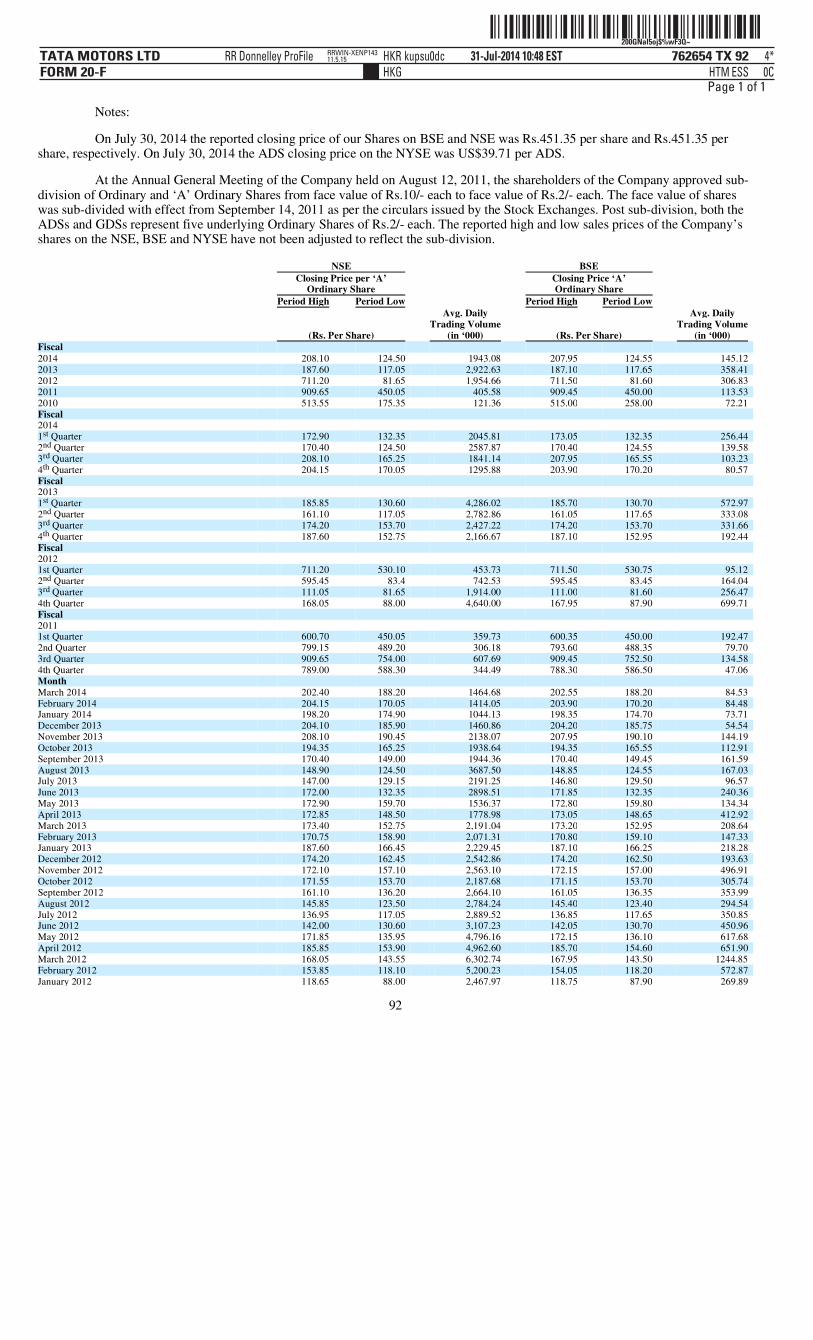
ˆ200GNal5oj$%wF3Q~Š 200GNal5oj$%wF3Q~
762654 TX 92TATA MOTORS LTDFORM 20-F
31-Jul-2014 10:48 ESTHTMHKG
RR Donnelley ProFile HKR kupsu0dc 4*ESS 0C
RRWIN-XENP14311.5.15
Page 1 of 1
Notes:
On July 30, 2014 the reported closing price of our Shares on BSE and NSE was Rs.451.35 per share and Rs.451.35 per share, respectively. On July 30, 2014 the ADS closing price on the NYSE was US$39.71 per ADS.
At the Annual General Meeting of the Company held on August 12, 2011, the shareholders of the Company approved sub-division of Ordinary and ‘A’ Ordinary Shares from face value of Rs.10/- each to face value of Rs.2/- each. The face value of shares was sub-divided with effect from September 14, 2011 as per the circulars issued by the Stock Exchanges. Post sub-division, both the ADSs and GDSs represent five underlying Ordinary Shares of Rs.2/- each. The reported high and low sales prices of the Company’s shares on the NSE, BSE and NYSE have not been adjusted to reflect the sub-division.
92
NSE BSE
Closing Price per ‘A’
Ordinary Share Closing Price ‘A’ Ordinary Share
Period High Period Low Period High Period Low
(Rs. Per Share)
Avg. Daily Trading Volume
(in ‘000) (Rs. Per Share)
Avg. Daily Trading Volume
(in ‘000) Fiscal 2014 208.10 124.50 1943.08 207.95 124.55 145.12 2013 187.60 117.05 2,922.63 187.10 117.65 358.41 2012 711.20 81.65 1,954.66 711.50 81.60 306.83 2011 909.65 450.05 405.58 909.45 450.00 113.53 2010 513.55 175.35 121.36 515.00 258.00 72.21 Fiscal 2014 1 Quarter 172.90 132.35 2045.81 173.05 132.35 256.44 2 Quarter 170.40 124.50 2587.87 170.40 124.55 139.58 3 Quarter 208.10 165.25 1841.14 207.95 165.55 103.23 4 Quarter 204.15 170.05 1295.88 203.90 170.20 80.57 Fiscal 2013 1 Quarter 185.85 130.60 4,286.02 185.70 130.70 572.97 2 Quarter 161.10 117.05 2,782.86 161.05 117.65 333.08 3 Quarter 174.20 153.70 2,427.22 174.20 153.70 331.66 4 Quarter 187.60 152.75 2,166.67 187.10 152.95 192.44 Fiscal 2012 1st Quarter 711.20 530.10 453.73 711.50 530.75 95.12 2 Quarter 595.45 83.4 742.53 595.45 83.45 164.04 3 Quarter 111.05 81.65 1,914.00 111.00 81.60 256.47 4th Quarter 168.05 88.00 4,640.00 167.95 87.90 699.71 Fiscal 2011 1st Quarter 600.70 450.05 359.73 600.35 450.00 192.47 2nd Quarter 799.15 489.20 306.18 793.60 488.35 79.70 3rd Quarter 909.65 754.00 607.69 909.45 752.50 134.58 4th Quarter 789.00 588.30 344.49 788.30 586.50 47.06 Month March 2014 202.40 188.20 1464.68 202.55 188.20 84.53 February 2014 204.15 170.05 1414.05 203.90 170.20 84.48 January 2014 198.20 174.90 1044.13 198.35 174.70 73.71 December 2013 204.10 185.90 1460.86 204.20 185.75 54.54 November 2013 208.10 190.45 2138.07 207.95 190.10 144.19 October 2013 194.35 165.25 1938.64 194.35 165.55 112.91 September 2013 170.40 149.00 1944.36 170.40 149.45 161.59 August 2013 148.90 124.50 3687.50 148.85 124.55 167.03 July 2013 147.00 129.15 2191.25 146.80 129.50 96.57 June 2013 172.00 132.35 2898.51 171.85 132.35 240.36 May 2013 172.90 159.70 1536.37 172.80 159.80 134.34 April 2013 172.85 148.50 1778.98 173.05 148.65 412.92 March 2013 173.40 152.75 2,191.04 173.20 152.95 208.64 February 2013 170.75 158.90 2,071.31 170.80 159.10 147.33 January 2013 187.60 166.45 2,229.45 187.10 166.25 218.28 December 2012 174.20 162.45 2,542.86 174.20 162.50 193.63 November 2012 172.10 157.10 2,563.10 172.15 157.00 496.91 October 2012 171.55 153.70 2,187.68 171.15 153.70 305.74 September 2012 161.10 136.20 2,664.10 161.05 136.35 353.99 August 2012 145.85 123.50 2,784.24 145.40 123.40 294.54 July 2012 136.95 117.05 2,889.52 136.85 117.65 350.85 June 2012 142.00 130.60 3,107.23 142.05 130.70 450.96 May 2012 171.85 135.95 4,796.16 172.15 136.10 617.68 April 2012 185.85 153.90 4,962.60 185.70 154.60 651.90 March 2012 168.05 143.55 6,302.74 167.95 143.50 1244.85 February 2012 153.85 118.10 5,200.23 154.05 118.20 572.87 January 2012 118.65 88.00 2,467.97 118.75 87.90 269.89
stndrdth
stndrdth
ndrd
ˆ200GNal5oj$%d8QQÉŠ 200GNal5oj$%d8QQ
762654 TX 93TATA MOTORS LTDFORM 20-F
31-Jul-2014 10:34 ESTHTMHKG
RR Donnelley ProFile HKR kupsu0dc 5*ESS 0C
RRWIN-XENP14311.5.15
Page 1 of 1
Notes:
On July 30, 2014, the reported closing price of our ‘A’ Ordinary Shares on BSE and NSE was Rs.296.25 per share and Rs.296.25 per share, respectively.
At the Annual General Meeting of the Company held on August 12, 2011, the shareholders of the Company approved sub-division of Ordinary and ‘A’ Ordinary Shares from face value of Rs.10/- each to face value of Rs.2/- each. The face value of Shares was sub-divided with effect from September 14, 2011 as per the circulars issued by the Stock Exchanges. The reported high and low sales prices of the Company’s shares on the NSE and BSE have not been adjusted to reflect the sub-division.
D. Selling Shareholders. Not applicable.
E. Dilution. Not applicable.
F. Expenses of the Issue. Not applicable.
A. Share Capital Our authorized share capital is Rs.39 billion divided into 3.5 billion Ordinary Shares of Rs.2 each, 1 billion ‘A’ Ordinary
Shares of Rs.2 each (the Ordinary Shares and the ‘A’ Ordinary Shares are hereinafter together referred to as Ordinary Shares or Shares unless otherwise specifically mentioned to the contrary) and 300 million Convertible Cumulative Preference Shares of Rs.100 each.
Under the Companies Act, as well as our Articles of Association, if our share capital is divided into different classes of shares, all or any of the rights or privileges attached to each class of shares may be varied, modified, abrogated or dealt with, with the consent in writing of the holders of not less than three-fourths of the issued shares of that class, or with the sanction of a special resolution passed at a separate meeting of the holders of the issued shares of that class. Our Articles of Association further provide that the rights conferred upon the holders of the shares of any class issued with preferred or other rights shall not, unless otherwise expressly prohibited by the terms of the issue of the shares of that class, be deemed to be varied by the creation or issue of further shares ranking pari passu thereto.
In accordance with the Articles, we may issue Ordinary Shares with differential rights as to voting and/or dividend up to an amount not exceeding 25% of the total issued Ordinary Share capital of the Company or such other limit as may be prescribed by applicable laws/regulations. This is stricter than the requirement under the Companies Act and the Companies (Share Capital and Debenture) Rule, 2014, according to which no Company may issue shares with differential rights exceeding 26% of its total post-issue paid up equity share capital including equity shares with differential rights issued at any point of time.
93
Item 10. Additional Information.

ˆ200GNal5ojo4Q#cQ+Š200GNal5ojo4Q#cQ+
762654 TX 94TATA MOTORS LTDFORM 20-F
25-Jul-2014 13:38 ESTHTMHKG
RR Donnelley ProFile HKR kotts0dc 3*ESS 0C
ACXFBU-MWE-XN1511.5.14
Page 1 of 1
Details of history and changes in our capital structure in the last three years The following table sets out the details of the equity shares allotted by us in the last three years:
B. Memorandum and Articles of Association. Objects and Purposes
Our principal objects, as provided by Clause 3 of our Memorandum of Association, include:
94
Description of Paid up Capital Ordinary
Shares Description of Paid up Capital
‘A’ Ordinary
Shares
Capital as on March 31, 2011 538,272,284 Capital as on March 31, 2011 96,341,706 Abeyance cases 50,199 Abeyance cases 44,765 Capital as on May 23, 2011 538,322,483 Capital as on May 23, 2011 96,386,471 Capital as on May 31, 2011 538,322,483 Capital as on May 31, 2011 96,386,471 Capital as on June 30, 2011 538,322,483 Capital as on June 30, 2011 96,386,471 Sub-division of shares to face value of Rs.2 each with effect from September 14, 2011 2,691,612,415
Sub-division of shares to face value of Rs.2 each with effect from September 14, 2011 481,932,355
Capital as on September 30, 2011 2,691,612,415 Capital as on September 30, 2011 481,932,355 Abeyance cases 665 Abeyance cases 665 Capital as on October 10, 2011 26,91,613,080 Capital as on October 10, 2011 481,933,020 Abeyance cases 375 Abeyance cases 95 Capital as on December 19, 2011 2,691,613,455 Capital as on December 19, 2011 481,933,115 Capital as on March 31, 2012 2,691,613,455 Capital as on March 31, 2012 481,933,115 Abeyance cases 25 Abeyance cases 26,075 Capital as on April 9, 2012 2,691,613,480 Capital as on April 9, 2012 481,959,190 FCCN Conversion 22,370
Capital as on April 30, 2012 2,691,635,850 Capital as on April 30, 2012 481,959,190 FCCN Conversion 16,095,391
Capital as on May 11, 2012 2,707,731,241 Capital as on May 11, 2012 481,959,190 Capital as on June 30, 2012 2,707,731,241 Capital as on June 30, 2012 481,959,190 Capital as on September 30, 2012 2,707,731,241 Capital as on September 30, 2012 481,959,190 4% FCCN allotment dated November 20, 2012 115,585
Abeyance allotment on January 7, 2013 1,100 Abeyance allotment on January 7, 2013 430 Capital as on January 7, 2013 2,707,847,926 Capital as on January 7, 2013 481,959,620 4% FCCN allotment dated February 11, 2013 308,225
Capital as on March 31, 2013 2,708,156,151 Capital as on March 31, 2013 481,959,620 4% FCCN allotment dated May 14, 2013 11,789,695
Capital as on May 14, 2013 2,719,945,846 Capital as on May 14, 2013 481,959,620 4% FCCN allotment dated June 4, 2013 16,759,871
Capital as on June 30, 2013 2,736,705,717 Capital as on June 30, 2013 481,959,620 Capital as on September 30, 2013 2,736,705,717 Capital as on September 30, 2013 481,959,620 Abeyance allotment on November 20, 2013 7,180 Abeyance allotment on November 20, 2013 7,180 Capital as on December 31, 2013 2,736,712,897 Capital as on December 31, 2013 481,966,800 Abeyance allotment on March 3, 2014 225 Abeyance allotment on March 3, 2014 145 Capital as on March 31, 2014 2,736,713,122 Capital as on March 31, 2014 481,966,945 Capital as on June 30, 2014 2,736,713,122 Capital as on June 30, 2014 481,966,945
• manufacturing, marketing, import, export, hiring and letting on hire of commercial vehicles, automobile cars, two
wheeler vehicles, heavy and construction equipment including components, accessories and spare parts in relation thereto;
• to carry on the business as manufacturers and dealers of machinery articles and goods of all classes;
• to carry on the business of manufacturing materials which may be usefully combined with our manufacturing and
engineering business; and
• to carry on the business of financing and re-financing of all types of vehicles, construction equipment, capital
equipment and services by way of credit, hire purchases, leases and loans.

ˆ200GNal5ojlWdPxwCŠ200GNal5ojlWdPxwC
762654 TX 95TATA MOTORS LTDFORM 20-F
25-Jul-2014 00:24 ESTHTMHKG
RR Donnelley ProFile HKR pf_rend 1*ESS 0C
hkrdoc211.5.15
Page 1 of 1
Directors Under the Companies Act, as well as our Articles of Association, each of our directors, who is in any way directly or
indirectly concerned or interested in a contract or arrangement or proposed contract or arrangement entered into or to be entered into by or on our behalf is required to disclose the nature of his concern or interest at a meeting of the Board in which the contract or arrangement is discussed and shall not vote or participate at such meeting or the first meeting of the Board held after the director becomes concerned or interested.
Under the Companies Act and our Articles of Association, the Company is restricted from directly or indirectly, advancing any loan, including any loan represented by a book debt, to any of its directors or to any other person in whom the director is interested or give any guarantee or provide any security in connection with any loan taken by the Director or such other person.
95

ˆ200GNal5ojnyL5jQzŠ200GNal5ojnyL5jQz
762654 TX 96TATA MOTORS LTDFORM 20-F
25-Jul-2014 13:12 ESTHTMHKG
RR Donnelley ProFile HKR megar0dc 2*ESS 0C
RRWIN-XENP14311.5.14
Page 1 of 1
Under our Articles of Association, a director is not required to hold any qualification shares. Our Articles of Association do not prescribe an age limit for the retirement of the directors. As per the Revised Guidelines (2012) adopted by our Board, Executive Directors retire at the age of 65, independent directors retire at the age of 75 and other non-Executive Directors retire at the age of 70 (subject to them meeting the transition clause). Further, as per the broad guidelines, the maximum tenure in case of non-Executive Directors is nine years and the Board may, based, inter alia, on the merit and contribution of each director, grant further tenure/s.
Under the Companies Act, an Independent Director shall hold office for a term of up to five consecutive years on the Board of a Company and would not be liable to retire by rotation. An Independent Director would be eligible to be re-appointed for another five years on passing of a special resolution by the Company. However no Independent Director should hold office for more than two consecutive terms of five years each but would be eligible for appointment after the expiration of three years of ceasing to become an Independent Director. Provided that during the said period of three years, he/she is not appointed in or be associated with the Company in any other capacity, either directly or indirectly.
Further under the Companies Act, every listed company is required to appoint at least one woman director on the Board of the Company, which the Company is in compliance with.
Under our Articles of Association, the number of our directors cannot be less than three or more than fifteen.
Dividends Under the Companies Act, unless the Board recommends the payment of a dividend, the shareholders at a general meeting
have no power to declare any dividend. Subject to certain conditions laid down under the Companies Act, no dividend can be declared or paid by a company for any Fiscal year except out of the profits of the company for that fiscal year calculated in accordance with the provisions of the Companies Act or out of the profits of the company for any previous Fiscal year(s) remaining undistributed, calculated pursuant to the provisions of the Companies Act or out of both.
Under our Articles of Association, the shareholders at a general meeting may declare a lower, but not higher, dividend than that recommended by the Board. Dividends are generally declared as a percentage of the par value. The dividend recommended by the Board and approved by the shareholders at a general meeting is distributed and paid to shareholders in proportion to the paid-up value of their shares as on the record date for which such dividend is payable. In addition, the Board may declare and pay interim dividends. The shares to be issued upon the conversion of the ADSs will be fully paid-up when delivered as provided herein. Under the Companies Act, dividends can only be paid in cash to shareholders listed on the register of shareholders on the date which is specified as the “record date” or “book closure date”. No shareholder is entitled to a dividend while any lien in respect of unpaid calls on any of their shares is outstanding.
Shares issued upon conversion of ADSs will rank pari passu with our existing Ordinary Shares of Rs.2/- each in all respects including entitlement of the dividend declared.
Dividends must be paid within 30 days from the date of the declaration and any dividend which remains unpaid or unclaimed after that period must be transferred within seven days to a special unpaid dividend account held at a scheduled bank. The company shall, within a period of ninety days of making any transfer to the Unpaid Dividend Account, prepare a statement containing the names, their last known addresses and the unpaid dividend to be paid to each person and place it on the website of the company and also on any other website approved by the Government of India for this purpose.
Any money along with interest thereon which remains unpaid or unclaimed for seven years from the date of transfer to the Unpaid Dividend account along with the shares in respect of which unpaid or unclaimed dividend has been transferred, must be transferred by the Company to the Investor Education and Protection Fund or IEPF established by the Central Government of India. Pursuant to which any claimant of shares transferred to IEPF shall be entitled to claim the shares from IEPF in accordance with the procedure prescribed under the Companies Act.
Under the Companies Act, if the Company has incurred loss during a financial year the Company may pay a dividend not exceeding the average rates at which dividend was declared by it in the immediately preceding 3 years. Dividend payable out of the undistributed / accumulated profits of the Company from any previous fiscal year(s) should not exceed 10% of paid-up capital and free reserves as stated in the latest audited financial statement, after setting off losses and depreciation incurred in that fiscal year. The balance of reserves after such withdrawal must not be below 15% of the paid up share capital as stated in the latest audited financial statement.
The holders of ‘A’ Ordinary Shares will receive dividends for any financial year at five percentage points more than the aggregate rate of dividend declared on Ordinary Shares for that financial year.
96

ˆ200GNal5ojrX$C9w(Š200GNal5ojrX$C9w(
762654 TX 97TATA MOTORS LTDFORM 20-F
27-Jul-2014 10:24 ESTHTMHKG
RR Donnelley ProFile HKR thavi0dc 3*ESS 0C
LANFBU-MWE-XN0511.5.15
Page 1 of 1
Capitalization of Reserves and Issue of Bonus Shares Our Articles of Association permit us by a resolution of our shareholders in a general meeting to resolve that amounts
standing to the credit of reserves or securities premium can be capitalized by the issue of fully paid bonus shares (also referred to as a stock dividend) or by crediting shares of the Company, which were issued in the past and not fully paid-up, with the whole or any part of the sum remaining unpaid thereon. Bonus shares must be issued pro rata to the amount of capital paid-up on existing shareholdings. Any issue of bonus shares would be subject to the guidelines issued by SEBI and the provisions of the Companies Act in this regard.
Calls on Shares, Pre-Emptive Rights and Alteration of Share Capital Under the Companies Act, as well as our Articles of Association, the Board of Directors may from time to time make such
calls as they think fit upon the members of the Company in respect of all moneys unpaid on the shares held by them respectively and each member is required to pay the amount of every call so made on them to the Company.
Subject to the provisions of the Companies Act, we may increase our share capital by issuing new shares on such terms and with such rights as we, by action of shareholders in a general meeting, determine. These new shares will be offered to existing shareholders listed on the members’ register on the record date in proportion to the amount paid-up on these shares at that date. The offer will be made by notice specifying the number of shares offered and the date after which the offer, if not accepted, will be deemed to have been declined. After this date, the Board may dispose of the shares offered in respect of which no acceptance has been received, in such manner as the Board thinks most beneficial to us. The offer is deemed to include a right exercisable by the person concerned to renounce the shares offered to such person in favor of any other person provided that the person in whose favor these shares have been renounced is approved by the Board in their absolute discretion.
Under the Companies Act, new shares may be offered to any persons whether or not those persons include existing shareholders, if a special resolution to that effect is passed by the shareholders of the company in a general meeting. The issuance of shares upon conversion of our outstanding convertible notes has been duly approved by a special resolution of our shareholders and our shareholders have waived their pre-emptive rights with respect to these shares.
The Company can also alter its share capital by way of a reduction of capital or by undertaking a buy-back of shares under the prescribed SEBI guidelines and the Companies Act, as may be applicable.
Our Articles of Association provide that, by a special resolution passed at the general meeting, we may consolidate or subdivide our share capital, convert all or any of our fully paid-up shares into stock and re-convert that stock into fully paid-up shares or cancel shares which have not been taken up by any person. The Company may also from time to time by special resolution reduce its capital.
The Company had, by way of resolution passed by the Shareholders at the Annual General Meeting held on August 12, 2011 altered the Capital Clause i.e. clause V of the Memorandum of Association.
An extract of Clause V of our Articles, as amended, reads as follows: “The Capital of the Company is Rs.39,00,00,00,000 divided into 3,50,00,00,000 Ordinary Shares of Rs.2 each, 1,00,00,00,000 ‘A’ Ordinary Shares of Rs.2 each (The Ordinary Shares and the ‘A’ Ordinary Shares are hereinafter together referred to as Ordinary Shares or shares unless otherwise specifically mentioned to the contrary) and 30,00,00,000 Convertible Cumulative Preference Shares of Rs.100 each.”
General Meetings of Shareholders We must hold our Annual General Meeting or AGM each year and not more than 15 months should elapse between the
date of one AGM of the Company and that of the next AGM. In any case the AGM should be held within a period of 6 months from the date of closing of the financial year, unless extended by the Registrar of Companies at our request for any special reason. Our Board of Directors may convene an Extraordinary General Meeting of shareholders when necessary or at the request of a shareholder or shareholders holding in aggregate not less than one tenth of our paid-up share capital. Written notices convening a meeting setting out the date, place and agenda of the meeting must be given to members at least 21 days prior to the date of the proposed meeting. A general meeting may be called after giving shorter notice if consent is received in writing or in electronic mode by not less than 95% of the shareholders entitled to vote at such meeting. Currently, we give written notices to all members and, in addition, give public notice of general meetings of shareholders in a daily newspaper of general circulation as prescribed under the Companies Act. General meetings are generally held at some place in Mumbai. In accordance with Companies Act, 1956 and the Articles of Association of the Company, the quorum required for a general meeting of the Company is five members, whereas the Companies Act, requires five, fifteen or thirty shareholders personally present, if the total number of shareholders on the date of the meeting is less than 1,000 or more than 1,000 but less than 5,000 or exceeds 5000, respectively. Those shareholders whose names appear in the Register of Members and transfer books of the Company during the book closure period fixed for the purpose of paying dividend would be eligible to attend the meeting.
97

ˆ200GNal5oj%Lju%w2Š200GNal5oj%Lju%w2
762654 TX 98TATA MOTORS LTDFORM 20-F
31-Jul-2014 15:32 ESTHTMHKG
RR Donnelley ProFile HKR adran0dc 4*ESS 0C
ACXFBU-MWE-XN0211.5.15
Page 1 of 1
A company intending to pass a resolution relating to matters such as, but not limited to, alteration of the objects clause in the memorandum, alteration of articles of association in order to constitute as a private company, change in place of registered office outside the local limits of any city, town or village, change in objects for which a company has raised money from public through prospectus, issue of shares with differential rights as to voting or dividend or otherwise, variation in the rights attached to a class of shares or debentures or other securities, sale of the whole or substantially the whole of an undertaking of a company, buy back of shares of the Company, giving loans or extending guarantee in excess of limits prescribed under the Companies Act, and the rules issued thereunder, is required to obtain the resolution passed by means of a postal ballot instead of transacting the business in the general meeting of the company. A notice to all the shareholders shall be sent along with a draft resolution explaining the reasons therefor and requesting them to send their assent or dissent in writing on a postal ballot form including evoting facility within a the prescribed number of days from the date of posting the notice. Postal ballot voting also allows shareholders to cast their votes by electronic means.
Voting Rights At a general meeting a resolution put to the vote at the meeting, unless a poll is demanded or the voting is carried out
electronically, shall be decided on a show of hands, whereby every member holding shares and entitled to vote and present in person has one vote. Upon a poll, the voting rights of each shareholder entitled to vote and present in person or by proxy is in the same proportion as the capital paid-up on each share held by such holder bears to the total paid-up capital. Before or on the declaration of the result of the voting on any resolution on show of hands, a poll may be ordered to be taken by the Chairman of the meeting or demanded by shareholder or shareholders holding at least one tenth of the voting rights in respect of the resolution or by those holding in aggregate paid-up capital of at least Rs.500,000.
Under the provisions of the revised Indian Listing Agreement with domestic stock exchanges, every listed company is required to provide its shareholders with the facility to exercise their right to vote, by electronic means, either at a general meeting of the company or by means of a postal ballot. Accordingly the Company has provided such electronic voting facility to all of its shareholders.
Holders of ADSs and of GDSs are not entitled to attend or vote at shareholders meetings. Holders of ADSs may exercise voting rights with respect to the Ordinary Shares represented by ADSs only in accordance with the provisions of our ADS deposit agreement (as amended) and Indian law. A holder of ADSs may withdraw from the ADS facility the related underlying shares and vote as a direct shareholder, but there may not be sufficient time to do so after the announcement of an upcoming vote. If requested by us, the depositary will notify holders of ADSs of upcoming votes and arrange to deliver our voting materials to holders of ADSs. The materials will describe the matters to be voted on and explain how holders of ADSs on a record date specified by the depositary may instruct the depositary to vote on the deposited securities underlying the ADSs as directed by the holders of ADSs. For the instructions to be valid, the depositary must receive them in writing on or before a date specified by the depositary. The depositary will try, insofar as practicable, subject to Indian laws and the provisions of our Articles of Association, to vote or have its agents vote the deposited securities as instructed. The depositary will only vote as instructed and is not entitled to exercise any voting discretion. If the depositary timely receives voting instructions from a holder of ADSs and which fails to specify the manner in which the depositary is to vote the shares underlying such holder’s ADSs, such holder will be deemed to have instructed the depositary to vote in favor of the items set forth in such voting instructions. If the depositary does not receive timely instructions from a holder of ADSs, the holder shall be deemed to have instructed the depositary to give a discretionary proxy to a person designated by us, subject to the conditions set forth in the deposit agreement (as amended). If requested by us, the depositary is required to represent all shares underlying the outstanding ADSs, regardless whether timely instructions have been received from the holders of such ADSs, for the sole purpose of establishing a quorum at a meeting of shareholders.
The Depositary for the holders of the GDSs shall exercise voting rights in respect of the GDSs by issue of an appropriate proxy or power of attorney in terms of the deposit agreement pertaining to the GDSs.
Ordinary resolutions may be passed by simple majority of those shareholders present and voting at the meeting. Special resolutions require that the votes cast in favor of the resolution must be at least three times the votes cast against the resolution. The Companies Act provides that in order to amend the Articles of Association, a special resolution is required to be passed by the Shareholders in the manner prescribed therein. Alteration of the Memorandum, varying the terms of contract or objects in the prospectus, issuance of GDRs or sweat equity shares, variation of shareholders rights, reduction of share capital, buy back of the Companies shares, to sell, lease or otherwise dispose of the whole or substantially the whole of the undertaking of the Company, to invest otherwise in trust securities the amount of compensation received by it as a result of any merger or amalgamation; to borrow money in excess of its paid-up share capital and free reserves, dissolutions, mergers or consolidations, removal of statutory auditors, et cetera, all require a special resolution. Our Articles of Association do not permit cumulative voting for the election of our directors. A person can act as proxy on behalf of members not exceeding fifty and holding in the aggregate not more than 10% of the total share capital of the company carrying voting rights.
98

ˆ200GNal5ojtdXk3wtŠ200GNal5ojtdXk3wt
762654 TX 99TATA MOTORS LTDFORM 20-F
28-Jul-2014 06:14 ESTHTMHKG
RR Donnelley ProFile HKR ganeg0dc 5*ESS 0C
SWRFBU-MWE-XN0311.5.14
Page 1 of 1
A shareholder may exercise his or her voting rights by proxy to be given in the form prescribed under the Companies Act. The instrument appointing a proxy is required to be lodged with the Company at least 48 hours before the time of the meeting. A shareholder may, by a single power of attorney, grant a general power of representation regarding several general meetings of shareholders. Any of our shareholders may appoint a proxy. A corporate shareholder is also entitled to nominate a representative to attend and vote on its behalf at general meetings. A proxy may not vote except on a poll and does not have a right to speak at meetings. A shareholder which is a legal entity may appoint an authorized representative who can vote in all respects as if a shareholder on a poll.
The Companies Act allows for a company to issue shares with differential rights as to dividend, voting or otherwise subject to the authority in its Articles of Association and other conditions prescribed under the applicable law. In this regard, the laws requires that a company may issue shares with differential voting rights, if it is authorized by its shareholders through a postal ballot, the company must have had distributable profits in terms of the Companies Act for a period of three financial years, the company has not defaulted in filing financial statements and annual returns for the immediately preceding three years, the articles of association of such company must allow for the issuance of such shares with differential voting rights and such other conditions set forth in the Companies (Share Capital and Debentures) Rules, 2014 must be fulfilled.
In the case where a resolution is put to vote on a poll, such voting entitlement (excluding fractions, if any), will be applicable to holders of ‘A’ Ordinary Shares. As per the terms of issue, the outstanding ‘A’ Ordinary Shares shall be entitled to one vote for every ten ‘A’ Ordinary Shares held.
In the case where a resolution is put to vote in the meeting and is to be decided on a show of hands, the holders of ‘A’ Ordinary Shares shall be entitled to the same number of votes as available to holders of Ordinary Shares.
Convertible Securities/Warrants We may issue from time to time debt instruments that are partly and fully convertible into shares and/or warrants to
purchase shares.
Register of Shareholders and Record Dates We are obliged to maintain a register of shareholders at our registered office in Mumbai or at some other place in the same
city. The register and index of our beneficial owners maintained by a depository under the Depositories Act, 1996 is deemed to be the index of members and register of shareholders. We recognize as shareholders only those persons who appear on our register of shareholders and we cannot recognize any person holding any share or part of it upon any trust, express, implied or constructive, except as permitted by law. In the case of shares held in physical form, we register transfers of shares on the register of shareholders upon lodgment of the share transfer form duly completed in all respects accompanied by a share certificate or if there is no certificate, the letter of allotment in respect of shares transferred together with duly stamped transfer forms. In respect of electronic transfers, the depository transfers shares by entering the name of the purchaser in its books as the beneficial owner of the shares. In turn, we enter the name of the depository in our records as the registered owner of the shares. The beneficial owner is entitled to all the rights and benefits as well as the liabilities with respect to the shares that are held by the depository. This activity is done by the Registrar and Transfer Agent (RTA) of the Company.
For the purpose of determining the shareholders, the register may be closed for periods not exceeding 45 days each year but not exceeding 30 days at any one time, subject to giving of previous notice of at least seven days or such lesser period as may be specified by Securities and Exchange Board of India for listed companies. In order to determine the shareholders entitled to dividends, we keep the register of shareholders closed for approximately 21 days, generally in each year. Under the listing regulations of the stock exchanges on which our outstanding shares are listed, we may, upon at least 7 working days advance notice to these stock exchanges, set a record date and/or close the register of shareholders in order to ascertain the identity of shareholders entitled to the dividend. The trading of shares and the delivery of certificates in respect thereof may continue while the register of shareholders is closed.
Annual Report and Financial Results Our Indian GAAP audited financial statements for the relevant fiscal year, the directors’ report and the auditors’ report,
(collectively the Annual Report), must be prepared before the Annual General Meeting. These also include other financial information, a corporate governance section and management’s discussion and analysis report and general shareholders’ information and are also made available for inspection at our registered office during normal working hours for 21 days prior to our Annual General Meeting (or AGM).
99
ˆ200GNal5ojnwd59wMŠ200GNal5ojnwd59wM
762654 TX 100TATA MOTORS LTDFORM 20-F
25-Jul-2014 12:51 ESTHTMHKG
RR Donnelley ProFile HKR subrn1dc 2*ESS 0C
RRWIN-XENP14111.5.14
Page 1 of 1
Under the Companies Act, we must file the AGM Report with the Registrar of Companies within 30 days from the date of the annual general meeting. As required under listing agreements with the applicable stock exchanges, copies are required to be simultaneously sent to all the stock exchanges on which our shares are listed. We must also publish our financial results in at least one national English language daily newspaper in India and also in a newspaper published in the language of the region where our registered office is situated as well as on the website of the Company.
We submit information, including our Annual Report and half yearly financial statements, in accordance with the requirements of the listing agreement with the Indian Stock Exchanges.
Transfer of Shares Shares held through depositories are transferred in book-entry form or in electronic form in accordance with the regulations
laid down by the SEBI. These regulations provide the regime for the functioning of the depositories and the participants and set out the manner in which the records are to be kept and maintained and the safeguards to be followed in this system. Transfers of beneficial ownership of shares held through a depository are exempt from stamp duty. We have entered into an agreement for these depository services with National Securities Depository Limited and the Central Depository Services (India) Limited.
The SEBI requires that all investors hold our Shares in book-entry form for trading and settlement purposes, except for transactions that are not made on a stock exchange and transactions that are not required to be reported to the stock exchange.
The requirement to hold shares in book-entry form will apply to ADS holders when the shares are withdrawn from the depositary facility upon surrender of the ADSs. In order to trade in our Shares in the Indian market, the withdrawing ADS holder will be required to comply with the procedures above.
Our Shares are freely transferable, subject only to the provisions of the Companies Act under which, if a transfer of securities is in contravention of any of the provisions of the Securities Contracts (Regulation) Act, 1956, the Securities and Exchange Board of India Act, 1992 or this Act or any other law for the time being in force, the National Company Law Tribunal (NCLT or Tribunal) may, on an application made by the depository, company, depository participant, the holder of the securities or the Securities and Exchange Board, direct any company or a depository to set right the contravention and rectify its register or records concerned. If a company without sufficient cause refuses to register a transfer of shares within one month from the date on which the instrument of transfer is delivered to the company, the transferee may appeal to the Tribunal seeking to register the transfer of equity shares. The Tribunal may after hearing the parties, either dismiss the appeal, or by order direct that the transfer or transmission shall be registered by the company and the company shall comply with such order within a period of ten days of the receipt of the order; or direct rectification of the register and also direct the company to pay damages, if any, sustained by any party aggrieved.
Pursuant to the Listing Agreement, in the event we have not effected the transfer of shares within 15 days or where the Issuer has failed to communicate to the transferee any valid objection to the transfer within the stipulated time period of 15 days, the Issuer is required to compensate the aggrieved party for the opportunity loss caused during the period of the delay.
The Companies Act provides that the shares or debentures of the public listed company (like the Company) shall be freely transferable. Our Articles of Association provide for restrictions on the transfer of shares, including granting power to the Board of Directors in certain circumstances to refuse to register or acknowledge transfer of shares or other securities issued by us. However, under the Companies Act these transfer restrictions are not enforceable.
Acquisition of Our Own Shares Under the Companies Act, companies have been empowered to purchase their own shares or other specified securities out
of their free reserves or the securities premium account or the proceeds of any shares or other specified securities (other than the kind of shares or other specified securities proposed to be bought back) subject to the following conditions:
100
(i) the buy back should be authorized by the Articles of Association;
(ii) a special resolution has been passed at our general meeting authorizing the buy back;
(iii) the buy back is 25% or less of the aggregate paid up capital and free reserves, provided that buy back of equity
shares is limited to 25% of the total equity capital in that financial year;
(iv) the ratio of the aggregate of secured and unsecured debts owed by the company after buy-back is not more than
twice the paid-up capital and its free reserves;
(v) all the shares or other specified securities for buy-back are fully paid-up;

ˆ200GNal5ojlbNglw7Š200GNal5ojlbNglw7
762654 TX 101TATA MOTORS LTDFORM 20-F
25-Jul-2014 00:34 ESTHTMHKG
RR Donnelley ProFile HKR pf_rend 2*ESS 0C
HKRPRFRS1011.5.15
Page 1 of 1
The condition mentioned above in (ii) would not be applicable if the buy-back is for less than 10% of the total paid-up equity capital and free reserves of the company and provided that this buy-back has been authorized by the Board of Directors at the Board meeting of the company. A company buying back its securities is required to extinguish and physically destroy the securities so bought back within seven days of the last date of completion of the buy-back. Further, a company buying back its securities is not permitted to buy-back any securities for a period of one year from the buy-back and to issue further securities of the same kind for six months. The aforesaid restriction relating to the one year period does not apply to a buyback authorized by a special resolution of the shareholders in general meeting. Every buy-back has to be completed within a period of one year from the date of passing of the special resolution or resolution of the Board, as the case may be.
A company is also prohibited from purchasing its own shares or specified securities through any subsidiary company including its own subsidiary companies or through any investment company (other than a purchase of shares in accordance with a scheme for the purchase of shares by trustees of or for shares to be held by or for the benefit of employees of the company) or if the company is defaulting on the repayment of deposit or interest, redemption of debentures or preference shares or payment of dividend to a shareholder or repayment of any term loan or interest payable thereon to any financial institution or bank, or in the event of non- compliance with other provisions of the Companies Act.
Liquidation Rights Subject to the rights of creditors, workmen and of the holders of any other shares entitled by their terms of issue to
preferential repayment over the shares, in the event of our winding up, the holders of our Shares are entitled to be repaid the amounts of capital paid-up or credited as paid-up on these shares, or in case of shortfall, proportionately. All surplus assets after payments due to workmen, the holders of any preference shares and other creditors belong to the holders of the equity shares in proportion to the amount paid up or credited as paid-up on these shares respectively at the commencement of the winding-up.
C. Material Contracts. Except as given below, neither Tata Motors Limited nor any of its consolidated subsidiaries or associated companies is a
party to any material contract other than contracts entered into in the ordinary course of business:
D. Exchange Controls. General
Prior to June 1, 2000, foreign investment in Indian securities, including the acquisition, sale and transfer of securities of Indian companies, was regulated by the Foreign Exchange Regulation Act, 1973, or FERA, and the notifications issued by the RBI thereunder.
With effect from June 1, 2000, foreign investment in Indian securities is regulated by the Foreign Exchange Management Act 1999, or FEMA (as amended from time to time), and the rules, regulations and notifications made under FEMA. A person resident outside India can transfer any security of an Indian company or any other security to an Indian resident only under the terms and conditions specified in FEMA and the rules and regulations made thereunder or as permitted by the RBI.
The RBI issued the Foreign Exchange Management (Transfer or issue of Security by a Person Resident Outside India) Regulations 2000, or the Regulations, to regulate the issue of Indian securities including American depository receipts to persons resident outside India and the transfer of Indian securities by or to persons resident outside India. The Regulations provide that an Indian entity may issue securities to a person resident outside India or record in its books any transfer of security from or to such person only in the manner set forth in FEMA and the rules and regulations made thereunder or as permitted by the RBI.
101
(vi) the buy-back of the shares or other specified securities listed on any recognized stock exchange is in accordance
with the regulations made by the Securities and Exchange Board in this behalf; and
(vii) the buy-back in respect of shares or other specified securities other than those specified in point (vi) is in accordance
of the Companies (Share Capital and Debentures) Rules 2014.
• The Tata Brand Equity and Business Promotion Agreement, dated December 18, 1998, incorporated by reference into this annual report as Exhibit 4.1. Tata Motors Limited and certain of our subsidiaries have agreed to pay an annual subscription fee to Tata Sons which is equal to 0.15%-0.25% of annual net income (defined as net revenues exclusive of excise duties and other governmental taxes and non-operating income), subject to a ceiling of 5% of annual profit before tax (defined as profit after interest and depreciation but before income tax) for participation and gain from promotion and protection of the Tata brand identity. Pursuant to the agreement, we have also undertaken certain obligations for the promotion and protection of the Tata brand licensed to us under the agreement.
• The agreement dated January 26, 2010, entered into by Jaguar Land Rover with Dr. Ralf Speth in connection with his
appointment as CEO and director. The compensation drawn by him pursuant to this agreement is shown in Item 6 B “— compensation”.

ˆ200GNal5ojlWo1YwÀŠ200GNal5ojlWo1Yw
762654 TX 102TATA MOTORS LTDFORM 20-F
25-Jul-2014 00:24 ESTHTMHKG
RR Donnelley ProFile HKR pf_rend 1*ESS 0C
hkrdoc211.5.15
Page 1 of 1
Foreign Direct Investment The Government of India, pursuant to its liberalization policy, set up the Foreign Investment Promotion Board, or the
FIPB, to regulate all foreign direct investment into India. Foreign Direct Investment, means investment by way of subscription and/or purchase of securities of an Indian company by a non-resident investor. Regulatory approval is required for investment in some sectors, including housing, petroleum (other than refining), defense and strategic industries. Also, the following investments would require the prior regulatory permission:
Prior no-objection certificates of the relevant financial regulator are required for transfers of shares from residents to non-residents in the financial services sector.
Subject to certain exceptions, Foreign Direct Investment and investment by individuals of Indian nationality or origin residing outside India, or Non-Resident Indians, in Indian companies does not require the prior approval of the FIPB or the RBI. The Government of India has indicated that in all cases where Foreign Direct Investment is allowed on an automatic basis without FIPB approval the RBI would continue to be the primary agency for the purposes of monitoring and regulating foreign investment. In cases where FIPB approval is obtained, no approval of the RBI is required, although a declaration in the prescribed form, detailing the foreign investment, must be filed with the RBI once the foreign investment is made in the Indian company. The foregoing description applies only to an issuance of shares by, and not to a transfer of shares of, Indian companies.
Pricing The price of shares of a listed Indian company issued to non-residents under the foreign direct investment scheme on an
automatic basis cannot be less than the price worked out in accordance with the guidelines issued by the SEBI for the preferential allotment of shares where the shares of such company are listed.
Every Indian company issuing shares or convertible debentures in accordance with the Regulations is required to submit a report to the RBI within 30 days of receipt of the consideration and another report within 30 days from the date of issue of the shares to the non-resident purchaser.
The above description applies only to a primary issue of shares or convertible debentures by an Indian company.
Portfolio Investment by Foreign Portfolio Investors In September 1992, the Government of India issued guidelines that enable foreign institutional investors, including
institutions such as pension funds, investment trusts, asset management companies, nominee companies and incorporated/institutional portfolio managers referred to as FIIs, to make portfolio investments in all securities of listed and unlisted companies in India. Investments by registered Foreign Institutional Investors or Non-Resident Indians made through a stock exchange are known as Portfolio Investments. Foreign investors wishing to invest and trade in Indian securities in India under these guidelines are required to register with the SEBI and obtain a general permission from the RBI under the Foreign Exchange Management Act, 1999. However, since the SEBI provides a single window clearance, a single application must be made to the SEBI. Foreign investors are not necessarily required to register with the SEBI under the Securities and Exchange Board of India (Foreign Portfolio Investors) Regulations, 2014 (the “Foreign Portfolio Investor Regulations”) as Foreign Portfolio Investors and may invest in securities of Indian companies pursuant to the Foreign Direct Investment route discussed above.
Foreign Portfolio Investors who are registered with the SEBI are required to comply with the provisions of the Securities and Exchange Board of India (Foreign Portfolio Investors) Regulations, 2014, or Foreign Portfolio Investor Regulations. A registered Foreign Portfolio Investor may buy, subject to the ownership restrictions discussed below, and sell freely securities issued by any Indian company, realize capital gains on investments made through the initial amount invested in India, subscribe to or renounce rights offerings for shares, appoint a domestic custodian for custody of investments made and repatriate the capital, capital gains, dividends, income received by way of interest and any compensation received towards sale or renunciation of rights offerings of shares. A Foreign Portfolio Investor may not hold more than 10% of the total issued capital of a company in its own name. The total holding of all Foreign Portfolio Investors in a company is subject to a cap of 24% of the total paid up capital of a company, which can be increased to the relevant sectoral cap/ceiling applicable to the said company under the Foreign Direct Investment Regime with the passing of a special resolution by the shareholders of the company in a general meeting and subject to prior intimation to the Reserve Bank of India.
102
• investments, including a transfer of shares, in excess of specified sectoral caps; • investments by an unincorporated entity; • investment in industries for which industrial licensing is compulsory; and
• all proposals relating to acquisition of shares of an Indian company by a foreign investor (including individuals of
Indian nationality or origin residing outside India (a “Non-Resident Indian”), the activities of which company are not under the “automatic” route under existing Indian foreign investment policy.
ˆ200GNal5ojlWpd7w+Š200GNal5ojlWpd7w+
762654 TX 103TATA MOTORS LTDFORM 20-F
25-Jul-2014 00:24 ESTHTMHKG
RR Donnelley ProFile HKR pf_rend 1*ESS 0C
hkrdoc211.5.15
Page 1 of 1
Foreign Portfolio Investors are permitted to purchase shares and convertible debentures, subject to limits, of an Indian company either through:
Registered FIIs are generally subject to tax under Section 115AD of the Income Tax Act of 1961. There is uncertainty under Indian law as to the tax regime applicable to FIIs that hold and trade in ADSs and Shares. See Item 10.E “— Taxation — Taxation of Capital Gains and Losses — Indian Taxation”.
Portfolio Investment by Non-Resident Indians A variety of methods for investing in shares of Indian companies are available to Non-Resident Indians. These methods
allow Non-Resident Indians to make Portfolio Investments in shares and other securities of Indian companies on a basis not generally available to other foreign investors. In addition to Portfolio Investments in Indian companies, non-resident Indians may also make foreign direct investments in Indian companies pursuant to the Foreign Direct Investment route discussed above.
Transfer of shares and convertible debentures of an Indian company by a person resident outside India The Government of India has granted general permission to persons residing outside India to transfer shares and
convertible debentures held by them to an Indian resident, subject to compliance with certain terms and conditions and reporting requirements. A resident who wishes to purchase shares from a non-resident must, pursuant to the relevant notice requirements, file a declaration with an authorized dealer in the prescribed Form FC-TRS, together with the relevant documents and file an acknowledgment thereof with the Indian company to effect transfer of the shares to his name.
Moreover, the transfer of shares between an Indian resident and a non-resident (except NRI) does not require the prior approval of the Government of India or RBI, provided that: (i) the activities of the investee company are under the automatic route pursuant to FDI Policy and the transfer is not subject to regulations under the Indian Takeover Code; (ii) the non-resident shareholding complies with sector limits under the FDI Policy; and (iii) the pricing is in accordance with the guidelines prescribed by SEBI and RBI.
Indirect Foreign Investment In April 2010, the Government of India issued the Consolidated FDI Policy, or the Policy, setting out guidelines for foreign
investment in India. The policy used to be reissued every six months and is now to be reissued annually. The Policy inter alia prescribes the guidelines for (i) the calculation of total indirect foreign investment in Indian companies, (ii) transfer of ownership or control of Indian companies in sectors with caps from resident Indian citizens to non-resident entities and (iii) guidelines on downstream investments by Indian companies. Pursuant to the Policy, for the purposes of computation of indirect foreign investment in an Indian company, foreign investments in its parent company, by FIIs and Qualified Foreign Investors (holding as of March 31 of the relevant year), NRIs, ADRs, GDRs, FCCBs, FDI, convertible preference shares and convertible currency debentures are required to be taken together.
Sponsored ADR Schemes By notification dated November 23, 2002, the RBI has permitted existing shareholders of Indian companies to sell their
shares through the issuance of ADRs against the block of existing shares of the Indian company, subject to the following conditions:
103
• a public offer, where the price of the shares to be issued is not less than the price at which the shares are issued to
Indian residents, or
• a private placement, where the price of the shares to be issued is not less than the price according to the terms of the
relevant guidelines or the guidelines issued by the former Controller of Capital Issues.
• The facility to sell the shares would be available pari passu to all categories of shareholders.
• The sponsoring company whose shareholders propose to divest existing shares in the overseas market through issue of ADRs will give an option to all its shareholders indicating the number of shares to be divested and the mechanism how the price will be determined under the ADR norms. If the shares offered for divestment are more than the pre-specified number to be divested, shares would be accepted from the existing shareholders in proportion to their existing shareholdings.
• The proposal for divestment of the shares would have to be approved by a special resolution of the Indian company.
• The proceeds of the ADR issue raised abroad shall be repatriated into India within a period of one month from the closure of the issue. However, the proceeds of the ADR issue can also be retained abroad to meet the future foreign exchange requirements of the company and by a recent notification this facility has been extended indefinitely until further notice.
ˆ200GNal5ojnxhRKQjŠ200GNal5ojnxhRKQj
762654 TX 104TATA MOTORS LTDFORM 20-F
25-Jul-2014 13:03 ESTHTMHKG
RR Donnelley ProFile HKR kotts0dc 3*ESS 0C
ACXFBU-MWE-XN1511.5.14
Page 1 of 1
Transfer of ADRs by Non-residents The Ministry of Finance, Government of India, has granted general permission for the transfer of ADRs outside India and
also permitted non-resident holders of ADRs to surrender ADRs in exchange for the underlying shares. Pursuant to the terms of the relevant deposit agreement (as amended) an investor who surrenders ADRs and withdraws shares is permitted to re-deposit such shares subject to the total issued ADRs and obtains ADRs at a later time.
Fungibility of ADRs/GDRs In March 2001, the RBI permitted the re-conversion of shares of Indian companies into ADRs/GDRs, subject to the
following conditions:
Also the RBI has prescribed that the domestic custodians are the entity required to ensure compliance with the RBI guidelines and to file reports with the RBI from time to time. The domestic custodian is also required to perform the following functions:
Two-way Fungibility of Depositary Receipts We offer foreign investors a limited facility for conversion of Ordinary Shares into American Depositary Receipts within
the limits permissible for two-way fungibility, as announced by the Reserve Bank of India pursuant to its operative guidelines for the limited two way fungibility under the “Issue of Foreign Currency Convertible Bond and Ordinary Shares (Through Depository Receipt Mechanism) Scheme, 1993” dated February 13, 2002.
E. Taxation. This section describes the material U.S. federal income tax consequences to “U.S. holders” (as defined below) and the
Indian stamp duty and income and service tax consequences to “non-residents” (as defined below) of owning Shares or ADSs. It applies to you only if you hold your Shares or ADSs as capital assets for tax purposes. This section does not apply to you if you are a member of a special class of holders subject to special rules, including:
104
• The issue related expenses in relation to public issue of ADRs under this scheme would be subject to a ceiling of 4% of the issue size in the case of public issues and 2% of the issue size in the case of private placements. The issue related expenses would include underwriting commissions, lead managers’ charges, legal expenses and reimbursable expenses. The issue expenses shall be passed on to the shareholders participating in the sponsored issue on a pro rata basis.
• the Indian company has issued ADRs/GDRs;
• the shares of the Indian company are purchased by a registered stock broker in India in the name of the Depository,
on behalf of the non-resident investor who wishes to convert such shares into ADRs/GDRs; • shares are purchased on a recognized stock exchange;
• the shares are purchased with the permission of the custodian of the ADRs/GDRs of the Indian company and are
deposited with the custodian;
• the issuer company has authorized the custodian to accept shares from non-resident investors for re-issuance of
ADRs/GDRs;
• the number of shares so purchased do not exceed the ADRs/GDRs converted into underlying shares, and are in
compliance with the sectorial caps applicable under the Foreign Direct Investment regime; and
• the non-resident investor, broker, custodian and the overseas depository comply with the provisions of the
Depository Receipt Mechanism and the guidelines issued thereunder from time to time.
• provide a certificate to the RBI and the SEBI stating that the sectorial caps for foreign investment in the relevant
company have not been breached; • monitor the total number of ADRs/GDRs that have been converted into underlying shares by non-resident investors;
• liaise with the issuer company to ensure that the foreign investment restrictions, if any, are not being breached; and
• file a monthly report about the ADRs/GDRs transactions under the two-way fungibility arrangement with the RBI
and the SEBI.
• a dealer in securities, • a trader in securities that elects to use a mark-to-market method of accounting for securities holdings, • a tax-exempt organization, • a life insurance company,

ˆ200GNal5oj!Q9HiwÄŠ200GNal5oj!Q9Hiw˜
762654 TX 105TATA MOTORS LTDFORM 20-F
30-Jul-2014 06:14 ESTHTMHKG
RR Donnelley ProFile HKR subrv6dc 4*ESS 0C
ACXFBU-MWE-XN0611.5.15
Page 1 of 1
With regard to United States tax, the following discussion addresses only the material U.S. federal income tax consequences for persons that are “U.S. holders”. You are a U.S. holder if you are a beneficial owner of Shares or ADSs and you are, for U.S. federal income tax purposes:
With regard to Indian tax, the following discussion addresses only the tax consequences for persons that are “non-residents” of India, as defined in the Indian Income Tax Act of 1961, the “Income Tax Act”, and is based on the provisions of Section 115AC and other applicable provisions of the Income Tax Act and the Issue of Foreign Currency Convertible Bonds and Ordinary Shares (Through Depository Receipt Mechanism) Scheme, 1993 promulgated by the Government of India (together, the “Section 115AC Regime)”.
If a partnership holds Shares or ADSs, the U.S. federal income tax treatment of a partner will generally depend on the status of the partner and the tax treatment of the partnership. If you hold shares or ADSs as a partner in a partnership, you should consult your tax advisor with regard to the U.S. federal income tax treatment of an investment in our Shares or ADSs.
This discussion addresses only U.S. federal income taxation and Indian stamp duty and income and service taxation. In addition, this section is based in part upon the representations of the depositary and the assumption that each obligation in the deposit agreement (as amended) and any related agreement will be performed in accordance with its terms.
The Proposed Direct Tax Code, or DTC, aims to replace the existing Income Tax Act, 1961, and other direct tax laws, with a view to simplify and rationalize the tax provisions into one unified code. The various proposals included in DTC are subject to review by the new government and, as such, the impact, if any, is not quantifiable at this stage.
This summary is not intended to constitute a complete analysis of the individual tax consequences to nonresident holders for the acquisition, ownership and sale of ADSs and equity shares.
Taxation of Dividends Indian Taxation Dividends paid to non-residents of India will not be subject to Indian tax. However, the Company has to pay a “dividend
distribution tax”, as applicable, currently at the rate of 15% (plus a surcharge at 10% and an education cess at the rate of 3% on the sum of the dividend distribution tax and surcharge) on the total amount distributed as a dividend. The effective rate of dividend distribution tax is 16.995%.
Distributions to non-residents of India of additional ADSs or shares or rights to subscribe for such shares made with respect to ADSs or shares are not subject to Indian tax.
U.S. Federal Income Taxation Under the U.S. federal income tax laws, and subject to the Passive Foreign Investment Company, or PFIC, rules described
below, if you are a U.S. holder, the gross amount of any dividend we pay out of our current or accumulated earnings and profits (as determined for U.S. federal income tax purposes) is subject to U.S. federal income taxation. If you are a non-corporate U.S. holder, dividends that constitute qualified dividend income will be taxable to you at the preferential rates applicable to long-term capital gains provided that you hold the Shares or ADSs for more than 60 days during the 121-day period beginning 60 days before the ex-dividend date and meet other holding period requirements. Dividends we pay with respect to our Shares or ADSs generally will be qualified dividend income.
105
• a person liable for alternative minimum tax, • a person that actually or constructively owns 10% or more of our voting stock, • a person that holds Shares or ADSs as part of a straddle or a hedging or conversion transaction, • a person that purchases or sells Shares or ADSs as part of a wash sale for tax purposes or • a U.S. holder whose functional currency is not the U.S. dollar.
• a citizen or resident of the United States, • a domestic corporation, • an estate whose income is subject to U.S. federal income tax regardless of its source, or
• a trust if a United States court can exercise primary supervision over the trust’s administration and one or more
United States persons are authorized to control all substantial decisions of the trust.

ˆ200GNal5ojlWuaaQXŠ200GNal5ojlWuaaQX
762654 TX 106TATA MOTORS LTDFORM 20-F
25-Jul-2014 00:24 ESTHTMHKG
RR Donnelley ProFile HKR pf_rend 1*ESS 0C
hkrdoc211.5.15
Page 1 of 1
The dividend is taxable to you when you, in the case of Shares, or the Depositary, in the case of ADSs, receive the dividend, actually or constructively. The dividend will not be eligible for the dividends-received deduction generally allowed to United States corporations in respect of dividends received from other United States corporations. The amount of the dividend distribution that you must include in your income as a U.S. holder will be the US dollar value of the Indian rupee payments made, determined at the spot Indian rupee/US dollar rate on the date the dividend distribution is includible in your income, regardless of whether the payment is in fact converted into US dollars. Generally, any gain or loss resulting from currency exchange fluctuations during the period from the date you include the dividend payment in income to the date you convert the payment into US dollars will be treated as ordinary income or loss and will not be eligible for the special tax rate applicable to qualified dividend income. The gain or loss generally will be income or loss from sources within the United States for foreign tax credit limitation purposes. Distributions in excess of current and accumulated earnings and profits, as determined for U.S. federal income tax purposes, will be treated as a non-taxable return of capital to the extent of your basis in the Shares or ADSs and thereafter as capital gain. However, we do not expect to calculate earnings and profits in accordance with United States federal income tax principles. Accordingly, you should expect to generally treat distributions we make as dividends for U.S. federal income tax purposes.
Dividends will generally be income from sources outside the United States and will, depending on your circumstances, be either “passive” or “general” income for purposes of computing the foreign tax credit limitation allowable to you.
Distributions of additional shares to you with respect to Shares or ADSs that are made as part of a pro rata distribution to all of our shareholders generally will not be subject to U.S. federal income tax.
Taxation of Capital Gains and Losses Indian Taxation Capital Gains: Under Section 115AC and other applicable provisions of the Income Tax Act, any gain realized on the sale
outside India of the ADSs from one non-resident of India to another non-resident of India is not subject to Indian capital gains tax. However, it is unclear whether a capital gain derived from the sale of rights by a non-resident of India to another non-resident of India outside of India may be subject to Indian capital gains tax.
Capital gains arising to the non-resident investor on the transfer of equity shares (including shares received in exchange of the ADSs) whether in India or outside India to a non-resident investor or Indian resident, will be liable for income tax under the provisions of the Income Tax Act.
Equity shares (including shares issuable on the exchange of the ADSs) held by a non-resident investor for a period of more than 12 months are treated as long-term capital assets and the capital gains arising on the sale thereof are treated as long-term capital gains. If the equity shares are held for a period of 12 months or less, the same are treated as short-term capital assets and the capital gains arising on the sale thereof are treated as short-term capital gains. A non-resident holder’s holding period (for purposes of determining the applicable Indian capital gains tax rate) in respect of shares received in exchange for ADSs commences on the date of the advice of withdrawal of such shares by the relevant depository to its custodian.
For the purpose of computing capital gains tax on the sale of the equity shares, the cost of acquisition of equity shares received in exchange for ADSs will be determined on the basis of the prevailing price of the shares on the Indian Stock Exchanges as on the date on which the relevant depository gives notice to its custodian for the delivery of such equity shares upon redemption of the ADSs, while the cost of acquisition of shares directly converted from the ADSs will be determined on the basis of the price prevailing on the Indian Stock Exchanges on the date of conversion into equity shares.
Gain realized on the sale of listed equity shares held for more than 12 months will not be subject to Indian capital gains tax if the Securities Transaction Tax, or STT has been paid on the transaction. The STT will be levied on and collected by a domestic stock exchange on which equity shares are sold at the rate of 0.025% to 0.1% depending upon the nature of the transaction.
Any gain realized on the sale of listed equity shares held for more than 12 months on which no STT has been paid will be subject to Indian capital gains tax at the rate of 10% plus applicable surcharge on income tax and education cess at the applicable rates.
Capital gains realized in respect of equity shares held (calculated in the manner set forth in the prior paragraph) for 12 months or less (short-term gain) on which STT is paid in the manner and rates set out above, is subject to tax at the rate of 15% plus applicable surcharge on income tax and an education cess at the applicable rate. In the event that no STT is paid, short-term gain is subject to tax at variable rates with the maximum rate of 40% plus applicable rate of surcharge on income tax and education cess at the applicable rate. The actual rate of tax on short-term gains depends on a number of factors, including the legal status of the non-resident holder and the type of income chargeable in India.
Tax on capital gains is to be deducted at source by the person paying for the shares in accordance with the relevant provisions of the Income Tax Act.
106

ˆ200GNal5ojlWw2BQ‹Š200GNal5ojlWw2BQ
762654 TX 107TATA MOTORS LTDFORM 20-F
25-Jul-2014 00:24 ESTHTMHKG
RR Donnelley ProFile HKR pf_rend 1*ESS 0C
hkrdoc211.5.15
Page 1 of 1
Capital Losses: The Section 115AC Regime does not deal with capital losses arising on a transfer of shares. In general terms, losses arising from a transfer of a capital asset in India can only be set off against capital gains and not against any other income. A short-term capital loss can be set off against a capital gain, whether short-term or long-term. However, long-term capital loss can only be set off against long-term capital gain and not against short-term capital gain. To the extent that the losses are not absorbed in the year of transfer, they may be carried forward for a period of eight assessment years immediately succeeding the assessment year for which the loss was first determined and may be set off against the capital gains assessable for such subsequent assessment years. In order to set off capital losses in this manner, the non-resident investor would be required to file appropriate and timely tax returns in India. The long-term capital loss arising on a sale of equity shares in respect of which STT is paid may not be available for set-off against any capital gains.
U.S. Federal Income Taxation Generally, subject to the PFIC rules discussed below, if you are a U.S. holder and you sell or otherwise dispose of your
Shares or ADSs, you will recognize capital gain or loss for U.S. federal income tax purposes equal to the difference between the US dollar value of the amount that you realize and your tax basis, determined in U.S. dollars, in your shares or ADSs. Capital gain of a non-corporate U.S. holder, is generally taxed at preferential rates where the holder has a holding period greater than one year. The gain or loss will generally be income or loss from sources within the United States for foreign tax credit limitation purposes.
As discussed under “Taxation of Capital Gains and Losses — Indian Taxation”, above, capital gains realized by a U.S. holder upon a sale of equity shares or ADSs may be subject to tax in India. U.S. holders should consult their tax advisors regarding the availability of the foreign tax credit in respect of any such taxes imposed.
Passive Foreign Investment Companies: We believe that the Shares and ADSs should not be treated as stock of a PFIC for U.S. federal income tax purposes, but this conclusion is a factual determination that is made annually and thus may be subject to change. If we were to be treated as a PFIC, then unless you elect to be taxed annually on a mark-to-market basis with respect to your Shares or ADSs, gain realized on the sale or other disposition of your Shares or ADSs would in general not be treated as capital gain. Instead, if you are a U.S. holder, you would be treated as if you had realized such gain and certain “excess distributions” ratably over your holding period for the Shares or ADSs and would be taxed at the highest tax rate in effect for each such year to which the gain was allocated, together with an interest charged in respect of the tax attributable to each such year. With certain exceptions, your Shares or ADSs will be treated as stock in a PFIC if we were a PFIC at any time during your holding period in your shares or ADSs. Dividends that you receive from us will not be eligible for the special tax rates applicable to qualified dividend income if we are treated as a PFIC with respect to you either in the taxable year of the distribution or the preceding taxable year, but instead will be taxable at rates applicable to ordinary income.
Indian Tax Treaties The provisions of the tax treaty entered into by India and the country of residence of the non-resident investor will be
applicable to the extent they are more beneficial to the non-resident investor. The Government of India has introduced General Anti Avoidance Rules, or GAAR, which will be operative from April 1, 2015. As per the provisions of GAAR, an arrangement entered into by the assesse may be declared by the Income Tax Authorities to be an impermissible avoidance arrangement if it satisfies the specified conditions and consequently benefit under a tax treaty could be denied. Also, the Government of India has introduced a provision as per which the non-resident would not be entitled to claim any relief under the tax treaty unless the tax residency certificate is obtained by him from the government of the country of which he is a tax resident.
Dividend income is not subject to tax in India in the hands of the non-resident holder of the shares. If any shares are held by a non-resident investor following withdrawal thereof from the depository facility under the deposit agreement (as amended), the provisions of a tax treaty, if any, entered into by India and the country of residence of such non-resident investor will be applicable to determine the taxation of any capital gain arising from a transfer of such shares.
However, during the period of fiduciary ownership of shares in the hands of the overseas depository bank, the provisions of the tax treaty entered into by India and the country of residence of the overseas depository bank will be applicable to determine the taxation of any capital gains in respect of ADSs.
Indian Stamp Duty Under Indian law, any transfer of ADSs will be exempt from liability to Indian stamp duty. Purchasers of shares who seek
to register such shares on the share register of the company are required to pay Indian stamp duty at the rate of Rs.0.25 for every Rs.100 or part thereof of the market value of such shares. In order to register a transfer of shares in physical form with the company, it is necessary to present a stamped deed of transfer. An acquisition of shares in physical form from the Depository in exchange for ADSs representing such shares will not render an investor liable to Indian stamp duty but the company will be required to pay stamp duty at the applicable rate on the share certificate. However, since our shares are compulsorily deliverable in dematerialized form (except for trades of up to 500 shares which may be delivered in physical form), no stamp duty is payable on the acquisition or transfer of shares in dematerialized form.
107

ˆ200GNal5ojlbVnMweŠ200GNal5ojlbVnMwe
762654 TX 108TATA MOTORS LTDFORM 20-F
25-Jul-2014 00:34 ESTHTMHKG
RR Donnelley ProFile HKR pf_rend 2*ESS 0C
HKRPRFRS1011.5.15
Page 1 of 1
Indian Service Tax Brokerage or commission fees paid to stockbrokers in India in connection with the sale or purchase of shares are now
subject to an Indian service tax of 12% (plus a 3% education cess). A stockbroker is responsible for collecting such service tax at such rate and for paying the same to the relevant authority
F. Dividends and Paying Agents. Not applicable.
G. Statement by Experts. Not applicable.
H. Documents on Display. You may review a copy of this annual report at the SEC’s public reference room at 100 F Street, N.E., Washington, D.C.
20549. You may call the SEC at 1-800-732-0330 for additional information on how to obtain copies of all or any portion of the documents we file with or furnish to the SEC. The Securities and Exchange Commission also maintains a web site www.sec.gov that contains reports, proxy statements and other information regarding registrants that file electronically with the Securities and Exchange Commission.
We are subject to the information requirements of the Securities Exchange Act of 1934 and, in accordance therewith, will file annual reports on Form 20-F within the time specified by the SEC and furnish other reports and information on Form 6-K with the SEC. These reports and other information can be inspected at the public reference room at the SEC. You can also obtain copies of this material from the public reference room or by calling or writing the SEC upon payment of a prescribed fee. As a foreign private issuer, we are exempt from the rules under the Securities Exchange Act of 1934 prescribing the furnishing and content of proxy statements to shareholders.
I. Subsidiary Information. Not applicable.
Our exposure to financial risks derives primarily from changes in interest rates and foreign exchange rates. To mitigate these risks, we utilize derivative financial instruments, including interest rate option contracts and currency swap agreements, the application of which is primarily for hedging purposes and not for speculative purposes.
Commodity price risk Commodity price risk is the possibility of impact from changes in the price of commodities, such as non-ferrous metals
(like aluminum), ferrous alloys (like steel) and others (like rubber, platinum and rhodium), which we use in production of automotive vehicles and their components.
See Note 36 of our audited consolidated financial statements included elsewhere in this annual report for additional disclosures on financial instruments including disclosure on fair value of financial instruments.
A. Debt Securities. Not applicable.
B. Warrants and Rights. Not applicable.
C. Other Securities. Not applicable.
108
Item 11. Quantitative and Qualitative Disclosures about Market Risk.
Item 12. Description of Securities Other than Equity Securities.

ˆ200GNal5oj%VR4RQ-Š200GNal5oj%VR4RQ-
762654 TX 109TATA MOTORS LTDFORM 20-F
31-Jul-2014 17:22 ESTHTMHKG
RR Donnelley ProFile HKR arumr0dc 4*ESS 0C
WCRFBU-MWE-XN0511.5.15
Page 1 of 1
D. American Depositary Shares. Fees Payable by ADS Holders Citibank, N.A., the depositary of our ADR program, collects fees for issuance and cancellation of ADSs directly from
investors depositing shares or surrendering ADSs for the purpose of withdrawal or from intermediaries acting for them on such fees as per the Depositary agreement.
An ADS holder is required to pay the following service fees to the depositary:
An ADS holder will also be responsible to pay certain fees and expenses incurred by the depositary bank and certain taxes and governmental charges such as:
The fees and charges an ADS holder may be required to pay may vary over time and may be changed by us and by the depositary bank. ADS holders will receive prior notice of such changes.
Fees and Other Payments Made by the Depositary to U.S. In Fiscal 2014, we have received US$2,945,454.81 from the Depositary for standard out of pocket maintenance costs of
our ADR Program consisting of continuing annual stock exchange listing fees, special investor promotion activities and issue related expenses, cost for preparing and audit of IFRS accounts, legal/ accounting fees associated with the foreign listing, miscellaneous expenses such as costs associated with voting of ADRs holders, payment made to proxy firms, etc.
PART II
None.
None.
Disclosure Controls and Procedures We performed an evaluation of the effectiveness of the design and operation of disclosure controls and procedures as at
March 31, 2014. Based on this evaluation, our management, identified a material weakness in our internal control over financial reporting, and consequently concluded that our disclosure controls and procedures as defined in Rules 13a-15(e) and 15d-15(e) under the Securities Exchange Act of 1934, as amended, or the Exchange Act, were not effective as at March 31, 2014.
109
Service Fees •
Issuance of ADSs, Cancellation of ADSs, Distribution of ADSs pursuant to stock dividends, free stock distributions or exercise of rights and Distribution of securities other than ADSs or rights to purchase additional ADSs
Up to US$0.05 per ADS issued
• Distribution of cash dividends or other cash distributions Up to US$0.02 per ADS held
•
Depositary services
Up to US$0.02 per ADS held on the applicable record date(s) established by the depositary
Service Fees •
Transfer and registration on the share register (for example, upon deposit and withdrawal of Ordinary Shares)
Registration and transfer fees
• Converting foreign currency into US dollars
• Cable, telex and fax transmissions and delivery expenses Expenses incurred by the depositary
•
Transfer of securities (for example, when Ordinary Shares are deposited or withdrawn from deposit)
Taxes and duties for the transfer of securities
• Delivery or servicing of Ordinary Shares on deposit Fees and expenses incurred by the depositary
Item 13. Defaults, Dividend Arrearages and Delinquencies.
Item 14. Material Modifications to the Rights of Security Holders and Use of Proceeds.
Item 15. Controls and Procedures.
ˆ200GNal5oj%VrS@wdŠ200GNal5oj%VrS@wd
762654 TX 110TATA MOTORS LTDFORM 20-F
31-Jul-2014 17:35 ESTHTMHKG
RR Donnelley ProFile HKR arumr0dc 7*ESS 0C
WCRFBU-MWE-XN0511.5.15
Page 1 of 2
Management’s Annual Report on Internal Control Over Financial Reporting Management is responsible for establishing and maintaining adequate internal control over financial reporting as defined in
Rules 13a-15(f) and 15d -15(f) under the Exchange Act. Our internal control over financial reporting is a process designed to provide reasonable assurance regarding the reliability of financial reporting and the preparation of our financial statements for external reporting purposes in accordance with IFRS. Our internal control over financial reporting includes policies and procedures that:
As of March 31, 2014, management conducted an assessment of the effectiveness of the internal control over financial reporting using the criteria in Internal Control-Integrated Framework, established by the Committee of Sponsoring Organizations of the Treadway Commission. Based on this assessment, management identified a deficiency in the internal controls over financial reporting that constitutes a material weakness under auditing standards established by the Public Company Accounting Oversight Board (“PCAOB”), and therefore concluded that our internal control over financial reporting as defined in Rules 13a-15(f) and 15d -15(f) under the Exchange Act were not effective as at March 31, 2014. A material weakness is a deficiency, or a combination of deficiencies, in internal control over financial reporting, such that there is a reasonable possibility that a material misstatement of the annual or interim financial statements will not be prevented or detected on a timely basis.
The material weakness identified related to a deficiency in the design and operating effectiveness of controls over the change management procedures relating to an information technology system and as a result an inappropriate change to a raw materials system data table in the year ended March 31, 2014, was not prevented or detected on timely basis. The inappropriate change to the raw material systems data resulted in an overpayment to one of the company’s suppliers subsequent to March 31, 2014. The overpayment was promptly recovered from the supplier and as a result there was no financial loss and there were no misstatements identified in the financial statements as of and for the year ended March 31, 2014. However, management have identified that a material weakness in the internal control over financial reporting existed as at March 31, 2014, as the internal control processes did not prevent or detect the inappropriate change in the information technology system on a timely basis which resulted in the overpayment to the supplier being made.
Specific remediation actions taken by management immediately following the identification of the deficiency relating to the foregoing material weakness in internal control over financial reporting include the following:
These improvements have been made at the time of issuance of this report and are subject to formal remediation testing.
Due to its inherent limitations, however, internal control over financial reporting may not prevent or detect misstatements. Also, projections of any evaluation of effectiveness to future periods are subject to the risk that controls may become inadequate because of changes in conditions or that the degree of compliance with the policies or procedures may deteriorate.
The attestation report of Deloitte Haskins & Sells LLP, an independent registered public accounting firm, on management’s assessment of our internal control over financial reporting is included in our consolidated financial statements, beginning on page F-3 of this annual report on Form 20-F.
Changes in Internal Control over Financial Reporting During the period covered by this annual report, except as discussed above, there were no changes to our internal control
over financial reporting that have materially affected or are reasonably likely to materially affect our internal control over financial reporting.
i. pertain to the maintenance of records that, in reasonable detail, accurately and fairly reflect transactions and
dispositions of assets;
ii. provide reasonable assurance that transactions are recorded as necessary to permit preparation of financial
statements in accordance with IFRS, and that receipts and expenditures are being made only in accordance with the authorization of our management and directors; and
iii. provide reasonable assurance regarding prevention or timely detection of unauthorized acquisition, use or
disposition of our assets that could have a material effect on our financial statements.
• The training of staff around the change management processes and controls over the Company’s IT systems • The design and implementation of additional detective controls to identify invalid data table changes • The strengthening of controls with respect of payment authorization

ˆ200GNal5oj%VrS@wdŠ200GNal5oj%VrS@wd
762654 TX 110TATA MOTORS LTDFORM 20-F
31-Jul-2014 17:35 ESTHTMHKG
RR Donnelley ProFile HKR arumr0dc 7*ESS 0C
WCRFBU-MWE-XN0511.5.15
Page 2 of 2
Our Board has determined that Mr. Nasser Munjee, an independent director and a member of our Audit Committee, is an Audit Committee financial expert as defined under the applicable rules of the SEC issued pursuant to Section 407 of the Sarbanes – Oxley Act of 2002.
We have adopted the “Tata Code of Conduct”, hereinafter referred as to ‘the Code’, a written code of ethics which is applicable to all our employees. The Code is available at all our offices and on our website www.tatamotors.com.
110
Item 16A. Audit Committee Financial Expert.
Item 16B. Code of Ethics.

ˆ200GNal5ojlbZ92Q.Š200GNal5ojlbZ92Q.
762654 TX 111TATA MOTORS LTDFORM 20-F
25-Jul-2014 00:34 ESTHTMHKG
RR Donnelley ProFile HKR pf_rend 2*ESS 0C
HKRPRFRS1011.5.15
Page 1 of 1
In August 2004, our Audit Committee adopted a Whistle Blower Policy, or the Policy, that provided a formal mechanism for all our directors and employees to approach our management (or the Audit Committee in cases where the concern involves the senior management) and make protective disclosures to the Management about unethical behavior, actual or suspected fraud or violations of the Company’s Code or ethics policy. The Policy was updated on May 29, 2014 pursuant to the provisions of the Companies Act. The Policy is an extension of the Code, which requires every employee to promptly report to the Management any actual or possible violation of the Code or an event such director or employee becomes aware of that could affect our business or reputation. The disclosures reported are addressed in the manner and within the time frames prescribed in the Policy. The Policy is available on our website www.tatamotors.com.
Our financial statements prepared in accordance with IFRS, are audited by Deloitte Haskins & Sells, or DHS, a firm registered with the Public Company Accounting Oversight Board in the United States and which is also registered with the Institute of Chartered Accountants of India.
DHS has served as our independent public accountant for each of the years ended March 31, 2014 and March 31, 2013, for which audited financial statements appear in this annual report. The following table presents the aggregate fees for professional services and other services rendered by DHS and the various member firms of Deloitte to us including some of our subsidiaries in Fiscal 2014 and 2013.
Audit Committee pre-approval for services rendered by independent accountants:
Not applicable.
None.
None.
111
Item 16C. Principal Accountant Fees and Services.
2014 2014 2013
US$ in million Rs. in million
Audit Fees 8.3 496.8 397.0 Audit and review of financial statementsTax Fees 0.3 15.7 21.0 Tax audit, certification of foreign remittances and tax advisory servicesAll Other Fees 1.0 57.1 31.5 Other certifications and advisory services
Total 9.6 569.6 449.5
• We have adopted a policy for pre-approval of services to be rendered by our independent accountants for us and our
subsidiaries based on an elaborate procedure for ensuring auditor independence and objectivity.
• At the beginning of each year, the Audit Committee approves the proposed services, including the nature, type and
scope of services contemplated and/or the related fees to be rendered by these firms during the year.
• In addition, Audit Committee pre-approval is also required for those engagements that may arise during the course
of the year that are outside the scope of the initial services and such fees are pre-approved by the audit Committee. • We do not engage our independent accountants for ‘prohibited services’. • Our Audit Committee recommends the appointment and compensation of independent accountants.
• In case of urgent requirements, our CFO and the Chairman of our Audit Committee jointly approve any services that
may be rendered by our independent accountants or their member firms and such services are subsequently ratified at the next Audit Committee meeting.
• The pre-approval is not required where the fees proposed to be paid for the non-audit services do not exceed 5% of the total amount of fees paid by us to our independent accountants and their member firms during the Fiscal year, provided that such services were not recognized as non audit services at the time of the engagement of services. Such services are also brought to the attention of the Audit Committee at the next meeting.
Item 16D. Exemptions from the Listing Standards for Audit Committees.
Item 16E. Purchases of Equity Securities by the Issuer and Affiliated Purchasers.
Item 16F. Change in Registrant’s Certifying Accountant.

ˆ200GNal5ojrZlVuQtŠ200GNal5ojrZlVuQt
762654 TX 112TATA MOTORS LTDFORM 20-F
27-Jul-2014 11:45 ESTHTMHKG
RR Donnelley ProFile HKR kumbh2dc 7*ESS 0C
LANFBU-MWE-XN2211.5.15
Page 1 of 1
As a foreign private issuer, as defined under Rule 3b-4 of the Exchange Act, Tata Motors Limited is permitted under the NYSE listing standards to follow applicable Indian corporate governance practices with regard to various corporate governance matters. The following is a summary comparison of significant differences between our corporate governance practices and those required by the NYSE for non-U.S. issuers.
Independent directors: The Board has determined the independence of its directors pursuant to applicable Indian listing requirements. Six directors of the Board of Directors are independent directors pursuant to such requirements. Under such requirements, a non-Executive Director is considered independent if he:
Non-management directors meetings: The NYSE listing standards require regularly scheduled executive sessions of non-management directors without management participation or regularly scheduled executive sessions consisting of only independent directors. There is no such requirement under applicable Indian legal requirements.
Please refer Item 10.B “Memorandum and Articles of Association – Directors” for more information regarding our Directors.
Nomination and Remuneration Committee: The NYSE listing standards require a listed company to maintain a Remuneration Committee, composed entirely of independent directors. Our Nomination and Remuneration Committee comprises two independent members and two non-independent members, which is in compliance with the requirement regarding the number of independent members of the Nomination and Remuneration Committee under applicable Indian laws. The constitution and main functions of this committee as approved by our Board are described above and, we believe, generally comply with the spirit of the NYSE requirements for non-U.S. issuers.
Please see Item 6.C “Directors, Senior Management and Employees — Board Practices — Committees” for more information regarding our Nomination and Remuneration Committee
PART III
We have elected to provide the financial statements and related information specified in Item 18 in lieu of Item 17.
The information required by this item is set forth beginning on page F-1 of this annual report.
112
Item 16G. Corporate Governance.
• apart from receiving director’s remuneration, does not have any material pecuniary relationships or transactions with
us or our promoters, our directors, our senior management or our holding company, its subsidiaries and associates which may affect the independence of the director;
• is not related to promoters or person occupying management position at the board level or at one level below the
board; • has not been an executive of the Company in the immediately preceding three financial years;
• is not a partner or an executive or was not a partner or an executive during the preceding three years, of our statutory
audit firm or internal audit firm or a legal/consulting firm that has a material association with us.
• is not a material supplier, service provider or customer or a lessor or lessee of the Company, which may affect their
independence; and • is not our substantial shareholders, owning two percent or more of our voting shares. • is not below 21 years of age.
Item 17. Financial Statements.
Item 18. Financial Statements.
Schedule 1 -
Tata Motors Ltd – condensed financial information as of March 31, 2014 and 2013 and for the year ended March 31, 2014, 2013 and 2012 on page F-93 of this annual report

ˆ200GNal5ojlbaWbQ)Š200GNal5ojlbaWbQ)
762654 TX 113TATA MOTORS LTDFORM 20-F
25-Jul-2014 00:34 ESTHTMHKG
RR Donnelley ProFile HKR pf_rend 2*ESS 0C
HKRPRFRS1011.5.15
Page 1 of 1
We have not included as exhibits certain instruments with respect to our long-term debt, the amount of debt authorized under each of which does not exceed 10% of our total assets, and we agree to furnish a copy of any such instrument to the Securities Exchange Commission upon request.
113
Item 19. EXHIBITS.
Exhibit Number Description
1.1— Our Certificate of Incorporation.***
1.2— Our Memorandum and Articles of Association,****; Capital Clause as amended.*****
2.2—
Form of Amended and Restated Deposit Agreement among Tata Motors Limited, Citibank, N.A. as Depositary and all owners and holders from time to time of American Depositary Receipts, including the form of American Depositary Receipt**; Amendment No.1 thereto, dated December 16, 2009.*****
4.1—
Tata Brand Equity & Business Promotion Agreement, dated December 18, 1998, between Tata Sons Limited and Tata Engineering and Locomotive Company Limited (now Tata Motors Limited).*
7.1— Computation of Net Debt to Shareholders’ Equity Ratio.@
8.1— List of our Subsidiaries.@
11.1— The Tata Code of Conduct.*
12.1— Certification of the Principal Executive Officer required by Rule 13a – 14(a).@
12.2— Certification of the Principal Financial Officer required by Rule 13a – 14(a).@
13—
Certification of the Chief Executive Officer and Chief Financial Officer required by Rule 13a – 14(b) and Section 1350 of Chapter 63 of Title 18 of the United States Code.@
* Incorporated by reference to our Registration Statement on Form 20-F File No. 001-32294 filed on September 15, 2004. ** Incorporated by reference to our Registration Statement on Form F-6 File No 333-119066 filed on September 16, 2004. *** Incorporated by reference to our Annual Report on Form 20-F File No. 001-32294 filed on September 27, 2005. **** Incorporated by reference to our Annual Report on Form 20-F File No. 001-32294 filed on September 28, 2008. ***** Incorporated by reference to our Annual Report on Form 20-F File No. 001-32294 filed on July 31, 2012. @ Filed with this Annual Report on Form 20-F.

ˆ200GNal5oj$aLV9wLŠ200GNal5oj$aLV9wL
762654 SIG 1TATA MOTORS LTDFORM 20-F
31-Jul-2014 04:29 ESTHTMHKG
RR Donnelley ProFile HKR kupsu0dcSTART PAGE
2*ESS 0C
RRWIN-XENP14311.5.15
Page 1 of 1
SIGNATURES
The registrant hereby certifies that it meets all of the requirements for filing on Form 20-F and that it has duly caused and authorized the undersigned to sign this annual report on its behalf.
July 31, 2014
TATA MOTORS LIMITED
By /s/ Ravindra Pisharody Name: Ravindra PisharodyTitle: Executive Director – Commercial Vehicles
By /s/ C. Ramakrishnan Name: C. RamakrishnanTitle: Chief Financial Officer

ˆ200GNal5oj%3JxxwjŠ200GNal5oj%3Jxxwj
762654 FIN 1TATA MOTORS LTDFORM 20-F
31-Jul-2014 12:30 ESTHTMHKG
RR Donnelley ProFile HKR chaja0dcSTART PAGE
7*ESS 0C
ACXFBU-MWE-XN1511.5.15
Page 1 of 1
INDEX TO CONSOLIDATED FINANCIAL STATEMENTS
F-1
Page
Consolidated Financial Statements of Tata Motors Limited and subsidiaries :
Reports of independent registered public accounting firm F-2-F-3Consolidated balance sheets as of March 31, 2014 and 2013 F-4Consolidated income statements for the years ended March 31, 2014, 2013 and 2012 F-5Consolidated statements of comprehensive income for the years ended March 31, 2014, 2013 and 2012 F-6Consolidated statements of cash flows for the years ended March 31, 2014, 2013 and 2012 F-7-F-8Consolidated statements of changes in equity for the years ended March 31, 2014, 2013 and 2012 F-9-F-11Notes to consolidated financial statements F-12Schedule 1 - Tata Motors Limited (“Parent Company”) – condensed financial information as of March 31, 2014 and
2013 and for the year ended March 31, 2014, 2013 and 2012 F-93
ˆ200GNal5oj%J2phwÆŠ200GNal5oj%J2phw˘
762654 FIN 2TATA MOTORS LTDFORM 20-F
31-Jul-2014 14:40 ESTHTMHKG
RR Donnelley ProFile HKR vaitp0dcSTART PAGE
6*ESS 0C
LANFBU-MWE-XN0611.5.15
Page 1 of 1
REPORT OF INDEPENDENT REGISTERED PUBLIC ACCOUNTING FIRM
To the Board of Directors and Shareholders of Tata Motors Limited Mumbai, India
We have audited the accompanying consolidated balance sheets of Tata Motors Limited and subsidiaries (the “Company” or “Tata Motors”) as of March 31, 2014 and 2013, and the related consolidated income statements, consolidated statements of comprehensive income, consolidated statements of cash flows, and consolidated statements of changes in equity for each of the three years in the period ended March 31, 2014. Our audits also included the financial statement schedule included as Schedule 1 at Item 18. These consolidated financial statements and financial statement schedule are the responsibility of the Company’s management. Our responsibility is to express an opinion on these consolidated financial statements and financial statement schedule based on our audits.
We conducted our audits in accordance with the standards of the Public Company Accounting Oversight Board (United States). Those standards require that we plan and perform the audit to obtain reasonable assurance about whether the financial statements are free of material misstatement. An audit includes examining, on a test basis, evidence supporting the amounts and disclosures in the financial statements. An audit also includes assessing the accounting principles used and significant estimates made by management, as well as evaluating the overall financial statement presentation. We believe that our audits provide a reasonable basis for our opinion.
In our opinion, such consolidated financial statements present fairly, in all material respects, the financial position of Tata Motors Limited and subsidiaries as of March 31, 2014 and 2013, and the results of their operations and their cash flows for each of the three years in the period ended March 31, 2014, in conformity with International Financial Reporting Standards as issued by the International Accounting Standards Board. Also, in our opinion, such financial statement schedule, when considered in relation to the basic consolidated financial statements taken as a whole, present fairly, in all material respects, the information set forth therein.
We have also audited, in accordance with the standards of the Public Company Accounting Oversight Board (United States), the Company’s internal control over financial reporting as of March 31, 2014, based on the criteria established in Internal Control — Integrated Framework (1992) issued by the Committee of Sponsoring Organizations of the Treadway Commission and our report dated July 31, 2014 expressed an adverse opinion on the Company’s internal control over financial reporting.
Our audit for the year ended and as of March 31, 2014 also comprehended the translation of Indian rupee amounts into United States dollar amounts and in our opinion, such translation has been made in conformity with the basis stated in Note 2(w) to the consolidated financial statements. The translation of the consolidated financial statements amounts into United States dollars have been made solely for the convenience of readers outside India.
/s/ DELOITTE HASKINS & SELLS LLP Mumbai, India July 31, 2014
F-2

ˆ200GNal5oj%J6CQQ)Š200GNal5oj%J6CQQ)
762654 FIN 3TATA MOTORS LTDFORM 20-F
31-Jul-2014 14:40 ESTHTMHKG
RR Donnelley ProFile HKR vaitp0dcSTART PAGE
3*ESS 0C
LANFBU-MWE-XN0611.5.15
Page 1 of 1
REPORT OF INDEPENDENT REGISTERED PUBLIC ACCOUNTING FIRM
To the Board of Directors and Shareholders of Tata Motors Limited Mumbai, India
We have audited Tata Motors Limited and subsidiaries (the “Company’s”) internal control over financial reporting as of March 31, 2014, based on criteria established in Internal Control — Integrated Framework (1992) issued by the Committee of Sponsoring Organizations of the Treadway Commission. The Company’s management is responsible for maintaining effective internal control over financial reporting and for its assessment of the effectiveness of internal control over financial reporting included in Item 15 under Controls and Procedures of the accompanying 20-F titled Management’s Annual Report on Internal Control over Financial Reporting. Our responsibility is to express an opinion on the Company’s internal control over financial reporting based on our audit.
We conducted our audit in accordance with the standards of the Public Company Accounting Oversight Board (United States). Those standards require that we plan and perform the audit to obtain reasonable assurance about whether effective internal control over financial reporting was maintained in all material respects. Our audit included obtaining an understanding of internal control over financial reporting, assessing the risk that a material weakness exists, testing and evaluating the design and operating effectiveness of internal control based on that risk, and performing such other procedures as we considered necessary in the circumstances. We believe that our audit provides a reasonable basis for our opinion.
A company’s internal control over financial reporting is a process designed by, or under the supervision of, the company’s principal executive and principal financial officers, or persons performing similar functions, and effected by the company’s board of directors, management, and other personnel to provide reasonable assurance regarding the reliability of financial reporting and the preparation of financial statements for external purposes in accordance with generally accepted accounting principles. A company’s internal control over financial reporting includes those policies and procedures that (1) pertain to the maintenance of records that, in reasonable detail, accurately and fairly reflect the transactions and dispositions of the assets of the company; (2) provide reasonable assurance that transactions are recorded as necessary to permit preparation of financial statements in accordance with generally accepted accounting principles, and that receipts and expenditures of the company are being made only in accordance with authorizations of management and directors of the company; and (3) provide reasonable assurance regarding prevention or timely detection of unauthorized acquisition, use, or disposition of the company’s assets that could have a material effect on the financial statements.
Because of the inherent limitations of internal control over financial reporting, including the possibility of collusion or improper management override of controls, material misstatements due to error or fraud may not be prevented or detected on a timely basis. Also, projections of any evaluation of the effectiveness of the internal control over financial reporting to future periods are subject to the risk that the controls may become inadequate because of changes in conditions, or that the degree of compliance with the policies or procedures may deteriorate.
A material weakness is a deficiency, or a combination of deficiencies, in internal control over financial reporting, such that there is a reasonable possibility that a material misstatement of the company’s annual financial statements will not be prevented or detected on a timely basis. Management’s assessment identified a material weakness relating to certain ineffective controls in respect of one of the Company’s information technology system. This material weakness was considered in determining the nature, timing, and extent of audit tests applied in our audit of the consolidated financial statements as of and for the year ended March 31, 2014, of the Company and this report does not affect our report on such financial statements.
In our opinion, because of the effect of the material weakness described above on the achievement of the objectives of the control criteria, the Company has not maintained effective internal control over financial reporting as of March 31, 2014, based on the criteria established in Internal Control — Integrated Framework (1992) issued by the Committee of Sponsoring Organizations of the Treadway Commission.
We have also audited, in accordance with the standards of the Public Company Accounting Oversight Board (United States), the consolidated financial statements as of and for the year ended March 31, 2014, of the Company and our report dated July 31, 2014 expressed an unqualified opinion on those financial statements.
/s/ DELOITTE HASKINS & SELLS LLP Mumbai, India July 31, 2014
F-3

ˆ200GNal5ojqrD2mQIŠ200GNal5ojqrD2mQI
762654 FIN 4TATA MOTORS LTDFORM 20-F
26-Jul-2014 12:40 ESTHTMHKG
RR Donnelley ProFile HKR balan2dcSTART PAGE
10*ESS 0C
LANFBU-MWE-XN1711.5.15
Page 1 of 1
Tata Motors Limited and subsidiaries Consolidated Balance Sheets
See accompanying notes to consolidated financial statements
F-4
As at March 31, Notes 2014 2014 2013 (In millions)
ASSETS:
Current assets:
Cash and cash equivalents 3 US$ 2,669.1 Rs. 159,921.5 Rs. 116,909.9 Short-term deposits 2,088.8 125,150.4 68,957.0 Finance receivables 4 1,516.0 90,832.5 71,460.5 Trade receivables 1,830.0 109,644.8 105,790.7 Investments 6 1,591.2 95,337.5 75,191.2 Other financial assets 7 734.0 43,974.3 22,144.0 Inventories 9 4,552.0 272,735.9 210,495.7 Other current assets 10 879.4 52,692.2 57,999.8 Current income tax assets 57.2 3,420.3 2,658.3
Total current assets 15,917.7 953,709.4 731,607.1
Non-current assets:
Finance receivables 4 1,576.3 94,442.7 126,758.7 Investments 6 109.1 6,539.3 6,282.2 Other financial assets 8 875.4 52,444.0 17,044.6 Property, plant and equipment 12 8,255.2 494,609.9 364,979.9 Goodwill 14 124.3 7,449.2 5,311.2 Intangible assets 15 8,214.6 492,184.1 351,666.9 Investments in equity accounted investees 16 337.8 20,236.7 20,829.7 Non-current income tax assets 142.8 8,558.2 7,551.7 Deferred income taxes 17 653.4 39,150.5 45,205.2 Other non-current assets 11 258.0 15,451.9 9,929.3
Total non-current assets 20,546.9 1,231,066.5 955,559.4
Total assets US$ 36,464.6 Rs. 2,184,775.9 Rs. 1,687,166.5
LIABILITIES AND EQUITY:
Liabilities:
Current liabilities:
Accounts payable 9,082.8 544,197.3 417,313.9 Acceptances 861.6 51,620.4 43,931.3 Short-term borrowings and current portion of
long-term debt 18 2,769.8 165,960.6 234,897.4 Other financial liabilities 20 582.9 34,924.2 38,513.3 Provisions 22 763.0 45,713.8 34,129.3 Other current liabilities 23 904.5 54,186.5 52,435.1 Current income tax liabilities 233.4 13,986.7 17,754.5
Total current liabilities 15,198.0 910,589.5 838,974.8
Non-current liabilities:
Long-term debt 19 7,579.7 454,138.6 330,718.1 Other financial liabilities 21 153.0 9,172.7 22,000.9 Deferred income taxes 17 588.7 35,271.8 16,056.4 Provisions 22 1,115.1 66,810.2 46,801.9 Other liabilities 24 1,286.9 77,096.8 58,708.7
Total non-current liabilities 10,723.4 642,490.1 474,286.0
Total liabilities 25,921.4 1,553,079.6 1,313,260.8
Equity:
Ordinary shares 25 91.4 5,473.8 5,416.7 ‘A’ Ordinary shares 25 16.1 964.0 964.0 Additional paid-in capital 3,126.8 187,341.3 178,971.7 Reserves 5,142.1 308,089.4 197,576.5 Other components of equity 26 2,096.4 125,609.2 (12,660.4)
Equity attributable to shareholders of Tata Motors Limited 10,472.8 627,477.7 370,268.5
Non-controlling interests 70.4 4,218.6 3,637.2
Total equity 10,543.2 631,696.3 373,905.7
Total liabilities and equity US$ 36,464.6 Rs. 2,184,775.9 Rs. 1,687,166.5

ˆ200GNal5oju2pRywÊ200GNal5oju2pRywˆ
762654 FIN 5TATA MOTORS LTDFORM 20-F
28-Jul-2014 08:39 ESTHTMHKG
RR Donnelley ProFile HKR durap0dcSTART PAGE
4*ESS 0C
HKGFBU-MWE-XN0111.5.14
Page 1 of 1
Tata Motors Limited and subsidiaries
Consolidated Income Statements
See accompanying notes to consolidated financial statements
F-5
Year ended March 31, Notes 2014 2014 2013 2012 (In millions, except per share amounts)
Revenues US$38,586.1 Rs.2,311,884.6 Rs.1,862,896.7 Rs.1,637,173.5
Finance revenues 498.6 29,875.9 30,013.3 24,340.4
Total revenues 39,084.7 2,341,760.5 1,892,910.0 1,661,513.9
Change in inventories of finished goods and work-in- progress (472.6) (28,317.3) (30,086.8) (25,861.4)
Purchase of products for sale 1,830.8 109,691.6 92,889.5 90,204.2 Raw materials components, and
consumables 22,758.4 1,363,572.1 1,138,214.3 1,025,448.0 Employee cost 28 3,570.1 213,903.0 167,169.5 125,204.9 Depreciation and amortization 1,843.7 110,462.6 75,767.9 56,424.0 Other expenses 29 8,324.8 498,777.7 384,423.3 312,456.1 Expenditure capitalized (2,257.3) (135,246.8) (101,934.5) (82,659.8) Other (income) / loss (net) 30 (129.0) (7,732.6) (12,099.1) (10,039.4) Foreign exchange (gain)/loss
(net) (318.9) (19,104.2) 15,774.9 11,511.7 Interest income (111.1) (6,656.7) (6,928.0) (4,953.4) Interest expense (net) 31 886.1 53,094.7 40,792.0 38,957.7 Impairment in respect of an
equity accounted investee 16 134.1 8,033.7 — 4,981.0 Share of (profit)/loss of equity
accounted investees 16 31.3 1,877.6 131.5 586.8
Net income before tax 2,994.3 179,405.1 128,795.5 119,253.5
Income tax expense 17 (804.9) (48,226.5) (39,238.8) (4,436.5)
Net income US$ 2,189.4 Rs. 131,178.6 Rs. 89,556.7 Rs. 114,817.0
Attributable to:
Shareholders of Tata Motors Limited 2,181.7 130,717.1 88,670.5 114,035.7
Non-controlling interests 7.7 461.5 886.2 781.3
Earnings per share: 41
Ordinary shares:
Basic US$ 0.7 Rs. 40.7 Rs. 27.8 Rs. 35.9 Diluted US$ 0.7 Rs. 40.6 Rs. 27.8 Rs. 35.5
‘A’ Ordinary shares:
Basic US$ 0.7 Rs. 40.8 Rs. 27.9 Rs. 36.0 Diluted US$ 0.7 Rs. 40.7 Rs. 27.9 Rs. 35.6

ˆ200GNal5ojuC9HnwÀŠ200GNal5ojuC9Hnw
762654 FIN 6TATA MOTORS LTDFORM 20-F
28-Jul-2014 09:25 ESTHTMHKG
RR Donnelley ProFile HKR durap0dcSTART PAGE
5*ESS 0C
HKGFBU-MWE-XN0111.5.14
Page 1 of 1
Tata Motors Limited and subsidiaries
Consolidated Statements of Comprehensive Income
See accompanying notes to consolidated financial statements
F-6
Year ended March 31, 2014 2014 2013 2012 (In millions)
Net income US$ 2,189.4 Rs. 131,178.6 Rs. 89,556.7 Rs.114,817.0 Other comprehensive income :
(i) Items that will not be reclassified subsequently to profit and loss :
Remeasurement gains and (losses) on defined benefit obligations (net) (216.0) (12,940.5) (29,207.2) (9,389.7)
Share of remeasurement gains and (losses) on defined benefit obligations (net) of equity accounted investees 0.2 10.9 12.5 5.8
Income tax relating to items that will not be reclassified subsequently (7.6) (455.6) 6,147.9 11,680.4
(223.4) (13,385.2) (23,046.8) 2,296.5
(ii) Items that may be reclassified subsequently to profit and loss :
Currency translation differences 1,112.9 66,678.4 797.6 23,500.3 Gain/(loss) on cash flow hedges (net) 1,496.4 89,657.1 (19,690.1) (4,363.5) Available-for-sale investments 7.4 441.9 408.0 (784.5) Share of other comprehensive income
of equity accounted investees 7.0 419.1 14.9 35.9 Income tax relating to items that may
be reclassified subsequently (310.9) (18,628.9) 4,529.0 1,126.6
2,312.8 138,567.6 (13,940.6) 19,514.8
Other comprehensive income/(loss) for the year, net of tax (i+ii) 2,089.4 125,182.4 (36,987.4) 21,811.3
Total comprehensive income for the year US$ 4,278.8 Rs. 256,361.0 Rs. 52,569.3 Rs.136,628.3
Attributable to:
Shareholders of Tata Motors Limited 4,266.2 255,605.1 51,652.6 135,751.2 Non-controlling interests 12.6 755.9 916.7 877.1

ˆ200GNal5oj!0PXfQuŠ200GNal5oj!0PXfQu
762654 FIN 7TATA MOTORS LTDFORM 20-F
30-Jul-2014 03:03 ESTHTMHKG
RR Donnelley ProFile HKR peetp0dcSTART PAGE
6*ESS 0C
WCRFBU-MWE-XN0311.5.15
Page 1 of 1
Tata Motors Limited and subsidiaries
Consolidated Statements of Cash Flows
F-7
Year ended March 31, 2014 2014 2013 2012 (In millions)
Cash flows from operating activities:
Net income US$ 2,189.4 Rs. 131,178.6 Rs. 89,556.7 Rs. 114,817.0 Adjustments for:
Depreciation and amortization 1,843.7 110,462.6 75,767.9 56,424.0 Inventory write-down 56.0 3,354.5 3,721.0 2,344.5 Allowances for finance receivables 402.9 24,138.9 9,427.9 5,747.3 Allowances for trade and other receivables 44.9 2,691.0 1,141.6 1,026.7 Impairment in respect of an equity accounted investee 134.1 8,033.7 — 4,981.0 Share of loss of equity accounted investees 31.3 1,877.6 131.5 586.8 Loss on sale of assets / assets written off 5.0 294.1 229.0 709.1 Goodwill impairment — — — 45.7 (Gain) on sale / loss on fair valuation of available-for-sale
investments (net) (18.4) (1,102.1) 275.2 (484.5) (Gain)/loss on change in the fair value of conversion
options 14.0 838.2 (801.6) (2,432.4) (Gain) / loss on fair value of prepayment option on Senior
Notes 80.0 4,791.6 (3,932.6) — Acquisition related cost 0.5 27.6 — — Foreign exchange (gain) / loss (35.6) (2,131.3) 9,985.1 13,442.6 Income tax expense 804.9 48,226.5 39,238.8 4,436.5 Interest expense (net) 886.1 53,094.7 40,792.0 38,957.7 Interest income (111.1) (6,656.7) (6,928.0) (4,953.4) Dividend income (4.1) (244.9) (384.0) (271.2) Gain on fair value of below market interest loans (36.0) (2,155.2) (1,462.8) — Non-cash dividend income on mutual funds (2.2) (130.2) — (145.6)
Cash flows from operating activities before changes in following assets and liabilities 6,285.4 376,589.2 256,757.7 235,231.8
Trade receivable 184.5 11,055.8 (17,527.8) (15,310.2) Finance receivable (186.8) (11,194.9) (36,406.2) (30,660.4) Other financial assets 27.0 1,620.5 (5,591.9) (1,368.3) Other current assets 271.3 16,252.4 1,980.3 (12,906.2) Inventories (530.1) (31,763.6) (30,006.3) (29,568.5) Other non-current assets (70.2) (4,205.0) 283.7 482.3 Accounts payable 785.7 47,075.4 63,474.1 80,138.8 Acceptances 126.0 7,548.5 3,087.5 (12,890.4) Other current liabilities (99.3) (5,948.4) (9,705.8) 14,019.2 Other financial liabilities (2.7) (159.7) 5,648.0 8,509.3 Other non-current liabilities (119.5) (7,159.6) 2,182.9 (6,417.2) Provisions 275.2 16,486.3 14,390.9 10,200.2
Cash generated from operations 6,946.5 416,196.9 248,567.1 239,460.4 Income tax paid (net) (747.1) (44,765.2) (23,017.8) (18,401.8)
Net cash provided by operating activities 6,199.4 371,431.7 225,549.3 221,058.6
Cash flows from investing activities: Deposits with banks (803.7) (48,154.3) (68,807.1) (13,142.8) Realization of deposits with banks 51.3 3,074.1 8,314.6 8,830.1 Repayment of loans / loans (given) to equity accounted
investees and others — — 501.2 (29.6) (Purchase) / sale of available-for-sale investments (net) (71.0) (4,252.2) 1,817.6 (58,263.3) Purchases of other investments (0.6) (38.8) (33.3) (355.7) Proceeds from sale of available-for-sale investments 0.7 43.7 27.5 20.2 Proceeds from sale of investments classified as loans and
receivables — — 257.5 7.5
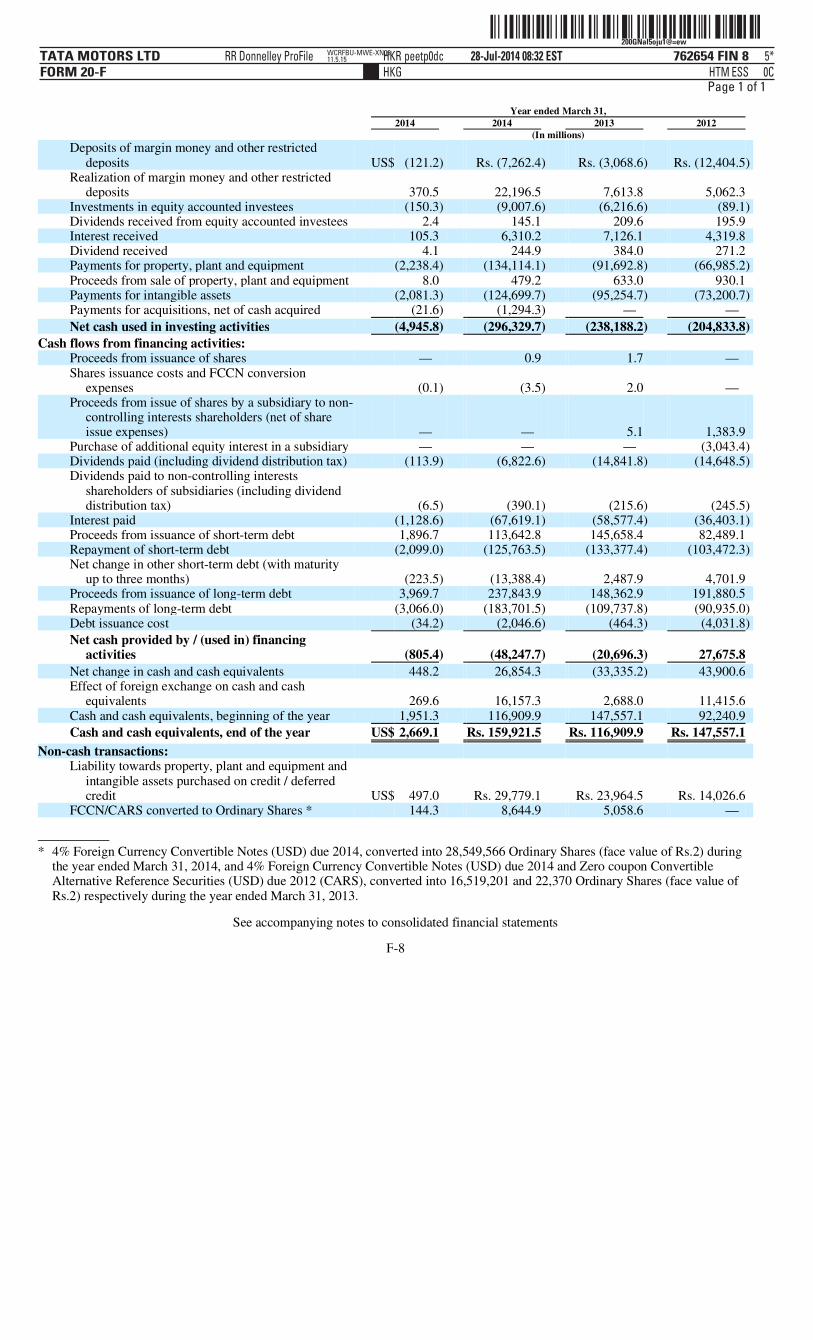
ˆ200GNal5oju1@=ewÉŠ 200GNal5oju1@=ew
762654 FIN 8TATA MOTORS LTDFORM 20-F
28-Jul-2014 08:32 ESTHTMHKG
RR Donnelley ProFile HKR peetp0dc 5*ESS 0C
WCRFBU-MWE-XN0611.5.15
Page 1 of 1
See accompanying notes to consolidated financial statements
F-8
Year ended March 31, 2014 2014 2013 2012 (In millions)
Deposits of margin money and other restricted deposits US$ (121.2) Rs. (7,262.4) Rs. (3,068.6) Rs. (12,404.5)
Realization of margin money and other restricted deposits 370.5 22,196.5 7,613.8 5,062.3
Investments in equity accounted investees (150.3) (9,007.6) (6,216.6) (89.1) Dividends received from equity accounted investees 2.4 145.1 209.6 195.9 Interest received 105.3 6,310.2 7,126.1 4,319.8 Dividend received 4.1 244.9 384.0 271.2 Payments for property, plant and equipment (2,238.4) (134,114.1) (91,692.8) (66,985.2) Proceeds from sale of property, plant and equipment 8.0 479.2 633.0 930.1 Payments for intangible assets (2,081.3) (124,699.7) (95,254.7) (73,200.7) Payments for acquisitions, net of cash acquired (21.6) (1,294.3) — —
Net cash used in investing activities (4,945.8) (296,329.7) (238,188.2) (204,833.8)
Cash flows from financing activities:
Proceeds from issuance of shares — 0.9 1.7 — Shares issuance costs and FCCN conversion
expenses (0.1) (3.5) 2.0 — Proceeds from issue of shares by a subsidiary to non-
controlling interests shareholders (net of share issue expenses) — — 5.1 1,383.9
Purchase of additional equity interest in a subsidiary — — — (3,043.4) Dividends paid (including dividend distribution tax) (113.9) (6,822.6) (14,841.8) (14,648.5) Dividends paid to non-controlling interests
shareholders of subsidiaries (including dividend distribution tax) (6.5) (390.1) (215.6) (245.5)
Interest paid (1,128.6) (67,619.1) (58,577.4) (36,403.1) Proceeds from issuance of short-term debt 1,896.7 113,642.8 145,658.4 82,489.1 Repayment of short-term debt (2,099.0) (125,763.5) (133,377.4) (103,472.3) Net change in other short-term debt (with maturity
up to three months) (223.5) (13,388.4) 2,487.9 4,701.9 Proceeds from issuance of long-term debt 3,969.7 237,843.9 148,362.9 191,880.5 Repayments of long-term debt (3,066.0) (183,701.5) (109,737.8) (90,935.0) Debt issuance cost (34.2) (2,046.6) (464.3) (4,031.8)
Net cash provided by / (used in) financing activities (805.4) (48,247.7) (20,696.3) 27,675.8
Net change in cash and cash equivalents 448.2 26,854.3 (33,335.2) 43,900.6 Effect of foreign exchange on cash and cash
equivalents 269.6 16,157.3 2,688.0 11,415.6 Cash and cash equivalents, beginning of the year 1,951.3 116,909.9 147,557.1 92,240.9
Cash and cash equivalents, end of the year US$ 2,669.1 Rs. 159,921.5 Rs. 116,909.9 Rs. 147,557.1
Non-cash transactions: Liability towards property, plant and equipment and
intangible assets purchased on credit / deferred credit US$ 497.0 Rs. 29,779.1 Rs. 23,964.5 Rs. 14,026.6
FCCN/CARS converted to Ordinary Shares * 144.3 8,644.9 5,058.6 —
* 4% Foreign Currency Convertible Notes (USD) due 2014, converted into 28,549,566 Ordinary Shares (face value of Rs.2) during the year ended March 31, 2014, and 4% Foreign Currency Convertible Notes (USD) due 2014 and Zero coupon Convertible Alternative Reference Securities (USD) due 2012 (CARS), converted into 16,519,201 and 22,370 Ordinary Shares (face value of Rs.2) respectively during the year ended March 31, 2013.

ˆ200GNal5ojw%l=mQ_Š 200GNal5ojw%l=mQ_
762654 FIN 9TATA MOTORS LTDFORM 20-F
29-Jul-2014 06:22 ESTHTMHKG
RR Donnelley ProFile HKR gurur0dc 5*ESS 0C
HKGFBU-MWE-XN0411.5.15
Page 1 of 1
Tata M
otors Lim
ited and subsidiaries
Consolidated statem
ents of changes in equity
For each of the years ended M
arch 31, 2014, 2013 and 2012
See accompanying notes to consolidated financial statem
ents
F-9
O
ther compon
ents of equity
Reserves*
Share
capital
Add
itional paid-in
cap
ital
Cu
rrency
translation
reserve
Availab
le-for-sale in
vest- m
ents
Hedgin
g R
eserve
Cap
ital red
em-
ption
reserve
Deben
ture
redem
ption
reserve
Reserve for
research and
hum
an resou
rce d
evelop- m
ent
S
pecial reserve
Earn
ed surp
lus
reserve
Retained
earn
ings
Eq
uity attribu-
table to
share-
hold
ers of
Tata
Motors
Lim
ited
Non
- con
trolling
interests
Total
equity
(In m
illions)
Balance as of A
pril 1, 2013
Rs.
6,380.7 R
s.178,971.7
Rs.
3,820.6 R
s.320.3
Rs.
(16,801.3) R
s.22.8
Rs.
10,421.6 R
s.1,644.3
Rs.
2,083.8 R
s.140.0
Rs.
183,264.0 R
s.370,268.5
Rs.
3,637.2 R
s.373,905.7
Income for the year
130,717.1
130,717.1
461.5
131,178.6 O
ther comprehensive incom
e /(loss) for the year
66,790.2
479.9
70,999.5
(13,381.6)
124,888.0
294.4
125,182.4
Total com
prehensive income for the year
—
—
66,790.2
479.9
70,999.5
—
—
—
—
—
117,335.5
255,605.1
755.9
256,361.0
Shares issued upon conversion of Foreign C
urrency Convertible N
otes (net of issue expenses of R
s. 3.5 million)
57.1
8,584.3
8,641.4
8,641.4 Issue of shares held in abeyance
—
0.9
0.9
0.9
Shares issued to non-controlling interests
—
—
Dividend paid (including dividend tax)
(6,822.6)
(6,822.6)
(390.1)
(7,212.7) T
ransfer to special reserve
217.9
(217.9)
—
—
Changes in ow
nership interests in subsidiaries that do not result in a loss of control
(215.6)
(215.6)
215.6
—
Balan
ce as of March 31, 2014
R
s.6,437.8
Rs.
187,341.3 R
s.70,610.8
Rs.
800.2 R
s.54,198.2
Rs.
22.8 R
s.10,421.6
Rs.
1,644.3 R
s.2,301.7
Rs.
140.0 R
s.293,559.0
Rs.
627,477.7 R
s.4,218.6
Rs.
631,696.3
R
s.125,609.2
R
s.308,089.4
U
S$107.5
US$
3,126.8 U
S$1,178.4
US$
13.4 U
S$904.6
US$
0.4 U
S$173.9
US$
27.4 U
S$38.5
US$
2.3 U
S$4,899.6
US$
10,472.8 U
S$70.4
US$
10,543.2
U
S$2,096.4
U
S$5,142.1
*R
efer note 27

ˆ200GNal5ojw%mi@wÁŠ 200GNal5ojw%mi@w`
762654 FIN 10TATA MOTORS LTDFORM 20-F
29-Jul-2014 06:22 ESTHTMHKG
RR Donnelley ProFile HKR gurur0dc 4*ESS 0C
HKGFBU-MWE-XN0411.5.15
Page 1 of 1
See accompanying notes to consolidated financial statem
ents
F-10
Other com
pon
ents of equity
Reserves*
Share
capital
Ad
ditional
paid-in
capital
Cu
rrency tran
slationreserve
Available- for-sale
investments
H
edgin
g R
eserve
Cap
ital redem
ptionreserve
Deben
ture
redemption
reserve
Reserve for
research and
hum
an resource
developmen
t Sp
ecial reserve
Earned
su
rplus reserve
R
etained
earnings
Eq
uity attributable
to sh
arehold
ersof
Tata
Motors
Lim
ited
Non-
controllingin
terests
T
otal eq
uity
(In million
s)
Balance as of A
pril 1, 2012
Rs.6,347.5
Rs.173,946.6
Rs.
3,033.0 R
s.(26.7)
Rs.
(1,695.3) R
s.22.8
Rs.11,721.6
Rs.
1,644.3 R
s.1,452.4 R
s.140.0 R
s.131,826.4 R
s.328,412.6 R
s.2,931.0
Rs.331,343.6
Income for the year
88,670.5
88,670.5
886.2
89,556.7 O
ther comprehensive incom
e /(loss) for the year
787.6
347.0
(15,106.0)
(23,046.5)
(37,017.9)
30.5
(36,987.4)
Total com
prehensive income for the year
—
—
787.6
347.0
(15,106.0)
—
—
—
—
—
65,624.0
51,652.6
916.7
52,569.3
Shares issued upon conversion of Foreign C
urrency C
onvertible Notes (net of issue expenses of R
s. 2.0 m
illion)
33.1
5,023.5
5,056.6
5,056.6
Issue of shares held in abeyance
0.1
1.6
1.7
1.7
Shares issued to non-controlling interests
—
5.1
5.1
Dividend paid (including dividend tax)
(14,855.0)
(14,855.0)
(215.6)
(15,070.6) T
ransfer to special reserve
631.4
(631.4)
—
—
Transfer from
debenture redemption reserve
(1,300.0)
1,300.0
—
—
Balan
ce as of March 31, 2013
R
s.6,380.7 R
s.178,971.7 R
s.3,820.6 R
s.320.3
Rs.(16,801.3)
Rs.
22.8 R
s.10,421.6 R
s.1,644.3
Rs.2,083.8
Rs.140.0
Rs.183,264.0
Rs.370,268.5
Rs.3,637.2
Rs.373,905.7
R
s.(12,660.4)
Rs.197,576.5
*R
efer note 27

ˆ200GNal5ojw%nsCQ)Š200GNal5ojw%nsCQ)
762654 FIN 11TATA MOTORS LTDFORM 20-F
29-Jul-2014 06:22 ESTHTMHKG
RR Donnelley ProFile HKR gurur0dc 4*ESS 0C
HKGFBU-MWE-XN0411.5.15
Page 1 of 1
See accompanying notes to consolidated financial statem
ents
F-11
O
ther comp
onents of equ
ity
R
eserves*
Share
capital
Ad
ditional
paid-in
capital
Curren
cy tran
slation reserve
Available- for-sale
investments
H
edgin
g R
eserve
Cap
ital redem
ptionreserve
Deben
ture
redemption
reserve
Reserve for
research and
hum
an resource
developmen
t Sp
ecial reserve
Earned
su
rplus reserve
R
etained
earnings
Eq
uity attributable
to sh
arehold
ersof
Tata
Motors
Lim
ited
Non-
controllingin
terests
T
otal eq
uity
(In m
illions)
B
alance as of April 1, 2011
R
s.6,346.5 R
s.175,484.7 R
s.(20,399.1) R
s.772.0
Rs.
1,528.7 R
s.22.8
Rs.11,021.6
Rs.
1,510.2 R
s.959.5
Rs.113.2
Rs.
31,508.9 R
s.208,869.0 R
s.2,390.3
Rs.211,259.3
Income for the year
114,035.7
114,035.7
781.3
114,817.0 O
ther comprehensive incom
e /(loss) for the year (net of tax)
23,432.1
(798.7)
(3,224.0)
2,306.1
21,715.5
95.8
21,811.3
Total com
prehensive income for the year
—
—
23,432.1
(798.7)
(3,224.0)
—
—
—
—
—
116,341.8
135,751.2
877.1
136,628.3
Issue of shares held in abeyance
1.0
29.8
30.8
30.8
Dividend paid (including dividend tax)
(14,670.5)
(14,670.5)
(245.5)
(14,916.0) T
ransfer to debenture redemption reserve
700.0
(700.0)
—
Transfer to earned surplus reserve
26.8
(26.8)
—
Transfer to special reserve
492.9
(492.9)
—
—
T
ransfer to reserve for human resource developm
ent
134.1
(134.1)
—
Changes in ow
nership interests in subsidiaries that do not result in a loss of control
(1,567.9)
(1,567.9)
(90.9)
(1,658.8)
Balan
ce as of March 31, 2012
R
s.6,347.5 R
s.173,946.6 R
s.3,033.0
Rs.
(26.7) R
s.(1,695.3) R
s.22.8
Rs.11,721.6
Rs.
1,644.3 R
s.1,452.4 R
s.140.0 R
s.131,826.4 R
s.328,412.6 R
s.2,931.0 R
s.331,343.6
R
s.1,311.0
R
s.146,807.5
*R
efer note 27

ˆ200GNal5oj$%FSpw=Š 200GNal5oj$%FSpw=
762654 FIN 12TATA MOTORS LTDFORM 20-F
31-Jul-2014 10:25 ESTHTMHKG
RR Donnelley ProFile HKR peetp0dcSTART PAGE
5*ESS 0C
HKGFBU-MWE-XN0311.5.15
Page 1 of 1
Tata Motors Limited and subsidiaries
Notes to Consolidated Financial Statements
Tata Motors Limited and its subsidiaries, collectively referred to as (“the Company” or “Tata Motors”), designs, manufactures and sells a wide range of automotive vehicles. The Company provides financing for the vehicles sold by dealers of the Company in certain markets. The Company also manufactures engines for industrial and marine applications, aggregates such as axles and transmissions for commercial vehicles and factory automation equipment, and provides information technology services.
Tata Motors Limited is a public limited company incorporated and domiciled in India and has its registered office at Mumbai, Maharashtra, India.
The Company’s subsidiaries includes the Jaguar Land Rover business (referred to as JLR) which has three manufacturing facilities and two advanced engineering centres in the UK and a world wide sales network.
As on March 31, 2014, Tata Sons Limited (or Tata Sons), together with its subsidiaries, owns 28.65% of the ordinary shares and 0.71% of ‘A’ ordinary shares of Tata Motors Limited, and has the ability to significantly influence the Company’s operations (refer note 25 for voting rights relating to ordinary shares and ‘A’ ordinary shares).
The consolidated financial statements were approved by the Board of Directors and authorised for issue on July 31, 2014.
These consolidated financial statements have been prepared in accordance with International Financial Reporting Standards (referred to as “IFRS”) as issued by the International Accounting Standards Board (referred to as “IASB”).
The consolidated financial statements have been prepared on historical cost basis except for certain financial instruments measured at fair value.
Subsidiaries The consolidated financial statements include Tata Motors Limited and its subsidiaries. Subsidiaries are
entities controlled by the Company. Control exists when the Company (a) has power over the investee, (b) it is exposed, or has rights, to variable returns from its involvement with the investee and (c) has the ability to affect those returns through its power over the investee. The Company reassess whether or not it controls an investee if facts and circumstances indicate that there are changes to one or more of the three elements listed above. In assessing control, potential voting rights that currently are exercisable are taken into account. The results of subsidiaries acquired or disposed of during the year are included in the consolidated financial statements from the effective date of acquisition and up to the effective date of disposal, as appropriate.
Inter-company transactions and balances including unrealized profits are eliminated in full on consolidation. Non-controlling interests in the net assets (excluding goodwill) of consolidated subsidiaries are identified
separately from the Company’s equity. The interest of non-controlling shareholders may be initially measured either at fair value or at the non-controlling interests’ proportionate share of the fair value of the acquiree’s identifiable net assets. The choice of measurement basis is made on an acquisition -by- acquisition basis. Subsequent to acquisition, the carrying amount of non-controlling interests is the amount of those interests at initial recognition plus the non-controlling interests’ share of subsequent changes in equity. Total comprehensive income is attributed to non-controlling interests even if it results in the non-controlling interest having a deficit balance.
Changes in the Company’s interests in subsidiaries that do not result in a loss of control are accounted for as equity transactions. The carrying amount of the Company’s interests and the non-controlling interests are adjusted to reflect the changes in their relative interests in the subsidiaries. Any difference between the amount by which the non-controlling interests are adjusted and the fair value of the consideration paid or received is recognized directly in equity and attributed to owners of the Company.
F-12
1. Background and operations
2. Significant accounting policies
a. Statement of compliance
b. Basis of preparation
c. Basis of consolidation

ˆ200GNal5oj!0oh!QyŠ200GNal5oj!0oh!Qy
762654 FIN 13TATA MOTORS LTDFORM 20-F
30-Jul-2014 03:04 ESTHTMHKG
RR Donnelley ProFile HKR gurur0dc 8*ESS 0C
HKGFBU-MWE-XN0311.5.15
Page 1 of 1
When the Company loses control of a subsidiary, the profit or loss on disposal is calculated as the difference between (i) the aggregate of the fair value of consideration received and the fair value of any retained interest and (ii) the previous carrying amount of the assets (including goodwill), and liabilities of the subsidiary and any non-controlling interests. Amounts previously recognized in other comprehensive income in relation to the subsidiary are accounted for (i.e. reclassified to profit or loss or transferred directly to retained earnings) in the same manner as would be required if the relevant assets or liabilities were disposed of. The fair value of any investment retained in the former subsidiary at the date when control is lost is regarded as the fair value on initial recognition for subsequent accounting under IAS 39 Financial Instruments: Recognition and Measurement or, when applicable, the cost on initial recognition of an investment in an associate or joint venture.
Interests in Joint arrangements A joint arrangement is an arrangement of which two or more parties have joint control. Joint control is the
contractually agreed sharing of control of an arrangement, which exists only when decisions about the relevant activities require the unanimous consent of the parties sharing control.
Joint operations Certain of the Company’s activities, are conducted through joint operations, which are joint arrangements
whereby the parties that have joint control of the arrangement have rights to the assets, and obligations for the liabilities, relating to the arrangement. The Company recognizes, in the consolidated financial statements, its share of the assets, liabilities, income and expenses of these joint operations incurred jointly with the other partners, along with its share of income from the sale of the output and any liabilities and expenses that it has incurred in relation to the joint operation.
Joint ventures A joint venture is a joint arrangement whereby the parties that have joint control of the arrangement have rights
to the net assets of the arrangement. The results, assets and liabilities of a joint venture are incorporated in these financial statements using the equity method of accounting as described below.
Associates Associates are those entities in which the Company has significant influence. Significant influence is the power
to participate in the financial and operating policy decisions of the investee but not control or joint control over those policies. Significant influence is presumed to exist when the Company holds between 20 and 50 percent of the voting power of another entity. The results, assets and liabilities of associates are incorporated in these financial statements using the equity method of accounting as described below.
Equity method of accounting (equity accounted investees) An interest in an associate or joint venture is accounted for using the equity method from the date in which the
investee becomes an associate or a joint venture and are recognized initially at cost. The Company’s investment includes goodwill identified on acquisition, net of any accumulated impairment losses. The consolidated financial statements include the Company’s share of profits or losses and equity movements of equity accounted investees, from the date that significant influence or joint control commences until the date that significant influence or joint control ceases. When the Company’s share of losses exceeds its interest in an equity accounted investee, the carrying amount of that interest (including any long-term investments in the nature of net investments) is reduced to nil and the recognition of further losses is discontinued except to the extent that the Company has an obligation or has made payments on behalf of the investee.
When the Company transacts with an associate or joint venture of the Company, unrealized profits and losses are eliminated to the extent of the Company’s interest in its associate or joint venture.
Acquisitions of subsidiaries and businesses are accounted for using the acquisition method. Acquisition related costs are recognized in profit or loss as incurred. The acquiree’s identifiable assets, liabilities and contingent liabilities that meet the conditions for recognition are recognized at their fair value at the acquisition date, except certain assets and liabilities required to be measured as per the applicable standard.
Purchase consideration in excess of the Company’s interest in the acquiree’s net fair value of identifiable assets, liabilities and contingent liabilities is recognized as goodwill. Excess of the Company’s interest in the net fair value of the acquiree’s identifiable assets, liabilities and contingent liabilities over the purchase consideration is recognized, after reassessment of fair value of net assets acquired, in the income statement.
F-13
d. Business combination

ˆ200GNal5oj$09z#Q+Š 200GNal5oj$09z#Q+
762654 FIN 14TATA MOTORS LTDFORM 20-F
31-Jul-2014 02:32 ESTHTMHKG
RR Donnelley ProFile HKR annal0dc 5*ESS 0C
LANFBU-MWE-XN2311.5.15
Page 1 of 1
The preparation of financial statements in conformity with IFRS requires management to make judgments, estimates and assumptions, that affect the application of accounting policies and the reported amounts of assets, liabilities, income, expenses and disclosures of contingent assets and liabilities at the date of these financial statements and the reported amounts of revenues and expenses for the years presented. Actual results may differ from these estimates.
Estimates and underlying assumptions are reviewed at each balance sheet date. Revisions to accounting estimates are recognised in the period in which the estimate is revised and future periods affected.
In particular, information about significant areas of estimation, uncertainty and critical judgments in applying accounting policies that have the most significant effect on the amounts recognized in the financial statements are included in the following notes:
As described in Note 12(3), the Company reasonably expects that the outcome of any legal proceeding in the Supreme Court of India, in respect of decision by the High Court of Calcutta, relating to the cancellation of the lease land will be upheld in the Company’s favor.
Revenue is measured at fair value of consideration received or receivable.
i. Sale of products The Company recognizes revenues on the sale of products, net of discounts, sales incentives, customer bonuses
and rebates granted, when products are delivered to dealers or when delivered to a carrier for export sales, which is when title and risks and rewards of ownership pass to the customer. Sale of products includes export and other recurring and non-recurring incentives from Governments (referred to as “incentives”). Sale of products is presented net of excise duty where applicable and other indirect taxes.
Revenues are recognized when collectability of the resulting receivable is reasonably assured. If the sale of products includes a determinable amount for subsequent services (multiple component contracts)
the related revenues are deferred and recognized as income over the relevant service period. Amounts are normally recognized as income by reference to the pattern of related expenditure.
Incentives are recognized when there is reasonable assurance that the Company will comply with the conditions and the incentives will be received. Incentives are recorded at fair value, where applicable. Revenues include incentives of Rs. 22,575.8 million, Rs. 9,986.1 million and Rs. 6,203.3 million for the year ended March 31, 2014, March 31, 2013 and March 31, 2012, respectively.
During the year ended March 31, 2014, Rs. 8,751.7 million was received by a foreign subsidiary as an indirect tax incentive that requires the subsidiary to meet certain criteria relating to vehicle efficiency and investment in engineering and research and development. The incentive is provided as a partial offset to the higher sales tax payable following implementation of new legislation. Rs. 8,463.2 million (included above) has been recognized in revenue and Rs. 288.5 million has been deferred to offset against capital expenditure, when incurred.
ii. Finance revenues Finance and service charges are accrued on the unpaid principal balance of finance receivables using the
effective interest method.
F-14
e. Use of estimates and judgments
i) Note 12(3) – Property, plant and equipment
ii) Note 14 – Impairment of goodwill
iii) Note 15 – Impairment of indefinite life intangible assets
iv) Note 16 – Impairment of equity accounted investees
v) Note 17 – Recoverability/recognition of deferred tax assets
vi) Note 22 – Provision for product warranty
vii) Note 32 – Assets and obligations relating to employee benefits
viii) Note 36(a) and (d)(iv) – Determination of fair value of conversion option
ix) Note 36 (a) and (d)(iv) – Financial instruments and fair valuation of prepayment options in Senior Notes.
f. Revenue recognition

ˆ200GNal5ojoPoBmwkŠ200GNal5ojoPoBmwk
762654 FIN 15TATA MOTORS LTDFORM 20-F
25-Jul-2014 15:30 ESTHTMHKG
RR Donnelley ProFile HKR venkp1dc 2*ESS 0C
ACXFBU-MWE-XN0311.5.14
Page 1 of 1
Costs and expenses are recognized when incurred and are classified according to their nature. Expenditure capitalized represents employee costs, stores and other manufacturing supplies, and other
expenses incurred for construction including product development undertaken by the Company.
A provision is recognized if, as a result of a past event, the Company has a present legal or constructive obligation that can be estimated reliably, and it is probable that an outflow of economic benefits will be required to settle the obligation. Provisions are determined by discounting the expected future cash flows at a pre-tax rate that reflects current market assessments of the time value of money and the risks specific to the liability.
i) Product warranty expenses The estimated liability for product warranties is recorded when products are sold. These estimates are
established using historical information on the nature, frequency and average cost of warranty claims and management estimates regarding possible future incidences based on actions on product failures. The timing of outflows will vary as and when warranty claim will arise, being typically up to five years.
ii) Residual risk In certain markets, the Company is responsible for the residual risk arising on vehicles sold by dealers under
leasing arrangements. The provision is based on the latest available market expectations of future residual value trends. The timing of the outflows will be at the end of the lease arrangements – being typically up to three years.
These consolidated financial statements are presented in Indian Rupees, which is the functional currency of Tata Motors Limited.
Transactions in foreign currencies are recorded at the exchange rate prevailing on the date of transaction. Foreign currency denominated monetary assets and liabilities are re-measured into the functional currency at the exchange rate prevailing on the balance sheet date. Exchange differences are recognized in the income statement except to the extent, exchange differences which are regarded as an adjustment to interest costs on foreign currency borrowings, are capitalized as part of borrowing costs.
For the purpose of consolidation, the assets and liabilities of the Company’s foreign operations are translated to Indian Rupee at the exchange rate prevailing on the balance sheet date, and the income and expenses at the average rate of exchange for the respective months. Exchange differences arising are recognized as currency translation reserve under equity.
Income tax expense comprises current and deferred taxes. Income tax expense is recognized in the income statement except, when they relate to items that are recognized outside profit or loss (whether in other comprehensive income or directly in equity), in which case tax is also recognized outside profit or loss, or where they arise from the initial accounting for business combination. In the case of a business combination the tax effect is included in the accounting for the business combination.
Current income taxes are determined based on respective taxable income of each taxable entity and tax rules applicable for respective tax jurisdictions.
Deferred tax assets and liabilities are recognized for the future tax consequences of temporary differences between the carrying values of assets and liabilities and their respective tax bases, and unutilized business loss and depreciation carry-forwards and tax credits. Such deferred tax assets and liabilities are computed separately for each taxable entity and for each taxable jurisdiction. Deferred tax assets are recognized to the extent that it is probable that future taxable income will be available against which the deductible temporary differences, unused tax losses, depreciation carry-forwards and unused tax credits could be utilized.
Deferred tax assets and liabilities are measured based on the tax rates that are expected to apply in the period when the asset is realized or the liability is settled, based on tax rates and tax laws that have been enacted or substantively enacted by the balance sheet date.
F-15
g. Cost recognition
h. Provisions
i. Foreign currency
j. Income taxes

ˆ200GNal5ojoQd$5QAŠ200GNal5ojoQd$5QA
762654 FIN 16TATA MOTORS LTDFORM 20-F
25-Jul-2014 15:35 ESTHTMHKG
RR Donnelley ProFile HKR venkp1dc 2*ESS 0C
ACXFBU-MWE-XN0311.5.14
Page 1 of 1
Deferred tax assets and liabilities are offset when there is a legally enforceable right to set off current tax assets against current tax liabilities and when they relate to income taxes levied by the same taxation authority and the Company intends to settle its current tax assets and liabilities on a net basis.
Basic earnings per share has been computed by dividing net income by the weighted average number of shares outstanding during the year. Partly paid up shares are included as fully paid equivalents according to the fraction paid up. Diluted earnings per share has been computed using the weighted average number of shares and dilutive potential shares, except where the result would be antidilutive.
Inventories (other than those recognized consequent to the sale of vehicles subject to repurchase arrangements) are valued at the lower of cost and net realizable value. Cost of raw materials, components and consumables are ascertained on a first in first out basis. Cost, including fixed and variable production overheads, are allocated to work-in-progress and finished goods determined on a full absorption cost basis. Net realizable value is the estimated selling price in the ordinary course of business less estimated cost of completion and selling expenses.
Inventories include vehicles sold subject to repurchase arrangements. These vehicles are carried at cost to the Company and are amortized in changes in inventories of finished goods to their residual values (i.e. estimated second hand sale value) over the term of the arrangement.
Property, plant and equipment are stated at cost of acquisition or construction less accumulated depreciation less accumulated impairment, if any.
Freehold land is measured at cost and is not depreciated. Cost includes purchase price, taxes and duties, labor cost and direct overheads for self-constructed assets and
other direct costs incurred up to the date the asset is ready for its intended use. Interest cost incurred for constructed assets is capitalized up to the date the asset is ready for its intended use,
based on borrowings incurred specifically for financing the asset or the weighted average rate of all other borrowings, if no specific borrowings have been incurred for the asset.
Depreciation is provided on a straight-line basis over estimated useful lives of the assets. Estimated useful lives of the assets are as follows:
Assets held under finance leases are depreciated over their expected useful lives on the same basis as owned assets or, where shorter, the term of the relevant lease.
Depreciation is not recorded on capital work-in-progress until construction and installation are complete and the asset is ready for its intended use. Capital-work-in-progress includes capital advances.
Intangible assets purchased including acquired in business combination, are measured at cost or fair value as of the date of acquisition where applicable less accumulated amortization and accumulated impairment, if any. Intangible assets with indefinite lives are reviewed annually to determine whether indefinite-life assessment continues to be supportable. If not, the change in the useful-life assessment from indefinite to finite is made on a prospective basis.
F-16
k. Earnings per share
l. Inventories
m. Property, plant and equipment
Estimated useful life
(years)
Buildings 20 to 40Plant and equipment 3 to 30Computers 3 to 6Vehicles 3 to 10Furniture and fixtures 3 to 20
n. Intangible assets

ˆ200GNal5ojoQjlLw,Š200GNal5ojoQjlLw,
762654 FIN 17TATA MOTORS LTDFORM 20-F
25-Jul-2014 15:35 ESTHTMHKG
RR Donnelley ProFile HKR venkp1dc 2*ESS 0C
ACXFBU-MWE-XN0311.5.14
Page 1 of 1
Amortization is provided on a straight-line basis over estimated useful lives of the intangible assets as per details below
The amortization period for intangible assets with finite useful lives is reviewed at least at each year-end. Changes in expected useful lives are treated as changes in accounting estimates.
Capital work-in-progress includes capital advances. Customer related intangible consists of dealer network.
Internally generated intangible asset Research costs are charged to the income statement in the year in which they are incurred. Product development costs incurred on new vehicle platform, engines, transmission and new products are
recognized as intangible assets, when feasibility has been established, the Company has committed technical, financial and other resources to complete the development and it is probable that asset will generate probable future economic benefits.
The costs capitalized include the cost of materials, direct labor and directly attributable overhead expenditure incurred up to the date the asset is available for use.
Interest cost incurred is capitalized up to the date the asset is ready for its intended use, based on borrowings incurred specifically for financing the asset or the weighted average rate of all other borrowings if no specific borrowings have been incurred for the asset.
Product development cost is amortized over a period of 24 months to 120 months or on the basis of actual production or planned production volume over such period.
Capitalized development expenditure is measured at cost less accumulated amortization and accumulated impairment, if any.
At the inception of a lease, the lease arrangement is classified as either a finance lease or an operating lease, based on the substance of the lease arrangement.
Assets taken on finance lease A finance lease is recognized as an asset and a liability at the commencement of the lease, at the lower of the
fair value of the asset and the present value of the minimum lease payments. Initial direct costs, if any, are also capitalized and, subsequent to initial recognition, the asset is accounted for in accordance with the accounting policy applicable to that asset. Minimum lease payments made under finance leases are apportioned between the finance expense and the reduction of the outstanding liability. The finance expense is allocated to each period during the lease term so as to produce a constant periodic rate of interest on the remaining balance of the liability.
Assets taken on operating lease Leases other than finance leases are operating leases, and the leased assets are not recognized on the
Company’s balance sheet. Payments made under operating leases are recognized in the income statement on a straight-line basis over the term of the lease.
Cash generating unit to which goodwill is allocated are tested for impairment annually at each balance sheet date, or more frequently when there is an indication that the unit may be impaired. If the recoverable amount of the cash generating unit is less than the carrying amount of the unit, the impairment loss is allocated first to reduce the carrying amount of any goodwill allocated to that unit and then to the other assets of the unit pro rata on the basis of carrying amount of each asset in the unit. Goodwill impairment loss recognized is not reversed in subsequent period.
F-17
Estimated amortization
period
Patents and technological know-how 2 to 12 yearsDealer network 20 yearsIntellectual property rights 7 to 9 yearsSoftware 2 to 8 years
o. Leases
p. Impairment
i) Goodwill

ˆ200GNal5ojlXW2NwŠ200GNal5ojlXW2Nw´
762654 FIN 18TATA MOTORS LTDFORM 20-F
25-Jul-2014 00:25 ESTHTMHKG
RR Donnelley ProFile HKR pf_rend 1*ESS 0C
HKRPRFRS1611.5.15
Page 1 of 1
At each balance sheet date, the Company assesses whether there is any indication that any property, plant and equipment and intangible assets with finite lives may be impaired. If any such impairment exists the recoverable amount of an asset is estimated to determine the extent of impairment, if any. Where it is not possible to estimate the recoverable amount of an individual asset, the Company estimates the recoverable amount of the cash-generating unit to which the asset belongs.
Intangible assets with indefinite useful lives and intangible assets not yet available for use, are tested for impairment annually at each balance sheet date, or earlier, if there is an indication that the asset may be impaired.
Recoverable amount is the higher of fair value less costs to sell and value in use. In assessing value in use, the estimated future cash flows are discounted to their present value using a pre-tax discount rate that reflects current market assessments of the time value of money and the risks specific to the asset for which the estimates of future cash flows have not been adjusted.
If the recoverable amount of an asset (or cash-generating unit) is estimated to be less than its carrying amount, the carrying amount of the asset (or cash-generating unit) is reduced to its recoverable amount. An impairment loss is recognized immediately in the income statement.
As of March 31, 2014 and 2013, none of the Company’s property, plant and equipment and intangible assets were considered impaired.
The Jaguar Land Rover subsidiaries operate several defined benefit pension plans, which are contracted out of the second state pension scheme. The assets of the plan are held in separate trustee administered funds. The plans provide for monthly pension after retirement as per salary drawn and service period as set out in rules of each fund.
Contributions to the plans by the subsidiary group take into consideration the results of actuarial valuations. The plans with a surplus position at the year end have been limited to the maximum economic benefit available from unconditional rights to refund from the scheme or reduction in future contributions. Where the subsidiary group is considered to have a contractual obligation to fund the pension plan above the accounting value of the liabilities, an onerous obligation is recognized.
A separate defined contribution plan is available to employees of Jaguar Land Rover. Costs in respect of this plan are charged to the income statement as incurred.
Tata Motors and its subsidiaries in India have an obligation towards gratuity, a defined benefit retirement plan covering eligible employees. The plan provides for a lump sum payment to vested employees at retirement, death while in employment or on termination of employment of an amount equivalent to 15 to 30 days salary payable for each completed year of service. Vesting occurs upon completion of five years of service. Tata Motors and such subsidiaries make annual contributions to gratuity funds established as trusts or insurance companies. Tata Motors and its subsidiaries in India account for the liability for gratuity benefits payable in the future based on an actuarial valuation.
Tata Motors and some of its subsidiaries in India have two superannuation plans, a defined benefit plan and a defined contribution plan. An eligible employee on April 1, 1996 could elect to be a member of either plan.
Employees who are members of the defined benefit superannuation plan are entitled to benefits depending on the years of service and salary drawn. The monthly pension benefits after retirement range from 0.75% to 2% of the annual basic salary for each year of service. Tata Motors and such subsidiaries account for superannuation benefits payable in future under the plan based on an actuarial valuation.
With effect from April 1, 2003, this plan was amended and benefits earned by covered employees have been protected as at March 31, 2003. Employees covered by this plan are prospectively entitled to benefits computed on a basis that ensures that the annual cost of providing the pension benefits would not exceed 15% of salary.
Separate irrevocable trusts are maintained for employees covered and entitled to benefits. Tata Motors and its subsidiaries contribute up to 15% of the eligible employees’ salary to the trust every year. Such contributions are recognized as an expense when incurred. Tata Motors and such subsidiaries have no further obligation beyond this contribution.
F-18
ii) Property, plant and equipment and other intangible assets
q. Employee benefits
i) Pension plans
ii) Gratuity
iii) Superannuation

ˆ200GNal5ojlXXd%w[Š200GNal5ojlXXd%w[
762654 FIN 19TATA MOTORS LTDFORM 20-F
25-Jul-2014 00:25 ESTHTMHKG
RR Donnelley ProFile HKR pf_rend 1*ESS 0C
HKRPRFRS1611.5.15
Page 1 of 1
Bhavishya Kalyan Yojana is an unfunded defined benefit plan for employees of Tata Motors and some of its subsidiaries. The benefits of the plan include pension in certain cases, payable upto the date of normal superannuation had the employee been in service, to an eligible employee at the time of death or permanent disablement, while in service, either as a result of an injury or as certified by the appropriate authority. The monthly payment to dependents of the deceased/disabled employee under the plan equals 50% of the salary drawn at the time of death or accident or a specified amount, whichever is higher. Tata Motors and these subsidiaries account for the liability for BKY benefits payable in the future based on an actuarial valuation.
In accordance with Indian law, eligible employees of Tata Motors and some of its subsidiaries are entitled to receive benefits in respect of provident fund, a defined contribution plan, in which both employees and the Company make monthly contributions at a specified percentage of the covered employees’ salary (currently 12% of employees’ salary). The contributions, as specified under the law, are made to the provident fund and pension fund set up as an irrevocable trust by Tata Motors and its subsidiaries or to respective Regional Provident Fund Commissioner and the Central Provident Fund under the State Pension scheme.
Tata Daewoo Commercial Vehicle Company Limited (TDCV), a subsidiary company incorporated in Korea has an obligation towards severance indemnity, a defined benefit retirement plan, covering eligible employees. The plan provides for a lump sum payment to all employees with more than one year of employment equivalent to 30 days’ salary payable for each completed year of service.
Under this unfunded scheme, employees of Tata Motors Limited and some of its subsidiaries receive medical benefits subject to certain limits of amount, periods after retirement and types of benefits, depending on their grade and location at the time of retirement. Employees separated from the Company as part of an Early Separation Scheme, on medical grounds or due to permanent disablement are also covered under the scheme. Tata Motors and such subsidiaries account for the liability for post-retirement medical scheme based on an actuarial valuation.
Remeasurement gains and losses Remeasurement comprising actuarial gains and losses, the effect of the asset ceiling and the return on assets
(excluding interest) relating to retirement benefit plans, are recognized directly in other comprehensive income in the period in which they arise. Remeasurement recorded in other comprehensive income is not reclassified to income statement.
Actuarial gains and losses relating to long-term employee benefits are recognized in the income statement in the period in which they arise.
Measurement date The measurement date of retirement plans is March 31.
Any dividend declared by Tata Motors Limited is based on the profits available for distribution as reported in the unconsolidated statutory financial statements of Tata Motors Limited prepared in accordance with Generally Accepted Accounting Principles in India (Indian GAAP). Further, Indian law mandates that dividend be declared out of distributable profits only after the transfer of a specified percentage of net income computed in accordance with current regulations to a general reserve. Accordingly, in certain years the net income reported in these financial statements may not be fully distributable. As of March 31, 2014 and 2013, the amounts available for distribution were Rs. 68,550.3 million and Rs. 69,481.9 million respectively.
The Company primarily operates in the automotive segment. The automotive segment comprises two reportable segments i.e. Tata and other brand vehicles, including financing thereof and Jaguar Land Rover. Other operating segments do not meet the quantitative thresholds for disclosure and have been aggregated.
F-19
iv) Bhavishya kalyan yojana (BKY)
v) Provident fund and family pension
vi) Severance indemnity
vii) Post-retirement medicare scheme
r. Dividends
s. Segments

ˆ200GNal5ojlXZ5iwCŠ200GNal5ojlXZ5iwC
762654 FIN 20TATA MOTORS LTDFORM 20-F
25-Jul-2014 00:25 ESTHTMHKG
RR Donnelley ProFile HKR pf_rend 1*ESS 0C
HKRPRFRS1611.5.15
Page 1 of 1
A financial instrument is any contract that gives rise to a financial asset of one entity and a financial liability or equity instrument of another entity. Financial assets are classified into categories: financial assets at fair value through profit or loss, held-to-maturity investments, loans and receivables and available-for-sale financial assets. Financial liabilities are classified into financial liabilities at fair value through profit or loss and other financial liabilities.
Financial instruments are recognized on the balance sheet when the Company becomes a party to the contractual provisions of the instrument.
Initially, a financial instrument is recognized at its fair value. Transaction costs directly attributable to the acquisition or issue of financial instruments are recognized in determining the carrying amount, if it is not classified as at fair value through profit or loss. Subsequently, financial instruments are measured according to the category in which they are classified.
Financial assets and financial liabilities at fair value through profit or loss: Derivatives, including embedded derivatives separated from the host contract, unless they are designated as hedging instruments, for which hedge accounting is applied, are classified into this category. These are measured at fair value with changes in fair value recognized in the income statement.
Loans and receivables: Loans and receivables are non-derivative financial assets with fixed or determinable payments that are not quoted in an active market and which are not classified as financial assets at fair value through profit or loss or financial assets available-for-sale. Subsequently, these are measured at amortized cost using the effective interest method less any impairment losses.
These include trade receivables, finance receivables, balances with banks, short-term deposits with banks, other financial assets and investments with fixed or determinable payments.
Available-for-sale financial assets: Available-for-sale financial assets are those non-derivative financial assets that are either designated as such upon initial recognition or are not classified in any of the other financial assets categories. Subsequently, these are measured at fair value and changes therein, other than impairment losses are recognized directly in other comprehensive income, net of applicable deferred income taxes.
Dividends from available-for-sale debt securities are recognized in the income statement when the right to receive payment has been established.
Equity instruments that do not have a quoted market price in an active market and whose fair value cannot be reliably measured, are measured at cost.
When the financial asset is derecognized, the cumulative gain or loss in equity is transferred to the income statement. Foreign currency convertible notes: Convertible notes issued in foreign currency are convertible at the option of the
holder into Ordinary Shares, Global Depository Shares, American Depository Shares or Qualified Securities of the Company as per the terms of the issue. Conversion option which is not settled by exchanging a fixed amount of cash for a fixed number of shares is accounted for separately from the liability component as derivative and initially accounted for at fair value. The liability component is recognized initially at the difference between the fair value of the note and the fair value of the conversion option. Directly attributable costs are allocated to the liability component and the conversion option in proportion to their initial carrying amounts.
Subsequent to initial recognition, the liability component of the foreign currency convertible notes is measured at amortized cost using the effective interest method. The conversion option is subsequently measured at fair value at each reporting date or on the date of conversion, as applicable, with changes in fair value recognized in income statement.
The conversion option is presented together with the related liability. Fair valuation of prepayment options in Senior Notes: Embedded derivatives relating to prepayment options in
Senior Notes are not considered as closely related and are separately accounted unless the exercise price of these options are approximately equal on each exercise date to the amortized cost of the Senior Notes.
F-20
t. Financial instruments
i) Classification, initial recognition and measurement

ˆ200GNal5ojlX=hLwHŠ200GNal5ojlX=hLwH
762654 FIN 21TATA MOTORS LTDFORM 20-F
25-Jul-2014 00:25 ESTHTMHKG
RR Donnelley ProFile HKR pf_rend 1*ESS 0C
HKRPRFRS1611.5.15
Page 1 of 1
The embedded derivative is initially accounted for separately from the liability component as derivative at fair value. The fair value represents the difference in the traded market price of the Notes and the expected price of the Notes would trade at if they did not contain any prepayment features. The expected price is based on market inputs including credit spreads and interest rates. Directly attributable costs are allocated to the liability component and the prepayment option in proportion to their initial carrying amounts.
Subsequent to initial recognition, the liability component of the Senior Notes are measured at amortized cost using the effective interest method. The prepayment option is subsequently measured at fair value at each reporting date with changes in fair value recognized in income statement.
The prepayment option is presented together with the related liability. Equity instruments: An equity instrument is any contract that evidences residual interests in the assets of the
Company after deducting all of its liabilities. Equity instruments issued by the Company are recorded at the proceeds received, net of direct issue costs.
Other financial liabilities: These are measured at amortized cost using the effective interest method.
The fair value of a financial instrument on initial recognition is normally the transaction price (fair value of the consideration given or received). Subsequent to initial recognition, the Company determines the fair value of financial instruments that are quoted in active markets using the quoted bid prices (financial assets held) or quoted ask prices (financial liabilities held) and using valuation techniques for other instruments. Valuation techniques include discounted cash flow method and other valuation models.
The Company derecognizes a financial asset only when the contractual rights to the cash flows from the asset expires or it transfers the financial asset and substantially all the risks and rewards of ownership of the asset to another entity. If the Company neither transfers nor retains substantially all the risks and rewards of ownership and continues to control the transferred asset, the Company recognizes its retained interest in the asset and an associated liability for amounts it may have to pay. If the Company retains substantially all the risks and rewards of ownership of a transferred financial asset, the Company continues to recognize the financial asset and also recognizes a collateralized borrowing for the proceeds received.
Financial liabilities are derecognized when these are extinguished, that is when the obligation is discharged, cancelled or has expired.
The Company assesses at each balance sheet date whether there is objective evidence that a financial asset or a group of financial assets is impaired. A financial asset is considered to be impaired if objective evidence indicates that one or more events have had a negative effect on the estimated future cash flows of that asset.
Loans and receivables: Objective evidence of impairment includes default in payments with respect to amounts receivable from
customers. Impairment loss in respect of loans and receivables is calculated as the difference between their carrying
amount and the present value of the estimated future cash flows discounted at the original effective interest rate. Such impairment loss is recognised in the income statement. If the amount of an impairment loss decreases in a subsequent period, and the decrease can be related objectively to an event occurring after the impairment was recognized, the previously recognized impairment loss is reversed. The reversal is recognized in the income statement.
Available-for-sale financial assets: If the available-for-sale financial assets is impaired, the difference between the financial asset’s acquisition
cost (net of any principal repayments and amortization) and the current fair value, less any previous impairment loss recognized in the income statement, is reclassified from equity to income statement. If, in a subsequent period, the fair value of a debt instrument classified as available-for-sale increases and the increase can be objectively related to an event occurring after the impairment loss was recognized, the impairment loss is reversed. The reversal is recognized in the income statement. Reversal of impairment loss on equity investments classified as available-for-sale, is not recognized in the income statement. Increase in their fair value after impairment, is recognized in other comprehensive income.
Impairment loss on equity investments carried at cost is not reversed.
F-21
ii) Determination of fair value:
iii) Derecognition of financial assets and financial liabilities:
iv) Impairment of financial assets:

ˆ200GNal5ojobVh5wfŠ200GNal5ojobVh5wf
762654 FIN 22TATA MOTORS LTDFORM 20-F
25-Jul-2014 16:27 ESTHTMHKG
RR Donnelley ProFile HKR vaitp0dc 3*ESS 0C
LANFBU-MWE-XN0811.5.15
Page 1 of 1
The Company uses foreign currency forward and option contracts to hedge its risks associated with foreign currency fluctuations relating to highly probable forecast transactions. The Company designates these forward and option contracts in a cash flow hedging relationship by applying the hedge accounting principles.
These forward and option contracts are stated at fair value at each reporting date. Changes in the fair value of these forward and option contracts that are designated and effective as hedges of future cash flows are recognized in other comprehensive income (net of tax), and the ineffective portion is recognized immediately in the consolidated income statement. Amounts accumulated in equity are reclassified to the consolidated income statement in the periods in which the forecasted transactions occurs.
For options, the time value is not considered part of the hedge, and this is treated as an ineffective hedge portion and recognised immediately in the consolidated income statement.
Hedge accounting is discontinued when the hedging instrument expires or is sold, terminated, or exercised, or no longer qualifies for hedge accounting. For forecast transactions, any cumulative gain or loss on the hedging instrument recognized in equity is retained there until the forecast transaction occurs.
If the forecast transaction is no longer expected to occur, the net cumulative gain or loss recognized in equity is immediately transferred to the consolidated income statement for the year.
New Accounting pronouncements affecting amounts reported and /or disclosures in the financial statements.
In the current year, the Company adopted/ early adopted the following new standards, revisions and amendments to standards and interpretations
Amendments to IAS 1- Presentation of Items of Other Comprehensive Income In accordance with the amendment, the presentation of items of other comprehensive income has been
modified in the consolidated statements of comprehensive income of the Company, to present separately (a) items that will not be reclassified subsequently to profit or loss; and (b) items that will be reclassified subsequently to profit or loss when specific conditions are met. Other than these changes, the application of the amendments to IAS 1 does not result in any impact on profit or loss, other comprehensive income and total comprehensive income. The presentation as required by the amendments to the standard have been included in the consolidated financial statements
Amendment to IAS 36- Recoverable Amount Disclosures for Non-Financial Assets In May 2013, the IASB issued “Amendment to IAS 36 Impairment of Assets”, requiring disclosure of
recoverable amount only when an impairment loss has been recognised or reversed. The amendments apply retrospectively for annual periods beginning on or after January 1, 2014 with an option to early adopt.
Amendments to IAS 19-Employee Benefits (as revised in 2011) The interest cost and expected return on plan assets used previously are replaced with a ‘net-interest’
amount, which is calculated by applying the discount rate to the net defined benefit liability or asset. This change has been retrospectively applied to the earliest period presented. Accordingly, employee cost increased by Rs. Nil, Rs. 34.4 million and Rs. 2,136.0 million and net income decreased by Rs. Nil, Rs. 26.5 million and Rs. 1,623.4 million for the year ended March 31, 2014, 2013 and 2012, respectively. The decrease in net income resulted in corresponding increase in other comprehensive income. The effect of this change on the earnings per share in each of the years presented is immaterial.
F-22
u. Hedge accounting:
v. New accounting pronouncements

ˆ200GNal5oj%425LQHŠ200GNal5oj%425LQH
762654 FIN 23TATA MOTORS LTDFORM 20-F
31-Jul-2014 12:50 ESTHTMHKG
RR Donnelley ProFile HKR balan2dc 4*ESS 0C
LANFBU-MWE-XN1111.5.15
Page 1 of 1
Amendments to IFRS 7 Financial Instruments: Disclosures The Company has applied the amendments to IFRS 7 Disclosures – Offsetting Financial Assets and Financial
Liabilities for the first time in the current year. The amendments to IFRS 7 require entities to disclose information and rights of offset and related arrangements (such as collateral posting requirements) for financial instruments under an enforceable master netting agreement or similar arrangement.
The amendment has been applied retrospectively and the disclosures have been provided in Note 36 to the Consolidated Financial Statements.
IFRS 10 Consolidated Financial Statements Effective April 1, 2013, Company adopted IFRS 10. IFRS 10 changes the definition of control such that an
investor has control over an investee when (a) it has the power over the investee; (b) it is exposed or has rights to variable returns from its investment with the investee and (c) it has the ability to use its power to affect its returns. Previously control was considered as power to govern the financial and operating policies of an investee to obtain benefits from its activities. On adoption of IFRS 10, the Company evaluated that it has control over its subsidiaries and it is appropriate to continue to consolidate these entities in accordance with IFRS 10. There were no new consolidating entities identified.
IFRS 11 Joint Arrangements In May 2011, the IASB issued IFRS 11 ‘Joint Arrangements’, one of a suite of standards relating to interests in
other entities and related disclosures. IFRS 11 establishes a principle that applies to the accounting for all joint arrangements, whereby parties to the arrangement account for their underlying contractual rights and obligations relating to the joint arrangement. IFRS 11 identifies two types of joint arrangements. A ‘joint venture’ is a joint arrangement whereby the parties that have joint control of the arrangement have rights to the net assets of the arrangement. A ‘joint operation’ is a joint arrangement whereby the parties that have joint control of the arrangement have rights to the assets, and obligations for the liabilities, relating to the arrangement. Investments in joint ventures are accounted for using the equity method. Investments in joint operations are accounted for by recognizing the Company’s assets, liabilities, revenue and expenses relating to the joint operation.
The main impact of IFRS 11 is that certain of the Company’s former jointly controlled entities, which were equity accounted, now fall under the definition of a joint operation under IFRS 11. The Company has derecognized Rs. 7,718.6 million of investments as of April 1, 2011 and recognized the Company’s assets, liabilities, revenue and expenses relating to these arrangements. The effect of the new requirements on the Company’s assets, liabilities, income and expenses are insignificant and therefore, the effects of such change in the previous and current periods have not been disclosed. This change in accounting policy has no effect on the net income, total comprehensive income and shareholders’ equity.
IFRS 12 Disclosure of Interests in Other Entities The Company has adopted the standard and the disclosures as required have been incorporated in the financial
statements.
IFRS 13 Fair Value Measurement On April 1, 2013, the Company adopted, IFRS 13, “Fair Value Measurement” which establishes a single
source of guidance for fair value measurement and disclosure about fair value measurements. The scope of IFRS 13 is broad; it applies to both financial instrument items and non-financial instrument items for which other IFRSs require or permit fair value measurements and disclosures about fair value measurements, except in specified circumstances. IFRS 13 defines fair value as the price that would be received to sell an asset or paid to transfer a liability in an orderly transaction in the principal market at the measurement date. Fair value under IFRS 13 is an exit price. Application of IFRS 13 has not had any material impact on the amounts recognised in the financial statements. The disclosures as required have been included in the consolidated financial statements.
F-23

ˆ200GNal5oj$%JuZQ?Š 200GNal5oj$%JuZQ?
762654 FIN 24TATA MOTORS LTDFORM 20-F
31-Jul-2014 10:26 ESTHTMHKG
RR Donnelley ProFile HKR peetp0dc 5*ESS 0C
HKGFBU-MWE-XN0311.5.15
Page 1 of 1
The Company has not applied the following new and revised IFRSs that have been issued but are not yet effective:
IFRS 9 - Financial Instruments In July 2014, the IASB completed the final element of its comprehensive response to the financial crisis by
issuing IFRS 9 Financial Instruments. The package of improvements introduced by IFRS 9 includes a logical model for classification and measurement, a single, forward-looking ‘expected loss’ impairment model and a substantially-reformed approach to hedge accounting. The new Standard will come into effect on January 1, 2018 with early application permitted.
Amendments to IFRS 10, IFRS 12 and IAS 27 – Investment Entities- Consolidation relief In October 2012, the IASB issued ‘‘Investment Entities’’, an amendment to IFRS 10, IFRS 12 and IAS 27.
This amendment is effective for annual periods beginning on or after January 1, 2014. An investment entity is an entity meeting specific criteria; in particular, its corporate purpose is to invest funds solely in order to obtain returns in the form of capital appreciation or investment income. The amendment requires investment entities to account for their investment in the entities they control at fair value through profit or loss; this is an exception to the IFRS 10 consolidation requirements.
IFRIC 21 - Levies In May 2013, IFRS Interpretation committee issued IFRIC 21 which provides guidance on accounting for the
liability to pay a government imposed levy. IFRIC 21 is effective for annual periods beginning on or after January 1, 2014. This interpretation clarifies that the obligating event that gives rise to a liability to pay a government levy is the activity that triggers the payment of the levy as set out in the relevant legislation. An entity does not have a constructive obligation to pay a levy that will be triggered by operating in a future period. It is not practicable to provide a reasonable estimate of the effect on the financial statements until a detailed review has been completed.
IAS 39 – Novation of Derivatives and Continuation of Hedge Accounting On June 27, 2013 the IASB issued ‘Novation of Derivatives and Continuation of Hedge
Accounting’ (Amendments to IAS 39). As per this amendment, there would be no need to discontinue hedge accounting if a hedging derivative was novated provided certain criteria are met.
Amendment to IAS 16 – Property, Plant and Equipment and IAS 38 – Intangible Assets In May 2014, the IASB issued “Amendments to IAS 16 and IAS 38”, clarifying that the use of methods based
on revenue to calculate the depreciation is not appropriate because revenue generated by an activity that includes the use of an asset typically reflects factors that are not directly linked to the consumption of the economic benefits embodied in the asset. Revenue is generally presumed to be an inappropriate basis for measuring the consumption of the economic benefits embodied in an intangible asset. This presumption, however, can be rebutted in certain limited circumstances.
F-24
IFRS 9 Financial InstrumentsAmendments to IFRS 10, IFRS 12 and IAS 27 Investment Entities- Consolidation reliefIFRIC 21 LeviesIAS 39
Novation of Derivatives and Continuation of Hedge Accounting
Amendments to IAS 16 & IAS 38 Property, Plant & Equipment and Intangible AssetsIFRS 15 Revenue from contracts with CustomersAmendments to IFRS 11 Joint ArrangementsAmendments to IAS 19 Defined Benefit Plans: Employee ContributionsAmendments to IAS 32 Offsetting Financial Assets and Financial LiabilitiesAnnual Improvements to IFRSs 2010-2012 Cycle IFRS 3, IFRS 8, IAS 16, IAS 24Annual Improvements to IFRSs 2011-2013 Cycle IFRS 3
Effective for annual periods beginning on or after January 1, 2014. Effective for annual periods beginning on or after July 1, 2014. Effective for annual periods beginning on or after January 1, 2016. Effective for annual periods beginning on or after January 1, 2017. Effective for annual periods beginning on or after January 1, 2018.
5
1
1
1
3
4
3
2
1
2
2
1
2
3
4
5

ˆ200GNal5ojlXfn!w,Š200GNal5ojlXfn!w,
762654 FIN 25TATA MOTORS LTDFORM 20-F
25-Jul-2014 00:25 ESTHTMHKG
RR Donnelley ProFile HKR pf_rend 1*ESS 0C
HKRPRFRS1611.5.15
Page 1 of 1
IFRS 15 – Revenue from contracts with Customers The standard outlines a single comprehensive model for entities to use in accounting for revenue arising from
contracts with customers and supersedes most current revenue recognition guidance, including industry-specific guidance. The core principle of the new standard is for companies to recognize revenue to depict the transfer of goods or services to customers in amounts that reflect the consideration (that is, payment) to which the company expects to be entitled in exchange for those goods or services. The new standard also will result in enhanced disclosures about revenue, provide guidance for transactions that were not previously addressed comprehensively (for example, service revenue and contract modifications) and improve guidance for multiple-element arrangements.
Amendments to IFRS 11 – Joint Arrangements When an entity acquires an interest in a joint operation in which the activity of the joint operation constitutes a
business, as defined in IFRS 3, it shall apply, to the extent of its share in accordance with this standard, all of the principles on business combinations accounting in IFRS 3, and other IFRSs, that do not conflict with the guidance in this standard and disclose the information that is required in those IFRSs in relation to business combinations.
Amendments to IAS 19 – Defined Benefit Plans: Employee Contributions In November 2013, IASB issued an Amendment to IAS 19 to clarify the requirements that relate to how
contributions from employees or third parties that are linked to service should be attributed to periods of service. In addition, it permits a practical expedient if the amount of the contributions is independent of the number of years of service, in those contributions, can, but are not required, to be recognised as a reduction in the service cost in the period in which the related service is rendered. This amendment is effective for annual periods beginning on or after July 1, 2014.
Amendments to IAS 32 Disclosures – Offsetting Financial Assets and Financial Liabilities The amendments to IAS 32 clarify existing application issues relating to the offset of financial assets and
financial liabilities requirements. Specifically, the amendments clarify the meaning of ‘currently has a legally enforceable right of set-off’ and ‘simultaneous realization and settlement’. The amendments to IAS 32 are not effective until annual periods beginning on or after January 1, 2014, with retrospective application required. The Company estimates anticipate that the application of these amendments to IAS 32 may result in more disclosures being made with regard to offsetting financial assets and financial liabilities in the future.
Annual Improvements to IFRSs 2010-2012 and 2011-2013 Cycle In December 2013, the IASB issued “Annual Improvements to IFRSs: 2010-2012 Cycle” and “Annual
Improvements to IFRSs: 2011-2013 Cycle”, as part of its annual process of revising and improving existing standards. These are effective for annual periods beginning on or after July 1, 2014.
The consolidated financial statements have been expressed in Indian rupees (“Rs.”), Tata Motors Limited functional currency. For the convenience of the reader, the financial statements as at and for the year ended March 31, 2014, have been translated into U.S. dollars at US$ 1.00 = Rs. 59.915, based on fixing rate in the City of Mumbai on March 31, 2014, for cable transfers in Indian rupees as published by the Foreign Exchange Dealers’ Association of India (FEDAI).
Such translation should not be construed as representation that the rupee amounts have been or could be converted into U.S. dollars at that or any other rate, or at all.
F-25
• IFRS 8 (Operating Segments): requires disclosure of judgments made by management in applying
aggregation criteria to segments.
• IAS 16 (Property, Plant and Equipment) and IAS 38 (Intangible Assets): clarifies the method used to
determine accumulated depreciation and amortisation under the revaluation model.
• IAS 24 (Related Party Disclosures): expand the definition of “related party” to include an entity, or any
member of a group of which it is a part, that provides key management personnel services to the reporting entity.
• IFRS 3 (Business Combinations) and IFRS 13 (Fair Value Measurement): clarifies some definitions.
w. Convenience translation

ˆ200GNal5oj@RVo2QJŠ200GNal5oj@RVo2QJ
762654 FIN 26TATA MOTORS LTDFORM 20-F
30-Jul-2014 15:09 ESTHTMHKG
RR Donnelley ProFile HKR balan2dc 2*ESS 0C
LANFBU-MWE-XN1811.5.15
Page 1 of 1
Cash and cash equivalents consist of the following:
Cash and cash equivalents includes Rs. Nil and Rs. 43,052.5 million as of March 31, 2014 and 2013 respectively, held by a subsidiary that operates in a country where exchange control restrictions prevent the balances being available for general use by Tata Motors Limited and other subsidiaries. During the year ended March 31, 2014, these exchange controls have been amended by that country’s authorities to allow lending of surplus cash to group entities.
Finance receivables consist of vehicle loans, the details of which are as follows:
Changes in the allowance for credit losses in finance receivables are as follows:
Change in the allowances for trade and other receivables are as follows:
F-26
3. Cash and cash equivalents
As at March 31, 2014 2014 2013 (In millions)
Cash balances US$ 6.4 Rs. 386.3 Rs. 414.5 Balances with banks (including deposits with
original maturity of upto three months) 2,662.7 159,535.2 116,495.4
Total US$ 2,669.1 Rs. 159,921.5 Rs. 116,909.9
4. Finance receivables
As at March 31, 2014 2014 2013 (In millions)
Finance receivables US$ 3,619.5 Rs. 216,862.7 Rs. 212,754.0 Less: allowance for credit losses 527.2 31,587.5 14,534.8
Total US$ 3,092.3 Rs. 185,275.2 Rs. 198,219.2
Current portion 1,516.0 90,832.5 71,460.5 Non-current portion 1,576.3 94,442.7 126,758.7
Total US$ 3,092.3 Rs. 185,275.2 Rs. 198,219.2
As at March 31, 2014 2014 2013 2012 (In millions)
Balance at the beginning US$ 242.6 Rs. 14,534.8 Rs. 11,089.6 Rs. 9,070.9 Allowances made during the year 402.9 24,138.9 9,427.9 5,747.3 Written off (118.3) (7,086.2) (5,982.7) (3,728.6)
Balance at the end US$ 527.2 Rs. 31,587.5 Rs. 14,534.8 Rs. 11,089.6
5. Allowance for trade and other receivables
As at March 31, 2014 2014 2013 2012 (In millions)
Balance at the beginning US$ 80.3 Rs. 4,813.7 Rs. 3,884.5 Rs. 2,971.2 Allowances made during the year 44.9 2,691.0 1,141.6 1,026.7 Written off (6.8) (408.2) (219.7) (211.5) Foreign exchange translation differences 3.8 225.3 7.3 98.1
Balance at the end US$ 122.2 Rs. 7,321.8 Rs. 4,813.7 Rs. 3,884.5

ˆ200GNal5ojlXirGw[Š200GNal5ojlXirGw[
762654 FIN 27TATA MOTORS LTDFORM 20-F
25-Jul-2014 00:25 ESTHTMHKG
RR Donnelley ProFile HKR pf_rend 1*ESS 0C
HKRPRFRS1611.5.15
Page 1 of 1
Investments consist of the following:
Available-for-sale, financial assets (investments) are as follows:
The current and non-current classifications of investments are as follows:
The fair value of the unquoted equity investments cannot be reliably measured as the variability in the range of fair value estimates is significant and the probabilities of the various estimates cannot be reasonably assessed.
F-27
6. Investments
As at March 31, 2014 2014 2013 (In millions)
Available-for-sale, at fair value US$ 1,633.6 Rs. 97,882.1 Rs. 77,516.4 Unquoted equity investments, at cost 65.4 3,919.7 3,877.0 Loans and receivables 1.3 75.0 80.0
Total US$ 1,700.3 Rs. 101,876.8 Rs. 81,473.4
As at March 31, 2014 2014 2013 (In millions)
Quoted equity shares US$ 46.2 Rs. 2,770.1 Rs. 2,067.2 Mutual funds 1,585.8 95,016.2 75,327.0 Corporate bonds and other debt instruments 1.6 95.8 122.2
Total available for sale securities US$ 1,633.6 Rs. 97,882.1 Rs. 77,516.4
As at March 31, 2014 2014 2013 (In millions)
Current investments US$1,591.2 Rs. 95,337.5 Rs. 75,191.2 Non-current investments 109.1 6,539.3 6,282.2
Total US$1,700.3 Rs. 101,876.8 Rs. 81,473.4

ˆ200GNal5oj@RKe6Q9Š200GNal5oj@RKe6Q9
762654 FIN 28TATA MOTORS LTDFORM 20-F
30-Jul-2014 15:05 ESTHTMHKG
RR Donnelley ProFile HKR adran0dc 4*ESS 0C
ACXFBU-MWE-XN1411.5.15
Page 1 of 1
Other financial assets - current consist of the following:
Margin money with banks is restricted cash deposits and consists of collateral provided for transfer of finance receivables. Restricted bank deposits include Rs. 1,928.9 million and Rs. 10,062.5 million as of March 31, 2014 and 2013 respectively, held as security in relation to debt service and repayment of bank borrowings. The deposits are pledged till the maturity of the respective borrowings.
Other financial assets - non-current consist of the following:
Margin money with banks is restricted cash deposits and consists of collateral provided for transfer of finance receivables. Restricted deposit relate to the Company’s residual risk arising on vehicle sold by dealer under leasing arrangement. Loan to joint operation is subordinated to other borrowings of the joint operation. Subject to certain conditions, the loan is convertible into equity of the joint operation, at the option of the joint operation.
Inventories consist of the following:
Inventories of finished goods include Rs. 17,319.1 million and Rs. 14,055.3 million as of March 31, 2014 and March 31, 2013, respectively, relating to vehicles sold subject to repurchase arrangements. Cost of inventories (including cost of purchased products) recognised as expense during the years ended March 31, 2014, March 31, 2013 and March 31, 2012 amounted to Rs. 1,662,646.2 million, Rs. 1,376,589.1 million and Rs. 1,211,567.5 million, respectively. During the years ended March 31, 2014, March 31, 2013 and March 31, 2012, the Company recorded inventory write-down expense of Rs. 3,354.5 million, Rs. 3,721.0 million and Rs. 2,344.5 million, respectively.
F-28
7. Other financial assets - current
As at March 31, 2014 2014 2013 (In millions)
Derivative financial instruments US$ 599.4 Rs. 35,912.4 Rs. 2,568.1 Advances and other receivables recoverable in cash 92.3 5,530.6 5,625.6 Inter corporate deposits 0.1 3.1 3.1 Margin money with banks 5.9 352.6 1,402.9 Restricted bank deposits 36.3 2,175.6 12,544.3
Total US$ 734.0 Rs. 43,974.3 Rs. 22,144.0
8. Other financial assets (non-current)
As at March 31, 2014 2014 2013 (In millions)
Margin money with banks US$ 16.8 Rs. 1,008.3 Rs. 693.1 Restricted deposits 42.1 2,524.5 4,036.9 Loans to employees 7.5 448.0 445.3 Loan to joint operation 22.1 1,325.0 1,325.0 Derivative financial instruments 728.5 43,646.9 6,194.7 Others 58.4 3,491.3 4,349.6
Total US$ 875.4 Rs. 52,444.0 Rs. 17,044.6
9. Inventories
As at March 31, 2014 2014 2013 (In millions)
Raw materials, components and consumables US$ 475.1 Rs. 28,468.3 Rs. 26,769.9 Work-in-progress 443.6 26,580.8 21,650.2 Finished goods 3,633.3 217,686.8 162,075.6
Total US$ 4,552.0 Rs. 272,735.9 Rs. 210,495.7
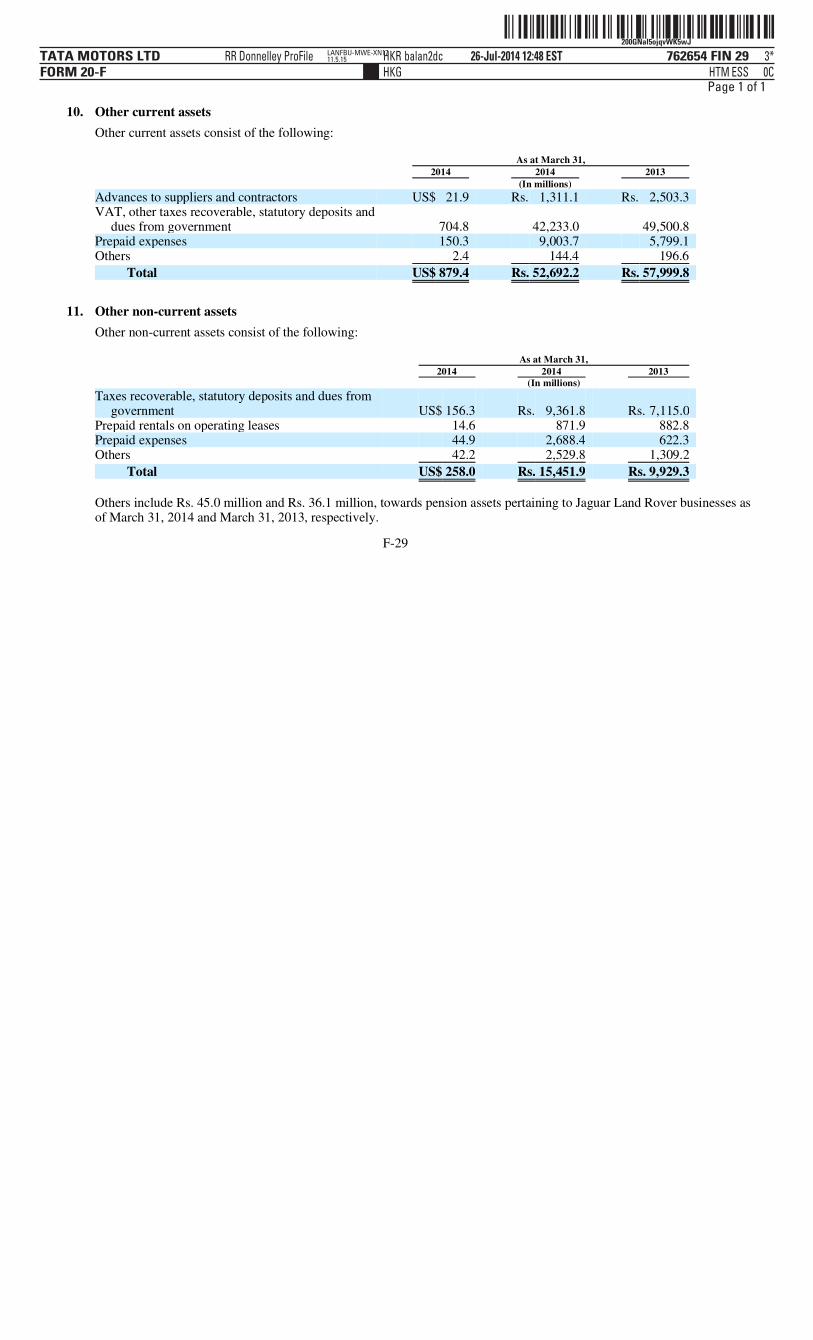
ˆ200GNal5ojqvWK5wJŠ200GNal5ojqvWK5wJ
762654 FIN 29TATA MOTORS LTDFORM 20-F
26-Jul-2014 12:48 ESTHTMHKG
RR Donnelley ProFile HKR balan2dc 3*ESS 0C
LANFBU-MWE-XN1711.5.15
Page 1 of 1
Other current assets consist of the following:
Other non-current assets consist of the following:
Others include Rs. 45.0 million and Rs. 36.1 million, towards pension assets pertaining to Jaguar Land Rover businesses as of March 31, 2014 and March 31, 2013, respectively.
F-29
10. Other current assets
As at March 31, 2014 2014 2013 (In millions)
Advances to suppliers and contractors US$ 21.9 Rs. 1,311.1 Rs. 2,503.3 VAT, other taxes recoverable, statutory deposits and
dues from government 704.8 42,233.0 49,500.8 Prepaid expenses 150.3 9,003.7 5,799.1 Others 2.4 144.4 196.6
Total US$ 879.4 Rs. 52,692.2 Rs. 57,999.8
11. Other non-current assets
As at March 31, 2014 2014 2013 (In millions)
Taxes recoverable, statutory deposits and dues from government US$ 156.3 Rs. 9,361.8 Rs. 7,115.0
Prepaid rentals on operating leases 14.6 871.9 882.8 Prepaid expenses 44.9 2,688.4 622.3 Others 42.2 2,529.8 1,309.2
Total US$ 258.0 Rs. 15,451.9 Rs. 9,929.3

ˆ200GNal5ojqwJl3w(Š200GNal5ojqwJl3w(
762654 FIN 30TATA MOTORS LTDFORM 20-F
26-Jul-2014 12:49 ESTHTMHKG
RR Donnelley ProFile HKR balan2dc 3*ESS 0C
LANFBU-MWE-XN1711.5.15
Page 1 of 1
Property, plant and equipment consist, of the following:
F-30
12. Property, plant and equipment
Land and buildings
Plant and equipment Vehicles Computers
Furniture and fixtures Total
(In millions)
Cost as of April 1, 2013 Rs. 74,900.7 Rs. 416,609.7 Rs. 2,396.3 Rs. 10,382.3 Rs. 5,922.8 Rs. 510,211.8 Additions 18,158.9 73,781.1 443.7 1,725.8 2,347.0 96,456.5 Acquisition through
business combination 6.1 — 0.4 17.3 2.6 26.4 Currency translation
differences 8,334.8 47,862.8 73.0 538.3 627.4 57,436.3 Disposal (316.6) (2,691.9) (346.1) (509.4) (168.8) (4,032.8)
Cost as of March 31, 2014 101,083.9 535,561.7 2,567.3 12,154.3 8,731.0 660,098.2 Accumulated depreciation
(net of Rs. 3,462.6 million in respect of disposals) (15,727.9) (230,644.3) (1,428.7) (8,295.4) (3,219.1) (259,315.4)
Net carrying amount as of March 31, 2014 Rs. 85,356.0 Rs. 304,917.4 Rs. 1,138.6 Rs. 3,858.9 Rs. 5,511.9 Rs. 400,782.8
Capital work-in-progress 93,827.1
Total Rs. 494,609.9
US$ 8,255.2
Depreciation for the year Rs. (2,644.6) Rs. (47,604.4) Rs. (464.7) Rs. (1,115.8) Rs. (596.4) Rs. (52,425.9)
US$ (874.9)
Cost as of April 1, 2012 Rs. 70,449.1 Rs. 337,215.6 Rs. 3,404.8 Rs. 9,672.0 Rs. 4,746.2 Rs. 425,487.7 Additions 5,014.6 86,931.7 809.6 983.1 1,625.3 95,364.3 Currency translation
differences 716.1 (1,218.2) 81.9 69.4 22.7 (328.1) Disposal (1,279.1) (6,319.4) (1,900.0) (342.2) (471.4) (10,312.1)
Cost as of March 31, 2013 74,900.7 416,609.7 2,396.3 10,382.3 5,922.8 510,211.8 Accumulated depreciation
(net of Rs. 8,233.6 million in respect of disposals) (12,030.4) (166,291.1) (1,225.0) (7,383.1) (2,431.2) (189,360.8)
Net carrying amount as of March 31, 2013 Rs. 62,870.3 Rs. 250,318.6 Rs. 1,171.3 Rs. 2,999.2 Rs. 3,491.6 Rs. 320,851.0
Capital work-in-progress 44,128.9
Total Rs. 364,979.9
Depreciation for the year Rs. (2,122.0) Rs. (35,576.1) Rs. (505.5) Rs. (1,032.7) Rs. (414.8) Rs. (39,651.1)

ˆ200GNal5oj%Gx%Yw&Š 200GNal5oj%Gx%Yw&
762654 FIN 31TATA MOTORS LTDFORM 20-F
31-Jul-2014 14:30 ESTHTMHKG
RR Donnelley ProFile HKR vaitp0dc 5*ESS 0C
LANFBU-MWE-XN0611.5.15
Page 1 of 1
Notes:
F-31
1. Net carrying amounts of property, plant and equipment under finance lease arrangements were as follows:
As at March 31, 2014 2014 2013 (In millions)
Land US$ 3.4 Rs. 202.9 Rs. 180.9 Buildings 9.8 588.2 414.1 Plant and equipment 36.4 2,179.4 2,034.0 Computers 6.8 406.0 566.7
Total US$ 56.4 Rs. 3,376.5 Rs. 3,195.7
2. Land and buildings include freehold land of Rs. 20,588.3 million and Rs. 17,265.4 million as of March 31, 2014 and
March 31, 2013 respectively.
3. Capital work in progress as at March 31, 2014, includes building of Rs. 3,098.8 million on leased land located in the State of West Bengal in India for the purposes of manufacturing automobiles. In June 2011, the newly elected Government of West Bengal (referred to as “State Government”) enacted legislation to cancel the land lease agreement.
The Company challenged the legal validity of the legislation. In June 2012, the High Court of Calcutta (referred to as the “High Court”) ruled against the validity of the legislation and restored the Company’s rights under the land lease agreement. The State Government filed an appeal in the Supreme Court of India. As of the date of the authorization of the financial statements, the Supreme Court has not concluded on the State Government appeal.
The Company reasonably expects that the High Courts’ judgment, based on established law, will be upheld by the
Supreme Court. Based on the management’s assessment, no adjustments to the carrying amount of buildings is considered necessary.
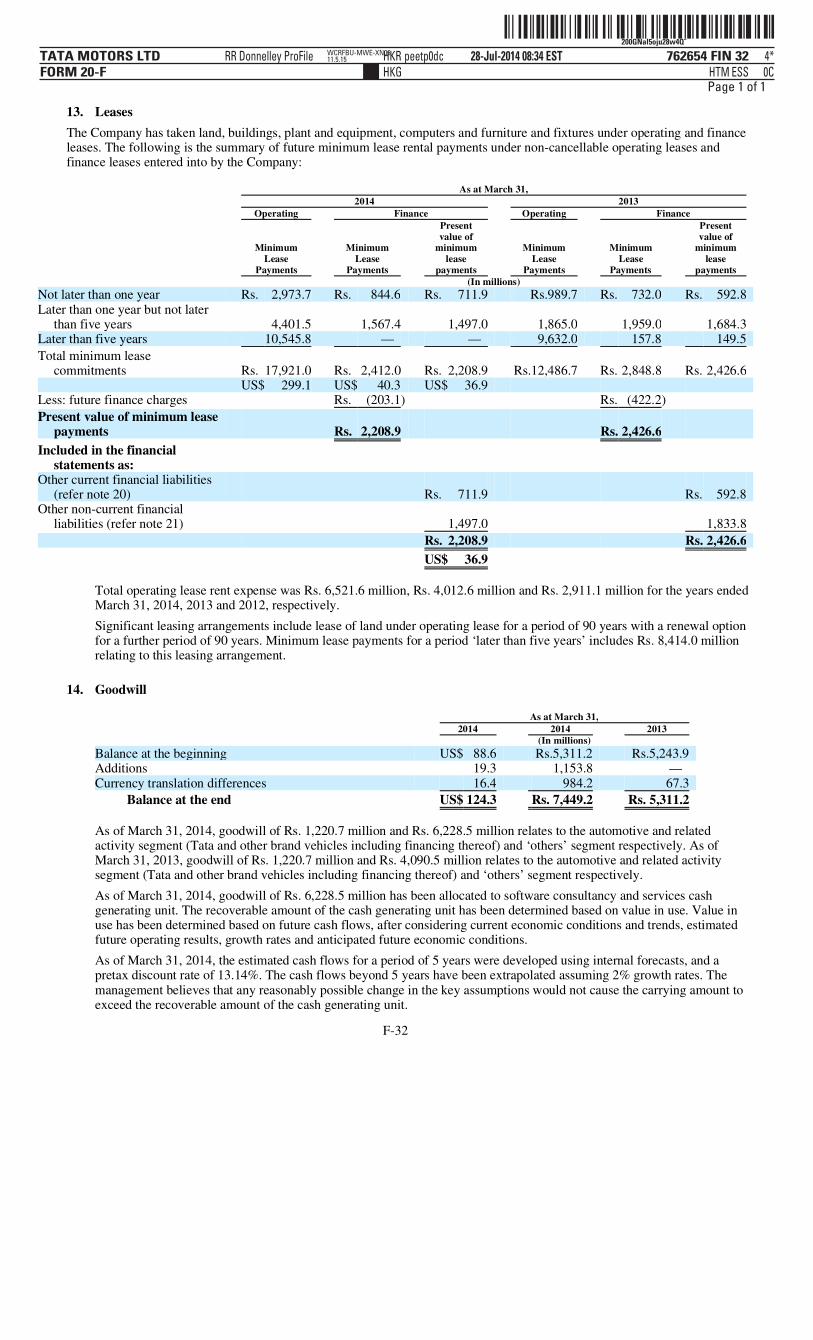
ˆ200GNal5oju28w4QÄŠ200GNal5oju28w4Q˜
762654 FIN 32TATA MOTORS LTDFORM 20-F
28-Jul-2014 08:34 ESTHTMHKG
RR Donnelley ProFile HKR peetp0dc 4*ESS 0C
WCRFBU-MWE-XN0611.5.15
Page 1 of 1
The Company has taken land, buildings, plant and equipment, computers and furniture and fixtures under operating and finance leases. The following is the summary of future minimum lease rental payments under non-cancellable operating leases and finance leases entered into by the Company:
Total operating lease rent expense was Rs. 6,521.6 million, Rs. 4,012.6 million and Rs. 2,911.1 million for the years ended March 31, 2014, 2013 and 2012, respectively. Significant leasing arrangements include lease of land under operating lease for a period of 90 years with a renewal option for a further period of 90 years. Minimum lease payments for a period ‘later than five years’ includes Rs. 8,414.0 million relating to this leasing arrangement.
As of March 31, 2014, goodwill of Rs. 1,220.7 million and Rs. 6,228.5 million relates to the automotive and related activity segment (Tata and other brand vehicles including financing thereof) and ‘others’ segment respectively. As of March 31, 2013, goodwill of Rs. 1,220.7 million and Rs. 4,090.5 million relates to the automotive and related activity segment (Tata and other brand vehicles including financing thereof) and ‘others’ segment respectively. As of March 31, 2014, goodwill of Rs. 6,228.5 million has been allocated to software consultancy and services cash generating unit. The recoverable amount of the cash generating unit has been determined based on value in use. Value in use has been determined based on future cash flows, after considering current economic conditions and trends, estimated future operating results, growth rates and anticipated future economic conditions. As of March 31, 2014, the estimated cash flows for a period of 5 years were developed using internal forecasts, and a pretax discount rate of 13.14%. The cash flows beyond 5 years have been extrapolated assuming 2% growth rates. The management believes that any reasonably possible change in the key assumptions would not cause the carrying amount to exceed the recoverable amount of the cash generating unit.
F-32
13. Leases
As at March 31, 2014 2013 Operating Finance Operating Finance
Minimum Lease
Payments
Minimum Lease
Payments
Present value of
minimum lease
payments
Minimum Lease
Payments
Minimum Lease
Payments
Present value of
minimum lease
payments (In millions) Not later than one year Rs. 2,973.7 Rs. 844.6 Rs. 711.9 Rs.989.7 Rs. 732.0 Rs. 592.8 Later than one year but not later
than five years 4,401.5 1,567.4 1,497.0 1,865.0 1,959.0 1,684.3 Later than five years 10,545.8 — — 9,632.0 157.8 149.5
Total minimum lease commitments Rs. 17,921.0 Rs. 2,412.0 Rs. 2,208.9 Rs.12,486.7 Rs. 2,848.8 Rs. 2,426.6
US$ 299.1 US$ 40.3 US$ 36.9
Less: future finance charges Rs. (203.1) Rs. (422.2)
Present value of minimum lease payments Rs. 2,208.9 Rs. 2,426.6
Included in the financial statements as:
Other current financial liabilities (refer note 20) Rs. 711.9 Rs. 592.8
Other non-current financial liabilities (refer note 21) 1,497.0 1,833.8
Rs. 2,208.9 Rs. 2,426.6
US$ 36.9
14. Goodwill
As at March 31, 2014 2014 2013 (In millions)
Balance at the beginning US$ 88.6 Rs.5,311.2 Rs.5,243.9 Additions 19.3 1,153.8 — Currency translation differences 16.4 984.2 67.3
Balance at the end US$ 124.3 Rs. 7,449.2 Rs. 5,311.2

ˆ200GNal5oj#!#7iwPŠ 200GNal5oj#!#7iwP
762654 FIN 33TATA MOTORS LTDFORM 20-F
31-Jul-2014 02:27 ESTHTMHKG
RR Donnelley ProFile HKR sivas5dc 11*ESS 0C
SWRFBU-MWE-XN0511.5.15
Page 1 of 1
Intangible assets consist of the following:
The useful life of trademarks and brands in respect of the acquired Jaguar Land Rover businesses have been determined to be indefinite as the Company expects to generate future economic benefits indefinitely from these assets.
The indefinite life intangible assets have been allocated to the Jaguar Land Rover businesses. The recoverable amount of the cash generating unit has been determined based on value in use. Value in use has been determined based on future cash flows after considering current economic conditions and trends, estimated future operating results, growth rates and anticipated future economic conditions.
The estimated cash flows for a period of five years were developed using internal forecasts, and a pre-tax discount rate of 10.9%. The cash flows beyond five years have been extrapolated assuming zero growth rate. The management believes that any reasonably possible change in the key assumptions would not cause the carrying amount to exceed the recoverable amount of the cash generating unit.
During the year, legislation was enacted to allow United Kingdom (UK) companies to elect for the Research and Development Expenditure Credit (RDEC) on qualifying expenditure incurred since April 1, 2013, instead of the existing super-deduction rules. As a result of this election by the Company’s subsidiary in the UK, Rs. 4,308.6 million of the RDEC, the proportion relating to capitalised product development expenditure, has been offset against these assets. The remaining Rs. 1,711.9 million has been recognised as miscellaneous income, a component of Other Income / (loss) (net).
F-33
15. Intangible assets
Software
Patents and technological
know how Customer
related
Intellectual property
rights and other
intangibles Product
development
Indefinite life trademarks and brands Total
(In millions)
Cost as of April 1, 2013 Rs. 18,513.5 Rs.12,718.5 Rs. 7,283.8 Rs. 55.1 Rs. 208,300.0 Rs. 50,762.4 Rs. 297,633.3 Additions through internal
development — — — — 60,677.9 — 60,677.9 Acquisition through business
combination 62.0 — 219.7 — — — 281.7 Other additions 8,697.8 2.2 — 659.7 — — 9,359.7 Currency translation
differences
3,084.1
2,563.1
1,572.0
65.3
36,120.6
10,781.2
54,186.3
Disposal (752.4) — — — (14,035.6) — (14,788.0)
Cost as of March 31, 2014 29,605.0 15,283.8 9,075.5 780.1 291,062.9 61,543.6 407,350.9 Accumulated amortization (net
of Rs. 14,788.0 million in respect of disposals) (14,045.6) (9,092.3) (4,601.0) (198.0) (116,913.5) — (144,850.4)
Net carrying amount as of March 31, 2014 Rs. 15,559.4 Rs. 6,191.5 Rs. 4,474.5 Rs. 582.1 Rs. 174,149.4 Rs. 61,543.6 Rs. 262,500.5
Capital work-in-progress 229,683.6
Total Rs. 492,184.1
US$ 8,214.6
Amortization for the year Rs. (3,487.2) Rs. (1,489.8) Rs. (343.8) Rs. (73.7) Rs. (52,642.2) Rs. — Rs. (58,036.7)
US$ (968.8)
Cost as of April 1, 2012 Rs. 17,279.2 Rs.12,623.7 Rs. 7,232.9 Rs. 207.8 Rs. 123,866.0 Rs. 50,407.5 Rs. 211,617.1 Additions through internal
development — — — — 87,985.8 — 87,985.8 Other additions 4,273.7 8.1 — — — — 4,281.8 Currency translation
differences
137.5
86.7
50.9
—
(3,551.8)
354.9
(2,921.8)
Disposal (3,176.9) — — (152.7) — — (3,329.6)
Cost as of March 31, 2013 18,513.5 12,718.5 7,283.8 55.1 208,300.0 50,762.4 297,633.3 Accumulated amortization (net
of Rs. 3,329.6 million in respect of disposals) (9,690.0) (6,385.7) (3,480.1) (16.2) (68,215.9) — (87,787.9)
Net carrying amount as of March 31, 2013 Rs. 8,823.5 Rs. 6,332.8 Rs. 3,803.7 Rs. 38.9 Rs. 140,084.1 Rs. 50,762.4 Rs. 209,845.4
Capital work-in-progress 141,821.5
Total Rs. 351,666.9
Amortization for the year Rs. (3,295.3) Rs. (1,401.1) Rs. (257.9) Rs. — Rs. (31,162.5) Rs. — Rs. (36,116.8)

ˆ200GNal5oj@RDgnwgŠ200GNal5oj@RDgnwg
762654 FIN 34TATA MOTORS LTDFORM 20-F
30-Jul-2014 15:04 ESTHTMHKG
RR Donnelley ProFile HKR venkp1dc 9*ESS 0C
NERFBU-MWE-XN0111.5.15
Page 1 of 1
The Company has no material associates as at March 31, 2014. The aggregate summarised financial information in respect of the Company’s immaterial associates that are accounted for using the equity method is set forth below.
Chery is a limited liability company, whose legal form confers separation between the parties to the joint arrangement. There is no contractual arrangement or any other facts and circumstances, that indicate that the parties to the joint venture have rights to the assets and obligations for the liabilities of the joint arrangement. Accordingly, Chery is classified as a joint venture. The summarised financial information in respect of Chery that is accounted for using the equity method is set forth below.
F-34
16. Investments in equity accounted investees:
(a) Associates:
As at March 31, 2014 2014 2013 (In millions)
Carrying amount of the Company’s interest in associates US$ 107.1 Rs. 6,409.4 Rs. 15,853.0
Year ended March 31, 2014 2014 2013 2012 (In millions)
Company’s share of profit / (loss) in associates* US$ (19.0) Rs. (1,142.0) Rs. 884.2 Rs. (586.6)
Company’s share of other comprehensive income in associates (2.5) (151.8) 26.4 41.7
Company’s share of total comprehensive income in associates US$ (21.5) Rs. (1,293.8) Rs. 910.6 Rs. (544.9)
(i) Fair value of investment in an equity accounted associate for which published price quotation is available, which is a
level 1 input, was Rs. 776.7 million and Rs. 684.8 million as of March 31, 2014 and 2013, respectively. The carrying amount as of March 31, 2014 and 2013, was Rs. 1,325.7 million and Rs. 1,306.0 million, respectively.
(ii) The Company recognized an impairment loss of Rs. 8,033.7 million, Rs. Nil and Rs. 4,981.0 million for the year ended March 31, 2014, 2013 and 2012, respectively, in respect of its investment in an associate which was caused by economic slowdown and increased competition from new entrants faced by the associates. The associate is engaged in the business of manufacture and sale of construction equipment. The recoverable amount of Rs. 2,682.6 million as at March 31, 2014, is determined based on value in use and a pretax discount rate of 17.45%.
(b) Joint ventures:
(i) Details of the Company’s material joint venture as at March 31, 2014 are as follows:
Name of joint venture Principal
activity
Principal place of the
business
% holding as at March 31,
2014 2013
Chery Jaguar Land Rover Automotive Co. Limited (Chery)
Manufacture and assembly of
vehicles China 50% 50%

ˆ200GNal5oj#@2&5w)Š200GNal5oj#@2&5w)
762654 FIN 35TATA MOTORS LTDFORM 20-F
31-Jul-2014 02:27 ESTHTMHKG
RR Donnelley ProFile HKR solas0dc 5*ESS 0C
ACXFBU-MWE-XN0411.5.15
Page 1 of 1
Reconciliation of above summarised financial information to the carrying amount of the interest in the joint venture recognised in the consolidated financial statements:
During the year ended March 31, 2013, the Company has invested towards 50% stake in Suzhou Chery Jaguar Land Rover Trading Company Limited and towards 50% stake in Chery Jaguar Land Rover Automotive Company Limited aggregating Rs. 6,216.6 million. During the year ended March 31, 2014, the Company has additionally invested Rs. 9,007.6 million in Chery Jaguar Land Rover Automotive Company Limited.
F-35
As at March 31, 2014 2014 2013 (In millions) Current assets US$ 281.7 Rs. 16,879.4 Rs. 10,471.8 Non-current assets 392.1 23,490.3 1,559.9 Current liabilities (111.3) (6,668.9) (2,216.7) Non-current liabilities (108.0) (6,469.8) —
The above amounts of assets and liabilities include the following:
Cash and cash equivalents 202.7 12,143.3 10,754.9 Current financial liabilities (excluding trade and
other payables and provisions) — — — Non-current financial liabilities (excluding trade
and other payables and provisions) (108.0) (6,469.8) — Carrying amount of the Company’s interest in
joint venture US$ 227.2 Rs. 13,615.5 Rs. 4,907.5
Year ended March 31, 2014 2014 2013 2012 (In millions)
Revenue US$ — Rs. — Rs. — Rs. — Net income / (loss) (26.9) (1,614.4) (1,632.8) — Other comprehensive income 17.0 1,016.8 — — Total comprehensive income for the year (9.9) (597.6) (1,632.8) — Dividend received from the joint venture during
the year — — — —
The above Net income includes the following:
Depreciation and amortization 1.6 96.2 — — Interest income (3.2) (192.3) — — Interest expense (net) 1.6 96.2 — — Income tax expense / (credit) (20.9) (1,250.2) — —
As at March 31, 2014 2014 2013 (In millions)
Net assets of the joint venture US$ 454.5 Rs. 27,231.0 Rs. 9,815.0 Proportion of the Company’s interest in joint
venture 227.2 13,615.5 4,907.5
Carrying amount of the Company’s interest in joint venture US$ 227.2 Rs. 13,615.5 Rs. 4,907.5

ˆ200GNal5oj@RBNGwEŠ200GNal5oj@RBNGwE
762654 FIN 36TATA MOTORS LTDFORM 20-F
30-Jul-2014 15:02 ESTHTMHKG
RR Donnelley ProFile HKR venkp1dc 6*ESS 0C
NERFBU-MWE-XN0111.5.15
Page 1 of 1
F-36
(ii) The aggregate summarised financial information in respect of the Company’s immaterial joint ventures that are
accounted for, using the equity method is set forth below.
As at March 31, 2014 2014 2013 (In millions)
Carrying amount of the Company’s interest in joint ventures US$ 3.5 Rs. 211.8 Rs. 69.2
Year ended March 31, 2014 2014 2013 2012 (In millions)
Company’s share of profit / (loss) in joint ventures* US$ 1.2 Rs. 71.6 Rs. (199.3) Rs. (0.2) Company’s share of other comprehensive income in joint
ventures 1.2 73.4 1.0 — Company’s share of total comprehensive income in joint
ventures US$ 2.4 Rs. 145.0 Rs. (198.3) Rs. (0.2)
(c) Summary of carrying amount of the Company’s interest in equity accounted investees:
As at March 31, 2014 2014 2013 (In millions)
Carrying amount in immaterial associates US$ 107.1 Rs. 6,409.4 Rs. 15,853.0 Carrying amount in material joint venture 227.2 13,615.5 4,907.5 Carrying amount in immaterial joint ventures 3.5 211.8 69.2
Total US$ 337.8 Rs. 20,236.7 Rs. 20,829.7
(d) Summary of Company’s share of profits / (loss) in equity accounted investees:
Year ended March 31, 2014 2014 2013 2012 (In millions)
Share of profit / (loss) in immaterial associates US$ (19.0) Rs. (1,142.0) Rs. 884.2 Rs. (586.6) Share of profit / (loss) in material joint venture (13.5) (807.2) (816.4) — Share of profit / (loss) in immaterial joint
ventures 1.2 71.6 (199.3) (0.2)
US$ (31.3) Rs. (1,877.6) Rs. (131.5) Rs. (586.8)
(e) Summary of Company’s share of other comprehensive income in equity accounted investees:
Year ended March 31, 2014 2014 2013 2012 (In millions)
Share of other comprehensive income in immaterial associates US$ (2.5) Rs. (151.8) Rs. 26.4 Rs. 41.7
Share of other comprehensive income in material joint venture 8.5 508.4 — —
Share of other comprehensive income in immaterial joint ventures 1.2 73.4 1.0 —
US$ 7.2 Rs. 430.0 Rs. 27.4 Rs. 41.7
* Company’s share of profit / (loss) of the equity accounted investees has been determined after giving effect for the subsequent amortization / depreciation and other adjustments, arising on account of fair value adjustments made to the identifiable net assets of the equity accounted investee as at the date of acquisition and other adjustment arising under the equity method of accounting.

ˆ200GNal5oj$y5H5wvŠ200GNal5oj$y5H5wv
762654 FIN 37TATA MOTORS LTDFORM 20-F
31-Jul-2014 07:37 ESTHTMHKG
RR Donnelley ProFile HKR kupsu0dc 8*ESS 0C
RRWIN-XENP14311.5.15
Page 1 of 1
The domestic and foreign components of net income before income tax:
The domestic and foreign components of income tax expense:
The reconciliation of estimated income tax to income tax expense is as follows:
The United Kingdom (UK) corporation tax rate changed from 23% to 21% with effect from April 1, 2014 and to 20% with effect from April 1, 2015. Accordingly, UK deferred tax has been recognised at 20% as at March 31, 2014, as the majority of the temporary differences are expected to reverse at that rate.
F-37
17. Income taxes
Year ended March 31, 2014 2014 2013 2012 (In millions)
Net income before income taxes
India US$ (1,028.2) Rs. (61,601.7) Rs. (9,456.7) Rs. 8,406.7 Other than India 4,022.5 241,006.8 138,252.2 110,846.8
Total US$ 2,994.3 Rs. 179,405.1 Rs. 128,795.5 Rs. 119,253.5
Year ended March 31, 2014 2014 2013 2012 (In millions)
Current taxes
India US$ 29.5 Rs. 1,770.4 Rs. 3,016.2 Rs. 5,601.1 Other than India 580.8 34,797.8 26,267.3 15,603.8
Deferred taxes
India (235.4) (14,102.7) (2,516.9) (2,782.3) Other than India 430.0 25,761.0 12,472.2 (13,986.1)
Total income tax expense US$ 804.9 Rs. 48,226.5 Rs. 39,238.8 Rs. 4,436.5
Year ended March 31, 2014 2014 2013 2012 (In millions)
Income before income taxes US$ 2,994.3 Rs. 179,405.1 Rs. 128,795.5 Rs. 119,253.5
Income tax expense at tax rates applicable to individual entities 596.5 35,741.4 30,460.9 32,146.9
Additional deduction for research and product development cost (142.9) (8,561.7) (7,936.3) (7,520.4)
Items (net) not deductible for tax / not liable to tax :
- foreign currency (gain) / loss relating to loans and deposits (net) 3.8 227.3 340.9 487.5
- interest, loss on conversion option and other expenses relating to borrowings for investment 38.4 2,302.3 2,350.6 1,698.6
- Dividend from subsidiaries, associates and available-for-sale investments 76.3 4,572.2 4,132.6 —
Undistributed earnings of subsidiaries and associates 216.9 12,993.6 5,611.1 4,497.9 Loss in respect of which deferred tax assets not recognized
due to uncertainty 11.4 684.8 582.0 1,193.4 Utilization / credit of unrecognised tax losses, unabsorbed
depreciation and other tax benefits (54.4) (3,257.0) (517.6) (29,528.7) Deferred tax assets not probable to be utilised 122.1 7,318.0 — — Tax on share of (profit) / loss of equity accounted investees 9.0 537.3 (33.7) 187.8 Impact of change in statutory tax rates (88.5) (5,299.9) 1,548.1 — Others 16.3 968.2 2,700.2 1,273.5
Income tax expense reported US$ 804.9 Rs. 48,226.5 Rs. 39,238.8 Rs. 4,436.5

ˆ200GNal5ojrZ%x@wdŠ200GNal5ojrZ%x@wd
762654 FIN 38TATA MOTORS LTDFORM 20-F
27-Jul-2014 11:57 ESTHTMHKG
RR Donnelley ProFile HKR kupsu0dc 11*ESS 0C
SWRFBU-MWE-XN0311.5.14
Page 1 of 1
Significant components of deferred tax assets and liabilities for the year ended March 31, 2014
Tata Motors Limited (on standalone basis, being its tax status) is liable to pay Minimum Alternate Tax (MAT). Under the Indian Income tax laws, the tax paid under MAT provisions can be carried forward and set-off against future income tax liabilities computed under normal tax provisions within a period of ten years. Deferred tax assets of Tata Motors Limited (on standalone basis, being its tax status) as at March 31, 2014 of Rs. 15,250.9 million, Rs. 19,897.8 million and Rs. 7,771.8 million relating to unabsorbed depreciation, unutilised business loss and MAT credit, respectively, have been assessed as probable of realization on the basis of estimated taxable income for future years including dividends from subsidiaries.
F-38
Opening balance
Recognised in profit or loss
Recognised in / reclassified from other
comprehensive income
Acquisition of
subsidiary Closing balance
(In millions)
Deferred tax assets:
Depreciation carry forwards Rs. 10,184.6 Rs. 5,244.0 Rs. — Rs. — Rs. 15,428.6 Business loss carry forwards 49,983.4 (926.1) 9,992.3 67.2 59,116.8 Expenses deductible in future
years: — – provisions and allowances for
doubtful receivables / finance receivables 20,319.6 8,807.4 1,065.5 — 30,192.5
Compensated absences and retirement benefits 14,985.6 (2,902.7) 2,541.2 3.7 14,627.8
Minimum alternate tax carry-forward 15,170.6 (7,291.4) — — 7,879.2
Property, plant and equipment 11,981.4 (7,168.1) 2,603.3 — 7,416.6 Derivative financial instruments 4,958.7 — (4,958.7) — — Others 6,963.9 7,956.2 1,551.0 — 16,471.1
Total deferred tax asset Rs. 134,547.8 Rs. 3,719.3 Rs. 12,794.6 Rs. 70.9 Rs. 151,132.6
Deferred tax liabilities:
Property, plant and equipment 15,216.8 5.6 7.4 1.3 15,231.1 Intangible assets 75,031.2 6,231.5 11,738.6 74.7 93,076.0 Undistributed earnings of
subsidiaries and associates 11,297.8 11,387.7 * 1,410.9 — 24,096.4 Fair valuation of retained interest
in a subsidiary subsequent to disposal of controlling equity interest 2,843.0 (2,673.5) — — 169.5
Derivative financial instruments — 14.4 13,327.7 — 13,342.1 Others 1,010.2 411.9 (83.3) — 1,338.8
Total deferred tax liability Rs. 105,399.0 Rs. 15,377.6 Rs. 26,401.3 Rs. 76.0 Rs. 147,253.9
Net assets / (liability) Rs. 29,148.8 Rs. (11,658.3) Rs. (13,606.7) Rs. (5.1) Rs. 3,878.7
US$ 486.5 US$ (194.6) US$ (227.1) US$ (0.1) US$ 64.7
Deferred tax asset US$ 653.4 Rs. 39,150.5 Deferred tax liability US$(588.7) Rs. (35,271.8)
* Net of Rs. 497.7 million reversed on dividend distribution by subsidiaries and Rs. 1,108.2 million reversed due to change in tax rate in subsidiaries.

ˆ200GNal5ojrZwxHQ<Š200GNal5ojrZwxHQ<
762654 FIN 39TATA MOTORS LTDFORM 20-F
27-Jul-2014 11:54 ESTHTMHKG
RR Donnelley ProFile HKR durap0dc 7*ESS 0C
ACXFBU-MWE-XN1011.5.14
Page 1 of 1
As of March 31, 2014, unrecognized deferred tax assets amount to Rs. 4,151.5 million and Rs. 4,538.7 million, which can be carried forward indefinitely and upto a specified period, respectively. These relate primarily to business and capital losses. The deferred tax asset has not been recognized on the basis that its recovery is not probable in the foreseeable future.
Unrecognized deferred tax assets expire unutilized based on the year of origination as follows:
The Company has not recognized deferred tax liability on undistributed profits of certain subsidiaries amounting to Rs. 405,841.6 million, because it is able to control the timing of the reversal of temporary differences associated with such undistributed profits and it is probable that such differences will not reverse in the foreseeable future.
Significant components of deferred tax assets and liabilities for the year ended March 31, 2013
F-39
March 31, In millions 2015 Rs. 254.7 US$ 4.3 2016 405.0 6.8 2017 211.8 3.5 2018 227.1 3.8 2019 708.4 11.8 Thereafter Rs.2,731.7 US$45.6
Opening balance
Recognised in profit or
loss
Recognised in / reclassified from other
comprehensive income
Closing balance
(In millions)
Deferred tax assets:
Depreciation carry forwards Rs. 5,284.8 Rs. 4,899.8 Rs. — Rs. 10,184.6 Business loss carry forwards 52,224.1 (2,852.2) 611.5 49,983.4 Expenses deductible in future years:
– provisions and allowances for doubtful receivables / finance receivables 13,445.5 7,121.0 (246.9) 20,319.6
– Interest and fair value change on conversion option 1,711.1 (1,711.1) — —
Compensated absences and retirement benefits 9,320.0 (259.0) 5,924.6 14,985.6 Minimum alternate tax carry-forward 14,513.0 657.6 — 15,170.6 Property, plant and equipment 11,861.5 37.8 82.1 11,981.4 Derivative financial instruments 1,491.9 (677.3) 4,144.1 4,958.7 Others 7,131.6 (195.1) 27.4 6,963.9
Total deferred tax asset Rs.116,983.5 Rs. 7,021.5 Rs.10,542.8 Rs.134,547.8
Deferred tax liabilities:
Property, plant and equipment 14,147.1 1,059.5 10.2 15,216.8 Intangible assets 61,537.3 13,659.0 (165.1) 75,031.2 Undistributed earnings of subsidiaries and associates 9,213.4 2,120.6 * (36.2) 11,297.8 Fair valuation of retained interest in a subsidiary
subsequent to disposal of controlling equity interest 2,843.0 — — 2,843.0
Others 815.8 137.7 56.7 1,010.2
Total deferred tax liability Rs. 88,556.6 Rs.16,976.8 Rs. (134.4) Rs. 105,399.0
Net assets / (liability) Rs. 28,426.9 Rs. (9,955.3) Rs.10,677.2 Rs. 29,148.8
Deferred tax asset Rs. 45,205.2 Deferred tax liability Rs. (16,056.4)
* Net of Rs. 3,490.5 million reversed on dividend distribution by subsidiaries.

ˆ200GNal5ojrZvn&wlŠ200GNal5ojrZvn&wl
762654 FIN 40TATA MOTORS LTDFORM 20-F
27-Jul-2014 11:54 ESTHTMHKG
RR Donnelley ProFile HKR ayyar0dc 7*ESS 0C
SWRFBU-MWE-XN0411.5.14
Page 1 of 1
Significant components of deferred tax assets and liabilities for the year ended March 31, 2012
In fiscal 2012, the Group recognised all previously unrecognised unused tax losses and other temporary differences pertaining to the subsidiary company in the UK of Rs. 38,934.2 million in light of the planned consolidation of the UK manufacturing business in fiscal 2013 and business forecasts showing continuing profitability. Accordingly, Rs. 11,553.4 million of previously unrecognised deductible temporary differences has been utilised to reduce current tax expense and previously unrecognized deferred tax benefit of Rs.17,975.3 million and Rs. 9,405.5 million has been recognized in the income statement and other comprehensive income respectively during the year ended March 31, 2012.
F-40
Opening balance
Recognised in profit or loss
Recognised in / reclassified from other
comprehensive income
Closing balance
(In millions)
Deferred tax assets:
Depreciation carry forwards Rs. 2,330.5 Rs. 2,954.3 Rs. — Rs. 5,284.8 Business loss carry forwards 2,270.7 48,150.1 1,803.3 52,224.1 Expenses deductible in future years:
– provisions and allowances for doubtful receivables / finance receivables 10,957.6 1,341.3 1,146.6 13,445.5
– Interest and fair value change on conversion option 1,263.9 447.2 — 1,711.1
Compensated absences and retirement benefits 4,941.5 (8,305.2) 12,683.7 9,320.0 Minimum alternate tax carry-forward 11,581.6 2,931.4 — 14,513.0 Property, plant and equipment 15,994.9 (6,156.7) 2,023.3 11,861.5 Derivative financial instruments — 762.3 729.6 1,491.9 Others 4,131.5 2,451.2 548.9 7,131.6
Total deferred tax asset Rs. 53,472.2 Rs. 44,575.9 Rs. 18,935.4 Rs. 116,983.5
Deferred tax liabilities:
Property, plant and equipment 13,432.7 690.2 24.2 14,147.1 Intangible assets 33,912.3 24,067.8 3,557.2 61,537.3 Undistributed earnings of subsidiaries and associates 4,364.7 4,497.9 350.8 9,213.4 Fair valuation of retained interest in a subsidiary
subsequent to disposal of controlling equity interest 3,991.2 (1,148.2) — 2,843.0 Others 1,406.4 (300.2) (290.4) 815.8
Total deferred tax liability Rs. 57,107.3 Rs. 27,807.5 Rs. 3,641.8 Rs. 88,556.6
Net assets / (liability) Rs. (3,635.1) Rs. 16,768.4 Rs. 15,293.6 Rs. 28,426.9
Deferred tax asset Rs. 46,493.9 Deferred tax liability Rs. (18,067.0)

ˆ200GNal5ojqvL=eQ5Š200GNal5ojqvL=eQ5
762654 FIN 41TATA MOTORS LTDFORM 20-F
26-Jul-2014 12:47 ESTHTMHKG
RR Donnelley ProFile HKR vaitp0dc 2*ESS 0C
LANFBU-MWE-XN0311.5.15
Page 1 of 1
Short-term borrowings and current portion of long-term debt consist of the following:
For details of carrying amount of assets pledged as security for secured borrowings refer note 37.
Long-term debt consists of the following:
F-41
18. Short-term borrowings and current portion of long-term debt
As at March 31, 2014 2014 2013 (In millions)
Commercial paper US$ 315.8 Rs. 18,919.4 Rs. 27,553.0 Loans from banks / financial institutions 1,356.6 81,285.3 89,530.2 Inter-corporate deposits 4.3 260.0 295.0 Current portion of long-term debt (refer note 19) 1,093.1 65,495.9 117,519.2
Total US$2,769.8 Rs.165,960.6 Rs.234,897.4
19. Long-term debt
As at March 31, 2014 2014 2013 (In millions)
Non Convertible Debentures US$1,932.0 Rs.115,755.2 Rs.114,976.7 4% Foreign Currency Convertible Notes
(USD) due 2014 (including fair value of conversion option) — — 7,704.8
Collateralized debt obligation 257.3 15,413.2 20,820.0 Buyers credit from banks at floating interest rate 222.8 13,350.2 9,519.9 Fixed deposits from public and shareholders — — 3,141.4 Loan from banks / financial institutions 2,874.9 172,254.1 139,239.6 Senior Notes (including fair value of prepayment
option) 3,334.8 199,807.1 150,087.3 Others 51.0 3,054.7 2,747.6
Total 8,672.8 519,634.5 448,237.3 Less: current portion (refer note 18) 1,093.1 65,495.9 117,519.2
Long-term debt US$7,579.7 Rs.454,138.6 Rs.330,718.1

ˆ200GNal5ojqsgXuw1Š200GNal5ojqsgXuw1
762654 FIN 42TATA MOTORS LTDFORM 20-F
26-Jul-2014 12:42 ESTHTMHKG
RR Donnelley ProFile HKR vaitp0dc 2*ESS 0C
LANFBU-MWE-XN0311.5.15
Page 1 of 1
Foreign currency convertible notes 4% foreign currency convertible notes (USD) due 2014 On October 15, 2009, Tata Motors Limited raised funds aggregating USD 375 million (Rs. 17,941.9 million at
issue) by issue of 4% Convertible Notes due on October 16, 2014. The noteholders had an option to convert these Notes into ordinary shares or GDSs or ADSs of Tata Motors Limited. The conversion was to be made by the noteholders, in the case of Shares or GDSs, at any time during the period from and including November 25, 2009 to and including October 9, 2014 and, in the case of ADSs, at any time from and including October 15, 2010 to and including October 9, 2014, at an initial conversion price of Rs. 623.88 per share (face value of Rs 10 each) (equivalent to USD13.48 per share at a fixed rate of exchange on conversion of Rs. 46.28 per USD). The conversion price of the notes was reset to a price of Rs. 613.77 (face value of Rs. 10 each) per share on account of cash dividend distribution anti dilution adjustment as per terms of issue in fiscal 2011, at fixed rate of conversion of Rs. 46.28 per USD. The conversion price is subject to adjustment in certain circumstances. Tata Motors Limited had a right to redeem in whole but not in part, these Notes at any time on or after October 15, 2012, subject to certain conditions. In the event of certain changes affecting taxation, Tata Motors Limited had an option to redeem in whole but not in part, these Notes at any time. Unless previously converted, redeemed or purchased and cancelled as per the terms of issue, these Notes will be due for redemption on October 16, 2014 at 108.505 % of the principal amount.
There had been no conversion during the year ended March 31, 2010. During the year ended March 31, 2011, 2,576 Notes were converted into 19,423,734 equity shares of face
value of Rs.10 each. There had been no conversion during the year ended March 31, 2012. During the year ended March 31, 2013, the conversion price of the notes had been reset to a price of
Rs. 120.119 per share on account of anti-dilution adjustment of shares at a fixed rate of conversion of Rs. 46.28 per USD.
During the year ended March 31, 2013, 433 Notes were converted into 16,519,201 equity shares of face value of Rs.2 each.
During the year ended March 31, 2014, 741 Notes were converted into 28,549,566 equity shares of face value of Rs.2 each.
The embedded conversion option in foreign currency convertible notes is not clearly and closely related to the host debt contracts, as the conversion options will be settled by delivery of fixed number of shares for fixed amounts of foreign currency which represents variable amount of cash in Indian Rupees, the functional currency of Tata Motors Limited. Change in the fair value of the conversion option is recognized in the income statement.
As at March 31, 2014, no Notes are outstanding.
Collateralized debt obligation These represent amount received against finance receivables securitized/ assigned, which does not qualify for derecognition.
Buyers credit The amount of buyers line of credit from banks is repayable within three years from the respective drawdown dates.
Fixed deposits from public and shareholders These are unsecured deposits for a fixed tenor of up to three years, bearing interest rates ranging from 8% to 12.25%.
F-42
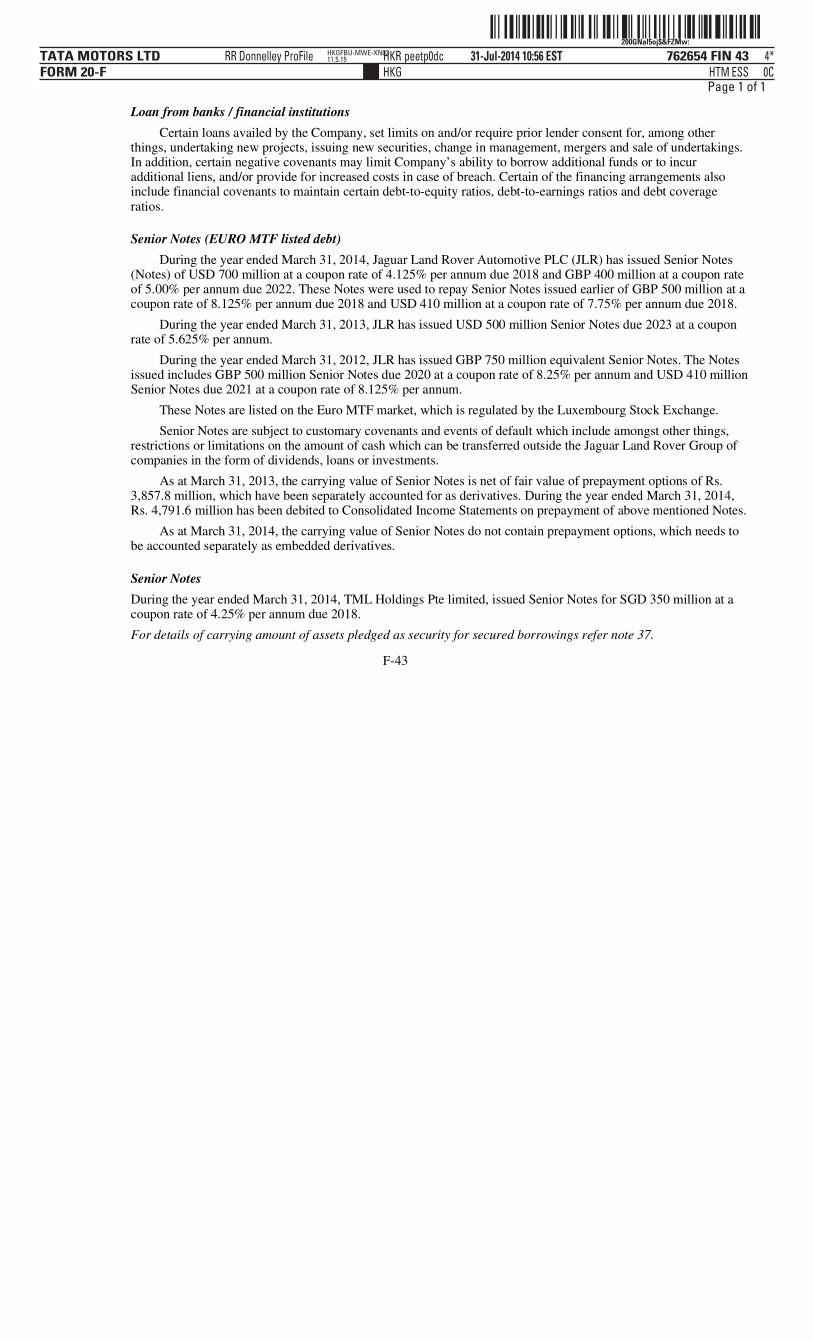
ˆ200GNal5oj$&FZMw:Š 200GNal5oj$&FZMw:
762654 FIN 43TATA MOTORS LTDFORM 20-F
31-Jul-2014 10:56 ESTHTMHKG
RR Donnelley ProFile HKR peetp0dc 4*ESS 0C
HKGFBU-MWE-XN0311.5.15
Page 1 of 1
Loan from banks / financial institutions Certain loans availed by the Company, set limits on and/or require prior lender consent for, among other
things, undertaking new projects, issuing new securities, change in management, mergers and sale of undertakings. In addition, certain negative covenants may limit Company’s ability to borrow additional funds or to incur additional liens, and/or provide for increased costs in case of breach. Certain of the financing arrangements also include financial covenants to maintain certain debt-to-equity ratios, debt-to-earnings ratios and debt coverage ratios.
Senior Notes (EURO MTF listed debt) During the year ended March 31, 2014, Jaguar Land Rover Automotive PLC (JLR) has issued Senior Notes
(Notes) of USD 700 million at a coupon rate of 4.125% per annum due 2018 and GBP 400 million at a coupon rate of 5.00% per annum due 2022. These Notes were used to repay Senior Notes issued earlier of GBP 500 million at a coupon rate of 8.125% per annum due 2018 and USD 410 million at a coupon rate of 7.75% per annum due 2018.
During the year ended March 31, 2013, JLR has issued USD 500 million Senior Notes due 2023 at a coupon rate of 5.625% per annum.
During the year ended March 31, 2012, JLR has issued GBP 750 million equivalent Senior Notes. The Notes issued includes GBP 500 million Senior Notes due 2020 at a coupon rate of 8.25% per annum and USD 410 million Senior Notes due 2021 at a coupon rate of 8.125% per annum.
These Notes are listed on the Euro MTF market, which is regulated by the Luxembourg Stock Exchange. Senior Notes are subject to customary covenants and events of default which include amongst other things,
restrictions or limitations on the amount of cash which can be transferred outside the Jaguar Land Rover Group of companies in the form of dividends, loans or investments.
As at March 31, 2013, the carrying value of Senior Notes is net of fair value of prepayment options of Rs. 3,857.8 million, which have been separately accounted for as derivatives. During the year ended March 31, 2014, Rs. 4,791.6 million has been debited to Consolidated Income Statements on prepayment of above mentioned Notes.
As at March 31, 2014, the carrying value of Senior Notes do not contain prepayment options, which needs to be accounted separately as embedded derivatives.
Senior Notes During the year ended March 31, 2014, TML Holdings Pte limited, issued Senior Notes for SGD 350 million at a coupon rate of 4.25% per annum due 2018. For details of carrying amount of assets pledged as security for secured borrowings refer note 37.
F-43
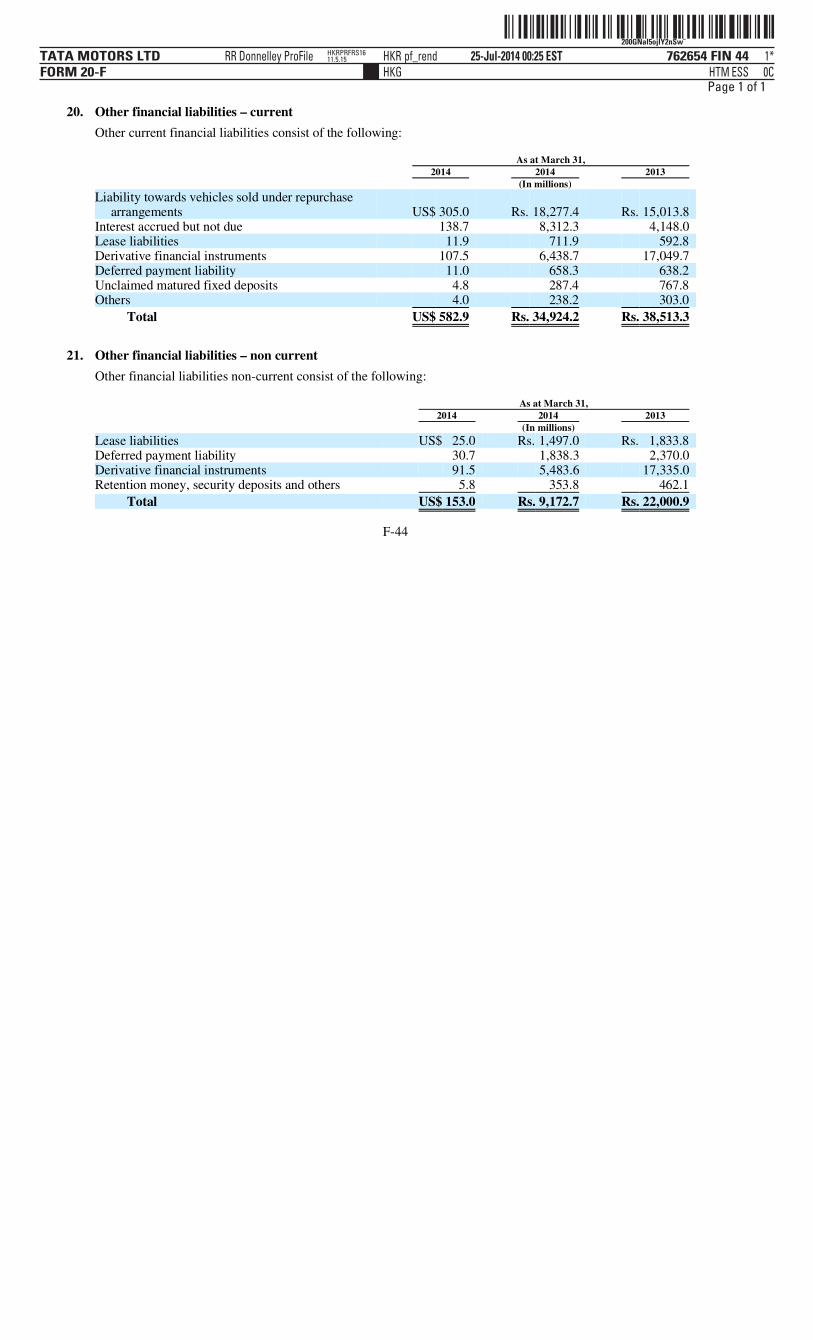
ˆ200GNal5ojlY2nSwÆŠ200GNal5ojlY2nSw˘
762654 FIN 44TATA MOTORS LTDFORM 20-F
25-Jul-2014 00:25 ESTHTMHKG
RR Donnelley ProFile HKR pf_rend 1*ESS 0C
HKRPRFRS1611.5.15
Page 1 of 1
Other current financial liabilities consist of the following:
Other financial liabilities non-current consist of the following:
F-44
20. Other financial liabilities – current
As at March 31, 2014 2014 2013 (In millions)
Liability towards vehicles sold under repurchase arrangements US$ 305.0 Rs. 18,277.4 Rs. 15,013.8
Interest accrued but not due 138.7 8,312.3 4,148.0 Lease liabilities 11.9 711.9 592.8 Derivative financial instruments 107.5 6,438.7 17,049.7 Deferred payment liability 11.0 658.3 638.2 Unclaimed matured fixed deposits 4.8 287.4 767.8 Others 4.0 238.2 303.0
Total US$ 582.9 Rs. 34,924.2 Rs. 38,513.3
21. Other financial liabilities – non current
As at March 31, 2014 2014 2013 (In millions)
Lease liabilities US$ 25.0 Rs. 1,497.0 Rs. 1,833.8 Deferred payment liability 30.7 1,838.3 2,370.0 Derivative financial instruments 91.5 5,483.6 17,335.0 Retention money, security deposits and others 5.8 353.8 462.1
Total US$ 153.0 Rs. 9,172.7 Rs. 22,000.9

ˆ200GNal5ojoXbW9QIŠ200GNal5ojoXbW9QI
762654 FIN 45TATA MOTORS LTDFORM 20-F
25-Jul-2014 15:53 ESTHTMHKG
RR Donnelley ProFile HKR venkp1dc 2*ESS 0C
HKGFBU-MWE-XN0211.5.14
Page 1 of 1
Provisions consist of the following:
F-45
22. Provisions
As at March 31, 2014 2014 2013 (In millions)
Current
Product warranty US$ 633.0 Rs. 37,925.2 Rs. 30,158.1 Product liability 30.7 1,841.7 1,306.1 Provision for residual risk 3.0 179.5 134.0 Employee related and other provisions 96.3 5,767.4* 2,531.1*
Total-Current US$ 763.0 Rs. 45,713.8 Rs. 34,129.3
Non-current
Employee benefits obligations US$ 130.6 Rs. 7,822.9 Rs. 7,340.8 Product warranty 922.7 55,285.2 36,353.8 Provision for residual risk 21.9 1,309.9 1,062.7 Provision for environmental liability 34.5 2,066.8 1,793.2 Other provisions 5.4 325.4 251.4
Total-Non-current US$ 1,115.1 Rs. 66,810.2 Rs. 46,801.9
* includes provision towards employee claims in foreign subsidiaries.
Year ended March 31, 2014 2014 2014 2014 Product Warranty Product Liability (In millions)
Balance at the beginning US$ 1,110.1 Rs. 66,511.9 US$ 21.8 Rs. 1,306.1 Provision made during the year 950.8 56,966.8 16.5 990.5 Provision used during the year (718.1) (43,022.3) (7.6) (455.2) Impact of discounting (9.7) (583.7) — — Impact of foreign exchange translation 222.6 13,337.7 — 0.3
Balance at the end US$ 1,555.7 Rs. 93,210.4 US$ 30.7 Rs. 1,841.7
Current US$ 633.0 Rs. 37,925.2 US$ 30.7 Rs. 1,841.7 Non-current US$ 922.7 Rs. 55,285.2 US$ — Rs. —
Year ended March 31, 2014 2014 2014 2014 Provision for residual risk Provision for environmental liability (In millions)
Balance at the beginning US$ 20.0 Rs. 1,196.7 US$ 29.9 Rs. 1,793.2 Provision made during the year 4.0 240.8 — — Provision used during the year — — (1.6) (92.9) Impact of foreign exchange translation 0.9 51.9 6.2 366.5
Balance at the end US$ 24.9 Rs. 1,489.4 US$ 34.5 Rs. 2,066.8
Current US$ 3.0 Rs. 179.5 US$ — Rs. — Non-current US$ 21.9 Rs. 1,309.9 US$ 34.5 Rs. 2,066.8
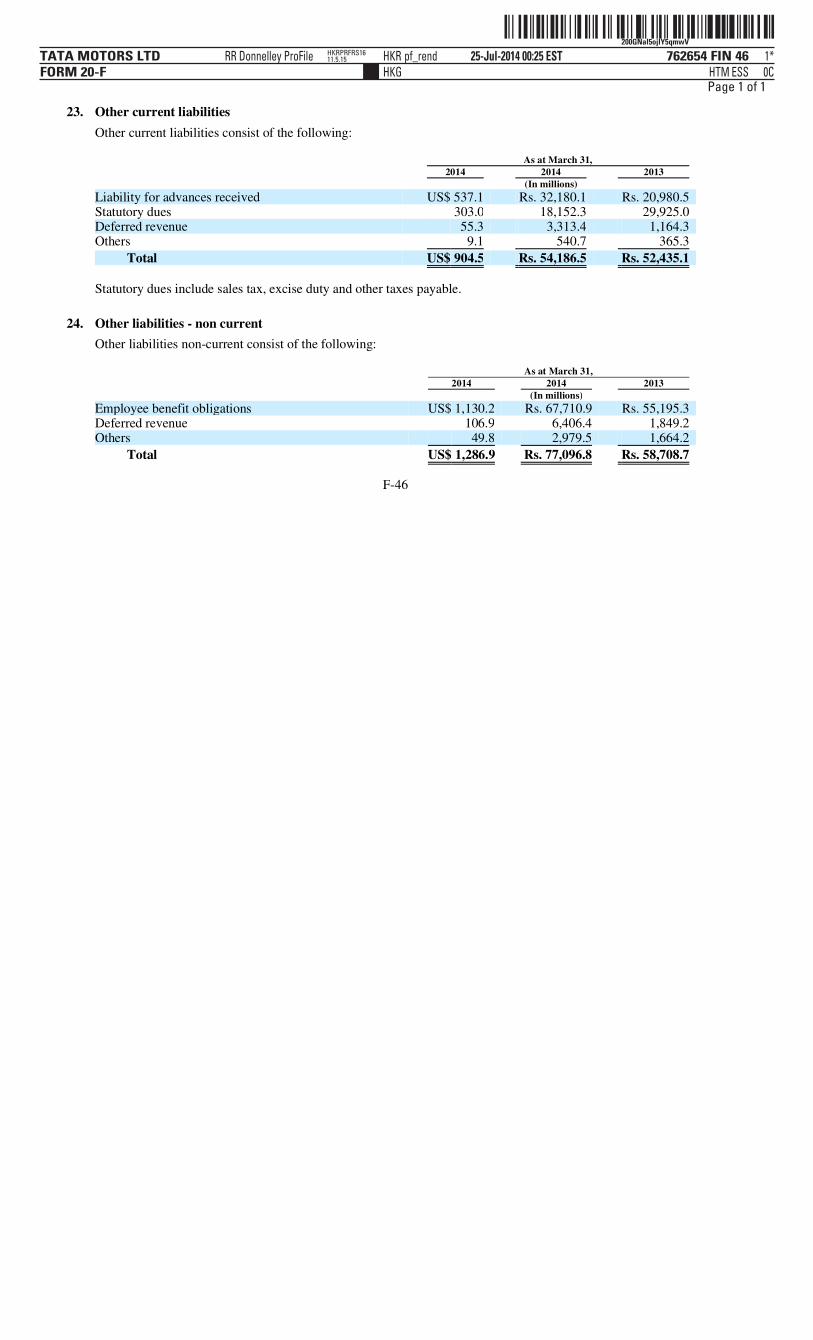
ˆ200GNal5ojlY5qmwVŠ200GNal5ojlY5qmwV
762654 FIN 46TATA MOTORS LTDFORM 20-F
25-Jul-2014 00:25 ESTHTMHKG
RR Donnelley ProFile HKR pf_rend 1*ESS 0C
HKRPRFRS1611.5.15
Page 1 of 1
Other current liabilities consist of the following:
Statutory dues include sales tax, excise duty and other taxes payable.
Other liabilities non-current consist of the following:
F-46
23. Other current liabilities
As at March 31, 2014 2014 2013 (In millions)
Liability for advances received US$ 537.1 Rs. 32,180.1 Rs. 20,980.5 Statutory dues 303.0 18,152.3 29,925.0 Deferred revenue 55.3 3,313.4 1,164.3 Others 9.1 540.7 365.3
Total US$ 904.5 Rs. 54,186.5 Rs. 52,435.1
24. Other liabilities - non current
As at March 31, 2014 2014 2013 (In millions)
Employee benefit obligations US$ 1,130.2 Rs. 67,710.9 Rs. 55,195.3 Deferred revenue 106.9 6,406.4 1,849.2 Others 49.8 2,979.5 1,664.2
Total US$ 1,286.9 Rs. 77,096.8 Rs. 58,708.7
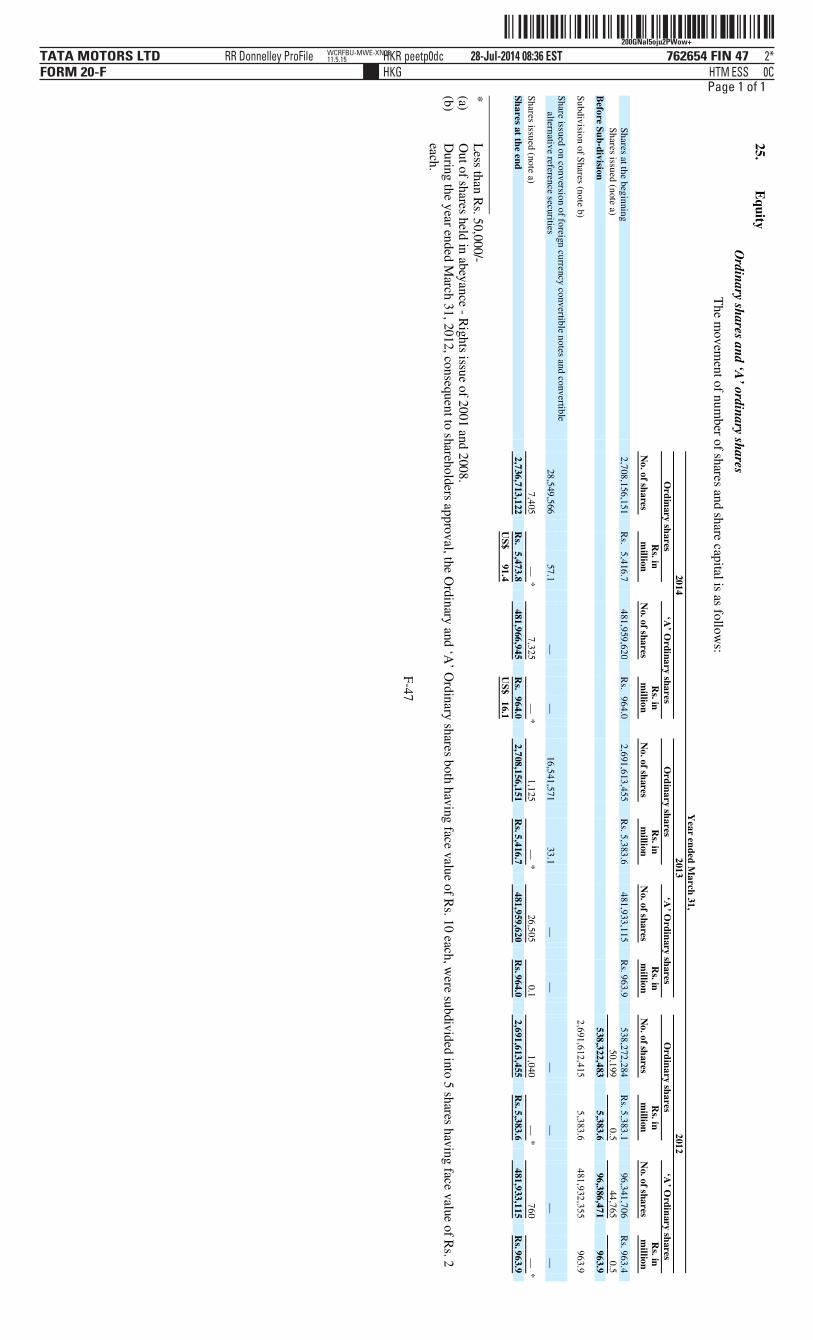
ˆ200GNal5oju2PWow+Š200GNal5oju2PWow+
762654 FIN 47TATA MOTORS LTDFORM 20-F
28-Jul-2014 08:36 ESTHTMHKG
RR Donnelley ProFile HKR peetp0dc 2*ESS 0C
WCRFBU-MWE-XN0611.5.15
Page 1 of 1O
rdinary shares and ‘A’ ordinary shares
The m
ovement of num
ber of shares and share capital is as follows:
F-47
25.
Equity
Year en
ded M
arch 31,
2014
2013
2012
Ord
inary sh
ares
‘A
’ Ordinary shares
Ord
inary sh
ares
‘A
’ Ordin
ary shares
O
rdin
ary shares
‘A’ O
rdinary sh
ares
No. of sh
ares
Rs. in
million
No. of shares
Rs. in
m
illion
N
o. of shares
R
s. in m
illion
N
o. of shares R
s. in
million
N
o. of shares
R
s. in m
illion
N
o. of shares R
s. in
million
Shares at the beginning
2,708,156,151 R
s.5,416.7
481,959,620
Rs.
964.0 2,691,613,455
Rs.5,383.6
481,933,115
Rs.963.9
538,272,284
Rs.5,383.1
96,341,706
Rs.963.4
Shares issued (note a)
50,199
0.5
44,765
0.5
Before Su
b-division
538,322,483
5,383.6
96,386,471
963.9
Subdivision of Shares (note b)
2,691,612,415
5,383.6
481,932,355
963.9
Share issued on conversion of foreign currency convertible notes and convertible alternative reference securities
28,549,566
57.1
—
—
16,541,571
33.1
—
—
—
—
—
—
Shares issued (note a)
7,405
—
*
7,325
— *
1,125
—
*
26,505
0.1
1,040
— *
760
—
*
Shares at th
e end
2,736,713,122 R
s.5,473.8
481,966,945
Rs.
964.0 2,708,156,151
Rs.5,416.7
481,959,620
Rs.964.0
2,691,613,455 R
s.5,383.6
481,933,115 R
s.963.9
US$
91.4
US$
16.1
*L
ess than Rs. 50,000/-
(a)O
ut of shares held in abeyance - Rights issue of 2001 and 2008.
(b)D
uring the year ended March 31, 2012, consequent to shareholders approval, the O
rdinary and ‘A’ O
rdinary shares both having face value of Rs. 10 each, w
ere subdivided into 5 shares having face value of Rs. 2
each.

ˆ200GNal5oj$3Xw!w[Š 200GNal5oj$3Xw!w[
762654 FIN 48TATA MOTORS LTDFORM 20-F
31-Jul-2014 02:40 ESTHTMHKG
RR Donnelley ProFile HKR solas0dc 2*ESS 0C
ACXFBU-MWE-XN0411.5.15
Page 1 of 1
Authorized share capital Authorized share capital includes 3,500,000,000 ordinary shares of Rs. 2 each as of March 31, 2014
(3,500,000,000 ordinary shares of Rs. 2 each as of March 31, 2013), 1,000,000,000 ‘A’ ordinary shares of Rs. 2 each as of March 31, 2014 (1,000,000,000 ‘A’ ordinary shares of Rs. 2 each as of March 31, 2013) and 300,000,000 convertible cumulative preference shares of Rs. 100 each as of March 31, 2014 (300,000,000 convertible cumulative preference shares of Rs. 100 each as of March 31, 2013).
Issued and subscribed share capital Share issued includes partly paid up shares of 68,750 ordinary shares of Rs. 2 each as of March 31,
2014, March 31, 2013 and March 31, 2012.
Ordinary shares and ‘A’ Ordinary shares:
F-48
• The Company has two classes of shares – the Ordinary shares and the ‘A’ Ordinary shares both of Rs.2 each (together referred to as shares). In respect of every Ordinary share (whether fully or partly paid), voting rights shall be in the same proportion as the capital paid up on such Ordinary share bears to the total paid up Ordinary share capital of the Company. In case of every ‘A’ Ordinary share, if any resolution is put to vote on a poll or by postal ballot at any general meeting of shareholders, the holder shall be entitled to one vote for every ten ‘A’ Ordinary shares held as per the terms of its issue.
• Under the provisions of the revised Indian Listing Agreement with domestic Stock Exchanges, every listed company is required to provide its shareholders with the facility to exercise their right to vote, by electronic means, either at a general meeting of the company or by means of a postal ballot. As per the terms of the issue, the holders of Ordinary Shares are entitled to one vote per Ordinary Share held whereas the holders of ‘A’ Ordinary shares shall be entitled to one vote for every ten ‘A’ Ordinary shares held.
• The dividend proposed by the Board of Directors is subject to the approval of the shareholders in the ensuing Annual General Meeting. Further, the Board of Directors may also announce an interim dividend. The holders of ‘A’ Ordinary shares shall be entitled to receive dividend for each financial year at five percentage point more than the aggregate rate of dividend declared on Ordinary shares for that financial year.
• In the event of liquidation, the shareholders are eligible to receive the remaining assets of the Company
after distribution of all preferential amounts, in proportion to their shareholdings.

ˆ200GNal5ojlYBPkwHŠ200GNal5ojlYBPkwH
762654 FIN 49TATA MOTORS LTDFORM 20-F
25-Jul-2014 00:25 ESTHTMHKG
RR Donnelley ProFile HKR pf_rend 1*ESS 0C
HKRPRFRS1611.5.15
Page 1 of 1
F-49
26. Other components of equity
(a) The movement of Currency translation reserve is as follows:
Year ended March 31, 2014 2014 2013 2012 (In millions)
Balance at the beginning US$ 63.8 Rs. 3,820.6 Rs.3,033.0 Rs.(20,399.1) Exchange differences arising on translating
the net assets of foreign operations (net) 1,107.8 66,376.4 774.2 23,398.1 Net change in translation reserve - equity
accounted investees (net) 6.8 413.8 13.4 34.0
Balance at the end US$1,178.4 Rs.70,610.8 Rs.3,820.6 Rs. 3,033.0
(b) The movement of Available-for-sale investments reserve is as follows:
Year ended March 31, 2014 2014 2013 2012 (In millions) Balance at the beginning US$ 5.3 Rs. 320.3 Rs. (26.7) Rs. 772.0 Gain/(loss) arising on revaluation of available-for
sale investments (net) 9.9 589.9 (623.1) (770.6) Income tax relating to gain/loss arising on
revaluation of available-for-sale investments (net), where applicable (0.6) (36.1) (72.3) (18.4)
Cumulative (gain)/loss reclassified to profit or loss on available-for-sale investments (net) (2.4) (142.7) 1,023.7 (17.1)
Income tax relating to cumulative gain/loss reclassified to profit or loss on available-for-sale investments (net), where applicable 1.1 63.5 17.2 5.5
Net change in share of available-for-sale investments reserves – equity accounted investees (net) 0.1 5.3 1.5 1.9
Balance at the end US$13.4 Rs. 800.2 Rs. 320.3 Rs. (26.7)
(c) The movement of Hedging reserve is as follows:
Year ended March 31, 2014 2014 2013 2012 (In millions)
Balance at the beginning US$ (280.4) Rs. (16,801.3) Rs. (1,695.3) Rs. 1,528.7 Gain/(loss) recognised on cash flow
hedges 1,676.2 100,428.5 (24,737.3) (2,748.5) Income tax relating to gain/loss
recognized on cash flow hedges (353.1) (21,158.1) 5,736.3 696.8 (Gain)/loss reclassified to profit or loss (179.8) (10,771.4) 5,047.2 (1,615.0) Income tax relating to gain/loss
reclassified to profit or loss 41.7 2,500.5 (1,152.2) 442.7
Balance at the end US$ 904.6 Rs. 54,198.2 Rs.(16,801.3) Rs.(1,695.3)
(d) Summary of Other components of equity:
As at March 31, 2014 2014 2013 2012 (In millions)
Currency translation reserve US$1,178.4 Rs. 70,610.8 Rs. 3,820.6 Rs. 3,033.0 Available-for-sale investments reserve 13.4 800.2 320.3 (26.7) Hedging reserve 904.6 54,198.2 (16,801.3) (1,695.3)
Total US$2,096.4 Rs.125,609.2 Rs.(12,660.4) Rs. 1,311.0

ˆ200GNal5oj$&WfiQ5Š200GNal5oj$&WfiQ5
762654 FIN 50TATA MOTORS LTDFORM 20-F
31-Jul-2014 11:06 ESTHTMHKG
RR Donnelley ProFile HKR palap0dc 6*ESS 0C
HKGFBU-MWE-XN0311.5.15
Page 1 of 1
Capital redemption reserve The Indian Companies Act, 1956 (the “Companies Act”) requires that where a company purchases its own shares
not out of proceeds of a fresh issue but out of free reserves, then a sum equal to the nominal value of the shares so purchased shall be transferred to a capital redemption reserve account, which may be applied to issue fully paid bonus shares. Tata Motors Limited established this reserve pursuant to the redemption of preference shares issued in earlier years.
Debenture redemption reserve The Companies Act requires that where a company issues debentures, it shall create a debenture redemption reserve
from profits every year until such debentures are redeemed. Manufacturing companies are required to maintain a minimum proportion of the outstanding redeemable debentures as a reserve. The amounts credited to the debenture redemption reserve may not be utilized by the company except to redeem debentures.
Reserve for research and human resource development In terms of Article 9 of the Act on Special Taxation Restriction in Korea, Tata Daewoo Commercial Vehicle
Company Limited (TDCV, a subsidiary company) is entitled for deferment of tax in respect of expenditure incurred on product development cost subject to fulfillment of certain conditions, by way of deduction from the taxable income, provided TDCV appropriates an equivalent amount from ‘Retained Earnings’ to ‘Reserve for Research and Human Resource Development’.
The deferment is for a period of three years and from the fourth year onwards one-third of the reserve is offered to tax and an equal amount is then transferred from the reserve to ‘Retained earnings available for appropriation’.
Special reserve The special reserve represents the reserve created by two subsidiaries of Tata Motors Limited pursuant to the
Reserve Bank of India Act, 1934 (the “RBI Act”) and related regulations applicable to those companies. Under the RBI Act, a nonbanking finance company is required to transfer an amount not less than 20 per cent of its net profit to a reserve fund before declaring any dividend. Appropriation from this reserve fund is permitted only for the purposes specified by the RBI.
Earned surplus reserve Under the Korean commercial code, Tata Daewoo Commercial Vehicle Company Limited (TDCV, a subsidiary
company) is required to appropriate at least 10% of cash dividend declared each year to a legal reserve until such reserves equal to 50% of capital stock. This reserve may not be utilized for cash dividends, but may only be used to offset against future deficit, if any, or may be transferred to capital stock.
Dividends The final dividend is recommended by the Board of Directors and is recorded in the books of account upon its
approval by the shareholders. Tata Motors Limited paid dividend per share of Rs. 2 for Ordinary Shares (face value of Rs. 2 each) and Rs. 2.10 for ‘A’ Ordinary Shares (face value of Rs. 2 each) during the year ended March 31, 2014, and Rs. 4 for Ordinary Shares (face value of Rs. 2 each) and Rs. 4.10 for ‘A’ Ordinary Shares (face value of Rs. 2 each) during the year ended March 31, 2013. In the meeting of Board of Directors of Tata Motors Limited held on May 29, 2014, the Board recommended a dividend of Rs. 2 per Ordinary Share (face value of Rs. 2 each) and Rs. 2.10 per ‘A’ Ordinary Share (face value of Rs. 2 each), which will be subject to approval by the shareholders at their Annual General Meeting on July 31, 2014, result of which is awaited.
F-50
27. Notes to reserves and dividends

ˆ200GNal5oju0xFYQTŠ200GNal5oju0xFYQT
762654 FIN 51TATA MOTORS LTDFORM 20-F
28-Jul-2014 08:23 ESTHTMHKG
RR Donnelley ProFile HKR durap0dc 3*ESS 0C
HKGFBU-MWE-XN0111.5.14
Page 1 of 1
Employee cost consists of the following:
A subsidiary of the Company operates a Long Term Incentive Plan (LTIP) arrangement for certain employees. The scheme provides a cash payment to the employee based on a specific number of phantom shares at grant and the share price of Tata Motors Limited (TML) at the vesting date. The cash payment is dependent on the performance of the underlying TML shares over the 3 year vesting period and continued employment at the end of the vesting period. The fair value of the awards is calculated using a Black Scholes model at the grant date. The fair value is updated at each reporting date as the awards are accounted for as cash settled plan. The inputs into the model are based on the Tata Motors Limited historic data, the risk-free rate and the weighted average fair value of shares, in the scheme at the reporting date. The amount expensed in relation to the long term incentive plan was Rs. 1,057.9 million, Rs. 464.3 million and Rs. 328.3 million, for the year ended March 31, 2014, 2013 and 2012, respectively. The Company considers these amounts as not material and accordingly has not provided further disclosures as required by IFRS 2 “Share-based payment”.
Other expenses consist of the following:
F-51
28. Employee cost
Year ended March 31, 2014 2014 2013 2012 (In millions)
Salaries, wages and welfare expenses US$3,135.5 Rs.187,862.2 Rs.149,928.7 Rs.110,171.0
Contribution to provident fund and other funds 434.6 26,040.8 17,240.8 15,033.9
Total US$3,570.1 Rs.213,903.0 Rs.167,169.5 Rs.125,204.9
29. Other expenses
Year ended March 31, 2014 2014 2013 2012 (In millions)
Stores, spare parts and tools consumed US$ 280.8 Rs. 16,823.4 Rs. 14,241.2 Rs. 12,606.9 Freight and transportation expenses 1,259.1 75,438.5 55,930.4 45,951.7 Research and product development
cost 428.1 25,651.2 20,339.5 13,957.1 Warranty and product liability
expenses 967.3 57,957.3 42,028.7 36,172.8 Allowance for trade and other
receivables, and finance receivables 447.8 26,829.9 10,569.5 6,774.0 Works operation and other expenses 3,105.7 186,066.6 143,923.5 111,888.2 Repairs to buildings and plant and
machinery 59.2 3,549.1 3,252.3 2,834.0 Processing charges 182.5 10,935.3 14,505.6 15,391.4 Power and fuel 188.2 11,278.0 10,777.2 10,275.9 Insurance 47.1 2,823.0 2,299.2 2,319.5 Publicity 1,359.0 81,425.4 66,556.2 54,284.6
Total US$8,324.8 Rs.498,777.7 Rs.384,423.3 Rs.312,456.1

ˆ200GNal5ojoX!%ywŠ 200GNal5ojoX!%yw´
762654 FIN 52TATA MOTORS LTDFORM 20-F
25-Jul-2014 15:55 ESTHTMHKG
RR Donnelley ProFile HKR venkp1dc 2*ESS 0C
HKGFBU-MWE-XN0211.5.14
Page 1 of 1
Other income/(loss) (net) consist of the following:
Interest expense (net) consists of the following:
The weighted average rate for capitalization of interest relating to general borrowings was approximately 7.9%, 8.7% and 8.3% for the year ended March 31, 2014, 2013 and 2012, respectively.
F-52
30. Other income/(loss) (net)
Year ended March 31, 2014 2014 2013 2012 (In millions)
Miscellaneous income US$203.3 Rs.12,179.3 Rs. 7,485.1 Rs. 7,414.8 Dividend income and income on mutual funds 6.3 375.1 384.0 416.8 Gain on sale / (loss) on fair valuation of
available-for-sale investments (net) 18.4 1,102.1 (275.2) 484.5 Gain/(loss) on change in the fair value of
conversion options (14.0) (838.2) 801.6 2,432.4 Gain / (loss) on fair value of prepayment
options on Senior Notes (80.0) (4,791.6) 3,932.6 — Loss on sale of assets/assets written off and
others (net) (5.0) (294.1) (229.0) (709.1)
Total US$129.0 Rs. 7,732.6 Rs.12,099.1 Rs.10,039.4
31. Interest expense (net)
Year ended March 31, 2014 2014 2013 2012 (In millions)
Gross interest expense US$1,136.1 Rs. 68,075.3 Rs. 54,152.1 Rs.47,044.6 Less: Interest capitalized * (250.0) (14,980.6) (13,360.1) (8,086.9)
Total US$ 886.1 Rs. 53,094.7 Rs. 40,792.0 Rs.38,957.7
* Represents borrowing costs capitalized during the year on qualifying assets (property plant and equipment and product
development).
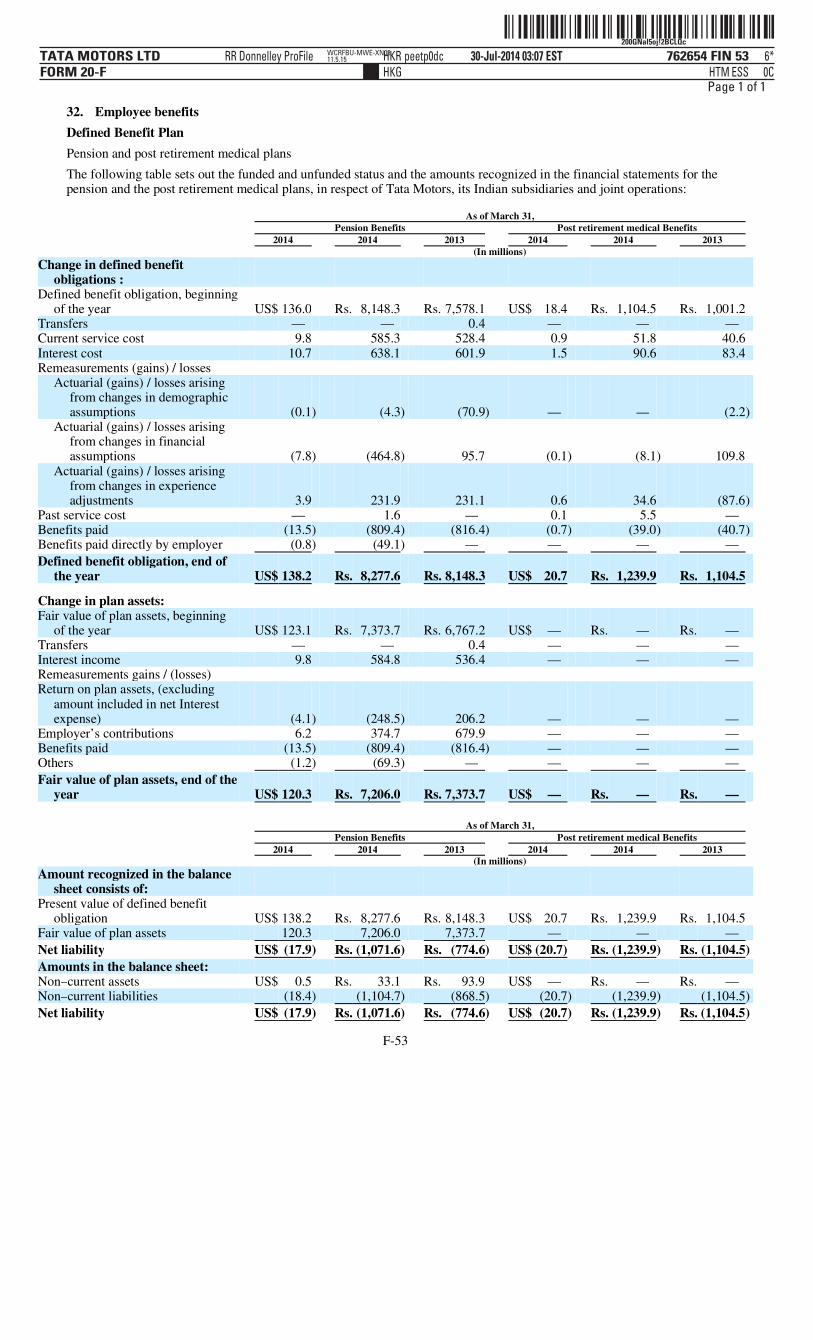
ˆ200GNal5oj!2BCLQcŠ200GNal5oj!2BCLQc
762654 FIN 53TATA MOTORS LTDFORM 20-F
30-Jul-2014 03:07 ESTHTMHKG
RR Donnelley ProFile HKR peetp0dc 6*ESS 0C
WCRFBU-MWE-XN0311.5.15
Page 1 of 1
Defined Benefit Plan Pension and post retirement medical plans The following table sets out the funded and unfunded status and the amounts recognized in the financial statements for the pension and the post retirement medical plans, in respect of Tata Motors, its Indian subsidiaries and joint operations:
F-53
32. Employee benefits
As of March 31, Pension Benefits Post retirement medical Benefits 2014 2014 2013 2014 2014 2013 (In millions)
Change in defined benefit obligations :
Defined benefit obligation, beginning of the year US$ 136.0 Rs. 8,148.3 Rs. 7,578.1 US$ 18.4 Rs. 1,104.5 Rs. 1,001.2
Transfers — — 0.4 — — — Current service cost 9.8 585.3 528.4 0.9 51.8 40.6 Interest cost 10.7 638.1 601.9 1.5 90.6 83.4 Remeasurements (gains) / losses
Actuarial (gains) / losses arising from changes in demographic assumptions (0.1) (4.3) (70.9) — — (2.2)
Actuarial (gains) / losses arising from changes in financial assumptions (7.8) (464.8) 95.7 (0.1) (8.1) 109.8
Actuarial (gains) / losses arising from changes in experience adjustments 3.9 231.9 231.1 0.6 34.6 (87.6)
Past service cost — 1.6 — 0.1 5.5 — Benefits paid (13.5) (809.4) (816.4) (0.7) (39.0) (40.7) Benefits paid directly by employer (0.8) (49.1) — — — —
Defined benefit obligation, end of the year US$ 138.2 Rs. 8,277.6 Rs. 8,148.3 US$ 20.7 Rs. 1,239.9 Rs. 1,104.5
Change in plan assets:
Fair value of plan assets, beginning of the year US$ 123.1 Rs. 7,373.7 Rs. 6,767.2 US$ — Rs. — Rs. —
Transfers — — 0.4 — — — Interest income 9.8 584.8 536.4 — — — Remeasurements gains / (losses) Return on plan assets, (excluding
amount included in net Interest expense) (4.1) (248.5) 206.2 — — —
Employer’s contributions 6.2 374.7 679.9 — — — Benefits paid (13.5) (809.4) (816.4) — — — Others (1.2) (69.3) — — — —
Fair value of plan assets, end of the year US$ 120.3 Rs. 7,206.0 Rs. 7,373.7 US$ — Rs. — Rs. —
As of March 31, Pension Benefits Post retirement medical Benefits 2014 2014 2013 2014 2014 2013 (In millions)
Amount recognized in the balance sheet consists of:
Present value of defined benefit obligation US$ 138.2 Rs. 8,277.6 Rs. 8,148.3 US$ 20.7 Rs. 1,239.9 Rs. 1,104.5
Fair value of plan assets 120.3 7,206.0 7,373.7 — — —
Net liability US$ (17.9) Rs. (1,071.6) Rs. (774.6) US$ (20.7) Rs. (1,239.9) Rs. (1,104.5)
Amounts in the balance sheet:
Non–current assets US$ 0.5 Rs. 33.1 Rs. 93.9 US$ — Rs. — Rs. — Non–current liabilities (18.4) (1,104.7) (868.5) (20.7) (1,239.9) (1,104.5)
Net liability US$ (17.9) Rs. (1,071.6) Rs. (774.6) US$ (20.7) Rs. (1,239.9) Rs. (1,104.5)
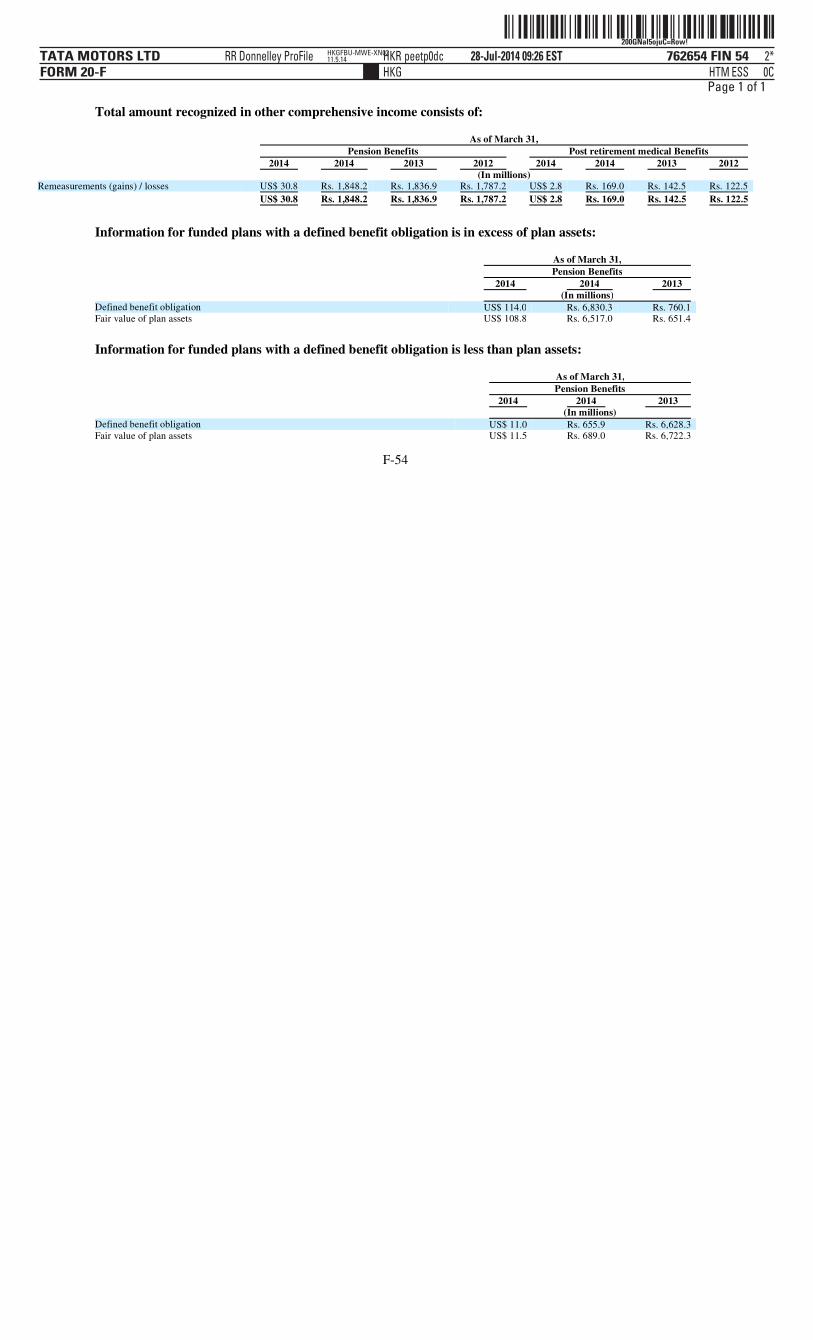
ˆ200GNal5ojuC=Row!Š200GNal5ojuC=Row!
762654 FIN 54TATA MOTORS LTDFORM 20-F
28-Jul-2014 09:26 ESTHTMHKG
RR Donnelley ProFile HKR peetp0dc 2*ESS 0C
HKGFBU-MWE-XN0211.5.14
Page 1 of 1
Total amount recognized in other comprehensive income consists of:
Information for funded plans with a defined benefit obligation is in excess of plan assets:
Information for funded plans with a defined benefit obligation is less than plan assets:
F-54
As of March 31, Pension Benefits Post retirement medical Benefits 2014 2014 2013 2012 2014 2014 2013 2012 (In millions) Remeasurements (gains) / losses US$ 30.8 Rs. 1,848.2 Rs. 1,836.9 Rs. 1,787.2 US$ 2.8 Rs. 169.0 Rs. 142.5 Rs. 122.5
US$ 30.8 Rs. 1,848.2 Rs. 1,836.9 Rs. 1,787.2 US$ 2.8 Rs. 169.0 Rs. 142.5 Rs. 122.5
As of March 31, Pension Benefits 2014 2014 2013 (In millions) Defined benefit obligation US$ 114.0 Rs. 6,830.3 Rs. 760.1 Fair value of plan assets US$ 108.8 Rs. 6,517.0 Rs. 651.4
As of March 31, Pension Benefits 2014 2014 2013 (In millions) Defined benefit obligation US$ 11.0 Rs. 655.9 Rs. 6,628.3 Fair value of plan assets US$ 11.5 Rs. 689.0 Rs. 6,722.3
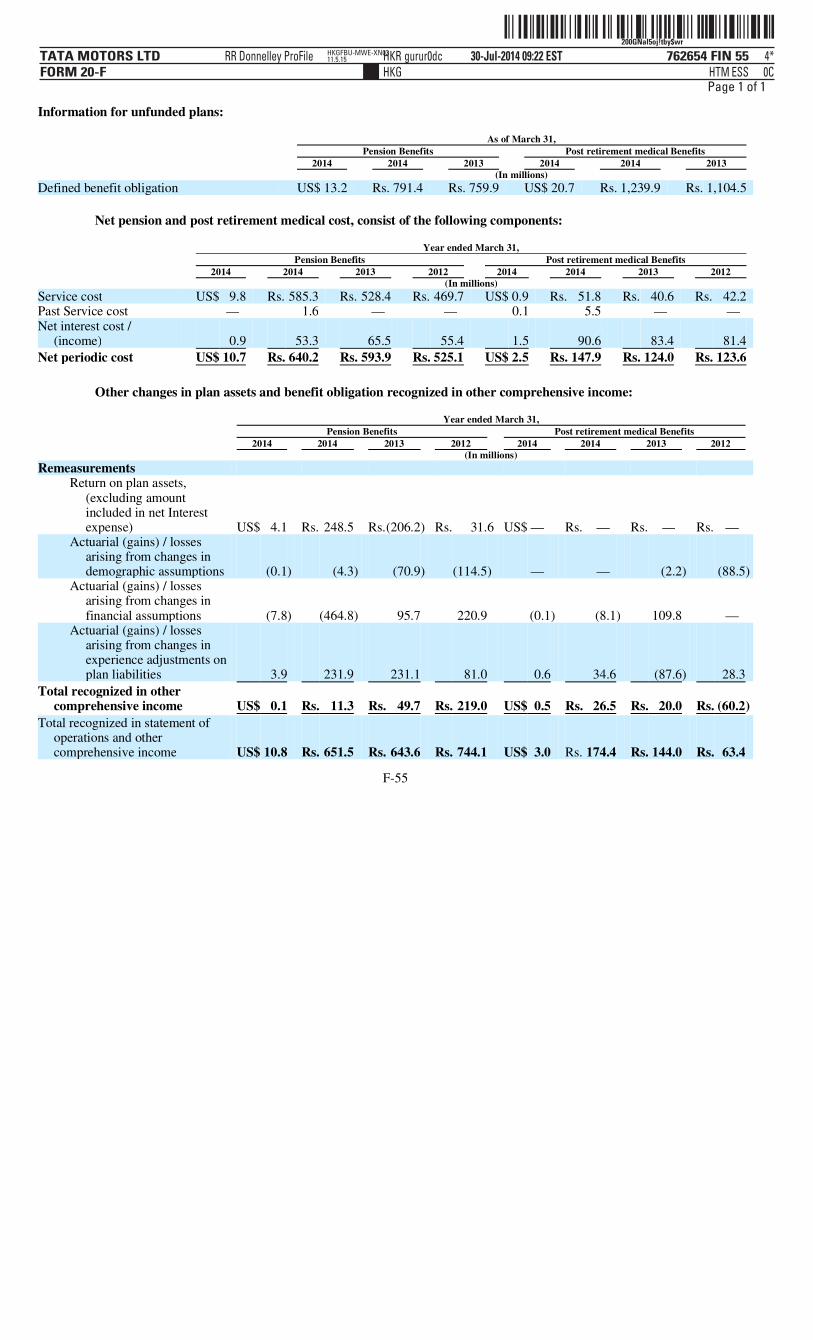
ˆ200GNal5oj!tby$wrŠ200GNal5oj!tby$wr
762654 FIN 55TATA MOTORS LTDFORM 20-F
30-Jul-2014 09:22 ESTHTMHKG
RR Donnelley ProFile HKR gurur0dc 4*ESS 0C
HKGFBU-MWE-XN0311.5.15
Page 1 of 1
Information for unfunded plans:
Net pension and post retirement medical cost, consist of the following components:
Other changes in plan assets and benefit obligation recognized in other comprehensive income:
F-55
As of March 31, Pension Benefits Post retirement medical Benefits 2014 2014 2013 2014 2014 2013 (In millions)
Defined benefit obligation US$ 13.2 Rs. 791.4 Rs. 759.9 US$ 20.7 Rs. 1,239.9 Rs. 1,104.5
Year ended March 31, Pension Benefits Post retirement medical Benefits 2014 2014 2013 2012 2014 2014 2013 2012 (In millions)
Service cost US$ 9.8 Rs. 585.3 Rs. 528.4 Rs. 469.7 US$ 0.9 Rs. 51.8 Rs. 40.6 Rs. 42.2 Past Service cost — 1.6 — — 0.1 5.5 — — Net interest cost /
(income) 0.9 53.3 65.5 55.4 1.5 90.6 83.4 81.4
Net periodic cost US$ 10.7 Rs. 640.2 Rs. 593.9 Rs. 525.1 US$ 2.5 Rs. 147.9 Rs. 124.0 Rs. 123.6
Year ended March 31, Pension Benefits Post retirement medical Benefits 2014 2014 2013 2012 2014 2014 2013 2012 (In millions)
Remeasurements Return on plan assets,
(excluding amount included in net Interest expense) US$ 4.1 Rs. 248.5 Rs.(206.2) Rs. 31.6 US$ — Rs. — Rs. — Rs. —
Actuarial (gains) / losses arising from changes in demographic assumptions (0.1) (4.3) (70.9) (114.5) — — (2.2) (88.5)
Actuarial (gains) / losses arising from changes in financial assumptions (7.8) (464.8) 95.7 220.9 (0.1) (8.1) 109.8 —
Actuarial (gains) / losses arising from changes in experience adjustments on plan liabilities 3.9 231.9 231.1 81.0 0.6 34.6 (87.6) 28.3
Total recognized in other comprehensive income US$ 0.1 Rs. 11.3 Rs. 49.7 Rs. 219.0 US$ 0.5 Rs. 26.5 Rs. 20.0 Rs. (60.2)
Total recognized in statement of operations and other comprehensive income US$ 10.8 Rs. 651.5 Rs. 643.6 Rs. 744.1 US$ 3.0 Rs. 174.4 Rs. 144.0 Rs. 63.4

ˆ200GNal5ojuCHQPwmŠ200GNal5ojuCHQPwm
762654 FIN 56TATA MOTORS LTDFORM 20-F
28-Jul-2014 09:25 ESTHTMHKG
RR Donnelley ProFile HKR peetp0dc 3*ESS 0C
WCRFBU-MWE-XN0611.5.15
Page 1 of 1
The assumptions used in accounting for the pension and post retirement medical plans are set out below:
Plan Assets The fair value of Company’s pension plan asset as of March 31, 2014 and 2013 by category are as follows:
The Company’s policy is driven by considerations of maximizing returns while ensuring credit quality of the debt instruments. The asset allocation for plan assets is determined based on investment criteria prescribed under the Indian Income Tax Act, 1961, and is also subject to other exposure limitations. The Company evaluates the risks, transaction costs and liquidity for potential investments. To measure plan asset performance, the Company compares actual returns for each asset category with published bench marks.
The weighted average duration of the defined benefit obligation is 15.6 years (2013 : 15.3 Years)
The Company expects to contribute Rs. 1,027.7 million to the funded pension plans in fiscal 2015.
The table below outlines the effect on the service cost, the interest cost and the defined benefit, obligation in the event of an increase/decrease of 1% in the assumed rate of discount rate, salary escalation and health care cost:
F-56
As of March 31, Pension Benefits Post retirement medical Benefits 2014 2013 2012 2014 2013 2012
Discount rate 6.75% - 9.30% 6.75% - 8.35% 6.75% - 8.50% 9.20% 8.35% 8.50%Rate of increase in compensation level of covered
employees 5.00% - 11.00% 5.00% - 11.00% 5.00% - 10.00% NA NA NAIncrease in health care cost NA NA NA 6.00% 5.00% 4.00%
Pension benefits Plan assets as of March 31 2014 2013 Asset category:
Cash and cash equivalents 1% 4% Debt instruments (Quoted) 65% 66% Debt instruments (Unquoted) 6% 7% Amounts with Insurance companies 28% 23%
100% 100%
Assumption Change in assumption Impact on defined benefit
obligation Impact on service cost and
interest cost
Discount rate
Increase by 1%, Decrease by 1%
Decrease by Rs. 616.7 millionIncrease by Rs. 713.9 million
Decrease by Rs. 106.9 million
Increase by Rs. 99.7 million
Salary escalation rate
Increase by 1%, Decrease by 1%
Increase by Rs. 530.9 millionDecrease by Rs. 472.4 million
Increase by Rs. 98.6 millionDecrease by Rs. 98.5 million
Health care cost
Increase by 1%, Decrease by 1%
Increase by Rs. 147.7 millionDecrease by Rs. 124.5 million
Increase by Rs. 25.0 millionDecrease by Rs. 20.5 million
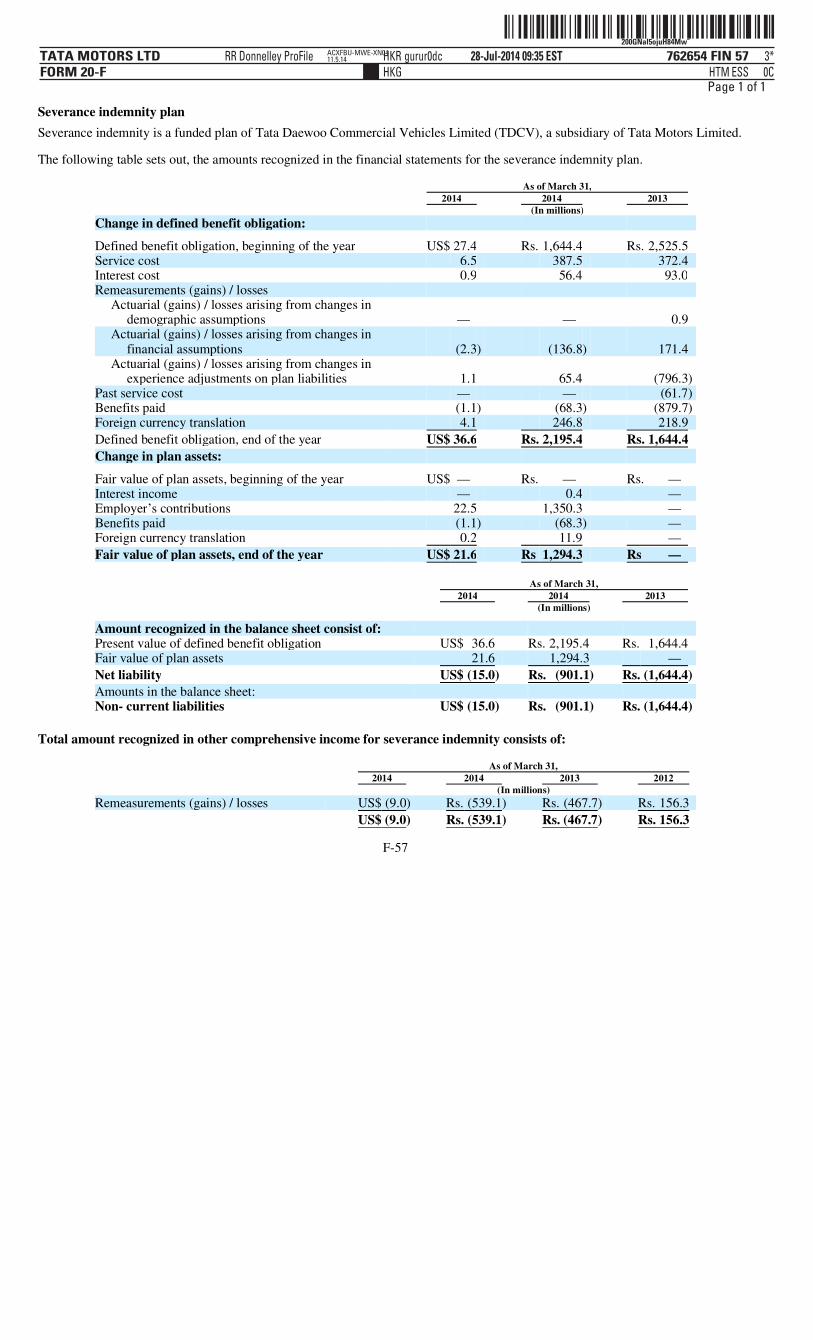
ˆ200GNal5ojuH84MwÄŠ200GNal5ojuH84Mw˜
762654 FIN 57TATA MOTORS LTDFORM 20-F
28-Jul-2014 09:35 ESTHTMHKG
RR Donnelley ProFile HKR gurur0dc 3*ESS 0C
ACXFBU-MWE-XN0411.5.14
Page 1 of 1
Severance indemnity plan Severance indemnity is a funded plan of Tata Daewoo Commercial Vehicles Limited (TDCV), a subsidiary of Tata Motors Limited.
The following table sets out, the amounts recognized in the financial statements for the severance indemnity plan.
Total amount recognized in other comprehensive income for severance indemnity consists of:
F-57
As of March 31, 2014 2014 2013 (In millions)
Change in defined benefit obligation:
Defined benefit obligation, beginning of the year US$ 27.4 Rs. 1,644.4 Rs. 2,525.5 Service cost 6.5 387.5 372.4 Interest cost 0.9 56.4 93.0 Remeasurements (gains) / losses
Actuarial (gains) / losses arising from changes in demographic assumptions — — 0.9
Actuarial (gains) / losses arising from changes in financial assumptions (2.3) (136.8) 171.4
Actuarial (gains) / losses arising from changes in experience adjustments on plan liabilities 1.1 65.4 (796.3)
Past service cost — — (61.7) Benefits paid (1.1) (68.3) (879.7) Foreign currency translation 4.1 246.8 218.9
Defined benefit obligation, end of the year US$ 36.6 Rs. 2,195.4 Rs. 1,644.4
Change in plan assets:
Fair value of plan assets, beginning of the year US$ — Rs. — Rs. — Interest income — 0.4 — Employer’s contributions 22.5 1,350.3 — Benefits paid (1.1) (68.3) — Foreign currency translation 0.2 11.9 —
Fair value of plan assets, end of the year US$ 21.6 Rs 1,294.3 Rs —
As of March 31, 2014 2014 2013 (In millions)
Amount recognized in the balance sheet consist of:
Present value of defined benefit obligation US$ 36.6 Rs. 2,195.4 Rs. 1,644.4 Fair value of plan assets 21.6 1,294.3 —
Net liability US$ (15.0) Rs. (901.1) Rs. (1,644.4)
Amounts in the balance sheet:
Non- current liabilities US$ (15.0) Rs. (901.1) Rs. (1,644.4)
As of March 31, 2014 2014 2013 2012 (In millions)
Remeasurements (gains) / losses US$ (9.0) Rs. (539.1) Rs. (467.7) Rs. 156.3
US$ (9.0) Rs. (539.1) Rs. (467.7) Rs. 156.3

ˆ200GNal5ojuHy8Zw[Š200GNal5ojuHy8Zw[
762654 FIN 58TATA MOTORS LTDFORM 20-F
28-Jul-2014 09:37 ESTHTMHKG
RR Donnelley ProFile HKR gurur0dc 4*ESS 0C
ACXFBU-MWE-XN0411.5.14
Page 1 of 1
Net severance indemnity cost consists of the following components:
Other changes in plan assets and benefit obligation recognized in other comprehensive income for severance indemnity plan:
The assumptions used in accounting for the Severance indemnity plan is set out below:
The table below outlines the effect on the service cost, the interest cost and the defined benefit obligation in the event of an increase/decrease of 1% in the assumed rate of discount rate, salary escalation rate:
Severance indemnity plans asset allocation by category is as follows:
The weighted average duration of the defined benefit obligation is 11.3 years (2013 : 11.4 Years)
The Company expects to contribute Rs. 336.1 million to the funded severance indemnity plans in fiscal 2015.
F-58
As of March 31, 2014 2014 2013 2012 (In millions)
Service cost US$ 6.5 Rs.387.5 Rs.372.4 Rs.211.8 Past service cost — — (61.7) — Net interest cost 0.9 56.0 93.0 102.6
Net periodic pension cost US$ 7.4 Rs.443.5 Rs.403.7 Rs.314.4
Year ended March 31, 2014 2014 2013 2012 (In millions)
Remeasurements (gains) / losses
Actuarial (gains) / losses arising from changes in demographic assumptions US$— Rs. — Rs. 0.9 Rs. —
Actuarial (gains) / losses arising from changes in financial assumptions (2.3) (136.8) 171.4 98.4
Actuarial (gains) / losses arising from changes in experience adjustments on plan liabilities 1.1 65.4 (796.3) (182.3)
Total recognized in other comprehensive income US$(1.2) Rs. (71.4) Rs.(624.0) Rs. (83.9)
Total recognized in statement of operations and other comprehensive income US$ 6.2 Rs. 372.1 Rs.(220.3) Rs. 230.5
Year ended March 31, 2014 2013 2012
Discount rate 3.60% 3.07% 4.03% Rate of increase in compensation level of covered employees 5% 5% 5%-7%
Assumption Change in assumption Impact on scheme liabilities Impact on service cost and
interest cost
Discount rate
Increase by 1% Decrease by 1%
Decrease by Rs. 227.8 millionIncrease by Rs. 268.9 million
Decrease by Rs. 41.5 millionIncrease by Rs. 54.2 million
Salary escalation rate
Increase by 1% Decrease by 1%
Increase by Rs. 262.4 millionDecrease by Rs. 227.1 million
Increase by Rs. 68.0 millionDecrease by Rs. 50.8 million
As of March 31, 2014 2013
Deposit with banks 100% —
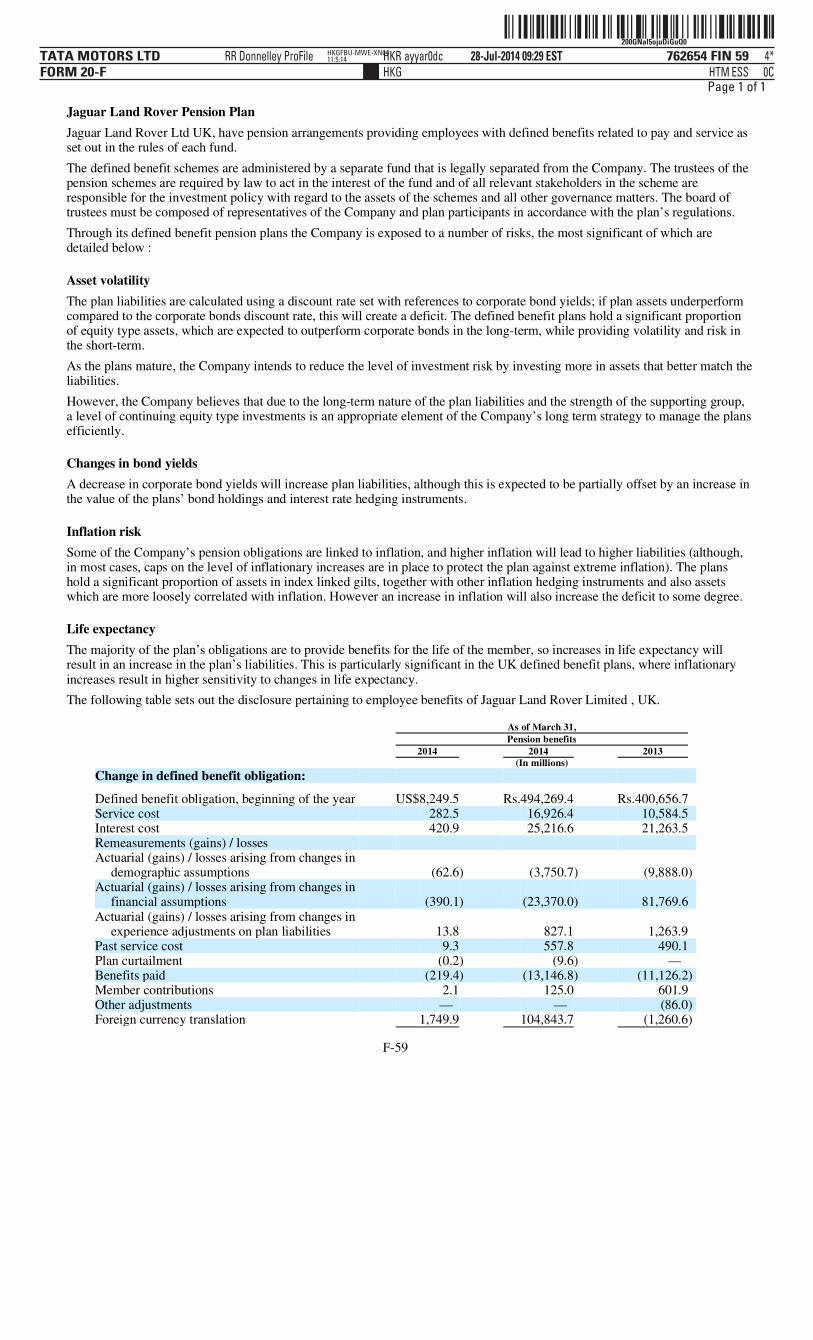
ˆ200GNal5ojuDiGuQ0Š200GNal5ojuDiGuQ0
762654 FIN 59TATA MOTORS LTDFORM 20-F
28-Jul-2014 09:29 ESTHTMHKG
RR Donnelley ProFile HKR ayyar0dc 4*ESS 0C
HKGFBU-MWE-XN0411.5.14
Page 1 of 1
Jaguar Land Rover Pension Plan Jaguar Land Rover Ltd UK, have pension arrangements providing employees with defined benefits related to pay and service as set out in the rules of each fund. The defined benefit schemes are administered by a separate fund that is legally separated from the Company. The trustees of the pension schemes are required by law to act in the interest of the fund and of all relevant stakeholders in the scheme are responsible for the investment policy with regard to the assets of the schemes and all other governance matters. The board of trustees must be composed of representatives of the Company and plan participants in accordance with the plan’s regulations. Through its defined benefit pension plans the Company is exposed to a number of risks, the most significant of which are detailed below :
Asset volatility The plan liabilities are calculated using a discount rate set with references to corporate bond yields; if plan assets underperform compared to the corporate bonds discount rate, this will create a deficit. The defined benefit plans hold a significant proportion of equity type assets, which are expected to outperform corporate bonds in the long-term, while providing volatility and risk in the short-term. As the plans mature, the Company intends to reduce the level of investment risk by investing more in assets that better match the liabilities. However, the Company believes that due to the long-term nature of the plan liabilities and the strength of the supporting group, a level of continuing equity type investments is an appropriate element of the Company’s long term strategy to manage the plans efficiently.
Changes in bond yields A decrease in corporate bond yields will increase plan liabilities, although this is expected to be partially offset by an increase in the value of the plans’ bond holdings and interest rate hedging instruments.
Inflation risk Some of the Company’s pension obligations are linked to inflation, and higher inflation will lead to higher liabilities (although, in most cases, caps on the level of inflationary increases are in place to protect the plan against extreme inflation). The plans hold a significant proportion of assets in index linked gilts, together with other inflation hedging instruments and also assets which are more loosely correlated with inflation. However an increase in inflation will also increase the deficit to some degree.
Life expectancy The majority of the plan’s obligations are to provide benefits for the life of the member, so increases in life expectancy will result in an increase in the plan’s liabilities. This is particularly significant in the UK defined benefit plans, where inflationary increases result in higher sensitivity to changes in life expectancy. The following table sets out the disclosure pertaining to employee benefits of Jaguar Land Rover Limited , UK.
F-59
As of March 31, Pension benefits 2014 2014 2013 (In millions)
Change in defined benefit obligation:
Defined benefit obligation, beginning of the year US$8,249.5 Rs.494,269.4 Rs.400,656.7 Service cost 282.5 16,926.4 10,584.5 Interest cost 420.9 25,216.6 21,263.5 Remeasurements (gains) / losses
Actuarial (gains) / losses arising from changes in demographic assumptions (62.6) (3,750.7) (9,888.0)
Actuarial (gains) / losses arising from changes in financial assumptions (390.1) (23,370.0) 81,769.6
Actuarial (gains) / losses arising from changes in experience adjustments on plan liabilities 13.8 827.1 1,263.9
Past service cost 9.3 557.8 490.1 Plan curtailment (0.2) (9.6) — Benefits paid (219.4) (13,146.8) (11,126.2) Member contributions 2.1 125.0 601.9 Other adjustments — — (86.0) Foreign currency translation 1,749.9 104,843.7 (1,260.6)

ˆ200GNal5ojxNlyVQ?Š200GNal5ojxNlyVQ?
762654 FIN 60TATA MOTORS LTDFORM 20-F
29-Jul-2014 08:34 ESTHTMHKG
RR Donnelley ProFile HKR gurur0dc 5*ESS 0C
LANFBU-MWE-XN0611.5.15
Page 1 of 1
Total amount recognized in other comprehensive income
F-60
Defined benefit obligation, end of the year US$ 10,055.7 Rs. 602,488.9 Rs. 494,269.4
Change in plan assets:
Fair value of plan assets, beginning of the year US$ 7,351.5 Rs.440,462.7 Rs.383,729.0
Interest Income 380.4 22,793.0 20,446.7 Remeasurements gains / (losses)
Return on plan assets, (excluding amount included in net Interest expense) (653.1) (39,132.8) 33,000.2
Employer’s contributions 534.5 32,025.6 14,427.9 Members contributions 2.2 134.6 601.9 Benefits paid (219.4) (13,146.8) (11,126.2) Expenses paid (12.8) (769.4) (851.2) Other adjustments — — (86.0) Foreign currency translation 1,559.0 93,410.6 320.4
Fair value of plan assets, end of the year US$ 8,942.3 Rs. 535,777.5 Rs. 440,462.7
Year ended March 31, Pension benefits 2014 2014 2013 (In millions)
Amount recognized in the balance sheet consists of:
Present value of defined benefit obligation US$ 10,055.7 Rs. 602,488.9 Rs. 494,269.4 Fair value of plan Assets 8,942.3 535,777.5 440,462.7
Surplus/ (deficit) (1,113.4) (66,711.4) (53,806.7) Restriction of pension asset (as per IFRIC 14) (5.0) (298.6) (61.1)
Net liability US$ (1,118.4) Rs. (67,010.0) Rs. (53,867.8)
Amount recognized in the balance sheet consists of:
Non-current assets US$ 0.8 Rs. 45.0 Rs. 36.1 Non-current liabilities (1,119.2) (67,055.0) (53,903.9)
Net liability US$ (1,118.4) Rs. (67,010.0) Rs. (53,867.8)
As of March 31, Pension benefits 2014 2014 2013 2012 (In millions)
Remeasurements (gains) / losses US$ 1,825.9 Rs. 109,398.5 Rs. 96,559.3 Rs. 56,414.0 Restriction of Pension asset (as per IFRIC 14) (228.0) (13,659.9) (13,871.5) (11,520.7) Onerous obligation, excluding amounts included in
interest expenses (143.1) (8,573.7) (8,573.7) (499.90)
US$ 1,454.8 Rs. 87,164.9 Rs. 74,114.1 Rs. 44,393.4

ˆ200GNal5ojx1ZTywŠ200GNal5ojx1ZTyw´
762654 FIN 61TATA MOTORS LTDFORM 20-F
29-Jul-2014 07:00 ESTHTMHKG
RR Donnelley ProFile HKR varsu0dc 5*ESS 0C
NERFBU-MWE-XN0111.5.15
Page 1 of 1
Net pension and post retirement cost, consist of the following components:
Amount recognized in other comprehensive income
The assumptions used in accounting for the pension plans are set out below:
In fiscal 2013, Jaguar Land Rover revised its mortality assumption which resulted in a decrease in pension liability by Rs. 12,467.5 million. The revision in mortality assumptions has been made consequent to the mortality analysis performed as part of the latest funding valuation of the benefit schemes. The revised mortality assumptions reflect the latest available tables/experience available for United Kingdom Pension Schemes.
F-61
Year ended March 31, Pension benefits 2014 2014 2013 2012 (In millions)
Current service cost US$ 282.5 Rs. 16,926.4 Rs. 10,584.5 Rs. 8,243.4 Past service cost 9.3 557.8 490.1 1,129.9 Administrative expenses 12.8 769.4 851.2 656.6 Interest cost on Onerous obligations — — 507.3 671.8 Net interest cost / (income) 40.5 2,423.6 816.8 328.3
Net periodic pension cost US$ 345.1 Rs. 20,677.2 Rs. 13,249.9 Rs. 11,030.0
Year ended March 31, Pension benefits 2014 2014 2013 2012 (In millions)
Remeasurements (gains) / losses
Actuarial (gains) / losses arising from changes in demographic assumptions US$ (62.6) Rs. (3,750.7) Rs. (9,888.0) Rs. 2,519.3
Actuarial (gains) / losses arising from changes in financial assumptions (390.1) (23,370.0) 81,769.6 19,772.9
Actuarial (gains) / losses arising from changes in experience adjustments on plan liabilities 13.8 827.1 1,263.9 5,725.7
Remeasurement losses / (gains) on the return on plan assets, (excluding amount included in net Interest expense) 653.1 39,132.8 (33,000.2) (14,505.2)
Change in restriction of pension asset (as per IFRIC 14) 3.6 211.6 (2,350.8) (427.5) Change in onerous obligation, excluding amounts
included in interest expenses — — (8,073.8) (3,710.3)
Total recognized in other comprehensive income US$ 217.8 Rs. 13,050.8 Rs. 29,720.7 Rs. 9,374.9
Total recognized in statement of operations and other comprehensive income US$ 562.9 Rs. 33,728.0 Rs. 42,970.6 Rs. 20,404.9
Year ended March 31, Pension benefits 2014 2013 2012
Discount rate 4.60% 4.40% 5.10% Expected rate of increase in compensation level of covered
employees 3.90% 3.90% 3.80% Inflation increase 3.40% 3.40% 3.30% The assumed life expectations on retirement at age 65 are (years)
Retiring today :
Male 20.0 22.2 23.3 Female 24.5 24.6 23.7 Retiring in 20 years :
Male 23.8 23.9 25.0 Female 26.4 26.6 25.6
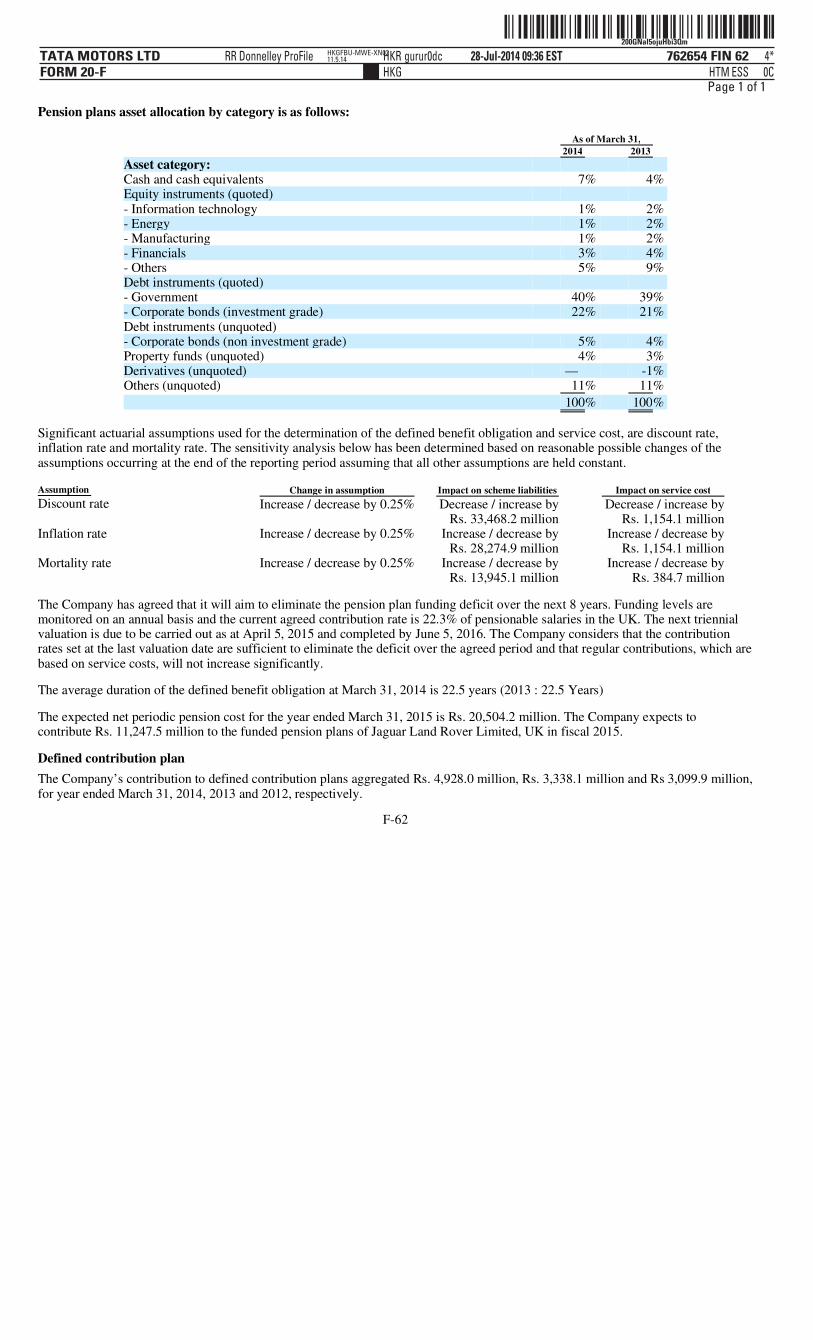
ˆ200GNal5ojuHbi3QmŠ200GNal5ojuHbi3Qm
762654 FIN 62TATA MOTORS LTDFORM 20-F
28-Jul-2014 09:36 ESTHTMHKG
RR Donnelley ProFile HKR gurur0dc 4*ESS 0C
HKGFBU-MWE-XN0211.5.14
Page 1 of 1
Pension plans asset allocation by category is as follows:
Significant actuarial assumptions used for the determination of the defined benefit obligation and service cost, are discount rate, inflation rate and mortality rate. The sensitivity analysis below has been determined based on reasonable possible changes of the assumptions occurring at the end of the reporting period assuming that all other assumptions are held constant.
The Company has agreed that it will aim to eliminate the pension plan funding deficit over the next 8 years. Funding levels are monitored on an annual basis and the current agreed contribution rate is 22.3% of pensionable salaries in the UK. The next triennial valuation is due to be carried out as at April 5, 2015 and completed by June 5, 2016. The Company considers that the contribution rates set at the last valuation date are sufficient to eliminate the deficit over the agreed period and that regular contributions, which are based on service costs, will not increase significantly.
The average duration of the defined benefit obligation at March 31, 2014 is 22.5 years (2013 : 22.5 Years)
The expected net periodic pension cost for the year ended March 31, 2015 is Rs. 20,504.2 million. The Company expects to contribute Rs. 11,247.5 million to the funded pension plans of Jaguar Land Rover Limited, UK in fiscal 2015.
Defined contribution plan The Company’s contribution to defined contribution plans aggregated Rs. 4,928.0 million, Rs. 3,338.1 million and Rs 3,099.9 million, for year ended March 31, 2014, 2013 and 2012, respectively.
F-62
As of March 31, 2014 2013
Asset category:
Cash and cash equivalents 7% 4% Equity instruments (quoted)
- Information technology 1% 2% - Energy 1% 2% - Manufacturing 1% 2% - Financials 3% 4% - Others 5% 9% Debt instruments (quoted)
- Government 40% 39% - Corporate bonds (investment grade) 22% 21% Debt instruments (unquoted)
- Corporate bonds (non investment grade) 5% 4% Property funds (unquoted) 4% 3% Derivatives (unquoted) — -1% Others (unquoted) 11% 11%
100% 100%
Assumption Change in assumption Impact on scheme liabilities Impact on service cost
Discount rate
Increase / decrease by 0.25%
Decrease / increase by
Rs. 33,468.2 million
Decrease / increase by
Rs. 1,154.1 million
Inflation rate
Increase / decrease by 0.25%
Increase / decrease by
Rs. 28,274.9 million
Increase / decrease by
Rs. 1,154.1 million
Mortality rate
Increase / decrease by 0.25%
Increase / decrease by
Rs. 13,945.1 million
Increase / decrease by
Rs. 384.7 million

ˆ200GNal5ojucTpSwbŠ200GNal5ojucTpSwb
762654 FIN 63TATA MOTORS LTDFORM 20-F
28-Jul-2014 10:17 ESTHTMHKG
RR Donnelley ProFile HKR ganeg0dc 8*ESS 0C
SWRFBU-MWE-XN0311.5.14
Page 1 of 1
In May 2013, the Company, through a subsidiary, acquired 100% equity stake in Cambric Holdings Inc, US, for a cash consideration of Rs. 1,630.6 million. The fair value of net assets acquired was Rs. 476.8 million resulting in a goodwill of Rs. 1,153.8 million. The goodwill is mainly attributable to the skilled work force with engineering and technological experience. The effect of the acquisition on the consolidated revenues, net income and other comprehensive income, is insignificant.
The goodwill arising on this acquisition is not expected to be deductible for tax purposes.
In the normal course, the Company faces claims and assertions by various parties. The Company assesses such claims and assertions and monitors the legal environment on an ongoing basis, with the assistance of external legal counsel, wherever necessary. The Company records a liability for any claims where a potential loss is probable and capable of being estimated and discloses such matters in its financial statements, if material. For potential losses that are considered possible, but not probable, the Company provides disclosure in the financial statements but does not record a liability in its accounts unless the loss becomes probable.
The following is a description of claims and assertions where a potential loss is possible, but not probable. The Company believes that none of the contingencies described below would have a material adverse effect on the Company’s financial condition, results of operations or cash flows.
Litigation The Company is involved in legal proceedings, both as plaintiff and as defendant. There are claims which
management does not believe to be of material nature, other than those described below.
Income Tax The Company has ongoing disputes with income tax authorities relating to tax treatment of certain items.
These mainly include disallowed expenses, tax treatment of certain expenses claimed by the Company as deductions, and the computation of, or eligibility of, certain tax incentives or allowances.
Most of these disputes/disallowances, being repetitive in nature, have been raised by the income tax authorities consistently in most of the years.
The Company has a right of appeal to the Commissioner of Income Tax (Appeals) [CIT(A)] or Income Tax Appellate Tribunal [ITAT] against adverse decisions by the income tax authorities or CIT(A). The income tax authorities have similar rights of appeal to the ITAT against adverse decisions by the CIT(A). The Company has a further right of appeal to the High Court or Supreme Court against adverse decisions by the appellate authorities for matters involving substantial question of law. The income tax authorities have similar rights of appeal.
As of March 31, 2014, there are matters/disputes pending in appeal aggregating Rs. 1,214 million, which includes Rs. 137 million in respect of equity accounted investees (Rs. 1,060 million, which includes Rs. Nil in respect of equity accounted investees as at March 31, 2013).
F-63
33. Acquisitions
34. Commitments and contingencies

ˆ200GNal5ojw$K5dwvŠ200GNal5ojw$K5dwv
762654 FIN 64TATA MOTORS LTDFORM 20-F
29-Jul-2014 05:54 ESTHTMHKG
RR Donnelley ProFile HKR kumbh2dc 9*ESS 0C
RRWIN-XENP14111.5.15
Page 1 of 1
Customs, Excise Duty and Service Tax As at March 31, 2014, there were pending litigations on various counts relating to Customs, Excise Duty and
Service Tax, involving demand (including interest and penalty) of Rs. 9,942 million, which includes Rs. 48 million in respect of equity accounted investees (Rs. 10,116 million, which includes Rs. 45 million in respect of equity accounted investees, as at March 31, 2013). These demands challenged the basis of valuation of the Company’s products and denial of the ‘Central Value Added Tax’ (“CENVAT”) credit on inputs. The details of the demands for more than Rs. 200 million are as follows:
The Excise Authorities had denied CENVAT credit of Rs. 797 million as at March 31, 2014 (Rs. 759 million as at March 31, 2013), in respect of consulting engineering services alleged to have been availed exclusively for producing prototypes at Engineering Research Centre Pune. The contention of the department is that since the Company claims exemption from CENVAT under Notification No.167/71-CE dated September 11, 1971, the Company is not entitled to avail service tax credit on consulting engineering services used in Engineering Research Centre. The matter is being contested by the Company before the Appellate Authorities. The Company, based on merits, is of the opinion that it has sustainable case, since the consulting engineering services are not exclusively used in the manufacture of prototypes and they form part of assessable value of final products manufactured by the Company on which CENVAT is paid. As of March 31, 2014, the Company has won the matter in appeals amounting to Rs. 362 million (Rs. 362 million as at March 31, 2013), which has been further contested by the department before the Appellate Tribunal.
The Excise Authorities have raised a demand for Rs. 907 million as at March 31, 2014 (Rs. 1,014 million as at March 31, 2013). The demand is on account of alleged undervaluation to the extent of ex-factory discount given by Company on passenger vehicles through invoice. The matter is being contested by the Company before the appellate authority.
The Excise Authorities had denied CENVAT credit of Rs. 837 million as at March 31, 2014 (Rs. 837 million as at March 31, 2013) in earlier years, on technical grounds. The matter is being contested by the Company before the appellate authorities.
The Excise Authorities had levied penalty and interest of Rs. 4,557 million as at March 31, 2014 (Rs. 4,560 million as at March 31, 2013) in the matter of CENVAT credit in earlier years, on inputs, stating that vehicles manufactured at Uttarakhand plant are “Exempted Products” and the Company is not eligible for CENVAT Credit. The Company has challenged this demand as vehicle suffers National Calamity Contingent Duty (NCCD) and Auto Cess, which are `duties of excise’. Therefore the vehicles cannot be called as exempted products. The matter is being contested by the Company before the appellate authorities.
The Excise Authorities have raised a demand of Rs. 295 million as at March 31, 2014 (Rs. 295 million as of March 31, 2013) on pre-delivery inspection charges and free after sales service charges incurred by dealers on certain products on the alleged ground that the pre delivery inspection and free after sales services are provided by the dealer on behalf of the Company and should be included in excisable value of the vehicle. The case is pending before Tribunal, which has granted an unconditional stay.
The Excise Authorities have raised a demand of Rs. 219 million as at March 31, 2014 (Rs. 219 million as at March 31, 2013) of Customs Duty on dies and fixtures imported under EPCG Scheme and installed at premises of a vendor. The matter is pending with adjudicating authority.
Sales Tax The total sales tax demands (including interest and penalty), which are being contested by the Company
amounting to Rs. 9,605 million, which includes Rs. 190 million in respect of equity accounted investees as at March 31, 2014 (Rs. 4,574 million, which includes Rs. 153 million in respect of equity accounted investees, as at March 31, 2013). The details of the demands for more than Rs. 200 million are as follows:
The Sales Tax Authorities have raised demand of Rs. 1,652 million as at March 31, 2014 (Rs. 855 million as at March 31, 2013) towards rejection of certain statutory forms for lower/nil tax rate (Form F and Form C) on technical grounds such as late submission, single form issued against two months dispatches, etc. and denial of exemption from tax in absence of proof of export for certain years. The Company has contended that the benefit cannot be denied on technicalities, which are being complied with. The matter is pending at various levels.
In some of the states in India, the Sales Tax Authorities have raised disputes totaling up to Rs. 431 million as at March 31, 2014 (Rs. 431 million as at March 31, 2013), treating the stock transfers of vehicles from the Company’s manufacturing plants to sales offices and the transfers between two sales offices, as sales liable for levy of sales tax. The Company is contesting this issue in appeal.
F-64

ˆ200GNal5oj$=spsQ8Š200GNal5oj$=spsQ8
762654 FIN 65TATA MOTORS LTDFORM 20-F
31-Jul-2014 04:27 ESTHTMHKG
RR Donnelley ProFile HKR kupsu0dc 11*ESS 0C
RRWIN-XENP14311.5.15
Page 1 of 1
The Sales tax authorities have denied input tax credit and levied interest and penalty on the same on various counts, aggregating to Rs. 3,348 million as at March 31, 2014 (Rs. Nil as at March 31, 2013). The reasons for disallowing credit was mainly, non-payment of taxes by vendors, incorrect method of calculation of set off as per the department, suppression of sales as alleged by the department etc. The matter is contested in appeal.
Sales tax demand aggregating Rs. 2,615 million as at March 31, 2014 (Rs. 1,611 million as at March 31, 2013) has been raised by Sales tax authorities disallowing the concessional rate of 2% on certain purchases of raw materials in case the final product is stock transferred for sale outside the state. The matter is is pending with various authorities.
Other Taxes and Dues Other amounts for which the Company may contingently be liable aggregate to Rs. 5,209 million, which
include Rs. 14 million in respect of equity accounted investees as at March 31, 2014 (Rs. 3,055 million, which include Rs. 24 million in respect of equity accounted investees, as at March 31, 2013). Following are the cases involving more than Rs. 200 million:
The municipal authorities in certain states levy octroi duty (a local indirect tax) on goods brought inside the municipal limits, at rates based on the classification of goods. Demands aggregating Rs. 617 million as at March 31, 2014 (Rs. 617 million as of March 31, 2013) had been raised demanding higher octroi duties on account of classification disputes relating to components purchased for the manufacture of vehicles and retrospective increase in octroi rates relating to past periods. The dispute relating to classification is presently pending before the Supreme Court and the other dispute is pending before the Bombay High Court on remand by the Supreme Court.
As at March 31, 2014, property tax amounting to Rs. 440 million (Rs. 394 million as at March 31, 2013) has been demanded by the local municipal authorities in respect of vacant land of the Company in the plant in Pimpri, Pune. The Company has filed Special Leave Petition (SLP) before the Supreme Court against an unfavorable decision of the Bombay High Court. The Supreme Court has disposed off the SLP and remanded the matter back to the local municipal corporation for fresh adjudication.
As at March 31, 2014, a penalty of Rs. 562 million is likely to be imposed relating to a matter of regularisation of the construction of certain buildings in respect of which approvals from appropriate authorities are awaited. However, as the buildings were constructed according to the applicable development rules, the Company believes it would be possible to obtain a waiver of the same.
Other claims There are other claims against the Company, majority of which pertain to motor accident claims and product
liability claims/consumer complaints. Some of the cases also relate to replacement of parts of vehicles and/or compensation for deficiency in the services by the Company or its dealers.
Commitments The Company has entered into various contracts with vendors and contractors for the acquisition of plant and
machinery, equipment and various civil contracts of capital nature aggregating Rs. 126,348 million, which includes Rs. 316 million in respect of equity accounted investees as at March 31, 2014 (Rs. 39,092 million, which includes Rs. 174 million in respect of equity accounted investees, as at March 31, 2013), which are yet to be executed.
The Company has entered into various contracts with vendors and contractors for the acquisition of intangible assets of capital nature aggregating Rs. 3,126 million as at March 31, 2014 (Rs. 1,959 million as at March 31, 2013), which are yet to be executed.
Under the joint venture agreement with Chery Jaguar Land Rover Automotive Co. Limited, the Company is committed to contribute Rs. 33,741 million towards its share in the capital of the joint venture of which Rs. 15,665 million has been contributed as at March 31, 2014. As at March 31, 2014, the Company has an outstanding commitment of Rs. 18,076 million.
For commitments related to leases, refer note 13.
F-65

ˆ200GNal5ojoj5CewJŠ200GNal5ojoj5CewJ
762654 FIN 66TATA MOTORS LTDFORM 20-F
25-Jul-2014 16:54 ESTHTMHKG
RR Donnelley ProFile HKR venkp1dc 4*ESS 0C
HKGFBU-MWE-XN0211.5.14
Page 1 of 1
The capital management is intended to create value for shareholders by facilitating meeting of long term and short term goals of the Company.
The Company determines the amount of capital required on the basis of annual operating plans and long-term product and other strategic investment plans. The funding requirements are met through equity, convertible and non-convertible debt securities and other long-term / short-term borrowings. The Company’s policy is aimed at combination of short-term and long-term borrowings.
The Company monitors the capital structure on the basis of total debt to equity ratio and maturity profile of the overall debt portfolio of the Company.
Total debt includes all long and short-term debts as disclosed in notes 18 and 19 to the consolidated financial statements. Equity comprises all components excluding (profit) / loss on cash flow hedges and foreign currency translation reserve.
The following table summarizes the capital of the Company:
F-66
35. Capital Management
As at March 31, 2014 2014 2013 (In millions)
Equity* US$ 8,454.8 Rs. 506,561.4 Rs.386,862.5 Short- term borrowings and current portion of long
term debt 2,769.8 165,960.6 234,897.4 Long- term debt 7,579.7 454,138.6 330,718.1
Total debt 10,349.5 620,099.2 565,615.5
Total capital ( Debt + Equity) US$18,804.3 Rs.1,126,660.6 Rs.952,478.0
* Details of equity
As at March 31, 2014 2014 2013 (In millions)
Total equity as reported in balance sheet US$10,543.2 Rs.631,696.3 Rs.373,905.7 Currency translation reserve attributable to
- Shareholders of Tata Motors Limited (1,178.4) (70,610.8) (3,820.6) - Non-controlling interests (5.4) (325.9) (23.9)
Hedging reserve (904.6) (54,198.2) 16,801.3
Equity as reported above US$ 8,454.8 Rs.506,561.4 Rs.386,862.5

ˆ200GNal5oj$aXN!wEŠ200GNal5oj$aXN!wE
762654 FIN 67TATA MOTORS LTDFORM 20-F
31-Jul-2014 04:32 ESTHTMHKG
RR Donnelley ProFile HKR khanz0dc 3*ESS 0C
ACXFBU-MWE-XN1111.5.15
Page 1 of 1T
his section gives an overview of the significance of financial instrum
ents for the Com
pany and provides additional information on balance sheet item
s that contain financial instrum
ents. T
he details of significant accounting policies, including the criteria for recognition, the basis of measurem
ent and the basis on which incom
e and expenses are recognized, in respect of each class of financial asset, financial liability and equity instrum
ent are disclosed in note 2 to the consolidated financial statements.
The follow
ing table presents the carrying amounts and fair value of each category of financial assets and liabilities as of M
arch 31, 2014.
F-67
36.
Disclosures on financial instrum
ents
(a)
Fin
ancial assets and liabilities
Finan
cial assets
Cash
, and loan
s and
receivables
Availab
le for-sale
financial
assets
Derivatives
in other than hedging
relationship
Derivatives
in hed
ging
relationship
Total carrying
value
Total fair valu
e
T
otal carrying
value
Total fair valu
e
(In m
illions)
Cash and cash equivalents
R
s.159,921.5 R
s.—
R
s.—
R
s.—
R
s.159,921.5 R
s.159,921.5 U
S$2,669.1
US$
2,669.1 Short-term
deposits with bank
125,150.4
—
—
—
125,150.4
125,150.4
2,088.8
2,088.8
Finance receivables
185,275.2
—
—
—
185,275.2
185,007.6
3,092.3
3,087.8 T
rade receivables
109,644.8
—
—
—
109,644.8
109,644.8
1,830.0
1,830.0 U
nquoted equity investments*
—
3,919.7
—
—
3,919.7
—
65.4
—
Other investm
ents
75.0
97,882.1
—
—
97,957.1
97,957.1
1,634.9
1,634.9
Other financial assets:
– current
8,061.9
—
1,174.7
34,737.7
43,974.3
43,974.3
734.0
734.0 – non-current
8,797.1
—
2,339.8
41,307.1
52,444.0
52,355.4
875.4
873.8
Total
R
s.596,925.9 R
s.101,801.8 R
s.3,514.5 R
s.76,044.8 R
s.778,287.0 R
s.774,011.1 U
S$12,989.9 U
S$12,918.4
*T
he fair value in respect of the unquoted equity investments cannot be reliably m
easured.
Finan
cial liabilities
Derivatives
other than in
hedging relationship
Derivatives
in hed
ging relationship
Oth
er finan
cial liab
ilities
T
otal carrying value
Total fair value
Total
carrying
value
Total fair valu
e
(In m
illions)
Accounts payable
R
s.—
R
s.—
R
s.544,197.3
Rs.
544,197.3 R
s.544,197.3
US$
9,082.8 U
S$9,082.8
Acceptances
—
—
51,620.4
51,620.4
51,620.4
861.6
861.6 Short-term
debt (excluding current portion of long-term
debt)
—
—
100,464.7
100,464.7
100,464.7
1,676.7
1,676.7
Long-term
debt (including current portion of long-term
debt)
—
—
519,634.5
519,634.5
538,824.4
8,672.8
8,993.1
Other financial liabilities:
– current
1,063.8
5,374.9
28,485.5
34,924.2
34,924.2
582.9
582.9
– non-current
1,800.8
3,682.8
3,689.1
9,172.7
9,305.6
153.0
155.3
Total
R
s.2,864.6 R
s.9,057.7 R
s.1,248,091.5 R
s.1,260,013.8 R
s.1,279,336.6 U
S$21,029.8 U
S$21,352.4
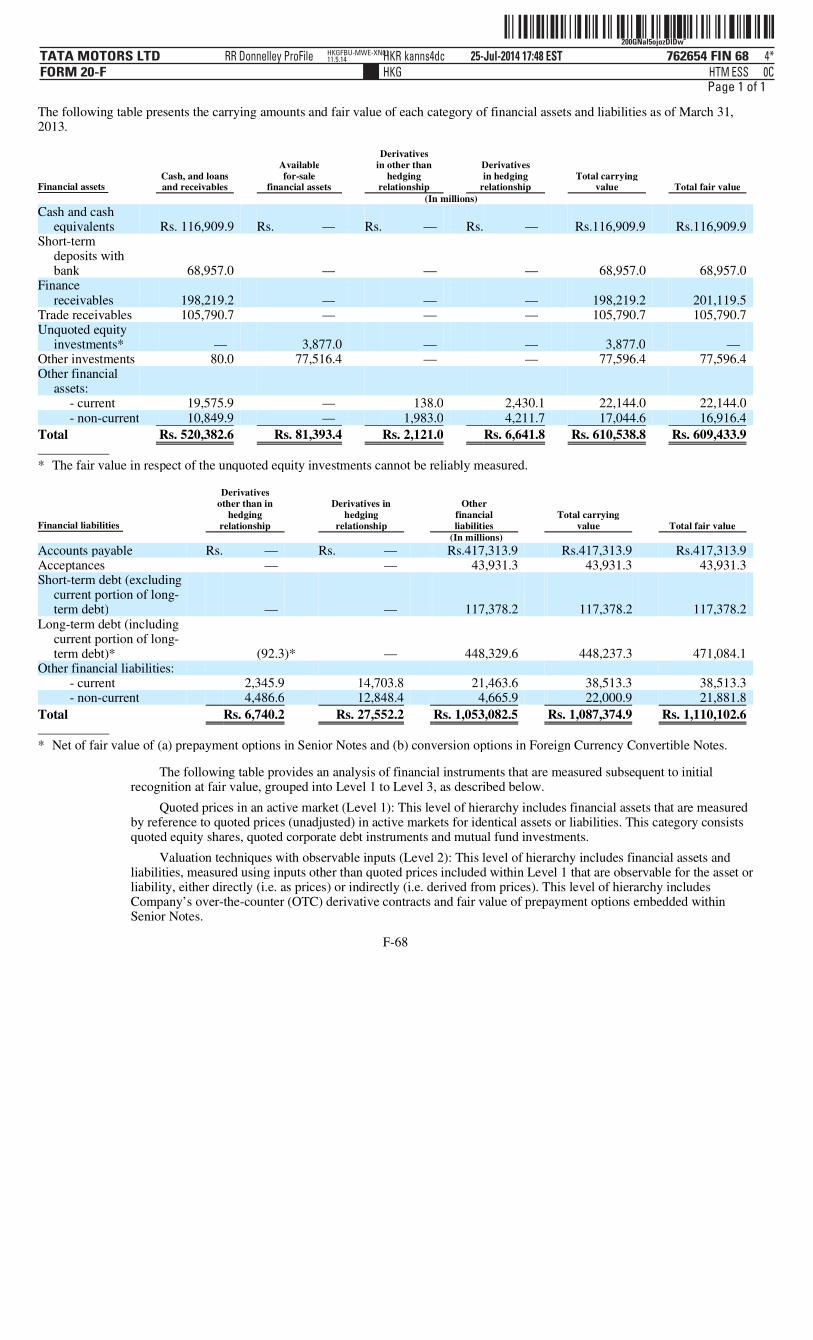
ˆ200GNal5ojozDlDwÄŠ200GNal5ojozDlDw˜
762654 FIN 68TATA MOTORS LTDFORM 20-F
25-Jul-2014 17:48 ESTHTMHKG
RR Donnelley ProFile HKR kanns4dc 4*ESS 0C
HKGFBU-MWE-XN0111.5.14
Page 1 of 1
The following table presents the carrying amounts and fair value of each category of financial assets and liabilities as of March 31, 2013.
The following table provides an analysis of financial instruments that are measured subsequent to initial recognition at fair value, grouped into Level 1 to Level 3, as described below.
Quoted prices in an active market (Level 1): This level of hierarchy includes financial assets that are measured by reference to quoted prices (unadjusted) in active markets for identical assets or liabilities. This category consists quoted equity shares, quoted corporate debt instruments and mutual fund investments.
Valuation techniques with observable inputs (Level 2): This level of hierarchy includes financial assets and liabilities, measured using inputs other than quoted prices included within Level 1 that are observable for the asset or liability, either directly (i.e. as prices) or indirectly (i.e. derived from prices). This level of hierarchy includes Company’s over-the-counter (OTC) derivative contracts and fair value of prepayment options embedded within Senior Notes.
F-68
Financial assets Cash, and loans and receivables
Available for-sale
financial assets
Derivatives in other than
hedging relationship
Derivatives in hedging
relationship Total carrying
value Total fair value (In millions)
Cash and cash equivalents Rs. 116,909.9 Rs. — Rs. — Rs. — Rs.116,909.9 Rs.116,909.9
Short-term deposits with bank 68,957.0 — — — 68,957.0 68,957.0
Finance receivables 198,219.2 — — — 198,219.2 201,119.5
Trade receivables 105,790.7 — — — 105,790.7 105,790.7 Unquoted equity
investments* — 3,877.0 — — 3,877.0 — Other investments 80.0 77,516.4 — — 77,596.4 77,596.4 Other financial
assets:
- current 19,575.9 — 138.0 2,430.1 22,144.0 22,144.0 - non-current 10,849.9 — 1,983.0 4,211.7 17,044.6 16,916.4
Total Rs. 520,382.6 Rs. 81,393.4 Rs. 2,121.0 Rs. 6,641.8 Rs. 610,538.8 Rs. 609,433.9
* The fair value in respect of the unquoted equity investments cannot be reliably measured.
Financial liabilities
Derivatives other than in
hedging relationship
Derivatives in hedging
relationship
Other financial liabilities
Total carrying value Total fair value
(In millions)
Accounts payable Rs. — Rs. — Rs.417,313.9 Rs.417,313.9 Rs.417,313.9 Acceptances — — 43,931.3 43,931.3 43,931.3 Short-term debt (excluding
current portion of long-term debt) — — 117,378.2 117,378.2 117,378.2
Long-term debt (including current portion of long-term debt)* (92.3)* — 448,329.6 448,237.3 471,084.1
Other financial liabilities:
- current 2,345.9 14,703.8 21,463.6 38,513.3 38,513.3 - non-current 4,486.6 12,848.4 4,665.9 22,000.9 21,881.8
Total Rs. 6,740.2 Rs. 27,552.2 Rs. 1,053,082.5 Rs. 1,087,374.9 Rs. 1,110,102.6
* Net of fair value of (a) prepayment options in Senior Notes and (b) conversion options in Foreign Currency Convertible Notes.
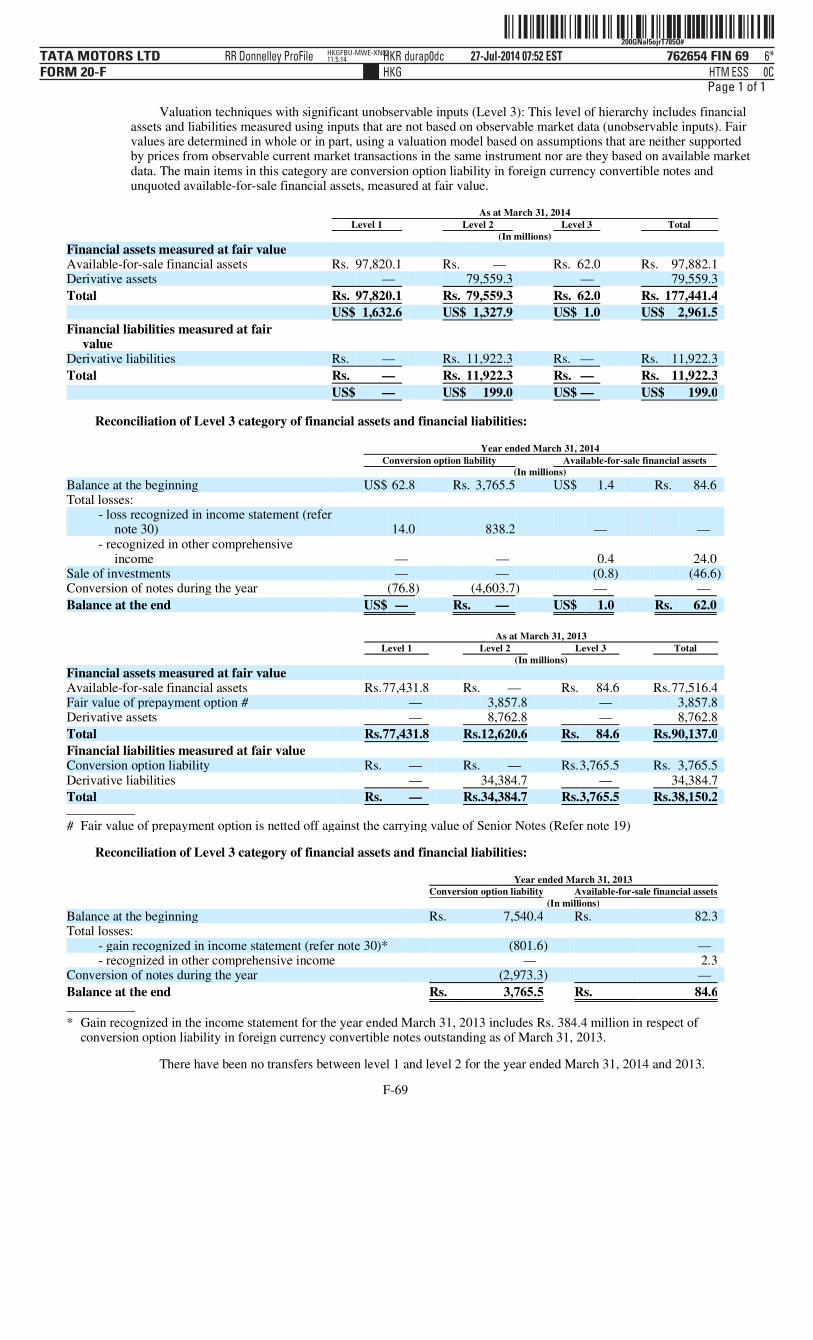
ˆ200GNal5ojrT785Q#Š200GNal5ojrT785Q#
762654 FIN 69TATA MOTORS LTDFORM 20-F
27-Jul-2014 07:52 ESTHTMHKG
RR Donnelley ProFile HKR durap0dc 6*ESS 0C
HKGFBU-MWE-XN0311.5.14
Page 1 of 1
Valuation techniques with significant unobservable inputs (Level 3): This level of hierarchy includes financial assets and liabilities measured using inputs that are not based on observable market data (unobservable inputs). Fair values are determined in whole or in part, using a valuation model based on assumptions that are neither supported by prices from observable current market transactions in the same instrument nor are they based on available market data. The main items in this category are conversion option liability in foreign currency convertible notes and unquoted available-for-sale financial assets, measured at fair value.
Reconciliation of Level 3 category of financial assets and financial liabilities:
Reconciliation of Level 3 category of financial assets and financial liabilities:
There have been no transfers between level 1 and level 2 for the year ended March 31, 2014 and 2013.
F-69
As at March 31, 2014 Level 1 Level 2 Level 3 Total (In millions)
Financial assets measured at fair value
Available-for-sale financial assets Rs. 97,820.1 Rs. — Rs. 62.0 Rs. 97,882.1 Derivative assets — 79,559.3 — 79,559.3
Total Rs. 97,820.1 Rs. 79,559.3 Rs. 62.0 Rs. 177,441.4
US$ 1,632.6 US$ 1,327.9 US$ 1.0 US$ 2,961.5
Financial liabilities measured at fair value
Derivative liabilities Rs. — Rs. 11,922.3 Rs. — Rs. 11,922.3
Total Rs. — Rs. 11,922.3 Rs. — Rs. 11,922.3
US$ — US$ 199.0 US$ — US$ 199.0
Year ended March 31, 2014 Conversion option liability Available-for-sale financial assets (In millions)
Balance at the beginning US$ 62.8 Rs. 3,765.5 US$ 1.4 Rs. 84.6 Total losses:
- loss recognized in income statement (refer note 30) 14.0 838.2 — —
- recognized in other comprehensive income — — 0.4 24.0
Sale of investments — — (0.8) (46.6) Conversion of notes during the year (76.8) (4,603.7) — —
Balance at the end US$ — Rs. — US$ 1.0 Rs. 62.0
As at March 31, 2013 Level 1 Level 2 Level 3 Total (In millions)
Financial assets measured at fair value
Available-for-sale financial assets Rs.77,431.8 Rs. — Rs. 84.6 Rs.77,516.4 Fair value of prepayment option # — 3,857.8 — 3,857.8 Derivative assets — 8,762.8 — 8,762.8
Total Rs.77,431.8 Rs.12,620.6 Rs. 84.6 Rs.90,137.0
Financial liabilities measured at fair value Conversion option liability Rs. — Rs. — Rs.3,765.5 Rs. 3,765.5 Derivative liabilities — 34,384.7 — 34,384.7
Total Rs. — Rs.34,384.7 Rs.3,765.5 Rs.38,150.2
# Fair value of prepayment option is netted off against the carrying value of Senior Notes (Refer note 19)
Year ended March 31, 2013 Conversion option liability Available-for-sale financial assets (In millions)
Balance at the beginning Rs. 7,540.4 Rs. 82.3 Total losses:
- gain recognized in income statement (refer note 30)* (801.6) — - recognized in other comprehensive income — 2.3
Conversion of notes during the year (2,973.3) —
Balance at the end Rs. 3,765.5 Rs. 84.6
* Gain recognized in the income statement for the year ended March 31, 2013 includes Rs. 384.4 million in respect of
conversion option liability in foreign currency convertible notes outstanding as of March 31, 2013.

ˆ200GNal5oj$aB12w,Š200GNal5oj$aB12w,
762654 FIN 70TATA MOTORS LTDFORM 20-F
31-Jul-2014 04:28 ESTHTMHKG
RR Donnelley ProFile HKR varsu0dc 6*ESS 0C
ACXFBU-MWE-XN1511.5.15
Page 1 of 1
The following table provides an analysis of fair value of financial instruments that are not measured at fair value on recurring basis, grouped into Level 1 to Level 3 categories:
F-70
As at March 31, 2014 Level 1 Level 2 Level 3 Total (In millions)
Financial assets not measured at fair value
Finance receivables — — 185,007.6 185,007.6 Other investments — 75.0 — 75.0
Total Rs. — Rs. 75.0 Rs. 185,007.6 Rs. 185,082.6
US$ — US$ 1.3 US$ 3,087.8 US$ 3,089.1
Financial liabilities not measured at fair value
Short-term debt (excluding current portion of long-term debt) — 100,464.7 — 100,464.7
Long-term debt (including current portion of long-term debt) 213,685.7 325,138.7 — 538,824.4
Total Rs. 213,685.7 Rs. 425,603.4 Rs. — Rs. 639,289.1
US$ 3,566.4 US$ 7,103.4 US$ — US$ 10,669.8
As at March 31, 2013 Level 1 Level 2 Level 3 Total (In millions)
Financial assets not measured at fair value
Finance receivables — — 201,119.5 201,119.5 Other investments — 80.0 — 80.0
Total Rs. — Rs. 80.0 Rs. 201,119.5 Rs. 201,199.5
Financial liabilities not measured at fair value
Short-term debt (excluding current portion of long-term debt) — 117,378.2 — 117,378.2
Long-term debt (including current portion of long-term debt) 168,967.0 302,209.4 — 471,176.4
Total Rs. 168,967.0 Rs. 419,587.6 Rs. — Rs. 588,554.6

ˆ200GNal5ojucL76wdŠ200GNal5ojucL76wd
762654 FIN 71TATA MOTORS LTDFORM 20-F
28-Jul-2014 10:15 ESTHTMHKG
RR Donnelley ProFile HKR peetp0dc 5*ESS 0C
SWRFBU-MWE-XN0911.5.14
Page 1 of 1
Notes The short term financial assets and liabilities are stated at amortized cost which is approximately equal to their
fair value. Derivatives are fair valued using market observable rates and published prices together with forecast cash flow
information, where applicable. Fair value of prepayment options relates to the GBP 500 million and USD 410 million Senior Notes due 2018,
which were bifurcated but have been repaid during the year ended March 31, 2014. The fair value represents the difference in the traded market price of the bonds and the expected price the bonds would trade at if they did not contain any prepayment features. The expected price is based on market inputs including credit spreads and interest rates.
The fair value of finance receivables have been estimated by discounting expected cash flows using rates at which loans of similar credit quality and maturity would be made and internal assumptions such as expected credit losses and estimated collateral value for repossessed vehicles as of March 31, 2014 and 2013. As unobservable inputs are applied, finance receivables are classified in Level 3.
Available-for-sale securities are carried at their fair values, which are generally based on market price quotations. The fair value in respect of the unquoted equity investments cannot be reliably measured.
The fair value of borrowings which have a quoted market price in an active market is based on its market price and for other borrowings the fair value is estimated by discounting expected future cash flows, using a discount rate equivalent to the risk free rate of return, adjusted for the credit spread considered by the lenders for instruments of the similar maturity.
Management uses its best judgment in estimating the fair value of its financial instruments. However, there are inherent limitations in any estimation technique. Therefore, for substantially all financial instruments, the fair value estimates presented above are not necessarily indicative of all the amounts that the Company could have realized or paid in sale transactions as of respective dates. As such, the fair value of the financial instruments subsequent to the respective reporting dates may be different from the amounts reported at each year end.
F-71

ˆ200GNal5ojxbLm9wbŠ200GNal5ojxbLm9wb
762654 FIN 72TATA MOTORS LTDFORM 20-F
29-Jul-2014 10:34 ESTHTMHKG
RR Donnelley ProFile HKR annal0dc 8*ESS 0C
RRWIN-XENP13911.5.15
Page 1 of 1
Certain financial assets and financial liabilities are subject to offsetting where there is currently a legally enforceable right to set off recognised amounts and the group intends to either settle on a net basis, or to realise the asset and settle the liability, simultaneously.
Certain derivative financial assets and financial liabilities are subject to master netting arrangements, whereby in the case of insolvency, derivative financial assets and financial liabilities will be settled on a net basis.
The following table discloses the amounts that have been offset, in arriving at the balance sheet presentation and the amounts that are available for offset only under certain conditions as at March 31, 2014:
The following table discloses the amounts that have been offset in arriving at the balance sheet presentation and the amounts that are available for offset only under certain conditions as at March 31, 2013:
F-72
Gross
amount recognised
Gross amount
recognised as set off in the balance
sheet
Net amount presented
in the balance
sheet
Amounts subject to an enforceable
master netting arrangement Net amount
after offsetting Financial assets
Financial instruments
Cash collateral
(In millions)
Derivative financial instruments Rs. 85,332.3 Rs. (5,773.0) Rs. 79,559.3 Rs. (11,944.2) Rs. — Rs. 67,615.1
Trade receivables 110,093.7 (448.9) 109,644.8 — — 109,644.8 Cash and cash equivalents 162,111.3 (2,189.8) 159,921.5 — — 159,921.5
Total Rs. 357,537.3 Rs. (8,411.7) Rs. 349,125.6 Rs. (11,944.2) Rs. — Rs. 337,181.4
US$ 5,967.4 US$ (140.4) US$ 5,827.0 US$ (199.4) US$ — US$ 5,627.6
Financial liabilities
Derivative financial instruments Rs. 17,695.3 Rs. (5,773.0) Rs. 11,922.3 Rs. (11,944.2) Rs. — Rs. (21.9)
Accounts payable 544,646.2 (448.9) 544,197.3 — — 544,197.3 Loans from banks /
financial institutions (Short-term) 83,475.1 (2,189.8) 81,285.3 — — 81,285.3
Total Rs. 645,816.6 Rs. (8,411.7) Rs. 637,404.9 Rs. (11,944.2) Rs. — Rs. 625,460.7
US$ 10,778.8 US$ (140.4) US$ 10,638.4 US$ (199.4) US$ — US$ 10,439.0
Gross
amount recognised
Gross amount
recognised as set off in the balance sheet
Net amount presented
in the balance
sheet
Amounts subject to an enforceable
master netting arrangement Net amount
after offsetting Financial assets
Financial instruments
Cash collateral
(In millions)
Derivative financial instruments Rs. 9,665.9 Rs. (903.1) Rs. 8,762.8 Rs. (8,620.3) Rs. — Rs. 142.5 Trade receivables 112,196.3 (6,405.6) 105,790.7 — — 105,790.7
Total Rs.121,862.2 Rs.(7,308.7) Rs.114,553.5 Rs. (8,620.3) Rs. — Rs.105,933.2
Financial liabilities
Derivative financial instruments Rs. 35,287.8 Rs. (903.1) Rs. 34,384.7 Rs. (8,620.3) Rs. — Rs. 25,764.4 Accounts payable 423,719.5 (6,405.6) 417,313.9 — — 417,313.9
Total Rs.459,007.3 Rs.(7,308.7) Rs.451,698.6 Rs. (8,620.3) Rs. — Rs.443,078.3

ˆ200GNal5ojucH3swSŠ200GNal5ojucH3swS
762654 FIN 73TATA MOTORS LTDFORM 20-F
28-Jul-2014 10:14 ESTHTMHKG
RR Donnelley ProFile HKR peetp0dc 3*ESS 0C
WCRFBU-MWE-XN0611.5.15
Page 1 of 1
The Company transfers finance receivables in securitization transactions / direct assignments. In such transactions the Company surrenders control over the receivables though it continues to act as an agent for the collection of receivables. In most of the transactions, the Company also provides credit enhancements to the transferee.
Consequent to the existence of credit enhancements in such transactions, the Company continues to have the obligation to pay to the transferee, limited to the extent of credit enhancement, even if it does not collect the equivalent amounts from the original asset and continues to retain substantially all risks and rewards associated with the receivables, and hence, such transfer /assignments do not meet the derecognition criteria resulting into the transfer not being recorded as sale. Consequently, the proceeds received from the transfer are recorded as collateralized debt obligation.
Further the Company transfers certain trade receivables under the debt factoring arrangements. These do not qualify for derecognition, due to the recourse arrangement in place. Consequently the proceeds received from transfer are recorded as loans from banks / financial institutions and classified under short term borrowings.
The carrying amount of trade receivables and finance receivables along with the associated liabilities is as follows:
As at March 31, 2014, the Company has a number of cash flow hedging instruments in a hedging relationship. The Company and its subsidiaries uses both USD/GBP forward and option contracts, USD/Euro forward contracts and other currency options to hedge future cash flows from sales and purchases. Cash flow hedges are expected to be recognised in profit or loss during the years ending March 31, 2015 to 2018.
The Company and its subsidiaries also have a number of USD/Euro options and other currency options, which are entered into as an economic hedge of the financial risks of the Company. These contracts do not meet the hedge accounting criteria as per IAS 39, hence, the change in fair value is recognised immediately in the income statement.
The time value of options is considered ineffective in the hedge relationship and thus the change in time value is recognised immediately in the income statement.
Changes in fair value of forward exchange contracts to the extent determined to be an effective hedge is recognized in other comprehensive income and the ineffective portion of the fair value change is recognized in income statement. Accordingly, the fair value change of (net gain) Rs. 79,270.4 million (net of tax), (net loss) Rs. 19,001.0 million (net of tax), (net loss) Rs. 2,051.7 million (net of tax), was recognized in other comprehensive income during the year ended March 31, 2014, March 31, 2013 and March 31, 2012, respectively. Amount reclassified from hedging reserve of (net gain) Rs. 8,270.9 million (net of tax), (net loss) Rs. 3,895.0 million (net of tax) and (net gain) Rs. 1,172.3 million (net of tax) during the year ended March 31, 2014, 2013, and 2012, respectively, has been classified as foreign exchange gain/loss in the income statement.
F-73
(b) Transfer of financial assets
As at March 31, 2014 2014 2013
Nature of Asset
Carrying amount of asset sold
Carrying amount of associated liabilities
Carrying amount of asset sold
Carrying amount of associated liabilities
Carrying amount of asset sold
Carrying amount of associated liabilities
(In millions) Trade receivables US$336.1 US$336.1 Rs.20,135.9 Rs.20,135.9 Rs.22,373.3 Rs.22,373.3 Finance receivables US$263.5 US$257.3 Rs.15,790.2 Rs.15,413.2 Rs.19,907.6 Rs.20,820.0
(c) Cash flow hedges
ˆ200GNal5ojucetTQ[Š200GNal5ojucetTQ[
762654 FIN 74TATA MOTORS LTDFORM 20-F
28-Jul-2014 10:19 ESTHTMHKG
RR Donnelley ProFile HKR peetp0dc 2*ESS 0C
HKGFBU-MWE-XN0211.5.14
Page 1 of 1
In the course of its business, the Company is exposed primarily to fluctuations in foreign currency exchange rates, interest rates, equity price, liquidity and credit risk, which may adversely impact the fair value of its financial instruments.
The Company has a risk management policy which not only covers the foreign exchange risks but also other risks associated with the financial assets and liabilities like interest rate risks and credit risks. The risk management policy is approved by the board of directors. The risk management framework aims to:
Market risk is the risk of any loss in future earnings, in realizable fair values or in future cash flows that may result from a change in the price of a financial instrument. The value of a financial instrument may change as a result of changes in the interest rates, foreign currency exchange rate, equity price fluctuations, liquidity and other market changes. Future specific market movements cannot be normally predicted with reasonable accuracy.
(i) – (a) Foreign currency exchange rate risk: The fluctuation in foreign currency exchange rates may have potential impact on the income statement and
equity, where any transaction references more than one currency or where assets/liabilities are denominated in a currency other than the functional currency of the respective consolidated entities.
Considering the countries and economic environment in which the Company operates, its operations are subject to risks arising from fluctuations in exchange rates in those countries. The risks primarily relate to fluctuations in US Dollar, Chinese Renminbi, Japanese Yen and Euro, against the respective functional currencies of Tata Motors Limited and its subsidiaries.
The Company, as per its risk management policy, uses foreign exchange and other derivative instruments primarily to hedge foreign exchange and interest rate exposure. Further, any movement in the functional currencies of the various operations of the Company against major foreign currencies may impact the Company’s revenues in international business. Any weakening of the functional currency may impact the Company’s cost of imports and cost of borrowings and consequently may increase the cost of financing our capital expenditures.
The Company evaluates the impact of foreign exchange rate fluctuations by assessing its exposure to exchange rate risks. It hedges a part of these risks by using derivative financial instruments in accordance with its risk management policies.
The foreign exchange rate sensitivity is calculated by aggregation of the net foreign exchange rate exposure and a simultaneous parallel foreign exchange rates shift in the foreign exchange rates of all the currencies by 10%.
F-74
(d) Financial risk management
• Create a stable business planning environment – by reducing the impact of currency and interest rate
fluctuations on the Company’s business plan.
• Achieve greater predictability to earnings – by determining the financial value of the expected earnings in
advance.
(i) Market risk

ˆ200GNal5ojuclkwQBŠ200GNal5ojuclkwQB
762654 FIN 75TATA MOTORS LTDFORM 20-F
28-Jul-2014 10:20 ESTHTMHKG
RR Donnelley ProFile HKR khanz0dc 5*ESS 0C
ACXFBU-MWE-XN1411.5.14
Page 1 of 1
The following analysis has been worked out based on the gross exposure as of the Balance Sheet date, which could affect the income statement. There is no exposure to the income statement on account of translation of financial statements of consolidated foreign entities. Further, the exposure as indicated below is mitigated by some of the derivative contracts entered into by the Company as disclosed at clause (iv) below.
The following table sets forth information relating to foreign currency exposure (other than risk arising from derivatives disclosed at clause (iv) below) as of March 31, 2014:
10% appreciation / depreciation of the respective foreign currencies with respect to functional currency of Tata Motors Limited and its subsidiaries would result in decrease / increase in the Company’s net income before tax by approximately Rs. 23,248.1 million and Rs. 50,037.4 million for financial assets and financial liabilities, respectively for the year ended March 31, 2014.
The following table sets forth information relating to foreign currency exposure (other than risk arising from derivatives disclosed at clause (iv) below) as of March 31, 2013:
10% appreciation / depreciation of the respective foreign currencies with respect to functional currency of Tata Motors Limited and its subsidiaries would result in decrease / increase in the Company’s net income before tax by approximately Rs. 14,087.6 million and Rs. 34,985.5 million for financial assets and financial liabilities, respectively for the year ended March 31, 2013.
The following table sets forth information relating to foreign currency exposure (other than risk arising from derivatives disclosed at clause (iv) below) as of March 31, 2012:
10% appreciation / depreciation of the respective foreign currencies with respect to functional currency of Tata Motors Limited and its subsidiaries would result in decrease / increase in the Company’s net income before tax by approximately Rs. 12,456.4 million and Rs. 31,184.7 million for financial assets and financial liabilities, respectively for the year ended March 31, 2012.
(Note: The impact is indicated on the income/loss before tax basis).
F-75
US Dollar Euro Chinese
Renminbi JPY Others* Total (In millions)
Financial assets Rs. 60,850.2 Rs. 31,938.5 Rs.83,609.6 Rs.1,692.9 Rs.54,389.8 Rs.232,481.0 Financial liabilities Rs.232,914.3 Rs.140,077.3 Rs.71,172.2 Rs.6,793.5 Rs.49,416.9 Rs.500,374.2
* Others mainly include currencies such as Russian Rouble, Singapore dollars, Swiss Franc, Australian dollars,
South African Rand, Thai baht and Korean won.
US Dollar Euro Chinese
Renminbi JPY Others* Total (In millions)
Financial assets Rs. 31,668.6 Rs. 22,032.6 Rs. 54,809.0 Rs.2,891.8 Rs. 29,474.5 Rs.140,876.5 Financial liabilities Rs. 163,664.9 Rs. 102,045.9 Rs. 54,144.3 Rs.9,076.0 Rs. 20,923.6 Rs.349,854.7
* Others mainly include currencies such as Russian Rouble, Singapore dollars, Swiss Franc, Australian dollars,
South African Rand, Thai baht and Korean won.
US Dollar Euro Chinese
Renminbi JPY Others* Total (In millions)
Financial assets Rs. 35,772.6 Rs. 19,799.6 Rs. 47,675.6 Rs. 2,607.9 Rs. 18,708.2 Rs.124,563.9 Financial liabilities Rs. 169,425.9 Rs. 82,859.3 Rs. 30,164.1 Rs. 12,261.5 Rs. 17,136.4 Rs.311,847.2
* Others mainly include currencies such as Russian Rouble, Singapore dollars, Swiss Franc, Australian dollars,
South African Rand, Thai baht and Korean won.

ˆ200GNal5ojx0#vXwGŠ200GNal5ojx0#vXwG
762654 FIN 76TATA MOTORS LTDFORM 20-F
29-Jul-2014 06:44 ESTHTMHKG
RR Donnelley ProFile HKR palap0dc 6*ESS 0C
NERFBU-MWE-XN0111.5.15
Page 1 of 1
(i) – (b) Interest rate risk Interest rate risk is measured by using the cash flow sensitivity for changes in variable interest rates. Any
movement in the reference rates could have an impact on the cash flows as well as costs. The Company is subject to variable interest rates on some of its interest bearing liabilities. The Company’s
interest rate exposure is mainly related to debt obligations. The Company also uses a mix of interest rate sensitive financial instruments to manage the liquidity and fund requirements for its day to day operations like short term non-convertible bonds and short term loans.
In its financing business, the Company enters into transactions with customers which primarily result in receivables at fixed rates. In order to manage this risk, the Company has a policy to match funding in terms of maturities and interest rates and also for certain part of the portfolio, the Company does not match funding with maturities, in order to take advantage of market opportunities.
The Company also enters into arrangements of securitization of receivables in order to reduce the impact of interest rate movements.
As at March 31, 2014, 2013 and 2012, financial liability of Rs. 223,225.2 million, Rs. 206,495.4 million and Rs.176,635.3 million, respectively, was subject to the variable interest rate. Increase/decrease of 100 basis points in interest rates at the balance sheet date would result in an impact (decrease/increase in case of net income) of Rs. 2,232.3 million, Rs. 2,065.0 million and Rs. 1,766.4 million on income for the year ended March 31, 2014, 2013 and 2012, respectively.
The model assumes that interest rate changes are instantaneous parallel shifts in the yield curve. Although some assets and liabilities may have similar maturities or periods to re-pricing, these may not react correspondingly to changes in market interest rates. Also, the interest rates on some types of assets and liabilities may fluctuate with changes in market interest rates, while interest rates on other types of assets may change with a lag.
The risk estimates provided assume a parallel shift of 100 basis points interest rate across all yield curves. This calculation also assumes that the change occurs at the balance sheet date and has been calculated based on risk exposures outstanding as at that date. The period end balances are not necessarily representative of the average debt outstanding during the period.
This analysis assumes that all other variables, in particular foreign currency rates, remain constant. (Note: The impact is indicated on the income/loss before tax basis).
(i) – (c) Equity Price risk Equity Price Risk is related to the change in market reference price of the investments in equity securities. The fair value of some of the Company’s investments in available-for-sale securities exposes the Company to
equity price risks. In general, these securities are not held for trading purposes. These investments are subject to changes in the market price of securities. The fair value of available- for- sale equity securities as of March 31, 2014, 2013 and 2012, was Rs. 2,770.1 million, Rs. 2,067.2 million and Rs. 2,885.3 million, respectively. A 10 % change in equity prices of available -for- sale securities held as of March 31, 2014, 2013 and 2012, would result in an impact of Rs. 277.0 million, Rs. 206.7 million and Rs. 288.5 million on equity, respectively.
The Company has investments in unquoted equity shares of Rs. 3,919.7 million as of March 31, 2014 and Rs. 3,877.0 million as of March 31, 2013, the fair value of which cannot be reliably measured.
(Note: The impact is indicated on equity before consequential tax impact, if any).
F-76

ˆ200GNal5ojucJfXwmŠ200GNal5ojucJfXwm
762654 FIN 77TATA MOTORS LTDFORM 20-F
28-Jul-2014 10:14 ESTHTMHKG
RR Donnelley ProFile HKR khanz0dc 8*ESS 0C
ACXFBU-MWE-XN1411.5.14
Page 1 of 1
Credit risk is the risk of financial loss arising from counterparty failure to repay or service debt according to the contractual terms or obligations. Credit risk encompasses both the direct risk of default and the risk of deterioration of creditworthiness as well as concentration risks.
Financial instruments that are subject to concentrations of credit risk, principally consist of investments classified as loans and receivables, available for sale debt instruments, trade receivables, finance receivables, loans and advances and derivative financial instruments. None of the financial instruments of the Company result in material concentrations of credit risks.
Exposure to credit risk The carrying amount of financial assets represents the maximum credit exposure. The maximum exposure to
credit risk was Rs. 771,210.9 million as of March 31, 2014 and Rs. 604,180.1 million as of March 31, 2013, being the total of the carrying amount of balances with banks, short term deposits with banks, trade receivables, finance receivables, margin money and other financial assets excluding equity investments.
Financial assets that are neither past due nor impaired None of the Company’s cash equivalents, including time deposits with banks, are past due or impaired.
Regarding trade receivables and other receivables, and other loans or receivables that are neither impaired nor past due, there were no indications as of March 31, 2014, that defaults in payment obligations will occur.
Credit quality of financial assets and impairment loss The ageing of trade receivables and finance receivables as of balance sheet date is given below. The age
analysis has been considered from the due date.
F-77
(ii) Credit risk
As at March 31, 2014 2014 2014 2014 2014 2014 2013 2013 2013 Trade receivables Gross Allowance Net Gross Allowance Net Gross Allowance Net (In millions) Period (in months) Not due US$ 1,585.0 US$ (1.4) US$ 1,583.6 Rs. 94,964.1 Rs. (82.5) 94,881.6 Rs. 82,701.4 Rs. (60.3) 82,641.1 Overdue upto 3 months 150.6 (0.8) 149.8 9,022.1 (47.0) 8,975.1 15,443.2 (64.3) 15,378.9 Overdue 3-6 months 38.7 (2.6) 36.1 2,319.9 (158.0) 2,161.9 3,245.4 (202.8) 3,042.6 Overdue more than 6 months 158.8 (98.3) 60.5* 9,518.5 (5,892.3) 3,626.2* 7,979.8 (3,251.7) 4,728.1*
Total US$ 1,933.1 US$ (103.1) US$ 1,830.0 Rs. 115,824.6 Rs. (6,179.8) Rs. 109,644.8 Rs. 109,369.8 Rs. (3,579.1) Rs. 105,790.7
* Trade receivables overdue more than six months include Rs. 1,627.8 million as of March 31, 2014 (Rs. 1,992.6 million as at
March 31, 2013), outstanding from State Government organizations in India, which are considered recoverable.
As at March 31, 2014 2014 2014 2014 2014 2014 2013 2013 2013 Finance receivables # Gross Allowance Net Gross Allowance Net Gross Allowance Net (In millions) Period (in months) Not due* US$ 3,262.5 US$ (370.2) US$2,892.3 Rs.195,470.3 Rs. (22,183.4) 173,286.9 Rs. 201,154.3 Rs. (7,053.1) 194,101.2 Overdue up to 11 months 243.3 (69.9) 173.4 14,574.5 (4,189.9) 10,384.6 6,704.0 (3,621.0) 3,083.0 Overdue more than 11 months 113.7 (87.1) 26.6 6,817.9 (5,214.2) 1,603.7 4,895.7 (3,860.7) 1,035.0
Total US$ 3,619.5 US$ (527.2) US$3,092.3 Rs.216,862.7 Rs. (31,587.5) Rs. 185,275.2 Rs. 212,754.0 Rs. (14,534.8) Rs. 198,219.2
* Allowance in the ‘Not due’ category includes allowance against installments pertaining to impaired finance receivables which
have not yet fallen due. # Finance receivables originated in India.

ˆ200GNal5ojob9XYQ3Š200GNal5ojob9XYQ3
762654 FIN 78TATA MOTORS LTDFORM 20-F
25-Jul-2014 16:24 ESTHTMHKG
RR Donnelley ProFile HKR venkp1dc 2*ESS 0C
HKGFBU-MWE-XN0211.5.14
Page 1 of 1
Liquidity risk refers to the risk that the Company cannot meet its financial obligations. The objective of liquidity risk management is to maintain sufficient liquidity and ensure that funds are available for use as per requirements.
The Company has obtained fund and non fund based working capital lines from various banks. Further, the Company has access to funds from debt markets through commercial paper programs, non -convertible debentures, fixed deposits from public and other debt instruments. The Company invests its surplus funds in bank fixed deposit and liquid and liquid plus schemes of mutual funds, which carry no/low mark to market risks. The Company has also invested 15% of the public deposits (taken by the Company) falling due for repayment in the next 12 months in bank deposits, to meet the regulatory norms of liquidity requirements.
The Company also constantly monitors funding options available in the debt and capital markets with a view to maintaining financial flexibility.
The table below provides details regarding the contractual maturities of financial liabilities, including estimated interest payments as of March 31, 2014:
Contractual maturity of borrowings includes cash flows relating to collateralized debt obligation. This represents the amount received against the transfer of finance receivables in securitization transactions/ direct assignments, which do not qualify for derecognition. The liability of the Company in such cases is limited to the extent of credit enhancements provided. The contractual maturity of such collateralized debt obligation is as follows:
F-78
(iii) Liquidity risk
Carrying amount
Due in 1 Year
Due in 2 Year
Due in 3 to 5 Year
Due after 5Year
Total contractual cash flows
Total contractual cash flows
(In millions) Financial liabilities
Accounts payable and acceptances Rs. 595,817.7 Rs. 595,817.7 Rs. — Rs. — Rs. — Rs. 595,817.7 US$ 9,944.4
Borrowings and interest thereon 628,411.5 195,668.5 108,082.5 250,009.6 220,964.5 774,725.1 12,930.4
Other financial liabilities 23,862.3 20,173.2 1,754.2 2,444.8 112.8 24,485.0 408.7
Derivative liabilities 11,922.3 7,067.0 4,802.7 1,094.9 — 12,964.6 216.4
Total Rs. 1,260,013.8 Rs. 818,726.4 Rs. 114,639.4 Rs. 253,549.3 Rs. 221,077.3 Rs. 1,407,992.4 US$ 23,499.9
Carrying amount
Due in 1Year
Due in 2Year
Due in 3 to 5 Year
Total contractual cash flows
Total contractual cash flows
(In millions)
Collateralized debt obligation Rs. 15,413.2 Rs. 9,767.8 Rs. 5,722.1 Rs. 1,149.3 Rs. 16,639.2 US$ 277.7
st nd rdth
th
st nd rdth

ˆ200GNal5ojobBfmw$Š200GNal5ojobBfmw$
762654 FIN 79TATA MOTORS LTDFORM 20-F
25-Jul-2014 16:24 ESTHTMHKG
RR Donnelley ProFile HKR venkp1dc 2*ESS 0C
HKGFBU-MWE-XN0211.5.14
Page 1 of 1
The table below provides details regarding the contractual maturities of financial liabilities, including estimated interest payments as of March 31, 2013:
Contractual maturity of borrowings includes cash flows relating to collateralized debt obligation. This represents the amount received against the transfer of finance receivables in securitization transactions/ direct assignments, which do not qualify for derecognition. The liability of the Company in such cases is limited to the extent of credit enhancements provided. The contractual maturity of such collateralized debt obligation is as follows:
For the purpose of compiling the contractual cash flows, it has been assumed that the foreign currency convertible notes will be repaid on maturity. If these are converted, the amount repayable will reduce as follows:
F-79
Carrying amount
Due in 1 Year
Due in 2 Year
Due in 3 to 5 Year
Due after 5Year
Total contractual cash flows
(In millions)
Financial liabilities
Accounts payable and acceptances Rs. 461,245.2 Rs. 461,245.2 Rs. — Rs. — Rs. — Rs. 461,245.2
Borrowings and interest thereon 569,763.5 264,754.7 88,977.0 137,203.9 222,407.1 713,342.7
Other financial liabilities 21,981.5 17,315.6 1,777.8 3,598.4 321.8 23,013.6
Derivative liabilities 34,384.7 17,049.7 9,996.2 7,338.8 — 34,384.7
Total Rs. 1,087,374.9 Rs. 760,365.2 Rs. 100,751.0 Rs. 148,141.1 Rs. 222,728.9 Rs. 1,231,986.2
Carrying amount
Due in 1 Year
Due in 2Year
Due in 3 to 5 Year
Total contractual cash flows
(In millions)
Collateralized debt obligation Rs. 20,820.0 Rs. 11,749.4 Rs. 7,263.3 Rs. 3,827.0 Rs. 22,839.7
Carrying amount
Due in 1Year
Due in 2Year
Due in 3 to5 Year
Total contractual cash flows
(In millions)
Foreign currency convertible Notes* Rs. 3,939.3 Rs. 160.9 Rs. 4,525.5 Rs. — Rs. 4,686.4
* excludes conversion option liability of Rs. 3,765.5 millions.
st nd rdth
th
st nd rdth
st nd rdth

ˆ200GNal5ojucDrMw"Š200GNal5ojucDrMw"
762654 FIN 80TATA MOTORS LTDFORM 20-F
28-Jul-2014 10:13 ESTHTMHKG
RR Donnelley ProFile HKR khanz0dc 3*ESS 0C
ACXFBU-MWE-XN1411.5.14
Page 1 of 1
The Company has entered into variety of interest rate and foreign currency forward contracts and options, to manage its exposure to fluctuations in foreign exchange rates and interest rates. The counter party is generally a bank. These financial exposures are managed in accordance with its risk management policies and procedures.
The Company also enters into interest rate swaps and interest rate currency swap agreements, mainly to manage exposure on its fixed rate or variable rate debt. The Company uses interest rate derivatives or currency swaps to hedge exposure to exchange rate fluctuations on principal and interest payments for borrowings denominated in foreign currencies.
Specific transactional risks include risks like liquidity and pricing risks, interest rate and exchange rate fluctuation risks, volatility risks, counterparty risks, settlement risks and gearing risks.
The Company is also exposed to equity price risk, interest rate risk and currency risk on embedded derivative, i.e., conversion option in foreign currency convertible notes/convertible alternative reference securities which are accounted for separately.
Fair value of derivative financial instruments other than conversion options are determined using valuation techniques based on information derived from observable market data.
Fair value of conversion option in foreign currency convertible notes is determined using various option valuation models such as Black Scholes Merton model, Cox Ross Rubinstein model and Monte Carlo simulation. These models consider various inputs, such as stock price as at the date of valuation, strike price of the option as per terms of issue of the instrument, time to expiry, volatility of the underlying share price, risk free interest rate and expected dividend rate.
Main assumptions used in valuation of conversion option in foreign currency convertible notes (FCCN) as of March 31, 2013:
The fair value of derivative financial instruments including embedded derivative is as follows:
The gain / loss on derivative contracts recognized in the income statement was Rs. 9,078.7 million (gain), Rs. 2,471.3 million (loss) and Rs. 1,316.4 million (loss) for the year ended March 31, 2014, 2013 and 2012, respectively.
F-80
(iv) Derivative financial instruments and risk management
Assumptions
Share price inforeign
currency Volatility inshare price
Risk free interest rate
FCCN due in 2014 US$ 4.96 35% 0.6%
As at March 31, 2014 2014 2013 (In millions)
Forward exchange contracts, options and interest rate swaps US$1,128.9 Rs.67,637.0 Rs.(25,621.9) Embedded derivative-conversion option — — (3,765.5) Embedded derivative- prepayment option — — 3,857.8
Total US$1,128.9 Rs.67,637.0 Rs.(25,529.6)

ˆ200GNal5ojw#s#wQ3Š200GNal5ojw#s#wQ3
762654 FIN 81TATA MOTORS LTDFORM 20-F
29-Jul-2014 05:41 ESTHTMHKG
RR Donnelley ProFile HKR varsu0dc 5*ESS 0C
ACXFBU-MWE-XN0211.5.15
Page 1 of 1
In respect of Company’s forward and option contracts (excluding conversion option and prepayment options), a 10% appreciation/ depreciation of the foreign currency underlying such contracts, would have resulted in an approximate gain / (loss) of Rs. 70,591 million / (Rs. 85,882.5 million) in Company’s hedging reserve and an approximate gain / (loss) of Rs. 4,904.8 million / (Rs. 2,981.4 million) respectively, in the Company’s income statement for the year ended March 31, 2014.
In respect of Company’s forward and option contracts (excluding conversion option and prepayment options), a 10% appreciation/ depreciation of the foreign currency underlying such contracts, would have resulted in an approximate gain / (loss) of Rs. 52,621.5 million / (Rs. 71,451.7 million) in Company’s hedging reserve and an approximate gain of Rs. 3,009.4 million / Rs. 2,407.5 million respectively, in the Company’s income statement for the year ended March 31, 2013.
In respect of Company’s forward and option contracts (excluding conversion option), a 10% appreciation/ depreciation of the foreign currency underlying such contracts, would have resulted in an approximate gain / (loss) of Rs. 37,637.2 million / (Rs. 29,392.1 million) in Company’s hedging reserve and an approximate gain / (loss) of Rs. 2,137.6 million / (Rs. 687.1 million) respectively, in the Company’s income statement for the year ended March 31, 2012.
Exposure to gain/loss on derivative instruments offset to some extent the exposure to foreign currency risk, interest rate risk as disclosed above.
In respect of embedded derivative, prepayment option: The Company was exposed to interest rate risk with regards to the fair value of the prepayment option. As at
March 31, 2013, a 25 basis points increase / decrease in interest rates would have resulted in an approximate gain / loss of Rs. 771.7 million, for the year ended March 31, 2013.
The Company was exposed to the impact of volatility with its own credit risk with regard to the fair value of prepayment option. As at March 31, 2013, a 25 basis points decrease / increase in credit spreads would have resulted in an approximate gain of Rs. 755.3 million and an approximate loss of Rs. 197.0 million respectively for the year ended March 31, 2013.
In respect of embedded derivative, conversion option: A 10% increase/decrease in Company’s share price volatility would have resulted in an approximate loss of
Rs. 31.2 million and an approximate gain of Rs. 27.7 million respectively, for the year ended March 31, 2013. A 10% increase/decrease in Company’s share price volatility would have resulted in an approximate loss of
Rs. 714.2 million and an approximate gain of Rs. 634.5 million respectively, for the year ended March 31, 2012. A 10% appreciation/depreciation in the underlying foreign currency would have resulted in an approximate
gain of Rs. 661.3 million and an approximate loss of Rs. 825.8 million respectively, for the year ended March 31, 2013.
A 10% appreciation/depreciation in the underlying foreign currency, would have resulted in an approximate gain of Rs. 1,566.2 million and an approximate loss of Rs. 2,748.3 million respectively, for the year ended March 31, 2012.
A 50 basis points increase/decrease in US interest rates would have resulted in an approximate loss of Rs. 27.6 million and an approximate gain of Rs. 27.8 million respectively, for the year ended March 31, 2013.
A 50 basis points increase/decrease in US interest rates would have resulted in an approximate loss of Rs. 73.5 million and an approximate gain of Rs. 73.5 million respectively, for the year ended March 31, 2012.
The above analysis assumes that all other variables (other than variable under consideration) remain constant. (Note: The impact is indicated on the income/loss before tax basis).
F-81

ˆ200GNal5oj%GMQnweŠ200GNal5oj%GMQnwe
762654 FIN 82TATA MOTORS LTDFORM 20-F
31-Jul-2014 14:25 ESTHTMHKG
RR Donnelley ProFile HKR adran0dc 8*ESS 0C
ACXFBU-MWE-XN0211.5.15
Page 1 of 1
Inventory, trade receivables, finance receivables, other financial assets, property, plant and equipment with a carrying amount of Rs. 239,650.1 million and Rs. 305,400.9 million are pledged as collateral/security against the borrowings and contingent liability as of March 31, 2014 and 2013, respectively. Fair value of collaterals for which the Company has taken possession and held as of March 31, 2014 and March 31, 2013, amounted to Rs. 1,563.0 million and Rs. 1,659.0 million, respectively. The collateral represents vehicles financed by the Company and the Company normally undertakes disposal of these vehicles through auction process.
The Company primarily operates in the Automotive segment. The Automotive segment includes all activities relating to development, design, manufacture, assembly and sale of vehicles including financing thereof, as well as sale of related parts and accessories. The Company provides financing for vehicles sold by dealers in India. The vehicle financing is intended to drive sale of vehicles by providing financing to the dealers’ customers and as such, is an integral part of automotive business. The financing activity is assessed as an integral part of the overall automotive business. The operating results of the financing activity does not include all of the interest or cost of funds employed for the purposes of financing, and therefore the operating results of this activity is not used to make decisions about resources to be allocated or to assess performance. The Company’s products mainly include Tata and other brand vehicles and Jaguar and Land Rover vehicles. The Company manages the automotive business globally with an integrated and synergic strategy. Towards this objective, various steps have been initiated/being taken which mainly include sharing of resources, platforms, facilities for product development and manufacturing, sourcing strategy and mutual sharing of best practices. As of March 31, 2014, the Automotive segment is bifurcated into the following two reportable segments: Tata and other brand vehicles, including financing thereof and Jaguar Land Rover. The Company’s other segment comprises primarily activities relating to information technology or IT services, machine tools and factory automation solutions. None of the other operating segments meets the quantitative thresholds, to be separately disclosed as a reportable segment. The segment information presented is in accordance with the accounting policies adopted for preparing the consolidated financial statements of the Company. Segment revenues, expenses and results include inter-segment transfers. Such transfers are undertaken either at competitive market prices charged to unaffiliated customers for similar goods or at contracted rates. These transfers are eliminated on consolidation.
F-82
37. Collaterals
38. Segment reporting

ˆ200GNal5oj!yyvFQÊ200GNal5oj!yyvFQˆ
762654 FIN 83TATA MOTORS LTDFORM 20-F
30-Jul-2014 09:53 ESTHTMHKG
RR Donnelley ProFile HKR khanz0dc 4*ESS 0C
ACXFBU-MWE-XN0111.5.15
Page 1 of 1 F-83
For th
e year ended / as of M
arch 31, 2014
Autom
otive and related activity
Tata and
other brand
vehicles in
cludin
g fin
ancing th
ereof *
Jaguar
Lan
d Rover
Intra-segm
entelim
inations
Total
Oth
ers
In
ter-segment
eliminations
Total
Total
(In m
illions)
Reven
ues:
E
xternal revenue
Rs.
434,922.1 R
s.1,894,589.8 R
s.—
R
s.2,329,511.9 R
s.12,248.6 R
s.—
R
s.2,341,760.5
US$39,084.7
Inter-segment / intra-segm
ent revenue
89.6
—
(20.0)
69.6
12,740.2
(12,809.8)
—
—
Total reven
ues
Rs.
435,011.7 R
s.1,894,589.8 R
s.(20.0)
Rs.2,329,581.5
Rs.24,988.8
Rs.
(12,809.8) R
s.2,341,760.5
US$39,084.7
Earnings before other incom
e, interest and tax
(20,630.6)
228,026.6
—
207,396.0
2,633.9
(1,112.3)
208,917.6
3,486.8 Share of profit/ (loss) of equity accounted investees
211.6
(727.7)
—
(516.1)
(1,361.5)
—
(1,877.6)
(31.3) Im
pairment in respect of an equity accounted investee
—
—
—
—
(8,033.7)
—
(8,033.7)
(134.1)
Recon
ciliation to net incom
e:
O
ther income / (loss) (net)
7,732.6
129.0 Foreign exchange gain/ (loss) (net)
19,104.2
318.9 Interest incom
e
6,656.7
111.1
Interest expense (net)
(53,094.7)
(886.1)
Income tax expense
(48,226.5)
(804.9)
Net In
come
Rs.131,178.6
US$
2,189.4
Depreciation and am
ortization
Rs.
25,046.5 R
s.84,941.8
Rs.
—
Rs.
109,988.3 R
s.474.3
Rs.
—
Rs.
110,462.6 U
S$1,843.7
Capital expenditure
37,806.0
235,384.1
—
273,190.1
819.6
(1,177.7)
272,832.0
4,553.7
Segmen
t assets
Rs.
563,864.4 R
s.1,223,005.6 R
s.—
R
s.1,786,870.0 R
s.19,086.6 R
s.(7,937.1)
Rs.
1,798,019.5 U
S$30,009.5 Investm
ent in equity accounted investees
3,690.6
13,848.9
17,539.5
2,697.2
20,236.7
337.8
Recon
ciliation to total assets:
Investm
ents
101,876.8
1,700.3
Current and non-current incom
e tax assets
11,978.5
200.0
Deferred incom
e taxes
39,150.5
653.4
Other unallocated financial assets
213,513.9
3,563.6
Total assets
Rs.2,184,775.9
US$36,464.6
Segmen
t liabilities
R
s.146,968.7
Rs.
706,413.2 R
s.—
R
s.853,381.9
Rs.
6,874.1 R
s.(1,961.8)
Rs.
858,294.2 U
S$14,325.2 R
econciliation to total liab
ilities:
B
orrowings
620,099.2
10,349.5 C
urrent income tax liabilities
13,986.7
233.4 D
eferred income taxes
35,271.8
588.7 O
ther unallocated financial liabilities
25,427.7
424.6
Total liabilities
R
s.1,553,079.6
US$25,921.4
*T
ata and other brand vehicles include Tata D
aewoo and Fiat traded vehicles.
1.Includes interest bearing loans and deposits and accrued interest incom
e. 2.
Includes interest accrued and other interest bearing liabilities.
1
2

ˆ200GNal5oj!y!pKwaŠ200GNal5oj!y!pKwa
762654 FIN 84TATA MOTORS LTDFORM 20-F
30-Jul-2014 09:54 ESTHTMHKG
RR Donnelley ProFile HKR durap0dc 4*ESS 0C
ACXFBU-MWE-XN1311.5.15
Page 1 of 1
F-84
For the year en
ded / as of M
arch 31, 2013
A
utom
otive and related
activity
Tata and
other brand
vehicles in
cludin
g fin
ancing th
ereof *
Jaguar L
and R
over
In
tra-segment
elimin
ations
T
otal
O
thers
Inter-segm
ent elim
inations
T
otal
(In m
illions)
Revenues
External revenue
R
s. 515,992.6
Rs.1,365,619.8
Rs.
—
Rs. 1,881,612.4
Rs. 11,297.6
Rs.
—
Rs. 1,892,910.0
Inter-segment / intra-segm
ent revenue
874.1
—
(865.9)
8.2
10,881.2
(10,889.4)
—
Total revenues
R
s. 516,866.7
Rs. 1,365,619.8
Rs.
(865.9) R
s. 1,881,620.6 R
s. 22,178.8 R
s. (10,889.4) R
s. 1,892,910.0
Earnings before other incom
e, interest and tax
13,553.7
150,652.8
—
164,206.5
3,294.1
(1,033.8)
166,466.8 Share of profit/ (loss) of equity accounted investees
1,596.4
(1,016.4)
—
580.0
(711.5)
—
(131.5) R
econciliation to net income:
Other incom
e / (loss) (net)
12,099.1
Foreign exchange gain/ (loss) (net)
(15,774.9)
Interest income
6,928.0 Interest expense (net)
(40,792.0) Incom
e tax expense
(39,238.8)
Net Incom
e
Rs.
89,556.7
Depreciation and am
ortization
Rs.
22,580.9 R
s.53,040.5
Rs.
—
Rs.
75,621.4 R
s.146.5
Rs.
—
Rs.
75,767.9 C
apital expenditure
31,506.2
181,313.2
(9.4)
212,810.0
375.5
(1,107.6)
212,077.9
Segment assets
R
s.569,686.0
Rs.
853,814.1 R
s.—
R
s.1,423,500.1 R
s.15,475.4 R
s.(6,446.9)
Rs.1,432,528.6
Investment in equity accounted investees
3,608.8
4,959.9
—
8,568.7
12,261.0
—
20,829.7 R
econciliation to total assets:
Investments
81,473.4 C
urrent and non-current income tax assets
10,210.0 D
eferred income taxes
45,205.2 O
ther unallocated financial assets
96,919.6
Total assets
R
s.1,687,166.5
Segment liabilities
R
s.139,901.9
Rs.
523,970.2 R
s.—
R
s.663,872.1
Rs.
6,613.4 R
s.(1,650.8)
Rs.
668,834.7 R
econciliation to total liabilities:
Borrow
ings
565,615.5
Current incom
e tax liabilities
17,754.5
Deferred incom
e taxes
16,056.4
Other unallocated financial liabilities
44,999.7
Total liabilities
R
s.1,313,260.8
*T
ata and other brand vehicles include Tata D
aewoo and Fiat traded vehicles.
1.Includes interest bearing loans and deposits and accrued interest incom
e. 2.
Includes interest accrued and other interest bearing liabilities.
1
2

ˆ200GNal5ojumQ22w4Š200GNal5ojumQ22w4
762654 FIN 85TATA MOTORS LTDFORM 20-F
28-Jul-2014 11:20 ESTHTMHKG
RR Donnelley ProFile HKR ayyar0dc 5*ESS 0C
HKGFBU-MWE-XN0411.5.14
Page 1 of 1 F-85
For the year ended
March
31, 2012
Au
tomotive an
d related activity
Tata and
other brand
vehicles in
cludin
g fin
ancing th
ereof *
Jaguar L
and R
over
In
tra-segment
elimin
ations
T
otal
O
thers
Inter-segmen
t elim
ination
s
T
otal
(In m
illions)
Revenues
External revenue
Rs.
607,017.9 Rs. 1,044,533.2 R
s. —
R
s. 1,651,551.1 Rs.
9,962.8 R
s.—
R
s.1,661,513.9 Inter-segm
ent / intra-segment revenue
691.5
—
(678.9)
12.6 8,941.9
(8,954.5)
—
Total revenues
Rs.
607,709.4 Rs.1,044,533.2 R
s. (678.9) R
s.1,651,563.7 Rs. 18,904.7 R
s. (8,954.5) Rs. 1,661,513.9
Earnings before other incom
e, interest and tax
42,227.6 116,758.6
—
158,986.2
2,442.8
(1,131.1)
160,297.9 Share of profit/ (loss) of equity accounted investees
371.0
—
—
371.0
(957.8)
—
(586.8)
Impairm
ent in respect of equity an accounted investee
—
—
—
—
(4,981.0)
—
(4,981.0) R
econciliation to net income:
Other incom
e / (loss) (net)
10,039.4
Foreign exchange gain/ (loss) (net)
(11,511.7)
Interest income
4,953.4 Interest expense (net)
(38,957.7) Incom
e tax expense
(4,436.5)
Net Incom
e
R
s.114,817.0
Depreciation and am
ortization R
s.20,740.5 R
s.35,576.9 R
s.—
R
s.56,317.4 R
s.106.6
Rs.
—
Rs.
56,424.0 C
apital expenditure
36,153.3 113,242.5
—
149,395.8
55.7
(1,197.0)
148,254.5
*T
ata and other brand vehicles include Tata D
aewoo and Fiat traded vehicles.

ˆ200GNal5ojlZ3CRQ?Š200GNal5ojlZ3CRQ?
762654 FIN 86TATA MOTORS LTDFORM 20-F
25-Jul-2014 00:26 ESTHTMHKG
RR Donnelley ProFile HKR pf_rend 1*ESS 0C
HKRPRFRS1611.5.15
Page 1 of 1
Entity wide disclosures Information concerning principal geographic areas is as follows:
Net sales to external customers by geographic area by location of customers:
Non-current assets (Property, plant and equipment, Intangible assets, other non-current assets and Goodwill) by geographic area:
Information about product revenues:
F-86
Year ended March 31, 2014 2014 2013 2012 (In millions)
India US$ 6,085.1 Rs. 364,590.6 Rs. 453,275.6 Rs. 549,173.9 United States of America 4,446.9 266,436.5 189,006.6 157,854.7 United Kingdom 4,842.9 290,161.9 224,604.0 179,865.6 Rest of Europe 4,879.9 292,377.8 221,035.4 190,056.5 China 10,951.1 656,138.0 446,508.4 296,923.2 Rest of the World 7,878.8 472,055.7 358,480.0 287,640.0
Total revenues US$39,084.7 Rs. 2,341,760.5 Rs. 1,892,910.0 Rs. 1,661,513.9
As at March 31, 2014 2014 2013 (In millions)
India US$ 3,948.6 Rs. 236,588.0 Rs. 225,245.1 United States of America 50.3 3,013.5 5,274.4 United Kingdom 12,232.7 732,920.0 476,632.8 Rest of Europe 26.2 1,568.7 1,417.4 China 13.3 796.3 361.2 Rest of the World 337.6 20,228.6 13,909.9
Total US$16,608.7 Rs. 995,115.1 Rs. 722,840.8
Year ended March 31, 2014 2014 2013 2012 (In millions)
Tata and Fiat vehicles US$ 5,950.4 Rs. 356,514.0 Rs. 445,392.8 Rs. 548,922.2 Tata Daewoo commercial vehicles 793.3 47,532.3 39,204.1 31,648.4 Hispano buses and coaches 16.7 999.9 1,365.7 2,164.4 Finance revenues 498.6 29,875.9 30,013.3 24,340.4 Jaguar Land Rover vehicles 31,621.3 1,894,589.8 1,365,619.8 1,044,533.2 Others 204.4 12,248.6 11,314.3 9,905.3
Total revenues US$39,084.7 Rs. 2,341,760.5 Rs. 1,892,910.0 Rs. 1,661,513.9
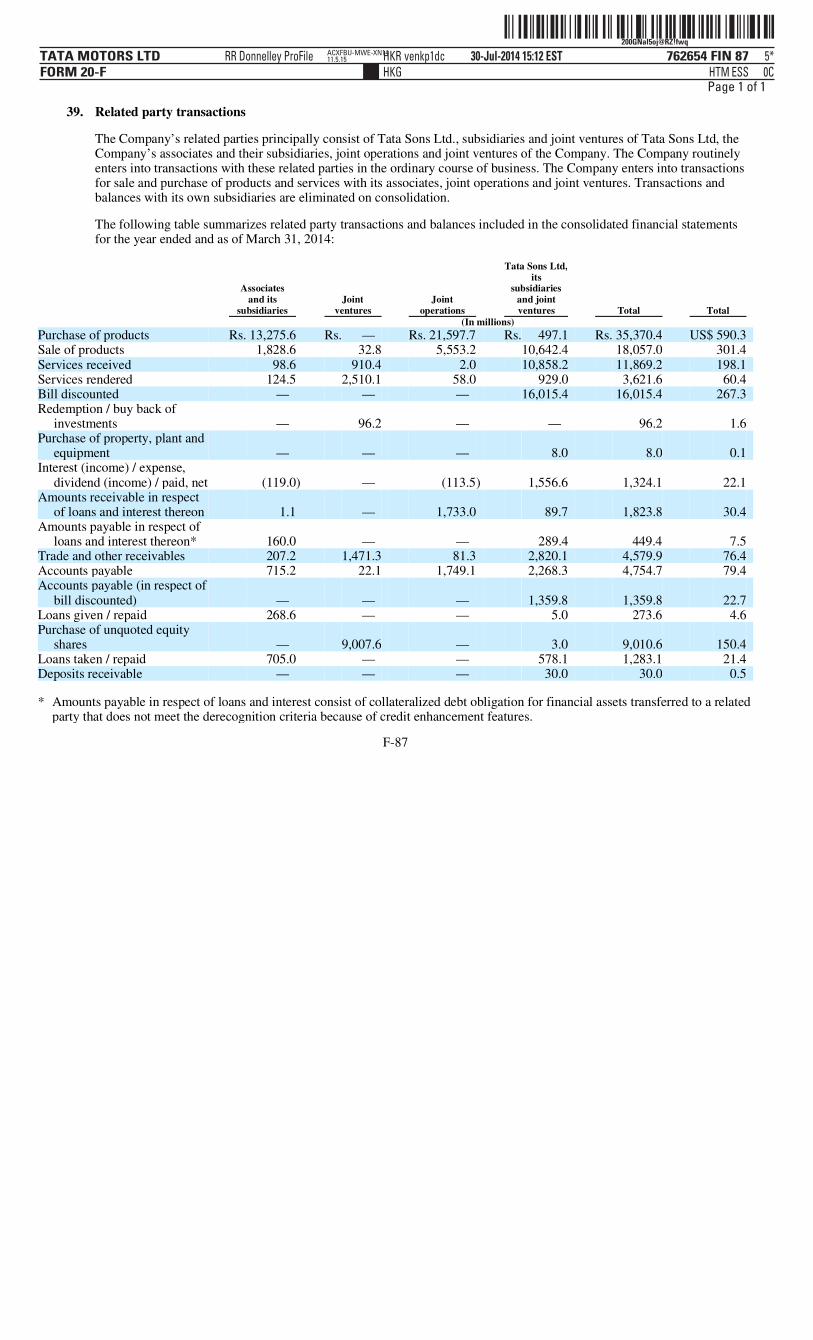
ˆ200GNal5oj@RZ!fwqŠ200GNal5oj@RZ!fwq
762654 FIN 87TATA MOTORS LTDFORM 20-F
30-Jul-2014 15:12 ESTHTMHKG
RR Donnelley ProFile HKR venkp1dc 5*ESS 0C
ACXFBU-MWE-XN1411.5.15
Page 1 of 1
The Company’s related parties principally consist of Tata Sons Ltd., subsidiaries and joint ventures of Tata Sons Ltd, the Company’s associates and their subsidiaries, joint operations and joint ventures of the Company. The Company routinely enters into transactions with these related parties in the ordinary course of business. The Company enters into transactions for sale and purchase of products and services with its associates, joint operations and joint ventures. Transactions and balances with its own subsidiaries are eliminated on consolidation.
The following table summarizes related party transactions and balances included in the consolidated financial statements for the year ended and as of March 31, 2014:
F-87
39. Related party transactions
Associates and its
subsidiaries Joint
ventures Joint
operations
Tata Sons Ltd, its
subsidiaries and joint ventures Total Total
(In millions)
Purchase of products Rs. 13,275.6 Rs. — Rs. 21,597.7 Rs. 497.1 Rs. 35,370.4 US$ 590.3 Sale of products 1,828.6 32.8 5,553.2 10,642.4 18,057.0 301.4 Services received 98.6 910.4 2.0 10,858.2 11,869.2 198.1 Services rendered 124.5 2,510.1 58.0 929.0 3,621.6 60.4 Bill discounted — — — 16,015.4 16,015.4 267.3 Redemption / buy back of
investments — 96.2 — — 96.2 1.6 Purchase of property, plant and
equipment — — — 8.0 8.0 0.1 Interest (income) / expense,
dividend (income) / paid, net (119.0) — (113.5) 1,556.6 1,324.1 22.1 Amounts receivable in respect
of loans and interest thereon 1.1 — 1,733.0 89.7 1,823.8 30.4 Amounts payable in respect of
loans and interest thereon* 160.0 — — 289.4 449.4 7.5 Trade and other receivables 207.2 1,471.3 81.3 2,820.1 4,579.9 76.4 Accounts payable 715.2 22.1 1,749.1 2,268.3 4,754.7 79.4 Accounts payable (in respect of
bill discounted) — — — 1,359.8 1,359.8 22.7 Loans given / repaid 268.6 — — 5.0 273.6 4.6 Purchase of unquoted equity
shares — 9,007.6 — 3.0 9,010.6 150.4 Loans taken / repaid 705.0 — — 578.1 1,283.1 21.4 Deposits receivable — — — 30.0 30.0 0.5
* Amounts payable in respect of loans and interest consist of collateralized debt obligation for financial assets transferred to a related party that does not meet the derecognition criteria because of credit enhancement features.

ˆ200GNal5oj@Ra3vQXŠ200GNal5oj@Ra3vQX
762654 FIN 88TATA MOTORS LTDFORM 20-F
30-Jul-2014 15:12 ESTHTMHKG
RR Donnelley ProFile HKR venkp1dc 6*ESS 0C
NERFBU-MWE-XN0111.5.15
Page 1 of 1
The following table summarizes related party transactions and balances included in the consolidated financial statements for the year ended and as of March 31, 2013:
The following table summarizes related party transactions and balances included in the consolidated financial statements for the year ended and as of March 31, 2012:
F-88
Associates and its
subsidiaries Joint
ventures Joint
operations
Tata Sons Ltd, its
subsidiaries andjoint ventures Total
(In millions)
Purchase of products Rs.26,224.5 Rs. — Rs.26,126.3 Rs. 1,354.4 Rs.53,705.2 Sale of products 2,078.8 9.8 3,111.1 8,303.6 13,503.3 Services received 1.5 0.4 2.4 5,181.1 5,185.4 Services rendered 153.7 745.0 23.0 575.7 1,497.4 Interest (income) / expense,
dividend (income) / paid, net (253.1) (25.4) (355.1) 2,986.7 2,353.1 Amounts receivable in respect
of loans and interest thereon 38.0 — 1,625.7 53.3 1,717.0 Amounts payable in respect of
loans and interest thereon* 295.0 — — 1,431.1 1,726.1 Trade and other receivables 246.6 636.4 399.6 1,858.0 3,140.6 Accounts payable 729.3 — 184.4 2,321.5 3,235.2 Loans given / repaid 238.4 710.3 — 410.0 1,358.7 Purchase of unquoted equity
shares — 6,216.6 — 18.4 6,235.0 Loans taken / repaid 1,215.0 — — 8,567.1 9,782.1 Deposits receivable — — — 30.0 30.0
* Amounts payable in respect of loans and interest consist of collateralized debt obligation for financial assets transferred to a related party that does not meet the derecognition criteria because of credit enhancement features.
Associates and its
subsidiaries Joint
ventures Joint
operations
Tata Sons Ltd, its
subsidiaries andjoint ventures Total
(In millions)
Purchase of products Rs.33,885.3 Rs. — Rs.34,980.4 Rs. 1,819.5 Rs.70,685.2 Sale of products 3,068.3 11.0 3,642.6 8,388.4 15,110.3 Services received 21.8 6.0 — 4,431.4 4,459.2 Services rendered 174.7 3.6 70.3 504.7 753.3 Issue of shares by a subsidiary to
non controlling interests shareholders — — — 1,410.6 1,410.6
Interest (income) / expense, dividend (income) / paid, net (206.7) — (299.5) 3,576.6 3,070.4
Amounts receivable in respect of loans and interest thereon 276.3 — 1,518.8 263.2 2,058.3
Amounts payable in respect of loans and interest thereon* 302.0 — — 3,962.6 4,264.6
Trade and other receivables 899.1 45.4 97.6 1,917.3 2,959.4 Accounts payable 784.0 — 816.2 1,344.2 2,944.4 Loans given / repaid 710.0 — — 10,106.3 10,816.3 Purchase of shares in subsidiary — — — 3,043.4 3,043.4 Purchase of unquoted equity
shares — — — 346.8 346.8 Loans taken / repaid 940.0 — — 4,019.8 4,959.8 Deposits receivable — — — 30.0 30.0
* Amounts payable in respect of loans and interest consist of collateralized debt obligation for financial assets transferred to a related party that does not meet the derecognition criteria because of credit enhancement features.

ˆ200GNal5ojw#vHPQ~Š200GNal5ojw#vHPQ~
762654 FIN 89TATA MOTORS LTDFORM 20-F
29-Jul-2014 05:42 ESTHTMHKG
RR Donnelley ProFile HKR durap0dc 5*ESS 0C
HKGFBU-MWE-XN0311.5.15
Page 1 of 1
Compensation of key management personnel:
Subsequent to the balance sheet date, the Company’s resolution for approval of the compensation to certain key management personnel in excess of the statutory limit, amounting to Rs. 201.2 million (including payment to legal heir) did not receive the required percentage of shareholder votes for approval. The Company is considering its options.
Other transactions with key management personnel:
Refer note 32 for information on transactions with post-employment benefit plans.
F-89
Year ended March 31, 2014 2014 2013 2012 (In millions)
Short-term benefits US$ 7.0 Rs.417.6 Rs.357.5 Rs.487.9 Termination benefits — — — 276.5 Post-employment benefits*# 1.6 95.3 148.9 219.3
* Excludes provision for encashable leave and gratuity for certain key management personnel as a separate actuarial valuation is not available.
# Excludes statutory dues paid on the demise of Mr. Karl Slym to his legal heirs namely social security benefit and gratuity, aggregating Rs. 24.1 million.
Year ended March 31, 2014 2014 2013 2012 (In millions)
Interest (income) / expense, dividend (income) / paid, net US$— Rs.— Rs. 5.9 Rs. 16.2 Amounts receivable in respect of loans and interest thereon — — — 0.9 Fixed deposits repaid — — — 129.0 Amounts payable in respect of fixed deposits and interest
thereon — — — 2.0

ˆ200GNal5ojlZ9K&QlŠ200GNal5ojlZ9K&Ql
762654 FIN 90TATA MOTORS LTDFORM 20-F
25-Jul-2014 00:26 ESTHTMHKG
RR Donnelley ProFile HKR pf_rend 1*ESS 0C
HKRPRFRS1611.5.15
Page 1 of 1
Subsequent to the year ended March 31, 2014, TML Holdings Pte Ltd Singapore (TMLHS), a subsidiary of the Company has issued unsecured USD 300 million (approximately Rs. 18,040.5 million), 5.75% Senior Notes due 2021.
F-90
40. Subsequent events

ˆ200GNal5ojlZBtjQDŠ200GNal5ojlZBtjQD
762654 FIN 91TATA MOTORS LTDFORM 20-F
25-Jul-2014 00:26 ESTHTMHKG
RR Donnelley ProFile HKR pf_rend 1*ESS 0C
HKRPRFRS1611.5.15
Page 1 of 1
F-91
41. Earnings per share (“EPS”)
Net income
attributable to shareholders of
Tata Motors Limited
(In millions)
Weighted average shares
(Nos.) Earnings per share
For the year ended March 31, 2014: Ordinary Shares
Basic net earnings per share Rs. 111,076.1 2,732,346,381 Rs. 40.7 US$ 1,853.9 US$ 0.7
Effect of shares kept in abeyance Rs. (5.5) 489,261 Rs. (11.2) US$ (0.1) US$ (0.2)
Diluted earnings per share Rs. 111,070.6 2,732,835,642 Rs. 40.6 US$ 1,853.8 US$ 0.7
‘A’ Ordinary Shares Basic net earnings per share Rs. 19,641.0 481,962,228 Rs. 40.8
US$ 327.8 US$ 0.7
Effect of shares kept in abeyance Rs. 5.5 244,287 Rs. 22.5 US$ 0.1 US$ 0.4
Diluted earnings per share Rs. 19,646.5 482,206,515 Rs. 40.7 US$ 327.9 US$ 0.7
For the year ended March 31, 2013:
Ordinary Shares Basic net earnings per share Rs. 75,224.4 2,706,014,707 Rs. 27.8
Effect of shares kept in abeyance Rs. (3.8) 492,722 Rs. (7.7)
Diluted earnings per share Rs. 75,220.6 2,706,507,429 Rs. 27.8 ‘A’ Ordinary Shares
Basic net earnings per share Rs. 13,446.1 481,958,717 Rs. 27.9
Effect of shares kept in abeyance Rs. 3.8 247,798 Rs. 15.3
Diluted earnings per share Rs. 13,449.9 482,206,515 Rs. 27.9 For the year ended March 31, 2012:
Ordinary Shares
Basic net earnings per share Rs. 96,677.9 2,691,542,867 Rs. 35.9
Effect of shares kept in abeyance Rs. (6.4) 529,377 Rs. (12.1)
Effect of Zero Coupon Convertible Alternative Reference Securities (USD) due 2012 (CARS) Rs. 2,730.8 105,818,480 25.8
Diluted earnings per share Rs. 99,402.3 2,797,890,724 Rs. 35.5 ‘A’ Ordinary Shares
Basic net earnings per share Rs. 17,357.8 481,900,898 Rs. 36.0
Effect of shares kept in abeyance Rs. 6.4 305,518 Rs. 20.9
Effect of Zero Coupon Convertible Alternative Reference Securities (USD) due 2012 (CARS) Rs. (184.3) — —
Diluted earnings per share Rs. 17,179.9 482,206,416 Rs. 35.6

ˆ200GNal5ojlZDPMQRŠ200GNal5ojlZDPMQR
762654 FIN 92TATA MOTORS LTDFORM 20-F
25-Jul-2014 00:26 ESTHTMHKG
RR Donnelley ProFile HKR pf_rend 1*ESS 0C
HKRPRFRS1611.5.15
Page 1 of 1
‘A’ Ordinary shares holders are entitled to receive dividend at 5 percentage points more than the aggregate rate of dividend determined by the Company on Ordinary shares for the financial year.
The effect of 28,549,588 Ordinary shares issuable as of March 31, 2013, on conversion of 4% Foreign Currency Convertible Notes (USD) due 2014, is anti-dilutive for the year ended March 31, 2013 and have not been considered in the computation of diluted EPS.
The effect of 44,777,255 Ordinary shares issuable as of March 31, 2012, on conversion of 4% Foreign Currency Convertible Notes (USD) due 2014 is anti-dilutive for the year ended March 31, 2012 and have not been considered in the computation of diluted EPS.
F-92

ˆ200GNal5ojx1in4Q*Š200GNal5ojx1in4Q*
762654 FIN 93TATA MOTORS LTDFORM 20-F
29-Jul-2014 07:05 ESTHTMHKG
RR Donnelley ProFile HKR durap0dcSTART PAGE
13*ESS 0C
HKGFBU-MWE-XN0311.5.15
Page 1 of 1
Schedule - 1 Condensed financial information of Tata Motors Limited (“Parent Company”) on a standalone basis A. Balance Sheet
F-93
As at March 31, 2014 2014 2013 (In millions)
EQUITY AND LIABILITIES
Shareholders’ funds
Share capital US$ 107.4 Rs. 6,437.8 Rs. 6,380.7 Reserves and surplus 3,093.2 185,328.7 184,967.7
Total shareholders’ fund 3,200.6 191,766.5 191,348.4
Non-current liabilities:
Long-term borrowings 1,626.7 97,464.5 80,517.8 Deferred tax liabilities (net) 7.2 431.1 19,639.1 Other long-term liabilities 192.9 11,554.8 12,384.4 Long-term provisions 136.1 8,152.0 6,911.9
Total non-current liabilities 1,962.9 117,602.4 119,453.2
Current liabilities:
Short-term borrowings 796.0 47,690.8 62,169.1 Trade payables 1,614.3 96,723.6 84,550.2 Other current liabilities 411.1 24,631.8 49,231.0 Short-term provisions 315.9 18,929.1 15,095.8
Total current liabilities 3,137.3 187,975.3 211,046.1
Total liabilities 5,100.2 305,577.7 330,499.3
Total equity and liabilities US$ 8,300.8 Rs. 497,344.2 Rs. 521,847.7
ASSETS: Non-current assets:
Fixed assets
Tangible assets 2,025.1 121,335.0 122,877.1 Intangible assets 518.6 31,070.7 31,680.3 Capital work-in-progress 286.5 17,168.5 15,078.4 Intangible assets under development 774.1 46,382.2 32,449.6
3,604.3 215,956.4 202,085.4 Non-current investments 3,063.9 183,575.7 181,717.1 Long-term loans and advances 487.1 29,183.0 35,752.4 Other non-current assets 20.7 1,238.5 943.2
Total non-current assets 7,176.0 429,953.6 420,498.1
Current assets:
Current investments 16.8 1,008.5 17,626.8 Inventories 644.7 38,625.3 44,550.3 Trade receivables 203.1 12,167.0 18,180.4 Cash and bank balances 37.7 2,261.5 4,628.6 Short-term loans and advances 204.3 12,237.7 15,320.9 Other current assets 18.2 1,090.6 1,042.6
Total current assets 1,124.8 67,390.6 101,349.6
Total assets US$ 8,300.8 Rs. 497,344.2 Rs. 521,847.7
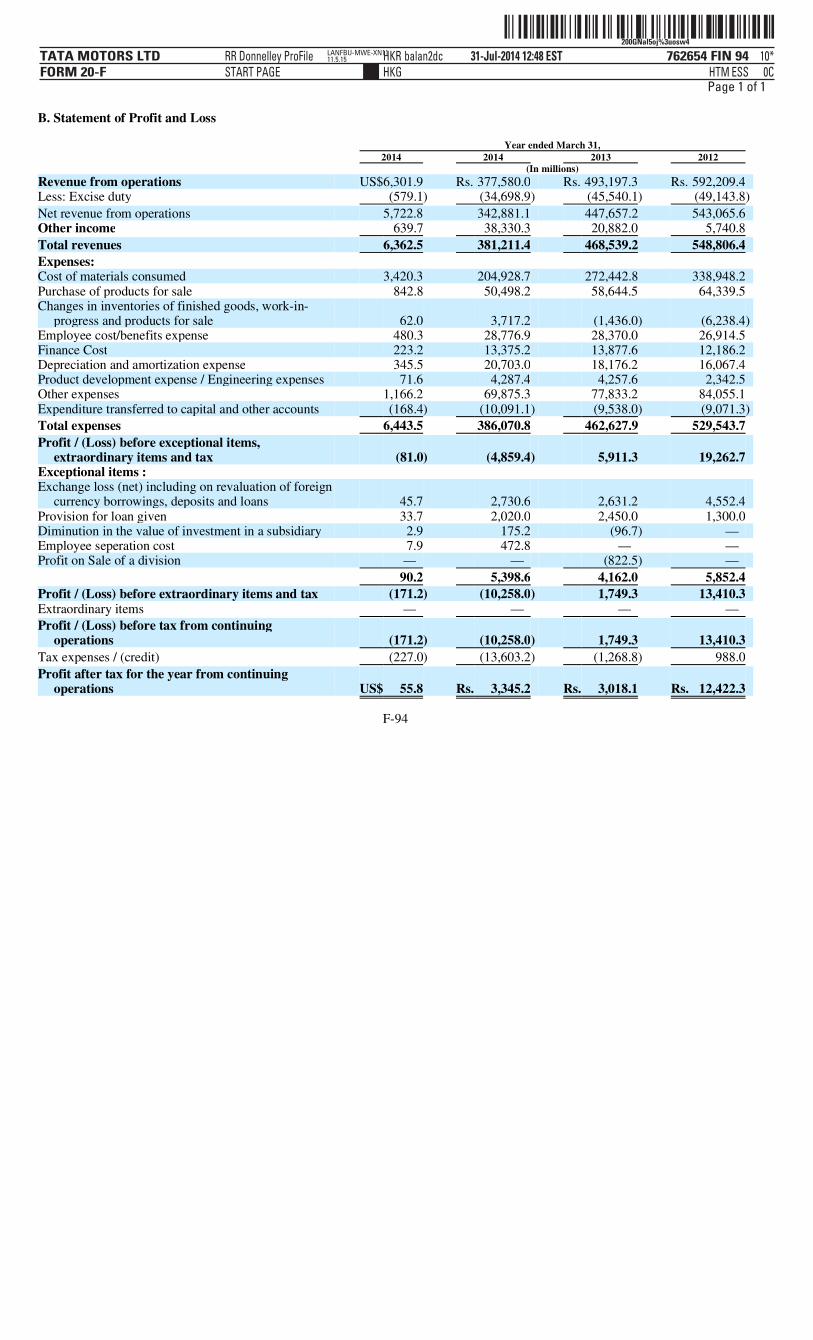
ˆ200GNal5oj%3uosw4Š200GNal5oj%3uosw4
762654 FIN 94TATA MOTORS LTDFORM 20-F
31-Jul-2014 12:48 ESTHTMHKG
RR Donnelley ProFile HKR balan2dcSTART PAGE
10*ESS 0C
LANFBU-MWE-XN1111.5.15
Page 1 of 1
B. Statement of Profit and Loss
F-94
Year ended March 31, 2014 2014 2013 2012 (In millions)
Revenue from operations US$6,301.9 Rs. 377,580.0 Rs. 493,197.3 Rs. 592,209.4 Less: Excise duty (579.1) (34,698.9) (45,540.1) (49,143.8)
Net revenue from operations 5,722.8 342,881.1 447,657.2 543,065.6 Other income 639.7 38,330.3 20,882.0 5,740.8
Total revenues 6,362.5 381,211.4 468,539.2 548,806.4
Expenses:
Cost of materials consumed 3,420.3 204,928.7 272,442.8 338,948.2 Purchase of products for sale 842.8 50,498.2 58,644.5 64,339.5 Changes in inventories of finished goods, work-in-
progress and products for sale 62.0 3,717.2 (1,436.0) (6,238.4) Employee cost/benefits expense 480.3 28,776.9 28,370.0 26,914.5 Finance Cost 223.2 13,375.2 13,877.6 12,186.2 Depreciation and amortization expense 345.5 20,703.0 18,176.2 16,067.4 Product development expense / Engineering expenses 71.6 4,287.4 4,257.6 2,342.5 Other expenses 1,166.2 69,875.3 77,833.2 84,055.1 Expenditure transferred to capital and other accounts (168.4) (10,091.1) (9,538.0) (9,071.3)
Total expenses 6,443.5 386,070.8 462,627.9 529,543.7
Profit / (Loss) before exceptional items, extraordinary items and tax (81.0) (4,859.4) 5,911.3 19,262.7
Exceptional items :
Exchange loss (net) including on revaluation of foreign currency borrowings, deposits and loans 45.7 2,730.6 2,631.2 4,552.4
Provision for loan given 33.7 2,020.0 2,450.0 1,300.0 Diminution in the value of investment in a subsidiary 2.9 175.2 (96.7) — Employee seperation cost 7.9 472.8 — — Profit on Sale of a division — — (822.5) —
90.2 5,398.6 4,162.0 5,852.4
Profit / (Loss) before extraordinary items and tax (171.2) (10,258.0) 1,749.3 13,410.3 Extraordinary items — — — —
Profit / (Loss) before tax from continuing operations (171.2) (10,258.0) 1,749.3 13,410.3
Tax expenses / (credit) (227.0) (13,603.2) (1,268.8) 988.0
Profit after tax for the year from continuing operations US$ 55.8 Rs. 3,345.2 Rs. 3,018.1 Rs. 12,422.3

ˆ200GNal5ojx4dHcwIŠ200GNal5ojx4dHcwI
762654 FIN 95TATA MOTORS LTDFORM 20-F
29-Jul-2014 07:24 ESTHTMHKG
RR Donnelley ProFile HKR jayab0dcSTART PAGE
7*ESS 0C
ACXFBU-MWE-XN1511.5.15
Page 1 of 1
C. Statements of Cash Flows
F-95
Year ended March 31, 2014 2014 2013 2012 (In millions)
Cash flows from operating activities:
Profit after tax US$ 55.8 Rs.3,345.2 Rs.3,018.1 Rs.12,422.3 Adjustments for:
Depreciation / amortization 345.5 20,703.0 18,176.2 16,067.4 Lease equalisation adjusted in income (0.8) (45.2) (45.2) (45.2) Profit on sale of a division — — (822.5) — Provision for loans and inter corporate deposits (net) — — 52.9 — Provision / (reversal) for dimunition in value of investments 2.9 175.2 (96.7) — Provision for loan given 33.7 2,020.0 2,450.0 1,300.0 (Profit) / loss on sale of assets (net) [including assets
scrapped / written off] 3.4 202.9 29.6 (17.9) Tax expenses / (credit) (net) (227.0) (13,603.2) (1,268.8) 988.0 Profit on sale of investments (net) (342.5) (20,523.3) (439.1) (297.8) Exchange differences (net) 46.2 2,769.0 1,993.9 5,875.9 Interest / Dividend (net) (74.0) (4,431.8) (6,565.2) 6,743.2
Operating profit / (loss) before working capital changes (156.8) (9,388.2) 16,483.2 43,035.9 Trade receivable 100.4 6,013.4 8,902.8 (927.9) Finance receivable 2.5 150.0 647.6 1,449.7 Other current and non-current assets 23.6 1,413.7 (1,383.0) 338.0 Inventories 98.9 5,925.0 1,294.2 (6,968.4) Trade payable and acceptances 202.4 12,128.3 (2,499.3) (780.2) Other current and non-current liabilities 41.6 2,492.5 (3,815.0) 1,713.2 Provisions 107.8 6,460.5 1,880.6 2,040.4
Cash generated from operations 420.4 25,195.2 21,511.1 39,900.7 Income taxes (paid) / credit (net) (9.4) (560.6) 1,073.3 (3,364.8)
Net cash from operating activities 411.0 24,634.6 22,584.4 36,535.9
Cash flows from investing activities:
Fixed / restricted deposits with scheduled banks made (88.5) (5,301.5) (2,058.5) (8,684.4) Fixed / restricted deposits with scheduled banks realised 126.9 7,604.0 7,800.0 6,655.1 Fixed deposit with financial institution made (33.4) (2,000.0) — — Fixed deposit with financial institution realised 33.4 2,000.0 — — Realisation of loans to associates and subsidiaries 49.7 2,978.3 — — Investment in subsidiary companies (74.0) (4,431.8) (1,861.2) (16,840.1) Investment in associate companies — — (0.1) (44.5) Investment- others — — (8.4) — Investment in mutual fund (purchased) / sold (net) 74.4 4,456.3 (3,155.1) 1,147.8 Loans to associates and subsidiaries (24.4) (1,462.8) (1,943.6) (869.2) Proceeds from sale of a division — — 1,100.0 — Sale / redemption of investments in subsidiary companies 664.0 39,784.8 13,789.5 41,469.8 Advance towards investment in subsidiary companies (22.6) (1,351.5) (168.2) (1,228.6) Advance towards investment in other companies — — — (250.0) Redemption of investments in associate companies — — 210.0 — Redemption of investments- others — — 107.5 7.5

ˆ200GNal5oj!td2FQNŠ200GNal5oj!td2FQN
762654 FIN 96TATA MOTORS LTDFORM 20-F
30-Jul-2014 09:22 ESTHTMHKG
RR Donnelley ProFile HKR gurur0dc 8*ESS 0C
HKGFBU-MWE-XN0311.5.15
Page 1 of 1
F-96
Year ended March 31, 2014 2014 2013 2012 (In millions)
Deposits of margin money / cash collateral US$ — Rs. — Rs.(13.8) Rs.(58.5) Realisation of margin money / cash collateral — — 912.5 3,642.4 Investments in joint venture (54.2) (3,250.0) — (425.0) (Increase) / decrease in short term inter corporate deposits (6.7) (400.0) 435.3 160.4 Interest received 30.3 1,817.0 4,040.7 3,311.1 Dividend received 267.5 16,026.8 16,606.5 1,806.3 Payments for fixed assets (518.3) (31,054.2) (26,053.9) (28,525.6) Proceeds from sale of fixed assets 1.9 113.7 169.5 170.9 Decrease in investments in retained interests in securitisation
transactions — — 6.3 1.8
Net cash from investing activities 426.0 25,529.1 9,915.0 1,447.2
Cash flows from financing activities:
Expenses on Foreign Currency Convertible Notes (FCCN) / Convertible Alternative Reference Securities (CARS) conversion (0.1) (3.5) (2.3) —
Proceeds from issue of shares held in abeyance — 0.9 1.6 0.2 Dividends paid (including dividend distribution tax) (108.3) (6,488.1) (14,604.1) (14,622.8) Interest paid [including discounting charges paid, Rs.
3,737.8 million (2012-13 Rs. 3,450.6 million and 2011-12 Rs. 3,656.2 million)] (292.1) (17,499.0) (18,094.2) (14,823.5)
Brokerage and other expenses on Non-Convertible Debentures (NCD) (14.6) (875.4) (930.2) (766.9)
Premium paid on redemption of Non-Convertible Debentures (NCD) (109.8) (6,580.5) (965.5) —
Premium on redemption of FCCN / (CARS) (including tax) — — (8,869.5) (9.7) Repayment of fixed deposits (60.5) (3,621.9) (18,683.8) (10,692.5) Proceeds from short-term borrowings 1,426.7 85,480.0 118,737.9 44,422.6 Repayment of short-term borrowings (1,448.7) (86,798.6) (101,778.0) (73,262.4) Net change in other short-term borrowing (with maturity up to
three months) (245.9) (14,734.1) 12,877.5 3,166.1 Proceeds from long-term borrowings 385.6 23,105.9 25,628.4 24,982.4 Repayments of long-term borrowings (372.6) (22,323.8) (33,774.7) (749.4)
Net cash used in financing activities (840.3) (50,338.1) (40,456.9) (42,355.9)
Net decrease in cash and cash equivalents (3.3) (174.4) (7,957.5) (4,372.8) Cash and cash equivalents as at April 01, (opening balance) 34.3 2,055.7 9,196.4 13,521.4 Exchange fluctuation on foreign currency bank balances 1.8 105.5 816.8 47.8
Cash and cash equivalents as at March 31, (closing balance) US$ 32.8 Rs.1,986.8 Rs.2,055.7 Rs.9,196.4
Non-cash transactions:
Foreign Currency Convertible Notes (FCCN) / Convertible Alternative Reference Securities (CARS) converted to Ordinary shares US$ 69.0 Rs.4,133.4 Rs.2,328.3 Rs. —

ˆ200GNal5ojw%@b5QÄŠ 200GNal5ojw%@b5Q˜
762654 FIN 97TATA MOTORS LTDFORM 20-F
29-Jul-2014 06:28 ESTHTMHKG
RR Donnelley ProFile HKR durap0dc 9*ESS 0C
HKGFBU-MWE-XN0311.5.15
Page 1 of 1
The financial statements are prepared under the historical cost convention on an accrual basis of accounting in accordance with the generally accepted accounting principles, Accounting Standards notified under Section 211 (3C) of the Companies Act, 1956, (the “Act”) and the relevant provisions thereof which continue to be applicable in respect of Section 133 of Companies Act, 2013 in terms of General Circular 15/2013 dated September 13, 2013 of the Ministry of Corporate Affairs.
The preparation of financial statements requires management to make judgments, estimates and assumptions, that affect the application of accounting policies and the reported amounts of assets, liabilities, income, expenses and disclosures of contingent liabilities at the date of these financial statements. Actual results may differ from these estimates. Estimates and underlying assumptions are reviewed at each balance sheet date. Revisions to accounting estimates are recognised in the period in which the estimate is revised and future periods affected.
The Company recognises revenues on the sale of products, net of discounts and sales incentives, when the products are delivered to the dealer / customer or when delivered to the carrier for export sales, which is when risks and rewards of ownership pass to the dealer / customer. Sales include income from services, and exchange fluctuations relating to export receivables. Sales include export and other recurring and non-recurring incentives from the Government at the national and state levels. Sale of products is presented gross of excise duty where applicable, and net of other indirect taxes. Revenues are recognised when collectability of the resulting receivables is reasonably assured. Dividend from investments is recognized when the right to receive the payment is established and when no significant uncertainty as to measurability or collectability exits. Interest income is recognized on the time basis determined by the amount outstanding and the rate applicable and where no significant uncertainty as to measurability or collectability exists.
F-97
D. Significant accounting policies
(a) Basis of preparation
(b) Use of estimates
(c) Revenue recognition
(d) Depreciation and amortisation
(i) Depreciation is provided on Straight Line Method (SLM), at the rates and in the manner prescribed in Schedule XIV
to the Companies Act, 1956 except in the case of :
• Leasehold Land – amortised over the period of the lease • Technical Know-how – at 16.67% (SLM) • Laptops – at 23.75% (SLM) • Cars – at 23.75% (SLM)
• Assets acquired prior to April 1, 1975 – on Written Down Value basis at rates specified in Schedule XIV to the
Companies Act, 1956.
• Software in excess of Rs. 25,000 is amortised over a period of 60 months or on the basis of estimated useful
life whichever is lower. • Assets taken on lease are amortised over the period of lease.
(ii) Product development cost are amortised over a period of 36 months to 120 months or on the basis of actual
production to planned production volume over such period.
(iii) In respect of assets whose useful life has been revised, the unamortised depreciable amount has been charged over
the revised remaining useful life.
(iv) Depreciation is not recorded on capital work-in-progress until construction and installation are complete and asset is
ready for its intended use.
(v) Capital assets, the ownership of which doesn’t vest with the Company, other than leased assets, are depreciated over
the estimated period of their utility or five years, whichever is less.
(e) Fixed assets
(i) Fixed assets are stated at cost of acquisition or construction less accumulated depreciation / amortization and
accumulated impairment, if any.
(ii) Product development cost incurred on new vehicle platform, engines, transmission and new products are recognised
as fixed assets, when feasibility has been established, the Company has committed technical, financial and other resources to complete the development and it is probable that asset will generate probable future benefits.
(iii) Cost includes purchase price, taxes and duties, labour cost and directly attributable overhead expenditure for self constructed assets incurred up to the date the asset is ready for its intended use. Borrowing cost incurred for qualifying assets is capitalised up to the date the asset is ready for intended use, based on borrowings incurred specifically for financing the asset or the weighted average rate of all other borrowings, if no specific borrowings have been incurred for the asset. The cost of acquisition is further adjusted for exchange differences relating to long term foreign currency borrowings attributable to the acquisition of depreciable asset w.e.f. April 1, 2007.
(iv) Software not exceeding Rs. 25,000 and product development costs relating to minor product enhancements, facelifts
and upgrades are charged off to the Statement of Profit and Loss as and when incurred.
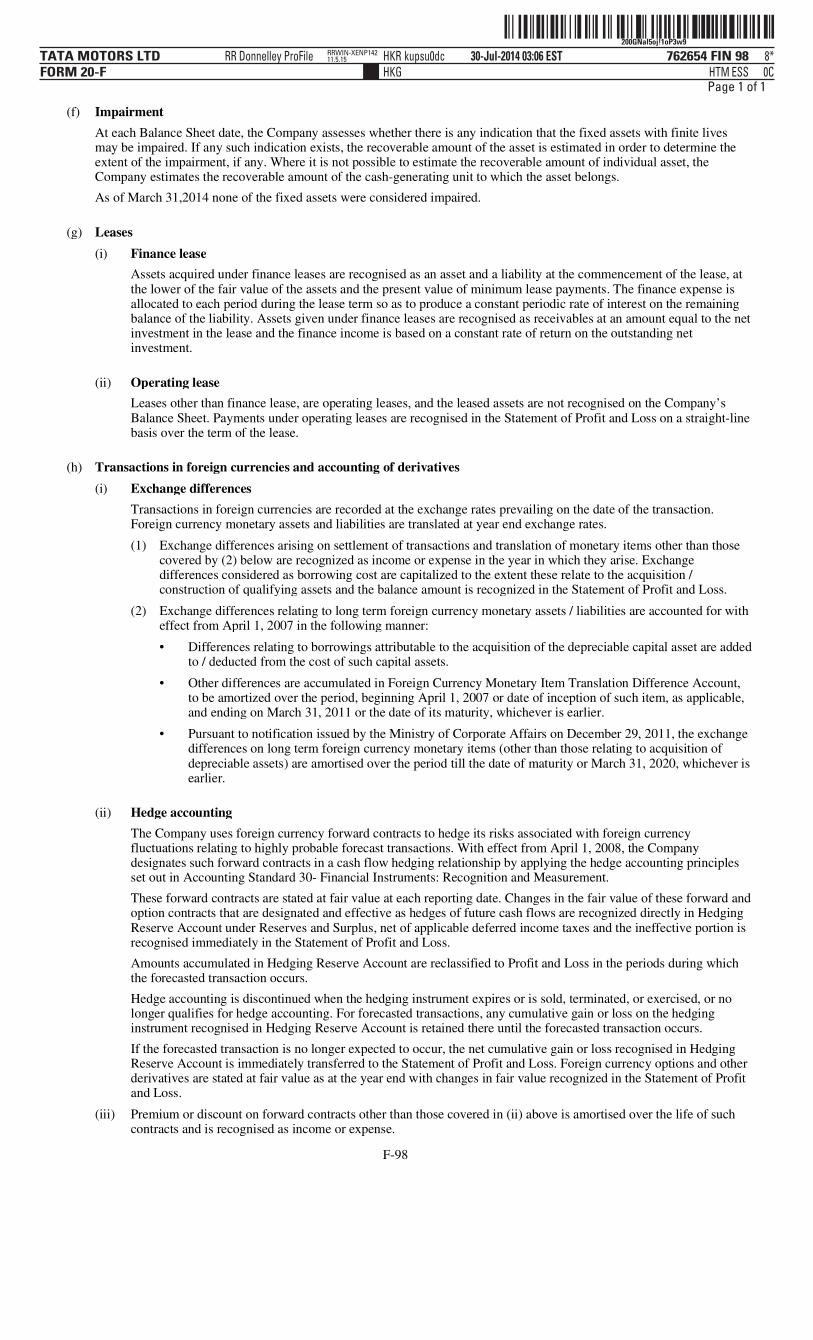
ˆ200GNal5oj!1oP3w9Š200GNal5oj!1oP3w9
762654 FIN 98TATA MOTORS LTDFORM 20-F
30-Jul-2014 03:06 ESTHTMHKG
RR Donnelley ProFile HKR kupsu0dc 8*ESS 0C
RRWIN-XENP14211.5.15
Page 1 of 1
At each Balance Sheet date, the Company assesses whether there is any indication that the fixed assets with finite lives may be impaired. If any such indication exists, the recoverable amount of the asset is estimated in order to determine the extent of the impairment, if any. Where it is not possible to estimate the recoverable amount of individual asset, the Company estimates the recoverable amount of the cash-generating unit to which the asset belongs. As of March 31,2014 none of the fixed assets were considered impaired.
Assets acquired under finance leases are recognised as an asset and a liability at the commencement of the lease, at the lower of the fair value of the assets and the present value of minimum lease payments. The finance expense is allocated to each period during the lease term so as to produce a constant periodic rate of interest on the remaining balance of the liability. Assets given under finance leases are recognised as receivables at an amount equal to the net investment in the lease and the finance income is based on a constant rate of return on the outstanding net investment.
Leases other than finance lease, are operating leases, and the leased assets are not recognised on the Company’s Balance Sheet. Payments under operating leases are recognised in the Statement of Profit and Loss on a straight-line basis over the term of the lease.
Transactions in foreign currencies are recorded at the exchange rates prevailing on the date of the transaction. Foreign currency monetary assets and liabilities are translated at year end exchange rates.
The Company uses foreign currency forward contracts to hedge its risks associated with foreign currency fluctuations relating to highly probable forecast transactions. With effect from April 1, 2008, the Company designates such forward contracts in a cash flow hedging relationship by applying the hedge accounting principles set out in Accounting Standard 30- Financial Instruments: Recognition and Measurement. These forward contracts are stated at fair value at each reporting date. Changes in the fair value of these forward and option contracts that are designated and effective as hedges of future cash flows are recognized directly in Hedging Reserve Account under Reserves and Surplus, net of applicable deferred income taxes and the ineffective portion is recognised immediately in the Statement of Profit and Loss. Amounts accumulated in Hedging Reserve Account are reclassified to Profit and Loss in the periods during which the forecasted transaction occurs. Hedge accounting is discontinued when the hedging instrument expires or is sold, terminated, or exercised, or no longer qualifies for hedge accounting. For forecasted transactions, any cumulative gain or loss on the hedging instrument recognised in Hedging Reserve Account is retained there until the forecasted transaction occurs. If the forecasted transaction is no longer expected to occur, the net cumulative gain or loss recognised in Hedging Reserve Account is immediately transferred to the Statement of Profit and Loss. Foreign currency options and other derivatives are stated at fair value as at the year end with changes in fair value recognized in the Statement of Profit and Loss.
F-98
(f) Impairment
(g) Leases
(i) Finance lease
(ii) Operating lease
(h) Transactions in foreign currencies and accounting of derivatives
(i) Exchange differences
(1) Exchange differences arising on settlement of transactions and translation of monetary items other than those covered by (2) below are recognized as income or expense in the year in which they arise. Exchange differences considered as borrowing cost are capitalized to the extent these relate to the acquisition / construction of qualifying assets and the balance amount is recognized in the Statement of Profit and Loss.
(2) Exchange differences relating to long term foreign currency monetary assets / liabilities are accounted for with
effect from April 1, 2007 in the following manner:
• Differences relating to borrowings attributable to the acquisition of the depreciable capital asset are added
to / deducted from the cost of such capital assets.
• Other differences are accumulated in Foreign Currency Monetary Item Translation Difference Account,
to be amortized over the period, beginning April 1, 2007 or date of inception of such item, as applicable, and ending on March 31, 2011 or the date of its maturity, whichever is earlier.
• Pursuant to notification issued by the Ministry of Corporate Affairs on December 29, 2011, the exchange differences on long term foreign currency monetary items (other than those relating to acquisition of depreciable assets) are amortised over the period till the date of maturity or March 31, 2020, whichever is earlier.
(ii) Hedge accounting
(iii) Premium or discount on forward contracts other than those covered in (ii) above is amortised over the life of such
contracts and is recognised as income or expense.

ˆ200GNal5oj!3b9mQ:Š200GNal5oj!3b9mQ:
762654 FIN 99TATA MOTORS LTDFORM 20-F
30-Jul-2014 03:12 ESTHTMHKG
RR Donnelley ProFile HKR peetp0dc 8*ESS 0C
WCRFBU-MWE-XN0311.5.15
Page 1 of 1
The estimated liability for product warranties is recorded when products are sold. These estimates are established using historical information on the nature, frequency and average cost of warranty claims and management estimates regarding possible future incidence based on corrective actions on product failures. The timing of outflows will vary as and when warranty claim will arise - being typically up to 3 to 4 years.
Interest income from loan contracts are accounted for by using the Internal Rate of Return method. Consequently, a constant rate of return on the net outstanding amount is accrued over the period of contract. The Company provides an allowance for hire purchase and loan receivables that are in arrears for more than 11 months, to the extent of an amount equivalent to the outstanding principal and amounts due but unpaid, considering probable inherent loss including estimated realisation based on past performance trends. In respect of loan contracts that are in arrears for more than 6 months but not more than 11 months, allowance is provided to the extent of 10% of the outstanding and amount due but unpaid.
Inventories are valued at the lower of cost and net realisable value. Cost of raw materials and consumables are ascertained on a moving weighted average / monthly moving weighted average basis. Cost, including variable and fixed overheads, are allocated to work-in-progress, stock-in-trade and finished goods determined on full absorption cost basis. Net realisable value is estimated selling price in the ordinary course of business less estimated cost of completion and selling expenses.
The Company has an obligation towards gratuity, a defined benefit retirement plan covering eligible employees. The plan provides for a lump sum payment to vested employees at retirement, death while in employment or on termination of employment of an amount equivalent to 15 to 30 days salary payable for each completed year of service. Vesting occurs upon completion of five years of service. The Company makes annual contributions to gratuity fund established as trust. The Company accounts for the liability for gratuity benefits payable in future based on an independent actuarial valuation carried out at each Balance Sheet date using the projected unit credit method.
The Company has two superannuation plans, a defined benefit plan and a defined contribution plan. An eligible employee on April 1, 1996 could elect to be a member of either plan. Employees who are members of the defined benefit superannuation plan are entitled to benefits depending on the years of service and salary drawn. The monthly pension benefits after retirement range from 0.75% to 2% of the annual basic salary for each year of service. The Company accounts for the liability for superannuation benefits payable in future under the plan based on an independent actuarial valuation as at Balance Sheet date. With effect from April 1, 2003, this plan was amended and benefits earned by covered employees have been protected as at March 31, 2003. Employees covered by this plan are prospectively entitled to benefits computed on a basis that ensures that the annual cost of providing the pension benefits would not exceed 15% of salary. The Company maintains a separate irrevocable trust for employees covered and entitled to benefits. The Company contributes up to 15% of the eligible employees’ salary to the trust every year. The Company recognizes such contributions as an expense when incurred. The Company has no further obligation beyond this contribution.
Bhavishya Kalyan Yojana is an unfunded defined benefit plan for employees of the Company. The benefits of the plan include pension in certain case, payable up to the date of normal superannuation had the employee been in service, to an eligible employee at the time of death or permanent disablement, while in service, either as a result of an injury or as certified by the appropriate authority. The monthly payment to dependents of the deceased / disabled employee under the plan equals 50% of the salary drawn at the time of death or accident or a specified amount, whichever is higher. The Company accounts for the liability for BKY benefits payable in future based on an independent actuarial valuation as at Balance Sheet date.
Under this scheme, employees of the Company receive medical benefits subject to certain limits of amount, periods after retirement and types of benefits, depending on their grade and location at the time of retirement. Employees separated from the Company as part of Early Separation Scheme, on medical grounds or due to permanent disablement are also covered under the scheme. The liability for post-retirement medical scheme is based on an independent actuarial valuation as at Balance Sheet date.
The eligible employees of the Company are entitled to receive benefits in respect of provident fund, a defined contribution plan, in which both employees and the Company make monthly contributions at a specified percentage of the covered employees’ salary (currently 12% of employees’ salary). The contributions as specified under the law are made to the provident fund and pension fund set up as irrevocable trust by the Company . The Company is generally liable for annual contributions and any shortfall in the fund assets based on the government specified minimum rates of return or pension and recognises such contributions and shortfall, if any, as an expense in the year incurred.
F-99
(i) Product warranty expenses
(j) Income on vehicle loan
(k) Inventories
(l) Employee benefits
(i) Gratuity
(ii) Superannuation
(iii) Bhavishya Kalyan Yojana (BKY)
(iv) Post-retirement medicare scheme
(v) Provident fund

ˆ200GNal5oj!2oVhw‹Š200GNal5oj!2oVhw
762654 FIN 100TATA MOTORS LTDFORM 20-F
30-Jul-2014 03:08 ESTHTMHKG
RR Donnelley ProFile HKR kupsu0dc 8*ESS 0C
RRWIN-XENP14211.5.15
Page 1 of 1
The Company provides for the encashment of leave or leave with pay subject to certain rules. The employees are entitled to accumulate leave subject to certain limits, for future encashment. The liability is provided based on the number of days of unutilised leave at each balance sheet date on the basis of an independent actuarial valuation.
Long term investments are stated at cost less other than temporary diminution in value, if any. Current investments are stated at lower of cost and fair value. Fair value of investments in mutual funds are determined on a portfolio basis.
Tax expenses comprises current and deferred taxes. Current tax is the amount of tax payable on the taxable income for the year as determined in accordance with the provisions of the Income Tax Act, 1961. Current tax is net of credit for entitlement for Minimum Alternative Tax (MAT). Deferred tax is recognised, on timing differences, being the difference between taxable income and accounting income that originate in one period and are capable of reversal in one or more subsequent periods. Deferred tax assets in respect of unabsorbed depreciation and carry forward of losses are recognised if there is virtual certainty that there will be sufficient future taxable income available to realise such losses. Other deferred tax assets are recognised if there is reasonable certainity that there will be sufficient future taxable income to realize such assets. Deferred tax assets and liabilities are measured based on the tax rates that are expected to apply in the period when asset is realised or the liability is settled, based on tax rates and tax laws that have been enacted or substantively enacted by the balance sheet date.
Premium payable on redemption of FCCN / NCD as per the terms of issue, is provided fully in the year of issue by adjusting against the Securities Premium Account (SPA) (net of tax). Any change in the premium payable, consequent to conversion or exchange fluctuations is adjusted to the SPA. Discount on redemption of FCCN, if any, is recognised on redemption.
Fees towards structuring / arrangements and underwriting and other incidental costs incurred in connection with borrowings are amortised over the period of the loan
The company records a liability for any claims where a potential loss is probable and capable of being estimated and discloses such matters in its financial statements, if material. For potential losses that are considered possible, but not probable, the Company provides disclosure in the financial statements but does not record a liability in its accounts unless the loss becomes probable.
The Company is engaged mainly in the business of automobile products consisting of all types of commercial and passenger vehicles including financing of the vehicles sold by the Company. These, in the context of Accounting Standard 17 on Segment Reporting, as specified in the Companies (Accounting Standards) Rules, 2006, are considered to constitute one single primary segment. Further, there is no reportable secondary segment i.e. Geographical Segment.
F-100
(vi) Compensated absences
(m) Investments
(n) Income taxes
(o) Redemption premium on Foreign Currency Convertible Notes (FCCN) / Non Convertible Debentures (NCD)
(p) Borrowing costs
(q) Liabilities and contingent liabilities
(r) Business segments
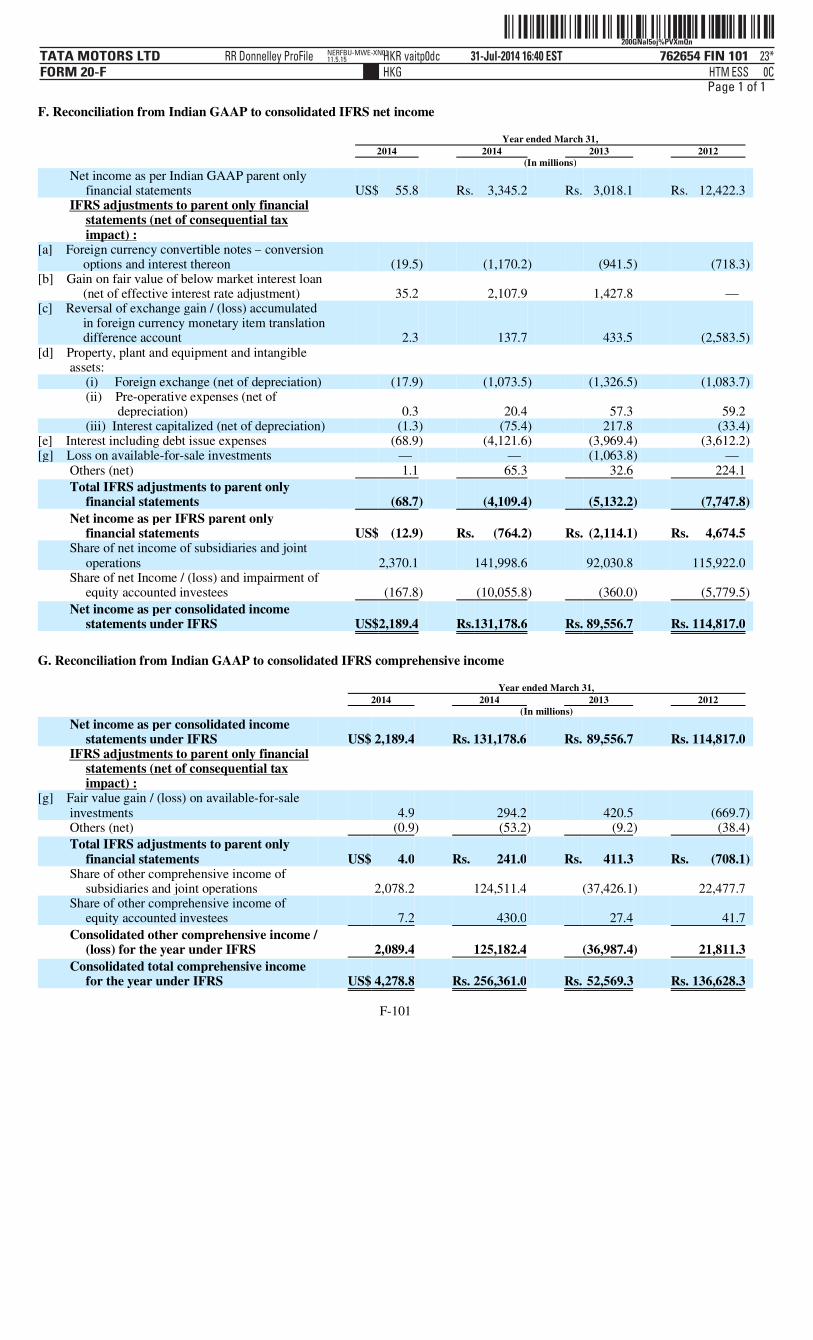
ˆ200GNal5oj%PVXmQnŠ200GNal5oj%PVXmQn
762654 FIN 101TATA MOTORS LTDFORM 20-F
31-Jul-2014 16:40 ESTHTMHKG
RR Donnelley ProFile HKR vaitp0dc 23*ESS 0C
NERFBU-MWE-XN0111.5.15
Page 1 of 1
F. Reconciliation from Indian GAAP to consolidated IFRS net income
G. Reconciliation from Indian GAAP to consolidated IFRS comprehensive income
F-101
Year ended March 31, 2014 2014 2013 2012 (In millions)
Net income as per Indian GAAP parent only financial statements US$ 55.8 Rs. 3,345.2 Rs. 3,018.1 Rs. 12,422.3
IFRS adjustments to parent only financial statements (net of consequential tax impact) :
[a] Foreign currency convertible notes – conversion options and interest thereon (19.5) (1,170.2) (941.5) (718.3)
[b] Gain on fair value of below market interest loan (net of effective interest rate adjustment) 35.2 2,107.9 1,427.8 —
[c] Reversal of exchange gain / (loss) accumulated in foreign currency monetary item translation difference account 2.3 137.7 433.5 (2,583.5)
[d] Property, plant and equipment and intangible assets:
(i) Foreign exchange (net of depreciation) (17.9) (1,073.5) (1,326.5) (1,083.7) (ii) Pre-operative expenses (net of
depreciation) 0.3 20.4 57.3 59.2 (iii) Interest capitalized (net of depreciation) (1.3) (75.4) 217.8 (33.4)
[e] Interest including debt issue expenses (68.9) (4,121.6) (3,969.4) (3,612.2) [g] Loss on available-for-sale investments — — (1,063.8) —
Others (net) 1.1 65.3 32.6 224.1
Total IFRS adjustments to parent only financial statements (68.7) (4,109.4) (5,132.2) (7,747.8)
Net income as per IFRS parent only financial statements US$ (12.9) Rs. (764.2) Rs. (2,114.1) Rs. 4,674.5
Share of net income of subsidiaries and joint operations 2,370.1 141,998.6 92,030.8 115,922.0
Share of net Income / (loss) and impairment of equity accounted investees (167.8) (10,055.8) (360.0) (5,779.5)
Net income as per consolidated income statements under IFRS US$2,189.4 Rs.131,178.6 Rs. 89,556.7 Rs. 114,817.0
Year ended March 31, 2014 2014 2013 2012 (In millions)
Net income as per consolidated income statements under IFRS US$ 2,189.4 Rs. 131,178.6 Rs. 89,556.7 Rs. 114,817.0
IFRS adjustments to parent only financial statements (net of consequential tax impact) :
[g] Fair value gain / (loss) on available-for-sale investments 4.9 294.2 420.5 (669.7) Others (net) (0.9) (53.2) (9.2) (38.4)
Total IFRS adjustments to parent only financial statements US$ 4.0 Rs. 241.0 Rs. 411.3 Rs. (708.1)
Share of other comprehensive income of subsidiaries and joint operations 2,078.2 124,511.4 (37,426.1) 22,477.7
Share of other comprehensive income of equity accounted investees 7.2 430.0 27.4 41.7
Consolidated other comprehensive income / (loss) for the year under IFRS 2,089.4 125,182.4 (36,987.4) 21,811.3
Consolidated total comprehensive income for the year under IFRS US$ 4,278.8 Rs. 256,361.0 Rs. 52,569.3 Rs. 136,628.3

ˆ200GNal5oj%P3CWw3Š200GNal5oj%P3CWw3
762654 FIN 102TATA MOTORS LTDFORM 20-F
31-Jul-2014 16:39 ESTHTMHKG
RR Donnelley ProFile HKR kalar0dc 19*ESS 0C
RRWIN-XENP13611.5.15
Page 1 of 1
H. Reconciliation from Indian GAAP to consolidated IFRS total shareholders’ equity
F-102
Year ended March 31, 2014 2014 2013 (In millions)
Shareholders’ equity as per Indian GAAP parent only financial statements US$ 3,200.6 Rs.191,766.5 Rs.191,348.4
IFRS adjustments to parent only financial statements (net of consequential tax impact) :
[a] Foreign currency convertible notes – conversion options and interest thereon — — (3,341.3)
[b] Gain on fair value of below market interest loan 59.0 3,535.7 1,427.8 [c] Property, plant and equipment and intangible assets:
& (i) Foreign exchange (net of depreciation) (76.5) (4,583.0) (3,509.5) [d] (ii) Pre-operative expenses (net of depreciation) (5.9) (356.3) (376.7) (iii) Interest capitalized (net of depreciation) 23.5 1,408.1 1,483.5 [e] Interest including debt issue expenses 56.1 3,359.0 6,606.5 [f] Dividend 123.8 7,419.5 7,242.2 [g] Fair value losses on available-for-sale investments (11.5) (686.5) (980.7)
Others (net) 8.0 485.7 814.8
Total IFRS adjustments to parent only financial statements 176.5 10,582.2 9,366.6
Shareholders’ equity as per IFRS parent only financial statements US$ 3,377.1 Rs.202,348.7 Rs.200,715.0
Share of equity of subsidiaries and joint operations 7,129.1 427,130.3 161,347.6 Share of retained earnings and fair value adjustment of equity
accounted investees 37.0 2,217.3 11,843.1
Shareholders’ equity as per Consolidated Balance Sheet under IFRS US$10,543.2 Rs.631,696.3 Rs.373,905.7
ˆ200GNal5oj%L1raQJŠ200GNal5oj%L1raQJ
762654 FIN 103TATA MOTORS LTDFORM 20-F
31-Jul-2014 15:00 ESTHTMHKG
RR Donnelley ProFile HKR narrr0dc 10*ESS 0C
RRWIN-XENP13811.5.15
Page 1 of 1
I. Notes to reconciliation between Indian GAAP to IFRS
Under IFRS, conversion option embedded in foreign currency convertible notes is accounted for separately as derivative instrument. At the inception, issue proceeds from notes are allocated to conversion option with residual allocated to the notes to establish its initial carrying cost. Subsequently the conversion option is measured at fair value through profit or loss with changes in fair value recognized in the income statement and the notes are carried at amortized cost. Under Indian GAAP conversion option is not separately accounted for and full proceeds are allocated to the notes. Further, entire redemption premium and debt issue expenses associated with the notes are charged directly to additional paid-in capital. This results into following differences between IFRS and Indian GAAP in addition to fair value movements of conversion option recorded in the income statement under IFRS:
Under IFRS, if the Company has received below market interest rate loan, it is required to be recorded in the books at the fair value by discounting with borrowing rate as on date of obtaining the loan. Accordingly, a gain has been recorded in the income statement. The gain recorded will reverse through income statement going forward till maturity of the loan as interest expense through the effective interest rate method. Under Indian GAAP, the loan is recorded at the amount received.
Under IFRS, all exchange differences are accounted for in the Income statement in the period in which they arise. Under Indian GAAP, exchange differences relating to long term foreign currency monetary assets/liabilities are accounted for in the following manner:
F-103
[a] Foreign currency convertible notes
(i) Higher interest costs under IFRS; and
(ii) Higher interest capitalization as described below (refer to note [d]).
[b] Gain on fair value of below market interest loan
[c] Reversal of exchange gain / (loss) accumulated in Foreign Currency Monetary Item Translation Difference Account
(i) Differences relating to borrowings attributable to the acquisition of the depreciable capital asset are added to /
deducted from the cost of such capital assets;
(ii) Other differences are accumulated in Foreign Currency Monetary Item Translation Difference Account, to be
amortised over the period, beginning April 1, 2011 or date of inception of such item, as applicable, and ending on March 31, 2020 or the date of its maturity, whichever is earlier.

ˆ200GNal5oj%2C46QÇŠ200GNal5oj%2C46Q˙
762654 FIN 104TATA MOTORS LTDFORM 20-F
31-Jul-2014 11:57 ESTHTMHKG
RR Donnelley ProFile HKR palap0dc 10*ESS 0C
HKGFBU-MWE-XN0311.5.15
Page 1 of 1
Under IFRS, all foreign exchange transaction gains and losses are included in net income except to the extent these are treated as an adjustment to interest cost and considered for capitalization. Under Indian GAAP, foreign exchange gains and losses arising on foreign currency denominated borrowings that are incurred to acquire property, plant and equipment and intangible assets are included in the cost of the asset and depreciated over their remaining useful life. Further under Indian GAAP, the cost of property, plant and equipment and intangible assets also includes indirectly attributable expenses that are incurred before a property, plant and equipment and intangible assets is ready for its intended use. Under IFRS, such costs are expensed as incurred. Under IFRS, interest costs are higher than under Indian GAAP resulting into higher interest capitalization (refer to note [a] above and [e] below). Consequently, depreciation relating to the above differences in the cost of property, plant and equipment under IFRS and Indian GAAP has also been adjusted.
Under IFRS, redemption premium and debt issue expenses are recognized as interest cost over the life of the debt instrument / borrowing using the effective interest method. Under Indian GAAP, entire redemption premium associated with the debt instruments is charged directly to additional paid-in capital and issue expenses are either charged directly to the additional paid-in capital and/or are deferred and amortized over the life of the debt instruments.
Under IFRS, dividends payable are recorded as a liability in the year in which these are declared and approved. Under Indian GAAP, dividends payable are recorded as a liability in the year to which they relate.
Under IFRS, available-for-sale investments consisting of debt securities and equity securities are measured at fair value at each reporting date except for investment in equity instruments which do not have quoted market price in an active market and whose fair value cannot be reliably measured. Unrealised gains or losses (net of tax) are recognized directly in statement of other comprehensive income. Impairment losses are reclassified to income statement. Under Indian GAAP, investments are classified into current and long-term investments. Current Investments are carried at lower of cost or market value, while long term investments are carried at cost less any impairment that is other than temporary.
F-104
[d] Property, plant and equipment and intangible assets
[e] Interest including debt issue expenses
[f] Dividends
[g] Investments

ˆ200GNal5oj$$SRDQEŠ200GNal5oj$$SRDQE
762654 FIN 105TATA MOTORS LTDFORM 20-F
31-Jul-2014 09:48 ESTHTMHKG
RR Donnelley ProFile HKR palap0dc 14*ESS 0C
RRWIN-XENP13711.5.15
Page 1 of 1
Notes to schedule – 1 Schedule-1 has been provided pursuant to the requirements of Rule 12-04 (a) and 4-08(e)(3) of Regulation S-X, which requires condensed financial information as to financial position, cash flows and results of operations of parent as of the same dates and for the same periods for which audited consolidated financial statements have been presented because restricted net assets of the consolidated subsidiaries exceed 25% of the consolidated net assets as at March 31, 2014. As of March 31, 2014, Rs. 245,349.0 million of the restricted net assets are not available for distribution.
Basis of preparation: The separate condensed financial information of Tata Motors Limited (parent only) has been presented in accordance with generally accepted accounting principles in India (“Indian GAAP”) and includes a reconciliation of shareholders’ equity, net income and total comprehensive income to the consolidated financial statements prepared under IFRS. There are no material differences between Indian GAAP and IFRS as it relates to the separate cash flow statement of Tata Motors Limited. Tata Motors Limited maintains its accounting records under Indian GAAP and does not provide separate financial information using IFRS for any other purpose. During the year ended March 31, 2014, 2013, 2012, cash dividends amounting to Rs. 15,884 million, Rs. 16,424 million and Rs. 1,620 million were paid to the parent company by its subsidiaries, joint operations and equity accounted investees, respectively.
F-105

ˆ200GNal5ojlZGHRwJŠ200GNal5ojlZGHRwJ
762654 EX7_1 1TATA MOTORS LTDFORM 20-F
25-Jul-2014 00:26 ESTHTMHKG
RR Donnelley ProFile HKR pf_rendSTART PAGE
1*ESS 0C
hkrdoc211.5.15
Page 1 of 1
EXHIBIT 7.1
COMPUTATION OF NET DEBT TO SHAREHOLDERS’ EQUITY RATIO
Computation of net debt to equity ratio The computation of net debt to equity ratio as of March 31, 2014 and 2013 is as follows.
As of March 31, 2014 2013 (Rs. millions)
Long-term debt 454,138.6 330,718.1 Short-term debt (including current portion) 165,960.6 234,897.4 Total debt (A) 620,099.2 565,615.5 Cash and cash equivalents 159,921.5 116,909.9 Mutual funds (current portion) 95,016.2 75,327.0 Total investible surplus (B) 254,937.7 192,236.9 Net debt (A - B) 365,161.5 373,378.6 Equity (including minority interest) 631,696.3 373,905.7 Net debt/equity 0.58 1.00

ˆ200GNal5ojlZJ9XQjŠ200GNal5ojlZJ9XQj
762654 EX8_1 1TATA MOTORS LTDFORM 20-F
25-Jul-2014 00:26 ESTHTMHKG
RR Donnelley ProFile HKR kotts0dcSTART PAGE
1*ESS 0C
HKGFBU-MWE-XN0311.5.14
Page 1 of 1
EXHIBIT 8.1
We have the following subsidiaries as of March 31, 2014:
Sr No. Name of the Subsidiary Company Country of
incorporation
1. Concorde Motors (India) Ltd. India2. Sheba Properties Ltd. India3. TAL Manufacturing Solutions Ltd. India4. Tata Motors European Technical Centre Plc. UK5. Tata Motors Insurance Broking and Advisory Services Ltd. India6. Tata Motors Finance Ltd. India7. TML Holdings Pte. Ltd. Singapore8. Tata Daewoo Commercial Vehicle Co. Ltd. South Korea9. Tata Daewoo Commercial Vehicle Sales and Distribution Co. Ltd. South Korea10. Tata Motors (Thailand) Ltd. Thailand11. Tata Motors (SA) (Proprietary) Ltd. South Africa12. TML Distribution Company Ltd. India13. Tata Hispano Motors Carrocera S.A. Spain14. Tata Hispano Motors Carrocerries Maghreb SA Morocco15. TML Drivelines Ltd. India16. PT Tata Motors Indonesia Indonesia17. PT Tata Motors Distribusi Indonesia Indonesia18. Trilix S.r.l. Italy19. Tata Precision Industries Pte. Ltd. Singapore20. Tata Marcopolo Motors Ltd. India21. Tata Technologies Ltd. India22. Tata Technologies (Thailand) Ltd. Thailand23. Tata Technologies Pte. Ltd, Singapore24. INCAT International Plc. UK25. Tata Technologies Europe Ltd UK26. INCAT GmbH Germany27. Tata Technologies Inc. USA28. Tata Technologies de Mexico, S.A. de C.V. Mexico29. Tata Technologies (Canada) Inc. Canada30. Cambric Holdings Inc. USA31. Cambric Corporation USA32. Cambric Limited Bahamas33. Cambric Consulting SRL Romania34. Cambric GmbH Germany35. Cambric UK, Limited UK36. Cambric Managed Services Inc. USA37. Midwest Managed Services USA38. Cambric Manufacturing Technologies (Shanghai) Co. Limited (Incorporated w.e.f. March 10, 2014) China39. Jaguar Land Rover Automotive Plc UK40. Jaguar Land Rover Ltd. UK41. Jaguar Land Rover Austria GmbH Austria42. Jaguar Land Rover Belux NV Belgium43. Jaguar Land Rover Japan Ltd. Japan44. Jaguar Cars South Africa (Pty) Ltd. South Africa45. Jaguar Land Rover Italia Spa Italy
ˆ200GNal5ojlZL3awFŠ200GNal5ojlZL3awF
762654 EX8_1 2TATA MOTORS LTDFORM 20-F
25-Jul-2014 00:26 ESTHTMHKG
RR Donnelley ProFile HKR kotts0dc 1*ESS 0C
HKGFBU-MWE-XN0311.5.14
Page 1 of 1
46. JLR Nominee Company Limited UK47. The Daimler Motor Company Ltd. UK48. The Jaguar Collection Ltd. UK49. Daimler Transport Vehicles Ltd. UK50. S.S. Cars Ltd. UK51. The Lanchester Motor Company Ltd. UK52. Jaguar Land Rover Espana SL Spain53. Jaguar Land Rover Deutschland GmbH Germany54. Land Rover Ireland Ltd. UK55. Land Rover Group Ltd. UK56. Jaguar Land Rover North America LLC USA57. Jaguar Land Rover Nederland BV Netherlands58. Jaguar Land Rover Portugal - Veiculos e Pecas, LDA Portugal59. Jaguar Land Rover Australia Pty Ltd Australia60. Jaguar Land Rover Korea Co. Ltd South Korea61. Jaguar Land Rover Automotive Trading (Shanghai) Ltd. China62. Jaguar Land Rover Canada ULC Canada63. Jaguar Land Rover France, SAS France64. Jaguar Land Rover South Africa (Pty) Ltd South Africa65. Jaguar e Land Rover Brasil Importacao e Comercia de Veiculos Ltda Brazil66. Limited Liability Company “Jaguar Land Rover” (Russia) Russia67. Land Rover Parts Ltd. UK68. Jaguar Land Rover (South Africa) Holdings Ltd. UK69. Jaguar Land Rover Holdings Limited UK70. Jaguar Land Rover India Ltd India

ˆ200GNal5oj%BcK1w1Š200GNal5oj%BcK1w1
762654 EX12_1 1TATA MOTORS LTDFORM 20-F
31-Jul-2014 13:26 ESTHTMHKG
RR Donnelley ProFile HKR balan2dcSTART PAGE
2*ESS 0C
RRWIN-XENP14111.5.15
Page 1 of 1
EXHIBIT 12.1
CERTIFICATION I, Ravindra Pisharody, certify that:
Date: July 31, 2014
1. I have reviewed this annual report on Form 20-F of Tata Motors Limited;
2. Based on my knowledge, this report does not contain any untrue statement of a material fact or omit to state a material fact necessary to make the statements made, in light of the circumstances under which such statements were made, not misleading with respect to the period covered by this report;
3. Based on my knowledge, the financial statements, and other financial information included in this report, fairly present in all material respects the financial condition, results of operations and cash flows of the company as of, and for, the periods presented in this report;
4. The company’s other certifying officer(s) and I are responsible for establishing and maintaining disclosure controls and procedures (as defined in Exchange Act Rules 13a-15(e) and 15d-15(e)) and internal control over financial reporting (as defined in Exchange Act Rules 13a-15(f) and 15d-15(f)) for the company and have:
(a) Designed such disclosure controls and procedures, or caused such disclosure controls and procedures to be designed under
our supervision, to ensure that material information relating to the company, including its consolidated subsidiaries, is made known to us by others within those entities, particularly during the period in which this report is being prepared;
(b) Designed such internal control over financial reporting, or caused such internal control over financial reporting to be
designed under our supervision, to provide reasonable assurance regarding the reliability of financial reporting and the preparation of financial statements for external purposes in accordance with generally accepted accounting principles;
(c) Evaluated the effectiveness of the company’s disclosure controls and procedures and presented in this report our
conclusions about the effectiveness of the disclosure controls and procedures, as of the end of the period covered by this report based on such evaluation; and
(d) Disclosed in this report any change in the company’s internal control over financial reporting that occurred during the
period covered by the annual report that has materially affected, or is reasonably likely to materially affect, the company’s internal control over financial reporting; and
5. The company’s other certifying officer(s) and I have disclosed, based on our most recent evaluation of internal control over financial reporting, to the company’s auditors and the audit committee of the company’s board of directors (or persons performing the equivalent functions):
(a) All significant deficiencies and material weaknesses in the design or operation of internal control over financial reporting
which are reasonably likely to adversely affect the company’s ability to record, process, summarize and report financial information; and
(b) Any fraud, whether or not material, that involves management or other employees who have a significant role in the
company’s internal control over financial reporting.
/s/ Ravindra Pisharody
Ravindra Pisharody
Executive Director – Commercial Vehicles

ˆ200GNal5oj%BDzvwgŠ200GNal5oj%BDzvwg
762654 EX12_2 1TATA MOTORS LTDFORM 20-F
31-Jul-2014 13:24 ESTHTMHKG
RR Donnelley ProFile HKR narrr0dcSTART PAGE
2*ESS 0C
RRWIN-XENP13811.5.15
Page 1 of 1
EXHIBIT 12.2
CERTIFICATION I, C. Ramakrishnan, certify that:
Date: July 31, 2014
1. I have reviewed this annual report on Form 20-F of Tata Motors Limited;
2. Based on my knowledge, this report does not contain any untrue statement of a material fact or omit to state a material fact necessary to make the statements made, in light of the circumstances under which such statements were made, not misleading with respect to the period covered by this report;
3. Based on my knowledge, the financial statements, and other financial information included in this report, fairly present in all material respects the financial condition, results of operations and cash flows of the company as of, and for, the periods presented in this report;
4. The company’s other certifying officer(s) and I are responsible for establishing and maintaining disclosure controls and procedures (as defined in Exchange Act Rules 13a-15(e) and 15d-15(e)) and internal control over financial reporting (as defined in Exchange Act Rules 13a-15(f) and 15d-15(f)) for the company and have:
(a) Designed such disclosure controls and procedures, or caused such disclosure controls and procedures to be designed under
our supervision, to ensure that material information relating to the company, including its consolidated subsidiaries, is made known to us by others within those entities, particularly during the period in which this report is being prepared;
(b) Designed such internal control over financial reporting, or caused such internal control over financial reporting to be
designed under our supervision, to provide reasonable assurance regarding the reliability of financial reporting and the preparation of financial statements for external purposes in accordance with generally accepted accounting principles;
(c) Evaluated the effectiveness of the company’s disclosure controls and procedures and presented in this report our
conclusions about the effectiveness of the disclosure controls and procedures, as of the end of the period covered by this report based on such evaluation; and
(d) Disclosed in this report any change in the company’s internal control over financial reporting that occurred during the
period covered by the annual report that has materially affected, or is reasonably likely to materially affect, the company’s internal control over financial reporting; and
5. The company’s other certifying officer(s) and I have disclosed, based on our most recent evaluation of internal control over financial reporting, to the company’s auditors and the audit committee of the company’s board of directors (or persons performing the equivalent functions):
(a) All significant deficiencies and material weaknesses in the design or operation of internal control over financial reporting
which are reasonably likely to adversely affect the company’s ability to record, process, summarize and report financial information; and
(b) Any fraud, whether or not material, that involves management or other employees who have a significant role in the
company’s internal control over financial reporting.
/s/ C. Ramakrishnan
C. Ramakrishnan
Chief Financial Officer

ˆ200GNal5oj%BVJPQÀŠ200GNal5oj%BVJPQ
762654 EX13 1TATA MOTORS LTDFORM 20-F
31-Jul-2014 13:25 ESTHTMHKG
RR Donnelley ProFile HKR narrr0dcSTART PAGE
3*ESS 0C
RRWIN-XENP13811.5.15
Page 1 of 1
EXHIBIT 13
CERTIFICATION Pursuant to 18 U.S.C. Section 1350, each of the undersigned officers of Tata Motors Limited (the “Company”) hereby certifies, to such officer’s knowledge, that:
Date: July 31, 2014
i. the Company’s annual report on Form 20-F for the year ended March 31, 2014 (the “Report”) fully complies with the requirements of Section 13(a) or 15(d), as applicable, of the Securities Exchange Act of 1934; and
ii. the information contained in the Report fairly presents, in all material respects, the financial condition and results of operations of the Company.
/s/ Ravindra Pisharody Ravindra Pisharody
Executive Director – Commercial Vehicles
/s/ C. Ramakrishnan
C. Ramakrishnan
Chief Financial Officer
Copyright © 2022 FDOKUMEN