red255 Tata Motors Ltd Key Stock Indicators
7
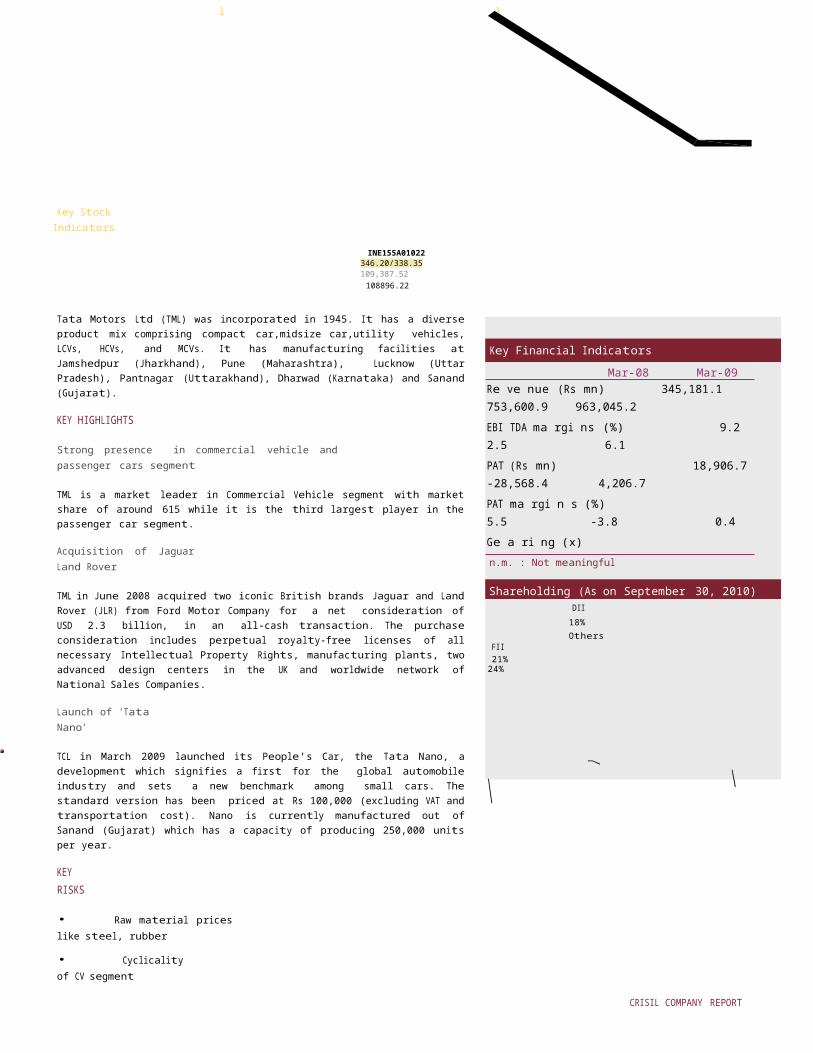
CRISIL COMPANY REPORT | 1 GICS Industry : Automobiles l Sub Industry : Automobile Manufacturers l Website : www.tatamotors.com Tata Motors Ltd Key Stock Indicators NSE Ticker : TATAMOTORS ISIN INE155A01022 Shares outstanding (mn) 506. Bloomberg Ticker : TTMT:IN 52-week high /low: 346.20/338.35 Free Float (%) : 63.0 Face value / Share: 2.00 Market Cap as on 28 SEP 2013 (Rs mn): 109,387.52 Average daily volumes (12 months) : 3,915,9 72 Enterprise Value as on 2013 (Rs mn): 108896.22 Beta (2 year) : 1.4 Tata Motors Ltd (TML) was incorporated in 1945. It has a diverse product mix comprising compact car,midsize car,utility vehicles, LCVs, HCVs, and MCVs. It has manufacturing facilities at Jamshedpur (Jharkhand), Pune (Maharashtra), Lucknow (Uttar Pradesh), Pantnagar (Uttarakhand), Dharwad (Karnataka) and Sanand (Gujarat). KEY HIGHLIGHTS Strong presence in commercial vehicle and passenger cars segment TML is a market leader in Commercial Vehicle segment with market share of around 615 while it is the third largest player in the passenger car segment. Acquisition of Jaguar Land Rover TML in June 2008 acquired two iconic British brands Jaguar and Land Rover (JLR) from Ford Motor Company for a net consideration of USD 2.3 billion, in an all-cash transaction. The purchase consideration includes perpetual royalty-free licenses of all necessary Intellectual Property Rights, manufacturing plants, two advanced design centers in the UK and worldwide network of National Sales Companies. Launch of ‘Tata Nano’ TCL in March 2009 launched its People's Car, the Tata Nano, a development which signifies a first for the global automobile industry and sets a new benchmark among small cars. The standard version has been priced at Rs 100,000 (excluding VAT and transportation cost). Nano is currently manufactured out of Sanand (Gujarat) which has a capacity of producing 250,000 units per year. KEY RISKS • Raw material prices like steel, rubber • Cyclicality of CV segment Key Financial Indicators Mar-08 Mar-09 Re ve nue (Rs mn) 345,181.1 753,600.9 963,045.2 EBI TDA ma rgi ns (%) 9.2 2.5 6.1 PAT (Rs mn) 18,906.7 -28,568.4 4,206.7 PAT ma rgi n s (%) 5.5 -3.8 0.4 Ge a ri ng (x) 2.0 n.m n.m n.m. : Not meaningful Shareholding (As on September 30, 2010) DII 18% Others FII 21% 24%
-
Upload
grandceremony -
Category
Documents
-
view
7 -
download
0
Transcript of red255 Tata Motors Ltd Key Stock Indicators
CRISIL COMPANY REPORT | 1
GICS Industry : Automobiles l Sub Industry : Automobile Manufacturers l Website : www.tatamotors.com
Tata Motors LtdKey StockIndicators
NSE Ticker : TATAMOTORS ISIN INE155A01022 Shares outstanding (mn):
506.4Bloomberg
Ticker :TTMT:IN 52-week high /low: 346.20/338.35 Free Float (%) : 63.0
Face value / Share:
2.00 Market Cap as on 28 SEP 2013 (Rs mn):
109,387.52 Average daily volumes (12 months) :
3,915,972Enterprise Value as on 2013 (Rs
mn): 108896.22 Beta (2 year) : 1.4
Tata Motors Ltd (TML) was incorporated in 1945. It has a diverseproduct mix comprising compact car,midsize car,utility vehicles,LCVs, HCVs, and MCVs. It has manufacturing facilities atJamshedpur (Jharkhand), Pune (Maharashtra), Lucknow (UttarPradesh), Pantnagar (Uttarakhand), Dharwad (Karnataka) and Sanand(Gujarat).
KEY HIGHLIGHTS
Strong presence in commercial vehicle andpassenger cars segment
TML is a market leader in Commercial Vehicle segment with marketshare of around 615 while it is the third largest player in thepassenger car segment.
Acquisition of JaguarLand Rover
TML in June 2008 acquired two iconic British brands Jaguar and LandRover (JLR) from Ford Motor Company for a net consideration ofUSD 2.3 billion, in an all-cash transaction. The purchaseconsideration includes perpetual royalty-free licenses of allnecessary Intellectual Property Rights, manufacturing plants, twoadvanced design centers in the UK and worldwide network ofNational Sales Companies.
Launch of ‘TataNano’
TCL in March 2009 launched its People's Car, the Tata Nano, adevelopment which signifies a first for the global automobileindustry and sets a new benchmark among small cars. Thestandard version has been priced at Rs 100,000 (excluding VAT andtransportation cost). Nano is currently manufactured out ofSanand (Gujarat) which has a capacity of producing 250,000 unitsper year.
KEYRISKS
• Raw material priceslike steel, rubber
• Cyclicalityof CV segment
Key Financial IndicatorsMar-08 Mar-09
Re ve nue (Rs mn) 345,181.1 753,600.9 963,045.2EBI TDA ma rgi ns (%) 9.2 2.5 6.1PAT (Rs mn) 18,906.7 -28,568.4 4,206.7PAT ma rgi n s (%) 5.5 -3.8 0.4Ge a ri ng (x) 2.0 n.m n.mn.m. : Not meaningful
Shareholding (As on September 30, 2010)DII18% Others
FII 21%24%

CRISIL COMPANY REPORT | 2
• Foreign exchangefluctuations
• Increasing competition inpassenger car segment
Stock Performances vis-à-vis market Returns (%)
YTD 1-m 3-m 12-m
(index)
200175
('000)
17500
15000
TATAMOTORS 74 14 28 84NI FTY 12 1 -1 19
Note:1) YTD returns are since April 1, 2010 to Dec 20, 2010.2) 1-m, 3-m and 12-m returns are up to Dec 20, 2010.
1501251007550250
12500
10000
7500
5000
2500
0
Volumes (RHS) TATAMOTORS NIFTY
Dec-
09 Jan-
10 Feb-
10 Mar-
10 Apr-
10 May-
10 Jun-

Tata Motors ltd
CRISIL COMPANY REPORT | 3
BACKGROUND
TML is the market leader in the CV industry; it has a strong position in medium and heavy commercial vehiclessegment and has also been the leading player in the small goods vehicles segments. TML is the third largest playerin passenger car segment. TML acquired JLR from Ford. Following JLRs acquisition in June 2008, TMLs business mix haschanged significantly, with JLR contributing more than 50% of TMLs revenues in FY10
COMPETITIVEPOSITION
PeerComparison
Tata Motors Ltd. Maruti Suzuki India Ltd. Mahindra & Mahindra Ltd. Ashok Leyland Ltd.
Re ve nue (Rs mn ) EBI TDA margi ns (%) PAT (Rs mn)PAT Ma rgi n(%) Ge a ring (x)EPS (Rs /s ha re ) PE(x)
963,045.26.1
4,206.70.4
n.m
7.4183.
300,767.0 299,867.3 74,392.6
13.4 13.2 10.2
26,247.0 28,895.2 4,236.7
8.7 9.6 5.70.1
n.m: Notmeaningful
FINANCIALPROFILE
Revenues grow significantly driven by strong revival inCV, JLR business and Nano
TML’s revenues grew significantly by 27.8% for FY10 on theback of strong growth of around 40% in the CV segment andaround 25% in the passenger vehicles segment. Sales ofJLR in FY10, showed an overall improvement. Its low-costsmall car Nano had already sold 30,350 units by March2010. This helped TML register around 25 % increase inits car volumes in FY10 as compared to FY09. Decrease incommodity prices and higher sales volumes improvedEBITDA margins from 2.5% in FY09 to6.1% in FY10. TML also undertook several cost-cutting measures for its JLRoperations like reducing incentives, switching tolow-cost sourcing, lowering its headcount, cuttingwarranty and other selling and administrativeexpenses to improve the operating margins from itsglobal operations.
INDUSTRYPROFILE
Automobiles
Key FinancialIndicators
Units Mar-08 Mar-09 Mar-10
Re ve nue Rs mi l l i on345,181.1 753,600.9 963,045.2
EBI TDA ma rgi n s Pe r ce nt9.2 2.5 6.1
PAT Rs mi l l i on18,906.7 -28,568.4 4,206.7
PAT ma rgi ns Pe r ce nt5.5 -3.8 0.4
Re ve nue growth Pe r ce nt9.5 118.3 27.8
EBI TDA gro wth Pe r ce nt-3.2 -41.8 218.0
PAT growth Pe r ce nt-14.5 n.m n.m Ge a
ri ng Ti me s2.0 n.m n.m RoCE
Pe r ce nt 23.15.2 18.8RoE Pe r ce nt29.7 0.0 0.0

Tata Motors ltd
CRISIL COMPANY REPORT | 4
The Indian automobile industry grew by 14% to Rs 1547 Bn in 2009-10. The industry which had witnessed steadygrowth until 2007-08, with rise in income levels and favourable demographic profile, was impacted in 2008-09 onaccount of slower economic growth, crunched finance scenario, poor consumer sentiments and input cost pressures.However, stimulus packages by the government enabled a quick recovery across segments in second half of2009-10. The automobile industry has also witnessed a number of structural changes over the past few yearswith launch of innovative vehicle models at competitive prices and emergence of the hub and spoke model forcommercial vehicles. Rise in rural incomes, player focus on rural sales and launch of low cost car enabled highercar sales. However, entry of new players has increased competitive intensity across auto segments.

Tata Motors ltd
CRISIL COMPANY REPORT | 5
ANNUAL RESULTS
Income Statement Balance sheet(Rs million ) Mar-08 Mar-09 Mar-10 (Rs
million )Mar-08 Mar-09 Mar-
10Net Sal es 342,902.6 748,423.8 956,787.2 Equi 3,855. 5,140. 5,706Operating Income 345,181.1 753,600.9 963,045.2
Reserves a nd s urpl us59,140.4
-70,604.
-95,174Tangible net worth 62,995.
8-65,463.
-89,468EBITDA 31,730.0 18,472.8 58,734.9
Deferred ta x l i a bl i ty:|a ss et|9,744.5
6,802.1
11,536.3EBITDA Margin 9.2 2.5 6.1
Long-term debt71,475.9
209,894.7
181,377.6Short-term-debt 44,372.
8139,843.8
170,546.0Depreci a ti on 7,820.7 25,067.7 38,871.3
Total debt115,848.7
349,738.5
351,923.6I nteres t 14,814.7 38,718.3 39,538.6
Current l i a bi l i ti es122,070.3
251,971.4
350,704.8Other I ncome 14,803.1 20,525.7 23,464.4
Tota l provi si ons14,375.3
59,646.3
62,922.9Total liabilities 325,034.
6602,694.6
687,619.5PBT 25,238.2 -25,872.1 14,347.3 118,631. 515,424. 526,629
PAT 18,906.7 -28,568.4 4,206.7 Net fi xed a ss ets
107,517.2
272,897.7
243,712.5Investments 26,658.
312,574.0
22,191.2PAT Margin 5.5 -3.8 0.4
Current assets190,859.1
317,222.9
421,715.8Recei vabl es 20,446.
547,948.6
71,911.8No. of s hares (Mn No.) 385.5 514.1 570.6
I nventori es32,946.4
101,546.8
113,120.3Ca
sh38,331.7
41,213.4
87,433.2Earni ngs per share
(EPS)49.0 -55.6 7.4 Total assets
325,034.6
602,694.6
687,619.5
Cash flow(Rs million )
Ratio Mar-08 Mar-09 Mar-
Pre-tax profi t 23,897.7 -24,787.5 3,789.4 9.5 118.3 27.Total ta x pa i d -4,759.7 -5,638.7 -5,406.4
EBITDA growth(%)-3.2 -
41.8218.0Depreci a ti on
Change i n worki ng ca pi ta l
7,820.7 25,067.7 38,871.3 PATgrowth(%)41,382.2 51,690.0 43,736.9
-14.5
9.
n.m
2.5
n.m
6.1Cash flow from operatingactivities
68,340.9 46,331.5 80,991.2 Tax ra te (%)
19.2 -17.7
39.9Ca pi tal Expendi ture
I nves tments a nd others
-62,243.6 -284,333.2 -62,841.0 PAT ma rgi ns (%)-14,912.4 14,084.3 -9,617.2
5.5
30.6
-3.8
0.4
204.2Cash flow from investing activities
-77,156.0 -270,248.9 -72,458.2 Return on Equi ty (%)
29.7 0.0 0.0Equi ty ra i s ed/(repa i d) Debt ra i s
-3,990.5 39,576.0 14,048.3 Return on ca pi ta l empl oyed (%)42,829.7 233,889.8 2,185.1
23.1
2.0
5.2
n.m
18.8
n.mOthers (i ncl extra ordi nari es )
3,532.3 -43,020.9 31,471.9 I nteres t covera ge (x)
2.1 0.5 1.5
Cash flow from Debt/EBI TDA (x)
35,604.1 226,799.1 37,686.83.7 18.9 6.0
Change i n ca sh pos i 26,789.0 2,881.7 46,219.8 3.2 2.4 1.8Openi ng ca sh 11,542.7 38,331.7 41,213.4
Current rati o (x)1.1 0.7 0.7
Cl osi ng cas h 38,331.7 41,213.4 87,433.2 Gros s current a s sets (days)
196 150 155n.m : Not meaningful;
QUARTERLY RESULTS
Profit and loss account(Rs million) Sep-10
% of Rev Sep-09 % of Rev Jun-10 % of Rev Sep-10
% of Rev
Sep-09
% of RevNo of Months
33 3
6Revenue 288,015.4
100.0 215,069.4 100.0 270,901.2 100.0 558,916.6
100.0 382,250.1
100.0EBITDA 40,209.8
14.0 19,125.9 8.9 38,899.4 14.4 79,111.2
14.2 27,365.6
7.2I nte re s t 5,312.7
1.8 5,590.3 2.6 5,616.0 2.1 10,928.7
2.0 11,425.5
3.0De pre ci a ti on 10,946.6
3.8 8,479.4 3.9 10,115.4 3.7 21,064.0
3.8 16,921.7
4.4PBT 25,473.7
8.8 3,069.6 1.4 22,910.2 8.5 48,383.9
8.7 373.6 0.1PAT 22,342.7
7.8 175.4 0.1 19,950.0 7.4 42,292.7
7.6 (3,163.2)
(0.8)

Tata Motors ltd
CRISIL COMPANY REPORT | 6
FOCUS CHARTS & TABLES
Rs mn Quarterly sales & y-o-y growth350,000
300,000
250,000
200,000
150,000
100,000
50,000
0
Percent200
150
100
50
0
-50
Rs mn30,000
20,000
10,000
0
-10,000
-20,000
-30,000
Quarterly PAT & y-o-ygrowth
Per cent14,00012,00010,0008,0006,0004,0002,0000-2,000
Sales Sales growth y-o-y (RHS)
Ne t Profit Net profit growth y-o-y (RHS)
Rs/share EPS60
20
0
-20
-40
-60
Per cent Movement in operating and net margins20151050-5-10-15-20
OPM NPM
Shareholding Pattern (Per cent)
Board of Directors
Dec Mar 2010 Jun Sep Director Name DesignationPro mo 38.1 37.0 37.0 37. Ra ta n Na va l Ta ta (Dr.) Non -Exe cu ti ve Cha
i rma n ,FI I 16.7 18.1 22.6 23. Promote r-Di re ctorDI I 17.4 17.9 18.4 17.
6Ra vi Ra jni Ka nt (Mr.) Non -Exe cu ti ve Vi
ce Cha i rma nOthe rs 27.8 26.9 22.0 21.6
Ca rl -Pe te r Fors te r (Mr.)Pra ka s h Ma nja na th Te l
Ma na gi n g D i re ctorMa na gi n g D i re Subod h K. Bha rga va (Mr.) Non -Exe cu ti ve Di re ctorJa ms h e d Ji ji I ra ni (D
r.)Promote r-Di re ctor
Dec-
07De
c-07 Mar-
08 Jun-
08 Sep-
08 Dec-
08 Mar-
09
Mar-
08 Jun-
08 Sep-
08 Dec-
08 Mar-
09Jun-
09Sep-
09De
c-09
Mar-
10Jun-
10 Sep-
10 Dec-
07De
c-07 Mar-
08 Jun-
08 Sep-
08 Dec-
08 Mar-
09
Mar-
08 Jun-
08 Sep-
08 Dec-
08 Mar-
09 Jun-
09 Sep-
09De
c-09
Mar-
10Jun-
10Sep-
10

Tata Motors ltd
CRISIL COMPANY REPORT | 7
Vi n e s h Kuma r Ma da n La Non -Exe cu ti ve Di Ra ghu na th An a nt Ma s hel ka r (Dr.)
Non -Exe cu ti ve Di re ctorNa s s e r Mukhta r Munje e
(Mr.)Non -Exe cu ti ve Di re ctorSa m Ma ne cks ha w Pa l i a
(Mr.)Non -Exe cu ti ve Di re ctorRa ne nd ra Se n (Mr.) Non -Exe cu ti ve Di re ctorRa l f Di e te r Spe th (Dr.) Non -Exe cu ti ve Di re ctorNus l i Ne vi l l e Wa di a
(Mr.)Non -Exe cu ti ve Di re ctor
AdditionalDisclosureThis report has been sponsored by NSE - InvestorProtection Fund Trust (NSEIPFT).
DisclaimerThis report is based on data publicly available or from sources considered reliable. CRISIL Ltd. (CRISIL) does not represent that it isaccurate or complete and hence, it should not be relied upon as such. The data / report is subject to change without any priornotice. Opinions expressed herein are our current opinions as on the date of this report. Nothing in this report constitutesinvestment, legal, accounting or tax advice or any solicitation, whatsoever. The subscriber / user assume the entire risk of anyuse made of this data / report. CRISIL especially states that, it has no financial liability whatsoever, to the subscribers /users of this report. This report is for the personal information only of the authorised recipient in India only. This reportshould not be reproduced or redistributed or communicated directly or indirectly in any form to any other person – especiallyoutside India or published or copied in whole or in part, for any purpose.
CRISIL is not responsible for any errors and especially states that it has no financial liability whatsoever to the subscribers /users / transmitters / distributors of this report. For information please contact 'Client Servicing' at +91-22-33423561, or viae-mail: [email protected].