Ability of traditional lipid ratios and apolipoprotein ratios to predict cardiovascular risk in...
10
ARTICLE Ability of traditional lipid ratios and apolipoprotein ratios to predict cardiovascular risk in people with type 2 diabetes M.-R. Taskinen & P. J. Barter & C. Ehnholm & D. R. Sullivan & K. Mann & J. Simes & J. D. Best & S. Hamwood & A. C. Keech & on behalf of the FIELD study investigators Received: 24 February 2010 / Accepted: 22 April 2010 / Published online: 6 June 2010 # Springer-Verlag 2010 Abstract Aims/hypothesis The apolipoprotein B (ApoB):apolipopro- tein A (ApoA)-I ratio may be a better indicator of cardiovas- cular disease (CVD) risk in people with type 2 diabetes than traditional lipid risk markers (LDL-cholesterol, HDL- cholesterol and triacylglycerol), but whether the ApoB: ApoA-I ratio should be used to indicate lipid-lowering therapy is still debated. Methods The Fenofibrate Intervention and Event Lowering in Diabetes (FIELD) study randomised 9,795 patients with type 2 diabetes to fenofibrate (200 mg daily) or placebo and followed them up for a median of 5 years. We compared ApoB, ApoA-I, ApoAII and the ApoB:ApoA-I ratio with traditional lipid variables as predictors of CVD risk. We estimated the HR of the effect of 1 SD difference in baseline concentrations of lipids, apolipoproteins and respective ratios on the risk of CVD events and also used receiver operating characteristic curve analysis. Results In the placebo group, the variables best predicting CVD events were non-HDL-cholesterol:HDL-cholesterol, total cholesterol:HDL-cholesterol (HR 1.21, p <0.001 for both), ApoB:ApoA-I (HR 1.20, p <0.001), LDL-cholesterol:HDL- cholesterol (HR 1.17, p <0.001), HDL-cholesterol (HR 0.84, p <0.001) and ApoA-I (HR 0.85, p <0.001). In the fenofibrate group, the first four predictors were very similar (but ApoB: ApoA-I was fourth), followed by non-HDL-cholesterol and ApoB. Lipid ratios and ApoB:ApoA-I performed better than any single lipid or apolipoprotein in predicting CVD risk. Conclusions/interpretation In patients with type 2 diabetes in the FIELD study, traditional lipid ratios were as strong as the ApoB:ApoA-I ratio in predicting CVD risk. The data provide little evidence for replacement of traditional lipids and their ratios with measures of ApoB, ApoA-I and their ratio. Keywords Cardiovascular risk . Diagnostic tests . Lipids . Lipoproteins . Non-HDL-cholesterol . Type 2 diabetes Abbreviations ApoA Apolipoprotein A ApoB Apolipoprotein B CARDS Collaborative Atorvastatin Diabetes Study Electronic supplementary material The online version of this article (doi:10.1007/s00125-010-1806-9) contains supplementary material, which is available to authorised users. M.-R. Taskinen (*) Department of Medicine, Division of Cardiology, Helsinki University Central Hospital, Biomedicum, Haartmaninkatu 8, 00029 Helsinki, Finland e-mail: [email protected] P. J. Barter Heart Research Institute, University of Sydney, Sydney, NSW, Australia C. Ehnholm Department of Molecular Medicine, National Public Health Institute, Biomedicum, Helsinki, Finland D. R. Sullivan Department of Clinical Biochemistry, Royal Prince Alfred Hospital, Sydney, NSW, Australia K. Mann : J. Simes : A. C. Keech National Health and Medical Research Council Clinical Trials Centre, University of Sydney, Sydney, NSW, Australia J. D. Best School of Medicine, University of Melbourne, Melbourne, VIC, Australia S. Hamwood Department of Medicine, Nambour General Hospital, Nambour, QLD, Australia Diabetologia (2010) 53:1846–1855 DOI 10.1007/s00125-010-1806-9
Transcript of Ability of traditional lipid ratios and apolipoprotein ratios to predict cardiovascular risk in...

ARTICLE
Ability of traditional lipid ratios and apolipoprotein ratiosto predict cardiovascular risk in people with type 2 diabetes
M.-R. Taskinen & P. J. Barter & C. Ehnholm &
D. R. Sullivan & K. Mann & J. Simes & J. D. Best &S. Hamwood & A. C. Keech &
on behalf of the FIELD study investigators
Received: 24 February 2010 /Accepted: 22 April 2010 /Published online: 6 June 2010# Springer-Verlag 2010
AbstractAims/hypothesis The apolipoprotein B (ApoB):apolipopro-tein A (ApoA)-I ratio may be a better indicator of cardiovas-cular disease (CVD) risk in people with type 2 diabetes thantraditional lipid risk markers (LDL-cholesterol, HDL-
cholesterol and triacylglycerol), but whether the ApoB:ApoA-I ratio should be used to indicate lipid-loweringtherapy is still debated.Methods The Fenofibrate Intervention and Event Loweringin Diabetes (FIELD) study randomised 9,795 patients withtype 2 diabetes to fenofibrate (200 mg daily) or placebo andfollowed them up for a median of 5 years. We comparedApoB, ApoA-I, ApoAII and the ApoB:ApoA-I ratio withtraditional lipid variables as predictors of CVD risk. Weestimated the HR of the effect of 1 SD difference in baselineconcentrations of lipids, apolipoproteins and respectiveratios on the risk of CVD events and also used receiveroperating characteristic curve analysis.Results In the placebo group, the variables best predictingCVD events were non-HDL-cholesterol:HDL-cholesterol, totalcholesterol:HDL-cholesterol (HR 1.21, p<0.001 for both),ApoB:ApoA-I (HR 1.20, p<0.001), LDL-cholesterol:HDL-cholesterol (HR 1.17, p<0.001), HDL-cholesterol (HR 0.84,p<0.001) and ApoA-I (HR 0.85, p<0.001). In the fenofibrategroup, the first four predictors were very similar (but ApoB:ApoA-I was fourth), followed by non-HDL-cholesterol andApoB. Lipid ratios and ApoB:ApoA-I performed better thanany single lipid or apolipoprotein in predicting CVD risk.Conclusions/interpretation In patients with type 2 diabetesin the FIELD study, traditional lipid ratios were as strong asthe ApoB:ApoA-I ratio in predicting CVD risk. The dataprovide little evidence for replacement of traditional lipids andtheir ratios with measures of ApoB, ApoA-I and their ratio.
Keywords Cardiovascular risk . Diagnostic tests . Lipids .
Lipoproteins . Non-HDL-cholesterol . Type 2 diabetes
AbbreviationsApoA Apolipoprotein AApoB Apolipoprotein BCARDS Collaborative Atorvastatin Diabetes Study
Electronic supplementary material The online version of this article(doi:10.1007/s00125-010-1806-9) contains supplementary material,which is available to authorised users.
M.-R. Taskinen (*)Department of Medicine, Division of Cardiology,Helsinki University Central Hospital,Biomedicum, Haartmaninkatu 8,00029 Helsinki, Finlande-mail: [email protected]
P. J. BarterHeart Research Institute, University of Sydney,Sydney, NSW, Australia
C. EhnholmDepartment of Molecular Medicine,National Public Health Institute,Biomedicum,Helsinki, Finland
D. R. SullivanDepartment of Clinical Biochemistry,Royal Prince Alfred Hospital,Sydney, NSW, Australia
K. Mann : J. Simes :A. C. KeechNational Health and Medical Research Council Clinical TrialsCentre, University of Sydney,Sydney, NSW, Australia
J. D. BestSchool of Medicine, University of Melbourne,Melbourne, VIC, Australia
S. HamwoodDepartment of Medicine, Nambour General Hospital,Nambour, QLD, Australia
Diabetologia (2010) 53:1846–1855DOI 10.1007/s00125-010-1806-9

CVD Cardiovascular diseaseERFC Emerging Risk Factors CollaborationFIELD Fenofibrate Intervention and Event Lowering
in DiabetesROC Receiver operating characteristicTRL Triacylglycerol-rich lipoproteins
Introduction
Atherosclerotic cardiovascular disease (CVD) results fromthe interplay of genetic and environmental factors. The newepidemic of type 2 diabetes and the dyslipidaemiaassociated with it is fuelling an alarming wave of prematureCVD. Diabetic dyslipidaemia is a cluster of lipid andapolipoprotein abnormalities, which include elevatedtriacylglycerol-rich lipoproteins (TRLs), an excess of smalldense LDL particles (independent of the concentration ofLDL-cholesterol) and reduced concentrations of both HDL-cholesterol and the major HDL apolipoprotein, apolipopro-tein A (ApoA)-I [1, 2].
There is evidence that the number of TRL and LDLparticles (as distinct from concentrations of the triacylgly-cerol and cholesterol transported by them) is a majordeterminant of cardiovascular risk [3–6]. As TRL and LDLparticles contain a single molecule of apolipoprotein B(ApoB), the concentration of ApoB in plasma provides ameasure of the concentration of all potentially atherogeniclipoproteins and thus may be a better indicator ofcardiovascular risk than the simple measurement of LDL-cholesterol [7–10]. This may be particularly important forpeople with type 2 diabetes, who tend to have increasedconcentrations of atherogenic TRL and small LDL par-ticles, such that the LDL-cholesterol concentration nolonger reflects the particle concentration of LDL [1, 11].
Another measure of the concentration of all potentiallyatherogenic lipoproteins is the level of non-HDL-cholesterol, as determined by subtracting the concentrationof cholesterol in HDL from that in total plasma [12]. Thereis growing evidence that the concentration of non-HDL-cholesterol is superior to LDL-cholesterol as a predictor offuture cardiovascular events [13–16]. As a consequence,non-HDL-cholesterol has been introduced into many guide-lines as a secondary target for therapy in people withelevated serum triacylglycerols, even if they have achievedrecommended LDL goals [17–21]. The question of whethernon-HDL-cholesterol has the same predictive power asApoB is a debated issue [7, 12, 15, 22, 23]. One recentstudy suggested that concentrations of non-HDL-cholesterol and ApoB are virtually identical in terms oftheir ability to predict cardiovascular events [24].
The other common lipid abnormality in people withtype 2 diabetes is a low level of potentially protective HDLparticles, whether measured as HDL-cholesterol or asApoA-I [1, 2]. People with type 2 diabetes have a doubleproblem: (1) a high particle concentration of atherogeniclipoproteins (TRL and LDL); and (2) a low concentration ofHDL particles [25]. Measurements that may capture thiscombined problem include ratios of total to HDL-cholesterol, non-HDL-cholesterol to HDL-cholesterol,LDL-cholesterol to HDL-cholesterol and ApoB to ApoA-I[16, 17, 19, 26–29]. The ApoB:ApoA-I ratio was superiorto traditional lipid and apolipoprotein levels as a predictorof CVD in large case–control studies (the Interheart studyand the Apolipoprotein-Related Mortality Risk study) [30,31] and in people treated with statins [32]. These analyseshave fuelled recommendations that routine assessment ofApoB and ApoA-I should replace measurements of thestandard lipids, particularly in people with diabetes [33–35]. It is uncertain, however, whether the ApoB:ApoA-Iratio is superior to lipid ratios such as total cholesterol:HDL-cholesterol, non-HDL-cholesterol:HDL-cholesterol orLDL-cholesterol:HDL-cholesterol. The Emerging RiskFactors Collaboration (ERFC) group analysed 68 studiesincluding more than 300,000 people and found comparableHRs for the non-HDL-cholesterol:HDL-cholesterol andApoB:ApoA-I ratios [36]. The Collaborative AtorvastatinDiabetes Study (CARDS) investigators reported that theApoB:ApoA-I ratio was only marginally superior to that ofLDL-cholesterol:HDL-cholesterol in predicting cardiovas-cular events in people with type 2 diabetes [37].
In this study we evaluated the performance of arange of lipid and apolipoprotein concentrations, includ-ing ApoA-II, as well as relevant ratios (expanding theERFC data), in predicting cardiovascular risk in 9,795patients with type 2 diabetes from the FenofibrateIntervention and Event Lowering in Diabetes (FIELD)study (International Standard Randomised ControlledTrial registration no. ISRCT64783481) [38].
Methods
Participants The FIELD participants have been described indetail elsewhere [38]. Briefly, type 2 diabetic patients aged 50to 75 years were eligible if they had an initial plasma totalcholesterol concentration of 3.0 to 6.5 mmol/l and a totalcholesterol:HDL-cholesterol ratio of 4.0 or higher, or a plasmatriacylglycerol concentration of 1.0 to 5.0 mmol/l, withoutrequiring lipid-modifying treatment at study entry. Significantrenal impairment (plasma creatinine >130 µmol/l), chronicliver disease, symptomatic gallbladder disease or a cardiovas-cular event within 3 months of recruitment were exclusioncriteria.
Diabetologia (2010) 53:1846–1855 1847
All patients provided written informed consent and thestudy protocol was approved by local and national ethicscommittees in accordance with the Declaration of Helsinkiand Good Clinical Practice guidelines.
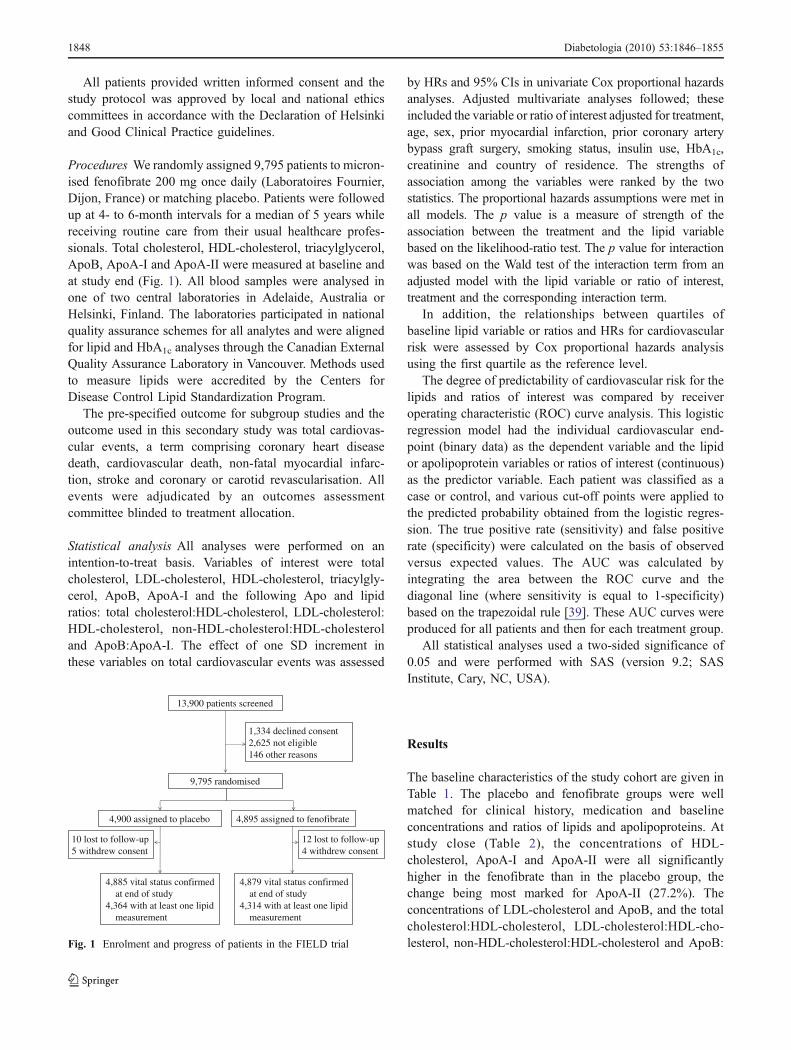
Procedures We randomly assigned 9,795 patients to micron-ised fenofibrate 200 mg once daily (Laboratoires Fournier,Dijon, France) or matching placebo. Patients were followedup at 4- to 6-month intervals for a median of 5 years whilereceiving routine care from their usual healthcare profes-sionals. Total cholesterol, HDL-cholesterol, triacylglycerol,ApoB, ApoA-I and ApoA-II were measured at baseline andat study end (Fig. 1). All blood samples were analysed inone of two central laboratories in Adelaide, Australia orHelsinki, Finland. The laboratories participated in nationalquality assurance schemes for all analytes and were alignedfor lipid and HbA1c analyses through the Canadian ExternalQuality Assurance Laboratory in Vancouver. Methods usedto measure lipids were accredited by the Centers forDisease Control Lipid Standardization Program.
The pre-specified outcome for subgroup studies and theoutcome used in this secondary study was total cardiovas-cular events, a term comprising coronary heart diseasedeath, cardiovascular death, non-fatal myocardial infarc-tion, stroke and coronary or carotid revascularisation. Allevents were adjudicated by an outcomes assessmentcommittee blinded to treatment allocation.
Statistical analysis All analyses were performed on anintention-to-treat basis. Variables of interest were totalcholesterol, LDL-cholesterol, HDL-cholesterol, triacylgly-cerol, ApoB, ApoA-I and the following Apo and lipidratios: total cholesterol:HDL-cholesterol, LDL-cholesterol:HDL-cholesterol, non-HDL-cholesterol:HDL-cholesteroland ApoB:ApoA-I. The effect of one SD increment inthese variables on total cardiovascular events was assessed
by HRs and 95% CIs in univariate Cox proportional hazardsanalyses. Adjusted multivariate analyses followed; theseincluded the variable or ratio of interest adjusted for treatment,age, sex, prior myocardial infarction, prior coronary arterybypass graft surgery, smoking status, insulin use, HbA1c,creatinine and country of residence. The strengths ofassociation among the variables were ranked by the twostatistics. The proportional hazards assumptions were met inall models. The p value is a measure of strength of theassociation between the treatment and the lipid variablebased on the likelihood-ratio test. The p value for interactionwas based on the Wald test of the interaction term from anadjusted model with the lipid variable or ratio of interest,treatment and the corresponding interaction term.
In addition, the relationships between quartiles ofbaseline lipid variable or ratios and HRs for cardiovascularrisk were assessed by Cox proportional hazards analysisusing the first quartile as the reference level.
The degree of predictability of cardiovascular risk for thelipids and ratios of interest was compared by receiveroperating characteristic (ROC) curve analysis. This logisticregression model had the individual cardiovascular end-point (binary data) as the dependent variable and the lipidor apolipoprotein variables or ratios of interest (continuous)as the predictor variable. Each patient was classified as acase or control, and various cut-off points were applied tothe predicted probability obtained from the logistic regres-sion. The true positive rate (sensitivity) and false positiverate (specificity) were calculated on the basis of observedversus expected values. The AUC was calculated byintegrating the area between the ROC curve and thediagonal line (where sensitivity is equal to 1-specificity)based on the trapezoidal rule [39]. These AUC curves wereproduced for all patients and then for each treatment group.
All statistical analyses used a two-sided significance of0.05 and were performed with SAS (version 9.2; SASInstitute, Cary, NC, USA).
Results
The baseline characteristics of the study cohort are given inTable 1. The placebo and fenofibrate groups were wellmatched for clinical history, medication and baselineconcentrations and ratios of lipids and apolipoproteins. Atstudy close (Table 2), the concentrations of HDL-cholesterol, ApoA-I and ApoA-II were all significantlyhigher in the fenofibrate than in the placebo group, thechange being most marked for ApoA-II (27.2%). Theconcentrations of LDL-cholesterol and ApoB, and the totalcholesterol:HDL-cholesterol, LDL-cholesterol:HDL-cho-lesterol, non-HDL-cholesterol:HDL-cholesterol and ApoB:
13,900 patients screened
9,795 randomised
1,334 declined consent2,625 not eligible146 other reasons
4,900 assigned to placebo
4,885 vital status confirmed at end of study4,364 with at least one lipid measurement
10 lost to follow-up5 withdrew consent
4,879 vital status confirmed at end of study4,314 with at least one lipid measurement
4,895 assigned to fenofibrate
12 lost to follow-up4 withdrew consent
Fig. 1 Enrolment and progress of patients in the FIELD trial
1848 Diabetologia (2010) 53:1846–1855

ApoA-I ratios were all significantly lower in the fenofibrategroup than the placebo group. These differences were evengreater when patients commencing statin therapy duringfollow-up were excluded (Electronic supplementary mate-rial Table 1).
Relationship between baseline levels and cardiovascularoutcomes The HRs for a one SD increment of each of thelipid and apolipoprotein concentrations and their ratios inthe placebo and fenofibrate groups (adjusted for major riskvariables of interest) are shown in Table 3. Of the lipid andapolipoprotein concentrations, significant effects wereobserved for HDL-cholesterol, ApoA-I, ApoB and non-HDL-cholesterol in both study groups. Baseline levels ofApoA-II weakly predicted cardiovascular events in thefenofibrate group, but not separately in the placebo group;there was no significance difference across the twotreatment groups (p=0.59 for interaction). Similarly, totalcholesterol and LDL-cholesterol were separately predictive
in the fenofibrate group, but not in the placebo group.Again, the interaction tests were not significant (p=0.28and p=0.14, respectively).
All lipid ratios and the ApoB:ApoA-I ratio were signifi-cantly associated with cardiovascular outcomes in bothgroups (Table 3). The likelihood ratio statistics (χ2) were ofapproximately the same magnitude for non-HDL-cholesterol:HDL-cholesterol, total cholesterol:HDL-choles-terol, LDL-cholesterol:HDL-cholesterol and ApoB:ApoA-Iratios. In terms of their ability to predict cardiovascularevents, these lipid and ApoB:ApoA-I ratios performed betteroverall than any of the individual lipid or apolipoproteinconcentrations in both groups. There was no indication thatApoB:ApoA-I ratio was superior to any of the lipid ratios.
The predictive performance of different variables forcardiovascular outcomes in the two groups was alsoevaluated using ROC curve analysis (Fig. 2). As judgedby the area under the ROC curve, performance was equalfor concentrations of HDL-cholesterol and ApoA-I, which
Characteristic Placebo Fenofibrate
n 4,900 4,895
General characteristics
Men (%) 63 63
Age at visit 1 (years) 62 (7) 62 (7)
Duration of diabetes (years) 5 (2–10) 5 (2–10)
Clinical history
Previous CVD (%) 22 22
History of hypertension (%) 56 57
Current or ex-smoker (%) 60 60
Laboratory data: lipids and lipoproteins
Atherogenic
Triacylglycerol (mmol/l) 1.73 (1.34–2.30) 1.74 (1.35–2.34)
Total cholesterol (mmol/l) 5.03 (0.71) 5.04 (0.69)
LDL-cholesterol (mmol/l) 3.07 (0.66) 3.07 (0.64)
ApoB (g/l) 0.97 (0.17) 0.97 (0.17)
Non-HDL-cholesterol (mmol/l) 3.94 (0.69) 3.95 (0.68)
Anti-atherogenic
HDL-cholesterol (mmol/l) 1.10 (0.26) 1.10 (0.26)
ApoA-I (g/l) 1.29 (0.21) 1.29 (0.21)
ApoA-II (g/l) 0.35 (0.07) 0.35 (0.07)
Ratios
Total cholesterol:HDL-cholesterol 4.80 (1.10) 4.81 (1.10)
Non-HDL-cholesterol:HDL-cholesterol 3.78 (1.10) 3.80 (1.09)
LDL-cholesterol:HDL-cholesterol 2.92 (0.84) 2.93 (0.82)
ApoB:ApoA-I 0.77 (0.18) 0.77 (0.18)
Other laboratory data
HbA1c 6.9 (6.1–7.8) 6.9 (6.1–7.8)
Plasma creatinine (μmol/l) 77 (16) 78 (16)
Homocysteine (µmol/l) 9.6 (8.0–11.4) 9.5 (7.9–11.6)
Microalbuminuria (%) 25 26
Table 1 Baseline characteristicsand medication per group
Unless otherwise indicated, val-ues are mean (SD) or median(interquartile range)
Diabetologia (2010) 53:1846–1855 1849

were superior to total cholesterol and ApoB in both groups.The performance of total cholesterol:HDL-cholesterol, non-HDL-cholesterol:HDL-cholesterol, LDL-cholesterol:HDL-cholesterol and ApoB:ApoA-I ratios was also similar in
the two groups. Analyses were repeated for each treatmentgroup separately, with similar results (data not shown).
The prediction of cardiovascular outcomes by lipid andratio quartiles is shown in Table 4. The HR for cardiovascular
Table 3 Hazard ratios and χ2 (likelihood ratio test) for total CVD events for one SD increment in lipid or lipid ratio variables at baseline
Variablea,b Placebo groupc Fenofibrate group
HR 95% CI χ2 p value HR 95% CI χ2 p value
Non-HDL-cholesterol:HDL-cholesterol 1.21 1.12–1.31 24.0 <0.001 1.28 1.18–1.39 36.2 <0.001
Total cholesterol:HDL-cholesterol 1.21 1.12–1.31 23.7 <0.001 1.28 1.18–1.39 35.8 <0.001
ApoB:ApoA-I 1.20 1.12–1.30 23.1 <0.001 1.25 1.16–1.36 31.2 <0.001
LDL-cholesterol:HDL-cholesterol 1.17 1.09–1.27 16.8 <0.001 1.29 1.19–1.40 36.2 <0.001
HDL-cholesterol 0.84 0.76–0.91 15.9 <0.001 0.83 0.76–0.92 14.3 <0.001
ApoA-I 0.85 0.78–0.93 14.0 <0.001 0.87 0.79–0.95 9.2 0.002
ApoB 1.14 1.05–1.23 11.1 0.001 1.22 1.12–1.32 22.3 <0.001
Non-HDL-cholesterol 1.13 1.04–1.22 8.9 0.003 1.23 1.13–1.33 23.8 <0.001
Triacylglycerold 1.07 1.00–1.15 3.2 0.07 1.06 0.98–1.15 1.8 0.18
Total cholesterol 1.06 0.98–1.15 2.4 0.12 1.16 1.07–1.26 12.3 <0.001
LDL-cholesterol 1.05 0.98–1.14 1.8 0.18 1.16 1.07–1.26 12.9 <0.001
ApoA-II 0.96 0.88–1.04 1.1 0.29 0.91 0.83–1.00 4.3 0.04
a There were no significant interactions between HR and treatment groupb Adjusted for sex, age, prior myocardial infarction, prior coronary artery bypass grafting, smoking, creatinine concentration, insulin use, HbA1c andcountry of residencec Values by χ2 rank in placebo groupd Additionally adjusted for HDL-cholesterol
Table 2 Lipids and lipoproteins at study close and percentage changes from baseline
Variable Fenofibrate group Placebo group Difference
Relativechange (%)a
95% CI p valueb Relativechange (%)a
95% CI p valueb In relativechange (%)
p value
Triacylglycerol (mmol/l) −25.8 −26.7, −24.9 <0.001 −4.7 −5.8, −3.6 <0.001 −21.1 <0.001
Total cholesterol (mmol/l) −16.8 −17.2, −16.33 <0.001 −10.4 −11.0, −9.9 <0.001 −6.4 <0.001
LDL-cholesterol (mmol/l) −22.2 −22.8, −21.5 <0.001 −17.7 −18.5, −16.9 <0.001 −4.5 <0.001
ApoB (g/l) −17.7 −18.3, −17.1 <0.001 −10.9 −11.6, −10.2 <0.001 −6.9 <0.001
Non-HDL-cholesterol(mmol/l)
−22.8 −23.3, −22.2 <0.001 −14.3 −14.9, −13.6 <0.001 −8.5 <0.001
HDL-cholesterol (mmol/l) 1.9 1.3, 2.5 <0.001 1.4 0.9, 1.9 <0.001 0.6 0.14
ApoA-I (g/l) 1.6 1.1, 2.2 <0.001 0.0 −0.4, 0.5 0.89 1.6 <0.001
ApoA-II (g/l) 25.9 25.0, 26.8 <0.001 −1.3 −1.9, −0.7 <0.001 27.2 <0.001
Total cholesterol:HDL-cholesterol
−18.5 −19.1, −18.0 <0.001 −11.8 −12.5, −11.2 <0.001 −6.7 <0.001
LDL-cholesterol:HDL-cholesterol
−23.8 −24.5, −23.0 <0.001 −18.9 −19.8, −18.0 <0.001 −4.9 <0.001
Non-HDL-cholesterol:HDL-cholesterol
−24.3 −25.0, −23.5 <0.001 −15.4 −16.2, −14.6 <0.001 −8.9 <0.001
ApoB:ApoA-I −19.0 −19.7, −18.3 <0.001 −10.9 −11.7, −10.1 <0.001 −8.1 <0.001
a Relative changes between baseline and close-out were calculated for each variable using geometric means based on log-transformation of data; analyseswere based on 4,289–4,367 patients in the placebo group and 4,244–4,314 patients in the fenofibrate groupb For comparison of baseline and close data in each treatment arm (paired data)
1850 Diabetologia (2010) 53:1846–1855

events in the top compared with the bottom quartile was 0.50for HDL-cholesterol, 0.50 for ApoA-I, 0.61 for ApoA-II and1.51 for ApoB. The HRs for HDL-cholesterol, ApoA-I andApoA-II were attenuated in the adjusted model (includingtreatment effect), whereas the HR for ApoB, if anything,improved in the adjusted model. The HR for triacylglycerolwas also attenuated in the adjusted model, which includedHDL-cholesterol. The HRs for the unadjusted models were2.34 for the total cholesterol:HDL-cholesterol ratio, 2.30 forthe non-HDL-cholesterol:HDL-cholesterol ratio, 2.16 for theApoB:ApoA-I ratio and 2.07 for the LDL-cholesterol:HDL-cholesterol ratio. All remained significant in the adjustedmodel (p<0.001 for all).
Discussion
Analysis of data from 9,795 diabetes patients in the FIELDstudy confirms previous observations that ratios that takeinto account concentrations of atherogenic and anti-atherogenic lipoproteins are superior to measurements ofconcentrations of either atherogenic or anti-atherogenicfractions alone, in terms of their ability to predictcardiovascular events over a follow-up period of 5 years.These ratios include total cholesterol:HDL-cholesterol, non-HDL-cholesterol:HDL-cholesterol, LDL-cholesterol:HDL-cholesterol and ApoB:ApoA-I. However, in contrast tosome previous reports [22, 26–31] but in confirmation ofothers [24, 36, 40–42], the ApoB:ApoA-I ratio performedno better as a predictor than any of the three lipid ratios.These observations were apparent in the placebo andfenofibrate groups as assessed by computing HRs from
Cox proportional hazards models and by ROC curveanalysis for different variables.
Diabetic dyslipidaemia is characterised by a highconcentration of potentially atherogenic TRLs and small,dense LDL particles in combination with a low concentra-tion of potentially anti-atherogenic HDL particles. Notably,in the FIELD and the Action to Control CardiovascularRisk in Diabetes studies the event rates were higher inparticipants with marked dyslipidaemia (triacylglycerol>2.3 mmol/l and low HDL-cholesterol) than in thosewithout [43, 44], although in FIELD the groups were notheterogeneous. Consequently, ratios that take account of thelevels of atherogenic and anti-atherogenic lipoproteins havebeen recommended as an effective way to estimatecardiovascular risk in people with type 2 diabetes. In theCARDS study (2,350 participants with type 2 diabetes), theratios at baseline of ApoB:ApoA-I and LDL-cholesterol:HDL-cholesterol were superior to measurements of eitherlipid fraction or apolipoprotein alone in terms of predictingcardiovascular events in people with diabetes [37]. Theauthors of that report concluded (as do we from thisanalysis of the FIELD study) that, in clinical practice, themeasurement of the ApoB:ApoA-I ratio has little to offerover the ratio of LDL-cholesterol:HDL-cholesterol. In thecurrent analysis of diabetic patients in the FIELD study, wealso found that the HR for the ApoB:ApoA-I ratio wasvirtually identical to that for the total cholesterol:HDL-cholesterol and non-HDL-cholesterol:HDL-cholesterol ratios,but little better than that for the LDL-cholesterol:HDL-cholesterol ratio. This observation is fully consistent withresults from the ERFC study reporting comparable HRs fornon-HDL-cholesterol:HDL-cholesterol, total cholesterol:
0
0.2
0.4
0.6
0.8
1.0
0 0.2 0.4 0.6 0.8 1.0
1–Specificity
0 0.2 0.4 0.6 0.8 1.0
1–Specificity
0 0.2 0.4 0.6 0.8 1.0
1–Specificity
Sen
sitiv
ity
0
0.2
0.4
0.6
0.8
1.0
Sen
sitiv
ity
0
0.2
0.4
0.6
0.8
1.0
Sen
sitiv
ity
a b c
Fig. 2 Receiver operating characteristic curves with AUCs and 95%CIs for (a) atherogenic and (b) protective lipids and lipoproteins, and(c) lipid and lipoprotein ratios. a Green line, non-HDL-cholesterol(0.547 [0.531–0.564]); orange line, ApoB (0.545 [0.528–0.561]); pinkline, LDL-cholesterol (0.530 [0.513–0.546]); blue line, total choles-terol (0.516 [0.500–0.533]); (b) green line, HDL-cholesterol (0.580
[0.564–0.597]); blue line, ApoA-I (0.578 [0.562–0.595]); red line,ApoA-II (0.551 [0.534–0.567]); (c) green line, LDL-cholesterol:HDL-cholesterol (0.585 [0.568–0.601]); blue line, ApoB:ApoA-I (0.589[0.572–0.605]); orange line, total cholesterol:HDL-cholesterol (0.592[0.575–0.608]); pink line, non-HDL-cholesterol:HDL-cholesterol(0.592 [0.575–0.608])
Diabetologia (2010) 53:1846–1855 1851

Table 4 Effect of lipid ratios and baseline levels on cardiovascular events, by quartiles
Variables in ranges CVD event rate Unadjusted Adjusteda
HR (95% CI) p value HR (95% CI) p value
Lipid and lipoprotein
Triacylglycerol (mmol/l)b
<1.34 2.9 1 1
1.34–1.73 3.0 1.02 (0.86–1.20) 0.84 1.02 (0.91–1.26) 0.81
1.74–2.33 3.5 1.19 (1.01–1.39) 0.03 1.15 (0.98–1.36) 0.08
>2.33 3.8 1.32 (1.13–1.53) <0.001 1.17 (0.99–1.39) 0.06
Total cholesterol (mmol/l)
<4.56 2.8 1 1
4.56–5.03 3.6 1.29 (1.10–1.51) 0.002 1.33 (1.14–1.56) <0.001
5.04–5.54 3.5 1.26 (1.07–1.47) 0.005 1.37 (1.17–1.61) <0.001
>5.54 3.4 1.21 (1.03–1.42) 0.02 1.41 (1.19–1.66) <0.001
LDL-cholesterol (mmol/l)
<2.63 2.7 1 1
2.63–3.08 3.5 1.30 (1.10–1.52) <0.002 1.28 (1.09–1.51) 0.002
3.09–3.52 3.6 1.35 (1.15–1.59) <0.001 1.34 (1.14–1.57) <0.001
>3.52 3.4 1.27 (1.08–1.50) 0.003 1.31 (1.11–1.54) 0.002
Non-HDL-cholesterol (mmol/l)
<3.47 2.5 1 1
3.47–3.93 3.5 1.42 (1.21–1.68) <0.001 1.39 (1.17–1.63) <0.001
3.94–4.40 3.4 1.38 (1.17–1.63) <0.001 1.42 (1.20–1.68) <0.001
>4.40 3.9 1.59 (1.35–1.87) <0.001 1.65 (1.40–1.95) <0.001
ApoB (g/l)
<0.86 2.6 1 1
0.86–0.97 3.6 1.34 (1.14–1.57) <0.001 1.35 (1.15–1.59) <0.001
0.98–1.09 3.3 1.38 (1.17–1.62) <0.001 1.41 (1.19–1.66) <0.001
>1.09 3.8 1.51 (1.28–1.77) <0.001 1.59 (1.35–1.87) <0.001
HDL-cholesterol (mmol/l)
<0.92 4.5 1 1
0.92–1.06 3.5 0.70 (0.61–0.81) <0.001 0.76 (0.66–0.88) <0.001
1.07–1.24 2.8 0.59 (0.51–0.68) <0.001 0.70 (0.60–0.82) <0.001
>1.24 2.4 0.50 (0.43–0.59) <0.001 0.66 (0.56–0.79) <0.001
ApoA-I (g/l)
<1.15 4.3 1 1
1.15–1.27 3.6 0.76 (0.66–0.87) <0.001 0.84 (0.73–0.97) 0.02
1.28–1.41 3.1 0.73 (0.63–0.85) <0.001 0.88 (0.76–1.03) 0.11
>1.41 2.2 0.50 (0.43–0.59) <0.001 0.69 (0.58–0.83) <0.001
ApoA-II (g/l)
<0.30 3.2 1 1
0.30–0.34 4.4 0.87 (0.75–1.00) 0.06 0.93 (0.81–1.08) 0.37
0.35–0.39 3.3 0.77 (0.66–0.90) 0.001 0.89 (0.76–1.05) 0.16
>0.39 2.3 0.61 (0.52–0.73) <0.001 0.78 (0.65–0.93) 0.006
Lipid and lipoprotein ratios
Total cholesterol:HDL-cholesterol
<4.04 2.2 1 1
4.04–4.71 2.9 1.34 (1.12–1.59) 0.001 1.27 (1.07–1.52) 0.008
4.72–5.49 3.1 1.43 (1.20–1.70) <0.001 1.30 (1.09–1.55) 0.004
>5.49 4.9 2.34 (1.99–2.74) <0.001 1.98 (1.67–2.34) <0.001
1852 Diabetologia (2010) 53:1846–1855

HDL-cholesterol and ApoB:ApoA-I ratios in non-diabetic anddiabetic participants [36]. Collectively, these results providelittle support for replacing measurement of non-HDL-cholesterol and HDL-cholesterol and their ratio by measure-ment of the ApoB:ApoA-I ratio in people with diabetes.
Baseline values of HDL-cholesterol, ApoA-I and ApoB allindividually significantly predicted cardiovascular outcome inthe placebo and fenofibrate groups. Surprisingly, in contrast tothe baseline level of ApoB, the baseline concentration ofLDL-cholesterol was a significant predictor only in thefenofibrate group. The failure of LDL-cholesterol to predictoutcomes in the placebo group may reflect the fact that whenLDL particle size is small (as in type 2 diabetes), theconcentration of LDL-cholesterol (in contrast to ApoB) is apoor indication of LDL particle concentration or totalconcentration of atherogenic lipoproteins. Since fenofibratewill probably have reduced the concentration of TRLs andalso increased LDL particle size, the baseline LDL concen-tration in the fenofibrate group may have remained morereflective of the atherogenic lipoprotein particle concentrationover the course of the study than would have been the case inthe placebo group.
In this analysis of people with type 2 diabetes, thebaseline concentration of ApoA-II (as a single variable)predicted future cardiovascular events in the fenofibrategroup. However, the HR for ApoA-II in the placebo group,while similar to that in the fenofibrate group, did not reach
statistical significance, although there was no evidence ofheterogeneity by treatment of the effect.
The observation that treatment with fenofibrate increasedthe concentration of ApoA-II by nearly 30% raises thepossibility that a proportion of the reduction in cardiovas-cular events in the treated group may have been theconsequence of the increase in ApoA-II. A robust increasein ApoA-II concentration in people treated with fenofibratehas been reported in several studies in addition to FIELD[45–47]. To the best of our knowledge, this analysis of theFIELD study is the first to suggest that ApoA-II may haveprotective properties in people with diabetes. This findingextends that reported by Birjmohun et al., who found thathigher levels of ApoA-II were associated with a lower riskof future coronary artery disease in the European Prospec-tive Investigation of Cancer–Norfolk cohort [48]. It should,however, be emphasised that our study provides no clues topotential mechanisms underlying this association.
A strength of the present study is that our cohortconsisted of 9,795 people with diabetes. It used ApoBand ApoB:ApoA-I ratios as CVD risk markers, which hasbeen most strongly advocated for people who have diabetesand the atherogenic triad, with elevation of ApoB [11, 22,33]. It should be noted that our samples were collected fromfasting patients. This may partly mask any predictive powerof non-fasting triacylglycerol levels, which perform betterthan fasting values as risk predictors [36, 49, 50]. However,
Table 4 (continued)
Variables in ranges CVD event rate Unadjusted Adjusteda
HR (95% CI) p value HR (95% CI) p value
Non-HDL:HDL
<3.03 2.2 1 1
3.03–3.71 2.9 1.31 (1.10–1.56) 0.003 1.23 (1.03–1.47) 0.02
3.72–4.48 3.2 1.48 (1.24–1.75) <0.001 1.35 (1.13–1.61) <0.001
>4.48 4.9 2.30 (1.96–2.70) <0.001 1.95 (1.65–2.31) <0.001
LDL-cholesterol:HDL-cholesterol
<2.36 2.3 1 1
2.36–2.88 2.9 1.27 (1.07–1.51) 0.007 1.22 (1.02–1.45) 0.03
2.89–3.44 3.3 1.44 (1.22–1.71) <0.001 1.28 (1.07–1.52) 0.006
>3.44 4.6 2.07 (1.77–2.43) <0.001 1.77 (1.50–2.09) <0.001
ApoB:ApoA-I
<0.65 2.2 1 1
0.65–0.76 3.0 1.35 (1.13–1.61) <0.001 1.26 (1.06–1.51) 0.01
0.77–0.88 3.6 1.66 (1.40–1.96) <0.001 1.45 (1.22–1.72) <0.001
>0.88 4.5 2.16 (1.84–2.55) <0.001 1.83 (1.55–2.17) <0.001
a Adjusted for treatment group, sex, age, prior myocardial infarction, prior coronary artery bypass grafting, smoking, creatinine concentration, insulin use,HbA1c and country of residenceb Additionally adjusted for HDL-cholesterol
Diabetologia (2010) 53:1846–1855 1853

both non-HDL-cholesterol and ApoB would be expected tocapture the additional risk of non-fasting triacylglycerol.
In conclusion, our analysis of 9,795 people with type 2diabetes in the FIELD study cohort showed that baselinelipid and apolipoprotein ratios performed better than anysingle lipid or apolipoprotein in predicting CVD risk. Ourfindings also confirmed that HRs for traditional lipid ratioswere as strong as those for the ApoB:ApoA-I ratio in thiscohort of type 2 diabetic patients. Thus, these analysesprovide little support for replacing traditional lipids andtheir ratios with measures of ApoB and ApoA-I, and theirratio, either as risk prediction tools or as a potential meansto monitor the effects of lipid management. This informa-tion is important for clinical practice, as measurements oflipid ratios can be calculated from traditional lipid measuresfamiliar to most clinicians.
Acknowledgements Fournier Pharma (now part of Abbott Pharma-ceuticals) sponsored the FIELD trial but had no role in data collectionor analysis. The authors acknowledge R. Pike for manuscript editingand A.-S. Veillard for assistance with statistical analysis. Both arefrom the National Health and Medical Research Council ClinicalTrials Centre, University of Sydney, Sydney, Australia, and wereuncompensated.
Duality of interest M.-R. Taskinen has received honoraria fromMerck Sharpe & Dohme, Novartis, Sanofi-Aventis and Kowa, and hasbeen an advisory board member for Merck Sharpe & Dohme andMerck/Schering-Plough. P. Barter has received research support fromPfizer and Merck Sharpe & Dohme, and honoraria from Abbott,Bristol Myers Squibb, Roche, Sanofi-Aventis, Astra Zeneca, Pfizerand Merck Sharpe & Dohme, and has been on advisory boards ofAstra Zeneca, Roche, Pfizer and Merck Sharpe & Dohme. C.Ehnholm has received honoraria from the pharmaceutical industry.D. Sullivan has received honoraria from and been an advisory boardmember for Solvay Pharmaceuticals, AstraZeneca, Merck Sharpe &Dohme, Pfizer and Schering Plough. R. J. Simes has received anhonorarium from Solvay. A. C. Keech has received honoraria from thepharmaceutical industry, has been on several pharmaceutical advisoryboards and has acted as an expert witness for Medicines Australia. Allother authors declare that there is no duality of interest associated withthis manuscript.
References
1. Taskinen MR (2005) Type 2 diabetes as a lipid disorder. Curr MolMed 5:297–308
2. Mooradian AD (2009) Dyslipidemia in type 2 diabetes mellitus.Nat Clin Pract Endocrinol Metab 5:150–159
3. Cromwell WC, Otvos JD, Keyes MJ et al (2007) LDL particlenumber and risk of future cardiovascular disease in the Framing-ham offspring study—implications for LDL management. J ClinLipidol 1:583–592
4. Blake GJ, Otvos JD, Rifai N, Ridker PM (2002) Low-densitylipoprotein particle concentration and size as determined bynuclear magnetic resonance spectroscopy as predictors of cardio-vascular disease in woman. Circulation 106:1930–1937
5. Otvos JD, Collins D, Freedman DS et al (2006) Low-densitylipoprotein and high-density lipoprotein particle subclasses predict
coronary events and are favorably changed by gemfibrozil therapyin the Veterans Affairs High-Density Lipoprotein InterventionTrial. Circulation 113:1556–1563
6. El Harchaoui K, van der Steeg WA, Stroes ES et al (2007) Valueof low-density lipoprotein particle number and size as predictorsof coronary artery disease in apparently healthy men and women:the EPIC-Norfolk prospective population study. J Am CollCardiol 49:547–553
7. Sniderman A (2009) Targets for LDL-lowering therapy. Curr OpinLipidol 20:282–287
8. Lau JF, Smith DA (2009) Advanced lipoprotein testing: recom-mendations based on current evidence. Endocrinol Metab ClinNorth Am 38:1–31
9. Contois JH, McConnell JP, Sethi AA et al (2009) ApolipoproteinB and cardiovascular disease risk: position statement from theAACC Lipoproteins and Vascular Diseases Division WorkingGroup on Best Practices. Clin Chem 55:407–419
10. Barter PJ, Ballantyne CM, Carmena R et al (2006) Apo B versuscholesterol in estimating cardiovascular risk and in guidingtherapy: report of the thirty-person/ten-country panel. J InternMed 259:247–258
11. Sniderman AD (2010) Apolipoprotein B, diabetes and medicalconsensus. Ann Clin Biochem 47:2–3
12. Miller M, Ginsberg HN, Schaefer EJ (2008) Relative atheroge-nicity and predictive value of non-high-density lipoproteincholesterol for coronary heart disease. Am J Cardiol 101:1003–1008
13. Robinson JG, Wang S, Smith BJ, Jacobson TA (2009) Meta-analysis of the relationship between non-high-density lipoproteincholesterol reduction and coronary heart disease risk. J Am CollCardiol 53:316–322
14. Rosenson RS (2009) Management of non-high-density lipoproteinabnormalities. Atherosclerosis 207:328–335
15. Lu W, Resnick HE, Jablonski KA et al (2003) Non-HDLcholesterol as a predictor of cardiovascular disease in type 2diabetes: the strong heart study. Diabetes Care 26:16–23
16. Jiang R, Schulze MB, Li T et al (2004) Non-HDL cholesterol andapolipoprotein B predict cardiovascular disease events amongmen with type 2 diabetes. Diabetes Care 27:1991–1997
17. Brunzell JD, Davidson M, Furberg CD, American DiabetesAssociation, American College of Cardiology Foundation et al(2008) Lipoprotein management in patients with cardiometabolicrisk: consensus statement from the American Diabetes Associa-tion and the American College of Cardiology Foundation.Diabetes Care 31:811–822
18. No authors listed (2009) Executive summary: standards ofmedical care in diabetes—2009. Diabetes Care 32(Suppl 1):S6–S12
19. Genest J, McPherson R, Frohlich J et al (2009) 2009 CanadianCardiovascular Society/Canadian guidelines for the diagnosis andtreatment of dyslipidemia and prevention of cardiovasculardisease in the adult—2009 recommendations. Can J Cardiol25:567–579
20. Grundy SM, Cleeman JI, Merz CN, Coordinating Committee ofthe National Cholesterol Education Program et al (2004) Impli-cations of recent clinical trials for the National CholesterolEducation Program Adult Treatment Panel III guidelines. Arte-rioscler Thromb Vasc Biol 24:e149–e161
21. Blaha M, Blumenthal R, Brinton E, Jacobson T (2008) Theimportance of non-HDL cholesterol reporting in lipid manage-ment. J Clin Lipidol 2:267–273
22. Chan DC, Watts GF (2006) Apolipoproteins as markers andmanagers of coronary risk. QJM 99:277–287
23. Denke MA (2005) Weighing in before the fight: low-densitylipoprotein cholesterol and non-high-density lipoprotein choles-terol versus apolipoprotein B as the best predictor for coronary
1854 Diabetologia (2010) 53:1846–1855

heart disease and the best measure of therapy. Circulation112:336–337
24. Kastelein JJ, van der Steeg WA, Holme I, NT Study Group,IDEAL Study Group et al (2008) Lipids, apolipoproteins, andtheir ratios in relation to cardiovascular events with statintreatment. Circulation 117:3002–3009
25. Barter PJ, Rye KA (2006) The rationale for using apoA-I as aclinical marker of cardiovascular risk. J Intern Med 259:447–454
26. Thompson A, Danesh J (2006) Associations between apolipopro-tein B, apolipoprotein AI, the apolipoprotein B/AI ratio andcoronary heart disease: a literature-based meta-analysis of pro-spective studies. J Intern Med 259:481–492
27. Lind L (2008) Apolipoprotein B/A1 and risk of cardiovasculardisease. Lancet 372:185–186
28. Sulkes D, Brown BG, Krauss RM, Segrest JP, Sniderman AD,Roberts WC (2008) The editor’s roundtable: expanded versusstandard lipid panels in assessing and managing cardiovascularrisk. Am J Cardiol 101:828–842
29. Charlton-Menys V, Durrington P (2006) Apolipoproteins AI andB as therapeutic targets. J Intern Med 259:462–472
30. Walldius G, Jungner I, Holme I, Aastveit AH, Kolar W, Steiner E(2001) High apolipoprotein B, low apolipoprotein A-I, andimprovement in the prediction of fatal myocardial infarction(AMORIS study): a prospective study. Lancet 358:2026–2033
31. McQueen MJ, Hawken S, Wang X, INTERHEART studyinvestigators et al (2008) Lipids, lipoproteins, and apolipoproteinsas risk markers of myocardial infarction in 52 countries (theINTERHEART study): a case–control study. Lancet 372:224–233
32. Holme I, Cater NB, Faergeman O, Incremental Decrease in End-points Through Aggressive Lipid-Lowering (IDEAL) StudyGroup et al (2008) Lipoprotein predictors of cardiovascular eventsin statin-treated patients with coronary heart disease. Insights fromthe Incremental Decrease in End-points Through AggressiveLipid-lowering Trial (IDEAL). Ann Med 40:456–464
33. Sniderman AD (2007) Low-density lipoprotein lowering in type 2diabetes mellitus: how to know how low to go. Curr OpinEndocrinol Diabetes Obes 14:116–123
34. Sniderman AD, Faraj M (2007) Apolipoprotein B, apolipoproteinA-I, insulin resistance and the metabolic syndrome. Curr OpinLipidol 18:633–637
35. Davidson MH (2008) Is LDL-C passed its prime? The emergingrole of non-HDL, LDL-P, and ApoB in CHD risk assessment.Arterioscler Thromb Vasc Biol 28:1582–1583
36. Emerging Risk Factors Collaboration, Di Angelantonio E, Sarwar N,Perry P et al (2009) Major lipids, apolipoproteins, and risk ofvascular disease. JAMA 302:1993–2000
37. Charlton-Menys V, Betteridge DJ, Colhoun H et al (2009)Apolipoproteins, cardiovascular risk and statin response in type 2diabetes: the Collaborative Atorvastatin Diabetes Study (CARDS).Diabetologia 52:218–225
38. FIELD study Investigators (2005) Effects of long-term fenofibratetherapy on cardiovascular events in 9795 people with type 2diabetes mellitus (the FIELD study): randomised controlled trial.Lancet 366:1849–1861
39. Hanley JA, McNeil BJ (1982) The meaning and use of the areaunder a receiver operating characteristic (ROC) curve. Radiology143:29–36
40. van der Steeg WA, Boekholdt SM, Stein EA et al (2007) Role ofthe apolipoprotein B-apolipoprotein A-I ratio in cardiovascularrisk assessment: a case–control analysis in EPIC-Norfolk. AnnIntern Med 146:640–648
41. Ingelsson E, Schaefer EJ, Contois JH et al (2007) Clinical utilityof different lipid measures for prediction of coronary heart diseasein men and women. JAMA 298:776–785
42. Ray KK, Cannon CP, Cairns R, Morrow DA, Ridker PM,Braunwald E (2009) Prognostic utility of apoB/AI, total choles-terol/HDL, non-HDL cholesterol, or hs-CRP as predictors ofclinical risk in patients receiving statin therapy after acutecoronary syndromes: results from PROVE IT-TIMI 22. Arterios-cler Thromb Vasc Biol 29:424–430
43. Scott R, O’Brien R, Fulcher G, Fenofibrate Intervention andEvent Lowering in Diabetes Study Investigators et al (2009)Effects of fenofibrate treatment on cardiovascular disease risk in9795 individuals with type 2 diabetes and various components ofthe metabolic syndrome: the Fenofibrate Intervention and EventLowering in Diabetes (FIELD) study. Diabetes Care 32:493–498
44. ACCORD Study Group (2010) Effects of combination lipidtherapy in type 2 diabetes mellitus. N Engl J Med 362:1563–1574
45. Keeting GM, Croom KF (2007) Fenofibrate: a review of its use inprimary dyslipidaemia, the metabolic syndrome and type 2diabetes mellitus. Drugs 67:121–153
46. Després JP, Lemieux I, Salomon H, Delaval D (2002) Effects ofmicronized fenofibrate versus atorvastatin in the treatment ofdyslipidaemic patients with low plasma HDL-cholesterol levels: a12-week randomized trial. J Intern Med 251:490–499
47. Bard JM, Parra HJ, Camare R et al (1992) A multicentercomparison of the effects of simvastatin and fenofibrate therapyin severe primary hypercholesterolemia, with particular emphasison lipoproteins defined by their apolipoprotein composition.Metabolism 41:498–503
48. Birjmohun RS, Dallinga-Thie GM, Kuivenhoven JA et al (2007)Apolipoprotein A-II is associated with risk of future coronaryartery disease. Circulation 116:2029–2035
49. Langsted A, Freiberg JJ, Nordestgaard BG (2008) Fasting andnonfasting lipid levels influence of normal food intake on lipids,lipoproteins, apolipoproteins, and cardiovascular risk prediction.Circulation 118:2047–2056
50. Nordestgaard BG, Benn M, Schnohr P, Tybjaerg-Hansen A (2007)Nonfasting triglycerides and risk of myocardial infarction, ischemicheart disease, and death in men and women. JAMA 298:299–308
Diabetologia (2010) 53:1846–1855 1855