
Antiatherogenic effects of oleanolic acid in apolipoprotein E knockout mice
Upload
independentCategory
view
1download
0
Apolipoprotein B, Fibrinogen, HDL Cholesterol, and
Apolipoprotein(a) Phenotypes Predict Coronary Artery
Disease in Hemodialysis Patients
MICHAEL KOCH,* BERND KUTKUHN,* EVI TRENKWALDER,t DIETER BACH,*
BERND GRABENSEE,* HANS DIEPLINGER,t and FLORIAN KRONENBERGt*Department of Internal Medicine, Division of Nephrologv and Rheumatology. Heinrich Heine University,
D#{252}sseldorf Germany; and tlnstitute of Medical Biology and Human Genetics, University of Innsbruck,
Innsbruck, Austria.
Abstract. Patients with end-stage renal disease have a markedly
elevated risk for coronary artery disease (CAD). Lipids and
most lipoproteins, however, seem to be not predictive for CAD
in these patients. Although there is clear evidence that lipopro-
tein(a) [Lp(a)] is significantly elevated in these patients, no
study with a sufficiently large group of hemodiaiysis patients
has investigated the relationship between CAD and Lp(a), as
well as the genetically determined apolipoprotein(a) [apo(a)]
phenotype. This cross-sectional study determines the preva-
lence of CAD in relation to the cardiovascular risk profile in an
unselected population of 607 hemodialysis patients, of which
33% were diabetic patients. Twenty-six percent (n = I 58) of
all patients suffered from CAD as diagnosed by a definitive
myocardial infarction (ii = 102) and/or at least one stenosis
>50% of a coronary artery (ii = 143). In univariate analysis,
several classic risk factors, including the concentration of
lipids, bipoproteins, apolipoproteins. and fibrinogen. correlated
with CAD. Lp(a) in patients with CAD showed only a ten-
dency to higher levels, without reaching significance, corn-
pared with patients without CAD (26.6 ± 30.8 rng/dl versus
22. 1 ± 30.4 mg/db, P = 0. 1 0). The frequency of low molecular
weight apo(a) isoforms, however, was significantly greater in
the group with CAD (34.8% versus 23.6%, P < 0.01 ). Step-
wise logistic regression analysis found seven variables associ-
ated with CAD: apobipoprotein B. the low molecular weight
apo(a) phenotype, male sex, age, fibrinogen, diabetes mellitus,
and HDL cholesterol. The association of these variables with
CAD differed depending on age. These results indicate that,
besides classic risk factors such as age, sex, and diabetes
mellitus, additional factors of the lipoprotein and fibrinobytic
system contribute to the high prevalence of CAD in hemodi-
alysis patients. (J Am Soc Nephrol 8: 1889-1898, 1997)
Patients with end-stage renal disease have a well documented
high risk for atherosclerotic complications, and cardiovascular
disease is the major cause of death in patients on renal replace-
ment therapy (1-4). Depending on comorbidity, cardiac events
such as myocardial infarction are approximately five to 50
times higher than in the general population (5). Although very
common in these patients (4,6-8), it is still a matter of dis-
cussion whether and how much lipoprotein and fibrinobytic
disorders contribute to the excessive cardiovascular morbidity
and mortality of these patients (9).
Lipoprotein(a) [Lp(a)] is a cholesterol-rich lipoprotein con-
sisting of an LDL attached to a large and highly polymorphic
glycoprotein named apolipoprotein(a) [apo(a)]. Lp(a) concen-
trations are highly heritable and mainly determined by the size
polymorphism of apo(a) (10). The right-skewed distribution,
together with the more than 1000-fold interindividual range of
Received February 13, 1997. Accepted May 19, 1997.Correspondence to Dr. Florian Kronenberg, Institute of Medical Biology and
Human Genetics, Sch#{246}pfstrasse 4 1. A-6020 Innsbruck, Austria.
1046-6673/0801 2- 1889$03.00/0
Journal of the American Society of Nephrology
Copyright iD 1997 by the American Society of Nephrology
Lp(a) (10), requires a high number of cases and controls to
detect differences of clinical relevance. Apo(a) phenotyping
can improve the reliability of such findings ( 1 1 , 1 2). From
numerous epidemiological studies. it seems that Lp(a) is a risk
factor and predictor of premature atherosclerosis ( I 3- 1 6). In
patients with end-stage renal disease, Lp(a) was found to be
significantly elevated (reviewed in reference 1 1 ). The obser-
vation of arteriovenous differences of Lp(a) between the aorta
and the renal vein, with lower concentrations in the renal vein,
suggests that the kidney is involved in the catabolism of Lp(a)
( 1 7). In contrast to the general population, the apo(a) pheno-
type seems to be more predictive of atherosclerosis in this
patient group than Lp(a) concentrations ( I 8).
Fibrinogen. a further risk factor for atherosclerosis in the
general population (19), was found to be elevated in patients
with chronic renal failure (20-22). Studies in small patient
groups with renal disease and coronary artery disease (CAD),
however, produced inconsistent results (2 1-23).
The aim of our study was to investigate whether elevated
Lp(a) concentrations and/or apo(a) phenotypes. as well as
fibrinogen levels and other lipids or lipoproteins, are predictive
ofCAD in hemodialysis patients. Therefore, we determined the
lipid profile, Lp(a), apo(a) phenotypes, lipoproteins. apoli-
I 890 Journal of the American Society of Nephrology
poproteins A-I and B, fibrinogen, and CAD status in a large
and unselected group of 607 hemodialysis patients, including
diabetic and nondiabetic patients.
Materials and MethodsPatients
During 1993 and 1994, we investigated the prevalence of cardio-
vascular events and the cardiovascular risk profile in 607 unselected
hemodialysis patients of seven dialysis centers in the Rhineland,
Germany. We decided to include nondiabetic and diabetic patients,
because we also wanted to investigate the relative importance of
diabetes mellitus as risk factor for CAD in this high-risk patient
population. Informed consent was obtained from all patients. The
study included 3 18 men and 289 women with a mean age of 58 ± 14
yr (range. 19 to 87 yr) and a mean duration of hemodialysis treatment
of 44 ± 5 1 IT1() (median. 27; range. I to 297 nb). Patients were treated
with bicarbonate-buffered dialysate three times weekly with 3 to 6 h
per session. Patients were considered diabetic ifthey were treated with
insulin or oral hypoglycemic agents. and/or fasting blood glucose was
higher than 140 mg/dl. Diabetes classification in the 200 diabetic
patients (42 of type I and 158 of type II) was done according to the
criteria of the National Diabetes Data Group (24). Patients were
classified as hypertensive if either the BP measured at the beginning
of dialysis treatment was greater than I 60/95 mmHg or patients were
on antihypertensive treatment. Smoking history was recorded by
interview. Body mass index was calculated with the body weight at
the end of dialysis treatment.
CAD was established by medical record documentation of defini-
tive myocardial infarction with the corresponding changes in electro-
cardiogram (significant Q waves) and/or a coronary angiography.
Selective coronary angiography was performed in patients who re-
ported angina pectoris and/or other clinical hints (changes of the ST
segment) suggesting coronary insufficiency. Multiple projections of
the left and right coronary artery were assessed, and the presence of
heniodynamically relevant stenosis (stenosis > 50% of the luminal
diameter) was classified as CAD.
Laborator’t’ Measurements
Blood was drawn in a fasting state before the beginning of dialysis
treatment. In patients with a myocardial infarction, blood was with-
drawn at the earliest 3 mo after the event to avoid the effect of acute
phase. After low-speed centrifugation, samples were frozen and kept
at -80#{176}Cbefore analysis (25). Lipids. lipoproteins. and apolipopro-
teins were measured in fresh serum and fibrinogen was measured in
fresh plasma in one laboratory, using commercially available kits
from Boehringer Mannheim (Mannheim, Germany): total cholesterol
with the CHOD-PAP method, HDL cholesterol after precipitation
with phosphotungstic acidIMgCl2, LDL cholesterol after precipitation
with heparin (26), triglycerides with the GPO-PAP method. and
apolipoprotein A-I and apolipoprotein B by nephelometry. Fibrinogen
was measured according to a modified method described by Clauss
(27). Plasma HbAlc was determined with DIAMAT-analysis system
(Bio-Rad, Richmond, CA) by ion exchange chromatography.
Lp(a) quantification was performed as described in detail (25) with
a double-antibody. enzyme-linked immunosorbent assay, using an
affinity-purified polycbonal apo(a) antibody for coating and the horse-
radish peroxidase-conjugated monoclonal antibody 1A2 for detection.
This anti-apo(a) antibody recognizes the epitope motif YYPN in
kringle IV (K-IV) type 2 (28). An Lp(a)-positive serum from Immuno
(Vienna, Austria) with the same apo(a) isoforms served as standard
throughout the study. Each sample was analyzed in duplicate, and
intra- and interassay coefficients of variation were 2.7 and 6%, re-
spectively. The reproducibility of our assay was monitored by four
control plasma samples used in each run. It was shown previously that
Lp(a) measurements with this assay give stable results in samples
stored for up to 2 yr (25). Apo(a) phenotyping was performed by
sodium dodecyl sulfate (SDS)-agarose gel electrophoresis under re-
ducing conditions, as outlined previously (29), with the following
modifications. In a first run, we applied 50 ng of Lp(a) to the gel. In
cases in which we detected only one apo(a) isoform, we repeated the
sample, applying up to 2000 ng. which often resulted in the detection
of a second apo(a) isoform that was weak in relation to the other one
detected in the previous run. By this procedure, it was possible to
detect two apo(a) isoforms in 79% of the patients under investigation.
In only two patients (0.3%), we were not able to detect any apo(a)isoform.
Statistical Analyses
Statistical analyses were performed with Statistical Analysis Sys-
tem (version 6. 1 1) and Statistical Package for the Social Sciences for
Windows 6. 1 .3. Univariate comparisons of continuous variables be-
tween groups were done by unpaired t test or by the nonparametric
Wilcoxon rank sum test in the case of non-normally distributed
variables [Lp(a), triglycerides. and time on dialysis]. Dichotomized
variables were compared using Pearson’s ,y� test. This test was also
applied to compare the prevalence of CAD between different catego-
ries of apolipoprotein B and fibrinogen levels, as well as K-IV repeats.
Variables contributing to diabetic status or CAD status were iden-
tified by stepwise logistic regression analysis. Lp(a) and triglyceride
concentrations and time on dialysis were included in the model after
logarithmic transformation. By removing single variables, we deter-
mined the most parsimonious model. Odds ratios (OR) as an approx-
imation of the relative risk of having CAD were calculated from the
regression coefficients, and adjustment was made for other variables.
To allow an easier interpretation of the OR of continuous variables,
we give the OR for clinically relevant increments as stated for each
variable. However, the calculation was not based on a “categoriza-
tion,” but on the continuous value of the variable divided by the step
of increment (e.g. . values of apolipoprotein B divided by 20).
To examine a possible effect modification, we built interactionterms of diabetes mellitus with age. fibrinogen, and triglyceride con-
centrations by calculating the product of the code for diabetic status
with age. fibrinogen, and triglycerides, respectively. These interaction
terms were used in logistic regression analysis.
To investigate whether differences for each variable between pa-tients with and without CAD in the total patient group depended on
the diabetic status, we introduced an interaction term of these two
variables. For continuous variables, we used 2-way ANOVA with
diabetic and CAD status and the interaction term as independent
variables. For dichotomized variables, multiple logistic regression
analysis was used with the same three variables as independent
variables.
Because of the high number of detectable apo(a) isoforms (>30),
many phenotypes were only represented in bow numbers. To account
for this problem, we decided a priori to combine apo(a) isoforms in
steps of three K-IV repeats according to the molecular weight of thesmaller apo(a) isoforms to get sufficient sample sizes in each category
(30). Because patients with 1 1 to 16 or >34 K-IV repeats were
represented relatively rarely. we built one group by combining 1 1 to
19 and one by combining >31 K-IV repeats. Furthermore, we divided
apo(a) phenotypes in two subgroups according to the molecular
weight of the smaller apo(a) isoforms, as done in previous works
CAD in Hemodialysis Patients 1891
(12,18,31-33). The low molecular weight group (LMW) included all
patients with at least one apo(a) isoform with I 1 to 22 K-IV repeats
(29); the high molecular weight (HMW) group comprised all patients
who had only isoforms with >22 K-IV repeats. If two apo(a) isoforms
were detectable, we generally used only the smaller apo(a) isoform for
categorization for the following reasons. First, phenotyping was per-
formed by SDS-agarose gel electrophoresis. Although we could detect
two apo(a) isoforms in 79% of the patients with this method. the
remaining patients cannot simply be classified as homozygous for the
observed isoform. From DNA phenotyping by pulsed-field gel elec-
trophoresis, only about 6% of the patients are known to be homozy-
gous (34,35). Therefore, more than two-thirds of the patients who
showed only one band in SDS-agarose gel electrophoresis are genet-
ically heterozygous. This discrepancy may be explained either by the
resolution power of SDS-agarose gel ebectrophoresis [e.g. . two iso-
forms differing only by one K-IV repeat are often seen as one apo(a)
band] or by the detection limit of immunoblotting in case of very low
expression of an isoform. Therefore, to classify a patient as homozy-
gous by SDS-agarose gel electrophoresis would result in a misclassi-
fication in most of the cases. Second, more than 80% of the patients
with two apo(a) bands expressed the smaller apo(a) band with more
intensity. Third, the results obtained were similar when we based our
calculations only on the predominantly expressed apo(a) isoform of
each patient.
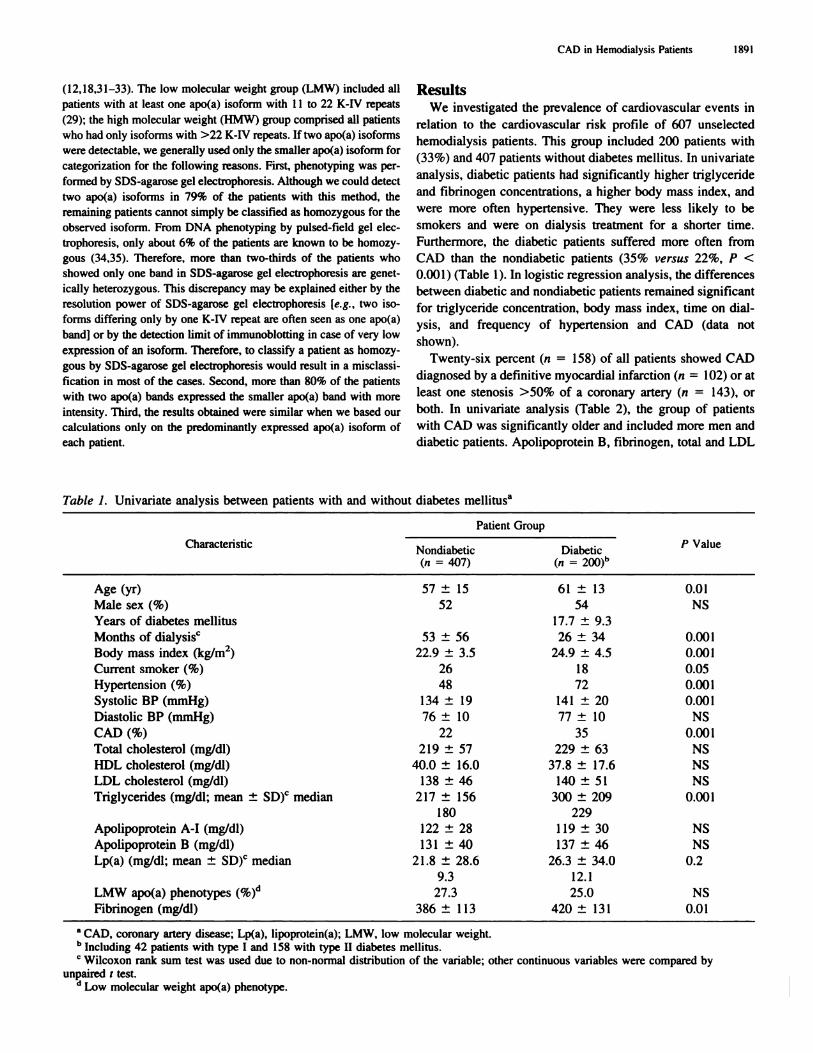
ResultsWe investigated the prevalence of cardiovascular events in
relation to the cardiovascular risk profile of 607 unselected
hemodialysis patients. This group included 200 patients with
(33%) and 407 patients without diabetes mellitus. In univariate
analysis, diabetic patients had significantly higher triglyceride
and fibrinogen concentrations, a higher body mass index, and
were more often hypertensive. They were less likely to be
smokers and were on dialysis treatment for a shorter time.
Furthermore, the diabetic patients suffered more often from
CAD than the nondiabetic patients (35% versus 22%. P <
0.001) (Table 1). In logistic regression analysis, the differences
between diabetic and nondiabetic patients remained significant
for triglyceride concentration, body mass index, time on dial-
ysis, and frequency of hypertension and CAD (data not
shown).
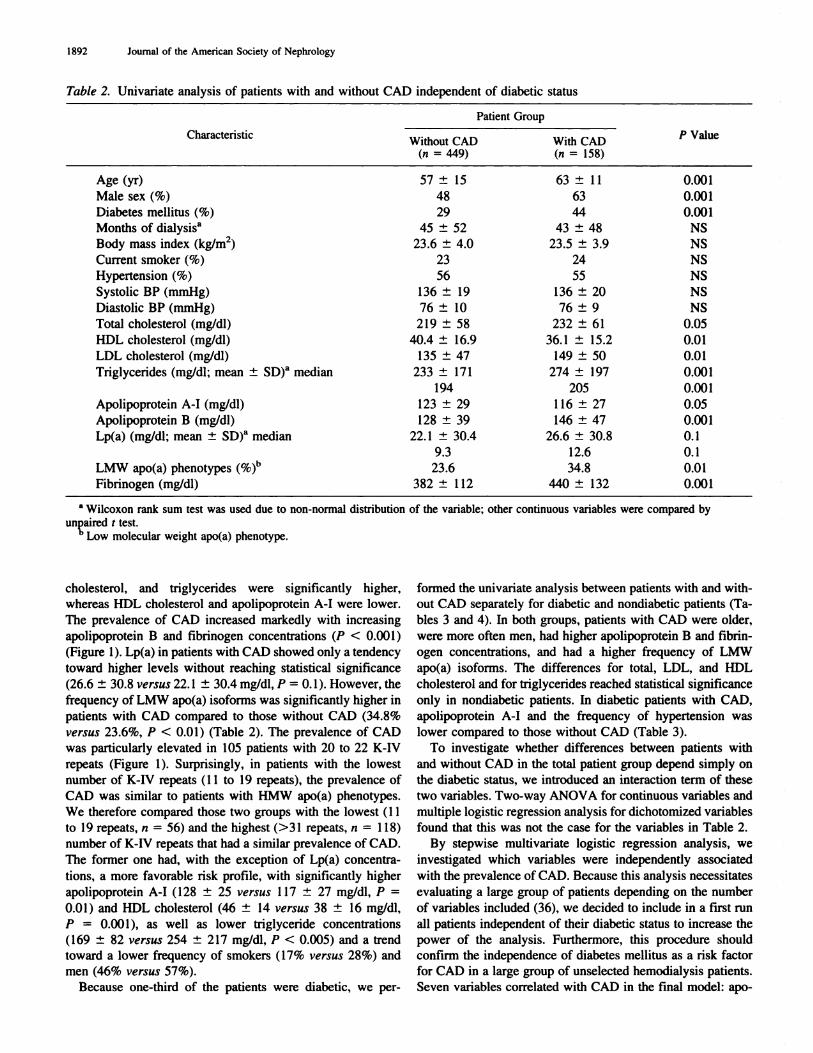
Twenty-six percent (ii = 158) of all patients showed CAD
diagnosed by a definitive myocardial infarction (ii = 102) or at
least one stenosis >50% of a coronary artery (n = 143), or
both. In univariate analysis (Table 2), the group of patients
with CAD was significantly older and included more men and
diabetic patients. Apobipoprotein B, fibrinogen, total and LDL
Table 1. Univariate analysis between patients with and without diabetes meblitusa
Characteristic
Patient Group
p Value. .Nondiabetic
. .Diabetic
(Ii = 407) (‘7 =
Age (yr) 57 ± 15 61 ± 13 0.01
Male sex (%) 52 54 NS
Years of diabetes mellitus 17.7 ± 9.3
Months of dialysisc 53 ± 56 26 ± 34 0.001
Body mass index (kg/rn2) 22.9 ± 3.5 24.9 ± 4.5 0.0()l
Current smoker (%) 26 1 8 0.05
Hypertension (%) 48 72 0.001
Systolic BP (mmHg) 134 ± 19 141 ± 20 0.00 1
Diastolic BP (mmHg) 76 ± 10 77 ± 10 NS
CAD(%) 22 35 0.001
Total cholesterol (mg/dl) 2 19 ± 57 229 ± 63 NS
HDL cholesterol (mg/dl) 40.0 ± 16.0 37.8 ± 17.6 NS
LDL cholesterol (mg/db) 1 38 ± 46 1 40 ± 5 1 NS
Triglycerides (mg/dl; mean ± SD)C median 2 1 7 ± 1 56 300 ± 209 0.0() 1
180 229
Apolipoprotein A-I (mg/dl) 122 ± 28 1 19 ± 30 NS
Apobipoprotein B (mg/dl) 131 ± 40 137 ± 46 NS
Lp(a) (mg/dl; mean ± SD)’ median 2 1 .8 ± 28.6 26.3 ± 34.0 0.2
9.3 12.1
LMW apo(a) phenotypes (%)(� 27.3 25.0 NS
Fibrinogen (mg/dl) 386 ± I 13 420 ± 131 0.01
a CAD, coronary artery disease; Lp(a), lipoprotein(a): LMW, low molecular weight.b Including 42 patients with type I and I 58 with type II diabetes mellitus.C Wilcoxon rank sum test was used due to non-normal distribution of the variable; other continuous variables were compared by
unpaired I test.d Low molecular weight apo(a) phenotype.
1892 Journal of the American Society of Nephrology
Table 2. Univariate analysis of patients with and without CAD independent of diabetic status
Characteristic
Patient Group
‘) ValueWithout CAD With CAD(n - 449) (?i = 158)
Age (yr) 57 ± 15 63 ± 1 1 0.00 1
Male sex (%) 48 63 0.001
Diabetes melbitus (%) 29 44 0.001
Months of dialysisa 45 ± 52 43 ± 48 NS
Body mass index (kg/m2) 23.6 ± 4.0 23.5 ± 3.9 NS
Current smoker (%) 23 24 NS
Hypertension (%) 56 55 NS
Systolic BP (mmHg) 136 ± 19 136 ± 20 NS
Diastolic BP (mmHg) 76 ± 10 76 ± 9 NS
Total cholesterol (mg/db) 219 ± 58 232 ± 61 0.05
HDL cholesterol (mg/db) 40.4 ± 16.9 36.1 ± 15.2 0.01
LDL cholesterol (mg/dl) 135 ± 47 149 ± 50 0.01
Triglycerides (mg/dl: mean ± SD)�’ median 233 ± 171 274 ± 197 0.001
194 205 0.001
Apobipoprotein A-I (mg/db) 123 ± 29 1 16 ± 27 0.05
Apolipoprotein B (mg/dl) 128 ± 39 146 ± 47 0.001
Lp(a) (mg/dl: mean ± SD)a median 22. 1 ± 30.4 26.6 ± 30.8 0.1
9.3 12.6 0.1
LMW apo(a) phenotypes (%)�‘ 23.6 34.8 0.01
Fibrinogen (mg/dl) 382 ± ii2 440 ± 132 0.001
a Wilcoxon rank sum test was used due to non-normal distribution of the variable; other continuous variables were compared by
unpaired t test.h Low molecular weight apo(a) phenotype.
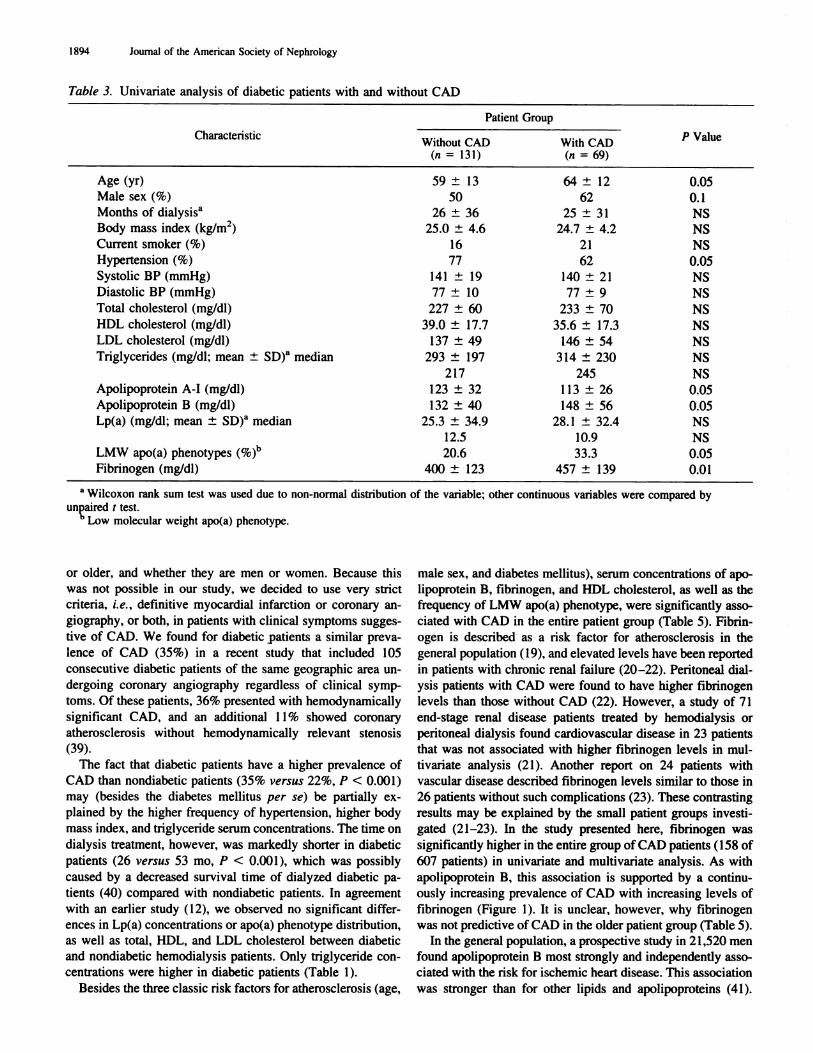
cholesterol, and triglycerides were significantly higher,
whereas HDL cholesterol and apolipoprotein A-I were lower.
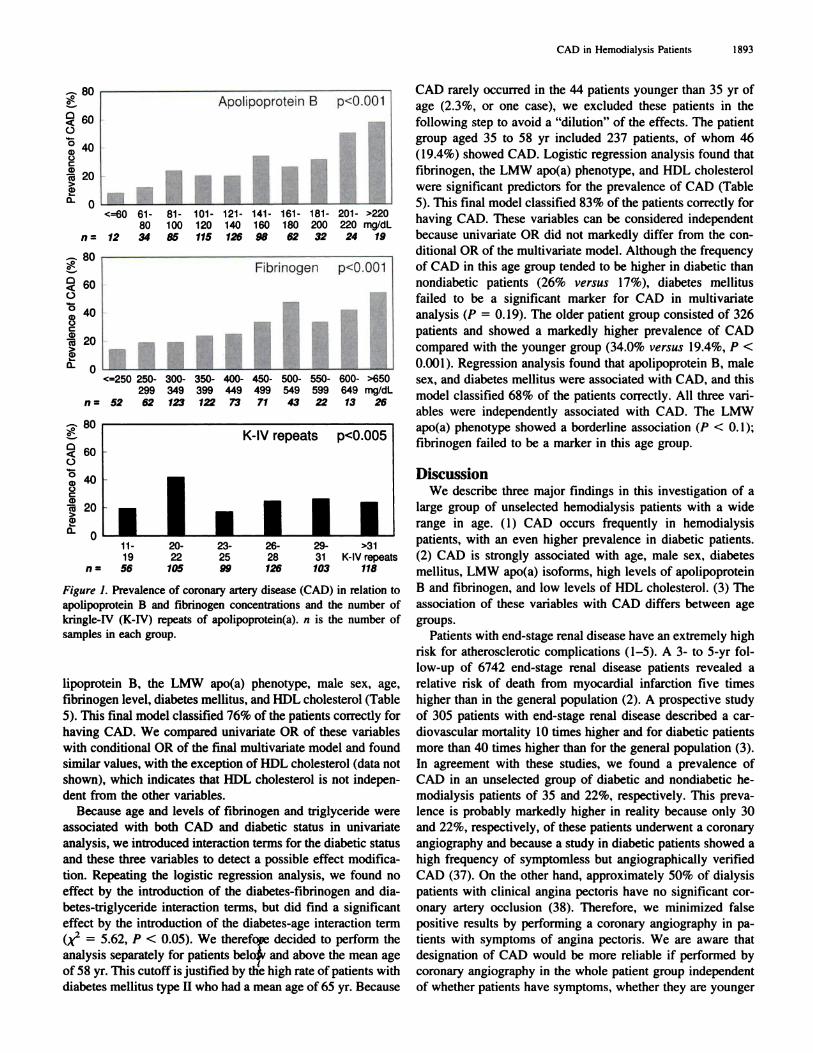
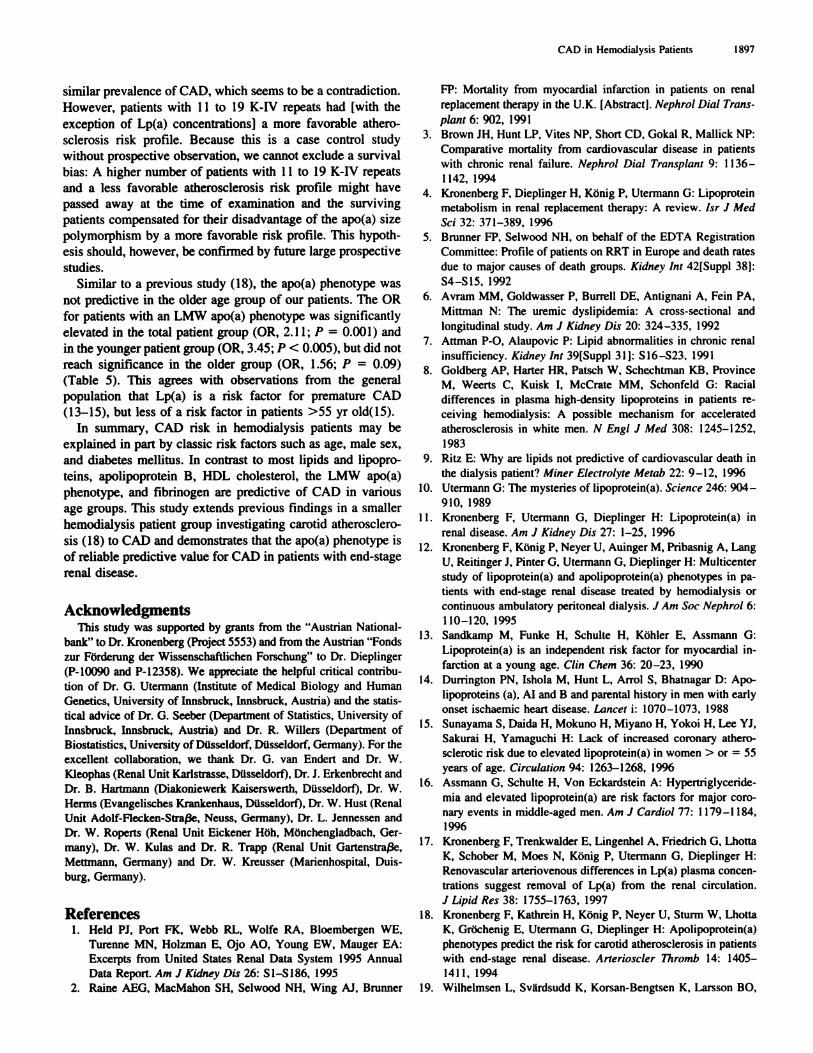
The prevalence of CAD increased markedly with increasing
apolipoprotein B and fibrinogen concentrations (P < 0.001)
(Figure 1 ). Lp(a) in patients with CAD showed only a tendency
toward higher levels without reaching statistical significance
(26.6 ± 30.8 versus 22. 1 ± 30.4 mg/dl, P 0. 1). However, the
frequency of LMW apo(a) isoforms was significantly higher in
patients with CAD compared to those without CAD (34.8%
versu.s 23.6%, P < 0.01) (Table 2). The prevalence of CAD
was particularly elevated in 105 patients with 20 to 22 K-IV
repeats (Figure 1 ). Surprisingly. in patients with the lowest
number of K-IV repeats (1 1 to 19 repeats). the prevalence of
CAD was similar to patients with HMW apo(a) phenotypes.
We therefore compared those two groups with the lowest (1 1
to 19 repeats, ii = 56) and the highest (>31 repeats, ii = 118)
number of K-tV repeats that had a similar prevalence of CAD.
The former one had, with the exception of Lp(a) concentra-
tions, a more favorable risk profile, with significantly higher
apobipoprotein A-I (128 ± 25 versus 117 ± 27 mg/dl, P =
0.01 ) and HDL cholesterol (46 ± 14 versus 38 ± 16 mg/dl.
P = 0.001), as well as lower triglyceride concentrations
( I 69 ± 82 versus 254 ± 2 1 7 mg/dl, P < 0.005) and a trend
toward a lower frequency of smokers ( 17% versus 28%) and
men (46% versus 57%).
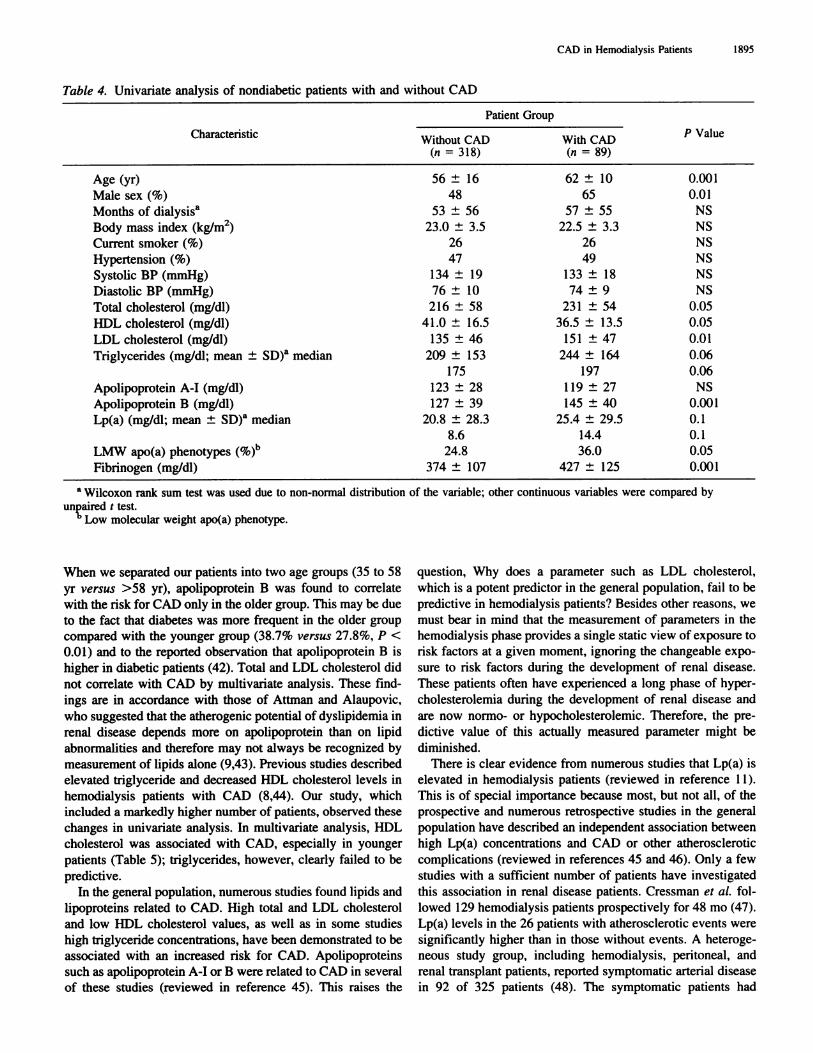
Because one-third of the patients were diabetic, we per-
formed the univariate analysis between patients with and with-
out CAD separately for diabetic and nondiabetic patients (Ta-
bles 3 and 4). In both groups, patients with CAD were older,
were more often men, had higher apolipoprotein B and fibrin-
ogen concentrations, and had a higher frequency of LMW
apo(a) isoforms. The differences for total, LDL, and HDL
cholesterol and for triglycerides reached statistical significance
only in nondiabetic patients. In diabetic patients with CAD,
apolipoprotein A-I and the frequency of hypertension was
lower compared to those without CAD (Table 3).
To investigate whether differences between patients with
and without CAD in the total patient group depend simply on
the diabetic status, we introduced an interaction term of these
two variables. Two-way ANOVA for continuous variables and
multiple logistic regression analysis for dichotomized variables
found that this was not the case for the variables in Table 2.
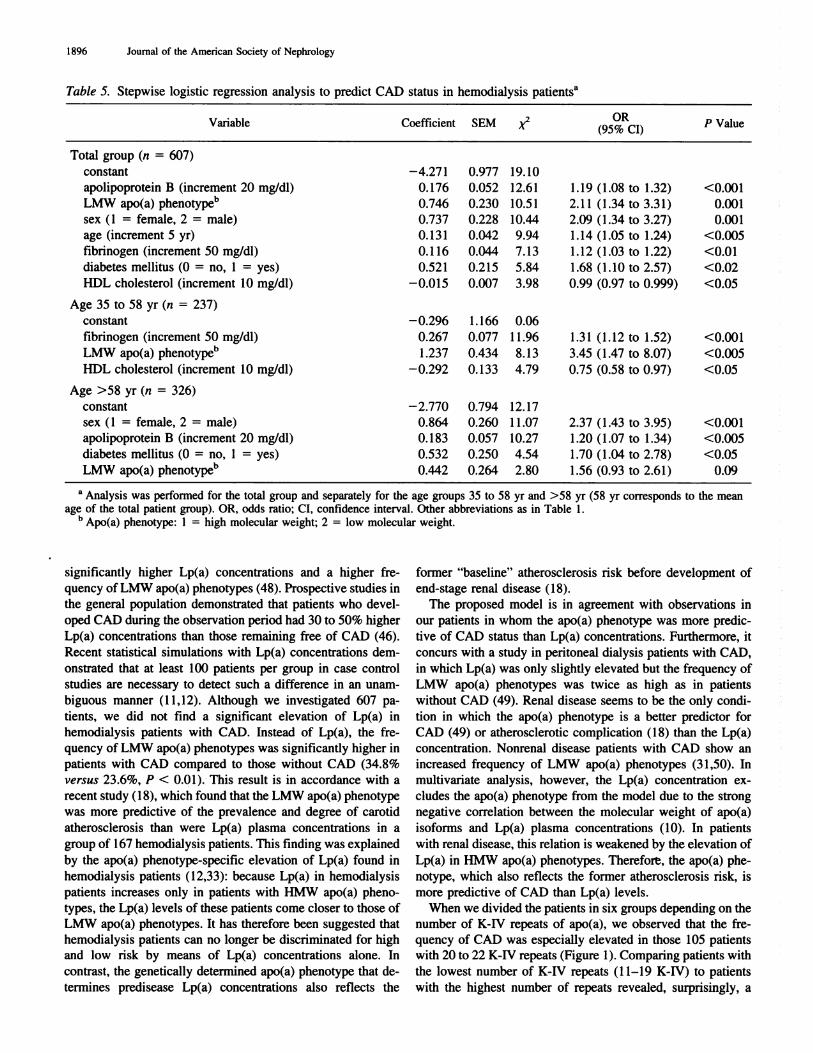
By stepwise mubtivariate logistic regression analysis. we
investigated which variables were independently associated
with the prevalence of CAD. Because this analysis necessitates
evaluating a large group of patients depending on the number
of variables included (36), we decided to include in a first run
all patients independent of their diabetic status to increase the
power of the analysis. Furthermore, this procedure should
confirm the independence of diabetes mellitus as a risk factor
for CAD in a large group of unselected hemodialysis patients.
Seven variables correlated with CAD in the final model: apo-
__80
0
0
I� 20>ci)
Rn
CAD in Hemodialysis Patients 1893
Apoli poprotein B p<0.OOl
0<=60 61-
80
81-
1 00101-
1 20121-
140141- 161- 181-
160 180 200
201- >220
220 mg/dL
n = 12 34 85 115 126 98 62 32 24 19
Fibrinogen p<0.O01
<=250 250-299
300-349
350-399
400-449
450- 500- 550-499 549 599
600- >650649 mg/dL
n = 52 62 123 122 73 71 43 22 13 26
.-. 80
0
0
� 40
ce 20>�i)
0�
e�_� 60
K-IV repeats pczO.005
0
40
20
‘ I I I I1 1 -1 9
20-22
23-25
26-28
29-31
>31K-lV repeats
n= 56 105 99 126 103 118
Figure 1. Prevalence of coronary artery disease (CAD) in relation toapolipoprotein B and fibrinogen concentrations and the number of
kringle-IV (K-IV) repeats of apobipoprotein(a). n is the number of
samples in each group.
lipoprotein B, the LMW apo(a) phenotype, male sex, age,
fibrinogen level, diabetes mellitus, and HDL cholesterol (Table
5). This final model classified 76% of the patients correctly for
having CAD. We compared univariate OR of these variables
with conditional OR of the final multivariate model and found
similar values, with the exception of HDL cholesterol (data not
shown), which indicates that HDL cholesterol is not indepen-
dent from the other variables.
Because age and levels of fibrinogen and triglyceride were
associated with both CAD and diabetic status in univariate
analysis, we introduced interaction terms for the diabetic status
and these three variables to detect a possible effect modifica-
tion. Repeating the logistic regression analysis, we found no
effect by the introduction of the diabetes-fibrinogen and dia-
betes-triglyceride interaction terms, but did find a significant
effect by the introduction of the diabetes-age interaction term
(x2 5.62, P < 0.05). We therefore decided to perform theanalysis separately for patients bel4’ and above the mean age
of 58 yr. This cutoff is justified by the high rate of patients with
diabetes mellitus type II who had a mean age of 65 yr. Because
0
CAD rarely occurred in the 44 patients younger than 35 yr of
age (2.3%, or one case), we excluded these patients in the
following step to avoid a “dilution” of the effects. The patient
group aged 35 to 58 yr included 237 patients. of whom 46
(19.4%) showed CAD. Logistic regression analysis found that
fibrinogen, the LMW apo(a) phenotype. and HDL cholesterol
were significant predictors for the prevalence of CAD (Table
5). This final model classified 83% of the patients correctly for
having CAD. These variables can be considered independent
because univariate OR did not markedly differ from the con-
ditional OR of the multivariate model. Although the frequency
of CAD in this age group tended to be higher in diabetic than
nondiabetic patients (26% versus 17%), diabetes mellitus
failed to be a significant marker for CAD in multivariate
analysis (P = 0.19). The older patient group consisted of 326
patients and showed a markedly higher prevalence of CAD
compared with the younger group (34.0% versus’ 19.4%, P <
0.001 ). Regression analysis found that apolipoprotein B. male
sex, and diabetes mellitus were associated with CAD, and this
model classified 68% of the patients correctly. All three van-
abbes were independently associated with CAD. The LMW
apo(a) phenotype showed a borderline association (P < 0. 1);
fibninogen failed to be a marker in this age group.
DiscussionWe describe three major findings in this investigation of a
large group of unselected hemodiabysis patients with a wide
range in age. ( 1 ) CAD occurs frequently in hemodialysis
patients, with an even higher prevalence in diabetic patients.
(2) CAD is strongly associated with age. male sex, diabetes
mellitus, LMW apo(a) isoforms, high levels of apolipoprotein
B and fibrinogen. and low bevels of HDL cholesterol. (3) The
association of these variables with CAD differs between age
groups.
Patients with end-stage renal disease have an extremely high
risk for atherosclerotic complications (1-5). A 3- to 5-yr fol-
low-up of 6742 end-stage renal disease patients revealed a
relative risk of death from myocardial infarction five times
higher than in the general population (2). A prospective study
of 305 patients with end-stage renal disease described a car-
diovascular mortality 10 times higher and for diabetic patients
more than 40 times higher than for the general population (3).
In agreement with these studies, we found a prevalence of
CAD in an unselected group of diabetic and nondiabetic he-
modialysis patients of 35 and 22%, respectively. This preva-
lence is probably markedly higher in reality because only 30
and 22%, respectively, of these patients underwent a coronary
angiography and because a study in diabetic patients showed a
high frequency of symptomless but angiographically verified
CAD (37). On the other hand, approximately 50% of dialysis
patients with clinical angina pectoris have no significant cor-
onary artery occlusion (38). Therefore. we minimized false
positive results by performing a coronary angiography in pa-
tients with symptoms of angina pectoris. We are aware that
designation of CAD would be more reliable if performed by
coronary angiography in the whole patient group independent
of whether patients have symptoms. whether they are younger
I 894 Journal of the American Society of Nephrology
Table 3. Univaniate analysis of diabetic patients with and without CAD
Characteristic
Patient Group
‘#{176}ValueWithout CAD With CAD
(‘I = 131) (0 = 69)
Age (yr) 59 ± 13 64 ± 12 0.05
Male sex (%) 50 62 0.1
Months of dialysis” 26 ± 36 25 ± 3 1 NS
Body mass index (kg/m2) 25.0 ± 4.6 24.7 ± 4.2 NSCurrent smoker (%) 16 21 NS
Hypertension (%) 77 62 0.05Systolic BP (mmHg) 141 ± 19 140 ± 21 NS
Diastolic BP (mmHg) 77 ± 10 77 ± 9 NS
Total cholesterol (mg/db) 227 ± 60 233 ± 70 NS
HDL cholesterol (mg/dl) 39.0 ± 17.7 35.6 ± 17.3 NSLDL cholesterol (mg/dl) 137 ± 49 146 ± 54 NS
Triglycerides (mg/dl: mean ± SD)�’ median 293 ± 197 314 ± 230 NS
217 245 NS
Apolipoprotein A-I (mg/dl) 123 ± 32 1 13 ± 26 0.05
Apobipoprotein B (mg/dl) 132 ± 40 148 ± 56 0.05Lp(a) (mg/dl: mean :�: SD)� median 25.3 ± 34.9 28.1 ± 32.4 NS
12.5 10.9 NS
LMW apo(a) phenotypes (%)b 20.6 33.3 0.05
Fibninogen (mg/dl) 400 ± 123 457 ± 139 0.01
.‘ Wilcoxon rank sum test was used due to non-normal distribution of the variable; other continuous variables were compared by
unpaired I test.h Low molecular weight apo(a) phenotype.
or older. and whether they are men or women. Because this
was not possible in our study, we decided to use very strict
criteria, i.e. , definitive myocardial infarction or coronary an-
giography. or both, in patients with clinical symptoms sugges-
tive of CAD. We found for diabetic patients a similar preva-
lence of CAD (35%) in a recent study that included 105
consecutive diabetic patients of the same geographic area un-
dergoing coronary angiography regardless of clinical symp-
toms. Of these patients. 36% presented with hemodynamically
significant CAD, and an additional 1 1% showed coronary
atherosclerosis without hemodynamically relevant stenosis
(39).
The fact that diabetic patients have a higher prevalence of
CAD than nondiabetic patients (35% versus 22%, P < 0.001)
may (besides the diabetes mellitus per se) be partially ex-
plained by the higher frequency of hypertension, higher body
mass index, and triglyceride serum concentrations. The time on
dialysis treatment, however, was markedly shorter in diabetic
patients (26 versus 53 mo, P < 0.001 ), which was possibly
caused by a decreased survival time of dialyzed diabetic pa-
tients (40) compared with nondiabetic patients. In agreement
with an earlier study (12), we observed no significant differ-
ences in Lp(a) concentrations or apo(a) phenotype distribution,
as well as total, HDL, and LDL cholesterol between diabetic
and nondiabetic hemodialysis patients. Only triglyceride con-
centrations were higher in diabetic patients (Table I).
Besides the three classic risk factors for atherosclerosis (age,
male sex, and diabetes mellitus), serum concentrations of apo-
lipoprotein B, fibrinogen, and HDL cholesterol, as well as the
frequency of LMW apo(a) phenotype, were significantly asso-
ciated with CAD in the entire patient group (Table 5). Fibrin-
ogen is described as a risk factor for atherosclerosis in the
general population ( 1 9). and elevated levels have been reported
in patients with chronic renal failure (20-22). Peritoneal dial-
ysis patients with CAD were found to have higher fibrinogen
levels than those without CAD (22). However, a study of 71
end-stage renal disease patients treated by hemodialysis or
peritoneab dialysis found cardiovascular disease in 23 patients
that was not associated with higher fibrinogen levels in mul-
tivaniate analysis (21 ). Another report on 24 patients with
vascular disease described fibrinogen levels similar to those in
26 patients without such complications (23). These contrasting
results may be explained by the small patient groups investi-
gated (21-23). In the study presented here, fibrinogen was
significantly higher in the entire group of CAD patients ( 1 58 of
607 patients) in univariate and multivariate analysis. As with
apolipoprotein B, this association is supported by a continu-
ously increasing prevalence of CAD with increasing levels of
fibninogen (Figure 1). It is unclear, however, why fibrinogen
was not predictive of CAD in the older patient group (Table 5).
In the general population, a prospective study in 2 1 ,520 men
found apolipoprotein B most strongly and independently asso-
ciated with the risk for ischemic heart disease. This association
was stronger than for other lipids and apolipoproteins (41).
CAD in Hemodialysis Patients 1895
Table 4. Univariate analysis of nondiabetic patients with and without CAD
Characteristic
Patient Group
�#{176}ValueWithout CAD With CAD(n = 318) (ii = 89)
Age (yr) 56 ± 16 62 ± 10 0.001
Male sex (%) 48 65 0.01
Months of dialysisa 53 ± 56 57 ± 55 NS
Body mass index (kg/rn2) 23.0 ± 3.5 22.5 ± 3.3 NS
Current smoker (%) 26 26 NS
Hypertension (%) 47 49 NS
Systolic BP (mmHg) I 34 ± 1 9 1 33 ± 1 8 NS
Diastolic BP (mmHg) 76 ± 10 74 ± 9 NS
Total cholesterol (mg/dl) 216 ± 58 231 ± 54 0.05
HDL cholesterol (mg/dl) 41.0 ± 16.5 36.5 ± 13.5 0.05
LDL cholesterol (mg/dl) 1 35 ± 46 1 5 1 ± 47 0.01
Triglycerides (mg/dl; mean ± SD)� median 209 ± 153
175
244 ± 164
197
0.06
0.06
Apolipoprotein A-I (mg/dl) 123 ± 28 1 19 ± 27 NS
Apolipoprotein B (mg/dl) 1 27 ± 39 145 ± 40 0.001
Lp(a) (mg/dl; mean ± SD)� median 20.8 ± 28.3
8.6
25.4 ± 29.5
14.4
0.1
0.1
LMW apo(a) phenotypes (%)“ 24.8 36.0 0.05
Fibrinogen (mg/dl) 374 ± 107 427 ± 125 0.001
a Wilcoxon rank sum test was used due to non-normal distribution of the variable; other continuous variables were compared by
unpaired t test.b Low molecular weight apo(a) phenotype.
When we separated our patients into two age groups (35 to 58
yr versus >58 yr). apolipoprotein B was found to correlate
with the risk for CAD only in the older group. This may be due
to the fact that diabetes was more frequent in the older group
compared with the younger group (38.7% versus 27.8%, P <
0.01) and to the reported observation that apolipoprotein B is
higher in diabetic patients (42). Total and LDL cholesterol did
not correlate with CAD by multivariate analysis. These find-
ings are in accordance with those of Attman and Alaupovic,
who suggested that the atherogenic potential of dyslipidemia in
renal disease depends more on apolipoprotein than on lipid
abnormalities and therefore may not always be recognized by
measurement of lipids alone (9,43). Previous studies described
elevated triglyceride and decreased HDL cholesterol levels in
hemodialysis patients with CAD (8,44). Our study, which
included a markedly higher number of patients, observed these
changes in univariate analysis. In multivariate analysis, HDL
cholesterol was associated with CAD, especially in younger
patients (Table 5); triglycerides, however, clearly failed to be
predictive.
In the general population, numerous studies found lipids and
lipoproteins related to CAD. High total and LDL cholesterol
and low HDL cholesterol values, as well as in some studies
high triglyceride concentrations, have been demonstrated to be
associated with an increased risk for CAD. Apolipoproteins
such as apolipoprotein A-I or B were related to CAD in several
of these studies (reviewed in reference 45). This raises the
question, Why does a parameter such as LDL cholesterol,
which is a potent predictor in the general population. fail to be
predictive in hemodialysis patients? Besides other reasons, we
must bear in mind that the measurement of parameters in the
hemodialysis phase provides a single static view of exposure to
risk factors at a given moment, ignoring the changeable expo-
sure to risk factors during the development of renal disease.
These patients often have experienced a long phase of hyper-
cholesterolemia during the development of renal disease and
are now normo- or hypocholesterobemic. Therefore, the pre-
dictive value of this actually measured parameter might be
diminished.
There is clear evidence from numerous studies that Lp(a) is
elevated in hemodialysis patients (reviewed in reference 1 1).
This is of special importance because most, but not all, of the
prospective and numerous retrospective studies in the general
population have described an independent association between
high Lp(a) concentrations and CAD or other atherosclerotic
complications (reviewed in references 45 and 46). Only a few
studies with a sufficient number of patients have investigated
this association in renal disease patients. Cressman et al. fob-
lowed 1 29 hemodialysis patients prospectively for 48 mo (47).
Lp(a) levels in the 26 patients with atherosclerotic events were
significantly higher than in those without events. A heteroge-
neous study group, including hemodialysis, peritoneal. and
renal transplant patients, reported symptomatic arterial disease
in 92 of 325 patients (48). The symptomatic patients had
I 896 Journal of the American Society of Nephrology
Table 5. Stepwise logistic regression analysis to predict CAD status in hemodialysis patients�’
Variable Coefficient SEM (9S�RCI) P Value
Total group (n = 607)
constant -4.271 0.977 19.10
apolipoprotein B (increment 20 mg/dl) 0.176 0.052 12.61 1.19 (1.08 to 1.32) <0.001
LMW apo(a) phenotyp&’ 0.746 0.230 10.51 2.1 1 (1.34 to 3.31) 0.001
sex ( 1 = female, 2 = male) 0.737 0.228 10.44 2.09 (1 .34 to 3.27) 0.001
age (increment 5 yr) 0.131 0.042 9.94 1.14 (1.05 to 1.24) <0.005
fibrinogen (increment 50 mg/dl) 0.1 16 0.044 7.13 1.12 (1.03 to 1.22) <0.01
diabetes mellitus (0 = no, 1 = yes) 0.521 0.215 5.84 1.68 (1.10 to 2.57) <0.02
HDL cholesterol (increment 10 mg/dl) -0.015 0.007 3.98 0.99 (0.97 to 0.999) <0.05
Age 35 to 58 yr (ii = 237)
constant -0.296 1.166 0.06
fibrinogen (increment 50 mg/dl) 0.267 0.077 1 1.96 1.31 (1.12 to 1.52) <0.001
LMW apo(a) phenotyp&’ I .237 0.434 8. 1 3 3.45 (1 .47 to 8.07) <0.005
HDL cholesterol (increment 10 mg/dl) -0.292 0.133 4.79 0.75 (0.58 to 0.97) <0.05
Age >58 yr (ii = 326)
constant -2.770 0.794 12.17
sex (I = female, 2 = male) 0.864 0.260 1 1.07 2.37 (1.43 to 3.95) <0.001
apolipoprotein B (increment 20 mg/dl) 0.183 0.057 10.27 1.20 (1.07 to 1.34) <0.005
diabetes mellitus (0 = no, I = yes) 0.532 0.250 4.54 1.70 (1.04 to 2.78) <0.05
LMW apo(a) phenotype” 0.442 0.264 2.80 1.56 (0.93 to 2.61) 0.09
a Analysis was performed for the total group and separately for the age groups 35 to 58 yr and >58 yr (58 yr corresponds to the mean
age of the total patient group). OR, odds ratio; CI, confidence interval. Other abbreviations as in Table 1.h Apo(a) phenotype: I = high molecular weight; 2 = low molecular weight.
significantly higher Lp(a) concentrations and a higher fre-
quency of LMW apo(a) phenotypes (48). Prospective studies in
the general population demonstrated that patients who devel-
oped CAD during the observation period had 30 to 50% higher
Lp(a) concentrations than those remaining free of CAD (46).
Recent statistical simulations with Lp(a) concentrations dem-
onstrated that at least 100 patients per group in case control
studies are necessary to detect such a difference in an unam-
biguous manner (11,12). Although we investigated 607 pa-
tients, we did not find a significant elevation of Lp(a) in
hemodialysis patients with CAD. Instead of Lp(a), the fre-
quency of LMW apo(a) phenotypes was significantly higher in
patients with CAD compared to those without CAD (34.8%
versus 23.6%, P < 0.01). This result is in accordance with a
recent study (1 8), which found that the LMW apo(a) phenotype
was more predictive of the prevalence and degree of carotid
atherosclerosis than were Lp(a) plasma concentrations in a
group of 167 hemodialysis patients. This finding was explained
by the apo(a) phenotype-specific elevation of Lp(a) found in
hemodialysis patients ( 12,33): because Lp(a) in hemodialysis
patients increases only in patients with HMW apo(a) pheno-
types, the Lp(a) levels of these patients come closer to those of
LMW apo(a) phenotypes. It has therefore been suggested that
hemodialysis patients can no longer be discriminated for high
and low risk by means of Lp(a) concentrations alone. In
contrast, the genetically determined apo(a) phenotype that de-
termines predisease Lp(a) concentrations also reflects the
former “baseline” atherosclerosis risk before development of
end-stage renal disease (18).
The proposed model is in agreement with observations in
our patients in whom the apo(a) phenotype was more predic-
tive of CAD status than Lp(a) concentrations. Furthermore, it
concurs with a study in peritoneal dialysis patients with CAD,
in which Lp(a) was only slightly elevated but the frequency of
LMW apo(a) phenotypes was twice as high as in patients
without CAD (49). Renal disease seems to be the only condi-
tion in which the apo(a) phenotype is a better predictor for
CAD (49) or atherosclerotic complication ( 1 8) than the Lp(a)
concentration. Nonrenal disease patients with CAD show an
increased frequency of LMW apo(a) phenotypes (3 1,50). In
multivariate analysis, however, the Lp(a) concentration ex-
eludes the apo(a) phenotype from the model due to the strong
negative correlation between the molecular weight of apo(a)
isoforms and Lp(a) plasma concentrations (10). In patients
with renal disease, this relation is weakened by the elevation of
Lp(a) in HMW apo(a) phenotypes. Therefore, the apo(a) phe-
notype, which also reflects the former atherosclerosis risk, is
more predictive of CAD than Lp(a) levels.
When we divided the patients in six groups depending on the
number of K-IV repeats of apo(a), we observed that the fre-
quency of CAD was especially elevated in those 105 patients
with 20 to 22 K-IV repeats (Figure 1). Comparing patients with
the lowest number of K-IV repeats (1 1-19 K-IV) to patients
with the highest number of repeats revealed, surprisingly, a
CAD in Hemodialysis Patients 1897
similar prevalence of CAD, which seems to be a contradiction.
However, patients with 1 1 to 19 K-IV repeats had [with the
exception of Lp(a) concentrations] a more favorable athero-
sclerosis risk profile. Because this is a case control study
without prospective observation, we cannot exclude a survival
bias: A higher number of patients with 1 1 to 19 K-IV repeats
and a less favorable atherosclerosis risk profile might have
passed away at the time of examination and the surviving
patients compensated for their disadvantage of the apo(a) size
polymorphism by a more favorable risk profile. This hypoth-
esis should, however, be confirmed by future large prospective
studies.
Similar to a previous study (1 8), the apo(a) phenotype was
not predictive in the older age group of our patients. The OR
for patients with an LMW apo(a) phenotype was significantly
elevated in the total patient group (OR, 2. 1 1 ; P = 0.001 ) and
in the younger patient group (OR, 3.45; P < 0.005), but did not
reach significance in the older group (OR, 1 .56; P = 0.09)
(Table 5). This agrees with observations from the general
population that Lp(a) is a risk factor for premature CAD
( 1 3- 15), but less of a risk factor in patients >55 yr old( IS).
In summary, CAD risk in hemodialysis patients may be
explained in part by classic risk factors such as age, male sex,
and diabetes mellitus. In contrast to most lipids and lipopro-
teins, apolipoprotein B, HDL cholesterol, the LMW apo(a)
phenotype, and fibrinogen are predictive of CAD in various
age groups. This study extends previous findings in a smaller
hemodialysis patient group investigating carotid atherosclero-
sis (1 8) to CAD and demonstrates that the apo(a) phenotype is
of reliable predictive value for CAD in patients with end-stage
renal disease.
AcknowledgmentsThis study was supported by grants from the “Austrian National-
bank” to Dr. Kronenberg (Project 5553) and from the Austrian “Fonds
zur Forderung der Wissenschaftlichen Forschung” to Dr. Dieplinger(P-10090 and P-12358). We appreciate the helpful critical contribu-
tion of Dr. G. Utermann (Institute of Medical Biology and Human
Genetics, University of Innsbruck, Innsbruck. Austria) and the statis-tical advice of Dr. G. Seeber (Department of Statistics, University of
Innsbruck, Innsbruck, Austria) and Dr. R. Willers (Department of
Biostatistics, University of D#{252}sseldorf, D#{252}sseldorf, Germany). For the
excellent collaboration, we thank Dr. G. van Endert and Dr. W.Kleophas (Renal Unit Karlstrasse, D#{252}sseldorf),Dr. J. Erkenbrecht and
Dr. B. Hartmann (Diakoniewerk Kaiserswerth, D#{252}sseldorf), Dr. W.Herms (Evangelisches Krankenhaus, D#{252}sseldorf),Dr. W. Hust (RenalUnit Adolf-Flecken-Straf3e, Neuss, Germany), Dr. L. Jennessen and
Dr. W. Roperts (Renal Unit Eickener H#{246}h.Monchengladbach, Ger-
many), Dr. W. Kulas and Dr. R. Trapp (Renal Unit Gartenstraj3e,Mettmann, Germany) and Dr. W. Kreusser (Marienhospital, Duis-burg, Germany).
References1. Held PJ, Port FK. Webb RL, Wolfe RA, Bloembergen WE,
Turenne MN, Hobzman E, Ojo AO, Young EW, Mauger EA:Excerpts from United States Renal Data System 1995 AnnualData Report. Am J Kidney Dis 26: Sl-Sl86, 1995
2. Raine AEG, MacMahon SH, Selwood NH, Wing AJ, Brunner
FP: Mortality from myocardial infarction in patients on renal
replacement therapy in the U.K. [Abstractb. Nephrol Dial Traits-
p/alit 6: 902, 1991
3. Brown JH, Hunt LP, Vites NP. Short CD, Gokal R. Mallick NP:
Comparative mortality from cardiovascular disease in patientswith chronic renal failure. Nephrol Dial Transplant 9: 1 136-
1142. 1994
4. Kronenberg F. Dieplinger H. Konig P. Utermann G: Lipoprotein
metabolism in renal replacement therapy: A review. !sr J Med
Sci 32: 371-389. 1996
5. Brunner FP. Selwood NH, on behalf of the EDTA Registration
Committee: Profile of patients on RRT in Europe and death rates
due to major causes of death groups. Kidney lot 42lSuppl 381:
54-515. 1992
6. Avram MM, Goldwasser P. Burrell DE. Antignani A. Fein PA.Mittman N: The uremic dyslipidemia: A cross-sectional and
longitudinal study. Am J Kidney Dis 20: 324-335. 1992
7. Attman P-O, Alaupovic P: Lipid abnormalities in chronic renal
insufficiency. Kidney ml 39[Suppl 31]: S16-S23. 1991
8. Goldberg AP. Harter HR. Patsch W, Schechtman KB. Province
M, Weerts C. Kuisk I, McCrate MM, Schonfeld G: Racialdifferences in plasma high-density lipoproteins in patients re-
ceiving hemodialysis: A possible mechanism for accelerated
atherosclerosis in white men. N EngI J Med 308: 124�-12S2,
1983
9. Ritz E: Why are lipids not predictive of cardiovascular death in
the dialysis patient? Miner Electrolyte Metab 22: 9 - 1 2. 199610. Utermann G: The mysteries of lipoprotein(a). Science 246: 904-
910. 1989
1 1. Kronenberg F, Utermann G. Dieplinger H: Lipoprotein(a) in
renal disease. Am J Kidney Dis 27: 1-25, 1996
12. Kronenberg F, Konig P. Neyer U. Auinger M. Pribasnig A. Lang
U. Reitinger I. Pinter G. Utermann G. Dieplinger H: Multicenter
study of lipoprotein(a) and apolipoprotein(a) phenotypes in pa-
tients with end-stage renal disease treated by hemodialysis or
continuous ambulatory peritoneal dialysis. J A,,: Soc Nep/irol 6:
110-120. 1995
13. Sandkamp M, Funke H, Schulte H, K#{246}hlerE, Assmann G:
Lipoprotein(a) is an independent risk factor for myocardial in-
farction at a young age. C/in C/tern 36: 20-23, 1990
14. Dumngton PN, Ishola M, Hunt L, Arrol 5, Bhatnagar D: Apo-
lipoproteins (a). Al and B and parental history in men with early
onset ischaemic heart disease. Lancet i: 1070-1073, 1988
15. Sunayama 5, Daida H, Mokuno H. Miyano H. Yokoi H. Lee YJ.
Sakurai H, Yamaguchi H: Lack of increased coronary athero-sclerotic risk due to elevated lipoprotein(a) in women > or 55years of age. Circulation 94: 1263-1 268. 1996
16. Assmann G, Schubte H, Von Eckardstein A: Hypertniglyceride-mia and elevated lipoprotein(a) are risk factors for major coro-
nary events in middle-aged men. Am J C’ardiol 77: 1 179-1 184,
I 996
I 7. Kronenberg F, Trenkwalder E. Lingenhel A. Fniedrich G. Lhotta
K, Schober M, Moes N, Konig P. Utermann G. Dieplinger H:Renovascular arteniovenous differences in Lp(a) plasma concen-
trations suggest removal of Lp(a) from the renal circulation.
J Lipid Res 38: 1755-1763, 1997
18. Kronenberg F, Kathrein H, Konig P. Neyer U. Sturm W. Lhotta
K. Gr#{246}chenig E. Utermann G. Dieplinger H: Apolipoprotein(a)
phenotypes predict the risk for carotid atherosclerosis in patients
with end-stage renal disease. Arterioscler Thromb I 4: 140S-
1411, 1994
19. Wilhelmsen L, Sv#{228}rdsuddK, Korsan-Bengtsen K. Larsson BO.
I 898 Journal of the American Society of Nephrology
Welin L, Tibblin G: Fibninogen as a risk factor for stroke and
myocardial infarction. N Engl J Med 31 1: 501-505, 1984
20. Haaber AB, Eidemak I, Jensen T, Feldt-Rasmussen B,
Strandgaard S: Vascular endothelial cell function and cardiovas-
cular risk factors in patients with chronic renal failure. J Am Soc
Nep/zrol5: 1581-1584, 1995
2 1. Bostom AG, Shemin D, Lapane KL. Sutherland P, Nadeau MR.
Wilson PWF. Yoburn D, Bausserman L. Tofler G, Jacques PF,
Selhub I, Rosenberg IH: Hyperhomocysteinemia. hyperfibrino-
genemia. and lipoprotein (a) excess in maintenance dialysis
patients: A matched case-control study. Atherosclerosis 125:
91-101, 1996
22. Bartens W. Nauck M. Schollmeyer P. Wanner C: Elevated Ii-
poprotein(a) and fibrinogen serum levels increase the cardiovas-
cular risk in continuous ambulatory peritoneal dialysis patients.
Peril Dial In! 16: 27-33. 1996
23. Bachmann J, Tepel M. Raidt H. Riezler R, Graefe U, Langer K,
Zidek W: Hyperhomocysteinemia and the risk for vascular dis-
ease in hemodialysis patients. J Am Soc Nephrol 6: 121-125,
I 995
24. National Diabetes Data Group: Classification and diagnosis of
diabetes mellitus and other categories of glucose intolerance.
Diabetes 28: 1039-1057, 1979
25. Kronenberg F. Lobentanz E-M, Konig P. Utermann G,
Dieplinger H: Effect of sample storage on the measurement of
Iipoprotein(a), apolipoproteins B and A-IV, total and high-den-
sity lipoprotein cholesterol and triglycerides. J Lipid Res 35:
1318-1328. 1994
26. Wieland H. Seidel D: A simple specific method for precipitation
of low density lipoproteins. J Lipid Res 24: 904-909, 1983
27. Clauss A: Gerinnungsphysiologische Schnellmethode zur
Bestimmung des Fibrinogens. Acta Haematol 17: 237-246, 1957
28. Dieplinger H. Gruber G. Krasznai K, Reschauer 5, Seidel C.
Burns G, Muller H-i, Cs#{225}sz#{225}rA, Vogel W, Robenek H, Uter-
mann G: Kringle 4 of human apolipoprotein[a] shares a linear
antigenic site with human catalase. J Lipid Res 36: 813-822.
I 995
29. Kraft HG. Lingenhel A, Bader G, Kostner GM, Utermann G: The
relative electrophoretic mobility of apo(a) isoforms depends on
the gel system: Proposal of a nomenclature for apo(a) pheno-
types. Atherosclerosis 125: 53-61, 1996
30. Budowle B, Giusti AM, Waye iS. Baechtel FS, Fourney RM,
Adams DE, Presley LA, Deadman HA, Monson KL: Fixed-bin
analysis for statistical evaluation of continuous distributions of
allelic data from VNTR loci, for use in forensic comparisons.
Am J Hum Genet 48: 841-855, 1991
3 1 . Sandholzer C. Saha N, Kark ID. Rees A, iaross W, Dieplinger H,
Hoppichler F, Boerwinkle E, Utermann G: Apo(a) isoforms
predict risk for coronary heart disease: A study in six popula-
tions. Arteriosc/er Thromb 12: 1214-1226, 1992
32. Molgaard i. Klausen IC. Lassvik C, Fa�rgeman 0, Gerdes LU,
Olsson AG: Significant association between low-molecular-
weight apolipoprotein(a) isoforms and intermittent claudication.
Arterioscler Thromb 12: 895-901 , 1992
33. Dieplinger H, Lackner C, Kronenberg F, Sandholzer C. Lhotta K,
Hoppichler F, Graf H, Konig P: Elevated plasma concentrations
of lipoprotein(a) in patients with end-stage renal disease are not
related to the size polymorphism of apolipoprotein(a). J C/in
hues! 91: 397-401. 1993
34. Boerwinkle E. Leffert CC, Lin I, Lackner C, Chiesa G. Hobbs
HH: Apolipoprotein(a) gene accounts for greater than 90% of the
variation in plasma lipoprotein(a) concentrations. J Clin Invest
90: 52-60, 1992
35. Kraft HG, K#{246}chl5, Menzel Hi, Sandholzer C. Utermann G: The
apolipoprotein(a) gene: A transcribed hypervariable locus con-
trolling plasma lipoprotein(a) concentration. Hum Genet 90:
220-230, 1992
36. Nunnally IC: Psychometric Theory, 2nd Ed., New York,
McGraw-Hill, 1978.
37. Braun WE, Phillips DG, Vidt AC, Novick AC, Nakamoto S,
Popowniak KL. Paganini E, Magnusson M, Pohl M, Steinmuller
DR. Protiva D, Buszta C: Coronary artery disease in 100 diabet-
ics with end-stage renal failure. Transplant Proc 16: 603-607,
1984
38. Rostand SG, Kirk KA, Rutsky EA: Dialysis-associated ischemic
heart disease: Insights from coronary angiography. Kidney hit
25: 653-659. 1984
39. Koch M, Gradaus F, Schoebel F-C, Leschke M, Grabensee B:
Relevance of conventional cardiovascular risk factors for the
prediction of coronary artery disease in diabetic patients on renal
replacement therapy. Nephrol Dial Transplant 12: 1187-1191,
I 997
40. Koch M, Thomas B, Tschope W, Ritz E: Survival and predictors
of death in dialysed diabetic patients. Diabeto/ogia 36: 1 1 13-
1117, 1993
41. Wald NJ, Law M, Watt HC, Wu TS, Bailey A, iohnson AM,
Craig WY, Ledue TB, Haddow JE: Apolipoproteins and isch-
aemic heart disease: Implications for screening. Lancet 343:
75-79. 1994
42. Attman P-O, Nyberg G. William-Olsson T, Knight-Gibson C,
Alaupovic P: Dyslipoproteinemia in diabetic renal failure. Kid-
nevlnt42: 1381-1389, 1992
43. Attman P-O. Alaupovic P: Lipid and apolipoprotein profiles of
uremic dyslipoproteinemia: Relation to renal function and dial-
ysis. Nephron 57: 401-410, 1991
44. Hahn R, Oette K, Mondorf H, Finke K, Sieberth HG: Analysis of
cardiovascular risk factors in chronic hemodialysis patients with
special attention to the hyperlipoproteinemias. Atherosclerosis
48: 279-288, 1983
45. Rader Di, Hoeg JM, Brewer HB ir: Quantitation of plasma
apolipoproteins in the primary and secondary prevention of cor-
onary artery disease. Ann Intern Med 120: 1012-1025, 1994
46. Kronenberg F, Steinmetz A, Kostner GM, Dieplinger H: Li-
poprotein(a) in health and disease. Crit Rev C/in Lab Sci 33:
495-543, 1996
47. Cressman MD, Heyka Ri, Paganini EP, O’Neil I, Skibinski CI,
Hoff HF: Lipoprotein(a) is an independent risk factor for cardio-
vascular disease in hemodialysis patients. Circulation 86: 475-
482, 1992
48. Webb AT, Reaveley DA, O’Donnell M, O’Connor B, Seed M,
Brown EA: Lipids and lipoprotein(a) as risk factors for vasculardisease in patients on renal replacement therapy. Nephrol Dial
Transplant 10: 354-357. 1995
49. Wanner C, Bartens W, Walz G, Nauck M, Schollmeyer P:
Protein loss and genetic polymorphism of apolipoprotein(a)
modulate serum lipoprotein(a) in CAPD patients. Nephrol Dial
Transplant 10: 75-81, 1995
50. Kraft HG, Lingenhel A, K#{246}chl5, Hoppichler F, Kronenberg F,
Abe A, MUhlberger V. Sch#{246}nitzerD, Utermann G: Apolipopro-
tein(a) Kringle IV repeat number predicts risk for coronary heart
disease. Arterioscler Thromb Vasc Biol 16: 7 13-7 19, 1996
Copyright © 2022 FDOKUMEN