Plasma proteome changes in cardiovascular disease patients: novel isoforms of apolipoprotein A1
7
RESEARCH Open Access Plasma proteome changes in cardiovascular disease patients: novel isoforms of apolipoprotein A1 Pavel Májek 1* , Zuzana Reicheltová 1 , Jiří Suttnar 1 , Martin Malý 2 , Milan Oravec 2 , Klára Pečánková 1 and Jan E Dyr 1 Abstract Background: The aim of this proteomic study was to look for changes taking place in plasma proteomes of patients with acute myocardial infarction (AMI), unstable angina pectoris (UAP), and stable angina pectoris (SAP). Methods: Depleted plasma proteins were separated by 2D SDS-PAGE (pI 4-7), and proteomes were compared using Progenesis SameSpots statistical software. Proteins were identified by nanoLC-MS/MS. Proteins were quantified using commercial kits. Apolipoprotein A1 was studied using 1D and 2D SDS-PAGE, together with western blotting. Results: Reciprocal comparison revealed 46 unique, significantly different spots; proteins in 34 spots were successfully identified and corresponded to 38 different proteins. Discrete comparisons of patient groups showed 45, 41, and 8 significantly different spots when AMI, UAP, and SAP were compared with the control group. On the basis of our proteomic data, plasma levels of two of them, alpha-1 microglobulin and vitamin D-binding protein, were determined. The data, however, failed to prove the proteins to be suitable markers or risk factors in the studied groups. The plasma level and isoform representation of apolipoprotein A1 were also estimated. Using 1D and 2D SDS-PAGE, together with western blotting, we observed extra high-molecular weight apolipoprotein A1 fractions presented only in the patient groups, indicating that the novel high-molecular weight isoforms of apolipoprotein A1 may be potential new markers or possible risk factors of cardiovascular disease. Conclusion: The reported data show plasma proteome changes in patients with AMI, UAP, and SAP. We propose some apolipoprotein A1 fractions as a possible new disease-associated marker of cardiovascular disorders. Introduction Cardiovascular disease (CVD) is the major cause of pre- mature death in Europe. It is an important cause of decrease in quality of life, disability, and contributes substantially to the escalating costs of health care [1]. Generally, the epidemic of CVD is a global phenom- enon, and the magnitude of its increase in incidence has potentially major implications for countries that repre- sent much of the developed world. There are two major approaches to the prevention of CVD: public health/ community-based strategies and clinical-based strategies with a targeted approach to high-risk patients using modern methods to estimate risk factors, plus various combinations of these approaches. Thus, laboratory medicine now plays a crucial role in identifying risk fac- tors, early events, and conditions triggering plaque rup- ture in coronary heart disease [2,3]. The greatest progress in laboratory research has resulted in the dis- covery of new and more-promising biochemical markers of myocardial damage [4]. Nowadays modern scientific techniques like genomics, proteomics, and metabolomics serve to discover new therapeutic targets and biomarkers [5,6]. In this way newly achieved insights into the mechanisms of cardio- vascular disease can lead to proposals of new modern therapies and to the improvement of CVD diagnostics and therapy monitoring [7]. The importance of measur- ing proteins as biomarkers has become increasingly clear, as mRNA transcripts cannot be directly correlated to protein expression [8]; and posttranslational * Correspondence: [email protected] 1 Institute of Hematology and Blood Transfusion, Prague, Czech Republic Full list of author information is available at the end of the article Májek et al. Journal of Translational Medicine 2011, 9:84 http://www.translational-medicine.com/content/9/1/84 © 2011 Májek et al; licensee BioMed Central Ltd. This is an Open Access article distributed under the terms of the Creative Commons Attribution License (http://creativecommons.org/licenses/by/2.0), which permits unrestricted use, distribution, and reproduction in any medium, provided the original work is properly cited.
-
Upload
independent -
Category
Documents
-
view
0 -
download
0
Transcript of Plasma proteome changes in cardiovascular disease patients: novel isoforms of apolipoprotein A1

RESEARCH Open Access
Plasma proteome changes in cardiovasculardisease patients: novel isoforms ofapolipoprotein A1Pavel Májek1*, Zuzana Reicheltová1, Jiří Suttnar1, Martin Malý2, Milan Oravec2, Klára Pečánková1 and Jan E Dyr1
Abstract
Background: The aim of this proteomic study was to look for changes taking place in plasma proteomes ofpatients with acute myocardial infarction (AMI), unstable angina pectoris (UAP), and stable angina pectoris (SAP).
Methods: Depleted plasma proteins were separated by 2D SDS-PAGE (pI 4-7), and proteomes were comparedusing Progenesis SameSpots statistical software. Proteins were identified by nanoLC-MS/MS. Proteins werequantified using commercial kits. Apolipoprotein A1 was studied using 1D and 2D SDS-PAGE, together withwestern blotting.
Results: Reciprocal comparison revealed 46 unique, significantly different spots; proteins in 34 spots weresuccessfully identified and corresponded to 38 different proteins. Discrete comparisons of patient groups showed45, 41, and 8 significantly different spots when AMI, UAP, and SAP were compared with the control group. On thebasis of our proteomic data, plasma levels of two of them, alpha-1 microglobulin and vitamin D-binding protein,were determined. The data, however, failed to prove the proteins to be suitable markers or risk factors in thestudied groups. The plasma level and isoform representation of apolipoprotein A1 were also estimated. Using 1Dand 2D SDS-PAGE, together with western blotting, we observed extra high-molecular weight apolipoprotein A1fractions presented only in the patient groups, indicating that the novel high-molecular weight isoforms ofapolipoprotein A1 may be potential new markers or possible risk factors of cardiovascular disease.
Conclusion: The reported data show plasma proteome changes in patients with AMI, UAP, and SAP. We proposesome apolipoprotein A1 fractions as a possible new disease-associated marker of cardiovascular disorders.
IntroductionCardiovascular disease (CVD) is the major cause of pre-mature death in Europe. It is an important cause ofdecrease in quality of life, disability, and contributessubstantially to the escalating costs of health care [1].Generally, the epidemic of CVD is a global phenom-enon, and the magnitude of its increase in incidence haspotentially major implications for countries that repre-sent much of the developed world. There are two majorapproaches to the prevention of CVD: public health/community-based strategies and clinical-based strategieswith a targeted approach to high-risk patients usingmodern methods to estimate risk factors, plus various
combinations of these approaches. Thus, laboratorymedicine now plays a crucial role in identifying risk fac-tors, early events, and conditions triggering plaque rup-ture in coronary heart disease [2,3]. The greatestprogress in laboratory research has resulted in the dis-covery of new and more-promising biochemical markersof myocardial damage [4].Nowadays modern scientific techniques like genomics,
proteomics, and metabolomics serve to discover newtherapeutic targets and biomarkers [5,6]. In this waynewly achieved insights into the mechanisms of cardio-vascular disease can lead to proposals of new moderntherapies and to the improvement of CVD diagnosticsand therapy monitoring [7]. The importance of measur-ing proteins as biomarkers has become increasinglyclear, as mRNA transcripts cannot be directly correlatedto protein expression [8]; and posttranslational
* Correspondence: [email protected] of Hematology and Blood Transfusion, Prague, Czech RepublicFull list of author information is available at the end of the article
Májek et al. Journal of Translational Medicine 2011, 9:84http://www.translational-medicine.com/content/9/1/84
© 2011 Májek et al; licensee BioMed Central Ltd. This is an Open Access article distributed under the terms of the Creative CommonsAttribution License (http://creativecommons.org/licenses/by/2.0), which permits unrestricted use, distribution, and reproduction inany medium, provided the original work is properly cited.

modifications are known to be instrumental in manyhuman diseases, including CVD.Although the cardiac myocytes are the best source
that might provide the possibility to observe proteomechanges in the failed heart tissue, plasma protein bio-markers have been the focus of extensive study in recentyears [4,6,9,10]. Moreover, cardiac myocytes are notusually available for diagnoses purposes; and blood col-lection is a quick and simple procedure that is less inva-sive and easily executable, with almost no patientdiscomfort.Proteomics offers a combination of different techni-
ques to analyze proteins in a sample at a given timewith the detection of protein levels, isoforms, posttran-slational modifications, etc. The possibility of exploringthe current state of organism, tissues, or other subpro-teomes of interest (cells, plasma, etc.) is an essentialattribute of proteomics. Information obtained by com-paring proteomic results between different groups orunder different conditions may be useful in general, aswell as at a personalized patient level [11].The aim of this study was to compare plasma pro-
teomes of patients with acute myocardial infarction(AMI), unstable angina pectoris (UAP), stable anginapectoris (SAP), and control subjects to find any signifi-cant protein differences within the groups of study, andto search for potential new proteomic markers of CVD.
MethodsA total of 130 patient plasma samples were used in thisproteomic study. The samples were divided into fourindividual groups: patients with acute myocardial infarc-tion with ST elevations; patients with unstable anginapectoris; patients with stable angina pectoris; and a con-trol group of donors exhibiting a normal coronaryangiogram. Characteristics of the study groups are sum-marized in Table 1.All acute coronary syndrome patients were classified
according to criteria including chest pain, ECG changes(ST elevation, non ST elevation) and troponin I positiv-ity. All these patients underwent coronary angiography -patients with ST elevation myocardial infarction imme-diately in the regime of primary PCI, and patients with-out ST elevations within 24 hours of admission withPCI of culprit lesion.All tested individuals agreed to participate in this
study, gave informed consent, and the study wasapproved by the Ethics Committee of the Motol Univer-sity Hospital. All samples were obtained and analyzed inaccordance with the Ethical Committee regulations ofthe Institute of Hematology and Blood Transfusion. Allinvestigations conform to the Declaration of Helsinki.Blood was collected by venipuncture into tubes coated
with EDTA within the 24-hour window with respect to
cardiac events. Plasma was obtained by the centrifuga-tion (15 min, 3000 × g) of blood samples; and plasmaaliquots were then transferred to polypropylene Eppen-dorf tubes and stored at -70°C until used.Thawed plasma samples were centrifuged (5 min,
12000 × g), diluted 1:4 by depletion buffer (Agilent,Santa Clara, CA, USA), and filtrated using 0.22 μm Spinfilters (Agilent) for 1 minute by centrifugation at 12000× g. A MARS Hu-6 4.6 × 100 mm column (Agilent) wasused to remove six high-abundant proteins (albumin,IgG, a1-antitrypsin, IgA, transferrin, and haptoglobin).5K MWCO Spin Concentrators (Agilent) were used todesalinate and concentrate the samples (3000 × g, 20°C).MilliQ water (4 mL) was added to concentrated sam-ples; and the desalinating-concentrating step wasrepeated three times. Finally, desalinated and concen-trated samples were vacuum dried, frozen rapidly, andstored at -70°C.1D electrophoresis was performed using 10 μL of an
undepleted plasma sample that was resuspended in 200μL of reducing sample buffer (62.5 mM Tris, 4.05% w/vSDS, 20% v/v glycerol, 10% v/v 2-mercaptoethanol, anda trace of bromophenol blue). The sample was thenheated at 95°C for 3 min, centrifuged; and 10 μL of the
Table 1 Characteristics of the study groups
AMI (n =27)
UAP (n =26)
SAP (n =38)
Control (n =39)
Age (years ±SEM)
65 ± 14 72 ± 12 66 ± 10 67 ± 12
Males n (%) 16 (59) 18 (69) 28 (74) 14 (36)
Hypertension n(%)
12 (44) 23 (88) 34 (89) 28 (72)
Dyslipidemia n(%)
14 (52) 16 (62) 32 (84) 26 (67)
Diabetes n (%) 6 (22) 7 (27) 15 (39) 8 (21)
Smoking n (%) 13 (48) 5 (19) 7 (18) 4 (10)
History of MI n 2 5 12 2
History ofstroke n
0 4 4 1
BMI 28.3 ± 3.3 27.9 ± 4.3 28.7 ± 5.3 27.5 ± 4.4
creatinine(μmol/L)
87.7 ± 31.6 88.5 ± 26.5 87.5 ± 26.9 75.3 ± 17.6
treatment n(%):
Aspirin 5 (19) 14 (54) 26 (68) 20 (51)
ADP blockers 1 (4) 6 (23) 12 (32) 6 (15)
Beta blockers 4 (15) 10 (39) 25 (66) 20 (51)
ACE inhibitors 2 (7) 16 (62) 22 (58) 12 (31)
ARB 2 (7) 1 (4) 5 (13) 8 (21)
Statins 2 (7) 11 (42) 28 (74) 20 (51)
Ca blockers 1 (4) 5 (19) 11 (29) 6 (15)
Warfarin 2 (7) 2 (8) 4 (11) 2 (5)
AMI acute myocardial infarction, SAP stable angina pectoris, UAP unstableangina pectoris, smoking reflects current smokers, body-mass index (BMI) andserum creatinine are expressed as average values ± standard deviation
Májek et al. Journal of Translational Medicine 2011, 9:84http://www.translational-medicine.com/content/9/1/84
Page 2 of 7

sample was used for analysis. Proteins were separated bySDS-PAGE (8 × 10 cm, 10% gradient gel, 3.75% stackinggel, 5°C, 30 mA/gel) using a P8SD vertical electrophor-esis separation system (Owl; Thermo Scientific, Wal-tham, MA, USA).2D SDS-PAGE, image analysis, protein digestion, and
mass spectrometry analysis were performed as describedbefore [12]. Briefly, isoelectric focusing (IPG strips pI 4-7, 7.7 cm) and SDS-PAGE (conditions as used in 1DSDS-PAGE) were used in the first and in the seconddimension, respectively. Gels were stained with colloidalCoomassie blue, scanned, and processed with ProgenesisSameSpots software (Nonlinear Dynamics, Newcastleupon Tyne, UK). All four groups (AMI, UAP, SAP, andnormal control group - N) were compared with eachother; and fold values, as well as p-values of all spots,were computed with the above mentioned software,using one way ANOVA analysis. Moreover, separatecomparisons of each patient group relative to the con-trol group were created. PCA (Principal ComponentAnalysis) of the compared groups was performed by theSameSpot software, using the spots of statistical signifi-cance. Protein identification was then only conductedon spots that significantly differed. The selected spotswere excised from the gel, and proteins were in-geldigested by trypsin. An HCT ultra ion-trap mass spec-trometer (Bruker Daltonics, Bremen, Germany) withnanoelectrospray ionization, coupled to a UltiMate 3000nanoLC system (Dionex, Sunnyvale, CA, USA) was usedto perform MS analysis. MASCOT (Matrix Science,London, UK) was used for database searching (SWISS-PROT release 2010_12). Two unique peptides (fulfillinga minimal Mascot score) were necessary to successfullyidentify a protein.Western blotting was performed using an Owl HEP-1
Semi Dry Electroblotting System (Thermo Scientific).Proteins were transferred from gel to a PVDF mem-brane (10 V constant voltage for 1 hr); the membranewas then incubated with a blocking buffer (3% BSA inPBS) at 4°C overnight, rinsed; and incubated with goatanti-Apolipoprotein A1 horseradish peroxidase conju-gated antibody (Baria, Psary, Czech Republic), 1:10000dilution, at 37°C for 30 min. After rinsing, a chemilumi-nescent substrate (SuperSignal West Pico; ThermoScientific) was added to the membrane for 5 min; and a2 hr film exposition (Amersham Hyperfilm ECL; GELife Sciences, Piscataway, NJ, US) was performed. Afterwhich, the film was developed and scanned.Apolipoprotein A1 (apoA1), alpha-1 microglobulin
(a1m), and vitamin D-binding protein (VDBP) plasmalevels were measured using kits (ApoA1 assay KAI-002and Apo A1/B calibrator KAI-008C, Alpha-1 Microglo-bulin assay KAI-056 and KAI-068C calibrator, and Vita-min D Binding Protein ELISA KT-515; all kits were
purchased from Kamiya Biomedical, Seattle, WA, USA)according to manufacturer instructions. ApoA1 anda1m were measured in triplet, VDBP in duplicate.Results were expressed as means ± standard deviations.One-way ANOVA was used to determine the statisticalsignificance of plasma level changes of apoA1 and a1min samples, while an unpaired t-test was used for thecomparison of VDBP when the AMI group was com-pared with the control group.
Results2D gels were prepared for the experiments, and scannedgel images were divided into four individual groupsaccording to patient group disposal: acute myocardialinfarction (AMI, n = 27), unstable angina pectoris (UAP,n = 26) stable angina pectoris (SAP, n = 38), and normalcontrol (N, n = 39). All four groups were comparedtogether, with a separate comparison of individualgroups relative to the control group.Reciprocal comparison of all four groups revealed 46
unique spots that significantly (p < 0.05) differed in nor-malized volumes (Figure 1); the proteins in 34 of the 46spots were successfully identified by mass spectrometry.These 34 identified spots correspond to 38 differentproteins. The list of spots, including protein identifica-tion, sequence coverage (%), protein accession number,fold value, ANOVA p-value, and logarithms of spot nor-malized volume (LSNV) with its standard deviation foreach group, is summarized in (Additional file 1: TableS1). The fold value shows the fold difference betweenthe groups with the lowest and highest normalizedvolumes.Separately comparing the three patient groups with
the control group we found: 45 significantly differing
Figure 1 Positions of significantly differed spots on a 2D gel.Positions of all spots that were found to significantly differ in 2Dgels of reciprocal comparison of all four groups and separatecomparisons of the three patient groups with the control group.
Májek et al. Journal of Translational Medicine 2011, 9:84http://www.translational-medicine.com/content/9/1/84
Page 3 of 7
spots when comparing AMI with N (Figure 1), 44 ofwhich were successfully identified and corresponded to38 different proteins; 41 significantly differing spotswhen comparing UAP with N (Figure 1), 38 of whichwere successfully identified and corresponded to 23 dif-ferent proteins; 8 significantly differing spots when com-paring SAP with N (Figure 1), 5 of which weresuccessfully identified and corresponded to 9 differentproteins. The lists of spots, including protein identifica-tion, sequence coverage (%), protein accession number,fold value, and ANOVA p-value, are summarized in(Additional file 2: Table S2). The fold value shows thefold difference of distinct groups relative to the controlgroup.PCA of the mutual comparison of all four groups indi-
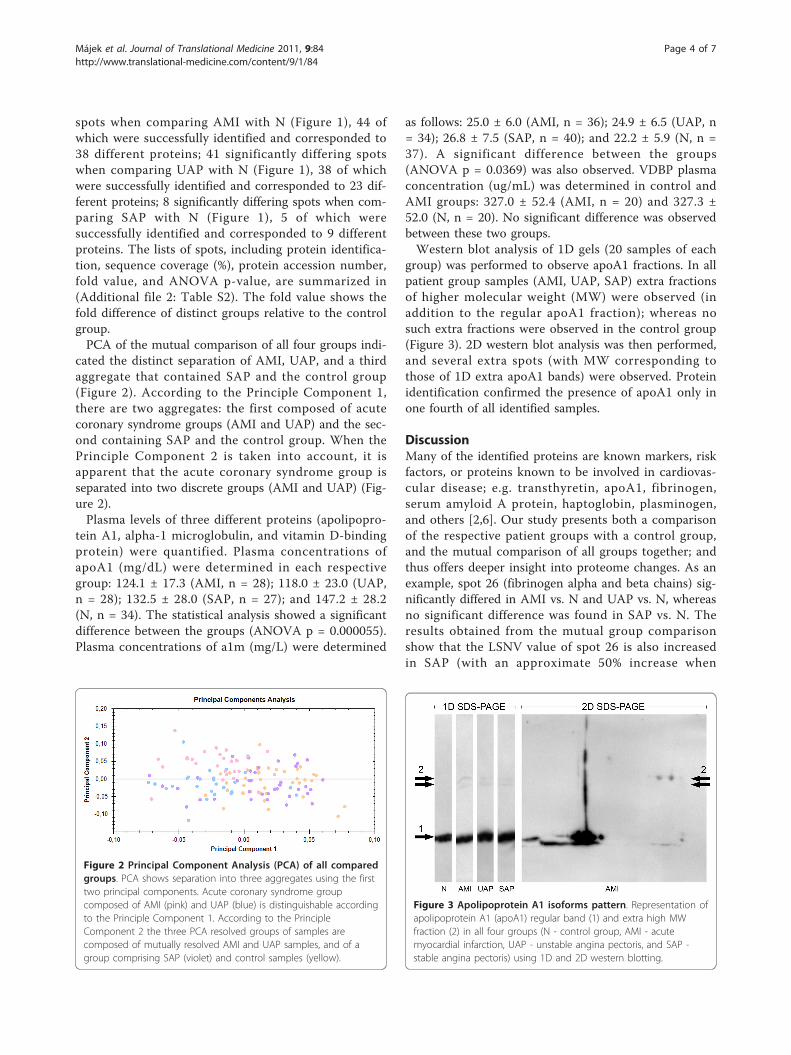
cated the distinct separation of AMI, UAP, and a thirdaggregate that contained SAP and the control group(Figure 2). According to the Principle Component 1,there are two aggregates: the first composed of acutecoronary syndrome groups (AMI and UAP) and the sec-ond containing SAP and the control group. When thePrinciple Component 2 is taken into account, it isapparent that the acute coronary syndrome group isseparated into two discrete groups (AMI and UAP) (Fig-ure 2).Plasma levels of three different proteins (apolipopro-
tein A1, alpha-1 microglobulin, and vitamin D-bindingprotein) were quantified. Plasma concentrations ofapoA1 (mg/dL) were determined in each respectivegroup: 124.1 ± 17.3 (AMI, n = 28); 118.0 ± 23.0 (UAP,n = 28); 132.5 ± 28.0 (SAP, n = 27); and 147.2 ± 28.2(N, n = 34). The statistical analysis showed a significantdifference between the groups (ANOVA p = 0.000055).Plasma concentrations of a1m (mg/L) were determined
as follows: 25.0 ± 6.0 (AMI, n = 36); 24.9 ± 6.5 (UAP, n= 34); 26.8 ± 7.5 (SAP, n = 40); and 22.2 ± 5.9 (N, n =37). A significant difference between the groups(ANOVA p = 0.0369) was also observed. VDBP plasmaconcentration (ug/mL) was determined in control andAMI groups: 327.0 ± 52.4 (AMI, n = 20) and 327.3 ±52.0 (N, n = 20). No significant difference was observedbetween these two groups.Western blot analysis of 1D gels (20 samples of each
group) was performed to observe apoA1 fractions. In allpatient group samples (AMI, UAP, SAP) extra fractionsof higher molecular weight (MW) were observed (inaddition to the regular apoA1 fraction); whereas nosuch extra fractions were observed in the control group(Figure 3). 2D western blot analysis was then performed,and several extra spots (with MW corresponding tothose of 1D extra apoA1 bands) were observed. Proteinidentification confirmed the presence of apoA1 only inone fourth of all identified samples.
DiscussionMany of the identified proteins are known markers, riskfactors, or proteins known to be involved in cardiovas-cular disease; e.g. transthyretin, apoA1, fibrinogen,serum amyloid A protein, haptoglobin, plasminogen,and others [2,6]. Our study presents both a comparisonof the respective patient groups with a control group,and the mutual comparison of all groups together; andthus offers deeper insight into proteome changes. As anexample, spot 26 (fibrinogen alpha and beta chains) sig-nificantly differed in AMI vs. N and UAP vs. N, whereasno significant difference was found in SAP vs. N. Theresults obtained from the mutual group comparisonshow that the LSNV value of spot 26 is also increasedin SAP (with an approximate 50% increase when
Figure 2 Principal Component Analysis (PCA) of all comparedgroups. PCA shows separation into three aggregates using the firsttwo principal components. Acute coronary syndrome groupcomposed of AMI (pink) and UAP (blue) is distinguishable accordingto the Principle Component 1. According to the PrincipleComponent 2 the three PCA resolved groups of samples arecomposed of mutually resolved AMI and UAP samples, and of agroup comprising SAP (violet) and control samples (yellow).
Figure 3 Apolipoprotein A1 isoforms pattern. Representation ofapolipoprotein A1 (apoA1) regular band (1) and extra high MWfraction (2) in all four groups (N - control group, AMI - acutemyocardial infarction, UAP - unstable angina pectoris, and SAP -stable angina pectoris) using 1D and 2D western blotting.
Májek et al. Journal of Translational Medicine 2011, 9:84http://www.translational-medicine.com/content/9/1/84
Page 4 of 7

compared to those in AMI and UAP); and the changesobserved in acute coronary syndrome (AMI and UAP)are non-significantly present in SAP. Fibrinogen chainsare known to be involved in cardiovascular disease(gamma chain variants associate with increased throm-botic risk; alpha and beta chains have been found to bemodified; etc.) [13,14].We have also found several new possible protein bio-
marker candidates: lumican, protein AMBP, VDBP, andbiotinidase. They have not been previously associatedwith CVD; or their role in CVD is not known. On thebasis of our data, we further focused on two proteins,quantifiable with commercially available immunodetec-tion kits, to estimate their plasma levels and thus toconsider their roles as possible biomarkers - VDBP andprotein AMBP. In apoA1, a known marker of CVD, weassessed its plasma levels, including proportional repre-sentation of isoforms.Vitamin D-binding protein is a multifunctional pro-
tein, which carries vitamin D sterols, associates withmembrane-bound immunoglobulin on the surface of B-lymphocytes, prevents the polymeratization of actin bybinding actin monomers, etc. As a part of the actinscavenging system, VDBP binds actin released from cellsupon injury; wherein these complexes are then rapidlycleared from the bloodstream [15]. It is assumed thatthe influence of VDBP prevents the harmful effects ofactin filaments in blood vessels. VDBP is also consideredto be a regulator of the inhibitory effect of acetylsalicylicacid on platelets [16]. We observed VDBP spot changewithin acute coronary syndrome groups (AMI and UAP)exclusively in the AMI group; therefore VDBP plasmalevel in AMI was compared with the control group. Wedid not, however, observe any significant VDBP leveldifference within these groups. So, the observed spotchange might be caused either by posttranslational mod-ification of VDBP in the AMI group or by other co-identified proteins in the spot.Protein AMBP is a complex glycoprotein secreted in
plasma. Its precursor is proteolytically processed intodistinct functioning proteins: alpha-1-microglobulin(a1m), a low molecular weight plasma glycoprotein, andan inter-alpha-trypsin inhibitor light chain (bikunin)that is further cleaved to trypstatin [17]. All proteinAMBP peptides identified by mass spectrometry werepart of the a1m sequence (peptides: 44-57, 63-85, 167-185, and 186-202; the amino acid sequence of proteinAMBP). Moreover, molecular mass estimated by SDS-PAGE corresponded to a1m. The function and physiolo-gical role of a1m is not fully understood; nevertheless,this protein presumably plays a role in the regulation ofthe immune system, and is involved in defending tissueagainst oxidation by reactive oxygen species and heme[18]. A1m is known to be complexed to macromolecules
(immunoglobulin A, albumin, and prothrombin), as wellas to be present in a free form of a monomeric protein[18]. This protein is considered to be a marker of renalinsufficiency, and to reflect the overall inflammatory sta-tus in patients with arterial hypertension and normalrenal function [19]. We found that spot 18 (proteinAMBP) differed significantly when mutually comparingall four groups. LSNV values of this spot were decreasedin all three patient groups with the lowest value in UAP.The comparison of individual groups with the controlgroup showed another significant LSNV decrease (UAPvs. N, spot 18, p = 0.002) and showed a difference inspot 50 (AMI vs. N) with non-unique protein identifica-tion. We quantified a1m plasma levels within all fourgroups to compare them with the results obtained by2D-electrophoresis. We found significant differences ofa1m plasma concentrations; nevertheless, the results didnot correspond to those observed by 2D-electrophoresis.This is probably caused by posttranslational modifica-tion (UAP vs. N, spot 18) or by the presence of otherproteins in spot 50 (AMI vs. N), as in the case of theVDBP described above. Summarizing our results, a1mdoes not seem to be a suitable marker or even a riskfactor of cardiovascular diseases.ApoA1 participates in the transport of cholesterol
(between tissues and the liver) by promoting cholesterolefflux and by acting as a cofactor for the lecithin choles-terol acyltransferase. This protein is known to be a use-ful tool in the assessment of coronary heart disease risk.High levels of apoA1 can help to prevent heart disease,and it has also been shown that apoA1 plasma level isdecreased in cardiovascular disease [2]. Further, it hasbeen demonstrated that several apoA1 isoforms are pre-sent in plasma, and that at least some of these isoformsprobably change during acute coronary syndrome [20].Our 2D SDS-PAGE results showed significant changesin apoA1 LSNV values (all patient groups vs. N, AMIvs. N, UAP vs. N), as well as changes of several isoforms(spots 61-69, UAP vs. N). We quantified apoA1 plasmalevels in all four groups to assess whether the changesare based on apoA1 isoforms (thus confirming the roleof posttranslational modifications) or on a total concen-tration. ApoA1 plasma levels were significantlydecreased as compared with the control in all threepatient groups, with the minimum in UAP in agreementwith previous literature [21-23]. The majority of apoA1changes obtained by 2D SDS-PAGE were observed inUAP vs. N (10 spots, 9 of them unique identification).This is consistent with the highest concentration differ-ence (UAP vs. N) obtained by apoA1 quantification. IfapoA1 changes were based on plasma concentrationonly, the values of both differences (in plasma concen-tration and that observed in 2D electrophoresis) shouldbe the same. ApoA1 plasma level change in UAP vs. N
Májek et al. Journal of Translational Medicine 2011, 9:84http://www.translational-medicine.com/content/9/1/84
Page 5 of 7

was found to be approximately 20%, whereas apoA1 iso-forms LSNV changes (spots 61-69) range from 20% to80%. This indicates that apoA1 changes in UAP arebased not only on plasma concentration differences, butalso on posttranslational changes of apoA1 isoforms.We performed western blotting with immunodetectionto observe all spots in 2D SDS-PAGE, which could con-tain apoA1 to test the possibility of the influence ofnon-identified apoA1 spots to the results. The spotsobserved by immunodetection matched those observedin 2D SDS-PAGE in which apoA1 was identified. Sur-prisingly, we also detected a region with a group of sev-eral apoA1 spots of higher molecular weight(approximately 50 kDa) than that of apoA1 (28 kDa).Based on this finding, 1D SDS-PAGE of 20 samples ofeach group (AMI, UAP, SAP, and N) followed by immu-noblotting, was performed to estimate the possible pre-sence of the high MW apoA1 fractions in other groups.Two different extra bands with detected apoA1 wereobserved (in addition to the regular apoA1 bands) in allsamples of all patient groups (AMI, UAP, and SAP),while no extra bands were detected in the samples ofthe control group (Figure 3). Despite the low number ofreplicates (n = 20, each group) and the observed varia-bility of band intensities, we assume that the high MWapoA1 fraction might be a new disease-associated mar-ker of cardiovascular disorders. The non-significantchange of this fraction in 2D SDS-PAGE analysis mightbe caused by a low concentration not detectable by 2Delectrophoresis, or by overlapping with more abundantproteins in spots. Finally, several 2D gels, as well as 2Dwestern blots, were prepared to estimate the pattern ofthe high MW apoA1 fraction spots, and to identify theextra apoA1 fraction by mass spectrometry. The spotpattern in 2D gels was extremely variable as expected,and corresponded to bands observed in the 1D gels. Weassume that either apoA1 is covalently linked (due tothe denaturing conditions of SDS-PAGE) to anotherprotein, or that apoA1 fragments are linked to a proteinor proteins. Unfortunately, mass spectrometry analysisdid not reveal the composition of the extra apoA1 frac-tion, with only a quarter of all identified samples con-taining apoA1. This might be caused by the presence ofhigh-abundant proteins that overlap the spots asobserved by western blotting. The presence of apoA1fragments instead of the intact protein molecule couldbe another explanation. It has been shown that thereare apoa1 fragments present in the plasma of patientswith nephrotic syndrome [24].The Principal Component Analysis applied to the data
obtained within all four groups of samples showed theirseparation into three rather well resolved aggregatesusing the first two principal components (Figure 2).
CVD patients in this study can be stratified by tradi-tional clinical diagnoses into acute syndrome groups(AMI together with UAP) and into SAP. This stratifica-tion (one acute coronary syndrome group composed ofAMI and UAP) is clearly distinguishable according tothe Principle Component 1. According to the PrincipleComponent 2, the three well-resolved PCA groups ofsamples are composed of mutually resolved AMI andUAP samples and of a group comprising SAP and con-trol samples. The SAP and control samples are poorlydistinguished mutually, using a given relatively small setof proteins for PCA, as compared with the normalhealthy population without atherosclerosis. This may bedue to comparable age and the common presence ofrisk factors in both SAP and control patients. Theobtained results of the PCA method are thus in agree-ment with the stratification of patients using classicalclinical diagnostics.The role of new markers is not only to distinguish the
studied groups. The knowledge of protein markers andchanges in their concentration and/or posttranslationmodification should increase our understanding of themechanisms that are involved in coronary disease, mayconstitute new potential risk factors and help to predictpersonal risk and thus help in the treatment. The cur-rent markers (troponin etc.) are sufficient to help orpredict diagnosis and distinguish the groups used in thisstudy. However, the role of novel apoA1 isoforms as anew risk factor should be further investigated. It is notknown at present whether the apoA1 isoforms are inpatients’ plasma as a result or the cause of the patient’sdisease. Moreover, it is hard to speculate on the roleand possible involvement of apoA1 isoforms in cardio-vascular diseases: to date neither the composition ofthese isoforms, nor the influence of other factors (age,treatment, smoking, etc.) on the level and compositionof these isoforms is known.
ConclusionThe reported data show plasma proteome changes inpatients with acute myocardial infarction, unstableangina pectoris, and stable angina pectoris. Proteins thatare known markers or risk factors of CVD wereobserved, as well as new possible marker candidates. Onthe basis of our data, we tested two of the candidates,vitamin D-binding protein and alpha-1 microglobulin, aspotential CVD markers. The estimation of their plasmalevels, however, did not indicate them as suitable CVDmarkers. The testing of the known CVD marker, apoA1,revealed the possible role of biomarker isoforms andtheir posttranslational modifications. Therefore, we pro-pose the high MW apoA1 fraction as a possible new dis-ease-associated marker of cardiovascular disorders.
Májek et al. Journal of Translational Medicine 2011, 9:84http://www.translational-medicine.com/content/9/1/84
Page 6 of 7

Additional material
Additional file 1: Table S1. List of spots that significantly differ inplasma proteomes of patients with acute myocardial infarction, unstableangina pectoris, and stable angina pectoris.
Additional file 2: Table S2. Lists of spots that significantly differ whenseparately comparing the three patient groups with the control group.
AcknowledgementsThis study was supported by Grants NS10633-3/2009, MZOFNM2005 and MZ02373601, from the Ministry of Health, Czech Republic; and by GrantKAN200670701 from the Academy of Sciences, Czech Republic.
Author details1Institute of Hematology and Blood Transfusion, Prague, Czech Republic.22nd Faculty of Medicine, Dept. of Cardiology, Charles University, Prague,Czech Republic.
Authors’ contributionsPM, ZR and JS designed and performed research, analyzed data and wrotethe manuscript. MM and MO collected samples and designed research. KPperformed research and analyzed data. JED designed research and wrotethe manuscript. All authors read and approved the final manuscript.
Competing interestsThe authors declare that they have no competing interests.
Received: 3 February 2011 Accepted: 1 June 2011Published: 1 June 2011
References1. De Backer G, Ambrosioni E, Borch-Johnsen K, Brotons C, Cifkova R,
Dallongeville J, Ebrahim S, Faergeman O, Graham I, Mancia G, MangerCats V, Orth-Gomér K, Perk J, Pyörälä K, Rodicio JL, Sans S, Sansoy V,Sechtem U, Silber S, Thomsen T, Wood D: European guidelines oncardiovascular disease prevention in clinical practice. Third Joint TaskForce of European and Other Societies on Cardiovascular DiseasePrevention in Clinical Practice. Eur Heart J 2003, 24:1601-1610.
2. Dunder K, Lind L, Lagerqvist B, Zethelius B, Vessby B, Lithell H:Cardiovascular risk factors for stable angina pectoris versus unheraldedmyocardial infarction. Am Heart J 2004, 147:502-508.
3. Schwartz KA, Schwartz DE, Barber K, Reeves M, De Franco AC: Non-compliance is the predominant cause of aspirin resistance in chroniccoronary arterial disease patients. J Transl Med 2008, 6:46.
4. Didangelos A, Simper D, Monaco C, Mayr M: Proteomics of acute coronarysyndromes. Curr Atheroscler Rep 2009, 11:188-195.
5. O’Donnell CJ, Nabel EG: Cardiovascular genomics, personalized medicine,and the National Heart, Lung, and Blood Institute: part I: the beginningof an era. Circ Cardiovasc Genet 2008, 1:51-57.
6. Arab S, Gramolini AO, Ping P, Kislinger T, Stanley B, van Eyk J, Ouzounian M,MacLennan DH, Emili A, Liu PP: Cardiovascular proteomics: tools todevelop novel biomarkers and potential applications. J Am Coll Cardiol2006, 48:1733-1741.
7. Sondergaard CS, Hess DA, Maxwell DJ, Weinheimer C, Rosová I, Creer MH,Piwnica-Worms D, Kovacs A, Pedersen L, Nolta JA: Human cord bloodprogenitors with high aldehyde dehydrogenase activity improvevascular density in a model of acute myocardial infarction. J Transl Med2010, 8:24.
8. Gygi SP, Rochon Y, Franza BR, Aebersold R: Correlation between proteinand mRNA abundance in yeast. Mol Cell Biol 1999, 19:1720-1730.
9. Stanley BA, Gundry RL, Cotter RJ, Van Eyk JE: Heart disease, clinicalproteomics and mass spectrometry. Dis Markers 2004, 20:167-178.
10. Berhane BT, Zong C, Liem DA, Huang A, Le S, Edmondson RD, Jones RC,Qiao X, Whitelegge JP, Ping P, Vondriska TM: Cardiovascular-relatedproteins identified in human plasma by the HUPO Plasma ProteomeProject pilot phase. Proteomics 2005, 5:3520-3530.
11. Chambers G, Lawrie L, Cash P, Murray GI: Proteomics: a new approach tothe study of disease. J Pathol 2000, 192:280-288.
12. Májek P, Reicheltová Z, Stikarová J, Suttnar J, Sobotková A, Dyr JE:Proteome changes in platelets activated by arachidonic acid, collagen,and thrombin. Proteome Sci 2010, 8:56.
13. Cooper AV, Standeven KF, Ariëns RA: Fibrinogen gamma-chain splicevariant gamma’ alters fibrin formation and structure. Blood 2003,102:535-540.
14. Parastatidis I, Thomson L, Burke A, Chernysh I, Nagaswami C, Visser J,Stamer S, Liebler DC, Koliakos G, Heijnen HF, Fitzgerald GA, Weisel JW,Ischiropoulos H: Fibrinogen beta-chain tyrosine nitration is aprothrombotic risk factor. J Biol Chem 2008, 283:33846-33853.
15. Gomme PT, Bertolini J: Therapeutic potential of vitamin D-bindingprotein. Trends Biotechnol 2004, 22:340-345.
16. López-Farré AJ, Mateos-Cáceres PJ, Sacristán D, Azcona L, Bernardo E, dePrada TP, Alonso-Orgaz S, Fernández-Arquero M, Fernández-Ortiz A,Macaya C: Relationship between vitamin D binding protein and aspirinresistance in coronary ischemic patients: a proteomic study. J ProteomeRes 2007, 6:2481-2487.
17. Itoh H, Ide H, Ishikawa N, Nawa Y: Mast cell protease inhibitor, trypstatin,is a fragment of inter-alpha-trypsin inhibitor light chain. J Biol Chem1994, 269:3818-3822.
18. Allhorn M, Lundqvist K, Schmidtchen A, Akerström B: Heme-scavengingrole of alpha1-microglobulin in chronic ulcers. J Invest Dermatol 2003,121:640-646.
19. Vyssoulis GP, Tousoulis D, Antoniades C, Dimitrakopoulos S, Zervoudaki A,Stefanadis C: Alpha-1 microglobulin as a new inflammatory marker innewly diagnosed hypertensive patients. Am J Hypertens 2007,20:1016-1021.
20. Mateos-Cáceres PJ, García-Méndez A, López Farré A, Macaya C, Núñez A,Gómez J, Alonso-Orgaz S, Carrasco C, Burgos ME, de Andrés R, Granizo JJ,Farré J, Rico LA: Proteomic analysis of plasma from patients during anacute coronary syndrome. J Am Coll Cardiol 2004, 44:1578-1583.
21. Puchois P, Kandoussi A, Fievet P, Fourrier JL, Bertrand M, Koren E,Fruchart JC: Apolipoprotein A-I containing lipoproteins in coronary arterydisease. Atherosclerosis 1987, 68:35-40.
22. Ishikawa T, Fidge N, Thelle DS, Førde OH, Miller NE: The Tromsø HeartStudy: serum apolipoprotein AI concentration in relation to futurecoronary heart disease. Eur J Clin Invest 1978, 8:179-182.
23. Reinhart RA, Gani K, Arndt MR, Broste SK: Apolipoproteins A-I and B aspredictors of angiographically defined coronary artery disease. ArchIntern Med 1990, 150:1629-1633.
24. Candiano G, Bruschi M, Petretto A, Santucci L, Del Boccio P, Urbani A,Bertoni E, Gusmano R, Salvadori M, Scolari F, Ghiggeri GM: Proteins andprotein fragments in nephrotic syndrome: Clusters, specificity andmechanisms. Proteomics Clin Appl 2008, 2:956-963.
doi:10.1186/1479-5876-9-84Cite this article as: Májek et al.: Plasma proteome changes incardiovascular disease patients: novel isoforms of apolipoprotein A1.Journal of Translational Medicine 2011 9:84.
Submit your next manuscript to BioMed Centraland take full advantage of:
• Convenient online submission
• Thorough peer review
• No space constraints or color figure charges
• Immediate publication on acceptance
• Inclusion in PubMed, CAS, Scopus and Google Scholar
• Research which is freely available for redistribution
Submit your manuscript at www.biomedcentral.com/submit
Májek et al. Journal of Translational Medicine 2011, 9:84http://www.translational-medicine.com/content/9/1/84
Page 7 of 7