Comparison of Methods for Profiling O-Glycosylation: HUMAN PROTEOME ORGANISATION HUMAN DISEASE...
31
1 Comparison of Methods for Profiling O-glycosylation: HUPO Human Disease Glycomics/Proteome Initiative Multi- Institutional Study of IgA1 Yoshinao Wada 1,2,4 , Anne Dell 1,3,5 , Stuart M. Haslam 3,5 , Bérangère Tissot 3,5 , Kévin Canis 3,5 , Parastoo Azadi 6 , Malin Bäckström 7 , Catherine E. Costello 8 , Gunnar C. Hansson 7 , Yoshiyuki Hiki 9 , Mayumi Ishihara 6 , Hiromi Ito 10 , Kazuaki Kakehi 11 , Niclas Karlsson 12 , Koichi Kato 13,14 , Nana Kawasaki 15 , Kay-Hooi Khoo 16 , Kunihiko Kobayashi 17 , Daniel Kolarich 18 , Akihiro Kondo 19 , Carlito Lebrilla 20 , Miyako Nakano 18 , Hisashi Narimatsu 10 , Jan Novak 21 , Milos V. Novotny 22 , Erina Ohno 14 , Nicolle H. Packer 18 , Matthew B. Renfrow 21 , Michiko Tajiri 4,23 , Kristina A. Thomsson 7 , Hirokazu Yagi 14 , Shin-Yi Yu 16 , and Naoyuki Taniguchi 2,24,25,26 4 Osaka Medical Center and Research Institute for Maternal and Child Health, Izumi, Japan 5 Division of Molecular Biosciences, Department of Life Sciences, Imperial College London, London, UK 6 Analytical Services, Complex Carbohydrate Research Center, University of Georgia, Athens, GA, USA 7 Dept. Medical Biochemistry, University of Gothenburg, Gothenburg, Sweden 8 Mass Spectrometry Resource, Department of Biochemistry, Boston University School of Medicine, Boston, MA, USA 9 Department of Internal Medicine, Fujita Health University School of Medicine, Toyoake, Japan MCP Papers in Press. Published on January 4, 2010 as Manuscript M900450-MCP200 Copyright 2010 by The American Society for Biochemistry and Molecular Biology, Inc.
Transcript of Comparison of Methods for Profiling O-Glycosylation: HUMAN PROTEOME ORGANISATION HUMAN DISEASE...

1
Comparison of Methods for Profiling O-glycosylation: HUPO
Human Disease Glycomics/Proteome Initiative Multi-
Institutional Study of IgA1
Yoshinao Wada1,2,4, Anne Dell1,3,5, Stuart M. Haslam3,5, Bérangère Tissot3,5, Kévin
Canis3,5, Parastoo Azadi6, Malin Bäckström7, Catherine E. Costello8, Gunnar C.
Hansson7, Yoshiyuki Hiki9, Mayumi Ishihara6, Hiromi Ito10, Kazuaki Kakehi11,
Niclas Karlsson12, Koichi Kato13,14, Nana Kawasaki15, Kay-Hooi Khoo16, Kunihiko
Kobayashi17, Daniel Kolarich18, Akihiro Kondo19, Carlito Lebrilla20, Miyako
Nakano18, Hisashi Narimatsu10, Jan Novak21, Milos V. Novotny22, Erina Ohno14,
Nicolle H. Packer18, Matthew B. Renfrow21, Michiko Tajiri4,23, Kristina A.
Thomsson7, Hirokazu Yagi14, Shin-Yi Yu16, and Naoyuki Taniguchi2,24,25,26
4Osaka Medical Center and Research Institute for Maternal and Child Health, Izumi,
Japan
5Division of Molecular Biosciences, Department of Life Sciences, Imperial College
London, London, UK
6Analytical Services, Complex Carbohydrate Research Center, University of Georgia,
Athens, GA, USA
7Dept. Medical Biochemistry, University of Gothenburg, Gothenburg, Sweden
8Mass Spectrometry Resource, Department of Biochemistry, Boston University
School of Medicine, Boston, MA, USA
9Department of Internal Medicine, Fujita Health University School of Medicine,
Toyoake, Japan
MCP Papers in Press. Published on January 4, 2010 as Manuscript M900450-MCP200
Copyright 2010 by The American Society for Biochemistry and Molecular Biology, Inc.

2
10Research Center for Medical Glycoscience, National Institute of Advanced
Industrial Science and Technology, Tsukuba, Japan
11Faculty of Pharmaceutical Sciences, Kinki University, Higashiosaka, Japan
12Chemistry Department, National University Ireland, Galway, Ireland
13Institute for Molecular Science and Okazaki Institute for Integrative Bioscience,
National Institutes of National Sciences, Okazaki, Japan
14Graduate School of Pharmaceutical Sciences, Nagoya City University, Nagoya,
Japan
15Division of Biological Chemistry and Biologicals, National Institute of Health
Sciences, Tokyo, Japan
16NRPGM Core Facilities for Proteomics and Glycomics, Institute of Biological
Chemistry, Academia Sinica, Taipei, Taiwan
17Department of Pediatrics, Hokkaido University Graduate School of Medicine,
Sapporo, Japan
18Department of Chemistry and Biomolecular Sciences, Macquarie University, Sidney,
Australia
19Laboratory of Molecular Diagnostics and Informatics, Division of Health Sciences,
Osaka University Graduate School of Medicine, Suita, Japan
20Department of Chemistry, University of California Davis, Davis, CA, USA
21Department of Microbiology and Biochemistry and Molecular Genetics, University
of Alabama at Birmingham, Birmingham, AL, USA
22Department of Chemistry, Indiana University, Bloomington, IN, USA
23CREST, Japan Science and Technology Agency, Kawaguchi, Japan
24Department of Biochemistry, Osaka University Graduate School of Medicine, Suita,
Japan

3
25 The Institute of Scientific and Industrial Research, Osaka University, Ibaraki, Japan
26Systems Glycobiology Group, Disease Glycomics Team, RIKEN Advanced Science
Institute, Wako, Japan
1To whom correspondence should be addressed: e-mail [email protected];
2 Study co-ordinators
3 Study assessors

4
ABSTRACT
The Human Proteome Organisation (HUPO) Human Disease Glycomics/Proteome
Initiative (HGPI) recently coordinated a multi-institutional study which evaluated
methodologies that are widely used for defining the N-glycan content in glycoproteins.
The study convincingly endorsed mass spectrometry as the technique of choice for
glycomic profiling in the discovery phase of diagnostic research. The present paper
reports the extension of HGPI’s activities to an assessment of the methodologies
currently employed for O-glycan analysis. Three samples of IgA1 isolated from the
serum of patients with multiple myeloma were distributed to fifteen laboratories
worldwide for O-glycomic analysis. A variety of mass spectrometric and
chromatographic procedures were employed, representative of current methodologies.
Similar to the previous N-glycan study, the results convincingly confirmed the pre-
eminent performance of mass spectrometry (MS) for O-glycan profiling. Two
general strategies were found to give the most reliable data, namely direct MS
analysis of mixtures of permethylated reduced glycans in the positive ion mode, and
analysis of native reduced glycans in the negative ion mode using LC-MS approaches.
In addition mass spectrometric methodologies to analyze O-glycopeptides were also
successful.

5
INTRODUCTION
Recently, the Human Proteome Organisation (HUPO) Human Disease
Glycomics/Proteome Initiative (HGPI), coordinated an evaluation of methodologies
that are widely used for defining the N-glycan content in glycoproteins (1). Twenty
laboratories around the world participated in the study in which the glycosylation of
standard samples of transferrin and immunoglobulin-G (IgG) was characterized by a
variety of chromatographic and mass spectrometric techniques. Two clear messages
emerged from this study. Firstly, there was significant variance amongst the datasets
from laboratories employing chromatographic profiling which was likely due to
incomplete derivatization with the fluorophores that had been employed to “tag” the
oligosaccharides in order to facilitate chromatography and provide a means of
detection. Secondly, mass spectrometry (MS) was shown to give consistent data in
inter-laboratory comparisons and it was concluded that MS-based strategies provide
the most effective means of both identification and quantitation of N-glycans in
glycomic studies.
HGPI has now extended its comparison of analytical methodologies to
encompass mucin-type O-glycosylation. In this type of glycosylation, O-glycans are
attached by a GalNAc to the amino acids serine and threonine. They can occur as
single O-glycans or clustered in mucin domains. Such domains are most abundant in
the class of glycoproteins known as mucins, which typically have a great number of
mucin domains arranged as tandem repeats, but are also found in many extracellular
proteins like IgA, which is the subject of the current study. IgA1 represents one of
two structurally and functionally distinct subclasses of IgA (2). The heavy chains of
IgA1 molecules contain a hinge-region segment between the first and second constant
region domains. This segment, which has a high content of Pro, Ser, and Thr, is the

6
site of attachment of usually up to six O-linked glycan chains (3-9). In circulatory
IgA1, these O-glycans consist of GalNAc with a ß1,3-linked Gal; both saccharides
may be sialylated (3, 4). The carbohydrate composition of the O-linked glycans in the
hinge-region of normal human serum IgA1 is variable. The prevailing forms include
Gal-GalNAc disaccharide, and its mono- and di-sialylated forms (4, 5, 10). Gal-
deficient variants with terminal GalNAc or sialylated GalNAc are rarely found in the
O-glycans of normal serum IgA1 (5), but are much more common in IgA nephritis
patients (11, 12), in whom IgG autoantibodies reactive to the hypogalactosylated
IgA1 form immune complexes and lead to mesangioproliferative glomerulonephritis
(13). These pathological features clearly demonstrate the importance of determining
the profile of the total glycan pool as an initial but essential step in tackling the
complex O-glycan structures. In the present study, IgA1 preparations from three
patients with multiple myeloma were delivered by HGPI to 15 experienced academic
laboratories and the results of O-glycomic analysis, especially the total glycoform
profiles, obtained using different analytical methodologies, were assessed. This study
was designed to compare and evaluate various methods, differing in sample
preparation and analytical modes, as well as to document levels of variance or
consistency among the data.
EXPERIMENTAL PROCEDURES
Sample Preparation
Three IgA1 myeloma proteins named "NUD", "VDS" and "SapII" were isolated
from respective serum samples from three patients with multiple myeloma by
precipitation with 50% saturated ammonium sulfate, followed by gel filtration
chromatography on Sepharose 6B and by ion exchange chromatography on DEAE

7
cellulose (14, 15). Purity was assessed by immunoelectrophoresis with rabbit anti-
human serum proteins. These samples were provided by one of the authors (KK).
Each 250 µg sample was delivered with dry ice in a solution for “NUD” at 250
µg/mL in 6M guanidine/HCl, 0.25M Tris-HCl, 1% dithiothreitol (pH8.6) and for
“Sap-II” at 2 mg/mL in 20mM Tris-HCl, 2% NaCl, 0.1% NaN3 (pH8.0), or a
lyophilized form for “VDS”.
Analytical Protocols
The analytical methods employed by each participating laboratory are given in
the Supplementary Material.
RESULTS AND DISCUSSION
Human IgA1 has both N- and O-glycosylation with the latter being the focus of
this study. The O-glycans are located on the hinge region of the heavy chain and five
sites of glycosylation have previously been identified (Thr-225, Thr-228, Ser-230,
Ser-232 and Thr-236), two of which (225 and 236) have been reported to be partially
occupied (3-6). Tryptic cleavage yields the 38 amino acid hinge-region O-
glycopeptide: HYTNPSQDVTVPCPVPST225PPT228PS230PS232TPPT236PSPSCCHPR.
The mass of core peptide containing carbamidomethylated cysteine residues is
4135.88 (monoisotopic) or 4138.56 (average).
The fifteen laboratories participating in the study analyzed tryptic glycopeptides
or released oligosaccharides, or both. General workflows are shown in Schemes 1
and 2 and methodologies employed by each laboratory are summarized in Table I

8
(note that the laboratory numbers designated in Table I are not the same as those
given to the authors in the title). IgA1 derived from three patients with multiple
myeloma (coded NUD, Sap-II and VDS) (14, 15) were prepared in Japan and
dispatched to the participating laboratories in 250 µg aliquots. Several of the
participating laboratories additionally analyzed a sample of IgA pooled from healthy
individuals.
Glycopeptide Analysis
Matrix-assisted laser desorption/ionization (MALDI) and/or electrospray
ionization (ESI) mass fingerprinting of cysteine-alkylated tryptic hinge O-
glycopeptides was carried out by six laboratories. Data of remarkable consistency
were obtained from most of these laboratories despite the employment of a variety of
sample handling procedures and mass spectrometric instrumentation (see Table 1 and
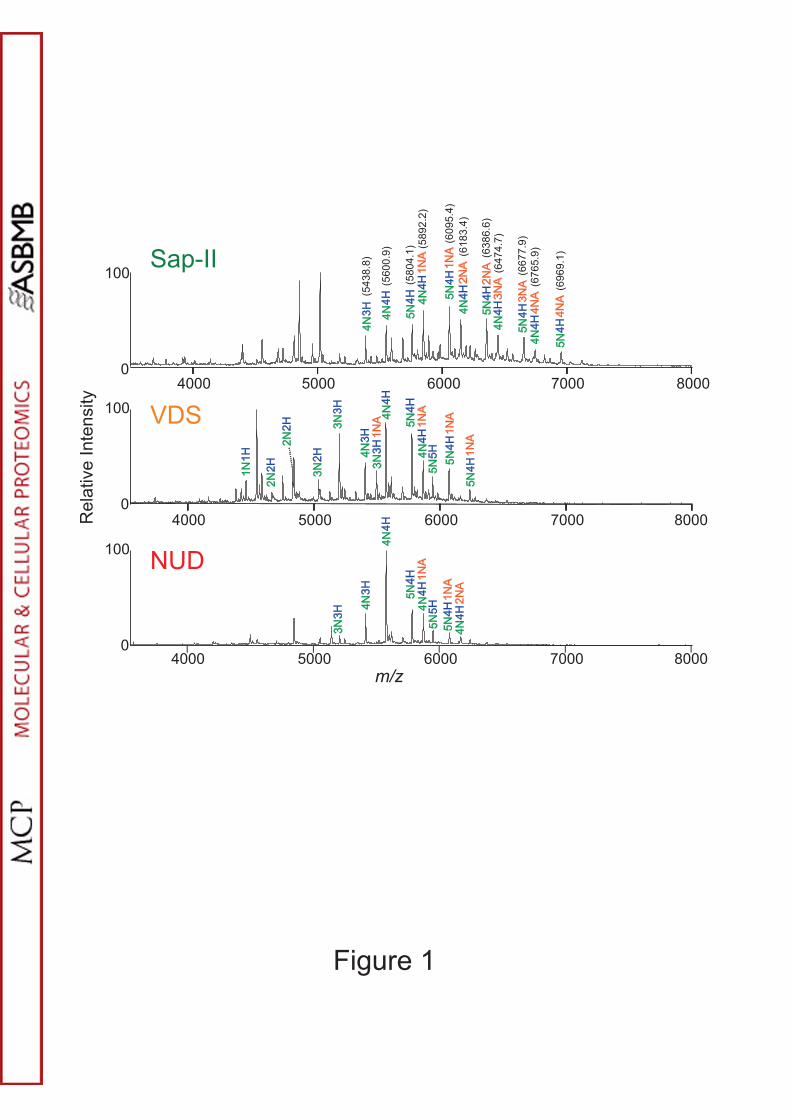
Supplementary Methods). Exemplar MALDI and ESI mass spectra from O-
glycopeptides isolated from solution digests using hydrophilic affinity extraction (16)
by two laboratories (1 and 4) are shown in Figure 1 and Supplementary Figure S1,
respectively. The enriched glycopeptide fraction was directly analyzed by MALDI
MS in linear TOF mode (lab1) or subjected to on-line LC-ESI-MS (lab4). Profiles
obtained from on-line LC-ESI-MS of solution digests and by in-gel digestion
followed by LC-ESI-MS are shown in Figure 2 and Supplementary Figures S2 and S3
(labs 2, 5 and 6, respectively). Some laboratories additionally analyzed a pooled
sample of IgA1 purified from healthy individuals. An exemplar mass fingerprint for
the hinge glycopeptide of normal IgA1 is shown in Supplementary Figure S4. For
simplicity molecular ions of the glycopeptide glycoforms are annotated in all spectra
with their predicted oligosaccharide compositions using N, H and NA to represent
9
HexNAc, Hex, and NeuAc, respectively.
Sialylation was prominent in Sap-II, and heterogeneity was small in NUD in all
the data sets. However, some differences were also observed. Typically, sialylated
glycans were less abundant in the MALDI mass spectra (lab1), when looking at the
ratio of 4N4H/4N4H1NA/4N4H2NA/4N4H3NA in Sap-II (Fig. 3) or that of
4N4H1/4N4H1NA in VDS in Figure 1 and Supplementary Figures S1 and S2. This
was likely due to low efficiency of the ionization of sialylated glycopeptides in the
positive ion mode, because the underestimation was less prominent in the MALDI
mass spectra taken in the negative mode (see Supplementary Fig. S5 from lab1). Loss
of sialyl residues is the major drawback of MALDI of oligosaccharides or
glycopeptides, and this was observed, even when using the negative ionization mode,
especially in the glycopeptide ions with multiple sialic acids: e.g., 5N4H3NA and
4N4H4NA (Supplementary Fig. S5). However, the extent of sialic acid loss from O-
glycans is less prominent than the cases of N-glycans (unpublished observations by
YW and MT).
On the other hand, the results from ESI from three laboratories, lab2 (Fig. 2),
lab4 (Supplementary Fig. S1) and lab5 (Supplementary Fig. S2), also showed some
discrepancies in the sialylated species. As indicated by the ratio of 4N4H to
4N4H1NA of NUD, sialylation levels were higher in the analysis of lab4 than in those
of lab 2 and lab5. From the mass spectrometric point of view, one issue that should
be clarified to address the disagreement is the charge-state distribution of the original
mass spectra from these laboratories or the charge-state of the source mass spectra for
deconvolution. Alternatively, the disagreement may be due to the usage of different
types of mass analyzers and detectors. In addition, lab5 reported predominance of
small glycans probably due to different sample preparation (Fig. 3); lab5 extracted

10
glycopeptides from SDS-PAGE gels by in-gel digestion.
One laboratory (lab3) employed Jacalin lectin chromatography to isolate the
glycopeptides, but the yields were found to be insufficient for a comprehensive MS
study and the limited data that were obtained differed substantially from the other
laboratories. Considering that this laboratory has sufficient experience of the analysis
of hinge O-glycopeptides obtained from a few mg of IgA1, their protocol was not
suited for a smaller scale analysis; probably the volume (2 mL) of Jacalin was too
much to efficiently recover the glycopeptides from the lectin column.
Additional analyses to decrease the complexity of the MS profiles were carried
out by lab1 (Supplementary Figs. S6 and S7). Desialylation removed the negative
effect of sialic acid on the ionization efficiency in the MALDI, and the small signals
corresponding to highly glycosylated glycopeptides with six or seven HexNAc
residues could be observed (Supplementary Fig. S6). The number of O-glycans
attached to the glycopeptides was clearly demonstrated by the mass spectra after
eliminating peripheral glycans attached to the Ser/Thr-GalNAc units by incubation
with trifluoromethanesulfonic acid (Supplementary Fig. S7). However, the current
protocol of reactions did not guarantee good reproducibility and some removal of
GalNAc residues was observed. Deglycosylation by glycosidase (galactosidase)
would be an alternative to this chemical treatment, but the removal of galactose
residues was incomplete in a preliminary experiment carried out by lab1 (data not
shown).
The major advantages of glycopeptide analysis are clearly illustrated in this
pilot study as follows. First, the average or maximum/minimum number of attached
sites can be counted. Second, relative abundances of different glycoform
compositions can be readily established at high sensitivity. Third, MS of

11
glycopeptides does not miss the GalNAc-α-O-Ser/Thr (Tn epitope), which is
characterized by components having a higher number of HexNAc than Hex such as
5N4H or 5N3H.
Chromatographic Analysis of Tagged O-glycans
Chromatography of reductively aminated oligosaccharides carrying fluorescent
“tags” at their reducing ends is a well established procedure for quantitating mixtures
of N-glycans. It remains a popular method despite issues of variance between
laboratories (1) because it does not require highly sophisticated and expensive
instrumentation. Exploitation of this type of methodology in the O-glycan field is far
less common because free reducing sugars are required for the tagging reaction and
no tools are available that are capable of liberating O-glycans efficiently and cleanly
from glycopeptides or glycoproteins whilst retaining their reducing sugars.
Unfortunately no broad spectrum O-glycanase has yet been discovered. Therefore the
release of O-glycans requires base catalyzed chemical elimination and it has been
known for over forty years that the core 1 arm of O-glycans is readily “peeled” from
the 3-position of the reducing GalNAc residue under basic conditions unless the latter
is reduced. Hence reductive elimination is the only way of obtaining an artifact-free
O-glycan population. Nevertheless chromatographic/tagging methodologies can play
a useful role in O-glycan analysis, for example in the analysis of complex mucins (17),
provided peeling products and other chemical artifacts are taken into account in data
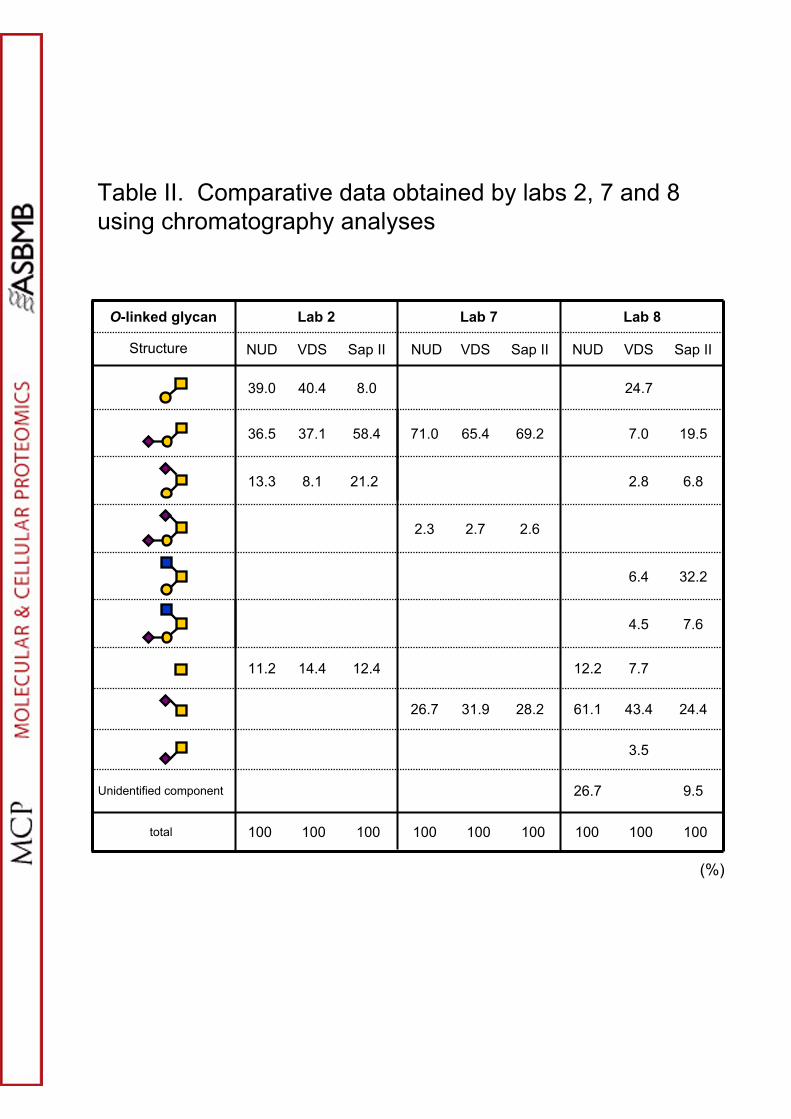
analysis. In the present study three laboratories (2,7,8) analyzed base-eliminated
fluorescently tagged glycans and their data nicely encapsulate the issues that need to
be considered when such methods are employed. O-Glycans were released manually
with anhydrous hydrazine (labs 2 and 7) or automatically with lithium hydroxide (lab

12
8) or were tagged with phenylhydrazine, 2-(2-aminobenzoylamino)-2-
hydrazinocarbonyl-ethanethiol (ABHE) or 2-aminobenzoic acid (AA), respectively.
The ABHE tagging procedure involved a nanoparticle immobilization/derivatization
step and subsequent release of the tagged O-glycans (see Supplementary Methods).
Workflows and protocols are given in Scheme 2 and Supplementary Methods and
chromatographic profiles are given in Supplementary Figures S8-S10. Comparative
quantitative data are shown in Table II. The stark discrepancies between the data sets
highlight the artifact problems mentioned earlier. Nevertheless where replicate
experiments were carried out reasonable consistency was observed, so it can be
concluded that comparative chromatographic profiling is a valid technique under
carefully controlled conditions.
Mass Spectrometric Analysis of Reduced O-glycans
Nine labs analyzed reductively eliminated O-glycans using three general MS
strategies: (i) positive ion mode MALDI-MS fingerprinting supplemented by MALDI
and/or ESI-MS/MS sequencing of mixtures of permethylated glycans (labs 1, 9-12);
(ii) negative ion mode ESI-MS fingerprinting and ESI-MS/MS sequencing of native
glycans which were purified and separated by graphitized carbon on-line LC (labs
5,13,14); (iii) negative and positive ion mode MALDI-FTICR-MS of mixtures of
native glycans without on-line LC purification (lab 15).
Workflows and protocols are given in Scheme II and Supplementary Methods,
respectively, and typical data are shown in Supplementary Figures S11 and S12.
Quantitative information was extracted from MALDI fingerprints and LC-MS profiles
by measuring peak heights and peak areas, respectively. With one exception (lab 13,
see Supplementary Methods) no corrections were made for differences in the response
13
factors of the various glycans. Exemplar quantitative data are shown in Table III for
permethylated and native samples, respectively, and data from all eight labs are
collated in Supplementary Table I. Collectively, these data are broadly in line with
the conclusions of the glycopeptide profiling experiments (see earlier), namely that
most of the glycans are core 1 type with monosialylated core 1 dominating in Sap-II
and non-sialylated core 1 being the major glycan in VDS and NUD. For technical
reasons the neutral glycans were missed in some of the on-line experiments (see
Supplementary Table 1). On-line graphitized carbon LC will not detect the Tn
antigen as single monosaccharides are not retained. Minor core 2 glycans were most
reliably observed in the analyses of permethylated samples (Supplementary Figs. S11
and S13 for confirmation via tandem MS). A weakness of both methodologies is that
monosaccharides such as Tn are difficult to analyze reliably because of masking by
matrix peaks in MALDI data and early elution together with impurities in on-line LC-
MS.
In summary, the study has shown that both (i) and (ii) are reliable strategies for
semi-quantitative O-glycan analysis except for the analysis of Tn. On the other hand,
strategy (iii), in which native samples were analyzed as mixtures by MS without
permethylation or on-line LC purification, gave equivocal data. Notably, spectra
were characterized by dominant matrix and artifact peaks and only one molecular ion
species was assignable to an authentic IgA O-glycan (see Supplementary Fig. S14). It
was also observed in some experiments that small quantities of glycopeptides (with
two or more amino acids) are recovered from reductive elimination reactions and their
presence may need to be taken into account when data are analyzed.
CONCLUSIONS

14
In this study the O-glycan content of three IgA1 samples were analyzed by
fifteen participating laboratories. Six of these laboratories used either MALDI or ESI
to obtain mass fingerprints of the hinge glycopeptide (which has up to five occupied
O-glycosylation sites), three laboratories eliminated the O-glycans without reduction
and then tagged the free reducing ends prior to chromatographic analysis, nine
laboratories used reductive elimination to release the glycans which were then
analyzed by MS after permethylation (five laboratories), or as native glycans by LC-
MS (three laboratories) or MS alone (one laboratory). The main conclusions that can
be drawn from the study are summarized below.
Tryptic glycopeptides that were purified using comparable chromatographic
procedures gave broadly similar mass fingerprints irrespective of whether MALDI or
ESI was used. It was noted, however, that the more highly sialylated glycoforms
were somewhat less abundant in the MALDI fingerprints suggesting some loss of
sialic acid during the analysis. Nevertheless the fact that most of the sialic acid was
preserved demonstrates that MALDI is a suitable tool for profiling sialylated
glycoforms provided the linear ion mode is employed in the TOF analysis. Semi-
quantitative assignment of total glycan compositions deduced from ion abundances in
the mass fingerprints enabled inter-sample comparisons with respect to heterogeneity
and overall levels of sialylation. The likely presence of the Tn epitope in some of the
glycoforms was revealed by compositions rich in HexNAc. The compositional data
gives clues to site occupancy: for example the number of sites occupied cannot be
greater than the number of HexNAc residues in the glycoform composition, while
detailed profiling by MS of glycopeptides requires prior knowledge of the glycan
structures obtained by other methods such as chromatography of tagged glycans,
supplementary experiments employing, for example. Electron capture dissociation

15
(ECD) or electron transfer dissociation MS/MS instrumentation are capable of
defining precise glycosylation sites as well as the size or suggested structures of
glycans at specific sites (6, 7, 18). Indeed, FTMS equipped with ECD has also been
used for structure determination of O-glycopeptides and shows potential for site
analysis (18, 19).
Chromatographic/tagging methodologies employed by three laboratories in this
study were found to give a diverse body of data that could not be readily reconciled
with the outputs of the more rigorous glycopeptide analyses described above. It was
clear from these experiments that peeling during non-reductive alkaline release of O-
glycans from glycopeptides, exacerbated by the frequent occurrence of artifactual
chromatographic peaks, severely impacts on the reliability of these methodologies for
quantitative O-glycomics. It was also apparent that neither automation of glycan
release nor the exploitation of nanoparticle technology for capturing the released
glycans has improved the efficacy of these methodologies.
On the other hand, there was good consistency amongst the data derived from
samples that were prepared by reductive elimination. Two general strategies were
shown to be highly effective for the reproducible analysis of reduced O-glycans: (i)
MALDI mass fingerprinting complemented by MALDI or ESI MS/MS sequencing of
mixtures of permethylated glycans, (ii) on-line LC-ESI-MS in the negative ion mode
of native samples. The first afforded the highest sensitivity detection of minor
components. Both methodologies are routinely semi-quantitative making them ideal
for comparative glycomics. Absolute quantification is also achievable with each
technology but requires well characterized standards for calibration of mass
spectrometry response factors. The lack of readily available quantified glycan
standards remains a logjam for quantitative glycomics.

16
O-glycans of IgA are relatively simple, lack isomers and are not densely
clustered as normally observed in the mucins. This makes analysis of the
glycopeptides after proteolytic degradation ideal. However, in the mucins with more
complex and longer oligosaccharides this approach will be less useful. The O-glycans
have then to be alkaline released. Permethylation followed by direct MALDI-MS and
separation by liquid chromatography coupled to ESI-MS analysis are the two methods
of choice for the structural characterization of O-glycans in complex mixtures. The
permethylation methods employed in this study are suitable for neutral and sialic
acid-containing compounds, but need to be modified for sulfated oligosaccharides
(20).
The IgA from patients with multiple myeloma is derived from a B-cell clonal
population that tends to be almost monoclonal with the progression of the disease.
Although the glycosylation of myeloma proteins will thus be more homogenous than
is observed in polyclonal IgA from healthy individuals, the O-glycans exhibit a
degree of heterogeneity specific for each myeloma protein (7, 10). The differences
observed here probably reflect varying regulation of O-glycosylation in the different
B-cells clones. The distribution of O-glycan heterogeneity in NUD, VDS and SAP-II
is comparable to published analysis of myeloma IgA1 from other sources (7).
Acknowledgments -- The work was supported by the Swedish Research Council
(#7461 and equipment), the Swedish Cancer Foundation, MIVAC, IngaBritt and Arne
Lundberg Foundation, and Knut and Alice Wallenberg Foundation (GCH). N.K.
would like to thank Dr. Satsuki Itoh and Dr. Noritaka Hashii (National Institute of
Health Sciences, Tokyo, Japan). K-H.K. is supported by NSC 96-3112-B-001-018

17
(for the NRPGM Core Facilities). M.B.R. and J.N. would like to thank Stacy Hall
and Stephanie B. Wall for technical support. J.N. and M.B.R. are supported in part by
grants from National Institutes of Health DK077279, DK078244, DK80301,
DK71802, DK082753, and DK064400. Y.W. is supported in part by a grant from
Takeda Science Foundation. A.D., S.M.H., B.T. and K.C. acknowledge the support
of a Biotechnology and Biological Sciences Research Council (BBSRC) core grant
and a BBSRC Professorial Fellowship (to A.D.). A part of this work was supported
by the Global COE (Centers of Excellence) Program of Osaka University from the
Japan Society for the Promotion of Science (JSPS) and by the JSPS Core-to-Core
program.

18
REFERENCES
1. Wada, Y., Azadi, P., Costello, C. E., Dell, A., Dwek, R. A., Geyer, H., Geyer,
R., Kakehi, K., Karlsson, N. G., Kato, K., Kawasaki, N., Khoo, K. H., Kim, S.,
Kondo, A., Lattova, E., Mechref, Y., Miyoshi, E., Nakamura, K., Narimatsu,
H., Novotny, M. V., Packer, N. H., Perreault, H., Peter-Katalinic, J., Pohlentz,
G., Reinhold, V. N., Rudd, P. M., Suzuki, A., and Taniguchi, N. (2007)
Comparison of the methods for profiling glycoprotein glycans--HUPO Human
Disease Glycomics/Proteome Initiative multi-institutional study. Glycobiology
17, 411-422
2. Mestecky, J. (1988) Immunobiology of IgA. Am J Kidney Dis 12, 378-383
3. Baenziger, J., and Kornfeld, S. (1974) Structure of the carbohydrate units of
IgA1 immunoglobulin. II. Structure of the O-glycosidically linked
oligosaccharide units. J Biol Chem 249, 7270-7281
4. Field, M. C., Dwek, R. A., Edge, C. J., and Rademacher, T. W. (1989) O-
linked oligosaccharides from human serum immunoglobulin A1. Biochem Soc
Trans 17, 1034-1035
5. Mattu, T. S., Pleass, R. J., Willis, A. C., Kilian, M., Wormald, M. R., Lellouch,
A. C., Rudd, P. M., Woof, J. M., and Dwek, R. A. (1998) The glycosylation
and structure of human serum IgA1, Fab, and Fc regions and the role of N-
glycosylation on Fc alpha receptor interactions. J Biol Chem 273, 2260-2272
6. Renfrow, M. B., Cooper, H. J., Tomana, M., Kulhavy, R., Hiki, Y., Toma, K.,
Emmett, M. R., Mestecky, J., Marshall, A. G., and Novak, J. (2005)
Determination of aberrant O-glycosylation in the IgA1 hinge region by
electron capture dissociation fourier transform-ion cyclotron resonance mass
spectrometry. J Biol Chem 280, 19136-19145
7. Renfrow, M. B., Mackay, C. L., Chalmers, M. J., Julian, B. A., Mestecky, J.,
Kilian, M., Poulsen, K., Emmett, M. R., Marshall, A. G., and Novak, J. (2007)
Analysis of O-glycan heterogeneity in IgA1 myeloma proteins by Fourier
transform ion cyclotron resonance mass spectrometry: implications for IgA

19
nephropathy. Anal Bioanal Chem 389, 1397-1407
8. Tarelli, E., Smith, A. C., Hendry, B. M., Challacombe, S. J., and Pouria, S.
(2004) Human serum IgA1 is substituted with up to six O-glycans as shown
by matrix assisted laser desorption ionisation time-of-flight mass spectrometry.
Carbohydr Res 339, 2329-2335
9. Tomana, M., Kulhavy, R., and Mestecky, J. (1988) Receptor-mediated binding
and uptake of immunoglobulin A by human liver. Gastroenterology 94, 762-
770
10. Novak, J., Tomana, M., Kilian, M., Coward, L., Kulhavy, R., Barnes, S., and
Mestecky, J. (2000) Heterogeneity of O-glycosylation in the hinge region of
human IgA1. Mol Immunol 37, 1047-1056
11. Moldoveanu, Z., Wyatt, R. J., Lee, J. Y., Tomana, M., Julian, B. A., Mestecky,
J., Huang, W. Q., Anreddy, S. R., Hall, S., Hastings, M. C., Lau, K. K., Cook,
W. J., and Novak, J. (2007) Patients with IgA nephropathy have increased
serum galactose-deficient IgA1 levels. Kidney Int 71, 1148-1154
12. Suzuki, H., Moldoveanu, Z., Hall, S., Brown, R., Vu, H. L., Novak, L., Julian,
B. A., Tomana, M., Wyatt, R. J., Edberg, J. C., Alarcon, G. S., Kimberly, R. P.,
Tomino, Y., Mestecky, J., and Novak, J. (2008) IgA1-secreting cell lines from
patients with IgA nephropathy produce aberrantly glycosylated IgA1. J Clin
Invest 118, 629-639
13. Suzuki, H., Fan, R., Zhang, Z., Brown, R., Hall, S., Julian, B. A., Chatham, W.
W., Suzuki, Y., Wyatt, R. J., Moldoveanu, Z., Lee, J. Y., Robinson, J.,
Tomana, M., Tomino, Y., Mestecky, J., and Novak, J. (2009) Aberrantly
glycosylated IgA1 in IgA nephropathy patients is recognized by IgG
antibodies with restricted heterogeneity. J Clin Invest 119, 1668-1677
14. Kobayashi, K., Vaerman, J. P., and Heremans, J. F. (1973) J-chain
determinants in polymeric immunoglobulins. Eur J Immunol 3, 185-191
15. Mestecky, J., Hamilton, R. G., Magnusson, C. G., Jefferis, R., Vaerman, J. P.,
Goodall, M., de Lange, G. G., Moro, I., Aucouturier, P., Radl, J.,

20
Cambiaso, C., Silvain, C., Preud'homme, J. L., Kusama, K., Carlone, G. M.,
Biewenga, J., Kobayashi, K., Skvaril, F., and Reimer, C. B. (1996) Evaluation
of monoclonal antibodies with specificity for human IgA, IgA subclasses and
allotypes and secretory component. Results of an IUIS/WHO collaborative
study. J Immunol Methods 193, 103-148
16. Wada, Y., Tajiri, M., and Yoshida, S. (2004) Hydrophilic affinity isolation and
MALDI multiple-stage tandem mass spectrometry of glycopeptides for
glycoproteomics. Anal Chem 76, 6560-6565
17. Xia, B., Royall, J. A., Damera, G., Sachdev, G. P., and Cummings, R. D.
(2005) Altered O-glycosylation and sulfation of airway mucins associated
with cystic fibrosis. Glycobiology 15, 747-775
18. Mirgorodskaya, E., Roepstorff, P., and Zubarev, R. A. (1999) Localization of
O-glycosylation sites in peptides by electron capture dissociation in a Fourier
transform mass spectrometer. Anal Chem 71, 4431-4436
19. Mormann, M., Paulsen, H., and Peter-Katalinic, J. (2005) Electron capture
dissociation of O-glycosylated peptides: radical site-induced fragmentation of
glycosidic bonds. Eur J Mass Spectrom (Chichester, Eng) 11, 497-511
20. Mitoma, J., Bao, X., Petryanik, B., Schaerli, P., Gauguet, J. M., Yu, S. Y.,
Kawashima, H., Saito, H., Ohtsubo, K., Marth, J. D., Khoo, K. H., von
Andrian, U. H., Lowe, J. B., and Fukuda, M. (2007) Critical functions of N-
glycans in L-selectin-mediated lymphocyte homing and recruitment. Nat
Immunol 8, 409-418

21
Table, Scheme and Figure Legends
Table I. Summary of the methodology/instrumentation employed in this study.
Notes: AE: anion exchange; AGC: AutoGlycoCutter; β-elim: beta-elimination; Ca:
graphitized carbon column, Gp: glycopeptide; HPLC: high performance liquid
chromatography; Hy: hydrazinolysis; Jac: affinity chromatography on Jacalin; OS:
oligosaccharides; Pe: permethylation; Pn; PNGase F treatment, N-glycan removal;
Pr: proteolytic digestion; RA: reduction and cysteine derivatization; RP: reverse
phase; Sep: chromatography Sepharose CL4B
Table II. Comparative data obtained by labs 2, 7 and 8 using chromatography
analyses.
Keys to symbols - yellow square: N-acetylgalactosamine, blue square: N-
acetylglucosamine, yellow circle: galactose, pink diamond: N-acetylneuraminic acid.
Table III. O-glycans comparative results obtained by lab 9 (MALDI-TOF MS) and
13 (LC-ESI MS).
Notes: *Combination of the two isomers; [Md+Na]+ corresponds to the mass of a
deutero-reduced permethylated glycan analyzed in positive mode (see Supplementary
Methods for lab 9), [M-H]- corresponds to the mass of a native glycan analyzed in
negative mode. For keys see Table II legend.
Scheme 1. Workflow of the various methodologies used for the O-glycopeptide
structural analysis.
Scheme 2. Workflow of the various methodologies used for the O-glycan structural

22
analysis.
Figure 1. MALDI profiles of IgA O-glycopeptides of Sap-II, VDS and NUD samples
(lab 1).
Spectra were acquired using the linear positive mode. Putative structures were deduced
from the molecular mass of glycopeptides and known structures of core 1 O-glycans for the
IgA1 hinge region. Average mass was used for these measurements, and mass accuracy was
± 1 Da. N, H and NA represent HexNAc (GalNAc), Hex (Gal) and Neu5Ac (N-
acetylneuraminic acid), respectively.
Figure 2. ESI mass spectra of IgA O-glycopeptides of Sap-II, VDS and NUD samples
(lab 2).
(a) Deconvoluted spectra of three samples. Monoisotopic masses of [M+H]+ ions are
indicated in the mass spectrum of Sap-II. (b) Real ESI mass spectrum of Sap-II
before deconvolution. Charge state of each peptide ion signal is given in parentheses.
Samples were analyzed by LC-MS in positive ion mode using a Paradigm MS4 HPLC
system coupled to a Thermo FT-ICR mass spectrometer. Mass accuracy was ± 0.1 Da.
N, H and NA represent HexNAc (GalNAc), Hex (Gal) and NeuAc (N-
acetylneuraminic acid), respectively.
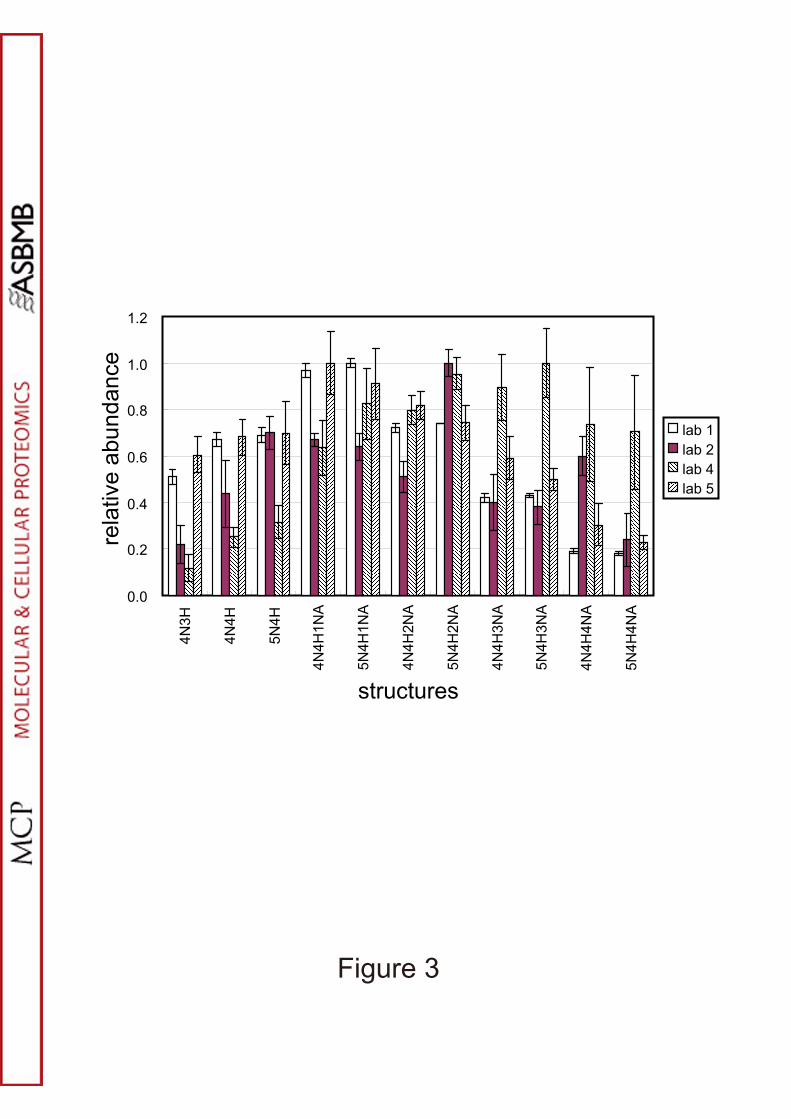
Figure 3. Comparison of the glycan profiles obtained by laboratories having used MS
of glycopeptides as analytical tool.
Relative abundance of glycan structures were calculated from the signal intensities in
the mass spectra of Sap-II (Figs 1 and 2 and supplementary Figs. 1 and 2). Error bars,
2 SD. Protonated ions were analysed. MS mode was MALDI linear-TOF in lab1,

23
and ESI LTQ-FT-ICR, ESI Orbitrap and ESI Q-TOF in labs 2, 4, and 5, respectively.

IonSpec FT-ICRMALDI-MS, ESI-MSOS / Pn, β-elimLab 15
Agilent 3D Ion TrapOn-line LC ESI-MSOS / RA, SDS-PAGE, β-elimLab 14
Thermo LTQOn-line Ca-LC ESI-MSOS / SDS-PAGE, β-elimLab 13
MALDIPe, MALDI-MSOS / β-elimLab 12
ABI 4700 Proteomics analyzerThermo LCQ-MS
Pe, MALDI-MS, ESI-MSOS / β-elimLab 11
ABI 4700 Proteomics analyzerWaters MALDI Q-TOF Ultima
Pe, MALDI-MSOS / β-elimLab 10
Bruker-Daltonik GmbH Reflex IV MALDI-TOFShimadzu AXIMA-QIT MALDI Quadrupole Ion Trap TOF
Pe, MALDI-MSOS / Pn, β-elimLab 9
ABI Voyager DE Pro MALDI-TOF Shimadzu LC MS-IT TOF
2-AA, HPLC, MALDI-MS, On-line LC ESI-MSOS / AGCLab 8
-ABHE, HPLCOS / Hy, BlotglycoLab 7
Thermo LTQ-FT-ICR On-line RP-LC ESI-MSGp / RA, SDS-PAGE, PrLab 6
Waters Ultima Q-TOF Bruker HCT Ultra PTM Discovery System
On-line AE-LC ESI-MSOn-line Ca-LC ESI-MS
Gp / RA, SDS-PAGE, PrOS / RA, SDS-PAGE, β-elim
Lab 5
Thermo OrbitrapSep, On-line RP-LC ESI-MSGp / RA, Pr, PnLab 4
Thermo LCQ Deca XPJac, HPLC, On-line RP-LC ESI-MSGp / RA, PrLab 3
Thermo LTQ-FT-ICR On-line RP-LC ESI-MSOn-line Ca-LC ESI-MS
Gp / RA, Pn, PrOS / Hy
Lab 2
ABI Voyager MALDI-TOF DE ProThermo LTQ with ETD
Sep, MALDI-MS, ESI-MSPe, MALDI-MS
Gp / RA, PrOS / β-elim
Lab 1
MS instrumentAnalysis strategyAnalyte / preparationLab
AE: anion exchange; AGC: AutoGlycoCutter; β-elim: beta-elimination; Ca: graphitized carbon column, Gp: glycopeptide; HPLC: high performance liquid chromatography; Hy: hydrazinolysis; Jac: affinity chromatography on Jacalin; OS: oligosaccharides; Pe: permethylation; Pn; PNGase F treatment, N-glycan removal; Pr: proteolytic digestion; RA: reduction and cysteine derivatisation; RP: reverse phase; Sep: chromatography sepharose CLB4
Table I. Summary of the methodologies/instrumentation employed
6.82.821.28.113.3
19.57.069.265.471.058.437.136.5
24.443.461.128.231.926.7
3.5
7.712.212.414.411.2
100 100 100 100 100 100 100 100 100
7.64.5
2.6
Sap II
2.7
VDS
2.3
NUD
Lab 7 Lab 8Lab 2O-linked glycan
9.526.7Unidentified component
total
32.26.4
24.78.040.439.0
Sap IIVDSNUDSap IIVDSNUDStructure
Table II. Comparative data obtained by labs 2, 7 and 8 using chromatography analyses
(%)

LC-ESI MSMALDI-TOF MSO-linked glycan
1.0--0.4-0.7
100total
(%)
100 100 100 100 100
[Md+Na]+ 1346 [M-H]- 1040
7.08.06.01.3-0.7[Md+Na]+ 1257 [M-H]- 966
---0.3-2.3[Md+Na]+ 984 [M-H]- 749
-1.01.0--[Md+Na]+ 896 [M-H]- 675
60.024.023.077.6
23.0*
26.3[Md+Na]+ 896[M-H]- 675
32.066.070.020.477.070.0[Md+Na]+ 535 [M-H]- 384
Sap IIVDSNUDSap IIVDSNUD(m/z)Structure
[Md+Na]+ corresponds to the mass of a deutero-reduced permethylated glycan analyzedin positive mode (see Supplementary Methods for lab 9). [M-H]- corresponds to the massof a reduced native glycan analyzed in negative mode (see Supplementary Methods for lab 13).*Combination of the two isomers.
Table III. O-glycans comparative results obtained by lab 9 (MALDI-TOF MS) and 13 (LC-ESI MS)
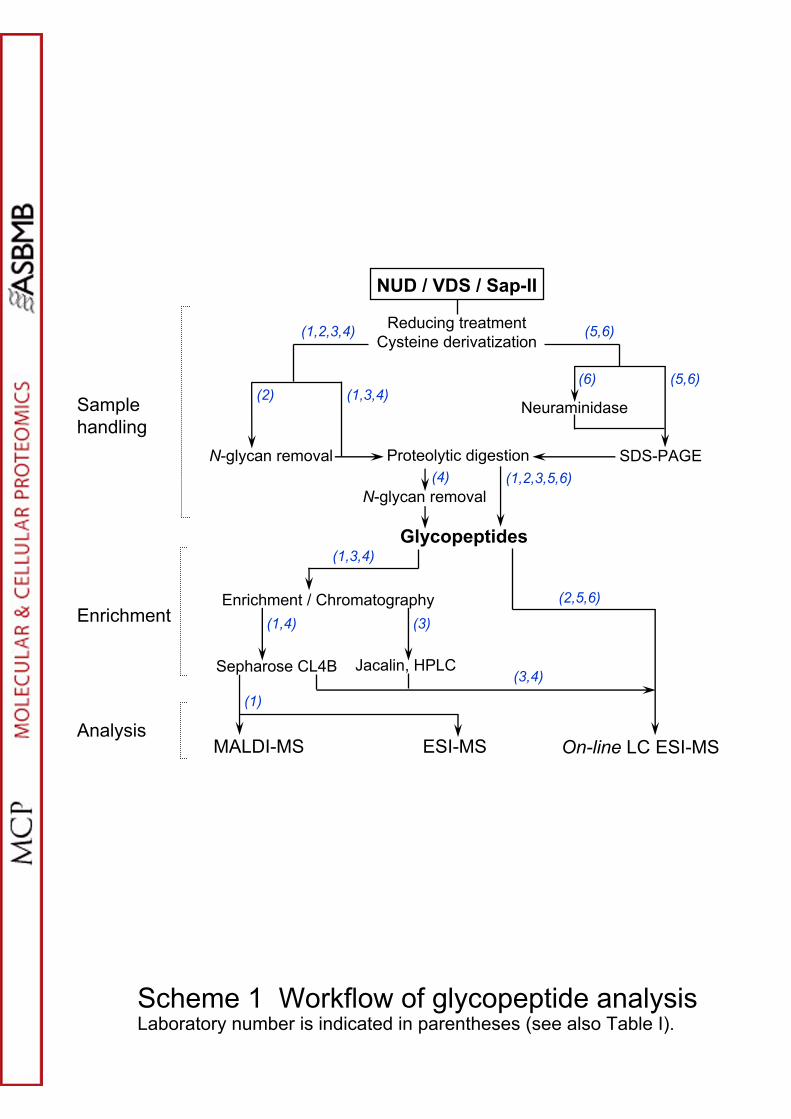
Scheme 1 Workflow of glycopeptide analysisLaboratory number is indicated in parentheses (see also Table I).
Glycopeptides
Enrichment / Chromatography
(1,3,4)
Sepharose CL4B Jacalin, HPLC
MALDI-MS On-line LC ESI-MS
(1,4) (3)
(3,4)
(1)
(2,5,6)
ESI-MS
Reducing treatment Cysteine derivatization
N-glycan removal
(1,3,4)(2)
Proteolytic digestion
NUD / VDS / Sap-II
)6,5()4,3,2,1(
SDS-PAGE
Neuraminidase
(6) (5,6)
Samplehandling
Enrichment
Analysis
N-glycan removal(4) (1,2,3,5,6)
4000 700060005000 8000
Sap-II
4000 700060005000 8000
4000 700060005000 8000
NUD
VDS
m/z
3H3N
1NA
1 H1N
4H4N
1NA
4 H5N
2NA
4 H4N
2NA
4H5N
1NA
4H4N
3NA
4H5 N
3NA
4H5 N
4NA
2H2N
2H3N
4 H4N
4 NA
3H4N
4H4N
4H5N
3H3N
3H4N
2H2N
4 H4N
4H4 N
1NA4H
5N
5H5N
4H5N
1NA
4H5N
1NA
3H3N
3H4N
4 H4N
4H4N
1NA
4H5N
5H5N
4 H5 N
1NA
4 H4 N
2NA
Rel
ativ
e In
tens
ity
100
0
100
0
100
0
Figure 1
(543
8.8)
(560
0.9)
(580
4.1) (5
892.
2)
(609
5.4)
(618
3.4)
(638
6.6)
(647
4.7)
(667
7.9)
(676
5.9)
(696
9.1)

Figure 2
(a)
(b)
NUD
5000 6000 7000
Rel
ativ
e ab
unda
nce
100
0
VDS
Rel
ativ
e ab
unda
nce
100
05000 6000 7000
Rel
ativ
e ab
unda
nce
100
05000 6000 7000
Sap- II
m/z
4N3H
4N3H
4N3H
3N3H
3N3H
4N2H
3N3H
1NA
4N4H
4N4H
4N4H
5N3H
5N3H
4N3H
1NA
4N3H
1NA
4N3H
1NA
5N4H
5N4H
5N4H
3N3H
2NA
3N3H
2NA
6N3H
6N3H
4N4H
1NA
4N4H
1NA
4N4H
1NA
5N3H
1NA
5N3H
1NA
5N5H
5N5H
5N5H
6N4H
6N4H
6N4H
4N3H
2NA
4N3H
2NA
5N4H
1NA
5N4H
1NA
5N4H
1NA
6N3H
1NA
4N4H
2NA
4N4H
2NA
4N4H
2NA
6N3H
1NA
5N3H
2NA
5N5H
1NA
5N5H
1NA
5N3H
2NA
6N4H
1NA
4N3H
3NA
5N4H
2NA
5N4H
2NA
5N4H
2NA
6N4H
1NA
6N3H
2NA
6N5H
1NA
6N5H
1NA
4N4H
3NA
4N4H
3NA
5N3H
3NA
5N5H
2NA
6N4H
2NA
5N4H
3NA
5N4H
3NA
5N5H
2NA
4N4H
4NA
5N5H
3NA
5N4H
4NA
5N4H
4NA
5N5H
4NA
Hex 5
HexN
Ac5N
euAc
4(4)
Hex 4
HexN
Ac6N
euAc
2(4)
Hex 3
HexN
Ac5N
euAc
3(4)
Hex 3
HexN
Ac6N
euAc
2(4)
Hex 3
HexN
Ac4N
euAc
3(4)
Hex 4
HexN
Ac5N
euAc
4(5)
Hex 4
HexN
Ac5N
euAc
3(5)
Hex 3
HexN
Ac4(4
) Hex 4
HexN
Ac4N
euAc
1(4)
Hex 4
HexN
Ac4(4
)
Hex 4
HexN
Ac5(4
) Hex 5
HexN
Ac5(4
)
Hex 4
HexN
Ac5N
euAc
1(4)
Hex 4
HexN
Ac4N
euAc
2(4)
Hex 5
HexN
Ac5N
euAc
1(4)
Hex 4
HexN
Ac4(3
)
Hex 3
HexN
Ac4(3
)
Hex 4
HexN
Ac5N
euAc
4(4)
Hex 4
HexN
Ac4N
euAc
4(4)He
x 4He
xNAc
4Neu
Ac3(4
)
Hex 3
HexN
Ac4N
euAc
1(4)
Hex 3
HexN
Ac5(4
)
Hex 2
HexN
Ac4(4
)He
x 3He
xNAc
3(4)
Hex 4
HexN
Ac4N
euAc
2(5)
Hex 4
HexN
Ac5N
euAc
1(5)
Hex 4
HexN
Ac4N
euAc
1(5)
Hex 4
HexN
Ac4(5
)
Hex 3
HexN
Ac4(5
)
Hex 4
HexN
Ac5N
euAc
2(4)
Hex 4
HexN
Ac5N
euAc
3(4)
Hex 5
HexN
Ac5N
euAc
2(4)
Hex 4
HexN
Ac6N
euAc
1(4)
Hex 3
HexN
Ac5N
euAc
2(4)
Hex 3
HexN
Ac6N
euAc
1(4)
Hex 3
HexN
Ac4N
euAc
2(4)
Hex 3
HexN
Ac5N
euAc
1(4)
Hex 3
HexN
Ac3N
euAc
2(4)
Hex 4
HexN
Ac4N
euAc
3(5)
Hex 4
HexN
Ac5N
euAc
2(5)
Hex 3
HexN
Ac4N
euAc
1(5)
1000 1100 1200 1300 1400 1500 1600 1700 1800 1900 2000
Relat
ive a
bund
ance
0
50
Hex 4
HexN
Ac4N
euAc
4(5)
m/z
Hex 5
HexN
Ac5N
euAc
3(4)
Hex 4H
exNA
c 6(4)
Hex 5
HexN
Ac6N
euAc
1(4)
Hex 3
HexN
Ac6(4
)
Hex 4
HexN
Ac5(5
)
Hex 5
HexN
Ac5N
euAc
4(4)
Hex 4
HexN
Ac6N
euAc
2(4)
Hex 3
HexN
Ac5N
euAc
3(4)
Hex 3
HexN
Ac6N
euAc
2(4)
Hex 3
HexN
Ac4N
euAc
3(4)
Hex 4
HexN
Ac5N
euAc
4(5)
Hex 4
HexN
Ac5N
euAc
3(5)
Hex 3
HexN
Ac4(4
) Hex 4
HexN
Ac4N
euAc
1(4)
Hex 4
HexN
Ac4(4
)
Hex 4
HexN
Ac5(4
) Hex 5
HexN
Ac5(4
)
Hex 4
HexN
Ac5N
euAc
1(4)
Hex 4
HexN
Ac4N
euAc
2(4)
Hex 5
HexN
Ac5N
euAc
1(4)
Hex 4
HexN
Ac4(3
)
Hex 3
HexN
Ac4(3
)
Hex 4
HexN
Ac5N
euAc
4(4)
Hex 4
HexN
Ac4N
euAc
4(4)He
x 4He
xNAc
4Neu
Ac3(4
)
Hex 3
HexN
Ac4N
euAc
1(4)
Hex 3
HexN
Ac5(4
)
Hex 2
HexN
Ac4(4
)He
x 3He
xNAc
3(4)
Hex 4
HexN
Ac4N
euAc
2(5)
Hex 4
HexN
Ac5N
euAc
1(5)
Hex 4
HexN
Ac4N
euAc
1(5)
Hex 4
HexN
Ac4(5
)
Hex 3
HexN
Ac4(5
)
Hex 4
HexN
Ac5N
euAc
2(4)
Hex 4
HexN
Ac5N
euAc
3(4)
Hex 5
HexN
Ac5N
euAc
2(4)
Hex 4
HexN
Ac6N
euAc
1(4)
Hex 3
HexN
Ac5N
euAc
2(4)
Hex 3
HexN
Ac6N
euAc
1(4)
Hex 3
HexN
Ac4N
euAc
2(4)
Hex 3
HexN
Ac5N
euAc
1(4)
Hex 3
HexN
Ac3N
euAc
2(4)
Hex 4
HexN
Ac4N
euAc
3(5)
Hex 4
HexN
Ac5N
euAc
2(5)
Hex 3
HexN
Ac4N
euAc
1(5)
1000 1100 1200 1300 1400 1500 1600 1700 1800 1900 20001000 1100 1200 1300 1400 1500 1600 1700 1800 1900 2000
Relat
ive a
bund
ance
0
50
Hex 4
HexN
Ac4N
euAc
4(5)
m/z
Hex 5
HexN
Ac5N
euAc
3(4)
Hex 4H
exNA
c 6(4)
Hex 5
HexN
Ac6N
euAc
1(4)
Hex 3
HexN
Ac6(4
)
Hex 4
HexN
Ac5(5
)
(543
5.37
)
(559
7.42
)(5
638.
45)
(572
6.46
)
(580
0.50
)(5
814.
48)
(584
1.52
)(5
888.
51)
(592
4.54
)(5
962.
55)
(600
3.58
)(6
017.
56)
(609
1.59
)(6
132.
62)
(617
9.61
)(6
220.
64)
(625
3.65
)(6
294.
67)
(630
8.65
)
(638
2.69
)(6
423.
72)
(645
6.73
)(6
470.
71)
(651
1.73
)(6
544.
74)
(658
5.77
)
(667
3.78
) (676
1.80
)
(696
4.88
)
(712
6.93
)
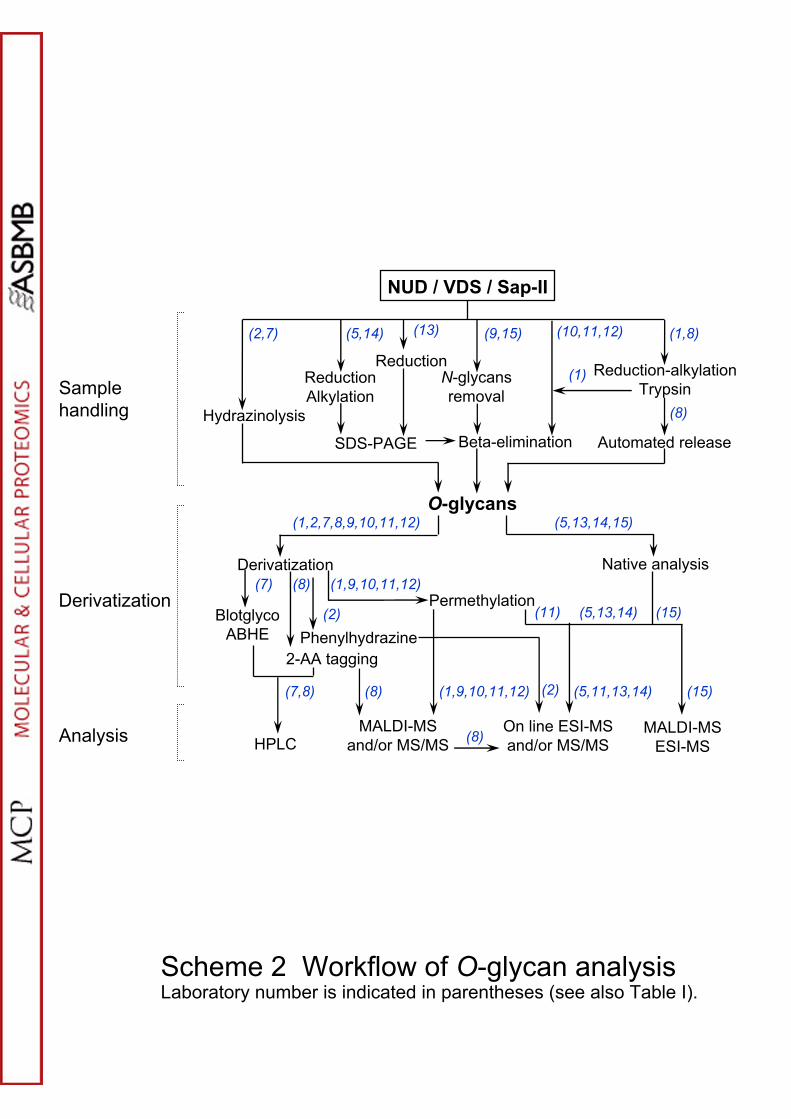
Scheme 2 Workflow of O-glycan analysisLaboratory number is indicated in parentheses (see also Table I).
(5,13,14)BlotglycoABHE
HPLC
(7,8)
Derivatization(7) (8)
2-AA tagging
MALDI-MS and/or MS/MS
On line ESI-MS and/or MS/MS
(8)
(8)
Permethylation
(1,2,7,8,9,10,11,12) (5,13,14,15)
Hydrazinolysis
(15)
Native analysis
(11)
Samplehandling
Derivatization
Analysis
O-glycans
(2,7) (1,8)
Automated releaseBeta-elimination
(10,11,12)
Reduction-alkylation Trypsin
(9,15)
N-glycans removal
(1)
(8)
(5,14)
SDS-PAGE
(13)
Reduction Alkylation
(1,9,10,11,12)
(1,9,10,11,12)
MALDI-MS ESI-MS
(5,11,13,14)
(15)
NUD / VDS / Sap-II
(2)Phenylhydrazine
(2)
Reduction
1.2
0.2
0.4
0.6
0.8
1.0
rela
tive
abun
danc
e
lab 1lab 2lab 4lab 5
4N3H
4N4H
5N4H
4N4H
1NA
5N4H
1NA
4N4H
2NA
5N4H
2NA
4N4H
3NA
5N4H
3NA
4N4H
4NA
5N4H
4NA
structures
0.0
Figure 3