Responses of the Emiliania huxleyi Proteome to Ocean Acidification
13
Responses of the Emiliania huxleyi Proteome to Ocean Acidification Bethan M. Jones 1 * ¤ , M. Debora Iglesias-Rodriguez 1,2,3 , Paul J. Skipp 2,4,5 , Richard J. Edwards 2,4,5 , Mervyn J. Greaves 6 , Jeremy R. Young 7 , Henry Elderfield 6 , C. David O’Connor 4,5,8 1 Ocean and Earth Science, National Oceanography Centre Southampton, University of Southampton, Southampton, United Kingdom, 2 Institute for Life Sciences, University of Southampton, Southampton, United Kingdom, 3 Department of Ecology, Evolution and Marine Biology, University of California Santa Barbara, Santa Barbara, California, United States of America, 4 Centre for Proteomic Research, University of Southampton, Southampton, United Kingdom, 5 Centre for Biological Sciences, University of Southampton, Southampton, United Kingdom, 6 Department of Earth Sciences, University of Cambridge, Cambridge, United Kingdom, 7 Department of Earth Sciences, University College London, London, United Kingdom, 8 Department of Biological Sciences, Xi’an Jiaotong-Liverpool University, Suzhou, China Abstract Ocean acidification due to rising atmospheric CO 2 is expected to affect the physiology of important calcifying marine organisms, but the nature and magnitude of change is yet to be established. In coccolithophores, different species and strains display varying calcification responses to ocean acidification, but the underlying biochemical properties remain unknown. We employed an approach combining tandem mass-spectrometry with isobaric tagging (iTRAQ) and multiple database searching to identify proteins that were differentially expressed in cells of the marine coccolithophore species Emiliania huxleyi (strain NZEH) between two CO 2 conditions: 395 (,current day) and ,1340 p.p.m.v. CO 2 . Cells exposed to the higher CO 2 condition contained more cellular particulate inorganic carbon (CaCO 3 ) and particulate organic nitrogen and carbon than those maintained in present-day conditions. These results are linked with the observation that cells grew slower under elevated CO 2 , indicating cell cycle disruption. Under high CO 2 conditions, coccospheres were larger and cells possessed bigger coccoliths that did not show any signs of malformation compared to those from cells grown under present-day CO 2 levels. No differences in calcification rate, particulate organic carbon production or cellular organic carbon: nitrogen ratios were observed. Results were not related to nutrient limitation or acclimation status of cells. At least 46 homologous protein groups from a variety of functional processes were quantified in these experiments, of which four (histones H2A, H3, H4 and a chloroplastic 30S ribosomal protein S7) showed down-regulation in all replicates exposed to high CO 2 , perhaps reflecting the decrease in growth rate. We present evidence of cellular stress responses but proteins associated with many key metabolic processes remained unaltered. Our results therefore suggest that this E. huxleyi strain possesses some acclimation mechanisms to tolerate future CO 2 scenarios, although the observed decline in growth rate may be an overriding factor affecting the success of this ecotype in future oceans. Citation: Jones BM, Iglesias-Rodriguez MD, Skipp PJ, Edwards RJ, Greaves MJ, et al. (2013) Responses of the Emiliania huxleyi Proteome to Ocean Acidification. PLoS ONE 8(4): e61868. doi:10.1371/journal.pone.0061868 Editor: Timothy Ravasi, King Abdullah University of Science and Technology, Saudi Arabia Received July 19, 2012; Accepted March 18, 2013; Published April 12, 2013 Copyright: ß 2013 Jones et al. This is an open-access article distributed under the terms of the Creative Commons Attribution License, which permits unrestricted use, distribution, and reproduction in any medium, provided the original author and source are credited. Funding: BMJ was supported in part by a Natural Environment Research Council (NERC) PhD studentship (NER/S/A2006/14211). This work is a contribution to the ‘‘European Project on Ocean Acidification’’ (EPOCA), which received funding from the European Community’s Seventh Framework Programme (FP7/2007–2013) under grant agreement no. 211384. The funders had no role in study design, data collection and analysis, decision to publish, or preparation of the manuscript. Competing Interests: The authors have declared that no competing interests exist. * E-mail: [email protected] ¤ Current address: Department of Earth and Environmental Sciences, Rutgers University, Newark, New Jersey, United States of America Introduction Anthropogenic increases in CO 2 are expected to cause a reduction in ocean pH within the next century [1] with unknown consequences for marine organisms. Dissolution of CO 2 in seawater causes the formation of carbonic acid (H 2 CO 3 ), which dissociates to form bicarbonate (HCO 3 2 ) and H + ions, causing a reduction in pH [2]. Liberated H + ions react with carbonate ions (CO 3 22 ), further increasing [HCO 3 2 ] whilst simultaneously causing a decrease in [CO 3 22 ]. This reaction results in a drop in the saturation state of the mineral form of calcite (V-cal). When V- cal is ,1.0, CaCO 3 (hereafter referred to as calcite) becomes thermodynamically unstable and dissolution can exceed precipi- tation, resulting in CaCO 3 loss. Ocean acidification is therefore expected to affect calcifying marine organisms that produce external CaCO 3 structures such as shells, plates and exoskeletons [3,4]. Coccolithophores, a group of unicellular eukaryotic phyto- plankton with an external coating of biogenically precipitated CaCO 3 plates (coccoliths), have been extensively studied in the context of ocean acidification [5]. This is because coccoliths are produced in intracellular compartments where V-cal .1.0 and CaCO 3 saturation is tightly controlled. Coccoliths are subsequent- ly extruded to the cell surface where they are subjected to the inorganic carbon chemistry conditions of surrounding seawater as modified by cell acid-base chemistry in the cell’s diffusion boundary layer. Coccolithophores play a significant role in the biological carbon pump through the combined effects of photosynthesis and calcification, via the sedimentation of cocco- liths, which are considered a major component of marine CaCO 3 sediments [6,7]. So far, only a limited number of studies have PLOS ONE | www.plosone.org 1 April 2013 | Volume 8 | Issue 4 | e61868
Transcript of Responses of the Emiliania huxleyi Proteome to Ocean Acidification

Responses of the Emiliania huxleyi Proteome to OceanAcidificationBethan M. Jones1*¤, M. Debora Iglesias-Rodriguez1,2,3, Paul J. Skipp2,4,5, Richard J. Edwards2,4,5,
Mervyn J. Greaves6, Jeremy R. Young7, Henry Elderfield6, C. David O’Connor4,5,8
1 Ocean and Earth Science, National Oceanography Centre Southampton, University of Southampton, Southampton, United Kingdom, 2 Institute for Life Sciences,
University of Southampton, Southampton, United Kingdom, 3 Department of Ecology, Evolution and Marine Biology, University of California Santa Barbara, Santa Barbara,
California, United States of America, 4 Centre for Proteomic Research, University of Southampton, Southampton, United Kingdom, 5 Centre for Biological Sciences,
University of Southampton, Southampton, United Kingdom, 6 Department of Earth Sciences, University of Cambridge, Cambridge, United Kingdom, 7 Department of
Earth Sciences, University College London, London, United Kingdom, 8 Department of Biological Sciences, Xi’an Jiaotong-Liverpool University, Suzhou, China
Abstract
Ocean acidification due to rising atmospheric CO2 is expected to affect the physiology of important calcifying marineorganisms, but the nature and magnitude of change is yet to be established. In coccolithophores, different species andstrains display varying calcification responses to ocean acidification, but the underlying biochemical properties remainunknown. We employed an approach combining tandem mass-spectrometry with isobaric tagging (iTRAQ) and multipledatabase searching to identify proteins that were differentially expressed in cells of the marine coccolithophore speciesEmiliania huxleyi (strain NZEH) between two CO2 conditions: 395 (,current day) and ,1340 p.p.m.v. CO2. Cells exposed tothe higher CO2 condition contained more cellular particulate inorganic carbon (CaCO3) and particulate organic nitrogen andcarbon than those maintained in present-day conditions. These results are linked with the observation that cells grewslower under elevated CO2, indicating cell cycle disruption. Under high CO2 conditions, coccospheres were larger and cellspossessed bigger coccoliths that did not show any signs of malformation compared to those from cells grown underpresent-day CO2 levels. No differences in calcification rate, particulate organic carbon production or cellular organic carbon:nitrogen ratios were observed. Results were not related to nutrient limitation or acclimation status of cells. At least 46homologous protein groups from a variety of functional processes were quantified in these experiments, of which four(histones H2A, H3, H4 and a chloroplastic 30S ribosomal protein S7) showed down-regulation in all replicates exposed tohigh CO2, perhaps reflecting the decrease in growth rate. We present evidence of cellular stress responses but proteinsassociated with many key metabolic processes remained unaltered. Our results therefore suggest that this E. huxleyi strainpossesses some acclimation mechanisms to tolerate future CO2 scenarios, although the observed decline in growth ratemay be an overriding factor affecting the success of this ecotype in future oceans.
Citation: Jones BM, Iglesias-Rodriguez MD, Skipp PJ, Edwards RJ, Greaves MJ, et al. (2013) Responses of the Emiliania huxleyi Proteome to OceanAcidification. PLoS ONE 8(4): e61868. doi:10.1371/journal.pone.0061868
Editor: Timothy Ravasi, King Abdullah University of Science and Technology, Saudi Arabia
Received July 19, 2012; Accepted March 18, 2013; Published April 12, 2013
Copyright: � 2013 Jones et al. This is an open-access article distributed under the terms of the Creative Commons Attribution License, which permitsunrestricted use, distribution, and reproduction in any medium, provided the original author and source are credited.
Funding: BMJ was supported in part by a Natural Environment Research Council (NERC) PhD studentship (NER/S/A2006/14211). This work is a contribution to the‘‘European Project on Ocean Acidification’’ (EPOCA), which received funding from the European Community’s Seventh Framework Programme (FP7/2007–2013)under grant agreement no. 211384. The funders had no role in study design, data collection and analysis, decision to publish, or preparation of the manuscript.
Competing Interests: The authors have declared that no competing interests exist.
* E-mail: [email protected]
¤ Current address: Department of Earth and Environmental Sciences, Rutgers University, Newark, New Jersey, United States of America
Introduction
Anthropogenic increases in CO2 are expected to cause a
reduction in ocean pH within the next century [1] with unknown
consequences for marine organisms. Dissolution of CO2 in
seawater causes the formation of carbonic acid (H2CO3), which
dissociates to form bicarbonate (HCO32) and H+ ions, causing a
reduction in pH [2]. Liberated H+ ions react with carbonate ions
(CO322), further increasing [HCO3
2] whilst simultaneously
causing a decrease in [CO322]. This reaction results in a drop in
the saturation state of the mineral form of calcite (V-cal). When V-
cal is ,1.0, CaCO3 (hereafter referred to as calcite) becomes
thermodynamically unstable and dissolution can exceed precipi-
tation, resulting in CaCO3 loss. Ocean acidification is therefore
expected to affect calcifying marine organisms that produce
external CaCO3 structures such as shells, plates and exoskeletons
[3,4].
Coccolithophores, a group of unicellular eukaryotic phyto-
plankton with an external coating of biogenically precipitated
CaCO3 plates (coccoliths), have been extensively studied in the
context of ocean acidification [5]. This is because coccoliths are
produced in intracellular compartments where V-cal .1.0 and
CaCO3 saturation is tightly controlled. Coccoliths are subsequent-
ly extruded to the cell surface where they are subjected to the
inorganic carbon chemistry conditions of surrounding seawater as
modified by cell acid-base chemistry in the cell’s diffusion
boundary layer. Coccolithophores play a significant role in the
biological carbon pump through the combined effects of
photosynthesis and calcification, via the sedimentation of cocco-
liths, which are considered a major component of marine CaCO3
sediments [6,7]. So far, only a limited number of studies have
PLOS ONE | www.plosone.org 1 April 2013 | Volume 8 | Issue 4 | e61868

investigated the molecular mechanisms underlying the responses
of coccolithophores to future CO2 scenarios, including a few
mRNA-led studies [8,9] and a recent microarray approach [10].
However, a poor correlation between protein and mRNA levels
has often been found in mammalian, yeast and bacterial cells [11–
15] and the coupling of protein and transcript abundance can be
as low as 40% depending on the system [16]. Recent results
suggesting an uncoupling between transcript and protein levels in
coccolithophores under ocean acidification [8] also indicate that a
proteomic approach is an appropriate method to define the
functional responses of these species to changing CO2.
To investigate the proteomic response of coccolithophores to
ocean acidification, cultures of Emiliania huxleyi (Lohmann) Hay et
Mohler strain NZEH were grown under 395 and 1340 p.p.m.v.
CO2, representing current day and projected CO2 levels for circa
2300 if all fossil fuel resources were released to the atmosphere
[17]. We previously developed methods to enable quantitative
proteomics on this species including a suite of bioinformatics tools
to enable protein identification from a range of reference
databases [18]. Therefore in addition to commonly measured
physiological parameters such as cellular organic carbon and
CaCO3, iTRAQ MS-based methods were applied to determine
quantitative cellular proteomic differences between pCO2 condi-
tions. iTRAQ tagging has recently been applied to other
phytoplankton species, for example studies on light adaptation in
marine cyanobacteria [19] and diatom toxicology [20] both utilize
this approach as a means to investigate relative cellular proteome
responses to environmental perturbations. For the current study,
we used E. huxleyi NZEH, a heavy calcified strain, previously
shown to exhibit an increase in calcification [21,22] and a lower
growth rate under high CO2 [21]. In view of a number of
conflicting results previously reported for coccolithophore calcifi-
cation under high CO2 [21–25], the aims of the present study
were: (i) to extend the upper pCO2 level applied to E. huxleyi and
examine its physiological responses, and (ii) survey the responses of
its proteome to elevated CO2 levels. Extending the upper pCO2
level previously applied to NZEH [21] provided an opportunity to
determine if our previous findings about calcification rates applied
at worse case scenarios projected for CO2.
Materials and Methods
Culturing conditionsOceanic seawater from the English Channel, offshore Plymouth
(U.K.) was filtered through 0.22 mm Polycap capsules (Whatman,
Maidstone, U.K.) and stored in the dark at 6uC. Emiliania huxleyi
strain NZEH (also known as ‘‘PLY M219’’ and ‘‘CAWPO 6 A’’)
was obtained from the Plymouth Culture Collection of the Marine
Biological Association of the U.K. This is a morphotype R strain
that was isolated from the South Pacific in 1992. In all instances,
cells were cultured in seawater supplemented with a modified f
medium containing 100 mmol kg21 nitrate, 6.24 mmol kg21
phosphate and f/2 concentrations of trace metals and vitamins
[26–28]. Cells were grown at 19.060.5uC in a 12:12 h light: dark
cycle typically between 80–120 mmol photons m21 s21 under
Sylvania Standard F36W/135-T8 white fluorescent lighting
(Havells Sylvania, Newhaven, U.K.). Cultures were bubbled with
air containing either 385 or 1500 p.p.m.v. CO2 (BOC, Guildford,
U.K.), filtered through 0.3 mm using sterile Hepavent discs
(Whatman), which subsequently equilibrated to 395 and
1340 p.p.m.v. CO2.
Exponentially growing E. huxleyi cells were initially inoculated to
a concentration of 76103 cells mL21 into 2.4 L media that were
previously bubbled for 72 h with the appropriate pCO2 in custom-
built 3 L glass flasks fitted with Dreschel heads [21]. Cultures
(,105 cells mL21) were bubbled very gently for ,2–4 generations
to allow cells to adjust to the bubbling regime. Aliquots of these
cultures were inoculated into 20 L Nalgene polycarbonate culture
vessels (Thermo Scientific Nalgene, Roskilde, Denmark) contain-
ing 14.7 L media to reach a starting cell density of 1.66103 cells
mL21. To enable dissolved inorganic carbon (DIC) equilibration,
media within these vessels were bubbled for 7 days prior to the
inoculation of cells. Cultures were continuously bubbled and,
approximately 5–6 generations after inoculation (when cells were
acclimated and cell density was ,56104 to 105 mL21), samples
were taken (start of experiment [‘‘t1’’] was day 6 and 7 for cells
grown under 395 and 1340 p.p.m.v. CO2 respectively). Cells from
this acclimation culture were used to inoculate a final 14.7 L
culture to a starting concentration of 56103 cells mL21. Cells were
harvested after ,4 generations, when cell density was #16105
cells mL21 (time of harvest [‘‘t2’’] was day 8 for cells grown under
395 p.p.m.v. CO2 and day 9 or 10 for those grown under
1340 p.p.m.v. CO2). The treatment-dependent differences in
sample days for t1 and 2 relate to differences in growth rates
between the two CO2 conditions. Experiments were conducted in
triplicate and one flask for each air-CO2 mixture was left without
cells to act as a blank for each experiment. Daily pH readings were
taken using a calibrated pH meter to monitor changes through the
experiment.
Coccosphere volume, cell density and growth rateCell density and coccosphere (cells and their surrounding
coccoliths) volume was measured daily. Aliquots of cultures were
diluted 1:10 with 3% NaCl (w/v) and analyzed using a Beckman
Coulter Counter III fitted with a 70 mm aperture (Beckman
Coulter, High Wycombe, UK). Mean coccosphere volume and
cell density were calculated from triplicate samples and the growth
rate (m) was calculated as follows:
m~(ln C1{ln C2)
Dt
whereby C1 and C0 refer to the end and initial cell densities during
the exponential phase of growth and Dt refers to the duration of
this phase. Following derivations from Novick and Szilard [29],
the number of generations of growth (g) for each stage of the
experiment was defined according to:
g~log(N1){log(N0)
log(2)
whereby N1 and N0 refer to the end and inoculum cell densities
respectively.
Particulate organic carbon and nitrogenSamples for particulate organic carbon (POC) and nitrogen
(PON) were obtained in triplicate at t1 and 2 by filtration of culture
aliquots onto pre-combusted 25 mm GF/F filters (Whatman). PIC
was removed by acidification of the filters for 48 hours in a
desiccator saturated with sulphuric acid fumes. Filters were then
dried, pelleted and analyzed as previously described [14]. Cellular
POC production (PPOC, pmol POC cell 21 day 21) was calculated
according as follows:
Response of Emiliania huxleyi Proteome to High CO2
PLOS ONE | www.plosone.org 2 April 2013 | Volume 8 | Issue 4 | e61868

PPOC~m � (pmol POC cell{1)
Particulate inorganic carbonSamples for cellular particulate inorganic carbon (specifically
CaCO3) were obtained as previously described [21]. Coccolith-
derived CaCO3 was dissolved by placing the filters in ,20 mL
0.1 M HNO3, and [Ca2+] was determined using a Varian Vista
Pro inductively coupled plasma emission spectrophotometer (ICP-
OES; Agilent, Stockport, UK). Instrument calibration followed
procedures used for the determination of Mg/Ca in foraminiferal
calcite [30]. [Na+] was measured as a proxy for residual seawater
Ca2+. Filters rinsed with the control media were also analyzed to
confirm that the seawater contribution to measured [Ca2+] was
negligible. Following the conversion of measured [Ca2+] to cellular
CaCO3, production (PCaCO3, pmol CaCO3 cell 21 day 21) was
calculated according as follows:
PCaCO3~m � (pmol CaCO3 cell{1)
Seawater nitrate, phosphate and silicateAliquots of 25 mL of culture were filtered through 0.22 mM for
determination of nitrate, phosphate and silicate concentrations
using a Seal QuAATro Autoanalyzer (Seal Analytical, Fareham,
U.K.) with appropriate standards in the bracket of the expected
concentrations.
Dissolved inorganic carbon and total alkalinityCulture aliquots were sampled for DIC and total alkalinity (TA)
as previously described [21] and analyzed using the Versatile
INstrument for Determination of Total Alkalinity (VINDTA;
Marianda, Germany), a combined DIC and TA measuring
system. Certified reference materials to calibrate and establish
correction factors for VINDTA measurements were obtained from
Professor Andrew Dickson at the Marine Physics Laboratory of
the Scripps Institute of Oceanography, University of California
San Diego, U.S.A. VINDTA-derived values for TA and DIC were
corrected for various parameters including titration acid density,
the nutrient concentration of the sample, temperature, salinity and
reference material values. Final carbonate system parameters and
pH were obtained with CO2SYS software [31] using a total pH
scale (mol/kg-SW), K1 and K2 constants [32] with refits [33] and
the acidity constant of the ion HSO42 in sea water taken into
account [34].
Scanning electron microscopy and coccolithmorphometrics
Samples for scanning electron microscopy (SEM) were pipetted
onto 25 mm Isopore polycarbonate filters (Millipore), washed
three times with alkaline milli-Q water (pH,9) and dried at 37uCovernight. Filters were coated with a gold-palladium alloy and
microscopic analysis was undertaken at the Natural History
Museum, London, UK using a Zeiss Gemini Ultra Plus scanning
electron microscope (Carl Zeiss, Oberkochen, Germany). The
ImageJ software suite [35] was used to measure coccolith distal
shield length and central area width [36]. A minimum of 23
detached coccoliths was considered for each replicate at t2. In
total, 115 and 82 coccoliths were analyzed from cultures bubbled
with 395 and 1340 p.p.m.v. CO2 respectively.
Photochemical quantum efficiencyMaximum quantum efficiency of photosystem II (PSII) was
analyzed at both t1 and 2 using a Satlantic FIRe (Fluorescence
Induction and RElaxation) system (Satlantic, Halifax, Canada)
[37]. Measurements of Fv/Fm were taken four hours into the 12 h
light phase, after samples were kept in the dark for 5 min.
Protein extractionAt t2, cells were spun down at ,500–1,000 g for 5 min and
washed four times with calcium-free artificial seawater (pH 8)
followed by hypersonication in 100 mM triethylammonium
bicarbonate (pH 8.0) with 0.1% (w/v) SDS [18]. Proteins were
subsequently precipitated using acetone (1:10) and solubilized as
previously described [18]. Protein concentrations in each sample
were then assayed using the bicinchoninic method (Sigma Aldrich,
Gillingham, U.K.).
8plex iTRAQ peptide labelingProteins were reduced, alkylated and then digested by adding
10 mL of 1 mg/mL trypsin in 80 mM CaCl2 followed by an
overnight incubation at 37uC. The resulting trypsin digests were
lyophilized and 90 mg of each sample were labeled with 8plex
iTRAQ tags according to manufacturer’s instructions (Applied
Biosystems, Foster City, U.S.A.). iTRAQ tags 113, 115, 117 and
119 were added to peptides extracted from first, second, third and
fourth 395 p.p.m.v. CO2 replicates respectively. Tags 114, 116,
118 and 121 were added to peptides from the first, second, third
and fourth 1340 p.p.m.v. CO2 replicates. Protein digests were
incubated at room temperature for 2 hours and vigorously
vortexed because of the presence of a heavy CaCO3-like pellet.
Resuspensions were spun down at 21,250 g for 30 min and
supernatants were combined, dried overnight and stored at 46C
prior to tandem mass spectrometry (MS/MS) analysis. Data from
the fourth replicate (reporter ions 119 and 121) were analyzed but
excluded from further investigation because cell density thresholds
of 105 cells mL21 were exceeded.
2D-UPLC and MS/MSTwo-dimensional separations were performed using a nanoAc-
quity 2D high performance liquid chromatography (UPLC) system
(Waters, Elstree, UK) as described in Methods S1. All data were
acquired using a Q-Tof Global Ultima (Waters, U.K.) and peak
lists were generated as previously described [18]. MS/MS spectra
were processed using a normal background subtraction with a
25% background threshold and medium de-isotoping with a
threshold of 1%. No smoothing was performed. All spectra
(24,119) obtained in these experiments were converted using
PRIDE Converter [38] and are available in the PRIDE database
[39] (www.ebi.ac.uk/pride) under accession number 20984.
Protein identification and quantificationPeak lists from the MS/MS analysis were submitted to the
Mascot search engine version 2.2.1 (Matrix Science, London, UK)
against a database containing 130,000 E. huxleyi expressed
sequence tags (ESTs) obtained from the NCBI EST database
[40–43]. Searches were performed in all 6 EST reading frames
and results were processed using BUDAPEST [18]. Output files
from BUDAPEST analysis can be found in Data S1 and at
http://bioware.soton.ac.uk/research/ehux/jones2012/
Response of Emiliania huxleyi Proteome to High CO2
PLOS ONE | www.plosone.org 3 April 2013 | Volume 8 | Issue 4 | e61868

Additional analyses were performed against the E. huxleyi
CCMP1516 draft genome produced by the US Department of
Energy Joint Genome Institute (JGI; http://www.jgi.doe.gov) in
collaboration with the user community. Searches were conducted
against a non-redundant set of E. huxleyi CCMP1516 draft genome
proteins using the ‘‘Emihu1_all_proteins.fasta’’ file downloaded on
02/16/12, which originally contained 217,034 filtered sequences
from all models generated by the JGI Annotation Pipeline. This
file was reduced to 115,995 non-redundant sequences for search
purposes. Further searches were also conducted against a
taxonomically restricted database constructed from UniProtKB
sequences as described [18] with the addition of Chlorophyta.
Mascot search criteria can be found in Methods S1. Pfam
domain searches (e#1.00e-04) [44] were conducted for any
sequences that either lacked BLAST homology or only had
homology to ‘‘hypothetical’’, ‘‘predicted’’ or ‘‘unknown’’ proteins.
Because of identification redundancy relating to the use of multiple
search databases, we clustered identifications into Homologous
Protein Groups (HPGs) using a combination of alignment and
BLAST-based comparative analyses (similarity threshold of
e#1.00e-10 and .5% identity) [45].
Protein expression ratios were calculated using Mascot software,
whereby peptide ratios were weighted and median normalization
was performed, automatic outlier removal was selected and the
peptide threshold was set to ‘at least homology’. If a protein
identification only contained data for a single iTRAQ associated
peptide, it was not further considered. Additionally, if an iTRAQ
ratio was derived from only 2 peptides and one of these showed
erroneously high or negative values, the protein was no longer
considered for quantitative analysis. Geometric means, G, for the
ratios of protein expression from each individual high: current day
CO2 incubation were calculated and variance assessed by
determination of the 95% confidence interval (CI). If the G6CI
was $1.5, the protein was considered up-regulated and if the value
was #0.67 then it was classed as down-regulated.
To expand our knowledge of the E. huxleyi proteome, data
generated from the current study were combined with proteins
identified from our previous proteomic investigation of E. huxleyi
[18]. A combination of direct (accession number), indirect (protein
name) and BLAST-based homology enabled the compilation of
identifications from both studies. Results can be found in DataS2.
Statistical analysesWe performed unpaired t-tests on physiological data using
Sigma Stat 3.5 (Systat software, Hounslow, UK).
Results
Carbonate chemistry and culturing conditionsMeasurements of DIC and TA were conducted at various times
of the experiment and were analyzed by the VINDTA system.
The remaining carbonate chemistry parameters (CO322, HCO3
2, CO2, pH, and V-cal) were calculated (Table 1). At the time of
cell harvest (t2), the media of cultures grown under 395.0 p.p.m.v.
CO2 had a pH of 7.94 and an V-cal of 3.96 whilst cells grown
under ,1340 p.p.m.v. CO2 were in media with a pH of 7.47 and
an V-cal of 1.52 (Table 1). At t2, less than ,5% DIC was utilized
by cells under 395 and 1340 p.p.m.v. CO2 compared to the blank,
thus indicating that a semi-constant chemistry state was main-
tained throughout these experiments by keeping cell densities,105
cells mL21. Data from the fourth incubation were excluded from
the analyses because cell densities exceeded this value. Carbonate
chemistry values for t1 and bubbled media prior to cell addition
can be found in Tables 1, S1 and S2.
Cells were nutrient-replete throughout the entire experiment
and, at the end of the experiment (t2), nitrate values ranged from
56.7–103.8 mmol kg21 and phosphate values ranged from 2.4–
4.2 mmol kg21 (Tables S3, S4). At the end of the experiment (t2),
there was no difference in nitrate utilization [t(4) = 20.0263;
p = 0.980] between the low and high CO2 conditions, with
respective decreases of 23.2%64.7 and 23.3%64.7. Also, even
though there was a trend towards increased phosphate utilization
under high CO2 at t2, this was not statistically significant
[t(4) = 21.830; p = 0.141]. Cells incubated under 395 p.p.m.v.
CO2 used 29.4%66.3 of phosphate compared to 41.7%69.8 for
cells grown under the 1340 p.p.m.v. CO2 treatment.
Cellular physiologyAt the time of harvest (t2), substantial differences in cell
physiology were observed for cells incubated under
1340 p.p.m.v. CO2. There was a significant increase in the
cellular content of POC [t(4) = 23.233; p = 0.032], CaCO3
[t(4) = 27.015; p = 0.002] and PON [t(4) = 24.399; p = 0.012] at
the end of the experiment and a significantly lower growth rate [m;
t(4) = 3.556; p = 0.024; Table 2]. However, no differences were
encountered in CaCO3 [t(4) = 20.173; p = 0.871] and POC
production rates [t(4) = 20.662; p = 0.544] or in CaCO3:POC
Table 1. Mean carbonate chemistry values associated withexperimental cultures (t2).
Ambient1340 p.p.m.v.CO2
pCO2 (p.p.m.v.) Initiala 433.1(395.9)b,c 1398.4 (1376.8)
Endd 395.0 (397.6) 1340.6 (1412.7)
[CO2] (mmol kgSW21)
Initial 14.4 (13.2) 47 (46.3)
End 13.2 (13.4) 44.7 (47.7)
[CO322] (mmol kg
SW21)Initial 167.4 (172.4) 65.6 (66.4)
End 166.7 (174.2) 63.8 (64.3)
[HCO32] (mmol kg
SW21)Initial 1870.9 (1863.4) 2136.5 (2132.9)
End 1785.5 (1856.3) 2037.1 (2140.6)
[DIC] (mmolkg SW21)
Initial 2052.8 (2049.2) 2249 (2245.5)
End 1965.4 (2043.8) 2145.7 (2252.6)
V-cal Initial 3.97 (4.16) 1.57 (1.59)
End 3.96 (4.18) 1.52 (1.55)
pH Initial 7.92 (8.05) 7.48 (7.48)
End 7.94 (7.95) 7.47 (7.48)
TA (mmol kgSW21)
Initital 2292.4 (2293.2) 2304.2 (2302.5)
End 2206.5 (2291.0) 2200.4 (2302.8)
aAverage values at the beginning of the experiment before the inoculation ofcells.bFigures in parentheses represent blank seawater medium bubbled with theappropriate pCO2 mixture.cThere was only one sample available for the initial pre-inoculation blank of theambient/current day CO2 condition. For this instance alone, values inparentheses are from the second 395 p.p.m.v. CO2 treatment.dAverage values at the end of the experiment (t2).doi:10.1371/journal.pone.0061868.t001
Response of Emiliania huxleyi Proteome to High CO2
PLOS ONE | www.plosone.org 4 April 2013 | Volume 8 | Issue 4 | e61868

[t(4) = 0.672; p = 0.538] and POC:PON [t(4) = 0.836; p = 0.450]
cellular ratios. Similarly, there was no change in the photosyn-
thetic energy conversion efficiency of PSII, with Fv/Fm values of
0.6460.01 and 0.6560.01 for cells incubated under 395 and
1340 p.p.m.v. CO2 respectively [t(4) = 20.164; p = 0.878; TableS5].
We observed differences in physiology between cells at different
stages of the experiment (t1 and t2). For example, there was a
significantly higher cellular POC [t(4) = 26.385; p = 0.003] and
PON content [t(4) = 25.790; p = 0.004] at t2 compared to t1 for
cells grown under 395 p.p.m.v. CO2. Similarly, there was also a
significantly higher cellular CaCO3 content at t2 for cells incubated
under both 395 [t(4) = 24.735; p = 0.009] and 1340 p.p.m.v. CO2
[t(4) = 23.927; p = 0.017; Table 2].
At the end of the experiment, increases in cellular CaCO3, POC
and PON in cells grown under 1340 p.p.m.v. CO2 coincided with
an increase in coccosphere volume (Figure 1). Cells grown in
nutrient-replete media equilibrated to this high CO2 condition
showed an increase in coccosphere volume 24 h after inoculation,
with a mean volume of 82.7 mm3617.1 compared to
52.0 mm367.5 under 395 p.p.m.v. CO2. The difference in
coccosphere volume between conditions was not always significant
(Figure 1). However, as generational time increased and cells
acclimated, the variability in coccosphere volume decreased
(Figure 1). Consequently, coccosphere volumes at the time of
harvest were significantly different, with a mean value of
69.44 mm368.37 for cells grown under the high CO2 treatment
compared to 52.00 mm362.26 for cells grown under 395 p.p.m.v.
CO2 [t(4) = 23.465; p = 0.026].
An increase in coccosphere volume at the time of harvest (t2)
was accompanied by a significant increase in the size of individual
coccoliths (Figure 2). Specifically, the mean distal length of
coccoliths for cells grown under the high CO2 condition was
3.56 mm60.44, whereas values for 395 p.p.m.v. CO2 were
3.03 mm60.52 [t(195) = 27.526; p,0.001]. Coccoliths from cells
incubated under 1340 p.p.m.v. CO2 did not show any sign of
dissolution or malformation (Figures 3a and 3b). However, they
were less calcified, possessing a central area width of
0.95 mm60.19 compared to those from current conditions that
had an average width of 0.67 mm60.19 [t(195) = 210.080;
p,0.001]. Despite these clear trends, we still found variation
within the dataset that is typical for coccoliths derived from
cultures.
Proteomic identificationsMS/MS spectra of peptides derived from E. huxleyi protein
extracts were searched against protein sequences from the E.
huxleyi CCMP1516 draft genome. This yielded 40 matches from
37 homologous protein groups (HPGs) and the identification of 21
HPGs with iTRAQ quantification. Data were also searched
against a taxonomically-restricted subset of UniProtKB. This
resulted in the identification of 21 HPGs based on the assignment
of at least two peptides, of which 10 could be quantified (Tables 3and 4). Data were also searched against a database containing
,130,000 E. huxleyi ESTs using Mascot, which resulted in 180
matches possessing $2 peptides. Following BUDAPEST analysis,
97 clusters were formed that comprised of 128 consensus
sequences assembled from 150 ESTs. The manual removal of
identifications with data for only one iTRAQ-tagged peptide
resulted in 37 HPGs with quantification information (Tables 3and 4). When all identifications from the genome project, the
taxonomically restricted UniProtKB database and EST searches
were considered and combined, we were able to identify 115
HPGs. Of these, 46 could be quantified; in depth information
regarding all quantified and non-quantified identifications can be
found in Data S2.
Proteomic correlatesRatios of peptide abundance from each high: low CO2 replicate
incubation were calculated (114:113, 116:115 and 118:117) and
values of G6CI$1.5 or #0.67 used to determine up and down-
regulation respectively (Table 3). According to these strict criteria,
Table 2. Physiological parameters of Emiliania huxleyi NZEH grown under 395 and 1340 p.p.m.v. CO2 at t1 and 2.
Condition m pmol POC cell21 pmol POC cell21 day21
395 t1 1.6360.36 0.8760.03**b 1.4360.35
1340 t1 1.3060.23 1.4360.15** 1.8760.48
395 t2 1.2960.04* 1.3760.13*b 1.7660.12
1340 t2 1.0560.11* 1.8460.22* 1.9260.40
Condition pmol CaCO3 cell21 pmol CaCO3 cell21 day21 pmol cell21 CaCO3:POC
395 t1 0.6660.15b 1.0960.44 0.7560.15
1340 t1 0.9860.17a 1.2560.11 0.6960.14
395 t2 1.0960.05**b 1.4160.10 0.8160.10
1340 t2 1.3760.04**a 1.4460.20 0.7560.09
Condition pmol PON cell21 pmol cell21 POC:PON (C:N)
395 t1 0.1060.00***b 8.5260.15
1340 t1 0.1760.01*** 8.5860.54
395 t2 0.1560.01*b 9.2860.49
1340 t2 0.2160.02* 8.8260.92
*, **, ***Significant results from t-tests comparing results from different pCO2 treatments at the same time point (i.e. 395 v 1340 p.p.m.v. CO2 at t1; 395 v. 1340 p.p.m.v.CO2 at t2) are designated as follows: * p#0.05; ** p#0.01; *** p#0.001.a, b,Significant results from t-tests comparing results from the same pCO2 treatment at different time points (e.g. 395 t1 v 395 p.p.m.v. CO2 t2) are defined according to: a
p#0.05; b p#0.01.doi:10.1371/journal.pone.0061868.t002
Response of Emiliania huxleyi Proteome to High CO2
PLOS ONE | www.plosone.org 5 April 2013 | Volume 8 | Issue 4 | e61868

no HPGs were up-regulated in response to high CO2, while only
four HPGs were down-regulated (histones H2A, H3 H4 and
chloroplastic 30S ribosomal protein S7). When results from the E.
huxleyi genome searches, protein databases and EST searches were
combined, 43 HPGs showed no difference in regulation under
high CO2 when all three replicates were considered. A number of
proteins, however, showed trends of up- or down-regulation in the
first two replicates, with a reduced/ambivalent response in the
third replicate (Table 4).
Discussion
Physiological properties of Emiliania huxleyi NZEH underhigh CO2
This study extends our knowledge of the physiological response
of Emiliania huxleyi strain NZEH (morphotype R) to increasing
pCO2 through the use of traditional approaches and by
quantitative proteomic analysis. Although previous studies have
investigated the responses of this strain to varying CO2, our levels
(1340 p.p.m.v.) were the highest applied so far, compared to 750
[14,15] and 909 p.p.m.v. CO2 [46] used in previous studies.
In our study, cells were under nutrient repletion for the duration
of the experiments (nitrate and phosphate levels at t1 and 2 being
between 86.18–103.79 and 3.23–4.32 mmol kg21 respectively).
Therefore, the observed increases in coccosphere volumes and
cellular CaCO3, POC and PON content are not attributable to
nutrient limitation. Using multiple generations of growth (,9–12
and ,12–13 generations for cells incubated under 1340 and
395 p.p.m.v. CO2 respectively), we found that multiple genera-
tions are a necessary step for the population to achieve acclimation
despite some studies reporting acclimation after one or a few cell
generations [47]. In our study, there were periods at the start of
the acclimation phase when there was no difference in cocco-
sphere size, but these trends were changed towards the end of the
experiment, after multiple generations of growth during which the
majority of cells had grown and divided under the experimental
conditions. Calcification also changed, since cells contained
significantly less cellular CaCO3 at the beginning of the
experiment compared to after ,5–8 generations (t2). Another
example, in this case, showing the opposite trend, is growth rate,
which displayed comparable values between the different treat-
ments at start of the experiment, but declined after subsequent
generations of incubation under 1340 p.p.m.v. CO2.
Observed increases in cellular POC content at elevated CO2
levels compared to current conditions are in agreement with other
studies on strain NZEH [21,22,46]. Similarly, the observed
Figure 1. Comparison of Emiliania huxleyi NZEH coccosphere sizes at 395 and 1340 p.p.m.v. CO2. * p#0.05; ** p#0.01; *** p#0.001. Apoint with no star indicates differences were non-significant. Arrows indicate inoculations into media with different pCO2 conditions, as outlined inMaterials and Methods. Open circles represent cells grown under under 395 p.p.m.v. CO2 that were harvested after 12–13 generations (t2 = day 8).Solid circles indicate cells grown under 1340 p.p.m.v. CO2. In order to ensure suitable biomass for proteomics, these were harvested after 9–12generations (t2 = day 9 or 10) because of their lower growth rates.doi:10.1371/journal.pone.0061868.g001
Response of Emiliania huxleyi Proteome to High CO2
PLOS ONE | www.plosone.org 6 April 2013 | Volume 8 | Issue 4 | e61868

increase in cellular CaCO3 is in agreement with some results using
this strain [21,22]. Despite an increase in CaCO3 content,
coccosphere volume, and coccolith size under the high CO2
condition, coccoliths were slightly less calcified but with larger
central area widths on the distal shield. However, there appeared
to be no sign of coccolith malformation or dissolution under either
pCO2 condition.
Cellular CaCO3:POC ratios did not change under high CO2,
comparable to trends found by Iglesias-Rodriguez et al. [21] but in
disagreement with findings by Hoppe et al. [46]. The CaCO3:-
POC ratio indicates the balance of CO2 fluxes as a result of
calcification and photosynthesis, which appeared not to be altered
under these ‘‘worst case’’ high (1340 p.p.m.v.) CO2 scenario.
Furthermore, the CaCO3:POC ratio was ,1.5 in all conditions
tested, which means that the cells are likely to be a sink of CO2 to
the surrounding environment [48]. CaCO3:POC ratios associated
with 1340 p.p.m.v. CO2 were virtually identical to values reported
in bubbling experiments under the highest pCO2 used on this
strain by Iglesias-Rodriguez et al. [21] and by Hoppe et al. [46].
There was no difference in the cellular POC:PON ratio between
the two CO2 conditions; this ratio was only 6.43% higher than
previously reported for NZEH cells grown under 750 p.p.m.v.
CO2 [21].
Cellular production rates of CaCO3 and POC did not vary
significantly under 1340 p.p.m.v. CO2 compared to present-day
conditions, unlike previous observations by Iglesias-Rodriguez et
al. [21] and Shi et al. [22] who found increases in these parameters
for this strain under 750 p.p.m.v. CO2. Hoppe et al. [46] also
found an increase in POC production under elevated pCO2 but a
decline in cellular CaCO3 production at 909 p.p.m.v. CO2. Since
CaCO3 and POC production did not differ between treatments,
the higher cellular CaCO3, PON and POC values that we found
are related to the lower growth rate of cells incubated under
1340 p.p.m.v. CO2. At present, the source of the variability in
Figure 2. Morphometric analysis of detached coccoliths obtained at the end of the experiment (t2) from monoclonal cultures ofEmiliania huxleyi NZEH bubbled with 395 and 1340 p.p.m.v. CO2.
doi:10.1371/journal.pone.0061868.g002
Response of Emiliania huxleyi Proteome to High CO2
PLOS ONE | www.plosone.org 7 April 2013 | Volume 8 | Issue 4 | e61868

carbon production under varying CO2 levels between our results
and other studies on NZEH remains unresolved.
Changes in carbonate chemistry were not associated with any
difference in the maximum quantum efficiency of PSII (as
measured by Fv/Fm), a proxy of cellular photosynthetic health.
This result was previously reported for cells of this strain incubated
under 750 p.p.m.v. CO2 [21]. A decline in cellular growth rate (m)
under high CO2 is also in agreement with some investigations on
this strain [21]; however others [22,46] have found no change in
growth under elevated pCO2. Eukaryote cells often undergo
growth delay or arrest when threatened with damage to cellular
components such as DNA [49] and significant growth rate
reductions in the current study suggests that E. huxleyi cells are
exhibiting one of the hallmarks of cellular stress response (CSR) to
prevent damage to macromolecular components under high CO2
[50,51].
Proteomic responses of Emiliania huxleyi to oceanacidification
Four E. huxleyi HPGs from all three replicate experiments
conducted under 1340 p.p.m.v. CO2 were down-regulated:
histones H2A, H3 and H4 and a chloroplast located 30S
ribosomal protein S7 (rps7). This is likely related to the lower
rate of cell division observed under high CO2, which may be
accompanied by a reduction in DNA and chromatin synthesis and
a consequent decrease in the requirement for histone proteins
[52]. Reduced rps7 expression is also likely related to lower growth
rates, although this has not been rigorously examined in
phytoplankton [53]. Our results suggest that E. huxleyi cells grown
under high CO2 undergo a reduction in translation initiation in
some instances [54]. The non-differential expression of histone
H2B under different CO2 conditions may be explained by
indications that this protein is involved in processes other than
nucleosome packaging since our identification the identified H2B
from the E. huxleyi genome (protein ID 96192) also contained a
50S ribosome-binding GTPase (Pfam: CL0023) and a peptidase
domain (Pfam: CL0012).
By nomenclature, we found that the expression of 43 HPGs
(over 93% of those quantified) was unchanged in all three
incubations under elevated pCO2. However, there was a tendency
for some proteins to show differential expression within the first
two of the three incubations (Table 4), which while not
significant, is potentially indicative of sub-lethal CSR in E. huxleyi
[50,51]. For example, HPGs with homology to FKBP-type
peptidyl-prolyl cis-trans isomerase and ubiquitin family proteins
were substantially up-regulated within the first two high CO2
replicates (Table 4). Additionally a cold shock protein HPG was
also up-regulated under high CO2 in the same two replicates; these
proteins have roles in multiple stress responses [55]. Meanwhile,
40S and 50S ribosomal proteins were up-regulated almost twofold
(Table 4) within these two high CO2 incubations, which might
relate to induction of translational processes to replace damaged
proteins or a role in extraribosomal functioning [56]. The
potential up-regulation of an HPG containing an ankyrin repeat
domain also suggests an increase in protein-protein interactions
under high CO2 but it is difficult to decipher the role of this HPG
because of the diverse functionality exhibited by proteins
containing this domain [57]. Similarly, a trend for reduction of
S-adenosylmethionine synthetase under high CO2 in the second
and third incubations is difficult to discuss because of the multiple
roles of this enzyme involved in methylation [58].
Trends from the first two incubations indicate that membrane
related processes have the potential to be affected by high CO2.
For example up-regulation of an acyl carrier protein from the first
two incubations could be responsible for increased lipid produc-
tion [59] that may be involved in membrane remodeling under
low pH [60]. An up-regulation of vacuolar membrane bound V-
Table 3. Proteins (Homolgous Protein Groups) down-regulated in Emilania huxleyi NZEH under high CO2.
Identification Accessiona/EST cluster 114:113b 116:115 118:117 Rangec
30S ribosomal protein S7 Q4G343 0.28 0.45 0.61 0.27–0.66
Histone H2A D0MWJ7 0.49 0.41 0.39 0.37–0.49
87a 0.62 0.55 0.45 0.45–0.64
EHUXJGI72235 0.49 0.45 0.39 0.38–0.50
Histone H3 EHUXJGI255477 0.36 0.20 0.32 0.20–0.40
Histone H4 C1MUM2 0.37 0.25 0.56 0.24–0.59
92a 0.37 0.25 0.56 0.24–0.59
EHUXJGI201707 0.37 0.22 0.39 0.21–0.46
aIdentifications are associated with either UniProtKB accession, Emiliania huxleyi genome protein ID or BUDAPEST consensus sequence. Further information can befound in Data S2; BUDAPEST sequence files can be found in Data S1.bRatio of protein identified between the two CO2 treatments for each replicate incubation, whereby 114:113 is the first replicate, 116:115 is the second and 118:117 thethird. Reporter ions 114, 116 and 118 were applied to peptides extracted from the high CO2 treatments and 113, 115, 117 to the current day treatment.c‘‘Range’’ (G2CI)–(G+CI) as defined in Materials and Methods.doi:10.1371/journal.pone.0061868.t003
Figure 3. Example of coccoliths derived at the end of theexperiment (t2). Panel A: typical coccoliths from 395 p.p.m.v. CO2
treatment; B: coccoliths from the lower pH (,7.6) and 1340 p.p.m.v.CO2 treatment which are typically larger and are slighly less calcified butpossess no signs of dissolution or malformation.doi:10.1371/journal.pone.0061868.g003
Response of Emiliania huxleyi Proteome to High CO2
PLOS ONE | www.plosone.org 8 April 2013 | Volume 8 | Issue 4 | e61868

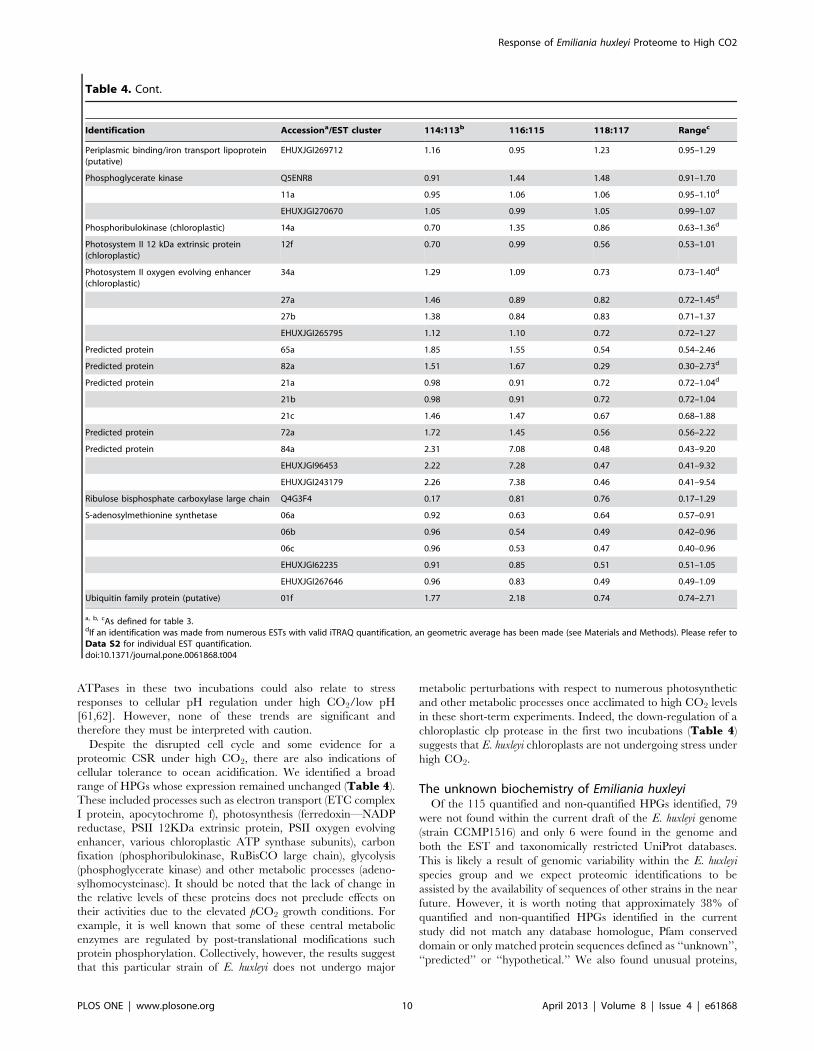
Table 4. Proteins (Homologous Protein Groups) exhibiting non-significant expressional change in Emilania huxleyi NZEH underhigh CO2.
Identification Accessiona/EST cluster 114:113b 116:115 118:117 Rangec
40S ribosomal protein S12 81a 2.09 2.01 0.27 0.28–3.90
EHUXJGI240824 2.01 1.87 0.28 0.29–3.60
50S ribosomal protein L12 (chloroplastic) 86a 1.95 1.88 0.24 0.25–3.70
EHUXJGI86748 1.86 1.83 0.23 0.24–3.60
Acyl carrier protein 97a 1.81 2.47 1.01 0.99–2.76d
Adenosylhomocysteinase 26a 0.27 1.05 1.27 0.27–1.86
Adenylate kinase (putative) 33a 1.45 1.82 0.68 0.67–2.18
Ankyrin repeat protein (putative) 51a 1.69 1.86 0.47 0.47–2.72
Apocytochrome f (precursor) Q4G3D7 0.88 0.81 0.61 0.61–0.94
35a 0.88 0.81 0.61 0.61–0.94
ATP ase/synthase (vacuolar) 91a 2.57 1.97 0.44 0.45–3.83
EHUXJGI210241 2.48 1.88 0.45 0.45–3.62
ATP synthase subunit alpha 07a 0.71 0.96 1.24 0.69–1.30
EHUXJGI199000 0.65 1.36 1.06 0.64–1.50
ATP synthase F(1) sector subunit alpha(chloroplastic)
Q4G397 0.32 0.78 1.12 0.32–1.35
C7BEK1 0.40 0.70 1.11 0.38–1.20
ATP synthase F (0) sector subunit b9
(chloroplastic)Q4G3A0 0.95 0.57 0.77 0.56–1.00
ATP synthase F(1) sector subunit beta(chloroplastic)
Q4G3C8 0.62 1.02 1.09 0.63–1.24
Chloroplast light harvesting protein isoform 12a 0.33 0.57 0.78 0.32–0.87d
12b 0.24 0.44 0.90 0.22–0.96
Clathrin small chain (putative) 18a 1.21 1.36 0.84 0.83–1.48
Clp protease ATP binding subunit Q4G3D0 0.43 0.59 0.74 0.42–0.78
Cold shock DNA-binding protein (putative) 96a 2.22 6.00 0.47 0.43–7.87
EHUXJGI111020 1.23 1.32 0.70 0.71–1.55
Demethylmenaquinone methyltransferase(putative)
09a 1.98 1.91 0.40 0.41–3.23
ETC complex I protein (putative) 44a 1.29 1.25 0.73 0.73–1.51
Ferredoxin–NADP reductase 29a 0.59 0.90 0.79 0.58–0.96
FKBP-type peptidyl-prolyl cis-trans isomerase 50a 1.68 4.68 0.71 0.61–5.15
50b 0.75 1.34 0.67 0.58–1.34
EHUXJGI239227 1.58 3.20 0.76 0.70–3.53
Glycerol-3-phosphate dehydrogenase EC 1.1.1.8 45a 0.77 0.91 0.67 0.66–0.92d
EHUXJGI87542 0.85 0.75 0.82 0.75–0.86
Histone H2B 89a 0.43 0.40 1.04 0.31–1.03
EHUXJGI96192 0.43 0.52 0.89 0.38–0.90
Nascent polypetide-associated complexprotein/transcription factor (putative)
52a 1.84 1.82 0.34 0.34–3.15
No BLAST hit 08a 0.76 0.69 0.32 0.32–0.94d
EHUXJGI349877 0.82 0.67 0.32 0.32–0.99
No BLAST hit 13a 3.28 1.01 0.43 0.36–3.57
EHUXJGI205571 2.51 1.01 0.53 0.45–2.67
No BLAST hit 57a 1.80 1.42 0.39 0.40–2.53
No BLAST hit 76a 1.16 1.27 0.76 0.76–1.42
EHUXJGI237243 1.17 1.36 0.78 0.78–1.48
No BLAST hit 83a 1.90 1.70 0.42 0.42–2.87
EHUX110219 1.32 1.35 0.87 0.88–1.53
No BLAST hit EHUXJGI218259 3.12 2.52 0.31 0.31–5.73
Response of Emiliania huxleyi Proteome to High CO2
PLOS ONE | www.plosone.org 9 April 2013 | Volume 8 | Issue 4 | e61868
ATPases in these two incubations could also relate to stress
responses to cellular pH regulation under high CO2/low pH
[61,62]. However, none of these trends are significant and
therefore they must be interpreted with caution.
Despite the disrupted cell cycle and some evidence for a
proteomic CSR under high CO2, there are also indications of
cellular tolerance to ocean acidification. We identified a broad
range of HPGs whose expression remained unchanged (Table 4).
These included processes such as electron transport (ETC complex
I protein, apocytochrome f), photosynthesis (ferredoxin—NADP
reductase, PSII 12KDa extrinsic protein, PSII oxygen evolving
enhancer, various chloroplastic ATP synthase subunits), carbon
fixation (phosphoribulokinase, RuBisCO large chain), glycolysis
(phosphoglycerate kinase) and other metabolic processes (adeno-
sylhomocysteinase). It should be noted that the lack of change in
the relative levels of these proteins does not preclude effects on
their activities due to the elevated pCO2 growth conditions. For
example, it is well known that some of these central metabolic
enzymes are regulated by post-translational modifications such
protein phosphorylation. Collectively, however, the results suggest
that this particular strain of E. huxleyi does not undergo major
metabolic perturbations with respect to numerous photosynthetic
and other metabolic processes once acclimated to high CO2 levels
in these short-term experiments. Indeed, the down-regulation of a
chloroplastic clp protease in the first two incubations (Table 4)
suggests that E. huxleyi chloroplasts are not undergoing stress under
high CO2.
The unknown biochemistry of Emiliania huxleyiOf the 115 quantified and non-quantified HPGs identified, 79
were not found within the current draft of the E. huxleyi genome
(strain CCMP1516) and only 6 were found in the genome and
both the EST and taxonomically restricted UniProt databases.
This is likely a result of genomic variability within the E. huxleyi
species group and we expect proteomic identifications to be
assisted by the availability of sequences of other strains in the near
future. However, it is worth noting that approximately 38% of
quantified and non-quantified HPGs identified in the current
study did not match any database homologue, Pfam conserved
domain or only matched protein sequences defined as ‘‘unknown’’,
‘‘predicted’’ or ‘‘hypothetical.’’ We also found unusual proteins,
Table 4. Cont.
Identification Accessiona/EST cluster 114:113b 116:115 118:117 Rangec
Periplasmic binding/iron transport lipoprotein(putative)
EHUXJGI269712 1.16 0.95 1.23 0.95–1.29
Phosphoglycerate kinase Q5ENR8 0.91 1.44 1.48 0.91–1.70
11a 0.95 1.06 1.06 0.95–1.10d
EHUXJGI270670 1.05 0.99 1.05 0.99–1.07
Phosphoribulokinase (chloroplastic) 14a 0.70 1.35 0.86 0.63–1.36d
Photosystem II 12 kDa extrinsic protein(chloroplastic)
12f 0.70 0.99 0.56 0.53–1.01
Photosystem II oxygen evolving enhancer(chloroplastic)
34a 1.29 1.09 0.73 0.73–1.40d
27a 1.46 0.89 0.82 0.72–1.45d
27b 1.38 0.84 0.83 0.71–1.37
EHUXJGI265795 1.12 1.10 0.72 0.72–1.27
Predicted protein 65a 1.85 1.55 0.54 0.54–2.46
Predicted protein 82a 1.51 1.67 0.29 0.30–2.73d
Predicted protein 21a 0.98 0.91 0.72 0.72–1.04d
21b 0.98 0.91 0.72 0.72–1.04
21c 1.46 1.47 0.67 0.68–1.88
Predicted protein 72a 1.72 1.45 0.56 0.56–2.22
Predicted protein 84a 2.31 7.08 0.48 0.43–9.20
EHUXJGI96453 2.22 7.28 0.47 0.41–9.32
EHUXJGI243179 2.26 7.38 0.46 0.41–9.54
Ribulose bisphosphate carboxylase large chain Q4G3F4 0.17 0.81 0.76 0.17–1.29
S-adenosylmethionine synthetase 06a 0.92 0.63 0.64 0.57–0.91
06b 0.96 0.54 0.49 0.42–0.96
06c 0.96 0.53 0.47 0.40–0.96
EHUXJGI62235 0.91 0.85 0.51 0.51–1.05
EHUXJGI267646 0.96 0.83 0.49 0.49–1.09
Ubiquitin family protein (putative) 01f 1.77 2.18 0.74 0.74–2.71
a, b, cAs defined for table 3.dIf an identification was made from numerous ESTs with valid iTRAQ quantification, an geometric average has been made (see Materials and Methods). Please refer toData S2 for individual EST quantification.doi:10.1371/journal.pone.0061868.t004
Response of Emiliania huxleyi Proteome to High CO2
PLOS ONE | www.plosone.org 10 April 2013 | Volume 8 | Issue 4 | e61868

for example searches against the E. huxleyi genome uncovered an
alanine-rich sulfotransferase protein (ID 270658) exhibiting
homology to several mucin-associated surface proteins (MASPs)
identified in the parasite Trypanosoma cruzi (Data S2). MASPs are
members of a recently discovered gene family containing ,1400
members that comprises ,6% of the parasite diploid genome
[63,64] and are thought to have a role in host immune system
evasion. Interestingly, we found homologs to this HPG in the
Thalassiosira pseudonana genome (e.g. UniProtKB accessions
B8BX85 and B8BTN5). At present, we are unable to propose a
role for MASP-like proteins within marine eukaryotic algae.
The large number of highly expressed proteins with unknown
features that we found within E. huxleyi highlights the multiple
unknown biochemical facets of these species and illustrates that
our incomplete knowledge on cellular processes, such as calcifi-
cation. It is therefore likely that components other than those
currently described for coccolithophores including proteins typi-
cally involved in carbon acquisition, proton extrusion or Ca2+
transport remain to be identified. For example, in two of our three
high CO2 replicates, an HPG containing a structural motif found
in demethylmenaquinone methyltransferases (DMMMs) was up-
regulated. This was particularly interesting since DMMMs
catalyze the last step of the biosynthesis of menaquinione (vitamin
K2; MK) through the conversion of demenaquinone to MK, a
pathway predominantly found within bacteria [65]. Within E.
huxleyi, it is possible that this HPG could be involved in
calcification since vitamin K is an essential cofactor of a c-
carboxylase that facilitates calcium ion chelation via the post-
translational conversion of glutamic acid to c-carboxyglutamyl
residues. Through this process, vitamin K2 has been shown to
regulate biomineralization by modulating the proliferation of
osteoblastic cells [66]. Since similar DMMM proteins are present
in a handful of other eukaryote phytoplankton such as T.
pseudonana and Phaeodactylum tricornutum, MK could instead be an
isoprenoid quinone within the photosynthetic or respiratory
electron transport chains, as in some prokaryotes [67–69]. A
further investigation of the role of this HPG and confirmation of its
up-regulation in association with cellular high CO2 responses is
therefore warranted.
To help develop future directions for research and assist the E.
huxleyi genomics community, we combined data from the current
study with those from our previous proteomic investigations of E.
huxleyi [18] resulting in the experimental validation of 189 HPGs.
There was limited overlap between the datasets from these two
studies (26 HPGs), which is likely to reflect incomplete proteome
sampling in each experiment as a result of the different protein
extraction protocols and identification approaches.
Could cellular tolerance lead to a competitivedisadvantage in future oceans?
This study adds to the increasing body of literature highlighting
variable responses in coccolithophore calcification relating to
ocean acidification. For example, it has been recently shown that
some coccolithophores may show increased [21,22,25] or negli-
gible changes in calcification in response to increasing partial
pressures of CO2 [9,70]. Our results are particularly interesting in
light of recent field data showing that heavily calcified E. huxleyi
cells of the same morphotype (R) were associated with naturally
low pH waters [71]. Another recent study found that E. huxleyi cells
of another morphotype (A), different from that used in our study,
possessed more CaCO3 in low pH waters [72]. Additionally,
recent models propose that coccolithophores might become more
heavily calcified and grow more slowly under high CO2 [73]. We
argue that the strain of E. huxleyi used in this study exhibits reduced
growth that may relate to cellular stress, suggested by the
reduction in growth rate and the potential induction of a sub-
lethal CSR proteome. This may, in part, explain these field results,
since we found reduced cell division resulted in an increase in
cellular CaCO3. The induction of shifts in the activities of these,
and other pathways, may act as a trade-offs to enable the
maintenance of cellular processes required in the short term,
perhaps ensuring cellular homeostasis or remodelling during
acclimation [51]. However, the decline in growth rates observed
in our study could ultimately be disadvantageous for E. huxleyi
under high CO2 [5] despite its ability to maintain many biological
functions. This could be particularly detrimental in scenarios of
phytoplankton group assemblages where other groups outnumber
coccolithophores. For example some studies have shown that
diatoms are able to maintain [22,74] or even increase growth rates
under increased pCO2 [75,76], which could lead to increased
interspecific competition and assemblage shifts in regions where
coccolithophores currently dominate. Long-term investigations
into coccolithophore CSRs are therefore required to confirm the
extent to which they are responsible for cellular resilience to
variations in pH and to determine the conditions under which cells
are capable of adaptation to high CO2. This would elucidate
whether a catastrophic metabolic collapse relating to acute stress
occurs in this particular ecotype of E. huxleyi through time or if
cellular mechanisms responding to high CO2 levels resulted in a
steady recovery of growth rates, thus preventing outcompetition by
other taxa that could otherwise cause a decrease in oceanic
CaCO3 fluxes in a future high CO2 world.
Supporting Information
Data S1 Output files from BUDAPEST analysis.
(ZIP)
Data S2 Detailed information regarding proteins iden-tified in the current study.
(XLS)
Methods S1 UPLC and MS/MS parameters; Mascotprotein identification search parameters.
(DOCX)
Table S1 Mean carbonate chemistry parameters of14.7L acclimation cultures before cell addition.
(DOCX)
Table S2 Mean carbonate chemistry parameters asso-ciated with 14.7L acclimation cultures at t1.
(DOCX)
Table S3 Nitrate, phosphate and silicate informationfor cells at t1.
(DOCX)
Table S4 Nitrate, phosphate and silicate informationfor cells at t2.
(DOCX)
Table S5 Fv/Fm values of PSII at t2.
(DOCX)
Acknowledgments
We thank Mrs Sue Hartman for help during VINDTA analysis and the
following for analytical assistance: Dr Tom Bibby (Fv/Fm), Mr Mark
Stinchcombe (nitrate, phosphate and silicate) and Mr Robert Head
(organic carbon and nitrogen). We are extremely grateful to Dr John
Gittins and Ms Shanon Pead for technical support and would like to thank
Dr Stephen Widdecombe and Ms Sarah Dashfield at Plymouth Marine
Response of Emiliania huxleyi Proteome to High CO2
PLOS ONE | www.plosone.org 11 April 2013 | Volume 8 | Issue 4 | e61868

Laboratory (U.K.) for access to seawater. We also thank Dr Maria-Nefeli
Tsaloglou for access to laboratory facilities and Mr Robert Jones for his
extensive help during seawater collection. We are grateful to the three
anonymous reviewers of this manuscript who provided constructive and
useful comments.
Author Contributions
Designed software used in analysis: RJE. Proteomic sample preparation:
BMJ PJS. Conceived and designed the experiments: BMJ MDI-R PJS
CDO RJE. Performed the experiments: BMJ. Analyzed the data: BMJ RJE
PJS MJG JRY. Contributed reagents/materials/analysis tools: MDI-R PJS
CDO RJE JRY MG HE. Wrote the paper: BMJ MDI-R PJS RJE CDO.
References
1. Caldeira K, Wickett ME (2003) Anthropogenic carbon and ocean pH. Nature
425: 365. doi: 10.1038/425365a.
2. Zeebe RE, Wolf-Gladrow D (2001) CO2 in seawater: Equilibrium, kinetics,
isotopes. New York: Elsevier. 360pp.
3. Raven JA, Caldeira K, Elderfield H, Hoegh-Guldberg O, Liss P, et al. (2005)
Ocean acidification due to increasing atmospheric carbon dioxide. London: The
Royal Society. 60pp.
4. Orr JC, Fabry VJ, Aumont O, Bopp L, Doney SC, et al. (2005) Anthropogenicocean acidification over the twenty-first century and its impact on calcifying
organisms. Nature 437: 681–686. doi: 10.1038/nature04095.
5. Ridgwell A, Schmidt DN, Turley C, Brownlee C, Maldonado MT, et al. (2009)
From laboratory manipulations to Earth system models: scaling calcification
impacts of ocean acidification. Biogeosciences 6: 2611–2623. doi: 10.5194/bg-6-2611-2009.
6. Milliman JD (1993) Production and accumulation of calcium carbonate in the
ocean: budget of a nonsteady state. Global Biogeochem Cycles 7: 927–957. doi:
10.1029/93GB02524.
7. Westbroek P, Brown CW, van Bleijswijk J, Brownlee C, Brummer GJ, et al.
(1993) A model system approach to biological climate forcing. The example of
Emiliania huxleyi. Glob Planet Change 8: 27–46. doi: 10.1016/0921-
8181(93)90061-R.
8. Lefebvre SC, Harris G, Webster R, Leonardos N, Geider RJ, et al. (2009)Characterization and expression analysis of the Lhcf gene family in Emiliania
huxleyi (Haptophyta) reveals differential responses to light and CO2. J Phycol 46:
123–134. doi: 10.1111/j.1529-8817.2009.00793.x.
9. Richier S, Fiorini S, Kerros M-E, von Dassow P, Gattuso J-P (2011) Response of
the calcifying coccolithophore Emiliania huxleyi to low pH/high pCO2: fromphysiology to molecular level. Mar Biol 158: 551–560. doi: 10.1007/s00227-
010-1580-8.
10. Rokitta S, John U, Rost B (2012) Ocean acidification affects redox-balance and
ion-homeostasis in the life-cycle stages of Emiliania huxleyi. PLoS ONE 7: e52212.
doi: 10.1371/journal.pone.0052212.
11. Anderson L, Seilhamer J (1997) A comparison of selected mRNA and protein
abundances in human liver. Electrophoresis 18: 533–537. doi: 10.1002/
elps.1150180333.
12. Gygi SP, Rochon,Y, Franza BR, Aebersold R (1999) Correlation between
protein and mRNA abundance in yeast. Mol Cell Biol 19: 1720–1730.
13. Chen G, Gharib TG, Huang C-C, Taylor JMG, Misek DE, et al. (2002)
Discordant protein and mRNA expression in lung adenocarcinomas. Mol Cell
Proteomics 1: 304–313. doi: 10.1074/mcp.M200008-MCP200.
14. Tian Q, Stepaniants SB, Mao M, Weng L, Feetham MC, et al. (2004) Integrated
genomic and proteomic analyses of gene expression in mammalian cells. Mol
Cell Proteomics 3: 960–969. doi: 10.1074/mcp.M400055-MCP200.
15. Choi,YW, Park SA, Lee HW, Kim DS, Lee NG (2008) Analysis of growthphase-dependent proteome profiles reveals differential regulation of mRNA and
protein in Helicobacter pylori. Proteomics 8: 2665–2675. doi: 10.1002/
pmic.200700689.
16. Vogel C, Marcotte EM (2012) Insights into the regulation of protein abundance
from protein and transcriptomic analyses. Nat Rev Genet 13: 227–232. doi:10.1038/nrg3185.
17. Bala G, Caldeira K, Mirin A, Wickett M, Delire C (2005) Multicentury changes
to the global climate and carbon cycle: results from a coupled climate and
carbon cycle model. J Clim 18: 4531–4544. doi: 10.1175/JCLI3542.1.
18. Jones BM, Edwards RJ, Skipp PJ, O’Connor CD, Iglesias-Rodriguez MD (2011)
Shotgun proteomic analysis of Emiliania huxleyi, a marine phytoplankton species
of major biogeochemical importance. Mar Biotechnol (NY) 13: 496–504. doi:
10.1007/s10126-010-9320-0.
19. Pandal J, Wright PC, Biggs CA (2007) A quantitative proteomic analysis of lightadaptation in a globally significant marine cyanobacterium Prochlorococcus marinus
MED4. J Proteome Res 6: 996–1005. doi: 10.1021/pr060460c.
20. Carvalho RN, Lettieri T (2011) Proteomic analysis of the marine diatom
Thalassiosira pseudonana upon exposure to benzo(a)pyrene. BMC Genomics 12:
159. doi: 10.1186/1471-2164-12-159.
21. Iglesias-Rodriguez MD, Halloran P, Rickaby R, Hall I, Colmenero-Hidalgo E,
et al. (2008) Phytoplankton calcification in a high-CO2 world. Science 320: 336–
340. doi: 10.1126/science.1154122.
22. Shi D, Xu Y, Morel FMM (2009) Effects of the pH/pCO2 method on medium
chemistry and phytoplankton growth. Biogeosciences 6: 1199–1207. doi:
10.5194/bg-6-1199-2009.
23. Riebesell U, Zondervan I, Rost B, Tortell PD, Zeebe RE, et al. (2000) Reduced
calcification of marine plankton in response to increased atmospheric CO2.Nature 407: 364–367. doi: 10.1038/35030078.
24. Zondervan I, Rost B, Riebesell U (2002) Effect of CO2 concentration on the
PIC/POC ratio in the coccolithophore Emiliania huxleyi grown under light-
limiting conditions and different daylengths. J Exp Mar Bio Ecol 272: 55–70.
doi: 10.1016/S0022-0981(02)00037-0.
25. Fiorini S, Middelburg JJ, Gattuso J-P (2011) Testing the effects of elevated pCO2
on coccolithophores (Prymnesiophyceae): comparison between haploid and
diploid life stages. J Phycol 47: 1281–1291. doi: 10.1111/j.1529-
8817.2011.01080.x.
26. Guillard RRL, Ryther JH (1962) Studies of marine planktonic diatoms. I.
Cyclotella nana Hustedt and Detonula confervacea Cleve. Can J Microbiol 8: 229–239.
27. Guillard RRL (1975) Culture of phytoplankton for feeding marine invertebrates.
In: Smith, WL, Chanley, MH, editors. Culture of Marine Invertebrate Animals.
New York: Plenum Press. pp. 26–60.
28. Langer G, Geisen M, Baumann K-H, Klas J, Riebesell U, et al. (2006) Species-
specific responses of calcifying algae to changing seawater carbonate chemistry.
Geochemistry Geophysics Geosystems 7: Q09006. doi: 10.1029/
2005GC001227.
29. Novick A, Szilard L (1950) Experiments with the chemostat on spontaneous
mutations in bacteria. Proc Natl Acad Sci U S A 36: 708–719.
30. de Villiers S, Greaves M, Elderfield H (2002) An intensity ratio calibration
method for the accurate determination of Mg/Ca and Sr/Ca of marine
carbonates by ICP-AES. Geochemistry Geophysics Geosystems 3: 10.1029/
2001GC000169. doi: 10.1029/2001GC000169.
31. Pierrot D, Lewis E, Wallace DWR (2006) MS Excel Program Developed for
CO2 System Calculations. ORNL/CDIAC-105a. Oak Ridge, Tennessee:
Carbon Dioxide Information Analysis Center, Oak Ridge National Laboratory.
32. Mehrbach C, Culberson CH, Hawley JE, Pytkowicz RN (1973) Measurement of
the apparent dissociation constants of carbonic acid in seawater at atmospheric
pressure. Limnol Oceanogr 18: 897–907.
33. Dickson AG, Millero FJ (1987) A comparison of the equilibrium constants for
the dissociation of carbonic acid in seawater media. Deep Sea Res Part 1
Oceanogr Res Pap 34: 1733–1743. doi: 10.1016/0198-0149(87)90021-5.
34. Dickson AG (1990) Standard potential of the reaction: AgCl (s) +1/2 H2 (g) = Ag
(s) +HCl (aq), and and the standard acidity constant of the ion HSO4- in
synthetic sea water from 273.15 to 318.15 K. J Chem Thermodyn 22: 113–127.
doi: 10.1016/0021-9614(90)90074-Z.
35. Abramoff M, Magelhaes P, Ram S (2004) Image processing with ImageJ.
Biophotonics International 11: 36–42.
36. Young J, Westbroek P (1991) Genotypic variation in the coccolithophorid
species Emiliania huxleyi. Marine Micropaleontology 18: 5–23. doi: 10.1016/
0377-8398(91)90004-P.
37. Kolber Z, Prasil O, Falkowski PG (1998) Measurements of variable chlorophyll
fluorescence using fast repetition rate techniques. I. Defining methodology and
experimental protocols. Biochim Biophys Acta 1367: 88–106. doi: 10.1016/
S0005-2728(98)00135-2.
38. Barsnes H, Vizcaıno JA, Eidhammer I, Martens L (2009) PRIDE converter:
making proteomics data-sharing easy. Nat Biotechnol 27: 598–599. doi:
10.1038/nbt0709-598.
39. Vizcaıno JA, Cote R, Reisinger F, Barsnes H, Foster JM, et al. (2010) The
Proteomics Identifications database: 2010 update. Nucleic Acids Res. 38 (suppl
1): D736–742. doi: 10.1093/nar/gkp964.
40. Wahlund TM, Hadaegh AR, Clark R, Nguyen B, Fanelli M, et al. (2004)
Analysis of expressed sequence tags from calcifying cells of marine coccolitho-
phorid (Emiliania huxleyi). Mar Biotechnol 6: 278–290. doi: 10.1007/s10126-003-
0035-3.
41. Wahlund TM, Zhang X, Read BA (2004) Expressed sequence tag profiles from
calcifying and non-calcifying cultures of Emiliania huxleyi. Micropaleontology 50:
145–155.
42. von Dassow P, Ogata H, Probert I, Wincker P, Da Silva C, et al. (2009)
Transcriptome analysis of functional differentiation between haploid and diploid
cells of Emiliania huxleyi, a globally significant photosynthetic calcifying cell.
Genome Biol 10: R114. doi: 10.1186/gb-2009-10-10-r114.
43. Kegel JU, Blaxter M, Allen MJ, Metfies K, Wilson WH, et al. (2010)
Transcriptional host-virus interaction of Emiliania huxleyi (Haptophyceae) and
EhV-86 deduced from combined analysis of expressed sequence tags and
microarrays. Eur J Phycol 45: 1–12. doi: 10.1080/09670260903349900.
44. Bateman A, Coin L, Durbin R, Finn RD, Holich V, et al. (2004) The Pfam
protein families database. Nucleic Acids Res 32: D138–141. doi: 10.1093/nar/
gkh121.
45. Davey NE, Shields DC, Edwards RJ (2006) SLiMDisc: short, linear motif
discovery, correcting for common evolutionary descent. Nucleic Acids Res 34:
3546–3554. doi: 10.1093/nar/gkl486.
Response of Emiliania huxleyi Proteome to High CO2
PLOS ONE | www.plosone.org 12 April 2013 | Volume 8 | Issue 4 | e61868

46. Hoppe CJM, Langer G, Rost B (2011) Emiliania huxleyi shows identical responses
to elevated pCO2 in TA and DIC manipulations. J Exp Mar Bio Ecol 406: 54–
62. doi: 10.1016/j.jembe.2011.06.008.
47. Barcelos e Ramos J, Muller MN, Riebesell U (2010) Short-term response of the
coccolithophore Emiliania huxleyi to an abrupt change in seawater carbon dioxide
concentrations. Biogeosciences 7: 177–186. doi: 10.5194/bg-7-177-2010.
48. Frankignoulle M, Canon C, Gattuso J-P (1994) Marine calcification as a source
of carbon dioxide: positive feedback of increasing atmosphere CO2. Limnol
Oceanogr 39: 458–462.
49. Zhou BB, Elledge SJ (2000) The DNA damage response: putting checkpoints in
perspective. Nature 408: 433–439. doi: 10.1038/35044005.
50. Kultz D (2003) Evolution of the cellular stress proteome: from monophyletic
origin to ubiquitous function. J Exp Biol 206: 3119–3124. doi: 10.1242/
jeb.00549.
51. Evans TG, Hofmann GE (2012) Defining the limits of physiological plasticity:
how gene expression can assess and predict the consequences of ocean change.
Philos Trans R Soc Lond B Biol Sci 367: 1733–1745. doi: 10.1098/
rstb.2012.0019.
52. Meshi T, Taoka K-I, Iwabuchi M (2000) Regulation of histone gene expression
during the cell cycle. Plant Mol Biol 43: 643–657.
53. Flynn KJ, Raven JA, Rees TAV, Finkel Z, Quigg A, et al. (2010) Is the growth
rate hypothesis applicable to microalgae? J Phycol 46: 1–12. doi: 10.1111/
j.1529-8817.2009.00756.x.
54. Fargo DC, Boynton JE, Gillham NW (2001) Chloroplast ribosomal protein S7 of
Chlamydomonas binds to chloroplast mRNA leader sequences and may be
involved in translation initiation. Plant Cell 13: 207–218.
55. Phadare S (2004) Recent developments in bacterial cold shock response. Curr
Issues Mol Biol 6: 125–136.
56. Bortoluzzi S, d’Alessi F, Romualdi C, Danieli GA (2002) Differential expression
of genes coding for ribosomal proteins in different human tissues. Bioinformatics
17: 1152–1157. doi: 10.1093/bioinformatics/17.12.1152.
57. Mosavi LK, Cammett TJ, Desrosiers DC, Peng Z-Y (2004) The ankryin repeat
as molecular architecture for protein recognition. Protein Sci 13: 1435–1448.
doi: 10.1110/ps.03554604.
58. Chiang P, Gordon R, Tal J, Zeng G, Doctor B, et al (1996) S-
Adenosylmethionine and methylation. FASEB J 10: 471–480.
59. Ohlrogge JB, Kuhn DN, Stumpft PK (1979) Subcellular localization of acyl
carrier protein in leaf protoplasts of Spinacia oleracea. Proc Natl Acad Sci USA 76:
1194–1198.
60. Petrackova D, Vecer J, Svobodova J, Herman P (2010) Long-term adaptation of
Bacillus subtilis 168 to extreme pH affects chemical and physical properties of the
cellular membrane. J Membrane Biol 233: 73–83. doi: 10.1007/s00232-010-
9226-9.
61. Dietz KJ, Tavakoli N, Kluge C, Mimura T, Sharma SS, et al. (2001)
Significance of the V-type ATPase for the adaptation to stressful growth
conditions and its regulation on the molecular and biochemical level. J Exp
Botany 52: 1969–1980. doi: 10.1093/jexbot/52.363.1969.
62. Sasaki T, Pronina NA, Maeshima M, Iwasaki I, Kurano N, et al. (1999)
Development of vacuoles and vacuolar H+ -ATPase activity under extremelyhigh CO2 conditions in Chlorococcum littorale cells. Plant Biol 1: 68–75. doi:
10.1111/j.1438-8677.1999.tb00710.x.
63. El-Sayed NM, Myler PJ, Blandin G, Berriman M, Crabtree J, et al. (2005)Comparative genomics of trypanosomatid parasitic protozoa. Science 309: 404–
409. doi: 10.1126/science.1112181.64. El-Sayed NM, Myler PJ, Bartholomeu DC, Nilsson D, Aggarwal G, et al. (2005)
The genome sequence of Trypanosoma cruzi, etiologic agent of Chagas disease.
Science 309: 409–415. doi: 10.1126/science.1112631.65. Daines AM, Payne RJ, Humphries ME, Abell AD (2003) The synthesis of
naturally occurring vitamin K and vitamin K analogues. Curr Org Chem 7:1625–1634. doi: 10.2174/1385272033486279.
66. Akedo Y, Hosoi T, Inoue S, Ikegami A, Mizuno Y, et al. (1992) Vitamin K2modulates proliferation and function of osteoblastic cells in vitro. Biochem
Biophys Res Commun 187: 814–820. doi: 10.1016/0006-291X(92)91269-V.
67. Lubben M (1995) Cytochromes of archael electron transfer chains. BiochimBiophys Acta 1229: 1–22.
68. Schoepp-Cothenet B, Lieutaud C, Baymann F, Vermeglio A, Friedrich T, et al.(2009) Menaquinone as pool quinone in a purple bacterium. Proc Natl Acad
Sci U S A 106: 8549–8554. doi: 10.1073/pnas.0813173106.
69. Kuroso M, Begari E (2010) Vitamin K2 in electron transport system: areenzymes involved in vitamin K2 biosynthesis promising drug targets? Molecules
15: 1531–1553. doi: 10.3390/molecules15031531.70. Langer G, Nehrke G, Probert I, Ly J, Ziveri P (2009) Strain-specific responses of
Emiliania huxleyi to changing seawater carbonate chemistry. Biogeosciences 6:2637–2646. doi: 10.5194/bg-6-2637-2009.
71. Beaufort L, Probert I, de Garidel-Thoron T, Bendif EM, Ruiz-Pino D, et al.
(2011) Sensitivity of coccolithophores to carbonate chemistry and oceanacidification. Nature 476: 80–83. doi: 10.1038/nature10295.
72. Smith HEK, Tyrrell T, Charalampopoulou A, Dumousseaud C, Legge OJ, et al.(2012) Predomindance of heavily calcified coccolithophores at low CaCO3
during winter in the Bay of Biscay. Proc Nat Acad Sci U S A 109: 8845–8849.
doi: 10.1073/pnas.1117508109.73. Irie T, Bessho K, Findlay HS, Calosi P (2010) Increasing costs due to ocean
acidification drives phytoplankton to be more heavily calcified: optimal growthstrategy of coccolithophores. PLoS ONE 5: e13436. doi: 10.1371/journal.
pone.0013436.74. Crawfurd KJ, Raven JA, Wheeler GL, Baxter EJ, Joint I (2011) The response of
Thalassiosira pseudonana to long-term exposure to increased CO2 and decreased
pH. PLoS ONE 6: e26695. doi: 10.1371/journal.pone.0026695.75. Kim J-M, Lee K, Shin K, Kang J-H, Lee H-W, et al. (2006) The effect of
seawater CO2 concentration on growth of a natural phytoplankton assemblagein a controlled mesocosm experiment. Limnol Oceanogr 51: 1629–1636. doi:
10.4319/lo.2006.51.4.1629.
76. Tortell PD, Payne CD, Li Y, Trimborn S, Rost B, et al. (2008) CO2 sensitivity ofSouthern Ocean phytoplankton. Geophys Res Lett 35: L04605. doi: 10.1029/
2007GL032583.
Response of Emiliania huxleyi Proteome to High CO2
PLOS ONE | www.plosone.org 13 April 2013 | Volume 8 | Issue 4 | e61868