Vitellogenin is not an appropriate biomarker of feminisation in a Crustacean
Upload
independentCategory
view
0download
0
J. P ~ Y C O ~ . 31, 272-282 (1995)
LIPID BIOMARKER DIVERSITY IN THE COCCOLITHOPHORID EMILIANIA HUXLEYI (PRYMNESIOPHYCEAE) AND THE
RELATED SPECIES GEPHYROCAPSA OCEANICA'
Maureen H . Conte,= Anthony Thompson, Geofrey Eglinton Biogeochemistry Centre, University of Bristol, Bristol BS8 1 TS United Kingdom
and
John C. Green Plymouth Marine Laboratory, Citadel Hill, Plymouth PL1 2PB United Kingdom
ABSTRACT
Twentyfour strains of Emiliania huxleyi and two strains of Gephyrocapsa oceanica were grown at 15OC under identical culture conditions to assess genetic vari- ability in key lipid biomarker profiles (C3,-C39 alkenones, C,, and Cj7 alkyl alkenoates, and C,-C?,alkenes). Under our culture conditions, little divergence an biomarker com- position was detected between E. huxleyi strains f rom different oceanic regions or between E. huxleyi and G. oceanica even though the strains originated f rom biogeo- graphical regions as diverse as the subpolar North At- lantic and subtropical Western Pacific. The major daxer- ences observed were i n tetraunsaturated alkenone abun- dance and alkene projles, which tended to separate neritic from open ocean strains. Dafferent strains from the same locality were as diferent as strains originating f rom widely separated ocean basins, indicating extreme genotypic di- zlersity within a population. Replicate cultures of the same strain showed signijicant variability in their biomarker profiles even though the culture temperature varied by only k0.3" C, indicating that their synthesis ratios are injluenced by environmental and/or physiological vari- able@), as yet unidentijied, i n addition to temperature. Strong covariance in C,, and C,, methyl alkenone un- saturation ratios (V17 and U38M#, respectively) and, in coastal strains, C3, alkene and alkenone unsaturation ratios indicates that these compounds are biochemically linked. Key index words: alkenes; alkenoates; alkenones; bio- markers; Emiliania huxleyi; Gephyrocapsa oceanica; haptophytes; lipids; Prymnesiophyceae; strain variability
The coccolithophorid Emiliania huxleyi (Lohm.) Hay and Mohler (Prymnesiophyceae) occurs throughout the world's oceans, from polar regions of high productivity to oligotrophic subtropical regions (reviewed in Westbroek et al. 1993). This species often accounts for a major fraction of the total coccolithophorid community and is noted for
Received 1 1 August 1994. Accepted 12 January 1995. * Present address and author for reprint requests: Department
of Marine Chemistry and Geochemistry, Woods Hole Oceano- graphic Institution, Woods Hole, Massachusetts 02543.
its propensity to form large blooms, easily visualized by satellite, in coastal and mid- to high-latitude areas. These blooms, which cover areas of 10-105 km*, have a major impact on the biological carbon cycle in the ocean and on ocean/atmosphere fluxes of carbon dioxide and volatile sulfur compounds (Westbroek et al. 1993).
In addition to its importance as a major producer of CaCO,, E. huxleyi synthesizes a unique suite of long-chain alkenone and alkyl alkenoates whose sed- imentary distribution provides an important proxy record of paleo-sea surface temperature (paleo-SST; reviewed in Brassell 1993). Early culture studies (Marlowe 1984, Prahl et al. 1988) showed that the synthesis ratio of the individual alkenones and alkyl alkenoate compounds in E. huxleyi, in particular the unsaturation ratio of the CS7 methyl alkenones (UkS7; Table l), is a function of growth temperature. Bras- sell et al. (1 986a, b) extended this work to sediments and demonstrated that alkenone unsaturation in surface sediments was correlated with overlying SST. They also observed that alkenone unsaturation in the sedimentary record was correlated with glacial to interglacial variations in P O and suggested that these compounds preserved a record of past SST variations. Further studies of U',, stratigraphy in ocean sediments have demonstrated the importance of these biomarkers as a paleo-SST proxy (e.g. Poyn- ter et al. 1989, Farrimond et al. 1990, Ten Haven and Kroon 1990, Eglinton et al. 1992).
Most commonly, the sedimentary UkS7 ratio is converted to a paleo-SST using the linear regression calibration of Ws7 versus temperature, which was measured in culture experiments using a NE Pacific strain of E. huxleyi (Prahl et al. 1988). While this temperature calibration is generally appropriate for the open ocean (Prahl and Wakeham 1987, Brassell 1993), recent studies in the North Atlantic (Conte et al. 1992, Conte and Eglinton 1993), Black Sea (Freeman and Wakeham 1992), Southern Ocean (Sikes and Volkman 1993), Norwegian fjords (Conte et al. 1995), and Mediterranean (Ternois et al., un- publ. results) have shown that a single calibration may not be applicable to all geographical regions. Multivariate calibrations derived using the entire suite of alkenone and alkenoate compounds may in
272
273 LIPID BIOMARKERS IN EMILIANIA HUXLEYI AND GEPHYROCAPSA OCEANICA
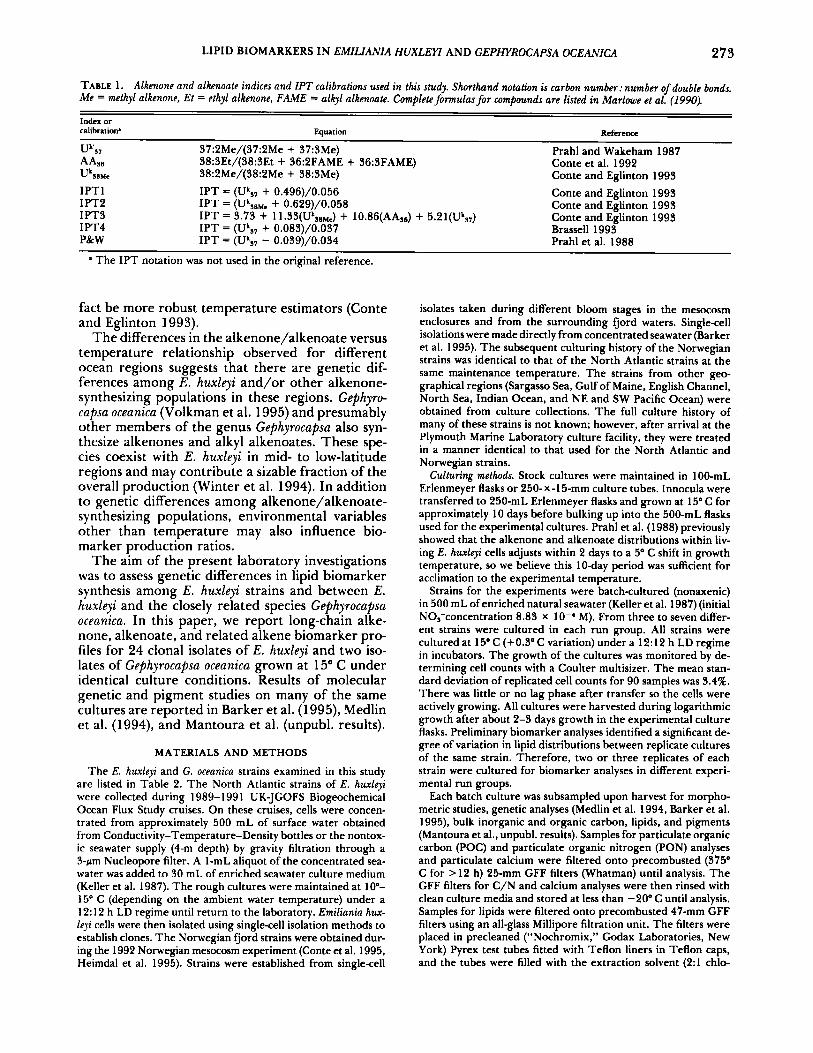
TABLE 1. Alkenone and alkenoate indices and IPT calibrations used in this study. Shorthand notation is carbon number: number of double bonds. Me = methyl alkenone, Et = ethyl alkenone, FAME = alkyl alkenoate. Complete formulas for compounds are listed in Marlowe et al. (1990).
Index or calibration' Equation Reference
Uk37 37:2Me/(37:2Me + 37:3Me) Prahl and Wakeham 1987 AA56 38:3Et/(38:3Et + 36:2FAME + 36:3FAME) Conte et al. 1992 UkS8Mc 38:2Me/(38:2Me + 38:3Me) Conte and Eglinton 1993 IPTl IPT = (UkS7 + 0.496)/0.056 Conte and Eglinton 1993 IPT2 IPT = (UkSBMe + 0.629)/0.058 Conte and Eglinton 1993 IPT3 Conte and Eglinton 1993 IPT4 IPT = (U'37 + 0.083)/0.037 Brassell 1993 P&W IPT = (U'37 - 0.039)/0.034 Prahl et al. 1988
IPT = 3.73 + 1 1.33(uk58M,) + 10.86(AASs) + 5.21(Uk57)
a The IPT notation was not used in the original reference.
fact be more robust temperature estimators (Conte and Eglinton 1993).
The differences in the alkenone/alkenoate versus temperature relationship observed for different ocean regions suggests that there are genetic dif- ferences among E. huxleyi and/or other alkenone- synthesizing populations in these regions. Gephyro- capsa oceanica (Volkman et al. 1995) and presumably other members of the genus Gephyrocapsa also syn- thesize alkenones and alkyl alkenoates. These spe- cies coexist with E. huxleyi in mid- to low-latitude regions and may contribute a sizable fraction of the overall production (Winter et al. 1994). In addition to genetic differences among alkenone/alkenoate- synthesizing populations, environmental variables other than temperature may also influence bio- marker production ratios.
The aim of the present laboratory investigations was to assess genetic differences in lipid biomarker synthesis among E. huxleyi strains and between E. huxleyi and the closely related species Gephyrocapsa oceanica. In this paper, we report long-chain alke- none, alkenoate, and related alkene biomarker pro- files for 24 clonal isolates of E. huxleyi and two iso- lates of Gephyrocapsa oceanica grown at 15" C under identical culture conditions. Results of molecular genetic and pigment studies on many of the same cultures are reported in Barker et al. (1995), Medlin et al. (1994), and Mantoura et al. (unpubl. results).
MATERIALS A N D METHODS
The E. huxleyi and G. oceanica strains examined in this study are listed in Table 2. The North Atlantic strains of E. huxleyi were collected during 1989-199 1 UK-JGOFS Biogeochemical Ocean Flux Study cruises. On these cruises, cells were concen- trated from approximately 500 mL of surface water obtained from Conductivity-Temperature-Density bottles or the nontox- ic seawater supply (4-m depth) by gravity filtration through a 3-am Nucleopore filter. A 1-mL aliquot of the concentrated sea- water was added to 30 mL of enriched seawater culture medium (Keller et al. 1987). The rough cultures were maintained at 10"- 15" C (depending on the ambient water temperature) under a 12:12 h LD regime until return to the laboratory. Emiliania hux- leji cells were then isolated using single-cell isolation methods to establish clones. The Norwegian fjord strains were obtained dur- ing the 1992 Norwegian mesocosm experiment (Conte et al. 1995, Heimdal et al. 1995). Strains were established from single-cell
isolates taken during different bloom stages in the mesocosm enclosures and from the surrounding fjord waters. Single-cell isolations were made directly from concentrated seawater (Barker et al. 1995). The subsequent culturing history of the Norwegian strains was identical to that of the North Atlantic strains at the same maintenance temperature. The strains from other geo- graphical regions (Sargasso Sea, Gulf of Maine, English Channel, North Sea, Indian Ocean, and NE and SW Pacific Ocean) were obtained from culture collections. The full culture history of ' many of these strains is not known; however, after arrival at the Plymouth Marine Laboratory culture facility, they were treated in a manner identical to that used for the North Atlantic and Norwegian strains.
Culturing methods. Stock cultures were maintained in 1 00-mL Erlenmeyer flasks or 250- x -1 5-mm culture tubes. Innocula were transferred to 250-mL Erlenmeyer flasks and grown at 15' C for approximately 10 days before bulking up into the 500-mL flasks used for the experimental cultures. Prahl et al. (1988) previously showed that the alkenone and alkenoate distributions within liv- ing E. huxleyi cells adjusts within 2 days to a 5' C shift in growth temperature, so we believe this 10-day period was sufficient for acclimation to the experimental temperature.
Strains for the experiments were batch-cultured (nonaxenic) in 500 mL of enriched natural seawater (Keller et al. 1987) (initial NO,-concentration 8.83 x lo-' M). From three to seven differ- ent strains were cultured in each run group. All strains were cultured at 15" C (+0.3" C variation) under a 12:12 h LD regime in incubators. The growth of the cultures was monitored by de- termining cell counts with a Coulter multisizer. The mean stan- dard deviation of replicated cell counts for 90 samples was 3.4%. There was little or no lag phase after transfer so the cells were actively growing. All cultures were harvested during logarithmic growth after about 2-3 days growth in the experimental culture flasks. Preliminary biomarker analyses identified a significant de- gree of variation in lipid distributions between replicate cultures of the same strain. Therefore, two or three replicates of each strain were cultured for biomarker analyses in different experi- mental run groups.
Each batch culture was subsampled upon harvest for morpho- metric studies, genetic analyses (Medlin et al. 1994, Barker et al. 1995), bulk inorganic and organic carbon, lipids, and pigments (Mantoura et al., unpubl. results). Samples for particulate organic carbon (POC) and particulate organic nitrogen (PON) analyses and particulate calcium were filtered onto precombusted (375' C for > 12 h) 25-mm GFF filters (Whatman) until analysis. The GFF filters for C/N and calcium analyses were then rinsed with clean culture media and stored at less than -20" C until analysis. Samples for lipids were filtered onto precombusted 47-mm GFF filters using an all-glass Millipore filtration unit. The filters were placed in precleaned ("Nochromix," Godax Laboratories, New York) Pyrex test tubes fitted with Teflon liners in Teflon caps, and the tubes were filled with the extraction solvent (2:l chlo-

274 MAUREEN H. CONTE ET AL.
TABLE 2. E. huxleyi and G. oceanica strains analyzed. (B) indicates T@e B coccolith morphology. Symbols used infigures aregivm in parmtkses.
Collection temperature E. huxlcyi Culture Colldon Collection
urain collection' location date c C)
NE Atlantic, Iceland Basin (0)
G1779Ga PML 60'0'N, 20"o'W Jun 89 9.8 G1779Ge PML 60'0'N. 20OO'W Jun 89 9.8 DW60/3/8 PML 61"74'N, 22'49'W Jun 91 12.5 DW6 1/3/16 PML 5 1'4 1 'N, 1 5'53'W JuI 91 12.5 DW6 1 / 12/6 PML 61'05'N, 20'00'W JuI 91 12.4 DW61/67/5 PML 60°41'N, 20'16'W Ju191 12.9 DW61/87/17 PML 56"14'N, 19'58'W Ju191 13.8
5/90/25g PML 48'20'N, 17'33'W May 90 14.3 NE Atlantic, temperate (0)
NE Atlantic, subtropical (0)
Sargasso Sea (0)
DW53/74/6 PML 2427'N, 20'24'W Oct 90 21.8
M181b PML 32'N, 62OW Jun 87 ndc MCH-1 (B) BIG "Off Bermuda" Jan 67 nd
CH25/90 (B) NIOZ 57'26'N, 06'13'E Ju190 nd 92D (B) PML 50'02'N, 04'22'W Jun 75 nd 92E PML. 49"52", 06'12'W Jun 92 nd
88COCCO BIG Gulf of Maine JuI 88 nd 88E BIG Gulf of Maine Ju188 nd
English Channel/North Sea (A)
Gulf of Maine (0)
SW Norwegian fjords (m) B92/ 1 1 PML MESOSd: prebloom Apr 92 7.8
B92/131 PML MESOSd: midbloom May 92 10.2
B92/2 1 PML 60'26'N, 5'38'E Apr 92 nd (Trengereid)
B92/317 PML MESOSd: midbloom May 92 13.4
S-AFRICA WITS 29'49'S, 31'01'E Mar 83 nd
VAN55 NEPCC 50'1 l'N, 145'57'W nd nd VAN556 NEPCC 49'40'N, 144'40'W nd nd
EH2 TSUKUBA Great Barrier Reef, Dec 90 nd
Indian Ocean, subtropical ( X )
NE Pacific, temperate (+)
SW Pacific, subtropical (A)
Australia G. oceanica strains (0)
EH 1 TSUKUBA Great Barrier Reef, Dec 90 nd
GO 1 TSUKUBA 41'N, 141'E Oct 91 nd Australia
* PML, Plymouth Marine Laboratory (UK); BIG, Bigelow Marine Laboratory (USA); WITS, University of Witwatersrand, Johan- nesburg (South Africa); NIOZ, Netherlands Institute of Sea Research (NIOZ), Texel (The Netherlands): NEPCC, Northeast Pacific Cultur; Collection, University of British Columbia (Canada); TSUKUBA, University of Tsukuba (Japan).'
Bigelow strain designation 1 A 1. nd, no details. MESO isolated from mesocosm enclosures; see text.
roform: methanol). The lipid samples were stored at less than -20" C until analysis. Filter blanks (CFF filters rinsed with clean culture media only) were made for each run group.
Sample filters for POC and PON determinations were dried at 60' C and preacidified using high-purity sulphurous acid (Al- drich) to remove carbonates. POC and PON were analyzed on a Carlo Erba CN analyzer (combustion temperature 1000' C). Par- ticulate Ca was analyzed by atomic adsorption spectroscopy. Ca measurements also include detached coccoliths suspended in the medium. Values for all analyses were blank-corrected using media + GFF blanks taken at harvest for each run group.
Lifiid analyses. Lipid analytical methods are detailed in Conte
et al. (1992, 1995). Briefly, lipids were extracted in 2:1 chloro- form :methanol using ultrasonication and separated from non- lipid components by washing with 0.88% aqueous KCI (Folch et al. 1957). The lipid extract was dried by passing it through com- busted Na,SO, and evaporated to just dryness. Lipids were trans- esterified using 5% methanolic HCI in toluene (55" C for 12 h; Christie 1982). The transesterified products were extracted into hexane. Just prior to gas chromatography, the sample was trans- methylsilylated under N, using BSTFA in pyridine to derivatize free sterols (and other compounds containing OH groups). The reagents were evaporated, and the sample was taken up in CH,CI, for gas chromatography. Samples were analyzed on a 50-m-x-
LIPID BIOMARKERS IN EMILIANIA HUXLEYI AND GEPHYROCAPSA OCEANICA 275
0.32-pm Chrompack CPSil5CB (0.25-pm film) column using a Carlo Erba 5160 gas chromatograph fitted with on-column in- jection. The gas chromatograph was programmed from 50" to 150°C at lO".min-I and from 15" to 310°C at 4".min-'. H, was used as the carrier gas. Compounds were quantified using Min- ichrom (VG Scientific) data acquisition/chromatography soft- ware. Compounds were identified by gas chromatography-mass spectrometry (GC-MS) using a Finnigan 4500 quadrupole mass spectrometer in electron impact mode (70 eV, emission current 350 mA, 1 scan.s-'). Gas chromatography conditions for GC-MS were identical except that He was used as the carrier gas.
a /
RESULTS
We observed a large amount of variability among replicate cultures of the same strains. Variations in cellular concentrations of carbon and lipid bio- markers were proportional to cell density at harvest, suggesting that cultures in which cell density was low had larger mean cell size. However, variations in alkenone, alkenoate, and alkene biomarker com- position could not be attributed to measured differ- ences in growth temperature or other culture vari- ables. The variability among replicate cultures in alkenone ratios especially was unexpected, as it is believed that alkenone and alkenoate distributions are primarily controlled by growth temperature.
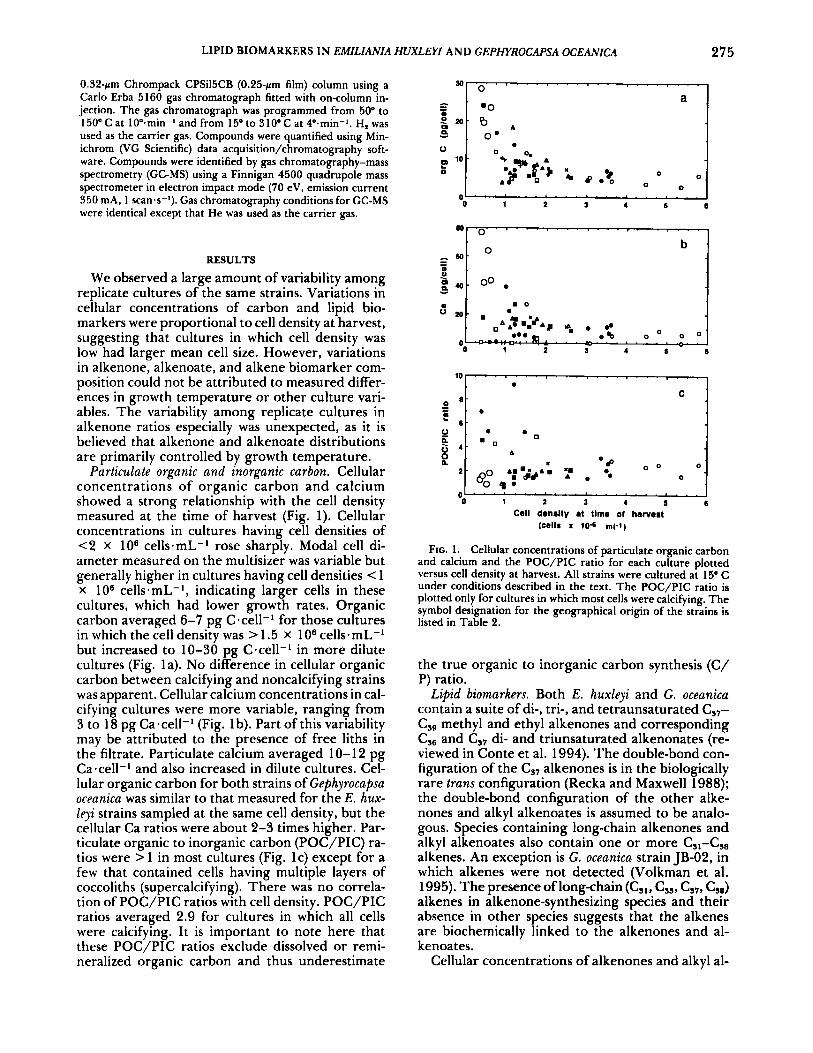
Particulate organic and inorganic carbon. Cellular concentrations of organic carbon and calcium showed a strong relationship with the cell density measured at the time of harvest (Fig. 1). Cellular concentrations in cultures having cell densities of <2 x lo6 cells-mL-I rose sharply. Modal cell di- ameter measured on the multisizer was variable but generally higher in cultures having cell densities < 1 x lo6 cells.mL-', indicating larger cells in these cultures, which had lower growth rates. Organic carbon averaged 6-7 pg C.cel1-l for those cultures in which the cell density was > 1.5 X lo6 cells.mL-' but increased to 10-30 pg C-cell-l in more dilute cultures (Fig. la). No difference in cellular organic carbon between calcifying and noncalcifying strains was apparent. Cellular calcium concentrations in cal- cifying cultures were more variable, ranging from 3 to 18 pg Ca-cell-l (Fig. 1 b). Part of this variability may be attributed to the presence of free liths in the filtrate. Particulate calcium averaged 10-12 pg Ca-cell-' and also increased in dilute cultures. Cel- lular organic carbon for both strains of Gephyrocapsa oceanica was similar to that measured for the E. hux- 1eji strains sampled at the same cell density, but the cellular Ca ratios were about 2-3 times higher. Par- ticulate organic to inorganic carbon (POC/PIC) ra- tios were > 1 in most cultures (Fig. lc) except for a few that contained cells having multiple layers of coccoliths (supercalcifying). There was no correla- tion of POC/PIC ratios with cell density. POC/PIC ratios averaged 2.9 for cultures in which all cells were calcifying. It is important to note here that these POC/PIC ratios exclude dissolved or remi- neralized organic carbon and thus underestimate
101 . . . ' . ' . ' .
c l Cell density at time of harvert
(cells x 10-6 ml-1)
FIG. 1 . Cellular concentrations of particulate organic carbon and calcium and the POC/PIC ratio for each culture plotted versus cell density at harvest. All strains were cultured at 15" C under conditions described in the text. The POC/PIC ratio is plotted only for cultures in which most cells were calcifying. The symbol designation for the geographical origin of the strains is listed in Table 2.
the true organic to inorganic carbon synthesis (C/ P) ratio.
Lipid biomarkers. Both E. huxleyi and G. oceanica contain a suite of di-, tri-, and tetraunsaturated CS7- Cs9 methyl and ethyl alkenones and corresponding c36 and CS7 di- and triunsaturated alkenonates (re- viewed in Conte et al. 1994). The double-bond con- figuration of the CS7 alkenones is in the biologically rare trans configuration (Recka and Maxwell 1988); the double-bond configuration of the other alke- nones and alkyl alkenoates is assumed to be analo- gous. Species containing long-chain alkenones and alkyl alkenoates also contain one or more C,,-C,, alkenes. An exception is G. oceanica strain JB-02, in which alkenes were not detected (Volkman et al. 1995). The presence of long-chain (C,,, Css, Cs7, Cs8) alkenes in alkenone-synthesizing species and their absence in other species suggests that the alkenes are biochemically linked to the alkenones and al- kenoates.
Cellular concentrations of alkenones and alkyl al-

2'76 MAUREEN H. CONTE ET AL.
0
8
0 1 2 3 4 6 6
(cellr x 10-6 ml-1) Cell dmelty at tlmr of harveat
0
A 0 .
m 00
Q 0 0
0
C '
0 ;
0 ,
0 '
1
"0 1 2 3 4 5 6
" L 1 A 2
A - 92D
1 1 3
4 , o o , : / 5 6
Coll drnelty at tlmr of harvrrt (cells x 10-8 ml-1)
FIG. 2. C17-CIp alkenones and Cs,, and C,7 alkyl alkenoates for individual culture replicates versus cell density at harvest. The symbol designation for the geographical origin of the strains is listed in Table 2. a) Cellular concentrations of total longchain alkenones and alkyl alkenoates. b) Total long-chain alkenones and alkyl alkenoates as a percentage of cellular organic carbon. c) Alkyl alkenoates as a percentage of total longchain alkenones and alkyl alkenoates. d) Tetraunsaturated C17 and Cm alkenones as a percentage of total long-chain alkenones and alkyl alkenoates. Error bars are 1 SD of gas chromatography replicate measurements.
kenoates in E. huxleyi cultures ranged from 0.2 to 1.5 pgvcell-l (Fig. 2a). The higher cellular concen- trations are comparable to those observed in E. hux- leqi blooms in the North Atlantic (Conte and Eglin- ton 1993, Conte et al., unpubl. results), but they are slightly lower than those observed in induced E. huxleyi blooms in mesocosm studies in a Norwegian fjord (Conte et al. 1995). As with organic carbon, replicate cultures of the same strain showed large differences in cellular concentrations. Cellular con- centrations of alkenones and alkenoates increased in cultures having cell densities at harvest of <2 x 1 O6 cells-mL-I, presumably due to the larger mean cell size in these cultures. Total alkenones and al- kenoates as a percentage of cellular organic carbon was quite variable and ranged from 2.5 to 15% (Fig. 2b). In cultures containing >1.5 x lo6 cells.mL-l, alkenones and alkenoates averaged about 5% of or- ganic carbon. These values are about 60% of the cellular levels of alkenones reported by Prahl et al. ( 1 988) for their cultures.
Due to the high variability among replicate cul- tures, no significant difference in total alkenone and alkenoate concentrations, on either a per cell or percentage of carbon basis could be detected among E. huxleyi strains isolated from the different geo- graphical regions. Cultures grown at more extreme temperatures or tighter control of culturing con- ditions and timing of harvesting may yet reveal ge- netic differences among the strains.
Alkyl alkenoates comprised from 6 to 22% of the total (Fig. 2c). Both G. oceanica strains tended to have lower alkenoate abundances than the E. huxleyi strains. T h e lower relative abundance of alkenoates in the G. oceanica strains examined here contrasts with the higher alkenoate abundances found for G. oceanica strain JB-02 from eastern Australia waters (Volkman et al. 1995).
Significant differences among the strains were found for the relative abundances of tetraunsatur- ated alkenones. Oceanic strains of E. huxleyi and G. oceanica contained low levels of tetraunsaturated al- kenones, whereas some coastal strains from the Gulf of Maine and Norwegian fjord and the English Channel strain 92D contained tetraunsaturated al- kenone abundances 2-5 times higher (Fig. 2d). As with the di- and triunsaturated alkenones and al- kenoates, abundances of tetraunsaturated alkenones varied among different culture replicates (e.g. strains B92/131, B92/317, and 92D). This indicates that tetraunsaturated alkenone abundance is controlled by environmental factors in addition to genetic makeup.
Large differences were observed between repli- cate cultures in biomarker indices for CS7 and C,, methyl alkenone unsaturation (Uk',7 and UkSBMe, re- spectively; Table 1) and for AA,, (Table l) , an index of alkenoate abundance (Fig. 3). Given this vari- ability, we could not detect strain-related differ- ences. T h e variability in biomarker indices within a
LIPID BIOMARKERS IN EMILIANIA HUXLEYI AND GEPHYROCAPSA OCEANICA 277
0.6 1 I
1 . I-. . , . . : : : : : : : : : : : : : : : .........................
0.9
02 " ' ~ ' ~ ' " ~ "
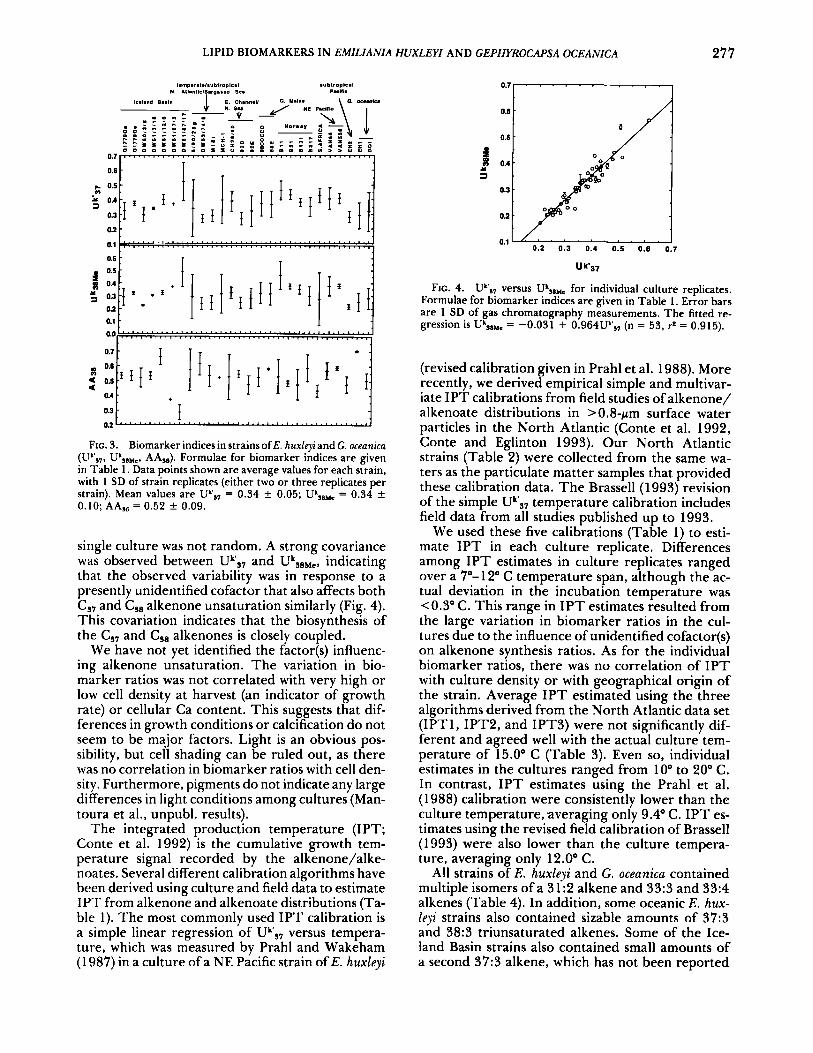
FIG. 3. Biomarker indices in strains of E. huxleyi and G. oceanica (U",?, Uk,aHL, AA,,). Formulae for biomarker indices are given in Table 1. Data points shown are average values for each strain, with 1 SD of strain replicates (either two or three replicates per strain). Mean values are Uk',? = 0.34 k 0.05; Uk,8He = 0.34 k 0.10; AA,, = 0.52 k 0.09.
single culture was not random. A strong covariance was observed between Uk'37 and UkSBMc, indicating that the observed variability was in response to a presently unidentified cofactor that also affects both CS7 and C,, alkenone unsaturation similarly (Fig. 4). This covariation indicates that the biosynthesis of the Cs, and Cs8 alkenones is closely coupled.
We have not yet identified the factor@) influenc- ing alkenone unsaturation. The variation in bio- marker ratios was not correlated with very high or low cell density at harvest (an indicator of growth rate) or cellular Ca content. This suggests that dif- ferences in growth conditions or calcification do not seem to be major factors. Light is an obvious pos- sibility, but cell shading can be ruled out, as there was no correlation in biomarker ratios with cell den- sity. Furthermore, pigments do not indicate any large differences in light conditions among cultures (Man- toura et al., unpubl. results).
The integrated production temperature (IPT; Conte et al. 1992) is the cumulative growth tem- perature signal recorded by the alkenone/alke- noates. Several different calibration algorithms have been derived using culture and field data to estimate IPT from alkenone and alkenoate distributions (Ta- ble 1). The most commonly used IPT calibration is a simple linear regression of Uk'37 versus tempera- ture, which was measured by Prahl and Wakeham ( 1 987) in a culture of a NE Pacific strain of E. huxleyi
0.6 .
0.5 -
i 3 0.4 . Y 3
0.3 .
0 2 .
0.2 0.3 0.4 0.6 0.6 0.7
Uk.37
FIG. 4. UVs7 versus Uk,a,, for individual culture replicates. Formulae for biomarker indices are given in Table 1. Error bars are 1 SD of gas chromatography measurements. The fitted re- gression is UkSllMe = -0.031 + 0.964Uk,7 (n = 53, + = 0.915).
(revised calibration given in Prahl et al. 1988). More recently, we derived empirical simple and multivar- iate IPT calibrations from field studies of alkenone/ alkenoate distributions in >0.8-pm surface water particles in the North Atlantic (Conte et al. 1992, Conte and Eglinton 1993). Our North Atlantic strains (Table 2) were collected from the same wa- ters as the particulate matter samples that provided these calibration data. T h e Brassell (1993) revision of the simple Uk',, temperature calibration includes field data from all studies published up to 1993.
We used these five calibrations (Table 1) to esti- mate IPT in each culture replicate. Differences among IPT estimates in culture replicates ranged over a 7"- 12" C temperature span, although the ac- tual deviation in the incubation temperature was C0.3" C. This range in I P T estimates resulted from the large variation in biomarker ratios in the cul- tures due to the influence of unidentified cofactor(s) on alkenone synthesis ratios. As for the individual biomarker ratios, there was no correlation of IPT with culture density or with geographical origin of the strain. Average IPT estimated using the three algorithms derived from the North Atlantic data set ( IPTl , IPT2, and IPT3) were not significantly dif- ferent and agreed well with the actual culture tem- perature of 15.0" C (Table 3). Even so, individual estimates in the cultures ranged from 10" to 20" C. In contrast, IPT estimates using the Prahl et al. ( 1 988) calibration were consistently lower than the culture temperature, averaging only 9.4" C. IPT es- timates using the revised field calibration of Brassell (1993) were also lower than the culture tempera- ture, averaging only 12.0" C.
All strains of E. huxleyi and G. oceanica contained multiple isomers of a 3 1:2 alkene and 33:3 and 33:4 alkenes (Table 4). In addition, some oceanic E. hux- 1eqi strains also contained sizable amounts of 37:3 and 38:3 triunsaturated alkenes. Some of the Ice- land Basin strains also contained small amounts of a second 37:3 alkene, which has not been reported

278 MAUREEN H. CONTE ET AL.
TABLE 3. IPT estimates for culture experiments. IPT algorithms are listed in Table 1. The measured temperature in the incubator during the experiments was 15.0' f 0.3" C. The variability in IPT estimates indicates the injluence of a secondary cofactor that, in addition to tem- perature, controlled alkenone unsaturation ratios in these cultures.
Calibration Range Mean SD
IPT 1 12.5-19.8 15.3 1.5 IPT2 1 1.6-20.6 16.2 1.6 IPT3 10.6-19.1 14.9 1.5 IPT4 7.8-1 8.8 12.0 2.3 P&W 4.9-16.9 9.4 2.5
in previous studies (e.g. Volkman et al. 1980). Small amounts of 37:3 and 38:3 alkenes were detected in one but not both cultures of G. oceanica strain GO 1, suggesting that the synthesis of these compounds is also, in part, physiologically controlled.
As with the alkenones and alkenoates, the cellular abundances of the total alkenes varied inversely with culture density (Fig. 5a). Cellular abundances av- eraged 0.005-0.015 pg-cell-' for most cultures and were significantly higher in strains that contained C37 and CS8 alkenes. Alkenes comprised from 0.25 to 1 .O% of cellular organic carbon in strains lacking CS7 and Cs8 alkenes but up to 2-3% of organic car- bon in strains that contained C3, and CS8 alkenes (Fig. 5b). Gephyrocapsa oceanica contained alkenes at
TABLE 4. Long-chain alkene distributions. Distribution data are shown as the percentage of total a l h e s . The compound designation is carbon number: number of double bonds. Values shown are meansfor each strain. + indicates that the compound comprises <0.5% of total a l h e s . The a l h e s are listed in order of elution on a CPSilSCB column. Locations of double bonds were not determined. No analyses were made for strains G1779Ga, MCH-I, or B92149.
Akene E. h u x y Z ALK
strain 31:P 31:P 31:P 31:P 33:4 33:s 33:4 33:s 33:4 37:s 3 7 3 383 @g.cell-') % POC
NE Atlantic, Iceland Basin G1779Ge 6 -b DW60/3/8 11 3 DW6 1/12/6 2 1 DW61/3/16 3 2 DW61/67/5 2 3 DW61/87/17 14 2
5/90/25g 6 5 NE Atlantic, temperate
NE Atlantic, subtropical
Sargasso Sea
English Channel/North Sea
DW53/74/6 18 -
Ml8l 15 +
C H 2 5/90 2 4 92 D 16 - 92E 8 5
88COCCO 6 3 88E 5 4
B92/11 10 1 B92/131 7 4 B92/21 7 2 B92/317 9 6
%AFRICA 18 1
VAN55 1 1 VAN556 1 +
EH2 5
EH 1 11 5 GO 1 12 4
Gulf of Maine
Norwegian fjords
Indian Ocean, subtropical
NE Pacific, temperate
NW Pacific, subtropical
G. oceanica strains
48 41 10 10 9
28
36
53
51
21 44 22
17 27
30 32 31 35
60
4 5
44
34 25
2 4 1 2 2 1
2
3
1
3
3 -
+ 2
- 2
3 -
-
1 +
3
4 25
- 3 1 + 3 2
2
2
2
+ - -
13 6
6 6
19 5
3
+ + -
- -
5 - - - 0.02 0.34 11 4 25 14 9 13 2 - - - 0.05 0.76 5 4 6 1 48 5 16 0.38 1.52 6 3 6 1 47 1 18 0.15 0.84 5 1 9 2 46 1 18 0.11 0.81
10 3 6 1 15 4 14 0.55 1.48
12 17 17 3 - - - 0.02 0.27
10 4 6 4 - - - 0.02 0.27
11 5 9 7 - - - 0.01 0.22
4 5 11 2 39 - 10 0.04 0.30 15 15 8 1 - - - 0.01 0.07 5 10 5 1 31 - 11 0.05 1.16
26 16 18 2 - - - 0.04 0.33 13 16 24 3 - - - 0.02 0.25
20 10 19 5 - - - 0.04 0.27 12 17 15 3 - - - 0.04 0.70 16 8 17 1 - - - 0.01 0.21 12 15 13 2 - - - 0.02 0.25
7 3 5 3 - - - 0.07 0.80
3 2 5 1 68 - 18 0.21 2.08 2 1 5 1 67 - 18 0.18 2.43
12 6 7 6 - - - 0.03 0.47
17 6 17 6 - - - 0.13 0.64 10 4 14 3 3 - 1 0.10 0.52
a Includes a small amount of an unidentified coelutant. Not present or trace component.

279 LIPID BIOMARKERS IN EMILIANIA HUXLEYI AND GEPHYROCAPSA OCEANICA
:= "/" A , , , , , , ~ , , , . ol L . A . e m 0
0 1 2 3 4 5 6 0.0
t b l
2 3 4 5 8 1 -
0 1 Cell denrlty mt Ilma of hiwas1
(eella I 104 ml-1)
FIG. 5. Long-chain C,,, C,,, C,,, and C,, alkenes. The symbol designation for the geographical origin of the strains is listed in Table 2. a) Cellular concentrations (pg.cell-l) of total alkenes in individual cultures plotted against cell concentration at the time of harvest. b) Total alkenes as the percentage of organic carbon.
cellular concentrations comparable to E. huxleyi and had similar alkene distributions to other oceanic strains, providing further evidence that these genera are closely related.
Alkene distributions showed significant differ- ences among the strains. Again, differences primar- ily separated neritic versus open ocean strains. The coastal Gulf of Maine and Norwegian fjord strains all lacked Cs7 and C,, alkenes. Furthermore, these strains had consistently lower CSI alkenes relative to the Css alkenes [C,,/(C,, + Css)] than other strains (Fig. 6a). In contrast, oceanic strains containing Cs7 and C,, alkenes had the highest C,,/(Csl + CSs) alkene ratios, and this ratio was strongly correlated with Cs7 and C,, alkene abundance (Fig. 6b). Rep- licate cultures of strains CH25/90 (North Sea) and 92E (Isles of Scilly, NE Atlantic) showed large dif- ferences in abundance of CS7 and C,, alkenes, in- dicating that alkene distributions also varied, in part, in response to environmental or physiological vari- ables.
The relative ratio of the tri- to tetraunsaturated C,, alkenes [2(33:3)/X(33:4)] also showed small but significant differences between neritic and oceanic strains (Fig. 6c). The 2(33:3)/2(33:4) ratio was con- sistently lower in coastal Gulf of Maine and Nor- wegian strains, ranging from about 0.25 to 1.0. The 2(33:3)/2(33:4) ratio in coastal Gulf of Maine and Norwegian fjord strains, but not in the oceanic strains, was also correlated with Uk's7. The corre- lation of this ratio with Uk',, suggests that alkene unsaturation in these strains is also controlled in part by the same factors that control alkenone unsatur- ation.
1.01. . - . . . . , . . . , . . . . . . . . . . . I
0 10 20 30 4 0 5 0 6 0 7 0 8 0 9 0 100
c37 + C38 alkanes (W of total rlkenes)
3.51 - . . . . I . , ,
0.0' . . ' . ' . I -
0.20 0.30 0.40 0.50 0.60
u k'37
FIG. 6. Alkene ratios. The symbol designation for the geo- graphical origin of the strains is listed in Table 2. a) Ratio of sum total C,, alkenes to total C,, + C,, alkenes [ q 3 1)/E(3 1 + 33)] in individual cultures plotted against cell density at harvest. The range encompassing the coastal Gulf of Maine and Norwegian fjord strains is circled. b) Ratio of C,, alkenes to total C,, + C,, alkenes versus total C,, + C,, alkenes as a percentage of total alkenes. The line shown is the best fit line for strains containing significant concentration of C,, and C,, alkenes (y = 0.67 + O.O029x, n = 13, I* = 0.89). c) Ratio of sum total 33:3 to total 33:4 [2(33:3)/2(33:4)] versus U",,. The regression line shown is for coastal Gulf of Maine and Norwegian fjord strains, shown here by solid squares (y = -1.14 + 4.86x, n = 12, r* = 0.63).
DISCUSSION
The POC/PIC ratio, which in our cultures pre- sumably provided a lower limit on the photosynthe- sis to calcification ratio, was >1 in most cultures, indicating that net photosynthesis exceeded calcifi- cation under these conditions. This implies that all intracellular CO, generated by calcification (Paasche 1964, Sikes et al. 1980, Nimer and Merrett 1992) was used to meet photosynthetic demands and that no excess C 0 2 was released into the surrounding medium. If these ratios are representative of those in natural waters, E. huxleyi production would not generally constitute a CO, source in surface waters, although calcification, which provides an alternative intracellular CO, source for photosynthesis, will re- duce the amount of C 0 2 drawdown.
280 MAUREEN H. CONTE ET AL.
Overall, only small differences were found in bio- marker profiles among the E. huxleyi and G. oceanica strains examined here, in spite of the fact that the strains originated from oceanic regions as diverse as the Iceland Basin and subtropical, oligotrophic Pa- cific. Strain differences were most apparent in the relative abundances of tetraunsaturated alkenones and in alkene profiles, which tended to separate ne- ritic strains from oceanic strains. This division be- tween neritic and oceanic strains was also observed in pigment profiles, with neritic strains having a higher fucoxanthin to 19’-hexanoylfucoxanthin ra- tio (Mantoura et al., unpubl. results). Divergence between neritic versus oceanic strains has previously been reported in reproductive rates and isozyme banding patterns in the marine diatom Thalassiosira pseudonana (Brand et al. 1981).
N o significant differences in lipid profiles were apparent between calcifying and noncalcifying cells, in agreement with the results of Volkman et al. (1980), or between cells having Type A or B mor- phology. These results are in agreement with mo- lecular genetic evidence (Medlin et al. 1994) that suggests that Type A and B morphotypes are not distinct subspecies (cf. van Bleijswijk et al. 1991).
Differences in biomarker profiles among strains isolated from the same area were often as large as those between biogeographically separated strains. For example, large differences were found among Norwegian fjord strains in tetraunsaturated alke- none abundance and among Iceland Basin strains in alkene profiles. This diversity is consistent with RAPD analyses indicating genetically diverse pop- ulations within these North Atlantic regions (Medlin et al. 1994, Barker et al. 1995) and the results of Brand (1 982), who demonstrated genetic differ- ences in reproductive rates among E. huxleyi clones isolated from the same Sargasso Sea population. Similarly, Brand et al. (1981) also found significant genetic differences in reproductive rates and in elec- trophoretic mobility of isozymes within a population of the diatom Thalassiosira pseudonana isolated from a single water bottle. Our results provide additional evidence for genetic diversity within oceanic phy- toplankton populations.
We observed only small differences in lipid bio- marker profiles between E. huxleyi and G. oceanica. This similarity between G. oceanica and E. huxleyi biomarker distributions is consistent with morpho- logical and paleontological inferences (reviewed in Marlowe et al. 1990) and recent molecular genetic evidence (Fujiwara et al. 1994) that the two genera are very closely related. Further studies of other Gephyrocapsa species and strains are clearly needed to define the alkenone/alkenoate versus tempera- ture relationship(s) for this genus. The four G. ocean- ica strains examined to date (this study, Volkman et al. 1995, M. H. Conte, unpubl. results) indicate sig- nificant genetic diversity in G. oceanica, as found for E. huxleyi.
The differences we observed in tetraunsaturated abundances among the strains in culture are consis- tent with field observations from the collection lo- cations. Low levels of tetraunsaturated alkenones were found in >0.8-pm surface water particles in subarctic waters of the eastern North Atlantic (Conte and Eglinton 1993), whereas tetraunsaturated al- kenones were abundant in Norwegian fjord particles collected at similar water temperatures (Conte et al. 1995). The low abundances of tetraunsaturated al- kenones in the oceanic strains examined is also con- sistent with the near absence of these compounds in the underlying oceanic sediments (Marlowe et al. 1990).
The anomalously high abundances of tetraunsat- urated alkenones in strain 92D relative to oceanic strains provides an explanation for earlier discrep- ancies between the temperature calibration work of Marlowe (1984) and Prahl et al. (1988). In his initial culture studies, Marlowe (1984) used the English Channel strain 92D whereas Prahl et al. (1988) used an unidentified NE Pacific strain. Extending Mar- lowe’s work, Brassell et al. (1 986b) included a term for 37:4Me concentration in the original index for CS7 alkenone unsaturation (Uks,; Table 1). Prahl et al. (1988) found that the correlation with temper- ature in their cultures was improved using a modi- fied UkS7 ratio (VS7; Table 1) that omitted the 37:4Me term. In contrast, the correlation with tem- perature in Norwegian fjords is best when the orig- inal UkS7 ratio, which includes the 37:4 term, is used (Conte et al. 1995). The difference in the goodness of fit seen between Uk’S7 and UkS7 in these two studies is consistent with our culture findings: both 92D and Norwegian fjord strains contain significant abun- dances of the tetraunsaturated alkenones, whereas the NE Pacific and other oceanic strains do not. These culture results indicate that in strains in which tetraunsaturated alkenones are relatively abundant the biochemical response to temperature involves major adjustment of the levels of tetraunsaturated as well as di- and triunsaturated alkenones.
The extreme variability observed here in bio- marker ratios among replicate cultures of the same strain provides conclusive evidence that unsatura- tion ratios of both CS7 and CS8 methyl alkenones are controlled by variable(s) in addition to temperature. Two possible factors are suggested by our study. We used seawater from an offshore coastal location to make the culture media. The dissolved organic car- bon and trace nutrient composition of this seawater, which would be expected to vary over the course of the experiments, could have had an influence on biomarker synthesis. However, we did not observe any systematic differences between culture run batches, suggesting that the difference in seawater composition was not a factor. Alternatively, the stage of the growth cycle or growth conditions could have varied among cultures. Dunstan et al. (1 993) found that cellular alkenone concentrations in the hapto-
LIPID BIOMARKERS IN EMILIANIA HUXLEYI AND GEPHYROCAPSA OCEANICA 28 1
phyte Zsochrysis galbana were sensitive to culture age and growth conditions. We tried to ensure that the cells were harvested in the log phase of growth; nevertheless, some of the cultures may have been later in the growth cycle than others. We did not observe, however, any consistent difference in bio- marker ratios between replicate cultures with high or low final cell densities, suggesting that growth rate per se, as reflected by final cell density, had not strongly affected the biomarker profiles in our cul- tures.
The influence of additional factor(s) controlling alkenone unsaturation ratios may account in part for the variation in Uks7 and UkSBMe seen in natural waters, especially at lower temperatures (Conte and Eglinton 1993, Sikes and Volkman 1993, Conte et al. 1995). It is important to note that the variability in biomarker ratios observed in these cultures great- ly exceeds that observed in surface water particles, suggesting that this variation is largely averaged out in the natural environment.
While this variability obscured more subtle strain- related differences in alkenone/alkenoate profiles, it allowed us to examine the biochemical adjust- ments of biomarker distributions in response to the forcing variable(s). The nearly perfect covariance observed between Uk’s7 and UksEMe (Fig. 4) indicates that CS7. and Cs8 methyl alkenone unsaturation is biochemically linked and that the biochemical re- sponse to this cofactor is essentially identical in all E. huxleyi and G. oceanica strains. Similar covariation in degree of unsaturation has also been observed in >0.8-pm surface water particles from the North At- lantic (Conte and Eglinton 1993) and Norwegian fjords (Conte et al. 1995) and in sediments from the NE Atlantic (Madureira et al. 1995).
Alkene distributions also varied in a systematic fashion in the cultures. In Gulf of Maine and Nor- wegian fjord strains, the unsaturation ratio of the C,, alkenes was positively correlated with UkS7, sug- gesting that the alkene and alkenone unsaturation in these neritic strains is controlled by similar fac- tors. In contrast, oceanic strains did not show any correlation of Css unsaturation with Uk’s7. Instead, those strains that contained Cs7 + Cs8 alkenes showed a close correlation in the relative abundance of Csl versus C,, alkenes and total Cs7 + Cs8 alkene abun- dance. These observations, as well as the greater significance of tetraunsaturated alkenones in some neritic strains, suggest that the oceanic and neritic populations have genetically diverged to a greater extent than strains from different ocean basins.
Our results have several implications for the re- finement of alkenone/alkenoate temperature cali- brations for use in paleoclimatic studies. First, field studies should be used to calibrate the alkenone/ alkenoate versus temperature response, as culture calibrations of a single strain may not be represen- tative of the alkenone-synthesizing population as a whole and additional cofactor(s) that also influence
alkenone unsaturation patterns may not be repre- sentative of the natural environment. In this regard, it is remarkable that the culture calibration of Prahl et al. (1988) agrees so closely with field data. Second, the strong covariance between UkS7 and UkSBMe pro- vides further support for the use of multivariate temperature calibrations (Table 1) to reduce mea- surement errors. The redundancy of the two inde- pendent measurements is advantageous for calibra- tion as estimation error associated with measure- ment of a single variable are minimized. Routine analysis of both ratios in cores, as well as the alke- noate abundance ratio (AASB), could easily identify outliers and coelution problems resulting in erro- neous biomarker indices and reduce analytical scat- ter in IPT estimates.
Our study provides strong evidence that the al- kenones, alkenoates, and alkenes are biochemically linked and vary in a coordinated manner in response to unknown environmental variables in addition to temperature. Only small differences in alkenone/ alkenoate distributions within the E. huxleyi strains and between G. oceanica and E. huxleyi were detected under the culture conditions used here. Differences observed between clones isolated from the same wa- ter mass were as great as those among biogeograph- ically separated strains. The lack of strong diver- gence among oceanic strains suggests that E. huxleyi has the genetic plasticity to respond physiologically over the range of environmental conditions found in open ocean waters. In contrast, both lipid and pigment (Mantoura et al., unpubl. results) profiles suggest that E. huxleyi populations have diverged in response to differences between the coastal and oce- anic environment. We thank L. A. S. Madureira, R. Jordan, R. Harris, and R. Head for assistance with collections on BOFS cruises and S. Brown and R. Green for assistance with laboratory analyses. We also thank R. L. A. Andersen (Bigelow Laboratory), R. N. Pienaar (Uni- versity of Witwaterstrand), F. J. R. Taylor (University of British Columbia), and I . lnouye (University of Tsukuba), who kindly made cultures available to us. This work was supported by NERC grants GST/02/386, GR3/8139, and GR9/787 and by EC fund- ing to the MAST I1 EHUX project, contract No. MASGCTS- 0038. Support for the mass spectrometry facilities by NERC grant GR3/3758 is also acknowledged. BOFS contribution No. 248 and EHUX (MAST) contribution No. 22.
Barker, G. L. A,, Green, J. C., Hayes, P. K. & Medlin, L. K. 1995. Preliminary results using the RAPD analysis to screen bloom populations of Emiliania huxlqri (Prymnesiophyceae). Sarsia (in press).
Brand, L. E. 1982. Genetic variability and spatial patterns of genetic differentiation in the reproductive rates of the ma- rine coccolithophorids Emiliania huxleyi and Gephyrocapsa oceanica. Limnol. Oceanogr. 27:236-45.
Brand, L. E., Murphy, L. S., Guillard, R. R. L. & Lee, H-T. 1981. Genetic variability and differentiation in the temperature niche component of the diatom Thalassiosira pseudonana. Mar. Biol. (Berl.) 62:lOl-10.
Brassell, S . C. 1993. Applications of biomarkers for delineating marine paleoclimatic fluctuations during the Pleistocene. In Engel, M . H. & Macko, S. A. [Eds.] Organic Geochemisty:

282 MAUREEN H. CONTE ET AL.
Principles and Applications. Plenum Press, New York, pp. 699- 738.
Brassell, S. C., Brereton, R. G., Eglinton, G., Grimalt, J., Lie- bezeit, G., Marlowe. I. T., Pflaumann, u. & Sarnthein, M. 1986a. Palaeoclimatic signals recognized by chemometric treatment of molecular stratigraphic data. Org. Geochem. 10:
Brassell, S. C., Eglinton. G., Marlowe, I. T., Pflaumann, U. & Sarnthein, M. 1986b. Molecular stratigraphy: a new tool for climatic assessment. Nature (Lond.) 320: 129-33.
Christie, W. W. 1982. Lipid Analysis. Pergamon Press, New York, 338 pp.
Conte, M. H. & Eglinton, G. 1993. Alkenone and alkenoate distributions within the euphotic zone of the eastern North Atlantic: correlation with production temperature. Deep-sea Res. 40:1935-61.
Conte, M. H., Eglinton, G. & Madureira, L. A. S. 1992. Long- chain alkenones and alkyl alkenoates as palaeotemperature indicators: their production, flux and early sedimentary dia- genesis in the eastern North Atlantic. In Eckardt, C. B., Larter, S. R., et al. [Eds.] Advances in Organic Geochemistry 1991. Org. Geochem. 19:287-98.
Conte, M. H., Thompson, A. & Eglinton, G. 1995. Primary production of lipid biomarker compounds by Emiliania hux- leyi: results from an experimental mesocosm study in Korsfjorden, southern Norway. Sarsia (in press).
Conte, M. H., Volkman, J. K. & Eglinton, G. 1994. Lipid biom- arkers of the Haptophyta. In Green, J. C. & Leadbeater, B. S. C. [Eds.] The Haptophyte Algae. Clarendon Press, Oxford,
Dunstan, G. A., Volkman, J. K., Barrett, S. M. & Garland, C. D. 1993. Changes in the lipid composition and maximization of the polyunsaturated fatty acid content of three microalgae grown in mass culture. J. Appl. Phycol. 5:71-83.
Eglinton, G., Bradshaw, S. A., Rosell, A,, Sarnthein, M., Pflau- mann, U. & Tiedemann, R. 1992. Molecular record of sec- ular sea surface changes on 100-year timescales for glacial terminations I, I1 and IV. Nature (Lond.) 356:423-6.
Farrimond, P., Poynter, J. G. & Eglinton, G. 1990. A molecular stratigraphic study of Peru margin sediments, Hole 686B, Leg 112. In Suess, E., von Huene, R., et al. [Eds.] Proceedings of the Ocean Drilling Program, Scientijic Results, Vol. 112. US. Government Printing Office, Washington, D.C., pp. 547-53.
Folch, J., Lees, M. & Sloane-Stanley, G. H. 1957. A simple meth- od for the isolation and purification of total lipids from an- imal tissues. J. Biol. Chem. 226:497-509.
Freeman, K. H. & Wakeham, S. G. 1992. Variations in the iso- topic compositions and concentrations of alkenones in Black Sea particles. In Eckardt, C. B., Larter, S. R., et al. [Eds.] Advances in Organic Geochemistry 1991. Org. Geochem. 19:277- 86.
Fujiwara, S., Sawada, M., Someya, J., Minaka, N., Kawachi, M. & Inouye, I. 1994. Molecular phylogenetic analysis of rbcL in the Prymnesiophyta. J. Phycol. 30:863-7 1.
Heimdal, B. R., Egge, J. K., Veldhuis, M. J. W. & Westbroek, P. 1995. The 1992 Norwegian Emiliania huxleyi experiment. An overview. Sarsia (in press).
Keller, M. D., Selvin, R. C., Claus, W. & Guillard, R. R. L. 1987. Media for the culture of oceanic u1traplankton.J. Phycol. 23:
Madureira, L. A. S., Conte, M. H. & Eglinton, G. 1995. The early diagenesis of lipid biomarker compounds in North At- lantic sediments. Paleoceanography (in press).
Marlowe, I. T. 1984. Lipids as palaeoclimatic indicators. Ph.D. thesis, University of Bristol, 273 pp.
Marlowe, I. T., Brassell, S. C., Eglinton, G. & Green, J. C. 1990.
661-9.
pp. 351-77.
633-8.
Long-chain alkenones and alkyl alkenoates and the fossil coccolith record of marine sediments. Chem. Geol. 88349- 75.
Medlin, L. K., Barker, G. L. A., Baumann, M., Hayes, P. K. & Lange, M. 1994. Molecular biology and systematics of the Haptophyta. In Green, J. C. & Leadbeater, B. [Eds.] The Haptophyte Algae. Clarendon Press, Oxford, pp. 393-41 1.
Nimer, N. A. & Merrett, M. J. 1992. Calcification and utilization of inorganic carbon by the coccolithophorid Emiliania hux-
Paasche, E. 1964. A tracer study of the inorganic carbon uptake during coccolith formation and photosynthesis in the coc- colithophorid Coccolithus huxleyi. Physiol. Plant. Suppl. 3: 1-82.
Poynter, J. G., Farrimond, P., Brassell, S. C. & Eglinton, G. 1989. A molecular stratigraphic study of sediments from Holes 658A and 660A, Leg 108. In Ruddiman, W., Sarnthein, M., et al. [Eds.] Proceedings of the Ocean Drilling Program, Scientijic Results, Vol. 108. U.S. Government Printing Office, Wash- ington, D.C., pp. 387-94.
Prahl, F. G., Muelhausen, L. A. & Zahnle, D. L. 1988. Further evaluation of long-chain alkenones as indicators of paleo- ceanographic conditions. Geochim. Cosmochim. Acta 52:2303- 10.
Prahl, F. G. & Wakeham, S. G. 1987. Calibration ofunsaturation patterns in long-chain ketone compositions for palaeotem- perature assessment. Nature (Lond.) 330:367-9.
Recka, J. A. &Maxwell, J. R. 1988. Characterisation of alkenone temperature indicators in sediments and organisms. In Mat- tavelli, L. & Novelli, L. [Eds.] Advances in Organic Geochemistry 1987. Pergamon Press, Oxford, pp. 727-34.
Sikes, C. S., Roer, R. D. & Wilbur, K. M. 1980. Photosynthesis and coccolith formation: inorganic carbon sources and net inorganic reaction of deposition. Limnol. Oceanogr. 25:248- 61.
Sikes, E. L. & Volkman, J. K. 1993. Calibration of long-chain alkenone unsaturation ratios for paleotemperature estima- tion in cold polar waters. Geochim. Cosmochim. Acta 52: 1883-9.
Ten Haven, H. L. & Kroon, H. 1990. Late Pleistocene sea sur- face temperature variations off Oman as revealed by the distribution of long-chain alkenones. In Prell, W. L.. Niit- suma, N., et al. [Eds.] Proceedings ofthe Ocean Drilling Program, Scientijic Results, Vol. 117. U.S. Government Printing Office, Washington, D.C., pp. 445-52.
Van Bleijswiijk, J., van der Wal, P., Kempers, R., Velduis, M., Young, J. R., Muyzer, G., de Vrindde Jong, E. & Westbroek, P. 199 1. Distribution of two types of Emiliania huxleyi (Prym- nesiophyceae) in the northeast Atlantic region as determined b immunofluorescence and coccolith morphology. J. Phycol. 2;:556-70.
Volkman, J. K., Barrett, S. M., Blackburn, S. I. & Sikes, E. L. 1995. Alkenones in Gephyrocapsa oceanica: implications for studies of paleoclimate. Geochim. Cosmochim. Acta (in press).
Volkman, J. K., Eglinton, G., Corner, E. D. S. & Sargent. J. R. 1980. Long-chain alkenes and alkenones in the marine coc- colithophorid Emiliania huxleyi. Phytochemistry 19:26 19-22.
Westbroek, P., Brown, C. W., van Bleijswijk, J., Brummer, G. J., Conte, M. H., Egge, J., Fernandez, E., Jordan, R., Knap pertsbusch, M., Stefels, J.. Veldhuis, M., van der Wal, P. & Young, J. 1993. A model system approach to biological cli- mate forcing: the example of Emiliania huxleyi. Global Plan- etary Change 8:27-46.
Winter, A., Jordan, R. W. & Roth, P. H. 1994. Biogeography of coccolithophores in oceanic waters. In Winter, A. & Sies- ser, W. G. [Eds.] Coccolithofihores. Cambridge University Press, Cambridge, pp. 161-78.
leyi. New Phytol. 121:173-7.
Copyright © 2022 FDOKUMEN