Potential acidification impacts on zooplankton in CCS leakage scenarios
Upload
independentCategory
view
4download
0
Ocean acidification reduces feeding rates in the scleractinian coralStylophora pistillata
Fanny Houlbreque,1* St�ephanie Reynaud,2 Claire Godinot,2 Francois Oberh€ansli,3
Riccardo Rodolfo-Metalpa,1 Christine Ferrier-Pages 2
1Laboratoire d’Excellence ‘Corail’, Institut de Recherche pour le D�eveloppement, UR 227, CoReUs, Noum�ea, New Caledonia2Centre Scientifique de Monaco, Monaco, Principality of Monaco3International Atomic Energy Agency, Environment Laboratories, Monaco, Principality of Monaco
Abstract
A general decline in coral calcification has been observed in response to ocean acidification. It has recently
been shown that heterotrophic feeding (the acquisition of organic nutrients) enables one massive coral spe-
cies to maintain its calcification rates while exposed to ocean acidification but the consequences of higher
seawater partial pressure of CO2 (PCO2) on coral feeding capacities themselves have never been investigated.
Exposing long-term acclimated starved and fed colonies of the major reef builder Stylophora pistillata to either
ambient pHT (8.06 6 0.05; 417 Pa PCO2) or low pHT (7.51 6 0.06; 1697 Pa PCO2
) showed that higher feeding
rates can counterbalance the negative effects of seawater acidification on coral calcification. Indeed, relative
to unfed corals under ambient pHT conditions, calcification rates in unfed corals decreased by 53.6% but
remained constant in fed corals under high PCO2conditions. Results also clearly show that acidification
affects the feeding capacity and feeding effort of the branching coral S. pistillata. Organic nutrient acquisition
was severely reduced under high PCO2, with a simultaneous decrease in the dissolved free amino acid uptake
rates, the alkaline phosphatase activities, and the feeding rates on Artemia salina nauplii. Considering that all
these processes are needed to fulfill the nutrient needs of the symbiotic association, on a long-term basis,
lower feeding rates will likely aggravate the already fragile physiological state of many corals under warmer,
more acidic conditions.
Reef-building corals, also called scleractinian corals, are scat-
tered throughout the oligotrophic tropical and subtropical
oceans. Their capacity to live in oligotrophic waters is probably
due to their polytrophic character, as they use both heterotro-
phy (incorporation of particulate and dissolved organic matter)
and autotrophy (photosynthates translocated from their symbi-
otic algae) as energy sources (reviewed by Houlbreque and
Ferrier-Pages 2009). Heterotrophy can account for more than
60% of the corals’ metabolic needs, depending on the coral spe-
cies and on the environmental conditions (reviewed by Houl-
breque and Ferrier-Pages 2009), although autotrophy is often
the primary nutrient source (Muscatine 1990).
Over the last decade, corals are facing several threats,
mainly due to human influences (Hughes et al. 2003). Rapid
increases in the atmospheric carbon dioxide concentration,
by driving global warming and ocean acidification, may be
the final danger to these ecosystems (Hoegh-Guldberg et al.
2007). These stressors may impair coral photosynthesis and
autotrophic carbon acquisition (Hoegh-Guldberg et al. 2007;
Anthony et al. 2008), and heterotrophy may act as a major
nutrient source for some coral species (Grottoli et al. 2006).
In this case, feeding was shown to maintain rates of calcifica-
tion, photosynthesis, tissue growth, and symbiont densities
(Grottoli et al. 2006; Ferrier-Pages et al. 2010). The positive
role of heterotrophy on coral metabolism depends on the
food concentration available to corals (Palardy et al. 2006),
as well as the feeding capacity and feeding effort, which are
species specific (Grottoli et al. 2006). Thus, some species are
able to increase their feeding rates on zooplankton when
needed, such as during bleaching events or in deep waters
while some others do not (Anthony and Fabricius 2000;
Grottoli et al. 2006). Feeding rates can also be affected by
physical factors, such as water flow and light level (Ferrier-
Pages et al. 1998).
Thus, the feeding capacity and feeding effort of individual
coral species, in normal and stress conditions, are key factors
for the determination of their resistance and resilience to
stress. The species Stylophora pistillata, is known to be “a typi-
cal heterotrophic species,” as it can use a large range of prey
size. Moreover, higher feeding rates under laboratory*Correspondence: [email protected]
1
LIMNOLOGYand
OCEANOGRAPHY Limnol. Oceanogr. 00, 2015, 00–00VC 2015 Association for the Sciences of Limnology and Oceanography
doi: 10.1002/lno.10003
conditions significantly stimulated its physiology (Houlbre-
que et al. 2004; Houlbreque and Ferrier-Pages 2009), both
under normal and thermal stress conditions (Ferrier-Pages
et al. 2010). However, under thermal stress, S. pistillata also
decreased its heterotrophic feeding (Ferrier-Pages et al. 2010;
Hoogenboom et al. 2012) and its acquisition of inorganic
nutrients (Godinot et al. 2011), meaning that unless food
supply is ad libitum, it will not sustain its metabolism. All
together, these first results suggest that this species, present
in most of the world’s reefs might be severely affected in the
near future if seawater temperature continues to rise.
This study aims at complementing the knowledge on the
feeding capacities and feeding effort of this species under
another main stress factor for corals, represented by seawater
acidification. It is already known that ocean acidification,
through a decrease in pH and carbonate ion concentration,
has negative effects on coral calcification, under not only
long-term but also short-term application (Anthony et al.
2008), and S. pistillata was shown to be affected by such stress
(Krief et al. 2010; Houlbreque et al. 2012). However, one study
has also recently shown that the massive species Porites spp.,
fed to repletion, was able to maintain its calcification rates
under a short-term incubation under low seawater pH
(Edmunds 2011), suggesting that feeding may counterbalance
both the negative effects of increased seawater acidification
and temperature on corals. This study has, thus, assessed both
the effect of feeding and ocean acidification on S. pistillata
metabolism, and also how ocean acidification will change the
feeding capacities of this species. This latter point has never
been investigated. Results will allow us to have a global view
on the effects of climate change on this very well studied spe-
cies and can be used in future models forecasting the effect of
climate change on branched coral species.
Methods
Aquaria setup
Five parent colonies of the scleractinian coral S. pistillata
(Esper 1797) were divided into 104 terminal portions of
branches (5-cm long fragments). Nubbins obtained were
attached to nylon wires. After three weeks, coral fragments
were entirely covered with new tissues. They were assigned
to eight 20-liter tanks (each colony being represented twice
in each tank), continuously supplied with clean carbon-
filtered seawater, pumped in front of the International
Atomic Energy Agency laboratories (Monaco). Temperature
(26.0 6 0.2�C) was kept constant in each tank using heaters
connected to electronic controllers (6 0.2�C precision), and
seawater was mixed using a submersible pump (Aquarium
systemVR , mini-jet 606). Corals received a constant irradiance
of 200 6 10 lmol photons m22 s21 (photoperiod was 12 : 12
light : dark) using metal halide lamps (PhilipsVR , HPI-T, 400
W). Ammonium, nitrate, nitrite, and phosphate were meas-
ured weekly in each tank with an AllianceVR II autoanalyser
to verify that concentrations remained low in all tanks
(<0.04 lmol L21 ammonium, 0 lmol L21 to 0.09 lmol L21
phosphate, and <0.5 lmol L21 for nitrate and nitrite).
Corals were first divided into two groups (four tanks per
condition) corresponding to two feeding levels: (1) starved
corals (SC) were not fed during the whole experiment; (2) fed
corals (FC) were fed four days per week during 1 h with Arte-
mia salina nauplii (1200 6 50 nauplii L21). The ingestion of
prey has been monitored in a previous experiment under a
dissecting microscope during feeding (Ferrier-Pages et al.
2010). After a first step of 12 weeks under these two nutri-
tional conditions, corals were either maintained for five addi-
tional weeks at ambient pHT (total scale; 8.06 6 0.05, 417 Pa
PCO2) or at low pHT (7.51 6 0.06; 1697 Pa PCO2
), with two
tanks per pHT and feeding conditions. pHT was controlled
using a pH-stat system (IKS Aquastar, precision 6 0.05 pH
unit) by independently bubbling pure CO2 in each tank. Each
tank was also continuously aerated with CO2-free air.
Seawater carbonate chemistry
The pH values of the pH-stat system were adjusted every
day from the measurements of pHT using a pH meter (Met-
rohmVR , 826pH mobile) with a glass electrode (MetrohmVR ,
electrode plus) calibrated on the total scale using Tris-HCl
buffer solution with a salinity of 38 (Dickson et al. 2007).
Mean pHT were calculated from hydrogen ion concentra-
tions of each measurement and then reconverted back to pH
(Dickson et al. 2007). Water samples were collected in glass
bottles and then passed through 0.45 lm pore size filters
(GF/F Whatman) and poisoned with 0.05 mL of 50% HgCl2(Merck, AnalarVR ) to avoid biological alteration and stored in
the dark at 4�C. Three replicated 20 mL subsamples were
analyzed at 25�C using a titration system composed of a pH
meter with a pH electrode and a 1 mL automatic burette
(MetrohmVR ). The pH was measured at 0.02 mL increments
of 0.1 mol L21 HCl. AT was calculated from the Gran func-
tion applied to pH variations from 4.2 to 3.0 as mEq L21
from the slope of the curve HCl volume vs. pH. Titrations of
total alkalinity standards provided by A.G. Dickson (batch
99 and 102) were within 0.7 lmol kg21 of the nominal
value. Mean AT of seawater was 2.482 6 0.025 mmol kg21 (n
5 20). PCO2was calculated from pHT, mean AT, temperature,
and salinity using the free access CO2 Systat package.
Physiological measurements
Calcification rates
Calcification rates were assessed at the end of the experi-
ment of incubation under the different feeding regimes and
PCO2conditions using 45Ca, according to a method adapted
from Tambutt�e et al. (1995). Five corals from each tank (n 5
10 per treatment) were randomly placed during 7 h into four
independent 7-liter tanks, where each received a spike of the
radiotracer 45Ca (45CaCl2, PerkinElmer Life and Analytical
Science Products) to reach an activity of 50 KBq L21. The
medium was continuously mixed using a submersible pump
Houlbreque et al. Acidification and Stylophora nutrition
2
(Aquarium system, mini-jet 606). Light and temperature con-
ditions were similar to those described above. One-milliliter
aliquots of seawater were removed at the beginning of the
incubation for the determination of the specific radioactivity.
At the end of the labeling period, colonies were rinsed in 30
mL unlabeled seawater for 1 h to achieve isotopic dilution of
the 45Ca contained in the coelenteron. Tissue was then dis-
solved completely in 1 mol L21 NaOH at 90�C for 20 min,
and the skeleton was rinsed twice in 1 mL NaOH and once in
distilled water. Skeletons were then dried, weighed, and dis-
solved in 1.5 mL of 12 mol L21 HCl. Liquid scintillation
medium (10 mL; UltimagoldVR Miniature Vials, Packard) was
added to the radioactive samples (seawater and dissolved skel-
etons), and b-emissions were measured using a liquid scintil-
lation counter (2100 Time-Resolved, Packard; TricarbVR ). We
considered a seawater calcium concentration of 10 mmol L21
(Tambutt�e et al. 1995). Results are expressed in nmol Ca21
g21 dry skeletal mass h21 (Houlbreque et al. 2004).
Photosynthesis, respiration, and photosystem II
photochemistry
Photosynthesis and respiration rates were measured at the
end of the experiment on five corals taken from each tank (n
5 10 per treatment) according to the same protocol as in
Houlbreque et al. (2012), using StrathkelvinVR 928R electrodes
and incubating nubbins at the right pHT and at the culture
irradiance. Data were normalized to skeletal surface area.
Chlorophyll a and c2 were extracted twice in 99% acetone (24
h at 4�C). The extracts were centrifuged at 11,000 3 g for 10
min at 4�C and the absorbances measured at 630 nm, 663
nm, and 750 nm. Chlorophyll contents were computed
according to the equations of Jeffrey and Humphrey (1975).
Surface area was determined using the wax-dipping method
described in Stimson and Kinzie (1991). In addition, their
photosynthetic efficiency (Fv : Fm), electron transport rate
(ETR) of the photosystem II (PSII) of zooxanthellae in hospite
as well as Quantum yield of nonphotochemical fluorescence
quenching other than caused by downregulation of the light-
harvesting function (Y(NO)) and quantum yield of nonphoto-
chemical fluorescence quenching due to downregulation of
the light-harvesting function (Y(NPQ)) were measured using a
Diving Pulse Amplitude Modulated fluorometerVR (Walz),
according to Ralph and Gademann (2005). In vivo, chloro-
phyll takes the form of pigment-protein complexes that are
embedded in thylakoid membranes and funnel excitation
energy to photosynthesis reaction centers (RCs). In darkness,
when all RCs are open, chlorophyll fluorescence from PSII is
minimal (denoted F0). Conversely, when all RCs are closed
after illumination with a saturating pulse, chlorophyll fluores-
cence is maximal (denoted Fm) and the ratio of Fm to F0 indi-
cates the maximum quantum yield of PSII. Under
illumination with photosynthetically active radiation (PAR),
when a subsequent saturating pulse is applied, the maximal
and minimal fluorescence yields (F0m and F
0
0) changes due to
the induction of nonphotosynthetic quenching mechanisms.
The saturation pulse method allows the partitioning of
absorbed excitation energy between light used for photo-
chemistry, Y(II) and excitation that is dissipated. The latter
component is split into regulated and nonregulated processes.
Regulated dissipation, Y(NPQ), is thought to function to pro-
tect the photosynthetic units from damage due to excess light
absorption. Nonregulated dissipation, Y(NO), is a conse-
quence of PSII RC closures due to inhibition of electron trans-
port. A high value of Y(NPQ) indicates that irradiance is
excessive but shows that the sample has retained the regula-
tory mechanisms to protect its photosynthetic apparatus. A
high value of Y(NO) indicates that both the photochemical
energy conversion and the protective regulatory mechanisms
are insufficient to process excitation energy (Hoogenboom
et al. 2012).
Total organic carbon fluxes
The beaker incubation technique (Wild et al. 2005) was
used to quantify net total organic carbon (TOC) flux rates in
the different conditions. For this purpose, at the end of the
experiment six corals in each condition (n 5 3 for each
tank) were transferred without aerial exposure into acid-
washed and seawater-rinsed 250-mL glass beakers filled with
200 mL 0.4 lm filtered seawater at the right pH. Control
beakers contained only seawater (n 5 3 for each pH condi-
tion). Stirring was applied by Teflon-coated magnetic stirring
bars. After 6 h, corals were transferred back to the experi-
mental tanks. Before and after incubations, seawater subsam-
ples (17 mL, n 5 3 per beaker and sampling) were drawn
with sterile syringes from the homogenized incubation
media into precombusted (450�C, 5 h) glass vials. Vials were
acidified with phosphoric acid (20%, 250 lL) to pH < 2 and
kept frozen (220�C) until analysis by high-temperature cata-
lytic oxidation using a TOC analyzer (ShimadzuVR TOC-VCPH;
CV maximum �1.5%, i.e., 6 1 lmol C L21; referenced by
Consensus Reference Materials of Hansell Research Labora-
tory, University of Miami). For calculation of TOC net flux
rates, concentration differences measured from the control
beakers were subtracted from those measured in coral-
containing beakers, and the results were normalized to incu-
bation time and corals-specific skeletal surface area.
Feeding measurements
To assess feeding capacity of S. pistillata under normal
and low pH conditions, several measurements were per-
formed on the same samples used for TOC flux rates. Alka-
line phosphatase activity (APA) and uptake of dissolved free
amino acids (DFAA) were measured to estimate the utiliza-
tion of dissolved organic phosphorus and nitrogen, respec-
tively. Grazing rates on A. salina nauplii provided a measure
of the capacity to feed on particulate organic matter.
APA assays
APA was performed according to Godinot et al. (2013),
using the nonbiological substrate p-nitrophenyl phosphate
Houlbreque et al. Acidification and Stylophora nutrition
3
(pNPP), which yields a colored product, p-nitrophenolate, on
hydrolysis. For this purpose, corals were individually
incubated in 250-mL beakers filled with 200 mL of filtered
(0.2 lm) seawater at the pH corresponding to their mainte-
nance tanks (either pHT 8.06 or 7.51) and continuously agi-
tated with a magnetic stirrer. Beakers without coral served as
a control for APA activity of the seawater and for any nonen-
zymatic hydrolysis of the pNPP substrate. At the end of the
experiments, corals were frozen for subsequent normaliza-
tion of the data to the protein and skeletal surface area. Pro-
teins were extracted in 1 mol L21 NaOH for 30 min at 90�C,
measured using the commercially available protein Assay Kit
(BiCinchoninic acid Assay Interchim kit) (Hoogenboom
et al. 2012).
DFAA depletion experiments
An algal mix containing 19 different amino acids (Algal
Amino Acid Mixture, Reference ULM-2314-1, Lot PR-19236,
Larodan Fine Chemicals ABVR ) was used for these measure-
ments, according to Tremblay et al. (2012). Corals were indi-
vidually incubated in beakers filled with 200 mL filtered
seawater, enriched with a solution of 3.0 6 0.1 lmol L21
DFAA, and continuously mixed using a magnetic stirrer. The
final concentration was precisely determined taking into
account the DFAA concentration already present in seawater.
Three additional beakers per pH were also kept as controls
(without corals). Corals were incubated for 3 h at a constant
temperature of 26�C in a water bath and at the same irradi-
ance and pH as for the culture. Five milliliters of subsamples
were taken every hour, filtered through a 0.2-lm syringe fil-
ter (Minisart, 16532, Sartorius Stedim BiotechVR ) to remove
any particles that could interfere, and DFAA concentrations
were quantified using a spectrofluorometer XeniusVR (Safas)
according to Grover et al. (2008). Standard solutions of
DFAA from 0.5 lmol L21 to 4.0 lmol L21 were prepared for
internal calibration and to set up the photomultiplier volt-
age. Results were normalized to the skeletal surface area or
protein content and expressed as lmol DFAA or lg C or lg
N. For this purpose, the C and N contents as well as the per-
centage of each amino acid present in the algal mix were
taken into account (ca., 58.2 lg C per lmol DFAA, ca., 17 lg
N per lmol DFAA).
Zooplankton feeding rates
Feeding rates were assessed using PlexiglasVR flow tanks
following Ferrier-Pages et al. (2010), with a mean flow rate of
3.6 cm s21 and 1200 Artemia nauplii L21 in total. Corals
were incubated during 1 h at a constant temperature of 26�C
in individual tanks and at the same irradiance and pH as for
the culture. One tank was kept as a control (without coral).
In preliminary experiments, we checked that high PCO2levels
did not affect the short-term mobility and growth of Artemia
nauplii. Feeding rates were calculated as the decrease in prey
concentration during this hour and were normalized to the
skeletal surface area. They were also expressed as lg of car-
bon or lg nitrogen ingested. For this purpose, about 1200
nauplii were filtered on precombusted GF/F glass microfiber
filters (25 mm, WhatmanVR , 1825-025), and carbon and
nitrogen contents were determined using a Perkin Elmer
2400 Series II CHNS-O Elemental Analyzer (Perkin ElmerVR ).
The calibration was conducted with standards (K-factor) of
glycine (32.00% of carbon and 18.66% of nitrogen) and the
carbon and nitrogen value of the filters (blank) was also
determined. The nauplii contained 1.25 6 0.30 lg C
nauplii21 and 0.25 6 0.01 lg N nauplii21.
Daily carbon acquisition in our culture conditions
Given our quantification of photosynthetic and grazing
rates, we compared total daily carbon acquisition via auto-
trophy and heterotrophy for colonies maintained under the
different pHs. Total daily acquisition of carbon through
autotrophy (PC) was calculated using the rates of gross pho-
tosynthesis measured at 200 lmol photons m22 s21, consid-
ering a 12-h daylight period. Oxygen fluxes were converted
to carbon equivalents based on molar weights, as: PC 5 lmol
O2 produced 3 12/PQ and RC 5 lmol O2 consumed 3 12 3
RQ (Anthony and Fabricius 2000), where PQ and RQ are
photosynthetic and respiratory quotients equal to 1.1 and
0.8, respectively (Muscatine 1981). The percentage contribu-
tion of zooxanthellae acquired C to daily animal respiration
(CZAR; adapted from Muscatine 1981; Grottoli et al. 2006)
was subsequently calculated by Eq. 1, for corals maintained
under both pHs and feeding conditions:
CZAR 5 PC=RCð Þ3 100% (1)
Potential daily carbon acquisition from heterotrophy (HC)
was calculated by Eq. 2:
HC 5 GR 3 t (2)
where GR is the grazing rate on A. salina nauplii for each
incubation condition, expressed in lg C cm22 and t is the
duration of feeding every day for S. pistillata. In our experi-
mental conditions, we considered 1 h. DFAA uptake was not
taken into account as concentrations are usually very low in
the tanks.
We calculated the percentage contribution of hetero-
trophically acquired carbon to daily animal respiration
(CHAR, Grottoli et al. 2006) by Eq. 3:
CHAR 5 HC=RCð Þ3 100%: (3)
Statistical analysis
All data were tested for assumptions of normality using
Shapiro Wilk’s test and homogeneity of variances was
checked using Cochran’s test and were transformed when
required. After verification of the absence of significant dif-
ferences between tanks in each pH treatment (three-way
ANOVA, p > 0.05), data were pooled. Two-way ANOVAs
Houlbreque et al. Acidification and Stylophora nutrition
4

were used to test the effect of pHT (7.51 and 8.06) and feed-
ing (fed, starved) on the different physiological parameters
and feeding measurements. STATISTICAVR software (StatSoft)
was used. When ANOVA determined a significant difference,
Tukey honest significant difference (HSD) test was used. All
data are expressed as the mean 6 standard deviation (SD).
Results
There was a significant difference in chlorophyll and pro-
tein concentrations between feeding treatments (ANOVA, p <
0.05; Table 1; Fig. 1a) with higher values found in FC (Tukey
HSD, p < 0.05). Protein contents (data not shown) averaged
across pH treatments is 1.00 6 0.31 mg cm22 and 2.12 6 0.35mg cm22 for starved and FC, respectively. Symbiont density(Fig. 1b) was significantly affected by feeding with lower val-ues on FC. However, feeding had an opposite effect amongpH treatments as showed by interactions with pH (ANOVA,pH 3 Feeding: F1,36 5 10.20, p 5 0.03; Table 1).
Rates of net photosynthesis (Pn) but not respiration,
expressed in lmol O2 h21 cm22, were significantly affected
by feeding (ANOVA, F1,36 5 15.98, p 5 0.00; Table 1). In
terms of carbon, gross photosynthesis (Pg) provided from
13.1 lmol C cm22 d21 to 15.1 lmol C cm22 d21 to corals (or
157 lg C cm22 d21 to 181 lg C cm22 d21), respectively, for
FC at pHT 7.51 and SC at pHT 8.06. The contribution of the
Table 1. Summary of two-way ANOVAs followed by Tukey honest significant difference post hoc testing the effect of pH (7.5 and8.1 pHT units) and feeding regime (fed [F] and starved [S]) on S. pistillata main physiological parameters. Bold face numbers indicatesp < 0.05.
Source of variation df MS F p Post hoc df MS F p Post hoc
Chlorophyll NPQmax
pH 1 18.45 1.65 0.206 1 0.061 27.86 0.000
Feeding (F) 1 96.14 8.63 0.006 F>S 1 0.212 96.00 0.000
pH3F 1 2.42 0.22 0.644 1 0.086 39.12 0.000
Error 36 401.06 36 0.079
Protein Gross calcification
pH 1 0.012 0.10 0.757 1 13E105 34.8 0.000 7.5<8.1
Feeding (F) 1 7.498 61.42 0.000 F>S 1 88E104 22.8 0.000 F>S
pH3F 1 0.004 0.03 0.865 1 52E103 1.34 0.255
Error 20 2.440 36 14E105
Symbiont density TOC
pH 1 13E111 2.94 0.095 1 1.754 24.20 0.000
Feeding (F) 1 14E112 32.37 0.000 1 0.401 5.51 0.029
pH3F 1 45E111 10.20 0.003 1 8.190 113.22 0.000
Error 36 1.6E113 20 1.440
Net photosynthesis APA
pH 1 0.044 2.10 0.156 1 34E104 293.7 0.000
Feeding (F) 1 0.338 15.98 0.000 F<S 1 3550 3.0 0.097
PCO23T 1 0.009 0.42 0.520 1 7528 6.4 0.020
Error 36 0.761 19 22E103
Respiration DFFA
pH 1 0.002 0.79 0.781 1 0.027 98.02 0.000 7.5<8.1
Feeding (F) 1 0.064 3.02 0.091 1 0.003 10.85 0.004 F<S
pH3F 1 0.027 1.30 0.262 1 0.000 1.09 0.308
Error 36 0.760 20 0.005
ETRmax Grazing rates
pH 1 449E102 183.3 0.000 7.5<8.1 1 65E103 27.42 0.000 7.5<8.1
Feeding (F) 1 393E102 160.3 0.000 F>S 1 13E103 5.59 0.028 F<S
pH3F 1 677,6 2.8 0.105 1 19E102 0.80 0.382
Error 36 8818.3 20 47E103
Y(NO)max
pH 1 0.133 88.07 0.000
Feeding (F) 1 0.133 88.07 0.000
pH3F 1 0.089 58.59 0.000
Error 36 0.054
Houlbreque et al. Acidification and Stylophora nutrition
5

zooxanthellae to the respiration of the holobiont (CZAR)
was, therefore, respectively, equal to about 228% 6 33% for
SC and 191% 6 31% for FC, maintained at both pHT. Con-
cerning the photosynthetic efficiency, there was a significant
effect of feeding and pH (ANOVA, p < 0.05; Table 1). ETRmax
values were higher in FC at low pH compared to starved
ones at normal pH, respectively (Tukey HSD, p < 0.001; Fig.
2a). Feeding, pH, and their interaction significantly affected
the nonphotochemical quenching, both Y(NO)max and
Y(NPQ)max (ANOVA, p < 0.001; Table 1; Fig. 2b,c). The two
nonphotochemical quenching had an opposite response to
treatments, as showed by post hoc comparisons of the inter-
action between feeding and pH. Although the regulated
nonphotochemical quenching Y(NPQ) decreased on FC kept
at normal pH, Y(NO)max increased for the same treatments
(Fig. 2c). For both nonphotochemical quenching parameters,
the interaction of pH and feeding were significant (Table 1).
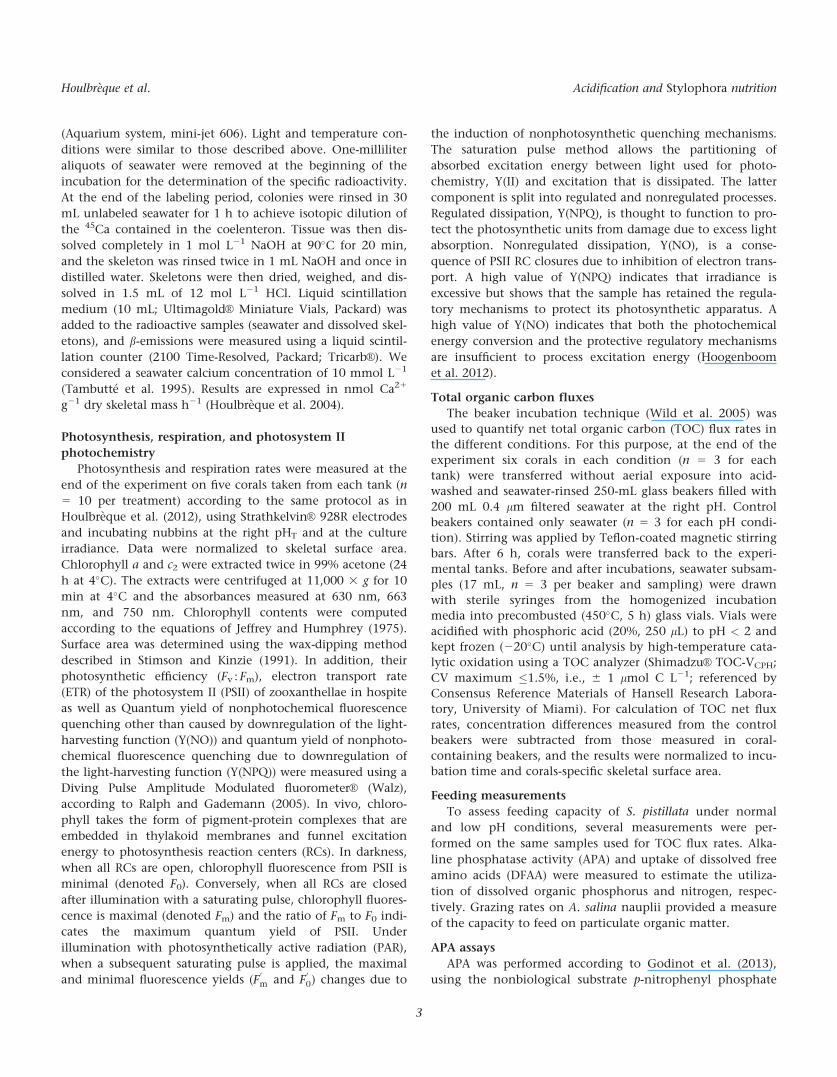
Significant differences in the calcification rates were
found between feeding and pH (ANOVA, p < 0.001; Table 1)
but not in their interaction. Under lower pH, calcification
was higher of 80% in FC compared to unfed ones
(from 253.9 6 87.9 nmol Ca21 g21 dry Skeleton h21 to 478.7
6 87.9 nmol Ca21 g21 dry Skeleton h21, respectively, for
starved and FC) and of 30% under normal pH (from 547.5 6
156.5 to 917.5 6 211.1, respectively, for starved and FC; Fig.
3). Additionally, for both fed and SC, calcification rates were
up to two fold higher at normal than at low pH.
TOC fluxes (data not shown) were all positive, showing a
release of organic carbon into seawater. TOC significantly
Fig. 1. (a) Chlorophyll content per unit surface area of skeleton(lg cm22); (b) Symbiont density per unit surface skeleton (zooxanthellae3 106 cm22); (c) Oxygen production and consumption rates per unit
surface area of skeleton (lmol O2 h21 cm22) for corals maintained fiveweeks under the two pH (pHT57.51 or 8.06) and feeding conditions.
F5fed corals, S5starved corals. Data are presented as means (n 5 5) 6
standard deviation.Fig. 2. (a) ETR vs. irradiance (PAR); (b) Y(N0); (c) Y(NPQ) for fed and
starved corals maintained under pHT 5 7.51 or pHT 5 8.06. Data arepresented as means (n 5 5) 6 standard deviation.
Houlbreque et al. Acidification and Stylophora nutrition
6
differed between pH and feeding and their interaction
(ANOVA, p < 0.001; Table 1). This release seems higher in
starved (1.2 6 0.3 lg cm22 h21 and 1.7 6 0.2 lg cm22 h21)
than in FC (0.5 6 0.4 lg cm22 h21 and 0.6 6 0.1 lg cm22
h21) exposed to pHT 5 8.06 and 7.51, respectively.
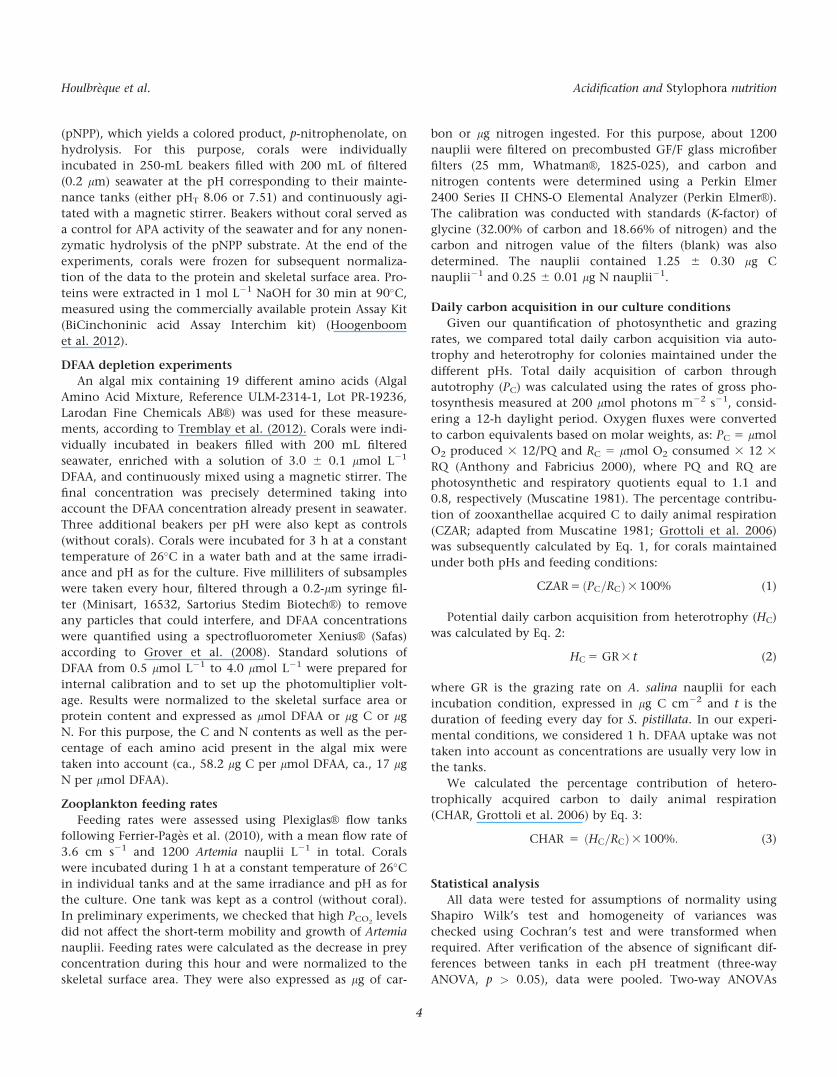
The activity of the alkaline phosphatase enzyme (i.e.,
APA; Fig. 4a), involved in the transformation of dissolved
organic phosphorus into dissolved inorganic phosphorus
(phosphate), was not significantly influenced by the feeding
regime, but significantly decreased by more than 50% under
low pH (ANOVA F1,19 5 293.7, p 5 0.000; Table 1). Uptake
of dissolved free amino acids (i.e., DFFA, Fig. 4b) was signifi-
cantly different between feeding and pH treatments
(ANOVA, p < 0.01). A decrease in pH, as well as feeding,
induced a significant decrease in the DFAA uptake rate corals
(Tukey HSD, p < 0.01; Table 1; Fig. 4b). In terms of carbon,
1 h of DFAA uptake at 3 lmol L21 supplied 7.19 6 0.05 lg C
cm22 to the corals maintained at pHT 5 8.06 and only 3.4 6
0.03 lg C cm22 to the corals maintained at pHT 5 7.51.
There was a significant effect of feeding and pH on grazing
rates (Fig. 4c; ANOVA, p < 0.05, Table 1). Grazing rates were
lower in SC at low pH (Tukey HSD, p < 0.05; Table 1). In
terms of carbon, 1 h of grazing on A. salina nauplii supplied
159 6 20 lg C cm22 to corals maintained at natural pHT of
8.06 and only 113 6 23 lg C cm22 to corals maintained at
low pH. The calculated CHAR varied between 134% and
172%, for FC maintained at low and normal pH, respectively.
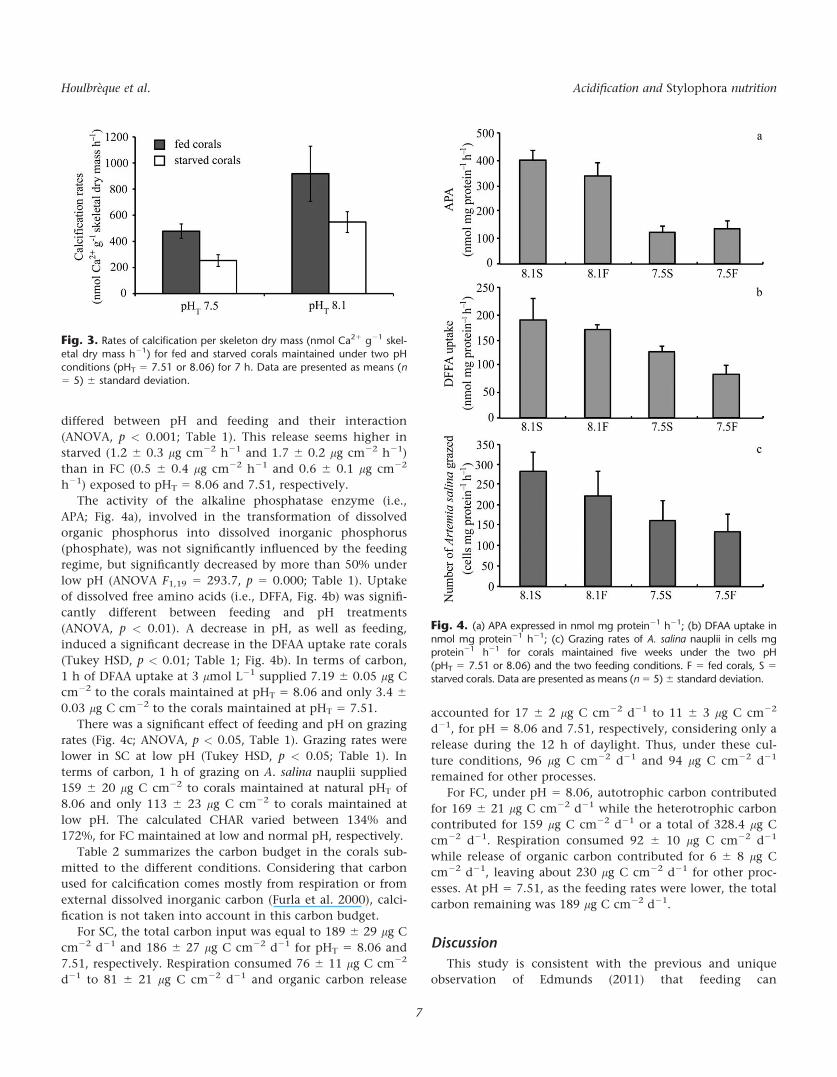
Table 2 summarizes the carbon budget in the corals sub-
mitted to the different conditions. Considering that carbon
used for calcification comes mostly from respiration or from
external dissolved inorganic carbon (Furla et al. 2000), calci-
fication is not taken into account in this carbon budget.
For SC, the total carbon input was equal to 189 6 29 lg C
cm22 d21 and 186 6 27 lg C cm22 d21 for pHT 5 8.06 and
7.51, respectively. Respiration consumed 76 6 11 lg C cm22
d21 to 81 6 21 lg C cm22 d21 and organic carbon release
accounted for 17 6 2 lg C cm22 d21 to 11 6 3 lg C cm22
d21, for pH 5 8.06 and 7.51, respectively, considering only a
release during the 12 h of daylight. Thus, under these cul-
ture conditions, 96 lg C cm22 d21 and 94 lg C cm22 d21
remained for other processes.
For FC, under pH 5 8.06, autotrophic carbon contributed
for 169 6 21 lg C cm22 d21 while the heterotrophic carbon
contributed for 159 lg C cm22 d21 or a total of 328.4 lg C
cm22 d21. Respiration consumed 92 6 10 lg C cm22 d21
while release of organic carbon contributed for 6 6 8 lg C
cm22 d21, leaving about 230 lg C cm22 d21 for other proc-
esses. At pH 5 7.51, as the feeding rates were lower, the total
carbon remaining was 189 lg C cm22 d21.
Discussion
This study is consistent with the previous and unique
observation of Edmunds (2011) that feeding can
Fig. 3. Rates of calcification per skeleton dry mass (nmol Ca21 g21 skel-etal dry mass h21) for fed and starved corals maintained under two pH
conditions (pHT 5 7.51 or 8.06) for 7 h. Data are presented as means (n5 5) 6 standard deviation.
Fig. 4. (a) APA expressed in nmol mg protein21 h21; (b) DFAA uptake innmol mg protein21 h21; (c) Grazing rates of A. salina nauplii in cells mgprotein21 h21 for corals maintained five weeks under the two pH
(pHT 5 7.51 or 8.06) and the two feeding conditions. F 5 fed corals, S 5
starved corals. Data are presented as means (n 5 5) 6 standard deviation.
Houlbreque et al. Acidification and Stylophora nutrition
7
counterbalance the negative effects of seawater acidification
on coral calcification. It, however, clearly shows that acidifi-
cation influences the feeding capacity and feeding intensity
of the branching coral S. pistillata. Considering that hetero-
trophy brings essential nutrients to the symbiotic associa-
tion, on a long-term basis, lower feeding rates will likely
weaken the already fragile physiological state of many corals
under more acidic and warmer conditions.
Effect of feeding and seawater acidification on
S. pistillata metabolism
Although feeding was shown to enhance rates of photo-
synthesis in some previous studies (Houlbreque and Ferrier-
Pages 2009), here the photosynthetic rates of FC have been
slightly decreased. Conversely, feeding changed the photo-
chemistry and enhanced ETRmax, under both pH conditions,
suggesting a better photosynthetic efficiency of PSII, prob-
ably due to a higher content of PSI and PSII proteins (PsbA
and PsaC), as previously observed (Hoogenboom et al. 2012).
Moreover, under normal PCO2conditions, feeding changed
the functioning of PSII, as it increased the unregulated non-
photochemical quenching Y(NO), which reflects the fraction
of energy that is passively dissipated in the form of heat and
fluorescence, and thus decreased the regulated nonphoto-
chemical quenching Y(NPQ), corresponding to the fraction
of energy dissipated in the form of heat via the photoprotec-
tive mechanisms. In addition, photosynthetic rates of S. pis-
tillata did not significantly change with the seawater
carbonate chemistry and/or the decrease in pH, as already
noticed in previous short-term studies conducted on other
scleractinian corals (Reynaud et al. 2003). These conclusions
are consistent with the assertion that corals do not rely on
dissolved CO2 for their photosynthesis (Gattuso et al. 1999).
A reduction in areal symbiont concentration, and subse-
quently in the areal rates of gross photosynthesis, was how-
ever observed after a long-term exposure to very low pH
(7.2; Tremblay et al. 2013), but the amount of carbon
acquired by the host remained unchanged due to a higher
percentage of carbon translocation from the symbionts.
Despite the lack of photosynthesis stimulation by feeding
under high PCO2condition, feeding maintained calcification
at a high rate (comparable to unfed corals under normal
conditions), whereas calcification rates significantly
decreased by 53.6% in unfed corals, relative to unfed corals
under ambient CO2 conditions. Such decline in calcification
rates observed in unfed corals under seawater acidification is
a common feature (Langdon and Atkinson 2005). One of the
main explanations is a greater energetic cost of mineralizing
at low Xarag, which under normal conditions, accounts for
13–30% of the energy supplied by respiration (Allemand
et al. 2011). Seawater acidification may thus increase the
energetic demand for CaCO3 production (Holcomb et al.
2010). Even if respired heterotrophic carbon might be also
used as carbon for calcification (Allemand et al. 2011), nutri-
ent supply, in either the inorganic dissolved form, or in the
particulate form as in this study, may reduce the influence
of seawater acidification on calcification, by offsetting the
additional energy demand. This process was suggested both
on adult corals (Langdon and Atkinson 2005; Holcomb et al.
2010), as well as on juveniles (Drenkard et al. 2013). The
additional energy can be used through an increase in tissue
biomass (Edmunds 2011; Drenkard et al. 2013), although
this is not always the case, as in this study. Such feeding
enhancement of calcification in S. pistillata was already
observed under normal culture conditions (seawater temper-
ature around 25�C and actual level of PCO2; Reynaud et al.
2003; Houlbreque et al. 2004; Houlbreque and Ferrier-Pages
2009) and is also valid under thermal or acidification stress,
as demonstrated in this study. Maintaining optimal levels of
calcification seems thus to be the priority in corals when
possible. It has to be noticed, however, that although rates
of calcification of FC at pH 5 7.51 were similar to the rates
measured in unfed corals at pH 5 8.06, they were signifi-
cantly lower (by 33%) than those measured in FC at pH 5
8.1. This may be due to lower grazing rates of S. pistillata on
A. salina at high PCO2, which would be consistent with the
energetic theory of the effect of feeding and seawater acidifi-
cation on coral calcification. An important question, still
unsolved, is the amount of food needed to sustain coral cal-
cification during stress events, as well as the amount actually
available for corals in situ. Prey levels added in our experi-
mental tanks (1200 Artemia nauplii L21 or a total of 24,000
Table 2. Percentage CZAR, percentage CHAR, and carbon left for other processes than respiration (noted C left), in starved and fedcorals (noted S and F, respectively) and submitted to a pHT of 8.06 or 7.51. Autotrophic and heterotrophic carbons are the quantityof carbon supplied via autotrophy and heterotrophy. Respiration (Rc) and release of TOC are the quantity of carbon consumed bythe respiration process and lost via the release of mucus, respectively. They are all expressed in lg C cm22 d21.
Incubation
conditions CZAR% CHAR%
C
left
Autotrophic
carbon
Heterotrophic
carbon RC
Release of
TOC
7.5 S 218620 94 186627 81621 1163
8.1 S 238642 96 189629 76611 1762
7.5 F 194638 134 189 165615 113623 84621 564
8.1 F 188625 172 230 169621 159620 92610 668
Houlbreque et al. Acidification and Stylophora nutrition
8
Artemia in the 20-liter tanks) are higher than natural reef
concentrations, but they were available for only 1 h, provid-
ing in total up to 24 mg C d21, if we consider that the total-
ity was ingested, which was not the case. Considering that
Heidelberg et al. (2004) estimated that zooplankton abun-
dance during nighttime is around 5 mg C m3 or 5 lg C L21,
and that in some reefs, 12,000 m3 flow over 1-m strip of a
reef during 24 h, or 6000 m3 during the 12-h night, (Ayukai
et al. 1995), a total of 30,000 mg C m3 (or 30 mg C L21)
should be available for corals at the end of the night, a value
close to what corals received in our tanks. Although this cal-
culation has to be considered with care, and although no
real in situ measurement of prey availability is available, we
might consider that calcification in some coral species can
be sustained by feeding under natural conditions. However,
as demonstrated in this study (and discussed below) with the
branching scleractinian coral S. pistillata, the capacity of prey
capture in some coral species is severely and negatively
affected by stress conditions, which mitigates the positive
effect of heterotrophy in the sustainment of coral metabo-
lism under stress conditions. This is especially true because
global productivity levels are predicted to decrease in the
future (Behrenfeld et al. 2006; Steinacher et al. 2010).
Effects of ocean acidification on feeding capacities and
carbon budget
Contrarily to what was shown for the uptake of dissolved
inorganic nitrogen and phosphorus, which were not influ-
enced by seawater acidification in S. pistillata (Godinot et al.
2011), this study shows that the organic nutrient acquisition
of that species was negatively affected under high PCO2, with a
simultaneous decrease in the DFAA uptake rates, in the APA,
and in the feeding rates, processes essential to fulfill the nitro-
gen and phosphorus needs of corals (Grover et al. 2006; Godi-
not et al. 2013). It has to be noticed that this latter effect was
independent of the trophic status of the coral colonies.
Uptake of DFAA involves a carrier-mediated transepithelial
transport (Grover et al. 2008), often proton-gradient depend-
ent (Tsuji et al. 1994), which might thus be influenced, under
low pH, by the increase in proton (H1) concentration at the
carrier surface. The transformation of dissolved organic phos-
phorus into dissolved inorganic phosphorus, readily usable by
corals, is mediated by metalloenzymes called phosphatases,
which are also pH-dependent. The alkaline phosphatase con-
sidered in this study, which has an optimum efficiency under
a basic pH (Godinot et al. 2013), had thus its activity lowered
by 50% under low pH conditions.
Finally, low seawater pH also affected the capture rates of
A. salina nauplii, but the process involved remains to be
determined. The decrease in capture rates could be due to a
polyp retraction or a slow down of their mobility due to
acidic waters. While it has been demonstrated that some
bleached corals (e.g., Montipora capitata) submitted to a ther-
mal stress were able to increase their feeding rates and to
acquire large quantities of heterotrophic carbon (Grottoli
et al. 2006), this is not the case for S. pistillata, whose capture
rates were halved when stressed by high temperatures (Fer-
rier-Pages et al. 2010) or here by seawater acidification. This
suggests that S. pistillata will lose part of its heterotrophic
capacities in the future. Although the uptake rates of dis-
solved inorganic nitrogen and phosphorus were not affected
by seawater acidification alone (Godinot et al. 2011), S. pistil-
lata will undoubtedly lack essential nutrients in the future, as
it thrives in oligotrophic waters in which inorganic nutrients
are in nanomolar concentrations (Ducklow 1990).
Concerning the carbon budget of S. pistillata, results
acquired in this study show that the acquisition of autotro-
phic carbon, and its consumption through respiration, should
not be changed by an increase in PCO2. Conversely, heterotro-
phy will be negatively affected, since the calculated CHAR
dropped from 172% at normal pHT to 134% under low pHT.
As autotrophic carbon was demonstrated to be junk food for
corals (Falkowski et al. 1984), mostly respired (Bachar et al.
2007), and as biomass is rather build through heterotrophy
(Houlbreque et al. 2004), corals like S. pistillata will likely see
their tissue and skeletal growth highly decreased in the future.
This experimental study has demonstrated that feeding sus-
tains calcification rates in the branching coral S. pistillata, sub-
mitted to seawater acidification, as it was demonstrated in the
massive coral species Porites sp. (Edmunds 2011). It has thus
the same positive effect on coral metabolism as during a ther-
mal stress induced bleaching (Grottoli et al. 2006; Ferrier-Pages
et al. 2010). Assuming calcification is an energy-requiring pro-
cess, the mechanism by which feeding sustains calcification
may very well be via a supply of energy. However, acidification
also decreased the feeding rates on dissolved and particulate
organic matter, impairing the heterotrophic acquisition of
energy by this coral species. Although recent studies suggested
that FC could maintain high rates of skeletal growth and
CaCO3 production under ocean acidification (Edmunds 2011;
Drenkard et al. 2013), this proposed mechanisms for resilience
will be in vain if rising CO2 conditions inhibit coral feeding to
the extent that they are unable to maintain calcification rates.
The major threat is that not only will ocean acidification
reduce coral feeding effort in some coral species but there will
also be less food available to corals in a warmer future (Behren-
feld et al. 2006; Steinacher et al. 2010). Under the most
extreme scenario for the likely trajectory for reef ecosystems,
corals will transition from “ambient CO2, fed” to “high CO2,
unfed” conditions, which would induce a large drop in calcifi-
cation rate.
References
Allemand, D., �E. Tambutt�e, D. Zoccola, and S. Tambutt�e.
2011. Coral calcification, cells to reefs, p. 119–150. In Z.
Dubinsky and N. Stambler [eds.], Coral reefs: An ecosys-
tem in transition. Springer Netherlands.
Houlbreque et al. Acidification and Stylophora nutrition
9
Anthony, K., and K. Fabricius. 2000. Shifting roles of hetero-
trophy and autotrophy in coral energetics under varying
turbidity. J. Exp. Mar. Biol. Ecol. 252: 221–253. doi:
10.1016/S0022-0981(00)00237-9
Anthony, K. R. N., D. I. Kline, G. Diaz-Pulido, S. Dove, and
O. Hoegh-Guldberg. 2008. Ocean acidification causes
bleaching and productivity loss in coral reef builders.
Proc. Natl. Acad. Sci. USA 105: 17442–17446. doi:
10.1073/pnas.0804478105
Ayukai, T. 1995. Retention of phytoplankton and planktonic
microbes on coral reefs within the Great Barrier Reef, Aus-
tralia. Coral Reefs 14: 141–147. doi:10.1007/BF00367231
Bachar, A., Y. Achituv, Z. Pasternak, and Z. Dubinsky. 2007.
Autotrophy versus heterotrophy: The origin of carbon
determines its fate in a symbiotic sea anemone. J. Exp. Mar.
Biol. Ecol. 349: 295–298. doi:10.1016/j.jembe.2007.05.030
Behrenfeld M. J., and others. 2006. Climate-driven trends in
contemporary ocean productivity. Nature 444: 752–755.
doi:10.1038/nature05317
Dickson, A. G., C. L. Sabine, and J. R. Christian. 2007. Guide
to best practices for CO2 measurements. PICES Special
Publication. 3.
Drenkard, E. J., A. L. Cohen, D. C. McCorkle, S. J. de Putron,
V. R., Starczak, and A. E. Zicht. 2013. Calcification by
juvenile corals under heterotrophy and elevated CO2.
Coral Reefs 32: 727–735. doi:10.1007/s00338-013-1021-5
Ducklow, H. W. 1990. The biomass, production and fate of
bacteria in coral reefs, p. 265–289. In Z. Dubinsky [ed.],
Ecosystems of the World, 25. Coral Reefs. Elsevier Science
Publishing Company.
Edmunds, P. J. 2011. Zooplanktivory ameliorates the effects
of ocean acidification on the reef coral Porites spp. Limnol.
Oceanogr. 56: 2402–2410. doi:10.4319/lo.2011.56.6.2402
Falkowski, P. G., Z. Dubinsky, L. Muscatine, and J. W. Porter.
1984. Light and bioenergetics of symbiotic coral. Bio-
science 11: 705–709. doi:10.2307/1309663
Ferrier-Pages, C., J. P. Gattuso, G. Cawet, J. Jaubert, and D.
Allemand. 1998. Release of dissolved organic carbon and
nitrogen by the zooxanthellate coral Galaxea fascicularis. Mar.
Ecol. Prog. Ser. 172: 265–274. doi:10.3354/meps172265
Ferrier-Pages, C., C. Rottier, E. Beraud, and O. Levy. 2010.
Experimental assessment of the feeding effort of three
scleractinian coral species during a thermal stress: Effect
on the rates of photosynthesis. J. Exp. Mar. Biol. Ecol.
390: 118–124. doi:10.1016/j.jembe.2010.05.007
Furla, P., D. Allemand, and M. N. Orsenigo. 2000. Involve-
ment of H1 ATPase and carbonic anhydrase in inorganic
carbon uptake for endosymbiont photosynthesis. Am. J.
Physiol. (Regul. Integr. Comp. Physiol). 278: R870–R881.
Gattuso, J. P., D. Allemand, and M. Frankignoulle. 1999.
Photosynthesis and calcification at cellular, organismal
and community levels in coral reefs: A review on
interactions and control by carbonate chemistry. Integ.
and Comp. Biol. 39: 160–183. doi:10.1093/icb/39.1.160
Godinot, C., C. Ferrier-Pages, S. Sikorski, and R. Grover.
2013. Alkaline phosphatase activity of reef-building cor-
als. Limnol. Oceanogr. 58: 227–234. doi:10.4319/
lo.2013.58.1.0227
Godinot, C., F. Houlbreque, R. Grover, and C. Ferrier-Pages.
2011. Coral uptake of inorganic phosphorus and nitrogen
negatively affected by simultaneous changes in tempera-
ture and pH. PLoS ONE. 6: e25024. doi:10.1371/
journal.pone.0025024
Grottoli, A., L. Rodrigues, and J. Palardy. 2006. Heterotro-
phic plasticity and resilience in bleached corals. Nature
440: 1186–1189. doi:10.1038/nature04565
Grover, R., J. F. Maguer, D. Allemand, and C. Ferrier-Pages.
2006. Urea uptake by the scleractinian coral Stylophora pis-
tillata. J. Exp. Mar. Biol. Ecol. 332: 216–225. doi:10.1016/
j.jembe.2005.11.020
Grover, R., J. F. Maguer, D. Allemand, and C. Ferrier-Pages.
2008. Uptake of dissolved free amino acids by the sclerac-
tinian coral Stylophora pistillata. J. Exp. Biol. 211: 860–
865. doi:10.1242/jeb.012807
Heidelberg K. B., K. Sebens, and P. Purcell. 2004. Composi-
tion and sources of near reef zooplankton on a Jamaican
forereef along with implications for coral feeding. Coral
reefs 23: 263–276. doi:10.1007/s00338-004-0375-0
Hoegh-Guldberg, O., P. J. Mumby, A. J. Hooten, R. S.
Steneck, P. Greenfield, E. Gomez, and M. E. Hatziolos.
2007. Coral reefs under rapid climate change and ocean
acidification. Science 318: 1737–1742. doi:10.1126/
science.1152509
Holcomb, M., D. C. McCorkle, and A. L. Cohen. 2010. Long-term
effects of nutrient and CO2 enrichment on the temperate
coral Astrangia poculata (Ellis and Solander, 1786). J. Exp. Mar.
Biol. Ecol. 386: 27–33. doi:10.1016/j.jembe.2010.02.007
Hoogenboom, M. O., D. A. Campbell, E. Beraud, K.
DeZeeuw, and C. Ferrier-Pages. 2012. Effects of light, food
availability and temperature stress on the function of
photosystem II and photosystem I of coral symbionts.
PLoS ONE. 7: e30167. doi:10.1371/journal.pone.0030167
Houlbreque, F., and C. Ferrier-Pages. 2009. Heterotrophy in
tropical scleractinian corals. Biol. Rev. 84: 1–17. doi:
10.1111/j.1469-185X.2008.00058.x
Houlbreque, F., �E. Tambutt�e, D. Allemand, and C. Ferrier-
Pages. 2004. Interactions between zooplankton feeding,
photosynthesis and skeletal growth in the Scleractinian
coral Stylophora pistillata. J. Exp. Biol. 207: 1461–1469.
doi:10.1242/jeb.00911
Houlbreque, F., R. Rodolfo-Metalpa, F. Oberh€ansli, J. L.
Teyssi�e, and R. Jeffree. 2012. Effects of increased PCO2on
zinc uptake and calcification in the tropical coral Stylo-
phora pistillata. Coral Reefs 31: 101–109. doi:10.1007/
s00338-011-0819-2
Hughes, T. P., and others. 2003. Climate change, human
impacts, and the resilience of coral reefs. Science 301:
929–933. doi:10.1126/science.1085046
Houlbreque et al. Acidification and Stylophora nutrition
10

Jeffrey, S. W., and G. F. Humphrey. 1975. New spectrophoto-
metric equations for determining chlorophylls a, b, c1 and
c2 in higher plants, algae and natural phytoplankton. Bio-
chemie und Physiologie der Pflanzen 167: 191–194.
Krief S., E. J Hendy, M. Fine, R. Yarn, A. Meibom, G. L. Foster,
A. Shemesh. 2010. Physiological and isotopic responses of
scleractinian corals to acidification. Geochim. Cosmo-
chim. Acta 74: 4988–5001. doi:10.1016/j.gca.2010.05.023
Langdon, C., and M. J. Atkinson. 2005. Effects of elevated
pCO2on photosynthesis and calcification of corals and
interactions with seasonal change in temperature/irradi-
ance and nutrient enrichment. J. Geophys. Res. 110:
C09S07. doi:10.1029/2004JC002576
Muscatine, L. 1981. Estimating the daily contribution of car-
bon from zooxanthellae to coral animal respiration. Limnol.
Oceanogr. 26: 601–611. doi:10.4319/lo.1981.26.4.0601
Muscatine, L. 1990. The role of symbiotic algae in carbon
and energy flux in reef corals. Ecosystems of the world.
25: 75–87.
Palardy, J. E., A. Grottoli, and K. Matthews. 2006. Effect of nat-
urally changing zooplankton concentrations on feeding
rates of two coral species in the Eastern Pacific. J. Exp. Mar.
Biol. Ecol. 331: 99–107. doi:10.1016/j.jembe.2005.10.001
Ralph, P. J., and R. Gademann. 2005. Rapid light curves: A
powerful tool to assess photosynthetic activity. Aqua. Bot.
82: 222–237. doi:10.1016/j.aquabot.2005.02.006
Reynaud, S., N. Leclercq, S. Romaine-Lioud, C. Ferrier-Pages, J.
Jaubert, and J. P. Gattuso. 2003. Interacting effects of CO2
partial pressure and temperature on photosynthesis and cal-
cification in a scleractinian coral. Global Change Biology 9:
1660–1668. doi:10.1046/j.1365-2486.2003.00678.x
Steinacher M., F. Joos, T. L. Frolicher, L. Bopp, P. Cadule, V.
Cocco, S. C. Doney, M. Gehlen, K. Lindsay, J. K. Moore,
B. Schneider, J. Segschneider. 2010. Projected 21st century
decrease in marine productivity: A multi-model analysis.
Biogeosciences 7: 979–1005. doi:10.5194/bg-7-979-2010
Stimson, J., and R. A. III Kinzie. 1991. The temporal pattern
and rate of release of zooxanthellae from the reef coral
Pocillopora damicornis (Linnaeus) under nitrogen-
enrichment and control conditions. J. Exp. Mar. Biol.
Ecol. 153: 63–74. doi:10.1016/S0022-0981(05)80006-1
Tambutt�e, �E., D. Allemand, I. Bourge, J. P. Gattuso, and J.
Jaubert. 1995. An improved 45Ca protocol for investigat-
ing physiological mechanisms in coral calcification. Mar.
Biol. 122: 453–459. doi:10.1007/BF00350879
Tremblay, P., R. Grover, J.F. Maguer, L. Legendre, and
C. Ferrier-Pages. 2012. Autotrophic carbon budget in
coral tissue: A new 13C-based model of photosynthate
translocation. J. Exp. Biol. 215: 1384–1393. doi:10.1242/
jeb.065201
Tremblay, P., M. Fine, J. F. Maguer, R. Grover, and C. Ferrier-
Pages. 2013. Ocean acidification increases photosynthate
translocation in a coral-dinoflagellates symbiosis. Biogeo-
sciences 10: 83–109. doi:10.5194/bgd-10-83-2013
Tsuji, A., H. Takanaga, I. Tamai, and T. Terasaki. 1994. Trans-
cellular transport of benzole acid across Caco-2 cells by a
pH-dependent and carrier-mediated transport mechanism.
Pharm. Res. 11: 30–37. doi:10.1023/A:1018933324914
Wild, C., M. Rasheed, C Jantzen, P. Cook, U. Struck, M.
Huettel, and A. Boetius. 2005. Benthic metabolism and
degradation of natural particulate organic matter in car-
bonate and silicate reef sands of the Northern Red Sea.
Mar. Ecol. Prog. Ser. 298: 69–78. doi:10.3354/meps298069
Acknowledgments
Thanks are due to Andy Foggo for his precious advice in the statisticalinterpretation of the data. We also thank Beat Gasser for his help in thesetting up the experiment and to three anonymous reviewers for their
helpful comments and constructive remarks on this paper.The international Atomic Energy Agency and the Centre Scientifique
de Monaco are grateful to the Government of the Principality of Mon-aco for the support provided to their laboratories.
Submitted 19 February 2014
Revised 16 September 2014
Accepted 17 September 2014
Associate editor: John Albert Raven
Houlbreque et al. Acidification and Stylophora nutrition
11
Copyright © 2022 FDOKUMEN