Economic analysis of using of slurry acidification technologies ...
233
Economic analysis of using of slurry acidification technologies in the BSR region Kalvi Tamm, Raivo Vettik Estonian Crop Research Institute
-
Upload
khangminh22 -
Category
Documents
-
view
1 -
download
0
Transcript of Economic analysis of using of slurry acidification technologies ...
Economic analysis of using of
slurry acidification technologies in
the BSR region
Kalvi Tamm, Raivo Vettik
Estonian Crop Research Institute
2019
2019
Economic analysis of using of
slurry acidification technologies in
the BSR region
Kalvi Tamm, Raivo Vettik
Estonian Crop Research Institute, 2019
The data from different countries were colleted by
Santa Pavila (Latvia),
Mikhail Ponomarev (Russia),
Nikolay Kapustsin (Belarus),
Sari Peltonen (Finland),
Jonas Ostermann (Germany),
Line Strand (Sweden),
Mateusz Sękowski (Poland),
Artūras Šiukščius (Lithuania),
Henning Lyngsø Foged (Denmark)

3
Contents
1. Summary ..................................................................................................... 7
2. Introduction ................................................................................................ 8
3. Collecting of data and calculation methods ................................................ 8
3.1. Data collecting methods ........................................................................ 8
3.2. In-house acidification – cattle farms ..................................................... 8
3.2.1. Investment costs in cattle farms ................................................. 8
3.2.2. Calculation of depreciation, cattle farm ................................... 11
3.2.3. Maintainance cost, cattle farm .................................................. 11
3.2.4. Cost of bank loan interest, cattle farm ...................................... 11
3.2.5. Insurance cost, cattle farm ........................................................ 12
3.2.6. Energy cost, cattle farm ............................................................ 12
3.2.7. Safety costs in cattle farm ......................................................... 13
3.2.8. Labour cost, cattle farm ............................................................ 13
3.3. In -house system, pig farms ................................................................. 13
3.3.1. Investment costs in pig farms ................................................... 13
3.3.2. Maintenance cost, pig farm ...................................................... 17
3.3.3. Energy cost, pig farm ............................................................... 17
3.3.4. Safety costs in pig farm ............................................................ 18
3.3.5. Labour cost, pig farm ............................................................... 18
3.4. In-pit acidification system ................................................................... 18
3.5. Safety costs .......................................................................................... 19
3.6. In-storage SAT costs ........................................................................... 19
3.7. In-field SAT costs ................................................................................ 21
3.8. Acid cost .............................................................................................. 26
3.9. Liming ................................................................................................. 29
3.9.1. Soil pH and liming .................................................................... 29
3.9.2. Fertilisers and soil acidity ......................................................... 30
3.9.3. Liming prices ............................................................................ 32
3.9.4. Liming cost ............................................................................... 33
3.10. N cost reduction ................................................................................... 34
3.11. S cost reduction ................................................................................... 41
3.12. Effect on slurry storage costs .............................................................. 44
3.12.1. Covering of storage .................................................................. 44
3.13. Yield response ..................................................................................... 49
4. Method of sensitivity analysis .................................................................. 51
5. Results ...................................................................................................... 53
4
5.1. Belarus ................................................................................................. 53
5.1.1. Annual slurry amount, Belarus ................................................. 53
5.1.2. Cover type, Belarus .................................................................. 55
5.1.3. Acid consumption, Belarus ...................................................... 57
5.1.4. Ntot in slurry, Belarus ................................................................ 59
5.1.5. N price, Belarus ........................................................................ 61
5.1.6. S price, Belarus ......................................................................... 63
5.1.7. Summary, Belarus .................................................................... 65
5.2. Denmark .............................................................................................. 67
5.2.1. Annual slurry amount, Denmark .............................................. 67
5.2.2. Cover type, Denmark ................................................................ 70
5.2.3. Acid consumption, Denmark .................................................... 74
5.2.4. Ntot in slurry, Denmark ............................................................. 76
5.2.5. N price, Denmark ..................................................................... 78
5.2.6. S price, Denmark ...................................................................... 80
5.2.7. Summary, Denmark .................................................................. 82
5.3. Estonia ................................................................................................. 84
5.3.1. Annual slurry amount, Estonia ................................................. 84
5.3.2. Cover type, Estonia .................................................................. 86
5.3.3. Acid consumption, Estonia ....................................................... 88
5.3.4. Ntot in slurry, Estonia ................................................................ 90
5.3.5. N price, Estonia ........................................................................ 92
5.3.6. S price, Estonia ......................................................................... 94
5.3.7. Summary, Estonia ..................................................................... 96
5.4. Finland ................................................................................................. 98
5.4.1. Annual slurry amount, Finland ................................................. 98
5.4.2. Slurry amount per hectare, Finland ........................................ 100
5.4.3. Cover type, Finland ................................................................ 102
5.4.4. Acid consumption, Finland .................................................... 104
5.4.5. Ntot in slurry, Finland .............................................................. 107
5.4.6. N price, Finland ...................................................................... 108
5.4.7. S price, Finland ....................................................................... 111
5.4.8. Summary, Finland .................................................................. 112
5.5. Germany ............................................................................................ 114
5.5.1. Annual slurry amount, Germany ............................................ 114
5.5.2. Cover type, Germany .............................................................. 116
5.5.3. Acid consumption, Germany .................................................. 118
5.5.4. Ntot in slurry, Germany ........................................................... 120
5.5.5. N price, Germany ................................................................... 122
5.5.6. S price, Germany .................................................................... 124
5
5.5.7. Summary, Germany ................................................................ 126
5.6. Latvia ................................................................................................. 128
5.6.1. Annual slurry amount, Latvia ................................................. 128
5.6.2. Cover type, Latvia .................................................................. 130
5.6.3. Acid consumption, Latvia ...................................................... 132
5.6.4. Ntot in slurry, Latvia ................................................................ 134
5.6.5. N price, Latvia ........................................................................ 136
5.6.6. S price, Latvia ......................................................................... 138
5.6.7. Summary, Latvia .................................................................... 140
5.7. Lithuania ............................................................................................ 142
5.7.1. Annual slurry amount, Lithuania ............................................ 142
5.7.2. Cover type, Lithuania ............................................................. 144
5.7.3. Acid consumption, Lithuania ................................................. 146
5.7.4. Ntot in slurry, Lithuania ........................................................... 148
5.7.5. N price, Lithuania ................................................................... 150
5.7.6. S price, Lithuania .................................................................... 152
5.7.7. Summary, Lithuania ............................................................... 154
5.8. Poland ................................................................................................ 156
5.8.1. Annual slurry amount, Poland ................................................ 156
5.8.2. Cover type, Poland ................................................................. 158
5.8.3. Acid consumption, Poland ...................................................... 160
5.8.4. Ntot in slurry, Poland ............................................................... 162
5.8.5. N price, Poland ....................................................................... 164
5.8.6. S price, Poland ........................................................................ 166
5.8.7. Summary, Poland ................................................................... 168
5.9. Russia ................................................................................................ 170
5.9.1. Annual slurry amount, Russia ................................................ 170
5.9.2. Cover type, Russia .................................................................. 172
5.9.3. Acid consumption, Russia ...................................................... 174
5.9.4. Ntot in slurry, Russia ............................................................... 176
5.9.5. N price, Russia ........................................................................ 178
5.9.6. S price, Russia ........................................................................ 180
5.9.7. Summary, Russia .................................................................... 182
5.10. Sweden .............................................................................................. 184
5.10.1. Animal number, Sweden ........................................................ 184
5.10.2. Cover type, Sweden ................................................................ 187
5.10.3. Acid consumption, Sweden .................................................... 189
5.10.4. Ntot in slurry, Sweden ............................................................. 191
5.10.5. N price, Sweden ...................................................................... 193
5.10.6. S price, Sweden ...................................................................... 195
6
5.10.7. Summary, Sweden .................................................................. 197
6. Summary of results, conclusions and recommendations ........................ 199
6.1.1. Summary of results ................................................................. 199
6.1.2. Conclusions ............................................................................ 202
6.1.3. Recommendations .................................................................. 203
References ............................................................................................................ 207
Appendix 1. Acid tank foundation cost items ...................................................... 210
Appendix 2. Information about sulphuric acid producing plants in Baltic Sea
region ................................................................................................................... 212
Appendix 3. Data for economic analyses, collected from countries participating
present project ...................................................................................................... 214
Belarus ........................................................................................................... 214
Denmark ........................................................................................................ 216
Estonia ........................................................................................................... 216
Finland ........................................................................................................... 218
Germany ........................................................................................................ 220
Latvia ............................................................................................................. 222
Lithuania ....................................................................................................... 224
Poland ............................................................................................................ 226
Russia ............................................................................................................ 228
Sweden .......................................................................................................... 230
7
1. Summary
The economic aspects have a crucial role for the farmer’s decision to choose one
of acidification technologies (SAT) or some other solution to minimise ammonia
emission from slurry. The calculation models are composed within the project to
compare different solutions. Excel applications are built on bases of these models.
Present report gives overview about data and methods used in analysis models.
The calculation results are presented for every country participating in Baltic
Slurry Acidification project. The report includes chapter about overall summary
and conclusions of economic analyses and gives recommendations to improve
cost-benefit of slurry acidification.
Slurry Acidification Technologies (SAT) decrease ammonia (NH3) emissions by
49–64%. Reduced emissions mean that farmers save nitrogen (N) in slurry.
Without SATs, farmers lose N from the slurry through NH3 volatilization: 8–30%
from pig or cattle house, 10–25% from open storage and 40–50% from non-tilled
fields. In-house SAT has impact on N loss from ex-animal, in-pit SAT has impact
on N loss from ex-house, in-storage and in-field SATs on ex-storage slurry,
resulting the decrease of mineral N-fertiliser.
One litre of sulphuric acid contains 0.56 kg sulphur (S) and consequently 1.5–2.5
kg of S is applied with a ton of acidified slurry. It decreases cost of mineral S-
fertiliser.
The investment to acidification system depends on which SAT is in use. However
highest is the acid cost. Additionally should be taken into the account that by use
of acidified slurry can be some rise of liming cost.
The results show cost-benefit of SATs by bigger slurry amounts compared to disc-
harrowing <12 h after band-application of non-acidified slurry. The smallest
minimum slurry amount was 1,100 m3 yearly in Sweden by in-storage
acidification of pig slurry.
All SATs have cost- benefit by pig slurry in all countries by bigger slurry
amounts. The SATs have cost- benefit by cattle slurry in some countries.
However, a careful analysis with local parameters and future prices should be
performed before deciding to invest to acidification system in the farm. The farm
savings do not always cover cost of acidification, so society must take some of the
burden as a compensation for reduced ammonia emissions.
8
2. Introduction
The aim of this report is to increase knowledge concerning the environmental and
economic impacts of slurry acidification technologies (SATs) in order to help
build end-user confidence in SATs and to help justify the risks involved with
investing in these innovative technologies. Environmental impact studies of SATs
implementation are critical for highlighting the potential that existing innovative
techniques have for improving manure fertilizer value, decreasing nitrogen loss
from agriculture and helping countries meet strict ammonia emission reduction
targets. Financial studies of SAT implementation are critical for providing
end-users with the tools necessary to make their own calculations and
estimates on the feasibility and potential profitability of Implementing SATs.
The economic analysis of SAT implementation that combines both the
environmental and financial analysis will be a key tool the project will provide to
authorities and policy makers for raising their capacity concerning the value of
supporting SAT implementation in relation to other measures for meeting the
ammonia emission reduction targetsObjective
The aim of this report is to increase knowledge concerning the environmental and
economic impacts of slurry acidification technologies (SATs) in order to help
build end-user confidence in SATs and to help justify the risks involved with
investing in these innovative technologies.
3. Collecting of data and calculation methods
3.1. Data collecting methods
Data about SATs technical parameters and prices directly fom SAT producers
a. In-Farm acidification - JH Agro A/S
b. In-storage acidification – HARSØ and Ørum Smeden
c. In filed acidification - BioCover
Country based data were collected by project partners( (see Appendix 3).
3.2. In-house acidification – cattle farms
3.2.1. Investment costs in cattle farms
In the cattle barn the mixing tank is not used, the slurry is acidified in slurry
channel. Acidification in one spot means that it’s possible to add the acid
somewhere in the stable or a ring channel.
The slurry-collecting channel in barn should be big enough and should contain so
much slurry, that the mixer can work and is able to store and treat with acid the
amount of one or more scraper interval. Important is ,that the amount of acidified
9
slurry is big enough to lower the pH in the new slurry from the cows. Also
important is that during the mixing no air is pumped into the slurry. The channel
should be designed with a cycle, so that mixer can work efficiently. A wall in the
middle is necessary.
The quality of the cattle slurry has to be such that it can be stirred in the stable so
that the acid can be mixed properly. If the slurry is separated then it will be more
susceptible to stir around and may need a less acid.
By the information from JH Agro A/S (e-mail contact with Ken Hyldgaard, Kurt
West and Holger Schulz) is possible to establish their acidification system for all
sizes of cattle farms. Generally there is one acidification spot, if there are up to
500 cows, and two, if there are more than 500 cows. Acid addition in spot No. 2 is
coupled to the system and it is possible to add more acid addition spots.
An approximately price for a system with one spot is 87,000 €. An approximately
price for Acid addition spot No. 2 is 10,000 €. Maximum distance from spot No. 1
is 25 m.
The system costs are relatively various. If the tank is small ( for a small barn) and
the installation is very easy , the price is low (50,000 €). However, if there are
some more details needed, so the price is higher. Small acid tank means that the
tank is then 4,000 liter and for roughly 150 cows , without mixer.
Example 1: For 800 cows has been installed a double system ( because of two
barns ) in Germany and the price for a double tank system is around 110,000 €.
That system can handle two acids, because the slurry is pumped to a biogas plant.
Example 2: In Germany are installed two acids system for 2 barns . 400 cows and
400 young cows. There we are going to use sulfur acid and acetic acid. There are
two big tanks included 15 m³. This system will cost 150,000 € without mixers.
Acetic acid is also known as ethanoic acid C2H4O2 and is for example produced in
a biogas plant during the methanation.
If there are scrapers in cattle stable and the slurry is not recirculating in cross
channels then there is no possibility to acidfy the slurry in the barn. In that case is
suggestable to use in-house acidification system in slurry pumping pit (or better in
extra processing tank) between stable and storage. If that pit is big enough is
possible to treat slurry for roughly 1,000 cows.
If a farmer wants to buy a acidification plant for cattle farm, then he have to build
concrete foundation for acid tank with power and water connections. The rest is
with the plant and will be installed when the plant is coming.
Spot No. 1 contains: (Report 2.1):
1) acid tank;
2) pH-meter, pumps, valves, flow meters, control panel which provides
complete automation of the acidification and slurry pumping process ;
10
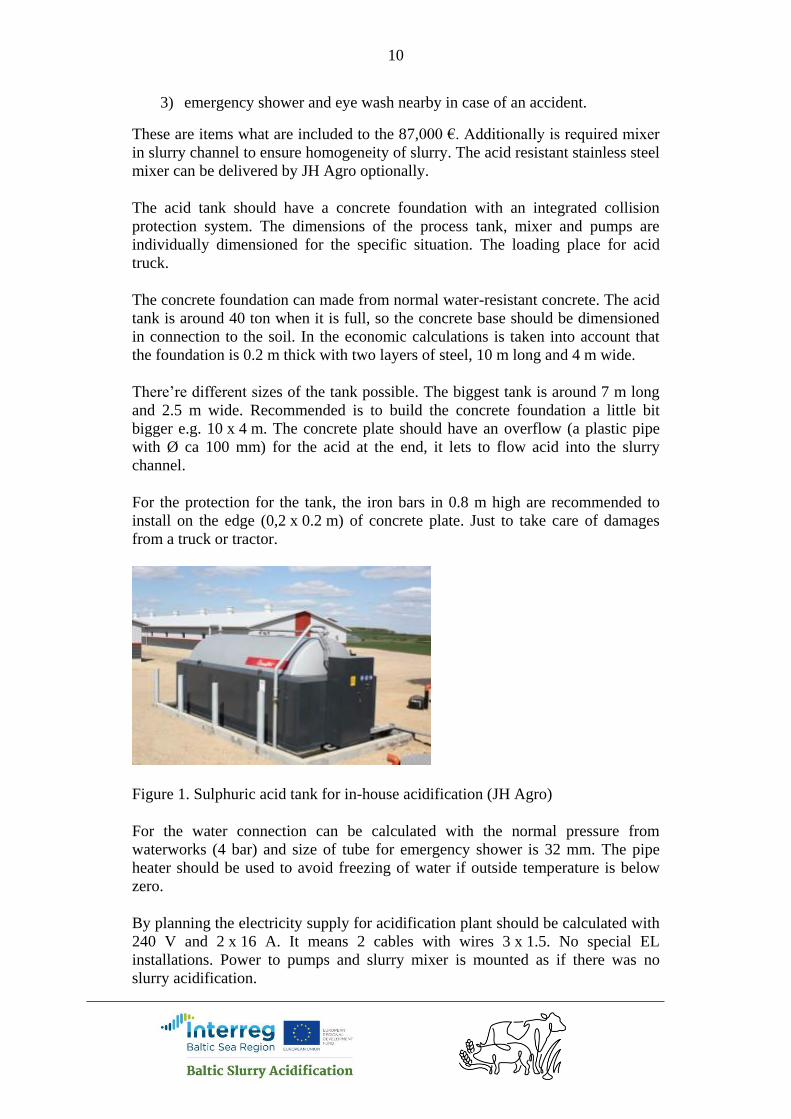
3) emergency shower and eye wash nearby in case of an accident.
These are items what are included to the 87,000 €. Additionally is required mixer
in slurry channel to ensure homogeneity of slurry. The acid resistant stainless steel
mixer can be delivered by JH Agro optionally.
The acid tank should have a concrete foundation with an integrated collision
protection system. The dimensions of the process tank, mixer and pumps are
individually dimensioned for the specific situation. The loading place for acid
truck.
The concrete foundation can made from normal water-resistant concrete. The acid
tank is around 40 ton when it is full, so the concrete base should be dimensioned
in connection to the soil. In the economic calculations is taken into account that
the foundation is 0.2 m thick with two layers of steel, 10 m long and 4 m wide.
There’re different sizes of the tank possible. The biggest tank is around 7 m long
and 2.5 m wide. Recommended is to build the concrete foundation a little bit
bigger e.g. 10 x 4 m. The concrete plate should have an overflow (a plastic pipe
with Ø ca 100 mm) for the acid at the end, it lets to flow acid into the slurry
channel.
For the protection for the tank, the iron bars in 0.8 m high are recommended to
install on the edge (0,2 x 0.2 m) of concrete plate. Just to take care of damages
from a truck or tractor.
Figure 1. Sulphuric acid tank for in-house acidification (JH Agro)
For the water connection can be calculated with the normal pressure from
waterworks (4 bar) and size of tube for emergency shower is 32 mm. The pipe
heater should be used to avoid freezing of water if outside temperature is below
zero.
By planning the electricity supply for acidification plant should be calculated with
240 V and 2 x 16 A. It means 2 cables with wires 3 x 1.5. No special EL
installations. Power to pumps and slurry mixer is mounted as if there was no
slurry acidification.

11
For distance control is internet connection needed and therefore data cable should
be installed.
The acidfication tank can be installed close to the barn wall and maximum
distance between slurry acidification point (slurry channel or pumping pit) and
acid tank can be 25 m.
A acid tank foundation building cost in Estonia 14,624 € without VAT. The
calcultion was ordered from Eelarvestusgrupp OÜ, a company making daily
building cost calculations for building companies in Estonia. The overview about
cost items is shown in Appendix 1.
Spot No. 2 additions mean there is possibility to add acid into two ring channels
or two stables.
3.2.2. Calculation of depreciation, cattle farm
By the information from JH Agro there has not replaced the in-house acidification
systems since the first system which works more than 10 years.
Thus, 20 year lifetime is used in calculation of depreciation of in-farm
acidification system depreciation.
30 year lifetime is used in calculation of concrete base, power connection, water
connection and loading place for acid truck. KTBL suggests to use 30 year
lifetime for long lasting building parts (KTBL 2016 pg 517).
To calculate depreciation cost per cubic meter of slurry, the investment costs are
divided by lifetimes of system parts and annual slurry production of the barn.
3.2.3. Maintainance cost, cattle farm
To calculate maintenance cost per cubic meter of slurry, the annual maintenance
cost is divided by the annual slurry production of the barn.
JH Agro offers a service contract for acidification system maintenance, so that
proved is the optimal work of the system. The price is about 1,500 € per year and
acidification spot for in-house SAT in cattle farm
3.2.4. Cost of bank loan interest, cattle farm
Interest is calculated as an average from the life-span of a investment:
WT
OHia
ca
f
pp
i1002
1001
−
= ,
where ap - length of loan period, years;
12
ip - rate of interest, % year-1 and
Of - rate of self-financing, % from loan sum.
The value “2” in formula is used to calculate the average remaining value of the
investment.
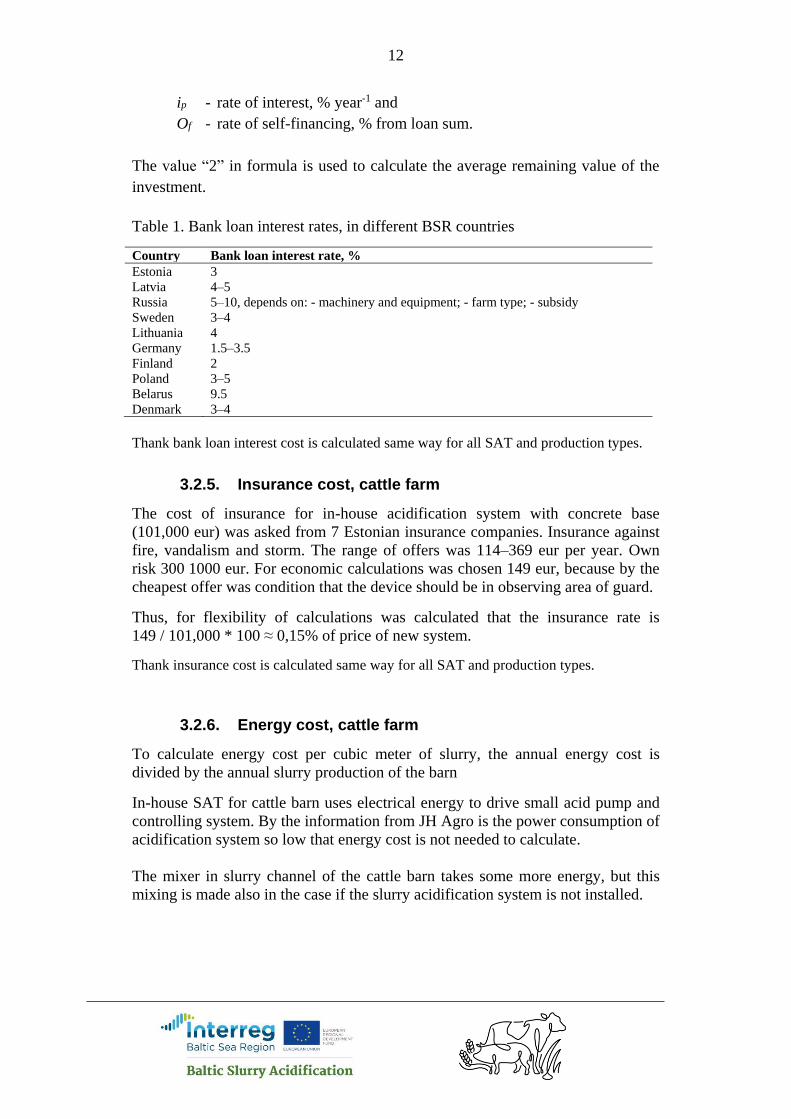
Table 1. Bank loan interest rates, in different BSR countries
Country Bank loan interest rate, %
Estonia 3
Latvia 4–5
Russia 5–10, depends on: - machinery and equipment; - farm type; - subsidy
Sweden 3–4
Lithuania 4
Germany 1.5–3.5
Finland 2
Poland 3–5
Belarus 9.5
Denmark 3–4
Thank bank loan interest cost is calculated same way for all SAT and production types.
3.2.5. Insurance cost, cattle farm
The cost of insurance for in-house acidification system with concrete base
(101,000 eur) was asked from 7 Estonian insurance companies. Insurance against
fire, vandalism and storm. The range of offers was 114–369 eur per year. Own
risk 300 1000 eur. For economic calculations was chosen 149 eur, because by the
cheapest offer was condition that the device should be in observing area of guard.
Thus, for flexibility of calculations was calculated that the insurance rate is
149 / 101,000 * 100 ≈ 0,15% of price of new system.
Thank insurance cost is calculated same way for all SAT and production types.
3.2.6. Energy cost, cattle farm
To calculate energy cost per cubic meter of slurry, the annual energy cost is
divided by the annual slurry production of the barn
In-house SAT for cattle barn uses electrical energy to drive small acid pump and
controlling system. By the information from JH Agro is the power consumption of
acidification system so low that energy cost is not needed to calculate.
The mixer in slurry channel of the cattle barn takes some more energy, but this
mixing is made also in the case if the slurry acidification system is not installed.

13
3.2.7. Safety costs in cattle farm
Extra acid-proof work clothes are not required if in-house SAT is used.
Workers don’t have any contact with acid.
3.2.8. Labour cost, cattle farm
There is no need for active work on the in-house system, it works automatically.
The operator should take care of the system regularly, check every day the pH and
look after the system at the mixer to be sure that there are no noticeable problems.
One hour per week is approximate time consumption for these actions (personal
contact with Holger Schulz, JH Agro).
The labour cost is calculated with formula
𝐶𝑙 =365𝑝𝑡𝑑
𝑄
where Cl –labour cost € m-3; p is operator’s hourly personal cost with taxes € h-1;
td is daily work time connected to acidification system h day-1; Q is annual slurry
amount produced in the barn.
Table 2. Labour personal costs with taxes.
Country Labour personal cost with taxes € h-1
Estonia 7.4
Latvia 5
Russia 3,6
Sweden 25
Lithuania 4.1
Germany 27.5
Finland 16
Poland 3.8
Belarus 2.4
Denmark 25
Additionally, the vacation cost should be calculated. It means that if worker has
28-day vacation per year (generally in Estonia) then the personal cost with taxes
should be multiplied with 1,083.
3.3. In -house system, pig farms
3.3.1. Investment costs in pig farms
Housing systems for intensive pig production are generally designed around slurry
manure handling and indoor confinement year-round and the buildings are
insulated and heated, although some solid manure systems still exist. The
defecating behaviour of pigs differs from cattle in that they have separate places
for resting and defecating. Most pig housing systems have either fully or partially
slatted floors with either a deep pit or shallow manure channel underneath. Deep

14
litter pens can also be used in conjunction with partially slatted floors over the
manure collection channels. Production of finishing pigs and weaners generally
occurs in smaller groups in pens, although large pens are used in some occasions.
Breeding pigs can be kept individually or in groups (except when farrowing).
Source: Baltic Manure. 2013.
In-house SAT for pig barn contains (WP 2.1, BSA 2018):
1) acid tank;
2) processing tank with mixer;
3) pH-meter, pumps, valves, flow meters, control panel which provides
complete automation of the acidification and slurry pumping process ;
4) acid pipes from acidification tank to acidfication point;
5) emergency shower and eye wash nearby in case of an accident.
The acid tank should have a concrete foundation with an integrated collision
protection system. The process tank is made of concrete and mixers are made
from acid resistant stainless steel. The dimensions of the process tank, mixer and
pumps are individually dimensioned for the specific situation.
If the in-house acidification system is used, then in the pig barns slurry is sluiced
out and pumped back again. The area of a cellar below slatted floor in a pig farm
(fatteners) is limited, it is not bigger than 1,500 m² and one valve is per cellar. At
present one JH Agro acidification system can run up to 8, in some cases 12
valves at the facility, depending on the total number of place units. There can be
as much cellars as the farm needs, JH Agro can handle them with their system
(personal contact with Holger Schultz, JH Agro).
JH Agro has systems for stables which produce 32,000 finishers per year and new
projects which produce up to 42,000 finishers per year.
The price of a system with 6 valves is about 200,000 €, plus process tank,
mixer and acid tank base.
The price of acid tank base and communications is same as by the cattle farm
(see 3.2.2 and Appendix 1).
The volume of the acid tank is suggestable to choose by the volume of acid truck
plus some extra space for residual amount of acid before refilling of acid tank plus
some airspace above acid level after refilling.
The volume of process tank must be same as amount of slurry coming weekly
from cellar plus 50 cm space for foaming plus rest in the bottom, so in total
additional 1,5 m (JH Agro). For the price of processing tank is required to:
1) calculate amount of slurry produced per m2 of pen floor;
2) calculate amount of slurry produced per slurry cellar and week;
3) calculate required size of processing tank;
4) ask price of this size round concrete tank from some company building
slurry tanks.
15
Calculation of amount of slurry produced per squaremeter of pen floor
Although there are national differences, housing with fully or partly slatted
flooring (typically on concrete slats with 17 mm slot spacing) with a pen floor
area of 0.7 m2 at the end of the finishing period predominates within the EU.
Partly slatted floors are mostly used in countries such as the Netherlands, the
Czech Republic and Denmark. In Germany fully slatted floors prevail and in
Spain both types of floor are used with the proportion of slatted to solid floor
being 60 : 40. In Belgium, fully slatted floors are prevalent in old housing or in
new houses equipped with a chemical scrubbing system. In the UK, straw bedding
is common.
Source: BREF 2017 , page 83.
In Finland and Sweden, housing systems with fully slatted floors are not allowed
due to animal welfare regulations. See also 'Cross-media effects' in Section 4.7.1.1
for fully slatted floors.
Source: BREF 2017 , page 373.
In economic calculations is calculated with 3,2 batches of finishers per year and
every finisher produces 0,5 t slurry. It means that 3,2 x 0,5 = 1,6 t a-1 slurry is
produced per animal place yearly. If one animal place is 0,7 m2, then
1.6 / 0.7 = 2.29 m3 m-2 a-1 slurry is produced.
The formula to calculate the amount of slurry produced per one m2 of floor of pen
is:
𝑄𝑓𝑙𝑜𝑜𝑟 =𝑛𝑏𝑎𝑡𝑐ℎ𝑄𝑝𝑖𝑔
𝑆𝑎𝑛𝑖𝑚𝑎𝑙
where Qfloor is amount of slurry produced per one m2 of floor and year, m3 m-2 a-1;
nbatch is number of fattener batches produced yearly per one animal place; Sanimal is
area of one animal place, m2 animal-1.
Calculation of amount of slurry produced per slurry cellar and week
If proportion of slatted to solid floor in pens is 60 : 40 and slatted floor area is
1500 m2, then total area of pens connected to one cellar is
1,500 * 100 / 60 = 2,500 m2. The annual slurry production from this area is
2500 * 2,29 = 5,725 t a-1.
The slurry cellar valve is opened once per week, it means that 5725/(365/7)=110
m3 week-1 of slurry is pumped from slurry cellar to the processing tank. 365/7 in
number of weeks in one year.
The formula to calculate the amount of slurry pumped from slurry cellar to the
processing tank once per week is:
𝑄𝑐𝑒𝑙𝑙𝑎𝑟 =7𝑄𝑓𝑙𝑜𝑜𝑟𝑆𝑐𝑒𝑙𝑙𝑎𝑟
3.65𝑟𝑠𝑙𝑎𝑡𝑡𝑒𝑑
16
where Qcellar is amount of slurry pumped from slurry cellar to the processing tank
once per week, m3 week-1; Scellar is area of slatted floor above one slurry cellar,
m2; rslatted is proportion of slatted to whole floor in pens, %.
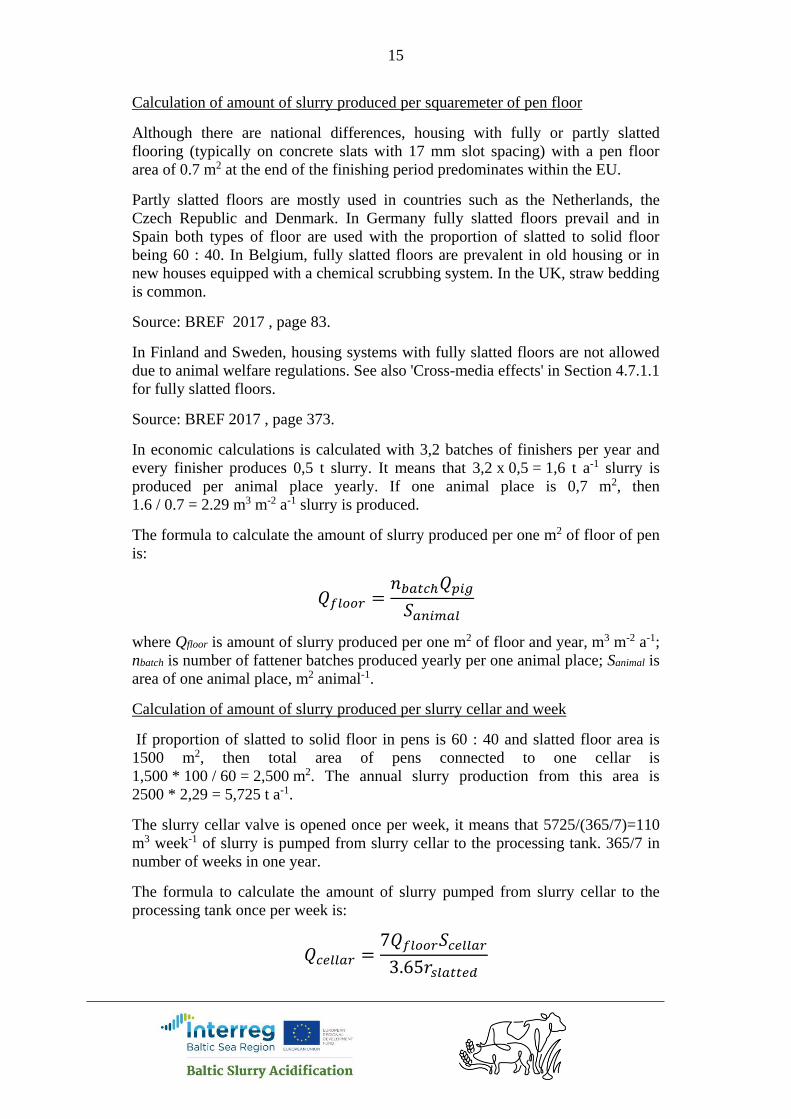
Calculation of required size of processing tank
The volume of process tank must be same as amount of slurry coming weekly
from cellar plus 50 cm space for foaming plus rest in the bottom, so in total
additional 1,5 m (JH Agro). In Denmark the heights of processing tanks are
between 3–5 m. If to calculate 4 m total inside height of tank, then tank inside
diameter is sqrt(110 / (4 – 1.5) / π) * 2=7.5 m.
The formula to calculate diameter of processing tank is:
𝐷𝑝𝑟𝑜𝑐 = 2√𝑄𝑐𝑒𝑙𝑙𝑎𝑟
𝜋(ℎ𝑤 − 1.5)
where Dproc is inside diameter of processing tank, m; hw is height of processing
tank wall inside, m.
Figure 2. Scheme of in-house SAT in pig barn. (JH Agro)
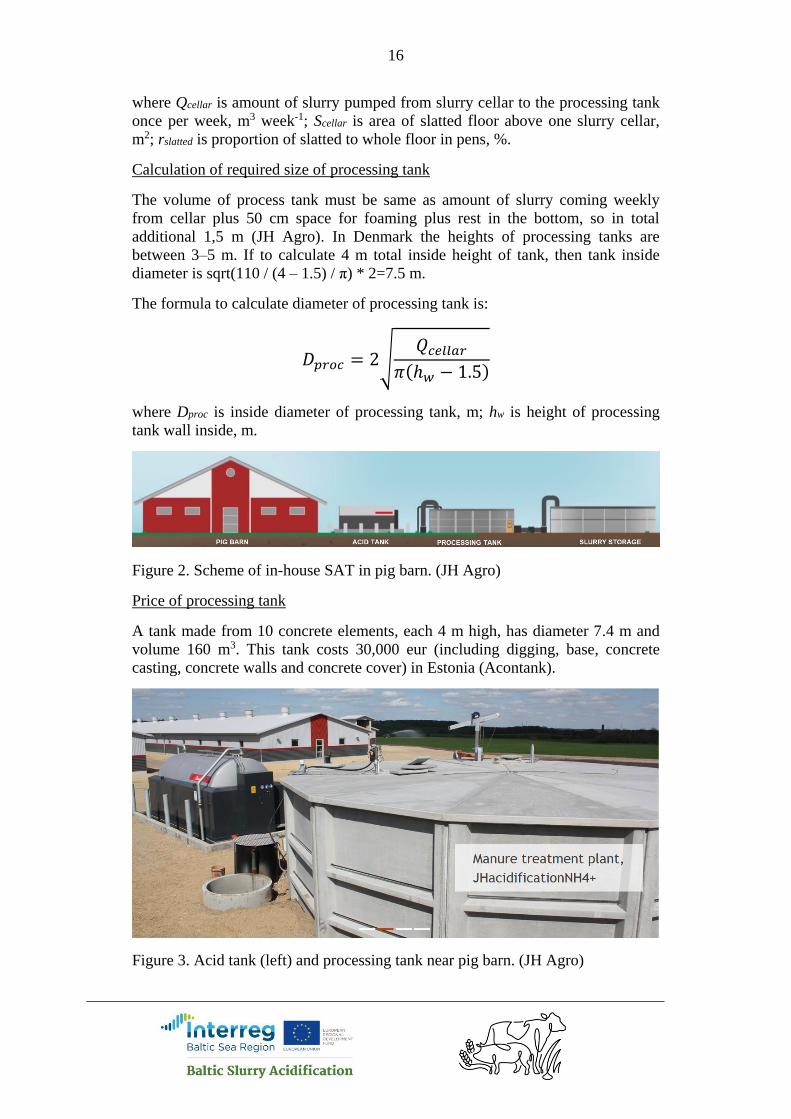
Price of processing tank
A tank made from 10 concrete elements, each 4 m high, has diameter 7.4 m and
volume 160 m3. This tank costs 30,000 eur (including digging, base, concrete
casting, concrete walls and concrete cover) in Estonia (Acontank).
Figure 3. Acid tank (left) and processing tank near pig barn. (JH Agro)

17
Slurry mixer and pump, power and price
Inside the processing tank is required a stationary mixer which is able to to mix the slurry
and acid in tank in total and for sure. The power of the mixer depends on size of the
process tank.
The mixer is not included to the price of acidification system. However, JH Agro offers
LJM mixer from 7.5 kW up to 15 kW. The cost for those mixers are around 5,000 € up to
7,500 €. For a 160 m3 tank containing 110 m3 of slurry a 10 kW mixer is suggested
by JH Agro. The interpolated price of 10 kW mixer is about 5,850 eur.
By the calculations of a Estonian company selling slurry mixers and pumps for
storages, the 7.5 kW mixer with stand, mast and cable clamber costs 4,700 eur.
The company advisor infromed that this mixer is powerful enough for these
conditions.
A 11 kW centrifugal pump between process tank and storage tank costs 6,000 eur
with sump and base wihth electical heating system.
JH Agro recommends also to separate slurry regularly, when the sluicing to the
process tank begins, it makes pumping easier and reduces acid consumption.
3.3.2. Maintenance cost, pig farm
To calculate maintenance cost per cubic meter of slurry, the annual maintenance
cost is divided by the annual slurry production of the barn.
JH Agro offers a service contract for acidification system maintenance, so that
proved is the optimal work of the system. The price is about 500 € per year and
valve of slurry cellar if in-house SAT in pig farm is used.
By the mixer in processing tank every second year the oil have to be changed,
about 10 litre, around 50 € in total.
3.3.3. Energy cost, pig farm
There is additional energy cost in pig farm to pump the slurry to the processing
tank and mix the slurry with acid in the tank.
The duration of mixing process depends on the slurry ph and volume. One
acidification cycle lasts 20–45 min per cellar. In sectioned pig houses, individual
sections will be treated this way sequentially. 45 min is used in present economic
analyses.
It is always important to mix the slurry absolute homogenous. The mixer size
depends on the size of the process tank. JH Agro offers up to 15 kW but e.g . for
160 m3 tank a 10 kW is optimal.
The electricity consumption of mixer is calculated with formula:
𝐸 =𝑏𝑛𝑣𝑎𝑙𝑣𝑒𝑠𝑃𝑚𝑖𝑥𝑒𝑟𝑡𝑚𝑖𝑥𝑒𝑟𝑊
𝑒

18
where E is yearly electricity consumption of mixer, kWh a-1; nvalves is number of
slurry cellars or valves; Pmixer is power of mixer engine, kW; tmixer is mixing time
of slurry coming from one slurry cellar per week, h week-1; W is number of weeks
in one year, week a-1 (the value of W is 365/7); b is work load of electric motor, %
of nominal power; e is energy use efficiency of electric motor, %.
In calculations is b = 50% and e = 90%.
The cost of the annual electricity consumed by the mixer is calculated with
formula
𝐶𝑒,𝑚𝑖𝑥𝑒𝑟 =𝑝𝑒𝐸
𝑄
where Ce,mixer is annual energy cost connected to the mixer, € m-3; pe is cost of
electricity, € kWh-1.
Similar way is calculated electricity consumption and annual eenergy cost of
slurry pump, moving slurry out from processing tank.
3.3.4. Safety costs in pig farm
Extra acid-proof work clothes are not required if in-house SAT is used. Workers
don’t have any contact with acid.
3.3.5. Labour cost, pig farm
The labour cost is calculated same way like in cattle farm, see chapter 3.2.8.
3.4. In-pit acidification system
For Sweden, the in-house tehnology is calculated with presumption that
acidification starts in slurry pumping pit in cattle and pig barn both. It means that
there is not taken inot account ammonia emission nor decrease of emission in
barn. The calculations base on slurry Ntot content ex-housing. By Lena Rodhe the
ex-housing and ex-storage data in Sweden are close.
By the information from JH Agro presenter Holger Schulz is the price of
acidification system is same for in-barn and in-pit acidification both. However,
5,000 € for addinional mixer should be calculated in pumping pit, to mix slurry
and acid during in-pit acidification. The slurry pump is controlled by acidification
system to adjust slurry level in pit.
SAT producer suggests, that some acidified slurry should be in the pit, so that the
new slurry from the barn flows into the prepared slurry. However, the process is
more or less continious. After start of use of acidification system, the pit contains
always some acidified slurry. The pit has to be so big that the amount of new
slurry is only a small part (lower than 5%) of the complete volume of the pit.
The other costs for in-pit SAT are same as by in-house SAT.

19
3.5. Safety costs
Sulphuric acid is classified as a substance with pH < 2 that is highly corrosive to
skin and eyes. Sulphuric acid vapours can also be harmful to the respiratory tract
and mucous membranes. The correct personal protective equipment is therefore
imperative when sulphuric acid is handled.
Appropriate personal protective equipment is (WP 2.5 BSA 2018)
• acid-resistant safety boots/shoes;
• fully covering acid-resistant protective suit (e.g. in butyl rubber or
neoprene), which may be disposable;
• protective gloves (in fluorocarbon rubber 0.4 mm thick or butyl rubber 0.5
mm thick) certified in accordance with EN 374-2003 (fabric, leather,
natural rubber, polychloroprene/chloroprene rubber and nitrile rubber are
unsuitable materials);
• protective eyewear or a full-face mask at concentrations above the
occupational exposure limits (with gas filter E, release of sulphur dioxide,
or an aerosol mask with filter P3, mist formation) in accordance with SS-
EN 141.
Table 3. Prices and the annual demand of personal protective equipment items for
in storage acidification
Personal protective
equipment item
Amount for one
year, pcs
Price,
€ pcs-1
Cost,
€ yr-1
Boots 0.5 12.5 6.25
Protective suits 3 11 33
Protective cloves 3 30.1 90.3
Protective mask 0.2 87.5 17.5
Filters for mask 3 14.5 43.5
Total cost 160.55
3.6. In-storage SAT costs
In-storage SATs acidify slurry in the storage. The most commonly practiced in- in
Denmark is slurry acidification just before the slurry is spread and therefore
storage acidification there are no benefits of the acidification during the main
storage period. There are two manufacturers that make systems for in-storage
acidification and both are modified slurry mixers that add acid to the slurry during
the mixing process. (WP 2.1, BSA 2018)
Prices of in-storage acidification devices (WP 3.1, BSA 2018)
HARSØ (pump-mixer):
€ 75,000, including
€ 10,000 for the acidification equipment and
€ 65,000 for the slurry pump

20
Ørum Smeden (propeller mixer):
€ 14,000 for the acidification equipment +
€ 25,000 for the GDM7500 slurry mixer or
(60–230 kW tractors)
€ 38,000 for the GDM8600 slurry mixer
(110–300 kW tractors)
Maintenance cost
Until now there is no knowledge of significant maintenance costs. The
components used are of high quality and not yet replaced any in the last 6 years
where the system has been on the market.
Expepcted is that probably the senso should be replaced after years of use. (The
sensor requires a little attention and it´s important that the protective cover is
mounted after use so that it does not dry out). Worst case, a new sensor will
amount to approx 400 EUR. (Personal contact with Henrik Nielsen, Ørum-
Smeden ).
In the economic calculations is calculated with 60 eur maintenance costs per year.
Mixing performance
If the acid is mixed into slurry before spreading to the field then there is no need
to calculate fuel cost, because slurry anyway have to be agitated and homogenised
before spreading.
If there is longer period between mixing of acid and spreading to the field, then
the homogenising should be made two times and fuel consumption of slurry
mixing during acidification should be calculate as cost of acidification.
Ørum Smeden gives data for power need of mixers. This is 150 kW in average for
smaller mixer.
The acid pumping performance is 100 litres of acid per minute. The mixing time
during acidification is calculated by this value in the formula:
𝑡𝑚𝑖𝑥𝑒𝑟,𝑠 =𝑎𝑎𝑄
60𝑞𝑎
where tmixer,s is mixing time during acidification, h; qa is acid pump performance, l
min-1.
Impact on slurry storage capacity.
When lowering the pH in slurry during acidification, bicarbonate components in
slurry are converted to carbon dioxide which bubbles to the surface and produces
foam. Because of the foaming, there must be free space in the storage to assure
21
the foaming does not spill over during the treatment. A height of 0.5 to 1 m is
commonly recommended. 1 m is used in present economic analyses.
In the KTBL 2016/2017 page 500 are given slurry storage costs € m-3 for different
storage capacities. The trendline, built by these values, has formula:
𝑦 = −0.257 ln(𝑥) + 3.364 R2 = 0.9975.
where x is torage capacity and y is cost of storage, € yr-1.
Labour demand and cost
Calculated is that during the acidification is involved one assisting worker from
farm.
Personal protection
The delvery of acid in IBC tanks offers logistical flexibility during acidification,
but puts also greater responsibility on the farmer/operator for maintaining safety.
Full body safety gear is necessary during operation. See section “Safety costs”.
N loss reduction after in-storage acidification.
The 55% is the reduction factor what is use in Denmark, following advice from
agricultural consultants (Personal contact with Henrik Nielsen, Ørum-Smeden ).
3.7. In-field SAT costs
In-field SAT is used to acidify slurry on the field during application. (WP 2.1
BSA 2018)
Prices of in-field acidification devices
BioCover SyreN:
List price is 65,000 Euro ex works + fitting (normally app. 5,000 Euro).
If the tractor has no ISO Bus terminal, then additional 3,000 € should be
calculated for that.
BioCover prototypes are still running after 10 years and with no view to stopping.
For depreciation is calculated with 20 years life time.
Kyndestoft acidification system:
List price: 40,000 €
Maintenance cost
Biocover Syren has service kit containing pH sensor, calibration fluids, gloves
and fee for data transmission (if fitted) = 900 Euro pr. year. No other cost is
known, but experience says that yearly maintenance is app. 1,400 Euro
If farm has own refillable IBC tanks for acid, then in some countries like Sweden,
is required to replace utilised IBC tanks after certain time span with new tanks. In
22
Sweden the life span of IBC tanks is 2.5 years. The acid delivery company keeps
track of the age of the IBC tanks and will not refill tanks that are damaged or have passed
their expiration date for safety reasons.
The cost of IBC tanks per cubicmeter of slurry is calculated with formula:
𝑘𝐼𝐵𝐶 =𝑎𝑎𝑛𝐼𝐵𝐶𝑝𝐼𝐵𝐶
𝑄𝑎𝑇𝐼𝐵𝐶
where kIBC is cost of IBC tanks per cubicmeter of slurry, € m-3; nIBC is number of
IBC tanks utilised for acid in farm; pIBC is price of an IBC tank, €; Qa is annual
demand of acid in farm, l a-1; TIBC is life span of a IBC tank, years.
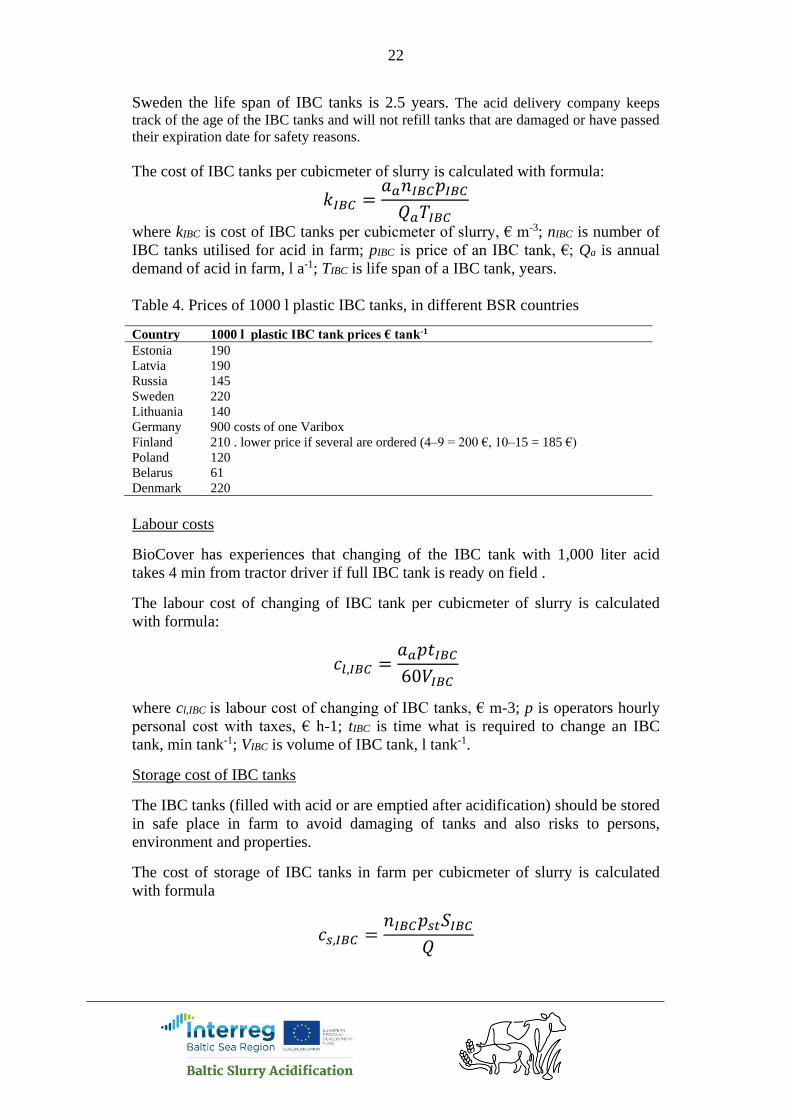
Table 4. Prices of 1000 l plastic IBC tanks, in different BSR countries
Country 1000 l plastic IBC tank prices € tank-1
Estonia 190
Latvia 190
Russia 145
Sweden 220
Lithuania 140
Germany 900 costs of one Varibox
Finland 210 . lower price if several are ordered (4–9 = 200 €, 10–15 = 185 €)
Poland 120
Belarus 61
Denmark 220
Labour costs
BioCover has experiences that changing of the IBC tank with 1,000 liter acid
takes 4 min from tractor driver if full IBC tank is ready on field .
The labour cost of changing of IBC tank per cubicmeter of slurry is calculated
with formula:
𝑐𝑙,𝐼𝐵𝐶 =𝑎𝑎𝑝𝑡𝐼𝐵𝐶
60𝑉𝐼𝐵𝐶
where cl,IBC is labour cost of changing of IBC tanks, € m-3; p is operators hourly
personal cost with taxes, € h-1; tIBC is time what is required to change an IBC
tank, min tank-1; VIBC is volume of IBC tank, l tank-1.
Storage cost of IBC tanks
The IBC tanks (filled with acid or are emptied after acidification) should be stored
in safe place in farm to avoid damaging of tanks and also risks to persons,
environment and properties.
The cost of storage of IBC tanks in farm per cubicmeter of slurry is calculated
with formula
𝑐𝑠,𝐼𝐵𝐶 =𝑛𝐼𝐵𝐶𝑝𝑠𝑡𝑆𝐼𝐵𝐶
𝑄

23
where cs,IBC is cost of storage of IBC tanks in farm per cubicmeter of slurry, € m-3;
pst is price of storage € m-2 a-1; SIBC is area required to store a IBC tank, m2 tank-1.
The KTBL 2016/2017 (pg 154) gives data for different type of storages. A storage
hangar closed in all sides has annual cost 14.43 € m-2 a-1.
Generally, the IBC tanks are stored and transported on wooden or plastic pallets
that ensure easier loading of tanks. The standard size of IBC tank bottom and also
pallet is 1,000 X 12,000 mm (Feraxo 2018). Thus, area required to store a IBC
tank is 1.2 m2. In the calculation is taken into the account that the IBC tanks with
acid are stored in one layer.
Acid transportation to the field
The IBC tanks can be transported from storage to the field and back on front hitch
of tractor which is working with slurry spreader and SyreN slurry acidification
system.
If spreader is filling slurry tank by slurry storage itself and it locates near to the
storage of the IBC tanks, then there is no need to calculate cost of transportation
of the IBC tank from storage to the field. The transportation of the slurry and IBC
tank to the field can be made by same drive.
If fields are further from slurry storage, then generally separate tank trucks are
used to transport the slurry from storage to the field and spreader should drive
from field away only to change IBC tank with acid.
In that case the cost of driving with spreader between field and storage should be
calculated.
The cost of transportation of IBC container with spreader per cubicmeter of
slurry is calculated with formula:
𝑘𝐼𝐵𝐶,𝑠𝑝𝑟𝑒𝑎𝑑𝑒𝑟 =𝑎𝑎𝑑𝐼𝐵𝐶𝑝𝑠𝑝𝑟𝑒𝑎𝑑𝑒𝑟
𝑣𝑠𝑝𝑟𝑒𝑎𝑑𝑒𝑟𝑉𝐼𝐵𝐶
where kIBC,spreader is cost of transportation of IBC container with spreader per
cubicmeter of slurry, € m-3; dIBC is average distance between fields and IBC
storage, km; vspreader is average velocity by transporting IBC tank with slurry
spreader, km h-1; pspreader is price of work hour of spreader, € h-1.
Another possibility to transport IBC tanks between storage and field is to use
separate transporting vehicle. It means that the IBC tanks should be loaded with
fork loader from storage to the vehicle, transported to the field and then loaded
from vehicle to the field side.
The cost of transportation of IBC container with separate vehicle is calculated
with formula:
𝑘𝐼𝐵𝐶,𝑣𝑒ℎ𝑖𝑐𝑙𝑒 =𝑎𝑎𝑝𝑣𝑒ℎ𝑖𝑐𝑙𝑒
𝑛𝑡𝑉𝐼𝐵𝐶(
𝑑𝐼𝐵𝐶
𝑣𝑣𝑒ℎ𝑖𝑐𝑙𝑒+
𝑡𝑙
60)
24
where kIBC,vehicle is cost of transportation of IBC container with spreader per
cubicmeter of slurry, € m-3; pvehicle is price of work hour of vehicle, € h-1; tl is
loading and unloading time of IBC tanks, min; nt is number of IBC tanks
transported with one drive, pcs; vvehicleis average velocity by transporting IBC tank
with separate vehicle, km h-1
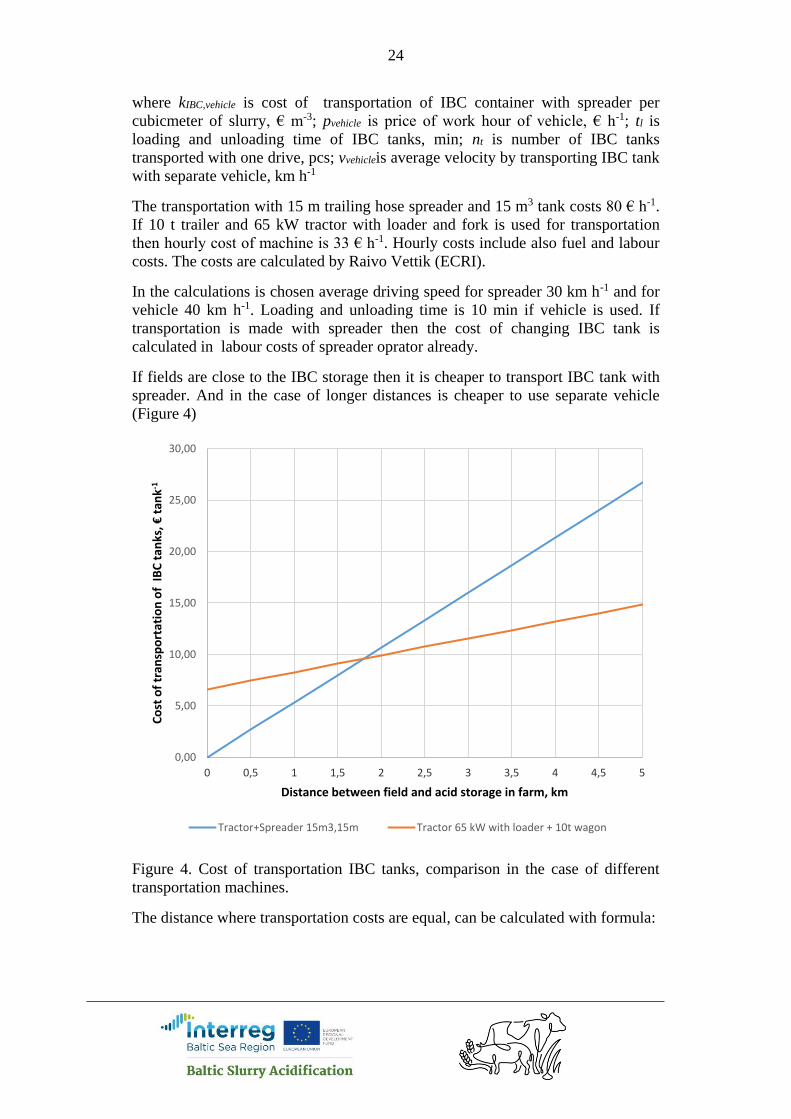
The transportation with 15 m trailing hose spreader and 15 m3 tank costs 80 € h-1.
If 10 t trailer and 65 kW tractor with loader and fork is used for transportation
then hourly cost of machine is 33 € h-1. Hourly costs include also fuel and labour
costs. The costs are calculated by Raivo Vettik (ECRI).
In the calculations is chosen average driving speed for spreader 30 km h-1 and for
vehicle 40 km h-1. Loading and unloading time is 10 min if vehicle is used. If
transportation is made with spreader then the cost of changing IBC tank is
calculated in labour costs of spreader oprator already.
If fields are close to the IBC storage then it is cheaper to transport IBC tank with
spreader. And in the case of longer distances is cheaper to use separate vehicle
(Figure 4)
Figure 4. Cost of transportation IBC tanks, comparison in the case of different
transportation machines.
The distance where transportation costs are equal, can be calculated with formula:
0,00
5,00
10,00
15,00
20,00
25,00
30,00
0 0,5 1 1,5 2 2,5 3 3,5 4 4,5 5
Co
st o
f tr
ansp
ort
atio
n o
f IB
C t
anks
, € t
ank-1
Distance between field and acid storage in farm, km
Tractor+Spreader 15m3,15m Tractor 65 kW with loader + 10t wagon
25
𝑑𝐼𝐵𝐶 =𝑡𝑙
120 (𝑝𝑠𝑝𝑟𝑒𝑎𝑑𝑒𝑟𝑛𝑡
𝑣𝑠𝑝𝑟𝑒𝑎𝑑𝑒𝑟𝑝𝑣𝑒ℎ𝑖𝑐𝑙𝑒−
1𝑣𝑣𝑒ℎ𝑖𝑐𝑙𝑒
)
The equal distance on Figure 4 is 1.8 km. It means, that if distance between field
and IBC storage is longer than 1.8 km, then for transportation of IBC tanks is
cheaper to use separate vehicle and not spreader.
Acid pump fuel consumption and cost
BioCover SyreN acid pump is driven by hydraulic engine. Acid pump oil need is
25 liter min-1 from hydraulic system. BioCover hasn’t data about acid pump
power consumption. The pressure in the hydraulic to the oil motor is variable as it
depends on the dosage pump speed. It is a max 25 liter oil motor. Known is that
when working stable, the pressure in the 1” acid dosage hose is about 3 bar.
(Morten Toft).
Thus, the power need of acid pump can be estimated by calculations. Hydraulic
power is a calculated of pressure and flow (Roeber et al. in Computers and
Electronics in Agriculture 127 (2016)):
𝑃ℎ =𝑝𝑎𝑓𝑎
𝑐𝑎600
where Ph is consumption of the hydraulic power of acid pump, kW; pa is pressure
of acid, bar; fa is flow of acid, l min-1 and ca – multiplied efficiencies of acid
pump, hydraulic motor and hydraulic engine.
The acid flow can be calculated by formula:
𝑓𝑎 =𝑎𝑎𝑎ℎ𝑎𝑏𝑣
600
where b is working width of slurry spreader, m; v is working speed of spreader,
km h-1. 600 is result of converting of units.
For example, if acid consumption aa = 2 l m-3; slurry amount aha = 30 m3 ha-1;
spreader width b = 18 m and working speed v = 8 km h-1, then acid flow is 14.4 l
min-1.
There are no data about acid pump efficiency. However, oil pump efficiency is by
literature typically in range 0.85–0.92 depending on type of pump (Casey, 2011).
The acid pump is driven by oil motor and oil motor is driven by oil pump. In the
calculations 0.9 as efficiency value is used for each of them: acid pump, hydraulic
motor and hydraulic pump. Thus total efficiency for system is ca = 0.93 = 0.73
Thus, in the previous example, the power demand for pumping of acid is 0,1 kW.
Fuel consumption per hour is calculated with formula
𝑝𝑓,𝑙 = 𝑞𝑃ℎ𝜌𝑓
26
where pf,l is fuel consumption l h-1; q is specific fuel consumption, kg kWh-1
(typically 0.21 kg kWh-1), m; ρf is diesel fuel density kg l-1 (0.861 kg l-1).
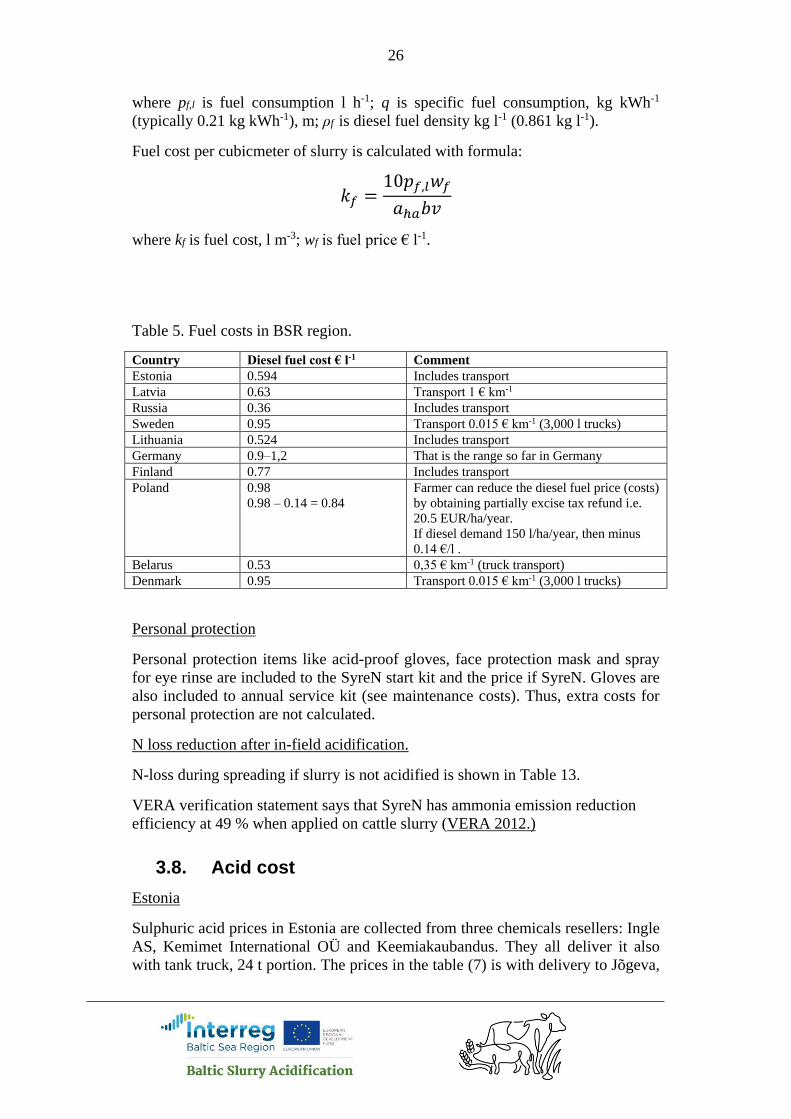
Fuel cost per cubicmeter of slurry is calculated with formula:
𝑘𝑓 =10𝑝𝑓,𝑙𝑤𝑓
𝑎ℎ𝑎𝑏𝑣
where kf is fuel cost, l m-3; wf is fuel price € l-1.
Table 5. Fuel costs in BSR region.
Country Diesel fuel cost € l-1 Comment
Estonia 0.594 Includes transport
Latvia 0.63 Transport 1 € km-1
Russia 0.36 Includes transport
Sweden 0.95 Transport 0.015 € km-1 (3,000 l trucks)
Lithuania 0.524 Includes transport
Germany 0.9–1,2 That is the range so far in Germany
Finland 0.77 Includes transport
Poland 0.98
0.98 – 0.14 = 0.84
Farmer can reduce the diesel fuel price (costs)
by obtaining partially excise tax refund i.e.
20.5 EUR/ha/year.
If diesel demand 150 l/ha/year, then minus
0.14 €/l .
Belarus 0.53 0,35 € km-1 (truck transport)
Denmark 0.95 Transport 0.015 € km-1 (3,000 l trucks)
Personal protection
Personal protection items like acid-proof gloves, face protection mask and spray
for eye rinse are included to the SyreN start kit and the price if SyreN. Gloves are
also included to annual service kit (see maintenance costs). Thus, extra costs for
personal protection are not calculated.
N loss reduction after in-field acidification.
N-loss during spreading if slurry is not acidified is shown in Table 13.
VERA verification statement says that SyreN has ammonia emission reduction
efficiency at 49 % when applied on cattle slurry (VERA 2012.)
3.8. Acid cost
Estonia
Sulphuric acid prices in Estonia are collected from three chemicals resellers: Ingle
AS, Kemimet International OÜ and Keemiakaubandus. They all deliver it also
with tank truck, 24 t portion. The prices in the table (7) is with delivery to Jõgeva,
27
(Estonia). Acid source is Belarus. Acid concentration is 94% and density is 1.831
g cm-3. The date of price is 14.11.2017. 2 hours of unloading time is included to
the price. If diver has to wait with unloading, then waiting time costs 50 € h-1. The
delivery is made 1–2 weeks after order. (Source: Ingle AS, Kemimet International
OÜ and Keemiakaubandus)
Russia
The prices collected from big companies in Moscow and Leningrad regions are:
1) technical sulphuric acid – 0.077 eur l-1;
2) improved sulphuric acid – 0.093 eur l-1.
These prices are without VAT and without transportation cost.
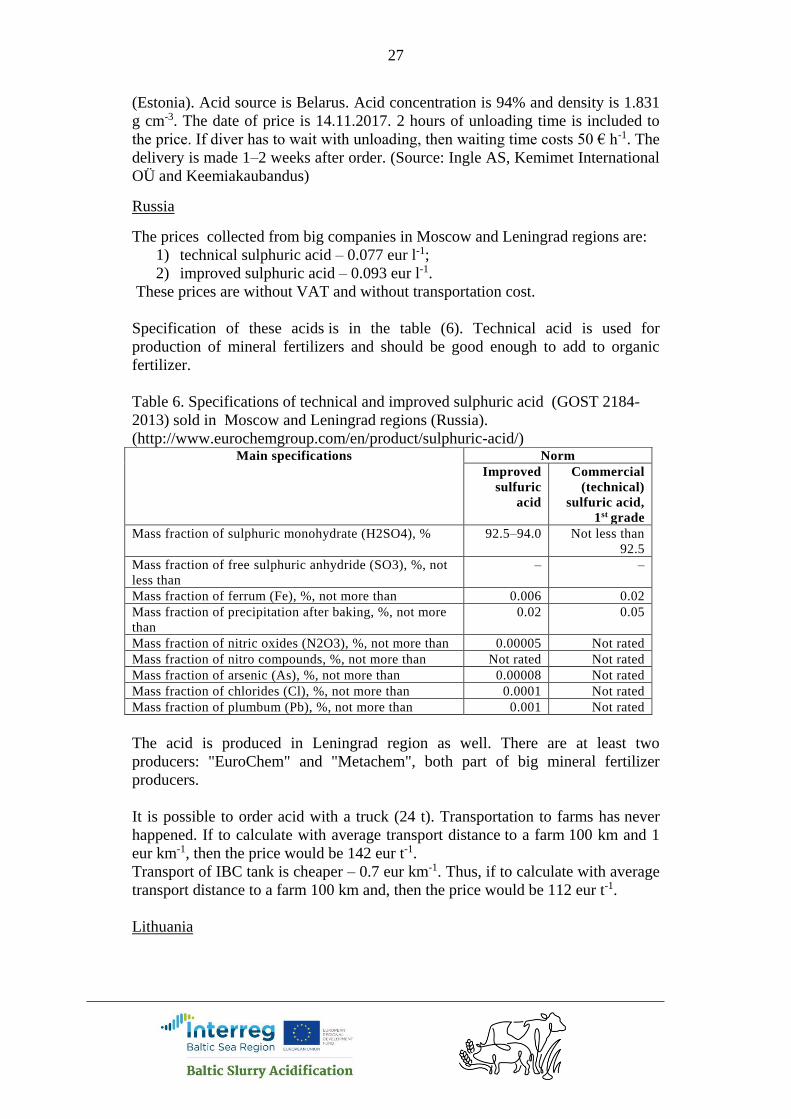
Specification of these acids is in the table (6). Technical acid is used for
production of mineral fertilizers and should be good enough to add to organic
fertilizer.
Table 6. Specifications of technical and improved sulphuric acid (GOST 2184-
2013) sold in Moscow and Leningrad regions (Russia).
(http://www.eurochemgroup.com/en/product/sulphuric-acid/)
The acid is produced in Leningrad region as well. There are at least two
producers: "EuroChem" and "Metachem", both part of big mineral fertilizer
producers.
It is possible to order acid with a truck (24 t). Transportation to farms has never
happened. If to calculate with average transport distance to a farm 100 km and 1
eur km-1, then the price would be 142 eur t-1.
Transport of IBC tank is cheaper – 0.7 eur km-1. Thus, if to calculate with average
transport distance to a farm 100 km and, then the price would be 112 eur t-1.
Lithuania
Main specifications Norm
Improved
sulfuric
acid
Commercial
(technical)
sulfuric acid,
1st grade
Mass fraction of sulphuric monohydrate (H2SO4), % 92.5–94.0 Not less than
92.5
Mass fraction of free sulphuric anhydride (SO3), %, not
less than
– –
Mass fraction of ferrum (Fe), %, not more than 0.006 0.02
Mass fraction of precipitation after baking, %, not more
than
0.02 0.05
Mass fraction of nitric oxides (N2O3), %, not more than 0.00005 Not rated
Mass fraction of nitro compounds, %, not more than Not rated Not rated
Mass fraction of arsenic (As), %, not more than 0.00008 Not rated
Mass fraction of chlorides (Cl), %, not more than 0.0001 Not rated
Mass fraction of plumbum (Pb), %, not more than 0.001 Not rated

28
Acid price 0,240 € l-1. 1000 l IBC tank (240 euro for 1,000 l). Acid transportation
cost to the farm 1.20 € km-1. Acid concentration, 96%. 131 + 12 = 143 € t-1 with
transport, if 10 tonne is transported 100 km.
Sweden
Acid price 0.62 € l-1 if acid is bought with 1,000 l IBC tank. If acid is bought with
25 t tank, then the price is 0.265 € l-1. Acid transportation cost to the farm is
included in the price. Acid concentration is 98%.
Finland
The acid price is 0.97 € l-1 if acid is transported with IBC containers. In addition,
transport cost 70 € t-1. Thus, the acid price is with transport is 1.1 € l-1 or 602 € t-1.
Table 7. Sulphuric acid prices in Baltic sea region. Prices are without VAT.
Country Acid price,
€ t-1
Acid
concent-
ration
Transport to
the farm
€ km-1
Comments
Estonia 118–127 94–98% Included to
acid price.
24 t portion.
Estonia 135 94–98% Included to
acid price.
10–12 t portion.
Estonia 150 94–98% Included to
acid price..
1,000 l, in IBC.
Latvia 150 98% 1 1,000 l, in IBC.
Russia 42 94–96% 0,7 1,000 l, in IBC.
Russia 42 94–96% 1 24 t.
Sweden 149 98% Included to
acid price.
0.265 € l-1, 25 t portion
Sweden 339 98% Included to
acid price.
0.62 € l-1, 1,000 l IBC
Lithuania 131
143 with
transport, 10
tonne and 100 km
96% 1,2 240 € m-3, 1,000 l IBC
Germany 262 96% 0,9 0,48 € l-1, 1000 l IBC
Finland 602 with transport 93% 70 € t-1 0.97 € l-1
1,300 kg container ≈ 710 l =
689 €
Poland 273 95% 0.72 0.5 € l-1, 25 l canister
Belarus 101 98% 0.35 1,000 l, in IBC. 0,35 € km-1
transport
Belarus 30 94% 1.25 Bulk. 1.25 € km-1 transport,
30 m3.
Denmark 120–128 Included to
acid price.
Delivery by truck
Denmark 136–157 Included to
acid price.
IBC tanks, but price
excluded the price of the
IBC tanks
29
The overview about acid producers is given in Appendix 2 “Information about
sulphuric acid producing plants in Baltic Sea region”.
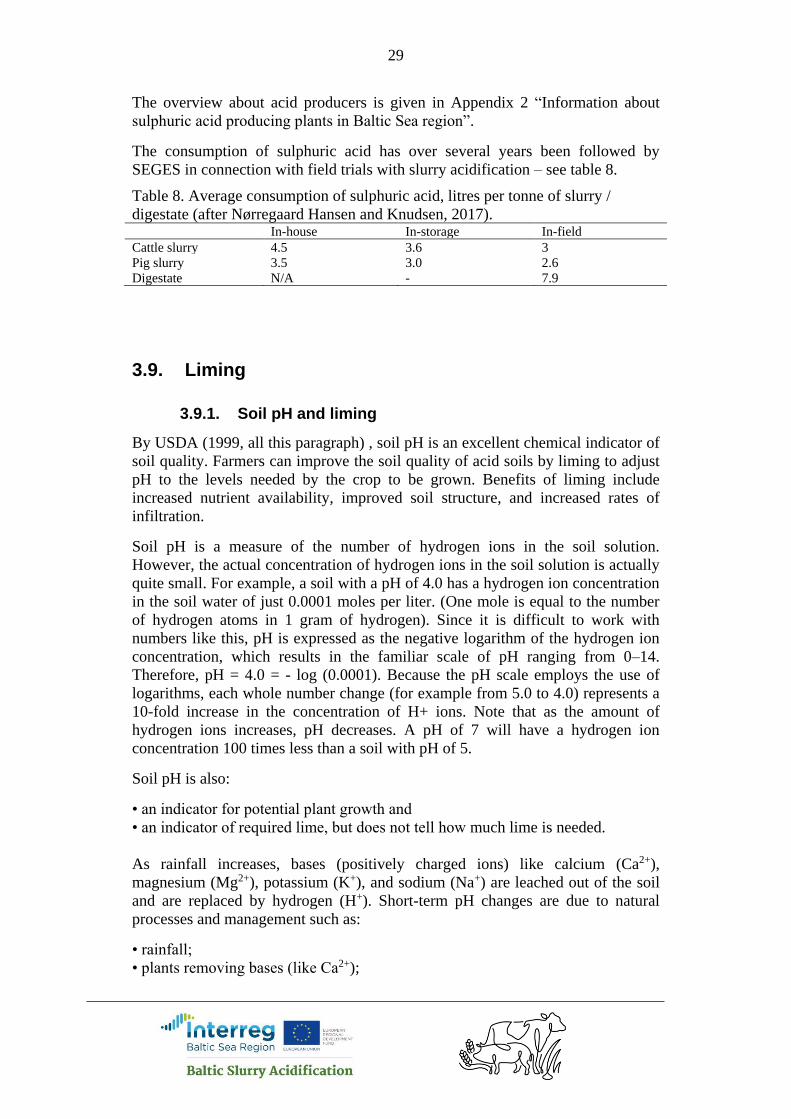
The consumption of sulphuric acid has over several years been followed by
SEGES in connection with field trials with slurry acidification – see table 8.
Table 8. Average consumption of sulphuric acid, litres per tonne of slurry /
digestate (after Nørregaard Hansen and Knudsen, 2017). In-house In-storage In-field
Cattle slurry 4.5 3.6 3
Pig slurry 3.5 3.0 2.6
Digestate N/A - 7.9
3.9. Liming
3.9.1. Soil pH and liming
By USDA (1999, all this paragraph) , soil pH is an excellent chemical indicator of
soil quality. Farmers can improve the soil quality of acid soils by liming to adjust
pH to the levels needed by the crop to be grown. Benefits of liming include
increased nutrient availability, improved soil structure, and increased rates of
infiltration.
Soil pH is a measure of the number of hydrogen ions in the soil solution.
However, the actual concentration of hydrogen ions in the soil solution is actually
quite small. For example, a soil with a pH of 4.0 has a hydrogen ion concentration
in the soil water of just 0.0001 moles per liter. (One mole is equal to the number
of hydrogen atoms in 1 gram of hydrogen). Since it is difficult to work with
numbers like this, pH is expressed as the negative logarithm of the hydrogen ion
concentration, which results in the familiar scale of pH ranging from 0–14.
Therefore, pH = 4.0 = - log (0.0001). Because the pH scale employs the use of
logarithms, each whole number change (for example from 5.0 to 4.0) represents a
10-fold increase in the concentration of H+ ions. Note that as the amount of
hydrogen ions increases, pH decreases. A pH of 7 will have a hydrogen ion
concentration 100 times less than a soil with pH of 5.
Soil pH is also:
• an indicator for potential plant growth and
• an indicator of required lime, but does not tell how much lime is needed.
As rainfall increases, bases (positively charged ions) like calcium (Ca2+),
magnesium (Mg2+), potassium (K+), and sodium (Na+) are leached out of the soil
and are replaced by hydrogen (H+). Short-term pH changes are due to natural
processes and management such as:
• rainfall;
• plants removing bases (like Ca2+);

30
• acid forming fertilizers such as ammonia nitrate (NH4NO3);
• organic acids from plants during decomposition;
• CO2 from root respiration and microbial respiration.
Active acidity (or soil-water pH) is due to the presence of H+ ions in the soil
solution. Active acidity will indicate a need for lime. Potential acidity (or buffer
pH) is the amount of Al3+ and H+ ions that are adsorbed on soil particles
(negatively charged cation exchange sites) and can be desorbed from these
exchange sites to the soil solution (buffering the soil) when liming materials are
added. It is the potential acidity that determines the amounts of agricultural
limestone to neutralize soil acidity. As potential acidity increases, a larger amount
of lime is required to raise pH by a given amount. As cation exchange capacity
increases (higher clay and organic matter), the amount of liming material needed
to change soil pH also increases. Soils with a low cation exchange capacity may
only require 1 ton of agricultural limestone to change a pH from 4.5 to 6.5;
whereas, a soil with a higher CEC may require 2 tons of agricultural lime to make
the same change.
Liming will provide the following benefits:
• reduces the possibility of Mn2+ and Al3+ toxicity;
• improves microbial activity;
• improves physical condition (better structure);
• improves symbiotic nitrogen fixation by legumes;
• improves palatability of forages;
• provides an inexpensive source for Ca2+ and Mg2+ when these nutrients are
deficient at lower pH;
• improves nutrient availability (availability of P and Mo increases as pH
increases at 6.0–7.0, however, other micronutrients availability increases as pH
decreases).
3.9.2. Fertilisers and soil acidity
By McLaughlin (2013, all this paragraph), soil acidification is a widespread
natural phenomenon in regions with medium to high rainfall, and agricultural
production systems can accelerate soil acidification processes through
perturbation of the natural cycles of nitrogen (N), phosphorus (P) and sulphur (S)
in soil, through removal of agricultural produce from the land, and through
addition of fertilizers and soil amendments that can either acidify soil or make it
more alkaline.
Changes in soil pH may be advantageous or detrimental depending on the starting
pH of the soil and the direction and speed of pH change – for example decreases
in soil pH in alkaline soils may be advantageous for crop production due to
benefits in terms of the availability of P and micronutrients e.g. zinc (Zn). On the
other hand, decreases in soil pH for a highly acidic soil may be detrimental in
terms of increasing crop susceptibility to toxicity induced by increased solubility
of aluminium (Al) or manganese (Mn) as soil pH falls.

31
N-fertilisers
The form of N and the fate of N in the soil-plant system is probably the major
driver of changes in soil pH in agricultural systems.
Ammonium-based fertilizers will acidify soil as they generate two H+ ions for
each ammonium molecule nitrified to nitrate. The extent of acidification depends
on whether the nitrate produced from ammonium is leached or is taken up by
plants. If nitrate is taken up by plants the net acidification per molecule of
ammonium is halved compared to the scenario when nitrate is leached. This is due
to the consumption of one H+ ion (or excretion of OH-) for each molecule of
nitrate taken up – this is often observed as pH increases in the rhizosphere.
Anhydrous ammonia and urea have a lower acidification potential compared to
ammonium-based products as one H+ ion is consumed in the conversion to
ammonium. Nitrate-based fertilizers have no acidification potential and actually
can increase soil pH as one H+ ion is absorbed by the plant (or OH- excreted) in
the uptake of nitrate.
S-fertilisers
The form of S fertilizer added to soil can affect soil acidity, principally through
the release of H+ ions by the addition of elemental S (S0) or thiosulfate (S2O32-, in
ammonium thiosulfate - ATS) . However, the amounts of S added to soil and
taken up by plants are generally small in comparison to N.
For each molecule of S0 added to soil, two H+ ions will be generated, and these
can be balanced through plant uptake by either uptake of H+ (same as excretion of
OH- ions) or the generation of OH- (effectively organic anions) within the plant to
form alkaline plant material (“ash alkalinity”). Where produce is removed (which
is often the case in agricultural systems) net acidification of soil will occur if S0 or
ATS are used.
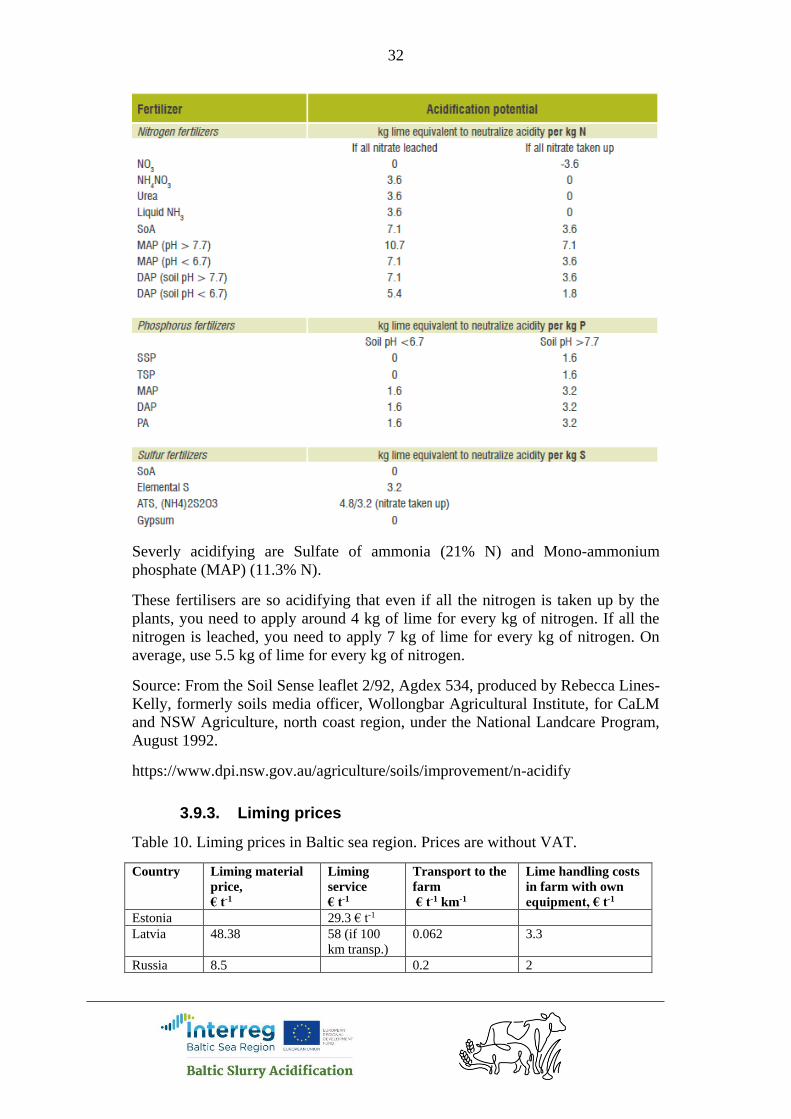
Table 9. Acidification potential for various N, P and S fertilizers expressed as kg
lime equivalent per kg of N, P or S applied (McLaughlin, 2013)
32
Severly acidifying are Sulfate of ammonia (21% N) and Mono-ammonium
phosphate (MAP) (11.3% N).
These fertilisers are so acidifying that even if all the nitrogen is taken up by the
plants, you need to apply around 4 kg of lime for every kg of nitrogen. If all the
nitrogen is leached, you need to apply 7 kg of lime for every kg of nitrogen. On
average, use 5.5 kg of lime for every kg of nitrogen.
Source: From the Soil Sense leaflet 2/92, Agdex 534, produced by Rebecca Lines-
Kelly, formerly soils media officer, Wollongbar Agricultural Institute, for CaLM
and NSW Agriculture, north coast region, under the National Landcare Program,
August 1992.
https://www.dpi.nsw.gov.au/agriculture/soils/improvement/n-acidify
3.9.3. Liming prices
Table 10. Liming prices in Baltic sea region. Prices are without VAT.
Country Liming material
price,
€ t-1
Liming
service
€ t-1
Transport to the
farm
€ t-1 km-1
Lime handling costs
in farm with own
equipment, € t-1
Estonia 29.3 € t-1
Latvia 48.38 58 (if 100
km transp.)
0.062 3.3
Russia 8.5 0.2 2
33
Sweden 30
Lithuania 130 175 Included to liming
material price.
45
Germany 31 1.1 € km-1 20–25 depending
field-farm distance
Finland 42
Poland 24 32 0.31–1.0
Belarus 60 77 0.07 3
Denmark 30
Estonia
Liming service price is 29,3 € t-1, it contains liming material, transport to Jõgeva
and spreading. Procduct is ENEFIX fly ash. Liming service with dolomite lime
from Rakke lime producer - 16.7 € t-1 with 50 km transport.
Latvia
Product is dry dolomite flour, Ca 20.3%, Mg 10.9%, packed in big bags 1 tonne.
Price of dry limestone flour with Ca 38.4% in big bags is 64.03 € t-1. Raw
dolomite sand - 6.5 € t-1 (without package). Transportation cost 0.062 € t-1 km-1,
with truck which has capacity over 10 tonnes. Service costs 0.089 € t-1 km-1.
Lime handling costs in farm with own equipment 3.3 € t-1 (storage, loading,
transport to the field, spreading or liming service cost).
Russia
Dolomitic lime in the bulk. Liming cost for 100 km distance is 30.5 eur t-1.
Lithuania
Liming material price, 130 € t-1 with transportation. Lime handling costs in farm
(storage, loading, transport to the field, spreading or liming service cost), 45 € t-1.
Liming service cost which includes three previous costs, 175 € t-1
Finland
Liming service cost includes liming material, transport to the farm and spreading.
Sweden
Liming service cost which includes liming material, delivery to farm and handling
costs in farm (storage, loading, transport to the field, spreading or liming service
cost), is 30 € t-1.
3.9.4. Liming cost
Addition of acid to slurry increases the need for lime because of a reaction
between acid and soil calcium carbonate, which evaporates CO2 and lowers the
soil pH. The addition of 1 litre of sulfuric acid per ton of manure and applying 30
t ha-1 a-1 will require 75 kg agricultural lime (75% CaCO3) a year, to offset
acidification from the acid. An acid consumption of 4 l t-1 of slurry (common by
storage acidification of pig manure, stable acidification often uses more acid)
requires an annual lime need of 300 kg ha-1. (SEGES report “Status, economy and
consideration by acidification of slurry”.)

34
Thus, the lime demand is 2.5 kg per litre of sulphuric acid.
The cost of additional liming in the case of acidified slurry is calculated with
formula
𝐾𝑙,𝑎 =𝑘𝑙𝑎𝑙𝑎𝑎
1000
where Kl,a – cost of additional liming € m-3 of slurry if slurry is acidified; kl – cost
of liming € t-1 of lime, al – lime demand kg per litre of sulphuric acid; aa –
amount of acid used for acidification of one cubic meter of slurry kg m-3.
If slurry is not acidified then the amount of N and S reaching to the plants is
smaller compared to acidified slurry. The lack of these elements should be
covered with use of the mineral NS fertilisers. In paragraph 3.8.2 were explained
that the use of mineral NS fertilisers cause also the acidifying of soils. By the data
in the table 8, if for example, a NS fertiliser SoA is used and all nitrate is leaching,
then 7.1 kg lime equivalent should be used to neutralise acidity per kg N. And if
all nitrate is taken up, then the lime amount should be 3.6 kg per kg of N. In the
calculation models is presumed that nearly all nitrate is taken up by plants and
lime amount is 4 kg per kg of N.
The cost of additional liming in the case of non-acidified slurry (and additional
mineral fertiliser is used) is calculated with formula
𝐾𝑙,𝑚 =𝑘𝑙𝑎𝑙,𝑁𝑚𝑁
1000
where Kl,m – cost of additional liming € m-3 of slurry if slurry is not-acidified; kl –
cost of liming € t-1 of lime, al,N – lime demand kg per kg of N given with mineral
fertilisers; mN – the amount of N saved by slurry acidification kg m-3 (see chapter
3.9 ).
3.10. N cost reduction
The main reason to acidify slurry is to decrease ammonia emission. It helps to
increase the on amount of inorganic N which is available for plants. Thus, the
need for mineral N fertiliser decreases. In the calculation is presumed that
additional amount of N saved by decrease of NH3 emission diminishes the
expenses on same amount of mineral N.
The calculation of the reduction of mineral N cost by slurry acidification consists
next steps:
1) calculation of N loss with ammonia if slurry is not acidified;
2) calculation of N loss with ammonia by use of some SAT, calculations are
different for in-house, in-storage and in-field SATs;
3) calculation of N saved by use of SATs;
4) calculation of mineral N element price;
5) calculation of reduction of mineral N cost by slurry acidification.

35
Calculation of N loss with ammonia if slurry is not acidified
The sum of the NH3-N loss in barn, storage and field is calculated with formula
𝐿 = 𝐿𝑏 + 𝐿𝑠 + 𝐿𝑓
where L – sum of NH3-N losses in barn, storage and field kg m-3; Lb – NH3-N
loss in barn kg m-3; Ls – NH3-N loss in storage kg m-3; Lf – NH3-N loss in field kg
m-3.
NH3-N loss in barn is calculated with formula
𝐿𝑏 = 𝑎𝑁𝑡𝑜𝑡
𝑘𝑏
100
where aNtot – amount of total nitrogen Ntot in slurry (ex-animal) kg m-3, kb– loss
of NH3-N in barn in the case of the non-acidified slurry % (Table 11).
NH3-N loss in storage is calculated with formula
𝐿𝑠 =𝑘𝑠
100(𝑎𝑁𝑡𝑜𝑡
− 𝐿𝑏)
where ks– loss of NH3-N in storage in the case of the non-acidified slurry %
(Table 12).
The average ammonia emission values in stable, storage and field depend
among othres on weather conditions. Thus in countries with different climate, the
values are different compared to the values in the tables 11, 12 and 13.
Reccomendable is to use in calculations country based ammonia emission values.
Table 11. NH3-N emissions in cattle barn by different slurry removing systems in
Estonia (ENVIR 2016)
Animal group Manure removal strategy NH3-N
emission, % TN
Dairy cows Loose housing, mobile manure removal 2…3 times
per day, little bedding
8
Loose housing, manure removal with scraper >3
times per day, little bedding
7.5
Loose housing, slatted floor, little bedding 10
Pigs, fatteners Fully slatted floor (concrete), vacuum system,
cooling of slurry bottom layer
10
Fully slatted floor (concrete), vacuum system,
without bedding
14
Fully slatted floor, slurry cellar, without bedding 30
Partially slatted floor (concrete), convex bedding
area, slurry channels, slurry flushing
15
Partially slatted floor (concrete), vacuum system,
without bedding
14
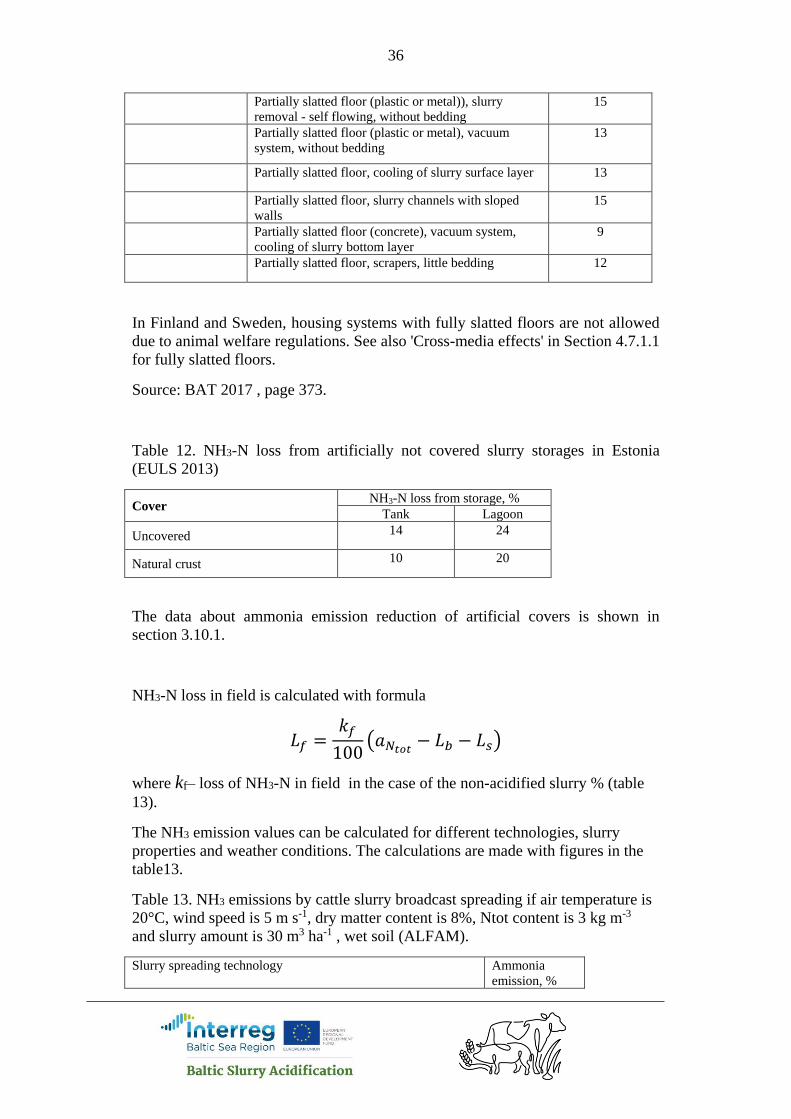
36
Partially slatted floor (plastic or metal)), slurry
removal - self flowing, without bedding
15
Partially slatted floor (plastic or metal), vacuum
system, without bedding
13
Partially slatted floor, cooling of slurry surface layer 13
Partially slatted floor, slurry channels with sloped
walls
15
Partially slatted floor (concrete), vacuum system,
cooling of slurry bottom layer
9
Partially slatted floor, scrapers, little bedding 12
In Finland and Sweden, housing systems with fully slatted floors are not allowed
due to animal welfare regulations. See also 'Cross-media effects' in Section 4.7.1.1
for fully slatted floors.
Source: BAT 2017 , page 373.
Table 12. NH3-N loss from artificially not covered slurry storages in Estonia
(EULS 2013)
Cover NH3-N loss from storage, %
Tank Lagoon
Uncovered 14 24
Natural crust 10 20
The data about ammonia emission reduction of artificial covers is shown in
section 3.10.1.
NH3-N loss in field is calculated with formula
𝐿𝑓 =𝑘𝑓
100(𝑎𝑁𝑡𝑜𝑡
− 𝐿𝑏 − 𝐿𝑠)
where kf– loss of NH3-N in field in the case of the non-acidified slurry % (table
13).
The NH3 emission values can be calculated for different technologies, slurry
properties and weather conditions. The calculations are made with figures in the
table13.
Table 13. NH3 emissions by cattle slurry broadcast spreading if air temperature is
20°C, wind speed is 5 m s-1, dry matter content is 8%, Ntot content is 3 kg m-3
and slurry amount is 30 m3 ha-1 , wet soil (ALFAM).
Slurry spreading technology Ammonia
emission, %
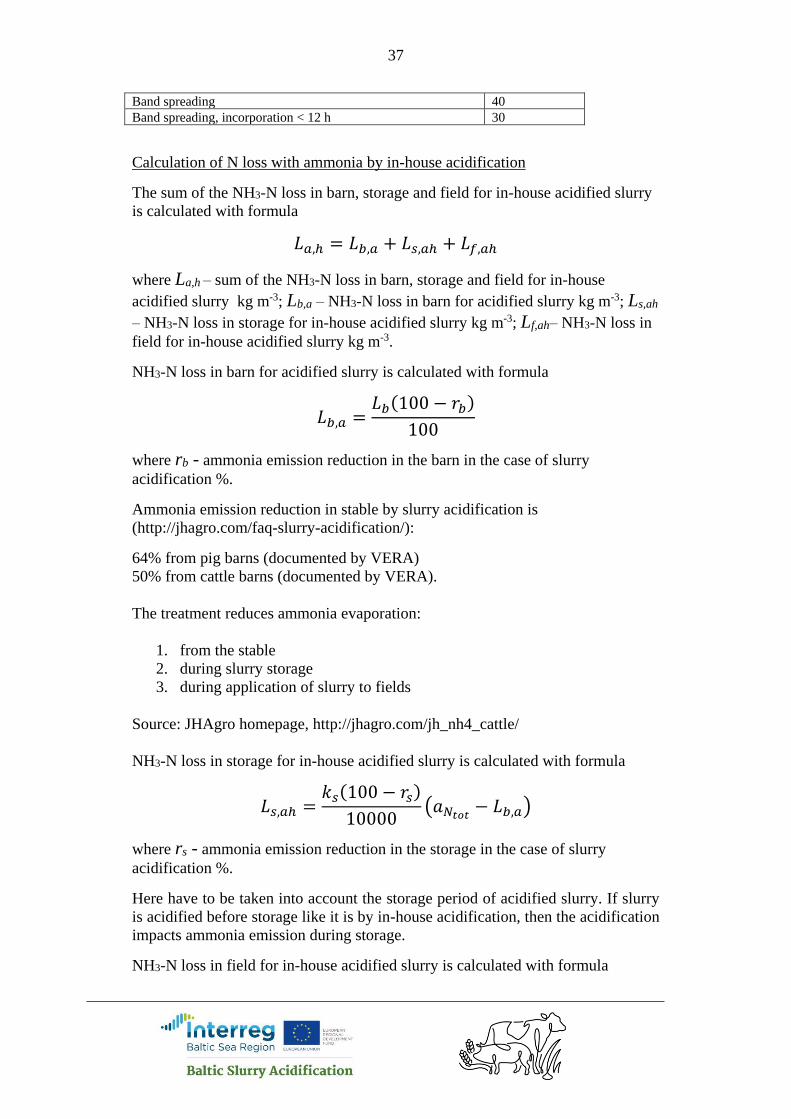
37
Band spreading 40
Band spreading, incorporation < 12 h 30
Calculation of N loss with ammonia by in-house acidification
The sum of the NH3-N loss in barn, storage and field for in-house acidified slurry
is calculated with formula
𝐿𝑎,ℎ = 𝐿𝑏,𝑎 + 𝐿𝑠,𝑎ℎ + 𝐿𝑓,𝑎ℎ
where La,h – sum of the NH3-N loss in barn, storage and field for in-house
acidified slurry kg m-3; Lb,a – NH3-N loss in barn for acidified slurry kg m-3; Ls,ah
– NH3-N loss in storage for in-house acidified slurry kg m-3; Lf,ah– NH3-N loss in
field for in-house acidified slurry kg m-3.
NH3-N loss in barn for acidified slurry is calculated with formula
𝐿𝑏,𝑎 =𝐿𝑏(100 − 𝑟𝑏)
100
where rb - ammonia emission reduction in the barn in the case of slurry
acidification %.
Ammonia emission reduction in stable by slurry acidification is
(http://jhagro.com/faq-slurry-acidification/):
64% from pig barns (documented by VERA)
50% from cattle barns (documented by VERA).
The treatment reduces ammonia evaporation:
1. from the stable
2. during slurry storage
3. during application of slurry to fields
Source: JHAgro homepage, http://jhagro.com/jh_nh4_cattle/
NH3-N loss in storage for in-house acidified slurry is calculated with formula
𝐿𝑠,𝑎ℎ =𝑘𝑠(100 − 𝑟𝑠)
10000(𝑎𝑁𝑡𝑜𝑡
− 𝐿𝑏,𝑎)
where rs - ammonia emission reduction in the storage in the case of slurry
acidification %.
Here have to be taken into account the storage period of acidified slurry. If slurry
is acidified before storage like it is by in-house acidification, then the acidification
impacts ammonia emission during storage.
NH3-N loss in field for in-house acidified slurry is calculated with formula

38
𝐿𝑓,𝑎ℎ =𝑘𝑓(100 − 𝑟𝑓)
10000(𝑎𝑁𝑡𝑜𝑡
− 𝐿𝑏,𝑎 − 𝐿𝑠,𝑎ℎ)
where rf - ammonia emission reduction in the field in the case of slurry
acidification %.
Calculation of N loss with ammonia by in-storage acidification
The sum of the NH3-N loss in barn, storage and field for in-storage acidified
slurry is calculated with formula
𝐿𝑎,𝑠 = 𝐿𝑏 + 𝐿𝑠,𝑎𝑠 + 𝐿𝑓,𝑎𝑠
where La,s– sum of the NH3-N loss in barn, storage and field for in-storage
acidified slurry kg m-3; Ls,as– NH3-N loss in storage for in-storage acidified slurry
kg m-3; Lf,as– NH3-N loss in field for in-storage acidified slurry kg m-3.
NH3-N loss in storage for in-storage acidified slurry is calculated with formula
𝐿𝑠,𝑎𝑠 =𝐿𝑠(100 − 𝑟𝑠)
100
Here have to be taken into account the storage period of acidified slurry. How
long was the slurry in storage without acidification, and how long with
acidification.
NH3-N loss in field for in-storage acidified slurry is calculated with formula
𝐿𝑓,𝑎𝑠 =𝑘𝑓(100 − 𝑟𝑓)
10000(𝑎𝑁𝑡𝑜𝑡
− 𝐿𝑏 − 𝐿𝑠,𝑎𝑠)
Calculation of N loss with ammonia by in-field acidification
The sum of the NH3-N loss in barn, storage and field for in-field acidified slurry is
calculated with formula
𝐿𝑎,𝑓 = 𝐿𝑏 + 𝐿𝑠 + 𝐿𝑓,𝑎𝑓
where La,f– sum of the NH3-N loss in barn, storage and field for in-field acidified
slurry kg m-3; Lf,af– NH3-N loss in field for in-field acidified slurry kg m-3.
NH3-N loss in field for in-field acidified slurry is calculated with formula
𝐿𝑓,𝑎𝑓 =𝐿𝑓(1 − 𝑟𝑓)
100
By the information from BioCover, if SyreN technology is used to make in-field
acidification of slurry, then the ammonia emission reduction effect of 49%
(VERA, 2012) and 40% (Environmental technology list, 2017) accordingly for
cattle and pig slurry.

39
Calculation of the amount of N saved by use of SATs
The amount of N saved by slurry acidification is calculated with formulas
𝑚𝑁,ℎ = 𝐿 − 𝐿𝑎,ℎ
𝑚𝑁,𝑠 = 𝐿 − 𝐿𝑎,𝑠
𝑚𝑁,𝑓 = 𝐿 − 𝐿𝑎,𝑓
where mN,b – N weight saved by in-house slurry acidification kg m-3; mN,s – N
weight saved by in-storage slurry acidification kg m-3; mN,f – N weight saved by
in-field slurry acidification kg m-3.
Calculating mineral N in-field -cost
In some mineral fertilisers like ammonium nitrate is the N the only nutrient
element in fertiliser. Such kind of fertiliser is used to calculate N element price.
All the costs (fertiliser cost, delivery to farm, and handling in farm) are taken into
account, which have to be made to rise N content in field with help of the mineral
fertiliser:
𝑝𝑁 =0,1(𝑝𝑓,𝑁 + 𝑝𝑑 + 𝑝𝑁,ℎ)
𝑐𝑁
where pN– mineral N element cost € kg-1; pf,N– mineral N fertiliser price € t-1; pd–
mineral fertiliser delivery cost , € t-1; pN,h– mineral N handling cost € t-1; cN–N
content in N fertiliser, % (table 14).
If the fertiliser price doesn’t include the delivery from reseller to the farm, then
the delivery cost is calculated with formula:
𝑝𝑑 = 𝑑𝑝𝑑,𝑘𝑚
where d – the transportation distance between reseller and the farm, km;, pd,km–
mineral N delivery cost per kilometre € t-1 km-1 (table 14).
Else the pd value is zero.
Table 14. Mineral N- fertiliser prices, mineral N prices (100% N) prices and
fertiliser handling costs in Baltic sea region. Prices are without VAT.
Country Fertiliser Price,
with
delivery
€ t-1
Price of mineral N
with delivery to
100 km
€ kg-1
Fertiliser
delivery1)
€ t-1 km-1
Fertiliser
handling2)
€ t-1
Estonia Ammonium nitrate N - 34% 249 0.72 Included3) 27.3
Latvia Ammonium nitrate N - 34% 230 0.68 0.062 33.97
Russia N-100% 523 0.523 0.2 20
Sweden Ammonium nitrate N - 34% 240 0.7 0.13 50
Lithuania Ammonium nitrate N - 34% 250 0.73 Included3) 35
Germany CAN 27 % 13.12.2017 213 0.79 0.9 with 15–20,
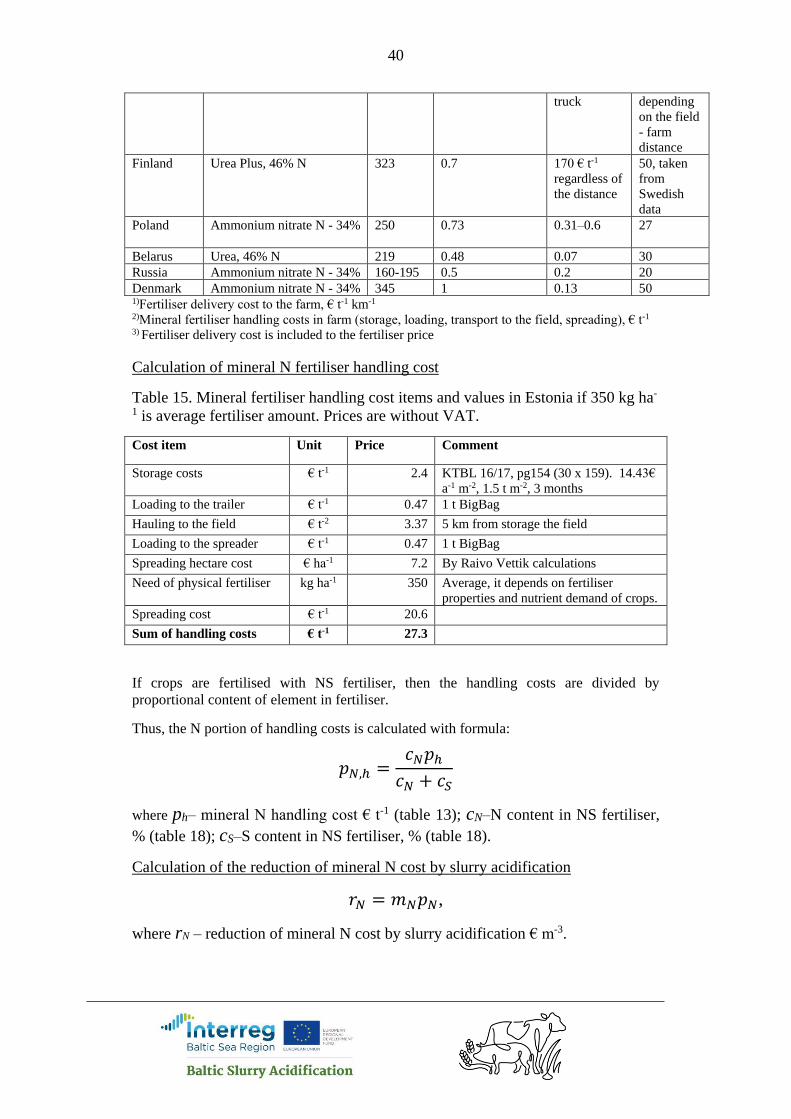
40
truck depending
on the field
- farm
distance
Finland Urea Plus, 46% N 323 0.7
170 € t-1
regardless of
the distance
50, taken
from
Swedish
data
Poland Ammonium nitrate N - 34% 250 0.73 0.31–0.6
27
Belarus Urea, 46% N 219 0.48 0.07 30
Russia Ammonium nitrate N - 34% 160-195 0.5 0.2 20
Denmark Ammonium nitrate N - 34% 345 1 0.13 50 1)Fertiliser delivery cost to the farm, € t-1 km-1 2)Mineral fertiliser handling costs in farm (storage, loading, transport to the field, spreading), € t-1
3) Fertiliser delivery cost is included to the fertiliser price
Calculation of mineral N fertiliser handling cost
Table 15. Mineral fertiliser handling cost items and values in Estonia if 350 kg ha-
1 is average fertiliser amount. Prices are without VAT.
Cost item Unit Price Comment
Storage costs € t-1 2.4 KTBL 16/17, pg154 (30 x 159). 14.43€
a-1 m-2, 1.5 t m-2, 3 months
Loading to the trailer € t-1 0.47 1 t BigBag
Hauling to the field € t-2 3.37 5 km from storage the field
Loading to the spreader € t-1 0.47 1 t BigBag
Spreading hectare cost € ha-1 7.2 By Raivo Vettik calculations
Need of physical fertiliser kg ha-1 350 Average, it depends on fertiliser
properties and nutrient demand of crops.
Spreading cost € t-1 20.6
Sum of handling costs € t-1 27.3
If crops are fertilised with NS fertiliser, then the handling costs are divided by
proportional content of element in fertiliser.
Thus, the N portion of handling costs is calculated with formula:
𝑝𝑁,ℎ =𝑐𝑁𝑝ℎ
𝑐𝑁 + 𝑐𝑆
where ph– mineral N handling cost € t-1 (table 13); cN–N content in NS fertiliser,
% (table 18); cS–S content in NS fertiliser, % (table 18).
Calculation of the reduction of mineral N cost by slurry acidification
𝑟𝑁 = 𝑚𝑁𝑝𝑁,
where rN – reduction of mineral N cost by slurry acidification € m-3.

41
3.11. S cost reduction
Following nitrogen, phosphorus, and potassium, sulphur is an essential plant
nutrient. It contributes to an increase in crop yields in three different ways: 1) it
provides a direct nutritive value; 2) it provides indirect nutritive value as soil
amendments, especially for calcareous and saline alkali soils; and 3) it improves
the use efficiency of other essential plant nutrients, particularly nitrogen and
phosphorus. Sulphur is necessary for plant growth and nutrition. (TSI 2018).
The suggestable N:S rate for oilseed rape and Brassica rapa subsp. oleifera
(Biennial turnip rape) is 4–6:1 (the lighter is the soil texture, the narrower have to
be the N:S), for cereals it is wider – 10–15:1 and grasslands 14–16:1. (Väetamise
ABC, 2014)
Most crops remove 15 to 30 kg for sulphur per hectare (S/ha). Oil crops, legumes,
forages, and some vegetables require more sulphur than phosphorus for optimal
yield and quality. Plants contain as much sulphur as phosphorus, with an average
content of approximately 0.25%. Usual recommendations for correcting
deficiency are 15 to 30 kg S/ha for cereal crops and silage grass; and 25 to 50 kg
S/ha for oil crops, legume, sugarcane, and some vegetable crops. (TSI 2018).
Table 16. S demand of agricultural crops. Sources : Malle Järvan, (ECRI) and
Government of Saskatchewan. (2017)
Crop S demand, kg per tonne of crop yield
Grasses 1.9
Alfalfa 2.7
Cereals 2
Oilseed rape 11
Silage maize 1.5 per DM tonne
An excess supply of S is not considered an environmental problem. However, it
cannot be excluded that a large excess supply in the future will be considered as a
problem especially in catchment areas for P-sensitive lakes. Depending on SAT
and crop choices results in different S doses in relation to the need. Using 2 l acid
per m3 of slurry delivered at 30 t ha-1 results in an application of 34 kg S ha-1. This
is about the requirement for need winter oilseed rape, but it is twice the
requirements of cereal crops. (SEGES 2015).
The calculation of the reduction of mineral S cost by slurry acidification consists
next steps:
1) Calculation of S amount spread with acidified slurry
2) Determining S demand of crop – see the table 14.
3) Calculation of required S amount covered by acidified slurry
4) Mineral S cost
5) Reduction of mineral S cost for farm crop nutrition
42
Calculation of S amount spread with acidified slurry
𝑄𝑆 = 𝑎𝑎𝑎ℎ𝑎𝑚𝑆,1
where QS - S amount applied to the field with acidified slurry kg ha-1; aa –
amount of acid used for acidification of one cubic meter of slurry l m-3; aha –
amount of slurry spread to the field, m3 ha-1 mS,1 – S weight in 1 liter acid
solution, kg l-1;
The S content in sulphuric acid can be calculated by the molar masses of S and
H2SO4, which are correspondingly 32 and 98 (personal contact with Kaspar Vulla,
ECRI). The portion of S in H2SO4 corresponds to the relation of the molar masses
– 32/98. For the calculation of content of pure S in acid solution, the relation
should be multiplied with weight of acid and solution concentration:
𝑚𝑆,𝑙 =𝑐𝐻2𝑆𝑂4
𝑚𝑎𝑀𝑆𝜌𝑎
100𝑀𝐻2𝑆𝑂4
,
where cH2SO4 is acid concentration, ma is weight of acid solution, MS –molar
mass of S and MH2SO4 molar mass of H2SO4; ρa is density of sulphuric acid kg l-1
Table 17. Density of sulphuric acid by different concentrations. (Steffen's
Chemistry Pages. 2018)
H2SO4 concentration,
%
Density ρa at 20°C,
kg l-1
50 1.3951
... ...
90 1.8144
91 1.8195
92 1.824
93 1.8279
94 1.8312
95 1.8337
96 1.8355
97 1.8364
98 1.8361
99 1.8342
100 1.8305
Thus the S content in 1 liter of 94% sulphuric acid solution is:
𝑚𝑆,1 =94% ∙ 1 𝑘𝑔 ∙ 32 ∙ 1.8312
100 ∙ 98= 0.562 𝑘𝑔 𝑙−1.
Calculation of crops S demand per hectare
The crop S demand kg per hectare is calculated by multiplying the value in table
16 with the planned yield tonnes per hectare. 𝑚𝑆,𝑐𝑟𝑜𝑝 = ℎ𝑚𝑆,𝑐𝑟𝑜𝑝,𝑡
43
where mS,crop – crop S demand per hectare, kg ha-1; h – planned crop yield, t ha-1;
mS,crop,t – crop S demand per tonne of yield, kg t-1 (table 16).
If several crops are fertilised with acidified slurry in the farm, then the average S
demand weighted by crop areas have to be calculated:
𝑚𝑆,𝑐𝑟𝑜𝑝 =∑ 𝐴𝑐,𝑖𝑚𝑆,𝑐𝑟𝑜𝑝,𝑖
𝑛𝑖=1
𝐴
where A is the total area fertilised with acidified slurry in the farm, ha; Ac,i is area
of crop i, fertilised with acidified slurry, ha; mS,crop,i is S demand of crop i per
hectare, kg ha-1; n is number of crops fertilised with acidified slurry in the farm.
Calculating mineral S cost
Generally the mineral S is one component in complex fertiliser. The most easy
way is to use some NS fertiliser data to calculate S price. First the N price is
calculated by mineral N fertiliser price (table 14) and then the S cost is calculated
with formula:
𝑝𝑆 =0.1(𝑝𝑓,𝑁𝑆 + 𝑝𝑑 + 𝑝ℎ) − 𝑐𝑁𝑝𝑁
𝑐𝑠
where pS is mineral S element cost € kg-1; pf,NS is NS mineral fertiliser price € t-1
(table 18); %; cS is S content in fertiliser, % (table 18).
Table 18. Mineral S- fertiliser prices, mineral S prices (100% S) prices in Baltic
Sea Region. Prices are without VAT.
Country Fertiliser Price, with delivery
€ t-1
Price of mineral S
€ kg-1
Estonia AmmoniumSulphate 21N-24S 209 0.24
Latvia AmmoniumSulphate 21N-24S 190 0.21
Russia NS 30:6 170 0.15
Sweden NS 27-4 220 0.85
Lithuania AmmoniumSulphate 21N-24S 200 0.15
Germany ASS (27% / 13%) 13.12.2017 236 0.18
Finland AmmoniumSulphate 21N-24S 245 0.41
Poland Ammonium sulphate 21N-24S 230 0.26
Belarus Ammonium sulphate 21N 24S 127 0.11
Denmark NS 27-S24 366 0.65
Calculation of mineral S fertiliser handling cost
If crops are fertilised with NS fertiliser, then the handling costs are divided by portion
element in fertiliser.
The N portion of handling costs was calculated in chapter 3.10. The S portion of handling
costs can be calculated with formula
𝑝𝑆,ℎ = 𝑝ℎ − 𝑝𝑁,ℎ
Calculating the reduction of mineral S cost for farm crop nutrition
44
If the crop S demand per hectare is smaller than S amount applied with slurry,
then the crop benefits only the part of slurry S and rest of S is presumed to leach
without use.
Thus, if crop S demand per hectare is equal or bigger than S amount applied with
slurry
𝑚𝑆,𝑐𝑟𝑜𝑝 ≥ 𝑄𝑆,
then in the S-fertiliser cost reduction calculation of the total amount of S applied
with slurry is taken into account
𝑚𝑆 = 𝑄𝑆
else in the S-fertiliser cost reduction calculation only the S amount needed by crop
is taken into account
𝑚𝑆 = 𝑚𝑆,𝑐𝑟𝑜𝑝
where mS,crop – crop S demand kg ha-1.
The reduction of mineral S cost
𝑟𝑆 =𝑚𝑆
𝑎ℎ𝑎
where rS – reduction of mineral N cost by slurry acidification € m-3.
3.12. Effect on slurry storage costs
3.12.1. Covering of storage
Covers for liquid manure storages significantly reduce odour and gas emissions
by creating a physical barrier between the liquid and the air. Covers are classified
as either impermeable or permeable. Impermeable covers do not allow any gases
coming from the manure to be emitted to the atmosphere. On the other hand,
permeable covers permit transmission of some gases. Various types of covers
have been tried and each has its own advantages and disadvantages. The overview
about different covers is given in the table 19.
Table 19. The overview about different slurry storage covers (English and
Fleming, 2006)
Permeable: Impermeable:
a) Straw
b) Geotextile
c) Clay Balls
d) Perlite
e) Rigid Foam
f) Oil
g) Natural Crust
h) Corn Stalks, Sawdust, Wood Shavings,
a)Inflatable Plastic (positively pressurized)
b) Floating Plastic (negatively pressurized)
c) Floating Plastic
d) Suspended Plastic
d) Concrete
e) Wood/Steel

45
Rice Hulls, Ground Corncobs, Grass
Clippings
In the present analyses the storing of acidified slurry is compared to different
slurry storage covers:
1) Clay balls like Fibo or Leca;
2) Hexa-Cover plastic plates;
3) Chopped straw;
4) Peat;
5) Rapeseed oil
6) Natural crust.
7) Tent cover
The calculation consist the computation of:
1) surface area of storage ;
2) amount of cover material ;
3) cost of cover material with placing ;
4) nitrogen loss from storage;
5) cost of additional mineral nitrogen to replace the loss
6) cost of handling of additional mineral nitrogen.
7) sum of costs per cubicmeter of slurry.
The minimum value of the sum shows the most economic solution.
Calulation of surface area of slurry storage in farm
The surface area of acidified slurry storage is calculated by capacity of storage
and height of storage from bottom to the edge.
𝑆𝑠𝑡 =𝐶𝑠𝑡
ℎ𝑠𝑡
where Sst – surface area of slurry storage, m2; Cst – capacity of slurry storage, m3;
hst – height of slurry storage from bottom to the edge, m.
The capacity of slurry storage depends on annual slurry production. In the
national regulations is determined the required minimum manure storage capacity,
in months (table 20).
Table 20. the required minimum manure storage capacity, in months, determined
in national regulations. The data are asked from project partners.
Country Minimum manure storage capacity, in months
Estonia 8
Latvia 8
Russia 6 month for cattle and poultry manure and 12 month for pig manure
(see also the info below the table)
Sweden It is very much up to farm size but in general 10 month for pig farms
and 8 month for cattle farms (part of the time the animals are outdoors

46
in summer, several spreading opportunities during summer on
grassland). However, larger farms could have harder demands
(individual permits) and small farms a bit less storage period.
Lithuania 6
Germany 6
Finland 12 months. For farms with grazing animals it is possible to decrease
manure left on pasture from storage volume. In this case the minimum
capacity is typically 8 months. Capacity can also be decreased if
manure is given out from the farm, e.g. for processing.
Poland 6 months for liquid natural fertilizers.
5 months.for solid natural fertilizers.
Belarus 6
Denmark 9 as general rule.
Russia
«Recommended Practice for Engineering Designing of Animal and Poultry
Manure Removal Systems and the Systems of Animal and Poultry Manure
Preparation for Application»
Management Directive for Agro-Industrial Complex (РД-АПК) 1.10.15.02-17
13.1 The period of storage of all types of manure and litter should be determined
by calculation depending on:
- duration of periods of autumn-spring off-road;
- availability of free agricultural land for spreading of manure and litter;
- epizootic status of a farm;
- climatic and organizational conditions.
The period should be from 4 to 8 (for cattle manure) and from 8 to 12 months (for
pig manure), depending on the structure, moisture content of manure and storage
technology.
Recommendations for North-West Russia:
Currently the main manure processing technique is long-term storage (maturing):
above 60% of agricultural farms consider it as a basic one. Up to 95% of slurry
and liquid manure is processed by this technique. It is characterized by long
processing periods:
● Storage (maturing) of cattle manure and poultry manure – 6 months, pig
slurry – 12 months;
Liquid fraction:
● Maturing of the liquid fraction of cattle manure after separation – at least 4
months;
● Maturing of the liquid fraction of pig slurry after separation in sectional
storages in spring and summer – 6 months; during the period of autumn
accumulation – 9 months.
(Management Directive for Agro-Industrial Complex 1.10.15.02-17).
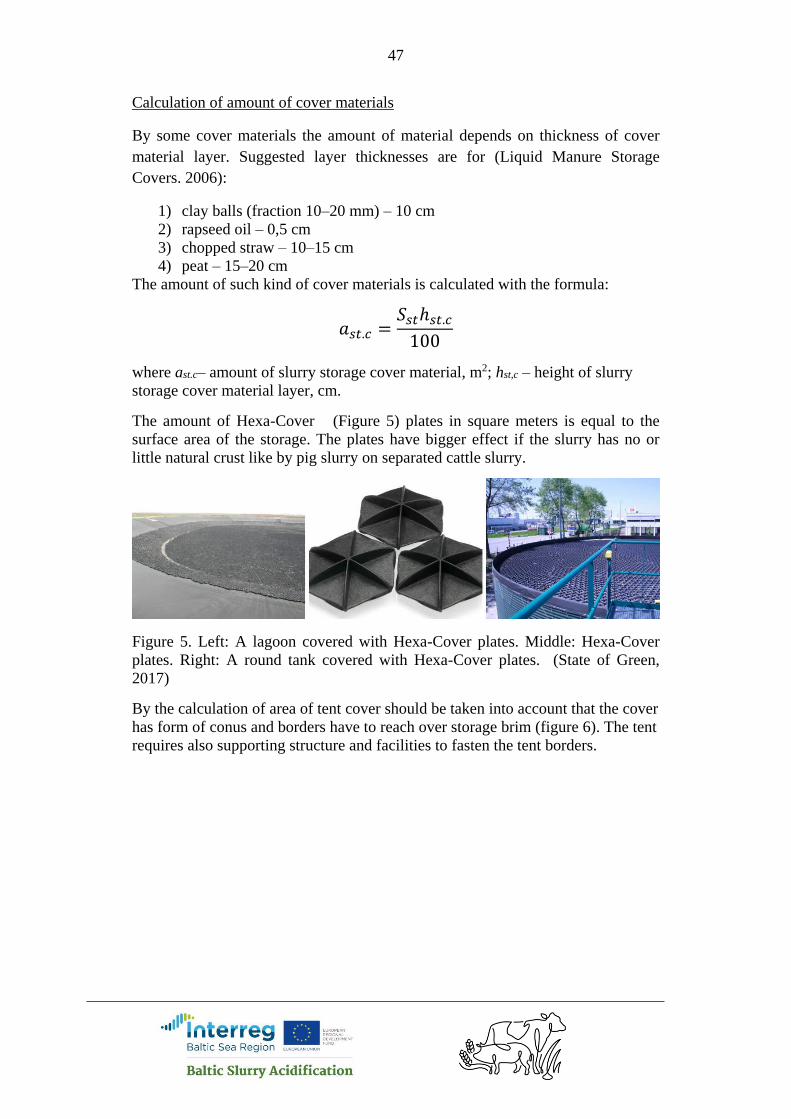
47
Calculation of amount of cover materials
By some cover materials the amount of material depends on thickness of cover
material layer. Suggested layer thicknesses are for (Liquid Manure Storage
Covers. 2006):
1) clay balls (fraction 10–20 mm) – 10 cm
2) rapseed oil – 0,5 cm
3) chopped straw – 10–15 cm
4) peat – 15–20 cm
The amount of such kind of cover materials is calculated with the formula:
𝑎𝑠𝑡.𝑐 =𝑆𝑠𝑡ℎ𝑠𝑡.𝑐
100
where ast.c– amount of slurry storage cover material, m2; hst,c – height of slurry
storage cover material layer, cm.
The amount of Hexa-Cover (Figure 5) plates in square meters is equal to the
surface area of the storage. The plates have bigger effect if the slurry has no or
little natural crust like by pig slurry on separated cattle slurry.
Figure 5. Left: A lagoon covered with Hexa-Cover plates. Middle: Hexa-Cover
plates. Right: A round tank covered with Hexa-Cover plates. (State of Green,
2017)
By the calculation of area of tent cover should be taken into account that the cover
has form of conus and borders have to reach over storage brim (figure 6). The tent
requires also supporting structure and facilities to fasten the tent borders.
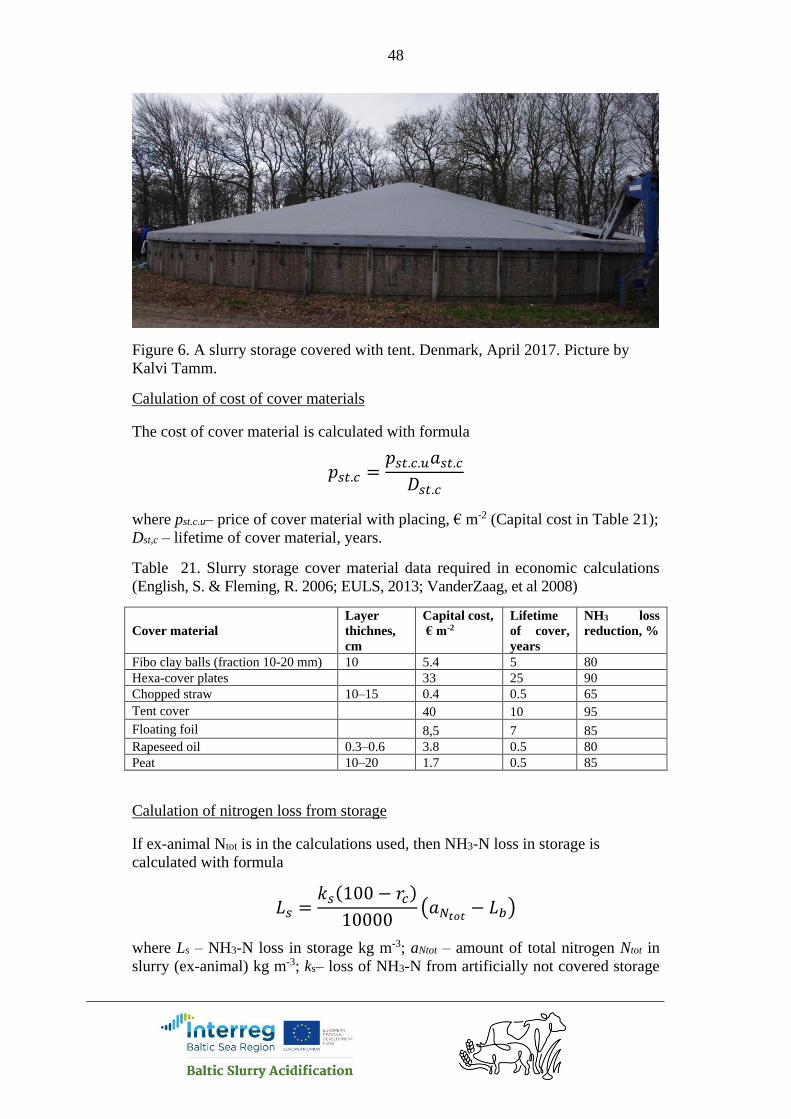
48
Figure 6. A slurry storage covered with tent. Denmark, April 2017. Picture by
Kalvi Tamm.
Calulation of cost of cover materials
The cost of cover material is calculated with formula
𝑝𝑠𝑡.𝑐 =𝑝𝑠𝑡.𝑐.𝑢𝑎𝑠𝑡.𝑐
𝐷𝑠𝑡.𝑐
where pst.c.u– price of cover material with placing, € m-2 (Capital cost in Table 21);
Dst,c – lifetime of cover material, years.
Table 21. Slurry storage cover material data required in economic calculations
(English, S. & Fleming, R. 2006; EULS, 2013; VanderZaag, et al 2008)
Cover material
Layer
thichnes,
cm
Capital cost,
€ m-2
Lifetime
of cover,
years
NH3 loss
reduction, %
Fibo clay balls (fraction 10-20 mm) 10 5.4 5 80
Hexa-cover plates 33 25 90
Chopped straw 10–15 0.4 0.5 65
Tent cover 40 10 95
Floating foil 8,5 7 85
Rapeseed oil 0.3–0.6 3.8 0.5 80
Peat 10–20 1.7 0.5 85
Calulation of nitrogen loss from storage
If ex-animal Ntot is in the calculations used, then NH3-N loss in storage is
calculated with formula
𝐿𝑠 =𝑘𝑠(100 − 𝑟𝑐)
10000(𝑎𝑁𝑡𝑜𝑡
− 𝐿𝑏)
where Ls – NH3-N loss in storage kg m-3; aNtot – amount of total nitrogen Ntot in
slurry (ex-animal) kg m-3; ks– loss of NH3-N from artificially not covered storage
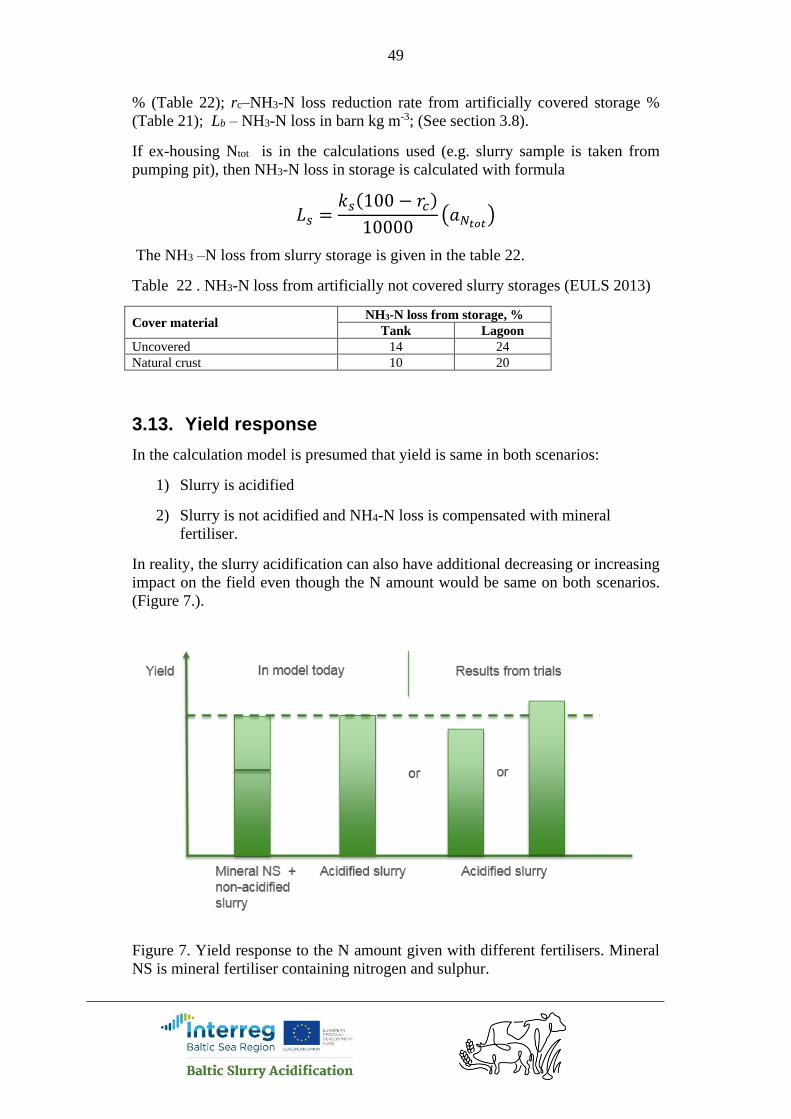
49
% (Table 22); rc–NH3-N loss reduction rate from artificially covered storage %
(Table 21); Lb – NH3-N loss in barn kg m-3; (See section 3.8).
If ex-housing Ntot is in the calculations used (e.g. slurry sample is taken from
pumping pit), then NH3-N loss in storage is calculated with formula
𝐿𝑠 =𝑘𝑠(100 − 𝑟𝑐)
10000(𝑎𝑁𝑡𝑜𝑡
)
The NH3 –N loss from slurry storage is given in the table 22.
Table 22 . NH3-N loss from artificially not covered slurry storages (EULS 2013)
Cover material NH3-N loss from storage, %
Tank Lagoon
Uncovered 14 24
Natural crust 10 20
3.13. Yield response
In the calculation model is presumed that yield is same in both scenarios:
1) Slurry is acidified
2) Slurry is not acidified and NH4-N loss is compensated with mineral
fertiliser.
In reality, the slurry acidification can also have additional decreasing or increasing
impact on the field even though the N amount would be same on both scenarios.
(Figure 7.).
Figure 7. Yield response to the N amount given with different fertilisers. Mineral
NS is mineral fertiliser containing nitrogen and sulphur.

50
The field trials were made in Baltic Slurry Acidification project to compare the
yield responses of acidified and non-acidified slurries.
Table 18. Dry matter (DM) yield response calculated by data collected form
grassland trial in Estonia, 2018.
Trial variant
Slurry,
m3 ha-1
N,
kg ha-1
DM yield,
2.+3. cut,
kg ha-1
Additional DM
yield with
fertilisers,
kg ha-1
Additional DM yield
with fertilisers, per kg
of N,
kg kg-1
Control/
Untreated 0 1340
Mineral
fertilizer 65 2540 1200 18.5
Untreated
slurry 43.3 67.1 2070 730 10.9
Acidified
slurry 43.3 69.3 2350 1010 14.6
By the data in the Table 18, the additional DM yield for untreated slurry, if N
amount would be same as by acidfied slurry, would be theoretically 730 + (69.3 -
67.1) × 18.5 = 770 kg ha-1. (The N difference is here compensated with mineal N.)
It means that, theoretically, even by same amounts of N kg ha-1, the acidified
slurry would give 1010 – 770 = 240 kg ha-1 or 240 : 43.3 = 5,54 kg m-3 additional
DM yield. If to calculate with DM content of silage is 35%, then the additional
silage amount would be 15.8 kg m-3. It should be taken into account in economic
calculations.
Background information about this trial:
1) The 1. cut yield taken before difffernciated fertilisation show that the
yield differences between variants were very minor.
2) Before 1. cut all plots got 35 kg P ha-1 and 42 kg S ha-1 with
superphosphate, to cover P and S demand of plants.
In the economic analyses, the additional slurry acidification effect on yield is
calculated with formula:
𝑟𝑦 = −1∆𝑦(𝑝𝑦 − 𝑝𝑦,ℎ)
1000
where ry is slurry acidfication effect on yield, € m-3; py is yield price, € t-1; py,h is
yield handling cost, € t-1 (Table 23); and Δy is yield difference, kg m-3.
The positive yield effect should be substracted from other costs, and therefore it is
calculated here as cost reduction and mutiplied with -1.
Table 23. Yield prices in different prices in Baltic sea region. Prices are without
VAT. Country Yield Yield price,
€ t-1
Yield handling cost
€ t-1

51
Estonia Rolled dry grass silage 50 15
Estonia Barley 130 47
Estonia Wheat 149 47
Latvia Rolled dry grass silage 25 10.8
Latvia Barley 124 11.8
Latvia Wheat 158 11.8
Russia Rolled dry grass silage 60 10
Russia Barley 73 15
Russia Wheat 97 15
Sweden Rolled dry grass silage 140 (DM)
Sweden Barley 112 30
Sweden Wheat 143 30
Lithuania Rolled dry grass silage 60 20
Lithuania Barley 130 25
Lithuania Wheat 150 25
Germany Rolled dry grass silage 30 10+1.1 per km
Germany Barley 140 10–15 depending on
field distance
Germany Wheat 148 10–15 depending on
field distance
Finland Rolled dry grass silage 120 (DM) 28
Finland Barley 140 50
Finland Wheat 165 50
Poland Rolled dry grass silage 19 12
Poland Barley 144
Poland Wheat 151
Belarus Rolled dry grass silage 22 8
Belarus Barley 140 13.2
Belarus Wheat 130 13.2
Denmark Rolled dry grass silage 140 (DM)
Denmark Barley 112 30
Denmark Wheat 143 30
4. Method of sensitivity analysis
The calculations are made for every country separately, with input data collected
by country presenters during project.
Compared are acidified slurry versus non-acidified slurry. The spreading
technology is band spreading for both slurries. No incorporation if slurry is
acidified and incorporation within less than 12 hours if slurry is not acidified.
Calculated are cost differences between non-acidified and acidified slurry, € m-3.
The difference is cost decrease by use of cattle slurry acidification compared to
disc-harrowing <12 h after band-application of non-acidified slurry.
The cost decrease by use of acidified slurry is also named as cost-benefit of slurry
acidification.
The cost benefit of SAT= sum of costs by non-acidification of slurry- sum of costs
by use of SAT.
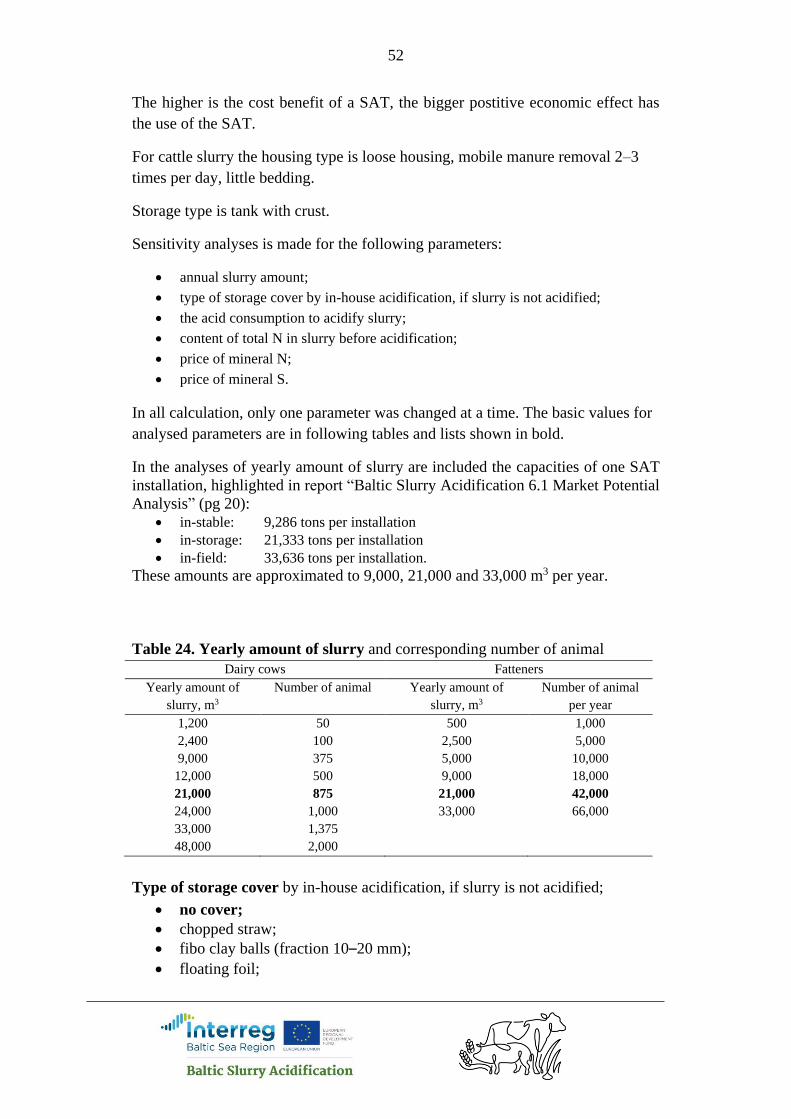
52
The higher is the cost benefit of a SAT, the bigger postitive economic effect has
the use of the SAT.
For cattle slurry the housing type is loose housing, mobile manure removal 2–3
times per day, little bedding.
Storage type is tank with crust.
Sensitivity analyses is made for the following parameters:
• annual slurry amount;
• type of storage cover by in-house acidification, if slurry is not acidified;
• the acid consumption to acidify slurry;
• content of total N in slurry before acidification;
• price of mineral N;
• price of mineral S.
In all calculation, only one parameter was changed at a time. The basic values for
analysed parameters are in following tables and lists shown in bold.
In the analyses of yearly amount of slurry are included the capacities of one SAT
installation, highlighted in report “Baltic Slurry Acidification 6.1 Market Potential
Analysis” (pg 20): • in-stable: 9,286 tons per installation
• in-storage: 21,333 tons per installation
• in-field: 33,636 tons per installation.
These amounts are approximated to 9,000, 21,000 and 33,000 m3 per year.
Table 24. Yearly amount of slurry and corresponding number of animal
Dairy cows Fatteners
Yearly amount of
slurry, m3
Number of animal Yearly amount of
slurry, m3
Number of animal
per year
1,200 50 500 1,000
2,400 100 2,500 5,000
9,000 375 5,000 10,000
12,000 500 9,000 18,000
21,000 875 21,000 42,000
24,000 1,000 33,000 66,000
33,000 1,375
48,000 2,000
Type of storage cover by in-house acidification, if slurry is not acidified;
• no cover;
• chopped straw;
• fibo clay balls (fraction 10–20 mm);
• floating foil;

53
• hexa-cover plates;
• peat;
• rapeseed oil;
• tent cover.
The acid consumption to acidify slurry is in calculations: 1, 2, 3, 4, 5 or 7 litres
per cubic-meter of slurry. The basic value were for in-field 3, and in-storage 3.6
in-house 4.5, litres per cubic-meter of slurry for cattle slurry. For pig slurry are
these values 3.5, 3 and 2.6.
Table 25. The content of total nitrogen Ntot in slurry before acidification
Diary cow slurry Fattener slurry
Ex animal Ex-storage Ex animal Ex-storage
In house SAT In storage and
in-field SAT
In house SAT In storage and
in-field SAT
4 3 5 4
5 4 6 5
5.9 4.74 5.5
6 5 7.0 6
7 6 8 7
Price of mineral N differs by country. So, the price sent by contact person is
changed to the levels: -50,-20, 0,+20 and +50%.
Price of mineral S also differs by country So, the price sent by contact person is
changed to the levels: -50,-20, 0,+20 and +50%.
5. Results
5.1. Belarus
5.1.1. Annual slurry amount, Belarus
Analysed is the cost-benefit of SATs compared to disc-harrowing <12 h after
band-application of non-acidified slurry.
The acid price in the calculations is 30 € t-1 for in-house acidification and 101
€ t-1 for in-storage and in-field acidification. N-fertilisers is Urea N46, 219 € t-1.
NS-fertiliser N21-S24, 127 € t-1. Thus N price 0.48 € kg-1 and S price 0.11 € kg-1.
The prices of project partner countries are between 0.48–1 and 0.11–0.8 5€ kg-1
respectively.
The in-house acidification has in Belarus significantly higher cost-benefit
comapred to other SATs. The reason is that by in-house SAT is used bulk acid
which is transported by big tank truck and has much lower price compared to the
case if acid is transported in the IBC tanks, which is used by other SATs.
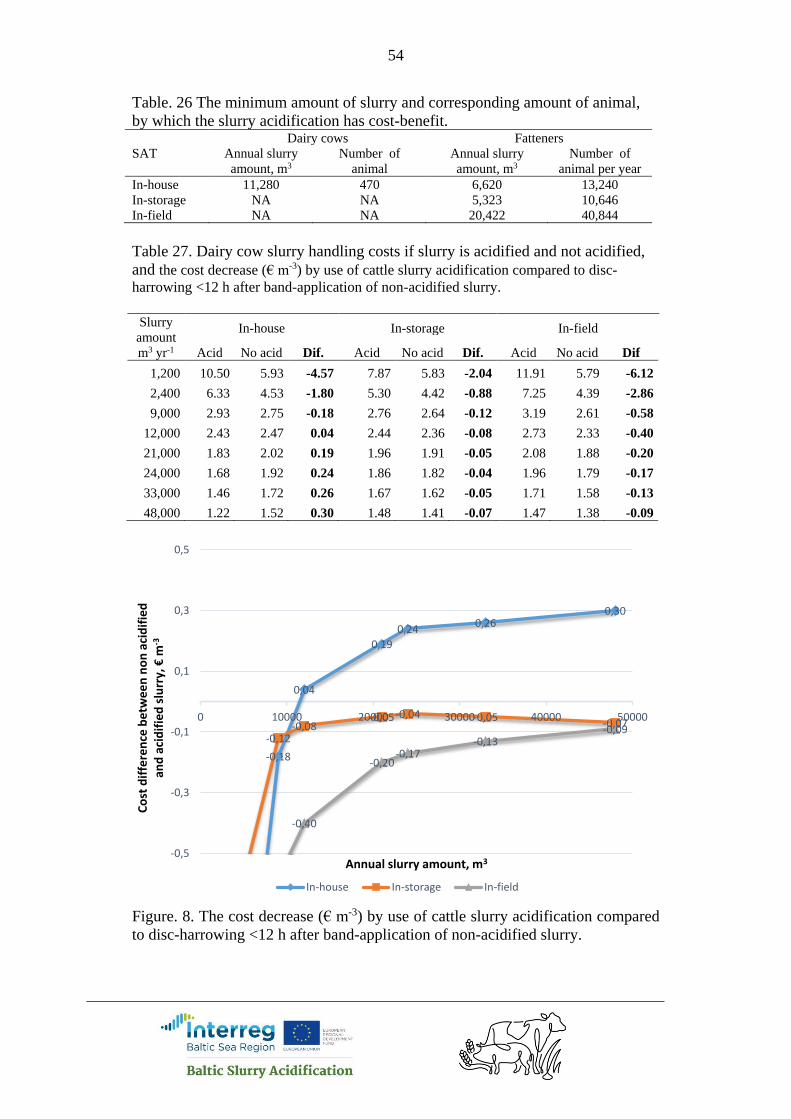
54
Table. 26 The minimum amount of slurry and corresponding amount of animal,
by which the slurry acidification has cost-benefit. Dairy cows Fatteners
SAT Annual slurry
amount, m3
Number of
animal
Annual slurry
amount, m3
Number of
animal per year
In-house 11,280 470 6,620 13,240
In-storage NA NA 5,323 10,646
In-field NA NA 20,422 40,844
Table 27. Dairy cow slurry handling costs if slurry is acidified and not acidified,
and the cost decrease (€ m-3) by use of cattle slurry acidification compared to disc-
harrowing <12 h after band-application of non-acidified slurry.
Slurry
amount
m3 yr-1
In-house In-storage In-field
Acid No acid Dif. Acid No acid Dif. Acid No acid Dif
1,200 10.50 5.93 -4.57 7.87 5.83 -2.04 11.91 5.79 -6.12
2,400 6.33 4.53 -1.80 5.30 4.42 -0.88 7.25 4.39 -2.86
9,000 2.93 2.75 -0.18 2.76 2.64 -0.12 3.19 2.61 -0.58
12,000 2.43 2.47 0.04 2.44 2.36 -0.08 2.73 2.33 -0.40
21,000 1.83 2.02 0.19 1.96 1.91 -0.05 2.08 1.88 -0.20
24,000 1.68 1.92 0.24 1.86 1.82 -0.04 1.96 1.79 -0.17
33,000 1.46 1.72 0.26 1.67 1.62 -0.05 1.71 1.58 -0.13
48,000 1.22 1.52 0.30 1.48 1.41 -0.07 1.47 1.38 -0.09
Figure. 8. The cost decrease (€ m-3) by use of cattle slurry acidification compared
to disc-harrowing <12 h after band-application of non-acidified slurry.
-0,18
0,04
0,19
0,240,26
0,30
-0,12-0,08
-0,05-0,04 -0,05-0,07
-0,40
-0,20-0,17
-0,13-0,09
-0,5
-0,3
-0,1
0,1
0,3
0,5
0 10000 20000 30000 40000 50000
Co
st d
iffe
ren
ce b
etw
ee
n n
on
aci
dif
ied
an
d a
cid
ifie
d s
lurr
y, €
m-3
Annual slurry amount, m3
In-house In-storage In-field

55
Table 28. Fattener slurry handling costs if slurry is acidified and not acidified, and
the cost decrease (€ m-3) by use of cattle slurry acidification compared to disc-
harrowing <12 h after band-application of non-acidified slurry. Slurry
amount
m3 yr-1
In-house In-storage In-field
Acid No acid Dif. Acid No acid Dif. Acid No acid Dif
500 36.84 8.77 -28.07 13.39 8.31 -5.08 23.34 8.27 -15.07
2,500 8.70 4.84 -3.86 4.93 4.39 -0.54 6.88 4.35 -2.53
5,000 4.69 3.80 -0.89 3.38 3.35 -0.03 4.32 3.31 -1.01
9,000 2.90 3.13 0.23 2.51 2.68 0.17 3.02 2.64 -0.38
21,000 1.37 2.40 1.03 1.71 1.95 0.24 1.90 1.91 0.01
33,000 0.88 2.10 1.22 1.42 1.65 0.23 1.53 1.61 0.08
Figure 9. The cost decrease (€ m-3) by use of fattener slurry acidification
compared to disc-harrowing <12 h after band-application of non-acidified slurry.
5.1.2. Cover type, Belarus
An alternative to in-house acidification to minimise the ammonia emission
from slurry storage is to cover storage. The cost calculations made for different
type of storage covers shows that cost benefit by in-house acidified slurry depends
on capital cost and ability to decrease the ammonia emission. The rapeseed oil has
highest capital cost and decreases 80% of ammonia emission (Table 21). Thus, the
in-house slurry acidification gives biggest cost effect compared to this type of
cover, which is followed by tent and peat. Compared to the Hexa-cover plates
-0,89
0,23
1,03
1,22
-0,54
-0,03
0,170,24 0,23
-1,01
-0,38
0,010,08
-1,5
-1,0
-0,5
0,0
0,5
1,0
1,5
0 5000 10000 15000 20000 25000 30000 35000
Co
st d
iffe
ren
ce b
etw
ee
n n
on
aci
dif
ied
an
d a
cid
ifie
d s
lurr
y, €
m-3
Annual slurry amount, m3
In-house In-storage In-field
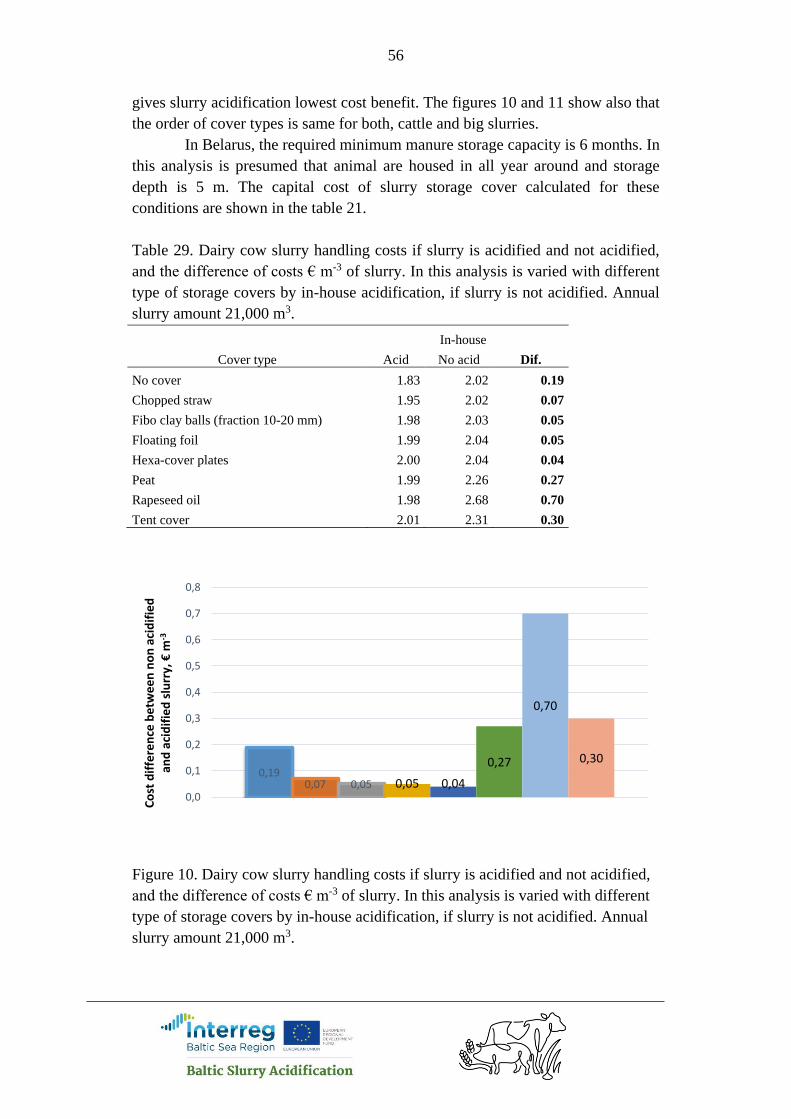
56
gives slurry acidification lowest cost benefit. The figures 10 and 11 show also that
the order of cover types is same for both, cattle and big slurries.
In Belarus, the required minimum manure storage capacity is 6 months. In
this analysis is presumed that animal are housed in all year around and storage
depth is 5 m. The capital cost of slurry storage cover calculated for these
conditions are shown in the table 21.
Table 29. Dairy cow slurry handling costs if slurry is acidified and not acidified,
and the difference of costs € m-3 of slurry. In this analysis is varied with different
type of storage covers by in-house acidification, if slurry is not acidified. Annual
slurry amount 21,000 m3.
In-house
Cover type Acid No acid Dif.
No cover 1.83 2.02 0.19
Chopped straw 1.95 2.02 0.07
Fibo clay balls (fraction 10-20 mm) 1.98 2.03 0.05
Floating foil 1.99 2.04 0.05
Hexa-cover plates 2.00 2.04 0.04
Peat 1.99 2.26 0.27
Rapeseed oil 1.98 2.68 0.70
Tent cover 2.01 2.31 0.30
Figure 10. Dairy cow slurry handling costs if slurry is acidified and not acidified,
and the difference of costs € m-3 of slurry. In this analysis is varied with different
type of storage covers by in-house acidification, if slurry is not acidified. Annual
slurry amount 21,000 m3.
0,190,07 0,05 0,05 0,04
0,27
0,70
0,30
0,0
0,1
0,2
0,3
0,4
0,5
0,6
0,7
0,8
Co
st d
iffe
ren
ce b
etw
ee
n n
on
aci
dif
ied
an
d a
cid
ifie
d s
lurr
y, €
m-3

57
Table 30. Fatteners slurry handling costs if slurry is acidified and not acidified,
and the difference of costs € m-3 of slurry. In this analysis is varied with different
type of storage covers by in-house acidification, if slurry is not acidified. Annual
slurry amount 21,000 m3.
In-house
Cover type Acid No acid Dif.
No cover 1.37 2.40 1.03
Chopped straw 1.53 2.38 0.85
Fibo clay balls (fraction 10-20 mm) 1.56 2.39 0.83
Floating foil 1.57 2.40 0.83
Hexa-cover plates 1.59 2.40 0.81
Peat 1.57 2.61 1.04
Rapeseed oil 1.56 3.04 1.48
Tent cover 1.60 2.66 1.06
Figure 11. Fatteners slurry handling costs if slurry is acidified and not acidified,
and the difference of costs € m-3 of slurry. In this analysis is varied with different
type of storage covers by in-house acidification, if slurry is not acidified. 42,000
fatteners.
5.1.3. Acid consumption, Belarus
While the acid cost is biggest running cost, then the amount of acid required
to lower slurry acidity to target pH (see Table 8) has essential impact on cost-
benefit of slurry acidification. The higher is the acid price, the bigger is the impact
of acid amount on total costs of slurry acidification. The cattle slurry in-storage
and in-field acidification would have cost benefit if acid amount would be less
than 3.5 and 2.5 litre per cubicmeter of slurry correspondigly.
The cost-benefit per cubicmeter of acidified slurry (€ m-3) decreases if acid
content in slurry rises.
1,030,85 0,83 0,83 0,81
1,04
1,48
1,06
0,0
0,2
0,4
0,6
0,8
1,0
1,2
1,4
1,6
Co
st d
iffe
ren
ce b
etw
ee
n n
on
aci
dif
ied
an
d a
cid
ifie
d s
lurr
y, €
m-3
No cover Chopped straw Fibo clay balls Floating foil
Hexa-cover plates Peat Rapeseed oil Tent cover
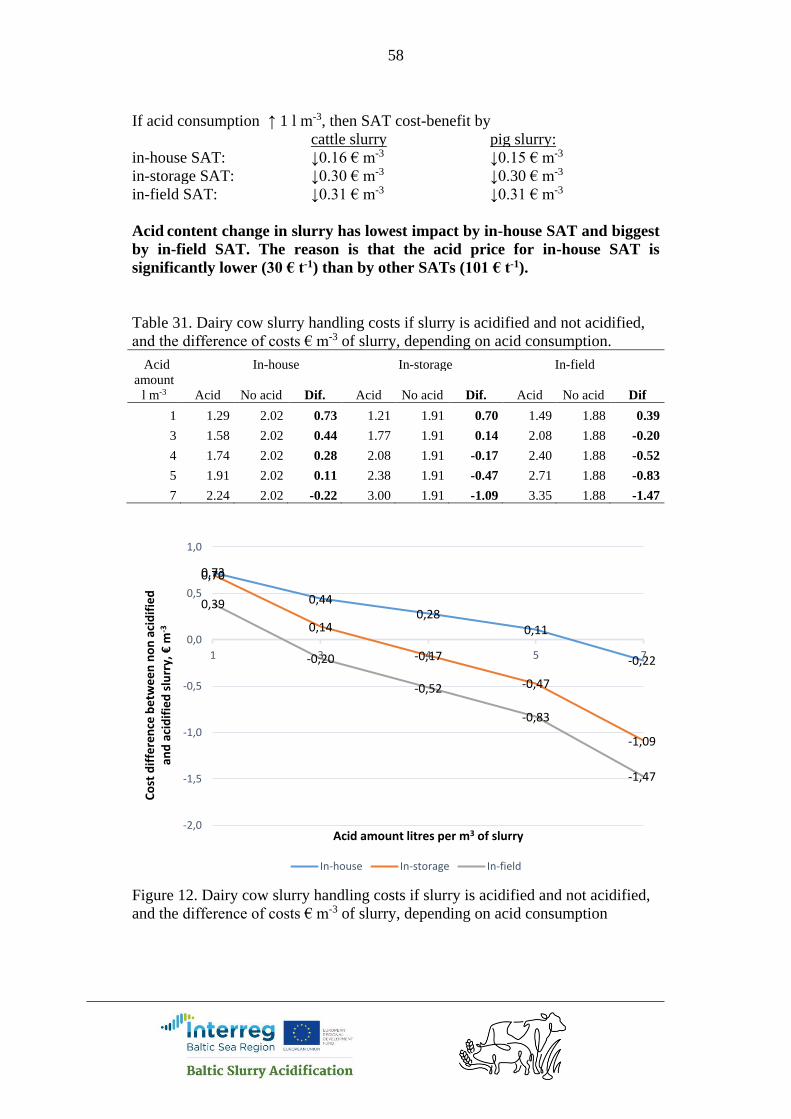
58
If acid consumption ↑ 1 l m-3, then SAT cost-benefit by
cattle slurry pig slurry:
in-house SAT: ↓0.16 € m-3 ↓0.15 € m-3
in-storage SAT: ↓0.30 € m-3 ↓0.30 € m-3
in-field SAT: ↓0.31 € m-3 ↓0.31 € m-3
Acid content change in slurry has lowest impact by in-house SAT and biggest
by in-field SAT. The reason is that the acid price for in-house SAT is
significantly lower (30 € t-1) than by other SATs (101 € t-1).
Table 31. Dairy cow slurry handling costs if slurry is acidified and not acidified,
and the difference of costs € m-3 of slurry, depending on acid consumption.
Acid In-house In-storage In-field
amount
l m-3 Acid No acid Dif. Acid No acid Dif. Acid No acid Dif
1 1.29 2.02 0.73 1.21 1.91 0.70 1.49 1.88 0.39
3 1.58 2.02 0.44 1.77 1.91 0.14 2.08 1.88 -0.20
4 1.74 2.02 0.28 2.08 1.91 -0.17 2.40 1.88 -0.52
5 1.91 2.02 0.11 2.38 1.91 -0.47 2.71 1.88 -0.83
7 2.24 2.02 -0.22 3.00 1.91 -1.09 3.35 1.88 -1.47
Figure 12. Dairy cow slurry handling costs if slurry is acidified and not acidified,
and the difference of costs € m-3 of slurry, depending on acid consumption
0,73
0,440,28
0,11
-0,22
0,70
0,14
-0,17
-0,47
-1,09
0,39
-0,20
-0,52
-0,83
-1,47
-2,0
-1,5
-1,0
-0,5
0,0
0,5
1,0
1 3 4 5 7
Co
st d
iffe
ren
ce b
etw
ee
n n
on
aci
dif
ied
an
d a
cid
ifie
d s
lurr
y, €
m-3
Acid amount litres per m3 of slurry
In-house In-storage In-field
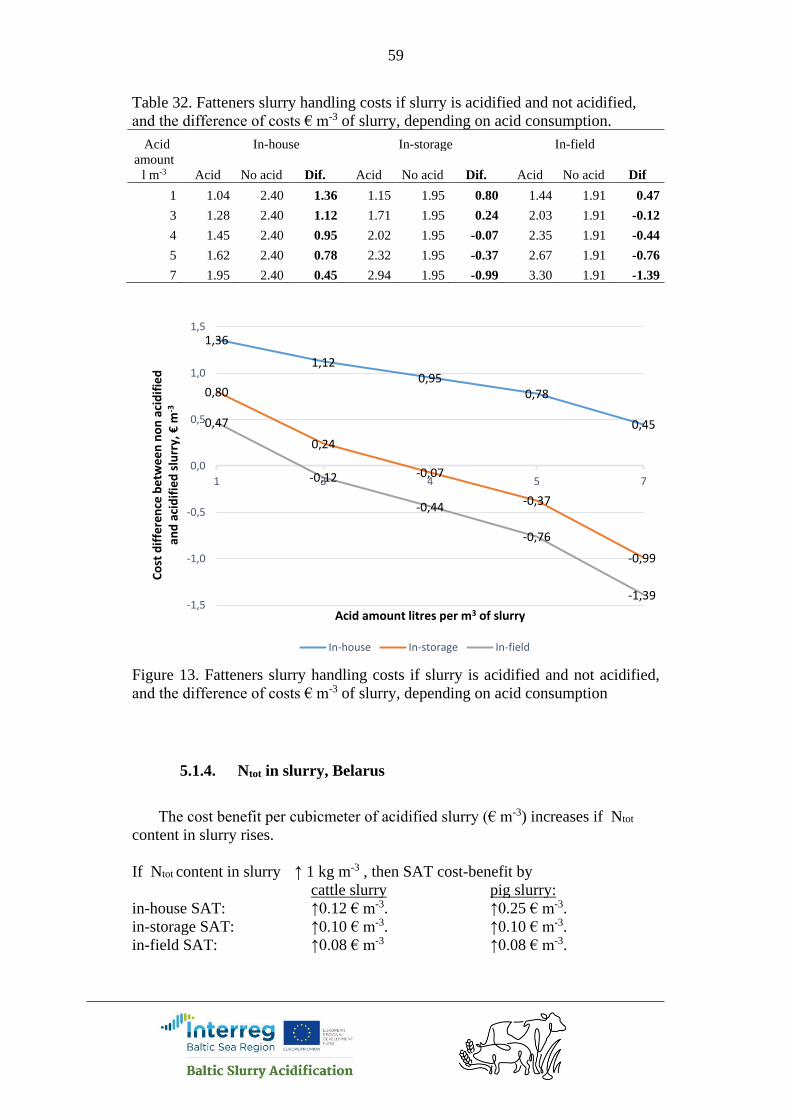
59
Table 32. Fatteners slurry handling costs if slurry is acidified and not acidified,
and the difference of costs € m-3 of slurry, depending on acid consumption.
Acid In-house In-storage In-field
amount
l m-3 Acid No acid Dif. Acid No acid Dif. Acid No acid Dif
1 1.04 2.40 1.36 1.15 1.95 0.80 1.44 1.91 0.47
3 1.28 2.40 1.12 1.71 1.95 0.24 2.03 1.91 -0.12
4 1.45 2.40 0.95 2.02 1.95 -0.07 2.35 1.91 -0.44
5 1.62 2.40 0.78 2.32 1.95 -0.37 2.67 1.91 -0.76
7 1.95 2.40 0.45 2.94 1.95 -0.99 3.30 1.91 -1.39
Figure 13. Fatteners slurry handling costs if slurry is acidified and not acidified,
and the difference of costs € m-3 of slurry, depending on acid consumption
5.1.4. Ntot in slurry, Belarus
The cost benefit per cubicmeter of acidified slurry (€ m-3) increases if Ntot
content in slurry rises.
If Ntot content in slurry ↑ 1 kg m-3 , then SAT cost-benefit by
cattle slurry pig slurry:
in-house SAT: ↑0.12 € m-3. ↑0.25 € m-3.
in-storage SAT: ↑0.10 € m-3. ↑0.10 € m-3.
in-field SAT: ↑0.08 € m-3 ↑0.08 € m-3.
1,36
1,120,95
0,78
0,45
0,80
0,24
-0,07
-0,37
-0,99
0,47
-0,12
-0,44
-0,76
-1,39-1,5
-1,0
-0,5
0,0
0,5
1,0
1,5
1 3 4 5 7
Co
st d
iffe
ren
ce b
etw
ee
n n
on
aci
dif
ied
an
d a
cid
ifie
d s
lurr
y, €
m-3
Acid amount litres per m3 of slurry
In-house In-storage In-field
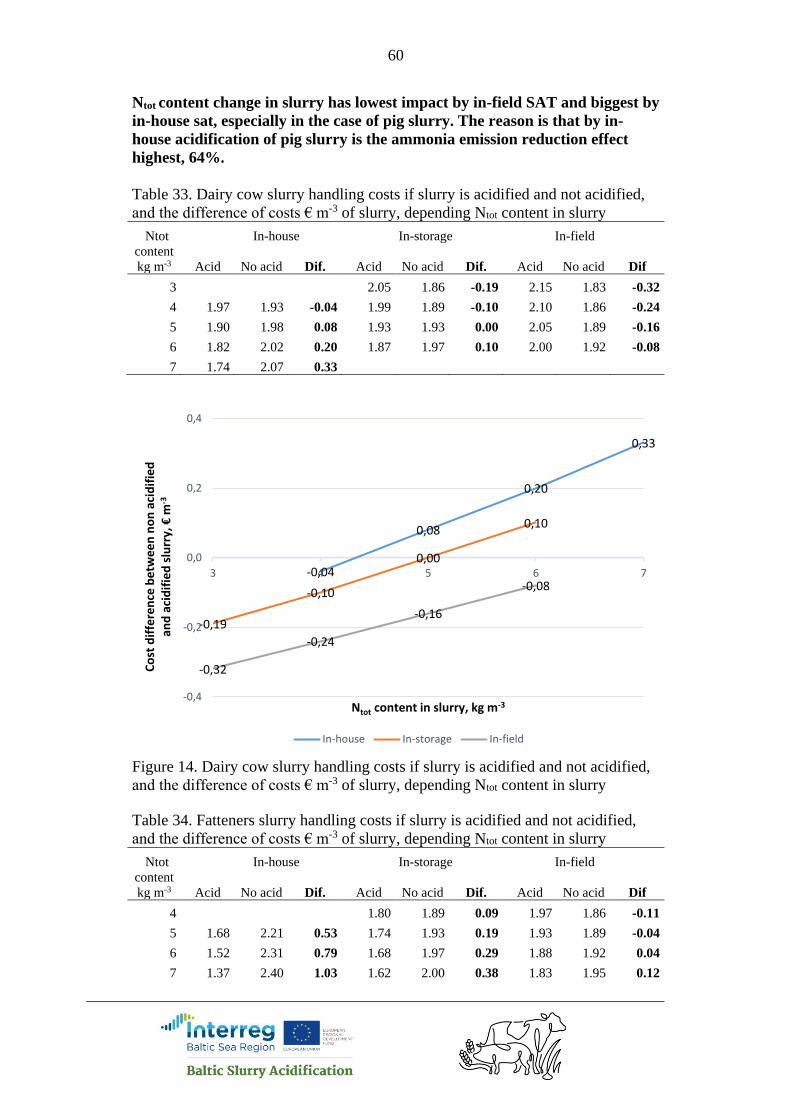
60
Ntot content change in slurry has lowest impact by in-field SAT and biggest by
in-house sat, especially in the case of pig slurry. The reason is that by in-
house acidification of pig slurry is the ammonia emission reduction effect
highest, 64%.
Table 33. Dairy cow slurry handling costs if slurry is acidified and not acidified,
and the difference of costs € m-3 of slurry, depending Ntot content in slurry
Ntot In-house In-storage In-field
content
kg m-3 Acid No acid Dif. Acid No acid Dif. Acid No acid Dif
3 2.05 1.86 -0.19 2.15 1.83 -0.32
4 1.97 1.93 -0.04 1.99 1.89 -0.10 2.10 1.86 -0.24
5 1.90 1.98 0.08 1.93 1.93 0.00 2.05 1.89 -0.16
6 1.82 2.02 0.20 1.87 1.97 0.10 2.00 1.92 -0.08
7 1.74 2.07 0.33
Figure 14. Dairy cow slurry handling costs if slurry is acidified and not acidified,
and the difference of costs € m-3 of slurry, depending Ntot content in slurry
Table 34. Fatteners slurry handling costs if slurry is acidified and not acidified,
and the difference of costs € m-3 of slurry, depending Ntot content in slurry
Ntot In-house In-storage In-field
content
kg m-3 Acid No acid Dif. Acid No acid Dif. Acid No acid Dif
4 1.80 1.89 0.09 1.97 1.86 -0.11
5 1.68 2.21 0.53 1.74 1.93 0.19 1.93 1.89 -0.04
6 1.52 2.31 0.79 1.68 1.97 0.29 1.88 1.92 0.04
7 1.37 2.40 1.03 1.62 2.00 0.38 1.83 1.95 0.12
-0,04
0,08
0,20
0,33
-0,19
-0,10
0,00
0,10
-0,32
-0,24
-0,16
-0,08
-0,4
-0,2
0,0
0,2
0,4
3 4 5 6 7
Co
st d
iffe
ren
ce b
etw
ee
n n
on
aci
dif
ied
an
d a
cid
ifie
d s
lurr
y, €
m-3
Ntot content in slurry, kg m-3
In-house In-storage In-field
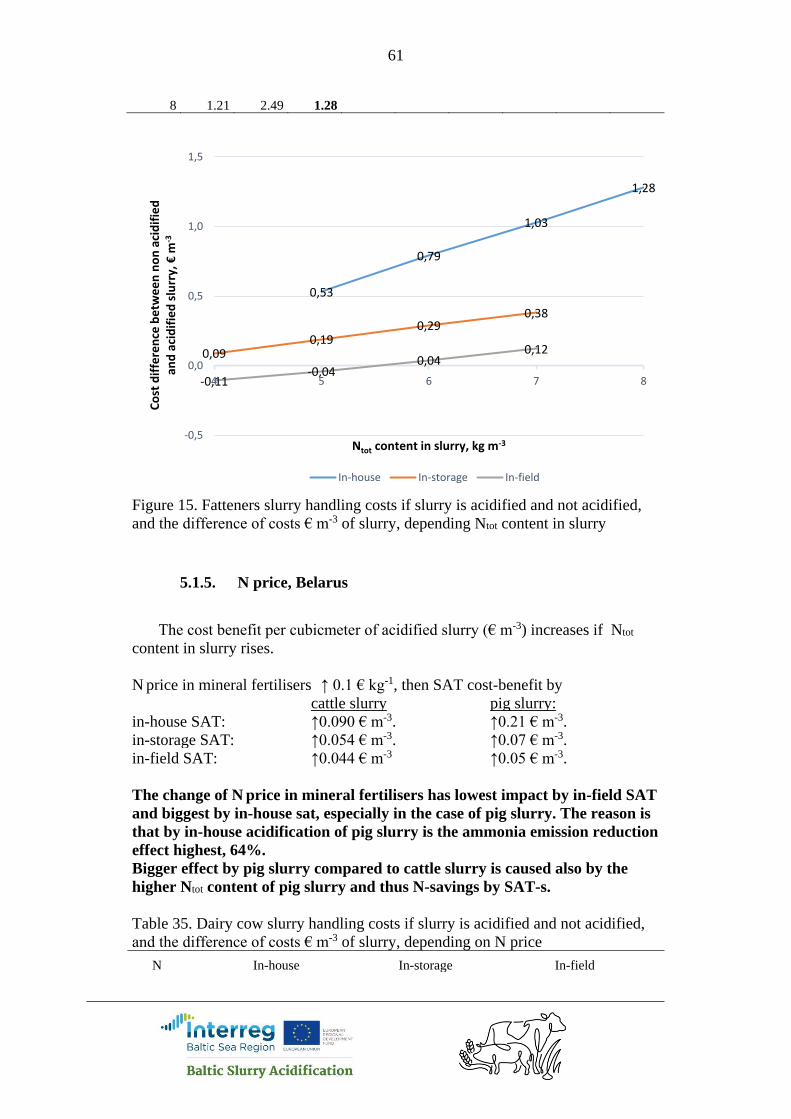
61
8 1.21 2.49 1.28
Figure 15. Fatteners slurry handling costs if slurry is acidified and not acidified,
and the difference of costs € m-3 of slurry, depending Ntot content in slurry
5.1.5. N price, Belarus
The cost benefit per cubicmeter of acidified slurry (€ m-3) increases if Ntot
content in slurry rises.
N price in mineral fertilisers ↑ 0.1 € kg-1, then SAT cost-benefit by
cattle slurry pig slurry:
in-house SAT: ↑0.090 € m-3. ↑0.21 € m-3.
in-storage SAT: ↑0.054 € m-3. ↑0.07 € m-3.
in-field SAT: ↑0.044 € m-3 ↑0.05 € m-3.
The change of N price in mineral fertilisers has lowest impact by in-field SAT
and biggest by in-house sat, especially in the case of pig slurry. The reason is
that by in-house acidification of pig slurry is the ammonia emission reduction
effect highest, 64%.
Bigger effect by pig slurry compared to cattle slurry is caused also by the
higher Ntot content of pig slurry and thus N-savings by SAT-s.
Table 35. Dairy cow slurry handling costs if slurry is acidified and not acidified,
and the difference of costs € m-3 of slurry, depending on N price
N In-house In-storage In-field
0,53
0,79
1,03
1,28
0,090,19
0,290,38
-0,11-0,04
0,040,12
-0,5
0,0
0,5
1,0
1,5
4 5 6 7 8
Co
st d
iffe
ren
ce b
etw
ee
n n
on
aci
dif
ied
an
d a
cid
ifie
d s
lurr
y, €
m-3
Ntot content in slurry, kg m-3
In-house In-storage In-field
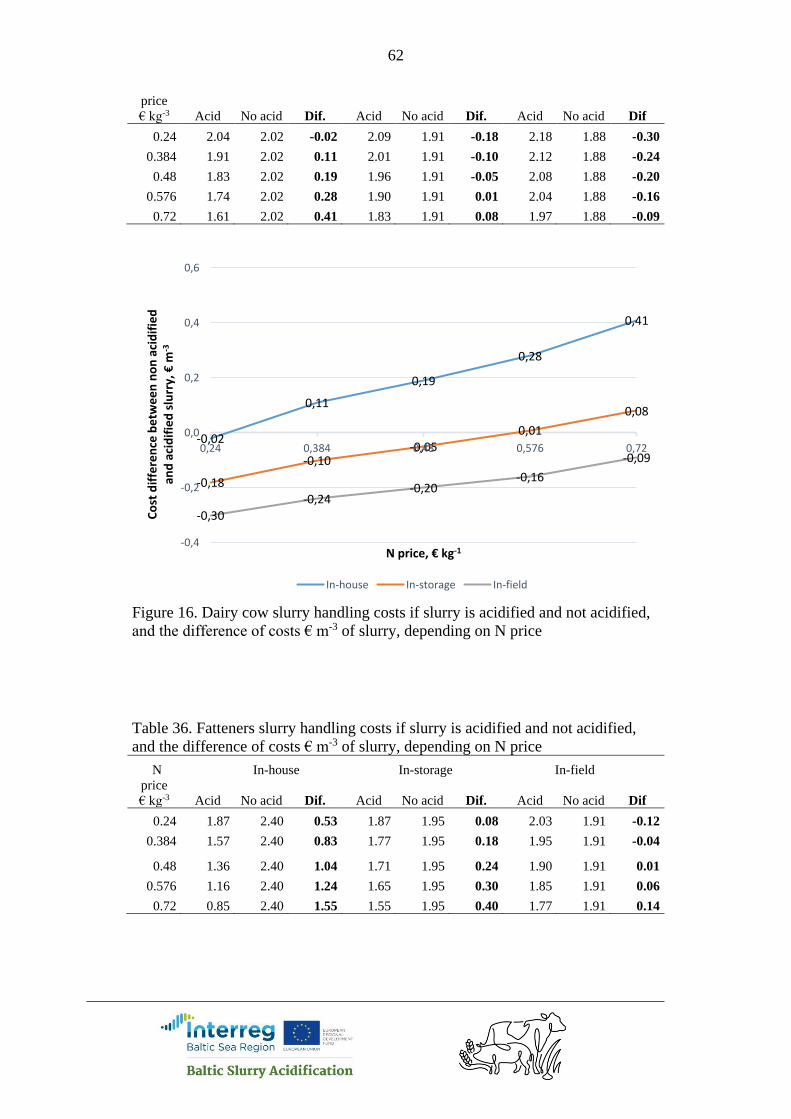
62
price
€ kg-3 Acid No acid Dif. Acid No acid Dif. Acid No acid Dif
0.24 2.04 2.02 -0.02 2.09 1.91 -0.18 2.18 1.88 -0.30
0.384 1.91 2.02 0.11 2.01 1.91 -0.10 2.12 1.88 -0.24
0.48 1.83 2.02 0.19 1.96 1.91 -0.05 2.08 1.88 -0.20
0.576 1.74 2.02 0.28 1.90 1.91 0.01 2.04 1.88 -0.16
0.72 1.61 2.02 0.41 1.83 1.91 0.08 1.97 1.88 -0.09
Figure 16. Dairy cow slurry handling costs if slurry is acidified and not acidified,
and the difference of costs € m-3 of slurry, depending on N price
Table 36. Fatteners slurry handling costs if slurry is acidified and not acidified,
and the difference of costs € m-3 of slurry, depending on N price
N In-house In-storage In-field
price
€ kg-3 Acid No acid Dif. Acid No acid Dif. Acid No acid Dif
0.24 1.87 2.40 0.53 1.87 1.95 0.08 2.03 1.91 -0.12
0.384 1.57 2.40 0.83 1.77 1.95 0.18 1.95 1.91 -0.04
0.48 1.36 2.40 1.04 1.71 1.95 0.24 1.90 1.91 0.01
0.576 1.16 2.40 1.24 1.65 1.95 0.30 1.85 1.91 0.06
0.72 0.85 2.40 1.55 1.55 1.95 0.40 1.77 1.91 0.14
-0,02
0,11
0,19
0,28
0,41
-0,18
-0,10-0,05
0,01
0,08
-0,30-0,24
-0,20-0,16
-0,09
-0,4
-0,2
0,0
0,2
0,4
0,6
0,24 0,384 0,48 0,576 0,72
Co
st d
iffe
ren
ce b
etw
ee
n n
on
aci
dif
ied
an
d a
cid
ifie
d s
lurr
y, €
m-3
N price, € kg-1
In-house In-storage In-field

63
Figure 17. Fatteners slurry handling costs if slurry is acidified and not acidified,
and the difference of costs € m-3 of slurry, depending on N price
5.1.6. S price, Belarus
The cost benefit per cubicmeter of acidified slurry (€ m-3) increases if S price in
mineral fertilisers rises.
S price in mineral fertilisers ↑ 0.1 € kg-1, then SAT cost-benefit by
cattle slurry pig slurry:
in-house SAT: ↑0.08 € m-3. ↑0.11 € m-3.
in-storage SAT: ↑0.08 € m-3. ↑0.08 € m-3.
in-field SAT: ↑0.08 € m-3 ↑0.08 € m-3.
The change of S price in mineral fertilisers has same impact by different
SATs and slurry types, except pig slurry with in-house SAT.
Table 37. Dairy cow slurry handling costs if slurry is acidified and not acidified,
and the difference of costs € m-3 of slurry, depending on S price
S In-house In-storage In-field
price
€ kg-3 Acid No acid Dif. Acid No acid Dif. Acid No acid Dif
0.055 1.87 2.02 0.15 2.00 1.91 -0.09 2.12 1.88 -0.24
0.088 1.84 2.02 0.18 1.97 1.91 -0.06 2.10 1.88 -0.22
0.11 1.83 2.02 0.19 1.96 1.91 -0.05 2.08 1.88 -0.20
0.132 1.81 2.02 0.21 1.94 1.91 -0.03 2.06 1.88 -0.18
0.165 1.78 2.02 0.24 1.91 1.91 0.00 2.03 1.88 -0.15
0,53
0,83
1,04
1,24
1,55
0,080,18
0,240,30
0,40
-0,12-0,04 0,01 0,06
0,14
-0,5
0,0
0,5
1,0
1,5
2,0
0,24 0,384 0,48 0,576 0,72
Co
st d
iffe
ren
ce b
etw
ee
n n
on
aci
dif
ied
an
d a
cid
ifie
d s
lurr
y, €
m-3
N price, € kg-1
In-house In-storage In-field
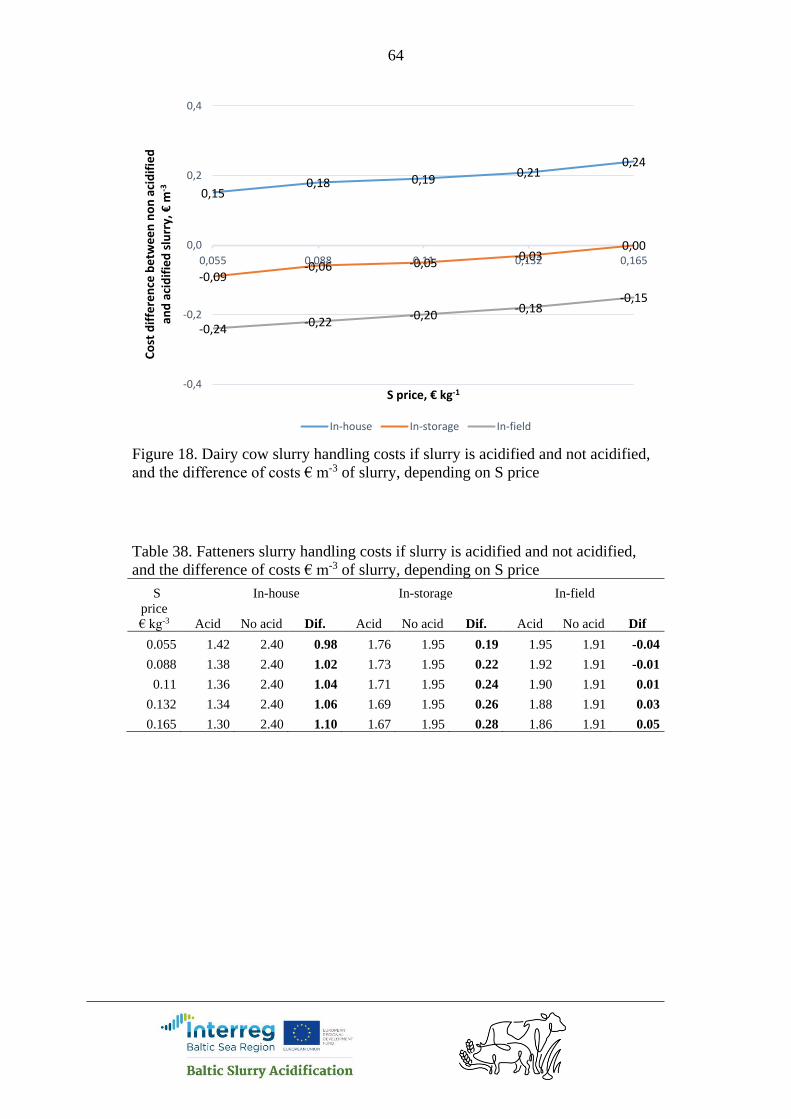
64
Figure 18. Dairy cow slurry handling costs if slurry is acidified and not acidified,
and the difference of costs € m-3 of slurry, depending on S price
Table 38. Fatteners slurry handling costs if slurry is acidified and not acidified,
and the difference of costs € m-3 of slurry, depending on S price
S In-house In-storage In-field
price
€ kg-3 Acid No acid Dif. Acid No acid Dif. Acid No acid Dif
0.055 1.42 2.40 0.98 1.76 1.95 0.19 1.95 1.91 -0.04
0.088 1.38 2.40 1.02 1.73 1.95 0.22 1.92 1.91 -0.01
0.11 1.36 2.40 1.04 1.71 1.95 0.24 1.90 1.91 0.01
0.132 1.34 2.40 1.06 1.69 1.95 0.26 1.88 1.91 0.03
0.165 1.30 2.40 1.10 1.67 1.95 0.28 1.86 1.91 0.05
0,150,18 0,19
0,210,24
-0,09-0,06 -0,05
-0,030,00
-0,24-0,22
-0,20-0,18
-0,15
-0,4
-0,2
0,0
0,2
0,4
0,055 0,088 0,11 0,132 0,165
Co
st d
iffe
ren
ce b
etw
ee
n n
on
aci
dif
ied
an
d a
cid
ifie
d s
lurr
y, €
m-3
S price, € kg-1
In-house In-storage In-field

65
Figure 19. Fatteners slurry handling costs if slurry is acidified and not acidified,
and the difference of costs € m-3 of slurry, depending on S price
5.1.7. Summary, Belarus
Analysed is the cost-benefit of SATs compared to disc-harrowing <12 h after
band-application of non-acidified slurry. The in-house acidification has in Belarus
significantly higher cost-benefit comapred to other SATs. The reason is that by in-
house SAT is used bulk acid which is transported by big tank truck and has much
lower price compared to the case if acid is transported in the IBC tanks, which is
used by other SATs.
This is the reason why in-house acidification of cattle slurry has cost-benefit
by annual amounts over 11,300 m3, but no cost-benefit by other SATs. The
acidification of pig slurry has cost-benefit by all SATs by bigger slurry amounts
(about 5,300–24,000 m3 ssslurry yearly , see Table 26).
Acidification of pig slurry has higher economic benefit compared to cattle
slurry, because
1) pig slurry contains more NH4-N to save
2) the in-house SAT has higher reduction effect on NH3 emission from pig
slurry
3) the acid need of pig slurry is lower
4) the risk to exceed S need of plants is lower (because the acid amount is
lower)
While the acid cost is biggest running cost, then the amount of acid required
to lower slurry acidity to target pH (see Table 8) has essential impact on cost-
benefit of slurry acidification. The higher is the acid price, the bigger is the impact
of acid amount on total costs of slurry acidification. The cattle slurry in-storage
0,98 1,02 1,04 1,06 1,10
0,19 0,22 0,24 0,26 0,28
-0,04 -0,01 0,01 0,03 0,05
-0,5
0,0
0,5
1,0
1,5
0,055 0,088 0,11 0,132 0,165
Co
st d
iffe
ren
ce b
etw
ee
n n
on
aci
dif
ied
an
d a
cid
ifie
d s
lurr
y, €
m-3
S price, € kg-1
In-house In-storage In-field

66
and in-field acidification would have cost-benefit if acid amount would be less
than 3.5 and 2.5 litre per cubicmeter of slurry correspondigly.
The cost-benefit of acidified slurry per cubicmeter (€ m-3) decreases if acid
content in slurry rises. Acid content change in slurry has lowest impact by in-
house SAT and biggest by in-field SAT. The reason is that the acid price for in-
house SAT is significantly lower (30 € t-1) than by other SATs (101 € t-1).
The calculations in paragraph 5.1 were done by slurry amount 30 m3 ha-1. The
extra calculations made for Finland for different hectare amounts (Figure 50)
show that cost-benefit of in-house SAT is higher if slurry amount is 20 or 10 m3
ha-1 .
One reason is that the slurry incorporation cost per hectare is constant despite
of slurry amount per hectare. Thus, the smaller is slurry amount per hectare the
higher is incorporation cost per cubicmeter of non-acidified slurry.
Another aspect, why low amount of acidified slurry give higher economic
effect, is the effective use of S applied with acidified slurry. In the calculations is
used 4.5 liter acid per m3 cattle slurry by in-house SAT. If the slurry amount is 30,
20 and 10 m3 ha-1 then the S amount applied to the field is 80, 53 and 26 kg ha-1
correspondingly. The S need for crops is in calculations 25 kg ha-1 in average. The
costs on mineral S are reduced if acidified slurry is applied and the reduction
effect is calculated until S amount reaches the demand of crop. After that S cost
reduction stays constant and the S amount what exceeds crop need, is not taken
into calculation. However, the S cost reduction value is always divided by slurry
amount per hectare and if the cost reduction is constant then by growing hectare
amount of slurry the S cost reduction per cubicmeter of slurry decreases.
An alternative to in-house acidification to minimise the ammonia emission
from slurry storage is to cover storage. The cost calculations made for different
type of storage covers shows that cost benefit by in-house acidified slurry depends
on capital cost and ability to decrease the ammonia emission. The rapeseed oil has
highest capital cost and decreases 80% of ammonia emission (Table 21). Thus, the
in-house slurry acidification gives biggest cost effect compared to this type of
cover, which is followed by tent and peat. Compared to the Hexa-cover plates
gives slurry acidification lowest cost benefit. The figures 10 and 11 show also that
the order of cover types is same for both, cattle and big slurries.
Ntot content change in slurry has lowest impact by in-field SAT and biggest by
in-house sat, especially in the case of pig slurry. The reason is that by in-house
acidification of pig slurry the ammonia emission reduction effect is highest, 64%.
The cost-benefit per cubicmeter of acidified slurry (€ m-3) increases if N price
in mineral fertilisers rises. The change of N price in mineral fertilisers has lowest
impact by in-field SAT and biggest by in-house sat, especially in the case of pig
slurry. The reason is that by in-house acidification of pig slurry is the ammonia
emission reduction effect highest, 64%. Bigger effect by pig slurry compared to
cattle slurry is caused also by the higher Ntot content of pig slurry and thus N-
savings by SAT-s.
The cost benefit per cubicmeter of acidified slurry (€ m-3) increases if S price
in mineral fertilisers rises. The change of S price in mineral fertilisers has same
impact by different SATs and slurry types, except bigger difference by pig slurry
with in-house SAT.

67
Although the present example shows cost benefit of slurry acidification by
bigger slurry amounts, a careful analysis with local parameters and future prices
should be performed before deciding to invest to acidification system. The
analysis model will be available on project website.
5.2. Denmark
5.2.1. Annual slurry amount, Denmark
Analysed is the cost-benefit of acidified slurry compared to non-acidified
slurry if they both are band-spreaded, but the non acidified slurry is
A) not incorporated after band-application or
B) incorporated by disc-harrow <12 h after band-application.
The acid price in the calculations is 128 € t-1 for in-house acidification and
157 € t-1 for in-storage and in-field acidification. N-fertilisers is AN34.4, 345 € t-1.
NS-fertiliser N21-S24, 366 € t-1. Thus N price 1 € kg-1 and S price 0,65 € kg-1.
The results show that by both incorporation scenarios of non-acidified slurry,
the slurry acidification has cost-benefit compared to non-acidification. The reason
for high cost-benefits is relatively high price of mineral N and S (1 and 0,65 € kg-
1) compared to other countries (0.48-0.79 and 0.11-0.41 € kg-1). However the cost-
benefit by scenario A was 0.87-1,26 € kg-1 lower than in scenario B, because of
smaller tillage cost (50 € ha-1).
Table 39. The minimum amount of slurry and corresponding amount of animal,
by which the slurry acidification has cost-benefit. The both types of slurry are
applyed to the field by bandspreader without incorporation after application.
Dairy cows Fatteners
SAT Annual slurry
amount, m3
Number of animal Annual slurry
amount, m3
Number of
animal per year
In-house 9,384 391 4,846 9,691
In-storage 3,528 147 2,012 4,024
In-field 10,944 456 7,293 14,585
Table 39a. The minimum amount of slurry and corresponding amount of
animal, by which the slurry acidification has cost-benefit. Analysed is the cost-
benefit of acidified slurry compared to non-acidified slurry if they both are band-
spreaded, but the no- acidified slurry is incorporated by disc-harrow <12 h after
band-application .
Dairy cows Fatteners
SAT Annual slurry
amount, m3
Number of animal Annual slurry
amount, m3
Number of
animal per year
In-house 3,072 128 3,302 6,603
In-storage 1,296 54 1,124 2,248
In-field 3,720 155 3,328 6,657
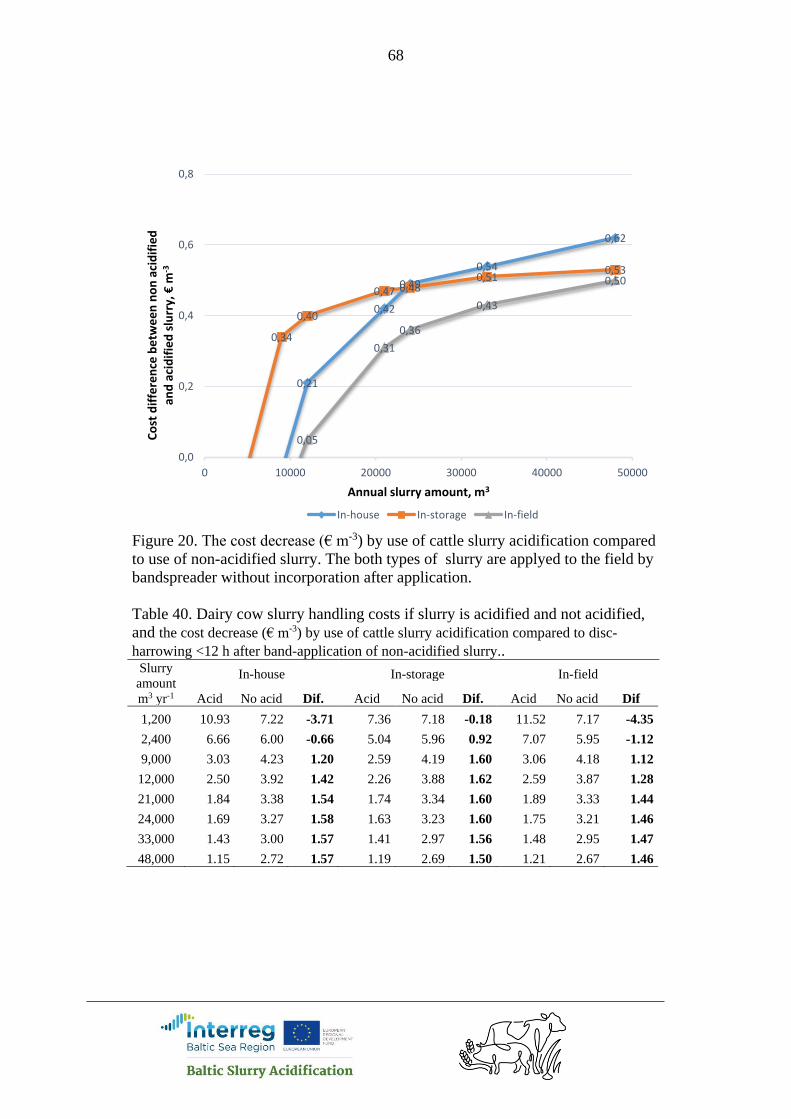
68
Figure 20. The cost decrease (€ m-3) by use of cattle slurry acidification compared
to use of non-acidified slurry. The both types of slurry are applyed to the field by
bandspreader without incorporation after application.
Table 40. Dairy cow slurry handling costs if slurry is acidified and not acidified,
and the cost decrease (€ m-3) by use of cattle slurry acidification compared to disc-
harrowing <12 h after band-application of non-acidified slurry.. Slurry
amount
m3 yr-1
In-house In-storage In-field
Acid No acid Dif. Acid No acid Dif. Acid No acid Dif
1,200 10.93 7.22 -3.71 7.36 7.18 -0.18 11.52 7.17 -4.35
2,400 6.66 6.00 -0.66 5.04 5.96 0.92 7.07 5.95 -1.12
9,000 3.03 4.23 1.20 2.59 4.19 1.60 3.06 4.18 1.12
12,000 2.50 3.92 1.42 2.26 3.88 1.62 2.59 3.87 1.28
21,000 1.84 3.38 1.54 1.74 3.34 1.60 1.89 3.33 1.44
24,000 1.69 3.27 1.58 1.63 3.23 1.60 1.75 3.21 1.46
33,000 1.43 3.00 1.57 1.41 2.97 1.56 1.48 2.95 1.47
48,000 1.15 2.72 1.57 1.19 2.69 1.50 1.21 2.67 1.46
0,21
0,42
0,49
0,54
0,62
0,34
0,40
0,47 0,480,51
0,53
0,05
0,31
0,36
0,43
0,50
0,0
0,2
0,4
0,6
0,8
0 10000 20000 30000 40000 50000
Co
st d
iffe
ren
ce b
etw
ee
n n
on
aci
dif
ied
an
d a
cid
ifie
d s
lurr
y, €
m-3
Annual slurry amount, m3
In-house In-storage In-field

69
Figure 21. The cost decrease (€ m-3) by use of cattle slurry acidification compared
to disc-harrowing <12 h after band-application of non-acidified slurry.
Figure 22. The cost decrease (€ m-3) by use of fatteners slurry acidification
compared to use of non-acidified slurry. The both types of slurry are applyed to
the field by bandspreader without incorporation after application.
1,20
1,42
1,541,58 1,57 1,57
0,92
1,60 1,62 1,60 1,601,56
1,50
1,12
1,28
1,44 1,46 1,47 1,46
0,0
0,2
0,4
0,6
0,8
1,0
1,2
1,4
1,6
1,8
0 10000 20000 30000 40000 50000
Co
st d
iffe
ren
ce b
etw
ee
n n
on
aci
dif
ied
an
d a
cid
ifie
d s
lurr
y, €
m-3
Annual slurry amount, m3
In-house In-storage In-field
0,09
1,14
1,96
2,19
0,18
0,58
0,760,88 0,92
0,18
0,630,76
0,0
0,5
1,0
1,5
2,0
2,5
0 5000 10000 15000 20000 25000 30000 35000
Co
st d
iffe
ren
ce b
etw
ee
n n
on
aci
dif
ied
an
d a
cid
ifie
d s
lurr
y, €
m-3
Annual slurry amount, m3
In-house In-storage In-field

70
Table 41. Fattener slurry handling costs if slurry is acidified and not acidified, and
the cost decrease (€ m-3) by use of cattle slurry acidification compared to disc-
harrowing <12 h after band-application of non-acidified slurry. Slurry
amount
m3 yr-1
In-house In-storage In-field
Acid No acid Dif. Acid No acid Dif. Acid No acid Dif
500 33.39 9.27 -24.12 12.00 9.10 -2.90 22.24 9.08 -13.16
2,500 7.45 6.08 -1.37 4.62 5.91 1.29 6.65 5.89 -0.76
5,000 3.66 5.08 1.42 3.15 4.91 1.76 4.15 4.90 0.75
9,000 1.91 4.37 2.46 2.28 4.20 1.92 2.84 4.18 1.34
21,000 0.37 3.52 3.15 1.43 3.35 1.92 1.66 3.34 1.68
33,000 -0.15 3.15 3.30 1.10 2.98 1.88 1.25 2.96 1.71
Figure 23. The cost decrease (€ m-3) by use of fattener slurry acidification
compared to disc-harrowing <12 h after band-application of non-acidified slurry.
5.2.2. Cover type, Denmark
An alternative to in-house acidification to minimise the ammonia emission
from slurry storage is to cover storage. The cost calculations made for different
type of storage covers shows that cost benefit by in-house acidified slurry depends
on capital cost and ability to decrease the ammonia emission. The rapeseed oil has
highest capital cost and decreases 80% of ammonia emission (Table 21). Thus, the
in-house slurry acidification gives biggest cost effect compared to this type of
cover, which is followed by tent and peat. Compared to the Hexa-cover plates
1,42
2,46
3,153,30
1,29
1,761,92 1,92 1,88
0,75
1,34
1,68 1,71
0,0
0,5
1,0
1,5
2,0
2,5
3,0
3,5
0 5000 10000 15000 20000 25000 30000 35000
Co
st d
iffe
ren
ce b
etw
ee
n n
on
aci
dif
ied
an
d a
cid
ifie
d s
lurr
y, €
m-3
Annual slurry amount, m3
In-house In-storage In-field
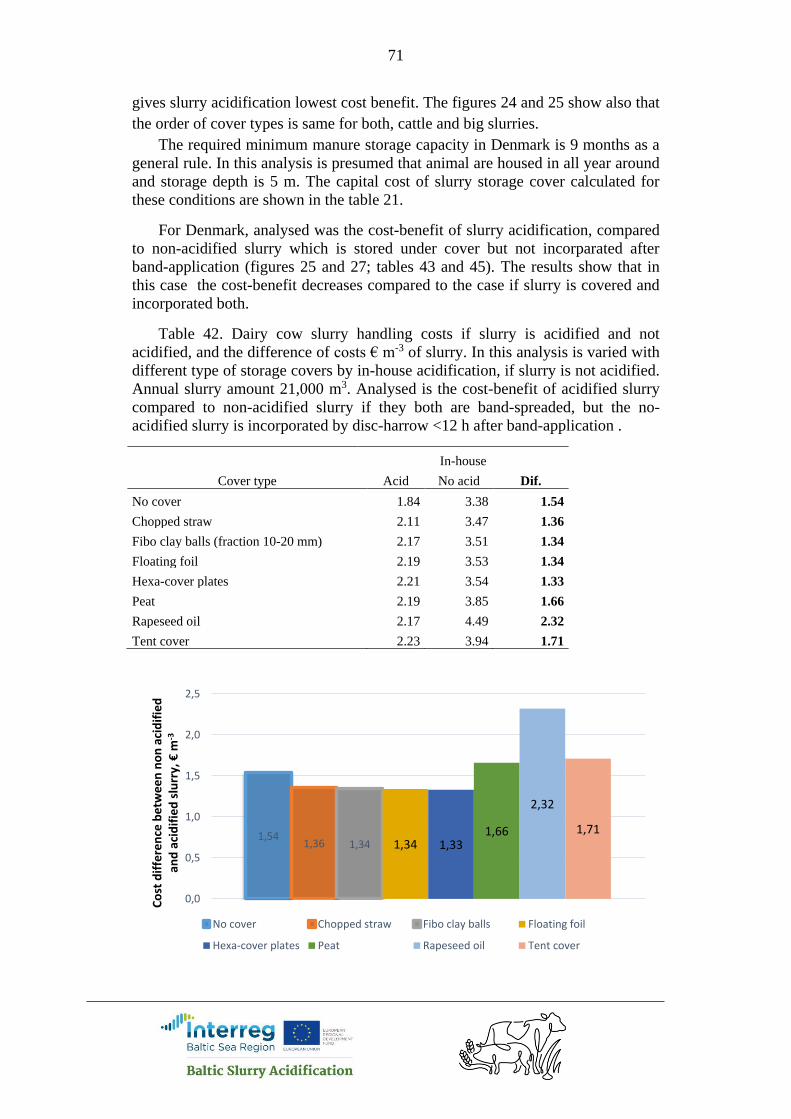
71
gives slurry acidification lowest cost benefit. The figures 24 and 25 show also that
the order of cover types is same for both, cattle and big slurries.
The required minimum manure storage capacity in Denmark is 9 months as a
general rule. In this analysis is presumed that animal are housed in all year around
and storage depth is 5 m. The capital cost of slurry storage cover calculated for
these conditions are shown in the table 21.
For Denmark, analysed was the cost-benefit of slurry acidification, compared
to non-acidified slurry which is stored under cover but not incorparated after
band-application (figures 25 and 27; tables 43 and 45). The results show that in
this case the cost-benefit decreases compared to the case if slurry is covered and
incorporated both.
Table 42. Dairy cow slurry handling costs if slurry is acidified and not
acidified, and the difference of costs € m-3 of slurry. In this analysis is varied with
different type of storage covers by in-house acidification, if slurry is not acidified.
Annual slurry amount 21,000 m3. Analysed is the cost-benefit of acidified slurry
compared to non-acidified slurry if they both are band-spreaded, but the no-
acidified slurry is incorporated by disc-harrow <12 h after band-application .
In-house
Cover type Acid No acid Dif.
No cover 1.84 3.38 1.54
Chopped straw 2.11 3.47 1.36
Fibo clay balls (fraction 10-20 mm) 2.17 3.51 1.34
Floating foil 2.19 3.53 1.34
Hexa-cover plates 2.21 3.54 1.33
Peat 2.19 3.85 1.66
Rapeseed oil 2.17 4.49 2.32
Tent cover 2.23 3.94 1.71
1,541,36 1,34 1,34 1,33
1,66
2,32
1,71
0,0
0,5
1,0
1,5
2,0
2,5
Co
st d
iffe
ren
ce b
etw
ee
n n
on
aci
dif
ied
an
d a
cid
ifie
d s
lurr
y, €
m-3
No cover Chopped straw Fibo clay balls Floating foil
Hexa-cover plates Peat Rapeseed oil Tent cover
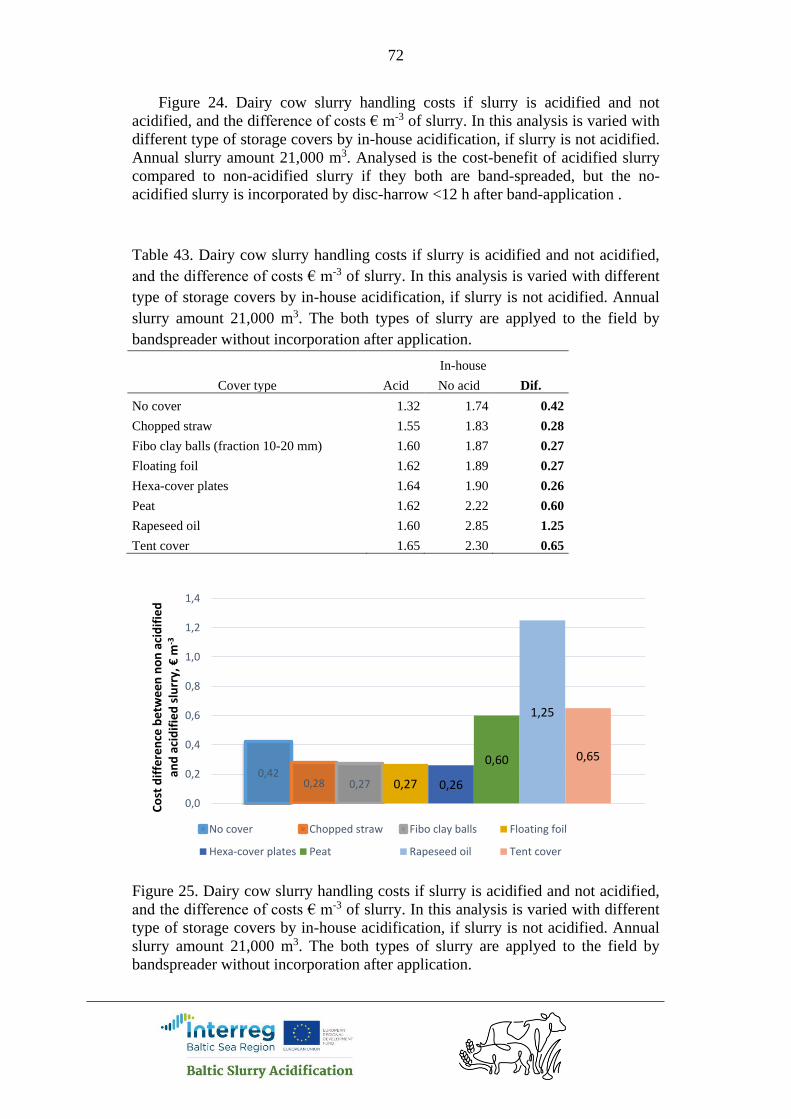
72
Figure 24. Dairy cow slurry handling costs if slurry is acidified and not
acidified, and the difference of costs € m-3 of slurry. In this analysis is varied with
different type of storage covers by in-house acidification, if slurry is not acidified.
Annual slurry amount 21,000 m3. Analysed is the cost-benefit of acidified slurry
compared to non-acidified slurry if they both are band-spreaded, but the no-
acidified slurry is incorporated by disc-harrow <12 h after band-application .
Table 43. Dairy cow slurry handling costs if slurry is acidified and not acidified,
and the difference of costs € m-3 of slurry. In this analysis is varied with different
type of storage covers by in-house acidification, if slurry is not acidified. Annual
slurry amount 21,000 m3. The both types of slurry are applyed to the field by
bandspreader without incorporation after application.
In-house
Cover type Acid No acid Dif.
No cover 1.32 1.74 0.42
Chopped straw 1.55 1.83 0.28
Fibo clay balls (fraction 10-20 mm) 1.60 1.87 0.27
Floating foil 1.62 1.89 0.27
Hexa-cover plates 1.64 1.90 0.26
Peat 1.62 2.22 0.60
Rapeseed oil 1.60 2.85 1.25
Tent cover 1.65 2.30 0.65
Figure 25. Dairy cow slurry handling costs if slurry is acidified and not acidified,
and the difference of costs € m-3 of slurry. In this analysis is varied with different
type of storage covers by in-house acidification, if slurry is not acidified. Annual
slurry amount 21,000 m3. The both types of slurry are applyed to the field by
bandspreader without incorporation after application.
0,420,28 0,27 0,27 0,26
0,60
1,25
0,65
0,0
0,2
0,4
0,6
0,8
1,0
1,2
1,4
Co
st d
iffe
ren
ce b
etw
ee
n n
on
aci
dif
ied
an
d a
cid
ifie
d s
lurr
y, €
m-3
No cover Chopped straw Fibo clay balls Floating foil
Hexa-cover plates Peat Rapeseed oil Tent cover

73
Table 44. Fatteners slurry handling costs if slurry is acidified and not
acidified, and the difference of costs € m-3 of slurry. In this analysis is varied with
different type of storage covers by in-house acidification, if slurry is not acidified.
Annual slurry amount 21,000 m3. Analysed is the cost-benefit of acidified slurry
compared to non-acidified slurry if they both are band-spreaded, but the no-
acidified slurry is incorporated by disc-harrow <12 h after band-application .
In-house
Cover type Acid No acid Dif.
No cover 0.37 3.52 3.15
Chopped straw 0.70 3.61 2.91
Fibo clay balls (fraction 10-20 mm) 0.78 3.64 2.86
Floating foil 0.80 3.66 2.86
Hexa-cover plates 0.83 3.67 2.84
Peat 0.80 3.99 3.19
Rapeseed oil 0.78 4.62 3.84
Tent cover 0.85 4.07 3.22
Figure 26. Fatteners slurry handling costs if slurry is acidified and not
acidified, and the difference of costs € m-3 of slurry. In this analysis is varied with
different type of storage covers by in-house acidification, if slurry is not acidified.
42,000 fatteners. Analysed is the cost-benefit of acidified slurry compared to non-
acidified slurry if they both are band-spreaded, but the no- acidified slurry is
incorporated by disc-harrow <12 h after band-application .
Table 45. Fatteners slurry handling costs if slurry is acidified and not acidified,
and the difference of costs € m-3 of slurry. In this analysis is varied with different
type of storage covers by in-house acidification, if slurry is not acidified. Annual
3,15 2,91 2,86 2,86 2,843,19
3,843,22
0,0
0,5
1,0
1,5
2,0
2,5
3,0
3,5
4,0
4,5
Co
st d
iffe
ren
ce b
etw
ee
n n
on
aci
dif
ied
an
d a
cid
ifie
d s
lurr
y, €
m-3
No cover Chopped straw Fibo clay balls Floating foil
Hexa-cover plates Peat Rapeseed oil Tent cover
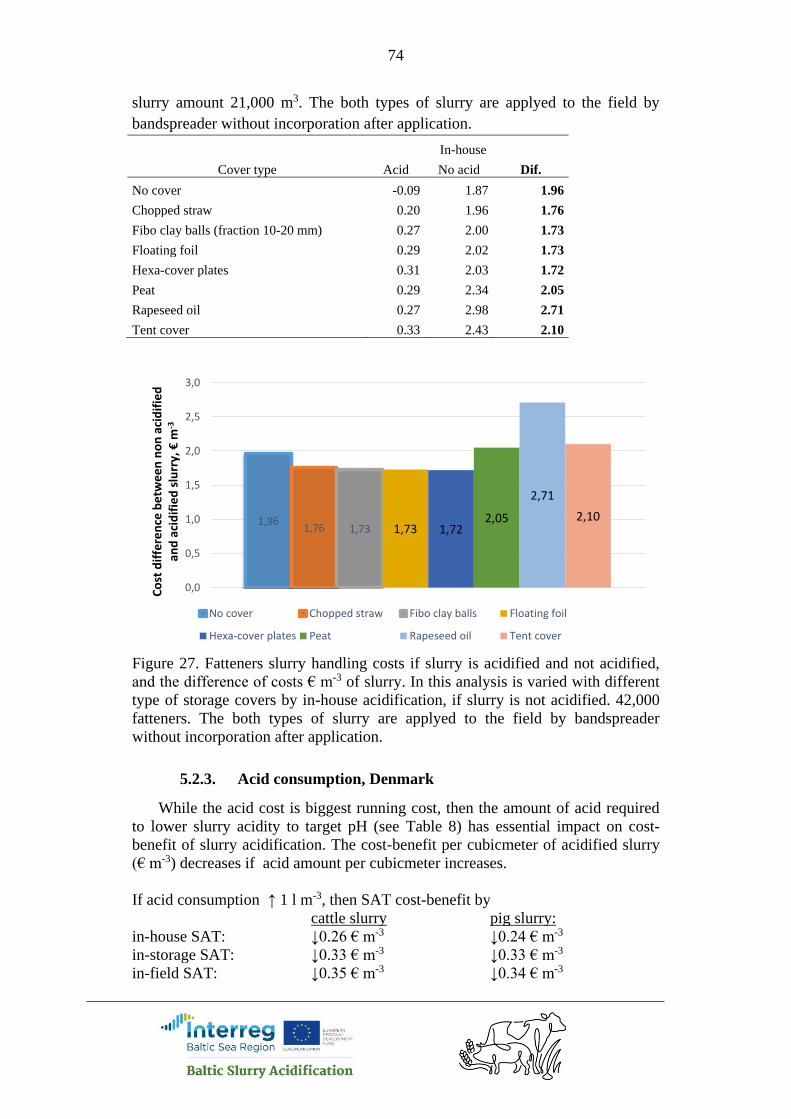
74
slurry amount 21,000 m3. The both types of slurry are applyed to the field by
bandspreader without incorporation after application.
In-house
Cover type Acid No acid Dif.
No cover -0.09 1.87 1.96
Chopped straw 0.20 1.96 1.76
Fibo clay balls (fraction 10-20 mm) 0.27 2.00 1.73
Floating foil 0.29 2.02 1.73
Hexa-cover plates 0.31 2.03 1.72
Peat 0.29 2.34 2.05
Rapeseed oil 0.27 2.98 2.71
Tent cover 0.33 2.43 2.10
Figure 27. Fatteners slurry handling costs if slurry is acidified and not acidified,
and the difference of costs € m-3 of slurry. In this analysis is varied with different
type of storage covers by in-house acidification, if slurry is not acidified. 42,000
fatteners. The both types of slurry are applyed to the field by bandspreader
without incorporation after application.
5.2.3. Acid consumption, Denmark
While the acid cost is biggest running cost, then the amount of acid required
to lower slurry acidity to target pH (see Table 8) has essential impact on cost-
benefit of slurry acidification. The cost-benefit per cubicmeter of acidified slurry
(€ m-3) decreases if acid amount per cubicmeter increases.
If acid consumption ↑ 1 l m-3, then SAT cost-benefit by
cattle slurry pig slurry:
in-house SAT: ↓0.26 € m-3 ↓0.24 € m-3
in-storage SAT: ↓0.33 € m-3 ↓0.33 € m-3
in-field SAT: ↓0.35 € m-3 ↓0.34 € m-3
1,961,76 1,73 1,73 1,72
2,05
2,71
2,10
0,0
0,5
1,0
1,5
2,0
2,5
3,0
Co
st d
iffe
ren
ce b
etw
ee
n n
on
aci
dif
ied
an
d a
cid
ifie
d s
lurr
y, €
m-3
No cover Chopped straw Fibo clay balls Floating foil
Hexa-cover plates Peat Rapeseed oil Tent cover

75
Acid content change in slurry has lowest impact by in-house SAT and biggest
by in-field SAT. The reason is that the acid price for in-house SAT is lower
(128 € t-1) than by other SATs (157 € t-1).
Table 46. Dairy cow slurry handling costs if slurry is acidified and not acidified,
and the difference of costs € m-3 of slurry, depending on acid consumption.
Acid In-house In-storage In-field
amount
l m-3 Acid No acid Dif. Acid No acid Dif. Acid No acid Dif
1 1.00 3.38 2.38 1.00 3.34 2.34 1.24 3.33 2.09
3 1.40 3.38 1.98 1.52 3.34 1.82 1.89 3.33 1.44
4 1.70 3.38 1.68 1.88 3.34 1.46 2.25 3.33 1.08
5 1.99 3.38 1.39 2.24 3.34 1.10 2.61 3.33 0.72
7 2.58 3.38 0.80 2.95 3.34 0.39 3.34 3.33 -0.01
Figure 28. Dairy cow slurry handling costs if slurry is acidified and not acidified,
and the difference of costs € m-3 of slurry, depending on acid consumption
Table 47. Fatteners slurry handling costs if slurry is acidified and not acidified,
and the difference of costs € m-3 of slurry, depending on acid consumption.
Acid In-house In-storage In-field
amount
l m-3 Acid No acid Dif. Acid No acid Dif. Acid No acid Dif
1 -0.02 3.52 3.54 0.90 3.35 2.45 1.26 3.34 2.08
3 0.22 3.52 3.30 1.43 3.35 1.92 1.81 3.34 1.53
2,38
1,98
1,68
1,39
0,80
2,34
1,82
1,46
1,10
0,39
2,09
1,44
1,08
0,72
0,0
0,5
1,0
1,5
2,0
2,5
1 3 4 5 7
Co
st d
iffe
ren
ce b
etw
ee
n n
on
aci
dif
ied
an
d a
cid
ifie
d s
lurr
y, €
m-3
Acid amount litres per m3 of slurry
In-house In-storage In-field

76
4 0.51 3.52 3.01 1.78 3.35 1.57 2.17 3.34 1.17
5 0.80 3.52 2.72 2.14 3.35 1.21 2.54 3.34 0.80
7 1.39 3.52 2.13 2.85 3.35 0.50 3.27 3.34 0.07
Figure 29. Fatteners slurry handling costs if slurry is acidified and not acidified,
and the difference of costs € m-3 of slurry, depending on acid consumption
5.2.4. Ntot in slurry, Denmark
The cost benefit per cubicmeter of acidified slurry (€ m-3) increases if Ntot
content in slurry rises.
If Ntot content in slurry ↑ 1 kg m-3 , then SAT cost-benefit by
cattle slurry pig slurry:
in-house SAT: ↑0.18 € m-3. ↑0.36 € m-3.
in-storage SAT: ↑0.14 € m-3. ↑0.15 € m-3.
in-field SAT: ↑0.11 € m-3 ↑0.12 € m-3.
Ntot content change in slurry has lowest impact by in-field SAT and biggest by
in-house sat, especially in the case of pig slurry. The reason is that by in-
house acidification of pig slurry is the ammonia emission reduction effect
highest, 64%.
Table 48. Dairy cow slurry handling costs if slurry is acidified and not acidified,
and the difference of costs € m-3 of slurry, depending Ntot content in slurry
3,543,30
3,01
2,72
2,13
2,45
1,92
1,57
1,21
0,50
2,08
1,53
1,17
0,80
0,070,0
0,5
1,0
1,5
2,0
2,5
3,0
3,5
4,0
1 3 4 5 7
Co
st d
iffe
ren
ce b
etw
ee
n n
on
aci
dif
ied
an
d a
cid
ifie
d s
lurr
y, €
m-3
Acid amount litres per m3 of slurry
In-house In-storage In-field

77
Ntot In-house In-storage In-field
content
kg m-3 Acid No acid Dif. Acid No acid Dif. Acid No acid Dif
3 1.96 3.32 1.36 2.06 3.31 1.25
4 2.15 3.35 1.20 1.83 3.33 1.50 1.96 3.32 1.36
5 1.99 3.37 1.38 1.70 3.35 1.65 1.86 3.33 1.47
6 1.83 3.38 1.55 1.58 3.36 1.78 1.76 3.34 1.58
7 1.67 3.40 1.73
Figure 30. Dairy cow slurry handling costs if slurry is acidified and not acidified,
and the difference of costs € m-3 of slurry, depending Ntot content in slurry
Table 49. Fatteners slurry handling costs if slurry is acidified and not acidified,
and the difference of costs € m-3 of slurry, depending Ntot content in slurry
Ntot In-house In-storage In-field
content
kg m-3 Acid No acid Dif. Acid No acid Dif. Acid No acid Dif
4 - - 1.62 3.33 1.71 1.82 3.32 1.50
5 1.02 3.45 2.43 1.49 3.35 1.86 1.71 3.33 1.62
6 0.69 3.49 2.80 1.36 3.36 2.00 1.61 3.34 1.73
7 0.37 3.52 3.15 1.23 3.38 2.15 1.51 3.36 1.85
8 0.04 3.56 3.52 - - - -
1,20
1,38
1,55
1,73
1,36
1,50
1,65
1,78
1,25
1,36
1,47
1,58
0,5
0,9
1,3
1,7
2,1
3 4 5 6 7
Co
st d
iffe
ren
ce b
etw
ee
n n
on
aci
dif
ied
an
d a
cid
ifie
d s
lurr
y, €
m-3
Ntot content in slurry, kg m-3
In-house In-storage In-field

78
Figure 31. Fatteners slurry handling costs if slurry is acidified and not acidified,
and the difference of costs € m-3 of slurry, depending Ntot content in slurry
5.2.5. N price, Denmark
The cost benefit per cubicmeter of acidified slurry (€ m-3) increases if Ntot
content in slurry rises.
N price in mineral fertilisers ↑ 0.1 € kg-1, then SAT cost-benefit by
cattle slurry pig slurry:
in-house SAT: ↑0.089 € m-3. ↑0.21 € m-3.
in-storage SAT: ↑0.057 € m-3. ↑0.07 € m-3.
in-field SAT: ↑0.045 € m-3 ↑0.05 € m-3.
The change of N price in mineral fertilisers has lowest impact by in-field SAT
and biggest by in-house sat, especially in the case of pig slurry. The reason is
that by in-house acidification of pig slurry is the ammonia emission reduction
effect highest, 64%.
Bigger effect by pig slurry compared to cattle slurry is caused also by the
higher Ntot content of pig slurry and thus N-savings by SAT-s.
Table 50. Dairy cow slurry handling costs if slurry is acidified and not acidified,
and the difference of costs € m-3 of slurry, depending on N price
N In-house In-storage In-field
price
€ kg-3 Acid No acid Dif. Acid No acid Dif. Acid No acid Dif
0.5 2.29 3.38 1.09 2.02 3.34 1.32 2.11 3.33 1.22
2,43
2,80
3,15
3,52
1,711,86
2,002,15
1,501,62
1,731,85
1,0
1,4
1,8
2,2
2,6
3,0
3,4
3,8
4 5 6 7 8
Co
st d
iffe
ren
ce b
etw
ee
n n
on
aci
dif
ied
an
d a
cid
ifie
d s
lurr
y, €
m-3
Ntot content in slurry, kg m-3
In-house In-storage In-field

79
0.8 2.02 3.38 1.36 1.85 3.34 1.49 1.98 3.33 1.35
1 1.84 3.38 1.54 1.74 3.34 1.60 1.88 3.33 1.45
1.2 1.67 3.38 1.71 1.62 3.34 1.72 1.79 3.33 1.54
1.5 1.40 3.38 1.98 1.45 3.34 1.89 1.66 3.33 1.67
Figure 32. Dairy cow slurry handling costs if slurry is acidified and not acidified,
and the difference of costs € m-3 of slurry, depending on N price
Table 51. Fatteners slurry handling costs if slurry is acidified and not acidified,
and the difference of costs € m-3 of slurry, depending on N price
N In-house In-storage In-field
price
€ kg-3 Acid No acid Dif. Acid No acid Dif. Acid No acid Dif
0.5 1.43 3.52 2.09 1.76 3.35 1.59 1.93 3.34 1.41
0.8 0.79 3.52 2.73 1.56 3.35 1.79 1.77 3.34 1.57
1 0.37 3.52 3.15 1.43 3.35 1.92 1.66 3.34 1.68
1.2 -0.06 3.52 3.58 1.29 3.35 2.06 1.56 3.34 1.78
1.5 -0.69 3.52 4.21 1.10 3.35 2.25 1.40 3.34 1.94
1,09
1,36
1,54
1,71
1,98
1,32
1,49
1,60
1,72
1,89
1,22
1,35
1,45
1,54
1,67
1,0
1,2
1,4
1,6
1,8
2,0
0,5 0,8 1 1,2 1,5
Co
st d
iffe
ren
ce b
etw
ee
n n
on
aci
dif
ied
an
d a
cid
ifie
d s
lurr
y, €
m-3
N price, € kg-1
In-house In-storage In-field

80
Figure 33. Fatteners slurry handling costs if slurry is acidified and not acidified,
and the difference of costs € m-3 of slurry, depending on N price
5.2.6. S price, Denmark
The cost benefit per cubicmeter of acidified slurry (€ m-3) increases if S price in
mineral fertilisers rises.
S price in mineral fertilisers ↑ 0.1 € kg-1, then SAT cost-benefit by
cattle slurry pig slurry:
in-house SAT: ↑0.08 € m-3. ↑0.10 € m-3.
in-storage SAT: ↑0.08 € m-3. ↑0.08 € m-3.
in-field SAT: ↑0.08 € m-3 ↑0.08 € m-3.
The change of S price in mineral fertilisers has same impact by different
SATs and slurry types, except pig slurry with in-house SAT.
Table 52. Dairy cow slurry handling costs if slurry is acidified and not acidified,
and the difference of costs € m-3 of slurry, depending on S price
S In-house In-storage In-field
price
€ kg-3 Acid No acid Dif. Acid No acid Dif. Acid No acid Dif
0.325 2.12 3.38 1.26 2.01 3.34 1.33 2.11 3.33 1.22
0.52 1.95 3.38 1.43 1.85 3.34 1.49 1.99 3.33 1.34
0.65 1.84 3.38 1.54 1.74 3.34 1.60 1.88 3.33 1.45
0.78 1.74 3.38 1.64 1.63 3.34 1.71 1.78 3.33 1.55
0.975 1.57 3.38 1.81 1.47 3.34 1.87 1.61 3.33 1.72
2,09
2,73
3,15
3,58
4,21
1,591,79
1,922,06
2,25
1,411,57
1,681,78
1,94
1,0
1,5
2,0
2,5
3,0
3,5
4,0
4,5
0,5 0,8 1 1,2 1,5
Co
st d
iffe
ren
ce b
etw
ee
n n
on
aci
dif
ied
an
d a
cid
ifie
d s
lurr
y, €
m-3
N price, € kg-1
In-house In-storage In-field
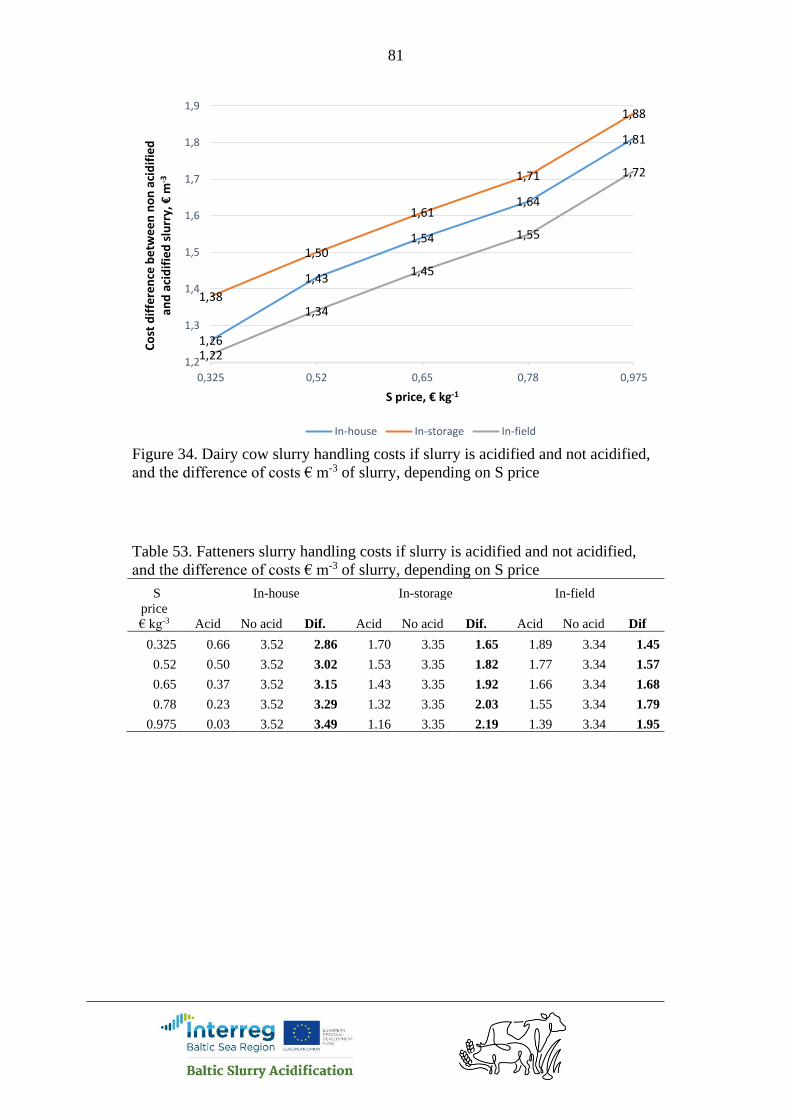
81
Figure 34. Dairy cow slurry handling costs if slurry is acidified and not acidified,
and the difference of costs € m-3 of slurry, depending on S price
Table 53. Fatteners slurry handling costs if slurry is acidified and not acidified,
and the difference of costs € m-3 of slurry, depending on S price
S In-house In-storage In-field
price
€ kg-3 Acid No acid Dif. Acid No acid Dif. Acid No acid Dif
0.325 0.66 3.52 2.86 1.70 3.35 1.65 1.89 3.34 1.45
0.52 0.50 3.52 3.02 1.53 3.35 1.82 1.77 3.34 1.57
0.65 0.37 3.52 3.15 1.43 3.35 1.92 1.66 3.34 1.68
0.78 0.23 3.52 3.29 1.32 3.35 2.03 1.55 3.34 1.79
0.975 0.03 3.52 3.49 1.16 3.35 2.19 1.39 3.34 1.95
1,26
1,43
1,54
1,64
1,81
1,38
1,50
1,61
1,71
1,88
1,22
1,34
1,45
1,55
1,72
1,2
1,3
1,4
1,5
1,6
1,7
1,8
1,9
0,325 0,52 0,65 0,78 0,975
Co
st d
iffe
ren
ce b
etw
ee
n n
on
aci
dif
ied
an
d a
cid
ifie
d s
lurr
y, €
m-3
S price, € kg-1
In-house In-storage In-field
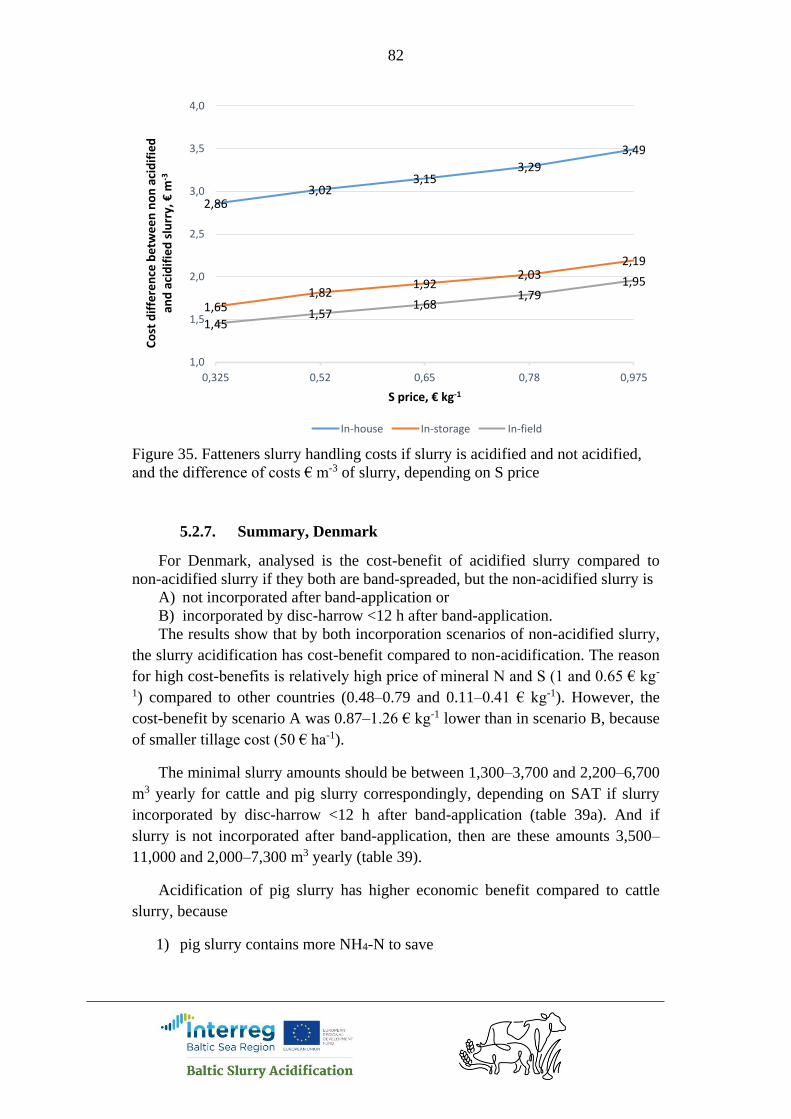
82
Figure 35. Fatteners slurry handling costs if slurry is acidified and not acidified,
and the difference of costs € m-3 of slurry, depending on S price
5.2.7. Summary, Denmark
For Denmark, analysed is the cost-benefit of acidified slurry compared to
non-acidified slurry if they both are band-spreaded, but the non-acidified slurry is
A) not incorporated after band-application or
B) incorporated by disc-harrow <12 h after band-application.
The results show that by both incorporation scenarios of non-acidified slurry,
the slurry acidification has cost-benefit compared to non-acidification. The reason
for high cost-benefits is relatively high price of mineral N and S (1 and 0.65 € kg-
1) compared to other countries (0.48–0.79 and 0.11–0.41 € kg-1). However, the
cost-benefit by scenario A was 0.87–1.26 € kg-1 lower than in scenario B, because
of smaller tillage cost (50 € ha-1).
The minimal slurry amounts should be between 1,300–3,700 and 2,200–6,700
m3 yearly for cattle and pig slurry correspondingly, depending on SAT if slurry
incorporated by disc-harrow <12 h after band-application (table 39a). And if
slurry is not incorporated after band-application, then are these amounts 3,500–
11,000 and 2,000–7,300 m3 yearly (table 39).
Acidification of pig slurry has higher economic benefit compared to cattle
slurry, because
1) pig slurry contains more NH4-N to save
2,863,02
3,153,29
3,49
1,651,82
1,922,03
2,19
1,451,57
1,681,79
1,95
1,0
1,5
2,0
2,5
3,0
3,5
4,0
0,325 0,52 0,65 0,78 0,975
Co
st d
iffe
ren
ce b
etw
ee
n n
on
aci
dif
ied
an
d a
cid
ifie
d s
lurr
y, €
m-3
S price, € kg-1
In-house In-storage In-field

83
2) the in-house SAT has higher reduction effect on NH3 emission from pig
slurry
3) the acid need of pig slurry is lower
4) the risk to exceed S need of plants is lower (because the acid amount is
lower)
The cost-benefit of acidified slurry per cubicmeter (€ m-3) decreases if acid
amount per cubicmeter increases. While the acid cost is biggest running cost, then
the amount of acid required to lower slurry acidity to target pH (see Table 8) has
essential impact on cost-benefit of slurry acidification. The acid price by in-house
SAT (128 € m-3) is lower than by other SATs (157 € m-3) and this is the reason
why change of acid amount has smaller effect on cost-benefit by first SAT
compared to others.
The calculations in paragraph 5.2 were done by slurry amount 30 m3 ha-1. The
extra calculations made for Finland for different hectare amounts (Figure 50)
show that cost-benefit of in-house SAT is higher if slurry amount is 20 or 10 m3
ha-1 .
One reason is that the slurry incorporation cost per hectare is constant despite
of slurry amount per hectare. Thus, the smaller is slurry amount per hectare the
higher is incorporation cost per cubicmeter of non-acidified slurry.
Another aspect, why low amount of acidified slurry give higher economic
effect, is the effective use of S applied with acidified slurry. In the calculations is
used 4.5 liter acid per m3 cattle slurry by in-house SAT. If the slurry amount is 30,
20 and 10 m3 ha-1 then the S amount applied to the field is 80, 53 and 26 kg ha-1
correspondingly. The S need for crops is in calculations 25 kg ha-1 in average. The
costs on mineral S are reduced if acidified slurry is applied and the reduction
effect is calculated until S amount reaches the demand of crop. After that S cost
reduction stays constant and the S amount what exceeds crop need, is not taken
into calculation. However, the S cost reduction value is always divided by slurry
amount per hectare and if the cost reduction is constant then by growing hectare
amount of slurry the S cost reduction per cubicmeter of slurry decreases.
An alternative to in-house acidification to minimise the ammonia emission
from slurry storage is to cover storage. The cost calculations made for different
type of storage covers shows that cost benefit by in-house acidified slurry depends
on capital cost and ability to decrease the ammonia emission. The rapeseed oil has
highest capital cost and decreases 80% of ammonia emission (Table 21). Thus, the
in-house slurry acidification gives biggest cost effect compared to this type of
cover, which is followed by tent and peat. Compared to the Hexa-cover plates
gives slurry acidification lowest cost benefit. The figures 24 and 25 show also that
the order of cover types is same for both, cattle and big slurries.
For Denmark, analysed was the cost-benefit of slurry acidification, compared
to non-acidified slurry which is stored under cover but not incorparated after
band-application (figures 25 and 27; tables 43 and 45). The results show that in
this case the cost-benefit decreases compared to the case if slurry is covered and
incorporated both.

84
The cost benefit per cubicmeter of acidified slurry (€ m-3) increases if Ntot
content in slurry rises (see 5.2.4). Ntot content change in slurry has lowest impact
by in-field SAT and biggest by in-house sat, especially in the case of pig slurry.
The reason is that by in-house acidification of pig slurry the ammonia emission
reduction effect is highest, 64%.
The cost-benefit per cubicmeter of acidified slurry (€ m-3) increases if N price
in mineral fertilisers rises (see 5.2.5).. The change of N price in mineral fertilisers
has lowest impact by in-field SAT and biggest by in-house sat, especially in the
case of pig slurry. The reason is that by in-house acidification of pig slurry is the
ammonia emission reduction effect highest, 64%. Bigger effect by pig slurry
compared to cattle slurry is caused also by the higher Ntot content of pig slurry and
thus N-savings by SAT-s.
The cost benefit per cubicmeter of acidified slurry (€ m-3) increases if S price
in mineral fertilisers rises (see 5.2.6.). The change of S price in mineral fertilisers
has same impact by different SATs and slurry types, except bigger difference by
pig slurry with in-house SAT.
Although the present example shows cost benefit of slurry acidification by
bigger slurry amounts, a careful analysis with local parameters and future prices
should be performed before deciding to invest to acidification system. The
analysis model will be available on project website.
5.3. Estonia
5.3.1. Annual slurry amount, Estonia
Analysed is the cost-benefit of SATs compared to disc-harrowing <12 h after
band-application of non-acidified slurry. The acid price in the calculations is 127
€ t-1 for in-house acidification and 150 € t-1 for in-storage and in-field
acidification. Minimum storage period 8 month. N-fertilisers is AN34.4, 249 € t-1.
NS-fertiliser N21-S24, 205 € t-1. Thus N price 0.72 € kg-1 and S price 0.24 € kg-1.
The prices of project partner countries are between 0.48–1 and 0.11–0.85€ kg-1
respectively.
All three SATs have cost- benefit by cattle and pig slurry both in Estonia. The
minimal slurry amounts should be between 3,300–9,900 and 2,300–7,300 m3
yearly for cattle and pig slurry correspondingly, depending on SAT (see Table
54).
Table 54. The minimum amount of slurry and corresponding amount of animal,
by which the slurry acidification has cost-benefit. Dairy cows Fatteners
SAT Annual slurry
amount, m3
Number of
animal
Annual slurry
amount, m3
Number of animal
per year
In-house 9,408 392 5,448 10,896
In-storage 3,312 138 2,339 4,678
In-field 9,942 414 7,339 14,678

85
Table 55. Dairy cow slurry handling costs if slurry is acidified and not acidified,
and the cost decrease (€ m-3) by use of cattle slurry acidification compared to disc-
harrowing <12 h after band-application of non-acidified slurry. Slurry
amount
m3 yr-1
In-house In-storage In-field
Acid No acid Dif. Acid No acid Dif. Acid No acid Dif
1,200 10.46 6.25 -4.21 7.57 6.21 -1.36 11.61 6.19 -5.42
2,400 6.51 4.93 -1.58 5.17 4.89 -0.28 7.13 4.88 -2.25
9,000 3.19 3.16 -0.03 2.73 3.12 0.39 3.17 3.10 -0.07
12,000 2.71 2.87 0.16 2.42 2.83 0.41 2.71 2.81 0.10
21,000 2.12 2.38 0.26 1.93 2.34 0.41 2.05 2.33 0.28
24,000 1.98 2.28 0.30 1.84 2.24 0.40 1.93 2.22 0.29
33,000 1.76 2.05 0.29 1.64 2.01 0.37 1.68 2.00 0.32
48,000 1.52 1.81 0.29 1.45 1.77 0.32 1.44 1.76 0.32
Figure 36. The cost decrease (€ m-3) by use of cattle slurry acidification compared
to disc-harrowing <12 h after band-application of non-acidified slurry.
0,16
0,26
0,30 0,29 0,29
0,390,41 0,41 0,40
0,37
0,32
0,10
0,28 0,29
0,32 0,32
0,0
0,1
0,2
0,3
0,4
0,5
0 10000 20000 30000 40000 50000
Co
st d
iffe
ren
ce b
etw
ee
n n
on
aci
dif
ied
and
aci
dif
ied
slu
rry,
€m
-3
Annual slurry amount, m3
In-house In-storage In-field

86
Table 56. Fattener slurry handling costs if slurry is acidified and not acidified, and
the cost decrease (€ m-3) by use of cattle slurry acidification compared to disc-
harrowing <12 h after band-application of non-acidified slurry. Slurry
amount
m3 yr-1
In-house In-storage In-field
Acid No acid Dif. Acid No acid Dif. Acid No acid Dif
500 32.57 8.57 -24.00 12.53 8.40 -4.13 22.50 8.39 -14.11
2,500 7.81 5.01 -2.80 4.77 4.84 0.07 6.72 4.82 -1.90
5,000 4.20 3.99 -0.21 3.28 3.82 0.54 4.24 3.81 -0.43
9,000 2.56 3.30 0.74 2.44 3.13 0.69 2.95 3.11 0.16
21,000 1.13 2.52 1.39 1.64 2.35 0.71 1.84 2.34 0.50
33,000 0.67 2.19 1.52 1.35 2.02 0.67 1.47 2.01 0.54
Figure 37. The cost decrease (€ m-3) by use of fattener slurry acidification
compared to disc-harrowing <12 h after band-application of non-acidified slurry.
5.3.2. Cover type, Estonia
An alternative to in-house acidification to minimise the ammonia emission
from slurry storage is to cover storage. The cost calculations made for different
type of storage covers shows that cost benefit by in-house acidified slurry depends
on capital cost and ability to decrease the ammonia emission. The rapeseed oil has
highest capital cost and decreases 80% of ammonia emission (Table 21). Thus, the
in-house slurry acidification gives biggest cost effect compared to this type of
0,74
1,39
1,52
0,07
0,54
0,69 0,710,67
0,16
0,500,54
0,0
0,2
0,4
0,6
0,8
1,0
1,2
1,4
1,6
0 5000 10000 15000 20000 25000 30000 35000
Co
st d
iffe
ren
ce b
etw
ee
n n
on
aci
dif
ied
an
d a
cid
ifie
d s
lurr
y, €
m-3
Annual slurry amount, m3
In-house In-storage In-field
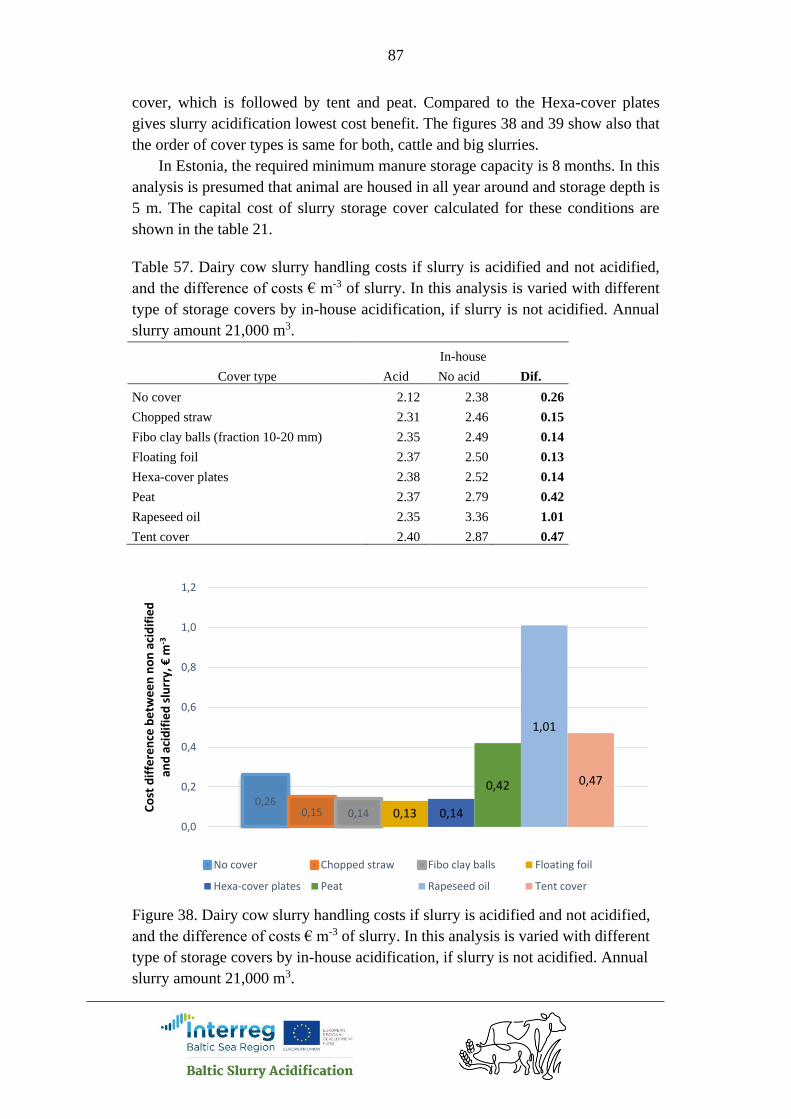
87
cover, which is followed by tent and peat. Compared to the Hexa-cover plates
gives slurry acidification lowest cost benefit. The figures 38 and 39 show also that
the order of cover types is same for both, cattle and big slurries.
In Estonia, the required minimum manure storage capacity is 8 months. In this
analysis is presumed that animal are housed in all year around and storage depth is
5 m. The capital cost of slurry storage cover calculated for these conditions are
shown in the table 21.
Table 57. Dairy cow slurry handling costs if slurry is acidified and not acidified,
and the difference of costs € m-3 of slurry. In this analysis is varied with different
type of storage covers by in-house acidification, if slurry is not acidified. Annual
slurry amount 21,000 m3.
In-house
Cover type Acid No acid Dif.
No cover 2.12 2.38 0.26
Chopped straw 2.31 2.46 0.15
Fibo clay balls (fraction 10-20 mm) 2.35 2.49 0.14
Floating foil 2.37 2.50 0.13
Hexa-cover plates 2.38 2.52 0.14
Peat 2.37 2.79 0.42
Rapeseed oil 2.35 3.36 1.01
Tent cover 2.40 2.87 0.47
Figure 38. Dairy cow slurry handling costs if slurry is acidified and not acidified,
and the difference of costs € m-3 of slurry. In this analysis is varied with different
type of storage covers by in-house acidification, if slurry is not acidified. Annual
slurry amount 21,000 m3.
0,260,15 0,14 0,13 0,14
0,42
1,01
0,47
0,0
0,2
0,4
0,6
0,8
1,0
1,2
Co
st d
iffe
ren
ce b
etw
ee
n n
on
aci
dif
ied
an
d a
cid
ifie
d s
lurr
y, €
m-3
No cover Chopped straw Fibo clay balls Floating foil
Hexa-cover plates Peat Rapeseed oil Tent cover
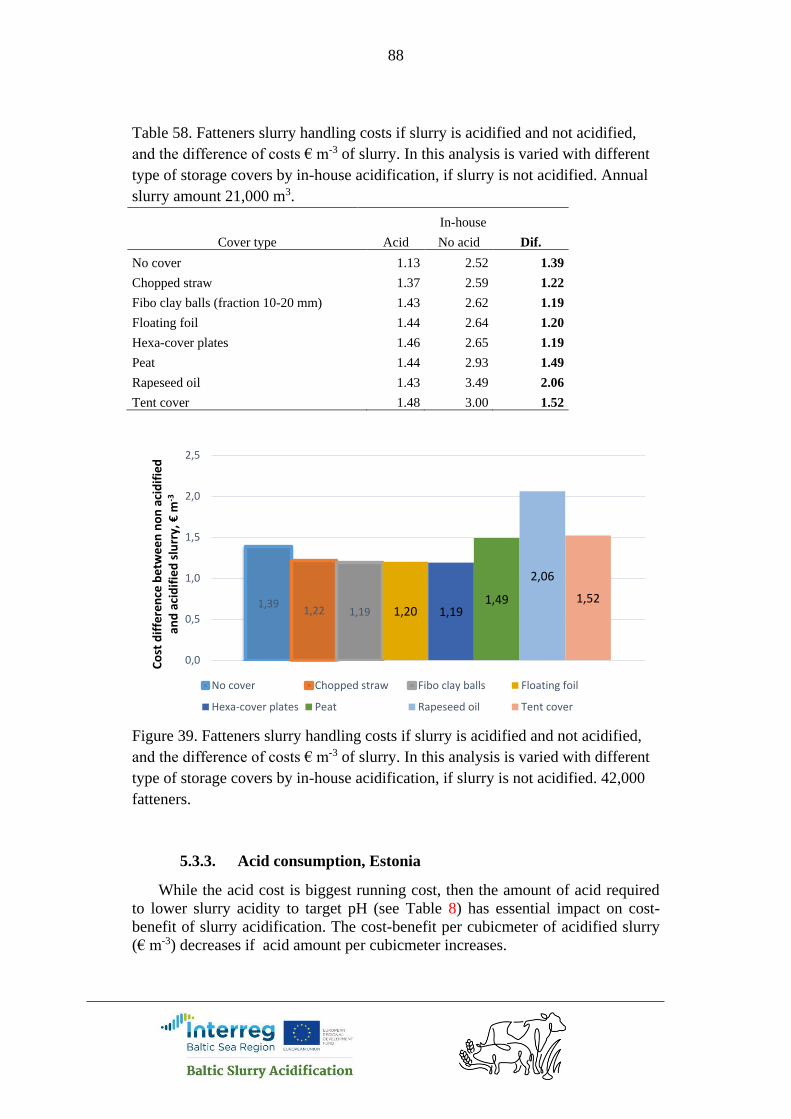
88
Table 58. Fatteners slurry handling costs if slurry is acidified and not acidified,
and the difference of costs € m-3 of slurry. In this analysis is varied with different
type of storage covers by in-house acidification, if slurry is not acidified. Annual
slurry amount 21,000 m3.
In-house
Cover type Acid No acid Dif.
No cover 1.13 2.52 1.39
Chopped straw 1.37 2.59 1.22
Fibo clay balls (fraction 10-20 mm) 1.43 2.62 1.19
Floating foil 1.44 2.64 1.20
Hexa-cover plates 1.46 2.65 1.19
Peat 1.44 2.93 1.49
Rapeseed oil 1.43 3.49 2.06
Tent cover 1.48 3.00 1.52
Figure 39. Fatteners slurry handling costs if slurry is acidified and not acidified,
and the difference of costs € m-3 of slurry. In this analysis is varied with different
type of storage covers by in-house acidification, if slurry is not acidified. 42,000
fatteners.
5.3.3. Acid consumption, Estonia
While the acid cost is biggest running cost, then the amount of acid required
to lower slurry acidity to target pH (see Table 8) has essential impact on cost-
benefit of slurry acidification. The cost-benefit per cubicmeter of acidified slurry
(€ m-3) decreases if acid amount per cubicmeter increases.
1,391,22 1,19 1,20 1,19
1,49
2,06
1,52
0,0
0,5
1,0
1,5
2,0
2,5
Co
st d
iffe
ren
ce b
etw
ee
n n
on
aci
dif
ied
an
d a
cid
ifie
d s
lurr
y, €
m-3
No cover Chopped straw Fibo clay balls Floating foil
Hexa-cover plates Peat Rapeseed oil Tent cover

89
If acid consumption ↑ 1 l m-3, then SAT cost-benefit by
cattle slurry pig slurry:
in-house SAT: ↓0.28 € m-3 ↓0.27 € m-3
in-storage SAT: ↓0.33 € m-3 ↓0.32 € m-3
in-field SAT: ↓0.34 € m-3 ↓0.34 € m-3
Acid content change in slurry has lowest impact by in-house SAT and biggest
by in-field SAT. The reason is that the acid price for in-house SAT is lower
(127 € t-1) than by other SATs (150 € t-1).
Table 59. Dairy cow slurry handling costs if slurry is acidified and not acidified,
and the difference of costs € m-3 of slurry, depending on acid consumption.
Acid In-house In-storage In-field
amount
l m-3 Acid No acid Dif. Acid No acid Dif. Acid No acid Dif
1 1.18 2.38 1.20 1.13 2.34 1.21 1.44 2.33 0.89
3 1.69 2.38 0.69 1.73 2.34 0.61 2.05 2.33 0.28
4 1.98 2.38 0.40 2.07 2.34 0.27 2.40 2.33 -0.07
5 2.27 2.38 0.11 2.40 2.34 -0.06 2.75 2.33 -0.42
7 2.85 2.38 -0.47 3.08 2.34 -0.74 3.45 2.33 -1.12
Figure 40. Dairy cow slurry handling costs if slurry is acidified and not acidified,
and the difference of costs € m-3 of slurry, depending on acid consumption
Table 60. Fatteners slurry handling costs if slurry is acidified and not acidified,
and the difference of costs € m-3 of slurry, depending on acid consumption.
Acid In-house In-storage In-field
1,20
0,69
0,40
0,11
-0,47
1,21
0,61
0,27
-0,06
-0,74
0,89
0,28
-0,07
-0,42
-1,12
-1,5
-1,0
-0,5
0,0
0,5
1,0
1,5
1 3 4 5 7
Co
st d
iffe
ren
ce b
etw
ee
n n
on
aci
dif
ied
an
d a
cid
ifie
d s
lurr
y, €
m-3
Acid amount litres per m3 of slurry
In-house In-storage In-field

90
amount
l m-3 Acid No acid Dif. Acid No acid Dif. Acid No acid Dif
1 0.54 2.52 1.98 1.04 2.35 1.31 1.34 2.34 1.00
3 0.99 2.52 1.53 1.64 2.35 0.71 1.98 2.34 0.36
4 1.28 2.52 1.24 1.97 2.35 0.38 2.33 2.34 0.01
5 1.57 2.52 0.95 2.31 2.35 0.04 2.68 2.34 -0.34
7 2.15 2.52 0.37 2.98 2.35 -0.63 3.37 2.34 -1.03
Figure 41. Fatteners slurry handling costs if slurry is acidified and not acidified,
and the difference of costs € m-3 of slurry, depending on acid consumption
5.3.4. Ntot in slurry, Estonia
The cost benefit per cubicmeter of acidified slurry (€ m-3) increases if Ntot
content in slurry rises.
If Ntot content in slurry ↑ 1 kg m-3 , then SAT cost-benefit by
cattle slurry pig slurry:
in-house SAT: ↑0.13 € m-3. ↑0.27 € m-3.
in-storage SAT: ↑0.11 € m-3. ↑0.10 € m-3.
in-field SAT: ↑0.09 € m-3 ↑0.09 € m-3.
Ntot content change in slurry has lowest impact by in-field SAT and biggest by
in-house sat, especially in the case of pig slurry. The reason is that by in-
house acidification of pig slurry is the ammonia emission reduction effect
highest, 64%.
1,98
1,53
1,24
0,95
0,37
1,31
0,71
0,38
0,04
-0,63
1,00
0,36
0,01
-0,34
-1,03
-1,5
-1,0
-0,5
0,0
0,5
1,0
1,5
2,0
2,5
1 3 4 5 7
Co
st d
iffe
ren
ce b
etw
ee
n n
on
aci
dif
ied
an
d a
cid
ifie
d s
lurr
y, €
m-3
Acid amount litres per m3 of slurry
In-house In-storage In-field
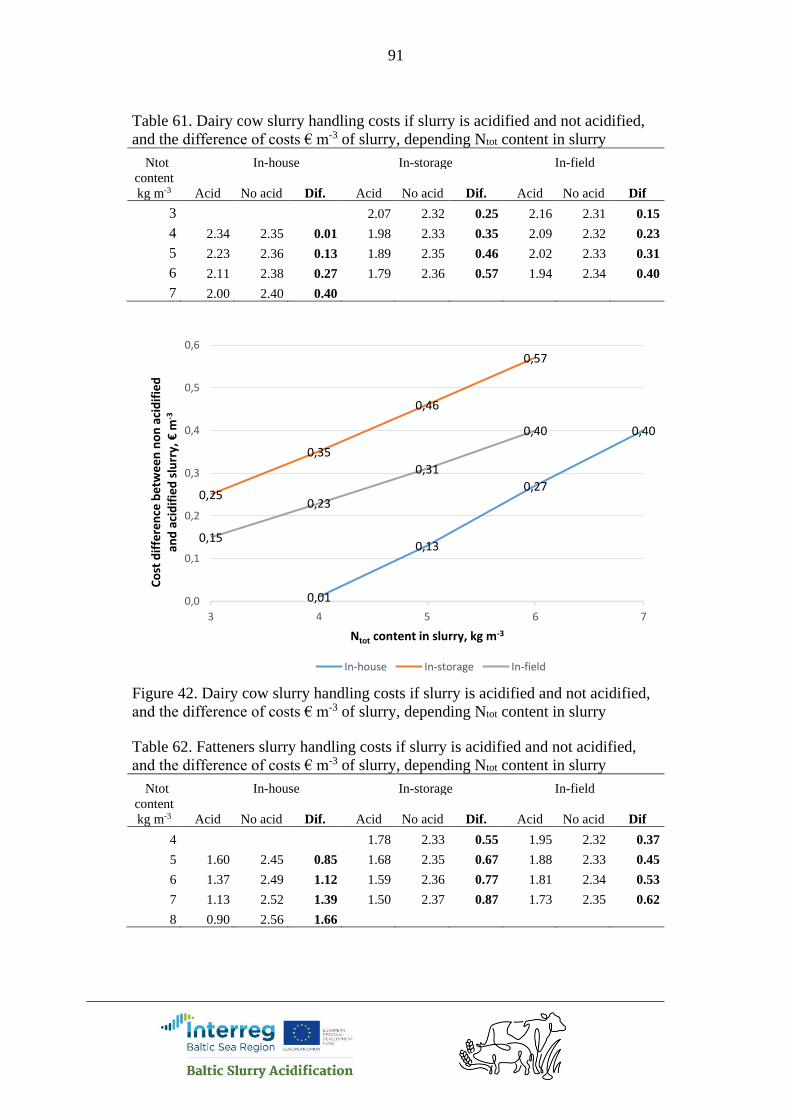
91
Table 61. Dairy cow slurry handling costs if slurry is acidified and not acidified,
and the difference of costs € m-3 of slurry, depending Ntot content in slurry
Ntot In-house In-storage In-field
content
kg m-3 Acid No acid Dif. Acid No acid Dif. Acid No acid Dif
3 2.07 2.32 0.25 2.16 2.31 0.15
4 2.34 2.35 0.01 1.98 2.33 0.35 2.09 2.32 0.23
5 2.23 2.36 0.13 1.89 2.35 0.46 2.02 2.33 0.31
6 2.11 2.38 0.27 1.79 2.36 0.57 1.94 2.34 0.40
7 2.00 2.40 0.40
Figure 42. Dairy cow slurry handling costs if slurry is acidified and not acidified,
and the difference of costs € m-3 of slurry, depending Ntot content in slurry
Table 62. Fatteners slurry handling costs if slurry is acidified and not acidified,
and the difference of costs € m-3 of slurry, depending Ntot content in slurry
Ntot In-house In-storage In-field
content
kg m-3 Acid No acid Dif. Acid No acid Dif. Acid No acid Dif
4 1.78 2.33 0.55 1.95 2.32 0.37
5 1.60 2.45 0.85 1.68 2.35 0.67 1.88 2.33 0.45
6 1.37 2.49 1.12 1.59 2.36 0.77 1.81 2.34 0.53
7 1.13 2.52 1.39 1.50 2.37 0.87 1.73 2.35 0.62
8 0.90 2.56 1.66
0,01
0,13
0,27
0,40
0,25
0,35
0,46
0,57
0,15
0,23
0,31
0,40
0,0
0,1
0,2
0,3
0,4
0,5
0,6
3 4 5 6 7
Co
st d
iffe
ren
ce b
etw
ee
n n
on
aci
dif
ied
an
d a
cid
ifie
d s
lurr
y, €
m-3
Ntot content in slurry, kg m-3
In-house In-storage In-field
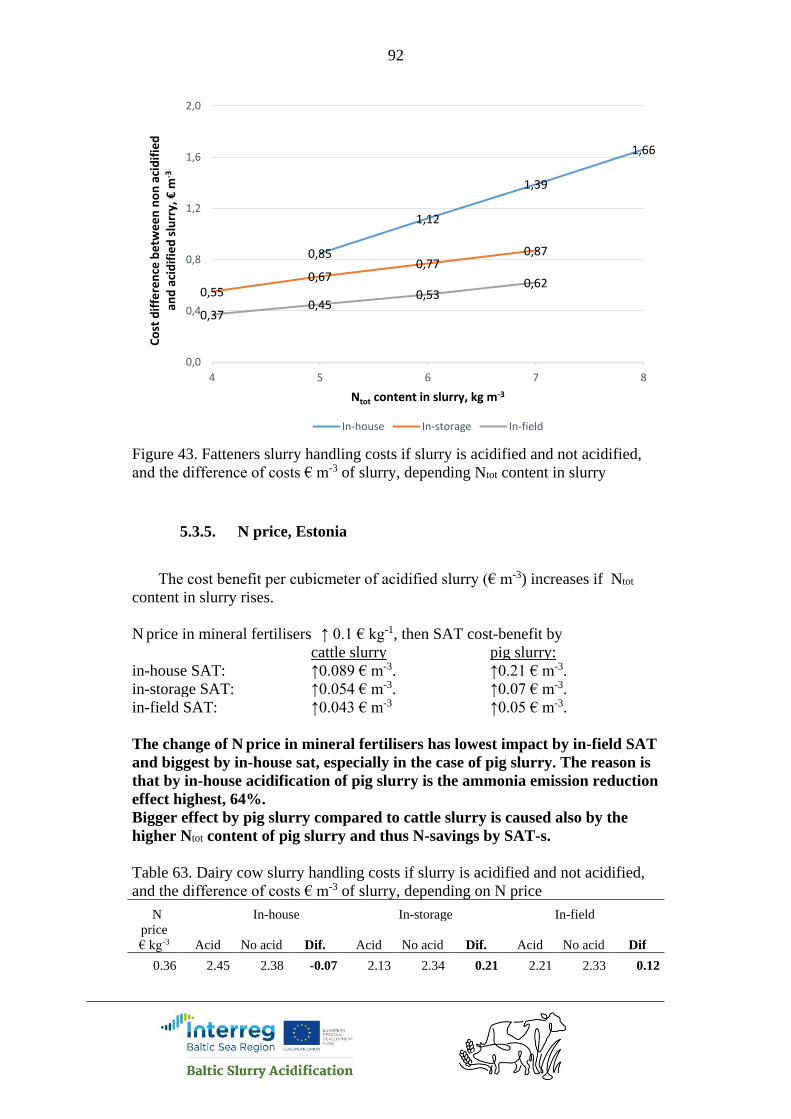
92
Figure 43. Fatteners slurry handling costs if slurry is acidified and not acidified,
and the difference of costs € m-3 of slurry, depending Ntot content in slurry
5.3.5. N price, Estonia
The cost benefit per cubicmeter of acidified slurry (€ m-3) increases if Ntot
content in slurry rises.
N price in mineral fertilisers ↑ 0.1 € kg-1, then SAT cost-benefit by
cattle slurry pig slurry:
in-house SAT: ↑0.089 € m-3. ↑0.21 € m-3.
in-storage SAT: ↑0.054 € m-3. ↑0.07 € m-3.
in-field SAT: ↑0.043 € m-3 ↑0.05 € m-3.
The change of N price in mineral fertilisers has lowest impact by in-field SAT
and biggest by in-house sat, especially in the case of pig slurry. The reason is
that by in-house acidification of pig slurry is the ammonia emission reduction
effect highest, 64%.
Bigger effect by pig slurry compared to cattle slurry is caused also by the
higher Ntot content of pig slurry and thus N-savings by SAT-s.
Table 63. Dairy cow slurry handling costs if slurry is acidified and not acidified,
and the difference of costs € m-3 of slurry, depending on N price
N In-house In-storage In-field
price
€ kg-3 Acid No acid Dif. Acid No acid Dif. Acid No acid Dif
0.36 2.45 2.38 -0.07 2.13 2.34 0.21 2.21 2.33 0.12
0,85
1,12
1,39
1,66
0,550,67
0,770,87
0,370,45
0,530,62
0,0
0,4
0,8
1,2
1,6
2,0
4 5 6 7 8
Co
st d
iffe
ren
ce b
etw
ee
n n
on
aci
dif
ied
an
d a
cid
ifie
d s
lurr
y, €
m-3
Ntot content in slurry, kg m-3
In-house In-storage In-field

93
0.576 2.25 2.38 0.13 2.01 2.34 0.33 2.12 2.33 0.21
0.72 2.13 2.38 0.25 1.93 2.34 0.41 2.06 2.33 0.27
0.864 2.00 2.38 0.38 1.86 2.34 0.48 1.99 2.33 0.34
1.08 1.81 2.38 0.57 1.74 2.34 0.60 1.90 2.33 0.43
Figure 44. Dairy cow slurry handling costs if slurry is acidified and not acidified,
and the difference of costs € m-3 of slurry, depending on N price
Table 64. Fatteners slurry handling costs if slurry is acidified and not acidified,
and the difference of costs € m-3 of slurry, depending on N price
N In-house In-storage In-field
price
€ kg-3 Acid No acid Dif. Acid No acid Dif. Acid No acid Dif
0.36 1.91 2.52 0.61 1.88 2.35 0.47 2.04 2.34 0.30
0.576 1.45 2.52 1.07 1.74 2.35 0.61 1.92 2.34 0.42
0.72 1.14 2.52 1.38 1.64 2.35 0.71 1.84 2.34 0.50
0.864 0.84 2.52 1.68 1.55 2.35 0.80 1.77 2.34 0.57
1.08 0.38 2.52 2.14 1.40 2.35 0.95 1.65 2.34 0.69
0,13
0,25
0,38
0,57
0,21
0,33
0,41
0,48
0,60
0,12
0,21
0,27
0,34
0,43
0,0
0,2
0,4
0,6
0,8
0,36 0,576 0,72 0,864 1,08
Co
st d
iffe
ren
ce b
etw
ee
n n
on
aci
dif
ied
an
d a
cid
ifie
d s
lurr
y, €
m-3
N price, € kg-1
In-house In-storage In-field

94
Figure 45. Fatteners slurry handling costs if slurry is acidified and not acidified,
and the difference of costs € m-3 of slurry, depending on N price
5.3.6. S price, Estonia
The cost benefit per cubicmeter of acidified slurry (€ m-3) increases if S price in
mineral fertilisers rises.
S price in mineral fertilisers ↑ 0.1 € kg-1, then SAT cost-benefit by
cattle slurry pig slurry:
in-house SAT: ↑0.09 € m-3. ↑0.10 € m-3.
in-storage SAT: ↑0.09 € m-3. ↑0.08 € m-3.
in-field SAT: ↑0.08 € m-3 ↑0.09 € m-3.
Table 65. Dairy cow slurry handling costs if slurry is acidified and not acidified,
and the difference of costs € m-3 of slurry, depending on S price
S In-house In-storage In-field
price
€ kg-3 Acid No acid Dif. Acid No acid Dif. Acid No acid Dif
0.11 2.22 2.38 0.16 2.03 2.34 0.31 2.15 2.33 0.18
0.176 2.16 2.38 0.22 1.97 2.34 0.37 2.09 2.33 0.24
0.22 2.13 2.38 0.25 1.93 2.34 0.41 2.06 2.33 0.27
0.264 2.09 2.38 0.29 1.90 2.34 0.44 2.02 2.33 0.31
0.33 2.03 2.38 0.35 1.84 2.34 0.50 1.97 2.33 0.36
0,61
1,07
1,38
1,68
2,14
0,470,61
0,710,80
0,95
0,300,42
0,500,57
0,69
0,0
0,5
1,0
1,5
2,0
2,5
0,36 0,576 0,72 0,864 1,08
Co
st d
iffe
ren
ce b
etw
ee
n n
on
aci
dif
ied
an
d a
cid
ifie
d s
lurr
y, €
m-3
N price, € kg-1
In-house In-storage In-field
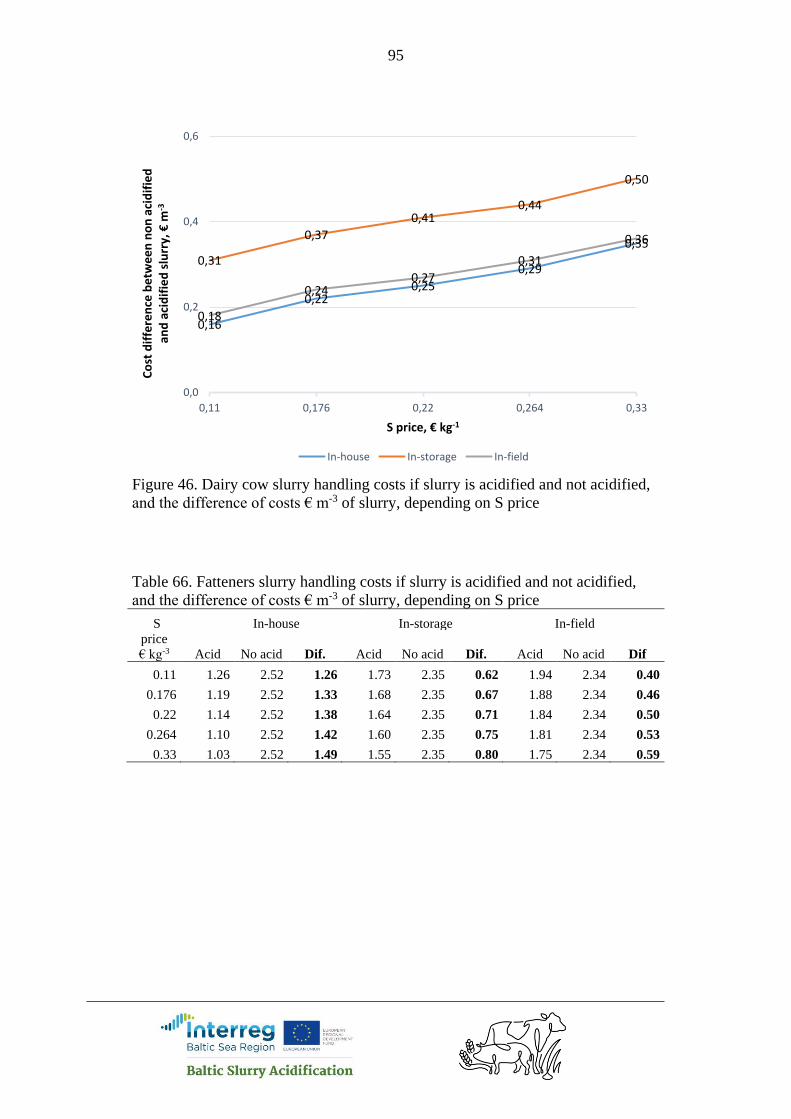
95
Figure 46. Dairy cow slurry handling costs if slurry is acidified and not acidified,
and the difference of costs € m-3 of slurry, depending on S price
Table 66. Fatteners slurry handling costs if slurry is acidified and not acidified,
and the difference of costs € m-3 of slurry, depending on S price
S In-house In-storage In-field
price
€ kg-3 Acid No acid Dif. Acid No acid Dif. Acid No acid Dif
0.11 1.26 2.52 1.26 1.73 2.35 0.62 1.94 2.34 0.40
0.176 1.19 2.52 1.33 1.68 2.35 0.67 1.88 2.34 0.46
0.22 1.14 2.52 1.38 1.64 2.35 0.71 1.84 2.34 0.50
0.264 1.10 2.52 1.42 1.60 2.35 0.75 1.81 2.34 0.53
0.33 1.03 2.52 1.49 1.55 2.35 0.80 1.75 2.34 0.59
0,16
0,220,25
0,29
0,35
0,31
0,37
0,410,44
0,50
0,18
0,240,27
0,31
0,36
0,0
0,2
0,4
0,6
0,11 0,176 0,22 0,264 0,33
Co
st d
iffe
ren
ce b
etw
ee
n n
on
aci
dif
ied
an
d a
cid
ifie
d s
lurr
y, €
m-3
S price, € kg-1
In-house In-storage In-field

96
Figure 47. Fatteners slurry handling costs if slurry is acidified and not acidified,
and the difference of costs € m-3 of slurry, depending on S price
5.3.7. Summary, Estonia
Analysed is the cost-benefit of SATs compared to disc-harrowing <12 h after
band-application of non-acidified slurry. All three SATs have cost- benefit by
cattle and pig slurry both in Estonia. The minimal slurry amounts should be
between 3,300–9,900 and 2,300–7,300 m3 yearly for cattle and pig slurry
correspondingly, depending on SAT (see Table 54).
Acidification of pig slurry has higher economic benefit compared to cattle
slurry, because
1) pig slurry contains more NH4-N to save
2) the in-house SAT has higher reduction effect on NH3 emission from pig
slurry
3) the acid need of pig slurry is lower
4) the risk to exceed S need of plants is lower (because the acid amount is
lower)
The cost-benefit of acidified slurry per cubicmeter (€ m-3) decreases if acid
amount per cubicmeter increases. While the acid cost is biggest running cost, then
the amount of acid required to lower slurry acidity to target pH (see Table 8) has
essential impact on cost-benefit of slurry acidification. The acid price by in-house
SAT (127 € m-3) is lower than by other SATs (150 € m-3) and this is the reason
why change of acid amount has smaller effect on cost-benefit by first SAT
compared to others.
1,261,33 1,38 1,42
1,49
0,62 0,67 0,71 0,75 0,80
0,400,46 0,50 0,53
0,59
0,0
0,5
1,0
1,5
2,0
0,11 0,176 0,22 0,264 0,33
Co
st d
iffe
ren
ce b
etw
ee
n n
on
aci
dif
ied
an
d a
cid
ifie
d s
lurr
y, €
m-3
S price, € kg-1
In-house In-storage In-field

97
The calculations in paragraph 5.3 were done by slurry amount 30 m3 ha-1. The
extra calculations made for Finland for different hectare amounts (Figure 50)
show that cost-benefit of in-house SAT is higher if slurry amount is 20 or 10 m3
ha-1 .
One reason is that the slurry incorporation cost per hectare is constant despite
of slurry amount per hectare. Thus, the smaller is slurry amount per hectare the
higher is incorporation cost per cubicmeter of non-acidified slurry.
Another aspect, why low amount of acidified slurry give higher economic
effect, is the effective use of S applied with acidified slurry. In the calculations is
used 4.5 liter acid per m3 cattle slurry by in-house SAT. If the slurry amount is 30,
20 and 10 m3 ha-1 then the S amount applied to the field is 80, 53 and 26 kg ha-1
correspondingly. The S need for crops is in calculations 25 kg ha-1 in average. The
costs on mineral S are reduced if acidified slurry is applied and the reduction
effect is calculated until S amount reaches the demand of crop. After that S cost
reduction stays constant and the S amount what exceeds crop need, is not taken
into calculation. However, the S cost reduction value is always divided by slurry
amount per hectare and if the cost reduction is constant then by growing hectare
amount of slurry the S cost reduction per cubicmeter of slurry decreases.
An alternative to in-house acidification to minimise the ammonia emission
from slurry storage is to cover storage. The cost calculations made for different
type of storage covers shows that cost benefit by in-house acidified slurry depends
on capital cost and ability to decrease the ammonia emission. The rapeseed oil has
highest capital cost and decreases 80% of ammonia emission (Table 21). Thus, the
in-house slurry acidification gives biggest cost effect compared to this type of
cover, which is followed by tent and peat. Compared to the Hexa-cover plates
gives slurry acidification lowest cost benefit. The figures 38 and 39 show also that
the order of cover types is same for both, cattle and big slurries.
The cost benefit per cubicmeter of acidified slurry (€ m-3) increases if Ntot
content in slurry rises (see 5.3.4).Ntot content change in slurry has lowest impact
by in-field SAT and biggest by in-house sat, especially in the case of pig slurry.
The reason is that by in-house acidification of pig slurry the ammonia emission
reduction effect is highest, 64%.
The cost-benefit per cubicmeter of acidified slurry (€ m-3) increases if N price
in mineral fertilisers rises (see 5.3.5). The change of N price in mineral fertilisers
has lowest impact by in-field SAT and biggest by in-house sat, especially in the
case of pig slurry. The reason is that by in-house acidification of pig slurry is the
ammonia emission reduction effect highest, 64%. Bigger effect by pig slurry
compared to cattle slurry is caused also by the higher Ntot content of pig slurry and
thus N-savings by SAT-s.
The cost benefit per cubicmeter of acidified slurry (€ m-3) increases if S price
in mineral fertilisers rises (see 5.3.6).
Although the present example shows cost benefit of slurry acidification by
bigger slurry amounts, a careful analysis with local parameters and future prices
should be performed before deciding to invest to acidification system. The
analysis model will be available on project website.
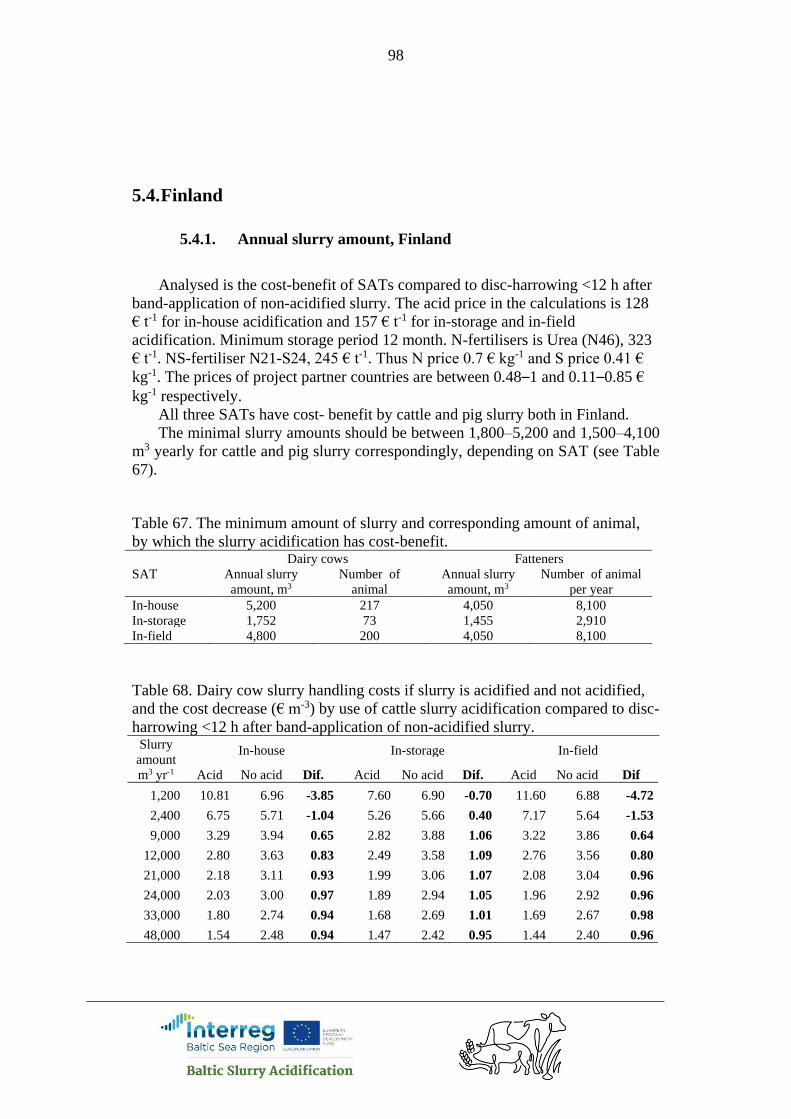
98
5.4. Finland
5.4.1. Annual slurry amount, Finland
Analysed is the cost-benefit of SATs compared to disc-harrowing <12 h after
band-application of non-acidified slurry. The acid price in the calculations is 128
€ t-1 for in-house acidification and 157 € t-1 for in-storage and in-field
acidification. Minimum storage period 12 month. N-fertilisers is Urea (N46), 323
€ t-1. NS-fertiliser N21-S24, 245 € t-1. Thus N price 0.7 € kg-1 and S price 0.41 €
kg-1. The prices of project partner countries are between 0.48–1 and 0.11–0.85 €
kg-1 respectively.
All three SATs have cost- benefit by cattle and pig slurry both in Finland.
The minimal slurry amounts should be between 1,800–5,200 and 1,500–4,100
m3 yearly for cattle and pig slurry correspondingly, depending on SAT (see Table
67).
Table 67. The minimum amount of slurry and corresponding amount of animal,
by which the slurry acidification has cost-benefit. Dairy cows Fatteners
SAT Annual slurry
amount, m3
Number of
animal
Annual slurry
amount, m3
Number of animal
per year
In-house 5,200 217 4,050 8,100
In-storage 1,752 73 1,455 2,910
In-field 4,800 200 4,050 8,100
Table 68. Dairy cow slurry handling costs if slurry is acidified and not acidified,
and the cost decrease (€ m-3) by use of cattle slurry acidification compared to disc-
harrowing <12 h after band-application of non-acidified slurry. Slurry
amount
m3 yr-1
In-house In-storage In-field
Acid No acid Dif. Acid No acid Dif. Acid No acid Dif
1,200 10.81 6.96 -3.85 7.60 6.90 -0.70 11.60 6.88 -4.72
2,400 6.75 5.71 -1.04 5.26 5.66 0.40 7.17 5.64 -1.53
9,000 3.29 3.94 0.65 2.82 3.88 1.06 3.22 3.86 0.64
12,000 2.80 3.63 0.83 2.49 3.58 1.09 2.76 3.56 0.80
21,000 2.18 3.11 0.93 1.99 3.06 1.07 2.08 3.04 0.96
24,000 2.03 3.00 0.97 1.89 2.94 1.05 1.96 2.92 0.96
33,000 1.80 2.74 0.94 1.68 2.69 1.01 1.69 2.67 0.98
48,000 1.54 2.48 0.94 1.47 2.42 0.95 1.44 2.40 0.96

99
Figure 48. The cost decrease (€ m-3) by use of cattle slurry acidification compared
to disc-harrowing <12 h after band-application of non-acidified slurry.
The biggest reason for economic benefit of SAT-s is the cost of slurry
incorporation (55 € ha-1) with disc harrow after spreading of non-acidified slurry.
If slurry amount is 30 m3 ha-1, then incorporation cost is 1.67 € m-3, which is
saved if acidified slurry is applied to the field suface.
Table 69. Fattener slurry handling costs if slurry is acidified and not acidified, and
the cost decrease (€ m-3) by use of cattle slurry acidification compared to disc-
harrowing <12 h after band-application of non-acidified slurry. Slurry
amount
m3 yr-1
In-house In-storage In-field
Acid No acid Dif. Acid No acid Dif. Acid No acid Dif
500 32.67 9.14 -23.53 12.37 8.89 -3.48 22.29 8.87 -13.42
2,500 7.88 5.85 -2.03 4.86 5.61 0.75 6.77 5.59 -1.18
5,000 4.25 4.85 0.60 3.38 4.60 1.22 4.30 4.58 0.28
9,000 2.58 4.14 1.56 2.53 3.90 1.37 3.01 3.88 0.87
21,000 1.12 3.32 2.20 1.70 3.07 1.37 1.88 3.05 1.17
33,000 0.64 2.95 2.31 1.39 2.71 1.32 1.49 2.68 1.19
0,65
0,83
0,930,97
0,94 0,94
0,40
1,061,09 1,07 1,05
1,010,95
0,64
0,80
0,96 0,96 0,98 0,96
0,0
0,1
0,2
0,3
0,4
0,5
0,6
0,7
0,8
0,9
1,0
1,1
1,2
0 10000 20000 30000 40000 50000
Co
st d
iffe
ren
ce b
etw
ee
n n
on
aci
dif
ied
an
d a
cid
ifie
d s
lurr
y, €
m-3
Annual slurry amount, m3
In-house In-storage In-field
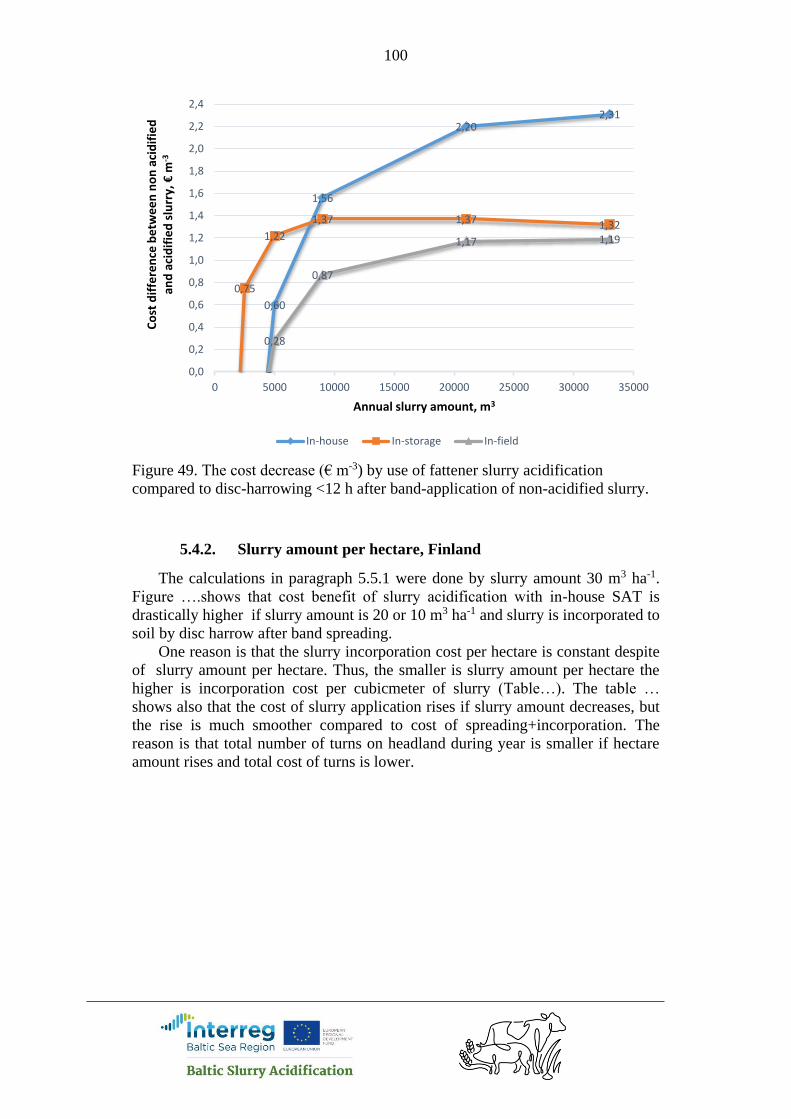
100
Figure 49. The cost decrease (€ m-3) by use of fattener slurry acidification
compared to disc-harrowing <12 h after band-application of non-acidified slurry.
5.4.2. Slurry amount per hectare, Finland
The calculations in paragraph 5.5.1 were done by slurry amount 30 m3 ha-1.
Figure ….shows that cost benefit of slurry acidification with in-house SAT is
drastically higher if slurry amount is 20 or 10 m3 ha-1 and slurry is incorporated to
soil by disc harrow after band spreading.
One reason is that the slurry incorporation cost per hectare is constant despite
of slurry amount per hectare. Thus, the smaller is slurry amount per hectare the
higher is incorporation cost per cubicmeter of slurry (Table…). The table …
shows also that the cost of slurry application rises if slurry amount decreases, but
the rise is much smoother compared to cost of spreading+incorporation. The
reason is that total number of turns on headland during year is smaller if hectare
amount rises and total cost of turns is lower.
0,60
1,56
2,202,31
0,75
1,22
1,37 1,37 1,32
0,28
0,87
1,17 1,19
0,0
0,2
0,4
0,6
0,8
1,0
1,2
1,4
1,6
1,8
2,0
2,2
2,4
0 5000 10000 15000 20000 25000 30000 35000
Co
st d
iffe
ren
ce b
etw
ee
n n
on
aci
dif
ied
an
d a
cid
ifie
d s
lurr
y, €
m-3
Annual slurry amount, m3
In-house In-storage In-field

101
Figure 50.The difference of dairy cow slurry handling costs (€ m-3 of slurry ) if
slurry is acidified and not acidified, by different slurry amounts per hectare.
Slurry is acidified with in-house SAT, not-acidified slurry is incorporated to soil
by disc harrow after band spreading.
Table 70. The change of slurry spreading cost (€ m-3) depending on slurry amount
per hectare, if 12,000 m3 of cattle slurry is spread annually.
Slurry spreading technology Slurry amount, m3 ha-1
10 20 30
Band spreading, no incorporation 1.94 1.84 1.82
Band spreading, incorporation < 12 h 6.75 4.3 3,48
Another aspect, why low acidified slurry amount give higher economic effect,
is the effective use of S applied with acidified slurry. In the calculations is used
4.5 liter acid per m3 cattle slurry by in-house SAT. If the slurry amount is 30, 20
and 10 m3 ha-1 then S amount applied to the field is 80, 53 and 26 kg ha-1
correspondingly. The S need for crops is in calculations 25 kg ha-1 in average. The
costs on mineral S are reduced if acidified slurry is applied and the reductional
effect is calculated until S amount is reached what is needed by crop. After that S
cost reduction stays constant and the S amount what exceeds crop need, is not
taken into calculation. However, the S cost reduction value is always divided by
slurry amount and if the cost reduction is constant then by growing hectare
amount of slurry the S cost reduction per cubicmeter of slurry decreases. In
present example the cost reductions by 30, 20 or 10 m3 ha-1 are 1.29, 0.65 and
0.43 € m-3 correspondingly.
The figure 51 below shows cost differences if not-acidfied slurry is not
incorporated to the soil. The reason for cost change depending on hectare amounts
of slurry is only different effect on cost reduction of mineral S.
0,650,83 0,93 0,97 0,94 0,940,89
1,661,85 1,92 1,94 1,91 1,88
2,1
3,05
3,813,98 4,01 4,02 3,96 3,88
0,0
0,5
1,0
1,5
2,0
2,5
3,0
3,5
4,0
4,5
0 5000 10000 15000 20000 25000 30000 35000 40000 45000 50000
Co
st d
iffe
ren
ce b
etw
ee
n n
on
aci
dif
ied
an
d
acid
ifie
d s
lurr
y, €
m-3
Slurry amount, m3
30 m3 ha-1 20 m3 ha-1 10 m3 ha-1
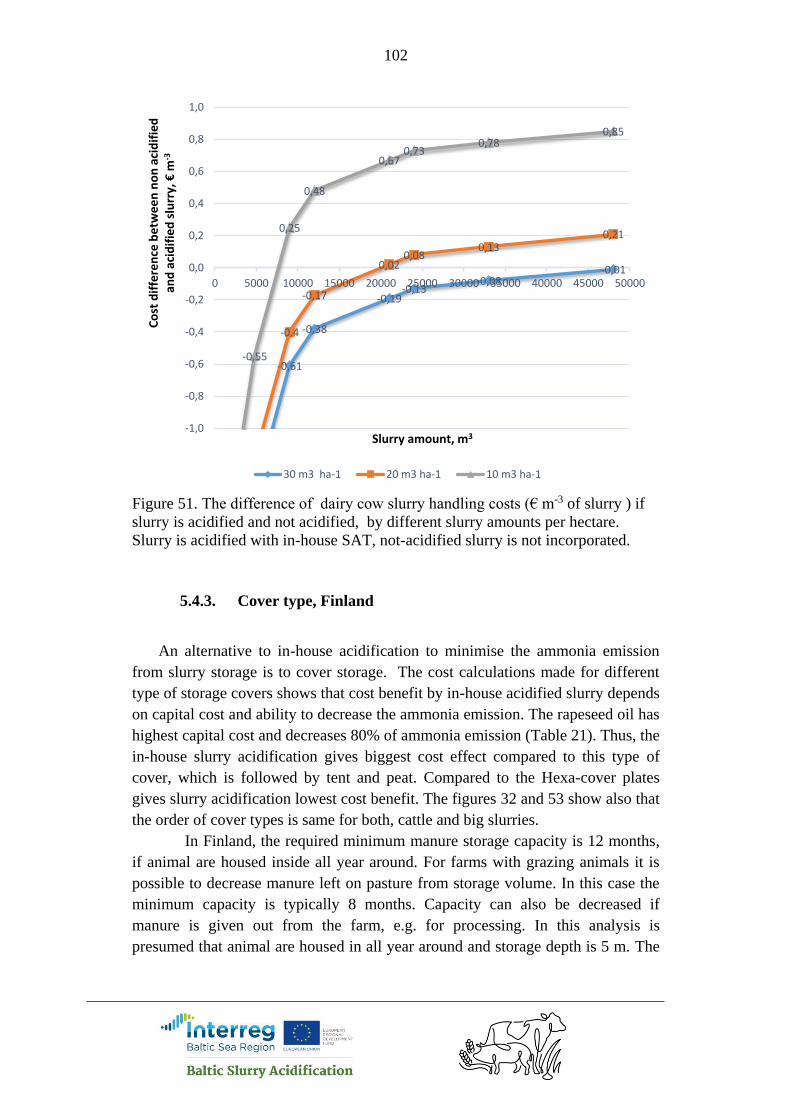
102
Figure 51. The difference of dairy cow slurry handling costs (€ m-3 of slurry ) if
slurry is acidified and not acidified, by different slurry amounts per hectare.
Slurry is acidified with in-house SAT, not-acidified slurry is not incorporated.
5.4.3. Cover type, Finland
An alternative to in-house acidification to minimise the ammonia emission
from slurry storage is to cover storage. The cost calculations made for different
type of storage covers shows that cost benefit by in-house acidified slurry depends
on capital cost and ability to decrease the ammonia emission. The rapeseed oil has
highest capital cost and decreases 80% of ammonia emission (Table 21). Thus, the
in-house slurry acidification gives biggest cost effect compared to this type of
cover, which is followed by tent and peat. Compared to the Hexa-cover plates
gives slurry acidification lowest cost benefit. The figures 32 and 53 show also that
the order of cover types is same for both, cattle and big slurries.
In Finland, the required minimum manure storage capacity is 12 months,
if animal are housed inside all year around. For farms with grazing animals it is
possible to decrease manure left on pasture from storage volume. In this case the
minimum capacity is typically 8 months. Capacity can also be decreased if
manure is given out from the farm, e.g. for processing. In this analysis is
presumed that animal are housed in all year around and storage depth is 5 m. The
-0,61
-0,38
-0,19-0,13
-0,08-0,01
-0,4
-0,17
0,020,08
0,130,21
-0,55
0,25
0,48
0,670,73
0,780,85
-1,0
-0,8
-0,6
-0,4
-0,2
0,0
0,2
0,4
0,6
0,8
1,0
0 5000 10000 15000 20000 25000 30000 35000 40000 45000 50000
Co
st d
iffe
ren
ce b
etw
ee
n n
on
aci
dif
ied
an
d a
cid
ifie
d s
lurr
y, €
m-3
Slurry amount, m3
30 m3 ha-1 20 m3 ha-1 10 m3 ha-1
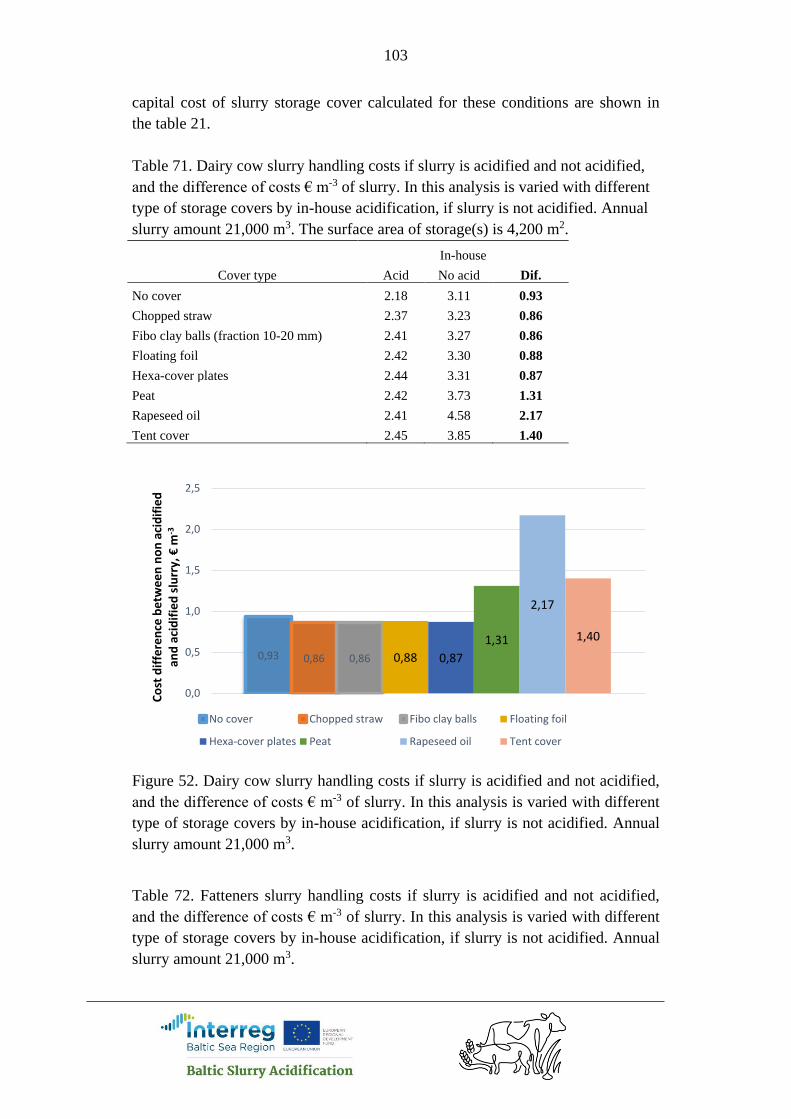
103
capital cost of slurry storage cover calculated for these conditions are shown in
the table 21.
Table 71. Dairy cow slurry handling costs if slurry is acidified and not acidified,
and the difference of costs € m-3 of slurry. In this analysis is varied with different
type of storage covers by in-house acidification, if slurry is not acidified. Annual
slurry amount 21,000 m3. The surface area of storage(s) is 4,200 m2.
In-house
Cover type Acid No acid Dif.
No cover 2.18 3.11 0.93
Chopped straw 2.37 3.23 0.86
Fibo clay balls (fraction 10-20 mm) 2.41 3.27 0.86
Floating foil 2.42 3.30 0.88
Hexa-cover plates 2.44 3.31 0.87
Peat 2.42 3.73 1.31
Rapeseed oil 2.41 4.58 2.17
Tent cover 2.45 3.85 1.40
Figure 52. Dairy cow slurry handling costs if slurry is acidified and not acidified,
and the difference of costs € m-3 of slurry. In this analysis is varied with different
type of storage covers by in-house acidification, if slurry is not acidified. Annual
slurry amount 21,000 m3.
Table 72. Fatteners slurry handling costs if slurry is acidified and not acidified,
and the difference of costs € m-3 of slurry. In this analysis is varied with different
type of storage covers by in-house acidification, if slurry is not acidified. Annual
slurry amount 21,000 m3.
0,93 0,86 0,86 0,88 0,87
1,31
2,17
1,40
0,0
0,5
1,0
1,5
2,0
2,5
Co
st d
iffe
ren
ce b
etw
ee
n n
on
aci
dif
ied
an
d a
cid
ifie
d s
lurr
y, €
m-3
No cover Chopped straw Fibo clay balls Floating foil
Hexa-cover plates Peat Rapeseed oil Tent cover

104
In-house
Cover type Acid No acid Dif.
No cover 1.12 3.32 2.20
Chopped straw 1.36 3.42 2.06
Fibo clay balls (fraction 10-20 mm) 1.41 3.47 2.06
Floating foil 1.43 3.49 2.06
Hexa-cover plates 1.45 3.51 2.06
Peat 1.43 3.93 2.50
Rapeseed oil 1.41 4.77 3.36
Tent cover 1.47 4.04 2.57
Figure 53. Fatteners slurry handling costs if slurry is acidified and not acidified,
and the difference of costs € m-3 of slurry. In this analysis is varied with different
type of storage covers by in-house acidification, if slurry is not acidified. 42,000
fatteners.
5.4.4. Acid consumption, Finland
While the acid cost is biggest running cost, then the amount of acid required
to lower slurry acidity to target pH (see Table 8) has essential impact on cost-
2,20 2,06 2,06 2,06 2,062,50
3,36
2,57
0,0
0,5
1,0
1,5
2,0
2,5
3,0
3,5
4,0
Co
st d
iffe
ren
ce b
etw
ee
n n
on
aci
dif
ied
an
d a
cid
ifie
d s
lurr
y, €
m-3
No cover Chopped straw Fibo clay balls Floating foil
Hexa-cover plates Peat Rapeseed oil Tent cover
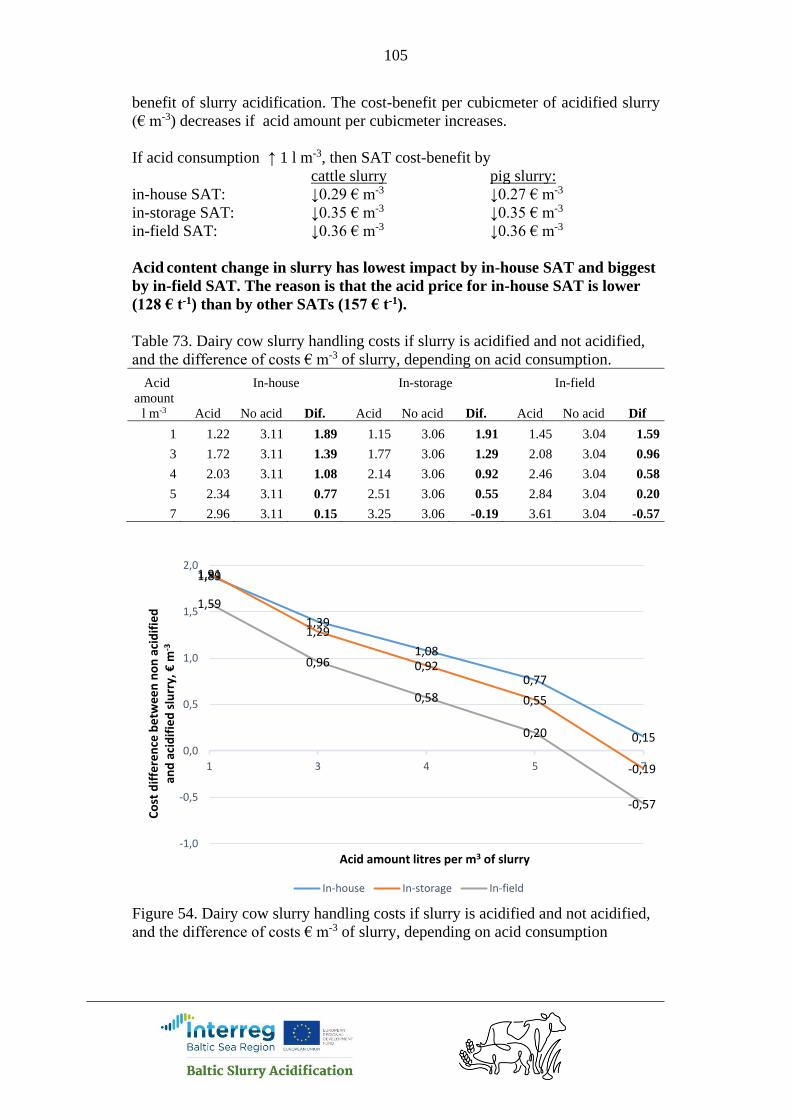
105
benefit of slurry acidification. The cost-benefit per cubicmeter of acidified slurry
(€ m-3) decreases if acid amount per cubicmeter increases.
If acid consumption ↑ 1 l m-3, then SAT cost-benefit by
cattle slurry pig slurry:
in-house SAT: ↓0.29 € m-3 ↓0.27 € m-3
in-storage SAT: ↓0.35 € m-3 ↓0.35 € m-3
in-field SAT: ↓0.36 € m-3 ↓0.36 € m-3
Acid content change in slurry has lowest impact by in-house SAT and biggest
by in-field SAT. The reason is that the acid price for in-house SAT is lower
(128 € t-1) than by other SATs (157 € t-1).
Table 73. Dairy cow slurry handling costs if slurry is acidified and not acidified,
and the difference of costs € m-3 of slurry, depending on acid consumption.
Acid In-house In-storage In-field
amount
l m-3 Acid No acid Dif. Acid No acid Dif. Acid No acid Dif
1 1.22 3.11 1.89 1.15 3.06 1.91 1.45 3.04 1.59
3 1.72 3.11 1.39 1.77 3.06 1.29 2.08 3.04 0.96
4 2.03 3.11 1.08 2.14 3.06 0.92 2.46 3.04 0.58
5 2.34 3.11 0.77 2.51 3.06 0.55 2.84 3.04 0.20
7 2.96 3.11 0.15 3.25 3.06 -0.19 3.61 3.04 -0.57
Figure 54. Dairy cow slurry handling costs if slurry is acidified and not acidified,
and the difference of costs € m-3 of slurry, depending on acid consumption
1,89
1,39
1,08
0,77
0,15
1,91
1,29
0,92
0,55
-0,19
1,59
0,96
0,58
0,20
-0,57
-1,0
-0,5
0,0
0,5
1,0
1,5
2,0
1 3 4 5 7
Co
st d
iffe
ren
ce b
etw
ee
n n
on
aci
dif
ied
an
d a
cid
ifie
d s
lurr
y, €
m-3
Acid amount litres per m3 of slurry
In-house In-storage In-field

106
Table 74. Fatteners slurry handling costs if slurry is acidified and not acidified,
and the difference of costs € m-3 of slurry, depending on acid consumption.
Acid In-house In-storage In-field
amount
l m-3 Acid No acid Dif. Acid No acid Dif. Acid No acid Dif
1 0.58 3.32 2.74 1.09 3.07 1.98 1.39 3.05 1.66
3 0.97 3.32 2.35 1.70 3.07 1.37 2.03 3.05 1.02
4 1.28 3.32 2.04 2.07 3.07 1.00 2.41 3.05 0.64
5 1.59 3.32 1.73 2.44 3.07 0.63 2.79 3.05 0.26
7 2.21 3.32 1.11 3.18 3.07 -0.11 3.55 3.05 -0.50
Figure 55. Fatteners slurry handling costs if slurry is acidified and not acidified,
and the difference of costs € m-3 of slurry, depending on acid consumption.
2,74
2,35
2,04
1,73
1,11
1,98
1,37
1,00
0,63
-0,11
1,66
1,02
0,64
0,26
-0,50
-1,0
-0,5
0,0
0,5
1,0
1,5
2,0
2,5
3,0
1 3 4 5 7
Co
st d
iffe
ren
ce b
etw
ee
n n
on
aci
dif
ied
an
d a
cid
ifie
d s
lurr
y, €
m-3
Acid amount litres per m3 of slurry
In-house In-storage In-field

107
5.4.5. Ntot in slurry, Finland
The cost benefit per cubicmeter of acidified slurry (€ m-3) increases if Ntot
content in slurry rises.
If Ntot content in slurry ↑ 1 kg m-3 , then SAT cost-benefit by
cattle slurry pig slurry:
in-house SAT: ↑0.14 € m-3. ↑0.29 € m-3.
in-storage SAT: ↑0.11 € m-3. ↑0.11 € m-3.
in-field SAT: ↑0.10 € m-3 ↑0.09 € m-3.
Ntot content change in slurry has lowest impact by in-field SAT and biggest by
in-house sat, especially in the case of pig slurry. The reason is that by in-
house acidification of pig slurry is the ammonia emission reduction effect
highest, 64%.
Table 75. Dairy cow slurry handling costs if slurry is acidified and not acidified,
and the difference of costs € m-3 of slurry, depending Ntot content in slurry
Ntot In-house In-storage In-field
content
kg m-3 Acid No acid Dif. Acid No acid Dif. Acid No acid Dif
3 2.15 3.02 0.87 2.21 3.01 0.80
4 2.40 3.06 0.66 2.06 3.04 0.98 2.14 3.02 0.88
5 2.28 3.09 0.81 1.97 3.06 1.09 2.06 3.04 0.98
6 2.17 3.11 0.94 1.88 3.08 1.20 1.99 3.06 1.07
7 2.06 3.14 1.08
Figure 56. Dairy cow slurry handling costs if slurry is acidified and not acidified,
and the difference of costs € m-3 of slurry, depending Ntot content in slurry
0,66
0,81
0,94
1,08
0,87
0,98
1,09
1,20
0,80
0,88
0,98
1,07
0,6
0,7
0,8
0,9
1,0
1,1
1,2
1,3
3 4 5 6 7
Co
st d
iffe
ren
ce b
etw
ee
n n
on
aci
dif
ied
an
d a
cid
ifie
d s
lurr
y, €
m-3
Ntot content in slurry, kg m-3
In-house In-storage In-field
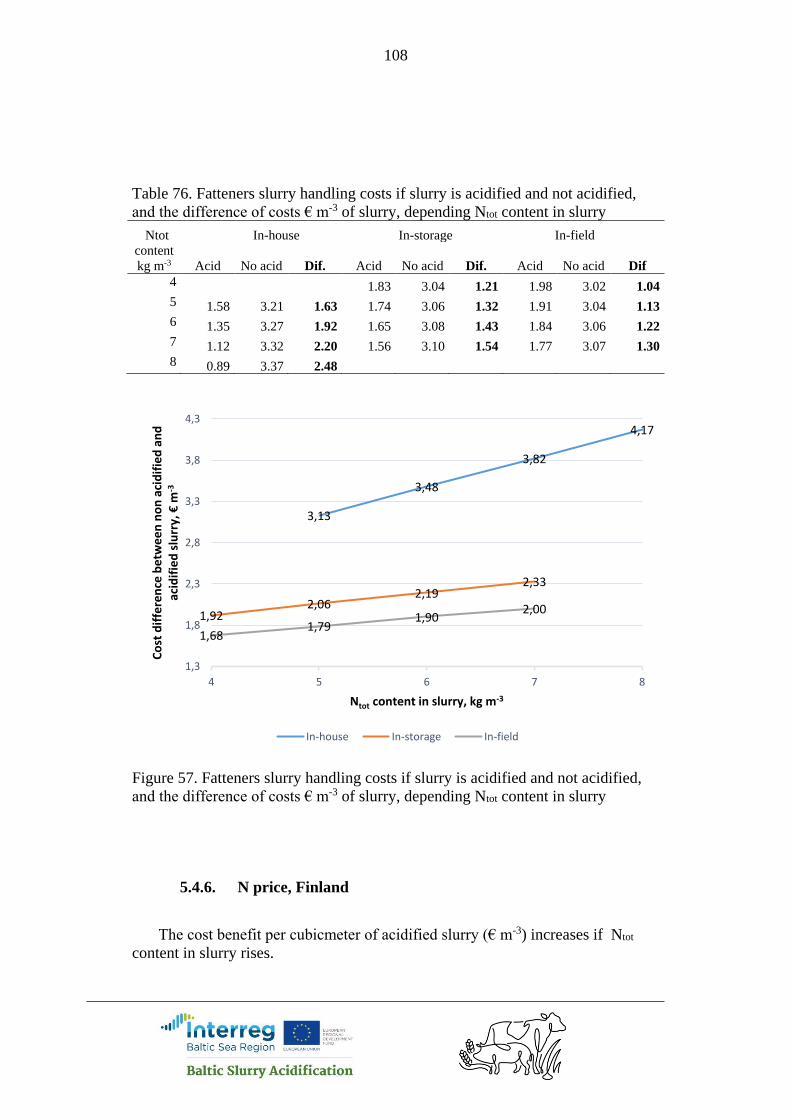
108
Table 76. Fatteners slurry handling costs if slurry is acidified and not acidified,
and the difference of costs € m-3 of slurry, depending Ntot content in slurry
Ntot In-house In-storage In-field
content
kg m-3 Acid No acid Dif. Acid No acid Dif. Acid No acid Dif
4 1.83 3.04 1.21 1.98 3.02 1.04
5 1.58 3.21 1.63 1.74 3.06 1.32 1.91 3.04 1.13
6 1.35 3.27 1.92 1.65 3.08 1.43 1.84 3.06 1.22
7 1.12 3.32 2.20 1.56 3.10 1.54 1.77 3.07 1.30
8 0.89 3.37 2.48
Figure 57. Fatteners slurry handling costs if slurry is acidified and not acidified,
and the difference of costs € m-3 of slurry, depending Ntot content in slurry
5.4.6. N price, Finland
The cost benefit per cubicmeter of acidified slurry (€ m-3) increases if Ntot
content in slurry rises.
3,13
3,48
3,82
4,17
1,922,06
2,192,33
1,681,79
1,902,00
1,3
1,8
2,3
2,8
3,3
3,8
4,3
4 5 6 7 8
Co
st d
iffe
ren
ce b
etw
ee
n n
on
aci
dif
ied
an
d
acid
ifie
d s
lurr
y, €
m-3
Ntot content in slurry, kg m-3
In-house In-storage In-field
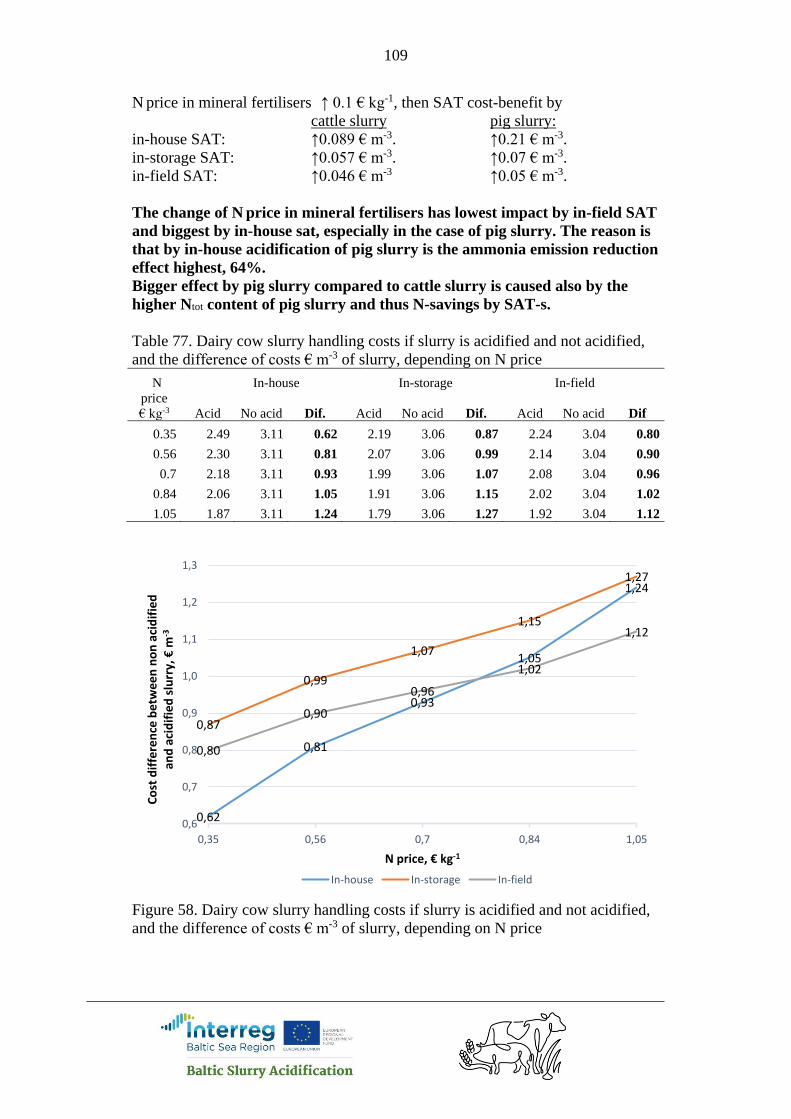
109
N price in mineral fertilisers ↑ 0.1 € kg-1, then SAT cost-benefit by
cattle slurry pig slurry:
in-house SAT: ↑0.089 € m-3. ↑0.21 € m-3.
in-storage SAT: ↑0.057 € m-3. ↑0.07 € m-3.
in-field SAT: ↑0.046 € m-3 ↑0.05 € m-3.
The change of N price in mineral fertilisers has lowest impact by in-field SAT
and biggest by in-house sat, especially in the case of pig slurry. The reason is
that by in-house acidification of pig slurry is the ammonia emission reduction
effect highest, 64%.
Bigger effect by pig slurry compared to cattle slurry is caused also by the
higher Ntot content of pig slurry and thus N-savings by SAT-s.
Table 77. Dairy cow slurry handling costs if slurry is acidified and not acidified,
and the difference of costs € m-3 of slurry, depending on N price
N In-house In-storage In-field
price
€ kg-3 Acid No acid Dif. Acid No acid Dif. Acid No acid Dif
0.35 2.49 3.11 0.62 2.19 3.06 0.87 2.24 3.04 0.80
0.56 2.30 3.11 0.81 2.07 3.06 0.99 2.14 3.04 0.90
0.7 2.18 3.11 0.93 1.99 3.06 1.07 2.08 3.04 0.96
0.84 2.06 3.11 1.05 1.91 3.06 1.15 2.02 3.04 1.02
1.05 1.87 3.11 1.24 1.79 3.06 1.27 1.92 3.04 1.12
Figure 58. Dairy cow slurry handling costs if slurry is acidified and not acidified,
and the difference of costs € m-3 of slurry, depending on N price
0,62
0,81
0,93
1,05
1,24
0,87
0,99
1,07
1,15
1,27
0,80
0,90
0,96
1,02
1,12
0,6
0,7
0,8
0,9
1,0
1,1
1,2
1,3
0,35 0,56 0,7 0,84 1,05
Co
st d
iffe
ren
ce b
etw
ee
n n
on
aci
dif
ied
an
d a
cid
ifie
d s
lurr
y, €
m-3
N price, € kg-1
In-house In-storage In-field
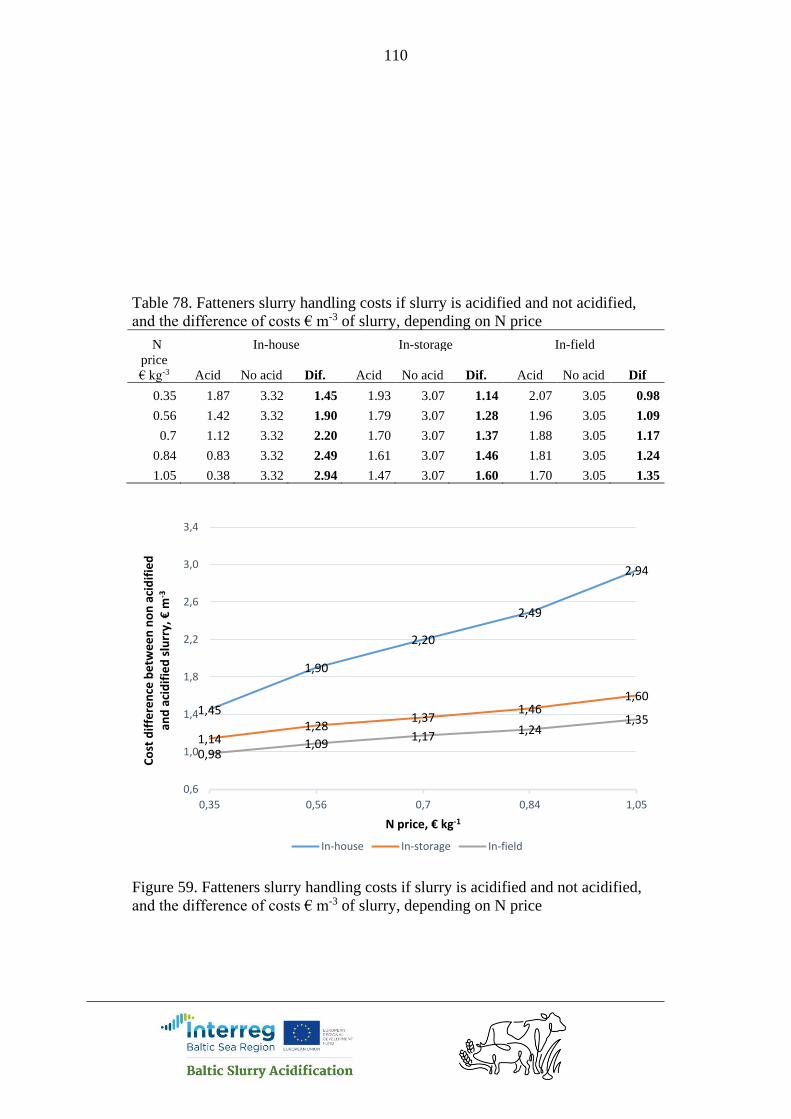
110
Table 78. Fatteners slurry handling costs if slurry is acidified and not acidified,
and the difference of costs € m-3 of slurry, depending on N price
N In-house In-storage In-field
price
€ kg-3 Acid No acid Dif. Acid No acid Dif. Acid No acid Dif
0.35 1.87 3.32 1.45 1.93 3.07 1.14 2.07 3.05 0.98
0.56 1.42 3.32 1.90 1.79 3.07 1.28 1.96 3.05 1.09
0.7 1.12 3.32 2.20 1.70 3.07 1.37 1.88 3.05 1.17
0.84 0.83 3.32 2.49 1.61 3.07 1.46 1.81 3.05 1.24
1.05 0.38 3.32 2.94 1.47 3.07 1.60 1.70 3.05 1.35
Figure 59. Fatteners slurry handling costs if slurry is acidified and not acidified,
and the difference of costs € m-3 of slurry, depending on N price
1,45
1,90
2,20
2,49
2,94
1,141,28
1,371,46
1,60
0,981,09
1,17 1,241,35
0,6
1,0
1,4
1,8
2,2
2,6
3,0
3,4
0,35 0,56 0,7 0,84 1,05
Co
st d
iffe
ren
ce b
etw
ee
n n
on
aci
dif
ied
an
d a
cid
ifie
d s
lurr
y, €
m-3
N price, € kg-1
In-house In-storage In-field

111
5.4.7. S price, Finland
The cost benefit per cubicmeter of acidified slurry (€ m-3) increases if S price in
mineral fertilisers rises.
S price in mineral fertilisers ↑ 0.1 € kg-1, then SAT cost-benefit by
cattle slurry pig slurry:
in-house SAT: ↑0.08 € m-3. ↑0.10 € m-3.
in-storage SAT: ↑0.08 € m-3. ↑0.08 € m-3.
in-field SAT: ↑0.08 € m-3 ↑0.09 € m-3.
Table 79. Dairy cow slurry handling costs if slurry is acidified and not acidified,
and the difference of costs € m-3 of slurry, depending on S price
S In-house In-storage In-field
price
€ kg-3 Acid No acid Dif. Acid No acid Dif. Acid No acid Dif
0.205 2.35 3.11 0.76 2.16 3.06 0.90 2.25 3.04 0.79
0.328 2.25 3.11 0.86 2.06 3.06 1.00 2.15 3.04 0.89
0.4 2.19 3.11 0.92 2.00 3.06 1.06 2.09 3.04 0.95
0.492 2.11 3.11 1.00 1.92 3.06 1.14 2.01 3.04 1.03
0.615 2.01 3.11 1.10 1.82 3.06 1.24 1.91 3.04 1.13
Figure 60. Dairy cow slurry handling costs if slurry is acidified and not acidified,
and the difference of costs € m-3 of slurry, depending on S price
0,76
0,86
0,92
1,00
1,10
0,90
1,00
1,06
1,14
1,24
0,79
0,89
0,95
1,03
1,13
0,7
0,8
0,9
1,0
1,1
1,2
1,3
0,205 0,328 0,4 0,492 0,615
Co
st d
iffe
ren
ce b
etw
ee
n n
on
aci
dif
ied
an
d a
cid
ifie
d s
lurr
y, €
m-3
S price, € kg-1
In-house In-storage In-field
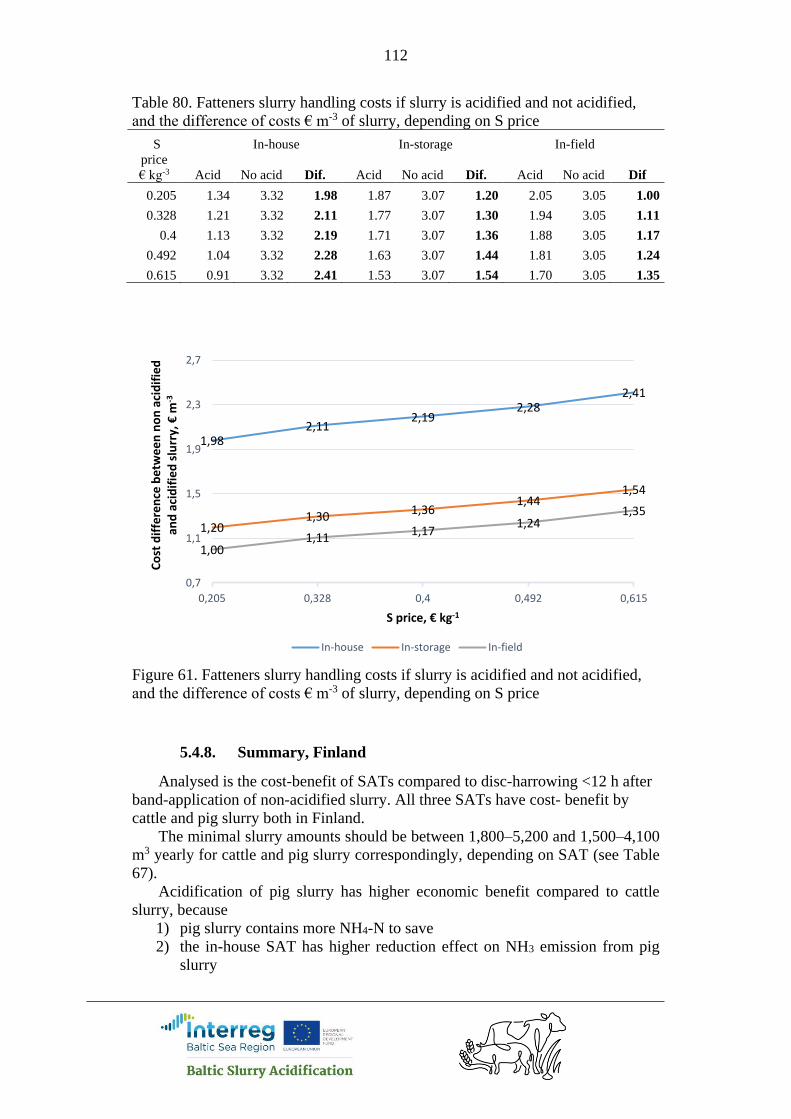
112
Table 80. Fatteners slurry handling costs if slurry is acidified and not acidified,
and the difference of costs € m-3 of slurry, depending on S price
S In-house In-storage In-field
price
€ kg-3 Acid No acid Dif. Acid No acid Dif. Acid No acid Dif
0.205 1.34 3.32 1.98 1.87 3.07 1.20 2.05 3.05 1.00
0.328 1.21 3.32 2.11 1.77 3.07 1.30 1.94 3.05 1.11
0.4 1.13 3.32 2.19 1.71 3.07 1.36 1.88 3.05 1.17
0.492 1.04 3.32 2.28 1.63 3.07 1.44 1.81 3.05 1.24
0.615 0.91 3.32 2.41 1.53 3.07 1.54 1.70 3.05 1.35
Figure 61. Fatteners slurry handling costs if slurry is acidified and not acidified,
and the difference of costs € m-3 of slurry, depending on S price
5.4.8. Summary, Finland
Analysed is the cost-benefit of SATs compared to disc-harrowing <12 h after
band-application of non-acidified slurry. All three SATs have cost- benefit by
cattle and pig slurry both in Finland.
The minimal slurry amounts should be between 1,800–5,200 and 1,500–4,100
m3 yearly for cattle and pig slurry correspondingly, depending on SAT (see Table
67).
Acidification of pig slurry has higher economic benefit compared to cattle
slurry, because
1) pig slurry contains more NH4-N to save
2) the in-house SAT has higher reduction effect on NH3 emission from pig
slurry
1,982,11
2,192,28
2,41
1,201,30
1,361,44
1,54
1,001,11
1,171,24
1,35
0,7
1,1
1,5
1,9
2,3
2,7
0,205 0,328 0,4 0,492 0,615
Co
st d
iffe
ren
ce b
etw
ee
n n
on
aci
dif
ied
an
d a
cid
ifie
d s
lurr
y, €
m-3
S price, € kg-1
In-house In-storage In-field

113
3) the acid need of pig slurry is lower
4) the risk to exceed S need of plants is lower (because the acid amount is
lower)
The cost-benefit of acidified slurry per cubicmeter (€ m-3) decreases if acid
amount per cubicmeter increases. While the acid cost is biggest running cost, then
the amount of acid required to lower slurry acidity to target pH (see Table 8) has
essential impact on cost-benefit of slurry acidification. The acid price by in-house
SAT (128 € m-3) is lower than by other SATs (157 € m-3) and this is the reason
why change of acid amount has smaller effect on cost-benefit by first SAT
compared to others.
The biggest reason for economic benefit of SAT-s is the cost of slurry
incorporation (32 € ha-1) with disc harrow after spreading of non-acidified slurry.
If slurry amount is 30 m3 ha-1, then incorporation cost is 1.67 € m-3, which is
saved if acidified slurry is applied to the field suface.
The calculations in paragraph 5.4 were done by slurry amount 30 m3 ha-1. The
extra calculations made for Finland for different hectare amounts (Figure 50)
show that cost-benefit of in-house SAT is higher if slurry amount is 20 or 10 m3
ha-1 .
One reason is that the slurry incorporation cost per hectare is constant despite
of slurry amount per hectare. Thus, the smaller is slurry amount per hectare the
higher is incorporation cost per cubicmeter of non-acidified slurry.
Another aspect, why low amount of acidified slurry give higher economic
effect, is the effective use of S applied with acidified slurry. In the calculations is
used 4.5 liter acid per m3 cattle slurry by in-house SAT. If the slurry amount is 30,
20 and 10 m3 ha-1 then the S amount applied to the field is 80, 53 and 26 kg ha-1
correspondingly. The S need for crops is in calculations 25 kg ha-1 in average. The
costs on mineral S are reduced if acidified slurry is applied and the reduction
effect is calculated until S amount reaches the demand of crop. After that S cost
reduction stays constant and the S amount what exceeds crop need, is not taken
into calculation. However, the S cost reduction value is always divided by slurry
amount per hectare and if the cost reduction is constant then by growing hectare
amount of slurry the S cost reduction per cubicmeter of slurry decreases.
An alternative to in-house acidification to minimise the ammonia emission
from slurry storage is to cover storage. The cost calculations made for different
type of storage covers shows that cost benefit by in-house acidified slurry depends
on capital cost and ability to decrease the ammonia emission. The rapeseed oil has
highest capital cost and decreases 80% of ammonia emission (Table 21). Thus, the
in-house slurry acidification gives biggest cost effect compared to this type of
cover, which is followed by tent and peat. Compared to the Hexa-cover plates
gives slurry acidification lowest cost benefit. The figures 52 and 53 show also that
the order of cover types is same for both, cattle and big slurries.
The cost benefit per cubicmeter of acidified slurry (€ m-3) increases if Ntot
content in slurry rises (see 5.4.5). Ntot content change in slurry has lowest impact
by in-field SAT and biggest by in-house sat, especially in the case of pig slurry.
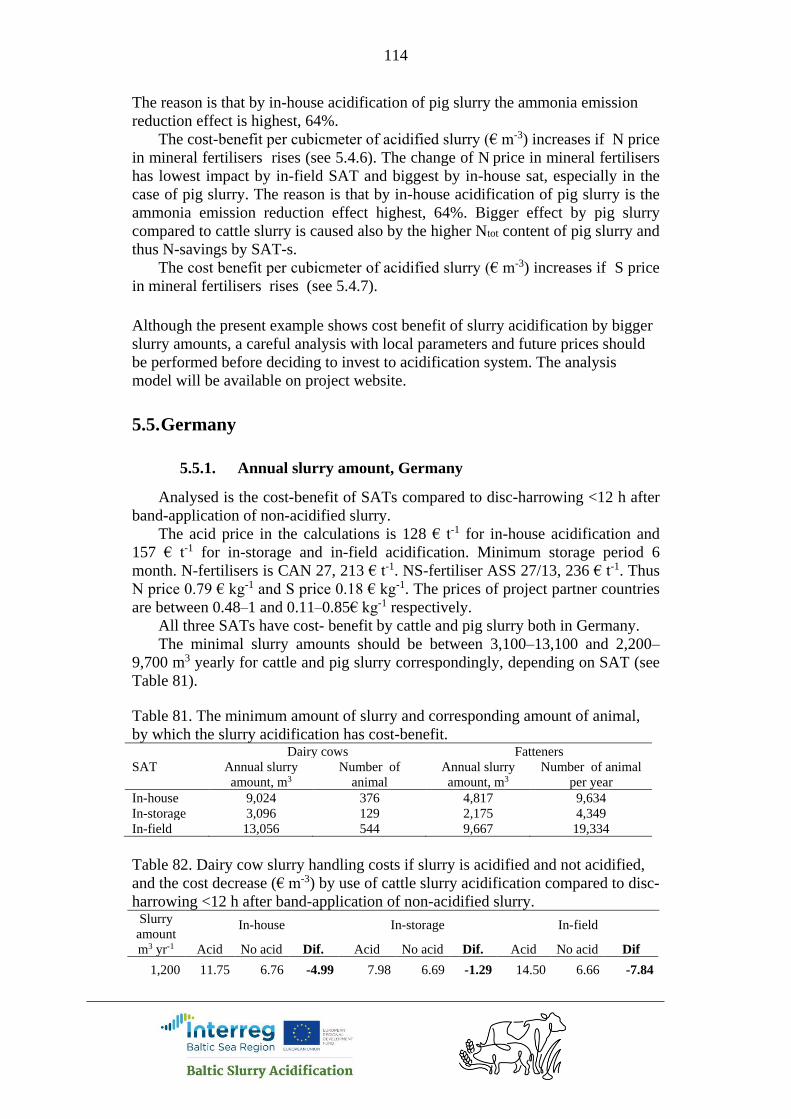
114
The reason is that by in-house acidification of pig slurry the ammonia emission
reduction effect is highest, 64%.
The cost-benefit per cubicmeter of acidified slurry (€ m-3) increases if N price
in mineral fertilisers rises (see 5.4.6). The change of N price in mineral fertilisers
has lowest impact by in-field SAT and biggest by in-house sat, especially in the
case of pig slurry. The reason is that by in-house acidification of pig slurry is the
ammonia emission reduction effect highest, 64%. Bigger effect by pig slurry
compared to cattle slurry is caused also by the higher Ntot content of pig slurry and
thus N-savings by SAT-s.
The cost benefit per cubicmeter of acidified slurry (€ m-3) increases if S price
in mineral fertilisers rises (see 5.4.7).
Although the present example shows cost benefit of slurry acidification by bigger
slurry amounts, a careful analysis with local parameters and future prices should
be performed before deciding to invest to acidification system. The analysis
model will be available on project website.
5.5. Germany
5.5.1. Annual slurry amount, Germany
Analysed is the cost-benefit of SATs compared to disc-harrowing <12 h after
band-application of non-acidified slurry.
The acid price in the calculations is 128 € t-1 for in-house acidification and
157 € t-1 for in-storage and in-field acidification. Minimum storage period 6
month. N-fertilisers is CAN 27, 213 € t-1. NS-fertiliser ASS 27/13, 236 € t-1. Thus
N price 0.79 € kg-1 and S price 0.18 € kg-1. The prices of project partner countries
are between 0.48–1 and 0.11–0.85€ kg-1 respectively.
All three SATs have cost- benefit by cattle and pig slurry both in Germany.
The minimal slurry amounts should be between 3,100–13,100 and 2,200–
9,700 m3 yearly for cattle and pig slurry correspondingly, depending on SAT (see
Table 81).
Table 81. The minimum amount of slurry and corresponding amount of animal,
by which the slurry acidification has cost-benefit. Dairy cows Fatteners
SAT Annual slurry
amount, m3
Number of
animal
Annual slurry
amount, m3
Number of animal
per year
In-house 9,024 376 4,817 9,634
In-storage 3,096 129 2,175 4,349
In-field 13,056 544 9,667 19,334
Table 82. Dairy cow slurry handling costs if slurry is acidified and not acidified,
and the cost decrease (€ m-3) by use of cattle slurry acidification compared to disc-
harrowing <12 h after band-application of non-acidified slurry. Slurry
amount
m3 yr-1
In-house In-storage In-field
Acid No acid Dif. Acid No acid Dif. Acid No acid Dif
1,200 11.75 6.76 -4.99 7.98 6.69 -1.29 14.50 6.66 -7.84

115
2,400 7.44 5.52 -1.92 5.68 5.45 -0.23 8.88 5.42 -3.46
9,000 3.78 3.78 0.00 3.24 3.71 0.47 4.00 3.68 -0.32
12,000 3.25 3.48 0.23 2.91 3.41 0.50 3.44 3.38 -0.06
21,000 2.59 2.97 0.38 2.39 2.90 0.51 2.64 2.87 0.23
24,000 2.43 2.87 0.44 2.28 2.79 0.51 2.48 2.77 0.29
33,000 2.17 2.62 0.45 2.06 2.55 0.49 2.17 2.52 0.35
48,000 1.89 2.36 0.47 1.84 2.29 0.45 1.88 2.26 0.38
Figure 62. The cost decrease (€ m-3) by use of cattle slurry acidification compared
to disc-harrowing <12 h after band-application of non-acidified slurry.
Table 83. Fattener slurry handling costs if slurry is acidified and not acidified, and
the cost decrease (€ m-3) by use of cattle slurry acidification compared to disc-
harrowing <12 h after band-application of non-acidified slurry. Slurry
amount
m3 yr-1
In-house In-storage In-field
Acid No acid Dif. Acid No acid Dif. Acid No acid Dif
500 34.29 9.02 -25.27 12.55 8.68 -3.87 28.51 8.65 -19.86
2,500 8.44 5.75 -2.69 5.26 5.41 0.15 8.41 5.38 -3.03
5,000 4.65 4.76 0.11 3.79 4.42 0.63 5.34 4.39 -0.95
9,000 2.90 4.07 1.17 2.92 3.73 0.81 3.77 3.70 -0.07
21,000 1.36 3.26 1.90 2.07 2.92 0.85 2.41 2.89 0.48
33,000 0.84 2.91 2.07 1.74 2.57 0.83 1.94 2.54 0.60
0,00
0,23
0,38
0,44 0,450,470,47
0,50 0,51 0,510,49
0,45
0,23
0,29
0,350,38
0,0
0,1
0,2
0,3
0,4
0,5
0,6
0 5000 10000 15000 20000 25000 30000 35000 40000 45000 50000
Co
st d
iffe
ren
ce b
etw
ee
n n
on
aci
dif
ied
an
d a
cid
ifie
d s
lurr
y, €
m-3
Annual slurry amount, m3
In-house In-storage In-field

116
Figure 63. The cost decrease (€ m-3) by use of fattener slurry acidification
compared to disc-harrowing <12 h after band-application of non-acidified slurry.
5.5.2. Cover type, Germany
An alternative to in-house acidification to minimise the ammonia emission
from slurry storage is to cover storage. The cost calculations made for different
type of storage covers shows that cost benefit by in-house acidified slurry depends
on capital cost and ability to decrease the ammonia emission. The rapeseed oil has
highest capital cost and decreases 80% of ammonia emission (Table 21). Thus, the
in-house slurry acidification gives biggest cost effect compared to this type of
cover, which is followed by tent and peat. Compared to the Hexa-cover plates
gives slurry acidification lowest cost benefit. The figures 64 and 65 show also that
the order of cover types is same for both, cattle and big slurries.
In Germany, the required minimum manure storage capacity is 6 months. In
this analysis is presumed that animal are housed in all year around and storage
depth is 5 m. The capital cost of slurry storage cover calculated for these
conditions are shown in the table 21.
Table 84. Dairy cow slurry handling costs if slurry is acidified and not acidified,
and the difference of costs € m-3 of slurry. In this analysis is varied with different
0,11
1,17
1,90
2,07
0,15
0,63
0,81 0,85 0,83
0,480,60
0,0
0,4
0,8
1,2
1,6
2,0
2,4
0 5000 10000 15000 20000 25000 30000 35000
Co
st d
iffe
ren
ce b
etw
ee
n n
on
aci
dif
ied
an
d a
cid
ifie
d s
lurr
y, €
m-3
Slurry amount, m3
In-house In-storage In-field

117
type of storage covers by in-house acidification, if slurry is not acidified. Annual
slurry amount 21,000 m3.
In-house
Cover type Acid No acid Dif.
No cover 2.59 2.97 0.38
Chopped straw 2.81 3.00 0.19
Fibo clay balls (fraction 10-20 mm) 2.87 3.01 0.14
Floating foil 2.88 3.02 0.14
Hexa-cover plates 2.90 3.03 0.13
Peat 2.88 3.24 0.36
Rapeseed oil 2.87 3.66 0.79
Tent cover 2.92 3.29 0.37
Figure 64. Dairy cow slurry handling costs if slurry is acidified and not acidified,
and the difference of costs € m-3 of slurry. In this analysis is varied with different
type of storage covers by in-house acidification, if slurry is not acidified. Annual
slurry amount 21,000 m3.
Table 85. Fatteners slurry handling costs if slurry is acidified and not acidified,
and the difference of costs € m-3 of slurry. In this analysis is varied with different
type of storage covers by in-house acidification, if slurry is not acidified. Annual
slurry amount 21,000 m3.
In-house
Cover type Acid No acid Dif.
No cover 1.36 3.26 1.90
Chopped straw 1.64 3.27 1.63
Fibo clay balls (fraction 10-20 mm) 1.71 3.28 1.57
Floating foil 1.73 3.29 1.56
0,38
0,19 0,14 0,14 0,13
0,36
0,79
0,37
0,0
0,1
0,2
0,3
0,4
0,5
0,6
0,7
0,8
0,9
Co
st d
iffe
ren
ce b
etw
ee
n n
on
aci
dif
ied
an
d a
cid
ifie
d s
lurr
y, €
m-3
No cover Chopped straw Fibo clay balls Floating foil
Hexa-cover plates Peat Rapeseed oil Tent cover
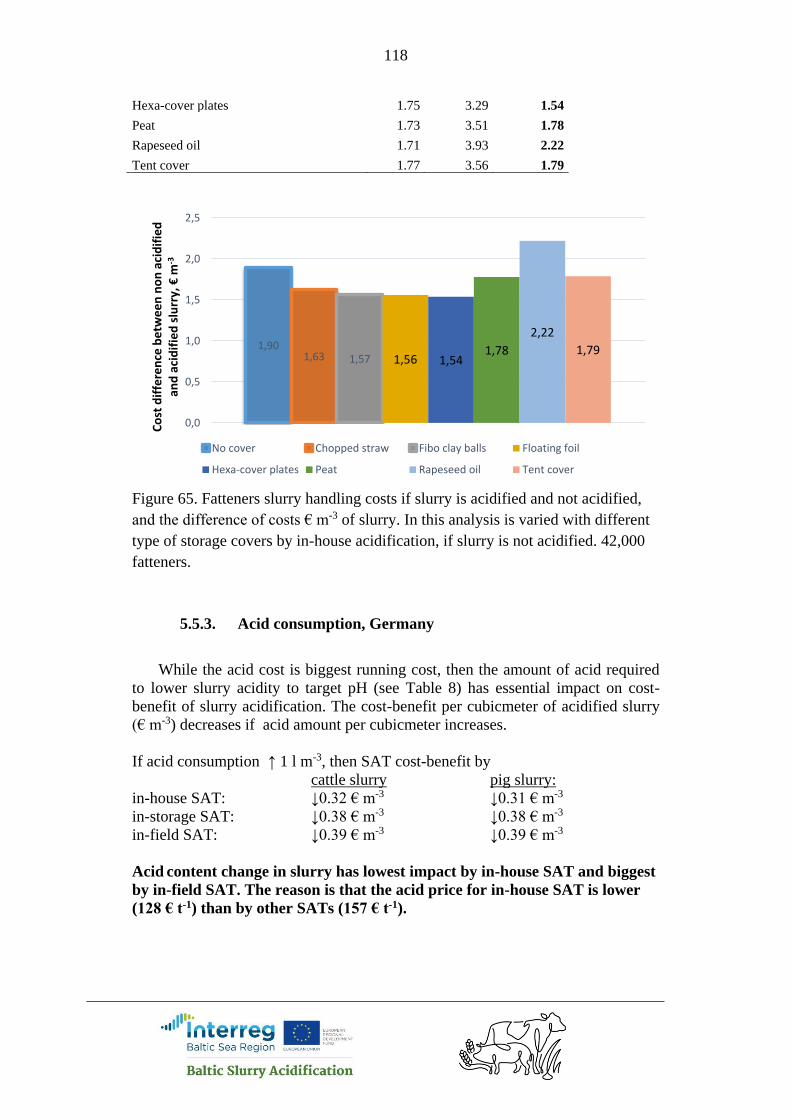
118
Hexa-cover plates 1.75 3.29 1.54
Peat 1.73 3.51 1.78
Rapeseed oil 1.71 3.93 2.22
Tent cover 1.77 3.56 1.79
Figure 65. Fatteners slurry handling costs if slurry is acidified and not acidified,
and the difference of costs € m-3 of slurry. In this analysis is varied with different
type of storage covers by in-house acidification, if slurry is not acidified. 42,000
fatteners.
5.5.3. Acid consumption, Germany
While the acid cost is biggest running cost, then the amount of acid required
to lower slurry acidity to target pH (see Table 8) has essential impact on cost-
benefit of slurry acidification. The cost-benefit per cubicmeter of acidified slurry
(€ m-3) decreases if acid amount per cubicmeter increases.
If acid consumption ↑ 1 l m-3, then SAT cost-benefit by
cattle slurry pig slurry:
in-house SAT: ↓0.32 € m-3 ↓0.31 € m-3
in-storage SAT: ↓0.38 € m-3 ↓0.38 € m-3
in-field SAT: ↓0.39 € m-3 ↓0.39 € m-3
Acid content change in slurry has lowest impact by in-house SAT and biggest
by in-field SAT. The reason is that the acid price for in-house SAT is lower
(128 € t-1) than by other SATs (157 € t-1).
1,901,63 1,57 1,56 1,54
1,78
2,22
1,79
0,0
0,5
1,0
1,5
2,0
2,5
Co
st d
iffe
ren
ce b
etw
ee
n n
on
aci
dif
ied
an
d a
cid
ifie
d s
lurr
y, €
m-3
No cover Chopped straw Fibo clay balls Floating foil
Hexa-cover plates Peat Rapeseed oil Tent cover
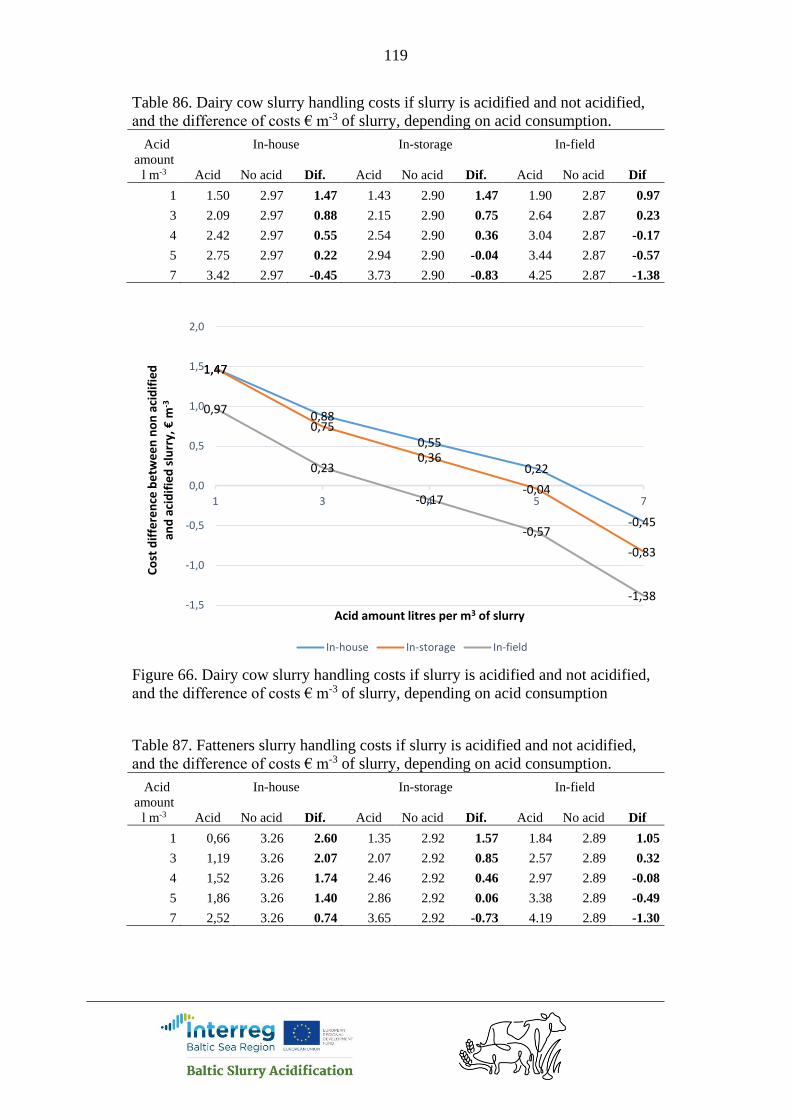
119
Table 86. Dairy cow slurry handling costs if slurry is acidified and not acidified,
and the difference of costs € m-3 of slurry, depending on acid consumption.
Acid In-house In-storage In-field
amount
l m-3 Acid No acid Dif. Acid No acid Dif. Acid No acid Dif
1 1.50 2.97 1.47 1.43 2.90 1.47 1.90 2.87 0.97
3 2.09 2.97 0.88 2.15 2.90 0.75 2.64 2.87 0.23
4 2.42 2.97 0.55 2.54 2.90 0.36 3.04 2.87 -0.17
5 2.75 2.97 0.22 2.94 2.90 -0.04 3.44 2.87 -0.57
7 3.42 2.97 -0.45 3.73 2.90 -0.83 4.25 2.87 -1.38
Figure 66. Dairy cow slurry handling costs if slurry is acidified and not acidified,
and the difference of costs € m-3 of slurry, depending on acid consumption
Table 87. Fatteners slurry handling costs if slurry is acidified and not acidified,
and the difference of costs € m-3 of slurry, depending on acid consumption.
Acid In-house In-storage In-field
amount
l m-3 Acid No acid Dif. Acid No acid Dif. Acid No acid Dif
1 0,66 3.26 2.60 1.35 2.92 1.57 1.84 2.89 1.05
3 1,19 3.26 2.07 2.07 2.92 0.85 2.57 2.89 0.32
4 1,52 3.26 1.74 2.46 2.92 0.46 2.97 2.89 -0.08
5 1,86 3.26 1.40 2.86 2.92 0.06 3.38 2.89 -0.49
7 2,52 3.26 0.74 3.65 2.92 -0.73 4.19 2.89 -1.30
1,47
0,88
0,55
0,22
-0,45
1,47
0,75
0,36
-0,04
-0,83
0,97
0,23
-0,17
-0,57
-1,38-1,5
-1,0
-0,5
0,0
0,5
1,0
1,5
2,0
1 3 4 5 7
Co
st d
iffe
ren
ce b
etw
ee
n n
on
aci
dif
ied
an
d a
cid
ifie
d s
lurr
y, €
m-3
Acid amount litres per m3 of slurry
In-house In-storage In-field

120
Figure 67. Fatteners slurry handling costs if slurry is acidified and not acidified,
and the difference of costs € m-3 of slurry, depending on acid consumption
5.5.4. Ntot in slurry, Germany
The cost benefit per cubicmeter of acidified slurry (€ m-3) increases if Ntot
content in slurry rises.
If Ntot content in slurry ↑ 1 kg m-3 , then SAT cost-benefit by
cattle slurry pig slurry:
in-house SAT: ↑0.18 € m-3. ↑0.35 € m-3.
in-storage SAT: ↑0.14 € m-3. ↑0.14 € m-3.
in-field SAT: ↑0.11 € m-3 ↑0.11 € m-3.
Ntot content change in slurry has lowest impact by in-field SAT and biggest by
in-house sat, especially in the case of pig slurry. The reason is that by in-
house acidification of pig slurry is the ammonia emission reduction effect
highest, 64%.
Table 88. Dairy cow slurry handling costs if slurry is acidified and not acidified,
and the difference of costs € m-3 of slurry, depending Ntot content in slurry
Ntot In-house In-storage In-field
content
kg m-3 Acid No acid Dif. Acid No acid Dif. Acid No acid Dif
3 2.58 2.85 0.27 2.79 2.84 0.05
4 2.85 2.91 0.06 2.47 2.88 0.41 2.70 2.86 0.16
2,60
2,07
1,74
1,40
0,74
1,57
0,85
0,46
0,06
-0,73
1,05
0,32
-0,08
-0,49
-1,30-1,5
-1,0
-0,5
0,0
0,5
1,0
1,5
2,0
2,5
3,0
1 3 4 5 7
Co
st d
iffe
ren
ce b
etw
ee
n n
on
aci
dif
ied
an
d a
cid
ifie
d s
lurr
y, €
m-3
Acid amount litres per m3 of slurry
In-house In-storage In-field
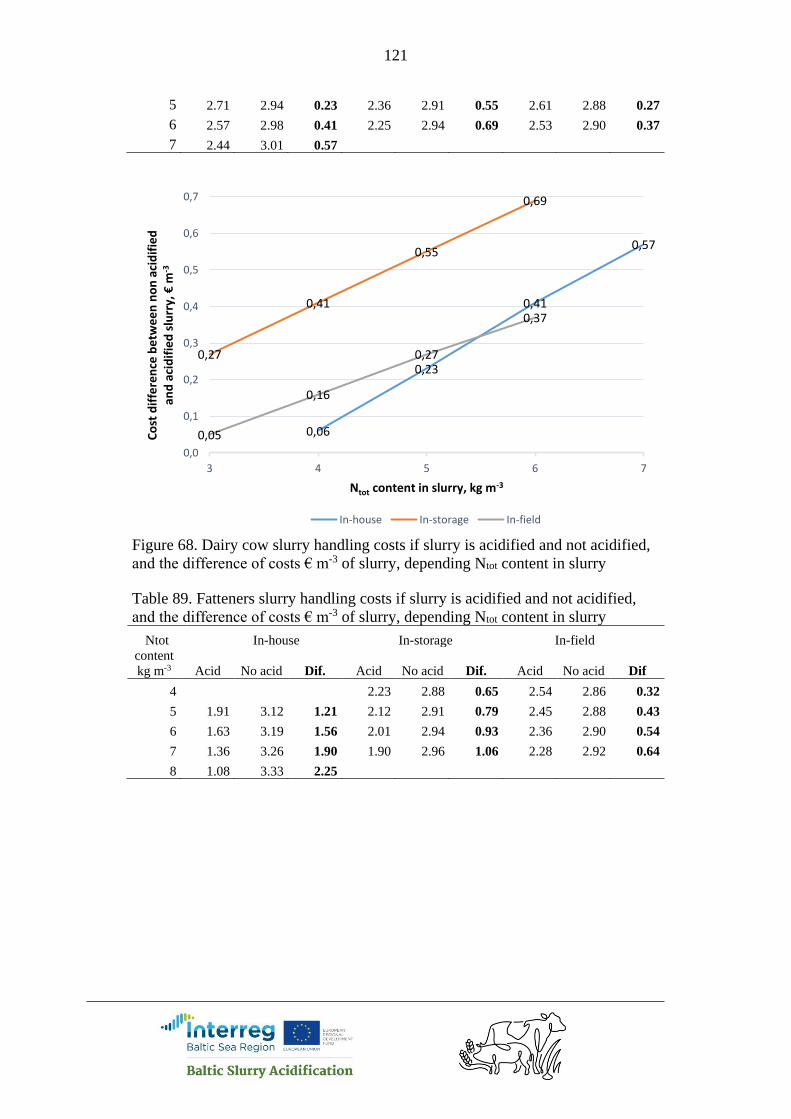
121
5 2.71 2.94 0.23 2.36 2.91 0.55 2.61 2.88 0.27
6 2.57 2.98 0.41 2.25 2.94 0.69 2.53 2.90 0.37
7 2.44 3.01 0.57
Figure 68. Dairy cow slurry handling costs if slurry is acidified and not acidified,
and the difference of costs € m-3 of slurry, depending Ntot content in slurry
Table 89. Fatteners slurry handling costs if slurry is acidified and not acidified,
and the difference of costs € m-3 of slurry, depending Ntot content in slurry
Ntot In-house In-storage In-field
content
kg m-3 Acid No acid Dif. Acid No acid Dif. Acid No acid Dif
4 2.23 2.88 0.65 2.54 2.86 0.32
5 1.91 3.12 1.21 2.12 2.91 0.79 2.45 2.88 0.43
6 1.63 3.19 1.56 2.01 2.94 0.93 2.36 2.90 0.54
7 1.36 3.26 1.90 1.90 2.96 1.06 2.28 2.92 0.64
8 1.08 3.33 2.25
0,06
0,23
0,41
0,57
0,27
0,41
0,55
0,69
0,05
0,16
0,27
0,37
0,0
0,1
0,2
0,3
0,4
0,5
0,6
0,7
3 4 5 6 7
Co
st d
iffe
ren
ce b
etw
ee
n n
on
aci
dif
ied
an
d a
cid
ifie
d s
lurr
y, €
m-3
Ntot content in slurry, kg m-3
In-house In-storage In-field
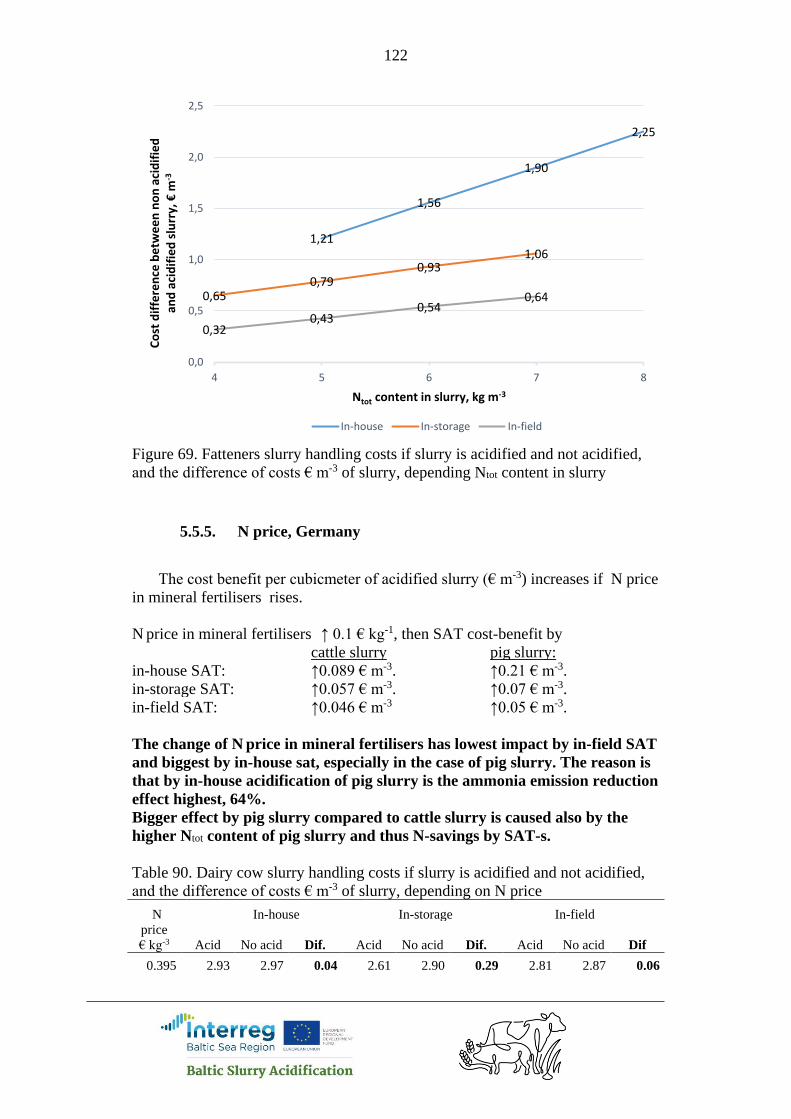
122
Figure 69. Fatteners slurry handling costs if slurry is acidified and not acidified,
and the difference of costs € m-3 of slurry, depending Ntot content in slurry
5.5.5. N price, Germany
The cost benefit per cubicmeter of acidified slurry (€ m-3) increases if N price
in mineral fertilisers rises.
N price in mineral fertilisers ↑ 0.1 € kg-1, then SAT cost-benefit by
cattle slurry pig slurry:
in-house SAT: ↑0.089 € m-3. ↑0.21 € m-3.
in-storage SAT: ↑0.057 € m-3. ↑0.07 € m-3.
in-field SAT: ↑0.046 € m-3 ↑0.05 € m-3.
The change of N price in mineral fertilisers has lowest impact by in-field SAT
and biggest by in-house sat, especially in the case of pig slurry. The reason is
that by in-house acidification of pig slurry is the ammonia emission reduction
effect highest, 64%.
Bigger effect by pig slurry compared to cattle slurry is caused also by the
higher Ntot content of pig slurry and thus N-savings by SAT-s.
Table 90. Dairy cow slurry handling costs if slurry is acidified and not acidified,
and the difference of costs € m-3 of slurry, depending on N price
N In-house In-storage In-field
price
€ kg-3 Acid No acid Dif. Acid No acid Dif. Acid No acid Dif
0.395 2.93 2.97 0.04 2.61 2.90 0.29 2.81 2.87 0.06
1,21
1,56
1,90
2,25
0,650,79
0,931,06
0,320,43
0,540,64
0,0
0,5
1,0
1,5
2,0
2,5
4 5 6 7 8
Co
st d
iffe
ren
ce b
etw
ee
n n
on
aci
dif
ied
an
d a
cid
ifie
d s
lurr
y, €
m-3
Ntot content in slurry, kg m-3
In-house In-storage In-field

123
0.632 2.72 2.97 0.25 2.47 2.90 0.43 2.71 2.87 0.16
0.79 2.58 2.97 0.39 2.38 2.90 0.52 2.63 2.87 0.24
0.948 2.44 2.97 0.53 2.29 2.90 0.61 2.56 2.87 0.31
1.185 2.23 2.97 0.74 2.16 2.90 0.74 2.45 2.87 0.42
Figure 70. Dairy cow slurry handling costs if slurry is acidified and not acidified,
and the difference of costs € m-3 of slurry, depending on N price
Table 91. Fatteners slurry handling costs if slurry is acidified and not acidified,
and the difference of costs € m-3 of slurry, depending on N price
N In-house In-storage In-field
price
€ kg-3 Acid No acid Dif. Acid No acid Dif. Acid No acid Dif
0.395 2.19 3.26 1.07 2.32 2.92 0.60 2.61 2.89 0.28
0.632 1.69 3.26 1.57 2.17 2.92 0.75 2.49 2.89 0.40
0.79 1.35 3.26 1.91 2.06 2.92 0.86 2.40 2.89 0.49
0.948 1.02 3.26 2.24 1.96 2.92 0.96 2.32 2.89 0.57
1.185 0.51 3.26 2.75 1.80 2.92 1.12 2.20 2.89 0.69
0,04
0,25
0,39
0,53
0,74
0,29
0,43
0,52
0,61
0,74
0,06
0,16
0,24
0,31
0,42
0,0
0,1
0,2
0,3
0,4
0,5
0,6
0,7
0,8
0,395 0,632 0,79 0,948 1,185
Co
st d
iffe
ren
ce b
etw
ee
n n
on
aci
dif
ied
an
d a
cid
ifie
d s
lurr
y, €
m-3
N price, € kg-1
In-house In-storage In-field

124
Figure 71. Fatteners slurry handling costs if slurry is acidified and not acidified,
and the difference of costs € m-3 of slurry, depending on N price
5.5.6. S price, Germany
The cost benefit per cubicmeter of acidified slurry (€ m-3) increases if S price in
mineral fertilisers rises.
S price in mineral fertilisers ↑ 0.1 € kg-1, then SAT cost-benefit by
cattle slurry pig slurry:
in-house SAT: ↑0.08 € m-3. ↑0.11 € m-3.
in-storage SAT: ↑0.08 € m-3. ↑0.08 € m-3.
in-field SAT: ↑0.08 € m-3 ↑0.08 € m-3.
Table 92. Dairy cow slurry handling costs if slurry is acidified and not acidified,
and the difference of costs € m-3 of slurry, depending on S price
S In-house In-storage In-field
price
€ kg-3 Acid No acid Dif. Acid No acid Dif. Acid No acid Dif
0.09 2.66 2.97 0.31 2.46 2.90 0.44 2.71 2.87 0.16
0.144 2.61 2.97 0.36 2.41 2.90 0.49 2.66 2.87 0.21
0.18 2.58 2.97 0.39 2.38 2.90 0.52 2.63 2.87 0.24
0.216 2.55 2.97 0.42 2.35 2.90 0.55 2.60 2.87 0.27
0.27 2.51 2.97 0.46 2.31 2.90 0.59 2.56 2.87 0.31
1,07
1,57
1,91
2,24
2,75
0,600,75
0,860,96
1,12
0,280,40
0,490,57
0,69
0,0
0,5
1,0
1,5
2,0
2,5
3,0
0,395 0,632 0,79 0,948 1,185
Co
st d
iffe
ren
ce b
etw
ee
n n
on
aci
dif
ied
an
d a
cid
ifie
d s
lurr
y, €
m-3
N price, € kg-1
In-house In-storage In-field

125
Figure 72. Dairy cow slurry handling costs if slurry is acidified and not acidified,
and the difference of costs € m-3 of slurry, depending on S price
Table 93. Fatteners slurry handling costs if slurry is acidified and not acidified,
and the difference of costs € m-3 of slurry, depending on S price
S In-house In-storage In-field
price
€ kg-3 Acid No acid Dif. Acid No acid Dif. Acid No acid Dif
0.09 1.45 3.26 1.81 2.14 2.92 0.78 2.48 2.89 0.41
0.144 1.39 3.26 1.87 2.09 2.92 0.83 2.43 2.89 0.46
0.18 1.35 3.26 1.91 2.06 2.92 0.86 2.40 2.89 0.49
0.216 1.31 3.26 1.95 2.03 2.92 0.89 2.37 2.89 0.52
0.27 1.26 3.26 2.00 1.99 2.92 0.93 2.33 2.89 0.56
0,31
0,360,39
0,42
0,460,44
0,490,52
0,55
0,59
0,16
0,210,24
0,27
0,31
0,0
0,1
0,2
0,3
0,4
0,5
0,6
0,09 0,144 0,18 0,216 0,27
Co
st d
iffe
ren
ce b
etw
ee
n n
on
aci
dif
ied
an
d a
cid
ifie
d s
lurr
y, €
m-3
S price, € kg-1
In-house In-storage In-field
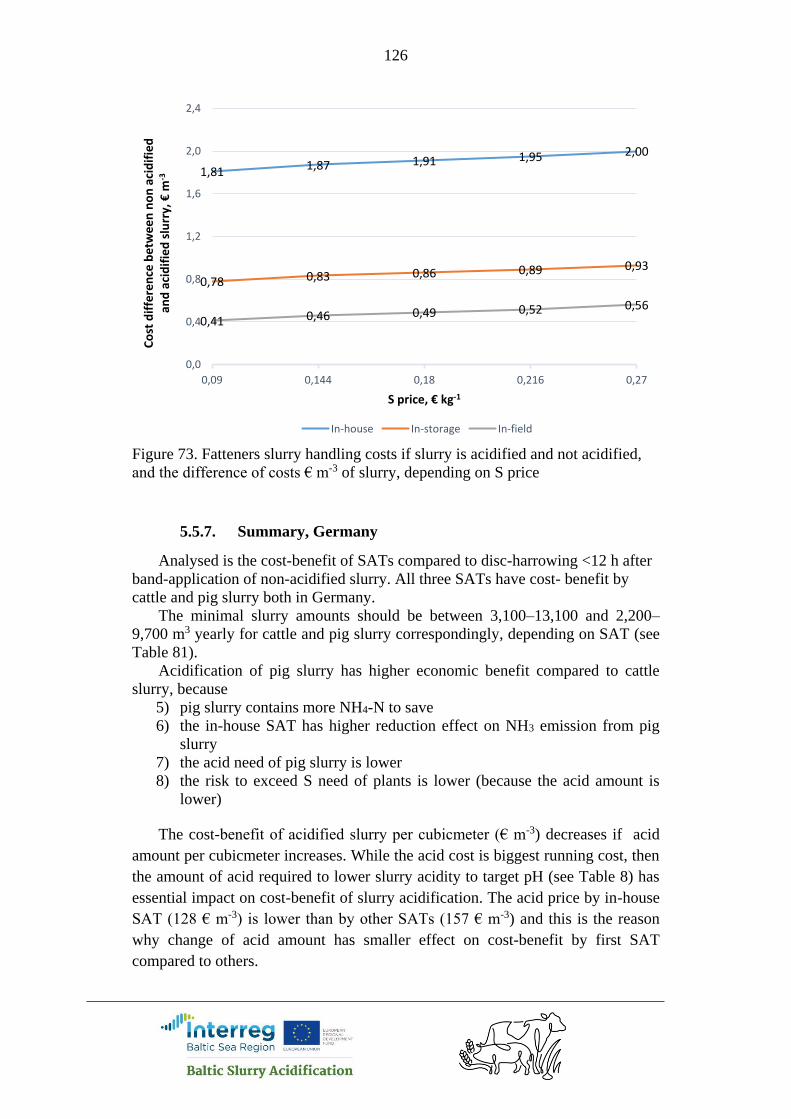
126
Figure 73. Fatteners slurry handling costs if slurry is acidified and not acidified,
and the difference of costs € m-3 of slurry, depending on S price
5.5.7. Summary, Germany
Analysed is the cost-benefit of SATs compared to disc-harrowing <12 h after
band-application of non-acidified slurry. All three SATs have cost- benefit by
cattle and pig slurry both in Germany.
The minimal slurry amounts should be between 3,100–13,100 and 2,200–
9,700 m3 yearly for cattle and pig slurry correspondingly, depending on SAT (see
Table 81).
Acidification of pig slurry has higher economic benefit compared to cattle
slurry, because
5) pig slurry contains more NH4-N to save
6) the in-house SAT has higher reduction effect on NH3 emission from pig
slurry
7) the acid need of pig slurry is lower
8) the risk to exceed S need of plants is lower (because the acid amount is
lower)
The cost-benefit of acidified slurry per cubicmeter (€ m-3) decreases if acid
amount per cubicmeter increases. While the acid cost is biggest running cost, then
the amount of acid required to lower slurry acidity to target pH (see Table 8) has
essential impact on cost-benefit of slurry acidification. The acid price by in-house
SAT (128 € m-3) is lower than by other SATs (157 € m-3) and this is the reason
why change of acid amount has smaller effect on cost-benefit by first SAT
compared to others.
1,81 1,87 1,91 1,95 2,00
0,78 0,83 0,86 0,89 0,93
0,41 0,46 0,49 0,52 0,56
0,0
0,4
0,8
1,2
1,6
2,0
2,4
0,09 0,144 0,18 0,216 0,27
Co
st d
iffe
ren
ce b
etw
ee
n n
on
aci
dif
ied
an
d a
cid
ifie
d s
lurr
y, €
m-3
S price, € kg-1
In-house In-storage In-field

127
The calculations in paragraph 5.5 were done by slurry amount 30 m3 ha-1. The
extra calculations made for Finland for different hectare amounts (Figure 50)
show that cost-benefit of in-house SAT is higher if slurry amount is 20 or 10 m3
ha-1 .
One reason is that the slurry incorporation cost per hectare is constant despite
of slurry amount per hectare. Thus, the smaller is slurry amount per hectare the
higher is incorporation cost per cubicmeter of non-acidified slurry.
Another aspect, why low amount of acidified slurry give higher economic
effect, is the effective use of S applied with acidified slurry. In the calculations is
used 4.5 liter acid per m3 cattle slurry by in-house SAT. If the slurry amount is 30,
20 and 10 m3 ha-1 then the S amount applied to the field is 80, 53 and 26 kg ha-1
correspondingly. The S need for crops is in calculations 25 kg ha-1 in average. The
costs on mineral S are reduced if acidified slurry is applied and the reduction
effect is calculated until S amount reaches the demand of crop. After that S cost
reduction stays constant and the S amount what exceeds crop need, is not taken
into calculation. However, the S cost reduction value is always divided by slurry
amount per hectare and if the cost reduction is constant then by growing hectare
amount of slurry the S cost reduction per cubicmeter of slurry decreases.
An alternative to in-house acidification to minimise the ammonia emission
from slurry storage is to cover storage. The cost calculations made for different
type of storage covers shows that cost benefit by in-house acidified slurry depends
on capital cost and ability to decrease the ammonia emission. The rapeseed oil has
highest capital cost and decreases 80% of ammonia emission (Table 21). Thus, the
in-house slurry acidification gives biggest cost effect compared to this type of
cover, which is followed by tent and peat. Compared to the Hexa-cover plates
gives slurry acidification lowest cost benefit. The figures 64 and 65 show also that
the order of cover types is same for both, cattle and big slurries.
The cost benefit per cubicmeter of acidified slurry (€ m-3) increases if Ntot
content in slurry rises (see 5.5.4). Ntot content change in slurry has lowest impact
by in-field SAT and biggest by in-house sat, especially in the case of pig slurry.
The reason is that by in-house acidification of pig slurry the ammonia emission
reduction effect is highest, 64%.
The cost-benefit per cubicmeter of acidified slurry (€ m-3) increases if N price
in mineral fertilisers rises (see 5.5.5). The change of N price in mineral fertilisers
has lowest impact by in-field SAT and biggest by in-house sat, especially in the
case of pig slurry. The reason is that by in-house acidification of pig slurry is the
ammonia emission reduction effect highest, 64%. Bigger effect by pig slurry
compared to cattle slurry is caused also by the higher Ntot content of pig slurry and
thus N-savings by SAT-s.
The cost benefit per cubicmeter of acidified slurry (€ m-3) increases if S price
in mineral fertilisers rises (see 5.5.6). The change of S price in mineral fertilisers
has same impact by different SATs and slurry types, except bigger difference by
pig slurry with in-house SAT.
Although the present example shows cost benefit of slurry acidification by bigger
slurry amounts, a careful analysis with local parameters and future prices should
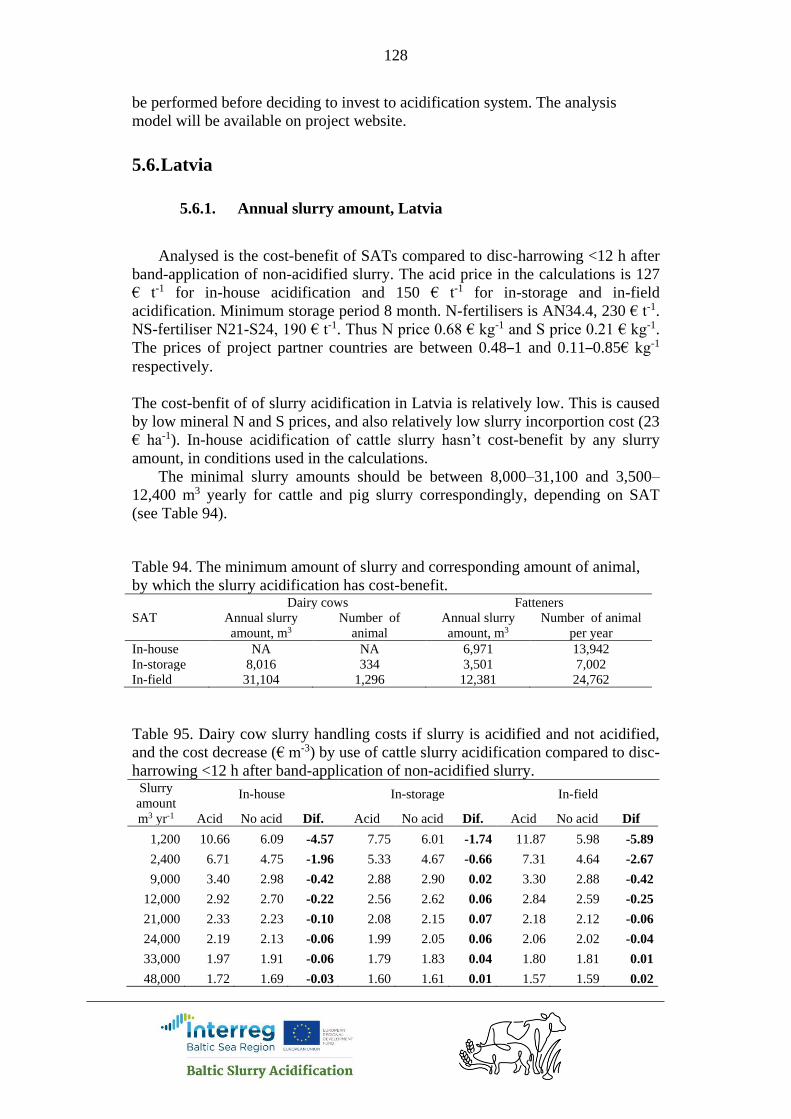
128
be performed before deciding to invest to acidification system. The analysis
model will be available on project website.
5.6. Latvia
5.6.1. Annual slurry amount, Latvia
Analysed is the cost-benefit of SATs compared to disc-harrowing <12 h after
band-application of non-acidified slurry. The acid price in the calculations is 127
€ t-1 for in-house acidification and 150 € t-1 for in-storage and in-field
acidification. Minimum storage period 8 month. N-fertilisers is AN34.4, 230 € t-1.
NS-fertiliser N21-S24, 190 € t-1. Thus N price 0.68 € kg-1 and S price 0.21 € kg-1.
The prices of project partner countries are between 0.48–1 and 0.11–0.85€ kg-1
respectively.
The cost-benfit of of slurry acidification in Latvia is relatively low. This is caused
by low mineral N and S prices, and also relatively low slurry incorportion cost (23
€ ha-1). In-house acidification of cattle slurry hasn’t cost-benefit by any slurry
amount, in conditions used in the calculations.
The minimal slurry amounts should be between 8,000–31,100 and 3,500–
12,400 m3 yearly for cattle and pig slurry correspondingly, depending on SAT
(see Table 94).
Table 94. The minimum amount of slurry and corresponding amount of animal,
by which the slurry acidification has cost-benefit. Dairy cows Fatteners
SAT Annual slurry
amount, m3
Number of
animal
Annual slurry
amount, m3
Number of animal
per year
In-house NA NA 6,971 13,942
In-storage 8,016 334 3,501 7,002
In-field 31,104 1,296 12,381 24,762
Table 95. Dairy cow slurry handling costs if slurry is acidified and not acidified,
and the cost decrease (€ m-3) by use of cattle slurry acidification compared to disc-
harrowing <12 h after band-application of non-acidified slurry. Slurry
amount
m3 yr-1
In-house In-storage In-field
Acid No acid Dif. Acid No acid Dif. Acid No acid Dif
1,200 10.66 6.09 -4.57 7.75 6.01 -1.74 11.87 5.98 -5.89
2,400 6.71 4.75 -1.96 5.33 4.67 -0.66 7.31 4.64 -2.67
9,000 3.40 2.98 -0.42 2.88 2.90 0.02 3.30 2.88 -0.42
12,000 2.92 2.70 -0.22 2.56 2.62 0.06 2.84 2.59 -0.25
21,000 2.33 2.23 -0.10 2.08 2.15 0.07 2.18 2.12 -0.06
24,000 2.19 2.13 -0.06 1.99 2.05 0.06 2.06 2.02 -0.04
33,000 1.97 1.91 -0.06 1.79 1.83 0.04 1.80 1.81 0.01
48,000 1.72 1.69 -0.03 1.60 1.61 0.01 1.57 1.59 0.02
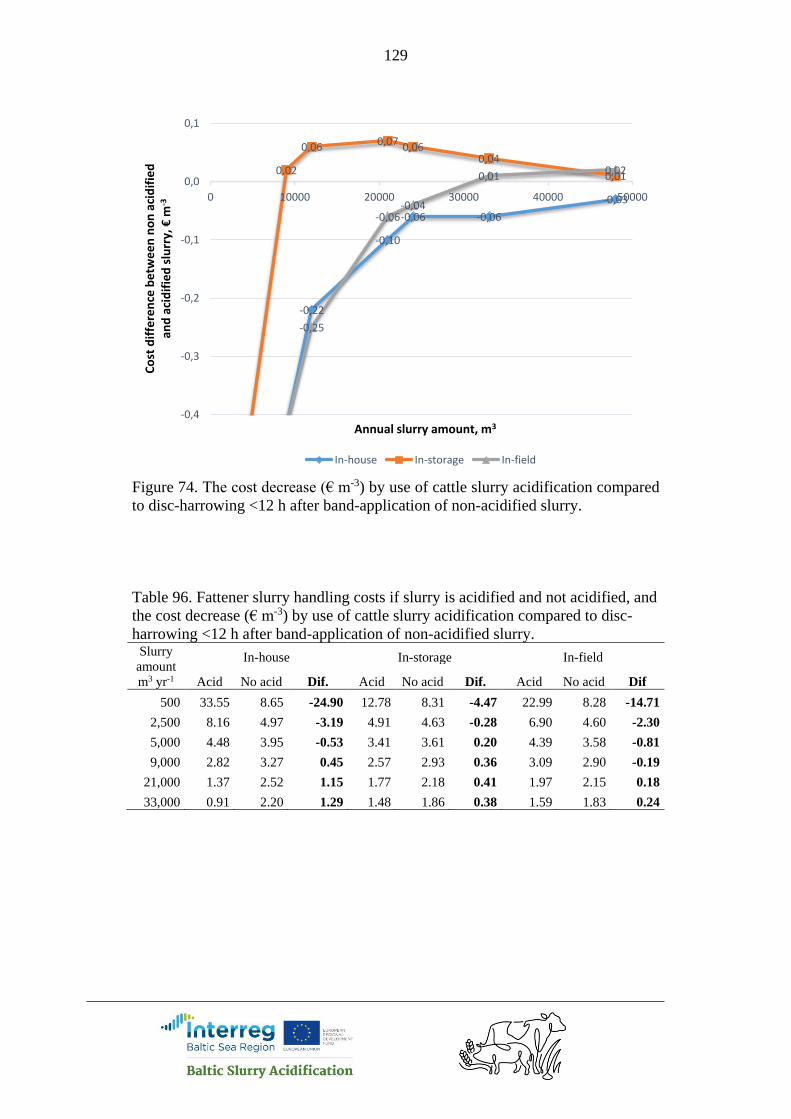
129
Figure 74. The cost decrease (€ m-3) by use of cattle slurry acidification compared
to disc-harrowing <12 h after band-application of non-acidified slurry.
Table 96. Fattener slurry handling costs if slurry is acidified and not acidified, and
the cost decrease (€ m-3) by use of cattle slurry acidification compared to disc-
harrowing <12 h after band-application of non-acidified slurry. Slurry
amount
m3 yr-1
In-house In-storage In-field
Acid No acid Dif. Acid No acid Dif. Acid No acid Dif
500 33.55 8.65 -24.90 12.78 8.31 -4.47 22.99 8.28 -14.71
2,500 8.16 4.97 -3.19 4.91 4.63 -0.28 6.90 4.60 -2.30
5,000 4.48 3.95 -0.53 3.41 3.61 0.20 4.39 3.58 -0.81
9,000 2.82 3.27 0.45 2.57 2.93 0.36 3.09 2.90 -0.19
21,000 1.37 2.52 1.15 1.77 2.18 0.41 1.97 2.15 0.18
33,000 0.91 2.20 1.29 1.48 1.86 0.38 1.59 1.83 0.24
-0,22
-0,10
-0,06 -0,06
-0,03
0,02
0,06 0,07 0,060,04
0,01
-0,25
-0,06-0,04
0,01 0,02
-0,4
-0,3
-0,2
-0,1
0,0
0,1
0 10000 20000 30000 40000 50000
Co
st d
iffe
ren
ce b
etw
ee
n n
on
aci
dif
ied
an
d a
cid
ifie
d s
lurr
y, €
m-3
Annual slurry amount, m3
In-house In-storage In-field
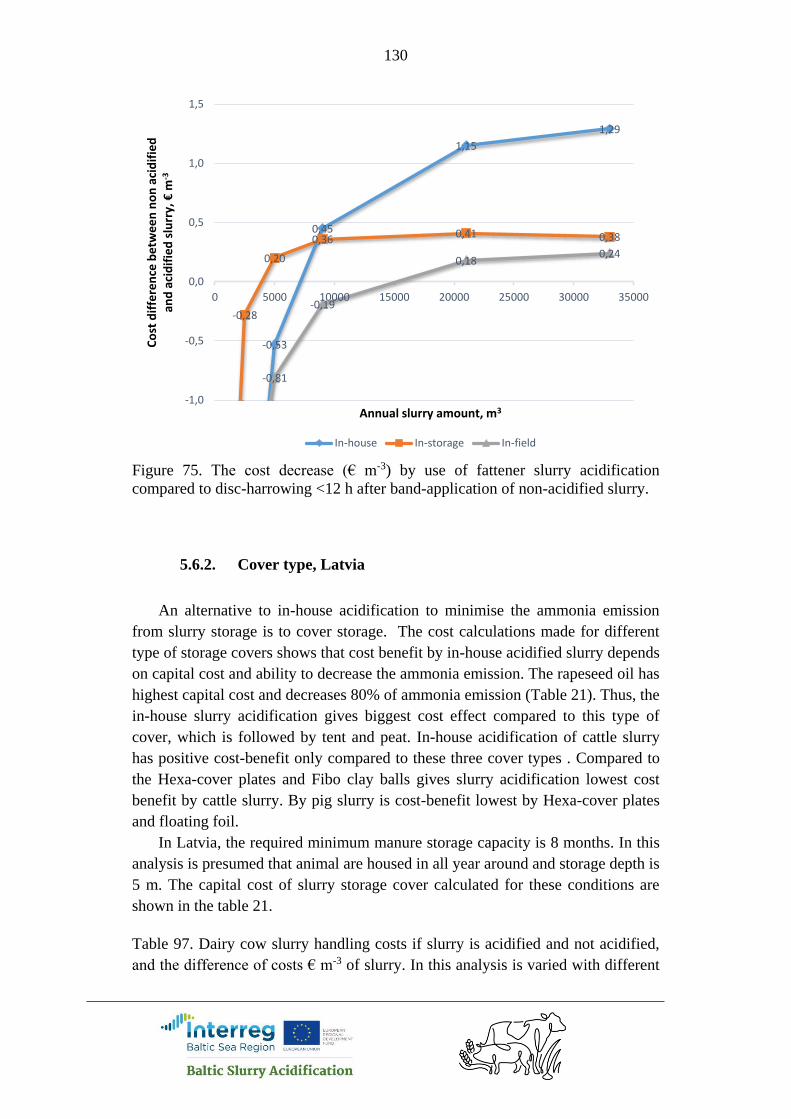
130
Figure 75. The cost decrease (€ m-3) by use of fattener slurry acidification
compared to disc-harrowing <12 h after band-application of non-acidified slurry.
5.6.2. Cover type, Latvia
An alternative to in-house acidification to minimise the ammonia emission
from slurry storage is to cover storage. The cost calculations made for different
type of storage covers shows that cost benefit by in-house acidified slurry depends
on capital cost and ability to decrease the ammonia emission. The rapeseed oil has
highest capital cost and decreases 80% of ammonia emission (Table 21). Thus, the
in-house slurry acidification gives biggest cost effect compared to this type of
cover, which is followed by tent and peat. In-house acidification of cattle slurry
has positive cost-benefit only compared to these three cover types . Compared to
the Hexa-cover plates and Fibo clay balls gives slurry acidification lowest cost
benefit by cattle slurry. By pig slurry is cost-benefit lowest by Hexa-cover plates
and floating foil.
In Latvia, the required minimum manure storage capacity is 8 months. In this
analysis is presumed that animal are housed in all year around and storage depth is
5 m. The capital cost of slurry storage cover calculated for these conditions are
shown in the table 21.
Table 97. Dairy cow slurry handling costs if slurry is acidified and not acidified,
and the difference of costs € m-3 of slurry. In this analysis is varied with different
-0,53
0,45
1,15
1,29
-0,28
0,20
0,36 0,41 0,38
-0,81
-0,19
0,180,24
-1,0
-0,5
0,0
0,5
1,0
1,5
0 5000 10000 15000 20000 25000 30000 35000
Co
st d
iffe
ren
ce b
etw
ee
n n
on
aci
dif
ied
an
d a
cid
ifie
d s
lurr
y, €
m-3
Annual slurry amount, m3
In-house In-storage In-field
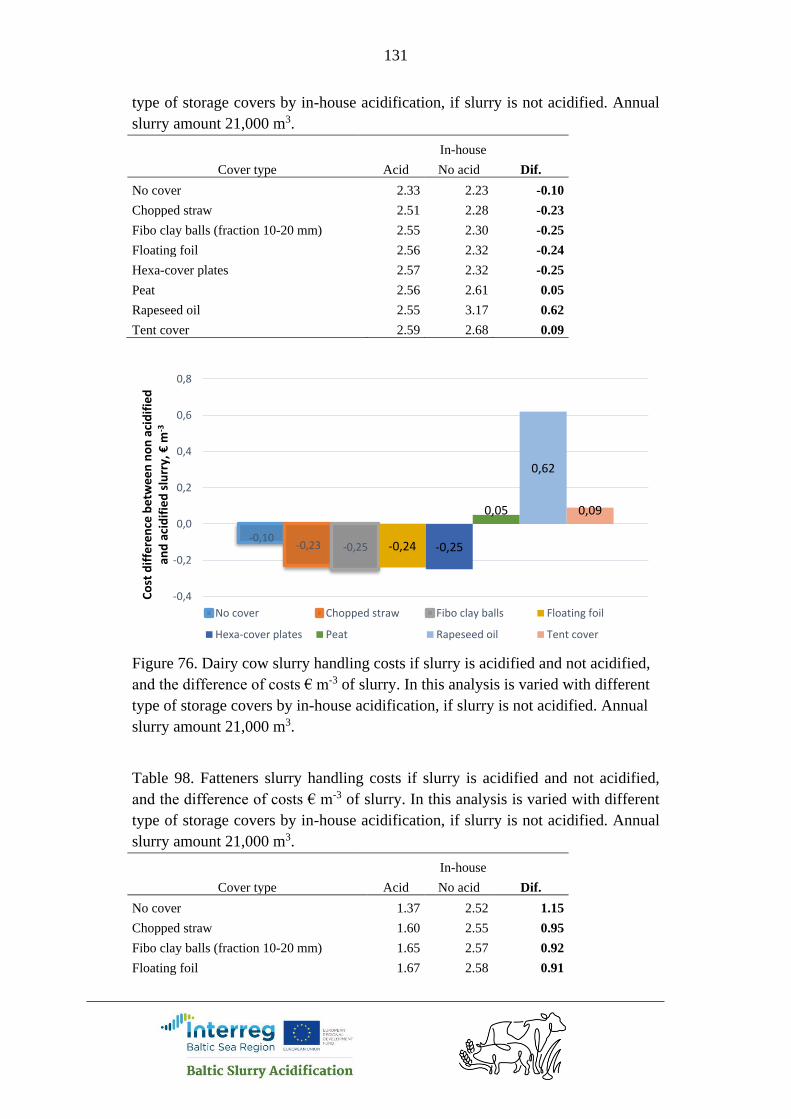
131
type of storage covers by in-house acidification, if slurry is not acidified. Annual
slurry amount 21,000 m3.
In-house
Cover type Acid No acid Dif.
No cover 2.33 2.23 -0.10
Chopped straw 2.51 2.28 -0.23
Fibo clay balls (fraction 10-20 mm) 2.55 2.30 -0.25
Floating foil 2.56 2.32 -0.24
Hexa-cover plates 2.57 2.32 -0.25
Peat 2.56 2.61 0.05
Rapeseed oil 2.55 3.17 0.62
Tent cover 2.59 2.68 0.09
Figure 76. Dairy cow slurry handling costs if slurry is acidified and not acidified,
and the difference of costs € m-3 of slurry. In this analysis is varied with different
type of storage covers by in-house acidification, if slurry is not acidified. Annual
slurry amount 21,000 m3.
Table 98. Fatteners slurry handling costs if slurry is acidified and not acidified,
and the difference of costs € m-3 of slurry. In this analysis is varied with different
type of storage covers by in-house acidification, if slurry is not acidified. Annual
slurry amount 21,000 m3.
In-house
Cover type Acid No acid Dif.
No cover 1.37 2.52 1.15
Chopped straw 1.60 2.55 0.95
Fibo clay balls (fraction 10-20 mm) 1.65 2.57 0.92
Floating foil 1.67 2.58 0.91
-0,10-0,23 -0,25 -0,24 -0,25
0,05
0,62
0,09
-0,4
-0,2
0,0
0,2
0,4
0,6
0,8
Co
st d
iffe
ren
ce b
etw
ee
n n
on
aci
dif
ied
an
d a
cid
ifie
d s
lurr
y, €
m-3
No cover Chopped straw Fibo clay balls Floating foil
Hexa-cover plates Peat Rapeseed oil Tent cover
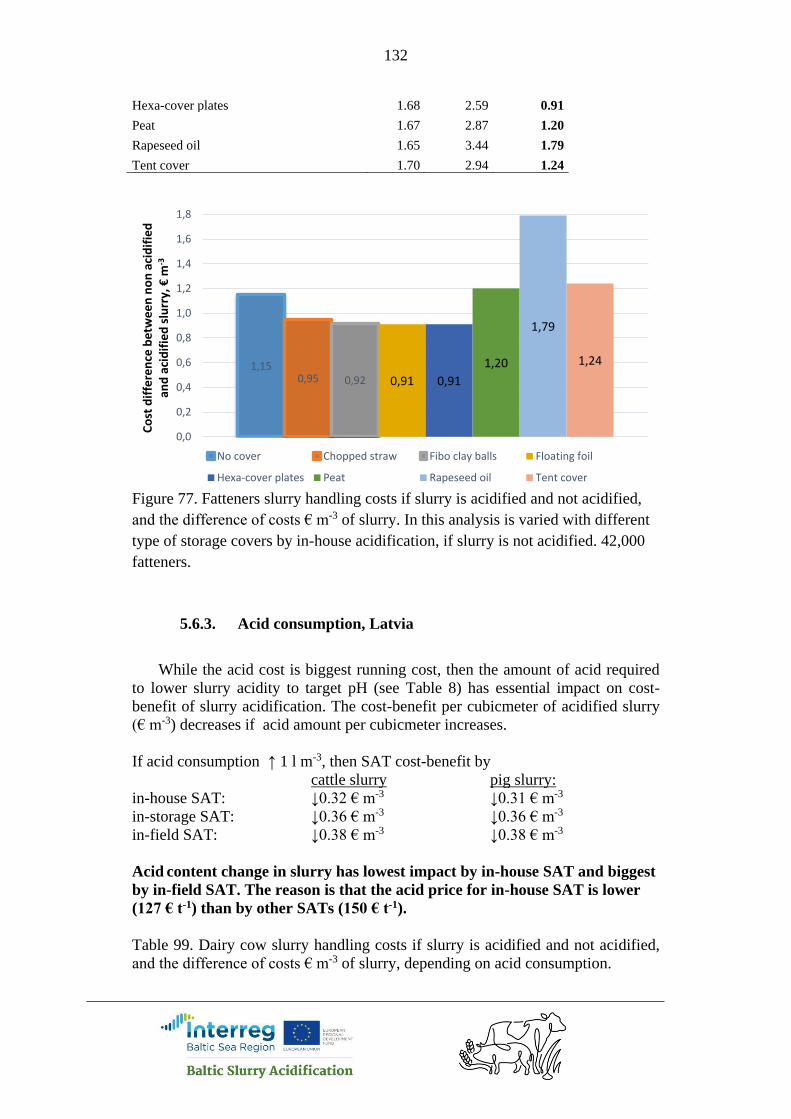
132
Hexa-cover plates 1.68 2.59 0.91
Peat 1.67 2.87 1.20
Rapeseed oil 1.65 3.44 1.79
Tent cover 1.70 2.94 1.24
Figure 77. Fatteners slurry handling costs if slurry is acidified and not acidified,
and the difference of costs € m-3 of slurry. In this analysis is varied with different
type of storage covers by in-house acidification, if slurry is not acidified. 42,000
fatteners.
5.6.3. Acid consumption, Latvia
While the acid cost is biggest running cost, then the amount of acid required
to lower slurry acidity to target pH (see Table 8) has essential impact on cost-
benefit of slurry acidification. The cost-benefit per cubicmeter of acidified slurry
(€ m-3) decreases if acid amount per cubicmeter increases.
If acid consumption ↑ 1 l m-3, then SAT cost-benefit by
cattle slurry pig slurry:
in-house SAT: ↓0.32 € m-3 ↓0.31 € m-3
in-storage SAT: ↓0.36 € m-3 ↓0.36 € m-3
in-field SAT: ↓0.38 € m-3 ↓0.38 € m-3
Acid content change in slurry has lowest impact by in-house SAT and biggest
by in-field SAT. The reason is that the acid price for in-house SAT is lower
(127 € t-1) than by other SATs (150 € t-1).
Table 99. Dairy cow slurry handling costs if slurry is acidified and not acidified,
and the difference of costs € m-3 of slurry, depending on acid consumption.
1,150,95 0,92 0,91 0,91
1,20
1,79
1,24
0,0
0,2
0,4
0,6
0,8
1,0
1,2
1,4
1,6
1,8
Co
st d
iffe
ren
ce b
etw
ee
n n
on
aci
dif
ied
an
d a
cid
ifie
d s
lurr
y, €
m-3
No cover Chopped straw Fibo clay balls Floating foil
Hexa-cover plates Peat Rapeseed oil Tent cover

133
Acid In-house In-storage In-field
amount
l m-3 Acid No acid Dif. Acid No acid Dif. Acid No acid Dif
1 1.25 2.23 0.98 1.18 2.15 0.97 1.48 2.12 0.64
3 1.83 2.23 0.40 1.85 2.15 0.30 2.18 2.12 -0.06
4 2.16 2.23 0.07 2.23 2.15 -0.08 2.57 2.12 -0.45
5 2.49 2.23 -0.26 2.61 2.15 -0.46 2.96 2.12 -0.84
7 3.15 2.23 -0.92 3.36 2.15 -1.21 3.73 2.12 -1.61
Figure 78. Dairy cow slurry handling costs if slurry is acidified and not acidified,
and the difference of costs € m-3 of slurry, depending on acid consumption
Table 100. Fatteners slurry handling costs if slurry is acidified and not acidified,
and the difference of costs € m-3 of slurry, depending on acid consumption.
Acid In-house In-storage In-field
amount
l m-3 Acid No acid Dif. Acid No acid Dif. Acid No acid Dif
1 0.68 2.52 1.84 1.09 2.18 1.09 1.41 2.15 0.74
3 1.21 2.52 1.31 1.77 2.18 0.41 2.11 2.15 0.04
4 1.54 2.52 0.98 2.14 2.18 0.04 2.50 2.15 -0.35
5 1.87 2.52 0.65 2.52 2.18 -0.34 2.89 2.15 -0.74
7 2.53 2.52 -0.01 3.27 2.18 -1.09 3.66 2.15 -1.51
0,98
0,40
0,07
-0,26
-0,92
0,97
0,30
-0,08
-0,46
-1,21
0,64
-0,06
-0,45
-0,84
-1,61
-2,0
-1,5
-1,0
-0,5
0,0
0,5
1,0
1 3 4 5 7
Co
st d
iffe
ren
ce b
etw
ee
n n
on
aci
dif
ied
an
d a
cid
ifie
d s
lurr
y, €
m-3
Acid amount litres per m3 of slurry
In-house In-storage In-field

134
Figure 79. Fatteners slurry handling costs if slurry is acidified and not acidified,
and the difference of costs € m-3 of slurry, depending on acid consumption
5.6.4. Ntot in slurry, Latvia
The cost benefit per cubicmeter of acidified slurry (€ m-3) increases if Ntot
content in slurry rises.
If Ntot content in slurry ↑ 1 kg m-3 , then SAT cost-benefit by
cattle slurry pig slurry:
in-house SAT: ↑0.21 € m-3. ↑0.29 € m-3.
in-storage SAT: ↑0.12 € m-3. ↑0.12 € m-3.
in-field SAT: ↑0.10 € m-3 ↑0.09 € m-3.
Ntot content change in slurry has lowest impact by in-field SAT and biggest by
in-house sat, especially in the case of pig slurry. The reason is that by in-
house acidification of pig slurry is the ammonia emission reduction effect
highest, 64%.
Table 101. Dairy cow slurry handling costs if slurry is acidified and not acidified,
and the difference of costs € m-3 of slurry, depending Ntot content in slurry
Ntot In-house In-storage In-field
content
kg m-3 Acid No acid Dif. Acid No acid Dif. Acid No acid Dif
3 2.21 2.11 -0.10 2.28 2.09 -0.19
4 2.64 2.13 -0.51 2.12 2.13 0.01 2.22 2.11 -0.11
1,84
1,31
0,98
0,65
-0,01
1,09
0,41
0,04
-0,34
-1,09
0,74
0,04
-0,35
-0,74
-1,51
-1,8
-1,2
-0,6
0,0
0,6
1,2
1,8
2,4
1 3 4 5 7
Co
st d
iffe
ren
ce b
etw
ee
n n
on
aci
dif
ied
an
d a
cid
ifie
d s
lurr
y, €
m-3
Acid amount litres per m3 of slurry
In-house In-storage In-field

135
5 2.43 2.20 -0.23 2.04 2.16 0.12 2.15 2.13 -0.02
6 2.32 2.23 -0.09 1.95 2.19 0.24 2.08 2.16 0.08
7 2.21 2.27 0.06
Figure 80. Dairy cow slurry handling costs if slurry is acidified and not acidified,
and the difference of costs € m-3 of slurry, depending Ntot content in slurry
Table 102. Fatteners slurry handling costs if slurry is acidified and not acidified,
and the difference of costs € m-3 of slurry, depending Ntot content in slurry
Ntot In-house In-storage In-field
content
kg m-3 Acid No acid Dif. Acid No acid Dif. Acid No acid Dif
4 1.90 2.13 0.23 2.07 2.11 0.04
5 1.81 2.38 0.57 1.81 2.16 0.35 2.00 2.13 0.13
6 1.59 2.45 0.86 1.73 2.19 0.46 1.93 2.16 0.23
7 1.37 2.52 1.15 1.64 2.22 0.58 1.87 2.18 0.31
8 1.16 2.59 1.43
-0,51
-0,23
-0,09
0,06
-0,10
0,01
0,12
0,24
-0,19
-0,11
-0,02
0,08
-0,6
-0,5
-0,4
-0,3
-0,2
-0,1
0,0
0,1
0,2
0,3
3 4 5 6 7
Co
st d
iffe
ren
ce b
etw
ee
n n
on
aci
dif
ied
an
d a
cid
ifie
d s
lurr
y, €
m-3
Ntot content in slurry, kg m-3
In-house In-storage In-field

136
Figure 81. Fatteners slurry handling costs if slurry is acidified and not acidified,
and the difference of costs € m-3 of slurry, depending Ntot content in slurry
5.6.5. N price, Latvia
The cost benefit per cubicmeter of acidified slurry (€ m-3) increases if N price
in mineral fertilisers rises.
N price in mineral fertilisers ↑ 0.1 € kg-1, then SAT cost-benefit by
cattle slurry pig slurry:
in-house SAT: ↑0.088 € m-3. ↑0.21 € m-3.
in-storage SAT: ↑0.054 € m-3. ↑0.07 € m-3.
in-field SAT: ↑0.043 € m-3 ↑0.05 € m-3.
The change of N price in mineral fertilisers has lowest impact by in-field SAT
and biggest by in-house sat, especially in the case of pig slurry. The reason is
that by in-house acidification of pig slurry is the ammonia emission reduction
effect highest, 64%.
Bigger effect by pig slurry compared to cattle slurry is caused also by the
higher Ntot content of pig slurry and thus N-savings by SAT-s.
Table 103. Dairy cow slurry handling costs if slurry is acidified and not acidified,
and the difference of costs € m-3 of slurry, depending on N price
N In-house In-storage In-field
price
€ kg-3 Acid No acid Dif. Acid No acid Dif. Acid No acid Dif
0.335 2.62 2.23 -0.39 2.26 2.15 -0.11 2.32 2.12 -0.20
0,57
0,86
1,15
1,43
0,23
0,35
0,46
0,58
0,040,13
0,230,31
0,0
0,2
0,4
0,6
0,8
1,0
1,2
1,4
1,6
4 5 6 7 8
Co
st d
iffe
ren
ce b
etw
ee
n n
on
aci
dif
ied
an
d a
cid
ifie
d s
lurr
y, €
m-3
Ntot content in slurry, kg m-3
In-house In-storage In-field
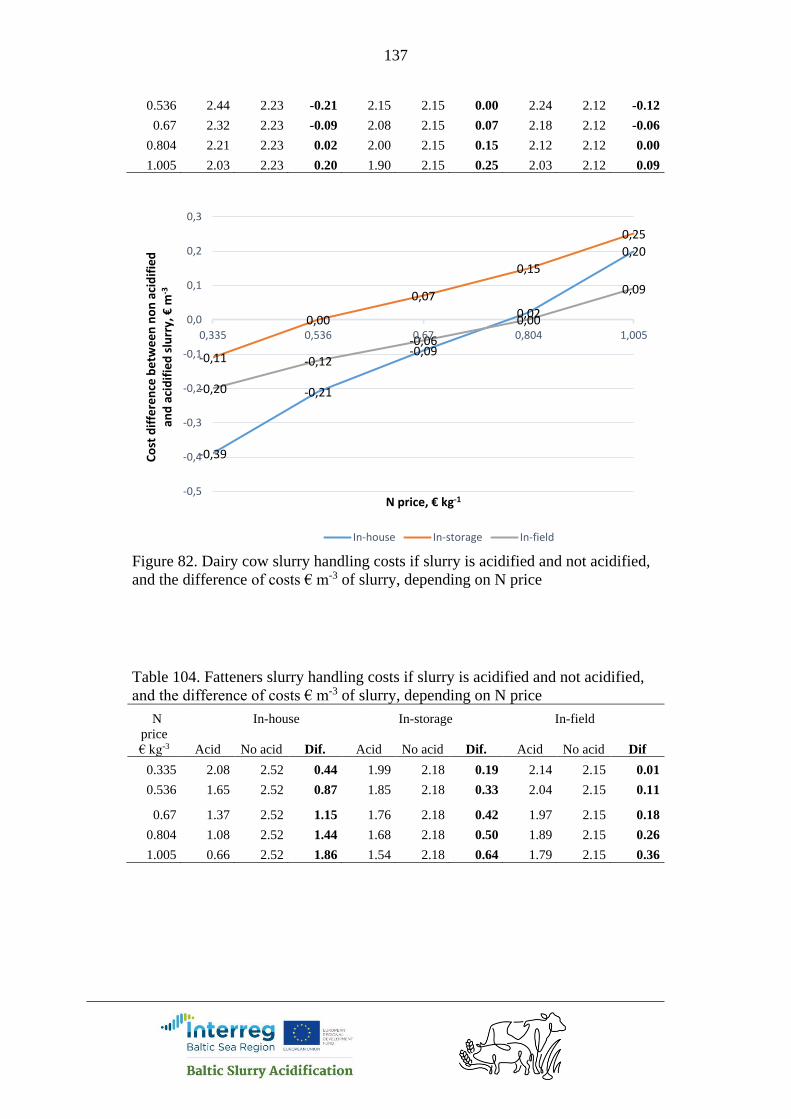
137
0.536 2.44 2.23 -0.21 2.15 2.15 0.00 2.24 2.12 -0.12
0.67 2.32 2.23 -0.09 2.08 2.15 0.07 2.18 2.12 -0.06
0.804 2.21 2.23 0.02 2.00 2.15 0.15 2.12 2.12 0.00
1.005 2.03 2.23 0.20 1.90 2.15 0.25 2.03 2.12 0.09
Figure 82. Dairy cow slurry handling costs if slurry is acidified and not acidified,
and the difference of costs € m-3 of slurry, depending on N price
Table 104. Fatteners slurry handling costs if slurry is acidified and not acidified,
and the difference of costs € m-3 of slurry, depending on N price
N In-house In-storage In-field
price
€ kg-3 Acid No acid Dif. Acid No acid Dif. Acid No acid Dif
0.335 2.08 2.52 0.44 1.99 2.18 0.19 2.14 2.15 0.01
0.536 1.65 2.52 0.87 1.85 2.18 0.33 2.04 2.15 0.11
0.67 1.37 2.52 1.15 1.76 2.18 0.42 1.97 2.15 0.18
0.804 1.08 2.52 1.44 1.68 2.18 0.50 1.89 2.15 0.26
1.005 0.66 2.52 1.86 1.54 2.18 0.64 1.79 2.15 0.36
-0,39
-0,21
-0,09
0,02
0,20
-0,11
0,00
0,07
0,15
0,25
-0,20
-0,12
-0,06
0,00
0,09
-0,5
-0,4
-0,3
-0,2
-0,1
0,0
0,1
0,2
0,3
0,335 0,536 0,67 0,804 1,005
Co
st d
iffe
ren
ce b
etw
ee
n n
on
aci
dif
ied
an
d a
cid
ifie
d s
lurr
y, €
m-3
N price, € kg-1
In-house In-storage In-field

138
Figure 83. Fatteners slurry handling costs if slurry is acidified and not acidified,
and the difference of costs € m-3 of slurry, depending on N price
5.6.6. S price, Latvia
The cost benefit per cubicmeter of acidified slurry (€ m-3) increases if S price in
mineral fertilisers rises.
S price in mineral fertilisers ↑ 0.1 € kg-1, then SAT cost-benefit by
cattle slurry pig slurry:
in-pit SAT: ↑0.08 € m-3. ↑0.10 € m-3.
in-storage SAT: ↑0.08 € m-3. ↑0.08 € m-3.
in-field SAT: ↑0.09 € m-3 ↑0.08 € m-3.
Table 105. Dairy cow slurry handling costs if slurry is acidified and not acidified,
and the difference of costs € m-3 of slurry, depending on S price
S In-house In-storage In-field
price
€ kg-3 Acid No acid Dif. Acid No acid Dif. Acid No acid Dif
0.105 2.41 2.23 -0.18 2.16 2.15 -0.01 2.27 2.12 -0.15
0.168 2.36 2.23 -0.13 2.11 2.15 0.04 2.21 2.12 -0.09
0.21 2.32 2.23 -0.09 2.08 2.15 0.07 2.18 2.12 -0.06
0.252 2.29 2.23 -0.06 2.04 2.15 0.11 2.14 2.12 -0.02
0.315 2.24 2.23 -0.01 1.99 2.15 0.16 2.09 2.12 0.03
0,44
0,87
1,15
1,44
1,86
0,19
0,330,42
0,50
0,64
0,010,11
0,180,26
0,36
0,0
0,3
0,6
0,9
1,2
1,5
1,8
2,1
0,335 0,536 0,67 0,804 1,005
Co
st d
iffe
ren
ce b
etw
ee
n n
on
aci
dif
ied
an
d a
cid
ifie
d s
lurr
y, €
m-3
N price, € kg-1
In-house In-storage In-field

139
Figure 84. Dairy cow slurry handling costs if slurry is acidified and not acidified,
and the difference of costs € m-3 of slurry, depending on S price
Table 106. Fatteners slurry handling costs if slurry is acidified and not acidified,
and the difference of costs € m-3 of slurry, depending on S price
S In-house In-storage In-field
price
€ kg-3 Acid No acid Dif. Acid No acid Dif. Acid No acid Dif
0.105 1.48 2.52 1.04 1.85 2.18 0.33 2.05 2.15 0.10
0.168 1.41 2.52 1.11 1.80 2.18 0.38 2.00 2.15 0.15
0.21 1.37 2.52 1.15 1.76 2.18 0.42 1.97 2.15 0.18
0.252 1.32 2.52 1.20 1.73 2.18 0.45 1.93 2.15 0.22
0.315 1.26 2.52 1.26 1.68 2.18 0.50 1.88 2.15 0.27
-0,18
-0,13
-0,09
-0,06
-0,01-0,01
0,04
0,07
0,11
0,16
-0,15
-0,09
-0,06
-0,02
0,03
-0,2
-0,1
0,0
0,1
0,2
0,105 0,168 0,21 0,252 0,315
Co
st d
iffe
ren
ce b
etw
ee
n n
on
aci
dif
ied
an
d a
cid
ifie
d s
lurr
y, €
m-3
S price, € kg-1
In-house In-storage In-field
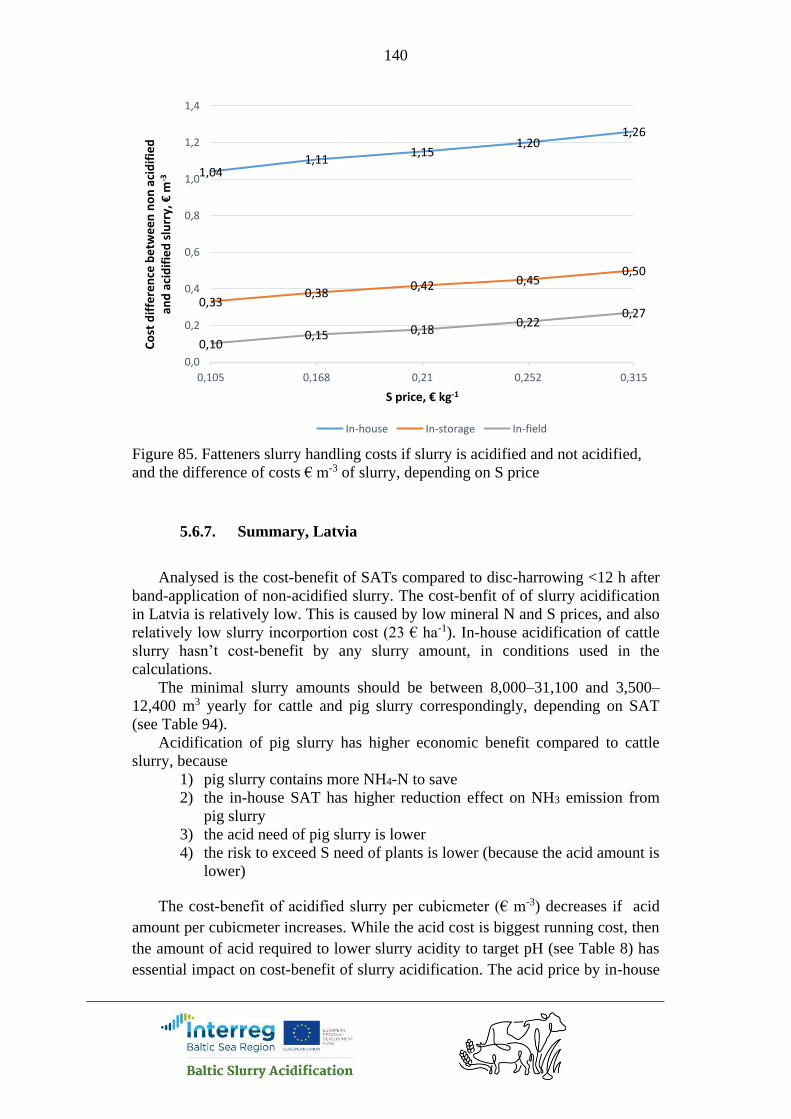
140
Figure 85. Fatteners slurry handling costs if slurry is acidified and not acidified,
and the difference of costs € m-3 of slurry, depending on S price
5.6.7. Summary, Latvia
Analysed is the cost-benefit of SATs compared to disc-harrowing <12 h after
band-application of non-acidified slurry. The cost-benfit of of slurry acidification
in Latvia is relatively low. This is caused by low mineral N and S prices, and also
relatively low slurry incorportion cost (23 € ha-1). In-house acidification of cattle
slurry hasn’t cost-benefit by any slurry amount, in conditions used in the
calculations.
The minimal slurry amounts should be between 8,000–31,100 and 3,500–
12,400 m3 yearly for cattle and pig slurry correspondingly, depending on SAT
(see Table 94).
Acidification of pig slurry has higher economic benefit compared to cattle
slurry, because
1) pig slurry contains more NH4-N to save
2) the in-house SAT has higher reduction effect on NH3 emission from
pig slurry
3) the acid need of pig slurry is lower
4) the risk to exceed S need of plants is lower (because the acid amount is
lower)
The cost-benefit of acidified slurry per cubicmeter (€ m-3) decreases if acid
amount per cubicmeter increases. While the acid cost is biggest running cost, then
the amount of acid required to lower slurry acidity to target pH (see Table 8) has
essential impact on cost-benefit of slurry acidification. The acid price by in-house
1,041,11
1,151,20
1,26
0,330,38
0,42 0,450,50
0,100,15 0,18
0,220,27
0,0
0,2
0,4
0,6
0,8
1,0
1,2
1,4
0,105 0,168 0,21 0,252 0,315
Co
st d
iffe
ren
ce b
etw
ee
n n
on
aci
dif
ied
an
d a
cid
ifie
d s
lurr
y, €
m-3
S price, € kg-1
In-house In-storage In-field
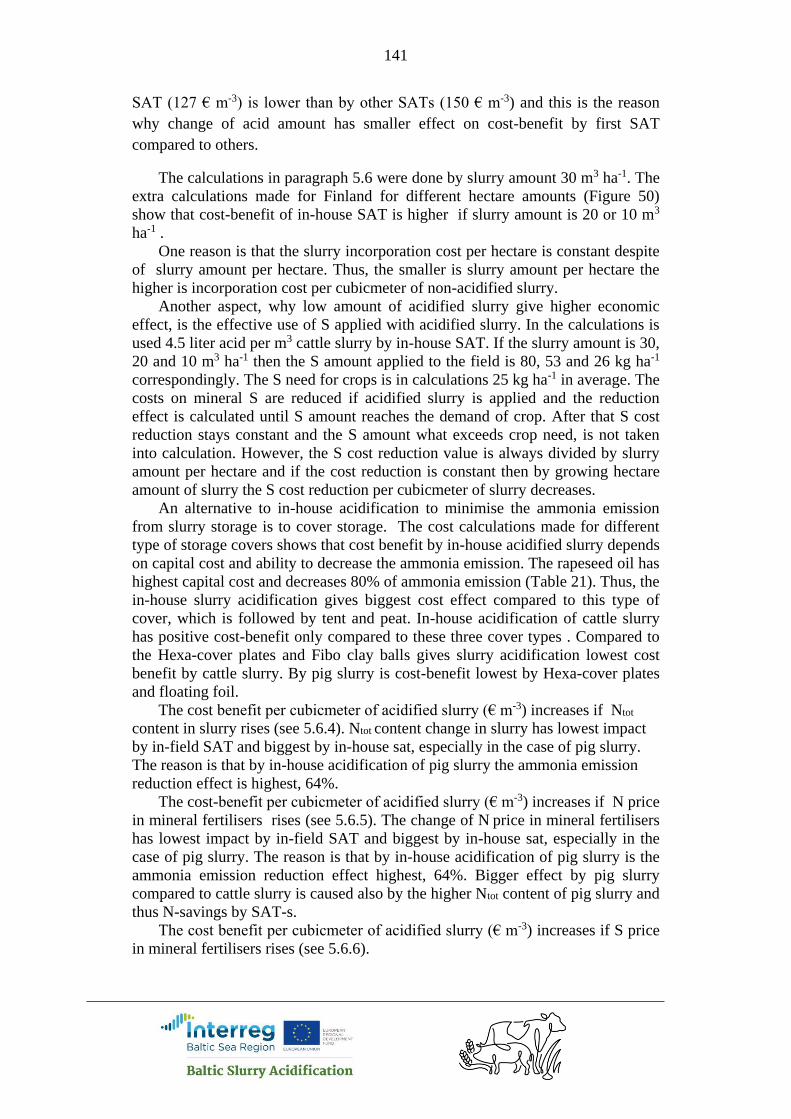
141
SAT (127 € m-3) is lower than by other SATs (150 € m-3) and this is the reason
why change of acid amount has smaller effect on cost-benefit by first SAT
compared to others.
The calculations in paragraph 5.6 were done by slurry amount 30 m3 ha-1. The
extra calculations made for Finland for different hectare amounts (Figure 50)
show that cost-benefit of in-house SAT is higher if slurry amount is 20 or 10 m3
ha-1 .
One reason is that the slurry incorporation cost per hectare is constant despite
of slurry amount per hectare. Thus, the smaller is slurry amount per hectare the
higher is incorporation cost per cubicmeter of non-acidified slurry.
Another aspect, why low amount of acidified slurry give higher economic
effect, is the effective use of S applied with acidified slurry. In the calculations is
used 4.5 liter acid per m3 cattle slurry by in-house SAT. If the slurry amount is 30,
20 and 10 m3 ha-1 then the S amount applied to the field is 80, 53 and 26 kg ha-1
correspondingly. The S need for crops is in calculations 25 kg ha-1 in average. The
costs on mineral S are reduced if acidified slurry is applied and the reduction
effect is calculated until S amount reaches the demand of crop. After that S cost
reduction stays constant and the S amount what exceeds crop need, is not taken
into calculation. However, the S cost reduction value is always divided by slurry
amount per hectare and if the cost reduction is constant then by growing hectare
amount of slurry the S cost reduction per cubicmeter of slurry decreases.
An alternative to in-house acidification to minimise the ammonia emission
from slurry storage is to cover storage. The cost calculations made for different
type of storage covers shows that cost benefit by in-house acidified slurry depends
on capital cost and ability to decrease the ammonia emission. The rapeseed oil has
highest capital cost and decreases 80% of ammonia emission (Table 21). Thus, the
in-house slurry acidification gives biggest cost effect compared to this type of
cover, which is followed by tent and peat. In-house acidification of cattle slurry
has positive cost-benefit only compared to these three cover types . Compared to
the Hexa-cover plates and Fibo clay balls gives slurry acidification lowest cost
benefit by cattle slurry. By pig slurry is cost-benefit lowest by Hexa-cover plates
and floating foil.
The cost benefit per cubicmeter of acidified slurry (€ m-3) increases if Ntot
content in slurry rises (see 5.6.4). Ntot content change in slurry has lowest impact
by in-field SAT and biggest by in-house sat, especially in the case of pig slurry.
The reason is that by in-house acidification of pig slurry the ammonia emission
reduction effect is highest, 64%.
The cost-benefit per cubicmeter of acidified slurry (€ m-3) increases if N price
in mineral fertilisers rises (see 5.6.5). The change of N price in mineral fertilisers
has lowest impact by in-field SAT and biggest by in-house sat, especially in the
case of pig slurry. The reason is that by in-house acidification of pig slurry is the
ammonia emission reduction effect highest, 64%. Bigger effect by pig slurry
compared to cattle slurry is caused also by the higher Ntot content of pig slurry and
thus N-savings by SAT-s.
The cost benefit per cubicmeter of acidified slurry (€ m-3) increases if S price
in mineral fertilisers rises (see 5.6.6).

142
Although the present example shows cost benefit of slurry acidification by bigger
slurry amounts, a careful analysis with local parameters and future prices should
be performed before deciding to invest to acidification system. The analysis
model will be available on project website
5.7. Lithuania
5.7.1. Annual slurry amount, Lithuania
Analysed is the cost-benefit of SATs compared to disc-harrowing <12 h after
band-application of non-acidified slurry. The acid price in the calculations is 128
€ t-1 for in-house acidification and 157 € t-1 for in-storage and in-field
acidification. Minimum storage period 6 month. N-fertilisers is AN34.4, 250 € t-1.
NS-fertiliser N21-S24, 200 € t-1. Thus N price 0.73 € kg-1 and S price 0.15 € kg-1.
The prices of project partner countries are between 0.48–1 and 0.11–0.85€ kg-1
respectively.
Table 107. The minimum amount of slurry and corresponding amount of animal,
by which the slurry acidification has cost-benefit. Dairy cows Fatteners
SAT Annual slurry
amount, m3
Number of
animal
Annual slurry
amount, m3
Number of animal
per year
In-house NA NA 4,564 9,127
In-storage NA NA 3,226 6,451
In-field NA NA 10,827 21,653
The calculation results show, that in Lithuania by all cattle slurry amounts, if
slurry is acidified, then costs are higher than by non-acidified but incorporated
slurry. The reason is mainly very high liming costs - 175 € t-1 for liming service
including liming material and transport. Another reason is relatively low S price
compared to other project countries (0.15 € kg-1 and 0.11–0.85 € kg-1 ) .
The minimal pig slurry amounts should be between 3,200–10,800 m3 yearly
depending on SAT (see Table 107).
Table 108. Dairy cow slurry handling costs if slurry is acidified and not acidified,
and the cost decrease (€ m-3) by use of cattle slurry acidification compared to disc-
harrowing <12 h after band-application of non-acidified slurry. Slurry
amount
m3 yr-1
In-house In-storage In-field
Acid No acid Dif. Acid No acid Dif. Acid No acid Dif
1,200 11.26 6.63 -4.63 8.28 6.39 -1.89 12.10 6.32 -5.78
2,400 7.31 5.31 -2.00 5.83 5.06 -0.77 7.63 4.99 -2.64
9,000 4.02 3.53 -0.49 3.38 3.29 -0.09 3.69 3.21 -0.48
12,000 3.54 3.24 -0.30 3.06 3.00 -0.06 3.24 2.93 -0.31
21,000 2.97 2.77 -0.20 2.59 2.52 -0.07 2.59 2.45 -0.14
24,000 2.83 2.66 -0.17 2.50 2.42 -0.08 2.47 2.35 -0.12
33,000 2.61 2.44 -0.17 2.30 2.20 -0.10 2.23 2.13 -0.10
48,000 2.37 2.21 -0.16 2.12 1.97 -0.15 1.99 1.90 -0.09
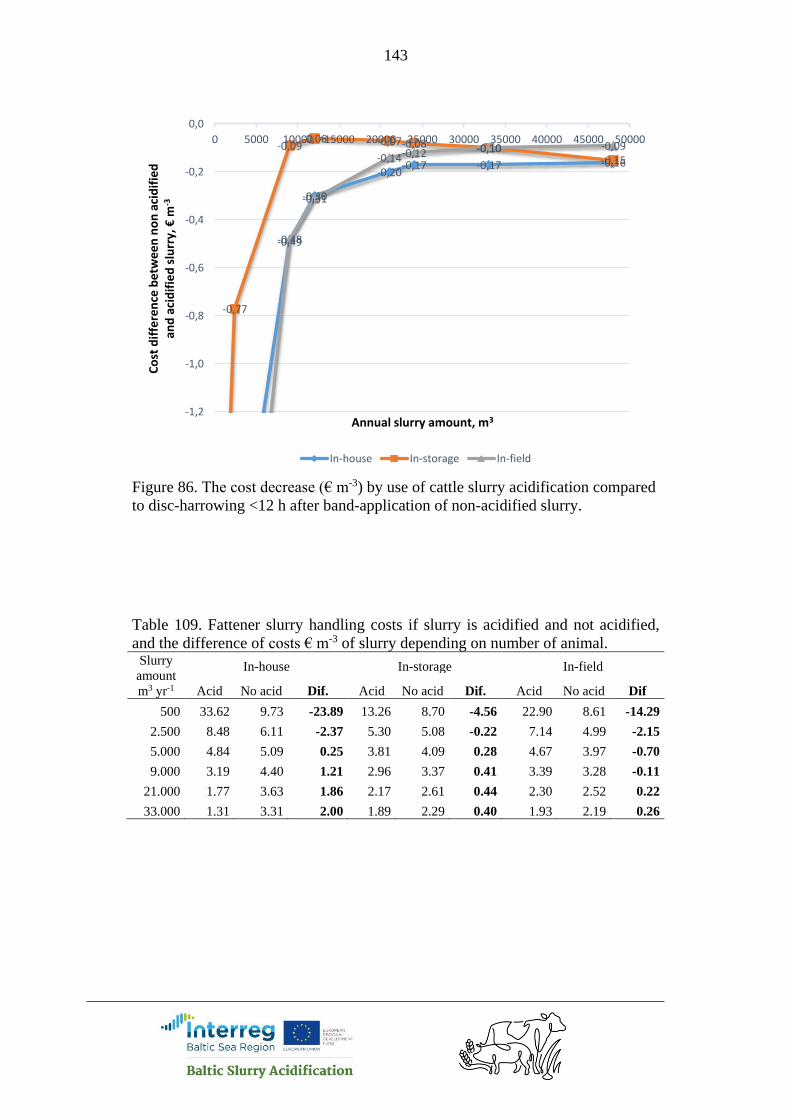
143
Figure 86. The cost decrease (€ m-3) by use of cattle slurry acidification compared
to disc-harrowing <12 h after band-application of non-acidified slurry.
Table 109. Fattener slurry handling costs if slurry is acidified and not acidified,
and the difference of costs € m-3 of slurry depending on number of animal. Slurry
amount
m3 yr-1
In-house In-storage In-field
Acid No acid Dif. Acid No acid Dif. Acid No acid Dif
500 33.62 9.73 -23.89 13.26 8.70 -4.56 22.90 8.61 -14.29
2.500 8.48 6.11 -2.37 5.30 5.08 -0.22 7.14 4.99 -2.15
5.000 4.84 5.09 0.25 3.81 4.09 0.28 4.67 3.97 -0.70
9.000 3.19 4.40 1.21 2.96 3.37 0.41 3.39 3.28 -0.11
21.000 1.77 3.63 1.86 2.17 2.61 0.44 2.30 2.52 0.22
33.000 1.31 3.31 2.00 1.89 2.29 0.40 1.93 2.19 0.26
-0,49
-0,30
-0,20-0,17 -0,17 -0,16
-0,77
-0,09-0,06 -0,07-0,08 -0,10
-0,15
-0,48
-0,31
-0,14-0,12 -0,10 -0,09
-1,2
-1,0
-0,8
-0,6
-0,4
-0,2
0,0
0 5000 10000 15000 20000 25000 30000 35000 40000 45000 50000C
ost
dif
fere
nce
be
twe
en
no
n a
cid
ifie
d
and
aci
dif
ied
slu
rry,
€m
-3
Annual slurry amount, m3
In-house In-storage In-field

144
Figure 87 The cost decrease (€ m-3) by use of fattener slurry acidification
compared to disc-harrowing <12 h after band-application of non-acidified slurry.
5.7.2. Cover type, Lithuania
An alternative to in-house acidification to minimise the ammonia emission
from slurry storage is to cover storage. The cost calculations made for different
type of storage covers shows that cost benefit by in-house acidified slurry depends
on capital cost and ability to decrease the ammonia emission. The rapeseed oil has
highest capital cost and decreases 80% of ammonia emission (Table 21). Thus, the
in-house slurry acidification gives biggest cost effect compared to this type of
cover, which is followed by tent and peat. In-house acidification of cattle slurry
has positive cost-benefit only compared to tent cover. In-house acidification of pig
slurry has positive cost-benefit compared to all cover types.
In Lithuania, the required minimum manure storage capacity is 6 months. In
this analysis is presumed that animal are housed in all year around and storage
depth is 5 m. The capital cost of slurry storage cover calculated for these
conditions are shown in the table 21.
Table 110. Dairy cow slurry handling costs if slurry is acidified and not acidified,
and the difference of costs € m-3 of slurry. In this analysis is varied with different
type of storage covers by in-house acidification, if slurry is not acidified. Annual
slurry amount 21,000 m3.
0,25
1,21
1,86
2,00
0,28
0,41 0,44 0,40
0,22 0,26
0,0
0,4
0,8
1,2
1,6
2,0
2,4
0 5000 10000 15000 20000 25000 30000 35000
Co
st d
iffe
ren
ce b
etw
ee
n n
on
aci
dif
ied
an
d a
cid
ifie
d s
lurr
y, €
m-3
Annual slurry amount, m3
In-house In-storage In-field
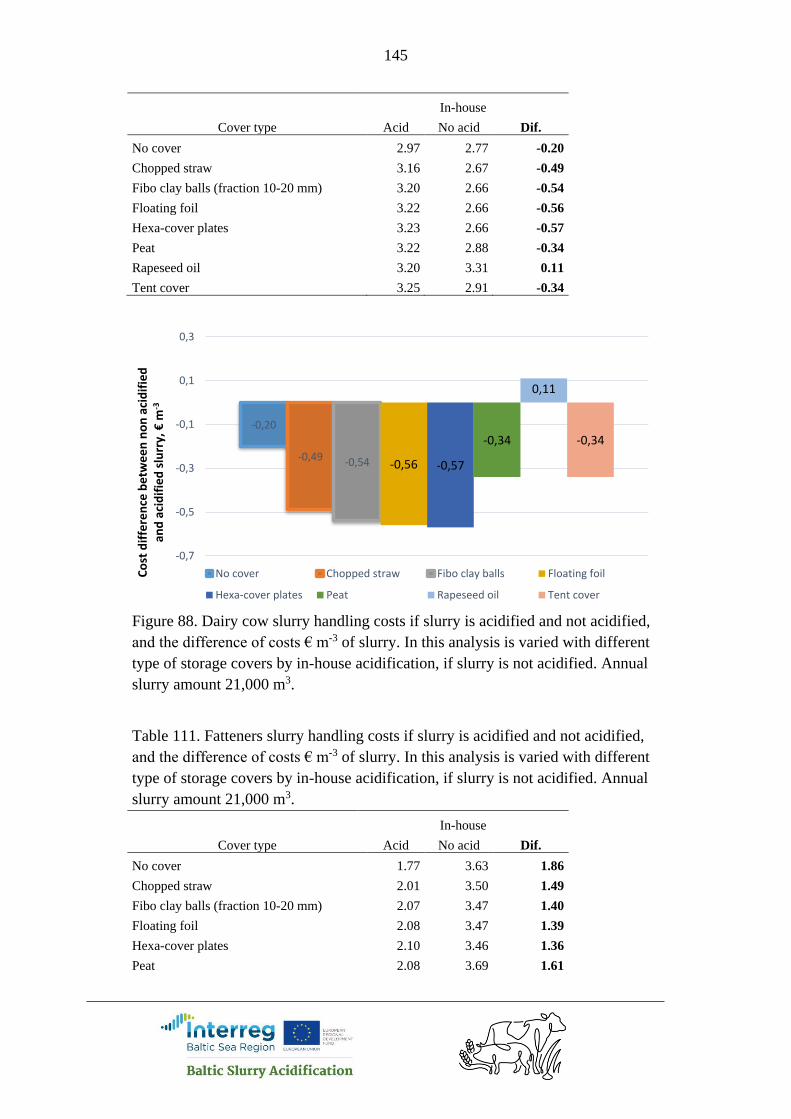
145
In-house
Cover type Acid No acid Dif.
No cover 2.97 2.77 -0.20
Chopped straw 3.16 2.67 -0.49
Fibo clay balls (fraction 10-20 mm) 3.20 2.66 -0.54
Floating foil 3.22 2.66 -0.56
Hexa-cover plates 3.23 2.66 -0.57
Peat 3.22 2.88 -0.34
Rapeseed oil 3.20 3.31 0.11
Tent cover 3.25 2.91 -0.34
Figure 88. Dairy cow slurry handling costs if slurry is acidified and not acidified,
and the difference of costs € m-3 of slurry. In this analysis is varied with different
type of storage covers by in-house acidification, if slurry is not acidified. Annual
slurry amount 21,000 m3.
Table 111. Fatteners slurry handling costs if slurry is acidified and not acidified,
and the difference of costs € m-3 of slurry. In this analysis is varied with different
type of storage covers by in-house acidification, if slurry is not acidified. Annual
slurry amount 21,000 m3.
In-house
Cover type Acid No acid Dif.
No cover 1.77 3.63 1.86
Chopped straw 2.01 3.50 1.49
Fibo clay balls (fraction 10-20 mm) 2.07 3.47 1.40
Floating foil 2.08 3.47 1.39
Hexa-cover plates 2.10 3.46 1.36
Peat 2.08 3.69 1.61
-0,20
-0,49 -0,54 -0,56 -0,57
-0,34
0,11
-0,34
-0,7
-0,5
-0,3
-0,1
0,1
0,3
Co
st d
iffe
ren
ce b
etw
ee
n n
on
aci
dif
ied
an
d a
cid
ifie
d s
lurr
y, €
m-3
No cover Chopped straw Fibo clay balls Floating foil
Hexa-cover plates Peat Rapeseed oil Tent cover
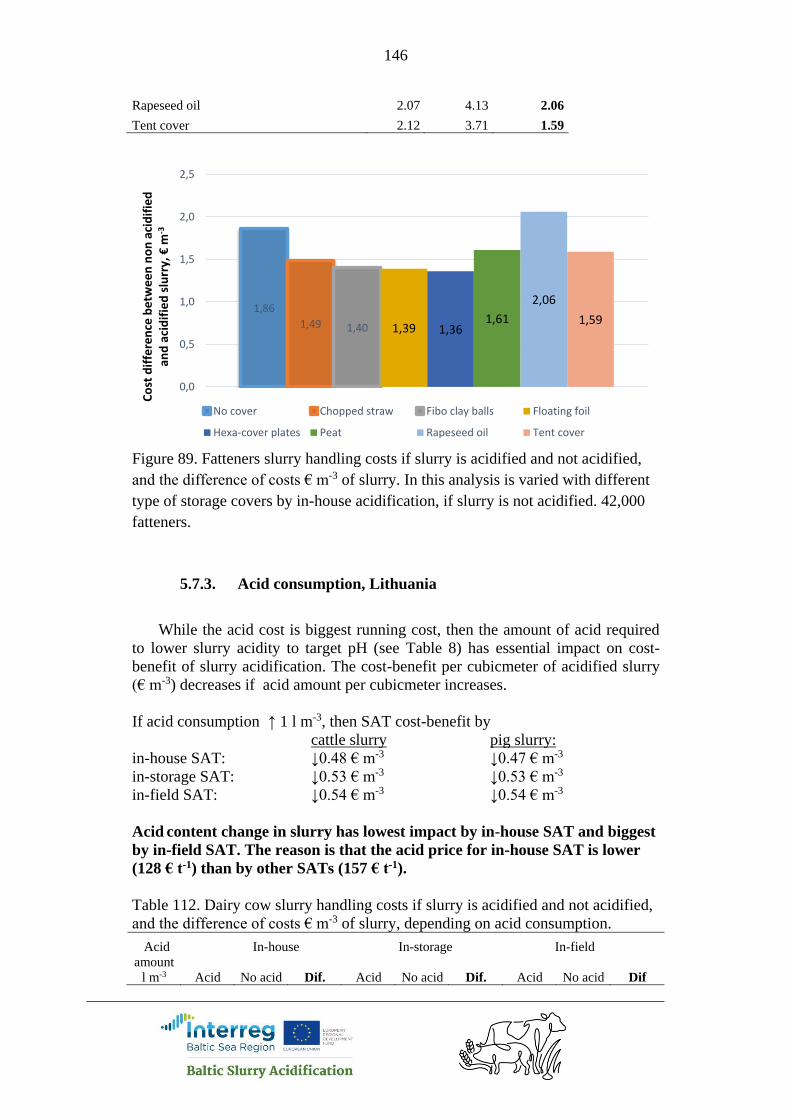
146
Rapeseed oil 2.07 4.13 2.06
Tent cover 2.12 3.71 1.59
Figure 89. Fatteners slurry handling costs if slurry is acidified and not acidified,
and the difference of costs € m-3 of slurry. In this analysis is varied with different
type of storage covers by in-house acidification, if slurry is not acidified. 42,000
fatteners.
5.7.3. Acid consumption, Lithuania
While the acid cost is biggest running cost, then the amount of acid required
to lower slurry acidity to target pH (see Table 8) has essential impact on cost-
benefit of slurry acidification. The cost-benefit per cubicmeter of acidified slurry
(€ m-3) decreases if acid amount per cubicmeter increases.
If acid consumption ↑ 1 l m-3, then SAT cost-benefit by
cattle slurry pig slurry:
in-house SAT: ↓0.48 € m-3 ↓0.47 € m-3
in-storage SAT: ↓0.53 € m-3 ↓0.53 € m-3
in-field SAT: ↓0.54 € m-3 ↓0.54 € m-3
Acid content change in slurry has lowest impact by in-house SAT and biggest
by in-field SAT. The reason is that the acid price for in-house SAT is lower
(128 € t-1) than by other SATs (157 € t-1).
Table 112. Dairy cow slurry handling costs if slurry is acidified and not acidified,
and the difference of costs € m-3 of slurry, depending on acid consumption.
Acid In-house In-storage In-field
amount
l m-3 Acid No acid Dif. Acid No acid Dif. Acid No acid Dif
1,86
1,49 1,40 1,39 1,361,61
2,06
1,59
0,0
0,5
1,0
1,5
2,0
2,5
Co
st d
iffe
ren
ce b
etw
ee
n n
on
aci
dif
ied
an
d a
cid
ifie
d s
lurr
y, €
m-3
No cover Chopped straw Fibo clay balls Floating foil
Hexa-cover plates Peat Rapeseed oil Tent cover
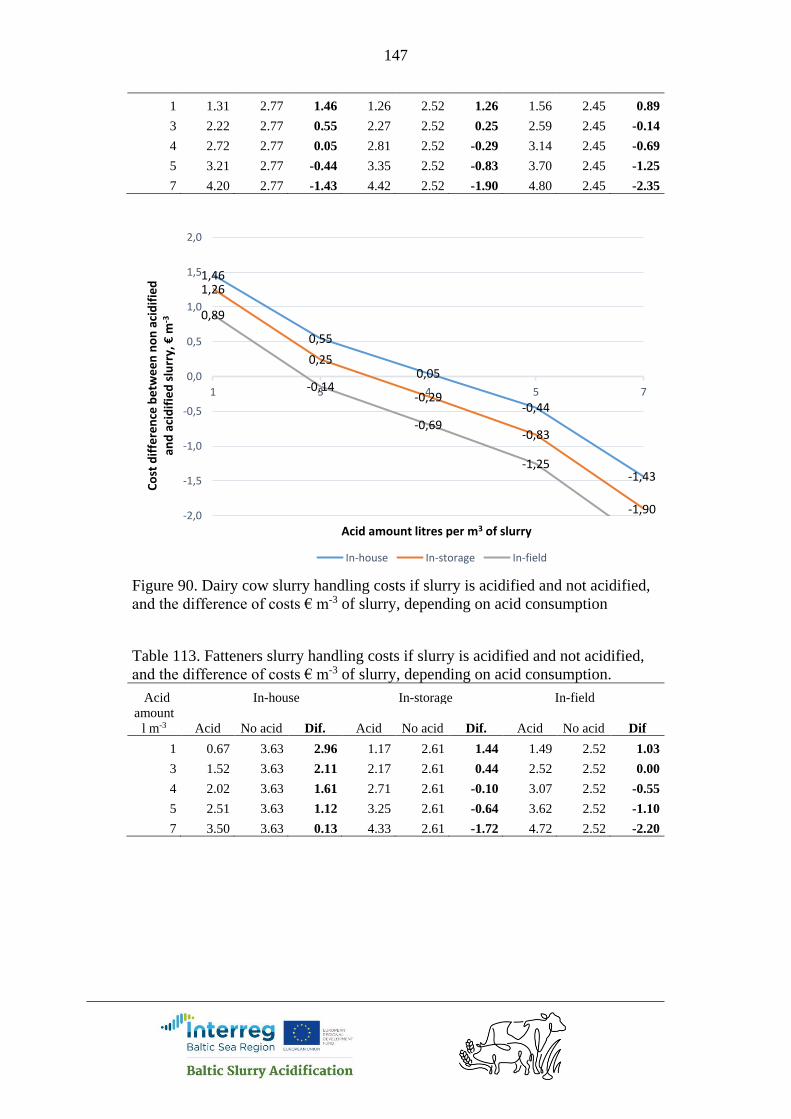
147
1 1.31 2.77 1.46 1.26 2.52 1.26 1.56 2.45 0.89
3 2.22 2.77 0.55 2.27 2.52 0.25 2.59 2.45 -0.14
4 2.72 2.77 0.05 2.81 2.52 -0.29 3.14 2.45 -0.69
5 3.21 2.77 -0.44 3.35 2.52 -0.83 3.70 2.45 -1.25
7 4.20 2.77 -1.43 4.42 2.52 -1.90 4.80 2.45 -2.35
Figure 90. Dairy cow slurry handling costs if slurry is acidified and not acidified,
and the difference of costs € m-3 of slurry, depending on acid consumption
Table 113. Fatteners slurry handling costs if slurry is acidified and not acidified,
and the difference of costs € m-3 of slurry, depending on acid consumption.
Acid In-house In-storage In-field
amount
l m-3 Acid No acid Dif. Acid No acid Dif. Acid No acid Dif
1 0.67 3.63 2.96 1.17 2.61 1.44 1.49 2.52 1.03
3 1.52 3.63 2.11 2.17 2.61 0.44 2.52 2.52 0.00
4 2.02 3.63 1.61 2.71 2.61 -0.10 3.07 2.52 -0.55
5 2.51 3.63 1.12 3.25 2.61 -0.64 3.62 2.52 -1.10
7 3.50 3.63 0.13 4.33 2.61 -1.72 4.72 2.52 -2.20
1,46
0,55
0,05
-0,44
-1,43
1,26
0,25
-0,29
-0,83
-1,90
0,89
-0,14
-0,69
-1,25
-2,0
-1,5
-1,0
-0,5
0,0
0,5
1,0
1,5
2,0
1 3 4 5 7
Co
st d
iffe
ren
ce b
etw
ee
n n
on
aci
dif
ied
an
d a
cid
ifie
d s
lurr
y, €
m-3
Acid amount litres per m3 of slurry
In-house In-storage In-field
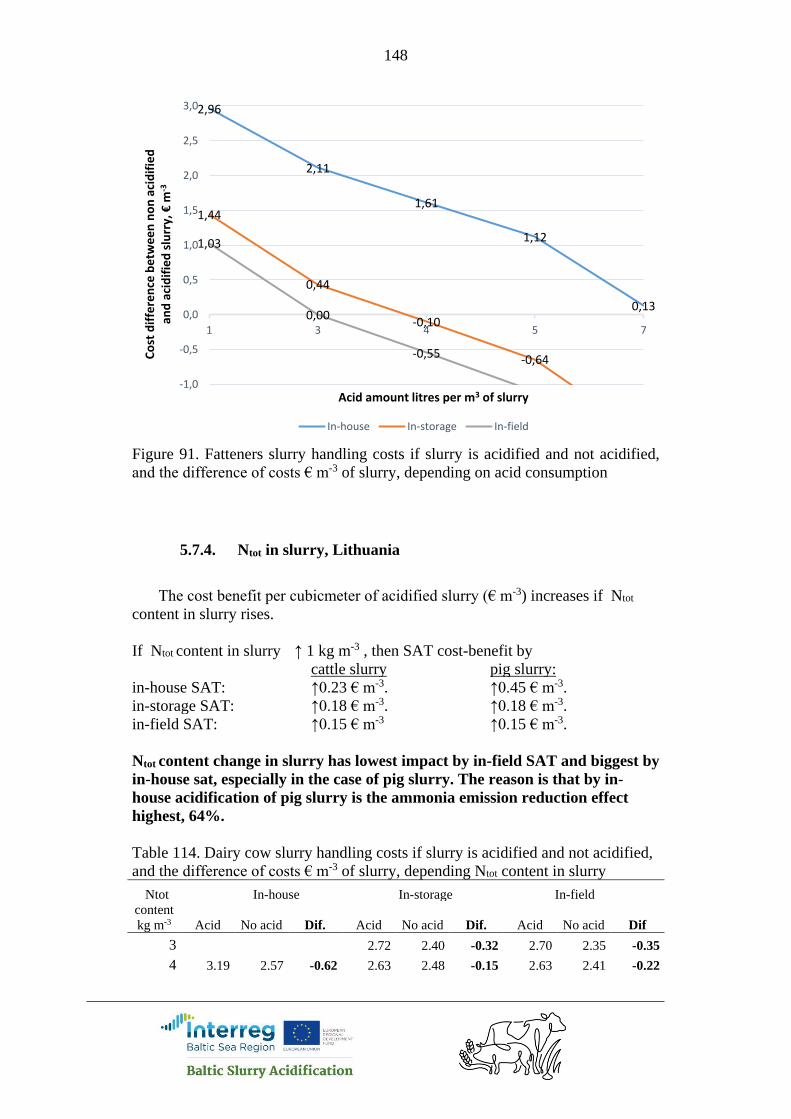
148
Figure 91. Fatteners slurry handling costs if slurry is acidified and not acidified,
and the difference of costs € m-3 of slurry, depending on acid consumption
5.7.4. Ntot in slurry, Lithuania
The cost benefit per cubicmeter of acidified slurry (€ m-3) increases if Ntot
content in slurry rises.
If Ntot content in slurry ↑ 1 kg m-3 , then SAT cost-benefit by
cattle slurry pig slurry:
in-house SAT: ↑0.23 € m-3. ↑0.45 € m-3.
in-storage SAT: ↑0.18 € m-3. ↑0.18 € m-3.
in-field SAT: ↑0.15 € m-3 ↑0.15 € m-3.
Ntot content change in slurry has lowest impact by in-field SAT and biggest by
in-house sat, especially in the case of pig slurry. The reason is that by in-
house acidification of pig slurry is the ammonia emission reduction effect
highest, 64%.
Table 114. Dairy cow slurry handling costs if slurry is acidified and not acidified,
and the difference of costs € m-3 of slurry, depending Ntot content in slurry
Ntot In-house In-storage In-field
content
kg m-3 Acid No acid Dif. Acid No acid Dif. Acid No acid Dif
3 2.72 2.40 -0.32 2.70 2.35 -0.35
4 3.19 2.57 -0.62 2.63 2.48 -0.15 2.63 2.41 -0.22
2,96
2,11
1,61
1,12
0,13
1,44
0,44
-0,10
-0,64
1,03
0,00
-0,55
-1,0
-0,5
0,0
0,5
1,0
1,5
2,0
2,5
3,0
1 3 4 5 7
Co
st d
iffe
ren
ce b
etw
ee
n n
on
aci
dif
ied
an
d a
cid
ifie
d s
lurr
y, €
m-3
Acid amount litres per m3 of slurry
In-house In-storage In-field
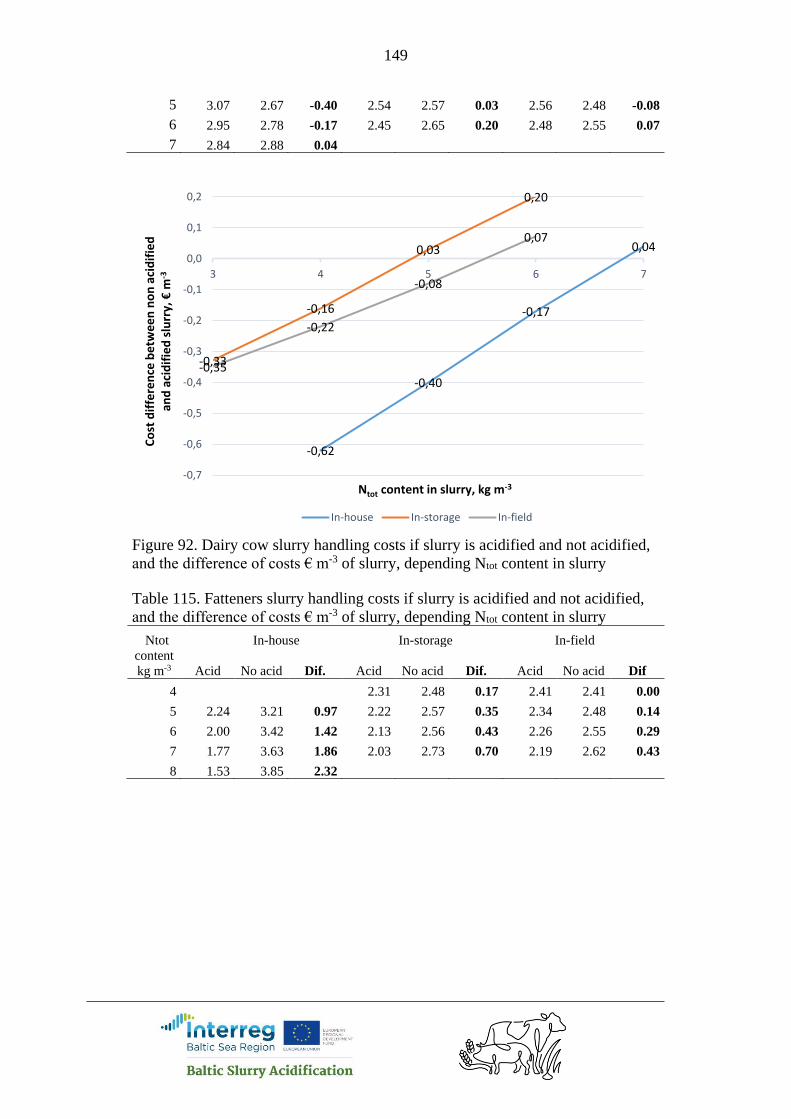
149
5 3.07 2.67 -0.40 2.54 2.57 0.03 2.56 2.48 -0.08
6 2.95 2.78 -0.17 2.45 2.65 0.20 2.48 2.55 0.07
7 2.84 2.88 0.04
Figure 92. Dairy cow slurry handling costs if slurry is acidified and not acidified,
and the difference of costs € m-3 of slurry, depending Ntot content in slurry
Table 115. Fatteners slurry handling costs if slurry is acidified and not acidified,
and the difference of costs € m-3 of slurry, depending Ntot content in slurry
Ntot In-house In-storage In-field
content
kg m-3 Acid No acid Dif. Acid No acid Dif. Acid No acid Dif
4 2.31 2.48 0.17 2.41 2.41 0.00
5 2.24 3.21 0.97 2.22 2.57 0.35 2.34 2.48 0.14
6 2.00 3.42 1.42 2.13 2.56 0.43 2.26 2.55 0.29
7 1.77 3.63 1.86 2.03 2.73 0.70 2.19 2.62 0.43
8 1.53 3.85 2.32
-0,62
-0,40
-0,17
0,04
-0,33
-0,16
0,03
0,20
-0,35
-0,22
-0,08
0,07
-0,7
-0,6
-0,5
-0,4
-0,3
-0,2
-0,1
0,0
0,1
0,2
3 4 5 6 7
Co
st d
iffe
ren
ce b
etw
ee
n n
on
aci
dif
ied
an
d a
cid
ifie
d s
lurr
y, €
m-3
Ntot content in slurry, kg m-3
In-house In-storage In-field
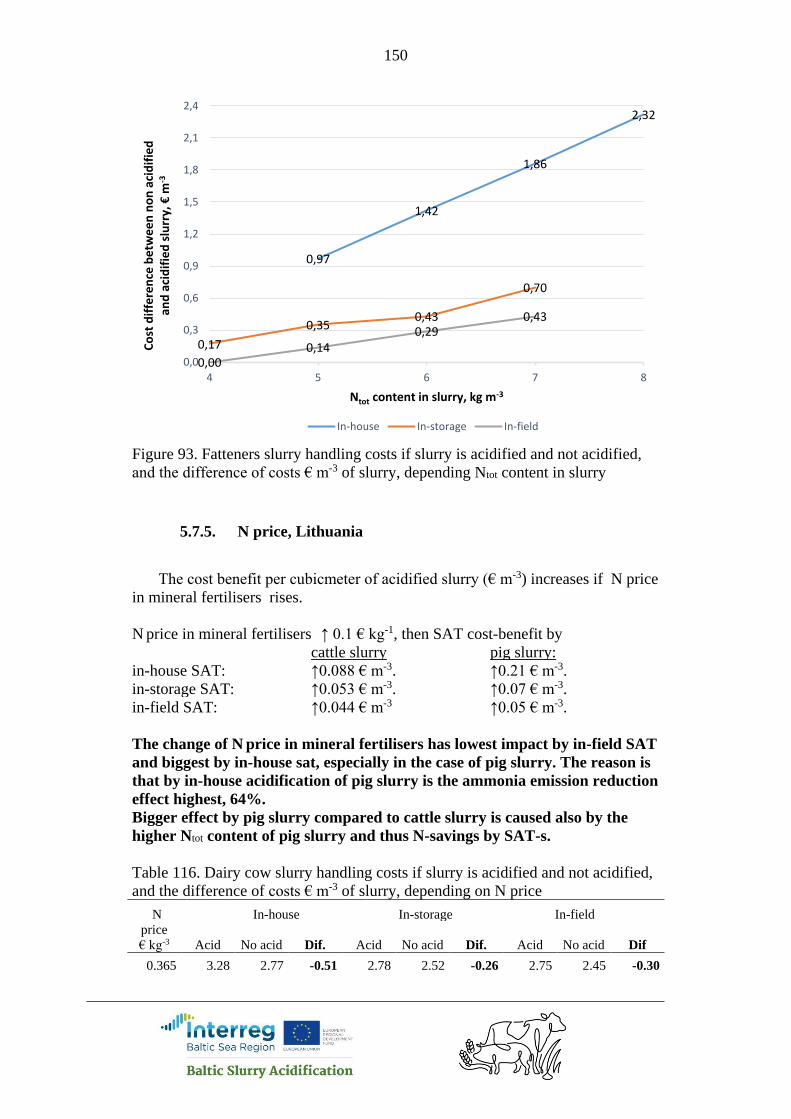
150
Figure 93. Fatteners slurry handling costs if slurry is acidified and not acidified,
and the difference of costs € m-3 of slurry, depending Ntot content in slurry
5.7.5. N price, Lithuania
The cost benefit per cubicmeter of acidified slurry (€ m-3) increases if N price
in mineral fertilisers rises.
N price in mineral fertilisers ↑ 0.1 € kg-1, then SAT cost-benefit by
cattle slurry pig slurry:
in-house SAT: ↑0.088 € m-3. ↑0.21 € m-3.
in-storage SAT: ↑0.053 € m-3. ↑0.07 € m-3.
in-field SAT: ↑0.044 € m-3 ↑0.05 € m-3.
The change of N price in mineral fertilisers has lowest impact by in-field SAT
and biggest by in-house sat, especially in the case of pig slurry. The reason is
that by in-house acidification of pig slurry is the ammonia emission reduction
effect highest, 64%.
Bigger effect by pig slurry compared to cattle slurry is caused also by the
higher Ntot content of pig slurry and thus N-savings by SAT-s.
Table 116. Dairy cow slurry handling costs if slurry is acidified and not acidified,
and the difference of costs € m-3 of slurry, depending on N price
N In-house In-storage In-field
price
€ kg-3 Acid No acid Dif. Acid No acid Dif. Acid No acid Dif
0.365 3.28 2.77 -0.51 2.78 2.52 -0.26 2.75 2.45 -0.30
0,97
1,42
1,86
2,32
0,17
0,350,43
0,70
0,000,14
0,290,43
0,0
0,3
0,6
0,9
1,2
1,5
1,8
2,1
2,4
4 5 6 7 8
Co
st d
iffe
ren
ce b
etw
ee
n n
on
aci
dif
ied
an
d a
cid
ifie
d s
lurr
y, €
m-3
Ntot content in slurry, kg m-3
In-house In-storage In-field
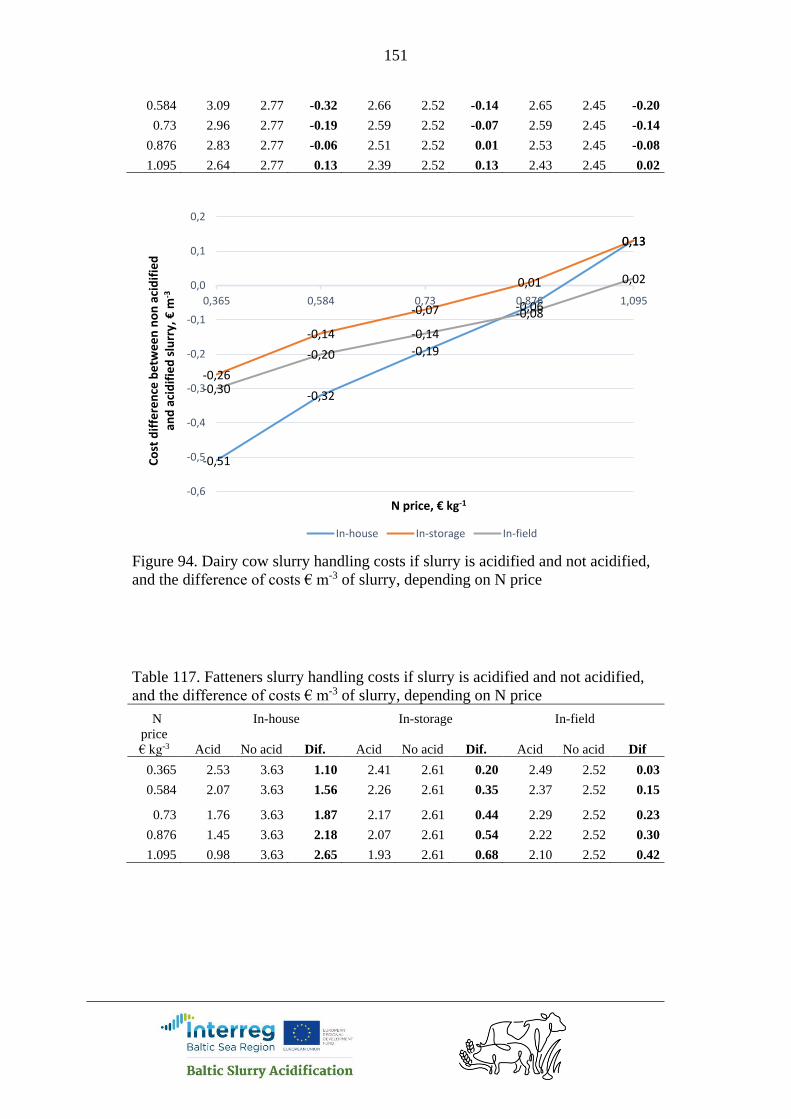
151
0.584 3.09 2.77 -0.32 2.66 2.52 -0.14 2.65 2.45 -0.20
0.73 2.96 2.77 -0.19 2.59 2.52 -0.07 2.59 2.45 -0.14
0.876 2.83 2.77 -0.06 2.51 2.52 0.01 2.53 2.45 -0.08
1.095 2.64 2.77 0.13 2.39 2.52 0.13 2.43 2.45 0.02
Figure 94. Dairy cow slurry handling costs if slurry is acidified and not acidified,
and the difference of costs € m-3 of slurry, depending on N price
Table 117. Fatteners slurry handling costs if slurry is acidified and not acidified,
and the difference of costs € m-3 of slurry, depending on N price
N In-house In-storage In-field
price
€ kg-3 Acid No acid Dif. Acid No acid Dif. Acid No acid Dif
0.365 2.53 3.63 1.10 2.41 2.61 0.20 2.49 2.52 0.03
0.584 2.07 3.63 1.56 2.26 2.61 0.35 2.37 2.52 0.15
0.73 1.76 3.63 1.87 2.17 2.61 0.44 2.29 2.52 0.23
0.876 1.45 3.63 2.18 2.07 2.61 0.54 2.22 2.52 0.30
1.095 0.98 3.63 2.65 1.93 2.61 0.68 2.10 2.52 0.42
-0,51
-0,32
-0,19
-0,06
0,13
-0,26
-0,14
-0,07
0,01
0,13
-0,30
-0,20
-0,14
-0,08
0,02
-0,6
-0,5
-0,4
-0,3
-0,2
-0,1
0,0
0,1
0,2
0,365 0,584 0,73 0,876 1,095
Co
st d
iffe
ren
ce b
etw
ee
n n
on
aci
dif
ied
an
d a
cid
ifie
d s
lurr
y, €
m-3
N price, € kg-1
In-house In-storage In-field
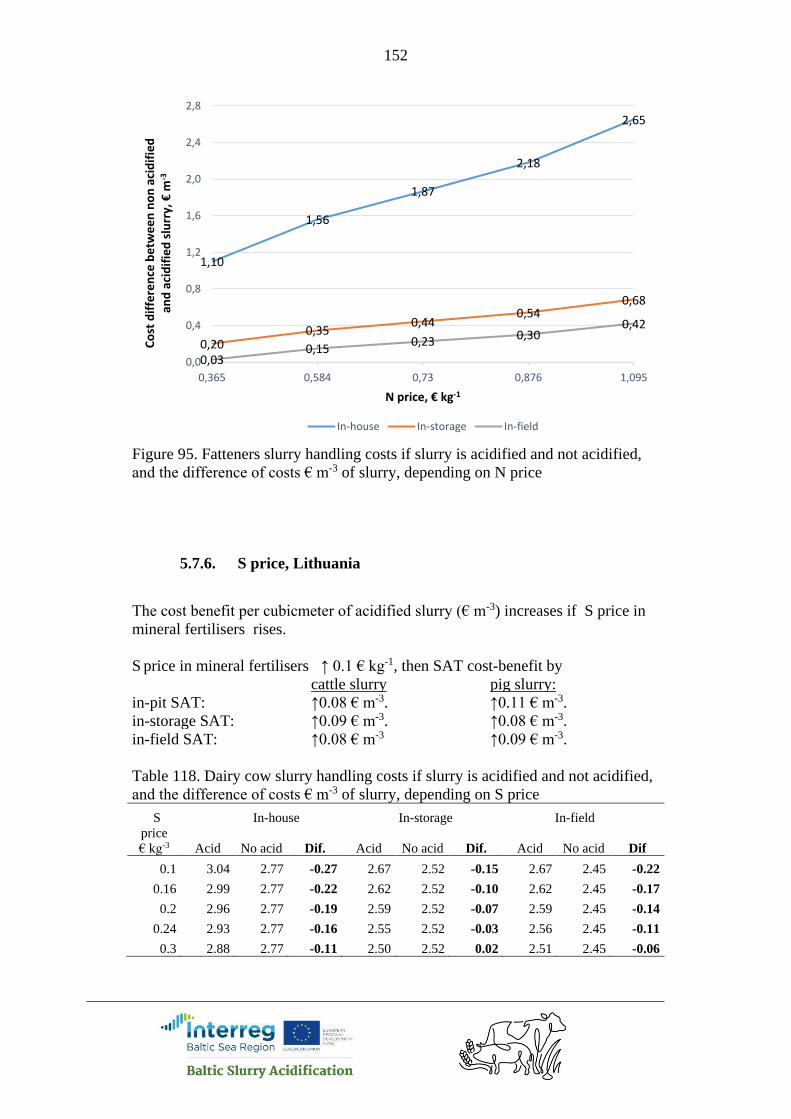
152
Figure 95. Fatteners slurry handling costs if slurry is acidified and not acidified,
and the difference of costs € m-3 of slurry, depending on N price
5.7.6. S price, Lithuania
The cost benefit per cubicmeter of acidified slurry (€ m-3) increases if S price in
mineral fertilisers rises.
S price in mineral fertilisers ↑ 0.1 € kg-1, then SAT cost-benefit by
cattle slurry pig slurry:
in-pit SAT: ↑0.08 € m-3. ↑0.11 € m-3.
in-storage SAT: ↑0.09 € m-3. ↑0.08 € m-3.
in-field SAT: ↑0.08 € m-3 ↑0.09 € m-3.
Table 118. Dairy cow slurry handling costs if slurry is acidified and not acidified,
and the difference of costs € m-3 of slurry, depending on S price
S In-house In-storage In-field
price
€ kg-3 Acid No acid Dif. Acid No acid Dif. Acid No acid Dif
0.1 3.04 2.77 -0.27 2.67 2.52 -0.15 2.67 2.45 -0.22
0.16 2.99 2.77 -0.22 2.62 2.52 -0.10 2.62 2.45 -0.17
0.2 2.96 2.77 -0.19 2.59 2.52 -0.07 2.59 2.45 -0.14
0.24 2.93 2.77 -0.16 2.55 2.52 -0.03 2.56 2.45 -0.11
0.3 2.88 2.77 -0.11 2.50 2.52 0.02 2.51 2.45 -0.06
1,10
1,56
1,87
2,18
2,65
0,200,35
0,440,54
0,68
0,030,15
0,23 0,300,42
0,0
0,4
0,8
1,2
1,6
2,0
2,4
2,8
0,365 0,584 0,73 0,876 1,095
Co
st d
iffe
ren
ce b
etw
ee
n n
on
aci
dif
ied
an
d a
cid
ifie
d s
lurr
y, €
m-3
N price, € kg-1
In-house In-storage In-field
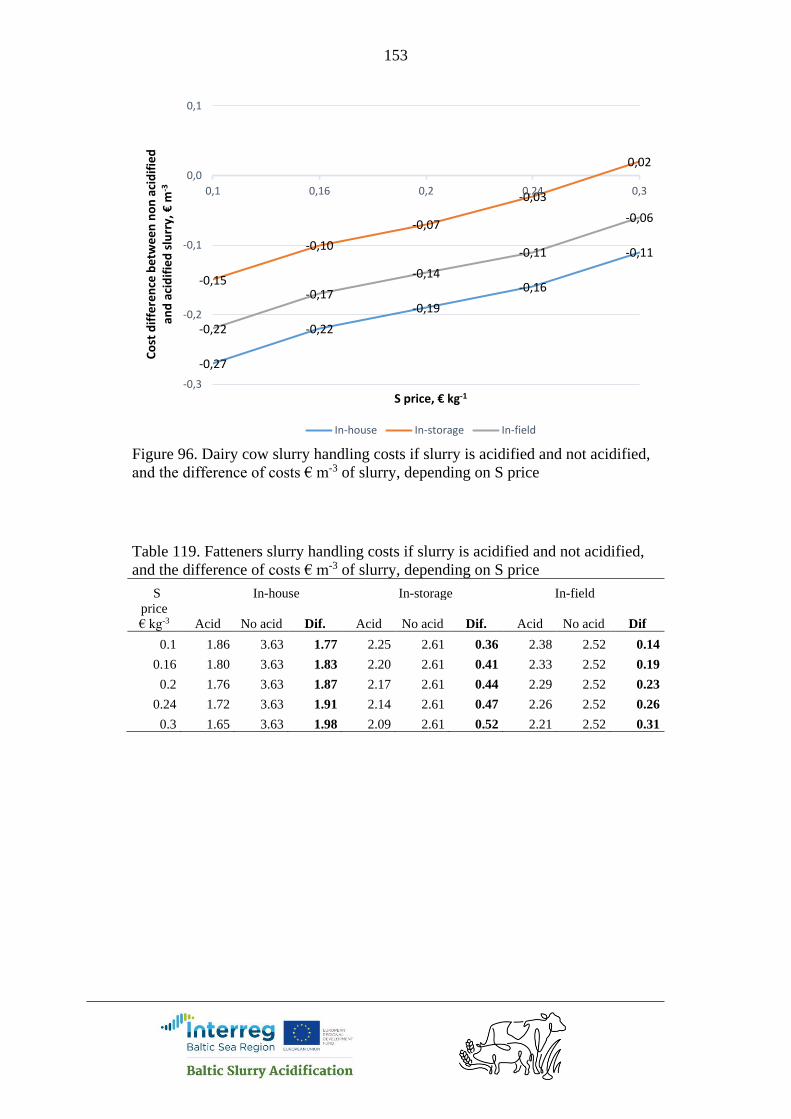
153
Figure 96. Dairy cow slurry handling costs if slurry is acidified and not acidified,
and the difference of costs € m-3 of slurry, depending on S price
Table 119. Fatteners slurry handling costs if slurry is acidified and not acidified,
and the difference of costs € m-3 of slurry, depending on S price
S In-house In-storage In-field
price
€ kg-3 Acid No acid Dif. Acid No acid Dif. Acid No acid Dif
0.1 1.86 3.63 1.77 2.25 2.61 0.36 2.38 2.52 0.14
0.16 1.80 3.63 1.83 2.20 2.61 0.41 2.33 2.52 0.19
0.2 1.76 3.63 1.87 2.17 2.61 0.44 2.29 2.52 0.23
0.24 1.72 3.63 1.91 2.14 2.61 0.47 2.26 2.52 0.26
0.3 1.65 3.63 1.98 2.09 2.61 0.52 2.21 2.52 0.31
-0,27
-0,22
-0,19
-0,16
-0,11
-0,15
-0,10
-0,07
-0,03
0,02
-0,22
-0,17
-0,14
-0,11
-0,06
-0,3
-0,2
-0,1
0,0
0,1
0,1 0,16 0,2 0,24 0,3
Co
st d
iffe
ren
ce b
etw
ee
n n
on
aci
dif
ied
an
d a
cid
ifie
d s
lurr
y, €
m-3
S price, € kg-1
In-house In-storage In-field

154
Figure 97. Fatteners slurry handling costs if slurry is acidified and not acidified,
and the difference of costs € m-3 of slurry, depending on S price
5.7.7. Summary, Lithuania
Analysed is the cost-benefit of SATs compared to disc-harrowing <12 h after
band-application of non-acidified slurry. The calculation results show, that in
Lithuania by all cattle slurry amounts, if slurry is acidified, then costs are higher
than by non-acidified but incorporated slurry. The reason is mainly very high
liming costs - 175 € t-1 for liming service including liming material and transport.
Another reason is relatively low S price compared to other project countries (0.15
€ kg-1 and 0.11–0.85 € kg-1 ). The cost- benefit of cattle slurry acidification would
be positive if the acid need would be lower (figure 90), Ntot content of slurry
higher (figure 92) or mineral N price higher (figure 94).
The minimal pig slurry amounts should be between 3,200–10,800 m3 yearly
depending on SAT (see Table 107).
Acidification of pig slurry has higher economic benefit compared to cattle
slurry, because
1) pig slurry contains more NH4-N to save
2) the in-house SAT has higher reduction effect on NH3 emission from
pig slurry
3) the acid need of pig slurry is lower
4) the risk to exceed S need of plants is lower (because the acid amount is
lower)
1,771,83 1,87 1,91
1,98
0,36 0,41 0,44 0,47 0,52
0,14 0,19 0,23 0,26 0,31
0,0
0,4
0,8
1,2
1,6
2,0
0,1 0,16 0,2 0,24 0,3
Co
st d
iffe
ren
ce b
etw
ee
n n
on
aci
dif
ied
an
d a
cid
ifie
d s
lurr
y, €
m-3
S price, € kg-1
In-house In-storage In-field
155
The cost-benefit of acidified slurry per cubicmeter (€ m-3) decreases if acid
amount per cubicmeter increases. While the acid cost is biggest running cost, then
the amount of acid required to lower slurry acidity to target pH (see Table 8) has
essential impact on cost-benefit of slurry acidification. The acid price by in-house
SAT (128 € m-3) is lower than by other SATs (157 € m-3) and this is the reason
why change of acid amount has smaller effect on cost-benefit by first SAT
compared to others.
The calculations in paragraph 5.5 were done by slurry amount 30 m3 ha-1. The
extra calculations made for Finland for different hectare amounts (Figure 50)
show that cost-benefit of in-house SAT is higher if slurry amount is 20 or 10 m3
ha-1 .
One reason is that the slurry incorporation cost per hectare is constant despite
of slurry amount per hectare. Thus, the smaller is slurry amount per hectare the
higher is incorporation cost per cubicmeter of non-acidified slurry.
Another aspect, why low amount of acidified slurry give higher economic
effect, is the effective use of S applied with acidified slurry. In the calculations is
used 4.5 liter acid per m3 cattle slurry by in-house SAT. If the slurry amount is 30,
20 and 10 m3 ha-1 then the S amount applied to the field is 80, 53 and 26 kg ha-1
correspondingly. The S need for crops is in calculations 25 kg ha-1 in average. The
costs on mineral S are reduced if acidified slurry is applied and the reduction
effect is calculated until S amount reaches the demand of crop. After that S cost
reduction stays constant and the S amount what exceeds crop need, is not taken
into calculation. However, the S cost reduction value is always divided by slurry
amount per hectare and if the cost reduction is constant then by growing hectare
amount of slurry the S cost reduction per cubicmeter of slurry decreases.
An alternative to in-house acidification to minimise the ammonia emission
from slurry storage is to cover storage. The cost calculations made for different
type of storage covers shows that cost benefit by in-house acidified slurry depends
on capital cost and ability to decrease the ammonia emission. The rapeseed oil has
highest capital cost and decreases 80% of ammonia emission (Table 21). Thus, the
in-house slurry acidification gives biggest cost effect compared to this type of
cover, which is followed by tent and peat. In-house acidification of cattle slurry
has positive cost-benefit only compared to tent cover. In-house acidification of pig
slurry has positive cost-benefit compared to all cover types.
The cost benefit per cubicmeter of acidified slurry (€ m-3) increases if Ntot
content in slurry rises (see 5.7.4). Ntot content change in slurry has lowest impact
by in-field SAT and biggest by in-house sat, especially in the case of pig slurry.
The reason is that by in-house acidification of pig slurry the ammonia emission
reduction effect is highest, 64%.
The cost-benefit per cubicmeter of acidified slurry (€ m-3) increases if N price
in mineral fertilisers rises (see 5.7.5). The change of N price in mineral fertilisers
has lowest impact by in-field SAT and biggest by in-house sat, especially in the
case of pig slurry. The reason is that by in-house acidification of pig slurry is the
ammonia emission reduction effect highest, 64%. Bigger effect by pig slurry
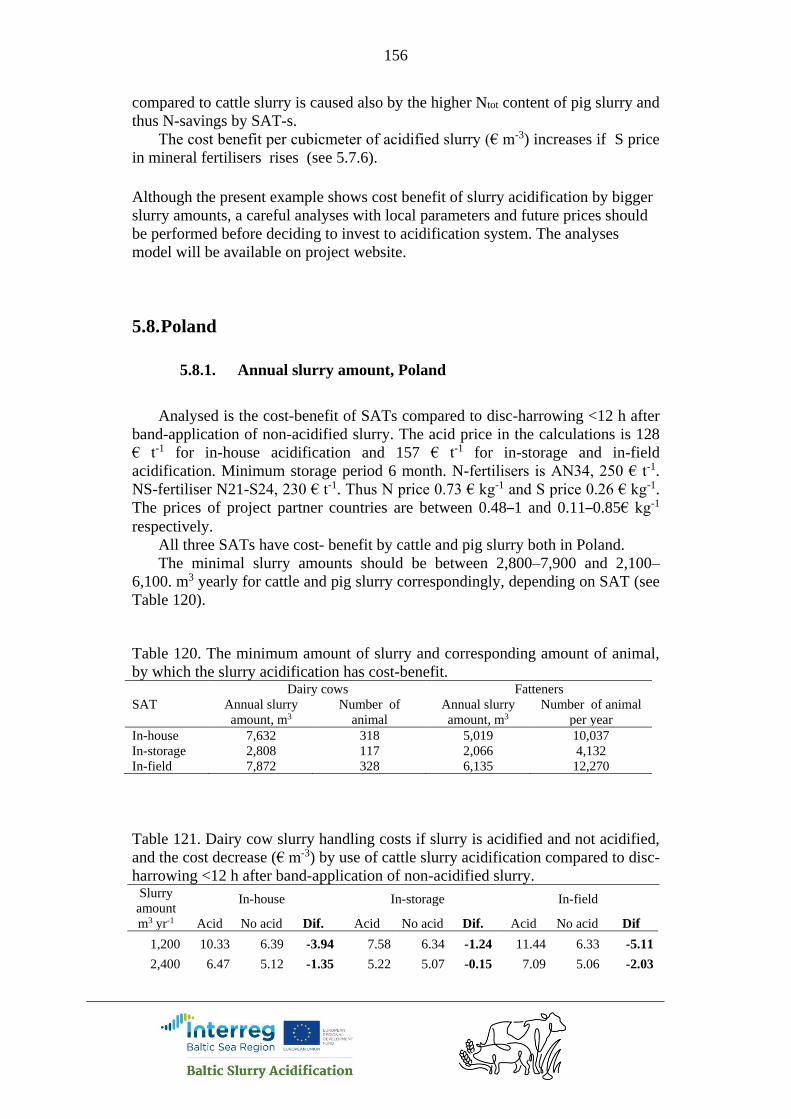
156
compared to cattle slurry is caused also by the higher Ntot content of pig slurry and
thus N-savings by SAT-s.
The cost benefit per cubicmeter of acidified slurry (€ m-3) increases if S price
in mineral fertilisers rises (see 5.7.6).
Although the present example shows cost benefit of slurry acidification by bigger
slurry amounts, a careful analyses with local parameters and future prices should
be performed before deciding to invest to acidification system. The analyses
model will be available on project website.
5.8. Poland
5.8.1. Annual slurry amount, Poland
Analysed is the cost-benefit of SATs compared to disc-harrowing <12 h after
band-application of non-acidified slurry. The acid price in the calculations is 128
€ t-1 for in-house acidification and 157 € t-1 for in-storage and in-field
acidification. Minimum storage period 6 month. N-fertilisers is AN34, 250 € t-1.
NS-fertiliser N21-S24, 230 € t-1. Thus N price 0.73 € kg-1 and S price 0.26 € kg-1.
The prices of project partner countries are between 0.48–1 and 0.11–0.85€ kg-1
respectively.
All three SATs have cost- benefit by cattle and pig slurry both in Poland.
The minimal slurry amounts should be between 2,800–7,900 and 2,100–
6,100. m3 yearly for cattle and pig slurry correspondingly, depending on SAT (see
Table 120).
Table 120. The minimum amount of slurry and corresponding amount of animal,
by which the slurry acidification has cost-benefit. Dairy cows Fatteners
SAT Annual slurry
amount, m3
Number of
animal
Annual slurry
amount, m3
Number of animal
per year
In-house 7,632 318 5,019 10,037
In-storage 2,808 117 2,066 4,132
In-field 7,872 328 6,135 12,270
Table 121. Dairy cow slurry handling costs if slurry is acidified and not acidified,
and the cost decrease (€ m-3) by use of cattle slurry acidification compared to disc-
harrowing <12 h after band-application of non-acidified slurry. Slurry
amount
m3 yr-1
In-house In-storage In-field
Acid No acid Dif. Acid No acid Dif. Acid No acid Dif
1,200 10.33 6.39 -3.94 7.58 6.34 -1.24 11.44 6.33 -5.11
2,400 6.47 5.12 -1.35 5.22 5.07 -0.15 7.09 5.06 -2.03

157
9,000 3.21 3.36 0.15 2.80 3.32 0.52 3.21 3.30 0.09
12,000 2.73 3.07 0.34 2.48 3.02 0.54 2.76 3.01 0.25
21,000 2.14 2.57 0.43 1.99 2.53 0.54 2.10 2.52 0.42
24,000 2.00 2.47 0.47 1.89 2.43 0.54 1.97 2.41 0.44
33,000 1.77 2.24 0.47 1.69 2.19 0.50 1.72 2.18 0.46
48,000 1.52 1.99 0.47 1.49 1.95 0.46 1.48 1.93 0.45
Figure 98. The cost decrease (€ m-3) by use of cattle slurry acidification compared
to disc-harrowing <12 h after band-application of non-acidified slurry.
Table 122. Fattener slurry handling costs if slurry is acidified and not acidified,
and the cost decrease (€ m-3) by use of cattle slurry acidification compared to disc-
harrowing <12 h after band-application of non-acidified slurry. Slurry
amount
m3 yr-1
In-house In-storage In-field
Acid No acid Dif. Acid No acid Dif. Acid No acid Dif
500 32.65 8.63 -24.02 12.43 8.44 -3.99 21.97 8.42 -13.55
2,500 7.84 5.21 -2.63 4.81 5.02 0.21 6.68 5.00 -1.68
5,000 4.22 4.21 -0.01 3.33 4.02 0.69 4.25 4.00 -0.25
9,000 2.57 3.52 0.95 2.49 3.33 0.84 2.99 3.31 0.32
21,000 1.13 2.73 1.60 1.68 2.55 0.87 1.88 2.53 0.65
33,000 0.66 2.40 1.74 1.38 2.21 0.83 1.50 2.19 0.69
0,15
0,34
0,43
0,47 0,47 0,47
0,520,54 0,54 0,54
0,50
0,46
0,09
0,25
0,420,44
0,46 0,45
0,0
0,1
0,2
0,3
0,4
0,5
0,6
0 10000 20000 30000 40000 50000
Co
st d
iffe
ren
ce b
etw
ee
n n
on
aci
dif
ied
and
aci
dif
ied
slu
rry,
€m
-3
Annual slurry amount, m3
In-house In-storage In-field

158
Figure 99. The cost decrease (€ m-3) by use of fattener slurry acidification
compared to disc-harrowing <12 h after band-application of non-acidified slurry.
5.8.2. Cover type, Poland
An alternative to in-house acidification to minimise the ammonia emission
from slurry storage is to cover storage. The cost calculations made for different
type of storage covers shows that cost benefit by in-house acidified slurry depends
on capital cost and ability to decrease the ammonia emission. The rapeseed oil has
highest capital cost and decreases 80% of ammonia emission (Table 21). Thus, the
in-house slurry acidification gives biggest cost effect compared to this type of
cover, which is followed by tent and peat. Compared to the Hexa-cover plates
gives slurry acidification lowest cost benefit. The figures 100 and 101 show also
that the order of cover types is same for both, cattle and big slurries.
In Poland, the required minimum manure storage capacity is 6 months. In this
analysis is presumed that animal are housed in all year around and storage depth is
5 m. The capital cost of slurry storage cover calculated for these conditions are
shown in the table 21.
Table 123. Dairy cow slurry handling costs if slurry is acidified and not acidified,
and the difference of costs € m-3 of slurry. In this analysis is varied with different
type of storage covers by in-house acidification, if slurry is not acidified. Annual
slurry amount 21,000 m3.
0,95
1,60
1,74
0,21
0,69
0,84 0,87 0,83
0,32
0,65 0,69
0,0
0,3
0,6
0,9
1,2
1,5
1,8
2,1
0 5000 10000 15000 20000 25000 30000 35000
Co
st d
iffe
ren
ce b
etw
ee
n n
on
aci
dif
ied
an
d a
cid
ifie
d s
lurr
y, €
m-3
Annual slurry amount, m3
In-house In-storage In-field
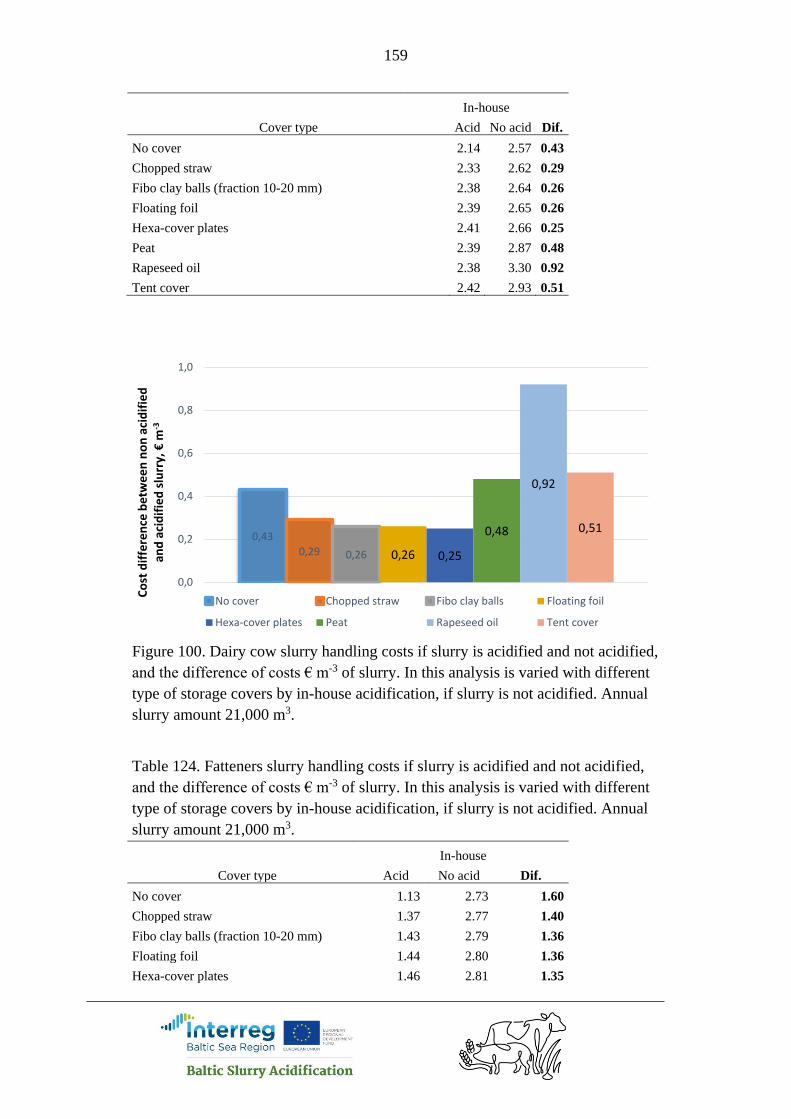
159
In-house
Cover type Acid No acid Dif.
No cover 2.14 2.57 0.43
Chopped straw 2.33 2.62 0.29
Fibo clay balls (fraction 10-20 mm) 2.38 2.64 0.26
Floating foil 2.39 2.65 0.26
Hexa-cover plates 2.41 2.66 0.25
Peat 2.39 2.87 0.48
Rapeseed oil 2.38 3.30 0.92
Tent cover 2.42 2.93 0.51
Figure 100. Dairy cow slurry handling costs if slurry is acidified and not acidified,
and the difference of costs € m-3 of slurry. In this analysis is varied with different
type of storage covers by in-house acidification, if slurry is not acidified. Annual
slurry amount 21,000 m3.
Table 124. Fatteners slurry handling costs if slurry is acidified and not acidified,
and the difference of costs € m-3 of slurry. In this analysis is varied with different
type of storage covers by in-house acidification, if slurry is not acidified. Annual
slurry amount 21,000 m3.
In-house
Cover type Acid No acid Dif.
No cover 1.13 2.73 1.60
Chopped straw 1.37 2.77 1.40
Fibo clay balls (fraction 10-20 mm) 1.43 2.79 1.36
Floating foil 1.44 2.80 1.36
Hexa-cover plates 1.46 2.81 1.35
0,43
0,29 0,26 0,26 0,25
0,48
0,92
0,51
0,0
0,2
0,4
0,6
0,8
1,0
Co
st d
iffe
ren
ce b
etw
ee
n n
on
aci
dif
ied
an
d a
cid
ifie
d s
lurr
y, €
m-3
No cover Chopped straw Fibo clay balls Floating foil
Hexa-cover plates Peat Rapeseed oil Tent cover
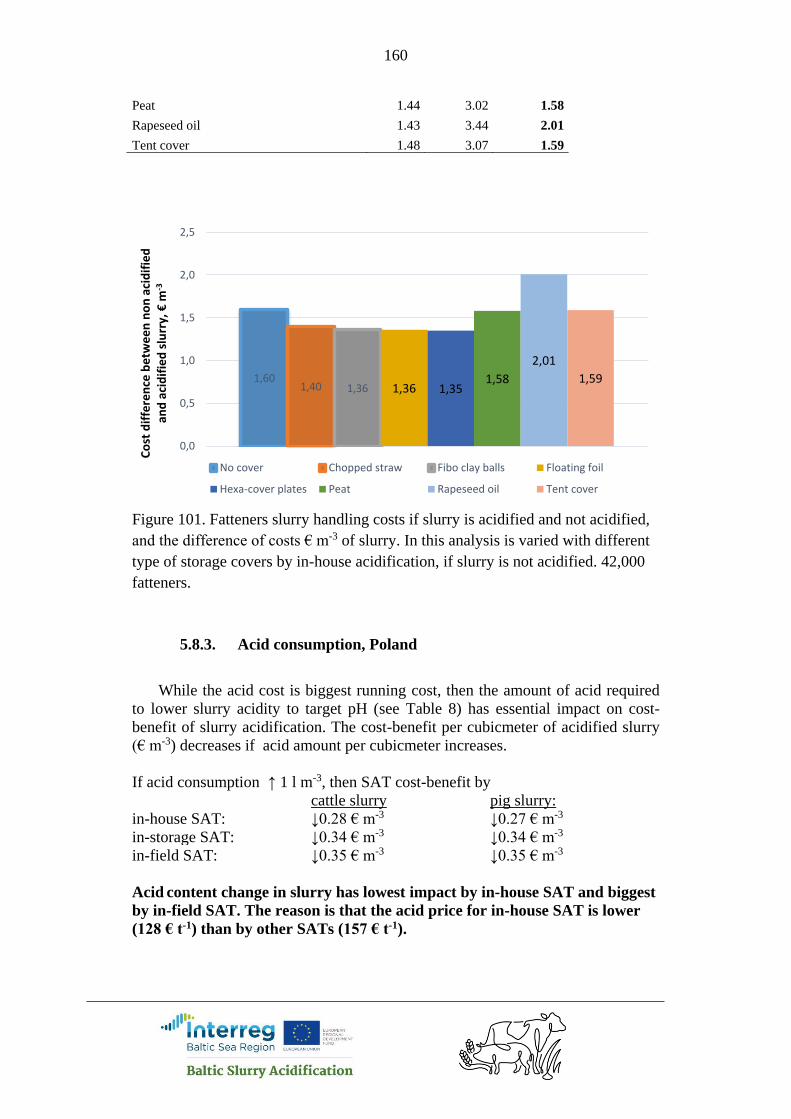
160
Peat 1.44 3.02 1.58
Rapeseed oil 1.43 3.44 2.01
Tent cover 1.48 3.07 1.59
Figure 101. Fatteners slurry handling costs if slurry is acidified and not acidified,
and the difference of costs € m-3 of slurry. In this analysis is varied with different
type of storage covers by in-house acidification, if slurry is not acidified. 42,000
fatteners.
5.8.3. Acid consumption, Poland
While the acid cost is biggest running cost, then the amount of acid required
to lower slurry acidity to target pH (see Table 8) has essential impact on cost-
benefit of slurry acidification. The cost-benefit per cubicmeter of acidified slurry
(€ m-3) decreases if acid amount per cubicmeter increases.
If acid consumption ↑ 1 l m-3, then SAT cost-benefit by
cattle slurry pig slurry:
in-house SAT: ↓0.28 € m-3 ↓0.27 € m-3
in-storage SAT: ↓0.34 € m-3 ↓0.34 € m-3
in-field SAT: ↓0.35 € m-3 ↓0.35 € m-3
Acid content change in slurry has lowest impact by in-house SAT and biggest
by in-field SAT. The reason is that the acid price for in-house SAT is lower
(128 € t-1) than by other SATs (157 € t-1).
1,601,40 1,36 1,36 1,35
1,58
2,01
1,59
0,0
0,5
1,0
1,5
2,0
2,5
Co
st d
iffe
ren
ce b
etw
ee
n n
on
aci
dif
ied
an
d a
cid
ifie
d s
lurr
y, €
m-3
No cover Chopped straw Fibo clay balls Floating foil
Hexa-cover plates Peat Rapeseed oil Tent cover

161
Table 125. Dairy cow slurry handling costs if slurry is acidified and not acidified,
and the difference of costs € m-3 of slurry, depending on acid consumption.
Acid In-house In-storage In-field
amount
l m-3 Acid No acid Dif. Acid No acid Dif. Acid No acid Dif
1 1.21 2.57 1.36 1.17 2.53 1.36 1.47 2.52 1.05
3 1.70 2.57 0.87 1.77 2.53 0.76 2.10 2.52 0.42
4 1.99 2.57 0.58 2.13 2.53 0.40 2.46 2.52 0.06
5 2.29 2.57 0.28 2.48 2.53 0.05 2.83 2.52 -0.31
7 2.88 2.57 -0.31 3.19 2.53 -0.66 3.56 2.52 -1.04
Figure 102. Dairy cow slurry handling costs if slurry is acidified and not acidified,
and the difference of costs € m-3 of slurry, depending on acid consumption
Table 126. Fatteners slurry handling costs if slurry is acidified and not acidified,
and the difference of costs € m-3 of slurry, depending on acid consumption.
Acid In-house In-storage In-field
amount
l m-3 Acid No acid Dif. Acid No acid Dif. Acid No acid Dif
1 0.57 2.73 2.16 1.07 2.55 1.48 1.39 2.53 1.14
3 0.98 2.73 1.75 1.68 2.55 0.87 2.02 2.53 0.51
4 1.28 2.73 1.45 2.04 2.55 0.51 2.39 2.53 0.14
5 1.57 2.73 1.16 2.39 2.55 0.16 2.75 2.53 -0.22
7 2.16 2.73 0.57 3.10 2.55 -0.55 3.49 2.53 -0.96
1,36
0,87
0,58
0,28
-0,31
1,36
0,76
0,40
0,05
-0,66
1,05
0,42
0,06
-0,31
-1,04-1,2
-0,8
-0,4
0,0
0,4
0,8
1,2
1,6
1 3 4 5 7
Co
st d
iffe
ren
ce b
etw
ee
n n
on
aci
dif
ied
an
d a
cid
ifie
d s
lurr
y, €
m-3
Acid amount litres per m3 of slurry
In-house In-storage In-field
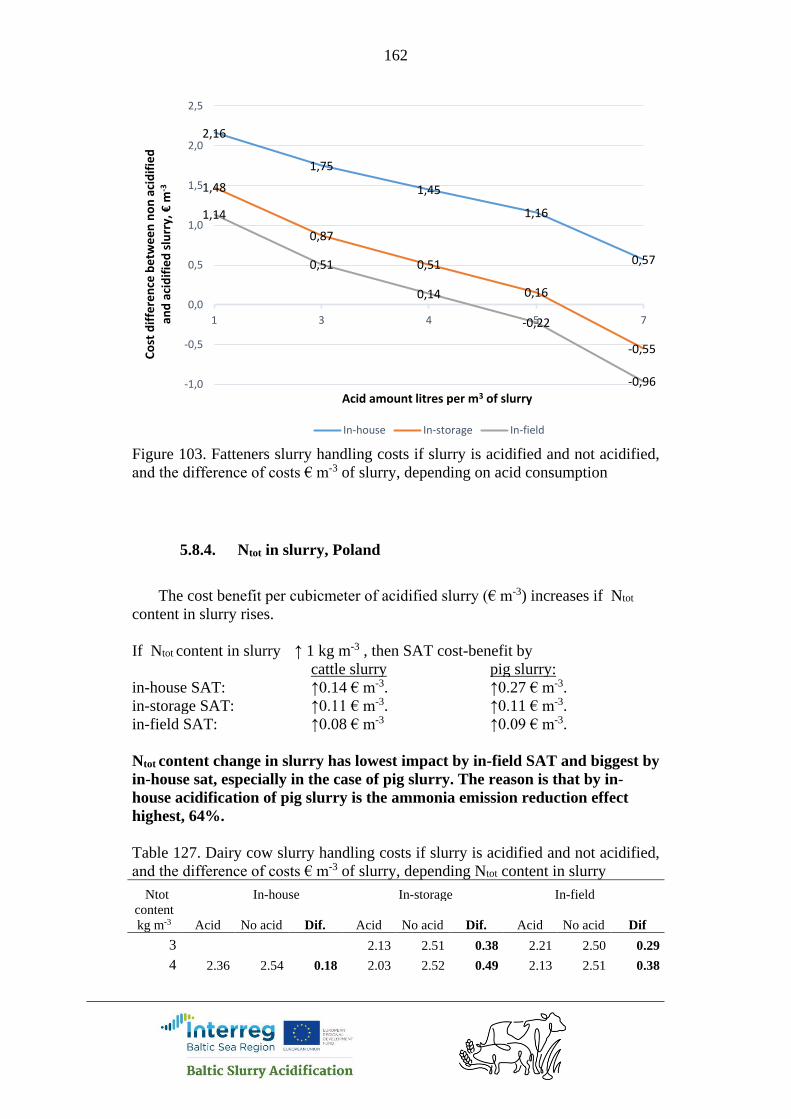
162
Figure 103. Fatteners slurry handling costs if slurry is acidified and not acidified,
and the difference of costs € m-3 of slurry, depending on acid consumption
5.8.4. Ntot in slurry, Poland
The cost benefit per cubicmeter of acidified slurry (€ m-3) increases if Ntot
content in slurry rises.
If Ntot content in slurry ↑ 1 kg m-3 , then SAT cost-benefit by
cattle slurry pig slurry:
in-house SAT: ↑0.14 € m-3. ↑0.27 € m-3.
in-storage SAT: ↑0.11 € m-3. ↑0.11 € m-3.
in-field SAT: ↑0.08 € m-3 ↑0.09 € m-3.
Ntot content change in slurry has lowest impact by in-field SAT and biggest by
in-house sat, especially in the case of pig slurry. The reason is that by in-
house acidification of pig slurry is the ammonia emission reduction effect
highest, 64%.
Table 127. Dairy cow slurry handling costs if slurry is acidified and not acidified,
and the difference of costs € m-3 of slurry, depending Ntot content in slurry
Ntot In-house In-storage In-field
content
kg m-3 Acid No acid Dif. Acid No acid Dif. Acid No acid Dif
3 2.13 2.51 0.38 2.21 2.50 0.29
4 2.36 2.54 0.18 2.03 2.52 0.49 2.13 2.51 0.38
2,16
1,75
1,45
1,16
0,57
1,48
0,87
0,51
0,16
-0,55
1,14
0,51
0,14
-0,22
-0,96-1,0
-0,5
0,0
0,5
1,0
1,5
2,0
2,5
1 3 4 5 7
Co
st d
iffe
ren
ce b
etw
ee
n n
on
aci
dif
ied
an
d a
cid
ifie
d s
lurr
y, €
m-3
Acid amount litres per m3 of slurry
In-house In-storage In-field
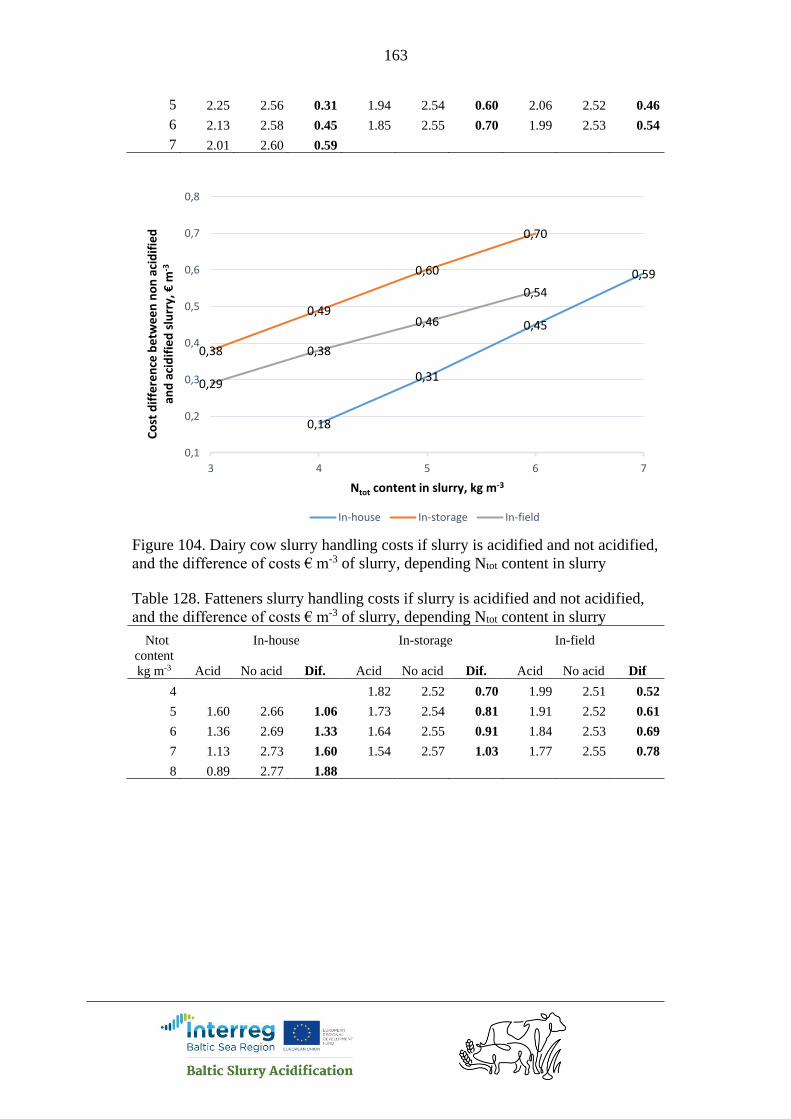
163
5 2.25 2.56 0.31 1.94 2.54 0.60 2.06 2.52 0.46
6 2.13 2.58 0.45 1.85 2.55 0.70 1.99 2.53 0.54
7 2.01 2.60 0.59
Figure 104. Dairy cow slurry handling costs if slurry is acidified and not acidified,
and the difference of costs € m-3 of slurry, depending Ntot content in slurry
Table 128. Fatteners slurry handling costs if slurry is acidified and not acidified,
and the difference of costs € m-3 of slurry, depending Ntot content in slurry
Ntot In-house In-storage In-field
content
kg m-3 Acid No acid Dif. Acid No acid Dif. Acid No acid Dif
4 1.82 2.52 0.70 1.99 2.51 0.52
5 1.60 2.66 1.06 1.73 2.54 0.81 1.91 2.52 0.61
6 1.36 2.69 1.33 1.64 2.55 0.91 1.84 2.53 0.69
7 1.13 2.73 1.60 1.54 2.57 1.03 1.77 2.55 0.78
8 0.89 2.77 1.88
0,18
0,31
0,45
0,59
0,38
0,49
0,60
0,70
0,29
0,38
0,46
0,54
0,1
0,2
0,3
0,4
0,5
0,6
0,7
0,8
3 4 5 6 7
Co
st d
iffe
ren
ce b
etw
ee
n n
on
aci
dif
ied
an
d a
cid
ifie
d s
lurr
y, €
m-3
Ntot content in slurry, kg m-3
In-house In-storage In-field
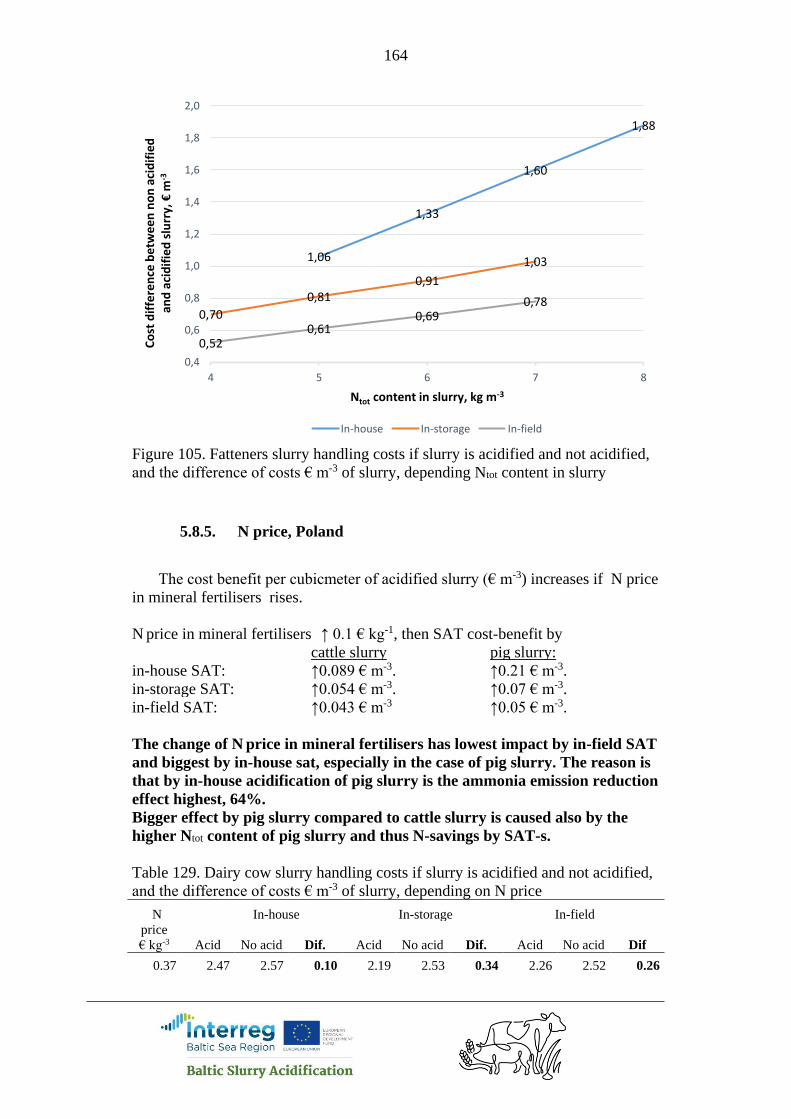
164
Figure 105. Fatteners slurry handling costs if slurry is acidified and not acidified,
and the difference of costs € m-3 of slurry, depending Ntot content in slurry
5.8.5. N price, Poland
The cost benefit per cubicmeter of acidified slurry (€ m-3) increases if N price
in mineral fertilisers rises.
N price in mineral fertilisers ↑ 0.1 € kg-1, then SAT cost-benefit by
cattle slurry pig slurry:
in-house SAT: ↑0.089 € m-3. ↑0.21 € m-3.
in-storage SAT: ↑0.054 € m-3. ↑0.07 € m-3.
in-field SAT: ↑0.043 € m-3 ↑0.05 € m-3.
The change of N price in mineral fertilisers has lowest impact by in-field SAT
and biggest by in-house sat, especially in the case of pig slurry. The reason is
that by in-house acidification of pig slurry is the ammonia emission reduction
effect highest, 64%.
Bigger effect by pig slurry compared to cattle slurry is caused also by the
higher Ntot content of pig slurry and thus N-savings by SAT-s.
Table 129. Dairy cow slurry handling costs if slurry is acidified and not acidified,
and the difference of costs € m-3 of slurry, depending on N price
N In-house In-storage In-field
price
€ kg-3 Acid No acid Dif. Acid No acid Dif. Acid No acid Dif
0.37 2.47 2.57 0.10 2.19 2.53 0.34 2.26 2.52 0.26
1,06
1,33
1,60
1,88
0,70
0,810,91
1,03
0,520,61
0,690,78
0,4
0,6
0,8
1,0
1,2
1,4
1,6
1,8
2,0
4 5 6 7 8
Co
st d
iffe
ren
ce b
etw
ee
n n
on
aci
dif
ied
an
d a
cid
ifie
d s
lurr
y, €
m-3
Ntot content in slurry, kg m-3
In-house In-storage In-field
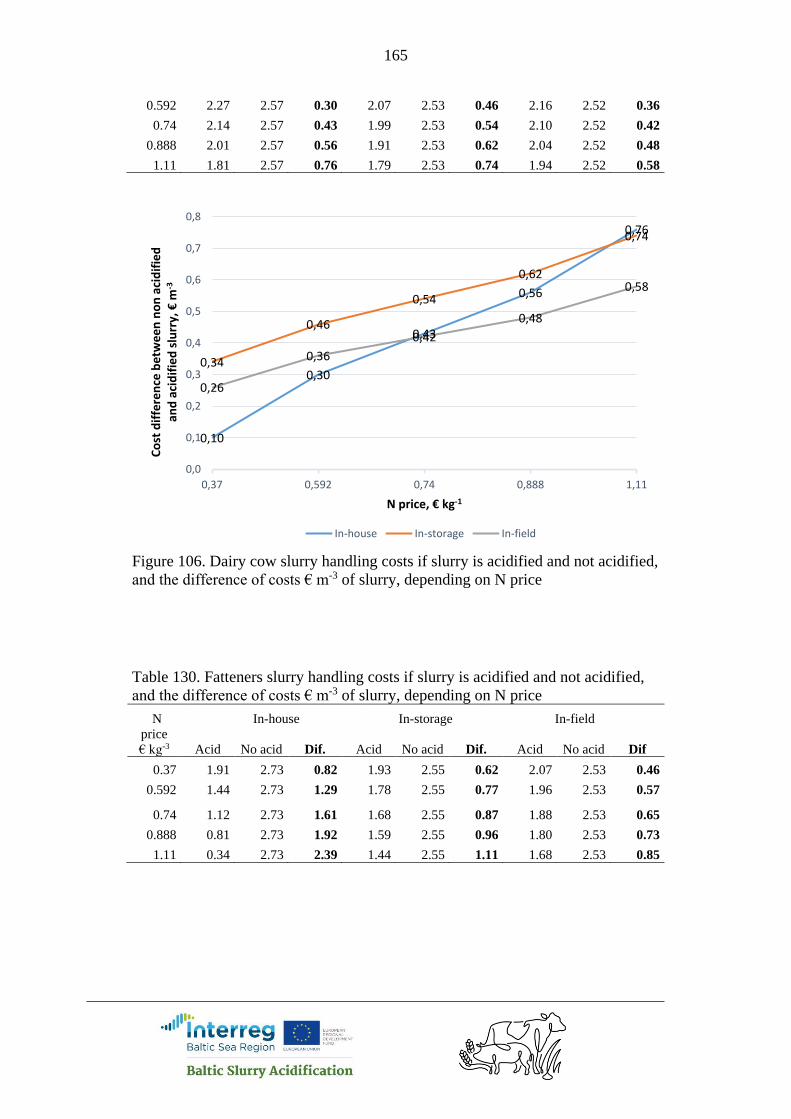
165
0.592 2.27 2.57 0.30 2.07 2.53 0.46 2.16 2.52 0.36
0.74 2.14 2.57 0.43 1.99 2.53 0.54 2.10 2.52 0.42
0.888 2.01 2.57 0.56 1.91 2.53 0.62 2.04 2.52 0.48
1.11 1.81 2.57 0.76 1.79 2.53 0.74 1.94 2.52 0.58
Figure 106. Dairy cow slurry handling costs if slurry is acidified and not acidified,
and the difference of costs € m-3 of slurry, depending on N price
Table 130. Fatteners slurry handling costs if slurry is acidified and not acidified,
and the difference of costs € m-3 of slurry, depending on N price
N In-house In-storage In-field
price
€ kg-3 Acid No acid Dif. Acid No acid Dif. Acid No acid Dif
0.37 1.91 2.73 0.82 1.93 2.55 0.62 2.07 2.53 0.46
0.592 1.44 2.73 1.29 1.78 2.55 0.77 1.96 2.53 0.57
0.74 1.12 2.73 1.61 1.68 2.55 0.87 1.88 2.53 0.65
0.888 0.81 2.73 1.92 1.59 2.55 0.96 1.80 2.53 0.73
1.11 0.34 2.73 2.39 1.44 2.55 1.11 1.68 2.53 0.85
0,10
0,30
0,43
0,56
0,76
0,34
0,46
0,54
0,62
0,74
0,26
0,36
0,42
0,48
0,58
0,0
0,1
0,2
0,3
0,4
0,5
0,6
0,7
0,8
0,37 0,592 0,74 0,888 1,11
Co
st d
iffe
ren
ce b
etw
ee
n n
on
aci
dif
ied
an
d a
cid
ifie
d s
lurr
y, €
m-3
N price, € kg-1
In-house In-storage In-field
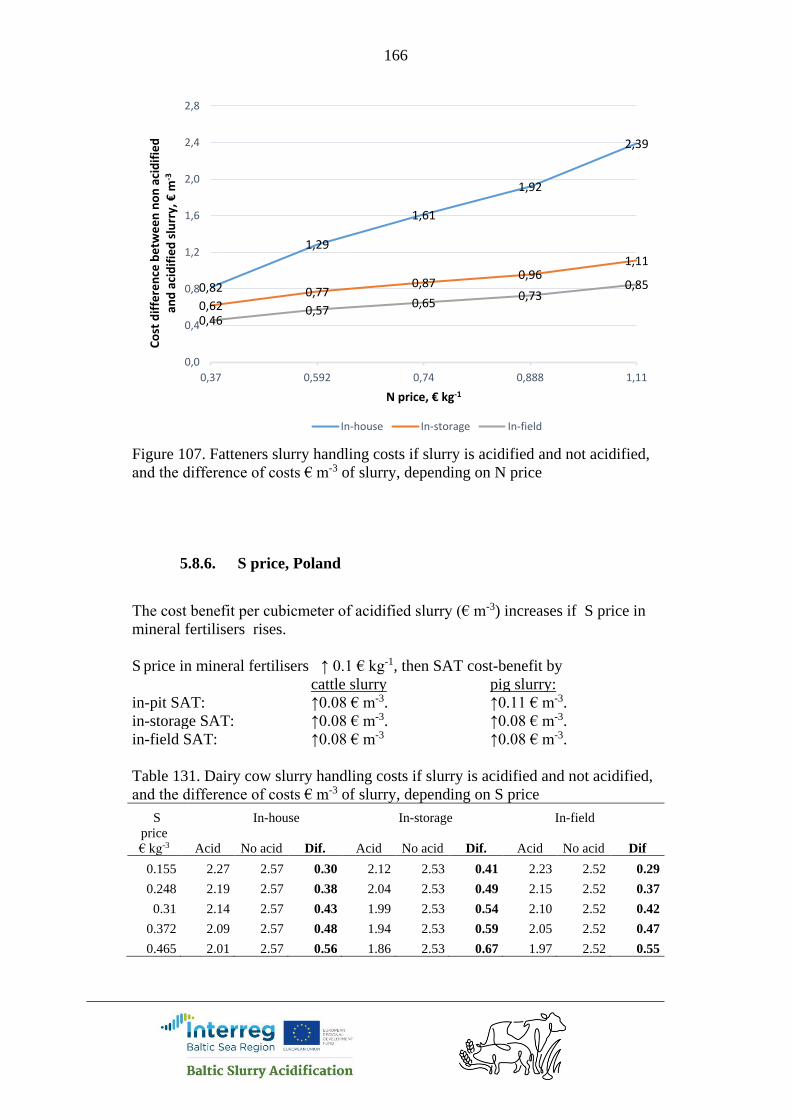
166
Figure 107. Fatteners slurry handling costs if slurry is acidified and not acidified,
and the difference of costs € m-3 of slurry, depending on N price
5.8.6. S price, Poland
The cost benefit per cubicmeter of acidified slurry (€ m-3) increases if S price in
mineral fertilisers rises.
S price in mineral fertilisers ↑ 0.1 € kg-1, then SAT cost-benefit by
cattle slurry pig slurry:
in-pit SAT: ↑0.08 € m-3. ↑0.11 € m-3.
in-storage SAT: ↑0.08 € m-3. ↑0.08 € m-3.
in-field SAT: ↑0.08 € m-3 ↑0.08 € m-3.
Table 131. Dairy cow slurry handling costs if slurry is acidified and not acidified,
and the difference of costs € m-3 of slurry, depending on S price
S In-house In-storage In-field
price
€ kg-3 Acid No acid Dif. Acid No acid Dif. Acid No acid Dif
0.155 2.27 2.57 0.30 2.12 2.53 0.41 2.23 2.52 0.29
0.248 2.19 2.57 0.38 2.04 2.53 0.49 2.15 2.52 0.37
0.31 2.14 2.57 0.43 1.99 2.53 0.54 2.10 2.52 0.42
0.372 2.09 2.57 0.48 1.94 2.53 0.59 2.05 2.52 0.47
0.465 2.01 2.57 0.56 1.86 2.53 0.67 1.97 2.52 0.55
0,82
1,29
1,61
1,92
2,39
0,620,77
0,870,96
1,11
0,460,57
0,650,73
0,85
0,0
0,4
0,8
1,2
1,6
2,0
2,4
2,8
0,37 0,592 0,74 0,888 1,11
Co
st d
iffe
ren
ce b
etw
ee
n n
on
aci
dif
ied
an
d a
cid
ifie
d s
lurr
y, €
m-3
N price, € kg-1
In-house In-storage In-field
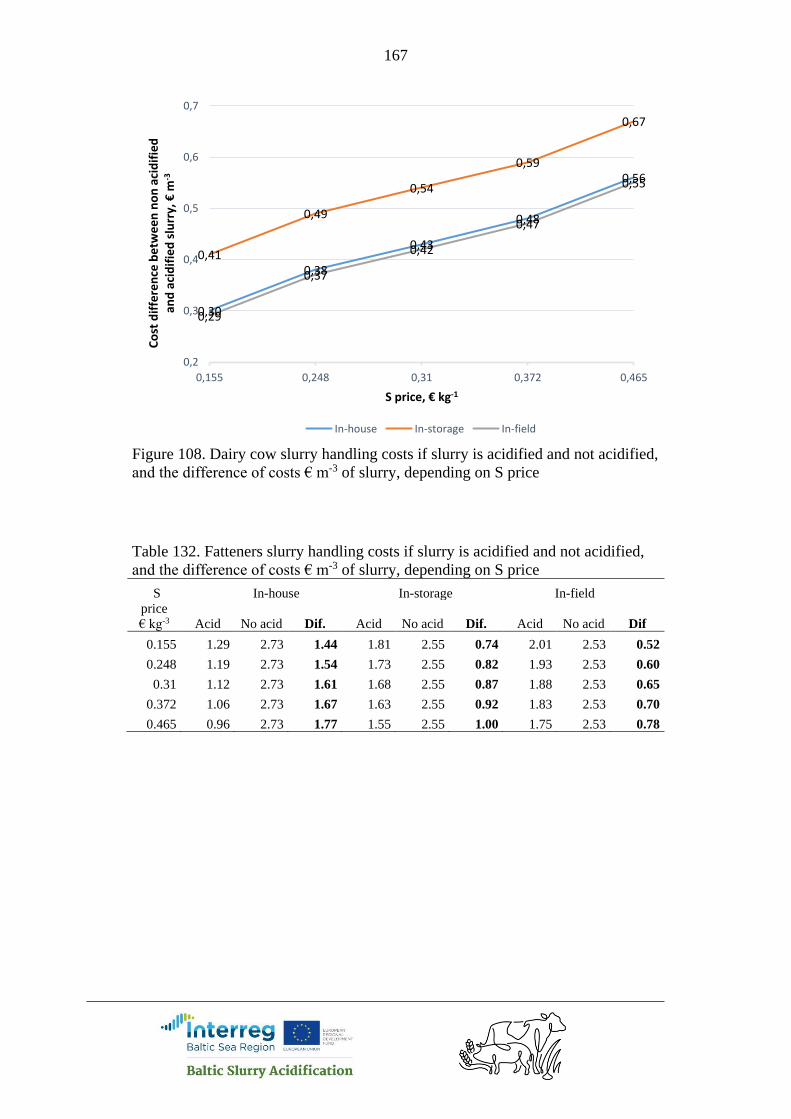
167
Figure 108. Dairy cow slurry handling costs if slurry is acidified and not acidified,
and the difference of costs € m-3 of slurry, depending on S price
Table 132. Fatteners slurry handling costs if slurry is acidified and not acidified,
and the difference of costs € m-3 of slurry, depending on S price
S In-house In-storage In-field
price
€ kg-3 Acid No acid Dif. Acid No acid Dif. Acid No acid Dif
0.155 1.29 2.73 1.44 1.81 2.55 0.74 2.01 2.53 0.52
0.248 1.19 2.73 1.54 1.73 2.55 0.82 1.93 2.53 0.60
0.31 1.12 2.73 1.61 1.68 2.55 0.87 1.88 2.53 0.65
0.372 1.06 2.73 1.67 1.63 2.55 0.92 1.83 2.53 0.70
0.465 0.96 2.73 1.77 1.55 2.55 1.00 1.75 2.53 0.78
0,30
0,38
0,43
0,48
0,56
0,41
0,49
0,54
0,59
0,67
0,29
0,37
0,42
0,47
0,55
0,2
0,3
0,4
0,5
0,6
0,7
0,155 0,248 0,31 0,372 0,465
Co
st d
iffe
ren
ce b
etw
ee
n n
on
aci
dif
ied
an
d a
cid
ifie
d s
lurr
y, €
m-3
S price, € kg-1
In-house In-storage In-field
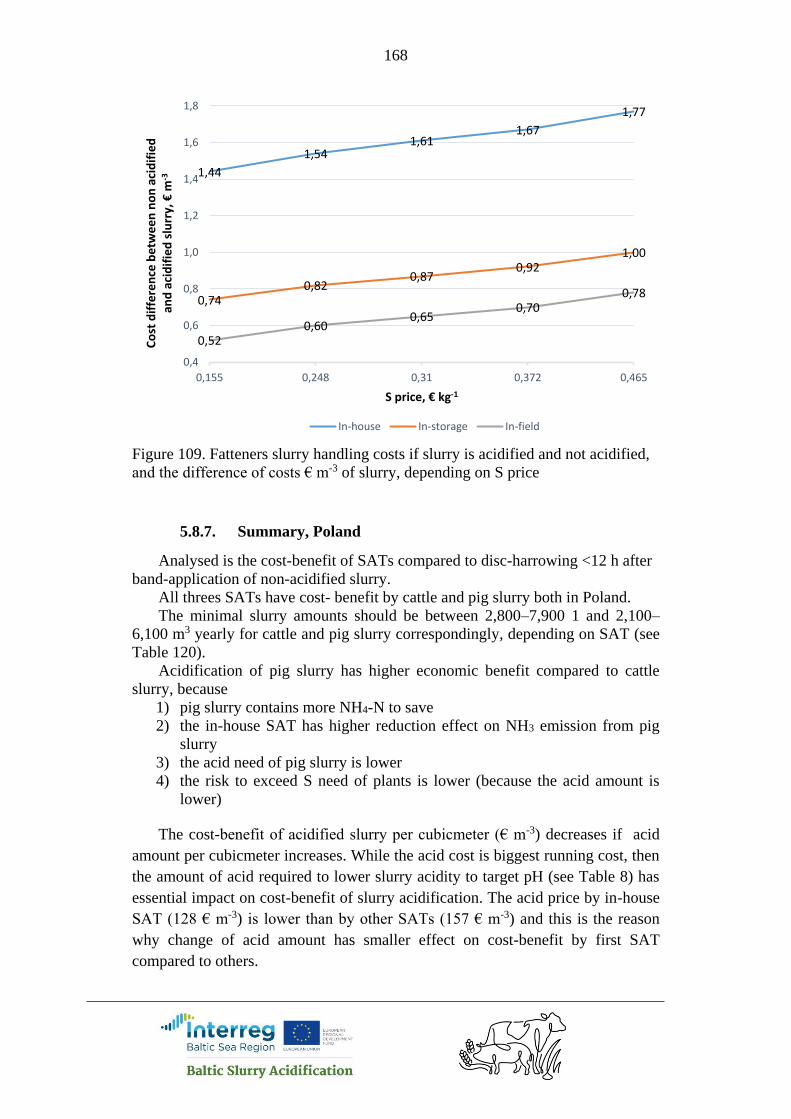
168
Figure 109. Fatteners slurry handling costs if slurry is acidified and not acidified,
and the difference of costs € m-3 of slurry, depending on S price
5.8.7. Summary, Poland
Analysed is the cost-benefit of SATs compared to disc-harrowing <12 h after
band-application of non-acidified slurry.
All threes SATs have cost- benefit by cattle and pig slurry both in Poland.
The minimal slurry amounts should be between 2,800–7,900 1 and 2,100–
6,100 m3 yearly for cattle and pig slurry correspondingly, depending on SAT (see
Table 120).
Acidification of pig slurry has higher economic benefit compared to cattle
slurry, because
1) pig slurry contains more NH4-N to save
2) the in-house SAT has higher reduction effect on NH3 emission from pig
slurry
3) the acid need of pig slurry is lower
4) the risk to exceed S need of plants is lower (because the acid amount is
lower)
The cost-benefit of acidified slurry per cubicmeter (€ m-3) decreases if acid
amount per cubicmeter increases. While the acid cost is biggest running cost, then
the amount of acid required to lower slurry acidity to target pH (see Table 8) has
essential impact on cost-benefit of slurry acidification. The acid price by in-house
SAT (128 € m-3) is lower than by other SATs (157 € m-3) and this is the reason
why change of acid amount has smaller effect on cost-benefit by first SAT
compared to others.
1,44
1,541,61
1,67
1,77
0,740,82
0,870,92
1,00
0,520,60
0,650,70
0,78
0,4
0,6
0,8
1,0
1,2
1,4
1,6
1,8
0,155 0,248 0,31 0,372 0,465
Co
st d
iffe
ren
ce b
etw
ee
n n
on
aci
dif
ied
an
d a
cid
ifie
d s
lurr
y, €
m-3
S price, € kg-1
In-house In-storage In-field
169
The calculations in paragraph 5.5 were done by slurry amount 30 m3 ha-1. The
extra calculations made for Finland for different hectare amounts (Figure 50)
show that cost-benefit of in-house SAT is higher if slurry amount is 20 or 10 m3
ha-1 .
One reason is that the slurry incorporation cost per hectare is constant despite
of slurry amount per hectare. Thus, the smaller is slurry amount per hectare the
higher is incorporation cost per cubicmeter of non-acidified slurry.
Another aspect, why low amount of acidified slurry give higher economic
effect, is the effective use of S applied with acidified slurry. In the calculations is
used 4.5 liter acid per m3 cattle slurry by in-house SAT. If the slurry amount is 30,
20 and 10 m3 ha-1 then the S amount applied to the field is 80, 53 and 26 kg ha-1
correspondingly. The S need for crops is in calculations 25 kg ha-1 in average. The
costs on mineral S are reduced if acidified slurry is applied and the reduction
effect is calculated until S amount reaches the demand of crop. After that S cost
reduction stays constant and the S amount what exceeds crop need, is not taken
into calculation. However, the S cost reduction value is always divided by slurry
amount per hectare and if the cost reduction is constant then by growing hectare
amount of slurry the S cost reduction per cubicmeter of slurry decreases.
An alternative to in-house acidification to minimise the ammonia emission
from slurry storage is to cover storage. The cost calculations made for different
type of storage covers shows that cost benefit by in-house acidified slurry depends
on capital cost and ability to decrease the ammonia emission. The rapeseed oil has
highest capital cost and decreases 80% of ammonia emission (Table 21). Thus, the
in-house slurry acidification gives biggest cost effect compared to this type of
cover, which is followed by tent and peat. Compared to the Hexa-cover plates
gives slurry acidification lowest cost benefit. The figures 100 and 101 show also
that the order of cover types is same for both, cattle and big slurries.
The cost benefit per cubicmeter of acidified slurry (€ m-3) increases if Ntot
content in slurry rises (see 5.8.4). Ntot content change in slurry has lowest impact
by in-field SAT and biggest by in-house sat, especially in the case of pig slurry.
The reason is that by in-house acidification of pig slurry the ammonia emission
reduction effect is highest, 64%.
The cost-benefit per cubicmeter of acidified slurry (€ m-3) increases if N price
in mineral fertilisers rises (see 5.8.5). The change of N price in mineral fertilisers
has lowest impact by in-field SAT and biggest by in-house sat, especially in the
case of pig slurry. The reason is that by in-house acidification of pig slurry is the
ammonia emission reduction effect highest, 64%. Bigger effect by pig slurry
compared to cattle slurry is caused also by the higher Ntot content of pig slurry and
thus N-savings by SAT-s.
The cost benefit per cubicmeter of acidified slurry (€ m-3) increases if S price
in mineral fertilisers rises (see 5.8.6). The change of S price in mineral fertilisers
has same impact by different SATs and slurry types, except bigger difference by
pig slurry with in-house SAT.
Although the present example shows cost benefit of slurry acidification by bigger
slurry amounts, a careful analysis with local parameters and future prices should

170
be performed before deciding to invest to acidification system. The analysis
model will be available on project website
5.9. Russia
5.9.1. Annual slurry amount, Russia
Analysed is the cost-benefit of SATs compared to disc-harrowing <12 h after
band-application of non-acidified slurry. The acid price in the calculations is 142
€ t-1 for in-house acidification and 112 € t-1 for in-storage and in-field
acidification. The acid transport in IBC tanks is in Russia cheaper than in big
tanks. Minimum storage period for cattle manure is 6 month and for pig manure
12 month. N-fertilisers is N 100%, 523 € t-1. NS-fertiliser N30-S6, 170 € t-1. Thus
N price 0.52 € kg-1 and S price 0.15 € kg-1. The prices of project partner countries
are between 0.48–1 and 0.11–0.85 € kg-1 respectively.
The calculation results show, that in Russia by all cattle slurry amounts, if
slurry is acidified by in-house or in-field SAT, then costs are higher to non-
acidified but incorporated slurry costs. The cost-benefit of in-storage acidification
of cattle slurry is zero if slurry mount is 17,800 m3 yealy. The reason of low cost-
benefit is small slurry incorporation cost - 14 € ha-1. Another reason is relatively
low N and S price.
The minimal pig slurry amounts should be between 5,000–17,900 m3 yearly
depending on SAT (see Table 133).
Table 133. The minimum amount of slurry and corresponding amount of animal,
by which the slurry acidification has cost-benefit. Dairy cows Fatteners
SAT Annual slurry
amount, m3
Number of
animal
Annual slurry
amount, m3
Number of animal
per year
In-house NA NA 12,938 25,876
In-storage 17,839 743 5,011 10,021
In-field NA NA 17,935 35,869
Table 134. Dairy cow slurry handling costs if slurry is acidified and not acidified,
and the cost decrease (€ m-3) by use of cattle slurry acidification compared to disc-
harrowing <12 h after band-application of non-acidified slurry. Slurry
amount
m3 yr-1
In-house In-storage In-field
Acid No acid Dif. Acid No acid Dif. Acid No acid Dif
1,200 11.15 5.83 -5.32 7.68 5.74 -1.94 11.88 5.72 -6.16
2,400 7.01 4.41 -2.60 5.12 4.32 -0.80 7.16 4.30 -2.86
9,000 3.63 2.62 -1.01 2.60 2.53 -0.07 3.06 2.51 -0.55
12,000 3.14 2.34 -0.80 2.29 2.26 -0.03 2.60 2.23 -0.37
21,000 2.55 1.90 -0.65 1.81 1.81 0.00 1.95 1.79 -0.16
24,000 2.41 1.80 -0.61 1.72 1.72 0.00 1.82 1.69 -0.13
33,000 2.19 1.60 -0.59 1.53 1.52 -0.01 1.58 1.49 -0.09
48,000 1.95 1.40 -0.55 1.35 1.32 -0.03 1.35 1.29 -0.06
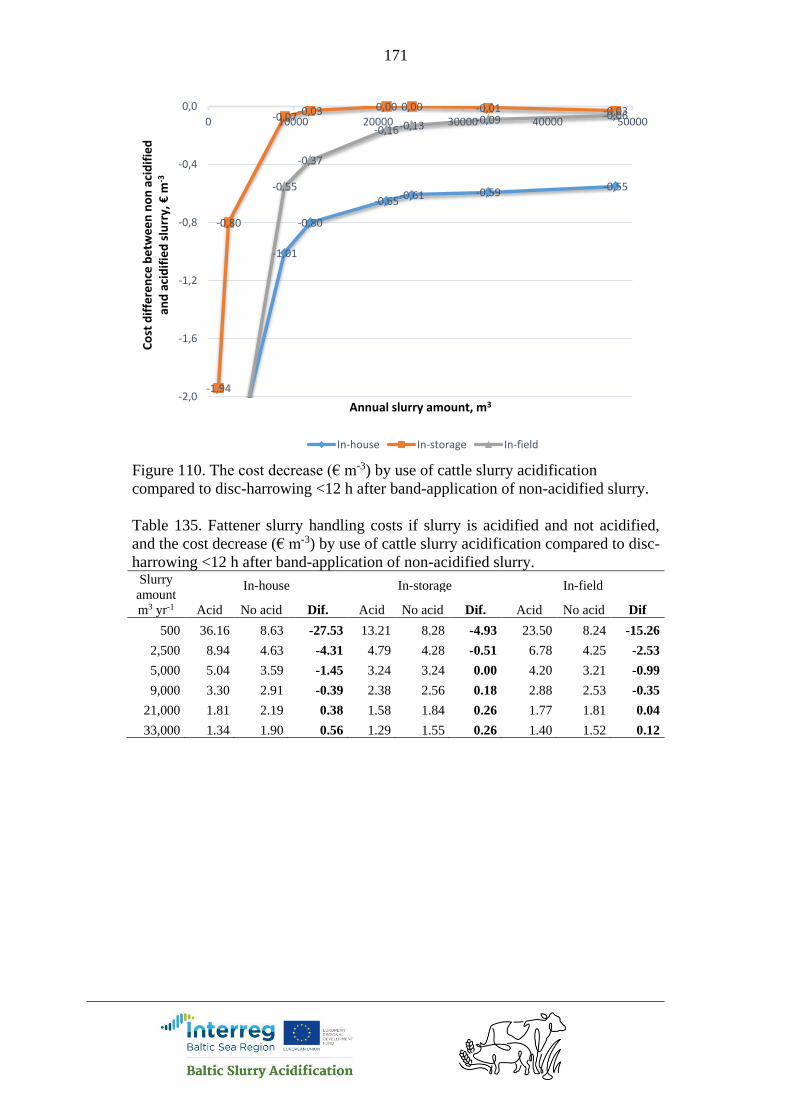
171
Figure 110. The cost decrease (€ m-3) by use of cattle slurry acidification
compared to disc-harrowing <12 h after band-application of non-acidified slurry.
Table 135. Fattener slurry handling costs if slurry is acidified and not acidified,
and the cost decrease (€ m-3) by use of cattle slurry acidification compared to disc-
harrowing <12 h after band-application of non-acidified slurry. Slurry
amount
m3 yr-1
In-house In-storage In-field
Acid No acid Dif. Acid No acid Dif. Acid No acid Dif
500 36.16 8.63 -27.53 13.21 8.28 -4.93 23.50 8.24 -15.26
2,500 8.94 4.63 -4.31 4.79 4.28 -0.51 6.78 4.25 -2.53
5,000 5.04 3.59 -1.45 3.24 3.24 0.00 4.20 3.21 -0.99
9,000 3.30 2.91 -0.39 2.38 2.56 0.18 2.88 2.53 -0.35
21,000 1.81 2.19 0.38 1.58 1.84 0.26 1.77 1.81 0.04
33,000 1.34 1.90 0.56 1.29 1.55 0.26 1.40 1.52 0.12
-1,01
-0,80
-0,65-0,61 -0,59 -0,55
-1,94
-0,80
-0,07-0,03 0,00 0,00 -0,01 -0,03
-0,55
-0,37
-0,16-0,13 -0,09 -0,06
-2,0
-1,6
-1,2
-0,8
-0,4
0,0
0 10000 20000 30000 40000 50000
Co
st d
iffe
ren
ce b
etw
ee
n n
on
aci
dif
ied
an
d a
cid
ifie
d s
lurr
y, €
m-3
Annual slurry amount, m3
In-house In-storage In-field

172
Figure 111. The cost decrease (€ m-3) by use of fattener slurry acidification
compared to disc-harrowing <12 h after band-application of non-acidified slurry.
5.9.2. Cover type, Russia
An alternative to in-house acidification to minimise the ammonia emission
from slurry storage is to cover storage. The cost calculations made for different
type of storage covers shows that cost benefit by in-house acidified slurry depends
on capital cost and ability to decrease the ammonia emission. The rapeseed oil has
highest capital cost and decreases 80% of ammonia emission (Table 21). Thus, the
in-house slurry acidification gives biggest cost effect compared to this type of
cover, which is followed by tent and peat. In-house acidification of cattle slurry
has no positive cost-benefit by any type of artificial coverer. In-house
acidification of pig slurry has positive cost-benefit compared to all cover types.
Biggest cost-effect of in-house acidification of pig slurry is compared to rapseed
oil, which is followed by tent and peat (Figure 113).
In Russia, minimum storage period for cattle manure is 6 month and for pig
manure 12 month.. In this analysis is presumed that animal are housed in all year
around and storage depth is 5 m. The capital cost of slurry storage cover
calculated for these conditions are shown in the table 21.
Table 136. Dairy cow slurry handling costs if slurry is acidified and not acidified,
and the difference of costs € m-3 of slurry. In this analysis is varied with different
type of storage covers by in-house acidification, if slurry is not acidified. Annual
slurry amount 21,000 m3.
0,38
0,56
0,00
0,18
0,26 0,26
0,04
0,12
0,0
0,1
0,2
0,3
0,4
0,5
0,6
0 5000 10000 15000 20000 25000 30000 35000
Co
st d
iffe
ren
ce b
etw
ee
n n
on
aci
dif
ied
an
d a
cid
ifie
d s
lurr
y, €
m-3
Annual slurry amount, m3
In-house In-storage In-field

173
In-house
Cover type Acid No acid Dif.
No cover 2.55 1.90 -0.65
Chopped straw 2.68 1.92 -0.76
Fibo clay balls (fraction 10-20 mm) 2.71 1.93 -0.78
Floating foil 2.72 1.94 -0.78
Hexa-cover plates 2.73 1.95 -0.78
Peat 2.72 2.16 -0.56
Rapeseed oil 2.71 2.58 -0.13
Tent cover 2.74 2.21 -0.53
Figure 112. Dairy cow slurry handling costs if slurry is acidified and not acidified,
and the difference of costs € m-3 of slurry. In this analysis is varied with different
type of storage covers by in-house acidification, if slurry is not acidified. Annual
slurry amount 21,000 m3.
Table 137. Fatteners slurry handling costs if slurry is acidified and not acidified,
and the difference of costs € m-3 of slurry. In this analysis is varied with different
type of storage covers by in-house acidification, if slurry is not acidified. Annual
slurry amount 21,000 m3.
In-house
Cover type Acid No acid Dif.
No cover 1.81 2.19 0.38
Chopped straw 1.98 2.28 0.30
Fibo clay balls (fraction 10-20 mm) 2.02 2.32 0.30
Floating foil 2.03 2.34 0.31
Hexa-cover plates 2.04 2.35 0.31
Peat 2.03 2.78 0.75
-0,65-0,76 -0,78 -0,78 -0,78
-0,56
-0,13
-0,53
-0,9
-0,8
-0,7
-0,6
-0,5
-0,4
-0,3
-0,2
-0,1
0,0
Co
st d
iffe
ren
ce b
etw
ee
n n
on
aci
dif
ied
an
d a
cid
ifie
d s
lurr
y, €
m-3
No cover Chopped straw Fibo clay balls Floating foil
Hexa-cover plates Peat Rapeseed oil Tent cover

174
Rapeseed oil 2.02 3.62 1.60
Tent cover 2.05 2.88 0.83
Figure 113. Fatteners slurry handling costs if slurry is acidified and not acidified,
and the difference of costs € m-3 of slurry. In this analysis is varied with different
type of storage covers by in-house acidification, if slurry is not acidified. 42,000
fatteners.
5.9.3. Acid consumption, Russia
While the acid cost is biggest running cost, then the amount of acid required
to lower slurry acidity to target pH (see Table 8) has essential impact on cost-
benefit of slurry acidification. The cost-benefit per cubicmeter of acidified slurry
(€ m-3) decreases if acid amount per cubicmeter increases.
If acid consumption ↑ 1 l m-3, then SAT cost-benefit by
cattle slurry pig slurry:
in-house SAT: ↓0.35 € m-3 ↓0.34 € m-3
in-storage SAT: ↓0.29 € m-3 ↓0.29 € m-3
in-field SAT: ↓0.31 € m-3 ↓0.31 € m-3
Acid content change in slurry has similar impact by all SATs. The reason is
that the acid price for in-house SAT is lower (128 € t-1) than by other SATs
(157 € t-1).
Table 138. Dairy cow slurry handling costs if slurry is acidified and not acidified,
and the difference of costs € m-3 of slurry, depending on acid consumption.
Acid In-house In-storage In-field
amount
l m-3 Acid No acid Dif. Acid No acid Dif. Acid No acid Dif
0,38 0,30 0,30 0,31 0,31
0,75
1,60
0,83
0,0
0,2
0,4
0,6
0,8
1,0
1,2
1,4
1,6
1,8
Co
st d
iffe
ren
ce b
etw
ee
n n
on
aci
dif
ied
an
d a
cid
ifie
d s
lurr
y, €
m-3
No cover Chopped straw Fibo clay balls Floating foil
Hexa-cover plates Peat Rapeseed oil Tent cover
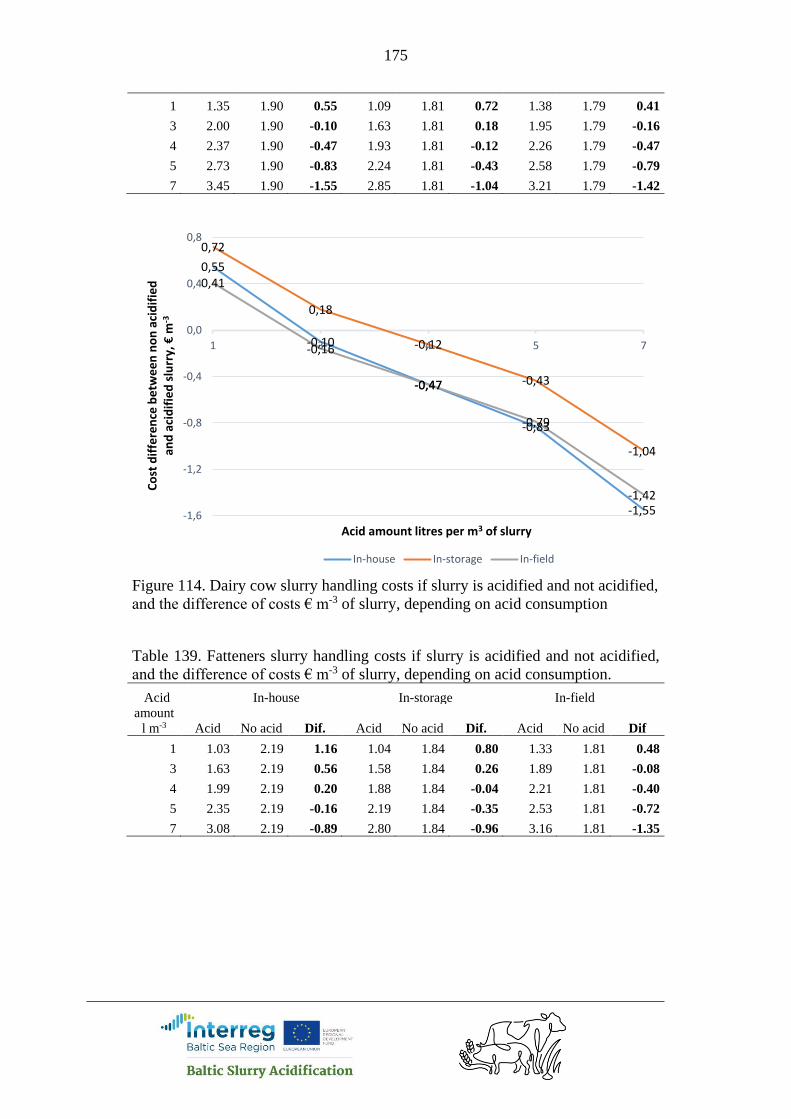
175
1 1.35 1.90 0.55 1.09 1.81 0.72 1.38 1.79 0.41
3 2.00 1.90 -0.10 1.63 1.81 0.18 1.95 1.79 -0.16
4 2.37 1.90 -0.47 1.93 1.81 -0.12 2.26 1.79 -0.47
5 2.73 1.90 -0.83 2.24 1.81 -0.43 2.58 1.79 -0.79
7 3.45 1.90 -1.55 2.85 1.81 -1.04 3.21 1.79 -1.42
Figure 114. Dairy cow slurry handling costs if slurry is acidified and not acidified,
and the difference of costs € m-3 of slurry, depending on acid consumption
Table 139. Fatteners slurry handling costs if slurry is acidified and not acidified,
and the difference of costs € m-3 of slurry, depending on acid consumption.
Acid In-house In-storage In-field
amount
l m-3 Acid No acid Dif. Acid No acid Dif. Acid No acid Dif
1 1.03 2.19 1.16 1.04 1.84 0.80 1.33 1.81 0.48
3 1.63 2.19 0.56 1.58 1.84 0.26 1.89 1.81 -0.08
4 1.99 2.19 0.20 1.88 1.84 -0.04 2.21 1.81 -0.40
5 2.35 2.19 -0.16 2.19 1.84 -0.35 2.53 1.81 -0.72
7 3.08 2.19 -0.89 2.80 1.84 -0.96 3.16 1.81 -1.35
0,55
-0,10
-0,47
-0,83
-1,55
0,72
0,18
-0,12
-0,43
-1,04
0,41
-0,16
-0,47
-0,79
-1,42
-1,6
-1,2
-0,8
-0,4
0,0
0,4
0,8
1 3 4 5 7
Co
st d
iffe
ren
ce b
etw
ee
n n
on
aci
dif
ied
an
d a
cid
ifie
d s
lurr
y, €
m-3
Acid amount litres per m3 of slurry
In-house In-storage In-field

176
Figure 115. Fatteners slurry handling costs if slurry is acidified and not acidified,
and the difference of costs € m-3 of slurry, depending on acid consumption
5.9.4. Ntot in slurry, Russia
The cost benefit per cubicmeter of acidified slurry (€ m-3) increases if Ntot
content in slurry rises.
If Ntot content in slurry ↑ 1 kg m-3 , then SAT cost-benefit by
cattle slurry pig slurry:
in-house SAT: ↑0.12 € m-3. ↑0.24 € m-3.
in-storage SAT: ↑0.10 € m-3. ↑0.09 € m-3.
in-field SAT: ↑0.07 € m-3 ↑0.07 € m-3.
Ntot content change in slurry has lowest impact by in-field SAT and biggest by
in-house sat, especially in the case of pig slurry. The reason is that by in-
house or in-house acidification of pig slurry is the ammonia emission
reduction effect highest, 64%.
Table 140. Dairy cow slurry handling costs if slurry is acidified and not acidified,
and the difference of costs € m-3 of slurry, depending Ntot content in slurry
Ntot In-house In-storage In-field
content
kg m-3 Acid No acid Dif. Acid No acid Dif. Acid No acid Dif
3 1.91 1.77 -0.14 2.02 1.75 -0.27
4 2.70 1.83 -0.87 1.84 1.80 -0.04 1.97 1.78 -0.19
1,16
0,56
0,20
-0,16
-0,89
0,80
0,26
-0,04
-0,35
-0,96
0,48
-0,08
-0,40
-0,72
-1,35-1,5
-1,0
-0,5
0,0
0,5
1,0
1,5
1 3 4 5 7
Co
st d
iffe
ren
ce b
etw
ee
n n
on
aci
dif
ied
an
d a
cid
ifie
d s
lurr
y, €
m-3
Acid amount litres per m3 of slurry
In-house In-storage In-field

177
5 2.62 1.86 -0.76 1.78 1.83 0.05 1.92 1.80 -0.12
6 2.54 1.90 -0.64 1.71 1.86 0.15 1.87 1.82 -0.05
7 2.46 1.93 -0.53
Figure 116. Dairy cow slurry handling costs if slurry is acidified and not acidified,
and the difference of costs € m-3 of slurry, depending Ntot content in slurry
Table 141. Fatteners slurry handling costs if slurry is acidified and not acidified,
and the difference of costs € m-3 of slurry, depending Ntot content in slurry
Ntot In-house In-storage In-field
content
kg m-3 Acid No acid Dif. Acid No acid Dif. Acid No acid Dif
4 1.68 1.80 0.12 1.84 1.78 -0.06
5 2.14 2.05 -0.09 1.61 1.83 0.22 1.79 1.80 0.01
6 1.97 2.12 0.15 1.55 1.86 0.31 1.74 1.82 0.08
7 1.81 2.19 0.38 1.48 1.88 0.40 1.69 1.84 0.15
8 1.64 2.27 0.63
-0,87
-0,76
-0,64
-0,53
-0,14
-0,040,05
0,15
-0,27-0,19
-0,12-0,05
-1,0
-0,8
-0,6
-0,4
-0,2
0,0
0,2
0,4
3 4 5 6 7
Co
st d
iffe
ren
ce b
etw
ee
n n
on
aci
dif
ied
an
d a
cid
ifie
d s
lurr
y, €
m-3
Ntot content in slurry, kg m-3
In-house In-storage In-field

178
Figure 117. Fatteners slurry handling costs if slurry is acidified and not acidified,
and the difference of costs € m-3 of slurry, depending Ntot content in slurry
5.9.5. N price, Russia
The cost benefit per cubicmeter of acidified slurry (€ m-3) increases if N price
in mineral fertilisers rises.
N price in mineral fertilisers ↑ 0.1 € kg-1, then SAT cost-benefit by
cattle slurry pig slurry:
in-house SAT: ↑0.088 € m-3. ↑0.21 € m-3.
in-storage SAT: ↑0.054 € m-3. ↑0.07 € m-3.
in-field SAT: ↑0.044 € m-3 ↑0.05 € m-3.
The change of N price in mineral fertilisers has lowest impact by in-field SAT
and biggest by in-house sat, especially in the case of pig slurry. The reason is
that by in-house acidification of pig slurry is the ammonia emission reduction
effect highest, 64%.
Bigger effect by pig slurry compared to cattle slurry is caused also by the
higher Ntot content of pig slurry and thus N-savings by SAT-s.
Table 142. Dairy cow slurry handling costs if slurry is acidified and not acidified,
and the difference of costs € m-3 of slurry, depending on N price
N In-house In-storage In-field
price
€ kg-3 Acid No acid Dif. Acid No acid Dif. Acid No acid Dif
0.26 2.78 1.90 -0.88 1.95 1.81 -0.14 2.06 1.79 -0.27
-0,09
0,15
0,38
0,63
0,12
0,22
0,31
0,40
-0,06
0,01
0,08
0,15
-0,2
0,0
0,2
0,4
0,6
0,8
4 5 6 7 8
Co
st d
iffe
ren
ce b
etw
ee
n n
on
aci
dif
ied
an
d a
cid
ifie
d s
lurr
y, €
m-3
Ntot content in slurry, kg m-3
In-house In-storage In-field
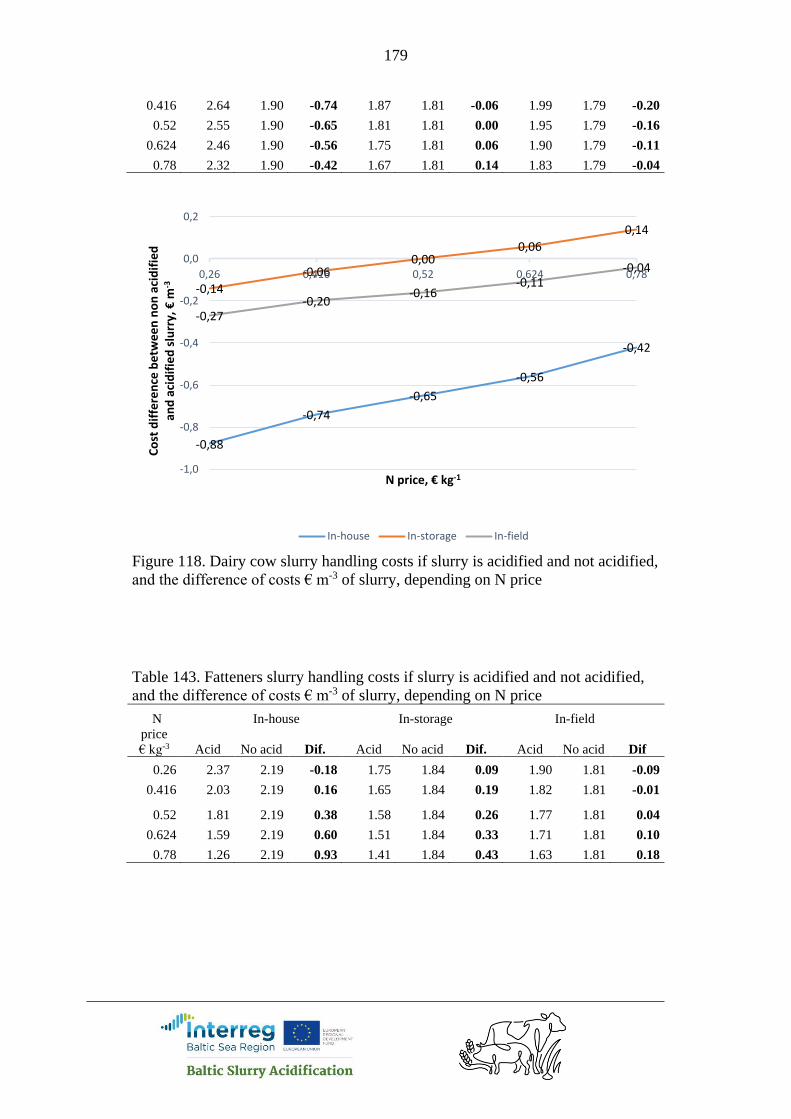
179
0.416 2.64 1.90 -0.74 1.87 1.81 -0.06 1.99 1.79 -0.20
0.52 2.55 1.90 -0.65 1.81 1.81 0.00 1.95 1.79 -0.16
0.624 2.46 1.90 -0.56 1.75 1.81 0.06 1.90 1.79 -0.11
0.78 2.32 1.90 -0.42 1.67 1.81 0.14 1.83 1.79 -0.04
Figure 118. Dairy cow slurry handling costs if slurry is acidified and not acidified,
and the difference of costs € m-3 of slurry, depending on N price
Table 143. Fatteners slurry handling costs if slurry is acidified and not acidified,
and the difference of costs € m-3 of slurry, depending on N price
N In-house In-storage In-field
price
€ kg-3 Acid No acid Dif. Acid No acid Dif. Acid No acid Dif
0.26 2.37 2.19 -0.18 1.75 1.84 0.09 1.90 1.81 -0.09
0.416 2.03 2.19 0.16 1.65 1.84 0.19 1.82 1.81 -0.01
0.52 1.81 2.19 0.38 1.58 1.84 0.26 1.77 1.81 0.04
0.624 1.59 2.19 0.60 1.51 1.84 0.33 1.71 1.81 0.10
0.78 1.26 2.19 0.93 1.41 1.84 0.43 1.63 1.81 0.18
-0,88
-0,74
-0,65
-0,56
-0,42
-0,14
-0,060,00
0,06
0,14
-0,27-0,20
-0,16-0,11
-0,04
-1,0
-0,8
-0,6
-0,4
-0,2
0,0
0,2
0,26 0,416 0,52 0,624 0,78
Co
st d
iffe
ren
ce b
etw
ee
n n
on
aci
dif
ied
an
d a
cid
ifie
d s
lurr
y, €
m-3
N price, € kg-1
In-house In-storage In-field
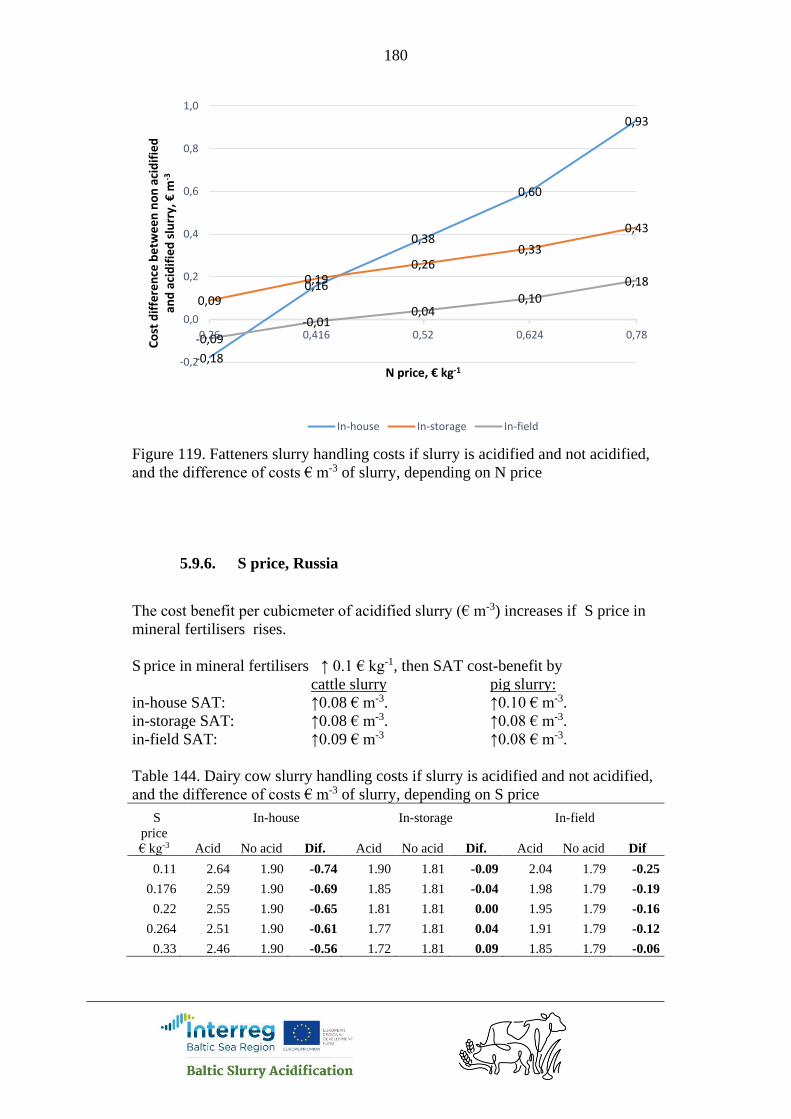
180
Figure 119. Fatteners slurry handling costs if slurry is acidified and not acidified,
and the difference of costs € m-3 of slurry, depending on N price
5.9.6. S price, Russia
The cost benefit per cubicmeter of acidified slurry (€ m-3) increases if S price in
mineral fertilisers rises.
S price in mineral fertilisers ↑ 0.1 € kg-1, then SAT cost-benefit by
cattle slurry pig slurry:
in-house SAT: ↑0.08 € m-3. ↑0.10 € m-3.
in-storage SAT: ↑0.08 € m-3. ↑0.08 € m-3.
in-field SAT: ↑0.09 € m-3 ↑0.08 € m-3.
Table 144. Dairy cow slurry handling costs if slurry is acidified and not acidified,
and the difference of costs € m-3 of slurry, depending on S price
S In-house In-storage In-field
price
€ kg-3 Acid No acid Dif. Acid No acid Dif. Acid No acid Dif
0.11 2.64 1.90 -0.74 1.90 1.81 -0.09 2.04 1.79 -0.25
0.176 2.59 1.90 -0.69 1.85 1.81 -0.04 1.98 1.79 -0.19
0.22 2.55 1.90 -0.65 1.81 1.81 0.00 1.95 1.79 -0.16
0.264 2.51 1.90 -0.61 1.77 1.81 0.04 1.91 1.79 -0.12
0.33 2.46 1.90 -0.56 1.72 1.81 0.09 1.85 1.79 -0.06
-0,18
0,16
0,38
0,60
0,93
0,09
0,190,26
0,33
0,43
-0,09
-0,010,04
0,10
0,18
-0,2
0,0
0,2
0,4
0,6
0,8
1,0
0,26 0,416 0,52 0,624 0,78
Co
st d
iffe
ren
ce b
etw
ee
n n
on
aci
dif
ied
an
d a
cid
ifie
d s
lurr
y, €
m-3
N price, € kg-1
In-house In-storage In-field
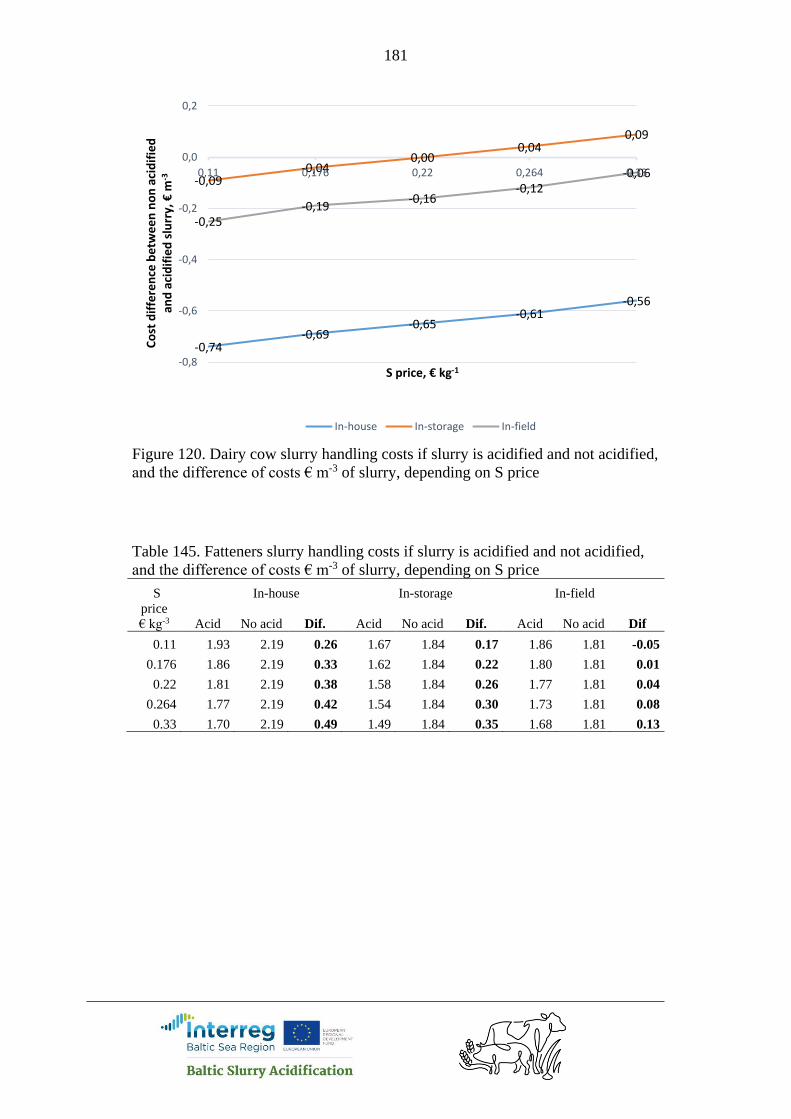
181
Figure 120. Dairy cow slurry handling costs if slurry is acidified and not acidified,
and the difference of costs € m-3 of slurry, depending on S price
Table 145. Fatteners slurry handling costs if slurry is acidified and not acidified,
and the difference of costs € m-3 of slurry, depending on S price
S In-house In-storage In-field
price
€ kg-3 Acid No acid Dif. Acid No acid Dif. Acid No acid Dif
0.11 1.93 2.19 0.26 1.67 1.84 0.17 1.86 1.81 -0.05
0.176 1.86 2.19 0.33 1.62 1.84 0.22 1.80 1.81 0.01
0.22 1.81 2.19 0.38 1.58 1.84 0.26 1.77 1.81 0.04
0.264 1.77 2.19 0.42 1.54 1.84 0.30 1.73 1.81 0.08
0.33 1.70 2.19 0.49 1.49 1.84 0.35 1.68 1.81 0.13
-0,74-0,69
-0,65-0,61
-0,56
-0,09-0,04
0,000,04
0,09
-0,25-0,19
-0,16-0,12
-0,06
-0,8
-0,6
-0,4
-0,2
0,0
0,2
0,11 0,176 0,22 0,264 0,33
Co
st d
iffe
ren
ce b
etw
ee
n n
on
aci
dif
ied
an
d a
cid
ifie
d s
lurr
y, €
m-3
S price, € kg-1
In-house In-storage In-field

182
Figure 121. Fatteners slurry handling costs if slurry is acidified and not acidified,
and the difference of costs € m-3 of slurry, depending on S price
5.9.7. Summary, Russia
Analysed is the cost-benefit of SATs compared to disc-harrowing <12 h after
band-application of non-acidified slurry. The calculation results show, that in
Russia by all cattle slurry amounts, if slurry is acidified by in-house or in-field
SAT, then costs are higher to non-acidified but incorporated slurry costs. The
cost-benefit of in-storage acidification of cattle slurry is zero if slurry mount is
17,800 m3 yealy. One reason of low cost-benefit is small slurry incorporation cost
- 14 € ha-1. Another reason is relatively low N (0.52 compared to 0.48–1 € kg-1)
and S price (0.15 compared to 0.11–0.85 € kg-1).
The minimal pig slurry amounts should be between 5,000–17,900 m3 yearly
depending on SAT (see Table 133).
Acidification of pig slurry has higher economic benefit compared to cattle
slurry, because
1) pig slurry contains more NH4-N to save
2) the in-house SAT has higher reduction effect on NH3 emission from
pig slurry
3) the acid need of pig slurry is lower
4) the risk to exceed S need of plants is lower (because the acid amount is
lower)
The cost-benefit of acidified slurry per cubicmeter (€ m-3) decreases if acid
amount per cubicmeter increases. While the acid cost is biggest running cost, then
the amount of acid required to lower slurry acidity to target pH (see Table 8) has
0,26
0,33
0,38
0,42
0,49
0,17
0,22
0,26
0,30
0,35
-0,05
0,010,04
0,08
0,13
-0,1
0,0
0,1
0,2
0,3
0,4
0,5
0,11 0,176 0,22 0,264 0,33
Co
st d
iffe
ren
ce b
etw
ee
n n
on
aci
dif
ied
an
d a
cid
ifie
d s
lurr
y, €
m-3
S price, € kg-1
In-house In-storage In-field
183
essential impact on cost-benefit of slurry acidification. The acid price by in-house
SAT (128 € m-3) is lower than by other SATs (157 € m-3) and this is the reason
why change of acid amount has smaller effect on cost-benefit by first SAT
compared to others.
The calculations in paragraph 5.5 were done by slurry amount 30 m3 ha-1. The
extra calculations made for Finland for different hectare amounts (Figure 50)
show that cost-benefit of in-house SAT is higher if slurry amount is 20 or 10 m3
ha-1 .
One reason is that the slurry incorporation cost per hectare is constant despite
of slurry amount per hectare. Thus, the smaller is slurry amount per hectare the
higher is incorporation cost per cubicmeter of non-acidified slurry.
Another aspect, why low amount of acidified slurry give higher economic
effect, is the effective use of S applied with acidified slurry. In the calculations is
used 4.5 liter acid per m3 cattle slurry by in-house SAT. If the slurry amount is 30,
20 and 10 m3 ha-1 then the S amount applied to the field is 80, 53 and 26 kg ha-1
correspondingly. The S need for crops is in calculations 25 kg ha-1 in average. The
costs on mineral S are reduced if acidified slurry is applied and the reduction
effect is calculated until S amount reaches the demand of crop. After that S cost
reduction stays constant and the S amount what exceeds crop need, is not taken
into calculation. However, the S cost reduction value is always divided by slurry
amount per hectare and if the cost reduction is constant then by growing hectare
amount of slurry the S cost reduction per cubicmeter of slurry decreases.
An alternative to in-house acidification to minimise the ammonia emission
from slurry storage is to cover storage. The cost calculations made for different
type of storage covers shows that cost benefit by in-house acidified slurry depends
on capital cost and ability to decrease the ammonia emission. The rapeseed oil has
highest capital cost and decreases 80% of ammonia emission (Table 21). Thus, the
in-house slurry acidification gives biggest cost effect compared to this type of
cover, which is followed by tent and peat. In-house acidification of cattle slurry
has no positive cost-benefit by any type of artificial coverer. In-house
acidification of pig slurry has positive cost-benefit compared to all cover types.
Biggest cost-effect of in-house acidification of pig slurry is compared to rapseed
oil, which is followed by tent and peat (Figure 113).
The cost benefit per cubicmeter of acidified slurry (€ m-3) increases if Ntot
content in slurry rises (see 5.9.4). Ntot content change in slurry has lowest impact
by in-field SAT and biggest by in-house sat, especially in the case of pig slurry.
The reason is that by in-house acidification of pig slurry the ammonia emission
reduction effect is highest, 64%.
The cost-benefit per cubicmeter of acidified slurry (€ m-3) increases if N price
in mineral fertilisers rises (see 5.9.5). The change of N price in mineral fertilisers
has lowest impact by in-field SAT and biggest by in-house sat, especially in the
case of pig slurry. The reason is that by in-house acidification of pig slurry is the
ammonia emission reduction effect highest, 64%. Bigger effect by pig slurry
184
compared to cattle slurry is caused also by the higher Ntot content of pig slurry and
thus N-savings by SAT-s.
The cost benefit per cubicmeter of acidified slurry (€ m-3) increases if S price
in mineral fertilisers rises (see 5.9.6).
Although the present example shows cost benefit of slurry acidification by bigger
slurry amounts, a careful analysis with local parameters and future prices should
be performed before deciding to invest to acidification system. The analysis
model will be available on project website
5.10. Sweden
5.10.1. Animal number, Sweden
Analysed is the cost-benefit of SATs compared to disc-harrowing <12 h after
band-application of non-acidified slurry. The acid price in the calculations is 128
€ t-1 for in-house acidification and 157 € t-1 for in-storage and in-field
acidification. N-fertilisers is AN34.4, 240 € t-1. NS-fertiliser AXAN 27N+4S, 220
€ t-1. Thus N price 0.7 € kg-1 and S price 0.85 € kg-1. The prices of project partner
countries are between 0.48–1 and 0.11–0.85€ kg-1 respectively.
As a default value in Sweden is used 3% of Ntot lost as ammonia from
storage with cattle slurry and 4% of tot-N from storage with pig slurry. (Personal
contact with Lena Rodhe).
For Sweden, the in-house tehnology is calculated with presumption that
acidification starts in slurry pumping pit in cattle and pig barn both. It means that
there is not taken into account ammonia emission nor decrease of emission in
barn. The calculations base on slurry Ntot content ex-housing. By Lena Rodhe the
ex-housing and ex-storage data are close. Thus, the data published in report by
Steineck et. al. (1999) are used in the calculations for all SATs. Ntot for
conventional cattle slurry is 3.9 and pig slurry 5.1 kg t-1. Instead of in-house SAT
is used the term in-pit SAT for Sweden.
By the information from JH Agro presenter Holger Schulz is the price of in-
pit acidification system for cattle and pig slurry is same as for cattle in-house
acidification system. However, 5,000 € for additional mixer should be calculated
in pumping pit, to mix slurry and acid during in-pit acidification. The slurry pump
is controlled by acidification system to adjust slurry level in pit.
SAT producer suggests, that some acidified slurry should be in the pit, so that
the new slurry from the barn flows into the prepared slurry. However, the process
is more or less continious. After start of use of acidification system, the pit
contains always some acidified slurry. The pit has to be so big that the amount of
new slurry is only a small part (lower than 5 %) of the complete volume of the pit.
The other costs for in-pit SAT are same as by in-house SAT.
All three SATs have cost- benefit by cattle and pig slurry both in Sweden.
185
The minimal slurry amounts should be between 1,300–5,000 and 1,100–3,300.
m3 yearly for cattle and pig slurry correspondingly, depending on SAT (see Table
146). The biggest reason for economic benefit of SAT-s is the cost of
incorporation (50 € ha-1 in Sweden) of non-acidified slurry by disc harrow after
spreading. If slurry amount is 30 m3 ha-1, then incorporation cost is 1.79 € m-3,
which is saved if acidified slurry is applied to the field surface and slurry is not
incorporated to the soil.
Table 146. The minimum amount of slurry and corresponding amount of animal,
by which the slurry acidification has cost-benefit. Dairy cows Fatteners
SAT Number of
animal
Annual slurry
amount, m3
Number of animal
per year
Annual slurry
amount, m3
In-pit 5,016 209 3,212 6,424
In-storage 1,320 55 1,123 2,245
In-field 3,672 153 3,257 6,513
Table 147. Dairy cow slurry handling costs if slurry is acidified and not acidified,
and the cost decrease (€ m-3) by use of cattle slurry acidification compared to disc-
harrowing <12 h after band-application of non-acidified slurry. Slurry
amount
m3 yr-1
In-pit In-storage In-field
Acid No acid Dif. Acid No acid Dif. Acid No acid Dif
1,200 11.31 7.17 -4.14 7.36 7.17 -0.19 11.48 7.16 -4.32
2,400 7.04 5.95 -1.09 5.04 5.95 0.91 7.03 5.94 -1.09
9,000 3.41 4.17 0.76 2.60 4.18 1.58 3.02 4.17 1.15
12,000 2.88 3.86 0.98 2.26 3.87 1.61 2.55 3.86 1.31
21,000 2.23 3.33 1.10 1.74 3.33 1.59 1.85 3.32 1.47
24,000 2.07 3.21 1.14 1.64 3.22 1.58 1.71 3.20 1.49
33,000 1.81 2.95 1.14 1.42 2.95 1.53 1.44 2.94 1.50
48,000 1.53 2.67 1.14 1.20 2.67 1.47 1.17 2.66 1.49

186
Figure 122. The cost decrease (€ m-3) by use of cattle slurry acidification
compared to disc-harrowing <12 h after band-application of non-acidified slurry.
Table 148. Fattener slurry handling costs if slurry is acidified and not acidified,
and the cost decrease (€ m-3) by use of cattle slurry acidification compared to disc-
harrowing <12 h after band-application of non-acidified slurry. Slurry
amount
m3 yr-1
In-pit In-storage In-field
Acid No acid Dif. Acid No acid Dif. Acid No acid Dif
500 24.62 9.15 -15.47 11.99 9.09 -2.90 22.18 9.08 -13.10
2,500 6.76 5.96 -0.80 4.62 5.90 1.28 6.60 5.89 -0.71
5,000 3.98 4.96 0.98 3.14 4.91 1.77 4.10 4.89 0.79
9,000 2.59 4.25 1.66 2.27 4.19 1.92 2.78 4.18 1.40
21,000 1.38 3.40 2.02 1.41 3.35 1.94 1.61 3.33 1.72
33,000 0.95 3.03 2.08 1.09 2.97 1.88 1.20 2.96 1.76
0,76
0,98
1,10 1,14 1,14 1,14
0,91
1,58 1,61 1,59 1,581,53
1,47
1,15
1,31
1,47 1,49 1,50 1,49
0,0
0,2
0,4
0,6
0,8
1,0
1,2
1,4
1,6
1,8
0 10000 20000 30000 40000 50000
Co
st d
iffe
ren
ce b
etw
ee
n n
on
aci
dif
ied
an
d a
cid
ifie
d s
lurr
y, €
m-3
Annual slurry amount, m3
In-pit In-storage In-field
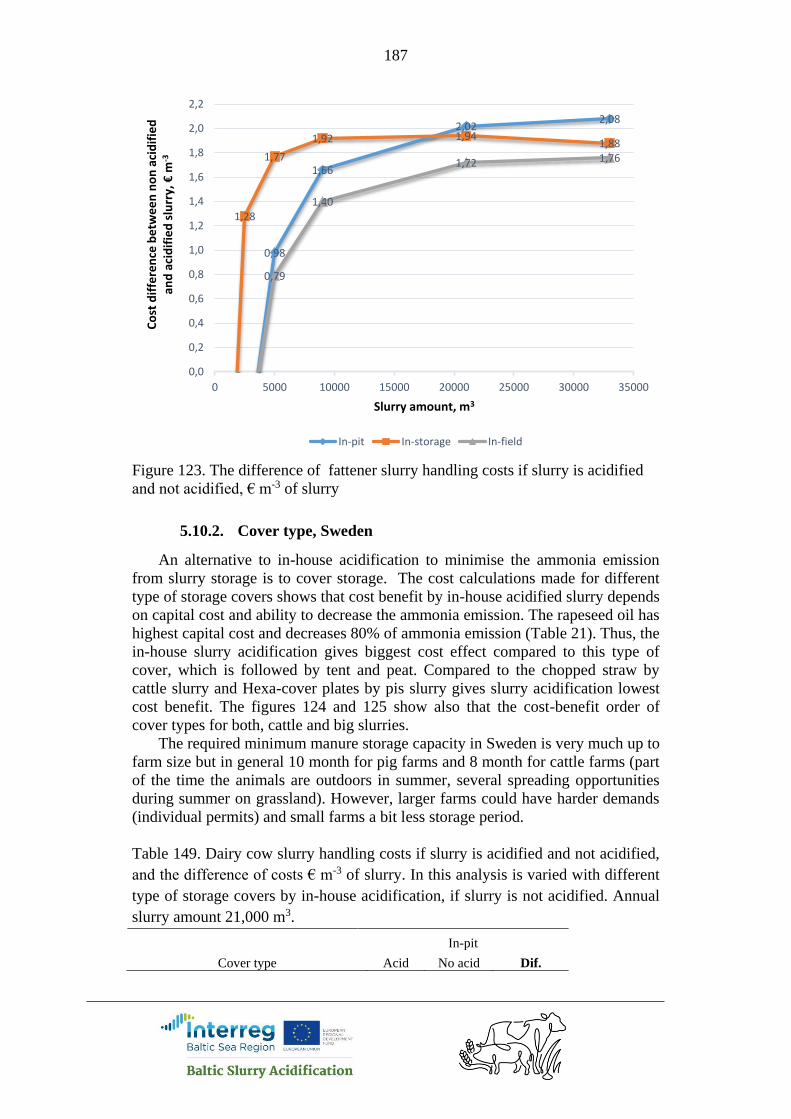
187
Figure 123. The difference of fattener slurry handling costs if slurry is acidified
and not acidified, € m-3 of slurry
5.10.2. Cover type, Sweden
An alternative to in-house acidification to minimise the ammonia emission
from slurry storage is to cover storage. The cost calculations made for different
type of storage covers shows that cost benefit by in-house acidified slurry depends
on capital cost and ability to decrease the ammonia emission. The rapeseed oil has
highest capital cost and decreases 80% of ammonia emission (Table 21). Thus, the
in-house slurry acidification gives biggest cost effect compared to this type of
cover, which is followed by tent and peat. Compared to the chopped straw by
cattle slurry and Hexa-cover plates by pis slurry gives slurry acidification lowest
cost benefit. The figures 124 and 125 show also that the cost-benefit order of
cover types for both, cattle and big slurries.
The required minimum manure storage capacity in Sweden is very much up to
farm size but in general 10 month for pig farms and 8 month for cattle farms (part
of the time the animals are outdoors in summer, several spreading opportunities
during summer on grassland). However, larger farms could have harder demands
(individual permits) and small farms a bit less storage period.
Table 149. Dairy cow slurry handling costs if slurry is acidified and not acidified,
and the difference of costs € m-3 of slurry. In this analysis is varied with different
type of storage covers by in-house acidification, if slurry is not acidified. Annual
slurry amount 21,000 m3.
In-pit
Cover type Acid No acid Dif.
0,98
1,66
2,022,08
1,28
1,77
1,92 1,941,88
0,79
1,40
1,72 1,76
0,0
0,2
0,4
0,6
0,8
1,0
1,2
1,4
1,6
1,8
2,0
2,2
0 5000 10000 15000 20000 25000 30000 35000
Co
st d
iffe
ren
ce b
etw
ee
n n
on
aci
dif
ied
an
d a
cid
ifie
d s
lurr
y, €
m-3
Slurry amount, m3
In-pit In-storage In-field

188
No cover 2.23 3.33 1.10
Chopped straw 2.27 3.43 1.16
Fibo clay balls 2.28 3.46 1.18
Floating foil 2.28 3.48 1.20
Hexa-cover plates 2.29 3.49 1.20
Peat 2.28 3.77 1.49
Rapeseed oil 2.28 4.33 2.05
Tent cover 2.29 3.85 1.56
Figure 124. Dairy cow slurry handling costs if slurry is acidified and not acidified,
and the difference of costs € m-3 of slurry. In this analysis is varied with different
type of storage covers by in-house acidification, if slurry is not acidified. Annual
slurry amount 21,000 m3.
Table 150. Fatteners slurry handling costs if slurry is acidified and not acidified,
and the difference of costs € m-3 of slurry. In this analysis is varied with different
type of storage covers by in-house acidification, if slurry is not acidified. Annual
slurry amount 21,000 m3.
In-pit
Cover type Acid No acid Dif.
No cover 1.38 3.40 2.02
Chopped straw 1.64 3.50 1.86
Fibo clay balls (fraction 10-20 mm) 1.71 3.54 1.83
Floating foil 1.73 3.56 1.83
Hexa-cover plates 1.75 3.57 1.82
Peat 1.73 3.92 2.19
Rapeseed oil 1.71 4.62 2.91
Tent cover 1.77 4.01 2.24
1,10 1,16 1,18 1,20 1,201,49
2,05
1,56
0,0
0,5
1,0
1,5
2,0
2,5
Co
st d
iffe
ren
ce b
etw
ee
n n
on
aci
dif
ied
an
d a
cid
ifie
d s
lurr
y, €
m-3
No cover Chopped straw Fibo clay balls Floating foil
Hexa-cover plates Peat Rapeseed oil Tent cover
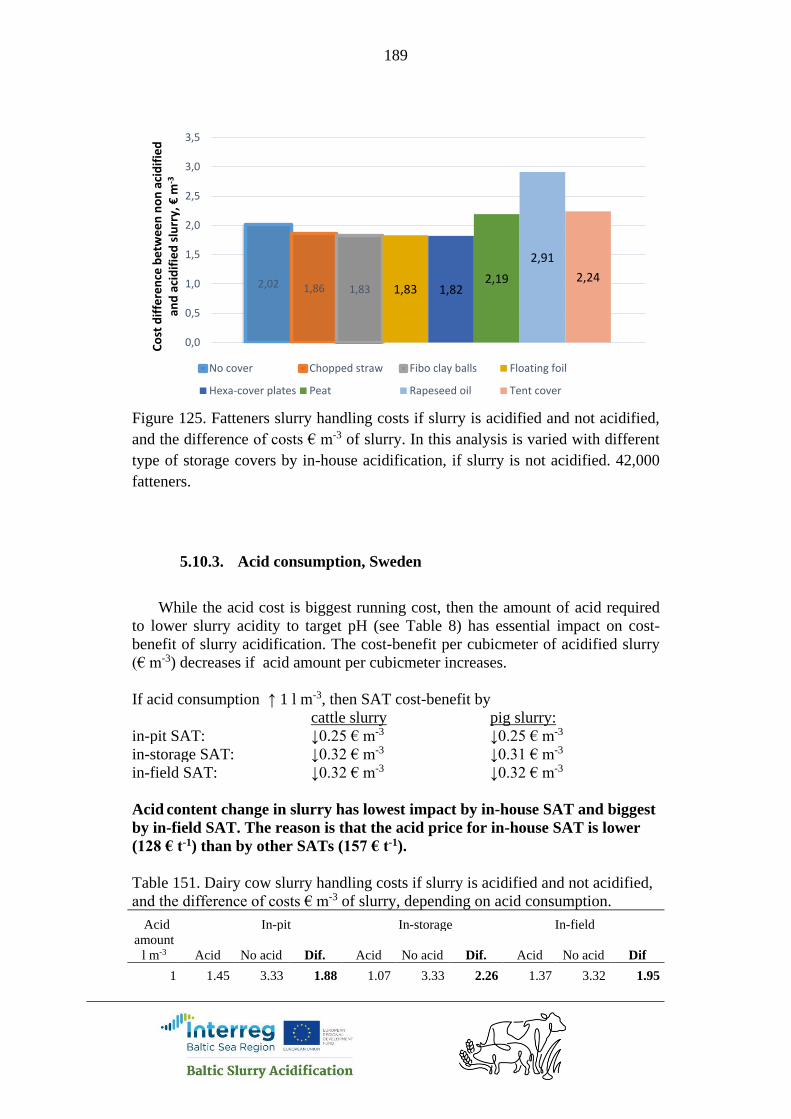
189
Figure 125. Fatteners slurry handling costs if slurry is acidified and not acidified,
and the difference of costs € m-3 of slurry. In this analysis is varied with different
type of storage covers by in-house acidification, if slurry is not acidified. 42,000
fatteners.
5.10.3. Acid consumption, Sweden
While the acid cost is biggest running cost, then the amount of acid required
to lower slurry acidity to target pH (see Table 8) has essential impact on cost-
benefit of slurry acidification. The cost-benefit per cubicmeter of acidified slurry
(€ m-3) decreases if acid amount per cubicmeter increases.
If acid consumption ↑ 1 l m-3, then SAT cost-benefit by
cattle slurry pig slurry:
in-pit SAT: ↓0.25 € m-3 ↓0.25 € m-3
in-storage SAT: ↓0.32 € m-3 ↓0.31 € m-3
in-field SAT: ↓0.32 € m-3 ↓0.32 € m-3
Acid content change in slurry has lowest impact by in-house SAT and biggest
by in-field SAT. The reason is that the acid price for in-house SAT is lower
(128 € t-1) than by other SATs (157 € t-1).
Table 151. Dairy cow slurry handling costs if slurry is acidified and not acidified,
and the difference of costs € m-3 of slurry, depending on acid consumption.
Acid In-pit In-storage In-field
amount
l m-3 Acid No acid Dif. Acid No acid Dif. Acid No acid Dif
1 1.45 3.33 1.88 1.07 3.33 2.26 1.37 3.32 1.95
2,02 1,86 1,83 1,83 1,822,19
2,91
2,24
0,0
0,5
1,0
1,5
2,0
2,5
3,0
3,5
Co
st d
iffe
ren
ce b
etw
ee
n n
on
aci
dif
ied
an
d a
cid
ifie
d s
lurr
y, €
m-3
No cover Chopped straw Fibo clay balls Floating foil
Hexa-cover plates Peat Rapeseed oil Tent cover
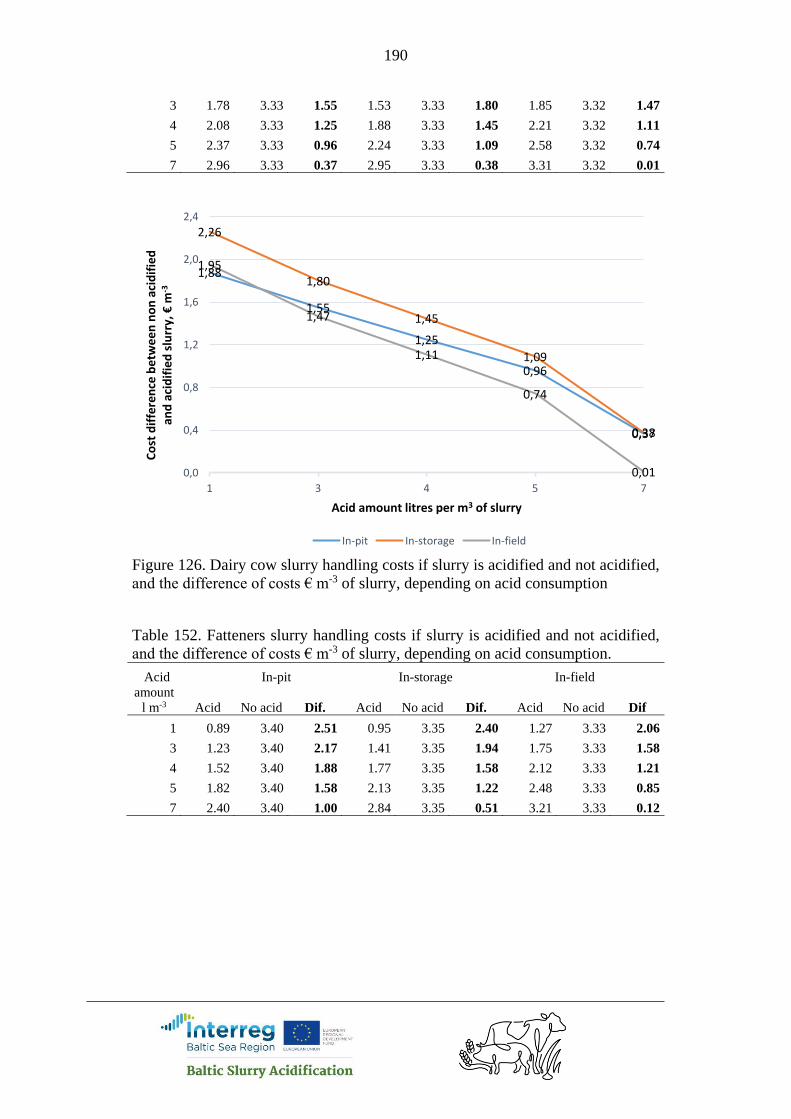
190
3 1.78 3.33 1.55 1.53 3.33 1.80 1.85 3.32 1.47
4 2.08 3.33 1.25 1.88 3.33 1.45 2.21 3.32 1.11
5 2.37 3.33 0.96 2.24 3.33 1.09 2.58 3.32 0.74
7 2.96 3.33 0.37 2.95 3.33 0.38 3.31 3.32 0.01
Figure 126. Dairy cow slurry handling costs if slurry is acidified and not acidified,
and the difference of costs € m-3 of slurry, depending on acid consumption
Table 152. Fatteners slurry handling costs if slurry is acidified and not acidified,
and the difference of costs € m-3 of slurry, depending on acid consumption.
Acid In-pit In-storage In-field
amount
l m-3 Acid No acid Dif. Acid No acid Dif. Acid No acid Dif
1 0.89 3.40 2.51 0.95 3.35 2.40 1.27 3.33 2.06
3 1.23 3.40 2.17 1.41 3.35 1.94 1.75 3.33 1.58
4 1.52 3.40 1.88 1.77 3.35 1.58 2.12 3.33 1.21
5 1.82 3.40 1.58 2.13 3.35 1.22 2.48 3.33 0.85
7 2.40 3.40 1.00 2.84 3.35 0.51 3.21 3.33 0.12
1,88
1,55
1,25
0,96
0,37
2,26
1,80
1,45
1,09
0,38
1,95
1,47
1,11
0,74
0,010,0
0,4
0,8
1,2
1,6
2,0
2,4
1 3 4 5 7
Co
st d
iffe
ren
ce b
etw
ee
n n
on
aci
dif
ied
an
d a
cid
ifie
d s
lurr
y, €
m-3
Acid amount litres per m3 of slurry
In-pit In-storage In-field
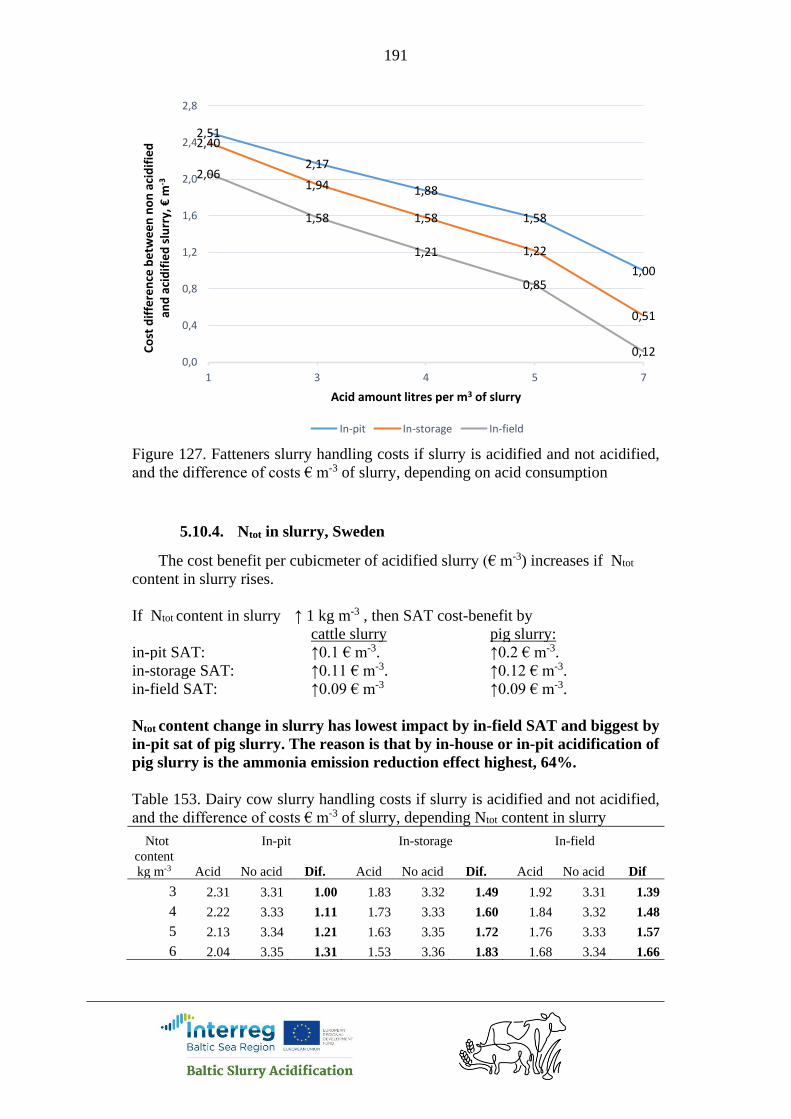
191
Figure 127. Fatteners slurry handling costs if slurry is acidified and not acidified,
and the difference of costs € m-3 of slurry, depending on acid consumption
5.10.4. Ntot in slurry, Sweden
The cost benefit per cubicmeter of acidified slurry (€ m-3) increases if Ntot
content in slurry rises.
If Ntot content in slurry ↑ 1 kg m-3 , then SAT cost-benefit by
cattle slurry pig slurry:
in-pit SAT: ↑0.1 € m-3. ↑0.2 € m-3.
in-storage SAT: ↑0.11 € m-3. ↑0.12 € m-3.
in-field SAT: ↑0.09 € m-3 ↑0.09 € m-3.
Ntot content change in slurry has lowest impact by in-field SAT and biggest by
in-pit sat of pig slurry. The reason is that by in-house or in-pit acidification of
pig slurry is the ammonia emission reduction effect highest, 64%.
Table 153. Dairy cow slurry handling costs if slurry is acidified and not acidified,
and the difference of costs € m-3 of slurry, depending Ntot content in slurry
Ntot In-pit In-storage In-field
content
kg m-3 Acid No acid Dif. Acid No acid Dif. Acid No acid Dif
3 2.31 3.31 1.00 1.83 3.32 1.49 1.92 3.31 1.39
4 2.22 3.33 1.11 1.73 3.33 1.60 1.84 3.32 1.48
5 2.13 3.34 1.21 1.63 3.35 1.72 1.76 3.33 1.57
6 2.04 3.35 1.31 1.53 3.36 1.83 1.68 3.34 1.66
2,51
2,17
1,88
1,58
1,00
2,40
1,94
1,58
1,22
0,51
2,06
1,58
1,21
0,85
0,120,0
0,4
0,8
1,2
1,6
2,0
2,4
2,8
1 3 4 5 7
Co
st d
iffe
ren
ce b
etw
ee
n n
on
aci
dif
ied
an
d a
cid
ifie
d s
lurr
y, €
m-3
Acid amount litres per m3 of slurry
In-pit In-storage In-field
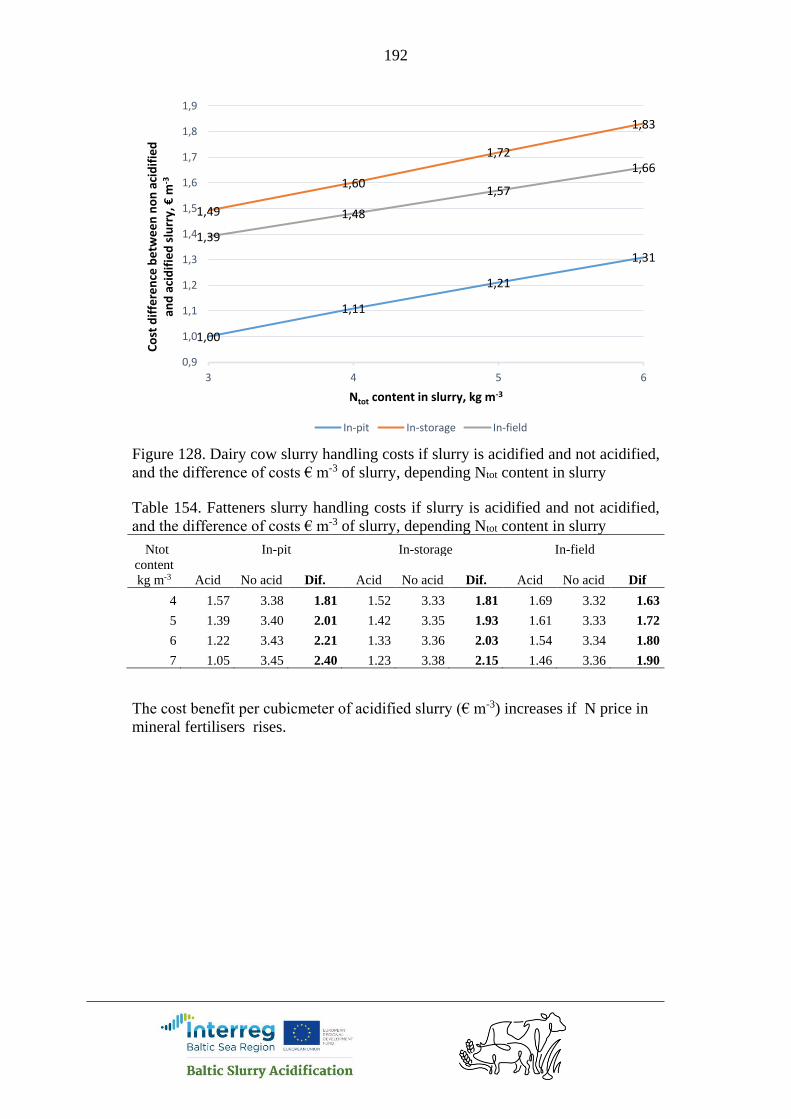
192
Figure 128. Dairy cow slurry handling costs if slurry is acidified and not acidified,
and the difference of costs € m-3 of slurry, depending Ntot content in slurry
Table 154. Fatteners slurry handling costs if slurry is acidified and not acidified,
and the difference of costs € m-3 of slurry, depending Ntot content in slurry
Ntot In-pit In-storage In-field
content
kg m-3 Acid No acid Dif. Acid No acid Dif. Acid No acid Dif
4 1.57 3.38 1.81 1.52 3.33 1.81 1.69 3.32 1.63
5 1.39 3.40 2.01 1.42 3.35 1.93 1.61 3.33 1.72
6 1.22 3.43 2.21 1.33 3.36 2.03 1.54 3.34 1.80
7 1.05 3.45 2.40 1.23 3.38 2.15 1.46 3.36 1.90
The cost benefit per cubicmeter of acidified slurry (€ m-3) increases if N price in
mineral fertilisers rises.
1,00
1,11
1,21
1,31
1,49
1,60
1,72
1,83
1,39
1,48
1,57
1,66
0,9
1,0
1,1
1,2
1,3
1,4
1,5
1,6
1,7
1,8
1,9
3 4 5 6
Co
st d
iffe
ren
ce b
etw
ee
n n
on
aci
dif
ied
an
d a
cid
ifie
d s
lurr
y, €
m-3
Ntot content in slurry, kg m-3
In-pit In-storage In-field

193
Figure 129. Fatteners slurry handling costs if slurry is acidified and not acidified,
and the difference of costs € m-3 of slurry, depending Ntot content in slurry
5.10.5. N price, Sweden
The cost benefit per cubicmeter of acidified slurry (€ m-3) increases if N price
in mineral fertilisers rises.
N price in mineral fertilisers ↑ 0.1 € kg-1, then SAT cost-benefit by
cattle slurry pig slurry:
in-pit SAT: ↑0.043 € m-3. ↑0.11 € m-3.
in-storage SAT: ↑0.046 € m-3. ↑0.06 € m-3.
in-field SAT: ↑0.037 € m-3 ↑0.05 € m-3.
The change of N price in mineral fertilisers has lowest impact by in-field SAT
and biggest by in-pit sat of pig slurry. The reason is that by in-house or in-pit
acidification of pig slurry is the ammonia emission reduction effect highest,
64%.
Bigger effect by pig slurry compared to cattle slurry is caused also by the
higher Ntot content of pig slurry and thus N-savings by SAT-s.
Table 155. Dairy cow slurry handling costs if slurry is acidified and not acidified,
and the difference of costs € m-3 of slurry, depending on N price
N In-pit In-storage In-field
price
€ kg-3 Acid No acid Dif. Acid No acid Dif. Acid No acid Dif
0.35 2.38 3.33 0.95 1.91 3.33 1.42 1.98 3.32 1.34
0.56 2.29 3.33 1.04 1.81 3.33 1.52 1.90 3.32 1.42
1,81
2,01
2,21
2,40
1,81
1,93
2,03
2,15
1,63
1,72
1,80
1,90
1,6
1,7
1,8
1,9
2,0
2,1
2,2
2,3
2,4
2,5
4 5 6 7
Co
st d
iffe
ren
ce b
etw
ee
n n
on
aci
dif
ied
an
d a
cid
ifie
d s
lurr
y, €
m-3
Ntot content in slurry, kg m-3
In-pit In-storage In-field
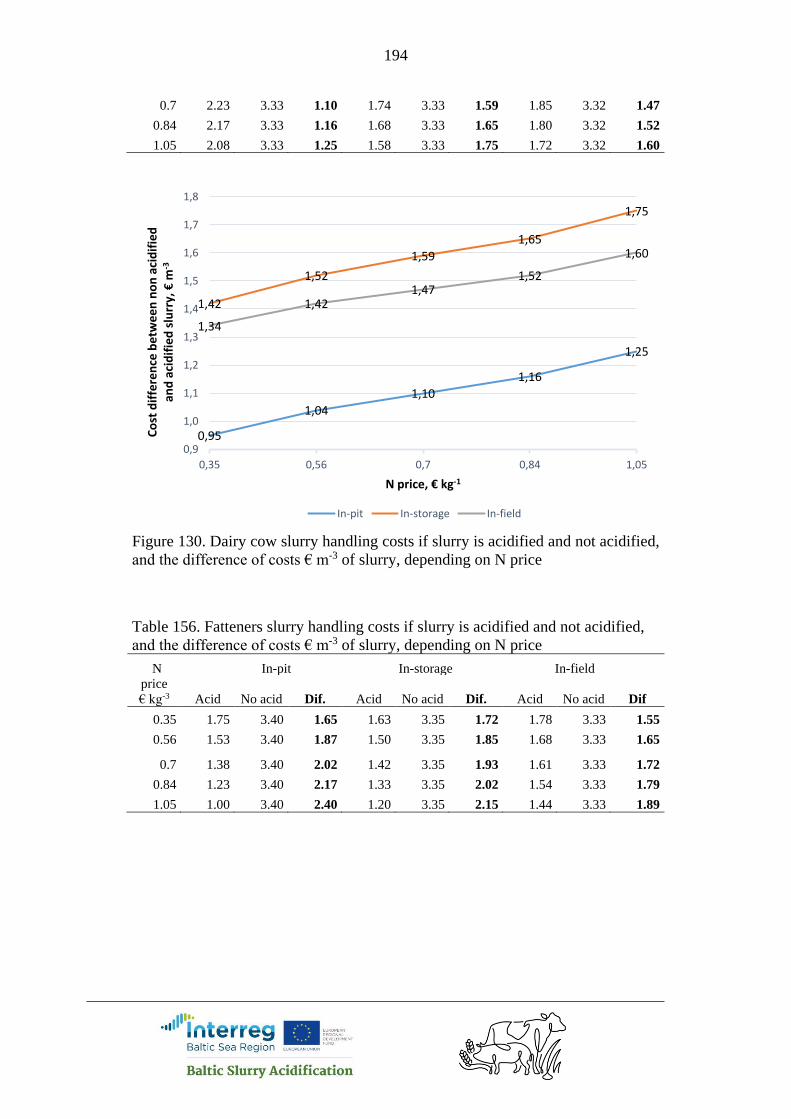
194
0.7 2.23 3.33 1.10 1.74 3.33 1.59 1.85 3.32 1.47
0.84 2.17 3.33 1.16 1.68 3.33 1.65 1.80 3.32 1.52
1.05 2.08 3.33 1.25 1.58 3.33 1.75 1.72 3.32 1.60
Figure 130. Dairy cow slurry handling costs if slurry is acidified and not acidified,
and the difference of costs € m-3 of slurry, depending on N price
Table 156. Fatteners slurry handling costs if slurry is acidified and not acidified,
and the difference of costs € m-3 of slurry, depending on N price
N In-pit In-storage In-field
price
€ kg-3 Acid No acid Dif. Acid No acid Dif. Acid No acid Dif
0.35 1.75 3.40 1.65 1.63 3.35 1.72 1.78 3.33 1.55
0.56 1.53 3.40 1.87 1.50 3.35 1.85 1.68 3.33 1.65
0.7 1.38 3.40 2.02 1.42 3.35 1.93 1.61 3.33 1.72
0.84 1.23 3.40 2.17 1.33 3.35 2.02 1.54 3.33 1.79
1.05 1.00 3.40 2.40 1.20 3.35 2.15 1.44 3.33 1.89
0,95
1,04
1,10
1,16
1,25
1,42
1,52
1,59
1,65
1,75
1,34
1,421,47
1,52
1,60
0,9
1,0
1,1
1,2
1,3
1,4
1,5
1,6
1,7
1,8
0,35 0,56 0,7 0,84 1,05
Co
st d
iffe
ren
ce b
etw
ee
n n
on
aci
dif
ied
an
d a
cid
ifie
d s
lurr
y, €
m-3
N price, € kg-1
In-pit In-storage In-field
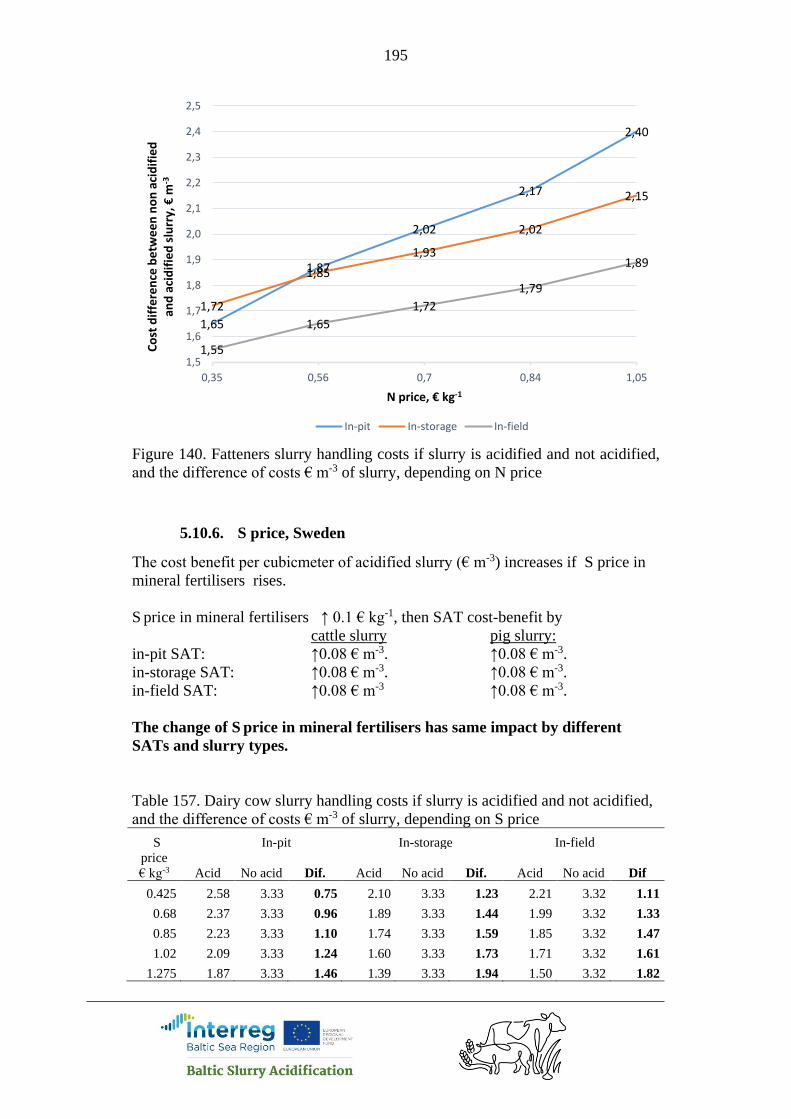
195
Figure 140. Fatteners slurry handling costs if slurry is acidified and not acidified,
and the difference of costs € m-3 of slurry, depending on N price
5.10.6. S price, Sweden
The cost benefit per cubicmeter of acidified slurry (€ m-3) increases if S price in
mineral fertilisers rises.
S price in mineral fertilisers ↑ 0.1 € kg-1, then SAT cost-benefit by
cattle slurry pig slurry:
in-pit SAT: ↑0.08 € m-3. ↑0.08 € m-3.
in-storage SAT: ↑0.08 € m-3. ↑0.08 € m-3.
in-field SAT: ↑0.08 € m-3 ↑0.08 € m-3.
The change of S price in mineral fertilisers has same impact by different
SATs and slurry types.
Table 157. Dairy cow slurry handling costs if slurry is acidified and not acidified,
and the difference of costs € m-3 of slurry, depending on S price
S In-pit In-storage In-field
price
€ kg-3 Acid No acid Dif. Acid No acid Dif. Acid No acid Dif
0.425 2.58 3.33 0.75 2.10 3.33 1.23 2.21 3.32 1.11
0.68 2.37 3.33 0.96 1.89 3.33 1.44 1.99 3.32 1.33
0.85 2.23 3.33 1.10 1.74 3.33 1.59 1.85 3.32 1.47
1.02 2.09 3.33 1.24 1.60 3.33 1.73 1.71 3.32 1.61
1.275 1.87 3.33 1.46 1.39 3.33 1.94 1.50 3.32 1.82
1,65
1,87
2,02
2,17
2,40
1,72
1,85
1,93
2,02
2,15
1,55
1,65
1,72
1,79
1,89
1,5
1,6
1,7
1,8
1,9
2,0
2,1
2,2
2,3
2,4
2,5
0,35 0,56 0,7 0,84 1,05
Co
st d
iffe
ren
ce b
etw
ee
n n
on
aci
dif
ied
an
d a
cid
ifie
d s
lurr
y, €
m-3
N price, € kg-1
In-pit In-storage In-field

196
Figure 150. Dairy cow slurry handling costs if slurry is acidified and not acidified,
and the difference of costs € m-3 of slurry, depending on S price
Table 158. Fatteners slurry handling costs if slurry is acidified and not acidified,
and the difference of costs € m-3 of slurry, depending on S price
S In-pit In-storage In-field
price
€ kg-3 Acid No acid Dif. Acid No acid Dif. Acid No acid Dif
0.425 1.73 3.40 1.67 1.77 3.35 1.58 1.96 3.33 1.37
0.68 1.52 3.40 1.88 1.56 3.35 1.79 1.75 3.33 1.58
0.85 1.38 3.40 2.02 1.42 3.35 1.93 1.61 3.33 1.72
1.02 1.24 3.40 2.16 1.28 3.35 2.07 1.47 3.33 1.86
1.275 1.02 3.40 2.38 1.06 3.35 2.29 1.26 3.33 2.07
0,75
0,96
1,10
1,24
1,46
1,23
1,44
1,59
1,73
1,94
1,11
1,33
1,47
1,61
1,82
0,6
0,8
1,0
1,2
1,4
1,6
1,8
2,0
0,425 0,68 0,85 1,02 1,275
Co
st d
iffe
ren
ce b
etw
ee
n n
on
aci
dif
ied
an
d a
cid
ifie
d s
lurr
y, €
m-3
S price, € kg-1
In-pit In-storage In-field

197
Figure 151. Fatteners slurry handling costs if slurry is acidified and not acidified,
and the difference of costs € m-3 of slurry, depending on S price
5.10.7. Summary, Sweden
For Sweden, the in-house tehnology is calculated with presumption that
acidification starts in slurry pumping pit in cattle and pig barn both. It means that
there is not taken into account ammonia emission nor decrease of emission in
barn. The calculations base on slurry Ntot content ex-housing. By Lena Rodhe the
ex-housing and ex-storage data are close. Thus, the data published in report by
Steineck et. al. (1999) are used in the calculations for all SATs. Ntot for
conventional cattle slurry is 3.9 and pig slurry 5.1 kg t-1. Instead of in-house SAT
is used the term in-pit SAT for Sweden.
By the information from JH Agro presenter Holger Schulz is the price of in-
pit acidification system for cattle and pig slurry is same as for cattle in-house
acidification system. However, 5,000 € for additional mixer should be calculated
in pumping pit, to mix slurry and acid during in-pit acidification. The slurry pump
is controlled by acidification system to adjust slurry level in pit.
SAT producer suggests, that some acidified slurry should be in the pit, so that
the new slurry from the barn flows into the prepared slurry. However, the process
is more or less continious. After start of use of acidification system, the pit
contains always some acidified slurry. The pit has to be so big that the amount of
new slurry (which requires acidification) is only a small part (lower than 5 %) of
the complete volume of the pit.
The other costs for in-pit SAT are same as by in-house SAT.
Analysed is the cost-benefit of SATs compared to disc-harrowing <12 h after
band-application of non-acidified slurry. All three SATs have cost- benefit by
1,67
1,88
2,02
2,16
2,38
1,58
1,79
1,93
2,07
2,29
1,37
1,58
1,72
1,86
2,07
1,2
1,4
1,6
1,8
2,0
2,2
2,4
2,6
0,425 0,68 0,85 1,02 1,275
Co
st d
iffe
ren
ce b
etw
ee
n n
on
aci
dif
ied
an
d a
cid
ifie
d s
lurr
y, €
m-3
S price, € kg-1
In-pit In-storage In-field

198
cattle and pig slurry both in Sweden. The minimal slurry amounts should be
between 1,300–5,000 and 1,100–3,300. m3 yearly for cattle and pig slurry
correspondingly, depending on SAT (see Table 146).
The biggest reason for economic benefit of SAT-s is the cost of incorporation
(50 € ha-1 in Sweden) of non-acidified slurry by disc harrow after spreading. If
slurry amount is 30 m3 ha-1, then incorporation cost is 1.79 € m-3, which is saved
if acidified slurry is applied to the field surface and slurry is not incorporated to
the soil.
Acidification of pig slurry has higher economic benefit compared to cattle
slurry, because
1) pig slurry contains more NH4-N to save
2) the in-pit SAT has higher reduction effect on NH3 emission from pig slurry
3) the acid need of pig slurry is lower
4) the risk to exceed S need of plants is lower (because the acid amount is lower).
The cost-benefit of acidified slurry per cubicmeter (€ m-3) decreases if acid
amount per cubicmeter increases. While the acid cost is biggest running cost, then
the amount of acid required to lower slurry acidity to target pH (see Table 8) has
essential impact on cost-benefit of slurry acidification. The acid price by in-pit
SAT (128 € m-3) is lower than by other SATs (157 € m-3) and this is the reason
why change of acid amount has smaller effect on cost-benefit by first SAT
compared to others.
The calculations in paragraph 5.10 were done by slurry amount 30 m3 ha-1.
The extra calculations made for Finland for different hectare amounts (Figure 50)
show that cost-benefit of in-house SAT is higher if slurry amount is 20 or 10 m3
ha-1 .
One reason is that the slurry incorporation cost per hectare is constant despite
of slurry amount per hectare. Thus, the smaller is slurry amount per hectare the
higher is incorporation cost per cubicmeter of non-acidified slurry.
Another aspect, why low amount of acidified slurry give higher economic
effect, is the effective use of S applied with acidified slurry. In the calculations is
used 4.5 liter acid per m3 cattle slurry by in-house or in-pit SAT. If the slurry
amount is 30, 20 and 10 m3 ha-1 then the S amount applied to the field is 80, 53
and 26 kg ha-1 correspondingly. The S need for crops is in calculations 25 kg ha-1
in average. The costs on mineral S are reduced if acidified slurry is applied and
the reduction effect is calculated until S amount is reaches demand of crop. After
that S cost reduction stays constant and the S amount what exceeds crop need, is
not taken into calculation. However, the S cost reduction value is always divided
by slurry amount and if the cost reduction is constant then by growing hectare
amount of slurry the S cost reduction per cubicmeter of slurry decreases.
An alternative to in-pit acidification to minimise the ammonia emission from
slurry storage is to cover storage. The cost calculations made for different type of
storage covers shows that cost benefit by in-pit acidified slurry depends on capital
cost and ability to decrease the ammonia emission. The rapeseed oil has highest
capital cost and decreases 80% of ammonia emission (Table 21). Thus, the in-pit
slurry acidification gives biggest cost effect compared to this type of cover, which
is followed by tent and peat. Compared to the chopped straw by cattle slurry and
199
Hexa-cover plates by pis slurry gives slurry acidification lowest cost benefit. The
figures 124 and 125 show also that the cost-benefit order of cover types for both,
cattle and big slurries.
The cost benefit per cubicmeter of acidified slurry (€ m-3) increases if Ntot content
in slurry rises (see 5.10.4). Ntot content change in slurry has lowest impact by in-
field SAT and biggest by in-pit sat of pig slurry. The reason is that by in-pit
acidification of pig slurry the ammonia emission reduction effect is highest, 64%.
The cost-benefit per cubicmeter of acidified slurry (€ m-3) increases if N price
in mineral fertilisers rises (see 5.10.5). The change of N price in mineral
fertilisers has lowest impact by in-field SAT and biggest by in-pit sat of pig
slurry. The reason is that by in-pit acidification of pig slurry is the ammonia
emission reduction effect highest, 64%. Bigger effect by pig slurry compared to
cattle slurry is caused also by the higher Ntot content of pig slurry and thus N-
savings by SAT-s.
The cost benefit per cubicmeter of acidified slurry (€ m-3) increases if S price
in mineral fertilisers rises (see 5.10.6).
Although the present example shows cost benefit of slurry acidification by bigger
slurry amounts, a careful analysis with local parameters and future prices should
be performed before deciding to invest to acidification system. The analysis
model will be available on project website.
6. Summary of results, conclusions and
recommendations
6.1.1. Summary of results
The economic aspects have a crucial role for the farmer’s decision to choose
one of acidification technologies (SAT) or some other solution to minimise
ammonia emission from slurry. The calculation models are composed within
project to compare different solutions. Excel applications are built on bases of
these models. Present report gives overview about data and methods used in
analysis models. The calculation results are presented for every country
participating in Baltic Slurry Acidification project. The analysis model and report
are available on project website balticslurry.eu.
In all countries were analysed the cost-benefit of SATs compared to disc-
harrowing <12 h after band-application of non-acidified slurry.
All three SATs have cost- benefit by pig slurry in all countries by bigger
slurry amounts. All three SATs have cost- benefit by cattle slurry in most
countries. The smallest minimum slurry amount was 1,100 m3 yearly in Sweden
by in-storage acidification of pig slurry.
In Lithuania the cattle slurry acidification had no cost-benefit compared to
non-acidified and incorporated slurry by any SAT and slurry amount. In some
200
countries cattle slurry acidification had has cost-benefit only by some SAT
(Belarus, Latvia and Russia).
In, Lithuania, the main reason for negative cost-benefit was mainly very high
liming costs - 175 € t-1. Another reason is relatively low S price compared to other
project countries (0.15 € kg-1 and 0.11–0.85 € kg-1 ).
The in-house acidification has in Belarus significantly higher cost-benefit
comapred to other SATs. The reason is that by in-house SAT is used bulk acid
which is transported by big tank truck and has much lower price (30 € t-1)
compared to transportation in the IBC tanks (101 € t-1), which is used by other
SATs.
In Latvia and Russia the small cost-benefits were caused by low mineral N
and S prices, and low slurry incorportion cost.
For Denmark, analysed was the cost-benefit of acidified slurry compared to
non-acidified slurry if they both are band-spreaded, but the non-acidified slurry is
A) not incorporated after band-application or
B) incorporated by disc-harrow <12 h after band-application.
The results show that by both incorporation scenarios of non-acidified slurry,
the slurry acidification has cost-benefit compared to non-acidification. The reason
for high cost-benefits is relatively high price of mineral N and S (1 and 0.65 € kg-
1) in Denmark compared to other countries (0.48–0.79 and 0.11–0.41 € kg-1).
However, the cost-benefit of SATs by scenario A was 0.87–1.26 € kg-1 lower than
in scenario B, because of smaller tillage cost (50 € ha-1).
For Sweden, the in-house tehnology is calculated with presumption that
acidification starts in slurry pumping pit in cattle and pig barn both. It means that
there is not taken into account ammonia emission nor decrease of emission in
barn. The calculations base on slurry Ntot content ex-housing.
By the information from JH Agro presenter Holger Schulz is the price of in-
pit acidification system for cattle and pig slurry is same as for cattle in-house
acidification system. However, 5,000 € for additional mixer should be calculated
in pumping pit, to mix slurry and acid during in-pit acidification. The other costs
for in-pit SAT are same as by in-house SAT.
All three SATs have cost- benefit by cattle and pig slurry both in Sweden. The
biggest reason for economic benefit of SAT-s is the cost of incorporation (50 € ha-
1 in) of non-acidified slurry by disc harrow after spreading.
In all countries the acidification of pig slurry has higher economic benefit
compared to cattle slurry, because
1) pig slurry contains more NH4-N to save
2) the in-house SAT has higher reduction effect on NH3 emission from pig slurry
3) the acid need of pig slurry is lower
4) the risk to exceed S need of plants is lower (because the acid amount is lower).
The cost-benefit of acidified slurry per cubicmeter (€ m-3) increases if acid
amount per cubicmeter decreases. While the acid cost is biggest running cost, then
the amount of acid required to lower slurry acidity to target pH (see Table 8) has
essential impact on cost-benefit of slurry acidification. The acid price by in-house
or in-pit SAT is lower than by other SATs (except Russia) and this is the reason
why change of acid amount has smaller effect on cost-benefit by first SAT
201
compared to others. The reason for lower acid cost by in-house SAT is the use of
bulk acid which is transported by big tank truck and has lower price compared to
transportation in the IBC tanks (except Russia).
The calculations in chapter 5 were done by slurry amount 30 m3 ha-1. The
extra calculations made for Finland for different hectare amounts show (Figure
50) that cost-benefit of in-house SAT is higher if slurry amount is 20 or 10 m3 ha-
1.
One reason is that the slurry incorporation cost per hectare is constant despite
of slurry amount per hectare. Thus, the smaller is slurry amount per hectare the
higher is incorporation cost per cubicmeter of non-acidified slurry.
Another aspect, why low amount of acidified slurry give higher economic
effect, is the effective use of S applied with acidified slurry. In the calculations is
used 4.5 liter acid per m3 of cattle slurry by in-house SAT. If the slurry amount is
30, 20 and 10 m3 ha-1 then the S amount applied to the field is 80, 53 and 26 kg
ha-1 correspondingly. The S need for crops is in calculations 25 kg ha-1 in average.
The costs on mineral S are reduced if acidified slurry is applied and the reduction
effect is calculated until S amount reaches the demand of crop. After that S cost
reduction stays constant and the S amount what exceeds crop need, is not taken
into calculation. However, the S cost reduction value is always divided by slurry
amount per hectare and if the cost reduction is constant then by growing hectare
amount of slurry the S cost reduction per cubicmeter of slurry decreases.
An alternative to in-house acidification to minimise the ammonia emission
from slurry storage is to cover storage. The cost calculations made for different
type of storage covers shows that cost benefit by in-house acidified slurry depends
on capital cost and ability to decrease the ammonia emission. The rapeseed oil has
highest capital cost and decreases 80% of ammonia emission (Table 21). Thus, in
all countries the in-house slurry acidification gives biggest cost effect compared to
this type of cover, which is followed by tent and peat. Compared to the Hexa-
cover plates gives slurry acidification lowest cost-benefit in most countries.
For Denmark, analysed was the cost-benefit of slurry acidification, compared
to non-acidified slurry which is stored under cover but not incorparated after
band-application (figures 25 and 27). The results show that in this case the cost-
benefit decreases compared to the case if slurry is covered and incorporated both.
The cost benefit per cubicmeter of acidified slurry (€ m-3) increases if Ntot
content in slurry rises. Ntot content change in slurry has lowest impact by in-field
SAT and biggest by in-house sat, especially in the case of pig slurry. The reason is
that by in-house acidification of pig slurry the ammonia emission reduction effect
is highest, 64%.
The cost-benefit per cubicmeter of acidified slurry (€ m-3) increases if N price
in mineral fertilisers rises. The change of N price in mineral fertilisers has lowest
impact by in-field SAT and biggest by in-house sat, especially in the case of pig
slurry. The reason is that by in-house acidification of pig slurry is the ammonia
emission reduction effect highest, 64%. Bigger effect by pig slurry compared to
cattle slurry is caused also by the higher Ntot content of pig slurry and thus N-
savings by SAT-s.

202
The cost benefit per cubicmeter of acidified slurry (€ m-3) increases if S price
in mineral fertilisers rises.
Although the present example shows cost benefit of slurry acidification by bigger
slurry amounts, a careful analysis with local parameters and future prices should
be performed before deciding to invest to acidification system.
6.1.2. Conclusions
The impact of different aspects on cost-benefit of slurry acidification were
calculated or collected during economic analyses. The overview of conclusions is
collected to the table 151.
Table 151. Directions of change of aspects to increase cost-benefit of slurry
acidification
The aspect Direction of change of
aspect to increase cost-
benefit of slurry
acidification
Acidified slurry amount yearly, m3 yr-1 ↑
Ntot content in slurry, kg m-3 ↑
pH of slurry ↑
Mineral N price cost (fertiliser plus handling) ↑
Mineral S price (fertiliser plus handling) ↑
Crop S demand ↑
Slurry incorporation cost per hectare, if in reference
scenario the non-acidified slurry is incorporated after
application.
↑
Slurry storage cover cost per cubicmeter of slurry, if in
reference scenario the non-acidified slurry is covered
with artificial cover. In the case of inhouse or in-pit
acidification.
↑
Outside temperature during slurry application
(ALFAM). ↑
Wind speed during slurry application, (ALFAM). ↑
Opnened area of slurry in slurry storage, per
cubicmeter of slurry. In the case of in-house or in-pit
acidification..
↑
Slurry amount per hectare (ALFAM), if
a) in reference scenario the non acidified slurry
is not ncorporated after application
b) S amount applied with acidified slurry doesn’t
↑
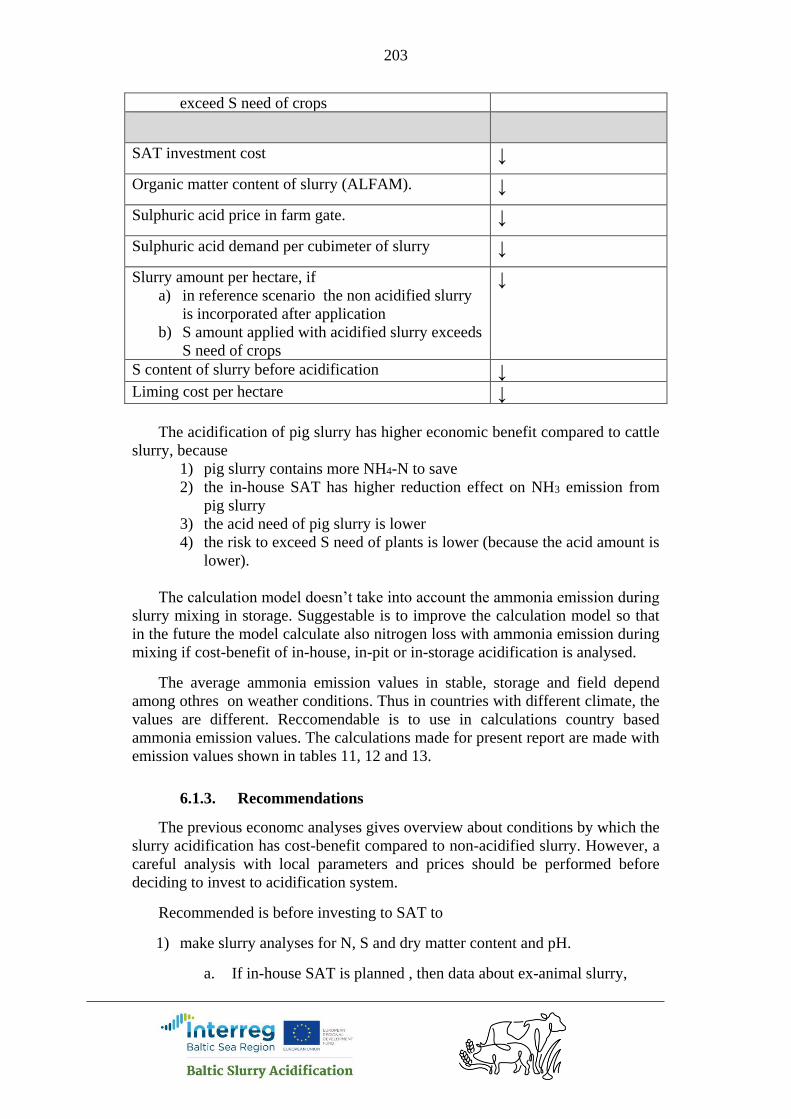
203
exceed S need of crops
SAT investment cost ↓
Organic matter content of slurry (ALFAM). ↓
Sulphuric acid price in farm gate. ↓
Sulphuric acid demand per cubimeter of slurry ↓
Slurry amount per hectare, if
a) in reference scenario the non acidified slurry
is incorporated after application
b) S amount applied with acidified slurry exceeds
S need of crops
↓
S content of slurry before acidification ↓ Liming cost per hectare ↓
The acidification of pig slurry has higher economic benefit compared to cattle
slurry, because
1) pig slurry contains more NH4-N to save
2) the in-house SAT has higher reduction effect on NH3 emission from
pig slurry
3) the acid need of pig slurry is lower
4) the risk to exceed S need of plants is lower (because the acid amount is
lower).
The calculation model doesn’t take into account the ammonia emission during
slurry mixing in storage. Suggestable is to improve the calculation model so that
in the future the model calculate also nitrogen loss with ammonia emission during
mixing if cost-benefit of in-house, in-pit or in-storage acidification is analysed.
The average ammonia emission values in stable, storage and field depend
among othres on weather conditions. Thus in countries with different climate, the
values are different. Reccomendable is to use in calculations country based
ammonia emission values. The calculations made for present report are made with
emission values shown in tables 11, 12 and 13.
6.1.3. Recommendations
The previous economc analyses gives overview about conditions by which the
slurry acidification has cost-benefit compared to non-acidified slurry. However, a
careful analysis with local parameters and prices should be performed before
deciding to invest to acidification system.
Recommended is before investing to SAT to
1) make slurry analyses for N, S and dry matter content and pH.
a. If in-house SAT is planned , then data about ex-animal slurry,

204
b. if in-pit SAT then data about ex-housing slurry and
c. if in-storage or in-field SAT is planned, then data about ex-storage
slurry are required.
2) ask from laboratory slurry titration using sulphuric acid, to learn acid need
per cubicmeter of slurry, it would be good to use acid with same quality as
planned to use in the farm,
3) define slurry amount planned to acidify,
4) clarify acid price at farm gate, if acid is delievered by tank truck and IBC
tank,
5) ask sulpuric acid quality certificate from acid provider, be sure that acid
doesn’t contain components harmful to the soil or plant (like heavy
metals),
6) define security of supply of acid
7) define crops and their S need planned to fertilise with acidified slurry,
8) define, when the crops need N and S,
9) define mineral N and S costs in field (fertiliser price plus handling costs)
10) define liming cost of fields planned to fertilise with acidified slurry
11) define cost of alternative ammonia emission abating technologies like
slurry injection or incorporation, or storage covering
12) discuss carefully with SAT producer about technical, safety and
economical aspects of establishing, maintainance and use of SAT.
13) calculate cost-benefit of use of acidified slurry in farm.
Several slurry handling operations like mixing, transportation and spreading
can be ordered from service provider. The in-storage and in-field acidification are
also possible to provide as services. Recommended is before investing to slurry
acidification technogy as service provider to:
1) define possible client farms and slurry amounts planned to acidify
yearly,
2) discuss carefully with SAT producer about technical, safety and
economical aspects of purchising, maintainance and use of SATs.
3) calculate the cost-benefit of use of acidified slurry in clients farms (see
the list below)
4) advice clients about slurry acidification agronomical, economical and
safety aspects so that clients and service provider both achive positive
result from slurry acidification service.
If slurry amount in the farm is smaller than required to achive the cost-benefit
of farm-own acidification system, then is suggestable to analyse the possibility to

205
use acidification service from service provider. Service provider can offer in-
storage or in-field acidification. Recommended is before ordering slurry
acidification service to:
1) define slurry acidification service cost
2) make ex-storage slurry analyses for N, S and dry matter content and pH,
3) ask from laboratory slurry titration using sulphuric acid, to learn acid need
per cubicmeter of slurry, it would be good to use acid with same quality as
planned to use in the farm,
4) ask sulpuric acid quality certificate from service provider, be sure that
acid doesn’t contain components harmful to the soil or plant (like heavy
metals),
5) define slurry amount planned to acidify,
6) define crops and their S need planned to fertilise with acidified slurry,
7) define, when N and S need of the crops,
8) define mineral N and S costs in farm (fertiliser price plus handling costs)
9) liming cost of fields planned to fertilise with with acidified slurry
10) define cost of alternative ammonia emission abating technologies like
slurry incorporation or storage covering.
11) calculate cost-benefit of use of acidified slurry in farm.
To maximise the cost-benefit of slurry acidification is important to minimise the
impact of cost-benefit decreasing factors and and maximise impact of cost-benefit
increasing factors.
The biggest running cost is acid cost. To minimise acid cost is important to
use minimum amount of acid per cubicmeter of slurry, required to achive optimal
level of ammonia emission.
If after slurry application is planned to till soil anyway is recommendable to
use acid amount by S need of crops.
If weather conditions are favourable for ammonia emission and in-storage or
in-field acidification are used, then is recommendable to adjust acid amount by
minimum ammonia emission level.
If farm has several stables and slurry storages but only some of them use in-
house acidification system, then is recommendable to apply acidified slurry to
fields with growing crops and weather conditions are favourable for ammonia
emission. The non-acidified slurry can be applied if weather conditions are not
favourable for ammonia emissions or slurry is incorporated to the soil.
By planning the use of acidified slurry should be taken into the account among
others the
206
1) S content of acidified slurry
2) S demand of crops in total and depending on growth stage
Optimal would be to adjust slurry amount among other nutrients also by S
need of crops, because if S amount applied with acidified slurry exceeds amount
required by plants, then:
1) cost-benefit of slurry acidification decreases
2) excess S in soil is leaching, which in long term can cause acidification of
soil and unpleasant odour of groundwater.
If slurry is applied to the fields in early spring when slurry storages are
emptied first time after winter, then the growth of crops is not very fast or they are
not drilled yet. Thus, the consumption of nutrients is low, and nutients not
consumed are free to leach after rainfalls. Another aspect is that the ammonia
emission depends on air temperature (ALFAM) and this is the reason why in
calm chilly days on early spring the emission is low.
Thus, recommendable is to make in-field and in-storage acidification in early
spring by S demand of crops. However, if possible, would be better to divide the
yearly slurry amount planned to the crop between several applications, because
then is possible to apply S and N in amount needed by crop until next slurry
application and decrease the risk that some amount from N and S depot is
leaching before uptake by plants. By divided slurry application the acidified slurry
has advantages compared to non-acidified slurry because
1) suggestable is to use acidified slurry if air temperature is high (this causes
high ammonia emissions if slurry is not acidified). Thus, if slurry is
applied in late spring or in summer, then probably the ammonia emission
abating effect of acidification is high and crops have power to consume
movable N and S in bigger amount than in early spring. It helps also to
minimise the amount of excess free N and S compounds in soil and risk
of leaching of these compunds by use of acidified slurry.;
2) the incorporation of acidified slurry is not required. The slurry applied on
field with growing of crops cannot be incorporated and the only possibilty
is surface spreading without incorporation or disc-injection. The surface
spreading by broadcast or band-spreader is cheaper, because spreading
performance is higher and spreader cost per unit of work width is lower
than by injection. Also number of tracks on field is smaller (wider
spreader) and damage of plants are less compared to use of injector.
Thus, if 1) the slurry is planned to apply without incorporation, 2) during slurry
acidification the weather conditions are favourable for ammonia emission and 3)
crop is able to consume applied N and S, then the use of acidified slurry is
recommendable.
In autumn if slurry is applied to the fields where nutrient uptake by crops is
poor or or is without growing crop, then the risk of leaching of free S and N
compounds is high. In autumn the weather conditions are not favourable for high
ammonia emission during field application.
207
Thus, the application of acidified slurry in late autumn is not recommendable
also from economic point of view because crop N and S demand is low and
mineral N and S cost reducing effect of acidified slurry is modest.
By use of in-pit SAT is recommendable to analyse optimal timing of slurry
acidification. In that SAT the slurry is pumped from stable to separate tank
(named also as slurry pit, which gives the name to the SAT), acidified and then
pumped forward to the slurry storage. In nordic condition, if slurry storage is
covered with ice or snow, then ammonia emission is abated. Thus, in that period
the slurry acidification has no economic effect in meaning of reducing mineral N
costs.
After winter, the slurry strorages are emptied 1) to make space for new slurry
cumulating during next season and 2) to supply crops with nutrients before
growing season.
If the soil tillage is made anyway before establishing of crop, then combining
the slurry application and soil tillage help to spare time and labour cost. The
combnination of these two operations is known also as incorporation spreading.
Incorporation of acidified slurry dos not give economic effect of slurry
acidification in meaning of reduction of tillage costs. And N loss is abated anyway
thanks to to use of incorporations spreading.
In point of view of reducing mineral N costs, the surface spreading of slurry
without incorporation has economic benefit compared to non-acidified slurry. The
use of acidified slurry has bigger chance to have cost-benefit compared to non-
acidified slurry if it is applied on fields with growing crops where slurry
incorporation is not possible.
References
ALFAM. The ALFAM model. The Alfam model is a calculation tool, based on
real emission results. Biocover a/s. This is a online illustration of a model
presented at the NJF Seminar "Sustainable Handling and Utilization of
Livestock Manure from Animals to Plants", Horsens, DK, 16-19 January
2001 by H.T. Søgaard et al. http://www.biocover.dk/radgivning/alfam-model
Baltic Manure. 2013. Knowledge report. Manure Handling Techniques on Case-
Study Farms in Baltic Sea Region. Baltic Forum for Innovative Technologies
for Sustainable Manure Management. By Erik Sindhöj and Lena Rodhe
(Editors)
BREF.2017. Germán Giner Santonja, Konstantinos Georgitzikis, Bianca Maria
Scalet, Paolo Montobbio, Serge Roudier, Luis Delgado Sancho; Best
Available Techniques (BAT) Reference Document for the Intensive Rearing
of Poultry or Pigs; EUR 28674 EN; doi:10.2760/020485
Casey, B. 2011. Hydraulic Pumps and Motors: Considering Efficiency.
Machinery Lubrication (3/2011).
https://www.machinerylubrication.com/Read/28430/hydraulic-pump-motors-
maintenance

208
ENVIR 2016. Looma- ja linnukasvatusest välisõhku väljutatavate saasteainete heidete
arvutusliku määramise meetodite kasutamiseks vajalikud lendumisprotsendid,
eriheited ja muud näitajad. Keskkonnaministri 14.12.2016. a määrus nr 66 „Looma-
ja linnukasvatusest välisõhku väljutatavate saasteainete heidete mõõtmise ja
arvutusliku määramise meetodid“ Lisa
EULS 2013. SAASTUSE KOMPLEKSNE VÄLTIMINE JA KONTROLL. Parim
võimalik tehnika veiste intensiivkasvatuses. (BAT in intensive cattle production).
Estonian University of Life Sciences.
http://vl.emu.ee/userfiles/instituudid/vl/VLI/tervisjakeskk/PVT_tooversioon_28_03_
2014.pdf.
Feraxo. 2018. Containers - IBC's 1000 L. .https://www.feraxo.com/en/containers.html)
Government of Saskatchewan. 2017. Sulphur Fertilization in Crop Production.
Sulphur uptake by crops in lb. sulphur/acre. Government of Saskatchewan.
Agriculture Knowledge Centre.
https://www.saskatchewan.ca/business/agriculture-natural-resources-and-
industry/agribusiness-farmers-and-ranchers/crops-and-irrigation/soils-
fertility-and-nutrients/sulphur-fertilization-in-crop-production
English, S and Fleming, R. 2006. Liquid Manure Storage Covers. Final Report,
prepared for Ontoraio Pork. University of Guelph Ridgetown Campus
Ridgetown, Ontario, Canada. 18 pages.
https://www.ridgetownc.com/research/documents/fleming_Liquid_manure_st
orage_covers.pdf
JHAgro. FAQ slurry acidification. http://jhagro.com/faq-slurry-acidification/
KTBL 2016/2017. Betriebsplanung Landwirtschaft 2016/2017. KTBL datensammlung.
Kuratorium für Technik und Bauwesen in der Landwirtschaft. Darmstadt.
McLaughlin, M. 2013. Fertilizers and Soil Acidity. Factsheet. Mosaic Fertilizer
Technology Research Centre, The University of Adelaide, Australia.
Misselbrook T., Hunt J., Perazzolo F., and Provolo G., 2016. Greenhouse Gas and
Ammonia Emissions from Slurry Storage: Impacts of Temperature and Potential
Mitigation through Covering (Pig Slurry) or Acidification (Cattle Slurry). JEQ 45,
1520-1530.
Roeber, J. B.W.; Pitla, Santosh; Kocher, Michael F.; Luck, Joe D.; and Hoy, Roger M.,
"Tractor hydraulic power data acquisition system" (2016). Biological Systems
Engineering: Papers and Publications.
471.https://digitalcommons.unl.edu/biosysengfacpub/471
SEGES, 2015. Status, economy and consideration by acidification of slurry. Original
report in Danish by Annette Vibeke Vestergaard, SEGES. Translation from
Danish to English by Google Translate and edited by Erik Sindhöj/RISE.
http://balticslurry.eu/wp-content/uploads/2017/03/SEGES-review-Slurry-
acidification.pdf
209
State of Green. 2017. Hexa-Cover® Floating Cover. State of Green.
https://stateofgreen.com/en/profiles/hexa-cover/solutions/hexa-cover-floating-
cover
Steffen's Chemistry Pages. 2018. Density of sulfuric acid and sulfur trioxide.
Steffen's Chemistry Pages. Facts and tables around chemistry.
https://wissen.science-and-fun.de/chemistry/chemistry/density-tables/density-
of-sulfuric-acid-and-sulfur-trioxide/
Steineck, S., Gustafson, G., Andersson, A., Tersmeden, M., & Bergström, J. 1999.
Plant nutrients and trace elements in livestock wastes in Sweden. Rapport
5111, Swedish Environmental Protection Agency, Stockholm.
TSI. 2018. Learn More About Sulphur. FAQ. The Sulphur Institute webpage
https://www.sulphurinstitute.org/learnmore/faq.cfm)
Toft, M., Madsen, C., T. 2017. Experiences with 7 years of acidification in Denmark –
SyreN system, a commercial method to fertilize with sulphate while reducing animal
slurry ammonia emission. BioCover. http://www.biocover.dk/articles/articles-from-
research
USDA 1999. Liming To Improve Soil Quality in Acid Soils. SOIL QUALITY –
AGRONOMY TECHNICAL NOTE No. 8.
VanderZaag, A. C.; Gordon, R. J.; Glass, V. M.; Jamieson, R. C. 2008. Floating
Covers To Reduce Gas Emissions From Liquid Manure Storages: A Review.
Applied Engineering in Agriculture, 24(5), 657–671
VERA. 2016. VERA VERIFICATION STATEMENT no 006. Technology: JH Forsuring
NH4+. (Version 2, 2011-29-08). www.vera-verification.eu/
VERA. 2012. VERA verification statement (SyreN).
Väetamise ABC. 2014. ABC of fertilisation. In Estonian. Põllumajandusuuringute
Keskus. Toimtaja J. Kanger. http://www.pria.ee/docs/resources/8899.pdf
WP 2.1. BSA 2018. Possibilities and bottlenecks for implementing slurry acidification
techniques in the Baltic Sea Region. Baltic Slurry Acidification project WP2,
Activity 1 report. http://balticslurry.eu/goals-and-achievements/reports/
WP 2.5. BSA 2018. Working environment and safety. Baltic Slurry Acidification project
WP2, Activity 5 report. http://balticslurry.eu/goals-and-achievements/reports/
WP 3.1. BSA 2018. Feasibility studies of the pilot installations planned in the project.
Baltic Slurry Acidification project WP3, Activity 1 Report.
http://balticslurry.eu/goals-and-achievements/reports/
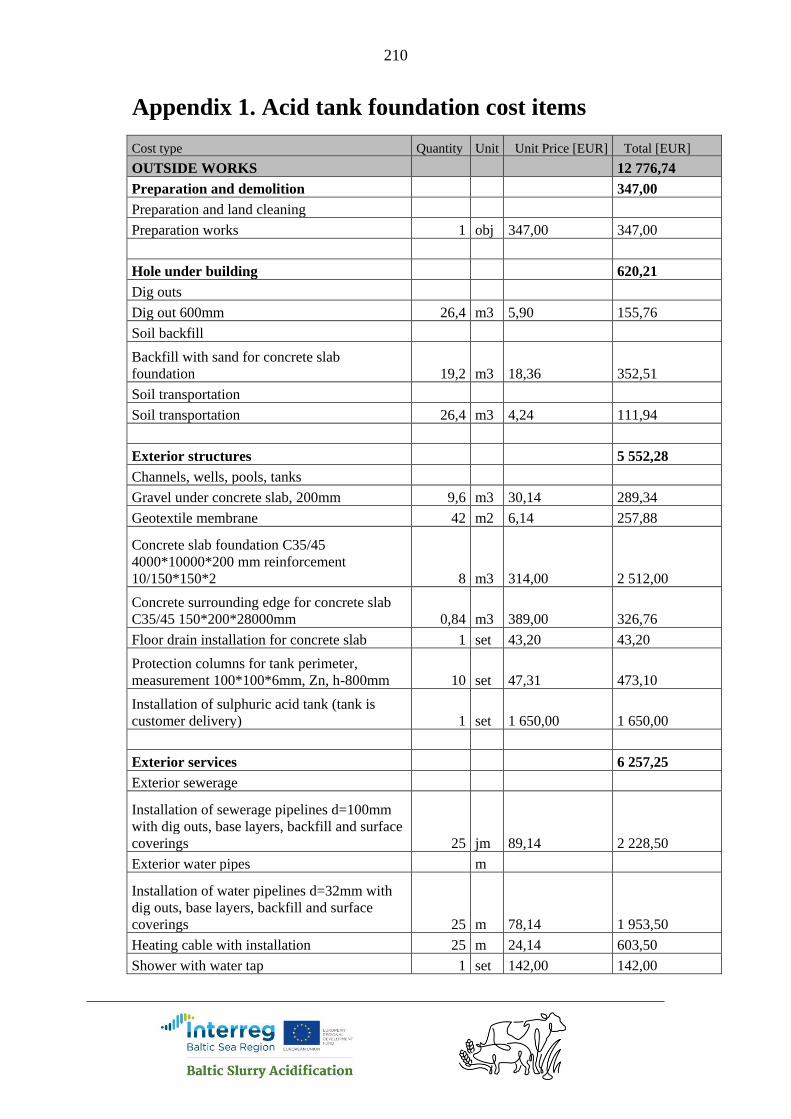
210
Appendix 1. Acid tank foundation cost items
Cost type Quantity Unit Unit Price [EUR] Total [EUR]
OUTSIDE WORKS 12 776,74
Preparation and demolition 347,00
Preparation and land cleaning
Preparation works 1 obj 347,00 347,00
Hole under building 620,21
Dig outs
Dig out 600mm 26,4 m3 5,90 155,76
Soil backfill
Backfill with sand for concrete slab
foundation 19,2 m3 18,36 352,51
Soil transportation
Soil transportation 26,4 m3 4,24 111,94
Exterior structures 5 552,28
Channels, wells, pools, tanks
Gravel under concrete slab, 200mm 9,6 m3 30,14 289,34
Geotextile membrane 42 m2 6,14 257,88
Concrete slab foundation C35/45
4000*10000*200 mm reinforcement
10/150*150*2 8 m3 314,00 2 512,00
Concrete surrounding edge for concrete slab
C35/45 150*200*28000mm 0,84 m3 389,00 326,76
Floor drain installation for concrete slab 1 set 43,20 43,20
Protection columns for tank perimeter,
measurement 100*100*6mm, Zn, h-800mm 10 set 47,31 473,10
Installation of sulphuric acid tank (tank is
customer delivery) 1 set 1 650,00 1 650,00
Exterior services 6 257,25
Exterior sewerage
Installation of sewerage pipelines d=100mm
with dig outs, base layers, backfill and surface
coverings 25 jm 89,14 2 228,50
Exterior water pipes m
Installation of water pipelines d=32mm with
dig outs, base layers, backfill and surface
coverings 25 m 78,14 1 953,50
Heating cable with installation 25 m 24,14 603,50
Shower with water tap 1 set 142,00 142,00

211
Electrical power cables
Installation of main power line cable with dig
outs, base layers, backfill and surface
coverings 25 m 36,14 903,50
Main power line and heating cable connection
in switchboard 1 set 240,00 240,00
Electrical low-current cables
Communication cable inside main powerline
trench 25 m 7,45 186,25
BUILDING SITE ARRANGEMENT 1 847,00
Building site arrangement costs 1 obj 1 847,00 1 847,00
14 623,74
The calculation are made by Estonian company Eelarvestusgrupp OÜ in February
2018.
The company notes are:
The length of exterior services will change, price estimation includes 25 metres
Price estimation is based on sketch drawings
Price estimation accuracy +/- 15%.
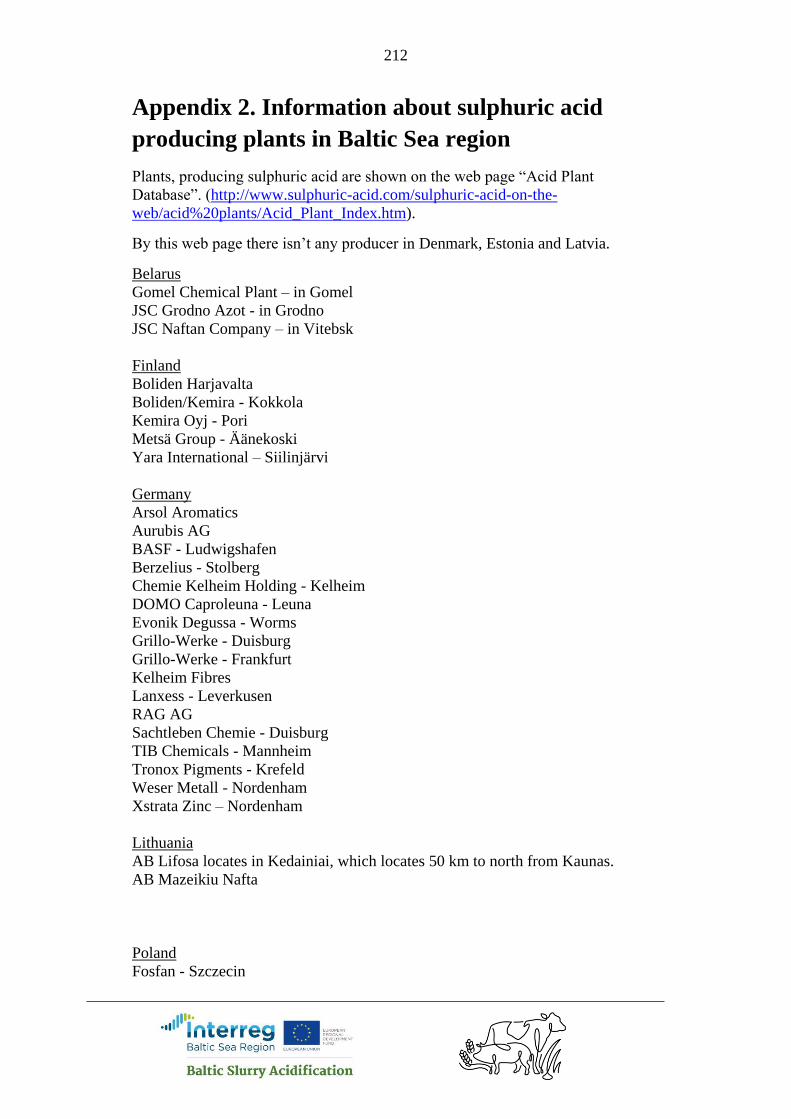
212
Appendix 2. Information about sulphuric acid
producing plants in Baltic Sea region
Plants, producing sulphuric acid are shown on the web page “Acid Plant
Database”. (http://www.sulphuric-acid.com/sulphuric-acid-on-the-
web/acid%20plants/Acid_Plant_Index.htm).
By this web page there isn’t any producer in Denmark, Estonia and Latvia.
Belarus
Gomel Chemical Plant – in Gomel
JSC Grodno Azot - in Grodno
JSC Naftan Company – in Vitebsk
Finland
Boliden Harjavalta
Boliden/Kemira - Kokkola
Kemira Oyj - Pori
Metsä Group - Äänekoski
Yara International – Siilinjärvi
Germany
Arsol Aromatics
Aurubis AG
BASF - Ludwigshafen
Berzelius - Stolberg
Chemie Kelheim Holding - Kelheim
DOMO Caproleuna - Leuna
Evonik Degussa - Worms
Grillo-Werke - Duisburg
Grillo-Werke - Frankfurt
Kelheim Fibres
Lanxess - Leverkusen
RAG AG
Sachtleben Chemie - Duisburg
TIB Chemicals - Mannheim
Tronox Pigments - Krefeld
Weser Metall - Nordenham
Xstrata Zinc – Nordenham
Lithuania
AB Lifosa locates in Kedainiai, which locates 50 km to north from Kaunas.
AB Mazeikiu Nafta
Poland
Fosfan - Szczecin

213
Fosfory - Gdansk
KGHM Polska - Glogow
KGHM Polska - Legnica
HCM S.A.
Petrochemia Blachownia
Zaklady Azotowe - Pulawy
Zaklady Boleslaw
ZCh Police
Russia
By the information from Eurochemgroup is one sulphuric acid producer
“Phosphorit” (http://www.eurochemgroup.com/en/product/sulphuric-acid/)
Additional information about plant is on web page
http://www.sulphuric-acid.com/sulphuric-acid-on-the-
web/acid%20plants/Phosphorit%20Industrial%20-%20Kingisepp.htm
The plant locates in Leningrad region, Kingisepp, which locates 20 km to east
from Russian-Estonian border.
Company LLC "MetaChem" locates in Volkhov (Leningrad region), which is
about 140 km east from St. Petersburg.
Sweden
Boliden - Ronnskar
Kemira Kemi - Helsingborg
Freudenberg Household Products

214
Appendix 3. Data for economic analyses, collected
from countries participating present project
Belarus
Organisation: RUE "SPC of NAC of Belarus for Agriculture Mechanization"
Contact person: Nikolay Kapustsin
Cost item Price, €,
without
VAT
Comments
Acid price € l-1. 0,18 The price of 1000 l IBC tank. The
wholesale price of Sulfur acid (94%)
is 25 Euro per 1 ton.
Acid transportation cost to
the farm € km-1.
1,25 In Belarus it is possible to order
specialized transport for
transportation of acid. Cost of
transportation of a capacity of 30 m3
is 250 euros without VAT for the
total length of the route 200 km
(round-trip);
Acid concentration, (e.g.
98%)
98
Price of new empty IBC tank 61 Полиэтиленовый 1000 l IBC tank
Electricity price, € kWh-1 0,08 With transfer cost and excise
Diesel fuel price for farms, €
l-1
0,53
Diesel transportation cost to
the farm € km-1.
0,35 Автомобильным транспортом
Labour cost with taxes, € h-1 2,4 Farm workers who operate
acidification systems in the farm.
Cost of slurry incorporation
with disc harrow, € ha-1
8,1 Costs with own equipment.
N fertiliser price, € kg-1 0,205 (Urea 46,2 % N) for 205 Euro per 1
ton

215
NS mineral fertiliser, € kg-1 113 21N-24S without delivery
NP mineral fertiliser price, €
kg-1
0,6 NPK mineral fertilizer: N-16%, P-
16%, K-16%
Fertiliser delivery cost to the
farm, € t-1 km-1
0,07 Truck with capacity 10 tonnes.
Mineral fertiliser handling
costs in farm (storage,
loading, transport to the field,
spreading), € t-1
30 With own equipment.
Liming material price, € t-1 60 Dry dolomite flour
(CaCO3+MgCO3)=93%
Liming material delivery to
farm, € t-1 km-1
0,07 Truck with capacity over 10 tonnes.
Lime handling costs in farm
(storage, loading, transport to
the field, spreading or liming
service cost), € t-1
3 With own equipment.
Or liming service cost which
includes three previous costs,
€ t-1
Rolled grass silage price, € t-1 22
Rolled grass silage handling
costs (harvest, loading,
transport from the field), € t-1
8
Barley price, € t-1 140
Wheat price, € t-1 130
Cereal yield handling costs
(transport from the field,
processing, loading and
storage), € t-1
13,2 Transport and processing costs.
Bank loan interest%, for
agricultural equipment
9,5
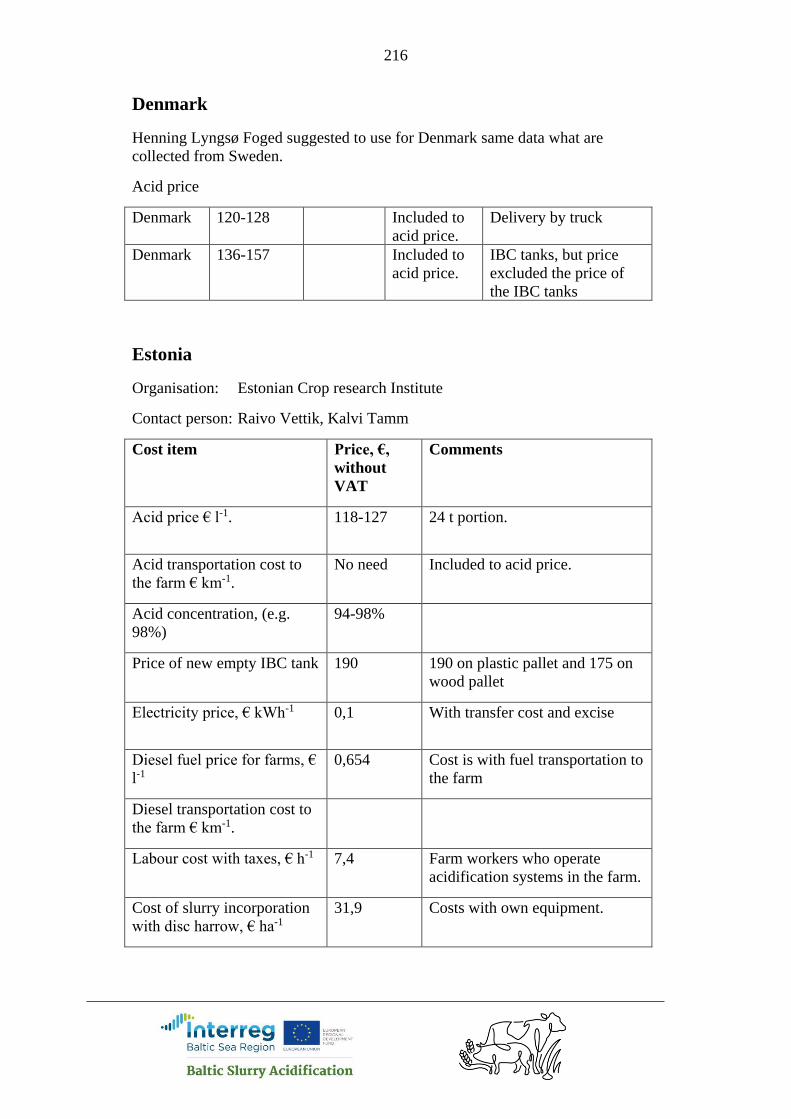
216
Denmark
Henning Lyngsø Foged suggested to use for Denmark same data what are
collected from Sweden.
Acid price
Denmark 120-128 Included to
acid price.
Delivery by truck
Denmark 136-157 Included to
acid price.
IBC tanks, but price
excluded the price of
the IBC tanks
Estonia
Organisation: Estonian Crop research Institute
Contact person: Raivo Vettik, Kalvi Tamm
Cost item Price, €,
without
VAT
Comments
Acid price € l-1. 118-127 24 t portion.
Acid transportation cost to
the farm € km-1.
No need Included to acid price.
Acid concentration, (e.g.
98%)
94-98%
Price of new empty IBC tank 190 190 on plastic pallet and 175 on
wood pallet
Electricity price, € kWh-1 0,1 With transfer cost and excise
Diesel fuel price for farms, €
l-1
0,654 Cost is with fuel transportation to
the farm
Diesel transportation cost to
the farm € km-1.
Labour cost with taxes, € h-1 7,4 Farm workers who operate
acidification systems in the farm.
Cost of slurry incorporation
with disc harrow, € ha-1
31,9 Costs with own equipment.
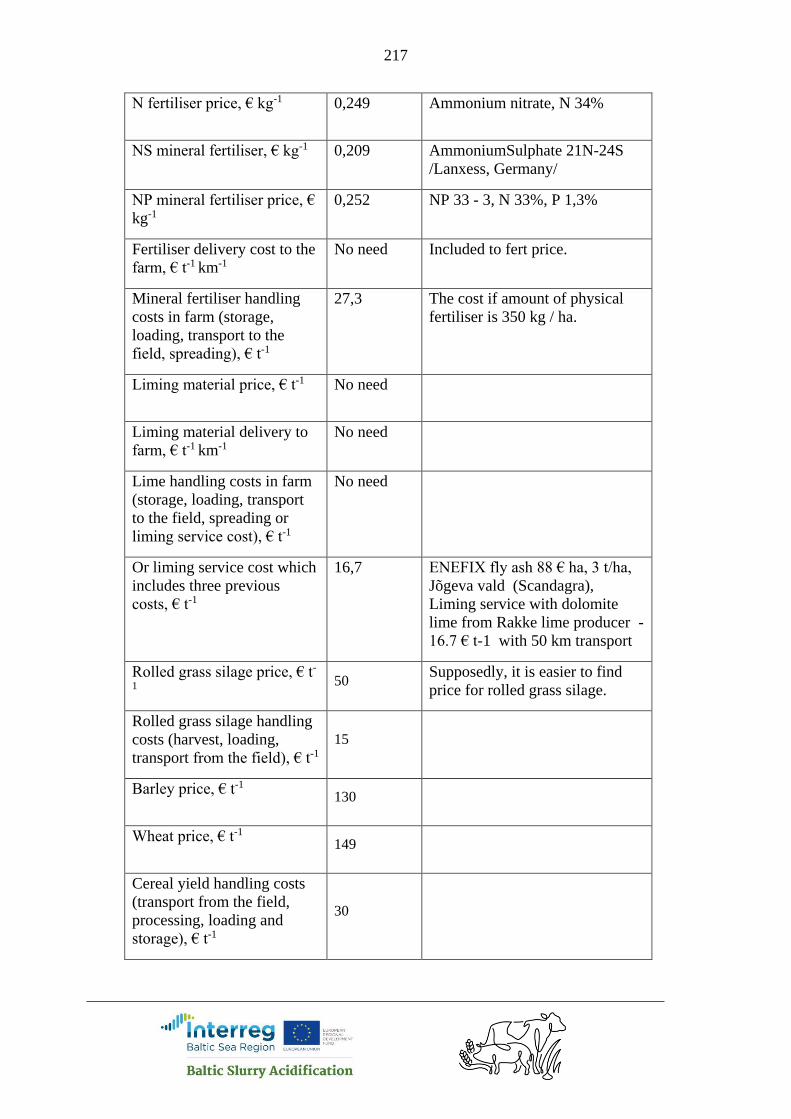
217
N fertiliser price, € kg-1 0,249 Ammonium nitrate, N 34%
NS mineral fertiliser, € kg-1 0,209 AmmoniumSulphate 21N-24S
/Lanxess, Germany/
NP mineral fertiliser price, €
kg-1
0,252 NP 33 - 3, N 33%, P 1,3%
Fertiliser delivery cost to the
farm, € t-1 km-1
No need Included to fert price.
Mineral fertiliser handling
costs in farm (storage,
loading, transport to the
field, spreading), € t-1
27,3 The cost if amount of physical
fertiliser is 350 kg / ha.
Liming material price, € t-1 No need
Liming material delivery to
farm, € t-1 km-1
No need
Lime handling costs in farm
(storage, loading, transport
to the field, spreading or
liming service cost), € t-1
No need
Or liming service cost which
includes three previous
costs, € t-1
16,7 ENEFIX fly ash 88 € ha, 3 t/ha,
Jõgeva vald (Scandagra),
Liming service with dolomite
lime from Rakke lime producer -
16.7 € t-1 with 50 km transport
Rolled grass silage price, € t-
1 50
Supposedly, it is easier to find
price for rolled grass silage.
Rolled grass silage handling
costs (harvest, loading,
transport from the field), € t-1
15
Barley price, € t-1 130
Wheat price, € t-1 149
Cereal yield handling costs
(transport from the field,
processing, loading and
storage), € t-1
30
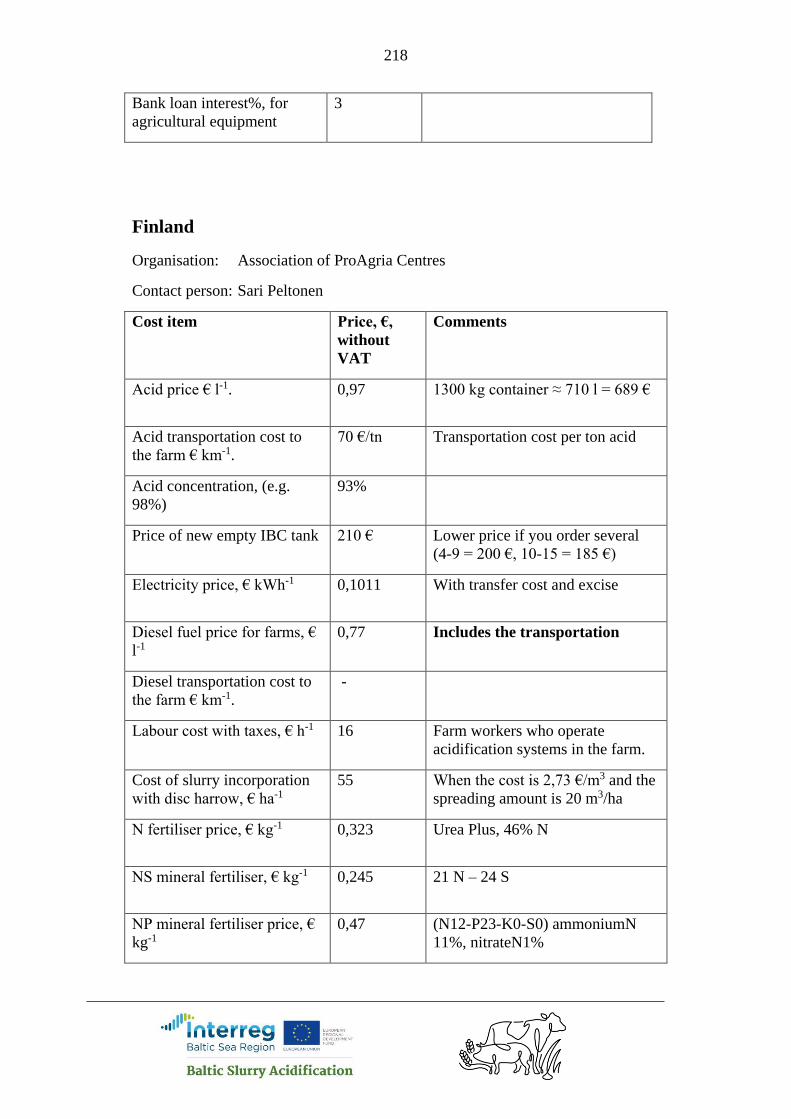
218
Bank loan interest%, for
agricultural equipment
3
Finland
Organisation: Association of ProAgria Centres
Contact person: Sari Peltonen
Cost item Price, €,
without
VAT
Comments
Acid price € l-1. 0,97 1300 kg container ≈ 710 l = 689 €
Acid transportation cost to
the farm € km-1.
70 €/tn Transportation cost per ton acid
Acid concentration, (e.g.
98%)
93%
Price of new empty IBC tank 210 € Lower price if you order several
(4-9 = 200 €, 10-15 = 185 €)
Electricity price, € kWh-1 0,1011 With transfer cost and excise
Diesel fuel price for farms, €
l-1
0,77 Includes the transportation
Diesel transportation cost to
the farm € km-1.
-
Labour cost with taxes, € h-1 16 Farm workers who operate
acidification systems in the farm.
Cost of slurry incorporation
with disc harrow, € ha-1
55 When the cost is 2,73 €/m3 and the
spreading amount is 20 m3/ha
N fertiliser price, € kg-1 0,323 Urea Plus, 46% N
NS mineral fertiliser, € kg-1 0,245 21 N – 24 S
NP mineral fertiliser price, €
kg-1
0,47 (N12-P23-K0-S0) ammoniumN
11%, nitrateN1%
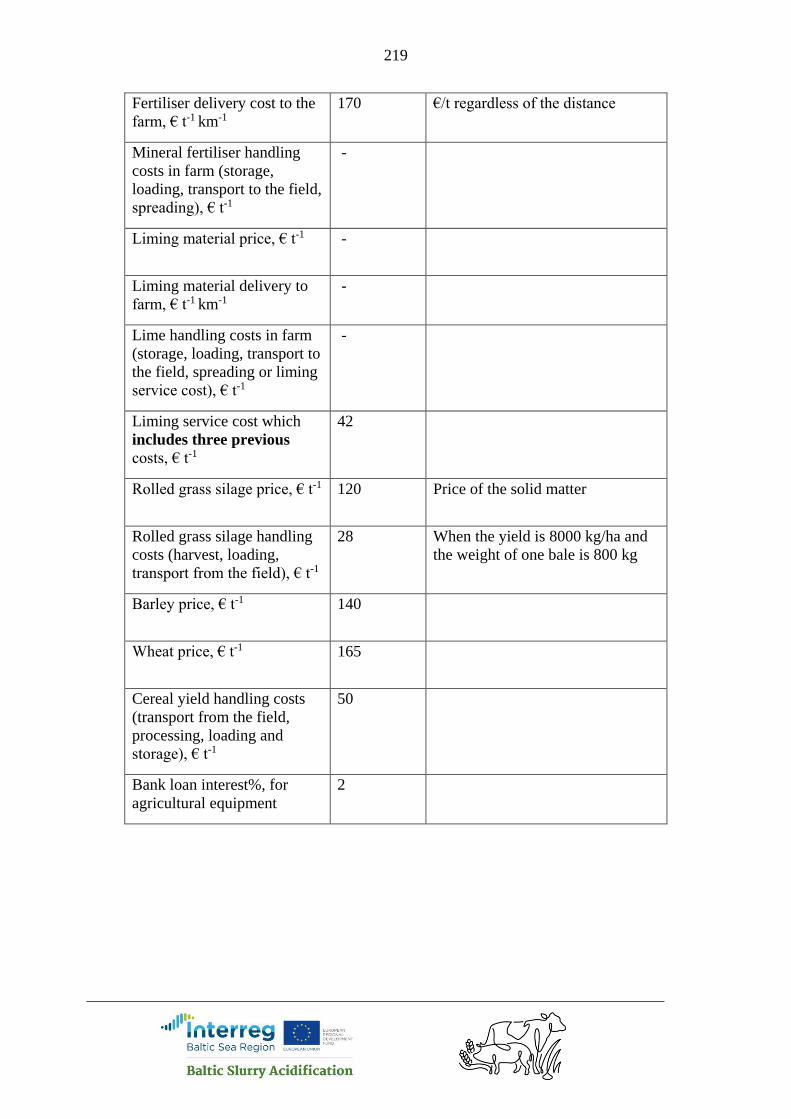
219
Fertiliser delivery cost to the
farm, € t-1 km-1
170 €/t regardless of the distance
Mineral fertiliser handling
costs in farm (storage,
loading, transport to the field,
spreading), € t-1
-
Liming material price, € t-1 -
Liming material delivery to
farm, € t-1 km-1
-
Lime handling costs in farm
(storage, loading, transport to
the field, spreading or liming
service cost), € t-1
-
Liming service cost which
includes three previous
costs, € t-1
42
Rolled grass silage price, € t-1 120 Price of the solid matter
Rolled grass silage handling
costs (harvest, loading,
transport from the field), € t-1
28 When the yield is 8000 kg/ha and
the weight of one bale is 800 kg
Barley price, € t-1 140
Wheat price, € t-1 165
Cereal yield handling costs
(transport from the field,
processing, loading and
storage), € t-1
50
Bank loan interest%, for
agricultural equipment
2
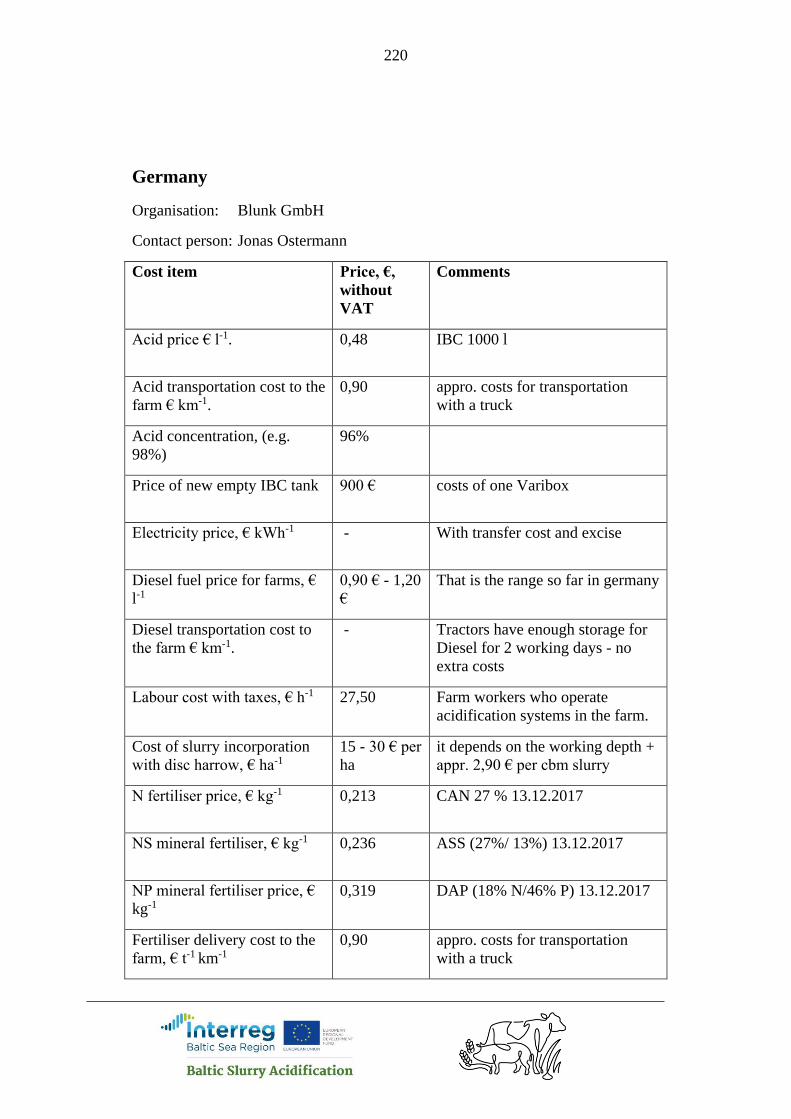
220
Germany
Organisation: Blunk GmbH
Contact person: Jonas Ostermann
Cost item Price, €,
without
VAT
Comments
Acid price € l-1. 0,48 IBC 1000 l
Acid transportation cost to the
farm € km-1.
0,90 appro. costs for transportation
with a truck
Acid concentration, (e.g.
98%)
96%
Price of new empty IBC tank 900 € costs of one Varibox
Electricity price, € kWh-1 - With transfer cost and excise
Diesel fuel price for farms, €
l-1
0,90 € - 1,20
€
That is the range so far in germany
Diesel transportation cost to
the farm € km-1.
- Tractors have enough storage for
Diesel for 2 working days - no
extra costs
Labour cost with taxes, € h-1 27,50 Farm workers who operate
acidification systems in the farm.
Cost of slurry incorporation
with disc harrow, € ha-1
15 - 30 € per
ha
it depends on the working depth +
appr. 2,90 € per cbm slurry
N fertiliser price, € kg-1 0,213 CAN 27 % 13.12.2017
NS mineral fertiliser, € kg-1 0,236 ASS (27%/ 13%) 13.12.2017
NP mineral fertiliser price, €
kg-1
0,319 DAP (18% N/46% P) 13.12.2017
Fertiliser delivery cost to the
farm, € t-1 km-1
0,90 appro. costs for transportation
with a truck

221
Mineral fertiliser handling
costs in farm (storage,
loading, transport to the field,
spreading), € t-1
15 - 20 approx. It depends on the field -
farm distance
Liming material price, € t-1 31
Liming material delivery to
farm, € t-1 km-1
1,1 € per km
Lime handling costs in farm
(storage, loading, transport to
the field, spreading or liming
service cost), € t-1
20 - 25 approx. It depends on the field -
farm distance
Or liming service cost which
includes three previous costs,
€ t-1
If You send liming service cost,
then three previous costs are not
needed.
Rolled grass silage price, € t-1 30 Supposedly, it is easier to find
price for rolled grass silage.
Rolled grass silage handling
costs (harvest, loading,
transport from the field), € t-1
10 € per to + 1,10 more per km
Barley price, € t-1 140 13.12.2017
Wheat price, € t-1 148 13.12.2017
Cereal yield handling costs
(transport from the field,
processing, loading and
storage), € t-1
10 - 15 approx. It depends on the field -
farm distance
Bank loan interest%, for
agricultural equipment
1,5 - 3,5 %

222
Latvia
Organisation: Latvian Rural Advisory and Training Centre
Contact person: Santa Pavila
Cost item Price, €,
without
VAT
Comments
Acid price € kg-1. 0,15 The price of 1000 l IBC tank.
Acid price for € l-1 - 0,27, 0.15 €
kg-1
Acid transportation cost to
the farm € km-1.
1
Acid concentration, (e.g.
98%)
98
Price of new empty IBC tank 190
Electricity price, € kWh-1 0,11 With transfer cost and excise
Diesel fuel price for farms, €
l-1
0,63
Diesel transportation cost to
the farm € km-1.
1
Labour cost with taxes, € h-1 5 Farm workers who operate
acidification systems in the farm.
Cost of slurry incorporation
with disc harrow, € ha-1
22,92 Costs with own equipment.
Service costs is 30.02 € ha-1
N fertiliser price, € kg-1 0,23 Ammonium nitrate N - 34%
NS mineral fertiliser, € kg-1 0,19 AmmoniumSulphate 21N-24S
NP mineral fertiliser price, €
kg-1
0,41 NP N - 33%, P - 3%
Fertiliser delivery cost to the
farm, € t-1 km-1
0,062 Truck with capacity 10 tonnes.
Service costs 0.089 € t-1 km-1
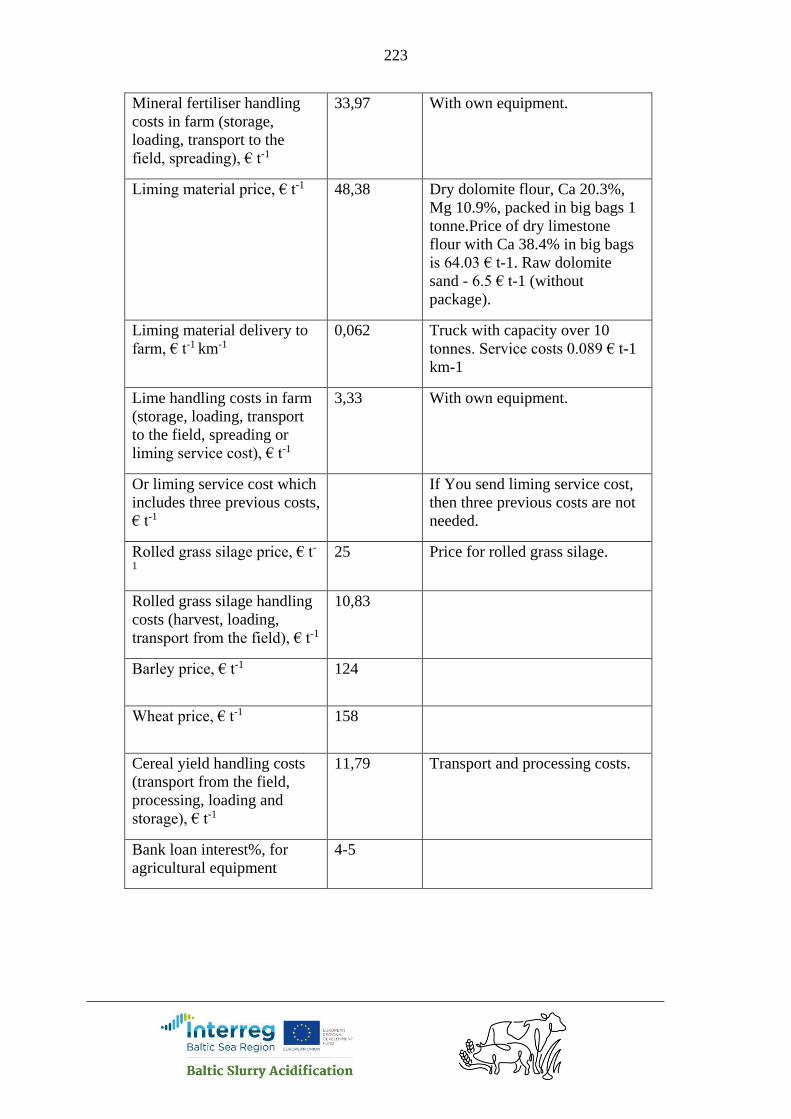
223
Mineral fertiliser handling
costs in farm (storage,
loading, transport to the
field, spreading), € t-1
33,97 With own equipment.
Liming material price, € t-1 48,38 Dry dolomite flour, Ca 20.3%,
Mg 10.9%, packed in big bags 1
tonne.Price of dry limestone
flour with Ca 38.4% in big bags
is 64.03 € t-1. Raw dolomite
sand - 6.5 € t-1 (without
package).
Liming material delivery to
farm, € t-1 km-1
0,062 Truck with capacity over 10
tonnes. Service costs 0.089 € t-1
km-1
Lime handling costs in farm
(storage, loading, transport
to the field, spreading or
liming service cost), € t-1
3,33 With own equipment.
Or liming service cost which
includes three previous costs,
€ t-1
If You send liming service cost,
then three previous costs are not
needed.
Rolled grass silage price, € t-
1
25 Price for rolled grass silage.
Rolled grass silage handling
costs (harvest, loading,
transport from the field), € t-1
10,83
Barley price, € t-1 124
Wheat price, € t-1 158
Cereal yield handling costs
(transport from the field,
processing, loading and
storage), € t-1
11,79 Transport and processing costs.
Bank loan interest%, for
agricultural equipment
4-5

224
Lithuania
Organisation: Lithuanian University of Health Science (Animal Science Institute)
Contact person: Artūras Šiukščius [email protected]
Cost item Price,
€,
without
VAT
Comments
Acid price € l-1. 0,240
1000 l IBC tank (240 euro
for 1000 l)
Acid transportation cost to the farm € km-1. 1,20
Acid concentration, (e.g. 98%) 96
Price of new empty IBC tank 140
Electricity price, € kWh-1 0,090 With transfer cost and
excise
Diesel fuel price for farms, € l-1 0,524 With diesel fuel
transportation
Diesel transportation cost to the farm € km-1. -----
Labour cost with taxes, € h-1 4,07 Farm workers who operate
acidification systems in the
farm.
Cost of slurry incorporation with disc harrow, €
ha-1
100
N fertiliser price, € kg-1 250 Please specify here the
nutrient content of fertiliser
( saltpetre N-34,4 %)
with transportation
NS mineral fertiliser, € kg-1 260 Please specify here the
nutrient content of fertiliser
(NS 30-10) %with
transportation
NP mineral fertiliser price, € kg-1 370 Please specify here the
nutrient content of fertiliser
(NP 12-52) with
transportation
Fertiliser delivery cost to the farm, € t-1km-1 ---
Mineral fertiliser handling costs in farm
(storage, loading, transport to the field,
spreading), € t-1
35
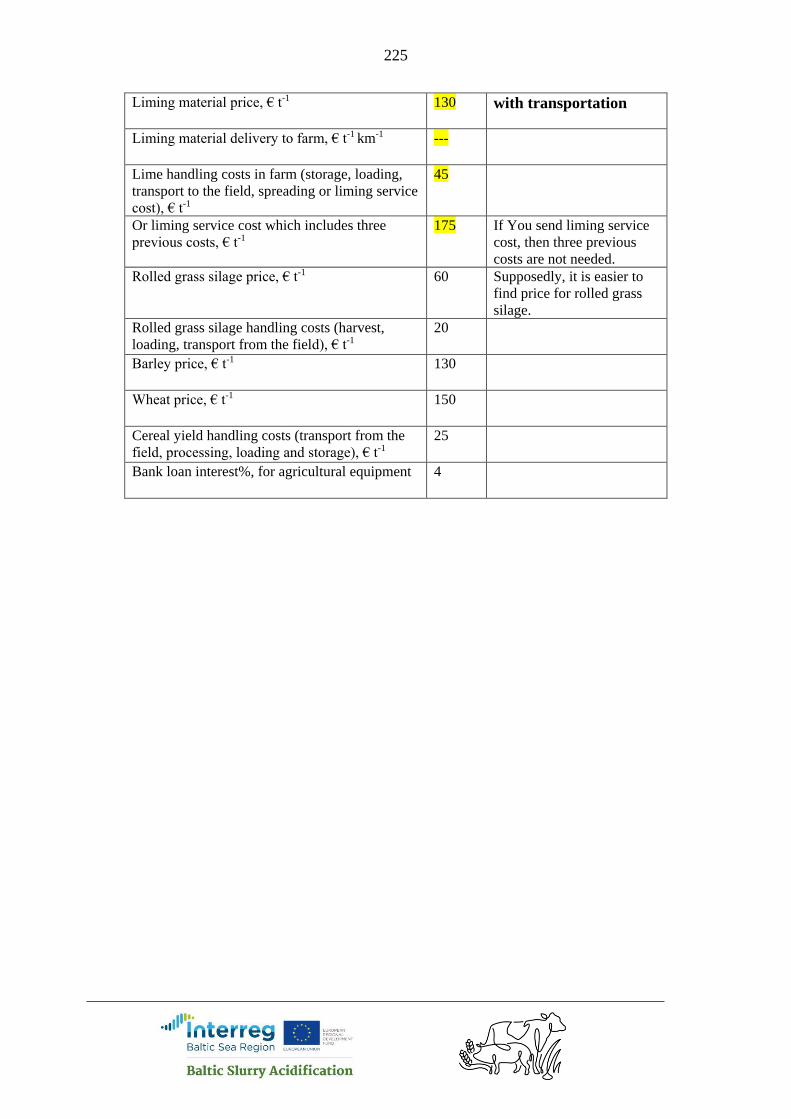
225
Liming material price, € t-1 130 with transportation
Liming material delivery to farm, € t-1 km-1 ---
Lime handling costs in farm (storage, loading,
transport to the field, spreading or liming service
cost), € t-1
45
Or liming service cost which includes three
previous costs, € t-1
175 If You send liming service
cost, then three previous
costs are not needed.
Rolled grass silage price, € t-1 60 Supposedly, it is easier to
find price for rolled grass
silage.
Rolled grass silage handling costs (harvest,
loading, transport from the field), € t-1
20
Barley price, € t-1 130
Wheat price, € t-1 150
Cereal yield handling costs (transport from the
field, processing, loading and storage), € t-1
25
Bank loan interest%, for agricultural equipment 4
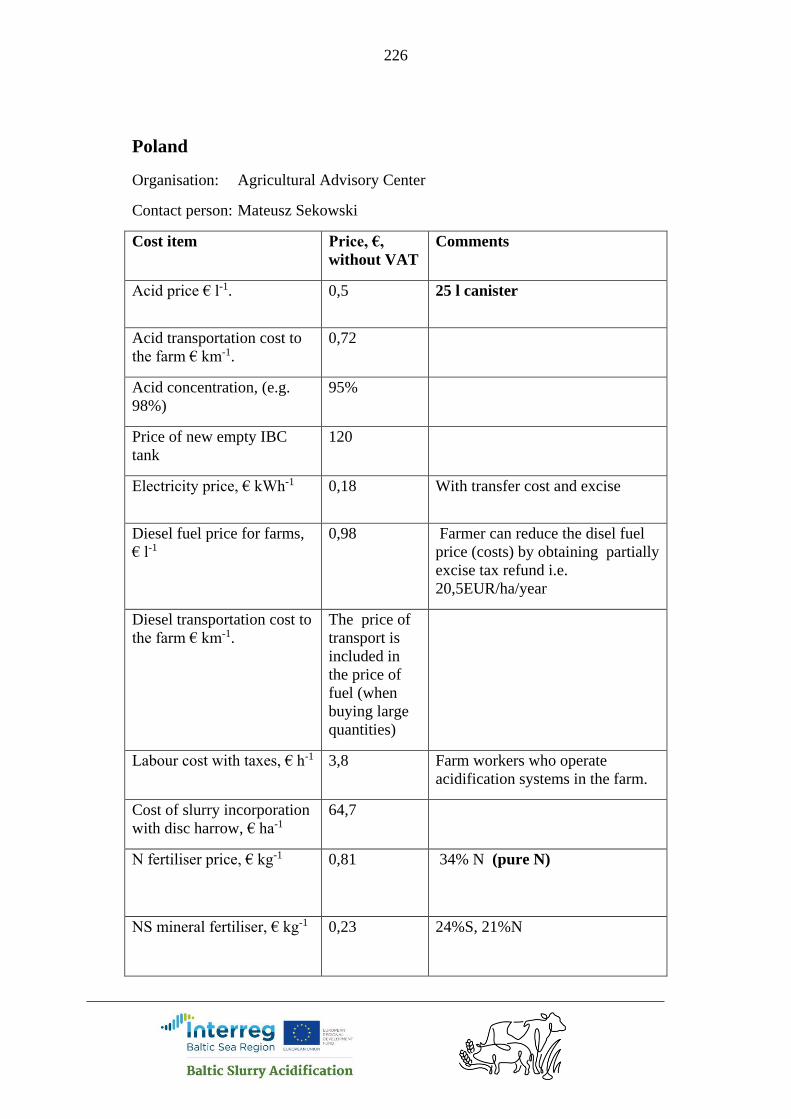
226
Poland
Organisation: Agricultural Advisory Center
Contact person: Mateusz Sekowski
Cost item Price, €,
without VAT
Comments
Acid price € l-1. 0,5 25 l canister
Acid transportation cost to
the farm € km-1.
0,72
Acid concentration, (e.g.
98%)
95%
Price of new empty IBC
tank
120
Electricity price, € kWh-1 0,18 With transfer cost and excise
Diesel fuel price for farms,
€ l-1
0,98 Farmer can reduce the disel fuel
price (costs) by obtaining partially
excise tax refund i.e.
20,5EUR/ha/year
Diesel transportation cost to
the farm € km-1.
The price of
transport is
included in
the price of
fuel (when
buying large
quantities)
Labour cost with taxes, € h-1 3,8 Farm workers who operate
acidification systems in the farm.
Cost of slurry incorporation
with disc harrow, € ha-1
64,7
N fertiliser price, € kg-1 0,81 34% N (pure N)
NS mineral fertiliser, € kg-1 0,23 24%S, 21%N
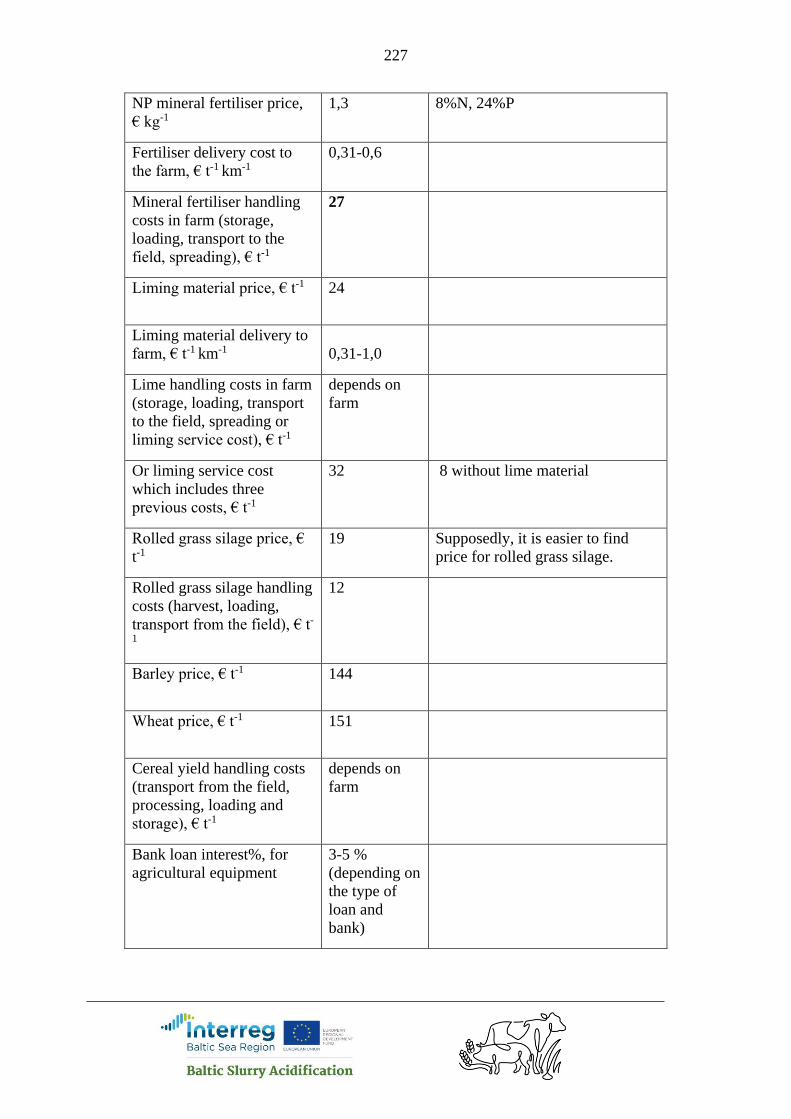
227
NP mineral fertiliser price,
€ kg-1
1,3 8%N, 24%P
Fertiliser delivery cost to
the farm, € t-1 km-1
0,31-0,6
Mineral fertiliser handling
costs in farm (storage,
loading, transport to the
field, spreading), € t-1
27
Liming material price, € t-1 24
Liming material delivery to
farm, € t-1 km-1
0,31-1,0
Lime handling costs in farm
(storage, loading, transport
to the field, spreading or
liming service cost), € t-1
depends on
farm
Or liming service cost
which includes three
previous costs, € t-1
32 8 without lime material
Rolled grass silage price, €
t-1
19 Supposedly, it is easier to find
price for rolled grass silage.
Rolled grass silage handling
costs (harvest, loading,
transport from the field), € t-
1
12
Barley price, € t-1 144
Wheat price, € t-1 151
Cereal yield handling costs
(transport from the field,
processing, loading and
storage), € t-1
depends on
farm
Bank loan interest%, for
agricultural equipment
3-5 %
(depending on
the type of
loan and
bank)
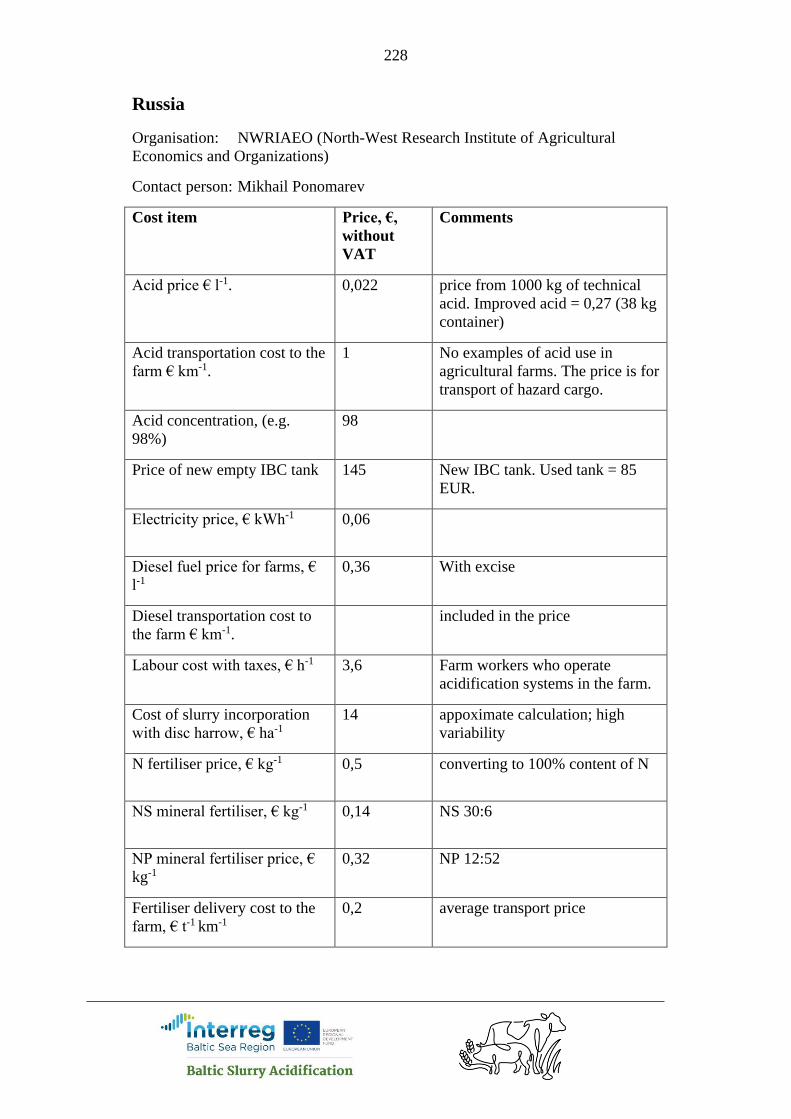
228
Russia
Organisation: NWRIAEO (North-West Research Institute of Agricultural
Economics and Organizations)
Contact person: Mikhail Ponomarev
Cost item Price, €,
without
VAT
Comments
Acid price € l-1. 0,022 price from 1000 kg of technical
acid. Improved acid = 0,27 (38 kg
container)
Acid transportation cost to the
farm € km-1.
1 No examples of acid use in
agricultural farms. The price is for
transport of hazard cargo.
Acid concentration, (e.g.
98%)
98
Price of new empty IBC tank 145 New IBC tank. Used tank = 85
EUR.
Electricity price, € kWh-1 0,06
Diesel fuel price for farms, €
l-1
0,36 With excise
Diesel transportation cost to
the farm € km-1.
included in the price
Labour cost with taxes, € h-1 3,6 Farm workers who operate
acidification systems in the farm.
Cost of slurry incorporation
with disc harrow, € ha-1
14 appoximate calculation; high
variability
N fertiliser price, € kg-1 0,5 converting to 100% content of N
NS mineral fertiliser, € kg-1 0,14 NS 30:6
NP mineral fertiliser price, €
kg-1
0,32 NP 12:52
Fertiliser delivery cost to the
farm, € t-1 km-1
0,2 average transport price
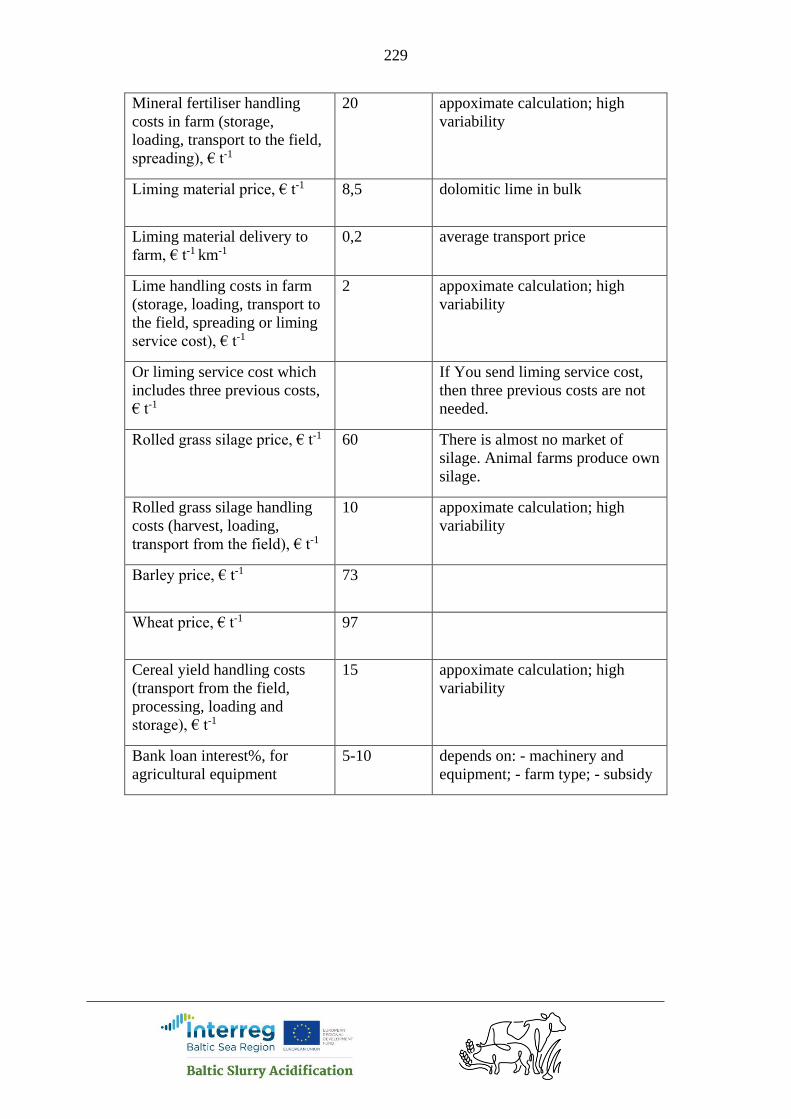
229
Mineral fertiliser handling
costs in farm (storage,
loading, transport to the field,
spreading), € t-1
20 appoximate calculation; high
variability
Liming material price, € t-1 8,5 dolomitic lime in bulk
Liming material delivery to
farm, € t-1 km-1
0,2 average transport price
Lime handling costs in farm
(storage, loading, transport to
the field, spreading or liming
service cost), € t-1
2 appoximate calculation; high
variability
Or liming service cost which
includes three previous costs,
€ t-1
If You send liming service cost,
then three previous costs are not
needed.
Rolled grass silage price, € t-1 60 There is almost no market of
silage. Animal farms produce own
silage.
Rolled grass silage handling
costs (harvest, loading,
transport from the field), € t-1
10 appoximate calculation; high
variability
Barley price, € t-1 73
Wheat price, € t-1 97
Cereal yield handling costs
(transport from the field,
processing, loading and
storage), € t-1
15 appoximate calculation; high
variability
Bank loan interest%, for
agricultural equipment
5-10 depends on: - machinery and
equipment; - farm type; - subsidy
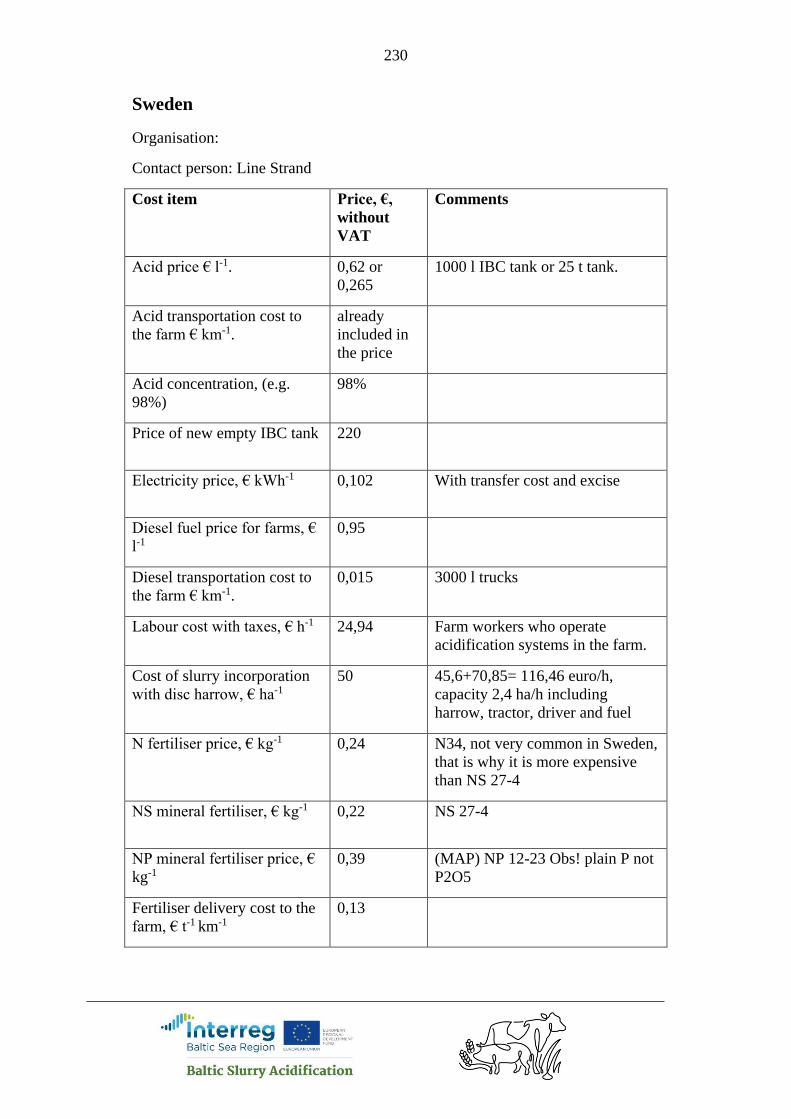
230
Sweden
Organisation:
Contact person: Line Strand
Cost item Price, €,
without
VAT
Comments
Acid price € l-1. 0,62 or
0,265
1000 l IBC tank or 25 t tank.
Acid transportation cost to
the farm € km-1.
already
included in
the price
Acid concentration, (e.g.
98%)
98%
Price of new empty IBC tank 220
Electricity price, € kWh-1 0,102 With transfer cost and excise
Diesel fuel price for farms, €
l-1
0,95
Diesel transportation cost to
the farm € km-1.
0,015 3000 l trucks
Labour cost with taxes, € h-1 24,94 Farm workers who operate
acidification systems in the farm.
Cost of slurry incorporation
with disc harrow, € ha-1
50 45,6+70,85= 116,46 euro/h,
capacity 2,4 ha/h including
harrow, tractor, driver and fuel
N fertiliser price, € kg-1 0,24 N34, not very common in Sweden,
that is why it is more expensive
than NS 27-4
NS mineral fertiliser, € kg-1 0,22 NS 27-4
NP mineral fertiliser price, €
kg-1
0,39 (MAP) NP 12-23 Obs! plain P not
P2O5
Fertiliser delivery cost to the
farm, € t-1 km-1
0,13

231
Mineral fertiliser handling
costs in farm (storage,
loading, transport to the field,
spreading), € t-1
50 Depending on how far away the
fields are, 5km distance in
calculation
Liming material price, € t-1
Liming material delivery to
farm, € t-1 km-1
Lime handling costs in farm
(storage, loading, transport to
the field, spreading or liming
service cost), € t-1
Or liming service cost which
includes three previous costs,
€ t-1
28,62-30,67
Rolled grass silage price, € t-1 0,14 price in Euro/kg DM. It is
uncommon in Sweden that you
buy your silage without all the
handling costs included.
Rolled grass silage handling
costs (harvest, loading,
transport from the field), € t-1
0,14 price in Euro/kg DM for the
farmer
Barley price, € t-1 173 or 112 Barley for beerproduction or
barley for fodder production
Wheat price, € t-1 143 or 132 Wheat for bakery industry or
wheat for fodder production
Cereal yield handling costs
(transport from the field,
processing, loading and
storage), € t-1
29,45 transport, drying, loading and
storage
Bank loan interest%, for
agricultural equipment
3 or 4 Machinery loan

Summary of the project
Baltic Slurry Acidification is an agro-
environmental project financed by
Interreg Baltic Sea Region under the
priority area Natural resources and
specific objective Clear waters. The aim
of the project is to reduce nitrogen
losses from livestock production by
promoting the use of slurry acidification
techniques in the Baltic Sea Region and
thus to mitigate eutrophication of the
Baltic Sea.
Summary of the report
The economic aspects have a
crucial role for the farmer’s
decision to choose one of
acidification technologies or
some other solution to minimise
ammonia emission from slurry.
The calculation models are
composed within the project to
compare different solutions.
Present report gives overview
about data and methods used in
analysis models. The calculation
results are presented for every
country participating in the
project. The report includes
chapter about overall summary
and conclusions of economic
analyses and gives
recommendations to improve
cost-benefit of slurry
acidification.