MCCIP Ecosystem Linkages Report Card 2009 CO2 and ocean acidification

Earth-Science Reviews 113 (2012) 72–93
Contents lists available at SciVerse ScienceDirect
Earth-Science Reviews
j ourna l homepage: www.e lsev ie r .com/ locate /earsc i rev
Recognising ocean acidification in deep time: An evaluation of the evidence foracidification across the Triassic-Jurassic boundary
Sarah E. Greene ⁎,1, Rowan C. Martindale 1, Kathleen A. Ritterbush, David J. Bottjer,Frank A. Corsetti, William M. BerelsonDepartment of Earth Sciences, University of Southern California, Los Angeles, California, USA 90089
⁎ Corresponding author at: School of Geographical ScE-mail addresses: [email protected] (S.E. Gr
[email protected] (F.A. Corsetti), [email protected] (W.M1 These authors contributed equally to this work.
0012-8252/$ – see front matter © 2012 Elsevier B.V. Alldoi:10.1016/j.earscirev.2012.03.009
a b s t r a c t
a r t i c l e i n f oArticle history:Received 22 July 2011Accepted 17 March 2012Available online 5 April 2012
Keywords:Ocean acidificationTriassic-Jurassic boundaryend-Triassic mass extinctionCentral Atlantic Magmatic Province
While demonstrating ocean acidification in the modern is relatively straightforward (measure increase inatmospheric CO2 and corresponding ocean chemistry change), identifying palaeo-ocean acidification isproblematic. The crux of this problem is that the rock record is a constructive archive while oceanacidification is essentially a destructive (and/or inhibitory) phenomenon. This is exacerbated in deep timewithout the benefit of a deep ocean record. Here, we discuss the feasibility of, and potential criteria for,identifying an acidification event in deep time. Furthermore, we investigate the evidence for oceanacidification during the Triassic-Jurassic (T-J) boundary interval, an excellent test case because 1) it occurs indeep time, beyond the reach of deep sea drilling coverage; 2) a potential trigger for acidification is known;and 3) it is associated with one of the ‘Big Five’ mass extinctions which disproportionately affected modern-style invertebrates.Three main criteria suggest that acidification may have occurred across the T-J transition. 1) The eruption ofthe Central Atlantic Magmatic Province (CAMP) and the associated massive and rapid release of CO2
coincident with the end-Triassic mass extinction provide a suitable trigger for an acidification event (fullcarbonate undersaturation in the surface ocean is possible but improbable). 2) Tentative evidence for a globalpaucity of carbonate across the end-Triassic mass extinction versus the adjacent stratigraphy is consistentwith a predicted sedimentary response to acidification. 3) The end-Triassic mass extinction was particularlyselective against acid-sensitive organisms (more so than perhaps any other extinction event) andtemporarily eliminated coral reefs. Therefore multiple lines of evidence are consistent with a T-J oceanacidification event within our current resolution to recognise such events in deep time. The conclusion thatthe end-Triassic extinction was influenced by acidification implies that short-term acidification perturbationsmay have long-term effects on ecosystems, a repercussion that has previously not been established.Although anthropogenic emissions are more rapid than any event in the geologic record, events such as theT-J can serve as partial analogues for the present anthropogenic carbon release. Since the T-J was such apronounced crisis for both modern-style marine invertebrates and scleractinian reefs, it is of particularinterest in terms of informing projections about the effects of modern ocean acidification.
© 2012 Elsevier B.V. All rights reserved.
Contents
1. Introduction . . . . . . . . . . . . . . . . . . . . . . . . . . . . . . . . . . . . . . . . . . . . . . . . . . . . . . . . . . . . . . . 732. Abiotic and biotic responses to ocean acidification . . . . . . . . . . . . . . . . . . . . . . . . . . . . . . . . . . . . . . . . . . . . . 74
2.1. Carbonate chemistry perturbation and sedimentary responses to acidification . . . . . . . . . . . . . . . . . . . . . . . . . . . . . 742.2. Biotic responses to ocean acidification in modern observations and experiments . . . . . . . . . . . . . . . . . . . . . . . . . . . . 74
2.2.1. Calcification . . . . . . . . . . . . . . . . . . . . . . . . . . . . . . . . . . . . . . . . . . . . . . . . . . . . . . . 742.2.2. Metabolism, growth and other physiological effects . . . . . . . . . . . . . . . . . . . . . . . . . . . . . . . . . . . . . 752.2.3. Reproduction . . . . . . . . . . . . . . . . . . . . . . . . . . . . . . . . . . . . . . . . . . . . . . . . . . . . . . . 762.2.4. Ecosystem effects . . . . . . . . . . . . . . . . . . . . . . . . . . . . . . . . . . . . . . . . . . . . . . . . . . . . . 76
iences, University of Bristol, University Road, Clifton, Bristol, BS8 1SS. Tel.: +44 117 3318351.eene), [email protected] (R.C. Martindale), [email protected] (K.A. Ritterbush), [email protected] (D.J. Bottjer),. Berelson).
rights reserved.

73S.E. Greene et al. / Earth-Science Reviews 113 (2012) 72–93
3. Recognising ocean acidification events in deep time . . . . . . . . . . . . . . . . . . . . . . . . . . . . . . . . . . . . . . . . . . . . 764. CAMP as a mechanism for ocean acidification across the
T-J Boundary . . . . . . . . . . . . . . . . . . . . . . . . . . . . . . . . . . . . . . . . . . . . . . . . . . . . . . . . . . . . . . 774.1. Dating and synchronicity of CAMP and the end-Triassic mass extinction . . . . . . . . . . . . . . . . . . . . . . . . . . . . . . . . 774.2. CAMP volume and emissions . . . . . . . . . . . . . . . . . . . . . . . . . . . . . . . . . . . . . . . . . . . . . . . . . . . 784.3. Rates of volatile injection and modelling the T-J acidification event . . . . . . . . . . . . . . . . . . . . . . . . . . . . . . . . . . 804.4. Triassic-Jurassic ocean sensitivity to CO2 injection . . . . . . . . . . . . . . . . . . . . . . . . . . . . . . . . . . . . . . . . . . 81
5. The sedimentary record of the T-J boundary interval . . . . . . . . . . . . . . . . . . . . . . . . . . . . . . . . . . . . . . . . . . . . 825.1. Boundary sections with decreased (or a lack of) carbonate . . . . . . . . . . . . . . . . . . . . . . . . . . . . . . . . . . . . . . 835.2. Predominantly siliciclastic sections . . . . . . . . . . . . . . . . . . . . . . . . . . . . . . . . . . . . . . . . . . . . . . . . . 845.3. Potentially continuous carbonate successions . . . . . . . . . . . . . . . . . . . . . . . . . . . . . . . . . . . . . . . . . . . . 845.4. Diagenesis and the δ13Ccarb signature across the T-J boundary interval . . . . . . . . . . . . . . . . . . . . . . . . . . . . . . . . . 855.5. Summary and discussion of T-J lithologies . . . . . . . . . . . . . . . . . . . . . . . . . . . . . . . . . . . . . . . . . . . . . 86
6. The fossil record of the end-Triassic extinction . . . . . . . . . . . . . . . . . . . . . . . . . . . . . . . . . . . . . . . . . . . . . . . 866.1. End-Triassic extinction selectivity and other palaeontological indicators of acidification . . . . . . . . . . . . . . . . . . . . . . . . . . . 866.2. Acidification and the fidelity of the fossil record . . . . . . . . . . . . . . . . . . . . . . . . . . . . . . . . . . . . . . . . . . . 87
7. Comparison of the T-J with other potential palaeo-oceanacidification events . . . . . . . . . . . . . . . . . . . . . . . . . . . . . . . . . . . . . . . . . . . . . . . . . . . . . . . . . . . 87
8. Conclusions . . . . . . . . . . . . . . . . . . . . . . . . . . . . . . . . . . . . . . . . . . . . . . . . . . . . . . . . . . . . . . . 88Acknowledgements . . . . . . . . . . . . . . . . . . . . . . . . . . . . . . . . . . . . . . . . . . . . . . . . . . . . . . . . . . . . . . 88References . . . . . . . . . . . . . . . . . . . . . . . . . . . . . . . . . . . . . . . . . . . . . . . . . . . . . . . . . . . . . . . . . . 88
1. Introduction
Ocean acidification in the modern is a predicted and measuredresponse to anthropogenic carbon dioxide emissions (Wootton et al.,2008) about which there has been rising concern over the pastseveral years (Kerr, 2010). Despite the “acidification” moniker, oceanacidification does not imply that the ocean will actually become acidic(pH b7), simply that ocean pH will fall below steady state and/ornormal levels. As CO2 levels increase in the atmosphere (Keeling et al.,1995), CO2 dissolves into the surface ocean and reacts with water,producing H2CO3 (carbonic acid). At modern ocean pH of 8.2, H2CO3
dissociates into HCO3- (bicarbonate) and H+, lowering the pH of the
ocean. Perhaps more importantly, CO32- (carbonate ion) can complex
with H+, lowering the concentration of this crucial building block ofcalcium carbonate. The overall reaction reads CO2+H2O+CO3
2-
2HCO3-. Over long timescales (ca. 105 yrs (Kump et al., 2009; Hönisch
et al., 2012)), this reaction is counterbalanced by silicate weathering,which delivers alkalinity to the ocean. On shorter timescales, whereCO2 is released faster than the buffering capacity of carbonate mineraldissolution and silicate weathering, ocean acidification may occur(Stuecker and Zeebe, 2010). Biologists predict ocean acidification willhave deleterious effects on corals and coral reefs (Kleypas et al.,1999a; Fine and Tchernov, 2007; Hoegh-Guldberg et al., 2007;Anthony et al., 2008; Veron et al., 2009; Pelejero et al., 2010; dePutron et al., 2011) and calcification in general for many other taxa(Orr et al., 2005; Fabry et al., 2008; Ries et al., 2009).
Ocean acidification can be quantified in a number of ways, eitheras a CO2-induced pH drop (Caldeira and Wickett, 2003; Orr et al.,2005; Jokiel et al., 2008; Breitbarth et al., 2010), a drop in carbonatesaturation state (Ω) (Ries et al., 2009) (Ω=Ion Activity Product/thesolubility constant or Ksp), or both a drop in pH and Ω (Feely et al.,2004; Fine and Tchernov, 2007; Leon-Rodriguez and Dickens, 2010;Hönisch et al., 2012). Since these aqueous attributes are very difficultto identify in the rock record, palaeontologists sometimes infer apalaeo-ocean acidification event from a biocalcification crisis (van deSchootbrugge et al., 2007; Clémence et al., 2010a; Kiessling andSimpson, 2011) or a decline inweight percent carbonate and calcareousorganisms (Črne et al., 2011), indicating a decline in surface carbonateproduction or subsequent dissolution. All of the above phenomena canbe intimately linked and all may result from a massive, rapid CO2
injection (a carbon cycle perturbation), but detecting definitiveevidence of ocean acidification in the rock record, particularly in deeptime, is challenging.
The end-Triassic extinction (see Fig. 1 for timescale) is one of the“Big Five” mass extinctions of the Phanerozoic (Raup and Sepkoski,1982). The end-Triassic extinction was particularly severe for the so-called ‘Modern Fauna’, benthic marine invertebrates similar to thosedominating today's ocean (Sepkoski and Miller, 1985; Alroy, 2010a,b). In recent years speculation that a carbon cycle perturbation causedthis extinction has mounted because a temporal correlation betweenthe eruption of Central Atlantic Magmatic Province (CAMP) (Marzoliet al., 1999; Hames et al., 2000; Nomade et al., 2007; Verati et al.,2007; Deenen et al., 2010; Whiteside et al., 2010), and a negativeexcursion in both organic and inorganic (carbonate) carbon isotoperecords has been demonstrated slightly before the Triassic-Jurassic(T-J) boundary as defined by the first Jurassic ammonite (Fig. 1)(Hallam and Goodfellow, 1990; Morante and Hallam, 1996;McRoberts et al., 1997; Pálfy et al., 2001, 2007; Ward et al., 2001,2007; Hesselbo et al., 2002, 2004; Jenkyns et al., 2002; Guex et al.,2003, 2004; Galli et al., 2005, 2007; Yin et al., 2006; Kuerschner et al.,2007; Michalík et al., 2007; Wignall et al., 2007; Williford et al., 2007;Korte et al., 2009; Ruhl et al., 2009, 2011; Clémence et al., 2010b; Pariset al., 2010; Whiteside et al., 2010) including the T-J Global BoundaryStratotype Section and Point or GSSP (Ruhl et al., 2009, 2011). Morespecifically, it has been suggested that a short-lived ocean acidifica-tion event produced by the release of CO2 and volatiles from theCAMP flood basalts was a key causal mechanism of the end-Triassicmass extinction (Fig. 1) (Hautmann, 2004; Hautmann et al., 2008a,b;Veron, 2008; Bernasconi et al., 2009; Clémence et al., 2010a; Kiesslingand Simpson, 2011).
In this paper we discuss how to recognise ocean acidification inthe geological record using the Triassic-Jurassic event as a test case.We first discuss the abiotic and biotic responses to ocean acidificationand the overall potential for the recognition of ocean acidification indeep time (Sections 2 and 3, respectively). We then apply thesecriteria to the T-J transition and review the evidence for/against a T-Jocean acidification event. We evaluate whether the Central AtlanticMagmatic Province constitutes an appropriate trigger mechanism toproduce an acidified (or even undersaturated) T-J ocean (Section 4).Then we assess whether acidification is a parsimonious explanationfor the Triassic-Jurassic sedimentary record (Section 5). We reviewwhether the signature of the end-Triassic mass extinction implicatesocean acidification (Section 6) and lastly we compare the T-Jacidification event to two other candidate acidification events, thePermian-Triassic (P-T) and Palaeocene-Eocene Thermal Maximum(PETM).

ME
SO
ZO
IC
Tria
ssic
Cre
tace
ou
sJu
rass
ic
L
M
E
L
M
E
L
E
CA
MP
(M
ain
Pha
se)
199.5 Ma ± 0.29
201.3 Ma ± 0.43
203.6 Ma ± 1.5
Ext
inct
ion
inte
rval
Initi
al C
IE
T-J
Aci
dif
icat
ion
Eve
nt
Rha
etia
n (L
ate
Tria
ssic
)H
etta
ngia
n (E
arly
Jur
assi
c)
Fig. 1. The Mesozoic timescale (~251 Ma to 65 Ma) modified from Walker andGeissman (2009). The latest Triassic and earliest Jurassic stages have been expanded tohighlight the T-J boundary, the initial carbon isotope excursion (CIE), the onset of themain phase of CAMP eruptions (shown as pulses), the end-Triassic extinction (all afterRuhl et al. (2010a, 2011)), and the potential ocean acidification event. Dates after Ogget al. (2008) and Gradstein et al. (2004) (base of the Rhaetian), Schoene et al. (2010)(base of the Hettangian), and Ruhl et al. (2010a) and Schaltegger et al. (2008) (base ofthe Sinemurian). Many dates are still in flux; in particular, Rhaetian duration estimatesrange from 2–9 myr (Gradstein et al., 2004; Gallet et al., 2007; Muttoni et al., 2010;Hüsing et al., 2011) and Hettangian duration estimates range from 1.8 - 3.1 myr(Gradstein et al., 2004; Schaltegger et al., 2008; Ruhl et al., 2010a).
74 S.E. Greene et al. / Earth-Science Reviews 113 (2012) 72–93
2. Abiotic and biotic responses to ocean acidification
2.1. Carbonate chemistry perturbation and sedimentary responses toacidification
The carbonate saturation state (Ω) is the most importantparameter in predicting abiotic carbonate precipitation/dissolution:
Ω ¼Ca2þh i
CO32−
h i
K�sp
where K⁎sp is the solubility product of the carbonate mineral ofinterest at a given temperature, pressure, and salinity. Ω>1 indicatesthat precipitation is thermodynamically favoured and Ωb1 thatdissolution is thermodynamically favoured. As an example, pH relatesto the concentration of H+ ions and thus relates to the speciation ofdissolved inorganic carbon (DIC) as carbonate (CO3
2-), bicarbonate(HCO3
-), or aqueous carbon dioxide (CO2(aq)) so that at lower pH thefollowing reaction is favoured: H+ + CO3
2- → HCO3-. This consumes
CO32- and thus decreases Ω. The reverse is true at high pH and the
reaction runs backward, producing CO32-. In this sense, pH and Ω are
intimately linked in that the fraction of the DIC reservoir that ispresent as the carbonate (CO3
2-) ion dictates pH. The size of the oceanDIC or alkalinity reservoir is equally important in dictating [CO3
2-] andis thus equally important in controlling Ω. This is a point that is oftenoverlooked (see Ridgwell and Zeebe (2005) for further review), asmany studies only consider pH and neglect other equally importantcarbonate parameters.
Associated with an ocean acidification event are a shoaling of thecarbonate compensation depth (CCD), the depth at which the rate of
carbonate supply equals the rate of dissolution (below the CCDsediments are devoid of carbonate), and/or a shoaling of the lysocline,the depth in the ocean at which the rate of dissolution drasticallyincreases (deeper for calcite than aragonite). In the modern ocean,the depth of the CCD varies from ~3 km in the Pacific Ocean to~4.5 km in the Atlantic Ocean (Chen et al., 1988) and the depth of thelysocline is several hundred metres shallower than the CCD (roughly2.5 km deeper than the saturation horizon, where Ω=1) (Zeebe andWolf-Gladrow, 2001).
2.2. Biotic responses to ocean acidification in modern observations andexperiments
Studies of modern marine organisms reveal that acidic conditionsimpact physiology in complex ways, oftenwith drastic - but sometimesunpredictable - consequences for biomineralization, growth, reproduc-tion, and ultimately survival (Fabry et al., 2008; Doney et al., 2009;Hendriks et al., 2010). It is difficult to generalise the biotic responsefrom modern experiments to the rock record because 1) little or noexperimental data exists for many of the groups with the richest fossilrecords (Kiessling and Simpson, 2011); 2) experimental conditions varyfrom one study to the next and are thus difficult to compare(Widdicombe and Spicer, 2008; Hendriks et al., 2010); 3) it is uncertainwhich carbonate parameter constrains physiological processes, partic-ularly calcification, in each organism (Schneider and Erez, 2006; Findlayet al., 2009; Jury et al., 2010; Hikami et al., 2011); 4) most studies limitthe upper range of the carbonate parameters to values appropriate forthe projected anthropogenically-induced changes, excluding valuesmore appropriate for deep time (Doney et al., 2009; Hendriks et al.,2010; Kroeker et al., 2010); and 5) biological experiments likely missthe evolutionary capacity for adaptation or acclimation only apparenton (multi-generational) geological timescales (Widdicombe and Spicer,2008; Hönisch et al., 2012). Regardless, it is useful to survey the effectsnoted in the modern acidification experiments in order to appreciatethe range of effects - some directly observable in the rock record, andsome not - that organisms can display when faced with acidification oftheir environment. Several recent summaries (Doney et al., 2009;Andersson et al., 2011) and meta-analyses (Hendriks et al., 2010;Kroeker et al., 2010) of the experimental biological literature haveexamined the body of knowledge about the effects of acidification onvarious physiological processes for different groups. We summarise theresults of these four studies in Fig. 2 and highlight which groups andeffectswould be directly discernible in the rock record. For example, it isnot likely that the effects of acidification on reproductive successwill bedirectly observable in the rock record given the rarity of larval,embryonic, or other reproductive-stage fossils, but it is likely that aclade experiencing reproductive stress may decline or suffer extinction.Thus, much of the current experimental data serves as a guide to whatcould happen during an acidification event, rather than providing adirect link to the rock record. The following sections address theconsequences of acidification for biomineralization, metabolism, repro-duction, and complications of ecology.
2.2.1. CalcificationGenerally acidification induces decreased calcification (Fig. 2),
albeit this result is more robust for some groups (corals, molluscs)than others (calcareous algae, coccolithophores, echinoderms).Notably, some invertebrates including crustaceans (Ries et al., 2009)and cuttlefish (Gutowska et al., 2010) actually increase calcification atlow carbonate saturation states, although increased calcification mayincur a physiological cost (Wood et al., 2008; Findlay et al., 2009).Overall, despite variability in response within and between clades,calcification seems to be the physiological process that is mostsensitive to acidification, calcifiers tend to be more susceptible toacidification across other physiological processes (Kroeker et al.,2010), and in general non-calcifying benthos are likely favoured over
Fish
Cyanobacteria
Other Phytoplankton
Coccolithophores
= Increase = Decrease = No change= Mixed response but overall Increase
= Mixed response but overall Decrease
= Mixed response but overall no change
Molluscs
Overall
† = InterspeciesVariability
Seagrasses
Fleshy Algae
Planktonic Foraminifera
Echinoderms
Crustaceans
Corals
Bivalves
Metabolism
Gastropods
Survival
Calcareous Algae
Growth† Photosynthesis†CalcificationReproduction orJuvenile stages
Slow embryonic development
Slow development, decreased fertilization and larval survival
B: Slow development, decreased fertilization & larval survival
Decreased recruitment
Applicable toRock Record
Yes
Yes
Yes
Yes
Yes
Maybe
Maybe
Maybe
Yes (Diatoms, Jr or younger)
No
No
Yes (Jr or younger)
N/A
N/A
N/A
N/A
N/A
N/A
N/A
N/A N/A
N/A
M: Reproduction decreaseM: Larval survival
Reproduction decrease
Reproduction decreaseLarval growth/survival
Larval growth/calcification
*
*
*
*
*
*
= Significant* *
* *
*
*
Yes (Jr or younger)
Kroeker et al. 2010 Hendriks et al. 2011Doney et al. 2009 Andersson et al. 2011
GeologicalManifestation
Survival vs.Extinction
Calcification rateShell Thickness
Skeletal Size/Mass
AnnualGrowth Rate
None None Survival vs. Extinction
**
Fig. 2. The physiological responses of marine organisms to biological ocean acidification experiments. Data in blue are from Kroeker et al. (2010), data in green are from Hendriks etal. (2010) (arrows represent the full range of increasing pCO2 treatment data rather than data clipped at anthropogenic-relevant pCO2 levels), data in orange are from Doney et al.(2009), and data in purple are from Andersson et al. (2011); significance data are only given in Kroeker et al. (2010) and Hendriks et al. (2010) (for ‘overall’ responses). Chart showsonly the overall results of meta-analyses of biological experiments or summary papers and is neither exhaustive nor quantitative; it is simply a schematic representation of thetrends in organism responses (increase, decrease, no change, or mixed) to low pH, lowΩ, low [CO3
2-], or high pCO2.(For interpretation of the references to color in this figure legend,the reader is referred to the web version of the article.)
75S.E. Greene et al. / Earth-Science Reviews 113 (2012) 72–93
calcifying benthos under acidification scenarios (Andersson et al.,2011).
A further application to the rock record arises because marinebiocalcifiers produce various carbonate polymorphs. Carbonate poly-morphs have different solubilities: aragonite is more soluble thancalcite under modern ocean conditions; calcite solubility increases withincreasing Mg content, with high-Mg calcite approaching the solubilityof aragonite (Tucker andWright, 1990). These differing solubilities haveled to the suggestion that production of mineral phases with lowerthermodynamic stability may be metabolically disadvantageous e.g.Hautmann (2004, 2006). In manymarine biocalcifiers, however, the siteof calcification occurs in relatively isolated internal compartments notdirectly exposed to seawater (Pörtner, 2008). For example, inbivalves the physiological control over shell mineralization withinan organic matrix occurs in internal fluids with chemistry differentfrom surrounding seawater (Lorens and Bender, 1977; Falini et al.,1996; Carter et al., 1998; Mount et al., 2004; Dalbeck et al., 2006;Cusack et al., 2008; Tunnicliffe et al., 2009). Carbonate polymorphsolubility may be associated with cost of shell maintenance.Maintaining a carbonate skeleton is a function of both calcification(shell deposition) and skeleton dissolution (Nienhuis et al., 2010)and the degree to which an organism's shell is affected by abioticdissolution may affect the metabolic cost of shell maintenance(Findlay et al., 2009). This effect is more likely to be important for
organisms whose skeleton or shell is in direct contact with corrosiveseawater, as opposed to organisms with organic coatings, whichmaybuffer the shell or skeleton against dissolution (Ries et al., 2009). Anadditional complication is that larval forms may biomineralise hardparts using different carbonate polymorphs than those found intheir adult forms e.g. Beniash et al. (1997); Weiss et al. (2002).Strong selective pressures on larval forms may influence extinction,masking true polymorph selectivity or resulting in patterns thatcould be misinterpreted if only adult polymorphs are known. Overall,mineralogical differences in acidification susceptibility present anopportunity for palaeontologists to make predictions about relativeextinction rates if these predications are adequately informed bybiology and physiology.
The effects of acidification on calcification could produce recogni-sable patterns in the fossil record aside from extinction rates. Wherepreservation is exceptional, calcification rate could potentially begauged for taxa that display growth banding or seasonal/annualisotopic variation. Additionally, shell thickness/skeletal mass can bemeasured from the fossil record and compared with experimentaldata (Findlay et al., 2009).
2.2.2. Metabolism, growth and other physiological effectsIn addition to calcification, ocean acidification can also affect
metabolism, growth, and photosynthesis (Fig. 2). Some photosynthetic
76 S.E. Greene et al. / Earth-Science Reviews 113 (2012) 72–93
organisms can increase metabolism and growth in acidificationexperiments due to the increased availability of CO2 (Hendriks et al.,2010). In calcifying organisms that photosynthesise (e.g. coccolitho-phores) or contain photosynthesising symbionts (e.g., zooxanthellae incorals), increased metabolismmay potentially offset deleterious effectsof calcification rates (Doney et al., 2009; Hendriks et al., 2010). In mostnon-photosynthetic calcifiers that have been tested, e.g. echinoids,bivalves, and gastropods, growth rates are reduced (Hendriks et al.,2010). With respect to cephalopods, experiments show that decreasedpH levels significantly alter oxygen consumption and are interpreted toincrease extinction risk for predatory jumbo squids (Rosa and Seibel,2008).Meanwhile cuttlefish canmaintainmetabolism and growth ratesin atmospheric carbon dioxide concentrations (pCO2) as high as6000 ppm (Gutowska et al., 2008). Although proxies for metabolismand photosynthesis are not preserved in the rock record, growth ratesmay be ascertainable for some fossils. To be applied to fossil recorddata, such physiological responses need to be expressed by organismswith common phylogeny, life mode, or habitats. Already the contrastbetween increased growth by photosynthesisers and decreasedgrowth in certain invertebrates is an intriguing pattern. Perhaps moreimportantly, these diverse responses highlight the need for physio-logical considerations beyond calcification in determining extinctionsusceptibility.
2.2.3. ReproductionReproductive and/or larval/juvenile success is compromised inmost
ocean acidification experiments (Fig. 2). The effects include sloweddevelopment as well as decreases in reproduction, recruitment,fertilization, larval growth, larval calcification, and larval survival (seeDoney et al. (2009), Kroeker et al. (2010), Andersson et al. (2011) andreferences therein). Exceptions are known; cuttlefish embryos createaragonite shells and juveniles tolerate acidification without deleteriouseffect (Gutowska et al., 2008, 2010) and some sea star larvae even showincreased growth in acidified conditions (Dupont et al., 2010). As notedabove, the paucity of larval or embryonic fossils indicates directobservation of reproductive stress in the fossil recordwould be difficult.Experiments indicating widespread reproductive stress within partic-ular clades may have the most significant impact on palaeontologicalstudies of extinction selectivity, by uncovering selective pressureshidden from direct view in fossil evidence.
2.2.4. Ecosystem effectsIn addition to responses at the level of the individual or species,
acidification may induce responses at the community or ecosystemlevel. For example, anthropogenic acidification is projected tosignificantly affect biogeochemical cycling, particularly with respectto nitrogen cycling (Hutchins et al., 2009; Beman et al., 2011). Atthe community scale, reef communities have been identified asespecially sensitive to thermal and acidification stresses, particularlywith the decline of keystone reef builders, such as corals (Kleypas etal., 1999b; Fine and Tchernov, 2007; Hoegh-Guldberg et al., 2007;Veron, 2008, Veron et al., 2009; Pelejero et al., 2010; Anthony et al.,2011). Where tolerant and intolerant species are in direct competi-tion, intolerant species are at an even further disadvantage. Forinstance, coral mortality increases significantly in the presence ofboth elevated CO2 and CO2-tolerant seaweed, with which theycompete for habitat space (Diaz-Pulido et al., 2011). Ecosystems arecomplex and the interdependence of organisms highlights the needfor a nuanced experimental approach that considers whole ecosys-tems and ecosystem thresholds. Extinction rates probably depend onecology as much as physiology. For this reason, analyses of the fossilrecord which assess success within specific habitats (e.g. Kiessling etal., 2007) will continue to be important as more is learned frommodern biological experiments.
3. Recognising ocean acidification events in deep time
Across many candidate deep time acidification events, the case forpalaeo-ocean acidification is made based on disparate lines of evidence,such as the carbonate record, the extinction selectivity, etc. These linesof evidence should be considered together to evaluate the likelihood ofacidification having occurred. We use the T-J transition as a case studyfor the recognition of acidification in deep time because it has noappreciable deep sea record, it has been called a putative acidificationevent from multiple lines of evidence, it is a particularly well-studiedinterval as it overlaps with one of the ‘Big Five’ mass extinctions, andbecause recent progress with cyclostratigraphy and absolute dating ofT-J sections/events makes evaluation of the acidification hypothesismore feasible.
Currently, recognition of palaeo-ocean acidification in deep time ishindered by a lack of predicted, preservable responses. Most acidif-ication indicators involve the absence of given features, such asthe absence of continuous carbonate preservation or the extinction/suppression of acid-sensitive organisms. There are other geochemicaltechniques being developed to identify ocean carbonate chemistryperturbations, such as boron isotopes in carbonates as a proxy for oceanpH (e.g. Sanyal et al. (1996), Palmer et al. (1998), Pearson and Palmer(2002)), calcium isotopes in carbonates as a proxy for ocean pH(Kasemann et al., 2005), and Li/Ca and B/Ca in carbonates as proxies forcarbonate saturation state (Hall and Chan, 2004; Lear and Rosenthal,2006; Yu and Elderfield, 2007; Foster, 2008), but thus far none havebeen applied across the Triassic-Jurassic transition. Furthermore, allof these proxies are applicable to carbonates only, which may beabsent in the case of a significant acidification event. Although theabsence of a carbonate record or the preferential extinction of acid-sensitive organisms alone are not sufficient to definitively demon-strate an acidification event in younger sediments, in conjunctionwith an appropriate trigger mechanism, they can be used to argue foracidification in deep time.
Without other carbonate chemistry proxies, the main criterion forestablishing an ocean acidification event is a global, temporarysedimentary response. The predicted manifestation thereof is variableand should include a rise in the CCD during time intervals for whichdeep-water sediments are preserved. However, nearly all of the pre-Jurassic ocean crust has been subducted (only ophiolites remain) and sofor events older than ~180 Ma a CCD/lysocline shoaling, which does notimpinge on the shelf may be undetectable. When the sedimentaryrecord is generally confined to shelf environments, the signature couldmanifest itself in several ways. If the CCD impinges upon the shelf, adissolution surface or a hiatus in carbonate deposition is expected. If theshelf waters are acidified but do not become fully undersaturated, a dropin wt% carbonate may be the only noticeable sedimentary response.Although local variability is expected (even in the modern there issubstantial variability in the CCD between and within ocean basins),overall these responses should be global, not local in nature. Becauseacidification is ameliorated on the timescales of weathering feedbacks(Kump et al., 2009; Schaller et al., 2012) a global carbonate hiatus shouldnot exceed the theoretical duration of acidification. A rock recordresponse of longer duration cannot be credibly attributed to oceanacidification. We review the carbonate sedimentary record of the T-Jboundary in Section 5.
Ideally, a trigger for inducing acidification is identifiable. The trigger(i.e. atmospheric CO2 injection) must be large and rapid enough toperturb the carbon cycle on a timescale faster than the system canbuffer against change - on the order of 10s of kyrs or fewer in order tooutpace weathering feedbacks (Hönisch et al., 2012). The requiredmagnitude of CO2 injection is not a fixed value across geologic timebecause the starting parameters at any given time dictate the sensitivityof the system to perturbation; a smaller CO2 injection is needed toperturb a poorly buffered vs. awell-buffered ocean e.g. Ridgwell (2005).Fig. 3 shows the duration of various T-J phenomena on a log plot. Crucial

Precision of U-Pb
0.7-1.0% Dating Offset
Cyclostratigraphy
CAMP
CAMP Peak
pCO2 doubling
Carbonate Gap
AtmosphericCO2 drawdown
Precision of 40Ar/39Ar
{
{
A) Dating Precision vs. Duration of C-cycle Perturbation
Coral/Reef gap
Low Biodiversity
Low Ecological Complexity
B) Timescale of biotic recovery
Dating Precision
Carbon Cycle Perturbation
?
104 105 106 107 108
Time (Years)
Biotic Recovery
Time (Years)104 105 106 107 108
PredictedObserved
PredictedObserved
Fig. 3. Duration of Triassic-Jurassic boundary features plotted on a logarithmic time scale. A) Dating precision (above) vs. duration of predicted and observed carbon cycleperturbation (below). The precision associated with different methods of dating; maximum precision of cyclostratigraphy (precession) (Olsen et al., 1996, 2003) maximumprecision on U-Pb zircon dates near the T-J (Schaltegger et al., 2008; Schoene et al., 2010) and maximum precision on 40Ar /39Ar dates near the T-J (Nomade et al., 2007). Themagnitude of the offset between U-Pb dates and 40Ar/39Ar dates, which is estimated to be 0.7%-1.0% (Renne, 2000; Knight et al., 2004; Schoene et al., 2010) or 1.5-2 million yearsacross the T-J interval. The time to doubling of atmospheric carbon dioxide concentration (pCO2) (Schaller et al., 2011), the modelled or predicted duration of a carbonate gap(Berner and Beerling, 2007; Kump et al., 2009) and the observed duration of the actual carbonate gap which is unknown, the modeled or predicted duration of atmospheric CO2
drawdown to pre-eruption levels (Dessert et al., 2001; Berner and Beerling, 2007; Kump et al., 2009) and the observed duration of atmospheric CO2 drawdown from the pedogeniccarbonate pCO2 proxy (Schaller et al., 2011), duration of CAMP peak eruption (Olsen et al., 1997, 2003; Marzoli et al., 1999, 2004; Hames et al., 2000; Cohen and Coe, 2007; Nomadeet al., 2007; Kent and Olsen, 2008; Cirilli et al., 2009; Schaller et al., 2011), and the total CAMP duration (Nomade et al., 2007). B) Timescales of biotic recovery following the end-Triassic mass extinction. The coral and reef gap following the T-J extinction (Kiessling et al., 2009; Ruhl et al., 2010a; Martindale et al., 2011), duration of sustained low bioticdiversity following the T-J extinction (Alroy et al., 2008; Mander et al., 2008; Alroy, 2010b), duration of sustained low ecological complexity following the T-J extinction, e.g.,evenness, trace fossil proxies, reef ecosystems, predator–prey interactions etc. (Flügel, 2002; Flügel and Kiessling, 2002; Fraser et al., 2004; Barras and Twitchett, 2007; Tomašovýchand Siblík, 2007; Mander et al., 2008; Lathuilière and Marchal, 2009; Thorne et al., 2011).
77S.E. Greene et al. / Earth-Science Reviews 113 (2012) 72–93
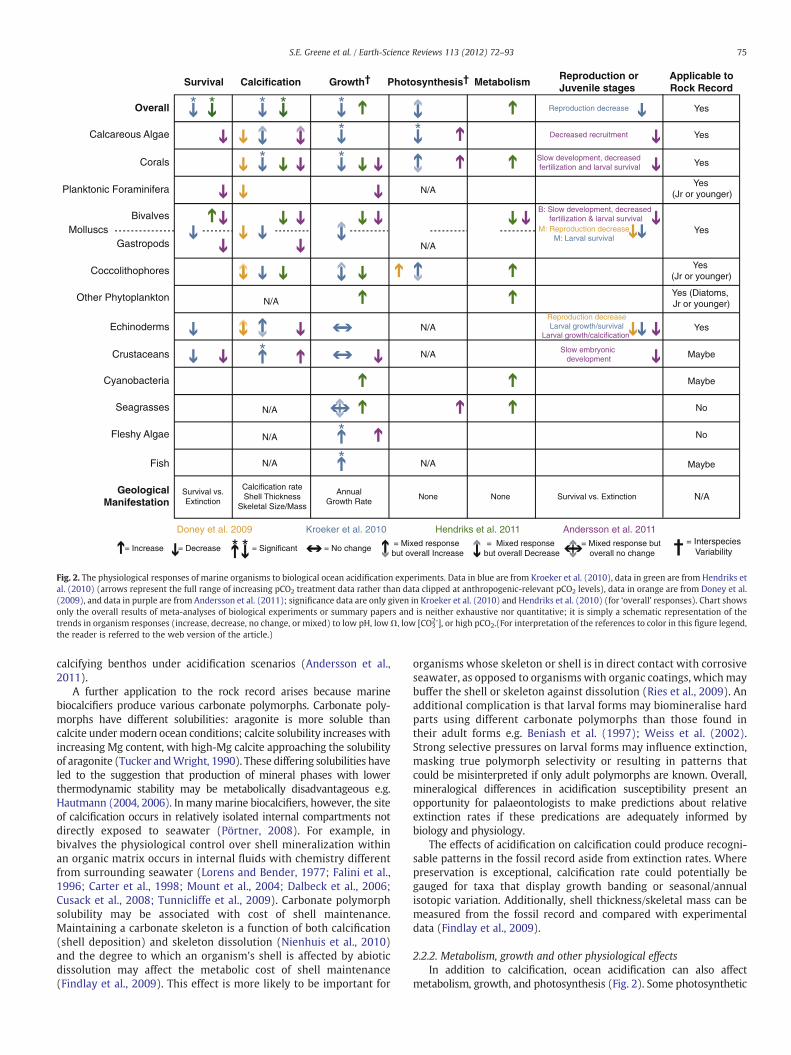
to note is that the expected/modeled durations of various aspectsof ocean acidification occur on timescales roughly equal to or shorterthan the maximum precision of absolute dating and cyclostratigraphy.For this reason, it is extremely difficult to constrain the duration ofa carbonate gap, pCO2 changes, rapidity of the extinction etc. across theT-J to within the timescales over which they are predicted to persist. Inthe case of the T-J event, the potential acidification trigger is theemplacement of a large igneous province (CAMP). Volcanism has beenshown to cause local acidification-induced mass kills in marine in-vertebrates in themodern – a signal that is preserved in ocean sediments(Wall-Palmer et al., 2011). We review the literature pertaining to themagnitude and timing of CAMP emplacement and CAMP emissions inSection 4. Fig. 4 illustrates the cascading effects and feedbacks of LIP-induced acidification.
Acidification can also be inferred based on extinction patterns - howselective the extinction is against acid-sensitive organisms, e.g. Knoll etal. (2007) or Kiessling and Simpson (2011). Because LIP-triggeredacidificationwould not have occurred in isolation, but rather as one of asuite of environmental effects (Wignall, 2001, 2005) (Fig. 4), it isunrealistic to expect that all of the extinction patterns will directlycorrespond with acid sensitivity. Nevertheless, extinction patternsinformed by physiology have been used across several intervals inearth's history to identify selective pressure. The extinction risk shouldbe higher for organisms interpreted to be vulnerable as compared to
non-vulnerable organisms. Extinction patterns across the end-Triassichave been evaluatedwith respect to the acidification hypothesis andwereview these results in Section 6.
4. CAMP as a mechanism for ocean acidification across theT-J Boundary
During the Triassic, the continents were united as the supercon-tinent Pangaea. Across the Triassic-Jurassic transition, the eruption ofthe Central Atlantic Magmatic Province (CAMP) heralded the riftingof Pangaea. Like other large igneous provinces (LIPs), CAMP was arapid outpouring of massive volumes of basaltic lava. Its originalextent is estimated at 10 million km2 over four continents (Fig. 5),from Iberia and eastern Canada in the north to Liberia and FrenchGuiana in the south (McHone, 2002; Knight et al., 2004; Nomade etal., 2007). A summary of the aspects of CAMP volcanism relevant tothe acidification hypothesis is presented in Table 1.
4.1. Dating and synchronicity of CAMPand the end-Triassicmass extinction
Over the past two decades, interest in the potential relationshipbetween the end-Triassic mass extinction and CAMP volcanism hasled to intensive efforts to date CAMP basalts, making CAMP one of thebest-dated LIPs. A recent review of the available 40Ar/39Ar dates of
Volcanic volatilesproduce strong acids
Weatheringincrease
Acidification
Carbonate Gap Extinction
Return toSupersaturation
Recovery of carbonateproduction & burial
Increased detrital sedimentation
(dilution of carbonates)
Possible cascading effects of CAMPwith respect to an ocean acidification scenario
Reduced carbonate burial (high Corg/Ccarb)
Warming MethaneRelease
CAMP
pCO2 rise
Fig. 4. Flow chart of LIP-induced acidification. Processes in red yield a carbonate gap (depositional hiatus or dissolution), blue denotes negative feedbacks yielding the resumption ofcarbonate production and burial, grey denotes feedback processes that could yield a carbonate gap irrespective of acidification. LIP emplacement results in an increase in pCO2,which yields global warming and, as the CO2 equilibrates into the ocean, acidification. Warming may yield methane clathrate destabilization; methane oxidises to CO2 in theatmosphere. Acidification and warming, potentially coupled with other LIP-induced effects (e.g. Wignall (2007)) cause extinction. Together the acidification (via dissolution orsuppressed carbonate production) and the extinction (biological carbonate production suppressed) produce a gap in the carbonate record. LIP emplacement also yields globallyincreased chemical weathering because of higher pCO2 and temperatures (Algeo and Twitchett, 2010); additionally the LIP itself (fresh basalt) is very susceptible to chemicalweathering. Because nearly all T-J marine sections are relatively shallow, increased detrital sedimentation may dilute the global carbonate signal or even stifle carbonate platformdevelopment. This may enhance an acidification-induced ‘carbonate gap’ or create an artificial ‘carbonate gap’without acidification. For example Michalík et al. (2010) consider thatthe T-J boundary claystone in the Western Carpathians resulted from an increase in chemical weathering due to increased humidity. Ultimately, the ocean saturation state willrecover; in the very short term the formation of the ‘carbonate gap’ represents a buffer in the form of reduced carbonate burial, while over timescales of ~104 years (Kump et al.,2009; Hönisch et al., 2012), weathering will regulate the saturation state of the ocean. (For interpretation of the references to color in this figure legend, the reader is referred to theweb version of the article.)
78 S.E. Greene et al. / Earth-Science Reviews 113 (2012) 72–93
CAMP basalts reveals that intrusive magmatism commenced at~202 Ma followed by the abrupt initiation of extrusive activity,reaching peak intensity at ~199 Ma (Nomade et al., 2007). Schoene etal. (2010) date the initiation of extrusive activity at ~201.38 Ma basedon U-Pb dating; there is a 0.7%-1.0% offset between U-Pb and 40Ar/39Ar dates so these ages are comparable (Renne, 2000; Knight et al.,2004; Schoene et al., 2010). The main phase of CAMP volcanism wasbrief, lasting in total less than 1.6-2 Myr (Marzoli et al., 1999; Hameset al., 2000; Marzoli et al., 2004; Nomade et al., 2007; Kent and Olsen,2008; Cirilli et al., 2009; Schaller et al., 2011), possibly on the orderof 580+100 ka based on cyclostratigraphic dating of sedimentpackages hosting CAMP lavas (Olsen et al., 1997, 2003). CAMP,however, was a pulsed eruption (Table 1), with 3 to 5 pulses oferuption in the main eruption phase (Knight et al., 2004; Schalleret al., 2011); each pulse was much shorter than the total duration ofthe main eruptive phase, on the order of hundreds to tens ofthousands of years (Knight et al., 2004; Deenen et al., 2010). The firstCAMP eruptions occurred slightly before the T-J boundary (Fig. 1) inthe latest Triassic (Marzoli et al., 2004; Cirilli et al., 2009; Deenenet al., 2010; Ruhl et al., 2010a; 2011; Schaller et al., 2011). Early flowsoccur in Rhaetian sediments and it has been posited that dykeemplacement affected the global carbon cycle even before the firstextrusive basalts (Ruhl and Kürschner, 2011). In Europe and NorthAfrica, the earliest pulses of CAMP volcanism are coincident with theend-Triassic extinctions (Ruhl et al., 2010a, 2011; Whiteside et al.,2010) to one precession cycle, ~20 kyr (Deenen et al., 2010).Although the extinction event occurs (~20 kyr) prior to the OrangeMountain Basalts in North America (Schaller et al., 2011), it has beenshown that the North American CAMP flows postdate the Moroccan
flows by ~20 kyr (Deenen et al., 2010). The end-Triassic extinction (asdefined by a turnover in foraminifera, dinoflagellates, palynology,radiolarians and theropod dinosaurs) and the first pulse of CAMPeruptions are coincident with each other and the initial carbonisotope excursion (Fig. 1), however, these events precede the official T-J boundary (as defined by the first occurrence of Jurassic ammonites)by roughly 100–120 kyrs (Deenen et al., 2010; Ruhl et al., 2010a, 2011).
Compound specific carbon isotopes also connect the end-Triassicextinction, the rise in pCO2, and the initial carbon isotopic excursionwith the onset of CAMP extrusive eruptions (Whiteside et al., 2010;Ruhl et al., 2011). A continental–marine correlation by Deenen et al.(2010) shows the first extrusive eruptions in Morocco coincidingwith the negative carbon isotope excursion, the initial extinctions,and biotic turnovers. Deenen et al. (2010) also correlate the secondpulse of CAMP eruptions with the transitions in the foraminifera andpalynomorph assemblages, the last conodonts, local marine anoxia(Wignall and Bond, 2008), and the marine calcification crisis (van deSchootbrugge et al., 2007). The timing, brief duration, and extent ofCAMP magmatism have led many authors to suggest that it may bethe primary trigger for the end-Triassic mass extinction (Hames et al.,2000; Marzoli et al., 2004; Nomade et al., 2007; Cirilli et al., 2009;Deenen et al., 2010; Whiteside et al., 2010).
4.2. CAMP volume and emissions
Despite the wide extent of CAMP, most of the extrusive basalts itproduced have been eroded away, making the volume of CAMPdifficult to estimate (Marzoli et al., 1999). Rough volume estimatesrange from ~2×10⁶ km3 (Holbrook and Kelemen, 1993; Marzoli et
Tria
ssic
Jura
ssic
Bou
ndar
yIn
terv
al
wt% CaCO3
Low High
Tria
ssic
Jura
ssic
Tria
ssic
Jura
ssic
Bou
ndar
yIn
terv
al
Tria
ssic
Jura
ssic
Bou
ndar
yIn
terv
al
Tria
ssic
Jura
ssic
Bou
ndar
yIn
terv
al
Tria
ssic
Jura
ssic
Bou
ndar
yIn
terv
al
Potential carbonate hiatus Siliciclastic Continuous carbonate
Shallow
Deep
2
3
89
571
10
4
17
16
6 12 12
11
15 14
13
CAMP extent
A)
B)
Pangaea
TethysPanthalassa
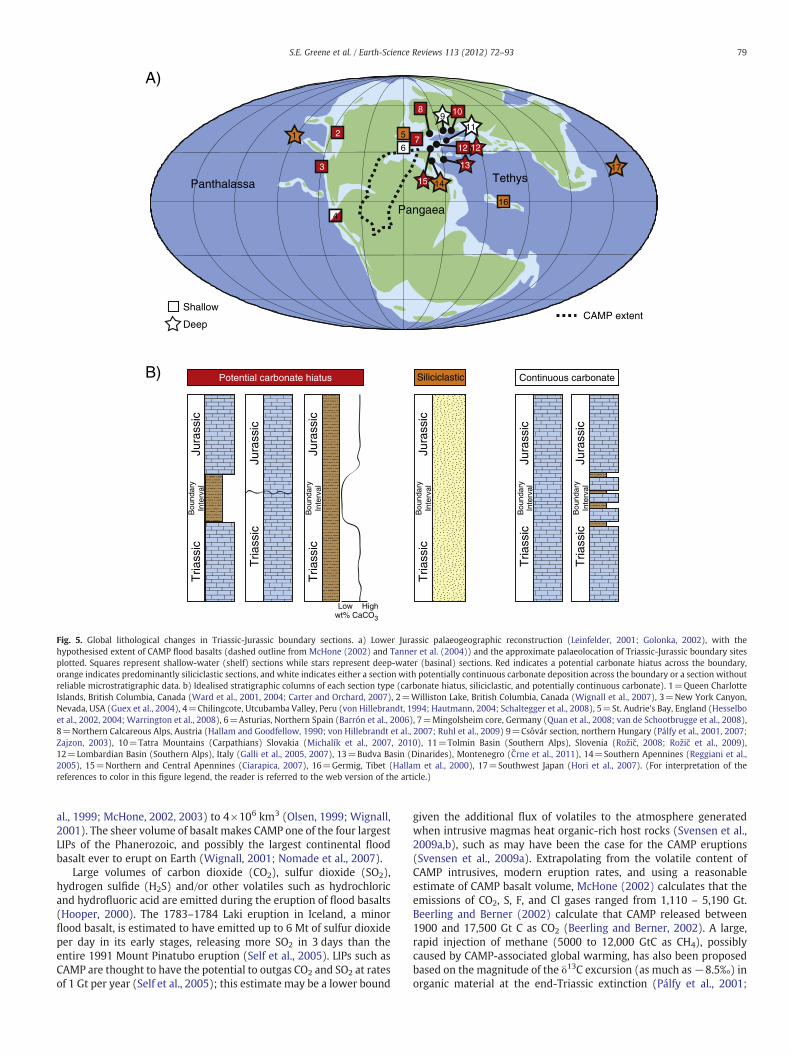
Fig. 5. Global lithological changes in Triassic-Jurassic boundary sections. a) Lower Jurassic palaeogeographic reconstruction (Leinfelder, 2001; Golonka, 2002), with thehypothesised extent of CAMP flood basalts (dashed outline from McHone (2002) and Tanner et al. (2004)) and the approximate palaeolocation of Triassic-Jurassic boundary sitesplotted. Squares represent shallow-water (shelf) sections while stars represent deep-water (basinal) sections. Red indicates a potential carbonate hiatus across the boundary,orange indicates predominantly siliciclastic sections, and white indicates either a section with potentially continuous carbonate deposition across the boundary or a section withoutreliable microstratigraphic data. b) Idealised stratigraphic columns of each section type (carbonate hiatus, siliciclastic, and potentially continuous carbonate). 1=Queen CharlotteIslands, British Columbia, Canada (Ward et al., 2001, 2004; Carter and Orchard, 2007), 2=Williston Lake, British Columbia, Canada (Wignall et al., 2007), 3=New York Canyon,Nevada, USA (Guex et al., 2004), 4=Chilingcote, Utcubamba Valley, Peru (von Hillebrandt, 1994; Hautmann, 2004; Schaltegger et al., 2008), 5=St. Audrie's Bay, England (Hesselboet al., 2002, 2004; Warrington et al., 2008), 6=Asturias, Northern Spain (Barrón et al., 2006), 7=Mingolsheim core, Germany (Quan et al., 2008; van de Schootbrugge et al., 2008),8=Northern Calcareous Alps, Austria (Hallam and Goodfellow, 1990; von Hillebrandt et al., 2007; Ruhl et al., 2009) 9=Csővár section, northern Hungary (Pálfy et al., 2001, 2007;Zajzon, 2003), 10=Tatra Mountains (Carpathians) Slovakia (Michalík et al., 2007, 2010), 11=Tolmin Basin (Southern Alps), Slovenia (Rožič, 2008; Rožič et al., 2009),12=Lombardian Basin (Southern Alps), Italy (Galli et al., 2005, 2007), 13=Budva Basin (Dinarides), Montenegro (Črne et al., 2011), 14=Southern Apennines (Reggiani et al.,2005), 15=Northern and Central Apennines (Ciarapica, 2007), 16=Germig, Tibet (Hallam et al., 2000), 17=Southwest Japan (Hori et al., 2007). (For interpretation of thereferences to color in this figure legend, the reader is referred to the web version of the article.)
79S.E. Greene et al. / Earth-Science Reviews 113 (2012) 72–93
al., 1999; McHone, 2002, 2003) to 4×10⁶ km3 (Olsen, 1999; Wignall,2001). The sheer volume of basalt makes CAMP one of the four largestLIPs of the Phanerozoic, and possibly the largest continental floodbasalt ever to erupt on Earth (Wignall, 2001; Nomade et al., 2007).
Large volumes of carbon dioxide (CO2), sulfur dioxide (SO2),hydrogen sulfide (H2S) and/or other volatiles such as hydrochloricand hydrofluoric acid are emitted during the eruption of flood basalts(Hooper, 2000). The 1783–1784 Laki eruption in Iceland, a minorflood basalt, is estimated to have emitted up to 6 Mt of sulfur dioxideper day in its early stages, releasing more SO2 in 3 days than theentire 1991 Mount Pinatubo eruption (Self et al., 2005). LIPs such asCAMP are thought to have the potential to outgas CO2 and SO2 at ratesof 1 Gt per year (Self et al., 2005); this estimate may be a lower bound
given the additional flux of volatiles to the atmosphere generatedwhen intrusive magmas heat organic-rich host rocks (Svensen et al.,2009a,b), such as may have been the case for the CAMP eruptions(Svensen et al., 2009a). Extrapolating from the volatile content ofCAMP intrusives, modern eruption rates, and using a reasonableestimate of CAMP basalt volume, McHone (2002) calculates that theemissions of CO2, S, F, and Cl gases ranged from 1,110 – 5,190 Gt.Beerling and Berner (2002) calculate that CAMP released between1900 and 17,500 Gt C as CO2 (Beerling and Berner, 2002). A large,rapid injection of methane (5000 to 12,000 GtC as CH4), possiblycaused by CAMP-associated global warming, has also been proposedbased on the magnitude of the δ13C excursion (as much as−8.5‰) inorganic material at the end-Triassic extinction (Pálfy et al., 2001;
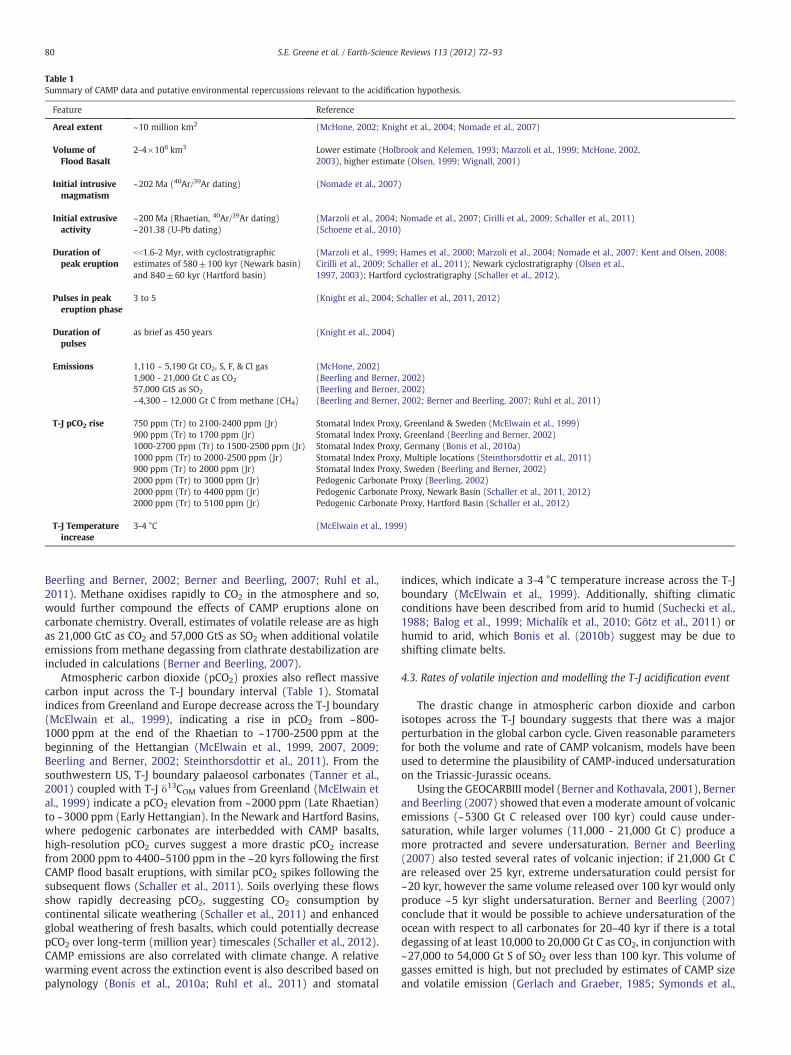
Table 1Summary of CAMP data and putative environmental repercussions relevant to the acidification hypothesis.
Feature Reference
Areal extent ~10 million km2 (McHone, 2002; Knight et al., 2004; Nomade et al., 2007)
Volume ofFlood Basalt
2-4×10⁶ km3 Lower estimate (Holbrook and Kelemen, 1993; Marzoli et al., 1999; McHone, 2002,2003), higher estimate (Olsen, 1999; Wignall, 2001)
Initial intrusivemagmatism
~202 Ma (40Ar/39Ar dating) (Nomade et al., 2007)
Initial extrusiveactivity
~200 Ma (Rhaetian, 40Ar/39Ar dating) (Marzoli et al., 2004; Nomade et al., 2007; Cirilli et al., 2009; Schaller et al., 2011)~201.38 (U-Pb dating) (Schoene et al., 2010)
Duration ofpeak eruption
bb1.6-2 Myr, with cyclostratigraphicestimates of 580±100 kyr (Newark basin)and 840±60 kyr (Hartford basin)
(Marzoli et al., 1999; Hames et al., 2000; Marzoli et al., 2004; Nomade et al., 2007; Kent and Olsen, 2008;Cirilli et al., 2009; Schaller et al., 2011); Newark cyclostratigraphy (Olsen et al.,1997, 2003); Hartford cyclostratigraphy (Schaller et al., 2012).
Pulses in peakeruption phase
3 to 5 (Knight et al., 2004; Schaller et al., 2011, 2012)
Duration ofpulses
as brief as 450 years (Knight et al., 2004)
Emissions 1,110 – 5,190 Gt CO2, S, F, & Cl gas (McHone, 2002)1,900 - 21,000 Gt C as CO2 (Beerling and Berner, 2002)57,000 GtS as SO2 (Beerling and Berner, 2002)~4,300 – 12,000 Gt C from methane (CH4) (Beerling and Berner, 2002; Berner and Beerling, 2007; Ruhl et al., 2011)
T-J pCO2 rise 750 ppm (Tr) to 2100-2400 ppm (Jr) Stomatal Index Proxy, Greenland & Sweden (McElwain et al., 1999)900 ppm (Tr) to 1700 ppm (Jr) Stomatal Index Proxy, Greenland (Beerling and Berner, 2002)1000-2700 ppm (Tr) to 1500-2500 ppm (Jr) Stomatal Index Proxy, Germany (Bonis et al., 2010a)1000 ppm (Tr) to 2000-2500 ppm (Jr) Stomatal Index Proxy, Multiple locations (Steinthorsdottir et al., 2011)900 ppm (Tr) to 2000 ppm (Jr) Stomatal Index Proxy, Sweden (Beerling and Berner, 2002)2000 ppm (Tr) to 3000 ppm (Jr) Pedogenic Carbonate Proxy (Beerling, 2002)2000 ppm (Tr) to 4400 ppm (Jr) Pedogenic Carbonate Proxy, Newark Basin (Schaller et al., 2011, 2012)2000 ppm (Tr) to 5100 ppm (Jr) Pedogenic Carbonate Proxy, Hartford Basin (Schaller et al., 2012)
T-J Temperatureincrease
3-4 °C (McElwain et al., 1999)
80 S.E. Greene et al. / Earth-Science Reviews 113 (2012) 72–93
Beerling and Berner, 2002; Berner and Beerling, 2007; Ruhl et al.,2011). Methane oxidises rapidly to CO2 in the atmosphere and so,would further compound the effects of CAMP eruptions alone oncarbonate chemistry. Overall, estimates of volatile release are as highas 21,000 GtC as CO2 and 57,000 GtS as SO2 when additional volatileemissions from methane degassing from clathrate destabilization areincluded in calculations (Berner and Beerling, 2007).
Atmospheric carbon dioxide (pCO2) proxies also reflect massivecarbon input across the T-J boundary interval (Table 1). Stomatalindices from Greenland and Europe decrease across the T-J boundary(McElwain et al., 1999), indicating a rise in pCO2 from ~800-1000 ppm at the end of the Rhaetian to ~1700-2500 ppm at thebeginning of the Hettangian (McElwain et al., 1999, 2007, 2009;Beerling and Berner, 2002; Steinthorsdottir et al., 2011). From thesouthwestern US, T-J boundary palaeosol carbonates (Tanner et al.,2001) coupled with T-J δ13COM values from Greenland (McElwain etal., 1999) indicate a pCO2 elevation from ~2000 ppm (Late Rhaetian)to ~3000 ppm (Early Hettangian). In the Newark and Hartford Basins,where pedogenic carbonates are interbedded with CAMP basalts,high-resolution pCO2 curves suggest a more drastic pCO2 increasefrom 2000 ppm to 4400–5100 ppm in the ~20 kyrs following the firstCAMP flood basalt eruptions, with similar pCO2 spikes following thesubsequent flows (Schaller et al., 2011). Soils overlying these flowsshow rapidly decreasing pCO2, suggesting CO2 consumption bycontinental silicate weathering (Schaller et al., 2011) and enhancedglobal weathering of fresh basalts, which could potentially decreasepCO2 over long-term (million year) timescales (Schaller et al., 2012).CAMP emissions are also correlated with climate change. A relativewarming event across the extinction event is also described based onpalynology (Bonis et al., 2010a; Ruhl et al., 2011) and stomatal
indices, which indicate a 3-4 °C temperature increase across the T-Jboundary (McElwain et al., 1999). Additionally, shifting climaticconditions have been described from arid to humid (Suchecki et al.,1988; Balog et al., 1999; Michalík et al., 2010; Götz et al., 2011) orhumid to arid, which Bonis et al. (2010b) suggest may be due toshifting climate belts.
4.3. Rates of volatile injection and modelling the T-J acidification event
The drastic change in atmospheric carbon dioxide and carbonisotopes across the T-J boundary suggests that there was a majorperturbation in the global carbon cycle. Given reasonable parametersfor both the volume and rate of CAMP volcanism, models have beenused to determine the plausibility of CAMP-induced undersaturationon the Triassic-Jurassic oceans.
Using the GEOCARBIII model (Berner and Kothavala, 2001), Bernerand Beerling (2007) showed that even a moderate amount of volcanicemissions (~5300 Gt C released over 100 kyr) could cause under-saturation, while larger volumes (11,000 - 21,000 Gt C) produce amore protracted and severe undersaturation. Berner and Beerling(2007) also tested several rates of volcanic injection: if 21,000 Gt Care released over 25 kyr, extreme undersaturation could persist for~20 kyr, however the same volume released over 100 kyr would onlyproduce ~5 kyr slight undersaturation. Berner and Beerling (2007)conclude that it would be possible to achieve undersaturation of theocean with respect to all carbonates for 20–40 kyr if there is a totaldegassing of at least 10,000 to 20,000 Gt C as CO2, in conjunction with~27,000 to 54,000 Gt S of SO2 over less than 100 kyr. This volume ofgasses emitted is high, but not precluded by estimates of CAMP sizeand volatile emission (Gerlach and Graeber, 1985; Symonds et al.,

Ara
g =
1
20
15
10
8
6
4
2
6
4
15
100
8000
2000 6000
1000
2000
3000
4000
5000
6000
3000 4000 5000
pC
O2
(pp
m)
Hettangian pCO2 peak
pCO2 peak
(Pedogenic Carbonate)
Hettangian
(StomatalIndex)
Locklair and Lerman (2005)
GEOCARB IIIBerner and Kothavala (2001),Beerling and Berner (2002)
MAGic and GENIEMackenzie et al. (2008)
Ridgwell (2005)
Maximum proxy
pCO2 value (error bars)
7000
Aragonite supersaturation Arag > 1), precipitation is
thermodynamically favored.
Aragonite undersaturation Arag < 1), dissolution is
thermodynamically favored.
DIC (µmol/kg)
Fig. 6. Fan diagram highlighting the dependence of aragonite saturation state on the atmospheric carbon dioxide levels (pCO2) and dissolved inorganic carbon (DIC) in the T-Joceans ([Ca2+]=17 mM). Curved lines represent equal aragonite saturation (saturation states, ΩArag), and the thickest line marks the aragonite saturation line (ΩArag=1). Theshaded regions represent the range of reported earliest Jurassic pCO2 highs (not including error bars) (see Table 1 for values and references), and the dashed line at 7000 ppmrepresents the maximum pCO2 error bar on the pedogenic carbonate estimates (Schaller et al., 2012). The vertical dotted lines denote the T-J DIC pools calculated from Phanerozoicocean models. Aragonite saturation states were calculated using CO2Sys (Pierrot and Wallace, 2006), with the carbonate constant formulations of K1, K2 from Mehrbach et al.(1973), refit by Dickson and Millero (1987); KSO4 from Dickson (1990), and seawater scale for pH. All calculations were conducted using the modern tropical surface oceangeochemical parameters of 34.75‰ salinity, 26 °C, and 1 dbar, representing plausible surface ocean conditions at most T-J boundary sites.
81S.E. Greene et al. / Earth-Science Reviews 113 (2012) 72–93
1994; Beerling and Berner, 2002). The emissions timeframe thatBerner and Beerling (2007) suggest is required to cause under-saturation (≤ ~100 kyr) also matches well with the data. In theNewark and Hartford basins, pCO2 values doubled to tripled (e.g.2000 ppm to 4400 ppm) immediately following (within ~20 kyr) theCAMP flows. Each of the 3–4 pulsed eruptions recorded in thesebasins are followed immediately by pCO2 elevations, suggesting thatCAMP eruptions has a geologically instantaneous influence on theglobal carbon cycle (Schaller et al., 2011, 2012). Palaomagnetic datasuggest individual CAMP flows may have been emplaced in as little as102 to 103 years (Knight et al., 2004).
4.4. Triassic-Jurassic ocean sensitivity to CO2 injection
The lack of proxies to quantify carbonate system dynamics in deeptime makes ocean sensitivity to a geologically abrupt CO2 outgassingdifficult to constrain, mainly because the response is highly
dependent on the buffering capacity of the ocean (Ridgwell andZeebe, 2005), a parameter that is typically not known in deep time.The larger the dissolved inorganic carbon (DIC) reservoir of the ocean,the better the system is able to buffer against changes; the smaller theDIC reservoir or alkalinity, the more sensitive the ocean becomes toenvironmental perturbations, such as CAMP volcanism. A fan diagramof two carbonate parameters helps illustrate this point; we plotcontours of equal saturation state (Ω) on a graph of pCO2 versus DIC(Fig. 6). The shaded regions represent the highest estimated earlyJurassic pCO2 values from stomatal index and pedogenic carbonateproxies (McElwain et al., 1999; Beerling, 2002; Beerling and Berner,2002; Schaller et al., 2011, 2012; Steinthorsdottir et al., 2011); thedashed line at 7000 ppm represents a calculated upper pCO2 limit(from the uncertainty inherent in the proxy calculation) from Schalleret al. (2012). The vertical dotted lines denote potential values of DICused in Phanerozoic ocean models (Berner and Kothavala, 2001;Beerling and Berner, 2002; Locklair and Lerman, 2005; Ridgwell,
[Ca
2+] =
21m
M
[Ca
2+] =
17m
M
[Ca
2+] =
10.
6mM
B)
DIC (µmol/kg)
[Ca
2+] =
21m
M[C
a2+
] = 1
7mM
[C
a2+
] = 1
0.6m
M
JurassicpCO2 range(Pedogenic Carbonate)
JurassicpCO2 range
(StomatalIndex)
2000
1000
2000
4000
5000
6000
2500 3000 3500 4000 4500
A)
pC
O2
(pp
m)
pC
O2
(pp
m)
DIC (µmol/kg)
7000
8000
2000
1000
5000
6000
2500 3000 3500 4000 4500
7000
8000Aragonite saturation state Calcite saturation state
JurassicpCO2 range(Pedogenic Carbonate)
JurassicpCO2 range
(StomatalIndex)
3000
2000
3000
4000
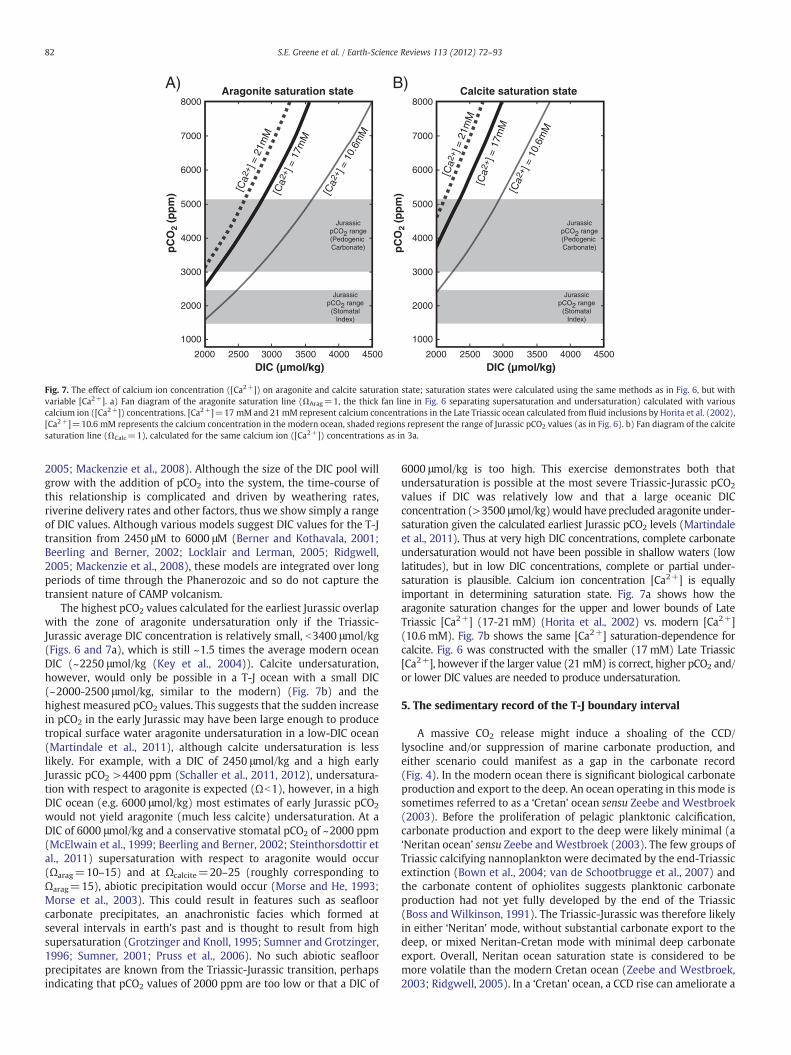
Fig. 7. The effect of calcium ion concentration ([Ca2+]) on aragonite and calcite saturation state; saturation states were calculated using the same methods as in Fig. 6, but withvariable [Ca2+]. a) Fan diagram of the aragonite saturation line (ΩArag=1, the thick fan line in Fig. 6 separating supersaturation and undersaturation) calculated with variouscalcium ion ([Ca2+]) concentrations. [Ca2+]=17 mM and 21 mM represent calcium concentrations in the Late Triassic ocean calculated from fluid inclusions by Horita et al. (2002),[Ca2+]=10.6 mM represents the calcium concentration in the modern ocean, shaded regions represent the range of Jurassic pCO2 values (as in Fig. 6). b) Fan diagram of the calcitesaturation line (ΩCalc=1), calculated for the same calcium ion ([Ca2+]) concentrations as in 3a.
82 S.E. Greene et al. / Earth-Science Reviews 113 (2012) 72–93
2005; Mackenzie et al., 2008). Although the size of the DIC pool willgrow with the addition of pCO2 into the system, the time-course ofthis relationship is complicated and driven by weathering rates,riverine delivery rates and other factors, thus we show simply a rangeof DIC values. Although various models suggest DIC values for the T-Jtransition from 2450 μM to 6000 μM (Berner and Kothavala, 2001;Beerling and Berner, 2002; Locklair and Lerman, 2005; Ridgwell,2005; Mackenzie et al., 2008), these models are integrated over longperiods of time through the Phanerozoic and so do not capture thetransient nature of CAMP volcanism.
The highest pCO2 values calculated for the earliest Jurassic overlapwith the zone of aragonite undersaturation only if the Triassic-Jurassic average DIC concentration is relatively small, b3400 μmol/kg(Figs. 6 and 7a), which is still ~1.5 times the average modern oceanDIC (~2250 μmol/kg (Key et al., 2004)). Calcite undersaturation,however, would only be possible in a T-J ocean with a small DIC(~2000-2500 μmol/kg, similar to the modern) (Fig. 7b) and thehighest measured pCO2 values. This suggests that the sudden increasein pCO2 in the early Jurassic may have been large enough to producetropical surface water aragonite undersaturation in a low-DIC ocean(Martindale et al., 2011), although calcite undersaturation is lesslikely. For example, with a DIC of 2450 μmol/kg and a high earlyJurassic pCO2 >4400 ppm (Schaller et al., 2011, 2012), undersatura-tion with respect to aragonite is expected (Ωb1), however, in a highDIC ocean (e.g. 6000 μmol/kg) most estimates of early Jurassic pCO2
would not yield aragonite (much less calcite) undersaturation. At aDIC of 6000 μmol/kg and a conservative stomatal pCO2 of ~2000 ppm(McElwain et al., 1999; Beerling and Berner, 2002; Steinthorsdottir etal., 2011) supersaturation with respect to aragonite would occur(Ωarag=10–15) and at Ωcalcite=20–25 (roughly corresponding toΩarag=15), abiotic precipitation would occur (Morse and He, 1993;Morse et al., 2003). This could result in features such as seafloorcarbonate precipitates, an anachronistic facies which formed atseveral intervals in earth's past and is thought to result from highsupersaturation (Grotzinger and Knoll, 1995; Sumner and Grotzinger,1996; Sumner, 2001; Pruss et al., 2006). No such abiotic seafloorprecipitates are known from the Triassic-Jurassic transition, perhapsindicating that pCO2 values of 2000 ppm are too low or that a DIC of
6000 μmol/kg is too high. This exercise demonstrates both thatundersaturation is possible at the most severe Triassic-Jurassic pCO2
values if DIC was relatively low and that a large oceanic DICconcentration (>3500 μmol/kg)would have precluded aragonite under-saturation given the calculated earliest Jurassic pCO2 levels (Martindaleet al., 2011). Thus at very high DIC concentrations, complete carbonateundersaturation would not have been possible in shallow waters (lowlatitudes), but in low DIC concentrations, complete or partial under-saturation is plausible. Calcium ion concentration [Ca2+] is equallyimportant in determining saturation state. Fig. 7a shows how thearagonite saturation changes for the upper and lower bounds of LateTriassic [Ca2+] (17-21 mM) (Horita et al., 2002) vs. modern [Ca2+](10.6 mM). Fig. 7b shows the same [Ca2+] saturation-dependence forcalcite. Fig. 6 was constructed with the smaller (17 mM) Late Triassic[Ca2+], however if the larger value (21 mM) is correct, higher pCO2 and/or lower DIC values are needed to produce undersaturation.
5. The sedimentary record of the T-J boundary interval
A massive CO2 release might induce a shoaling of the CCD/lysocline and/or suppression of marine carbonate production, andeither scenario could manifest as a gap in the carbonate record(Fig. 4). In the modern ocean there is significant biological carbonateproduction and export to the deep. An ocean operating in this mode issometimes referred to as a ‘Cretan’ ocean sensu Zeebe and Westbroek(2003). Before the proliferation of pelagic planktonic calcification,carbonate production and export to the deep were likely minimal (a‘Neritan ocean’ sensu Zeebe andWestbroek (2003). The few groups ofTriassic calcifying nannoplankton were decimated by the end-Triassicextinction (Bown et al., 2004; van de Schootbrugge et al., 2007) andthe carbonate content of ophiolites suggests planktonic carbonateproduction had not yet fully developed by the end of the Triassic(Boss and Wilkinson, 1991). The Triassic-Jurassic was therefore likelyin either ‘Neritan’ mode, without substantial carbonate export to thedeep, or mixed Neritan-Cretan mode with minimal deep carbonateexport. Overall, Neritan ocean saturation state is considered to bemore volatile than the modern Cretan ocean (Zeebe and Westbroek,2003; Ridgwell, 2005). In a ‘Cretan’ ocean, a CCD rise can ameliorate a
-6 -5 -4 -3 -2 -1 0 1 2 3 4
13Ccarb
A
C
B
D
F
E
G
L
H
I
J
K
Western Carpathians
Italian Alps
Austrian Alps
Queen Charlotte Islands, Canada
Tibet
Hungary
United Kingdom
Montenegro
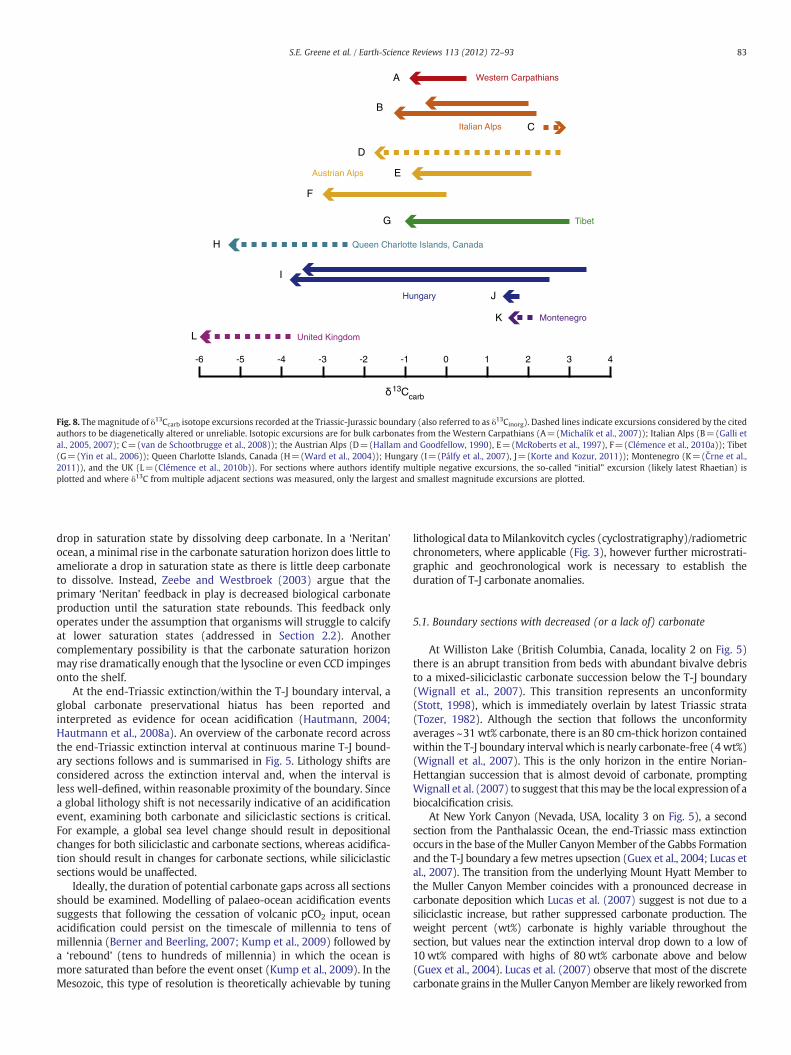
Fig. 8. Themagnitude of δ13Ccarb isotope excursions recorded at the Triassic-Jurassic boundary (also referred to as δ13Cinorg). Dashed lines indicate excursions considered by the citedauthors to be diagenetically altered or unreliable. Isotopic excursions are for bulk carbonates from the Western Carpathians (A=(Michalík et al., 2007)); Italian Alps (B=(Galli etal., 2005, 2007); C=(van de Schootbrugge et al., 2008)); the Austrian Alps (D=(Hallam and Goodfellow, 1990), E=(McRoberts et al., 1997), F=(Clémence et al., 2010a)); Tibet(G=(Yin et al., 2006)); Queen Charlotte Islands, Canada (H=(Ward et al., 2004)); Hungary (I=(Pálfy et al., 2007), J=(Korte and Kozur, 2011)); Montenegro (K=(Črne et al.,2011)), and the UK (L=(Clémence et al., 2010b)). For sections where authors identify multiple negative excursions, the so-called “initial” excursion (likely latest Rhaetian) isplotted and where δ13C from multiple adjacent sections was measured, only the largest and smallest magnitude excursions are plotted.
83S.E. Greene et al. / Earth-Science Reviews 113 (2012) 72–93
drop in saturation state by dissolving deep carbonate. In a ‘Neritan’ocean, a minimal rise in the carbonate saturation horizon does little toameliorate a drop in saturation state as there is little deep carbonateto dissolve. Instead, Zeebe and Westbroek (2003) argue that theprimary ‘Neritan’ feedback in play is decreased biological carbonateproduction until the saturation state rebounds. This feedback onlyoperates under the assumption that organisms will struggle to calcifyat lower saturation states (addressed in Section 2.2). Anothercomplementary possibility is that the carbonate saturation horizonmay rise dramatically enough that the lysocline or even CCD impingesonto the shelf.
At the end-Triassic extinction/within the T-J boundary interval, aglobal carbonate preservational hiatus has been reported andinterpreted as evidence for ocean acidification (Hautmann, 2004;Hautmann et al., 2008a). An overview of the carbonate record acrossthe end-Triassic extinction interval at continuous marine T-J bound-ary sections follows and is summarised in Fig. 5. Lithology shifts areconsidered across the extinction interval and, when the interval isless well-defined, within reasonable proximity of the boundary. Sincea global lithology shift is not necessarily indicative of an acidificationevent, examining both carbonate and siliciclastic sections is critical.For example, a global sea level change should result in depositionalchanges for both siliciclastic and carbonate sections, whereas acidifica-tion should result in changes for carbonate sections, while siliciclasticsections would be unaffected.
Ideally, the duration of potential carbonate gaps across all sectionsshould be examined. Modelling of palaeo-ocean acidification eventssuggests that following the cessation of volcanic pCO2 input, oceanacidification could persist on the timescale of millennia to tens ofmillennia (Berner and Beerling, 2007; Kump et al., 2009) followed bya ‘rebound’ (tens to hundreds of millennia) in which the ocean ismore saturated than before the event onset (Kump et al., 2009). In theMesozoic, this type of resolution is theoretically achievable by tuning
lithological data toMilankovitch cycles (cyclostratigraphy)/radiometricchronometers, where applicable (Fig. 3), however further microstrati-graphic and geochronological work is necessary to establish theduration of T-J carbonate anomalies.
5.1. Boundary sections with decreased (or a lack of) carbonate
At Williston Lake (British Columbia, Canada, locality 2 on Fig. 5)there is an abrupt transition from beds with abundant bivalve debristo a mixed-siliciclastic carbonate succession below the T-J boundary(Wignall et al., 2007). This transition represents an unconformity(Stott, 1998), which is immediately overlain by latest Triassic strata(Tozer, 1982). Although the section that follows the unconformityaverages ~31 wt% carbonate, there is an 80 cm-thick horizon containedwithin the T-J boundary interval which is nearly carbonate-free (4 wt%)(Wignall et al., 2007). This is the only horizon in the entire Norian-Hettangian succession that is almost devoid of carbonate, promptingWignall et al. (2007) to suggest that thismay be the local expression of abiocalcification crisis.
At New York Canyon (Nevada, USA, locality 3 on Fig. 5), a secondsection from the Panthalassic Ocean, the end-Triassic mass extinctionoccurs in the base of theMuller CanyonMember of the Gabbs Formationand the T-J boundary a fewmetres upsection (Guex et al., 2004; Lucas etal., 2007). The transition from the underlying Mount Hyatt Member tothe Muller Canyon Member coincides with a pronounced decrease incarbonate deposition which Lucas et al. (2007) suggest is not due to asiliciclastic increase, but rather suppressed carbonate production. Theweight percent (wt%) carbonate is highly variable throughout thesection, but values near the extinction interval drop down to a low of10 wt% compared with highs of 80 wt% carbonate above and below(Guex et al., 2004). Lucas et al. (2007) observe that most of the discretecarbonate grains in theMuller CanyonMember are likely reworked from

84 S.E. Greene et al. / Earth-Science Reviews 113 (2012) 72–93
a shallower setting and so do not represent carbonate deposition at thislocality.
A reduction in weight percent carbonate is also observed fromsections surrounding the second major ocean basin of the time, theTethys. In the Northern Calcareous Alps, (Austria, locality 8 on Fig. 5)the T-J boundary occurs in the Tiefengraben member (also known asthe Grenzmergel or boundary marl) (von Hillebrandt et al., 2007). Atthe well-studied Kendelbach Gorge section, the underlying andoverlying units are relatively pure carbonate, while the boundarymarl contains only 9–15 wt% carbonate (Hallam and Goodfellow,1990). At Kuhjoch, the GSSP, the marls immediately post-extinctioncontain b1% total inorganic carbon (Ruhl et al., 2010b). TheGrenzmergelcarbonate is also likely of diagenetic origin (sourced from bacterialoxidation of organic matter to DIC) based on its relatively light isotopicvalues (Hallam and Goodfellow, 1990) (see Fig. 8). This relativelycarbonate-free expression of the T-J boundary interval extends overmore than 800 km fromwestern Austria (McRoberts et al., 1997) to theTatraMountains (Carpathians, locality 10 on Fig. 5) in Slovakia (Michalíket al., 2007, 2010) (here referred to as boundary clay). Marls are acommon feature across Triassic-Jurassic boundary intervals – it isperhapsworth consideringwhether thesemarlsmay simply represent adiagenetic cement precipitated between siliciclastic grains; in this sensewhere marls occur across the boundary interval the carbonate may besecondary in nature. Further support for this interpretation can also befound from the section at Montenegro (locality 13 on Fig. 5)– sampleswith low wt% carbonate tend to have lower δ13Ccarb values, which Črneet al. (2011) suggest implies diagenetic alteration. This is particularlytrue near the boundary where some of the lowest wt% carbonatesamples occur and an excursion is observed.
In the Southern Alps (locality 12 on Fig. 5), both latest Triassic andearliest Jurassic carbonate rocks are present in the Lombardian Basin(Galli et al., 2007). At proximal sections (Valcava-Torre dei Bussi andItalcementi Quarry), the extinction and boundary coincide with aniron-hardground condensation horizon, which Galli et al. (2005,2007) consider an expression of the biocalcification crisis. At moredistal sections (Malanotte, Cavlera, Val Cavallina, Adrara, Iseo) theextinction most likely occurs across the transition from the Zulimestone to the Malanotte Formation, which contains a one-metrethick silty-marly horizon at its base (Galli et al., 2007).
A drop in carbonate production across the T-J boundary is alsorecorded from basinal facies in the Northern and Central Apennines(locality 15 on Fig. 5) (Ciarapica, 2007). In the Northern Apennineslimestones give way to dark shale intercalations potentially repre-senting euxinic conditions in the latest Rhaetian Grotta Arpaia bedsand the last Rhaetian unit is a siltstone; in the Central Apennines ananoxic episode (black shale) occurs within the boundary interval(Ciarapica, 2007). In the Budva Basin (Dinarides, Montenegro, locality13 on Fig. 5), deep-water settings show an abrupt transition fromUpper Triassic pelagic limestones (90 wt% carbonate) to LowerJurassic pelagic siliceous limestones and shales (b10 wt% carbonate),interpreted as either a biocalcification crisis or a shoaling of the CCD(Črne et al., 2011).
At the calcareous Chilingcote section in the Utcubamba Valley(Peru, locality 4 on Fig. 5), the T-J boundary occurs in a calcareoussuccession with no apparent changes in lithology near the boundary(von Hillebrandt, 1994). The first Jurassic ammonites are found in abed originally described as reworked tempestites (von Hillebrandt,1994), however Hautmann (2004) reinterpreted the basal contact ofthis bed as a dissolution surface on the basis of its resemblance to akarstification surface in a fully marine setting. Chilingcote is theshallowest of the sections in the area (Schaltegger et al., 2008). Deepersections should record the same dissolution over perhaps an evenlonger duration, e.g. as observed in deep-water cores at the PETM,interpreted as an acidification event (Zachos et al., 2005). However, thisdissolution feature has not been described from deeper sections in theUtcubamba Valley recording the T-J boundary. Additionally, other
tempestites are noted in the section (vonHillebrandt, 1994), although itis not clear whether these show the same karst-like irregularity of thebase. Further sedimentological work is necessary to confirm thepresence of dissolution surfaces in the stratigraphic sections represent-ing deeper water deposition.
Lastly, theMingolsheim core (Germany, locality 7 on Fig. 5) shows amixed carbonate/siliciclastic record (van de Schootbrugge et al., 2008).The background carbonate wt% is highly variable (0-90%), however theboundary interval encompasses a carbonate-poor claystone (Quan etal., 2008).
5.2. Predominantly siliciclastic sections
The Queen Charlotte Islands (British Columbia, Canada, locality 1 onFig. 5) is a deep-water section that records no carbonate across the T-Jboundary. Below the boundary there is a shift from calcareous tosiliciclastic sedimentation which is accompanied by a shift in preserva-tion from body fossils to shell impressions. Although these shifts havebeen linked to a global interruption of carbonate sedimentation at theT-J boundary (Hautmann, 2004), they occur ~100 m below theboundary between the Peril Formation and the Sandilands Formation(Ward et al., 2001, 2004). The basal Sandilands Formation is latestNorian in age (Carter and Orchard, 2007). A generous interpretation ofthe timing puts the cessation of carbonate sedimentation close to thebase of the Rhaetian, at least 2 million years before the boundary (theminimum suggested duration of the Rhaetian (Gallet et al., 2007)) andperhaps asmuch as 9my before the boundary (themaximum suggestedRhaetian duration (Hüsing et al., 2011)), which is too far from theextinction level to be relevant to ocean acidification. In addition,Ward etal. (2001) are careful to point out that there is no discernable lithologicalchange across the T-J boundary. Similarly to the Queen Charlotte Islandssuccession, in the southern Apennines (locality 14 on Fig. 5) deep watercarbonate deposition ceases across the Norian-Rhaetian transition(Reggiani et al., 2005). Likewise, in a carbonate-free section fromsouthwest Japan (locality 17 on Fig. 5), radiolarian cherts persist acrossthe T-J transition (Hori et al., 2007). Finally, a shallow-water siliciclasticmarine setting, the Germig section in southern Tibet (locality 16 onFig. 5), also shows no facies change across the boundary interval (Hallamet al., 2000). This section is particularly important in that it hints that sealevel fall coincident with the T-J boundary may not be a global feature.Localised sea level change, particularly adjacent to CAMP emplacement,may be more likely.
The carbonate signature across the extinction interval at St. Audrie'sBay (UK, locality 5 on Fig. 5), perhaps one of the most studied T-Jsections, is less clear. The extinction likely occurs in the uppermostWestbury Formation or in the overlying Lilstock Formation (an intervalof ~3 m) (Mander et al., 2008), a primarily siliciclastic interval(Warrington et al., 2008). An initial negative δ13Corg excursion in theCotham Member of the Lilstock Formation (Hesselbo et al., 2002) hasbeen linked with excursions at other sites, which are synchronous withthe extinction (Ruhl et al., 2011). There are some primary carbonatesrepresented in the CothamMember, such as the ooids at St. Audrie's Bay(Hesselbo et al., 2004) and carbonate stromatolites, known as the‘Cotham Marble’, at UK sections further afield (Mayall and Wright,1981; Radley et al., 2008; Gallois, 2009).
5.3. Potentially continuous carbonate successions
Eastern Europe contains perhaps the best candidates for continuouscarbonate deposition across the T-J boundary. Continuous carbonatedeposition may be recorded in the Tolmin Basin of the Southern Alps(Slovenia, locality 11 on Fig. 5) where the boundary interval most likelyoccurs within thin-bedded hemipelagic limestones (Rožič, 2008; Rožičet al., 2009). At the Slatnik locality, a number of marly interbeds occurwithin the likely boundary interval (Rožič et al., 2009). Although nosuch marls are specifically noted from the Kobla locality, an overall

Ext
inct
ion
Rat
e (p
er G
enus
per
myr
)
10%
50%
40%
30%
20%
0%
230 180190200210220 170
oarLadinian oria s Cll BJ
JurassicTriassic
Time (Ma)
Num
ber
of g
ener
a
Cm O
TRCarnian N leinSine Aa
D P T J Pg Ng
0100200300400500
010
020
030
040
0
ModernPalaeozoicCambrian
Pn BH
KCS
A) Phanerozoic Biodiversity
B) Extinction Rate
OverallCarbonate affinity (non-reef)
Reef Affinity
Fig. 9. The end-Triassic extinction and extinction severity for organisms with an affinity for carbonate environments. a) Phanerozoic biodiversity (Alroy, 2010b), note that the end-Triassic extinction represents perhaps the most severe Phanerozoic biodiversity crises for the ‘Modern Fauna’. b) Extinction rates through the Middle and Late Triassic to the EarlyMiddle Jurassic. Extinction rates of reef genera and level-bottom (non-reef) genera that have an affinity for carbonate substrates (Kiessling and Aberhan, 2007a), compared with theoverall extinction rates of benthic invertebrate taxa based on PBDB data (Kiessling et al., 2007). Note how Rhaetian extinction rates are much higher for both carbonate level bottomfaunas and reef faunas than the overall extinction rate and background levels. Extinction rates are binned by stage and therefore plotted at the midpoint of each age interval.
85S.E. Greene et al. / Earth-Science Reviews 113 (2012) 72–93
latest Rhaetian increase in terrigenous material occurs in the SlovenianBasin (Rožič et al., 2009). In the Csővár region of northern Hungary(locality 9 on Fig. 5), the boundary is also contained within a carbonatesuccession (Pálfy et al., 2001). However there is fluctuating carbonatecontent in the section with at least one clay horizon in the uppermostTriassic, interpreted as a condensed layer reflecting decreased carbon-ate input into the basin alongside constant clay sedimentation (Zajzon,2003). At a nearby section the extinction event coincides with amaximum sea-level drop, immediately followed by a sequence ofmarls,marly limestomes, and silty shales very poor in fossils (Korte and Kozur,2011). Although cessation of carbonate input to both the Slovenian andCsővár Basins could be due to either a biocalcification crisis on theplatforms (thus shedding less carbonate into the basins) or to a sea-level fall, the former explanation is favoured because both successionsrecord the boundary within a transgressive sequence (Pálfy et al., 2001,2007; Rožič et al., 2009). Additionally, although theremay be carbonatedeposited across the extinction interval in Hungary and Slovenia, as inNevada this is not necessarily carbonate that was biomineralised duringthis interval (does not represent the active building of new carbonatefacies). Another candidate for a boundary within carbonates is fromboreholes taken in Asturias (Northern Spain, locality 6 on Fig. 5). The T-Jboundary interval occurs within the Solis Member of the GijonFormation, a shallow subtidal to inter- and supratidal carbonate platform.
The Solis Member is comprised of well-bedded dolostones andlimestones, however thin mudstone interbeds are also present (Barrónet al., 2006). Two further regions that exhibit potentially continuousdeepwater carbonate sedimentation are the Carnian Prealps and theSouthern Karawanks (Rožič et al., 2009), however further microstrati-graphic study is needed to evaluate these sections.
5.4. Diagenesis and the δ13Ccarb signature across the T-J boundary interval
A potentially global excursion in δ13C (initial CIE) is observed priorto the T-J boundary (near or at the extinction horizon) sometimesfollowed by a second main excursion (Hallam and Goodfellow, 1990;Morante and Hallam, 1996; McRoberts et al., 1997; Pálfy et al., 2001,2007; Ward et al., 2001, 2007; Hesselbo et al., 2002, 2004; Jenkyns etal., 2002; Guex et al., 2003, 2004; Galli et al., 2005, 2007; Yin et al.,2006; Kuerschner et al., 2007; Michalík et al., 2007; Wignall et al.,2007; Williford et al., 2007; Korte et al., 2009; Clémence et al., 2010b;Paris et al., 2010; Whiteside et al., 2010; Ruhl et al., 2011),presumably related to the input of light volcanogenic carbon intothe ocean DIC reservoir. The prevalence of diagenetic carbonate (the‘marl phenomenon’ and associated light δ13Ccarb) across this intervalmay also be informative about the nature of ocean chemistry (Greeneet al., 2010). Clémence et al. (2010b) argue that the excursion is not
86 S.E. Greene et al. / Earth-Science Reviews 113 (2012) 72–93
globally consistent in absolute value, although generally consistent inshape. The discrepancy between sites in both magnitude and absolutevalue of this excursion becomes apparent when all the reported initialCIE excursions in δ13Ccarb are plotted on the same axis (Fig. 8).Additionally, multiple chemostratigraphic studies from the same orneighboring localities have failed to yield reproducible results. Van deSchootbrugge (2008) (Fig. 8C) did not reproduce the negativeexcursion recognised by Galli et al. (2005, 2007) (Fig. 8B) at the ValAdrara section in the Italian Alps. Although van de Schootbrugge et al.(2008) concede that this may reflect insufficient sample resolution,they note deviations by as much as 3‰ from the general trend atvarious horizons. The authors attribute this to the incorporation ofdiagenetic, isotopically light carbon, likely due to remineralization oforganic matter. Clémence et al. (2010b) also concede that short termfluctuations at the Doniford Bay section (UK) (Fig. 8L) were driven bylocal early diagenetic processes. Pálfy et al. (2007) and Korte andKozur (2011) measured isotopes from adjacent sections near Csővár,Hungary and find grossly different initial excursions (−6‰ andb−1‰, respectively) (Fig. 8I, J). The variability between sections acrosswhich δ13Ccarb has been measured and the observation by variousgroups of authors working palaeogeographically disparate sections(Austrian Alps, (Hallam and Goodfellow, 1990); Italian Alps, (van deSchootbrugge et al., 2008); Doniford Bay, UK (Clémence et al.,2010b)) that incorporation of diagenetic, isotopically light carbon isprevalent, suggests that the abundance of early diagenetic carbonateacross the T-J transitionmay be a global feature. Perhaps themagnitudeof the negative excursion at any local site simply represents the degreeto which diagenetic carbonate has contaminated the primary signal. Iftrue, this implies that caution should be used when modelling T-Jcarbon cycle events based on the magnitude of the excursion. Overall,the prevalence of diagenetic carbonate (the ‘marl phenomenon’ andassociated light δ13Ccarb at the boundary) suggests that a simplesiliciclastic weathering increase (e.g. the grey arrow in Fig. 4) is notthe only phenomenon at play with respect to the observed globallithology shift.
5.5. Summary and discussion of T-J lithologies
Overall, there are very few successions (Chilingcote, Peru; TolminBasin, Slovenia; Northern Spain) with potentially continuous carbonatedeposition across the T-J extinction interval. For some of these thecarbonate that is present is shed from nearby platforms or ramps (e.g.Muller Canyon, Nevada; Tolmin Basin, Slovenia; Csővár Basin, Hungary)and so the presence of carbonate is not indicative of primary carbonatefacies construction. Additionally, the existence of possible continuouscarbonate deposition (particularly in shallow sections) does not precludethe occurrence of ocean acidification. Even a significant shoaling of theCCD or lysoclinemay not impinge upon the shelf, and regional disparitiesin the depths to which the CCD shoals may be expected, as is the caseacross the PETM (Ridgwell, 2007). Because of the episodic nature of therock record, most packages of rock will contain condensed horizons orhiatuses. For this reason it is difficult to conclude that a global dearth ofsections with continuous carbonate deposition across the T-J transitionnecessitates the occurrence of an acidification event.
Increased terrestrial weathering/siliciclastic input has been in-ferred as an explanation for the carbonate-poor boundary interval insome T-J sections, such as the Mingolsheim core (locality 7 on Fig. 5)in Germany (Quan et al., 2008). This theory of carbonate dilution hasbeen rejected as a mechanism for the lithological shift across thePETM because of the implausibly high clay rain rate change thatwould be required to produce the observed lithology shift (Zeebe andZachos, 2007). Similar approaches could prove insightful for the T-Jlithologic signal, particularly given that a CAMP-related weatheringincrease is inferred across the latest Triassic and into the Hettangianbased on 187Os/188Os and 87Sr/86Sr ratios (Cohen and Coe, 2002,2007; Kuroda et al., 2010). A weathering increase resulting from
CAMP volcanism would also bring an influx of alkalinity back into theocean; if the proposed global carbonate hiatus is a real byproduct ofacidification, it should be succeeded by enhanced carbonate preser-vation. In a modern-style (‘Cretan’) ocean with abundant calcifyingplankton, this should result in the deepening of the CCD andenhancing deep carbonate preservation over ~10s of kyrs (Kump etal., 2009). However, because calcifying nannoplankton were deci-mated by the extinction (Bown et al., 2004; van de Schootbrugge etal., 2007) it is hard to envision these surviving groups comprising asubstantial flux of carbonate to the deep ocean in the earliest Jurassic.In this ‘Neritan’ ocean without significant carbonate export to thedeep ocean, it is less certain how alkalinity influx from CAMPweathering would manifest – perhaps as enhanced preservation ofshelf carbonate and/or simply as a build-up of the ocean alkalinityreservoir (potentially resulting in abiotic precipitation).
As more absolute or astronomical constraints across boundaryintervals become available, it will be instructive to calculate the durationsof potential carbonate hiatuses to gauge whether they represent areasonable duration relative to modeled acidification duration (Fig. 3a),however, such high-resolution data are currently not available for mostsections. Regardless, an overall paucity of carbonate deposits across the T-J boundary exists and ocean acidification at the Triassic-Jurassic boundarymay be the most parsimonious explanation.
6. The fossil record of the end-Triassic extinction
Intensified scrutiny of the end-Triassic mass extinction has revealedstrong relevance to modern ecological concerns. The end-Triassic wasthemost severemass extinction among invertebrates since the ‘ModernFauna’ (invertebrates such as molluscs that dominate most benthicecosystems today) came to dominate the ocean (Fig. 9a) (Sepkoski andMiller, 1985; Alroy, 2010a,b) and rivals the end-Permian massextinction as the most severe reef crisis of the Phanerozoic (Flügel andKiessling, 2002; Kiessling and Simpson, 2011). The severity and rapidityof the end-Triassic extinction event have only recently come intosharper focus with the advent of the Paleobiology Database (PBDB). In astudy of benthic marine genera, Kiessling et al. (2007) find that 41% ofRhaetian genera died out before the beginning of the Hettangian.Extinction coupled with low origination rates during the Rhaetianproduced a 33% observed decline in standing diversity between theRhaetian and Hettangian. Pelagic organisms such as ammonoids alsoexperienced severe extinctions at the end of the Triassic (vonHillebrandt and Krystyn, 2009) and the conodonts went completelyextinct (Clark, 1987).
Though the extinction interval may have been as brief as ~50 kyr(Ward et al., 2001), diversity did not recover for perhaps millions ofyears (Carter and Hori, 2005; Alroy et al., 2008; Mander et al., 2008;Schaltegger et al., 2008; Alroy, 2010b), and full ecological recoverymay not have occurred for several tens of millions of years (Flügel,2002; Flügel and Kiessling, 2002; Thorne et al., 2011) (Fig. 3b). If theend-Triassic extinction was heavily influenced by acidification, thisimplies that short-term acidification perturbations may have lastingeffects on ecosystems.
6.1. End-Triassic extinction selectivity and other palaeontological indicatorsof acidification
Biological responses to ocean acidification demonstrated in modernexperiments can inform interpretations of the fossil recordwhen patternsare found among animals with common phylogenies, habitats, or lifemodes. The end-Triassic mass extinction was one of the most severeevents to have affected sensitive carbonate biomineralisers through theentire Phanerozoic (Kiessling and Simpson, 2011). Based on previouscategorizations (Knoll et al., 1996; Bambach et al., 2002; Pörtner et al.,2004, 2005; Knoll et al., 2007) which assume that organisms with amassive calcium carbonate skeleton and little physiological buffering are
87S.E. Greene et al. / Earth-Science Reviews 113 (2012) 72–93
sensitive to acidification (corals, hypercalcifying sponges, calcareousalgae, calcareous foraminifers, calcifying bryozoans, calcareous brachio-pods, pelmatozoans), Kiessling and Simpson (2011) find that in additionto the T-J reef crises, acid-sensitive groups experienced higher extinctionrates between the Rhaetian andHettangian.While these assumptions aregenerally in accordance with the current biological literature, the authorsconcede that little or no experimental data exists to support many ofthese classifications, particularly for groups with a rich fossil record(hypercalcified sponges, calcareous brachiopods, calcifying bryozoans,pelmatozoans) (Kiessling and Simpson, 2011). As discussed in Section 2.2(Fig. 2), corals fare poorly inmodern acidification experiments and the T-Jevent was the most severe extinction for scleractinian corals in theirentire history, with a >50% extinction rate at the genus level (Kiessling etal., 2009); the extinction rates for corals and calcareous sponges werehigher than for other benthic invertebrates (Kiessling et al., 2007).Benthic invertebrate genera associated with reef and carbonate habitats(as well as those with an affinity for inshore, or tropical environments)experienced elevated extinction rates between the Rhaetian andHettangian as compared to genera preferring level-bottom, siliciclastic,offshore, or non-tropicial environments (Kiessling and Aberhan, 2007a;Kiessling et al., 2007) (Fig. 9). In a departure from background extinctionpatterns, wide geographic range and high abundance are not significantpredictors of success during the Triassic-Jurassic event (Kiessling andAberhan, 2007b). In thepelagic realm, a biocalcification crisis across the T-J extinction is reported from several sites (Lucas et al., 2007; van deSchootbrugge et al., 2007; Črne et al., 2011) manifesting as the extinctionand malformation of calcareous nannoplankton concurrent with bloomsof organic-walled green algal ‘disaster’ taxa (van de Schootbrugge et al.,2007).
Within a given clade, there are also differences in T-J survivorshipthatmay relate to lifemode. For example, infaunal bivalves experiencedhigher extinction rates than epifaunal bivalves during the T-J boundary(McRoberts and Newton, 1995; Kiessling et al., 2007). Hautmann et al.(2008a) suggest that end-Triassic extinction risk is correlated with thecarbonate polymorph in an organism's shell or skeleton, based on theassumption that the thermodynamic stability of carbonate polymorphsis a key factor for organism survival. Kiessling et al. (2007) substantiatethis pattern for bivalves, but when diverse benthic genera fromdifferent clades are taken as a whole, extinction rates from sub-sampled occurrence data show no significant correlation with carbon-ate polymorph. Beyond extinction rates, fossils can also reveal trends inshell size and thickness (e.g., Mander et al. (2008)), though inter-pretation of the meanings of these trends may change as modernexperiments present new data.
Given the current state of biological knowledge about acid sensitivityand end-Triassic extinction data, ocean acidification is a reasonableexplanation for the interpreted extinction selectivity during this timeinterval. The extinction rates amongst certain susceptible organisms andecosystems are elevated and differ significantly from backgroundextinction. This implies that selective pressures across the end-Triassicextinction differ from the mechanisms driving background extinction.Although other factors, such as warming (Kiessling and Simpson, 2011),may have contributed to the extinction, an acidification event (coupledwith associated environmental perturbations) is consistent with theobservations and is arguably the most parsimonious explanation forwhat is observed in the fossil record.
6.2. Acidification and the fidelity of the fossil record
Solubility differences between carbonate polymorphs have beeninvoked to explain preservational biases favouring calcite overaragonite (Tucker and Wright, 1990). Fraiser et al. (2011) suggest thatacidification resulting from high pCO2 can enhance this bias, helping toexplain the prevalence of Lazarus taxa (taxa that briefly disappear fromthe fossil record in the aftermath of an extinction only to reappear later(Flessa and Jablonski, 1983)) in the Early Triassic (following the end-
Permianmass extinction). Kiessling and Simpson (2011) point out thatacidification-induced preservation gaps are geologically short-livedphenomena; decreased preservation would be immediately succeededby an episode of enhanced carbonate preservation (Kump et al., 2009).Thus acidification is not a mechanism that would produce a sustained(i.e. million year timescale) preservational bias against more solublepolymorphs beyond background biases.
The “naked coral hypothesis” is another acidification-inducedpreservational effect (Stanley, 2003;Medina et al., 2006). Somemodernscleractinian corals can exist for a year in undersaturated water aspolypswithout a skeleton,maintaining their symbionts and their abilityto reproduce (Fine and Tchernov, 2007). When returned to supersat-urated waters these corals resume biomineralization. There is a lagbetween the origination of scleractinians (based on molecular clockdating) and the first scleractinian fossil (Medina et al., 2006), suggestingthat corals may have lived as polyps without a carbonate skeleton forthe first 60 myr of their evolutionary history. Therefore, Stanley (2003)suggests scleractinian corals may have the ability to survive oceanacidification events, or other intervals of biocalcification stress by livingas polyps without a skeleton, as “naked corals”. Since several coralspecies survived the end–Triassic mass extinction but are absent fromthe fossil record for the first ammonite zone (Kiessling et al., 2009;Martindale et al., 2011), ~370,000 kyr (Ruhl et al., 2010a), it is possiblethat earliest Jurassic corals did not leave a fossil record because theywere living as naked corals and thus without a skeleton, could not buildreefs.
7. Comparison of the T-J with other potential palaeo-oceanacidification events
Several intervals in earth history have been identified as possiblepalaeo-ocean acidification events (see Hönisch et al. (2012) andreferences therein). Here we discuss the similarity of T-J phenomenawith the Permian-Triassic event (P-T) and the PETM, which are allcandidate ocean acidification events. All are coincident with theeruptions of large igneous provinces (Wignall, 2001, 2005), whichmay have released additional volatiles from the heating of organicmatter in organic rich rocks during their emplacement (Svensen et al.,2009a, 2010), and all three may have been associated with methanerelease (Erwin, 1993; Dickens et al., 1995; Wignall, 2001; Ruhl et al.,2011). The volumes of carbon and the rate of injection for theseevents are extremely difficult to constrain; Hönisch et al. (2012)catalogue the volumes and rates of carbon dioxide injection for theseevents and conclude that the PETM had the lowest volume of carbondioxide, but the fastest injection while the P-T had the highestvolume, but the slowest injection. Nevertheless, the duration andvolume of LIP injections is difficult to determine accurately due to thepulsed nature of some flood basalts, such as CAMP and the precisionof dating techniques (particularly in deep time).
Lithological comparison of these three carbon cycle perturbationsis complicated. One of the key issues when comparing the PETM withthe T-J and P-T is that much of the research on the PETM is from cores(deep ocean records) whereas the mid-Mesozoic and earlier lackrecords from the deep ocean floor. Furthermore, ocean carbonatecycling is thought to have been fundamentally different between thePETM and the Mesozoic because of the rise of pelagic calcification.Carbon cycling in P-T and T-J oceans would have been morecomparable; calcium ion concentrations were similar: Late Permian[Ca2+]=13–17 and Late Triassic [Ca2+]=17–21 (Horita et al.,2002), and the modelled values of ocean DIC and surface Ω are high(two or three fold higher than modern values) during both intervals(Ridgwell, 2005) making their susceptibility to acidification eventscomparable. Comparatively little work has been done to identify acarbonate gap across the P-T; Payne et al. (2007, 2010) have identifiedevidence for carbonate dissolution in shelf settings, however, theinterpretation of these observations as acidification events is
88 S.E. Greene et al. / Earth-Science Reviews 113 (2012) 72–93
controversial (Wignall et al., 2009). While the P-T and T-J are notidentical there are some instructive similarities between the twoevents, but further studies may reveal important nuances, particularlywith pH or Ω proxy development and application to these events.
Palaeontological studies of the P-T, T-J, and PETM, demonstrateincreased extinction selectivity towards unbuffered or acid-sensitiveorganisms across these intervals. Studies focused specifically on the end-Permian mass extinction conclude that there is extreme selectivityagainst sensitive taxa (Knoll et al., 2007; Clapham and Payne, 2011).Kiessling and Simpson (2011) found that during all three events, there isstrong evidence of extinction selectivity against sensitive or physiolog-ically unbuffered organisms in reef environments; they interpret thisselectivity as evidence for ocean acidification during these intervals. Inthe same study, the authors also point out that the PETM and T-J werelikely influenced by thermal stress in addition to acidification stress andthat, while the PETM reef crisis was restricted to coral-sponge reefs, theT-J and P-T reef crises affected all Triassic reef types (microbial,metazoan, and coral-sponge reefs). Further comparison between thesethree extinctions is difficult because few in situ, shallow-water carbonateplatform sections across the PETM are known (Robinson, 2011) and thusfew PETM macroinvertebrate fossil assemblages have been described.Consequently PETM effects on marine ecosystems are seen almostentirely through microfossils (McInerney and Wing, 2011). This recordbiased towards deep-sea deposits is the exact opposite of the shallow-water T-J and P-T bias and makes comparisons complicated. The fewpublished PETM macroinvertebrate datasets show patterns that differfrom the T-J. Mollusc fauna from the US Gulf Coastal Plain showtaxonomic diversity, ecological structure, and abundance distributionsthat differ little between the latest Palaeocene and earliest Eocene (Ivanyand Sessa, 2010). Additionally, a carbonate production crisis is not seenat Limayok Guyot (Ocean Drilling Program Site 871), one of the fewknown shallow water carbonate sections (Robinson, 2011), suggestingthat shallow-water pH effects were either short-lived or relativelyminorduring the PETM. In short, the PETM likely created only transientdisturbances to nearshore assemblages, quite unlike the end-Triassic orend-Permian mass extinctions.
8. Conclusions
It is possible to recognise ocean acidification events in deep time;however, an extraordinary amount of high-resolution data is needed toconfidently assert that an acidification event occurred. Ideally, a causalmechanism for acidification should be identified – a carbon cycleperturbation that is rapid enough and severe enough to achieveacidification (though not necessarily undersaturation). We find that theemplacement of CAMP is a credible mechanism to induce acidification atthe T-J transition. CAMP was sufficiently large in volume and itsemplacement likely rapid enough to have caused acidification andpotentially, albeit unlikely, even undersaturate the ocean with respect toaragonite and calcite. Themajor caveat is the uncertainty surrounding thebuffering capacity of the ocean at the time (DIC), particularly given theelevated [Ca2+] of the T-J ocean,whichmakes undersaturation less likely.The T-J sedimentary record is tentatively consistent with an oceanacidification event. Many marine sections show a paucity or lack ofprimary carbonate within the boundary interval. Additionally, there arefew, if any, marine sections with continuous carbonate deposition acrossthe T-J transition. There is a fundamental breakdown in the carbonatecycle at this time. The signature of the biological response (the selectiveextinction of acid-sensitive taxa) provides additional supporting evi-dence for acidification. The end-Triassic extinction event appears to havebeen selective against acid-sensitive biomineralising taxa, and taxainhabiting reef and level bottom carbonate habitats (Kiessling andAberhan, 2007a; Kiessling and Simpson, 2011). The end-Triassic was themost severe extinction for acidification-sensitive faunas, and rivals theend-Permian mass extinction as the most severe reef crisis of thePhanerozoic (Sepkoski and Miller, 1985; Flügel and Kiessling, 2002;
Alroy, 2010a,b; Kiessling and Simpson, 2011). The selective extinctionrecord across the end-Triassic extinction is strong evidence thatacidification occurred (whether or not acidification was the primarycause of the mass extinction).
The T-J acidification event is relevant to phenomena associatedwith modern anthropogenic emissions. Both large igneous provinces,such as CAMP, and anthropogenic emissions release large amounts ofcarbon dioxide rapidly. Although anthropogenic emissions are morerapid than perhaps any event in the geologic record (Kerr, 2010; Cuiet al., 2011), events such as the PETM (Zeebe, 2011; Hönisch et al.,2012) or T-J (Hönisch et al., 2012) can serve as (imperfect) analoguesfor the present anthropogenic carbon release. Because the rate ofanthropogenic emissions may be unprecedented (Kerr, 2010; Cui et al.,2011) and because acidification occurs as one of a suite of cascadingenvironmental effects (Fig. 4) (Hönisch et al., 2012), it is essential toexamine amyriad of past acidification events to elucidate the full rangeof possible outcomes of anthropogenic emissions. Because the T-J wassuch a pronounced crisis for modern-style marine invertebrates andscleractinian reefs, this event can provide key information about theeffects of anthropogenic ocean acidification. The T-J event had asignificant impact on reef ecosystems and may provide some insightinto the future of modern coral reefs (often considered the ‘canary inthe coal mine’ with respect to ecosystem collapse).
In sum, it is likely that the end-Triassic extinction was heavilyinfluenced by acidification, which implies that short-term acidifica-tion perturbations may have long-term effects on ecosystems, arepercussion that has not previously been correlated with acidifica-tion events. Despite the clear differences between the modern andancient acidification events, the Triassic-Jurassic event can informpredictions for the future.
Acknowledgements
We thank Kathleen Harazin, Yadira Ibarra, Sean Loyd, VictoriaPetryshyn, Lydia Tackett, and A. Joshua West for helpful discussions.We also thank Micha Ruhl and editor Paul Wignall as well as ananonymous reviewer for thoughtful comments that greatly improvedthis manuscript. This work was supported by funding from: NSFEAGER Grant 1017536 to DJB and FAC; NSERC PGS D3 grant to RCM;SEPM Student Research Grants to SEG, RCM, KAR; AAPG Grants-in-Aid to SEG, RCM; AMNH Lerner-Grey Grant for Marine Research toSEG, KAR; AMNH Theodore Roosevelt Memorial Grant to RCM, KAR;GSA Graduate Student Research Grants to SEG, RCM; Evolving EarthFoundation Student Grant to RCM; IAS Postgraduate Grant to RCM;Paleontological Society Student Research Award to RCM; USCSonosky-Wrigley Fellowship to KAR; and the USC Dana and DavidDornsife College of Letters Arts and Sciences.
References
Algeo, T.J., Twitchett, R.J., 2010. Anomalous Early Triassic sediment fluxes due toelevated weathering rates and their biological consequences. Geology 38 (11),1023–1026.
Alroy, J., 2010a. The Shifting Balance of Diversity Among Major Marine Animal Groups.Science 329, 1191–1194.
Alroy, J., 2010b. Fair sampling of taxonomic richness and unbiased estimation oforigination and extinction rates. In: Alroy, J., Hunt, G. (Eds.), Quantitative Methodsin Paleobiology, Paleontological Society Papers, pp. 55–60.
Alroy, J., Aberhan, M., Bottjer, D.J., Foote, M., Fürsich, F.T., Harries, P.J., Hendy, A.J.W.,Holland, S.M., Ivany, L.C., Kiessling, W., Kosnik, M.A., Marshall, C.R., McGowan, A.J.,Miller, A.I., Olszewski, T.D., Patzkowsky, M.E., Peters, S.E., Villier, L., Wagner, P.J.,Bonuso, N., Borkow, P.S., Brenneis, B., Clapham, M.E., Fall, L.M., Ferguson, C.A.,Hanson, V.L., Krug, A.Z., Layou, K.M., Leckey, E.H., Nürnberg, S., Powers, C.M., Sessa,J.A., Simpson, C., Tomašových, A., Visaggi, C.C., 2008. Phanerozoic trends in theglobal diversity of marine invertebrates. Science 321 (5885), 97–100.
Andersson, A.J., Mackenzie, F.T., Gattuso, J.-P., 2011. Effects of Ocean Acidification onBenthic Processes, Organisms, and Ecosystems. In: Gattuso, J.-P., Hansson, L. (Eds.),Ocean Acidification. Oxford University Press, Oxford, p. 352.
Anthony, K.R.N., Kline, D.I., Diaz-Pulido, G., Dove, S., Hoegh-Guldberg, O., 2008. Oceanacidification causes bleaching and productivity loss in coral reef builders.
89S.E. Greene et al. / Earth-Science Reviews 113 (2012) 72–93
Proceedings of the National Academy of Sciences of the United States of America105 (45), 17442–17446.
Anthony, K.R.N., Maynard, J.A., Diaz-Pulido, G., Mumby, P.J., Marshall, P.A., Cao, L.,Hoegh-Guldberg, O., 2011. Ocean acidification and warming will lower coral reefresilience. Global Change Biology 17 (5), 1798–1808.
Balog, A., Read, J.F., Haas, J., 1999. Climate-controlled early dolomite, Late Triassiccyclic platform carbonates, Hungary. Journal of Sedimentary Research 69 (1),267–282.
Bambach, R.K., Knoll, A.H., Sepkoski Jr., J.J., 2002. Anatomical and ecological constraintson Phanerozoic animal diversity in the marine realm 99 (10), 6854–6859.
Barras, C.G., Twitchett, R.J., 2007. Response of the marine infauna to Triassic-Jurassicenvironmental change: Ichnological data from southern England. Palaeogeography,Palaeoclimatology, Palaeoecology 244 (1–4), 223–241.
Barrón, E., Gómez, J.J., Goy, A., Pieren, A.P., 2006. The Triassic-Jurassic boundary inAsturias (northern Spain): Palynological characterisation and facies. Review ofPalaeobotany and Palynology 138 (3–4), 187–208.
Beerling, D., 2002. CO2 and the end-Triassic mass extinction. Nature 415 (6870), 386–387.Beerling, D.J., Berner, R.A., 2002. Biogeochemical constraints on the Triassic-Jurassic
boundary carbon cycle event. Global Biogeochemical Cycles 16, 1–13.Beman, J.M., Chow, C.-E., King, A.L., Feng, Y., Fuhrman, J.A., Andersson, A., Bates, N.R.,
Popp, B.N., Hutchins, D.A., 2011. Global declines in oceanic nitrification rates as aconsequence of ocean acidification. Proceedings of the National Academy ofSciences 108 (1), 208–213.
Beniash, E., Aizenberg, J., Addadi, L., Weiner, S., 1997. Amorphous calcium carbonatetransforms into calcite during sea urchin larval spicule growth. Proceedings of theRoyal Society of London, Series B: Biological Sciences 264 (1380), 461–465.
Bernasconi, S.M., Črne, A.E., Méhay, S., Keller, C.E., Hochuli, P., Erba, E., Weissert, H.,2009. CO2 pulses and carbonate and biotic crises in the Mesozoic. Geochimica etCosmochimica Acta Supplement 73, A113.
Berner, R.A., Beerling, D.J., 2007. Volcanic degassing necessary to produce a CaCO3
undersaturated ocean at the Triassic-Jurassic boundary. Palaeogeography, Palaeo-climatology, Palaeoecology 244 (1–4), 368–373.
Berner, R.A., Kothavala, Z., 2001. GEOCARB III; a revised model of atmospheric CO2 overPhanerozoic time. American Journal of Science 301 (2), 182–204.
Bonis, N.R., Ruhl, M., Kürschner, W.M., 2010a. Climate change driven black shaledeposition during the end-Triassic in the western Tethys. Palaeogeography,Palaeoclimatology, Palaeoecology 290 (1–4), 151–159.
Bonis, N.R., Ruhl, M., Kürschner, W.M., 2010b. Milankovitch-scale palynologicalturnover across the Triassic – Jurassic transition at St . Audrie's Bay, SW UK.Journal of the Geological Society 167 (5), 877–888.
Boss, S.K., Wilkinson, B.H., 1991. Planktogenic/Eustatic Control on Cratonic/OceanicCarbonate Accumulation. Journal of Geology 99 (4), 497–513.
Bown, P.R., Lees, J.A., Young, J.R., 2004. Calcareous nannoplankton evolution anddiversity through time. In: Thierstein, H.R., Young, J.R. (Eds.), From MolecularProcesses to Global Impact. Springer Verlag, Berlin, pp. 481–508.
Breitbarth, E., Bellerby, R.G.J., Neill, C.C., Ardelan, M.V., Meyerhöfer, M., Zöllner, E.,Croot, P.L., Riebesell, U., 2010. Ocean acidification affects iron speciation during acoastal seawater mesocosm experiment. Biogeosciences 7, 1065–1073.
Caldeira, K., Wickett, M.E., 2003. Oceanography: Anthropogenic carbon and ocean pH.Nature 425 (6956), 365.
Carter, E.S., Hori, R.S., 2005. Global correlation of the radiolarian faunal change acrossthe Triassic-Jurassic boundary. Canadian Journal of Earth Sciences 42 (5), 777–790.
Carter, E.S., Orchard, M.J., 2007. Radiolarian - conodont - ammonoid intercalibrationaround the Norian-Rhaetian Boundary and implications for trans-Panthalassancorrelation Albertiana, 36, pp. 149–163.
Carter, J.G., Barrera, E., Tevesz, M.J.S., 1998. Thermal potentiation and mineralogicalevolution in the Bivalvia (Mollusca). Journal of Paleontology 72 (6), 991–1010.
Chen, C.T.A., Feely, R.A., Gendron, J.F., 1988. Lysocline, Calcium Carbonate Compensa-tion Depth, and Calcareous Sediments in the North Pacific Ocean. Pacific Science 42(3–4), 237–252.
Ciarapica, G., 2007. Regional and global changes around the Triassic-Jurassic boundaryreflected in the late Norian-Hettangian history of the Apennine basins. Palaeogeo-graphy, Palaeoclimatology, Palaeoecology 244 (1–4), 34–51.
Cirilli, S., Marzoli, A., Tanner, L., Bertrand, H., Buratti, N., Jourdan, F., Bellieni, G., Kontak,D., Renne, P.R., 2009. Latest Triassic onset of the Central Atlantic MagmaticProvince (CAMP) volcanism in the Fundy Basin (Nova Scotia): New stratigraphicconstraints. Earth and Planetary Science Letters 286 (3–4), 514–525.
Clapham, M.E., Payne, J.L., 2011. Acidification, anoxia, and extinction: A multiplelogistic regression analysis of extinction selectivity during the Middle and LatePermian. Geology 39 (11), 1059–1062.
Clark, D.L., 1987. Conodonts: the final fifty million years. In: Aldridge, R.J. (Ed.),Palaeobiology of Conodonts. Ellis Horwood, Chichester, pp. 165–174.
Clémence, M.-E., Bartolini, A., Gardin, S., Paris, G., Beaumont, V., Page, K.N., 2010a. EarlyHettangian benthic–planktonic coupling at Doniford (SW England) Palaeoenviron-mental implications for the aftermath of the end-Triassic crisis. Palaeogeography,Palaeoclimatology, Palaeoecology 295, 102–115.
Clémence, M.-E., Gardin, S., Bartolini, A., Paris, G., Beaumont, V., Guex, J., 2010b.Bentho-planktonic evidence from the Austrian Alps for a decline in sea-surfacecarbonate production at the end of the Triassic. Swiss Journal of Geosciences 103,293–315.
Cohen, A.S., Coe, A.L., 2002. New geochemical evidence for the onset of volcanism in theCentral Atlantic magmatic province and environmental change at the Triassic-Jurassic boundary. Geology 30, 267–270.
Cohen, A.S., Coe, A.L., 2007. The impact of the Central Atlantic Magmatic Province onclimate and on the Sr- and Os-isotope evolution of seawater. Palaeogeography,Palaeoclimatology, Palaeoecology 244 (1–4), 374–390.
Črne, A.E., Weissert, H., Goričan, Š., Bernasconi, S.M., 2011. A biocalcification crisis atthe Triassic-Jurassic boundary recorded in the Budva Basin (Dinarides, Montene-gro). GSA Bulletin 123 (1/2), 40–50.
Cui, Y., Kump, L.R., Ridgwell, A.J., Charles, A.J., Junium, C.K., Diefendorf, A.F., Freeman,K.H., Urban, N.M., Harding, I.C., 2011. Slow release of fossil carbon during thePalaeocene-Eocene Thermal Maximum. Nature Geoscience 4 (7), 481–485.
Cusack, M., Parkinson, D., Freer, A., Perez-Huerta, A., Fallick, A.E., Curry, G.B., 2008.Oxygen isotope composition in Modiolus modiolus aragonite in the context ofbiological and crystallographic control. Mineralolgical Magazine 72 (2), 569–577.
Dalbeck, P., England, J., Cusack, M., Lee, M.R., Fallick, A.E., 2006. Crystallography andchemistry of the calcium carbonate polymorph switch inM. edulis shells. EuropeanJournal of Mineralogy 18 (5), 601–609.
de Putron, S., McCorkle, D., Cohen, A., Dillon, A., 2011. The impact of seawatersaturation state and bicarbonate ion concentration on calcification by new recruitsof two Atlantic corals. Coral Reefs 30 (2), 321–328.
Deenen, M.H.L., Ruhl, M., Bonis, N.R., Krijgsman, W., Kuerschner, W.M., Reitsma, M., vanBergen, M.J., 2010. A new chronology for the end-Triassic mass extinction. Earthand Planetary Science Letters 291 (1–4), 113–125.
Dessert, C., Dupré, B., François, L.M., Schott, J., Gaillardet, J., Chakrapani, G., Bajpai, S.,2001. Erosion of Deccan Traps determined by river geochemistry: impact on theglobal climate and the 87Sr/86Sr ratio of seawater. Earth and Planetary ScienceLetters 188 (3–4), 459–474.
Diaz-Pulido, G., Gouezo, M., Tilbrook, B., Dove, S., Anthony, K.R.N., 2011. High CO2 enhancesthe competitive strength of seaweeds over corals. Ecology Letters 14 (2), 156–162.
Dickens, G.R., O'Neil, J.R., Rea, D.K., Owen, R.M., 1995. Dissociation of Oceanic MethaneHydrate as a Cause of the Carbon Isotope Excursion at the End of the Paleocene.Paleoceanography 10 (6), 965–971.
Dickson, A.G., 1990. Standard potential of the reaction: AgCl(s) + 1/2 H2(g) = Ag(s)+ HCl(aq), and the standard acidity constant of the ion HSO4
- in syntheticseawater from 273.15 to 318.15 K. The Journal of Chemical Thermodynamics 22,113–127.
Dickson, A.G., Millero, F.J., 1987. A comparison of the equilibrium constants for thedissociation of carbonic acid in seawater media. Deep Sea Research Part A.Oceanographic Research Papers 34 (10), 1733–1743.
Doney, S.C., Fabry, V.J., Feely, R.A., Kleypas, J.A., 2009. Ocean Acidification: The OtherCO2 Problem. Annual Review of Marine Science 1, 169–192.
Dupont, S., Lundve, B., Thorndyke, M., 2010. Near future ocean acidification increasesgrowth rate of the lecithotrophic larvae and juveniles of the sea star Crossasterpapposus. Journal of Experimental Zoology, Part B 314B (5), 382–389.
Erwin, D.H., 1993. The Great Paleozoic Crisis: Life and Death in the Permian. ColumbiaUniversity Press, New York. 327 pp.
Fabry, V.J., Seibel, B.A., Feely, R.A., Orr, J.C., 2008. Impacts of ocean acidification onmarine fauna and ecosystem processes. ICES Journal of Marine Science: Journal duConseil 65 (3), 414–432.
Falini, G., Albeck, S., Weiner, S., Addadi, L., 1996. Control of Aragonite or CalcitePolymorphism by Mollusk Shell Macromolecules. Science 271 (5245), 67–69.
Feely, R.A., Sabine, C.L., Lee, K., Berelson, W., Kleypas, J., Fabry, V.J., Millero, F.J., 2004.Impact of anthropogenic CO2 on the CaCO3 system in the oceans. Science 305(5682), 362–366.
Findlay, H., Wood, H., Kendall, M., Spicer, J., Twitchett, R., Widdicombe, S., 2009.Calcification, a physiological process to be considered in the context of the wholeorganism. Biogeosciences Discussions 6, 2267–2284.
Fine, M., Tchernov, D., 2007. Scleractinian coral species survive and recover fromdecalcification. Science 315 (5820), 1811.
Flessa, K.W., Jablonski, D., 1983. Extinction is Here to Stay. Paleobiology 9 (4), 315–321.Flügel, E., 2002. Triassic reef patterns. In: Kiessling, W., Flügel, E., Golonka, J. (Eds.),
Phanerozoic Reef Patterns, Special Publication, 72. Society for SedimentaryGeology (SEPM), Tulsa, pp. 391–463.
Flügel, E., Kiessling, W., 2002. Patterns of Phanerozoic reef crises. In: Kiessling, W.,Flügel, E., Golonka, J. (Eds.), Phanerozoic Reef Patterns, Special Publication, 72.Society for Sedimentary Geology (SEPM), Tulsa, pp. 691–733.
Foster, G.L., 2008. Seawater pH, pCO2 and [CO32-] variations in the Caribbean Sea over
the last 130 kyr: A boron isotope and B/Ca study of planktic foraminifera. Earth andPlanetary Science Letters 271 (1–4), 254–266.
Fraiser, M.L., Clapham, M.E., Bottjer, D.J., 2011. Mass Extinctions and ChangingTaphonomic Processes: Fidelity of the Guadelupian, Lopingian, and Early TriassicFossil Records. In: Allison, P.A., Bottjer, D.J. (Eds.), Taphonomy: Process and biasthrough time. : Topics in Geobiology. Springer Netherlands, pp. 569–590.
Fraser, N.M., Bottjer, D.J., Fischer, A.G., 2004. Dissecting "Lithiotis" Bivalves: Implicationsfor the Early Jurassic Reef Eclipse. Palaios 19 (1), 51–67.
Gallet, Y., Krystyn, L., Marcoux, J., Besse, J., 2007. New constraints on the End-Triassic(Upper Norian-Rhaetian) magnetostratigraphy. Earth and Planetary ScienceLetters 255 (3–4), 458–470.
Galli, M.T., Jadoul, F., Bernasconi, S.M., Weissert, H., 2005. Anomalies in global carboncycling and extinction at the Triassic/Jurassic boundary; evidence from a marine C-isotope record. Palaeogeography, Palaeoclimatology, Palaeoecology 216 (3–4),203–214.
Galli, M.T., Jadoul, F., Bernasconi, S.M., Cirilli, S., Weissert, H., 2007. Stratigraphy andpalaeoenvironmental analysis of the Triassic–Jurassic transition in the westernSouthern Alps (Northern Italy). Palaeogeography, Palaeoclimatology, Palaeoecol-ogy 244, 52–70.
Gallois, R.W., 2009. The lithostratigraphy of the Penarth Group (Late Triassic) of theSevern Estuary area. Geoscience in South-West England. Proceedings of the UssherSociety 12 (2), 71–84.
Gerlach, T.M., Graeber, E.J., 1985. Volatile budget of Kilauea Volcano. Nature 313(6000), 273–277.
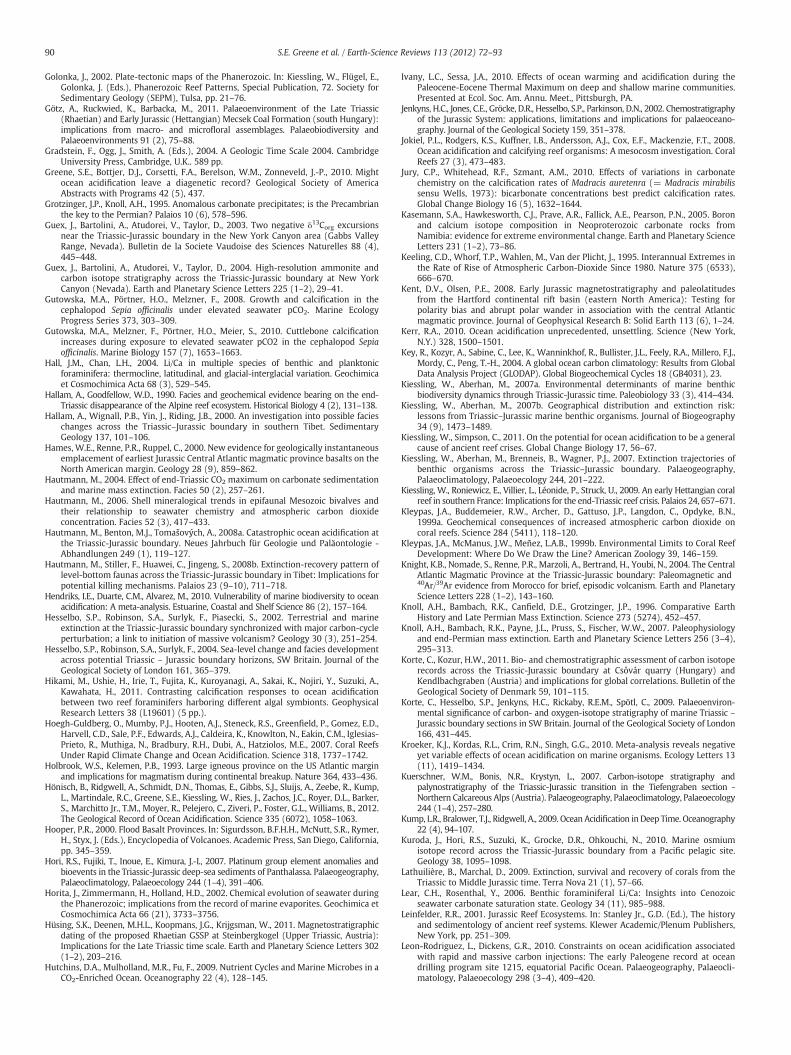
90 S.E. Greene et al. / Earth-Science Reviews 113 (2012) 72–93
Golonka, J., 2002. Plate-tectonic maps of the Phanerozoic. In: Kiessling, W., Flügel, E.,Golonka, J. (Eds.), Phanerozoic Reef Patterns, Special Publication, 72. Society forSedimentary Geology (SEPM), Tulsa, pp. 21–76.
Götz, A., Ruckwied, K., Barbacka, M., 2011. Palaeoenvironment of the Late Triassic(Rhaetian) and Early Jurassic (Hettangian) Mecsek Coal Formation (south Hungary):implications from macro- and microfloral assemblages. Palaeobiodiversity andPalaeoenvironments 91 (2), 75–88.
Gradstein, F., Ogg, J., Smith, A. (Eds.), 2004. A Geologic Time Scale 2004. CambridgeUniversity Press, Cambridge, U.K.. 589 pp.
Greene, S.E., Bottjer, D.J., Corsetti, F.A., Berelson, W.M., Zonneveld, J.-P., 2010. Mightocean acidification leave a diagenetic record? Geological Society of AmericaAbstracts with Programs 42 (5), 437.
Grotzinger, J.P., Knoll, A.H., 1995. Anomalous carbonate precipitates; is the Precambrianthe key to the Permian? Palaios 10 (6), 578–596.
Guex, J., Bartolini, A., Atudorei, V., Taylor, D., 2003. Two negative δ13Corg excursionsnear the Triassic-Jurassic boundary in the New York Canyon area (Gabbs ValleyRange, Nevada). Bulletin de la Societe Vaudoise des Sciences Naturelles 88 (4),445–448.
Guex, J., Bartolini, A., Atudorei, V., Taylor, D., 2004. High-resolution ammonite andcarbon isotope stratigraphy across the Triassic-Jurassic boundary at New YorkCanyon (Nevada). Earth and Planetary Science Letters 225 (1–2), 29–41.
Gutowska, M.A., Pörtner, H.O., Melzner, F., 2008. Growth and calcification in thecephalopod Sepia officinalis under elevated seawater pCO2. Marine EcologyProgress Series 373, 303–309.
Gutowska, M.A., Melzner, F., Pörtner, H.O., Meier, S., 2010. Cuttlebone calcificationincreases during exposure to elevated seawater pCO2 in the cephalopod Sepiaofficinalis. Marine Biology 157 (7), 1653–1663.
Hall, J.M., Chan, L.H., 2004. Li/Ca in multiple species of benthic and planktonicforaminifera: thermocline, latitudinal, and glacial-interglacial variation. Geochimicaet Cosmochimica Acta 68 (3), 529–545.
Hallam, A., Goodfellow, W.D., 1990. Facies and geochemical evidence bearing on the end-Triassic disappearance of the Alpine reef ecosystem. Historical Biology 4 (2), 131–138.
Hallam, A., Wignall, P.B., Yin, J., Riding, J.B., 2000. An investigation into possible facieschanges across the Triassic–Jurassic boundary in southern Tibet. SedimentaryGeology 137, 101–106.
Hames, W.E., Renne, P.R., Ruppel, C., 2000. New evidence for geologically instantaneousemplacement of earliest Jurassic Central Atlantic magmatic province basalts on theNorth American margin. Geology 28 (9), 859–862.
Hautmann, M., 2004. Effect of end-Triassic CO2 maximum on carbonate sedimentationand marine mass extinction. Facies 50 (2), 257–261.
Hautmann, M., 2006. Shell mineralogical trends in epifaunal Mesozoic bivalves andtheir relationship to seawater chemistry and atmospheric carbon dioxideconcentration. Facies 52 (3), 417–433.
Hautmann, M., Benton, M.J., Tomašových, A., 2008a. Catastrophic ocean acidification atthe Triassic-Jurassic boundary. Neues Jahrbuch für Geologie und Paläontologie -Abhandlungen 249 (1), 119–127.
Hautmann, M., Stiller, F., Huawei, C., Jingeng, S., 2008b. Extinction-recovery pattern oflevel-bottom faunas across the Triassic-Jurassic boundary in Tibet: Implications forpotential killing mechanisms. Palaios 23 (9–10), 711–718.
Hendriks, I.E., Duarte, C.M., Alvarez, M., 2010. Vulnerability of marine biodiversity to oceanacidification: A meta-analysis. Estuarine, Coastal and Shelf Science 86 (2), 157–164.
Hesselbo, S.P., Robinson, S.A., Surlyk, F., Piasecki, S., 2002. Terrestrial and marineextinction at the Triassic-Jurassic boundary synchronized with major carbon-cycleperturbation; a link to initiation of massive volcanism? Geology 30 (3), 251–254.
Hesselbo, S.P., Robinson, S.A., Surlyk, F., 2004. Sea-level change and facies developmentacross potential Triassic – Jurassic boundary horizons, SW Britain. Journal of theGeological Society of London 161, 365–379.
Hikami, M., Ushie, H., Irie, T., Fujita, K., Kuroyanagi, A., Sakai, K., Nojiri, Y., Suzuki, A.,Kawahata, H., 2011. Contrasting calcification responses to ocean acidificationbetween two reef foraminifers harboring different algal symbionts. GeophysicalResearch Letters 38 (L19601) (5 pp.).
Hoegh-Guldberg, O., Mumby, P.J., Hooten, A.J., Steneck, R.S., Greenfield, P., Gomez, E.D.,Harvell, C.D., Sale, P.F., Edwards, A.J., Caldeira, K., Knowlton, N., Eakin, C.M., Iglesias-Prieto, R., Muthiga, N., Bradbury, R.H., Dubi, A., Hatziolos, M.E., 2007. Coral ReefsUnder Rapid Climate Change and Ocean Acidification. Science 318, 1737–1742.
Holbrook, W.S., Kelemen, P.B., 1993. Large igneous province on the US Atlantic marginand implications for magmatism during continental breakup. Nature 364, 433–436.
Hönisch, B., Ridgwell, A., Schmidt, D.N., Thomas, E., Gibbs, S.J., Sluijs, A., Zeebe, R., Kump,L., Martindale, R.C., Greene, S.E., Kiessling, W., Ries, J., Zachos, J.C., Royer, D.L., Barker,S., Marchitto Jr., T.M., Moyer, R., Pelejero, C., Ziveri, P., Foster, G.L., Williams, B., 2012.The Geological Record of Ocean Acidification. Science 335 (6072), 1058–1063.
Hooper, P.R., 2000. Flood Basalt Provinces. In: Sigurdsson, B.F.H.H., McNutt, S.R., Rymer,H., Styx, J. (Eds.), Encyclopedia of Volcanoes. Academic Press, San Diego, California,pp. 345–359.
Hori, R.S., Fujiki, T., Inoue, E., Kimura, J.-I., 2007. Platinum group element anomalies andbioevents in the Triassic-Jurassic deep-sea sediments of Panthalassa. Palaeogeography,Palaeoclimatology, Palaeoecology 244 (1–4), 391–406.
Horita, J., Zimmermann, H., Holland, H.D., 2002. Chemical evolution of seawater duringthe Phanerozoic; implications from the record of marine evaporites. Geochimica etCosmochimica Acta 66 (21), 3733–3756.
Hüsing, S.K., Deenen, M.H.L., Koopmans, J.G., Krijgsman, W., 2011. Magnetostratigraphicdating of the proposed Rhaetian GSSP at Steinbergkogel (Upper Triassic, Austria):Implications for the Late Triassic time scale. Earth and Planetary Science Letters 302(1–2), 203–216.
Hutchins, D.A., Mulholland, M.R., Fu, F., 2009. Nutrient Cycles and Marine Microbes in aCO2-Enriched Ocean. Oceanography 22 (4), 128–145.
Ivany, L.C., Sessa, J.A., 2010. Effects of ocean warming and acidification during thePaleocene-Eocene Thermal Maximum on deep and shallow marine communities.Presented at Ecol. Soc. Am. Annu. Meet., Pittsburgh, PA.
Jenkyns, H.C., Jones, C.E., Gröcke, D.R., Hesselbo, S.P., Parkinson, D.N., 2002. Chemostratigraphyof the Jurassic System: applications, limitations and implications for palaeoceano-graphy. Journal of the Geological Society 159, 351–378.
Jokiel, P.L., Rodgers, K.S., Kuffner, I.B., Andersson, A.J., Cox, E.F., Mackenzie, F.T., 2008.Ocean acidification and calcifying reef organisms: A mesocosm investigation. CoralReefs 27 (3), 473–483.
Jury, C.P., Whitehead, R.F., Szmant, A.M., 2010. Effects of variations in carbonatechemistry on the calcification rates of Madracis auretenra (= Madracis mirabilissensu Wells, 1973): bicarbonate concentrations best predict calcification rates.Global Change Biology 16 (5), 1632–1644.
Kasemann, S.A., Hawkesworth, C.J., Prave, A.R., Fallick, A.E., Pearson, P.N., 2005. Boronand calcium isotope composition in Neoproterozoic carbonate rocks fromNamibia: evidence for extreme environmental change. Earth and Planetary ScienceLetters 231 (1–2), 73–86.
Keeling, C.D., Whorf, T.P., Wahlen, M., Van der Plicht, J., 1995. Interannual Extremes inthe Rate of Rise of Atmospheric Carbon-Dioxide Since 1980. Nature 375 (6533),666–670.
Kent, D.V., Olsen, P.E., 2008. Early Jurassic magnetostratigraphy and paleolatitudesfrom the Hartford continental rift basin (eastern North America): Testing forpolarity bias and abrupt polar wander in association with the central Atlanticmagmatic province. Journal of Geophysical Research B: Solid Earth 113 (6), 1–24.
Kerr, R.A., 2010. Ocean acidification unprecedented, unsettling. Science (New York,N.Y.) 328, 1500–1501.
Key, R., Kozyr, A., Sabine, C., Lee, K., Wanninkhof, R., Bullister, J.L., Feely, R.A., Millero, F.J.,Mordy, C., Peng, T.-H., 2004. A global ocean carbon climatology: Results from GlobalData Analysis Project (GLODAP). Global Biogeochemical Cycles 18 (GB4031), 23.
Kiessling, W., Aberhan, M., 2007a. Environmental determinants of marine benthicbiodiversity dynamics through Triassic-Jurassic time. Paleobiology 33 (3), 414–434.
Kiessling, W., Aberhan, M., 2007b. Geographical distribution and extinction risk:lessons from Triassic–Jurassic marine benthic organisms. Journal of Biogeography34 (9), 1473–1489.
Kiessling, W., Simpson, C., 2011. On the potential for ocean acidification to be a generalcause of ancient reef crises. Global Change Biology 17, 56–67.
Kiessling, W., Aberhan, M., Brenneis, B., Wagner, P.J., 2007. Extinction trajectories ofbenthic organisms across the Triassic–Jurassic boundary. Palaeogeography,Palaeoclimatology, Palaeoecology 244, 201–222.
Kiessling, W., Roniewicz, E., Villier, L., Léonide, P., Struck, U., 2009. An early Hettangian coralreef in southern France: Implications for the end-Triassic reef crisis. Palaios 24, 657–671.
Kleypas, J.A., Buddemeier, R.W., Archer, D., Gattuso, J.P., Langdon, C., Opdyke, B.N.,1999a. Geochemical consequences of increased atmospheric carbon dioxide oncoral reefs. Science 284 (5411), 118–120.
Kleypas, J.A., McManus, J.W., Meñez, L.A.B., 1999b. Environmental Limits to Coral ReefDevelopment: Where Do We Draw the Line? American Zoology 39, 146–159.
Knight, K.B., Nomade, S., Renne, P.R., Marzoli, A., Bertrand, H., Youbi, N., 2004. The CentralAtlantic Magmatic Province at the Triassic-Jurassic boundary: Paleomagnetic and40Ar/39Ar evidence from Morocco for brief, episodic volcanism. Earth and PlanetaryScience Letters 228 (1–2), 143–160.
Knoll, A.H., Bambach, R.K., Canfield, D.E., Grotzinger, J.P., 1996. Comparative EarthHistory and Late Permian Mass Extinction. Science 273 (5274), 452–457.
Knoll, A.H., Bambach, R.K., Payne, J.L., Pruss, S., Fischer, W.W., 2007. Paleophysiologyand end-Permian mass extinction. Earth and Planetary Science Letters 256 (3–4),295–313.
Korte, C., Kozur, H.W., 2011. Bio- and chemostratigraphic assessment of carbon isotoperecords across the Triassic-Jurassic boundary at Csővár quarry (Hungary) andKendlbachgraben (Austria) and implications for global correlations. Bulletin of theGeological Society of Denmark 59, 101–115.
Korte, C., Hesselbo, S.P., Jenkyns, H.C., Rickaby, R.E.M., Spötl, C., 2009. Palaeoenviron-mental significance of carbon- and oxygen-isotope stratigraphy of marine Triassic –
Jurassic boundary sections in SW Britain. Journal of the Geological Society of London166, 431–445.
Kroeker, K.J., Kordas, R.L., Crim, R.N., Singh, G.G., 2010. Meta-analysis reveals negativeyet variable effects of ocean acidification on marine organisms. Ecology Letters 13(11), 1419–1434.
Kuerschner, W.M., Bonis, N.R., Krystyn, L., 2007. Carbon-isotope stratigraphy andpalynostratigraphy of the Triassic-Jurassic transition in the Tiefengraben section -Northern Calcareous Alps (Austria). Palaeogeography, Palaeoclimatology, Palaeoecology244 (1–4), 257–280.
Kump, L.R., Bralower, T.J., Ridgwell, A., 2009. Ocean Acidification in Deep Time. Oceanography22 (4), 94–107.
Kuroda, J., Hori, R.S., Suzuki, K., Grocke, D.R., Ohkouchi, N., 2010. Marine osmiumisotope record across the Triassic-Jurassic boundary from a Pacific pelagic site.Geology 38, 1095–1098.
Lathuilière, B., Marchal, D., 2009. Extinction, survival and recovery of corals from theTriassic to Middle Jurassic time. Terra Nova 21 (1), 57–66.
Lear, C.H., Rosenthal, Y., 2006. Benthic foraminiferal Li/Ca: Insights into Cenozoicseawater carbonate saturation state. Geology 34 (11), 985–988.
Leinfelder, R.R., 2001. Jurassic Reef Ecosystems. In: Stanley Jr., G.D. (Ed.), The historyand sedimentology of ancient reef systems. Klewer Academic/Plenum Publishers,New York, pp. 251–309.
Leon-Rodriguez, L., Dickens, G.R., 2010. Constraints on ocean acidification associatedwith rapid and massive carbon injections: The early Paleogene record at oceandrilling program site 1215, equatorial Pacific Ocean. Palaeogeography, Palaeocli-matology, Palaeoecology 298 (3–4), 409–420.

91S.E. Greene et al. / Earth-Science Reviews 113 (2012) 72–93
Locklair, R.E., Lerman, A., 2005. A model of Phanerozoic cycles of carbon and calcium inthe global ocean; evaluation and constraints on ocean chemistry and input fluxes.Chemical Geology 217 (1–2), 113–126.
Lorens, R.B., Bender, M.L., 1977. Physiological exclusion of magnesium from Mytilusedulis calcite. Nature 267, 793–794.
Lucas, S.G., Taylor, D.G., Guex, J., Tanner, L.H., Krainer, K., 2007. Updated proposal forGlobal Stratotype Section and Point for the base of the Jurassic System in the NewYork Canyon area, Nevada, USA. International Subcommission on JurassicStratigraphy Newsletter 34 (1), 34–42.
Mackenzie, F.T., Arvidson, R.S., Guidry, M., 2008. Chemostatic modes of the ocean–atmosphere-sediment system through Phanerozoic time. In: Hodson, M.E. (Ed.),Eighth international symposium on the Geochemistry of the Earth's surface.Mineralogical Society, pp. 329–332.
Mander, L., Twitchett, R.J., Benton, M.J., 2008. Palaeoecology of the Late Triassicextinction event in the SW UK. Journal of the Geological Society 165, 319–332.
Martindale, R.C., Berelson, W.M., Corsetti, F.A., Bottjer, D.J., West, A.J., 2011. Coralsconstrain CaCO3 chemistry at the Triassic–Jurassic boundary, a potential oceanacidification event. Mineralogical Magazine 75 (3), 42.
Marzoli, A., Renne, P.R., Piccirillo, E.M., Ernesto, M., Bellieni, G., De Min, A., 1999.Extensive 200-million-year-old continental flood basalts of the Central AtlanticMagmatic Province. Science 284 (5414), 616–618.
Marzoli, A., Bertrand, H., Knight, K.B., Cirilli, S., Buratti, N., Vérati, C., Nomade, S., Renne,P.R., Youbi, N., Martini, R., Allenbach, K., Neuwerth, R., Rapaille, C., Zaninetti, L.,Bellieni, G., 2004. Synchrony of the Central Atlantic magmatic province and theTriassic-Jurassic boundary climatic and biotic crisis. Geology 32 (11), 973–976.
Mayall, M.J., Wright, V.P., 1981. Algal tuft structures in the stromatolites from theUpper Triassic of South-West England. Palaeontology 24 (3), 655–660.
McElwain, J.C., Beerling, D.J., Woodward, F.I., 1999. Fossil plants and global warming atthe Triassic-Jurassic boundary. Science 285 (5432), 1386–1390.
McElwain, J.C., Popa, M.E., Hesselbo, S.P., Haworth, M., Surlyk, F., 2007. Macroecologicalresponses of terrestrial vegetation to climatic and atmospheric change across theTriassic/Jurassic boundary in East Greenland. Paleobiology 33 (4), 547–573.
McElwain, J.C., Wagner, P.J., Hesselbo, S.P., 2009. Fossil Plant Relative AbundancesIndicate Sudden Loss of Late Triassic Biodiversity in East Greenland. Science 324,1554–1556.
McHone, J.G., 2002. Volatile Emissions from Central Atlantic Magmatic Province Basalts:Mass Assumptions and Environmental Consequences. AGU Monograph, pp. 1–13.
McHone, G., 2003. Volatile emissions of Central Atlantic Magmatic Province basalts:Mass assumptions and environmental consequences. In: Hames, W.E., McHone,J.G., Renne, P.R., Ruppel, C. (Eds.), The Central Atlantic Magmatic Province: Insightsfrom Fragments of Pangea. the American Geophysical Union, Washington, D.C, pp.241–254.
McInerney, F.A., Wing, S.L., 2011. The Paleocene-Eocene Thermal Maximum: APerturbation of Carbon Cycle, Climate, and Biosphere with Implications for theFuture. Annual Review of Earth and Planetary Sciences 39 (1), 489–516.
McRoberts, C.A., Newton, C.R., 1995. Selective extinction among end-Triassic Europeanbivalves. Geology 23 (2), 102–104.
McRoberts, C.A., Furrer, H., Jones, D.S., 1997. Palaeoenvironmental interpretation of aTriassic-Jurassic boundary section from western Austria based on palaeoecologicaland geochemical data. Palaeogeography, Palaeoclimatology, Palaeoecology 136(1–4), 79–95.
Medina, M., Collins, A.G., Takaoka, T.L., Kuehl, J.V., Boore, J.L., 2006. Naked corals:Skeleton loss in Scleractinia. Proceedings of the National Academy of Sciences 103(24), 9096–9100.
Mehrbach, C., Culberson, C.H., Hawley, J.E., Pytkowicz, R.N., 1973. Measurement of theapparent dissociation constants of carbonic acid in seawater at atmosphericpressure. Limnology and Oceanography 18, 897–907.
Michalík, J., Lintnerová, O., Gazdzicki, A., Soták, J., 2007. Record of environmentalchanges in the Triassic-Jurassic boundary interval in the Zliechov Basin, WesternCarpathians. Palaeogeography, Palaeoclimatology, Palaeoecology 244 (1–4),71–88.
Michalík, J., Biroň, A., Lintnerova, O., Götz, A.E., Ruckwied, K., 2010. Climate change atthe Triassic/Jurassic boundary in the northwestern Tethyan realm, inferred fromsections in the Tatra Mountains (Slovakia). Acta Geologica Polonica 60 (4),535–548.
Morante, R., Hallam, A., 1996. Organic carbon isotopic record across the Triassic-Jurassic boundary in Austria and its bearing on the cause of the mass extinction.Geology 24 (5), 391–394.
Morse, J.W., He, S., 1993. Influences of T, S and pCO2 on the pseudo-homogeneousprecipitation of CaCO3 from seawater: implications for whiting formation. MarineChemistry 41 (4), 291–297.
Morse, J.W., Gledhill, D.K., Millero, F.J., 2003. CaCO3 precipitation kinetics in watersfrom the great Bahama bank: Implications for the relationship between bankhydrochemistry and whitings. Geochimica et Cosmochimica Acta 67 (15),2819–2826.
Mount, A.S., Wheeler, A.P., Paradkar, R.P., Snider, D., 2004. Hemocyte-Mediated ShellMineralization in the Eastern Oyster. Science 304, 297–300.
Muttoni, G., Kent, D.V., Jadoul, F., Olsen, P.E., Rigo, M., Galli, M.T., Nicora, A., 2010. Rhaetianmagneto-biostratigraphy from the Southern Alps (Italy): Constraints on Triassicchronology. Palaeogeography, Palaeoclimatology, Palaeoecology 285 (1–2), 1–16.
Nienhuis, S., Palmer, A.R., Harley, C.D.G., 2010. Elevated CO2 affects shell dissolutionrate but not calcification rate in a marine snail. Proceedings of the Royal Society B:Biological Sciences 277 (1693), 2553–2558.
Nomade, S., Knight, K.B., Beutel, E., Renne, P.R., Verati, C., Féraud, G., Marzoli, A., Youbi,N., Bertrand, H., 2007. Chronology of the Central Atlantic Magmatic Province:Implications for the Central Atlantic rifting processes and the Triassic-Jurassic
biotic crisis. Palaeogeography, Palaeoclimatology, Palaeoecology 244 (1–4),326–344.
Ogg, J.G., Ogg, G., Gradstein, F.M., 2008. Triassic Period. The concise geologic time scale.Cambridge University Press, Cambridge, UK, pp. 95–106.
Olsen, P.E., 1999. Giant lava flows, mass extinctions, and mantle plumes. Science 284(5414), 604–605.
Olsen, P.E., Schlische, R.W., Fedosh, M.S., 1996. 580 ky duration of the Early Jurassicflood basalt event in eastern North America estimated using Milankovitchcyclostratigraphy. In: Morales, M. (Ed.), The Continental Jurassic: Museum ofNorthern Arizona Bulletin, 60, pp. 11–22.
Olsen, P.E., Kent, D.V., Fowell, S.J., 1997. Causal? association of the Triassic – Jurassic massextinction and Pangean flood basalt —a matter of timing. Eos 78 (F721 Suppl.).
Olsen, P.E., Kent, D.V., Et-Touhami, M., Puffer, J., 2003. Cyclo-, magneto-, and bio-stratigraphic constraints on the duration of the CAMP event and its relationship tothe Triassic–Jurassic boundary. In: Hames, W.E., McHone, J.G., Renne, P.R., Ruppel,C. (Eds.), The Central Atlantic Magmatic Province- Insights from Fragments ofPangea. : Geophysical Monograph Series. The American Geophysical Union,Washington, D.C, pp. 7–32.
Orr, J.C., Fabry, V.J., Aumont, O., Bopp, L., Doney, S.C., Feely, R.A., Gnanadesikan, A.,Gruber, N., Ishida, A., Joos, F., Key, R.M., Lindsay, K., Maier-Reimer, E., Matear, R.,Monfray, P., Mouchet, A., Najjar, R.G., Plattner, G.-K., Rodgers, K.B., Sabine, C.L.,Sarmiento, J.L., Schlitzer, R., Slater, R.D., Totterdell, I.J., Weirig, M.-F., Yamanaka, Y.,Yool, A., 2005. Anthropogenic ocean acidification over the twenty-first century andits impact on calcifying organisms. Nature 437 (7059), 681–686.
Pálfy, J., Demény, A., Hass, J., Hetényi, M., Orchard, M.J., Vető, I., 2001. Carbon isotopeanomaly and other geochemical changes at the Triassic-Jurassic boundary from amarine section in Hungary. Geology 29 (11), 1047–1050.
Pálfy, J., Demény, A., Haas, J., Carter, E.S., Görög, Á., Halász, D., Oravecz-Scheffer, A., Hetényi,M., Márton, E., Orchard, M.J., Ozsvárt, P., Vető, I., Zajzon, N., 2007. Triassic-Jurassicboundary events inferred from integrated stratigraphy of the Csövár section, Hungary.Palaeogeography, Palaeoclimatology, Palaeoecology 244 (1–4), 11–33.
Palmer, M.R., Pearson, P.N., Cobb, S.J., 1998. Reconstructing Past Ocean pH-DepthProfiles. Science 282 (5393), 1468–1471.
Paris, G., Beaumont, V., Bartolini, A., Clémence, M.-E., Gardin, S., Page, K., 2010. Nitrogenisotope record of a perturbed paleoecosystem in the aftermath of the end-Triassiccrisis, Doniford section, SW England. Geochemistry, Geophysics, Geosystems 11(Q08021), 1–15.
Payne, J.L., Lehrmann, D.J., Follett, D., Seibel, M., Kump, L.R., Riccardi, A., Altiner, D.,Sano, H., Wei, J., 2007. Erosional truncation of uppermost Permian shallow-marinecarbonates and implications for Permian-Triassic boundary events. GeologicalSociety of America Bulletin 119 (7–8), 771–784.
Payne, J.L., Turchyn, A.V., Paytan, A., DePaolo, D.J., Lehrmann, D.J., Yu, M., Wei, J., 2010.Calcium isotope constraints on the end-Permian mass extinction. Proceedings ofthe National Academy of Sciences 107 (19), 8543–8548.
Pearson, P.N., Palmer, M.R., 2002. The boron isotope approach to paleo-pCO2
estimation. Geochimica et Cosmochimica Acta 66 (15A), A586.Pelejero, C., Calvo, E., Hoegh-Guldberg, O., 2010. Paleo-perspectives on ocean
acidification. Trends in Ecology & Evolution 25 (6), 332–344.Pierrot, D.E.L., Wallace, D.W.R., 2006. MS Excel Program Developed for CO2 System
Calculations. ORNL/CDIAC-105a.Pörtner, H.-O., 2008. Ecosystem effects of ocean acidification in times of ocean
warming: a physiologist's view. Marine Ecology Progress Series 373, 203–217.Pörtner, H., Langenbuch, M., Reipschläger, A., 2004. Biological Impact of Elevated Ocean
CO2 Concentrations: Lessons from Animal Physiology and Earth History. Journal ofOceanography 60 (4), 705–718.
Pörtner, H.O., Langenbuch, M., Michaelidis, B., 2005. Synergistic effects of temperatureextremes, hypoxia, and increases in CO2 on marine animals: From Earth history toglobal change. Journal of Geophysical Research 110 (C9), C09S10.
Pruss, S.B., Bottjer, D.J., Corsetti, F.A., Baud, A., 2006. A global marine sedimentaryresponse to the end-Permian mass extinction: Examples from southern Turkey andthe western United States. Earth-Science Reviews 78 (3–4), 193–206.
Quan, T.M., van de Schootbrugge, B., Field, M.P., Rosenthal, Y., Falkowski, P.G., 2008.Nitrogen isotope and trace metal analyses from the Mingolsheim core (Germany):Evidence for redox variations across the Triassic-Jurassic boundary. GlobalBiogeochemical Cycles 22, 1–14.
Radley, J.D., Twitchett, R.J., Mander, L., Cope, J.C.W., 2008. Discussion on palaeoecologyof the Late Triassic extinction event in the SW UK. Journal of the Geological Society165 (1), 319–332.
Raup, D.M., Sepkoski Jr., J.J., 1982. Mass extinctions in the marine fossil record. Science215 (4539), 1501–1503.
Reggiani, L., Bertinelli, A., Ciarapica, G., Marcucci, M., Passeri, L., Ricci, C., Rigo, M., 2005.Triassic-Jurassic stratigraphy of the Madonna del Sirino succession (LagonegroBasin, Southern Apennines, Italy). Bolletino della Società geologica italiana 124 (1),281–291.
Renne, P.R., 2000. 40Ar/39Ar age of plagioclase from Acapulco meteorite and theproblem of systematic errors in cosmochronology. Earth and Planetary ScienceLetters 175 (1–2), 13–26.
Ridgwell, A., 2005. A Mid Mesozoic Revolution in the regulation of ocean chemistry.Marine Geology 217 (3–4), 339–357.
Ridgwell, A., 2007. Interpreting transient carbonate compensation depth changes bymarine sediment core modeling. Paleoceanography 22 (4), PA4102.
Ridgwell, A., Zeebe, R.E., 2005. The role of the global carbonate cycle in the regulationand evolution of the Earth system. Earth and Planetary Science Letters 234 (3–4),299–315.
Ries, J.B., Cohen, A.L., McCorkle, D.C., 2009. Marine calcifiers exhibit mixed responses toCO2-induced ocean acidification. Geology 37 (12), 1131–1134.

92 S.E. Greene et al. / Earth-Science Reviews 113 (2012) 72–93
Robinson, S.A., 2011. Shallow-water carbonate record of the Paleocene-EoceneThermal Maximum from a Pacific Ocean guyot. Geology 39 (1), 51–54.
Rosa, R., Seibel, B.A., 2008. Synergistic effects of climate-related variables suggestfuture physiological impairment in a top oceanic predator. Proceedings of theNational Academy of Sciences 105 (52), 20776–20780.
Rožič, B., 2008. Upper Triassic and Lower Jurassic limestones from Mt Kobla in thenorthern Tolmin Basin: tectonically repeated or continuous succession? RMZ -Materials and Geoenvironment 55 (3), 345–362.
Rožič, B., Kolar-Jurkovšek, T., Šmuc, A., 2009. Late Triassic sedimentary evolution ofSlovenian Basin (eastern Southern Alps): description and correlation of the SlatnikFormation. Facies 55, 137–155.
Ruhl, M., Kürschner, W.M., 2011. Multiple phases of carbon cycle disturbance fromlarge igneous province formation at the Triassic-Jurassic transition. Geology 39 (5),431–434.
Ruhl, M., Kürschner, W.M., Krystyn, L., 2009. Triassic–Jurassic organic carbon isotopestratigraphy of key sections in the western Tethys realm (Austria). Earth andPlanetary Science Letters 281 (3–4), 169–187.
Ruhl, M., Deenen, M.H.L., Abels, H.A., Bonis, N.R., Krijgsman, W., Kürschner, W.M., 2010a.Astronomical constraints on the duration of the early Jurassic Hettangian stage andrecovery rates following the end-Triassic mass extinction (St Audrie's Bay/EastQuantoxhead, UK). Earth and Planetary Science Letters 295 (1–2), 262–276.
Ruhl, M., Veld, H., Kürschner, W.M., 2010b. Sedimentary organic matter characteriza-tion of the Triassic–Jurassic boundary GSSP at Kuhjoch (Austria). Earth andPlanetary Science Letters 292, 17–26.
Ruhl, M., Bonis, N.R., Reichart, G.-J., Damsté, J.S.S., Kürschner, W.M., 2011. AtmosphericCarbon Injection Linked to End-TriassicMass Extinction. Science 333 (6041), 430–434.
Sanyal, A., Hemming, H.G., Broecker, W.S., Lea, D.W., Spero, H.J., Hanson, G.N., 1996.Oceanic pH control on the boron isotopic composition of foraminifera: evidencefrom culture experiments. Paleoceanography 11 (5), 513–517.
Schaller, M.F., Wright, J.D., Kent, D.V., 2011. Atmospheric pCO2 Perturbations Associatedwiththe Central Atlantic Magmatic Province. Science 331 (6023), 1404–1409.
Schaller, M.F., Wright, J.D., Kent, D.V., Olsen, P.E., 2012. Rapid emplacement of theCentral Atlantic Magmatic Province as a net sink for CO2. Earth and PlanetaryScience Letters 323–324, 27–39.
Schaltegger, U., Guex, J., Bartolini, A., Schoene, B., Ovtcharova, M., 2008. Precise U–Pb ageconstraints for end-Triassic mass extinction, its correlation to volcanism and Hettangianpost-extinction recovery. Earth and Planetary Science Letters 267, 266–275.
Schneider, K., Erez, J., 2006. The Effect of Carbonate Chemistry on Calcification andPhotosynthesis in the Hermatypic Coral Acropora eurystoma. Limnology andOceanography 51 (3), 1284–1293.
Schoene, B., Guex, J., Bartolini, A., Schaltegger, U., Blackburn, T.J., 2010. Correlating theend-Triassic mass extinction and flood basalt volcanism at the 100 ka level.Geology 38 (5), 387–390.
Self, S., Thordarson, T., Widdowson, M., 2005. Gas fluxes from flood basalt eruptions.Elements 1 (5), 283–287.
Sepkoski Jr., J.J., Miller, A.I., 1985. Evolutionary Faunas and the distribution of paleozoicmarine communities in space and time. In: Valentine, J.W. (Ed.), PhanerozoicDiversity Patterns. : Princeton Series in Geology and Paleontology. AmericanAssociation for the Advancement of Science, Princeton, pp. 153–190.
Stanley, G.D.J., 2003. The evolution of modern corals and their early history. Earth-Science Reviews 60 (3–4), 195–225.
Steinthorsdottir, M., Jeram, A.J., McElwain, J.C., 2011. Extremely elevated CO2
concentrations at the Triassic/Jurassic boundary. Palaeogeography, Palaeoclima-tology, Palaeoecology 308 (3–4), 418–432.
Stott, D.F., 1998. Fernie Formation and Minnes Group (Jurassic and lowermostCretaceous), northern Rocky Mountain foothills, Alberta and British Columbia.Geological Survey of Canada Bulletin 516.
Stuecker, M.F., Zeebe, R.E., 2010. Ocean chemistry and atmospheric CO2 sensitivity tocarbon perturbations throughout the Cenozoic. Geophysical Research Letters 37 (3).
Suchecki, R.K., Hubert, J.F., Wet, C.C.B.D., 1988. Isotopic imprint of climate andhydrogeochemistry on terrestrial strata of the Triassic-Jurassic Hartford and Fundyrift basins. Journal of Sedimentary Petrology 58 (5), 801–811.
Sumner, D.Y., 2001. Decimetre-Thick Encrustations of Calcite and Aragonite on the Sea-Floor and Implications for Neoarchaean and Neoproterozoic Ocean Chemistry. In:Altermann, W., Corcoran, P.L. (Eds.), Precambrian Sedimentary Environments: AModern Approach to Ancient Depositional Systems. : Special Publication #33 of theInternational Association of Sedimentologists. Blackwell Publishing Ltd, pp. 107–120.
Sumner, D.Y., Grotzinger, J.P., 1996. Were kinetics of Archean calcium carbonateprecipitation related to oxygen concentration? Geology 24 (2), 119–122.
Svensen, H., Planke, S., Polozov, A.G., Schmidbauer, N., Corfu, F., Podladchikov, Y.Y.,Jamtveit, B., 2009a. Siberian gas venting and the end-Permian environmental crisis.Earth and Planetary Science Letters 277 (3–4), 490–500.
Svensen, H., Schmidbauer, N., Roscher, M., Stordal, F., Planke, S., 2009b. Contactmetamorphism, halocarbons, and environmental crises of the past. EnvironmentalChemistry 6 (6), 466–471.
Svensen, H., Planke, S., Corfu, F., 2010. Zircon dating ties NE Atlantic sill emplacement toinitial Eocene global warming. Journal of the Geological Society 167 (3), 433–436.
Symonds, R.B., Rose, W.I., Bluth, G.J.S., Gerlach, T.M., 1994. Volcanic-gas studies;methods, results, and applications. Volatiles in magmas 30, 1–66.
Tanner, L.H., Hubert, J.F., Coffey, B.P., McInerney, D.P., 2001. Stability of atmosphericCO2 levels across the Triassic-Jurassic boundary. Nature 411, 675–677.
Tanner, L.H., Lucas, S.G., Chapman, M.G., 2004. Assessing the record and causes of LateTriassic extinctions. Earth-Science Reviews 65 (1–2), 103–139.
Thorne, P.M., Ruta, M., Benton, M.J., 2011. Resetting the evolution of marine reptiles atthe Triassic-Jurassic boundary. Proceedings of the National Academy of Sciences108 (20), 8339–8344.
Tomašových, A., Siblík, M., 2007. Evaluating compositional turnover of brachiopodcommunities during the end-Triassic mass extinction (Northern Calcareous Alps):Removal of dominant groups, recovery and community reassembly. Palaeogeo-graphy, Palaeoclimatology, Palaeoecology 244 (1–4), 170–200.
Tozer, E.T., 1982. Late Triassic (Upper Norian) and earliest Jurassic (Hettangian) rocksand ammonoid faunas. Halfway River and Pine Pass areas, British Columbia:Geological Survey of Canada, Current Research, 82-1A, pp. 385–391.
Tucker, M.E., Wright, V.P., 1990. Carbonate sedimentology. Blackwell Science, London.482 pp.
Tunnicliffe, V., Davies, K.T.A., Butterfield, D.A., Embley, R.W., Rose, J.M., Chadwick,W.W., 2009. Survival of mussels in extremely acidic waters on a submarinevolcano. Nature Geoscience 2 (5), 344–348.
van de Schootbrugge, B., Tremolada, F., Rosenthal, Y., Bailey, T.R., Feist-Burkhardt, S.,Brinkhuis, H., Pross, J., Kent, D.V., Falkowski, P.G., 2007. End-Triassic calcificationcrisis and blooms of organic-walled 'disaster species'. Palaeogeography, Palaeocli-matology, Palaeoecology 244 (1–4), 126–141.
van de Schootbrugge, B., Payne, J.L., Tomašových, A., Pross, J., Fiebig, J., Benbrahim, M.,Föllmi, K.B., Quan, T.M., 2008. Carbon cycle perturbation and stabilization in thewake of the Triassic-Jurassic boundary mass-extinction event. Geochemistry,Geophysics, Geosystems 9 (4), Q04028 (16 pp.).
Verati, C., Rapaille, C., Féraud, G., Marzoli, A., Bertrand, H., Youbi, N., 2007. 40Ar/39Arages and duration of the Central Atlantic Magmatic Province volcanism in Moroccoand Portugal and its relation to the Triassic-Jurassic boundary. Palaeogeography,Palaeoclimatology, Palaeoecology 244 (1–4), 308–325.
Veron, J.E.N., 2008. Mass extinctions and ocean acidification: biological constraints ongeological dilemmas. Coral Reefs 27 (3), 459–472.
Veron, J.E.N., Hoegh-Guldberg, O., Lenton, T.M., Lough, J.M., Obura, D.O., Pearce-Kelly,P., Sheppard, C.R.C., Spalding, M., Stafford-Smith, M.G., Rogers, A.D., 2009. The coralreef crisis: The critical importance of b350 ppm CO2. Marine Pollution Bulletin 58(10), 1428–1436.
von Hillebrandt, A., 1994. The Triassic/Jurassic boundary and Hettangian biostratigra-phy in the area of the Utcubamba valley (Northern Peru). Geobios 27, 297–307.
von Hillebrandt, A., Krystyn, L., 2009. On the oldest Jurassic ammonites of Europe(Northern Calcareous Alps, Austria) and their global significance. Neues Jahrbuchfür Geologie und Paläontologie - Abhandlungen 253, 163–195.
von Hillebrandt, A., Krystyn, W.M., Kuerschner, 2007. A candidate GSSP for the base ofthe Jurassic in the Northern Calcareous Alps (Kuhjoch section, KarwendelMountains, Tyrol, Austria). International Subcommission on Jurassic StratigraphyNewsletter 34 (1), 2–20.
Walker, J.D., Geissman, J.W., 2009. 2009 GSA Geologic Time Scale. GSA Today 19 (4),60–61.
Wall-Palmer, D., Jones, M.T., Hart, M.B., Fisher, J.K., Smart, C.W., Hembury, D.J., Palmer,M.R., Fones, G.R., 2011. Explosive volcanism as a cause for mass mortality ofpteropods. Marine Geology 282 (3–4), 231–239.
Ward, P.D., Haggart, J.W., Carter, E.S., Wilbur, D., Tipper, H.W., Evans, T., 2001. Suddenproductivity collapse associated with the Triassic-Jurassic boundary mass extinc-tion. Science 292 (5519), 1148–1151.
Ward, P.D., Garrison, G.H., Haggart, J.W., Kring, D.A., Beattie, M.J., 2004. Isotopicevidence bearing on Late Triassic extinction events, Queen Charlotte Islands,British Columbia, and implications for the duration and cause of the Triassic/Jurassic mass extinction. Earth and Planetary Science Letters 224 (3–4), 589–600.
Ward, P.D., Garrison, G.H., Williford, K.H., Kring, D.A., Goodwin, D., Beattie, M.J.,McRoberts, C.A., 2007. The organic carbon isotopic and paleontological recordacross the Triassic-Jurassic boundary at the candidate GSSP section at FergusonHill, Muller Canyon, Nevada, USA. Palaeogeography, Palaeoclimatology, Palaeoe-cology 244 (1–4), 281–289.
Warrington, G., Cope, J.C.W., Ivimey-Cook, H.C., 2008. The St Audrie's Bay – DonifordBay section, Somerset, England: updated proposal for a candidate GlobalStratotype Section and Point for the base of the Hettangian Stage, and of theJurassic System. International Subcommission on Jurassic Stratigraphy Newsletter35 (1), 2–66.
Weiss, I.M., Tuross, N., Addadi, L., Weiner, S., 2002. Mollusc larval shell formation:amorphous calcium carbonate is a precursor phase for aragonite. The Journal ofExperimental Zoology 293 (5), 478–491.
Whiteside, J.H., Olsen, P.E., Eglinton, T., Brookfield, M.E., Sambrotto, R.N., 2010.Compound-specific carbon isotopes from Earth's largest flood basalt eruptionsdirectly linked to the end-Triassic mass extinction. Proceedings of the NationalAcademy of Sciences 107 (15), 6721–6725.
Widdicombe, S., Spicer, J.I., 2008. Predicting the impact of ocean acidification onbenthic biodiversity: What can animal physiology tell us? Journal of ExperimentalMarine Biology and Ecology 366 (1–2), 187–197.
Wignall, P.B., 2001. Large igneous provinces and mass extinctions. Earth-ScienceReviews 53 (1–2), 1–33.
Wignall, P., 2005. The Link between Large Igneous Province Eruptions and MassExtinctions. Elements 1 (5), 293–297.
Wignall, P.B., 2007. The End-Permian mass extinction – how bad did it get? Geobiology5 (4), 303–309.
Wignall, P.B., Bond, D.P.G., 2008. The end-Triassic and Early Jurassic mass extinctionrecords in the British Isles. Proceedings of the Geologists Association 119 (1), 73–84.
Wignall, P.B., Zonneveld, J.-P., Newton, R.J., Amor, K., Sephton, M.A., Hartley, S., 2007.The end Triassic mass extinction record of Williston Lake, British Columbia.Palaeogeography, Palaeoclimatology, Palaeoecology 253 (3–4), 385–406.
Wignall, P.B., Kershaw, S., Collin, P.-Y., Crasquin-Soleau, S., 2009. Erosional truncationof uppermost Permian shallow-marine carbonates and implications for Permian-Triassic boundary events: Comment. Geological Society of America Bulletin 121(5–6), 954–956.

93S.E. Greene et al. / Earth-Science Reviews 113 (2012) 72–93
Williford, K.H., Ward, P.D., Garrison, G.H., Buick, R., 2007. An extended organic carbon-isotope record across the Triassic-Jurassic boundary in the Queen Charlotte Islands,British Columbia, Canada. Palaeogeography, Palaeoclimatology, Palaeoecology 244(1–4), 290–296.
Wood, H.L., Spicer, J.I., Widdicombe, S., 2008. Ocean acidification may increasecalcification rates, but at a cost. Proceedings of the Royal Society B: BiologicalSciences 275 (1644), 1767–1773.
Wootton, J.T., Pfister, C.A., Forester, J.D., 2008. Dynamic patterns and ecological impacts ofdeclining ocean pH in a high-resolution multi-year dataset. Proceedings of theNational Academy of Sciences of the United States of America 105 (48), 18848–18853.
Yin, J., Cai, H., Zhang, Y., 2006. Carbon isotope negative excursions across the Triassic-Jurassic boundary interval in the Tibetan Himalayas. Progress in Natural Science 16(13).
Yu, J., Elderfield, H., 2007. Benthic foraminiferal B/Ca ratios reflect deep watercarbonate saturation state. Earth and Planetary Science Letters 258 (1–2), 73–86.
Zachos, J.C., Röhl, U., Schellenberg, S.A., Sluijs, A., Hodell, D.A., Kelly, D.C., Thomas, E.,Nicolo, M., Raffi, I., Lourens, L.J., McCarren, H., Kroon, D., 2005. Rapid Acidification
of the Ocean During the Paleocene-Eocene Thermal Maximum. Science 308(5728), 1611–1615.
Zajzon, N., 2003. Micro- and Clay Mineralogy of Carbonates in the Tr/J BoundarySection at Csővár, Hungary. 3rd Field Workshop of IGCP 458 (Tr/J BoundaryEvents), Stará Lesná, Slovakia: Abstracts, pp. 41–42. Oct. 12–14.
Zeebe, R.E., 2011. Where are you heading Earth? Nature Geoscience 4 (7), 416–417.Zeebe, R.E., Westbroek, P., 2003. A simple model for the CaCO3 saturation state of the
ocean: The “Strangelove”, the “Neritan”, and the “Cretan” Ocean. Geochemistry,Geophysics, Geosystems 4 (1104), 1–26.
Zeebe, R.E., Wolf-Gladrow, D., 2001. CO2 in Seawater: Equilibrium, Kinetics, Isotopes.Elsevier Oceanography Series, 65. Elsevier, Amsterdam. 346 pp.
Zeebe, R.E., Zachos, J.C., 2007. Reversed deep-sea carbonate ion basin gradient duringPaleocene-Eocene thermal maximum. Paleoceanography 22 (PA3201) (17 pp.).
Copyright © 2022 FDOKUMEN