Apiaceae Essential Oils: Boosters of Terbinafine Activity ...
Upload
independentCategory
view
6download
0
BGD10, 1831–1865, 2013
Benthic carbonfluxes and ocean
acidification
K. R. N. Anthony et al.
Title Page
Abstract Introduction
Conclusions References
Tables Figures
J I
J I
Back Close
Full Screen / Esc
Printer-friendly Version
Interactive Discussion
Discussion
Paper
|D
iscussionP
aper|
Discussion
Paper
|D
iscussionP
aper|
Biogeosciences Discuss., 10, 1831–1865, 2013www.biogeosciences-discuss.net/10/1831/2013/doi:10.5194/bgd-10-1831-2013© Author(s) 2013. CC Attribution 3.0 License.
EGU Journal Logos (RGB)
Advances in Geosciences
Open A
ccess
Natural Hazards and Earth System
Sciences
Open A
ccess
Annales Geophysicae
Open A
ccess
Nonlinear Processes in Geophysics
Open A
ccess
Atmospheric Chemistry
and Physics
Open A
ccess
Atmospheric Chemistry
and Physics
Open A
ccess
Discussions
Atmospheric Measurement
Techniques
Open A
ccess
Atmospheric Measurement
Techniques
Open A
ccess
Discussions
Biogeosciences
Open A
ccess
Open A
ccess
BiogeosciencesDiscussions
Climate of the Past
Open A
ccess
Open A
ccess
Climate of the Past
Discussions
Earth System Dynamics
Open A
ccess
Open A
ccess
Earth System Dynamics
Discussions
GeoscientificInstrumentation
Methods andData Systems
Open A
ccess
GeoscientificInstrumentation
Methods andData Systems
Open A
ccess
Discussions
GeoscientificModel Development
Open A
ccess
Open A
ccess
GeoscientificModel Development
Discussions
Hydrology and Earth System
Sciences
Open A
ccess
Hydrology and Earth System
Sciences
Open A
ccess
Discussions
Ocean ScienceO
pen Access
Open A
ccess
Ocean ScienceDiscussions
Solid Earth
Open A
ccess
Open A
ccess
Solid EarthDiscussions
The Cryosphere
Open A
ccess
Open A
ccess
The CryosphereDiscussions
Natural Hazards and Earth System
Sciences
Open A
ccess
Discussions
This discussion paper is/has been under review for the journal Biogeosciences (BG).Please refer to the corresponding final paper in BG if available.
Benthic buffers and boosters of oceanacidification on coral reefsK. R. N. Anthony1,3, G. Diaz-Pulido2, N. Verlinden3, B. Tilbrook4, andA. J. Andersson5
1Australian Institute of Marine Science, Townsville, Qld 4810, Australia2Griffith School of Environment and Australian Rivers Institute – Coasts & Estuaries,Nathan Campus, Griffith University, Nathan, Queensland 4111, Australia3Biological Sciences, The University of Queensland, St Lucia, Q4072, Australia4Marine and Atmospheric Research, CSIRO, Hobart, Tasmania 7000, Australia5Scripps Institution of Oceanography, University of California San Diego, 9500 Gilman Drive,La Jolla, CA 92093-0202, USA
Received: 9 January 2013 – Accepted: 10 January 2013 – Published: 1 February 2013
Correspondence to: K. R. N. Anthony ([email protected])
Published by Copernicus Publications on behalf of the European Geosciences Union.
1831

BGD10, 1831–1865, 2013
Benthic carbonfluxes and ocean
acidification
K. R. N. Anthony et al.
Title Page
Abstract Introduction
Conclusions References
Tables Figures
J I
J I
Back Close
Full Screen / Esc
Printer-friendly Version
Interactive Discussion
Discussion
Paper
|D
iscussionP
aper|
Discussion
Paper
|D
iscussionP
aper|
Abstract
Ocean acidification is a threat to marine ecosystems globally. In shallow-water systems,however, ocean acidification can be masked by benthic carbon fluxes, depending oncommunity composition, seawater residence time, and the magnitude and balance ofnet community production (pn) and calcification (gn). Here, we examine how six benthic5
groups from a coral reef environment on Heron Reef (Great Barrier Reef, Australia)contribute to changes in seawater aragonite saturation state (Ωa). Results of flumestudies showed a hierarchy of responses across groups, depending on CO2 level, timeof day and water flow. At low CO2 (350–450 µatm), macroalgae (Chnoospora implexa),turfs and sand elevated Ωa of the flume water by around 0.10 to 1.20 h−1 – normalised10
to contributions from 1 m2 of benthos to a 1 m deep water column. The rate of Ωaincrease in these groups was doubled under acidification (560–700 µatm) and high flow(35 compared to 8 cm s−1). In contrast, branching corals (Acropora aspera) increasedΩa by 0.25 h−1 at ambient CO2 (350–450 µatm) during the day, but reduced Ωa underacidification and high flow. Nighttime changes in Ωa by corals were highly negative15
(0.6–0.8 h−1) and exacerbated by acidification. Calcifying macroalgae (Halimeda spp.)raised Ωa by day (by around 0.13 h−1), but lowered Ωa by a similar or higher amountat night. Analyses of carbon flux contributions from four different benthic compositionsto the reef water carbon chemistry across Heron Reef flat and lagoon indicated thatthe net lowering of Ωa by coral-dominated areas can to some extent be countered by20
long water residence times in neighbouring areas dominated by turfs, macroalgae andpotentially sand.
1 Introduction
Ocean acidification is the chemical consequence of the increasing carbon dioxide con-centration in the atmosphere (Caldeira and Wickett, 2003; Sabine et al., 2004), and is25
a growing threat to marine calcifiers globally (Raven et al., 2005). Modelling studies,
1832

BGD10, 1831–1865, 2013
Benthic carbonfluxes and ocean
acidification
K. R. N. Anthony et al.
Title Page
Abstract Introduction
Conclusions References
Tables Figures
J I
J I
Back Close
Full Screen / Esc
Printer-friendly Version
Interactive Discussion
Discussion
Paper
|D
iscussionP
aper|
Discussion
Paper
|D
iscussionP
aper|
experimental evidence and reviews suggest that calcification rates of coral reef builderswill decline significantly during this century (Kleypas et al., 1999; Hoegh-Guldberg etal., 2007; Langdon and Atkinson, 2005), shifting reefs from being net accreting to netdissolving communities (Andersson et al., 2009; Silverman et al., 2009). Ocean acid-ification projections, however, are mainly based on the exchange of carbon between5
atmosphere and open-ocean surface waters (Caldeira and Wickett, 2003; Gledhill etal., 2008) and therefore do not formally take account of the carbon exchange betweenseawater and benthic communities. The carbon chemistry of tropical and subtropical,open-ocean surface seawater is largely driven by air-sea CO2 exchange, and increas-ing surface seawater pCO2 closely tracks the observed increase in atmospheric CO210
arising from anthropogenic activities (Bates and Peters, 2007; Orr, 2011). On shorttimescales (hours to decades), benthic carbon exchange has a small influence onthe open ocean surface seawater. However, in shallow waters characteristic of trop-ical coral reefs and some coastal environmental settings, benthic carbon fluxes aresuperimposed on the anthropogenic carbon signal, and may in some situations mask15
variations in the carbon chemistry of the open ocean source water (Anthony et al.,2011; Santos et al., 2011).
Although a large body of evidence indicates that coral reefs are likely to becomeadversely affected by ocean acidification during this century (Kleypas et al., 1999;Hoegh-Guldberg et al., 2007; Silverman et al., 2009), spatial and temporal variation20
in physical reef settings (e.g. depth and flow) and benthic community composition islikely to interact with ocean acidification. For example, high rates of net photosynthe-sis of non-calcifying primary producers (macroalgae, benthic microalgae, seagrasses)can draw down CO2 significantly, potentially counteracting ocean acidification locally inshallow waters, and elevating seawater aragonite saturation state (Ωa) in downstream25
habitats. However, the net effect is dependent on the fate of the organic matter andwhether it is stored as biomass, permanently buried in the sediments, exported or rem-inerialized. As the rate of coral calcification is generally positively related to Ωa (e.g.Langdon and Atkinson, 2005; Schneider and Erez, 2006; Silverman et al., 2007), high
1833

BGD10, 1831–1865, 2013
Benthic carbonfluxes and ocean
acidification
K. R. N. Anthony et al.
Title Page
Abstract Introduction
Conclusions References
Tables Figures
J I
J I
Back Close
Full Screen / Esc
Printer-friendly Version
Interactive Discussion
Discussion
Paper
|D
iscussionP
aper|
Discussion
Paper
|D
iscussionP
aper|
rates of net photosynthesis in neighbouring upstream waters may enhance calcifica-tion downstream. Conversely, high rates of calcification in upstream habitats elevatepCO2 and lower Ωa, potentially exacerbating ocean acidification and worsening thecarbon chemical conditions for calcification in downstream habitats. These feedbacksbetween benthic carbon fluxes and seawater carbon chemistry have been explored for5
mixed reef communities (Suzuki, 1995; Bates et al., 2010), and recently for corals andmacroalgae specifically (Anthony et al., 2011; Kleypas et al., 2011). To understand howdifferent benthic habitats drive carbon chemistry changes on reefs, however, requiresintegration of carbon fluxes for a larger set of key benthic groups.
Benthic reef communities are composed of a broad suite of groups with different ca-10
pacities for photosynthesis, metabolism, calcification and dissolution (Chisholm, 2000,2003; Kleypas et al., 2011) and with varying responses to ocean acidification (Kroekeret al., 2010). The net direction and strength of these carbon flux processes will af-fect their contribution to carbon chemistry variation in reef waters. Here, we exam-ine experimentally how the carbon fluxes (net photosynthesis and net calcification)15
of six common and abundant benthic groups in a shallow-water coral reef environ-ment in the southern Great Barrier Reef (GBR) influence the Ωa of reef water underlow pCO2 (350–450 µatm) and acidified (560–700 µatm) conditions. We used a recir-culating flume (550-Litre flow channel) to assay community carbon fluxes during dayand night, and for contrasting water flows (8 and 35 cm s−1) representing contrasting20
tidal states. This allowed interpretation of the feedbacks between natural changes inreef water carbon chemistry and benthic carbon fluxes, as well as potential impacts ofocean acidification on carbon flux processes in different reef habitats. We then usedthese community carbon flux data to address the question: to what extent will reefswith different benthic community compositions, particularly reefs with contrasting algal25
and coral abundances, and physical settings alleviate vs. exacerbate natural carbonchemistry variation and ocean acidification?
1834

BGD10, 1831–1865, 2013
Benthic carbonfluxes and ocean
acidification
K. R. N. Anthony et al.
Title Page
Abstract Introduction
Conclusions References
Tables Figures
J I
J I
Back Close
Full Screen / Esc
Printer-friendly Version
Interactive Discussion
Discussion
Paper
|D
iscussionP
aper|
Discussion
Paper
|D
iscussionP
aper|
2 Methods
2.1 Modelling framework: integration of biological and physical processes
The seawater saturation state with respect to calcium carbonate (CaCO3) is definedas:
Ω= [Ca2+][CO2−3 ]/K ∗
sp (1)5
where K ∗sp is the stoichiometric solubility product for a given CaCO3 mineral phase
(e.g., aragonite or calcite). The solubility product is determined experimentally and cor-responds to the product of calcium and carbonate ions at equilibrium, i.e., when theforward (precipitation) and backward (dissolution) reaction of CaCO3 are equal to oneanother at any given temperature, salinity and pressure. Because calcium concentra-10
tion varies little in the ocean and is by a factor 30 to 50 greater than the concentrationof the carbonate ion in surface seawater, Ω is mainly controlled by the abundance ofthis anion (Zeebe and Wolf-Gladrow, 2001). The [CO2−
3 ], and hence Ω, in seawatercan be calculated from any given concentrations of total dissolved inorganic carbon(CT) and total alkalinity (AT ), temperature, salinity and pressure (Dickson et al., 2007).15
Thus, changes in the aragonite saturation state (Ωa) under a given scenario undertypical seawater saturation state conditions on coral reefs (where changes in Ωa areapproximately linearly with the typical range of changes in CT and AT; Fig. 1), can beexpressed empirically:
dΩa
dt= a
dAT
dt+ b
dCT
dt(2)20
where a and b (kg µmol−1) are regression coefficients that vary with any parameter(physical or chemical) that alters the relationship between CT, AT and Ωa. For example,rates of change in AT and CT are directly related to net rate of volume-specific net com-munity production (pnV, µmol m−3 h−1), net community calcification (gnV, µmol m−3 h−1)and air-sea exchange of CO2 (fnV) (Anthony et al., 2011).25
1835

BGD10, 1831–1865, 2013
Benthic carbonfluxes and ocean
acidification
K. R. N. Anthony et al.
Title Page
Abstract Introduction
Conclusions References
Tables Figures
J I
J I
Back Close
Full Screen / Esc
Printer-friendly Version
Interactive Discussion
Discussion
Paper
|D
iscussionP
aper|
Discussion
Paper
|D
iscussionP
aper|
dAT
dt= −2gnV (3)
dCT
dt= −pnV − gnV + fnV (4)
To determine how benthic net community calcification and production affect Ωa viachanges in CT and AT, we consider carbon fluxes into a fixed, but advecting, uniformly5
mixed water mass; that is, a water parcel of constant dimensions travelling over a ho-mogeneous benthic community. The framework can be expanded to a spatially explicitmodel for complex community settings by taking into account horizontal and verticaladvection and mixing (Falter et al., 2008). We convert volume-specific carbon fluxesto area-specific rates (pn and gn, µmol m−2 h−1) through division by water depth (z,10
m), under the assumption that the water column is equally mixed for different depths.Equations (2)–(4) can thus be combined to
dΩa
dt=
b(pn − fn)+gn(b−2a)
z. (5)
Values of the coefficients a and b represent the thermodynamic and compositionalcontrol of K ∗
sp eqn 1 and were estimated using multiple regression analyses of eqn 115
for a broad range of CT and AT values (1800–2100 and 2100–2400 µmol kg−1, respec-tively, Fig. 1) and for temperature, salinity, pressure and nutrient conditions represen-tative of shallow-water areas of tropical coral reefs (20–30 C, 32–37 S, 1–2 bar, <1 µMphosphate). For each set of conditions, Ωa was calculated using CO2SYS (Lewis andWallace, 1998). Here, a ranged from 0.0105 to 0.0120 m2 mmol−1 and b ranged from20
0.0090 to 0.0100 m2 mmol−1. For the purpose of our analyses, we used the means ofthese ranges for a and b, representing conditions on the study reef during the studyperiod (25 C, 35 S, 1 dbar and negligible nutrient levels).
1836

BGD10, 1831–1865, 2013
Benthic carbonfluxes and ocean
acidification
K. R. N. Anthony et al.
Title Page
Abstract Introduction
Conclusions References
Tables Figures
J I
J I
Back Close
Full Screen / Esc
Printer-friendly Version
Interactive Discussion
Discussion
Paper
|D
iscussionP
aper|
Discussion
Paper
|D
iscussionP
aper|
2.2 Study location and species
This study was conducted at Heron Reef (2327′S, 15154′E) in the southern GreatBarrier Reef (GBR, Australia, Fig. 2). This section of the GBR has a 3-m tidal range,with the reef crest and parts of the reef flat becoming air exposed at spring low tides,and submerged by 3–3.5 m of water during spring high tide. Heron Reef is a large la-5
goonal reef system with a well-defined fore reef, crest and extensive reef flat (Phinnet al., 2012). In the focus area, a diversity of Acropora species dominate the fore reef,crest and parts of the outer reef-flat zone. Pavements of crustose coralline algae (CCA,mainly Porolithon spp., including P. onkodes and Lithophyllum spp.) are also abundanton the wave-impacted front of the crest. Mixed zones of branching corals (large clones10
of Acropora aspera), fleshy and calcareous macroalgae (e.g. Halimeda) dominate the50–100 m belt behind the crest (outer reef flat). Patches of sand and turfs (reef ma-trix with assemblages of cropped macroalgae and benthic microalgae) and scatteredmacroalgae increase in size and spatial dominance with distance from the crest andtowards the lagoon or island. During the time of the study (October–March 2011, Aus-15
tral summer) the inner to mid sections of the reef flat were characterised by a highabundance of fleshy macroalgae, predominantly Chnoospora implexa.
To determine the carbon flux contributions from major benthic groups to changes inthe seawater carbon chemistry of the focus reef area, the following six groups wereassayed in a detailed laboratory flume study: Corals (monospecific beds of Acropora20
aspera), crustose coralline algae (CCAs: mixture of different species of coralline redalgae, including Porolithon onkodes, P . spp, Lithophyllumspp), calcareous macroal-gae (monospecific beds of Halimeda cuneata f. undulata), turf areas (assemblagesof cropped and filamentous algae with scattered CCAs, fine sand and bare substrate),fleshy macroalgae (monospecific beds of Chnoospora implexa) and reef sand between25
patches of corals and mixed communities (Fig. 3). For each benthic group exceptCCAs, approximately 0.5 m2 of material was collected from the reef flat; CCAs werecollected from the reef crest. Care was taken to collect the material so that the in
1837

BGD10, 1831–1865, 2013
Benthic carbonfluxes and ocean
acidification
K. R. N. Anthony et al.
Title Page
Abstract Introduction
Conclusions References
Tables Figures
J I
J I
Back Close
Full Screen / Esc
Printer-friendly Version
Interactive Discussion
Discussion
Paper
|D
iscussionP
aper|
Discussion
Paper
|D
iscussionP
aper|
situ configuration of each habitat type (e.g. coral colony branch density) could be re-produced in the flume environment. The material was transported while submerged(or kept wet) in seawater to the aquarium facilities on Heron Island Research Station(HIRS). Only one habitat type was assayed per two-day flume run to ensure that onlyfresh material was used.5
2.3 Flume studies: experimental design and environmental settings
Flume assays were designed to account for the effect of four variables on carbon fluxes:(1) habitat composition, (2) light/darkness, (3) flow environment, and (4) dissolved in-organic carbon chemistry (acidification). Firstly, effects of reef composition were testedby running duplicate or triplicate series of flume assays for each of the six benthic10
groups, alternating between groups in time to avoid temporal dependence betweenreplicates. Secondly, benthic groups differ in their photosynthesis, metabolic rates andcalcification responses over day-night cycles. Therefore, to obtain a full picture of theirnet effects on the seawater carbon chemistry requires an understanding of both dayand night rates (Kleypas et al., 2011). Thirdly, the flow environment across Heron Reef15
varies diurnally due to tides, and episodically with wind and wave conditions. At lowesttide, ponding water can be near stagnant over reef-flat habitats for up to 4 h. At incom-ing high tide, currents over the reef crest and outer reef flat can vary from <1 cm s−1
to >30 cm s−1, depending on depth, winds and waves. Fourthly, the seawater carbonchemistry on and around Heron Reef shows strong diurnal and seasonal variation20
due to the net community production (pn) and net ecosystem calcification (gn) of thereef and neighbouring systems. For example, pCO2 of open surface waters SE of thestudy area (Wistari Channel) can range from 200 to 500 µatm between tidal cycles andseasons (www.pmel.noaa.gov/co2/story/Heron+Island). Also, in lagoonal or reef flatenvironments, the pCO2 range can extend to 150–700 µatm and seawater aragonite25
saturation state (Ωa) can vary between 2 and 6 (Anthony et al., 2008).
1838

BGD10, 1831–1865, 2013
Benthic carbonfluxes and ocean
acidification
K. R. N. Anthony et al.
Title Page
Abstract Introduction
Conclusions References
Tables Figures
J I
J I
Back Close
Full Screen / Esc
Printer-friendly Version
Interactive Discussion
Discussion
Paper
|D
iscussionP
aper|
Discussion
Paper
|D
iscussionP
aper|
2.4 Experimental procedures and carbon flux assays
Each collected assemblage was reconstructed in the 1.2 m long by 0.35 m wide by0.1 m deep working section of a laboratory flume (Fig. 3) and allowed to acclimate tolaboratory conditions overnight. The flume is a 550-Litre recirculating Perspex race-way (2.4 m long by 1.2 m wide) with a 0.38 m wide by 0.25 m deep channel (Fig. 4).5
To mimic the roughness and structure of natural assemblages, Acropora, Chnoospora,Halimeda and turfs (rocks) protruded above the flume floor by 5–15 cm (Fig. 3a, c, d, f),whereas CCAs and sand were flush with the flume floor (Fig. 3b and e). As the waterin the flume was recirculating (repeatedly passing over the assemblages) it approxi-mated Lagrangian water transects running along a path of reef with a monospecific10
assemblage. Flow velocity of the flume water was adjusted by an electrical outboardmotor (WaterSnake 34 lb, Jarvis Marine, Dandenong, Australia) connected to a 12 Vregulated power supply (Amtek, Meadowbank, Australia). Collimators were installedupstream of the 1.2 m working section of the flume to reduce turbulence, which was ver-ified by near-linear particle tracks in the midstream water above the assemblages along15
the entire working section. Light was supplied by two metal halide lamps (2×150 W,AquaMedic, Germany) producing down-welling irradiance of ∼1000 µmol m−2 s−1 atthe level of the assemblages, measured by a Li-192s underwater light sensor (LiCor,Lincoln, NE, USA).
Flume assays for each benthic group was replicated 2 or more times using newly col-20
lected assemblages for each assay, with replicate assays interspersed among those ofother groups during a period of two months (October–December 2010). Each replicateassay was run over 48 h: first day/night period in “ambient” (350–450 µatm CO2) andsecond day/night period in “acidified” (560–700 µatm) seawater. The ambient and acid-ified treatments, as well as light and flow ranges, encompassed the range of physical25
and chemical variation characteristic of the Heron reef flat (Anthony et al., 2011; Santoset al., 2011). Before each series of flume runs, seawater was pumped from the reef flatat high tide at night and conditioned in a 2000-L aerated and temperature-controlled
1839
BGD10, 1831–1865, 2013
Benthic carbonfluxes and ocean
acidification
K. R. N. Anthony et al.
Title Page
Abstract Introduction
Conclusions References
Tables Figures
J I
J I
Back Close
Full Screen / Esc
Printer-friendly Version
Interactive Discussion
Discussion
Paper
|D
iscussionP
aper|
Discussion
Paper
|D
iscussionP
aper|
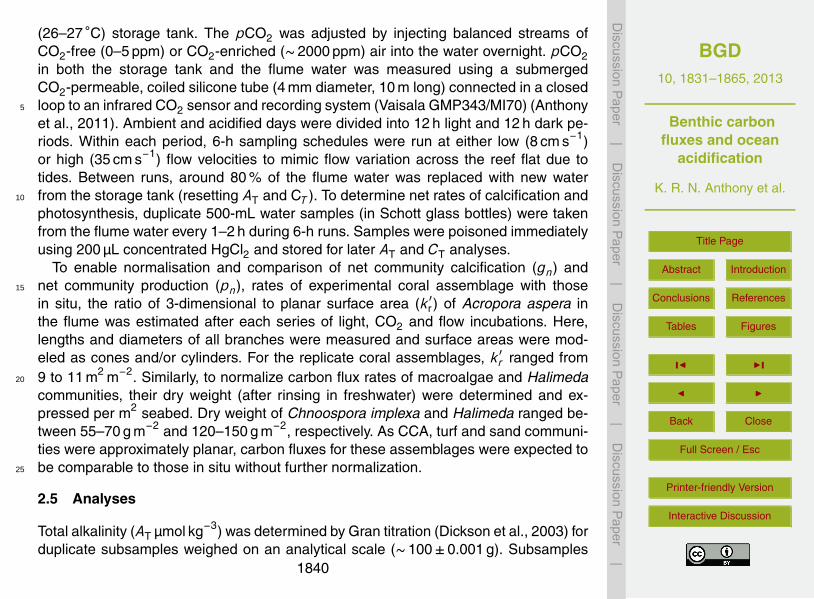
(26–27 C) storage tank. The pCO2 was adjusted by injecting balanced streams ofCO2-free (0–5 ppm) or CO2-enriched (∼2000 ppm) air into the water overnight. pCO2in both the storage tank and the flume water was measured using a submergedCO2-permeable, coiled silicone tube (4 mm diameter, 10 m long) connected in a closedloop to an infrared CO2 sensor and recording system (Vaisala GMP343/MI70) (Anthony5
et al., 2011). Ambient and acidified days were divided into 12 h light and 12 h dark pe-riods. Within each period, 6-h sampling schedules were run at either low (8 cm s−1)or high (35 cm s−1) flow velocities to mimic flow variation across the reef flat due totides. Between runs, around 80 % of the flume water was replaced with new waterfrom the storage tank (resetting AT and CT ). To determine net rates of calcification and10
photosynthesis, duplicate 500-mL water samples (in Schott glass bottles) were takenfrom the flume water every 1–2 h during 6-h runs. Samples were poisoned immediatelyusing 200 µL concentrated HgCl2 and stored for later AT and CT analyses.
To enable normalisation and comparison of net community calcification (gn) andnet community production (pn), rates of experimental coral assemblage with those15
in situ, the ratio of 3-dimensional to planar surface area (k′r ) of Acropora aspera in
the flume was estimated after each series of light, CO2 and flow incubations. Here,lengths and diameters of all branches were measured and surface areas were mod-eled as cones and/or cylinders. For the replicate coral assemblages, k′
r ranged from9 to 11 m2 m−2. Similarly, to normalize carbon flux rates of macroalgae and Halimeda20
communities, their dry weight (after rinsing in freshwater) were determined and ex-pressed per m2 seabed. Dry weight of Chnoospora implexa and Halimeda ranged be-tween 55–70 g m−2 and 120–150 g m−2, respectively. As CCA, turf and sand communi-ties were approximately planar, carbon fluxes for these assemblages were expected tobe comparable to those in situ without further normalization.25
2.5 Analyses
Total alkalinity (AT µmol kg−3) was determined by Gran titration (Dickson et al., 2003) forduplicate subsamples weighed on an analytical scale (∼100±0.001 g). Subsamples
1840

BGD10, 1831–1865, 2013
Benthic carbonfluxes and ocean
acidification
K. R. N. Anthony et al.
Title Page
Abstract Introduction
Conclusions References
Tables Figures
J I
J I
Back Close
Full Screen / Esc
Printer-friendly Version
Interactive Discussion
Discussion
Paper
|D
iscussionP
aper|
Discussion
Paper
|D
iscussionP
aper|
were titrated in an open glass beaker with 0.05 N HCl in the pH range ∼4 to below 3using a Mettler-Toledo (T50) system. AT values were determined with a precision of±2–3 µmol kg−3. Total dissolved carbon dioxide (CT) was analysed at the CSIRO Ma-rine Laboratories (Hobart, Australia) by acidifying the seawater to convert dissolved bi-carbonate and carbonate ions to CO2, extracting the CO2 from the solution by bubbling5
with high purity nitrogen (>99.995 %), and trapping and quantifying the amount of CO2using a UIC model 5011 coulometer (see detailed procedure in Dickson et al., 2007;Johnson et al., 1993). The precision of the measurements was ±2 µmol kg−1, based onthe analyses of duplicate samples and certified reference material from Prof. A. Dick-son’s lab (Scripps Institution of Oceanography, USA).10
Area-specific net rate of calcification (gn, mmol m−2 h−1) was estimated based on thedifference in total alkalinity (∆AT converted to mmol m−3) of duplicate water samplescollected before and after 2-h incubations, assuming AT was solely affected by calci-fication and dissolution processes, and that 2 mol of AT was consumed/produced forevery mol CaCO3 precipitated/dissolved (Gattuso et al., 1995):15
gn =∆AT V2∆tS
(6)
where V is flume water volume (0.55 m3), ∆t is time between sampling (h), and S isthe planar surface area of the benthic group (0.4 m2).
Net rate of photosynthesis (pn, mmol m−2 h−1) was determined based on differencesin total dissolved inorganic carbon (∆CT , mmol m−3) corrected for air-seawater ex-20
change of CO2 (fn) determined for empty flume runs (seawater only) at all light, CO2and flow conditions and changes in CT owing to net calcification estimated from ∆AT:
pn =(∆CT + fn −∆AT/2)V
∆tS(7)
Air-sea CO2 exchange in the flume was calculated empirically for the different flowspeeds and pCO2(aq) levels based on differences in pCO2 in water relative to air using25
1841

BGD10, 1831–1865, 2013
Benthic carbonfluxes and ocean
acidification
K. R. N. Anthony et al.
Title Page
Abstract Introduction
Conclusions References
Tables Figures
J I
J I
Back Close
Full Screen / Esc
Printer-friendly Version
Interactive Discussion
Discussion
Paper
|D
iscussionP
aper|
Discussion
Paper
|D
iscussionP
aper|
the software CO2Calc (Robbins et al., 2010). For applications of Eq. (6) to projectionsin reef settings, fn was calculated using wind speed and gas exchange coefficientsdetermined by Wanninkhof (1992).
For each benthic group and environmental condition, the contribution from benthiccarbon fluxes to the hourly rates of change in seawater aragonite saturation state of the5
overlying water column, ∆Ωa/∆t was calculated based on pn, gn and fn. Here, ∆Ωa/∆twas normalized to a 1 m2 planar surface area and a depth of 1 m, the latter represent-ing the average water depth across the Heron reef flat and across tidal states. Underassumptions of full mixing between reference points along the water path (Lagrangiantransect), the contribution of benthic fluxes to ∆Ωa/∆t will scale inversely with depth10
Eq. (5).Data on gn, pn and ∆Ωa/∆t as functions of light, flow and CO2 were not amenable to
statistical testing as replication ranged from only 2 to 5 for some benthic groups. There-fore, means between treatment combinations were compared based on the degree ofoverlap of error bars. To explore how combinations of light, flow velocity, CO2 regime15
and benthic groups drive hourly changes in Ωa over a reef flat area, carbon flux datafrom flume runs were used as input into Eq. (5) for four benthic reef compositions inshallow reef flat and lagoon environments. These compositions represented two gen-eral types of reef settings: (1) crest and outer reef flat environments and (2) back-reefsand lagoon. In turn, each type was represented by two scenarios: firstly, dominance20
of corals and crustose coralline algae (A); and secondly, dominance of macroalgae orturfs relative to corals. Compositions were based on extensive surveys of Heron reefenvironments (Anthony, personal observation, 2006–2010) combined with analyses ofhyper spectral remote sensing data (Phinn et al., 2012).
1842

BGD10, 1831–1865, 2013
Benthic carbonfluxes and ocean
acidification
K. R. N. Anthony et al.
Title Page
Abstract Introduction
Conclusions References
Tables Figures
J I
J I
Back Close
Full Screen / Esc
Printer-friendly Version
Interactive Discussion
Discussion
Paper
|D
iscussionP
aper|
Discussion
Paper
|D
iscussionP
aper|
3 Results
3.1 Effects of CO2 and flow on benthic day/night calcification
Daytime calcification rates were highest for corals (maximum of 50 mmol m−2 h−1,grey columns in Fig. 5a) and lowest for turfs (1–4 mmol m−2 h−1, Fig. 5d) and sand(−5 to 1 mmol m−2 h−1, Fig. 5e). Calcifying epibionts on the thalli of the non-calcifying5
macroalgae produced negligible gn rates (Fig. 5f). Differences in flow velocity (8 vs.35 cm s−1) did not affect daytime gn under low CO2 in any group except sand (leftmostbars in Fig. 5a–e). Under acidification, however, low and high flow tended to reduce vs.increase gn, respectively, in corals and CCAs (Fig. 5a and b), but flow variation andacidification did not markedly affect gn in Halimeda and turfs (Fig. 5c and d). Interest-10
ingly, high flow and acidification led to net daytime dissolution in the sand community(Fig. 5e).
Only corals showed markedly positive nighttime gn rates, approximately 30 % of day-time rates Fig. 5a). Conversely, nightime gn in CCAs, Halimeda, turfs and sand weremostly negative but varied with flow and pCO2 (Fig. 5b–e). Net nighttime calcification15
by CCAs decreased markedly (2–3 fold increase in net dissolution) in response to acid-ification (Fig. 5b). The nighttime gn pattern for turfs was qualitatively similar to that ofthe CCAs whereas gn pattern for Halimeda varied between marginally positive andnegative (Fig. 5c). The sand community showed the strongest variation in gn variationacross treatment combinations (Fig. 5e). Interestingly, the pattern of nighttime gn rates20
was largely similar to the daytime pattern. Specifically, gn at low CO2 and low flow wasnot significantly different from zero, whereas high flow and acidification led to signifi-cant rates of dissolution. Other flow and CO2 combinations led to intermediate rates ofdissolution (Fig. 5e).
1843
BGD10, 1831–1865, 2013
Benthic carbonfluxes and ocean
acidification
K. R. N. Anthony et al.
Title Page
Abstract Introduction
Conclusions References
Tables Figures
J I
J I
Back Close
Full Screen / Esc
Printer-friendly Version
Interactive Discussion
Discussion
Paper
|D
iscussionP
aper|
Discussion
Paper
|D
iscussionP
aper|
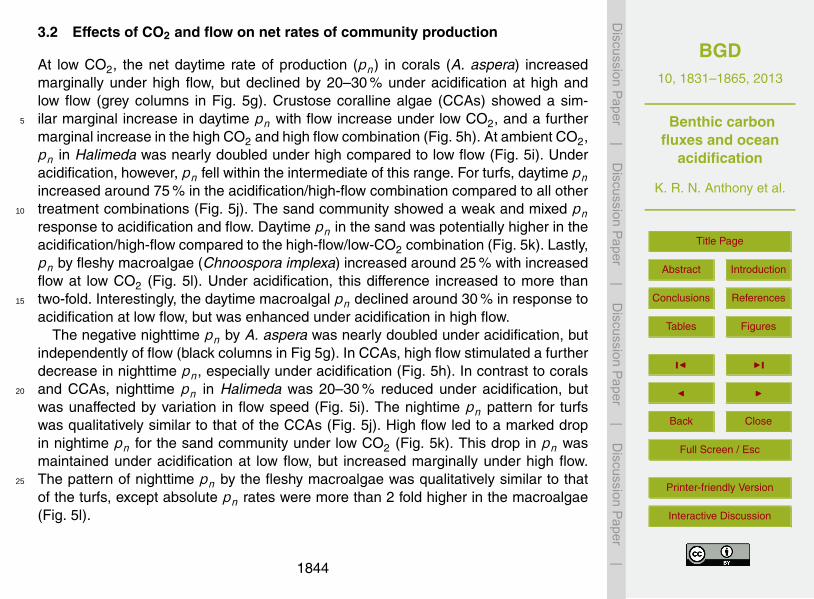
3.2 Effects of CO2 and flow on net rates of community production
At low CO2, the net daytime rate of production (pn) in corals (A. aspera) increasedmarginally under high flow, but declined by 20–30 % under acidification at high andlow flow (grey columns in Fig. 5g). Crustose coralline algae (CCAs) showed a sim-ilar marginal increase in daytime pn with flow increase under low CO2, and a further5
marginal increase in the high CO2 and high flow combination (Fig. 5h). At ambient CO2,pn in Halimeda was nearly doubled under high compared to low flow (Fig. 5i). Underacidification, however, pn fell within the intermediate of this range. For turfs, daytime pnincreased around 75 % in the acidification/high-flow combination compared to all othertreatment combinations (Fig. 5j). The sand community showed a weak and mixed pn10
response to acidification and flow. Daytime pn in the sand was potentially higher in theacidification/high-flow compared to the high-flow/low-CO2 combination (Fig. 5k). Lastly,pn by fleshy macroalgae (Chnoospora implexa) increased around 25 % with increasedflow at low CO2 (Fig. 5l). Under acidification, this difference increased to more thantwo-fold. Interestingly, the daytime macroalgal pn declined around 30 % in response to15
acidification at low flow, but was enhanced under acidification in high flow.The negative nighttime pn by A. aspera was nearly doubled under acidification, but
independently of flow (black columns in Fig 5g). In CCAs, high flow stimulated a furtherdecrease in nighttime pn, especially under acidification (Fig. 5h). In contrast to coralsand CCAs, nighttime pn in Halimeda was 20–30 % reduced under acidification, but20
was unaffected by variation in flow speed (Fig. 5i). The nightime pn pattern for turfswas qualitatively similar to that of the CCAs (Fig. 5j). High flow led to a marked dropin nightime pn for the sand community under low CO2 (Fig. 5k). This drop in pn wasmaintained under acidification at low flow, but increased marginally under high flow.The pattern of nighttime pn by the fleshy macroalgae was qualitatively similar to that25
of the turfs, except absolute pn rates were more than 2 fold higher in the macroalgae(Fig. 5l).
1844

BGD10, 1831–1865, 2013
Benthic carbonfluxes and ocean
acidification
K. R. N. Anthony et al.
Title Page
Abstract Introduction
Conclusions References
Tables Figures
J I
J I
Back Close
Full Screen / Esc
Printer-friendly Version
Interactive Discussion
Discussion
Paper
|D
iscussionP
aper|
Discussion
Paper
|D
iscussionP
aper|
3.3 Contributions from benthic groups to changes in aragonite saturationstate (Ωa)
Net daytime carbon fluxes driven by corals (A. aspera) led to positive changes in theΩa of the flume water at low CO2 (grey columns in Fig. 6a). Here, high flow led to adoubling of the positive Ωa change over corals (from 0.12±0.07 to 0.26±0.08 h−1).5
Under acidification, however, a change from low to high flow shifted the daytime Ωa
changes from positive to negative (−0.15±0.10 h−1) owing to increasing net commu-nity calcification. At night, corals lowered the flumewater Ωa dramatically (−0.55 to−0.86 h−1), approximately 3–5 times more so than the positive changes during the day(black columns in Fig. 6a). Here, the negative nighttime changes in Ωa were 20–30 %10
greater than under low CO2 mainly as a result of increasing dark respiration.Contributions from crustose coralline algae (CCAs) to changes in Ωa were less than
20–30 % of the changes observed for the corals (Fig. 6b, note different scales on y-axes). Also, in contrast to corals, daytime changes in Ωa did not vary significantlyamong CO2 levels and flow speeds, but showed large variation at night. Specifically,15
at ambient CO2, negative Ωa changes by CCAs at night were amplified under highflow by around 50 % as a result of increasing dark respiration. Interestingly, acidifica-tion reduced the negative Ωa change at low flow by more than 50 % (potentially due tonet dissolution), but the combination of acidification and high flow did not alter the Ωachange compared to the ambient CO2/high-flow combination (Fig. 6b).20
The daytime pattern of Ωa changes caused by the Halimeda communities largelyreflected the pattern of net community production in this group (Figs. 5c and 6c). Atlow CO2, high flow increased the Ωa change five-fold (but with large uncertainty dueto low community replication). Under acidification, the daytime change in Ωa was in-creased four-fold within the low-flow treatment relative to the low-flow/low-CO2 condi-25
tions. The uncertainly around Ωa changes in the high flow treatments was too largeto allow comparison with other treatment combinations. At night, negative changes inΩa were decreased by approximately 50 % under acidification (Fig. 6c), in part due to
1845

BGD10, 1831–1865, 2013
Benthic carbonfluxes and ocean
acidification
K. R. N. Anthony et al.
Title Page
Abstract Introduction
Conclusions References
Tables Figures
J I
J I
Back Close
Full Screen / Esc
Printer-friendly Version
Interactive Discussion
Discussion
Paper
|D
iscussionP
aper|
Discussion
Paper
|D
iscussionP
aper|
the increased, albeit low, net dissolution at high CO2 and decreasing dark respiration(Fig. 5c). Overall, positive changes in Ωa by Halimeda during the day were approxi-mately balanced by negative changes during the night.
Turf areas elevated seawater Ωa by more than 0.2 during the day, and almosttwice so compared to negative changes in Ωa at night (Fig. 6d). Interestingly, the5
acidification/high-flow combination elevated Ωa almost twice that of the other treat-ment combinations (0.52±0.02 h−1). The nighttime pattern in Ωa changes over turfsfollowed that of CCA and Halimeda, except that Ωa changes over turfs were smaller forthe acidification/low-flow treatment
The daytime pattern in Ωa changes over the sand community was comparable to10
that of turfs, but with Ωa changes being around 50 % lower and exhibiting more within-treatment variation (Fig. 6e). Daytime changes in Ωa in the sand incubations were alsomore than twice those at nighttime. Analogous to turfs, the positive Ωa change by turfsin the acidification/high-flow combination was around 50 % greater than at ambientCO2 for both flows. At night, carbon fluxes in the sand community led to a marginally15
decreased Ωa at ambient CO2, but this pattern was reversed under acidification/highflow treatment (Fig. 6e).
In contrast to the pattern for corals and to some extend CCAs, hourly changes inΩa driven by macroalgae (Chnoospora implexa) were high (0.5–1.1 h−1) for all CO2and flow combinations during the day (Fig. 6f). Here, CO2 and flow showed inter-20
action: positive Ωa changes were exacerbated by flow, and the flow effect was fur-ther enhanced under acidification. Interestingly, acidification led to reduced change inΩa at low flow. At night, the acidification/high-flow combination enhanced negative Ωachanges by 20–30 %. Similar to the turfs and sand communities, carbon fluxes by C.implexa led for most CO2/flow combinations to significantly positive net changes in Ωa25
over the day/night cycle.
1846

BGD10, 1831–1865, 2013
Benthic carbonfluxes and ocean
acidification
K. R. N. Anthony et al.
Title Page
Abstract Introduction
Conclusions References
Tables Figures
J I
J I
Back Close
Full Screen / Esc
Printer-friendly Version
Interactive Discussion
Discussion
Paper
|D
iscussionP
aper|
Discussion
Paper
|D
iscussionP
aper|
3.4 Relative contributions from carbon flux processes to Ωa patterns
The six benthic groups varied with respect to carbon flux contributions to Ωa changesfrom photosynthesis, calcification, respiration and dissolution. In corals, contributionswere strongly, and near equally, driven by photosynthesis and calcification during theday and respiration and calcification by night (Fig. 7a). In CCA, daytime changes in5
Ωa were driven slightly more by net community production than calcification (Fig. 7b).At night, Ωa changes by CCA were driven by respiration and to an increasing degreeby dissolution under acidification. The partitioning of flux contributions from Halimedafollowed a similar pattern to that of CCAs except with less dissolution and a largercontribution from net community production under acidification (Fig. 7c). The pattern of10
flux contributions to Ωa changes for turfs and macroalgae were largely similar in thatthey were near parallel with the P-R axis under ambient CO2 (Fig. 7d and f). Underacidification, turfs in particular showed a larger contribution from dissolution. The fluxcontribution pattern for sand was nearly the opposite of that of corals (Fig. 7e). Here,dissolution was a dominant driver especially under high flow.15
3.5 Predicted changes in Ωa by different benthic communities
To estimate how different benthic habitats contribute to carbon chemistry changesacross shallow-water reef environments, we used four community compositions repre-senting those found in two major zones: crest/outer reef flat and back-reef/lagoon. Forcrest/outer reef flat we compared the observed changes in Ωa driven by coral vs. algal-20
dominated habitats. This community variation reflects differences between parts of thereef crest and reef flat, seasonal variation in algal abundance, and to some extent vari-ation in herbivory on macroalgae. Also, the contrasts in community composition withinzones used here can represent a shift from coral to algal dominance expected tem-porarily under environmental stress including cyclones and bleaching events. For the25
back-reef/lagoon environment we compared a sand/turf-dominated habitat with vary-ing abundance of macroalgae. Again, these scenarios represent spatial and seasonal
1847

BGD10, 1831–1865, 2013
Benthic carbonfluxes and ocean
acidification
K. R. N. Anthony et al.
Title Page
Abstract Introduction
Conclusions References
Tables Figures
J I
J I
Back Close
Full Screen / Esc
Printer-friendly Version
Interactive Discussion
Discussion
Paper
|D
iscussionP
aper|
Discussion
Paper
|D
iscussionP
aper|
variation as well as community shifts caused by disturbances. As most shallow-waterhabitats across Heron Reef experience varying water flows over the day due to tidesand wind (Gourlay and Colleter, 2005) we combined flux data for low and high flowrates and only produced community estimates of Ωa changes for day vs. night and forlow vs. high CO2.5
Diurnal net carbon fluxes by the coral-dominated (60 %) crest community led tomarginally negative (−0.11±0.09 h−1) average changes in Ωa under low CO2 butsignificantly negative average Ωa changes under acidification (−0.23±0.14 h h−1, Ta-ble 1B(i)). At ambient CO2, the negative nighttime value of ∆Ωa/∆t driven by the coraldominated community (−0.43 h−1) was almost twice the positive value during the day10
(0.21 h−1). Under acidification, this difference increased to almost 5-fold (−0.57 vs.0.13 h−1). This was partly due to the drop in ∆Ωa/∆t under acidification, which wasdriven principally by reduced net community production.
In contrast, the daily average ∆Ωa/∆t value over the macroalgae/turfs/sand – com-munity (representing a coral- and CCA-degraded habitat) in the back-reef/lagoon envi-15
ronment was marginally positive (∼0.12±0.09 h−1) under both ambient and high CO2regimes, Table 1B (iv). Here, positive daytime changes in Ωa were approximately twicethe negative nighttime changes (0.47 vs. −0.21 h−1 and 0.45 vs. −0.22 h−1, respec-tively). Interestingly, this community type (iv) elevated Ωa twice as much as the coralcommunity (i) during the day at ambient CO2 and four-fold under acidification. At night,20
the macroalgae/turf/sand community lowered Ωa by only half that of the coral commu-nity.
In the mixed turf/macroalgae (ii) and sand/macroalgae (iii) back-reef and lagoon envi-ronments, benthic carbon fluxes driving positive changes in Ωa during the day were bal-anced almost completely by negative changes at night, Table 1B (ii) and (iii). The large25
negative nighttime values of ∆Ωa/∆t for the turf/macroalgae community (ii) were due tosignificant abundances of corals 15 % and fleshy macroalgae (30 %), both having highrates of dark respiration (Fig. 5). Similar to the macroalgae/sand/turf community in the
1848

BGD10, 1831–1865, 2013
Benthic carbonfluxes and ocean
acidification
K. R. N. Anthony et al.
Title Page
Abstract Introduction
Conclusions References
Tables Figures
J I
J I
Back Close
Full Screen / Esc
Printer-friendly Version
Interactive Discussion
Discussion
Paper
|D
iscussionP
aper|
Discussion
Paper
|D
iscussionP
aper|
lagoon environment (iv), but in contrast to corals (i), acidification did not significantlychange the extent to which benthic carbon fluxes affected Ωa.
4 Discussion
4.1 Contributions from benthic groups to changes in reef water Ωa
The results of this study demonstrate that the carbon fluxes of six common ben-5
thic community groups drive seawater inorganic carbon-chemistry and carbonate sat-uration state changes in different directions and to varying extent in shallow-waterreef habitats. At one extreme, reef-building corals (here represented by the branch-ing species Acropora aspera) reduce significantly the reef-water Ωa, especially un-der ocean acidification (560–700 µatm CO2). The net drawdown of Ωa by corals is10
partly due to high rates of day- and nighttime calcification and respiration. Specifically,changes in Ωa driven by corals stems from the coupling and ratio of net organic carbonproduction to net calcification, and the subsequent modification on the seawater CT: ATratio (Andersson and Gledhill, 2013; Suzuki and Kawahata, 2003). At typical coral reefseawater conditions and assuming constant temperature and salinity, a ∆CT :∆AT ratio15
approximately equal to 1 results in no net change in the seawater Ωa while changes ata ratio >1 will increase Ωa, and changes at a ratio <1 will reduce Ωa (Andersson andGledhill, 2013). In the present case, net coral calcification was only negatively affectedat high CO2 and low flow whereas net community production strongly decreased dur-ing the day and respiration strongly increased at night under all high CO2 conditions.20
The increased metabolic activity may indicate that the corals were stressed or simplyhad to work harder to maintain their calcification rates under these conditions. At theother extreme, macroalgae, turfs and sand communities contributed on average withpositive changes in Ωa of the reef water. This was illustrated most clearly by the coral-degraded back reef scenario, Table 1 (iv). Here, the average day and night changes in25
Ωa approximated around 0.12±0.09 h−1 at both low CO2 (350–450 µatm) and under
1849

BGD10, 1831–1865, 2013
Benthic carbonfluxes and ocean
acidification
K. R. N. Anthony et al.
Title Page
Abstract Introduction
Conclusions References
Tables Figures
J I
J I
Back Close
Full Screen / Esc
Printer-friendly Version
Interactive Discussion
Discussion
Paper
|D
iscussionP
aper|
Discussion
Paper
|D
iscussionP
aper|
acidified conditions. This result implies that extensive areas dominated by macroal-gae, turfs and sand may partially counteract net reductions in Ωa by corals and CCA,depending partly on the residence time of water over each habitat type and partly ontheir upstream-downstream arrangement. The projections of Ωa changes for water overmixed reef communities (ii) and (iii) supported this hypothesis as their average net Ωa5
changes were intermediate of those of the coral dominated (i) and macroalgal/sandturf dominated (iv) communities.
Benthic carbon fluxes and their contributions to changes in Ωa showed mixed re-sponses to CO2 and flow variation across the benthic groups. Interestingly, high flowspeed (35 compared to 8 cm s−1) did not enhance calcification in corals, CCA or Hal-10
imeda under ambient CO2. Under acidification, however, high water flow increasedcalcification to the extent that it effectively counteracted the observed negative effectof acidification at low flow. Flow has previously been demonstrated to enhance coralcalcification (Dennison and Barnes, 1988), photosynthesis (Mass et al., 2010) and res-piration (Patterson et al., 1991) through forced convection (Patterson, 1992) and in-15
creased time-integrated supply of food and nutrients. Furthermore, as effects of flowincrements on mass transfer are strongest for flows below around 5 cm s−1 (Baird andAtkinson, 1997) it is likely that the mass fluxes of carbon species affecting rate-limitationof calcification in this study were already strongly elevated at 8 cm s−1. Nonetheless,the positive interaction between flow and acidification on coral net calcification may20
be attributed to the increased supply of food and nutrients, but further investigation isrequired to fully explore these results.
Acidification reduced calcification of CCA but only at low flow (Fig 5b). The mech-anism by which increased water flow ameliorated the effects of ocean acidification onCCA is not clear, but could partly be due to increased supply of nutrients. However,25
as production and calcification are positively correlated, and since we found enhancedproduction of CCA with increasing water flow (Fig. 5b), possibly due to increased sup-ply of CO2 to the site of photosynthesis (particularly under acidification), it is likely thatproduction enhanced calcification in our experiments. These results partly support the
1850
BGD10, 1831–1865, 2013
Benthic carbonfluxes and ocean
acidification
K. R. N. Anthony et al.
Title Page
Abstract Introduction
Conclusions References
Tables Figures
J I
J I
Back Close
Full Screen / Esc
Printer-friendly Version
Interactive Discussion
Discussion
Paper
|D
iscussionP
aper|
Discussion
Paper
|D
iscussionP
aper|
observation that CCAs typically thrive in high-energy environments (Chisholm, 2003).In contrast, calcification by turfs, and to a larger extent the sand community, respondednegatively to both acidification and flow as rate of net dissolution by sand was exacer-bated under high flow. These results are consistent with observations from field studiesof calcification/dissolution responses of sand and sediment communities on Heron reef5
under natural carbon chemistry variation and tidal cycles (Santos et al., 2011).The strong interaction between flow and acidification in their impact on net photosyn-
thesis of turfs and macroalgae may be explained by two processes: First, since CO2 isa substrate for algal photosynthesis (Lobban and Harrison, 1997) an increase in CO2can potentially enhance algal photosynthesis (at least for those species relying on CO210
utilization via diffusion, e.g. red algal turfs, Fig. 5b) (Raven, 2011). Second, increasedflow means breakdown of boundary layers over the thick algal mats and mixing of wa-ter in between the thalli, contributing to nutrient uptake, including uptake of inorganiccarbon (Wheeler, 1980) and enhanced gas exchange. For example, net primary pro-ductivity of tropical algal turfs and seaweeds was significantly enhanced by increased15
water flow in the Caribbean (Carpenter et al., 1991). Similar processes may be oc-curring during dark respiration. Under ambient, non-acidified scenarios, the responseof turf algae and fleshy macroalgae to increased flow was minor, compared to a dra-matic increase in both net production and respiration under high flow and acidificationtreatments, supporting the importance of water flow as a major driver of carbon fluxes20
particularly in reefs dominated by algae.Patterns of ∆Ωa/∆t were driven by flux contributions from calcification and respira-
tion (negative ∆Ωa contributions via a relative increase in the CT: AT ratio, Figs. 1 and7), and from photosynthesis and dissolution (positive ∆Ωa contributions by a relativeredrease in the CT :AT ratio). For all groups, variation in net production was more diag-25
nostic of Ωa variation than was net calcification. For example, the effect of acidificationon the contribution of corals to changes in Ωa were driven mostly by the 20–40 % de-crease in net photosynthesis and 30–50 % increase in dark respiration (Figs. 5 and 6).Also, the pattern of variation in Ωa of the flume water over Halimeda was mapped more
1851

BGD10, 1831–1865, 2013
Benthic carbonfluxes and ocean
acidification
K. R. N. Anthony et al.
Title Page
Abstract Introduction
Conclusions References
Tables Figures
J I
J I
Back Close
Full Screen / Esc
Printer-friendly Version
Interactive Discussion
Discussion
Paper
|D
iscussionP
aper|
Discussion
Paper
|D
iscussionP
aper|
by the pattern of net photosynthesis than by that of calcification. Importantly, ∆Ωa/∆twas here normalised to a 1-m deep water column, but is scalable to other depths de-pending on the degree of vertical mixing.
4.2 How does benthic community composition affect seawater chemistry?
Our analyses showed that variations in benthic compositions, especially for corals and5
algae, can lead to large spatial and diurnal variations in Ωa in shallow water. In ex-tensive back-reef and lagoonal environments on reefs like Heron Reef (10 km scale),even small variations in net community calcification and production by sand and theturf assemblages, which both contribute relatively little to Ωa changes per unit time andper m2, may translate to large absolute contributions to Ωa changes in downstream10
habitats. Transitions from coral-CCA dominance to algal and turf dominance on reefsystems subjected to disturbances (e.g., Done, 1992) may hence shift the seawatercarbonate chemistry dramatically. For example, the net balance in Ωa in a system withabundant calcifying groups is negative, while the opposite occurs in reefs with domi-nance of benthic seaweeds, algal turfs and sand. These findings have important impli-15
cations for understanding variability in carbon fluxes and calcification in the GBR andsuggest that degraded coral reefs may potentially assist to calcification in downstreamhabitats.
Potential positive effects of macroalgae on reef acidification (e.g. by providing “chemi-cal resilience” to the system) may be counteracted by negative effects of macroalgae on20
ecological resilience, e.g. coral recruitment and space competition (Diaz-Pulido et al.,2010; Mccook et al., 2001). This negative effect will, however, depend on the type of al-gae dominating the reef. For example, reefs dominated by seaweeds that are known tokill corals through secondary metabolites, such as Lobophora, Chlorodesmis (Rasherand Hay, 2010; Diaz-Pulido et al., 2011), or by altering microbial environments on the25
surface of the corals (Smith et al., 2006) may not benefit from seaweed abundance. Onthe other hand, reefs with abundant seaweeds that are not chemically loaded suchas Chnoospora, Hydroclathrus, etc., may benefit substantially by algal abundance,
1852

BGD10, 1831–1865, 2013
Benthic carbonfluxes and ocean
acidification
K. R. N. Anthony et al.
Title Page
Abstract Introduction
Conclusions References
Tables Figures
J I
J I
Back Close
Full Screen / Esc
Printer-friendly Version
Interactive Discussion
Discussion
Paper
|D
iscussionP
aper|
Discussion
Paper
|D
iscussionP
aper|
disregarding other indirect affects arising from for example competition for space andnutrients. Reefs adjacent to seagrass beds and back reef areas with abundant brownalgal populations can also potentially benefit from these scenarios (Anthony et al.,2011; Mcleod et al., 2013).
Acknowledgements. We thank staff at Heron Island Research Station for logistical support and5
K. Berry for help with analyses of seawater carbon chemistry. This study was funded by aLinkage Grant from the Australian Research Council and the Great Barrier Reef Marine ParkAuthority to KRNA and GDP.
References
Andersson, A. J. and Gledhill, D.: Ocean acidification and coral reefs: Effects on break-10
down, dissolution and net ecosystem calcification, Annu. Rev. Mar. Sci., 5, 321–348,doi:10.1146/annurev-marine-121211-172241, 2013.
Andersson, A. J., Kuffner, I. B., Mackenzie, F. T., Jokiel, P. L., Rodgers, K. S., and Tan, A.:Net Loss of CaCO3 from a subtropical calcifying community due to seawater acidification:mesocosm-scale experimental evidence, Biogeosciences, 6, 1811-1823, doi:10.5194/bg-6-15
1811-2009, 2009.Anthony, K. R. N., Kline, D. I., Diaz-Pulido, G., Dove, S., and Hoegh-Guldberg, O.: Ocean
acidification causes bleaching and productivity loss in coral reef builders, P. Natl. Ac. Sci.,105, 17442–17446, 2008.
Anthony, K. R. N., Kleypas, J., and Gattuso, J.-P.: Coral reefs modify the carbon chemistry of20
their seawater – implications for the impacts of ocean acidification, Glob. Change Biol., 17,3655–3666, 2011.
Baird, M. E. and Atkinson, M. J.: Measurement and prediction of mass transfer to experimentalcoral reef communities, Limnol. Oceanogr., 42, 1685–1693, 1997.
Bates, N. R. and Peters, A. J.: The contribution of atmospheric acid deposition to ocean acidi-25
fication in the subtropical North Atlantic Ocean, Mar. Chem., 107, 547–558, 2007.Bates, N. R., Amat, A., and Andersson, A. J.: Feedbacks and responses of coral calcification
on the Bermuda reef system to seasonal changes in biological processes and ocean acidifi-cation, Biogeosciences, 7, 2509–2530, doi:10.5194/bg-7-2509-2010, 2010.
1853

BGD10, 1831–1865, 2013
Benthic carbonfluxes and ocean
acidification
K. R. N. Anthony et al.
Title Page
Abstract Introduction
Conclusions References
Tables Figures
J I
J I
Back Close
Full Screen / Esc
Printer-friendly Version
Interactive Discussion
Discussion
Paper
|D
iscussionP
aper|
Discussion
Paper
|D
iscussionP
aper|
Caldeira, K. and Wickett, M. E.: Anthropogenic carbon and ocean pH, Nature, 425, 365, 2003.Carpenter, R. C., Hackney, J. M., and Adey, W. H.: Measurements of primary productivity and
nitrogenase activity of coral reef algae in a chamber incorporating oscillatory flow, Limnol.Oceanogr., 36, 40–49, 1991.
Chisholm, J. R. M.: Calcification by crustose coralline algae on the northern Great Barrier Reef,5
Australia, Limnol. Oceanogr., 1476–1484, 2000.Chisholm, J. R. M.: Primary productivity of reef-building crustose coralline algae, Limnol.
Oceanogr., 48, 1376–1387, 2003.Dennison, W. C. and Barnes, D. J.: Effects of water motion on coral photosynthesis and calcifi-
cation, J. Exp. Mar. Biol. Ecol., 115, 67–77, 1988.10
Diaz-Pulido, G., Harii, S., Mccook, L. J., and Hoegh-Guldberg, O.: The impact of benthic algaeon the settlement of a reef-building coral, Coral Reefs, 29, 203–208, 2010.
Diaz-Pulido, G., Gouezo, M., Tilbrook, B., Dove, S. G., and Anthony, K. R. N.: High CO2 en-hances the competitive strength of seaweeds over corals, Ecol. Lett., 14, 156–162, 2011.
Dickson, A. G., Afghan, J. D., and Anderson, G. C.: Reference materials for oceanic CO2 anal-15
ysis: a method for the certification of total alkalinity, Mar. Chem., 80, 185–197, 2003.Dickson, A. G., Sabine, C. L., and Christian, J. R.: Guide to best practices for ocean CO2
measurements, PICES special publication 3, IOCCP report No., 8, 2007.Done, T. J.: Phase shifts in coral reef communities and their ecological significance, Hydrobi-
ologia, 247, 121–132, 1992.20
Falter, J. L., Lowe, R. J., Atkinson, M. J., Monismith, S. G., and Schar, D. W.: Continuousmeasurements of net production over a shallow reef community using a modified Eulerianapproach, J. Geophys. Res., 113, C07035, doi:07010.01029/02007JC004663, 2008.
Gattuso, J.-P., Pichon, M., and Frankignoulle, M.: Biological control of air-sea CO2 fluxes: effectof photosynthetic and calcifying marine organisms and ecosystems, Mar. Ecol. Prog. Ser.,25
129, 307–312, 1995.Gledhill, D. K., Wanninkhof, R., Millero, F. J., and Eakin, C. M.: Ocean acidifica-
tion of the Greater Caribbean Region 1996–2006, J. Geophys. Res., 113, C10031,doi:10010.11029/12007JC004629, 2008.
Gourlay, M. R. and Colleter, G.: Wave-generated flow on coral reefs Aıan analysis for two-30
dimensional horizontal reef-tops with steep faces, Coast. Eng., 52, 353–387, 2005.Hoegh-Guldberg, O., Mumby, P. J., Hooten, A. J., Steneck, R. S., Greenfield, P., Gomez, E.,
Harvell, C. D., Sale, P. F., Edwards, A. J., Caldeira, K., Knowlton, N., Eakin, C. M., Iglesias-
1854

BGD10, 1831–1865, 2013
Benthic carbonfluxes and ocean
acidification
K. R. N. Anthony et al.
Title Page
Abstract Introduction
Conclusions References
Tables Figures
J I
J I
Back Close
Full Screen / Esc
Printer-friendly Version
Interactive Discussion
Discussion
Paper
|D
iscussionP
aper|
Discussion
Paper
|D
iscussionP
aper|
Prieto, R., Muthiga, N., Bradbury, R. H., Dubi, A., and Hatziolos, M. E.: Coral reefs underrapid climate change and ocean acidification, Science, 318, 1737–1742, 2007.
Johnson, K. M., Wills, K. D., Butler, D. B., Johnson, W. K., and Wong, C. S.: Coulometric totalcarbon dioxide analysis for marine studies: maximizing the performance of an automatedcontinuous gas extraction system and coulometric detector, Mar. Chem., 44, 167–187, 1993.5
Kleypas, J. A., Buddemeier, R. W., Archer, D., Gattuso, J. P., Langdon, C., and Opdyke, B.N.: Geochemical consequences of increased atmospheric carbon dioxide on coral reefs,Science, 284, 118–120, 1999.
Kleypas, J., Gattuso, J.-P., and Anthony, K. R. N.: Coral reefs modify their seawater carbonchemistry – case study from a barrier reef (Moorea, French Polynesia), Glob. Change Biol.,10
17, 3667–3678, 2011.Kroeker, K., Kordas, R. L., Crim, R. N., and Singh, G. G.: Meta-analysis reveals negative
yet variable effects of ocean acidification on marine organisms, Ecol. Lett., 13, 1419–1434,2010.
Langdon, C. and Atkinson, M. J.: Effect of elevated pCO2 on photosynthesis and calcification15
of corals and interactions with seasonal change in temperature/irradiance and nutrient en-richment, J. Geophys. Res.-Oceans, 110, C09S07, doi:10.1029/2004JC002576, 2005.
Lewis, E. and Wallace, D. W. R.: Program developed for CO2 system calculations,ORNL/CDIAC-105, Carbon Dioxide Information Analysis Center, Oak Ridge National Lab-oratory, US Department of Energy, Oak Ridge, Tennessee, 1998.20
Lobban, C. S. and Harrison, P. J.: Seaweed ecology and physiology, Cambridge UniversityPress, 1997.
Mass, T., Genin, A., Shavit, U., Grinstein, M., and Tchernov, D.: Flow enhances photosynthesisin marine benthic autotrophs by increasing the efflux of oxygen from the organism to thewater, P. Natl. Ac. Sci., 107, 2527–2531, 2010.25
Mccook, L. J., Jompa, J., and Diaz-Pulido, G.: Competition between corals and algae on coralreefs: a review of evidence and mechanisms, Coral Reefs, 19, 400–417, 2001.
Mcleod, E. Anthony, K. R. N., Andersson, A. J., Beeden, R., Golbuu, Y., Kleypas, J., Kroeker,K., Manzello, D., Salm, R. V., Schuttenberg, H., and Smith, J. E.: Preparing to manage coralreefs for ocean acidification: lessons from coral bleaching, Frontiers of Ecology and the En-30
vironment, doi:10.1890/110240, 2013.Orr, J.: Recent and future changes in carbonate chemistry, in: Ocean Acidification, edited by:
Gattuso, J.-P. and Hansson, L., Oxford University Press, 2011.
1855

BGD10, 1831–1865, 2013
Benthic carbonfluxes and ocean
acidification
K. R. N. Anthony et al.
Title Page
Abstract Introduction
Conclusions References
Tables Figures
J I
J I
Back Close
Full Screen / Esc
Printer-friendly Version
Interactive Discussion
Discussion
Paper
|D
iscussionP
aper|
Discussion
Paper
|D
iscussionP
aper|
Patterson, M. R.: A mass transfer explanation of metabolic scaling relations in some aquaticinvertebrates and algae, Science, 255, 1421–1423, 1992.
Patterson, M. R., Sebens, K. P., and Olson, R. R.: In situ measurements of flow effects on pri-mary production and dark respiration in reef corals, Limnol. Oceanogr., 35, 936–948, 1991.
Phinn, S., Roelfsema, C., and Mumby, P. J.: Multi-scale, object-based image analysis for map-5
ping geomorphic and ecological zones on coral reefs, Int. J. Remote Sens., 33, 3768–3797,2012.
Rasher, D. B. and Hay, M. E.: Chemically rich seaweeds poison corals when not controlled byherbivores, P. Natl. A. Sci. USA, 107, 9683–9688, 2010.
Raven, J. A.: Effects on marine algae of changed seawater chemistry with increasing atmo-10
spheric CO2, Biology and Environment-Proceedings of the Royal Irish Academy, 111, 1–17,2011.
Raven, J. A., Caldeira, K., Elderfield, H., Hoegh-Guldberg, O, Liss, P., Riebesell, U., Shepherd,J., Turley, C., and Watson, A.: Ocean acidification due to increasing atmospheric carbondioxide, The Royal Society, 2005.15
Robbins, L. L., Hansen, M. E., Kleypas, J. A., and Meylan, S. C.: CO2calc–A user-friendlyseawater carbon calculator for Windows, Max OS X, and iOS (iPhone), 17, US GeologicalSurvey Open-File Report 2010–1280, 2010.
Sabine, C. L., Feely, R. A., Gruber, N., Key, R. M., Lee, K., Bullister, J. L., Wanninkhof, R.,Wong, C. S., Wallace, D. W. R., Tilbrook, B., Millero, F. J., Peng, T.-H., Kozyr, A., Ono, T., and20
Rios, A. F.: The oceanic sink for anthropogenic CO2, Science, 305, 367–371, 2004.Santos, I. R., Glud, R. N., Maher, D., Erler, D., and Eyre, B. D.: Diel coral reef acidification
driven by porewater advection in permeable carbonate sands, Heron Island, Great BarrierReef, Geophys. Res. Lett., 38, L03604, doi:03610.01029/02010GL046053, 2011.
Schneider, K. and Erez, J.: The effect of carbonate chemistry on calcification and photosynthe-25
sis in the hermatypic coral Acropora eurystoma, Limnol. Oceanogr., 51, 1284–1293, 2006.Silverman, J., Lazar, B., and Erez, J.: Effect of aragonite saturation, temperature, and nutri-
ents on the community calcification rate of a coral reef, J. Geophys. Res.-Oceans, 112,doi:10.1029/2006JC003770, C05004, , 2007.
Silverman, J., Lazar, B., Cao, L., Caldeira, K., and Erez, J.: Coral reefs may30
start dissolving when atmospheric CO2 doubles, Geophys. Res. Lett., 36, L05606,doi:10.1029/2008GL036282, 2009.
1856

BGD10, 1831–1865, 2013
Benthic carbonfluxes and ocean
acidification
K. R. N. Anthony et al.
Title Page
Abstract Introduction
Conclusions References
Tables Figures
J I
J I
Back Close
Full Screen / Esc
Printer-friendly Version
Interactive Discussion
Discussion
Paper
|D
iscussionP
aper|
Discussion
Paper
|D
iscussionP
aper|
Smith, J. E., Shaw, M., Edwards, R. A., Obura, D., Pantos, O., Sala, E., Sandin, S. A., Smriga,S., Hatay, M., and Rohwer, F. L.: Indirect effects of algae on coral: algae-mediated, microbe-induced coral mortality, Ecol. Lett., 9, 835–845, 2006.
Suzuki, A. N. T. and Kayanne, H.: The mechanism of production enhancement in coral reefcarbonate systems: Model and empirical results, Sediment. Geol., 99, 259–280, 1995.5
Suzuki, A. and Kawahata, H.: Carbon budget of coral reef systems: an overview of observationsin fringing reefs, barrier reefs and atolls in the Indo-Pacific regions, Tellus B, 55, 428–444,2003.
Wheeler, W. N.: Effect of boundary-layer transport on the fixation of carbon by the giant-kelpMacrocystis pyrifera, Mar. Biol., 56, 103–110, 1980.10
Zeebe, R. E. and Wolf-Gladrow, D.: CO2 in seawater: equilibrium, kinetics, isotopes, Elsevier,2001.
1857

BGD10, 1831–1865, 2013
Benthic carbonfluxes and ocean
acidification
K. R. N. Anthony et al.
Title Page
Abstract Introduction
Conclusions References
Tables Figures
J I
J I
Back Close
Full Screen / Esc
Printer-friendly Version
Interactive Discussion
Discussion
Paper
|D
iscussionP
aper|
Discussion
Paper
|D
iscussionP
aper|
Table 1. Four scenarios for (A) benthic reef community compositions across the shallow-waterenvironments of Heron Reef flat and lagoon, and their (B) predicted impacts on hourly changesin the aragonite saturation state (∆Ωa/∆t h−1) of a 1-m deep water column under ambient(350–450 µatm) and high (560–700 µatm) CO2. Effects of flow are omitted so data encompassdaily flow variation. Projections assume full vertical mixing and advection only. Estimates of∆Ωa/∆t are here the sum of hourly day and night contributions (assuming 12 h day : 12 h night)from the benthic groups based on data in Fig. 5. Means of day and night contributions aregiven on bold. Standard errors (in brackets) are calculated using Monte Carlo analyses – seemethods.
Crest/Outer reef flat Back Reef/lagoon
Scenarios: (i) Corals/ (ii) Turfs/ (iii) Sand/ (iv) Macroalgae/CCAs/ macroalgae/ macroalgae/ sand/
turfs corals corals turfs
A: Benthos (cover, %) Corals 60 15 10 0CCA 20 5 5 0Halimeda 0 10 5 5Algal turfs 15 30 10 25Sand 0 10 50 30Fleshy macroalgae 5 30 20 40
B: Impact on carbon chemistry (∆Ωa/∆t, h−1) for whole communities at 1 m depth
Low CO2 Day 0.21 0.40 0.28 0.47(0.08) (0.07) (0.05) (0.07)
Night −0.43 −0.32 −0.20 −0.22(0.09) (0.07) (0.05) (0.07)
Mean −0.08 0.04 0.04 0.10(0.09) (0.10) (0.07) (0.07)
High CO2 Day 0.13 0.42 0.30 0.45(0.11) (0.06) (0.05) (0.06)
Night −0.57 −0.35 −0.23 −0.22(0.07) (0.07) (0.06) (0.08)
Mean −0.23 0.04 0.04 0.12(0.12) (0.09) (0.07) (0.09)
1858

BGD10, 1831–1865, 2013
Benthic carbonfluxes and ocean
acidification
K. R. N. Anthony et al.
Title Page
Abstract Introduction
Conclusions References
Tables Figures
J I
J I
Back Close
Full Screen / Esc
Printer-friendly Version
Interactive Discussion
Discussion
Paper
|D
iscussionP
aper|
Discussion
Paper
|D
iscussionP
aper|
Benthic carbon fluxes and ocean acidification 29
FIGURES 1
2
3
4 5 Fig. 1. Biogeochemical drivers of reef water carbon chemistry and effects of ocean 6
acidification on aragonite saturation state (Ωa). Calcification and dissolution affect 7
total alkalinity (AT) as well as the concentration of dissolved inorganic carbon (CT), 8
whereas photosynthesis and respiration affect CT only. Ωa changes linearly with AT 9
and CT and can thus be expressed directly as a compound function of carbon fluxes 10
(eqn 5). Vectors indicate the directions and relative strengths of the benthic 11
biological/biogeochemical processes under a present-day (solid) and acidified 12
(dashed) scenario. Absolute vector lengths are hypothetical, but will vary with water 13
depth, residence time, and the abundances and composition of primary producers and 14
calcifiers. The projection was run for temperature = 27˚C and salinity = 35. Modified 15
from (Anthony et al., 2011). 16
17
Fig. 1. Biogeochemical drivers of reef water carbon chemistry and effects of ocean acidificationon aragonite saturation state (Ωa). Calcification and dissolution affect total alkalinity (AT ) aswell as the concentration of dissolved inorganic carbon (CT ), whereas photosynthesis and res-piration affect CT only. Ωa changes linearly with AT and CT and can thus be expressed directlyas a compound function of carbon fluxes Eq. (5). Vectors indicate the directions and relativestrengths of the benthic biological/biogeochemical processes under a present-day (solid) andacidified (dashed) scenario. Absolute vector lengths are hypothetical, but will vary with waterdepth, residence time, and the abundances and composition of primary producers and calci-fiers. The projection was run for temperature=27 C and salinity=35. Modified from Anthonyet al. (2011).
1859

BGD10, 1831–1865, 2013
Benthic carbonfluxes and ocean
acidification
K. R. N. Anthony et al.
Title Page
Abstract Introduction
Conclusions References
Tables Figures
J I
J I
Back Close
Full Screen / Esc
Printer-friendly Version
Interactive Discussion
Discussion
Paper
|D
iscussionP
aper|
Discussion
Paper
|D
iscussionP
aper|
Benthic carbon fluxes and ocean acidification 30
1
2
3
Fig. 2. Study areas on Heron Reef, Southern Great Barrier Reef, Australia. All benthic 4
groups except crustose coralline algae (CCAs) were collected from across the 500 m 5
reef flat within the large area (top insert). CCAs were collected from within the small 6
area. 7
8
Fig. 2. Study areas on Heron Reef, Southern Great Barrier Reef, Australia. All benthic groupsexcept crustose coralline algae (CCAs) were collected from across the 500 m reef flat withinthe large area (top insert). CCAs were collected from within the small area.
1860

BGD10, 1831–1865, 2013
Benthic carbonfluxes and ocean
acidification
K. R. N. Anthony et al.
Title Page
Abstract Introduction
Conclusions References
Tables Figures
J I
J I
Back Close
Full Screen / Esc
Printer-friendly Version
Interactive Discussion
Discussion
Paper
|D
iscussionP
aper|
Discussion
Paper
|D
iscussionP
aper|
Benthic carbon fluxes and ocean acidification 31
1
2 3 Fig. 3. Flume assemblages of six benthic groups from the Heron reef flat 4
environment. A: branching coral, Acropora aspera; B: Crustose coralline algae 5
(CCA) dominated by Porolithon onkodes; C: calcifying macroalgae, Halimeda 6
cuneata f. undulata; D: turf assemblage consisting of a mixture of cropped algae, 7
benthic microalgae and fine sand; E: close-up of sand community dominated by a 8
grain size of 0.5 - 2 mm; and F: fleshy macroalgae (Chnoospora implexa). 9
10 11
Fig. 3. Flume assemblages of six benthic groups from the Heron reef flat environment.(A) Branching coral, Acropora aspera; (B) crustose coralline algae (CCA) dominated byPorolithon onkodes; (C) calcifying macroalgae, Halimeda cuneata f. undulata; (D) turf assem-blage consisting of a mixture of cropped algae, benthic microalgae and fine sand; (E) close-up of sand community dominated by a grain size of 0.5–2 mm; and (F) fleshy macroalgae(Chnoospora implexa).
1861

BGD10, 1831–1865, 2013
Benthic carbonfluxes and ocean
acidification
K. R. N. Anthony et al.
Title Page
Abstract Introduction
Conclusions References
Tables Figures
J I
J I
Back Close
Full Screen / Esc
Printer-friendly Version
Interactive Discussion
Discussion
Paper
|D
iscussionP
aper|
Discussion
Paper
|D
iscussionP
aper|
Benthic carbon fluxes and ocean acidification 32
1 2 Fig. 4. Recirculating laboratory flume used for carbon flux studies of benthic reef flat 3
communities. A and B: end and side perspectives during run with a community of 4
crustose coralline algae. C: top-view diagram showing flow collimators (curved 5
lines), flow direction (arrows) and position of propeller. The sunken (0.1 m) working 6
section (grey area) measures 0.3 m by 1.2 m. 7
Fig. 4. Recirculating laboratory flume used for carbon flux studies of benthic reef flat communi-ties. (A) and (B) end and side perspectives during run with a community of crustose corallinealgae. (C) Top-view diagram showing flow collimators (curved lines), flow direction (arrows) andposition of propeller. The sunken (0.1 m) working section (grey area) measures 0.3 m by 1.2 m.
1862

BGD10, 1831–1865, 2013
Benthic carbonfluxes and ocean
acidification
K. R. N. Anthony et al.
Title Page
Abstract Introduction
Conclusions References
Tables Figures
J I
J I
Back Close
Full Screen / Esc
Printer-friendly Version
Interactive Discussion
Discussion
Paper
|D
iscussionP
aper|
Discussion
Paper
|D
iscussionP
aper|
Benthic carbon fluxes and ocean acidification 33
1
Fig. 5. Net rates of calcification (left panels) and photosynthesis (right panels) at high 2
light (day, grey columns) and in darkness (night, black columns) under varying flow 3
velocities (8 and 35 cm s-1) and pCO2 regimes (Low = 350-450 µatm, High = 560-700 4
µatm). Data are means ± SE of N = 2 to 4 replicate communities. Note different scales 5
on y-axes. 6
Fig. 5. Net rates of calcification (left panels) and photosynthesis (right panels) at high light(day, grey columns) and in darkness (night, black columns) under varying flow velocities (8 and35 cm s−1) and pCO2 regimes (Low=350–450 µatm, High=560–700 µatm). Data are means±SE of N=2 to 4 replicate communities. Note different scales on y-axes.
1863

BGD10, 1831–1865, 2013
Benthic carbonfluxes and ocean
acidification
K. R. N. Anthony et al.
Title Page
Abstract Introduction
Conclusions References
Tables Figures
J I
J I
Back Close
Full Screen / Esc
Printer-friendly Version
Interactive Discussion
Discussion
Paper
|D
iscussionP
aper|
Discussion
Paper
|D
iscussionP
aper|
Benthic carbon fluxes and ocean acidification 34
1
Fig. 6. Estimated hourly changes in seawater aragonite saturation state (∆Ωa/∆t) for 2
benthic groups in a 1-m deep reef flat area based on eqn 5 and carbon flux rates in 3
Fig. 1. Error bars are standard errors of the mean determined based on Monte Carlo 4
analyses of data in Fig. 5 (see methods). Note different scales on y-axes. 5
6
Fig. 6. Estimated hourly changes in seawater aragonite saturation state (∆Ωa/∆t) for benthicgroups in a 1-m deep reef flat area based on Eq. (5) and carbon flux rates in Fig. 1. Error barsare standard errors of the mean determined based on Monte Carlo analyses of data in Fig. 5(see methods). Note different scales on y-axes.
1864

BGD10, 1831–1865, 2013
Benthic carbonfluxes and ocean
acidification
K. R. N. Anthony et al.
Title Page
Abstract Introduction
Conclusions References
Tables Figures
J I
J I
Back Close
Full Screen / Esc
Printer-friendly Version
Interactive Discussion
Discussion
Paper
|D
iscussionP
aper|
Discussion
Paper
|D
iscussionP
aper|
Benthic carbon fluxes and ocean acidification 35
1
Fig. 7. Partitioning of contributions from net photosynthesis (x-axis) and net 2 calcification (y-axis) to changes in aragonite saturation state (∆Ωa/∆t for 1-m water 3 depth) depicted in Fig. 6. The contribution from net photosynthesis was calculated as 4 b pn (corrected for air-sea CO2 exchange) and the contribution from net calcification 5 was calculated as gn (b – 2a), forming the two terms in eqn 5. The lengths of arrows 6 are proportional to their contribution to ∆Ωa/∆t. Note different scales on both axes and 7 the reversed scale of the x-axis. The symbols p, r, g and d denote the direction 8 towards photosynthesis, respiration, calcification and calcium carbonate dissolution, 9 consistent with CT and AT axes in Fig. 1. 10
!1.0%
!0.5%
0.0%
0.5%
1.0%
!1.0%!0.5%0.0%0.5%1.0%
Night%
Day%
r"
d"
g"
p"
!0.3%
!0.2%
!0.1%
0.0%
0.1%
0.2%
0.3%
!0.3%!0.2%!0.1%0.0%0.1%0.2%0.3%
Night%
Day%
r"
d"
g"
p"
!0.6%
!0.3%
0.0%
0.3%
0.6%
!0.6%!0.3%0.0%0.3%0.6%
Night%
Day%
r"
d"
g"
p"
!0.8%
!0.4%
0.0%
0.4%
0.8%
!0.8%!0.4%0.0%0.4%0.8%
Night%
Day%r"
d"
g"
p"
!0.2%
!0.1%
0.0%
0.1%
0.2%
!0.2%!0.1%0.0%0.1%0.2%
Night%Day%
r"
d"
g"
p"
!1.5%
!1.0%
!0.5%
0.0%
0.5%
1.0%
1.5%
!1.5%!1.0%!0.5%0.0%0.5%1.0%1.5%
Night%Day%
r"
d"
g"
p"
Contribution from net photosynthesis to ∆Ωa / ∆t
Con
tribu
tion
from
net
cal
cific
atio
n to
∆Ω
a / ∆
t
A:#Corals# B:#CCA!
C:#Halimeda!! D:#Turfs#
E:#Sand# F:#Macro6######algae#
Low#CO2##low#flow#Low#CO2###High#flow#High#CO2###low#flow#High#CO2###High#flow#
Fig. 7. Partitioning of contributions from net photosynthesis (x-axis) and net calcification (y-axis)to changes in aragonite saturation state (∆Ωa/∆t for 1-m water depth) depicted in Fig. 6.The contribution from net photosynthesis was calculated as bpn (corrected for air-sea CO2exchange) and the contribution from net calcification was calculated as gn (b–2a), forming thetwo terms in Eq. (5). The lengths of arrows are proportional to their contribution to ∆Ωa/∆t.Note different scales on both axes and the reversed scale of the x-axis. The symbols p, r , g andd denote the direction towards photosynthesis, respiration, calcification and calcium carbonatedissolution, consistent with CT and AT axes in Fig. 1.
1865
Copyright © 2022 FDOKUMEN