
INVESTIGATING THE RELATIONSHIP BETWEEN LABOR PRODUCTIVITY AND WORK-IN-PROCESS BUFFERS: A CASE STUDY
11
1 INVESTIGATING THE RELATIONSHIP BETWEEN LABOR PRODUCTIVITY AND WORK-IN-PROCESS BUFFERS: A CASE STUDY Luis González 1 , Vicente González 2 and Garry Miller 3 ABSTRACT In the last two decades, buffer-driven production strategies have been an emerging issue among lean construction researchers and practitioners alike. However, an in-depth understanding about the extent to which buffers impact system performance is still limited in construction, reducing the potential of using them to improve performance. To overcome this, the relationship between task-level labor productivity and buffer levels in a repetitive building project is investigated. In this research, a specific kind of inventory buffer is studied: work-in-process (WIP). A specific process was selected and analyzed in-detail as a case study to understand this relationship. The main result of this research indicates, through a linear regression, that an improvement in task-level labor productivity may be achieved when WIP buffer sizes greater than the size proposed by the lean ideal or the industry practice. However, this suggests a more in-depth investigation about the mechanisms operating in theory and practice in managing buffers in construction. Further research should focus on improving the analytical description of the relationship productivity/buffer on-site, as well as the understanding of the mechanisms at task and multiple task levels working in this relationship, and developing practical ways of using buffers to improve project-level performance. KEY WORDS: Buffers, Labor Productivity, Work-In-Process, Performance. INTRODUCTION Variability is an inherent feature of production systems and is one of the factors that adversely affect the performance of construction projects. This phenomenon is seen daily in construction projects in the variable behavior of factors such as production rates, labor productivity, and construction schedules, (González et al, 2009). One of the collateral consequences of such variability is the use of buffers, which can protect the production processes against the negative impacts arising (Hopp and Spearman, 2000). Hopp and Spearman (2000) provide a generic classification of buffers, which is applicable in construction, namely: inventory buffers; buffer capacity; and time buffers. 1 Undergraduate Student, Construction Engineering School, Universidad de Valparaiso, Chile. E- Mail: [email protected] 2 PhD, Lecturer, Department of Civil and Environmental Engineering, The University of Auckland, New Zealand. E-Mail: [email protected] 3 Professional Teaching Fellow, Department of Civil and Environmental Engineering, The University of Auckland, New Zealand. E-Mail: [email protected]
Transcript of INVESTIGATING THE RELATIONSHIP BETWEEN LABOR PRODUCTIVITY AND WORK-IN-PROCESS BUFFERS: A CASE STUDY
1
INVESTIGATING THE RELATIONSHIP BETWEEN
LABOR PRODUCTIVITY AND WORK-IN-PROCESS
BUFFERS: A CASE STUDY
Luis González1, Vicente González2 and Garry Miller3
ABSTRACT
In the last two decades, buffer-driven production strategies have been an emerging issue
among lean construction researchers and practitioners alike. However, an in-depth
understanding about the extent to which buffers impact system performance is still
limited in construction, reducing the potential of using them to improve performance. To
overcome this, the relationship between task-level labor productivity and buffer levels in
a repetitive building project is investigated. In this research, a specific kind of inventory
buffer is studied: work-in-process (WIP). A specific process was selected and analyzed
in-detail as a case study to understand this relationship. The main result of this research
indicates, through a linear regression, that an improvement in task-level labor
productivity may be achieved when WIP buffer sizes greater than the size proposed by
the lean ideal or the industry practice. However, this suggests a more in-depth
investigation about the mechanisms operating in theory and practice in managing buffers
in construction. Further research should focus on improving the analytical description of
the relationship productivity/buffer on-site, as well as the understanding of the
mechanisms at task and multiple task levels working in this relationship, and developing
practical ways of using buffers to improve project-level performance.
KEY WORDS: Buffers, Labor Productivity, Work-In-Process, Performance.
INTRODUCTION
Variability is an inherent feature of production systems and is one of the factors that
adversely affect the performance of construction projects. This phenomenon is seen daily
in construction projects in the variable behavior of factors such as production rates, labor
productivity, and construction schedules, (González et al, 2009). One of the collateral
consequences of such variability is the use of buffers, which can protect the production
processes against the negative impacts arising (Hopp and Spearman, 2000).
Hopp and Spearman (2000) provide a generic classification of buffers, which is
applicable in construction, namely: inventory buffers; buffer capacity; and time buffers.
1 Undergraduate Student, Construction Engineering School, Universidad de Valparaiso, Chile. E-
Mail: [email protected] 2 PhD, Lecturer, Department of Civil and Environmental Engineering, The University of Auckland,
New Zealand. E-Mail: [email protected] 3 Professional Teaching Fellow, Department of Civil and Environmental Engineering, The
University of Auckland, New Zealand. E-Mail: [email protected]
2
Elsewhere, buffers that relate specifically to construction have been defined: plan buffer
(Ballard and Howell, 1995) and technical information buffer (González et al, 2004).
In the last two decades, research in the field of Lean Construction has helped to better
understand the role of buffers as a production strategy in construction (Alarcón and
Ashley, 1999; González and Alarcón, 2010; González et al, 2009 and 2011; Horman,
2000; Tommelein et al, 1998; among others). These authors claim that a planned and
deliberate use of buffers in construction has a positive impact upon project performance.
Buffer-driven production strategies can minimize the impacts of variability, thereby
achieving significant reductions in lead times, waste and costs associated with projects.
Horman (2000) suggests that when a buffer is used correctly, it not only provides a
cushion or protection, but it also increases the ability to respond efficiently to changing
conditions, and thus may be used to maintain or even increase system performance.
Otherwise, a theoretical buffer level of zero is desirable from a lean standpoint.
Nevertheless, even the leanest production system needs a certain level of buffer to
perform work. In other words, it appears that a ‘balance problem’ exists between the use
of buffers to reduce variability impacts and overall production system performance based
on lean principles (González et al, 2009). Then, it is argued that a more in-depth
understanding about the extent to which buffers impact system performance is necessary.
In this research, the relationship between task-level labor productivity and inventory
buffer levels in a repetitive building project is investigated to promote a progress in the
understanding of this ‘balance problem’. Thus, a specific kind of inventory buffer is
studied: work-in-process (WIP). Hopp and Spearman (2000) define inventory buffer as
in-excess stock of raw materials, WIP and finished goods, categorized according their
position and purposes in the supply chain. In construction, WIP can be defined as the
difference between the cumulative progress of two consecutive and dependent processes,
which are characterized by units of work in front of a crew to perform their work
(González et al, 2009).
Whilst some studies have analyzed the relationship between buffer and labor
productivity, it would appear that little research has been undertaken to understand this
relationship: For instance, Horman (2000) analyzed the impact of process dynamics on
labor performance. Also, Horman and Thomas (2005) studied the impact of material
buffers on labor productivity. However, previous researches have been either rather
specific or have practical limitations in application.
On the other hand, different studies have used WIP buffers in construction. Alarcón
and Ashley (1999) analyzed the impact of these buffers on the project duration and cost,
as well as the variability of production. Alves and Tommelein (2003, 2004) modeled the
supply chain for sizing buffers, addressing their impact on system performance, WIP and
delivery times, in the processes of design, manufacturing and installation of metal ducts.
Bashford et al (2005) applied the Little’s Law to model WIP Bf which fitted quite well to
the production behavior of construction at project level and for a long time horizon.
Sakamoto et al. (2002) analyzed the influence of WIP buffers on the performance of three
commercial projects, and used the so-called project waste index (PWI) to measure waste
in labor performance. Tommelein et al. (1998) illustrated, through the use of a simulation
3
game, the impact of workflow variability and WIP buffers in a production system. Walsh
et al. (2007) proposed general equations for WIP and cycle time for unsteady state at
process level and limited run production, using the Little's Law and conservation of mass
concepts. González et al (2009 and 2011) and González and Alarcón (2010) proposed the
use of a general methodology for WIP buffer design and management in repetitive
projects.
All these researches have produced interesting results in terms of WIP buffer
understanding and its application in construction projects. But more detailed research is
still necessary in relation to the impacts of such buffers upon project performance, in this
case labor productivity, during the construction processes on-site.
The following sections address the research methodology and the case study before
moving to discussion and the main conclusions of this research.
RESEARCH METHODOLOGY
In this paper, the case study approach has been used. The following stages define the
research conducted: 1) Literature review in relation to buffer management and
productivity impacts; 2) Selection of activities following an exploratory field analysis to
become familiar with the project under study; 3) Gathering information, in which
productivity and WIP buffers data were collected; and finally 4) Analysis, in which
statistical and linear regression analyses were performed between labor productivity and
WIP buffers, seeking to understand the relationship between them. It is necessary to bear
in mind that this research is exploratory and descriptive in nature and this has not the
purpose to find out the “real” or “true” relationship between labor productivity and WIP
buffers. Otherwise, this research effort tries to provide a more precise explanation
between these variables, if possible, with the available data and limitations of this
research.
CASE STUDY
The selected case study was a multistory building project located in the city of
Valparaiso, Chile. The project comprises of a two-tower building of fourteen floors each,
with multiple apartments on each floor (eight apartments levels 2-11 and nine apartments
levels 12-14). This study was performed in the finishes stage of the construction
programmed. At the beginning, the researchers selected a number of field activities. In
consideration of the quality of measurements and continuity of work, two specific and
interdependent activities were selected; ‘tiling’ and ‘fixtures and fittings’ activities (the
latter represents the subsequent activity). The tiles were laid on floors and walls in the
apartments, in bathrooms and kitchen, while fixtures and fittings comprised of fixed units
in kitchens and vanity units in bathrooms. Both activities were subcontracted out, and
performed by different subcontractors.
MEASUREMENT APPROACH
To analyze the progress of each activity a ‘standard apartment’ was defined. This enabled
the measurement of equivalent progress in work units compared to this ‘standard
4
apartment’. It was essential to use the same unit of measure in both activities in order to
investigate the relationship between activities for accumulated progress (.e.g. velocity
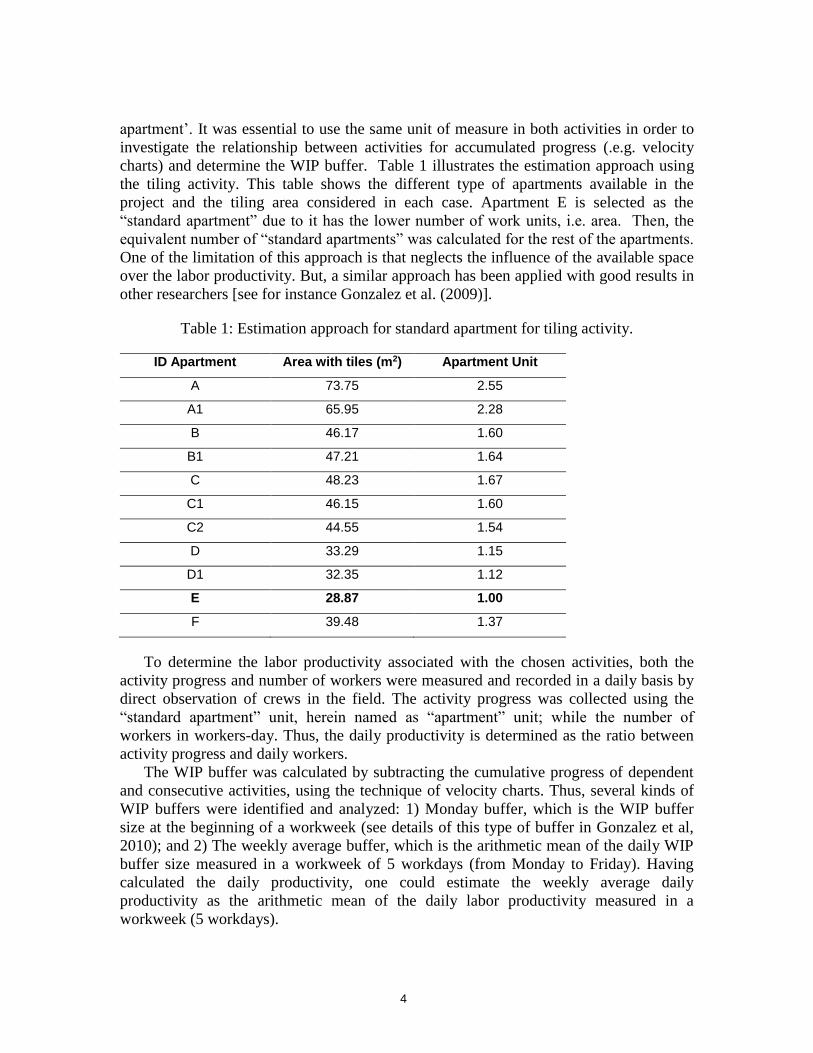
charts) and determine the WIP buffer. Table 1 illustrates the estimation approach using
the tiling activity. This table shows the different type of apartments available in the
project and the tiling area considered in each case. Apartment E is selected as the
“standard apartment” due to it has the lower number of work units, i.e. area. Then, the
equivalent number of “standard apartments” was calculated for the rest of the apartments.
One of the limitation of this approach is that neglects the influence of the available space
over the labor productivity. But, a similar approach has been applied with good results in
other researchers [see for instance Gonzalez et al. (2009)].
Table 1: Estimation approach for standard apartment for tiling activity.
ID Apartment Area with tiles (m2) Apartment Unit
A 73.75 2.55
A1 65.95 2.28
B 46.17 1.60
B1 47.21 1.64
C 48.23 1.67
C1 46.15 1.60
C2 44.55 1.54
D 33.29 1.15
D1 32.35 1.12
E 28.87 1.00
F 39.48 1.37
To determine the labor productivity associated with the chosen activities, both the
activity progress and number of workers were measured and recorded in a daily basis by
direct observation of crews in the field. The activity progress was collected using the
“standard apartment” unit, herein named as “apartment” unit; while the number of
workers in workers-day. Thus, the daily productivity is determined as the ratio between
activity progress and daily workers.
The WIP buffer was calculated by subtracting the cumulative progress of dependent
and consecutive activities, using the technique of velocity charts. Thus, several kinds of
WIP buffers were identified and analyzed: 1) Monday buffer, which is the WIP buffer
size at the beginning of a workweek (see details of this type of buffer in Gonzalez et al,
2010); and 2) The weekly average buffer, which is the arithmetic mean of the daily WIP
buffer size measured in a workweek of 5 workdays (from Monday to Friday). Having
calculated the daily productivity, one could estimate the weekly average daily
productivity as the arithmetic mean of the daily labor productivity measured in a
workweek (5 workdays).
5
More in detail in this research, the WIP buffer is the difference between the
cumulative progress of the ’tiling’ and ‘fixtures and fittings’’ activities. We contend that
the WIP buffer analyzed influences the task-level labor productivity of the subsequent
activity, (i.e. ‘fixtures and fittings’ activity), as one of a number of possible influencing
factors. Other possible influencing factors may include items such as team formation,
skills and training, sickness, site conditions etc. It was not possible to isolate such factors,
and hence is a limitation of this study. Also, the learning effect was neglected just to
develop an exploratory description of the analyzed relationship, having in mind the
limited number of data and the differences in the work units measured (different
apartment dimensions). Another limitation was to ignore the effect of subcontractors’
setup at the beginning of a workweek, which could be affected by the Monday buffer
size. That is to say, crew composition or changes in construction practices were not
analyzed when buffer is increased or reduced at the beginning of a workweek.
In terms of the associated variables, the labor productivity of the ‘fixtures and
fittings’ activity depends on the WIP buffer size generated at the end of the previous day
by the ‘tiling’ activity. Both buffer and productivity are considered to be related as
ordered pairs for purposes of further analysis.
DATA ANALYSIS
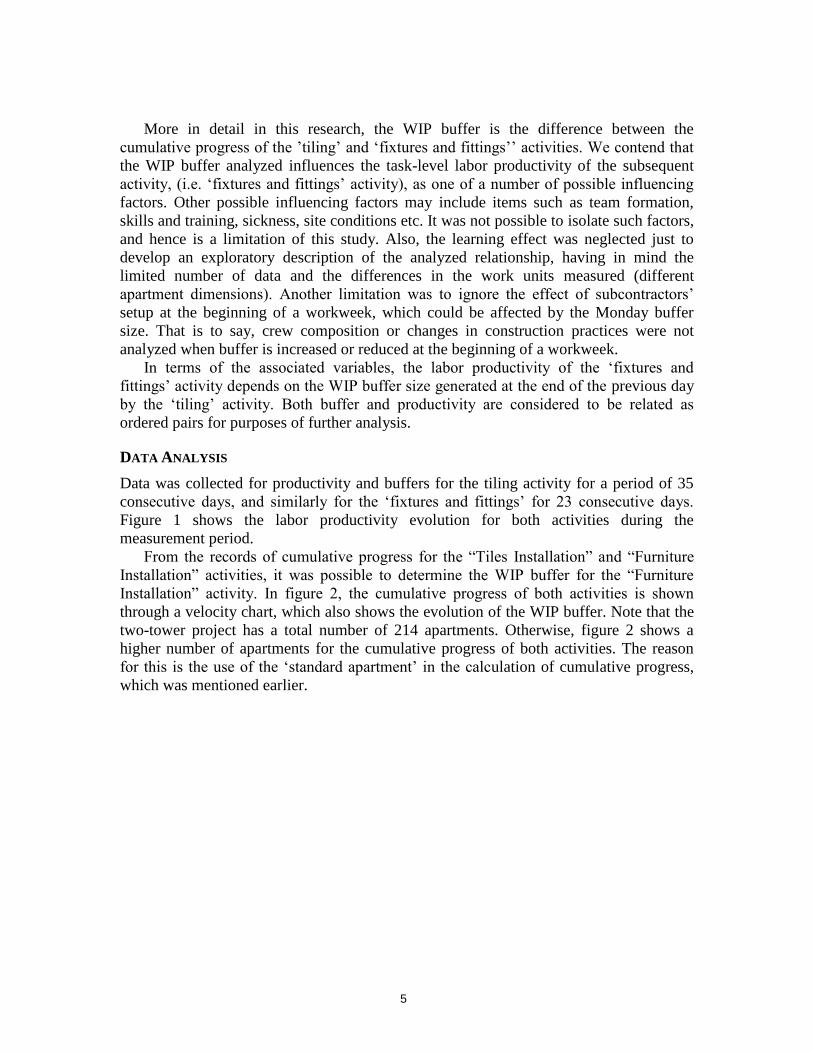
Data was collected for productivity and buffers for the tiling activity for a period of 35
consecutive days, and similarly for the ‘fixtures and fittings’ for 23 consecutive days.
Figure 1 shows the labor productivity evolution for both activities during the
measurement period.
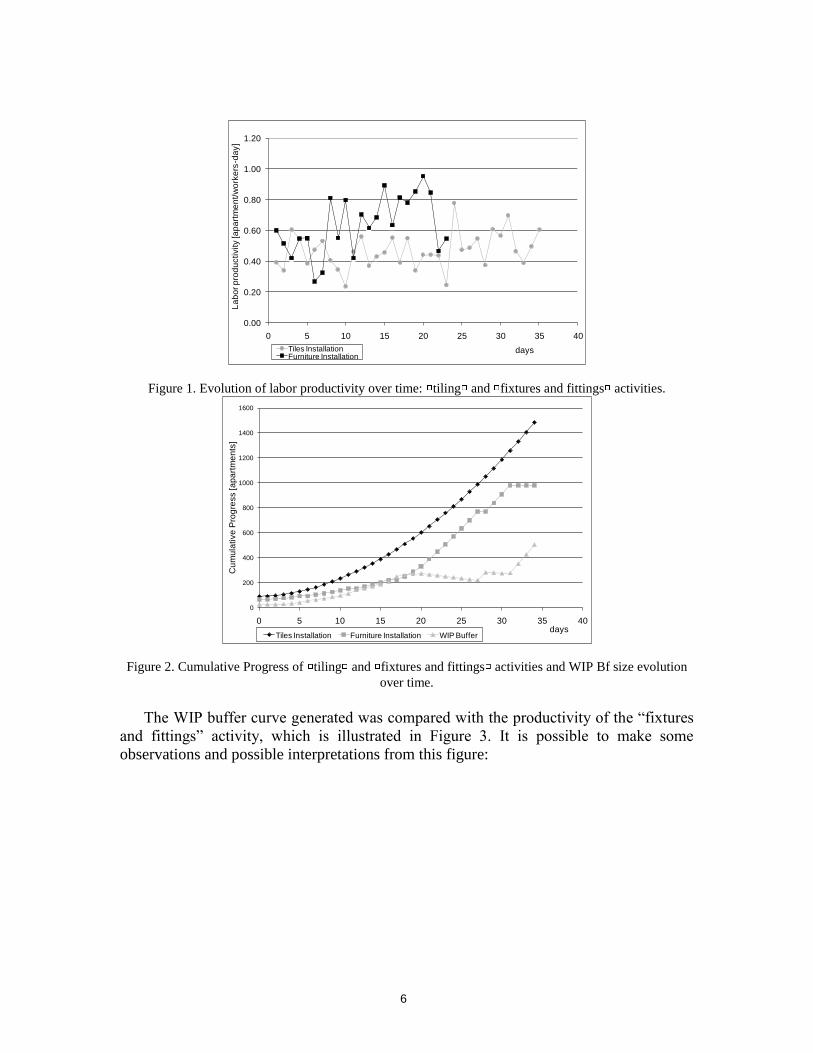
From the records of cumulative progress for the “Tiles Installation” and “Furniture
Installation” activities, it was possible to determine the WIP buffer for the “Furniture
Installation” activity. In figure 2, the cumulative progress of both activities is shown
through a velocity chart, which also shows the evolution of the WIP buffer. Note that the
two-tower project has a total number of 214 apartments. Otherwise, figure 2 shows a
higher number of apartments for the cumulative progress of both activities. The reason
for this is the use of the ‘standard apartment’ in the calculation of cumulative progress,
which was mentioned earlier.
6
0.00
0.20
0.40
0.60
0.80
1.00
1.20
0 5 10 15 20 25 30 35 40
La
bo
r p
rod
uctivity [a
pa
rtm
en
t/w
ork
ers
-da
y]
daysTiles InstallationFurniture Installation
Figure 1. Evolution of labor productivity over time: tiling and fixtures and fittings activities.
0
200
400
600
800
1000
1200
1400
1600
0 5 10 15 20 25 30 35 40
Cu
mu
lative
Pro
gre
ss [a
pa
rtm
en
ts]
daysTiles Installation Furniture Installation WIP Buffer
Figure 2. Cumulative Progress of tiling and fixtures and fittings activities and WIP Bf size evolution
over time.
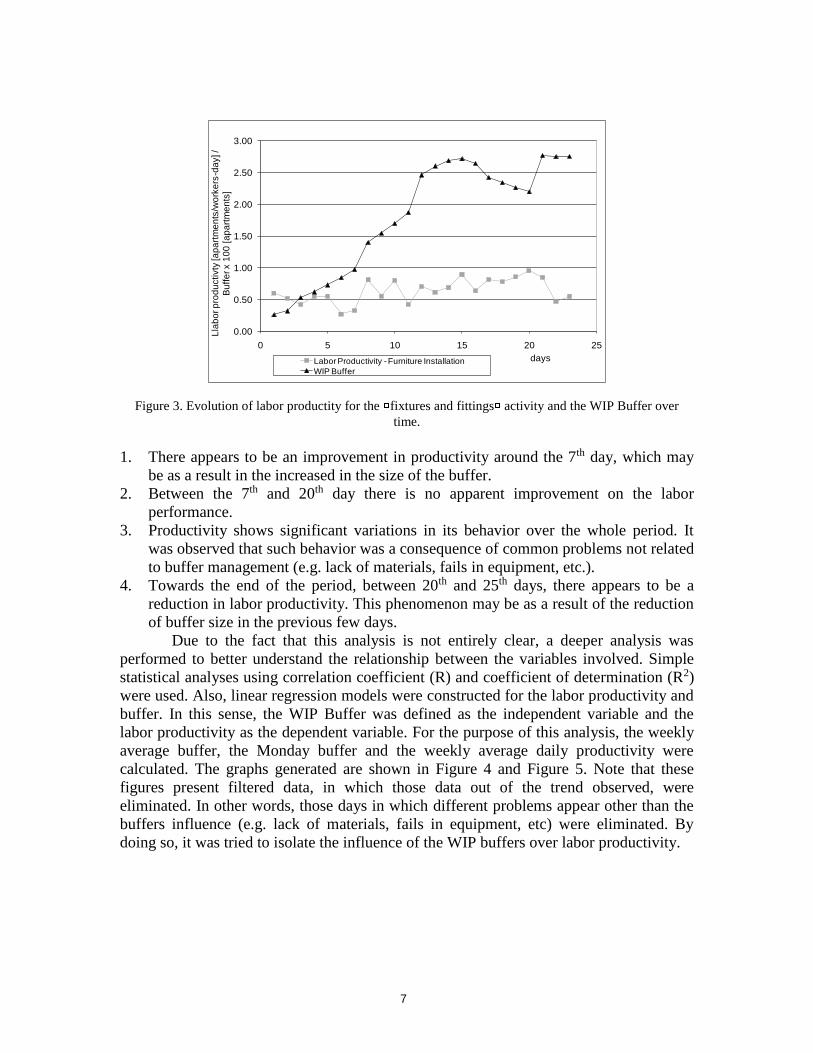
The WIP buffer curve generated was compared with the productivity of the “fixtures
and fittings” activity, which is illustrated in Figure 3. It is possible to make some
observations and possible interpretations from this figure:
7
0.00
0.50
1.00
1.50
2.00
2.50
3.00
0 5 10 15 20 25
Lla
bo
r p
rod
uctivty
[ap
art
me
nts
/wo
rke
rs-d
ay] /
Bu
ffe
r x 1
00
[a
pa
rtm
en
ts]
daysLabor Productivity - Furniture Installation
WIP Buffer
Figure 3. Evolution of labor productity for the fixtures and fittings activity and the WIP Buffer over
time.
1. There appears to be an improvement in productivity around the 7th day, which may
be as a result in the increased in the size of the buffer.
2. Between the 7th and 20th day there is no apparent improvement on the labor
performance.
3. Productivity shows significant variations in its behavior over the whole period. It
was observed that such behavior was a consequence of common problems not related
to buffer management (e.g. lack of materials, fails in equipment, etc.).
4. Towards the end of the period, between 20th and 25th days, there appears to be a
reduction in labor productivity. This phenomenon may be as a result of the reduction
of buffer size in the previous few days.
Due to the fact that this analysis is not entirely clear, a deeper analysis was
performed to better understand the relationship between the variables involved. Simple
statistical analyses using correlation coefficient (R) and coefficient of determination (R2)
were used. Also, linear regression models were constructed for the labor productivity and
buffer. In this sense, the WIP Buffer was defined as the independent variable and the
labor productivity as the dependent variable. For the purpose of this analysis, the weekly
average buffer, the Monday buffer and the weekly average daily productivity were
calculated. The graphs generated are shown in Figure 4 and Figure 5. Note that these
figures present filtered data, in which those data out of the trend observed, were
eliminated. In other words, those days in which different problems appear other than the
buffers influence (e.g. lack of materials, fails in equipment, etc) were eliminated. By
doing so, it was tried to isolate the influence of the WIP buffers over labor productivity.
8
Labor Productivity= 0.0008 WIP Buffer+ 0.4968R² = 0.37
0.00
0.10
0.20
0.30
0.40
0.50
0.60
0.70
0.80
0.90
0 50 100 150 200 250 300 350
La
bo
r P
rod
uctivity [a
pa
rtm
en
ts/w
ork
ers
-da
y]
WIP Buffer [apartments]
R=0,61
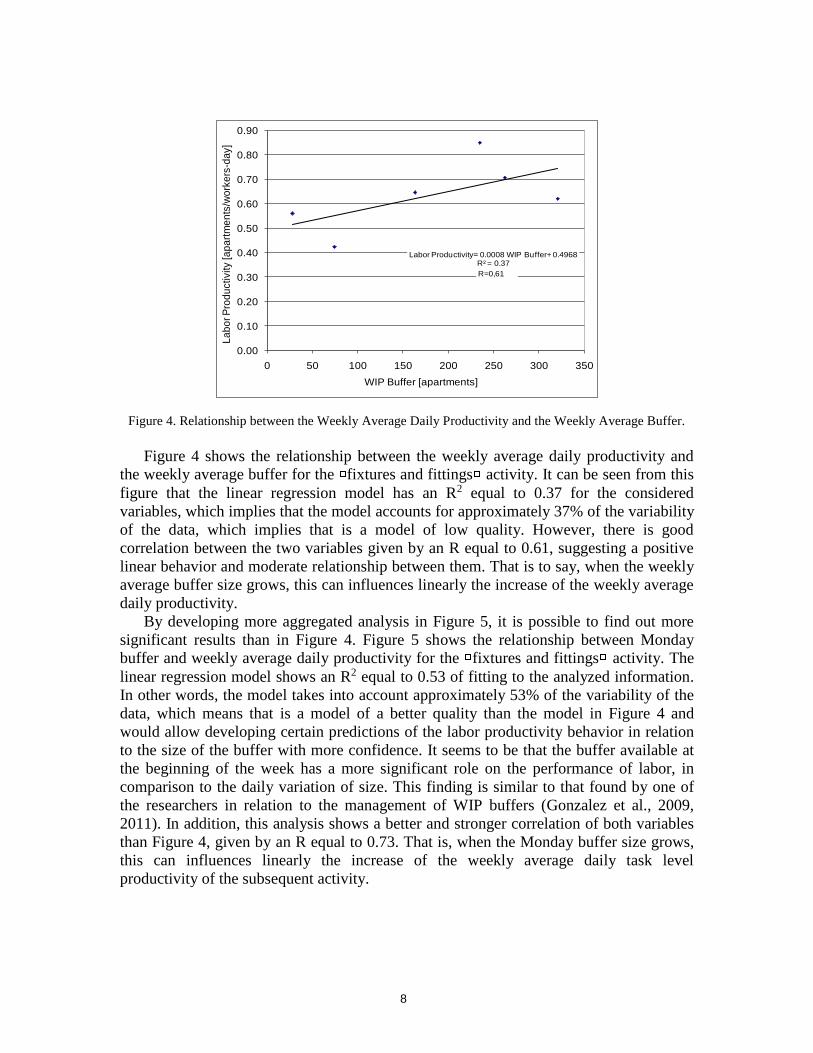
Figure 4. Relationship between the Weekly Average Daily Productivity and the Weekly Average Buffer.
Figure 4 shows the relationship between the weekly average daily productivity and
the weekly average buffer for the fixtures and fittings activity. It can be seen from this
figure that the linear regression model has an R2 equal to 0.37 for the considered
variables, which implies that the model accounts for approximately 37% of the variability
of the data, which implies that is a model of low quality. However, there is good
correlation between the two variables given by an R equal to 0.61, suggesting a positive
linear behavior and moderate relationship between them. That is to say, when the weekly
average buffer size grows, this can influences linearly the increase of the weekly average
daily productivity.
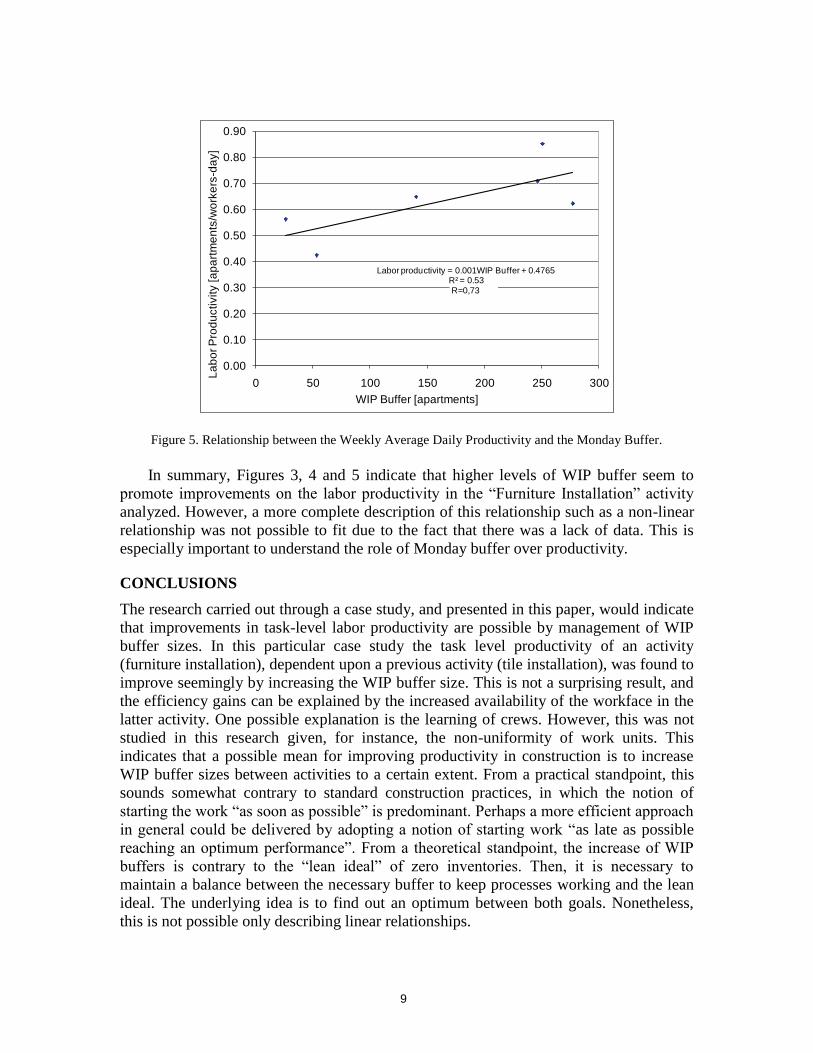
By developing more aggregated analysis in Figure 5, it is possible to find out more
significant results than in Figure 4. Figure 5 shows the relationship between Monday
buffer and weekly average daily productivity for the fixtures and fittings activity. The
linear regression model shows an R2 equal to 0.53 of fitting to the analyzed information.
In other words, the model takes into account approximately 53% of the variability of the
data, which means that is a model of a better quality than the model in Figure 4 and
would allow developing certain predictions of the labor productivity behavior in relation
to the size of the buffer with more confidence. It seems to be that the buffer available at
the beginning of the week has a more significant role on the performance of labor, in
comparison to the daily variation of size. This finding is similar to that found by one of
the researchers in relation to the management of WIP buffers (Gonzalez et al., 2009,
2011). In addition, this analysis shows a better and stronger correlation of both variables
than Figure 4, given by an R equal to 0.73. That is, when the Monday buffer size grows,
this can influences linearly the increase of the weekly average daily task level
productivity of the subsequent activity.
9
Labor productivity = 0.001WIP Buffer + 0.4765R² = 0.53
0.00
0.10
0.20
0.30
0.40
0.50
0.60
0.70
0.80
0.90
0 50 100 150 200 250 300
La
bo
r P
rod
uctivity [a
pa
rtm
en
ts/w
ork
ers
-da
y]
WIP Buffer [apartments]
R=0,73
Figure 5. Relationship between the Weekly Average Daily Productivity and the Monday Buffer.
In summary, Figures 3, 4 and 5 indicate that higher levels of WIP buffer seem to
promote improvements on the labor productivity in the “Furniture Installation” activity
analyzed. However, a more complete description of this relationship such as a non-linear
relationship was not possible to fit due to the fact that there was a lack of data. This is
especially important to understand the role of Monday buffer over productivity.
CONCLUSIONS
The research carried out through a case study, and presented in this paper, would indicate
that improvements in task-level labor productivity are possible by management of WIP
buffer sizes. In this particular case study the task level productivity of an activity
(furniture installation), dependent upon a previous activity (tile installation), was found to
improve seemingly by increasing the WIP buffer size. This is not a surprising result, and
the efficiency gains can be explained by the increased availability of the workface in the
latter activity. One possible explanation is the learning of crews. However, this was not
studied in this research given, for instance, the non-uniformity of work units. This
indicates that a possible mean for improving productivity in construction is to increase
WIP buffer sizes between activities to a certain extent. From a practical standpoint, this
sounds somewhat contrary to standard construction practices, in which the notion of
starting the work “as soon as possible” is predominant. Perhaps a more efficient approach
in general could be delivered by adopting a notion of starting work “as late as possible
reaching an optimum performance”. From a theoretical standpoint, the increase of WIP
buffers is contrary to the “lean ideal” of zero inventories. Then, it is necessary to
maintain a balance between the necessary buffer to keep processes working and the lean
ideal. The underlying idea is to find out an optimum between both goals. Nonetheless,
this is not possible only describing linear relationships.
10
Note that, given the limited amount of empirical data as evidence, we found a simple
linear relationship between the buffers and labor productivity. Other types of
relationships and behavior patterns (e.g. non-linear) that may exist are hidden, due to the
limited scope and nature of this research. This is a key aspect to understand the
mechanisms involved in this relationship and to what extent is possible to improve labor
productivity given a certain buffer level. In other words, to what extent the productivity
curve would be asymptotic or declining. Therefore, there is still uncertainty about the
"real" or more reliable behavior between these variables. At last, it could contribute to
complement the body of knowledge in terms of the “construction physics”.
On the other hand, it seems to be that the buffer size at the beginning of a workweek
may have a stronger relationship than daily buffer size with labor productivity. The
reasons why there is a stronger correlation between productivity and WIP buffer size on
Mondays has not been investigated qualitatively in this research. However, a speculative
reason may be that contractors (and subcontractors) typically establish weekly forward
work plans on Mondays. It is likely that weekly work targets are established at
commencement of the week based on the WIP as of Monday morning, and not then
checked during the week unless there is a significant change against expectation. This
could can have a significant application in the practice of construction project
management, since the buffer size could be a production variable explicitly managed to
improve the performance of labor at a weekly level.
We recognize that the primary role of buffers is to reduce the negative impact of
variability in production systems. As we mentioned earlier, we also understand that, from
a lean thinking view, the goal of a production system is to minimize buffers, and that a
theoretical ideal production system would have a zero buffer level. However, we believe
that in construction there is a trade-off between the theoretical goals of buffer
minimization in lean thinking with the pragmatic implications of optimizing buffer sizes
in construction. This is due in part to the practical implications of physical access to the
workface, limitations of skilled labor, the need to optimize efficiency whilst at the same
time using buffers to manage risk. We acknowledge that this study has several
limitations, and as such further investigations are necessary in order to achieve a deeper
understanding of these relationships, to provide strong managerial tools to deal with the
buffer issue in construction.
REFERENCES
Alarcón, L. y Ashley, D. B. (1999). Playing Games: Evaluating the Impact of Lean
Production Strategies on Project Cost and Schedule. Proceedings of 7th Annual
Conference of International Group for Lean Construction, University of Berkeley,
California, U.S.A., 26-28 July.
Alves, T. and Tommelein, I.D. (2004). Simulation of Buffering and Batching Practices in
the Interface Detailing-Fabrication-Installation of HVAC Ductwork. Proceedings of
12th Annual Conference of International Group for Lean Construction, Helsinore,
Denmark, August 5th – 8th.
11
Alves, T. and Tommelein, I.D. (2003). Buffering and Batching Practices in la HVAC
Industry. Proceedings of 11th Annual Conference of International Group for Lean
Construction, Virginia Tech, Blacksburgh, Virginia, U.S.A, 16-17 July.Ballard, G. y
Howell G. (1995). Toward Construction JIT. In L. F. Alarcón (ed.), Lean
Construction, A.A. Balkema, The Netherlands, pp. 291-300.
Bashford, H. H., Walsh, K. D. and Sawhney, A. (2005). Production System Loading -
Cycle Time in Residential Construction. Journal of Construction Engineering and
Management, ASCE, Vol. 131, N° 1, pp. 15-22.
González, V., Alarcón, L.F., Maturana, S. and Bustamante, J. A. (2011). Site
Management of Work-In-Process Buffers to Enhance Project Performance Using the
Reliable Commitment Model: A Case Study. Journal of Construction Engineering
and Management, doi: 10.1061/(ASCE)CO.1943-7862.0000346 (in-press).
González, V. and Alarcón, L. F. (2010). Uncertainty Management in Repetitive Projects
using Work-In-Process Buffers, Editorial LAMBERT Academic Publishing AG &
Co. KG, Germany.
González, V., Alarcón, L.F. and Molenaar, K. (2009). Multiobjective Design of Work-In-
Process Buffer for Scheduling Repetitive Building Projects. Automation in
Construction, Vol. 18, N°2, pp. 95-108.
González, V., Rischmoller, L. y Alarcón, L. (2004). Design of Buffers in Repetitive
Projects: Using Production Management Theory and IT Tools. Proceedings of 4th
International Postgraduate Research Conference, University of Salford, Manchester,
U.K., April 1st –2nd.
Hopp, W. y Spearman, M. (2000). Factory physics: foundations of manufacturing
management. Irwin/McGraw-Hill, Boston, 698 p.
Horman, M. (2000). Process dynamics: Buffer management in building projects
operations, PhD dissertation, The University of Melbourne, Australia.
Sakamoto, M., Horman, M. y Thomas, H. (2002). A Study of the Relationship between
Buffers and Performance in Construction. Proceedings of 10th International
Conference for Lean Construction, Gramado, Brazil, August.
Tommelein I., Riley, D., y Howell G. (1998). Parade game: Impact of work flow
variability on succeeding trade performance. Proceedings of 6th International
Conference for Lean, Guarujá, São Paulo, Brazil.
Tommelein, I. D. and Weissenberger, M.(1999). More Just in Time: Location of Buffers
in Structural Steel Supply and Construction Process. Proceedings of 7th Annual
Conference of International Group for Lean Construction, University of Berkeley,
California, U.S.A., 26-28 July.
Walsh, K. D., Sawhney, A. and Bashford, H. H. (2007). Production Equation for
Unsteady-State Construction Processes. Journal of Construction Engineering and