Coagulation and Ultrafiltration in Seawater Reverse Osmosis ...
Upload
independentCategory
view
0download
0
Marine Chemistry, 44 (1993) 143-152 143 0304-4203/93/$06.00 © 1993 - Elsevier Science Publishers B.V. All rights reserved
The use of buffers to measure the pH of seawater
Frank J. Millero a, Jia-Zhong Zhang a, Sarah Fiol a, Sara Sotolongo a, Rabindra N. Roy b, Kitack Lee a, Sanjay Mane a
~Rosenstiel School of Marine and Atmospheric Science, University of Miami, Miami, FL 33149, USA bHoffman Department of Chemistry. Drury College, Springfield, MO 65802, USA
(Received January 29, 1993; revision accepted June 7, 1993)
Abstract
The pH of seawater can be measured in the field using potentiometric and spectrophotometric methods. The use of pH standards or buffers is an important aspect of the calibration of both methods in a laboratory on a common concen- tration scale. The buffers can also be used to monitor the performance of pH meter and spectrophotometer during a cruise. A procedure is described for the determination of the pH of seawater, where the proton concentration is expressed as moles kg-H20 -l using seawater buffers. The buffers are prepared in synthetic seawater in the laboratory by the methods outlined by Bates and coworkers. We have prepared four buffers (Bis, Tris, Morpholine and 2-Amino- pyridine) that cover a pH range from 6.8 to 8.8. The emf values of the buffers were measured with a H2, Pt/AgC1, Ag electrode system after their preparation and bottling for use at sea. The measured emf values were found to be in good agreement (4-0.05 mV) with the original measurements of Bates and coworkers from 0 to 45°C. The measured pH of these buffers are in good agreement (-4-0.001 pH units) with the values calculated from the equations of Dickson on the total pH scale based on Bates et al. Studies are underway to access the long term stability of these buffers. We have also used these buffers to calibrate systems used to make potentiometric and spectrophotometric measurements of pH on seawater relative to the H2, Pt/Ag, AgCi electrode from 5 to 45°C.
1. Introduction
In the next ten years a concerted effort is going to be made in studying the ca rbona te system in the oceans. These studies are being made in an a t t empt to detect the changes in the carbonate
system in the oceans as a result o f the increases of CO2 in the a tmosphere due to the burning o f fossil fuels. At present it is est imated that abou t 40% of the CO2 being released to the a tmosphere is being lost to the oceans. The rate of increase of total ca rbon dioxide in the ocean is abou t 1 # M /
yr. To detect these small changes in the CO2 system it is necessary to make reliable and precise measurements o f the componen t s of the carbonate system (pH, total ca rbon dioxide, the part ial presssure of CO2, and the carbonate alkalinity). The observable parameters are inter-
related by the the rmodynamics of the ca rbona te
system in seawater and the buffers used to deter- mine the pH. At present the mos t reliable way to determine the dissociation constants o f carbonic
acid and buffers in seawater is to use the H2, Pt/ AgC1, Ag electrode cell in synthetic seawater. Bates and coworkers (Ramet te et al., 1977;
Bates and Calais, 1981; Czerminski et al., 1982; Bates and Erickson, 1986) have used this cell to develop a p H scale using seawater buffers. More recently this cell has been used to determine the p ro ton concentra t ion in seawater (Dickson, 1990a; Campbel l et al., i993-this issue) and the dissociation constant for boric (Dickson, 1990b; Roy et al., 1993a-this issue) and carbonic acids (Roy et al., 1993b-this issue) in seawater.
The p H o f seawater has been measured on three scales which are dependent on different

1 4 4 F.J. Millero et al./Marine Chemistry 44 (1993) 143-152
buffer systems (Dickson, 1984; Culberson, 1981; Millero, 1986). The pH on the NBS (National Bureau of Standards) scale is given by:
pHNBs = --log aH (1)
This scale uses dilute NBS buffers (Bates, 1973) to define the pH or activity of the proton, all. Although it is useful in dilute natural waters such as rivers and lakes, it is not suggested for use in ocean waters (Dickson, 1984; Millero, 1986).
A pH scale based on the hydrogen ion con- centration is more useful for oceanographic measurements (Dickson, 1984; Whitfield et al., 1985; Millero, 1986). Three scales have been suggested using the proton concentration scale, the free hydrogen ion scale, the total hydrogen ion scale and the seawater scale.
The free hydrogen ion scale is defined by (Bates and Culberson, 1977; Khoo et al., 1977; Ramette et al., 1977):
p i le = - l o g m ( H +) (2)
The total hydrogen ion scale accounts for the HSO4 ion and is defined by (Hansson, 1973; Dickson, 1984):
pHx = - logm*(H +) (3)
where the total hydrogen ion is given by:
m*(H +) = m(H +) + m(HSO4) (4)
= m(H+)[1 +rn(SOZ4-)/K(HSO4)] (5)
where m(SO42-) is the stoichiometric con- centration of sulfate and K(HSO4) is the dissociation constant for bisulfate ion (Dickson and Riley, 1979; Millero, 1986; Dickson, 1990a). Use of the total hydrogen ion scale allows pH measurements to be calibrated in solutions containing SO 2- without defining the physical- chemical properties of K(HSO4).
The seawater scale includes both sulfate and floride ions (Dickson and Riley, 1979; Dickson and Millero, 1987) and the pH is defined by:
pHsw s = - l og m(H+)sws (6)
where the total proton concentration is given by
(Dickson, 1984):
m(H+)sws = m(H +) + m(HSO4) + m(HF- ) (7)
= re(H+)[1 + m(SO]-)/K(HSO4)
+ m(F-)/K(HF)] (8)
where m(F-) is the stoichiometric concentration of fluoride and K(HF) is the dissociation con- stant for hydrogen fluoride (Dickson and Riley, 1979). These three proton concentration scales are related by Eqs. (5) and (8).
Recently Dickson (1993) has suggested that the effects of fluoride should not be incor- porated into the definition of pH. He feels that it is simpler to treat F- as a minor acid base species analogue to the borate ion. Some equilibrium constants reported in literature are in seawater scale. To convert seawater scale to total proton scale one can use following expression (Dickson and Millero, 1987):
pHT = pHsws - log {[1 + m(SO2-)/K(HSO;)]
/[1 + m(SO24-)/K(HSO;) + m(F-)/K(HF)]} (9)
Beside different scales used, ignoring the unit for pH also causes confusion. Two units are com- monly used, molality (mol kg-H2 O-1) and oceanographer's prefered unit of mol kg-SW -l . The two units are related by (Dickson, 1993):
pH(mol k g - SW -1) = pH(mol kg - H2 O-1 )
- log(1 - 0.00106S) (10)
where S is the salinity. At salinity of 35 the two concentration units differ by 0.0164 in pH. Due to different scales and units are used it is recom- mended that values of pH should be reported along with the scale and unit used. Values of pH in this paper are give on total scale in unit of molatity.
Dickson (1993) has re-evaluated the emf data of Bates and coworkers for the various buffers (Ramette et al., 1977; Bates and Calais, 1981; Czerminski et al., 1982; Bates and Erickson, 1986) using the total proton scale. He provides

F.J. Millero et al./Marine Chemistry 44 (1993) 143-152 145
equations that can be used to calculate the pH of 0.04 m seawater buffers at various temperatures and salinities. Thus, it is now possible to use these buffers to make reliable seawater pH measurements on the total proton scale.
In this paper we demonstrate how the pH of Bates seawater buffers can be determined from emf measurements using the H2, Pt/AgC1, Ag electrode. These buffers have been used to cali- brate potentiometric and spectrophotometric systems used to measure the pH of seawater. The values of pH made by the two methods are in good agreement (+0.002) for measurements made on Gulf Stream seawater and certified reference material.
2. Experimental
The composition (Table l) of the artificial seawater buffers used in this study was the same as used by Khoo et al. (1977). The buffer solutions in artificial seawater were prepared using analytical grade reagents purified by recrystallization. Approximately 20 1 of four buffers (TRIs, 2-amino-2-hydroxymethyl-l,3- propanediol; Bis, 2-amino-2-methyl- 1,3- p r o p a n e d i o l ; MORPHOLINE, tetrahydro- 1,4- isoxazine; and AMINOPYRIDINE, 2-Amino pyridine) were prepared. The buffers were bottled in 500 cm 3 Corning pyrex bottles sealed with Apiezon grease. The water used was ion exchanged Millipore super Q (18 megaohm). The NaC1, NazSO 4 and KC1 were dried at l l0°C before weighing. Stock solution of MgC12 and CaC12 were used for the preparation of artificial seawaters. The densities of these solution were determined by densimeter and the molality was calculated from the known equations of state of these electrolyte. Buoyancy corrections were applied to all weighings. The HC1 solutions (suprapur, EM Science) were standardized gravimetrically by weighing as AgC1. The seawater used was surface Gulf Stream water and filtered through a 0.45 #m Millipore filter before use. The salinity of this
Table 1 Preparation of 0.04 m seawater buffers a
Salt MW Molality Mol/kg Salt (g)
(1)Tms/Tms-HCI NaCI 58.443 0 . 3 8 6 6 4 0 . 3 6 9 9 4 21.620 Na2SO4 142.037 0 . 0 2 9 2 6 0.02800 3.977 KC1 74.555 0 . 0 1 0 5 8 0.01012 0.755 CaC12 110.986 0 . 0 1 0 7 7 0.01030 1.143 MgCI2 95.210 0 . 0 5 5 1 8 0.05280 5.027
Tals 121.14 0.04 0.03827 4.636 TREs-HCI 157.60 0.04 0.03827 6.031
XH20 = 0.95681 43.189 g salt 956.81 g H20
(2)B~s/BIs-HCI NaC1 58.443 0 . 3 8 6 6 4 0 . 3 7 0 3 9 21.647 Na2SO4 142.037 0 . 0 2 9 2 6 0.02803 3.981 KCI 74.555 0 . 0 1 0 5 8 0.01014 0.755 CaCI 2 110.986 0 . 0 1 0 7 7 0.01032 1.145 MgC12 95.210 0 . 0 5 5 1 8 0.05286 5.033
Brs 105.14 0.08 0.07664 8.058 HC1 36.46 0.04 0.03832 1.397
X82o -- 0.95798 42.016 g salt 957.983 g H20
(3) AMINOPYRIDINEIAMINOPYRIDINE-HCI NaC1 58.443 0 . 3 8 6 6 4 0 .37071 21.665 NazSO4 42.037 0 . 0 2 9 2 6 0.02805 3.984 KCI 74.555 0 . 0 1 0 5 8 0.01014 0.756 CaCI z 110.986 0 . 0 1 0 7 7 0.01033 1.146 MgCI2 95.210 0 . 0 5 5 1 8 0.05291 5.038
AMINOPYRIDINE 94.12 0.08 0.07670 7.219 HCI 36.46 0.04 0.03835 1.398
XH2 0 = 0.95879 41.206 g salt 958.793 g H20
(4) MORPHOLINEIMoRPHOLINE--HCI NaC1 58.443 0 . 3 8 6 6 4 0 .37091 21.677 Na2SO 4 142.037 0 . 0 2 9 2 6 0.02807 3.987 KCI 74.555 0 . 0 1 0 5 8 0.01015 0.757 CaCI 2 110.986 0 . 0 1 0 7 7 0.01033 1.146 MgC12 95.210 0 . 0 5 5 1 8 0.05293 5.039
MORPHOLINE 87.12 0.08 0.07674 6.685 HC1 36.46 0.04 0.03837 1.399
XH20 = 0.95931 40.690 g salt 959.308 g H20
aKhoo et al. (1977) with adjustments for the level of C1- added as HCI or TRls-HC1.
water was determined using a Guildline Autosal on the Practical Salinity Scale.
The potentiometric measurements of the buffers were made using the H2, Pt/AgC1, Ag electrode.

146 F.J. Millero et al./Marine Chemistry 44 (1993) 143-152
Pt; H2(g, 1 atm) I HCI(m) in seawater I AgC1, Ag
(12)
The H2, Pt/AgCl, Ag cells were the all glass type described by Bates (1973). The cells were cali- brated with 0.01 m HCI (Bates et al., 1956a,b). The AgCl, Ag electrodes were of the thermal electrolytic type (Bates, 1973) and prepared by the methods used by Roy et al. (1982) and Dickson (1987). The hydrogen electrodes were platinized in accordance with the technique used by Feltham and Spiro (1971). The cells were placed in a Forma water bath, controlled to +0.01°C during the measurements and monitored using a Guiline platinum resistance thermometer. The emf measurements were made with a Keithly 181 digital nanovoltmeter. All the emf measurements were corrected for water vapor pressure to a standard pressure of 101.325 kPa.
The potentiometric pH measurements were also made with an Orion model 720A pH meter using a Ross glass electrode and a double junction AgCl, Ag (Orion) reference electrode with a 0.7 m NaC1 outer chamber filling solution. The temperature was set and con- trolled to +0.01°C during the measurement. The performance of the electrodes was examined by titrating a 0.7 M NaC1 solution with a standard HC1 solution. The experimental slope for the electrode selected was within 4-0.1 mV with the theoretical value of 59.16 mV at 25°C.
The spectrophotometric pH measurements were made using the techniques of Byrne and others (Byrne, 1987; Byrne and Breland, 1989). The thymolblue, cresol red, and phenol red indicators were used for most of this study. The absorbance measurements were made with a Varian Cary 2200 spectrophotometer. The cell compartment of the spectrophotometer was controlled with a Neslab temperature bath to +0.01°C during a measurement. The tempera- ture was set and monitored with a Guildine platinium resistance thermometer.
3. Results and discussion
3.1 Calculation of the pH of buffers using the H2 Pt/AgCl, Ag electrode
The buffers TRIS, BIS, MORPHOLINE and AMINOPYRIDINE were prepared (Table 1) accord- ing to the recipe of Khoo et al. (1977). The total concentration of Cl-, m o =0.5691 is kept constant by adjusting the concentation of NaC1 (Millero, 1986). Dickson (1993) has reanalyzed the measured emf values for these buffers (Ramette et al., 1977; Bates and Calais, 1981; Czerminski et al., 1982; Bates and Erickson, 1986) in terms of the total proton scale. He has formulated equations that can be used to estimate the pH of 0.04 m buffers with a known composition (Dickson, 1993). To account for possible errors in the preparation of these buffers, direct measurements should be made of the emf values of these buffers. This can be done by measuring the level of H + in the buffers using a HE, Pt/Ag, AgC1 electrode. The Nernst equation for the hydrogen; silver, silver chloride cell is given by:
E = E o _ k log m H -- k log mc1 -- 2k log 7+ (HC1)
(13)
where 7±(HC1) is the mean activity coefficient of HC1 in the cell solution, k = R T In IO/F = 0.198412 T (T in K and E in mV) and E ° is the standard potential in the hypothetical ideal 1 m standard state. For seawater solutions (Khoo et al., 1979) it is convenient to alter the standard reference state so that the activity coefficients become unity in pure seawater. This change is made by defining a seawater standard potential by (Dickson, 19903):
E *° = E ° - 2klog')'t,r(UC1) + k
x log[1 ÷ m(SO4)/K(HS04)] (14)
where E *° is the standard potential for the cell reaction:
AgCl(s) + 0.sn2(g) = Ag(s) + HCI (15)
The values of E *° can be used to determine the
F.J. Millero et al./Marine Chemistry 44 (1993) 143-152 147
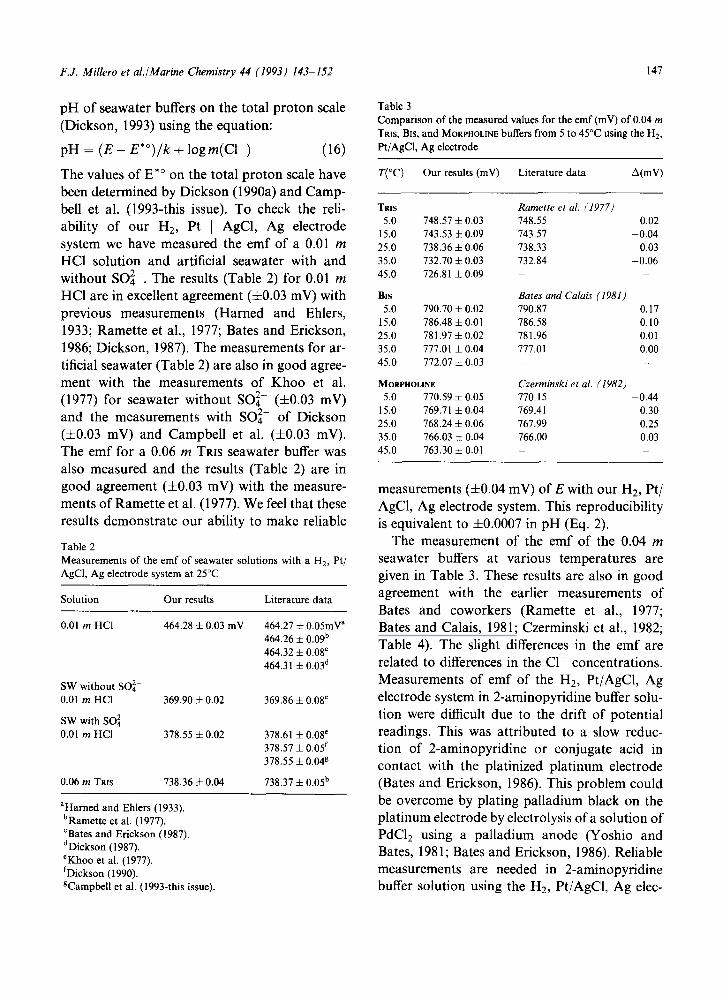
pH of seawater buffers on the total proton scale (Dickson, 1993) using the equation:
pH = ( E - E * ° ) / k + logm(Cl-) (16)
The values of E *° on the total proton scale have been determined by Dickson (1990a) and Camp- bell et al. (1993-this issue). To check the reli- ability of our HE, Pt I AgC1, Ag electrode system we have measured the emf of a 0.01 m HC1 solution and artificial seawater with and without SO 2-. The results (Table 2) for 0.01 m HC1 are in excellent agreement (-!-0.03 mV) with previous measurements (Harned and Ehlers, 1933; Ramette et al., 1977; Bates and Erickson, 1986; Dickson, 1987). The measurements for ar- tificial seawater (Table 2) are also in good agree- ment with the measurements of Khoo et al. (1977) for seawater without SO~- (4-0.03 mV) and the measurements with SO 2- of Dickson (-4-0.03 mV) and Campbell et al. (+0.03 mV). The emf for a 0.06 m TRIS seawater buffer was also measured and the results (Table 2) are in good agreement (4-0.03 mV) with the measure- ments of Ramette et al. (1977). We feel that these results demonstrate our ability to make reliable
Table 2
Measurements of the emf of seawater solutions with a H2, Pt/ AgCI, Ag electrode system at 25°C
Solution Our results Literature data
0.01 m HC1 464.28 5:0.03 mV 464.27 4- 0.05mV ~ 464.26 4- 0.09 b 464.32 4- 0.08 c
464.31 4- 0.03 d
SW without SO 2-
0.01 m HCI 369.90 4- 0.02
SW with SO42-
0.01 m HCI 378.55 ~ 0.02
0.06 m TRIS 738.36 4- 0.04
369.86 4- 0.08 e
378.61 4- 0.08 e
378.57 4- 0.05 f 378.55 4- 0.04 g
738.37 + 0.05 b
aHarned and Ehlers (1933). bRamette et al. (1977).
CBates and Erickson (1987). dDickson (1987).
eKhoo et al. (1977). fDickson (1990).
SCampbell et al. (1993-this issue).
Table 3
Comparison of the measured values for the emf (mV) of 0.04 m
TRIS, BIS, and MORPHOLINE buffers from 5 to 45°C using the H2,
Pt/AgC1, Ag electrode
T(°C) Our results (mY) Literature data A(mV)
Tais Ramette et al. (1977) 5.0 748.57 4- 0.03 748.55 0.02
15.0 743.53 ± 0.09 743.57 -0 .04
25.0 738.36 4- 0.06 738.33 0.03
35.0 732.70 4- 0.03 732.84 -0 .06
45.0 726.81 4- 0.09 -
BIs Bates and Calais (1981) 5.0 790.70 + 0.02 790.87 0.17
15.0 786.48 4- 0.01 786.58 0.10 25.0 781.97 4- 0.02 781.96 0.01
35.0 777.01 4- 0.04 777.01 0.00 45.0 772.07 4- 0.03 -
MOai'ItOLINE Czerminski et al. (1982) 5.0 770.59 + 0.05 770.15 -0 .44
15.0 769.71 4- 0.04 769.41 0.30
25.0 768.24 4- 0.06 767.99 0.25 35.0 766.03 ± 0.04 766.00 0.03 45.0 763.30 4- 0.01 -
measurements (+0.04 mV) of E with our H2, Pt/ AgC1, Ag electrode system. This reproducibility is equivalent to +0.0007 in pH (Eq. 2).
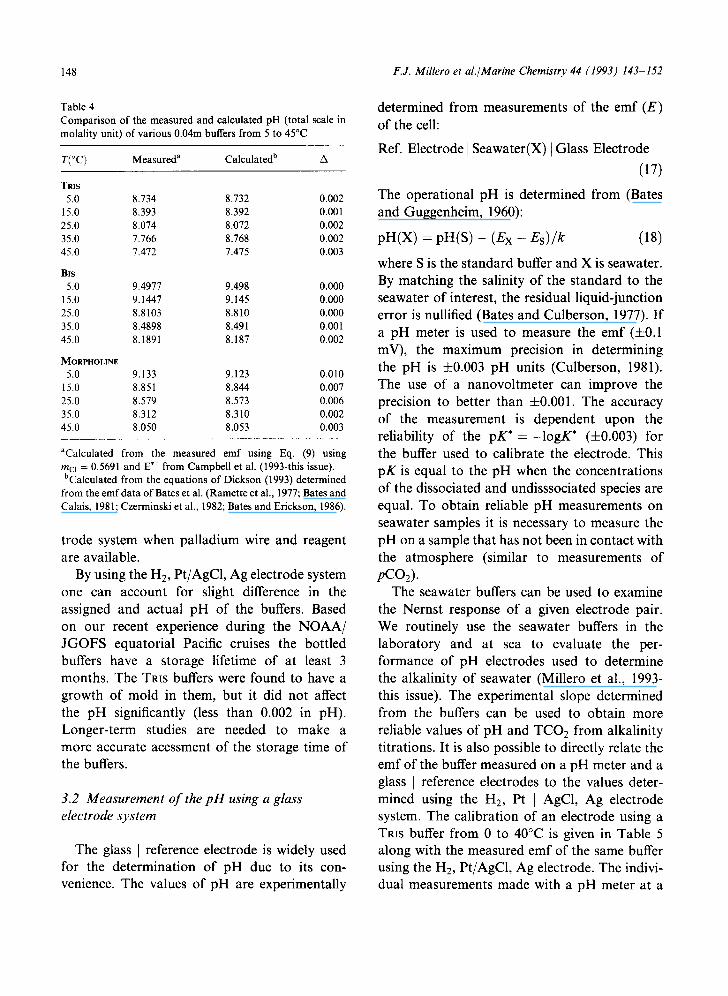
The measurement of the emf of the 0.04 m seawater buffers at various temperatures are given in Table 3. These results are also in good agreement with the earlier measurements of Bates and coworkers (Ramette et al., 1977; Bates and Calais, 1981; Czerminski et al., 1982; Table 4). The slight differences in the emf are related to differences in the C1- concentrations. Measurements of emf of the H2, Pt/AgC1, Ag electrode system in 2-aminopyridine buffer solu- tion were difficult due to the drift of potential readings. This was attributed to a slow reduc- tion of 2-aminopyridine or conjugate acid in contact with the platinized platinum electrode (Bates and Erickson, 1986). This problem could be overcome by plating palladium black on the platinum electrode by electrolysis of a solution of PdC12 using a palladium anode (Yoshio and Bates, 1981; Bates and Erickson, 1986). Reliable measurements are needed in 2-aminopyridine buffer solution using the H2, Pt/AgC1, Ag elec-
148 F.J. Millero et al./Marine Chemistry 44 (1993) 143-152
TabLe 4 Comparison of the measured and calculated pH (total scale in molality unit) of various 0.04m buffers from 5 to 45°C
T(°C) Measured a Calculated b A
TRIS 5.0 8.734 8.732 0.002
15.0 8.393 8.392 0.001 25.0 8.074 8.072 0.002 35.0 7.766 8.768 0.002 45.0 7.472 7.475 0.003
BIS 5.0 9.4977 9.498 0.000
15.0 9.1447 9.145 0.000 25.0 8.8103 8.810 0.000 35.0 8.4898 8.491 0.001 45.0 8.1891 8.187 0.002
MORPHOLINE 5.0 9.133 9.123 0.010
15.0 8.851 8.844 0.007 25.0 8.579 8.573 0.006 35.0 8.312 8.310 0.002 45.0 8.050 8.053 0.003
aCalculated from the measured emf using Eq. (9) using mcl = 0.5691 and E *° from Campbell et al. (1993-this issue). bCalculated from the equations of Dickson (1993) determined
from the emf data of Bates et al. (Ramette et al., 1977; Bates and Calais, 1981; Czerminski et al., 1982; Bates and Erickson, 1986).
trode system when palladium wire and reagent are available.
By using the H2, Pt/AgC1, Ag electrode system one can account for slight difference in the assigned and actual pH of the buffers. Based on our recent experience during the NOAA/ JGOFS equatorial Pacific cruises the bottled buffers have a storage lifetime of at least 3 months. The TRIS buffers were found to have a growth of mold in them, but it did not affect the pH significantly (less than 0.002 in pH). Longer-term studies are needed to make a more accurate acessment of the storage time of the buffers.
3.2 Measurement of the pH using a glass electrode system
The glass I reference electrode is widely used for the determination of pH due to its con- venience. The values of pH are experimentally
determined from measurements of the emf (E) of the cell:
Ref. Electrode] Seawater(X) [Glass Electrode
(17)
The operational pH is determined from (Bates and Guggenheim, 1960):
pH(X) = pH(S) - (Ex - Es)/k (18)
where S is the standard buffer and X is seawater. By matching the salinity of the standard to the seawater of interest, the residual liquid-junction error is nullified (Bates and Culberson, 1977). If a pH meter is used to measure the emf (4-0.1 mV), the maximum precision in determining the pH is +0.003 pH units (Culberson, 1981). The use of a nanovoltmeter can improve the precision to better than +0.001. The accuracy of the measurement is dependent upon the reliability of the p K * = - l o g K * (+0.003) for the buffer used to calibrate the electrode. This pK is equal to the pH when the concentrations of the dissociated and undisssociated species are equal. To obtain reliable pH measurements on seawater samples it is necessary to measure the pH on a sample that has not been in contact with the atmosphere (similar to measurements of p C O j .
The seawater buffers can be used to examine the Nernst response of a given electrode pair. We routinely use the seawater buffers in the laboratory and at sea to evaluate the per- formance of pH electrodes used to determine the alkalinity of seawater (Millero et al., 1993- this issue). The experimental slope determined from the buffers can be used to obtain more reliable values of pH and TCO 2 from alkalinity titrations. It is also possible to directly relate the emf of the buffer measured on a pH meter and a glass [ reference electrodes to the values deter- mined using the H2, Pt ] AgC1, Ag electrode system. The calibration of an electrode using a TRIS buffer from 0 to 40°C is given in Table 5 along with the measured emf of the same buffer using the H2, Pt/AgC1, Ag electrode. The indivi- dual measurements made with a pH meter at a

F.J. Millero et al./Marine Chemistry 44 (1993) 143-152
Table 5 Comparisons of the emf values measured with a pH meter and the H2, Pt/AgC1, Ag electrode (mV) for 0.04 m Tins buffer a
T(°C) pH meter H 2 electrode
1.0 79.6 750.50 5.0 84,9 748.57
10.0 91,1 746.20 15.0 97.7 743.53 20.0 104.2 741.41 25.0 110.7 738.36 30.0 117.2 736.63 35.0 123.9 732.70 40.0 130.4 731.85
aTbe values at 1, 10, 20, 30, and 40°C have been estimated from the direct measurements given in Table 4 using a cubic fit (or = 0.02 mV).
given temperature are reproducible to 4-0.1 mV (equivalent to +0.002 in pH). The correlation between the emf measured with the pH meter at various temperatures has the same precision.
3.3 Measurements of the pH using colorimetric indicators
Recent studies (Robert-Baldo et al., 1985; Byrne, 1987; Byrne et al., 1988; Byrne and Breland, 1989; King and Kester, 1989) have led to spectrophotometric methods to measure the pH of seawater. The use of colorimetric indica- tors offers an alternative to the potentiometric methods. Indicators have the advantage of rapid equilibration time and eliminate the pro- blem of electrode drift and liquid junction errors. Once the pK* of a given indicator is known in seawater over a range of salinities, temperatures and pressures, the pH indicators may provide an absolute pH scale (Byrne, 1987).
Various sulfonephthalein indicators have been used for pH measurement. Most sulfo- nephthalein indicators are diprotic acid and undergo two-step dissociation,
H2A ¢=> H + + HA- ¢* 2H + + A 2 - (19)
H2A and A 2- are highly colored species while HA- usually has yellow color. Since the difference in the values of pK2 and pKl for an indicator usually is larger than 6, the indicator
149
can be treated as a monoprotic acid within three pH units of pK2 or pKI.
HA ¢~ H + + A- (20)
The pH of test solution with added indicator is related to dissociation constant of indicator in the medium, PKi*nd, and the concentration ratio of A- and HA by:
pH = pKi*nd + log([A-] / [HA]) (21)
The ratio of [A-] to [HA] can be determined colorimetrically by measuring the absorbance of indicator at two wavelengths (Robert-Baldo et al., 1985; King and Kester, 1989)
[A-]/[HA] = (R - EHA)/[(E A - - R)E2] (22)
where R is the ratio of the measured absorbances at wavelength Al and A2 corrected for baseline absorbance at 730 nm. The absorbance ratio is independent of indicator concentration and light pathlength. The constants Ei are the ratio of the molar absorptivities of species i at wavelength Al and )~2. The constant E2 is the ratio of the molar absorptivities of HA and A- at wavelength )~2. The molar absorptivities of HA and A- are equal at the isosbestic point. If )~2 is chosen to be the wavelength of the isosbestic point of the indicator, E2 equals to one.
Thymol blue, cresol red, and phenol red have been used as indicators for our determination of pH of seawater. The pH of a solution using a thymol blue indicator can be calulated from (Byrne, 1987):
pH = pKTB + log[(R - 0.0021)
× (2.3240 - 0.1439R)] (23)
where KTa is the dissociation constant for thymol blue and R is the ratio of absorbances measured at 596 and 435 nm. The values of pKTB at a given temperature have been deter- mined using a 0.04m TRIS buffers with a known pH obtained from the H E electrode system. The resultant values of PKTB of thymol blue at sali- nity of 35 has been fit to the equation

150 F.J. Millero et al./Marine Chemistry 44 (1993) 143-152
(a = 0.0005):
pKTB = 448.2514/T+ 22.3854 - 6.2201 log T
(24)
The pH of a solution using a cresol red indicator can be determined from (Byrne and Breland, 1989):
pH = pKcR + log[(R - 0.00286)
x (2.7985 - 0.09025R)] (25)
where R is the ratio of absorbances measured at 573 and 433 nm. The values of pKcR at a given temperature have been determined using a 0.04m TRIS buffer of known pH. These values have been fit to the equation (cr = 0.0005):
pKcR = -301.58293/T + 35.24365
- 10.71485 log T (26)
The pH of a solution using a phenol red indicator can be determined from (Byrne, 1987):
pH = pKpR + log[(R - 0.0038)
x (2.6155 - 0.1234R)] (27)
where R is the ratio of absorbances measured at 558 and 433 nm. The values of pKpR at a given temperature have been determined using a 0.04 m TRlS buffer of known pH. These values have been fit to the equation (~r = 0.0005):
pKI, R = --4054.8374/T + 116.6037
-38.6645 log T (28)
The pKI,d we obtained from this study are smaller then the values of Byrne (1987) by 0.13. The differences are due to the different pH scales used. The total proton scale is related to free proton scale by:
pHT = pHF -- log[1 + m(SO2-)/K(HS04)] (29)
In seawater of salinity of 35, the total proton scale will result in 0.13 lower in pKind than the free proton scale.
The absorbance ratios measured in the indica- tors exhibit little or no dependence on medium
Table 6 The pH of certified reference material (Batch #10) determined by potentiometric (P) and spectrophotometric (S) (using cresol red as indicator) methods
T(°C) pH T (m)
P S A
1.26 8.409 8.4007 0.0083 5.32 8.341 8.3385 0.0025 10.02 8.262 8.2658 -0.0038 15.05 8.181 8.1869 -0.0059 20.01 8.103 8.1081 -0.0051 24.98 8.028 8.0284 -0.0004 29.96 7.954 7.9478 0.0062
composition. The precision of the colorimetric pH is +0.001 if the absorption measurements are made on a high-quality spectrophotometer. Comparisons between the pH determined with indicators and electrodes were in agreement to +0.002 pH units (King and Kester, 1989) and measurements in seawater can be made to a precision better than 4-0.001 (Byrne et al., 1988; Byrne and Breland, 1989).
3.4 Comparisons of different techniques for pH measurements in seawater
We have used the potentiometric and spectro- photometric techniques described above to measure the pH of seawater. We were interested in comparing the two methods. Measurement of the pH of certified reference material Batch #10 and #12 was determined by both techniques
Table 7 The pH of certified seawater reference material (Batch #12) determined by potentiometric (P) and spectrophotometric (S) (using cresol red as indicator) methods
T(°C) pH T (m)
P S A
0.97 8.325 8.3324 -0.0074 5.22 8.253 8.2611 -0.0081 9.98 8.177 8.1826 -0.0054
15.00 8.098 8.1010 -0.0012 19.98 8.022 8.0215 -0.0005 25.06 7.941 7.9416 -0.0006 30.02 7.864 7.8648 -0.0008
F.J. Millero et al./Marine Chemistry 44 (1993) 143-152 151
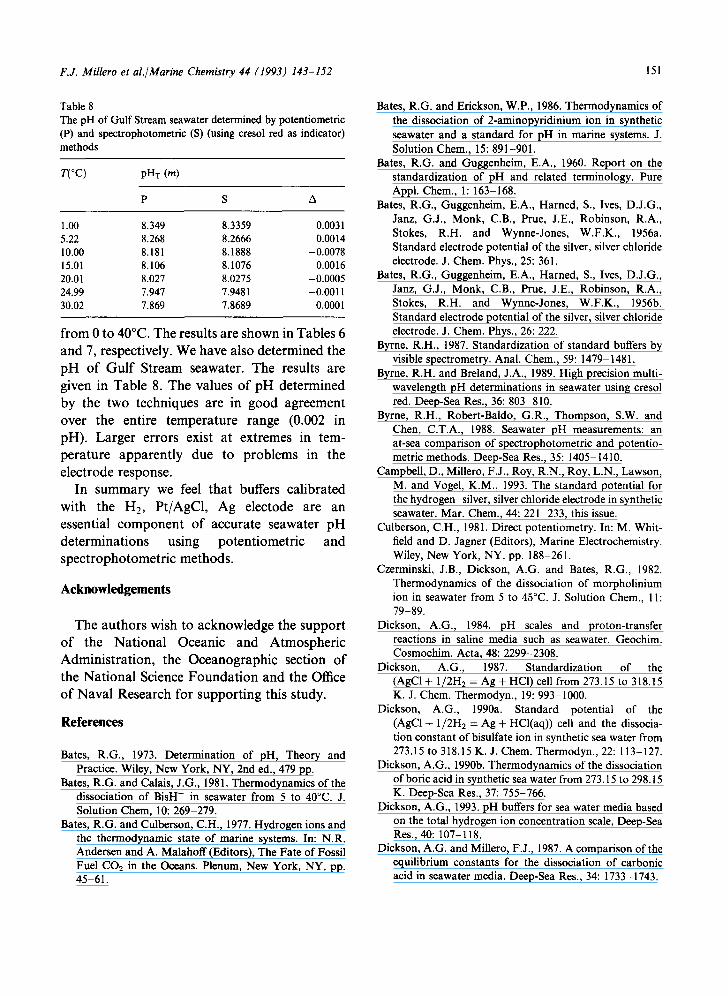
Table 8 The pH of Gulf Stream seawater determined by potentiometric (P) and spectrophotometric (S) (using cresol red as indicator) methods
T(°C) pH T (m)
P S A
1.00 8.349 8.3359 0.0031 5.22 8.268 8.2666 0.0014 10.00 8.181 8.1888 -0.0078 15.01 8.106 8.1076 -0.0016 20.01 8.027 8.0275 -0.0005 24.99 7.947 7.9481 -0.0011 30.02 7.869 7.8689 0.0001
from 0 to 40°C. The results are shown in Tables 6 and 7, respectively. We have also determined the pH of Gulf Stream seawater. The results are given in Table 8. The values of pH determined by the two techniques are in good agreement over the entire temperature range (0.002 in pH). Larger errors exist at extremes in tem- perature apparently due to problems in the electrode response.
In summary we feel that buffers calibrated with the H2, Pt/AgC1, Ag electode are an essential component of accurate seawater pH determinations using potentiometric and spectrophotometric methods.
Acknowledgements
The authors wish to acknowledge the support of the National Oceanic and Atmospheric Administration, the Oceanographic section of the National Science Foundation and the Office of Naval Research for supporting this study.
References
Bates, R.G., 1973. Determination of pH, Theory and Practice. Wiley, New York, NY, 2nd ed., 479 pp.
Bates, R.G. and Calais, J.G., 1981. Thermodynamics of the dissociation of BisH + in seawater from 5 to 40°C. J. Solution Chem, 10: 269-279.
Bates, R.G. and Culberson, C.H., 1977. Hydrogen ions and the thermodynamic state of marine systems. In: N.R. Andersen and A. Malahoff (Editors), The Fate of Fossil Fuel CO2 in the Oceans. Plenum, New York, NY, pp. 45-61.
Bates, R.G. and Erickson, W.P., 1986. Thermodynamics of the dissociation of 2-aminopyridinium ion in synthetic seawater and a standard for pH in marine systems. J. Solution Chem., 15: 891-901.
Bates, R.G. and Guggenheim, E.A., 1960. Report on the standardization of pH and related terminology. Pure Appl. Chem., 1: 163-168.
Bates, R.G., Guggenheim, E.A., Harned, S., Ives, D.J.G., Janz, G.J., Monk, C.B., Prue, J.E., Robinson, R.A., Stokes, R.H. and Wynne-Jones, W.F.K., 1956a. Standard electrode potential of the silver, silver chloride electrode. J. Chem. Phys., 25: 361.
Bates, R.G., Guggenheim, E.A., Harned, S., Ives, D.J.G., Janz, G.J., Monk, C.B., Prue, J.E., Robinson, R.A., Stokes, R.H. and Wynne-Jones, W.F.K., 1956b. Standard electrode potential of the silver, silver chloride electrode. J. Chem. Phys., 26: 222.
Byrne, R.H., 1987. Standardization of standard buffers by visible spectrometry. Anal. Chem., 59:1479-1481.
Byrne, R.H. and Breland, J.A., 1989. High precision multi- wavelength pH determinations in seawater using cresol red. Deep-Sea Res., 36: 803-810.
Byrne, R.H., Robert-Baldo, G.R., Thompson, S.W. and Chen, C.T.A., 1988. Seawater pH measurements: an at-sea comparison of spectrophotometric and potentio- metric methods. Deep-Sea Res., 35: 1405-1410.
Campbell, D., Millero, F.J., Roy, R.N., Roy, L.N., Lawson, M. and Vogel, K.M., 1993. The standard potential for the hydrogen-silver, silver chloride electrode in synthetic seawater. Mar. Chem., 44: 221-233, this issue.
Culberson, C.H., 1981. Direct potentiometry. In: M. Whit- field and D. Jagner (Editors), Marine Electrochemistry. Wiley, New York, NY, pp. 188-261.
Czerminski, J.B., Dickson, A.G. and Bates, R.G., 1982. Thermodynamics of the dissociation of morpholinium ion in seawater from 5 to 45°C. J. Solution Chem., 11: 79-89.
Dickson, A.G., 1984. pH scales and proton-transfer reactions in saline media such as seawater. Geochim. Cosmochim. Acta, 48: 2299-2308.
Dickson, A.G., 1987. Standardization of the (AgCI + 1/2H2 = Ag + HCI) cell from 273.15 to 318.15 K. J. Chem. Thermodyn., 19: 993-1000.
Dickson, A.G., 1990a. Standard potential of the (AgCI + 1/2H2 = Ag + HCl(aq)) cell and the dissocia- tion constant of bisulfate ion in synthetic sea water from 273.15 to 318.15 K. J. Chem. Thermodyn., 22: 113-127.
Dickson, A.G., 1990b. Thermodynamics of the dissociation of boric acid in synthetic sea water from 273.15 to 298.15 K. Deep-Sea Res., 37: 755-766.
Dickson, A.G., 1993. pH buffers for sea water media based on the total hydrogen ion concentration scale, Deep-Sea Res., 40: 107-118.
Dickson, A.G. and Millero, F.J., 1987. A comparison of the equilibrium constants for the dissociation of carbonic acid in seawater media. Deep-Sea Res., 34: 1733-1743.
152 F.J. M illero et al./ Marine Chemistry 44 (1993) 143-152
Dickson, A.G. and Riley, J.P., 1979. The estimation of acid dissociation constants in seawater media from potentio- metric titration with strong base. I. The ionic product of water - - Kw. Mar. Chem., 7: 89-99.
Feltham, A.M. and Spiro, M., 1971. Platinized platinum electrodes. Chem. Rev., 71: 177-193.
Hansson, I., 1973. A new set of pH-scales and standard buffers for seawater. Deep-Sea Res., 20: 479-491.
Harned, H.S. and Ehlers, R.W., 1933. The thermodynamics of aqueous hydrochloric acid solutions from electro- motive force measurements. J. Am. Chem. Soc., 55: 2179-2193.
Khoo, K.H., Ramette, R.W., Culberson, C.H. and Bates, R.G., 1977. Determination of hydrogen ion con- centrations in seawater from 5 to 40°C: standard potentials at salinities from 20 to 45%o. Anal. Chem., 49: 29-34.
King, D.W. and Kester, D.R., 1989. Determination of sea- water pH from 1.5 to 8.5 using colorimetric indicators. Mar. Chem., 26: 5-20.
Millero, F.J., 1986. The pH of estuarine waters. Limnol. Oceanogr., 31: 839-847.
Millero, F.J., Zhang, J.-Z., Lee, K. and Campbell, D., 1993. Titration alkalinity of seawater. Mar. Chem., 44:153- 165, this issue.
Ramette, R.W., Culberson, C.H. and Bates, R.G., 1977. Acid base properties of tris(hydrolymethyl) amino-
methane (tris) buffers in seawater form 5 to 40°C. Anal. Chem., 49: 867-870.
Roy, R.N., Gibbons, J.J., Ovens, L.K., Bliss, G.A. and Hartley J.J., 1982. VII. Activity coefficients for the system HC1 + CaCI2 + H20 at various temperatures. J. Chem. Soc. Faraday Trans., 78: 1405-1422.
Robert-Baldo, G., Morris, M.J. and Byrne, R.H., 1985. Spectrophotometric determination of seawater pH using phenol red. Anal. Chem., 57: 2564-2567.
Roy, R.N., Roy, L.N., Lawson, M., Vogel, K.M., Moore, C.P., Davis, W. and Millero, F.J., 1993a. Thermo- dynamics of the dissociation of boric acid in seawater at S = 35 from 0 to 55°C. Mar. Chem., 44: 243-248, this issue.
Roy, R.N., Roy, L.N., Vogel, K.M., Porter-Moore, C., Pearson, T. and Good, C.E., 1993b. The dissociation constants of carbonic acid at salinities 5 to 45 and tem- perature 0 to 45°C. Mar. Chem., 44: 249-267, this issue.
Whitfieid, M. Butler, R.A. and Covington, A.K., 1985. The determination of pH in estuarine waters. I. Definition of pH scales and selection of buffers. Oceanol., Acta, 8: 423-432.
Yoshio, M. and Bates, R.G., 1981. Dissociation constant and related thermodynamic quantities for 2-amino- pyridium ion from 5 to 40°C. J. Chem. Eng. Data, 26: 246-248.
Copyright © 2022 FDOKUMEN