Supplemental Poverty Measure: Alternative Geographic ...
46
Supplemental Poverty Measure: Alternative Geographic Adjustments Trudi Renwick Assistant Division Chief for Economic Characteristics Social, Economic and Housing Statistics Division U.S. Census Bureau DRB-FY19-ROSS-B0121 May 20, 2019 This presentation was developed to promote research and advancements in our understanding of poverty measurement. In that spirit and to encourage discussion and thoughtful feedback at early stages of our work, this paper has undergone a more limited review than official Census Bureau reports. All views and any errors are solely those of the author and do not necessarily reflect any official position of the Bureau. All comparative statements in this presentation have undergone statistical testing, and, unless otherwise noted, all comparisons are statistically significant at the 10 percent significance level. Do not cite or distribute without author permission. The Census Bureau reviewed this data product for unauthorized disclosure of confidential information and has approved the disclosure avoidance practices applied to this release. DRB‐FY19‐ROSS‐B0121
-
Upload
khangminh22 -
Category
Documents
-
view
0 -
download
0
Transcript of Supplemental Poverty Measure: Alternative Geographic ...

Supplemental Poverty Measure:Alternative Geographic Adjustments
Trudi RenwickAssistant Division Chief for Economic Characteristics
Social, Economic and Housing Statistics DivisionU.S. Census Bureau
DRB-FY19-ROSS-B0121
May 20, 2019
This presentation was developed to promote research and advancements in our understanding of poverty measurement. In that spirit and to encourage discussion and thoughtful feedback at early stages of our work, this paper has undergone a more limited review than official Census Bureau reports. All views and any errors are solely those of the author and do not necessarily reflect any official position of the Bureau. All comparative statements in this presentation have undergone statistical testing, and, unless otherwise noted, all comparisons are statistically significant at the 10 percent significance level. Do not cite or distribute without author permission.
The Census Bureau reviewed this data product for unauthorized disclosure of confidential information and has approved the disclosure avoidance practices applied to this release. DRB‐FY19‐ROSS‐B0121

Official and SPM Thresholds for Units with Two Adults and Two Children
$24,858$27,085
$23,261
$27,005
Officialpovertymeasure
Ownerswith a
mortgage
Ownerswithout amortgage
Renters
Supplemental Poverty MeasureThresholds, 2017
Source: Official Poverty Thresholds, <www.census.gov/data/tables/time‐series/demo/income‐poverty/historical‐poverty‐thresholds.html>, Supplemental Poverty Measure Thresholds, Bureau of Labor Statistics (BLS), <https://stats.bls.gov/pir/spmhome.htm>, Geographic adjustments based on housing costs from the American Community Survey 2012‐2016.
Supplemental Poverty Measure Thresholds for Renters, 2016
2

Median Rent Index
3
Thresholdijt=[(HousingSharet×MRIij) +(1‐HousingSharet)]×Thresholdti = statej = specific metro area, other metro or nonmetro area t = tenure: owner with mortgage, owner without a mortgage, renterHousingShare = percent of threshold represented by housing and
utilities which ranges from 40 to 50 percent of total expenditures, depending on tenure status
MRI = Median Rent IndexThreshold = national average dollar value for income below which
consumer units are considered in poverty

Washington DC vs. Nonmetro Mississippi2017– Two Adults Two Children - Renter Washington, DC Mississippi Nonmetro
Areas
Official Poverty Threshold $24,858 $24,858
SPM Threshold: Renters $27,005 $27,005
4

Washington, DC vs. Nonmetro Mississippi
2017 – Two Adults Two Children - Renter Washington DC Mississippi NonmetroAreas
Official Poverty Threshold $24,858 $24,858
SPM Threshold: Renters $27,005 $27,005
Rent-based Index Using Median Rent Index (MRI) $1,297/972=1.63 $598/972=0.78
Apply to Only Housing Portion of Thresholds 50%*1.63+50%*1.0 50%*0.78+50%*1.0
MRI Index 1.32 0.89
5

Washington, DC vs. Nonmetro Mississippi
2017– Two Adults Two Children - Renter Washington, DC Mississippi NonmetroAreas
Official Poverty Threshold $24,858 $24,858
SPM Threshold: Renters $27,005 $27,005
Rent-based Index Using Median Rent Index (MRI) $1,297/972=1.63 $598/972=0.78
Apply to Only Housing Portion of Thresholds 50%*1.63+50%*1.0 50%*0.78+50%*1.0
Median Rent Index (MRI) 1.32 0.89
Adjusted SPM Threshold $35,512 $24,034
6

Two Adult, Two Child Thresholds: Renters
$24,858 $24,858$27,005 $27,005
$35,521
$24,034
Washington, DC Nonmetro Mississippi
Official SPM‐NGA SPM
7

Percent of Individuals with Change in Poverty Status Due to the Geographic Adjustments
2.7
3.3
2.02.3
3.6
2.5
4.1
U.S. Total Northeast Midwest South West Inside MSA OutsideMSA
8Source: 2018 CPS ASEC

Comparing Poverty Rates by Adjustment Mechanism
14.9
20.7
15.2
21.7
0
5
10
15
20
25
California MississippiOfficial SPM‐NGA
9Source: 2015 and 2016 CPS ASEC

Comparing Poverty Rates by Adjustment Mechanism
14.9
20.7
15.2
21.720.3
17.0
0
5
10
15
20
25
California MississippiOfficial SPM‐NGA SPM
10Source: 2015 and 2016 CPS ASEC

Media likes to focus on state changes
11

Concerns with the MRI Methodology
• Adjusts only the housing portion of the thresholds – Regional Price Parities produced by BEA could adjust the entire threshold
• BUT they include many expenditure items not included in the SPM thresholds and therefore give a much smaller weight to housing – see Renwick, Aten, Figueroa, and Martin (2014)
– Custom RPPs using only Food, Apparel and Rent (FAR RPPs) • Adjustments using FAR‐RPPS are even “stronger” than using the MRI’s – see Renwick, Figueroa and Aten (2017)
• Simple medians may not capture differences in housing quality – Using housing component of the RPPs – based on a hedonic regression rather than a simple median – BUT lose the simplicity of the median
• Adjust the MRI index to recognize amenities that may reduce the impact of housing costs on economic well‐being
12

Regional Price Parities (RPPs)
• Spatial price indexes produced by the Bureau of Economic Analysis to measure price level differences across regions
• Stage One – price and expenditures inputs collected by the BLS CPI program and the CE – 38 urban areas (weights available for 38 urban areas plus 4 rural regions)
• Stage Two – combined with data from the ACS on housing costs to calculate index values for all metro areas
• Index values applied to the entire threshold
13

Washington, DC vs. Rural Mississippi2017– Two Adults Two Children - Renter Washington, DC Mississippi Nonmetro
Areas
Official Poverty Threshold $24,858 $24,858
SPM Threshold: Renters $27,005 $27,005
Rent Index from Regional Price Parities 1.70 .51
Apply to Only Housing Portion of Thresholds 50%*1.70+50%*1.0 50%*0.51+50%*1.0
Index using RPP Rents 1.35 .76
Adjusted SPM Threshold $36,457 $20,389
14

2017 Two Adult, Two Child Thresholds: Renters
$27,005 $27,005
$35,521
$24,034
$36,457
$20,389
Washington, DC Nonmetro Mississippi
Not Geographically Adjusted SPM RPP Rent‐Only
15

Washington DC vs Nonmetro Mississippi
2017 – Two Adults Two Children Washington, DC Mississippi – outside metro area
Official Poverty Threshold $24,858 $24,858
SPM Threshold: Renters $27,005 $27,005
RPP Index – Broad based 1.19 .83
Adjusted SPM Threshold – Broad Based $32,136 $22,414
16

2017 Two Adult, Two Child Thresholds: Renters
$24,858 $24,858$27,005 $27,005
$35,521
$24,034
$36,457
$20,389
$32,136
$22,414
Washington, DC Nonmetro Mississippi
Official Not Geographically Adjusted2 SPM RPP Rent‐Only Regional Price Parities
17

Regional Price Parities – Narrowly Defined or FAR
• 2014 analysis examined differences between the MRI adjustments and the RPP adjustments.
• Concern that this index includes many goods and services not in the SPM thresholds. Differences in poverty rates driven by differences in expenditure shares.
• BEA developed a special RPP – based solely on Food, Apparel and Rent (FAR).• One advantage of the FAR RPP is that expenditure shares vary by geography. They do not vary by tenure type.
18

Washington, DC vs Nonmetro Mississippi
2017 – Two Adults Two Children Washington, DC Mississippi – outside metro area
Official Poverty Threshold $24,858 $24,858
SPM Threshold: Renters $27,005 $27,005
RPP Index – Broad based 1.19 .83
Adjusted SPM Threshold – Broad Based $32,136 $22,414
FAR RPP Index 1.36 .70
Adjusted SPM Threshold – FAR RPP $36,727 $18,904
19

2017 Two Adult, Two Child Thresholds: Renters
$24,858 $24,858$27,005 $27,005
$35,521
$24,034
$36,457
$20,389
$32,136
$22,414
$36,727
$18,903
Washington, DC Nonmetro Mississippi
Official Not Geographically Adjusted2SPM RPP Rent‐OnlyRegional Price Parities Narrow RPPs
20

Adjusting for Amenities
• Differences in prices reflect differences in the ability to purchase a given bundle of goods. This may or may not translate into equal quality of life.
• Amenities: nonmarket goods that improve the quality of life.• MRI will over‐adjust poverty thresholds if places with higher median rents also have higher “amenities”. MRI will under‐adjust poverty thresholds if places with higher median rents have lower amenities or “dis‐amenities”.
• Considerations:– Assumes that amenities are not completely capitalized in rents– Assumes that these amenities are fungible ‐‐‐ can live in a smaller house because the “weather is so wonderful you can spend more time outside”. Some amenities probably not fungible – “can’t eat the scenery”. Still need enough resources to purchase basic bundle of necessities.
– Value of amenities may vary across the income distribution• No clear methodology to incorporate amenities – this analysis arbitrarily cuts the weight of the MRI index in half.
21

Washington, DC vs. Nonmetro Mississippi
2017– Two Adults Two Children - Renter Washington, DC Mississippi NonmetroAreas
Official Poverty Threshold $24,858 $24,858
SPM Threshold: Renters $27,005 $27,005
Rent-based Index Using Median Rent Index (MRI) $1,297/972=1.63 $598/972=0.78
Apply to Only Housing Portion of Thresholds 25%*1.63+75%*1.0 25%*0.78+75%*1.0
Amenities Adjusted Index (AAI) 1.16 0.95
Adjusted SPM Threshold $31,258 $25,520
22

2017 Two Adult, Two Child Thresholds: Renters
$24,858 $24,858$27,005 $27,005
$35,521
$24,034
$36,457
$20,389
$32,136
$22,414
$36,727
$18,903
$31,258
$25,520
Washington, DC Nonmetro Mississippi
Official Not Geographically Adjusted2SPM RPP Rent‐OnlyRegional Price Parities Narrow RPPsAmenities
23

California vs Mississippi: Poverty Rates and Material Deprivation Rates
11.2
18.0
20.3
15.2
14.9
17.2
19.7
17.0
21.7
20.7
0 5 10 15 20 25
Food Insecurity
Multi‐Dimensional Deprivation
SPM
SPM ‐ No Geo Adjustments
Official Poverty
Mississippi California
24
Sources: Poverty rates – 2015‐2016 CPS ASECMDD – Glassman, 2019 forthcomingFood Insecurity – USDA Economic Research Service
https://www.ers.usda.gov/topics/food‐nutrition‐assistance/food‐security‐in‐the‐us/key‐statistics‐graphics.aspx#map

California vs Mississippi: Deprivation Rates for Specific Dimensions
4.0
16.8
8.4
20.7
5.1
6.9
14.1
13.4
10.2
8.9
0 5 10 15 20 25
Health Dimension
Education
Economic Security
Housing Qualilty
Neighborhood Quality
Mississippi California
25
Source: MDD – Glassman, 2019 forthcoming

Comparing Poverty Rates by Adjustment Mechanism
14.9
20.7
15.2
21.7
California MississippiOfficial SPM‐NGA
26
Source: 2015 and 2016 CPS ASEC

Comparing Poverty Rates by Adjustment Mechanism
14.9
20.7
15.2
21.720.3
17.0
California MississippiOfficial SPM‐NGA SPM
27
Source: 2015 and 2016 CPS ASEC

Comparing Poverty Rates by Adjustment Mechanism
14.9
20.7
15.2
21.720.3
17.0
21.9
14.9
California MississippiOfficial SPM‐NGA SPM RPP‐Rent Only
28
Source: 2015 and 2016 CPS ASEC

Comparing Poverty Rates by Adjustment Mechanism
14.9
20.7
15.2
21.720.3
17.0
21.9
14.9
21.7
12.8
California MississippiOfficial SPM‐NGA SPM RPP‐Rent Only RPP Narrow
Source: 2015 and 2016 CPS ASEC 29

Comparing Poverty Rates by Adjustment Mechanism
14.9
20.7
15.2
21.720.3
17.0
21.9
14.9
21.7
12.8
18.4
16.5
California MississippiOfficial SPM‐NGA SPM RPP‐Rent Only RPP Narrow RPP Broad
30Source: 2015 and 2016 CPS ASEC

Comparing Poverty Rates by Adjustment Mechanism
14.9
20.7
15.2
21.720.3
17.0
21.9
14.9
21.7
12.8
18.4
16.5
18.720.0
California MississippiOfficial SPM‐NGA SPM RPP‐Rent Only RPP Narrow RPP Broad Amenities
31Source: 2015 and 2016 CPS ASEC

Comparing Poverty Rates by Adjustment Mechanism
16.9 16.816.417.4
Inside Principal Cities Outside MetroOfficial SPM‐NGA
32
Source: 2016 CPS ASEC

Comparing Poverty Rates by Adjustment Mechanism
16.9 16.816.417.417.8
13.2
Inside Principal Cities Outside MetroOfficial SPM‐NGA SPM
33Source: 2016 CPS ASEC

Comparing Poverty Rates by Adjustment Mechanism
16.9 16.816.417.417.8
13.2
17.9
12.2
0
2
4
6
8
10
12
14
16
18
20
Inside Principal Cities Outside MetroOfficial SPM‐NGA SPM RPP‐Rent Only
34Source: 2016 CPS ASEC

Comparing Poverty Rates by Adjustment Mechanism
16.9 16.816.417.417.8
13.2
17.9
12.2
17.5
10.8
Inside Principal Cities Outside MetroOfficial SPM‐NGA SPM RPP‐Rent Only RPP Narrow
35Source: 2016 CPS ASEC
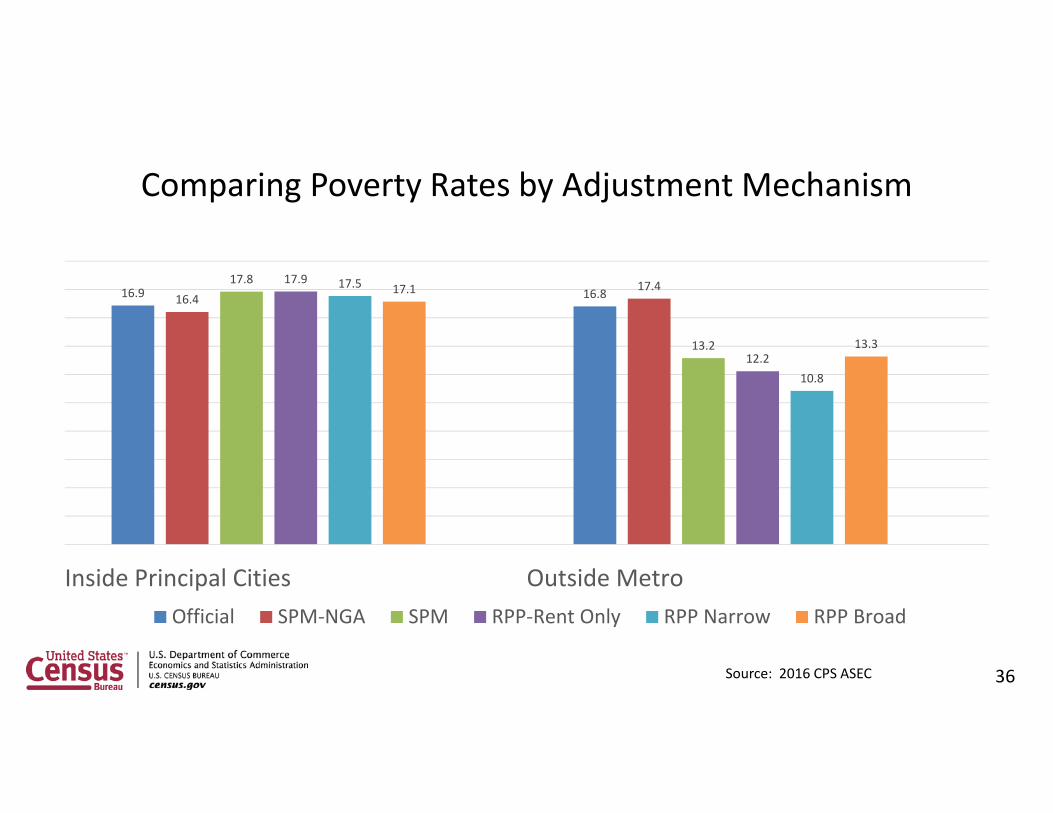
Comparing Poverty Rates by Adjustment Mechanism
16.9 16.816.417.417.8
13.2
17.9
12.2
17.5
10.8
17.1
13.3
Inside Principal Cities Outside MetroOfficial SPM‐NGA SPM RPP‐Rent Only RPP Narrow RPP Broad
36Source: 2016 CPS ASEC

Comparing Poverty Rates by Adjustment Mechanism
16.9 16.816.417.417.8
13.2
17.9
12.2
17.5
10.8
17.1
13.3
18.3
15.8
Inside Principal Cities Outside MetroOfficial SPM‐NGA SPM RPP‐Rent Only RPP Narrow RPP Broad Amenities
37Source: 2016 CPS ASEC

Correlation of State Level Poverty Rates to Multi‐dimensional Deprivation Index
0.821
0.711
0.755
0.64 0.66 0.68 0.7 0.72 0.74 0.76 0.78 0.8 0.82 0.84
Amenities‐Adjusted (AAI)
Current Methodology (MRI)
Not Geographically Adjusted (NGA)
Correlation to MDDI
Amenities‐Adjusted (AAI) Current Methodology (MRI) Not Geographically Adjusted (NGA)
38Source: 2016 ‐ 2018 CPS ASEC and Glassman, 2019 forthcoming

Correlation of State Level Poverty Rates to Multi‐dimensional Deprivation Index
0.821
0.711
0.755
0.733
0.531
0 0.1 0.2 0.3 0.4 0.5 0.6 0.7 0.8 0.9
Amenities‐Adjusted (AAI)
Current Methodology (MRI)
Not Geographically Adjusted (NGA)
Regional Price Parities ‐ broadly defined
Regional Price Parities ‐ FAR (narrow)
Correlation to MDDI
39Source: 2016 ‐ 2018 CPS ASEC and Glassman, 2019 forthcoming

Correlation of State Level Poverty Rates to Multi‐dimensional Deprivation Index – Individual Dimensions
0.821
0.816
0.561
0.764
0.762
0.390
0.420
Overall Correlation
Official Poverty
Health
Education
Economic Security
Housing Qualilty
Neighborhood Quality
Amenities‐Adjusted (AAI)
40Source: 2016 ‐ 2018 CPS ASEC and Glassman, 2019 forthcoming
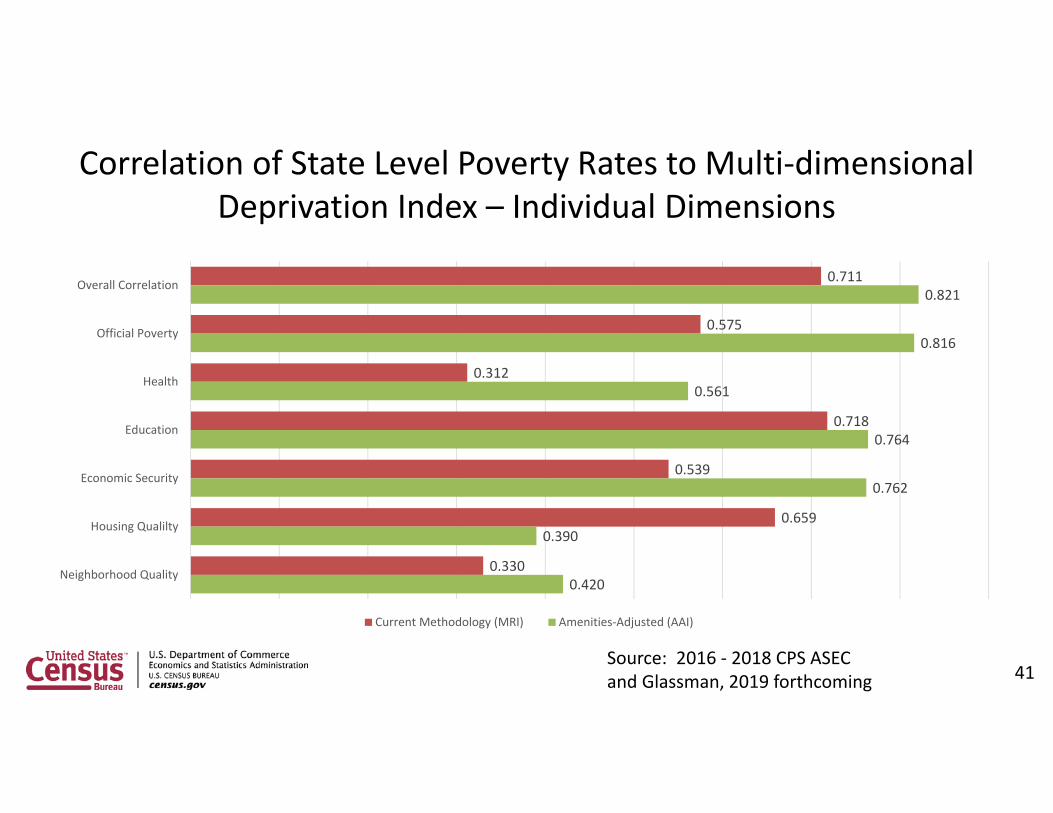
Correlation of State Level Poverty Rates to Multi‐dimensional Deprivation Index – Individual Dimensions
0.711
0.575
0.312
0.718
0.539
0.659
0.330
0.821
0.816
0.561
0.764
0.762
0.390
0.420
Overall Correlation
Official Poverty
Health
Education
Economic Security
Housing Qualilty
Neighborhood Quality
Current Methodology (MRI) Amenities‐Adjusted (AAI)
41Source: 2016 ‐ 2018 CPS ASEC and Glassman, 2019 forthcoming

Conclusions
• Amenities‐adjusted appears to be more highly correlated with the Multi‐dimensional Deprivation Index
• Suggests that the MRI index may provide an adjustment that is too strong• Need for further research to establish a defensible “adjustment” factor
– Looking at wage/price elasticities – law of one wage
• Open to suggestions as to other mechanisms to incorporate amenities• Need to test against deprivations at the individual level – perhaps using the Survey of Income and Program Participation
42

ReferencesFox, Liana. 2018. Supplemental Poverty Measure: 2017. Current Population Reports P60‐265. September.
Glassman, Brian. Forthcoming. Multidimensional Deprivation in the United States: 2019. U.S. Census Bureau.
Interagency Technical Working Group. 2010. “Observations from the Interagency Technical Working Group on Developing a Supplemental Poverty Measure.” Available at <www.census.gov/hhes/www/poverty/SPM_TWGObservations.
Renwick, Trudi, Eric Figueroa and Bettina Aten. 2017. Supplemental Poverty Measure: A Comparison of Geographic Adjustments with Regional Price Parities vs. Median Rents from the American Community Survey: An Update. SEHSD Working Paper 2017‐36. Paper presented at the 2017 International Statistical Institute World Statistics Congress in Marrakech, Morocco.
Renwick, Trudi, Bettina Aten, Eric Figueroa and Troy Martin. 2014. Supplemental Poverty Measure: A Comparison of GeographicAdjustments with Regional Price Parities vs Median Rents from the American Community Survey. Paper presented at the Allied Social Sciences Association meetings, January 2014.
Renwick, Trudi. 2011. “Geographic Adjustments of Supplemental Poverty Measure Thresholds: Using the American Community Survey Five‐Year Data on Housing Costs. Paper presented at the July 2011 Western Economic Association, San Diego, CA. Available from Census Bureau working papers.
Ziliak, James P. 2011. Cost of Living and the Supplemental Poverty Measure. A Research Forum Submitted to the Office of the Assistance Secretary for Planning and Evaluation U.S. Department of Health and Human Services.
43

Correlation of State Level Poverty Rates to Multi‐dimensional Deprivation Index – Individual Dimensions
0.755
0.917
0.705
0.702
0.800
‐0.032
0.431
0.711
0.575
0.312
0.718
0.539
0.659
0.330
0.821
0.816
0.561
0.764
0.762
0.390
0.420
‐0.2 0 0.2 0.4 0.6 0.8 1
Correlation to MDDI
OPM
Health
Education
Economic_security
Housing_quality
Neighborhood_quality
Not Geographically Adjusted (NGA) Current Methodology (MRI) Amenities‐Adjusted (AAI)
45Source: 2016 ‐ 2018 CPS ASEC

46
The Multidimensional Deprivation Index Defined
Dimensions How Dimensions are Measured
Standard of living In poverty according to the official poverty measure
Education Aged 19 or older and without a high school diploma or GED; based on head of household educational attainment for those under age 19.
Health Predicted health status is poor. Based on cutoff value of 3 for people under age 65 and 3.5 for people age 65 and over.
Economic security
At least two of the following conditions: lacked health insurance unemployed all of the prior 12 months cumulative hours worked per week for the household was less than 35 hours and no retirement or social security income in the
household.
Housing quality
At least two of the following conditions: lack complete kitchen lack complete plumbing overcrowded housing unit high cost burden.
Neighborhood quality
Lived in a county with at least two of the following: high crime poor air quality poor food environment.