Optimal design of measures to correct seawater intrusion
14
Optimal design of measures to correct seawater intrusion Elena Abarca, 1 Enric Va ´zquez-Sun ˜e ´, 1 Jesu ´s Carrera, 1 Bernardo Capino, 1 Desire ´ Ga ´mez, 1 and Francisco Batlle 1 Received 23 August 2005; revised 7 April 2006; accepted 27 April 2006; published 26 September 2006. [1] Numerous studies have been devoted to the optimization of groundwater management strategies in coastal aquifers. However, little has been done to address the problem of initially contaminated aquifers, the subject of this paper. Corrective measures need to be optimally designed to improve water quality while minimizing changes in the existing pumping regime. To this end, we compare two optimization methods. The first one is linear and consists of maximizing pumping rates while constraining heads to prevent seawater inflow. The second one consists of minimizing the changes from current pumping rates, so as to preserve existing rights, while constraining concentrations, which leads to a nonlinear programming problem. In both cases, corrective measures include a reduction in pumping rates, inland artificial recharge, and a coastal hydraulic barrier. Not surprisingly, the nonlinear problem leads to a more efficient solution, both in terms of pumping rates and actual cleanup of the aquifer. Nevertheless, the linear formulation yields insights into the optimal allocation of pumping. More importantly, the linear formulation enables us to readily calculate the hydraulic efficiency (gain in pumping rate per unit increase in recharge rate) of corrective measures. The fact that efficiency is consistently greater than 1 proves that the hydraulic barrier not only increases resources but also protects the existing ones. Therefore we conclude that both optimization approaches are useful and should be used. Citation: Abarca, E., E. Va ´zquez-Sun ˜e ´, J. Carrera, B. Capino, D. Ga ´mez, and F. Batlle (2006), Optimal design of measures to correct seawater intrusion, Water Resour. Res., 42, W09415, doi:10.1029/2005WR004524. 1. Introduction [2] Seawater intrusion is a widespread contamination phenomenon affecting coastal semiarid areas where ground- water becomes a critical factor for economic and demo- graphic growth. High pumping rates cause groundwater heads to fall below sea level, inducing the inland flow of the denser saltwater. Many coastal aquifers are nowadays affected by seawater intrusion. They require corrective measures to restore groundwater quality or, at least, to reverse current negative trends. These can be grouped into actions over the demand (i.e., reduce pumping), actions over the recharge (i.e., artificial recharge and territorial planning), relocation of pumping wells and additional engineering solutions (i.e., seawater intrusion barriers). The decision of the selected management policy is subject to a number of constraints including: strategic nature of the aquifer; existing infrastructures that may affect the relocation of pumping wells; and historical rights that require the abstraction rates and water quality to be as close as possible to the present rates. A balance between pumping demand and quality requirements is necessary. This balance is hard to maintain when the final goal is to reverse the qualitative status of the already contaminated aquifer. Precautionary corrective measures are not applicable once a portion of the aquifer has already been affected by seawater intrusion. The recovery of groundwater quality is usually a very slow process as seawater intrusion is the result of a long-term negative mass balance in the aquifer. Some measures are needed to boost the recovery of the aquifer while helping to maintain pumping. In our case study, an artificial increase in recharge and specific measures such as a seawater intrusion barrier are proposed to restore groundwater quality in a coastal aquifer suffering from severe seawater intrusion. [3] Optimization is a classical tool to evaluate ground- water management alternatives. Optimization of ground- water resources has been subject of much research. Reviews of the topic have been covered by Gorelick [1983], Wagner [1995], and Ahlfeld and Heidari [1994]. The last study provides an overview of optimization methods applied to real cases. [4] Optimization problems are often aimed at maximizing the overall pumping rate subject to some hydraulic or/and economic constraints, which leads to relatively easy for- mulations when heads depend linearly on flow rates. Un- fortunately, this approach is not valid for coastal aquifers that are well connected to the sea, where water quality is the critical factor. Application of quality constraints results in nonlinear optimization problems since concentration is non- linearly related to the decision variables (groundwater abstraction). Nevertheless, in the last decades a broad range of optimization formulations have been used in coastal 1 Department of Geotechnical Engineering and Geoscience, Technical University of Catalonia, Barcelona, Spain. Copyright 2006 by the American Geophysical Union. 0043-1397/06/2005WR004524$09.00 W09415 WATER RESOURCES RESEARCH, VOL. 42, W09415, doi:10.1029/2005WR004524, 2006 Click Here for Full Articl e 1 of 14
-
Upload
independent -
Category
Documents
-
view
0 -
download
0
Transcript of Optimal design of measures to correct seawater intrusion

Optimal design of measures to correct seawater
intrusion
Elena Abarca,1 Enric Vazquez-Sune,1 Jesus Carrera,1 Bernardo Capino,1 Desire Gamez,1
and Francisco Batlle1
Received 23 August 2005; revised 7 April 2006; accepted 27 April 2006; published 26 September 2006.
[1] Numerous studies have been devoted to the optimization of groundwater managementstrategies in coastal aquifers. However, little has been done to address the problem ofinitially contaminated aquifers, the subject of this paper. Corrective measures need to beoptimally designed to improve water quality while minimizing changes in the existingpumping regime. To this end, we compare two optimization methods. The first one islinear and consists of maximizing pumping rates while constraining heads to preventseawater inflow. The second one consists of minimizing the changes from currentpumping rates, so as to preserve existing rights, while constraining concentrations, whichleads to a nonlinear programming problem. In both cases, corrective measures include areduction in pumping rates, inland artificial recharge, and a coastal hydraulic barrier. Notsurprisingly, the nonlinear problem leads to a more efficient solution, both in terms ofpumping rates and actual cleanup of the aquifer. Nevertheless, the linear formulationyields insights into the optimal allocation of pumping. More importantly, the linearformulation enables us to readily calculate the hydraulic efficiency (gain in pumping rateper unit increase in recharge rate) of corrective measures. The fact that efficiency isconsistently greater than 1 proves that the hydraulic barrier not only increases resourcesbut also protects the existing ones. Therefore we conclude that both optimizationapproaches are useful and should be used.
Citation: Abarca, E., E. Vazquez-Sune, J. Carrera, B. Capino, D. Gamez, and F. Batlle (2006), Optimal design of measures to correct
seawater intrusion, Water Resour. Res., 42, W09415, doi:10.1029/2005WR004524.
1. Introduction
[2] Seawater intrusion is a widespread contaminationphenomenon affecting coastal semiarid areas where ground-water becomes a critical factor for economic and demo-graphic growth. High pumping rates cause groundwaterheads to fall below sea level, inducing the inland flow ofthe denser saltwater. Many coastal aquifers are nowadaysaffected by seawater intrusion. They require correctivemeasures to restore groundwater quality or, at least, toreverse current negative trends. These can be grouped intoactions over the demand (i.e., reduce pumping), actions overthe recharge (i.e., artificial recharge and territorial planning),relocation of pumping wells and additional engineeringsolutions (i.e., seawater intrusion barriers). The decision ofthe selected management policy is subject to a number ofconstraints including: strategic nature of the aquifer; existinginfrastructures that may affect the relocation of pumpingwells; and historical rights that require the abstraction ratesand water quality to be as close as possible to the presentrates. A balance between pumping demand and qualityrequirements is necessary. This balance is hard to maintainwhen the final goal is to reverse the qualitative status of thealready contaminated aquifer. Precautionary corrective
measures are not applicable once a portion of the aquifer hasalready been affected by seawater intrusion. The recovery ofgroundwater quality is usually a very slow process asseawater intrusion is the result of a long-term negative massbalance in the aquifer. Some measures are needed to boostthe recovery of the aquifer while helping to maintainpumping. In our case study, an artificial increase in rechargeand specific measures such as a seawater intrusion barrierare proposed to restore groundwater quality in a coastalaquifer suffering from severe seawater intrusion.[3] Optimization is a classical tool to evaluate ground-
water management alternatives. Optimization of ground-water resources has been subject of much research. Reviewsof the topic have been covered by Gorelick [1983], Wagner[1995], and Ahlfeld and Heidari [1994]. The last studyprovides an overview of optimization methods applied toreal cases.[4] Optimization problems are often aimed at maximizing
the overall pumping rate subject to some hydraulic or/andeconomic constraints, which leads to relatively easy for-mulations when heads depend linearly on flow rates. Un-fortunately, this approach is not valid for coastal aquifersthat are well connected to the sea, where water quality is thecritical factor. Application of quality constraints results innonlinear optimization problems since concentration is non-linearly related to the decision variables (groundwaterabstraction). Nevertheless, in the last decades a broad rangeof optimization formulations have been used in coastal
1Department of Geotechnical Engineering and Geoscience, TechnicalUniversity of Catalonia, Barcelona, Spain.
Copyright 2006 by the American Geophysical Union.0043-1397/06/2005WR004524$09.00
W09415
WATER RESOURCES RESEARCH, VOL. 42, W09415, doi:10.1029/2005WR004524, 2006ClickHere
for
FullArticle
1 of 14

aquifers. Differential equations of groundwater flow andsolute transport have been solved using either analyticalsolutions [Cheng et al., 2000; Mantoglou, 2003] or numer-ical simulation to represent the aquifer response. Numericalsimulations of exclusively groundwater flow have beenused [Hallaji and Yazicigil, 1996; Zhou et al., 2003] usingequivalent freshwater heads as constraints to prevent sea-water intrusion. In other cases, seawater intrusion has beenexplicitly simulated using a sharp interface model [Emchand Yeh, 1998; Rao et al., 2003; Mantoglou, 2003;Mantoglou et al., 2004; Park and Aral, 2004] or chloridetransport models [Gordon et al., 2000]. Some of the lattermodels used density-dependent flow codes [Das and Datta,1999a, 1999b]. However, computational cost restrictedtheir application to relatively simple hypothetical cases.In fact, not only simulation cost but also optimizationcomplexity increases when density variations are takeninto account, which may lead to highly nonlinear andnonconvex problems [Finney et al., 1992].[5] The choice of optimization method is ideally deter-
mined by the nature of decision variables (discrete orcontinuous), the linearity of the problem (degree of non-linear dependence of objective function and constraints ondecision variables), the continuity of the objective function,the availability of information about derivatives and by thepotential existence of local minima [Cheng et al., 2000].Therefore it is not surprising that many different objectivefunctions and sets of constraints have been applied tocoastal aquifers. Some authors aim at maximizing the totalpumping rate [Shamir et al., 1984; Hallaji and Yazicigil,1996; Cheng et al., 2000; Mantoglou, 2003] whereas othersaim at minimizing the salinity of pumped water [Das andDatta, 1999a, 1999b] or the volume of saltwater into theaquifer [Finney et al., 1992; Emch and Yeh, 1998]. Emchand Yeh [1998] and Gordon et al. [2000] also includepumping costs into the objective function. It is alsopossible to consider a multiobjective optimization problem[Shamir et al., 1984; Emch and Yeh, 1998; Das andDatta, 1999a; Park and Aral, 2004]. Constraints appliedin those studies include maximum and minimum pumpingrates [Hallaji and Yazicigil, 1996; Emch and Yeh, 1998;Das and Datta, 1999a; Cheng et al., 2000; Zhou et al.,2003], toe location [Cheng et al., 2000; Mantoglou, 2003;Mantoglou et al., 2004; Rao et al., 2004; Park and Aral,2004], groundwater heads [Hallaji and Yazicigil, 1996;Emch and Yeh, 1998; Zhou et al., 2003], flow potential[Mantoglou, 2003; Mantoglou et al., 2004] or salt con-centration of the pumped water [Gordon et al., 2000; Dasand Datta, 1999a, 1999b].[6] The aforementioned papers provide interesting meth-
odological developments and often yield insights into thebest methods of managing coastal aquifers. Application toreal aquifers is less abundant but can be found in recentliterature [Shamir et al., 1984; Willis and Finney, 1988;Finney et al., 1992; Reichard, 1995; Hallaji and Yazicigil,1996; Nishikawa, 1998; Zhou et al., 2003; Mantoglou et al.,2004; Reichard and Johnson, 2005]. All of these applica-tions aim at maximizing pumping while preventing sea-water intrusion. However, optimization methods have notbeen tested to design corrective measures to restore waterquality in initially salinized aquifers, such as the mainaquifer of the Llobregat delta.
[7] We applied two different approaches to select anddesign corrective measures so as to ensure a water qualitytrend reversal in the Llobregat delta main aquifer. Thefirst one consists of maximizing pumping rates whileconstraining coastal heads. This approach is similar tothe one used by Reichard [1995], Hallaji and Yazicigil[1996], Nishikawa [1998], Zhou et al. [2003], and Reichardand Johnson [2005]. The second method uses concentra-tion constraints to guarantee a satisfactory qualitative statusof the aquifer. This approach has been used by Gordon etal. [2000] in some synthetic cases. We aim at quantifyingthe efficiency of different corrective measures that included(1) reductions in pumping rates, (2) inland artificial re-charge and (3) a coastal freshwater injection barrier, cou-pled to inland pumping to clean up trapped salinized water.The aim of this paper is to systematically compare bothoptimization approaches and to discuss the efficiency ofcorrective measures.
2. Methodology
[8] Two different approaches are applied to assess thefeasibility and to quantify the effectiveness of the pro-posed measures. A groundwater flow and chloride trans-port model is combined with two different optimizationmethods. In the first one head constraints are used toensure a gradient reversal along the coast line, whichresults in a linear optimization problem. The secondmethod consists of maximizing the amount of waterpumped subject to quality constraints, which leads to anonlinear optimization problem. Results of both method-ologies are compared and the drawbacks and advantagesof each method are discussed. The basic steps to followare as follows: (1) groundwater flow and transport modelconstruction and calibration, (2) definition of the refer-ence scenario, and (3) optimization process, conisting of(1) problem formulation and (2) solution of the optimi-zation problem.[9] The first two steps follow standard modeling
approaches. Here, we focus on the description of the twooptimization procedures. We defined the objective functionsfor both procedures in terms of pumping rates. Economicexpressions could have been used. In fact, our objectivefunctions could have been expressed in terms of theminimization of costs of meeting demand and satisfyinghydraulic or chemical constraints. For the sake of simplicity,we used pumping rates as optimization variables.
2.1. Linear Optimization Problem
[10] Our aim is to maximize the amount of water pumpedsubject to head constraints. The objective function isexpressed as:
Qopt ¼X
Qi i ¼ 1; . . . ;M ð1Þ
where Qi the pumping rates in each of the M pumping areas.[11] Constraints can be applied at a certain number (N) of
control points at any time in the simulation period. Thesecontrol points can be divided into two groups: inland andcoastal control points. Constraints applied at inland pointscontrol drawdowns produced by pumping, either to ensurethat heads remain above a minimum (i.e., to prevent dryinga wetland) or below a maximum (i.e., to prevent flooding a
2 of 14
W09415 ABARCA ET AL.: MEASURES TO CORRECT SEAWATER INTRUSION W09415
landfill). Constraints at coastal points aim at reversing thehydraulic gradient along the coast. Heads are required tostay above the equivalent freshwater head of seawater atthat particular location. The aim of these coastal controlpoints is to try to reverse seawater intrusion only byconstraining heads (note that this concept is only valid forrelatively thin aquifers, where vertical variations of salinitycan be neglected). In our case, head constraints are appliedat the end of the simulation period as
hjmin� hj0 � SQi Aij � hjmax
ð2Þ
where hj0 is the groundwater head for the unstressed aquiferat the jth control point, hjmax
and hjminare, respectively, the
maximum and minimum allowed head at the jth controlpoint and Aij is the response matrix, defined as thecalculated drawdown at point j in response to a unitpumping in well i.[12] Constraints in the maximum allowed pumping rate
may also be applied:
Qi � Qmax i ð3Þ
where Qmaxiis the maximum allowed pumping rate at well i.
[13] The same type of constraints can be applied to anycorrective measure implemented into the optimization pro-cess. To determine where freshwater injection is mostefficient, the corrective measure (i.e., a barrier) can bedivided into segments and the constraint applied is the totalamount of water available for injection through the wholecorrective measure by applying:
Qdesigni¼
XQsegi
ð4Þ
where Qdesigniis the injection rate in corrective measure i
and Qsegithe injection rate in each of the segments in which
the corrective measure has been divided.[14] Maximizing equation (1) subject to constraints (2),
(3), and (4) results in a linear problem. We used VisualNumerics’ [1997] routines to solve the linear problem.[15] One of the outputs of linear programming codes is
the shadow price of each constraint. The shadow price is theLagrange multiplier of the constraint. It represents thesensitivity of the objective function to the value imposedto the constraint. It is termed price because it expresses themarginal cost (in terms of objective function units) of a unitincrease in the constraint. Thus inactive constraints yieldzero shadow price because the objective function is notsensitive to them. For management purposes, shadow pricesare very useful. They enable us to express, in terms of theobjective function, the cost of all active constraints. We willuse them to evaluate the hydraulic efficiency of correctivemeasures (i.e., the ratio between the increase in pumpingrate per unit increase in recharge rate). As such, they willallow us to answer the question of whether or not a rechargebarrier implies a net gain of resources.
2.2. Nonlinear Optimization Problem
[16] Groundwater abstraction is linked to groundwaterquality in coastal aquifers. Therefore it may be necessary toascertain whether the projected alternatives warrant a min-imum groundwater quality. Given that one of the goals is toprotect existing water rights, our aim is to obtain (1) apumping rate regime as close as possible to the current one
and (2) the corrective measures needed to achieve a satis-factory groundwater qualitative status. To this end, con-straints in concentration are imposed. Since concentration isnon linearly related to groundwater abstraction, the resultingoptimization problem is nonlinear. The problem is some-what simplified by assuming that maximum pumping rateslead to generalized intrusion (in fact, this is the currentsituation along the Llobregat delta shores). Therefore, ifconcentration is constrained to be below a certain thresholdat a point where intrusion is known to occur, such aconstraint will be active. Knowledge of the active con-straints allows us to substitute the constraint by a penaltyfunction in the objective function. We have used the penaltyfunction of Courant [Fletcher, 1985]:
ci � ci* active ) ci ¼ ci* � minci � ci*ð Þ2
si2ð5Þ
where ci is the computed concentration at the ith controlpoint, c*i is the desired (maximum) concentration at suchpoint and si is the penalty’s tolerance, which allows one toimpose variable weights on each constraint (penalty). Infact, ci will tend to be slightly larger than c*i. However, cican be as close as desired by reducing si. Using equation (5)together with the desired pumping and recharge rates allowsus to replace the general optimization problem by theminimization of the multiobjective function:
F ¼lc
XN
i¼1
ci*� cið Þ2
s2ciþ lQ
XM
j¼1
Qj*� Qj
� �2
s2Qj
þ lR
XL
k¼1
Rk*� Rkð Þ2
s2Rk
ð6Þ
where N, M and L are the number of control points,pumping zones and additional corrective measures, respec-tively; Q*j the desirable pumping rate for the jth flow zone;Qj the calculated flow for the jth flow zone; R*k the desirableinjection rate in the kth corrective measure; Rk the calculatedinjection for the kth corrective measure; sQj and sRk aretolerance parameters (analogous to sci) for the jth flow zoneand the kth corrective measure; lc, lQ and lR are theweights of the objective function of concentration, pumpingrates and corrective measures, respectively. The toleranceparameters allow us to vary the relative contribution to eachobjective. Note that for the concentration term, lc isequivalent to the s parameter of Fletcher [1985]. Themethod calls for sequential optimization runs with increas-ing lc while doing away with the control points whoseconcentrations do not satisfy equation (5) (i.e., those forwhich ci is strictly smaller than c*i). However, in practice, weperformed some preliminary runs to find appropriate lvalues and obtained satisfactory results.[17] With this formulation, the resulting problem is sim-
ilar to that of parameter estimation. We used the method ofMedina and Carrera [1996] to minimize equation (6).
3. Case Study: Application to the LlobregatDelta Main Aquifer
3.1. Background and Problem Statement
[18] The Llobregat delta is located to the south ofBarcelona (Spain) (Figure 1). It is a quaternary formation
W09415 ABARCA ET AL.: MEASURES TO CORRECT SEAWATER INTRUSION
3 of 14
W09415

and is considered to be a classic example of a MediterraneanDelta controlled by fluvial and coastal processes (i.e.,storms and alongshore drift). Geological studies [Marques,1984; Simo et al., 2005] consider the delta to be formed byan upper complex (Q4 in Figure 2) and a lower complex(Q3, Q2, and Q1 in Figure 2). The upper complex is atypical stratigraphic delta sequence. The lower complex isformed by three fluvial systems associated with threecurrently submerged paleodeltas.[19] Hydraulically, the prodelta silts of Q4 act as a
confining unit separating the permeable upper units (upper,shallow aquifer) from a very thin and basal very permeablelayer of reworked gravels and beach sands. This thin layertogether with the upper gravels of Q3 constitute the Mainaquifer of the Llobregat delta. It is an essentially horizontalaquifer (around 100 km2) of 15–20 m thickness. High-transmissivity zones are associated with the paleochannelsystems of Q3 (Figure 3). The presence of this higher-permeability channels are of extreme importance for theoptimal management of this aquifer.[20] The Llobregat delta is well-known since numerous
studies have been carried out in this area since the 60s,including among others, the hydrogeological synthesisworks by Ministerio de Obras Publicas [1966], PlanHidrologico del Pirineo Oriental (PHPO) [1985], and,more recently, Iribar and Custodio [1992] and Iribar[1992]. In the late 70s, when salinization problems became
a concern, hydrochemistry research improved the knowl-edge of the aquifer systems and the mechanisms that causeseawater intrusion in the main aquifer of the Llobregatdelta [Custodio et al., 1976; Custodio, 1981; Manzano etal., 1992; Bayo et al., 1977; Domenech et al., 1983]. Somegroundwater flow models have also been developed for themain aquifer, termed lower aquifer in earlier works, [Cuenaand Custodio, 1971; PHPO, 1985; Custodio et al., 1989;Iribar et al., 1997; Vazquez-Sune et al., 2005]. Nowadays,groundwater heads are still below sealevel in most of thedelta region (Figure 4), and large areas are still affected byseawater intrusion, as shown by the chloride distribution inFigure 5.[21] We seek to assess sustainable management alterna-
tives in this aquifer as well as to correct the currentsalinization problem. Our goal is to reverse the negativetrends and recover the natural quality existing 35 years ago.Abstraction rates should remain as close as possible tocurrent values. To achieve this goal, the following correc-tive measures are considered: (1) a reduction in currentpumping rates, (2) a coastal barrier and (3) upland artificialrecharge ponds. The last two measures should be chosen inaccordance with efficiency and the optimized recharge/injection rates.
3.2. Groundwater Flow and Solute TransportModel Construction and Calibration
[22] A two-layer areal model was built to simulategroundwater flow and chloride transport in the Llobregatdelta aquifers. A two-dimensional horizontal model is usedgiven that the concentration is well mixed in the verticaldirection and that the aquifer thickness is small comparedwith the horizontal extent. Two dimensional models cantake into account the density differences by working withfreshwater equivalent heads at points with high salinity suchas the seaside boundary [Iribar et al., 1997]. Therefore oursimulation model is linear. Note that this does not imply thatthe optimization problem needs to be linear. Linearity of thelatter depends on whether constraints and objective functionare a linear function of design variables (pumping rates). Ifthe simulation problem is linear, then the optimization
Figure 1. Location of the Llobregat delta and lowervalley.
Figure 2. Geological cross section perpendicular to the coast of the emerged and submerged Llobregatdelta. The very thin layer below the silts off Q4 and the upper gravels of Q3 form the main aquifer studiedin this work. Note that they are well separated from the shallow aquifer by the prodelta silts with theresult that the main aquifer is effectively confined and relatively thin. Modified from Simo et al. [2005],with permission from la Sociedad Geologica de Espana.
4 of 14
W09415 ABARCA ET AL.: MEASURES TO CORRECT SEAWATER INTRUSION W09415

problem may or may not be linear. In fact, these two optionsare discussed in this paper. However, if the simulationproblem had been nonlinear, optimization would also havebeen nonlinear.[23] The flow and transport problem uses a finite element
grid of 4354 nodes and 9698 elements, divided into twolayers. The upper layer depicts the upper aquifer (upper Q4in Figure 2) and the lower layer represents the Main aquifer.These two layers are separated by 1D elements representingthe silty wedge. The submerged portion of the lower aquiferis complex (Figure 2), but this complexity is deemedirrelevant for the management alternatives considered here.
This submerged portion is modeled by extending the modeldomain (lower layer) 4 km seaward and the hydraulicparameters are estimated by calibration. Although bothaquifers are considered in the simulation model, all pump-ing and corrective measures as well as constraints areapplied to the Main aquifer.[24] Temporal variability of most sink and source terms
make it necessary to evaluate management alternatives witha transient simulation model. The model was calibrated forthe period from 1965 to 2001. Model parameters are dividedinto zones representing the aquifer heterogeneity. The valueof the parameters are considered constant in each zone. The
Figure 3. Paleochannel systems (A, B, C) associated with the main aquifer of the Llobregat delta. Thesepaleochannels correspond to high-permeability zones that may act as preferential seawater intrusionpathways and that make transmissivity distribution highly heterogeneous. Modified from Simo et al.[2005].
Figure 4. Piezometric map calculated for December 2001 together with the heads mean error and thecalculated versus measured heads at four observation points. Calculated heads are plotted as a gray line,measured data used for calibration are plotted as dots, and data used for model validation are shown ascrosses.
W09415 ABARCA ET AL.: MEASURES TO CORRECT SEAWATER INTRUSION
5 of 14
W09415

main aquifer inputs are the recharge from rain infiltrationalong with the recharge from the river during flood events[Vazquez-Sune et al., 2006; E. Vazquez-Sune et al., Estima-tion of recharge floods in disconnected sream-aquiferssystems: Application to the Baix Llobregat aquifers, Barce-lona, Spain, submitted to Journal of Hydrology, 2005] whilethe main output is groundwater pumping. Inputs fromsurrounding aquifers are considered as well as interactionwith surface flow (rivers, drainage systems, lakes, etc.).[25] Parameter values were updated during calibration.
Automatic adjustments were carried out with the codeTRANSIN-IV [Medina and Carrera, 2003], starting fromthe prior estimates available for every parameter. The codeminimizes an objective function that considers the differ-ences between measured and calculated head and/or con-centrations, as well as the likelihood of calculatedparameters [Medina and Carrera, 1996]. Therefore the codeneeds measured heads and concentrations at the definedobservation points. The observation points provide a goodcoverage of the model domain. Head data at many obser-vation points extend over almost the whole calibrationperiod (1965–2001). However, the concentration data aremore disperse in time. Parameter values obtained fromcalibration are consistent with prior information. The
obtained fit both in terms of heads (Figure 4) and chlorideconcentrations (Figure 5) are considered satisfactory. Thecalibrated model was validated with additional data (2002–2004) showing a reasonable fit between measured andcalculated data (Figures 4 and 5).
3.3. Definition of a Reference Scenario
[26] The model needs to be updated to be used as amanagement tool. As it will be applied to optimized futuremanagement strategies, some assumptions about the futurebehavior of the main terms of the water balance arenecessary. These assumptions are uncertain. Some scenariosrelated to pumping rates, city growth and infrastructureswere considered to evaluate this uncertainty. All thesescenarios showed that current pumping is unsustainablegiven that seawater intrusion progressed further inland.[27] One of these scenarios was chosen as the reference
with which to compare the optimization results. It considersthe following assumptions.[28] 1. For the simulation/optimization period (2002–
2036) meteorology was considered to be similar to that of1965–2001. This would include both long dry periods andlong wet periods.
Figure 5. Chloride concentration map calculated for December 2001 together with the concentrationmean error and the calculated versus measured heads in six observation points. Calculated heads areplotted as a gray line, measured data used for calibration are plotted as dots, and data used for modelvalidation are shown as crosses.
6 of 14
W09415 ABARCA ET AL.: MEASURES TO CORRECT SEAWATER INTRUSION W09415

[29] 2. Pumping history assumed for future years is theaverage of the last five years (1997–2001) for all wellsexcept for the main pumping area (AGBAR) whose tem-poral variability of the last five years was repeated along thesimulation period.[30] 3. Location of the current pumping wells is main-
tained. The distribution of wells and the reference pumpingrates are shown in Figure 6.
3.4. Management Model
[31] Optimization was applied to groups of existing wellsdefined as management polygons. Six polygons or manage-ment areas were defined in the main aquifer of the Llobregat
lower valley. Five of them were defined according togeological, hydrological and management criteria. The sixtharea, located along the coast, was defined for linear opti-mization requirements, as explained below. An equityprinciple was applied to the pumping wells located in thesame management area with the result that pumping rateswere reduced in the same proportion at all pumping wells.Figure 7a shows the six management zones defined in thisaquifer.[32] Two actions are considered, first to exclusively
reduce the pumping rates and second, to increase theavailable resource by designing some additional corrective
Figure 6. Location of the pumping wells and their average pumping rate in the period from 1997 to2001 and location of the proposed corrective measures that are included in the optimization process.
Figure 7. (a) Management areas defined in the aquifer according to geological, hydrological, andmanagement criteria and (b) location of the control points used for the optimization process.
W09415 ABARCA ET AL.: MEASURES TO CORRECT SEAWATER INTRUSION
7 of 14
W09415
measures that help to maintain the current pumping rates.The considered additional measures are as follows.[33] 1. Recharge ponds to artificially increase the re-
charge. Two recharge ponds are proposed in the alluvialpart of the main aquifer. The total area proposed is about11 ha with a projected infiltration rate of 0.25 m/d,resulting in a total projected recharge of 11 hm3/y. Thelocation of the proposed ponds is indicated in Figure 6.[34] 2. A seawater intrusion barrier (hereinafter, referred
to as barrier). A freshwater injection barrier, divided intofour sections according to the different transmissivity zonesdefined in the numerical model, is proposed in the easternpart of the coast (Figure 6). The four segments are locatedin management zone 6, however three of them are locatedin front of management zone 4 and one in managementzone 5. Segment 1 is located over a preferential flow pathcaused by the paleochannel C structure in Figure 3. Theoptimization problem allows us to optimally distribute thetotal amount of water injected into the four segments and,in the case of the nonlinear problem, to quantify the totalamount of water needed to inject. This total projectedinjection rate is 3.65 hm3/y.
3.5. Linear Optimization Problem
3.5.1. Problem Definition[35] Our aim is to maximize the total amount of water
pumped so that, by the end of the 35 year period, heads fallbetween a prescribed minimum and maximum head con-straints. The constraints were applied to 30 control pointsspread all over the aquifer, 19 of them located along thecoast (Figure 7b). Applied head constraints depend on thepoint location into the aquifer:[36] Minimum head constraints were applied at 25 con-
trol points. Minimum historic heads were applied at 6inland control points located in the confined aquifer. hmin
equaled the equivalent freshwater head of seawater at the
other 19 points located along the coast, thereby imposing aseaward hydraulic gradient.[37] Maximum and minimum head constraints were ap-
plied at 5 control points located in the unconfined portion ofthe aquifer. The maximum head was also constrainedbecause of the risk of affecting underground structures inthe urban area and of washing out some dangerous landfillsburied along the fluvial valley. The minimum head con-straint at these points was 1/3 of the saturated thickness.[38] Initially, no restrictions were applied to pumping
rates in the management areas. The total injection into therecharge ponds and the barrier equaled the projected values.In the case of the barrier, the total injected water is specifiedand the model optimizes the distribution of the totalinjection (11 hm3/y for the ponds and 3.65 hm3/y for thebarrier) into the four defined segments.3.5.2. Linear Optimization Results[39] Application of linear programming could lead to
absurd results whenever the constraints are inappropriate.Therefore care must be exercised to identify unrealisticsolutions. Specifically, attention should be paid to theDirichlet and Cauchy boundary conditions. While theseboundary conditions may be necessary for modeling, theycan act as unrealistic source terms for management prob-lems (e.g., pumping near a Dirichlet boundary may lead tohuge pumping rates with small computed drawdowns).Some of the constraints discussed above were used tominimize these problems. In fact, we started the optimiza-tion process with five management zones. Results showedthat the first division was not suitable for linear program-ming. Initially, zones 3, 4 and 5 reached the coast. Sincethese zones contained pumping wells located close to thecoast line where strict minimum head constraints wereimposed, it was impossible to pump water from any ofthe three zones. Therefore a long and thin additionalmanagement zone, the sixth in Figure 7a, was delineated
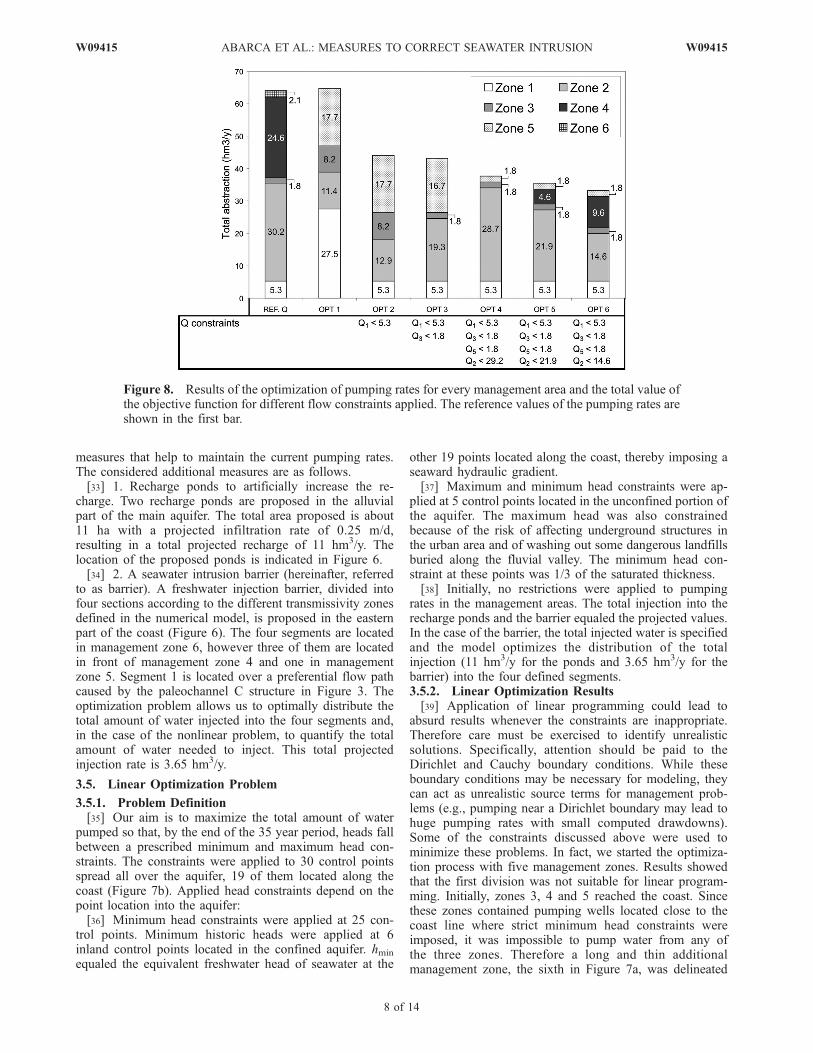
Figure 8. Results of the optimization of pumping rates for every management area and the total value ofthe objective function for different flow constraints applied. The reference values of the pumping rates areshown in the first bar.
8 of 14
W09415 ABARCA ET AL.: MEASURES TO CORRECT SEAWATER INTRUSION W09415

parallel to the coast. This zone was defined as a dead zonein terms of water extraction since the constraints preventedpumping.[40] Results in terms of total pumping and its distribution
per management zones are presented in Figure 8 togetherwith current values (REF. Q in Figure 8) in the absence ofcorrective measures. Several optimization runs were re-quired to obtain reasonable results, which were achievedby adding lateral constraints (equation (3)) to the pumpingrates per management zone. In fact, when no lateral con-straints are added (OPT1 in Figure 8), the total amount ofwater pumped turned out to be slightly above currentvalues. However, the result is not acceptable in terms ofthe pumping distribution because most water must beextracted from the management zone, which is farther fromthe coast. This is caused by (1) the distance from thecoast, which causes drawdown to be uniformly distributedand (2) by the presence of a Cauchy boundary condition(Figure 6), which acts as an unrealistic source of fresh-water. Therefore this result cannot be considered to bereliable. Moreover, insufficient water can be pumped fromthe critical management areas (zone 2 and 4, actually,zero from zone 4), where the main drinking supplycompanies are located. This solution is socially unaccept-able with the result that ad hoc lateral constraints topumping rates (i.e., maximum values) had to be imposed.When zone 1 was constrained (OPT 2 in Figure 8), ahigh pumping rate was assigned to zone 3. Nevertheless,pumping rates of zones 2 and 4 were below the requiredvalues, which gave rise to the subsequent runs. The additionof these constraints causes a reduction in the total objectivefunction (OPT2-OPT6 in Figure 8). Only in the last twooptimization problems (OPT5 and OPT6) can water bepumped from zone 4. OPT6 is the most similar to the existing
pumping distribution (REF. Q in Figure 8). A trade-offbetween zone 2 and zone 4 is clearly observed in OPT4-6.Constraining pumping in zone 2 causes a pumping increasein zone 4 together with a slight reduction in the totalabstraction. Both zones are located over a high transmissivityzone (paleochannel C in Figure 3) and this trade-off showshow these zones compete for the same resource.[41] The evolution of the total abstraction, the distribution
of pumping and the shadow prices when additional correc-tive measures are implemented are presented in Figure 9.Total abstraction is smaller in Figure 8 because water isinjected into the recharge ponds (10.96 hm3/y) and into theseawater intrusion barrier (3.65 hm3/y). The first threeoptimization scenarios yield total pumping above the refer-ence values. However, in this case also, the distribution ofpumping presents problems. According to optimizationresults, no water can be pumped from zone 4 and mostwater must be pumped from zone 5, where little water iscurrently pumped. This zone was added to the optimizationprocess for possible use in future management scenarios.However, an underground structure acts as drainage in thiszone. This drainage is implemented as a Cauchy boundarycondition, which could act as an unrealistic source of waterif the piezometric head should fall below the infrastructurebase. In order to avoid this, pumping in zone 5 is con-strained to 1.8 hm3/y, which allows pumping from zones 2and 4, although total abstraction is significantly reduced. InOPT4-6, the trade-off between zones 2 and 4 is alsoobserved. The most appropriate solution is OPT5 since itis the most similar to the existing distribution of abstraction.This result leads to a reduction of only a 25% in pumpingrates of zones 2 and 4.[42] The shadow prices obtained for the two additional
corrective measures proposed are also shown in Figure 9.
Figure 9. Results of the optimization with additional corrective measures of pumping rates for everymanagement area and the total value of the objective function for different flow constraints applied. Thereference values of the pumping rates are shown in the first bar.
W09415 ABARCA ET AL.: MEASURES TO CORRECT SEAWATER INTRUSION
9 of 14
W09415

These shadow prices quantify the hydraulic efficiency ofeach corrective measure for each optimization scenario. Thehydraulic efficiency of the recharge ponds is in all caseslower than 1. This means that some of the injected resourceis lost before it gets to the active wells. This resourceprobably reaches the river (where it drains the aquifer)and the drainage underground structures located in man-agement zone 5. This is evidenced by the higher efficiencycalculated when the maximum abstraction in zone 5 is notconstrained. The hydraulic efficiency calculated by the lastthree optimization cases (OPT4-6) is 0.69, i.e., almost 70%of the water recharged through the ponds can be pumpedfrom the active wells. However, the calculated efficiency forthe seawater intrusion barrier is higher than 1 in all cases.This is a striking result as efficiency higher than 1 meansthat the barrier allows pumping to increase by more thanwhat is injected. Freshwater injection barriers are oftencriticized as corrective measures because part of the injectedwater flows seaward, causing part of the new resource to belost. Although part of the injected water is indeed lost, ourresults show that the protective effect of the barrier is highlyefficient. This barrier prevents a large amount of freshwaterfrom being contaminated, resulting in an increase in avail-able resources. The calculated hydraulic efficiency dependson lateral constraints. As in the case of the recharge ponds,the efficiency is higher when the maximum pumping rate inzone 5 is not constrained (OPT1-3). In fact, it is linearlyrelated to the pumping rate in zone 5. It should be noted thatthe barrier was divided into 4 segments depending on thedifferent transmissivity zones defined in the numericalmodel. The four segments are located in the managementzone 6 (Figure 7). However three of them are located infront of management zone 4 and one in front of manage-ment zone 3 over paleochannel C in Figure 3. The optimi-zation problem allows us to optimally distribute the totalamount of water injected into the four segments. In scenar-ios OPT1-3, water is injected into the three segmentslocated in front of zone 5. However, when the maximumpumping rate in zone 5 is constrained, an abrupt decrease inthe hydraulic efficiency is observed together with the
reduction in the total abstraction. Furthermore, this isaccompanied by a change in the segments where water isinjected into the barrier. In cases OPT4-6, the optimalinjection takes place exclusively in the segment located infront of management zone 4, over a hydraulic preferentialpath (paleochannel C in Figure 3, which communicates thebarrier with the main pumping areas in zones 2 and 4.[43] Given the importance of maintaining a pumping
distribution similar to the current one, the best solutionsare obtained for OPT6 when no additional measures areconsidered and for OPT5 when the recharge pond and theinjection barrier are added. In the former case, a reduction ofmore than the 50% of the pumping rates should be appliedto zones 2 and 4. In the latter, the reduction is limited to25% in the same zones.[44] These optimal pumping rates guarantee that head
objectives imposed as constraints are achieved after 35 years.As for seawater intrusion, head constraints at the coastalpoints ensure a reversal of the hydraulic gradient. However,this reversal may be not be sufficient to clean the aquiferareas that are currently contaminated. In order to confirmthis, a transport simulation beginning with present chloridedistribution was carried out with the optimal pumping ratescalculated in OPT5 together with additional correctivemeasures. The concentration distribution obtained is shownin Figure 10b and compared with the chloride distributioncalculated after 35 years of pumping according to thereference values (Figure 10a). An improvement in thequality is observed, but the existing salt continues to movetoward the pumping or drainage areas. Although the pump-ing rates have been reduced and corrective measures im-posed, the good qualitative status cannot be reached bysimply optimizing hydraulic variables.
3.6. Nonlinear Optimization Problem
3.6.1. Problem Definition[45] The above results suggest that maximum salinity
should be used as a constraint to guarantee the recoveryof water quality. The resulting nonlinear problem is pre-sented below.
Figure 10. Chloride concentration map in the main aquifer of the Llobregat lower valley obtained(a) for the reference scenario and (b) for the linearly optimized pumping rates and the implementationof corrective measures.
10 of 14
W09415 ABARCA ET AL.: MEASURES TO CORRECT SEAWATER INTRUSION W09415

[46] Pumping and injection rates are optimized so that adesired chloride concentration is reached at control pointsafter 35 years. To ensure good water quality throughout thedomain, control points were located along the coastline atthe same 19 locations used in the linear optimizationproblem. Desired concentrations at the end of the 35 yearmanagement period, c*, and tolerance, sci, (see equation 5)were set to 1000 mg/l of chloride. Therefore final concen-trations at the control points should not exceed 2000 mg/l.The desired recharge rate (R* in equation (6)) was initiallyprescribed as the projected value. However, the penaltyfunction was relaxed (large sR compared to sQ) to allow thisvariable to increase or reduce its value if necessary. Inaddition to the recharge ponds and injection barrier, twowells (Figure 6) were established for pumping 2500 m3/dayeach during the first ten years to clean saltwater trapped bythe barrier. Optimization parameters used are presented inTable 1.[47] Management areas are those of the linear problem,
except for zone 6, which is no longer needed and wasdistributed among zones 3, 4 and 5, as originally planned.[48] Minimizing the objective function as presented in
equation (6), yields the values of Qwell for each pumpingarea and QR for the recharge measures.3.6.2. Nonlinear Optimization Results[49] Results are compared with reference pumping rates
and projected recharge values in Figure 11. It should benoted that pumping can be maintained at current rates ifcorrective measures are applied with higher recharge ratesthan originally planned. Recharge should increase by 50%at the ponds and by 200% at the seawater intrusion barrier.[50] These results were obtained with the values of l
presented in Table 1, being lQ a hundred times greater thanlc. When increasing the weight of the pumping ratefunction, pumping rates approach the desired values whilerelaxing concentration objectives. Concentration results inour case are twice the desired values at some of the controlpoints remaining within the range of tolerance. A highervalue of lc would result in lower concentrations to thedetriment of the pumping rate objectives.[51] The concentration distribution of the transport sim-
ulation optimization model after 35 years is shown inFigure 12b to assess the effectiveness of the methodology.This result is compared with the chloride distribution cal-culated with the reference scenario, i.e., the current pumpingrates (Figure 12a). The areas already contaminated locatedin the left margin of the delta are almost recovered with theoptimized pumping and recharge rates. Some salty areascontinue to be present, probably due to a poor choice of thelocation of the two pumping wells to extract salt trapped bythe barrier or because the pumping period (ten years) wasnot long enough. A more detailed work would be necessaryto design this pumping location and duration.
[52] Another result that differs from the linear problem isthe distribution of the injection water into the barrier seg-ments. In the best linear result (OPT5 in Figure 8) optimalrecharge at the barrier was concentrated in segment 4(Figure 6), which is hydraulically more efficient since itcoincides with a high permeability channel connected withinland pumping. However, in the nonlinear problem, injec-tion is equally distributed in order to meet quality criteriaalong the whole coastline.
3.7. Comparison of Results
[53] The solutions obtained using both methods arepresented in Table 2. Two solutions are offered for thelinear optimization method: with (LOP+) and without(LOP) additional measures. A reduction of more than50% of the pumping rates must be applied to zones 2 and4 when no additional measures are considered. If rechargeponds and the injection barrier are added, this reduction islimited to 25% in the same zones. These values would besuitable for managing an initially uncontaminated or un-stressed aquifer. However, as the aquifer already suffersfrom considerable seawater contamination, these pumpingreductions are not able to recover the quality of the aquifer.Nevertheless, this simple methodology yields informationon the hydraulic efficiency of each corrective measure. Inthis case, the hydraulic efficiency for the ponds is alwayslower than 1 whereas for the seawater intrusion barrier it isabout 1.5, resulting in a much more efficient measure.[54] The nonlinear problem (NLOP) quantifies the
amount of water to be artificially recharged to maintainthe total current abstraction as well as its current distribu-tion, while guaranteeing a groundwater quality recovery.Therefore this method provides a satisfactory estimation ofthe injection rate that would be suitable for designingefficient corrective measures. Note that recharge rate valuesexceed the projected value both in the ponds and barrier, asshown in the results (Table 2).[55] The two methods lead to varying results (Table 2)
since the application of alternative formulations leads toslightly different approaches and therefore to differentsolutions. However, both provide helpful and complemen-tary information.
Table 1. Statistical Parameters Used in the Simulations
Parameter Value Units
lc 1.lQ 100.sci 1000. mg/LsQwell
0.1 Qi m3/dsQpond
0.25 m/dsQbarrier
10000. m3/d
Figure 11. Results of the nonlinear optimization problem.Obtained pumping rates per management zones andmeasures (gray bars) are compared to current values orprojected values in the case of corrective measures (whitebars).
W09415 ABARCA ET AL.: MEASURES TO CORRECT SEAWATER INTRUSION
11 of 14
W09415

[56] Table 3 contains a summary of the characteristics andmain outcomes of each method as derived from theirapplication to the main aquifer of the Llobregat delta. Themost obvious difference is the definition of the objectivefunction. The linear problem (LOP) aims at the maximiza-tion of the total pumping while the nonlinear problem(NLOP) minimizes the differences with respect to currentpumping values.[57] LOP effectively ensures that heads remain above sea
level, thus ensuring that seawater will not penetrate. Assuch, it is suitable for evaluating sustainable pumping ratesthat prevent seawater intrusion. However, results cannotguarantee the recovery of an initially salinized aquifer.[58] The LOP was solved with a linear programming
approach, a general optimization method. It is both simpleand rapid. After some preliminary runs of the simulationmodel and once the response matrix is calculated, optimi-zation runs are extremely rapid. This capacity makes it avery agile tool to test different optimization scenarios.Testing different possibilities is advisable since this methodoften yields unrealistic results. Ad hoc changes are oftenneeded to adjust the optimization formulation. In our case,these changes consisted in the redefinition of managementzones and in the addition of lateral constraints to thepumping rates of some management zones. However, theaddition of constraints helps us to understand the trade-offs between management zones by revealing the areasthat compete for the same resources, thereby providingguidelines for management. This is a valuable tool that canshed light on the behavior of the system and detectinconsistences in the simulation model that could lead tofalse optimization results.[59] As regards corrective measures, a number of points
should be raised about the LOP methodology. First, in ourmethodology, recharge rates need to be constrained. Oth-erwise, the resulting optimization problem would be illposed leading to an unlimited increase in both totalpumping and recharge rates. Our implementation of LOPcannot quantify the optimal recharge rate in additionalcorrective measures such as recharge ponds and freshwater
injection barriers. The resolution of this problem demandsan economic analysis and the formulation of the problem interms of maximizing the benefits of pumping minus the costof recharge. The resulting optimization problem can beformulated in a linear programming framework providedthat the objective function is convex. This option was notattempted here because we ignored the benefit functions ofpumping and because our aim was to limit the changes tothe present situation. This apparent disadvantage turned outto be of little importance because constraining correctivemeasures allowed us to identify their efficiency by means ofshadow prices. Therefore one could still assess the profit-ability of corrective measures, if necessary.[60] One of the main drawbacks of LOP is the lack of
flexibility for the optimization problem due to the largeamount of constraints often needed to obtain satisfactoryresults. Another important restriction is that this method isonly applicable to linear simulation models.[61] The nonlinear optimization method (NLOP) provides
a reliable assessment of the required corrective measuresneeded to achieve a negligible deviation from the currentpumping regime. Results are more complete than those ofLOP since they guarantee the fulfilment of the quality
Figure 12. Chloride concentration map in the main aquifer of the Llobregat lower valley obtained(a) for the reference scenario and (b) for the non-linearly optimized pumping rates and theimplementation of corrective measures.
Table 2. Comparison of the Results Obtained With the Linear and
Nonlinear Optimization Process for the More Realistic Optimiza-
tion Scenariosa
Management ZonesAverage
1997–2001 LOP LOP+ NLOP
Zone 1 5.29 5.28 5.28 5.29Zone 2 30.23 21.92 21.92 28.62Zone 3 1.77 1.83 1.83 1.98Zone 4 24.59 4.64 18.49 23.38Zone 5 0.00 1.83 1.83 4.16Zone 6 2.14 0.00 0.0 –Recharge ponds �10.96 �16.45Injection barrier 1 �3.65 �2.68Injection barrier 2 0.00 �2.84Injection barrier 3 0.00 �1.27Injection barrier 4 0.00 �4.50Total 64.02 35.48 49.35 63.41
12 of 14
W09415 ABARCA ET AL.: MEASURES TO CORRECT SEAWATER INTRUSION W09415

objectives. Therefore NLOP is useful to design remediationmeasures for aquifers undergoing seawater intrusion.[62] One advantage of NLOP is its applicability to any
simulation model, either linear or nonlinear. Given thatthe objective function is multiobjective, its main advan-tage is its flexibility. On the one hand, a simple change inthe weights (lc, lQ and/or lR) redirects the objective ofthe optimization problem. On the other hand, varying thetolerance parameters (sc, sQ and/or sR) allows us toprioritize the accomplishment of the objectives in aparticular management zone (reducing sQj), or, on thecontrary, to relax the concentration constraint at specificlocations (increasing sci). Performing sequential optimiza-tions with varying ls and ss, the tradeoffs between objectives(pumping versus quality, one zone versus another, pumpingversus corrective action, etc) can be analyzed. Flexibility inthe formulation of NLOP also results in increased manage-ment flexibility. For example, one could ideally take advan-tage of the relatively large volume of aquifer below the sea forregulation purposes. It is possible to promote the displace-ment of the seawater front seaward in the confined portion ofthe aquifer during wet years. This leads to extendedfreshwater reserves that can be pumped during dry years.This possibility, which would have required the modificationof the objective function, was not explored in our study sinceit demands a careful characterization of heterogeneities in thesubmarine portion of the aquifer. This kind of managementscheme could not be achieved with LOP.[63] However, the simulation optimization runs of NLOP
are considerably longer than those of LOP (about 6 hourscompared with a few seconds). Moreover, preliminary runsare needed to test the values of the weights of the objectivefunction and of the tolerance parameters to obtain satisfac-tory results and to activate the constraints. Furthermore,NLOP may encounter a number of difficulties in convergingwhen it starts from inappropriate values. This formulationprovides a high degree of flexibility and control despitebeing fairly specific.
4. Conclusions
[64] Two optimization methods, linear and nonlinear,were successfully used to design management alternativesin the Llobregat delta Main aquifer. The application of these
approaches to a real aquifer initially affected by seawaterintrusion, and more specifically to a socially and hydrauli-cally complex aquifer was a challenge in itself. Thesemethods allowed us to do the following.[65] 1. We were able to evaluate the efficiency of correc-
tive actions, as measured by means of the shadow pricesderived from linear programming. Shadow prices representa measure of the hydraulic efficiency of recharge correctivemeasures (i.e., the net increase in total pumping per unitincrease in recharge). The hydraulic efficiency calculatedfor the recharge ponds is around 0.7. However, it is greaterthan 1 for the hydraulic barrier. This contradicts the widelyheld belief that coastal injection is inefficient because itloses water to the sea. While this is true, the net gainobtained from protection of inland pumping more thancompensates for this loss.[66] 2. We were able to quantify the optimal injection rate
to be implemented in the ponds and in the barrier. Thisinjection guarantees the recovery of aquifer quality withoutmodifying the current pumping regime. This result wasobtained through the nonlinear optimization problem.[67] 3. We were also able to quantify the sustainable
pumping rates to be applied once the aquifer quality hasbeen recovered. Linear optimization of pumping and injec-tion rates can be applicable to pristine aquifers in order toprevent seawater intrusion from reoccurring.[68] The combined use of these optimization approaches
(linear and nonlinear) to a real case allowed us to (1) test thesuitability of optimization methodologies for the design ofcorrective measures in aquifers suffering from problems ofseawater intrusion, (2) systematically compare both ap-proaches identifying theirmain outcomes, advantages and ap-plications, and (3) improve our understanding of the system.The combination of methodologies provides insights into thesystem behavior and internal trade-offs. It is these insightsrather than the optimal results themselves that increase theconfidence of decision makers and prompt them to act.[69] In short, linear and nonlinear optimizations were
tested as methodologies to design remediation measuresfor aquifers contaminated by seawater intrusion. We believethat they should be jointly used since they provide acomprehensive view of the problem and address a widerange of management questions.
Table 3. Comparison of the Two Methods Considered in This Paper
Optimization Problem 1 Optimization Problem 2
Objective SQi max F = lc Sci �cið Þ2s2ci
+ lQ S Qj �Qjð Þ2s2Qj
+ lR S Rk�Rkð Þ2s2Rk
Constraints hjmin� SiAij Qj � hjmax
QR � Qdesign
Qi � Qmaxi
ci = ci (Qi, QR) [Flow and transport equations]
Resulting problem linear nonlinear
Results optimal pumping regime to prevent seawaterintrusion; hydraulic efficiency of correctivemeasures (
@Qopt
@QR); trade-offs
between management zones
optimal injection rate to restore a goodqualitative status; pumping rates close tocurrent regime
Advantages and disadvantages only applies to linear simulation model; adhoc changes needed (management zonesredefinition and additional lateralconstraints); does not ensure restoration
any simulation model; previous sensitivityanalysis to l needed; flexibility to obtainrealistic results; allows optimizing QR
W09415 ABARCA ET AL.: MEASURES TO CORRECT SEAWATER INTRUSION
13 of 14
W09415

[70] Acknowledgments. This work was funded by the EuropeanCommission (SALTRANS project, contract EVK1-CT-2000-00062), theCatalonian Water Agency (ACA) and the Spanish Geological Survey(IGME). The first author was supported by the Catalonia Government witha FI doctoral scholarship and by the Technical University of Catalonia(UPC) with a scholarship to finish the Ph.D. thesis. The authors would liketo thank also to the community of end users of the Llobregat delta aquifers(CUADLL) for their support and help.
ReferencesAhlfeld, D., and M. Heidari (1994), Applications of optimal hydrauliccontrol to groundwater systems, J. Water Resour. Plann. Manage.,120(3), 350–365.
Bayo, A., E. Batista, and E. Custodio (1977), Sea water encroachment inCatalonia coastal aquifers, paper presented at General Assembly IAH,Int. Assoc. of Hydrogeol., Birmingham U. K.
Cheng, A., D. Halhal, A. Naji, and D. Ouazar (2000), Pumping optimiza-tion in saltwater-intruded coastal aquifers, Water Resour. Res., 36(8),2155–2165.
Cuena, S., and E. Custodio (1971), Construction and adjustment of a twolayer mathematical model of the Llobregat Delta, Barcelona, Spain, inMathematical Models in Hydrology, Stud. Rep. Hydrol., vol. 15,pp. 960–964, U.N. Educ., Sci., and Cultural Organ., Paris.
Custodio, E. (1981), Sea water encroachment in the Llobregat delta andBesos areas, near Barcelona (Catalonia, Spain), in Sea Water IntrusionMeeting: Intruded and Fosil Groundwater of Marine Origin, Rapp. Med-delanden, vol. 27, edited by U. S. G. Undersokning, pp. 120–152,SverigesGelogiska Underskning, Upsala, Sweden.
Custodio, E., F. Cacho, and M. Pelaez (1976), Problematica de la intrusionmarina en los acuıferos del Delta del Llobregat, in Segunda AsambleaNacional de Geodesia y Geofısica, Barcelona, Vol. 3, pp. 2069–2101,Inst. Geof. y Catastral Madrid, Madrid.
Custodio, E., L. Glorioso, M. Manzano, and E. Skupien (1989), Evoluciony alternativas de un acuıfero sobreexplotado: El Delta del Llobregat, inSobreexplotacion de acuıferos, pp. 207–227, Inst. Tec. Geominero deEsp., Granada, Spain.
Das, A., and B. Datta (1999a), Development of multiobjective managementmodels for coastal aquifers, J. Water Resour. Plann. Manage., 125(2),76–87.
Das, A., and B. Datta (1999b), Development of management models forsustainable use of coastal aquifers, 125(3), 112–121.
Domenech, J., E. Batista, A. Bayo, and E. Custodio (1983), Some aspectsof sea water intrusion in Catalonia (Spain), in 8th Salt Water IntrusionMeeting, p. 15, Inst. di Geol. Appicata e Geotec., Bari, Italy.
Emch, P., and W. Yeh (1998), Management model for conjunctive use ofcoastal surface water and ground water, J. Water Resour. Plan. Manage.,124(3), 129–139.
Finney, B., Samsuhadi, and R. Willis (1992), Quasi-3-dimensional optimi-zation model of Jakarta basin, J. Water Resour. Plann. Manage., 118(1),18–31.
Fletcher, R. (1985), Practical Methods of Optimization, vol. II, 224 pp.,John Wiley, Hoboken, N. J.
Gordon, E., U. Shamir, and J. Bensabat (2000), Optimal management of aregional aquifer under salinization conditions, Water Resour. Res.,36(11), 3193–3203.
Gorelick, S. (1983), A review of distributed parameter groundwater-management modeling methods, Water Resour. Res., 19(2), 305–319.
Hallaji, K., and H. Yazicigil (1996), Optimal management of a coastalaquifer in southern Turkey, J. Water Resour. Plann. Manage., 122(4),233–244.
Iribar, V. (1992), Evolucion hidroquımica e isotopica de los acuıferos delBaix Llobregat (Barcelona, Espana), Ph.D. thesis, Univ. de Barcelona,Barcelona, Spain.
Iribar, V., and E. Custodio (1992), Advancement of seawater intrusion inthe Llobregat delta aquifer, in SWIM Study and Modelling of Salt-water Intrusion Into Aquifers, edited by E. Custodio and A. Galofre,pp. 35–50, Int. Cent. for Numer. Methods in Eng., Barcelona, Spain.
Iribar, V., J. Carrera, E. Custodio, and A. Medina (1997), Inverse modellingof sea water intrusion in the Llobregat delta deep aquifer, J. Hydrol.,198(1–4), 226–244.
Mantoglou, A. (2003), Pumping management of coastal aquifers usinganalytical models of saltwater intrusion, Water Resour. Res., 39(12),1335, doi:10.1029/2002WR001891.
Mantoglou, A., M. Papantoniou, and P. Giannoulopoulos (2004), Manage-ment of coastal aquifers based on nonlinear optimization and evolution-ary algorithms, J. Hydrol., 297(1–4), 209–228.
Manzano, M., E. Custodio, and J. Carrera (1992), Fresh and salt water inthe Llobregat delta aquifer: Application of ion chromatography to thefield data, in SWIM Study and Modelling of Saltwater Intrusion IntoAquifers, edited by E. Custodio and A. Galofre, pp. 207–228, Int. Cent.for Numer. Methods in Eng., Barcelona, Spain.
Marques, M. (1984), Les formacions quaternaries del delta del Llobregat.,Ph.D. thesis, 208 pp., Inst. d’Estud. Catalans, Univ. de Barcelona,Barcelona, Spain.
Medina, A., and J. Carrera (1996), Coupled estimation of flow and solutetransport parameters, Water Resour. Res., 32(10), 3063–3076.
Medina, A., and J. Carrera (2003), Geostatistical inversion of coupledproblems: Dealing with computational burden and different types of data,J. Hydrol., 281(4), 251–264.
Ministerio de Obras Publicas (1966), Estudio de los recursos hidraulicostotales de las cuencas de los rıos Besos y Bajo Llobregat, technicalreport, Com. de Aguas del Pirineo Oriental, Serv. Geol. de Obras Pub-licas, Barcelona, Spain.
Nishikawa, T. (1998), Water-resources optimization model for Santa Barbara,California, J. Water Resour. Plann. Manage., 124(5), 252–263.
Park, C., and M. Aral (2004), Multi-objective optimization of pumping ratesand well placement in coastal aquifers, J. Hydrol., 290(1–2), 80–99.
Plan Hidrologico del Pirineo Oriental (PHPO) (1985), Modelo de simula-cion de los acuıferos del delta del Bajo Llobregat. Plan HidrologicoNacional, technical report, Confed. Hidrogr. del Pirineo Oriental, Comis.de Aguas del Pirineo Oriental, Barcelona, Spain.
Rao, S., B. Thandaveswara, S. Bhallamudi, and V. Srivivasulu (2003),Optimal groundwater management in deltaic regions using simulatedannealing and neural networks, , 17(6), 409–428.
Rao, S., S. Bhallamudi, B. Thandaveswara, and G. Mishra (2004), Con-junctive use of surface and groundwater for coastal and deltaic systems,J. Water Resour. Plann. Manage., 130(3), 255–267.
Reichard, E. (1995), Groundwater-surface water management with stochas-tic surface water supplies: A simulation optimization approach, WaterResour. Res., 31(11), 2845–2865.
Reichard, E., and T. Johnson (2005), Assessment of regional managementstrategies for controlling seawater intrusion, J. Water Resour. Plann.Manage., 131(4), 280–291.
Shamir, U., J. Bear, and A. Gamliel (1984), Optimal annual operation of acoastal aquifer, Water Resour. Res., 20(4), 435–444.
Simo, J., D. Gamez, J. Salvany, E. Vazquez-Sune, J. Carrera, A. Barnolas,and F. Alcala (2005), Arquitectura de facies de los deltas cuaternarios delrıo Llobregat, Barcelona, Espana, Geogaceta, 37, 171–174.
Vazquez-Sune, E., et al. (2005), Groundwater flow and saltwater intrusionmodeling of the low valley and Llobregat Delta aquifers, in Groundwaterand Saline Intrusion: Selected Papers From the 18th Salt Water IntrusionMeeting, edited by L. Araguas, E. Custodio, and M. Manzano, pp. 693–705, Inst. Geol. y Minero de Esp., Madrid.
Vazquez-Sune, E., et al. (2006), Groundwater modelling as a tool for theEuropean Water Framework Directive (WFD) applicationL: The Llobre-gat case, Phys. Chem. Earth, in press.
Visual Numerics (1997), IMSL Math Library: FORTRAN subroutine formathematical applications, software, Houston, Tex.
Wagner, B. (1995), Recent advances in simulation optimization ground-water-management modeling, Rev. Geophys., 33, 1021–1028.
Willis, R., and B. Finney (1988), Planning-model for optimal-control ofsaltwater intrusion, J. Water Resour. Plann. Manage., 114(2), 163–178.
Zhou, X., M. Chen, and C. Liang (2003), Optimal schemes of groundwaterexploitation for prevention of seawater intrusion in the Leizhou peninsulain southern China, Environ. Geol., 43(8), 978–985.
����������������������������E. Abarca, F. Batlle, B. Capino, J. Carrera, D. Gamez, and
E. Vazquez-Sune, Hydrogeology Group, Department of GeotechnicalEngineering and Geoscience, School of Civil Engineering, TechnicalUniversity of Catalonia, Building D-2, Campus Nord, E-08034Barcelona, Spain. ([email protected])
14 of 14
W09415 ABARCA ET AL.: MEASURES TO CORRECT SEAWATER INTRUSION W09415