Numerical modeling of seawater intrusion in Khan-Younis area of the Gaza Strip Aquifer, Palestine
13
1629 Numerical modeling of seawater intrusion in Khan-Younis area of the Gaza Strip Aquifer, Palestine K. Qahman a and A. Larabi a a LIMEN, Ecole Mohammadia d’Ing´ enieurs, Universit´ e Mohammed V–Agdal, B.P.765–Agdal–Rabat–Morocco. Numerical simulation were carried out for studying seawater intrusion in Khan-Younis coastal areas with SEAWAT code: a Computer Program for Simulation of Three-Dimensional Variable-Density Ground-Water Flow coupled to solute transport using a finite difference method (MODFLOW-MT3DMS). The conceptual model and groundwater data was col- lected for this study from previous projects such as the SWIMCA (Salt Water Intrusion Management in Coastal Aquifers) project. In the SWIMCA project, the same hydro- logical cross section was simulated using the SUTRA code, which uses a finite element method. In this paper, the SEAWAT code was used in order to estimate the extent of solute migration in depth and time in Khan-Younis area in the south of Gaza Strip; and to compare it with SUTRA results. This work is being conducted in the framework of the SWIMED (Sustainable Water management In MEDiterranean coastal aquifers) re- gional project. A finite difference grid was developed to adequately discretize the model domain. For the Khan-Younis cross section, an irregularly spaced grid was constructed with 178 cells in horizontal direction and 19 cells (layers) in the vertical direction. The total number of cells is 3382. The horizontal size of cells in x direction is 25m in the 1.5 km zone near the sea, increases to 50m between 1.5-3 km, and becomes 100m in the last zone (3-11 km) near the eastern boundary. The results generated by the SEAWAT code showed very good agreement with SUTRA results. The extent of saltwater intrusion for 1997 (based on 1g/l of chlorides) was simulated to be 1300m and 1350m in the middle sub-aquifer by SEAWAT and SUTRA, respectively. Predictive simulations by both codes SEWAT and SUTRA for the year 2006 showed that the saltwater intrusion would be 1500m and 1750m respectively. 1. INTRODUCTION Water is the most precious and valuable natural resource in the Middle East in general and in Palestine (Gaza Strip) in particular. It is vital for socio-economic growth and sustainability of the environment. The development of groundwater resources in coastal areas is a delicate issue, and careful management is required if water quality degradation due to the encroachment of seawater is to be avoided. In many cases, difficulties arise when aquifers are pumped beyond their natural rate and seawater is drawn into system to maintain the regional groundwater balance. Problems can also occur when excessive pumping at individual wells lowers the potentiometric surface on a localized scale and
Transcript of Numerical modeling of seawater intrusion in Khan-Younis area of the Gaza Strip Aquifer, Palestine

1629
Numerical modeling of seawater intrusion in Khan-Younis area of theGaza Strip Aquifer, Palestine
K. Qahmana and A. Larabia
aLIMEN, Ecole Mohammadia d’Ingenieurs, Universite Mohammed V–Agdal,B.P.765–Agdal–Rabat–Morocco.
Numerical simulation were carried out for studying seawater intrusion in Khan-Youniscoastal areas with SEAWAT code: a Computer Program for Simulation of Three-DimensionalVariable-Density Ground-Water Flow coupled to solute transport using a finite differencemethod (MODFLOW-MT3DMS). The conceptual model and groundwater data was col-lected for this study from previous projects such as the SWIMCA (Salt Water IntrusionManagement in Coastal Aquifers) project. In the SWIMCA project, the same hydro-logical cross section was simulated using the SUTRA code, which uses a finite elementmethod. In this paper, the SEAWAT code was used in order to estimate the extent ofsolute migration in depth and time in Khan-Younis area in the south of Gaza Strip; andto compare it with SUTRA results. This work is being conducted in the framework ofthe SWIMED (Sustainable Water management In MEDiterranean coastal aquifers) re-gional project. A finite difference grid was developed to adequately discretize the modeldomain. For the Khan-Younis cross section, an irregularly spaced grid was constructedwith 178 cells in horizontal direction and 19 cells (layers) in the vertical direction. Thetotal number of cells is 3382. The horizontal size of cells in x direction is 25m in the 1.5km zone near the sea, increases to 50m between 1.5-3 km, and becomes 100m in the lastzone (3-11 km) near the eastern boundary. The results generated by the SEAWAT codeshowed very good agreement with SUTRA results. The extent of saltwater intrusion for1997 (based on 1g/l of chlorides) was simulated to be 1300m and 1350m in the middlesub-aquifer by SEAWAT and SUTRA, respectively. Predictive simulations by both codesSEWAT and SUTRA for the year 2006 showed that the saltwater intrusion would be1500m and 1750m respectively.
1. INTRODUCTION
Water is the most precious and valuable natural resource in the Middle East in generaland in Palestine (Gaza Strip) in particular. It is vital for socio-economic growth andsustainability of the environment. The development of groundwater resources in coastalareas is a delicate issue, and careful management is required if water quality degradationdue to the encroachment of seawater is to be avoided. In many cases, difficulties arisewhen aquifers are pumped beyond their natural rate and seawater is drawn into systemto maintain the regional groundwater balance. Problems can also occur when excessivepumping at individual wells lowers the potentiometric surface on a localized scale and
1630
causes upconing of the natural interface between fresh water and saline water.In the last twenty years, many models have been developed to represent and study the
problem of seawater intrusion. They range from relatively simple analytical solutions tocomplex numerical models. This paper presents a case study conducted on Khan-Younisarea in the southern part of Gaza aquifer, in which the numerical model, SEAWAT [1]was used for the simulation of seawater intrusion. The main objective of the paper isto estimate the extent of solute migration in depth and time in Khan-Younis area in thesouth of the Gaza Strip, and to compare the results with those of the SUTRA code, whichhave been performed previously by SWIMCA project team.
2. DESCRIPTION OF THE GAZA AQUIFER
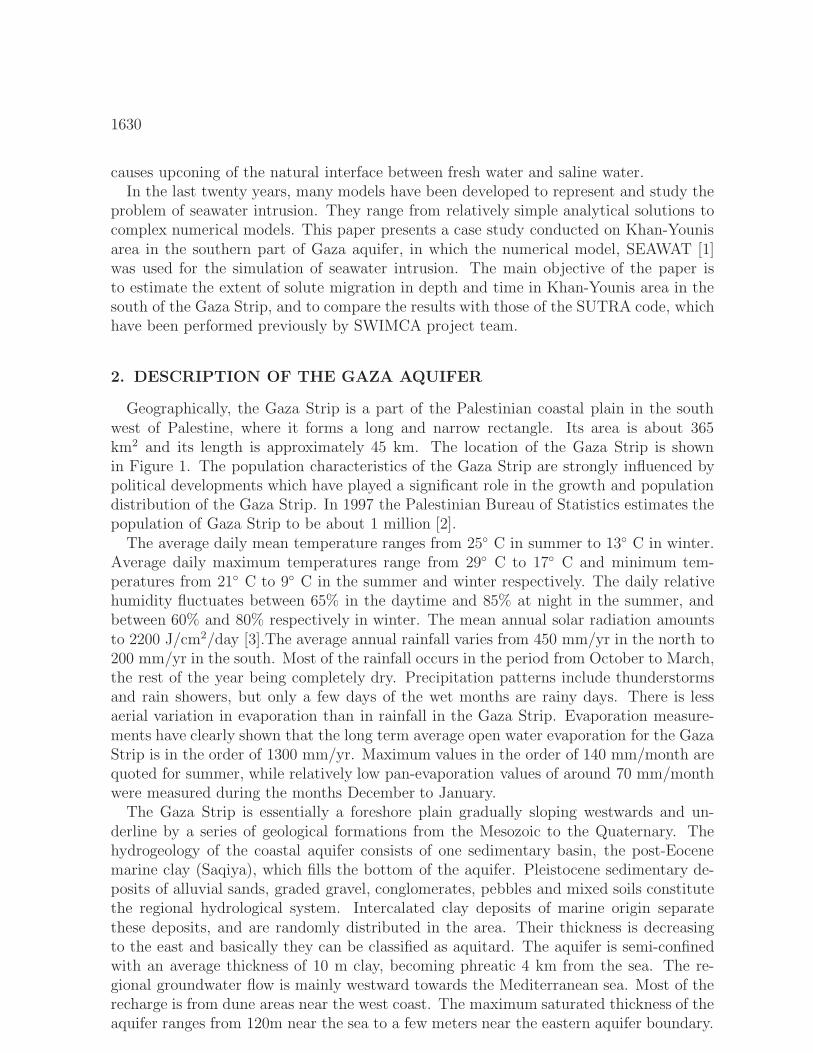
Geographically, the Gaza Strip is a part of the Palestinian coastal plain in the southwest of Palestine, where it forms a long and narrow rectangle. Its area is about 365km2 and its length is approximately 45 km. The location of the Gaza Strip is shownin Figure 1. The population characteristics of the Gaza Strip are strongly influenced bypolitical developments which have played a significant role in the growth and populationdistribution of the Gaza Strip. In 1997 the Palestinian Bureau of Statistics estimates thepopulation of Gaza Strip to be about 1 million [2].
The average daily mean temperature ranges from 25◦ C in summer to 13◦ C in winter.Average daily maximum temperatures range from 29◦ C to 17◦ C and minimum tem-peratures from 21◦ C to 9◦ C in the summer and winter respectively. The daily relativehumidity fluctuates between 65% in the daytime and 85% at night in the summer, andbetween 60% and 80% respectively in winter. The mean annual solar radiation amountsto 2200 J/cm2/day [3].The average annual rainfall varies from 450 mm/yr in the north to200 mm/yr in the south. Most of the rainfall occurs in the period from October to March,the rest of the year being completely dry. Precipitation patterns include thunderstormsand rain showers, but only a few days of the wet months are rainy days. There is lessaerial variation in evaporation than in rainfall in the Gaza Strip. Evaporation measure-ments have clearly shown that the long term average open water evaporation for the GazaStrip is in the order of 1300 mm/yr. Maximum values in the order of 140 mm/month arequoted for summer, while relatively low pan-evaporation values of around 70 mm/monthwere measured during the months December to January.
The Gaza Strip is essentially a foreshore plain gradually sloping westwards and un-derline by a series of geological formations from the Mesozoic to the Quaternary. Thehydrogeology of the coastal aquifer consists of one sedimentary basin, the post-Eocenemarine clay (Saqiya), which fills the bottom of the aquifer. Pleistocene sedimentary de-posits of alluvial sands, graded gravel, conglomerates, pebbles and mixed soils constitutethe regional hydrological system. Intercalated clay deposits of marine origin separatethese deposits, and are randomly distributed in the area. Their thickness is decreasingto the east and basically they can be classified as aquitard. The aquifer is semi-confinedwith an average thickness of 10 m clay, becoming phreatic 4 km from the sea. The re-gional groundwater flow is mainly westward towards the Mediterranean sea. Most of therecharge is from dune areas near the west coast. The maximum saturated thickness of theaquifer ranges from 120m near the sea to a few meters near the eastern aquifer boundary.
1631
Figure 1. Location map of the study area.
Natural average groundwater heads decline sharply east of Gaza strip and then graduallydecline towards the sea.
The major source of renewable groundwater in the aquifer is rainfall. The total rainfallrecharge to the aquifer is estimated to be approximately 45 MCM/y. The remainingrainwater evaporates or dissipates as run-off during the short periods of heavy rainstorms.The lateral inflow to the aquifer is estimated at between 10-15 MCM/y. Some rechargeis available from the major surface flow (Wadi Gaza). But because of the extensiveextraction from Wadi Gaza by Israel, this recharge is limited to, at its best 2 MCMduring the ten days the Wadi actually flows in a normal year. As a result, the totalfreshwater recharge at present is limited to approximately 60 MCM/y.
The coastal aquifer holds approximately 5000 MCMof groundwater of different quality.However, only 1400 MCMof this is “ freshwater”, with chloride content of less than 500mg/l. This fresh groundwater typically occurs in the form of lenses that float on the topof the brackish and/or saline groundwater. This means that approximately 70% of theaquifer are brackish or saline water and only 30% are fresh water.
Depth to water level of the coastal aquifer varies between few meters in the low land areaalong the shoreline and about 70 m along the eastern border. The Gaza aquifer can be
1632
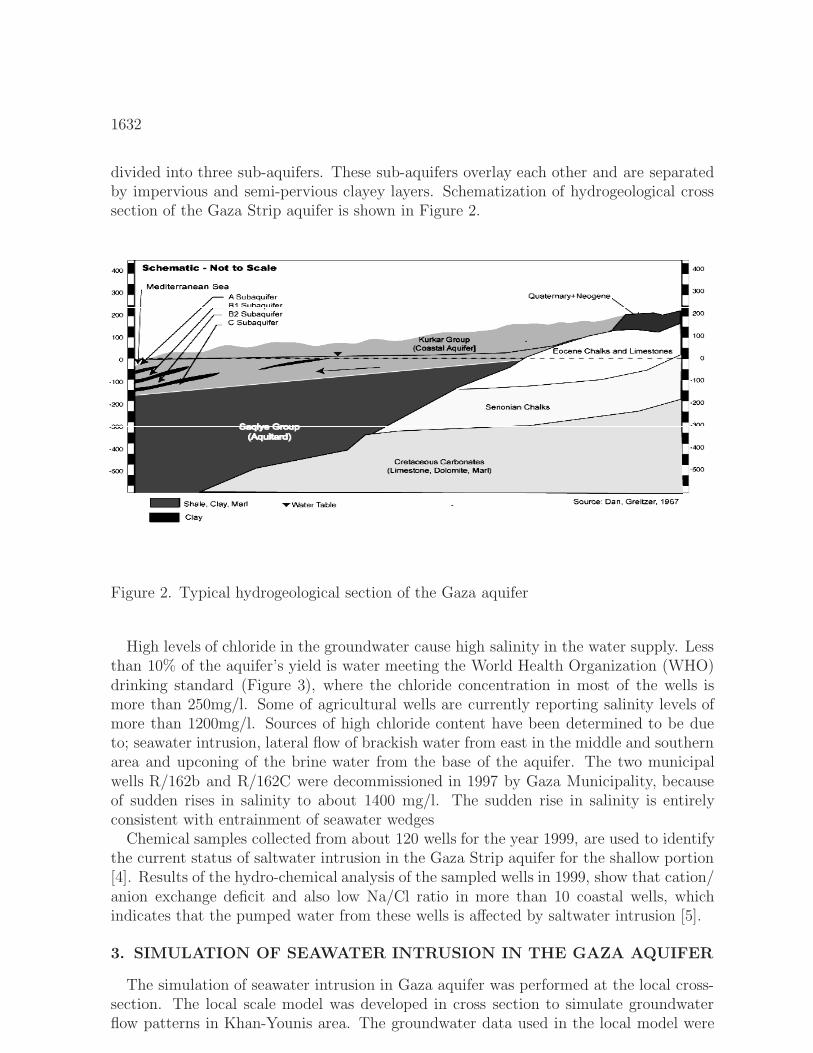
divided into three sub-aquifers. These sub-aquifers overlay each other and are separatedby impervious and semi-pervious clayey layers. Schematization of hydrogeological crosssection of the Gaza Strip aquifer is shown in Figure 2.
Figure 2. Typical hydrogeological section of the Gaza aquifer
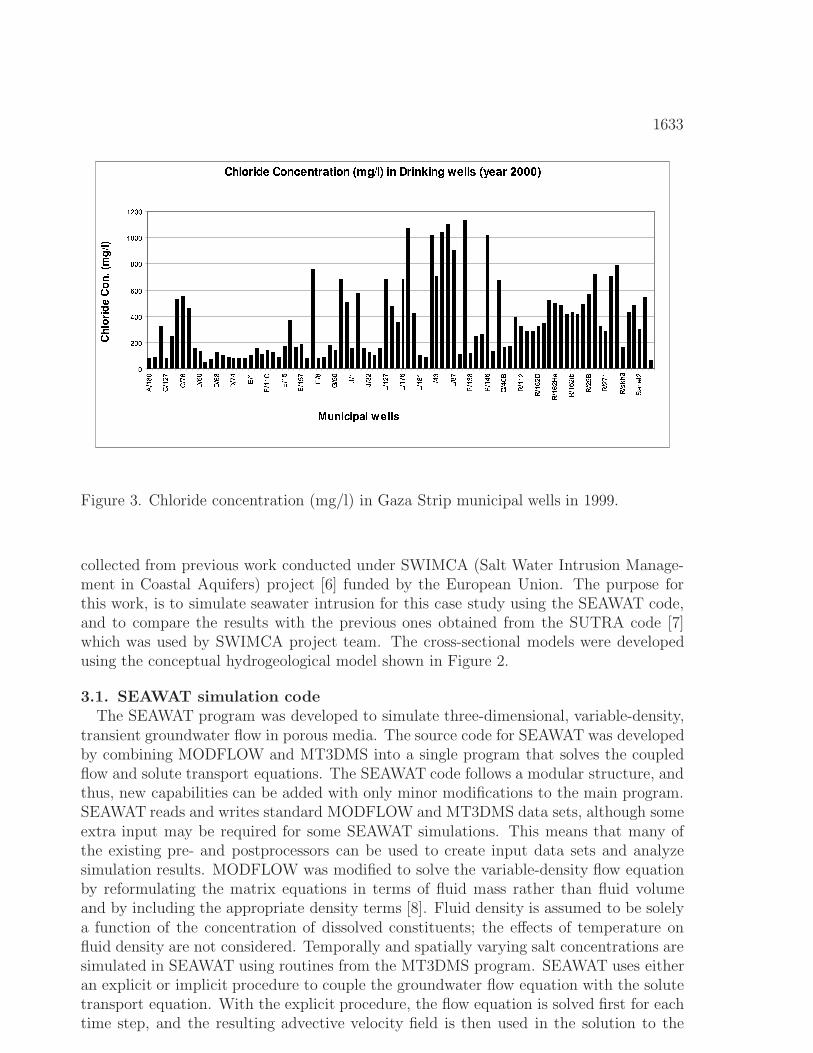
High levels of chloride in the groundwater cause high salinity in the water supply. Lessthan 10% of the aquifer’s yield is water meeting the World Health Organization (WHO)drinking standard (Figure 3), where the chloride concentration in most of the wells ismore than 250mg/l. Some of agricultural wells are currently reporting salinity levels ofmore than 1200mg/l. Sources of high chloride content have been determined to be dueto; seawater intrusion, lateral flow of brackish water from east in the middle and southernarea and upconing of the brine water from the base of the aquifer. The two municipalwells R/162b and R/162C were decommissioned in 1997 by Gaza Municipality, becauseof sudden rises in salinity to about 1400 mg/l. The sudden rise in salinity is entirelyconsistent with entrainment of seawater wedges
Chemical samples collected from about 120 wells for the year 1999, are used to identifythe current status of saltwater intrusion in the Gaza Strip aquifer for the shallow portion[4]. Results of the hydro-chemical analysis of the sampled wells in 1999, show that cation/anion exchange deficit and also low Na/Cl ratio in more than 10 coastal wells, whichindicates that the pumped water from these wells is affected by saltwater intrusion [5].
3. SIMULATION OF SEAWATER INTRUSION IN THE GAZA AQUIFER
The simulation of seawater intrusion in Gaza aquifer was performed at the local cross-section. The local scale model was developed in cross section to simulate groundwaterflow patterns in Khan-Younis area. The groundwater data used in the local model were
1633
Figure 3. Chloride concentration (mg/l) in Gaza Strip municipal wells in 1999.
collected from previous work conducted under SWIMCA (Salt Water Intrusion Manage-ment in Coastal Aquifers) project [6] funded by the European Union. The purpose forthis work, is to simulate seawater intrusion for this case study using the SEAWAT code,and to compare the results with the previous ones obtained from the SUTRA code [7]which was used by SWIMCA project team. The cross-sectional models were developedusing the conceptual hydrogeological model shown in Figure 2.
3.1. SEAWAT simulation codeThe SEAWAT program was developed to simulate three-dimensional, variable-density,
transient groundwater flow in porous media. The source code for SEAWAT was developedby combining MODFLOW and MT3DMS into a single program that solves the coupledflow and solute transport equations. The SEAWAT code follows a modular structure, andthus, new capabilities can be added with only minor modifications to the main program.SEAWAT reads and writes standard MODFLOW and MT3DMS data sets, although someextra input may be required for some SEAWAT simulations. This means that many ofthe existing pre- and postprocessors can be used to create input data sets and analyzesimulation results. MODFLOW was modified to solve the variable-density flow equationby reformulating the matrix equations in terms of fluid mass rather than fluid volumeand by including the appropriate density terms [8]. Fluid density is assumed to be solelya function of the concentration of dissolved constituents; the effects of temperature onfluid density are not considered. Temporally and spatially varying salt concentrations aresimulated in SEAWAT using routines from the MT3DMS program. SEAWAT uses eitheran explicit or implicit procedure to couple the groundwater flow equation with the solutetransport equation. With the explicit procedure, the flow equation is solved first for eachtime step, and the resulting advective velocity field is then used in the solution to the
1634
solute transport equation. This procedure for alternately solving the flow and transportequations is repeated until the stress periods and simulation are complete. With theimplicit procedure for coupling, the flow and transport equations are solved multiple timesfor the same time step until the maximum difference in fluid density between consecutiveiterations is less than a user-specified tolerance [8].
3.2. Governing equationsVariable density groundwater flow is described by the following partial differential equa-
tion [9]:
∇ · ρKf
(∇ hf +
(ρ − ρf)ρf
∇z
)= ρSf
∂ hf
∂t+ n
∂ρ
∂C
∂C
∂t− ρq (1)
where :x,y, and z are coordinate directions where z is aligned with gravity (L).ρ is fluid density (ML−3).Kf is the equivalent fresh water hydraulic conductivity (LT−1).hf is the equivalent fresh water head (L).is the density of fresh water (ML−3).Sf is equivalent fresh water storage coefficient (L−1).t is time (T).n is porosity (L0).C is the concentration of the dissolved constituent that affect fluid density (ML−3).ρ is the fluid density of a source or a sink (ML−3).q is the flow rate of the source or sink (T−1).To solve the variable density groundwater flow equation, the solute transport equation
also must be solved because fluid density is a function of solute concentration, and concen-tration may change in response to the groundwater flow field. For dissolved constituentsthat are conservative, such as those found in sea water, the solute transport equation is:
∂C
∂t= ∇ · (D∇C) −∇ · (νC) − qs
nCs (2)
where :D is the dispersion coefficient (L2T−1).ν.is the groundwater flow velocity (LT−1).qsis the flux of a source or sink (T−1).Cs is the concentration of the source or sink (ML−3).
3.3. Vertical cross-sectional groundwater model3.3.1. conceptual model
This cross sectional model concerns the Khan-Younis section. A typical hydro-geologicalsection is shown in Figure 2. In most of this area, the coastal aquifer is composed of layersof dunes sand, sandstone, calcareous sandstone, silt, with interaction of clay and loam.Some of them are lenses; other begin at the coast and separate the aquifer into varioussub-aquifers. The aquifer overlies marine clay of Neogene’s age, known as the Saqiye Clayaquiclude [6].
1635
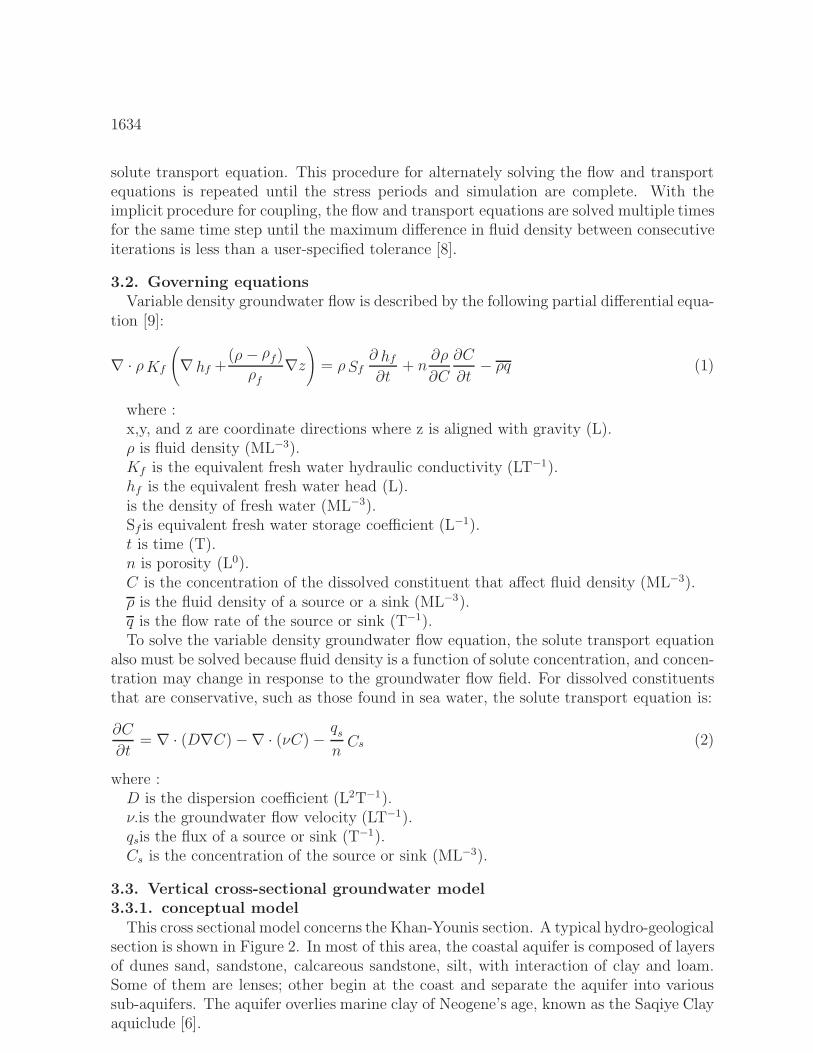
3.3.2. finite difference gridA finite difference grid was developed to adequately discretize the model domain. For
the Khan-Younis cross section, an irregularly spaced grid was constructed with 178 cellsin horizontal direction and 19 cells (layers) in the vertical direction with variable thickness(∆Z). The total number of cells are 3382. The horizontal size of cells in x direction is 25m in the 1.5 km zone near the sea, increases to 50 m between 1.5-3 km, and increases to100 m in the last zone (3-11 km) near the eastern boundary (Figure 4).
Figure 4. Finite difference grid along the first 5 km of Khan-Younis Vertical cross section.
3.3.3. aquifer parametersThe aquifer parameters used in the simulations are summarized in Table 1. The values
of saturated hydraulic conductivities were estimated from pumping and laboratory tests.The estimate of range for the transport equation parameters, i.e., the longitudinal andvertical transverse dispersivities, are obtained from published data from the literature [6].
Table 1Aquifer parameters assigned for Khan-Younis cross section
Parameter Sand Sandstone ClayPorosity 0.4 0.35 0.45Hydraulic conductivity (m/day) 30 15 0.01Longitudinal dispersivity (m) 12.5 25 50Transversal dispersivity (m) 0.25 0.5 1
1636
3.3.4. boundary conditions and internal sinksA Neumann-type no-flux boundary conditions was assigned to the bottom of the aquifer
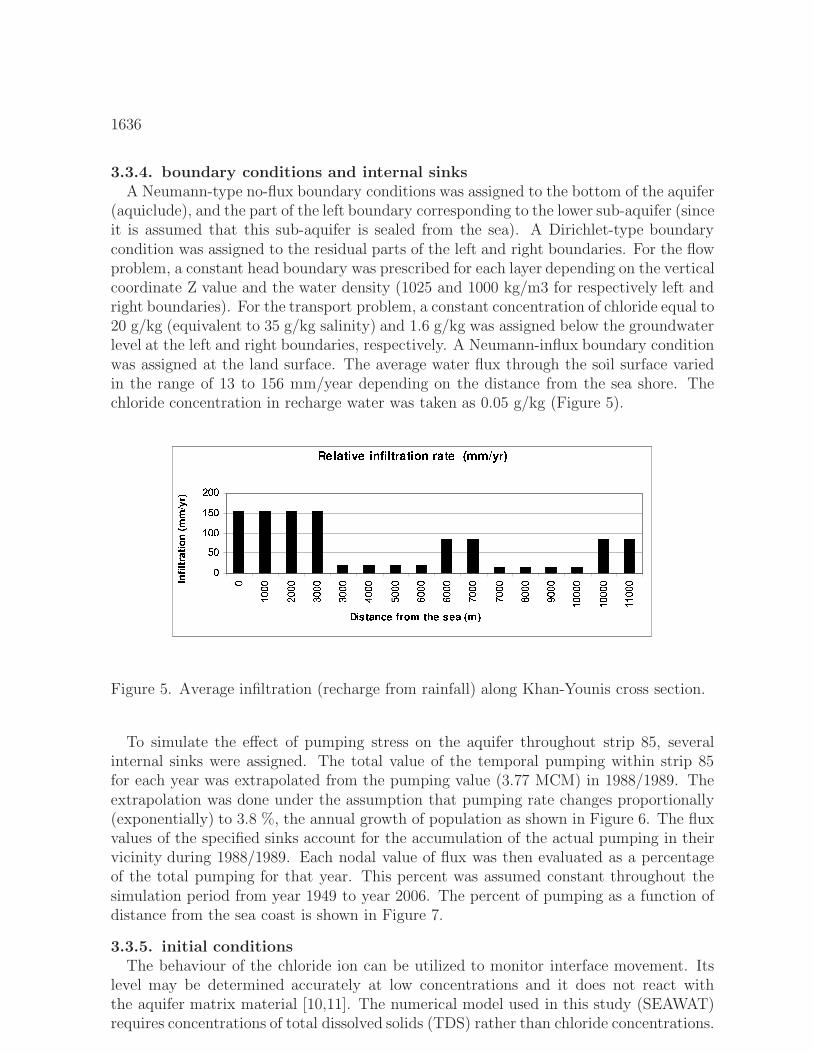
(aquiclude), and the part of the left boundary corresponding to the lower sub-aquifer (sinceit is assumed that this sub-aquifer is sealed from the sea). A Dirichlet-type boundarycondition was assigned to the residual parts of the left and right boundaries. For the flowproblem, a constant head boundary was prescribed for each layer depending on the verticalcoordinate Z value and the water density (1025 and 1000 kg/m3 for respectively left andright boundaries). For the transport problem, a constant concentration of chloride equal to20 g/kg (equivalent to 35 g/kg salinity) and 1.6 g/kg was assigned below the groundwaterlevel at the left and right boundaries, respectively. A Neumann-influx boundary conditionwas assigned at the land surface. The average water flux through the soil surface variedin the range of 13 to 156 mm/year depending on the distance from the sea shore. Thechloride concentration in recharge water was taken as 0.05 g/kg (Figure 5).
Figure 5. Average infiltration (recharge from rainfall) along Khan-Younis cross section.
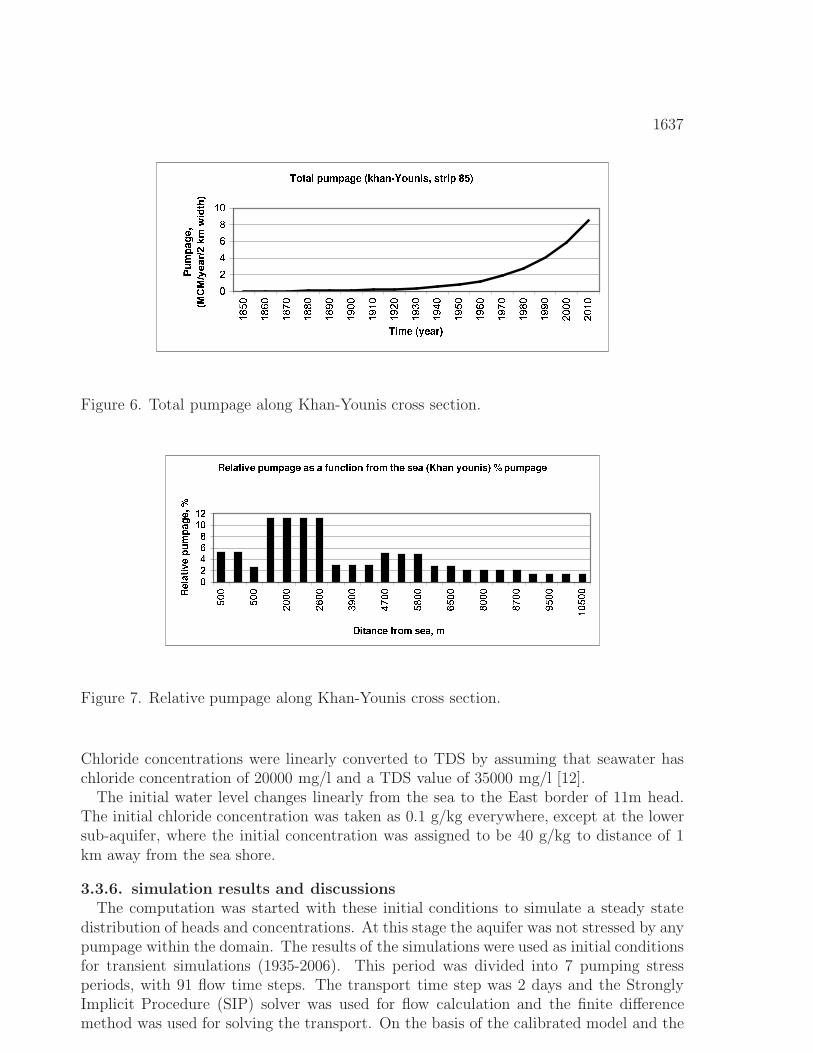
To simulate the effect of pumping stress on the aquifer throughout strip 85, severalinternal sinks were assigned. The total value of the temporal pumping within strip 85for each year was extrapolated from the pumping value (3.77 MCM) in 1988/1989. Theextrapolation was done under the assumption that pumping rate changes proportionally(exponentially) to 3.8 %, the annual growth of population as shown in Figure 6. The fluxvalues of the specified sinks account for the accumulation of the actual pumping in theirvicinity during 1988/1989. Each nodal value of flux was then evaluated as a percentageof the total pumping for that year. This percent was assumed constant throughout thesimulation period from year 1949 to year 2006. The percent of pumping as a function ofdistance from the sea coast is shown in Figure 7.
3.3.5. initial conditionsThe behaviour of the chloride ion can be utilized to monitor interface movement. Its
level may be determined accurately at low concentrations and it does not react withthe aquifer matrix material [10,11]. The numerical model used in this study (SEAWAT)requires concentrations of total dissolved solids (TDS) rather than chloride concentrations.
1637
Figure 6. Total pumpage along Khan-Younis cross section.
Figure 7. Relative pumpage along Khan-Younis cross section.
Chloride concentrations were linearly converted to TDS by assuming that seawater haschloride concentration of 20000 mg/l and a TDS value of 35000 mg/l [12].
The initial water level changes linearly from the sea to the East border of 11m head.The initial chloride concentration was taken as 0.1 g/kg everywhere, except at the lowersub-aquifer, where the initial concentration was assigned to be 40 g/kg to distance of 1km away from the sea shore.
3.3.6. simulation results and discussionsThe computation was started with these initial conditions to simulate a steady state
distribution of heads and concentrations. At this stage the aquifer was not stressed by anypumpage within the domain. The results of the simulations were used as initial conditionsfor transient simulations (1935-2006). This period was divided into 7 pumping stressperiods, with 91 flow time steps. The transport time step was 2 days and the StronglyImplicit Procedure (SIP) solver was used for flow calculation and the finite differencemethod was used for solving the transport. On the basis of the calibrated model and the

1638
assumed temporal pumping stress, the transient changes in groundwater levels and of theCl migration were simulated.
Figure 8. Calculated groundwater levels by SEAWAT versus observed levels in year 1985.
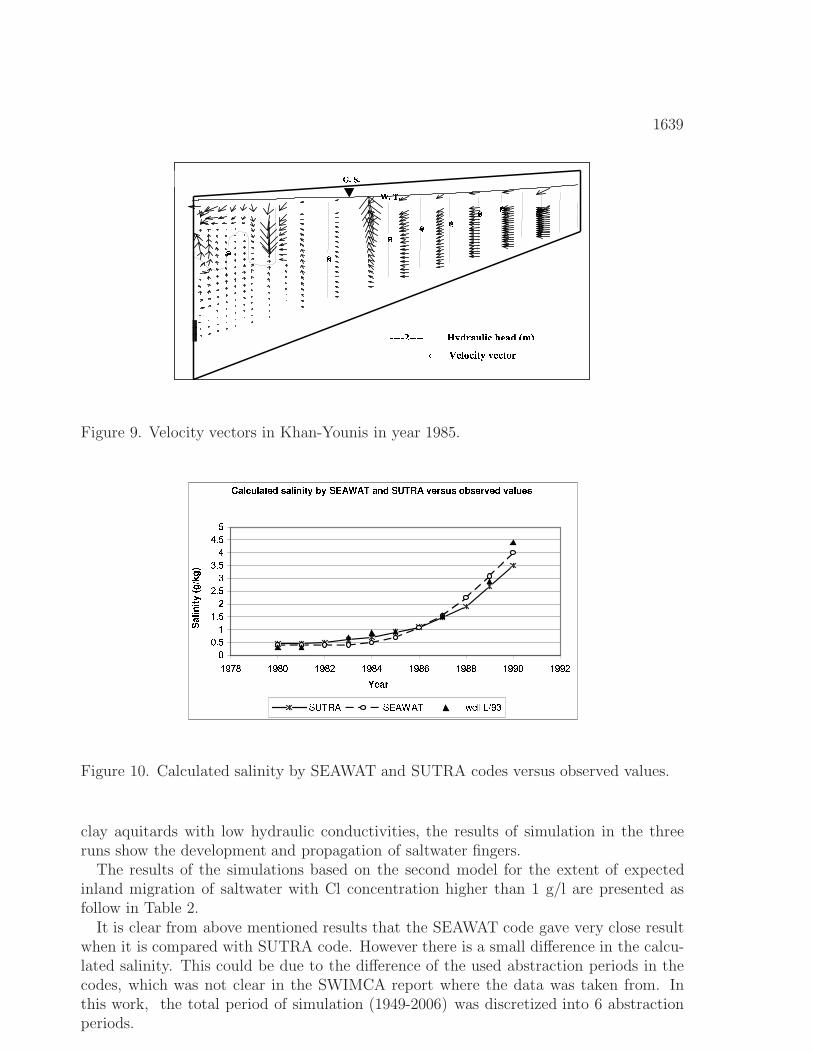
Figure 8 compares the simulated and observed groundwater levels along strip 85 for year1985. Figure 9 shows the velocity vector distribution in Khan-Younis cross section for year1985. It is clear from this figure that the discharge to the sea is very low, which meansthat there is overexploitation from this area. Also, the velocity is high and upward nearthe middle of the cross section, due to the low infiltration rates (see Figure 5) and highabstraction rates (see Figure 7). On the other hand, the velocity is high and downwardnear the sea-shore due to high rate of pumping, but there are high infiltration rates (seealso Figures 5 and 7).
Figure 10 compares the observed and the simulated Cl concentrations by SEAWAT andSUTRA codes for well L/93 which is very close to the seashore (about 300m from the seashore) with about 10m below sea level of screen bottom.
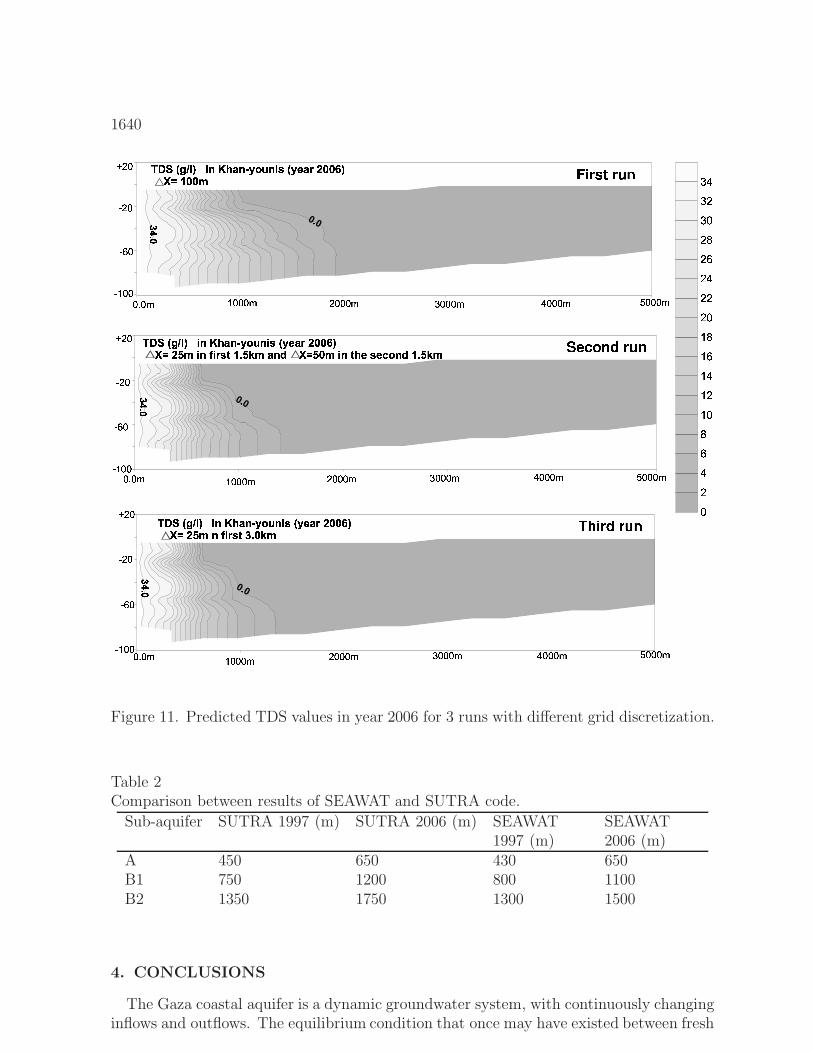
Based on the calibrated model, some predictions of the groundwater levels and salinitieswere made until year 2006 (Figure 11). In order to check the possibility of numericaldispersion and the uncertainty within the results, sensitivity analysis for the model withdifferent grid descritization were conducted. The first one was a uniform grid in the x-direction with horizontal size of 100m. In the second one, the horizontal size of cells inthe x direction is 25m in the 1.5km zone near the sea, increases to 50m between 1.5-3km,and increases to 100m in the last zone (3-11km) near the eastern boundary which waspresented earlier. In the third one, the horizontal size of cells in x direction is 25m in the3km zone near the sea, and increases to 100m in the last zone (3-11km) near the easternboundary. The result indicates that there are clear differences between the first run andthe other two runs. In the first run, the prediction of concentration is higher which meansthere was numerical dispersion (error) through the calculation. On the other hand therewas no difference between the last two runs. Because the sub-aquifers are separated by
1639
Figure 9. Velocity vectors in Khan-Younis in year 1985.
Figure 10. Calculated salinity by SEAWAT and SUTRA codes versus observed values.
clay aquitards with low hydraulic conductivities, the results of simulation in the threeruns show the development and propagation of saltwater fingers.
The results of the simulations based on the second model for the extent of expectedinland migration of saltwater with Cl concentration higher than 1 g/l are presented asfollow in Table 2.
It is clear from above mentioned results that the SEAWAT code gave very close resultwhen it is compared with SUTRA code. However there is a small difference in the calcu-lated salinity. This could be due to the difference of the used abstraction periods in thecodes, which was not clear in the SWIMCA report where the data was taken from. Inthis work, the total period of simulation (1949-2006) was discretized into 6 abstractionperiods.
1640
Figure 11. Predicted TDS values in year 2006 for 3 runs with different grid discretization.
Table 2Comparison between results of SEAWAT and SUTRA code.
Sub-aquifer SUTRA 1997 (m) SUTRA 2006 (m) SEAWAT1997 (m)
SEAWAT2006 (m)
A 450 650 430 650B1 750 1200 800 1100B2 1350 1750 1300 1500
4. CONCLUSIONS
The Gaza coastal aquifer is a dynamic groundwater system, with continuously changinginflows and outflows. The equilibrium condition that once may have existed between fresh
1641
and saline water has been disturbed by large scale pumping. Fresh groundwater (less than250 mg/l) can only be found in the north and in the south-west in sandy dunes areas,and shallow, where recharge from rainfall is high.
Vertical cross section simulation of density dependent groundwater flow coupled tosolute transport for Khan-Younis area is performed using SEAWAT. The model gavegood results for evolution of salinity in the aquifer. This result shows that seawaterintrusion is happening in the Khan-Younis area in the south of Gaza strip. The modelprovides a reasonable representation of seawater intrusion and gave very good agreementwith previous simulation results by SUTRA for the same cross section with the same data.
ACKNOWLEDGMENTS
This work was supported primarily with research funds from UNESCO/KEIZO OBUCHIfellowship Program. Additional support was made from the SWIMED regional projectfunded by EU on behalf of Gaza Islamic University partner-Palestine.
REFERENCES
1. W. Guo and G.D. Bennett, Simulation of Saline/fresh water flows using MODFLOW,in Poeter, E. and others, MODFLOW-98 Conference, Proceedings : Golden, Colorado,v.1, p. 267-274. 1998.
2. PCBS , Population Data for the Gaza Strip, Palestinian Central Bureau of Statistics(PCBS), Palestine, 1998.
3. EPD/IWACO-EUROCONSULT, Gaza Environmental Profile, Part one, Inventoryof Resources, Environmental Planning Directorate (EPD), Ministry of Planning andInternational Cooperation (MOPIC), Palestine, 1994.
4. PWA/USAID, Coastal Aquifer Management Program (CAMP)/Water Quality Base-line Survey (task 5B), Palestinian Water Authority (PWA), Palestine, 2000.
5. K. Qahman and A. LARABI, Identification and Modeling of Seawater Intrusion ofthe Gaza Strip Aquifer-Palestine, Proceedings: TIAC03 Conference, V. 1, p. 245-254,Alicante- Spain, 2003.
6. EC Initiative AVICENNA (AVI-CT95-73), Salt Water Intrusion Management inCoastal Aquifers, Pages 238-254, European Commission, 2000.
7. C.I. Voss, , SUTRA, Saturated-Unsaturated Transport a Finite Simulation Model,USGS, Virginia, U.S.A, 1984.
8. C. Langevin and W. Guo, User’s Guide to SEAWAT, A computer program for simu-lation of three-dimensional variable density groundwater flow, U.S.G.S, Florida, 2002.
9. C. Langevin, Simulation of Submarine Ground Water Discharge to a Marine Estu-ary:Biscayne Bay, Florida, J. Ground Water, No. 6, Vol. 21:758-771, 2003.
10. KE White, Tracer methods for the determination of Groundwater residence-time dis-tributions., In Groundwater quality measurement, prediction and protection, Waterresearch Center: 246-273, 1977.
11. LF Kinkow and AJ. Rodriguez, Advection and diffusion in a variable salinity confininglayer, Water resources Research, 29:2747-2761, 1993.
12. C. Langevin, Simulation of Groundwater Discharge to Biscayne Bay, South-easternFlorida, USGS, Florida, 2001.

![Israeli Liturgical Reponses to the Disengagement Process from Gaza Strip in 2005 [Hebrew] תפילת כל פה: תפילות שנכתבו לקראת תהליך ההתנתקות ובעקבותיו](https://static.fdokumen.com/doc/165x107/631539065cba183dbf07e57d/israeli-liturgical-reponses-to-the-disengagement-process-from-gaza-strip-in-2005.jpg)