Evidence from the Gaza Strip in Palestine - MDPI
22
applied sciences Article Hospital Site Suitability Assessment Using Three Machine Learning Approaches: Evidence from the Gaza Strip in Palestine Khaled Yousef Almansi 1,2, *, Abdul Rashid Mohamed Shariff 2,3 , Ahmad Fikri Abdullah 2,3 and Sharifah Norkhadijah Syed Ismail 4 Citation: Almansi, K.Y.; Shariff, A.R.M.; Abdullah, A.F.; Syed Ismail, S.N. Hospital Site Suitability Assessment Using Three Machine Learning Approaches: Evidence from the Gaza Strip in Palestine. Appl. Sci. 2021, 11, 11054. https://doi.org/ 10.3390/app112211054 Academic Editor: Lorena Parra Received: 3 September 2021 Accepted: 14 October 2021 Published: 22 November 2021 Publisher’s Note: MDPI stays neutral with regard to jurisdictional claims in published maps and institutional affil- iations. Copyright: © 2021 by the authors. Licensee MDPI, Basel, Switzerland. This article is an open access article distributed under the terms and conditions of the Creative Commons Attribution (CC BY) license (https:// creativecommons.org/licenses/by/ 4.0/). 1 Department of Civil Engineering, Faculty of Engineering, Universiti Putra Malaysia (UPM), Serdang 43400, Malaysia 2 GISRC Research Group, Universiti Putra Malaysia, Serdang 43400, Malaysia; [email protected] (A.R.M.S.); ahmadfi[email protected] (A.F.A.) 3 Department of Biological and Agricultural Engineering, Faculty of Engineering, Universiti Putra Malaysia (UPM), Serdang 43400, Malaysia 4 Department of Environmental and Occupational Health, Faculty of Medicine and Health Sciences, Universiti Putra Malaysia (UPM), Serdang 43400, Malaysia; [email protected] * Correspondence: [email protected] Abstract: Palestinian healthcare institutions face difficulties in providing effective service delivery, particularly in times of crisis. Problems arising from inadequate healthcare service delivery are traceable to issues such as spatial coverage, emergency response time, infrastructure, and manpower. In the Gaza Strip, specifically, there is inadequate spatial distribution and accessibility to healthcare facilities due to decades of conflicts. This study focuses on identifying hospital site suitability areas within the Gaza Strip in Palestine. The study aims to find an optimal solution for a suitable hospital location through suitability mapping using relevant environmental, topographic, and geodemo- graphic parameters and their variable criteria. To find the most significant parameters that reduce the error rate and increase the efficiency for the suitability analysis, this study utilized machine learning methods. Identification of the most significant parameters (conditioning factors) that influence a suitable hospital location was achieved by employing correlation-based feature selection (CFS) with the search algorithm (greedy stepwise). Thus, the suitability map of potential hospital sites was modeled using a support vector machine (SVM), multilayer perceptron (MLP), and linear regression (LR) models. The results of the predicted sites were validated using CFS cross-validation and the receiver operating characteristic (ROC) curve metrics. The CFS analysis shows very high correlations with R2 values of 0.94, 0. 93, and 0.75 for the SVM, MLP, and LR models, respectively. Moreover, based on areas under the ROC curve, the MLP model produced a prediction accuracy of 84.90%, SVM of 75.60%, and LR of 64.40%. The findings demonstrate that the machine learning techniques used in this study are reliable, and therefore are a promising approach for assessing a suitable location for hospital sites for effective health delivery planning and implementation. Keywords: GIS; site suitability; machine learning; healthcare; Palestine 1. Introduction The Gaza Strip has faced several challenges in the last seven decades that have led to the poor distribution of infrastructural facilities, especially in the healthcare sector which, notably, is of the utmost importance. The healthcare sector suffers inadequate spatial coverage and poor planning standards in their distribution in line with population and urban growth. A report published by the World Health Organization [1] narrated the vulnerable population groups suffering from the lack of access to primary healthcare, emergency services, and mental health services in Palestine. According to the report, there are 250,000 people in communities within the restricted access areas (about 2 km of the Appl. Sci. 2021, 11, 11054. https://doi.org/10.3390/app112211054 https://www.mdpi.com/journal/applsci
-
Upload
khangminh22 -
Category
Documents
-
view
2 -
download
0
Transcript of Evidence from the Gaza Strip in Palestine - MDPI

applied sciences
Article
Hospital Site Suitability Assessment Using Three MachineLearning Approaches: Evidence from the Gaza Stripin Palestine
Khaled Yousef Almansi 1,2,*, Abdul Rashid Mohamed Shariff 2,3 , Ahmad Fikri Abdullah 2,3
and Sharifah Norkhadijah Syed Ismail 4
�����������������
Citation: Almansi, K.Y.;
Shariff, A.R.M.; Abdullah, A.F.; Syed
Ismail, S.N. Hospital Site Suitability
Assessment Using Three Machine
Learning Approaches: Evidence from
the Gaza Strip in Palestine. Appl. Sci.
2021, 11, 11054. https://doi.org/
10.3390/app112211054
Academic Editor: Lorena Parra
Received: 3 September 2021
Accepted: 14 October 2021
Published: 22 November 2021
Publisher’s Note: MDPI stays neutral
with regard to jurisdictional claims in
published maps and institutional affil-
iations.
Copyright: © 2021 by the authors.
Licensee MDPI, Basel, Switzerland.
This article is an open access article
distributed under the terms and
conditions of the Creative Commons
Attribution (CC BY) license (https://
creativecommons.org/licenses/by/
4.0/).
1 Department of Civil Engineering, Faculty of Engineering, Universiti Putra Malaysia (UPM),Serdang 43400, Malaysia
2 GISRC Research Group, Universiti Putra Malaysia, Serdang 43400, Malaysia;[email protected] (A.R.M.S.); [email protected] (A.F.A.)
3 Department of Biological and Agricultural Engineering, Faculty of Engineering, Universiti PutraMalaysia (UPM), Serdang 43400, Malaysia
4 Department of Environmental and Occupational Health, Faculty of Medicine and Health Sciences, UniversitiPutra Malaysia (UPM), Serdang 43400, Malaysia; [email protected]
* Correspondence: [email protected]
Abstract: Palestinian healthcare institutions face difficulties in providing effective service delivery,particularly in times of crisis. Problems arising from inadequate healthcare service delivery aretraceable to issues such as spatial coverage, emergency response time, infrastructure, and manpower.In the Gaza Strip, specifically, there is inadequate spatial distribution and accessibility to healthcarefacilities due to decades of conflicts. This study focuses on identifying hospital site suitability areaswithin the Gaza Strip in Palestine. The study aims to find an optimal solution for a suitable hospitallocation through suitability mapping using relevant environmental, topographic, and geodemo-graphic parameters and their variable criteria. To find the most significant parameters that reduce theerror rate and increase the efficiency for the suitability analysis, this study utilized machine learningmethods. Identification of the most significant parameters (conditioning factors) that influence asuitable hospital location was achieved by employing correlation-based feature selection (CFS) withthe search algorithm (greedy stepwise). Thus, the suitability map of potential hospital sites wasmodeled using a support vector machine (SVM), multilayer perceptron (MLP), and linear regression(LR) models. The results of the predicted sites were validated using CFS cross-validation and thereceiver operating characteristic (ROC) curve metrics. The CFS analysis shows very high correlationswith R2 values of 0.94, 0. 93, and 0.75 for the SVM, MLP, and LR models, respectively. Moreover,based on areas under the ROC curve, the MLP model produced a prediction accuracy of 84.90%, SVMof 75.60%, and LR of 64.40%. The findings demonstrate that the machine learning techniques used inthis study are reliable, and therefore are a promising approach for assessing a suitable location forhospital sites for effective health delivery planning and implementation.
Keywords: GIS; site suitability; machine learning; healthcare; Palestine
1. Introduction
The Gaza Strip has faced several challenges in the last seven decades that have led tothe poor distribution of infrastructural facilities, especially in the healthcare sector which,notably, is of the utmost importance. The healthcare sector suffers inadequate spatialcoverage and poor planning standards in their distribution in line with population andurban growth. A report published by the World Health Organization [1] narrated thevulnerable population groups suffering from the lack of access to primary healthcare,emergency services, and mental health services in Palestine. According to the report, thereare 250,000 people in communities within the restricted access areas (about 2 km of the
Appl. Sci. 2021, 11, 11054. https://doi.org/10.3390/app112211054 https://www.mdpi.com/journal/applsci
Appl. Sci. 2021, 11, 11054 2 of 22
Gaza Strip border); over a million people fall into vulnerable groups across the Gaza Strip,including 287,000 neonates and children, 60,000 pregnant women, 700,000 chronic diseasepatients, 41 000 elderly people, and 6475 of the most vulnerable people with a disabilitydue to conflict.
Central to improving healthcare service delivery in the region under study is the issueof location. A suitably located hospital addresses important issues such as accessibilitywithin a reasonable distance and time at a reasonable cost, availability of space thatmeets current service operational capacity and, at the same time, accommodates futuredevelopment/emergency needs, capability for the projected target service population, anddelivering community obligations [2–4]. From the forego, it is obvious that finding suitablesites for locating a hospital is a multicriteria problem that has numerous fundamentalsocietal factors to be considered for the maximum benefit.
Among healthcare experts and other stakeholders, there are mixed views and argu-ments on which criteria are most important–social, environmental, or economic. However,the entire decision-making process requires a multidisciplinary approach, involving health-care professionals, government officials, engineers, environmentalists and social scientists,and other stakeholders [5]. On the part of the government, locating a hospital in the mostappropriate place will help enhance the efficient allocation of medical resources, match-ing the provision of healthcare with the social and economic demands. In addition, itwill ease the coordination of urban–rural health service development network and socialchallenges [6]. From the citizen point of view, building a hospital in a suitable locationwill improve access to healthcare services, minimizes emergency response time, improvescitizen medical service satisfaction, and ultimately enhances the quality of life [7,8]. For thehealthcare services investors and operators, locating a hospital in the right place will cer-tainly reduce the cost and guarantee a return on investment. For this, stakeholders usuallyemploy the services of cost accounting to adapt to the development of the market econ-omy. Overall, suitably locating a hospital in the appropriate site enhances the competitiveadvantage, and promotes branding, marketing, and human resources supply [6].
The optimal location of healthcare facilities is crucial to healthcare service delivery,accessibility, cost, and time response to patient-centered emergency needs. Over therecent decades, the capabilities of geospatial technologies have been utilized to optimizesuitable site selection for different purposes [9]. Site suitability assessment has been widelyaccepted as a tool for making objective decisions related to locating public infrastructuresby considering and balancing key factors such as topography, land availability, land use,population, economic, and other relevant parameters [2]. For example, the siting of somefacilities requires that the site is free of any natural and environmental interference, such asnatural hazard, noise, or business or traffic hazards, while at the same time is accessible tothe present and future populations [10,11].
The advances in computational intelligence have promoted the development of differ-ent algorithms, techniques, and procedures to solve issues of location problems such as sitesuitability, hazard susceptibility mapping, and spatial prediction [12–14]. In recent times,artificial intelligence and machine learning algorithms have gained wide applicability in thefield of geosciences. For example, identifying suitable land for agricultural purposes [15],predicting locations susceptible to flooding [14,16–18], landslides [19–21], forest fire [22,23],and groundwater potential [24–26] have been accomplished using prominent algorithmssuch as artificial neural network (ANN), support vector machine (SVM), multilayer per-ceptron (MLP), multivariate adaptive regression splines (MARS), boosted regression tree(BRT), fuzzy logic, and logistic regression. Locating a healthcare facility like a hospital is acritical multicriteria location-based problem but based on a thorough literature search bythe authors, no work has been reported specifically for a hospital location using these noveltechniques to optimize the decision-making process despite its success in similar fields.This study investigates the efficiency of SVM, MLP, and LR models to predict suitablelocations to site a hospital in the Gaza Strip. The outcome of this study will provide a

Appl. Sci. 2021, 11, 11054 3 of 22
methodology to assist in the site suitability assessment of hospitals in the study area forefficient healthcare planning, management, and delivery.
2. Background
The site selection of public facilities is a strategic matter. The selection of a publicfacility site usually results in success or failure, especially a hospital [27]. The selection of ahospital location is theorized as a problem of multicriteria decision making that includesmany criteria that can be conflicting and dependent, or independent [28]. Various studieshave used geographic information systems (GIS) to select a proper site for constructinga new hospital. The analytical hierarchy process (AHP) developed by Saaty (1980) isone of the most valuable methods which plays a major role in the optimal preferenceselection [29,30]. Wu et al. [31] identified the optimal location of hospitals in Taiwan andperformed a sensitivity analysis utilizing AHP together with a modified method of Delphi.Another study by Lin and Tsai [32] implemented an expert system for the selection of thehealth utilities for ideal cities. The researchers utilized a combined system operated by theanalytic network process (ANP) integrated with the TOPSIS method. Vahidnia et al. [33]suggested a combination method of GIS and a fuzzy AHP for hospital site selection inTehran. Another research project used a fuzzy AHP (FAHP) to select a suitable site forconstructing a new hospital in Ankara by Aydın [34]. Soltani and Marandi [35] proposed atwo-stage method of fuzzy multicriteria. First, the authors assessed developable parcelsusing GIS and FAHP, while for the second, they employed a fuzzy ANP (FANP).
Previous studies have demonstrated the use of several approaches to analyze datasetswith a different application for different parameters [12–14,36]. Among the methods usedare correlation feature selection, multilayer perceptron, support vector machines, and linearregression models. These are machine learning’s most common models, and yet they havenot been applied in hospital site suitability which motivated their selection and application.Correlation feature selection (CFS) is a method of choosing a feature that uses subsetevaluators and search algorithms to produce the most accurate subset for each dataset. Inthis analysis, the correlation feature selection subset evaluator and the search method ofgreedy stepwise were applied directly to the algorithm of the feature selection. The subsetranked the features according to the correlation with the class label and other featuresusing the correlation feature selection subset evaluator (CfsSubsetEval). The subsetsof the features that were highly correlated with the class label and less correlated withother features were classified as giving a higher value. Moreover, this method eliminatesinappropriate and repetitive features of the dataset [37–39]. The greedy stepwise searchbegins from the blank set, then defines the variables through the forward selection, andalso reduces the unwanted variables through the back selection to get the most accuratesubset of the feature. A new set of nominee feature subsets forms by attaching additionalfeatures to the most accurate subset during the search process. After evaluating all of thesubsets, the best feature subset is selected. The algorithm persists these processes until thenewly created set of the subsets exceeds no more than the best existing subset [39–41].
The multilayer perceptron (MLP) is an important artificial neural network model thatfeeds sets of input data to a suitable set of outputs. The MLP model helps understand thesystem behavior according to input notes and can round values without prior knowledgeof the data relationships [42]. MLP has many advantages, such as distributing trainingdatasets that are not based on the presumptions, and no decision is required regardingthe relevant importance of individual input measures, and most of the input measures arechosen according to the weight adjustment throughout the training phase [43]. MLP iscomprised of various layers of nodes that are directed in lines, completely associated witheach layer. It has been largely utilized in classification [44,45]. Three major structures areinput layers, hidden layers, and output layers, which construct the neural networks of aMLP (Figure 1). The input layers are considered to be factors of relevance and the outputlayers are the categorized outcomes, while the hidden layers are the categorized layers toconvert the inputs to the outputs.

Appl. Sci. 2021, 11, 11054 4 of 22
Figure 1. Neural network (MLP) model.
The support vector machine (SVM) is an important machine learning model thatis based on the theoretical foundation of statistical learning and applies the principle ofstructural risk reduction, which Cortes and Vapnik first introduced in 1995 [15,46,47]. TheSVM works through a learning algorithm that makes use of high-dimensional features.The precision of the SVM model largely depends on specifying the parameters of its model.Structured strategies for selecting the parameters are critical, and it is extremely importantto arrange the alignment of the model parameters. SVMs have been successfully performedfor multiple purposes [16,19,48–50]. The SVM is a supervised learning algorithm usuallyused to sort images of different classes of images from different disciplines. The SVM hasbeen used in classification problems of two classes and is usable for the analysis of theclassification of linear and nonlinear data. The SVM produces two types of hyperplanesin a high-dimensional space, namely, single and multiple hyperplanes. The optimumhyperplane splits the data into several classes with the highest division between classes.The nonlinear classifier employs several kernels for margins estimation. The primarypurpose of these kernels (i.e., radial basis, polynomial, sigmoid, and linear) is to increasethe margins between the individual hyperplanes. Recently, researchers have developed avery good number of promising applications due to the growing interest in SVMs [14,36,51].
Linear regression (LR) is the most popular regression model which is generally em-ployed to discover the relationship between a dependent variable and a single or multipleexplanatory variables. In terms of the number of explanatory variables, a linear regressionhas two types of models, which are simple and multiple. A simple linear regression is thecase of an explanatory variable that contains one independent variable (predictor) and acontinuous dependent variable (response). Multiple linear regression is the case wheremore than one explanatory variable (predictors) is present. The linear regression modelis used to indicate the linear dependence of one variable on another, to gauge the estima-tions of one variable from the estimations of different variables, and to address the lineardependence of one variable over the other to show the other features of its variability [52].
3. Materials and Methods3.1. Study Area and Data Used
The Gaza Strip is one of the administrative regions of Palestine, located on the south-western Mediterranean coast. Geographically, it is located between longitudes 34◦13” Eand 34◦34” E and latitudes 31◦13” N and 31◦59” N with an approximate area of about365 km2 and an altitude ranging between 0 m and 90 m above mean sea level (MSL) [53].The population of the Gaza Strip is reported to be about 2 million people (5315 people

Appl. Sci. 2021, 11, 11054 5 of 22
per square kilometer) according to the Palestinian Central Bureau of Statistics [54]. TheGaza Strip is bordered in the east by the Sinai Peninsula, Egypt in the south, and Israelisettlements in the east and north (Figure 2). In terms of climate, the Gaza Strip belongs tothe temperate Mediterranean climate and the arid climate of the Negev and Sinai deserts’climatic zones with annual rainfall ranges of about 335 mm/y and temperature between27 ◦C and 13 ◦C [55]. The Gaza Strip is made up of five administrative regions, namely,the Gaza Governorate, which is the capital of the Gaza Strip and accounts for about 34.3%of the population of the Gaza Strip [56], the North Governorate, the Middle Governorate,Khan Yunis, and the Rafah Governorates in the south.
Figure 2. Map of the study area showing Palestine (a) and the Gaza Strip (b).
In this study, the process of assessing site suitability for locating a hospital in theGaza Strip involves a number of datasets on the geodemographics, the environment, andthe topography, as well as remote sensing imagery obtained from the Ministry of LocalGovernment, the United Nation Relief and Work Agency (UNRWA), and the United StatesGeological Survey (USGS) data archive. The Gaza Strip and its governorates’ boundary data(in shapefile), neighborhood data, and land-use base map were provided by the Ministry

Appl. Sci. 2021, 11, 11054 6 of 22
of Local Government; the geographic position of the hospitals was provided by the healthministry; the population census data of 2018 was obtained from the Ministry of Interior,while the no-go zone, aerial photo, and digital elevation model (DEM) were obtained fromthe UNRWA. In addition to these sources, Landsat 8 imagery acquired on June 2016, anddownloaded from the USGS data depository on April 2018 (http://earthexplorer.usgs.gov,accessed on 4 November 2021) was utilized to update the land-use map. From thesedatasets, 15 conditioning factors were obtained: population number, population density,distance from road, distance from main road, distance from river, distance from residentialareas, distance from agricultural land, distance from refugee camps, slope, altitude, plancurvature, topographic wetness index, topographic roughness index, and stream powerindex. Based on the literature sources [12,13,57], the conditioning factors are identified asimportant criteria for determining hospital locations.
3.2. Methodology
First, we obtained the sampling dataset of 29 hospital inventory points from the GazaStrip Ministry of Health and an additional 29 nonhospital locations were randomly selectedand added to the hospital points as the dependent variable. This was followed by thegeneration of 15 conditioning factors (independent variables) generated from the datacollected from the various sources mentioned earlier. Thereafter, the raster values of the 15conditioning factors corresponding to the position of the sampling points were extractedfor these points as input for the modeling process. For the modeling operation in Weka,using SVM, MLP, and LR algorithms, the sampling data, comprised of a combination of thedependent and independent variables, was divided into a 70% and 30% ratio for the modeltraining and validation, respectively, and the results were subsequently used to producehospital site susceptibility maps. The performance of the models was evaluated using the30% testing sample dataset through the interpretation of the statistical evaluation metrics,including the sensitivity, specificity, and area under the curve (AUC) parameters. Figure 3shows the overall methodology of the study.
Figure 3. Overall methodological flowchart.
3.3. Data Preparation
To assess suitable sites for locating hospitals in the Gaza Strip, the datasets collectedin digital format from different organizations were assembled in a GIS environment andevaluated for quality and suitability for the purpose by comparing them with the Landsat8 imagery and high-resolution Google Earth map. The conditioning factors used are

Appl. Sci. 2021, 11, 11054 7 of 22
categorized under three classifications: environmental (land use related), topographic, andgeodemographic factors. In the literature, there is no consensus among researchers onspecific factors to be used for location suitability assessments. However, some specificfactors that have been widely used by researchers indicate their importance in the location-based decision-making process [58,59]. From each of the classifications, the relevantdata layers were organized for further processing. All of the conditioning factors weretransformed to 10 m resolution raster products using ArcGIS 10.5.
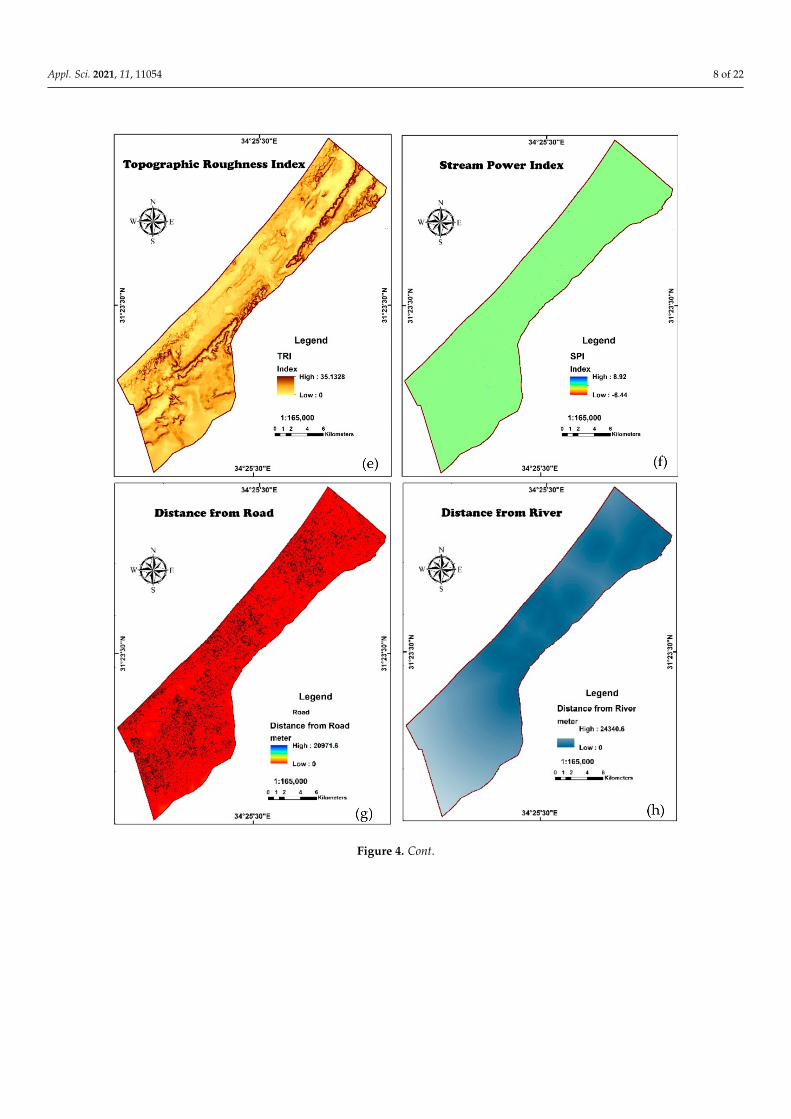
The topography of an area has a direct impact on site selection because it controlsa number of natural processes that constitute environmental concerns, such as floodingand erosion. In this study, the 6 topographical factors identified to be relevant to assessinghospital site suitability are slope, altitude, plan curvature, topographic wetness index,topographic roughness index, and stream power index (Figure 4a–f). These data layerswere derived from the 20 m resolution DEM obtained from the UNRWA.
Figure 4. Cont.
Appl. Sci. 2021, 11, 11054 8 of 22
Figure 4. Cont.

Appl. Sci. 2021, 11, 11054 9 of 22
Figure 4. Cont.

Appl. Sci. 2021, 11, 11054 10 of 22
Figure 4. Conditioning factors considered for the hospital site suitability; (a) elevation altitude, (b) slope surface, (c) plancurvature, (d) topographic wetness index, (e) topographic roughness index, (f) stream power index, (g) distance from road,(h) distance from river, (i) distance from main road (j) distance from residential, (k) distance from agriculture, (l) distancefrom refugee camps (m) population size, (n) population density, and (o) no−go zone.
Human settlement is largely controlled by natural phenomena, such as the physicallandscape, water availability, vegetation/forest distribution, and fertile soil for crop pro-duction. For the environmental variables, 6 data layers, including roads, main road, rivernetwork, residential area, agricultural land, and refugee camps, were extracted from theland use data. Using the Euclidean distance tool, the distance from any road, the distancefrom a main road, the distance from the river network, the distance from a residentialarea, the distance from an agricultural area, and the distance from a refugee camp, theconditioning factors were generated (Figure 4g–l). The Euclidean distance analysis allows
Appl. Sci. 2021, 11, 11054 11 of 22
quantifying the spatial relationship between the factors and the suitable location in lineardistance [13,20,60–62].
In any community, the inhabitants are not spread evenly; this accounts for the variationin population density along different societal dimensions that influence the choice of sitinga new hospital [6,63–66]. In terms of the cost and response time, locating a hospital closeto where people live has a direct implication on the emergency response during disasters.Combining the demographic parameters to the geographic factors allows for the additionof population size and density as important factors to provide a comprehensive foundationfor the analysis and planning of the health service. In the current study, the population dataobtained from the Ministry of Interior 2018 census data of districts and governorate areawere interpolated using the inverse distance weightage (IDW) algorithm [13] to generate araster data layer and were combined with the vector map of each district in ArcGIS 10.5,thus the population size and the population density geodemographic factors (Figure 4m,n)were produced.
3.3.1. Environmental Factors
The distances from road and main road, river network, residential areas, agricultureareas, and refugee camps merit special attention Accessibility is key to locating a hospital,so, the decision makers are usually interested in locations close to roads, particularly mainroads; the nearer to the road a hospital is sited, the better for ease of service delivery andfacility maintenance. Beyond the advantages of proximity to a road is also the concernabout noise pollution from motor vehicles and/or a railway line. Therefore, there is alwaysa compromise between how far or close to roads the ideal location should be.
The distance from a river is considered another related conditioning factor. As waterrunoff increases and drains into streams/rivers, there is a risk of floods in areas abuttingthe river, particularly at a lower elevation and slope. In this respect, the distance of apotential site from streams/rivers is an important criterion.
Healthcare facilities are sited to serve the people; thus, residential areas are favorabletargets for locating a healthcare facility. The nearer a hospital is to a residential area, thebetter. The residential factor is normally examined in terms of the population data anddistribution, which is converted to a thematic map layer in raster format. The better theinformation provided, the better the resulting factor contributes to the overall accuracy.
Food security is important to the well-being of any society. So, policies exist all overthe world to prohibit the location of facilities on land designated as agricultural lands.For this, a specified distance away from agricultural areas is imposed as a condition toevaluate whether a candidate piece of land that is suitable for building a hospital is outsideof agricultural land.
Political crisis and civil unrest across the world gave birth to a completely new settle-ment called a refugee camp. Such refugee camps are an important factor to be consideredin the site selection for suitable space to construct a hospital and other healthcare facilities.The reason being that refugee camps are always overcrowded, often unorganized, andwithout the provision for basic infrastructure. This is the case in the Gaza Strip, which hasbeen in crises for decades.
3.3.2. Topographical Factors
The slope and elevation altitude are geographical characteristics that influence highaccelerated runoff potential (high altitude, high slopes) and water stagnation areas thatare highly prone to flooding, generally at low altitudes and slope. These factors determinehow stable the topography is to the slope related hazard, such as flooding, landslides, anderosion. With respect to building siting, many studies have identified the slope and altitudeas vital conditioning factors [67–69].
Like the slope and altitude, the plan curvature influences the runoff potential of anytopography. It is described as the surface perpendicular to the direction of the maximumslope [70]. A negative plan curvature indicates areas where there is a convergent (accel-
Appl. Sci. 2021, 11, 11054 12 of 22
erated) overland flow, while positive values show the divergent areas with a deceleratedoverland flow.
The stream power index (SPI) is a secondary product of the DEM that indicates thepower of flowing water and erosion potential based on the presumption that the erosivepower of a topography is related to the quantity of water discharge to the definite catchmentarea. The SPI is computed from the combination of the information of the catchment areaand slope gradient [71] using the formula introduced by Moore and Wilson [72].
SPI = A tan β/b (1)
where A is the specific catchment area and β is the local slope gradient computed in degrees.The topographic wetness index (TWI) is a secondary derivative of the DEM obtained
from the flow accumulation and flow direction. High values of this index is indicativeof areas favoring water accumulation. It has been widely used to measure the effect oftopography in terms of the location and size of the saturated source of water runoff [73].The TWI can be calculated using the equation [74]:
TWI = loge
(A
b tan β
)(2)
where A denotes flow accumulation in square meters, b refers to the pixel width throughwhich water flows in meters, and β (radian) represents the slope.
The topographic roughness index (TRI) is also a secondary derivative of a topographicproduct that characterizes the variability in elevation within a spatial unit [71]. This factoris used to define landform components. The terrain roughness is usually considered withother terrain attributes in order to understand and describe the landform process thatdifferentiates the geomorphological units [75]. The TRI is derived using the followingequation proposed by Riley [76].
TRI =√|x|(max2 −min2) (3)
where max denotes the pixel largest value in nine rectangular altitude neighborhoods, andmin denotes the minimum value.
3.3.3. Geodemographic Factors
Population size is associated with the demand and performance of a hospital. Popula-tion density is directly linked to the demand and supply factors. In addition, it influencesthe effectiveness and performance of healthcare service delivery to the citizenry. Populationdensity is the number of people per unit area, e.g., persons per square meter or kilometer,calculated using the census data on a census tract base as the spatial unit of analysis.
3.4. Model Implementation and Validation
As mentioned earlier, the current study implements SVM, MLP, and LR models inWaikato Environment for Knowledge Analysis (Weka Version 3.8.2, developed by theUniversity of Waikato, New Zealand [77]. Using the random partition algorithm in Weka,the sampling data was divided into training and validation data subsets in the ratio 70%(41 points) and 30% (17 points), respectively. In practice, there is no generally acceptablemechanism for partitioning a sampling dataset; the choice varies in the literature, usuallydepending on the quantity and quality of the sample data [61]. Before using the datafor modeling, it was subjected to a correlation-based feature selection (CFS), employingthe greedy stepwise search algorithm 10-fold cross-validation method to reduce the errorrate, increase efficiency, and to achieve a better performance [78,79]. CFS is an efficientfeature selection technique; the greedy algorithm adds either the most favorable featureor deletes the most unfavorable one in each round [80]. In the current study, the processranks attributes in their order of influence on the model. The resulting models were

Appl. Sci. 2021, 11, 11054 13 of 22
executed in ArcGIS 10.5 and the output raster data was reclassified into five suitabilityclasses using the quantile classification method [13] to produce the final hospital suitabilitymaps. The quantile method is an efficient classification technique that measures equivalentrepresentation of each class by statistically evaluating the range of raster values in the inputlayer [81].
Validation is essentially a necessary step in any predictive modeling task. In this study,the data was divided into 70% training dataset and 30% test dataset for validation. Forevery classifier, a 10-fold cross-validation was executed. The cross-validation process splitsthe dataset into 10 subgroups; 9 subgroups utilized for training and the remaining subgroupfor testing. In each step of the 10-fold processing stage, a different segment is utilizedfor testing the accuracy and the final result represents the average of the 10 results [82].The performance of each model was assessed using the correlation coefficient (R2), andthe associated quantitative metrics, root mean square error (RMSE), mean absolute error(MAE), relative absolute error (RAE), and root relative squared error (RRSE) for the cross-validation result. In addition, the overall performance of the models was validated usingthe receiver operating characteristics (ROC) accuracy assessment parameter, specifically,sensitivity, specificity, and area under the curve (AUC) measures.
4. Results
An assessment of the independent variables (conditioning factors) relative to thedependent variable (hospital location) using the correlation feature selection providesinsight into the degree of importance of each conditioning factor to the overall modelbuilding. The CFS analysis ranks the parameters according to the correlation with the classlabel and the other parameters (Table 1). From the table, it can be observed that the relativeinfluence between hospital locations and the other parameters showed that the populationdensity and distance from the road had the highest values of CFS (100%), closely followedby the distance from the main road and the distance from the residential area (90%). Thefactors in the mid-range are the distance from agricultural land and population number(70%), slope, plan curvature, and no-go zone with a relative influence value of 60%, 50%,and 40%, respectively. Those with a low relative influence on hospital siting are altitude,the distance from the refugee camp (20%), and the distance from a river (10%). The resultalso reveals that SPI, TWI, and TRI have 0% influence and therefore were eliminated fromthe model building process. The CFS evaluation is based on merit, evaluated based on thecoefficient of correlation and error rates [83].
Table 1. Relative influence (%) of the effective parameters.
Parameters Values Relative Influence %
Population density Density of population 100%Road Distance from the road 100%
Main road Distance from the main road 90%Residential Distance from the residential 90%Agriculture Distance from the agriculture 70%Population Populations number 70%
Slope Slope degree 60%Curvature Plan curvature 50%
Prohibited zone No-go zone 40%Altitude Altitude 20%
Refugee camp Distance from the refugee camp 20%River Distance from the river 10%TRI Topographic roughness index 0%TWI Topographic wetness index 0%SPI Stream power index 0%
In this study, we investigate the performance of the SVM, MLP, and LR models atdifferent stages of the modeling process. The first is at the level of feature selection to

Appl. Sci. 2021, 11, 11054 14 of 22
appraise the conditioning factors relative to the models through an analysis of the cross-validation accuracy measures (correlation coefficient, MAE, RMSE, RAE, and RRSE). Thesecond stage assesses the performance of the model, also determined using the ROCcurve metrics; sensitivity, specificity, and area under curve (AUC) values. Table 2 presentsdetailed result of both of the stages of evaluation.
Table 2. Model validation result: area under the curve and CFS 10-fold cross correlation.
95% Confidence Interval
Model AUC Std Error LowerBound
UpperBound
MLP 0.849 0.017 0.816 0.883SVM 0.756 0.021 0.714 0.798LR 0.644 0.024 0.596 0.692
10-Fold cross-correlation method
R2 MAE RMSE RAE(%) RRSE(%)
MLP 0.925 0.070 0.231 13.62 25.20SVM 0.940 0.011 0.001 4.18 12.23LR 0.751 0.254 0.310 19.73 40.58
The cross-validation result revealed a high correlation between the conditioningfactors and hospital site for the models used (Table 2). SVM and MLP have a very highcorrelation with the R2 value of 0.94 and 0.93, respectively. However, the SVM has thelowest error rate with the MAE, RMSE, and RAE value of 0.011%, 0.001%, and 4.18%,respectively compared to 0.07%, 0.231%, and 13.62% for the MLP classifier. The LR modelalso indicates a moderately high correlation with the R2 value of 0.75 but with a slightlyhigh error rate based on the reported MAE, RMSE, and RAE value of 0.25, 0.31, and 0.60,respectively. The cross correlation is a pre-modeling assessment of the applicability ofthe SVM, MLP, and LR models for predicting a suitable site to locate a hospital with theconditioning factors considered in the study.
Figure 5 and Table 2 show the result of the model performance evaluation usingthe 30% validation (testing) dataset. The graph of sensitivity–specificity plots providesa visual and statistical understanding of how well the models can classify a suitable sitefor a hospital location from an unsuitable position. It can be seen from the figure thatthe ROC curves of the three models approach the upper left corner of the plot. Thisis interpreted to mean a high overall accuracy [84]. Comparatively, the results of themodeling process yield a superior classification capability with sensitivity (lower band)and specificity (upper band) values of (0.82, 0.88), (0.71, 0.80), and (0.60, 0.69) for the MLP,SVM, and LR models, respectively (Table 2). The model performance based on the areaunder the ROC curve analysis produced an overall accuracy value of 0.85, 0.76, and 0.64 forthe MLP, SVM, and LR models with a standard error of 0.017, 0.021, and 0.024, respectively,at 95% confidence interval.
The results of the hospital site suitability map are presented in Figure 6. The mapswere generated from the effective conditioning factors with a relative influence greaterthan zero (in Table 1) to determining potentially suitable sites in which to locate hospitalsin the study area. The modeling process exploits the interaction between these indicators(independent variables) based on the sampled dataset to establish a relationship thataccurately produces the hospital site suitability map using SVM, MLP, and LR models.In each map, the degree of susceptibility is categorized into five classes: very high, high,moderate, low, and very low (Figure 6), utilizing the quantile classification method [13].

Appl. Sci. 2021, 11, 11054 15 of 22
Figure 5. Comparative plot of the ROC curve for MLP, SVM, and LR.
Figure 6. Cont.

Appl. Sci. 2021, 11, 11054 16 of 22
Figure 6. Suitability map produced using (a) multilayer perceptron, (b) support ector machine, and(c) linear regression models.
Obviously, there is spatial variation in the respective suitability class across the models.For example, the MLP output map (Figure 6a) shows a relatively balanced presence of

Appl. Sci. 2021, 11, 11054 17 of 22
all the suitability classes across the study area. However, the central region, a sectionof the southern part, and small portion in the north indicate very high suitability levels.Moreover, the SVM-generated map (Figure 6b) is biased to very high (in small areas), high,and moderate classes, whereas the low and very low classes rarely exist. Unlike the othermaps, the LR map product shows a distinct pattern (Figure 6c); the study area appearsdivided into two where the very high and high suitability classes occupy the southernsection and the low and very low classes, interposed with the moderate class, are in thecentral and northern part of the Gaza Strip.
The quantitative analysis has shown that for the MLP, the very high, high, and moderatesuitability classes cover 10.10%, 27.74%, and 29.82%, approximately 36.9 km2, 101.25 km2, and108.8 km2, respectively. Moreover, the low and very low classes take up 21.62% (78.9 km2) and10.72% (39.15 km2). For the suitability map produced with the SVM model (Figure 6b), the veryhigh (3.65%), low (9.85%), and very low (0.35%) suitability classes represent a relatively verysmall percentage of the total area (~13.85%) which constitutes 50.5 km2. Meanwhile, the largerpercentage of the area is shared between the high and moderate suitable classes (36.38 and49.77% respectively)„ amounting to 314.5 km2 with the latter occupying nearly half of the studyarea. Moreover, for the LR-generated suitability map (Figure 6c), the model predicts spatialcoverage of 10.78%, 15.02%, 23.47%, 32.61%, and 18.12% for the very high, high, moderate,low, and very low suitability class, respectively, representing 39.35 km2, 54.80 km2, 85.65 km2,119.10 km2, and 66.10 km2, respectively
5. Discussion
Determining an appropriate method to identify suitable locations to build a hospitalis a difficult process that involves taking decisions on the appropriate conditioning factorsand dealing with the spatial heterogeneity associated with them. Therefore, the firststep to ensure a reliable result was to assess how related the chosen variables consideredare to determining a potential hospital location by examining their relative influenceand correlation with the models using the 10-fold cross-correlation approach. Throughthis process, the conditioning factors that have no contribution were excluded from themodeling process. Moreover, the correlation values obtained, 0.94, 0. 93, and 0.75 forthe SVM, MLP, and LR, respectively, shows that the variables considered are fit for thepurpose. Top on the list of relative influence are population density and the distancefrom the road (100%), the distance from the main road and from residential areas (90%),the distance from agricultural land and population number (70%), while the slope, plancurvature, and no-go zone are in the average with a relative influence of 60%, 50%, and40%, respectively. This indicates that human factors dominate the choice of location ratherthan topographic factors since the altitude of a place determines the slope, curvature, andother morphometric elements.
The model performance evaluation is based on the ROC curve parameters (sensitivity,specificity, and AUC) measured on a standard scale of 0–1; where a value <0.6 indicateslow accuracy, while those between 0.6–0.7, 0.7–0.8, 0.8–0.9, and >0.9 are interpreted to be inthe accuracy range of either moderate, good, very good, or excellent [61]. The sensitivityand specificity metrics interactively provide insight into the classification capability of themodels. Sensitivity, otherwise called the true positive, indicates how well a model canclassify the sampled data to truly identify the ideal position to build a hospital, while thespecificity (or true negative) indicates the model’s ability to correctly classify unsuitablelocations through the sample data. The sensitivity–specificity values obtained for theMLP model are 0.82, 0.88, SVM are 0.71, 0.80, and LR are 0.60, 0.69. According to Idreesand Pradhan [84], on a scale of 0 to 1, the closer the value obtained is to 1, the better thecapability of the model in classifying data. In this study, the overall performance evaluationproduced AUC values of 0.85, 0.76, and 0.64 for the MLP, SVM, and LR model, which fallinto very good, good, and moderate accuracy, respectively.
Using the knowledge of the first author about the study area, combined with ex-ploration of high-resolution Google Earth map, we observed that the result of the MLP

Appl. Sci. 2021, 11, 11054 18 of 22
truly reflects the natural environmental setting of the study area (consistent with previousreports in the study area [54]). For example, the very high and high suitable area occurredin the cities with more population and easy accessibility (Figure 6a). Similarly, the low andvery low suitable area appears in areas designated as a no-go zone, open land, and verysparsely populated area. In contrast, the SVM result (Figure 6b) predicts high and moderateclasses in areas such as a no-go zone and open unoccupied areas ordinarily consideredinappropriate as optimal locations. The map in Figure 6c (LR model) partitions the classesinto upper, middle, and lower bands as a contiguous neighbor in a way that neither reflectsthe input data nor the reality on the ground.
The application of SVM, MLP, and LR models in this study provides scientific evidenceof the resourcefulness of multilayer (ML) techniques for a hospital site suitability assess-ment similar to the results obtained in other fields of study, such as flooding [14,16–18],landslide [19–21], forest fire [22,23], erosion, and water resources [24–26], etc. In this investi-gation, MLP and SVM perform satisfactorily with AUC values of 85% and 76%, respectively,compared to the LR model which produced poor results. Obviously, the MLP model isthe most appropriate and stable model because of its ability to constructs and weight theconditioning factors using a nonlinear projection, unlike the LR model that analyzes theconditioning factors as linear functions [21]. The MLP model, for each training samplesubset, calculates the neuron output from each layer and makes a prediction with the finallayer (forward pass). The prediction is based on how fast the variation between the pre-dicted and the actual output is calculated to get the prediction error, which is subsequentlyused to vary the weights of the neurons in all of the previous layers (backpropagation)until it reaches the optimal prediction accuracy [43,85]. This intricate procedure allows it tohandle both linear and nonlinear datasets accurately.
The result of the SVM model based on the standard evaluation [86,87] is normallyacceptable, but in this study, it is observed that the classification map appears more suitablethan it is in the actual situation. This is traceable to the influence of the neighboring trainingpoints of the optimal hyperplane using the radial basis function which employs a nonlinearkernel function to project a linear model [22,88–90], even though not all of the conditioningfactors exhibit a linear feature. As a result, error is introduced in the classification result,particularly in the very high and very low suitability classes. Similarly, the LR modelemploys a linear function [52], contrary to the characteristics of the conditioning factors.For instance, it is observed that some conditioning factors which have a high relativeinfluence, in turn have a negative effect on determining hospital site suitability. In theGaza Strip, road, river, and population density influenced the LR model most but contraryfactors such as altitude and slope, both of which have a low relative influence, indicate arelatively high sensitivity in the resulting suitability map. Perhaps, testing SVM with otherkernels may improve the accuracy but caution needs to be observed with the LR model.
6. Conclusions
The prolonged conflict in Palestine over the past seven decades has inflicted enormoussuffering to the Palestinians, particularly in the health sector. The Gaza Strip, which is oneof the most important service sectors in terms of population, suffers from an inadequatedistribution of healthcare service facilities. This paper examined three novel predictionmodels, multilayer perceptron (MLP), support vector machine (SVM), and linear regression(LR), to optimize and analyze the influence that some selected factors considered have toinfluence assessing hospital site suitability. The models were considered because they havebeen successfully implemented in different areas of study and proven to be superior tothe traditional methods. Motivated by the void in the research in the application of thesemethods for hospital site suitability prediction, the models have been experimented in thisstudy and the result is validated at different stages of the work.
In this study, fifteen hospital site suitability conditioning factors were optimized andranked using the CFS algorithm (greedy stepwise search method). The process permits theidentification of factors that contribute to determining a suitable site and, thus, the unfit

Appl. Sci. 2021, 11, 11054 19 of 22
factors detected can be removed to minimize error in the model. The result of the CFSindicated that twelve conditioning factors (slope degree, altitude, plan curvature, distancefrom the road, distance from the main road, distance from the residential area, distancefrom the agricultural area, distance from the refugee camp, distance from the river, densityof population, populations number, no-go zone) are fit for use. The topographic wetnessindex, topographic roughness index, and stream power index factors were excluded basedon our investigations. Amongst the three models implemented, the MLP model has provennot only to perform optimally but produced a more balance result in terms of the reality ofthe study area. According to the experimental result, it is valid to conclude that MLP is themost suitable machine learning method as provided in the validation results with the CFSand the AUC values. The outcome is very reasonable in agreement with the location ofexisting hospitals and field inspection. In summary, the high performance achieved withthe MLP model indicates that the proposed approach is appropriate and promising forhospital site suitability assessment. With further studies, experimenting different kernels,accuracy of the SVM may be improved. Based on this study, the authors believe the LRmodel should be used for hospital site suitability assessment with caution because it isunable to capture the nonlinear characteristics of the conditioning factors. Future studiesmay involve investigating other machine learning models for the same purpose, integratingadvanced optimization and ensemble methods to improve the model predictive efficiency.Traffic variations within the day, variations between the weekdays, weekends, holidays,and celebration effects on traffic are also the subject of future studies.
Author Contributions: K.Y.A.: conceptualization, methodology, data acquisition, data analysis,validation, and manuscript writing. A.R.M.S., A.F.A. and S.N.S.I. supervised. All authors have readand agreed to the published version of the manuscript.
Funding: The research is supported by the Universiti Putra Malaysia.
Institutional Review Board Statement: Not applicable.
Informed Consent Statement: Not applicable.
Data Availability Statement: Available on request.
Acknowledgments: The authors would like to thank the Universiti Putra Malaysia for providing allfacilities during this research.
Conflicts of Interest: The authors declare no conflict of interest.
References1. Reinicke, C.; MacDonald, J.; Donald, J. Report of a Field Assessment of Health Conditions in the Occupied Palestinian Territory; World
Health Organization Reports, Palestine 2016; World Health Organization: Geneva, Switzerland, 2016; Available online: https://apps.who.int/gb/Statements/Report_Palestinian_territory/Report_Palestinian_territory-en.pdf (accessed on 4 November 2021).
2. Ahmed, S.; Adams, A.M.; Islam, R.; Hasan, S.M.; Panciera, R. Impact of traffic variability on geographic accessibility to 24/7emergency healthcare for the urban poor: A GIS study in Dhaka, Bangladesh. PLoS ONE 2019, 14, e0222488. [CrossRef] [PubMed]
3. Higgs, G.; Langford, M.; Jarvis, P.; Page, N.; Richards, J.; Fry, R. Using Geographic Information Systems to investigate variationsin accessibility to ‘extended hours’ primary healthcare provision. Health Soc. Care Commun. 2019, 27, 1074–1084. [CrossRef][PubMed]
4. Strozzi, F.; Garagiola, E.; Trucco, P. Analysing the attractiveness, availability and accessibility of healthcare providers via socialnetwork analysis (SNA). Decis. Support Syst. 2019, 120, 25–37. [CrossRef]
5. Turnbull, J.; Martin, D.; Lattimer, V.; Pope, C.; Culliford, D. Does distance matter? Geographical variation in GP out-of-hoursservice use: An observational study. Br. J. Gen. Pract. 2008, 58, 471–477. [CrossRef]
6. Zhou, L.; Wu, J. GIS-Based Multi-Criteria Analysis for Hospital Site Selection in Haidian District of Beijing. 2012. Available online:https://www.diva-portal.org/smash/record.jsf?pid=diva2:555935 (accessed on 4 November 2021).
7. Al-Assar, K.A.M. The Assessment and Planning of Health Services in the Middle Governorate of the Gaza Strip Using GeographicInformation System. Master’s Thesis, The Islamic University Gaza, Gaza, Palestine, 2014.
8. Almansi, K.Y.M. Evaluation of the Service Areas and Accessibility of the Tertiary Hospitals Using GIS in Gaza Strip. Master’sThesis, Universiti Putra Malaysia, Serdang, Malaysia, 2016.

Appl. Sci. 2021, 11, 11054 20 of 22
9. Kumar, M.; Mario Denis, D.; Mohammad Ali Gabril, E.; Nath, S.; Paul, A.; Mukesh Kumar, C. Site Suitability Analysis for UrbanDevelopment Using Geospatial Technologies and AHP: A Case Study in Prayagraj, Uttar Pradesh, India. Pharma Innov. J. 2019, 8,676–681.
10. LaGro, J.A., Jr. Site Analysis: Informing Context-Sensitive and Sustainable site Planning and Design; John Wiley & Sons: Hoboken, NJ,USA, 2013.
11. Samani, Z.N.; Karimi, M.; Alesheikh, A.A. A novel approach to site selection: Collaborative multi-Criteria decision makingthrough geo-social network (Case study: Public parking). ISPRS Int. J. Geo-Inf. 2018, 7, 82. [CrossRef]
12. Jebur, M.N. Universiti Putra Malaysia Multi Remote Sensing Data in Landslide Detection and Modelling. 2015. Available online:http://psasir.upm.edu.my/id/eprint/58131/1/FK2015105IR.pdf (accessed on 4 November 2021).
13. Mojaddadi, H.R. Flood Risk Assessment Using Multi-Sensor Remote Sensing, Geographic Information System, 2D Hydraulicand Machine Learning Based Models. 2018. Available online: https://opus.lib.uts.edu.au/handle/10453/133315 (accessed on 4November 2021).
14. Tehrany, M.S.; Kumar, L.; Shabani, F. A novel GIS-based ensemble technique for flood susceptibility mapping using evidentialbelief function and support vector machine: Brisbane. Aust. Peer J. 2019, 7, e7653. [CrossRef]
15. Ornella, L.; Tapia, E. Supervised machine learning and heterotic classification of maize (Zea mays L.) using molecular marker data.Comput. Electron. Agric. 2010, 74, 250–257. [CrossRef]
16. Xiong, J.; Li, J.; Cheng, W.; Wang, N.; Guo, L. A GIS-based support vector machine model for flash flood vulnerability assessmentand mapping in China. ISPRS Int. J. Geo-Inf. 2019, 8, 297. [CrossRef]
17. Singh, A.; Singh, K.K. Satellite image classification using Genetic Algorithm trained radial basis function neural network,application to the detection of flooded areas. J. Vis. Commun. Image Represent. 2017, 42, 173–182. [CrossRef]
18. Tehrany, M.S.; Pradhan, B.; Jebur, M.N. Flood susceptibility analysis and its verification using a novel ensemble support vectormachine and frequency ratio method. Stoch. Environ. Res. Risk Assess. 2015, 29, 1149–1165. [CrossRef]
19. Pandey, V.K.; Pourghasemi, H.R.; Sharma, M.C. Landslide susceptibility mapping using maximum entropy and support vectormachine models along the highway corridor, Garhwal Himalaya. Geocarto Int. 2020, 35, 168–187. [CrossRef]
20. Pham, B.T.; Tien Bui, D.; Prakash, I.; Dholakia, M.B. Hybrid integration of Multilayer Perceptron Neural Networks and machinelearning ensembles for landslide susceptibility assessment at Himalayan area (India) using GIS. Catena 2017, 149, 52–63. [CrossRef]
21. Bui, D.T.; Tuan, T.A.; Klempe, H.; Pradhan, B.; Revhaug, I. Spatial prediction models for shallow landslide hazards: A comparativeassessment of the efficacy of support vector machines, artificial neural networks, kernel logistic regression, and logistic modeltree. Landslides 2016, 13, 361–378.
22. Thach, N.N.; Ngo DB, T.; Xuan-Canh, P.; Hong-Thi, N.; Thi, B.H.; Nhat-Duc, H.; Dieu, T.B. Spatial pattern assessment of tropicalforest fire danger at Thuan Chau area (Vietnam) using GIS-based advanced machine learning algorithms: A comparative study.Ecol. Inform. 2018, 46, 74–85. [CrossRef]
23. Stojanova, D.; Panov, P.; Kobler, A.; Džeroski, S. Learning to predict forest fires with different data mining techniques. InProceedings of the Data Mining and Data Warehouses (SiKDD 2006), Ljubljana, Slovenia, 17 October 2006.
24. Kim, G.B. A study on the establishment of groundwater protection area around a saline waterway by combining artificial neuralnetwork and GIS-based AHP. Environ. Earth Sci. 2020, 79, 117. [CrossRef]
25. Lu, F.; Zhang, H.; Liu, W. Development and application of a GIS-based artificial neural network system for water qualityprediction: A case study at the Lake Champlain area. J. Oceanol. Limnol. 2019, 38, 1835–1845. [CrossRef]
26. Maier, H.R.; Dandy, G.C. Neural networks for the prediction and forecasting of water resources variables: A review of modellingissues and applications. Environ. Model. Softw. 2000, 15, 101–124. [CrossRef]
27. Chatterjee, D.; Mukherjee, B. Potential hospital location selection using AHP: A study in rural India. Int. J. Comput. Appl. 2013, 71,1–7. [CrossRef]
28. Kahraman, C.; Gundogdu, F.K.; Onar, S.C.; Oztaysi, B. Hospital Location Selection Using Spherical Fuzzy TOPSIS. In Proceedingsof the 2019 Conference of the International Fuzzy Systems Association and the European Society for Fuzzy Logic and Technology(EUSFLAT 2019), Prague, Czech Republic, 9–13 September 2019; Atlantis Press: Prague, Czech Republic, 2019.
29. Dey, P.K.; Ramcharan, E.K. Analytic hierarchy process helps select site for limestone quarry expansion in Barbados. J. Environ.Manag. 2008, 88, 1384–1395. [CrossRef]
30. Saaty, T. The Analytic Hierarchy Process; McGraw-Hill: New York, NY, USA, 1980.31. Wu, C.R.; Lin, C.T.; Chen, H.C. Optimal selection of location for Taiwanese hospitals to ensure a competitive advantage by using
the analytic hierarchy process and sensitivity analysis. Build. Environ. 2007, 42, 1431–1444. [CrossRef]32. Lin, C.T.; Tsai, M.C. Development of an expert selection system to choose ideal cities for medical service ventures. Expert Syst.
Appl. 2009, 36, 2266–2274. [CrossRef]33. Vahidnia, M.H.; Alesheikh, A.A.; Alimohammadi, A. Hospital site selection using fuzzy AHP and its derivatives. J. Environ.
Manag. 2009, 90, 3048–3056. [CrossRef]34. Aydın, Ö. Hospital Location for Ankara with Fuzzy AHP. Dokuz Eylül Univ. Fac. Econ. Adm. Sci. J. 2009, 24, 87–104.35. Soltani, A.; Marandi, E.Z. Hospital site selection using two-stage fuzzy multi-criteria decision-making process. J. Urban Environ.
Eng. 2011, 5, 32–43. [CrossRef]36. Ahmad, I.; Basheri, M.; Iqbal, M.J.; Rahim, A. Performance comparison of support vector machine, random forest, and extreme
learning machine for intrusion detection. IEEE Access 2018, 6, 33789–33795. [CrossRef]

Appl. Sci. 2021, 11, 11054 21 of 22
37. Hall, M.A. Correlation-Based Feature Selection for Machine Learning. Ph.D. Thesis, University of Waikato, Hamilton, NewZealand, 1999.
38. Onik, A.R.; Haq, N.F.; Alam, L.; Mamun, T.I. An analytical comparison on filter feature extraction method in data mining usingJ48 classifier. Int. J. Comput. Appl. 2015, 124, 1–8.
39. Sahoo, G.; Kumar, Y. Analysis of parametric & non parametric classifiers for classification technique using WEKA. Int. J. Inf.Technol. Comput. Sci. 2012, 4, 43.
40. Sadeghi, R.; Zarkami, R.; Sabetraftar, K.; Van Damme, P. Application of genetic algorithm and greedy stepwise to select inputvariables in classification tree models for the prediction of habitat requirements of Azolla filiculoides (Lam.) in Anzali wetland,Iran. Ecol. Model. 2013, 251, 44–53. [CrossRef]
41. Wald, R.; Khoshgoftaar, T.M.; Napolitano, A. Optimizing wrapper-based feature selection for use on bioinformatics data. InProceedings of the The Twenty-Seventh International Flairs Conference, Pensacola Beach, FL, USA, 21–23 May 2014.
42. Walker, A.L. Machine learning in geosciences and remote sensing. Geosci. Front. 2016, 7, 3–10. [CrossRef]43. Gardner, M.W.; Dorling, S.R. Artificial neural networks (the multilayer perceptron)—A review of applications in the atmospheric
sciences. Atmos. Environ. 1998, 32, 2627–2636. [CrossRef]44. Adeyemo, O.O.; Adeyeye, T.O.; Ogunbiyi, D. Comparative study of ID3/C4. 5 decision tree and multilayer perceptron algorithms
for the prediction of typhoid fever. Afr. J. Comput. ICT 2015, 8, 103–112.45. Haykin, S. Neural Networks and Learning Machines, 3/E; Pearson Education India: Delhi, India, 2010.46. Cortes, C.; Vapnik, V. Support-vector networks. Mach. Learn. 1995, 20, 273–297. [CrossRef]47. Jain, P.; Garibaldi, J.M.; Hirst, J.D. Supervised machine learning algorithms for protein structure classification. Comput. Biol. Chem.
2009, 33, 216–223. [CrossRef]48. Bao, Y.; Hu, Z.; Xiong, T. A PSO and pattern search based memetic algorithm for SVMs parameters optimization. Neurocomputing
2013, 117, 98–106. [CrossRef]49. Friedrichs, F.; Igel, C. Evolutionary tuning of multiple SVM parameters. Neurocomputing 2005, 64, 107–117. [CrossRef]50. Lorena, A.C.; De Carvalho, A.C. Evolutionary tuning of SVM parameter values in multiclass problems. Neurocomputing 2008, 71,
3326–3334. [CrossRef]51. Bamakan SM, H.; Wang, H.; Yingjie, T.; Shi, Y. An effective intrusion detection framework based on MCLP/SVM optimized by
time-varying chaos particle swarm optimization. Neurocomputing 2016, 199, 90–102. [CrossRef]52. Shelke, M.B.; Badade, K.B. Processing of Incomplete Data Sets: Prediction of Missing Values by using Multiple Regression. Int. J.
Comput. Electron. Res. 2013, 2, 5.53. Al-Qutob, M.A.; Al-Rimawi, F. Analysis of Different Rare Metals, and Rare Earth Metals in Harvested Rain Water in Gaza
Strip/Palestine by ICP/MS-Data and Health Aspects. Sci. Res. Publ. 2016, 8, 905–912. [CrossRef]54. Palestinian Central Bureau of Statistics (PCBS). Statistical Year Book of Palestine; PCBS: Ramallah, Palestine, 2017.55. El Baba, M.; Kayastha, P.; Huysmans, M.; De Smedt, F. Evaluation of the groundwater quality using the water quality index and
geostatistical analysis in the Dier al-Balah Governorate, Gaza Strip, Palestine. Water 2020, 12, 262. [CrossRef]56. Ajjur, S.B.; Mogheir, Y.K. Flood hazard mapping using a multi-criteria decision analysis and GIS (case study Gaza Governorate,
Palestine). Arab. J. Geosci. 2020, 13, 1–11. [CrossRef]57. Miller, A.J. Assessing landslide susceptibility by incorporating the surface cover index as a measurement of vegetative cover.
Land Degrad. Dev. 2013, 24, 205–227. [CrossRef]58. Mojaddadi, H.; Pradhan, B.; Nampak, H.; Ahmad, N.; Ghazali AH, B. Ensemble machine-learning-based geospatial approach
for flood risk assessment using multi-sensor remote-sensing data and GIS. Geomatics. Nat. Hazards Risk 2017, 8, 1080–1102.[CrossRef]
59. Tehrany, M.S.; Pradhan, B.; Jebur, M.N. Flood susceptibility mapping using a novel ensemble weights-of-evidence and supportvector machine models in GIS. J. Hydrol. 2014, 512, 332–343. [CrossRef]
60. Pham, B.T.; Tien Bui, D.; Dholakia, M.B.; Prakash, I.; Pham, H.V. A Comparative Study of Least Square Support Vector Machinesand Multiclass Alternating Decision Trees for Spatial Prediction of Rainfall-Induced Landslides in a Tropical Cyclones Area.Geotech. Geol. Eng. 2016, 34, 1807–1824. [CrossRef]
61. Kalantar, B.; Ueda, N.; Idrees, M.O.; Janizadeh, S.; Ahmadi, K.; Shabani, F. Forest Fire Susceptibility Prediction Based on MachineLearning Models with Resampling Algorithms on Remote Sensing Data. Remote Sens. 2020, 12, 3682. [CrossRef]
62. Chen, W.; Yan, X.; Zhao, Z.; Hong, H.; Bui, D.T.; Pradhan, B. Spatial prediction of landslide susceptibility using data mining-basedkernel logistic regression, naive Bayes and RBFNetwork models for the Long County area (China). Bull. Eng. Geol. Environ. 2019,78, 247–266. [CrossRef]
63. McLafferty, S.L. GIS and health care. Annu. Rev. Public Health 2003, 24, 25–42. [CrossRef]64. Maantay, J.A.; Maroko, A.R.; Herrmann, C. Mapping population distribution in the urban environment: The Cadastral-based
expert dasymetric system (CEDS). Cartogr. Geogr. Inf. Sci. 2007, 34, 77–102. [CrossRef]65. Devkota, K.C.; Regmi, A.D.; Pourghasemi, H.R.; Yoshida, K.; Pradhan, B.; Ryu, I.C.; Dhital, M.R.; Althuwaynee, O.F. Landslide
susceptibility mapping using certainty factor, index of entropy and logistic regression models in GIS and their comparison atMugling-Narayanghat road section in Nepal Himalaya. Nat. Hazards 2013, 65, 135–165. [CrossRef]
66. Youzi, H.; Nemati, G.; Emamgholi, S. The Optimized Location of Hospital Using an Integrated Approach GIS and AnalyticHierarchy Process: A Case Study of Kohdasht City. Int. J. Econ. Manag. Sci. 2018, 7. [CrossRef]

Appl. Sci. 2021, 11, 11054 22 of 22
67. Dai, F.C.; Lee, C.F. Landslide characteristics and slope instability modeling using GIS, Lantau Island, Hong Kong. Geomorphology2002, 42, 213–228. [CrossRef]
68. Ayalew, L.; Yamagishi, H.; Ugawa, N. Landslide susceptibility mapping using GIS-based weighted linear combination, the casein Tsugawa area of Agano River, Niigata Prefecture, Japan. Landslides 2004, 1, 73–81. [CrossRef]
69. Gómez, H.; Kavzoglu, T. Assessment of shallow landslide susceptibility using artificial neural networks in Jabonosa River Basin,Venezuela. Eng. Geol. 2005, 78, 11–27. [CrossRef]
70. Lawther, A. The Application of GIS-Based Binary Logistic Regression for Slope Failure Susceptibility Mapping in the WesternGrampian Mountains, Scotland. 2008. Available online: http://lup.lub.lu.se/student-papers/record/3558914 (accessed on 4November 2021).
71. Conforti, M.; Pascale, S.; Robustelli, G.; Sdao, F. Evaluation of prediction capability of the artificial neural networks for mappinglandslide susceptibility in the Turbolo River catchment (northern Calabria, Italy). Catena 2014, 113, 236–250. [CrossRef]
72. Moore, I.D.; Wilson, J.P. Length-slope factors for the revised universal soil loss equation: Simplified method of estimation. J. SoilWater Conserv. 1992, 47, 423–428.
73. Bui, D.T.; Ho, T.C.; Revhaug, I.; Pradhan, B.; Nguyen, D.B. Landslide susceptibility mapping along the national road 32 of Vietnamusing GIS-based J48 decision tree classifier and its ensembles. In Cartography from Pole to Pole; Springer: Berlin/Heidelberg,Germany, 2014; pp. 303–317.
74. Beven, K.J.; Kirkby, M.J.; Kirkby, A.J. A physically based, variable contributing area model of basin hydrology/Un modèle à basephysique de zone d’appel variable de l’hydrologie du bassin versant) A physically based, variable contributing area model ofbasin hydrology/Un modèle à base physique de zone d’appel variable de l’hydrologie du bassin versant A physically based,variable contributing area model of basin hydrology. Hydrol. Sci. J. 1979, 24, 43–69. [CrossRef]
75. Althuwaynee, O.F.; Pradhan, B.; Park, H.J.; Lee, J.H. A novel ensemble bivariate statistical evidential belief function withknowledge-based analytical hierarchy process and multivariate statistical logistic regression for landslide susceptibility mapping.Catena 2014, 114, 21–36. [CrossRef]
76. Riley, S.J.; DeGloria, S.D.; Elliot, R. Index that quantifies topographic heterogeneity. Intermt. J. Sci. 1999, 5, 23–27.77. Katla, S.; Xu, D.; Wu, Y.; Pan, Q.; Wu, X. DPWeka: Achieving Differential Privacy in WEKA. In Proceedings of the 2017 IEEE
Symposium on Privacy-Aware Computing, PAC 2017, Washington, DC, USA, 1–4 August 2017. [CrossRef]78. Hall, M. Correlation-Based Feature Selection for Discrete and Numeric Class Machine Learning. Ph.D. Thesis, University of
Waikato, Hamilton, New Zealand, 2000.79. Pourhashemi, S.; Mashalizadeh, A. A Novel Feature Selection Method Using CFS with Greedy-Stepwise Search Algorithm in
e-mail Spam Filtering; AMO—Advanced Modeling and Optimization: 2013. Available online: https://camo.ici.ro/journal/vol15/v15c21.pdf (accessed on 4 November 2021).
80. Guyon, I.; Elisseeff, A. An introduction to variable and feature selection. J. Mach. Learn. Res. 2003, 3, 1157–1182.81. Mayfield, C.J. Automating the Classification of Thematic Rasters for Weighted Overlay Analysis in GeoPlanner for ArcGIS. Ph.D.
Thesis, University of Redlands, Redlands, CA, USA, 2015.82. Borra, S.; Di Ciaccio, A. Measuring the prediction error. A comparison of cross-validation, bootstrap and covariance penalty
methods. Comput. Stat. Data Anal. 2010, 54, 2976–2989. [CrossRef]83. Azeez, O.S.; Pradhan, B.; Shafri, H.Z.; Shukla, N.; Lee, C.W.; Rizeei, H.M. Modeling of CO emissions from traffic vehicles using
artificial neural networks. Appl. Sci. 2019, 9, 313. [CrossRef]84. Idrees, M.O.; Pradhan, B. Hybrid Taguchi-Objective Function optimization approach for automatic cave bird detection from
terrestrial laser scanning intensity image. Int. J. Speleol. 2016, 45, 289–301. [CrossRef]85. Murata, N.; Yoshizawa, S.; Amari, S.I. Network information criterion-determining the number of hidden units for an artificial
neural network model. IEEE Trans. Neural Netw. 1994, 5, 865–872. [CrossRef]86. Huang, S.; Cai, N.; Pacheco, P.P.; Narrandes, S.; Wang, Y.; Xu, W. Applications of support vector machine (SVM) learning in
cancer genomics. Cancer Genom. Proteom. 2018, 15, 41–51.87. Noble, W.S. What is a support vector machine? Nat. Biotechnol. 2006, 24, 1565. [CrossRef]88. Krell, M.M. Generalizing, decoding, and optimizing support vector machine classification. arXiv preprint 2018, arXiv:1801.04929.89. Hoang, N.D.; Bui, D.T.; Liao, K.W. Groutability estimation of grouting processes with cement grouts using differential flower
pollination optimized support vector machine. Appl. Soft Comput. 2016, 45, 173–186. [CrossRef]90. Hoang, N.D.; Tien Bui, D. A novel relevance vector machine classifier with cuckoo search optimization for spatial prediction of
landslides. J. Comput. Civ. Eng. 2016, 30, 04016001. [CrossRef]