2 3 Arabian Journal of Geosciences Geological structure of the coastal aquifer in the southern part...
14
1 23 Arabian Journal of Geosciences ISSN 1866-7511 Arab J Geosci DOI 10.1007/s12517-013-1082-3 Geological structure of the coastal aquifer in the southern part of the Gaza Strip, Palestine Usama Zaineldeen, Khalid Qahman & Jehad Al-Dasht
Transcript of 2 3 Arabian Journal of Geosciences Geological structure of the coastal aquifer in the southern part...

1 23
Arabian Journal of Geosciences ISSN 1866-7511 Arab J GeosciDOI 10.1007/s12517-013-1082-3
Geological structure of the coastal aquiferin the southern part of the Gaza Strip,Palestine
Usama Zaineldeen, Khalid Qahman &Jehad Al-Dasht

1 23
Your article is protected by copyright and
all rights are held exclusively by Saudi
Society for Geosciences. This e-offprint is
for personal use only and shall not be self-
archived in electronic repositories. If you wish
to self-archive your article, please use the
accepted manuscript version for posting on
your own website. You may further deposit
the accepted manuscript version in any
repository, provided it is only made publicly
available 12 months after official publication
or later and provided acknowledgement is
given to the original source of publication
and a link is inserted to the published article
on Springer's website. The link must be
accompanied by the following text: "The final
publication is available at link.springer.com”.

ORIGINAL PAPER
Geological structure of the coastal aquifer in the southern partof the Gaza Strip, Palestine
Usama Zaineldeen & Khalid Qahman & Jehad Al-Dasht
Received: 6 February 2013 /Accepted: 22 August 2013# Saudi Society for Geosciences 2013
Abstract The current study introduces the geological subsur-face cross-sections in the southern part of the Gaza Strip toshow the structure of the aquifer in the area. The cross-sections give evidence of four subaquifers of the coastalaquifer in the southern part of the Gaza Strip. These cross-sections give the natural reasons for the deterioration of thegroundwater in the study area. The results show presence ofclay lenses that prevent the replenishment processes of theaquifer of fresh water from the rainfall and returns flow fromagricultural activities. Lithological formation was evident asone of the natural causes which accelerate destroying processof the coastal aquifer. The results also show that the structureof the aquifer causes the increase of the groundwater salinityin the Gaza Strip. The cross-sections had shown the shortageof storage capacity of high quantities of fresh water in thecoastal aquifer in these areas. The role of lithological forma-tion was evident as one of the natural causes to accelerate theprocess of destroying the coastal aquifer.
Keywords Gaza Strip . Aquifer . Subaquifer . Clay lenses
Introduction
The coastal aquifer plays an important role for water supply inthe Gaza Strip. The Gaza Strip aquifer is the southern part ofPalestine's coastal aquifer (Fig. 1). The southern part of theGaza Strip is considered as one of the most densely populatedareas in the world. Groundwater is the main source of fresh-water in this area. Geology, land use, poor hydrological man-agement, climate change, and land cover are the most impor-tant factors that influence groundwater quality.
The study area (Fig. 1) is located in the southern part of theGaza Strip represented by the governorate of KhanYounis andRafah and is considered as one of the most densely populatedareas. The Gaza Strip is located on the southeastern coast ofthe Mediterranean Sea between longitudes 34°2″ and 34°25″east and latitudes 31°16″ and 31°45″ north. The width of thestrip ranges between 5 km at the middle to 8 km at the northand 12 km at the south, where the study area is located. Itslength is approximately 40 km along the coastline and its areais about 378 km2 (UNDP 2009).
The Gaza Strip surface, as a whole, is covered by thePliocene–Quaternary sediments varying from the Pliocenesand dunes and alternating Pleistocene loess and gravels out-cropping in the Wadi Gaza (Picard 1943; El Khoudary andAnan 1985). The Pleistocene coastal area has alternatingstratified calcareous sandstones (locally termed as Kurkar)and red sandy paleosoils (locally termed as Hamra, meaningred in Arabic). The Holocene sediments are represented bycoastal sand dunes and alluvial deposits. The Kurkar is inter-calated by the Hamra formed the coastal ridges. Theseridges are designated to represent typical longitudinal con-cave forms parallel to the coastline by dominant wind direc-tion perpendicular to the coast (Anan and Zaineldeen 2008;Zaineldeen and Aish 2012).
Due to the importance of the Gaza coastal aquifer, watersupply, and the difficult groundwater situation, a study is
U. Zaineldeen (*)Department of Geology, Al Azhar University–Gaza, Gaza, Palestinee-mail: [email protected]
U. Zaineldeene-mail: [email protected]
U. Zaineldeene-mail: [email protected]
K. QahmanEnvironment Quality Authority, Gaza, Palestine
J. Al-DashtPalestinian Water Authority, Gaza, Palestine
Arab J GeosciDOI 10.1007/s12517-013-1082-3
Author's personal copy

conducted to give a model for the structure of the aquifer ofthe study area. Therefore, the aim of the study is to obtain thesubsurface lithological structure in the study area and itspossible role in the salinization of groundwater. This is con-sidered as an update to the geological cross-section alreadyexisting (Fig. 2) for the Gaza Strip (Greitzer and Dan 1967).
Geological setting of the Gaza coastal aquifer
The coastal plain aquifer extends from the coast of the Med-iterranean Sea in the west to the foothills of the mountain areain the east (Fig. 3). It is part of a regional groundwater systemthat stretches from the coastal area of Sinai in the south to
Fig. 1 Location map of the studyarea
Fig. 2 Generalized geologicalcross-section of the coastalaquifer (Greitzer and Dan 1967)
Arab J Geosci
Author's personal copy

Haifa in the north. The coastal aquifer underlies Palestine'scoastal plain and runs parallel to the Mediterranean Sea coast.The aquifer lithologies were deposited in several depositionalcycles from the glacial and interglacial periods. The Plio-Pleistocene sand and calcareous sandstone of the aquifer (theKurkar Group) is interbedded with marine and continentalclay, silt, and shale lenses which represent the different periodsof sea water transgressions and regressions of the Pleistocene(Issar 1968). Below the Kurkar Group is the Yafo Formationof the Saqiye Group, which is composed of impermeablemarine clays and shales of the Pliocene and Miocene Series.The Yafo Formation forms a layer of low permeability thatseparates the Kurkar Group from the underlying rock units. Inthe western section, the aquifer is composed of silt, loam, andclay interbedded with sand and calcareous sandstone. Itsthickness along the coast reaches up to 200 m below meansea level and becomes thinner towards the eastern sectionsnear the armistice line.
The study area represents the southwestern part of thismain aquifer. It is composed of Pliocene–Pleistocene calcare-ous sandstone and layers of clay (Gavish and Friedman 1969).The coastal aquifer is a major component of the water resourceand drinking water supply in the Gaza Strip. It is naturallyrecharged by precipitation, and additional recharge occurs byirrigation return flow (PWA 2000). The thickness of the aqui-fer varies from 200 m in the west to a fewmeters in the easternmargins and foothills of the mountains area (about 25 km eastto the seashore).
In the Gaza Strip, the aquifer extends about 15–20 kminland, where it overlies the Eocene Age chalks and limestoneor the Miocene–Pliocene Age Saqiye Group. The SaqiyeGroup is a 400- to 1,000-m thick sequence of marls, marineshales, and clay stones. Approximately 10–15 km inland fromthe coast, the Saqiye Group pinches out and the coastal aquiferrests directly on Eocene chalks and clastic sediments of Neo-gene Age (Vengosh and Rosenthal 1994; Vengosh et al. 1994;Mercado 1985). Up to a distance of 4–6 km from the coastline,impermeable layers of clay divide the aquifer into unconfined,semiconfined, and confined subaquifers (marked as A, B1,B2, and C in Fig. 2), whereas in its central and eastern sections,the aquifer is undivided. These subaquifers, therefore, arelimited to only a few kilometers from the seashore.
The structure and the thickness of the aquifer vary signif-icantly from north to south in the Gaza Strip. In the northernsection, the thickness of the aquifer in its western and centralarea is 180–200 m. In the Central Gaza Strip, the thicknessdecreases from 140 to 160 m. While in the southern part, thethickness of the aquifer is only 100–120 m.
The natural flow regime was from SE to NW toward theMediterranean Sea (Mercado 1968; Fink 1992; Livshitz 1999;Guttman 2002). This means that part of the recharge of theGaza groundwater occurs in the east. Groundwater isrecharged from different sources including rainwater, runoffand return flow which includes leakage from municipal waterdistribution system, sewage infiltration, and irrigation returnflow. Rainfall is considered as the major recharge componentthat replenishes the aquifer in the Gaza Strip.
Technique
Lithological subsurface data are obtained through drillingboreholes. More than hundred boreholes had been selected(Fig. 4) to draw the subsurface structure of the aquifer in thestudy area. Correlation between these wells was presented as across-section by using WinLog and WinFence software. Sixcross-sections have been drawn within the study area (Fig. 4).The direction of these section is NW–SE. ArcGIS, version9.3, has been used for drawing various maps.
WinLog and WinFence can be used to create graphicallydetailed full-color cross-sections. WinLog, version 4, has nu-merous features to create and edit the logs.Most of the existingfeatures have been enhanced in version 4 of the program, andmany features have been added such as: (1) project reports canbe generated for all data in a project, for example: layer tops,thickness, lithological description, and water table; (2) useddata can be imported and/or exported; boreholes data can beentered and displayed manually or imported from excel. Sev-eral methods for calculating true depth are supported. WhileWinFence shares the same database in WinLog that can beused to access and plot the borehole data entered in WinLog.
Fig. 3 The coastal aquifer basin of Palestine
Arab J Geosci
Author's personal copy

A: 2001 B: 2002
C: 2004 D: 2006
E: 2008 F: 2010Fig. 4 Salinity (Cl concentration) of the groundwater in the study area during the period 2001–2010
Arab J Geosci
Author's personal copy

Cross-sections were created by specifying path lines on alocation map (Fig. 4). The location map in Fig. 4 shows allwells entered in WinLog.
Salinity of the groundwater in the study area
Salinization of coastal aquifers is a global phenomenon thatendangers the present and future utilization of groundwaterresources, particularly in arid and semiarid zones. The increas-ing salinity which is often described by chloride (Cl) concen-tration (in milligram per liter) in the groundwater is one of theimportant problems that affect the usability of water for irri-gation and water supply. In most areas, salinity rates areincreasing with time. High concentrations of chloride in thegroundwater are considered major water quality problems.Chlorides in groundwater may come from many processessuch as dissolution of rocks containing chlorides, irrigationdrainage, and seawater intrusion in coastal aquifers.
Most wells in the Gaza Strip have salinity exceeding theWHO standard of 250 mg/l. Cl concentration value varied inthe drinking wells depending on depth and locations of thesewells. The percentage of suitable wells that have Cl concen-tration matching WHO standards (<250 mg/l) is 27 % fromthe total wells that is distributed in the study area. Chlorideconcentration in the groundwater has been evaluated duringthe period 2001–2010 through the pumped water quality bythe municipal wells. Figure 4 shows the Cl maps in thestudy area for the period 2001–2010. The wells that islocated in the western side of Rafah are characterized withgood quality and Cl concentration is relatively low (with anaverage of <400 mg/l), while the wells that is located in thecentral and/or in the eastern part of Rafah is characterized byhigh Cl concentration (with average of 500–1,000 mg/l). InKhan Younis, 90 % of the total wells have Cl concentrationthat exceeds the WHO limit. In their study, Al Hallaq andAbu Elaish (2012) showed that the western part of KhanYounis area is vulnerable to contamination that ranges be-tween high and very high due to the relatively shallow watertable with moderate to high recharge potential and perme-able soils.
It can be inferred that Cl concentration in the study area isranging from 250 mg/l in the western part to reach up to morethan 1,000 mg/l in the middle and eastern part of the studyarea. In addition, Cl concentration (salinity) has increased withtime (from 2001 to 2010) as shown from the maps in Fig. 4.Baalousha (2011) showed that the high-risk areas of groundwater contamination in the Gaza Strip are those located in thetowns of Khan Younis and Rafah in the southern Gaza Strip.One of the factors that cause the variation of Cl concentrationin the study area is the structure of the aquifer where the claylenses prevent the replenishment processes of the aquifer offreshwater from the rainfall.
Results and discussion
Data of 100 lithological wells have been used to draw sixcross-sections along the NW–SE direction with a path line of2 km width (Fig. 5). The lithological subsurface data arelogged as boreholes through WinLog software. The distribu-tion of the wells in the study area and the path of the cross-sections are shown in Fig. 5. Figure 6 shows some examplesof these logs that have been used to draw lithological cross-sections using WinFence software.
Six cross-sections have been created within the study areaand numbered as 1–6. Three of them (1–3) are for the Rafahdistrict and the other three sections (4–6) are for the KhanYounis district. Cross-sections show the distribution of imper-vious to semi-impervious layers and lenses alternating withpredominantly permeable sand and calcareous sandstones.The aquifer in the study area consists of alternations of sand,sandstone (Kurkar), silty clay, and clay as represented in thelithological cross-section of Fig. 6.
Cross-section no. 1
Cross-section no. 1 (Fig. 7) represents the southern part ofRafah district close to the Egyptian border. Ten lithologicalwell logs have been used to draw this cross-section. Thesewells arranged from west to east as follows: Pizo/32, Pizo/14,Pizo/33, P/153, Camp/7, Pizo/39, P/78, Pizo/3, P/94, andCamp/9. The section shows the fundamental difference repre-sented by the thick clay lens extending to the mid of cross-section (Fig. 7). This section shows the role of lithologicalsubsurface in limiting of the aquifer capacity for receivingquantities of renewable water due to these clay lens. From thissection, it can be inferred that many of the coastal clay lensesextend towards the east from 1 to about 4 km in the aquiferstructure and divided into four subaquifers.
Saturated aquifer is characterized by very low thickness ofabout 20 m in the eastern part and increased gradually to thewestern part reaching 90 m. The aquifer in the west includes avery thick clay lens within lithological structure that extends4 km to the east reaching to the center of Rafah district wherethe municipal wells are located. All these clay masses thatoccupied a large part of an aquifer do not give the aquifer theopportunity to receive or store large amounts of freshwater inthis region (minimize storage capacity). Wells have varieddepths due to the existence of thick clay lens. The presenceof this thick lens causes decrease of the water level andincrease of Cl concentration in these wells.
Cross-section no. 2
Cross-section no. 2 (Fig. 8) is parallel to cross-section no. 1and located also at Rafah district. Eleven lithological well logshave been used to draw this cross-section. These wells are
Arab J Geosci
Author's personal copy

from west to east: Pizo/27, Pizo/31, Pizo/14, P/164, P/148, P/147, P/142, P/77, P/141, P/94, and Camp/9. An insignificantvariation can be inferred from the thickness of the clay lensthat was observed in this section compared to cross-sectionno. 1. The presence of this clay lens that extends to the westernpart leads to insignificant amount of rainwater infiltration tothe groundwater. As a result, it accelerates the reduction ofwater level and increased Cl concentration in this area.
Cross-section no. 3
Cross-section no. 3 (Fig. 9) is also located at Rafah district.Nine lithological well logs have been used to draw thiscross-section. These wells include L/81, Pizo/16, L/181, P/146, L/70, P/163, Pizo/10, P151, and Pizo/7. This cross-section shows the presence of two separate thick clay lensesin the middle and east of the cross-section as shown inFig. 9. This section shows the lithological subsurface rolein reducing the aquifer storage capacity for receiving quan-tities of renewable water.
At the center of the section, the rainfall can infiltrate toreplenish groundwater due to the absence of clay lenses.Therefore, the wells located at this area have less Cl concen-tration. Towards the west, the wells have been influenced byrainwater infiltration that flow with natural slope of the layers.Again, the wells at this location have less Cl concentrations(Fig. 4). While, the wells located to the east of this cross-section have more Cl concentration because the area is faraway from the area of replenishment and close to the seawhich might was affected by sea water intrusion. The waterlevel is varied in this area due to the differences of the depth ofthe wells in this area.
Cross-section no. 4
Cross-section no. 4 (Fig. 10) was obtained from boreholeslocated at Khan Younis district. The cross-section is parallel tothe previous three sections. Eight lithological well logs havebeen used for drawing this section. These wells are Pizo/5,Pizo/38, L/86A, L/182, L/184, L/70, P151, and Pizo/7. From
Fig. 5 Cross-sections path linesin the study area
Arab J Geosci
Author's personal copy

Fig. 6 Some examples of the well logs that have been used to draw the lithological cross-sections
Arab J Geosci
Author's personal copy
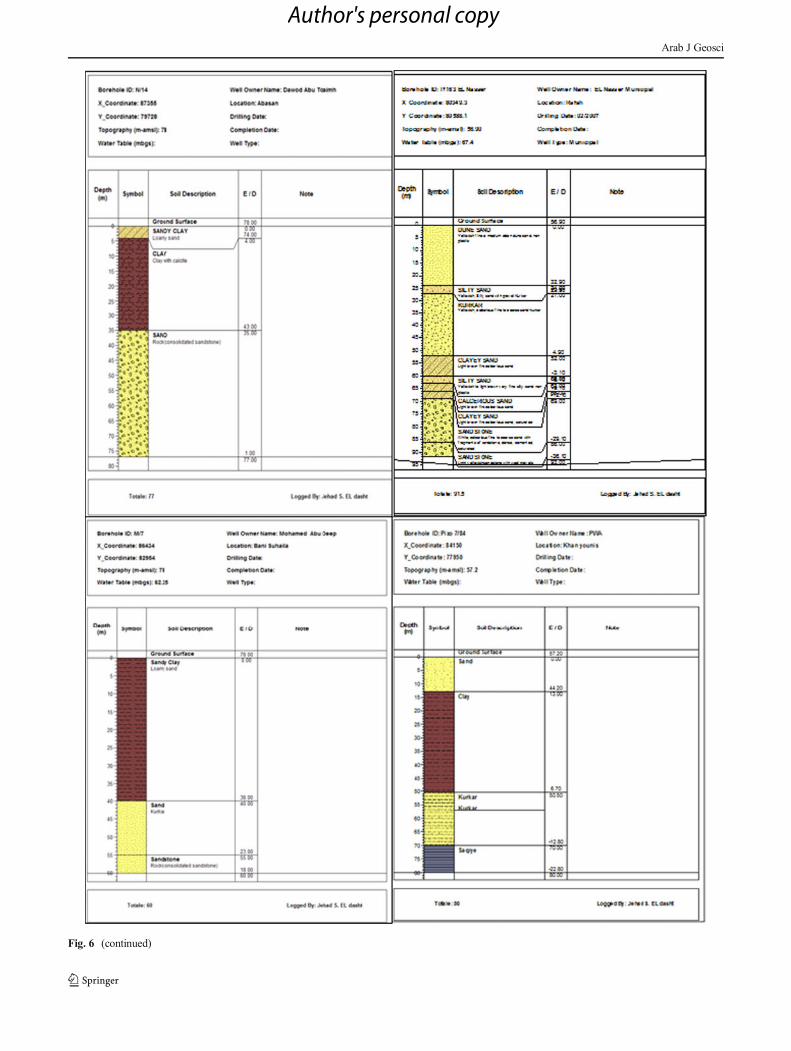
Fig. 6 (continued)
Arab J Geosci
Author's personal copy

this cross-section, the presence of two large clay lenses joinedtogether (Fig. 10) can be noticed. This section shows thelithological subsurface role in reducing the aquifer capacityfor receiving quantities of renewable water due to the presenceof these two clay lenses.
There is an insignificant variation in cross-section no. 4compared with cross-section no. 3 in terms of saturated zonethickness. The numbers of clay lenses at the western part aredecreased. The thick clay lens extends more in section no. 4towards the eastern part. This causes the reduction of the
Fig. 7 Cross-section no. 1 at Rafah district
Fig. 8 Cross-section no. 2 at Rafah district
Arab J Geosci
Author's personal copy
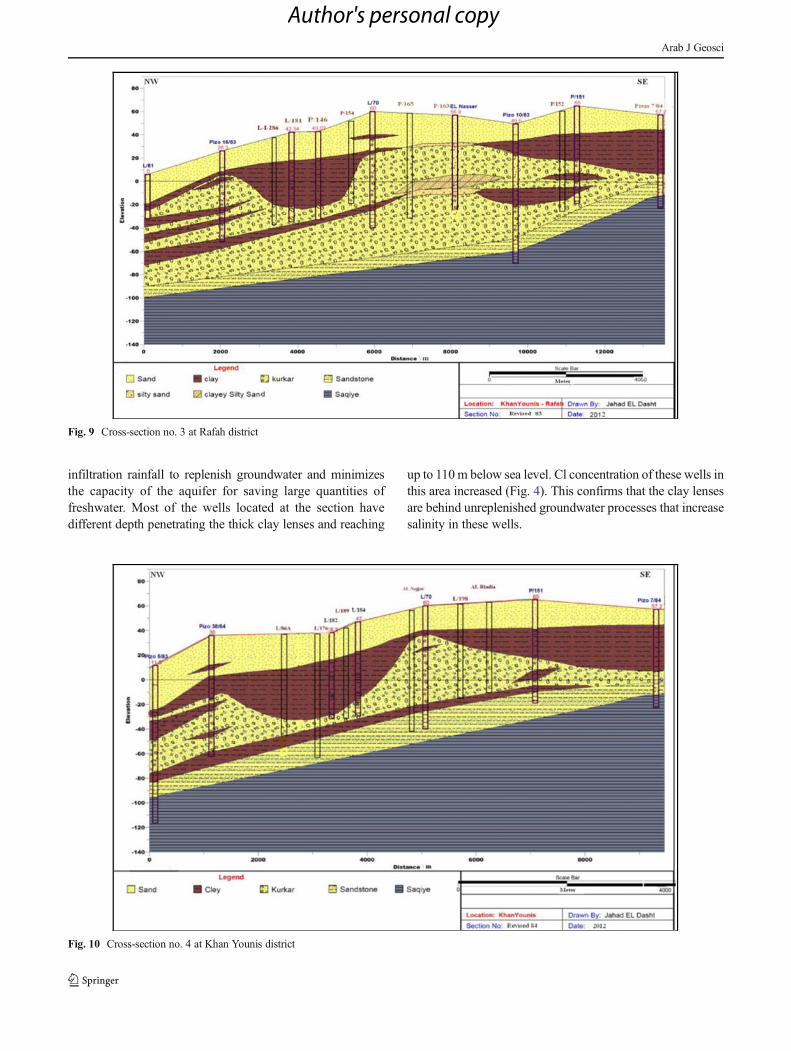
infiltration rainfall to replenish groundwater and minimizesthe capacity of the aquifer for saving large quantities offreshwater. Most of the wells located at the section havedifferent depth penetrating the thick clay lenses and reaching
up to 110m below sea level. Cl concentration of these wells inthis area increased (Fig. 4). This confirms that the clay lensesare behind unreplenished groundwater processes that increasesalinity in these wells.
Fig. 9 Cross-section no. 3 at Rafah district
Fig. 10 Cross-section no. 4 at Khan Younis district
Arab J Geosci
Author's personal copy

Cross-section no. 5
Cross-section no. 5 (Fig. 11) is also located at Khan Younisdistrict as cross-section no. 4. Seven lithological well logs
have been used to draw this section. These wells are arrangedfrom west to east as Peizo/18, Peizo/19, Camp/11, L/43, M/11, L/198, and Camp/8. From this cross-section, the disap-pearance of the thick clay lenses can be noticed. This can give
Fig. 11 Cross-section no. 5 at Khan Younis district
Fig. 12 Cross-section no. 6 at Khan Younis district
Arab J Geosci
Author's personal copy

the opportunity of increasing the thickness of saturated zone inthis area. Consequently, the aquifer has the chance to receivelarge amount of freshwater in this region. Additionally, thewells of this section are located at sand dunes area that allowsincreasing rainwater infiltration.
Cross-section no. 6
Cross-section no. 6 (Fig. 12) was obtained from wells locatedalso at Khan Younis district. Nine lithological well logs havebeen used to draw this section. These are L/97, Pizo/21, Pizo/20, L/185, L/186, Camp/11, M/7, N/14, and Ala'a well. Twolarge thick clay lenses have been found in this cross-section asshown in Fig. 12. The Cl concentration of the wells obtainedin cross-section no. 6 is so high (Fig. 4). This is again due tothe presence of the two thick clay lenses in the area.
Conclusion
Subsurface lithological structures in the study area show theirimportant and main role in aquifer deterioration in terms ofgroundwater quantity and quality. The current study introducethe geological structure of the aquifer in the southern part ofthe Gaza Strip throw cross-sections (nos. 1–6) that have beendrawn along six path lines within the study area. From thesecross-sections, the following can be concluded:
1. Presence of clay lenses intruded the aquifer and divided itinto four subaquifers
2. The thickness of saturated aquifer in the western part isabout 90 m and gradually decreases toward the east toreach about 20 m or less
3. The presence of thick clay lenses reduce the infiltratedrainfall to replenish the groundwater and minimize thecapacity of the aquifer for saving large quantities offreshwater
4. Most of the wells that located at thick clay lenses havebeen drilled reaching the deep saline groundwater
5. The level of salinity decreases at the wells that are drilledin an area where no clay lenses appear and increases at thewells that penetrate the thick clay lenses
6. Most of the wells penetrate the thick clay lenses have highsalinity
7. There are significant variations in terms of available litho-logical information and shape of the present clay lenses withthe old cross-section drawn by Greitzer and Dan (1967)
It is evident that the lithological structure of the aquiferplays a key role as natural causes to accelerate the destroyingprocess of the coastal aquifer.
References
Al Hallaq AH, Abu Elaish BS (2012) Assessment of aquifer vulnerabilityto contamination in Khanyounis Governorate, Gaza Strip—Pales-tine, using the DRASTIC model within GIS environment. Arab JGeosci 5:833–847
Anan HS, Zaineldeen U (2008) Kurkar ridges in the Gaza Strip ofPalestine.M.E.R.C. Ain Shams University. Earth Sci Ser 22:139–146
Baalousha HM (2011) Mapping groundwater contamination risk usingGIS and groundwater modelling. A case study from the Gaza Strip,Palestine. Arab J Geosci 4:483–494
El Khoudary RH, AnanHS (1985) Prelimainary study on the geology andgeomorphology of Wadi Ghazzah, Gaza Strip. Proceedings of theSecond Jordanian Geological Conference, Amman, 531–539
Fink M (1992) An update of the hydrological situation in the Gaza Strip–1992 (in Hebrew), Rep. 04/92/45. Tahal, Tel Aviv, Israel
Gavish E, Friedman GM (1969) Progressive diagenesis in Quaternary toLate Tertiary carbonate sediments: sequence and time scale. J Sed-iment Petrol 39:980–1006
Greitzer Y, Dan J (1967) The effect of soil landscape and quaternarygeology on the distribution of saline and fresh water aquifers in theCoastal Plain of Israel. Tahal Ltd., Water Planning for Israel
Guttman J (2002) Producing brackish water from the Pleistocene andJudea Group aquifers in the northern Negev (in Hebrew), Rep. 733.Mekorot, Tel Aviv, Israel
Issar A (1968) Geology of the central coastal plain of Israel. Israel J EarthSci 17:16–29
Livshitz Y (1999) Influence of natural and artificial factors on the chem-ical composition of groundwater in the north-western Negev and thesouthern portion of the HaShefela region, Israel (in Hebrew), Ph. D.thesis. Ben Gurion University, Beer Sheva, Israel, 146 pp
Mercado A (1968) A hydrological survey of groundwater in the GazaStrip (in Hebrew), Rep. 1968. Tahal, Tel Aviv, Israel
Mercado A (1985) The use of hydrogeochemical patterns in carbonatesand and sandstone aquifers to identify intrusion and flushing ofsaline waters. Groundwater 23(5):635–645
Picard L (1943) Structure and Evolution of Palestine. Bulletin of theGeology Department, Hebrew University, Jerusalem, 4/2–4, 134p
PWA (2000) Coastal Aquifer Management Program (CAMP). Finalmodel report (task 7). PWA, Palestine
UNEP (2009) Environmental assessment of the Gaza Strip, following theescalation of hostilities in December 2008–January 2009
Vengosh A, Rosenthal E (1994) Saline groundwater in Israel: its bearingon the water crisis in the country. J Hydrol 156:389–430
Vengosh A, Heumann KG, Juraske S, Kasher R (1994) Boron isotopeapplication for tracing sources of contamination in groundwater.Environ Sci Technol 28:1968–1974
Zaineldeen U, Aish A (2012) Geology, geomorphology and hydrology oftheWadi Gaza catchment, Gaza Strip, Palestine. J Afr Earth Sci 76:1–7
Arab J Geosci
Author's personal copy

![Israeli Liturgical Reponses to the Disengagement Process from Gaza Strip in 2005 [Hebrew] תפילת כל פה: תפילות שנכתבו לקראת תהליך ההתנתקות ובעקבותיו](https://static.fdokumen.com/doc/165x107/631539065cba183dbf07e57d/israeli-liturgical-reponses-to-the-disengagement-process-from-gaza-strip-in-2005.jpg)