Combining seawater air conditioning and desalination
17
HAL Id: hal-03335514 https://hal.archives-ouvertes.fr/hal-03335514v2 Submitted on 11 Apr 2022 HAL is a multi-disciplinary open access archive for the deposit and dissemination of sci- entific research documents, whether they are pub- lished or not. The documents may come from teaching and research institutions in France or abroad, or from public or private research centers. L’archive ouverte pluridisciplinaire HAL, est destinée au dépôt et à la diffusion de documents scientifiques de niveau recherche, publiés ou non, émanant des établissements d’enseignement et de recherche français ou étrangers, des laboratoires publics ou privés. Distributed under a Creative Commons Attribution| 4.0 International License Deep seawater cooling and desalination: Combining seawater air conditioning and desalination J. D. Hunt, N. D. A. B. Weber, Behnam Zakeri, A.T. Diaby, Paul Byrne, W. L. Filho, P. S. Schneider To cite this version: J. D. Hunt, N. D. A. B. Weber, Behnam Zakeri, A.T. Diaby, Paul Byrne, et al.. Deep seawater cooling and desalination: Combining seawater air conditioning and desalination. Sustainable Cities and Society, Elsevier, 2021, 74, pp.103257. 10.1016/j.scs.2021.103257. hal-03335514v2
-
Upload
khangminh22 -
Category
Documents
-
view
1 -
download
0
Transcript of Combining seawater air conditioning and desalination

HAL Id: hal-03335514https://hal.archives-ouvertes.fr/hal-03335514v2
Submitted on 11 Apr 2022
HAL is a multi-disciplinary open accessarchive for the deposit and dissemination of sci-entific research documents, whether they are pub-lished or not. The documents may come fromteaching and research institutions in France orabroad, or from public or private research centers.
L’archive ouverte pluridisciplinaire HAL, estdestinée au dépôt et à la diffusion de documentsscientifiques de niveau recherche, publiés ou non,émanant des établissements d’enseignement et derecherche français ou étrangers, des laboratoirespublics ou privés.
Distributed under a Creative Commons Attribution| 4.0 International License
Deep seawater cooling and desalination: Combiningseawater air conditioning and desalination
J. D. Hunt, N. D. A. B. Weber, Behnam Zakeri, A.T. Diaby, Paul Byrne, W.L. Filho, P. S. Schneider
To cite this version:J. D. Hunt, N. D. A. B. Weber, Behnam Zakeri, A.T. Diaby, Paul Byrne, et al.. Deep seawatercooling and desalination: Combining seawater air conditioning and desalination. Sustainable Citiesand Society, Elsevier, 2021, 74, pp.103257. �10.1016/j.scs.2021.103257�. �hal-03335514v2�

Sustainable Cities and Society 74 (2021) 103257
Available online 13 August 20212210-6707/© 2021 The Author(s). Published by Elsevier Ltd. This is an open access article under the CC BY license (http://creativecommons.org/licenses/by/4.0/).
Deep seawater cooling and desalination: Combining seawater air conditioning and desalination
Julian David Hunt a,b,*, Natalia de Assis Brasil Weber b, Behnam Zakeri a,c, Ahmadou Tidiane Diaby d, Paul Byrne d, Walter Leal Filho e, Paulo Smith Schneider b
a Energy, Climate, and Environment, International Institute of Applied Systems Analysis (IIASA), Austria b Mechanical Engineering Graduate Program, Federal University of Rio Grande do Sul, Brazil c Sustainable Energy Planning Research Group, Aalborg University Copenhagen, Denmark d Laboratoire de Genie Civil et Genie Mecanique, Universite de Rennes, France e Hamburg University of Applied Sciences, Germany
A R T I C L E I N F O
Keywords: Building cooling Industrial cooling Energy efficiency Seawater air conditioning Low temperature thermal desalination Vertical farming
A B S T R A C T
In tropical climates, the energy consumed by heating, ventilation and air conditioning can exceed 50% of the total energy consumption of a building. The demand for cooling is rising steadily, driven by global warming and rapidly increasing living standards in developing economies. In addition, there is a rise in water demand due to population increase, life quality, and global warming. Coastal areas with narrow continental shelves are the perfect site for implementing Seawater Air Conditioning (SWAC), a renewable and low CO2 emission cooling process. This article proposes the combination of SWAC and reverse osmosis (RO) desalination with the objective of providing desalinated cold water for integrated water supply and cooling services. This combination was named Deep Seawater Cooling and Desalination (DSCD). It was found that DSCD can supply 49 MWt of cooling and 1 m3/s of water simultaneously with an electricity consumption of 12 MWe. DSCD has several benefits compared to SWAC and RO individually, such as in how the cooling service and water supply are delivered together, reducing distribution costs. A case study was performed in Male, Maldives. It shows that the technology has substantial potential to contribute to the sustainable development of tropical islands.
1. Introduction
Providing safe drinking water to the world’s population is a persis-tent global challenge. Indeed, water shortages pose significant threats to local water security and food production around the world. Living with varying degrees of water insecurity, billions of people around the world obtain drinking water from various sources. Drinking water can corre-spond to a high share of a household’s income (Stoler et al., 2020). According to the World Health Organization, 2.1 billion people of the world’s population (or 29%) did not have access to safely managed water. Water managers have used a variety of robust water resource planning and estimation measures to overcome these challenges (Kar-andish, Hogeboom, & Hoekstra, 2021; Miller et al., 2021). Several fac-tors such as poor water management, pollution of water resources and climate change have made the development of conventional desalina-tion water treatment systems essential. Desalination of seawater is seen as one of the most viable processes to meet the growing demand for fresh
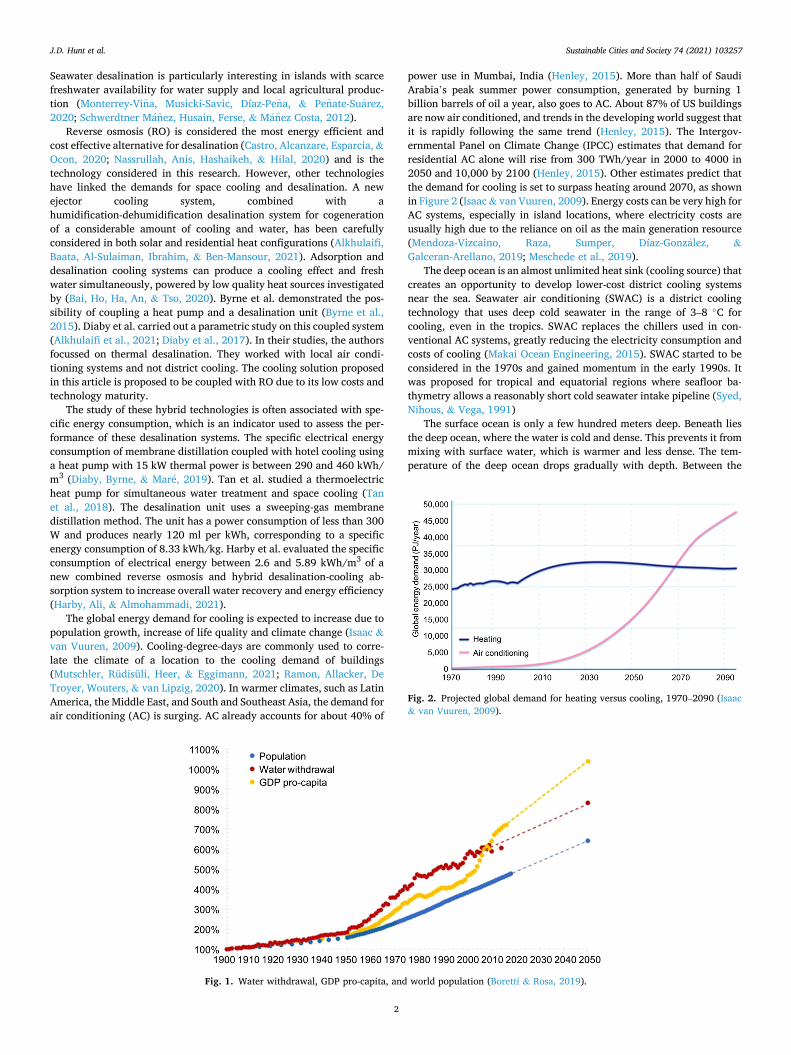
water. There are presently 15,906 operational desalination plants with a total desalination capacity of approximately 95.37 million m3/day, constituting respectively 81% and 93% of the total number and capacity of desalination plants ever built (IDA, 2016; Jones, Qadir, van Vliet, Smakhtin, & Kang, 2019). Desalination capacity is expected to exceed 200 million m3/day in 2030 (Ihsanullah, Atieh, Sajid, & Nazal, 2021). The three main desalination technologies are reverse osmosis (RO), multiple effect distillation (MED) and multi-flash distillation (MSF). They represent a significant share of around 94% of the total desalinated water production, while the remaining 6% are provided by others (Jones et al., 2019). Water resources are dwindling due to growth in demand, population increase and poor water management, and on the supply side, caused by climate change (Rasifaghihi, Li, & Haghighat, 2020). Water withdrawal might not be able to supply this increase in demand for water, as shown in Figure 1 (Boretti & Rosa, 2019). Therefore, the demand for seawater desalination is expected to increase three-fold by 2050 (Gao, Yoshikawa, Iseri, Fujimori, & Kanae, 2017).
* Corresponding author. E-mail address: [email protected] (J.D. Hunt).
Contents lists available at ScienceDirect
Sustainable Cities and Society
journal homepage: www.elsevier.com/locate/scs
https://doi.org/10.1016/j.scs.2021.103257 Received 1 May 2021; Received in revised form 11 August 2021; Accepted 11 August 2021
Sustainable Cities and Society 74 (2021) 103257
2
Seawater desalination is particularly interesting in islands with scarce freshwater availability for water supply and local agricultural produc-tion (Monterrey-Vina, Musicki-Savic, Díaz-Pena, & Penate-Suarez, 2020; Schwerdtner Manez, Husain, Ferse, & Manez Costa, 2012).
Reverse osmosis (RO) is considered the most energy efficient and cost effective alternative for desalination (Castro, Alcanzare, Esparcia, & Ocon, 2020; Nassrullah, Anis, Hashaikeh, & Hilal, 2020) and is the technology considered in this research. However, other technologies have linked the demands for space cooling and desalination. A new ejector cooling system, combined with a humidification-dehumidification desalination system for cogeneration of a considerable amount of cooling and water, has been carefully considered in both solar and residential heat configurations (Alkhulaifi, Baata, Al-Sulaiman, Ibrahim, & Ben-Mansour, 2021). Adsorption and desalination cooling systems can produce a cooling effect and fresh water simultaneously, powered by low quality heat sources investigated by (Bai, Ho, Ha, An, & Tso, 2020). Byrne et al. demonstrated the pos-sibility of coupling a heat pump and a desalination unit (Byrne et al., 2015). Diaby et al. carried out a parametric study on this coupled system (Alkhulaifi et al., 2021; Diaby et al., 2017). In their studies, the authors focussed on thermal desalination. They worked with local air condi-tioning systems and not district cooling. The cooling solution proposed in this article is proposed to be coupled with RO due to its low costs and technology maturity.
The study of these hybrid technologies is often associated with spe-cific energy consumption, which is an indicator used to assess the per-formance of these desalination systems. The specific electrical energy consumption of membrane distillation coupled with hotel cooling using a heat pump with 15 kW thermal power is between 290 and 460 kWh/ m3 (Diaby, Byrne, & Mare, 2019). Tan et al. studied a thermoelectric heat pump for simultaneous water treatment and space cooling (Tan et al., 2018). The desalination unit uses a sweeping-gas membrane distillation method. The unit has a power consumption of less than 300 W and produces nearly 120 ml per kWh, corresponding to a specific energy consumption of 8.33 kWh/kg. Harby et al. evaluated the specific consumption of electrical energy between 2.6 and 5.89 kWh/m3 of a new combined reverse osmosis and hybrid desalination-cooling ab-sorption system to increase overall water recovery and energy efficiency (Harby, Ali, & Almohammadi, 2021).
The global energy demand for cooling is expected to increase due to population growth, increase of life quality and climate change (Isaac & van Vuuren, 2009). Cooling-degree-days are commonly used to corre-late the climate of a location to the cooling demand of buildings (Mutschler, Rüdisüli, Heer, & Eggimann, 2021; Ramon, Allacker, De Troyer, Wouters, & van Lipzig, 2020). In warmer climates, such as Latin America, the Middle East, and South and Southeast Asia, the demand for air conditioning (AC) is surging. AC already accounts for about 40% of
power use in Mumbai, India (Henley, 2015). More than half of Saudi Arabia’s peak summer power consumption, generated by burning 1 billion barrels of oil a year, also goes to AC. About 87% of US buildings are now air conditioned, and trends in the developing world suggest that it is rapidly following the same trend (Henley, 2015). The Intergov-ernmental Panel on Climate Change (IPCC) estimates that demand for residential AC alone will rise from 300 TWh/year in 2000 to 4000 in 2050 and 10,000 by 2100 (Henley, 2015). Other estimates predict that the demand for cooling is set to surpass heating around 2070, as shown in Figure 2 (Isaac & van Vuuren, 2009). Energy costs can be very high for AC systems, especially in island locations, where electricity costs are usually high due to the reliance on oil as the main generation resource (Mendoza-Vizcaino, Raza, Sumper, Díaz-Gonzalez, & Galceran-Arellano, 2019; Meschede et al., 2019).
The deep ocean is an almost unlimited heat sink (cooling source) that creates an opportunity to develop lower-cost district cooling systems near the sea. Seawater air conditioning (SWAC) is a district cooling technology that uses deep cold seawater in the range of 3–8 ◦C for cooling, even in the tropics. SWAC replaces the chillers used in con-ventional AC systems, greatly reducing the electricity consumption and costs of cooling (Makai Ocean Engineering, 2015). SWAC started to be considered in the 1970s and gained momentum in the early 1990s. It was proposed for tropical and equatorial regions where seafloor ba-thymetry allows a reasonably short cold seawater intake pipeline (Syed, Nihous, & Vega, 1991)
The surface ocean is only a few hundred meters deep. Beneath lies the deep ocean, where the water is cold and dense. This prevents it from mixing with surface water, which is warmer and less dense. The tem-perature of the deep ocean drops gradually with depth. Between the
Fig. 1. Water withdrawal, GDP pro-capita, and world population (Boretti & Rosa, 2019).
Fig. 2. Projected global demand for heating versus cooling, 1970–2090 (Isaac & van Vuuren, 2009).
J.D. Hunt et al.

Sustainable Cities and Society 74 (2021) 103257
3
surface and deep ocean is the thermocline, a transition layer of water from 400 m down to about 1,000 m deep, where the temperature rapidly decreases with depth (J.D. Hunt et al., 2020). Fig. 3 illustrates the variation of temperature with water depth in oceans. The temperature variation is higher at tropical and equatorial latitudes than at middle latitudes. In addition, the surface temperature does not vary much depending on the season. These characteristics are favorable for the performance and reliability of systems that exploit the temperature difference of water between the surface and the deep ocean.
Fig. 4 presents a schematic model of a conventional SWAC system. It consists of 1) a deep cold seawater inlet pipeline, 2) a warm seawater outlet pipeline, 3) a heat exchanger and 4) a district cooling system. SWAC has several benefits, including: reduced costs of tunnel drilling and deep water pipes due to the experience of the oil and gas industry; refrigeration energy and cost savings for large customers compared to conventional heating; operation costs partially independent of volatile energy prices; and a proven technology that has been operating in several locations (J.D. Hunt et al., 2019). Environmental studies have been developed to provide an understanding of the impacts of SWAC sites and to enable a more accurate environmental assessment (Comfort, McManus, Clark, Karl, & Ostrander, 2015). Long-term testing of heat exchangers is reported to have demonstrated that fouling is not a problem with deep seawater, and corrosion can be eliminated using either titanium or aluminum heat exchangers (Ryzin & Leraand, 1992). SWAC projects have high investment costs and low operation costs. The main disadvantage of SWAC lies in its high initial investment require-ment, along with the great amount of source material for its construc-tion. The main limiting parameters for SWAC projects is the distance from the coast to the cold source, and the demand for cooling, which should be available throughout the whole year to justify the upfront investment. Therefore, applications in tropical locations are considered potentially cost-effective. SWAC systems energy savings can approach 80% when compared to conventional chillers (Ryzin & Leraand, 1991).
In a typical SWAC system, the cold seawater is pumped at 5 ◦C, ar-rives at 7–8 ◦C in the heat exchanger, goes through the heat exchanger, and leaves at 12–13 ◦C, as shown in Fig. 5. The fresh water of the air conditioning system arrives at 13 ◦C and leaves at 8 ◦C, as shown in (International Renewable Energy Agency, 2014; Development Bank of Latin America, 2015). Titanium heat exchangers are commonly used, since they combine corrosion resistance in salty water with high thermal conductivity (Elsafty & Saeid, 2009; Makai Ocean Engineering, 2014). Long-term testing of heat exchangers is reported to have demonstrated that fouling is not a serious problem with deep seawater (Makai Ocean Engineering, 2014). Once the seawater passes through the heat exchanger, it is returned to the ocean through the warm seawater outlet.
Fig. 6 presents an estimate of the global cost for SWAC. SWAC has been applied in several locations for different purposes. The first pro-totype was installed by the Natural Energy Laboratory of Hawaii Au-thority (NELHA) (Lewis, Ryzin, & Vega, 1988; Vuillemot, Ryzin, &
Resnick, 1988). Makai has engineered the main seawater supply source for the Hawaii Ocean Science Technology Park (HOST Park) at Keahole Point, Hawaii (H. Kim et al., 2012). SWAC was employed in the "Green Olympic Blue Ice (GOBI) rink" of the 2018 Winter Olympics in South Korea (Lee, Chang, Kim, Baek, & Ra, 2014). It has been used in the Tomorrow Museum in Rio de Janeiro (Museu do Amanha, 2017). The DOW Industry used SWAC for temperature control and fishery produc-tion (Hou, Hou, & Lee, 2010). It has been implemented in the cooling processes of data centers in Mauritius (Elahee & Jugoo, 2013). SWAC
Fig. 3. Variation of temperature with water depth in oceans.
Fig. 4. Schematic model of a seawater air conditioning (SWAC) system (Hon-olulu Seawater Air Conditioning, 2017; J.D. Hunt, Byers, & Sanchez, 2019).
Fig. 5. Diagram of a SWAC system heat exchanger (Development Bank of Latin America, 2015).
J.D. Hunt et al.

Sustainable Cities and Society 74 (2021) 103257
4
has also been considered in district cooling in Florida (Porak, Zwieten, & Rauchenstein, 2012; Porak, Zwieten, & Wiles, 2013), for a resort com-munity in upper Egypt (Elsafty & Saeid, 2009), in San Andres, Colombia (Devis-Morales, Montoya-Sanchez, Osorio, & Otero-Díaz, 2014), in Malta (Sant, Buhagiar, & Farrugia, 2014), in California (Davidson, 2003) and for cooling in oil production platforms on the Brazilian coast (Miranda, 2008).
The main contribution of this article is to analyze the insertion of Deep Seawater Cooling and Desalination (DSCD), which combines SWAC and RO desalination in one system with the intention to supply both affordable water and cooling services in a one-way district cooling system. The paper is divided into three main sections. The first section is a preliminary assessment of the solar resource, climate change, cooling demand in terms of CDD, and possible desalination needs of major coastal cities around the world. Section 2 presents the methodology, the benefits and the challenges of integrating SWAC and RO desalination systems. Section 3 presents the results of the case study in Male, Maldives and is completed with a discussion and conclusion.
2. Assessment of solar resource, climate change, cooling demand and possible desalination needs of coastal cities
The method employs a selection of coastal cities and an assessment of the energy demand for cooling, of the solar resource and of the possible desalination needs. The major coastal cities (Fig. 7(a)) were chosen depending on the following criteria: 1) the majority of the coastlines have to be covered; 2) the city has to be less than 1000 km from the ocean; 3) the capitals of major countries with a coastline are chosen; 4) the city has preferably more than 1 million inhabitants; 5) if populated cities are close (less than 1000 km), the city with the major population is chosen; 6) the data must be available in the weather database of Trnsys software (Klein, 2010).
The relative populations are represented in Fig. 7(b). The maps were generated with Microsoft 3D maps in Excel. Table 1 reports the list of the 162 chosen cities and the corresponding latest population census on (City Population, 2021). Among the 162 cities, 113 have a population over 1 million inhabitants. The most populated city is Shanghai with 24 million inhabitants. The 162 chosen cities regard a total population of around 636 million inhabitants, i.e. around 8.5% of the world’s popu-lation. The population growth rate in (City Population, 2021) is shown in Fig. 7 (c). The highest values are recorded in Africa and the Middle East.
The method evaluates in parallel the solar resource, the climate change, the cooling-degree-hours and the precipitation variation. It aims at showing a correlation between high solar resource, high cooling de-mands and possible desalination needs. The method was described byByrne et al. (2015). It uses the population of agglomerations and their population growth rate (City Population, 2021). The data on climate change (temperature increase between 1901 and 2012) and the change in annual precipitation from recorded values over the past 60 years is available in the latest IPCC report (weatherbase, 2021). The annual precipitation is retrieved from the website www.weatherbase.com (Stocker et al., 2013). The solar resource and cooling-degree-days (CDD) were obtained and calculated using Trnsys software (Klein, 2010). The weather data is read from a typical meteorological year (TMY) file that was built using hourly values of temperatures, humidity ratios, wind velocities and orientations, solar radiation and other meteorological variables recorded over a few decades. TMY files are representative of the climates of an average year in terms of global values and show, at the same time, typical hot and cold periods. CDD is the sum over a year of daily temperature differences (positive only) between the average outdoor temperature and the indoor temperature threshold that a cooling system should compensate for to satisfy the comfort requirements. The indoor temperature threshold is estimated at 18 ◦C, considering that internal and solar gains correspond to an addi-tional indoor temperature lift (Sivak, 2009).
Solar resource, climate change, CDD and precipitation are presented
Fig. 6. SWAC global projects cost estimate in dollars per KWht of cooling (J.D. Hunt et al., 2019).
Fig. 7. (a) Major coastal cities, (b) relative population index, (c) relative population growth rate.
Table 1 Impact of temperature on RO desalination performance (AquaticLife, 2019).
Temperature (Co) 4 10 16 21 25 27 32 38 Correction Factor 0.32 0.52 0.7 0.88 1 1.05 1.23 1.41
J.D. Hunt et al.

Sustainable Cities and Society 74 (2021) 103257
5
in absolute and relative values. Relative values are calculated by ratios of the site value over the average value of all sites (superscripts “rel” for relative and “ave” for average) of Solar Resource (SR) Eq. 1), Cooling Degree Days (CDD) (Eq. 2), temperature variation due to climate change (DT) (Eq. 3) and Precipitation Decrease Per Inhabitant (PDPI) (Eqs. 4 and (5). The precipitation decrease is considered as a possible need for desalination.
SRrelcity =
SRcity
SRaveall cities
(1)
DTrelcity =
DTcity
DTaveall cities
(2)
CDDrelcity =
CDDcity
CDDaveall cities
(3)
PDPIrelcity =
PDPIcity
PDPIaveall cities
(4)
Fig. 8 (a) shows the annual solar resource in absolute values. The maximum value is obtained for the city of Khartoum, Sudan with 2397 kWh/m2, and the lowest for Reykjavik, Iceland with 455 kWh/m2. The average solar resource is 1621 kWh/m2. More than half of the cities receive an annual solar energy amount between 1500 and 2000 kWh/m2
(Fig. 8 (a)). Climate change is represented by the temperature variation between 1901 and 2012. The colour in Fig. 8 (b) is dependent on the temperature difference recorded in the area of the city. According to the results for the selected cities, the global climate change is around 1 ◦C (Fig. 8 (b)). The recorded climate change is higher in the chosen cities of Central Europe, the Iberian Peninsula, Northern Africa, North-East Asia and Western South America. Three cities have experienced a tempera-ture increase higher than 2 K in Brazil: Porto Alegre, Recife and Sao Paulo. Fig. 8 (c) shows that the cooling demand in terms of CDD is greater in Africa, eastern South America and Southern Asia, and more generally in tropical regions. Cities of Oceania show average cooling degree-days. The demand is lower in Europe, Northern America, Northern China and Japan. The result of counting per interval of 500 degree days is shown in Fig. 8 (c). The most numerous category is for CDD lower than 500. Another peak appears for CDDs between 3000 and 3500. Fig. 8 (d) shows the mean annual precipitation recorded per year in the major coastal cities. The precipitation is higher in West Africa, India and South-East Asia. The highest precipitation was recorded in the city of Conakry (New Guinea) at a value of 4061 mm/year. The lowest was recorded in Male (Maldives) at a value of 0.9 mm/year. Fig. 8 (d) presents the number of cities per interval of precipitation. The average precipitation is around 1000 mm/year. The precipitation decrease per inhabitant depends on the precipitation variation and on the population growth rate (Fig. 8 (e)). In regions where hydric stress exist, nearly all cities have a negative precipitation variation per inhabitant. The city of Lima in Peru shows an increase of precipitation per inhabitant. How-ever, the very low annual precipitation (10.3 mm/year) exacerbates this result. Fig. 8 (e) shows the number of cities depending on intervals of PDPI. The intervals increase by doubling each time the values of the boundaries. The major interval of precipitation decrease is between 0 and 2.5 mm per year and per million inhabitants. However, 92 cities record a PDPI index greater than 2.5.
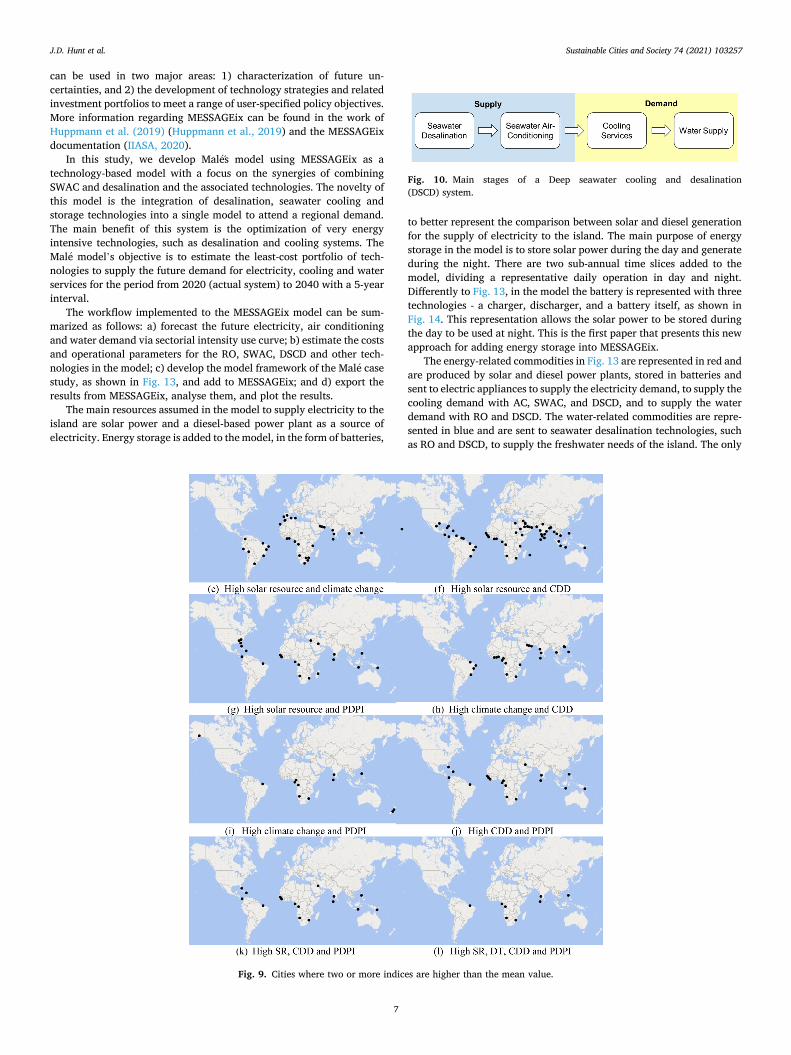
Fig. 9 shows the cities where two or more indices are simultaneously higher than the mean value. There are 17 sites where the three indices SR, CDD and PDPI are simultaneously high. 8 sites have the four indices higher than the mean value, including the city of Male in Maldives. 92 cities have a PDPI index over 2.5 mm per year and per inhabitant and could require desalination plants to compensate for the precipitation decrease. The cooling demand in buildings (CDD) and the solar re-sources of major coastal cities show the possibility of developing simultaneous cooling and desalination technologies.
3. Methodology, benefits and challenges of integrated SWAC and RO systems
3.1. Deep seawater cooling and desalination
The proposed DSCD system consists of the desalination of the warm superficial seawater with RO membrane, followed by cooling of the desalinated water with SWAC and the distribution of the cold water for both cooling and water supply services (Fig. 10). The cooling services must be provided prior to the water supply, as the water is the cooling
medium required for the cooling service. After the cooling service is provided, the temperature of the water will reach close to ambient temperature and the water can be supplied for other customers.
The superficial water should be used for desalination. This is because the efficiency and desalination capacity of RO systems is directly impacted by the temperature of the water. As water cools, its viscosity increases, and the diffusion rates and desalination productivity are reduced. There is a reduction of around 1.5%/◦C of product flow. To find the membrane permeate rate at any temperature, multiply the rated permeate flow of the RO membrane by the temperature conversion factor shown in Table 1. It is not recommended to heat the salty water to increase water temperature. RO membranes cannot handle water tem-peratures over 38 ◦C, and water heaters have silt and other sediment that can damage the membrane and RO unit.
Looking at the supply side, this paper proposes three different sys-tems for DSCD as shown in Fig. 11. Two approaches require a barge or a ship with desalination equipment and an electrical connection to the coast, and for the third approach the DSCD facility is installed on the coast. The offshore, open cycle DSCD plant (Fig. 11 (a)) consists of a barge with a desalination plant, a SWAC plant and four pipelines. One pipeline extracts warm superficial water for desalination, the second pipeline transports the cold deep seawater to the barge, the third pipe-line returns the warm deep seawater mixed with the brine from the desalination plant to the ocean, and the fourth pipeline transports the cold, freshwater to the coast, where it is used for cooling and water supply. The offshore, closed cycle DSCD (Fig. 11 (b)) is like the previous proposal, but the heat exchanger used to cool down the desalinated water is installed in the deep sea instead of on the ship, which reduces pumping costs and increases investment costs. The onshore, open cycle DSCD (Fig. 11 (c)) consists of a desalination and SWAC plant on the coast with three pipelines: one superficial seawater inlet, one cold deep seawater inlet and one pipeline to return the warm brine from the desalination and SWAC processes. Table 2 compares the advantages and disadvantages of the three proposed DSCD plants.
The demand side of DSCD systems requires detailed planning for all the cooling potential to be extracted from the cold freshwater before the water is consumed. This paper considers three possible customers for the use of the cold fresh water produced in DSCD plants. These are presented
PDPIcity =precipitation (year 2010)population (year 2010)
−precipitation (year 2010) − mean change in annual precipitation per year
population (year 2010) × (1 − growth rate)(5)
J.D. Hunt et al.

Sustainable Cities and Society 74 (2021) 103257
6
in Fig. 12 and Table 3, where in the first case the customer will consume all the cooling potential and water delivered. In the second case, one customer consumes the cooling services; however, its water demand is not so high, and thus the water is then delivered to another customer that consumes the water. The main benefit of this system is that the cooling energy carrier, which is the freshwater in this case, does not need to be returned to the district cooling facility. This reduces the in-vestment and operational costs of the system, as the energy carrier will only flow from the district cooling facility to the customer. The return trip will not be required as the freshwater will be consumed for water supply afterwards. Similar arrangements could be implemented in other district cooling systems, where the water supply and the cooling service are combined.
3.2. MESSAGEix energy system modelling for the case study of Male
In this case study, the MESSAGEix energy system modeling tool is used to simulate Males cooling and water services demand and optimize the renewable energy supply. The MESSAGEix is a dynamic, linear, least-cost optimization model developed by the IIASA Energy Program in the 1980s (Huppmann et al., 2019). MESSAGEix is a free and open-source documentation wherein a Python package links together all components of the framework. The model seeks to satisfy given demand levels by country or region at a minimal cost (Hall & Buckley, 2016). It determines the optimal configuration of the energy system under various technical engineering, socio-economical, or biophysical con-straints (S. Zhang et al., 2016). It helps the user determine the optimal capacity portfolio and least-cost solution for satisfying a given demand for commodities or energy services. With MESSAGEix a scenario analysis
Fig. 8. (a) solar resources (kWh/m2), (b) temperature increase (Co), (c) cooling degree days (Codays). (d) precipitation (mm/year), (e) precipitation per inhabitant (mm/year/million inhabitants) in coastal cities. Among the major coastal cities, the relative values of indices SR, DT, CDD and PDPI are above the average value. The indices are first coupled two by two and then by three and four.
J.D. Hunt et al.
Sustainable Cities and Society 74 (2021) 103257
7
can be used in two major areas: 1) characterization of future un-certainties, and 2) the development of technology strategies and related investment portfolios to meet a range of user-specified policy objectives. More information regarding MESSAGEix can be found in the work of Huppmann et al. (2019) (Huppmann et al., 2019) and the MESSAGEix documentation (IIASA, 2020).
In this study, we develop Males model using MESSAGEix as a technology-based model with a focus on the synergies of combining SWAC and desalination and the associated technologies. The novelty of this model is the integration of desalination, seawater cooling and storage technologies into a single model to attend a regional demand. The main benefit of this system is the optimization of very energy intensive technologies, such as desalination and cooling systems. The Male model’s objective is to estimate the least-cost portfolio of tech-nologies to supply the future demand for electricity, cooling and water services for the period from 2020 (actual system) to 2040 with a 5-year interval.
The workflow implemented to the MESSAGEix model can be sum-marized as follows: a) forecast the future electricity, air conditioning and water demand via sectorial intensity use curve; b) estimate the costs and operational parameters for the RO, SWAC, DSCD and other tech-nologies in the model; c) develop the model framework of the Male case study, as shown in Fig. 13, and add to MESSAGEix; and d) export the results from MESSAGEix, analyse them, and plot the results.
The main resources assumed in the model to supply electricity to the island are solar power and a diesel-based power plant as a source of electricity. Energy storage is added to the model, in the form of batteries,
to better represent the comparison between solar and diesel generation for the supply of electricity to the island. The main purpose of energy storage in the model is to store solar power during the day and generate during the night. There are two sub-annual time slices added to the model, dividing a representative daily operation in day and night. Differently to Fig. 13, in the model the battery is represented with three technologies - a charger, discharger, and a battery itself, as shown in Fig. 14. This representation allows the solar power to be stored during the day to be used at night. This is the first paper that presents this new approach for adding energy storage into MESSAGEix.
The energy-related commodities in Fig. 13 are represented in red and are produced by solar and diesel power plants, stored in batteries and sent to electric appliances to supply the electricity demand, to supply the cooling demand with AC, SWAC, and DSCD, and to supply the water demand with RO and DSCD. The water-related commodities are repre-sented in blue and are sent to seawater desalination technologies, such as RO and DSCD, to supply the freshwater needs of the island. The only
Fig. 10. Main stages of a Deep seawater cooling and desalination (DSCD) system.
Fig. 9. Cities where two or more indices are higher than the mean value.
J.D. Hunt et al.

Sustainable Cities and Society 74 (2021) 103257
8
technology that has two outputs is DSCD, which produces both fresh-water and cooling services. Details such as costs assumed in the model are described in Table 4. Note that these prices change with time. For further details on the model, please refer to the following GitHub re-pository on the link in (Weber, Zakeri, & Hunt, 2021).
Eq. 6 was used to estimate the cooling potential of the SWAC system in the MESSAGEix-Male model, and Table 5 assumes the onshore, open- cycle, DSCD type. The potential for cooling varies with the temperature of the deep seawater, the ambient temperature, the temperature of the brine returned to the ocean, the flow of water and the losses in the system.
CP = CD − LH − LD (6)
Where, CP is the cooling potential of the DSCD system, CD is the cooling extracted from the deep seawater, LH is heat loss in the heat exchanger between the deep seawater and the fresh desalinated water, assumed to be 5% of the CD and LD is the heat loss in the distribution system, assumed to be 15% of CD. This results in Eq. 7 below. Eq. 8 describes the calculation of CD.
CP = 0.8 CD (7)
CD = (TI − TO) F CS ρ (8)
Where, TI is the deep seawater inlet temperature to the heat
exchanger, assumed to be 8◦C. TO is the temperature of the deep seawater leaving the SWAC plant, assumed to be 23◦C. F is the flow of deep seawater to the SWAC plant, assumed to be 1 m3/s. CS is the spe-cific heat of the deep seawater, assumed to be 4.0 kJ/kg.K. ρ is the density of the seawater, assumed to be 1,028 kg/m3.
4. Results
An important aspect of DSCD plants is the balance between the cooling and water supply services that the system provides and the en-ergy consumption of the system. For example, to desalinate 1 m3/s of seawater, around 10 MWe of electricity is required. This flow of cold fresh water produced from the DSCD plant has the cooling potential of 82 MWt, which could replace an AC system that requires 20 MWe. In other words, a DSCD plant desalinates water and can still reduce the overall electricity consumption of the grid. Table 5 compares the amount of cooling energy potential in the deep ocean seawater with other electricity generation sources, assuming that the conversion of electricity to cooling power has a Coefficient of Performance (COP) of 4.1. It should be noted that for deep seawater, electricity is still needed to pump the cold seawater and to ensure the water distributed in the district cooling system. Comparing the energetic potential of deep seawater and hydropower for cooling purposes, 1 m3/s of deep seawater producing a 15 ◦C temperature change is equivalent to a 1380 meters high hydropower dam with the same flow, or equivalent to a 280,000 m2
solar PV farm, or equivalent to 15 wind turbines with 2 MW capacity. One should note that electricity generation technologies have additional costs involved to convert electricity to cooling services.
The site selection for the case study of DSCD process involves three main aspects: the demand for cooling, the cost of SWAC systems in the location and the demand for water desalination. It is important that cooling and desalination demands are constantly high throughout the year, as DSCD and SWAC systems are baseload-cooling solutions, due to the high investment costs and low operational costs. These two
Fig. 11. Diagram presenting Deep Seawater Cooling and Desalination, (a) open cycle DSCD plant, (b) offshore, closed cycle DSCD, (c) onshore open cycle DSCD (adapted from (Makai Ocean Engineerging, 2017)).
Table 2 Advantages and disadvantages of the proposed DSCD systems.
DSCD types Advantages Disadvantages
Offshore, open cycle DSCD, Figure 11 (a)
- Requires only one pipeline to the coast.
- No cavitation issues, which limits the flow velocity in the onshore proposal (J.D. Hunt et al., 2020).
- It is a good solution for locations with long continental platforms.
- Lower environmental impacts on coastal area (Venkatesan, 2014).
- The need of a barge increases the cost of the system.
- Two pipelines are required to catch and release deep seawater.
- Underwater electrical connection required to supply the system with electricity.
Offshore, closed cycle DSCD, Figure 11 (b)
- Requires only one pipeline to the coast.
- No cavitation issues, which limits the flow velocity in the onshore proposal (J.D. Hunt et al., 2020).
- It is a good solution for locations with long continental platforms.
- Lower environmental impacts on coastal area (Venkatesan, 2014).
- The need of a barge increases the cost of the system.
- Deep sea heat exchanger is not a mature technology.
- Underwater electrical connection required to supply the system with electricity.
Onshore, open cycle DSCD, Fig. 11 (c)
- Does not require underwater electrical connection.
- Does not require a barge. - It is a good solution for
locations with short distance to the deep ocean.
- Three pipelines are required.
- The process facility on the coast depends on land availability and cost.
J.D. Hunt et al.

Sustainable Cities and Society 74 (2021) 103257
9
requirements are met in Male, Maldives (Liu, Mei, Wang, Shao, & Xiang, 2018). Male has a population of around 400,000 inhabitants with a growth rate of 4%/year (City Population, 2021). The annual solar resource is 2126 kWh. The temperature variation between 1901 and 2012 is 1.125 K. Fig. 15 presents the ambient temperature in Male in 2019, which has an average air temperature of 28.2 ◦C. Note that there are only a couple of hours when the temperature is lower than 26 ◦C. The CDD is high, equal to 3662 ◦C.h. The average annual precipitation recorded is 1953 mm/year (weatherbase, 2021). The latest IPCC report shows no evolution of precipitation over the past 60 years (Stocker et al.,
2013). Because of the high growth rate, the PDPI index is extremely high, equal to 250 mm per year and per million inhabitants. The city of Male was assessed as one of the eight most suitable sites among the 162 major coastal cities in terms of solar resource, climate change, CDD and PDPI. As it can be seen in Fig. 12, the cost of cooling in the Maldives is 0.25 $/KWht. Fig. 16 presents the potential for SWAC in the Maldives islands, where the lines in yellow are the tunnels required to connect the coast and the deep sea with seawater at 5◦C. The maximum length of the tunnels allowed are 30 km. More details on how this potential for SWAC was estimated can be found in (J.D. Hunt et al., 2019) (Fig. 16).
Fig. 14 shows two maps of the Maldives Islands. The demand for water is high in Male and the Hulhumale islands. Male is one of the most densely populated locations in the world with a population of 133,412 people in an area of 1.95 km2 and relies on seawater desalination to meet almost all of its water supply. This amounts to around 80,000 m3/ day or 1 m3/s (International Renewable Energy Agency, 2015a). In 2014, a fire in the desalination plant resulted in a loss of the freshwater supply, and the island had to rely on imported bottled water (Freyberg, 2014). The desalination capacity of the island further expanded in 2020 to increase water production and reliability (HITACHI, 2019). As Male is the capital of the Maldives, it also provides water supply to some of its 1190 islands. Total freshwater withdrawal is estimated at 27,400 m3/day (International Renewable Energy Agency, 2015a). Given the surge in tourism to the Maldives Islands, and several land reclaimant projects that could more than double the country’s land area, the de-mand for seawater desalination is expected to increase substantially in the future. Also, agricultural water consumption is assumed to be zero (International Renewable Energy Agency, 2015a). With the increase in vertical, artificial farming (Kalantari, Tahir, Joni, & Fatemi, 2017; Stępien et al., 2021), desalinated water can be used to produce leaves, vegetables and fruits locally, substantially reducing the costs of food, which are transported by airplane and ship to the islands. This shows that DSCD could be an interesting alternative to increase the reliability of water supply to the inland and increase the efficiency of current cooling solutions.
The Maldives consists of several low altitude atolls with more than a thousand islands (Fig. 17). The atolls are located on the edge of a con-tinental plate, which is shaped as an ellipse facing north. In the middle of the continental plate the average depth is around 300 meters, which is not adequate for SWAC. Over the continental plate, the depths are more than 2000 meters. Some islands require 1 to 5 km tunnel to reach these depths, which increases its SWAC potential.
SWAC projects are already under consideration for Hulumale (DEVCCO District Energy Ventury, 2016; Makai Ocean Engineering, 2008). Exploring the potential on other islands with large cooling loads in the Greater Male region, especially Male, might be worthwhile. SWAC has the potential to reduce the electricity demand for cooling, contrib-uting to the overall renewable energy deployment of the island (Inter-national Renewable Energy Agency, 2015b). Figure 18 shows the
Fig. 12. Cooling and water distribution for different customers.
Table 3 Services provided by DSCD systems.
Number of Customers
Service Description Examples of customers
One Cooling and water services
The customer cooling demand is higher than the water demand. In this case, the cold water reaches the customer, and the water absorbs as much heat as possible, providing cooling services, and the water is consumed in the same locations. Note that the cooling demand might not be met totally by the DSCD system, and additional sources of water or cooling might be required.
Restaurants, hotels, resorts, spas, hospitals, cold water fish and crustacean farming, residential districts.
Two Cooling services
The customer requires a considerable amount of cooling and not so much water demand. In this case, the cold water is used for refrigeration and the water is then sold to other customers.
Commercial buildings, airports, data centres, industrial cooling processes, shopping centres, department stores, artificial ski resorts, grains storage, food storage.
Water services
The customer requires a considerable amount of water and does not require cooling services. In this case, another customer with high cooling requirements should use the cold water first.
Greenhouse, vertical farming, agricultural fields, industrial processes, power generation.
Fig. 13. Framework of MESSAGEix-Male model.
J.D. Hunt et al.

Sustainable Cities and Society 74 (2021) 103257
10
change in temperature and salinity depending on depth. This data was extracted from the NODC (Levitus) World Ocean Atlas project (National oceanic and atmospheric administration, 2018). It provides annual, seasonal, and monthly temperature and salinity data at multiple depths with 1 arc degree resolution. The present study assumes that the DSCD plants extract water at a depth of 1,000 meters, where the temperature is on average 5◦C. Comparing this temperature with the average air tem-perature of the island results in an average temperature difference of
23.2◦C. Given that the continental crust between Male and the deep ocean is
small, this paper proposes the construction of the onshore, open cycle DSCD as shown in Fig. 19. The bathymetric data used in the project was taken from the General Bathymetric Chart of the Oceans (GEBCO) project (GEBCO, 2021). GEBCO presents bathymetric data with 30 arc second resolution of the world’s oceans, seas and lakes and the topog-raphy of islands and continents (Weatherall et al., 2012). The proposed
Fig. 14. Energy storage representation in MESSAGEix.
Table 4 Cost description of the technologies and commodities in the Male MESSAGEix model in 2020.
Technology Service Investment cost (USD/ KW)
Fixed costs (USD/ KWa)
Fuel costs (USD/ KWa)
Lifetime (years)
Capacity factor (%)
Input Output
Diesel power plant
Electricity 950 25 778 15 75 - 1 MWa
Solar power plant
677 5 - 20 30 - 1 MWa
Battery 450 32 - 5 40 1.1 MWa
1 MWa
Appliances 50 - - 10 50 1 MWa 1 MWa AC Cooling 450 30 - 15 50 1 MWa 3 MWta SWAC 768 195 - 40 80 1 MWa 20 MWta RO Desalination 950 280 - 20 80 1 MWa 3.1 × 10⁶
m3/a DSCD Cooling &
desalination 1203 333 - 40 80 2 MWa 20 MWa
3.1 × 10⁶
m3/a
Table 5 Comparison of deep ocean seawater with other technologies for supplying the same amount of cooling.
Technology Driving force Quantity Electricity generation or consumption
Cooling potential
DSCD Seawater Desalination with Reverse-Osmosis
Electricity Desalinated water: 1 m3/s
− 10 MWe -
Deep Seawater Temperature difference: ΔT =15oC
Deep seawater flow: 1 m3/s
− 2 MWe 15 oC × 4.0 kJ/kg.Ki x 1 m3/s ×1028 kg/m3ii × 0.8 = 49 MWt
Renewable energy sources
Hydropower Height: ΔH = 1,380 m at 90% efficiency
Dam turbine flow: 1 m3/s
1,380 m × 9.8 m3/s × 1 m3/s × 0.9 = 12 MWe
12 MW × 4.1 COP) = 49 MWt
Photovoltaic Cells Solar irradiation: 0.24 kW/m2
at 18% capacity factor Photovoltaic cells: 600,000 m2
0.24 kW/m2 × 280,000 m2
× 0.18 = 12 MWe
12 MW × 4.1 (COP) = 49 MWt
Wind Power Wind generation: 2 MW at 40% capacity factor
Number of wind turbines: 15 turbines
2 MW × 0.4 × 15 = 12 MWe
12 MW × 4.1 (COP) = 49 MWt
iThe specific heat of seawater at 0 ◦C with 35 g of salt/kg of water is 3,985 kJ/kg.K. iiThe density of seawater at 5 ◦C and with 35 g of salt/kg of water is 1028 kg/m3.
J.D. Hunt et al.

Sustainable Cities and Society 74 (2021) 103257
11
deep-sea pipeline has a length of 5 km and depth of 1000 m and trans-ports cold deep seawater to the DSCD plants, while the mix water pipeline with 1 km length and 200 meters depth discharges cold brine back to the sea. The surface water pipeline with 0.2 km length and 30 meters depth catches warm seawater for desalination. The bathymetry of the location is appropriate for the installation of the DSCD system.
The planned developments in Hulhumale will generate a very large demand for cooling. Based on the master plan for the island, the po-tential demand has been estimated at 300 MW cooling capacity and 1.8 million MWh of cooling energy consumption annually (DEVCCO District Energy Ventury, 2016). Fig. 20 presents more details on the distribution of the cold freshwater. The airport and the fuel storage facility in the Hulhule island would consume the 82 MWt cooling capacity of the freshwater and some of the 1.0 m3/s desalinated water. Then the water would be pumped to residences, hotels, and resorts on the Hulhumale Island, where some residential cooling demands could be satisfied, reducing the energy consumption for cooling, and the water will be eventually consumed or transported by ship or pipeline to other islands, like Male.
Male consumed 390 GWh of electricity in 2019, and it is expected that consumption will increase to 540 GWh by 2030 (Hillendahl, Fischer, Jess, Schimanek, & Wieck, 2017). Electricity consumed in Male is divided into 35% for manufacturing and commerce sectors, 53% for the residential sectors and 12% in government buildings (Hillendahl et al., 2017). 30% of the electricity is consumed for cooling (Hillendahl et al., 2017). Fig. 21 presents the impact of rising solar PV shares in the Maldives islands (International Renewable Energy Agency, 2015b). With the implementation of a DSCD plant, the requirement of battery storage would reduce due to the capacity of seawater desalination and SWAC to vary its electricity consumption with the availability of energy, as a demand side management solution (J.D. Hunt et al., 2020). The main sources of electricity for operating the DSCD system would prob-ably be solar rooftop photovoltaic generation, followed by floating solar panels on the atolls, as proposed in (International Renewable Energy Agency, 2015b). The advantage of combining DSCD and solar genera-tion is that desalination and the SWAC system can operate only when there is cheap solar energy available, and the cold freshwater produced can be stored in tanks to guarantee the supply of cooling and water during periods without solar generation. This operational aspect of the DSCD system is an ideal demand side management solution to allow the best use of the renewable generation potential of the islands. In the future, imported hydrogen could also provide the backup power required.
Fig. 21 presents the results from the MESSAGEix model. It shows that additional generation capacity will be supplied by solar panels backed up by batteries, and the current diesel generator will provide base load generation until 2040 (Luo et al., 2020). RO will remain the main source of water to the island. However, a DSCD plant is expected to supply water and cooling services, and the number of customers will increase with the growing demand in water and cooling. AC is expected to be
almost entirely replaced by SWAC and DSCD due to its high electricity consumption and the high costs of electricity generation on the island. For more details on the model, please refer to the GitHub repository on the website in (Weber et al., 2021).
5. Discussion
DSCD plants have several benefits when compared to a SWAC plant. For instance, in SWAC systems, the district cooling system requires two pipelines, one to supply the cooling demand and another to return the water to the SWAC plant. The district cooling system of DSCD plants only requires one tube to provide both the water supply and the cooling services. This substantially reduces the investment and operational costs of the district cooling network. The onshore DSCD plant has only three pipelines, where individual desalination and a SWAC plant require four pipelines. The main challenge for DSCD systems is the combination of water supply and cooling requirements of the system.
DSCD is an energy, water and land nexus technology, similarly to other technologies with the objective to provide energy and water ser-vices with the least resources possible (J.D. Hunt, Freitas, & Pereira Junior, 2014; Julian D Hunt & Leal Filho, 2018; Julian David Hunt, Byers, et al., 2019; Julian David Hunt, Guillot, Freitas, & Solari, 2016; Julian David Hunt et al., 2020; G. Zhang, He, & Dewancker, 2020)(Hunt et al., 2019)(Hunt et al., 2020). The Maldives is under threat due to global warming and rising sea levels. However, action has been taken to reduce CO2 emissions. More specifically, there are proposed geo-engineering projects to contain sea level rise (J.D. Hunt & Byers, 2019;
Fig. 16. Potential for SWAC in the Maldives islands (J.D. Hunt et al., 2019).
Fig. 15. Temperature variation in Male in 2019 (data taken from (Renewables.ninja, 2019)).
J.D. Hunt et al.

Sustainable Cities and Society 74 (2021) 103257
12
Julian David Hunt, Nascimento, et al., 2019; Moore, Gladstone, Zwin-ger, & Wolovick, 2018).
Another benefit of having desalination plants built on ships (without integration with SWAC) is that the ship would have a large operational flexibility, as it can move from one location to another depending on the demand for desalination, substantially increasing its operational ca-pacity and returns on investment. This is particularly interesting due to global warming and the unpredictability of the climate, particularly droughts, and in the case of areas impacted by natural disasters such as floods, fires, hurricanes, earthquakes, and tsunamis.
An example of a water consumption customer that could use the water after most of the cooling potential in the cold freshwater is extracted is vertical farming. The supply of leaves, vegetables and fruits of the island is dependent on imports from other countries, which sub-stantially increase the costs of these foods. Being able to produce food in vertical farms on the island using natural and artificial solar power, when there is excess solar generation in the grid and the cold and fresh water from the DSCD plant, could reduce the costs of these foods.
The difference in temperature between the deep sea and shallow sea has been considered for energy generation and seawater desalination (The New Indian Express, 2013). This technique is called Low Temper-ature Thermal Desalination and has successfully been applied in India. Other authors have proposed the combination of Ocean Thermal Energy Conversion (OTEC) and low-temperature thermal desalination (LTTD) (Fachina, 2016; A. Kim, Kim, Lee, & Cha, 2016), as well as ice produc-tion (Claude, 1930; Pittman, 1982; Sah, Choudhury, & Das, 2016) and other energy carriers (hydrogen) (Gilmore, Blohm, & Sinsabaugh, 2014). However, due to its low efficiency it has not yet proven to be a viable electricity generation alternative (Nithesh & Chatterjee, 2016;
Fig. 17. (a) Bathymetry of the Maldives archipelago (b) Gaafaru atoll, North Male and South Male atolls with the lagoons (Green) and islands (Grey) marked. 1:Male, 3:Hulhule, 4:Hulhumale (Rasheed, Warder, Plancherel, & Piggott, 2020).
Fig. 19. Proposed DSCD plant in Male.
Fig. 18. Temperature and salt concentration in front of Male’s island (data taken from (National oceanic and atmospheric administration, 2018)). Fig. 20. Proposed DSCD plant and distribution system in Male, Maldives.
J.D. Hunt et al.

Sustainable Cities and Society 74 (2021) 103257
13
Wang, Yang, Wang, Zhang, & Wang, 2019). Currently, attention has been given to a Barge Mounted Desalination Plant with a capacity of 1.000 m3/day, which was successfully commissioned off the coast of Chennai during April 2007. The plant runs on the principle of Low Temperature Thermal Desalination (LTTD) that involves evaporating warm surface seawater (at about 29◦C) in a Flash Chamber maintained under partial vacuum (at about 25 mbar) and consequently liquefying the resulting vapor in a condenser. The coolant water for the condenser is drawn using the thermal gradient available in the ocean, namely using the feature of reduction of ocean water temperature with an increase in depth. A pipe is deployed in the ocean to draw the cold water (at about 10 ◦C) from a depth of about 450 m. The entire plant and mooring was designed by NIOT and manufactured and installed using local labor (National Institute of Ocean Technology - Chennai, 2017). Four Low Temperature Thermal Desalination (LTTD) plants have been success-fully commissioned in India at Kavaratti in 2005, at the North Chennai Thermal Power Station (NCTPS) in 2008, at Minicoy, Agatti and in the islands of Lakshadweep in 2011. The capacity of each one of these LTTD plants is 1.000 m3/day. The capital cost of the LTTD plant in Kavaratti was 1 million dollars, in Minicoy 2 million dollars, in Agatti 3 million dollars, and at NCTPS 1 million dollars (The New Indian Express, 2013), and electricity consumption is similar to RO plants (Venkatesan, 2014). RO systems, with capital costs around 800 thousand dollars, are cheaper. However, it should be noted that as 1.000 m3/day is a rela-tively small amount of water production, there is the possibility of cost reduction with the increase in scale, and LTTD is a new development with significant scope for cost reduction as the technology matures. In comparison, the system presented in this case study produces 80,000 m3/day. In addition, old ships may be converted into floating desali-nation plants (Kreamer, 2009), and this article assumes the combination of LTTD and SWAC; in other words, the fresh water will be used for
cooling purposes as well as for water supply. Other features of LTTD plants are that they do not require pre-treatment of feed water, they provide assured consistent quality water as per WHO standards, oper-ational simplicity and easy maintenance, there is no environmental (chemical or thermal) pollution on the coast, and highly nutrient cold water enhances marine life (National Institute of Ocean Technology - Chennai, 2017). The LTTD is affected by the El Nino phenomenon in the Pacific Ocean. This is because during the El Nino oscillation in the Eastern Pacific countries, the shallow water surface temperature in-creases, which increases the efficiency of LTTD as well. However, during the El Nino there is also an increase in the rain patterns, reducing the need for desalination. On the other hand, in the Western Pacific the demand for water increases, while at the same time the potential for Ocean Thermal Desalination decreases. As proposed by Du et al. (Du, Ma, & Wang, 2008), the integration between LTTD and SWAC, i.e. DSCD, is performed through a new water supply network to distribute the cold water to the customer. This water distribution network would only distribute cold water and would have a certain amount of insulation to reduce heat gains to the cold water. The cold-water network is expensive and should prioritize large water and cooling consumers such as airports, hotels, resorts, industrial processes, etc. After the technology is mature and implementation costs reduce, DSCD services could then be expanded to the general customers through district cooling.
The warm seawater outlet should return the deep seawater at around half of the length of the inlet pipeline or at depths of at least 50 meters (Development Bank of Latin America, 2015). This is to reduce the impact of the colder, saltier water on the marine environment. De Profundis prescribes an output at a minimum of about 200 m to avoid algae bloom. Environmental studies of the coastal areas of Hawaii (Mamala Bay, Ohanu and Honolulu SWAC projects) have been developed to provide an understanding of pre-impact conditions at the future SWAC site and
Fig. 21. Scenario for electricity generation, cooling and desalination demands in Male between 2020 and 2040, every 5 years.
J.D. Hunt et al.

Sustainable Cities and Society 74 (2021) 103257
14
enable a more accurate environmental assessment (Comfort, et al., 2015; Cardno TEC, 2014). An alternative use of the warmer seawater outlet, which can be rich in nutrients, is to produce algae, fish and crustaceans in controlled tanks or in the open ocean (International Renewable Energy Agency, 2014; Asian Development Bank, 2014; von Herzen, et al., 2017).
6. Conclusions
Based on the preliminary assessment of solar resources, climate change, cooling degree-days and possible desalination needs, this article presents the possibility of combining seawater desalination with seawater air conditioning (SWAC). Both services originate from the same source, the ocean. The distribution of cooling and water supply services could be integrated in the same system to reduce distribution costs, which is the main benefit from the technology as presented in this paper. Comparing the electricity demand to desalinate 1 m3/s of seawater (10 MWe) and the cooling service provided with the cold water (49 MWt), with initial investment a DSCD plant could provide fresh-water at the same time it reduces the electricity consumption for cooling in the grid. In typical SWAC systems, the water from the district cooling system returns at around 13-15◦C, as this is the operating temperature of the cooling system of the building. This results in the deep seawater returning to the ocean at low temperatures, and a useful change in temperature of only 5–7 ◦C from the deep seawater, i.e. a significant cooling potential is wasted. DSCD plants manage to use all the cooling potential from the deep seawater (15–18 ◦C) because the desalinated water is consumed at a low temperature, providing cooling and water supply services simultaneously. The Male, Hulhule and Hulhumale islands in the Maldives are very interesting locations for the imple-mentation of a DSCD project, due to a concentrated and year-around cooling demand, its cheap potential for SWAC and its demand for desalinated water. Summing up, DSCD is a technically renewable energy alternative that has a significant potential, particularly in island or coastal tropical and equatorial regions with pressing water scarcity.
Declaration of Competing Interest
None.
Acknowledgments
We would like to thank the PRINT/UFRGS, CAPES/BRAZIL for the visiting professor research grant. The contribution from BZ is funded by IIASA.
Code Access
The MESSAGEix model implemented in the paper is available in the link: https://github.com/JulianHunt4/Male-MESSAGEix-Model
References
Alkhulaifi, Y. M., Baata, E., Al-Sulaiman, F. A., Ibrahim, N. I., & Ben-Mansour, R. (2021). Performance and exergoeconomic assessment of a novel combined ejector cooling with humidification-dehumidification (HDH) desalination system. Desalination, 500, Article 114843. https://doi.org/10.1016/j.desal.2020.114843. https://doi.org/ https://doi.org/.
AquaticLife. (2019). How Temperature Affects RO Water Production. Retrieved from https://aquaticlife.com/blogs/news/how-temperature-affects-ro-water-production #:~:text=All flow rates stated on,about 3%25 of product flow.&text=The result is the permeate flow at that temperature.
Bai, S., Ho, T. C., Ha, J., An, A. K., & Tso, C. Y. (2020). Study of the salinity effects on the cooling and desalination performance of an adsorption cooling cum desalination system with a novel composite adsorbent. Applied Thermal Engineering, 181, Article 115879. https://doi.org/10.1016/j.applthermaleng.2020.115879. https://doi.org/ https://doi.org/.
Boretti, A., & Rosa, L. (2019). Reassessing the projections of the World water development report. Npj Clean Water, 2(1), 15. https://doi.org/10.1038/s41545- 019-0039-9. https://doi.org/.
Byrne, P., Fournaison, L., Delahaye, A., Ait Oumeziane, Y., Serres, L., Loulergue, P., … Mare, T. (2015). A review on the coupling of cooling, desalination and solar photovoltaic systems. Renewable and Sustainable Energy Reviews, 47, 703–717. https://doi.org/10.1016/j.rser.2015.03.083. https://doi.org/https://doi.org/.
Castro, M., Alcanzare, M., Esparcia, E., & Ocon, J. (2020). A comparative techno- economic analysis of different desalination technologies in off-grid islands. Energies, (9), 13. https://doi.org/10.3390/en13092261. https://doi.org/.
City Population. (2021). City Population. Retrieved from www.citypopulation.de. Claude, G. (1930). Power from the tropical seas. Mechanical Engineering, 52(12). Comfort, C., McManus, M., Clark, S., Karl, D., & Ostrander, C. (2015). Environmental
properties of coastal waters in mamala bay, oahu, hawaii, at the future site of a seawater air conditioning outfall. Oceanography, 28(2), 230–239.
Davidson, J. (2003). California’s energy future and cold ocean water. Sea Technology, 44 (7), 30–34.
DEVCCO District Energy Ventury. (2016). Final Feasibility Report: Male and Holhumale District Cooling Feasibility Study. Stockholm.
Devis-Morales, A., Montoya-Sanchez, R., Osorio, A., & Otero-Díaz, L. (2014). Ocean thermal energy resources in Colombia. Renewable Energy, 66, 759–769.
Diaby, A. T., Byrne, P., Loulergue, P., Balannec, B., Szymczyk, A., Mare, T., & Sow, O. (2017). Design study of the coupling of an air gap membrane distillation unit to an air conditioner. Desalination, 420, 308–317. https://doi.org/10.1016/j. desal.2017.08.001. https://doi.org/https://doi.org/.
Diaby, A. T., Byrne, P., & Mare, T. (2019). Simulation of heat pumps for simultaneous heating and cooling using CO2. International Journal of Refrigeration, 106, 616–627. https://doi.org/10.1016/j.ijrefrig.2019.03.010. https://doi.org/https://doi.org/.
Du, L., Ma, J., & Wang, J. (2008). New heat exchange scheme of drawing the cool capacity from the subsurface layer of seawater. Taiyangneng Xuebao/Acta Energiae Solaris Sinica, 29(9), 1057–1062.
Elahee, K., & Jugoo, S. (2013). Ocean thermal energy for air-conditioning: Case study of a green data center. Energy Sources, Part A: Recovery, Utilization and Environmental Effects, 35(7), 679–684.
Elsafty, A., & Saeid, L. (2009). Sea water air conditioning [SWAC]: A cost effective alternative. International Journal of Engineering, 3(3), 346–358.
Fachina, V. (2016). Sustainable freshwater from the tropical oceans. Brazilian Society of Mechanical Sciences and Engineering, 38, 1269–1277.
Freyberg, T. (2014). Desalination dependence highlighted by Maldives water crisis. Retrieved from WaterWorld website: https://www.waterworld.com/drinking -water/treatment/article/16215236/desalination-dependence-highlighted-by-maldi ves-water-crisis.
Gao, L., Yoshikawa, S., Iseri, Y., Fujimori, S., & Kanae, S. (2017). An economic assessment of the global potential for seawater desalination to 2050. Water, 9(10). https://doi.org/10.3390/w9100763. https://doi.org/.
GEBCO. (2021). GEBCO 2020 gridded bathymetry data download. Retrieved from https://download.gebco.net/.
Gilmore, E., Blohm, A., & Sinsabaugh, S. (2014). An economic and environmental assessment of transporting bulk energy from a grazing ocean thermal energy conversion facility. Renewable Energy, 71, 361–367.
Hall, L. M. H., & Buckley, A. R. (2016). A review of energy systems models in the UK: Prevalent usage and categorisation. Applied Energy, 169, 607–628. https://doi.org/ 10.1016/j.apenergy.2016.02.044. https://doi.org/https://doi.org/.
Harby, K., Ali, E. S., & Almohammadi, K. M. (2021). A novel combined reverse osmosis and hybrid absorption desalination-cooling system to increase overall water recovery and energy efficiency. Journal of Cleaner Production, 287, Article 125014. https://doi.org/10.1016/j.jclepro.2020.125014. https://doi.org/https://doi.org/.
Henley, J. (2015). World set to use more energy for cooling than heating. Retrieved from The Guardian website: https://www.theguardian.com/environment/2015/oct/26/ cold-economy-cop21-global- warming-carbon-emissions.
Hillendahl, J. L., Fischer, M., Jess, P., Schimanek, S., & Wieck, S. (2017). Sustainable Energy Systems in Male. Flensburg.
HITACHI. (2019). Hitachi capital received an order for seawater RO desalination system with financing for water supply infrastructure in the Maldives. Retrieved from http://www.hitachi.com/New/cnews/month/2019/02/190221.pdf.
Honolulu Seawater Air Conditioning. (2017). Honolulu seawater air conditioning. Retrieved from http://honoluluswac.com/.
Hou, H., Hou, Y., & Lee, Y. (2010). Study of Deep Ocean Water (DOW) cooling energy and DOW Industry. In International conference on energy and sustainable development: issues and strategies, ESD 2010.
Hunt, J. D., & Byers, E. (2019). Reducing sea level rise with submerged barriers and dams in Greenland. Mitigation and Adaptation Strategies for Global Change, 24(5). https:// doi.org/10.1007/s11027-018-9831-y. https://doi.org/.
Hunt, J. D., Byers, E., & Sanchez, A. S. (2019). Technical potential and cost estimates for seawater air conditioning. Energy, 166. https://doi.org/10.1016/j. energy.2018.10.146. https://doi.org/.
Hunt, J. D., Freitas, M. A. V., & Pereira Junior, A. O. (2014). Enhanced-Pumped-Storage: Combining pumped-storage in a yearly storage cycle with dams in cascade in Brazil. Energy, 78. https://doi.org/10.1016/j.energy.2014.10.038. https://doi.org/.
Hunt, J. D., Zakeri, B., Nascimento, A., Garnier, B., Pereira, M. G., Bellezoni, R. A., … Ramos, D. S. (2020). High velocity seawater air-conditioning with thermal energy storage and its operation with intermittent renewable energies. Energy Efficiency. https://doi.org/10.1007/s12053-020-09905-0. https://doi.org/.
Hunt, Julian D, & Leal Filho, W. (2018). Land, Water, and Wind Watershed Cycle: A strategic use of water, land and wind for climate change adaptation. Climatic Change, 147(3–4), 427–439. https://doi.org/10.1007/s10584-018-2164-8. https://doi.org/.
Hunt, Julian David, Byers, E., Balogun, A.-L., Filho, W. L., Colling, A. V., Nascimento, A., & Wada, Y (2019). Using the jet stream for sustainable airship and balloon transportation of cargo and hydrogen. Energy Conversion and Management: X, 3,
J.D. Hunt et al.

Sustainable Cities and Society 74 (2021) 103257
15
Article 100016. https://doi.org/10.1016/j.ecmx.2019.100016. https://doi.org/ https://doi.org/.
Hunt, Julian David, Guillot, V., Freitas, M. A. V.de, & Solari, R. S. E (2016). Energy crop storage: An alternative to resolve the problem of unpredictable hydropower generation in Brazil. Energy. https://doi.org/10.1016/j.energy.2016.02.011. https://doi.org/.
Hunt, Julian David, Nascimento, A., Diuana, F. A., de Assis Brasil Weber, N., Castro, G. M., Chaves, A. C., , … Schneider, & P., S (2019). Cooling down the world oceans and the earth by enhancing the North Atlantic Ocean current. SN Applied Sciences, 2(1), 15. https://doi.org/10.1007/s42452-019-1755-y. https://doi.org/.
Hunt, Julian David, Zakeri, B., Lopes, R., Barbosa, P. S. F., Nascimento, A., Castro, N. J. de, … Wada, Y. (2020). Existing and new arrangements of pumped-hydro storage plants. Renewable and Sustainable Energy Reviews, 129, Article 109914.
Huppmann, D., Gidden, M., Fricko, O., Kolp, P., Orthofer, C., Pimmer, M., … Krey, V. (2019). The MESSAGEix Integrated Assessment Model and the ix modeling platform (ixmp): An open framework for integrated and cross-cutting analysis of energy, climate, the environment, and sustainable development. Environmental Modelling and Software,, 112, 143–156. https://doi.org/10.1016/j.envsoft.2018.11.012. https:// doi.org/.
IDA. (2016). Desalination Yearbook 2016-2017(G. W. I. (Media Analytics), Ed.). Ihsanullah, I., Atieh, M. A., Sajid, M., & Nazal, M. K. (2021). Desalination and
environment: A critical analysis of impacts, mitigation strategies, and greener desalination technologies. Science of the Total Environment, 780, Article 146585. https://doi.org/10.1016/j.scitotenv.2021.146585. https://doi.org/https://doi.org/.
IIASA. (2020). MESSAGE: A modeling framework for medium- to long-term energy system planning, energy policy analysis, and scenario development. Retrieved from http://www.iiasa.ac.at/web/home/research/researchPrograms/Energy/MESSAGE. en.html.
International Renewable Energy Agency. (2015a). Renewable Desalination: Technology Options for Islands. Abu Dhabi.
International Renewable Energy Agency. (2015b). Renewable Energy Roadmap: The Republic of Maldives. Abu Dhabi.
Isaac, M., & van Vuuren, D. P. (2009). Modeling global residential sector energy demand for heating and air conditioning in the context of climate change. Energy Policy, 37 (2), 507–521. https://doi.org/10.1016/j.enpol.2008.09.051. https://doi.org/ https://doi.org/.
Jones, E., Qadir, M., van Vliet, M. T. H., Smakhtin, V., & Kang, S. (2019). The state of desalination and brine production: A global outlook. Science of the Total Environment, 657, 1343–1356. https://doi.org/10.1016/j.scitotenv.2018.12.076. https://doi.org/ https://doi.org/.
Kalantari, F., Tahir, O. M., Joni, R. A., & Fatemi, E. (2017). Opportunities and challenges in sustainability of vertical farming: A review. Journal of Landscape Ecology, 11(1), 35–60. https://doi.org/10.1515/jlecol-2017-0016. https://doi.org/https://doi.org/.
Karandish, F., Hogeboom, R. J., & Hoekstra, A. Y. (2021). Physical versus virtual water transfers to overcome local water shortages: A comparative analysis of impacts. Advances in Water Resources, 147, Article 103811. https://doi.org/10.1016/j. advwatres.2020.103811. https://doi.org/https://doi.org/.
Kim, A., Kim, H., Lee, H., & Cha, S. (2016). Dual-use open cycle ocean thermal energy conversion (OC-OTEC) using multiple condensers for adjustable power generation and seawater desalination. Renewable Energy, 85, 344–358.
Kim, H., Lee, H., Lee, S., Oh, W., Shin, S., & Jun, S. (2012). Feasibility study on the utilization of sea water resources for green olympic blue ice rink. In 10th ISOPE pacific/Asia offshore mechanics symposium, PACOMS 2012.
Klein, S. (2010). TRNSYS 17: A Transient System Simulation Program. Madison, USA: University of Wisconsin. Retrieved from Solar Energy Laboratorywebsite http://sel. me.wisc.edu/trnsys.
Kreamer, D. (2009). Dry dock to wet tap: Old ships become floating desalination plants. Lee, G., Chang, K., Kim, K., Baek, Y., & Ra, H. (2014). Sea water heat pump systems for
Ice rink energy saving. In 7th Asian Conference on refrigeration and air conditioning, ACRA 2014.
Lewis, L., Ryzin, J. Van, & Vega, L (1988). Steep slope seawater supply pipeline. In American society of civil engineers, 21st conference on coastal engineering.
Liu, J., Mei, C., Wang, H., Shao, W., & Xiang, C. (2018). Powering an island system by renewable energy—a feasibility analysis in the Maldives. Applied Energy, 227, 18–27. https://doi.org/10.1016/j.apenergy.2017.10.019. https://doi.org/https://doi.org/.
Luo, J.(Tom), Joybari, M. M., Panchabikesan, K., Sun, Y., Haghighat, F., Moreau, A., & Robichaud, M. (2020). Performance of a self-learning predictive controller for peak shifting in a building integrated with energy storage. Sustainable Cities and Society, 60, Article 102285. https://doi.org/10.1016/j.scs.2020.102285. https://doi.org/ https://doi.org/.
Makai Ocean Engineerging. (2017). Makai Connects World’s Largest Ocean Thermal Plant to U.S. Grid. Retrieved from Makai Ocean Engineerging website: https://www. makai.com/makai-news/2015_08_29_makai_connects_otec.
Makai Ocean Engineering. (2008). In SWAC: An Introduction to Seawater Air Conditioning. Makai Ocean Engineering. (2015). New renewable energy report released: Seawater air
conditioning in the Caribbean. Retrieved from Makai Ocean Engineering website: htt ps://www.makai.com/makai-news /2015_07_24_new_renewable_energy_report_ released/.
Mendoza-Vizcaino, J., Raza, M., Sumper, A., Díaz-Gonzalez, F., & Galceran-Arellano, S. (2019). Integral approach to energy planning and electric grid assessment in a renewable energy technology integration for a 50/50 target applied to a small island. Applied Energy, 233–234, 524–543. https://doi.org/10.1016/j. apenergy.2018.09.109. https://doi.org/https://doi.org/.
Meschede, H., Esparcia, E. A., Holzapfel, P., Bertheau, P., Ang, R. C., Blanco, A. C., & Ocon, J. D. (2019). On the transferability of smart energy systems on off-grid islands using cluster analysis – a case study for the Philippine archipelago. Applied Energy,
251, Article 113290. https://doi.org/10.1016/j.apenergy.2019.05.093. https://doi. org/https://doi.org/.
Miller, O. L., Putman, A. L., Alder, J., Miller, M., Jones, D. K., & Wise, D. R. (2021). Changing climate drives future streamflow declines and challenges in meeting water demand across the southwestern United States. Journal of Hydrology X, 11, Article 100074. https://doi.org/10.1016/j.hydroa.2021.100074. https://doi.org/https:// doi.org/.
Miranda, C. (2008). In Sistemas de Refrigeraçao em Plataformas Offshore com o Uso de Agua.
Monterrey-Vina, A., Musicki-Savic, A., Díaz-Pena, F. J., & Penate-Suarez, B. (2020). Technical and agronomical assessment of the use of desalinated seawater for coastal irrigation in an insular context. Water, (1), 12. https://doi.org/10.3390/ w12010272. https://doi.org/.
Moore, J., Gladstone, R., Zwinger, T., & Wolovick, M. (2018). Geoengineer polar glaciers to slow sea-level rise. Nature, 555, 303–305.
Museu do Amanha. (2017). Sustentabilidade, pilar do Museu. Retrieved from Rio de Janeiro Municipality website: http://museudoamanha.org.br/pt-br/content/sust entabilidade-pilar-do-muse.
Mutschler, R., Rüdisüli, M., Heer, P., & Eggimann, S. (2021). Benchmarking cooling and heating energy demands considering climate change, population growth and cooling device uptake. Applied Energy, 288, Article 116636. https://doi.org/10.1016/j. apenergy.2021.116636. https://doi.org/https://doi.org/.
Nassrullah, H., Anis, S. F., Hashaikeh, R., & Hilal, N. (2020). Energy for desalination: A state-of-the-art review. Desalination, 491, Article 114569. https://doi.org/10.1016/j. desal.2020.114569. https://doi.org/https://doi.org/.
National Institute of Ocean Technology - Chennai. (2017). Energy and fresh water - facilities. Retrieved from NIOT website: https://www.niot.res.in/index.ph p/node/index/164/#.
National oceanic and atmospheric administration. (2018). NODC (Levitus) world ocean atlas. Retrieved from NOAA website: https://www.esrl.noaa.gov/psd/%0Athredds/c atalog/Datasets/nodc.woa98/catalog.html.
Nithesh, K. G., & Chatterjee, D. (2016). Numerical prediction of the performance of radial inflow turbine designed for ocean thermal energy conversion system. Applied Energy, 167, 1–16. https://doi.org/10.1016/j.apenergy.2016.01.033. https://doi. org/https://doi.org/.
Pittman, W. (1982). Energy from the oceans: George Claude’s magnificent failure. Environmental Review, 6(1), 2–13.
Porak, D., Zwieten, J. Van, & Rauchenstein, L (2012). Florida’s sea water cooling resource: An updated assessment. In OCEANS 2012 MTS/IEEE.
Porak, D., Zwieten, J. Van, & Wiles, B (2013). An analysis of Florida’s sea water cooling resource. Marine Technology Society Journal, 47(4), 226–239.
Ramon, D., Allacker, K., De Troyer, F., Wouters, H., & van Lipzig, N. P. M. (2020). Future heating and cooling degree days for Belgium under a high-end climate change scenario. Energy and Buildings, 216, Article 109935. https://doi.org/10.1016/j. enbuild.2020.109935. https://doi.org/https://doi.org/.
Rasheed, S., Warder, S., Plancherel, Y., & Piggott, M. (2020). Response of tidal flow regime and sediment transport in North Male’ Atoll, Maldives to coastal modification and sea level rise. https://doi.org/ 10.5194/os-2020-80.
Rasifaghihi, N., Li, S. S., & Haghighat, F. (2020). Forecast of urban water consumption under the impact of climate change. Sustainable Cities and Society, 52, Article 101848. https://doi.org/10.1016/j.scs.2019.101848. https://doi.org/https://doi.org/.
Renewables.ninja. (2019). Welcome to Renewables.ninja. Retrieved from https://www. renewables.ninja/.
Ryzin, J. Van, & Leraand, T (1991). Air conditioning with deep seawater: A reliable, cost effective technology. In IEEE Oceans’91 conference: Ocean technologies and opportunities in the Pacific for the 90’s.
Ryzin, J. Van, & Leraand, T (1992). Air conditioning with deep seawater: a cost-effective alternative. Sea Technology, 33(9), 37–44.
Sah, R., Choudhury, B., & Das, R. (2016). A review on low grade heat powered adsorption cooling systems for ice production. Renewable and Sustainable Energy Reviews, 62, 109–120.
Sant, T., Buhagiar, D., & Farrugia, R. (2014). Offshore floating wind turbine-driven deep sea water pumping for combined electrical power and district cooling. In 5th science of making torque from wind conference, TORQUE 2014.
Schwerdtner Manez, K., Husain, S., Ferse, S. C. A., & Manez Costa, M. (2012). Water scarcity in the Spermonde Archipelago, Sulawesi, Indonesia: Past, present and future. Environmental Science & Policy, 23, 74–84. https://doi.org/10.1016/j. envsci.2012.07.004. https://doi.org/https://doi.org/.
Sivak, M. (2009). Potential energy demand for cooling in the 50 largest metropolitan areas of the world: Implications for developing countries. Energy Policy, 37(4), 1382–1384. https://doi.org/10.1016/j.enpol.2008.11.031. https://doi.org/https:// doi.org/.
Stępien, S., Czyzewski, B., Sapa, A., Borychowski, M., Poczta, W., & Poczta-Wajda, A. (2021). Eco-efficiency of small-scale farming in Poland and its institutional drivers. Journal of Cleaner Production, 279, Article 123721. https://doi.org/10.1016/j. jclepro.2020.123721. https://doi.org/https://doi.org/.
Stocker, T. F., Qin, D., Plattner, G. K., Tignor, M., Allen, S. K., Boschung, J., … Midgley, P. M. (2013). IPCC: Summary for Policymakers. Climate Change 2013: The physical science basis. Contribution of working group I to the fifth assessment report of the intergovernmental panel on climate change. Cambridge: Cambridge University Press.
Stoler, J., Pearson, A. L., Staddon, C., Wutich, A., Mack, E., Brewis, A., … Zinab, H. (2020). Cash water expenditures are associated with household water insecurity, food insecurity, and perceived stress in study sites across 20 low- and middle-income countries. Science of The Total Environment, 716, Article 135881. https://doi.org/ 10.1016/j.scitotenv.2019.135881. https://doi.org/https://doi.org/.
J.D. Hunt et al.

Sustainable Cities and Society 74 (2021) 103257
16
Syed, M., Nihous, G., & Vega, L. (1991). Use of cold seawater for air conditioning. In IEEE oceans’91 conference: Ocean technologies and opportunities in the pacific for the 90’s.
Tan, Y. Z., Han, L., Chew, N. G. P., Chow, W. H., Wang, R., & Chew, J. W. (2018). Membrane distillation hybridized with a thermoelectric heat pump for energy- efficient water treatment and space cooling. Applied Energy, 231, 1079–1088. https://doi.org/10.1016/j.apenergy.2018.09.196. https://doi.org/https://doi.org/.
The New Indian Express. (2013). Thermal desalination is the new spring. Retrieved from http://www.newindianexpress.com/cities/chennai/2013/oct/17/ Thermal- desalination-is-the-new-spring-527056.html.
Venkatesan, R. (2014). Comparison between LTTD and RO process of sea-water desalination: an integrated economic, environmental and ecological framework. Current Science, 106(3), 378–386.
Vuillemot, F., Ryzin, J. Van, & Resnick, A (1988). The HOST-seacoast test facility (OTEC) project in Hawaii, planning, design and construction. In Marine technology society pacific congress on marine science and technology (PACON ’88).
Wang, G., Yang, Y., Wang, S., Zhang, H., & Wang, Y. (2019). Efficiency analysis and experimental validation of the ocean thermal energy conversion with phase change
material for underwater vehicle. Applied Energy, 248, 475–488. https://doi.org/ 10.1016/j.apenergy.2019.04.146. https://doi.org/https://doi.org/.
Weatherall, P., Marks, K., Jakobsson, M., Schmitt, T., Tani, S., Arndt, J., … Wigley, R. (2012). A new digital bathymetric model of the world’s oceans. Earth and Space Science, 2, 331–345.
weatherbase. (2021). Browse 41,997 cities worldwide. Retrieved from https://www. weatherbase.com/.
Weber, N. A. B., Zakeri, B., & Hunt, J. D. (2021). Male-MESSAGEix-Model. Retrieved from GitHub website: https://github.com/JulianHunt4/Male-MESSAGEix-Model.
Zhang, G., He, B.-J., & Dewancker, B. J. (2020). The maintenance of prefabricated green roofs for preserving cooling performance: A field measurement in the subtropical city of Hangzhou, China. Sustainable Cities and Society, 61, Article 102314. https:// doi.org/10.1016/j.scs.2020.102314. https://doi.org/https://doi.org/.
Zhang, S., Worrell, E., Crijns-Graus, W., Krol, M., de Bruine, M., Geng, G., … Cofala, J. (2016). Modeling energy efficiency to improve air quality and health effects of China’s cement industry. Applied Energy, 184, 574–593. https://doi.org/10.1016/j. apenergy.2016.10.030. https://doi.org/https://doi.org/.
J.D. Hunt et al.