Submerged membrane adsorption bioreactor as a pretreatment in seawater desalination for biofouling...
8
Submerged membrane adsorption bioreactor as a pretreatment in seawater desalination for biofouling control Sanghyun Jeong, Gayathri Naidu, Saravanamuthu Vigneswaran ⇑ Faculty of Engineering and IT, University of Technology Sydney (UTS), P.O. Box 123, Broadway, NSW 2007, Australia highlights " Submerged membrane adsorption bioreactor (SMABR) as a pretreatment to reverse osmosis (RO). " Optimization of powder activated carbon (PAC) retention time in terms of organic removal and biomass. " A small amount of PAC was sufficient (2.13 g/m 3 ) to reduce biofouling potential in SMABR. " Stable long term operation (50 d) of SMABR with a residence time of PAC of 66 d. " Low biofouling potential after SMABR treatment in terms of assimilable organic carbon (AOC) concentration. article info Article history: Available online 16 January 2013 Keywords: Adsorption Biofouling potential Membrane bio-reactor Powder activated carbon Seawater abstract Submerged membrane adsorption bioreactor (SMABR) was investigated as a pretreatment to reverse osmosis (RO). SMABR removed organic matter by adsorption and biological degradation. At a powder activated carbon (PAC) residence time of 66 d (1.5% of PAC replacement daily), higher organic removal was achieved with removal of a majority of biopolymers (94–97%) and humics (71–76%). A continuous MBR operation with the optimal PAC residence time of 66 d was conducted and compared with MBR with no PAC replenishment in terms of the removal of organic and microbes. High removal of organics of up to 72% was maintained with only a marginal increment of trans-membrane pressure and stable bioactivity (total cell number and adenosine tri-phosphate) during the 50 d of operation. The SMABR was found to be a sustainable biological pretreatment to RO with only a small amount of PAC requirement (2.14 g of PAC/ m 3 of seawater treated). Ó 2013 Elsevier Ltd. All rights reserved. 1. Introduction A major issue in RO desalination operations is membrane fouling that adversely affects the filtration performance. It usually leads to serious decline in the flux and quality of permeate, ulti- mately resulting in an increase in the operating pressure with time (Matin et al., 2011). The major types of fouling in RO membranes are crystalline (scaling), organic, particulate (or colloidal) and microbiological. The first three types of fouling can be reduced to a great extent through pretreatment while biofouling can be difficult to control, since deposited microbial cells can grow, multiply and relocate. Biofouling is mainly the accumulation of microorganisms accom- panied with agglomeration of extracellular materials on the mem- brane surface. When a microorganism adheres to the membrane surface, it starts building up aggregates in the form of biofilm ma- trix (Al-Juboori and Yusaf, 2012). Even if 99.99% of all bacteria are eliminated by pre-treatment (e.g. microfiltration or biocide appli- cation), a few surviving cells will enter the system, adhere to sur- faces, and multiply at the expense of biodegradable substances dissolved in the bulk aqueous phase. Therefore, membrane biofoul- ing has been found to occur extensively on RO membranes even after significant periodic direct cleaning of membranes and contin- uous upstream application of biocides and disinfectants such as chlorine (Flemming et al., 1997). Further, polymeric membranes are sensitive to oxidizing disinfectants and hence continuous 0960-8524/$ - see front matter Ó 2013 Elsevier Ltd. All rights reserved. http://dx.doi.org/10.1016/j.biortech.2013.01.021 Abbreviations: AOC, assimilable organic carbon; ATP, adenosine tri-phosphate; BOM, biodegradable organic matter; CFU, colony forming unit; COD, chemical oxygen demand; DOC, dissolved organic carbon; HRT, hydraulic retention time; LC- OCD, liquid chromatography with organic carbon detection; LMW, low molecular weight; MBR, membrane bio-reactor; MF, microfiltration; MLSS, mixed liquor suspended solids; OUR, oxygen uptake rate; PAC, powder activated carbon; RO, reverse osmosis; SMABR, submerged membrane adsorption bio-reactor; SW, seawater; TMP, trans-membrane pressure; UF-MFI, ultrafiltration-modified fouling index. ⇑ Corresponding author. Tel.: +61 2 9514 2614; fax: +61 2 9514 2633. E-mail address: [email protected] (S. Vigneswaran). Bioresource Technology 141 (2013) 57–64 Contents lists available at SciVerse ScienceDirect Bioresource Technology journal homepage: www.elsevier.com/locate/biortech
Transcript of Submerged membrane adsorption bioreactor as a pretreatment in seawater desalination for biofouling...

Bioresource Technology 141 (2013) 57–64
Contents lists available at SciVerse ScienceDirect
Bioresource Technology
journal homepage: www.elsevier .com/locate /bior tech
Submerged membrane adsorption bioreactor as a pretreatmentin seawater desalination for biofouling control
0960-8524/$ - see front matter � 2013 Elsevier Ltd. All rights reserved.http://dx.doi.org/10.1016/j.biortech.2013.01.021
Abbreviations: AOC, assimilable organic carbon; ATP, adenosine tri-phosphate;BOM, biodegradable organic matter; CFU, colony forming unit; COD, chemicaloxygen demand; DOC, dissolved organic carbon; HRT, hydraulic retention time; LC-OCD, liquid chromatography with organic carbon detection; LMW, low molecularweight; MBR, membrane bio-reactor; MF, microfiltration; MLSS, mixed liquorsuspended solids; OUR, oxygen uptake rate; PAC, powder activated carbon; RO,reverse osmosis; SMABR, submerged membrane adsorption bio-reactor; SW,seawater; TMP, trans-membrane pressure; UF-MFI, ultrafiltration-modified foulingindex.⇑ Corresponding author. Tel.: +61 2 9514 2614; fax: +61 2 9514 2633.
E-mail address: [email protected] (S. Vigneswaran).
Sanghyun Jeong, Gayathri Naidu, Saravanamuthu Vigneswaran ⇑Faculty of Engineering and IT, University of Technology Sydney (UTS), P.O. Box 123, Broadway, NSW 2007, Australia
h i g h l i g h t s
" Submerged membrane adsorption bioreactor (SMABR) as a pretreatment to reverse osmosis (RO)." Optimization of powder activated carbon (PAC) retention time in terms of organic removal and biomass." A small amount of PAC was sufficient (2.13 g/m3) to reduce biofouling potential in SMABR." Stable long term operation (50 d) of SMABR with a residence time of PAC of 66 d." Low biofouling potential after SMABR treatment in terms of assimilable organic carbon (AOC) concentration.
a r t i c l e i n f o
Article history:Available online 16 January 2013
Keywords:AdsorptionBiofouling potentialMembrane bio-reactorPowder activated carbonSeawater
a b s t r a c t
Submerged membrane adsorption bioreactor (SMABR) was investigated as a pretreatment to reverseosmosis (RO). SMABR removed organic matter by adsorption and biological degradation. At a powderactivated carbon (PAC) residence time of 66 d (1.5% of PAC replacement daily), higher organic removalwas achieved with removal of a majority of biopolymers (94–97%) and humics (71–76%). A continuousMBR operation with the optimal PAC residence time of 66 d was conducted and compared with MBR withno PAC replenishment in terms of the removal of organic and microbes. High removal of organics of up to72% was maintained with only a marginal increment of trans-membrane pressure and stable bioactivity(total cell number and adenosine tri-phosphate) during the 50 d of operation. The SMABR was found to bea sustainable biological pretreatment to RO with only a small amount of PAC requirement (2.14 g of PAC/m3 of seawater treated).
� 2013 Elsevier Ltd. All rights reserved.
1. Introduction
A major issue in RO desalination operations is membranefouling that adversely affects the filtration performance. It usuallyleads to serious decline in the flux and quality of permeate, ulti-mately resulting in an increase in the operating pressure with time(Matin et al., 2011).
The major types of fouling in RO membranes are crystalline(scaling), organic, particulate (or colloidal) and microbiological.The first three types of fouling can be reduced to a great extentthrough pretreatment while biofouling can be difficult to control,since deposited microbial cells can grow, multiply and relocate.Biofouling is mainly the accumulation of microorganisms accom-panied with agglomeration of extracellular materials on the mem-brane surface. When a microorganism adheres to the membranesurface, it starts building up aggregates in the form of biofilm ma-trix (Al-Juboori and Yusaf, 2012). Even if 99.99% of all bacteria areeliminated by pre-treatment (e.g. microfiltration or biocide appli-cation), a few surviving cells will enter the system, adhere to sur-faces, and multiply at the expense of biodegradable substancesdissolved in the bulk aqueous phase. Therefore, membrane biofoul-ing has been found to occur extensively on RO membranes evenafter significant periodic direct cleaning of membranes and contin-uous upstream application of biocides and disinfectants such aschlorine (Flemming et al., 1997). Further, polymeric membranesare sensitive to oxidizing disinfectants and hence continuous
58 S. Jeong et al. / Bioresource Technology 141 (2013) 57–64
biocide addition from the usage of disinfectant and biocide can af-fect the growth of resistant strains of bacteria (Kang et al., 2007;Shannon et al., 2008).
Thus the removal of biodegradable organics as well as microbialinactivation at the same time would be effective to control the bio-fouling. A promising option to control biofouling is membrane bio-reactor (MBR). The removal of organics and nutrients (such asammonia, nitrate and phosphorus) for wastewater by MBR wasachieved through the microbial decomposition of these materials.The MBR system can also effectively treat saline water such asblackish water and seawater (Ahmad et al., 2010; Lay et al.,2010; Chen et al., 2012; Johir et al., 2011; Tian et al., 2011).
A few initial studies have been conducted on the use of MBR totreat saline water. Visvanathan et al. (2002) conducted experi-ments with MBR to investigate the effects of biodegradable organiccontent removal in biofouling control. Their results showed thatMBR was able to remove 78% of dissolved organic carbon (DOC).They also reported that effluent from MBR increased the RO per-meate flux by 300% more than the untreated seawater. Yogalaksh-mi and Joseph (2010) studied the effect of sodium chloride (NaCl)shock loading on the removal efficiency of chemical oxygen de-mand (COD) on a bench-scale aerobic submerged MBR operatedat a steady state oxygen uptake rate (OUR) of 3.6 g of COD/L/dand hydraulic retention time (HRT) of 8 h. They found almost95% of COD was removed with a sodium chloride shock loadingof 5–30 g/L. The removal efficiency of COD at a NaCl shock of 50and 60 g/L was 77% and 64% respectively. From the above studies,it is evident that MBR technology can be effectively applied as apre-treatment of seawater with high salt concentration.
Lay et al. (2010) reported that true halophilic microorganismsor halophiles grown in a saline environment required a certainminimum level of salt for continued existence. These groups ofmicroorganisms contained a large number of aerobic heterotrophsthat are able to biodegrade organic carbon matter from salinewater. Lefebvre and Moletta (2006) also stated that biologicaltreatment of carbonaceous, nitrogenous and phosphorous pollu-tion had proven to be feasible at high salt concentrations but itsefficiency depended on proper adaptation of the biomass or theuse of halophilic organisms.
Organic pollutant cannot be completely removed by conven-tional MBR systems (Orem et al., 2011). A submerged membraneadsorption bio-reactor (SMABR), on the other hand is expected toremove a superior amount of organic pollutants (Guo et al.,2008). This is because adsorbent added in a submerged MBR in asmall quantity increases the organic pollutant removal capacity.The SMABR system can reduce RO membrane bio-fouling by elim-inating biodegradable organic matter (BOM). It is robust, environ-mentally friendly due to reduced usage of chemicals (coagulantsand biocides), and requires little maintenance as well as energy.
The effect of adding powder activated carbon (PAC) on the per-formance of submerged microfiltration system with seawater wasinvestigated in this study. In a short-term study (Jeong et al., 2011)the submerged membrane system coupled with PAC adsorptionwas investigated with 1.5 g/L of PAC added. It showed superiorDOC removal (76.6%) and most of the hydrophilic fraction(73.3%) had been removed. The detailed analysis of the hydrophilicportion showed that the removal efficiencies of biopolymer, hu-mics, building blocks and neutrals were as high as 92.3%, 70.0%,89.5% and 88.9%, respectively. The RO lab-scale cross-flow testshowed that the initial permeate flux was improved by 6.2 L/m2 h when the seawater was pretreated using the submergedmembrane system coupled with PAC adsorption (Jeong et al.,2012). This also led to a lower permeate flux decline in RO opera-tion. Apart from this, less foulant was found on the RO membrane(consisting of less biopolymer). Moreover, this system resulted in asignificant decline in bacteria cell numbers and cell viability. The
positive results obtained from these preliminary studies demon-strated the necessity for a detailed and a long-term study onMBR as a sustainable pre-treatment to reduce biofouling.
In this study, PAC replenishment was optimized to maintainstable bioactivity and produce high quality permeate in terms oforganic removal by adsorption and consistent increase of biomass.The effect of residence time in SMABR to treat seawater was eval-uated by comparing optimal PAC replenishment with maximumbiological mode. Not only organic removal but also biofouling po-tential reductions were investigated in terms of assimilable organiccarbon (AOC).
2. Methods
2.1. Materials
2.1.1. SeawaterThe continuous SMABR study was conducted at Sydney
Institute of Marine Science, Chowder Bay, Sydney, Australia. Theseawater was pumped from 1 m below seawater surface leveland pre-filtered through a 140 lm large-pore filtration system toremove the large suspended particles. During the entire operationperiod, the average pH, turbidity and DOC values of seawater usedin experiments were 8.1 (±0.3), 0.65 (±0.15) NTU and 2.15(±0.85) mg/L, respectively. Total suspended solid in seawater was3.6 (±0.8) mg/L.
2.1.2. Powder activated carbon (PAC)Powdered activated carbon (PAC, MDW3545CB powder, coal
based) was used as an adsorbent in this study. The mean diameterand the nominal size (80% min finer than) of PAC were 19.7 and75.0 lm, respectively.
2.1.3. Microfiltration membraneIn the SMABR system a hollow fiber microfiltration (MF)
membrane with an effective surface area (0.044 m2) was used. Thishollow fiber MF (Cleanfil�-S, Polysulfone, Polyethersulfone, Poly-vinlidene Fluoride of 0.1 lm, Kolon membrane) was vertically sub-merged into a reactor with a 2 L volume. The braid-reinforcedhollow fiber MF used in this study comprised of three materials(Polysulfone, Polyethersulfone, Polyvinlidene Fluoride) as a coatinglayer. The U-type membrane length was 47.0 cm with an outer fi-ber diameter of 2.0 mm and an inner fiber diameter of 0.8 mm.
2.2. Optimization of PAC replenishment
PAC replenishment (replacement) needs to be optimized tomaintain a stable biological activity in a submerged membranebio-reactor while achieving consistently high rates of organic re-moval. A renewed PAC has high capacity to absorb the organic mat-ters but too frequent replacement leads to low growth ofmicroorganisms. Here, optimal conditions were selected based onhigh DOC removal and continuous increase of mixed liquor sus-pended solids (MLSS) by microbes in the reactor. In order to findthe optimal PAC replenishment range, a semi-batch test was car-ried out for 28 d. This batch experiment was conducted in a car-bon-free glass bottle (300 mL) shaked at 150 rpm and 25 �C usingtemperature controlled shake incubator. In order to avoid theevaporation of sample, the top of the bottle was sealed. An initialamount of 5 g/L (1 g in 200 mL) of PAC was dosed initially. Therewas no seeding done at the start. The microbes in the seawater uti-lized the organic matter in the seawater during incubation (accu-mulation) period of 28 d. Visvanathan et al. (2002) also observedbiomass accumulation with seawater without any seeding. Ourprevious work with biofilter to treat seawater also did not have
S. Jeong et al. / Bioresource Technology 141 (2013) 57–64 59
any prior seeding and a significant biological activity was observedafter 15–20 d of filter run (Naidu et al., 2013). PAC with five differ-ent amounts was replenished daily and fresh seawater of 100 mL(half of total water volume) was replaced on a daily basis after set-tlement. MLSS concentration was calculated as suspended solidconcentration. The mixed liquor was taken together with PAC par-ticles. The batch reactor was shaked vigorously at 150 rpm whenthe mixed liquor was taken for MLSS analysis. Thus, it was as-sumed that the biomass attached on PAC was detached into thesuspension. Further, MLSS measurement was triplicated and anaverage value was taken. At the same time, sampling of superna-tant for other measurements was done intermittently. The mea-surement of MLSS was carried out in the laboratory according tothe standard procedures (APHA/AWWA/WEF, 1995). The residencetime of the PAC can be defined as the ratio between the mass ofPAC in the bottle and the mass of PAC replaced daily. PAC residencetime corresponds to the ratio of PAC replenishment. The replace-ments of PAC were 0%, 1.0%, 1.5%, 2.5%, 5.0% and 20% which corre-spond to a PAC residence time of 1, 100, 66, 40, 20 and 5 drespectively.
In SMABR, the residence time of PAC (dPAC, in d) is defined as theratio between the mass of PAC in reactor (mPAC, in g) and the mass ofPAC replaced daily. This relationship can be identified with the re-placed volume (QR, in L/d) and PAC concentration within the reactor(CPAC, in g/L). Also, this equation can be used simply to calculate thereplacement % (R, in %) and reactor volume (Vr, in L) as below.
dPAC ¼mPAC
CPAC � Q R¼ V r
R=100� V rð1Þ
Thus, PAC residence time was calculated based on the replacedfraction of PAC as shown in Eq. (1).
2.3. Long-term on-site experimental set-up
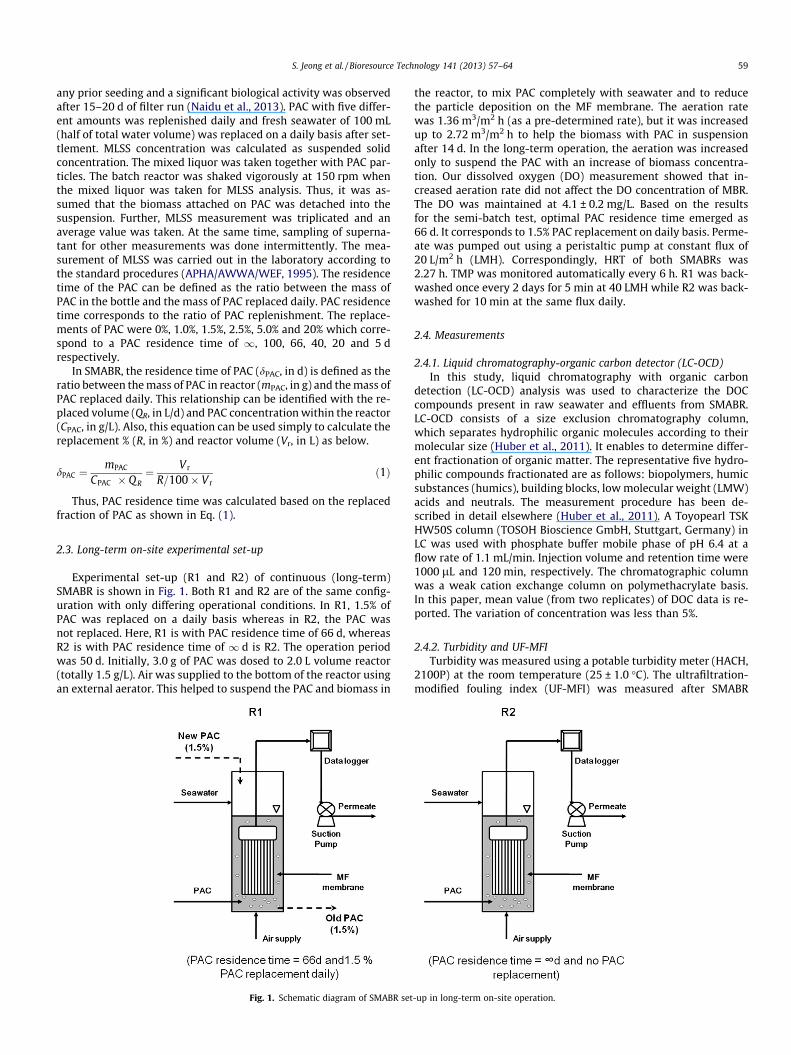
Experimental set-up (R1 and R2) of continuous (long-term)SMABR is shown in Fig. 1. Both R1 and R2 are of the same config-uration with only differing operational conditions. In R1, 1.5% ofPAC was replaced on a daily basis whereas in R2, the PAC wasnot replaced. Here, R1 is with PAC residence time of 66 d, whereasR2 is with PAC residence time of 1 d is R2. The operation periodwas 50 d. Initially, 3.0 g of PAC was dosed to 2.0 L volume reactor(totally 1.5 g/L). Air was supplied to the bottom of the reactor usingan external aerator. This helped to suspend the PAC and biomass in
Fig. 1. Schematic diagram of SMABR set
the reactor, to mix PAC completely with seawater and to reducethe particle deposition on the MF membrane. The aeration ratewas 1.36 m3/m2 h (as a pre-determined rate), but it was increasedup to 2.72 m3/m2 h to help the biomass with PAC in suspensionafter 14 d. In the long-term operation, the aeration was increasedonly to suspend the PAC with an increase of biomass concentra-tion. Our dissolved oxygen (DO) measurement showed that in-creased aeration rate did not affect the DO concentration of MBR.The DO was maintained at 4.1 ± 0.2 mg/L. Based on the resultsfor the semi-batch test, optimal PAC residence time emerged as66 d. It corresponds to 1.5% PAC replacement on daily basis. Perme-ate was pumped out using a peristaltic pump at constant flux of20 L/m2 h (LMH). Correspondingly, HRT of both SMABRs was2.27 h. TMP was monitored automatically every 6 h. R1 was back-washed once every 2 days for 5 min at 40 LMH while R2 was back-washed for 10 min at the same flux daily.
2.4. Measurements
2.4.1. Liquid chromatography-organic carbon detector (LC-OCD)In this study, liquid chromatography with organic carbon
detection (LC-OCD) analysis was used to characterize the DOCcompounds present in raw seawater and effluents from SMABR.LC-OCD consists of a size exclusion chromatography column,which separates hydrophilic organic molecules according to theirmolecular size (Huber et al., 2011). It enables to determine differ-ent fractionation of organic matter. The representative five hydro-philic compounds fractionated are as follows: biopolymers, humicsubstances (humics), building blocks, low molecular weight (LMW)acids and neutrals. The measurement procedure has been de-scribed in detail elsewhere (Huber et al., 2011). A Toyopearl TSKHW50S column (TOSOH Bioscience GmbH, Stuttgart, Germany) inLC was used with phosphate buffer mobile phase of pH 6.4 at aflow rate of 1.1 mL/min. Injection volume and retention time were1000 lL and 120 min, respectively. The chromatographic columnwas a weak cation exchange column on polymethacrylate basis.In this paper, mean value (from two replicates) of DOC data is re-ported. The variation of concentration was less than 5%.
2.4.2. Turbidity and UF-MFITurbidity was measured using a potable turbidity meter (HACH,
2100P) at the room temperature (25 ± 1.0 �C). The ultrafiltration-modified fouling index (UF-MFI) was measured after SMABR
-up in long-term on-site operation.
(a)
(b)
4,000
5,000
6,000
7,000
8,000
9,000
10,000
11,000
12,000
13,000
0 5 10 15 20 25
Bio
mas
s (M
LSS
) (m
g/L
)
Time (d)
0.7
0.9
1.1
1.3
1.5
1.7
1.9
2.1
2.3
2.5
0 5 10 15 20 25
DO
C (
mg/
L)
Time (d)
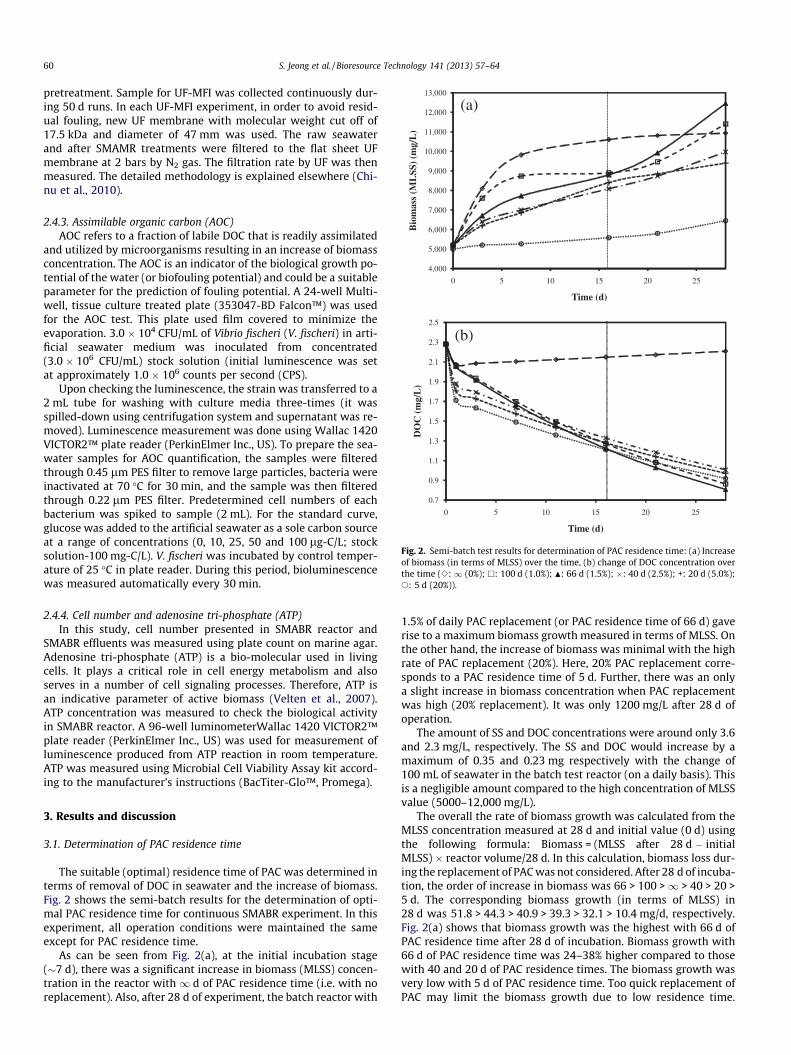
Fig. 2. Semi-batch test results for determination of PAC residence time: (a) Increaseof biomass (in terms of MLSS) over the time, (b) change of DOC concentration overthe time (e:1 (0%); h: 100 d (1.0%); N: 66 d (1.5%); �: 40 d (2.5%); +: 20 d (5.0%);s: 5 d (20%)).
60 S. Jeong et al. / Bioresource Technology 141 (2013) 57–64
pretreatment. Sample for UF-MFI was collected continuously dur-ing 50 d runs. In each UF-MFI experiment, in order to avoid resid-ual fouling, new UF membrane with molecular weight cut off of17.5 kDa and diameter of 47 mm was used. The raw seawaterand after SMAMR treatments were filtered to the flat sheet UFmembrane at 2 bars by N2 gas. The filtration rate by UF was thenmeasured. The detailed methodology is explained elsewhere (Chi-nu et al., 2010).
2.4.3. Assimilable organic carbon (AOC)AOC refers to a fraction of labile DOC that is readily assimilated
and utilized by microorganisms resulting in an increase of biomassconcentration. The AOC is an indicator of the biological growth po-tential of the water (or biofouling potential) and could be a suitableparameter for the prediction of fouling potential. A 24-well Multi-well, tissue culture treated plate (353047-BD Falcon™) was usedfor the AOC test. This plate used film covered to minimize theevaporation. 3.0 � 104 CFU/mL of Vibrio fischeri (V. fischeri) in arti-ficial seawater medium was inoculated from concentrated(3.0 � 106 CFU/mL) stock solution (initial luminescence was setat approximately 1.0 � 106 counts per second (CPS).
Upon checking the luminescence, the strain was transferred to a2 mL tube for washing with culture media three-times (it wasspilled-down using centrifugation system and supernatant was re-moved). Luminescence measurement was done using Wallac 1420VICTOR2™ plate reader (PerkinElmer Inc., US). To prepare the sea-water samples for AOC quantification, the samples were filteredthrough 0.45 lm PES filter to remove large particles, bacteria wereinactivated at 70 �C for 30 min, and the sample was then filteredthrough 0.22 lm PES filter. Predetermined cell numbers of eachbacterium was spiked to sample (2 mL). For the standard curve,glucose was added to the artificial seawater as a sole carbon sourceat a range of concentrations (0, 10, 25, 50 and 100 lg-C/L; stocksolution-100 mg-C/L). V. fischeri was incubated by control temper-ature of 25 �C in plate reader. During this period, bioluminescencewas measured automatically every 30 min.
2.4.4. Cell number and adenosine tri-phosphate (ATP)In this study, cell number presented in SMABR reactor and
SMABR effluents was measured using plate count on marine agar.Adenosine tri-phosphate (ATP) is a bio-molecular used in livingcells. It plays a critical role in cell energy metabolism and alsoserves in a number of cell signaling processes. Therefore, ATP isan indicative parameter of active biomass (Velten et al., 2007).ATP concentration was measured to check the biological activityin SMABR reactor. A 96-well luminometerWallac 1420 VICTOR2™plate reader (PerkinElmer Inc., US) was used for measurement ofluminescence produced from ATP reaction in room temperature.ATP was measured using Microbial Cell Viability Assay kit accord-ing to the manufacturer’s instructions (BacTiter-Glo™, Promega).
3. Results and discussion
3.1. Determination of PAC residence time
The suitable (optimal) residence time of PAC was determined interms of removal of DOC in seawater and the increase of biomass.Fig. 2 shows the semi-batch results for the determination of opti-mal PAC residence time for continuous SMABR experiment. In thisexperiment, all operation conditions were maintained the sameexcept for PAC residence time.
As can be seen from Fig. 2(a), at the initial incubation stage(�7 d), there was a significant increase in biomass (MLSS) concen-tration in the reactor with 1 d of PAC residence time (i.e. with noreplacement). Also, after 28 d of experiment, the batch reactor with
1.5% of daily PAC replacement (or PAC residence time of 66 d) gaverise to a maximum biomass growth measured in terms of MLSS. Onthe other hand, the increase of biomass was minimal with the highrate of PAC replacement (20%). Here, 20% PAC replacement corre-sponds to a PAC residence time of 5 d. Further, there was an onlya slight increase in biomass concentration when PAC replacementwas high (20% replacement). It was only 1200 mg/L after 28 d ofoperation.
The amount of SS and DOC concentrations were around only 3.6and 2.3 mg/L, respectively. The SS and DOC would increase by amaximum of 0.35 and 0.23 mg respectively with the change of100 mL of seawater in the batch test reactor (on a daily basis). Thisis a negligible amount compared to the high concentration of MLSSvalue (5000–12,000 mg/L).
The overall the rate of biomass growth was calculated from theMLSS concentration measured at 28 d and initial value (0 d) usingthe following formula: Biomass = (MLSS after 28 d � initialMLSS) � reactor volume/28 d. In this calculation, biomass loss dur-ing the replacement of PAC was not considered. After 28 d of incuba-tion, the order of increase in biomass was 66 > 100 >1 > 40 > 20 >5 d. The corresponding biomass growth (in terms of MLSS) in28 d was 51.8 > 44.3 > 40.9 > 39.3 > 32.1 > 10.4 mg/d, respectively.Fig. 2(a) shows that biomass growth was the highest with 66 d ofPAC residence time after 28 d of incubation. Biomass growth with66 d of PAC residence time was 24–38% higher compared to thosewith 40 and 20 d of PAC residence times. The biomass growth wasvery low with 5 d of PAC residence time. Too quick replacement ofPAC may limit the biomass growth due to low residence time.
S. Jeong et al. / Bioresource Technology 141 (2013) 57–64 61
Considering the economics of PAC replacement and biomass growth,a PAC residence time of 66 d was chosen as a suitable value.
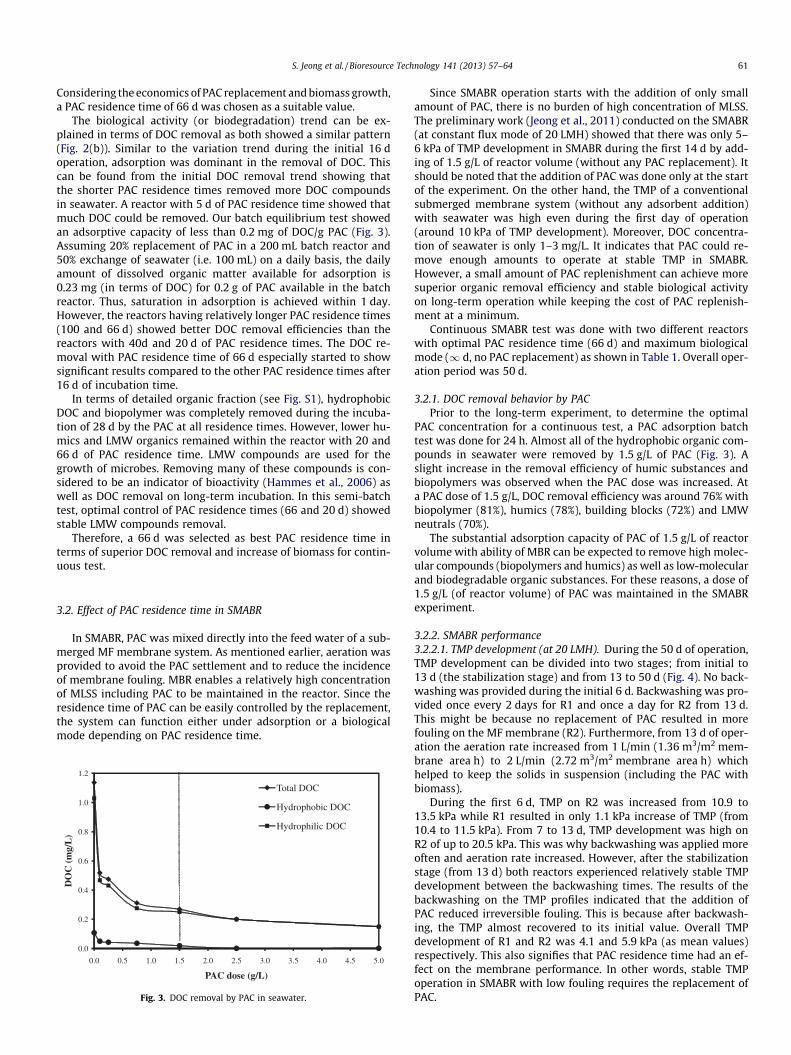
The biological activity (or biodegradation) trend can be ex-plained in terms of DOC removal as both showed a similar pattern(Fig. 2(b)). Similar to the variation trend during the initial 16 doperation, adsorption was dominant in the removal of DOC. Thiscan be found from the initial DOC removal trend showing thatthe shorter PAC residence times removed more DOC compoundsin seawater. A reactor with 5 d of PAC residence time showed thatmuch DOC could be removed. Our batch equilibrium test showedan adsorptive capacity of less than 0.2 mg of DOC/g PAC (Fig. 3).Assuming 20% replacement of PAC in a 200 mL batch reactor and50% exchange of seawater (i.e. 100 mL) on a daily basis, the dailyamount of dissolved organic matter available for adsorption is0.23 mg (in terms of DOC) for 0.2 g of PAC available in the batchreactor. Thus, saturation in adsorption is achieved within 1 day.However, the reactors having relatively longer PAC residence times(100 and 66 d) showed better DOC removal efficiencies than thereactors with 40d and 20 d of PAC residence times. The DOC re-moval with PAC residence time of 66 d especially started to showsignificant results compared to the other PAC residence times after16 d of incubation time.
In terms of detailed organic fraction (see Fig. S1), hydrophobicDOC and biopolymer was completely removed during the incuba-tion of 28 d by the PAC at all residence times. However, lower hu-mics and LMW organics remained within the reactor with 20 and66 d of PAC residence time. LMW compounds are used for thegrowth of microbes. Removing many of these compounds is con-sidered to be an indicator of bioactivity (Hammes et al., 2006) aswell as DOC removal on long-term incubation. In this semi-batchtest, optimal control of PAC residence times (66 and 20 d) showedstable LMW compounds removal.
Therefore, a 66 d was selected as best PAC residence time interms of superior DOC removal and increase of biomass for contin-uous test.
3.2. Effect of PAC residence time in SMABR
In SMABR, PAC was mixed directly into the feed water of a sub-merged MF membrane system. As mentioned earlier, aeration wasprovided to avoid the PAC settlement and to reduce the incidenceof membrane fouling. MBR enables a relatively high concentrationof MLSS including PAC to be maintained in the reactor. Since theresidence time of PAC can be easily controlled by the replacement,the system can function either under adsorption or a biologicalmode depending on PAC residence time.
0.0
0.2
0.4
0.6
0.8
1.0
1.2
0.0 0.5 1.0 1.5 2.0 2.5 3.0 3.5 4.0 4.5 5.0
DO
C (
mg/
L)
PAC dose (g/L)
Total DOC
Hydrophobic DOC
Hydrophilic DOC
Fig. 3. DOC removal by PAC in seawater.
Since SMABR operation starts with the addition of only smallamount of PAC, there is no burden of high concentration of MLSS.The preliminary work (Jeong et al., 2011) conducted on the SMABR(at constant flux mode of 20 LMH) showed that there was only 5–6 kPa of TMP development in SMABR during the first 14 d by add-ing of 1.5 g/L of reactor volume (without any PAC replacement). Itshould be noted that the addition of PAC was done only at the startof the experiment. On the other hand, the TMP of a conventionalsubmerged membrane system (without any adsorbent addition)with seawater was high even during the first day of operation(around 10 kPa of TMP development). Moreover, DOC concentra-tion of seawater is only 1–3 mg/L. It indicates that PAC could re-move enough amounts to operate at stable TMP in SMABR.However, a small amount of PAC replenishment can achieve moresuperior organic removal efficiency and stable biological activityon long-term operation while keeping the cost of PAC replenish-ment at a minimum.
Continuous SMABR test was done with two different reactorswith optimal PAC residence time (66 d) and maximum biologicalmode (1 d, no PAC replacement) as shown in Table 1. Overall oper-ation period was 50 d.
3.2.1. DOC removal behavior by PACPrior to the long-term experiment, to determine the optimal
PAC concentration for a continuous test, a PAC adsorption batchtest was done for 24 h. Almost all of the hydrophobic organic com-pounds in seawater were removed by 1.5 g/L of PAC (Fig. 3). Aslight increase in the removal efficiency of humic substances andbiopolymers was observed when the PAC dose was increased. Ata PAC dose of 1.5 g/L, DOC removal efficiency was around 76% withbiopolymer (81%), humics (78%), building blocks (72%) and LMWneutrals (70%).
The substantial adsorption capacity of PAC of 1.5 g/L of reactorvolume with ability of MBR can be expected to remove high molec-ular compounds (biopolymers and humics) as well as low-molecularand biodegradable organic substances. For these reasons, a dose of1.5 g/L (of reactor volume) of PAC was maintained in the SMABRexperiment.
3.2.2. SMABR performance3.2.2.1. TMP development (at 20 LMH). During the 50 d of operation,TMP development can be divided into two stages; from initial to13 d (the stabilization stage) and from 13 to 50 d (Fig. 4). No back-washing was provided during the initial 6 d. Backwashing was pro-vided once every 2 days for R1 and once a day for R2 from 13 d.This might be because no replacement of PAC resulted in morefouling on the MF membrane (R2). Furthermore, from 13 d of oper-ation the aeration rate increased from 1 L/min (1.36 m3/m2 mem-brane area h) to 2 L/min (2.72 m3/m2 membrane area h) whichhelped to keep the solids in suspension (including the PAC withbiomass).
During the first 6 d, TMP on R2 was increased from 10.9 to13.5 kPa while R1 resulted in only 1.1 kPa increase of TMP (from10.4 to 11.5 kPa). From 7 to 13 d, TMP development was high onR2 of up to 20.5 kPa. This was why backwashing was applied moreoften and aeration rate increased. However, after the stabilizationstage (from 13 d) both reactors experienced relatively stable TMPdevelopment between the backwashing times. The results of thebackwashing on the TMP profiles indicated that the addition ofPAC reduced irreversible fouling. This is because after backwash-ing, the TMP almost recovered to its initial value. Overall TMPdevelopment of R1 and R2 was 4.1 and 5.9 kPa (as mean values)respectively. This also signifies that PAC residence time had an ef-fect on the membrane performance. In other words, stable TMPoperation in SMABR with low fouling requires the replacement ofPAC.
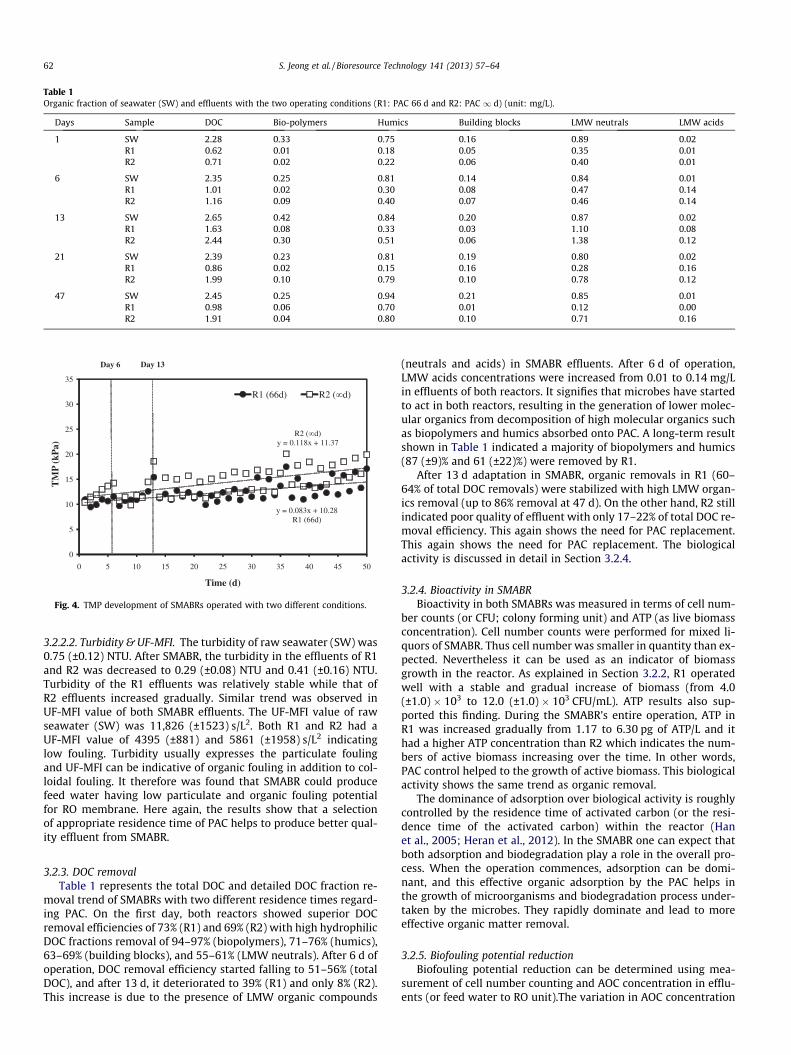
Table 1Organic fraction of seawater (SW) and effluents with the two operating conditions (R1: PAC 66 d and R2: PAC 1 d) (unit: mg/L).
Days Sample DOC Bio-polymers Humics Building blocks LMW neutrals LMW acids
1 SW 2.28 0.33 0.75 0.16 0.89 0.02R1 0.62 0.01 0.18 0.05 0.35 0.01R2 0.71 0.02 0.22 0.06 0.40 0.01
6 SW 2.35 0.25 0.81 0.14 0.84 0.01R1 1.01 0.02 0.30 0.08 0.47 0.14R2 1.16 0.09 0.40 0.07 0.46 0.14
13 SW 2.65 0.42 0.84 0.20 0.87 0.02R1 1.63 0.08 0.33 0.03 1.10 0.08R2 2.44 0.30 0.51 0.06 1.38 0.12
21 SW 2.39 0.23 0.81 0.19 0.80 0.02R1 0.86 0.02 0.15 0.16 0.28 0.16R2 1.99 0.10 0.79 0.10 0.78 0.12
47 SW 2.45 0.25 0.94 0.21 0.85 0.01R1 0.98 0.06 0.70 0.01 0.12 0.00R2 1.91 0.04 0.80 0.10 0.71 0.16
y = 0.083x + 10.28R1 (66d)
R2 (y = 0.118x + 11.37
0
5
10
15
20
25
30
35
0 5 10 15 20 25 30 35 40 45 50
TM
P (k
Pa)
Time (d)
R1 (66d) R2 (
Day 6 Day 13
Fig. 4. TMP development of SMABRs operated with two different conditions.
62 S. Jeong et al. / Bioresource Technology 141 (2013) 57–64
3.2.2.2. Turbidity & UF-MFI. The turbidity of raw seawater (SW) was0.75 (±0.12) NTU. After SMABR, the turbidity in the effluents of R1and R2 was decreased to 0.29 (±0.08) NTU and 0.41 (±0.16) NTU.Turbidity of the R1 effluents was relatively stable while that ofR2 effluents increased gradually. Similar trend was observed inUF-MFI value of both SMABR effluents. The UF-MFI value of rawseawater (SW) was 11,826 (±1523) s/L2. Both R1 and R2 had aUF-MFI value of 4395 (±881) and 5861 (±1958) s/L2 indicatinglow fouling. Turbidity usually expresses the particulate foulingand UF-MFI can be indicative of organic fouling in addition to col-loidal fouling. It therefore was found that SMABR could producefeed water having low particulate and organic fouling potentialfor RO membrane. Here again, the results show that a selectionof appropriate residence time of PAC helps to produce better qual-ity effluent from SMABR.
3.2.3. DOC removalTable 1 represents the total DOC and detailed DOC fraction re-
moval trend of SMABRs with two different residence times regard-ing PAC. On the first day, both reactors showed superior DOCremoval efficiencies of 73% (R1) and 69% (R2) with high hydrophilicDOC fractions removal of 94–97% (biopolymers), 71–76% (humics),63–69% (building blocks), and 55–61% (LMW neutrals). After 6 d ofoperation, DOC removal efficiency started falling to 51–56% (totalDOC), and after 13 d, it deteriorated to 39% (R1) and only 8% (R2).This increase is due to the presence of LMW organic compounds
(neutrals and acids) in SMABR effluents. After 6 d of operation,LMW acids concentrations were increased from 0.01 to 0.14 mg/Lin effluents of both reactors. It signifies that microbes have startedto act in both reactors, resulting in the generation of lower molec-ular organics from decomposition of high molecular organics suchas biopolymers and humics absorbed onto PAC. A long-term resultshown in Table 1 indicated a majority of biopolymers and humics(87 (±9)% and 61 (±22)%) were removed by R1.
After 13 d adaptation in SMABR, organic removals in R1 (60–64% of total DOC removals) were stabilized with high LMW organ-ics removal (up to 86% removal at 47 d). On the other hand, R2 stillindicated poor quality of effluent with only 17–22% of total DOC re-moval efficiency. This again shows the need for PAC replacement.This again shows the need for PAC replacement. The biologicalactivity is discussed in detail in Section 3.2.4.
3.2.4. Bioactivity in SMABRBioactivity in both SMABRs was measured in terms of cell num-
ber counts (or CFU; colony forming unit) and ATP (as live biomassconcentration). Cell number counts were performed for mixed li-quors of SMABR. Thus cell number was smaller in quantity than ex-pected. Nevertheless it can be used as an indicator of biomassgrowth in the reactor. As explained in Section 3.2.2, R1 operatedwell with a stable and gradual increase of biomass (from 4.0(±1.0) � 103 to 12.0 (±1.0) � 103 CFU/mL). ATP results also sup-ported this finding. During the SMABR’s entire operation, ATP inR1 was increased gradually from 1.17 to 6.30 pg of ATP/L and ithad a higher ATP concentration than R2 which indicates the num-bers of active biomass increasing over the time. In other words,PAC control helped to the growth of active biomass. This biologicalactivity shows the same trend as organic removal.
The dominance of adsorption over biological activity is roughlycontrolled by the residence time of activated carbon (or the resi-dence time of the activated carbon) within the reactor (Hanet al., 2005; Heran et al., 2012). In the SMABR one can expect thatboth adsorption and biodegradation play a role in the overall pro-cess. When the operation commences, adsorption can be domi-nant, and this effective organic adsorption by the PAC helps inthe growth of microorganisms and biodegradation process under-taken by the microbes. They rapidly dominate and lead to moreeffective organic matter removal.
3.2.5. Biofouling potential reductionBiofouling potential reduction can be determined using mea-
surement of cell number counting and AOC concentration in efflu-ents (or feed water to RO unit).The variation in AOC concentration

0
5
10
15
20
25
30
35
40
1 6 15 17 21 47
AO
C (
µg-C
glu
cose
/L)
Time (d)
SW R1 (PAC 66d) R2 (PAC d)
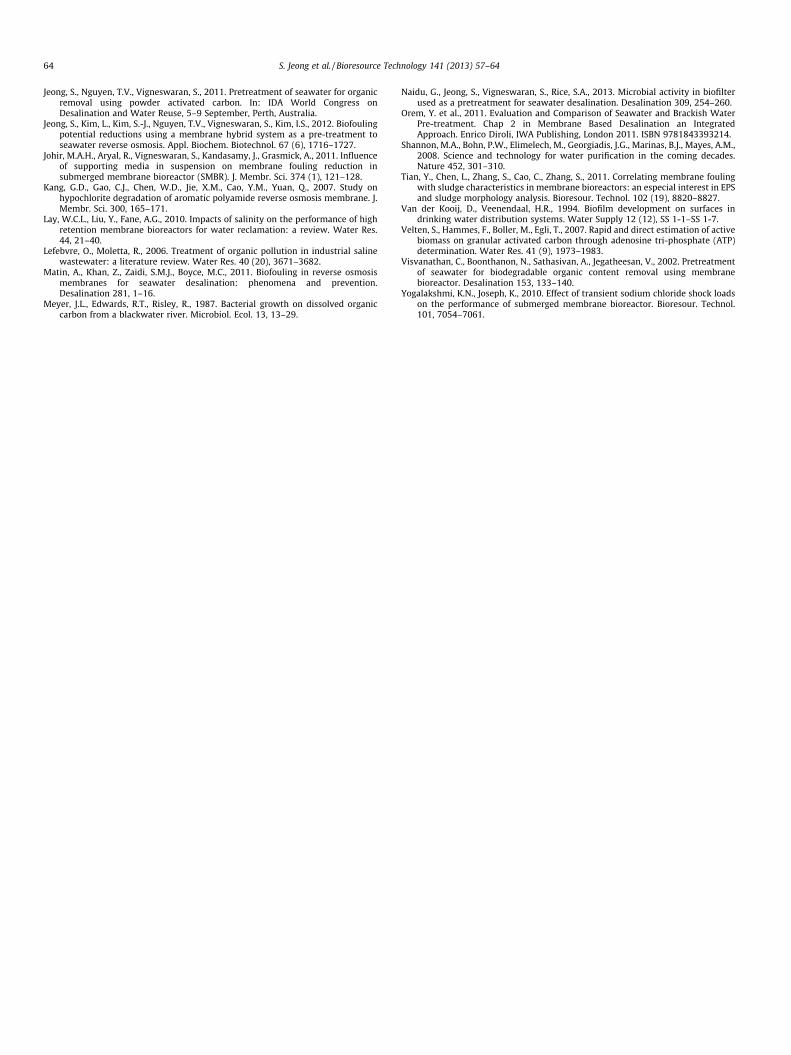
Fig. 5. Changes of AOC concentrations of SW and effluents.
S. Jeong et al. / Bioresource Technology 141 (2013) 57–64 63
of raw SW (feed water) and SMABR effluents (R1 and R2) duringthe operation time is represented in Fig. 5. The cell number count-ing can be a direct indicator of microbes being transferred to thepoor treatment of RO in seawater desalination. Raw seawaterhad 2.73 (±1.57) � 105 cells/mL. On the first day of operation, bothSMABRs (R1 and R2) producing effluent had a similar number ofcells with 1.65 (±0.07) � 102 cells/mL. During the entire operation,R1 showed relatively stable quality of effluents while R2 increasedgradually the number of cell in effluents to 2.00 (±0.23) � 104 cells/mL at 47 d of operation. However, both SMABRs (R1 and R2) lim-ited most of the microorganisms entering from seawater and theyshowed 99.7 (±0.3)% and 95.8 (±5.6)% cell number removal effi-ciency, respectively.
The AOC measurement can be used to indicate the biologicalgrowth potential of the water (or biofouling potential) and serveas a suitable parameter for predicting fouling potential. AOC refersto a fraction of labile DOC that is readily assimilated and utilized bymicroorganisms resulting in an increase of biomass. AOC can influ-ence biological fouling (biofouling) in water treatment systems anddistribution processes. Thus, a high value of AOC is directly linkedto rapid biofilm formation and loss of performance in membraneprocesses (Hambsch and Werner, 1996; Chien et al., 2007). In thisstudy, AOC concentration of raw seawater (SW) was 20.8 (±4.0) lg-C glucose/L. On average, the AOC was removed by R1 (66 d) signif-icantly which is 6.0 (±2.9) lg-C glucose/L indicating 71.0% (as amean value with less than 5% of standard deviation) of AOC re-moval efficiency. On the other hand, R2 effluents showed slightlyhigher AOC concentration (14–23%) than seawater after 21 d. Thismay be due to the LMW organics (generated and remained, butthey could not be removed, Table 1) which can be easily utilizedby microorganisms. Meyer et al. (1987) found that bacterialgrowth was greatest in the low molecular weight fraction(Mw < 1000) of water. Thus the presence of low molecular weightfraction measured to high concentration in AOC. During most ofthe operation periods, AOC in R1 effluents was less than 10 lg-Cglucose/L. It has been reported that at AOC levels of <10 lg/L canlimit the growth/regrowth of some heterotrophic plate countsand coliform bacteria (Van der Kooij and Veenendaal, 1994). Thus,SMABR could reduce the biofouling potential by removing of AOCcompounds and biomass.
To conclude, SMABR is a sustainable and environmentallyfriendly (using biological activity without the biocides and chemi-cals) pretreatment strategy for reducing biofouling potential. Eventhe amount of PAC used is minimal. The amount of PAC necessaryis only 2.14 g/m3 under the operation conditions used (flux =20 LMH; initial amount of PAC of 1.5 g/L of reactor volume; PACreplacement rate = 1.5%).
4. Conclusions
SMABR emerged as a suitable biological pretreatment strategyfor RO with minimum biofouling. PAC replenishment was opti-mized in terms of DOC removal and stable biomass increase. PACresidence time of 66 d was found to be the optimum. A smallamount of PAC (approximately 2.13 g/m3 of seawater treated) inSMABR was sufficient to obtain an effluent with low biofouling po-tential. High rates of removal of DOC were maintained with a mar-ginal increase of TMP and low fouling potential with a residencetime of PAC of 66 d. High removal rates of biopolymers includingprotein and TEP were also achieved with a residence time of PACof 66 d. Low fouling potential permeates with low AOC concentra-tion of 6.0 (±2.9) lg-C glucose/L (PAC residence time of 66 d) werealso achieved.
Acknowledgements
The authors acknowledge the financial support of the NationalCentre of Excellence in Desalination Australia (Membrane Adsorp-tion Bioreactor Hybrid System as a Pre-Treatment to ReverseOsmosis Desalination), Sydney Institute of Marine Science (SIMS)and Centre for Marine Bio-Innovation and Biofouling at Universityof New South Wales (UNSW).
Appendix A. Supplementary data
Supplementary data associated with this article can be found, inthe online version, at http://dx.doi.org/10.1016/j.biortech.2013.01.021.
References
Ahmad, R.T., Nguyen, T.V., Vigneswaran, S., Khorshed, C., 2010. Influence of powderactivated carbon on the operation of a submerged microfiltration system withsea water. In: Challenges in Environmental Science & Engineering, CESE-2010,26 September to 1 October, Cairns, Australia.
Al-Juboori, R.A., Yusaf, T., 2012. Biofouling in RO system: mechanisms, monitoringand controlling. Desalination 302, 1–23.
American Public Health Association/American Water Works Association/WaterEnvironment Federation (APHA/AWWA/WEF), 1995. Standard Methods for theExamination of Water and Wastewater, 19th ed. American Public HealthAssociation, American Water Works Association and Water EnvironmentFederation, USA.
Chen, J., Zhang, M., Wang, A., Lin, H., Hong, H., Lu, X., 2012. Osmotic pressure effecton membrane fouling in a submerged anaerobic membrane bioreactor and itsexperimental verification. Bioresour. Technol. 125, 97–101.
Chien, C.C., Kao, C.M., Dong, C.D., Chen, T.Y., Chen, J.Y., 2007. Effectiveness of AOCremoval by advanced water treatment systems: a case study. Desalination 202(1–3), 318–325.
Chinu, K., Johir, A.H., Vigneswaran, S., Shon, H.K., Kandasamy, J., 2010. Assessment ofpretreatment to microfiltration for desalination in terms of fouling index andmolecular weight distribution. Desalination 250, 644–647.
Flemming, H.C., Schaule, G., Griebe, T., Schmitt, J., Tamachkiarowa, A., 1997.Biofouling—the Achilles heel of membrane processes. Desalination 113, 215.
Guo, W., Vigneswaran, S., Ngo, H.-H., Xing, W., Goteti, P., 2008. Comparison of theperformance of submerged membrane bioreactor (SMBR) and submergedmembrane adsorption bioreactor (SMABR). Bioresour. Technol. 99 (5), 1012–1017.
Hambsch, B., Werner, P., 1996. The removal of regrowth enhancing organic matterby slow sand filtration. In: Advances in Slow Sand and Alternative BiologicalFiltration. John Wiley & Sons, pp. 21–27.
Hammes, F., Salhi, E., Koster, O., Kaiser, H.-P., Egli, T., von Gunten, U., 2006.Mechanistic and kinetic evaluation of organic disinfection by-product andassimilable organic carbon (AOC) formation during the ozonation of drinkingwater. Water Res. 40 (12), 2275–2286.
Han, S.S., Bae, T.H., Jang, G.G., Tak, T.M., 2005. Influence of sludge retention time onmembrane fouling and bioactivies in membrane bioreactor system. ProcessBiochem. 40, 2393–2400.
Heran, M., Aryal, R., Shon, H.K., Vigneswaran, S., Elmaleh, S., Grasmick, A., 2012.How to optimize hollow-fiber submerged membrane bioreactors. WaterEnviron. Res. 84 (2), 115–119.
Huber, S.A., Balz, A., Abert, M., Pronk, W., 2011. Characterisation of aquatic humicand non-humic matter with size-exclusion chromatography-organic carbondetection-organic nitrogen detection (LC-OCD-OND). Water Res. 45, 879–885.
64 S. Jeong et al. / Bioresource Technology 141 (2013) 57–64
Jeong, S., Nguyen, T.V., Vigneswaran, S., 2011. Pretreatment of seawater for organicremoval using powder activated carbon. In: IDA World Congress onDesalination and Water Reuse, 5–9 September, Perth, Australia.
Jeong, S., Kim, L., Kim, S.-J., Nguyen, T.V., Vigneswaran, S., Kim, I.S., 2012. Biofoulingpotential reductions using a membrane hybrid system as a pre-treatment toseawater reverse osmosis. Appl. Biochem. Biotechnol. 67 (6), 1716–1727.
Johir, M.A.H., Aryal, R., Vigneswaran, S., Kandasamy, J., Grasmick, A., 2011. Influenceof supporting media in suspension on membrane fouling reduction insubmerged membrane bioreactor (SMBR). J. Membr. Sci. 374 (1), 121–128.
Kang, G.D., Gao, C.J., Chen, W.D., Jie, X.M., Cao, Y.M., Yuan, Q., 2007. Study onhypochlorite degradation of aromatic polyamide reverse osmosis membrane. J.Membr. Sci. 300, 165–171.
Lay, W.C.L., Liu, Y., Fane, A.G., 2010. Impacts of salinity on the performance of highretention membrane bioreactors for water reclamation: a review. Water Res.44, 21–40.
Lefebvre, O., Moletta, R., 2006. Treatment of organic pollution in industrial salinewastewater: a literature review. Water Res. 40 (20), 3671–3682.
Matin, A., Khan, Z., Zaidi, S.M.J., Boyce, M.C., 2011. Biofouling in reverse osmosismembranes for seawater desalination: phenomena and prevention.Desalination 281, 1–16.
Meyer, J.L., Edwards, R.T., Risley, R., 1987. Bacterial growth on dissolved organiccarbon from a blackwater river. Microbiol. Ecol. 13, 13–29.
Naidu, G., Jeong, S., Vigneswaran, S., Rice, S.A., 2013. Microbial activity in biofilterused as a pretreatment for seawater desalination. Desalination 309, 254–260.
Orem, Y. et al., 2011. Evaluation and Comparison of Seawater and Brackish WaterPre-treatment. Chap 2 in Membrane Based Desalination an IntegratedApproach. Enrico Diroli, IWA Publishing, London 2011. ISBN 9781843393214.
Shannon, M.A., Bohn, P.W., Elimelech, M., Georgiadis, J.G., Marinas, B.J., Mayes, A.M.,2008. Science and technology for water purification in the coming decades.Nature 452, 301–310.
Tian, Y., Chen, L., Zhang, S., Cao, C., Zhang, S., 2011. Correlating membrane foulingwith sludge characteristics in membrane bioreactors: an especial interest in EPSand sludge morphology analysis. Bioresour. Technol. 102 (19), 8820–8827.
Van der Kooij, D., Veenendaal, H.R., 1994. Biofilm development on surfaces indrinking water distribution systems. Water Supply 12 (12), SS 1-1–SS 1-7.
Velten, S., Hammes, F., Boller, M., Egli, T., 2007. Rapid and direct estimation of activebiomass on granular activated carbon through adenosine tri-phosphate (ATP)determination. Water Res. 41 (9), 1973–1983.
Visvanathan, C., Boonthanon, N., Sathasivan, A., Jegatheesan, V., 2002. Pretreatmentof seawater for biodegradable organic content removal using membranebioreactor. Desalination 153, 133–140.
Yogalakshmi, K.N., Joseph, K., 2010. Effect of transient sodium chloride shock loadson the performance of submerged membrane bioreactor. Bioresour. Technol.101, 7054–7061.