Physical and Biological Study of Cell Cultures in a Bioreactor
11
35167 -1 Applied Rheology Volume 21 · Issue 3 Abstract: Rheological behaviour of culture broth stands as a fundamental parameter in bioprocess performances because it affects simultaneously the heat and mass transfer as well as the flow pattern. On-line measurements of rheological behaviour are hardly compatible with the operating condition with respect to accurate and stringent conditions imposed by cell culture strategy. Our scientific and technical objectives are (i) to develop and identify an experimen- tal device enabling on-line rheometry and (ii) to discuss and compare on-line and off-line measurements. In this aim, a bioreactor was equipped with a derivation loop including a specific on-line rheometric device as well as additional physical and biological measurements (specific density, mass flow rate, electrical conductivity, pH, pO 2 and temper- ature) during microbial cell cultures. In a first time, friction curves of calibrated ducts were established with New- tonian and non-Newtonian shear-thinning fluids. In a second time, axenic cultures with two microorganisms (bac- teria and yeast exhibiting different sizes) were investigated in pure oxidative culture in order to produce biomass under high cell concentrations: ~ 40 to 110 g CDW /l for E. coli (bacteria) and ~ 75 to 105 g CDW /l for Y. lipolytica (yeast). Cell broths exhibited Newtonian behaviour for E. coli and shear-thinning behaviour for Y. lipolytica, which were both depen- dant on biomass concentration. On-line and off-line rheological measurements are consistent for E. coli and Y. lipoly- tica, but significantly differed. On-line estimated viscosity appears higher than off-line apparent viscosity. Several assumptions in relation with microorganism physiology and metabolism (size, morphology, surface properties, con- centration, biological activity) could be formulated in agreement with scientific literature. On-line rheology brings new insight to investigate complex interaction between physical and biological phenomena. Zusammenfassung: Das rheologische Verhalten von Kulturen stellt einen entscheidenden Paramter in der Leistungsfähigkeit von bio- logischen Prozessen dar, da es sowohl die Wärme und Massenübertragung, als auch das Flussverhalten beeinflusst. On-line Messungen des rheologischen Verhaltens sind nicht mit den exakten Arbeitsbedingungen die für die Zell- kulturenstrategie nötig sind, vereinbar. Unsere wissenschaftlichen und technischen Ziele sind (i) die Entwicklung eines experimentellen Instruments zur on-line Rheometrie und (ii) on-line und off-line Messungen miteinander zu vergleichen. Dafür wurde ein Bioreaktor mit einem Rohr in Derivation mit einem spezifischen on-line Rheometrie Instrument und zusätzlichen physikalischen und biologischen Meßgeräten (spezifische Dichte, Durchflussrate, elektrische Leitfähigkeit, pH, pO 2 und Temperatur) ausgestattet. Zunächst wurden Reibwertkurven erstellt mit kali- brierten Mitteln mit Newtonsches und allgemeinen Nicht-Newtonsches strukturviskosen Flüssigkeiten. Im zwei- ten Schritt wurden axenische Kulturen von zwei Mikroorganismen (Bakterien und Hefern verschiedener Größen) in reiner oxidativen Kultur untersucht um Biomasse mit hoher Zellkonzentration zu erzeugen: ~ 40 – 110 g CDW /l für E. coli (Bakterien) und ~ 75 – 105 g CDW /l für Y. lipolytica (Hefe). Das Kulturmedium zeigte Newtonsches Verhalten mit E. coli und strukturviskoses Verhalten bei Y. lipolytica, wobei beides von der Biomassekonzentration anhing. On- line und off-line rheologische Messungen sind consistent für E. coli und Y. lipolytica, aber unter scheiden sich deut- lich. Die geschätzen Werte für Viskosität sind höher wenn on-line gemessen. Verschiedene Annahmen über die Physiology des Mikroorganismus und den Metabolismus (Größe, Morphologie, Oberflächeneigenschaften, Kon- zentration, biologische Aktivität) konnten im Einklang mit der Literatur formuliert werden. On-liner Rheologie ermöglicht neue Einblicke in die Untersuchung der komplexem Interaktion zwischen physikalischen und bilogi- schen Phänomenen. Résumé: Le comportement rhéologique des moûts de fermentation représente un paramètre fondamental pour le contrô- le et l’intensification des bioprocédés car il affecte simultanément les transferts de chaleur, de matière et de Physical and Biological Study of Cell Cultures in a Bioreactor: On-line and Off-line Rheological Analyses Yannick Manon 1 , Dominique Anne-Archard 3 , Jean-Louis Uribelarrea 1 , Carole Molina-Jouve 1 and Luc Fillaudeau 1-3 * 1 Université de Toulouse, INRA & CNRS & INSA, LISBP (Laboratoire d’Ingénierie des Systèmes Biologiques et des Procédés), 135 avenue de Rangueil, 31077 Toulouse, France 2 Université de Toulouse, INPT-UPS & CNRS, IMFT (Institut de Mécanique des Fluides de Toulouse), Allée Camille Soula, 31400 Toulouse, France 3 CNRS, Féderatio de Recherche FERMAT, 31400 Toulouse, France * Corresponding author: [email protected] Fax: x33.5.61559400 Received: 7.12.2010, Final version: 19.2.2011 © Appl. Rheol. 21 (2011) 35167 DOI: 10.3933/ApplRheol-21-35167
-
Upload
khangminh22 -
Category
Documents
-
view
0 -
download
0
Transcript of Physical and Biological Study of Cell Cultures in a Bioreactor

35167-1 Applied RheologyVolume 21 · Issue 3
Abstract:Rheological behaviour of culture broth stands as a fundamental parameter in bioprocess performances because itaffects simultaneously the heat and mass transfer as well as the flow pattern. On-line measurements of rheologicalbehaviour are hardly compatible with the operating condition with respect to accurate and stringent conditionsimposed by cell culture strategy. Our scientific and technical objectives are (i) to develop and identify an experimen-tal device enabling on-line rheometry and (ii) to discuss and compare on-line and off-line measurements. In this aim,a bioreactor was equipped with a derivation loop including a specific on-line rheometric device as well as additionalphysical and biological measurements (specific density, mass flow rate, electrical conductivity, pH, pO2 and temper-ature) during microbial cell cultures. In a first time, friction curves of calibrated ducts were established with New-tonian and non-Newtonian shear-thinning fluids. In a second time, axenic cultures with two microorganisms (bac-teria and yeast exhibiting different sizes) were investigated in pure oxidative culture in order to produce biomassunder high cell concentrations: ~ 40 to 110 gCDW/l for E. coli (bacteria) and ~ 75 to 105 gCDW/l for Y. lipolytica (yeast). Cellbroths exhibited Newtonian behaviour for E. coliand shear-thinning behaviour for Y. lipolytica, which were both depen-dant on biomass concentration. On-line and off-line rheological measurements are consistent for E. coli and Y. lipoly-tica, but significantly differed. On-line estimated viscosity appears higher than off-line apparent viscosity. Severalassumptions in relation with microorganism physiology and metabolism (size, morphology, surface properties, con-centration, biological activity) could be formulated in agreement with scientific literature. On-line rheology bringsnew insight to investigate complex interaction between physical and biological phenomena.
Zusammenfassung:Das rheologische Verhalten von Kulturen stellt einen entscheidenden Paramter in der Leistungsfähigkeit von bio-logischen Prozessen dar, da es sowohl die Wärme und Massenübertragung, als auch das Flussverhalten beeinflusst.On-line Messungen des rheologischen Verhaltens sind nicht mit den exakten Arbeitsbedingungen die für die Zell-kulturenstrategie nötig sind, vereinbar. Unsere wissenschaftlichen und technischen Ziele sind (i) die Entwicklungeines experimentellen Instruments zur on-line Rheometrie und (ii) on-line und off-line Messungen miteinander zuvergleichen. Dafür wurde ein Bioreaktor mit einem Rohr in Derivation mit einem spezifischen on-line RheometrieInstrument und zusätzlichen physikalischen und biologischen Meßgeräten (spezifische Dichte, Durchflussrate,elektrische Leitfähigkeit, pH, pO2und Temperatur) ausgestattet. Zunächst wurden Reibwertkurven erstellt mit kali-brierten Mitteln mit Newtonsches und allgemeinen Nicht-Newtonsches strukturviskosen Flüssigkeiten. Im zwei-ten Schritt wurden axenische Kulturen von zwei Mikroorganismen (Bakterien und Hefern verschiedener Größen)in reiner oxidativen Kultur untersucht um Biomasse mit hoher Zellkonzentration zu erzeugen: ~ 40–110 gCDW/l fürE. coli (Bakterien) und ~ 75–105 gCDW/l für Y. lipolytica (Hefe). Das Kulturmedium zeigte Newtonsches Verhalten mitE. coli und strukturviskoses Verhalten bei Y. lipolytica, wobei beides von der Biomassekonzentration anhing. On-line und off-line rheologische Messungen sind consistent für E. coli und Y. lipolytica, aber unter scheiden sich deut-lich. Die geschätzen Werte für Viskosität sind höher wenn on-line gemessen. Verschiedene Annahmen über diePhysiology des Mikroorganismus und den Metabolismus (Größe, Morphologie, Oberflächeneigenschaften, Kon-zentration, biologische Aktivität) konnten im Einklang mit der Literatur formuliert werden. On-liner Rheologieermöglicht neue Einblicke in die Untersuchung der komplexem Interaktion zwischen physikalischen und bilogi-schen Phänomenen.
Résumé:Le comportement rhéologique des moûts de fermentation représente un paramètre fondamental pour le contrô-le et l’intensification des bioprocédés car il affecte simultanément les transferts de chaleur, de matière et de
Physical and Biological Study of Cell Cultures in a Bioreactor:On-line and Off-line Rheological Analyses
Yannick Manon1, Dominique Anne-Archard3, Jean-Louis Uribelarrea1, CaroleMolina-Jouve1 and Luc Fillaudeau1-3*
1 Université de Toulouse, INRA & CNRS & INSA, LISBP (Laboratoire d’Ingénierie des SystèmesBiologiques et des Procédés), 135 avenue de Rangueil, 31077 Toulouse, France2 Université de Toulouse, INPT-UPS & CNRS, IMFT (Institut de Mécanique des
Fluides de Toulouse), Allée Camille Soula, 31400 Toulouse, France3 CNRS, Féderatio de Recherche FERMAT, 31400 Toulouse, France
* Corresponding author: [email protected]: x33.5.61559400
Received: 7.12.2010, Final version: 19.2.2011
© Appl. Rheol. 21 (2011) 35167 DOI: 10.3933/ApplRheol-21-35167

1 INTRODUCTIONDuring cell culture in bioreactor, micro-organismphysiology closely interacts with physico-chem-ical parameters (gas and feed flow rate, mixing,temperature, pH, pressure). The specificity ofmicrobial bioreactions in relation with irre-ducible couplings between heat and mass trans-fers and fluid mechanics, led to complex anddynamic systems [1]. Our scientific approachaims to understand and control dynamic inter-actions between physical and biological systemsat different scales (macro, micro and molecular)for molecules, strains and/or bioprocess innova-tion. Rheological behaviour of culture brothstands as a fundamental parameter in bio-process performances because it affects simul-taneously heat and mass transfer as well as flowpattern. Then, the identification and quantifica-tion of rheological behaviour is determinant tomonitor cell culture process and to optimise theperformances according to various criteria suchas biomass production, extra or intra cellularmetabolite production, substrate biodegrada-tion, etc. [2, 3].
In our study axenic cultures, defined as cul-tures of a pure and unicellular microorganism inbioreactor, are considered. During these cultures,cells (concentration, shape, dimension, phy sio -logy, … ) strongly affect physico-chemical prop-erties of broth. The modification of these char-
acteristics interacts with bioprocess perfor-mances (specific rates, yields, … ) with an im -prove ment or more generally a decrease ofyields. Rheological behaviour is a strategy wide-ly used to understand the impact of cells and themodification of performance of bioprocess [4].These biological suspensions are of different cat-egories, linked to the cell nature: plant-cell [5 – 7],animal cell [8, 9], microalgae [10], fungi [11 – 13],yeast [14, 15] or bacteria [16 – 18]. Many studiesexplain the modification of viscosity by a pro-duction of biopolymer secreted by microorgan-isms [18] or/and a macroscopic change of mor-phology with pellet formation [2, 13, 19]. In thesecases, the contribution of the biomass is not sig-nificant and could not explain the changes ofphysical properties. A limited number of scien-tific studies focused on the impact of biomass [14,15, 20], but the samples treatment post experi-ment or before analysis may differ from the insitu rheological behaviour during the bioprocess.
Approaches based on on-line torque mea-surements are confronted to several lacks: (i)variation of the frequency rotation is oftenincompatible with culture strategy (mass trans-fer limitation) and (ii) precision of torque mea-surement within a large range of torque, as gen-erally observed in cell cultures, is heterogeneousand sometimes weak. To avoid the problem ofmeasurement relevance, the development of
35167-2Applied RheologyVolume 21 · Issue 3
quantité de mouvement. Les métrologies en-ligne et in-situ permettant l’étude du comportement rhéologiquesont difficilement compatibles avec les conditions opératoires permettant de contrôler l’activité microbiolo-gique, et avec la précision et les contraintes imposées par une stratégie de culture cellulaire. Nos objectifs scien-tifiques et techniques sont (i) de développer et d’identifier un dispositif expérimental autorisant une mesurerhéométrique en-ligne et (ii) de comparer et discuter les mesures en-ligne et hors-ligne. Dans cet objectif, unbioréacteur couplé à une boucle de dérivation spécifiquement instrumentée permettant des mesures rhéolo-giques ainsi que des mesures physiques et biologiques en ligne, a été développé. Dans un premier temps, lescourbes de frottement des conduites calibrées ont été établies avec des fluides newtoniens puis étendues auxfluides non-newtoniens de type rhéofluidifiant. Dans un second temps, deux cultures axéniques avec deuxmicroorganismes (une bactérie et une levure ayant des tailles différentes) ont été étudiés en mode purementoxydatif afin de produire une biomasse catalytique sous condition de haute concentration cellulaire : ~ 40 à 110gMS/l pour E. coli (bactérie) et ~ 75 à 105 gMS/l pour Y. lipolytica (levure). Les moûts montrent un comportementnewtonien pour E. coli et un comportement rhéofluidifiant pour Y. lipolytica, lesquels sont tous deux dépen-dants de la concentration en biomasse. Les mesures rhéologiques en-ligne et hors-ligne sont cohérentes et per-tinentes pour chaque culture, mais diffèrent significativement. La viscosité équivalente en-ligne est plus élevéeque la viscosité hors-ligne. Plusieurs hypothèses liées à la physiologie et au métabolisme des microorganismes(taille, morphologie, caractéristiques physico-chimiques, activité biologique) peuvent être formulées en accordavec la littérature scientifique. La caractérisation en ligne du comportement rhéologique apporte un nouveléclairage sur les interactions dynamiques entre les phénomènes physiques et biologiques.
Key words: rheology, broth, cell culture, bioreactor, on-line viscosity, physical measurements

new devices is necessary to preserve biologicalactivity in the broth (Kemblowski [21] for axenicculture and Seyssiecq et al. [22] for other type ofbiological complex matrix).
In this context our scientific and technicalobjectives are to investigate coupling effectsbetween physical and biological mechanisms.They rest on physical on-line (rheology, visualobservation of flow in the derivation loop, physi-co-chemical parameters) and off-line (rheology,microscopy, granulometry) measurements, ana -lysed simultaneously with usual biological mea-surements during fed-batch cultures. For thispurpose, a bioreactor was equipped with aderivation loop including a specific on-line rheo-metric device. First, friction curves of calibratedducts were achieved with Newtonian and non-Newtonian shear-thinning model fluids. Second,axenic cultures with two microorganisms withdifferent size were carried out in order to producehigh biomass concentrations. With this new tool,Escherichia coli (E. coli) and Yarrowia lipolytica (Y.lipolytica) cultures are presented and discussed.Some evolutions of physico-chemical parame-ters are explained in relation to cultures realisedin a continuous feeding mode (i.e. fed-batch cul-tures). Finally, on-line and off-line rheologicalmeasurements are compared. This first studyallows demonstrating the necessity of develop-ing accurate tools to understand the impact ofthe biological activity on rheological behaviour,and more generally on the physico-chemistry ofthese three phases media.
2 MATERIALS AND METHODS
2.1 EXPERIMENTAL SET-UPThe experimental set-up consisted of a 20 l biore-actor (Chemap-Fermenter, Chemap AG, 8601Volketswil, Switzerland), a displacement pump(TUTHILL DSG 1.3EEET, Qmax = 350 l/h, Pmax = 5 bar)and a fully instrumented derivation loop (Fig-ure 1). The derivation loop (volume = 0.93 ±0.04 l) consisted in a tube of 2.50 m lengthincluding a 300 mm hydrodynamic developing
length and a pressure drop (DP) measurementalong L = 2.00 m. Two smooth tubes, D1 and D2were regular circular straight tubes (stainlesssteel 316L, 1 mm thickness) with respectivelynominal diameter of 12 mm and 6 mm. Otherconnections (90° junction, etc.) were tubes with12 mm nominal diameter.
The bioreactor consisted in a cylindrical trans-parent vessel (h = 480 mm, Dv= 250 mm) equippedwith three Rushton turbines (Da = 80 mm, fourblades wa= la= 20 mm) and baffle basket (nb= 4, Hb= 300 mm, wb= 30 mm, on a 170 mm diameter ring).Aeration (Qair,max= 20 Nl/min) was ensured by an airinjection located under the first turbine. Regulationloops enabled to control temperature, pH and dis-solved oxygen. Anti-foam add was included. Theinlet of the derivation loop is located at the biore-actor bottom and an external radial position inorder to avoid suction of bubble issued from aera-tion tube. Experimental measurements along thederivation loop were performed on: relative and dif-ferential pressures, mass flow rate, temperature,specific density, pH, dissolved oxygen and electri-cal conductivity. The relative pressure (BOURBON-HAENNI E913 33 B22 n°6008, ± 0.2 % full scale) wasmeasured at pump outlet. A Coriolis effect flow-meter (KROHNE, type MFS-7050-S06) enabledmass flow rate (accuracy ± 0.1 % for a liquid and± 0.5 % for a gas), temperature (precision ± 1°C) andspecific density (precision ± 2 kg/m3) measure-ments. The differential pressure (HONEYWELL-STD120 n°0630–C2856562001001 and n°0630–C2856562001002, precision ± 0.003 % for 105 Pa infull scale) was used to determine the pressure dropalong the calibrated length. Dissolved oxygen andpH were measured with two specific sensors (pH:Easyferm Plus VP/120–238 633, pO2: OxyfermFDA/120–237 450). Finally, electrical conductivityand temperature were controlled by an electricalconductimeter (KEMOTRON-type 9147 n°36036 –cell constant: K = 0.3131, precision ± 3 % per decade)and a platinum resistance probes (Pt 1000W – IEC751 – Class A). All electrical signals of sensors wereconditioned using a data acquisition system(Agilent technologies, Loveland, USA, 34901A)including a multiplexer acquisition module(34901A) and a control command card (34907A) viaa RS-232 liaison.
A specific pump command was developedunder Labview software to monitor the flow ratewithin the derivation loop. Two working modeswere used: (i) constant flow-rate and (ii) flow rate
35167-3 Applied RheologyVolume 21 · Issue 3
Figure 1:Overview of experimentalset-up.

sequences. The flow rate sequences were definedby the number and duration of steps, minimumand maximum flow rates. In this case, the flowrate sequence was a gradual reduction by step ofthirty seconds to new constant flow rate until alow flow rate (about 20 l h-1). Then, the flow ratewas increased always by step of thirty secondsuntil highest flow rate of the pump. These lastone enabled to investigate on-line rheologicalcharacterisation during cell cultures only on thegradual reduction of flow rate.
2.2 TEST FLUIDSThe experimental device was calibrated usingNewtonian and non-Newtonian fluids. Concern-ing Newtonian fluids, osmosed water and severalglucose solutions were used with viscosity rang-ing from 0.001 to 25 Pa·s to ensure a large Reynoldsnumber range. Glucose solutions were preparedby dissolving hydrated glucose (dextrose, C6H12O6,1H2O) powder in osmosed water. Non-Newtonianfluids were aqueous Xanthane solutions (0.2 and0.4 %wt, Satiaxane CX910) exhibiting a shear-thinning behaviour. Rheological characterizationwas conducted with a Bohlin rheometer (seeChapter 2.4) and a power-law model, m= kgn-1 wasadjusted within 1 to 100 s-1. Consistency, k, andflow behaviour index, n, for 0.2 and 0.4 %wt solu-tions were respectively 0.474 Pa·sn and 0.282, and1.668 Pa·sn and 0.177. Density and viscosity weremeasured for each solution during experimentsconducted at 20°C.
2.3 CELL CULTURE CONDITIONSAxenic cultures with two microorganisms wereconducted in order to produce high catalytic bio-mass concentrations. E. coli is the most widelyused microorganism for biological research ex -periments in microbiology. For this culture, themutant used was of the strain E. coliK12. Y. lipoly-tica strains (wild strain W29) is a non-pathogen-ic ascomycetous yeast. It is one of the most stud-ied ‘non-conventional’ yeast species, in terms ofits genetics, molecular biology and biotechno-logical applications. Fed-batch cultures were per-formed in a Chemap AG (20 l) bioreactor underhighly aerated (< 3.3 VVM) and agitated condi-tions (1500 RPM). pH was regulated by additionof 28 % (w/w) ammoniac solution also used as anitrogen source. Bioreactor contained 2 l of min-eral medium and was inoculated with around 4.0
± 0.5 l of broth issued from a previous culture. ForE. coli and Y. lipolytica, temperature and pH wereregulated at (37°C, 6.8) and (28°C, 5.5), respec-tively. During culture, the bioreactor was fedwith sterile solutions (glucose solution, mineralmedium, pH regulation solutions, anti-foam)using peristaltic pump (Masterflex and Gilson).Carbohydrate feed allowed the growth rate con-trol in agreement with a substrate limitationstrategy. Oxygen transfer was performed thanksto air flow, mixing (3 Rushton turbines) and to asmall counter-pressure (£ 100 mbar). Biologicalactivity was controlled within the derivation loopby monitoring dissolved oxygen, pH and control-ling mean residence time with respect to specif-ic growth rate and substrate consumption.
2.4 ANALYSESBroth is sampled along experiment and stored at4°C during several hours (off-line rheometry,laser diffraction analyse) in order to quantify thefollowing parameters: � Cell concentration: with spectrophotometric
measurement at l = 600 nm for Y. lipolyticaand l= 620 nm for E. coli (SpectrophotometerHitachi U-1100, linear range 0.2 –0.6 AU =Absorbance Unit). Cell dry weight, X [gCDW/l]was calculated from an experimental correla-tion between absorbance and dry matter.These correlation stemmed from previous cul-ture used to inoculate the bioreactor:
(1)
(2)
Where X is the concentration in gram of cell dryweight per litre respectively of E. coli or Y. lipoly-tica, A is the absorbance in [AU] read to the spec-trophotometer at l = 620 nm for E. coli and l =600 nm for Y. lipolytica (with osmosed water inblank), and d is the dilution necessary to obtaina measurement of the absorbance in the linearrange of the spectrophometer.� Particle size distribution: with laser diffrac-
tion analyse (Mastersizer 2000 Malvern In -stru ments Ltd. range from 0.02 to 2000 mm)
� Cell morphology: with optical microscopy(Nikon, x100, in oil immersion, phase contrastmode)
35167-4Applied RheologyVolume 21 · Issue 3
� Off-line rheometry: rheometer Bohlin C-VOR200 (Malvern Instruments Ltd). Geometry:cone-plate 2°/60 mm, shear rate explored = 1to 100 s-1. The usual cares were observed forthe measurements (torque > 10-6 Nm, mea-sured without inertia effect). Serrated geome-tries were also used and confirmed no-slipcondition under investigated shear rates. E.coli broths were characterized at 20, 25 and30°C and Y. lipolytica at 28°C.
2.5 GENERALISED FRICTION CURVESIsothermal flow of Newtonian fluids in simplegeometries has been studied extensively. Shahand London [23] gave an exhaustive overview ofthe analytical solutions obtained in laminar flowand semi-empirical correlations for transitionand turbulent flow regimes. f/2 is the friction fac-tor and Re is the classical Reynolds numbersdefined as follows:
(3)
where r and h are respectively the density andthe viscosity, U the mean velocity and dh thehydraulic diameter of the duct. The friction curveis the representation of f/2 against Re. The rela-tionship between the friction factor and theReynolds numbers for laminar isothermal flow ofNewtonian fluids in cylindrical ducts is given byEquation 4. The parameter x stands as a geo-metrical parameter. It can be evaluated from the-ory for simple geometries (e.g. circular ducts x =8, infinite parallel plate x= 12, square duct x= 7.113)or using a semi-theoretical or an experimentalway. For transition and turbulent flow regimes,numerous semi-empirical correlations can be
used (e.g.: Blasius) with the following expression(a, b, c and d being constant coefficients):
(4)
(5)
The range for laminar-turbulent transition liesbetween two critical Reynolds numbers Rec1 andRec2. The friction curve could be described usingan unique expression based on Churchill’s mod-el (Equation 6). For cylindrical duct, this expres-sion integrates the three regimes contributionsas follows [24]:
(6)
In non-Newtonian cases, a generalised Reynoldsnumber is widely used according to Metzner andReed concept [25]. It assumes the uniqueness ofthe friction curve in laminar flow regime. Writ-ing Equation 7 for shear-thinning fluids de -scribed by a power-law model leads to the fol-lowing expression for generalized Reynoldsnum ber in Poiseuille flow:
(7)
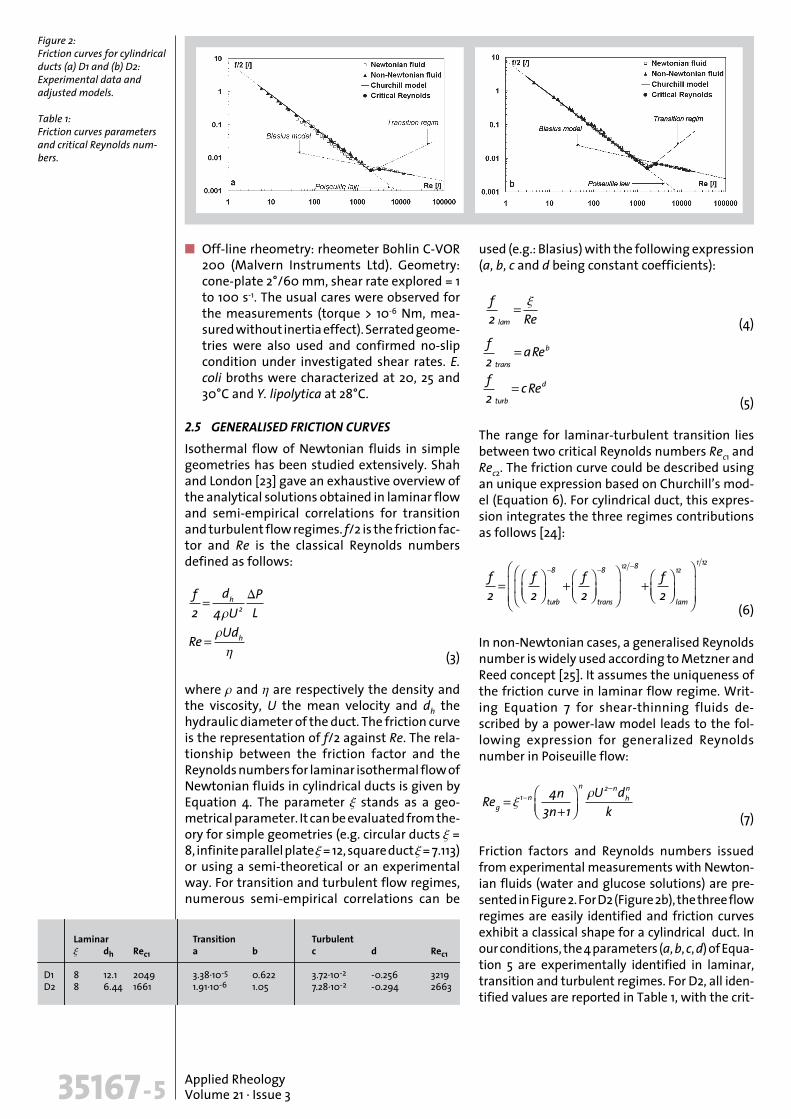
Friction factors and Reynolds numbers issuedfrom experimental measurements with Newton-ian fluids (water and glucose solutions) are pre-sented in Figure 2. For D2 (Figure 2b), the three flowregimes are easily identified and friction curvesexhibit a classical shape for a cylindrical duct. Inour conditions, the 4 parameters (a, b, c, d) of Equa-tion 5 are experimentally identified in laminar,transition and turbulent regimes. For D2, all iden-tified values are reported in Table 1, with the crit-
35167-5 Applied RheologyVolume 21 · Issue 3
Figure 2:Friction curves for cylindricalducts (a) D1 and (b) D2:Experimental data andadjusted models.
Table 1:Friction curves parametersand critical Reynolds num-bers.

ical Reynolds numbers Rec1 and Rec2 values. Theyare determined at the points where differencesbetween experimental data and laminar and tur-bulent adjusted laws exceed 5 %. D1 duct wasdimensioned to investigate specifically low shearrates and friction curve (Figure 2b) was establishedin the laminar flow regime. Finally, friction curvesallow the identification of the mean hydraulicdiameter for both industrial ducts (see Table 1).Relative standard uncertainty for hydraulic diam-eter could be estimated at ± 1.4 %.
The Churchill model (Equation 6) using fric-tion factors (Equations 4 and 5) calculated with thecoefficients defined in Table 1 is then consideredas a reference curve for on-line rheological mea-surements. In a second step, experiments withnon-Newtonian fluids were carried out. On-linepilot plant measurements enabled to calculatefriction factor for a range of shear rates. Corre-sponding generalized Reynolds numbers were cal-culated using mean velocity and power law para-meters determined with off-line measurement(Bohlin rheometer). Non-Newtonian data shownin Figure 2 are provided by on-line and off-linemeasurements restricted to similar investigatedshear rate range. The uniqueness of friction curveis confirmed and validates our ap proach to inves-tigate on-line rheometry of fermentation broths.
2.6 MEASUREMENT UNCERTAINTYIn this section, we have followed the recommenda-tions of the International Organisation of LegalMetrology to evaluate our measurement uncertain-ties [26]. Based on the uncertainty of friction curvesand hydraulic diameter identification, the resolutionof friction factor, the Reynolds number and the on-line estimated viscosity must be evaluated. It is pos-sible to express each variable of the form:
(8)
Where Y could be f/2, Re or h, Xi are the on-linemeasurements, pi is positive or negative numberhaving negligible uncertainty, q is a constant.Measurement uncertainty is evaluated with thedetermination of relative combined standarduncertainty uc(y)/|y| of each variable associatedto friction curve. In our case, each standard uncer-tainty u(xi) is evaluated by combining (when thisis possible) a Type A and B of standard uncer-tainty (respectively uA(xi) and uB(xi)).
(9)
An expanded uncertainty U is evaluated by mul-tiplying the standard uncertainty u(xi) by a cov-erage factor k= 3 to obtain a high confidence lev-el (probability > 99 %). For uncorrelated and inde-pendent input quantities, the combined variance[uc(y)/y]2 is given by:
(10)
The relative combined standard uncertaintyUc(y)/|y| is the positive square root of the com-bined variance ([Uc(y)/y]2 or [Uc(xi)/xi]2) where |y|π 0 and |xi| π 0. All the relative combined stan-dard uncertainties are shown in the Table 2.
3 RESULTS
3.1 OVERVIEW OF CELL CULTURESE. coli culture was monitored during 14 hourswhere pH, temperature, agitation and aerationflow rate stayed constant respectively to 6.8,37°C, 1500 RPM and 20 Nl/min (equivalent toVVM of ~ 3l/lh). Dissolved oxygen evolved infunction of input of glucose solution and feedsalts. Biomass concentration increased from ~ 40up to ~ 110 gCDW/l with a mean specific growthrate of 0.063 ± 0.032/h (evaluated on spec-trophotometric measurements). This culture hadnot been limited in oxygen transfer. Microscop-ic observations (Figure 3) showed ovoidal shapes.The mean particle diameter measured by granu-
35167-6Applied RheologyVolume 21 · Issue 3
Figure 3:Microscopic observation of(a) E. coli and (b) Y. lipolytica(oil immersion, phase con-trast illumination, x 100magnification).
Table 2:Summary of different rela-tive combined standarduncertainty [%].

lometry was constant, with D(4,3) = 1.13 ± 0.05 mm(D0.1 = 0.72 ± 0.04 mm and D0.9 = 1.6 ± 0.2 mm). Y.lipolytica culture was monitored during 10 hourswhere pH, temperature, agitation and aerationflow rate stayed constant respectively to 5.5,28°C, 1500 RPM and 20 Nl/min (equivalent toVVM of ~ 3l/lh). Biomass concentration increasedfrom ~ 75 up to ~ 105 gCDW/l with a mean specif-ic growth rate of 0.044 ± 0.017/h (evaluated onspectrophotometric measurements), despite alimitation in oxygen transfer since the beginningof the culture. In a similar way with E. coli culture,microscopic observations (Figure 3) showedovoidal shapes. The mean particle diameter mea-sured by granulometry gave the following valuewith D(4,3) = 6.5 ± 0.2 mm (D0.1 = 2.61 ± 0.04 mmand D0.9 = 12.7 ± 0.5 mm).
Figures 5 and 6 present the pressure drop,flow rate, specific density and conductivity as afunction of time for both cultures. These resultsare mean values and associated standard devia-tion evaluated using 51 experimental points. ForE. coli culture (Figure 5), pressure drop signifi-cantly increased (+ 25%) and density slightlydecreased whereas flow rate in the derivationloop was maintained constant (around 200 l/h).Specific density values demonstrated that animportant gas fraction was present in broth. Afterhave fed the bioreactor with an overflow of salt
until 3 h, conductivity values explained that thesalts had been consumed by the microorganismsafter 3 h. For Y. lipolytica culture (Figure 6), pres-sure drop significantly increased (+ 85%) and den-sity slightly increased whereas flow rate wasmaintained constant (around 250 l/h). Viscosityof supernatant staying constant close to viscosi-ty of water during the culture, pressure drop trendis explained by the impact of cell concentrationincrease. The evolution of specific density showeda gradual decrease of the volume fraction of gasphase in the derivation loop. This one could belinked to an increase of coalescence: as coales-cence increased, only smallest bubbles weresucked up in the derivation loop as demonstrat-ed by the increase of specific density from r =948.9 ± 1.9 kg/m3 at 3 h to r = 978.4 ± 1.5 kg/m3 at10 h. This coalescence mechanism may be relatedto limitation of oxygen transfer and assumptionincluding cells characteristics (size, shape, com-position and mechanical properties of cell wallsor intracellular fluidity of microorganisms [1, 9]may be formulated. This is coherent with the con-ductivity curve which is linked to salts feedingstrategy (constant flow rate along culture): dur-ing the first three hours of culture, the salts con-sumption exceeds salts feeding and conductivitydecreased in agreement with growth rate. Afterthree hours of culture, in crease of coalescenceinduced larger bubble size with higher migrationto the upper part of bioreactor. Electrical conduc-tivity evolved as a function of gas volume fractionin the derivation loop as shown in Figure 6.
3.2 ON-LINE AND OFF-LINE RHEOLOGY ANDANALYSES (OF PHYSICO-CHEMICAL PARAMETERS)Results in the previous section were concernedwith measurements at constant flow rate in thederivation loop and provide information aboutculture condition monitoring as a function oftime. Now, we are going to analyse results com-ing from the flow rate sequences in the deriva-tion loop. Figures 7, 8, and 9 show the evolutionof specific density and electrical conductivity as
35167-7 Applied RheologyVolume 21 · Issue 3
Figure 4 (left above):Evolution of dissolveddioxygen and biomass con-centration for E. coli and Y.lipolytica culture.
Figure 5 (left below):Physico-cheminal parame-ters as a function of timeduring E. coli culture.
Figure 6 (right):Physico-chemical parame-ters as a function of timeduring Y. lipolytica culture.

a function of flow rate for different biomassconcentrations. In addition, the mean residencetime calculated for the whole derivation loop isplotted. The specific density curves for the dif-ferent biomass concentrations are in agree-ment with previous observations. The specificdensity mean values decreased with lower flowrates. This trend may be explained by the de -crease of relative pressure and expansion of gasphase in the derivation loop. The global evolu-tion of specific density and electrical conductiv-ity exhibits two parts whereas initial mediumvalues (without cells) stayed quasi-constant forboth measurements.
For flow rate less than around 100 l/h,strong increase of specific density and electricalconductivity and decrease of associated varianceversus flow rate are observed. This observationrelated to variances is dramatically true for E.coli. These evolutions could be explained by theincrease of mean residence time of broth in thederivation loop. The working mode consisting inflow rates sequence leads to residence time larg-er than the duration of step. Liquid-gas phaseseparation may occur at low flow rate becauseof an abrupt decrease of relative pressure. Thisdecrease involved an increase of bubble sizeinduced by the flow rate sequences, troublingon-line specific density and electrical conductiv-ity measurements. These points are subject tocaution and they will not be considered for fur-ther analyses, namely for on-line rheometry. Forthe highest flow rate (above around 100 l/h), thespecific density for both cultures shows a slightincrease versus flow rate. Curves of electricalconductivity versus flow rate show a slightdecrease for E. coli and exhibit constant valuesfor Y. lipolytica. In each case, associated vari-ances became negligible. For E. coli, this tenden-cy could be explained by an increase of extracel-lular salt in response to abrupt decrease of rela-tive pressure inside broth. The decrease of hydro-static pressure would involve readjustment ofturgor pressure cell with a hydration and aswelling of cell. Cells increased intracellularwater quantities [27] involving a increase of saltsin extracellular medium.
Figure 10 illustrates the evolution of pres-sure drop along calibrated duct (D2) as a functionof flow rate, biomass concentration and microor-ganism. A first curve is established with initialmedium (without cell) and exhibit a non-linear
shape in agreement with a turbulent flow regime(8000 < Re < 16000). The pressure drop curvesexhibit a quasi-linear evolution and increase ver-sus flow rate with increasing slopes in agreementwith increase of biomass concentration. For flowrate lower than about 60 l/h, higher variances areobserved and attributed to liquid-gas phase sep-aration as previously discussed for specific den-sity and electrical conductivity. However, even ifaverage biomass concentrations were similar forE. coli and Y. lipolytica, pressure drop are highlydifferent. That can be explained by microorgan-ism physiology including the size differencesbetween E. coli and Y. lipolytica. The workingmode based on flow rate sequences enabled toexplore the on-line rheological behaviour. Mea-surements were carried out under laminar flow
35167-8Applied RheologyVolume 21 · Issue 3
Figure 7 (above):Evolution of specific densityand residence time in thederivation loop in fonctionof the flow rate of circula-tion (*estimated biomassconcentration).
Figure 8 (middle):Evolution of conductivityand residence time duringflow rate sequences for E.coli culture (identical legendas Figure 7).
Figure 9 (below):Evolution of conductivityand residence time duringflow rate sequences for Y.lipolytica culture (identicallegend as Figure 7).

regime (Re < 1230) and in respect with microbio-logical activity within the derivation loop (Q> 100l/h). Reynolds number did not exceed Rec1 forthese measurements (see Table 1). Using estab-lished friction curves and experimental mea-surements, the friction factor was calculated foreach point. Reynolds numbers were estimatedand a viscosity deduced.
In Figure 11, the curves for on-line and off-line viscosity as a function of shear rates are plot-ted. The off-line viscosity is obtained with arheometer and corresponds to the classicalapparent viscosity. Regarding on-line rheometry,an estimated viscosity is then measured undermicroorganism culture conditions. In Table 3, therelative combined standard uncertainty of on-line estimated viscosity is evaluated to less than± 10 % in laminar and ± 23 % in turbulent flowregime. This resolution is the result of the uncer-
tainty of friction curves and hydraulic diameteridentification. During culture, supernatant ex -hibits a Newtonian behaviour with a constantapparent viscosity (between 1.25·10-3and 1.39·10-3Pa·s) which is close to viscosity of water. On-lineviscosity measurements of initial medium wereestablished under aerated conditions in turbu-lent flow regime. Estimated viscosity can be eval-uated between 0.72·10-3 and 0.96·10-3 Pa·s (rela-tive combined standard uncertainty of ± 23 %).On-line and off-line measurements exhibit thesame order of magnitude even if uncertaintiesare different. Nevertheless the evaluated viscos-ity of initial medium exhibits a slight increaseversus shear rates but within relative combinedstandard uncertainty.
For both cultures, off-line measurements ofrheological behaviour confirmed that cell brothsexhibited a quasi-Newtonian behaviour for E. coliand shear-thinning behaviour for Y. lipolytica.Both depend on biomass concentration. On-lineviscosity measurements were established in la -minar flow regime and show a non constant vis-cosity for higher shear rates (g· > 1000 s-1) and low-er biomass concentration. For all biomass con-centration and in spite of investigation in differ-ent shear rate ranges, significant differencesbetween apparent (off-line) and estimated (on-line) viscosities of broths are observed. Theyhighlight that the apparent viscosity is signifi-cantly lower than on-line measurements. The on-line overestimation was particularly marked foron-line broth analyses with E. coli for low biomassand higher shear rate in spite of the measure-ment uncertainties.
Several assumptions can be proposed toexplain the differences between on-line and off-line measurements: (i) physical factors (morphol-ogy, dimension and cell concentration), (ii) cell wallproperties (chemical composition, surface ten-sion, and mechanical properties), (iii) physico-chemical properties of supernatant, (iv) biologicalactivity with the impact of gas phase and respira-tion. The influence of physical factors is clearlyestablished by numerous works in literature whichdisplayed the non Newtonian behaviour of cellbroths and analyzed the influence of the cell con-centration [14– 16]. Some works also focused oncell morphology and had established a link withbroth rheology [2, 6, 8] or size distribution [3]. Thecell wall properties, because it may affect cellaggregation, can also be involved in rheological
35167-9 Applied RheologyVolume 21 · Issue 3
Figure 10 (above):Evolution of physical para-meters during E. coli culture(blue) and Y. lipolytica cul-ture (green) (identical leg-end as Figure 7).
Figure 11:On-line and off-line rheom-etry with E. coli and Y.lipolytica for different bio-mass concentrations.
Table 3:Relative combined standarduncertainty on apparentand estimated viscosity [%].

behaviour [8] and it may not be excluded thatthese wall properties evolved when the cell cultureconditions are not respected, as occurs when asample is taken. Supernatant properties can alsoaffect the broth behaviour when cells producemetabolites or extracellular polymeric substances[17]. But this third assumption is not true here asthe supernatant of broth cultures is Newtonianwith very low viscosity. However, all these worksare usually realised off-line and do not take intoaccount the impact of biological activity and thepresence of gas volume fraction (aeration/re -spiration) in broth. This point needs to be takeninto account as shown by Barbot et al. [28] whoexplored the influence of respiration in the case ofactivated sludge under aerated condition within abioreactor. In their experiment, rheological behav-iour was evaluated using on-line torque measure-ments. They observed that inhibition of respira-tion by sodium azide addition leads to an evolu-tion of the rheological behaviour. However, thecomparison between activated sludge and axeniccell cultures is limited considering differencesbetween experimental conditions and broth com-position. But this demonstrates that biologicalactivity is an additional difficulty for broth charac-terization and has to be considered during themeasurements.
4 CONCLUSIONRheological behaviour of broth stands as a fun-damental parameter that could limit bioprocessperformances. Therefore axenic culture of micro -organism in bioreactor involves culture strategywith aeration as a necessary and obligatory para-meter. All the complexity related to on-line mon-itoring of rheological behaviour results in the set-ting up of an adapted tool with correct mea-surement in respect of cell culture conditions. Inthe case of torque measurement, the variation ofagitation speed and aeration flow rate to allowcorrect flow regime can hardly be achieved (riskof disrupt the system) except in robust biopro -cess (wastewater treatment).
In this study, our objectives were to investi-gate on-line and off-line physical measurementwith a new device during axenic cell culturesunder high biomass concentration. This dedicat-ed and innovative experimental set-up wasdeveloped and was calibrated with well-definedNewtonian and non-Newtonian fluids. Two
microorganisms (E. coliand Y. lipolytica) with dif-ferent cell size were cultivated. The physical mea-surements showed different results: (i) the im -pact of cell concentration on pressure drop, (ii)the contribution of the gas phase in the broth,(iii) the possible impact of difference betweenoff-line and on-line shear rate ranges that can beexplored and (iv) a setting up of caution to useproperly our experimental set-up and to esti-mate the on-line viscosity equivalent to a homo -genous liquid medium. Our works demonstratedthe need and usefulness of on-line rheology mea-surements to achieve and quantify reliable infor-mation about the dynamic rheological behaviourof cell broths during cultures. Our researchesbring new insights on the dynamical interactionsbetween physical and biological phenomena inbioprocess which will be useful to progress in theevaluation and the control of their performances.
ACKNOWLEDGMENTSAuthors are grateful to Fédération de rechercheFERMaT FR3089 INPT-UT3-CNRS-INSA TOU -LOUSE and Bérangère PORTELLI (Ph. D. Student,LISBP) for scientific and technical contribution.
REFERENCES[1] Cascaval D, Oniscu C, Galaction AI: Rheology of
fermentation broths. 2 – Influence of the rheo-logical behavior on biotechnological processes,Rev. Roum. Chim. 48 (2003) 339 – 356.
[2] Pamboukian CRD, Facciotti MCR: Rheological andmorphological characterization of Streptomycesolindensis growing in batch and fed-batch fer-mentations, Braz. J. Chem. Eng. 22 (2005) 31 – 40.
[3] Petersen N, Stocks S, Gernaey KV: Multivariatemodels for prediction of rheological characteris-tics of filamentous fermentation broth from thesize distribution, Biotechnol. Bioeng. 100 (2008)61 – 71.
[4] Corrieu G: The influence of rheological behavioron the performance of bioreactors, Biofutur(1997) A2 –A4.
[5] Ballica R, Ryu DDY, Powell RL, Owen D: Rheologi-cal Properties Of Plant-Cell Suspensions, Biotech-nol. Prog. 8 (1992) 413 – 420.
[6] Curtis WR, Emery AH: Plant-Cell Suspension-Cul-ture Rheology, Biotechnol. Bioeng. 42 (1993)520– 526.
[7] Raposo S, Lima-Costa ME: Rheology and shearstress of Centaurea calcitrapa cell suspension cul-tures grown in bioreactor, Biotechnol. Lett. 28(2006) 431 – 438.
[8] Iordan A, Duperray A, Verdier C: Fractal approach
35167-10Applied RheologyVolume 21 · Issue 3

to the rheology of concentrated cell suspensions,Phys. Rev. E 77 (2008) 011911.
[9] Trepat X, Deng LH, An SS, Navajas D, Tschumper-lin DJ, Gerthoffer WT, Butler JP, Fredberg JJ: Uni-versal physical responses to stretch in the livingcell, Nature 447 (2007) 592 – 596.
[10] Chen F, Chen H, Gong XD: Mixotrophic and het-erotrophic growth of Haematococcus lacustrisand rheological behaviour of the cell suspen-sions, Bioresour. Technol. 62(1997) 19 – 24.
[11] Cho YJ, Hwang HJ, Kim SW, Song CH, Yun JW:Effect of carbon source and aeration rate on brothrheology and fungal morphology during red pig-ment production by Paecilomyces sinclairii in abatch bioreactor, J. Biotechnol. 95 (2002)13 – 23.
[12] Rodríguez Porcel EM. Casas López JL, SánchezPérez JA, Fernández Sevilla JM, Chisti Y: Effects ofpellet morphology on broth rheology in fermen-tations of Aspergillus terreus, Biochem. Eng. J. 26(2005) 139 – 144.
[13] Gogus N. Tari C, Oncu S, Unluturk S, Tokatli F: Rela-tionship between morphology, rheology andpolygalacturonase production by Aspergillussojae ATCC 20235 in submerged cultures, Bio -chem. Eng. J. 32 (2006) 171 – 178.
[14] Mancini M, Moresi M: Rheological behaviour ofbaker’s yeast suspensions, J. Food Eng. 44 (2000)225 – 231.
[15] Klein J, Maia J, Vicente AA, Domingues L, TeixeiraJA, Jurascik M: Relationships between hydrody-namics and rheology of flocculating yeast sus-pensions in a high-cell-density airlift bioreactor,Biotechnol. Bioeng. 89 (2005) 393 – 399.
[16] Toda K, Furuse H, Amari T, Wei XF: Cell concen-tration dependence of dynamic viscoelasticity ofEscherichia coli culture suspensions, J. Ferment.Bioeng. 85 (1998) 410 –415.
[17] O'Cleirigh C, Casey JT, Walsh PK, O'Shea DG: Mor-phological engineering of Streptomyces hygro-scopicus var. geldanus: regulation of pellet mor-phology through manipulation of broth viscosity,Appl. Microbiol. Biotechnol. 68 (2005) 305–310.
[18] Borges CD, Vendruscolo CT: Xanthan synthesizedby strains of Xanthomonas campestris pv pruni:production, viscosity and chemical composition,Bioscience Journal 23 (2007) 67 – 73.
[19] Porcel EMR, Lopez JLC, Perez JAS, Sevilla JMF,Chisti Y: Effects of pellet morphology on brothrheology in fermentations of Aspergillus terreus,Biochem. Eng. J. 26 (2005) 139 – 144.
[20] Al-Asheh S, Abu-Jdayil B, Abunasser N, Barakat A:Rheological characteristics of microbial suspen-sions of Pseudomonas aeruginosa and Bacilluscereus, Int. J. Biol. Macromol. 30 (2002) 67 – 74.
[21] Kemblowski ZBPOP: On-line measurements ofthe rheological properties of fermentation broth,Rheol. Acta 29 (1990) 588 – 593.
[22] Seyssiecq I, Marrot B, Djerroud D, Roche N: In situtriphasic rheological characterisation of activat-ed sludge, in an aerated bioreactor, Chem. Eng. J.142 (2008) 40–47.
[23] Shah RK, London AL: Laminar flow forced con-vection in ducts: a source book for compact heatexchanger analytical data, Advances in HeatTransfer, Academic Press, New York (1978).
[24] Churchill SW: Friction-Factor Equation Spans AllFluid-Flow Regimes, Chem. Eng. 84 (1977) 91 –92.
[25] Metzner AB, Reed JC: Flow of non-newtonian flu-ids-correlation of the laminar, transition, and tur-bulent-flow regions, Aiche J. 1 (1955) 434 –440.
[26] OIML-GUM: Evaluation of measurement data –Guide to the expression of uncertainty in mea-surement, Joint Committee on Guides in Metrol-ogy OIML G 1-100 Edition 2008, Corrected version2010.
[27] Wood JM: Osmosensing by bacteria: Signals andmembrane-based sensors, Microbiology AndMolecular Biology Reviews 63 (1999) 230– 262.
[28] Barbot E, Seyssiecq I, Roche N, Marrot B: Inhibi-tion of activated sludge respiration by sodiumazide addition: Effect on rheology and oxygentransfer, Chem. Eng. J. 163 (2010) 230– 235.
35167-11 Applied RheologyVolume 21 · Issue 3


![[Composite Cultures] - CORE](https://static.fdokumen.com/doc/165x107/6325e67de491bcb36c0a86c0/composite-cultures-core.jpg)