Reuse of RO Desalination Plant Reject Brine
7
Reuse of RO Desalination Plant Reject Brine Ferid Hajbi, Halim Hammi, and Adel M’nif (Submitted July 27, 2009) In this work we try to study the feasibility of salt production from a reject brine coming from a desalination plant in Skhira in the south of Tunisia, This plant treats 22,008 m 3 /day of raw water to produce 9984 m 3 of fresh water and 12,024 m 3 of rejected water and has the advantages of being environmentally friendly and producing commercial products in crystalline, slurry, and liquid forms. The process involves an application of the solubility diagrams in order to valorize the reject brines. These solutions are considered as strongly concentrated brines and containing several elements such as: Na + ,K + , Mg 2+ , Ca 2+ , Cl 2 , and SO 4 22 . This observation leads us to consider the complete hexary system Na + , Mg 2+ ,K + , Ca 2+ /Cl 2 , SO 4 22 //H 2 O which includes four quinary systems. A number of physico-chemical analyses were employed (Potentiometry, com- plexometry, gravimetry, XRD, and SEM). At the end of an isothermal and isobaric evaporation of the reject brine, we could recover various salts (NaCl, KCl, CaSO 4 2H 2 O, MgSO 4 7H 2 O…) very useful for industry and agriculture. Keywords brines, evaporation, hexary system, reverse osmosis, solubility diagrams 1. Introduction This paper will focus on how saline effluent resulting from desalination plants could be used as raw material on solar ponds in order to recover salts very useful for industry and agriculture. [1-6] In fact the generation of saline effluent from direct desalination or industry is viewed as severe environmental problem. [7,8] The brine disposal exhibits elevated salt contents. So this brine must be properly managed in order to avoid environmental contamina- tion. [9,10] On the other hand, the natural evaporation could be applied to reduce the energy consumption of the treatment and the associated costs. Many authors treated these concentrated solutions as a reciprocal quinary system (class II) [11,12] Na + , K + , Mg 2+ /Cl , SO 4 2 //H 2 O, they supposed that calcium had a very low concentration and it was ignored. [13] However, in the reject brine resulting from the studied desalination plants, the calcium is abundant and must to be considered. So if we add calcium to the quinary system we obtain a hexary system with seven constituents with the electrical neutrality condition, and can be expressed in a six-component space. [14] Hence, in an NaCl-saturated Ja ¨necke projection. 2. Description of the Desalination Unit The station of Skhira is located near the plant of phosphoric acid (Tunisian Chemical Group). Drilling water is pumped from five wells, before entering the treatment, water is passed through a sand filter and microfilters, to eliminate all impurities and suspended solids. This unit has four main lines, three lines (A, B, and C) with cellulose acetate membranes (each line contains 28 tubes each containing four membranes). The fourth line is a pilot (D) and employs polyamide membranes (10 tubes each con- taining five membranes). Mineral abbreviations Chemical formula Abbreviation Mineralogical name 3K 2 SO 4 Na 2 SO 4 Ap Aphthialite CaCl 2 6H 2 O Ant Antarcticite CaSO 4 A Anhydrite CaSO 4 2H 2 O G Gypse K 2 Ca(SO 4 ) 2 6H 2 O Syn Syngenite K 2 Mg(SO) 2 4H 2 O Le Leonite K 2 Mg(SO 4 ) 2 6H 2 O Pic Picrome ´rite K 2 MgCa 2 (SO 4 ) 4 2H 2 O Po Polyhalite KCl Syl Sylvite KCl MgSO 4 3H 2 O Ka Kainite KMgCl 3 6H 2 O Car Carnallite Mg 2 CaCl 6 12H 2 O Tc Tachyhydrite MgCl 2 6H 2 O Bi Bishofite MgSO 4 6H 2 O Hx Hexahydrite MgSO 4 7H 2 O Ep Epsomite MgSO 4 H 2 O Ki Kie ´serite Na 2 Mg(SO 4 ) 2 4H 2 O Bl Bloedite Na 2 Ca(SO 4 ) 2 Gl Glauberite Na 2 SO 4 10H 2 O Th Thenardite NaCl H Halite Ferid Hajbi, Halim Hammi, and Adel M’nif, LVRNMR, National Centre of Research in Materials Science; Technologic Park of Borj Cedria, B.P. 95-2050 Hammam-Lif, Tunisia. Contact e-mail: [email protected]. JPEDAV DOI: 10.1007/s11669-010-9727-3 1547-7037 ÓASM International Basic and Applied Research: Section I Journal of Phase Equilibria and Diffusion
Transcript of Reuse of RO Desalination Plant Reject Brine

Reuse of RO Desalination Plant Reject BrineFerid Hajbi, Halim Hammi, and Adel M’nif
(Submitted July 27, 2009)
In this work we try to study the feasibility of salt production from a reject brine coming from adesalination plant in Skhira in the south of Tunisia, This plant treats 22,008 m3/day of raw waterto produce 9984 m3 of fresh water and 12,024 m3 of rejected water and has the advantages ofbeing environmentally friendly and producing commercial products in crystalline, slurry, andliquid forms. The process involves an application of the solubility diagrams in order to valorizethe reject brines. These solutions are considered as strongly concentrated brines and containingseveral elements such as: Na+, K+, Mg2+, Ca2+, Cl2, and SO4
22. This observation leads us toconsider the complete hexary system Na+, Mg2+, K+, Ca2+/Cl2, SO4
22//H2O which includes fourquinary systems. A number of physico-chemical analyses were employed (Potentiometry, com-plexometry, gravimetry, XRD, and SEM). At the end of an isothermal and isobaric evaporationof the reject brine, we could recover various salts (NaCl, KCl, CaSO4Æ2H2O, MgSO4Æ7H2O…)very useful for industry and agriculture.
Keywords brines, evaporation, hexary system, reverse osmosis,solubility diagrams
1. Introduction
This paper will focus on how saline effluent resultingfrom desalination plants could be used as raw material onsolar ponds in order to recover salts very useful for industryand agriculture.[1-6] In fact the generation of saline effluentfrom direct desalination or industry is viewed as severeenvironmental problem.[7,8] The brine disposal exhibitselevated salt contents. So this brine must be properlymanaged in order to avoid environmental contamina-tion.[9,10] On the other hand, the natural evaporation couldbe applied to reduce the energy consumption of thetreatment and the associated costs. Many authors treatedthese concentrated solutions as a reciprocal quinary system(class II)[11,12] Na+, K+, Mg2+/Cl�, SO4
2�//H2O, theysupposed that calcium had a very low concentration and itwas ignored.[13] However, in the reject brine resulting fromthe studied desalination plants, the calcium is abundant andmust to be considered. So if we add calcium to the quinarysystem we obtain a hexary system with seven constituentswith the electrical neutrality condition, and can be expressedin a six-component space.[14] Hence, in an NaCl-saturatedJanecke projection.
2. Description of the Desalination Unit
The station of Skhira is located near the plant ofphosphoric acid (Tunisian Chemical Group). Drilling wateris pumped from five wells, before entering the treatment,water is passed through a sand filter and microfilters, toeliminate all impurities and suspended solids. This unit hasfour main lines, three lines (A, B, and C) with celluloseacetate membranes (each line contains 28 tubes eachcontaining four membranes). The fourth line is a pilot (D)and employs polyamide membranes (10 tubes each con-taining five membranes).
Mineral abbreviations
Chemical formula Abbreviation Mineralogical name
3K2SO4ÆNa2SO4 Ap Aphthialite
CaCl2Æ6H2O Ant Antarcticite
CaSO4 A Anhydrite
CaSO4Æ2H2O G Gypse
K2Ca(SO4)2Æ6H2O Syn Syngenite
K2Mg(SO)2Æ4H2O Le Leonite
K2Mg(SO4)2Æ6H2O Pic Picromerite
K2MgCa2(SO4)4Æ2H2O Po Polyhalite
KCl Syl Sylvite
KClÆMgSO4Æ3H2O Ka Kainite
KMgCl3Æ6H2O Car Carnallite
Mg2CaCl6Æ12H2O Tc Tachyhydrite
MgCl2Æ6H2O Bi Bishofite
MgSO4Æ6H2O Hx Hexahydrite
MgSO4Æ7H2O Ep Epsomite
MgSO4ÆH2O Ki Kieserite
Na2Mg(SO4)2Æ4H2O Bl Bloedite
Na2Ca(SO4)2 Gl Glauberite
Na2SO4Æ10H2O Th Thenardite
NaCl H Halite
Ferid Hajbi, Halim Hammi, and Adel M’nif, LVRNMR, NationalCentre of Research in Materials Science; Technologic Park of BorjCedria, B.P. 95-2050 Hammam-Lif, Tunisia. Contact e-mail:[email protected].
JPEDAVDOI: 10.1007/s11669-010-9727-31547-7037 �ASM International
Basic and Applied Research: Section I
Journal of Phase Equilibria and Diffusion

The volume of treated raw water, permeate and rejectedconcentrate for the different lines are listed in Table 1.
In this study sample is taken from the D line (membrane-type polyamide). The compositions of the raw water andpermeate are listed in Table 2.
3. Phase Diagram
Figure 1 shows the six-component system with referencetetrahedron, using Janecke projection from the H2O cornerat 25 �C and 1 atm pressure and assuming halite saturationthroughout. Any point in the interior of the tetrahedronrepresents a 6 component system and an invariant assem-blage is formed by four salts + halite + solution. All fieldboundaries remain close to the bounding quinary triangles.Solubility calculations give brine compositions in equilib-rium with a specified assemblage of minerals, and theevaporation of any water falling within the system can befollowed quantitatively for equilibrium crystallization. Inaddition, the activities of all neutral species are known atevery step. Furthermore, the effect of mixing brines or ofadding salt minerals to given brine can be predicted.[14]
4. Experimental
In this work we study the reject brine from the reverseosmosis station of Skhira referred hereinafter by ‘‘Sk’’.
The brine undergoes an isothermal and isobaric evapo-ration (T = 25 �C) in order to follow its evolution duringevaporation.
The evolution of evaporation is monitored daily. At eachstage of evaporation specific gravity measurements wasmade and chemical analysis of liquid samples and differentsalts deposited are carried out. The recovered solids are alsocharacterized by XRD and SEM.
4.1 Equipments and Analysis Methods
The equipment used for this work is listed below:
– A thermostatic bath fixed at 25 �C.– A crystallizer for brine evaporation.– A filtration equipment (a vacuum pump, a buchner and
a vacuum flask).
The K+ and Na+ ions concentrations in the phases wereanalyzed by spectrophotometer using a Jenway PFP7instrument. The Mg2+ and Ca2+ ions concentrations weredetermined by an EDTA complexometric titration. Potenti-ometric titration was applied to Cl� ions (Titrino DMS 716,X Metrohm instrument). The SO4
2� ion concentration wasdetermined gravimetrically. The solid phases were oftencharacterized by chemical analysis and XRD (the experi-mental apparatus is composed of a Philips PW 3040generator, a PW 3050/60 h/2h goniometer and a PW 3373/00 copper cathode). The microstructural differences be-tween the obtained salts were examined using ESM FEIQuanta 200.
5. Results and Discussion
The liquids and the precipitated salts were analyzed inorder to determine the major ion composition of the brine,
Table 1 Characteristics of reverse osmosis lines(Skhira station)
Treatedwater volume,
m3/day
Permeatevolume,m3/day
Concentratevolume, m3/day
Lines A, B, and C 20160 8784 11376
Line D 1848 1200 648
Total 22008 9984 12024
Table 2 Composition of raw water, permeate,and concentrate
Designation Units Raw water Permeate Concentrate
Temperature �C 30 30 30
pH … 7.2 7.2 7.2
Conductivity ls/cm 12500 300 33000
Ca2+ mg/L 720 10 2.08 9 103
Mg2+ mg/L 335 5 0.77 9 103
Na+ mg/L 1950 40 5.12 9 103
Cl� mg/L 3550 100 14.17 9 103
SO42� mg/L 2250 25 5.92 9 103
Fe3+ mg/L 0.2 0.01 …Ba2+ ppb 10 … …Sr2+ mg/L 13 … …HCO3
� mg/L 135 5 …TDS mg/L 9000 185 28000
Fig. 1 Hexary system Na+, Mg2+, K+, Ca2+/Cl�, SO42�//H2O
Section I: Basic and Applied Research
Journal of Phase Equilibria and Diffusion

and this analysis helped us to draw crystallization path ondifferent diagrams. The precipitated solids recovered at eachstage were analyzed by using x-ray diffractometry andScanning electron microscopy. At the end a correlationbetween all these techniques was deduced in order to betterevaluate these kinds of effluents.
5.1 Evolution of the Ionic Composition
In Fig. 2(a) and (b) it can be seen that the first regionsbegin at a specific gravity 1.0269 and ends at d = 1.0313;this area corresponds to a slight increase in the concentra-tions of Cl�, SO4
2�, Mg2+, Na+, K+.Between the specific gravity of 1.0313 and 1.194 there is
a drop in the concentration of Ca2+, and a significantincrease in the concentrations of Na+ and Cl�, whileconcentrations of K+, Mg2+, and SO4
2� increase slightly.The observed variations can be attributed to the gypsum
crystallization in this step and for a wide range of specificgravity [1.0313-1.1940].
The decrease of Na+ concentration is the most notablevariation in the specific gravity interval [1.194-1.257]. Theconcentration of Cl� is almost constant while the concen-trations of Mg2+, SO4
2�, K+ show an important increase.This variation is probably due to a crystallization of NaCl.
The last sequence [1.257-1.288] corresponds to:
– The concentration of Na+ continuing to diminish.– SO4
2� concentration decreasing slightly.– Concentrations of Mg2+, Cl�, and K+ continuing to rise.
This change in composition is probably due to thecrystallization of epsomite or the hexahydrite thereof.
5.2 Identification of the Recovered Salts by XRD
The characterization of deposited salts by XRD willmake easier the identification of minerals nature corre-sponding to each sequence. Throughout this evaporation wehave recovered 10 salts, the diffractograms of the four mostrepresentative salts are given by Fig. 3(a)-(d).
XRD confirms the deductions suggested by the evolutionof ionic composition, in fact salt No. 1 is a pure gypsum(Fig. 3a), the salt No. 2 is constituted of halite + gypsum forthe specific gravity range from 1.1065 to 1.194 (Fig. 3b).After this value is precipitated only NaCl (Fig. 3c), and thelast sequence arises from a mixture of epsomite + hexahy-drite + halite (Fig. 3d).
5.3 Morphological Characterization
We examined by SEM some salts among those charac-terized by XRD, this helped us to predict a correlationbetween morphological and mineralogical nature of recov-ered salts.
Figure 4(a) presents an image with a zoom 1200 times ofsalt No. 1, the texture of this salt is clear, showing needles ofgypsum. In Fig. 4(b) we have the salt No. 3 enlarged 240times; we note the presence of a cube with well-definededges (NaCl). Figure 4(c) represents two photos of salt No.4 with two enlargements, 800 times and 6000 times, with anprismatic shape very clearly characteristic of hexahydrite.
5.4 Crystallization Path
The crystallization path is the progress of physicaltransformations by the loss or the addition of a constituentthrough a given solubility phase diagram. During thesystem’s evolution, it can define the number, the nature,the composition and the relative quantity of differentcondensed phases that precipitate or disappear. In our case,the constituent that disappears is the water, which leaves aswater vapor at constant pressure and temperature. Thegraphic representation shows the reactions that occur bychanging an intensive variable (pressure, temperature,composition).[15] Drawing the crystallization path demon-strates the extractive process from brines. If we adopt theJanecke representation[11] from the bibliographic datacompiled by d’Ans[12] to the representative point of thebrine at 25 �C, we obtain a crystallization path in confor-mity with the Berthon rules.[13]
Fig. 2 (a) Evolution of ionic concentration of Na+, Mg2+, Cl�,and SO4
2� vs. specific gravity. (b) Evolution of ionic concentra-tion of Ca2+ and K+ vs. specific gravity
Basic and Applied Research: Section I
Journal of Phase Equilibria and Diffusion

Pratically and during evaporation, we filter the solutionwhenever the salts are deposited then we will remove saltdeposits at every step of evaporation, and the crystallization
path can cut the two salts line and continues until it reachesthe border of a new line of two salts. Thus the crystallizationpath does not follow monovariant lines and there will be a
Fig. 3 (a) Diffractogram of salt No. 1, (b) diffractogram of salt No. 2, (c) diffractogram of salt No. 3, and (d) diffractogram of salt No.4
Fig. 4 (a) SEM image of salt No. 1, (b) SEM image of salt No. 3, and (c) SEM image of salt No. 4
Section I: Basic and Applied Research
Journal of Phase Equilibria and Diffusion
change in the nature of the phase deposited when thefigurative point arrive at a border. In Table 3 we have theionic composition of the concentrate.
The crystallization paths were studied for the followingquinary systems then for the hexary system:
Naþ; Kþ;Mg2þ=Cl�; SO2�4 ==H2O
Naþ; Kþ;Ca2þ=Cl�; SO2�4 ==H2O
Naþ; Mg2þ;Ca2þ=Cl�; SO2�4 ==H2O
The coordinates of the studied solutions in the differentdiagrams were calculated from the concentrations of theions present in the brine and they are summarized inTable 4.
According to the figure, we note that the theoretical (line)and experimental (points) pathways evolve in the samedirection. Theoretically, the crystallization point continuesthrough Z.
While experimentally, it is limited to the field ofepsomite. We notice that the salts recovered are differentfrom those predictable in this diagram; this is explained thatcalcium is present in the brine but the adopted diagramignores it (see Fig. 5).
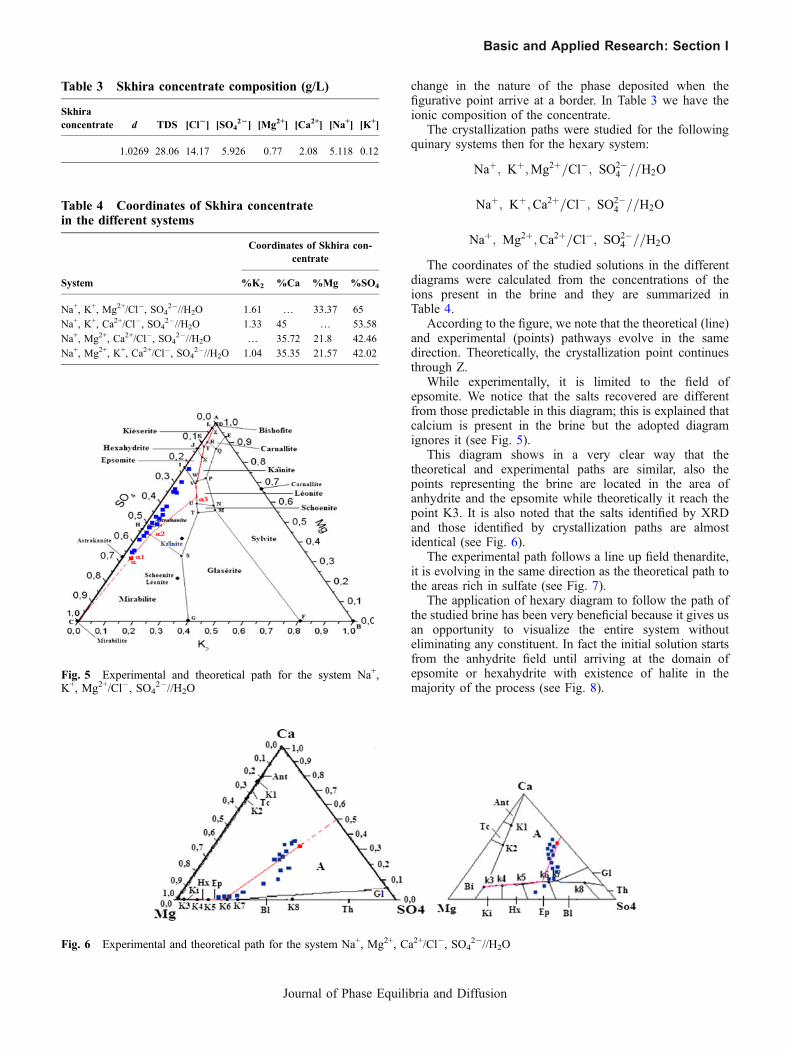
This diagram shows in a very clear way that thetheoretical and experimental paths are similar, also thepoints representing the brine are located in the area ofanhydrite and the epsomite while theoretically it reach thepoint K3. It is also noted that the salts identified by XRDand those identified by crystallization paths are almostidentical (see Fig. 6).
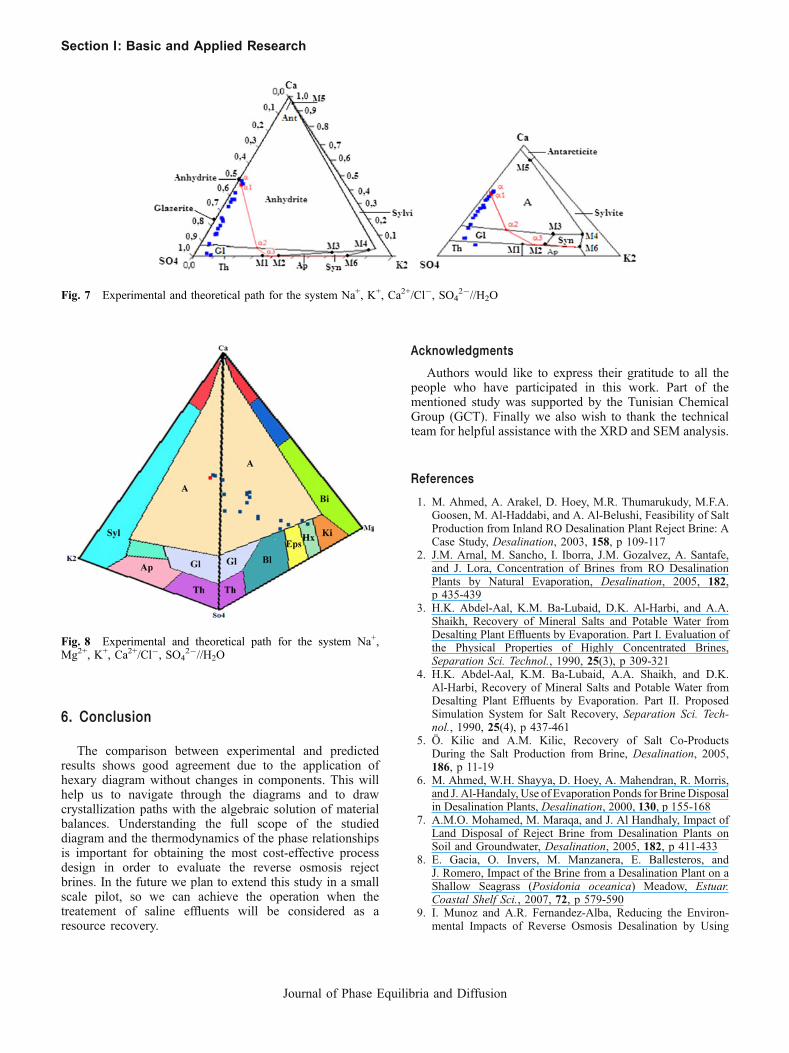
The experimental path follows a line up field thenardite,it is evolving in the same direction as the theoretical path tothe areas rich in sulfate (see Fig. 7).
The application of hexary diagram to follow the path ofthe studied brine has been very beneficial because it gives usan opportunity to visualize the entire system withouteliminating any constituent. In fact the initial solution startsfrom the anhydrite field until arriving at the domain ofepsomite or hexahydrite with existence of halite in themajority of the process (see Fig. 8).
Table 3 Skhira concentrate composition (g/L)
Skhiraconcentrate d TDS [Cl2] [SO4
22] [Mg2+] [Ca2+] [Na+] [K+]
1.0269 28.06 14.17 5.926 0.77 2.08 5.118 0.12
Table 4 Coordinates of Skhira concentratein the different systems
System
Coordinates of Skhira con-centrate
%K2 %Ca %Mg %SO4
Na+, K+, Mg2+/Cl�, SO42�//H2O 1.61 … 33.37 65
Na+, K+, Ca2+/Cl�, SO42�//H2O 1.33 45 … 53.58
Na+, Mg2+, Ca2+/Cl�, SO42�//H2O … 35.72 21.8 42.46
Na+, Mg2+, K+, Ca2+/Cl�, SO42�//H2O 1.04 35.35 21.57 42.02
Fig. 5 Experimental and theoretical path for the system Na+,K+, Mg2+/Cl�, SO4
2�//H2O
Fig. 6 Experimental and theoretical path for the system Na+, Mg2+, Ca2+/Cl�, SO42�//H2O
Basic and Applied Research: Section I
Journal of Phase Equilibria and Diffusion
6. Conclusion
The comparison between experimental and predictedresults shows good agreement due to the application ofhexary diagram without changes in components. This willhelp us to navigate through the diagrams and to drawcrystallization paths with the algebraic solution of materialbalances. Understanding the full scope of the studieddiagram and the thermodynamics of the phase relationshipsis important for obtaining the most cost-effective processdesign in order to evaluate the reverse osmosis rejectbrines. In the future we plan to extend this study in a smallscale pilot, so we can achieve the operation when thetreatement of saline effluents will be considered as aresource recovery.
Acknowledgments
Authors would like to express their gratitude to all thepeople who have participated in this work. Part of thementioned study was supported by the Tunisian ChemicalGroup (GCT). Finally we also wish to thank the technicalteam for helpful assistance with the XRD and SEM analysis.
References
1. M. Ahmed, A. Arakel, D. Hoey, M.R. Thumarukudy, M.F.A.Goosen, M. Al-Haddabi, and A. Al-Belushi, Feasibility of SaltProduction from Inland RO Desalination Plant Reject Brine: ACase Study, Desalination, 2003, 158, p 109-117
2. J.M. Arnal, M. Sancho, I. Iborra, J.M. Gozalvez, A. Santafe,and J. Lora, Concentration of Brines from RO DesalinationPlants by Natural Evaporation, Desalination, 2005, 182,p 435-439
3. H.K. Abdel-Aal, K.M. Ba-Lubaid, D.K. Al-Harbi, and A.A.Shaikh, Recovery of Mineral Salts and Potable Water fromDesalting Plant Effluents by Evaporation. Part I. Evaluation ofthe Physical Properties of Highly Concentrated Brines,Separation Sci. Technol., 1990, 25(3), p 309-321
4. H.K. Abdel-Aal, K.M. Ba-Lubaid, A.A. Shaikh, and D.K.Al-Harbi, Recovery of Mineral Salts and Potable Water fromDesalting Plant Effluents by Evaporation. Part II. ProposedSimulation System for Salt Recovery, Separation Sci. Tech-nol., 1990, 25(4), p 437-461
5. O. Kilic and A.M. Kilic, Recovery of Salt Co-ProductsDuring the Salt Production from Brine, Desalination, 2005,186, p 11-19
6. M. Ahmed, W.H. Shayya, D. Hoey, A. Mahendran, R. Morris,and J. Al-Handaly, Use of Evaporation Ponds for Brine Disposalin Desalination Plants, Desalination, 2000, 130, p 155-168
7. A.M.O. Mohamed, M. Maraqa, and J. Al Handhaly, Impact ofLand Disposal of Reject Brine from Desalination Plants onSoil and Groundwater, Desalination, 2005, 182, p 411-433
8. E. Gacia, O. Invers, M. Manzanera, E. Ballesteros, andJ. Romero, Impact of the Brine from a Desalination Plant on aShallow Seagrass (Posidonia oceanica) Meadow, Estuar.Coastal Shelf Sci., 2007, 72, p 579-590
9. I. Munoz and A.R. Fernandez-Alba, Reducing the Environ-mental Impacts of Reverse Osmosis Desalination by Using
Fig. 7 Experimental and theoretical path for the system Na+, K+, Ca2+/Cl�, SO42�//H2O
Fig. 8 Experimental and theoretical path for the system Na+,Mg2+, K+, Ca2+/Cl�, SO4
2�//H2O
Section I: Basic and Applied Research
Journal of Phase Equilibria and Diffusion

Brackish Groundwater Resources, Water Res., 2007, doi:10.1016/j.watres.2007.08.021
10. T. Hoepner, A Procedure for Environmental Impact Assess-ments (EIA) for Seawater Desalination Plants, Desalination,1999, 124, p 1-12
11. E. Janecke, Erganzung zu der neuen Darstellungsform dervan’t Hoffschen Untersuchungen, Z. Anorg. Allgem. Chem.,1907, 53, p 319
12. J. d’Ans, Die Losungsgleichgewichte der Systeme der SalzeOzeanischer Salzablagerungen 2545 Kali-Forschung sanstalt,Verl. ges. F. Ackerbau, 1933
13. R. Berthon, Representation des equilibres de solubilite etutilisation des diagrammes, Gauthier-Villars, Paris, 1962,p 237-241
14. H.P. Eugster, C.E. Harvie, and J.H. Weare, Mineral Equilibriain a Six Component Seawater System, Na-K-Mg-Ca-SO4-Cl-H2O, at 25 �C, Geochim. Cosmochim. Acta, 1980, 44, p 1335-1347
15. H. Hammi, J. Musso, A. M’nif, and R. Rokbani,Crystallization Path of a Natural Brine EvaporationUsing the DPAO Method, Desalination, 2004, 166, p 205-208
Basic and Applied Research: Section I
Journal of Phase Equilibria and Diffusion