Integrated PV-thermal system for desalination and power production
12
Integrated PV-thermal system for desalination and power production Veera Gnaneswar Gude a , Nagamany Nirmalakhandan a , Shuguang Deng b a Civil Engineering Department, New Mexico State University, Las Cruces, NM 88003, USA Tel.: þ15307516061; Fax: þ15418851654; email: [email protected] b Chemical Engineering Department, New Mexico State University, Las Cruces, NM 88003, USA Received 19 August 2010; accepted 3 March 2011 ABSTRACT A new process configuration for efficient utilization of solar energy for simultaneous production of potable water and electricity is presented. The proposed configuration incorporates photovol- taic/thermal (PVT) collectors to produce electricity and to collect thermal energy, which is used to drive a low temperature phase-change desalination process to produce potable water. This con- figuration takes advantage of the fact that PVT collectors operating at lower temperatures are more efficient than the traditional PV panels; and low temperature phase-change desalination processes are more efficient than the traditional ones. Results from the theoretical analysis and mathematical modeling of the integrated system show that the PVT area of 30 m 2 with a cooling mass flow rate of 40–50 kg/h m 2 is adequate to supply the electricity (16–18 kWh) and freshwater needs (120 L) of a household of four. A case study was conducted to study the annual performance of the integrated system to provide the needs of the freshwater and electricity. Based on the economic analysis, additional costs incurred to modify an existing PV system will result in freshwater costs of 12.9$/m 3 which is acceptable for small scale desalination systems. Keywords: Desalination; Solar energy; Photovoltaic thermal collectors; Electricity; Renewable energy 1. Introduction Incident solar energy, an abundant source of renew- able energy, is said to be sufficient to support the energy needs of the world. For example, it has been reported that the annual solar radiation reaching the earth is 7,500 times the global annual electricity demand, which is about 450 EJ [1]. Collecting and converting solar energy to electricity can be a cleaner and sustainable approach as the conversion process does not emit environmental pollutants or green- house gases and the source is a renewable one. Photovoltaic (PV) cells with an input-to-output energy ratio of 1:7 are currently being used as solar energy harvesting factories in many domestic and industrial applications [2]. 70–80% of incident solar radiation on the PV panels is absorbed by absorber plate and rejected to the environment in the form of heat. As a result, it is very common that the PV laminate tempera- tures can reach as high as 35 C above ambient tempera- tures [3]. However, the performance of PV panels decreases as the panel temperature increases and the relationship between electrical power production by PV panels and panel temperature can be described by the following equation [4]: P e ¼ Z std 1 0:005 T pv 298:15 ð1Þ where P e is the electrical energy, Z std is the efficiency at the standard conditions and T pv is the photovoltaic Corresponding author. Present address: Oregon Institute of Technology, Civil Engineering Department, 3201 Campus Drive, Klamath Falls, OR 97601, USA Desalination and Water Treatment 36 (2011) 129–140 December www.deswater.com 1944-3994/1944-3986 # 2011 Desalination Publications. All rights reserved doi: 10.5004/dwt.2011.2231
Transcript of Integrated PV-thermal system for desalination and power production

Integrated PV-thermal system for desalination and power production
Veera Gnaneswar Gudea�, Nagamany Nirmalakhandana, Shuguang Dengb
aCivil Engineering Department, New Mexico State University, Las Cruces, NM 88003, USATel.: þ15307516061; Fax: þ15418851654; email: [email protected] Engineering Department, New Mexico State University, Las Cruces, NM 88003, USA
Received 19 August 2010; accepted 3 March 2011
A B S T R A C T
A new process configuration for efficient utilization of solar energy for simultaneous productionof potable water and electricity is presented. The proposed configuration incorporates photovol-taic/thermal (PVT) collectors to produce electricity and to collect thermal energy, which is used todrive a low temperature phase-change desalination process to produce potable water. This con-figuration takes advantage of the fact that PVT collectors operating at lower temperatures aremore efficient than the traditional PV panels; and low temperature phase-change desalinationprocesses are more efficient than the traditional ones. Results from the theoretical analysis andmathematical modeling of the integrated system show that the PVT area of 30 m2 with a coolingmass flow rate of 40–50 kg/h m2 is adequate to supply the electricity (16–18 kWh) and freshwaterneeds (120 L) of a household of four. A case study was conducted to study the annualperformance of the integrated system to provide the needs of the freshwater and electricity.Based on the economic analysis, additional costs incurred to modify an existing PV system willresult in freshwater costs of 12.9$/m3 which is acceptable for small scale desalination systems.
Keywords: Desalination; Solar energy; Photovoltaic thermal collectors; Electricity; Renewable energy
1. Introduction
Incident solar energy, an abundant source of renew-able energy, is said to be sufficient to support theenergy needs of the world. For example, it has beenreported that the annual solar radiation reaching theearth is 7,500 times the global annual electricitydemand, which is about 450 EJ [1]. Collecting andconverting solar energy to electricity can be a cleanerand sustainable approach as the conversion processdoes not emit environmental pollutants or green-house gases and the source is a renewable one.Photovoltaic (PV) cells with an input-to-output
energy ratio of 1:7 are currently being used as solarenergy harvesting factories in many domestic andindustrial applications [2]. 70–80% of incident solarradiation on the PV panels is absorbed by absorber plateand rejected to the environment in the form of heat. As aresult, it is very common that the PV laminate tempera-tures can reach as high as 35�C above ambient tempera-tures [3]. However, the performance of PV panelsdecreases as the panel temperature increases and therelationship between electrical power production byPV panels and panel temperature can be described by thefollowing equation [4]:
Pe ¼ Zstd 1� 0:005 Tpv � 298:15� �� �
ð1Þ
where Pe is the electrical energy, Zstd is the efficiency atthe standard conditions and Tpv is the photovoltaic
�Corresponding author. Present address: Oregon Institute ofTechnology, Civil Engineering Department, 3201 CampusDrive, Klamath Falls, OR 97601, USA
Desalination and Water Treatment 36 (2011) 129–140Decemberwww.deswater.com
1944-3994/1944-3986 # 2011 Desalination Publications. All rights reserveddoi: 10.5004/dwt.2011.2231
panel operating temperature. Based on this equation, itcan be seen that the power output can decrease by 22%when the temperature increases from 25 to 70�C. Theenergy absorbed by the panels is eventually dissipatedto the environment.
In PVT collectors, thermal energy absorbed by thePV modules is harvested by a circulating cooling fluid,whereby the temperature of the panel is kept low main-taining a higher electrical efficiency compared to thepanels without cooling fluid circulation. The outlettemperature of the circulating fluid can be as high as60�C, which has the potential to serve as a low-gradeheat source for many domestic and industrial applica-tions [5–8]. The combined energy efficiency of PVT sys-tems can be higher than PV and solar thermal collectors(SC) operated individually. It has been reported that1 m2 of the ST collector and 1 m2 of PV would togetheryield 520 kWh thermal and 72 kWh electrical energyannually; whereas 2 m2 of PVT collector would aloneyield 700 kWh thermal and 132 kWh electrical energy[3]. Cost of the PVT system is equal to or 25% lowerthan the combined cost of solar collectors and PVpanels [9]. The economic payback time is much shorterfor PVT systems compared to PV modules [3,10]. Thelife cycle greenhouse gas emission of PV modules isonly 30–45 gCO2 equivalent/kWh compared to 960gCO2/kWh for coal-fired power plants [11–13]. Inaddition to the above advantages, other benefits of PVTsystems include: (1) lower capital costs; (2) smallerfootprint; (3) reliable source of thermal and electricalenergy; (4) clean and environment-friendliness; (5)aesthetically pleasing without any noise pollution; and(6) low maintenance.
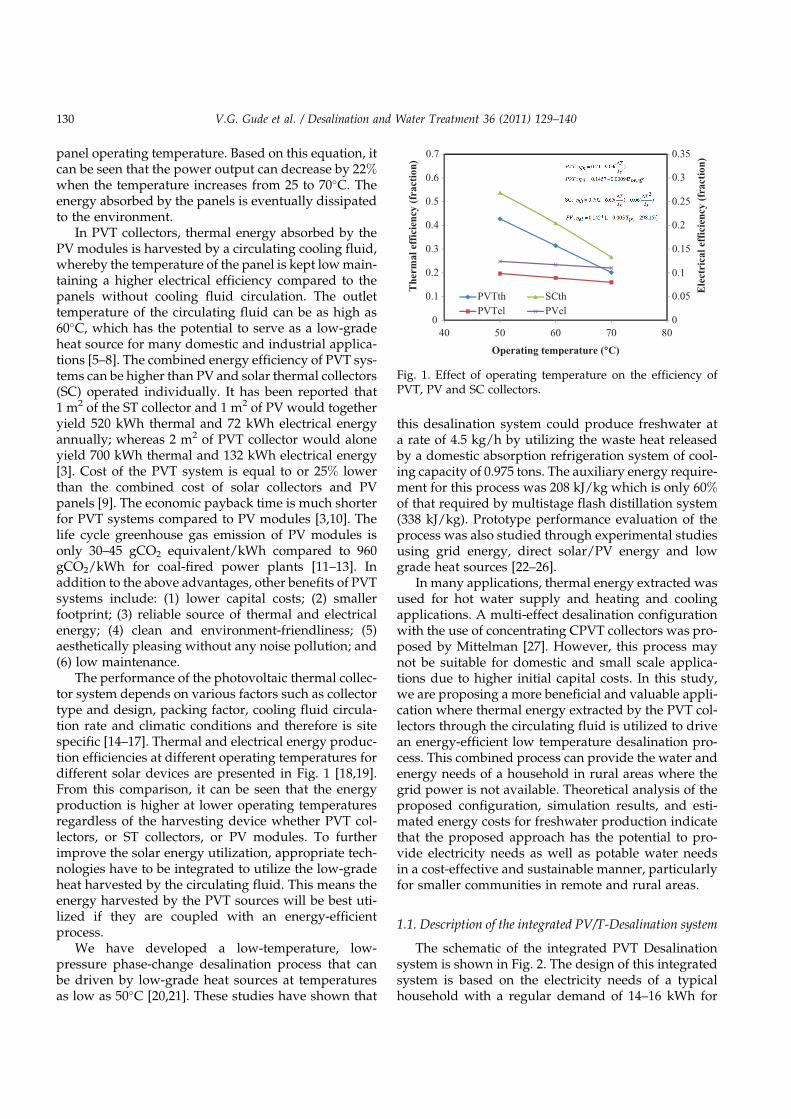
The performance of the photovoltaic thermal collec-tor system depends on various factors such as collectortype and design, packing factor, cooling fluid circula-tion rate and climatic conditions and therefore is sitespecific [14–17]. Thermal and electrical energy produc-tion efficiencies at different operating temperatures fordifferent solar devices are presented in Fig. 1 [18,19].From this comparison, it can be seen that the energyproduction is higher at lower operating temperaturesregardless of the harvesting device whether PVT col-lectors, or ST collectors, or PV modules. To furtherimprove the solar energy utilization, appropriate tech-nologies have to be integrated to utilize the low-gradeheat harvested by the circulating fluid. This means theenergy harvested by the PVT sources will be best uti-lized if they are coupled with an energy-efficientprocess.
We have developed a low-temperature, low-pressure phase-change desalination process that canbe driven by low-grade heat sources at temperaturesas low as 50�C [20,21]. These studies have shown that
this desalination system could produce freshwater ata rate of 4.5 kg/h by utilizing the waste heat releasedby a domestic absorption refrigeration system of cool-ing capacity of 0.975 tons. The auxiliary energy require-ment for this process was 208 kJ/kg which is only 60%of that required by multistage flash distillation system(338 kJ/kg). Prototype performance evaluation of theprocess was also studied through experimental studiesusing grid energy, direct solar/PV energy and lowgrade heat sources [22–26].
In many applications, thermal energy extracted wasused for hot water supply and heating and coolingapplications. A multi-effect desalination configurationwith the use of concentrating CPVT collectors was pro-posed by Mittelman [27]. However, this process maynot be suitable for domestic and small scale applica-tions due to higher initial capital costs. In this study,we are proposing a more beneficial and valuable appli-cation where thermal energy extracted by the PVT col-lectors through the circulating fluid is utilized to drivean energy-efficient low temperature desalination pro-cess. This combined process can provide the water andenergy needs of a household in rural areas where thegrid power is not available. Theoretical analysis of theproposed configuration, simulation results, and esti-mated energy costs for freshwater production indicatethat the proposed approach has the potential to pro-vide electricity needs as well as potable water needsin a cost-effective and sustainable manner, particularlyfor smaller communities in remote and rural areas.
1.1. Description of the integrated PV/T-Desalination system
The schematic of the integrated PVT Desalinationsystem is shown in Fig. 2. The design of this integratedsystem is based on the electricity needs of a typicalhousehold with a regular demand of 14–16 kWh for
0
0.05
0.1
0.15
0.2
0.25
0.3
0.35
0
0.1
0.2
0.3
0.4
0.5
0.6
0.7
40 50 60 70 80
Ele
ctri
cal e
ffic
ienc
y (f
ract
ion)
The
rmal
eff
icie
ncy
(fra
ctio
n)
Operating temperature (°C)
PVTth SCthPVTel PVel
Fig. 1. Effect of operating temperature on the efficiency ofPVT, PV and SC collectors.
130 V.G. Gude et al. / Desalination and Water Treatment 36 (2011) 129–140
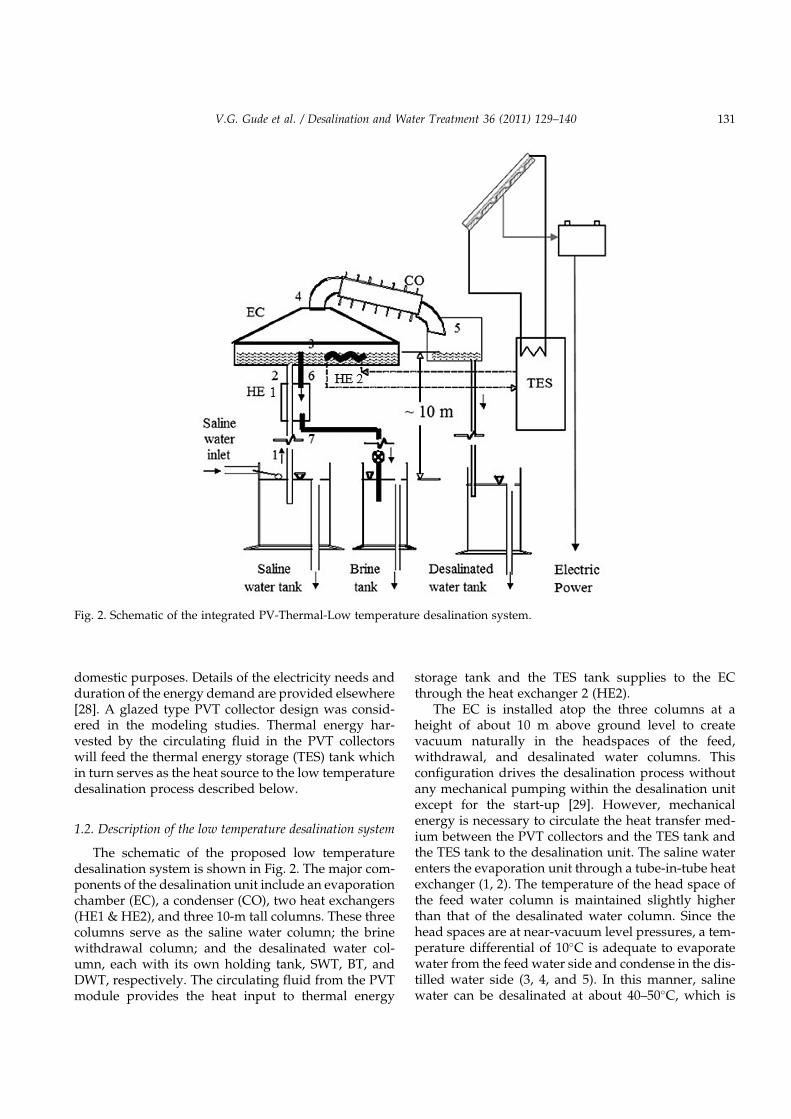
domestic purposes. Details of the electricity needs andduration of the energy demand are provided elsewhere[28]. A glazed type PVT collector design was consid-ered in the modeling studies. Thermal energy har-vested by the circulating fluid in the PVT collectorswill feed the thermal energy storage (TES) tank whichin turn serves as the heat source to the low temperaturedesalination process described below.
1.2. Description of the low temperature desalination system
The schematic of the proposed low temperaturedesalination system is shown in Fig. 2. The major com-ponents of the desalination unit include an evaporationchamber (EC), a condenser (CO), two heat exchangers(HE1 & HE2), and three 10-m tall columns. These threecolumns serve as the saline water column; the brinewithdrawal column; and the desalinated water col-umn, each with its own holding tank, SWT, BT, andDWT, respectively. The circulating fluid from the PVTmodule provides the heat input to thermal energy
storage tank and the TES tank supplies to the ECthrough the heat exchanger 2 (HE2).
The EC is installed atop the three columns at aheight of about 10 m above ground level to createvacuum naturally in the headspaces of the feed,withdrawal, and desalinated water columns. Thisconfiguration drives the desalination process withoutany mechanical pumping within the desalination unitexcept for the start-up [29]. However, mechanicalenergy is necessary to circulate the heat transfer med-ium between the PVT collectors and the TES tank andthe TES tank to the desalination unit. The saline waterenters the evaporation unit through a tube-in-tube heatexchanger (1, 2). The temperature of the head space ofthe feed water column is maintained slightly higherthan that of the desalinated water column. Since thehead spaces are at near-vacuum level pressures, a tem-perature differential of 10�C is adequate to evaporatewater from the feed water side and condense in the dis-tilled water side (3, 4, and 5). In this manner, salinewater can be desalinated at about 40–50�C, which is
Fig. 2. Schematic of the integrated PV-Thermal-Low temperature desalination system.
V.G. Gude et al. / Desalination and Water Treatment 36 (2011) 129–140 131

in contrast to the 60–100�C range in traditional solarstills and other distillation processes. This configura-tion enables brine to be withdrawn continuously fromthe EC through HE1 preheating the saline water feedentering the EC (6, 7). Further, by maintaining constantlevels of inflow and outflow rates in SWT, BT andDWT, the system can function without any energyinput for fluid transfer.
2. Theoretical analysis
2.1. PVT collector system
Solar energy incident on the PVT collectors resultsin generation of both thermal and electrical energy.Part of the incident solar energy is lost to the environ-ment by radiation and heat losses from the PVT collec-tor materials. The energy balance on the PVT collectorand the absorber plate can be written as follows [30]:
MpCpdTpvt
dt¼ Qs �Qls � Pe �Qu; ð2Þ
where Mp and Cp are the mass and specific heat capa-city of the absorber plate, Qs is the incident solarenergy, Qls are the losses from the PVT collector, Pe isthe electrical energy derived from the module and Qu
is the useful energy (thermal) extracted by the collectorfluid.
Solar energy absorbed by the PVT panel material isgiven as:
Qs ¼ Istgap: ð3Þ
Heat losses through radiation and convection from thePVT absorber plate to the glass cover can be written as[30]:
Qls ¼ "a"gs T4p � T4
g
n oþ hpg Tp � Tg
� �: ð4Þ
Electrical energy generated by PVT collector system isgiven as [31]:
Pe ¼ IstgFcZstd 1� 0:005 Tpv � 298:15� �� �
: ð5Þ
Useful thermal energy derived from PVT collectorscan be expressed as:
Qu ¼ mCpf Tf � Tið Þ; ð6Þ
where Tf is the collector fluid exit temperature and Ti isthe collector fluid inlet temperature. m and Cpf are themass flow rate and specific heat capacity of the collec-tor fluid which is water in this case.
The circulating fluid exit temperature, Tf, can be cal-culated as follows [30]:
Tf ¼ TPVT � Tið Þ 1� exp �4 � x=dð ÞNu
Re:Pr
� �� þ Ti; ð7Þ
where TPVT is the absorber plate temperature, x and dare the length and diameter of the circulating fluidtube, respectively.
Thermal and electrical efficiencies of the PVT collec-tor at a given time are as follows [32]:
Thermal efficiency of the PVT collector ¼ ZPVT;thermal
¼mCpf Tf � Tið Þ
IAc;
ð8Þ
Total PV=Thermal Collector efficiency ¼ ZPVT
¼mCpf Tf � Tið Þ þ Pe
IAc;
ð9Þ
where Ac is the collector area.
2.2. Prime energy saving efficiency
Thermal and electrical energies produced byPVT system differ from each other in that one ishigh-grade form of energy since it is converted fromthermal energy. To account for the energy savingefficiency of the PVT system, the following expres-sion known as prime energy saving efficiency can beused [33]:
Zpes ¼Zel
ZTpower
þ Zth; ð10Þ
where Zpes is the primary energy saving efficiency, Zel
is the PV conversion efficiency, ZTpower is the conver-sion efficiency of a conventional thermal power plant(assumed to be 38%), and Zth is the thermal efficiencyof the PVT system.
2.3. Low temperature desalination system
Mass and heat balances around the evaporationchamber (EC) yield the following coupled differentialequations, where the subscripts refer to the state pointsshown in Fig. 2. The variables are defined in theNomenclature.
Mass balance on volume of water in EC:
d
dtðrVÞ ¼ m2 �m6 �m3 ð11Þ
132 V.G. Gude et al. / Desalination and Water Treatment 36 (2011) 129–140

Mass balance on solute in EC:
d
dtðrVCÞEC ¼ m2C2 �m6C6 ð12Þ
Heat balance for volume of water in EC:
d
dtðrVcpTÞEC ¼ Qin þ ðmcpTÞ2 � ðmcpTÞ6
�m3hLðtÞ �Ql;
ð13Þ
where Qin is the rate of heat input to the EC and Ql is therate of heat loss from the EC. The heat input to the EC isthe useful heat extracted from the PVT collectors andstored in thermal energy storage tank and is given by:
vdðrcpTÞsdt
¼ Qu �Qin �Qlo ð14Þ
where v is the volume of the storage tank, Cps is thespecific heat of the water in the storage tank, Ts is thestorage tank temperature, Qin is the heat supplied tothe EC and Qlo is the energy losses from the storagetank.
Actual amount of thermal energy supplied by theTES to the evaporation chamber, Qin can be written as:
Qin ¼ mSCpsðTS � TECÞ ð15Þ
where ms is the mass flow rate of water from TES withspecific heat Cps
Desalination efficiency is defined as
Z ¼MhLðTÞP
Qin�tð Þ þQp; ð16Þ
where
hLðTÞ ¼ 3:146� 2:36ðT þ 273Þ ð17Þ
and Qp is the mechanical energy (pump) required forheat transfer.
Evaporation rate as a function of pressure andtemperature [34]:
m3 ¼ AECk f ðCECÞpðTECÞ
ðTEC þ 273Þ0:5� pðT5ÞðT5 þ 273Þ0:5
" #ð18Þ
where
pðTÞ ¼ ½expð63:02� 7139:6=ðT þ 273Þ� 6:2558 lnðT þ 273ÞÞ� � 102 Pa
ð19Þ
The above equations were solved using Extend(ImagineThat Inc., San Jose, CA) simulation software.This simulation software is widely used by manyprofessionals around the world in academic, businessand engineering projects to derive solutions for realworld, scientific and technical processes and problems[35]. Heat losses and latent heat dissipation through thecondenser and the design procedure are presentedelsewhere [20,23].
3. Results and discussion
3.1. Integrated PV-Thermal desalination system
Numerical simulations have been performed for asite in southern New Mexico. Solar insolation andambient temperature data were extracted from Renew-able resource data center, NREL, USA [36]. Parametersused in numerical simulations are presented in Table 1for the PVT collector system. The solar insolation andambient temperatures on a summer day in June variedbetween 225 and 1,100 W/m2 and 16–33�C, respec-tively. Hourly solar insolation and the ambient tem-peratures for a typical summer day in the month ofJune are shown in Fig. 3. The temperature profiles forthe PVT system are shown in Fig. 4. The absorber platetemperatures reached up to 68.7�C while the collectorfluid temperature reached 64.5�C in the middle of theday. The average temperature of the collector fluid was60.8�C which maintains the absorber area at lower
Table 1Model parameters used in simulations for PVT collectors
Parameter Parameter
Cell material Mono-Si Material of absorber aluminum
PV/T module area (m2) variable Absorption factor, PV cell 0.9Total PV/T module area (m2) 20–30 Radiation factors, cover glass-"g and absorber "a 0.05, 0.75Cell efficiency (%)� 17.5 Absorption factor, cover glass-"g and absorber "a 0.05, 0.16Coefficient of temperature inversion (%/�C) 0.5 Collector fluid (kg/hr/m2) Water, 1-80
�At Ta ¼ 25�C, Is ¼ 1,000 W/m2.
V.G. Gude et al. / Desalination and Water Treatment 36 (2011) 129–140 133
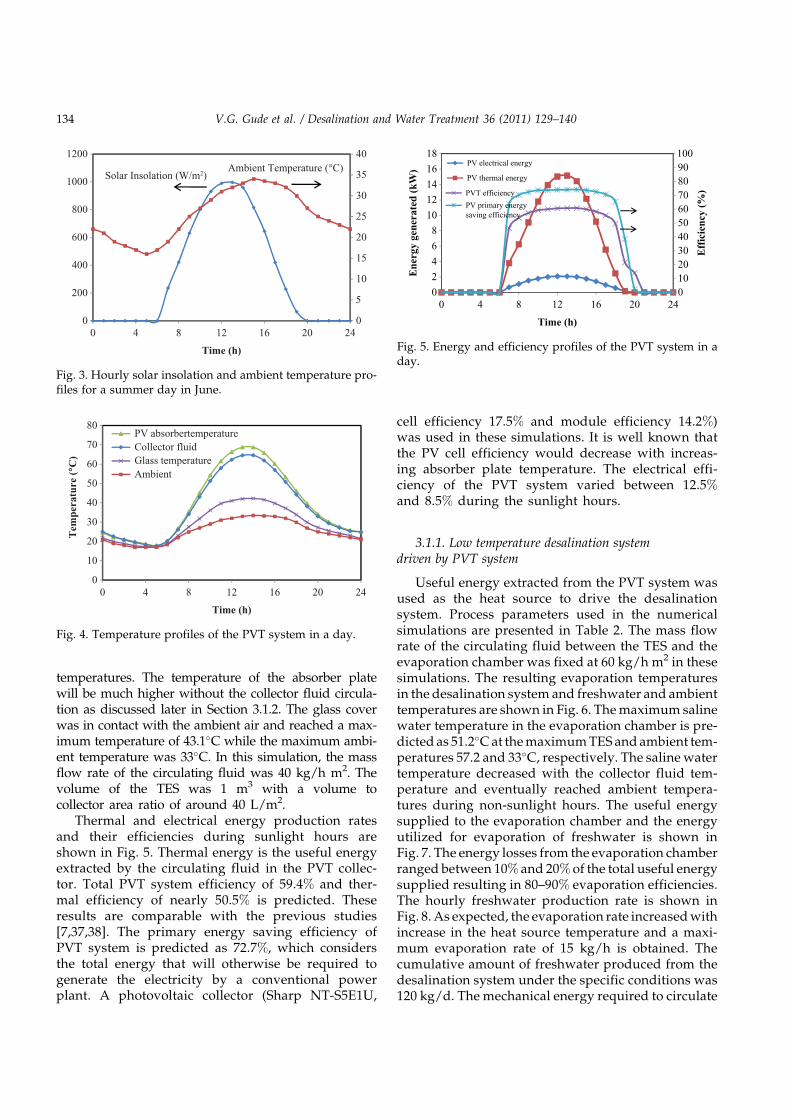
temperatures. The temperature of the absorber platewill be much higher without the collector fluid circula-tion as discussed later in Section 3.1.2. The glass coverwas in contact with the ambient air and reached a max-imum temperature of 43.1�C while the maximum ambi-ent temperature was 33�C. In this simulation, the massflow rate of the circulating fluid was 40 kg/h m2. Thevolume of the TES was 1 m3 with a volume tocollector area ratio of around 40 L/m2.
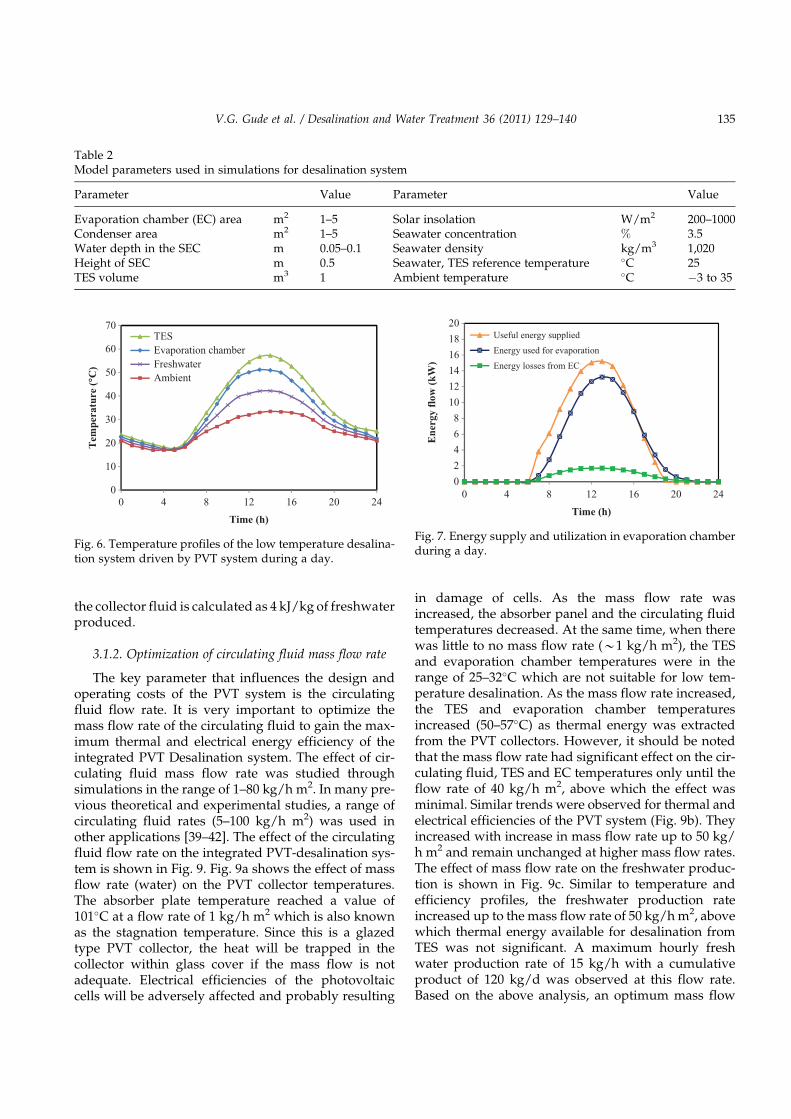
Thermal and electrical energy production ratesand their efficiencies during sunlight hours areshown in Fig. 5. Thermal energy is the useful energyextracted by the circulating fluid in the PVT collec-tor. Total PVT system efficiency of 59.4% and ther-mal efficiency of nearly 50.5% is predicted. Theseresults are comparable with the previous studies[7,37,38]. The primary energy saving efficiency ofPVT system is predicted as 72.7%, which considersthe total energy that will otherwise be required togenerate the electricity by a conventional powerplant. A photovoltaic collector (Sharp NT-S5E1U,
cell efficiency 17.5% and module efficiency 14.2%)was used in these simulations. It is well known thatthe PV cell efficiency would decrease with increas-ing absorber plate temperature. The electrical effi-ciency of the PVT system varied between 12.5%and 8.5% during the sunlight hours.
3.1.1. Low temperature desalination systemdriven by PVT system
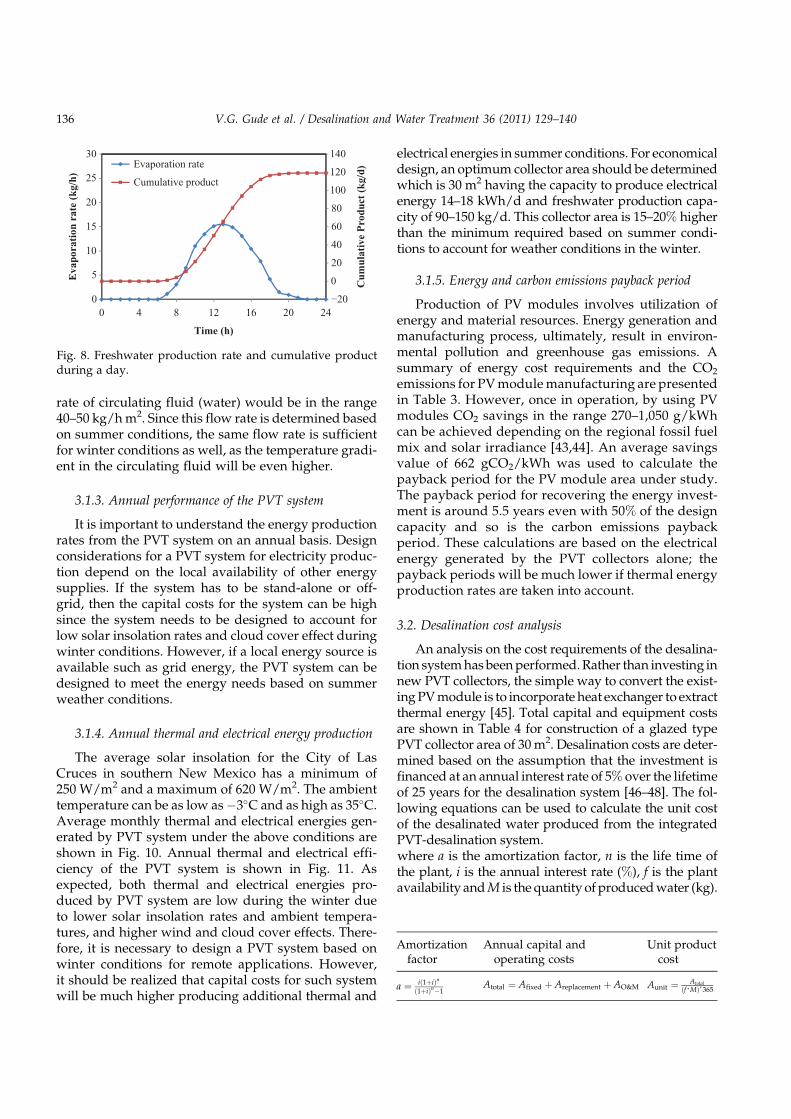
Useful energy extracted from the PVT system wasused as the heat source to drive the desalinationsystem. Process parameters used in the numericalsimulations are presented in Table 2. The mass flowrate of the circulating fluid between the TES and theevaporation chamber was fixed at 60 kg/h m2 in thesesimulations. The resulting evaporation temperaturesin the desalination system and freshwater and ambienttemperatures are shown in Fig. 6. The maximum salinewater temperature in the evaporation chamber is pre-dicted as 51.2�C at the maximum TES and ambient tem-peratures 57.2 and 33�C, respectively. The saline watertemperature decreased with the collector fluid tem-perature and eventually reached ambient tempera-tures during non-sunlight hours. The useful energysupplied to the evaporation chamber and the energyutilized for evaporation of freshwater is shown inFig. 7. The energy losses from the evaporation chamberranged between 10% and 20% of the total useful energysupplied resulting in 80–90% evaporation efficiencies.The hourly freshwater production rate is shown inFig. 8. As expected, the evaporation rate increased withincrease in the heat source temperature and a maxi-mum evaporation rate of 15 kg/h is obtained. Thecumulative amount of freshwater produced from thedesalination system under the specific conditions was120 kg/d. The mechanical energy required to circulate
0102030405060708090100
0
2
4
6
8
10
12
14
16
18
Eff
icie
ncy
(%)
Ene
rgy
gene
rate
d (k
W)
Time (h)
PV electrical energy
PV thermal energy
PVT efficiency
PV primary energysaving efficiency
0 4 8 12 16 20 24
Fig. 5. Energy and efficiency profiles of the PVT system in aday.
0
5
10
15
20
25
30
35
40
0
200
400
600
800
1000
1200
0 4 8 12 16 20 24
Time (h)
Solar Insolation (W/m2)Ambient Temperature (°C)
Fig. 3. Hourly solar insolation and ambient temperature pro-files for a summer day in June.
0
10
20
30
40
50
60
70
80
0 4 8 12 16 20 24
Tem
pera
ture
(°C
)
Time (h)
PV absorbertemperatureCollector fluidGlass temperatureAmbient
Fig. 4. Temperature profiles of the PVT system in a day.
134 V.G. Gude et al. / Desalination and Water Treatment 36 (2011) 129–140
the collector fluid is calculated as 4 kJ/kg of freshwaterproduced.
3.1.2. Optimization of circulating fluid mass flow rate
The key parameter that influences the design andoperating costs of the PVT system is the circulatingfluid flow rate. It is very important to optimize themass flow rate of the circulating fluid to gain the max-imum thermal and electrical energy efficiency of theintegrated PVT Desalination system. The effect of cir-culating fluid mass flow rate was studied throughsimulations in the range of 1–80 kg/h m2. In many pre-vious theoretical and experimental studies, a range ofcirculating fluid rates (5–100 kg/h m2) was used inother applications [39–42]. The effect of the circulatingfluid flow rate on the integrated PVT-desalination sys-tem is shown in Fig. 9. Fig. 9a shows the effect of massflow rate (water) on the PVT collector temperatures.The absorber plate temperature reached a value of101�C at a flow rate of 1 kg/h m2 which is also knownas the stagnation temperature. Since this is a glazedtype PVT collector, the heat will be trapped in thecollector within glass cover if the mass flow is notadequate. Electrical efficiencies of the photovoltaiccells will be adversely affected and probably resulting
in damage of cells. As the mass flow rate wasincreased, the absorber panel and the circulating fluidtemperatures decreased. At the same time, when therewas little to no mass flow rate (*1 kg/h m2), the TESand evaporation chamber temperatures were in therange of 25–32�C which are not suitable for low tem-perature desalination. As the mass flow rate increased,the TES and evaporation chamber temperaturesincreased (50–57�C) as thermal energy was extractedfrom the PVT collectors. However, it should be notedthat the mass flow rate had significant effect on the cir-culating fluid, TES and EC temperatures only until theflow rate of 40 kg/h m2, above which the effect wasminimal. Similar trends were observed for thermal andelectrical efficiencies of the PVT system (Fig. 9b). Theyincreased with increase in mass flow rate up to 50 kg/h m2 and remain unchanged at higher mass flow rates.The effect of mass flow rate on the freshwater produc-tion is shown in Fig. 9c. Similar to temperature andefficiency profiles, the freshwater production rateincreased up to the mass flow rate of 50 kg/h m2, abovewhich thermal energy available for desalination fromTES was not significant. A maximum hourly freshwater production rate of 15 kg/h with a cumulativeproduct of 120 kg/d was observed at this flow rate.Based on the above analysis, an optimum mass flow
Table 2Model parameters used in simulations for desalination system
Parameter Value Parameter Value
Evaporation chamber (EC) area m2 1–5 Solar insolation W/m2 200–1000Condenser area m2 1–5 Seawater concentration % 3.5Water depth in the SEC m 0.05–0.1 Seawater density kg/m3 1,020Height of SEC m 0.5 Seawater, TES reference temperature �C 25TES volume m3 1 Ambient temperature �C �3 to 35
0
10
20
30
40
50
60
70
Tem
pera
ture
(°C
)
Time (h)
TESEvaporation chamberFreshwaterAmbient
0 4 8 12 16 20 24
Fig. 6. Temperature profiles of the low temperature desalina-tion system driven by PVT system during a day.
0
2
4
6
8
10
12
14
16
18
20
Ene
rgy
flow
(kW
)
Time (h)
Useful energy supplied
Energy used for evaporation
Energy losses from EC
0 4 8 12 16 20 24
Fig. 7. Energy supply and utilization in evaporation chamberduring a day.
V.G. Gude et al. / Desalination and Water Treatment 36 (2011) 129–140 135
rate of circulating fluid (water) would be in the range40–50 kg/h m2. Since this flow rate is determined basedon summer conditions, the same flow rate is sufficientfor winter conditions as well, as the temperature gradi-ent in the circulating fluid will be even higher.
3.1.3. Annual performance of the PVT system
It is important to understand the energy productionrates from the PVT system on an annual basis. Designconsiderations for a PVT system for electricity produc-tion depend on the local availability of other energysupplies. If the system has to be stand-alone or off-grid, then the capital costs for the system can be highsince the system needs to be designed to account forlow solar insolation rates and cloud cover effect duringwinter conditions. However, if a local energy source isavailable such as grid energy, the PVT system can bedesigned to meet the energy needs based on summerweather conditions.
3.1.4. Annual thermal and electrical energy production
The average solar insolation for the City of LasCruces in southern New Mexico has a minimum of250 W/m2 and a maximum of 620 W/m2. The ambienttemperature can be as low as�3�C and as high as 35�C.Average monthly thermal and electrical energies gen-erated by PVT system under the above conditions areshown in Fig. 10. Annual thermal and electrical effi-ciency of the PVT system is shown in Fig. 11. Asexpected, both thermal and electrical energies pro-duced by PVT system are low during the winter dueto lower solar insolation rates and ambient tempera-tures, and higher wind and cloud cover effects. There-fore, it is necessary to design a PVT system based onwinter conditions for remote applications. However,it should be realized that capital costs for such systemwill be much higher producing additional thermal and
electrical energies in summer conditions. For economicaldesign, an optimum collector area should be determinedwhich is 30 m2 having the capacity to produce electricalenergy 14–18 kWh/d and freshwater production capa-city of 90–150 kg/d. This collector area is 15–20% higherthan the minimum required based on summer condi-tions to account for weather conditions in the winter.
3.1.5. Energy and carbon emissions payback period
Production of PV modules involves utilization ofenergy and material resources. Energy generation andmanufacturing process, ultimately, result in environ-mental pollution and greenhouse gas emissions. Asummary of energy cost requirements and the CO2
emissions for PV module manufacturing are presentedin Table 3. However, once in operation, by using PVmodules CO2 savings in the range 270–1,050 g/kWhcan be achieved depending on the regional fossil fuelmix and solar irradiance [43,44]. An average savingsvalue of 662 gCO2/kWh was used to calculate thepayback period for the PV module area under study.The payback period for recovering the energy invest-ment is around 5.5 years even with 50% of the designcapacity and so is the carbon emissions paybackperiod. These calculations are based on the electricalenergy generated by the PVT collectors alone; thepayback periods will be much lower if thermal energyproduction rates are taken into account.
3.2. Desalination cost analysis
An analysis on the cost requirements of the desalina-tion system has been performed. Rather than investing innew PVT collectors, the simple way to convert the exist-ing PV module is to incorporate heat exchanger to extractthermal energy [45]. Total capital and equipment costsare shown in Table 4 for construction of a glazed typePVT collector area of 30 m2. Desalination costs are deter-mined based on the assumption that the investment isfinanced at an annual interest rate of 5% over the lifetimeof 25 years for the desalination system [46–48]. The fol-lowing equations can be used to calculate the unit costof the desalinated water produced from the integratedPVT-desalination system.where a is the amortization factor, n is the life time ofthe plant, i is the annual interest rate (%), f is the plantavailability and M is the quantity of produced water (kg).
Amortizationfactor
Annual capital andoperating costs
Unit productcost
a ¼ ið1þiÞnð1þiÞn�1
Atotal ¼ Afixed þ Areplacement þ AO&M Aunit ¼ Atotal
ðf �MÞ�365
−20
0
20
40
60
80
100
120
140
0
5
10
15
20
25
30
0 4 8 12 16 20 24
Cum
ulat
ive
Pro
duct
(kg
/d)
Eva
pora
tion
rat
e (k
g/h)
Time (h)
Evaporation rate
Cumulative product
Fig. 8. Freshwater production rate and cumulative productduring a day.
136 V.G. Gude et al. / Desalination and Water Treatment 36 (2011) 129–140

Based on annual performance and above eco-nomic analysis, average cost for unit desalinatedwater is determined as 1.3¢/L or 13$/m3 for a singlestage low temperature desalination unit. Seasonalvariation in desalinated water cost is shown inFig. 12. Desalination cost can be improved withmulti-effect operation of the process similar tomulti-stage flash distillation (MSF), and multi-effectdistillation (MED) processes. A comparison of
desalination cost with other conventional desalina-tion processes powered by renewable energy sourcesis shown in Table 5 [47,48].
4. Conclusions
The feasibility of integrating a PVT collectorsystem to drive a low temperature desalination
30
40
50
60
70
80
90
100
110
0 10 20 30 40 50 60 70 80 90 0 10 20 30 40 50 60 70 80 90
Tem
pera
ture
(°C
)
0
10
20
30
40
50
60
Eff
icie
ncy
(%)
1. PVT absorber plate 2. Collector fluid 3. TES tank
4. Evaporation Chamber
1
2 3 4
1
2
3
1. PVT Total 2. PVT Thermal 3. PVT Electrical
B A
0 10 20 30 40 50 60 70 80 90
0
20
40
60
80
100
120
140
Des
alin
ated
wat
er (
kg)
Mass flow rate (kg/h m2)
1. Cumulative freshwater (kg/d)
2. Freshwater output rate (kg/hr)
1
2
C
Fig. 9. Effect of mass flow rate on the integrated PVT Desalination system.
8
8.5
9
9.5
10
10.5
11
0
10
20
30
40
50
60
70
80
1 2 3 4 5 6 7 8 9 10 11 12
Ele
ctri
cal e
ffic
ienc
y (%
)
The
rmal
Eff
icie
ncy
(%)
Month of the year
Thermal EfficiencyTotal PV/T EfficiencyPrimary Energy Saving EfficiencyPV Electrical Efficiency
Fig. 11. Annual thermal and electrical energy efficiency of thePVT system.
0
100000
200000
300000
400000
500000
1 2 3 4 5 6 7 8 9 10 11 12
Month of the year
Thermal Energy (kJ/d)Electrical Energy (kJ/d)
Fig. 10. Annual thermal and electrical energy production.
V.G. Gude et al. / Desalination and Water Treatment 36 (2011) 129–140 137

system has been studied. A glazed type PVT collec-tor was used in the simulations with a thermal sto-rage tank to provide the thermal energy needs fordesalination. The mass flow rate of the circulatingfluid was optimized based on the performance ofboth the PVT collector and desalination systems. Itwas observed that a mass flow rate of 40–50 kg/h m2 was sufficient to drive both the systems atmaximum efficiencies. A case study was performedto analyze the annual performance of the system.The integrated PVT desalination system was ableto provide a household with both energy and fresh-water needs. The combined system could provide ahousehold a maximum of 18 kWh/d of electricalenergy and 150 L of freshwater. The energy and car-bon emissions calculations show that the integratedsystem has a payback period of less than 6 yearseven when operating at 50% of the design capacity
based on electrical energy production alone. Fresh-water costs for single stage desalination unit werefound to be round 13 $/m3 which is an acceptable valuefor a small size desalination plant. The integrated systembest utilizes solar thermal energy harvested by providing
Table 3Energy and carbon emissions payback period
Description Unit Value
Energy cost of the PV module kWh/m2 600CO2 emissions in energy production kg/kWh 0.66CO2 emissions generated to manufacture PV module kg/m2 397Total PV area in this study m2 30Total energy required to produce PV modules kWh 18,000Total CO2 emissions kg 11,916Total electricity generated per day (Design capacity) kWh 18Annual energy production (100% design capacity) kWh 6,570CO2 emissions eliminated in a year kg 4,349CO2 emissions payback time yr 2.7Energy payback time yr 2.7Annual energy production (50% design capacity) kWh 3,285CO2 emissions eliminated in a year kg 2,175CO2 emissions payback time yr 5.5Energy payback time yr 5.5
Table 4Costs to modify the existing photovoltaic modules and fordesalination unit
Item description Cost ($)
Additional cost due to modification 2,000Heat exchanger, evaporator and condenser 2,000Pumps 300Storage tank 300Total equipment cost 4,600Annual interest rate (%) 5Plant life expectancy (Years) 25Operation and Maintenance (%) 10Replacement costs (%) 10Total investment ($) 5,500
0
5
10
15
20
25
0
20
40
60
80
100
120
140
160
1 2 3 4 5 6 7 8 9 10 11 12
Fre
shw
ater
cos
t ($
/m3 )
Fre
shw
ater
pro
duct
ion
rate
(L
/d)
Month of the year
Fig. 12. Seasonal variation in the desalination costs of the inte-grated process.
Table 5Desalination cost comparison with other desalinationprocesses
ProcessCapacity(m3/d)
Cost($/m3)
Solar Still 0.5–1 12–12.50Multi effect distillation
(MED, solar)85 7–10
PV-Reverse Osmosis 1 12.05–15.60Membrane Distillation (solar) <1 13–18PV-Thermal desalination
(single stage)<1 12.9
138 V.G. Gude et al. / Desalination and Water Treatment 36 (2011) 129–140
it as a heat source to the low temperature desalinationsystem and is a viable option for remote and ruralapplications.
Acknowledgements
The research reported here was supported by grantsfrom the New Mexico Water Resources ResearchInstitute (NM-WRRI).
Nomenclature
A area [m2], annual costscp specific heat capacity of saline water [kJ/
kg�C]C solute concentration [%], specific heat capacity
[kJ/kg�C]d diameter of the circulating fluid tube [m]F heat removal factor [dimensionless], packing
factor [%]f(C) correlation factor for the presence of solute
concentration [%]h latent heat [kJ/kg], heat transfer coefficient
(convective) [kJ/h m2�C]I solar insolation [kJ/h m2]m mass of water [kg]Q energy flow [kJ/hr]q evaporation rate [m3/s]Re Reynolds numberPr Prandtl numberNu Nusselt numberT temperature [
�C]
U heat loss coefficient [kJ/h m2�C]V volume of water in EC [m3]x length of the circulating fluid route [m]
Subscripts
a ambient, amortization factorc cell, collector, specific heatd desalination systeme,E electrical, evaporation, evaporatedel electricalEC evaporation chamberf fresh, circulating fluid exit, amortization
factorg glassi inletI solar insolationIn suppliedl,lo, ls, L latent heat, lossesp panel, photovoltaic, absorber plate,
pressure and pump
pv photovoltaic modulepes prime energy savingPVT photovoltaic thermal collectorr radiative, absorbers saline water, solar energy, storage tank,
surfacestd standard or referenceTpower power plant efficiencyu usefulw withdrawalv volume of storage tank
Greek Symbols
a absorptivity [dimensionless]am an experimental coefficient [10�7 – 10�6
kg-K0.5/m2-Pa-s]r density [kg/m3]t transmitivity of glass [dimensionless]� volume of the thermal energy storage system
[m3]" radiation factors Stefan-Boltzmann constant, (5.7�10�8 W/
m2K4)
References
[1] M. Tirugnanasambandam, S. Iniyan and R. Goic, A review ofsolar thermal technologies, Renew. Sustain. Energy Rev., 14(2010) 312–322.
[2] D. Pimentel, Biofuels, Solar and Wind as Renewable Energy Sys-tems: Benefits and risks, Springer, USA 2008.
[3] W.G.J. van Helden, J.C.Z. Ronald and A.Z. Herbert, PV thermalsystems: PV panels supplying renewable electricity and heat,progress in photovoltaics, Res. Appl., 12 (2004) 415–426.
[4] H.P. Garg and R.S. Adhikari, Performance analysis of a hybridphotovoltaic/thermal (PV/T) collector with integrated CPCtroughs, Int. J. Energy Res., 23 (1999) 1295–1304.
[5] S.A. Kalogirou and Y. Tripanagnostopoulos, Hybrid PV/T solarsystems for domestic hot water and electricity production,Energy Conv. Manag., 47 (2006) 3368–3382.
[6] Y. Tripanagnostopoulos, S. Tselepis, M. Souliotis and J.K.Tonui, Design aspects of hybrid PVT/Water solar systems,19th European Solar Energy Conference and Exhibition,France 2004.
[7] A. Kribus, D. Kaftori, G. Mittelman, A. Hirshfeld, Y. Flitsanovand A. Dayan, A miniature concentrating photovoltaic and ther-mal system, Energy Conv. Manag., 47 (2006) 3582–3590.
[8] V.G. Gude, N.N. Khandan and S. Deng, Renewable and sustain-able approaches for desalination. Renew. Sustain. Energy Rev.,14 (2010) 2641–2654.
[9] S. Jaikra, T. Nualboonrueng and P. Sichanugrist, Developmentof PVIT System in Thailand, 31st IEEE Photovoltaic SpecialistsConference Proceedings, 2005, pp. 1687–1689.
[10] Y. Tripanagnostopoulos, M. Souliotis, R. Battisti and A.Corrado, Energy, cost and LCA results of PV and hybrid PV/T solar systems, Prog. Photovolt: Res. Appl., 13 (2005) 235–250.
[11] CO2 emissions per kilowatt hour of electricity production; 2009.http://www.eia.doe.gov/cneaf/electricity/page/co2_report/co2report.html#electric2000 retrieved on 07-03-2010.
[12] V.M. Fthenakis, C.K. Hyung and E. Alsema, Emissions fromphotovoltaic life cycles, Environ. Sci. Technol., 42 (2008) 2168–2174.
V.G. Gude et al. / Desalination and Water Treatment 36 (2011) 129–140 139

[13] V.M. Fthenakis and E. Alsema, Photovoltaics energy paybacktimes, greenhouse gas emissions and external costs: 2004-early 2005 status, Prog. Photovolt: Res. Appl., 14 (2006)275–280.
[14] W. He, T.T. Chow, J. Ji, J. Lu, G. Pei and L. Chan, Hybrid photo-voltaic and thermal solar collector designed for natural circula-tion of water, Appl. Energy, 83 (3) (2006) 199–210.
[15] J. Ji, J. Han, T.T. Chow, Y. Hua, J. Lu, W. He and W. Sun, Effectof fluid flow and packing factor on energy performance of awall-mounted hybrid photovoltaic/water-heating collector sys-tem, Energy Build., 38 (12) (2006) 1380–1387.
[16] T.T. Chow, W. He, J. Ji and A.L.S. Chan, Performance evaluationof photovoltaic-thermosyphon system for subtropical climateapplication, Solar Energy, 81 (1) (2007) 123–130.
[17] T.T. Chow, J. Ji and W. He, Photovoltaic-thermal collector sys-tem for domestic application, J. Solar Energy Eng. Trans. ASME,129 (2) (2007) 205–209.
[18] S.A. Kalogirou and Y. Tripanagnostopoulos, Industrial applica-tion of PV/T solar energy systems, Appl. Thermal Eng., 27(2007) 1259–1270.
[19] S.A. Kalogirou, Solar thermal collectors and applications, Progr.Energy Combust. Sci., 30 (2004) 231–295.
[20] V.G. Gude and N.N. Khandan, Combined desalination andsolar-assisted air-conditioning system, Energy Conv. Manag.,49 (2008) 3326–3330.
[21] V.G. Gude and N.N. Khandan, Desalination using low-gradeheat sources, ASCE J Energy Engrg., 134 (3) (2008) 95–101.
[22] V.G. Gude and N.N. Khandan, Desalination at low tempera-tures and low pressures, Desalination, 244 (1–3) (2009) 239–247.
[23] V.G. Gude, Desalination using low grade heat sources. Ph.D.dissertation, New Mexico State University, Las Cruces, NM,USA, 2007.
[24] V.G. Gude, N.N. Khandan and S. Deng, Low temperature pro-cess to recover impaired waters, Desalination Water Treat., 20(2010) 281–290.
[25] V.G. Gude and N.N. Khandan, Sustainable desalination usingsolar energy, Energy Conv. Manag., 51 (2010) 2245–2251.
[26] V.G. Gude, N.N. Khandan and S. Deng, Desalination using solarenergy: Towards sustainability, Energy, 36 (1) (2011) 78–85.
[27] G. Mittelman, A. Kribus, O. Mouchtar and A. Dayan, Waterdesalination with concentrating photovoltaic/thermal (CPVT)systems, Solar Energy, 83 (8) (2009) 1322–1334.
[28] G.A. Mertz, G.S. Raffio, K. Kissock and K.P. Hallinan, Concep-tual design of net zero energy campus residence, Proceedings ofISEC Conference, Florida, 2005.
[29] S. Al-Kharabsheh and D.Y. Goswami, Analysis of an innovativewater desalination system using low-grade solar heat, Desalina-tion, 156 (2003) 323–332.
[30] Y. Morita, T. Fujisawa and T. Tani, Momentary performance ofphotovoltaic/thermal hybrid panel (numerical analysis andexergetic evaluation), Electrical Engineering in Japan 133(2000) 43–51.
[31] M.M. Jong and H.A. Zondag, System studies on combined PVthermal panels, The 9th International Conference on Solar Energyin High Latitudes, Northsun, Leiden, The Netherlands, 2001.
[32] H.P. Garg and R.K. Agarwal, Some aspects of a PV/T collector/Forced circulation flat plate solar water heater with solar cells,Energy Conv. Manag., 36 (1995) 87–99.
[33] B.J. Huang, T.H. Lin, W.C. Hung and F.S. Sun, Performance eva-luation of solar photovoltaic/thermal systems, Solar Energy, 70(5) (2001) 443–448.
[34] G.A. Bemporad, Basic hydrodynamic aspects of a solarenergy based desalination process, Solar Energy, 54 (2)(1995) 125–134.
[35] Extend simulation software, http://www.extendsim.com/index.html, accessed on 12/18/2010.
[36] http://rredc.nrel.gov/solar/old_data/nsrdb/tmy2/Sta-te.html, accessed on 12/23/2010.
[37] T. Fujisawa and T. Tani, Binary utilization of solar energy withphotovoltaic-thermal hybrid collector. Proceedings of ISES solarworld congress, Aug 24–28, Taejon, Korea 1997.
[38] T. Bergene and O. Lovik, Model calculations on a flat-plate solarheat collector with integral solar cells, Solar Energy, 55 (6) (1998)453–462.
[39] M. Boubekri, A. Chaker and A. Cheknane, Numerical approachfor performance study of hybrid PV/Thermal collector, Rev.Energ. Renouvelables, 12 (3) (2009) 355–368.
[40] A. Ibrahim, G.L. Jin, R. Daghigh, M.H.M. Salleh, M.F. Othman,M.H. Ruslan, S. Mat and K. Sopian, Hybrid photovoltaic ther-mal (PV/T) air and water based solar collectors suitable forbuilding integrated applications, Am. J. Environ. Sci., 5 (5)(2009) 618–624.
[41] B. Singh and M.Y. Othman, A review on photovoltaic thermalcollectors, J. Renew. Sustain. Energy, 1 (2009) 627021–13.
[42] H.A. Zondag, D.W. de Vries, W.G.J. van Helden, R.J.C. vanZolingen, A.A. van Steenhoven, The yield of different combinedPV-thermal collector designs, Solar Energy, 74 (2003) 253–269.
[43] J.A. Turner, A realizable renewable energy future, Science, 285(1999) 687–689.
[44] E. Alsema, Report BNL-52557, Brookhaven National Labora-tory, Upton, NY, 1998.
[45] S.A. Kalogirou, Use of TRNSYS for modeling and simulation ofa hybrid pv-thermal solar system for Cyprus, Renew. Energy, 23(2001) 247–260.
[46] M. Bakker, H.A. Zondag, M.J. Elswijk, K.J. Strootman andM.J.M. Jong, Performance and costs of a roof-sized PV/thermalarray combined with a ground coupled heat pump, SolarEnergy, 78 (2005) 331–339.
[47] F. Banat and N. Jwaied, Economic evaluation of desalination bysmall scale autonomous solar powered membrane distillationunits, Desalination, 220 (2008) 566–573.
[48] F. Banat, H. Qiblawey and Q. Al-Nasser, Economic evaluation of asmall RO unit powered by PV installed in the village of Hartha,Jordan, Desalination Water Treat., 3 (2009) 169–174.
140 V.G. Gude et al. / Desalination and Water Treatment 36 (2011) 129–140