
desalination technologies and environmental aspects: case ...
ELSEVIER Desalination 141 (2001) 145-156
DESALINATION
www.elsevier.com/locate/desal
The continued challenge of capacity building in desalination
I b r ah i m S. A1-Mutaz Chemical Engineering Department, College of Engineering, King Saud University,
PO Box 800, Riyadh 11421, Saudi Arabia email: [email protected]
Received 3 October 2000; accepted 17 October 2000
Abstract
Desalination has become a major source of fresh water almost everywhere. The best choice for providing fresh water in the Middle East and North Africa, especially in the Arabian Gulf counlries, was through seawater desalination with ground water as back up. Desalination in the Arabian Gulfcouna'ies is an example of the fast growth of the desalination industry. It is expected to show a steady growth in the coming years. Existing plants will experience expansions in their capacities. New plants will be constructed. The long experience of the Arabian Gulf countries in the desalination field together with massive desalting capacities represent a continued challenge in capacity building. More efforts in training for desalination technology are needed, together with human resources management, planning, academic education and research. A capacity-building program is necessary not only to improve the operation and maintenance of existing desalination plants but also to build an integrated adoption of this sustainable technology in the region. This paper will focus on discussing the need and necessity of research in desalination by reviewing possible improvement of the current desalination processes regarding lower water production cost, better utilization of energy, environmental aspects, etc. A training program for desalination technology to enhance human resources and expertise via academic education and research is outlined.
Keywords: Training; Capacity building; Desalination processes; Arabian Gulf
1. Desalination in the Arabian Gulf countries
Desalination has become a major source of fresh water in the Middle East and North Africa, especially in the Arabian Gulf countries. Many
other countries utilize or will utilize desalination to obtain fresh water due to the limited natural resources of potable water and the rapid increase in water consumption. Recently about 65% of desalination plants that are in operation
Presented at the session on Capacity Building at the conference on Desalination Strategies in South Mediterranean Countries, Cooperation between Mediterranean Countries of Europe and the Southern Rim of the Mediterranean, sponsored by the European Desalination Society and Ecole Nationale d'Ingenieurs de Tunis, September 11-13, 2000, Jerba, Tunisia.
0011-9164/01/$- See front matter © 2001 Elsevier Science B.V. All rights reserved PII: soo 11-9164(01)00399-x

146 l.S. Al-Mutaz / Desalination 141 (2001) 145-156
worldwide are located in the Arabian Gulf countries. Arabian Gulf countries are located in an arid area with limited water resources. Rainfall varies in time and quantities among the Gulf States. The average annual precipitation is between 50 and 100 mm (2-4"). The annual rate of water evaporation exceeds 3000 mm (120") in some parts. Surface water resources are scarce. Hydrological investigations pointed to the large resources of underground water. Underground water is saline and need to be desalted.
The best choice for providing fresh water in the Arabian Gulf countries was through seawater desalination with ground water as back up. Desalination in Saudi Arabia started in 1907. The first multi-stage flash plant (MSF) was built in Doba and AI-Wajh on the Red Sea coast in 1969 with a capacity of 227.1 m3/d (60,000 gpd). Then the first dual-purpose plant was built in Jeddah (Jeddah Phase I) in 1970 with a capacity of 18,925 m3/d (5 mgd) and 50MW electricity. On the Arabian Gulf, AI-Khobar Phase I was started in 1973 with a capacity of 28,390 m3/d (7.5 mgd). All these are MSF plants. The first RO seawater desalination plant in Saudi Arabia was con- structed in Jeddah (Jeddah RO-I) in 1978 with a capacity of 12,110m3/d (3.2 mgd). Al-Jobail phase II is considered the world's largest desali- nation plant. It has a design capacity of about 960,000m3/d (253.5 mgd) and 812MW of elec- tricity and began operation in 1983.
In Kuwait, the first desalination plant was built in 1950 in AI-Ahmadi with a capacity of 3028m3/d (800,000gpd). In 1953, Qatar estab- lished the first desalination plant in Doha with a capacity of 567.8m3/d (150,000 gpd). United Arab Emirates had the first desalination plant in Abu Dhabi in 1969 with a capacity of 22,710 m3/d (6 mgd). The capacity increased to 45,420 m3/d (12 mgd) and 68,130 m3/d (18 mgd) in 1974 and 1984, respectively. Currently three major desalination plants are in operation in the United Arab Emirates at Abu Dhabi power and desalination plants (ADPS), Umm AI Nar (UAN)
and AI Taweelah (TAW). The UNA station is the largest water production plant in the country. It accounts for about 71% of the total desalination capacity.
In Bahrain, the first desalination plant was built in 1976 in Sitrah with a capacity of 18,925m3/d (5mgd). In 1984, Bahrain com- missioned its first high brackish water RO plant at Ras Abu Jarjur with a capacity of 46,000 m3/d (12.15 mgd). This plant is considered the largest brackish water RO plant. Oman built its first desalination plant in 1976 in AI-Gubrah with a capacity of 22,710 m3/d (6 mgd). The capacity increased to 45,420 m3/d (12 mgd) in 1983.
There are now about 60 desalination plants in operation in the Arabian Gulf countries with a capacity of more than 1,550,000m3/d (409,511.2 mgd), 86.3% of which use MSF and 13.8% RO.
2. Desalination pattern
Large numbers of MSF evaporation plants are used for seawater desalination. MSF dominates the desalination market by more than 73% of units, producing 4000 m3/d (1.06 mgd) and 51% of units producing more than 100 m3/d (26,420 gpd) [1]. RO is used mainly for brackish water treatment. A growing trend is toward the application of RO in the desalting of seawater due to the high energy consumption of distillation processes and recent advancements in membrane technology. Limited numbers of multiple-effect distillation (MED) plants are used in the Arabian Gulf countries. Table 1 shows the desalination capacities in the Arabian Gulf countries.
3. RO and MSF process description
The RO process consists of three main steps: (1) pretreatment, (2) membrane assembly system and (3) posttreatment. Fig. 1 shows the basic arrangements of RO system.

I.S. Al-Mutaz / Desalination 141 (2001) 145-156
Table 1 Desalination capacities in the Arabian Gulf countries, 1990
147
Country No. of plants Capacity, Mm 3/y Share (%) by plant type
MSF RO Other
Bahrain 5 70 57 Kuwait 6 240 98 Oman 2 32 90 Qatar 2 95 98 Saudi Arabia 23 715 80 UAE 20 400 95
40 3 1 1 7 3
-- 2 18 2 3 2
Saline Feedwatcr
---~ Pre-Tr©atment I
Membrane High Assem bly Pressure Fresh Pump
~ "~[Po|t -~
Stabilized Freshwater
Brine Discharge Fig. 1. Basic component of the RO system.
The purpose of the pretreatment step is to avoid any risk of clogging, fouling or scaling of the membrane. Pretreatment is an important aspect of RO system. All RO devices required pretreatment to remove the suspended solids, scalants, foulants and colloidal matter.
In the pretreatment system, some chemicals are usually used before the filtration step. Chlorine is often injected to disinfect feed water. Then copper sulfate is sometimes used to eliminate the danger of membrane damage by chlorine. Sodium bisulfate may be used to dechlorinate the feed water. Ferric chloride, alum or polymers are the typical coagulants used at the pre-filter stage. In the filtration stage, a gravity
filter with different sand particle sizes is used. Then a fine cartridge filter is used after the sand filtration. Sulfuric acid or sodium hexameta phosphate is also used to prevent carbonate scale. The exact dosage o f each chemical depends on the chemical analysis of the feed water.
In the posttreatment step, product water passes through a decarbonation system, a pH adjustment system and chlorine injection to comply with the required quality and use of the product water. Calcium hydroxide with a concentration o f 30- 40 ppm is added to the product water to adjust its alkalinity. The purpose of chlorine addition is to eliminate the presence of microorganisms during storage and distribution.

148 LS. Al-Mutaz / Desalination 141 (2001) 145-156
Table 2 Commercial RO membranes and modules
Company Material Membrane Type Module
Desal CA Asymmetric Spiral wound PA Composite Spiral wound
DuPont CA Composite Spiral wound Aramid Composite Spiral wound Aramid Asymmetric Hollow fiber
Film Tech (Dow Chemical) PA Composite Spiral wound UOP PA-300 Composite Spiral wound
RC-100 Composite Spiral wound DDS CA Asymmetric Plate and frame
PA Composite PCI CA Asymmetric Tubular
PA Composite Nitto Denko PA Composite Spiral wound Sumitomo Chem. PAN Asymmetric Spiral wound Toray CA Asymmetric Spiral wound
PA Composite Spiral wound Toyobo CA Homogeneous Hollow fiber
CA, cellulose acetate; PA, polyamide; PAN, polyacrylonitrile.
Several types of RO membranes are commercially available. These are prepared either as fiat sheet or as hollow fibers made from cellulose acetate (CA) ester or aromatic poly- amide (PA). There are different ways of packing RO membranes. Of these, three configurations have been produced commercially: tubular, spiral wound (SW) and hollow fine fiber (HFF). Hollow-fine-fiber and spiral-wound modules have proved to be appropriate for seawater and brackish water RO desalination. Table 2 illustrates the commercially available RO membranes and modules.
In the membrane system, water and a small portion of dissolved salt pass through the membrane due to the application of high pressure. The flow of water and salts, Qw and Q.,., across the membrane depends on many factors. The flow of water is directly proportional to the
differential pressure across the membrane, Ap. Part of the differential pressure across the membrane had to be use to overcome the osmotic pressure across the membrane, Ar~. On the other hand, the salt flow rate is directly proportional to the differential salt concentration across the membrane, AC. The basic mathematical relations often used in the RO system are:
Qw =A (Ap - Arg) (1)
Q,. = K,. ( A c ) (2)
c , = 2,/Qw (3)
SP = Cp x 100/(7/ (4)
whereA is the membrane permeability coefficient for water, K, is the membrane permeability

LS. Al-Mutaz / Desalination 141 (2001) 145-156 149
R E.J(CT SEAWAT Eli k C W
_ 2
, o , t o o I TSo ~ , • CB 0 R£COVI~RY SECTIQH
Fig. 2. Simplified MSF flow diagram.
; . ,!I " " I r i l l
i li, A£JECTI~I'
n E ~ ' C t t
R
H
I
1,1 -111
SEAV~tT ER FEEO "- " ' WT
T S E ~ 01STILLATE ,..
014 Ta.
Bu 8 L ~
80 '1' Ceo
coefficient for salt, Cp is the salt concentration in the product stream, Cy is the salt concentration in the feed stream and SP is the percentage of salt passage.
Fig. 2 shows the MSF process which has three distinct sections: heat rejection, heat recovery
a n d brine heater. The feed water (WT) passes through the heat rejection and heat recovery sections.
On leaving the first (warmest) rejection stage, the feed stream is split into two parts: reject seawater (CW) which passes back to the sea and a make-up stream (F) which is then combined with the recycle stream (R). The combined stream (W) now passes through a series of heat exchangers, its temperature rising as it proceeds towards the heat input section of the plant. Passing through the brine heater, the brine temperature is raised from TF~ at the inlet of the brine heater to a maximum value of TBo approximately equal to the saturation temperature at the system pressure.
The brine then enters the first heat recovery stage through an orifice, thus reducing the pressure. As the brine was already at its saturation temperature for a higher pressure, it will become superheated and flashes in the flashing chambers of the heat recovery and rejection sections to give off water vapor. This
vapor passes through a wire mesh (demister) to remove any entrained brine droplets and on to a heat exchanger (as show in Fig. 2) where the vapor is condensed and drips into the distillate tray. The process is then repeated all the way down the plant as both brine and distillate enter the next stage, which is at a lower pressure. The concentrated brine is divided into two parts as it leaves the plant, the blowdown (BD) which is pumped back to the sea and a recycle stream (R), which returns to mix with the make-up stream (F).
The vapor formed in the flashing chambers condenses on the heat tubes of the heat recovery and rejection sections thus heating the incoming feed to temperature TF I. The brine heater supplies the remaining energy to raise the feed temperature to TB o before flashing commences. The fraction of brine which flashes in the first stage, AW,, is given by:
AW, = [Cp (:rS0 - rB, + (5)
where Cp is the specific heat of water, TB, is the temperature of the flashing brine in the first stage, ABPE is the boiling point elevation and is the latent heat of evaporation of water.
The following are the basic mathematical relations in a MSF system:
150 I.S. Al-Mutaz / Desalination 141 (2001) 145-156
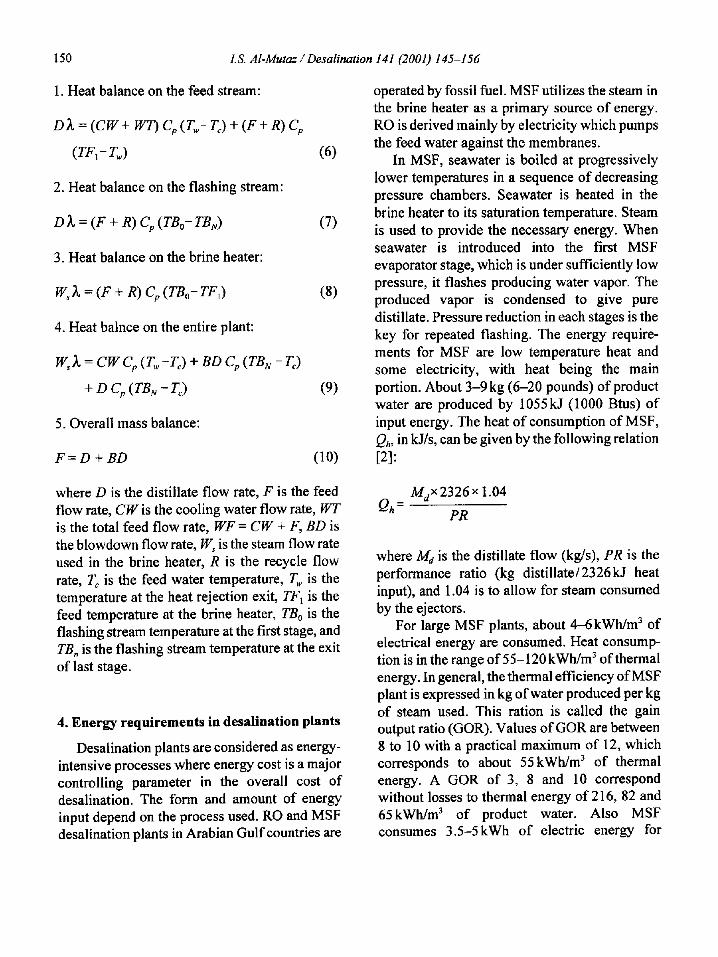
1. Heat balance on the feed stream:
D ~, = (CW + WT) Cp (T~- T~) + (F + R) Cp
(TF,- Tw) (6)
2. Heat balance on the flashing stream:
O )~ = (F + R) Cp (TBo- TB~) (7)
3. Heat balance on the brine heater:
W~.)~ = (F + R) Cp (TBo- TF1) (8)
4. Heat balnce on the entire plant:
Ws)t, = CW Cp (Tw-L) + BD Cp (TBN -T~)
+ D Cp (TBN - T~) (9)
5. Overall mass balance:
F = D + BD (10)
operated by fossil fuel. MSF utilizes the steam in the brine heater as a primary source of energy. RO is derived mainly by electricity which pumps the feed water against the membranes.
In MSF, seawater is boiled at progressively lower temperatures in a sequence of decreasing pressure chambers. Seawater is heated in the brine heater to its saturation temperature. Steam is used to provide the necessary energy. When seawater is introduced into the first MSF evaporator stage, which is under sufficiently low pressure, it flashes producing water vapor. The produced vapor is condensed to give pure distillate. Pressure reduction in each stages is the key for repeated flashing. The energy require- ments for MSF are low temperature heat and some electricity, with heat being the main portion. About 3-9 kg (6-20 pounds) of product water are produced by 1055kJ (1000 Btus) of input energy. The heat of consumption of MSF, Qh, in k J/s, can be given by the following relation [2]:
where D is the distillate flow rate, F is the feed flow rate, C W is the cooling water flow rate, WT is the total feed flow rate, WF = CW + F, BD is the blowdown flow rate, Ws is the steam flow rate used in the brine heater, R is the recycle flow rate, T¢ is the feed water temperature, T, v is the temperature at the heat rejection exit, TF~ is the feed temperature at the brine heater, TBo is the flashing stream temperature at the first stage, and TB, is the flashing stream temperature at the exit of last stage.
4. Energy requirements in desalination plants
Desalination plants are considered as energy- intensive processes where energy cost is a major controlling parameter in the overall cost of desalination. The form and amount of energy input depend on the process used. RO and MSF desalination plants in Arabian Gulf countries are
MdX2326 x 1.04
Qh = PR
where Md is the distillate flow (kg/s), PR is the performance ratio (kg distillate/2326kJ heat input), and 1.04 is to allow for steam consumed by the ejectors.
For large MSF plants, about 4-6kWh/m 3 of electrical energy are consumed. Heat consump- tion is in the range of 55-120kWh/m 3 of thermal energy. In general, the thermal efficiency of MSF plant is expressed in kg of water produced per kg of steam used. This ration is called the gain output ratio (GOR). Values of GOR are between 8 to 10 with a practical maximum of 12, which corresponds to about 55kWh/m 3 of thermal energy. A GOR of 3, 8 and 10 correspond without losses to thermal energy of 216, 82 and 65kWh/m 3 of product water. Also MSF consumes 3.5-5kWh of electric energy for
I.S. Al-Mutaz / Desalination 141 (2001) 145-156 151
pumping per 1 m 3 of product water, i.e., about twice what is consumed by a typical multiple effect distillation (MED) plant.
RO is operated on the opposite principle of osmosis. Seawater is subjected to a pressure higher than the osmotic pressure. Desalted water is then forced to permeate through the semi- permeable membrane. So the energy required for RO is in the mechanical form. This can be supplied by electrical motors or directly by shaft power from turbines or diesel engines. For typical seawater of about 35,000ppm total dissolved salts (TDS), the minimum energy needed to separate 3.785 m 3 ( 1 0 0 0 gal) is 3 kWh. Typical energy consumption of RO with 30% water conversion is about 9.7kWh/m 3. When using an energy recovery turbine of 80% efficiency, the electrical energy consumption will be reduced to 6.5 kWh/m 3 [2] where about 30% of the input energy can be recovered. The percentage of recovered energy increases as the plant size increases because the pump and motor efficiencies improves with sizes. Roughly 4.5- 7kWh of electrical energy are required for producing 1 m 3 of potable water. About 85% of
this energy consumption is required for the high pressure pumps. The exact figure depends on the design, unit size, site conditions, water quality requirements, membrane properties, feed water temperature and salinity as well as the usage of energy recovery system.
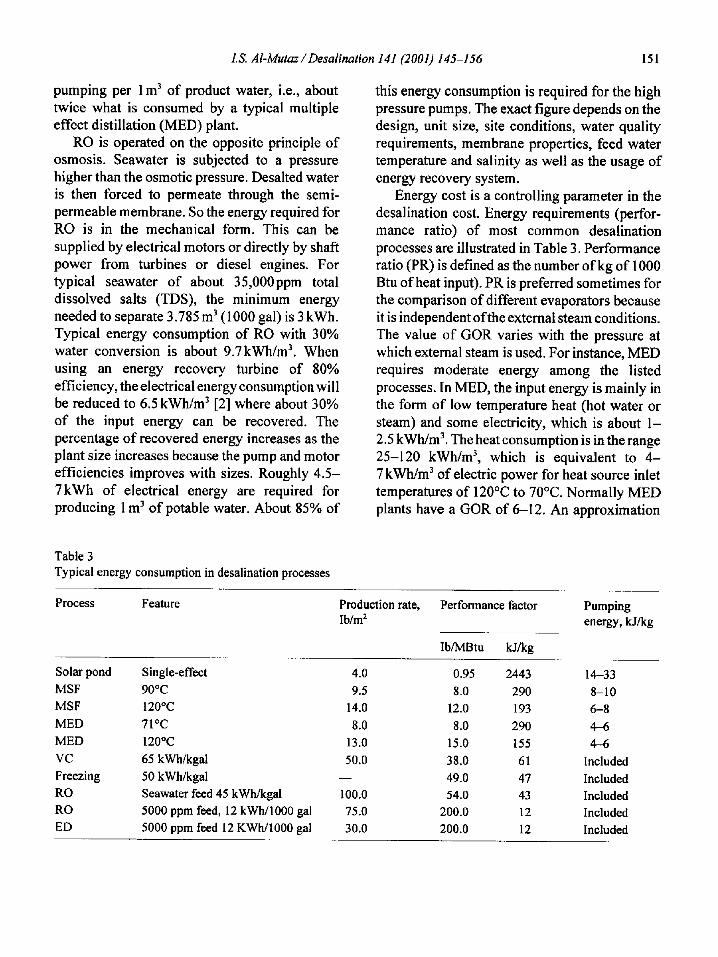
Energy cost is a controlling parameter in the desalination cost. Energy requirements (perfor- mance ratio) of most common desalination processes are illustrated in Table 3. Performance ratio (PR) is defined as the number o fkg of 1000 Btu of heat input). PR is preferred sometimes for the comparison of different evaporators because it is independent of the external steam conditions. The value of GOR varies with the pressure at which external steam is used. For instance, MED requires moderate energy among the listed processes. In MED, the input energy is mainly in the form of low temperature heat (hot water or steam) and some electricity, which is about 1- 2.5 kWh/m 3. The heat consumption is in the range 25-120 kWh/m 3, which is equivalent to 4 - 7 kWh/m 3 of electric power for heat source inlet temperatures of 120°C to 70°C. Normally MED plants have a GOR of 6-12. An approximation
Table 3 Typical energy consumption in desalination processes
Process Feature Production rate, Performance factor Pumping I b /m 2 energy, kJ/kg
Ib/MBtu kJ/kg
Solar pond MSF MSF MED MED VC Freezing RO RO ED
Single-effect 4.0 0.95 2443 14-33 90°C 9.5 8.0 290 8-10 120°C 14.0 12.0 193 6-8 71°C 8.0 8.0 290 4-6 120°C 13.0 15.0 155 4-6 65 kWh/kgal 50.0 38.0 61 Included 50 kWh/kgal - - 49.0 47 Included Seawater feed 45 kWh/kgal 100.0 54.0 43 Included 5000 ppm feed, 12 kWh/1000 gal 75.0 200.0 12 Included 5000 ppm feed 12 KWh/1000 gal 30.0 200.0 12 Included

152 LS. Al-Mutaz / Desalination 141 (2001) 145-156
Table 4 Comparison of distillation and reverse osmosis desalination processes
RO MSF MED
Energy consumption: Electricity, KWeh/M 5-7 Thermal, KWth/M None
Electric equivalent for thermal None energy, KWelI JM ~
Total equivalent energy consumption, 5.7 KWeh/M 3
Possible unit size, M3/d Limiting factors
24,000 Pumps Vacuum units
Total capital costs Lowest Fully automatic and unattended Possible
operation Tolerance to operator faults Low Tolerance to change seawater Medium
composition and pollution Maintenance requirements Spare parts or replacement parts
requirements
Heat transfer area Failure potential if corrosion occurs
Scaling potential when solutes in seawater are above precipitation level
On-site assembly/erection requirements
Engineering requirements (quantitative)
Manufacturing requirements
Ratio between product and total seawater flow
Experience available Potential for further improvement
High High (delicate, large pumps, expensive membrane replacement every 3.5 years) Not applicable High (some membranes are sensitive to dissolved metals) High
4-6 2-2.5 55.120 30.120 8.18 2.5.10
12.24 4.5.12.5
60,000 60,000 Pumps Erection and Valves construction aspects;
plant reliability Highest (at same GOR) Low Possible Possible
Medium High Medium High
Medium Low Medium (large Low (only small special pumps) pumps required)
High Low Medium Low
Medium Low
Low Medium Medium
Low Medium Medium
High (especially for Medium Low membranes) 0.3.0.5 0.08.0.15 0.1.0.25
Medium Highest High High Low (at technological Medium
limit)

I.S. Al-Mutaz / Desalination 141 (2001) 145-156 153
to the GOR value can be made by multiplying the number of effects by 0.80 [3].
It is important to note that the low energy requirements do not necessarily indicate the least-cost desalination method. Selecting a desalination process requires an extensive cost analysis of other system parameters such as capital cost, operation and maintenance costs, etc.
Apart from energy consumption, Table 4 shows a comparison of distillation and RO desalination processes.
5. Future challenge of desalination systems
Water production costs continue to be the important issue facing the development of desali- nation processes. The most significant costs associated with RO plants are the capital cost, the electricity costs, membrane replacement costs, and labor costs. Recovery is an important key for reducing water production costs in RO units.
The MSF market share in the desalination industry is more than 60%. The first MSF units were built with a capacity of about 3785m3/d (1 mgd) in the late 1950s. Nowadays, massive MSF units are built reaching a capacity of about 960,000m3/d (253.5 mgd) as in AI-Jobail phase II. Progress in the MSF process includes increase in the unit capacity, development of antiscalent chemical additives, dearation of the feed seawater, design of control loops, construction of cross/long-tube arrangement, use of alloy tubing and cladding sheets [4].
Since energy is so important in desalination, a few directions on possible energy usage may significantly reduce desalination costs [5]. These include: • Use of spent energy from large steam power
plants: the dual cycle • Desalination-dedicated power plants • Increased production scale and maintenance
of the best energy utilization schemes.
The general outlook of future research activities in different desalination directions falls into the following directions [5].
5.1. Reduction o f desalination energy require- ments
• Develop concepts and schemes for optimal integration, by cogeneration or otherwise, of various energy sources and desalination technologies: (a) hybrid systems, (b) solar energy integration, and (c) desalination- dedicated power plants.
• Identify novel schemes for improving desali- nation processes and/or energy recuperation.
5.2. Improvements in current thermal technologies
• Develop improved designs and manufacturing technologies for heat transfer bundles and containment vessels that reduce investment costs.
• Develop improved pretreatment methods for controlling scaling, fouling, and biofouling.
• Consider proposals for increasing heat transfer coefficients to reduce heat transfer areas.
• Improve plant performance through advanced control tools.
5. 3. Improvements in current membrane technologies
• Develop membranes which achieve better performance at reduced permeation pressures.
• Develop an improved methodology for achieving optimal pretreatment.
• Improve the resistance of membranes to oxidizing agents.
• Enhance possibilities of integrating micro and ultrafiltration in feed pretreatment.
• Extend membrane lifetime. • Improve membrane salt rejection.

154 l.S. Al-Mutaz / Desalination 141 (2001) 145-156
Reduce membrane compaction. Develop higher efficiency pumps and energy recovery turbines.
5.4. Integration o f desalination into the overall water system
• Widen the scope of water reuse through membrane technologies.
• Focus on processes enabling exploitation of polluted streams.
• Investigate supply and demand curves for water of different qualities by various consumer groups or industries.
• Investigate the effect of integrating desali- nation in varying degrees into national and/or regional water systems on the supply and demand for water.
• Develop new concepts for optimal desalination-oriented water supply systems.
• Integration of desalinated water into modern agriculture.
5.5. Reduction o f environmental problems associated with brine disposal
• Development of the zero-discharge concept. • Development of natural pre-treatment
additives.
6. The challenge of capacity building
There are several definitions of capacity building. The Adept Community Development Agency gives an excellent vision of capacity building [6], which can be summarized as follows:
Capacity building includes making efforts to find and support local community groups, so that they can assist in identifying and prioritizing problems and opportunities, in assessing possible ways forward, and in planning and delivering an implementation.
Capacity building is aimed at supporting groups to play a part in the economic and social regeneration of their communities. It is defined as development work that strengthens activities and the ability of community organizations and projects to build their structures, systems, people, networks and competencies so that they are better able to: define and achieve their objectives engage in consultation and planning manage community projects, and take part in partnerships and community enterprises.
where "groups" means community groups and not individuals, but do contain individuals, both as members and as leaders. A distinction between "community development" and "capacity building" is that community development is a broader, less output-focused activity. Capacity building is about develop- ing the capacities of groups to achieve some activity as participants in a process. "Capacity" refers to the ability of the group to play its role, in a partnership or process, towards economic or social regeneration. That capacity may result from the internal features of any of the partner organizations, or from the partnership arrangements. Development or capacity building occurs when people and organizations are engaged in activities that stretch and consolidate their competencies. The internal features of organizations have been defined as the "Seven SsS: structure, systems, staff, style, skills, strategy, and shared values.
Capacity building is not defined through the instruments used, but through its goal to enhance the capability of people and institutions sustainably to improve their competence and problem-solving capacities [7]. Capacity-building interventions must address the unique needs of an

I.S. AI-Mutaz / Desalination 141 (2001) 145-156 155
organization in its particular stage of develop- ment at that specific time. There is no single way to build organizational capacity [8]. Capacity development is the process by which individuals, groups, organizations, institutions and societies increase their abilities to (1) perform core functions, solve problems, define and achieve objectives; and (2) understand and deal with their development needs in a broad context and in a sustainable manner [9].
Capacity building is an approach to develop- ment - - not something separate from it. It is a response to the multi-dimensional processes of change, not a set of discrete or pre-packaged technical interventions intended to bring about a pre-defined outcome. In supporting organizations working for social justice, it is also necessary to support the various capacities they require to do this: intellectual, organizational, social, political, cultural, material, practical, or financial [ 10].
Desalination is now successfully practiced in many countries, particularly in the Middle East and North Africa, to meet industrial and domestic water requirements. The current number of desalination plants worldwide is about 12,500, with a combined capacity of nearly 22.8Mm3/d (5 billion gal/d) of fresh water, i.e., about 1 gal/d ofdesalted water per person. Approximately 60% of the installed desalination capacity is in the Middle East. The installed capacity has been rapidly growing, not only due to the increasing numbers of plants but also to increasing sizes of plants. The largest individual operating plant capacity is nearly 454,000 m3/d.
The initiation, formulation and implemen- tation of desalination plants need organizational structures for managing required activities at the governmental level as well as within the utilities, industry, research and development, and educa- tional institutes involved. The distribution of tasks, functions and responsibilities among involved organizations is required. The function of these organizations will be to ensure their
design, manufacture, construction, commission- ing and operation of desalination plants.
Qualified human resources are an important factor to maintain successful of operation of desalination plants. A plan for developing manpower must also be established at the earliest stage to develop highly qualified human resources.
A country considering a desalination program should have a national energy and water policy specifying the objectives for the national energy and water plans. Key aspects to be addressed by the national energy and water policy include: • improved energy independence • development of indigenous energy and water
resources and their infrastructure and distribution
• optimum management of energy and water supply
• stable and secure energy and water supply • energy and water demand projections • pricing of energy and water
The analysis of the water structure includes the following aspects: • water consumption by different sectors • water production, availability, and source
potential • cost structure of the fresh water produced or
treated and supplied.
The objective of such an analysis is to determine the trends in the composition of consumption of water, water sources and costs. In order to develop a national water policy, a survey is needed to provide a reasonable knowledge of the country's available and potential water resources. The survey should consider fulfilment of national water requirements from natural resources and water reclamation. In principle, the use of natural resources should have the first priority for any country.

156 I.S. Al-Mutaz / Desalination 141 (2001) 145-156
References
[1] K. Wangnick, IDA Worldwide Desalting Plants Inventory, Report No. 12, IDA and Wangnick Consulting, 1992.
[2] N.W. Wade, R. Heaton. and D.G. Boulter, Desalination, 55 (1985) 373.
[3] E.D. Howe, Fundamentals of Water Desalination, Marcel Dekker, New York, 1974.
[4] A. AI-Shuaib, M. AI-Bahu, H. EI-Dessouky and H. Ettouney, Progress of the desalination industry in Kuwait, IDA World Congress on Desalination and Water Re-Use, San Diego, 1999.
[5] R. Semiat, Water Intemational, 25(1) (2000) 54. [6] Action checklists for capacity building, Adept
Community Development Agency and Coventry & Warwickshire Partnerships, UK, 1998.
[7] Capacity building for sustainable development concepts, strategies and instruments of the German Technical Cooperation (GTZ)", Deutsche Gesell- schaft fOr technische Zusammenarbeit, Eschbom, Germany, 1999.
[8] A. Kaplan and S. Soal, Institutional Development 2(2) (1995).
[9] Capacity development, Technical Advisory Paper II, Capacity Development Resource Book, Management Development and Governance Division, UNDP, 1997.
[10] D. Eade, in: Capacity-Building, An Approach to People-Centred Development, Oxford, 1997, pp. 23- 49.
Copyright © 2022 FDOKUMEN