Humidification–Dehumidification (HDH) Desalination ... - MDPI
Upload
khangminh22Category
view
0download
0
* Corresponding author.
1944-3994/1944-3986 © 2021 Desalination Publications. All rights reserved.
Desalination and Water Treatment www.deswater.com
doi: 10.5004/dwt.2021.27076
222 (2021) 60–80May
Assessment of the design, operation, and economy of the seawater reverse osmosis plant in Al-Jubail region, Saudi Arabia
Irfan Wazeera, Salah Ud-Din Khanb,c,*, Ibrahim S. Al-Mutaza, Ibrahim M. AlAteeqa, Achmad Chafidzd, Shahab Ud-Din Khane
aChemical Engineering Department, King Saud University, P.O. Box: 800, Riyadh 11421, Saudi Arabia, emails: [email protected] (I. Wazeer), [email protected] (I.S. Al-Mutaz), [email protected] (I.M. AlAteeq) bSustainable Energy Technologies Center, College of Engineering, King Saud University, P.O. Box: 800, Riyadh 11421, Saudi Arabia, email: [email protected] cK.A. CARE Energy Research and Innovation Center in Riyadh, Riyadh, Saudi Arabia dDepartment of Chemical Engineering, Universitas Islam Indonesia, Yogyakarta 55584, Indonesia, email: [email protected] ePakistan Tokamak Plasma Research Institute (PTPRI) P.O. Box: 3329 Islamabad, Pakistan, email: [email protected]
Received 22 June 2020; Accepted 25 January 2021
a b s t r a c tThe aim of this study is to conduct performance evaluation of a seawater reverse osmosis plant located in Jubail, Arabian Gulf, via the development of theoretical and computational models. A sim-ulation package was used to validate the simulated data against the real plant data, and resulted in good agreement with the actual plant data. A parametric analysis was also performed to study the effect of various parameters for a broad range of design considerations. Most of the previ-ous studies involved the modeling of single-stage RO process; however, in the current work, we investigated both single- and two-stage RO systems. Besides, detailed economic assessment was also conducted in terms of standardization in design and cost analysis by utilizing a theoretical and computational model. Results indicated that with enhancing recovery ratio from 25% to 40%, maximum flux of 34.13 lmh was obtained for single-stage RO system. The economic analysis pre-dicted that fuel ratio corresponded to power utilization factor constitute about 62% of the total cost of the plant. Another important aspect is to calculate the effect of membrane life on TDS values annually and it was concluded that the most stable values were achieved during month of April.
Keywords: Reverse osmosis; Theoretical model; Simulation; Techno-economical model; Verification and validation; Economically viable plant
1. Introduction
In the developing nations, one of the ultimate chal-lenges is the inadequate delivery of drinking water. Water is known as one of the world’s most abundant and substan-tial compounds; nonetheless, it is an irrefutable fact that the resources of freshwater are radically being reduced due to human consumption across the globe [1–4]. Consequently, various desalination processes have been used to pro-duce drinking water in order to overcome the growing
demand for clean water [5,6]. Presently, many countries, especially in the Persian Gulf, are employing desalination technologies to produce drinkable and industrial water for their supplies [7,8]. The reverse osmosis (RO) process became more competitive with the traditional thermal desalination technologies in the 1980s, and the worldwide installed capacity of RO systems across the globe has been surpassing the thermal technologies since the mid-1990s.
RO process depends on a property of specific poly-mers called semi-permeability in order to remove ions.
61I. Wazeer et al. / Desalination and Water Treatment 222 (2021) 60–80
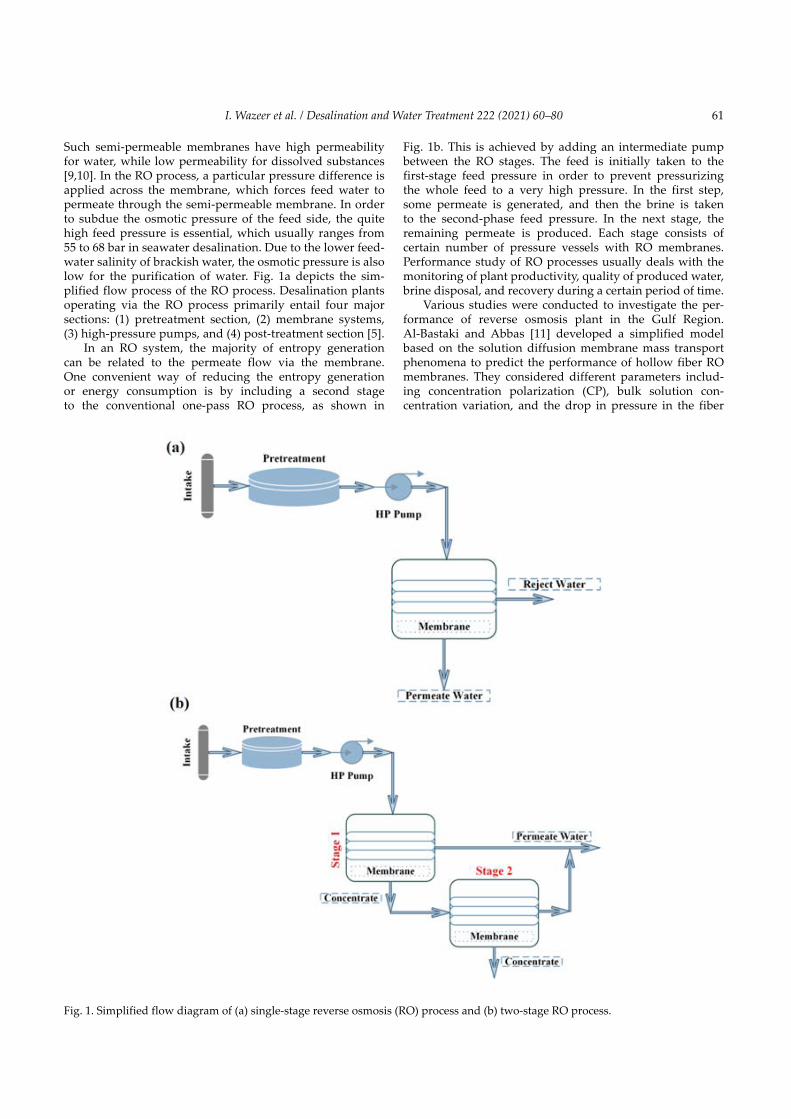
Such semi-permeable membranes have high permeability for water, while low permeability for dissolved substances [9,10]. In the RO process, a particular pressure difference is applied across the membrane, which forces feed water to permeate through the semi-permeable membrane. In order to subdue the osmotic pressure of the feed side, the quite high feed pressure is essential, which usually ranges from 55 to 68 bar in seawater desalination. Due to the lower feed-water salinity of brackish water, the osmotic pressure is also low for the purification of water. Fig. 1a depicts the sim-plified flow process of the RO process. Desalination plants operating via the RO process primarily entail four major sections: (1) pretreatment section, (2) membrane systems, (3) high-pressure pumps, and (4) post-treatment section [5].
In an RO system, the majority of entropy generation can be related to the permeate flow via the membrane. One convenient way of reducing the entropy generation or energy consumption is by including a second stage to the conventional one-pass RO process, as shown in
Fig. 1b. This is achieved by adding an intermediate pump between the RO stages. The feed is initially taken to the first-stage feed pressure in order to prevent pressurizing the whole feed to a very high pressure. In the first step, some permeate is generated, and then the brine is taken to the second-phase feed pressure. In the next stage, the remaining permeate is produced. Each stage consists of certain number of pressure vessels with RO membranes. Performance study of RO processes usually deals with the monitoring of plant productivity, quality of produced water, brine disposal, and recovery during a certain period of time.
Various studies were conducted to investigate the per-formance of reverse osmosis plant in the Gulf Region. Al-Bastaki and Abbas [11] developed a simplified model based on the solution diffusion membrane mass transport phenomena to predict the performance of hollow fiber RO membranes. They considered different parameters includ-ing concentration polarization (CP), bulk solution con-centration variation, and the drop in pressure in the fiber
Fig. 1. Simplified flow diagram of (a) single-stage reverse osmosis (RO) process and (b) two-stage RO process.
I. Wazeer et al. / Desalination and Water Treatment 222 (2021) 60–8062
bundle and fiber bore. They obtained good agreement between model data and the industrial RO plant data for hollow fiber RO membranes. However, a more systematic approach would yield improved results.
Kaghazchi et al. [12] developed a mathematical model to study the performance of two industrial desalination plants in the Persian Gulf region. They developed a semi- rigorous mathematical model and compared the results with the plant’s operational data. For the first industrial plant and for the second industrial plant, relative errors in the water recovery and salt rejection were 10.03% and 0.03%, and 3.1% and 0.07%, respectively. The effect on the plant efficiency of performance parameters including pressure and feed flux were investigated. The increase in pressure resulted in a non-linear increase in flux due to the accumulation of salt along the membrane surface. Furthermore, an increase in the feed water flow rate reduced the permeate concen-tration because the mass transfer coefficient increased due to higher feed flow rate and CP factor approached unity.
Atab et al. [13] conducted a numerical analysis to study the performance of RO membrane for a desali-nation process. Thermolib and Matlab/Simulink were used to develop the mathematical model for a case study based in Iraq. In order to establish efficiencies and reduce losses, a thorough mathematical analysis was performed. They studied the effect of various parameters including feed pressure, feed water temperature, recovery ratio, and salinity. Moreover, economic assessment of RO sys-tem was also conducted. The study using the developed model indicated that salt discharge could be decreased from 97% to 88% in order to deliver large volumes of fresh water with agricultural acceptability (lower quality).
Al-Sahali and Al-Qattan [14] conducted a detailed analysis in terms of operating and design characteristics of a small RO plant located in Kuwait. A solution dif-fusion model and costing analysis were performed and results were compared against the plant performance. They obtained reasonable agreement with the plant data in regard with the salt permeability coefficient. The normal-ized plant data over a 1-y period was used for the evalua-tion purpose. During the simulation of plant characteristics through algebraic and differential forms of the solution diffusion model, permeability data were used along with other plant characteristics. Fairly uniform production rate was obtained via the adjustment of operating pressure, membrane cleaning and feed flow rate.
Al-Shayji and Liu [15] presented practical guidelines and methodology to develop predictive models for large-scale desalination plants. They used data-based and mod-el-based approaches for developing predictive models. They used actual operating data of RO plant located in Saudi Arabia. Data-based neural networks model was able to successfully predict the performance variables of RO desalination plant. They suggested to use a data-based model when it is difficult to develop a model-based pro-cess simulation. However, the precision of a neural network model relies on the proper choice of input variables. For instance, neural networks model will not generate favor-able results if the data are not within the range with which the network is trained. The neural network can precisely
interpolate data, but sometimes does not extrapolate it correctly. On the other hand, different tools available in the model-based approaches (such as sensitivity analysis tool) will help to measure effectively the impact of various operating variables on desalination output variables.
A parametric analysis has been conducted by the Saline Water Conversion Corporation on three seawater reverse osmosis (SWRO) plants [16]. This study includes the 4,400 m3/d Ummlujj plant, the 2,275 m3/d Al-Birk plant, and the 12,000 m3/d Jeddah plant. A continued work was done to include the study of the performance of five more SWRO plants. This study includes Al-Birk plant, Umm Lujj plant, Jeddah-I plant, Duba plant, and Hagl plant [17]. These two studies have shown that the prod-uct quantity, product quality, and plant availability, as well as the annual decline in the total capacity, and salt rejection of these plants were varied with time. Mobayed et al. [18] investigated the features of polyamide hollow fine fiber and polyamide spiral-wound (SW) membranes in the Al-Jubail SWRO desalination plant. The objective of their study was to investigate the performance of differ-ent parameters such as feed water pressure, salt rejection, and flux decline of the two types of membranes. Al-Mutaz and Al-Sultan [19] predicted the plant performance of the RO system by utilizing the complete mixing model. The proposed model was validated against the operating data of the Manfuhah (Saudi Arabia) RO system.
The principle objective of this research is to conduct a performance evaluation of the SWRO plant in Jubail. The study includes the monitoring of product flow and qual-ity of water during longer operational period (over a 1-y period) of the plant. We have collected the intensive plant operated data to analyze and compare with the theoreti-cally developed model. The verification and validation concept is used to compare the plant operational data, by developing theoretical and computational models. Besides, the economic assessment of the SWRO system is also performed for the cost-effectiveness of the plant. The results obtained from the plant, as well as with theoreti-cal calculations demonstrate the technical and economic feasibility of the Al-Jubail plant.
2. Research methodology
The work structure consists of: (1) description of the SWRO plant, including its operation and design limits, (2) theoretical and computational assessment of the SWRO plant, (3) verification and validation (V & V) analysis and (4) an economic assessment of the plant.
3. Description of the SWRO plant including the operation and limits in the design
Construction of the Al-Jubail SWRO plant started in 1994 and ended in 1998, with the commissioning period running from September 2000 to January 2001. The SWRO plant has 15 RO trains, each with a capacity of 253 m3/h. The salient features of this plant are summarized in the following sections.
The plant has been designed for an output of at least 20 MIGD under the design conditions;
63I. Wazeer et al. / Desalination and Water Treatment 222 (2021) 60–80
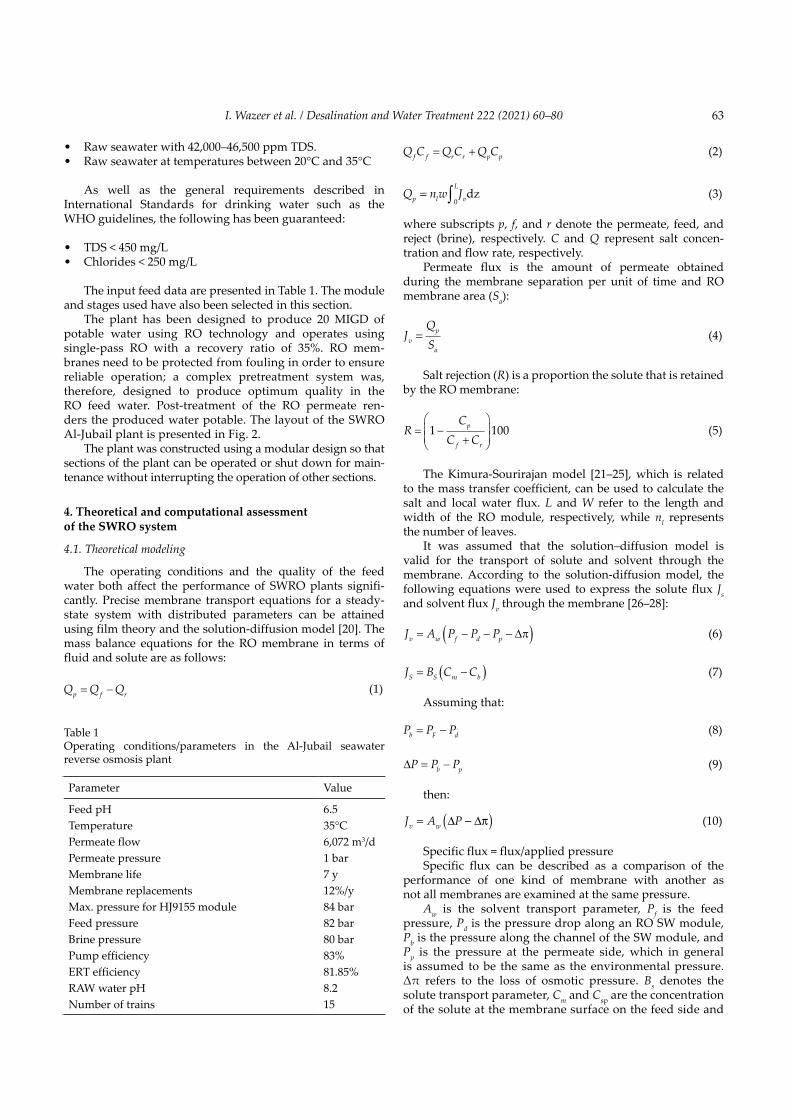
• Raw seawater with 42,000–46,500 ppm TDS.• Raw seawater at temperatures between 20°C and 35°C
As well as the general requirements described in International Standards for drinking water such as the WHO guidelines, the following has been guaranteed:
• TDS < 450 mg/L• Chlorides < 250 mg/L
The input feed data are presented in Table 1. The module and stages used have also been selected in this section.
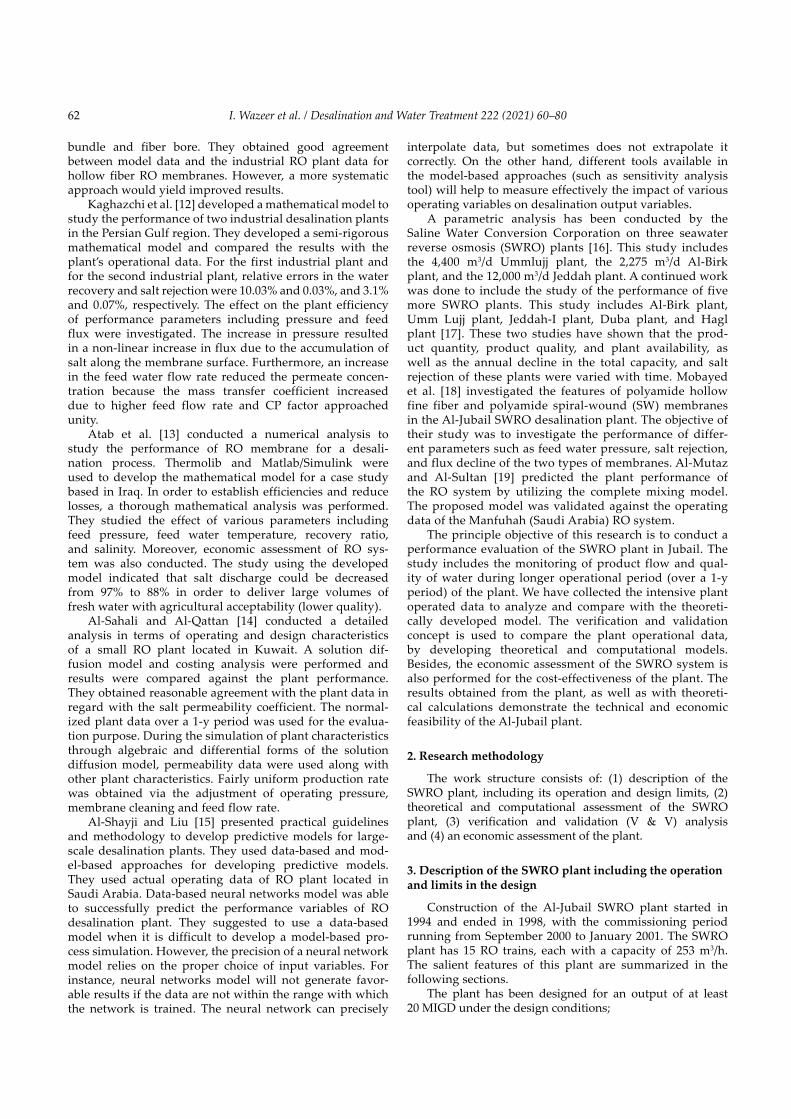
The plant has been designed to produce 20 MIGD of potable water using RO technology and operates using single-pass RO with a recovery ratio of 35%. RO mem-branes need to be protected from fouling in order to ensure reliable operation; a complex pretreatment system was, therefore, designed to produce optimum quality in the RO feed water. Post-treatment of the RO permeate ren-ders the produced water potable. The layout of the SWRO Al-Jubail plant is presented in Fig. 2.
The plant was constructed using a modular design so that sections of the plant can be operated or shut down for main-tenance without interrupting the operation of other sections.
4. Theoretical and computational assessment of the SWRO system
4.1. Theoretical modeling
The operating conditions and the quality of the feed water both affect the performance of SWRO plants signifi-cantly. Precise membrane transport equations for a steady-state system with distributed parameters can be attained using film theory and the solution-diffusion model [20]. The mass balance equations for the RO membrane in terms of fluid and solute are as follows:
Q Q Qp f r= − (1)
Q C Q C Q Cf f r r p p= + (2)
Q nw Jp l
L
v= ∫ 0dz (3)
where subscripts p, f, and r denote the permeate, feed, and reject (brine), respectively. C and Q represent salt concen-tration and flow rate, respectively.
Permeate flux is the amount of permeate obtained during the membrane separation per unit of time and RO membrane area (Sa):
JQSvp
a
= (4)
Salt rejection (R) is a proportion the solute that is retained by the RO membrane:
RC
C Cp
f r
= −+
1 100 (5)
The Kimura-Sourirajan model [21–25], which is related to the mass transfer coefficient, can be used to calculate the salt and local water flux. L and W refer to the length and width of the RO module, respectively, while nl represents the number of leaves.
It was assumed that the solution–diffusion model is valid for the transport of solute and solvent through the membrane. According to the solution-diffusion model, the following equations were used to express the solute flux Js and solvent flux Jv through the membrane [26–28]:
J A P P Pv w f d p= − − −( )∆π (6)
J B C CS S m b= −( ) (7)
Assuming that:
P P Pb F d= − (8)
∆P P Pb p= − (9)
then:
J A Pv w= −( )∆ ∆π (10)
Specific flux = flux/applied pressureSpecific flux can be described as a comparison of the
performance of one kind of membrane with another as not all membranes are examined at the same pressure.
Aw is the solvent transport parameter, Pf is the feed pressure, Pd is the pressure drop along an RO SW module, Pb is the pressure along the channel of the SW module, and Pp is the pressure at the permeate side, which in general is assumed to be the same as the environmental pressure. Δπ refers to the loss of osmotic pressure. Bs denotes the solute transport parameter, Cm and Csp are the concentration of the solute at the membrane surface on the feed side and
Table 1Operating conditions/parameters in the Al-Jubail seawater reverse osmosis plant
Parameter Value
Feed pH 6.5Temperature 35°CPermeate flow 6,072 m3/dPermeate pressure 1 barMembrane life 7 yMembrane replacements 12%/yMax. pressure for HJ9155 module 84 barFeed pressure 82 barBrine pressure 80 barPump efficiency 83%ERT efficiency 81.85%RAW water pH 8.2Number of trains 15

I. Wazeer et al. / Desalination and Water Treatment 222 (2021) 60–8064
the permeate side, respectively, and Cp is the value of Cb at the end of the module. This means Cp = Cb(L). Aw and Bs are relatively sensitive to operating temperature; this relation-ship is represented as follows [20,26,28] by the following:
A A T P Pw w f d=−
− −( )
0 1 2
273273
exp α α (11)
B B Ts s=
−
0 1
273273
exp β (12)
where Aw0 and Bs0 are defined as the intrinsic transport parameters in standard condition while α1, α2, and β1 are the constant parameters for transport. The operational temperature is expressed by T. Following as the follow-ing expression demonstrates an almost linear relationship between osmotic pressure and concentration [29]:
∆π = −( )RT C Cm p (13)
Here R denotes the gas law constant.Knowledge of the different RO parameters, process
specifications, and solute concentration at the membrane boundary (which is relatively different from the bulk con-centration because of CP) is required in order to solve the above system of equations. The following simple relation-ship is, therefore, developed based on the steady-state across the boundary and CP theory:
φ =−
−=
C CC C
JK
m p
b p
V
c
exp (14)
Both Cb and JV vary across the membrane channel. The mass transfer coefficient Kc is computed by using the following relation [30]:
Sh ScAB
= =K dDc e 0 065 0 875 0 25. Re . . (15)
where
Re =ρ
µVde (16)
ScAB
=µ
ρD (17)
ρ is the density of permeate water, de is hydraulic diam-eter of the feed spacer channel, μ is kinematic viscosity, and DAB is dynamic viscosity; it can be obtained from the regression equation [31–33]:
D CTbAB = × × −
+
− −6 725 10 0 1546 10 2 513273 15
6 3. exp . ,.
(18)
The relationship between JV and Js is [34]:
J J CS v p= (19)
The pressure loss along the RO module can be formu-lated as [20,30] follows:
dPdz d
Vd
e
= −λρ 2
2 (20)
where
λ λ= −6 23 0 3. Re .K (21)
Kl is known as the empirical parameter. As the pressure across RO channel is: Pb = Pf−Pd.
dPdz
dPdz d
Vb d
e
= − = λρ 2
2 (22)
Fig. 2. Layout of the seawater reverse osmosis Al-Jubail plant.
65I. Wazeer et al. / Desalination and Water Treatment 222 (2021) 60–80
At z = 0, Pb = Pf, at z = L, Pb = Pr.where V is the axial velocity on the feed side, satisfying:
dVdz
Jhv= −
2
sp
(23)
At sp
z V VQ
n Whff
e
= = =0 (24)
At z L V VQ
n Whrr
e
sp
= = = (25)
hsp denotes the height of the feed spacer channel.The bulk concentration Cb changes across the membrane
and can be given as [35] follows:
dCdz
Jh V
C Cb vb p= −( )2
sp
(26)
At z = 0, Cb = Cf; at z = L, Cb = CrAfter solving these equations, both Qp and Cp can
be calculated at specific operating conditions and mem-brane specifications, from which the recovery rate (Rec) of water and the specific energy consumption (SEC) can be obtained using the following equations [13]:
Rec =QQp
f
(27)
SEC ef=−P Q PQQ
f f P r r
p
/ ε ε (28)
whereεpreferstothemechanicalenergyandεef refers to the energy recovery efficiency.
Salt passage (Sp) and rejection coefficient (Ry) are two significant factors that reflect the performance of the RO system [36]:
Sp %= ×CCp
f
100 (29)
Ry %=−
×C CCf p
f
100 (30)
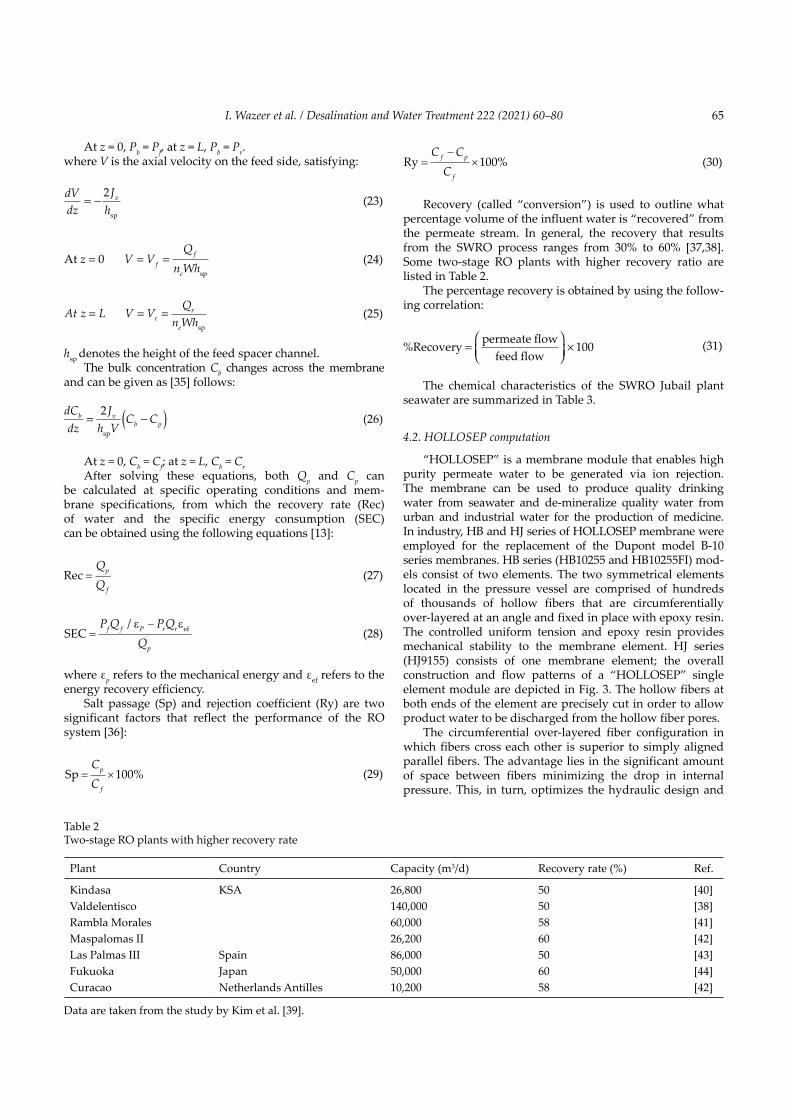
Recovery (called “conversion”) is used to outline what percentage volume of the influent water is “recovered” from the permeate stream. In general, the recovery that results from the SWRO process ranges from 30% to 60% [37,38]. Some two-stage RO plants with higher recovery ratio are listed in Table 2.
The percentage recovery is obtained by using the follow-ing correlation:
%Recoverypermeate flow
feed flow=
× 100 (31)
The chemical characteristics of the SWRO Jubail plant seawater are summarized in Table 3.
4.2. HOLLOSEP computation
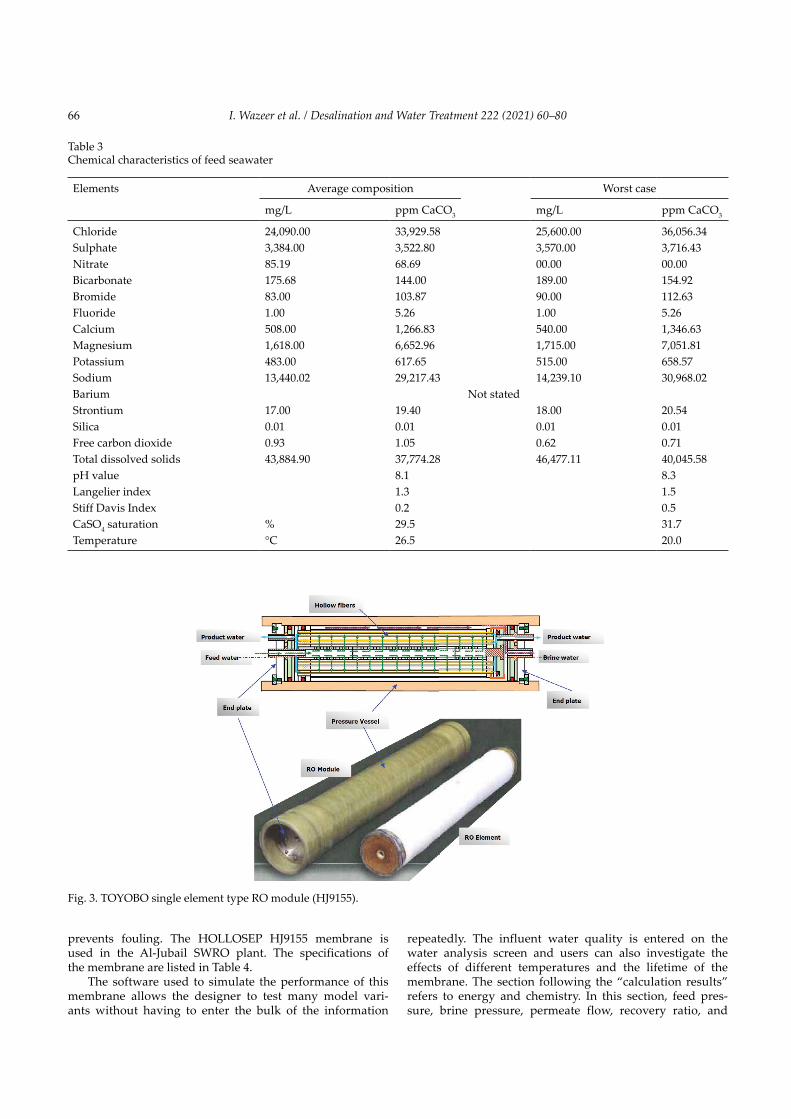
“HOLLOSEP” is a membrane module that enables high purity permeate water to be generated via ion rejection. The membrane can be used to produce quality drinking water from seawater and de-mineralize quality water from urban and industrial water for the production of medicine. In industry, HB and HJ series of HOLLOSEP membrane were employed for the replacement of the Dupont model B-10 series membranes. HB series (HB10255 and HB10255FI) mod-els consist of two elements. The two symmetrical elements located in the pressure vessel are comprised of hundreds of thousands of hollow fibers that are circumferentially over-layered at an angle and fixed in place with epoxy resin. The controlled uniform tension and epoxy resin provides mechanical stability to the membrane element. HJ series (HJ9155) consists of one membrane element; the overall construction and flow patterns of a “HOLLOSEP” single element module are depicted in Fig. 3. The hollow fibers at both ends of the element are precisely cut in order to allow product water to be discharged from the hollow fiber pores.
The circumferential over-layered fiber configuration in which fibers cross each other is superior to simply aligned parallel fibers. The advantage lies in the significant amount of space between fibers minimizing the drop in internal pressure. This, in turn, optimizes the hydraulic design and
Table 2Two-stage RO plants with higher recovery rate
Plant Country Capacity (m3/d) Recovery rate (%) Ref.
Kindasa KSA 26,800 50 [40]Valdelentisco 140,000 50 [38]Rambla Morales 60,000 58 [41]Maspalomas II 26,200 60 [42]Las Palmas III Spain 86,000 50 [43]Fukuoka Japan 50,000 60 [44]Curacao Netherlands Antilles 10,200 58 [42]
Data are taken from the study by Kim et al. [39].
I. Wazeer et al. / Desalination and Water Treatment 222 (2021) 60–8066
prevents fouling. The HOLLOSEP HJ9155 membrane is used in the Al-Jubail SWRO plant. The specifications of the membrane are listed in Table 4.
The software used to simulate the performance of this membrane allows the designer to test many model vari-ants without having to enter the bulk of the information
repeatedly. The influent water quality is entered on the water analysis screen and users can also investigate the effects of different temperatures and the lifetime of the membrane. The section following the “calculation results” refers to energy and chemistry. In this section, feed pres-sure, brine pressure, permeate flow, recovery ratio, and
Fig. 3. TOYOBO single element type RO module (HJ9155).
Table 3Chemical characteristics of feed seawater
Elements Average composition Worst case
mg/L ppm CaCO3 mg/L ppm CaCO3
Chloride 24,090.00 33,929.58 25,600.00 36,056.34Sulphate 3,384.00 3,522.80 3,570.00 3,716.43Nitrate 85.19 68.69 00.00 00.00Bicarbonate 175.68 144.00 189.00 154.92Bromide 83.00 103.87 90.00 112.63Fluoride 1.00 5.26 1.00 5.26Calcium 508.00 1,266.83 540.00 1,346.63Magnesium 1,618.00 6,652.96 1,715.00 7,051.81Potassium 483.00 617.65 515.00 658.57Sodium 13,440.02 29,217.43 14,239.10 30,968.02Barium Not statedStrontium 17.00 19.40 18.00 20.54Silica 0.01 0.01 0.01 0.01Free carbon dioxide 0.93 1.05 0.62 0.71Total dissolved solids 43,884.90 37,774.28 46,477.11 40,045.58pH value 8.1 8.3Langelier index 1.3 1.5Stiff Davis Index 0.2 0.5CaSO4 saturation % 29.5 31.7Temperature °C 26.5 20.0

67I. Wazeer et al. / Desalination and Water Treatment 222 (2021) 60–80
pump efficiency entered as input parameters that will result in pumping energy, recovered energy, and the amount of energy required for the process. The plant flow section pro-vides an overview report of the process, providing an over-view of the configuration of the system and the flow rates for each channel.
5. Verification and validation (V & V) analysis:
5.1. Validation of the theoretical model with HOLLOSEP
Eq. (24) can be applied to calculate the absolute deviation of the simulation program from the plant data [45]:
Deviation act sim
act
=−
×i i
i100% (32)
where iact is the actual plant data and isim is the simulated value.
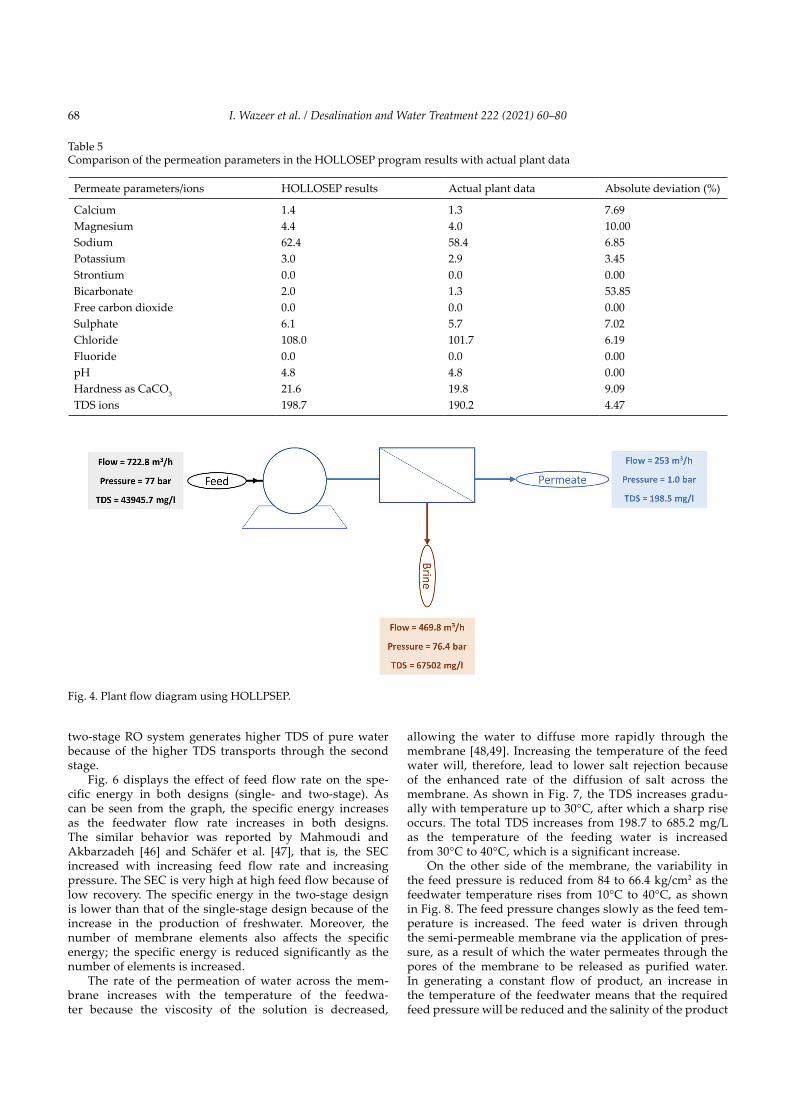
The permeate parameters from the simulated HOL-LOSEP and the actual plant are compared in Table 5, in which the absolute deviation of each permeate parameter is given. Overall, it was noted that the quality of the simu-lated permeate was in good agreement with the plant data in terms of pH, hardness, and TDS ions. However, high deviation was observed for some individual ions; this could be due to the fact that the software was not fed with the con-centration of some chemicals, which often used in the actual plant. Normally, ions behaved somehow different than the theoretical prediction. Nonetheless, the deviations between the actual plant data and HOLLOSEP simulation results for pH, hardness, and TDS are small at 0.0%, 9.09%, and 4.47%, respectively. This indicates that the HOLLOSEP membrane worked efficiently in extracting the TDS from seawa-ter; the permeate content (permeate quality) is in compli-ance with the Drinking Water Quality Standards (DWQS). The plant flow using HOLLOSEP is presented in Fig. 4.
6. Results and discussion
In this section, some of the key terms are described and an explanation of the factors that affect the quality of RO membranes, such as temperature, pressure, feedwa-ter flow rate, permeate recovery, the number of membrane elements, and pH of water is given.
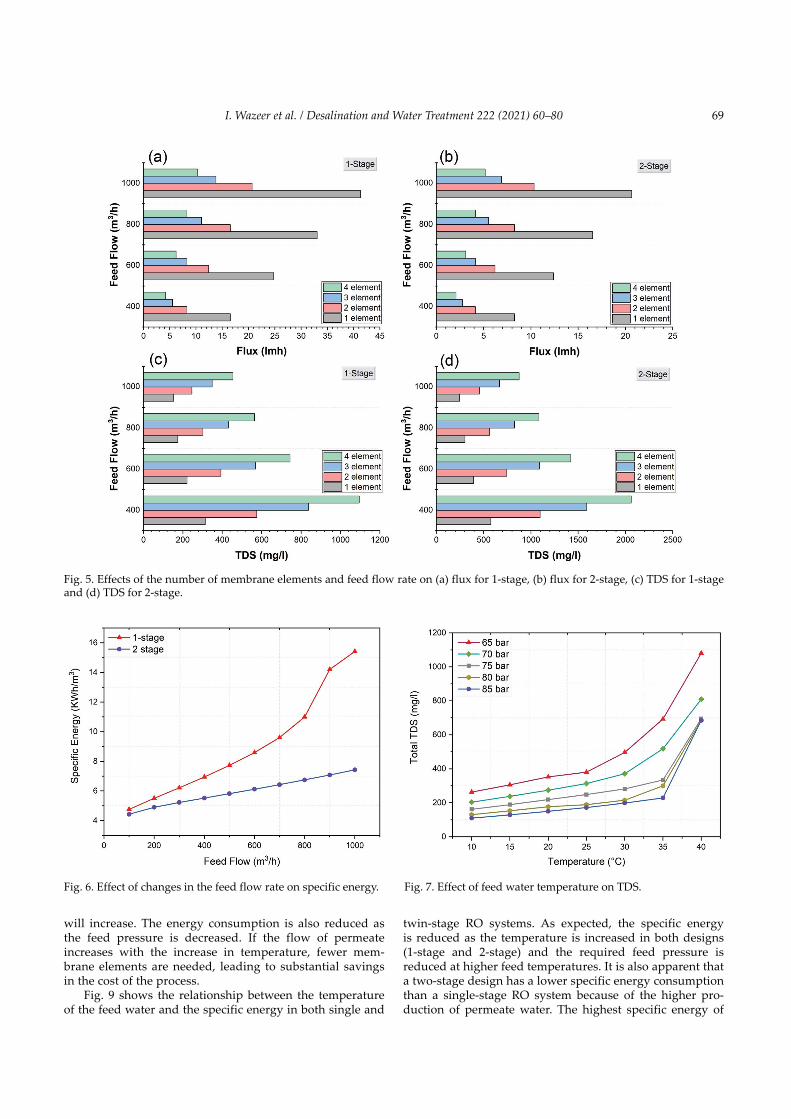
Feed flow is the rate at which feedwater is injected into the membrane. Fig. 5 illustrates the impact of membrane elements used and feed flow on the TDS and flux in both one and two-stage systems. In the one stage system, the maximum flux observed was 41.31 lmh at a feed flow of 1,000 m3/h. The flux is divided into two stages (stage 1 and stage 2). For two-stage RO system, Fig. 5 shows the flux after the final stage only (second stage). The high-est flux of second stage is of 20.66 lmh at the same feed flow (1,000 m3/h) in the two-stage system, using one mem-brane element, while average flux of two-stage RO design is same as of single-stage system (41.31 lmh at feed flow 1,000 m3/h). As seen in the figure, the number of ele-ments influences the flux significantly in both designs. Both flux and NaCl rejection are observed to increase as the feed flow increases. At higher feed flow rates, the increase in flux is possibly attributed to an increase in the cross-flow velocity shear force at the membrane sur-face, which helps in minimizing the effect of external CP. The increase in cross-flow velocity shear force enhances the mass transfer coefficient of the feed and eventually leads to higher water flux through the membrane.
Fig. 5 also depicts the effect of feed flow on total TDS in both one- and two-stage designs. It is apparent that the amount of TDS within the permeate in both designs decreases when the feed flow rate is increased. The high-est TDS value of 2,059.94 mg/L was achieved using four membrane elements at a feed flow rate of 400 m3/h. The minimum TDS using the single-stage system is 152.67, and 245.47 mg/L with the double stage design. Single- and two-stage RO systems depict the same pattern in terms of relationship between the operating parameters, however, two-stage system produces more permeate water and
Table 4Specifications of “HOLLOSEP” element model: HJ9155PI
Parameters Value
Material used to construct membrane Cellulose triacetateNumber of elements 1Size, diameter 294 mm Length 2,051 mm Weight when filled with water Approx. 180 kgConnectionsFeed NPT 1” Product NPT 1/2” Brine NPT 1” Initial performance under Toyobo standardconditionProduct flow rate 34 (30) m3/dSalt rejection (test conditions) 99.6 (99.4)%Feed water (NaCl solution) 35,000 mg/LPressure 55 kg/cm2 GTemperature 25°CRecovery ratio 30%Initial performance under Dupont’s conditionProduct flow rate 56 (50) m3/dSalt rejection (test conditions) 99.8 (99.6)%Feed water (NaCl solution) 35,000 mg/LPressure 1,000 psigTemperature 25°CRecovery ratio 35%Operating conditionsPressure (max) 84 kg/cm2GTemperature (min, max) 5°C, 40°CBrine flow rate (min, max) *,a3 50, 150 m3/dFeed water qualitiesFI (SDI 15) 4.0 or lesspH (min, max) 3, 6.6Max. residual chlorine 0.5 mg/L
aThe brine flow rate range is limited by the temperature and quality of the feed water.
I. Wazeer et al. / Desalination and Water Treatment 222 (2021) 60–8068
two-stage RO system generates higher TDS of pure water because of the higher TDS transports through the second stage.
Fig. 6 displays the effect of feed flow rate on the spe-cific energy in both designs (single- and two-stage). As can be seen from the graph, the specific energy increases as the feedwater flow rate increases in both designs. The similar behavior was reported by Mahmoudi and Akbarzadeh [46] and Schäfer et al. [47], that is, the SEC increased with increasing feed flow rate and increasing pressure. The SEC is very high at high feed flow because of low recovery. The specific energy in the two-stage design is lower than that of the single-stage design because of the increase in the production of freshwater. Moreover, the number of membrane elements also affects the specific energy; the specific energy is reduced significantly as the number of elements is increased.
The rate of the permeation of water across the mem-brane increases with the temperature of the feedwa-ter because the viscosity of the solution is decreased,
allowing the water to diffuse more rapidly through the membrane [48,49]. Increasing the temperature of the feed water will, therefore, lead to lower salt rejection because of the enhanced rate of the diffusion of salt across the membrane. As shown in Fig. 7, the TDS increases gradu-ally with temperature up to 30°C, after which a sharp rise occurs. The total TDS increases from 198.7 to 685.2 mg/L as the temperature of the feeding water is increased from 30°C to 40°C, which is a significant increase.
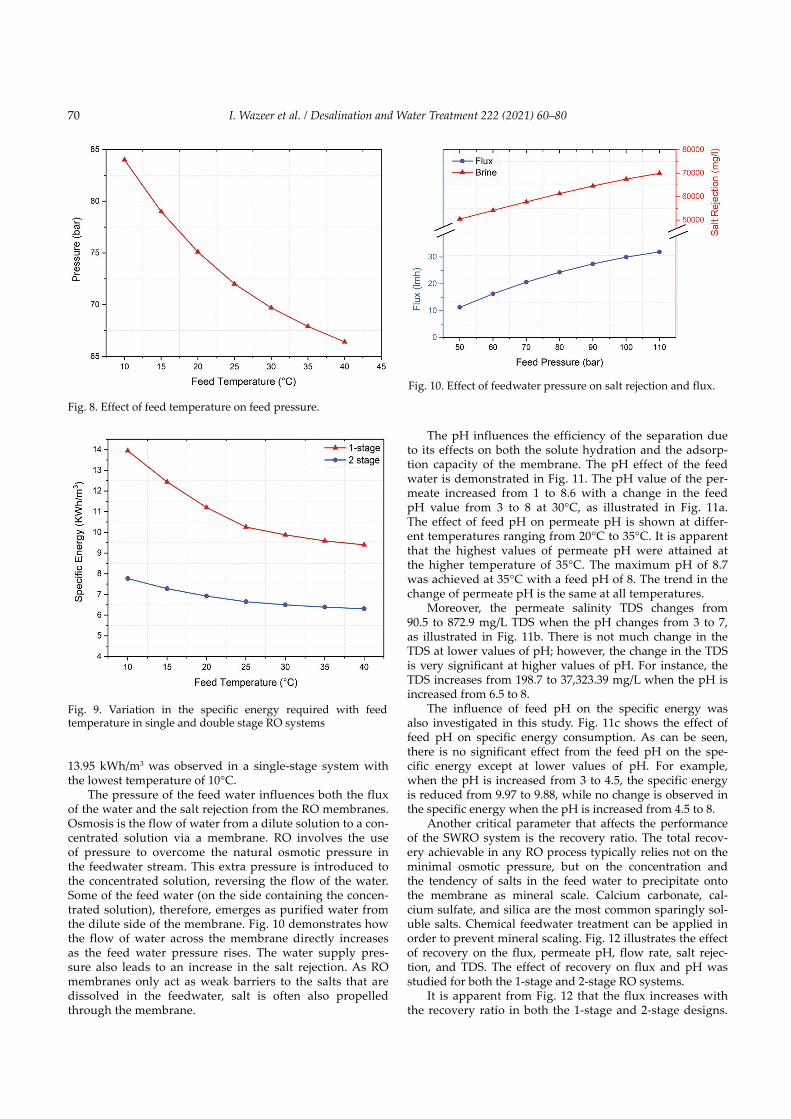
On the other side of the membrane, the variability in the feed pressure is reduced from 84 to 66.4 kg/cm2 as the feedwater temperature rises from 10°C to 40°C, as shown in Fig. 8. The feed pressure changes slowly as the feed tem-perature is increased. The feed water is driven through the semi-permeable membrane via the application of pres-sure, as a result of which the water permeates through the pores of the membrane to be released as purified water. In generating a constant flow of product, an increase in the temperature of the feedwater means that the required feed pressure will be reduced and the salinity of the product
Table 5Comparison of the permeation parameters in the HOLLOSEP program results with actual plant data
Permeate parameters/ions HOLLOSEP results Actual plant data Absolute deviation (%)
Calcium 1.4 1.3 7.69Magnesium 4.4 4.0 10.00Sodium 62.4 58.4 6.85Potassium 3.0 2.9 3.45Strontium 0.0 0.0 0.00Bicarbonate 2.0 1.3 53.85Free carbon dioxide 0.0 0.0 0.00Sulphate 6.1 5.7 7.02Chloride 108.0 101.7 6.19Fluoride 0.0 0.0 0.00pH 4.8 4.8 0.00Hardness as CaCO3 21.6 19.8 9.09TDS ions 198.7 190.2 4.47
Fig. 4. Plant flow diagram using HOLLPSEP.
69I. Wazeer et al. / Desalination and Water Treatment 222 (2021) 60–80
will increase. The energy consumption is also reduced as the feed pressure is decreased. If the flow of permeate increases with the increase in temperature, fewer mem-brane elements are needed, leading to substantial savings in the cost of the process.
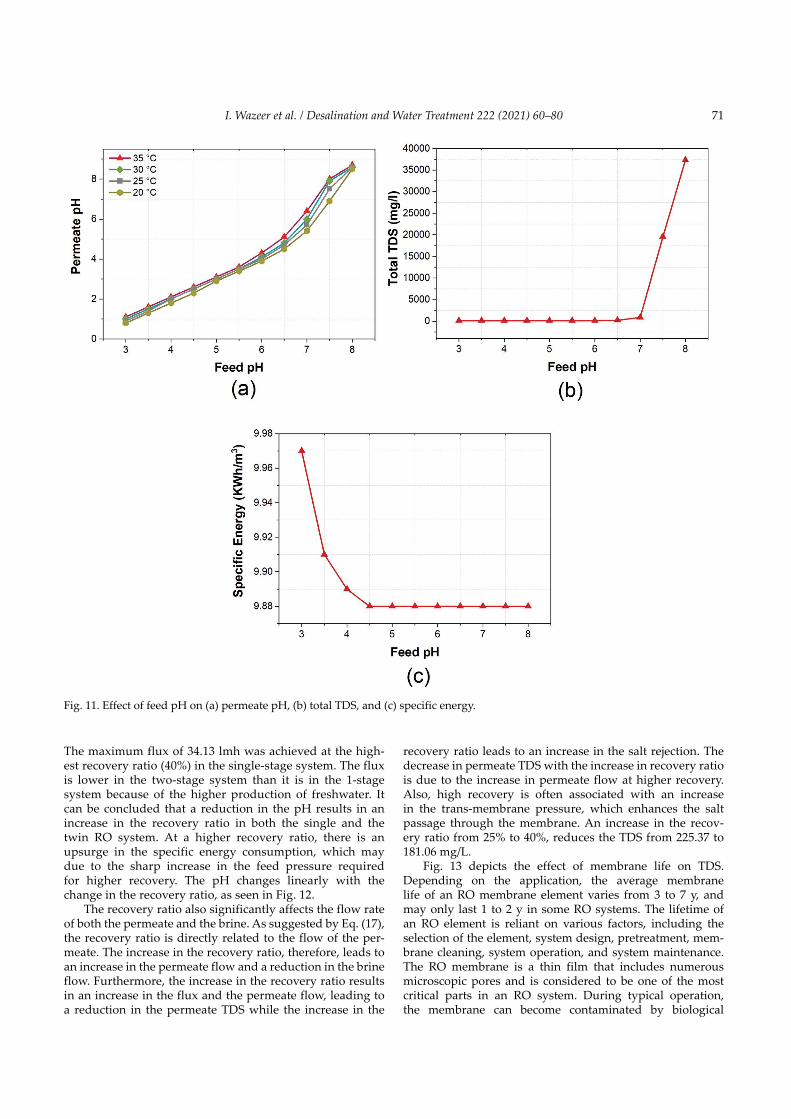
Fig. 9 shows the relationship between the temperature of the feed water and the specific energy in both single and
twin-stage RO systems. As expected, the specific energy is reduced as the temperature is increased in both designs (1-stage and 2-stage) and the required feed pressure is reduced at higher feed temperatures. It is also apparent that a two-stage design has a lower specific energy consumption than a single-stage RO system because of the higher pro-duction of permeate water. The highest specific energy of
Fig. 5. Effects of the number of membrane elements and feed flow rate on (a) flux for 1-stage, (b) flux for 2-stage, (c) TDS for 1-stage and (d) TDS for 2-stage.
Fig. 6. Effect of changes in the feed flow rate on specific energy. Fig. 7. Effect of feed water temperature on TDS.
I. Wazeer et al. / Desalination and Water Treatment 222 (2021) 60–8070
13.95 kWh/m3 was observed in a single-stage system with the lowest temperature of 10°C.
The pressure of the feed water influences both the flux of the water and the salt rejection from the RO membranes. Osmosis is the flow of water from a dilute solution to a con-centrated solution via a membrane. RO involves the use of pressure to overcome the natural osmotic pressure in the feedwater stream. This extra pressure is introduced to the concentrated solution, reversing the flow of the water. Some of the feed water (on the side containing the concen-trated solution), therefore, emerges as purified water from the dilute side of the membrane. Fig. 10 demonstrates how the flow of water across the membrane directly increases as the feed water pressure rises. The water supply pres-sure also leads to an increase in the salt rejection. As RO membranes only act as weak barriers to the salts that are dissolved in the feedwater, salt is often also propelled through the membrane.
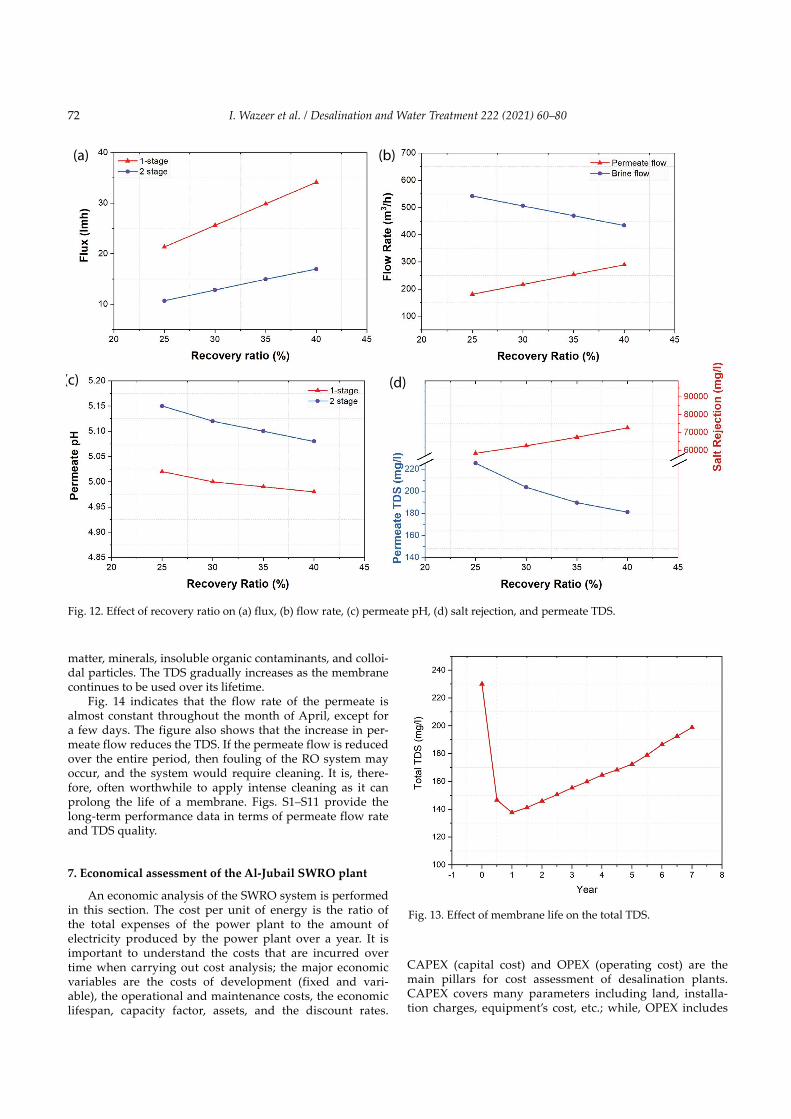
The pH influences the efficiency of the separation due to its effects on both the solute hydration and the adsorp-tion capacity of the membrane. The pH effect of the feed water is demonstrated in Fig. 11. The pH value of the per-meate increased from 1 to 8.6 with a change in the feed pH value from 3 to 8 at 30°C, as illustrated in Fig. 11a. The effect of feed pH on permeate pH is shown at differ-ent temperatures ranging from 20°C to 35°C. It is apparent that the highest values of permeate pH were attained at the higher temperature of 35°C. The maximum pH of 8.7 was achieved at 35°C with a feed pH of 8. The trend in the change of permeate pH is the same at all temperatures.
Moreover, the permeate salinity TDS changes from 90.5 to 872.9 mg/L TDS when the pH changes from 3 to 7, as illustrated in Fig. 11b. There is not much change in the TDS at lower values of pH; however, the change in the TDS is very significant at higher values of pH. For instance, the TDS increases from 198.7 to 37,323.39 mg/L when the pH is increased from 6.5 to 8.
The influence of feed pH on the specific energy was also investigated in this study. Fig. 11c shows the effect of feed pH on specific energy consumption. As can be seen, there is no significant effect from the feed pH on the spe-cific energy except at lower values of pH. For example, when the pH is increased from 3 to 4.5, the specific energy is reduced from 9.97 to 9.88, while no change is observed in the specific energy when the pH is increased from 4.5 to 8.
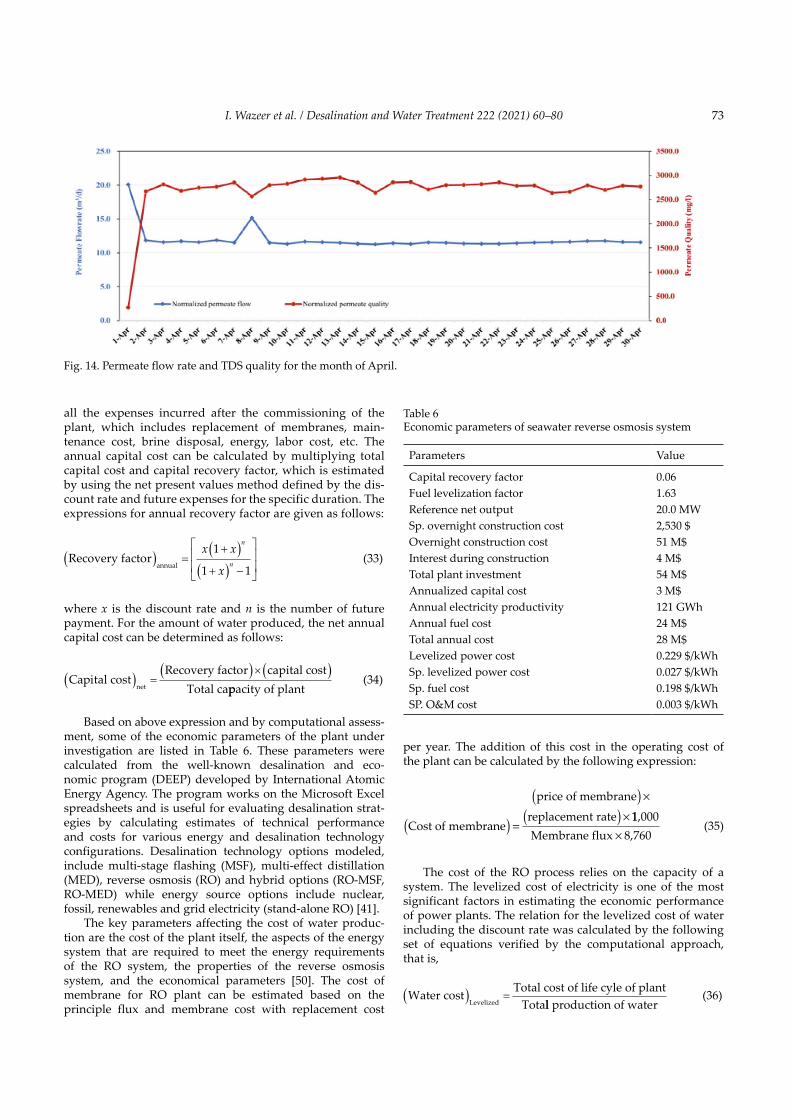
Another critical parameter that affects the performance of the SWRO system is the recovery ratio. The total recov-ery achievable in any RO process typically relies not on the minimal osmotic pressure, but on the concentration and the tendency of salts in the feed water to precipitate onto the membrane as mineral scale. Calcium carbonate, cal-cium sulfate, and silica are the most common sparingly sol-uble salts. Chemical feedwater treatment can be applied in order to prevent mineral scaling. Fig. 12 illustrates the effect of recovery on the flux, permeate pH, flow rate, salt rejec-tion, and TDS. The effect of recovery on flux and pH was studied for both the 1-stage and 2-stage RO systems.
It is apparent from Fig. 12 that the flux increases with the recovery ratio in both the 1-stage and 2-stage designs.
Fig. 8. Effect of feed temperature on feed pressure.
Fig. 9. Variation in the specific energy required with feed temperature in single and double stage RO systems
Fig. 10. Effect of feedwater pressure on salt rejection and flux.
71I. Wazeer et al. / Desalination and Water Treatment 222 (2021) 60–80
The maximum flux of 34.13 lmh was achieved at the high-est recovery ratio (40%) in the single-stage system. The flux is lower in the two-stage system than it is in the 1-stage system because of the higher production of freshwater. It can be concluded that a reduction in the pH results in an increase in the recovery ratio in both the single and the twin RO system. At a higher recovery ratio, there is an upsurge in the specific energy consumption, which may due to the sharp increase in the feed pressure required for higher recovery. The pH changes linearly with the change in the recovery ratio, as seen in Fig. 12.
The recovery ratio also significantly affects the flow rate of both the permeate and the brine. As suggested by Eq. (17), the recovery ratio is directly related to the flow of the per-meate. The increase in the recovery ratio, therefore, leads to an increase in the permeate flow and a reduction in the brine flow. Furthermore, the increase in the recovery ratio results in an increase in the flux and the permeate flow, leading to a reduction in the permeate TDS while the increase in the
recovery ratio leads to an increase in the salt rejection. The decrease in permeate TDS with the increase in recovery ratio is due to the increase in permeate flow at higher recovery. Also, high recovery is often associated with an increase in the trans-membrane pressure, which enhances the salt passage through the membrane. An increase in the recov-ery ratio from 25% to 40%, reduces the TDS from 225.37 to 181.06 mg/L.
Fig. 13 depicts the effect of membrane life on TDS. Depending on the application, the average membrane life of an RO membrane element varies from 3 to 7 y, and may only last 1 to 2 y in some RO systems. The lifetime of an RO element is reliant on various factors, including the selection of the element, system design, pretreatment, mem-brane cleaning, system operation, and system maintenance. The RO membrane is a thin film that includes numerous microscopic pores and is considered to be one of the most critical parts in an RO system. During typical operation, the membrane can become contaminated by biological
Fig. 11. Effect of feed pH on (a) permeate pH, (b) total TDS, and (c) specific energy.
I. Wazeer et al. / Desalination and Water Treatment 222 (2021) 60–8072
matter, minerals, insoluble organic contaminants, and colloi-dal particles. The TDS gradually increases as the membrane continues to be used over its lifetime.
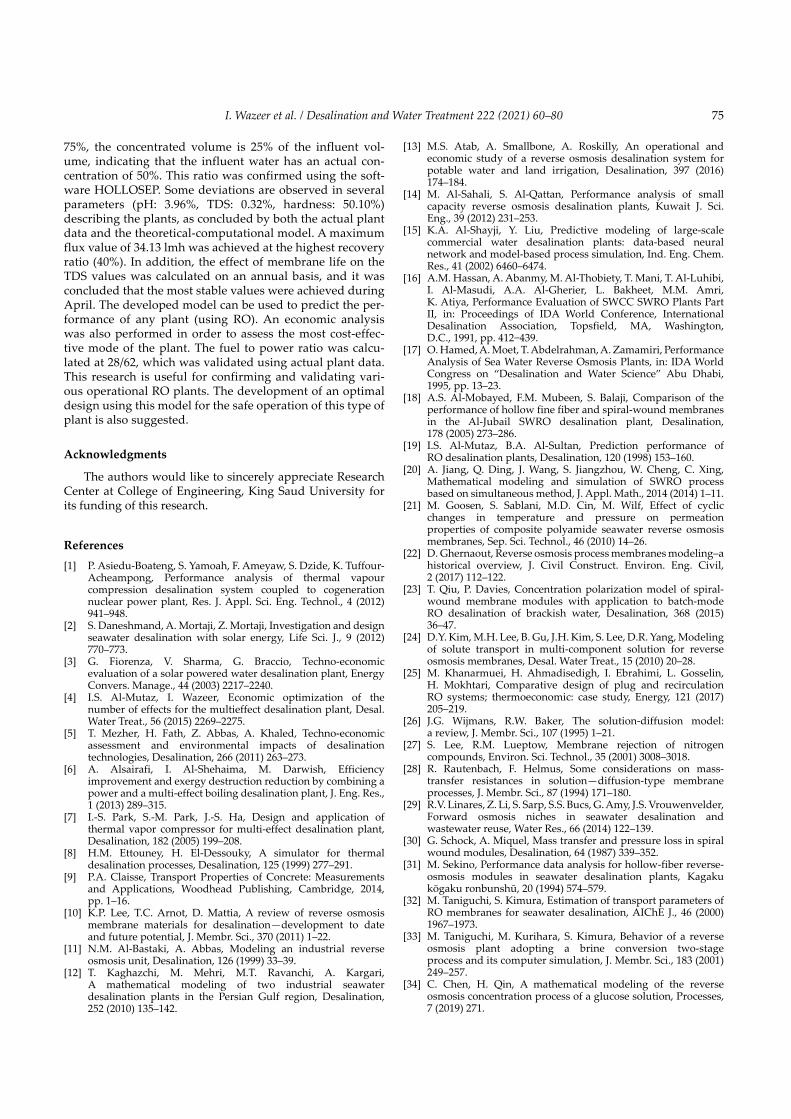
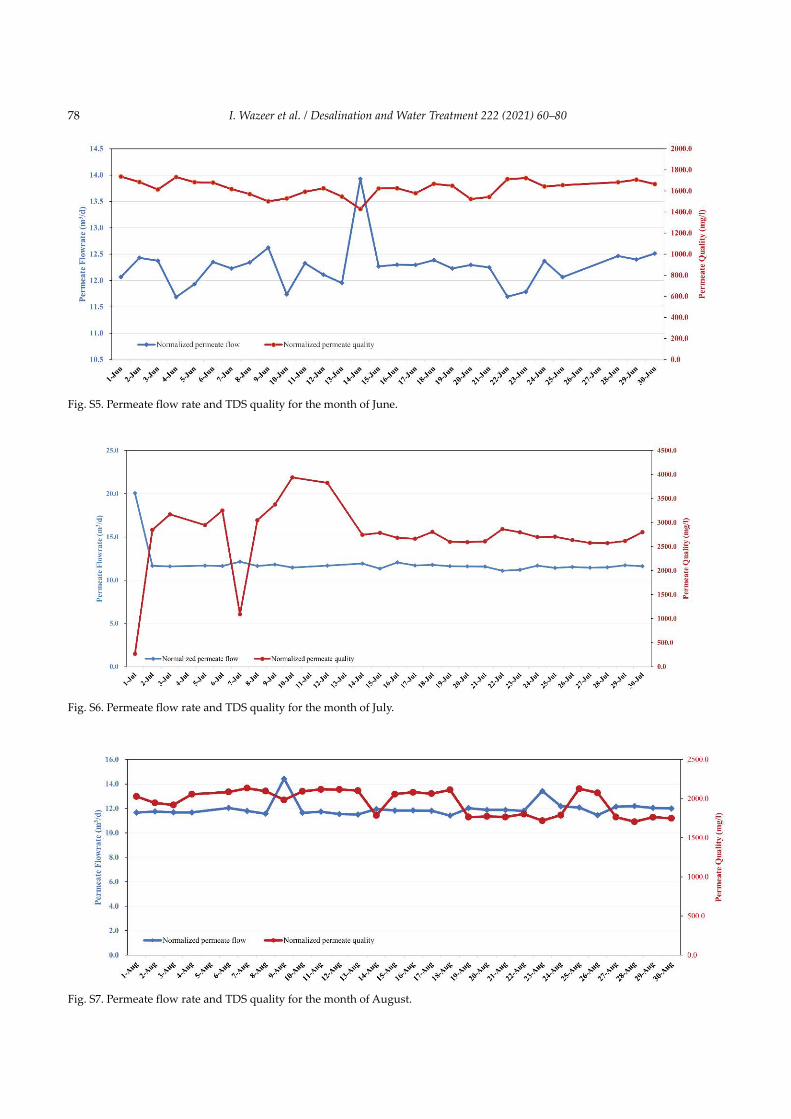
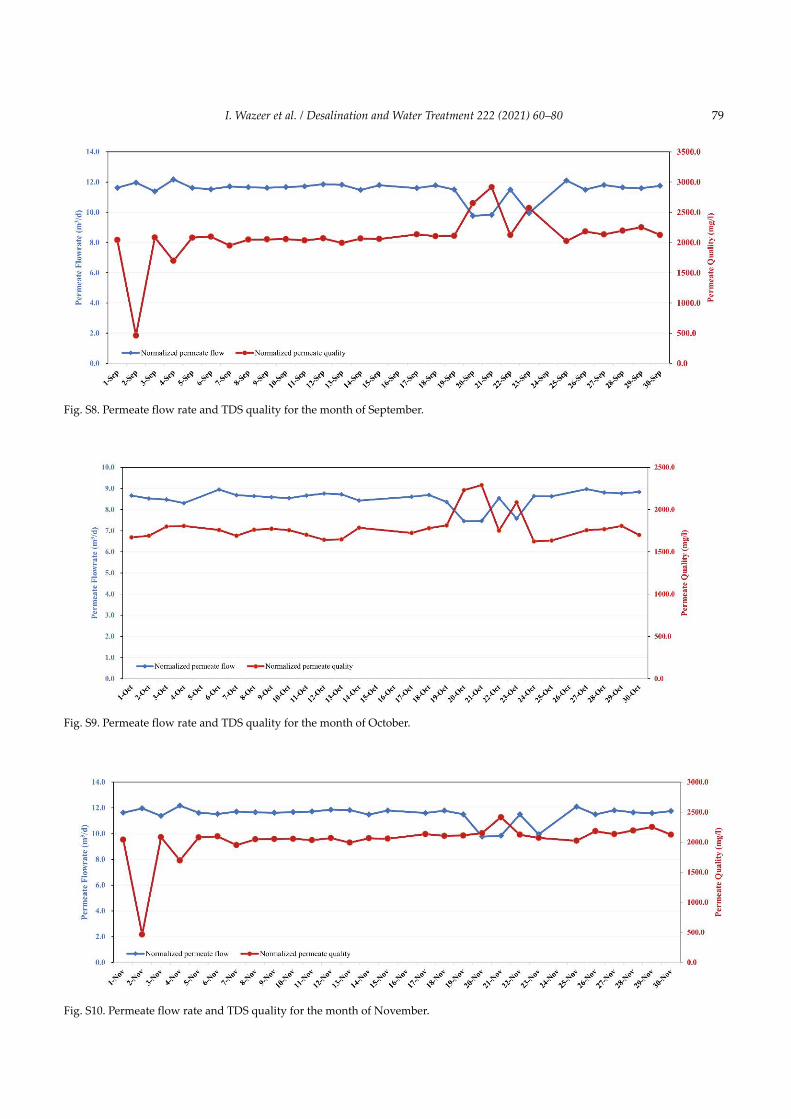
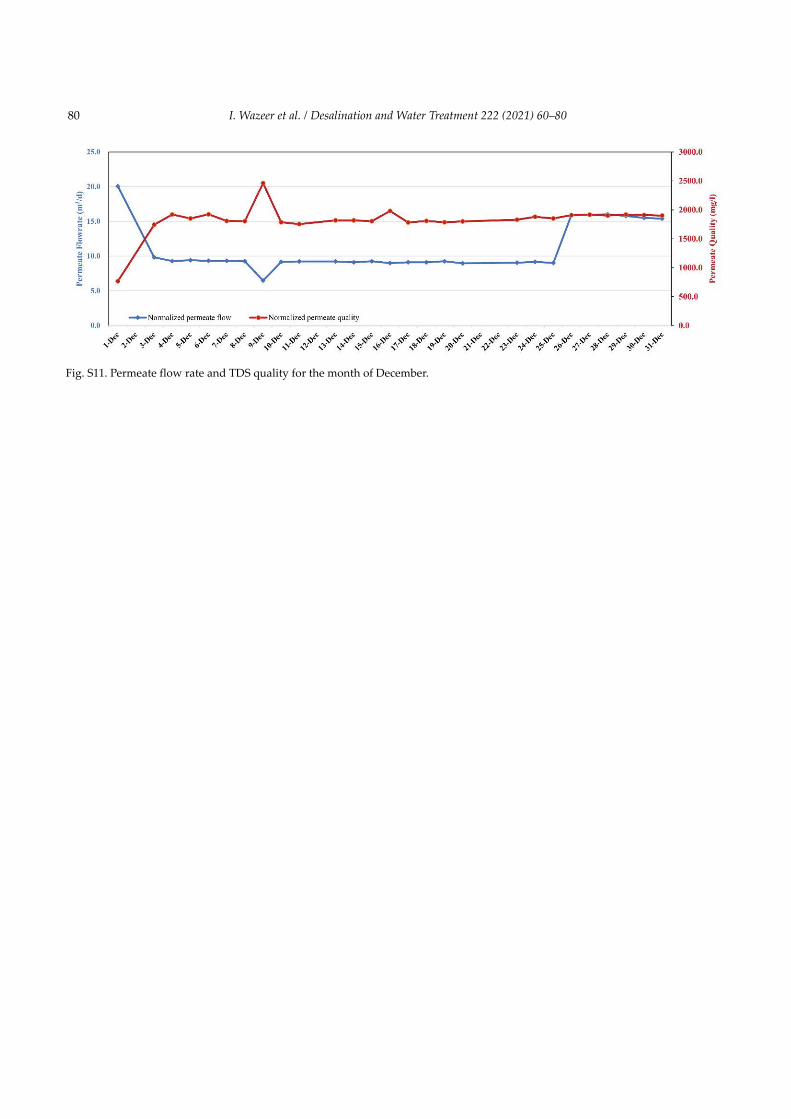
Fig. 14 indicates that the flow rate of the permeate is almost constant throughout the month of April, except for a few days. The figure also shows that the increase in per-meate flow reduces the TDS. If the permeate flow is reduced over the entire period, then fouling of the RO system may occur, and the system would require cleaning. It is, there-fore, often worthwhile to apply intense cleaning as it can prolong the life of a membrane. Figs. S1–S11 provide the long-term performance data in terms of permeate flow rate and TDS quality.
7. Economical assessment of the Al-Jubail SWRO plant
An economic analysis of the SWRO system is performed in this section. The cost per unit of energy is the ratio of the total expenses of the power plant to the amount of electricity produced by the power plant over a year. It is important to understand the costs that are incurred over time when carrying out cost analysis; the major economic variables are the costs of development (fixed and vari-able), the operational and maintenance costs, the economic lifespan, capacity factor, assets, and the discount rates.
CAPEX (capital cost) and OPEX (operating cost) are the main pillars for cost assessment of desalination plants. CAPEX covers many parameters including land, installa-tion charges, equipment’s cost, etc.; while, OPEX includes
(a) (b)
(c) (d)
Fig. 12. Effect of recovery ratio on (a) flux, (b) flow rate, (c) permeate pH, (d) salt rejection, and permeate TDS.
Fig. 13. Effect of membrane life on the total TDS.
73I. Wazeer et al. / Desalination and Water Treatment 222 (2021) 60–80
all the expenses incurred after the commissioning of the plant, which includes replacement of membranes, main-tenance cost, brine disposal, energy, labor cost, etc. The annual capital cost can be calculated by multiplying total capital cost and capital recovery factor, which is estimated by using the net present values method defined by the dis-count rate and future expenses for the specific duration. The expressions for annual recovery factor are given as follows:
Recovery factorannual( ) =
+( )+( ) −
x x
x
n
n
1
1 1 (33)
where x is the discount rate and n is the number of future payment. For the amount of water produced, the net annual capital cost can be determined as follows:
Capital costRecovery factor capital cost
Total canet( ) =( )× ( )
ppacity of plant (34)
Based on above expression and by computational assess-ment, some of the economic parameters of the plant under investigation are listed in Table 6. These parameters were calculated from the well-known desalination and eco-nomic program (DEEP) developed by International Atomic Energy Agency. The program works on the Microsoft Excel spreadsheets and is useful for evaluating desalination strat-egies by calculating estimates of technical performance and costs for various energy and desalination technology configurations. Desalination technology options modeled, include multi-stage flashing (MSF), multi-effect distillation (MED), reverse osmosis (RO) and hybrid options (RO-MSF, RO-MED) while energy source options include nuclear, fossil, renewables and grid electricity (stand-alone RO) [41].
The key parameters affecting the cost of water produc-tion are the cost of the plant itself, the aspects of the energy system that are required to meet the energy requirements of the RO system, the properties of the reverse osmosis system, and the economical parameters [50]. The cost of membrane for RO plant can be estimated based on the principle flux and membrane cost with replacement cost
per year. The addition of this cost in the operating cost of the plant can be calculated by the following expression:
Cost of membrane
price of membrane
replacement rate( ) =
( ) ×
( ) × 11,000Membrane flux 8,760×
(35)
The cost of the RO process relies on the capacity of a system. The levelized cost of electricity is one of the most significant factors in estimating the economic performance of power plants. The relation for the levelized cost of water including the discount rate was calculated by the following set of equations verified by the computational approach, that is,
Water cost Total cost of life cyle of plantTotaLevelized( ) =
ll production of water (36)
Fig. 14. Permeate flow rate and TDS quality for the month of April.
Table 6Economic parameters of seawater reverse osmosis system
Parameters Value
Capital recovery factor 0.06 Fuel levelization factor 1.63Reference net output 20.0 MWSp. overnight construction cost 2,530 $Overnight construction cost 51 M$Interest during construction 4 M$Total plant investment 54 M$Annualized capital cost 3 M$Annual electricity productivity 121 GWh Annual fuel cost 24 M$Total annual cost 28 M$Levelized power cost 0.229 $/kWhSp. levelized power cost 0.027 $/kWhSp. fuel cost 0.198 $/kWhSP. O&M cost 0.003 $/kWh
I. Wazeer et al. / Desalination and Water Treatment 222 (2021) 60–8074
Water costcapital cost
water costDiscount( ) =
( )
( )=
=
∑ ii
n
ii
n0
0∑∑
× +( )1 xi (37)
Water cost
capital cost
water cost
Annual( ) =
( )
( )×=
=
∑
∑
ii
n
ii
n0
0
11
0
+( )
( )=∑
xi
ii
n
water production cost (38)
The total cost of the water can thus be calculated by using the following relation:
W
XX
XX
WP T
c i
i
A i
c i
P ii
n
=
( )( ) ×
( )( )
( )=∑ 0
1 (39)
where X = cost, O = operation, A = amortization, and WP = water production.
The total costs of the RO process include the intake cost, and pre-treatment or post-treatment systems, among others. The performance and cost parameters are given in Table 7. Two major groups of fixed costs are investment and O&M. O&M costs include the cost of proper operation and main-tenance, replacement parts, membrane substitution, and auxiliary consumption expenses. All external consumption, involving chemical dosage, regulation and control, mem-brane cleaning, blowdown pumping, lighting, and other minor consumables comprise auxiliary consumption.
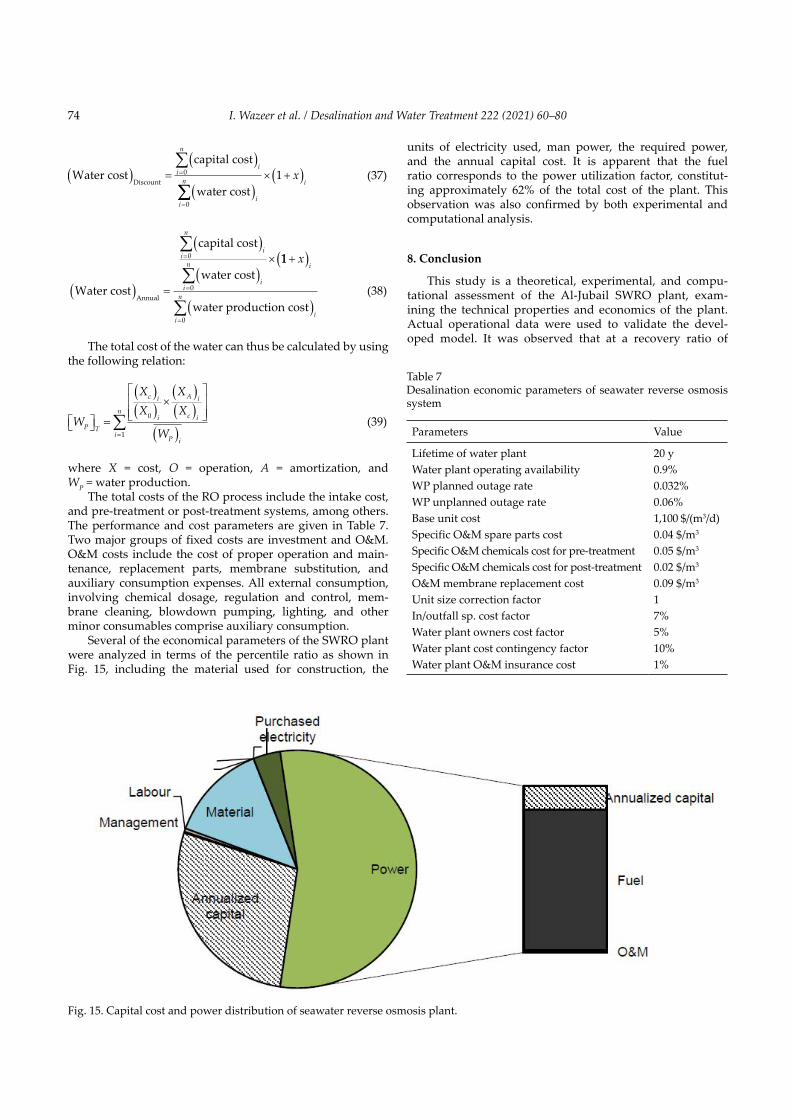
Several of the economical parameters of the SWRO plant were analyzed in terms of the percentile ratio as shown in Fig. 15, including the material used for construction, the
units of electricity used, man power, the required power, and the annual capital cost. It is apparent that the fuel ratio corresponds to the power utilization factor, constitut-ing approximately 62% of the total cost of the plant. This observation was also confirmed by both experimental and computational analysis.
8. Conclusion
This study is a theoretical, experimental, and compu-tational assessment of the Al-Jubail SWRO plant, exam-ining the technical properties and economics of the plant. Actual operational data were used to validate the devel-oped model. It was observed that at a recovery ratio of
Table 7Desalination economic parameters of seawater reverse osmosis system
Parameters Value
Lifetime of water plant 20 yWater plant operating availability 0.9%WP planned outage rate 0.032%WP unplanned outage rate 0.06%Base unit cost 1,100 $/(m3/d)Specific O&M spare parts cost 0.04 $/m3
Specific O&M chemicals cost for pre-treatment 0.05 $/m3
Specific O&M chemicals cost for post-treatment 0.02 $/m3
O&M membrane replacement cost 0.09 $/m3
Unit size correction factor 1In/outfall sp. cost factor 7%Water plant owners cost factor 5%Water plant cost contingency factor 10%Water plant O&M insurance cost 1%
Fig. 15. Capital cost and power distribution of seawater reverse osmosis plant.
75I. Wazeer et al. / Desalination and Water Treatment 222 (2021) 60–80
75%, the concentrated volume is 25% of the influent vol-ume, indicating that the influent water has an actual con-centration of 50%. This ratio was confirmed using the soft-ware HOLLOSEP. Some deviations are observed in several parameters (pH: 3.96%, TDS: 0.32%, hardness: 50.10%) describing the plants, as concluded by both the actual plant data and the theoretical-computational model. A maximum flux value of 34.13 lmh was achieved at the highest recovery ratio (40%). In addition, the effect of membrane life on the TDS values was calculated on an annual basis, and it was concluded that the most stable values were achieved during April. The developed model can be used to predict the per-formance of any plant (using RO). An economic analysis was also performed in order to assess the most cost-effec-tive mode of the plant. The fuel to power ratio was calcu-lated at 28/62, which was validated using actual plant data. This research is useful for confirming and validating vari-ous operational RO plants. The development of an optimal design using this model for the safe operation of this type of plant is also suggested.
Acknowledgments
The authors would like to sincerely appreciate Research Center at College of Engineering, King Saud University for its funding of this research.
References[1] P. Asiedu-Boateng, S. Yamoah, F. Ameyaw, S. Dzide, K. Tuffour-
Acheampong, Performance analysis of thermal vapour compression desalination system coupled to cogeneration nuclear power plant, Res. J. Appl. Sci. Eng. Technol., 4 (2012) 941–948.
[2] S. Daneshmand, A. Mortaji, Z. Mortaji, Investigation and design seawater desalination with solar energy, Life Sci. J., 9 (2012) 770–773.
[3] G. Fiorenza, V. Sharma, G. Braccio, Techno-economic evaluation of a solar powered water desalination plant, Energy Convers. Manage., 44 (2003) 2217–2240.
[4] I.S. Al-Mutaz, I. Wazeer, Economic optimization of the number of effects for the multieffect desalination plant, Desal. Water Treat., 56 (2015) 2269–2275.
[5] T. Mezher, H. Fath, Z. Abbas, A. Khaled, Techno-economic assessment and environmental impacts of desalination technologies, Desalination, 266 (2011) 263–273.
[6] A. Alsairafi, I. Al-Shehaima, M. Darwish, Efficiency improvement and exergy destruction reduction by combining a power and a multi-effect boiling desalination plant, J. Eng. Res., 1 (2013) 289–315.
[7] I.-S. Park, S.-M. Park, J.-S. Ha, Design and application of thermal vapor compressor for multi-effect desalination plant, Desalination, 182 (2005) 199–208.
[8] H.M. Ettouney, H. El-Dessouky, A simulator for thermal desalination processes, Desalination, 125 (1999) 277–291.
[9] P.A. Claisse, Transport Properties of Concrete: Measurements and Applications, Woodhead Publishing, Cambridge, 2014, pp. 1–16.
[10] K.P. Lee, T.C. Arnot, D. Mattia, A review of reverse osmosis membrane materials for desalination—development to date and future potential, J. Membr. Sci., 370 (2011) 1–22.
[11] N.M. Al-Bastaki, A. Abbas, Modeling an industrial reverse osmosis unit, Desalination, 126 (1999) 33–39.
[12] T. Kaghazchi, M. Mehri, M.T. Ravanchi, A. Kargari, A mathematical modeling of two industrial seawater desalination plants in the Persian Gulf region, Desalination, 252 (2010) 135–142.
[13] M.S. Atab, A. Smallbone, A. Roskilly, An operational and economic study of a reverse osmosis desalination system for potable water and land irrigation, Desalination, 397 (2016) 174–184.
[14] M. Al-Sahali, S. Al-Qattan, Performance analysis of small capacity reverse osmosis desalination plants, Kuwait J. Sci. Eng., 39 (2012) 231–253.
[15] K.A. Al-Shayji, Y. Liu, Predictive modeling of large-scale commercial water desalination plants: data-based neural network and model-based process simulation, Ind. Eng. Chem. Res., 41 (2002) 6460–6474.
[16] A.M. Hassan, A. Abanmy, M. Al-Thobiety, T. Mani, T. Al-Luhibi, I. Al-Masudi, A.A. Al-Gherier, L. Bakheet, M.M. Amri, K. Atiya, Performance Evaluation of SWCC SWRO Plants Part II, in: Proceedings of IDA World Conference, International Desalination Association, Topsfield, MA, Washington, D.C.,1991,pp.412−439.
[17] O. Hamed, A. Moet, T. Abdelrahman, A. Zamamiri, Performance Analysis of Sea Water Reverse Osmosis Plants, in: IDA World Congress on “Desalination and Water Science” Abu Dhabi, 1995, pp. 13–23.
[18] A.S. Al-Mobayed, F.M. Mubeen, S. Balaji, Comparison of the performance of hollow fine fiber and spiral-wound membranes in the Al-Jubail SWRO desalination plant, Desalination, 178 (2005) 273–286.
[19] I.S. Al-Mutaz, B.A. Al-Sultan, Prediction performance of RO desalination plants, Desalination, 120 (1998) 153–160.
[20] A. Jiang, Q. Ding, J. Wang, S. Jiangzhou, W. Cheng, C. Xing, Mathematical modeling and simulation of SWRO process based on simultaneous method, J. Appl. Math., 2014 (2014) 1–11.
[21] M. Goosen, S. Sablani, M.D. Cin, M. Wilf, Effect of cyclic changes in temperature and pressure on permeation properties of composite polyamide seawater reverse osmosis membranes, Sep. Sci. Technol., 46 (2010) 14–26.
[22] D. Ghernaout, Reverse osmosis process membranes modeling–a historical overview, J. Civil Construct. Environ. Eng. Civil, 2 (2017) 112–122.
[23] T. Qiu, P. Davies, Concentration polarization model of spiral-wound membrane modules with application to batch-mode RO desalination of brackish water, Desalination, 368 (2015) 36–47.
[24] D.Y. Kim, M.H. Lee, B. Gu, J.H. Kim, S. Lee, D.R. Yang, Modeling of solute transport in multi-component solution for reverse osmosis membranes, Desal. Water Treat., 15 (2010) 20–28.
[25] M. Khanarmuei, H. Ahmadisedigh, I. Ebrahimi, L. Gosselin, H. Mokhtari, Comparative design of plug and recirculation RO systems; thermoeconomic: case study, Energy, 121 (2017) 205–219.
[26] J.G. Wijmans, R.W. Baker, The solution-diffusion model: a review, J. Membr. Sci., 107 (1995) 1–21.
[27] S. Lee, R.M. Lueptow, Membrane rejection of nitrogen compounds, Environ. Sci. Technol., 35 (2001) 3008–3018.
[28] R. Rautenbach, F. Helmus, Some considerations on mass-transfer resistances in solution—diffusion-type membrane processes, J. Membr. Sci., 87 (1994) 171–180.
[29] R.V. Linares, Z. Li, S. Sarp, S.S. Bucs, G. Amy, J.S. Vrouwenvelder, Forward osmosis niches in seawater desalination and wastewater reuse, Water Res., 66 (2014) 122–139.
[30] G. Schock, A. Miquel, Mass transfer and pressure loss in spiral wound modules, Desalination, 64 (1987) 339–352.
[31] M. Sekino, Performance data analysis for hollow-fiber reverse-osmosis modules in seawater desalination plants, Kagaku kōgakuronbunshū,20(1994)574–579.
[32] M. Taniguchi, S. Kimura, Estimation of transport parameters of RO membranes for seawater desalination, AIChE J., 46 (2000) 1967–1973.
[33] M. Taniguchi, M. Kurihara, S. Kimura, Behavior of a reverse osmosis plant adopting a brine conversion two-stage process and its computer simulation, J. Membr. Sci., 183 (2001) 249–257.
[34] C. Chen, H. Qin, A mathematical modeling of the reverse osmosis concentration process of a glucose solution, Processes, 7 (2019) 271.
I. Wazeer et al. / Desalination and Water Treatment 222 (2021) 60–8076
[35] J.A. Howell, V. Sanchez, R.W. Field, Membranes in Bioprocessing: Theory and Applications, Springer Netherlands, 2012, pp. 55–112.
[36] H.T. El-Dessouky, H.M. Ettouney, Fundamentals of Salt Water Desalination, Elsevier Science, New York, 2002, pp. 409–437.
[37] G. Amy, N. Ghaffour, Z. Li, L. Francis, R.V. Linares, T. Missimer, S. Lattemann, Membrane-based seawater desalination: present and future prospects, Desalination, 401 (2017) 16–21.
[38] J. Kim, K. Park, D.R. Yang, S. Hong, A comprehensive review of energy consumption of seawater reverse osmosis desalination plants, Appl. Energy, 254 (2019) 113652.
[39] J. Kim, K. Park, S. Hong, Optimization of two-stage seawater reverse osmosis membrane processes with practical design aspects for improving energy efficiency, J. Membr. Sci., 601 (2020) 117889.
[40] A.H. Gulamhusein, A.S. Al Sheikh Khalil, I.A. Fatah, R. Boda, S. Rybar, IMS SWRO Kindasa—Two years of operational experience, Desal. Water Treat., 10 (2009) 245–254.
[41] R. de Morales, Planta desaladora de agua de mar con capacidad para producir 60.000 m3/día de agua apta para riego, Infoenviro, (2016) 35–50.
[42] S. Meyer-Steele, A. von Gottberg, J.L. Talavera, seawater reverse osmosis plants in the Caribbean recover energy and brine and reduce costs, (2005).
[43] R. Lemes, R. Falcon, R. Arocha, J. Curbelo, V. Platas, L.D. Lorenzo, Different designs in energy savings of
SWRO Plant of Las Palmas III, Desal. Water Treat., 51 (2013) 749–758.
[44] T. Hamano, Operation of Fukuoka sea water desalination plant, Bull. Soc. Sea Water Sci. Jpn., 60 (2006) 415–421.
[45] F. Rezazadeh, W.F. Gale, M. Akram, K.J. Hughes, M. Pourkashanian, Performance evaluation and optimisation of post combustion CO2 capture processes for natural gas applications at pilot scale via a verified rate-based model, Int. J. Greenhouse Gas Control, 53 (2016) 243–253.
[46] F. Mahmoudi, A. Akbarzadeh, Sustainable Desalination by Permeate Gap Membrane Distillation Technology, in: Emerging Technologies for Sustainable Desalination Handbook, Elsevier, Oxford, 2018, pp. 157–204.
[47] A. Schäfer, A. Broeckmann, B. Richards, Membranes and renewable energy—a new era of sustainable development for developing countries, Membr. Technol., 2005 (2005) 6–10.
[48] S. Sourirajan, The science of reverse osmosis-mechanisms, membranes, transport and applications, Pure Appl. Chem., 50 (1978) 593–615.
[49] S. Sourirajan, The Science of Reverse Osmosis-Mechanisms, Membranes, Transport and Applications, in: Chemistry for the Welfare of Mankind, Elsevier, Great Britain, 1979, pp. 593–615.
[50] Z. Triki, M. Bouaziz, M. Boumaza, Techno-economic feasibility of wind-powered reverse osmosis brackish water desalination systems in southern Algeria, Desal. Water Treat., 52 (2014) 1745–1760.
Fig. S1. Permeate flow rate and TDS quality for the month of January.
Supporting information
77I. Wazeer et al. / Desalination and Water Treatment 222 (2021) 60–80
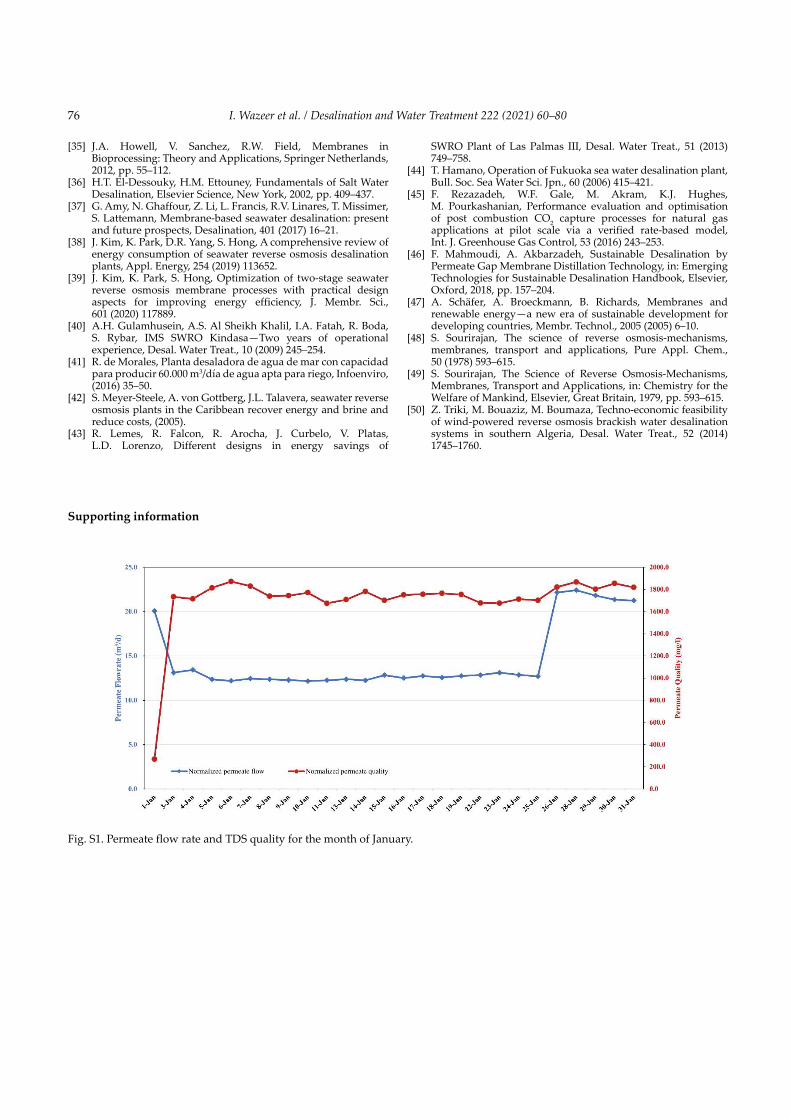
Fig. S2. Permeate flow rate and TDS quality for the month of February.
Fig. S3. Permeate flow rate and TDS quality for the month of March.
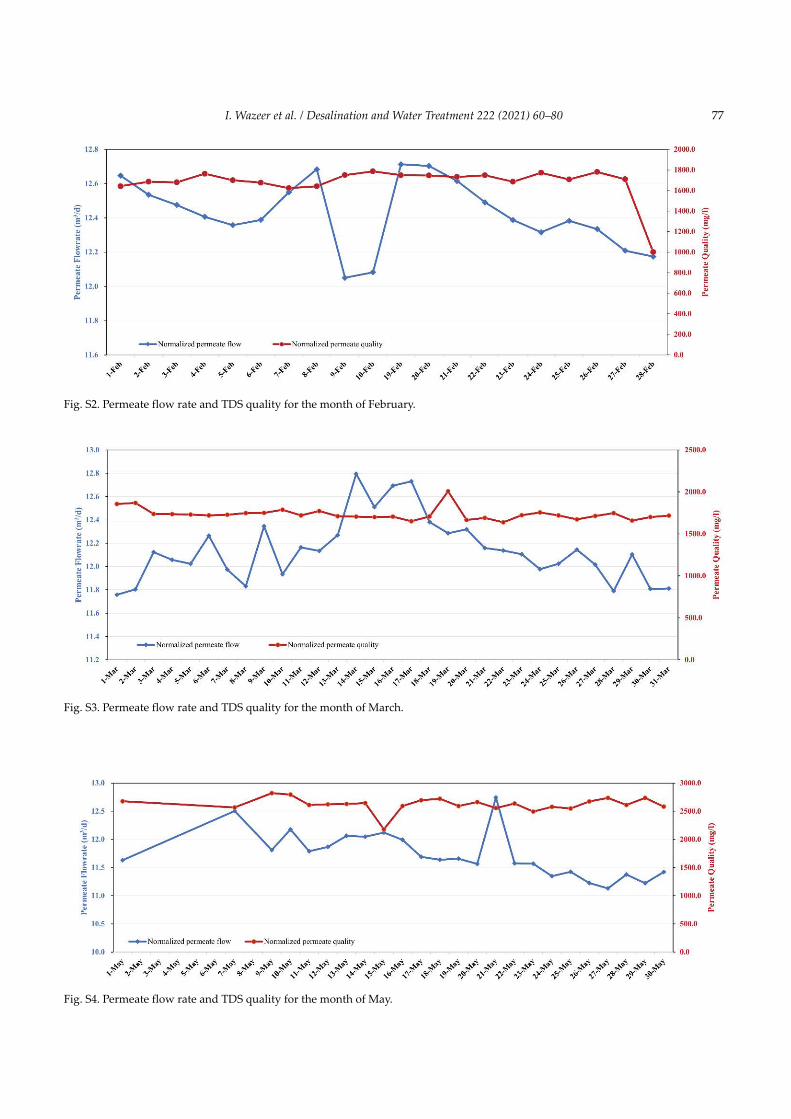
Fig. S4. Permeate flow rate and TDS quality for the month of May.
I. Wazeer et al. / Desalination and Water Treatment 222 (2021) 60–8078
Fig. S5. Permeate flow rate and TDS quality for the month of June.
Fig. S6. Permeate flow rate and TDS quality for the month of July.
Fig. S7. Permeate flow rate and TDS quality for the month of August.
79I. Wazeer et al. / Desalination and Water Treatment 222 (2021) 60–80
Fig. S8. Permeate flow rate and TDS quality for the month of September.
Fig. S9. Permeate flow rate and TDS quality for the month of October.
Fig. S10. Permeate flow rate and TDS quality for the month of November.
I. Wazeer et al. / Desalination and Water Treatment 222 (2021) 60–8080
Fig. S11. Permeate flow rate and TDS quality for the month of December.
Copyright © 2022 FDOKUMEN