Membrane Technology for Water and Wastewater Treatment ...
380
Editors: Ahmad Fauzi Ismail & Takeshi Matsuura Series: Sustainable Water Developments 3 Membrane Technology for Water and Wastewater Treatment, Energy and Environment
-
Upload
khangminh22 -
Category
Documents
-
view
2 -
download
0
Transcript of Membrane Technology for Water and Wastewater Treatment ...

Editors: Ahmad Fauzi Ismail & Takeshi Matsuura
IsmailMatsuura
3
Mem
brane Technology for Water and W
astewater Treatm
ent,Energy and Environm
ent
Series: Sustainable Water Developments 3
Membrane Technology for Water and Wastewater Treatment, Energy and Environment
an informa business
SUSTAINABLE WATER DEVELOPMENTS – VOLUME 3 ISSN 2373-7506
The book series addresses novel techniques and measures related to sustainable water de-velopments with an interdisciplinary focus on different fields of water resources assessment and management, freshwater production, water and wastewater treatment and wastewater reuse as well as water-efficient technologies and water-saving measures. Particular attention is paid to the role of water issues within the water-energy-food-public health-ecosystem-climate nexus. Water and wastewater industries are rapidly growing sectors providing significant opportunities for investments. This applies especially to those industries using sustainable water and wastewater technologies, which are increasingly favored. The series of books constitutes an information source and facilitator for the transfer of knowledge, focusing on practical solutions and better understanding. It is aimed at academics, manufacturers and consultants, and professionals from governmental and non-governmental organizations, international funding agencies, public health, policy, regulatory and other relevant institutions, as well as the wider public, and targets communities and industries both great and small.The series includes books authored and edited by world-renowned scientists and engineers as well as by leading authorities in economics and politics. Women are particularly encouraged to contribute, either as author or editor.
SERIES EDITOR: Jochen Bundschuh
Realizing that water, energy and food are the three pillars to sustain the growth of human population in the future, this book deals with all the above aspects with particular emphasis on water and energy. In particular, the book addresses applications of membrane science and technology for water and wastewater treatment, energy and environment. The readers are also offered a glimpse into the rapidly growing R & D activities in the ASEAN and the Middle East regions that are emerging as the next generation R & D centers of membrane technologies, especially owing to their need of technology for water and wastewater treatment. Hence, this book will be useful not only for the engineers, scientists, professors and graduate students who are engaged in the R & D activities in this field, but also for those who are interested in the sustainable development of these geographical regions. Thus, it is believed that the book will open up new avenues for the establishment of global collaborations to achieve our common goal of welfare of the human society.

MEMBRANE TECHNOLOGY FOR WATER AND WASTEWATERTREATMENT, ENERGY AND ENVIRONMENT

This page intentionally left blankThis page intentionally left blank

Sustainable Water DevelopmentsResources, Management, Treatment,Efficiency and Reuse
Series Editor
Jochen BundschuhUniversity of Southern Queensland (USQ), Toowoomba, AustraliaRoyal Institute of Technology (KTH), Stockholm, Sweden
ISSN: 2373-7506
Volume 3

This page intentionally left blankThis page intentionally left blank
Membrane Technology for Waterand Wastewater Treatment,Energy and Environment
Editors
Ahmad Fauzi Ismail
Advanced Membrane Technology Research Centre (AMTEC),Universiti Teknologi Malaysia (UTM), Skudai, Johor, Malaysia
Takeshi Matsuura
Department of Chemical and Biological Engineering,University of Ottawa, Ottawa, Ontario, Canada
Co-published by IWA Publishing Alliance House, 12 Caxton Street, London SW1H 0QS, UK Tel: +44 (0)20 7654 5500, Fax: +44 (0)20 7654 5555 [email protected] www.iwapublishing.com ISBN: 9781780407951
Cover photoThe cover shows the asymmetric structure of a hollow fiber membrane configuration which iswidely used for fluid separation processes. Fine structural details of the membrane are importantto ensure effective and efficient separation processes. Thus the cover shows an integral part of themembrane process if optimization of the membrane system for water and waste water treatment,energy and environment is to be envisaged.
CRC Press/Balkema is an imprint of the Taylor & Francis Group, an informa business
© 2016 Taylor & Francis Group, London, UK
Typeset by MPS Limited, Chennai, IndiaPrinted and Bound in The Netherlands by PrintSupport4U, Meppel
All rights reserved. No part of this publication or the information contained herein may bereproduced, stored in a retrieval system, or transmitted in any form or by any means, electronic,mechanical, by photocopying, recording or otherwise, without written prior permission fromthe publishers.
Although all care is taken to ensure integrity and the quality of this publication and theinformation herein, no responsibility is assumed by the publishers nor the author for anydamage to the property or persons as a result of operation or use of this publication and/orthe information contained herein.
Library of Congress Cataloging-in-Publication Data
Names: Ismail, Ahmad Fauzi editor. | Matsuura, Takeshie editor.Title: Membrane technology for water and wastewater treatment, energy and
environment / editors, Ahmad Fauzi Ismail, Takeshi Matsuura.Description: Boca Raton : CRC Press, 2016. | Includes bibliographical
references and index. | Description based on print version record and CIPdata provided by publisher; resource not viewed.
Identifiers: LCCN 2015048706 (print) | LCCN 2015046520 (ebook) | ISBN9781315645773 (ebook) | ISBN 9781138029019 (hardcover : alk. paper)
Subjects: LCSH: Water—Purification—Membrane filtration.Classification: LCC TD442.5 (print) | LCC TD442.5 .M4735 2016 (ebook) | DDC
628.1/64–dc23
Published by: CRC Press/BalkemaP.O. Box 11320, 2301 EH Leiden, The Netherlandse-mail: [email protected] – www.taylorandfrancis.com
ISBN: 978-1-138-02901-9 (Hardback)ISBN: 978-1-315-64577-3 (eBook PDF)
About the book series
Augmentation of freshwater supply and better sanitation are two of the world’s most pressingchallenges. However, such improvements must be done economically in an environmentally andsocietally sustainable way.
Increasingly, groundwater – the source that is much larger than surface water and which providesa stable supply through all the seasons – is used for freshwater supply, which is exploited from ever-deeper groundwater resources. However, the availability of groundwater in sufficient quantityand good quality is severely impacted by the increased water demand for industrial production,cooling in energy production, public water supply and in particular agricultural use, which atpresent consumes on a global scale about 70% of the exploited freshwater resources. In addition,climate change may have a positive or negative impact on freshwater availability, but whichone is presently unknown. These developments result in a continuously increasing water stress,as has already been observed in several world regions and which has adverse implications forthe security of food, water and energy supplies, the severity of which will further increase infuture. This demands case-specific mitigation and adaptation pathways, which require a betterassessment and understanding of surface water and groundwater systems and how they interactwith a view to improve their protection and their effective and sustainable management.
With the current and anticipated increased future freshwater demand, it is increasingly difficultto sustain freshwater supply security without producing freshwater from contaminated, brack-ish or saline water and reusing agricultural, industrial, and municipal wastewater after adequatetreatment, which extends the life cycle of water and is beneficial not only to the environment butalso leads to cost reduction. Water treatment, particularly desalination, requires large amounts ofenergy, making energy-efficient options and use of renewable energies important. The technolo-gies, which can either be sophisticated or simple, use physical, chemical and biological processesfor water and wastewater treatment, to produce freshwater of a desired quality. Both industrial-scale approaches and smaller-scale applications are important but need a different technologicalapproach. In particular, low-tech, cost-effective, but at the same time sustainable water andwastewater treatment systems, such as artificial wetlands or wastewater gardens, are options suit-able for many small-scale applications. Technological improvements and finding new approachesto conventional technologies (e.g. those of seawater desalination), and development of innovativeprocesses, approaches, and methods to improve water and wastewater treatment and sanitationare needed. Improving economic, environmental and societal sustainability needs research anddevelopment to improve process design, operation, performance, automation and managementof water and wastewater systems considering aims, and local conditions.
In all freshwater consuming sectors, the increasing water scarcity and correspondingly increas-ing costs of freshwater, calls for a shift towards more water efficiency and water savings. In theindustrial and agricultural sector, it also includes the development of technologies that reducecontamination of freshwater resources, e.g. through development of a chemical-free agriculture.In the domestic sector, there are plenty of options for freshwater saving and improving efficiencysuch as water-efficient toilets, water-free toilets, or on-site recycling for uses such as toilet flush-ing, which alone could provide an estimated 30% reduction in water use for the average household.As already mentioned, in all water-consuming sectors, the recycling and reuse of the respectivewastewater can provide an important freshwater source. However, the rate at which these waterefficient technologies and water-saving applications are developed and adopted depends on thebehavior of individual consumers and requires favorable political, policy and financial conditions.
vii
viii About the book series
Due to the interdependency of water and energy (water-energy nexus); i.e. water productionneeds energy (e.g. for groundwater pumping) and energy generation needs water (e.g. for cooling),the management of both commodities should be more coordinated. This requires integrated energyand water planning, i.e. management of both commodities in a well-coordinated form rather thanmanaging water and energy separately as is routine at present. Only such integrated managementallows reducing trade-offs between water and energy use.
However, water is not just linked to energy, but must be considered within the whole of thewater-energy-food-ecosystem-climate nexus. This requires consideration of what a planned waterdevelopment requires from the other sectors or how it affects – positively or negatively – theother sectors. Such integrated management of water and the other interlinked resources canimplement synergies, reduce trade-offs, optimize resources use and management efficiency, allin all improving security of water, energy, and food security and contributing to protection ofecosystems and climate. Corresponding actions, policies and regulations that support such integralapproaches, as well as corresponding research, training and teaching are necessary for theirimplementation.
The fact that in many developing and transition countries women are disproportionately dis-advantaged by water and sanitation limitation requires special attention to this aspect in thesecountries. Women (including schoolgirls) often spend several hours a day fetching water. Thistime could be much better used for attending school or working to improve knowledge and skillsas well as to generate income and so to reduce gender inequality and poverty. Absence of in-doorsanitary facilities exposes women to potential harassment. Moreover, missing single-sex sanita-tion facilities in schools and absence of clean water contributes to diseases. This is why women andgirls are a critical factor in solving water and sanitation problems in these countries and necessi-tates that men and women work side by side to address the water and wastewater related operationsfor improvement of economic, social and sustainable freshwater provision and sanitation.
Individual volumes published in the series span the wide spectrum between research, develop-ment and practice in the topic of freshwater and related areas such as gender and social aspectsas well as policy, regulatory, legal and economic aspects of water. The series covers all fields andfacets in optimal approaches to the:
• Assessment, protection, development and sustainable management of groundwater and surfacewater resources thereby optimizing their use.
• Improvement of human access to water resources in adequate quantity and good quality.• Meeting of the increasing demand for drinking water, and irrigation water needed for food
and energy security, protection of ecosystems and climate and contribution to a socially andeconomically sound human development.
• Treatment of water and wastewater also including its reuse.• Implementation of water efficient technologies and water saving measures.
A key goal of the series is to include all countries of the globe in jointly addressing the challengesof water security and sanitation. Therefore, we aim for a balanced selection of authors and editorsoriginating from developing and developed countries as well as for gender equality. This willhelp society to provide access to freshwater resources in adequate quantity and of good quality,meeting the increasing demand for drinking water, domestic water and irrigation water neededfor food security while contributing to socially and economically sound development.
This book series aims to become a state-of-the-art resource for a broad group of readers includ-ing professionals, academics and students dealing with ground and surface water resources, theirassessment, exploitation and management as well as the water and wastewater industry. This com-prises especially hydrogeologists, hydrologists, water resources engineers, wastewater engineers,chemical engineers and environmental engineers and scientists.
The book series provides a source of valuable information on surface water but especially onaquifers and groundwater resources in all their facets. As such, it covers not only the scien-tific and technical aspects but also environmental, legal, policy, economic, social, and gender
About the book series ix
aspects of groundwater resources management. Without departing from the larger frameworkof integrated groundwater resources management, the topics are centered on water, solute andheat transport in aquifers, hydrogeochemical processes in aquifers, contamination, protection,resources assessment and use.
The book series constitutes an information source and facilitator for the transfer of knowl-edge, both for small communities with decentralized water supply and sanitation as well as largeindustries that employ hundreds or thousands of professionals in countries worldwide, workingin the different fields of freshwater production, wastewater treatment and water reuse as wellas those concerned with water efficient technologies and water saving measures. In contrast tomany other industries, suffering from the global economic downturn, water and wastewater indus-tries are rapidly growing sectors providing significant opportunities for investments. This appliesespecially to those using sustainable water and wastewater technologies, which are increasinglyfavored. The series is also aimed at communities, manufacturers and consultants as well as arange of stakeholders and professionals from governmental and non-governmental organizations,international funding agencies, public health, policy, regulating and other relevant institutions,and the broader public. It is designed to increase awareness of water resources protection andunderstanding of sustainable water and wastewater solutions including the promotion of waterand wastewater reuse and water savings.
By consolidating international research and technical results, the objective of this book seriesis to focus on practical solutions in better understanding groundwater and surface water systems,the implementation of sustainable water and wastewater treatment and water reuse and the imple-mentation of water efficient technologies and water saving measures. Failing to improve and moveforward would have serious social, environmental and economic impacts on a global scale.
The book series includes books authored and edited by world-renowned scientists and engineersand by leading authorities in economics and politics. Women are particularly encouraged tocontribute, either as author or editor.
Jochen Bundschuh(Series Editor)

This page intentionally left blankThis page intentionally left blank
Editorial board
Blanca Jiménez Cisneros Director of the Division of Water Sciences, Secretary of theInternational Hydrological Programme (IHP), UNESCO, Paris,France
Glen T. Daigger Immediate Past President, International Water Association (IWA),IWA Board Member, Senior Vice President and Chief TechnologyOfficer CH2M HIL, Englewood, CO, USA
Anthony Fane Director, Singapore Membrane Technology Centre (SMTC),Nanyang Technological University (NTU), Singapore
Carlos Fernandez-Jauregui
Director, International Water Chair-EUPLA, Director, WaterAssessment & Advisory Global Network (WASA-GN), Madrid,Spain
ADVISORY EDITORIAL BOARD
AFGHANISTAN
Naim Eqrar (water resources; water quality; hydrology; hydrogeology; environmentalawareness), Full Member of the Secretariat of Supreme Council of Water and Land ofAfghanistan (SCWLA); Full Member of the National Hydrological Committee ofAfghanistan (NHCA) & Geoscience Faculty, Kabul University, Kabul
ALGERIA
Hacene Mahmoudi (renewable energy for desalination and water treatment; membranetechnologies), Faculty of Sciences, Hassiba Ben Bouali University of Chlef (UHBC),Chlef
ANGOLA
Helder de Sousa Andrade (geomorphology; impact of land use on water resources (watercourses, rivers and lakes); climate variability impacts on agriculture), Department ofGeology, Faculty of Sciences, Agostinho Neto University (UAN), Luanda
ARGENTINA
Alicia Fernández Cirelli (water quality; aquatic ecosystems; aquatic humic substances; heavymetal pollution; use of macrophytes as biosorbents for simultaneous removal of heavymetals; biotransfer of arsenic from water to the food chain), Director, Center forTransdisciplinary Studies on Water Resources, Faculty of Veterinary Sciences, University ofBuenos Aires (UBA) & National Scientific and Technical Research Council (CONICET),Buenos Aires
Carlos Schulz (hydrogeology; groundwater management planning; water chemistry;groundwater-surface water interactions; trace element contaminants), President IAH ChapterArgentina; Faculty of Exact and Natural Sciences, National University of La Pampa(UNLPam), Santa Rosa, La Pampa
xi

xii Editorial board
ARMENIA
Vilik Sargsyan (hydrology; water resources; assessment of environmental flows;transboundary rivers), Yerevan National University of Architecture and Construction ofArmenia, Yerevan
ARUBA
Filomeno A. Marchena (seawater desalination for the production of drinking and industrialwater: improving excellence performance and efficiency, improvement through theoreticaland practical research and knowledge transfer, sustainable green desalination and energytechnologies for Small Islands Development States (SIDS); drinking water conditioning;corrosion inhibition), Chair “Sustainable Water Technology and Management”, Faculty ofTechnical Sciences, University of Curacao Dr. Moises Da Costa Gomez; President andFounder of the Aruba Sustainable Water Education Foundation FESTAS; National FocalPoint for the International Hydrological Programme (IHP) of UNESCO; Advisor SustainableDesalination Technology and Innovation at WEB Aruba NV, Oranjestad
AUSTRALIA
Habib Alehossein (geothermal aquifers; geomechanics; modeling), School of CivilEngineering and Surveying, Faculty of Health, Engineering and Science, University ofSouthern Queensland (USQ), Toowoomba, QLD
Vasanthadevi Aravinthan (environmental water engineering), School of Civil Engineering andSurveying, Faculty of Health, Sciences and Engineering, University of Southern Queensland(USQ), Toowoomba, QLD
Hui Tong Chua (thermal desalination; low grade heat driven multi-effect distillation), Schoolof Mechanical and Chemical Engineering, University of Western Australia (UWA), Perth, WA
Laszlo Erdei (wastewater treatment; membrane technologies), School of Civil Engineeringand Surveying, Faculty of Health, Engineering and Science, University of SouthernQueensland (USQ), Toowoomba, QLD
Howard Fallowfield (aquatic microbial ecology; health aspects of water quality (drinkingwater, wastewater and recreational waters); design, construction, operation and evaluation ofthe performance of pilot plants for both drinking water and wastewater treatment; applicationof HRAPs for the treatment of wastewaters and on-site biomass energy production; removalof pharmaceuticals and personal care products from water using biological filters), Health &Environment Group, School of the Environment, Flinders University, Bedford Park, SA
Ashantha Goonetilleke (integrated water resources management; climate change adaptation;stormwater quality; pollutant processes and treatment; water sensitive urban design; waterpollution, recycling, security and infrastructure resilience), Science and Engineering Faculty,Queensland University of Technology (QUT), Brisbane, QLD
Stephen Gray (chemical coagulation; membrane distillation; membrane fouling; brinemanagement; solid/liquid separation processes; sustainable water systems; water treatment;silica removal), Director, Institute for Sustainability and Innovation (ISI), Victoria University(VU), Melbourne, VIC
Goen Ho (small and decentralized water supply and wastewater systems), School ofEngineering and Information Technology, Murdoch University, Perth, WA
Sandra Kentish (membrane technology), Department of Chemical and BiomolecularEngineering, University of Melbourne, Melbourne, VIC
Steven Kenway (urban metabolism and the water-energy nexus; quantifying water-energylinkages (cause and effect relationships) in households, industry, water utilities and cities),

Editorial board xiii
School of Chemical Engineering, Faculty of Engineering, Architecture and InformationTechnologies, The University of Queensland (UQ), Brisbane, QLD
Nasreen Islam Khan (water quality assessment; modeling and mapping geogeniccontaminants; arsenic in food chain and mitigation; human health risk assessment andmapping; willingness to pay; climate change impact on land use; GIS and remote sensing),Fenner School of Environment and Society, Australian National University (ANU),Canberra, ACT
Ross Kleinschmidt (natural and anthropogenic radioactive matter in groundwater, surfacewater and soil), Radiation & Nuclear Sciences, Forensic & Scientific Services, HealthSupport Queensland Department of Health, Queensland Government, Coopers Plains, QLD
Mitchell Laginestra (water and wastewater treatment; odor control; winery wastewatermanagement), GHD Australia, Adelaide, SA
Shahbaz Mushtaq (water economics; water-energy nexus; integrated water resourcesmanagement, regional economic modeling, managing climate variability and climate change,risk management and adaptation, water and agricultural policies development), ActingDirector, International Centre for Applied Climate Science, University of SouthernQueensland (USQ), Toowoomba, QLD
Long D. Nghiem (removal of trace contaminants by NF/RO membranes; membrane foulingand autopsy studies; non-potable and indirect potable water reuse; membrane bioreactors;membrane extraction; membrane electrolysis), School of Civil Mining and EnvironmentalEngineering, University of Wollongong (UOW), NSW
Gary Owens (environmental contaminants; environmental risk assessment and remediation;engineered nanoparticles remediation; environmental chemistry and toxicology; metalbioavailability; cost effective in-situ and ex-situ remediation techniques), Division ofInformation Technology, Engineering and the Environment, Future Industries Institute,University of South Australia (UniSA), Adelaide, SA
Neil Palmer (desalination), CEO, National Centre of Excellence in Desalination Australia,Murdoch University, Perth, WA
Ric Pashley (household wastewater treatment and recycling; thermal and membranedesalination; arsenic removal and water sterilization), School of Physical, Environmental &Mathematical Sciences, University of New South Wales (UNSW), Canberra, ACT
Jehangir F. Punthakey (groundwater flow and transport modeling; seawater intrusion; climatechange impacts on water resources; indicators for managing stressed aquifers; groundwaterresource management and protection; agricultural water management; groundwater policies),Director, Ecoseal Pty Ltd, Roseville, NSW & Adjunct at the Institute for Land, Water andSociety, Wagga Wagga Campus, Charles Sturt University, North Wagga Wagga, NSW
Robert J. Seviour (activated sludge microbiology), Department of Microbiology, School ofLife Sciences, Faculty of Science, Technology and Engineering, Latrobe University,Bendigo, VIC
Rodney A. Stewart (water resource management (water end-use analysis, recycled waterstrategies, least cost demand management solutions); environmental management (water andenergy conservation); renewable energy systems (PV systems, battery storage, smart grid);smart asset management; water-energy nexus), Director, Centre for InfrastructureEngineering & Management, Griffith School of Engineering, Griffith University,Gold Coast, QLD
Guangzhi Sun (wastewater treatment; tidal-flow artificial wetlands), Chemical Engineering,School of Engineering, Edith Cowan University (ECU), Perth, WA

xiv Editorial board
Simon Toze (reuse of water in urban environment), CSIRO EcoSciences Precinct – DuttonPark, Dutton Park, QLD
Hao Wang (water and wastewater treatment using activated carbon and graphene-like carbonfrom biomass; hazardous and nuclear waste stabilization using mineral and alkali activatedcement), Leader, Biomass Composites and Green Concrete Programs, Centre of Excellencein Engineered Fibre Composites (CEEFC), University of Southern Queensland (USQ),Toowoomba, QLD
Talal Yusaf (water treatment using micro-organism; ultrasonic applications in watertreatment), Executive Director, USQ International and Development, University of SouthernQueensland (USQ), Toowoomba, QLD
AUSTRIA
Alfred Paul Blaschke (groundwater modeling and management; contaminant transport andbehavior in the subsurface with a focus on microbiology and micropollutants; effects ofinfiltration of treated wastewater; integrated approaches: river – floodplain – infiltration –groundwater – groundwater use; climate change effects on water resources; thermal watersfor water resource purposes), Deputy Head of the Interuniversity Cooperation CentreWater & Health (ICC); Centre for Water Resource Systems, Institute of Hydrology and WaterResource Management, Vienna University of Technology (TU Wien), Vienna
AZERBAIJAN
Farda Imanov (integrated water resource management, including assessment ofenvironmental flows), Chairperson, UNESCO-IHP National Committee of Azerbaijan; Dean,Geography Department, Chair of Hydrometeorology, Baku State University (BSU), Baku
Rashail Ismayilov (hydrometeorology; hydrology; hydroecology; water resourcesmanagement and water supply; ecology and environment; climate change), “Azersu” JointStock Company, Water Canal Scientific Research and Design Institute, Baku
BAHRAIN
Waleed Al-Zubari (water resources; environmental awareness; sustainable development;climate change), Coordinator of the UNU Water Virtual Learning Center for the ArabRegion; Water Resources Management Division, Arabian Gulf University (AGU), Manama
BANGLADESH
Rafiqul Islam (natural resources; environment; climate change mitigation and management;energy technology), Dean, Faculty of Engineering & Technology, Director, Center forClimate Change Study and Resource Utilization, Chairman, Department of NuclearEngineering, University of Dhaka (DU), Dhaka
BELARUS
Valiantsin Ramanouski (water resources; water and wastewater treatment; environmentalengineering and science; sustainability; environmental awareness, impact and compliance),Department of Industrial Ecology, Belarusian State Technological University (BSTU),Central Research Institute for Complex Use of Water Resources, Minsk
BELGIUM
Michel Penninckx (depollution of agroindustrial effluents; bioremediation; valorization ofeffluents), Unit of Microbial Physiology and Ecology (UPEM), Free University of Brussels(ULB), Brussels
Enrico Ulisse Remigi (wastewater process modeling), DHI Group, Merelbeke

Editorial board xv
BELIZE
Ulric O’D Trotz (climate change impacts on small islands including water resources;adaptation across multi sectors and coordinating response to climate change impacts),Deputy Director, Caribbean Community Climate Change Centre, Belmopan
BOLIVIA
Carlos E. Román Calvimontes (hydrology; water and environmental management andmodeling; wastewater use for irrigation), Center for Aerospace Survey and GIS Applicationsfor Sustainable Development of Natural Resources (CLAS), University of San Simón(UMSS); Consultant, Cochabamba
BOSNIA AND HERZEGOVINA
Tarik Kupusovic (water and environment management; hydraulics; resources efficiency; karstenvironment), Civil Engineering Faculty, University of Sarajevo (UNSA); Director,Hydro-Engineering Institute Sarajevo; President, Center for Environmentally SustainableDevelopment, Sarajevo
BOTSWANA
Berhanu F. Alemaw (sustainable water development, management and integrated modeling;surface and groundwater resources, use and management in agriculture; water supply; powerand climate change mitigation; GIS and remote sensing), Hydraulic & Water ResourcesEngineering, Department of Geology, University of Botswana (UB), Gaborone
BRAZIL
Virginia S.T. Ciminelli (wastewater and tailings in mining and metallurgy: environmentalimpact assessment, effluent treatment; aqueous processing of materials), Department ofMetallurgical and Materials Engineering & Director, National Institute of Science andTechnology on Mineral Resources, Water and Biodiversity (INCT-Acqua), Federal Universityof Minas Gerais (UFMG), Belo Horizonte, MG
Luiz R.G. Guilherme (water, wastewater and soil in mining areas: contamination assessment,bioavailability, bioaccessibility and mitigation), Soil Science Department, Federal Universityof Lavras (UFLA), Lavras, MG
Erich Kellner (wastewater stabilization ponds; sustainability indicators to wastewatertreatment systems), Department of Civil Engineering, Center of Exact Sciences andTechnology, Federal University of São Carlos (UFSCar), São Carlos, SP
Eduardo Cleto Pires (aerobic and anaerobic wastewater treatment reactors), Department ofHydraulic and Sanitary Engineering, São Carlos School of Engineering, University of SãoPaulo (USP), São Paulo, SP
Jerusa Schneider (environmental sciences; phytoremediation; phytoextration; soilmanagement, soil pollution, soil quality bioindicators, trace elements and nutrients fromplants; influence of sanitary wastewater disinfection in functional diversity of soil microbialcommunities and vegetable production), Sanitation and Environment Department, School ofCivil Engineering, Architecture and Urban Design, State University of Campinas(UNICAMP), Campinas, SP
BRUNEI
Jaya Narayan Sahu (water treatment using engineered low-cost natural materials, e.g.biogenic waste; sustainable wastewater and waste management; synthesis of nanomaterialsfor water and wastewater treatment; renewable energy; water-energy nexus; microwaveenergy application in chemical reaction engineering), Petroleum and Chemical Engineering
xvi Editorial board
Program, Faculty of Engineering, Institute Technology Brunei (ITB), Our NationalEngineering and Technology University, Brunei Darussalam
BULGARIA
Roumen Arsov (technologies for wastewater treatment; sludge treatment and management;sewer and drainage networks and facilities), Bulgarian Water Association; Faculty ofHydraulic Engineering, Department of Water Supply, Sewerage, Water and WastewaterTreatment, University of Architecture, Civil Engineering and Geodesy (UACEG), Sofia
CAMEROON
Samuel N. Ayonghe (hydrogeology; environmental geology; geophysics), Department ofEnvironmental Science, Faculty of Science, University of Buea (UB), Buea
Mathias Fru Fonteh (water resources management; water policy), Head, Department ofAgricultural Engineering, Faculty of Agronomy and Agricultural Sciences, University ofDschang (UD), Dschang, West Region
CANADA
David Bethune (hydrogeology; water resources management; rural water supply andsanitation; hydrogeology/water resource management training programs in Latin America),founding member, Hydrogeologists Without Borders; International Centre, University ofCalgary (U of C), Calgary, AB
Jeffrey J. McDonnell (isotope hydrology; ecohydrology; hillslope hydrology; foresthydrology), Global Institute for Water Security, University of Saskatchewan (U of S),Saskatoon, SK
Gunilla Öberg (sustainable sewage management in growing urban areas; water futures forsustainable cities; use of science in policy; chlorine biogeochemistry in soil), Institute forResources, Environment and Sustainability (IRES), University of British Columbia (UBC),Vancouver, BC.
Rajinikanth Rajagopal (sustainable agro-food industrial wastewater treatment), Dairy andSwine Research and Development Centre, Agriculture and Agri-Food Canada, Quebec, QC
CHILE
Lorena Cornejo (distribution and dynamics of the chemical elements in water and soil;development, optimization and application of spectroscope techniques for environmentalmatrices; decontamination technologies and water disinfection), Laboratory ofEnvironmental Research on Arid Zones (LIMZA, EUDIM), University of Tarapacá (UTA) &Environmental Resources Area, Research Center of the Man in the Desert (CIHDE), Arica
James McPhee (snow and mountain hydrology; hydrologic modeling; water resourcesengineering), Department of Civil Engineering, Faculty of Physical and MathematicalSciences, University of Chile; Chilean focal point for water in the InterAmerican Network ofAcademies of Sciences (IANAS), Santiago de Chile
Bernabe Rivas (adsorption based water treatment), Faculty of Chemistry & Vice-Rector,University of Concepción (UdeC), Concepción
CHINA
Huaming Guo (water quality; hydrogeology; biogeochemistry; bioaccessibility and in-vivobioavailability to trace contaminants; geochemistry; stable isotopes; environmentalengineering; environmental chemistry), School of Water Resources and Environment, ChinaUniversity of Geosciences – Beijing (CUGB), Beijing
Editorial board xvii
Hong-Ying Hu (wastewater reclamation and reuse; quality evaluation and risk managementof reclaimed water; biological/ecological technologies for environmental pollution controland biomass/bio-energy production (micro-algae based wastewater treatment andbiomass/bio-fuel production)), School of Environment, Tsinghua University (THU), Beijing
Kuan-Yeow Show (accelerated startup and operation of anaerobic reactors; microbialgranulation in wastewater treatment; ultrasound applications in sludge and wastewatertreatment; conversion of sludge and wastes into engineering materials), Department ofEnvironmental Science and Engineering, Fudan University (FDU), Shanghai
Eddy Yong-Ping Zeng (inter-compartmental processes and fluxes of persistent organicpollutants (POPs); bioaccumulation and foodweb transfer of POPs; feasibility of usingsolid-phase microextraction-based technologies to measure freely dissolved concentrations ofPOPs in sediment porewater; human exposure and health risk), Dean, School ofEnvironment, Jinan University (JNU), Guangzhou
COLOMBIA
Claudia Patricia Campuzano Ochoa (water and environment: research, planning,development, policy framework and strategic management; environmental integratedmanagement of water resources and territorial dynamics; water footprint; inter-institutionalcoordination; education and environment; culture), Director of Water and Environment, andCoordinator of the Inter-Institutional Water Agreement at the Antioquia in the Science andTechnology Center Corporation, Medellin, Antioquia
Gabriel Roldán Pérez (limnology and water resources), Colombian focal point for water inthe InterAmerican Network of Academies of Sciences (IANAS); Research Group inLimnology and Water Resources, Catholic University of Oriente (UCO), Antioquia
COSTA RICA
Guillermo Alvarado Induni (geothermal fluids; water chemistry; balneology; interrelationsbetween water chemistry and seismic/volcanic activity), Head, Seismology and Volcanology,Costa Rican Institute of Electricity (ICE), San Jose
CROATIA
Ognjen Bonacci (hydrology; karst hydrology; ecohydrology), Faculty of Civil Engineering,Architecture, and Geodesy, University of Split, Split
CYPRUS
Soteris Kalogirou (solar energy collectors; solar energy for seawater desalination;combination of CSP with desalination), Department of Mechanical Engineering andMaterials Sciences and Engineering, Cyprus University of Technology (CUT), Limassol
CZECH REPUBLIC
Barbora Doušová (water and wastewater treatment; adsorption technologies; study,preparation, modification and testing of new sorbents to the verification of adsorptionproperties of natural matter – soils, sediments, dusts, etc.; geochemical processes on thesolid-liquid interface), Department of Solid State Chemistry, University of Chemistry andTechnology Prague (UCT Prague), Prague
Nada Rapantova (water resources and water quality; hydrogeology; groundwater pollution;groundwater modeling; mine water technology; uranium mining), Faculty of Mining andGeology, VSB – Technical University of Ostrava, Ostrava

xviii Editorial board
Tomáš Vanek (plant biotechnology; natural products chemistry; environment protection;phytotechnologies), Head, Laboratory of Plant Biotechnologies, Institute of ExperimentalBotany, Czech Academy of Sciences, Prague
DEMOCRATIC REPUBLIC OF THE CONGO
Dieudonné Musibono (ecotoxicology; ecosystems health; natural resources management;aquatic biodiversity; environmental & social impact assessment of projects; sustainabledevelopment; mining environment monitoring), Head, Department of Environmental Scienceand Engineering, Faculty of Science, University of Kinshasa; Former Programme Advisorand National Coordinator at UNEP, Kinshasa
DENMARK
Hans Brix (constructed wetlands for the treatment of polluted water; urban stormwater reuse;sustainable water/wastewater management in developing countries), Department ofBioscience, Aarhus University (AU), Aarhus
DOMINICAN REPUBLIC
Osiris de León (urban and industrial water pollution; water scarcity; groundwater explorationand exploitation; geophysical methods; dam sites exploration; environmental assessment forwater pollution identification), Dominican focal point for water in the InterAmerican Networkof Academies of Sciences (IANAS); Commission of Natural Sciences and Environment ofthe Science Academy, Academy of Sciences of the Dominican Republic, Santo Domingo
EGYPT
Fatma El-Gohary (water reuse), Water Pollution Research Department, National ResearchCentre, Dokki
Mohamed Fahmy Hussein (isotope hydrology and geochemistry applied in the holisticapproach on surface and groundwater resources use; conservation and improvement of waterquality; water management by integrating unsaturated and saturated zones and the potentialpromotion of water users implication in the control of water resources in the irrigated soilsvia water treatment and reuse), Soil and Water Department, Faculty of Agriculture, CairoUniversity (CU), Cairo
ESTONIA
Ülo Mander (landscape ecology (nutrient cycling at landscape and catchment levels) andecological engineering (constructed wetlands and riparian buffer zones: design andperformance), Department of Geography, Institute of Ecology and Earth Sciences,University of Tartu (UT), Tartu
ETHIOPIA
Tesfaye Tafesse (transboundary water issues, with emphasis on the Nile; natural resourcesmanagement and institutions; rural development and agricultural problems in the ThirdWorld), College of Social Sciences, Addis Ababa University (AAU), Addis Ababa
Taffa Tulu (watershed hydrology; watershed management; water resources engineering;irrigation engineering; water harvesting), Center of Environment and Development, Collegeof Development Studies, Addis Ababa University (AAU), Addis Ababa
FEDERATED STATES OF MICRONESIA
Leerenson Lee Airens (water supply for Small Islands Development States (SIDS)),GEF IWRM Focal Point; Manager, Water Works, Pohnpei Utilities Corporation (PUC),Pohnpei State
Editorial board xix
FIJI
Johann Poinapen (water and wastewater engineering and management; design and operationof water and wastewater treatment plants including membrane systems (MF & RO); brinetreatment (thermal technologies); mine water treatment; water recycling), Acting Director,Institute of Applied Sciences, University of the South Pacific (USP), Suva
FINLAND
Riku Vahala (drinking water quality and treatment), Water and Environmental Engineering,Department of Civil and Environmental Engineering, School of Engineering, AaltoUniversity, Aalto
FRANCE
Catherine Faur (water treatment involving fluid-solid interactions; engineering of polymermembranes by twin product – processes approaches), Department Engineering of MembraneProcesses, University of Montpellier (UM), Montpellier
GEORGIA
Givi Gavardashvili (water management; erosion-debris flow processes; floods),Ts. Mirstkhulava Water Management Institute, Georgian Technical University (GTU),Tbilisi
GERMANY
Regina Maria de Oliveira Barros Nogueira (water and wastewater biology), Institute forSanitary Engineering and Waste Management, Leibnitz University Hannover,Hannover
Jan Hoinkis (membrane technologies; membrane bioreactor technology; water andwastewater treatment; water reuse; sensor and control systems in water treatment), Instituteof Applied Research, Karlsruhe University of Applied Sciences (HsKA), Karlsruhe
Heidrun Steinmetz (resource oriented sanitation (nutrient recovery, energy efficiency);biological and advanced wastewater treatment; water quality management), Chair of SanitaryEngineering and Water Recycling, University of Stuttgart, Stuttgart
GREECE
Maria Mimikou (hydrology; water resources management; hydro-energy engineering; climatechange), School of Civil Engineering, National Technical University of Athens (NTUA),Athens
Anastasios Zouboulis (water and wastewater treatment; biotechnological applications),School of Chemistry, Aristotle University of Thessaloniki (AUTH), Thessaloniki
HAITI
Urbain Fifi (hydrogeology; environment engineering; groundwater quality and pollution;water resources management; hydrogeological modeling), President of IHP Haitian NationalCommittee for UNESCO; Head of Research Master in “Ecotoxicology, Environment andWater Management”, Faculty of Sciences, Engineering and Architecture, UniversityQuisqueya, Haut de Turgeau, Port-au-Prince
HONDURAS
Sadia Iraisis Lanza (water resources and climate change; physical hydrogeology; hydrology;water quality), Physics Department, National Autonomous University of Honduras (UNAH),San Pedro Sula, Cortés
xx Editorial board
HONG KONG
Jiu Jimmy Jiao (hydrogeology; influence of groundwater and rainfall on landslides; impact ofhuman activities on groundwater regimes; dewatering system design; contaminant fate andtransport modeling and groundwater remediation design; global optimization approaches forparameter identification in flow and transport modeling; parameter sensitivity analysis andits influence on parameter estimation), Editor Hydrogeology Journal; Department of EarthSciences, The University of Hong Kong (HKU), Hong Kong
HUNGARY
László Somlyódy (wastewater treatment; environmental engineering), past President of theInternational Water Association (IWA), Head, Department of Sanitary and EnvironmentalEngineering, Faculty of Engineering, Budapest University of Technology and Economics(BME), Budapest
INDIA
Makarand M. Ghangrekar (wastewater treatment in microbial fuel cell and electricitygeneration), Department of Civil Engineering, Indian Institute of Technology – Kharagpur(IIT Kgp), Kharagpur, West Bengal
Arun Kumar (environmental management of water bodies), Alternate Hydro Energy Centre,Indian Institute of Technology – Roorkee (IITR), Roorkee, Uttarakhand
Rakesh Kumar (urban hydrology; hydrological modeling; watershed management; droughtmitigation and management; flood estimation, routing, management and socio-economicaspects; impact of climate change on water resources), Head, Surface Water HydrologyDivision, National Institute of Hydrology (NIH), Roorkee, Uttarakhand
Abhijit Mukherjee (physical, chemical and isotope hydrogeology; modeling of groundwaterflow and solute transport; hydrostratigraphy; contaminant fate and transport; surfacewater-seawater-groundwater interactions; effect of climate change on water resources;mine-site hydrology; environmental geochemistry), Department of Geology and Geophysics,Indian Institute of Technology – Kharagpur (IIT Kgp), Kharagpur, West Bengal
INDONESIA
Budi Santoso Wignyosukarto (water resources; low land hydraulics, mathematical modeling),Department of Civil & Environmental Engineering, Faculty of Engineering, Gagjah MadaUniversity (UGM), Yogyakarta
IRAN
Ahmad Abrishamchi (water resources and environmental systems: analysis and management),Chairholder, UNESCO Chair in Water and Environment Management for Sustainable Cities;Department of Civil Engineering, Sharif University of Technology (SUT), Tehran
ISRAEL
Ofer Dahan (vadose zone and groundwater hydrology; quantitative assessment of waterinfiltration and groundwater recharge; water flow and contaminant transport through thevadose zone; arid land hydrology; monitoring technologies for the deep vadose zone),Department of Hydrology & Microbiology, Zuckerberg Institute for Water Research,Blaustein Institute for Desert Research, Ben Gurion University of the Negev (BGU), SdeBoker Campus, Ben Gurion
Michael Zilberbrand (groundwater resources; hydrogeochemical processes andhydrogeological and hydrogeochemical modeling in aquifers and in the unsaturated zone),Israeli Water Authority, Hydrological Service, Jerusalem
Editorial board xxi
ITALY
Alessandra Criscuoli (membrane science and technology; membrane distillation andmembrane contactors; integrated membrane processes; water and wastewater treatment;desalination of brackish water and seawater), Institute on Membrane Technology, ITM-CNR,Rende (CS)
Enrico Drioli (membrane science and engineering; membrane preparation and transportphenomena in membranes; desalination of brackish and saline water; integrated membraneprocesses; membrane distillation and membrane contactors; catalytic membrane and catalyticmembrane reactors; salinity gradient energy fuel cells), Institute on Membrane Technology,ITM-CNR, Rende (CS)
Alberto Figoli (membrane science and technology; membrane preparation andcharacterization; transport phenomena in membranes; pervaporation; water and wastewatertreatment; desalination of brackish and saline water), Institute on Membrane Technology,ITM-CNR, Rende (CS)
Marco Petitta (groundwater pollution, management, and protection), President IAH ChapterItaly; Department of Earth Sciences, Sapienza University of Rome, Rome
Ludovico Spinosa (sludge management), (retired) National Research Council (CNR);Consultant at Governmental Commissariat Environmental Emergencies in Region Puglia;Convenor at ISO/TC275/WG6 (Thickening and Dewatering) and CEN/TC308/WG1(Process Control Methods) on sludge standardization
JAMAICA
Arpita Mandal (hydrology; hydrogeology; water resources and impacts of climate change;water supply; climate variability; flood risk and control; hydrochemistry of groundwater;saline water intrusion), Department of Geography and Geology, University of the West Indies(UWI), Mona Campus, Mona, Kingston
JAPAN
Hiroaki Furumai (build-up and wash-off of micropollutants in urban areas; characterizationof DOM/NOM in lakes and reservoirs for drinking water sources; fate and behavior of DOMin flocculation and advanced oxidation processes; biological nutrient removal fromwastewater; modeling activated sludge in aerobic/anaerobic SBR; characterization ofdomestic sewage from the viewpoint of nutrient removal), Board of Directors, IWA;Department of Urban Engineering, The University of Tokyo (Todai), Tokyo
Makoto Nishigaki (modeling groundwater and multiphase flow and solute transport in porousmedia; modeling seepage in the saturated-unsaturated zone; development of methods ofmeasuring hydraulic properties in rock mass), Department of Environmental and CivilDesign, Faculty of Environmental Science and Technology, Okayama University,Okayama
Taikan Oki (global water balance and world water resources; climatic variation and the Asianmonsoon; land-atmosphere interaction and its modeling; remote sensing in hydrology;temporal and spatial distribution of rainfall), Institute of Industrial Science, The University ofTokyo, Komaba, Tokyo
Yuichi Onda (hillslope hydrology; hydro-geomorphology; radionuclide transfer; foresthydrology), Center for Research in Isotopes and Environmental Dynamics, University ofTsukuba, Tsukuba, Ibaraki
Kaoru Takara (innovative technologies for predicting floods; global environmental changes;risk and emergency management; interactions between social changes and hydrologicalcycle/water-related disasters; disaster mitigation strategy; policy development; integrated
xxii Editorial board
numerical modeling for lakes and surrounding catchments), Director, Disaster PreventionResearch Institute, Kyoto University (Kyodai), Kyoto
JORDAN
Fawzi A. Banat (desalination), Department of Chemical Engineering, Jordan University ofScience and Technology (JUST), Irbid
Samer Talozi (irrigation and water resources engineering, planning and policy), CivilEngineering Department, Jordan University of Science and Technology (JUST), Irbid
KENYA
Daniel Olago (environmental geology; surface and sub-surface water chemistry anddynamics; water-energy and related nexuses; human impact on the environment, globalchange processes, vulnerability and adaptation to climate change: past and present;environmental policies, laws and regulations and capacity development in globalenvironmental change), Chairman, Network of African Science Academies (NASAC) WaterProgram; Member, International Lake Environment Committee; Member and focal point forwater, Kenya National Academy of Sciences (KNAS); Institute for Climate Change andAdaptation (ICCA) & Department of Geology, University of Nairobi, Nairobi
Mwakio Tole (water and geothermal energy resources; waste disposal; environmental impactassessment), School of Environmental and Earth Sciences, Department of EnvironmentalSciences, Pwani University, Kilifi
KOREA
Jaeweon Cho (water reuse; membrane filtration; ecological engineering (treatment wetland);desalination), School of Urban and Environmental Engineering, Ulsan Institute of Scienceand Technology (UNIST), Ulsan
KYRGYZSTAN
Bolot Moldobekov (hydrogeology; engineering geology; geographic information systems –GIS; geoinformatics; interdisciplinary geosciences; natural hazards), Co-Director,Central-Asian Institute for Applied Geosciences (CAIAG), Bishkek
LATVIA
Maris Klavinš (aquatic chemistry; geochemical analysis; environmental pollution and itschemical analysis; environmental education, including also political and social sciences),Head, Department of Environmental Science, University of Latvia (LU), Riga
LITHUANIA
Robert Mokrik (groundwater resources, flow and transport modeling; hydrogeochemistry andgroundwater isotopes; palaeohydrogeology), Department of Hydrogeology and EngineeringGeology, Faculty of Natural Sciences, Vilnius University, Vilnius
LUXEMBOURG
Joachim Hansen (wastewater treatment; micropollutants; wastewater reuse; water-energynexus), Engineering Science – Hydraulic Engineering, Faculty of Science, Technology andCommunication, University of Luxembourg – Campus Kirchberg, Luxembourg
MADAGASCAR
Désiré Rakotondravaly (hydrology; hydrogeology; hydraulics; geology; rural water supply;vulnerability mapping; water and sanitation; GIS; project management; capacity building;community development; conservation; development cooperation), Ministry of Mines,Antananarivo
Editorial board xxiii
MALAWI
Victor Chipofya (urban water utility operation and management; groundwater development,monitoring and management; groundwater quality; rural water supply; water and sanitation inperi-urban and rural areas; water reuse; hygiene promotion), Executive Director, Institute ofWater and Environmental Sanitation (IWES); National Coordinator of the Malawi WaterPartnership (MWP); Steering Committee Member: Water Supply and SanitationCollaborative Council (WSSCC) for Eastern and Southern Africa, Blantyre
MALAYSIA
Mohamed Kheireddine Aroua (separation processes; water and wastewater treatment),Director, Centre for Separation Science & Technology (CSST), Department of ChemicalEngineering, Faculty of Engineering, University of Malaya (UM), Kuala Lumpur
Hamidi Abdul Aziz (water supply engineering; wastewater engineering; solid wastemanagement), School of Civil Engineering, University of Science Malaysia (USM),Engineering Campus, Nibong Tebal, Penang
Ali Hashim (separation processes – flotation; liquid-liquid extraction; water and wastewatertreatment; ionic liquids – synthesis and applications), Department of Chemical Engineering,Faculty of Engineering, University of Malaya (UM), Kuala Lumpur
Ahmad Fauzi Ismail (development of membrane technology for reverse osmosis,nanofiltration, ultrafiltration and membrane contactor), Deputy Vice Chancellor(Research & Innovation) & Founder and Director, Advanced Membrane TechnologyResearch Center (AMTEC), University of Technology Malaysia (UTM), Johor Bahru,Kuala Lumpur
Hilmi Mukhtar (membrane development; membrane modeling; membrane applicationsincluding wastewater treatment engineering and natural gas separation), Department ofChemical Engineering, Faculty of Engineering, Petronas University of Technology (UTP),Bandar Seri Iskandar, Perak
Mohd Razman Bin Salim (water and wastewater treatment), Deputy Director, Centre forEnvironmental Sustainability and Water Security (IPASA), Faculty of Civil Engineering,University of Technology Malaysia (UTM), Johor Bahru, Johor
Saim Suratman (hydrogeology; groundwater management), Deputy Director General,National Hydraulics Research Institute of Malaysia (NAHRIM), Seri Kembangan SelangorDarul Ehsan, Malaysia
Wan Azlina Wan Ab Karim Ghani (chemical and environmental engineering; biochar andcomposites for water, wastewater and soil treatment; biomass conversion; biomass energy),Research Coordinator, Department of Chemical & Environmental Engineering, Faculty ofEngineering, Putra University Malaysia (UPM), Serdang
MALTA
Kevin Gatt (governance, policy and planning issues related to water resources; wastemanagement and sustainable development), Faculty for the Built Environment, University ofMalta (UoM), Tal-Qroqq, Msida
MAURITIUS
Arvinda Kumar Ragen (wastewater engineering; constructed wetlands for householdgreywater; water pollution control in sugar factories; environmental impact assessment),Department of Chemical & Environmental Engineering, Faculty of Engineering,University of Mauritius (UoM), Le Reduit, Moka.
xxiv Editorial board
MEXICO
Ma. Teresa Alarcón Herrera (water resources; water treatment using artificial wetlands),Director, Durango Unit of the Advanced Materials Research Center (CIMAV), Durango, Dgo.
Maria Aurora Armienta (hydrogeology; trace element contaminants; water treatment usinggeological materials), Institute of Geophysics, National Autonomous University of Mexico(UNAM), Ciudad Universitaria, Mexico City, D.F.
Sofia Garrido Hoyos (drinking water; collection and treatment of rainwater; biologicalwastewater treatment; treatment and/or utilization of sludge and biosolids), Mexican Instituteof Water Technology (IMTA), Jiutepec, Mor.
Luz Olivia Leal Quezada (environmental engineering; environmental chemistry; automationof chemical analysis techniques for environmental monitoring, particularly for thedetermination and speciation of trace elements; techniques for determining water quality andchemical aspects of their treatment), Advanced Materials Research Center (CIMAV),Environment and Energy Department, Chihuahua, Chih.
MOROCCO
Lhoussaine Bouchaou (hydrology; water quality; aquatic ecosystems; environmental impactassessment; climatology; climate change), President IAH Chapter Morocco; AppliedGeology and Geo-Environment Laboratory, Faculty of Sciences, University Ibn Zohr (UIZ),Agadir
MOZAMBIQUE
Catine Chimene (municipal water and infrastructure; water supply engineering; agriculturalwater; rural development), Higher School of Rural Development (ESUDER), EduardoMondlane University (UEM), Inhambane, Vilankulo
MYANMAR
Khin-Ni-Ni Thein (hydroinformatics, integrated water resources management, river basinmanagement, coastal-zone management, sustainable hydropower assessment, disaster riskreduction, climate change; sustainability; capacity building; community development; waterand environmental policy; public policy analysis; green economy and green growth),Secretary, Advisory Group, Member, National Water Resources Committee; Advisory GroupMember, National Disaster Management Committee; Founder and President, Water, Researchand Training Centre (WRTC); Visiting Senior Professor, Yangon Technological University(YTU), Yangon, Myanmar; Regional Water Expert for Green Growth, UNESCAP
NAMIBIA
Benjamin Mapani (groundwater recharge and vulnerability mapping; groundwaterdevelopment, management, monitoring and modeling; environmental hydrogeology; climatechange), Board of Trustees, WaterNet; Department of Geology, University of Namibia(UNAM), Windhoek
NEPAL
Bandana K. Pradhan (environment and public health), Department of Community Medicineand Public Health, Institute of Medicine, Tribhuvan University (TU), Maharajgunj

Editorial board xxv
NEW ZEALAND
David Hamilton (modeling of water quality in lakes and reservoirs; sediment-waterinteractions in lakes; boom-forming algae, particularly cyanobacteria; ice cover in lakes),Environmental Research Institute (ERI), University of Waikato, Waikato
NICARAGUA
Andrew Longley (hydrogeology; groundwater engineering; catchment studies andgroundwater modeling; international development: projects in the water, geothermal,agriculture, environment and health sectors; rural water supply; arsenic contamination:mapping, hydrogeology, epidemiology; bridging the gap between academia, industry, publicand charity sectors), Director, Nuevas Esperanzas UK, León
Katherine Vammen (aquatic microbiology; climate change and water resources; water supplyand sanitation for the poor; urban waters), Co-Chair of the Water Programme of theInteramerican Network of the Academies of Science; Nicaraguan focal point for waterprogramme in the InterAmerican Network of Academies of Sciences (IANAS); CentralAmerican University, Managua
NIGERIA
Peter Cookey (sustainable water and wastewater management in developing countries),Rivers State College of Health Science and Technology, Port Harcourt, Nigeria andEarthwatch Research Institute (EWRI), Port Harcourt
NORWAY
Torleiv Bilstad (water, oil and gas separation; environmental science and engineering),Former President of EWA-Norway; Department of Mathematics and Natural Sciences,University of Stavanger (UiS), Stavanger
Hallvard Ødegaard (water and wastewater treatment; innovative solutions for integratedapproaches to urban water management), Department of Hydraulic and EnvironmentalEngineering, Norwegian University of Science and Technology (NTNU), Trondheim
OMAN
Mohammed Zahir Al-Abri (thermal desalination; water and wastewater treatment;nanotechnology), Petroleum and Chemical Engineering Department, Sultan QaboosUniversity (SQU), Al Khoudh, Muscat
PAKISTAN
Ghani Akbar (agricultural engineering; integrated water management; soil and waterconservation and climate-smart agricultural practices), Program Leader, IntegratedWatershed Management Program (IWMP), Climate Change, Alternate Energy and WaterResources Institute (CAEWRI), National Agricultural Research Centre (NARC), ChakShahzad, Islamabad
PALESTINIAN AUTONOMOUS AREAS
Marwan Haddad (interdisciplinary approaches to water resources and quality management;renewable energy; recycling), Director, Water and Environmental Studies Institute, An NajahNational University, Nabus
PANAMA
José R. Fábrega (sustainable water and wastewater management; environmental fate ofchemicals in water and soil systems), Panamanian focal point for water in theInterAmerican Network of Academies of Sciences (IANAS); Hydraulic and
xxvi Editorial board
Hydrotechnical Research Center (CIHH), Technological University of Panama (UTP),Panama City
PARAGUAY
Alicia Eisenkölbl (environmental management; environmental impact assessment;trans-boundary aquifers; rural development), Faculty of Agricultural Sciences Hohenau,Catholic University Our Lady of the Assumption (UCA), Campus Itapúa,Encarnación
PERU
Nicole Bernex Weiss de Falen (integrated water resources management; human sustainabledevelopment; climate change adaptation; integrated ecosystemic services, water managementand risks (droughts and floods) with land planning at a water basin, regional and nationallevel), Peruvian focal point for water in the InterAmerican Network of Academies ofSciences (IANAS); member of the technical Committee of Global Water Partnership GWP;LAC Chair in the CST of the UNCCD; Center of Research in Applied Geography (CIGA),Pontifical Catholic University of Peru (PUCP), Lima
PHILIPPINES
Victor Ella (surface and groundwater hydrology; irrigation and drainage engineering; waterquality; simulation modeling; wastewater engineering; contaminant transport in soils;geostatistics; hydraulic engineering), Land and Water Resources Division, Institute ofAgricultural Engineering, College of Engineering and Agro-Industrial Technology, Universityof the Philippines Los Baños (UPLB), College, Laguna
POLAND
Marek Bryjak (adsorption based water treatment), Department Polymer & Carbon Materials,Wrocław University of Technology, Wrocław
Wieslaw Bujakowski (geothermics), Mineral and Energy Economy Research Institute, PolishAcademy of Sciences (PAS), Kraków
Jacek Makinia (wastewater treatment; nutrient removal and recovery from wastewater),Faculty of Hydro and Environmental Engineering, Vice-Rector for Cooperation andInnovation, Gdansk University of Technology (GUT), Gdansk
Barbara Tomaszewska (monitoring of the aquatic environments; geothermics; scaling ofgeothermal systems; membrane technologies for geothermal water treatment for waterresource purposes), AGH University of Science and Technology; Mineral and EnergyEconomy Research Institute, Polish Academy of Sciences (PAS MEER), Kraków
PORTUGAL
Maria do Céu Almeida (sewer processes and networks), National Laboratory of CivilEngineering (LNEC), Lisbon
Helena Marecos (water reuse), Civil Engineering Department, Lisbon Engineering SuperiorInstitute (ISEL), Lisbon
Helena Ramos (water-energy nexus; energy efficiency and renewable energies; hydraulics;hydrotransients; hydropower; pumping systems; leakage control; water supply; watervulnerability), Department of Civil Engineering, University of Lisbon (ULisboa), Lisbon
Editorial board xxvii
QATAR
Farid Benyahia (immobilized nitrifiers in wastewater treatment; membrane distillationdesalination; water quality and energy efficiency analysis; airlift bioreactors; low-grade heatin membrane distillation for freshwater production; bioremediation of oil spills; development,design and evaluation of advanced refinery wastewater treatment processes), College ofEngineering, Department of Chemical Engineering, Qatar University (QU), Doha
Patrick Linke (design, engineering and optimization of efficient processes, integratedsystems and associated infrastructures; efficient utilization of natural resources (energy,water and raw materials); water-energy-food nexus), Chair, Chemical Engineering Program,Texas A&M University at Qatar (TAMUQ), Managing Director of the Qatar SustainableWater and Energy Utilization Initiative (QWE) at TAMUQ, Qatar Environment and EnergyResearch Institute (QEERI), Doha
REPUBLIC OF GUINEA
Hafiziou Barry (integrated water resources management), Polytechnic Institute, UniversityGamal Abdel Nasser, Conakry
ROMANIA
Anton Anton (pumping stations; municipal water networks), Hydraulics and EnvironmentalProtection Department, Technical University of Civil Engineering (UTCB), Bucharest
RUSSIAN FEDERATION
Sergey Pozdniakov (water resources; water quality; hydrogeology; contaminant transport;geostatistics; water balance; climate change), Faculty of Geology, Moscow State University(MSU), Moscow
RWANDA
Omar Munyaneza (hydrology; climate change and water resources management), College ofScience and Technology, Department of Civil Engineering, University of Rwanda (UR),Kigali
SAUDI ARABIA
Noreddine Ghaffour (renewable energy for desalination and water treatment), WaterDesalination and Reuse Research Center, King Abdullah University of Science andTechnology (KAUST), Thuwal
Mattheus Goosen (renewable energy for desalination and water treatment; membranes),Office of Research and Graduate Studies, Alfaisal University, Riyadh
SENEGAL
Alioune Kane (water quality; hydraulics; water-poverty relationships; climate variability andwater availability), Director of the Master Programme GIDEL (Integrated Management andSustainable Development of Coastal West Africa); Coordinator of WANWATCE (CentresNetwork of Excellence for Science and Water Techniques NEPAD), Department ofGeography, Cheikh Anta Diop University (UCAD), Dakar
SERBIA
Petar Milanovic (karst hydrogeology; theory and engineering practice in karst), PresidentIAH Chapter Serbia and Montenegro, Belgrade

xxviii Editorial board
SINGAPORE
Vladan Babovic (hydroinformatics; data assimilation; data mining), Department of Civil andEnvironmental Engineering, National University of Singapore (NUS), Singapore
Jiangyong Hu (water treatment technology; water quality; water reuse; health impacts),Department of Civil and Environmental Engineering & Co-Director, Centre for WaterResearch, National University of Singapore (NUS), Singapore
SLOVAKIA
Ján Derco (environmental engineering; nutrients removal; ozone-based oxidation processes;water resources protection; water and wastewater technology), Institute of Chemical andEnvironmental Engineering, Faculty of Chemical and Food Technology, Slovak University ofTechnology (SUT), Bratislava
SLOVENIA
Boris Kompare (wastewater treatment; modeling), Past President EWA-Slovenia; Faculty ofCivil Engineering and Geodesy, University of Ljubljana (UL), Ljubljana
SOMALIA
Abdullahi Mohumed Abdinasir (water resources management; groundwater governance;water supply), Ministry of Water, Petroleum, Energy and Mineral Resources, Mogadishu
SOUTH AFRICA
Tamiru A. Abiye (community water supply problems; water quality assessment andmonitoring; hydrochemical modeling; groundwater flow and solute transport; trace metals ingroundwater; surface and groundwater interactions; climate change impact on groundwater;spatial and temporal variability of groundwater recharge), School of Geosciences, Faculty ofScience (East Campus), University of the Witwatersrand (Wits University), Johannesburg
Hamanth C. Kasan (sustainable water and wastewater management in developing countries),General Manager, Scientific Services Division, Rand Water; President, African WaterAssociation (AfWA), Johannesburg
Sabelo Mhlanga (water-energy nexus; nano-structured materials for water purification andrecovery; energy-efficient and antifouling membrane filtration technologies for watertreatment; community involvement in water related problems in rural communities; greenchemistry), Deputy Director, Nanotechnology and Water Sustainability (NanoWS) ResearchUnit, College of Science Engineering and Technology, University of South Africa (Unisa),Johannesburg
Anthony Turton (water-energy-food nexus; hydropolitical risk model; mine watermanagement; mine closure planning and strategies; groundwater governance; wastewaterreuse), Director, Environmental Engineering Institute of Africa; Centre for EnvironmentalManagement, University of Free State (UFS), Bloemfontein; professor at UNESCO Chair inGroundwater, Department of Earth Sciences, University of Western Cape (UWC)
SPAIN
José Ignacio Calvo (membrane technologies; modifications of structure and surfaceproperties of membranes to increase selectivity), School of Agriculture, Food Technology andForestry, ETSIIAA, University of Valladolid (UVa), Palencia
Jesús Colprim (small water supply and wastewater systems), Laboratory of Chemical andEnvironmental Engineering (LEQUIA), Institute of Environment, University of Girona(UdG), Girona
Editorial board xxix
Elena Giménez-Forcada (hydrogeology; hydrogeochemistry; water quality; groundwatercontamination; trace elements), Geological Survey of Spain (IGME), Salamanca
J. Jaime Gómez-Hernández (stochastic hydrogeology; geostatistics; inverse modeling;nuclear waste disposal), Head of the Group of Hydrogeology, Research Institute of Water andEnvironmental Engineering, UPV, Valencia
Aurora Seco Torrecillas (nutrient removal and recovery from wastewater; anaerobicmembrane bioreactor for wastewater treatment (WWT); microalgae cultivation for WWT),Chemical Engineering Department, University of Valencia (UV), Valencia
Guillermo Zaragoza (solar energy for desalination; thermal and membrane technologies forwater treatment), Solar Platform of Almería (PSA-CIEMAT), Almería
SRI LANKA
Nadeeka S. Miguntanna (urban stormwater quality and monitoring; surrogate water qualityparameters; urban water pollution; rainwater harvesting), Environmental EngineeringLaboratory, Department of Civil and Environmental Engineering, Faculty of Engineering,University of Ruhuna (UOR), Hapugala, Galle
Meththika Suharshini Vithanage (water quality; water chemistry; impact of tsunamis onaquifers; groundwater modeling; soil and water monitoring for pollution; mechanisticmodeling of biochar and nano materials for water and soil remediation (landfill leachates,nutrients and toxic metal(loid)s)), Group Leader – Chemical and Environmental SystemsModeling Research Group, National Institute of Fundamental Studies (NIFS), Kandy
SUDAN (REPUBLIC OF)
Abdin Mohamed Ali Salih (environmental sciences with emphasis on water resourcesmanagement in arid and semi-arid zones), Board Member at UNESCO-IHE; CivilEngineering Department, Faculty of Engineering, The University of Khartoum (UofK),Khartoum
SURINAME
Sieuwnath Naipal (hydrology; climate change impact on climate variability; marine andcoastal engineering), Anton De Kom University of Suriname (AdeKUS), Tammenga
SWAZILAND
Absalom M. Manyatsi (land and water resources management; environmental impactassessment; remote sensing; GIS and spatial climate change impacts; climate changeadaptation and mitigation; climate smart agriculture; climate change and climate variabilityimpacts on water resources and agriculture), Head of Department, Agricultural andBiosystems Engineering Department, University of Swaziland (UNISWA), Luyengo
SWEDEN
Prosun Bhattacharya (groundwater resources; hydrogeochemistry; arsenic), Coordinator,KTH-International Groundwater Arsenic Research Group, Department of SustainableDevelopment, Environmental Science and Engineering, Royal Institute of Technology(KTH), Stockholm
Joydeep Dutta (application of nanotechnology for water treatment; water-environment-energynexus; photocatalytic materials, electrocatalysis and capacitive desalination of water,plasmon resonance sensors for heavy metal ion detection), Chair, Functional MaterialsDivision, Materials- and Nano Physics Department, ICT School, Kista, Stockholm
Gunnar Jacks (hydrology; hydrogeology; hydrochemistry; groundwater chemistry;groundwater arsenic and fluoride; acidification of soil and groundwater; artificial
xxx Editorial board
groundwater recharge; water supply and sanitation in suburban areas), (retired) Departmentof Sustainable Development, Environmental Science and Engineering, Royal Institute ofTechnology (KTH), Stockholm
Erik Kärrman (sustainable wastewater management; decision support and multi-criteriaanalysis of municipal and local water and wastewater systems), Director of Research andDevelopment, Urban Water & Royal Institute of Technology (KTH), Stockholm
Andrew Martin (membrane distillation for desalination and water purification; biomass andmunicipal solid waste; polygeneration), Department of Energy Technology, Royal Institute ofTechnology (KTH), Stockholm
Aapo Sääsk (development of polygeneration and zero liquid discharge), CEO, ScarabDevelopment AB, Stockholm
Nury Simfors (geothermal exploration, geogenic trace contaminants, GISand hazard mitigation), MVI/MTA, Swedish National Defence University (FHS),Stockholm
SWITZERLAND
Annette Johnson (geochemistry of inorganic contaminants in surface- and groundwater;chemistry of the mineral-water interface; geogenic contamination of groundwater anddrinking water; waste management), Leader, Department of Water Resources and DrinkingWater, Swiss Federal Institute of Aquatic Science and Technology (Eawag),Düebendorf
Eberhard Morgenroth (biological wastewater treatment using activated sludge, granularbiomass, or biofilm based systems; biological drinking water treatment; mixed cultureenvironmental biotechnology for bioenergy production; mathematical modeling; sustainabledevelopment of urban water management), Chair of Process Engineering in Urban WaterManagement, ETH Zurich & Swiss Federal Institute of Aquatic Science and Technology(Eawag), Dübendorf
Thomas Wintgens (water reuse), Institute for Ecopreneurship, School for Life Sciences,University of Applied Sciences and Arts Northwestern Switzerland (FHNW),Muttenz
TAIWAN
How-Ran Guo (epidemiology; environmental health and medicine; health impacts of watercontaminants; cancers and chronic diseases in endemic areas of arsenic intoxication;epidemiologic characteristics of diseases associated with arsenic), Department ofEnvironmental and Occupational Health, College of Medicine, National Cheng-KungUniversity (NCKU), Tainan
Tsair-Fuh Lin (analysis and monitoring of algae, cyanobacteria and metabolites; watertreatment; site remediation; adsorption technology), Director, Global Water Quality ResearchCenter, Department of Environmental Engineering, National Cheng-Kung University(NCKU), Tainan
Jyoti Prakash Maity (water and wastewater treatment with microbes and algae), Departmentof Earth and Environmental Sciences, National Chung Cheng University (CCU),Ming-Shung, Chiayi County
TANZANIA
Jamidu H.Y. Katima (sustainable wastewater management), College of Engineering andTechnology, University of Dar es Salaam (UDSM), Dar es Salaam
Editorial board xxxi
THAILAND
Nathaporn Areerachakul (rainwater utilization; photocatalytic hybrid systems), GraduateSchool, Suan Sunandha Rajhabhat University (SSRU), Dusit, Bangkok
Mukand S. Babel (hydrologic and water resources modeling as applied to integrated waterresources management; watershed modeling and management; water resources allocation andmanagement; water resources and socio-economic development; water supply system andmanagement; climate change impact and adaptation in the water sector), Coordinator, WaterEngineering and Management (WEM), Director, COE for Sustainable Development in theContext of Climate Change (SDCC), Asian Institute of Technology (AIT), Pathumthani
Thammarat Koottatep (sustainable wastewater management in developing countries;decentralized waste and wastewater treatment systems; eco-engineering technology forwastewater treatment and management; environmental health and sanitation), EnvironmentalEngineering and Management, School of Environment, Resources and Development, AsianInstitute of Technology (AIT), Khlong Luang, Pathum Thani
Chongrak Polprasert (sustainable wastewater management technology; hazardous waste mini-mization and control; global warming and climate change mitigation and adaptation), Depart-ment of Civil Engineering, Faculty of Engineering, Thammasat University (TU), Bangkok
Wipada Sanongraj (water and air pollution control and modeling), Chemical EngineeringDepartment, Ubon Ratchathani University (UBU), Ubon Ratchathani
Sangam Shrestha (hydrology and water quality model development; water and climatechange impacts and adaptation; water-energy-climate change nexus; impacts of climatechange on: agriculture and food security, urbanization, land use and forestry, water supplyand sanitation, infrastructure, and energy security), Water Engineering and Management,School of Engineering and Technology, Asian Institute of Technology (AIT), Pathumthani
THE NETHERLANDS
Arslan Ahmad (removal of arsenic, chromium, fluoride, iron, manganese, pharmaceuticalresidues, emerging compounds from drinking water, and industrial water treatment forrecovery of salts through eutectic freeze crystallization process), KWR Watercycle ResearchInstitute, Nieuwegein
Tony Franken (membrane technologies; nanofiltration; reverse osmosis; membranedistillation), Director, Membrane Application Centre Twente (MACT bv), Enschede
Antoine J.B. Kemperman (membrane technology), Faculty of Science and Technology,University of Twente (UT), Enschede
TONGA
Taaniela Kula (water supply for Small Islands Development States (SIDS)), GEF- IWRMFocal Point; Deputy Secretary for Natural Resources Division, Ministry of Lands Survey andNatural Resources, Nuku’alofa
TRINIDAD AND TOBAGO
John Agard (wetland restoration; tropical small island ecology; socio-economic climatechange mitigation and adaptation scenarios; ecosystem services; marine benthic ecology;pollution control), Tropical Island Ecology, Faculty of Science and Technology, TheUniversity of the West Indies (UWI), St. Augustine Campus
Everson Peters (water resources; water management; rainwater harvesting in Small IslandsDeveloping States (SIDS); wastewater reuse; willingness to pay), The Faculty of Engineering,The University of The West Indies (UWI), St. Augustine Campus
xxxii Editorial board
TURKEY
Ibrahim Gurer (surface and groundwater engineering; snow hydrology; flood hydrology;ecohydrology; transboundary waters; climatic trend analysis; water politics), Department ofCivil Engineering, Faculty of Engineering, Gazi University, Ankara
Nalan Kabay (water and wastewater treatment by ion exchange and membrane processes (NF,RO, ED, EDI, MBR); water reuse; desalination; boron separation), Chemical EngineeringDepartment, Engineering Faculty, Ege University, Bornova, Izmir
UGANDA
Albert Rugumayo (hydrology; water resources engineering and management; energymanagement, policy and planning project design; renewable energy), Faculty of Engineering,Ndejje University and School of Engineering, CEDAT, Makerere University – Kampala(MUK), Kampala
UK
Rafid Alkhaddar (wastewater treatment; water reuse and conservation), Head, Department ofCivil Engineering, Liverpool John Moores University (LJMU), Liverpool
J.A. [Tony] Allan (water resources and the political economy of water policy and its reform;water resources in food supply chains; hydro-politics), Department of Geography, King’sCollege & SOAS Food Studies Centre, University of London, London
Vinay Chand (rural development; renewable energy cogeneration water purification; waterreuse and recycling in the semiconductor industry; remediation of arsenic-contaminated wellwaters; developing polygeneration as a way of overcoming both technical and economicimpediments to the food-energy-water cycle; low grade waste heat for membranedistillation), CEO of Xzero AB, Chairman of HVR Water Purification AB, Stockholm,Consultant Economist, London
Ian Griffiths (mathematical modeling of strategies for water purification, includingmembrane filtration and contaminant removal via magnetic separation), MathematicalInstitute, University of Oxford, Oxford
Nidal Hilal (water treatment; desalination; membrane separation; engineering applications ofatomic force microscopy; fluidization engineering), Director, Centre for Water AdvancedTechnologies and Environmental Research (CWATER), College of Engineering, SwanseaUniversity, Swansea
Chuxia Lin (acid mine drainage; water-soil-plant interaction), College of Science &Technology, University of Salford, Manchester
Victor Starov (influence of surface forces on membrane separation: nano-filtration, ultra- andmicrofiltration (fouling and/or gel layers formation)), Department of Chemical Engineering,Loughborough University, Loughborough
James Wilsdon (social science of the ‘nexus’: joined-up approaches to food, energy, waterand environment; politics of scientific advice; interdisciplinarity, particularly between naturaland social sciences; governance of new and emerging technologies; science and innovationpolicy; public engagement in science, technology and research), Science Policy ResearchUnit, University of Sussex, Brighton
UKRAINE
Valeriy Orlov (technology for potable water; water supply and sewerage; intakes; drilling;environmental aspects of water supply; system analysis), Academician of the InternationalAcademy of Ecology and Life Safety, Academician of the Academy of Building of Ukraine;
Editorial board xxxiii
Academician of the Academy of Higher Education of Ukraine; National University of WaterManagement and Natural Resources (NUWMNRU), Rivne
UNITED ARAB EMIRATES
Fares M. Howari (water and soil management; environmental quality; fate and transport ofcontaminants; natural resources assessment and development; heavy metals; uraniumgeology; salinity; geochemistry; hydrology; remote sensing), Department of Natural Scienceand Public Health, Zayed University (ZU), Abu Dhabi
URUGUAY
Maria Paula Collazo (water resources management; water quality; hydrogeology;hydrogeochemistry; environmental awareness; sustainable development; groundwaterremediation), Regional Centre for Groundwater Management for Latin America and theCaribbean (CeReGAS), MVOTMA/UNESCO; Faculty of Sciences, University of theRepublic (UdelaR), Montevideo
USA
David Austin (emerging sustainable wastewater treatment technologies: design and operation;low-energy and positive-energy yield wastewater treatment; tidal-flow wetlands; improvingraw water quality in reservoirs for drinking water plants), President (2015–2016), AmericanEcological Engineering Association; David Austin, Global Technology Lead NaturalTreatment Systems; CH2M, Mendota Heights, MN
Leslie Behrends (decentralized wastewater technology; tidal-flow reciprocating wetlands),President, Tidal-flow Reciprocating Wetlands LLC; Consultant/Partner for ReCip systems,Florence, AL
Harry R. Beller (environmental engineering and microbiology; renewable fuels andchemicals; design and engineering of novel biofuel pathways in bacteria; biological treatmentof contaminated groundwater; physiology and biochemistry of anaerobic bacteria;biodegradation and biotransformation of organic and inorganic contaminants (environmentalbiogeochemistry); development of mass spectrometric and biomolecular techniques todocument in situ metabolism; hydraulic fracturing and water quality; water-energy nexus),Director of Biofuels Pathways in DOE’s Joint BioEnergy Institute (JBEI); Senior Scientist inEarth & Environmental Sciences Area (EESA), Lawrence Berkeley National Laboratory(LBNL), Berkeley, CA
Mohamed F. Dahab (water reuse; pollution prevention; sustainable systems for water qualityimprovement including biological treatment; nutrients removal; biosolids and energymanagement; use of natural systems for wastewater treatment), College of Engineering,Civil Engineering, University of Nebraska – Lincoln (UNL), Lincoln, NE
Benny D. Freeman (membrane science; oxidatively stable desalination and forward osmosismembrane materials; bioinspired membranes to control fouling of water purificationmembranes; physical aging of glassy polymeric materials and membranes), Richard B.Curran Centennial Chair in Engineering, Department of Chemical Engineering, University ofTexas at Austin (UT Austin), Austin, TX
Pierre Glynn (groundwater geochemistry and integrated modeling; behavioralbiogeosciences & policy; green urban infrastructure; multi-resources analyses; ecosystemservices; citizen science), Branch Chief for National Research Program in Hydrology; WaterMission Representative to USGS Science and Decisions Center, US Geological Survey(USGS), Reston, VA
xxxiv Editorial board
James Kilduff (application of sorption and membrane separations to water purification),Department of Civil and Environmental Engineering, School of Engineering, RensselaerPolytechnic Institute (RPI), Troy, NY
Thomas R. Kulp (microbiological cycling of environmentally relevant trace metal(loids);novel microbial metabolisms involving metalloids that permit bacterial life at extremeconditions; microbiologically mediated reactions), Department of Geological Sciences andEnvironmental Studies, Binghamton University (BU), Binghamton, NY
Dina L. López (hydrogeology; water quality; environmental geochemistry; geochemistry ofhydrothermal systems; fluid flow and heat transfer; acid mine drainage (AMD) and arseniccontamination in water; environmental causes of chronic kidney disease of unknownetiology), Department of Geological Sciences, Ohio University, Athens, OH
Lena Ma (phytoremediation and stabilization of contaminated soil and water), Soil & WaterScience Department, University of Florida (UF), Gainesville, FL
Rabi Mohtar (quantify the interlinkages of the water-energy-food nexus that is constrained byclimate change and social, political, and technological pressures; design and evaluation ofinternational sustainable water management programs to address water scarcity), FoundingDirector of Qatar Environment and Energy Research Institute (QEERI); TEES endowedprofessor, Department of Biological and Agricultural Engineering and Zachary CivilEngineering, Texas A&M University (TAMU), College Station, TX
Lee Newman (phytoremediation; plant nanoparticle interactions; phytoremediation ofgroundwater contaminated with industrial organic pollutants; hyperspectral imaging of plantsto determine contaminant exposure and plant microbe interactions to increase plantproductivity and decrease stress responses), Past President, International PhytotechnologySociety; College of Environmental Science and Forestry, State University of New York(SUNY), Syracuse, NY
Bethany O’Shea (geogenic contaminants in groundwater; water-rock interactions),Department of Environmental and Ocean Sciences, University of San Diego (USD),Alcala Park, San Diego, CA
Faruque Parvez (human exposure and consequences to geogenic trace contaminants),Department of Environmental Health Sciences, Mailman, School of Public Health, ColumbiaUniversity (CU), New York, NY
Madeline Schreiber (chemical and contaminant hydrogeology: environmental fate of traceelements; biodegradation processes; epikarst hydrology and geochemistry), Department ofGeosciences, Virginia Polytechnic Institute and State University (Virginia Tech),Blacksburg, VA
Arup K. Sengupta (water and wastewater treatment: preparation, characterization andinnovative use of novel adsorbents, ion exchangers, reactive polymers and specialtymembrane in separation and control; hybrid separation processes), Department of Civil andEnvironmental Engineering & Department of Chemical Engineering, Lehigh University(LU), Bethlehem, PA
Shikha Sharma (stable isotope geochemistry with focus on issues related to thewater-energy-environment nexus and isotope applications in unconventional and sustainableenergy resources), Director, WVU Stable Isotope Laboratory, Department of Geology &Geography, West Virginia University (WVU), Morgantown, WV
Subhas K. Sikdar (water quality regulations; clean and sustainable technologies;environmental policy; measurement of sustainability; chemical engineering; water-energyand related nexuses; process development; separation processes), Associate Director for
Editorial board xxxv
Science, National Risk Management Research Laboratory, U.S. Environmental ProtectionAgency, Cincinnati, OH
Vijay P. Singh (surface water and groundwater hydrology; groundwater and watershedmodeling; hydraulics; irrigation engineering; environmental quality and water resources;hydrologic impacts of climate change), Distinguished Professor and Caroline & William N.Lehrer Distinguished Chair in Water Engineering, Department of Biological & AgriculturalEngineering (College of Agriculture and Life Sciences), Texas A&M University (TAMU),College Station, TX
Shane Snyder (identification, fate, and health relevance of emerging water pollutants andcontaminants of emerging concern (ECEs)), Department of Chemical and EnvironmentalEngineering, College of Engineering, University of Arizona (UA); Co-Director of theArizona Laboratory for Emerging Contaminants, Tucson, AZ
Paul Sullivan (water-energy-food nexus; water and conflict; economics of water resources;water-insurgency-revolution-war nexus; the political economy of water), National DefenseUniversity (NDU), Georgetown University; National Council on US-Arab Relations, andFederation of American Scientists, Washington, DC
Paul Sylvester (drinking water; wastewater and nuclear waste treatment; ion exchange;materials chemistry; radiochemistry; product commercialization; research management),Consultant, Waltham, MA
Maya A. Trotz (sustainability; water quality, ecotourism and small scale mining impacts onsustainable livelihoods; climate change; environmental engineering education in formal andinformal settings in the US and in developing countries), Civil and EnvironmentalEngineering Department, University of South Florida (USF), Tampa, FL
Richard Tsang (sludge treatment), Senior Vice President, CDM Smith, Raleigh, NC
Nikolay Voutchkov (desalination and water reuse – applied research; advanced technologydevelopment and expert review; project scoping, feasibility analysis, planning,cost-estimating, design, contractor procurement and implementation oversight; operation,optimization and troubleshooting for desalination plants), President of Water GlobeConsulting, Stamford, CT
Zimeng Wang (water quality; water chemistry; biogeochemistry; water treatment;environmental engineering; soil and groundwater; contaminant transport; geochemicalmodeling), Department of Civil and Environmental Engineering, Stanford University,Stanford, CA
Y. Jun Xu (ecohydrology; watersheds hydrologic and biogeochemical processes; riverinesediment and nutrient transport; water quality; impacts of land use and global climate changeon hydrologic and biogeochemical cycles), School of Renewable Natural Resources,Louisiana State University (LSU), Baton Rouge, LA
Yan Zheng (water, sanitation, and hygiene; hydrochemistry; biogeochemistry of chemicalcompounds and elements in the environment and their effects on human and ecosystemhealth; arsenic in groundwater and mitigation), Queens College, City University of New York(CUNY), Flushing, NY & Lamont-Doherty Earth Observatory, Columbia University (CU),Palisades, NY
VENEZUELA
Ernesto Jose Gonzalez Rivas (reservoir limnology; plankton ecology; eutrophication of waterbodies), Venezuelan Focal Point for the water program of the InterAmerican Network ofAcademies of Sciences (IANAS); Institute of Experimental Biology, Faculty of Sciences,Central University of Venezuela (UCV), Caracas
xxxvi Editorial board
VIETNAM
Vo Thanh Danh (water resources and environmental economics), School of Economics andBusiness Administration, Cantho University (CTU), Ninh Kieu District, Cantho City
YEMEN
Hussain Al-Towaie (solar power for seawater desalination; thermal desalination), Owner &CEO at Engineering Office “CE&SD” (Clean Environment & Sustainable Development),Aden
ZAMBIA
Imasiku A. Nyambe (geology, sedimentology, hydrogeology, environment and integratedwater resources management; remote sensing and GIS; geochemical/environmental mapping;mining), Coordinator, Integrated Water Resources Management Centre, Director of theDirectorate of Research and Graduate Studies, University of Zambia (UNZA), Lusaka
ZIMBABWE
Innocent Nhapi (sanitary and environmental engineering; climate change adaptation),Department of Environmental Engineering, Chinhoyi University of Technology (CUT),Chinhoyi
Table of contents
About the book series vii
Editorial board xi
List of contributors xlvii
Foreword by Nidal Hilal liii
Editors’ foreword lv
About the editors lvii
Part I Water and wastewater treatment (novel membrane development)
1. Preparation and characterization of blended polysulfone/polyphenylsulfoneultrafiltration membranes for palm oil mill effluent treatment 3Norafiqah Ismail, Woei Jye Lau & Ahmad Fauzi Ismail1.1 Introduction 31.2 Experimental 4
1.2.1 Materials 41.2.2 Membrane preparation 41.2.3 Membrane characterizations 41.2.4 UF experiment 51.2.5 POME sample and analysis 5
1.3 Results and discussion 61.3.1 Effect of PSF:PPSF weight ratio on membrane properties 6
1.3.1.1 Morphological studies 61.3.1.2 Membrane filtration performance and its relation to
membrane characteristics 61.3.2 POME treatment using blended PSF/PPSF UF membrane 8
1.4 Conclusion 9
2. Development and characterization of sago/PVA blend membranefor recovery of ethyl acetate from water 11Abdulhakim M. Alamaria & M.M. Nawawia Ghazali2.1 Introduction 112.2 Experimental 11
2.2.1 Materials 112.2.2 Preparation of sago starch/PVA membranes 12
2.3 Characterization 122.3.1 Differential scanning calorimetry (DSC) and thermogravimetric
analysis (TGA) 122.3.2 FTIR spectroscopy 132.3.3 Pervaporation 13
2.4 Results and discussion 142.4.1 Membrane characterization 14
2.4.1.1 DSC 14
xxxvii
xxxviii Table of contents
2.4.1.2 Thermal stability TGA 142.4.1.3 FTIR 16
2.4.2 Pervaporation 172.4.2.1 Effect of feed temperature 172.4.2.2 Effect of feed concentration 17
2.5 Conclusion 19
3. Development of adsorbents based cellulose acetate mixed matrix membranesfor removal of pollutants from textile industry effluent 21Ramesh Kumar Saranya, Yogarathinam Lukka Thuyavan,Gangasalam Arthanareeswaran & Ahmad Fauzi Ismail3.1 Introduction 213.2 Experimental 22
3.2.1 Materials 223.2.2 Preparation of CA MMMs 223.2.3 Characterization of CA MMMs 223.2.4 Performance of CA MMMs 23
3.2.4.1 Permeability studies 233.2.4.2 Performance of CA MMMs in the treatment of textile industry
effluent 233.3 Results and discussion 23
3.3.1 Morphological characteristics of CA MMMs 233.3.2 XRD characterization of CA MMMs 253.3.3 Effect of IO and AC on permeability of CA MMMs 253.3.4 Effect of AC and IO on polymer assisted UF 263.3.5 Effect of CA MMMs on COD removal 263.3.6 Effect of CA MMMs on BOD removal 273.3.7 Effect of CA MMMs on sulfate removal 28
3.4 Conclusions 29
4. Studying the role of magnetite (Fe3O4) colloids functionality on PES membrane inremoving of humic acid foulant using QCM-D 31Qi-Hwa Ng, Jit-Kang Lim, Abdul Latif Ahmad & Siew-Chun Low4.1 Introduction 314.2 Experimental 32
4.2.1 Materials 324.2.2 Functionalization of nanoparticles 324.2.3 Quartz crystal microbalance with dissipation (QCM-D) 32
4.2.3.1 Monitoring F-MNPs adsorption 324.2.3.2 Adsorption/cleaning of HA on the membrane surface 33
4.3 Results and discussion 334.3.1 Stability of the functionalized MNPs and characteristics of the model
PES membrane 334.3.2 The F-MNPs adsorption onto PES model membrane 344.3.3 Adsorption of HA foulant on the membrane surface 36
4.4 Conclusion 37
5. The effect of spinning parameters on PLA hollow fiber membrane formation 39Arisa Jaiyu, Kanungnuch Keawsupsak, Julaluk Pannoi,Passakorn Sueprasit & Chutima Eamchotchawalit5.1 Introduction 395.2 Experimental 39
5.2.1 Materials 395.2.2 Fabrication of PLA hollow fiber membranes 40
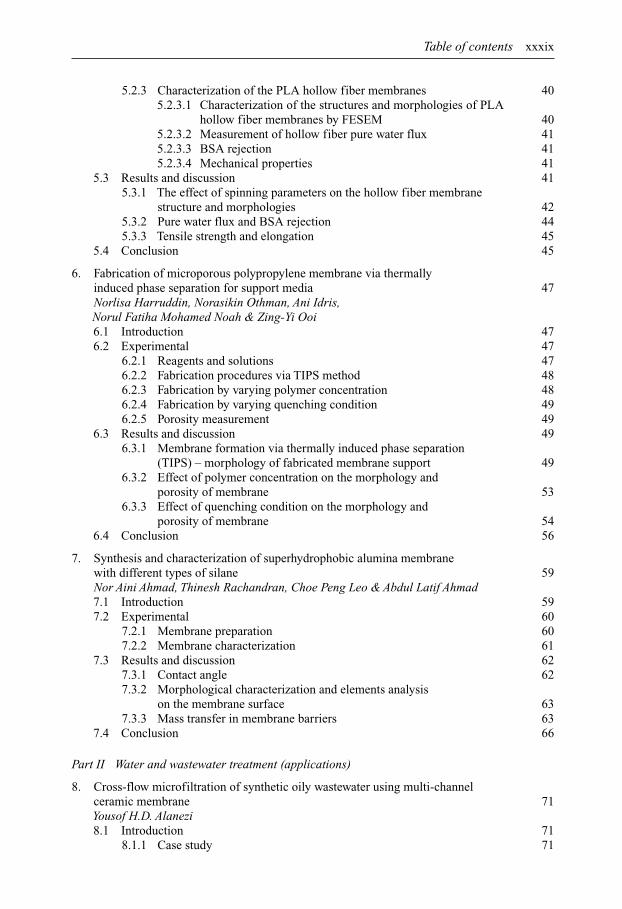
Table of contents xxxix
5.2.3 Characterization of the PLA hollow fiber membranes 405.2.3.1 Characterization of the structures and morphologies of PLA
hollow fiber membranes by FESEM 405.2.3.2 Measurement of hollow fiber pure water flux 415.2.3.3 BSA rejection 415.2.3.4 Mechanical properties 41
5.3 Results and discussion 415.3.1 The effect of spinning parameters on the hollow fiber membrane
structure and morphologies 425.3.2 Pure water flux and BSA rejection 445.3.3 Tensile strength and elongation 45
5.4 Conclusion 45
6. Fabrication of microporous polypropylene membrane via thermallyinduced phase separation for support media 47Norlisa Harruddin, Norasikin Othman, Ani Idris,Norul Fatiha Mohamed Noah & Zing-Yi Ooi6.1 Introduction 476.2 Experimental 47
6.2.1 Reagents and solutions 476.2.2 Fabrication procedures via TIPS method 486.2.3 Fabrication by varying polymer concentration 486.2.4 Fabrication by varying quenching condition 496.2.5 Porosity measurement 49
6.3 Results and discussion 496.3.1 Membrane formation via thermally induced phase separation
(TIPS) – morphology of fabricated membrane support 496.3.2 Effect of polymer concentration on the morphology and
porosity of membrane 536.3.3 Effect of quenching condition on the morphology and
porosity of membrane 546.4 Conclusion 56
7. Synthesis and characterization of superhydrophobic alumina membranewith different types of silane 59Nor Aini Ahmad, Thinesh Rachandran, Choe Peng Leo & Abdul Latif Ahmad7.1 Introduction 597.2 Experimental 60
7.2.1 Membrane preparation 607.2.2 Membrane characterization 61
7.3 Results and discussion 627.3.1 Contact angle 627.3.2 Morphological characterization and elements analysis
on the membrane surface 637.3.3 Mass transfer in membrane barriers 63
7.4 Conclusion 66
Part II Water and wastewater treatment (applications)
8. Cross-flow microfiltration of synthetic oily wastewater using multi-channelceramic membrane 71Yousof H.D. Alanezi8.1 Introduction 71
8.1.1 Case study 71
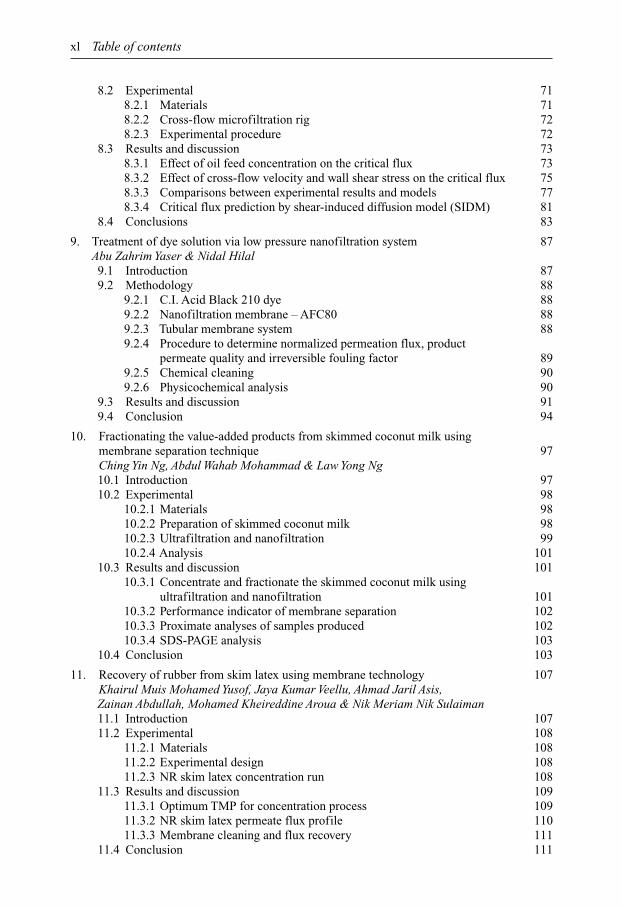
xl Table of contents
8.2 Experimental 718.2.1 Materials 718.2.2 Cross-flow microfiltration rig 728.2.3 Experimental procedure 72
8.3 Results and discussion 738.3.1 Effect of oil feed concentration on the critical flux 738.3.2 Effect of cross-flow velocity and wall shear stress on the critical flux 758.3.3 Comparisons between experimental results and models 778.3.4 Critical flux prediction by shear-induced diffusion model (SIDM) 81
8.4 Conclusions 83
9. Treatment of dye solution via low pressure nanofiltration system 87Abu Zahrim Yaser & Nidal Hilal9.1 Introduction 879.2 Methodology 88
9.2.1 C.I. Acid Black 210 dye 889.2.2 Nanofiltration membrane – AFC80 889.2.3 Tubular membrane system 889.2.4 Procedure to determine normalized permeation flux, product
permeate quality and irreversible fouling factor 899.2.5 Chemical cleaning 909.2.6 Physicochemical analysis 90
9.3 Results and discussion 919.4 Conclusion 94
10. Fractionating the value-added products from skimmed coconut milk usingmembrane separation technique 97Ching Yin Ng, Abdul Wahab Mohammad & Law Yong Ng10.1 Introduction 9710.2 Experimental 98
10.2.1 Materials 9810.2.2 Preparation of skimmed coconut milk 9810.2.3 Ultrafiltration and nanofiltration 9910.2.4 Analysis 101
10.3 Results and discussion 10110.3.1 Concentrate and fractionate the skimmed coconut milk using
ultrafiltration and nanofiltration 10110.3.2 Performance indicator of membrane separation 10210.3.3 Proximate analyses of samples produced 10210.3.4 SDS-PAGE analysis 103
10.4 Conclusion 103
11. Recovery of rubber from skim latex using membrane technology 107Khairul Muis Mohamed Yusof, Jaya Kumar Veellu, Ahmad Jaril Asis,Zainan Abdullah, Mohamed Kheireddine Aroua & Nik Meriam Nik Sulaiman11.1 Introduction 10711.2 Experimental 108
11.2.1 Materials 10811.2.2 Experimental design 10811.2.3 NR skim latex concentration run 108
11.3 Results and discussion 10911.3.1 Optimum TMP for concentration process 10911.3.2 NR skim latex permeate flux profile 11011.3.3 Membrane cleaning and flux recovery 111
11.4 Conclusion 111
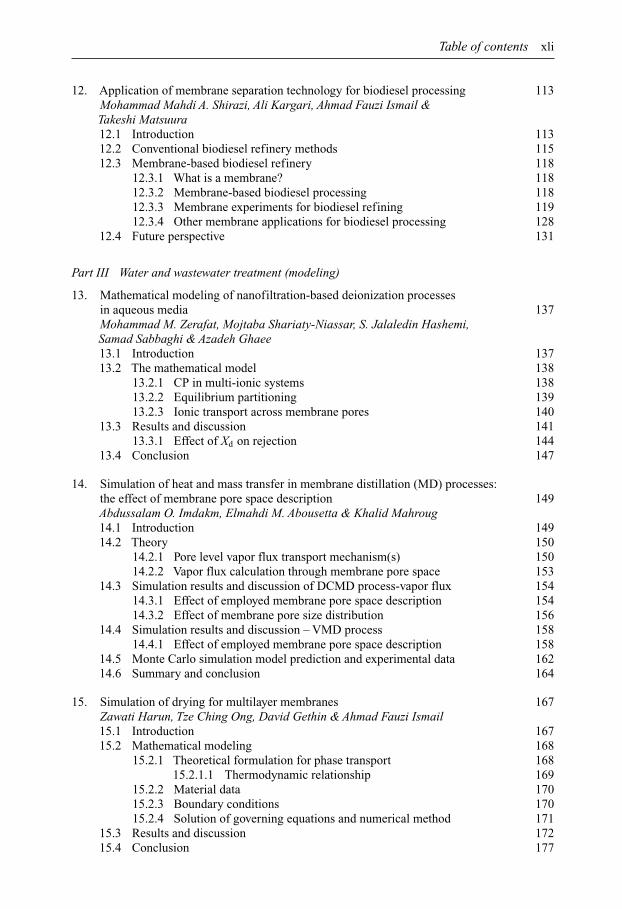
Table of contents xli
12. Application of membrane separation technology for biodiesel processing 113Mohammad Mahdi A. Shirazi, Ali Kargari, Ahmad Fauzi Ismail &Takeshi Matsuura12.1 Introduction 11312.2 Conventional biodiesel refinery methods 11512.3 Membrane-based biodiesel refinery 118
12.3.1 What is a membrane? 11812.3.2 Membrane-based biodiesel processing 11812.3.3 Membrane experiments for biodiesel refining 11912.3.4 Other membrane applications for biodiesel processing 128
12.4 Future perspective 131
Part III Water and wastewater treatment (modeling)
13. Mathematical modeling of nanofiltration-based deionization processesin aqueous media 137Mohammad M. Zerafat, Mojtaba Shariaty-Niassar, S. Jalaledin Hashemi,Samad Sabbaghi & Azadeh Ghaee13.1 Introduction 13713.2 The mathematical model 138
13.2.1 CP in multi-ionic systems 13813.2.2 Equilibrium partitioning 13913.2.3 Ionic transport across membrane pores 140
13.3 Results and discussion 14113.3.1 Effect of Xd on rejection 144
13.4 Conclusion 147
14. Simulation of heat and mass transfer in membrane distillation (MD) processes:the effect of membrane pore space description 149Abdussalam O. Imdakm, Elmahdi M. Abousetta & Khalid Mahroug14.1 Introduction 14914.2 Theory 150
14.2.1 Pore level vapor flux transport mechanism(s) 15014.2.2 Vapor flux calculation through membrane pore space 153
14.3 Simulation results and discussion of DCMD process-vapor flux 15414.3.1 Effect of employed membrane pore space description 15414.3.2 Effect of membrane pore size distribution 156
14.4 Simulation results and discussion – VMD process 15814.4.1 Effect of employed membrane pore space description 158
14.5 Monte Carlo simulation model prediction and experimental data 16214.6 Summary and conclusion 164
15. Simulation of drying for multilayer membranes 167Zawati Harun, Tze Ching Ong, David Gethin & Ahmad Fauzi Ismail15.1 Introduction 16715.2 Mathematical modeling 168
15.2.1 Theoretical formulation for phase transport 16815.2.1.1 Thermodynamic relationship 169
15.2.2 Material data 17015.2.3 Boundary conditions 17015.2.4 Solution of governing equations and numerical method 171
15.3 Results and discussion 17215.4 Conclusion 177

xlii Table of contents
Part IV Membranes for energy and environmental applications(novel membrane developments for gas separation)
16. Effect of poly phenylene oxide (PPO) concentration on the morphological,thermal, crystalline and CO2 permeation properties of as-synthesizedflat sheet dense PPO polymeric membranes 183Biruh Shimekit, Hilmi Mukhtar, Zakaria Man & Azmi Mohd Shariff16.1 Introduction 18316.2 Experimental 183
16.2.1 Materials 18316.2.2 Membrane preparation 18416.2.3 Characterizations 184
16.2.3.1 Field emission scanning electron microscope (FESEM) 18416.2.3.2 Thermogravimetric analyzer (TGA) 18416.2.3.3 Differential scanning calorimetry (DSC) 18416.2.3.4 X-ray diffraction analysis (XRD) 18416.2.3.5 Response surface methodology (RSM) 18516.2.3.6 Gas permeation 185
16.3 Results and discussion 18516.3.1 Effect of concentration of PPO polymer on the morphological
properties of as-synthesized flat sheet dense PPO membranes 18516.3.2 Effect of PPO concentration on the thermal properties of
as-synthesized flat sheet dense PPO membranes 18616.3.3 Effect of PPO concentration on the crystalline behavior of the
as-synthesized flat sheet dense PPO membranes 18816.3.4 CO2 permeation and parameters optimization 188
16.4 Conclusion 190
17. Critical concentration of PEI in NMP as a criterion for the preparationof asymmetric membranes for gas separation 191Ahmad Arabi Shamsabadi, Masoud Bahrami Babaheidari &Kaveh Majdian17.1 Introduction 19117.2 Experimental 192
17.2.1 Materials 19217.2.2 Characterizations 192
17.3 Results and discussion 19217.3.1 The influence of the polymer concentration on the solution density
and viscosity 19217.3.2 Critical concentration determination 19217.3.3 The effect of the polymer concentration 19417.3.4 Effect of non-solvent type 194
17.4 Conclusion 198
18. Powder preparation effect on oxygen permeation flux of hollow fiberLSCF6428 ceramic perovskite membrane 199Haikal Mustafa, Ammar Mohd Akhir, Sharifah Aishah Syed Abdul Kadir,Ahmad Fauzi Ismail, Pei Sean Goh, Be Cheer Ng & Mohd Sohaimi Abdullah18.1 Introduction 19918.2 Experimental 200
18.2.1 LSCF6428 powders 20018.2.2 Hollow fiber membranes 20118.2.3 Oxygen permeation experiments 201
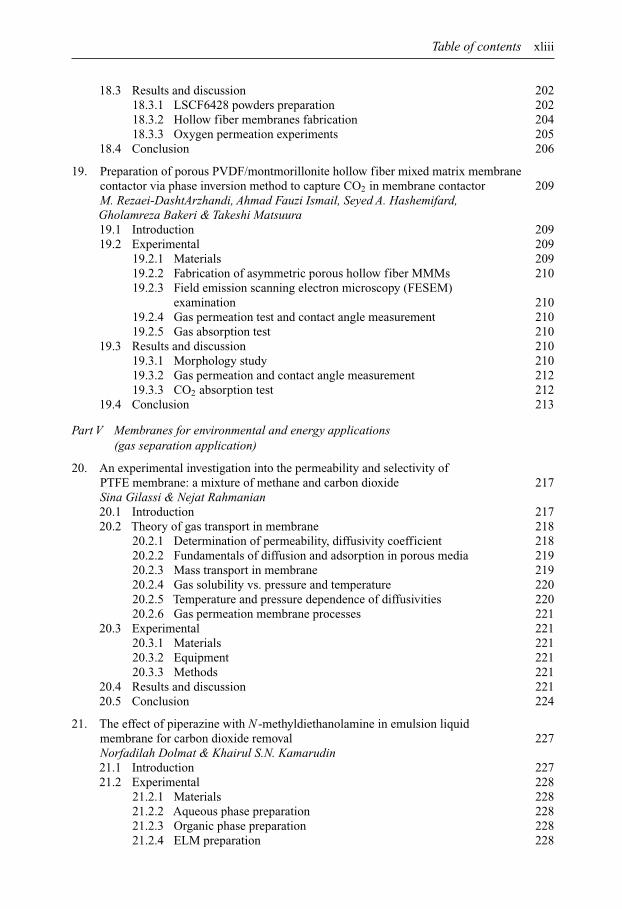
Table of contents xliii
18.3 Results and discussion 20218.3.1 LSCF6428 powders preparation 20218.3.2 Hollow fiber membranes fabrication 20418.3.3 Oxygen permeation experiments 205
18.4 Conclusion 206
19. Preparation of porous PVDF/montmorillonite hollow fiber mixed matrix membranecontactor via phase inversion method to capture CO2 in membrane contactor 209M. Rezaei-DashtArzhandi, Ahmad Fauzi Ismail, Seyed A. Hashemifard,Gholamreza Bakeri & Takeshi Matsuura19.1 Introduction 20919.2 Experimental 209
19.2.1 Materials 20919.2.2 Fabrication of asymmetric porous hollow fiber MMMs 21019.2.3 Field emission scanning electron microscopy (FESEM)
examination 21019.2.4 Gas permeation test and contact angle measurement 21019.2.5 Gas absorption test 210
19.3 Results and discussion 21019.3.1 Morphology study 21019.3.2 Gas permeation and contact angle measurement 21219.3.3 CO2 absorption test 212
19.4 Conclusion 213
Part V Membranes for environmental and energy applications(gas separation application)
20. An experimental investigation into the permeability and selectivity ofPTFE membrane: a mixture of methane and carbon dioxide 217Sina Gilassi & Nejat Rahmanian20.1 Introduction 21720.2 Theory of gas transport in membrane 218
20.2.1 Determination of permeability, diffusivity coefficient 21820.2.2 Fundamentals of diffusion and adsorption in porous media 21920.2.3 Mass transport in membrane 21920.2.4 Gas solubility vs. pressure and temperature 22020.2.5 Temperature and pressure dependence of diffusivities 22020.2.6 Gas permeation membrane processes 221
20.3 Experimental 22120.3.1 Materials 22120.3.2 Equipment 22120.3.3 Methods 221
20.4 Results and discussion 22120.5 Conclusion 224
21. The effect of piperazine with N -methyldiethanolamine in emulsion liquidmembrane for carbon dioxide removal 227Norfadilah Dolmat & Khairul S.N. Kamarudin21.1 Introduction 22721.2 Experimental 228
21.2.1 Materials 22821.2.2 Aqueous phase preparation 22821.2.3 Organic phase preparation 22821.2.4 ELM preparation 228

xliv Table of contents
21.2.5 ELM characterization and performance 22921.2.5.1 Stability studies 22921.2.5.2 Carbon dioxide absorption analysis 230
21.3 Results and discussion 23021.3.1 ELM characterization 230
21.3.1.1 Stability of emulsion 23021.3.1.2 pH analysis 231
21.3.2 ELM performance 23221.3.2.1 Carbon dioxide removal 232
21.3.3 Formulation of MDEA and PZ for CO2 removal 23221.4 Conclusion 233
22. Separation of olefins from paraffins by membrane contactor – a review 235Gholamreza Bakeri, Ali Kazemi Joujili, Mostafa Rahimnejad,Ahmad Fauzi Ismail & Takeshi Matsuura22.1 Introduction 23522.2 Olefin and paraffin 235
22.2.1 Olefin production technologies 23522.2.2 The importance of olefin/paraffin separation 23622.2.3 Olefin/paraffin separation methods 23622.2.4 Membrane processes 236
22.3 Membrane contactor 23622.4 Membrane characteristics 237
22.4.1 Membrane stability 23822.5 Mathematical correlations for mass transfer coefficients 238
22.5.1 Mass transfer coefficient in lumen side of contactor 23922.5.2 Mass transfer coefficient in shell side of contactor 23922.5.3 Membrane mass transfer coefficient 239
22.6 The type of absorbent 24022.7 Reactions in olefin/paraffin separation 241
22.7.1 Complex formation between Ag+ and olefin 24122.7.2 Kinetics and equilibrium constants 24122.7.3 Gas absorption rate in olefin/paraffin separation 242
22.8 Olefin/paraffin separation using membrane contactor 24322.9 Recommendations 246
23. The reliability of the conventional gas permeation testing method forcharacterizing the porous asymmetric membranes: a conceptual review 251Seyed A. Hashemifard, Ahmad Fauzi Ismail & Takeshi Matsuura23.1 Introduction 25123.2 Theoretical background 25223.3 Results and discussion 256
23.3.1 Analyzing the Wakao et al. (1965) model for GPT 25623.3.2 Predictions of the model for integrated porous skin
layer membranes 25723.3.3 Drawbacks of the conventional GPT method 259
23.4 Conclusion 263
24. Modeling of concurrent and counter-current flow hollow fiber membranemodules for multi-component systems 265Serene Sow Mun Lock, Kok Keong Lau & Azmi Mohd Shariff24.1 Introduction 26524.2 Methodology 267
24.2.1 Multi-component progressive cell balance methodology 267

Table of contents xlv
24.2.2 Multi-component progressive cell balance in concurrent flowmechanism 268
24.2.3 Multi-component progressive cell balance in concurrent flowmechanism: Type I entity with feed on the shell side 268
24.2.4 Multi-component progressive cell balance in concurrent flowmechanism: Type II entity with feed on the shell and tube sides 269
24.2.5 Multi-component progressive cell balance in counter-current flowmechanism 270
24.3 Results and discussion 27124.3.1 Mathematical model validation 27124.3.2 Comparison between concurrent and counter-current flow 272
24.4 Conclusion 276
Part VI Membranes for other applications
25. Preparation of sulfonated polyether ether ketone (SPEEK) and optimizationof degree of sulfonation for using in microbial fuel cells 281Mostafa Ghasemi, Wan Ramli Wan Daud,Ahmad Fauzi Ismail & Takeshi Matsuura25.1 Introduction 28125.2 Materials and methods 282
25.2.1 Synthesis of SPEEK 28225.2.2 Determination of the degree of sulfonation 28225.2.3 Fabrication of membranes 28225.2.4 MFC configuration 28225.2.5 Enrichment 28225.2.6 Analysis and calculation 28325.2.7 Pre-treatment of PEMs 283
25.3 Results and discussion 28325.3.1 Attachment of microorganisms on anode electrode 28325.3.2 Degree of sulfonation of SPEEK 28325.3.3 FTIR analysis 28425.3.4 Power density and polarization curve 28525.3.5 COD removal and CE 285
25.4 Conclusion 287
26. Performance of polyphenylsulfone solvent resistant nanofiltration membrane:effects of polymer concentration, membrane pretreatment andoperating pressure 289Nur Aimie Abdullah Sani, Woei Jye Lau & Ahmad Fauzi Ismail26.1 Introduction 28926.2 Experimental 290
26.2.1 Materials 29026.2.2 Preparation of membranes 29026.2.3 Experimental procedure 290
26.3 Results and discussion 29126.3.1 Effect of polymer concentration on membrane morphology and
methanol flux 29126.3.2 Performance of PPSF membrane in RB5 removal 29226.3.3 Effect of pretreatment process duration on membrane performance 29326.3.4 Effect of operating pressure on membrane performance:
comparison of PPSF with commercial membranes 29426.4 Conclusion 295

xlvi Table of contents
27. Application of membrane technology in degumming and deacidificationof vegetable oils refining 297Noor Hidayu Othman, Ahmadilfitri Md Noor, Mohd Suria Affandi Yusoff,Ahmad Fauzi Ismail, Pei Sean Goh & Woei Jye Lau27.1 Introduction 297
27.1.1 Membrane technology and its basic principles 29727.2 Vegetable oils and degumming 298
27.2.1 Overview and principle of degumming process 29827.2.2 Membrane degumming of vegetable oils 30027.2.3 Membrane degumming using polymeric membrane 30027.2.4 Membrane degumming using nonporous polymeric composite
membrane 30127.2.5 Membrane degumming using ceramic membrane 302
27.3 Vegetable oils and deacidification 30227.3.1 Conventional method and principle of deacidification process 30227.3.2 Membrane deacidification of vegetable oils 303
27.3.2.1 Direct membrane deacidification 30327.3.2.2 Membrane deacidification with solvent 304
27.4 Conclusion 304
28. Preparation of polysulfone electrospun nanofibers: effect of electrospinningand solution parameters 309Zafarullah Khan & Feras M. Kafiaha28.1 Introduction 30928.2 Experimental 310
28.2.1 Materials 31028.2.2 Electrospinning and characterization 310
28.3 Results and discussion 31128.3.1 Effect of PSF concentration on fiber morphology 31128.3.2 Effect of applied voltage on fiber morphology 31328.3.3 Effect of solution feed rate on fiber morphology 31428.3.4 Effect of distance between nozzle and collector on fiber
morphology 31528.4 Conclusion 316
Index 319Book series page 329
List of contributors
Ahmad Arabi Shamsabadi Marun Petrochemical Company, Petzone, Mahshahr, Iran andPetroleum University of Technology, Ahwaz, Iran
Mohd Sohaimi Abdullah Advanced Membrane Technology Research Centre (AMTEC),Universiti Teknologi Malaysia, Skudai, Johor, Malaysia
Zainan Abdullah Sime Darby Latex Sdn. Bhd., Batu Anam, Segamat, Johor,Malaysia
Elmahdi M. Abousetta Chemical Engineering Department, Computer EngineeringDepartment, University of Tripoli, Tripoli, Libya
Abdul Latif Ahmad School of Chemical Engineering Campus, Universiti SainsMalaysia, Seri Ampangan, Nibong Tebal Penang, Malaysia
Nor Aini Ahmad School of Chemical Engineering, Engineering Campus,Universiti Sains Malaysia, Nibong Tebal, Penang, Malaysia
Ammar Mohd Akhir Faculty of Chemical Engineering, Universiti Teknologi MARA,Shah Alam, Selangor, Malaysia
Abdulhakim M. Alamaria Department of Chemical Engineering, Faculty of ChemicalEngineering, Universiti Teknologi Malaysia, Johor Bahru,Malaysia
Yousof H.D. Alanezi Department of Chemical Engineering Technology, Collegeof Technological Studies (CTS), Public Authority of AppliedEducation and Training (PAAET), Adailiyah, Kuwait
Mohamed KheireddineAroua
Department of Chemical Engineering, University of Malaya,Kuala Lumpur, Malaysia
GangasalamArthanareeswaran
Membrane Research Laboratory, Department of ChemicalEngineering, National Institute of Technology, Tiruchirappalli,India
M. Rezaei-DashtArzhandi Advanced Membrane Technology Research Centre (AMTEC),Universiti Teknologi Malaysia, Skudai, Johor, Malaysia
Ahmad Jaril Asis Processing & Engineering, R&D Centre, Sime Darby Research,Jalan Pulau Carey, Pulau Carey, Kuala Langat, Selangor,Malaysia
Masoud BahramiBabaheidari
Petroleum University of Technology, Ahwaz, Iran
Gholamreza Bakeri Advanced Membrane and Biotechnology Research Center,Faculty of Chemical Engineering, Babol Noshirvani Universityof Technology, Babol, Iran
Wan Ramli Wan Daud Fuel Cell Institute, Universiti Kebangsaan Malaysia, UKMBangi, Selangor, Malaysia
Norfadilah Dolmat Faculty of Petroleum and Renewable Energy Engineering,Universiti Teknologi Malaysia, UTM Skudai Johor, Malaysia
Chutima Eamchotchawalit Thailand Institute of Scientific and Technological Research,Khlong Luang, Pathumthani, Thailand
David Gethin Civil and Computational Engineering Center, University ofWales, Swansea, UK
xlvii

xlviii List of contributors
Azadeh Ghaee Department of Life Science Engineering, Faculty ofInterdisciplinary New Science and Technologies, University ofTehran, Tehran, Iran
Mostafa Ghasemi Fuel Cell Institute, Universiti Kebangsaan Malaysia, UKMBangi, Selangor, Malaysia
M.M. Nawawi Ghazali Department of Chemical Engineering, Faculty of ChemicalEngineering, Universiti Teknologi Malaysia, Skudai, Johor,Malaysia
Sina Gilassi Department of Chemical Engineering, Universiti TeknologiPETRONAS, Bandar Seri Iskandar, Perak, Malaysia
Pei Sean Goh Advanced Membrane Technology Research Centre (AMTEC),Universiti Teknologi Malaysia, Skudai, Johor, Malaysia andFaculty of Petroleum and Renewable Energy Engineering,Universiti Teknologi Malaysia, Skudai, Johor, Malaysia
Norlisa Harruddin Centre of Lipids Engineering and Applied Research (CLEAR),Department of Chemical Engineering, Faculty of ChemicalEngineering, Universiti Teknologi Malaysia, Skudai Johor,Malaysia
Zawati Harun University Tun Hussien Onn, Parit Raja, Batu Pahat, Johor,Malaysia
S. Jalaledin Hashemi School of Chemical Engineering, College of Engineering,University of Tehran, Tehran, Iran
Seyed A. Hashemifard Chemical Engineering Department, Gas and PetrochemicalFaculty, Persian Gulf University, Bushehr, Iran
Nidal Hilal Centre for Water Advanced Technologies and EnvironmentalResearch (CWATER), College of Engineering, SwanseaUniversity, Swansea, UK and Qatar Energy and EnvironmentResearch Institute (QEERI), Doha, Qatar
Ani Idris Institute of Bioproduct Development (IBD), Department ofBioprocess Engineering Faculty of Chemical Engineering,Universiti Teknologi Malaysia, Skudai Johor, Malaysia
Abudussalam O. Imdakm Chemical Engineering Department, Computer EngineeringDepartment, University of Tripoli, Tripoli, Libya
Ahmad Fauzi Ismail Advanced Membrane Technology Research Centre (AMTEC),Universiti Teknologi Malaysia, Skudai, Johor, Malaysia andFaculty of Petroleum and Renewable Energy Engineering,Universiti Teknologi Malaysia, Skudai, Johor, Malaysia
Norafiqah Ismail Advanced Membrane Technology Research Centre (AMTEC),Universiti Teknologi Malaysia, Skudai, Johor, Malaysia
Arisa Jaiyu Thailand Institute of Scientific and Technological Research,Khlong Luang, Pathumthani, Thailand
Ali Kazemi Joujili Advanced Membrane and Biotechnology Research Center,Faculty of Chemical Engineering, Babol Noshirvani Universityof Technology, Babol, Iran
Sharifah Aishah Syed AbdulKadir
Faculty of Chemical Engineering, Universiti Teknologi MARA,Shah Alam, Selangor, Malaysia
Feras M. Kafiah Mechanical Engineering Department, King Fahd University ofPetroleum & Minerals, Dhahran, Kingdom of Saudi Arabia(KSA)
Khairul S.N. Kamarudin Faculty of Petroleum and Renewable Energy Engineering,Universiti Teknologi Malaysia, Skudai Johor, Malaysia
List of contributors xlix
Ali Kargari Membrane Processes Research Laboratory (MPRL),Department of Petrochemical Engineering, AmirkabirUniversity of Technology (Tehran Polytechnic), MahshahrCampus, Mahshahr, Iran
Kanungnuch Keawsupsak Thailand Institute of Scientific and Technological Research,Khlong Luang, Pathumthani, Thailand
Zafarullah Khan King Fahd University of Petroleum & Minerals, MechanicalEngineering Department, Dhahran, Kingdom of Saudi Arabia(KSA)
Kok Keong Lau Chemical Engineering Department, Universiti TeknologiPETRONAS, Bandar Sri Iskandar, Perak, Malaysia
Woei Jye Lau Advanced Membrane Technology Research Centre (AMTEC),Universiti Teknologi Malaysia, Skudai, Johor, Malaysia andFaculty of Petroleum and Renewable Energy Engineering,Universiti Teknologi Malaysia, Skudai, Johor, Malaysia
Choe Peng Leo School of Chemical Engineering, Engineering Campus,Universiti Sains Malaysia, Nibong Tebal, Penang, Malaysia
Jit-Kang Lim School of Chemical Engineering Campus, Universiti SainsMalaysia, Seri Ampangan, Nibong Tebal, Penang, Malaysiaand Department of Physics, Carnegie Mellon University,Pittsburgh, USA
Serene Sow Mun Lock Chemical Engineering Department, Universiti TeknologiPETRONAS, Bandar Sri Iskandar, Perak, Malaysia
Siew-Chun Low School of Chemical Engineering Campus, Universiti SainsMalaysia, Seri Ampangan, Nibong Tebal, Penang, Malaysia
Khalid Mahroug Chemical Engineering Department, Computer EngineeringDepartment, University of Tripoli, Tripoli, Libya
Kaveh Majdian Marun Petrochemical Company, Petzone, Mahshahr, IranZakaria Man CO2 Management, MOR, Universiti Teknologi PETRONAS,
Bandar Sri Iskandar, Perak, MalaysiaTakeshi Matsuura Department of Chemical and Biological Engineering, University
of Ottawa, Ottawa, Ontario, CanadaAbdul Wahab Mohammad Research Centre for Sustainable ProcessTechnology (CESPRO),
Faculty Engineering and Built Environment, UniversitiKebangsaan Malaysia (UKM), Bangi, Selangor, Malaysia andDepartment of Chemical and Process Engineering, Faculty ofEngineering and Built Environment, Universiti KebangsaanMalaysia (UKM), Bangi, Selangor, Malaysia
Hilmi Mukhtar CO2 Management, MOR, Universiti Teknologi PETRONAS,Bandar Sri Iskandar, Perak, Malaysia
Haikal Mustafa Faculty of Chemical Engineering, Universiti Teknologi MARA,Shah Alam, Selangor, Malaysia
Be Cheer Ng Advanced Membrane Technology Research Centre (AMTEC),Universiti Teknologi Malaysia, Skudai, Johor, Malaysia.
Ching Yin Ng Department of Chemical and Process Engineering, Faculty ofEngineering and Built Environment, Universiti KebangsaanMalaysia (UKM), Bangi, Selangor, Malaysia
Law Yong Ng Department of Chemical and Process Engineering, Faculty ofEngineering and Built Environment, Universiti KebangsaanMalaysia (UKM), Selangor, Malaysia
Qi-Hwa Ng School of Chemical Engineering Campus, Universiti SainsMalaysia, Seri Ampangan, Nibong Tebal, Penang, Malaysia
l List of contributors
Norul Fatiha MohamedNoah
Centre of Lipids Engineering and Applied Research (CLEAR),Department of Chemical Engineering, Faculty of ChemicalEngineering, Universiti Teknologi Malaysia, Skudai Johor,Malaysia
Ahmadilfitri Md Noor Sime Darby R&D Center Carey Island – Downstream, JalanPulau Carey, Pulau Carey, Selangor, Malaysia
Tze Ching Ong University Tun Hussien Onn, Parit Raja, Batu Pahat, Johor,Malaysia
Zing-Yi Ooi Centre of Lipids Engineering and Applied Research (CLEAR),Department of Chemical Engineering, Faculty of ChemicalEngineering, Universiti Teknologi Malaysia, Skudai Johor,Malaysia
Noor Hidayu Othman Sime Darby R&D Center Carey Island – Downstream, JalanPulau Carey, Pulau Carey, Selangor, Malaysia and Facultyof Petroleum and Renewable Energy Engineering, UniversitiTeknologi Malaysia, Skudai, Johor, Malaysia
Norasikin Othman Centre of Lipids Engineering and Applied Research (CLEAR),Department of Chemical Engineering, Faculty of ChemicalEngineering, Universiti Teknologi Malaysia, Skudai Johor,Malaysia
Julaluk Pannoi Thailand Institute of Scientific and Technological Research,Khlong Luang, Pathumthani, Thailand
Thinesh Rachandran School of Chemical Engineering, Engineering Campus,Universiti Sains Malaysia, Nibong Tebal, Penang, Malaysia
Mostafa Rahimnejad Advanced Membrane and Biotechnology Research Center,Faculty of Chemical Engineering, Babol NoshirvaniUniversity of Technology, Babol, Iran
Nejat Rahmanian School of Engineering, University of Bradford, Bradford, UKSamad Sabbaghi Faculties of Advanced Technologies, Nano Chemical
Engineering Department, Shiraz University, Shiraz, IranNur Aimie Abdullah Sani Advanced Membrane Technology Research Centre (AMTEC),
Universiti Teknologi Malaysia, Skudai, Johor, MalaysiaRamesh Kumar Saranya Membrane Research Laboratory, Department of Chemical
Engineering, National Institute of Technology, Tiruchirappalli,India
Mojtaba Shariaty-Niassar Transport Phenomenon and Nanotechnology Laboratory, Schoolof Chemical Engineering, College of Engineering, University ofTehran, Tehran, Iran
Azmi Mohd Shariff Chemical Engineering Department, Universiti TeknologiPETRONAS, Bandar Sri Iskandar, Perak, Malaysia
Biruh Shimekit CO2 Management, MOR, Universiti Teknologi PETRONAS,Bandar Sri Iskandar, Perak, Malaysia and Addis AbabaInstitute of Technology, School of Chemical andBio-Engineering, Addis Ababa, Ethiopia
Mohammad Mahdi A.Shirazi
Membrane Processes Research Laboratory (MPRL),Department of Petrochemical Engineering, AmirkabirUniversity of Technology, Mahshahr Campus, Mahshahr, Iran
Passakorn Sueprasit Thailand Institute of Scientific and Technological Research,Khlong Luang, Pathumthani, Thailand
Nik Meriam Nik Sulaiman Department of Chemical Engineering, University of Malaya,Kuala Lumpur, Malaysia

List of contributors li
Yogarathinam LukkaThuyavan
Membrane Research Laboratory, Department of ChemicalEngineering, National Institute of Technology, Tiruchirappalli,India
Jaya Kumar Veellu Processing & Engineering, R&D Centre, Sime Darby Research,Jalan Pulau Carey, Pulau Carey, Kuala Langat, Selangor,Malaysia
Abu Zahrim Yaser Chemical Engineering Programme, Faculty of Engineering,Universiti Malaysia Sabah, Jalan UMS, Kota Kinabalu, Sabah,Malaysia
Khairul Muis MohamedYusof
Processing & Engineering, R&D Centre, Sime Darby Research,Jalan Pulau Carey, Pulau Carey, Kuala Langat, Selangor,Malaysia
Mohd Suria Affandi Yusoff Sime Darby R&D Center Carey Island – Downstream, JalanPulau Carey, Pulau Carey, Selangor, Malaysia
Mohammad M. Zerafat Transport Phenomenon and Nanotechnology Laboratory, Schoolof Chemical Engineering, College of Engineering, University ofTehran, Tehran, Iran

This page intentionally left blankThis page intentionally left blank
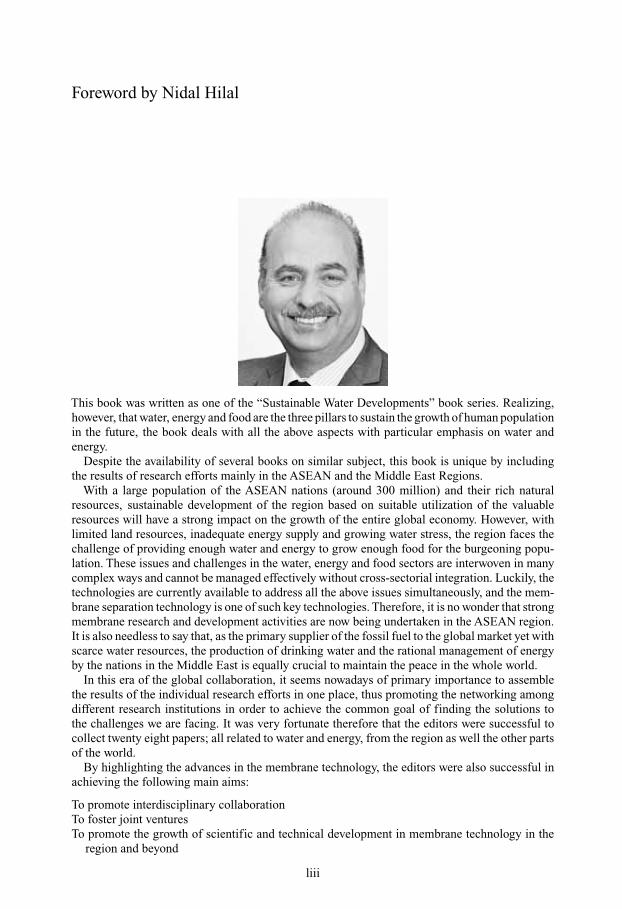
Foreword by Nidal Hilal
This book was written as one of the “Sustainable Water Developments” book series. Realizing,however, that water, energy and food are the three pillars to sustain the growth of human populationin the future, the book deals with all the above aspects with particular emphasis on water andenergy.
Despite the availability of several books on similar subject, this book is unique by includingthe results of research efforts mainly in the ASEAN and the Middle East Regions.
With a large population of the ASEAN nations (around 300 million) and their rich naturalresources, sustainable development of the region based on suitable utilization of the valuableresources will have a strong impact on the growth of the entire global economy. However, withlimited land resources, inadequate energy supply and growing water stress, the region faces thechallenge of providing enough water and energy to grow enough food for the burgeoning popu-lation. These issues and challenges in the water, energy and food sectors are interwoven in manycomplex ways and cannot be managed effectively without cross-sectorial integration. Luckily, thetechnologies are currently available to address all the above issues simultaneously, and the mem-brane separation technology is one of such key technologies. Therefore, it is no wonder that strongmembrane research and development activities are now being undertaken in the ASEAN region.It is also needless to say that, as the primary supplier of the fossil fuel to the global market yet withscarce water resources, the production of drinking water and the rational management of energyby the nations in the Middle East is equally crucial to maintain the peace in the whole world.
In this era of the global collaboration, it seems nowadays of primary importance to assemblethe results of the individual research efforts in one place, thus promoting the networking amongdifferent research institutions in order to achieve the common goal of finding the solutions tothe challenges we are facing. It was very fortunate therefore that the editors were successful tocollect twenty eight papers; all related to water and energy, from the region as well the other partsof the world.
By highlighting the advances in the membrane technology, the editors were also successful inachieving the following main aims:
To promote interdisciplinary collaborationTo foster joint venturesTo promote the growth of scientific and technical development in membrane technology in the
region and beyond
liii

liv Foreword by Nidal Hilal
I am confident that the book will open up a new avenue for international collaboration notonly within but also beyond ASEAN and the Middle East regions on the development of newmembranes and membrane processes, thus contributing to the welfare of the entire humancommunity.
Nidal HilalProfessor and Director, CWATER
Swansea UniversityUnited Kingdom
andEditor-in-Chief, Desalination
October 2015
Editors’ foreword
As the book title “Membrane Technology for Water and Wastewater Treatment, Environment andEnergy” indicates, the book is primarily concerned with environmental applications of membranetechnology, particularly the treatment of water and wastewater.
Even though several books may have been written on a similar subject, this book is veryunique for the reason that the chapters have been contributed, on invitation, mainly by the activeresearchers from the ASEAN and the Middle East regions.
With the large population ofASEAN nations (about 300 million) and their rich natural resources,e.g. agricultural products in Thailand, and petroleum, natural gas and water in Indonesia andMalaysia, sustainable development of the region based on suitable utilization of the valuableresources will have a strong impact on the growth of the entire global economy.
This book provides information to assess the quantity and quality of current research anddevelopment activities in the ASEAN region, especially on membrane science and technology,which are recognized nowadays as one of the most powerful tools to solve environmental andenergy problems. The book also reflects upon those in the Middle East region, where the researchon water treatment is growing due to scarcity of water. Thus, it is believed that the book will openup a new avenue for the establishment of global collaborations to achieve our common goal ofthe welfare of human society.
Part I is for the development of novel separation membranes for water and wastewater treatment.The membranes were fabricated either by blending of different polymers (Chapters 1 and 2)or incorporation of nanoparticles (Chapter 3). The membrane surface was modified and themembrane surface-pollutant interaction was studied by the QCM-D method (Chapter 4). Hollowfibers were spun from polylactic acid (PLA) (Chapter 5). Flat sheet isotactic polypropylenemembrane was fabricated by the TIPS method (Chapter 6). Superhydrophobic membrane wasprepared by grafting of saline compounds on an alumina surface (Chapter 7). The first 5 chaptersare for the pressure driven membrane processes, whereas the last two chapters are for watertreatment by membrane distillation (MD).
Part II is for various applications of membrane separation processes in water and wastewatertreatment. Synthetic oily wastewater was treated by ceramic membrane (Chapter 8). Removal ofdye solutions typical for palm oil mill, leather, textile, pulp and paper industries was attemptedby nanofiltration (NF) (Chapter 9). Wastewater from palm oil (Chapter 10) and rubber industries(Chapter 11), typical for Malaysia, was treated by ultrafiltration (UF)/NF and ceramic UF mem-brane, respectively. Application of membrane separation technology for biodiesel processing isreviewed (Chapter 12).
Part III is for modeling concerning water and wastewater treatment. Mathematical models weredeveloped for NF based deionization process (Chapter 13). The Monte Carlo method was appliedto simulate MD process (Chapter 14). Finally, drying in the multilayer formation of ceramicmembrane was simulated by a mathematical model (Chapter 15).
Part IV is for the preparation of membranes for energy and environment applications, morespecifically for gas separation membranes. The first two chapters are for the preparation of poly-meric flat sheet membranes from polyphenylene oxide (PPO) (Chapter 16) and polyetherimide(PEI) (Chapter 17). The third one is for the preparation of inorganic (perovskite) hollow fibermembranes (Chapter 18), which is followed by two chapters where the fabrication of mixedmatrix membranes (MMMs) by filling clay nanoparticles (Chapter 19) into the polymer matrix
lv
lvi Editors’ foreword
is discussed. Two chapters (Chapters 16 and 19) are for removing CO2, a powerful greenhousegas, whereas others are for CH4/H2 (Chapter 17) and O2/N2 (Chapter 18) separation.
PartV is for energy and environmental applications. Two of them are for CO2/CH4 separation byusing either commercially available PTFE membrane (Chapter 20) or emulsion liquid membrane(Chapter 21). The third one is a review of olefin and paraffin separation by membrane contactor(MC) (Chapter 22). The forth chapter discusses on the reliability of the gas permeation methodwhich is often used to measure the pore size of membranes for membrane distillation (MD)and membrane contactor (MC) where Knudsen and viscous flow dominate (Chapter 23). Thelast chapter compares co-current and counter-current flow for the separation of gas mixtures byhollow fiber membranes (Chapter 24).
Part VI is dedicated to various applications of membrane separation processes concerningenergy, environment and food. The first one is for microbial fuel cell application (Chapter 25).The second and third chapters are for membranes used in the organic environment. Polyphenylsulfone membrane is used for the separation of dye from methanol (Chapter 26) and a review ismade on degumming and deacidification of vegetable oils by membrane processes (Chapter 27).The last chapter is for the fabrication of electro-spun nanofiber membrane, a novel membranethat can be used for various applications (Chapter 28).
The editors believe that many innovative ideas on the development of membrane science andtechnology are assembled in this book. The readers may also have a glimpse into the rapidlygrowing R and D activities in the ASEAN and the Middle East regions that are emerging asthe next generation R and D centers of membrane technologies, especially owing to their needof technology for water and wastewater treatment. As the table of contents indicates the bookaddresses applications of membrane science and technology for water and wastewater treatment,energy and environment. Hence, this book will be useful not only for the engineers, scientists,professors and graduate students who are engaged in the R & D activities of the field, but alsofor those who are interested in the sustainable development of these particular regions.
Ahmad Fauzi IsmailTakeshi Matsuura
(Editors)November 2015
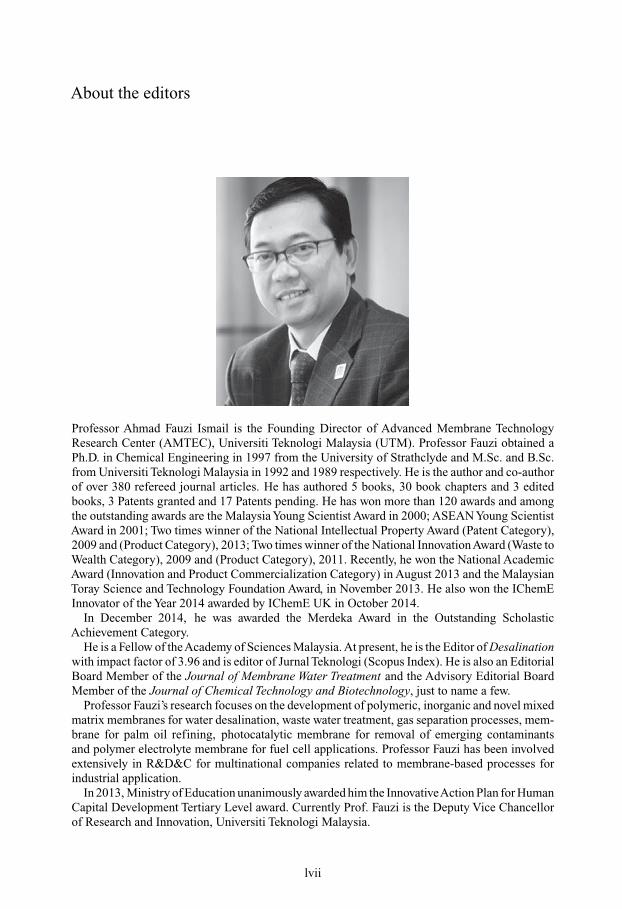
About the editors
Professor Ahmad Fauzi Ismail is the Founding Director of Advanced Membrane TechnologyResearch Center (AMTEC), Universiti Teknologi Malaysia (UTM). Professor Fauzi obtained aPh.D. in Chemical Engineering in 1997 from the University of Strathclyde and M.Sc. and B.Sc.from Universiti Teknologi Malaysia in 1992 and 1989 respectively. He is the author and co-authorof over 380 refereed journal articles. He has authored 5 books, 30 book chapters and 3 editedbooks, 3 Patents granted and 17 Patents pending. He has won more than 120 awards and amongthe outstanding awards are the Malaysia Young Scientist Award in 2000; ASEAN Young ScientistAward in 2001; Two times winner of the National Intellectual Property Award (Patent Category),2009 and (Product Category), 2013; Two times winner of the National InnovationAward (Waste toWealth Category), 2009 and (Product Category), 2011. Recently, he won the National AcademicAward (Innovation and Product Commercialization Category) in August 2013 and the MalaysianToray Science and Technology Foundation Award, in November 2013. He also won the IChemEInnovator of the Year 2014 awarded by IChemE UK in October 2014.
In December 2014, he was awarded the Merdeka Award in the Outstanding ScholasticAchievement Category.
He is a Fellow of theAcademy of Sciences Malaysia. At present, he is the Editor of Desalinationwith impact factor of 3.96 and is editor of Jurnal Teknologi (Scopus Index). He is also an EditorialBoard Member of the Journal of Membrane Water Treatment and the Advisory Editorial BoardMember of the Journal of Chemical Technology and Biotechnology, just to name a few.
Professor Fauzi’s research focuses on the development of polymeric, inorganic and novel mixedmatrix membranes for water desalination, waste water treatment, gas separation processes, mem-brane for palm oil refining, photocatalytic membrane for removal of emerging contaminantsand polymer electrolyte membrane for fuel cell applications. Professor Fauzi has been involvedextensively in R&D&C for multinational companies related to membrane-based processes forindustrial application.
In 2013, Ministry of Education unanimously awarded him the InnovativeAction Plan for HumanCapital Development Tertiary Level award. Currently Prof. Fauzi is the Deputy Vice Chancellorof Research and Innovation, Universiti Teknologi Malaysia.
lvii
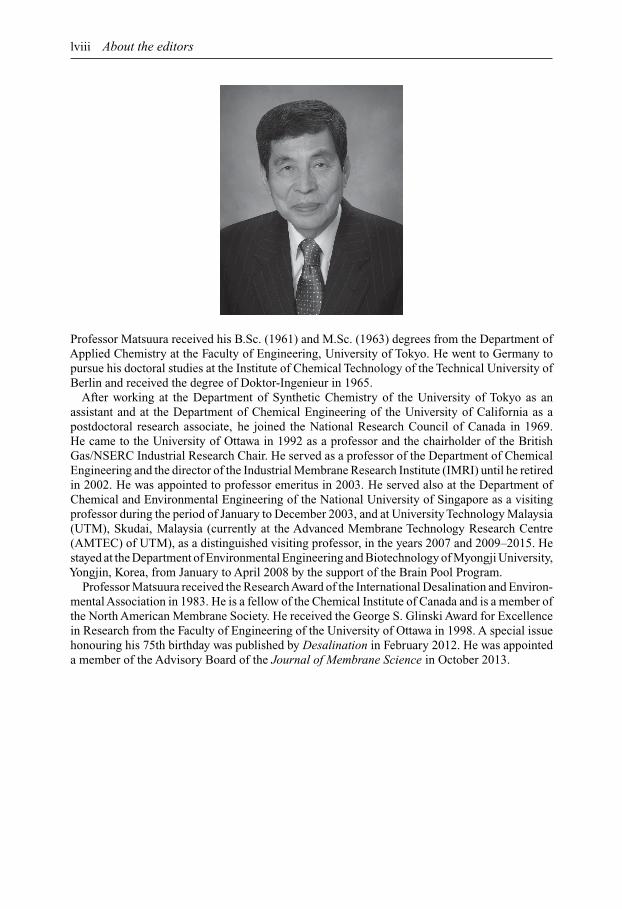
lviii About the editors
Professor Matsuura received his B.Sc. (1961) and M.Sc. (1963) degrees from the Department ofApplied Chemistry at the Faculty of Engineering, University of Tokyo. He went to Germany topursue his doctoral studies at the Institute of Chemical Technology of the Technical University ofBerlin and received the degree of Doktor-Ingenieur in 1965.
After working at the Department of Synthetic Chemistry of the University of Tokyo as anassistant and at the Department of Chemical Engineering of the University of California as apostdoctoral research associate, he joined the National Research Council of Canada in 1969.He came to the University of Ottawa in 1992 as a professor and the chairholder of the BritishGas/NSERC Industrial Research Chair. He served as a professor of the Department of ChemicalEngineering and the director of the Industrial Membrane Research Institute (IMRI) until he retiredin 2002. He was appointed to professor emeritus in 2003. He served also at the Department ofChemical and Environmental Engineering of the National University of Singapore as a visitingprofessor during the period of January to December 2003, and at University Technology Malaysia(UTM), Skudai, Malaysia (currently at the Advanced Membrane Technology Research Centre(AMTEC) of UTM), as a distinguished visiting professor, in the years 2007 and 2009–2015. Hestayed at the Department of Environmental Engineering and Biotechnology of Myongji University,Yongjin, Korea, from January to April 2008 by the support of the Brain Pool Program.
Professor Matsuura received the ResearchAward of the International Desalination and Environ-mental Association in 1983. He is a fellow of the Chemical Institute of Canada and is a member ofthe North American Membrane Society. He received the George S. Glinski Award for Excellencein Research from the Faculty of Engineering of the University of Ottawa in 1998. A special issuehonouring his 75th birthday was published by Desalination in February 2012. He was appointeda member of the Advisory Board of the Journal of Membrane Science in October 2013.
Part IWater and wastewater treatment(novel membrane development)

This page intentionally left blankThis page intentionally left blank
CHAPTER 1
Preparation and characterization of blendedpolysulfone/polyphenylsulfone ultrafiltrationmembranes for palm oil mill effluent treatment
Norafiqah Ismail, Woei Jye Lau & Ahmad Fauzi Ismail
1.1 INTRODUCTION
The palm oil industry forms the backbone of the economy of Malaysia, where the country todayis the world’s second largest producer and exporter of palm oil after Indonesia. In Malaysia, thepalm oil mill industry is identified as the one discharging the largest pollution load into the riversand this has been reported for the last three decades (Hwang et al., 1978). Currently, there aremore than 250 palm oil mills distributed in peninsular Malaysia, generating over 20 million metrictons of effluent every year. In addition, one of the most crucial problems that the oil palm industryfaces is waste disposal, since about 2.5–3.0 m3 of palm oil mill effluent (POME) are generatedfor every metric ton of crude palm oil produced (Borja and Banks, 1994). An efficient treatmentsystem is therefore highly desirable in palm oil mills in order to control the effluent dischargeand to meet the standard parameters set by the Malaysian Department of Environment (DOE).
There are several common POME treatment methods being adopted in Malaysia. One of thetypes of POME treatment is biological treatment of anaerobic and aerobic systems. Accordingto Perez et al. (2001), the anaerobic process is a suitable treatment method due to the organiccharacteristics of POME and thus is widely applied in Malaysia. However, the biological treat-ment process needs proper maintenance and closed monitoring as the efficiency of the processstrongly depends on microorganisms to break down the pollutants which usually require longretention time and skilled personnel to handle (Quah et al., 1982). An efficient POME treatmenthas always been considered a burden to industrial players since no profit is gained from thisactivity. Although biogas can be potentially produced from biological treatment, it still requiresan additional treatment process (Ahmad et al., 2005). Besides biological treatment, pond systemshave also been applied in Malaysia for POME treatment since 1982 and they are classified aswaste stabilization pond (Onyia et al., 2001). The main reason of using ponding systems is due totheir low operating and maintenance costs. In general, ponding systems are easy to operate, butit is always associated with several drawbacks which include the vast amount of land required,relatively long hydraulic retention time (between 45 and 60 days), bad odor created and diffi-culty in maintaining the liquor distribution and collecting biogas. In order to tackle this problem,membrane-based treatment processes have become the main focus among researchers due to theirexcellent performance in treating POME and producing permeate of high quality, in addition toits much smaller treatment footprint. This phenomenon can be reflected by the increasing numberof technical papers published (Abdurahman et al., 2011; Ahmad et al., 2006; Idris et al., 2007).
Membrane technology, particularly ultrafiltration (UF), appears to be a potential treatmentprocess to treat POME efficiently owing to its micrometer (µm) range pore size. Industrially, UFmembranes have been successfully implemented in municipal and industrial wastewater treat-ments. It is gaining importance for water and industrial wastewater treatment especially in therecovery of chemicals from the industrial wastewater, desalination, drinking water purification,and removal of oil from oil-water emulsions (Tansel et al., 2000). It is reported in the work ofMameri et al. (2000) that UF membrane could reduce up to 90% of the COD value of olive
3
4 N. Ismail, W.J. Lau & A.F. Ismail
mill washing water. Lo et al. (2005) and Wu et al. (2007) on the other hand found that UFmembranes made of polysulfone (PSF) were able to treat and reclaim the protein from poultryprocessing wastewater and POME, respectively, with significant efficiencies in reducing the valueof several important effluent parameters. In recent years, the potential of using polyphenylsulfone(PPSF) membranes has been reported in different fields of membrane applications such as fuelcell fabrication, pervaporation, gas separation and water treatment processes. PPSF, which is athird member of the PSF family, comprises sulfone moieties, ether linkages and biphenyl groupin its repeat group. The replacement of the bisphenolA group by biphenyl group in PSF struc-ture increases the impact strength of PPSF polymer, making it more suitable for UF membranepreparation.
The main objective of the present work was to investigate the potential of the PSF mem-branes blended with different content of PSSU for POME treatment process. Prior to the effluenttreatment process, the membranes were characterized using different instruments, i.e. scanningelectron microscope (SEM), atomic force microscope (AFM) and contact angle goniometer, inaddition to the water flux and BSA rejection tests. The performances of membranes for POMEtreatment process were evaluated in terms of BOD3, COD and turbidity.
1.2 EXPERIMENTAL
1.2.1 Materials
Polysulfone (Udel-P1700, MW: 35,400 g mol−1) obtained from Amoco Chemical was used inthis study as membrane forming material. Another type of polymer – polyphenylsulfone (MW:53,000–59,000 g mol−1) purchased from Sigma-Aldrich was used together with PSF in preparingPSF/PPSF blend membranes. 1-methyl-2-pyrrolidone (NMP) with analytical purity of 99.5%purchased from Merck was used as solvent. Bovine serum albumin (BSA, 67 kDa) purchasedfrom Sigma Aldrich was used as test solute by dissolving it in DI water.
1.2.2 Membrane preparation
Table 1.1 shows the composition of five different dope solutions that were used to prepare UFhollow fiber membranes of various properties. These membranes were prepared from a dopesolution consisted of 20 wt% total polymer (with different PSF/PPSF ratio) and 80 wt% NMPsolvent. The details of dry-jet wet spinning process for hollow fiber membrane fabrication can befound elsewhere (Ismail, 2014). In order to remove the residual solvent from membrane matrix, itwas needed to immerse the membrane in water bath for at least 1 day. Afterwards, the membranewas air-dried naturally before it was used for module making.
1.2.3 Membrane characterizations
The morphologies of the membranes were observed by a tabletop scanning electron microscope(SEM) (TM3000, Hitachi).The cross sections of samples were prepared by fracturing the mem-branes in liquid nitrogen followed by a thin layer of platinum coating using sputter coater. Thesurface roughness of the dried hollow fiber membranes on the other hand was determined byAFM(Multimode Nanoscope, DI company) in a dynamic force mode (DFM) with a 20 µm scannerand SI-DF40 (spring constant = 42 N m−1) cantilever. For this analysis, the membrane sampleswere required to be cut into lengths of approximately 1 cm and located on the top of the scannertube by carbon tape. The outer surface of the hollow fiber membranes was observed within thescan size of 1 µm × 1 µm. In this study, Ra and RMS were used as the evaluation parameter tocompare the roughness of membrane produced. The hydrophilicity of membranes was studied bymeasuring the angle between the membrane surface and the meniscus formed by the water using

Blended polysulfone/polyphenylsulfone ultrafiltration membranes for POME treatment 5
Table 1.1. Composition of the dope solution for blended PSF/PPSFmembranes preparation.
Dope solution compositions [wt%]
Total polymer weight (20%) Solvent (80%)
Membrane PSF PPSF NMP
PSF 20 – 8075PSF/25PPSF 15 5 8050PSF/50PPSF 10 10 8025PSF/75PPSF 5 15 80PPSF – 20 80
contact angle goniometer (OCA 15plus, DataPhysics). To determine membrane porosity, ε [%],the gravimetric method as expressed in the following equation can be employed:
ε =w1 − w2
ρww1 − w2
ρw+ w2
ρp
(1.1)
where w1 is the weight of the wet membrane [g], w2 is the weight of the dry membrane [g], ρp isthe density of the polymer [g cm−3] and ρw is the density of water [g cm−3].
1.2.4 UF experiment
The permeation flux and BSA rejection of all resultant membranes were measured by a customizedcross-flow UF system. In this experiment, the pressure was applied on the shell side (feed side)of the hollow fiber membranes and the permeate flux was created in outside-in filtration mode.For each membrane sample, a module consisted of 10 fibers in 21 cm long was used. The purewater flux, JPWF [L m−2 h−1], was measured at 0.2 MPa after a steady-state flux was achieved:
JPWF = V
AT(1.2)
where V is the permeate volume [L], A is the membrane surface area [m2] and T is the time [h].To determine membrane separation efficiency, a feed solution containing 1000 mg L−1 of BSA
test solute was prepared. The membrane rejection against BSA solute, R [%], was determined bymeasuring the concentration in the feed and permeate using UV-VIS spectrophotometer (DR5000,Hach) at the wavelength of 280 nm:
R =(
1 − cp
cf
)× 100 (1.3)
where cp is the concentration of the permeate [mg L−1] and cf is the concentration of thefeed [mg L−1].
1.2.5 POME sample and analysis
The POME sample used in this work was collected from Sime Darby East Oil Mill, CareyIsland, Selangor, without undergoing any pretreatment process. Analytical tests were carried outto evaluate the quality of the POME before and after membrane treatment process. Chemical
6 N. Ismail, W.J. Lau & A.F. Ismail
oxygen demand (COD) tests were carried out by putting 2 mL sample into the oxidizing acidreagent solution and then it was held at 150◦C for 2 h. After it was cooled down to ambienttemperature, the COD value of sample was analyzed using a colorimeter (DR/890, Hach) withreadings taken at 435 nm wavelength. Biological oxygen demand (BOD) tests on the other handwere performed based on 3-day period, i.e. BOD3. For this analysis, initial dissolved oxygen(DO) of each solution was first determined using a portable dissolved oxygen meter (PRODO,YSI). After 3 days of incubation in the dark condition at 20◦C, the DO of the final samples wasre-analyzed in order to calculate the change of DO value, i.e. BOD value. With respect to sampleturbidity, a portable turbidimeter (2100Q, Hach) was used for measuring the turbidity of feed andpermeate sample at room condition.
1.3 RESULTS AND DISCUSSION
1.3.1 Effect of PSF:PPSF weight ratio on membrane properties
1.3.1.1 Morphological studiesThe cross-sectional morphology of membranes prepared in this study was examined using SEM.The effects of PPSF concentration on the structural properties of PSF is presented in Figure 1.1.As can be seen, the addition of PPSF in the dope solution has indeed played a role in alteringmembrane morphology. With increasing PPSF concentration in the PSF dope solution, it isfound that the finger-like structures were extended from both the inner and outer skin layerof membrane by suppressing the number of big macrovoids formed at the intermediate layer.However, when the dope solution was prepared from PPSF only, the viscosity of the dope solutionwas increased, owing to the higher molecular weight of PPSF compared to PSF. Because of this,a relatively denser and thick active layer was formed in PPSF membrane as shown in Figure 1.1e.In this PPSF membrane, a very thick dense top layer was observed followed by sponge-like layersupported a uniformly formed finger-liked inner layer. These results indicate that kinetically theoverall diffusion between components in phase inversion system can be suppressed because ofthe increase in the rheological hindrance or delayed exchange between solvent and non-solvent.In the following section, the effects of the morphology change of PSF membrane due to theintroduction of PPSF polymer at different weight ratio on the water flux and BSA removal arefurther discussed.
1.3.1.2 Membrane filtration performance and its relation to membrane characteristicsFigure 1.2 shows the pure water flux and BSA rejection of all the resultant membranes measuredat operating pressure of 0.2 MPa. The water flux of membrane was improved with increasing thePPSF concentration from PSF:PPSF weight ratio of 1:0 to 0.5:0.5, recording 82.81 L m−2 h−1 inthe 50PSF/50PPSF membrane compared to 11.09 L m−2 h−1 shown in the pristine PSF membrane,i.e. PSF. The flux enhancement is mainly due to the development of more finger-like structures asevidenced in the SEM image (Fig. 1.1) coupled with the increase in overall membrane porosity(Table 1.2), which reduces the transport resistance of water and increases the water permeationrate. Further increase in PPSF concentration to weight ratio of 0.25:0.75, however resulted inlower pure water flux as evidenced in 25PSF/75PPSF membrane. This is probably due to thedecrease in overall membrane porosity coupled with increase in membrane hydrophobicity (i.e.higher water contact angle value). As PPSF is naturally more hydrophobic than PSF, increasing thecontent of PPSF in the PSF membrane matrix would therefore reduce membrane hydrophilicity(Liu et al., 2012). In this study, it was found that the influence of PPSF on PSF membranehydrophilicity became more obvious when more than 75% of the total polymer used was PPSF.Interestingly, the membrane prepared from pure PPSF exhibited zero flux (tested at 0.2 MPa),even though the dope solution containing same polymer weight as the PSF dope solution wasused in preparing pure PSF membrane. The zero-flux membrane is mainly due to the formationof relatively dense skin layer which is the result of the high viscosity of PPSF dope solution and
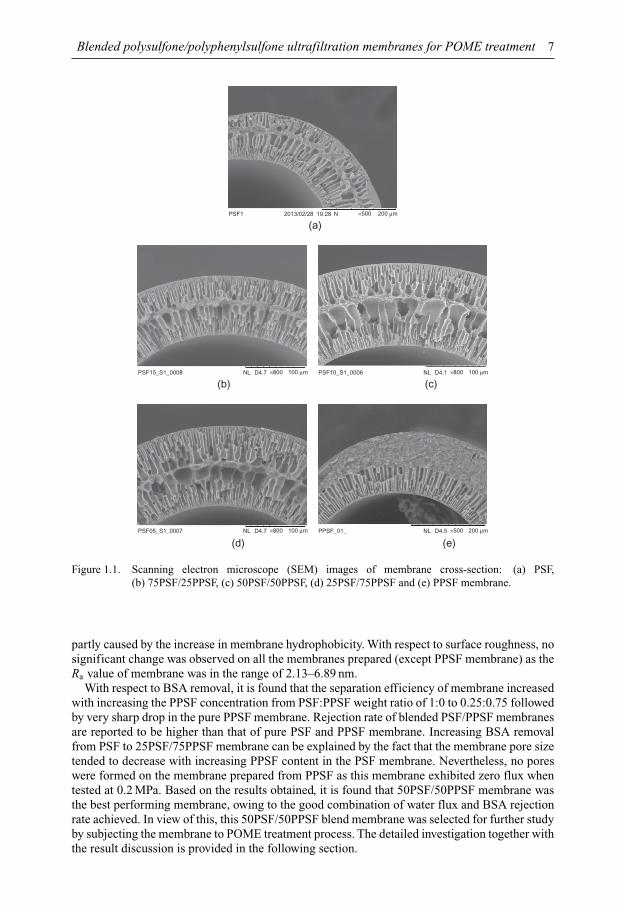
Blended polysulfone/polyphenylsulfone ultrafiltration membranes for POME treatment 7
(a)
(b) (c)
(d) (e)
PSF1 2013/02/28 10:28 N ×500 200 µm
PSF15_S1_0008 NL D4.7 ×800 100 µm PSF10_S1_0006 NL D4.1 ×800 100 µm
PSF05_S1_0007 NL D4.7 ×800 100 µm PPSF_01_ NL D4.5 ×500 200 µm
Figure 1.1. Scanning electron microscope (SEM) images of membrane cross-section: (a) PSF,(b) 75PSF/25PPSF, (c) 50PSF/50PPSF, (d) 25PSF/75PPSF and (e) PPSF membrane.
partly caused by the increase in membrane hydrophobicity. With respect to surface roughness, nosignificant change was observed on all the membranes prepared (except PPSF membrane) as theRa value of membrane was in the range of 2.13–6.89 nm.
With respect to BSA removal, it is found that the separation efficiency of membrane increasedwith increasing the PPSF concentration from PSF:PPSF weight ratio of 1:0 to 0.25:0.75 followedby very sharp drop in the pure PPSF membrane. Rejection rate of blended PSF/PPSF membranesare reported to be higher than that of pure PSF and PPSF membrane. Increasing BSA removalfrom PSF to 25PSF/75PPSF membrane can be explained by the fact that the membrane pore sizetended to decrease with increasing PPSF content in the PSF membrane. Nevertheless, no poreswere formed on the membrane prepared from PPSF as this membrane exhibited zero flux whentested at 0.2 MPa. Based on the results obtained, it is found that 50PSF/50PPSF membrane wasthe best performing membrane, owing to the good combination of water flux and BSA rejectionrate achieved. In view of this, this 50PSF/50PPSF blend membrane was selected for further studyby subjecting the membrane to POME treatment process. The detailed investigation together withthe result discussion is provided in the following section.
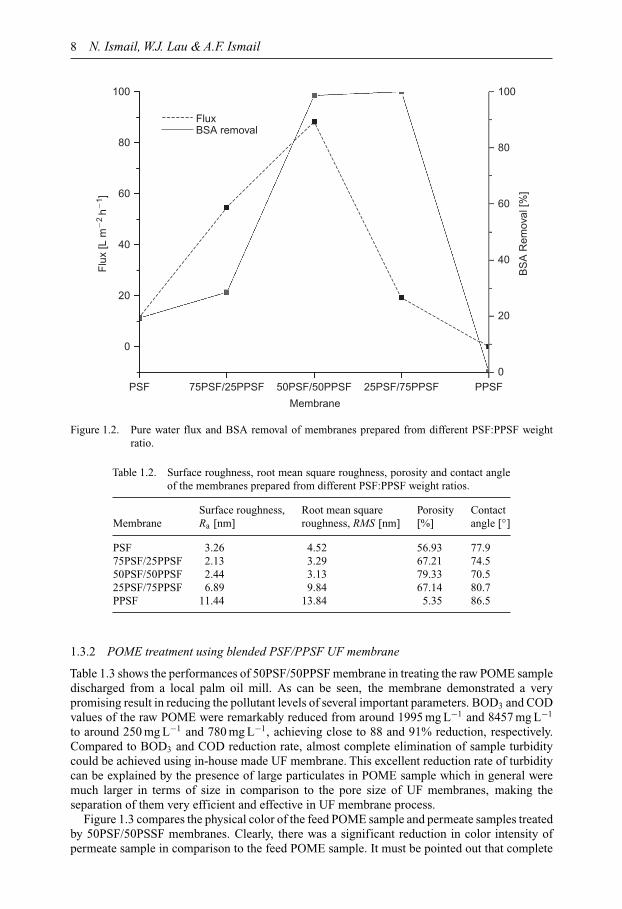
8 N. Ismail, W.J. Lau & A.F. Ismail
PSF 75PSF/25PPSF 50PSF/50PPSF 25PSF/75PPSF PPSF
Membrane
Flu
x [L
m�
2 h�
1 ]
BS
A R
emov
al [%
]
0
20
40
60
80
100
0
20
40
60
80
100
FluxBSA removal
Figure 1.2. Pure water flux and BSA removal of membranes prepared from different PSF:PPSF weightratio.
Table 1.2. Surface roughness, root mean square roughness, porosity and contact angleof the membranes prepared from different PSF:PPSF weight ratios.
Surface roughness, Root mean square Porosity ContactMembrane Ra [nm] roughness, RMS [nm] [%] angle [◦]
PSF 3.26 4.52 56.93 77.975PSF/25PPSF 2.13 3.29 67.21 74.550PSF/50PPSF 2.44 3.13 79.33 70.525PSF/75PPSF 6.89 9.84 67.14 80.7PPSF 11.44 13.84 5.35 86.5
1.3.2 POME treatment using blended PSF/PPSF UF membrane
Table 1.3 shows the performances of 50PSF/50PPSF membrane in treating the raw POME sampledischarged from a local palm oil mill. As can be seen, the membrane demonstrated a verypromising result in reducing the pollutant levels of several important parameters. BOD3 and CODvalues of the raw POME were remarkably reduced from around 1995 mg L−1 and 8457 mg L−1
to around 250 mg L−1 and 780 mg L−1, achieving close to 88 and 91% reduction, respectively.Compared to BOD3 and COD reduction rate, almost complete elimination of sample turbiditycould be achieved using in-house made UF membrane. This excellent reduction rate of turbiditycan be explained by the presence of large particulates in POME sample which in general weremuch larger in terms of size in comparison to the pore size of UF membranes, making theseparation of them very efficient and effective in UF membrane process.
Figure 1.3 compares the physical color of the feed POME sample and permeate samples treatedby 50PSF/50PSSF membranes. Clearly, there was a significant reduction in color intensity ofpermeate sample in comparison to the feed POME sample. It must be pointed out that complete
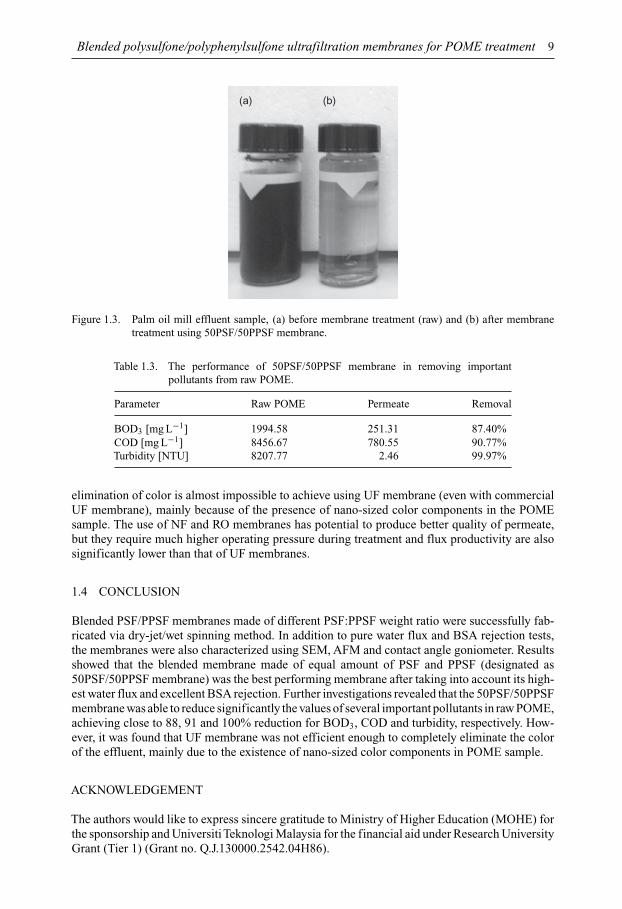
Blended polysulfone/polyphenylsulfone ultrafiltration membranes for POME treatment 9
(a) (b)
Figure 1.3. Palm oil mill effluent sample, (a) before membrane treatment (raw) and (b) after membranetreatment using 50PSF/50PPSF membrane.
Table 1.3. The performance of 50PSF/50PPSF membrane in removing importantpollutants from raw POME.
Parameter Raw POME Permeate Removal
BOD3 [mg L−1] 1994.58 251.31 87.40%COD [mg L−1] 8456.67 780.55 90.77%Turbidity [NTU] 8207.77 2.46 99.97%
elimination of color is almost impossible to achieve using UF membrane (even with commercialUF membrane), mainly because of the presence of nano-sized color components in the POMEsample. The use of NF and RO membranes has potential to produce better quality of permeate,but they require much higher operating pressure during treatment and flux productivity are alsosignificantly lower than that of UF membranes.
1.4 CONCLUSION
Blended PSF/PPSF membranes made of different PSF:PPSF weight ratio were successfully fab-ricated via dry-jet/wet spinning method. In addition to pure water flux and BSA rejection tests,the membranes were also characterized using SEM, AFM and contact angle goniometer. Resultsshowed that the blended membrane made of equal amount of PSF and PPSF (designated as50PSF/50PPSF membrane) was the best performing membrane after taking into account its high-est water flux and excellent BSA rejection. Further investigations revealed that the 50PSF/50PPSFmembrane was able to reduce significantly the values of several important pollutants in raw POME,achieving close to 88, 91 and 100% reduction for BOD3, COD and turbidity, respectively. How-ever, it was found that UF membrane was not efficient enough to completely eliminate the colorof the effluent, mainly due to the existence of nano-sized color components in POME sample.
ACKNOWLEDGEMENT
The authors would like to express sincere gratitude to Ministry of Higher Education (MOHE) forthe sponsorship and UniversitiTeknologi Malaysia for the financial aid under Research UniversityGrant (Tier 1) (Grant no. Q.J.130000.2542.04H86).
10 N. Ismail, W.J. Lau & A.F. Ismail
REFERENCES
Abdurahman, N.H., Rosli,Y.M. &Azhari, N.H. (2011) Development of a membrane anaerobic system (MAS)for palm oil mill effluent (POME). Desalination, 266 (1–3), 208–212.
Ahmad, A.L., Ismail, S. & Bhatia, S. (2005) Ultrafiltration behavior in the treatment of agro-industry effluent:pilot scale studies. Chemical Engineering Science, 60, 5385–5394.
Ahmad, A.L., Chong, M.F. & Bhatia, S. (2006) Drinking water reclamation from palm oil mill effluent(POME) using membrane technology. Journal of Hazardous Materials, 171 (1–3), 166–174.
Borja, R. & Banks, C.J. (1994) Anaerobic digestion of palm oil mill effluent using up-flow anaerobic sludgeblanket reactor. Biomass Bioenergy, 6, 381–389.
Hwang, T.K., Ong, S.M., Seow, C.C. & Tan, H.K. (1978) Chemical composition of palm oil mill effluents.Planter, 54, 749–756.
Idris, A., Ahmad, I. & Jye, H.W. (2007) Performance cellulose acetate-polyethersulfone (CA-PS) blendmembranes prepared using microwave heating for palm oil mill effluent treatment. Water of ScienceTechnology, 56 (8), 167–177.
Ismail, N. (2014) Preparation and characterization of polysulfone/polyphenylsulfone/titanium dioxide ultra-filtrationmembrane for palm oil mill effluent treatment. Master Thesis, Universiti Teknologi Malaysia,Johor, Malaysia.
Liu,Y.,Yue, X., Zhang, S., Ren, J.,Yang, L., Wang, Q. & Wang, G. (2012) Synthesis of sulfonatedpolyphenyl-sulfone ascandidates for antifouling ultrafiltration membrane. Separation and Purification Technology,98, 298–307.
Lo, Y.M., Cao, D., Argin-Soysal, S., Wang, J. & Hahm, T.-S. (2005) Recovery of protein from poultryprocessing wastewater using membrane ultrafiltration. Bioresource Technology, 96, 687–698.
Mameri, N., Halet, F., Drouiche, M., Grib, H., Lounici, H., Pauss, A., Piron, D. & Belhocine, D. (2000)Treatment of olive mill washing water by ultrafiltration. Canadian Journal of Chemical Engineering, 78,590–595.
Onyia, C.O., Uyub, A.M., Akunna, J.C., Norulaini, N.A. & Omar, A.K.M. (2001) Increasing the fertilizervalue of palm oil mill sludge: bioaugmentation in nitrification. Sludge Management Entering the ThirdMillennium – Industrial, Combined, Water and Wastewater Residues, 44, 157–162.
Perez, M., Romero, L.J. & Sales, D. (2001) Organic matter degradation kinetics in an anaerobic thermophilicfluidized bed bioreactor. Anaerobe, 7, 25–35.
Quah, S.K., Lim, K.H., Gillies, D., Wood, B.J. & Kanagaratnam, J. (1982) POME treatment and land appli-cation system. Proceeding of Regional Workshop On Palm Oil Mill Technology and Effluent Treatment,PORIM, Kuala Lumpur, Malaysia. pp. 193–200.
Tansel, B., Bao, Y.W. & Tansel, I.N. (2000) Characterization of fouling kinetics in ultrafiltration systems byresistance in series model. Desalination, 129 (1), 7–14.
Wu, T.Y., Mohammad, A.W., Md. Jahim, J. & Anuar, N. (2007) Palm oil mill effluent (POME) treat-ment and bioresourcesrecovery using ultrafiltration membrane: effect of pressure on membrane fouling.Biochemical Engineering Journal, 35, 309–317.

CHAPTER 2
Development and characterization of sago/PVA blend membranefor recovery of ethyl acetate from water
Abdulhakim M. Alamaria & M.M. Nawawia Ghazali
2.1 INTRODUCTION
Pervaporation (PV) is a membrane separation process that has been studied intensively to separatealcohol/water mixtures such as ethanol/water, iso-propanol/water and ethyl acetate/water (Ghazaliet al., 1997; Xia et al., 2011; Zhang et al., 2009). A good advantage of pervaporation is that nopollution occurs and high efficiency production is expected (Feng et al., 1997; Lipnizki et al.,1999). All chemical and pharmaceutical industries are presently showing incredible interest inthis new technology that is low energy consuming, has high separation efficiency and is of an eco-friendly nature (Hyder et al., 2006; Rachipudi et al., 2011). Pervaporation has several applicationslike recovery of organic mixture from water, separation of mixtures of similar boiling points anddehydration of organic solvents (Feng et al., 1997; Hasanoglu et al., 2005; Liua, Y. et al. 2011).Ethyl acetate is one of the important solvents, and wildly used in various manufacturing industriessuch as pharmaceutical industries and chemical industries for cleaning fluids, inks, coated papersand perfume (Hai-Kuan Yuana et al., 2011; Yongquan et al., 2012). Recovery of ethyl acetatefrom water is however very difficult because ethyl acetate forms azeotrope with the water andthe separation becomes expensive by distillation which requires entrainers that must be removedafter distillation is completed (Wua et al., 2012). Hence PV is considered most appropriate forthe recovery of ethyl acetate from water. Many different natural and synthetic polymers havebeen used to develop membranes for PV. As well, some polymers such as chitosan, polyvinylalcohol, and cellulose were blended to fabricate membranes for dehydration of the alcohol/watermixture. It is also known that separation factor and permeation flux depend not only on membranematerial but also on the operating conditions such as feed temperature and liquid composition(Huang et al., 1999). Table 2.1 summarizes the effect of different materials for recovery of ethylacetate from its aqueous solution. The hydrophilic polymers that have O–H group are usuallypreferred to prepare membranes for ethyl acetate recovery by dehydration. In addition to thoselisted in Table 2.1, much work has been done to develop starch-based membranes for producingrenewable energy, reducing environmental effect, and finding for more applications (Lu et al.,2009). Sago starch is evidently a hydrophilic polymer, which makes it an interesting materialto be developed into membranes for dehydration of ethyl acetate. There are several chemicaland physical modification methods to improve the properties of sago starch and one of thoseis blending with other polymers. Sago starch has not yet been studied as a membrane material,especially for PV. In this study, an attempt is made to separate azeotrope forming mixtures ofethyl acetate-water using sago starch/PVA blend membranes. The effects of operating conditionsare also discussed in the work.
2.2 EXPERIMENTAL
2.2.1 Materials
Sago starch was supplied by Ng Kia Heng Sago Industries Sdn Bhd, Batu Pahat, Johor Malaysia.Polyvinyl alcohol (86,000 Mwt, 99–100% hydrolyzed) from New Jersey USA, ethyl acetate (99%)
11
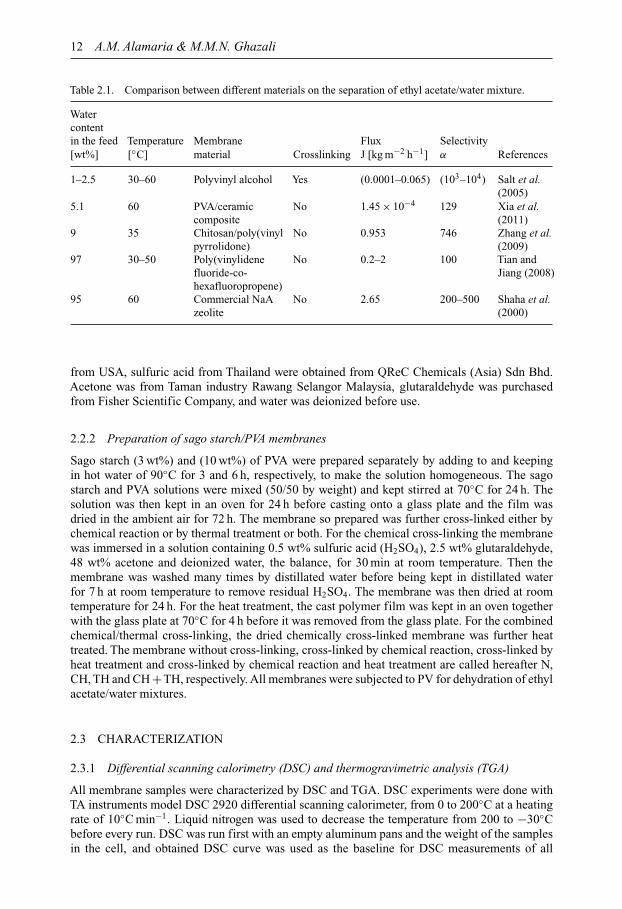
12 A.M. Alamaria & M.M.N. Ghazali
Table 2.1. Comparison between different materials on the separation of ethyl acetate/water mixture.
Watercontentin the feed Temperature Membrane Flux Selectivity[wt%] [◦C] material Crosslinking J [kg m−2 h−1] α References
1–2.5 30–60 Polyvinyl alcohol Yes (0.0001–0.065) (103–104) Salt et al.(2005)
5.1 60 PVA/ceramic No 1.45 × 10⁻⁴ 129 Xia et al.composite (2011)
9 35 Chitosan/poly(vinyl No 0.953 746 Zhang et al.pyrrolidone) (2009)
97 30–50 Poly(vinylidene No 0.2–2 100 Tian andfluoride-co- Jiang (2008)hexafluoropropene)
95 60 Commercial NaA No 2.65 200–500 Shaha et al.zeolite (2000)
from USA, sulfuric acid from Thailand were obtained from QReC Chemicals (Asia) Sdn Bhd.Acetone was from Taman industry Rawang Selangor Malaysia, glutaraldehyde was purchasedfrom Fisher Scientific Company, and water was deionized before use.
2.2.2 Preparation of sago starch/PVA membranes
Sago starch (3 wt%) and (10 wt%) of PVA were prepared separately by adding to and keepingin hot water of 90◦C for 3 and 6 h, respectively, to make the solution homogeneous. The sagostarch and PVA solutions were mixed (50/50 by weight) and kept stirred at 70◦C for 24 h. Thesolution was then kept in an oven for 24 h before casting onto a glass plate and the film wasdried in the ambient air for 72 h. The membrane so prepared was further cross-linked either bychemical reaction or by thermal treatment or both. For the chemical cross-linking the membranewas immersed in a solution containing 0.5 wt% sulfuric acid (H2SO4), 2.5 wt% glutaraldehyde,48 wt% acetone and deionized water, the balance, for 30 min at room temperature. Then themembrane was washed many times by distillated water before being kept in distillated waterfor 7 h at room temperature to remove residual H2SO4. The membrane was then dried at roomtemperature for 24 h. For the heat treatment, the cast polymer film was kept in an oven togetherwith the glass plate at 70◦C for 4 h before it was removed from the glass plate. For the combinedchemical/thermal cross-linking, the dried chemically cross-linked membrane was further heattreated. The membrane without cross-linking, cross-linked by chemical reaction, cross-linked byheat treatment and cross-linked by chemical reaction and heat treatment are called hereafter N,CH, TH and CH +TH, respectively. All membranes were subjected to PV for dehydration of ethylacetate/water mixtures.
2.3 CHARACTERIZATION
2.3.1 Differential scanning calorimetry (DSC) and thermogravimetric analysis (TGA)
All membrane samples were characterized by DSC and TGA. DSC experiments were done withTA instruments model DSC 2920 differential scanning calorimeter, from 0 to 200◦C at a heatingrate of 10◦C min−1. Liquid nitrogen was used to decrease the temperature from 200 to −30◦Cbefore every run. DSC was run first with an empty aluminum pans and the weight of the samplesin the cell, and obtained DSC curve was used as the baseline for DSC measurements of all
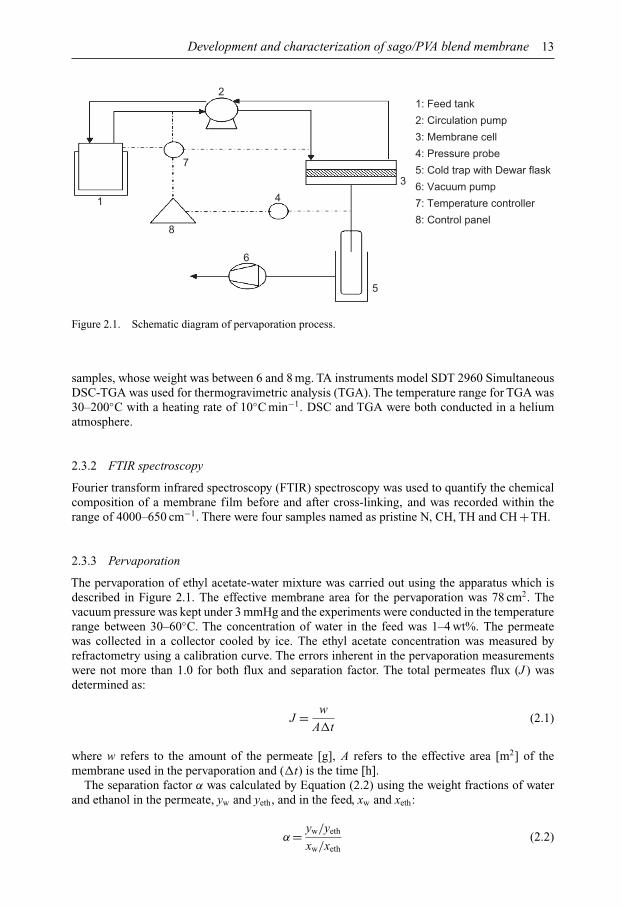
Development and characterization of sago/PVA blend membrane 13
1
7
8
2
4
3
5
6
1: Feed tank
4: Pressure probe
6: Vacuum pump
2: Circulation pump
3: Membrane cell
5: Cold trap with Dewar flask
7: Temperature controller
8: Control panel
Figure 2.1. Schematic diagram of pervaporation process.
samples, whose weight was between 6 and 8 mg. TA instruments model SDT 2960 SimultaneousDSC-TGA was used for thermogravimetric analysis (TGA). The temperature range for TGA was30–200◦C with a heating rate of 10◦C min−1. DSC and TGA were both conducted in a heliumatmosphere.
2.3.2 FTIR spectroscopy
Fourier transform infrared spectroscopy (FTIR) spectroscopy was used to quantify the chemicalcomposition of a membrane film before and after cross-linking, and was recorded within therange of 4000–650 cm−1. There were four samples named as pristine N, CH, TH and CH +TH.
2.3.3 Pervaporation
The pervaporation of ethyl acetate-water mixture was carried out using the apparatus which isdescribed in Figure 2.1. The effective membrane area for the pervaporation was 78 cm2. Thevacuum pressure was kept under 3 mmHg and the experiments were conducted in the temperaturerange between 30–60◦C. The concentration of water in the feed was 1–4 wt%. The permeatewas collected in a collector cooled by ice. The ethyl acetate concentration was measured byrefractometry using a calibration curve. The errors inherent in the pervaporation measurementswere not more than 1.0 for both flux and separation factor. The total permeates flux (J ) wasdetermined as:
J = w
A�t(2.1)
where w refers to the amount of the permeate [g], A refers to the effective area [m2] of themembrane used in the pervaporation and (�t) is the time [h].
The separation factor α was calculated by Equation (2.2) using the weight fractions of waterand ethanol in the permeate, yw and yeth, and in the feed, xw and xeth:
α = yw/yeth
xw/xeth(2.2)

14 A.M. Alamaria & M.M.N. Ghazali
3015
20
25
30
35
40
45
40 60 80 100
N
TH
CH
CH+TH
120Temperature [°C]
140 160 180 200
Hea
t flo
w e
ndo
up [m
W]
Figure 2.2. Differential scanning calorimetry (DSC) curve of effect of different crosslinking on sagostarch/PVA blend membrane (N: non crosslinking, CH: chemical crosslinking, TH: thermalcrosslinking, CH +TH: chemical + thermal crosslinking).
2.4 RESULTS AND DISCUSSION
2.4.1 Membrane characterization
2.4.1.1 DSCSago starch has a helical structure which can be crystallized and polyvinyl alcohol is semi-crystalline. For both of them, the structure may change by cross-linking. From the DSC curvesN and TH samples showed glass transition temperature (Tg) at 60◦C, CH showed Tg at 96◦C and(CH +TH) showed Tg and melting point (Tm) at 90◦C and 208◦C, respectively. Thus the structureof the membranes changed considerably by cross-linking as presented in Figure 2.2.
2.4.1.2 Thermal stability TGAThe thermal stability of sago starch/PVA membrane and its cross-linked derivatives were investi-gated by TGA analysis under nitrogen flow. The resulting thermograms are shown in Figure 2.3.From the thermograms, it is clear that all membranes exhibited three consecutive steps for weightloss. In N (Fig. 2.3a) the first weight loss of 20% occurred in a range of temperature between60 and 250◦C. The second weight loss of 6% occurred between 250 and 300◦C, correspondingto physically absorbed water molecules. The majority of these absorbed water molecules exist ina bound state rather than in a free molecular state (Guana et al., 2006; Shaoa et al., 2003) andlooks like to be bound directly to the polymer chain through hydrogen bonds. For CH membraneshown in Figure 2.3b, the first weight loss of 22% occurred at temperature between 50 and 300◦C.Compared to N membrane the weight loss increased in a wider temperature range up to 300◦C.This also is attributed to desorption of physically absorbed water molecules in the membrane. Thesecond weight loss for CH membrane was 80% in a temperature range between 300 and 450◦C,which corresponds to decomposition of sago starch and polyvinyl alcohol. For TH membraneshown in Figure 2.3c the first weight loss of 19.87% occurred between 60 and 200◦C, which isdue to a loss of absorbed water. The second weight loss of 83% occurred at around 200–400◦C,which may correspond to the structural decomposition of sago starch/PVA. For CE +TH mem-brane the first weight loss of 12.17% occurred between 50 and 280◦C, due to its physical change
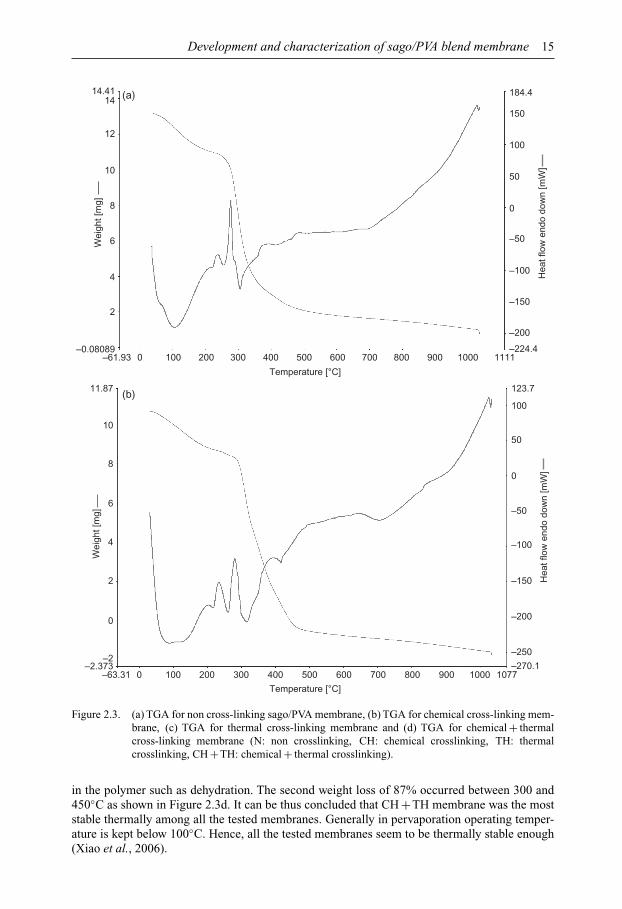
Development and characterization of sago/PVA blend membrane 15
–61.93–0.08089
2
–224.4
–200
–150
–100
–50
0
50
100
150
184.4
4
6
8
10
12
1414.41
0 100 200 300 400 500
Temperature [°C]
600 700 800 900 1000 1111
–63.31–2.373
–2
0
–270.1
–250
–200
–150
–100
–50
0
50
100
123.7
2
4
6
Wei
ght [
mg]
8
10
11.87(b)
(a)
0 100 200 300 400 500
Temperature [°C]
600 700 800 900 1000 1077
Wei
ght [
mg]
Hea
t flo
w e
ndo
dow
n [m
W]
Hea
t flo
w e
ndo
dow
n [m
W]
Figure 2.3. (a) TGA for non cross-linking sago/PVA membrane, (b) TGA for chemical cross-linking mem-brane, (c) TGA for thermal cross-linking membrane and (d) TGA for chemical + thermalcross-linking membrane (N: non crosslinking, CH: chemical crosslinking, TH: thermalcrosslinking, CH +TH: chemical + thermal crosslinking).
in the polymer such as dehydration. The second weight loss of 87% occurred between 300 and450◦C as shown in Figure 2.3d. It can be thus concluded that CH +TH membrane was the moststable thermally among all the tested membranes. Generally in pervaporation operating temper-ature is kept below 100◦C. Hence, all the tested membranes seem to be thermally stable enough(Xiao et al., 2006).
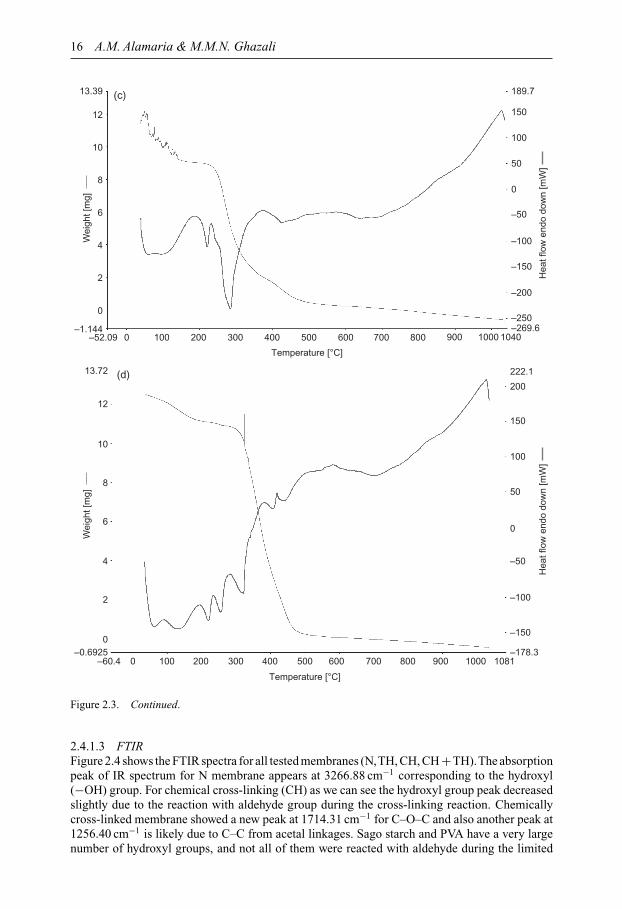
16 A.M. Alamaria & M.M.N. Ghazali
–60.4
–52.09–1.144
0
2
4
6
8
10
12
(c)
(d)
13.39
0 100 200 300 400 500 600 700 800 900 1000 1040
–250
–200
–150
–100
–50
0
50
100
150
189.7
–269.6
–0.69250
2
4
6
Wei
ght [
mg]
8
10
12
13.72
0 100 200 300 400 500
Temperature [°C]
Temperature [°C]
600 700 800 900 1000 1081–178.3
–150
–100
–50
0
50
100
150
200
222.1
Hea
t flo
w e
ndo
dow
n [m
W]
Wei
ght [
mg]
Hea
t flo
w e
ndo
dow
n [m
W]
Figure 2.3. Continued.
2.4.1.3 FTIRFigure 2.4 shows the FTIR spectra for all tested membranes (N,TH, CH, CH +TH).The absorptionpeak of IR spectrum for N membrane appears at 3266.88 cm−1 corresponding to the hydroxyl(−OH) group. For chemical cross-linking (CH) as we can see the hydroxyl group peak decreasedslightly due to the reaction with aldehyde group during the cross-linking reaction. Chemicallycross-linked membrane showed a new peak at 1714.31 cm−1 for C–O–C and also another peak at1256.40 cm−1 is likely due to C–C from acetal linkages. Sago starch and PVA have a very largenumber of hydroxyl groups, and not all of them were reacted with aldehyde during the limited
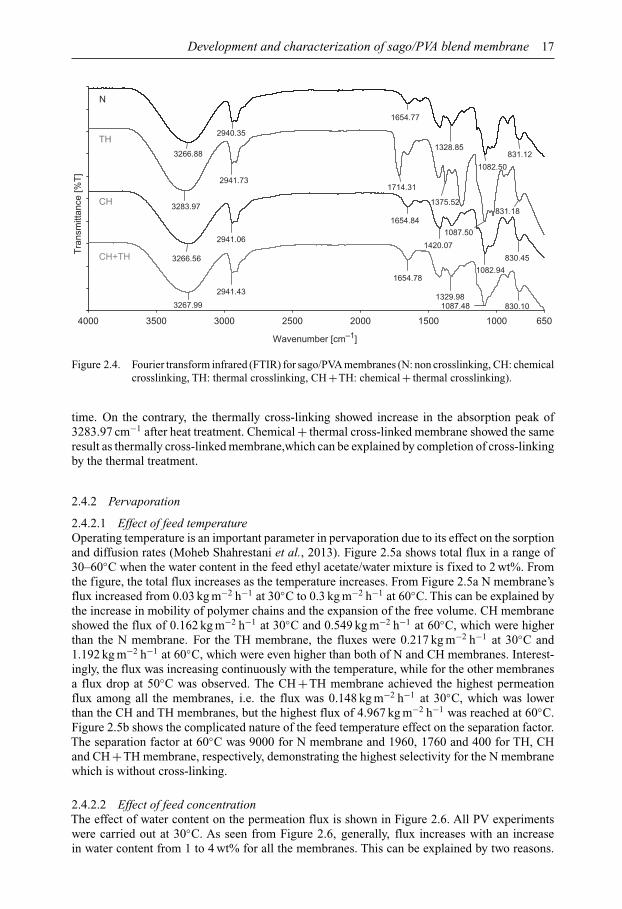
Development and characterization of sago/PVA blend membrane 17
4000 6503500 3000 2500 2000 1500 1000
Wavenumber [cm–1]
1082.50
3266.88 831.121328.85
2940.35
1654.77
1087.50
831.183283.97 1375.52
1714.312941.73
1082.943266.56 830.45
1420.072941.06
1654.84
1087.483267.99 830.101329.98
2941.43
1654.78
TH
CH
CH+TH
N
Tra
nsm
ittan
ce [%
T]
Figure 2.4. Fourier transform infrared (FTIR) for sago/PVA membranes (N: non crosslinking, CH: chemicalcrosslinking, TH: thermal crosslinking, CH +TH: chemical + thermal crosslinking).
time. On the contrary, the thermally cross-linking showed increase in the absorption peak of3283.97 cm−1 after heat treatment. Chemical + thermal cross-linked membrane showed the sameresult as thermally cross-linked membrane,which can be explained by completion of cross-linkingby the thermal treatment.
2.4.2 Pervaporation
2.4.2.1 Effect of feed temperatureOperating temperature is an important parameter in pervaporation due to its effect on the sorptionand diffusion rates (Moheb Shahrestani et al., 2013). Figure 2.5a shows total flux in a range of30–60◦C when the water content in the feed ethyl acetate/water mixture is fixed to 2 wt%. Fromthe figure, the total flux increases as the temperature increases. From Figure 2.5a N membrane’sflux increased from 0.03 kg m−2 h−1 at 30◦C to 0.3 kg m−2 h−1 at 60◦C. This can be explained bythe increase in mobility of polymer chains and the expansion of the free volume. CH membraneshowed the flux of 0.162 kg m−2 h−1 at 30◦C and 0.549 kg m−2 h−1 at 60◦C, which were higherthan the N membrane. For the TH membrane, the fluxes were 0.217 kg m−2 h−1 at 30◦C and1.192 kg m−2 h−1 at 60◦C, which were even higher than both of N and CH membranes. Interest-ingly, the flux was increasing continuously with the temperature, while for the other membranesa flux drop at 50◦C was observed. The CH +TH membrane achieved the highest permeationflux among all the membranes, i.e. the flux was 0.148 kg m−2 h−1 at 30◦C, which was lowerthan the CH and TH membranes, but the highest flux of 4.967 kg m−2 h−1 was reached at 60◦C.Figure 2.5b shows the complicated nature of the feed temperature effect on the separation factor.The separation factor at 60◦C was 9000 for N membrane and 1960, 1760 and 400 for TH, CHand CH +TH membrane, respectively, demonstrating the highest selectivity for the N membranewhich is without cross-linking.
2.4.2.2 Effect of feed concentrationThe effect of water content on the permeation flux is shown in Figure 2.6. All PV experimentswere carried out at 30◦C. As seen from Figure 2.6, generally, flux increases with an increasein water content from 1 to 4 wt% for all the membranes. This can be explained by two reasons.
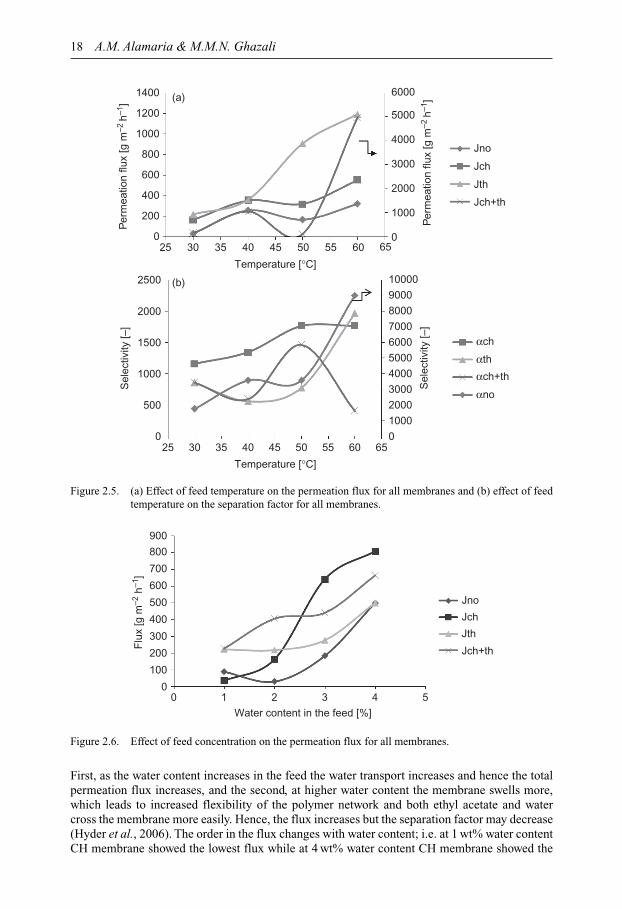
18 A.M. Alamaria & M.M.N. Ghazali
250
025 30 35 40 45 50 55 60 65
0
1000
2000
3000
4000
5000
6000
7000
Sel
ectiv
ity [–
]
8000
9000
10000
αch
Jno
Jch
Jth
Jch+th
αth
αch+th
αno500
1000
1500
2000
Sel
ectiv
ity [–
]
2500
200
400
600
800
1000P
erm
eatio
n flu
x [g
m–2
h–1
]1200
1400 (a)
(b)
30 35 40 45 50 55 60 650
1000
2000
3000
4000
5000
6000
Per
mea
tion
flux
[g m
–2 h
–1]
Temperature [°C]
Temperature [°C]
Figure 2.5. (a) Effect of feed temperature on the permeation flux for all membranes and (b) effect of feedtemperature on the separation factor for all membranes.
00 1 2
Water content in the feed [%]3 4 5
Jno
Jch
Jth
Jch+th
100
200
300
400
500
Flu
x [g
m–2
h–1
]
600
700
800
900
Figure 2.6. Effect of feed concentration on the permeation flux for all membranes.
First, as the water content increases in the feed the water transport increases and hence the totalpermeation flux increases, and the second, at higher water content the membrane swells more,which leads to increased flexibility of the polymer network and both ethyl acetate and watercross the membrane more easily. Hence, the flux increases but the separation factor may decrease(Hyder et al., 2006). The order in the flux changes with water content; i.e. at 1 wt% water contentCH membrane showed the lowest flux while at 4 wt% water content CH membrane showed the

Development and characterization of sago/PVA blend membrane 19
highest flux. As mentioned above, when the water content increases in the feed, the degree ofswelling of the membrane will increase. Moreover, when water content increases, the couplingof water and ethyl acetate transport is enhanced.
2.5 CONCLUSION
The intrinsic properties of sago starch/PVA blend membranes with and without cross-linkingwere characterized by FTIR, DSC and TGA. FTIR revealed that the hydroxyl groups of sagostarch and PVA decreased by chemical cross-linking due to formation of acetal linkage. As aresult, the membranes became less hydrophilic. On the other hand, CH+TH and TH membranesare more hydrophilic than CH membrane. DSC showed increase in Tg by cross-linking. PV ofethyl acetate/water mixture showed that the flux of the CH +TH membrane is the highest but theselectivity is the lowest due to the hydrophilic nature of the membrane. TH membrane with goodpermeation flux and high selectivity is considered to be the best.
ACKNOWLEDGEMENT
The authors acknowledge University of Technology Malaysia, and Chemical EngineeringDepartment for their support (No. 03H73).
REFERENCES
Feng, X. & Huang, R.Y.M. (1997) Liquid separation by membrane pervaporation: a review. Industrial &Engineering Chemistry Research, 36 (4), 1048–1066.
Ghazali, M., Nawawi, M. & Huang, R.Y.M. (1997) Pervaporation dehydration of isopropanol with chitosanmembranes. Journal of Membrane Science, 124 (1), 53–62.
Guan, H.-M. ChungT.-S., Huang Mei, Z., Chng, L. & Kulprathipanja, S. (2006) Poly(vinyl alcohol) multilayermixed matrix membranes for the dehydration of ethanol-water mixture. Journal of Membrane Science,268 (2), 113–122.
Hasanoglu, A. Salt, Y., Keleser, S., Özkan, D. & Dinçer, S. (2005) Pervaporation separation of ethyl acetate-ethanol binary mixtures using polydimethylsiloxane membranes. Chemical Engineering and Processing:Process Intensification, 44 (3), 375–381.
Huang, R.Y.M., Pal, R. & Moon, G.Y. (1999) Characteristics of sodium alginate membranes for the perva-poration dehydration of ethanol-water and isopropanol-water mixtures. Journal of Membrane Science,160 (1), 101–113.
Hyder, M.N., Huang, R.Y.M. & Chen, P. (2006) Correlation of physicochemical characteristics with per-vaporation performance of poly(vinyl alcohol) membranes. Journal of Membrane Science, 283 (1–2),281–290.
Lipnizki, F., Field, R.W. & Ten, P.-K. (1999) Pervaporation-based hybrid process: a review of process design,applications and economics. Journal of Membrane Science, 153 (2), 183–210.
Liu, Y., Zhu, M., Zhao, Q., An, Q., Qian, J., Lee, K. & Lai, J. (2011) The chemical crosslinking of poly-electrolyte complex colloidal particles and the pervaporation performance of their membranes. Journalof Membrane Science, 385–386, 132–140.
Lu, D.R., Xiao, C.M. & Xu, S.J. (2009) Starch-based completely biodegradable polymer materials. EXPRESSPolymer Letters, 6, 366–375.
Moheb Shahrestani, M., Moheb, A. & Ghiaci, M. (2013) High performance dehydration of ethyl acetate/watermixture by pervaporation using NaA zeolite membrane synthesized by vacuum seeding method. Vacuum,92, 70–76.
Rachipudi, P.S., Kariduraganavara, M.Y., Kitturb, A.A. & Sajjana, A.M. (2011) Synthesis and character-ization of sulfonated-poly(vinyl alcohol) membranes for the pervaporation dehydration of isopropanol.Journal of Membrane Science, 383 (1–2), 224–234.
Salt, Y., Hasanoglu A., Salt, I., Keleser, S., Özkan, S. & Dinçer, S. (2005) Pervaporation separation ofethylacetate-water mixtures through a crosslinked poly(vinylalcohol) membrane. Vacuum, 79 (3–4),215–220.
20 A.M. Alamaria & M.M.N. Ghazali
Shah, D., Kissick, K., Ghorpade A., Hannah, R. & Bhattacharyyaa, D. (2000) Pervaporation of alcohol-water and dimethylformamide-water mixtures using hydrophilic zeolite NaA membranes: mechanismsand experimental results. Journal of Membrane Science, 179 (1–2), 185–205.
Shaoa, C., Kim, H.-Y., Gong, J., Ding, B., Lee, D.-R. & Park, S.J. (2003) Fiber mats of poly(vinylalcohol)/silica composite via electrospinning. Materials Letters, 57 (9–10), 1579–1584.
Tian, X. & Jiang, X. (2008) Poly(vinylidene fluoride-co-hexafluoropropene) (PVDFHFP) membranes forethyl acetate removal from water. Journal of Hazardous Materials, 153 (1–2), 128–135.
Wu, S., Wang, J., Liu, G., Yang, Y. & Lu, J. (2012) Separation of ethyl acetate (EA)/water by tubularsilylated MCM-48 membranes grafted with different alkyl chains. Journal of Membrane Science, 390–391,175–181.
Xia, S., Dong, X., Zhu, Y., Wei, W., Xiangli, F. & Jin, W. (2011) Dehydration of ethyl acetate-water mixturesusing PVA/ceramic composite pervaporationmembrane. Separation and Purification Technology, 77 (1),53–59.
Xiao, S., Huang, R.Y.M. & Feng, X. (2006) Preparation and properties of trimesoyl chloride crosslinked-poly(vinyl alcohol) membranes for pervaporation dehydration of isopropanol. Journal of MembraneScience, 286 (1–2), 245–254.
Yongquan, D., Ming, W., Lin, C. & Mingjun, L. (2012) Preparation, characterization of P(VDF-HFP)/[bmim]BF4 ionic liquids hybrid membranes and their pervaporation performance for ethyl acetaterecovery from water. Desalination, 295, 53–60.
Yuan, H.-K., Ren, J., Ma, X.-H. & Xu, Z.-L. (2011) Dehydration of ethyl acetate aqueous solution bypervaporation using PVA/PAN hollow fiber composite membrane. Desalination, 280 (1–3), 252–258.
Zhang, X.H., Liu, Q.L., Xiong, Y., Zhu, A.M., Chen, Y. & Zhang, Q.G. (2009) Pervaporation dehydration ofethyl acetate/ethanol/water azeotrope using chitosan/poly (vinyl pyrrolidone) blend membranes. Journalof Membrane Science, 327 (1–2), 274–280.
CHAPTER 3
Development of adsorbents based cellulose acetate mixed matrixmembranes for removal of pollutants from textile industry effluent
Ramesh Kumar Saranya, Yogarathinam Lukka Thuyavan,Gangasalam Arthanareeswaran & Ahmad Fauzi Ismail
3.1 INTRODUCTION
Polymeric modification using adsorptive inorganic particles is gaining prime importance forits significance in enhancing the filtration properties of membranes. Membranes can removevarious pollutants through the separation mechanisms of impaction, diffusion, electrostatic inter-action, hydrophobic property, and adsorption (Walther et al., 1988). Among several mechanisms,adsorption is the process most commonly used in to remove the dye constituents of textile industryeffluent. The combination of different methods like adsorption and filtration for enhanced mem-brane separation is highly presumed to achieve significant reduction on pollutants due to textileindustries. For a long time, application of activated carbon (AC) as dye adsorbent in textile anddye wastewater treatment has been studied (Choy et al., 1999; Kannan et al., 2001; Malik, 2003;Namasivayam and Kavitha, 2002) because of its large surface area, polymodal porous structure,high adsorption capacity and variable surface chemical composition (Marsh Rodríguez-Reinoso,2006). However, the addition of AC in organic polymer matrix for the synthesis of mixed matrixmembranes (MMMs) has been very rarely studied. Ballinas et al. (2004) studied the influence ofcharacters of AC on polysulfone (PSF) composite membranes in a continuous operation systemand concluded the high performance of a hybrid AC/PSF composite membrane better than non-hybrid ones. The effect of polyethersulfone concentration and AC loading on the performance ofMMMs in terms of permeability and selectivity of O2/N2 gas separation has also been investigated(Kusworo et al., 2010). Yet, the studies on application of AC coupled with membrane separationin wastewater treatment show much less evidence.
Iron oxide (IO) particles due to their high surface reactivity as a result of their small size rangeof 1–100 nm (Zhang, 2003) can transform chemical pollutants such as PCBs, TCE, pesticidesand chlorinated organic solvents in biosolids (Li et al., 2007). They have the ability to degradepollutants effectively by reductive (Tratnyek and Johnson, 2006; Xu et al., 2005) and/or oxidativepathways depending on the state of iron (Laine and Cheng, 2007; Pignatello et al., 2006). Severalmethods to synthesize IO nanoparticles were available but the main challenges of these numerousand novel techniques lie in their capacity to obtain a narrow dispersion in particle size together withthe desired compositional, structural and crystalline uniformity (Martínez-Mera et al., 2007). Theinterface between a polymer matrix and inorganic filler plays an important role in the performanceof MMMs. Hence, in this study, the feasibility of synthesis of AC and IO based MMMs wasexamined. The recent development of MMMs makes it an ideal platform for incorporation ofadsorptive particles for the removal of pollutants from textile industry effluent.
To fully exploit the use of AC and IO for an adsorbent enhanced membrane filtration, differentwt% ofAC and IO was blended in solution with cellulose acetate (CA).The influence of adsorptionand reaction of incorporated nanoparticles owing to dispersion was confirmed by ultrasonicationfollowed by which the CA/AC and CA/IO membranes have been successfully synthesized byphase inversion method. The characteristics of MMMs in terms of surface morphology, particlesize distribution have been studied by field emission scanning electron microscopy (FESEM) and
21

22 R.K. Saranya et al.
X-ray diffraction (XRD), respectively. The performance of prepared MMMs was also evaluated forits permeability and rejection efficiency of chemical oxygen demand (COD), biological oxygendemand (BOD) and sulfates from textile dye effluent by means of polymer enhanced ultrafiltration.
3.2 EXPERIMENTAL
3.2.1 Materials
All chemicals and reagents used were of analytical grade and used without any further purifi-cation. Cellulose acetate (CA) was obtained from Sigma Aldrich, India Limited. N ,N ′-dimethylformamide (DMF) was purchased from Qualigens fine chemicals, Glaxo India limited. Analyti-cal grade AC prepared from charcoal with the surface area of 800 to 850 m2 g−1 and methyleneblue adsorption of 0.13 g g−1 was purchased from Merck (India) Limited. IO particles were alsoprocured from Merck India Limited. Polyethyleneimine (PEI) of 50 kDa MW was obtained fromAlfa Aesar (India) Limited. Double distilled and Millipore water were produced in the laboratory.
3.2.2 Preparation of CA MMMs
The phase inversion method of membrane synthesis was carried out for the fabrication of CA/IOand CA/ACMMMs. The composition of various CA MMMs prepared is provided in Table 3.1.The homogenous casting solution for each composition was obtained by dissolving IO and ACinitially in DMF solvent which after complete dissolution by means of ultrasonication was mixedwith CA under mechanical stirring. The final dope solution was also sonicated for 30 min beforecasting to ensure homogeneity and casted on a cleaned glass plate. The thickness of the membranewas fixed as 400 µm using a film applicator (elicometer). After leaving for 30 s evaporation time,the membrane was immersed in distilled water maintained at 20◦C.
3.2.3 Characterization of CA MMMs
The X-ray diffraction (XRD) pattern was recorded for both neat CA and CA MMMs using an X-raydiffractometer (Rigaku Corporation, Japan) constituting Ni-filtered Cu Kα as a monochromaticradiation source (40 kV, 30 mA) with scintillation counter (NaI) as a detector.
The top and cross-section morphology of synthesized CA MMMs were visualized with the helpof field emission scanning electron microscopy (FESEM, Hitachi, S-4160, Japan) operated at anaccelerating voltage of 20 kV. The dried membrane samples were pre-treated using Au sputteringto impart electrical conductivity.
Table 3.1. Casting composition of prepared CA MMMs.
Casting solution composition
CA AC/IO DMF solventMembrane type [g] [g] [mL] Membrane description
CA 4.375 – 21.7 Neat CACA/AC1 4.353 0.022 21.7 CA + 0.5 wt% ACCA/AC2 4.310 0.065 21.7 CA + 1.5 wt% ACCA/AC3 4.266 0.109 21.7 CA + 2.5 wt% ACCA/IO1 4.354 0.022 21.7 CA + 0.5 wt% IOCA/IO2 4.310 0.065 21.7 CA + 1.5 wt% IOCA/IO3 4.266 0.109 21.7 CA + 2.5 wt% IO
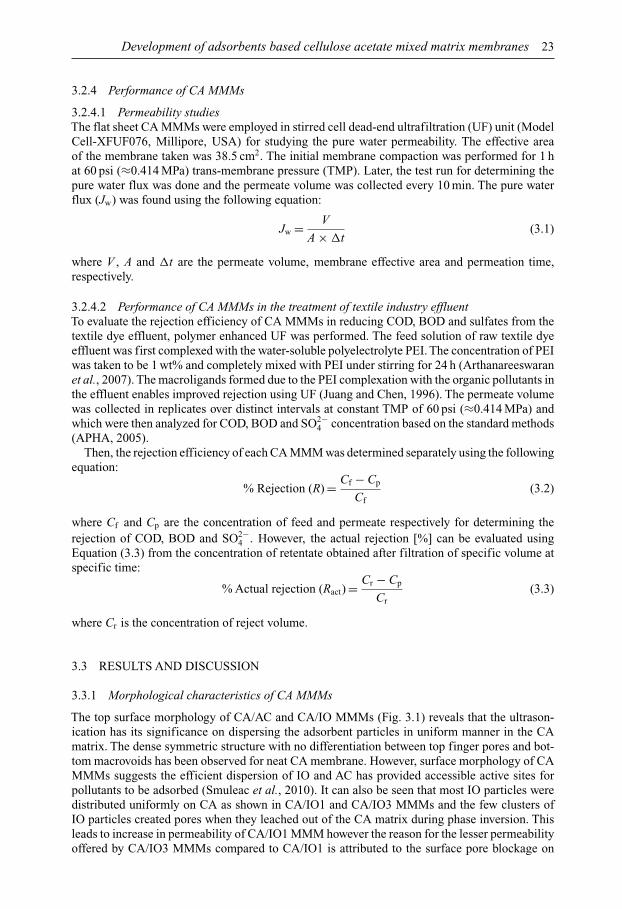
Development of adsorbents based cellulose acetate mixed matrix membranes 23
3.2.4 Performance of CA MMMs
3.2.4.1 Permeability studiesThe flat sheet CA MMMs were employed in stirred cell dead-end ultrafiltration (UF) unit (ModelCell-XFUF076, Millipore, USA) for studying the pure water permeability. The effective areaof the membrane taken was 38.5 cm2. The initial membrane compaction was performed for 1 hat 60 psi (≈0.414 MPa) trans-membrane pressure (TMP). Later, the test run for determining thepure water flux was done and the permeate volume was collected every 10 min. The pure waterflux (Jw) was found using the following equation:
Jw = V
A × �t(3.1)
where V , A and �t are the permeate volume, membrane effective area and permeation time,respectively.
3.2.4.2 Performance of CA MMMs in the treatment of textile industry effluentTo evaluate the rejection efficiency of CA MMMs in reducing COD, BOD and sulfates from thetextile dye effluent, polymer enhanced UF was performed. The feed solution of raw textile dyeeffluent was first complexed with the water-soluble polyelectrolyte PEI. The concentration of PEIwas taken to be 1 wt% and completely mixed with PEI under stirring for 24 h (Arthanareeswaranet al., 2007). The macroligands formed due to the PEI complexation with the organic pollutants inthe effluent enables improved rejection using UF (Juang and Chen, 1996). The permeate volumewas collected in replicates over distinct intervals at constant TMP of 60 psi (≈0.414 MPa) andwhich were then analyzed for COD, BOD and SO2−
4 concentration based on the standard methods(APHA, 2005).
Then, the rejection efficiency of each CA MMM was determined separately using the followingequation:
% Rejection (R) = Cf − Cp
Cf(3.2)
where Cf and Cp are the concentration of feed and permeate respectively for determining therejection of COD, BOD and SO2−
4 . However, the actual rejection [%] can be evaluated usingEquation (3.3) from the concentration of retentate obtained after filtration of specific volume atspecific time:
% Actual rejection (Ract) = Cr − Cp
Cr(3.3)
where Cr is the concentration of reject volume.
3.3 RESULTS AND DISCUSSION
3.3.1 Morphological characteristics of CA MMMs
The top surface morphology of CA/AC and CA/IO MMMs (Fig. 3.1) reveals that the ultrason-ication has its significance on dispersing the adsorbent particles in uniform manner in the CAmatrix. The dense symmetric structure with no differentiation between top finger pores and bot-tom macrovoids has been observed for neat CA membrane. However, surface morphology of CAMMMs suggests the efficient dispersion of IO and AC has provided accessible active sites forpollutants to be adsorbed (Smuleac et al., 2010). It can also be seen that most IO particles weredistributed uniformly on CA as shown in CA/IO1 and CA/IO3 MMMs and the few clusters ofIO particles created pores when they leached out of the CA matrix during phase inversion. Thisleads to increase in permeability of CA/IO1 MMM however the reason for the lesser permeabilityoffered by CA/IO3 MMMs compared to CA/IO1 is attributed to the surface pore blockage on
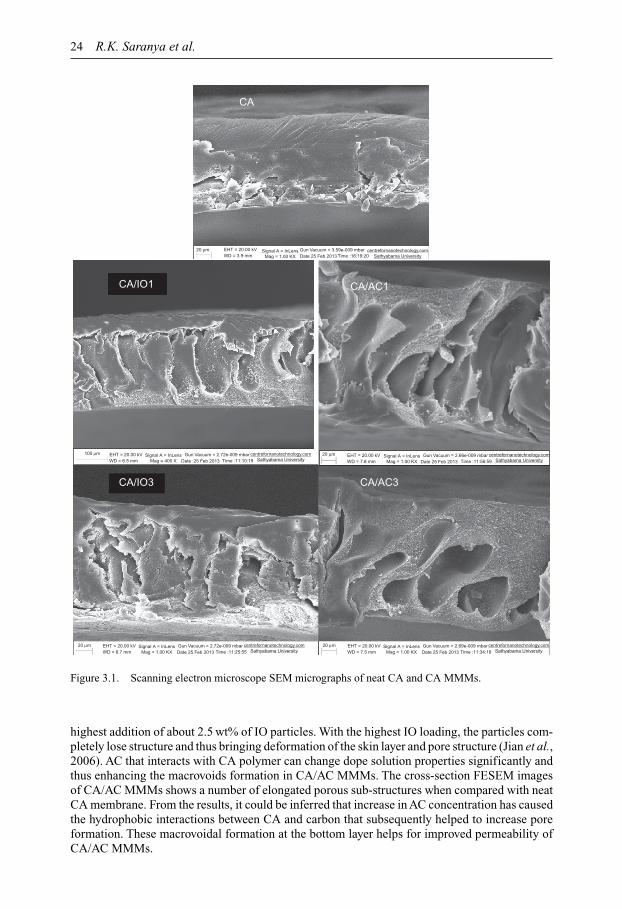
24 R.K. Saranya et al.
Figure 3.1. Scanning electron microscope SEM micrographs of neat CA and CA MMMs.
highest addition of about 2.5 wt% of IO particles. With the highest IO loading, the particles com-pletely lose structure and thus bringing deformation of the skin layer and pore structure (Jian et al.,2006). AC that interacts with CA polymer can change dope solution properties significantly andthus enhancing the macrovoids formation in CA/AC MMMs. The cross-section FESEM imagesof CA/AC MMMs shows a number of elongated porous sub-structures when compared with neatCA membrane. From the results, it could be inferred that increase in AC concentration has causedthe hydrophobic interactions between CA and carbon that subsequently helped to increase poreformation. These macrovoidal formation at the bottom layer helps for improved permeability ofCA/AC MMMs.
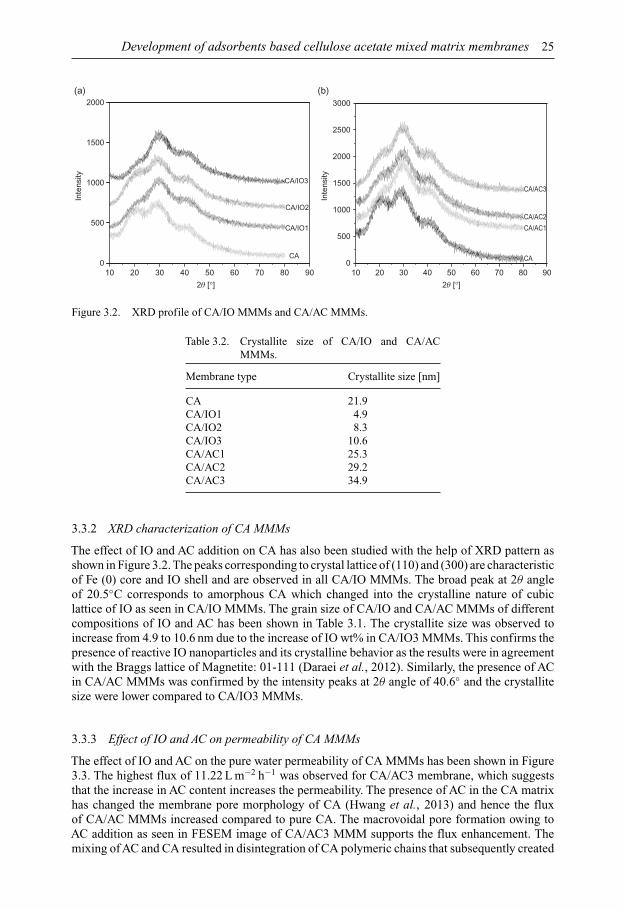
Development of adsorbents based cellulose acetate mixed matrix membranes 25
10 20 30 40 50 60 70 80 90
Inte
nsity
0
500
1000
(a) (b)
1500
2000
2θ [°]10 20 30 40 50 60 70 80 90
2θ [°]
CA
CA/IO1
CA/IO2
CA/IO3
0
500
1000
1500
2000
2500
3000
Inte
nsity
CA
CA/AC1
CA/AC2
CA/AC3
Figure 3.2. XRD profile of CA/IO MMMs and CA/AC MMMs.
Table 3.2. Crystallite size of CA/IO and CA/ACMMMs.
Membrane type Crystallite size [nm]
CA 21.9CA/IO1 4.9CA/IO2 8.3CA/IO3 10.6CA/AC1 25.3CA/AC2 29.2CA/AC3 34.9
3.3.2 XRD characterization of CA MMMs
The effect of IO and AC addition on CA has also been studied with the help of XRD pattern asshown in Figure 3.2. The peaks corresponding to crystal lattice of (110) and (300) are characteristicof Fe (0) core and IO shell and are observed in all CA/IO MMMs. The broad peak at 2θ angleof 20.5◦C corresponds to amorphous CA which changed into the crystalline nature of cubiclattice of IO as seen in CA/IO MMMs. The grain size of CA/IO and CA/AC MMMs of differentcompositions of IO and AC has been shown in Table 3.1. The crystallite size was observed toincrease from 4.9 to 10.6 nm due to the increase of IO wt% in CA/IO3 MMMs. This confirms thepresence of reactive IO nanoparticles and its crystalline behavior as the results were in agreementwith the Braggs lattice of Magnetite: 01-111 (Daraei et al., 2012). Similarly, the presence of ACin CA/AC MMMs was confirmed by the intensity peaks at 2θ angle of 40.6◦ and the crystallitesize were lower compared to CA/IO3 MMMs.
3.3.3 Effect of IO and AC on permeability of CA MMMs
The effect of IO and AC on the pure water permeability of CA MMMs has been shown in Figure3.3. The highest flux of 11.22 L m−2 h−1 was observed for CA/AC3 membrane, which suggeststhat the increase in AC content increases the permeability. The presence of AC in the CA matrixhas changed the membrane pore morphology of CA (Hwang et al., 2013) and hence the fluxof CA/AC MMMs increased compared to pure CA. The macrovoidal pore formation owing toAC addition as seen in FESEM image of CA/AC3 MMM supports the flux enhancement. Themixing of AC and CA resulted in disintegration of CA polymeric chains that subsequently created

26 R.K. Saranya et al.
0
2
4
6
8
10
12
CA CA/IO1 CA/IO2 CA/IO3 CA/AC1 CA/AC2 CA/AC3
Flu
x [L
m–2
h–1
]
Membrane type
Pure water flux
Figure 3.3. Pure water flux studies on synthesized MMMs.
interfacial voids. This change in interfacial membrane morphology is mainly due to the adhesionof AC in CA matrix and thus contributes to the enhancement of permeability.
In case of CA/IO MMMs, the increase in wt% of IO reduced the water permeability from7.17 to 3.63 L m−2 h−1 and the reason would be due to the obstruction of majority of holes andchannels by the presence of IO particles at higher loading of 1.5 and 2.5 wt% (Gholami et al.,2014). The permeation capacity also depends on the thinner top-layer of the membrane and hencethe increase in thickness due to increased IO content tends to reduce the water permeability incase of CA/IO3 MMMs. Hence, the minimal loading of IO of about 0.5 wt% has only helped toretain the nanoparticle size of IO without aggregation that ultimately enhanced the permeabilityproperties of CA.
3.3.4 Effect of AC and IO on polymer assisted UF
PEI complexation leads to the formation of macromolecules which resulted in decrease of perme-ate flux of the textile dye effluent (Fig. 3.4). The virgin CA showed 2.56 L m−2 h−1 of permeateflux for PEI complexed textile effluent which is 48.43% lower compared to the flux of effluentwithout PEI complexation. The binding capacity due to imine groups of PEI and its electrostaticinteractions with molecules present in the effluent caused increase in liquid phase polymer-basedretention (LPR) of PEI bound effluent that subsequently led to a decrease in permeate flux (Rivaset al., 2003). However, the presence of IO and AC in the CA polymer matrix helped to decreasethe reduction in permeate flux owing to PEI complexation.
Inspite of PEI complexation, for CA/AC3 MMM there was observed only a 25% flux decreasecompared to the flux observed for effluent without PEI. The reason for decrease in reduction offlux difference would be due to the surface non-electrostatic interactions of AC (Moreno-Castilla,2004). For CA/IO1 MMMs, there was observed a reduction in decrease of permeate flux ofonly about 35% compared to that of effluent having no PEI binding. The reactive and catalyticproperty of IO particles has been effectively utilized as they are situated at CA polymeric matrix.The reactivity of IO helped potentially for the inhibition of PEI complexed pollutants due to itssurface acidity that tends to be involved in proton exchange and hence not much in reduction ofeffluent flux of CA MMMs compared to virgin CA.
3.3.5 Effect of CA MMMs on COD removal
Similar to BOD, the rejection efficiency of CA/IO in reducing COD was higher (by about 89.9%)with the reject concentration of 654 mg L−1. The natural organic matter (NOM) and heavy metal
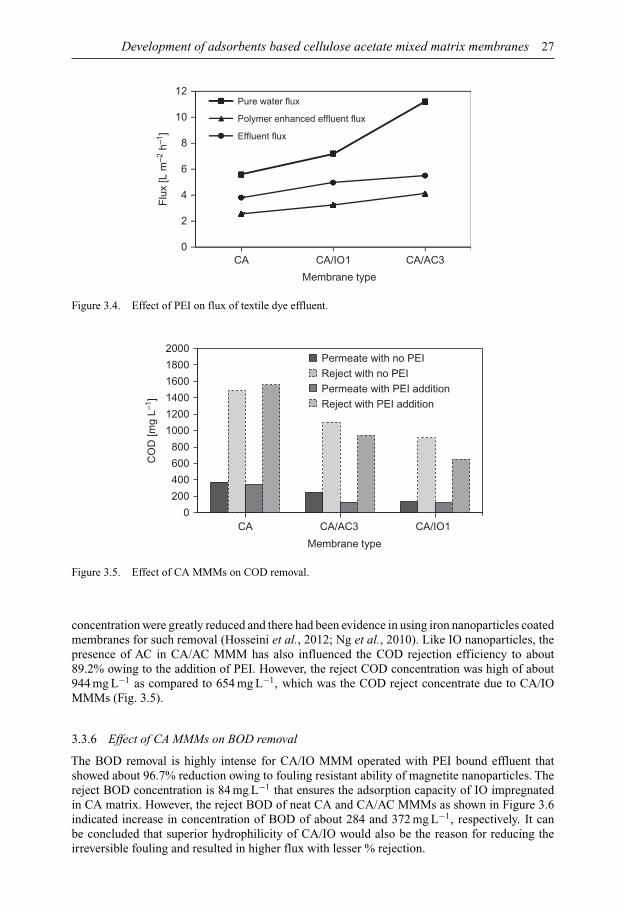
Development of adsorbents based cellulose acetate mixed matrix membranes 27
0
2
4
6
8
10
12
CA CA/IO1 CA/AC3
Flu
x [L
m–2
h–1
]
Membrane type
Pure water flux
Polymer enhanced effluent flux
Effluent flux
Figure 3.4. Effect of PEI on flux of textile dye effluent.
0
200
400
600
800
1000
1200
1400
1600
1800
2000
CA CA/AC3 CA/IO1
CO
D [m
g L–1
]
Membrane type
Permeate with no PEIReject with no PEIPermeate with PEI additionReject with PEI addition
Figure 3.5. Effect of CA MMMs on COD removal.
concentration were greatly reduced and there had been evidence in using iron nanoparticles coatedmembranes for such removal (Hosseini et al., 2012; Ng et al., 2010). Like IO nanoparticles, thepresence of AC in CA/AC MMM has also influenced the COD rejection efficiency to about89.2% owing to the addition of PEI. However, the reject COD concentration was high of about944 mg L−1 as compared to 654 mg L−1, which was the COD reject concentrate due to CA/IOMMMs (Fig. 3.5).
3.3.6 Effect of CA MMMs on BOD removal
The BOD removal is highly intense for CA/IO MMM operated with PEI bound effluent thatshowed about 96.7% reduction owing to fouling resistant ability of magnetite nanoparticles. Thereject BOD concentration is 84 mg L−1 that ensures the adsorption capacity of IO impregnatedin CA matrix. However, the reject BOD of neat CA and CA/AC MMMs as shown in Figure 3.6indicated increase in concentration of BOD of about 284 and 372 mg L−1, respectively. It canbe concluded that superior hydrophilicity of CA/IO would also be the reason for reducing theirreversible fouling and resulted in higher flux with lesser % rejection.
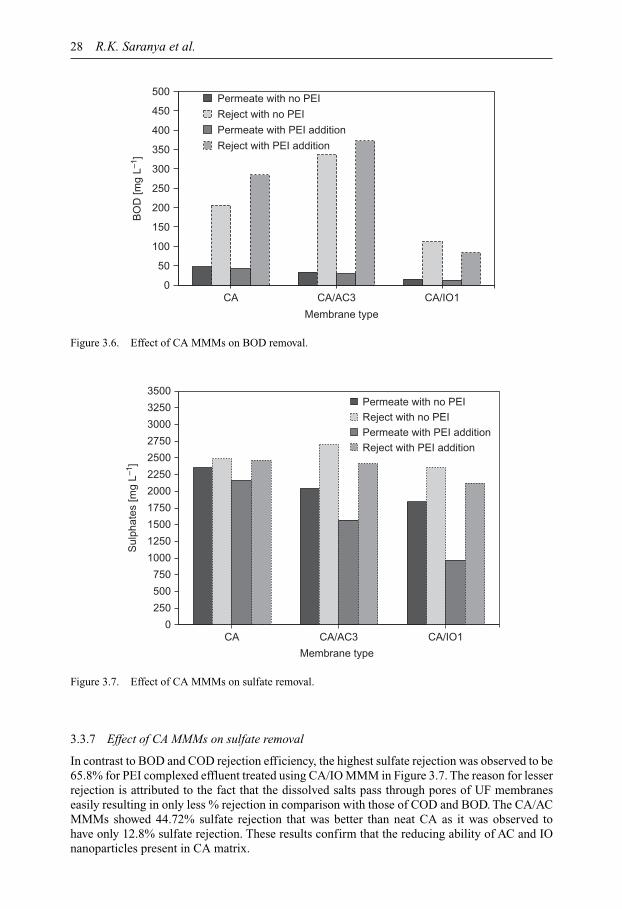
28 R.K. Saranya et al.
0
50
100
150
200
250
300
350
400
450
500
CA CA/AC3 CA/IO1
BO
D [m
g L–1
]
Membrane type
Permeate with no PEI
Reject with no PEI
Permeate with PEI addition
Reject with PEI addition
Figure 3.6. Effect of CA MMMs on BOD removal.
0
250
500
750
1000
1250
1500
1750
2000
2250
2500
2750
3000
3250
3500
CA CA/AC3 CA/IO1
Sul
phat
es [m
g L–1
]
Membrane type
Permeate with no PEIReject with no PEIPermeate with PEI addition Reject with PEI addition
Figure 3.7. Effect of CA MMMs on sulfate removal.
3.3.7 Effect of CA MMMs on sulfate removal
In contrast to BOD and COD rejection efficiency, the highest sulfate rejection was observed to be65.8% for PEI complexed effluent treated using CA/IO MMM in Figure 3.7. The reason for lesserrejection is attributed to the fact that the dissolved salts pass through pores of UF membraneseasily resulting in only less % rejection in comparison with those of COD and BOD. The CA/ACMMMs showed 44.72% sulfate rejection that was better than neat CA as it was observed tohave only 12.8% sulfate rejection. These results confirm that the reducing ability of AC and IOnanoparticles present in CA matrix.
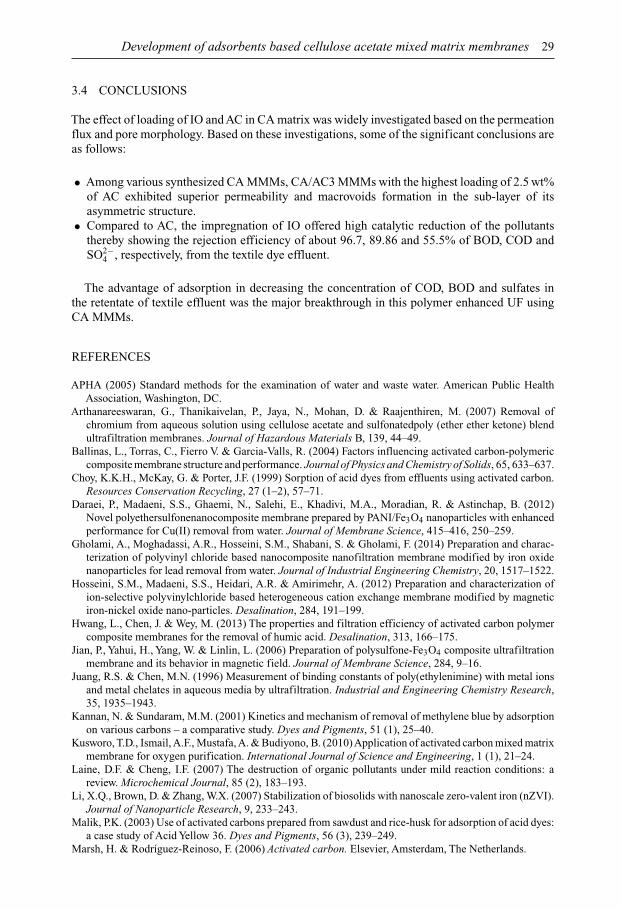
Development of adsorbents based cellulose acetate mixed matrix membranes 29
3.4 CONCLUSIONS
The effect of loading of IO and AC in CA matrix was widely investigated based on the permeationflux and pore morphology. Based on these investigations, some of the significant conclusions areas follows:
• Among various synthesized CA MMMs, CA/AC3 MMMs with the highest loading of 2.5 wt%of AC exhibited superior permeability and macrovoids formation in the sub-layer of itsasymmetric structure.
• Compared to AC, the impregnation of IO offered high catalytic reduction of the pollutantsthereby showing the rejection efficiency of about 96.7, 89.86 and 55.5% of BOD, COD andSO2−
4 , respectively, from the textile dye effluent.
The advantage of adsorption in decreasing the concentration of COD, BOD and sulfates inthe retentate of textile effluent was the major breakthrough in this polymer enhanced UF usingCA MMMs.
REFERENCES
APHA (2005) Standard methods for the examination of water and waste water. American Public HealthAssociation, Washington, DC.
Arthanareeswaran, G., Thanikaivelan, P., Jaya, N., Mohan, D. & Raajenthiren, M. (2007) Removal ofchromium from aqueous solution using cellulose acetate and sulfonatedpoly (ether ether ketone) blendultrafiltration membranes. Journal of Hazardous Materials B, 139, 44–49.
Ballinas, L., Torras, C., Fierro V. & Garcia-Valls, R. (2004) Factors influencing activated carbon-polymericcomposite membrane structure and performance. Journal of Physics and Chemistry of Solids, 65, 633–637.
Choy, K.K.H., McKay, G. & Porter, J.F. (1999) Sorption of acid dyes from effluents using activated carbon.Resources Conservation Recycling, 27 (1–2), 57–71.
Daraei, P., Madaeni, S.S., Ghaemi, N., Salehi, E., Khadivi, M.A., Moradian, R. & Astinchap, B. (2012)Novel polyethersulfonenanocomposite membrane prepared by PANI/Fe3O4 nanoparticles with enhancedperformance for Cu(II) removal from water. Journal of Membrane Science, 415–416, 250–259.
Gholami, A., Moghadassi, A.R., Hosseini, S.M., Shabani, S. & Gholami, F. (2014) Preparation and charac-terization of polyvinyl chloride based nanocomposite nanofiltration membrane modified by iron oxidenanoparticles for lead removal from water. Journal of Industrial Engineering Chemistry, 20, 1517–1522.
Hosseini, S.M., Madaeni, S.S., Heidari, A.R. & Amirimehr, A. (2012) Preparation and characterization ofion-selective polyvinylchloride based heterogeneous cation exchange membrane modified by magneticiron-nickel oxide nano-particles. Desalination, 284, 191–199.
Hwang, L., Chen, J. & Wey, M. (2013) The properties and filtration efficiency of activated carbon polymercomposite membranes for the removal of humic acid. Desalination, 313, 166–175.
Jian, P., Yahui, H., Yang, W. & Linlin, L. (2006) Preparation of polysulfone-Fe3O4 composite ultrafiltrationmembrane and its behavior in magnetic field. Journal of Membrane Science, 284, 9–16.
Juang, R.S. & Chen, M.N. (1996) Measurement of binding constants of poly(ethylenimine) with metal ionsand metal chelates in aqueous media by ultrafiltration. Industrial and Engineering Chemistry Research,35, 1935–1943.
Kannan, N. & Sundaram, M.M. (2001) Kinetics and mechanism of removal of methylene blue by adsorptionon various carbons – a comparative study. Dyes and Pigments, 51 (1), 25–40.
Kusworo, T.D., Ismail, A.F., Mustafa, A. & Budiyono, B. (2010)Application of activated carbon mixed matrixmembrane for oxygen purification. International Journal of Science and Engineering, 1 (1), 21–24.
Laine, D.F. & Cheng, I.F. (2007) The destruction of organic pollutants under mild reaction conditions: areview. Microchemical Journal, 85 (2), 183–193.
Li, X.Q., Brown, D. & Zhang, W.X. (2007) Stabilization of biosolids with nanoscale zero-valent iron (nZVI).Journal of Nanoparticle Research, 9, 233–243.
Malik, P.K. (2003) Use of activated carbons prepared from sawdust and rice-husk for adsorption of acid dyes:a case study of Acid Yellow 36. Dyes and Pigments, 56 (3), 239–249.
Marsh, H. & Rodríguez-Reinoso, F. (2006) Activated carbon. Elsevier, Amsterdam, The Netherlands.

30 R.K. Saranya et al.
Martínez-Mera, I., Espinosa-Pesqueira, M.E., Perez-Hernandez, R. & Arenas-Alatorre, J. (2007) Synthe-sis of magnetite (Fe3O4) nanoparticles without surfactants at room temperature. Material Letters, 61,4447–4451.
Moreno-Castilla, C. (2004) Adsorption of organic molecules from aqueous solutions on carbon materials.Carbon, 42, 83.
Namasivayam, C. & Kavitha, D. (2002) Removal of Congo Red from water by adsorption onto activatedcarbon prepared from coir pith, an agricultural solid waste. Dyes and Pigments, 54 (1), 47–58.
Ng, L.Y., Mohammad, A.W., Leo, C.P. & Hilal, N. (2010) Polymeric membranes incorporated withmetal/metal oxide nanoparticles: a comprehensive review. Desalination, 261 (3), 313–320.
Pignatello, J.J., Oliveros, E. & MacKay, A. (2006) Advanced oxidation processes for organic contaminantdestruction based on the Fenton reaction and related chemistry. Critical Reviews on Environmental Scienceand Technology, 36 (1), 1–84.
Rivas, B.L., Pereira, E.D. & Moreno-Villoslada, I. (2003) Water-soluble polymer-metal ion interactions.Progress in Polymer Science, 28, 173–208.
Smuleac, V., Bachas, L. & Bhattacharyya, D. (2010) Aqueous-phase synthesis of PAA in PVDF mem-brane pores for nanoparticles synthesis and dichlorobiphenyl degradation. Journal of Membrane Science,346 (2), 310–317.
Tratnyek, P.G. & Johnson, R.L. (2006) Nanotechnologies for environmental cleanup. Nanotechnology Today,1 (2), 44–48.
Walther, H., Faust, S.D. & Aly, O.M. (1988) Adsorption processes for water treatment. Acta Hydrochimicaet Hydrobiologica, 16, 572–591.
Xu, J., Dozier, A. & Bhattacharyya, D. (2005) Synthesis of nanoscale bimetallic particles in polyelec-trolyte membrane matrix for reductive transformation of halogenated organic compounds. Journal ofNanoparticle Research, 7 (4–5), 449–467.
Zhang, W.X. (2003) Nanoscale iron particles for environmental remediation: an overview. Journal ofNanoparticle Research, 5, 323–332.

CHAPTER 4
Studying the role of magnetite (Fe3O4) colloids functionality onPES membrane in removing of humic acid foulant using QCM-D
Qi-Hwa Ng, Jit-Kang Lim, Abdul Latif Ahmad & Siew-Chun Low
4.1 INTRODUCTION
Over the past few decades, the usage of membranes for potable water production has progressedremarkably due to the compact design of the membrane module, lower energy consumption,and reliable effluent quality. However, membrane fouling still remains as a critical issue in manyapplications of water filtration processes and it restricts the widespread application of membranes.In water treatment, humic acid (HA) has been considered to be one of the most significantfoulants among many potential natural organic matters (NOMs) in both surface and ground water(Lahoussine-Turcaud et al., 1990; Wang et al., 2005). Previous studies of HA fouling were focusedon the role of several important factors (e.g., pH and ionic strength) in humic acid solutions (Jonesand O’Melia, 2000; Wang et al., 2005). For example, Jones and O’Melia (2000) had demonstratedthe effects of solution chemistry (pH and ionic strength) on the adsorption of HA to a membranesurface. The HA adsorption was found to increase with the increased of ionic strength and pHof the HA solution, as also observed in many studies dealing with various types of membranes.However, this kind of research approach is labor intensive, and normally requires tedious analysisof the feed stream before it enters the filtration process.
In general, hydrophilic membranes exhibit lower level of fouling (Jones and O’Melia, 2000;2001). This is due to the formation of a water boundary between the hydrophilic membrane and thesurrounding water molecules that resists the approach of hydrophobic foulants near the membranesurface. In turns out to make the membrane less vulnerable to fouling. Many approaches have beentaken to improve the hydrophilicity of membranes, including the blending of the hydrophilic poly-mers and the surface modification of membranes (Ma et al., 2001; Malaisamy and Bruening 2005;Peeva et al., 2010). However, the polymer chain undergoing chemical modification sometimesbecomes highly swollen, leading to the low mechanical properties of the membrane (Mbarecket al., 2009). As a solution, the integration of nanoparticles into the membrane matrix allows bothcontrol of the membrane fouling and the ability to produce specific functionalities to the mem-brane (Li et al., 2009; McLachlan, 2010). Generally, this type of composite membrane can beproduced through polyelectrolyte multilayer modification (PEM) method, phase inversion tech-niques, self-assembly through covalent attachment or blending with a polymer casting solution(Liu et al., 1997; Schlemmer et al., 2009; Taurozzi et al., 2008).
The quartz crystal microbalance with dissipation monitoring (QCM-D) technology is a surfacesensitive technique which gives real time information about the deposition of the thin surfacelayers by measuring the changes of mass and viscoelastic properties at a surface. It has been usedto evaluate the surface adsorption kinetics and to analyze the nanoparticle-surface interactionsin real time (Chen and Elimelech, 2006; Xu et al., 2010). For example, Xu et al. (2010) hadinvestigated the adsorption behavior of Laponite and Ludox silica nanoparticles on surface ofpoly(diallyldimethylammonium chloride) through QCM-D. The adsorption rates of both silicananoparticles were found to be concentration dependent and signifying that the Ludox adsorbedlayer was more softly bound than the Laponite adsorbed layer. A series of reports have alsobeen presented on the study of the membrane fouling using QCM-D technique and proved its
31

32 Q.-H. Ng et al.
effectiveness in assessing the adsorption and viscoelastic properties of the foulants (organic andinorganic) onto the membrane surfaces (Arkhangelsky et al., 2012; Contreras et al., 2011; Hashinoet al., 2011).
In the present study, we aimed to quantify the adsorption of functionalized magnetic nanopar-ticles (F-MNPs) onto the PES membrane surfaces in different dispersants (DI water and PSS) atconditions with or without PSS and PDDA as precursors through QCM-D measurement. First, theMNPs were functionalized using PSS polymer and flocculation studies for the nano-colloids werecarried out. Then, different membrane surfaces functionalities in adsorptive fouling by commonorganic foulants (HA) were elucidated.
4.2 EXPERIMENTAL
4.2.1 Materials
The magnetite Fe3O4 nanoparticles (MNPs) were supplied by NanoAmor (USA). PSS and PDDApolyelectrolyte were purchased from Sigma (St. Louis, USA). Ultrafiltration PES membrane withmolecular weight cut-off of 20,000 was obtained from GE Osmonics (USA). In this study, PESpolymer supplied by BASF was used as the model membrane used in QCM-D measurement. Thesolvent N -Methyl-2-pyrrolidone (NMP) and humic acid used as the membrane foulant were pur-chased from Merck (Germany) andAldrich (Switzerland), respectively. NaOH (Merck, Germany)and HCl were used for pH adjustment.
4.2.2 Functionalization of nanoparticles
A suspension with 2500 mg L−1 of MNPs was prepared using deionized water and ultrasonicatedto break the existing aggregates. Similarly, PSS solution (0.00412 g mL−1) was prepared andultrasonicated to promote good dispersity of polymeric solution. Both colloids suspension andPSS solution were adjusted to pH 3.5 before the former was added drop wise into the latter solution,where the physisorption process was allowed to occur for 1 day. The PSS-coated nanoparticles(F-MNPs) were then separated using a permanent magnet and pre-washed before final dispersionin deionized water or PSS. Dynamic light scattering (Zetasized) was used to determine the sizedistribution and colloidal stability of naked Fe3O4 and functionalized Fe3O4 in suspension. Themeasurement was performed at an angle of 90◦ under a light source of 650 nm, and the calculationwas based on the assumption of spherical particles in Brownian motion and single scattering.
4.2.3 Quartz crystal microbalance with dissipation (QCM-D)
The QCM-D measurements were performed with AT-cut quartz crystals mounted in an E1 system(Q-Sense, Goteborg, Sweden). 1% w/v of PES polymer dissolved in NMP was spin coated ontothe gold quartz crystal (Q-Sense, Sweden) and evaporated at room temperature for 24 hours.All QCM-D measurements were conducted under flow-through condition via a digital peristalticpump operating in sucking mode at a constant flow rate 50 µL min−1 and at 25◦C. The ATR-FTIR spectra of the commercial PES membrane and the model PES membrane coated on thequartz crystal were analyzed using Thermo Scientific Fourier transform infrared spectrometer(NICOLET iS10, USA) to confirm the similarly of the functional groups. Each spectrum wasobtained from 32 scans with 4 cm−1 resolutions at a 45◦ incident angle using a diamond crystalover the wavenumber range of 4000–600 cm−1.
4.2.3.1 Monitoring F-MNPs adsorptionFirst, the solutions of PSS/PDDA precursor were alternately pumped through the QCM-D cham-ber at 50 µL min−1. The flow-through precursor solution will be absorbed to the surface of thePES coated gold crystal cell. Negatively charged PSS solution will be first interacted with the
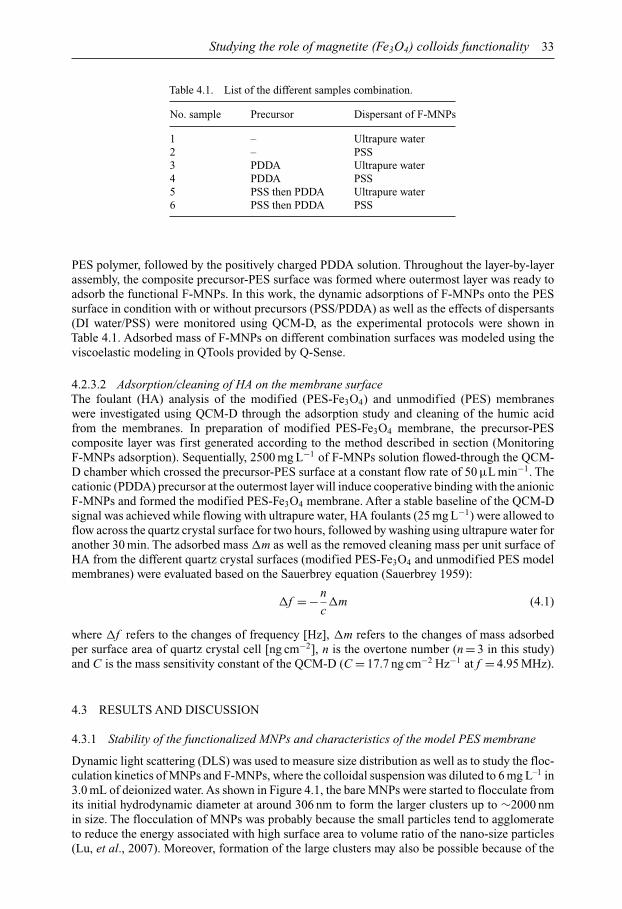
Studying the role of magnetite (Fe3O4) colloids functionality 33
Table 4.1. List of the different samples combination.
No. sample Precursor Dispersant of F-MNPs
1 – Ultrapure water2 – PSS3 PDDA Ultrapure water4 PDDA PSS5 PSS then PDDA Ultrapure water6 PSS then PDDA PSS
PES polymer, followed by the positively charged PDDA solution. Throughout the layer-by-layerassembly, the composite precursor-PES surface was formed where outermost layer was ready toadsorb the functional F-MNPs. In this work, the dynamic adsorptions of F-MNPs onto the PESsurface in condition with or without precursors (PSS/PDDA) as well as the effects of dispersants(DI water/PSS) were monitored using QCM-D, as the experimental protocols were shown inTable 4.1. Adsorbed mass of F-MNPs on different combination surfaces was modeled using theviscoelastic modeling in QTools provided by Q-Sense.
4.2.3.2 Adsorption/cleaning of HA on the membrane surfaceThe foulant (HA) analysis of the modified (PES-Fe3O4) and unmodified (PES) membraneswere investigated using QCM-D through the adsorption study and cleaning of the humic acidfrom the membranes. In preparation of modified PES-Fe3O4 membrane, the precursor-PEScomposite layer was first generated according to the method described in section (MonitoringF-MNPs adsorption). Sequentially, 2500 mg L−1 of F-MNPs solution flowed-through the QCM-D chamber which crossed the precursor-PES surface at a constant flow rate of 50 µL min−1. Thecationic (PDDA) precursor at the outermost layer will induce cooperative binding with the anionicF-MNPs and formed the modified PES-Fe3O4 membrane. After a stable baseline of the QCM-Dsignal was achieved while flowing with ultrapure water, HA foulants (25 mg L−1) were allowed toflow across the quartz crystal surface for two hours, followed by washing using ultrapure water foranother 30 min. The adsorbed mass �m as well as the removed cleaning mass per unit surface ofHA from the different quartz crystal surfaces (modified PES-Fe3O4 and unmodified PES modelmembranes) were evaluated based on the Sauerbrey equation (Sauerbrey 1959):
�f = −n
c�m (4.1)
where �f refers to the changes of frequency [Hz], �m refers to the changes of mass adsorbedper surface area of quartz crystal cell [ng cm−2], n is the overtone number (n = 3 in this study)and C is the mass sensitivity constant of the QCM-D (C = 17.7 ng cm−2 Hz−1 at f = 4.95 MHz).
4.3 RESULTS AND DISCUSSION
4.3.1 Stability of the functionalized MNPs and characteristics of the model PES membrane
Dynamic light scattering (DLS) was used to measure size distribution as well as to study the floc-culation kinetics of MNPs and F-MNPs, where the colloidal suspension was diluted to 6 mg L–1 in3.0 mL of deionized water. As shown in Figure 4.1, the bare MNPs were started to flocculate fromits initial hydrodynamic diameter at around 306 nm to form the larger clusters up to ∼2000 nmin size. The flocculation of MNPs was probably because the small particles tend to agglomerateto reduce the energy associated with high surface area to volume ratio of the nano-size particles(Lu, et al., 2007). Moreover, formation of the large clusters may also be possible because of the
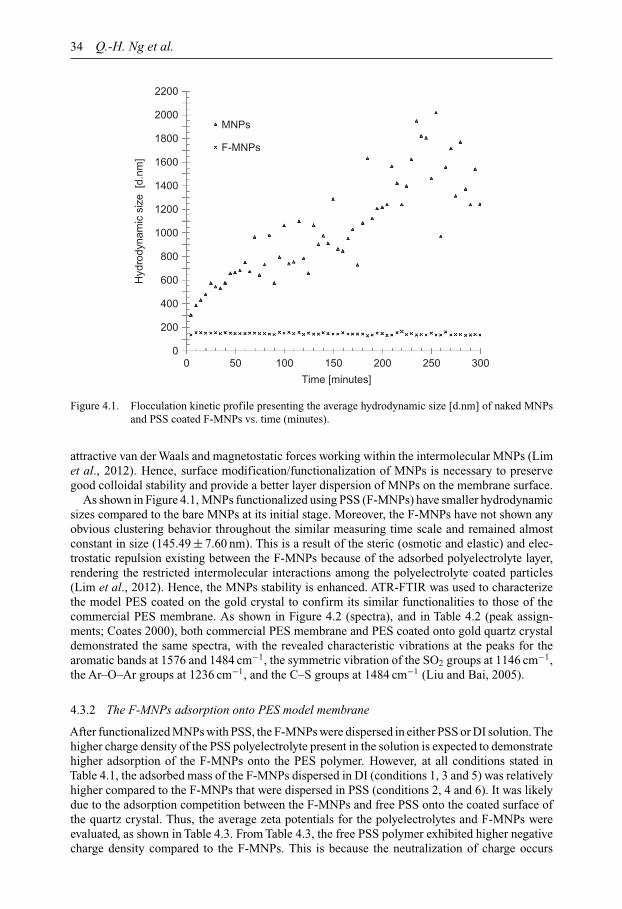
34 Q.-H. Ng et al.
Time [minutes]
Hyd
rody
nam
ic s
ize
[d.n
m]
MNPs
F-MNPs
0 50 100 150 200 250 3000
200
400
600
800
1000
1200
1400
1600
1800
2000
2200
Figure 4.1. Flocculation kinetic profile presenting the average hydrodynamic size [d.nm] of naked MNPsand PSS coated F-MNPs vs. time (minutes).
attractive van der Waals and magnetostatic forces working within the intermolecular MNPs (Limet al., 2012). Hence, surface modification/functionalization of MNPs is necessary to preservegood colloidal stability and provide a better layer dispersion of MNPs on the membrane surface.
As shown in Figure 4.1, MNPs functionalized using PSS (F-MNPs) have smaller hydrodynamicsizes compared to the bare MNPs at its initial stage. Moreover, the F-MNPs have not shown anyobvious clustering behavior throughout the similar measuring time scale and remained almostconstant in size (145.49 ± 7.60 nm). This is a result of the steric (osmotic and elastic) and elec-trostatic repulsion existing between the F-MNPs because of the adsorbed polyelectrolyte layer,rendering the restricted intermolecular interactions among the polyelectrolyte coated particles(Lim et al., 2012). Hence, the MNPs stability is enhanced. ATR-FTIR was used to characterizethe model PES coated on the gold crystal to confirm its similar functionalities to those of thecommercial PES membrane. As shown in Figure 4.2 (spectra), and in Table 4.2 (peak assign-ments; Coates 2000), both commercial PES membrane and PES coated onto gold quartz crystaldemonstrated the same spectra, with the revealed characteristic vibrations at the peaks for thearomatic bands at 1576 and 1484 cm−1, the symmetric vibration of the SO2 groups at 1146 cm−1,the Ar–O–Ar groups at 1236 cm−1, and the C–S groups at 1484 cm−1 (Liu and Bai, 2005).
4.3.2 The F-MNPs adsorption onto PES model membrane
After functionalized MNPs with PSS, the F-MNPs were dispersed in either PSS or DI solution. Thehigher charge density of the PSS polyelectrolyte present in the solution is expected to demonstratehigher adsorption of the F-MNPs onto the PES polymer. However, at all conditions stated inTable 4.1, the adsorbed mass of the F-MNPs dispersed in DI (conditions 1, 3 and 5) was relativelyhigher compared to the F-MNPs that were dispersed in PSS (conditions 2, 4 and 6). It was likelydue to the adsorption competition between the F-MNPs and free PSS onto the coated surface ofthe quartz crystal. Thus, the average zeta potentials for the polyelectrolytes and F-MNPs wereevaluated, as shown in Table 4.3. From Table 4.3, the free PSS polymer exhibited higher negativecharge density compared to the F-MNPs. This is because the neutralization of charge occurs
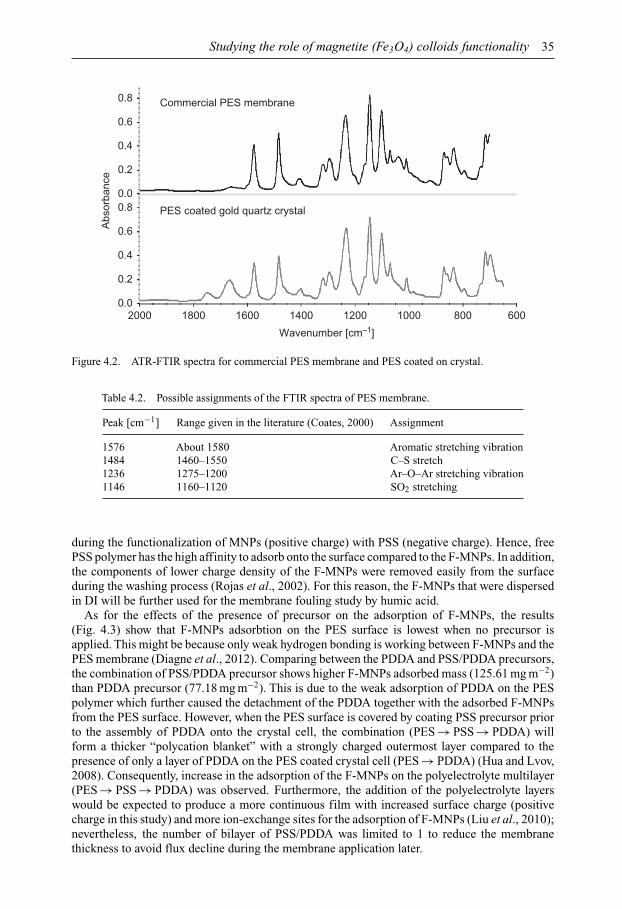
Studying the role of magnetite (Fe3O4) colloids functionality 35
0.0
0.2
0.4
0.6
0.80.0
0.2
0.4
0.6
0.8
Wavenumber [cm–1]
PES coated gold quartz crystal
Abs
orba
nce
Commercial PES membrane
2000 1800 1600 1400 1200 1000 800 600
Figure 4.2. ATR-FTIR spectra for commercial PES membrane and PES coated on crystal.
Table 4.2. Possible assignments of the FTIR spectra of PES membrane.
Peak [cm−1] Range given in the literature (Coates, 2000) Assignment
1576 About 1580 Aromatic stretching vibration1484 1460–1550 C–S stretch1236 1275–1200 Ar–O–Ar stretching vibration1146 1160–1120 SO2 stretching
during the functionalization of MNPs (positive charge) with PSS (negative charge). Hence, freePSS polymer has the high affinity to adsorb onto the surface compared to the F-MNPs. In addition,the components of lower charge density of the F-MNPs were removed easily from the surfaceduring the washing process (Rojas et al., 2002). For this reason, the F-MNPs that were dispersedin DI will be further used for the membrane fouling study by humic acid.
As for the effects of the presence of precursor on the adsorption of F-MNPs, the results(Fig. 4.3) show that F-MNPs adsorbtion on the PES surface is lowest when no precursor isapplied. This might be because only weak hydrogen bonding is working between F-MNPs and thePES membrane (Diagne et al., 2012). Comparing between the PDDA and PSS/PDDA precursors,the combination of PSS/PDDA precursor shows higher F-MNPs adsorbed mass (125.61 mg m−2)than PDDA precursor (77.18 mg m−2). This is due to the weak adsorption of PDDA on the PESpolymer which further caused the detachment of the PDDA together with the adsorbed F-MNPsfrom the PES surface. However, when the PES surface is covered by coating PSS precursor priorto the assembly of PDDA onto the crystal cell, the combination (PES → PSS → PDDA) willform a thicker “polycation blanket” with a strongly charged outermost layer compared to thepresence of only a layer of PDDA on the PES coated crystal cell (PES → PDDA) (Hua and Lvov,2008). Consequently, increase in the adsorption of the F-MNPs on the polyelectrolyte multilayer(PES → PSS → PDDA) was observed. Furthermore, the addition of the polyelectrolyte layerswould be expected to produce a more continuous film with increased surface charge (positivecharge in this study) and more ion-exchange sites for the adsorption of F-MNPs (Liu et al., 2010);nevertheless, the number of bilayer of PSS/PDDA was limited to 1 to reduce the membranethickness to avoid flux decline during the membrane application later.

36 Q.-H. Ng et al.
0
50
100
150
PSS and PDDA PDDA
Types of precursors used
F-M
NP
s ad
sorb
ed a
mou
nt [m
g m
–2]
Without precursor
F-MNPsin PSS
F-MNPsin DI
Figure 4.3. Amount of F-MNPs in PSS or DI adsorbed on PES spin-coated quartz crystal sensor with orwithout precursor.
Table 4.3. Details on average zeta potential forpolyelectrolytes and F-MNPs.
Polyelectrolyte Average zeta potential [mV]
PSS −63.40 ± 3.41PDDA +63.83 ± 3.76F-MNPs −40.53 ± 0.81
4.3.3 Adsorption of HA foulant on the membrane surface
QCM-D was used to study the interactions between foulants and membrane surface, and theresults are shown in Table 4.4. The amount of HA adsorbed on the pure PES membrane was muchhigher than that of the modified PES-Fe3O4 membrane. This is due to the increase of negativecharge density and hydrophilicity on the surface of modified membrane that makes them not easyto foul. Almost all foulants were washed out (95.27%) from the modified PES-Fe3O4 membranesurface, whereas only 33.63% of HA was removed or 56.15 ng cm−2 was retained on the pure PESmembrane surface after the washing step. There is only weak interaction between the HA foulantand the modified membrane due to the impregnation of F-MNPs with negative charge and of highhydrophilicity to the PES membrane. Thus, the attachment of HA foulant which has the similarnegative charge is reduced. In contrast, the stronger attachment of HA foulant occurred whenstrong hydrophobic-hydrophobic interactions occurred between the HA and the unmodified PESmembrane.
However, some minor HA foulants were still deposited on the surface of the modified membrane(3 ng cm–2) due to the higher membrane roughness by the presence of the nanoparticles. However,the deposited amount of HA foulant (3 ng cm−2) was negligible compared to the unmodified PESmembrane (56.15 ng cm−2), showing that the lower irreversible fouling occurred for the modifiedPES-Fe3O4 during fouling experiments.

Studying the role of magnetite (Fe3O4) colloids functionality 37
Table 4.4. Adsorption level for HA on different membrane surfaces and percentual mass of adsorbed layer(HA) removed by pure water.
Membrane Adsorbed mass [ng cm−2] HA mass removed after washing [%]
PES 84.60 33.63PES-Fe3O4 63.51 95.27
4.4 CONCLUSION
Surface modified/functionalized MNPs were successfully end-capped to the surface of PES mem-brane due to improved colloidal stability. In this study, membrane modified with F-MNPs in thepresence of PSS/PDDA precursors exhibited lower membrane fouling by the HA foulant, dueto the formation of highly negatively charged and hydrophilic surface. The F-MNPs modifiedmembrane developed in this work achieved high efficiency for the removal of humic substancesup to 97.25%, which make the membrane processes more economical (longer life span of themembrane) and more sustainable.
ACKNOWLEDGEMENT
The authors wish to thank financial support granted by Universiti Sains Malaysia Research Uni-versity (RU) Grant (1001/PJKIMIA/814230). All authors are affiliated to the Membrane Scienceand Technology Cluster of USM. Q.H. Ng is financially assisted by Ministry of Higher Education(MOHE) and Universiti Malaysia Perlis (UniMAP).
REFERENCES
Arkhangelsky, E., Wicaksana, F., Tang, C., Al-Rabiah, A.A., Al-Zahrani, S.M. & Wang, R. (2012) Combinedorganic-inorganic fouling of forward osmosis hollow fiber membranes. Water Research, 46, 6329–6338.
Chen, K.L. & Elimelech, M. (2006) Aggregation and deposition kinetics of fullerene (C60) nanoparticles.Langmuir, 22, 10,994–11,001.
Coates, J. (2000) Interpretation of infrared spectra, a practical approach. In: Meyers, R.A. (ed.) Encyclopediaof analytical chemistry. John Wiley & Sons Ltd, Chichester, UK. pp. 10,815–10,837.
Contreras, A.E., Steiner, Z., Miao, J., Kasher, R. & Li., Q. (2011) Studying the role of common membranesurface functionalities on adsorption and cleaning of organic foulants using QCM-D. EnvironmentalScience & Technology, 45, 6309–6315.
Diagne, F., Malaisamy, R., Boddie, V., Holbrook, R.D., Eribo, B. & Jones, K.L. (2012) Polyelectrolyte andsilver nanoparticle modification of microfiltration membranes to mitigate organic and bacterial fouling.Environmental Science & Technology, 46, 4025–4033.
Hashino, M., Hirami, K., Katagiri, T., Kubota, N., Ohmukai,Y., Ishigami, T., Maruyama, T. & Matsuyama, H.(2011) Effects of three natural organic matter types on cellulose acetate butyrate microfiltration membranefouling. Journal of Membrane Science, 379, 233–238.
Hua, F. & Lvov, Y.M. (2008) Layer-by-layer assembly. Chapter 1 in Erokhin, V., Ram, M.K. & Yavuz, O.(eds.)The new frontiers of organic and composite nanotechnology. Elsevier, Amsterdam, The Netherlands.pp. 1–44.
Jones, K.L. & O’Melia, C.R. (2000) Protein and humic acid adsorption onto hydrophilic membrane surfaces:effects of pH and ionic strength. Journal of Membrane Science, 165, 31–46.
Jones, K.L. & O’Melia, C.R. (2001) Ultrafiltration of protein and humic substances: effect of solutionchemistry on fouling and flux decline. Journal of Membrane Science, 193, 163–173.
Lahoussine-Turcaud, V., Wiesner, M.R. & Bottero, J.Y. (1990) Fouling in tangential-flow ultrafiltration: theeffect of colloid size and coagulation pretreatment. Journal of Membrane Science, 52, 173–190.
Li, J.H., Xu, Y.Y., Zhu, L.P., Wang, J.H. & Du, C.H. (2009) Fabrication and characterization of a novel TiO2nanoparticle self-assembly membrane with improved fouling resistance. Journal of Membrane Science,326, 659–666.
38 Q.-H. Ng et al.
Lim, J.K., Chan, D.J.C., Jalak, S.A., Toh, P.Y., Yasin, N.H.M., Ng, B.W. & Ahmad, A.K. (2012) Rapidmagnetophoretic separation of microalgae. Small, 8, 1683–1692.
Liu, C. & Bai, R. (2005) Preparation of chitosan/cellulose acetate blend hollow fibers for adsorptiveperformance. Journal of Membrane Science, 267, 68–77.
Liu, G., Dotzauer, D.M. & Bruening, M.L. (2010) Ion-exchange membranes prepared using layer-by-layerpolyelectrolyte deposition. Journal of Membrane Science, 354, 198–205.
Liu, Y., Wang, A. & Claus, R.O. (1997) Layer-by-layer electrostatic self-assembly of nanoscale Fe3O4particles and polyimide precursor on silicon and silica surfaces. Applied Physics Letters, 71, 2265–2267.
Lu, A.H., Salabas, E.L. & Schüth, F. (2007) Magnetic nanoparticles: synthesis, protection, functionalization,and application. Angewandte Chemie International Edition, 46, 1222–1244.
Ma, H., Hakim, L.F., Bowman, C.M. & Davis, R.H. (2001) Factors affecting membrane fouling reductionby surface modification and backpulsing. Journal of Membrane Science, 189, 255–270.
Malaisamy, R. & Bruening, M.L. (2005) High-flux nanofiltration membranes prepared by adsorption ofmultilayer polyelectrolyte membranes on polymeric supports. Langmuir, 21, 10,587–10,592.
Mbareck, C., Nguyen, Q.T., Alaoui, O.T. & Barillier, D. (2009) Elaboration, characterization and applicationof polysulfone and polyacrylic acid blends as ultrafiltration membranes for removal of some heavy metalsfrom water. Journal of Hazardous Materials, 171, 93–101.
McLachlan, D. (2010)The defouling of membranes using polymer beads containing magnetic micro particles.Water SA, 36, 641–650.
Peeva, P.D., Pieper, T. & Ulbricht, M. (2010) Tuning the ultrafiltration properties of anti-fouling thin-layerhydrogel polyethersulfone composite membranes by suited crosslinker monomers and photo-graftingconditions. Journal of Membrane Science, 362, 560–568.
Rojas, O.J., Ernstsson, M., Neuman, R.D. & Claesson, P.M. (2002) Effect of polyelectrolyte charge densityon the adsorption and desorption behavior on mica. Langmuir, 18, 1604–1612.
Sauerbrey, G. (1959)Verwendung von Schwingquarzen zurWägung dünner Schichten und zur Mikrowägung.Zeitschrift für Physik, 155, 206–222.
Schlemmer, C., Betz, W., Berchtold, B., Rühe, J. & Santer, S. (2009) The design of thin polymer membranesfilled with magnetic particles on a microstructured silicon surface. Nanotechnology, 20, 255–301.
Taurozzi, J.S., Arul, H., Bosak, V.Z., Burban, A.F., Voice, T.C., Bruening, M.L. & Tarabara, V.V. (2008)Effect of filler incorporation route on the properties of polysulfone-silver nanocomposite membranes ofdifferent porosities. Journal of Membrane Science, 325, 58–68.
Wang, Z., Zhao, Y., Wang, J. & Wang, S. (2005) Studies on nanofiltration membrane fouling in the treatmentof water solutions containing humic acids. Desalination, 178, 171–178.
Xu, D., Hodges, C., Ding, Y., Biggs, S., Brooker, A. & York, D. (2010) Adsorption kinetics of laponite andludox silica nanoparticles onto a deposited poly(diallyldimethylammonium chloride) layer measured bya quartz crystal microbalance and optical reflectometry. Langmuir, 26, 18,105–18,112.
CHAPTER 5
The effect of spinning parameters on PLA hollow fibermembrane formation
Arisa Jaiyu, Kanungnuch Keawsupsak, Julaluk Pannoi,Passakorn Sueprasit & Chutima Eamchotchawalit
5.1 INTRODUCTION
Development of renewable and decomposable material from the agriculture feed stocks hasbecome one of the most popular topics for research interest due to environmental ecologicalawareness and a shortage of petroleum resource (Berkesch, 2005). Poly(lactic acid) (PLA) is theone of the most attractive decomposable and renewable polymers derived from corn and sugarcane (Datta and Henry, 2006; Lim et al., 2008; Liu et al., 2000). Nowadays, the manufacture ofPLA successfully developed into the commercial scale and the price of PLA has become muchcheaper compared to the past.
Membranes play a central role of our daily life (Mulder, 1996) and have gained an importantplace in chemical technology because they can be used in broad range of applications (Baker,2004). Most of the polymeric membranes were made from petroleum-based polymers. If thesepolymer membranes are discarded into the environment, ending up as wastes that do not degradein a hundred years, it causes a serious global problem in the management of the increasing amountof solid waste. In this study, PLA was chosen to use as the membrane material for hollow fibermembrane fabrication.
The fabrication of hollow fiber is still a complex process especially when the new material isused. Nonsolvent induced phase separation (NIPS) has been widely used for fabrication of hollowfiber membrane on a commercial scale (Moriya et al., 2009; Witte et al., 1996) since NIPS is asimple and convenient method to prepare porous membranes. There are few publications aboutpreparation of PLA membrane in flat sheet and hollow fiber (Moriya et al., 2009; Witte et al.,1996; Zereshki et al., 2010a; 2010b). Moriya et al. (2009) studied the effect of solvent, nonsolventand PEG on membrane morphologies and filtration performance of PLA hollow fiber membranesprepared via NIPS. In the NIPS method, factors involved in the hollow fiber membrane formationinclude (i) polymer dope formulation such as polymer and additive concentrations and (ii) spinningparameters such as air gap, take-up speed, coagulation and bore fluid temperature (Chakrabartyet al., 2008; Garca-Payo et al., 2009; Loh et al., 2011). In this chapter, PLA hollow fiber withgood ultrafiltration performance was fabricated via NIPS using only one formulation of dopesolution containing 20% PLA, 2% glycerin 0.5% Polyethylene glycol (PEG1500) and N -methyl-2-pyrollidone (NMP). The effects of spinning parameters on the structure, morphologies andfiltration performance of hollow fiber membrane have been studied.
5.2 EXPERIMENTAL
5.2.1 Materials
Poly(lactic acid) (Ingeo 2003D) was purchased from NatureWorks LLC and dried in a conven-tional oven at 50◦C for 24 hours before use. NMP was purchased from POSH. S.A. (Labscan).Glycerin was purchased from Iltalmar company. Bovine serum albumin (BSA) and PEG1500 were
39
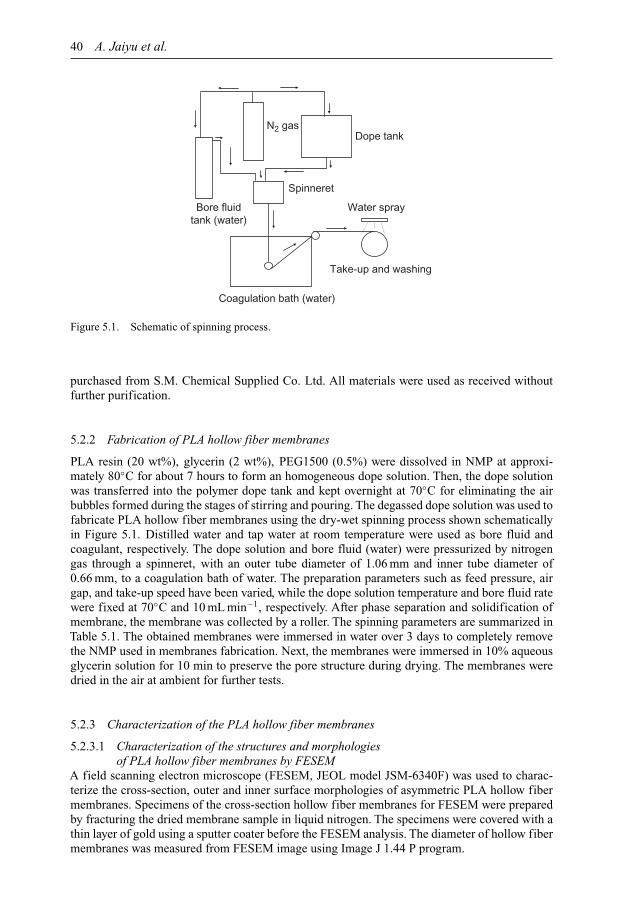
40 A. Jaiyu et al.
Spinneret
Coagulation bath (water)
N2 gas
Bore fluidtank (water)
Dope tank
Take-up and washing
Water spray
Figure 5.1. Schematic of spinning process.
purchased from S.M. Chemical Supplied Co. Ltd. All materials were used as received withoutfurther purification.
5.2.2 Fabrication of PLA hollow fiber membranes
PLA resin (20 wt%), glycerin (2 wt%), PEG1500 (0.5%) were dissolved in NMP at approxi-mately 80◦C for about 7 hours to form an homogeneous dope solution. Then, the dope solutionwas transferred into the polymer dope tank and kept overnight at 70◦C for eliminating the airbubbles formed during the stages of stirring and pouring. The degassed dope solution was used tofabricate PLA hollow fiber membranes using the dry-wet spinning process shown schematicallyin Figure 5.1. Distilled water and tap water at room temperature were used as bore fluid andcoagulant, respectively. The dope solution and bore fluid (water) were pressurized by nitrogengas through a spinneret, with an outer tube diameter of 1.06 mm and inner tube diameter of0.66 mm, to a coagulation bath of water. The preparation parameters such as feed pressure, airgap, and take-up speed have been varied, while the dope solution temperature and bore fluid ratewere fixed at 70◦C and 10 mL min−1, respectively. After phase separation and solidification ofmembrane, the membrane was collected by a roller. The spinning parameters are summarized inTable 5.1. The obtained membranes were immersed in water over 3 days to completely removethe NMP used in membranes fabrication. Next, the membranes were immersed in 10% aqueousglycerin solution for 10 min to preserve the pore structure during drying. The membranes weredried in the air at ambient for further tests.
5.2.3 Characterization of the PLA hollow fiber membranes
5.2.3.1 Characterization of the structures and morphologiesof PLA hollow fiber membranes by FESEM
A field scanning electron microscope (FESEM, JEOL model JSM-6340F) was used to charac-terize the cross-section, outer and inner surface morphologies of asymmetric PLA hollow fibermembranes. Specimens of the cross-section hollow fiber membranes for FESEM were preparedby fracturing the dried membrane sample in liquid nitrogen. The specimens were covered with athin layer of gold using a sputter coater before the FESEM analysis. The diameter of hollow fibermembranes was measured from FESEM image using Image J 1.44 P program.

The effect of spinning parameters on PLA hollow fiber membrane formation 41
Table 5.1. Spinning parameters and structure of hollow fiber membranes.
WallFeed pressure Air gap Take-up speed thickness
Code [MPa] [cm] [m min−1] i.d. [µm]∗ o.d. [µm]∗ [µm]
HF-PLA1 0.045 25 220 916 1237 161HF-PLA2 0.045 5 220 955 1206 125HF-PLA3 0.045 5 270 808 1017 105HF-PLA4 0.065 5 220 938 1223 142HF-PLA5 0.1 5 220 909 1207 149HF-PLA6 0.1 5 270 746 991 123
∗i.d.: inner diameter; o.d.: outer diameter (of hollow fiber membrane).
5.2.3.2 Measurement of hollow fiber pure water fluxThe hollow fiber membranes were prepared for measurement of pure water flux using a lab-scalepermeation system. Prior to the test, the hollow fiber membranes were immersed in pure water toremove glycerin for overnight. Pure water was circulated through the inside of membrane underpressure (0.1 MPa) and then, the pure water permeate from the membrane was collected. Thepure water flux of the membrane (J ) was calculated by the following equation:
J = Q
At= Q
nπdlt(5.1)
where Q is the total filtrate volume [m3] within the operation time t [h], A the membrane area[m2], n the number of fibers in one testing, d the inner diameter of the testing fibers [m], and lthe effective length of the fiber [m].
5.2.3.3 BSA rejectionThe BSA (MW = 67,000) solution at 1000 mg L−1 was used as the feed solution. The BSAconcentration of feed and permeate was evaluated using UV-visible spectroscopy (Shimadzumodel UV-1700) at 280 nm.
The % BSA rejection can be calculated using the following equation:
R [%] =(
1 − Cp
Cf
)× 100 (5.2)
where Cp and Cf are the BSA concentration [mg L−1] of permeate and feed, respectively.
5.2.3.4 Mechanical propertiesTensile strength and elongation at break of each sample were determined using a tensometer(Monsanto model T10) at room temperature with a crosshead rate of 50 mm min−1 and a 25 mmgauge length. At least 5 replicates were tested, and average values were reported.
5.3 RESULTS AND DISCUSSION
The fabrication of hollow fiber is still a complex process especially when the new material isused. The spinning parameters play an important role in formation of membrane hollow fiber viaNIPS. In this study, a number of PLA hollow fiber membranes were prepared by dry-wet solutionspinning process via NIPS. The spinning parameters such as feed pressure, air gap and take-upspeed were varied while the formulation of polymer dope solution was fixed.
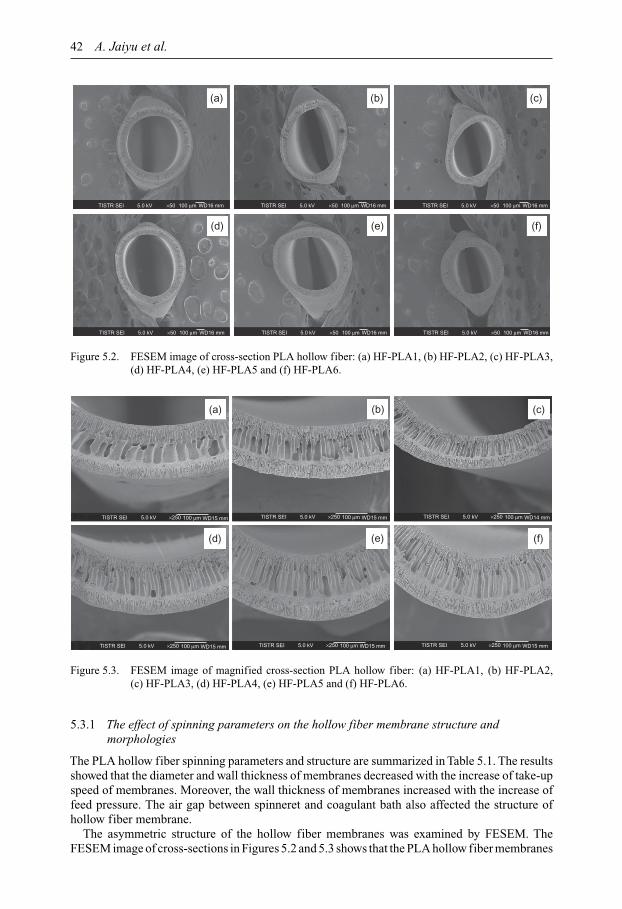
42 A. Jaiyu et al.
(a)
TISTR SEI 5.0 kV ×50 100 µm WD16 mm
(b) (c)
(d) (e) (f)
TISTR SEI 5.0 kV ×50 100 µm WD16 mm TISTR SEI 5.0 kV ×50 100 µm WD16 mm
TISTR SEI 5.0 kV ×50 100 µm WD16 mm TISTR SEI 5.0 kV ×50 100 µm WD16 mm TISTR SEI 5.0 kV ×50 100 µm WD16 mm
Figure 5.2. FESEM image of cross-section PLA hollow fiber: (a) HF-PLA1, (b) HF-PLA2, (c) HF-PLA3,(d) HF-PLA4, (e) HF-PLA5 and (f) HF-PLA6.
(a) (b) (c)
(d) (e) (f)
TISTR SEI 5.0 kV ×250 100 µm WD15 mm TISTR SEI 5.0 kV ×250 100 µm WD15 mm TISTR SEI 5.0 kV ×250 100 µm WD14 mm
TISTR SEI 5.0 kV ×250 100 µm WD15 mm TISTR SEI 5.0 kV ×250 100 µm WD15 mm TISTR SEI 5.0 kV ×250 100 µm WD15 mm
Figure 5.3. FESEM image of magnified cross-section PLA hollow fiber: (a) HF-PLA1, (b) HF-PLA2,(c) HF-PLA3, (d) HF-PLA4, (e) HF-PLA5 and (f) HF-PLA6.
5.3.1 The effect of spinning parameters on the hollow fiber membrane structure andmorphologies
The PLA hollow fiber spinning parameters and structure are summarized in Table 5.1. The resultsshowed that the diameter and wall thickness of membranes decreased with the increase of take-upspeed of membranes. Moreover, the wall thickness of membranes increased with the increase offeed pressure. The air gap between spinneret and coagulant bath also affected the structure ofhollow fiber membrane.
The asymmetric structure of the hollow fiber membranes was examined by FESEM. TheFESEM image of cross-sections in Figures 5.2 and 5.3 shows that the PLA hollow fiber membranes
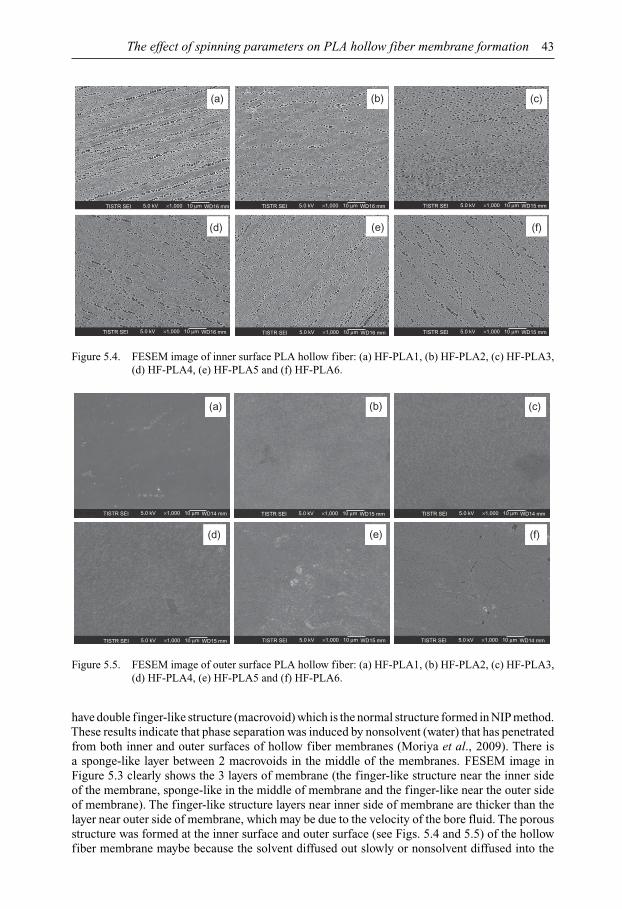
The effect of spinning parameters on PLA hollow fiber membrane formation 43
(a) (b) (c)
(d) (e) (f)
TISTR SEI 5.0 kV ×1,000 10 µm WD16 mm
TISTR SEI 5.0 kV ×1,000 10 µm WD16 mm TISTR SEI 5.0 kV ×1,000 10 µm WD16 mm TISTR SEI 5.0 kV ×1,000 10 µm WD15 mm
TISTR SEI 5.0 kV ×1,000 10 µm WD15 mmTISTR SEI 5.0 kV ×1,000 10 µm WD16 mm
Figure 5.4. FESEM image of inner surface PLA hollow fiber: (a) HF-PLA1, (b) HF-PLA2, (c) HF-PLA3,(d) HF-PLA4, (e) HF-PLA5 and (f) HF-PLA6.
(a) (b) (c)
(d) (e) (f)
TISTR SEI 5.0 kV ×1,000 10 µm WD14 mm
TISTR SEI 5.0 kV ×1,000 10 µm WD15 mm TISTR SEI 5.0 kV ×1,000 10 µm WD15 mm
TISTR SEI 5.0 kV ×1,000 10 µm WD14 mm
TISTR SEI 5.0 kV ×1,000 10 µm WD14 mm
TISTR SEI 5.0 kV ×1,000 10 µm WD15 mm
Figure 5.5. FESEM image of outer surface PLA hollow fiber: (a) HF-PLA1, (b) HF-PLA2, (c) HF-PLA3,(d) HF-PLA4, (e) HF-PLA5 and (f) HF-PLA6.
have double finger-like structure (macrovoid) which is the normal structure formed in NIP method.These results indicate that phase separation was induced by nonsolvent (water) that has penetratedfrom both inner and outer surfaces of hollow fiber membranes (Moriya et al., 2009). There isa sponge-like layer between 2 macrovoids in the middle of the membranes. FESEM image inFigure 5.3 clearly shows the 3 layers of membrane (the finger-like structure near the inner sideof the membrane, sponge-like in the middle of membrane and the finger-like near the outer sideof membrane). The finger-like structure layers near inner side of membrane are thicker than thelayer near outer side of membrane, which may be due to the velocity of the bore fluid. The porousstructure was formed at the inner surface and outer surface (see Figs. 5.4 and 5.5) of the hollowfiber membrane maybe because the solvent diffused out slowly or nonsolvent diffused into the

44 A. Jaiyu et al.
0
20
40
60
80
100
HF-PLA1 HF-PLA2 HF-PLA3 HF-PLA4 HF-PLA5 HF-PLA6
BSA rejection [%]
Pure water flux [L m2 h–1]
BS
A r
ejec
tion
[%]
Figure 5.6. BSA rejection [%] and pure water flux of PLA hollow fiber membrane.
0
1
2
3
4
5
6
7
0
0.5
1
1.5
2
2.5
3
HF-PLA1 HF-PLA2 HF-PLA3 HF-PLA4 HF-PLA5 HF-PLA6
Elo
ngat
ion
[%]
Ten
sile
str
engt
h [M
Pa]
Tensile strength [MPa]
Elongation [%]
Figure 5.7. Tensile strength and elongation of PLA hollow fiber membrane.
dope solution rapidly. The inner surface showed larger pores compared to the outer surface dueto the velocity of the bore fluid. The larger finger-like structure was formed when the air gapincreased from 5 cm to 25 cm.
5.3.2 Pure water flux and BSA rejection
The pure water flux and BSA rejection of PLA hollow fiber membranes are shown in Figure5.6. The PLA hollow fiber membranes HF-PLA-2, HF-PLA3 and HF-PLA6 showed high purewater flux because the wall thickness of these membranes were thinner compared to the othermembranes.
The PLA hollow fiber membranes exhibited 71–99% in BSA rejection. The BSA rejectionof HF-PLA1, HF-PLA3 and HF-PLA4 were higher than 90%. These results indicated that thesemembranes exhibited excellent ultrafiltration performance.
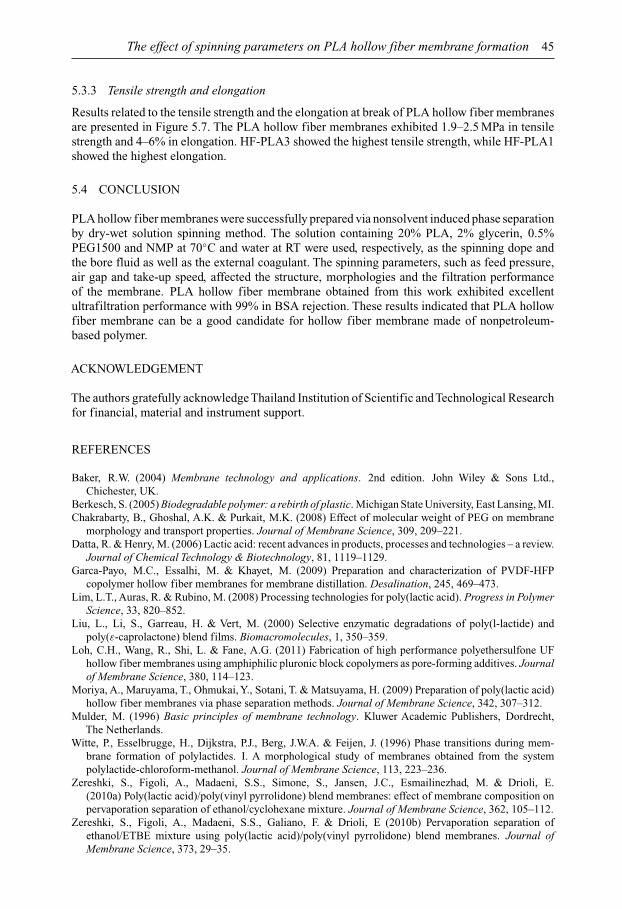
The effect of spinning parameters on PLA hollow fiber membrane formation 45
5.3.3 Tensile strength and elongation
Results related to the tensile strength and the elongation at break of PLA hollow fiber membranesare presented in Figure 5.7. The PLA hollow fiber membranes exhibited 1.9–2.5 MPa in tensilestrength and 4–6% in elongation. HF-PLA3 showed the highest tensile strength, while HF-PLA1showed the highest elongation.
5.4 CONCLUSION
PLA hollow fiber membranes were successfully prepared via nonsolvent induced phase separationby dry-wet solution spinning method. The solution containing 20% PLA, 2% glycerin, 0.5%PEG1500 and NMP at 70◦C and water at RT were used, respectively, as the spinning dope andthe bore fluid as well as the external coagulant. The spinning parameters, such as feed pressure,air gap and take-up speed, affected the structure, morphologies and the filtration performanceof the membrane. PLA hollow fiber membrane obtained from this work exhibited excellentultrafiltration performance with 99% in BSA rejection. These results indicated that PLA hollowfiber membrane can be a good candidate for hollow fiber membrane made of nonpetroleum-based polymer.
ACKNOWLEDGEMENT
The authors gratefully acknowledge Thailand Institution of Scientific and Technological Researchfor financial, material and instrument support.
REFERENCES
Baker, R.W. (2004) Membrane technology and applications. 2nd edition. John Wiley & Sons Ltd.,Chichester, UK.
Berkesch, S. (2005) Biodegradable polymer: a rebirth of plastic. Michigan State University, East Lansing, MI.Chakrabarty, B., Ghoshal, A.K. & Purkait, M.K. (2008) Effect of molecular weight of PEG on membrane
morphology and transport properties. Journal of Membrane Science, 309, 209–221.Datta, R. & Henry, M. (2006) Lactic acid: recent advances in products, processes and technologies – a review.
Journal of Chemical Technology & Biotechnology, 81, 1119–1129.Garca-Payo, M.C., Essalhi, M. & Khayet, M. (2009) Preparation and characterization of PVDF-HFP
copolymer hollow fiber membranes for membrane distillation. Desalination, 245, 469–473.Lim, L.T., Auras, R. & Rubino, M. (2008) Processing technologies for poly(lactic acid). Progress in Polymer
Science, 33, 820–852.Liu, L., Li, S., Garreau, H. & Vert, M. (2000) Selective enzymatic degradations of poly(l-lactide) and
poly(ε-caprolactone) blend films. Biomacromolecules, 1, 350–359.Loh, C.H., Wang, R., Shi, L. & Fane, A.G. (2011) Fabrication of high performance polyethersulfone UF
hollow fiber membranes using amphiphilic pluronic block copolymers as pore-forming additives. Journalof Membrane Science, 380, 114–123.
Moriya, A., Maruyama, T., Ohmukai, Y., Sotani, T. & Matsuyama, H. (2009) Preparation of poly(lactic acid)hollow fiber membranes via phase separation methods. Journal of Membrane Science, 342, 307–312.
Mulder, M. (1996) Basic principles of membrane technology. Kluwer Academic Publishers, Dordrecht,The Netherlands.
Witte, P., Esselbrugge, H., Dijkstra, P.J., Berg, J.W.A. & Feijen, J. (1996) Phase transitions during mem-brane formation of polylactides. I. A morphological study of membranes obtained from the systempolylactide-chloroform-methanol. Journal of Membrane Science, 113, 223–236.
Zereshki, S., Figoli, A., Madaeni, S.S., Simone, S., Jansen, J.C., Esmailinezhad, M. & Drioli, E.(2010a) Poly(lactic acid)/poly(vinyl pyrrolidone) blend membranes: effect of membrane composition onpervaporation separation of ethanol/cyclohexane mixture. Journal of Membrane Science, 362, 105–112.
Zereshki, S., Figoli, A., Madaeni, S.S., Galiano, F. & Drioli, E (2010b) Pervaporation separation ofethanol/ETBE mixture using poly(lactic acid)/poly(vinyl pyrrolidone) blend membranes. Journal ofMembrane Science, 373, 29–35.

This page intentionally left blankThis page intentionally left blank
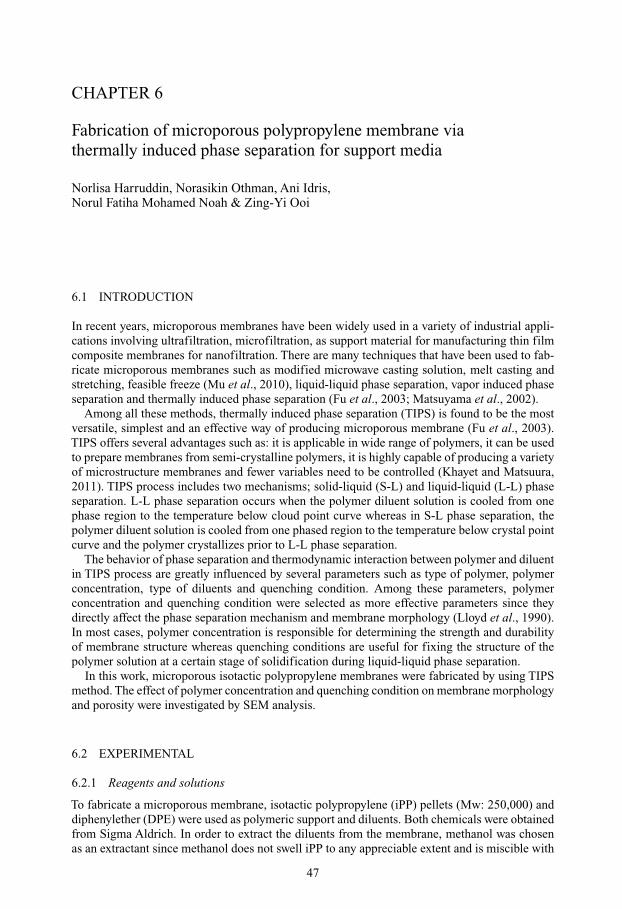
CHAPTER 6
Fabrication of microporous polypropylene membrane viathermally induced phase separation for support media
Norlisa Harruddin, Norasikin Othman, Ani Idris,Norul Fatiha Mohamed Noah & Zing-Yi Ooi
6.1 INTRODUCTION
In recent years, microporous membranes have been widely used in a variety of industrial appli-cations involving ultrafiltration, microfiltration, as support material for manufacturing thin filmcomposite membranes for nanofiltration. There are many techniques that have been used to fab-ricate microporous membranes such as modified microwave casting solution, melt casting andstretching, feasible freeze (Mu et al., 2010), liquid-liquid phase separation, vapor induced phaseseparation and thermally induced phase separation (Fu et al., 2003; Matsuyama et al., 2002).
Among all these methods, thermally induced phase separation (TIPS) is found to be the mostversatile, simplest and an effective way of producing microporous membrane (Fu et al., 2003).TIPS offers several advantages such as: it is applicable in wide range of polymers, it can be usedto prepare membranes from semi-crystalline polymers, it is highly capable of producing a varietyof microstructure membranes and fewer variables need to be controlled (Khayet and Matsuura,2011). TIPS process includes two mechanisms; solid-liquid (S-L) and liquid-liquid (L-L) phaseseparation. L-L phase separation occurs when the polymer diluent solution is cooled from onephase region to the temperature below cloud point curve whereas in S-L phase separation, thepolymer diluent solution is cooled from one phased region to the temperature below crystal pointcurve and the polymer crystallizes prior to L-L phase separation.
The behavior of phase separation and thermodynamic interaction between polymer and diluentin TIPS process are greatly influenced by several parameters such as type of polymer, polymerconcentration, type of diluents and quenching condition. Among these parameters, polymerconcentration and quenching condition were selected as more effective parameters since theydirectly affect the phase separation mechanism and membrane morphology (Lloyd et al., 1990).In most cases, polymer concentration is responsible for determining the strength and durabilityof membrane structure whereas quenching conditions are useful for fixing the structure of thepolymer solution at a certain stage of solidification during liquid-liquid phase separation.
In this work, microporous isotactic polypropylene membranes were fabricated by using TIPSmethod. The effect of polymer concentration and quenching condition on membrane morphologyand porosity were investigated by SEM analysis.
6.2 EXPERIMENTAL
6.2.1 Reagents and solutions
To fabricate a microporous membrane, isotactic polypropylene (iPP) pellets (Mw: 250,000) anddiphenylether (DPE) were used as polymeric support and diluents. Both chemicals were obtainedfrom Sigma Aldrich. In order to extract the diluents from the membrane, methanol was chosenas an extractant since methanol does not swell iPP to any appreciable extent and is miscible with
47
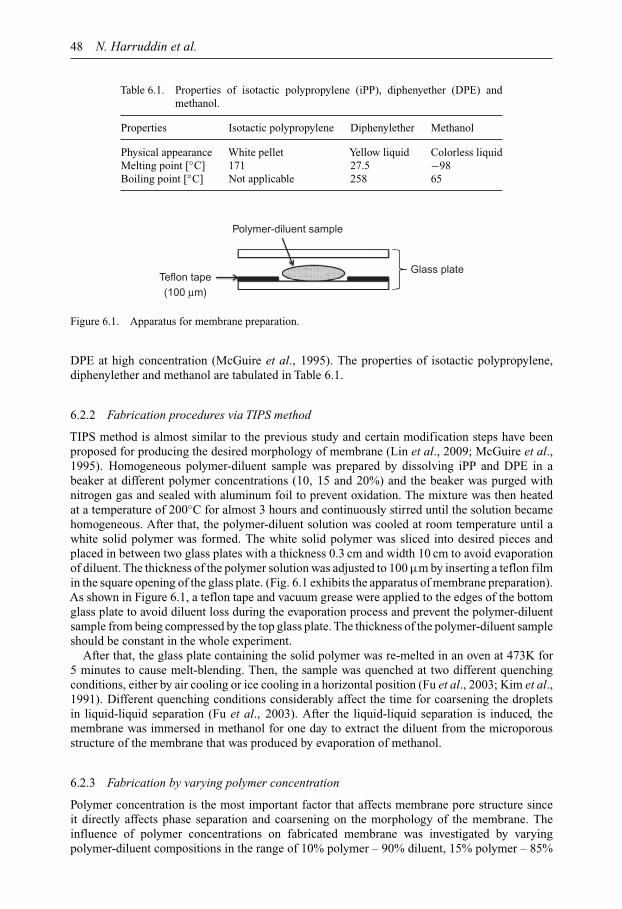
48 N. Harruddin et al.
Table 6.1. Properties of isotactic polypropylene (iPP), diphenyether (DPE) andmethanol.
Properties Isotactic polypropylene Diphenylether Methanol
Physical appearance White pellet Yellow liquid Colorless liquidMelting point [◦C] 171 27.5 −98Boiling point [◦C] Not applicable 258 65
Glass plate
Polymer-diluent sample
Teflon tape(100 µm)
Figure 6.1. Apparatus for membrane preparation.
DPE at high concentration (McGuire et al., 1995). The properties of isotactic polypropylene,diphenylether and methanol are tabulated in Table 6.1.
6.2.2 Fabrication procedures via TIPS method
TIPS method is almost similar to the previous study and certain modification steps have beenproposed for producing the desired morphology of membrane (Lin et al., 2009; McGuire et al.,1995). Homogeneous polymer-diluent sample was prepared by dissolving iPP and DPE in abeaker at different polymer concentrations (10, 15 and 20%) and the beaker was purged withnitrogen gas and sealed with aluminum foil to prevent oxidation. The mixture was then heatedat a temperature of 200◦C for almost 3 hours and continuously stirred until the solution becamehomogeneous. After that, the polymer-diluent solution was cooled at room temperature until awhite solid polymer was formed. The white solid polymer was sliced into desired pieces andplaced in between two glass plates with a thickness 0.3 cm and width 10 cm to avoid evaporationof diluent. The thickness of the polymer solution was adjusted to 100 µm by inserting a teflon filmin the square opening of the glass plate. (Fig. 6.1 exhibits the apparatus of membrane preparation).As shown in Figure 6.1, a teflon tape and vacuum grease were applied to the edges of the bottomglass plate to avoid diluent loss during the evaporation process and prevent the polymer-diluentsample from being compressed by the top glass plate. The thickness of the polymer-diluent sampleshould be constant in the whole experiment.
After that, the glass plate containing the solid polymer was re-melted in an oven at 473K for5 minutes to cause melt-blending. Then, the sample was quenched at two different quenchingconditions, either by air cooling or ice cooling in a horizontal position (Fu et al., 2003; Kim et al.,1991). Different quenching conditions considerably affect the time for coarsening the dropletsin liquid-liquid separation (Fu et al., 2003). After the liquid-liquid separation is induced, themembrane was immersed in methanol for one day to extract the diluent from the microporousstructure of the membrane that was produced by evaporation of methanol.
6.2.3 Fabrication by varying polymer concentration
Polymer concentration is the most important factor that affects membrane pore structure sinceit directly affects phase separation and coarsening on the morphology of the membrane. Theinfluence of polymer concentrations on fabricated membrane was investigated by varyingpolymer-diluent compositions in the range of 10% polymer – 90% diluent, 15% polymer – 85%
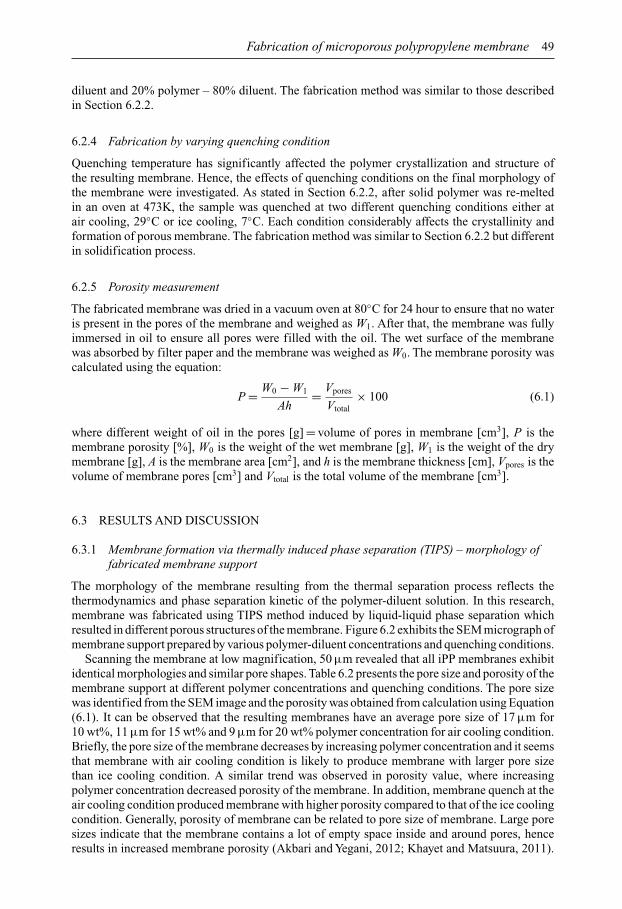
Fabrication of microporous polypropylene membrane 49
diluent and 20% polymer – 80% diluent. The fabrication method was similar to those describedin Section 6.2.2.
6.2.4 Fabrication by varying quenching condition
Quenching temperature has significantly affected the polymer crystallization and structure ofthe resulting membrane. Hence, the effects of quenching conditions on the final morphology ofthe membrane were investigated. As stated in Section 6.2.2, after solid polymer was re-meltedin an oven at 473K, the sample was quenched at two different quenching conditions either atair cooling, 29◦C or ice cooling, 7◦C. Each condition considerably affects the crystallinity andformation of porous membrane. The fabrication method was similar to Section 6.2.2 but differentin solidification process.
6.2.5 Porosity measurement
The fabricated membrane was dried in a vacuum oven at 80◦C for 24 hour to ensure that no wateris present in the pores of the membrane and weighed as W1. After that, the membrane was fullyimmersed in oil to ensure all pores were filled with the oil. The wet surface of the membranewas absorbed by filter paper and the membrane was weighed as W0. The membrane porosity wascalculated using the equation:
P = W0 − W1
Ah= Vpores
Vtotal× 100 (6.1)
where different weight of oil in the pores [g] = volume of pores in membrane [cm3], P is themembrane porosity [%], W0 is the weight of the wet membrane [g], W1 is the weight of the drymembrane [g], A is the membrane area [cm2], and h is the membrane thickness [cm], Vpores is thevolume of membrane pores [cm3] and Vtotal is the total volume of the membrane [cm3].
6.3 RESULTS AND DISCUSSION
6.3.1 Membrane formation via thermally induced phase separation (TIPS) – morphology offabricated membrane support
The morphology of the membrane resulting from the thermal separation process reflects thethermodynamics and phase separation kinetic of the polymer-diluent solution. In this research,membrane was fabricated using TIPS method induced by liquid-liquid phase separation whichresulted in different porous structures of the membrane. Figure 6.2 exhibits the SEM micrograph ofmembrane support prepared by various polymer-diluent concentrations and quenching conditions.
Scanning the membrane at low magnification, 50 µm revealed that all iPP membranes exhibitidentical morphologies and similar pore shapes. Table 6.2 presents the pore size and porosity of themembrane support at different polymer concentrations and quenching conditions. The pore sizewas identified from the SEM image and the porosity was obtained from calculation using Equation(6.1). It can be observed that the resulting membranes have an average pore size of 17 µm for10 wt%, 11 µm for 15 wt% and 9 µm for 20 wt% polymer concentration for air cooling condition.Briefly, the pore size of the membrane decreases by increasing polymer concentration and it seemsthat membrane with air cooling condition is likely to produce membrane with larger pore sizethan ice cooling condition. A similar trend was observed in porosity value, where increasingpolymer concentration decreased porosity of the membrane. In addition, membrane quench at theair cooling condition produced membrane with higher porosity compared to that of the ice coolingcondition. Generally, porosity of membrane can be related to pore size of membrane. Large poresizes indicate that the membrane contains a lot of empty space inside and around pores, henceresults in increased membrane porosity (Akbari and Yegani, 2012; Khayet and Matsuura, 2011).
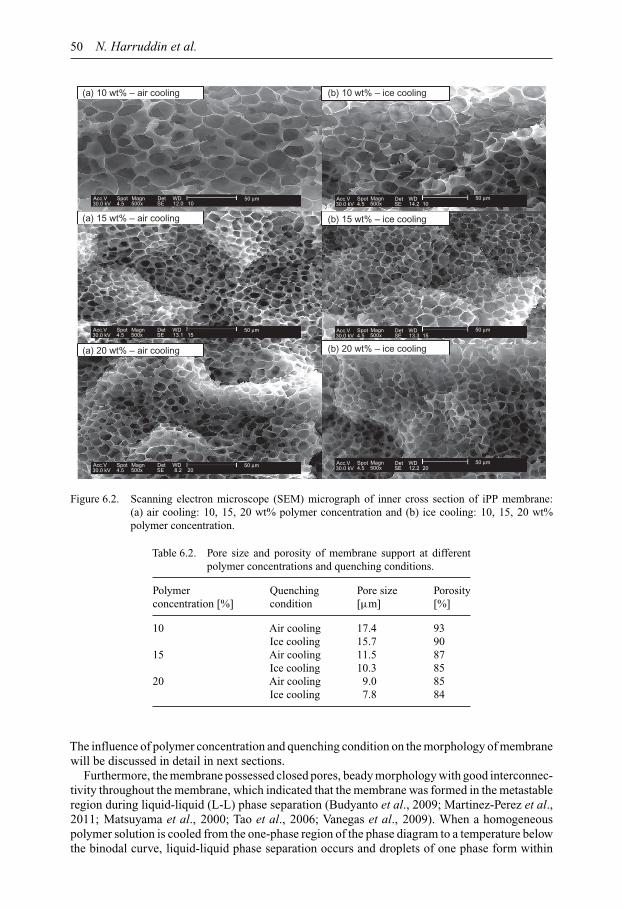
50 N. Harruddin et al.
(a) 10 wt% – air cooling
(a) 15 wt% – air cooling
(a) 20 wt% – air cooling
(b) 15 wt% – ice cooling
(b) 20 wt% – ice cooling
(b) 10 wt% – ice cooling
Magn Det WD 50 µmAcc.V30.0 kV 4.5 500x SE 12.0 10
Spot
Magn Det WD 50 µmAcc.V30.0 kV 4.5 500x SE 13.1 15
Spot
Magn Det WD 50 µmAcc.V30.0 kV 4.5 500x SE 8.2 20
Spot Magn Det WD 50 µmAcc.V30.0 kV 4.5 500x SE 12.2 20
Spot
Magn Det WD 50 µmAcc.V30.0 kV 4.5 500x SE 13.3 15
Spot
Magn Det WD 50 µmAcc.V30.0 kV 4.5 500x SE 14.2 10
Spot
Figure 6.2. Scanning electron microscope (SEM) micrograph of inner cross section of iPP membrane:(a) air cooling: 10, 15, 20 wt% polymer concentration and (b) ice cooling: 10, 15, 20 wt%polymer concentration.
Table 6.2. Pore size and porosity of membrane support at differentpolymer concentrations and quenching conditions.
Polymer Quenching Pore size Porosityconcentration [%] condition [µm] [%]
10 Air cooling 17.4 93Ice cooling 15.7 90
15 Air cooling 11.5 87Ice cooling 10.3 85
20 Air cooling 9.0 85Ice cooling 7.8 84
The influence of polymer concentration and quenching condition on the morphology of membranewill be discussed in detail in next sections.
Furthermore, the membrane possessed closed pores, beady morphology with good interconnec-tivity throughout the membrane, which indicated that the membrane was formed in the metastableregion during liquid-liquid (L-L) phase separation (Budyanto et al., 2009; Martinez-Perez et al.,2011; Matsuyama et al., 2000; Tao et al., 2006; Vanegas et al., 2009). When a homogeneouspolymer solution is cooled from the one-phase region of the phase diagram to a temperature belowthe binodal curve, liquid-liquid phase separation occurs and droplets of one phase form within
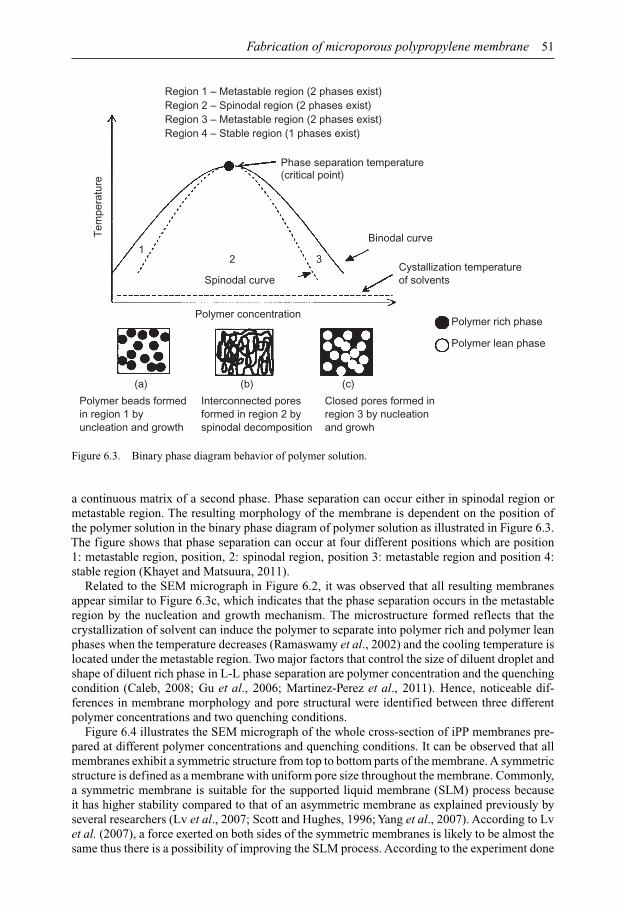
Fabrication of microporous polypropylene membrane 51
Region 1 – Metastable region (2 phases exist)Region 2 – Spinodal region (2 phases exist)
Region 4 – Stable region (1 phases exist)
Phase separation temperature
Binodal curve
Polymer concentration
Polymer beads formedin region 1 byuncleation and growth
Interconnected poresformed in region 2 byspinodal decomposition
Closed pores formed inregion 3 by nucleationand growh
Spinodal curve
Tem
pera
ture
(a) (b) (c)
Cystallization temperatureof solvents
Polymer rich phase
Polymer lean phase
(critical point)
12 3
Region 3 – Metastable region (2 phases exist)
Figure 6.3. Binary phase diagram behavior of polymer solution.
a continuous matrix of a second phase. Phase separation can occur either in spinodal region ormetastable region. The resulting morphology of the membrane is dependent on the position ofthe polymer solution in the binary phase diagram of polymer solution as illustrated in Figure 6.3.The figure shows that phase separation can occur at four different positions which are position1: metastable region, position, 2: spinodal region, position 3: metastable region and position 4:stable region (Khayet and Matsuura, 2011).
Related to the SEM micrograph in Figure 6.2, it was observed that all resulting membranesappear similar to Figure 6.3c, which indicates that the phase separation occurs in the metastableregion by the nucleation and growth mechanism. The microstructure formed reflects that thecrystallization of solvent can induce the polymer to separate into polymer rich and polymer leanphases when the temperature decreases (Ramaswamy et al., 2002) and the cooling temperature islocated under the metastable region. Two major factors that control the size of diluent droplet andshape of diluent rich phase in L-L phase separation are polymer concentration and the quenchingcondition (Caleb, 2008; Gu et al., 2006; Martinez-Perez et al., 2011). Hence, noticeable dif-ferences in membrane morphology and pore structural were identified between three differentpolymer concentrations and two quenching conditions.
Figure 6.4 illustrates the SEM micrograph of the whole cross-section of iPP membranes pre-pared at different polymer concentrations and quenching conditions. It can be observed that allmembranes exhibit a symmetric structure from top to bottom parts of the membrane. A symmetricstructure is defined as a membrane with uniform pore size throughout the membrane. Commonly,a symmetric membrane is suitable for the supported liquid membrane (SLM) process becauseit has higher stability compared to that of an asymmetric membrane as explained previously byseveral researchers (Lv et al., 2007; Scott and Hughes, 1996; Yang et al., 2007). According to Lvet al. (2007), a force exerted on both sides of the symmetric membranes is likely to be almost thesame thus there is a possibility of improving the SLM process. According to the experiment done
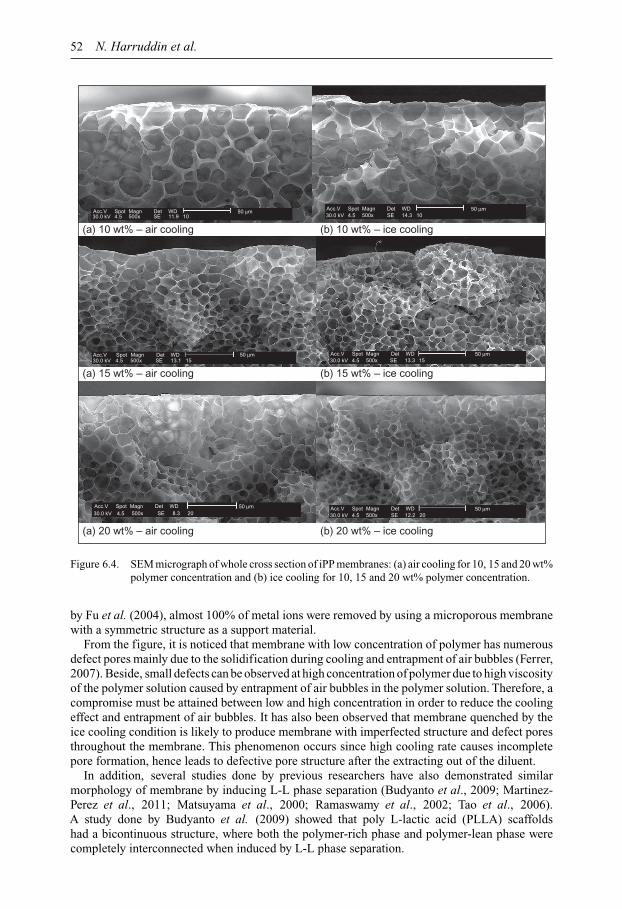
52 N. Harruddin et al.
(a) 10 wt% – air cooling (b) 10 wt% – ice cooling
(a) 15 wt% – air cooling (b) 15 wt% – ice cooling
(a) 20 wt% – air cooling (b) 20 wt% – ice cooling
Magn Det WD 50 µmAcc.V30.0 kV 4.5 500x SE 11.9 10
Spot Magn Det WD 50 µmAcc.V30.0 kV 4.5 500x SE 14.3 10
Spot
Magn Det WD 50 µmAcc.V30.0 kV 4.5 500x SE 13.3 15
Spot
Magn Det WD 50 µmAcc.V30.0 kV 4.5 500x SE 12.2 20
Spot
Magn Det WD 50 µmAcc.V30.0 kV 4.5 500x SE 13.1 15
Spot
Magn Det WD 50 µmAcc.V30.0 kV 4.5 500x SE 8.3 20
Spot
Figure 6.4. SEM micrograph of whole cross section of iPP membranes: (a) air cooling for 10, 15 and 20 wt%polymer concentration and (b) ice cooling for 10, 15 and 20 wt% polymer concentration.
by Fu et al. (2004), almost 100% of metal ions were removed by using a microporous membranewith a symmetric structure as a support material.
From the figure, it is noticed that membrane with low concentration of polymer has numerousdefect pores mainly due to the solidification during cooling and entrapment of air bubbles (Ferrer,2007). Beside, small defects can be observed at high concentration of polymer due to high viscosityof the polymer solution caused by entrapment of air bubbles in the polymer solution. Therefore, acompromise must be attained between low and high concentration in order to reduce the coolingeffect and entrapment of air bubbles. It has also been observed that membrane quenched by theice cooling condition is likely to produce membrane with imperfected structure and defect poresthroughout the membrane. This phenomenon occurs since high cooling rate causes incompletepore formation, hence leads to defective pore structure after the extracting out of the diluent.
In addition, several studies done by previous researchers have also demonstrated similarmorphology of membrane by inducing L-L phase separation (Budyanto et al., 2009; Martinez-Perez et al., 2011; Matsuyama et al., 2000; Ramaswamy et al., 2002; Tao et al., 2006).A study done by Budyanto et al. (2009) showed that poly L-lactic acid (PLLA) scaffoldshad a bicontinuous structure, where both the polymer-rich phase and polymer-lean phase werecompletely interconnected when induced by L-L phase separation.
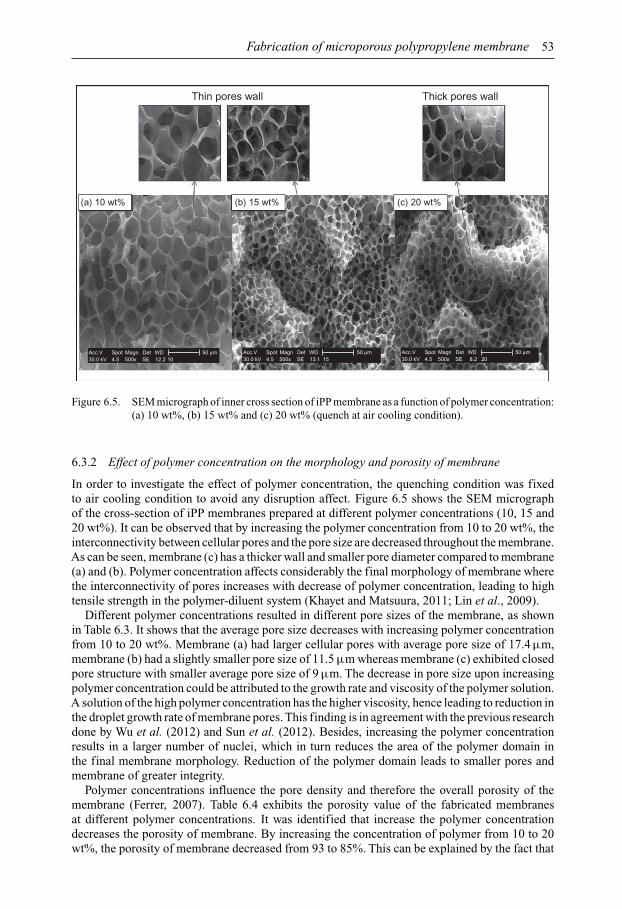
Fabrication of microporous polypropylene membrane 53
Thin pores wall
(b) 15 wt%(a) 10 wt% (c) 20 wt%
Thick pores wall
Magn Det WD 50 µmAcc.V30.0 kV 4.5 500x SE 12.2 10
Spot Magn Det WD 50 µmAcc.V30.0 kV 4.5 500x SE 13.1 15
Spot Magn Det WD 50 µmAcc.V30.0 kV 4.5 500x SE 8.2 20
Spot
Figure 6.5. SEM micrograph of inner cross section of iPP membrane as a function of polymer concentration:(a) 10 wt%, (b) 15 wt% and (c) 20 wt% (quench at air cooling condition).
6.3.2 Effect of polymer concentration on the morphology and porosity of membrane
In order to investigate the effect of polymer concentration, the quenching condition was fixedto air cooling condition to avoid any disruption affect. Figure 6.5 shows the SEM micrographof the cross-section of iPP membranes prepared at different polymer concentrations (10, 15 and20 wt%). It can be observed that by increasing the polymer concentration from 10 to 20 wt%, theinterconnectivity between cellular pores and the pore size are decreased throughout the membrane.As can be seen, membrane (c) has a thicker wall and smaller pore diameter compared to membrane(a) and (b). Polymer concentration affects considerably the final morphology of membrane wherethe interconnectivity of pores increases with decrease of polymer concentration, leading to hightensile strength in the polymer-diluent system (Khayet and Matsuura, 2011; Lin et al., 2009).
Different polymer concentrations resulted in different pore sizes of the membrane, as shownin Table 6.3. It shows that the average pore size decreases with increasing polymer concentrationfrom 10 to 20 wt%. Membrane (a) had larger cellular pores with average pore size of 17.4 µm,membrane (b) had a slightly smaller pore size of 11.5 µm whereas membrane (c) exhibited closedpore structure with smaller average pore size of 9 µm. The decrease in pore size upon increasingpolymer concentration could be attributed to the growth rate and viscosity of the polymer solution.A solution of the high polymer concentration has the higher viscosity, hence leading to reduction inthe droplet growth rate of membrane pores. This finding is in agreement with the previous researchdone by Wu et al. (2012) and Sun et al. (2012). Besides, increasing the polymer concentrationresults in a larger number of nuclei, which in turn reduces the area of the polymer domain inthe final membrane morphology. Reduction of the polymer domain leads to smaller pores andmembrane of greater integrity.
Polymer concentrations influence the pore density and therefore the overall porosity of themembrane (Ferrer, 2007). Table 6.4 exhibits the porosity value of the fabricated membranesat different polymer concentrations. It was identified that increase the polymer concentrationdecreases the porosity of membrane. By increasing the concentration of polymer from 10 to 20wt%, the porosity of membrane decreased from 93 to 85%. This can be explained by the fact that
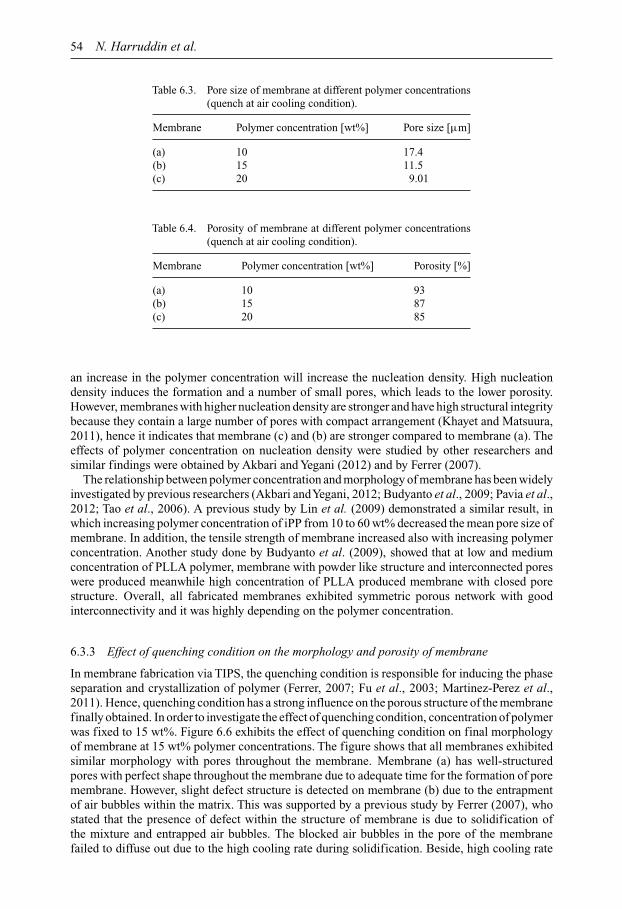
54 N. Harruddin et al.
Table 6.3. Pore size of membrane at different polymer concentrations(quench at air cooling condition).
Membrane Polymer concentration [wt%] Pore size [µm]
(a) 10 17.4(b) 15 11.5(c) 20 9.01
Table 6.4. Porosity of membrane at different polymer concentrations(quench at air cooling condition).
Membrane Polymer concentration [wt%] Porosity [%]
(a) 10 93(b) 15 87(c) 20 85
an increase in the polymer concentration will increase the nucleation density. High nucleationdensity induces the formation and a number of small pores, which leads to the lower porosity.However, membranes with higher nucleation density are stronger and have high structural integritybecause they contain a large number of pores with compact arrangement (Khayet and Matsuura,2011), hence it indicates that membrane (c) and (b) are stronger compared to membrane (a). Theeffects of polymer concentration on nucleation density were studied by other researchers andsimilar findings were obtained by Akbari and Yegani (2012) and by Ferrer (2007).
The relationship between polymer concentration and morphology of membrane has been widelyinvestigated by previous researchers (Akbari andYegani, 2012; Budyanto et al., 2009; Pavia et al.,2012; Tao et al., 2006). A previous study by Lin et al. (2009) demonstrated a similar result, inwhich increasing polymer concentration of iPP from 10 to 60 wt% decreased the mean pore size ofmembrane. In addition, the tensile strength of membrane increased also with increasing polymerconcentration. Another study done by Budyanto et al. (2009), showed that at low and mediumconcentration of PLLA polymer, membrane with powder like structure and interconnected poreswere produced meanwhile high concentration of PLLA produced membrane with closed porestructure. Overall, all fabricated membranes exhibited symmetric porous network with goodinterconnectivity and it was highly depending on the polymer concentration.
6.3.3 Effect of quenching condition on the morphology and porosity of membrane
In membrane fabrication via TIPS, the quenching condition is responsible for inducing the phaseseparation and crystallization of polymer (Ferrer, 2007; Fu et al., 2003; Martinez-Perez et al.,2011). Hence, quenching condition has a strong influence on the porous structure of the membranefinally obtained. In order to investigate the effect of quenching condition, concentration of polymerwas fixed to 15 wt%. Figure 6.6 exhibits the effect of quenching condition on final morphologyof membrane at 15 wt% polymer concentrations. The figure shows that all membranes exhibitedsimilar morphology with pores throughout the membrane. Membrane (a) has well-structuredpores with perfect shape throughout the membrane due to adequate time for the formation of poremembrane. However, slight defect structure is detected on membrane (b) due to the entrapmentof air bubbles within the matrix. This was supported by a previous study by Ferrer (2007), whostated that the presence of defect within the structure of membrane is due to solidification ofthe mixture and entrapped air bubbles. The blocked air bubbles in the pore of the membranefailed to diffuse out due to the high cooling rate during solidification. Beside, high cooling rate
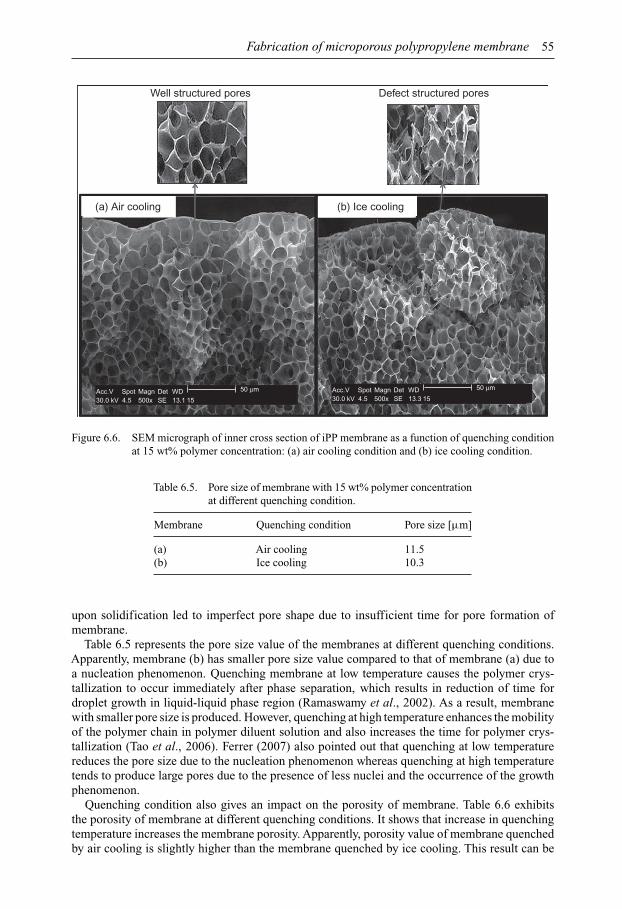
Fabrication of microporous polypropylene membrane 55
(a) Air cooling (b) Ice cooling
Well structured pores Defect structured pores
Magn Det WD 50 µmAcc.V30.0 kV 4.5 500x SE 13.1 15
Spot Magn Det WD 50 µmAcc.V30.0 kV 4.5 500x SE 13.3 15
Spot
Figure 6.6. SEM micrograph of inner cross section of iPP membrane as a function of quenching conditionat 15 wt% polymer concentration: (a) air cooling condition and (b) ice cooling condition.
Table 6.5. Pore size of membrane with 15 wt% polymer concentrationat different quenching condition.
Membrane Quenching condition Pore size [µm]
(a) Air cooling 11.5(b) Ice cooling 10.3
upon solidification led to imperfect pore shape due to insufficient time for pore formation ofmembrane.
Table 6.5 represents the pore size value of the membranes at different quenching conditions.Apparently, membrane (b) has smaller pore size value compared to that of membrane (a) due toa nucleation phenomenon. Quenching membrane at low temperature causes the polymer crys-tallization to occur immediately after phase separation, which results in reduction of time fordroplet growth in liquid-liquid phase region (Ramaswamy et al., 2002). As a result, membranewith smaller pore size is produced. However, quenching at high temperature enhances the mobilityof the polymer chain in polymer diluent solution and also increases the time for polymer crys-tallization (Tao et al., 2006). Ferrer (2007) also pointed out that quenching at low temperaturereduces the pore size due to the nucleation phenomenon whereas quenching at high temperaturetends to produce large pores due to the presence of less nuclei and the occurrence of the growthphenomenon.
Quenching condition also gives an impact on the porosity of membrane. Table 6.6 exhibitsthe porosity of membrane at different quenching conditions. It shows that increase in quenchingtemperature increases the membrane porosity. Apparently, porosity value of membrane quenchedby air cooling is slightly higher than the membrane quenched by ice cooling. This result can be

56 N. Harruddin et al.
Table 6.6. Porosity of membrane with 15 wt% polymer concentrationat different quenching condition.
Quenching condition Polymer concentration [wt%] Porosity [%]
Air cooling 15 87Ice cooling 15 85
explained by the fact that when the quenching temperature increases, the cooling rate decreases,hence pores have sufficient time to complete their growth and leafy structure of membrane iscreated (Akbari and Yegani, 2012). Hence, an increment on pore size and space between poreslead to higher porosity of membrane. However, the porosity values for both membranes are notmuch different.
The effect of the quenching condition on the resulted membrane structure has been discussed byprevious researchers (Akbari andYegani, 2012; Ferrer, 2007; Lin et al., 2009; Ramaswamy et al.,2002). Similar finding was obtained by Tao et al. (2006), who found that pore size of membranepoly(4-methyl-1-pentene) was greatly influenced by quenching temperature, in which smallerpore size was produced by quenching at lower temperature and vice versa. Fu et al. (2003) alsodemonstrated a similar observation in which iPP membrane quenched by ice water has smallerpore size due to high cooling rate. High cooling rate corresponds to shorter time for coarseningthe droplets generated by liquid-liquid phase separation process.
6.4 CONCLUSION
Microporous polypropylene membranes with bicontinuous and symmetric structure was preparedfrom the iPP-DPE system via TIPS technique by varying polymer concentration and quenchingcondition. The mechanism of phase separation and final morphology was greatly influenced bypolymer concentration and quenching condition. Increasing the polymer concentration causeda decrease in pore size and membrane porosity due to high viscosity of polymer solution andreduced droplet growth rate. Meanwhile, at different quenching conditions, smaller pore sizeswere obtained by quenching in ice cooling, and the larger and well-structured pores were formedwhen quenched in air cooling condition. The growth rate of pores was higher in air cooling thanice cooling, as the polymer-rich phase had more time for polymer crystallization in the L-L phaseseparation region.
ACKNOWLEDGEMENT
The authors would like to acknowledge Ministry of Higher Education (FRGS GRANT: 4F048)and Universiti Teknologi Malaysia (UTM) for financial and technical support of this research.
REFERENCES
Akbari, A. & Yegani, R. (2012) Study on the impact of polymer of poly-ethylene membranes fabricated viaTIPS method. Journal of Membrane and Separation Technology, 1, 100–107.
Budyanto, L., Gohand Y.Q. & Ooi, C.P. (2009) Fabrication of porous poly(L-Lactide) (PLLA) scaffoldsfor tissue engineering using liquid-liquid phase separation and freeze extraction. Journal of MaterialsScience, 20, 105–111.
Caleb, V.F. (2008) The microporous mixed matrix (ZeoTIPS) membranes. PhD Thesis, University of Texas atAustin, Austin, TX.
Fabrication of microporous polypropylene membrane 57
Ferrer M.C.-H. (2007) Development and characterisation of completely degradable composite tissueengineering scaffolds. PhD Thesis, Polytechnic University of Catalonia, Barcelona, Spain.
Fu, S.S., Matsuyama, H., Teramoto, M. & Lloyd, D.R. (2003) Preparation of microporous polypropylenemembrane via thermally induced phase separation as support of liquid membrane used for metal ionrecovery. Journal of Chemical Engineering of Japan, 36, 1397–1404.
Fu, S.S., Mastuyama, H. & Teramoto, M. (2004) Ce(III) recovery by supported liquid membrane usingpolyethylene hollow fiber prepared via thermally induced phase separation. Separation and PurificationTechnology, 36, 17–22.
Gu, M., Zhang, J., Wang, X., Tao, H. & Ge, L. (2006) Formation of poly(vinylidene fluoride) (PVDF)membranes via thermally induced phase separation. Desalination, 192, 160–167.
Khayet, M. & Matsuura, T. (2011) Membrane distillation: principles and applications. Elsevier, Amsterdam,The Netherlands.
Kim, S.S., Lim, G.B.A., Alwattari, A.A., Wang,Y.F. & Lloyd, D.R. (1991) Microporous membrane formationvia thermally induced phase separation. V. Effect of diluent mobility and crystallization kinetics onmembrane structuresof isotactic polypropylene membranes. Journal of Membrane Science, 64, 41–53.
Lin, Y.K., Chen, G., Yang, J. & Wang, X.L. (2009) Formation of isotactic polypropylene membranes withbicontinuous structure and good strength via thermally induced phase separation method. Desalination,236, 8–15.
Lloyd, D.R., Kinzer, K.E. & Tseng, H.S. (1990) Microporous membrane formation via thermally inducedphase separation. I. Solid-liquid phase separation. Journal of Membrane Science, 52, 239–261.
Lv, J., Yang, Q., Jiang, J. & Chung, T.S. (2007) Exploration of heavy metal ions transmembrane fluxenhancement across a supported liquid membrane by appropriate carrier selection.Chemical EngineeringScience, 62, 6032–6039.
Martinez-Perez, C.A., Olivas-Armendariz, I., Castro-Carmona, J.S. & Garcia-Casillas, P.E. (2011) Scaffoldsfor tissue engineering via thermally induced phase separation. Intech Open Science Publisher, Rijeka,Croatia.
Matsuyama, H., Kudari, S., Kiyofuji, H. & Kitamura, Y., (2000). Kinetic studies of thermally induced phaseseparation in polymer-diluent system. Journal of Applied Polymer Science, 76, 1028–1036.
Matsuyama, H., Man Kim, M. & Lloyd, R.D. (2002) Effect of extraction and drying on the structureof microporous polyethylene membranes prepared via thermally induced phase separation. Journal ofMembrane Science, 204, 413–419.
McGuire, K.S., Laxminarayan, A. & Lloyd, D.R. (1995) Kinetics of droplet growth in liquid-liquid phaseseparation of polymer-diluent systems: experimental results. Polymer, 36, 4951–4960.
Mu, C., Su, Y., Sun, M., Chen, W. & Jiang, Z. (2010) Fabrication of microporous membranes by a feasiblefreeze method. Journal of Membrane Science, 361, 15–21.
Pavia, F.C., Carrubba, V.L. & Brucato, V. (2012) Morphology and thermal properties of foams preparedvia thermally induced phase separation based on polylacticacid blends. Journal of Cellular Plastics, 48,399–407.
Ramaswamy, S., Greenberg, A.R. & Krantz, W.B. (2002) Fabrication of poly (ECTFE) membranes viathermally induced phase separation. Journal of Membrane Science, 210, 175–180.
Scott, K. & Hughes, R. (1996) Industrial membrane separation technology. 1st edition. Blackie Academic &Professional, an imprint of Chapman & Hall, London, UK.
Sun,Y., Salehand, L. & Bai, B. (2012) Measurement and impact factors of polymer rheology in porous media.In: Vicente, J.D. (ed.) Rheology. Intech Open Science, Rijeka, Croatia.
Tao, H., Zhang, J., Wang, X. & Gao, J. (2006) Phase separation and polymer crystallization in a poly(4-methyl-1-pentene)-dioctylsebacate-dimetylphtalate system via thermally induced phase separation.Journal of Polymer Science, 45, 153–161.
Vanegas, M.E., Quijada, R. & Serafini, D. (2009) Microporous membranes prepared via thermally inducedphase separation from metallocenic syndiotactic polypropylenes. Polymer, 50, 2081–2086.
Wu, Q.Y., Wan, L.S. & Xu, Z.K. (2012) Structure and performance of polyacrylonitrile membranes preparedvia thermally induced phase separation. Journal of Membrane Science, 409, 355–364.
Yang, Q., Chung, T.S., Xiao, Y. & Wang, K. (2007) The development of chemically modified P84 co-polyimide membranes as supported liquid membrane matrix for Cu(II) removal with prolonged stability.Chemical Engineering Science, 62, 1721–1729.

This page intentionally left blankThis page intentionally left blank

CHAPTER 7
Synthesis and characterization of superhydrophobic aluminamembrane with different types of silane
Nor Aini Ahmad, Thinesh Rachandran, Choe Peng Leo & Abdul Latif Ahmad
7.1 INTRODUCTION
Hydrophobic membrane permits the passage of nonpolar compounds selectively in a feed stream.This is because the hydrophobic surface with “water repellent” feature has less bonds with polarmolecules such as water.
Hydrophobic membranes with large liquid entry pressure, fast permeation of nonpolarmolecules, excellent rejection of polar compounds, great mechanical strength and outstand-ing chemical stability are nowadays required in the advanced membrane separation process.Membranes with superhydrophobic features (water contact angle >150◦) are most desirable inmembrane distillation, osmotic evaporation, membrane gas absorption and filtration. Hydropho-bic membranes have been successfully applied in membrane distillation for desalination, withsalt rejection reported to be higher than 90% at a feed temperature more than 90◦C (Cerneauxet al., 2009; Gazagnes et al., 2007; Hendren et al., 2009; Khemakhem and Amar, 2011;Krajewski et al., 2006; Larbot et al., 2004). Hydrophobic membrane with a water contactangle of 139◦ has also been effectively used to concentrate fruit juices (Vargas-Garcia et al.,2011). Hydrophobic polymeric membranes such as polytetrafluoroethylene (PTFE), polypropy-lene (PP), polyvinylidenefluoride (PVDF), poly(amide-ethylene oxide) copolymer (Pebax),poly(1-trimethylsilyl-1-propyne) (PTMSP) and polymers of intrinsic microporosity (PIMs) arecommonly used due to their low cost, ease of preparation and wide range of commercial availability(Pierre and Christian, 2008).
However, polymeric membranes are morphologically unstable in corrosive media, under highoperating temperature and/or pressure. Membrane deformation, membrane swelling and plasti-cization impair the membrane performance which leads to higher operating cost and maintenanceexpenditure. (Brodard et al., 2003). Due to these reasons, ceramic membranes with superiormechanical strength, excellent chemical resistance and great thermal stability are of great interest.Unlike polymeric membranes, ceramic membranes naturally possess hydrophilic characteristicbecause their metal oxides can form hydroxyl (OH) groups encouraging adsorption of water(Mansur et al., 2008). Thus, ceramic membranes must be modified into superhydrophobic ceramicmembranes for the mentioned applications.
Ceramic membranes are naturally hydrophilic; hence they show low rejection of polar compo-nents and permeate flux of non-polar species. The conversion of a hydrophilic ceramic membraneinto a hydrophobic ceramic membrane can be easily achieved by chemical grafting of silane (Cotet al., 2000; Han et al., 2012; Jun et al., 2008; Lu et al., 2009; Mansur et al., 2008; Picard et al.,2001; Zhang et al., 2008), n-dodecanethiol (Pan et al., 2008) and lipid solution (Romero et al.,2006) onto the membrane surface. The preparation of hydrophobic ceramic membranes via silanegrafting has been widely reported (Gazagnes et al., 2007; Krajewski et al., 2004; 2006; Larbotet al., 2004; Krajewski et al., 2004). Membrane grafting via immersion of the ceramic mem-brane in silane solution is a simple procedure which requires a short time to produce hydrophobicceramic membrane. The reactive silane solution is prepared by hydrolyzing silane in solvents likehexane (Lu et al., 2009) and alcohol (Sugimura, 2012; Zhang et al., 2008).
59
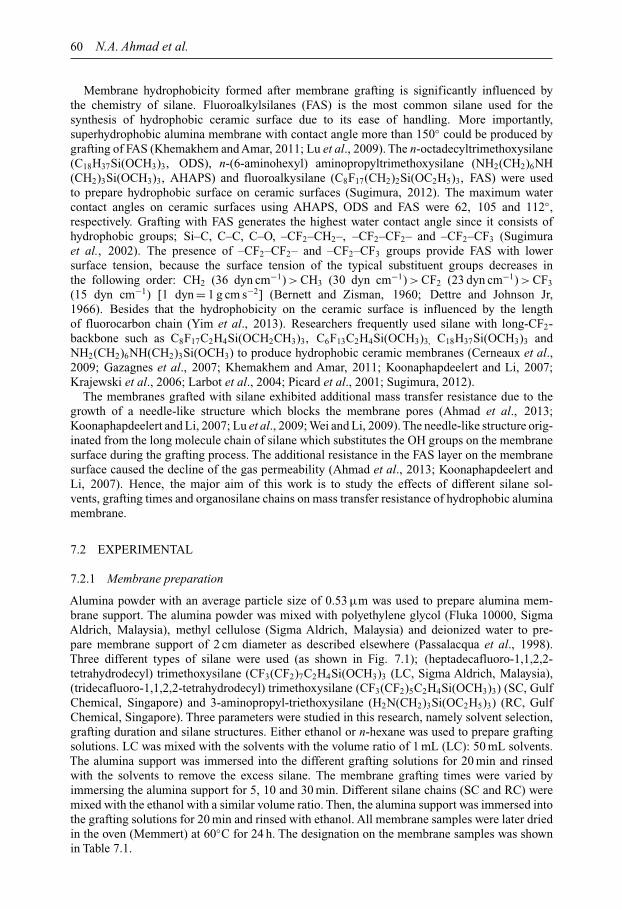
60 N.A. Ahmad et al.
Membrane hydrophobicity formed after membrane grafting is significantly influenced bythe chemistry of silane. Fluoroalkylsilanes (FAS) is the most common silane used for thesynthesis of hydrophobic ceramic surface due to its ease of handling. More importantly,superhydrophobic alumina membrane with contact angle more than 150◦ could be produced bygrafting of FAS (Khemakhem and Amar, 2011; Lu et al., 2009). The n-octadecyltrimethoxysilane(C18H37Si(OCH3)3, ODS), n-(6-aminohexyl) aminopropyltrimethoxysilane (NH2(CH2)6NH(CH2)3Si(OCH3)3, AHAPS) and fluoroalkysilane (C8F17(CH2)2Si(OC2H5)3, FAS) were usedto prepare hydrophobic surface on ceramic surfaces (Sugimura, 2012). The maximum watercontact angles on ceramic surfaces using AHAPS, ODS and FAS were 62, 105 and 112◦,respectively. Grafting with FAS generates the highest water contact angle since it consists ofhydrophobic groups; Si–C, C–C, C–O, –CF2–CH2–, –CF2–CF2– and –CF2–CF3 (Sugimuraet al., 2002). The presence of –CF2–CF2– and –CF2–CF3 groups provide FAS with lowersurface tension, because the surface tension of the typical substituent groups decreases inthe following order: CH2 (36 dyn cm−1) > CH3 (30 dyn cm−1) > CF2 (23 dyn cm−1) > CF3
(15 dyn cm−1) [1 dyn = 1 g cm s−2] (Bernett and Zisman, 1960; Dettre and Johnson Jr,1966). Besides that the hydrophobicity on the ceramic surface is influenced by the lengthof fluorocarbon chain (Yim et al., 2013). Researchers frequently used silane with long-CF2-backbone such as C8F17C2H4Si(OCH2CH3)3, C6F13C2H4Si(OCH3)3, C18H37Si(OCH3)3 andNH2(CH2)6NH(CH2)3Si(OCH3) to produce hydrophobic ceramic membranes (Cerneaux et al.,2009; Gazagnes et al., 2007; Khemakhem and Amar, 2011; Koonaphapdeelert and Li, 2007;Krajewski et al., 2006; Larbot et al., 2004; Picard et al., 2001; Sugimura, 2012).
The membranes grafted with silane exhibited additional mass transfer resistance due to thegrowth of a needle-like structure which blocks the membrane pores (Ahmad et al., 2013;Koonaphapdeelert and Li, 2007; Lu et al., 2009; Wei and Li, 2009). The needle-like structure orig-inated from the long molecule chain of silane which substitutes the OH groups on the membranesurface during the grafting process. The additional resistance in the FAS layer on the membranesurface caused the decline of the gas permeability (Ahmad et al., 2013; Koonaphapdeelert andLi, 2007). Hence, the major aim of this work is to study the effects of different silane sol-vents, grafting times and organosilane chains on mass transfer resistance of hydrophobic aluminamembrane.
7.2 EXPERIMENTAL
7.2.1 Membrane preparation
Alumina powder with an average particle size of 0.53 µm was used to prepare alumina mem-brane support. The alumina powder was mixed with polyethylene glycol (Fluka 10000, SigmaAldrich, Malaysia), methyl cellulose (Sigma Aldrich, Malaysia) and deionized water to pre-pare membrane support of 2 cm diameter as described elsewhere (Passalacqua et al., 1998).Three different types of silane were used (as shown in Fig. 7.1); (heptadecafluoro-1,1,2,2-tetrahydrodecyl) trimethoxysilane (CF3(CF2)7C2H4Si(OCH3)3 (LC, Sigma Aldrich, Malaysia),(tridecafluoro-1,1,2,2-tetrahydrodecyl) trimethoxysilane (CF3(CF2)5C2H4Si(OCH3)3) (SC, GulfChemical, Singapore) and 3-aminopropyl-triethoxysilane (H2N(CH2)3Si(OC2H5)3) (RC, GulfChemical, Singapore). Three parameters were studied in this research, namely solvent selection,grafting duration and silane structures. Either ethanol or n-hexane was used to prepare graftingsolutions. LC was mixed with the solvents with the volume ratio of 1 mL (LC): 50 mL solvents.The alumina support was immersed into the different grafting solutions for 20 min and rinsedwith the solvents to remove the excess silane. The membrane grafting times were varied byimmersing the alumina support for 5, 10 and 30 min. Different silane chains (SC and RC) weremixed with the ethanol with a similar volume ratio. Then, the alumina support was immersed intothe grafting solutions for 20 min and rinsed with ethanol. All membrane samples were later driedin the oven (Memmert) at 60◦C for 24 h. The designation on the membrane samples was shownin Table 7.1.

Synthesis and characterization of superhydrophobic alumina membrane 61
F F
C F C F C OCH3
F3C F C F C F Si OCH3
F F OCH3
(a) LC silane
(c) SC silane (b) RC silane
F F F F
C F C F C F C OCH3
F3C F C F C F C F Si OCH3
F F F OCH3
O NH2
Si
O O
F
Figure 7.1. Molecular structures of silanes.
Table 7.1. Designation and the water contact angles of the membrane samples.
Contact GraftingSample Description angle [◦] time [min]
S Alumina membrane support 0 0ETLC-5 Immersion of membrane sample in 1 mL LC: 129.34 ± 7.24 5
50 mL ethanol for 5 minETLC-10 Immersion of membrane sample in 1 mL LC: 134.32 ± 8.12 10
50 mL ethanol for 10 minETLC-20 Immersion of membrane sample in 1 mL LC: 152.26 ± 3.92 20
50 mL ethanol for 20 minETLC-30 Immersion of membrane sample in 1mL LC: 147.73 ± 4.27 30
50 mL ethanol for 30 minHXLC-5 Immersion of membrane sample in 1 mL LC: 148.73 ± 1.14 5
50 mL n-hexane for 5 minHXLC-10 Immersion of membrane sample in 1 mL LC: 144.70 ± 3.28 10
50 mL n-hexane for 10 minHXLC-20 Immersion of membrane sample in 1 mL LC: 148.24 ± 1.53 20
50 mL n-hexane for 20 minHXLC-30 Immersion of membrane sample in 1 mL LC: 149.51 ± 8.38 30
25 mL n-hexane for 30 minETSC-20 Immersion of membrane sample in 1 mL SC: 128.06 ± 3.92 20
50 mL ethanol for 20 minETRC-20 Immersion of membrane sample in 1 mL RC: 0 20
50 mL ethanol for 20 min
7.2.2 Membrane characterization
A goniometer (Ramé-Hart Instruments Co.) was used to determine the water contact angle onalumina (Al2O3) membranes.A few drops of deionized water were placed on each of the membranesamples to get an average value of contact angle. A scanning electron microscopy (SEM, CrestSystem (M) Sdn. Bhd, Quanta Feg 450) with energy dispersive X-ray (EDX) was used to observethe morphology and chemical elements of the membranes before and after grafting. Furtheranalysis with porometer (Porolux1000) was made to investigate membrane resistance and pore
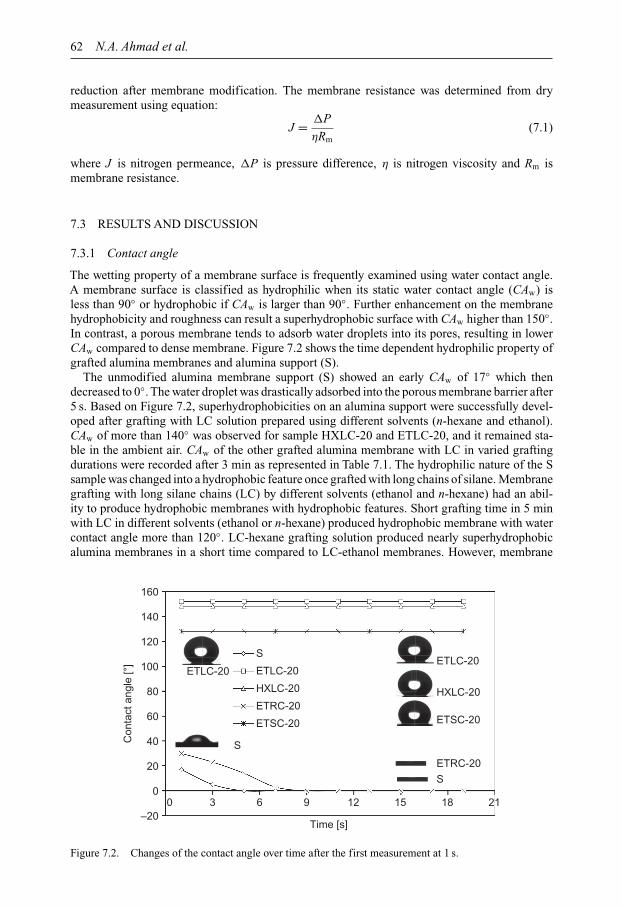
62 N.A. Ahmad et al.
reduction after membrane modification. The membrane resistance was determined from drymeasurement using equation:
J = �P
ηRm(7.1)
where J is nitrogen permeance, �P is pressure difference, η is nitrogen viscosity and Rm ismembrane resistance.
7.3 RESULTS AND DISCUSSION
7.3.1 Contact angle
The wetting property of a membrane surface is frequently examined using water contact angle.A membrane surface is classified as hydrophilic when its static water contact angle (CAw) isless than 90◦ or hydrophobic if CAw is larger than 90◦. Further enhancement on the membranehydrophobicity and roughness can result a superhydrophobic surface with CAw higher than 150◦.In contrast, a porous membrane tends to adsorb water droplets into its pores, resulting in lowerCAw compared to dense membrane. Figure 7.2 shows the time dependent hydrophilic property ofgrafted alumina membranes and alumina support (S).
The unmodified alumina membrane support (S) showed an early CAw of 17◦ which thendecreased to 0◦. The water droplet was drastically adsorbed into the porous membrane barrier after5 s. Based on Figure 7.2, superhydrophobicities on an alumina support were successfully devel-oped after grafting with LC solution prepared using different solvents (n-hexane and ethanol).CAw of more than 140◦ was observed for sample HXLC-20 and ETLC-20, and it remained sta-ble in the ambient air. CAw of the other grafted alumina membrane with LC in varied graftingdurations were recorded after 3 min as represented in Table 7.1. The hydrophilic nature of the Ssample was changed into a hydrophobic feature once grafted with long chains of silane. Membranegrafting with long silane chains (LC) by different solvents (ethanol and n-hexane) had an abil-ity to produce hydrophobic membranes with hydrophobic features. Short grafting time in 5 minwith LC in different solvents (ethanol or n-hexane) produced hydrophobic membrane with watercontact angle more than 120◦. LC-hexane grafting solution produced nearly superhydrophobicalumina membranes in a short time compared to LC-ethanol membranes. However, membrane
–20
0
20
40
60
80
100
120
140
160
3 6 9 12 15 18 21
Con
tact
ang
le [°
]
Time [s]
S
ETLC-20
HXLC-20
ETRC-20
ETSC-20
ETLC-20ETLC-20
HXLC-20
ETSC-20
ETRC-20
S
S
0
Figure 7.2. Changes of the contact angle over time after the first measurement at 1 s.

Synthesis and characterization of superhydrophobic alumina membrane 63
grafting with LC-ethanol produced more superhydrophobic ETLC-20 with the water contact of152.26 ± 3.92◦ than membrane grafting with LC-hexane. The chemical structure of the solventcould affect the membrane hydrophobicity. Meanwhile, membrane grafting with different silanechains showed a different scenario as shown in Figure 7.2. Membrane grafting with SC producedETSC-20 membrane with lower 128.06 ± 3.92◦. About 24◦ reduction in CAw occurred comparedto ETLC-20 membrane even though grafted with similar grafting duration (20 min). This mighthave been caused by the different length of –CF2– chain. The grafted ETRC-20 membrane showedCAw of 34◦ when water was dropped to the membrane surface, however the water contact anglesurprisingly decreased to 0◦ within 10 s. This situation might be due to the presence of aminogroup (R–NH2) in the silane structure.
As reported in some works (Ahmad et al., 2013; Gao et al., 2011; Krajewski et al., 2006),membrane grafting with a long silane chain (LC), (heptadecafluoro-1,1,2,2-tetrahydrodecyl)triethoxysilane (CF3(CF2)7C2H4Si(OCH3)3), commonly recognized as FAS, changed thehydrophilic nature into hydrophobic. A smooth surface modified with FAS rendered the sur-face hydrophobic with the CAw of about 120◦. In addition, CAw values rose proportionally withthe grafting time as more hydrolysable groups from LC reacted with OH groups of the aluminamembrane surface. The chemical reaction between the hydrolysable and OH groups forms ahydrophobic layer. Nevertheless, extended grafting duration until 30 min changed the water con-tact angle only to 147.73 ± 4.27◦ of ETLC-30 and to 149.51 ± 8.38◦ of HXLC-30 membranes.It may be due to the saturation of bonding between the OH and the hydrolysable groups of LC.Membrane grafting with long –CF2– silane chain introduces mass transfer hindrance as reportedin some earlier researches (Ahmad et al., 2013; Lu et al., 2009). In order to form a superhydropho-bic membrane with low membrane resistance, the alumina membrane supports were grafted withdifferent silane chains. SC silane has two less –CF2– chains compared to LC. The presence of twoextra –CF2– chains with lower surface tension (23 dyn cm−1) (Bernett and Zisman, 1960; Dettreand Johnson Jr, 1966; 1969) in LC enhanced the hydrophobic strength on the grafted membrane.In contrast, the introduction of functional amino groups in the silane structure resulted in highlywater permeable hydrophilic features as reported in other studies (Herder et al., 1988; Paradiset al., 2012; Wang et al., 2010). The protonated amino groups are bound to the alumina surface,thereby orienting the hydrophilic silanol end groups. Thus, silane with amino groups could notbe used as the grafting agent to produce hydropobic membrane.
7.3.2 Morphological characterization and elements analysis on the membrane surface
A scanning electron microscope (SEM) with energy-dispersive X-ray spectroscopy (EDX) wasused to study the membrane’s morphological difference and the element variation of FAS graftedalumina membranes. Figure 7.3a–f shows the surface structure and cross-sectional morphologyof the alumina support (S) and the grafted membranes with LC and SC. There was no significantdifference in the membrane structure after direct grafting with LC, SC or RC silane, concurringwith the reports by other scholars (Gao et al., 2011; Koonaphapdeelert and Li, 2007; Noack et al.,2000; Vargas-Garcia et al., 2011). Membrane grafting with varied grafting solvents, times andsilane chains did not show any significant changes on the membrane morphology. Although therewas no clear structural difference from the SEM images, the chemical element analysis by EDX(Fig. 7.4) showed the presence of additional elements of fluorine (F), carbon (C) and silicon (Si).The elements of hydrogen (H) and nitrogen (N) were not included in the EDX image of ETRC-20.This is because nitrogen was present in small abundance and it was unable to detect chemicalelement abundances with atomic numbers less than 11 (Na) (Swapp, 2012).
7.3.3 Mass transfer in membrane barriers
Direct membrane grafting with silane causes serious mass transfer resistance in the membranebarrier due to the existence of silane chains on the membrane surface and pore. A capillaryflow porometer with nitrogen permeability measurement could be used to determine membrane
64 N.A. Ahmad et al.
4/2/20134:29:46 PM
HV WD spot3.0 LFD
det mag10 000 x
10 µmSupport5.00 kV 10.1 mm
4/2/20134:25:37 PM
HV WD spot3.0 LFD
det mag10 000 x
10 µmSupport5.00 kV 10.5 mm
4/2/20133:16:18 PM
HV WD spot3.0 LFD
det mag10 000 x
10 µmET 305.00 kV 10.0 mm
4/2/20134:06:55 PM
HV WD spot3.0 LFD
det mag10 000 x
10 µmSC 205.00 kV 10.0 mm
4/2/20133:34:53 PM
HV WD spot3.0 LFD
det mag10 000 x
10 µmET 305.00 kV 10.2 mm
4/2/20134:16:00 PM
HV WD spot3.0 LFD
det mag10 000 x
10 µmSC 205.00 kV 10.7 mm
(a) (d)
(b) (e)
(c) (f)
Figure 7.3. Scanning electron microscope (SEM) images for the surface view of: (a) S, (b) ETLC-30,(c) ETSC-20 and cross-sectional view of (d) S, (e) ETRC-30 and (f) ETSC-20.
resistance. Figure 7.5 shows the nitrogen flow rate through membrane samples. Nitrogen flowrate through the hydrophobic membranes decreased when the membrane grafting duration and thelength of the silane chain increased. Extended membrane grafting duration up to 30 min causedthe coupling reaction between the OH groups of the alumina and the difuctional or trifunctionalsilane groups of silane. Consequently, chemically bonded layers of Si–O–Al were formed, whichcaused an additional membrane barrier and reduced the internal pore size by pore blockage(Lu et al., 2009; Van Gestel et al., 2003). Membrane grafting with short silane chain (SC and
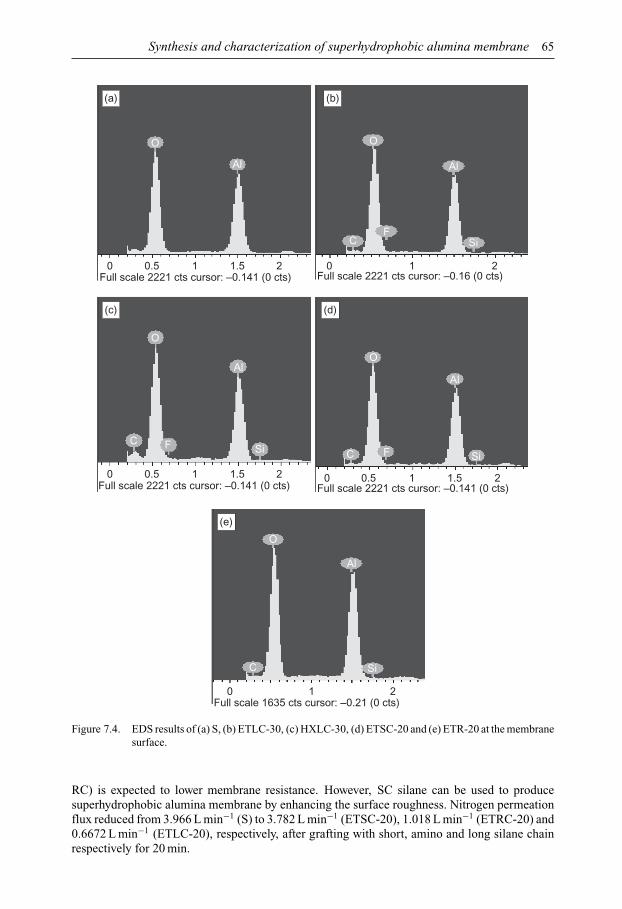
Synthesis and characterization of superhydrophobic alumina membrane 65
(a)
0 0.5
O
O
C F
Al
Si
O
Al
C Si
C
O
F
Al
Si
O
CF
Al
Si
Al
1 1.5 2 0 1 2
0Full scale 2221 cts cursor: –0.141 (0 cts)
Full scale 2221 cts cursor: –0.141 (0 cts) Full scale 2221 cts cursor: –0.16 (0 cts)
Full scale 2221 cts cursor: –0.141 (0 cts)
Full scale 1635 cts cursor: –0.21 (0 cts)0 1 2
0.5 1 1.5 2 0 0.5 1 1.5 2
(c) (d)
(b)
(e)
Figure 7.4. EDS results of (a) S, (b) ETLC-30, (c) HXLC-30, (d) ETSC-20 and (e) ETR-20 at the membranesurface.
RC) is expected to lower membrane resistance. However, SC silane can be used to producesuperhydrophobic alumina membrane by enhancing the surface roughness. Nitrogen permeationflux reduced from 3.966 L min−1 (S) to 3.782 L min−1 (ETSC-20), 1.018 L min−1 (ETRC-20) and0.6672 L min−1 (ETLC-20), respectively, after grafting with short, amino and long silane chainrespectively for 20 min.
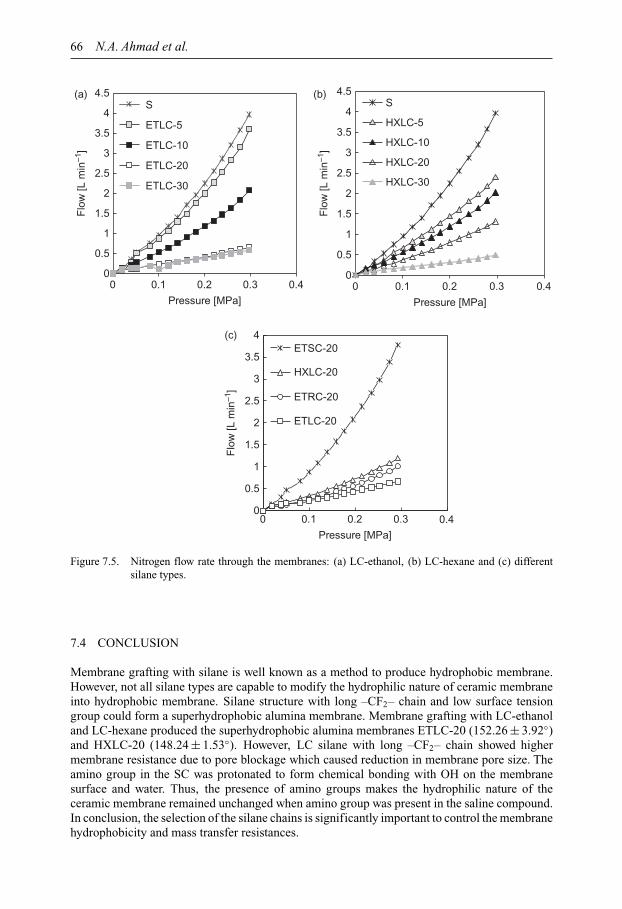
66 N.A. Ahmad et al.
0
0.5
1
1.5
2
2.5
3
3.5
4
4.5
0 0.1 0.2 0.3 0.4
Flo
w [L
min
–1]
Pressure [MPa]
0
0.5
1
1.5
2
2.5
3
3.5
4
4.5
0 0.1 0.2 0.3 0.4
Flo
w [L
min
–1]
Pressure [MPa]
S
ETLC-5
ETLC-10
ETLC-20
ETLC-30
(a)S
HXLC-5
HXLC-10
HXLC-20
HXLC-30
(b)
0
0.5
1
1.5
2
2.5
3
3.5
4
0 0.1 0.2 0.3 0.4
Flo
w [L
min
–1]
Pressure [MPa]
ETSC-20
HXLC-20
ETRC-20
ETLC-20
(c)
Figure 7.5. Nitrogen flow rate through the membranes: (a) LC-ethanol, (b) LC-hexane and (c) differentsilane types.
7.4 CONCLUSION
Membrane grafting with silane is well known as a method to produce hydrophobic membrane.However, not all silane types are capable to modify the hydrophilic nature of ceramic membraneinto hydrophobic membrane. Silane structure with long –CF2– chain and low surface tensiongroup could form a superhydrophobic alumina membrane. Membrane grafting with LC-ethanoland LC-hexane produced the superhydrophobic alumina membranes ETLC-20 (152.26 ± 3.92◦)and HXLC-20 (148.24 ± 1.53◦). However, LC silane with long –CF2– chain showed highermembrane resistance due to pore blockage which caused reduction in membrane pore size. Theamino group in the SC was protonated to form chemical bonding with OH on the membranesurface and water. Thus, the presence of amino groups makes the hydrophilic nature of theceramic membrane remained unchanged when amino group was present in the saline compound.In conclusion, the selection of the silane chains is significantly important to control the membranehydrophobicity and mass transfer resistances.
Synthesis and characterization of superhydrophobic alumina membrane 67
ACKNOWLEDGEMENTS
The authors would like to acknowledge Ministry of Higher Education Malaysia (MOHE) forproviding LRGS (304/PJKIMIA/6050296). The authors would also like to thank UniversitiSains Malaysia for the facilities and equipment (Membrane Science and Technology Cluster1001/PSF/8610013). Last but not least, the authors would like to thank Mr. Wan MuhammadHaniffah Wan Husin for proof-reading this manuscript.
REFERENCES
Ahmad, N.A., Leo, C.P. &Ahmad, A.L. (2013) Superhydrophobic alumina membrane by steam impingement:minimum resistance in microfiltration. Separation and Purification Technology, 107, 187–194.
Bernett, M.K. & Zisman, W.A. (1960) Wetting properties of tetrafluoroethylene and hexafluoropropylenecopolymers 1. The Journal of Physical Chemistry, 64, 1292–1294.
Brodard, F., Romero, J., Belleville, M.P., Sanchez, J., Combe-James, C., Dornier, M. & Rios, G.M. (2003)New hydrophobic membranes for osmotic evaporation process. Separation and Purification Technology,32, 3–7.
Cerneaux, S., Struzynska, I., Kujawski, W.M., Persin, M. & Larbot, A. (2009). Comparison of various mem-brane distillation methods for desalination using hydrophobic ceramic membranes. Journal of MembraneScience, 337, 55–60.
Cot, L., Ayral, A., Durand, J., Guizard, C., Hovnanian, N., Julbe, A. & Larbot, A. (2000) Inorganic membranesand solid state sciences. Solid State Sciences, 2, 313–334.
Dettre, R.H. & Johnson, R.E., Jr. (1966) Surface properties of polymers. I. The surface tensions of somemolten polyethylenes. Journal of Colloid and Interface Science, 21, 367–377.
Dettre, R.H. & Johnson, R.E., Jr. (1969) Surface tensions of perfluoroalkanes and polytetrafluoroethylene.Journal of Colloid and Interface Science, 31, 568–569.
Fang, X., Yu, Z., Sun, X., Liu, X. & Qin, F. (2009) Formation of superhydrophobic boehmite film on glasssubstrate by sol-gel method. Frontiers of Chemical Engineering in China, 3, 97–101.
Gao, N., Li, M., Jing, W., Fan, Y. & Xu, N. (2011) Improving the filtration performance of ZrO2 membranein non-polar organic solvents by surface hydrophobic modification. Journal of Membrane Science, 375,276–283.
Gazagnes, L., Cerneaux, S., Persin, M., Prouzet, E. & Larbot, A. (2007) Desalination of sodium chloridesolutions and seawater with hydrophobic ceramic membranes. Desalination, 217, 260–266.
Han, K.D., Leo, C.P. & Chai, S.P. (2012) Fabrication and characterization of superhydrophobic surface byusing water vapor impingement method. Applied Surface Science, 258, 6739–6744.
Hendren, Z.D., Brant, J. & Wiesner, M.R. (2009) Surface modification of nanostructured ceramic membranesfor direct contact membrane distillation. Journal of Membrane Science, 331, 1–10.
Herder, P., Vågberg, L. & Stenius, P. (1988) ESCA and contact angle studies of the adsorption of aminosilaneson mica. Colloids and Surfaces, 34, 117–132.
Jun, Y., Wei, D., Li-Ya, G. & Ya-Pu, Z. (2008) Surface forces, surface energy, and adhesion of SAMs andsuperhydrophobic films. In: Biresaw, G. & Mittal, K.L. (eds.) Surfactants in tribology, Volume 1. CRCPress, Boca Raton, FL.
Khemakhem, S. & Amar, R.B. (2011) Grafting of fluoroalkylsilanes on microfiltration Tunisian claymembrane. Ceramics International, 37, 3323–3328.
Koonaphapdeelert, S. & Li, K. (2007) Preparation and characterization of hydrophobic ceramic hollow fibremembrane. Journal of Membrane Science, 291, 70–76.
Krajewski, S.R., Kujawski, W., Dijoux, F., Picard, C. & Larbot, A. (2004) Grafting of ZrO2 powder and ZrO2membrane by fluoroalkylsilanes. Colloids and Surfaces A: Physicochemical and Engineering Aspects,243, 43–47.
Krajewski, S.R., Kujawski, W., Bukowska, M., Picard, C. & Larbot, A. (2006) Application of fluoroalkylsi-lanes (FAS) grafted ceramic membranes in membrane distillation process of NaCl solutions. Journal ofMembrane Science, 281, 253–259.
Larbot, A., Gazagnes, L., Krajewski, S., Bukowska, M. & Wojciech, K. (2004) Water desalination usingceramic membrane distillation. Desalination, 168, 367–372.
Lu, J., Yu, Y., Zhou, J., Song, L., Hu, X. & Larbot, A. (2009) FAS grafted superhydrophobic ceramicmembrane. Applied Surface Science, 255, 9092–9099.

68 N.A. Ahmad et al.
Mansur, A.A.P., do Nascimento, O.L., Vasconcelos, W.L. & Mansur, H.S. (2008) Chemical functionaliza-tion of ceramic tile surfaces by silane coupling agents: polymer modified mortar adhesion mechanismimplications. Materials Research, 11, 293–302.
Noack, M., Kölsch, P., Caro, J., Schneider, M., Toussaint, P. & Sieber, I. (2000) MFI membranes of differentSi/Al ratios for pervaporation and steam permeation. Microporous and Mesoporous Materials, 35–36,253–265.
Pan, Q., Wang, M. & Wang, H. (2008) Separating small amount of water and hydrophobic solvents by novelsuperhydrophobic copper meshes. Applied Surface Science, 254, 6002–6006.
Paradis, G.G., Kreiter, R., van Tuel, M.M.A., Nijmeijer, A. & Vente, J.F. (2012) Amino-functionalizedmicroporous hybrid silica membranes. Journal of Materials Chemistry, 22, 7258–7264.
Passalacqua, E., Freni, S. & Barone, F. (1998) Alkali resistance of tape-cast SiC porous ceramic membranes.Materials Letters, 34, 257–262.
Picard, C., Larbot, A., Guida-Pietrasanta, F., Boutevin, B. & Ratsimihety, A. (2001) Grafting of ceramic mem-branes by fluorinated silanes: hydrophobic features. Separation and Purification Technology, 25, 65–69.
Picard, C., Larbot, A., Tronel-Peyroz, E. & Berjoan, R. (2004) Characterization of hydrophilic ceramic mem-branes modified by fluoroalkylsilanes into hydrophobic membranes. Solid State Sciences, 6, 605–612.
Pierre, A. & Christian, G. (2008) Current status and prospects for ceramic membrane applications. In: Pabby,A.K., Rizvi, S.S.H. & Sastre, A.M. (eds.) Handbook of membrane separations. CRC Press, Boca Raton,FL. pp. 139–179.
Romero, J., Draga, H., Belleville, M.P., Sanchez, J., Combe-James, C., Dornier, M. & Rios, G.M. (2006) Newhydrophobic membranes for contactor processes – applications to isothermal concentration of solutions.Desalination, 193, 280–285.
Sugimura, H. Self-assembled monolayer on silicon. Kyoto University, Kyoto, Japan. pp. 1–22. Availablefrom: www.mtl.kyoto-u.ac-jp/groups/sugimura-g/PDF/SAM-on-si.pdf [Accessed January, 18, 2012].
Sugimura, H., Hozumi, A., Kameyama, T. & Takai, O. (2002) Organosilane self-assembled monolayersformed at the vapour/solid interface. Surface and Interface Analysis, 34, 550–554.
Swapp, S. (2012) Scanning electron microscopy (SEM). Available from: http://serc.carleton.edu/research_education/geochemsheets/techniques/SEM.html [accessed April 2012].
Van Gestel, T., Van der Bruggen, B., Buekenhoudt, A., Dotremont, C., Luyten, J., Vandecasteele, C. & Maes,G. (2003) Surface modification of γ-Al2O3/TiO2 multilayer membranes for applications in non-polarorganic solvents. Journal of Membrane Science, 224, 3–10.
Vargas-Garcia, A., Torrestiana-Sanchez, B., Garcia-Borquez, A. & Aguilar-Uscanga, G. (2011) Effect ofgrafting on microstructure, composition and surface and transport properties of ceramic membranes forosmotic evaporation. Separation and Purification Technology, 80, 473–481.
Wang, J., Bratko, D., Luzar, A. & Widom, B. (2010) Probing surface tension additivity on chemicallyheterogeneous surfaces by a molecular approach. Chemistry, 108, 6374–6379.
Wei, C.C. & Li, K. (2009) Preparation and characterization of a robust and hydrophobic ceramic membrane viaan improved surface grafting technique. Industrial & Engineering Chemistry Research, 48, 3446–3452.
Yim, J.H., Rodriguez-Santiago, V., Williams,A.A., Gougousi, T., Pappas, D.D. & Hirvonen, J.K. (2013)Atmo-spheric pressure plasma enhanced chemical vapor deposition of hydrophobic coatings using fluorine-basedliquid precursors. Surface and Coatings Technology, 234, 21–32.
Zhang, X., Honkanen, M., Järn, M., Peltonen, J., Pore, V., Levänen, E. & Mäntylä, T. (2008) Thermal stabilityof the structural features in the superhydrophobic boehmite films on austenitic stainless steels. AppliedSurface Science, 254, 5129–5133.
Part IIWater and wastewater treatment
(applications)

This page intentionally left blankThis page intentionally left blank
CHAPTER 8
Cross-flow microfiltration of synthetic oily wastewaterusing multi-channel ceramic membrane
Yousof H.D. Alanezi
8.1 INTRODUCTION
Produced water is water formed in underground formations and is brought up to the surfacealong with crude oil during production. It comprises mainly dispersed oil, organic compounds,and suspended solids. The most popular preference to deal with produced water is to re-inject itback into the formation. Produced water re-injection (PWRI) needs a modified treatment such asseparation units to eliminate oil and suspended solids before re-injection for pressure build up.De-oiling treatment normally consists of gravity or corrugated plate separator and a gas flotationunit. However, gravity separation is not successful with emulsified oil droplets smaller than20 µm. The reason is that as the oil droplets size reduces, the essential retention time to obtainacceptable separator efficiency increases considerably.
A promising membrane technology is cross-flow microfiltration (MF) for removal of suspendedparticles and emulsified oil droplets in the size range of 0.1–20 µm from their feed suspensions.For the technique to be industrially acceptable it must provide an increase of the filtrate volumewith an oil concentration of less than 5 mg L−1 and also eliminate any solids in suspension. Incontrast, the main drawback associated with MF relates to fouling, i.e. the membrane surfaces orpores become clogged.
8.1.1 Case study
Due to the increasing amounts of produced water during oil production in Kuwait, the establish-ment of wastewater treatment units for produced water re-injection purposes had become essential.It is estimated there that oil wells generate in quantity of 15 to 40% of produced water. The unitconsists of surge tank, oily water treatment, and oil drum. The oily water treatment comprisesparallel/corrugated plate separator and induced gas flotation. The main objective of this treatmenttrain is to reduce the oil in water concentration from 2000 to 10 mg L−1, the maximum allowableconcentration for reinjection and disposal. The produced water characteristic are presented inTable 8.1.
8.2 EXPERIMENTAL
8.2.1 Materials
Dodecane and Sorbitan monooleate (Aldrich Chemical) were used to form oil in water emul-sions. Emulsion particle size distributions were measured using a Malvern Zetasizer 3000HS; theaverage particle size of the distributions was 3–5 µm. The membrane used was a tubular ceramic(zirconia) microfiltration module obtained from Fairey Industrial Ceramics Ltd. The membraneaverage pore diameter was 0.2 µm and its effective length was 0.55 m. The membrane consists of7 channels, each being circular with an inner diameter of 4.7 mm. The membrane was mountedhorizontally in a stainless steel module.
71
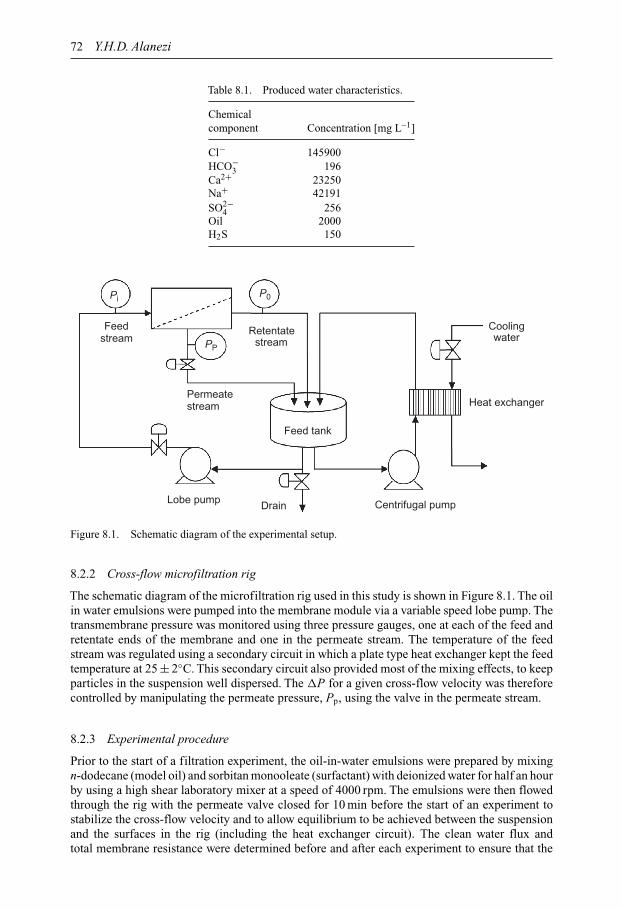
72 Y.H.D. Alanezi
Table 8.1. Produced water characteristics.
Chemicalcomponent Concentration [mg L–1]
Cl− 145900HCO−
3 196Ca2+ 23250Na+ 42191SO2−
4 256Oil 2000H2S 150
Lobe pump Drain Centrifugal pump
Feed tank
Heat exchanger
Coolingwater
Retentate
Pi P0
PP stream
Feedstream
streamPermeate
Figure 8.1. Schematic diagram of the experimental setup.
8.2.2 Cross-flow microfiltration rig
The schematic diagram of the microfiltration rig used in this study is shown in Figure 8.1. The oilin water emulsions were pumped into the membrane module via a variable speed lobe pump. Thetransmembrane pressure was monitored using three pressure gauges, one at each of the feed andretentate ends of the membrane and one in the permeate stream. The temperature of the feedstream was regulated using a secondary circuit in which a plate type heat exchanger kept the feedtemperature at 25 ± 2◦C. This secondary circuit also provided most of the mixing effects, to keepparticles in the suspension well dispersed. The �P for a given cross-flow velocity was thereforecontrolled by manipulating the permeate pressure, Pp, using the valve in the permeate stream.
8.2.3 Experimental procedure
Prior to the start of a filtration experiment, the oil-in-water emulsions were prepared by mixingn-dodecane (model oil) and sorbitan monooleate (surfactant) with deionized water for half an hourby using a high shear laboratory mixer at a speed of 4000 rpm. The emulsions were then flowedthrough the rig with the permeate valve closed for 10 min before the start of an experiment tostabilize the cross-flow velocity and to allow equilibrium to be achieved between the suspensionand the surfaces in the rig (including the heat exchanger circuit). The clean water flux andtotal membrane resistance were determined before and after each experiment to ensure that the
Cross-flow microfiltration of synthetic oily wastewater 73
permeability of the membrane was approximately the same at the start of each experiment. Thiswas necessary to enable analysis of the extent of irreversible fouling and the efficiency of thecleaning method.
Jcrit is the critical flux; this was measured experimentally by successive increments/decrementsof transmembrane pressure using a step by step technique. The technique consisted of systematicincreases of �P, each step had minimum 15 min duration or until the equilibrium permeate fluxhad been reached. The first unstable permeation flux was determined when the flux declined overthe course of time at a given �P step. After incrementing the pressure to a point beyond thecritical �P, the pressure is then decremented. The flux points corresponding to the upwards anddownwards steps are plotted against �P and the deviation point from the clean water flux or firststep extrapolation line was obtained.
8.3 RESULTS AND DISCUSSION
8.3.1 Effect of oil feed concentration on the critical flux
With the 0.2 µm tubular multi-channel ceramic membrane, the critical flux was determined at fourdifferent cross-flow velocities (1.14, 1.52, 1.92, 2.28 m s−1). At each cross-flow velocity, four oilfeed concentrations were examined: 300, 600, 1200, and 2400 mg L−1. TheTMP stepping methodwas used to determine the critical flux in each case and Table 8.2 summarizes these results. Fromthe results shown Table 8.2, it is seen that as the oil concentration increased in the feed, the criticalflux value decreased at different operating conditions. This behavior is in agreement with severalstudies conducted before (Chen, 1998; Field et al., 1995; Fradin and Field, 1999; Kwon et al.,2000; Madaeni, 1997).
Gesan-Guiziou et al. (2000) observed that as the latex concentration in the feed increasedfrom 400 to 2000 mg L−1, the critical flux was decreased by two thirds. At higher concentrations(3000–8000 mg L−1) the critical flux stayed approximately invariant. In the current study, whenthe oil concentration in the feed increased from 300 to 2400 mg L−1, the critical flux valueswere decreased by almost one third while operating at cross-flow velocities of 1.14, 1.52, and1.92 m s−1. For the case of operating at cross-flow velocity of 2.28 m s−1, the critical flux valuesdecreased approximately by one quarter as the oil feed increased from 300 to 2400 mg L−1, asshown in the Table 8.2.
As a result of increases in the oil feed concentration, the mass transfer rate of the oil droplets tothe membrane surface increased, which led to more accumulation in the boundary layer near themembrane surface. Consequently, an increase in the membrane resistance is observed due to theexpansion of concentration polarization and the formation of a thicker cake layer. During filtrationof BSA at two different feed concentrations (at 0.1 and 1.0 wt%), the critical flux for the lower
Table 8.2. Summary of estimated critical flux values from TMP steppingexperiments at varying oil feed (dodecane) concentrations withoutadding NaCl.
Cross-flow velocity [m s−1]
1.14 1.52 1.92 2.28Oil feed Case A Case B Case C Case Dconcentration[mg L−1] Apparent critical flux [L m−2 h−1]
300 65 118 143.36 238600 73 115.67 137.13 2171200 47 89 116.42 197.82400 44 79.74 99.33 179.9
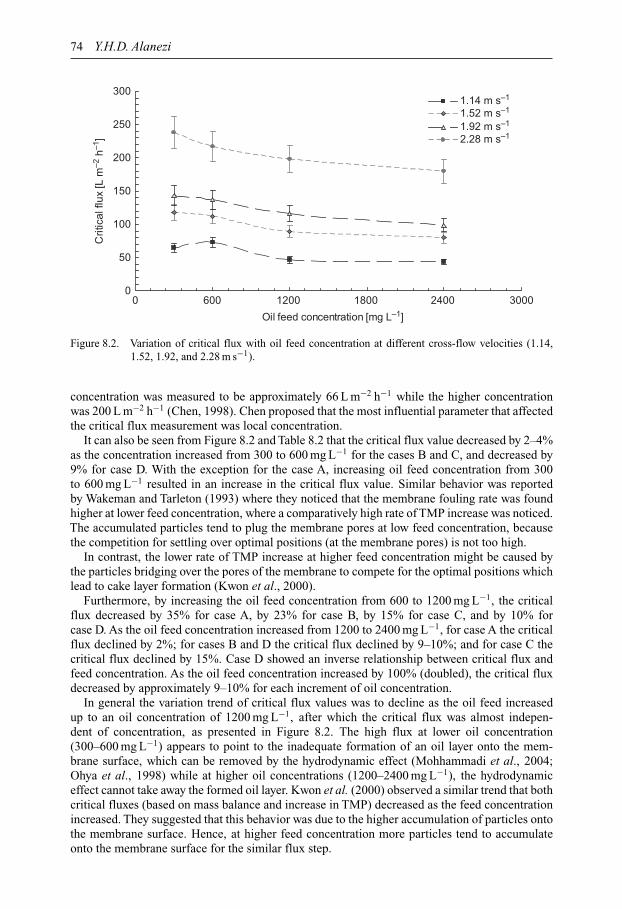
74 Y.H.D. Alanezi
0
50
100
150
200
250
300
0 600 1200 1800 2400 3000
Oil feed concentration [mg L–1]
Crit
ical
flux
[L m
–2 h
–1]
1.14 m s–1
1.52 m s–1
1.92 m s–1
2.28 m s–1
Figure 8.2. Variation of critical flux with oil feed concentration at different cross-flow velocities (1.14,1.52, 1.92, and 2.28 m s−1).
concentration was measured to be approximately 66 L m−2 h−1 while the higher concentrationwas 200 L m−2 h−1 (Chen, 1998). Chen proposed that the most influential parameter that affectedthe critical flux measurement was local concentration.
It can also be seen from Figure 8.2 and Table 8.2 that the critical flux value decreased by 2–4%as the concentration increased from 300 to 600 mg L−1 for the cases B and C, and decreased by9% for case D. With the exception for the case A, increasing oil feed concentration from 300to 600 mg L−1 resulted in an increase in the critical flux value. Similar behavior was reportedby Wakeman and Tarleton (1993) where they noticed that the membrane fouling rate was foundhigher at lower feed concentration, where a comparatively high rate of TMP increase was noticed.The accumulated particles tend to plug the membrane pores at low feed concentration, becausethe competition for settling over optimal positions (at the membrane pores) is not too high.
In contrast, the lower rate of TMP increase at higher feed concentration might be caused bythe particles bridging over the pores of the membrane to compete for the optimal positions whichlead to cake layer formation (Kwon et al., 2000).
Furthermore, by increasing the oil feed concentration from 600 to 1200 mg L−1, the criticalflux decreased by 35% for case A, by 23% for case B, by 15% for case C, and by 10% forcase D. As the oil feed concentration increased from 1200 to 2400 mg L−1, for case A the criticalflux declined by 2%; for cases B and D the critical flux declined by 9–10%; and for case C thecritical flux declined by 15%. Case D showed an inverse relationship between critical flux andfeed concentration. As the oil feed concentration increased by 100% (doubled), the critical fluxdecreased by approximately 9–10% for each increment of oil concentration.
In general the variation trend of critical flux values was to decline as the oil feed increasedup to an oil concentration of 1200 mg L−1, after which the critical flux was almost indepen-dent of concentration, as presented in Figure 8.2. The high flux at lower oil concentration(300–600 mg L−1) appears to point to the inadequate formation of an oil layer onto the mem-brane surface, which can be removed by the hydrodynamic effect (Mohhammadi et al., 2004;Ohya et al., 1998) while at higher oil concentrations (1200–2400 mg L−1), the hydrodynamiceffect cannot take away the formed oil layer. Kwon et al. (2000) observed a similar trend that bothcritical fluxes (based on mass balance and increase in TMP) decreased as the feed concentrationincreased. They suggested that this behavior was due to the higher accumulation of particles ontothe membrane surface. Hence, at higher feed concentration more particles tend to accumulateonto the membrane surface for the similar flux step.
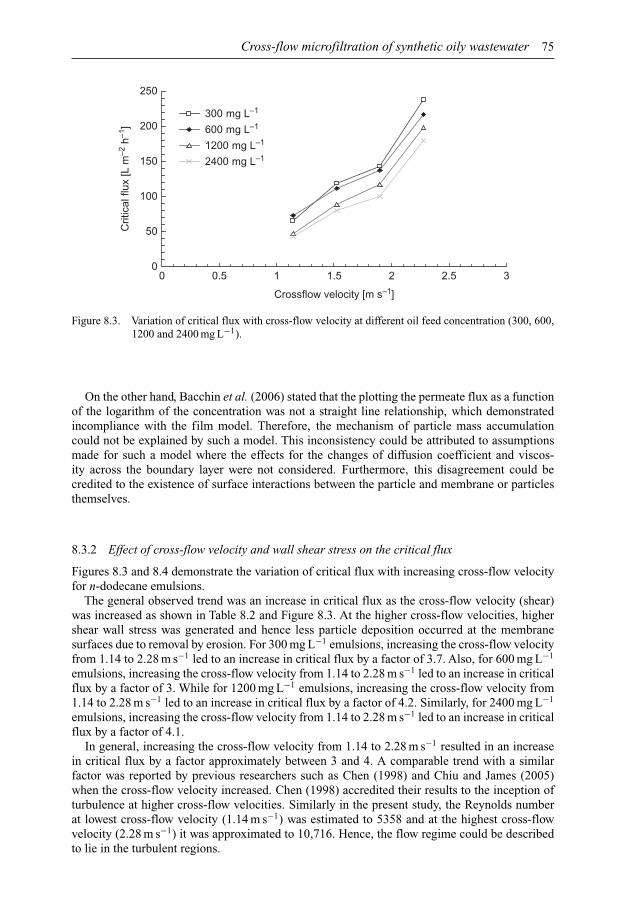
Cross-flow microfiltration of synthetic oily wastewater 75
0
50
100
150
200
250
0 0.5 1 1.5 2 2.5 3
Crossflow velocity [m s–1]
Crit
ical
flux
[L m
–2 h
–1]
300 mg L–1
600 mg L–1
1200 mg L–1
2400 mg L–1
Figure 8.3. Variation of critical flux with cross-flow velocity at different oil feed concentration (300, 600,1200 and 2400 mg L−1).
On the other hand, Bacchin et al. (2006) stated that the plotting the permeate flux as a functionof the logarithm of the concentration was not a straight line relationship, which demonstratedincompliance with the film model. Therefore, the mechanism of particle mass accumulationcould not be explained by such a model. This inconsistency could be attributed to assumptionsmade for such a model where the effects for the changes of diffusion coefficient and viscos-ity across the boundary layer were not considered. Furthermore, this disagreement could becredited to the existence of surface interactions between the particle and membrane or particlesthemselves.
8.3.2 Effect of cross-flow velocity and wall shear stress on the critical flux
Figures 8.3 and 8.4 demonstrate the variation of critical flux with increasing cross-flow velocityfor n-dodecane emulsions.
The general observed trend was an increase in critical flux as the cross-flow velocity (shear)was increased as shown in Table 8.2 and Figure 8.3. At the higher cross-flow velocities, highershear wall stress was generated and hence less particle deposition occurred at the membranesurfaces due to removal by erosion. For 300 mg L−1 emulsions, increasing the cross-flow velocityfrom 1.14 to 2.28 m s−1 led to an increase in critical flux by a factor of 3.7. Also, for 600 mg L−1
emulsions, increasing the cross-flow velocity from 1.14 to 2.28 m s−1 led to an increase in criticalflux by a factor of 3. While for 1200 mg L−1 emulsions, increasing the cross-flow velocity from1.14 to 2.28 m s−1 led to an increase in critical flux by a factor of 4.2. Similarly, for 2400 mg L−1
emulsions, increasing the cross-flow velocity from 1.14 to 2.28 m s−1 led to an increase in criticalflux by a factor of 4.1.
In general, increasing the cross-flow velocity from 1.14 to 2.28 m s−1 resulted in an increasein critical flux by a factor approximately between 3 and 4. A comparable trend with a similarfactor was reported by previous researchers such as Chen (1998) and Chiu and James (2005)when the cross-flow velocity increased. Chen (1998) accredited their results to the inception ofturbulence at higher cross-flow velocities. Similarly in the present study, the Reynolds numberat lowest cross-flow velocity (1.14 m s−1) was estimated to 5358 and at the highest cross-flowvelocity (2.28 m s−1) it was approximated to 10,716. Hence, the flow regime could be describedto lie in the turbulent regions.
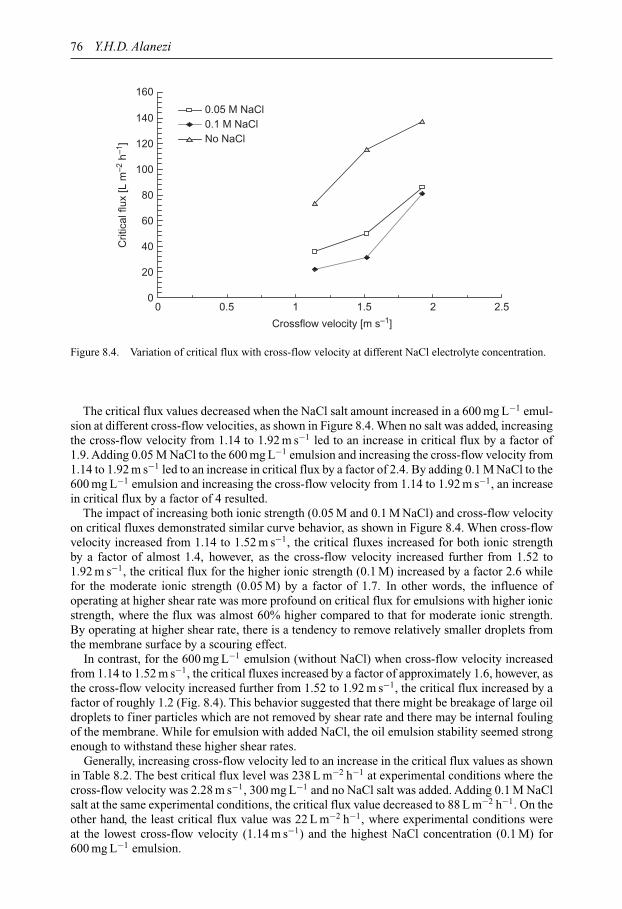
76 Y.H.D. Alanezi
0
20
40
60
80
100
120
140
160
0 0.5 1 1.5 2 2.5
Crossflow velocity [m s–1]
Crit
ical
flux
[L m
–2 h
–1]
0.05 M NaCl0.1 M NaClNo NaCl
Figure 8.4. Variation of critical flux with cross-flow velocity at different NaCl electrolyte concentration.
The critical flux values decreased when the NaCl salt amount increased in a 600 mg L−1 emul-sion at different cross-flow velocities, as shown in Figure 8.4. When no salt was added, increasingthe cross-flow velocity from 1.14 to 1.92 m s−1 led to an increase in critical flux by a factor of1.9. Adding 0.05 M NaCl to the 600 mg L−1 emulsion and increasing the cross-flow velocity from1.14 to 1.92 m s−1 led to an increase in critical flux by a factor of 2.4. By adding 0.1 M NaCl to the600 mg L−1 emulsion and increasing the cross-flow velocity from 1.14 to 1.92 m s−1, an increasein critical flux by a factor of 4 resulted.
The impact of increasing both ionic strength (0.05 M and 0.1 M NaCl) and cross-flow velocityon critical fluxes demonstrated similar curve behavior, as shown in Figure 8.4. When cross-flowvelocity increased from 1.14 to 1.52 m s−1, the critical fluxes increased for both ionic strengthby a factor of almost 1.4, however, as the cross-flow velocity increased further from 1.52 to1.92 m s−1, the critical flux for the higher ionic strength (0.1 M) increased by a factor 2.6 whilefor the moderate ionic strength (0.05 M) by a factor of 1.7. In other words, the influence ofoperating at higher shear rate was more profound on critical flux for emulsions with higher ionicstrength, where the flux was almost 60% higher compared to that for moderate ionic strength.By operating at higher shear rate, there is a tendency to remove relatively smaller droplets fromthe membrane surface by a scouring effect.
In contrast, for the 600 mg L−1 emulsion (without NaCl) when cross-flow velocity increasedfrom 1.14 to 1.52 m s−1, the critical fluxes increased by a factor of approximately 1.6, however, asthe cross-flow velocity increased further from 1.52 to 1.92 m s−1, the critical flux increased by afactor of roughly 1.2 (Fig. 8.4). This behavior suggested that there might be breakage of large oildroplets to finer particles which are not removed by shear rate and there may be internal foulingof the membrane. While for emulsion with added NaCl, the oil emulsion stability seemed strongenough to withstand these higher shear rates.
Generally, increasing cross-flow velocity led to an increase in the critical flux values as shownin Table 8.2. The best critical flux level was 238 L m−2 h−1 at experimental conditions where thecross-flow velocity was 2.28 m s−1, 300 mg L−1 and no NaCl salt was added. Adding 0.1 M NaClsalt at the same experimental conditions, the critical flux value decreased to 88 L m−2 h−1. On theother hand, the least critical flux value was 22 L m−2 h−1, where experimental conditions wereat the lowest cross-flow velocity (1.14 m s−1) and the highest NaCl concentration (0.1 M) for600 mg L−1 emulsion.
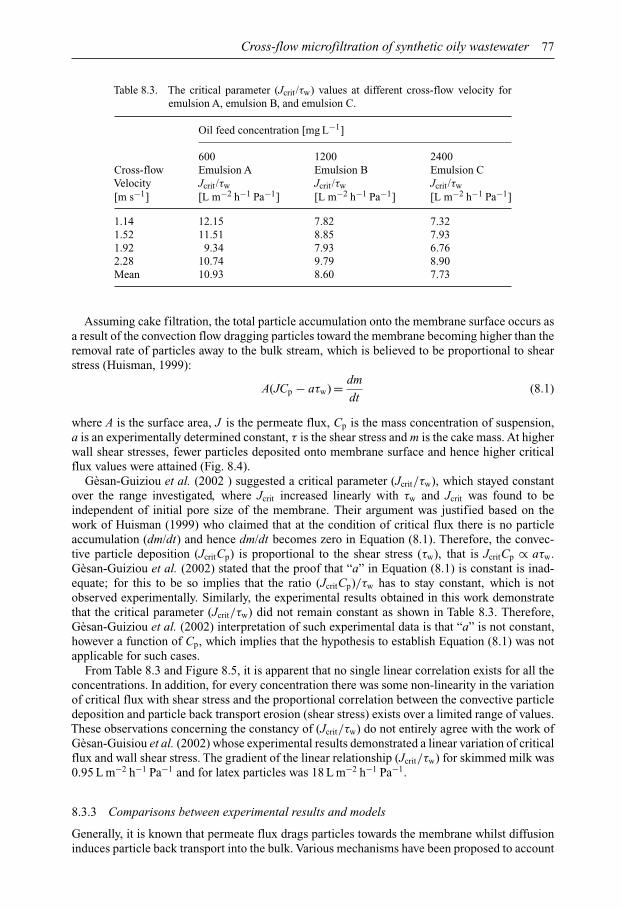
Cross-flow microfiltration of synthetic oily wastewater 77
Table 8.3. The critical parameter (Jcrit /τw) values at different cross-flow velocity foremulsion A, emulsion B, and emulsion C.
Oil feed concentration [mg L−1]
600 1200 2400Cross-flow Emulsion A Emulsion B Emulsion CVelocity Jcrit /τw Jcrit /τw Jcrit /τw[m s−1] [L m−2 h−1 Pa−1] [L m−2 h−1 Pa−1] [L m−2 h−1 Pa−1]
1.14 12.15 7.82 7.321.52 11.51 8.85 7.931.92 9.34 7.93 6.762.28 10.74 9.79 8.90Mean 10.93 8.60 7.73
Assuming cake filtration, the total particle accumulation onto the membrane surface occurs asa result of the convection flow dragging particles toward the membrane becoming higher than theremoval rate of particles away to the bulk stream, which is believed to be proportional to shearstress (Huisman, 1999):
A(JCp − aτw) = dm
dt(8.1)
where A is the surface area, J is the permeate flux, Cp is the mass concentration of suspension,a is an experimentally determined constant, τ is the shear stress and m is the cake mass. At higherwall shear stresses, fewer particles deposited onto membrane surface and hence higher criticalflux values were attained (Fig. 8.4).
Gèsan-Guiziou et al. (2002 ) suggested a critical parameter (Jcrit/τw), which stayed constantover the range investigated, where Jcrit increased linearly with τw and Jcrit was found to beindependent of initial pore size of the membrane. Their argument was justified based on thework of Huisman (1999) who claimed that at the condition of critical flux there is no particleaccumulation (dm/dt) and hence dm/dt becomes zero in Equation (8.1). Therefore, the convec-tive particle deposition (JcritCp) is proportional to the shear stress (τw), that is JcritCp ∝ aτw.Gèsan-Guiziou et al. (2002) stated that the proof that “a” in Equation (8.1) is constant is inad-equate; for this to be so implies that the ratio (JcritCp)/τw has to stay constant, which is notobserved experimentally. Similarly, the experimental results obtained in this work demonstratethat the critical parameter (Jcrit/τw) did not remain constant as shown in Table 8.3. Therefore,Gèsan-Guiziou et al. (2002) interpretation of such experimental data is that “a” is not constant,however a function of Cp, which implies that the hypothesis to establish Equation (8.1) was notapplicable for such cases.
From Table 8.3 and Figure 8.5, it is apparent that no single linear correlation exists for all theconcentrations. In addition, for every concentration there was some non-linearity in the variationof critical flux with shear stress and the proportional correlation between the convective particledeposition and particle back transport erosion (shear stress) exists over a limited range of values.These observations concerning the constancy of (Jcrit/τw) do not entirely agree with the work ofGèsan-Guisiou et al. (2002) whose experimental results demonstrated a linear variation of criticalflux and wall shear stress. The gradient of the linear relationship (Jcrit/τw) for skimmed milk was0.95 L m−2 h−1 Pa−1 and for latex particles was 18 L m−2 h−1 Pa−1.
8.3.3 Comparisons between experimental results and models
Generally, it is known that permeate flux drags particles towards the membrane whilst diffusioninduces particle back transport into the bulk. Various mechanisms have been proposed to account
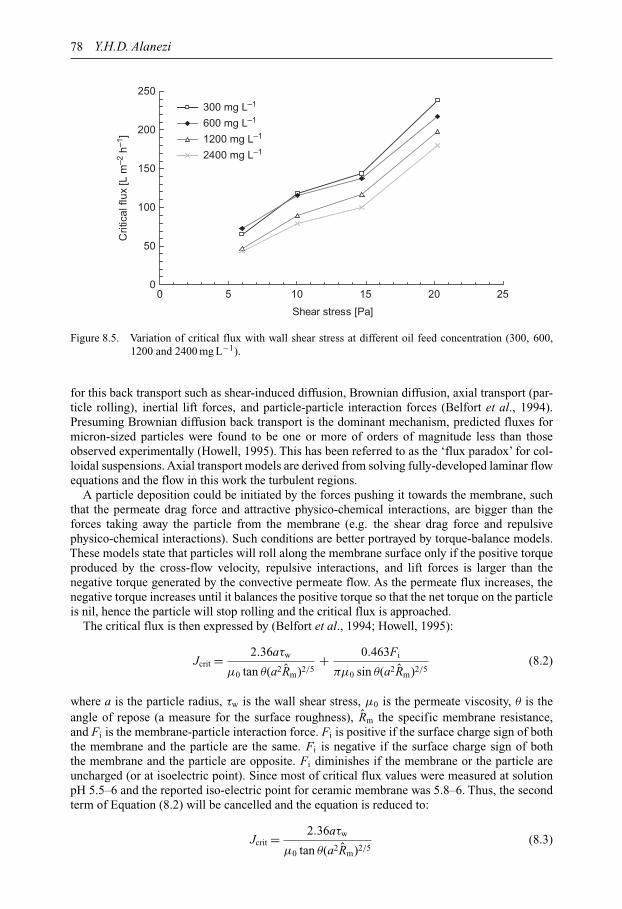
78 Y.H.D. Alanezi
0
50
100
150
200
250
0 5 10 15 20 25
Shear stress [Pa]
Crit
ical
flux
[L m
–2 h
–1]
300 mg L–1
600 mg L–1
1200 mg L–1
2400 mg L–1
Figure 8.5. Variation of critical flux with wall shear stress at different oil feed concentration (300, 600,1200 and 2400 mg L−1).
for this back transport such as shear-induced diffusion, Brownian diffusion, axial transport (par-ticle rolling), inertial lift forces, and particle-particle interaction forces (Belfort et al., 1994).Presuming Brownian diffusion back transport is the dominant mechanism, predicted fluxes formicron-sized particles were found to be one or more of orders of magnitude less than thoseobserved experimentally (Howell, 1995). This has been referred to as the ‘flux paradox’ for col-loidal suspensions. Axial transport models are derived from solving fully-developed laminar flowequations and the flow in this work the turbulent regions.
A particle deposition could be initiated by the forces pushing it towards the membrane, suchthat the permeate drag force and attractive physico-chemical interactions, are bigger than theforces taking away the particle from the membrane (e.g. the shear drag force and repulsivephysico-chemical interactions). Such conditions are better portrayed by torque-balance models.These models state that particles will roll along the membrane surface only if the positive torqueproduced by the cross-flow velocity, repulsive interactions, and lift forces is larger than thenegative torque generated by the convective permeate flow. As the permeate flux increases, thenegative torque increases until it balances the positive torque so that the net torque on the particleis nil, hence the particle will stop rolling and the critical flux is approached.
The critical flux is then expressed by (Belfort et al., 1994; Howell, 1995):
Jcrit = 2.36aτw
µ0 tan θ(a2Rm)2/5+ 0.463Fi
πµ0 sin θ(a2Rm)2/5(8.2)
where a is the particle radius, τw is the wall shear stress, µ0 is the permeate viscosity, θ is theangle of repose (a measure for the surface roughness), Rm the specific membrane resistance,and Fi is the membrane-particle interaction force. Fi is positive if the surface charge sign of boththe membrane and the particle are the same. Fi is negative if the surface charge sign of boththe membrane and the particle are opposite. Fi diminishes if the membrane or the particle areuncharged (or at isoelectric point). Since most of critical flux values were measured at solutionpH 5.5–6 and the reported iso-electric point for ceramic membrane was 5.8–6. Thus, the secondterm of Equation (8.2) will be cancelled and the equation is reduced to:
Jcrit = 2.36aτw
µ0 tan θ(a2Rm)2/5(8.3)
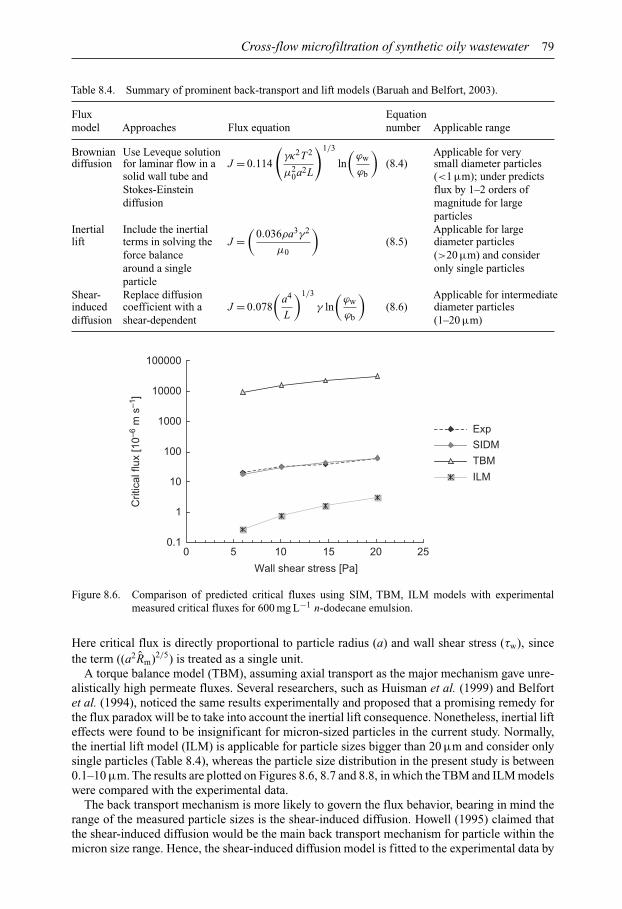
Cross-flow microfiltration of synthetic oily wastewater 79
Table 8.4. Summary of prominent back-transport and lift models (Baruah and Belfort, 2003).
Flux Equationmodel Approaches Flux equation number Applicable range
Brownian Use Leveque solution Applicable for verydiffusion for laminar flow in a J = 0.114
(γκ2T 2
µ20a2L
)1/3
ln(
ϕw
ϕb
)(8.4) small diameter particles
solid wall tube and (<1 µm); under predictsStokes-Einstein flux by 1–2 orders ofdiffusion magnitude for large
particlesInertial Include the inertial Applicable for largelift terms in solving the J =
(0.036ρa3γ2
µ0
)(8.5) diameter particles
force balance (>20 µm) and consideraround a single only single particlesparticle
Shear- Replace diffusion Applicable for intermediateinduced coefficient with a J = 0.078
(a4
L
)1/3
γ ln(
ϕw
ϕb
)(8.6) diameter particles
diffusion shear-dependent (1–20 µm)
0.1
1
10
100
1000
10000
100000
0 5 10 15 20 25
Wall shear stress [Pa]
Crit
ical
flux
[10–6
m s
–1]
Exp
SIDM
TBM
ILM
Figure 8.6. Comparison of predicted critical fluxes using SIM, TBM, ILM models with experimentalmeasured critical fluxes for 600 mg L−1 n-dodecane emulsion.
Here critical flux is directly proportional to particle radius (a) and wall shear stress (τw), sincethe term ((a2Rm)2/5) is treated as a single unit.
A torque balance model (TBM), assuming axial transport as the major mechanism gave unre-alistically high permeate fluxes. Several researchers, such as Huisman et al. (1999) and Belfortet al. (1994), noticed the same results experimentally and proposed that a promising remedy forthe flux paradox will be to take into account the inertial lift consequence. Nonetheless, inertial lifteffects were found to be insignificant for micron-sized particles in the current study. Normally,the inertial lift model (ILM) is applicable for particle sizes bigger than 20 µm and consider onlysingle particles (Table 8.4), whereas the particle size distribution in the present study is between0.1–10 µm. The results are plotted on Figures 8.6, 8.7 and 8.8, in which the TBM and ILM modelswere compared with the experimental data.
The back transport mechanism is more likely to govern the flux behavior, bearing in mind therange of the measured particle sizes is the shear-induced diffusion. Howell (1995) claimed thatthe shear-induced diffusion would be the main back transport mechanism for particle within themicron size range. Hence, the shear-induced diffusion model is fitted to the experimental data by

80 Y.H.D. Alanezi
0.1
1
10
100
1000
10000
100000
0 5 10 15 20 25
Wall shear stress [Pa]
Crit
ical
flux
[10–6
m s
–1]
ExpSIDMTBMILM
Figure 8.7. Comparison of predicted critical fluxes using SIM,TBM, ILM models with experimental criticalfluxes for 1200 mg L−1 n-dodecane emulsions.
0.1
1
10
100
1000
10000
100000
0 5 10 15 20 25
Wall shear stress [Pa]
Crit
ical
flux
[10–6
m s
–1]
ExpSIDMTBMILM
Figure 8.8. Comparison of predicted critical fluxes using SIM,TBM, ILM models with experimental criticalfluxes for 2400 mg L−1 n-dodecane emulsion.
using the particle size as the curve fitting parameter, providing physical illustrations of the particlesizes at critical flux value for different cross-flow velocities. The shear-induced model (SIDM)makes use of the shear-induced hydrodynamic diffusivity rather than the Brownian diffusivity,determined by using Stokes-Einstein correlation. The model employed here has been obtainedfrom prior researchers (Belfort et al., 1994; Howell, 1995) where detailed description of themodel was provided. Comparisons with other models are shown in Figures 8.6, 8.7 and 8.8; theSID model showed a better prediction of experimental results of critical fluxes at different oilfeed concentrations and various cross-flow velocities than did either the ILM or IBM models.
The distinction between employing Brownian diffusion (DBD) and employing shear-induceddiffusion (Ds) in evaluating particle depolarization is important. DBD is a function of particle sizeand increases as the particle size decreases (DBD ∝ a−1). The implication of Brownian diffusionbecoming the predominant mechanism for particle back transport is that the back diffusion turnsout to be more significant for finer particles and hence they tend to depolarize from the membranesurface. However, this implication is in disagreement with several experimental observations inwhich the smaller particles have a preference for deposition on the membrane surface duringcross-flow filtration. In addition, because DBD is invariable for specified particle size, the degree
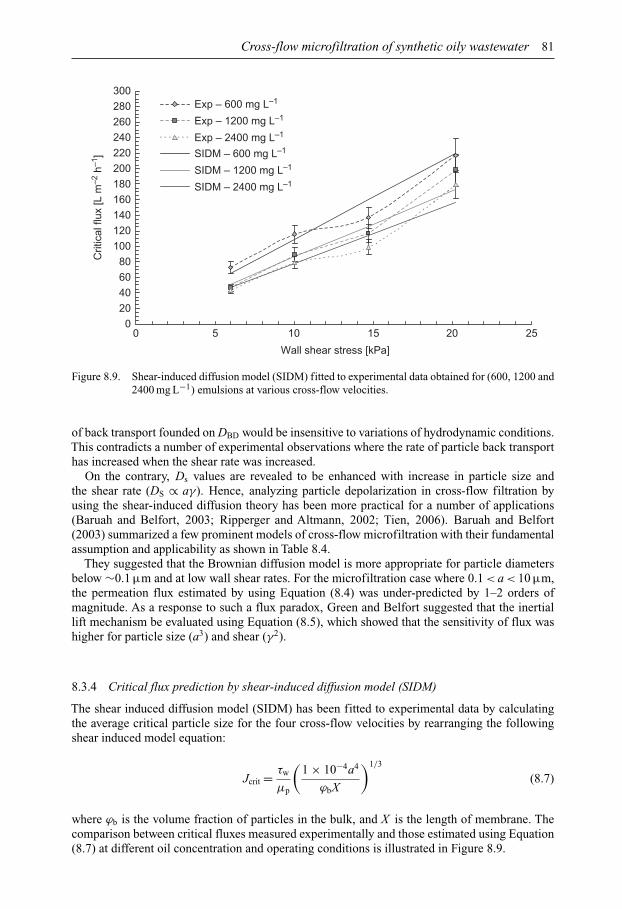
Cross-flow microfiltration of synthetic oily wastewater 81
020406080
100120140160180200220240260280300
0 5 10 15 20 25
Wall shear stress [kPa]
Crit
ical
flux
[L m
–2 h
–1]
Exp – 600 mg L–1
Exp – 1200 mg L–1
Exp – 2400 mg L–1
SIDM – 600 mg L–1
SIDM – 1200 mg L–1
SIDM – 2400 mg L–1
Figure 8.9. Shear-induced diffusion model (SIDM) fitted to experimental data obtained for (600, 1200 and2400 mg L−1) emulsions at various cross-flow velocities.
of back transport founded on DBD would be insensitive to variations of hydrodynamic conditions.This contradicts a number of experimental observations where the rate of particle back transporthas increased when the shear rate was increased.
On the contrary, Ds values are revealed to be enhanced with increase in particle size andthe shear rate (DS ∝ aγ). Hence, analyzing particle depolarization in cross-flow filtration byusing the shear-induced diffusion theory has been more practical for a number of applications(Baruah and Belfort, 2003; Ripperger and Altmann, 2002; Tien, 2006). Baruah and Belfort(2003) summarized a few prominent models of cross-flow microfiltration with their fundamentalassumption and applicability as shown in Table 8.4.
They suggested that the Brownian diffusion model is more appropriate for particle diametersbelow ∼0.1 µm and at low wall shear rates. For the microfiltration case where 0.1 < a < 10 µm,the permeation flux estimated by using Equation (8.4) was under-predicted by 1–2 orders ofmagnitude. As a response to such a flux paradox, Green and Belfort suggested that the inertiallift mechanism be evaluated using Equation (8.5), which showed that the sensitivity of flux washigher for particle size (a3) and shear (γ2).
8.3.4 Critical flux prediction by shear-induced diffusion model (SIDM)
The shear induced diffusion model (SIDM) has been fitted to experimental data by calculatingthe average critical particle size for the four cross-flow velocities by rearranging the followingshear induced model equation:
Jcrit = τw
µp
(1 × 10⁻⁴a4
ϕbX
)1/3
(8.7)
where ϕb is the volume fraction of particles in the bulk, and X is the length of membrane. Thecomparison between critical fluxes measured experimentally and those estimated using Equation(8.7) at different oil concentration and operating conditions is illustrated in Figure 8.9.
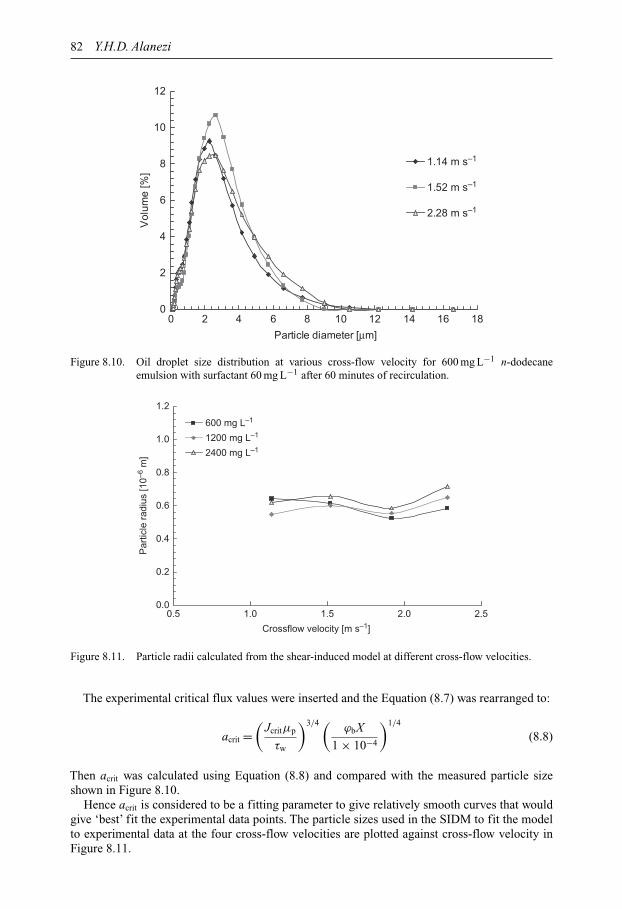
82 Y.H.D. Alanezi
0
2
4
6
8
10
12
0 2 4 6 8 10 12 14 16 18
Particle diameter [µm]
Vol
ume
[%]
1.14 m s–1
1.52 m s–1
2.28 m s–1
Figure 8.10. Oil droplet size distribution at various cross-flow velocity for 600 mg L−1 n-dodecaneemulsion with surfactant 60 mg L−1 after 60 minutes of recirculation.
0.0
0.2
0.4
0.6
0.8
1.0
1.2
0.5 1.0 1.5 2.0 2.5
Crossflow velocity [m s–1]
Par
ticle
rad
ius
[10–6
m]
600 mg L–1
1200 mg L–1
2400 mg L–1
Figure 8.11. Particle radii calculated from the shear-induced model at different cross-flow velocities.
The experimental critical flux values were inserted and the Equation (8.7) was rearranged to:
acrit =(
Jcritµp
τw
)3/4 (ϕbX
1 × 10⁻⁴
)1/4
(8.8)
Then acrit was calculated using Equation (8.8) and compared with the measured particle sizeshown in Figure 8.10.
Hence acrit is considered to be a fitting parameter to give relatively smooth curves that wouldgive ‘best’ fit the experimental data points. The particle sizes used in the SIDM to fit the modelto experimental data at the four cross-flow velocities are plotted against cross-flow velocity inFigure 8.11.
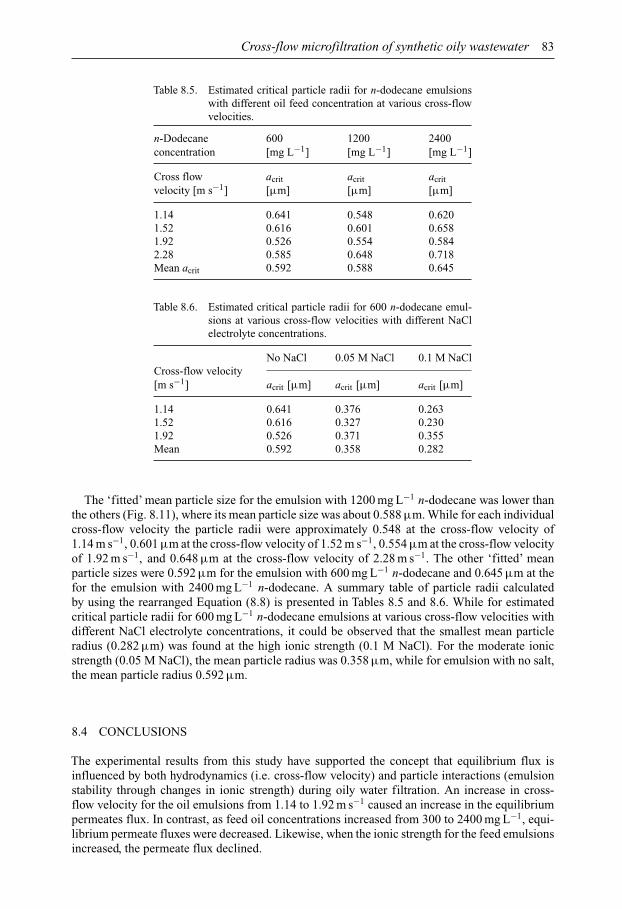
Cross-flow microfiltration of synthetic oily wastewater 83
Table 8.5. Estimated critical particle radii for n-dodecane emulsionswith different oil feed concentration at various cross-flowvelocities.
n-Dodecane 600 1200 2400concentration [mg L−1] [mg L−1] [mg L−1]
Cross flow acrit acrit acritvelocity [m s−1] [µm] [µm] [µm]
1.14 0.641 0.548 0.6201.52 0.616 0.601 0.6581.92 0.526 0.554 0.5842.28 0.585 0.648 0.718Mean acrit 0.592 0.588 0.645
Table 8.6. Estimated critical particle radii for 600 n-dodecane emul-sions at various cross-flow velocities with different NaClelectrolyte concentrations.
No NaCl 0.05 M NaCl 0.1 M NaClCross-flow velocity[m s−1] acrit [µm] acrit [µm] acrit [µm]
1.14 0.641 0.376 0.2631.52 0.616 0.327 0.2301.92 0.526 0.371 0.355Mean 0.592 0.358 0.282
The ‘fitted’ mean particle size for the emulsion with 1200 mg L−1 n-dodecane was lower thanthe others (Fig. 8.11), where its mean particle size was about 0.588 µm. While for each individualcross-flow velocity the particle radii were approximately 0.548 at the cross-flow velocity of1.14 m s−1, 0.601 µm at the cross-flow velocity of 1.52 m s−1, 0.554 µm at the cross-flow velocityof 1.92 m s−1, and 0.648 µm at the cross-flow velocity of 2.28 m s−1. The other ‘fitted’ meanparticle sizes were 0.592 µm for the emulsion with 600 mg L−1 n-dodecane and 0.645 µm at thefor the emulsion with 2400 mg L−1 n-dodecane. A summary table of particle radii calculatedby using the rearranged Equation (8.8) is presented in Tables 8.5 and 8.6. While for estimatedcritical particle radii for 600 mg L−1 n-dodecane emulsions at various cross-flow velocities withdifferent NaCl electrolyte concentrations, it could be observed that the smallest mean particleradius (0.282 µm) was found at the high ionic strength (0.1 M NaCl). For the moderate ionicstrength (0.05 M NaCl), the mean particle radius was 0.358 µm, while for emulsion with no salt,the mean particle radius 0.592 µm.
8.4 CONCLUSIONS
The experimental results from this study have supported the concept that equilibrium flux isinfluenced by both hydrodynamics (i.e. cross-flow velocity) and particle interactions (emulsionstability through changes in ionic strength) during oily water filtration. An increase in cross-flow velocity for the oil emulsions from 1.14 to 1.92 m s−1 caused an increase in the equilibriumpermeates flux. In contrast, as feed oil concentrations increased from 300 to 2400 mg L−1, equi-librium permeate fluxes were decreased. Likewise, when the ionic strength for the feed emulsionsincreased, the permeate flux declined.

84 Y.H.D. Alanezi
Particle back transport models such as torque balance model, inertial lift model, and shear-induced diffusion model, were compared to experimental data where particle size was used as afitting parameter at different oil feed concentration and wall shear stresses. The torque balanceover-predicted by three orders of magnitude the experimental fluxes, while the inertial lift modelunder-predicted by one order of magnitude. However, the shear-induced model showed a betterprediction for the experimental data. The ‘fitted’ particle sizes were in the lower ranges of themeasured feed particle size distributions, suggesting that these smaller particles were responsiblefor the initial permanent particle fouling on the membrane surface at Jcrit . It is difficult to provideproof directly by experiment because of the lack of ability to visualize and size particles resting onthe membrane in situ in the filter. In particular for oily wastewater streams, where the measuredparticle size distribution of feed emulsions was in the range 0.1–10 µm.
In the current investigation, the critical parameter (Jcrit/τw) was not found to be linear, which wasin disagreement with the findings of a number of previous research works, where the measuredparticle sizes were kept invariant and not influenced by the increase in the shear rate. However,there were a few researchers who encountered similar behavior of nonlinearity of the criticalparameter (Jcrit/τw) for flocculated feed, where they attributed that to the change of particlesize as a result of the increase in the shear rate, particularly those of loosely flocculated. Thus,correlation between critical flux the product of the wall shear stress and the critical particle sizewas investigated on the basis of a number of most commonly used models.
REFERENCES
Bacchin, P., Aimar, P. & Field, R.W. (2006) Critical and sustainable fluxes: theory, experiments andapplications. Journal of Membrane Science, 281, 42–69.
Baruah, G.L. & Belfort, G. (2003) A predictive aggregate transport model for microfiltration of combinedmacromolecular solutions and poly-disperse suspensions: model development. Biotechnology Progress,19, 1524–1532.
Belfort, G., Davis, R.H. & Zydney, A.L. (1994) The behavior of suspensions and macromolecular solutionsin cross-flow microfiltration. Journal of Membrane Science, 96 (1–2), 1–58.
Chen, V. (1998) Performance of partially permeable microfiltration membranes under low fouling conditions.Journal of Membrane Science, 147 (2), 265–278.
Chiu, T.Y. & James,A.E. (2005) Critical flux determination of non-circular multi-channel ceramic membranesusing TiO2 suspensions. Journal of Membrane Science, 254, 295–301.
Field, R.W., Wu, D., Howell, J.A. & Gupta, B.B. (1995) Critical flux concept for microfiltration fouling.Journal of Membrane Science, 100, 259–272.
Fradin, B. & Field, R.W. (1999) Cross-flow microfiltration of magnesium hydroxide suspensions: determi-nation of critical fluxes, measurement and modelling of fouling. Separation and Purification Technology,16 (1), 25–45.
Gésan-Guiziou, G., Wakeman, R.J. & Daufin, G. (2002) Stability of latex cross-flow filtration: cakeproperties and critical conditions of deposition. Chemical Engineering Journal, 85 (1), 27–34.
Howell, J.A. (1995) Sub-critical flux operation of microfiltration. Journal of Membrane Science, 107 (1–2),165–171.
Huisman, I.H. (1999) Particle transport in cross-flow microfiltration. I. Effects of hydrodynamics anddiffusion. Chemical Engineering Science, 54 (2), 271–280.
Kwon, D.Y., Vigneswaran, S., Fane, A.G. & Ben Aim, R. (2000) Experimental determination of critical fluxin cross-flow microfiltration. Separation and Purification Technology, 19 (3), 169–181.
Li, H., Fane, A.G., Coster, H.G.L. & Vigneswaran, S. (2000) An assessment of depolarisation models ofcross-flow microfiltration by direct observation through the membrane. Journal of Membrane Science,172 (1–2), 135–147.
Madaeni, S.S. (1997) The effect of operating conditions on critical flux in membrane filtration of activatedsludge. Journal of Chemical Technology and Biotechnology, 74, 539–543.
Mohhammadi, T., Pak, A., Karbbassian, M. & Golshan, M. (2004) Effect of operating conditions onmicrofiltration of oil-water emulsion by a kaolin membrane. Desalination, 168, 201–205.
Cross-flow microfiltration of synthetic oily wastewater 85
Ohya, H., Kim, J.J., Chinen, A., Aihara, M., Semenova, S.I., Negishi, Y., Mori, O. & Yasuda, M. (1998)Effects of pore size on separation mechanisms of microfiltration of oily water, using porous glass tubularmembrane. Journal of Membrane Science, 145 (1), 1–14.
Ripperger, S. & Altmann, J. (2002) Cross-flow microfiltration – state of the art. Separation and PurificationTechnology, 26 (1), 19–31.
Tien, C. (2006) Introduction to cake filtration: analyses, experiments and applications. 1st edition. Elsevier,Amsterdam, The Netherlands.
Wakeman, R.J. & Tarleton, E.S. (1993) Sensitivity analysis for solid liquid separation equipment selec-tion using an expert system. Proceedings Filtech Conference, Karlsruhe, Germany, October 1993. TheFiltration Society. pp. 43–57.

This page intentionally left blankThis page intentionally left blank
CHAPTER 9
Treatment of dye solution via low pressure nanofiltration system
Abu Zahrim Yaser & Nidal Hilal
9.1 INTRODUCTION
Many industries including palm oil mill, leather, textile, pulp and paper etc. generate largeamounts of colored wastewater. It is the first pollutant that can be seen by the public and maycause reduction in photosynthetic activities, produce carcinogenic by-products in drinking water,chelate with metal ions, and are toxic to aquatic biota (Anjaneyulu et al., 2005; Neoh et al., 2012;Zahrim et al., 2009). Color is a combination of dissolved and colloidal materials (Davies andCornwell, 2013). Color from wastewater is due to various sources. Petroleum refinery wastewatercolor is due to the presence of creosote, asphalt and heavy oil fractions. The agricultural basedindustry wastewater may be due to the presence of lignin, tannin, melanoidin, humic acid etc.For dye manufacturing, textile, leather, and pulp and paper, the colored appearance is due to thedye’s compound (Anjaneyulu et al., 2005; Zahrim et al., 2009).
Nanofiltration (NF) is located between reverse osmosis (RO) and ultrafiltration (UF). Nanofil-tration membranes carry quite unique properties such as pore radius size (1–5 nm) and surfacecharge density which influences the separation of various solutes. Over the years, nanofiltration(NF) has been studied by many researchers for the treatment of various colored wastewater forwater reuse (Hilal et al., 2004a; Zahrim et al., 2011a). The nanofiltration (NF) process of pulp andpaper wastewater for the purpose of reuse was investigated by Z. Beril Gönder et al. (2012). Underthe optimized conditions i.e. pH 10, 25◦C, 1.2 MPa, 91% chemical oxygen demand (COD), 92%total hardness and 98% sulfate removal were achieved (Gönder et al., 2012). Noghabi et al. (2012)studied nanofiltration (AFC80) of sugar industry wastewater at 1.0 MPa. At this pressure, theyfound that permeate flux was around 15 kg m−2 h−1 and sucrose, sodium and potassium rejectionexceeded 98, 74 and 67%, respectively (Noghabi et al., 2012). Produced water is generated inthe petroleum industry as a by-product of various processes in production and refining. The NFtreatment of produced water has been reported by Alzahrani et al. (2013). They reported that NFmembrane successfully attained 96% of overall drinking water standards, despite its inefficiencyin removing boron, molybdenum and ammonia (Alzahrani et al., 2013). Recently, nanofiltrationwas used to treat a raw textile effluent supplied from rinsing baths of the Spanish textile industry(Aouni et al., 2012). At the operating pressure 0.5 MPa, pH 7.1; the COD, color and conductivityremoval was reported to be around 95, 98, and 55%, respectively (Aouni et al., 2012). The esti-mated concentration of dyes at dyeing bath is around 90–8000 mg L−1 (Van der Bruggen et al.,2001; Zahrim et al., 2011a). Reviews on nanofiltration of real textile effluents have been writtenby several authors (Hilal et al., 2004a; Lau and Ismail, 2009; Zahrim et al., 2011a).
Since there are more than 8000 chemically different types of dyes for different applications(Anjaneyulu et al., 2005), the researchers also put great effort into investigating the interactionbetween the dye(s) molecule and membrane system. Patel and Nath (2013) investigated theeffect of ultrasonic irradiation during nanofiltration of two-component dye (C.I. Reactive Black5 and C.I. Reactive Yellow 160) and NaCl mixture. The study to determine the influence ofdye’s molecular mass on membranes types and cut-offs was carried out by Aouni et al. (2012).The C.I. Acid Black 201 dye is frequently used in dyeing of leather, cotton and woollen fabric(Manu and Chaudhari, 2002; Zahrim et al., 2010). Several studies have been conducted for
87
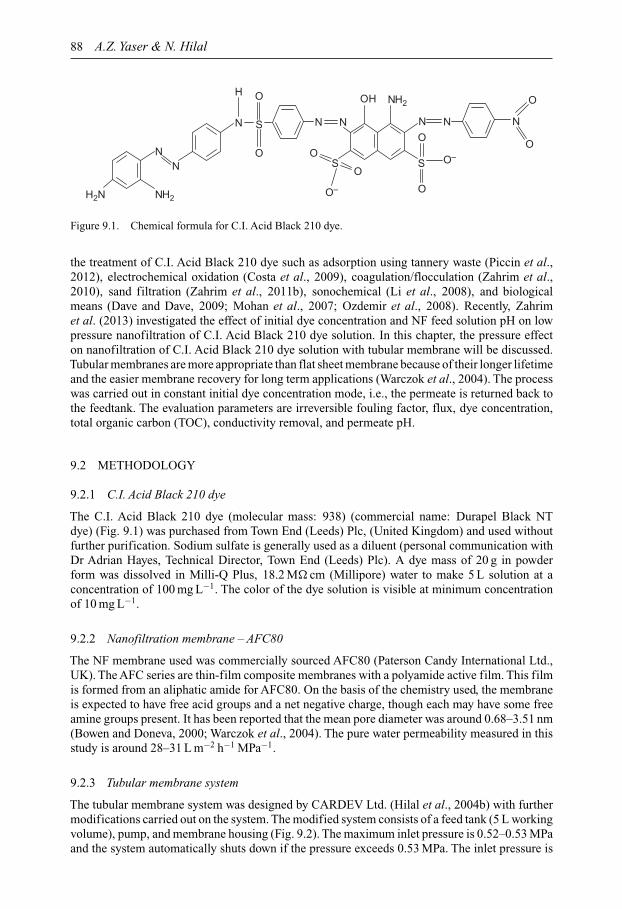
88 A.Z. Yaser & N. Hilal
NN
N
H
S
O
O
N N N
O
O
S
O
O
O–
NH2H2N
N
S
N
O
O
O–
OH NH2
Figure 9.1. Chemical formula for C.I. Acid Black 210 dye.
the treatment of C.I. Acid Black 210 dye such as adsorption using tannery waste (Piccin et al.,2012), electrochemical oxidation (Costa et al., 2009), coagulation/flocculation (Zahrim et al.,2010), sand filtration (Zahrim et al., 2011b), sonochemical (Li et al., 2008), and biologicalmeans (Dave and Dave, 2009; Mohan et al., 2007; Ozdemir et al., 2008). Recently, Zahrimet al. (2013) investigated the effect of initial dye concentration and NF feed solution pH on lowpressure nanofiltration of C.I. Acid Black 210 dye solution. In this chapter, the pressure effecton nanofiltration of C.I. Acid Black 210 dye solution with tubular membrane will be discussed.Tubular membranes are more appropriate than flat sheet membrane because of their longer lifetimeand the easier membrane recovery for long term applications (Warczok et al., 2004). The processwas carried out in constant initial dye concentration mode, i.e., the permeate is returned back tothe feedtank. The evaluation parameters are irreversible fouling factor, flux, dye concentration,total organic carbon (TOC), conductivity removal, and permeate pH.
9.2 METHODOLOGY
9.2.1 C.I. Acid Black 210 dye
The C.I. Acid Black 210 dye (molecular mass: 938) (commercial name: Durapel Black NTdye) (Fig. 9.1) was purchased from Town End (Leeds) Plc, (United Kingdom) and used withoutfurther purification. Sodium sulfate is generally used as a diluent (personal communication withDr Adrian Hayes, Technical Director, Town End (Leeds) Plc). A dye mass of 20 g in powderform was dissolved in Milli-Q Plus, 18.2 M� cm (Millipore) water to make 5 L solution at aconcentration of 100 mg L−1. The color of the dye solution is visible at minimum concentrationof 10 mg L−1.
9.2.2 Nanofiltration membrane – AFC80
The NF membrane used was commercially sourced AFC80 (Paterson Candy International Ltd.,UK). The AFC series are thin-film composite membranes with a polyamide active film. This filmis formed from an aliphatic amide for AFC80. On the basis of the chemistry used, the membraneis expected to have free acid groups and a net negative charge, though each may have some freeamine groups present. It has been reported that the mean pore diameter was around 0.68–3.51 nm(Bowen and Doneva, 2000; Warczok et al., 2004). The pure water permeability measured in thisstudy is around 28–31 L m−2 h−1 MPa−1.
9.2.3 Tubular membrane system
The tubular membrane system was designed by CARDEV Ltd. (Hilal et al., 2004b) with furthermodifications carried out on the system. The modified system consists of a feed tank (5 L workingvolume), pump, and membrane housing (Fig. 9.2). The maximum inlet pressure is 0.52–0.53 MPaand the system automatically shuts down if the pressure exceeds 0.53 MPa. The inlet pressure is

Treatment of dye solution via low pressure nanofiltration system 89
Permeate
Membranehousing Pump
Inlet
Outlet
Controlvalve
Figure 9.2. Tubular nanofiltration system.
controlled by an outlet valve. This unit is fitted with tubular nanofiltration membranes with innerdiameter of 1.27 cm and effective length of 28.6 cm. Thus, the calculated area of membrane tubeis around 0.0114 m2. In this system, the retentate is sent back to the tank. The pump used is fromMono Pump Ltd, Manchester model CMM253/H13F and delivers a maximum transmembranepressure around 0.43 MPa. The pump is fitted with a motor from Brook Compton Ltd., DoncasterModel KP 7575. At the maximum inlet pressure, the maximum flow rate measured is 1 m3 h−1
(Akbari et al., 2002; Zahrim and Hilal, 2013).
9.2.4 Procedure to determine normalized permeation flux, product permeate qualityand irreversible fouling factor
The procedures followed for the determination of normalized permeation flux, product permeatesquality and irreversible fouling factor are outlined as:
• The membrane is soaked in RO water for 24 hours before the first permeation test with ROwater. The pump is switched on at maximum outlet valve opening for 2 minutes after placing5 L RO water.
• The valve is slowly reduced until it reaches highest “unsteady” inlet pressure (inlet: 0.55 MPa,outlet: 0.40 MPa). After maximum inlet pressure is reached, reduction of valve opening causessystem to automatically shut down.
• The system is then left for at least two hours to minimize the compaction effect. Permeate andretentate are returned to the feed tank.
• The outlet valve is then opened again to get the desired inlet pressure.• The pure water flux (PWF) is determined by changing the inlet valve. The system is left
until steady state is reached (50 minutes). The permeate volume is measured for 20 minutesoperation. Temperature (θ) is measured every 10 minutes. A minimum of three points at varioustransmembrane pressures are obtained.The membrane permeability is determined by plottingpure water flux (PWF) against transmembrane pressure.
The transmembrane pressure (�P) is calculated as:
�P = Inlet pressure + Outlet pressure2
(9.1)
90 A.Z. Yaser & N. Hilal
Normalized pure water permeation flux (J25) is determined using the temperature correctionas stated by Akbari et al. (2002):
J25 = Jθ exp(0.0239(25 − θ)) (9.2)
• The pump is switched off and the RO water is then replaced with dye solution (5 L) and thesystem is left for 50 minutes to achieve steady state condition. The zero time is begun after50 minutes.
• The UV/Vis absorbance, pH and conductivity of permeate taken at time 20, 40, 60, 80, 100and 120 minutes after steady state condition is reached. The permeate is returned, after eachanalysis, to the feed tank to maintain initial dye concentration.
• After collecting sample at the 120th minute, about 30 mL of permeate is collected, kept at 4◦Cand analyzed for TOC.
• The pump is then switched off and the dye solution replaced with the tap water (approximately10 L). The pump is set at the lowest transmembrane pressure available (maximum outlet valveopening). Both retentate and permeate are discarded.
• The pump is switched off and tap water replaced with RO water. The pump is set at the lowesttransmembrane pressure (maximum outlet valve opening). Both retentate and permeate arereturned to the feed tank and the system operated for one hour. The system was then leftovernight.
• The membrane permeability is determined as step (5). The irreversible fouling factor definesas IFF was determined as (Mänttäri and Nyström, 2000; Warczok et al., 2004):
Initial membrane permeability – Membrane permeability after cleaning with water
Initial membrane permeability× 100%
(9.3)
9.2.5 Chemical cleaning
Before dismantling the membrane, about 10 L of 0.1 mM NaOH (pH 10.30) was passed through thesystem without returning the retentate. The system was rinsed by about 10 L RO water. The mainpurpose of this procedure is to minimize the dye stain attached on the surface of the tubing/pump.Cleaning of the membrane is carried out by submerging the membrane in the solution by followingthe sequence: 0.01 M HNO3 (pH 1.94), 0.0001 M NaOH (pH 10.30) and RO water for 60 minuteseach. The water permeability is then measured again. If the pure water permeability is greaterthan 15 L m−2 h−1 MPa−1; no membrane replacement is implemented. Then the membrane isdismantled and stored in 20% glycerol (ACROS Organic) + 1% sodium metabisulfite (ACROSOrganic) solution to prevent biological growth on the surface of the membrane.
9.2.6 Physicochemical analysis
The pH and conductivity were measured using a Jenway 3540 pH/conductivity meter. The cal-ibration was carried out daily at 20◦C. The buffer solutions (pH: 4, 7 and 0) for pH metercalibration were supplied by Fisher Scientific, UK. Residual concentration of dye (without filter-ing or centrifuging) was obtained with a UV/vis-spectrophotometer (UVmini-1240, Shimadzu)by measuring the absorbance (315 nm). Before the absorbance was measured, the baseline flatnessand wavelength accuracy for the UV-spectrophotometer were carried out daily. The absorbancewas measured using Milli-Q water as background and the concentration of dye was computed fromcalibration curves preliminary determined at different pH values. If the reading of absorbancewas greater than 3.0, then the necessary dilution was made. After every experiment, the precisioncell (10.00 mm, quartz SUPRASIL® (Hellma GmbH & Co., Germany)) was cleaned by soakingin methanol (HPLC grade, Fischer Scientific UK Ltd., UK) overnight. The values of the initial

Treatment of dye solution via low pressure nanofiltration system 91
and final concentrations of the dye measured as outlined above were used to calculate the removalpercentage of the dye using Equation (9.4):
Dye removal [%] = 100 × C0 − Cf
C0(9.4)
where: C0 is the initial dye concentration and Cf is the permeate dye concentration.Total organic carbon (TOC) content was measured by TOC analyzer with autosampler (ASI-V)
(model TOC-VCPH, Shimadzu). For estimation of the dye’s isoelectric point (IEP), the pH meterwas placed in the dye solution (100 mg L−1 while stirring (XULA, 2011). Then the 0.001 M HClwas added, the volume of HCl and the solution pH was recorded. The isoelectric point (IEP)observed was around 7.2.
9.3 RESULTS AND DISCUSSION
Fouling problems will lead to higher operation costs: higher energy demand, increased cleaningand reduced life time of the membrane elements (Hilal et al., 2004a). Membrane fouling canbe classified as reversible and irreversible. Reversible fouling can be cleaned easily by changingprocess parameters and water rinsing while irreversible fouling is difficult to clean and mightrequire chemical cleaning like caustic soda cleaning (Tansel et al., 2000; Zahrim et al., 2011a).The factors that affect membrane fouling can be classified into three categories: membraneproperties, dyeing wastewater and operating parameters (Cheryan, 1998; Zahrim et al., 2011a).In this study, the irreversible fouling factor for pressure of 0.36, 0.39 and 0.44 MPa is 8.6, 10 and12%, respectively (Fig. 9.3). It can be shown that the increase in pressure caused an increase inirreversible fouling (Fig. 9.3). From the previous study, it is believed that at pH 10, the dye isin aggregate (Zahrim et al., 2010) and hydrophobic form (Koyuncu, 2003). The higher pressuresupplied induces a greater shear stress that may lead to the dye aggregates breakage (Crozeset al., 1997). Then the diffusion of smaller dye aggregates through the membrane is higher thanconvection (interception) transport and hence caused more fouling (Aydiner et al., 2010). The dye-membrane surface interaction might include multiple effect interaction such as covalent bond, vander Waals, hydrogen bond, and hydrophobic interactions (Zahrim et al., 2011a). Generally, cakelayer formation, adsorption and pore blocking (i.e., complete, standard and intermediate blocking)are the expected mechanisms for irreversible fouling (Bowen et al., 1995; Tansel et al., 2000;Zahrim et al., 2011a). At higher pressure, the contribution of cake formation, complete blockingand standard blocking mechanism may be little since the dye aggregates become smaller (Schaferet al., 2005; Zahrim et al., 2011a). Furthermore, during nanofiltration process, only a monolayerof dye aggregates is speculated. Thus, the adsorption (Gomes et al., 2005; Zahrim and Hilal, 2013)and standard blocking (Bowen et al., 1995) could be the dominant mechanism. Standard blockinghas possibility since the dye aggregates/molecules could be less than AFC80 membrane pore(Bowen and Doneva, 2000; Warczok et al., 2004). As an example, the dye molecules at acid dyebath is estimated about 0.8 nm (Van der Bruggen et al., 2005). The adsorption of dye aggregatescould occur on the membrane surface, in the pores and the back of the membrane (e.g., supportlayer) (Schafer et al., 2005). De et al. (2009) carried out an investigation into leather dyeingwastewater using nanofiltration membrane. They found that the deposition thickness increasedfrom 13.3 to 14.6 µm as the transmembrane pressure increased from 0.83 to 1.24 MPa (De et al.,2009). Fouling at constant pressure of 0.39 MPa characterized by monolayer adsorption showsweak interaction between dye aggregates (Zahrim et al., 2013).
Figure 9.4 shows that the increase in pressure also increases the normalized flux. At trans-membrane pressures of 0.36, 0.39 and 0.44 MPa, the corresponding normalized flux is 0.78, 0.89and 1.34, respectively. A similar pattern was observed by Wu et al. (1998) during AFC80 mem-brane nanofiltration of simulated textile wastewater (total dye concentration around 2400 mg L−1).They stated that at the pressure of 1.0, 2.6 and 2.8 MPa, the flux is 7.0, 8.5 and 12.0 L m−2 h−1,
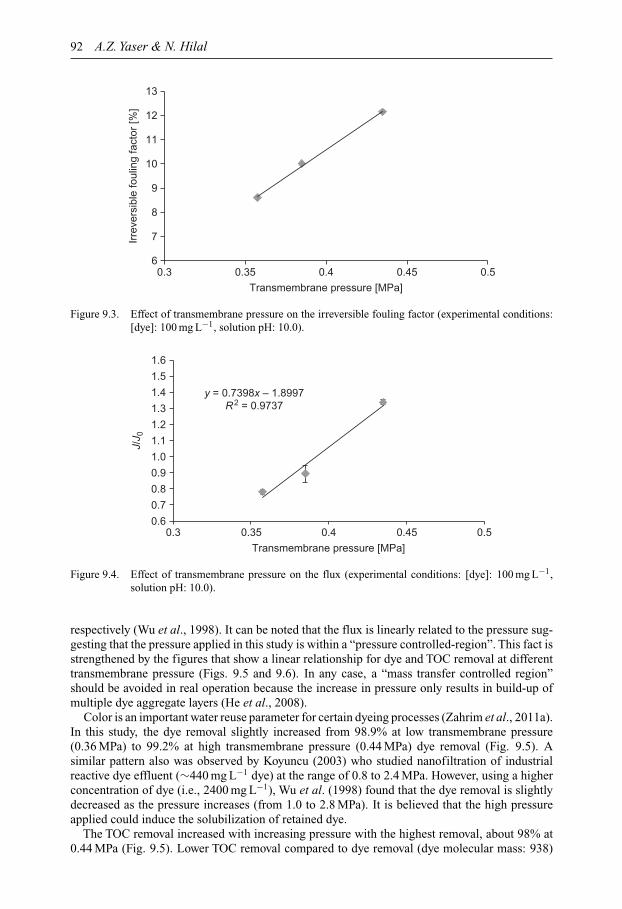
92 A.Z. Yaser & N. Hilal
6
7
8
9
10
11
12
13
0.3 0.35 0.4 0.45 0.5
Irre
vers
ible
foul
ing
fact
or [%
]
Transmembrane pressure [MPa]
Figure 9.3. Effect of transmembrane pressure on the irreversible fouling factor (experimental conditions:[dye]: 100 mg L−1, solution pH: 10.0).
y = 0.7398x – 1.8997R2 = 0.9737
0.6
0.7
0.8
0.9
1.0
1.1
1.2
1.3
1.4
1.5
1.6
0.3 0.35 0.4 0.45 0.5
J/J 0
Transmembrane pressure [MPa]
Figure 9.4. Effect of transmembrane pressure on the flux (experimental conditions: [dye]: 100 mg L−1,solution pH: 10.0).
respectively (Wu et al., 1998). It can be noted that the flux is linearly related to the pressure sug-gesting that the pressure applied in this study is within a “pressure controlled-region”. This fact isstrengthened by the figures that show a linear relationship for dye and TOC removal at differenttransmembrane pressure (Figs. 9.5 and 9.6). In any case, a “mass transfer controlled region”should be avoided in real operation because the increase in pressure only results in build-up ofmultiple dye aggregate layers (He et al., 2008).
Color is an important water reuse parameter for certain dyeing processes (Zahrim et al., 2011a).In this study, the dye removal slightly increased from 98.9% at low transmembrane pressure(0.36 MPa) to 99.2% at high transmembrane pressure (0.44 MPa) dye removal (Fig. 9.5). Asimilar pattern also was observed by Koyuncu (2003) who studied nanofiltration of industrialreactive dye effluent (∼440 mg L−1 dye) at the range of 0.8 to 2.4 MPa. However, using a higherconcentration of dye (i.e., 2400 mg L−1), Wu et al. (1998) found that the dye removal is slightlydecreased as the pressure increases (from 1.0 to 2.8 MPa). It is believed that the high pressureapplied could induce the solubilization of retained dye.
The TOC removal increased with increasing pressure with the highest removal, about 98% at0.44 MPa (Fig. 9.5). Lower TOC removal compared to dye removal (dye molecular mass: 938)

Treatment of dye solution via low pressure nanofiltration system 93
90
91
92
93
94
95
96
97
98
99
100
0.3 0.35 0.4 0.45 0.5
Rem
oval
[%]
Transmembrane pressure [MPa]
Dye removal
TOC removal
Figure 9.5. Effect of transmembrane pressure on the dye and TOC removal (experimental conditions: [dye]:100 mg L−1, solution pH: 10.0).
88
89
90
91
92
93
94
95
96
97
98
0.3 0.35 0.4 0.45 0.5
Con
duct
ivity
rem
oval
[%]
Transmembrane pressure [MPa]
Figure 9.6. Effect of transmembrane pressure on the conductivity removal (experimental conditions: [dye]:100 mg L−1, solution pH: 10.0, initial conductivity: 272 µS cm−1).
might be due to the presence of low molecular mass impurities such as various amine compoundsand acetic acid (molecular mass: 60) in the permeate (Blus, 1999; Qin et al., 2007). This resultsuggests that low molecular mass impurities might have more adsorption tendency at high pressure(Weng et al., 2009). In another study, Weng et al. (2009) reported that only 60, 75 and 85% ofacetic acid was retained during nanofiltration of acetic acid + xylose at pressure 0.5, 0.98 and1.47 MPa, respectively. Sabate et al. (2008) reported 20–40% retention of amine compounds atan operating pressure 0.8 MPa.
In this study, the conductivity in the permeate is predominantly affected by the presence ofsodium sulfate. At transmembrane pressures of 0.36, 0.39 and 0.44 MPa, the correspondingconductivity removal is 90.4, 91.7 and 94.6%, respectively, (Fig. 9.6) might be due to higheradsorption tendency for dye-sodium sulfate aggregates. In another study, Zhang et al. (2005)reported 18–95% rejection of sodium sulfate alone at pressure 0.25 MPa. Inlet pressure wasfound to have minimal effect on permeate pH (Fig. 9.7).
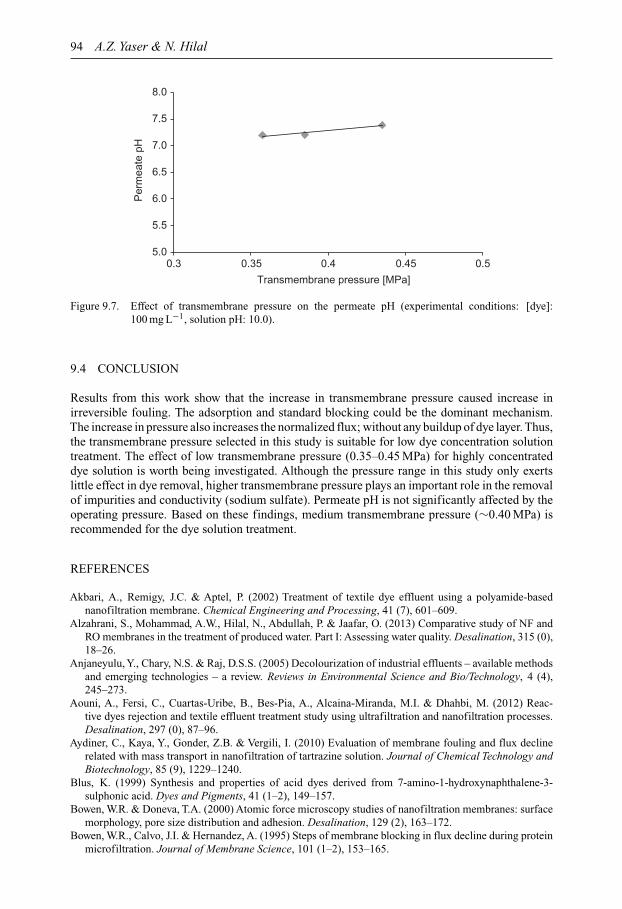
94 A.Z. Yaser & N. Hilal
5.0
5.5
6.0
6.5
7.0
7.5
8.0
0.3 0.35 0.4 0.45 0.5
Per
mea
te p
H
Transmembrane pressure [MPa]
Figure 9.7. Effect of transmembrane pressure on the permeate pH (experimental conditions: [dye]:100 mg L−1, solution pH: 10.0).
9.4 CONCLUSION
Results from this work show that the increase in transmembrane pressure caused increase inirreversible fouling. The adsorption and standard blocking could be the dominant mechanism.The increase in pressure also increases the normalized flux; without any buildup of dye layer. Thus,the transmembrane pressure selected in this study is suitable for low dye concentration solutiontreatment. The effect of low transmembrane pressure (0.35–0.45 MPa) for highly concentrateddye solution is worth being investigated. Although the pressure range in this study only exertslittle effect in dye removal, higher transmembrane pressure plays an important role in the removalof impurities and conductivity (sodium sulfate). Permeate pH is not significantly affected by theoperating pressure. Based on these findings, medium transmembrane pressure (∼0.40 MPa) isrecommended for the dye solution treatment.
REFERENCES
Akbari, A., Remigy, J.C. & Aptel, P. (2002) Treatment of textile dye effluent using a polyamide-basednanofiltration membrane. Chemical Engineering and Processing, 41 (7), 601–609.
Alzahrani, S., Mohammad, A.W., Hilal, N., Abdullah, P. & Jaafar, O. (2013) Comparative study of NF andRO membranes in the treatment of produced water. Part I: Assessing water quality. Desalination, 315 (0),18–26.
Anjaneyulu, Y., Chary, N.S. & Raj, D.S.S. (2005) Decolourization of industrial effluents – available methodsand emerging technologies – a review. Reviews in Environmental Science and Bio/Technology, 4 (4),245–273.
Aouni, A., Fersi, C., Cuartas-Uribe, B., Bes-Pia, A., Alcaina-Miranda, M.I. & Dhahbi, M. (2012) Reac-tive dyes rejection and textile effluent treatment study using ultrafiltration and nanofiltration processes.Desalination, 297 (0), 87–96.
Aydiner, C., Kaya, Y., Gonder, Z.B. & Vergili, I. (2010) Evaluation of membrane fouling and flux declinerelated with mass transport in nanofiltration of tartrazine solution. Journal of Chemical Technology andBiotechnology, 85 (9), 1229–1240.
Blus, K. (1999) Synthesis and properties of acid dyes derived from 7-amino-1-hydroxynaphthalene-3-sulphonic acid. Dyes and Pigments, 41 (1–2), 149–157.
Bowen, W.R. & Doneva, T.A. (2000) Atomic force microscopy studies of nanofiltration membranes: surfacemorphology, pore size distribution and adhesion. Desalination, 129 (2), 163–172.
Bowen, W.R., Calvo, J.I. & Hernandez, A. (1995) Steps of membrane blocking in flux decline during proteinmicrofiltration. Journal of Membrane Science, 101 (1–2), 153–165.
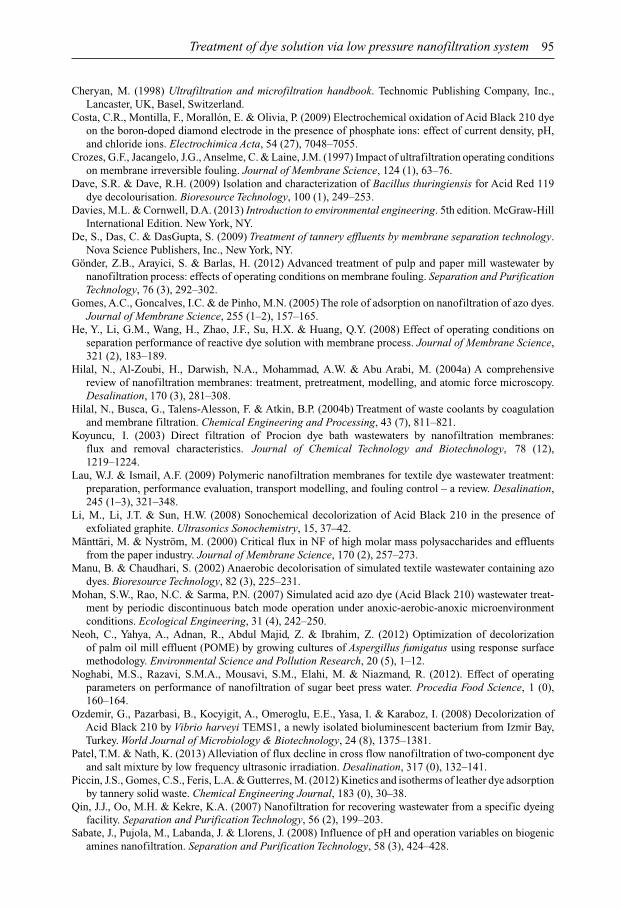
Treatment of dye solution via low pressure nanofiltration system 95
Cheryan, M. (1998) Ultrafiltration and microfiltration handbook. Technomic Publishing Company, Inc.,Lancaster, UK, Basel, Switzerland.
Costa, C.R., Montilla, F., Morallón, E. & Olivia, P. (2009) Electrochemical oxidation of Acid Black 210 dyeon the boron-doped diamond electrode in the presence of phosphate ions: effect of current density, pH,and chloride ions. Electrochimica Acta, 54 (27), 7048–7055.
Crozes, G.F., Jacangelo, J.G., Anselme, C. & Laine, J.M. (1997) Impact of ultrafiltration operating conditionson membrane irreversible fouling. Journal of Membrane Science, 124 (1), 63–76.
Dave, S.R. & Dave, R.H. (2009) Isolation and characterization of Bacillus thuringiensis for Acid Red 119dye decolourisation. Bioresource Technology, 100 (1), 249–253.
Davies, M.L. & Cornwell, D.A. (2013) Introduction to environmental engineering. 5th edition. McGraw-HillInternational Edition. New York, NY.
De, S., Das, C. & DasGupta, S. (2009) Treatment of tannery effluents by membrane separation technology.Nova Science Publishers, Inc., New York, NY.
Gönder, Z.B., Arayici, S. & Barlas, H. (2012) Advanced treatment of pulp and paper mill wastewater bynanofiltration process: effects of operating conditions on membrane fouling. Separation and PurificationTechnology, 76 (3), 292–302.
Gomes, A.C., Goncalves, I.C. & de Pinho, M.N. (2005) The role of adsorption on nanofiltration of azo dyes.Journal of Membrane Science, 255 (1–2), 157–165.
He, Y., Li, G.M., Wang, H., Zhao, J.F., Su, H.X. & Huang, Q.Y. (2008) Effect of operating conditions onseparation performance of reactive dye solution with membrane process. Journal of Membrane Science,321 (2), 183–189.
Hilal, N., Al-Zoubi, H., Darwish, N.A., Mohammad, A.W. & Abu Arabi, M. (2004a) A comprehensivereview of nanofiltration membranes: treatment, pretreatment, modelling, and atomic force microscopy.Desalination, 170 (3), 281–308.
Hilal, N., Busca, G., Talens-Alesson, F. & Atkin, B.P. (2004b) Treatment of waste coolants by coagulationand membrane filtration. Chemical Engineering and Processing, 43 (7), 811–821.
Koyuncu, I. (2003) Direct filtration of Procion dye bath wastewaters by nanofiltration membranes:flux and removal characteristics. Journal of Chemical Technology and Biotechnology, 78 (12),1219–1224.
Lau, W.J. & Ismail, A.F. (2009) Polymeric nanofiltration membranes for textile dye wastewater treatment:preparation, performance evaluation, transport modelling, and fouling control – a review. Desalination,245 (1–3), 321–348.
Li, M., Li, J.T. & Sun, H.W. (2008) Sonochemical decolorization of Acid Black 210 in the presence ofexfoliated graphite. Ultrasonics Sonochemistry, 15, 37–42.
Mänttäri, M. & Nyström, M. (2000) Critical flux in NF of high molar mass polysaccharides and effluentsfrom the paper industry. Journal of Membrane Science, 170 (2), 257–273.
Manu, B. & Chaudhari, S. (2002) Anaerobic decolorisation of simulated textile wastewater containing azodyes. Bioresource Technology, 82 (3), 225–231.
Mohan, S.W., Rao, N.C. & Sarma, P.N. (2007) Simulated acid azo dye (Acid Black 210) wastewater treat-ment by periodic discontinuous batch mode operation under anoxic-aerobic-anoxic microenvironmentconditions. Ecological Engineering, 31 (4), 242–250.
Neoh, C., Yahya, A., Adnan, R., Abdul Majid, Z. & Ibrahim, Z. (2012) Optimization of decolorizationof palm oil mill effluent (POME) by growing cultures of Aspergillus fumigatus using response surfacemethodology. Environmental Science and Pollution Research, 20 (5), 1–12.
Noghabi, M.S., Razavi, S.M.A., Mousavi, S.M., Elahi, M. & Niazmand, R. (2012). Effect of operatingparameters on performance of nanofiltration of sugar beet press water. Procedia Food Science, 1 (0),160–164.
Ozdemir, G., Pazarbasi, B., Kocyigit, A., Omeroglu, E.E., Yasa, I. & Karaboz, I. (2008) Decolorization ofAcid Black 210 by Vibrio harveyi TEMS1, a newly isolated bioluminescent bacterium from Izmir Bay,Turkey. World Journal of Microbiology & Biotechnology, 24 (8), 1375–1381.
Patel, T.M. & Nath, K. (2013) Alleviation of flux decline in cross flow nanofiltration of two-component dyeand salt mixture by low frequency ultrasonic irradiation. Desalination, 317 (0), 132–141.
Piccin, J.S., Gomes, C.S., Feris, L.A. & Gutterres, M. (2012) Kinetics and isotherms of leather dye adsorptionby tannery solid waste. Chemical Engineering Journal, 183 (0), 30–38.
Qin, J.J., Oo, M.H. & Kekre, K.A. (2007) Nanofiltration for recovering wastewater from a specific dyeingfacility. Separation and Purification Technology, 56 (2), 199–203.
Sabate, J., Pujola, M., Labanda, J. & Llorens, J. (2008) Influence of pH and operation variables on biogenicamines nanofiltration. Separation and Purification Technology, 58 (3), 424–428.
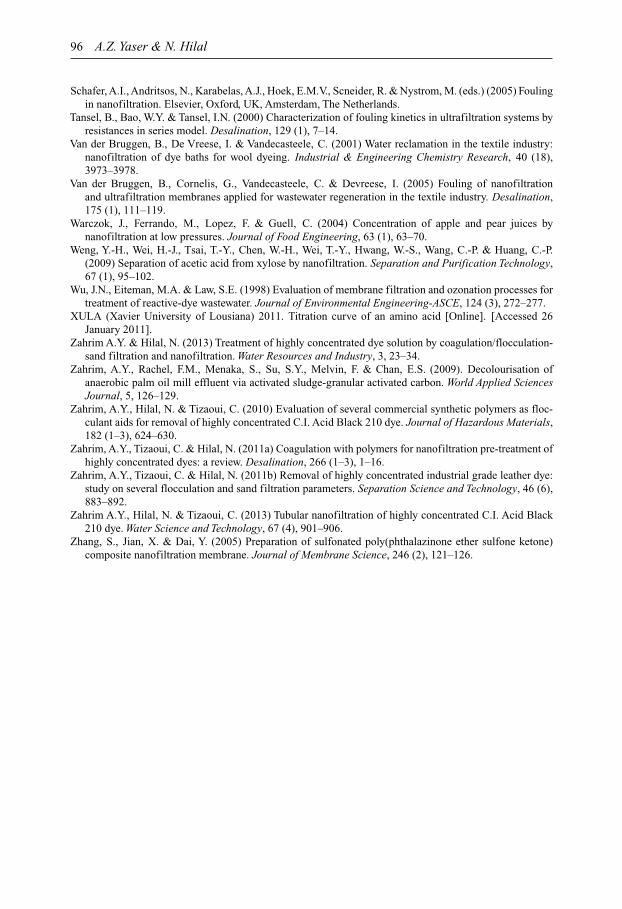
96 A.Z. Yaser & N. Hilal
Schafer, A.I., Andritsos, N., Karabelas, A.J., Hoek, E.M.V., Scneider, R. & Nystrom, M. (eds.) (2005) Foulingin nanofiltration. Elsevier, Oxford, UK, Amsterdam, The Netherlands.
Tansel, B., Bao, W.Y. & Tansel, I.N. (2000) Characterization of fouling kinetics in ultrafiltration systems byresistances in series model. Desalination, 129 (1), 7–14.
Van der Bruggen, B., De Vreese, I. & Vandecasteele, C. (2001) Water reclamation in the textile industry:nanofiltration of dye baths for wool dyeing. Industrial & Engineering Chemistry Research, 40 (18),3973–3978.
Van der Bruggen, B., Cornelis, G., Vandecasteele, C. & Devreese, I. (2005) Fouling of nanofiltrationand ultrafiltration membranes applied for wastewater regeneration in the textile industry. Desalination,175 (1), 111–119.
Warczok, J., Ferrando, M., Lopez, F. & Guell, C. (2004) Concentration of apple and pear juices bynanofiltration at low pressures. Journal of Food Engineering, 63 (1), 63–70.
Weng, Y.-H., Wei, H.-J., Tsai, T.-Y., Chen, W.-H., Wei, T.-Y., Hwang, W.-S., Wang, C.-P. & Huang, C.-P.(2009) Separation of acetic acid from xylose by nanofiltration. Separation and Purification Technology,67 (1), 95–102.
Wu, J.N., Eiteman, M.A. & Law, S.E. (1998) Evaluation of membrane filtration and ozonation processes fortreatment of reactive-dye wastewater. Journal of Environmental Engineering-ASCE, 124 (3), 272–277.
XULA (Xavier University of Lousiana) 2011. Titration curve of an amino acid [Online]. [Accessed 26January 2011].
Zahrim A.Y. & Hilal, N. (2013) Treatment of highly concentrated dye solution by coagulation/flocculation-sand filtration and nanofiltration. Water Resources and Industry, 3, 23–34.
Zahrim, A.Y., Rachel, F.M., Menaka, S., Su, S.Y., Melvin, F. & Chan, E.S. (2009). Decolourisation ofanaerobic palm oil mill effluent via activated sludge-granular activated carbon. World Applied SciencesJournal, 5, 126–129.
Zahrim, A.Y., Hilal, N. & Tizaoui, C. (2010) Evaluation of several commercial synthetic polymers as floc-culant aids for removal of highly concentrated C.I. Acid Black 210 dye. Journal of Hazardous Materials,182 (1–3), 624–630.
Zahrim, A.Y., Tizaoui, C. & Hilal, N. (2011a) Coagulation with polymers for nanofiltration pre-treatment ofhighly concentrated dyes: a review. Desalination, 266 (1–3), 1–16.
Zahrim, A.Y., Tizaoui, C. & Hilal, N. (2011b) Removal of highly concentrated industrial grade leather dye:study on several flocculation and sand filtration parameters. Separation Science and Technology, 46 (6),883–892.
Zahrim A.Y., Hilal, N. & Tizaoui, C. (2013) Tubular nanofiltration of highly concentrated C.I. Acid Black210 dye. Water Science and Technology, 67 (4), 901–906.
Zhang, S., Jian, X. & Dai, Y. (2005) Preparation of sulfonated poly(phthalazinone ether sulfone ketone)composite nanofiltration membrane. Journal of Membrane Science, 246 (2), 121–126.

CHAPTER 10
Fractionating the value-added products from skimmed coconut milkusing membrane separation technique
Ching Yin Ng, Abdul Wahab Mohammad & Law Yong Ng
10.1 INTRODUCTION
The abundance of coconut by-products after oil extraction in the coconut industry has createdthe environmental issue in some areas near to coconut processing plants. Coconut is well knownfor its great versatility as seen in nutraceutical, pharmaceutical, medicine, food and beverageindustries (Yong et al., 2009). Precious and valuable virgin coconut oil (VCO) can be obtainedfrom coconut, and the remaining residues after VCO production contain some very nutritionalcomponents which are highly beneficial to the consumers. These valuable components can beseparated by suitable separation techniques or other appropriate processes. The components thatcan be extracted from the coconut include coconut protein, plant hormones, vitamins, minerals,amino acids etc. The skimmed coconut milk consists of total proteins (approximately 70%) andnumerous carbohydrates, sugars, vitamins and minerals (Seow and Gwee, 1997). Therefore, thesecomponents can be separated and/or concentrated and used as functional food, food supplementand food formulation through fractionation and concentration processes by membrane separationtechnique. The great versatility of these valuable compounds from the coconut has attractedthe attention of many researchers and industrialists to produce more profitable and value-addedcoconut products.
Fractionation is a common separation process used to obtain multiple components with higherpurity from a complex mixture due to their sizes and physical-chemical properties. Membranetechnology is one of the promising methods which manages to fractionate the mixture due to themolecular size of components in the solution. For more than a decade, the membrane separationtechnique has been applied in different areas such as food industry, dairy manufacturing, medical,pharmaceutical field and other industries. The outputs of the membrane process are consideredas better in some aspects when compared to other fractionating processes. The purity and qualityof the products can be assured whilst the aroma of the aromatic compounds in the food and dairyproducts can be retained by the membrane process (Daufin et al., 2001; Engel et al., 2002; Jiao,et al., 2004). This is the most significant advantage in employing the membrane separation methodfor the food and dairy industry. A combination of ultrafiltration (UF) and nanofiltration (NF) hasbeen widely employed in the food industry to concentrate and extract valuable components fromthe natural solutions. Many researchers have reported similar topics in their studies (Hagenmaieret al., 2006; Mohammad et al., 2012; Rao et al., 1994; Yin et al., 2013). In addition, theemployment of NF membrane can also contribute to the selective separation of finer chargedmolecules like protein hydrolysates due to the size-exclusion and Donnan-exclusion mechanisms(Bourseau et al., 2009).
In this study, high value-added plant hormones (kinetin and zeatin) and coconut protein are thetargeted products after the filtration process using UF and NF membranes. The feed solution ofthe UF process is skimmed coconut milk, while the permeate of the UF process will be used asthe feed for the NF process in order to retain the plant hormones compounds. The concentratedprotein solution after the UF process can be a great functional food in food-related industries.Figure 10.1 shows the molecular structures of kinetin and zeatin compounds. These hormones
97
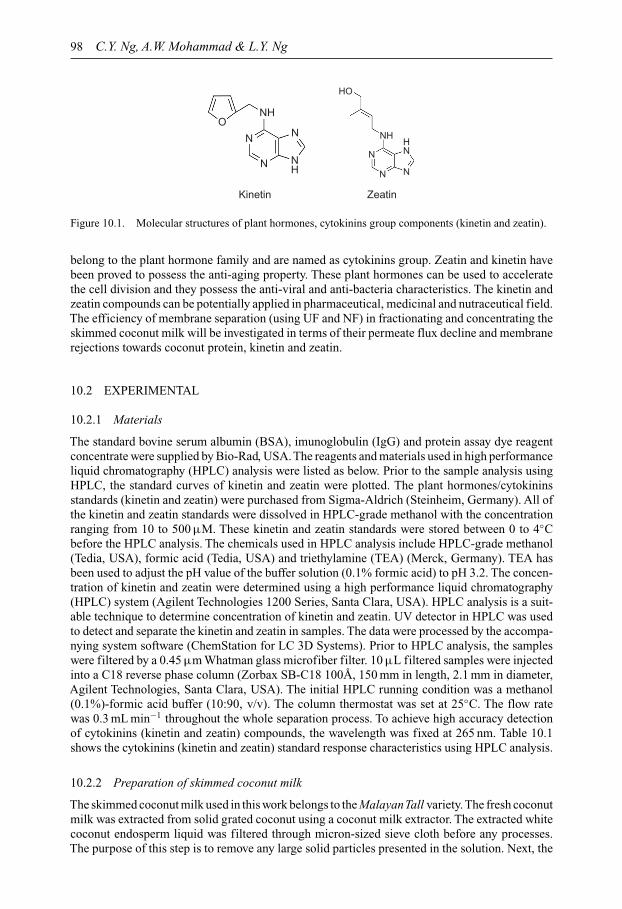
98 C.Y. Ng, A.W. Mohammad & L.Y. Ng
N
N
N
HO
NH
N
N N
NH
O
NH
Kinetin Zeatin
NH
Figure 10.1. Molecular structures of plant hormones, cytokinins group components (kinetin and zeatin).
belong to the plant hormone family and are named as cytokinins group. Zeatin and kinetin havebeen proved to possess the anti-aging property. These plant hormones can be used to acceleratethe cell division and they possess the anti-viral and anti-bacteria characteristics. The kinetin andzeatin compounds can be potentially applied in pharmaceutical, medicinal and nutraceutical field.The efficiency of membrane separation (using UF and NF) in fractionating and concentrating theskimmed coconut milk will be investigated in terms of their permeate flux decline and membranerejections towards coconut protein, kinetin and zeatin.
10.2 EXPERIMENTAL
10.2.1 Materials
The standard bovine serum albumin (BSA), imunoglobulin (IgG) and protein assay dye reagentconcentrate were supplied by Bio-Rad, USA.The reagents and materials used in high performanceliquid chromatography (HPLC) analysis were listed as below. Prior to the sample analysis usingHPLC, the standard curves of kinetin and zeatin were plotted. The plant hormones/cytokininsstandards (kinetin and zeatin) were purchased from Sigma-Aldrich (Steinheim, Germany). All ofthe kinetin and zeatin standards were dissolved in HPLC-grade methanol with the concentrationranging from 10 to 500 µM. These kinetin and zeatin standards were stored between 0 to 4◦Cbefore the HPLC analysis. The chemicals used in HPLC analysis include HPLC-grade methanol(Tedia, USA), formic acid (Tedia, USA) and triethylamine (TEA) (Merck, Germany). TEA hasbeen used to adjust the pH value of the buffer solution (0.1% formic acid) to pH 3.2. The concen-tration of kinetin and zeatin were determined using a high performance liquid chromatography(HPLC) system (Agilent Technologies 1200 Series, Santa Clara, USA). HPLC analysis is a suit-able technique to determine concentration of kinetin and zeatin. UV detector in HPLC was usedto detect and separate the kinetin and zeatin in samples. The data were processed by the accompa-nying system software (ChemStation for LC 3D Systems). Prior to HPLC analysis, the sampleswere filtered by a 0.45 µm Whatman glass microfiber filter. 10 µL filtered samples were injectedinto a C18 reverse phase column (Zorbax SB-C18 100Å, 150 mm in length, 2.1 mm in diameter,Agilent Technologies, Santa Clara, USA). The initial HPLC running condition was a methanol(0.1%)-formic acid buffer (10:90, v/v). The column thermostat was set at 25◦C. The flow ratewas 0.3 mL min−1 throughout the whole separation process. To achieve high accuracy detectionof cytokinins (kinetin and zeatin) compounds, the wavelength was fixed at 265 nm. Table 10.1shows the cytokinins (kinetin and zeatin) standard response characteristics using HPLC analysis.
10.2.2 Preparation of skimmed coconut milk
The skimmed coconut milk used in this work belongs to the MalayanTall variety. The fresh coconutmilk was extracted from solid grated coconut using a coconut milk extractor. The extracted whitecoconut endosperm liquid was filtered through micron-sized sieve cloth before any processes.The purpose of this step is to remove any large solid particles presented in the solution. Next, the

Fractionating the value-added products from skimmed coconut milk 99
Table 10.1. Cytokinins standard response characteristics using HPLC.
Cytokinins standard
Details Kinetin Zeatin
Mean retention time– Minute [min]a 26.8 18.4– Relative standard deviation (RSD) [%] 0.19 0.002Peak areaa
– Mean 7327.34 612.17– RSD [%] 1.7 0.5Equation of calibration curves y = 160.4x – 749.2 y = 122.4x – 53.31Regression (R2)b 0.977 0.999Linear range [mg L−1] 2–100 2–100LOQ [µM]c 1.7 3.47
aData were measured with repeated injection (n = 5) of plant hormone standard at aconcentration of 20 mg L−1 each.bIn the calibration equation, x represents concentration of the analyte [mg L−1] and y thepeak area (mili absorption unit in second [mAu s].cLimit of quantification (LOQ) was estimated based on signal-to-noise ration (S/N ) = 10.
filtered coconut milk was pasteurized to prolong the shelf-life of coconut milk as it is a perishableliquid. In this step, the coconut milk was heated at 60◦C for 15 minutes and this can reducethe microbial load to 10% (Hagenmaier, 1980). The high temperature of pasteurization should beavoided as protein molecules start to denature at 70◦C.The warm coconut milk was processed withcoconut cream separation process using 125 L capacity cream separator (Elecrem, France). Thewarm skimmed coconut milk makes the separation process easier and more effective. There aretwo outputs from the cream separator: concentrated coconut cream and skimmed coconut milk.The skimmed coconut milk was used as the feed solution throughout this work. A membranefiltration process was applied to further fractionate and concentrate the components inside theskimmed coconut milk to obtain high value-added coconut products.
10.2.3 Ultrafiltration and nanofiltration
The UF membrane employed in this study is made of polysulfone (PSF) material with a molec-ular weight-cut-off (MWCO) of 10,000 Da from Koch, USA. The abbreviation used for the UFmembrane is PSF10. The employed NF membrane (NF1) is produced by Amfor Inc., China. Allof the membranes used were soaked in ultrapure water overnight to remove any preservative layerand dirt particles prior to the experimental runs. The membrane compaction was conducted at ahigher pressure than the operating pressure. This was aimed to enhance the permeate flux andpermeability of the membranes (Persson et al., 1995). The pure water was used to conduct thepermeability test of the membrane. The purpose of this step is to confirm that the membrane isin good condition before filtration process using skimmed coconut milk.
The UF process was performed by a cross-flow filtration unit, which was equipped with a 4 Lstainless steel jacketed feed tank with an embedded mixer (Ika, Germany) and a variable feedpump (Hydra-cell Pump, MN, USA).The temperature of the feed was controlled by circulating thewater through a jacketed feed tank. The cross-flow velocity (CFV ) and trans-membrane pressure(TMP) were controlled using a feed flowmeter (F-400, Blue-White, USA) and a permeate needlevalve (Swagelok, UK). A digital balance (GF 6100, A&D, Japan) was connected to a computerto record the permeate flux in the continuous manner. The pressure at 0.2 MPa and temperatureat 60◦C were set during ultrafiltration of skimmed coconut milk using cross-flow system. Thevalue of CFV was 2.728 L min−1 while the stirring rate was 400 rpm throughout the UF process
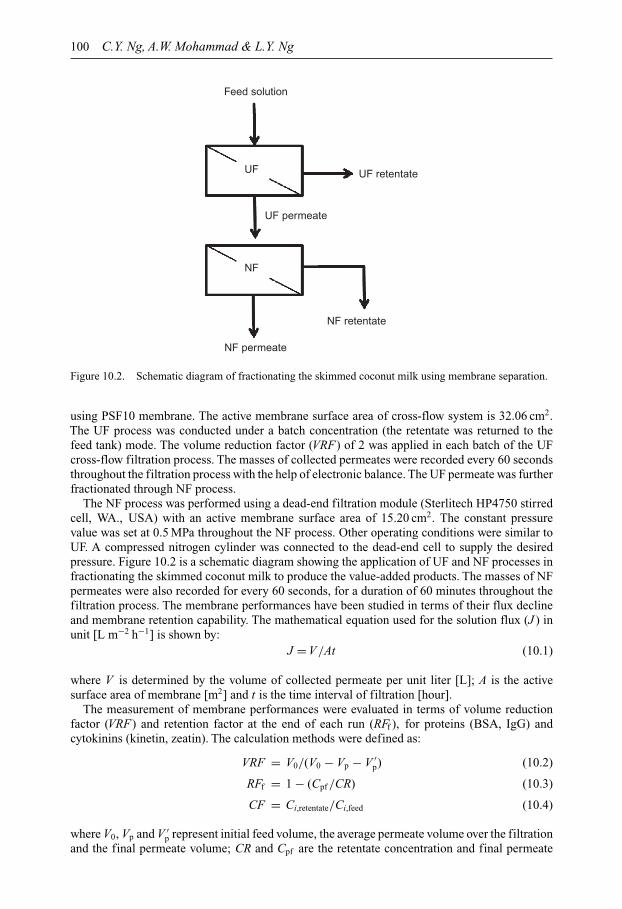
100 C.Y. Ng, A.W. Mohammad & L.Y. Ng
Feed solution
UF retentate
UF permeate
NF permeate
NF retentate
UF
NF
Figure 10.2. Schematic diagram of fractionating the skimmed coconut milk using membrane separation.
using PSF10 membrane. The active membrane surface area of cross-flow system is 32.06 cm2.The UF process was conducted under a batch concentration (the retentate was returned to thefeed tank) mode. The volume reduction factor (VRF) of 2 was applied in each batch of the UFcross-flow filtration process. The masses of collected permeates were recorded every 60 secondsthroughout the filtration process with the help of electronic balance. The UF permeate was furtherfractionated through NF process.
The NF process was performed using a dead-end filtration module (Sterlitech HP4750 stirredcell, WA., USA) with an active membrane surface area of 15.20 cm2. The constant pressurevalue was set at 0.5 MPa throughout the NF process. Other operating conditions were similar toUF. A compressed nitrogen cylinder was connected to the dead-end cell to supply the desiredpressure. Figure 10.2 is a schematic diagram showing the application of UF and NF processes infractionating the skimmed coconut milk to produce the value-added products. The masses of NFpermeates were also recorded for every 60 seconds, for a duration of 60 minutes throughout thefiltration process. The membrane performances have been studied in terms of their flux declineand membrane retention capability. The mathematical equation used for the solution flux (J ) inunit [L m−2 h−1] is shown by:
J = V/At (10.1)
where V is determined by the volume of collected permeate per unit liter [L]; A is the activesurface area of membrane [m2] and t is the time interval of filtration [hour].
The measurement of membrane performances were evaluated in terms of volume reductionfactor (VRF) and retention factor at the end of each run (RFf ), for proteins (BSA, IgG) andcytokinins (kinetin, zeatin). The calculation methods were defined as:
VRF = V0/(V0 − Vp − V ′p) (10.2)
RFf = 1 − (Cpf /CR) (10.3)
CF = Ci,retentate/Ci,feed (10.4)
where V0, Vp and V ′p represent initial feed volume, the average permeate volume over the filtration
and the final permeate volume; CR and Cpf are the retentate concentration and final permeate
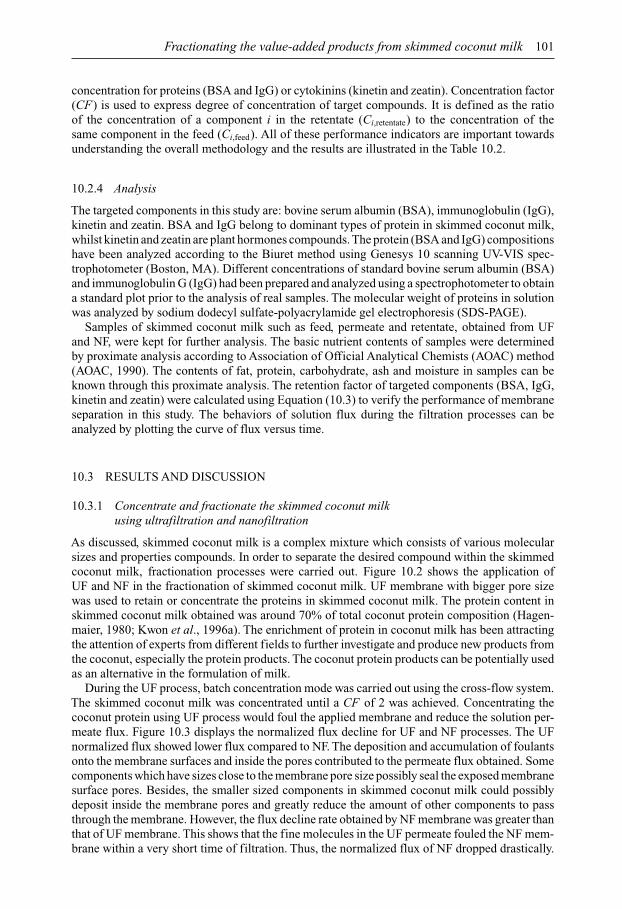
Fractionating the value-added products from skimmed coconut milk 101
concentration for proteins (BSA and IgG) or cytokinins (kinetin and zeatin). Concentration factor(CF) is used to express degree of concentration of target compounds. It is defined as the ratioof the concentration of a component i in the retentate (Ci,retentate) to the concentration of thesame component in the feed (Ci,feed). All of these performance indicators are important towardsunderstanding the overall methodology and the results are illustrated in the Table 10.2.
10.2.4 Analysis
The targeted components in this study are: bovine serum albumin (BSA), immunoglobulin (IgG),kinetin and zeatin. BSA and IgG belong to dominant types of protein in skimmed coconut milk,whilst kinetin and zeatin are plant hormones compounds. The protein (BSA and IgG) compositionshave been analyzed according to the Biuret method using Genesys 10 scanning UV-VIS spec-trophotometer (Boston, MA). Different concentrations of standard bovine serum albumin (BSA)and immunoglobulin G (IgG) had been prepared and analyzed using a spectrophotometer to obtaina standard plot prior to the analysis of real samples. The molecular weight of proteins in solutionwas analyzed by sodium dodecyl sulfate-polyacrylamide gel electrophoresis (SDS-PAGE).
Samples of skimmed coconut milk such as feed, permeate and retentate, obtained from UFand NF, were kept for further analysis. The basic nutrient contents of samples were determinedby proximate analysis according to Association of Official Analytical Chemists (AOAC) method(AOAC, 1990). The contents of fat, protein, carbohydrate, ash and moisture in samples can beknown through this proximate analysis. The retention factor of targeted components (BSA, IgG,kinetin and zeatin) were calculated using Equation (10.3) to verify the performance of membraneseparation in this study. The behaviors of solution flux during the filtration processes can beanalyzed by plotting the curve of flux versus time.
10.3 RESULTS AND DISCUSSION
10.3.1 Concentrate and fractionate the skimmed coconut milkusing ultrafiltration and nanofiltration
As discussed, skimmed coconut milk is a complex mixture which consists of various molecularsizes and properties compounds. In order to separate the desired compound within the skimmedcoconut milk, fractionation processes were carried out. Figure 10.2 shows the application ofUF and NF in the fractionation of skimmed coconut milk. UF membrane with bigger pore sizewas used to retain or concentrate the proteins in skimmed coconut milk. The protein content inskimmed coconut milk obtained was around 70% of total coconut protein composition (Hagen-maier, 1980; Kwon et al., 1996a). The enrichment of protein in coconut milk has been attractingthe attention of experts from different fields to further investigate and produce new products fromthe coconut, especially the protein products. The coconut protein products can be potentially usedas an alternative in the formulation of milk.
During the UF process, batch concentration mode was carried out using the cross-flow system.The skimmed coconut milk was concentrated until a CF of 2 was achieved. Concentrating thecoconut protein using UF process would foul the applied membrane and reduce the solution per-meate flux. Figure 10.3 displays the normalized flux decline for UF and NF processes. The UFnormalized flux showed lower flux compared to NF. The deposition and accumulation of foulantsonto the membrane surfaces and inside the pores contributed to the permeate flux obtained. Somecomponents which have sizes close to the membrane pore size possibly seal the exposed membranesurface pores. Besides, the smaller sized components in skimmed coconut milk could possiblydeposit inside the membrane pores and greatly reduce the amount of other components to passthrough the membrane. However, the flux decline rate obtained by NF membrane was greater thanthat of UF membrane. This shows that the fine molecules in the UF permeate fouled the NF mem-brane within a very short time of filtration. Thus, the normalized flux of NF dropped drastically.

102 C.Y. Ng, A.W. Mohammad & L.Y. Ng
Time [min]
0 100 200 300 400
J/J 0
0.00
0.05
0.10
0.15
0.20
0.25
NF (NF1)UF (PSF10)
Figure 10.3. Permeate normalized flux along the entire filtration time for UF and NF.
10.3.2 Performance indicator of membrane separation
The Bradford protein assay method was conducted to determine the protein concentration in UFfeed, retentate and permeate. The proteins considered in this study were BSA and IgG as they arethe predominant protein fractions in the coconut milk (Kwon et al., 1996a; Samson et al., 1971).Retention of proteins by UF membrane was calculated using Equation (10.3).
Table 10.2 shows the volume reduction factor (VRF) of feed, concentration factor (CF) ofsolutes and retention factor (RFf ) of solutes in UF and NF processes. In the UF of skimmedcoconut milk, the VRF of 2 was set. The soluble protein of BSA and IgG were concentrated toabout 1.12 times in the retentate of UF process. The retention factors obtained for the proteinsare 0.9836 (for BSA) and 0.9981 (for IgG). The amount of protein in the UF permeate was toolittle and negligible compared to the UF feed. NF process was conducted using the UF permeate(which was conducted previously) as its feed solution. The VRF of 10 was achieved by NFafter approximately 5 hours of filtration time. Concentration factors (CF) of kinetin and zeatinobtained using NF membrane (NF1) were around 2.25 and 3.0, respectively, while the retentionfactor (RFf ) obtained for kinetin and zeatin was 0.9238 and 0.9511, respectively. The retentionof zeatin in this study was higher than that of kinetin using the membrane NF1. This can beexplained by the molecular structure of zeatin (Fig. 10.1). The reactive hydroxyl bond (–OH) inthe zeatin molecule can be readily combined with any reactive compounds within the coconutsolution. Hence, the sizes of compounds formed can be larger than the kinetin molecules itself.As a result, more zeatin molecules can be retained by the NF membrane when compared to thekinetin molecules. The concentration and retention factor results verified that the application ofUF and NF processes is a feasible technique to fractionate complex coconut solution to obtainvarious value-added products.
10.3.3 Proximate analyses of samples produced
Table 10.3 displays the results of proximate analyses of the UF and NF samples from feed, retentateand permeate streams. Through these analyses, the amount of protein, fat, carbohydrate, ash andmoisture content in every sample was reported in unit g/100 g or percentage. The moisture or watercontent constituted the highest percentage in all analyzed samples. From the Table 10.3, it canbe clearly seen that the fat content only presents in the UF feed stream or the so-called skimmed

Fractionating the value-added products from skimmed coconut milk 103
Table 10.2. The volume reduction factors (VRF), concentration factors (CF) and retention factors (RFf )of solutes in UF and NF processes, which were performed by PSF10 and NF1 membranes,respectively.
Concentration factor (CF) Retention factor (RFf )
Process VRF BSA IgG Kinetin Zeatin BSA IgG Kinetin Zeatin
UF (PSF10) 2 1.116 1.118 – – 0.9836 0.9981 0.5400 0.0618NF (NF1) 10 – – 2.25 3.00 – – 0.9238 0.9511
Table 10.3. Basic nutrient contents in UF and NF samples by proximate analysis.
Parameter, unit UF feed UF retentate UF permeate/NF feed NF retentate NF permeate
Protein [g/100 g] 2.1 6.5 0.2 0.3 0.2Fat [g/100 g] 0.8 0 0 0 0Carbohydrate [g/100 g] 4.5 3.5 2.9 2.7 1.3Ash [g/100 g] 1.0 0.8 0.8 0.8 0.6Moisture [g/100 g] 91.6 89.2 96.1 96.2 97.9Energy [kJ/100 g] 142 79 50 50 25
coconut milk, with a concentration of about around 0.8%. From Table 10.3, the composition ofprotein in the UF feed was about 2.1%.After the skimmed coconut milk is concentrated through UFprocess, the concentration of protein was increased to 6.5% in the UF retentate stream. Accordingto the result obtained, there was only 0.2% of protein in the UF permeate. Water content is themajor constituent in all of the NF streams (retentate and permeate). Other constituents such asprotein, fat, carbohydrate and ash in NF samples were much lower in percentage than UF samplesexcept water content.
10.3.4 SDS-PAGE analysis
Gel-electrophoresis method using SDS-PAGE to determine the molecular weight of protein ispresented in Figure 10.4. The left lane indicates molecular marker (10–260 kDa), the middle laneindicates the feed of UF and the right lane indicates the UF retentate. From the SDS-PAGE profile,it is easy to observe that the protein bands presented in the UF feed were the same as the UFretentate. But, the bands presented in the UF retentate showed higher intensity than UF feed. Thismeans that the concentration of protein fractions in the UF retentate were higher than the UF feed.Thus, the concentration of coconut proteins through the employment of UF process was successful.Four major bands ranging from 16 kDa to 150 kDa dominated the total protein composition in theunreduced form. Kwon et al. (1996a) reported that the prominent bands belonged to albumin andglobulin proteins. The albumin and globulin fractions were the predominant protein fractions,accounting for 60 and 30% of the total protein, respectively (Angelia et al., 2010; Samson et al.,1971). In the previous study, the total coconut protein was found to have a similar pattern asshown in Figure 10.4 (Kwon et al., 1996b). The coconut proteins are separated into four bandswhich indicate that the protein molecular weights are greater than 150, 55, 34 and 17 kDa.
10.4 CONCLUSION
From the obtained results, it can be concluded that the utilization of ultrafiltration membraneto concentrate the protein content in skimmed coconut milk can be successfully achieved with
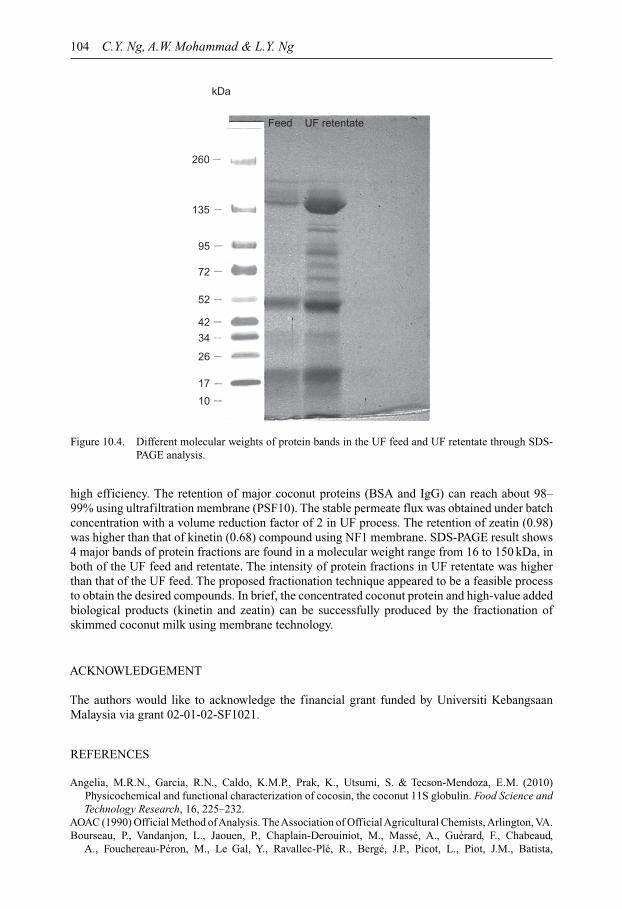
104 C.Y. Ng, A.W. Mohammad & L.Y. Ng
10
17
26
34
42
52
72
95
135
260
kDa
Feed UF retentate
Figure 10.4. Different molecular weights of protein bands in the UF feed and UF retentate through SDS-PAGE analysis.
high efficiency. The retention of major coconut proteins (BSA and IgG) can reach about 98–99% using ultrafiltration membrane (PSF10). The stable permeate flux was obtained under batchconcentration with a volume reduction factor of 2 in UF process. The retention of zeatin (0.98)was higher than that of kinetin (0.68) compound using NF1 membrane. SDS-PAGE result shows4 major bands of protein fractions are found in a molecular weight range from 16 to 150 kDa, inboth of the UF feed and retentate. The intensity of protein fractions in UF retentate was higherthan that of the UF feed. The proposed fractionation technique appeared to be a feasible processto obtain the desired compounds. In brief, the concentrated coconut protein and high-value addedbiological products (kinetin and zeatin) can be successfully produced by the fractionation ofskimmed coconut milk using membrane technology.
ACKNOWLEDGEMENT
The authors would like to acknowledge the financial grant funded by Universiti KebangsaanMalaysia via grant 02-01-02-SF1021.
REFERENCES
Angelia, M.R.N., Garcia, R.N., Caldo, K.M.P., Prak, K., Utsumi, S. & Tecson-Mendoza, E.M. (2010)Physicochemical and functional characterization of cocosin, the coconut 11S globulin. Food Science andTechnology Research, 16, 225–232.
AOAC (1990) Official Method ofAnalysis. TheAssociation of OfficialAgricultural Chemists, Arlington, VA.Bourseau, P., Vandanjon, L., Jaouen, P., Chaplain-Derouiniot, M., Massé, A., Guérard, F., Chabeaud,
A., Fouchereau-Péron, M., Le Gal, Y., Ravallec-Plé, R., Bergé, J.P., Picot, L., Piot, J.M., Batista,
Fractionating the value-added products from skimmed coconut milk 105
I., Thorkelsson, G., Delannoy, C., Jakobsen, G. & Johansson, I. (2009) Fractionation of fish proteinhydrolysates by ultrafiltration and nanofiltration: impact on peptidic populations. Desalination, 244,303–320.
Daufin, G., Escudier, J.P., Carrere, H., Berot, S., Fillaudeau, L. & Decloux, M. (2001) Recent and emergingapplications of membrane processes in the food and dairy Industry. Food and Bioproducts Processing,79, 89–102.
Engel, E., Lombardot, J.-B., Garem, A., Leconte, N., Septier, C., Le Quéré, J.-L. & Salles, C. (2002) Frac-tionation of the water-soluble extract of a cheese made from goats’ milk by filtration methods: behaviourof fat and volatile compounds. International Dairy Journal, 12, 609–619.
Hagenmaier, R. (ed.) (1980) Coconut aqueous processing. 2nd edition. Publications, University of SanCarlos, Cebu City, Philippines.
Hagenmaier, R.D., Cater, C.M. & Mattil, K.F. (2006) Coconut skim milk as an intermediate moisture product.Journal of Food Science, 40, 717–720.
Jiao, B., Cassano, A. & Drioli, E. (2004) Recent advances on membrane processes for the concentration offruit juices: a review. Journal of Food Engineering, 63, 303–324.
Kwon, K., Park, K.H. & Rhee, K.C. (1996a) Fractionation and characterization of proteins from coconut(Cocos nucifera L.). Journal of Agricultural and Food Chemistry, 44, 1741–1745.
Kwon, K.S., Bae, D., Park, K.H. & Rhee, K.C. (1996b) Aqueous extraction and membrane techniquesimprove coconut protein concentrate functionality. Journal of Food Science, 61, 753–756.
Mohammad, A., Ng, C., Lim, Y. & Ng, G. (2012) Ultrafiltration in food processing industry: review onapplication, membrane fouling, and fouling control. Food and Bioprocess Technology, 5, 1143.
Persson, K.M., Gekas, V. & Trägårdh, G. (1995) Study of membrane compaction and its influence onultrafiltration water permeability. Journal of Membrane Science, 100, 155–160.
Rao, H.G.R., Grandison, A.S. & Lewis, M.J. (1994) Flux pattern and fouling of membranes duringultrafiltration of some dairy products. Journal of the Science of Food and Agriculture, 66, 563–571.
Samson, A.S., Khaund, R.N., Cater, C.M. & Mattil, K.F. (1971) Extractability of coconut proteins. Journalof Food Science, 36, 725–728.
Seow, C.C. & Gwee, C.N. (1997) Coconut milk: chemistry and technology. International Journal of FoodScience & Technology, 32, 189–201.
Yin, N.C., Mohammad, A.W. & Yong, N.L. (2013) Membrane performance and potential separation ofcytokinins during ultrafiltration of skimmed coconut milk. Advanced Science Letters, 19, 3620–3624.
Yong, J.W.H., Ge, L., Ng, Y.F. & Tan, S.N. (2009) The chemical composition and biological properties ofcoconut (Cocos nucifera L.) water. Journal of Molecules, 14, 5144–5164.

This page intentionally left blankThis page intentionally left blank

CHAPTER 11
Recovery of rubber from skim latex using membrane technology
Khairul Muis Mohamed Yusof, Jaya Kumar Veellu, Ahmad Jaril Asis, Zainan Abdullah,Mohamed Kheireddine Aroua & Nik Meriam Nik Sulaiman
11.1 INTRODUCTION
Natural rubber field latex (NRFL) obtained from the Hevea brasiliensis tree remains one of themost important agricultural products in Malaysia. There are two main types of natural rubberprocessing factories in Malaysia, namely for the production of latex concentrate (NR latex)and the Standard Malaysian Rubber (SMR). NR latex as an industrial raw material is suppliedas concentrated latex, where the dry rubber content (DRC) is about 60%. Currently there arethree main methods to concentrate the latex, namely centrifugation, creaming and evaporation.Centrifugation is the most preferable method to concentrate NRFL into latex concentrate andaccounts for some 98% of the total concentrate produced in Malaysia (Cheng, 1988).
Natural rubber skim latex (NRSL) which contains about 3–5% DRC is discharged as wasteduring centrifugation of NRFL into latex concentrate. It is well known in the industry that rubbercan be recovered from NRSL by coagulation using sulfuric acid. The recovered rubber is thendried in the open before the rubber is sold as skim crepe rubber. However, the skim rubber obtainedfrom this coagulation method is of an inferior quality as it contains a high proportion of entrainednon-rubber constituents and acid content. The skim rubber also possesses undesirable physicalproperties including the generation of obnoxious odor, leading to low economic value in skimrubber. Furthermore, the method also produces highly acidic effluent which may cause pollutionto the environment if the effluent is not treated in a proper manner before being discharged to theenvironment (Devaraj et al., 2003).
Studies by Devaraj (2004) and Devaraj et al. (2005) reported that membrane technology couldbe an alternative method of concentrating NRFL into latex concentrate. In those studies, NRFLwith a DRC of 28% was concentrated to 50% using tubular cross flow ultrafiltration (UF) wherepolymeric PVDF membranes were used. This method yields a clear serum which can be furtherused for extraction of many valuable bio-chemicals such as proteins and carbohydrate sugar(L-Quebrachitol) (Rhodes and Wiltshire, 1932). In another study by Devaraj and Zairossani(2007) it was reported that using UF polymeric membrane (PVDF), the DRC of NRSL can beincreased from 5 to 30% but it takes more than 10 hours concentration process.
Polymeric membranes are known for their rapid fouling in presence of high solids contentof the feed and at high temperatures polymeric membranes are not able to operate (>50◦C). Incomparison to polymeric membranes, ceramic membranes are slower to foul and can be cleanedusing more extreme membrane cleaning methods (Panglisch, 2009). Moreover, the operating lifespan of ceramic membrane is usually five times more than polymeric membrane thus enableshigher productivity (Panglisch, 2009). This study is focused on evaluating the use of ceramicmembrane (tubular and hollow fiber type) in concentrating NRSL and to study the effect of trans-membrane pressure (TMP) on the concentration process and degree of concentration. A suitablesequence of cleaning in place (CIP) procedure was established to regenerate the fouled ceramicmembrane. To the best of our knowledge, there is no study in the open literature on the evaluationof ceramic membranes in concentrating NRSL.
107

108 K.M.M. Yusof et al.
11.2 EXPERIMENTAL
11.2.1 Materials
The source of feed was NRSL and the samples were obtained from centrifugation process of NRFLinto latex concentrate at Sime Darby Plantation Latex Factory, Batu Anam, Johor, Malaysia. Toensure the NRSL stability is maintained during UF concentration run, the latex was preservedwith ammonia and ammonium laureate.
11.2.2 Experimental design
Ceramic type ultrafiltration membranes which were commercially available were selected for thisevaluation with a range of suitable pore sizes. The schematic diagram of the system is shown inFigure 11.1. Two types of ceramic membrane configuration were evaluated which were ceramicmulti-tubular (MT) and ceramic hollow fiber (HF) membranes. For both MT and HF membranes,two pore sizes were evaluated. The membranes were thus coded as PMT1 (smaller pore size) andPMT2 (larger pore size) for MT membranes, and PHF1 (smaller pore size) and PHF2 (larger poresize) for HF membranes, respectively. Both membranes were mounted onto stainless steel housingand connected to a diaphragm pump for circulation. Optimum TMP was identified by comparingpermeate flux at different preset TMPs for MT membrane and HF membrane. A different set ofCIP procedures and chemicals were evaluated to give maximum membrane recovery after theconcentration run.
11.2.3 NR skim latex concentration run
Membrane recovery was first determined before the start of any experiments. This was done bycomparing water flux of unused membrane with water flux measured after using the membrane.Membrane recovery [%] is calculated by dividing the water flux of used membrane by that ofunused membrane. If the recovery is below 80% the membrane is considered fouled and has to be
Diaphragm pump
Diaphragm pump
Membrane
Pressuregauge#
Membrane Membrane
Sieve
Sieve
Sieve
P
T
T
P P P P P
P P P P P P
P
Feedtank CIP
tank
Sieve
Pre-treatmenttank
Diaphragmpump
Skimlatextank
Chemical pump
Laptop
Weighing machine
Permeatetank
Figure 11.1. Schematic diagram of an ultrafiltration system.
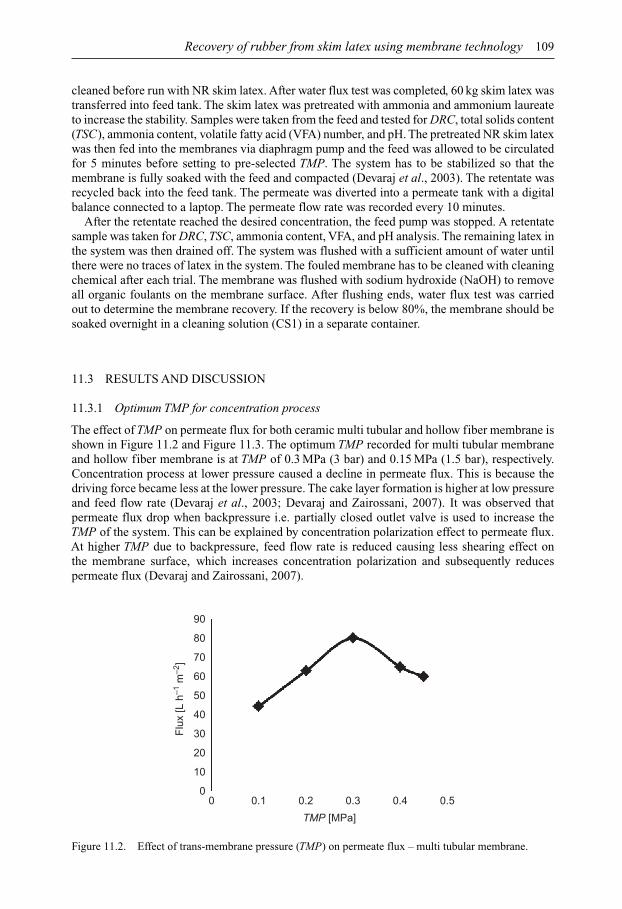
Recovery of rubber from skim latex using membrane technology 109
cleaned before run with NR skim latex. After water flux test was completed, 60 kg skim latex wastransferred into feed tank. The skim latex was pretreated with ammonia and ammonium laureateto increase the stability. Samples were taken from the feed and tested for DRC, total solids content(TSC), ammonia content, volatile fatty acid (VFA) number, and pH. The pretreated NR skim latexwas then fed into the membranes via diaphragm pump and the feed was allowed to be circulatedfor 5 minutes before setting to pre-selected TMP. The system has to be stabilized so that themembrane is fully soaked with the feed and compacted (Devaraj et al., 2003). The retentate wasrecycled back into the feed tank. The permeate was diverted into a permeate tank with a digitalbalance connected to a laptop. The permeate flow rate was recorded every 10 minutes.
After the retentate reached the desired concentration, the feed pump was stopped. A retentatesample was taken for DRC, TSC, ammonia content, VFA, and pH analysis. The remaining latex inthe system was then drained off. The system was flushed with a sufficient amount of water untilthere were no traces of latex in the system. The fouled membrane has to be cleaned with cleaningchemical after each trial. The membrane was flushed with sodium hydroxide (NaOH) to removeall organic foulants on the membrane surface. After flushing ends, water flux test was carriedout to determine the membrane recovery. If the recovery is below 80%, the membrane should besoaked overnight in a cleaning solution (CS1) in a separate container.
11.3 RESULTS AND DISCUSSION
11.3.1 Optimum TMP for concentration process
The effect of TMP on permeate flux for both ceramic multi tubular and hollow fiber membrane isshown in Figure 11.2 and Figure 11.3. The optimum TMP recorded for multi tubular membraneand hollow fiber membrane is at TMP of 0.3 MPa (3 bar) and 0.15 MPa (1.5 bar), respectively.Concentration process at lower pressure caused a decline in permeate flux. This is because thedriving force became less at the lower pressure. The cake layer formation is higher at low pressureand feed flow rate (Devaraj et al., 2003; Devaraj and Zairossani, 2007). It was observed thatpermeate flux drop when backpressure i.e. partially closed outlet valve is used to increase theTMP of the system. This can be explained by concentration polarization effect to permeate flux.At higher TMP due to backpressure, feed flow rate is reduced causing less shearing effect onthe membrane surface, which increases concentration polarization and subsequently reducespermeate flux (Devaraj and Zairossani, 2007).
0
TMP [MPa]
Flu
x [L
h–1
m–2
]
0 0.1 0.2 0.3 0.4 0.5
10
20
30
40
50
60
70
80
90
Figure 11.2. Effect of trans-membrane pressure (TMP) on permeate flux – multi tubular membrane.
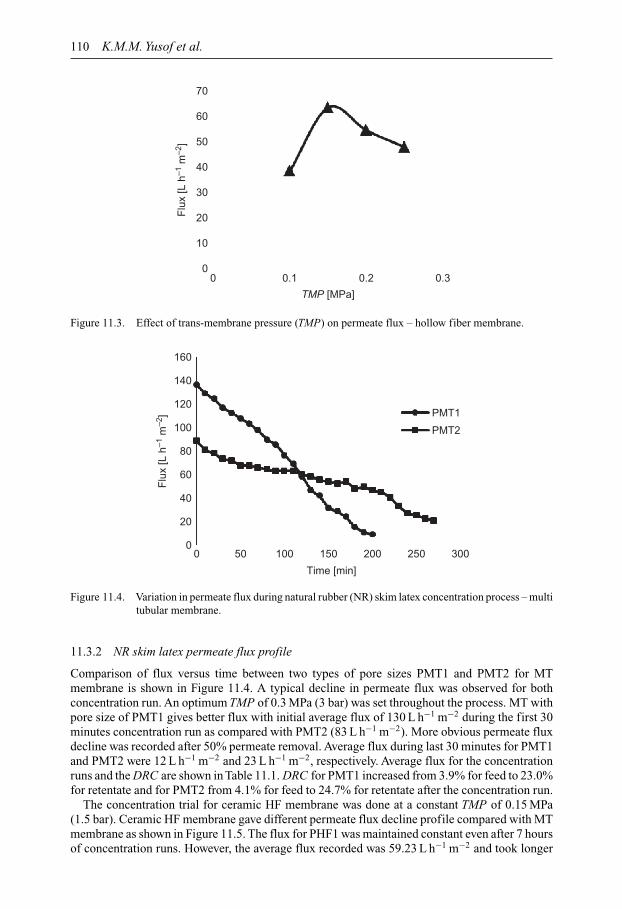
110 K.M.M. Yusof et al.
TMP [MPa]
Flu
x [L
h–1
m–2
]
0 0.1 0.2 0.30
10
20
30
40
50
60
70
Figure 11.3. Effect of trans-membrane pressure (TMP) on permeate flux – hollow fiber membrane.
Time [min]
PMT1
PMT2
0 50 100 150 200 250 300
Flu
x [L
h–1
m–2
]
0
20
40
60
80
100
120
140
160
Figure 11.4. Variation in permeate flux during natural rubber (NR) skim latex concentration process – multitubular membrane.
11.3.2 NR skim latex permeate flux profile
Comparison of flux versus time between two types of pore sizes PMT1 and PMT2 for MTmembrane is shown in Figure 11.4. A typical decline in permeate flux was observed for bothconcentration run. An optimum TMP of 0.3 MPa (3 bar) was set throughout the process. MT withpore size of PMT1 gives better flux with initial average flux of 130 L h−1 m−2 during the first 30minutes concentration run as compared with PMT2 (83 L h−1 m−2). More obvious permeate fluxdecline was recorded after 50% permeate removal. Average flux during last 30 minutes for PMT1and PMT2 were 12 L h−1 m−2 and 23 L h−1 m−2, respectively. Average flux for the concentrationruns and the DRC are shown in Table 11.1. DRC for PMT1 increased from 3.9% for feed to 23.0%for retentate and for PMT2 from 4.1% for feed to 24.7% for retentate after the concentration run.
The concentration trial for ceramic HF membrane was done at a constant TMP of 0.15 MPa(1.5 bar). Ceramic HF membrane gave different permeate flux decline profile compared with MTmembrane as shown in Figure 11.5. The flux for PHF1 was maintained constant even after 7 hoursof concentration runs. However, the average flux recorded was 59.23 L h−1 m−2 and took longer

Recovery of rubber from skim latex using membrane technology 111
Table 11.1. Membrane performance after natural rubber (NR) skimlatex run.
Membrane and Average flux Feed DRC Retentate DRCpore size [L h−1 m−2] [%] [%]
PMT1 88.40 3.9 23.0PMT2 62.20 4.1 24.7PHF1 59.23 3.5 12.1PHF2 64.38 3.7 13.8
DRC: dry rubber content.
Time [min]
PHF1
PHF2
Flu
x [L
h–1
m–2
]
0 200 400 60030
35
40
45
50
55
60
65
70
75
80
Figure 11.5. Variation in permeate flux during natural rubber (NR) skim latex concentration process –hollow fiber membrane.
concentration time as compared with MT membrane. The DRC of the retentate was low. DRC forPHF1 increased from 3.5% to 12.1%. Slight improvement was shown by PHF2 concentration run.The flux remained constant during the initial 3.7 hours of concentration run and the flux startedto decline gradually towards the end of the run. The average flux recorded was 64.38 L h−1 m−2
and the DRC increased from 3.7 to 13.8%.
11.3.3 Membrane cleaning and flux recovery
NRSL has a narrow particle size distribution ranging from 0.2 to 0.6 µm with the mean valueof 0.5 µm (Devaraj et al., 2005). The smaller rubber particles of skim latex could contribute tomembrane fouling together with NR proteins which have a molecular weight ranging from 5 to50 kD and could be the other membrane foulant (Devaraj et al., 2005).
From the study, flushing method is suitable to clean the fouled ceramic membrane comparedwith backwashing method. The effects of cleaning chemical composition were investigated in thischapter. Flushing with NaOH for a specified time followed by overnight soaking in a cleaningsolution (CS1) gave better membrane recovery with 88.9% improvement as compared with othermethods and chemicals Table 11.2.
11.4 CONCLUSION
A pretreated NRSL with ammonia and ammonium laureate was concentrated using ceramic typemembranes to a certain DRC with average flux of more than 50 L h−1 m−2. MT membrane with
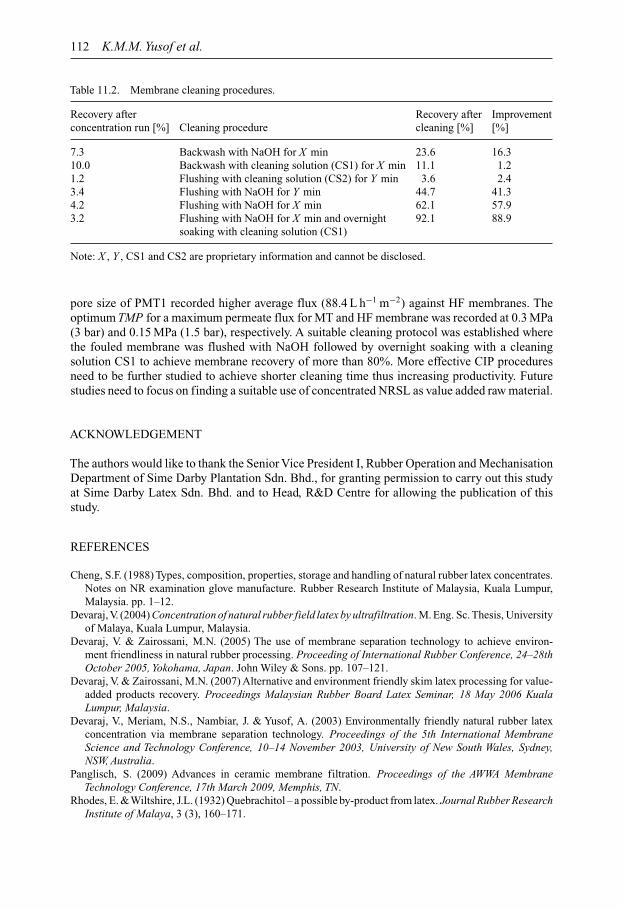
112 K.M.M. Yusof et al.
Table 11.2. Membrane cleaning procedures.
Recovery after Recovery after Improvementconcentration run [%] Cleaning procedure cleaning [%] [%]
7.3 Backwash with NaOH for X min 23.6 16.310.0 Backwash with cleaning solution (CS1) for X min 11.1 1.21.2 Flushing with cleaning solution (CS2) for Y min 3.6 2.43.4 Flushing with NaOH for Y min 44.7 41.34.2 Flushing with NaOH for X min 62.1 57.93.2 Flushing with NaOH for X min and overnight 92.1 88.9
soaking with cleaning solution (CS1)
Note: X , Y , CS1 and CS2 are proprietary information and cannot be disclosed.
pore size of PMT1 recorded higher average flux (88.4 L h−1 m−2) against HF membranes. Theoptimum TMP for a maximum permeate flux for MT and HF membrane was recorded at 0.3 MPa(3 bar) and 0.15 MPa (1.5 bar), respectively. A suitable cleaning protocol was established wherethe fouled membrane was flushed with NaOH followed by overnight soaking with a cleaningsolution CS1 to achieve membrane recovery of more than 80%. More effective CIP proceduresneed to be further studied to achieve shorter cleaning time thus increasing productivity. Futurestudies need to focus on finding a suitable use of concentrated NRSL as value added raw material.
ACKNOWLEDGEMENT
The authors would like to thank the Senior Vice President I, Rubber Operation and MechanisationDepartment of Sime Darby Plantation Sdn. Bhd., for granting permission to carry out this studyat Sime Darby Latex Sdn. Bhd. and to Head, R&D Centre for allowing the publication of thisstudy.
REFERENCES
Cheng, S.F. (1988) Types, composition, properties, storage and handling of natural rubber latex concentrates.Notes on NR examination glove manufacture. Rubber Research Institute of Malaysia, Kuala Lumpur,Malaysia. pp. 1–12.
Devaraj, V. (2004) Concentration of natural rubber field latex by ultrafiltration. M. Eng. Sc. Thesis, Universityof Malaya, Kuala Lumpur, Malaysia.
Devaraj, V. & Zairossani, M.N. (2005) The use of membrane separation technology to achieve environ-ment friendliness in natural rubber processing. Proceeding of International Rubber Conference, 24–28thOctober 2005, Yokohama, Japan. John Wiley & Sons. pp. 107–121.
Devaraj, V. & Zairossani, M.N. (2007) Alternative and environment friendly skim latex processing for value-added products recovery. Proceedings Malaysian Rubber Board Latex Seminar, 18 May 2006 KualaLumpur, Malaysia.
Devaraj, V., Meriam, N.S., Nambiar, J. & Yusof, A. (2003) Environmentally friendly natural rubber latexconcentration via membrane separation technology. Proceedings of the 5th International MembraneScience and Technology Conference, 10–14 November 2003, University of New South Wales, Sydney,NSW, Australia.
Panglisch, S. (2009) Advances in ceramic membrane filtration. Proceedings of the AWWA MembraneTechnology Conference, 17th March 2009, Memphis, TN.
Rhodes, E. &Wiltshire, J.L. (1932) Quebrachitol – a possible by-product from latex. Journal Rubber ResearchInstitute of Malaya, 3 (3), 160–171.
CHAPTER 12
Application of membrane separation technologyfor biodiesel processing
Mohammad Mahdi A. Shirazi, Ali Kargari, Ahmad Fauzi Ismail & Takeshi Matsuura
12.1 INTRODUCTION
Energy use has become a crucial concern in recent years due to a rapid increase in energyconsumption and worldwide demand in both developed and developing countries. In addition tothat, environmental issues such as climate change and global warming caused by utilization ofthe conventional energy resources (i.e., petroleum, natural gas, coal etc.) have also highlightedthe necessity to search for alternative energies.
Currently, conventional energy sources constitute almost 80% of global energy consumption(Hasheminejad et al., 2011). Consequently, renewable and clean energy resources such as wind,solar, biomass, hydropower and geothermal as promising CO2-free alternatives are of grow-ing interest and will play an important role in the world’s future (Kargari and Takht Ravanchi,2012; Sanaeepur et al., 2014). Renewable energy resources, i.e. solar energy, wind energy andgeothermal sources, and bioenergy obtained by chemical conversion of biomass, can be usedto generate energy, either in thermal or electrical form, again and again. However, one of thepromising sources of renewable energies is bioenergy, or more specifically, biofuels (Noureddinet al., 2014), including biogas, biodiesel, bioethanol, and biomass gasifier. It is to be noted thatamong various biofuels, the biodiesel has gained more worldwide attention (Noureddin et al.,2014).
Biodiesel, referred to as monoalkyl esters are alcohols of lower molecular weights (e.g. ethanoland methanol) derived from vegetable oils and animal fats in the presence of catalysts (eitherbasic or acidic agents, or either homogeneous or heterogeneous catalysts). The biodiesel, asa good alternative fuel for diesel engines has been gaining great importance worldwide for itsproper quality exhaust, sustainability and biodegrability (Sharma et al., 2008). Transesterificationreaction is the most used method for commercial biodiesel production (Helwani et al., 2009; Leunget al., 2010). The use of homogeneous alkaline catalysts, i.e. mostly NaOH and KOH, providea higher reaction rate and conversion for the transesterification of triglycerides to biodiesel. Theproblems of reversibility encountered in stepwise reactions to biodiesel production were overcomeusing higher alcohol molar ratios to shift the reaction to completion (Noureddin et al., 2014).However, it should be noted that this higher molar ratio and further amount of basic catalystwill lead to higher soap generation which consequently leads to more complicated downstreamprocessing (Shirazi M.M.A. et al., 2013a).
Biodiesel generation was intended to mainly address the issue of fuel supply security; however,recently, attention has been centered on the use of biodiesel for the transportation sector in orderto minimize the overall production of CO2 from petro-based fuels combustion (Salvi et al., 2013;Rajasekar and Selvi, 2014). Moreover, biodiesel does not increase green-house gases (GHGs) inthe atmosphere due to its closed cycle. In other words, it is said to be carbon-neutral, as biodieselyielding plants take away more CO2 than that contributed to the atmosphere when used as sourceof transportation energy. Table 12.1 summarizes the liquid biofuels consumption, i.e. biodieseland bioethanol, in the transportation sector, 2006–2012, for typical countries.
113
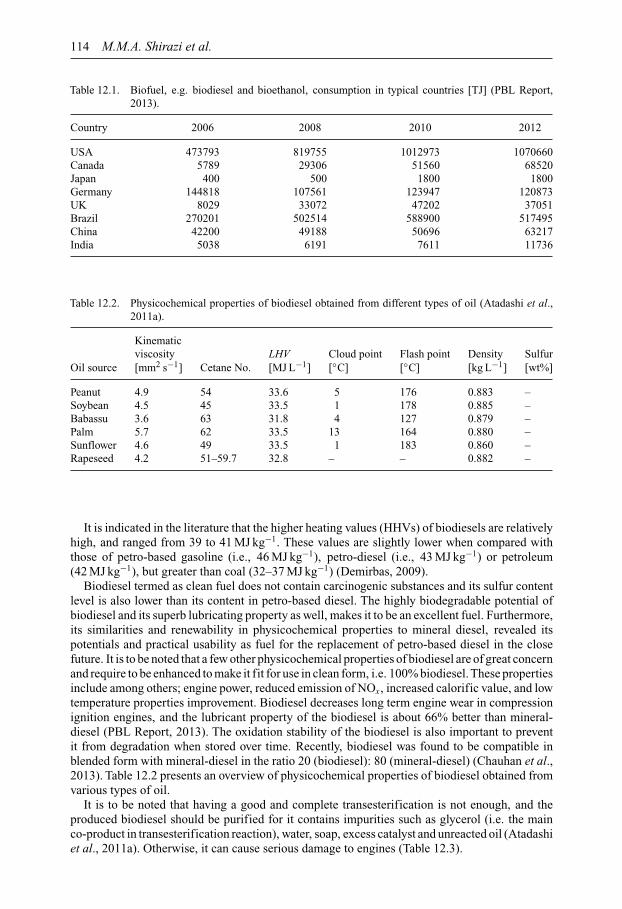
114 M.M.A. Shirazi et al.
Table 12.1. Biofuel, e.g. biodiesel and bioethanol, consumption in typical countries [TJ] (PBL Report,2013).
Country 2006 2008 2010 2012
USA 473793 819755 1012973 1070660Canada 5789 29306 51560 68520Japan 400 500 1800 1800Germany 144818 107561 123947 120873UK 8029 33072 47202 37051Brazil 270201 502514 588900 517495China 42200 49188 50696 63217India 5038 6191 7611 11736
Table 12.2. Physicochemical properties of biodiesel obtained from different types of oil (Atadashi et al.,2011a).
Kinematicviscosity LHV Cloud point Flash point Density Sulfur
Oil source [mm2 s−1] Cetane No. [MJ L−1] [◦C] [◦C] [kg L−1] [wt%]
Peanut 4.9 54 33.6 5 176 0.883 –Soybean 4.5 45 33.5 1 178 0.885 –Babassu 3.6 63 31.8 4 127 0.879 –Palm 5.7 62 33.5 13 164 0.880 –Sunflower 4.6 49 33.5 1 183 0.860 –Rapeseed 4.2 51–59.7 32.8 – – 0.882 –
It is indicated in the literature that the higher heating values (HHVs) of biodiesels are relativelyhigh, and ranged from 39 to 41 MJ kg−1. These values are slightly lower when compared withthose of petro-based gasoline (i.e., 46 MJ kg−1), petro-diesel (i.e., 43 MJ kg−1) or petroleum(42 MJ kg−1), but greater than coal (32–37 MJ kg−1) (Demirbas, 2009).
Biodiesel termed as clean fuel does not contain carcinogenic substances and its sulfur contentlevel is also lower than its content in petro-based diesel. The highly biodegradable potential ofbiodiesel and its superb lubricating property as well, makes it to be an excellent fuel. Furthermore,its similarities and renewability in physicochemical properties to mineral diesel, revealed itspotentials and practical usability as fuel for the replacement of petro-based diesel in the closefuture. It is to be noted that a few other physicochemical properties of biodiesel are of great concernand require to be enhanced to make it fit for use in clean form, i.e. 100% biodiesel. These propertiesinclude among others; engine power, reduced emission of NOx, increased calorific value, and lowtemperature properties improvement. Biodiesel decreases long term engine wear in compressionignition engines, and the lubricant property of the biodiesel is about 66% better than mineral-diesel (PBL Report, 2013). The oxidation stability of the biodiesel is also important to preventit from degradation when stored over time. Recently, biodiesel was found to be compatible inblended form with mineral-diesel in the ratio 20 (biodiesel): 80 (mineral-diesel) (Chauhan et al.,2013). Table 12.2 presents an overview of physicochemical properties of biodiesel obtained fromvarious types of oil.
It is to be noted that having a good and complete transesterification is not enough, and theproduced biodiesel should be purified for it contains impurities such as glycerol (i.e. the mainco-product in transesterification reaction), water, soap, excess catalyst and unreacted oil (Atadashiet al., 2011a). Otherwise, it can cause serious damage to engines (Table 12.3).
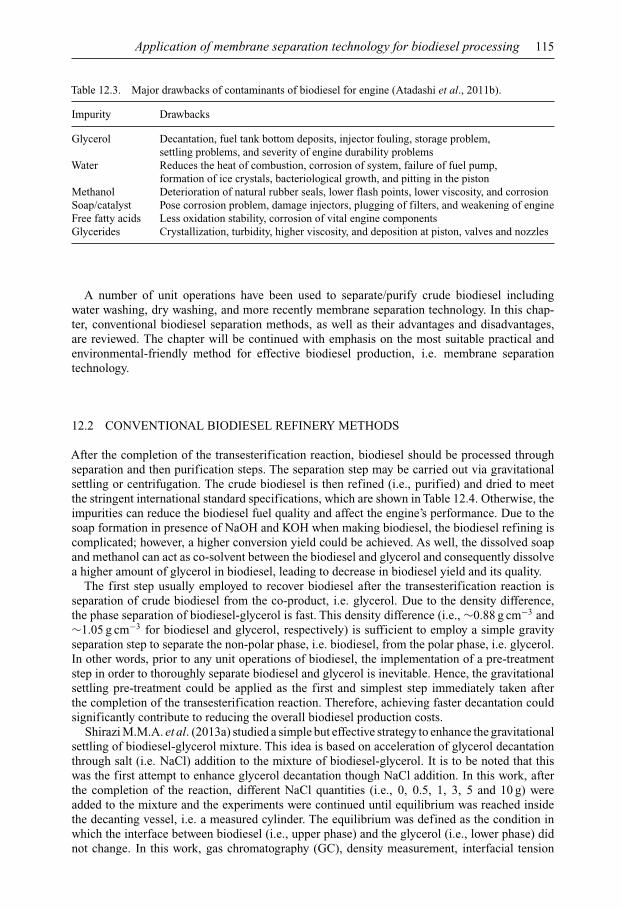
Application of membrane separation technology for biodiesel processing 115
Table 12.3. Major drawbacks of contaminants of biodiesel for engine (Atadashi et al., 2011b).
Impurity Drawbacks
Glycerol Decantation, fuel tank bottom deposits, injector fouling, storage problem,settling problems, and severity of engine durability problems
Water Reduces the heat of combustion, corrosion of system, failure of fuel pump,formation of ice crystals, bacteriological growth, and pitting in the piston
Methanol Deterioration of natural rubber seals, lower flash points, lower viscosity, and corrosionSoap/catalyst Pose corrosion problem, damage injectors, plugging of filters, and weakening of engineFree fatty acids Less oxidation stability, corrosion of vital engine componentsGlycerides Crystallization, turbidity, higher viscosity, and deposition at piston, valves and nozzles
A number of unit operations have been used to separate/purify crude biodiesel includingwater washing, dry washing, and more recently membrane separation technology. In this chap-ter, conventional biodiesel separation methods, as well as their advantages and disadvantages,are reviewed. The chapter will be continued with emphasis on the most suitable practical andenvironmental-friendly method for effective biodiesel production, i.e. membrane separationtechnology.
12.2 CONVENTIONAL BIODIESEL REFINERY METHODS
After the completion of the transesterification reaction, biodiesel should be processed throughseparation and then purification steps. The separation step may be carried out via gravitationalsettling or centrifugation. The crude biodiesel is then refined (i.e., purified) and dried to meetthe stringent international standard specifications, which are shown in Table 12.4. Otherwise, theimpurities can reduce the biodiesel fuel quality and affect the engine’s performance. Due to thesoap formation in presence of NaOH and KOH when making biodiesel, the biodiesel refining iscomplicated; however, a higher conversion yield could be achieved. As well, the dissolved soapand methanol can act as co-solvent between the biodiesel and glycerol and consequently dissolvea higher amount of glycerol in biodiesel, leading to decrease in biodiesel yield and its quality.
The first step usually employed to recover biodiesel after the transesterification reaction isseparation of crude biodiesel from the co-product, i.e. glycerol. Due to the density difference,the phase separation of biodiesel-glycerol is fast. This density difference (i.e., ∼0.88 g cm−3 and∼1.05 g cm−3 for biodiesel and glycerol, respectively) is sufficient to employ a simple gravityseparation step to separate the non-polar phase, i.e. biodiesel, from the polar phase, i.e. glycerol.In other words, prior to any unit operations of biodiesel, the implementation of a pre-treatmentstep in order to thoroughly separate biodiesel and glycerol is inevitable. Hence, the gravitationalsettling pre-treatment could be applied as the first and simplest step immediately taken afterthe completion of the transesterification reaction. Therefore, achieving faster decantation couldsignificantly contribute to reducing the overall biodiesel production costs.
Shirazi M.M.A. et al. (2013a) studied a simple but effective strategy to enhance the gravitationalsettling of biodiesel-glycerol mixture. This idea is based on acceleration of glycerol decantationthrough salt (i.e. NaCl) addition to the mixture of biodiesel-glycerol. It is to be noted that thiswas the first attempt to enhance glycerol decantation though NaCl addition. In this work, afterthe completion of the reaction, different NaCl quantities (i.e., 0, 0.5, 1, 3, 5 and 10 g) wereadded to the mixture and the experiments were continued until equilibrium was reached insidethe decanting vessel, i.e. a measured cylinder. The equilibrium was defined as the condition inwhich the interface between biodiesel (i.e., upper phase) and the glycerol (i.e., lower phase) didnot change. In this work, gas chromatography (GC), density measurement, interfacial tension
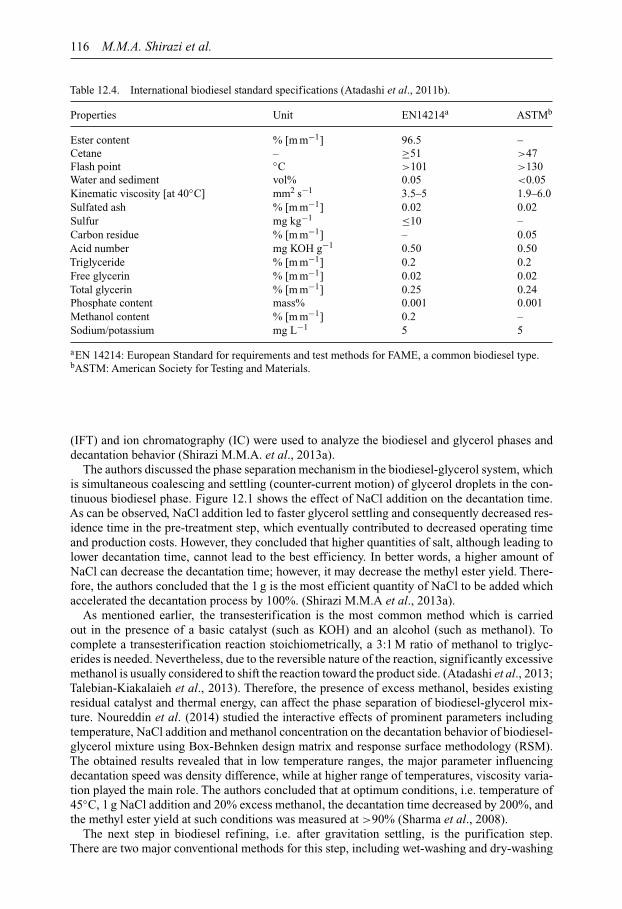
116 M.M.A. Shirazi et al.
Table 12.4. International biodiesel standard specifications (Atadashi et al., 2011b).
Properties Unit EN14214a ASTMb
Ester content % [m m−1] 96.5 –Cetane – ≥51 >47Flash point ◦C >101 >130Water and sediment vol% 0.05 <0.05Kinematic viscosity [at 40◦C] mm2 s−1 3.5–5 1.9–6.0Sulfated ash % [m m−1] 0.02 0.02Sulfur mg kg−1 ≤10 –Carbon residue % [m m−1] – 0.05Acid number mg KOH g−1 0.50 0.50Triglyceride % [m m−1] 0.2 0.2Free glycerin % [m m−1] 0.02 0.02Total glycerin % [m m−1] 0.25 0.24Phosphate content mass% 0.001 0.001Methanol content % [m m−1] 0.2 –Sodium/potassium mg L−1 5 5
aEN 14214: European Standard for requirements and test methods for FAME, a common biodiesel type.bASTM: American Society for Testing and Materials.
(IFT) and ion chromatography (IC) were used to analyze the biodiesel and glycerol phases anddecantation behavior (Shirazi M.M.A. et al., 2013a).
The authors discussed the phase separation mechanism in the biodiesel-glycerol system, whichis simultaneous coalescing and settling (counter-current motion) of glycerol droplets in the con-tinuous biodiesel phase. Figure 12.1 shows the effect of NaCl addition on the decantation time.As can be observed, NaCl addition led to faster glycerol settling and consequently decreased res-idence time in the pre-treatment step, which eventually contributed to decreased operating timeand production costs. However, they concluded that higher quantities of salt, although leading tolower decantation time, cannot lead to the best efficiency. In better words, a higher amount ofNaCl can decrease the decantation time; however, it may decrease the methyl ester yield. There-fore, the authors concluded that the 1 g is the most efficient quantity of NaCl to be added whichaccelerated the decantation process by 100%. (Shirazi M.M.A et al., 2013a).
As mentioned earlier, the transesterification is the most common method which is carriedout in the presence of a basic catalyst (such as KOH) and an alcohol (such as methanol). Tocomplete a transesterification reaction stoichiometrically, a 3:1 M ratio of methanol to triglyc-erides is needed. Nevertheless, due to the reversible nature of the reaction, significantly excessivemethanol is usually considered to shift the reaction toward the product side. (Atadashi et al., 2013;Talebian-Kiakalaieh et al., 2013). Therefore, the presence of excess methanol, besides existingresidual catalyst and thermal energy, can affect the phase separation of biodiesel-glycerol mix-ture. Noureddin et al. (2014) studied the interactive effects of prominent parameters includingtemperature, NaCl addition and methanol concentration on the decantation behavior of biodiesel-glycerol mixture using Box-Behnken design matrix and response surface methodology (RSM).The obtained results revealed that in low temperature ranges, the major parameter influencingdecantation speed was density difference, while at higher range of temperatures, viscosity varia-tion played the main role. The authors concluded that at optimum conditions, i.e. temperature of45◦C, 1 g NaCl addition and 20% excess methanol, the decantation time decreased by 200%, andthe methyl ester yield at such conditions was measured at >90% (Sharma et al., 2008).
The next step in biodiesel refining, i.e. after gravitation settling, is the purification step.There are two major conventional methods for this step, including wet-washing and dry-washing
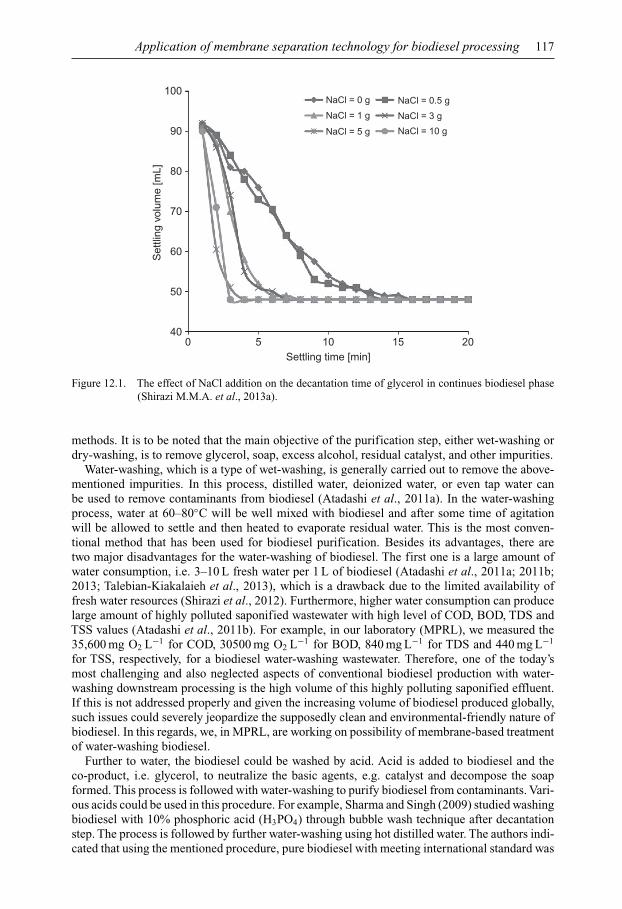
Application of membrane separation technology for biodiesel processing 117
040
50
60
70
Set
tling
vol
ume
[mL] 80
90
100NaCl = 0 g NaCl = 0.5 g
NaCl = 3 g
NaCl = 10 g
NaCl = 1 g
NaCl = 5 g
5 10Settling time [min]
15 20
Figure 12.1. The effect of NaCl addition on the decantation time of glycerol in continues biodiesel phase(Shirazi M.M.A. et al., 2013a).
methods. It is to be noted that the main objective of the purification step, either wet-washing ordry-washing, is to remove glycerol, soap, excess alcohol, residual catalyst, and other impurities.
Water-washing, which is a type of wet-washing, is generally carried out to remove the above-mentioned impurities. In this process, distilled water, deionized water, or even tap water canbe used to remove contaminants from biodiesel (Atadashi et al., 2011a). In the water-washingprocess, water at 60–80◦C will be well mixed with biodiesel and after some time of agitationwill be allowed to settle and then heated to evaporate residual water. This is the most conven-tional method that has been used for biodiesel purification. Besides its advantages, there aretwo major disadvantages for the water-washing of biodiesel. The first one is a large amount ofwater consumption, i.e. 3–10 L fresh water per 1 L of biodiesel (Atadashi et al., 2011a; 2011b;2013; Talebian-Kiakalaieh et al., 2013), which is a drawback due to the limited availability offresh water resources (Shirazi et al., 2012). Furthermore, higher water consumption can producelarge amount of highly polluted saponified wastewater with high level of COD, BOD, TDS andTSS values (Atadashi et al., 2011b). For example, in our laboratory (MPRL), we measured the35,600 mg O2 L−1 for COD, 30500 mg O2 L−1 for BOD, 840 mg L−1 for TDS and 440 mg L−1
for TSS, respectively, for a biodiesel water-washing wastewater. Therefore, one of the today’smost challenging and also neglected aspects of conventional biodiesel production with water-washing downstream processing is the high volume of this highly polluting saponified effluent.If this is not addressed properly and given the increasing volume of biodiesel produced globally,such issues could severely jeopardize the supposedly clean and environmental-friendly nature ofbiodiesel. In this regards, we, in MPRL, are working on possibility of membrane-based treatmentof water-washing biodiesel.
Further to water, the biodiesel could be washed by acid. Acid is added to biodiesel and theco-product, i.e. glycerol, to neutralize the basic agents, e.g. catalyst and decompose the soapformed. This process is followed with water-washing to purify biodiesel from contaminants. Vari-ous acids could be used in this procedure. For example, Sharma and Singh (2009) studied washingbiodiesel with 10% phosphoric acid (H3PO4) through bubble wash technique after decantationstep. The process is followed by further water-washing using hot distilled water. The authors indi-cated that using the mentioned procedure, pure biodiesel with meeting international standard was
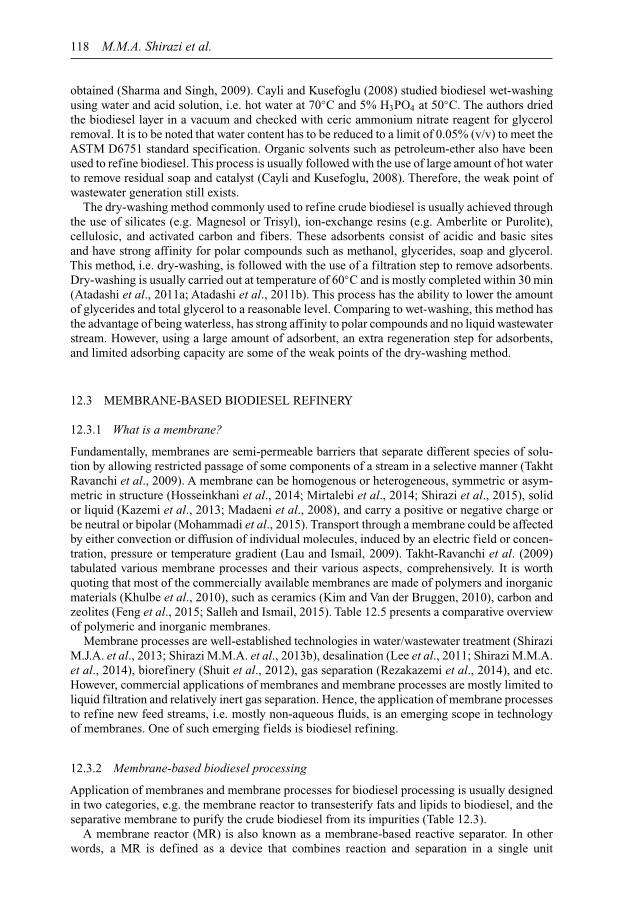
118 M.M.A. Shirazi et al.
obtained (Sharma and Singh, 2009). Cayli and Kusefoglu (2008) studied biodiesel wet-washingusing water and acid solution, i.e. hot water at 70◦C and 5% H3PO4 at 50◦C. The authors driedthe biodiesel layer in a vacuum and checked with ceric ammonium nitrate reagent for glycerolremoval. It is to be noted that water content has to be reduced to a limit of 0.05% (v/v) to meet theASTM D6751 standard specification. Organic solvents such as petroleum-ether also have beenused to refine biodiesel. This process is usually followed with the use of large amount of hot waterto remove residual soap and catalyst (Cayli and Kusefoglu, 2008). Therefore, the weak point ofwastewater generation still exists.
The dry-washing method commonly used to refine crude biodiesel is usually achieved throughthe use of silicates (e.g. Magnesol or Trisyl), ion-exchange resins (e.g. Amberlite or Purolite),cellulosic, and activated carbon and fibers. These adsorbents consist of acidic and basic sitesand have strong affinity for polar compounds such as methanol, glycerides, soap and glycerol.This method, i.e. dry-washing, is followed with the use of a filtration step to remove adsorbents.Dry-washing is usually carried out at temperature of 60◦C and is mostly completed within 30 min(Atadashi et al., 2011a; Atadashi et al., 2011b). This process has the ability to lower the amountof glycerides and total glycerol to a reasonable level. Comparing to wet-washing, this method hasthe advantage of being waterless, has strong affinity to polar compounds and no liquid wastewaterstream. However, using a large amount of adsorbent, an extra regeneration step for adsorbents,and limited adsorbing capacity are some of the weak points of the dry-washing method.
12.3 MEMBRANE-BASED BIODIESEL REFINERY
12.3.1 What is a membrane?
Fundamentally, membranes are semi-permeable barriers that separate different species of solu-tion by allowing restricted passage of some components of a stream in a selective manner (TakhtRavanchi et al., 2009). A membrane can be homogenous or heterogeneous, symmetric or asym-metric in structure (Hosseinkhani et al., 2014; Mirtalebi et al., 2014; Shirazi et al., 2015), solidor liquid (Kazemi et al., 2013; Madaeni et al., 2008), and carry a positive or negative charge orbe neutral or bipolar (Mohammadi et al., 2015). Transport through a membrane could be affectedby either convection or diffusion of individual molecules, induced by an electric field or concen-tration, pressure or temperature gradient (Lau and Ismail, 2009). Takht-Ravanchi et al. (2009)tabulated various membrane processes and their various aspects, comprehensively. It is worthquoting that most of the commercially available membranes are made of polymers and inorganicmaterials (Khulbe et al., 2010), such as ceramics (Kim and Van der Bruggen, 2010), carbon andzeolites (Feng et al., 2015; Salleh and Ismail, 2015). Table 12.5 presents a comparative overviewof polymeric and inorganic membranes.
Membrane processes are well-established technologies in water/wastewater treatment (ShiraziM.J.A. et al., 2013; Shirazi M.M.A. et al., 2013b), desalination (Lee et al., 2011; Shirazi M.M.A.et al., 2014), biorefinery (Shuit et al., 2012), gas separation (Rezakazemi et al., 2014), and etc.However, commercial applications of membranes and membrane processes are mostly limited toliquid filtration and relatively inert gas separation. Hence, the application of membrane processesto refine new feed streams, i.e. mostly non-aqueous fluids, is an emerging scope in technologyof membranes. One of such emerging fields is biodiesel refining.
12.3.2 Membrane-based biodiesel processing
Application of membranes and membrane processes for biodiesel processing is usually designedin two categories, e.g. the membrane reactor to transesterify fats and lipids to biodiesel, and theseparative membrane to purify the crude biodiesel from its impurities (Table 12.3).
A membrane reactor (MR) is also known as a membrane-based reactive separator. In otherwords, a MR is defined as a device that combines reaction and separation in a single unit

Application of membrane separation technology for biodiesel processing 119
Table 12.5. A comparative overview of polymeric and inorganic membranes.
Membrane Advantages Disadvantages Applications Current status
Polymeric – Cheap– Good quality control– Flexibility in fabrication– High structural integrity
– Weak structure– Sensitive to pH,
temperature and harshenvironment
– Prone to denature– Short life
– Water/wastewatertreatment
– Gas separation– Biorefinery
Wideapplications,specificallymature inliquid filtration
Inorganic – High thermal stability– Non-sensitive to pH and
harsh environment– Long term durability
– Brittle– Expensive
– Water/wastewatertreatment
– Biorefinery
Small scaleapplications
(Shuit et al., 2012). Development of MRs and their successful application for producing biodieselhave renewed the strong interest to develop alternative fuel to replace petro-diesel fuel. MRs canserve different purposes such as intensify the contact between reactants and catalysts, selectivelyremove the products from the reaction mixture, and control the addition of reactants to the mixture(Andric et al., 2010). It is to be noted that MRs can be employed to avoid the equilibrium conver-sion limits of conventional reactors. Moreover, the MRs can efficiently improve the maximumachievable conversion of reversible reactions (Sanaeepour et al., 2012). Besides, MRs providethe potential of higher selectivities and/or yields in many different processes as well as beingsafe and more environmentally friendly (Rios et al., 2004; Uemiya, 2004). Various aspects ofbiodiesel production using MRs by examining the fundamental concepts of the membrane reactortechnology and relevant operating conditions are reviewed by Shuit et al. (2012). However, inthis chapter the application of selective membranes and related processes to refine biodiesel isdiscussed and investigated.
12.3.3 Membrane experiments for biodiesel refining
Wang et al. (2009) studied the application of ceramic membrane (Pall Membrane Co., USA) withvarious pore sizes, i.e. 0.6, 0.2 and 0.1 µm to remove the residual soap and free glycerol fromcrude biodiesel. In this work, refined palm oil-methanol (MeOH) (6:1 mol/mol) and potassiumhydroxide (KOH, 1.2 wt%) were used to produce biodiesel through the transesterification reaction.In this work, a ceramic membrane tube (outer diameter (OD): 26 mm, inner diameter (ID): 25 mm)with 19 channels of diameter of 3 mm giving a filtration area of 0.045 m2 was used for theexperiments. In order to select a suitable membrane, first, the particle size distribution of crudebiodiesel was analyzed by zeta-potential analyzer (at 25◦C), and the mean diameter of particles wasrecorded as a reference for selection of suitable membrane. A known amount of crude biodieselsample was cross-filtrated by all membranes at the pressure of 0.15 MPa and temperature of 60◦C.The initial flux permeate, defined as the flux of permeate (at first 3 min) was recorded and thepermeate samples were analyzed for the content of potassium, sodium, calcium, magnesium andfree glycerol. Table 12.6 presents the impurities content of permeate samples for each appliedmembrane. Then, the most suitable membrane, i.e. microfilter membrane with 0.1 µm pore size(at various feed pressures between 0.05 and 0.20 MPa and temperatures of 30 and 70◦C) was usedfor the next experiments (Wang et al., 2009).
In this work, the authors concluded that due to the immiscibility of free glycerol and biodieseland also the surface activity of soap, the soap existed in the form of reversed micelle whichwas very similar to the form of phospholipids in the hexane miscella, the size of which waslarger than a single molecule. Moreover, most of the impurities such as residual catalysts aresoluble in the glycerol, and the glycerol droplets and hydrophilic ends of soaps can form larger
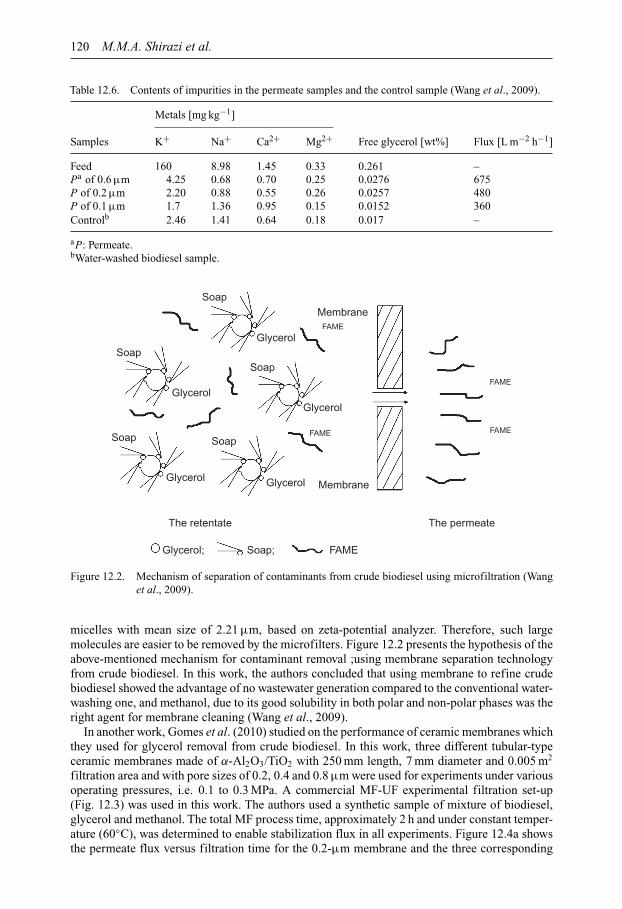
120 M.M.A. Shirazi et al.
Table 12.6. Contents of impurities in the permeate samples and the control sample (Wang et al., 2009).
Metals [mg kg−1]
Samples K+ Na+ Ca2+ Mg2+ Free glycerol [wt%] Flux [L m−2 h−1]
Feed 160 8.98 1.45 0.33 0.261 –Pa of 0.6 µm 4.25 0.68 0.70 0.25 0.0276 675P of 0.2 µm 2.20 0.88 0.55 0.26 0.0257 480P of 0.1 µm 1.7 1.36 0.95 0.15 0.0152 360Controlb 2.46 1.41 0.64 0.18 0.017 –
aP: Permeate.bWater-washed biodiesel sample.
Soap
Glycerol
Glycerol
Glycerol
Glycerol;
The retentate
Glycerol
Glycerol Membrane
The permeate
FAME
FAME
SoapSoap
Soap
Soap;
Soap
MembraneFAME
FAME
FAME
Figure 12.2. Mechanism of separation of contaminants from crude biodiesel using microfiltration (Wanget al., 2009).
micelles with mean size of 2.21 µm, based on zeta-potential analyzer. Therefore, such largemolecules are easier to be removed by the microfilters. Figure 12.2 presents the hypothesis of theabove-mentioned mechanism for contaminant removal ;using membrane separation technologyfrom crude biodiesel. In this work, the authors concluded that using membrane to refine crudebiodiesel showed the advantage of no wastewater generation compared to the conventional water-washing one, and methanol, due to its good solubility in both polar and non-polar phases was theright agent for membrane cleaning (Wang et al., 2009).
In another work, Gomes et al. (2010) studied on the performance of ceramic membranes whichthey used for glycerol removal from crude biodiesel. In this work, three different tubular-typeceramic membranes made of α-Al2O3/TiO2 with 250 mm length, 7 mm diameter and 0.005 m2
filtration area and with pore sizes of 0.2, 0.4 and 0.8 µm were used for experiments under variousoperating pressures, i.e. 0.1 to 0.3 MPa. A commercial MF-UF experimental filtration set-up(Fig. 12.3) was used in this work. The authors used a synthetic sample of mixture of biodiesel,glycerol and methanol. The total MF process time, approximately 2 h and under constant temper-ature (60◦C), was determined to enable stabilization flux in all experiments. Figure 12.4a showsthe permeate flux versus filtration time for the 0.2-µm membrane and the three corresponding
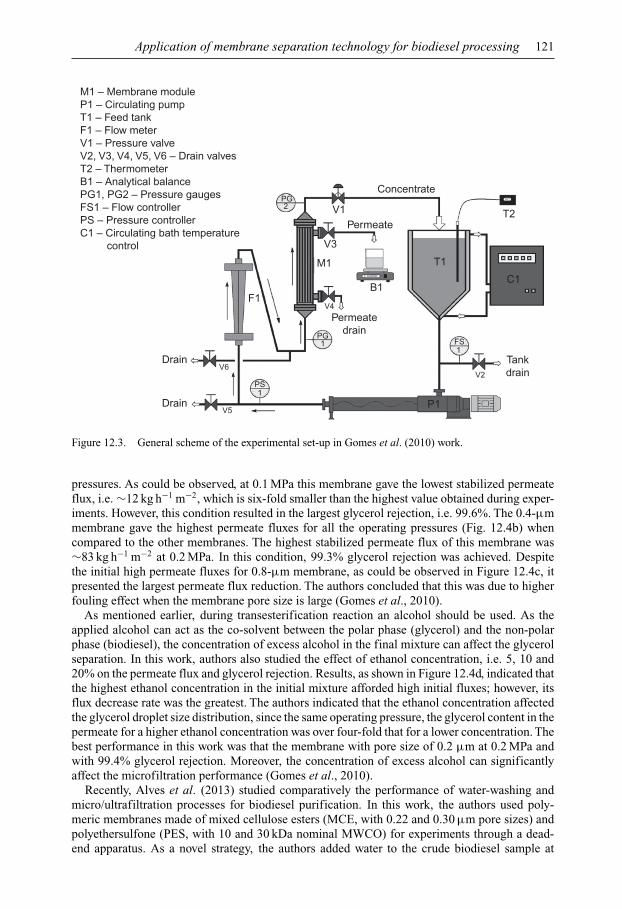
Application of membrane separation technology for biodiesel processing 121
Concentrate
PermeateV1
V3
M1
F1
Drain
M1 – Membrane moduleP1 – Circulating pumpT1 – Feed tankF1 – Flow meterV1 – Pressure valveV2, V3, V4, V5, V6 – Drain valvesT2 – ThermometerB1 – Analytical balancePG1, PG2 – Pressure gaugesFS1 – Flow controllerPS – Pressure controllerC1 – Circulating bath temperature control
Drain
B1
P1
T1
C1
Tank
Permeatedrain
drainV2
V4
V6
PS1
V5
PG1
PG2
FS1
T2
Figure 12.3. General scheme of the experimental set-up in Gomes et al. (2010) work.
pressures. As could be observed, at 0.1 MPa this membrane gave the lowest stabilized permeateflux, i.e. ∼12 kg h−1 m−2, which is six-fold smaller than the highest value obtained during exper-iments. However, this condition resulted in the largest glycerol rejection, i.e. 99.6%. The 0.4-µmmembrane gave the highest permeate fluxes for all the operating pressures (Fig. 12.4b) whencompared to the other membranes. The highest stabilized permeate flux of this membrane was∼83 kg h−1 m−2 at 0.2 MPa. In this condition, 99.3% glycerol rejection was achieved. Despitethe initial high permeate fluxes for 0.8-µm membrane, as could be observed in Figure 12.4c, itpresented the largest permeate flux reduction. The authors concluded that this was due to higherfouling effect when the membrane pore size is large (Gomes et al., 2010).
As mentioned earlier, during transesterification reaction an alcohol should be used. As theapplied alcohol can act as the co-solvent between the polar phase (glycerol) and the non-polarphase (biodiesel), the concentration of excess alcohol in the final mixture can affect the glycerolseparation. In this work, authors also studied the effect of ethanol concentration, i.e. 5, 10 and20% on the permeate flux and glycerol rejection. Results, as shown in Figure 12.4d, indicated thatthe highest ethanol concentration in the initial mixture afforded high initial fluxes; however, itsflux decrease rate was the greatest. The authors indicated that the ethanol concentration affectedthe glycerol droplet size distribution, since the same operating pressure, the glycerol content in thepermeate for a higher ethanol concentration was over four-fold that for a lower concentration. Thebest performance in this work was that the membrane with pore size of 0.2 µm at 0.2 MPa andwith 99.4% glycerol rejection. Moreover, the concentration of excess alcohol can significantlyaffect the microfiltration performance (Gomes et al., 2010).
Recently, Alves et al. (2013) studied comparatively the performance of water-washing andmicro/ultrafiltration processes for biodiesel purification. In this work, the authors used poly-meric membranes made of mixed cellulose esters (MCE, with 0.22 and 0.30 µm pore sizes) andpolyethersulfone (PES, with 10 and 30 kDa nominal MWCO) for experiments through a dead-end apparatus. As a novel strategy, the authors added water to the crude biodiesel sample at
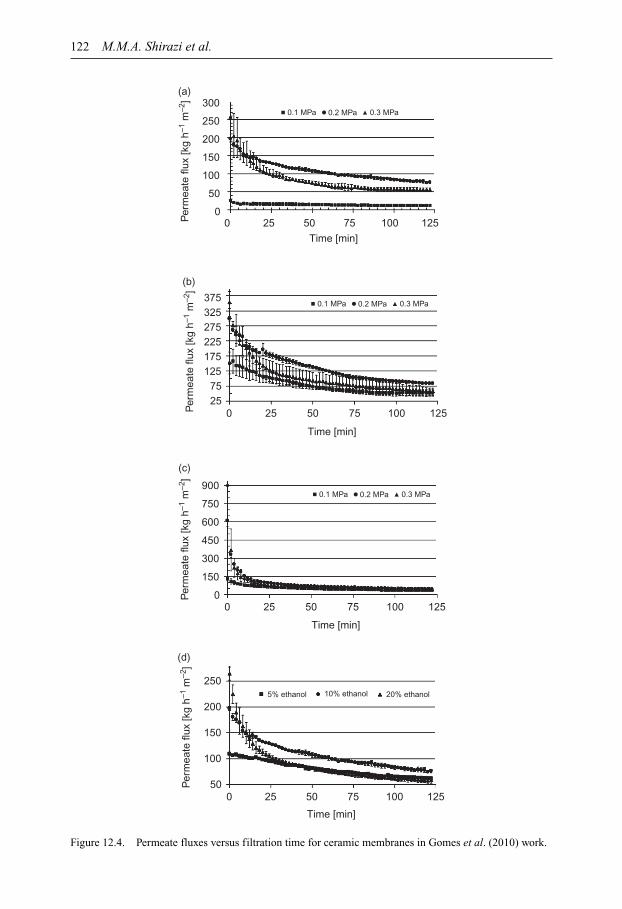
122 M.M.A. Shirazi et al.
0 25 50 75 100 125
0 25 50
Time [min]
Time [min]
Time [min]
Time [min]
(c)
(d)
(a)
(b)
75 100 125
00
50
100
150
Per
mea
te fl
ux [k
g h–1
m–2
]
200
250
150
300
450
600
750
900
2575
125175
Per
mea
te fl
ux [k
g h–1
m–2
]
225275325375
0
50
100
150
Per
mea
te fl
ux [k
g h–1
m–2
]P
erm
eate
flux
[kg
h–1 m
–2]
200
250
300
5% ethanol 10% ethanol 20% ethanol
25 50 75 100 125
0 25 50 75 100 125
0.1 MPa 0.2 MPa 0.3 MPa
0.1 MPa 0.2 MPa 0.3 MPa
0.1 MPa 0.2 MPa 0.3 MPa
Figure 12.4. Permeate fluxes versus filtration time for ceramic membranes in Gomes et al. (2010) work.
Application of membrane separation technology for biodiesel processing 123
Table 12.7. Characterization of crude and water-washed biodiesel inAlveset al. (2013) work.
Biodiesel sample
Parameter Unit Crude Washed
Density kg m−3 880 880Kinematic viscosity mm2 s−1 5 5Water content mg L−1 525.4 1026.2Acid value mgKOH g−1 0.08 0.14Saponification value mgKOH g−1 191.5 179.2Amount of soap gsoap g−1
sample 2.6 × 10⁻³ –Free glycerol % (wt wt−1) 0.029 0.007
concentrations of 0.1 and 0.2 wt%. Deionized water was mixed with the crude biodiesel using amagnet stirrer for 1 h at ambient temperature prior to the filtration experiments. At first step, i.e.after transesterification reaction and the settling process to separate biodiesel-glycerol mixture,the crude biodiesel and the water-washed sample were characterized, as shown in Table 12.7. Ascould be observed, water-washing did not change density and viscosity values of crude biodiesel.According to international standards, the limit for water content in biodiesel is 500 mg L−1; how-ever, obviously water-washing increased the water content and water-washed biodiesel has morewater than the limit allowed by the legislation. This behavior can be associated with the interactionbetween mono and diglycerides molecules and water, since water solubility in the ester phase isvery small. It is to be noted that the mono and diglycerides, left from an incomplete reaction, canact as an emulsifier, allowing the water to be mixed with the biodiesel. For the first step, the authorsconcluded that except for the water content, all the other analyzed parameters of the water-washedbiodiesel are in accordance the limits imposed by international standards. However, as mentionedearlier, the generation of highly polluted wastewater should be noted (Alves et al., 2013).
Figure 12.5 shows the obtained permeate flux of biodiesel through the MF membranes at0.1 and 0.2 MPa. As could be observed, a flux decline is in the first 2 min of operation for the0.22-µm membrane (Fig. 12.5a). However, for the 0.33-µm membrane steady declines areobserved (Fig. 12.5b) for 1 and 5 min at 0.1 and 0.2 MPa of operating pressure, respectively.The stabilized flux is greater at 0.2 MPa than at 0.1 MPa, showing that greater operating pres-sure enables greater fluxes within the analyzed pressure range. Ultrafiltration tests were carriedout under constant operating pressure of 0.4 MPa, using 10 and 30 kDa membranes. Besides thehigher pressure, the flux with UF membranes was smaller than with the MF ones and a lesspronounced flux decline was observed in this case (Alves et al., 2013).
The physico-chemical characteristics of permeate samples showed that the filtration process,either MF or UF, did not change the density and the viscosity of biodiesel. Moreover, the resultsof this work show that the applied membranes were not able to remove the excess catalyst andfree acid content of crude biodiesel. Only the UF membrane of 30 kDa (at 0.4 MPa) was not ableto reduce the amount of soap and free glycerol content detected in the crude biodiesel sample.Hence, an additional test was carried out with the same membrane (i.e. 30 kDa) at 0.3 MPaoperating pressure. The authors indicated that this reduction in the applied pressure increasedthe membrane performance for biodiesel refining. However, the 30 kDa membrane did not showpromising values for biodiesel separation. It could be probably due to the more open pore size incomparison with 10 kDa membrane. The operating pressure in MF experiments did not changethe biodiesel quality. Regarding the free glycerol content, only the 10-kDa membrane was ableto reduce the glycerol content according to the international legislation limit for biodiesel, i.e.less than 0.02 wt% (Table 12.8). The authors confirmed these results by gas chromatography(GC) analysis. Results indicated that UF process with the 10 kDa membrane is able to reduce theglycerol content to the desired level, as mentioned above (Alves et al., 2013).
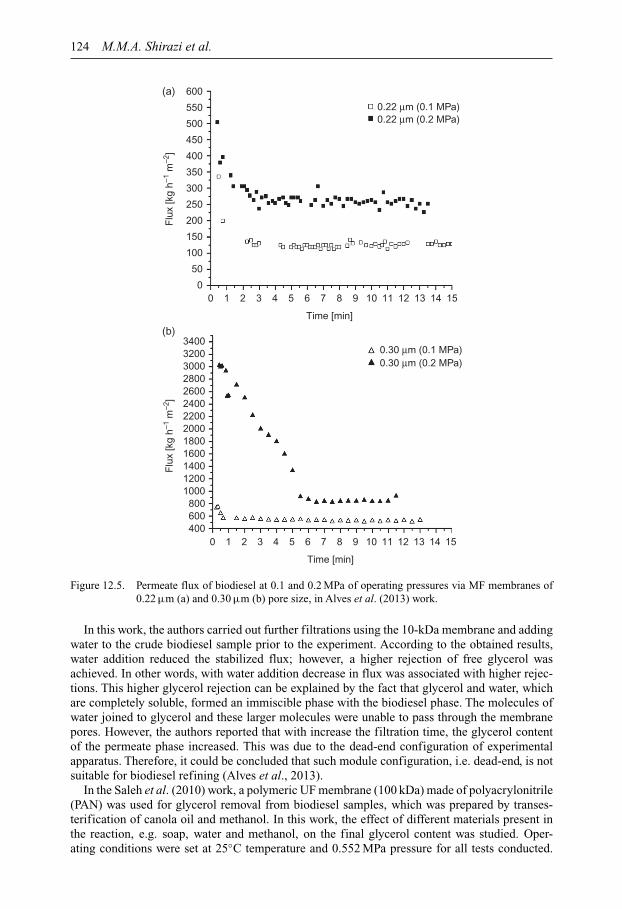
124 M.M.A. Shirazi et al.
0
400600800
100012001400160018002000
Flu
x [k
g h–1
m–2
]
2200240026002800300032003400
0 1 2 3 4 5 6 7
Time [min]
Time [min]
8 9 10
0.22 µm (0.1 MPa)0.22 µm (0.2 MPa)
0.30 µm (0.1 MPa)0.30 µm (0.2 MPa)
11 12 13 14 15
0 1 2 3 4 5 6 7 8 9 10 11 12 13 14 15
(a)
(b)
50
100
150
200
250
Flu
x [k
g h–1
m–2
]
300
350
400
450
500
550
600
Figure 12.5. Permeate flux of biodiesel at 0.1 and 0.2 MPa of operating pressures via MF membranes of0.22 µm (a) and 0.30 µm (b) pore size, in Alves et al. (2013) work.
In this work, the authors carried out further filtrations using the 10-kDa membrane and addingwater to the crude biodiesel sample prior to the experiment. According to the obtained results,water addition reduced the stabilized flux; however, a higher rejection of free glycerol wasachieved. In other words, with water addition decrease in flux was associated with higher rejec-tions. This higher glycerol rejection can be explained by the fact that glycerol and water, whichare completely soluble, formed an immiscible phase with the biodiesel phase. The molecules ofwater joined to glycerol and these larger molecules were unable to pass through the membranepores. However, the authors reported that with increase the filtration time, the glycerol contentof the permeate phase increased. This was due to the dead-end configuration of experimentalapparatus. Therefore, it could be concluded that such module configuration, i.e. dead-end, is notsuitable for biodiesel refining (Alves et al., 2013).
In the Saleh et al. (2010) work, a polymeric UF membrane (100 kDa) made of polyacrylonitrile(PAN) was used for glycerol removal from biodiesel samples, which was prepared by transes-terification of canola oil and methanol. In this work, the effect of different materials present inthe reaction, e.g. soap, water and methanol, on the final glycerol content was studied. Oper-ating conditions were set at 25◦C temperature and 0.552 MPa pressure for all tests conducted.
Application of membrane separation technology for biodiesel processing 125
Table 12.8. Characterization of permeate samples after filtering biodiesel in Alves et al. (2013) work.
Parameter
Soap Free glycerolExperiment [10−3 gsoap g−1
sample] [%wt wt−1]
0.22 µm at 0.1 MPa 1.3 0.0220.22 µm at 0.2 MPa 1.3 0.0250.3 µm at 0.1 MPa 1.6 0.0260.3 µm at 0.2 MPa 1.6 0.02610 kDa at 0.4 MPa 1.0 0.02030 kDa at 0.4 MPa 2.7 0.03130 kDa at 0.3 MPa 2.4 0.029
Table 12.9. Free glycerol in the permeate and retentate samples after UF process in Saleh et al. (2010)work.
Free glycerol [mass%] at 25◦C and 0.552 MPa
FAME + 1%soap + 1% FAME + 1%
FAME+ FAME + FAME + FAME + methanol + soap +Time FAME 0.06% 0.1% 0.2% 1% FAME + 1% 0.06% 0.06%[min] only water water water soap methanol water water
Feed 0.037 0.036 0.032 0.040 0.029 0.039 0.047 0.030Permeate 15 0.027 0.030 0.020 0.013 0.025 0.031 0.041 0.021
30 0.027 0.029 0.018 0.012 0.029 0.035 0.038 0.02060 0.032 0.028 0.017 0.013 0.028 0.033 0.038 0.020120 0.032 0.028 0.017 0.014 0.029 0.031 0.041 0.020180 0.033 0.027 0.017 0.013 0.030 0.031 0.040 0.018
Retentate 15 0.037 0.039 0.033 0.045 0.029 0.037 0.043 0.02530 0.037 0.040 0.034 0.037 0.032 0.037 0.042 0.02560 0.036 0.040 0.034 0.036 0.032 0.036 0.040 0.026120 0.034 0.041 0.032 0.034 0.029 0.034 0.043 0.028180 0.034 0.039 0.035 0.035 0.032 0.034 0.041 0.031
The authors characterized the samples of feed, permeate and retentate for the glycerol contentusing CG method based on the ASTM D6584 standard (Table 12.9). Results of this work showedlow concentrations of water had considerable effect on glycerol rejection from crude biodiesel,even at approximately 0.08 mass%. It is to be noted that this is 4 orders of magnitude less thanthe amount of water required in a conventional water-washing process. The authors suggestedthat the separation mechanism for free glycerol was due to the removal of an ultrafine dispersedglycerol-rich phase present in the crude biodiesel. This hypothesis was confirmed by the presenceof particulates in the crude biodiesel. The size of the particles and the free glycerol separationboth increased with increase the water content (mass%) of the crude biodiesel phase. In thiswork, the results indicated that the trends of separation and particle size versus water content inbiodiesel phase were very similar and exhibited a sudden increase to 0.08 wt% water in the crudebiodiesel. This hypothesis supports the conclusion in this work that water increased the size ofthe distributed glycerol droplets in the crude biodiesel leading to its separation by UF membrane.The authors finally concluded that the technology for biodiesel refining, i.e. UF process, wasfound to use 2.0 g of water per 1 L of treated biodiesel versus the current 10 L of water per 1 L oftreated biodiesel in water-washing (Saleh et al., 2010).
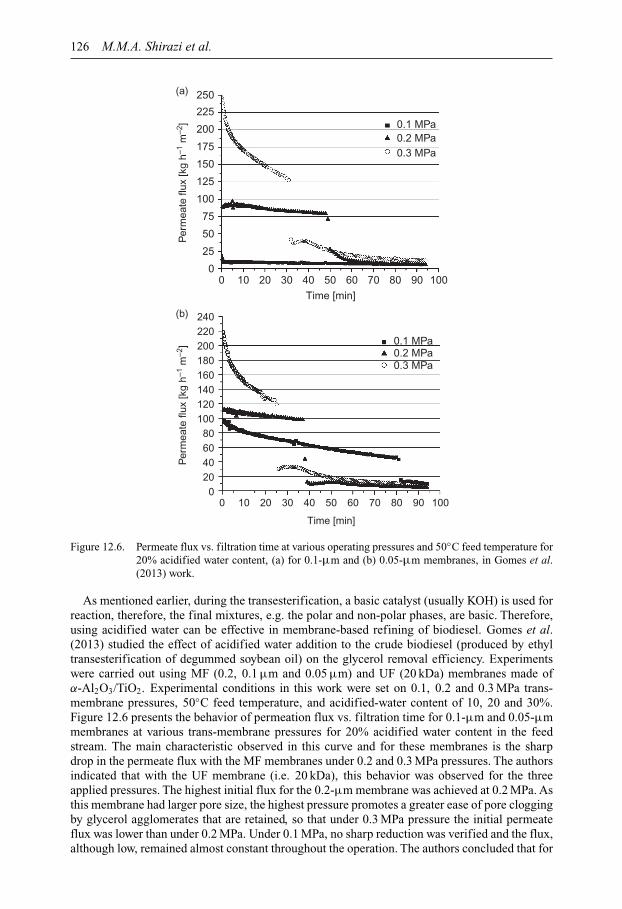
126 M.M.A. Shirazi et al.
00
25
50
75
100
125P
erm
eate
flux
[kg
h–1 m
–2]
150
175
200
225
250
0.1 MPa0.2 MPa0.3 MPa
0.1 MPa0.2 MPa0.3 MPa
020406080
100
Per
mea
te fl
ux [k
g h–1
m–2
]
120140160180200220240
10 20 30 40Time [min]
50 60 70 80 90 100
0 10 20 30
Time [min]
40 50 60 70 80 90 100
(a)
(b)
Figure 12.6. Permeate flux vs. filtration time at various operating pressures and 50◦C feed temperature for20% acidified water content, (a) for 0.1-µm and (b) 0.05-µm membranes, in Gomes et al.(2013) work.
As mentioned earlier, during the transesterification, a basic catalyst (usually KOH) is used forreaction, therefore, the final mixtures, e.g. the polar and non-polar phases, are basic. Therefore,using acidified water can be effective in membrane-based refining of biodiesel. Gomes et al.(2013) studied the effect of acidified water addition to the crude biodiesel (produced by ethyltransesterification of degummed soybean oil) on the glycerol removal efficiency. Experimentswere carried out using MF (0.2, 0.1 µm and 0.05 µm) and UF (20 kDa) membranes made ofα-Al2O3/TiO2. Experimental conditions in this work were set on 0.1, 0.2 and 0.3 MPa trans-membrane pressures, 50◦C feed temperature, and acidified-water content of 10, 20 and 30%.Figure 12.6 presents the behavior of permeation flux vs. filtration time for 0.1-µm and 0.05-µmmembranes at various trans-membrane pressures for 20% acidified water content in the feedstream. The main characteristic observed in this curve and for these membranes is the sharpdrop in the permeate flux with the MF membranes under 0.2 and 0.3 MPa pressures. The authorsindicated that with the UF membrane (i.e. 20 kDa), this behavior was observed for the threeapplied pressures. The highest initial flux for the 0.2-µm membrane was achieved at 0.2 MPa. Asthis membrane had larger pore size, the highest pressure promotes a greater ease of pore cloggingby glycerol agglomerates that are retained, so that under 0.3 MPa pressure the initial permeateflux was lower than under 0.2 MPa. Under 0.1 MPa, no sharp reduction was verified and the flux,although low, remained almost constant throughout the operation. The authors concluded that for
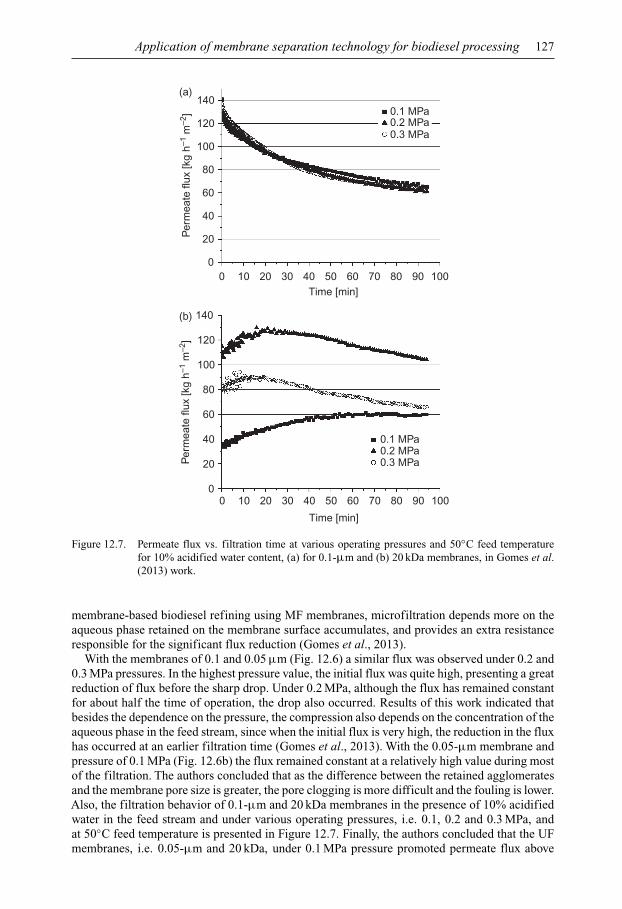
Application of membrane separation technology for biodiesel processing 127
Time [min]
Per
mea
te fl
ux [k
g h–1
m–2
]
10090807060504030201000
20
40
60
80
100
120
140
Time [min]
Per
mea
te fl
ux [k
g h–1
m–2
]
10090807060504030201000
20
40
60
80
100
120
140
(a)
(b)
0.1 MPa0.2 MPa0.3 MPa
0.1 MPa0.2 MPa0.3 MPa
Figure 12.7. Permeate flux vs. filtration time at various operating pressures and 50◦C feed temperaturefor 10% acidified water content, (a) for 0.1-µm and (b) 20 kDa membranes, in Gomes et al.(2013) work.
membrane-based biodiesel refining using MF membranes, microfiltration depends more on theaqueous phase retained on the membrane surface accumulates, and provides an extra resistanceresponsible for the significant flux reduction (Gomes et al., 2013).
With the membranes of 0.1 and 0.05 µm (Fig. 12.6) a similar flux was observed under 0.2 and0.3 MPa pressures. In the highest pressure value, the initial flux was quite high, presenting a greatreduction of flux before the sharp drop. Under 0.2 MPa, although the flux has remained constantfor about half the time of operation, the drop also occurred. Results of this work indicated thatbesides the dependence on the pressure, the compression also depends on the concentration of theaqueous phase in the feed stream, since when the initial flux is very high, the reduction in the fluxhas occurred at an earlier filtration time (Gomes et al., 2013). With the 0.05-µm membrane andpressure of 0.1 MPa (Fig. 12.6b) the flux remained constant at a relatively high value during mostof the filtration. The authors concluded that as the difference between the retained agglomeratesand the membrane pore size is greater, the pore clogging is more difficult and the fouling is lower.Also, the filtration behavior of 0.1-µm and 20 kDa membranes in the presence of 10% acidifiedwater in the feed stream and under various operating pressures, i.e. 0.1, 0.2 and 0.3 MPa, andat 50◦C feed temperature is presented in Figure 12.7. Finally, the authors concluded that the UFmembranes, i.e. 0.05-µm and 20 kDa, under 0.1 MPa pressure promoted permeate flux above

128 M.M.A. Shirazi et al.
Table 12.10. SEM images of electrospun nano-fibrous polystyrene filters before and after thermaltreating, in Shirazi M.J.A. et al. (2014) work.
Bef
ore
ther
mal
trea
ting
90°C
ther
mal
trea
ting
100°
C th
erm
al tr
eatin
g
120°
C th
erm
al tr
eatin
g
130°
C th
erm
al tr
eatin
g
140°
C th
erm
al tr
eatin
g
145°
C th
erm
al tr
eatin
g
150°
C th
erm
al tr
eatin
g
(a) (b)
(c) (d)
(a) (b)
(c) (d)
60 kg h−1 m−2 and glycerol content in the permeate lower than 0.02%, being thus selected as themost appropriate for biodiesel refining (Gomes et al., 2013).
12.3.4 Other membrane applications for biodiesel processing
Further to above mentioned applications, i.e. biodiesel refinery, membrane processes also canbe used for other subjects related to biodiesel processing. Shirazi M.J.A. et al. (2014) studiedthe possibility of a new and low cost source for biodiesel production, i.e. edible oil mill effluent.The authors investigated the application of membrane-based coalescing filtration for separationof edible oil and water emulsion. In this work, electrospun nano-fibrous filters were used forfiltration process. The novelty of this work is focused on a simple and versatile surface treatmentmethod, i.e. thermal treatment, to improve the filtration efficiency of electrospun polystyrenefilters (Table 12.10). Results indicated that thermal treatment of electrospun nano-fibrous fil-ters significantly had affected the edible oil separation through coalescing phenomenon (ShiraziM.J.A. et al., 2014).
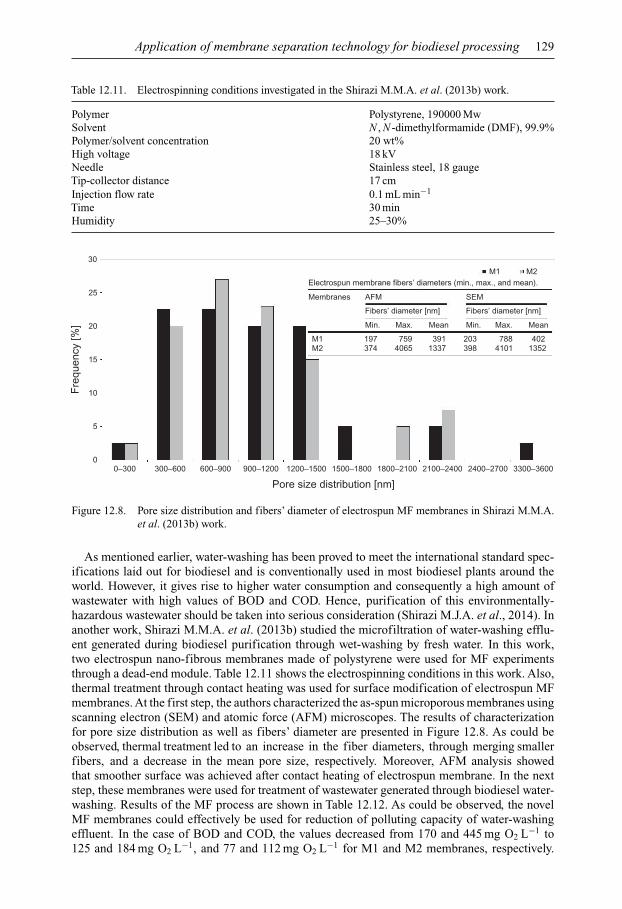
Application of membrane separation technology for biodiesel processing 129
Table 12.11. Electrospinning conditions investigated in the Shirazi M.M.A. et al. (2013b) work.
Polymer Polystyrene, 190000 MwSolvent N , N -dimethylformamide (DMF), 99.9%Polymer/solvent concentration 20 wt%High voltage 18 kVNeedle Stainless steel, 18 gaugeTip-collector distance 17 cmInjection flow rate 0.1 mL min−1
Time 30 minHumidity 25–30%
0
5
10
15
20
25
30
Fre
quen
cy [%
]
Pore size distribution [nm]
0–300 300–600 600–900 900–1200 1200–1500 1500–1800 1800–2100 2100–2400
M1 197
Min.
Membranes AFM
Electrospun membrane fibers’ diameters (min., max., and mean).
SEM
M1 M2
Fibers’ diameter [nm] Fibers’ diameter [nm]
Max. Mean Min. Max. Mean
374 4065759
1337391
398203
4101788
1352402
M2
2400–2700 3300–3600
Figure 12.8. Pore size distribution and fibers’ diameter of electrospun MF membranes in Shirazi M.M.A.et al. (2013b) work.
As mentioned earlier, water-washing has been proved to meet the international standard spec-ifications laid out for biodiesel and is conventionally used in most biodiesel plants around theworld. However, it gives rise to higher water consumption and consequently a high amount ofwastewater with high values of BOD and COD. Hence, purification of this environmentally-hazardous wastewater should be taken into serious consideration (Shirazi M.J.A. et al., 2014). Inanother work, Shirazi M.M.A. et al. (2013b) studied the microfiltration of water-washing efflu-ent generated during biodiesel purification through wet-washing by fresh water. In this work,two electrospun nano-fibrous membranes made of polystyrene were used for MF experimentsthrough a dead-end module. Table 12.11 shows the electrospinning conditions in this work. Also,thermal treatment through contact heating was used for surface modification of electrospun MFmembranes. At the first step, the authors characterized the as-spun microporous membranes usingscanning electron (SEM) and atomic force (AFM) microscopes. The results of characterizationfor pore size distribution as well as fibers’ diameter are presented in Figure 12.8. As could beobserved, thermal treatment led to an increase in the fiber diameters, through merging smallerfibers, and a decrease in the mean pore size, respectively. Moreover, AFM analysis showedthat smoother surface was achieved after contact heating of electrospun membrane. In the nextstep, these membranes were used for treatment of wastewater generated through biodiesel water-washing. Results of the MF process are shown in Table 12.12. As could be observed, the novelMF membranes could effectively be used for reduction of polluting capacity of water-washingeffluent. In the case of BOD and COD, the values decreased from 170 and 445 mg O2 L−1 to125 and 184 mg O2 L−1, and 77 and 112 mg O2 L−1 for M1 and M2 membranes, respectively.

130 M.M.A. Shirazi et al.
Table 12.12. Characteristics of biodiesel wash water effluent, (A) raw wastewater sample, (B) filtratedusing M1 membrane (before thermal treatment), and (C) filtrated using M2 membrane (afterthermal treatment), in Shirazi M.M.A. et al. (2013b) work.
Sample COD [mg O2 L−1] BOD [mg O2 L−1] TS [mg L−1] TDS [mg L−1] TSS [mg L−1]
A 445 170 740 700 40B 184 125 60 40 20C 112 77 56 28 28
COD: Chemical oxygen demand.BOD: Biological oxygen demand.TS: Total solids.TDS: Total dissolved solid.TSS: Total suspended solid.
A large agglomer
Dispersed biodiesel droplets
Dispersed glyceroldroplets
Microporousmembrane
Figure 12.9. General scheme of the proposed mechanism involved in the treatment of saponified wastewaterin biodiesel water-washing process, investigated in Shirazi M.M.A. et al. (2013b) work.
These results, i.e. proposed mechanism for treatment of biodiesel wastewater using electrospunmembranes, could be explained as follows (Shirazi M.M.A. et al., 2013b).
Biodiesel wastewater contains various impurities such as soap, glycerol, catalyst residue,alcohol and unreacted oil. Moreover, biodiesel droplets could be found in this highly pollutedwastewater. It is to be noted that all these impurities, except biodiesel, are soluble in water.Moreover, the soap (i.e. saponified coagulum) has two components, hydrophilic and hydropho-bic ends. Therefore, both biodiesel and glycerol droplets can be attached to the related ends ofsoap molecules, which is ultimately the final mixture that contains water (aqueous phase) andlarge agglomers (Fig. 12.9). As in contrast to the conventional commercial membranes whichmostly have a 2D structure, the electrospun membranes have a 3D structure (Shirazi M.M.A.et al., 2013b). Therefore, the separation mechanism of this kind of membranes is triplicate, i.e.screening-depth filtration-adsorption. As the size of formed agglomers in the wastewater aremuch larger than the membranes’ pore size, and due to both depth filtration mechanism andadsorption of impurities on the nano-fibers’ surface, it was found out clearly that electrospunmembranes could be used efficiently for treating the biodiesel’s water-washing effluent. In better
Application of membrane separation technology for biodiesel processing 131
words, the multi-objective separation mechanism of electrospun membranes can be the cause oftheir superior separation performance.
12.4 FUTURE PERSPECTIVE
High demands for clean fuels and the problems associated with fossil fuels make the use of newclean fuels such as biodiesel, biogas, hydrogen, etc. necessary. Among these fuels, biodiesel hasfound more attention because of very similar properties to the diesel fuels. The major problemswith this biofuel are the source of feedstock (i.e. waste cooking oils and non-edible vegetable oils)and the large amount of wastewater during the production and purification steps. Fortunately, newgenetically modified types of plants for this purpose have been introduced which can be irrigatedby wastewaters. The perspective of a biodiesel production plant could be a fully integrated systemcontaining several membrane units for purification of raw materials, i.e. oil degumming, mem-brane reactors for heterogeneous transesterification reactions, oil dewatering and water de-oilingsteps for purification of raw biodiesel and separation of byproducts such as glycerol and water,separation of biodiesel washing wastewaters, etc. The recovered waters from different wastewatertreatment steps could be integrated for reuse in washing steps. Then, the development of mem-brane knowledge including fabrication of new generation of polymeric and inorganic membranesfor these applications is critical. In this regard, low-cost and low-fouling electrospun membranescan play an important role especially for the fabrication of super hydrophobic membranes forbiodiesel and its wastewater processing.
REFERENCES
Alves, M.J., Nascimento, S.M., Pereira, I.G. & Martins, M.I. (2013) Biodiesel purification using micro andultrafiltration membranes. Renewable Energy, 58, 15–20.
Andric, P., Meye, A.S., Jensen, P.A. & Dam-Johnsen, K. (2010) Reactor design for minimizing productinhibition during enzymatic lignocellulose hydrolysis. II. Quantification of inhibition and suitability ofmembrane reactors. Biotechnology Advances, 28, 407–425.
Atadashi, I.M., Aroua, M.K. &AbdulAziz, A. (2010) High quality biodiesel and its diesel engine application:a review. Renewable and Sustainable Energy Reviews, 14, 1999–2008.
Atadashi, I.M., Aroua, M.K. & Abdul Aziz, A. (2011a) Biodiesel separation and purification: a review.Renewable Energy, 36, 437–443.
Atadashi, I.M., Aroua, M.K., Abdul Aziz, A.R. & Sulaiman, N.M.N. (2011b) Refining technologies for thepurification of crude biodiesel. Applied Energy, 88, 4239–4251.
Atadashi, I.M., Aroua, M.K., Abdul Aziz, A.R. & Sulaiman, N.M.N. (2013) The effects of catalysts inbiodiesel production: a review. Journal of Industrial and Engineering Chemistry, 19, 14–26.
Cayli, G. & Kusefoglu, S. (2008) Increased yields in biodiesel production from used cooking oils by a twosteps process: comparison with one step process by usingTGA. Fuel ProcessingTechnology, 89, 118–122.
Chauhan, B.S., Kumar, N., Cho, H.M. & Lim, H.C. (2013) A study on the performance and emission of adiesel engine fueled with karanja biodiesel and its blends. Energy, 56, 1–7.
Demirbas, A. (2009) Progress and recent trends in biodiesel fuels. Energy Conversion and Management, 50,14–34.
Feng, C., Khulbe, K.C., Matsuura, T., Farnood, R. & Ismail, A.F. (2015) Recent progress in zeolite/zeotypemembranes. Journal of Membrane Science and Research, 1, 49–72.
Gomes, M.C.S., Pereira, N.C. & Davantel de Barros, S.T. (2010) Separation of biodiesel and glycerol usingceramic membranes. Journal of Membrane Science, 352, 271–276.
Gomes, M.C.S., Arroyo, P.A. & Pereira, N.C. (2013) Influence of acidified water addition on the biodieseland glycerol separation through membrane technology. Journal of Membrane Science, 431, 28–36.
Hasheminejad, M., Tabatabaei, M., Mansourpanah, Y. & Javani, A. (2011) Upstream and downstreamstrategies to economize biodiesel production. Bioresource Technology, 102, 461–468.
Helwani, Z., Othman, M.R., Aziz, N., Fernando, W.J.N. & Kim, J. (2009) Technologies for production ofbiodiesel focusing on green catalytic techniques: a review. Fuel Processing Technology, 90, 1502–1514.
Hosseinkhani, O., Kargari, A. & Sanaeepour, H. (2014) Facilitated transport of CO2 through Co (III)S-EPDM ionomer membrane. Journal of Membrane Science, 469, 151–161.

132 M.M.A. Shirazi et al.
Kargari, A. & Takht Ravanchi, N. (2012) Carbon dioxide: capturing and utilization. In: Liu, G. (ed.)Greenhouse gases-capturing, utilization and reduction. InTech, Rijeka, Croatia.
Kazemi, P., Peydayesh, M., Bandegi, A., Mohammadi, T. & Bakhtiari, O. (2013) Pertraction of methyleneblue using a mixture of D2EHPA/M2EHPA and sesame oil as a liquid membrane. Chemical Papers, 67,722–729.
Khulbe, K.C., Feng, C. & Matsuura, T. (2010) The art of surface modification of synthetic polymericmembranes. Journal of Applied Polymer Science, 115, 855–895.
Kim, J. &Van der Bruggen, B. (2010)The use of nanoparticles in polymeric and ceramic membrane structures:review of manufacturing procedures and performance improvement for water treatment. EnvironmentalPollution, 158, 2335–2349.
Lau, W.J. & Ismail, A.F. (2009) Polymeric nanofiltration membranes for textile dye wastewater treatment:preparation, performance evaluation, transport modelling, and fouling control – a review. Desalination,245, 321–348.
Lee, K.P., Arnot, T.C. & Mattia, D. (2011) A review of reverse osmosis membrane materials for desalination-development to date and future potential. Journal of Membrane Science, 370, 1–22.
Leung, D.Y.C., Wu, X. & Leung, M.K.H. (2010) A review on biodiesel production using catalyzedtransestrification. Applied Energy, 87, 1083–1095.
Madaeni, S.S., Aalami-Aleagha, M.E. & Daraei, P. (2008) Preparation and characterization of metallicmembrane using wire arc spraying. Journal of Membrane Science, 320, 541–548.
Mirtalebi, E., Shirazi, M.M.A., Kargari, A., Tabatabei, M. & Ramakrishna, S. (2014) Assessment ofatomic force and scanning electron microscopes for characterization of commercial and electrospunnylon membranes for coke removal from wastewater. Desalination and Water Treatment, 52, 6611–6619.
Mohammadi, S., Kargari, A., Sanaeepour, H., Abbassian, K., Najafi, A. & Mofarrah, E. (2015) Phe-nol removal from industrial wastewaters: a short review. Desalination and Water Treatment, 53 (8),2215–2234.
Noureddin, A., Shirazi, M.M.A., Tofeily, J., Kazemi, P., Motaee, E., Kargari, A., Mostafaei, M., Akia, M.,Karout, A., Jaber, R., Hamieh, T. & Tabatabaei, M. (2014) Accelerated decantation of biodiesel-glycerolmixtures: optimization of a critical stage in biodiesel biorefinery. Separation and PurificationTechnology,132, 272–280.
PBL Report (2013) Trends in global CO2 emissions: 2013 Report. PBL Netherlands EnvironmentalAssessment Agency, The Netherlands.
Rajasekar, E. & Selvi, S. (2014) Review of combustion characteristics of CI engines fueled with biodiesel.Renewable and Sustainable Energy Reviews, 35, 390–399.
Rezakazemi, M., Ebadi Amooghin, A., Montazer-Rahmati, M.M., Ismail, A.F. & Matsuura, T. (2014) State-of-the-art membrane based CO2 separation using mixed matrix membranes (MMMs): an overview oncurrent status and future directions. Progress in Polymer Science, 39, 817–861.
Rios, G.M., Belleville, M.P., Paolucci, D. & Sanchez, J. (2004) Progress in enzymatic membrane reactors –a review. Journal of Membrane Science, 242, 189–196.
Saleh, J., Trembly, A.Y. & Dube, M.A. (2010) Glycerol removal from biodiesel using membrane separationtechnology. Fuel, 89, 2260–2266.
Salleh, W.N.W. & Ismail, A.F. (2015) Carbon membranes for gas separation processes: recent progress andfuture perspective. Journal of Membrane Science and Research, 1, 2–15.
Salvi, B.L., Subramanian, K.A. & Panwar, N.L. (2013) Alternative fuels for transportation vehicles: atechnical review. Renewable and Sustainable Energy Reviews, 25, 404–419.
Sanaeepour, H., Hosseinkhani, O., Kargari, A., Ebadi Amooghin, A. & Raisi, A. (2012) Mathematicalmodeling of a time-dependent extractive membrane bioreactor for denitrification of drinking water.Desalination, 289, 58–65.
Sanaeepur, S., Sanaeepur, H., Kargari, A. & Habibi, M.H. (2014) Renewable energies: climate-changemitigation and international climate policy. International Journal of Sustainable Energy, 33, 203–2012.
Sharma, Y.C. & Singh, B. (2009) Development of biodiesel: current scenario. Renewable and SustainableEnergy Reviews, 13, 1646–1651.
Sharma, Y.C., Singh, B. & Upadhyay, S.N. (2008) Advancements in development and characterization ofbiodiesel: a review. Fuel, 87, 2355–2373.
Shirazi, M.J.A., Bazgir, S. & Shirazi, M.M.A. (2014) Edible oil mill effluent; a low-cost source for econ-omizing biodiesel production: electrospun nanofibrous coalescing filtration approach. Biofuel ResearchJournal, 1, 39–42.
Application of membrane separation technology for biodiesel processing 133
Shirazi, M.J.A., Bazgir, S., Shirazi, M.M.A. & Ramakrishna, S. (2013) Coalescing filtration of oily wastew-aters: characterization and application of thermal treated electrospun polystyrene filters. Desalinationand Water Treatment, 51, 5974–5986.
Shirazi, M.M.A., Kargari, A. & Shirazi, M.J.A. (2012) Direct contact membrane distillation for seawaterdesalination. Desalination and Water Treatment, 49, 368–375.
Shirazi, M.M.A., Kargari, A., Tabatabaei, M., Akia, M., Barkhi, M. & Shirazi, M.J.A. (2013a) Accelerationof biodiesel-glycerol decantation through NaCl-assisted gravitational settling: a strategy to economizebiodiesel production. Bioresource Technology, 134, 401–406.
Shirazi, M.M.A., Kargari, A., Bazgir, Tabatabaei, M., Shirazi, M.J.A., Abdullah, M.S., Matsuura, T. &Ismail, A.F. (2013b) Characterization of electrospun polystyrene membrane for treatment of biodiesel’swater-washing effluent using atomic force microscopy. Desalination, 329, 1–8.
Shirazi, M.M.A., Kargari, A., Bastani, D. & Fatehi, L. (2014) Production of drinking water from seawaterusing membrane distillation (MD) alternative: direct contact MD and sweeping gas MD approaches.Desalination and Water Treatment, 52, 2372–2381.
Shirazi, M.M.A., Kargari, A. & Tabatabaei, M. (2015) Sweeping gas membrane distillation (SGMD) asan alternative for integration of bioethanol processing: study on a commercial membrane and operatingparameters. Chemical Engineering Communications, 202, 457–466.
Shuit, S.H., Ong, Y.T., Lee, K.T., Subhash, B. & Tan, S.H. (2012) Membrane technology as a promisingalternative in biodiesel production: a review. Biotechnology Advances, 30, 1364–1380.
Takht Ravanchi, M., Kaghazchi, T. & Kargari, A. (2009) Application of membrane separation processes inpetrochemical industry: a review. Desalination, 235, 199–244.
Talebian-Kiakalaieh, A., Amin, N.A.S. & Mazaheri, H. (2013) A review on novel processes of biodieselproduction from waste cooking oil. Applied Energy, 104, 683–710.
Uemiya, S. (2004) Brief review of steam reforming using a metal membrane reactor. Topics in Catalysis, 29,79–84.
Wang, Y., Wang, X., Liu, Y., Ou, S., Tan, Y. & Tang, S. (2009). Refining of biodiesel by ceramic membraneseparation. Fuel Processing Technology, 90, 422–427.

This page intentionally left blankThis page intentionally left blank

Part IIIWater and wastewater treatment
(modeling)

This page intentionally left blankThis page intentionally left blank

CHAPTER 13
Mathematical modeling of nanofiltration-based deionizationprocesses in aqueous media
Mohammad M. Zerafat, Mojtaba Shariaty-Niassar, S. Jalaledin Hashemi,Samad Sabbaghi & Azadeh Ghaee
13.1 INTRODUCTION
Nanofiltration (NF) membrane properties stand between those of reverse osmosis (RO) and ultra-filtration (UF) giving them special advantages in separation processes and proposing them as asuitable alternative for RO in many applications due to lower energy requirement and extended fluxrates (Szymczyk et al., 2006). Ionic rejection by NF is mainly governed by: (i) transport throughconcentration polarization (CP) layer, (ii) partitioning phenomena at membrane interfaces and,(iii) solute transport through membrane pores (Deon et al., 2007).
Several attempts have been made to model NF separation processes. The TMS (Torell, Meyerand Sievers) model is one of the first approaches in this regard (Garcia-Aleman and Dickson,2004). Space charge (SC) modeling was proposed by Gross & Osterle (1969) as a modification toTMS. Although, successful NF predictions by SC is reported (Wang et al., 1995), the applicationis limited due to complex calculation requirements especially in mixed electrolyte solutions.
Today, the most prevalent NF models are derived from SC by assuming radial homogeneity ofionic concentration and potential across the pores, which is valid in the case of small surface chargedensities and sufficiently narrow pores, maintained under most NF conditions. The most widelyused pore transport models have also been built upon the extended Nernst-Planck (ENP) equation.Tsuru et al. (1991) were the first to propose an ENP-based model for NF. Bowen and Mukhtar(1996) suggested a hybrid model based on ENP with a Donnan condition at membrane-electrolyteinterfaces and the hindered nature of transport through the membranes. Bowen et al. (1997) mod-ified the hybrid model proposing “Donnan-steric-pore model” (DSPM). Several modificationshave been suggested for DSPM since, taking into account the effects of pore size distribution onthe rejection of uncharged solutes and NaCl for hypothetical NF membranes (Bowen and Welfoot,2002) incorporating dielectric constant variations between bulk and pore to calculate ionic distri-bution between bulk and pore solutions. Different approaches are proposed to include dielectricexclusion (DE) in the modeling, namely DSPM&DE (Bandini and Vezzani, 2003) and SEDE(steric-electric-dielectric exclusion) (Szymczyk and Fievet, 2005). Finite difference linearizationof pore concentration gradient is also proposed to simplify the solution of a 3-parameter model(ε, Xd, and εp) for electrolyte rejection by removing the requirement of numerical integration forENP leading to the linearized transport model (LTM) (Bowen et al., 2002).
Further development of existing models entails the inclusion of more complex or just neglectedphenomena governing the separation behavior in order to improve the physical relevance of processdescription. As an example, SEDE is modified considering the variations of volumetric chargedensity by including a charge isotherm in the model (SEDE-VCh) (Silva et al., 2011).
In the present chapter, the modeling of the NF separation process is considered by a modifiedversion of ENP (MENP) based on the inclusion of activity coefficient variations for solute trans-port through the membrane active layer (Zerafat et al., 2013) and advection-diffusion (AD) forCP which has been previously considered by linearized assumptions (Bhattacharjee et al., 1999).Activity coefficient variations can have a significant influence on model predictions especially in
137

138 M.M. Zerafat et al.
CP Layer
y
x0(–)
∆y(–)
∆y(+)
0(+)
c(y)u(y)
CNa+,b
CCI–,p = CNa+,p
CCl– CNa+
CNa+,m
Figure 13.1. The schematic of a cross-flow membrane filtration channel.
concentrated electrolyte solutions. Partitioning phenomena (steric, Donnan and dielectric exclu-sion) are also considered at membrane external interfaces. In the case of pure salt solutions (NaCland Na2SO4), the competition of ionic species on the rejection of chloride ions will be investigatedbased on simulation results.
13.2 THE MATHEMATICAL MODEL
Prediction of permeate flux and rejection of ionic solutes from a multi-component mixture involvesa simultaneous solution of 3 transport models: (i) mass transport in CP, (ii) equilibrium partition-ing at membrane interfaces and, (iii) pore ionic transport. The coupled ionic transport processesin a cross-flow membrane filtration channel are depicted in Figure 13.1. The CP model is appliedto the filtration channel, describing local variations of permeate flux and surface concentration.The pore transport model provides a detailed analysis of ionic transport across the membrane.Interaction among ions in a multi-component mixture is considered by examining activity coef-ficient variations due to the reduction in ionic strength, negligible in dilute solutions. The poretransport model is then coupled to CP through membrane surface boundary conditions. Parti-tioning phenomena (steric, Donnan and dielectric exclusion) are also considered at membraneexternal interfaces.
13.2.1 CP in multi-ionic systems
CP as a type of reversible fouling mechanism is a serious challenge restricting both the possiblemembrane application fields and life-time at the same time. Efforts have been performed for theinclusion of CP through a coupled model applied for multi-component electrolyte solutions incross-flow NF (Bhattacharjee et al., 1999; 2001). This model predicts local variations of ionicconcentrations, flux and ionic rejections along a rectangular cross-flow filtration channel by acoupled solution of the convective-diffusion equation for transport of ions in the boundary layeradjacent to the membrane surface and ENP for ionic migration through membrane pores. Thisphenomenon is a common field between all pressure-driven membrane separation processes (MF,UF, RO and NF), which can be modeled by simple film theory (FT):
Jv = Di
δln(
Ci,m − Ci,p
Ci,b − Ci,p
)(13.1)
where δ is the boundary layer thickness, Di is the diffusion coefficient, Ci,m is the concentration ofthe ith ion at the membrane surface, Ci,b is the concentration of the ith ion in the bulk solution, Ci,p
the permeate concentration and Jv the permeate flux. More rigorous descriptions of CP are also

Mathematical modeling of nanofiltration-based deionization processes 139
applied among which convective-diffusion (CD) formulation has been given special consideration(Kim and Hoek, 2005). For a multi-component ionic system in a cross-flow unit, the general formof CD for each component in the polarization layer is:
u(y)∂Ci
∂x+ Jv
∂Ci
∂y= Di
∂2Ci
∂y2(13.2)
where u is the axial velocity, Ci is the concentration of the ith ion and Di the diffusion coeffi-cient (Fig. 13.1). This equation can be solved through an implicit finite difference discretizationapproach given as:
ui,n
�xCi,n =
(ui,n
�x+ 2Di
�y2
)Ci,n+1 +
(Jv(i,n)
2�y− Di
�y2
)Ci+1,n+1
−(
Jv(i,n)
2�y+ Di
�y2
)Ci−1,n+1 (13.3)
Linear or free flow axial velocity profiles may be assumed for NF of dilute electrolyte solutions incase that boundary layer is quite thin compared with channel height (Bhattacharjee et al., 2001),while more generalized equations can be introduced based on simplified versions of Navier-Stokesequation in narrow channels:
Jv∂u
∂y= ∂P
∂x+ µ
ρ
∂2u
∂y2(13.4)
The boundary conditions at the channel inlet and bulk solution are, respectively:
Ci|x=0 = Ci,b (13.5a)
Ci
∣∣y=δ = Ci,b (13.5b)
where, Ci,b denotes the bulk ionic concentration. A flux continuity is also maintained at themembrane surface:
∂Ci
∂y
∣∣∣∣y=0
= − Jv
Di(Ci,m − Ci,p) (13.6)
13.2.2 Equilibrium partitioning
Non-steric mechanisms involved in the exclusion at membrane interfaces are less understood andthus described through the assumption of equilibrium partitioning at the pore entrance or exit byusing partition coefficients that relate intra-pore to interfacial bulk concentrations. Partitioningphenomena consist of steric, Donnan and dielectric exclusion mechanisms:
Ci(0+)
Ci(0−)= γi(0−)
γi(0+)ϕi exp
(−�Wi
kBT
)exp(
− ziF
RT�ψD
)(13.7)
Activity coefficients are considered in some studies (Geraldes and Alves, 2008; Szymczyk andFievet, 2005) while others have neglected their effect based on the assumption of dilute solutions.The energy barrier due to dielectric constant reduction (�Wi) impedes ionic transport, due to thehigher solvation energy in a medium with reduced dielectric constant (Parsegian, 1969). Ionicsolvation energy is given by the Born model (Born, 1920):
�Wi = z2i e2
8πε0ai
(1
εp− 1
εb
)(13.8)
where ai is the Stokes radius of the solute, ε0 is the permittivity of free space, εp and εb aredielectric constants in the pore and bulk solution, respectively. Inside narrow membrane pores,
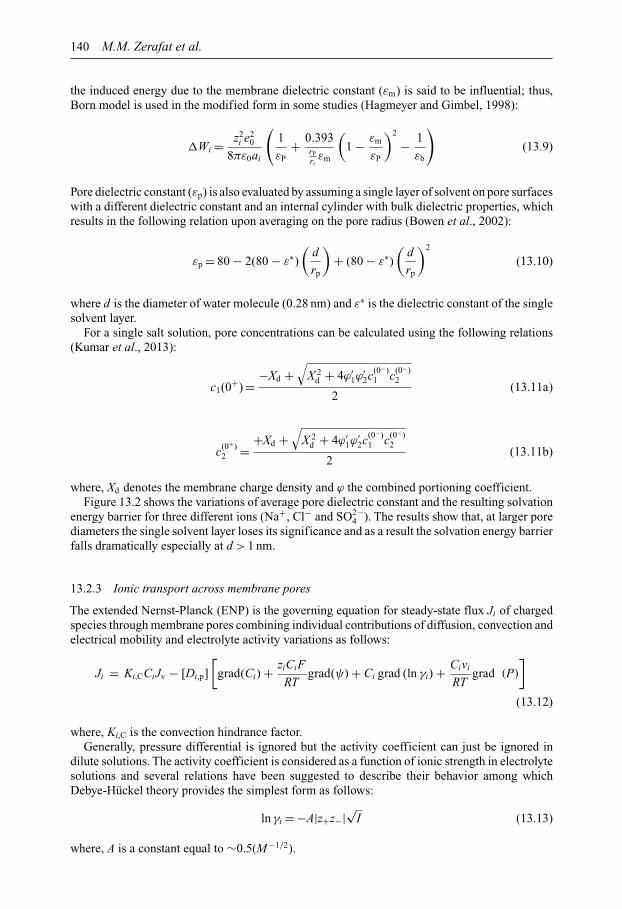
140 M.M. Zerafat et al.
the induced energy due to the membrane dielectric constant (εm) is said to be influential; thus,Born model is used in the modified form in some studies (Hagmeyer and Gimbel, 1998):
�Wi = z2i e2
0
8πε0ai
(1
εP+ 0.393
rP
riεm
(1 − εm
εP
)2
− 1
εb
)(13.9)
Pore dielectric constant (εp) is also evaluated by assuming a single layer of solvent on pore surfaceswith a different dielectric constant and an internal cylinder with bulk dielectric properties, whichresults in the following relation upon averaging on the pore radius (Bowen et al., 2002):
εp = 80 − 2(80 − ε∗)(
d
rp
)+ (80 − ε∗)
(d
rp
)2
(13.10)
where d is the diameter of water molecule (0.28 nm) and ε∗ is the dielectric constant of the singlesolvent layer.
For a single salt solution, pore concentrations can be calculated using the following relations(Kumar et al., 2013):
c1(0+) = −Xd +√
X 2d + 4ϕ′
1ϕ′2c(0−)
1 c(0−)2
2(13.11a)
c(0+)2 = +Xd +
√X 2
d + 4ϕ′1ϕ
′2c(0−)
1 c(0−)2
2(13.11b)
where, Xd denotes the membrane charge density and ϕ the combined portioning coefficient.Figure 13.2 shows the variations of average pore dielectric constant and the resulting solvation
energy barrier for three different ions (Na+, Cl− and SO2−4 ). The results show that, at larger pore
diameters the single solvent layer loses its significance and as a result the solvation energy barrierfalls dramatically especially at d > 1 nm.
13.2.3 Ionic transport across membrane pores
The extended Nernst-Planck (ENP) is the governing equation for steady-state flux Ji of chargedspecies through membrane pores combining individual contributions of diffusion, convection andelectrical mobility and electrolyte activity variations as follows:
Ji = Ki,CCiJv − [Di,p][
grad(Ci) + ziCiF
RTgrad(ψ) + Ci grad (ln γi) + Civi
RTgrad (P)
](13.12)
where, Ki,C is the convection hindrance factor.Generally, pressure differential is ignored but the activity coefficient can just be ignored in
dilute solutions. The activity coefficient is considered as a function of ionic strength in electrolytesolutions and several relations have been suggested to describe their behavior among whichDebye-Hückel theory provides the simplest form as follows:
ln γi = −A|z+z−|√I (13.13)
where, A is a constant equal to ∼0.5(M−1/2).
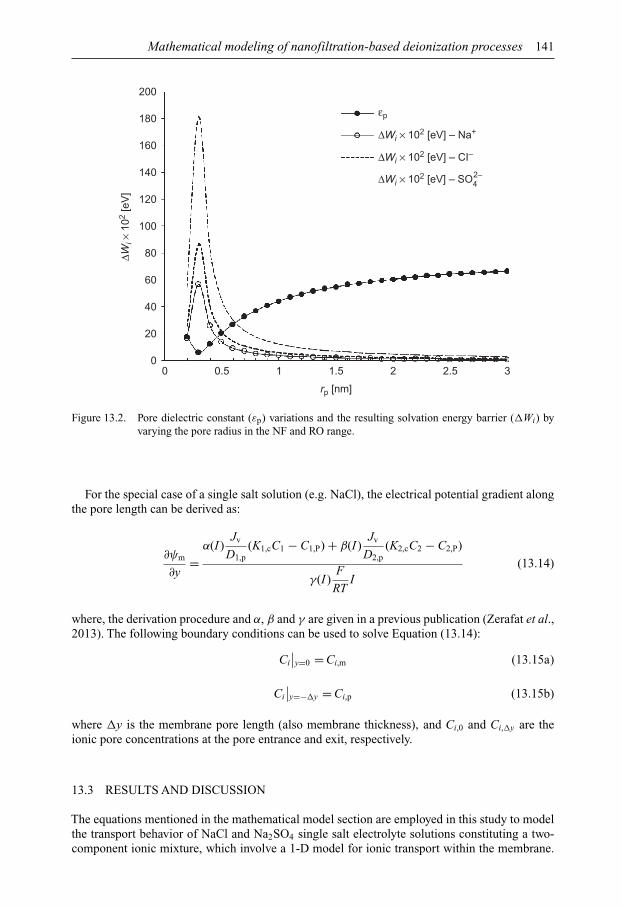
Mathematical modeling of nanofiltration-based deionization processes 141
00 0.5 1 1.5
rp [nm]
2 2.5
εp
∆Wi × 102 [eV] – Na+
∆Wi × 102 [eV] – CI–
∆Wi × 102 [eV] – SO42–
3
20
40
60
80
100
120
140
160
180
200
∆Wi ×
102
[eV
]
Figure 13.2. Pore dielectric constant (εp) variations and the resulting solvation energy barrier (�Wi) byvarying the pore radius in the NF and RO range.
For the special case of a single salt solution (e.g. NaCl), the electrical potential gradient alongthe pore length can be derived as:
∂ψm
∂y=
α(I )Jv
D1,p(K1,cC1 − C1,P) + β(I )
Jv
D2,p(K2,cC2 − C2,P)
γ(I )F
RTI
(13.14)
where, the derivation procedure and α, β and γ are given in a previous publication (Zerafat et al.,2013). The following boundary conditions can be used to solve Equation (13.14):
Ci
∣∣y=0 = Ci,m (13.15a)
Ci
∣∣y=−�y = Ci,p (13.15b)
where �y is the membrane pore length (also membrane thickness), and Ci,0 and Ci,�y are theionic pore concentrations at the pore entrance and exit, respectively.
13.3 RESULTS AND DISCUSSION
The equations mentioned in the mathematical model section are employed in this study to modelthe transport behavior of NaCl and Na2SO4 single salt electrolyte solutions constituting a two-component ionic mixture, which involve a 1-D model for ionic transport within the membrane.
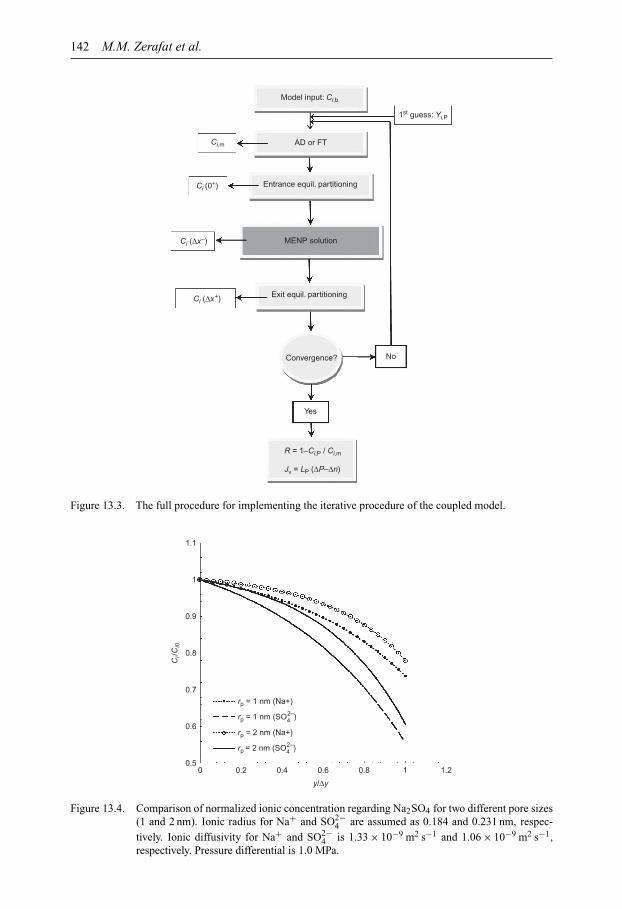
142 M.M. Zerafat et al.
Model input: Ci,b
AD or FT
1st guess: Yi,P
Entrance equil. partitioning
Exit equil. partitioning
Convergence?
R = 1–Ci,P / Ci,m
Jv = LP (∆P–∆n)
Yes
No
Ci,m
Ci (0+)
Ci (∆x–)
Ci (∆x+)
MENP solution
Figure 13.3. The full procedure for implementing the iterative procedure of the coupled model.
00.5
0.6
0.7
0.8
0.9
1
1.1
0.2 0.4
Ci/C
i0
y/∆y
0.80.6
rp = 1 nm (Na+)
rp = 2 nm (Na+)
rp = 1 nm (SO42–)
rp = 2 nm (SO42–)
1 1.2
Figure 13.4. Comparison of normalized ionic concentration regarding Na2SO4 for two different pore sizes(1 and 2 nm). Ionic radius for Na+ and SO2−
4 are assumed as 0.184 and 0.231 nm, respec-tively. Ionic diffusivity for Na+ and SO2−
4 is 1.33 × 10⁻⁹ m2 s−1 and 1.06 × 10⁻⁹ m2 s−1,respectively. Pressure differential is 1.0 MPa.
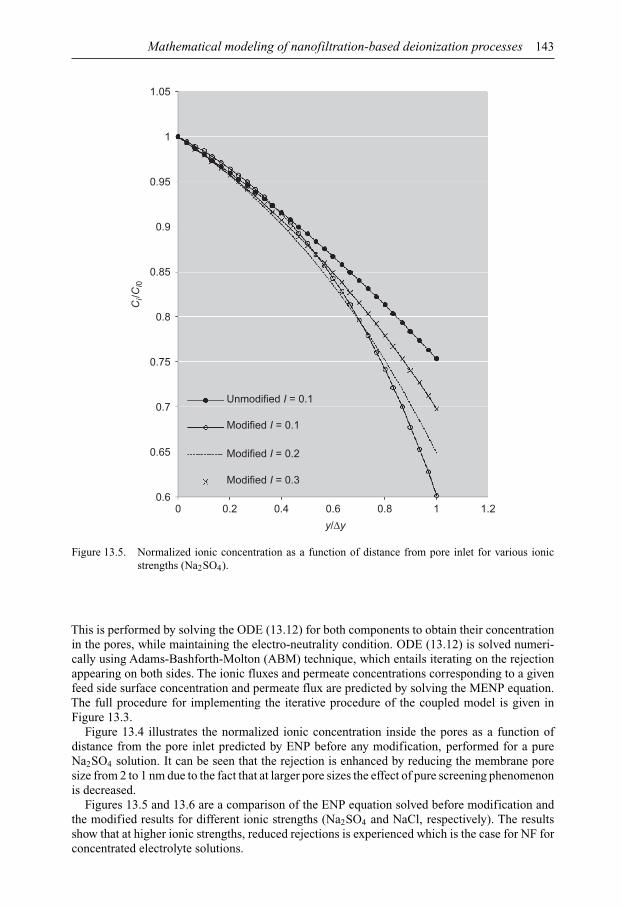
Mathematical modeling of nanofiltration-based deionization processes 143
y/∆y
Ci/C
i0
0 0.2 0.4 0.6
Unmodified I = 0.1
Modified I = 0.1
Modified I = 0.2
Modified I = 0.3
0.8 1 1.20.6
0.65
0.7
0.75
0.8
0.85
0.9
0.95
1
1.05
Figure 13.5. Normalized ionic concentration as a function of distance from pore inlet for various ionicstrengths (Na2SO4).
This is performed by solving the ODE (13.12) for both components to obtain their concentrationin the pores, while maintaining the electro-neutrality condition. ODE (13.12) is solved numeri-cally using Adams-Bashforth-Molton (ABM) technique, which entails iterating on the rejectionappearing on both sides. The ionic fluxes and permeate concentrations corresponding to a givenfeed side surface concentration and permeate flux are predicted by solving the MENP equation.The full procedure for implementing the iterative procedure of the coupled model is given inFigure 13.3.
Figure 13.4 illustrates the normalized ionic concentration inside the pores as a function ofdistance from the pore inlet predicted by ENP before any modification, performed for a pureNa2SO4 solution. It can be seen that the rejection is enhanced by reducing the membrane poresize from 2 to 1 nm due to the fact that at larger pore sizes the effect of pure screening phenomenonis decreased.
Figures 13.5 and 13.6 are a comparison of the ENP equation solved before modification andthe modified results for different ionic strengths (Na2SO4 and NaCl, respectively). The resultsshow that at higher ionic strengths, reduced rejections is experienced which is the case for NF forconcentrated electrolyte solutions.
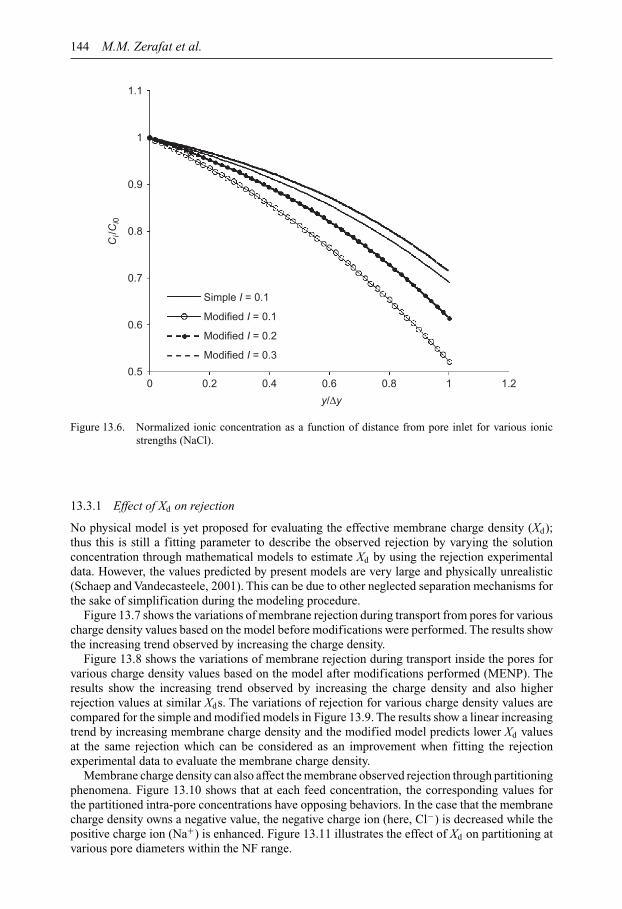
144 M.M. Zerafat et al.
y/∆y
Ci/C
i0
0 0.2 0.4
Simple I = 0.1
Modified I = 0.1
Modified I = 0.2
Modified I = 0.3
0.6 0.8 1 1.20.5
0.6
0.7
0.8
0.9
1
1.1
Figure 13.6. Normalized ionic concentration as a function of distance from pore inlet for various ionicstrengths (NaCl).
13.3.1 Effect of Xd on rejection
No physical model is yet proposed for evaluating the effective membrane charge density (Xd);thus this is still a fitting parameter to describe the observed rejection by varying the solutionconcentration through mathematical models to estimate Xd by using the rejection experimentaldata. However, the values predicted by present models are very large and physically unrealistic(Schaep and Vandecasteele, 2001). This can be due to other neglected separation mechanisms forthe sake of simplification during the modeling procedure.
Figure 13.7 shows the variations of membrane rejection during transport from pores for variouscharge density values based on the model before modifications were performed. The results showthe increasing trend observed by increasing the charge density.
Figure 13.8 shows the variations of membrane rejection during transport inside the pores forvarious charge density values based on the model after modifications performed (MENP). Theresults show the increasing trend observed by increasing the charge density and also higherrejection values at similar Xds. The variations of rejection for various charge density values arecompared for the simple and modified models in Figure 13.9. The results show a linear increasingtrend by increasing membrane charge density and the modified model predicts lower Xd valuesat the same rejection which can be considered as an improvement when fitting the rejectionexperimental data to evaluate the membrane charge density.
Membrane charge density can also affect the membrane observed rejection through partitioningphenomena. Figure 13.10 shows that at each feed concentration, the corresponding values forthe partitioned intra-pore concentrations have opposing behaviors. In the case that the membranecharge density owns a negative value, the negative charge ion (here, Cl−) is decreased while thepositive charge ion (Na+) is enhanced. Figure 13.11 illustrates the effect of Xd on partitioning atvarious pore diameters within the NF range.

Mathematical modeling of nanofiltration-based deionization processes 145
y/∆y
Xd = 0.5
Xd = 4
Xd = 7
Xd = 10
Xd = 13
Xd = 15
Xd = 18
Xd = 20
mEq
0.8 0.85 0.9 0.95 1
Ci/C
i0
0.45
0.5
0.55
0.6
0.65
0.7
0.75
Figure 13.7. Enhancement of membrane rejection by increasing the effective charge density values (simplemodel).
Xd = 0.5
Xd = 4
Xd = 7
Xd = 10
Xd = 13
y/∆y
Ci/C
i0
mEq
Figure 13.8. Enhancement of membrane rejection by increasing the effective charge density values(MENP).
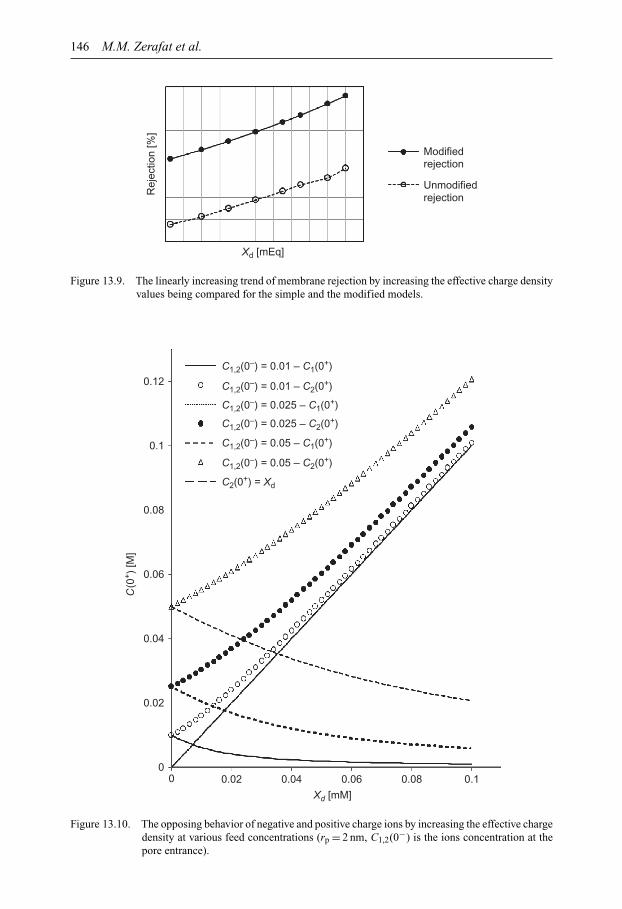
146 M.M. Zerafat et al.
Xd [mEq]
Rej
ectio
n [%
]Modified
Unmodified
rejection
rejection
Figure 13.9. The linearly increasing trend of membrane rejection by increasing the effective charge densityvalues being compared for the simple and the modified models.
Xd [mM]
0 0.02 0.04 0.06 0.08 0.1
C1,2(0–) = 0.01 – C1(0+)
C1,2(0–) = 0.01 – C2(0+)
C1,2(0–) = 0.025 – C1(0+)
C1,2(0–) = 0.025 – C2(0+)
C1,2(0–) = 0.05 – C1(0+)
C1,2(0–) = 0.05 – C2(0+)
C2(0+) = Xd
C(0
+ ) [M
]
0
0.02
0.04
0.06
0.08
0.1
0.12
Figure 13.10. The opposing behavior of negative and positive charge ions by increasing the effective chargedensity at various feed concentrations (rp = 2 nm, C1,2(0−) is the ions concentration at thepore entrance).
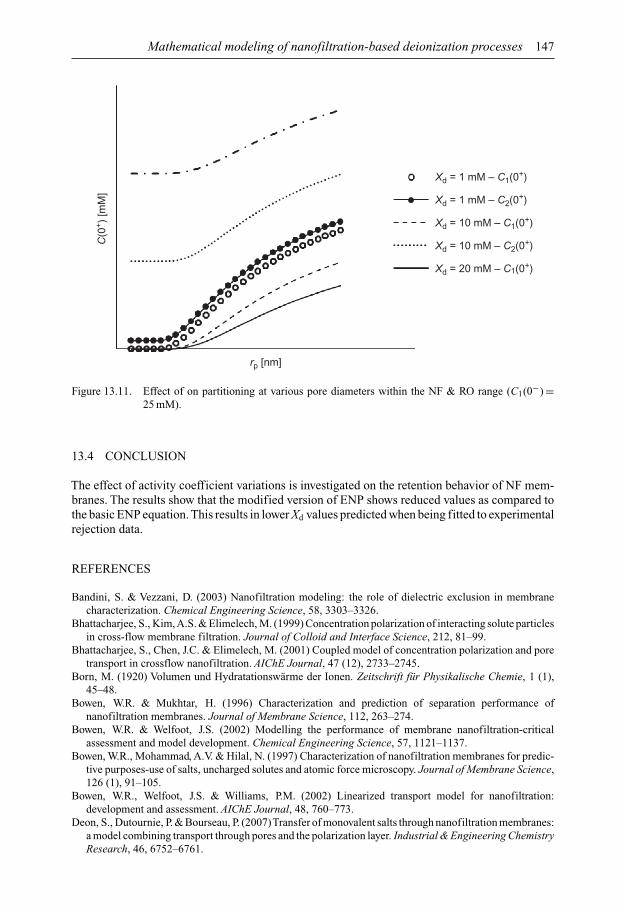
Mathematical modeling of nanofiltration-based deionization processes 147
Xd = 1 mM – C1(0+)
Xd = 1 mM – C2(0+)
Xd = 10 mM – C1(0+)
Xd = 10 mM – C2(0+)
Xd = 20 mM – C1(0+)
rp [nm]
C(0
+ ) [m
M]
Figure 13.11. Effect of on partitioning at various pore diameters within the NF & RO range (C1(0−) =25 mM).
13.4 CONCLUSION
The effect of activity coefficient variations is investigated on the retention behavior of NF mem-branes. The results show that the modified version of ENP shows reduced values as compared tothe basic ENP equation. This results in lower Xd values predicted when being fitted to experimentalrejection data.
REFERENCES
Bandini, S. & Vezzani, D. (2003) Nanofiltration modeling: the role of dielectric exclusion in membranecharacterization. Chemical Engineering Science, 58, 3303–3326.
Bhattacharjee, S., Kim, A.S. & Elimelech, M. (1999) Concentration polarization of interacting solute particlesin cross-flow membrane filtration. Journal of Colloid and Interface Science, 212, 81–99.
Bhattacharjee, S., Chen, J.C. & Elimelech, M. (2001) Coupled model of concentration polarization and poretransport in crossflow nanofiltration. AIChE Journal, 47 (12), 2733–2745.
Born, M. (1920) Volumen und Hydratationswärme der Ionen. Zeitschrift für Physikalische Chemie, 1 (1),45–48.
Bowen, W.R. & Mukhtar, H. (1996) Characterization and prediction of separation performance ofnanofiltration membranes. Journal of Membrane Science, 112, 263–274.
Bowen, W.R. & Welfoot, J.S. (2002) Modelling the performance of membrane nanofiltration-criticalassessment and model development. Chemical Engineering Science, 57, 1121–1137.
Bowen, W.R., Mohammad, A.V. & Hilal, N. (1997) Characterization of nanofiltration membranes for predic-tive purposes-use of salts, uncharged solutes and atomic force microscopy. Journal of Membrane Science,126 (1), 91–105.
Bowen, W.R., Welfoot, J.S. & Williams, P.M. (2002) Linearized transport model for nanofiltration:development and assessment. AIChE Journal, 48, 760–773.
Deon, S., Dutournie, P. & Bourseau, P. (2007)Transfer of monovalent salts through nanofiltration membranes:a model combining transport through pores and the polarization layer. Industrial & Engineering ChemistryResearch, 46, 6752–6761.
148 M.M. Zerafat et al.
Garcia-Aleman, J. & Dickson, J.M. (2004) Mathematical modeling of nanofiltration membranes with mixedelectrolyte solutions. Journal of Membrane Science, 235, 1–13.
Geraldes, V. & Alves, A.M.B. (2008) Computer program for simulation of mass transport in nanofiltrationmembranes. Journal of Membrane Science, 321, 172–182.
Gross, R.J. & Osterle, J.F. (1968) Membrane transport characteristics of ultraflne capillaries. JournalChemical Physics, 49, 228–234.
Hagmeyer, G. & Gimbel, R. (1998) Modelling the salt rejection of nanofiltration membranes for ternary ionmixtures and for single salts at different pH values. Desalination, 117, 247–256.
Kim, S. & Hoek, E.M.V. (2005) Modeling concentration polarization in reverse osmosis processes.Desalination, 186 (1), 111–128.
Kumar, V.S., Hariharan, K.S., Mayya, K.S. & Han, S. (2013) Volume averaged reduced order Donnan stericpore model for nanofiltration membranes. Desalination, 322, 21–28.
Parsegian, A. (1969) Energy of an ion crossing a low dielectric membrane: solutions to four relevantelectrostatic problems. Nature, 22, 844–846.
Schaep, J. & Vandecasteele, C. (2001) Evaluating the charge of nanofiltration membranes. Journal ofMembrane Science, 188, 129–36.
Silva, V., Geraldes, V., Brites Alves, A.M., Palacio, L., Prádanos, P. & Hernández, A. (2011) Multi-ionicnanofiltration of highly concentrated salt mixtures in the seawater range. Desalination, 277, 29–39.
Szymczyk, A. & Fievet, P. (2005) Investigating transport properties of nanofiltration membranes by meansof a steric, electric and dielectric exclusion model. Journal of Membrane Science, 252, 77–88.
Szymczyk, A., Sbaï, M. & Fievet, P. (2006) Transport properties and electrokinetic characterization of anamphoteric nanofilter. Langmuir, 22, 3910–3919.
Tsuru, T., Nakao, S. & Kimura, S. (1991) Calculation of ion rejection by extended Nernst-Planck equationwith charged reverse osmosis membranes for single and mixed electrolyte solutions. Journal of ChemicalEngineering of Japan, 24, 511–517.
Wang, X., Tsuru, T., Nakao, S. & Kimura, S. (1995) Electrolyte transport through nanofiltration membranesby the space-charge model and the comparison with Teorell-Meyer-Sievers model. Journal of MembraneScience, 103 (1–2), 117–133.
Zerafat, M.M., Shariati-Niassar, M., Hashemi, S.J., Sabbaghi, S., Ismail, A.F. & Matsuura, T. (2013)Mathematical modeling of nanofiltration for concentrated electrolyte solutions. Desalination, 320, 17–23.

CHAPTER 14
Simulation of heat and mass transfer in membrane distillation (MD)processes: the effect of membrane pore space description
Abdussalam O. Imdakm, Elmahdi M. Abousetta & Khalid Mahroug
14.1 INTRODUCTION
Membrane distillation (MD) processes, in general, are thermal separation processes in whichwater vapor is generated by the evaporation of aqueous solution in direct contact with one sideof the employed hydrophobic porous membrane (feed side), to be transported through mem-brane pores, and finally it will condense at the other side of the membrane (permeate side). Inmembrane distillation literature, various models of MD processes and physical setups have beendeveloped in order to improve MD processes output, depending on the convenience of the MDseparation process of interest, e.g., direct contact membrane distillation process (DCMD), vac-uum membrane distillation (VMD), air gap membrane distillation (AGMD), and sweeping gasmembrane distillation (SGMD), each of these has its own advantage and disadvantage, and itsuseful applications in many areas of industrial interest.
Among all MD processes published in the literature, direct contact membrane distillation(DCMD) and vacuum membrane distillation (VMD) processes have shown the most frequentinterest. This is because of their simplicity in terms of construction and operating conditions,lower operating temperature and pressure, lower energy consumption, and their relatively highpermeation rate. These MD configurations are commonly applied for processes in which watervapor is the main flux component, as in distillation, for removal of volatile components (VOC’S),and for waste water treatment (Calabro et al., 1991; 1994; Wu et al., Xu, 1991). In these processes,heated feed and cold permeate streams are in direct contact with the applied membrane surfaces(feed and permeate), and the separation process is carried out at atmospheric pressure as in DCMDor under moderate vacuum as in VMD processes, utilizing hydrophobic porous membrane. Theyare characterized by a simultaneous heat and mass transfer across the membrane pores and solidphase, resulting from the difference in temperature (vapor pressure) and/or composition in thefluid layers adjacent to membrane surfaces (feed and permeate).
When the aqueous feed solution is very low in solute concentration or pure water, the solutionvapor pressure at liquid-vapor interface is generally governed by fluid temperatures adjacent to themembrane surface feed and permeate, ts,f and ts,p, respectively as in DCMD, or Ts,f and imposedvacuum condition at the permeate side as in VMD. These bulk-membrane interfacial surfacetemperatures differ significantly from their corresponding measured bulk temperature, tb,f andtb,p, their values cannot be measured directly and they are influenced significantly by MD processoperating conditions (process dynamics), membrane pore space topology (inter-connectivity),and employed hydrophobic membrane physical properties. This phenomenon is known in theliterature as the temperature polarization, and the temperature polarization coefficient, τ, isdefined in the literature (Lawson and Lloyd, 1996; 1997; Phattaranawik and Jiraratananon, 2001;Phattaranawik et al., 2003a; Schofield et al., 1987; 1990a; 1990b) as: τ = (ts,f − ts,p)/(tb,f − tb,p)for DCMD process, where tb,f is the feed side bulk temperature, ts,f , is the feed side membranesurface temperature, tb,p and ts,p are the equivalent permeate side temperatures, and for the VMDprocess it is defined, in many cases as: τ = (Ts,f – Tv)/(Tb,f − Tv), where Tv is the temperatureset on the vacuum side. The concept of the temperature polarization factor is used, in many
149
150 A.O. Imdakm, E.M. Abousetta & K. Mahroug
cases, as a tool for evaluating the effects of input parameters on maximizing the mass flux. Forexample, when the value of τ approaches zero for VMD process, this means Ts,f → Tv, and forDCMD process this means ts,f → ts,p, and thus the MD processes in both cases are limited by masstransfer through the liquid phase boundary layer and the resistance in the membrane is negligible.However, when τ → 1, Ts,f → Tb,f in VMD and ts,f → tb,f and ts,p → tb,p in DCMD, this impliesthat in these MD processes, the resistance in the membrane is dominant and the liquid phaseboundary layer resistance is negligible.
Modeling of MD processes to predict process vapor flux and related transport properties ofinterest have received a great deal of attention from many investigators; e.g., Schofield et al.(1987; 1990a; 1990b), Phattaranawik et al. (2001; 2003a; 2003b), and Lawson and Lloyd (1996,1997). These models, are based on the dusty-gas model (Mason, and Malinauskas 1983; Masonet al. 1967), which is a general model developed to describe mass transport in porous media,assuming a geometrical structure of the porous medium in the form of a collection of an assemblyof spherical molecules. The vapor flux expressions applied in this model were described by one or acombination of the following gas transport mechanisms, founded on the classical kinetic theory ofgases for single cylindrical pore (Lawson and Lloyd 1997; Mason, and Malinauskas 1983; Masonet al. 1967): Knudsen diffusion, viscous flow (Poiseuille), and surface and molecular diffusion,depending on applied pore level operating conditions (pressure and temperature), average meanfree path of transporting molecules, λ, and pore size, rpore. In the simplest general form the vaporflux, J , can be expressed as: J = C(Ps,f − Ps,p), where C is the vapor flux coefficient of theapplied membrane. Note molecular diffusion through membrane pores, and molecular transportas a result of surface diffusion transport mechanism, are rarely taken into consideration in MDprocesses.
Recently, several models were developed to predict MD vapor flux and related transport prop-erties, assuming a geometrical structure of the membrane pore space (Lagana et al., 2000;Phattaranawik et al., 2003b; Present, 1958). In these models, vapor flux is described by thesame vapor flux transport mechanisms applied in the dusty-gas model mentioned above, and themembrane pore space is either described by a single or a bundle of capillary tubes, known as thecapillary tube model (CT). In these models, the membrane pores are assumed to be infinitely longcylindrical pores of experimentally reported effective pore radii. In many cases, the membranepore size distribution was assumed to be uniform. This assumption is founded on the simplicityof vapor flux calculation, arguing that in most MD processes of practical interest, the membranepore size distribution is very narrow and is equivalent to a uniform pore size distribution. Only afew attempts have been made to relate membrane pore space description (pore size distribution,and inter-connectivity), to the precision of MD’s vapor flux calculation.
In previous studies (Imdakm and Matsuura, 2004; 2005; Imdakm et al., 2007), we havedeveloped a Monte Carlo simulation model to describe DCMD and VMD processes for predictingMD vapor flux. In these MC simulation models, the membrane pore space is described by a three-dimensional network (NW) model of inter-connected bonds (pores) and sites (nodes). To illustratethe influence of membrane pore space description and how it may affect the resultant vapor flux andrelated transport properties, a comparison is made in this study between the NW and CT modelsconsidering both DCMD and VMD processes. In both models, NW and CT, the membrane poresare simulated by cylindrical tubes of distributed effective sizes, based on experimentally reportedmembrane pore size distribution, or they may be assumed to be of uniform radii. Vapor fluxthrough membrane pores is assumed to be governed by gas transport mechanisms founded on thekinetic theory of gases for a single cylindrical pore (Present, 1958).
14.2 THEORY
14.2.1 Pore level vapor flux transport mechanism(s)
As mentioned above, the calculation method applied in this study is a Monte Carlo simulationmethod (Imdakm and Matsuura, 2004; 2005; Imdakm and Sahimi, 1991; Imdakm et al., 2007;

Simulation of heat and mass transfer in membrane distillation (MD) processes 151
Sahimi and Imdakm, 1988); this means the calculation is carried out by generating several inde-pendent realizations of membrane pore space. Thus, resulting MD vapor flux and any othertransport properties of interest are the average value of the results obtained over all these realiza-tions. This averaging process is applied on the overall results reported in this study regardless ofmembrane pore space description, NW or CT model.
The vapor flux transport mechanism through membrane pores depends upon the mean freepath, λ, which is defined as the average distance that a molecule travels between two successivecollisions (Present, 1958):
λ = KBT
P√
2πσ2(14.1)
where KB is the Boltzmann constant, T the absolute temperature [K], P is the applied operatingpressure [Pa], and σ is the collision diameter [m]. The value of λ and how it is interrelated to themembrane pore sizes plays an essential role in determining the type of transport mechanism(s)governing vapour flux through membrane pores. In both models, temperature (T ) and pressure(P) in Equation (14.1) are replaced by the arithmetic average pore temperature (Tpore) and thearithmetic average pore pressure (Ppore). The vapour transport mechanism through each pore (seeFigs. 14.1a–c and 14.2) is then dictated by the ratio of mean free path, λ, to pore radius. Forexample, if the ratio of λ to the pore radius, rp, is less than unity, then the transport mechanismthrough this pore is the viscous (Poiseuille) type of flow. In this case, the flow rate through thepore, Nvis, is given by (Imdakm and Matsuura, 2004; 2005; Imdakm and Sahimi, 1991; Imdakmet al., 2007; Present, 1958; Sahimi and Imdakm, 1988):
Nvis = Pporeπr4p
8RTporeµδMw�P (14.2)
where �P is the pressure difference across the membrane pore, Ppore is the arithmetic averagepore pressure, Tpore the arithmetic average pore temperature, and rp is the pore radius. However,when the transporting species has a mean free path, λ, larger than the membrane pore radius,rp, then the mass transport mechanism through this pore is Knudsen diffusion type of flow.Accordingly, the flow rate through the pore, NKn, is given as:
NKn = − 2
3δ
(8
πRTporeMw
)1/2
rp�P (14.3)
where Mw is the molecular weight of the transporting species. It must be stated that other transportmechanisms, such as surface diffusion and ordinary diffusion, are not taken into considerationas stated in previous studies (Imdakm and Matsuura, 2004; 2005; Imdakm and Sahimi, 1991;Imdakm et al., 2007; Sahimi and Imdakm, 1988). In most MD processes, the ordinary moleculardiffusion resistance is neglected because it is proportional to the partial pressure of air in themembrane pores and in all MD processes, only traces of air are actually present within themembrane pores, which makes its contribution to the transporting process very small if not nilcompared to other transport mechanisms. Moreover, the surface diffusion is also neglected dueto the fact that the surface diffusion area of the membrane matrix is very small compared to thepore area and for hydrophobic membranes as those used in MD, the “affinity” between water andthe membrane material is very weak, which may allow us to neglect the contribution of transportby surface diffusion, especially for porous membranes with large pore sizes and high porosities(Lawson and Lloyd 1996; 1997).
With the assumption that all MD processes operate on, the principle of vapor-liquid equilibrium(VLE), partial vapor pressure can be calculated using VLE data. Therefore, the saturation vaporpressure at the membrane feed-side can be estimated by the Antoine equation as a function ofthe interfacial surface temperature; see Figures 14.1c and 14.2 for a detailed description of vaporflux at the membrane feed-side (entry pores). These entry pores, particularly when the membranepore space is described by a network model, plays a very essential role in vapor flux calculations,
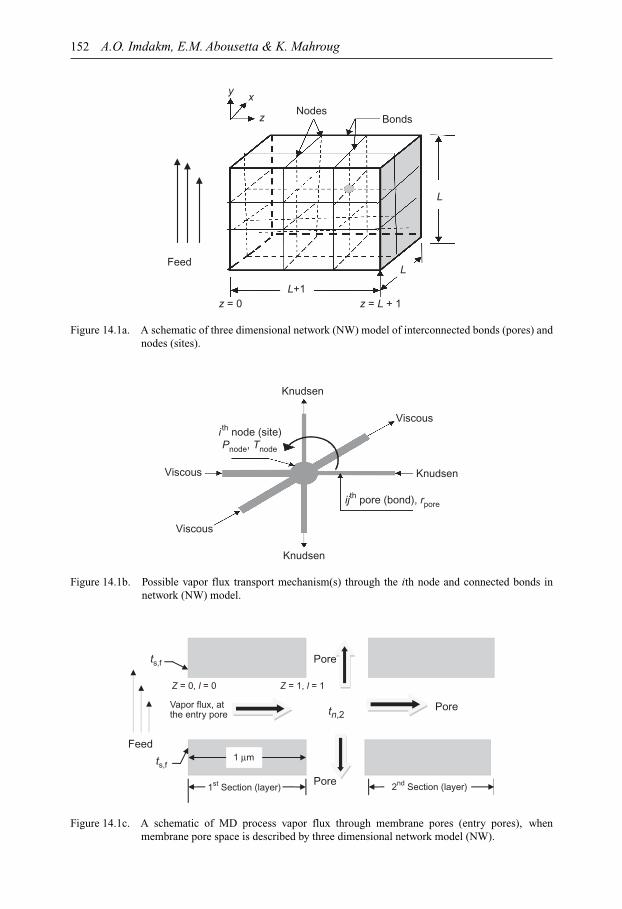
152 A.O. Imdakm, E.M. Abousetta & K. Mahroug
L
Nodes
L
L+1
Feed
z = 0 z = L + 1
xy
z Bonds
Figure 14.1a. A schematic of three dimensional network (NW) model of interconnected bonds (pores) andnodes (sites).
Viscous
Viscous
i th node (site)Pnode, Tnode
Knudsen
Viscous
Knudsen
Knudsen
ijth pore (bond), rpore
Figure 14.1b. Possible vapor flux transport mechanism(s) through the ith node and connected bonds innetwork (NW) model.
Feed
ts,f
Pore
ts,f
Z = 0, l = 0 Z = 1, l = 1
Pore
Pore
Vapor flux, at the entry pore tn,2
1 µm
2nd Section (layer)1st Section (layer)
Figure 14.1c. A schematic of MD process vapor flux through membrane pores (entry pores), whenmembrane pore space is described by three dimensional network model (NW).

Simulation of heat and mass transfer in membrane distillation (MD) processes 153
Permeate Under vacuum
Feed
i th pore
Tpore and Ppore
δ
ts,f
ts,f
ts,p
ts,p
Vapor flux direction
Figure 14.2. A schematic of vapour flux of MD process through membrane pores when membrane porespace is described by capillary tube (CT) model.
0
A
B
C
Pore size, µpore [nm]
0 200 400 600 800 1000
0.04
Pro
babi
lity
dens
ity fu
nctio
n
0.08
0.12
Figure 14.3. Probability density function curves for membranes A (µpore = 200 nm), B (µpore = 250 nm)and C (µpore = 300 nm), with a constant σpore = 1.25 (Wang et al., 2001).
for further details see Imdakm and Matsuura (2004; 2005) and Imdakm et al. (2007) and referencestherein. Figure 14.3 shows the geometrical pore sizes, standard deviations, and the correspondingprobability density curves for three membranes, A, B, and C, which are employed for both NWand CT models. These pore size distributions are actually based on experimentally reported poresize distribution published in the literature (Wang et al., 2001).
14.2.2 Vapor flux calculation through membrane pore space
As mentioned above, when the membrane pore space is described by a three-dimensional networkmodel, the entire calculation procedure of mass and energy flux in any MD process, is an iterativeprocedure, thus, membrane-bulk interfacial surface temperatures and MD processes energy andvapour flux and other transport properties of interest are also calculated iteratively using properiterative methods such as the method of successive substitutions (Imdakm and Matsuura, 2004;2005; Imdakm et al., 2007; Rice and Do, 1995) and references therein. When the membrane porespace is described by CT model, this iterative method is also applied. In this case, an initial guess ofinterfacial membrane surface temperatures, ts,f , and ts,p is given to calculate membrane boundariesvapor pressure, Ps,f and Ps,p using the Antoine equation. Note that the applied permeate vapourpressure is lower than the saturation pressure (Psat.). Since in this CT model, the membrane poretopology (connectivity) is totally ignored, the temperature and pressure distribution across themembrane cannot be calculated. Thus, inlet, outlet, and average vapor pressure and temperatureare of the same values for all membrane pores. Accordingly, pore level vapor flux transportmechanism depends on the pore size, rp only. When λ < rp, then the flow rate of vapor through
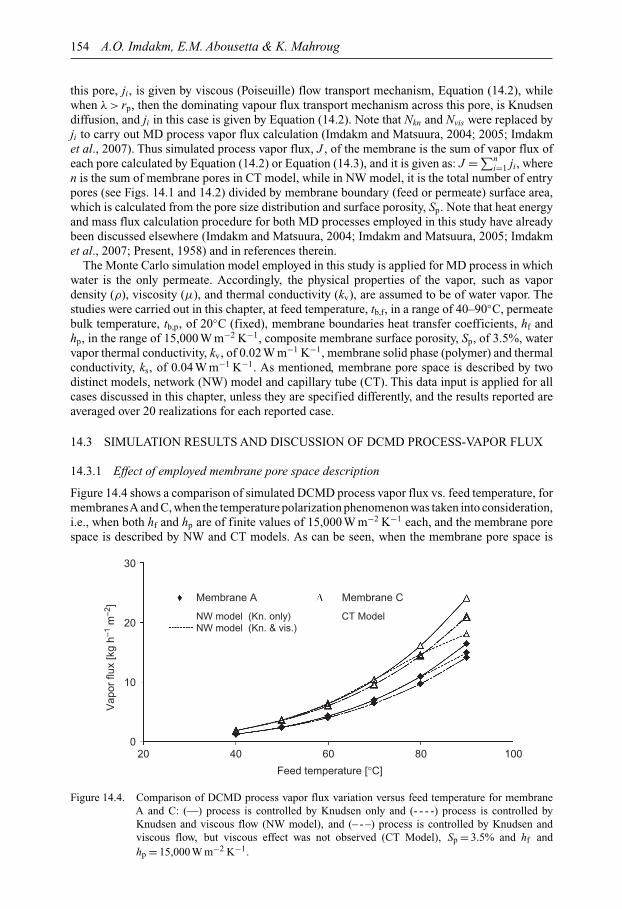
154 A.O. Imdakm, E.M. Abousetta & K. Mahroug
this pore, ji, is given by viscous (Poiseuille) flow transport mechanism, Equation (14.2), whilewhen λ > rp, then the dominating vapour flux transport mechanism across this pore, is Knudsendiffusion, and ji in this case is given by Equation (14.2). Note that Nkn and Nvis were replaced byji to carry out MD process vapor flux calculation (Imdakm and Matsuura, 2004; 2005; Imdakmet al., 2007). Thus simulated process vapor flux, J , of the membrane is the sum of vapor flux ofeach pore calculated by Equation (14.2) or Equation (14.3), and it is given as: J =∑n
i=1 ji, wheren is the sum of membrane pores in CT model, while in NW model, it is the total number of entrypores (see Figs. 14.1 and 14.2) divided by membrane boundary (feed or permeate) surface area,which is calculated from the pore size distribution and surface porosity, Sp. Note that heat energyand mass flux calculation procedure for both MD processes employed in this study have alreadybeen discussed elsewhere (Imdakm and Matsuura, 2004; Imdakm and Matsuura, 2005; Imdakmet al., 2007; Present, 1958) and in references therein.
The Monte Carlo simulation model employed in this study is applied for MD process in whichwater is the only permeate. Accordingly, the physical properties of the vapor, such as vapordensity (ρ), viscosity (µ), and thermal conductivity (kv), are assumed to be of water vapor. Thestudies were carried out in this chapter, at feed temperature, tb,f, in a range of 40–90◦C, permeatebulk temperature, tb,p, of 20◦C (fixed), membrane boundaries heat transfer coefficients, hf andhp, in the range of 15,000 W m−2 K−1, composite membrane surface porosity, Sp, of 3.5%, watervapor thermal conductivity, kv, of 0.02 W m−1 K−1, membrane solid phase (polymer) and thermalconductivity, ks, of 0.04 W m−1 K−1. As mentioned, membrane pore space is described by twodistinct models, network (NW) model and capillary tube (CT). This data input is applied for allcases discussed in this chapter, unless they are specified differently, and the results reported areaveraged over 20 realizations for each reported case.
14.3 SIMULATION RESULTS AND DISCUSSION OF DCMD PROCESS-VAPOR FLUX
14.3.1 Effect of employed membrane pore space description
Figure 14.4 shows a comparison of simulated DCMD process vapor flux vs. feed temperature, formembranesA and C, when the temperature polarization phenomenon was taken into consideration,i.e., when both hf and hp are of finite values of 15,000 W m−2 K−1 each, and the membrane porespace is described by NW and CT models. As can be seen, when the membrane pore space is
0
10
20
30
20 40 60 80 100
Vap
or fl
ux [k
g h–1
m–2
]
Feed temperature [°C]
Membrane A Membrane C
NW model (Kn. only) CT Model NW model (Kn. & vis.)
Figure 14.4. Comparison of DCMD process vapor flux variation versus feed temperature for membraneA and C: (—) process is controlled by Knudsen only and (- - - -) process is controlled byKnudsen and viscous flow (NW model), and (– - –) process is controlled by Knudsen andviscous flow, but viscous effect was not observed (CT Model), Sp = 3.5% and hf andhp = 15,000 W m−2 K−1.
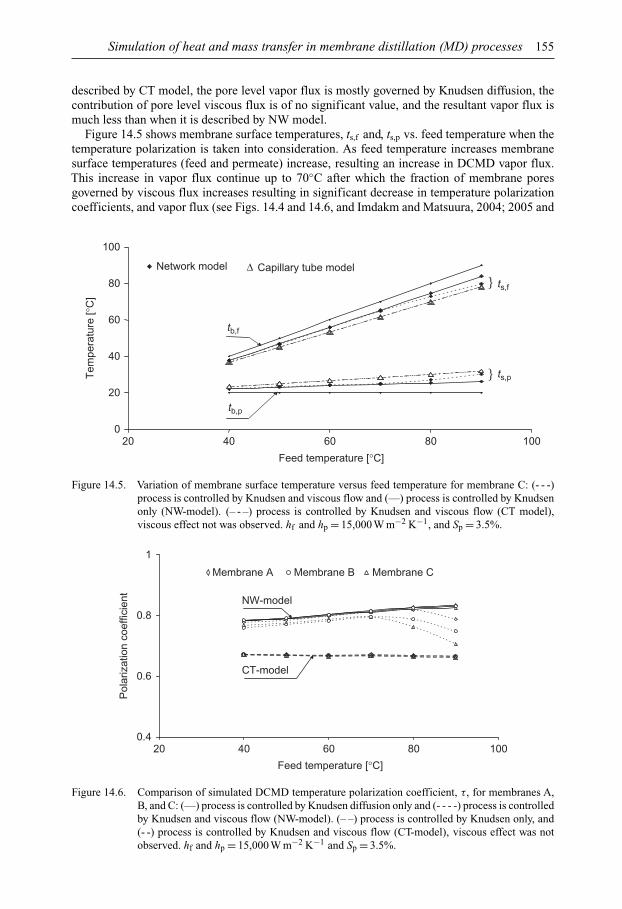
Simulation of heat and mass transfer in membrane distillation (MD) processes 155
described by CT model, the pore level vapor flux is mostly governed by Knudsen diffusion, thecontribution of pore level viscous flux is of no significant value, and the resultant vapor flux ismuch less than when it is described by NW model.
Figure 14.5 shows membrane surface temperatures, ts,f and, ts,p vs. feed temperature when thetemperature polarization is taken into consideration. As feed temperature increases membranesurface temperatures (feed and permeate) increase, resulting an increase in DCMD vapor flux.This increase in vapor flux continue up to 70◦C after which the fraction of membrane poresgoverned by viscous flux increases resulting in significant decrease in temperature polarizationcoefficients, and vapor flux (see Figs. 14.4 and 14.6, and Imdakm and Matsuura, 2004; 2005 and
0
20
40
60
80
100
20 40 60 80 100
Feed temperature [°C]
Network model ∆ Capillary tube model
ts,f
ts,p
tb,f
Tem
pera
ture
[°C
]
tb,p
Figure 14.5. Variation of membrane surface temperature versus feed temperature for membrane C: (- - -)process is controlled by Knudsen and viscous flow and (—) process is controlled by Knudsenonly (NW-model). (– - –) process is controlled by Knudsen and viscous flow (CT model),viscous effect not was observed. hf and hp = 15,000 W m−2 K−1, and Sp = 3.5%.
0.4
0.6
0.8
1
20 40 60 80 100
Feed temperature [°C]
Pol
ariz
atio
n co
effic
ient NW-model
CT-model
Membrane A Membrane B Membrane C
Figure 14.6. Comparison of simulated DCMD temperature polarization coefficient, τ, for membranes A,B, and C: (—) process is controlled by Knudsen diffusion only and (- - - -) process is controlledby Knudsen and viscous flow (NW-model). (– –) process is controlled by Knudsen only, and(- -) process is controlled by Knudsen and viscous flow (CT-model), viscous effect was notobserved. hf and hp = 15,000 W m−2 K−1 and Sp = 3.5%.
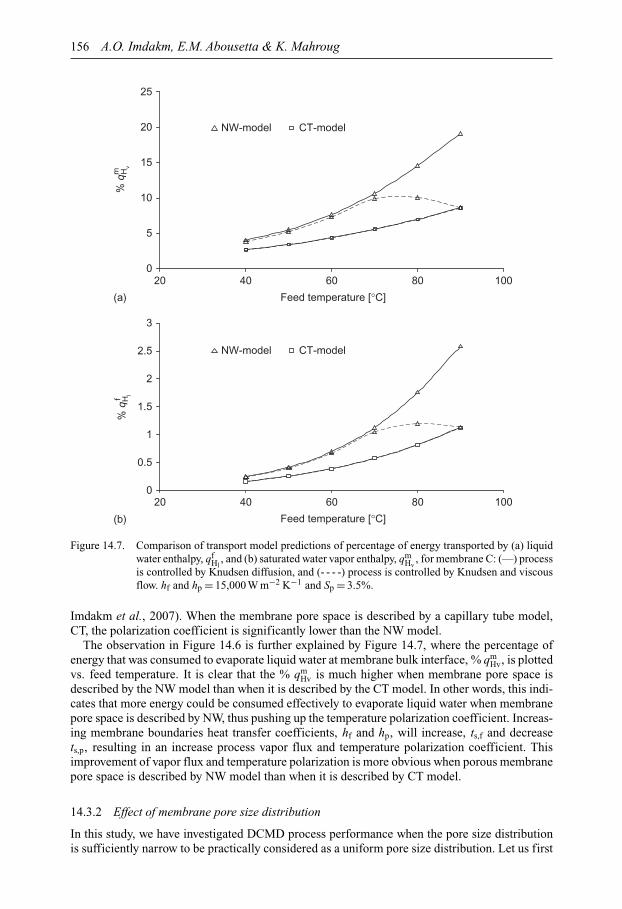
156 A.O. Imdakm, E.M. Abousetta & K. Mahroug
0
5
10
15
20
25
20 40 60 80 100
Feed temperature [°C]
% q
m Hv
NW-model CT-model
Feed temperature [°C]
NW-model CT-model
0
0.5
1
1.5
2
2.5
3
20 40 60 80 100
% q
Hlf
(a)
(b)
Figure 14.7. Comparison of transport model predictions of percentage of energy transported by (a) liquidwater enthalpy, qf
Hl, and (b) saturated water vapor enthalpy, qm
Hv, for membrane C: (—) process
is controlled by Knudsen diffusion, and (- - - -) process is controlled by Knudsen and viscousflow. hf and hp = 15,000 W m−2 K−1 and Sp = 3.5%.
Imdakm et al., 2007). When the membrane pore space is described by a capillary tube model,CT, the polarization coefficient is significantly lower than the NW model.
The observation in Figure 14.6 is further explained by Figure 14.7, where the percentage ofenergy that was consumed to evaporate liquid water at membrane bulk interface, % qm
Hv, is plottedvs. feed temperature. It is clear that the % qm
Hv is much higher when membrane pore space isdescribed by the NW model than when it is described by the CT model. In other words, this indi-cates that more energy could be consumed effectively to evaporate liquid water when membranepore space is described by NW, thus pushing up the temperature polarization coefficient. Increas-ing membrane boundaries heat transfer coefficients, hf and hp, will increase, ts,f and decreasets,p, resulting in an increase process vapor flux and temperature polarization coefficient. Thisimprovement of vapor flux and temperature polarization is more obvious when porous membranepore space is described by NW model than when it is described by CT model.
14.3.2 Effect of membrane pore size distribution
In this study, we have investigated DCMD process performance when the pore size distributionis sufficiently narrow to be practically considered as a uniform pore size distribution. Let us first

Simulation of heat and mass transfer in membrane distillation (MD) processes 157
0
10
20
30
40
50
1 3 5 7 9 11
Location in the direction of flow, Z
Vap
or p
ress
ure
×10–3
[P
a] Feed temperature [°C]
40 60 80
1 3 5 7 9 11
Location in the direction of flow, Z
275
300
325
350
375
Tem
pera
ture
[°C
]
Feed temperature [°C]
40 60 80
(a)
(b)
Figure 14.8. Pressure (a) and temperature (b) profile when the membrane pore space is described by anetwork model (—), and when it is described by capillary tube model (– –), for membrane ofuniform pore size distribution (120 nm), process vapor flux is dominated by Knudsen diffusion,hf and hp → ∞ and Sp = 3.5%.
consider the case when the temperature polarization is neglected. When the membrane pore spaceis described by an NW model of uniformly distributed pore radius, and process vapor flux isdominated by Knudsen flow only. Then, the resultant vapor pressure distribution is linear in thedirection of flow (Z-direction only) as shown in Figure 14.8a. In other words, at any given valueof Z , the pressure gradient is nil in the X and Y directions. This implies that, there is no fluxamong membrane pores in directions perpendicular to the direction of flow (Z). Note that thetemperature distribution across the membrane (Z-direction) is not necessary linear, but it is alsoof same value at each network section, i.e., there is no temperature gradient perpendicular to thedirection of fluid flow, Z (see Fig. 14.8b).
When membrane boundaries heat transfer coefficients are finite (hf and hp =15,000 W m−2 K−1), the pore space model has a considerable effect on both vapor and tem-perature profile in the Z-direction, i.e., both vapor pressure and temperature are much lowerwhen predicted by the CT model (see Fig. 14.9a,b), which results in much lower temperaturepolarization coefficient for the CT model as shown in Figure 14.10. This also makes the vaporflux predicted by the CT model lower than the NW model (Fig. 14.11).
Figure 14.12 shows vapor flux versus membrane thickness for both NW and CT model. Asmentioned already, CT model predicts much lower flux than the NW model. The difference
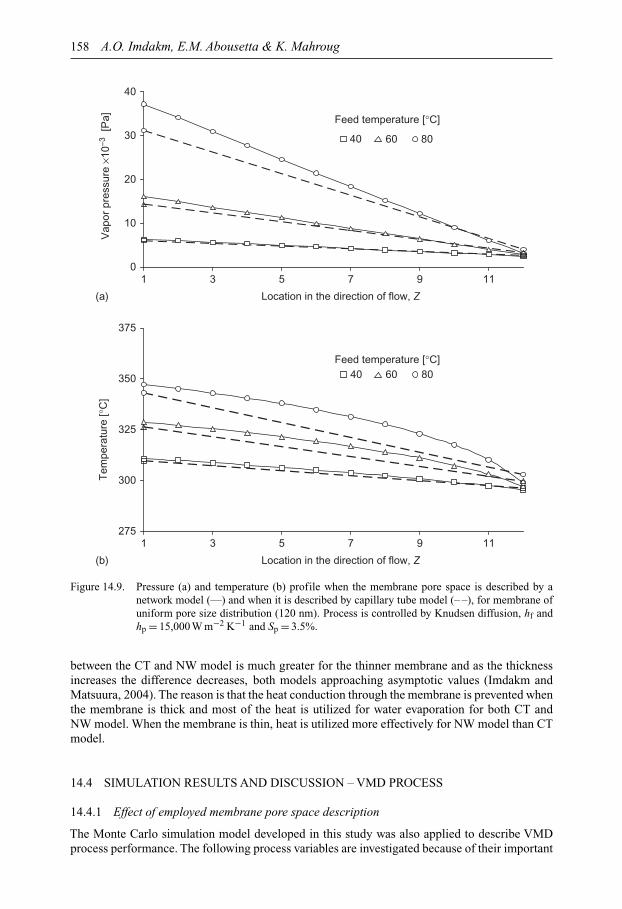
158 A.O. Imdakm, E.M. Abousetta & K. Mahroug
0
10
20
30
40
1 3 5 7 9 11
Location in the direction of flow, Z
Vap
or p
ress
ure
×10–3
[P
a] Feed temperature [°C]
1 3 5 7 9 11
Location in the direction of flow, Z
275
300
325
350
375
Tem
pera
ture
[°C
]
Feed temperature [°C]
40 60 80
40 60 80
(a)
(b)
Figure 14.9. Pressure (a) and temperature (b) profile when the membrane pore space is described by anetwork model (—) and when it is described by capillary tube model (– –), for membrane ofuniform pore size distribution (120 nm). Process is controlled by Knudsen diffusion, hf andhp = 15,000 W m−2 K−1 and Sp = 3.5%.
between the CT and NW model is much greater for the thinner membrane and as the thicknessincreases the difference decreases, both models approaching asymptotic values (Imdakm andMatsuura, 2004). The reason is that the heat conduction through the membrane is prevented whenthe membrane is thick and most of the heat is utilized for water evaporation for both CT andNW model. When the membrane is thin, heat is utilized more effectively for NW model than CTmodel.
14.4 SIMULATION RESULTS AND DISCUSSION – VMD PROCESS
14.4.1 Effect of employed membrane pore space description
The Monte Carlo simulation model developed in this study was also applied to describe VMDprocess performance. The following process variables are investigated because of their important
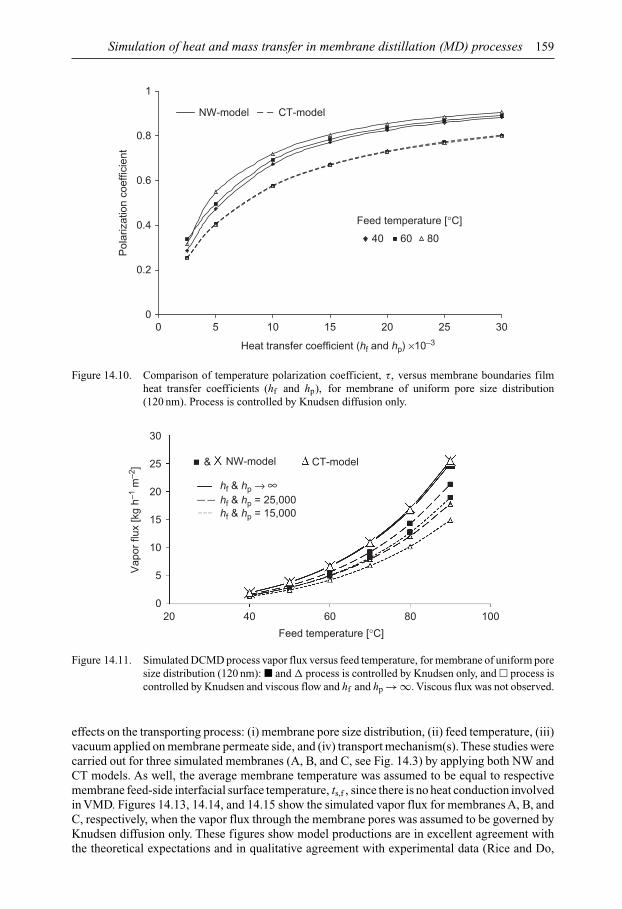
Simulation of heat and mass transfer in membrane distillation (MD) processes 159
0
0.2
0.4
0.6
0.8
1
0 5 10 15 20 25 30
Heat transfer coefficient (hf and hp) ×10–3
Pol
ariz
atio
n co
effic
ient
Feed temperature [°C]
40 60 80
NW-model CT-model
Figure 14.10. Comparison of temperature polarization coefficient, τ, versus membrane boundaries filmheat transfer coefficients (hf and hp), for membrane of uniform pore size distribution(120 nm). Process is controlled by Knudsen diffusion only.
0
5
10
15
20
25
30
20 40 60 80 100
Vap
or fl
ux [k
g h–1
m–2
]
Feed temperature [°C]
NW-model CT-model
hf & hp = 25,000hf & hp → ∞
&
hf & hp = 15,000
Figure 14.11. Simulated DCMD process vapor flux versus feed temperature, for membrane of uniform poresize distribution (120 nm): � and � process is controlled by Knudsen only, and � process iscontrolled by Knudsen and viscous flow and hf and hp → ∞. Viscous flux was not observed.
effects on the transporting process: (i) membrane pore size distribution, (ii) feed temperature, (iii)vacuum applied on membrane permeate side, and (iv) transport mechanism(s). These studies werecarried out for three simulated membranes (A, B, and C, see Fig. 14.3) by applying both NW andCT models. As well, the average membrane temperature was assumed to be equal to respectivemembrane feed-side interfacial surface temperature, ts,f , since there is no heat conduction involvedin VMD. Figures 14.13, 14.14, and 14.15 show the simulated vapor flux for membranes A, B, andC, respectively, when the vapor flux through the membrane pores was assumed to be governed byKnudsen diffusion only. These figures show model productions are in excellent agreement withthe theoretical expectations and in qualitative agreement with experimental data (Rice and Do,
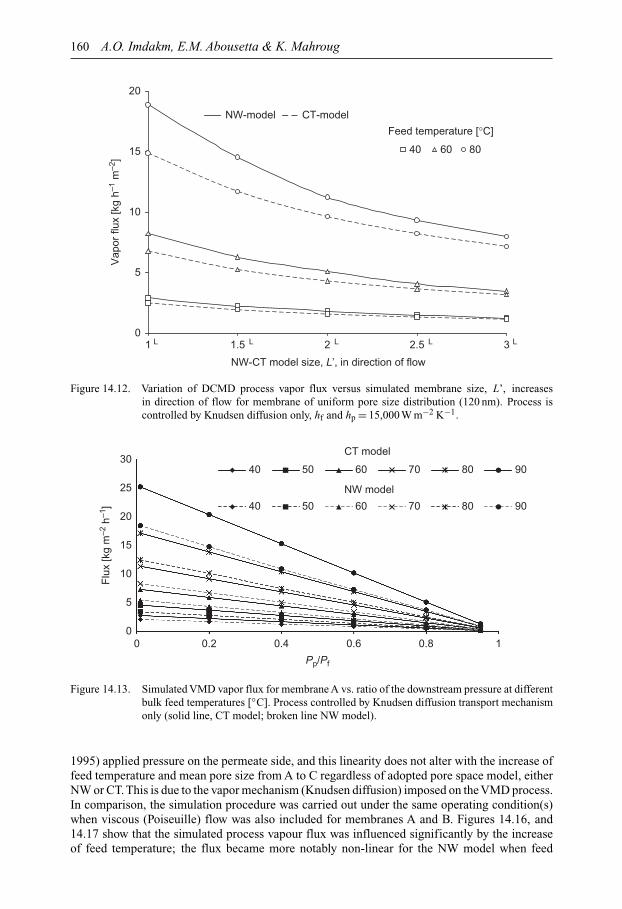
160 A.O. Imdakm, E.M. Abousetta & K. Mahroug
0
5
10
15
20
1 L L L L L1.5 2 2.5 3
NW-CT model size, L’, in direction of flow
Vap
or fl
ux [k
g h–1
m–2
]
Feed temperature [°C]
40 60 80
NW-model CT-model
Figure 14.12. Variation of DCMD process vapor flux versus simulated membrane size, L’, increasesin direction of flow for membrane of uniform pore size distribution (120 nm). Process iscontrolled by Knudsen diffusion only, hf and hp = 15,000 W m−2 K−1.
0
5
10
15
20
25
30
0 0.2 0.4 0.6 0.8 1
Flu
x [k
g m
–2 h
–1]
40 50 60 70 80 90
40 50 60 70 80 90
Pp/Pf
CT model
NW model
Figure 14.13. Simulated VMD vapor flux for membrane A vs. ratio of the downstream pressure at differentbulk feed temperatures [◦C]. Process controlled by Knudsen diffusion transport mechanismonly (solid line, CT model; broken line NW model).
1995) applied pressure on the permeate side, and this linearity does not alter with the increase offeed temperature and mean pore size from A to C regardless of adopted pore space model, eitherNW or CT. This is due to the vapor mechanism (Knudsen diffusion) imposed on the VMD process.In comparison, the simulation procedure was carried out under the same operating condition(s)when viscous (Poiseuille) flow was also included for membranes A and B. Figures 14.16, and14.17 show that the simulated process vapour flux was influenced significantly by the increaseof feed temperature; the flux became more notably non-linear for the NW model when feed
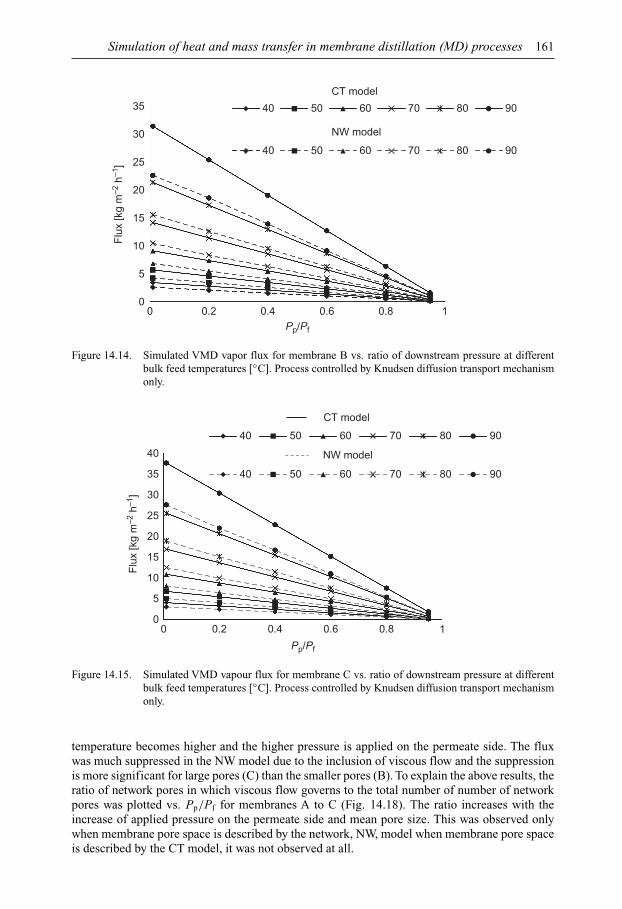
Simulation of heat and mass transfer in membrane distillation (MD) processes 161
0
5
10
15
20
25
30
35
0 0.2 0.4 0.6 0.8 1
Flu
x [k
g m
–2 h
–1]
Pp/Pf
CT model
40 50 60 70 80 90
40 50 60 70 80 90
NW model
Figure 14.14. Simulated VMD vapor flux for membrane B vs. ratio of downstream pressure at differentbulk feed temperatures [◦C]. Process controlled by Knudsen diffusion transport mechanismonly.
0
5
10
15
20
25
30
35
40
0 0.2 0.4 0.6 0.8 1
Flu
x [k
g m
–2 h
–1]
CT model
40 50 60 70 80 90
40 50 60 70 80 90
Pp/Pf
NW model
Figure 14.15. Simulated VMD vapour flux for membrane C vs. ratio of downstream pressure at differentbulk feed temperatures [◦C]. Process controlled by Knudsen diffusion transport mechanismonly.
temperature becomes higher and the higher pressure is applied on the permeate side. The fluxwas much suppressed in the NW model due to the inclusion of viscous flow and the suppressionis more significant for large pores (C) than the smaller pores (B). To explain the above results, theratio of network pores in which viscous flow governs to the total number of number of networkpores was plotted vs. Pp/Pf for membranes A to C (Fig. 14.18). The ratio increases with theincrease of applied pressure on the permeate side and mean pore size. This was observed onlywhen membrane pore space is described by the network, NW, model when membrane pore spaceis described by the CT model, it was not observed at all.
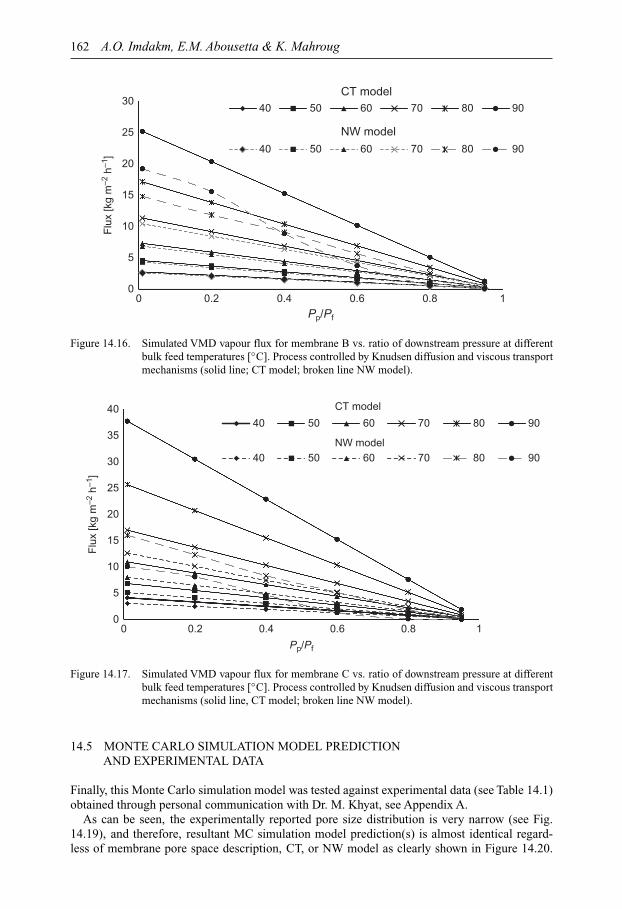
162 A.O. Imdakm, E.M. Abousetta & K. Mahroug
0
5
10
15
20
25
30
0 0.2 0.4 0.6 0.8 1
Flu
x [k
g m
–2 h
–1]
Pp/Pf
40 50 60 70 80 90
40 50 60 70 80 90
CT model
NW model
Figure 14.16. Simulated VMD vapour flux for membrane B vs. ratio of downstream pressure at differentbulk feed temperatures [◦C]. Process controlled by Knudsen diffusion and viscous transportmechanisms (solid line; CT model; broken line NW model).
0
5
10
15
20
25
30
35
40
0 0.2 0.4 0.6 0.8 1
Flu
x [k
g m
–2 h
–1]
Pp/Pf
40 50 60 70 80 90
40 50 60 70 80 90
CT model
NW model
Figure 14.17. Simulated VMD vapour flux for membrane C vs. ratio of downstream pressure at differentbulk feed temperatures [◦C]. Process controlled by Knudsen diffusion and viscous transportmechanisms (solid line, CT model; broken line NW model).
14.5 MONTE CARLO SIMULATION MODEL PREDICTIONAND EXPERIMENTAL DATA
Finally, this Monte Carlo simulation model was tested against experimental data (see Table 14.1)obtained through personal communication with Dr. M. Khyat, see Appendix A.
As can be seen, the experimentally reported pore size distribution is very narrow (see Fig.14.19), and therefore, resultant MC simulation model prediction(s) is almost identical regard-less of membrane pore space description, CT, or NW model as clearly shown in Figure 14.20.
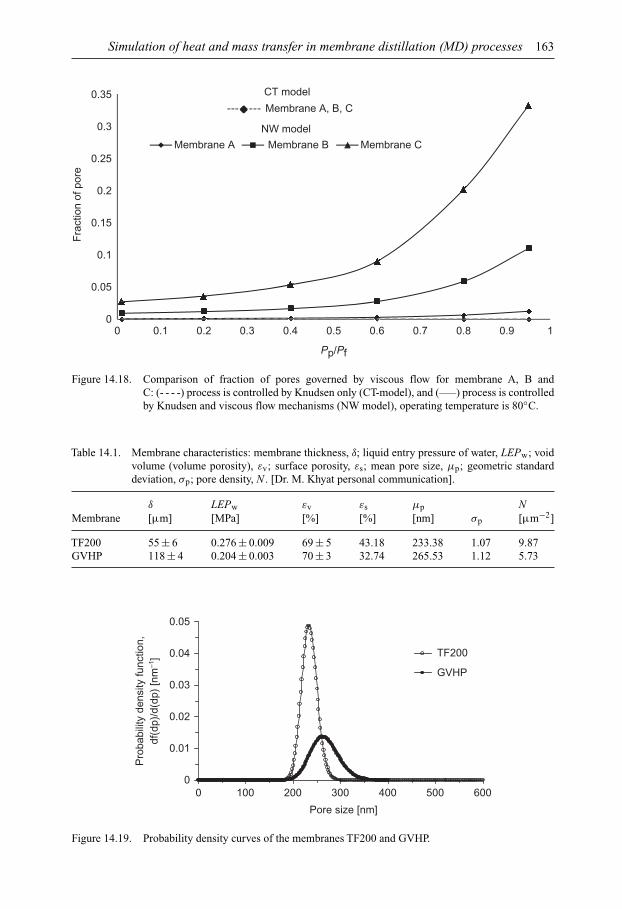
Simulation of heat and mass transfer in membrane distillation (MD) processes 163
0
0.05
0.1
0.15
0.2
0.25
0.3
0.35
0 0.1 0.2 0.3 0.4 0.5 0.6 0.7 0.8 0.9 1
Fra
ctio
n of
por
e
CT model
Membrane A Membrane B Membrane C
Membrane A, B, C
NW model
Pp/Pf
Figure 14.18. Comparison of fraction of pores governed by viscous flow for membrane A, B andC: (- - - -) process is controlled by Knudsen only (CT-model), and (—–) process is controlledby Knudsen and viscous flow mechanisms (NW model), operating temperature is 80◦C.
Table 14.1. Membrane characteristics: membrane thickness, δ; liquid entry pressure of water, LEPw; voidvolume (volume porosity), εv; surface porosity, εs; mean pore size, µp; geometric standarddeviation, σp; pore density, N . [Dr. M. Khyat personal communication].
δ LEPw εv εs µp NMembrane [µm] [MPa] [%] [%] [nm] σp [µm−2]
TF200 55 ± 6 0.276 ± 0.009 69 ± 5 43.18 233.38 1.07 9.87GVHP 118 ± 4 0.204 ± 0.003 70 ± 3 32.74 265.53 1.12 5.73
0
0.01
0.02
0.03
0.04
0.05
0 100 200 300 400 500 600
Pore size [nm]
Pro
babi
lity
dens
ity fu
nctio
n,df
(dp)
/d(d
p) [n
m–1
] TF200
GVHP
Figure 14.19. Probability density curves of the membranes TF200 and GVHP.
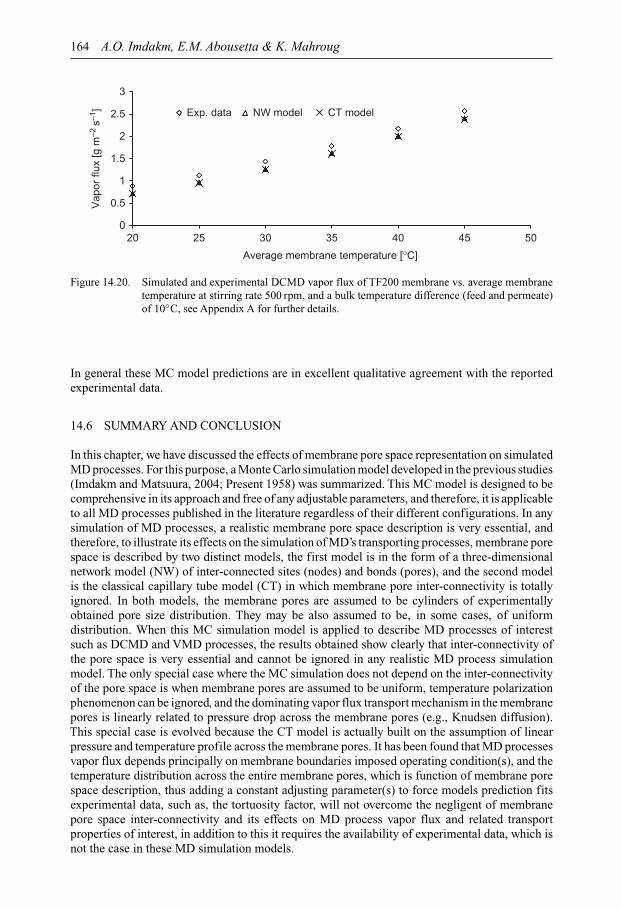
164 A.O. Imdakm, E.M. Abousetta & K. Mahroug
0
0.5
1
1.5
2
2.5
3
20 25 30 35 40 45 50
Exp. data NW model CT model
Average membrane temperature [°C]
Vap
or fl
ux [g
m–2
s–1
]
Figure 14.20. Simulated and experimental DCMD vapor flux of TF200 membrane vs. average membranetemperature at stirring rate 500 rpm, and a bulk temperature difference (feed and permeate)of 10◦C, see Appendix A for further details.
In general these MC model predictions are in excellent qualitative agreement with the reportedexperimental data.
14.6 SUMMARY AND CONCLUSION
In this chapter, we have discussed the effects of membrane pore space representation on simulatedMD processes. For this purpose, a Monte Carlo simulation model developed in the previous studies(Imdakm and Matsuura, 2004; Present 1958) was summarized. This MC model is designed to becomprehensive in its approach and free of any adjustable parameters, and therefore, it is applicableto all MD processes published in the literature regardless of their different configurations. In anysimulation of MD processes, a realistic membrane pore space description is very essential, andtherefore, to illustrate its effects on the simulation of MD’s transporting processes, membrane porespace is described by two distinct models, the first model is in the form of a three-dimensionalnetwork model (NW) of inter-connected sites (nodes) and bonds (pores), and the second modelis the classical capillary tube model (CT) in which membrane pore inter-connectivity is totallyignored. In both models, the membrane pores are assumed to be cylinders of experimentallyobtained pore size distribution. They may be also assumed to be, in some cases, of uniformdistribution. When this MC simulation model is applied to describe MD processes of interestsuch as DCMD and VMD processes, the results obtained show clearly that inter-connectivity ofthe pore space is very essential and cannot be ignored in any realistic MD process simulationmodel. The only special case where the MC simulation does not depend on the inter-connectivityof the pore space is when membrane pores are assumed to be uniform, temperature polarizationphenomenon can be ignored, and the dominating vapor flux transport mechanism in the membranepores is linearly related to pressure drop across the membrane pores (e.g., Knudsen diffusion).This special case is evolved because the CT model is actually built on the assumption of linearpressure and temperature profile across the membrane pores. It has been found that MD processesvapor flux depends principally on membrane boundaries imposed operating condition(s), and thetemperature distribution across the entire membrane pores, which is function of membrane porespace description, thus adding a constant adjusting parameter(s) to force models prediction fitsexperimental data, such as, the tortuosity factor, will not overcome the negligent of membranepore space inter-connectivity and its effects on MD process vapor flux and related transportproperties of interest, in addition to this it requires the availability of experimental data, which isnot the case in these MD simulation models.
Simulation of heat and mass transfer in membrane distillation (MD) processes 165
NOMENCLATURE
C membrane distillation coefficient [kg m−2 s−1 Pa−1]rpore pore radius [m]hf and hp heat transfer coefficient at feed and permeate side [W m−2 K−1]Hl{T } liquid water enthalpy at temperature T [kJ kg−1]Hv{T } saturated vapor water enthalpy at temperature T [kJ kg−1]J vapor flux [kg m−2 h−1]l pore length [µm]L network size [number of nodes (sites)]km composite membrane effective thermal conductivity [W m−1 K1]ks membrane solid phase (polymer) thermal conductivity [W m−1 K−1]kv membrane vapor phase (water vapor) thermal conductivity [W m−1 K−1]Pf feed side membrane pressure [Pa]Pp permeate side membrane pressure [Pa]Ppore average pore pressure [Pa]Pb,f and Pb,p vapor pressure at feed and permeate side [Pa]Ps,f and Ps,p vapor pressure at membrane-feed and membrane-permeate interface [Pa]qm
cond. conduction heat transfer rate across membrane solid phase and vapor phasein direct contact with the feed [kW m−2]
qfHv heat transfer due to liquid flux across membrane – feed boundary
layer [kW m−2]qm
Hvheat transfer due to vapor flowing through membrane pores [kW m−2]
Sp membrane surface porositytb,f and tb,p bulk temperatures at feed and permeate sides [◦C], respectivelyts,f and ts,p interfacial membrane-surface temperatures at feed and permeate sides [◦C],
respectivelyT temperature [K]Tp average pore temperature [K]Ts,f VMD process interfacial membrane-surface temperature at feed side [K]X , Y and Z axial coordinates
Greek symbols
µpore mean pore size of the pores [m]σpore geometrical standard deviation of the poresσ collision diameter [m]δ membrane thickness [m]λ molecules mean free path [m]τ temperature polarization coefficient
REFERENCES
Bandini, S., Saavedra, A. & Sarti, G.C. (1997) Vacuum membrane distillation: experiments and modeling.AICHE Journal, 43, 398–408.
Calabro, V., Drioli, E. & Matera, F. (1991) Membrane distillation in textile wastewater treatment.Desalination, 83, 209–224.
Calabro, V., Jiao, B.L. & Drioli, E. (1994) Theoretical and experimental study on membrane distillation inthe concentration of orange juice. Industrial & Engineering Chemistry Research, 33, 1803–1808.
Imdakm, A.O. & Matsuura, Y. (2004) A Monte Carlo simulation model for membrane distillation processes:direct contact (MD). Journal of Membrane Science, 237, 51–59.
Imdakm, A.O. & Matsuura, T. (2005) Simulation of heat and mass transfer in direct contact membranedistillation (MD): the effect of membrane physical properties. Journal of Membrane Science, 262,117–128.
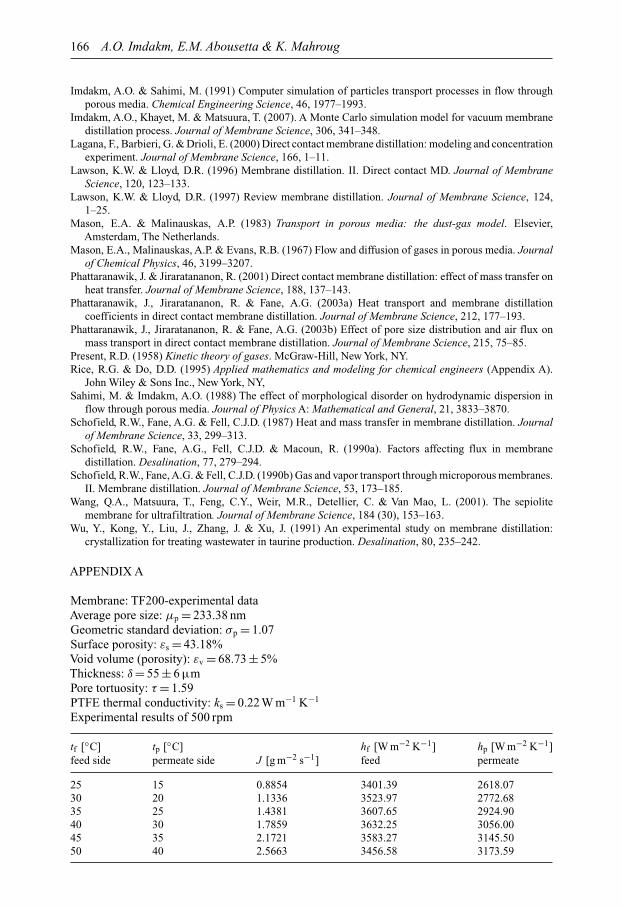
166 A.O. Imdakm, E.M. Abousetta & K. Mahroug
Imdakm, A.O. & Sahimi, M. (1991) Computer simulation of particles transport processes in flow throughporous media. Chemical Engineering Science, 46, 1977–1993.
Imdakm, A.O., Khayet, M. & Matsuura, T. (2007). A Monte Carlo simulation model for vacuum membranedistillation process. Journal of Membrane Science, 306, 341–348.
Lagana, F., Barbieri, G. & Drioli, E. (2000) Direct contact membrane distillation: modeling and concentrationexperiment. Journal of Membrane Science, 166, 1–11.
Lawson, K.W. & Lloyd, D.R. (1996) Membrane distillation. II. Direct contact MD. Journal of MembraneScience, 120, 123–133.
Lawson, K.W. & Lloyd, D.R. (1997) Review membrane distillation. Journal of Membrane Science, 124,1–25.
Mason, E.A. & Malinauskas, A.P. (1983) Transport in porous media: the dust-gas model. Elsevier,Amsterdam, The Netherlands.
Mason, E.A., Malinauskas, A.P. & Evans, R.B. (1967) Flow and diffusion of gases in porous media. Journalof Chemical Physics, 46, 3199–3207.
Phattaranawik, J. & Jiraratananon, R. (2001) Direct contact membrane distillation: effect of mass transfer onheat transfer. Journal of Membrane Science, 188, 137–143.
Phattaranawik, J., Jiraratananon, R. & Fane, A.G. (2003a) Heat transport and membrane distillationcoefficients in direct contact membrane distillation. Journal of Membrane Science, 212, 177–193.
Phattaranawik, J., Jiraratananon, R. & Fane, A.G. (2003b) Effect of pore size distribution and air flux onmass transport in direct contact membrane distillation. Journal of Membrane Science, 215, 75–85.
Present, R.D. (1958) Kinetic theory of gases. McGraw-Hill, New York, NY.Rice, R.G. & Do, D.D. (1995) Applied mathematics and modeling for chemical engineers (Appendix A).
John Wiley & Sons Inc., New York, NY,Sahimi, M. & Imdakm, A.O. (1988) The effect of morphological disorder on hydrodynamic dispersion in
flow through porous media. Journal of Physics A: Mathematical and General, 21, 3833–3870.Schofield, R.W., Fane, A.G. & Fell, C.J.D. (1987) Heat and mass transfer in membrane distillation. Journal
of Membrane Science, 33, 299–313.Schofield, R.W., Fane, A.G., Fell, C.J.D. & Macoun, R. (1990a). Factors affecting flux in membrane
distillation. Desalination, 77, 279–294.Schofield, R.W., Fane, A.G. & Fell, C.J.D. (1990b) Gas and vapor transport through microporous membranes.
II. Membrane distillation. Journal of Membrane Science, 53, 173–185.Wang, Q.A., Matsuura, T., Feng, C.Y., Weir, M.R., Detellier, C. & Van Mao, L. (2001). The sepiolite
membrane for ultrafiltration. Journal of Membrane Science, 184 (30), 153–163.Wu, Y., Kong, Y., Liu, J., Zhang, J. & Xu, J. (1991) An experimental study on membrane distillation:
crystallization for treating wastewater in taurine production. Desalination, 80, 235–242.
APPENDIX A
Membrane: TF200-experimental dataAverage pore size: µp = 233.38 nmGeometric standard deviation: σp = 1.07Surface porosity: εs = 43.18%Void volume (porosity): εv = 68.73 ± 5%Thickness: δ = 55 ± 6 µmPore tortuosity: τ = 1.59PTFE thermal conductivity: ks = 0.22 W m−1 K−1
Experimental results of 500 rpm
tf [◦C] tp [◦C] hf [W m−2 K−1] hp [W m−2 K−1]feed side permeate side J [g m−2 s−1] feed permeate
25 15 0.8854 3401.39 2618.0730 20 1.1336 3523.97 2772.6835 25 1.4381 3607.65 2924.9040 30 1.7859 3632.25 3056.0045 35 2.1721 3583.27 3145.5050 40 2.5663 3456.58 3173.59

CHAPTER 15
Simulation of drying for multilayer membranes
Zawati Harun, Tze Ching Ong, David Gethin & Ahmad Fauzi Ismail
15.1 INTRODUCTION
Theoretically, a membrane can be divided into several layers as shown in Figure 15.1.The first top layer having a fine pore structure is used as a filter for separation processes (Li,
2007). The next three layers which are the intermediate layers and the bottom layer are fabricatedin the form of a porous structure to support the membrane itself and to facilitate the permeationprocess (Li, 2007). Obviously, the top separation layer with a fine porous structure possesses ahygroscopic property compared to the intermediate and bottom layers that have to be porous andnon-hygroscopic. All layers have their own characteristic and structure and shrink at differentrates when the membrane is dried.
Drying is one of the stages of ceramic membrane preparation that is undertaken betweenprecursor formation and sintering. Although drying is one of the most energy intensive industrialprocesses (Mujumdar, 2006), it is also one of the least understood as it involves a lot of variablesthat change concurrently as the phases and stages change (Perré et al., 2007; Rattanadecho et al.,2007). Further complications arise if drying involves materials that comprise multilayers (Harunand Gethin, 2008; Harun et al., 2008; 2012; Ismail et al., 2012). In particular, the top hygroscopiclayer of the ceramic membrane involves bound water that is strongly attached to the capillarywall. The amount of the water is quite difficult to measure experimentally due to the strongercapillarity suction and the slower permeation than in the non-hygroscopic material. Typically,drying of the membrane of a layered structure not only involves the compatible issue of dryingparameters but the different materials that possess different properties also strongly influence theconsistency of shrinkage. This often leads to defect formation which is associated with leakagedue to cracks induced during the drying and firing processes. Warping and cracking occur dueto non-uniform stresses arising from the pressure gradient caused by the flow of liquid duringthe constant rate period (CRP) of shrinkage, the macroscopic pressure gradient of escaping gasesduring falling rate period (FRP) and different thermal expansion of the ceramic material due tothe temperature gradient (Ring, 1996). The flow of liquid, the macroscopic pressure gradient, andthe temperature gradient are controlled by the drying rate, which is ultimately controlled by theexternal conditions (Ring, 1996). Therefore, understanding the stages and variables that evolvewith time throughout the drying sequence is essential to eliminate all the problems associatedwith membrane manufacture.
1
2
3
4
Figure 15.1. Schematic representation of an asymmetric membrane (extracted from Li, 2007).
167
168 Z. Harun et al.
In general, material that has undergone drying will induce several compression and strainchanges in the porous network, which results in formation of a shrinkage mechanism (Perré et al.,2007). Shrinkage mechanism can be defined as dimensional changes due to the elimination ofwater in a porous structure, which will generate the non-uniform stress distribution, either fromthe inner structure and outer surface layer. This non-uniform stress is attributed mainly to drasticor fluctuated changes of moisture gradient (Kowalski and Mierzwa, 2013; Pourcel et al., 2007) ornetwork capillary pressure that has a high tendency to build cracks. When drying is at a constantrate period, the surface of the green body is always wet by the flow of liquid to the surface, resultingin the rearrangement of particles in the green body, which is caused by the compressive capillarypressure. This eventually leads to shrinkage and deformation of the solid as particles come intocontact to maintain an expelling of liquid flow to the surface. However, the dried product is freefrom stress at this moment as there is no crack formation being observed in this period (Colinaand Roux, 2000). When drying reaches a decreasing drying rate period, the liquid-vapor interfacestarts to recede into the pores and capillary flow will continue as long as there is a continuouspathway from the liquid front of the green body surface. At this moment, the particles are inclose contact or touching each other, which leads to minimal or no shrinkage happening beyondthis period of drying. However, the critical point of saturation when entering FRP is the vitalpoint for the crack initiation (Nascimento et al., 2005). There is much lower shrinkage in FRPbut the fracture phenomenon becomes the most intensive in this period of drying process due toinhomogeneous moisture distribution in the solid matrix. The differential in strain correspondingto the surface that tends to contract faster than the interior causes non-uniform moisture andpressure gradient. Subsequently, this leads to crack formation. It appears that shrinkage of dryingmaterials, which is also a characteristic property of the dried material and cracking, is more likelyto happen in the low permeability material that offers higher resistance for moisture transferthat causes a nonhomogeneous moisture gradient between the upper and bottom layer shrinkageinside the solid matrix (Scherer, 1990). In this present study, a mathematical model of the dryingprocess with coupled mass, heat and gas transfer for ceramic materials has been developed. Thismodel will emphasize on the transport mechanism of liquid by capillary action, vapor and gasby diffusion and bulk air convective flow. The introduction of bound water over the later period(FRP2) of drying was incorporated by referring to the earlier work (Zhang et al., 1999). Thematerial slab used has been divided into two layers, hygroscopic and non-hygroscopic layers, torepresent the layered structure of the membrane.
15.2 MATHEMATICAL MODELING
15.2.1 Theoretical formulation for phase transport
The conservation law of the heat and mass balance equations applied here for the drying process isbased on the work by Zawati et al. 2008 and others (Harun et al., 2012; Zhang et al., 1999). In thegoverning equations, the liquid phase is water in which vapor and air are dissolved and transportedby diffusion, whilst the gas phase consists of the binary mixture of vapor and dry air which arealso transported in the gas phase by diffusion. The transport of liquid by the capillarity effect isalso included. Both mass and heat transport are taken into account. For the hygroscopic material,bound water is considered in the transport mechanism especially in the FRP2 (Defraeye et al.,2012; Zhang et al., 1999) stage. Based on these physical principles, the governing equations areexpressed in terms of three primary variables; water pressure, Pl, temperature, T and gas pressure,Pg. The water mass conservation equation is formulated as follows for both non hygroscopic(15.1a) and hygroscopic material (15.1b):
∂(φρlSl)
∂t+ ∂(φρvSg)
∂t= −∇ · (ρlVl) − ∇ · (ρvVv) − ∇ · (ρvVg) (15.1a)
∂(φρlSl)
∂t+ ∂(φρvSg)
∂t= −∇ · (ρlVl) − ∇ · (ρvVv) − ∇ · (ρvVg) − ∇ · (ρlVb) (15.1b)
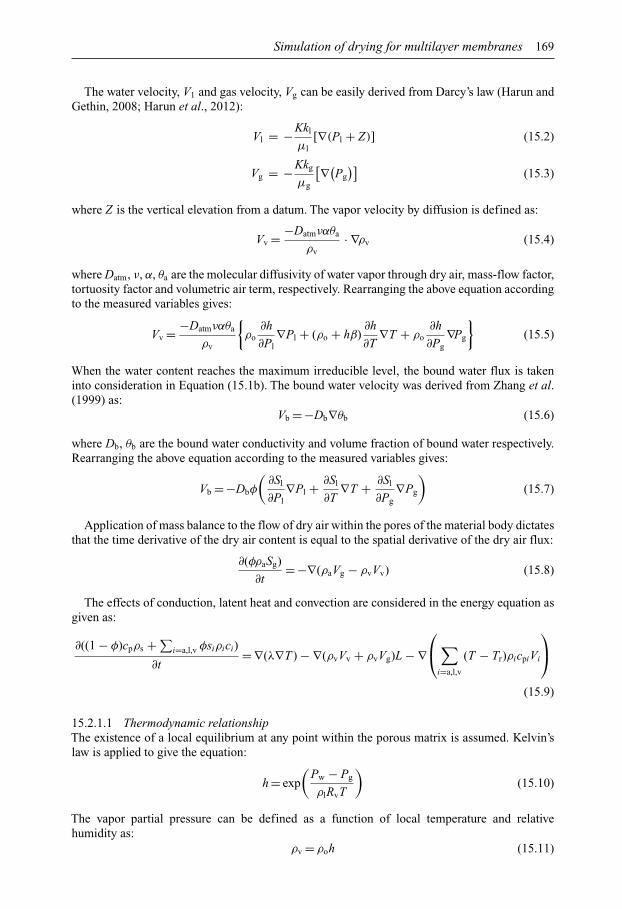
Simulation of drying for multilayer membranes 169
The water velocity, V1 and gas velocity, Vg can be easily derived from Darcy’s law (Harun andGethin, 2008; Harun et al., 2012):
Vl = −Kkl
µl[∇(Pl + Z)] (15.2)
Vg = −Kkg
µg
[∇(Pg)]
(15.3)
where Z is the vertical elevation from a datum. The vapor velocity by diffusion is defined as:
Vv = −Datmναθa
ρv· ∇ρv (15.4)
where Datm, ν, α, θa are the molecular diffusivity of water vapor through dry air, mass-flow factor,tortuosity factor and volumetric air term, respectively. Rearranging the above equation accordingto the measured variables gives:
Vv = −Datmναθa
ρv
{ρo
∂h
∂Pl∇Pl + (ρo + hβ)
∂h
∂T∇T + ρo
∂h
∂Pg∇Pg
}(15.5)
When the water content reaches the maximum irreducible level, the bound water flux is takeninto consideration in Equation (15.1b). The bound water velocity was derived from Zhang et al.(1999) as:
Vb = −Db∇θb (15.6)
where Db, θb are the bound water conductivity and volume fraction of bound water respectively.Rearranging the above equation according to the measured variables gives:
Vb = −Dbφ
(∂Sl
∂Pl∇Pl + ∂Sl
∂T∇T + ∂Sl
∂Pg∇Pg
)(15.7)
Application of mass balance to the flow of dry air within the pores of the material body dictatesthat the time derivative of the dry air content is equal to the spatial derivative of the dry air flux:
∂(φρaSg)
∂t= −∇(ρaVg − ρvVv) (15.8)
The effects of conduction, latent heat and convection are considered in the energy equation asgiven as:
∂((1 − φ)cpρs +∑i=a,l,v φsiρici)
∂t= ∇(λ∇T ) − ∇(ρvVv + ρvVg)L − ∇
⎛⎝∑
i=a,l,v
(T − Tr)ρicpiVi
⎞⎠
(15.9)
15.2.1.1 Thermodynamic relationshipThe existence of a local equilibrium at any point within the porous matrix is assumed. Kelvin’slaw is applied to give the equation:
h = exp(
Pw − Pg
ρlRvT
)(15.10)
The vapor partial pressure can be defined as a function of local temperature and relativehumidity as:
ρv = ρoh (15.11)
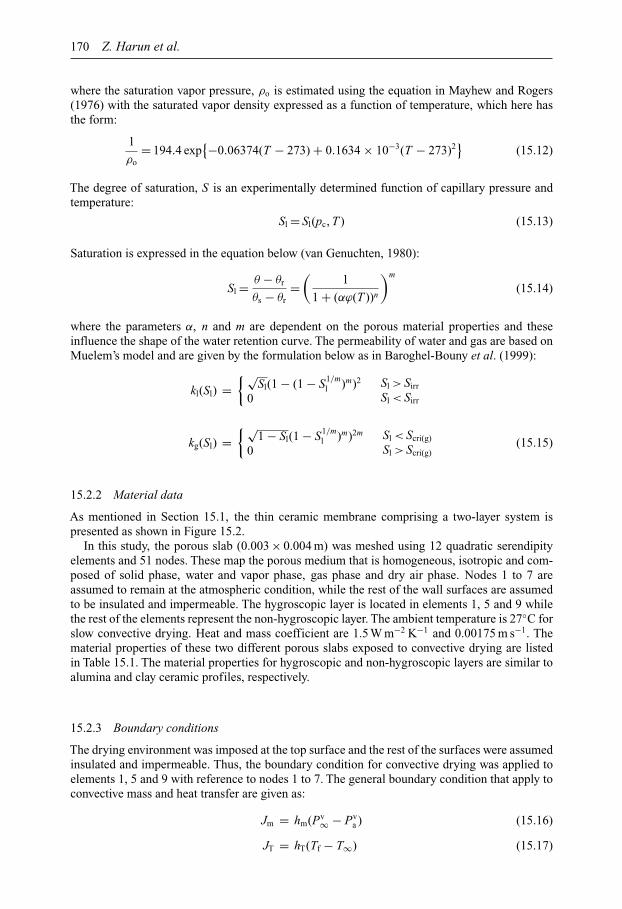
170 Z. Harun et al.
where the saturation vapor pressure, ρo is estimated using the equation in Mayhew and Rogers(1976) with the saturated vapor density expressed as a function of temperature, which here hasthe form:
1
ρo= 194.4 exp
{−0.06374(T − 273) + 0.1634 × 10⁻³(T − 273)2}
(15.12)
The degree of saturation, S is an experimentally determined function of capillary pressure andtemperature:
Sl = Sl(pc, T ) (15.13)
Saturation is expressed in the equation below (van Genuchten, 1980):
Sl = θ − θr
θs − θr=(
1
1 + (αϕ(T ))n
)m
(15.14)
where the parameters α, n and m are dependent on the porous material properties and theseinfluence the shape of the water retention curve. The permeability of water and gas are based onMuelem’s model and are given by the formulation below as in Baroghel-Bouny et al. (1999):
kl(Sl) ={√
Sl(1 − (1 − S1/ml )m)2
0Sl > Sirr
Sl < Sirr
kg(Sl) ={√
1 − Sl(1 − S1/ml )m)2m
0Sl < Scri(g)
Sl > Scri(g)(15.15)
15.2.2 Material data
As mentioned in Section 15.1, the thin ceramic membrane comprising a two-layer system ispresented as shown in Figure 15.2.
In this study, the porous slab (0.003 × 0.004 m) was meshed using 12 quadratic serendipityelements and 51 nodes. These map the porous medium that is homogeneous, isotropic and com-posed of solid phase, water and vapor phase, gas phase and dry air phase. Nodes 1 to 7 areassumed to remain at the atmospheric condition, while the rest of the wall surfaces are assumedto be insulated and impermeable. The hygroscopic layer is located in elements 1, 5 and 9 whilethe rest of the elements represent the non-hygroscopic layer. The ambient temperature is 27◦C forslow convective drying. Heat and mass coefficient are 1.5 W m−2 K−1 and 0.00175 m s−1. Thematerial properties of these two different porous slabs exposed to convective drying are listedin Table 15.1. The material properties for hygroscopic and non-hygroscopic layers are similar toalumina and clay ceramic profiles, respectively.
15.2.3 Boundary conditions
The drying environment was imposed at the top surface and the rest of the surfaces were assumedinsulated and impermeable. Thus, the boundary condition for convective drying was applied toelements 1, 5 and 9 with reference to nodes 1 to 7. The general boundary condition that apply toconvective mass and heat transfer are given as:
Jm = hm(Pv∞ − Pv
a ) (15.16)
JT = hT(Tf − T∞) (15.17)
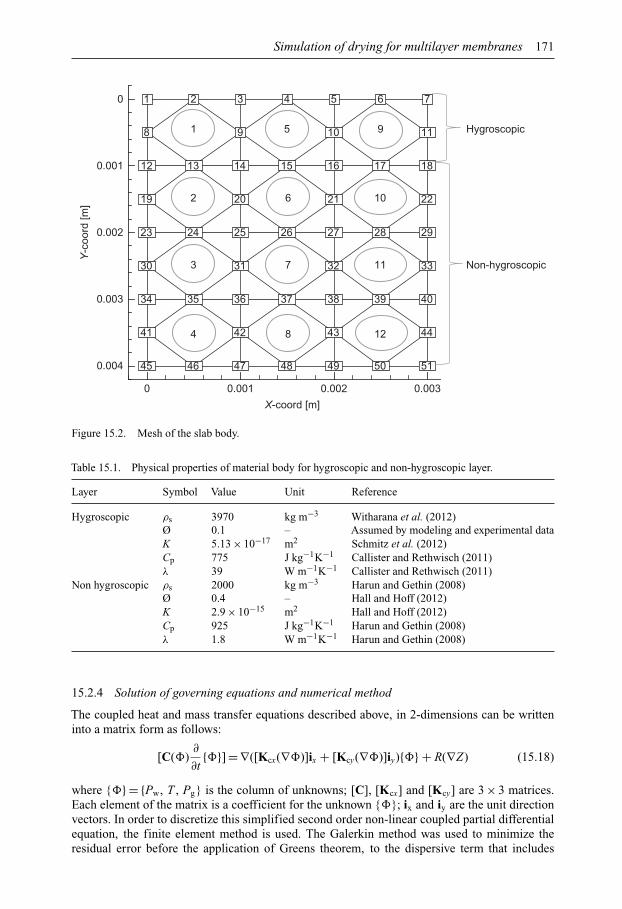
Simulation of drying for multilayer membranes 171
1 2 3 4 5 6 7
8 9 10 11
12 13 14 15 16 17 18
19 20 21 22
23 24 25 26 27 28 29
30 31 32 33
34 35 36 37 38 39 40
41 42 43 44
45 46 47 48 49 50 51
X-coord [m]
Y-c
oord
[m]
0 0.001 0.002 0.003
0
0.001
0.002
0.003
0.004
Hygroscopic
Non-hygroscopic
1
2 6 10
3 7 11
4 8 12
5 9
Figure 15.2. Mesh of the slab body.
Table 15.1. Physical properties of material body for hygroscopic and non-hygroscopic layer.
Layer Symbol Value Unit Reference
Hygroscopic ρs 3970 kg m−3 Witharana et al. (2012)Ø 0.1 – Assumed by modeling and experimental dataK 5.13 × 10⁻¹⁷ m2 Schmitz et al. (2012)Cp 775 J kg−1K−1 Callister and Rethwisch (2011)λ 39 W m−1K−1 Callister and Rethwisch (2011)
Non hygroscopic ρs 2000 kg m−3 Harun and Gethin (2008)Ø 0.4 – Hall and Hoff (2012)K 2.9 × 10⁻¹⁵ m2 Hall and Hoff (2012)Cp 925 J kg−1K−1 Harun and Gethin (2008)λ 1.8 W m−1K−1 Harun and Gethin (2008)
15.2.4 Solution of governing equations and numerical method
The coupled heat and mass transfer equations described above, in 2-dimensions can be writteninto a matrix form as follows:
[C(�)∂
∂t{�}] = ∇([Kcx(∇�)]ix + [Kcy(∇�)]iy){�} + R(∇Z) (15.18)
where {�} = {Pw, T , Pg} is the column of unknowns; [C], [Kcx] and [Kcy] are 3 × 3 matrices.Each element of the matrix is a coefficient for the unknown {�}; ix and iy are the unit directionvectors. In order to discretize this simplified second order non-linear coupled partial differentialequation, the finite element method is used. The Galerkin method was used to minimize theresidual error before the application of Greens theorem, to the dispersive term that includes
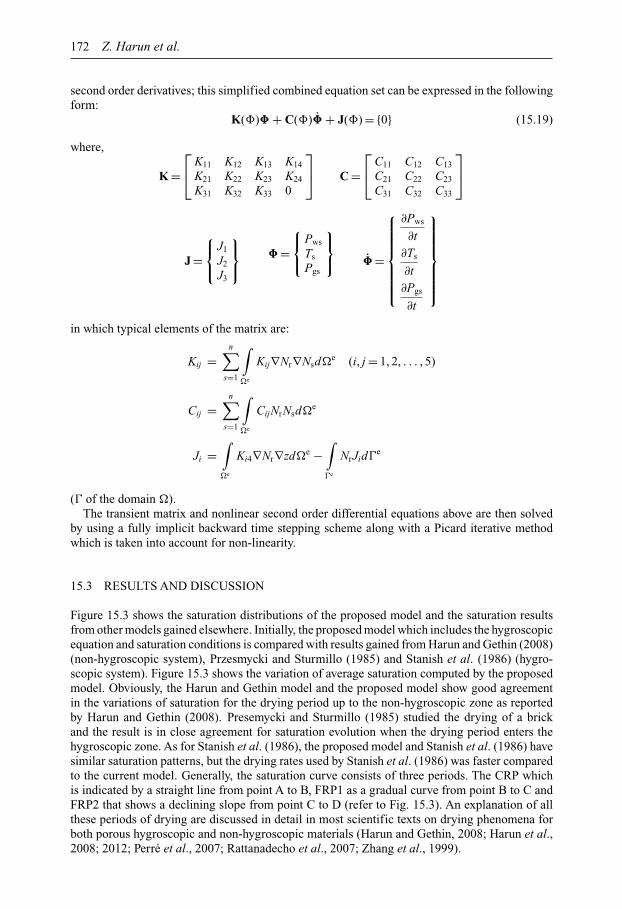
172 Z. Harun et al.
second order derivatives; this simplified combined equation set can be expressed in the followingform:
K(�)� + C(�)� + J(�) = {0} (15.19)
where,
K =⎡⎣K11 K12 K13 K14
K21 K22 K23 K24
K31 K32 K33 0
⎤⎦ C =
⎡⎣C11 C12 C13
C21 C22 C23
C31 C32 C33
⎤⎦
J =⎧⎨⎩
J1
J2
J3
⎫⎬⎭ � =
⎧⎨⎩
Pws
Ts
Pgs
⎫⎬⎭ � =
⎧⎪⎪⎪⎪⎪⎪⎨⎪⎪⎪⎪⎪⎪⎩
∂Pws
∂t∂Ts
∂t∂Pgs
∂t
⎫⎪⎪⎪⎪⎪⎪⎬⎪⎪⎪⎪⎪⎪⎭
in which typical elements of the matrix are:
Kij =n∑
s=1
∫�e
Kij∇Nr∇Nsd�e (i, j = 1, 2, . . . , 5)
Cij =n∑
s=1
∫�e
CijNrNsd�e
Ji =∫�e
Ki4∇Nr∇zd�e −∫�e
NrJid�e
(� of the domain �).The transient matrix and nonlinear second order differential equations above are then solved
by using a fully implicit backward time stepping scheme along with a Picard iterative methodwhich is taken into account for non-linearity.
15.3 RESULTS AND DISCUSSION
Figure 15.3 shows the saturation distributions of the proposed model and the saturation resultsfrom other models gained elsewhere. Initially, the proposed model which includes the hygroscopicequation and saturation conditions is compared with results gained from Harun and Gethin (2008)(non-hygroscopic system), Przesmycki and Sturmillo (1985) and Stanish et al. (1986) (hygro-scopic system). Figure 15.3 shows the variation of average saturation computed by the proposedmodel. Obviously, the Harun and Gethin model and the proposed model show good agreementin the variations of saturation for the drying period up to the non-hygroscopic zone as reportedby Harun and Gethin (2008). Presemycki and Sturmillo (1985) studied the drying of a brickand the result is in close agreement for saturation evolution when the drying period enters thehygroscopic zone. As for Stanish et al. (1986), the proposed model and Stanish et al. (1986) havesimilar saturation patterns, but the drying rates used by Stanish et al. (1986) was faster comparedto the current model. Generally, the saturation curve consists of three periods. The CRP whichis indicated by a straight line from point A to B, FRP1 as a gradual curve from point B to C andFRP2 that shows a declining slope from point C to D (refer to Fig. 15.3). An explanation of allthese periods of drying are discussed in detail in most scientific texts on drying phenomena forboth porous hygroscopic and non-hygroscopic materials (Harun and Gethin, 2008; Harun et al.,2008; 2012; Perré et al., 2007; Rattanadecho et al., 2007; Zhang et al., 1999).
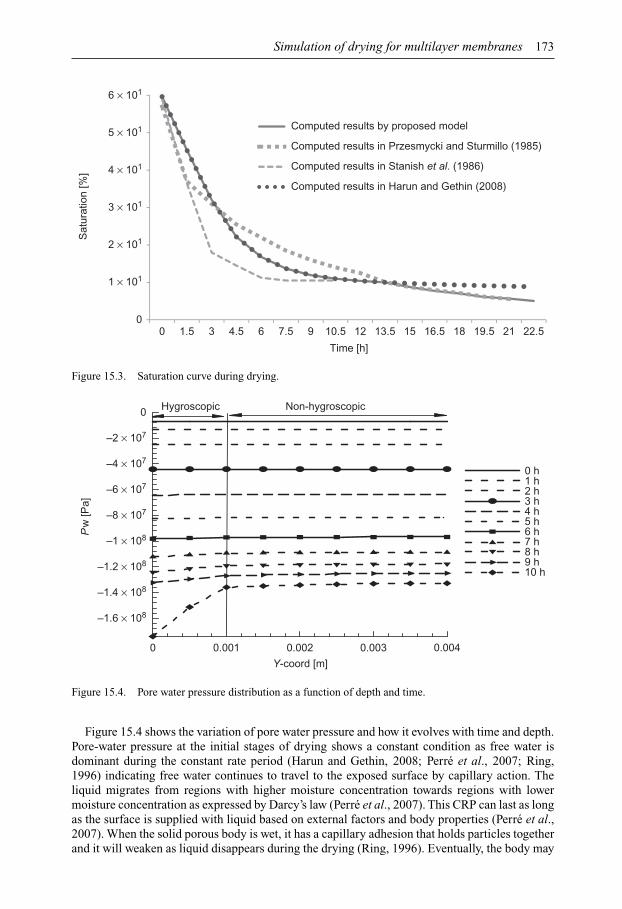
Simulation of drying for multilayer membranes 173
0
1 × 101
2 × 101
3 × 101
4 × 101
5 × 101
6 × 101
Figure 15.3. Saturation curve during drying.
Y-coord [m]
Pw
[Pa]
0 0.001 0.002 0.003 0.004
–1.6 × 10⁸
–1.4 × 10⁸
–1.2 × 10⁸
–1 × 10⁸
–8 × 10⁷
–6 × 10⁷
–4 × 10⁷
–2 × 10⁷
0
0 h1 h2 h3 h4 h5 h6 h7 h8 h9 h10 h
Hygroscopic Non-hygroscopic
Figure 15.4. Pore water pressure distribution as a function of depth and time.
Figure 15.4 shows the variation of pore water pressure and how it evolves with time and depth.Pore-water pressure at the initial stages of drying shows a constant condition as free water isdominant during the constant rate period (Harun and Gethin, 2008; Perré et al., 2007; Ring,1996) indicating free water continues to travel to the exposed surface by capillary action. Theliquid migrates from regions with higher moisture concentration towards regions with lowermoisture concentration as expressed by Darcy’s law (Perré et al., 2007). This CRP can last as longas the surface is supplied with liquid based on external factors and body properties (Perré et al.,2007). When the solid porous body is wet, it has a capillary adhesion that holds particles togetherand it will weaken as liquid disappears during the drying (Ring, 1996). Eventually, the body may
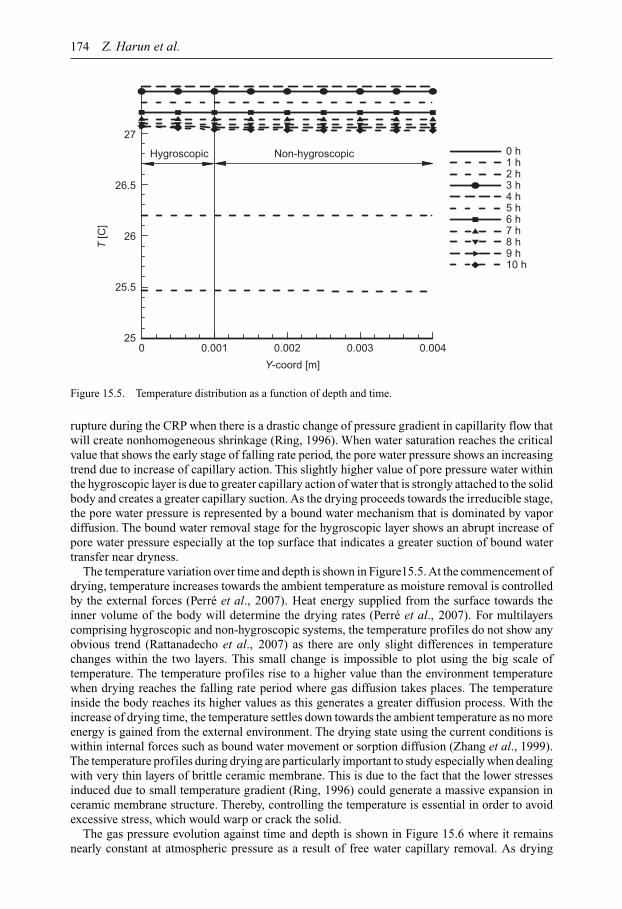
174 Z. Harun et al.
T [C
]
25
25.5
26
26.5
27
Y-coord [m]
0 0.001 0.002 0.003 0.004
0 h1 h2 h3 h4 h5 h6 h7 h8 h9 h10 h
Hygroscopic Non-hygroscopic
Figure 15.5. Temperature distribution as a function of depth and time.
rupture during the CRP when there is a drastic change of pressure gradient in capillarity flow thatwill create nonhomogeneous shrinkage (Ring, 1996). When water saturation reaches the criticalvalue that shows the early stage of falling rate period, the pore water pressure shows an increasingtrend due to increase of capillary action. This slightly higher value of pore pressure water withinthe hygroscopic layer is due to greater capillary action of water that is strongly attached to the solidbody and creates a greater capillary suction. As the drying proceeds towards the irreducible stage,the pore water pressure is represented by a bound water mechanism that is dominated by vapordiffusion. The bound water removal stage for the hygroscopic layer shows an abrupt increase ofpore water pressure especially at the top surface that indicates a greater suction of bound watertransfer near dryness.
The temperature variation over time and depth is shown in Figure15.5. At the commencement ofdrying, temperature increases towards the ambient temperature as moisture removal is controlledby the external forces (Perré et al., 2007). Heat energy supplied from the surface towards theinner volume of the body will determine the drying rates (Perré et al., 2007). For multilayerscomprising hygroscopic and non-hygroscopic systems, the temperature profiles do not show anyobvious trend (Rattanadecho et al., 2007) as there are only slight differences in temperaturechanges within the two layers. This small change is impossible to plot using the big scale oftemperature. The temperature profiles rise to a higher value than the environment temperaturewhen drying reaches the falling rate period where gas diffusion takes places. The temperatureinside the body reaches its higher values as this generates a greater diffusion process. With theincrease of drying time, the temperature settles down towards the ambient temperature as no moreenergy is gained from the external environment. The drying state using the current conditions iswithin internal forces such as bound water movement or sorption diffusion (Zhang et al., 1999).The temperature profiles during drying are particularly important to study especially when dealingwith very thin layers of brittle ceramic membrane. This is due to the fact that the lower stressesinduced due to small temperature gradient (Ring, 1996) could generate a massive expansion inceramic membrane structure. Thereby, controlling the temperature is essential in order to avoidexcessive stress, which would warp or crack the solid.
The gas pressure evolution against time and depth is shown in Figure 15.6 where it remainsnearly constant at atmospheric pressure as a result of free water capillary removal. As drying
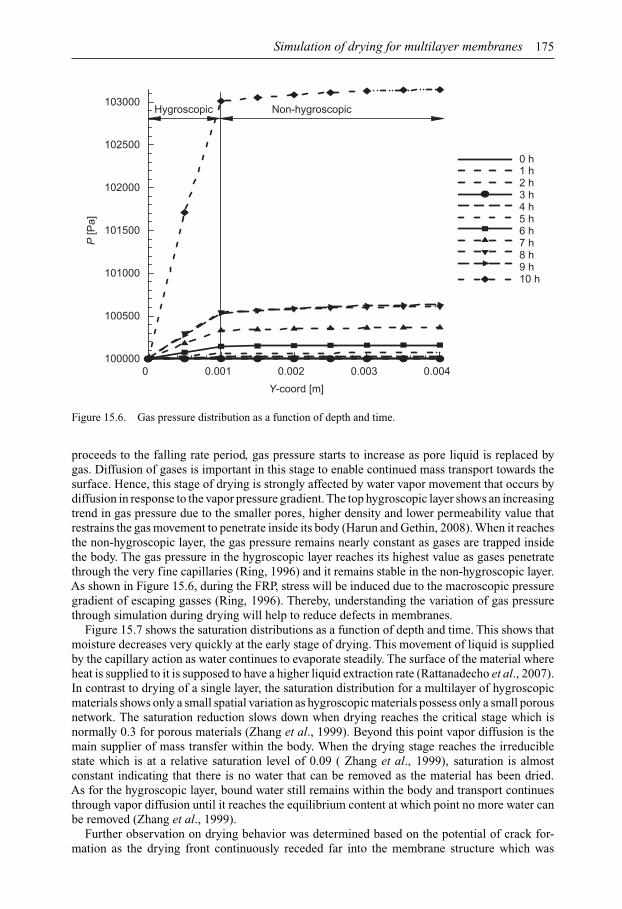
Simulation of drying for multilayer membranes 175
P [P
a]
0 0.001 0.002 0.003 0.004100000
100500
101000
101500
102000
102500
103000
0 h1 h2 h3 h4 h5 h6 h7 h8 h9 h10 h
Hygroscopic Non-hygroscopic
Y-coord [m]
Figure 15.6. Gas pressure distribution as a function of depth and time.
proceeds to the falling rate period, gas pressure starts to increase as pore liquid is replaced bygas. Diffusion of gases is important in this stage to enable continued mass transport towards thesurface. Hence, this stage of drying is strongly affected by water vapor movement that occurs bydiffusion in response to the vapor pressure gradient. The top hygroscopic layer shows an increasingtrend in gas pressure due to the smaller pores, higher density and lower permeability value thatrestrains the gas movement to penetrate inside its body (Harun and Gethin, 2008). When it reachesthe non-hygroscopic layer, the gas pressure remains nearly constant as gases are trapped insidethe body. The gas pressure in the hygroscopic layer reaches its highest value as gases penetratethrough the very fine capillaries (Ring, 1996) and it remains stable in the non-hygroscopic layer.As shown in Figure 15.6, during the FRP, stress will be induced due to the macroscopic pressuregradient of escaping gasses (Ring, 1996). Thereby, understanding the variation of gas pressurethrough simulation during drying will help to reduce defects in membranes.
Figure 15.7 shows the saturation distributions as a function of depth and time. This shows thatmoisture decreases very quickly at the early stage of drying. This movement of liquid is suppliedby the capillary action as water continues to evaporate steadily. The surface of the material whereheat is supplied to it is supposed to have a higher liquid extraction rate (Rattanadecho et al., 2007).In contrast to drying of a single layer, the saturation distribution for a multilayer of hygroscopicmaterials shows only a small spatial variation as hygroscopic materials possess only a small porousnetwork. The saturation reduction slows down when drying reaches the critical stage which isnormally 0.3 for porous materials (Zhang et al., 1999). Beyond this point vapor diffusion is themain supplier of mass transfer within the body. When the drying stage reaches the irreduciblestate which is at a relative saturation level of 0.09 ( Zhang et al., 1999), saturation is almostconstant indicating that there is no water that can be removed as the material has been dried.As for the hygroscopic layer, bound water still remains within the body and transport continuesthrough vapor diffusion until it reaches the equilibrium content at which point no more water canbe removed (Zhang et al., 1999).
Further observation on drying behavior was determined based on the potential of crack for-mation as the drying front continuously receded far into the membrane structure which was
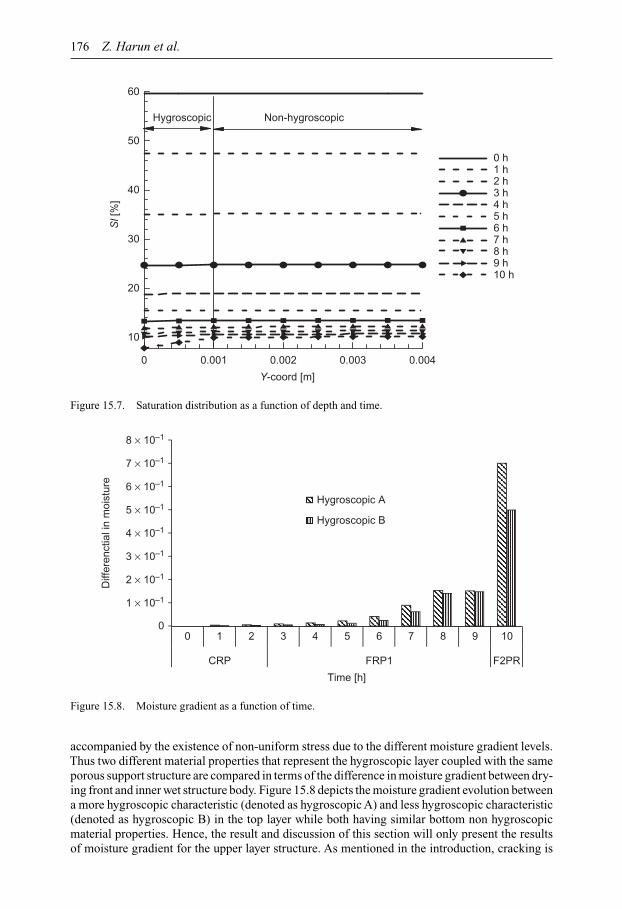
176 Z. Harun et al.
Y-coord [m]
Sl [
%]
0 0.001 0.002 0.003 0.004
10
20
30
40
50
60
0 h1 h2 h3 h4 h5 h6 h7 h8 h9 h10 h
Hygroscopic Non-hygroscopic
Figure 15.7. Saturation distribution as a function of depth and time.
0
1 × 10⁻¹
2 × 10⁻¹
3 × 10⁻¹
4 × 10⁻¹
5 × 10⁻¹
6 × 10⁻¹
7 × 10⁻¹
8 × 10⁻¹
0 1 2 3 4 5 6 7 8 9 10
F2PRFRP1CRP
Diff
eren
ctia
l in
moi
stur
e
Time [h]
Hygroscopic AHygroscopic A
Hygroscopic B
Figure 15.8. Moisture gradient as a function of time.
accompanied by the existence of non-uniform stress due to the different moisture gradient levels.Thus two different material properties that represent the hygroscopic layer coupled with the sameporous support structure are compared in terms of the difference in moisture gradient between dry-ing front and inner wet structure body. Figure 15.8 depicts the moisture gradient evolution betweena more hygroscopic characteristic (denoted as hygroscopic A) and less hygroscopic characteristic(denoted as hygroscopic B) in the top layer while both having similar bottom non hygroscopicmaterial properties. Hence, the result and discussion of this section will only present the resultsof moisture gradient for the upper layer structure. As mentioned in the introduction, cracking is
Simulation of drying for multilayer membranes 177
a characteristic of the dried porous matrix that is always associated with the non-homogenousmoisture gradient within the solid matrix. As clearly illustrated in Figure 15.8 moisture gradientfor hygroscopic A is higher than hygroscopic B at all times. Hence, it can be deduced that morehygroscopic behavior will offer more resistance of moisture transport or higher capillary suctionwhich is attributed to lower permeability value and porosity. Consequently, drying of the uppersurface layer and bottom layer exhibits non-uniform moisture content within the solid matrixwhich may cause higher possibilities of crack formation due to non-homogenous stress distri-bution especially in strongly hygroscopic materials. Since the gradient of moisture or capillarysuction increases gradually with the drying period as increasing the capillary suction, crack for-mation is more likely to happen in hygroscopic material. Thus, drying from the top surface mustbe carefully controlled especially in hygroscopic material to avoid undesired defects at the endof the drying process.
15.4 CONCLUSION
The drying procedure of multilayer membranes is quite different from that of a single layer due todifferent characteristics of those membranes. The hygroscopic layer that inherits higher density,smaller permeability and smaller pores leads to higher pore water pressure and gas pressure. Forhygroscopic materials, the transport of the bound water will also take place with the vapor pressuregradient in the gas phase as the driving force. Stresses due to pressure gradient arising from theliquid flow, macroscopic pressure gradient of escaping gases and temperature gradient can affectthe drying speed. Material selection is also vitally essential as more hygroscopic characteristiccontributed to higher non-uniform evaporation losses inside the porous matrix which increasethe probabilities of defects due to crack formation. Based on these simulated results, it can beconcluded that a better understanding of drying phenomena could be achieved, which will play animportant role in predicting and determining the drying rate during the formation of the separationlayer of the ceramic membrane.
ACKNOWLEDGEMENT
We are grateful for the KPTM scholarship for author 2.
NOMENCLATURE
µ viscosity [N s m−2]Cij capacity coefficient [ad]Cp specific heat capacity [J mol−1 K−1]h relative humidity [%]hm mass transfer coefficient [m s−1]hT heat transfer coefficient [W m−2 K−1]Jm mass transfer flux [kg m−2 s−1]JT heat transfer flux [W m−2]K intrinsic permeability [m2]k relative permeability [ad]Kij kinetic coefficients [ad]L latent heat of vaporization [J kg−1]Nr shape function of residual error [ad]Ns shape function of system variables [ad]P pressure [Pa]R gas constant [J mol−1 K−1]S saturation [ad]
178 Z. Harun et al.
T temperature [K]t time [s]V velocity [ms−1]
GREEK SYMBOLS
Ø porosity [ad]θ volumetric content [ad]λ thermal conductivity [W m−1 K−1]ρ density [kg m−3]�e element domain [ad]
SUBSCRIPTS
∞ calculateda, c, v, g, l, b air, capillary, vapor, gas, liquid, bound watercri criticalF finalirr irreducibler residuals saturated
REFERENCES
Baroghel-Bouny, V., Mainguy, M., Lassabatere, T. & Coussy, O. (1999) Characterization and identification ofequilibrium and transfer moisture properties for ordinary and high-performance cementitious materials.Cement and Concrete Research, 29 (8), 1225–1238.
Callister, W.D. & Rethwisch, D.G. (2011) Materials science and engineering. John Wiley & Sons, Inc.,New York, NY.
Colina, H. & Roux, S. (2000) Experimental model of cracking induced by drying shrinkage. The EuropeanPhysical Journal E, 194, 189–194.
Defraeye, T., Blocken, B. & Derome, D. (2012) Convective heat and mass transfer modelling at air-porousmaterial interfaces: overview of existing methods and relevance. Chemical Engineering Science, 32,49–58.
Hall, C. & Hoff, W.D. (2012) Water transport in brick, stone and concrete. Spon Press, London, UK.Harun, Z. & Gethin, D.T. (2008) Drying simulation of ceramic shell build up process. Modeling & Simulation,
2008. AICMS 08. Second Asia International Conference on Modeling & Simulation 2008, 13–15 May2008, Kuala Lumpur, Malaysia. IEEE. pp. 794–799.
Harun, Z., Gethin, D.T. & Lewis, R.W. (2008) Combined heat and mass transfer for drying ceramic (shell)body. The International Journal of Multiphysics, 2, 1–19.
Harun, Z., Nawi, N.M., Batcha, M.F. & Gethin, D.T. (2012) Modeling of layering ceramic shell mould.Applied Mechanics and Materials, 232, 548–552.
Ismail, N.F., Harun, Z. & Badarulzaman, N.A. (2012). A comparative study of double layersAl2O3/Al2O3 andAl2O3/SiO2 prepared by microwave and natural drying. International Journal of Integrated Engineering,4–1, 16–21.
Kowalski, S.J. & Mierzwa, D. (2013) Numerical analysis of drying kinetics for shrinkable products such asfruits and vegetables. Journal of Food Engineering, 114 (4), 522–529.
Li, K. (2007) Ceramic membranes for separation and reaction. John Wiley & Sons Ltd., Chichester, UK.Mayhew, Y.R. & Rogers, G.F.C. (1976) Thermodynamic and transport properties of fluids. Blackwell,
Oxford, UK.Mujumdar, A.S. (ed.), (2006) Handbook of industrial drying. CRC Press, Boca Raton, FL.Nascimento, J.J.S., Belo, F.A. & de Lima, A.G.B. (2015) Experimental drying of ceramics bricks including
shrinkage. Defect and Diffusion Forum, 365, 106–111.
Simulation of drying for multilayer membranes 179
Perré, P., Remond, R. & Turner, I. (2007) Comprehensive drying models based on volume averaging: back-ground, application and perspective. In: Tsotsas, E & Mujumdar, A.S. (eds.) Modern drying technology.Wiley VCH Verlag GmbH & Co. KGaA, Weinheim, Germany. pp. 1–12.
Pourcel, F., Jomaa, W., Puiggali, J.R. & Rouleau, L. (2007) Criterion for crack initiation during drying:alumina porous ceramic strength improvement. Powder Technology, 172 (2), 120–127.
Przesmycki, Z. & Strumillo, C. (1985) The mathematical modelling of drying process based on moisturetransfer Mechanism. In: Mujumdar A.S. (ed.) Drying’85. Hemisphere, New York, NY. pp. 126–134.
Rattanadecho, P., Pakdee, W. & Stakulcharoen, J. (2007). Analysis of multiphase flow and heat transfer:pressure buildup in an unsaturated porous slab exposed to hot gas. Drying Technology, 26, 39–53.
Ring, T.A. (1996) Fundamentals of ceramic powder processing and synthesis. Academic Press, SanDiego, CA.
Scherer, G.W. (1990) Theory of drying. Journal of the American Ceramic Society, 73 (1), 3–14.Schmitz, A.V., Mutlu,Y.S., Glatt, E., Klein, S. & Nestler, B. (2012) Flow simulation through porous ceramics
used as a throttle in an implantable infusion pump. Biomedizinische Technik. Biomedical Engineering,57 (Suppl. 1), 277–280.
Stanish, M.A., Schajer, G.S. & Kayihan, F. (1986) A mathematical model of drying for hygroscopic porousmedia. AIChE Journal, 32 (8), 1301–1311.
van Genuchten, M. (1980) A closed-form equation for predicting the hydraulic conductivity of unsaturatedsoils. Soil Science Society of America Journal, 8, 892–898.
Witharana, S., Hodges, C., Xu, D., Lai, X. & Ding,Y. (2012)Aggregation and settling in aqueous polydispersealumina nanoparticle suspensions. Journal of Nanoparticle Research, 14 (5), 851–862.
Zhang, Z., Yang, S. & Liu, D. (1999) Mechanism and mathematical model of heat and mass transfer duringconvective drying of porous materials. Heat Transfer-Asian Research, 28 (5), 337–351.

This page intentionally left blankThis page intentionally left blank
Part IVMembranes for energy and environmental
applications (novel membrane developmentsfor gas separation)

This page intentionally left blankThis page intentionally left blank
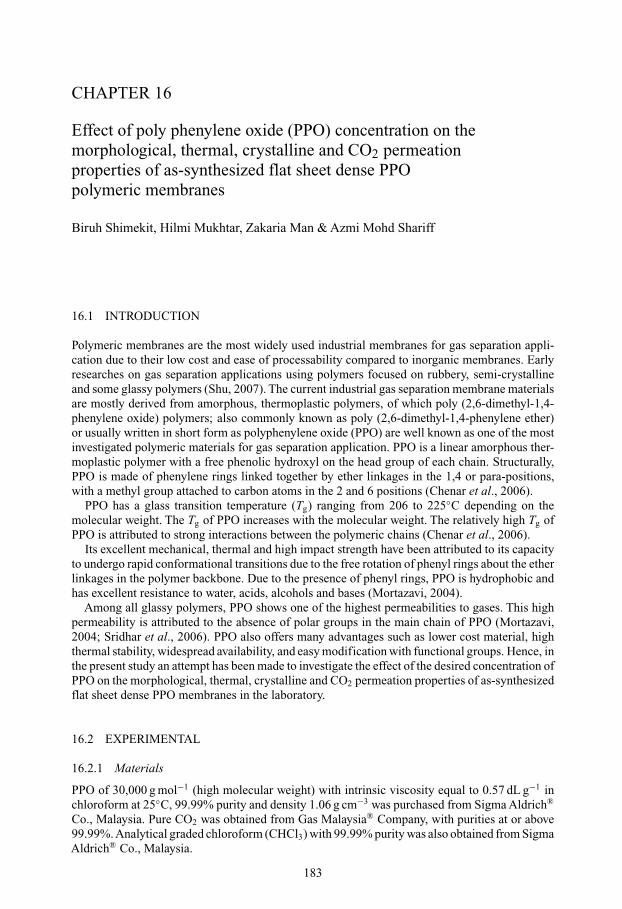
CHAPTER 16
Effect of poly phenylene oxide (PPO) concentration on themorphological, thermal, crystalline and CO2 permeationproperties of as-synthesized flat sheet dense PPOpolymeric membranes
Biruh Shimekit, Hilmi Mukhtar, Zakaria Man & Azmi Mohd Shariff
16.1 INTRODUCTION
Polymeric membranes are the most widely used industrial membranes for gas separation appli-cation due to their low cost and ease of processability compared to inorganic membranes. Earlyresearches on gas separation applications using polymers focused on rubbery, semi-crystallineand some glassy polymers (Shu, 2007). The current industrial gas separation membrane materialsare mostly derived from amorphous, thermoplastic polymers, of which poly (2,6-dimethyl-1,4-phenylene oxide) polymers; also commonly known as poly (2,6-dimethyl-1,4-phenylene ether)or usually written in short form as polyphenylene oxide (PPO) are well known as one of the mostinvestigated polymeric materials for gas separation application. PPO is a linear amorphous ther-moplastic polymer with a free phenolic hydroxyl on the head group of each chain. Structurally,PPO is made of phenylene rings linked together by ether linkages in the 1,4 or para-positions,with a methyl group attached to carbon atoms in the 2 and 6 positions (Chenar et al., 2006).
PPO has a glass transition temperature (Tg) ranging from 206 to 225◦C depending on themolecular weight. The Tg of PPO increases with the molecular weight. The relatively high Tg ofPPO is attributed to strong interactions between the polymeric chains (Chenar et al., 2006).
Its excellent mechanical, thermal and high impact strength have been attributed to its capacityto undergo rapid conformational transitions due to the free rotation of phenyl rings about the etherlinkages in the polymer backbone. Due to the presence of phenyl rings, PPO is hydrophobic andhas excellent resistance to water, acids, alcohols and bases (Mortazavi, 2004).
Among all glassy polymers, PPO shows one of the highest permeabilities to gases. This highpermeability is attributed to the absence of polar groups in the main chain of PPO (Mortazavi,2004; Sridhar et al., 2006). PPO also offers many advantages such as lower cost material, highthermal stability, widespread availability, and easy modification with functional groups. Hence, inthe present study an attempt has been made to investigate the effect of the desired concentration ofPPO on the morphological, thermal, crystalline and CO2 permeation properties of as-synthesizedflat sheet dense PPO membranes in the laboratory.
16.2 EXPERIMENTAL
16.2.1 Materials
PPO of 30,000 g mol−1 (high molecular weight) with intrinsic viscosity equal to 0.57 dL g−1 inchloroform at 25◦C, 99.99% purity and density 1.06 g cm−3 was purchased from Sigma Aldrich®
Co., Malaysia. Pure CO2 was obtained from Gas Malaysia® Company, with purities at or above99.99%. Analytical graded chloroform (CHCl3) with 99.99% purity was also obtained from SigmaAldrich® Co., Malaysia.
183
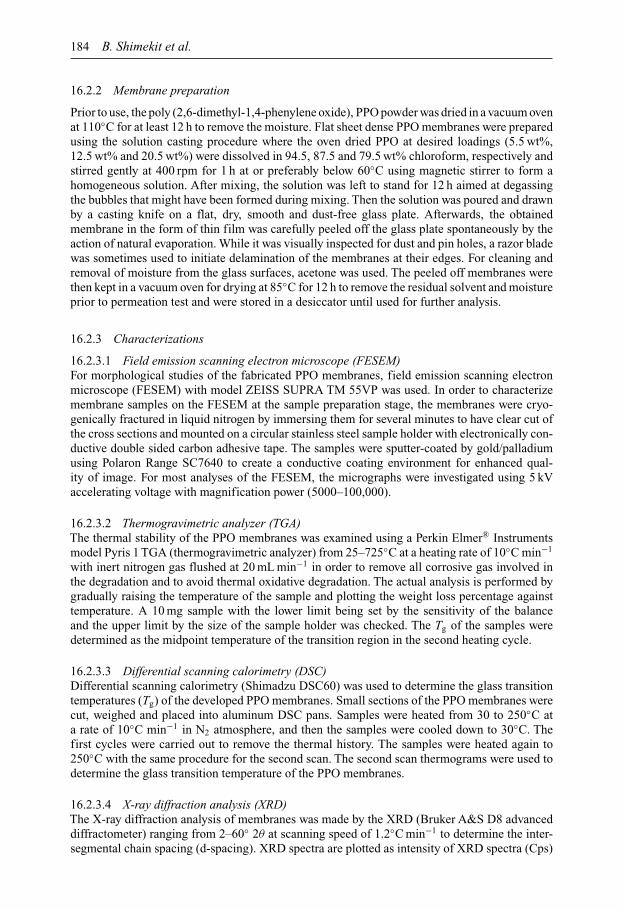
184 B. Shimekit et al.
16.2.2 Membrane preparation
Prior to use, the poly (2,6-dimethyl-1,4-phenylene oxide), PPO powder was dried in a vacuum ovenat 110◦C for at least 12 h to remove the moisture. Flat sheet dense PPO membranes were preparedusing the solution casting procedure where the oven dried PPO at desired loadings (5.5 wt%,12.5 wt% and 20.5 wt%) were dissolved in 94.5, 87.5 and 79.5 wt% chloroform, respectively andstirred gently at 400 rpm for 1 h at or preferably below 60◦C using magnetic stirrer to form ahomogeneous solution. After mixing, the solution was left to stand for 12 h aimed at degassingthe bubbles that might have been formed during mixing. Then the solution was poured and drawnby a casting knife on a flat, dry, smooth and dust-free glass plate. Afterwards, the obtainedmembrane in the form of thin film was carefully peeled off the glass plate spontaneously by theaction of natural evaporation. While it was visually inspected for dust and pin holes, a razor bladewas sometimes used to initiate delamination of the membranes at their edges. For cleaning andremoval of moisture from the glass surfaces, acetone was used. The peeled off membranes werethen kept in a vacuum oven for drying at 85◦C for 12 h to remove the residual solvent and moistureprior to permeation test and were stored in a desiccator until used for further analysis.
16.2.3 Characterizations
16.2.3.1 Field emission scanning electron microscope (FESEM)For morphological studies of the fabricated PPO membranes, field emission scanning electronmicroscope (FESEM) with model ZEISS SUPRA TM 55VP was used. In order to characterizemembrane samples on the FESEM at the sample preparation stage, the membranes were cryo-genically fractured in liquid nitrogen by immersing them for several minutes to have clear cut ofthe cross sections and mounted on a circular stainless steel sample holder with electronically con-ductive double sided carbon adhesive tape. The samples were sputter-coated by gold/palladiumusing Polaron Range SC7640 to create a conductive coating environment for enhanced qual-ity of image. For most analyses of the FESEM, the micrographs were investigated using 5 kVaccelerating voltage with magnification power (5000–100,000).
16.2.3.2 Thermogravimetric analyzer (TGA)The thermal stability of the PPO membranes was examined using a Perkin Elmer® Instrumentsmodel Pyris 1 TGA (thermogravimetric analyzer) from 25–725◦C at a heating rate of 10◦C min−1
with inert nitrogen gas flushed at 20 mL min−1 in order to remove all corrosive gas involved inthe degradation and to avoid thermal oxidative degradation. The actual analysis is performed bygradually raising the temperature of the sample and plotting the weight loss percentage againsttemperature. A 10 mg sample with the lower limit being set by the sensitivity of the balanceand the upper limit by the size of the sample holder was checked. The Tg of the samples weredetermined as the midpoint temperature of the transition region in the second heating cycle.
16.2.3.3 Differential scanning calorimetry (DSC)Differential scanning calorimetry (Shimadzu DSC60) was used to determine the glass transitiontemperatures (Tg) of the developed PPO membranes. Small sections of the PPO membranes werecut, weighed and placed into aluminum DSC pans. Samples were heated from 30 to 250◦C ata rate of 10◦C min−1 in N2 atmosphere, and then the samples were cooled down to 30◦C. Thefirst cycles were carried out to remove the thermal history. The samples were heated again to250◦C with the same procedure for the second scan. The second scan thermograms were used todetermine the glass transition temperature of the PPO membranes.
16.2.3.4 X-ray diffraction analysis (XRD)The X-ray diffraction analysis of membranes was made by the XRD (Bruker A&S D8 advanceddiffractometer) ranging from 2–60◦ 2θ at scanning speed of 1.2◦C min−1 to determine the inter-segmental chain spacing (d-spacing). XRD spectra are plotted as intensity of XRD spectra (Cps)

Effect of poly phenylene oxide (PPO) concentration 185
against diffraction angle (2θ). As a general trend, the X-ray diffraction scans of amorphous poly-mers are typically dominated by a broad peak associated with the center to center chain distanceof d-spacing.
16.2.3.5 Response surface methodology (RSM)Response surface methodology (RSM) was employed to optimize the permeance of CO2 in PPOhomogeneous membranes. The results of experimental design were analyzed using MiniTab 14.13statistical software to predict the response of the dependent response variable. The responsesurface is normally represented graphically, where the contour plots are often drawn to visualizethe shape of the response surface. When the process is close to optimum, the second order modelthat incorporates curvature is usually required to approximate the response:
y = B0 +k∑
i=1
Bixi +k∑
i=1
Biix2i +
∑i<j
∑Bijxixj + ε (16.1)
where y is the predicted response, B0 is the offset term, Bi is the linear effect, Bii is the squaredeffect and Bij represents the interaction effect. The optimized condition was obtained from contourplots graphically and also by solving the polynomial regression of determination R2 and statisticalsignificance with probability level of 0.5% was employed.
In the present study, two level factors were chosen, the factors included various PPO con-centration (5.5, 12.5 and 20.5 wt%) and applied feed pressures (0.2, 0.6 and 1.0 MPa) and thepermeance of CO2 was the response. Screening of independent factors affecting the permeationof CO2 was carried out with blocks of experiments.
16.2.3.6 Gas permeationThe CO2 permeation flux of the as-synthesized PPO membranes was measured using a gaspermeation testing unit. In such a system, the amount of CO2 that permeates across the membraneper unit area (flux) was measured by constant volume-variable pressure method. This is maintainedby the desired feed and permeate pressure together with constant volume with a known thicknessand area of the membrane (14.5 cm2) on permeate phase.
Each experiment was conducted at feed pressure of 0.2, 0.4, 0.6, 0.8 and 1.0 MPa and thepermeate stream was at atmospheric pressure. The flow rate of the permeate stream was measuredby the calibrated bubble flow meter. In this experiment, the time required to reach a desired volumeof gas in the permeate stream was observed and recorded. The permeation of CO2 through themembranes was measured twice at steady state condition. For ease of comparison and accuracyof results (i.e. to avoid any uncertainty due to slight fluctuation of the actual measurement ofthickness of membranes), pressure normalized flux or permeance (GPU ) was selected as the unitof measurement.
16.3 RESULTS AND DISCUSSION
16.3.1 Effect of concentration of PPO polymer on the morphological properties ofas-synthesized flat sheet dense PPO membranes
The effect of concentration of PPO on the morphologies of the fabricated dense flat sheet PPOmembranes was analyzed using the FESEM. Figure 16.1a–c shows the FESEM micrographs forthe cross section view of the 5.5, 12.5 and 20.5 wt% PPO flat sheet dense membranes with theiraverage thickness ranging between 3.5 and 5.5 µm.
Figure 16.1a–c clearly shows that there is no significant change in the morphology of the PPOmembranes when increasing the concentration of the PPO polymer from 5.5 to 12.5 wt%. Thisis due to the homogeneity of the dense membranes that arise from good interaction of the PPOpolymer and the chloroform at lower loadings of PPO. However, increasing PPO concentration
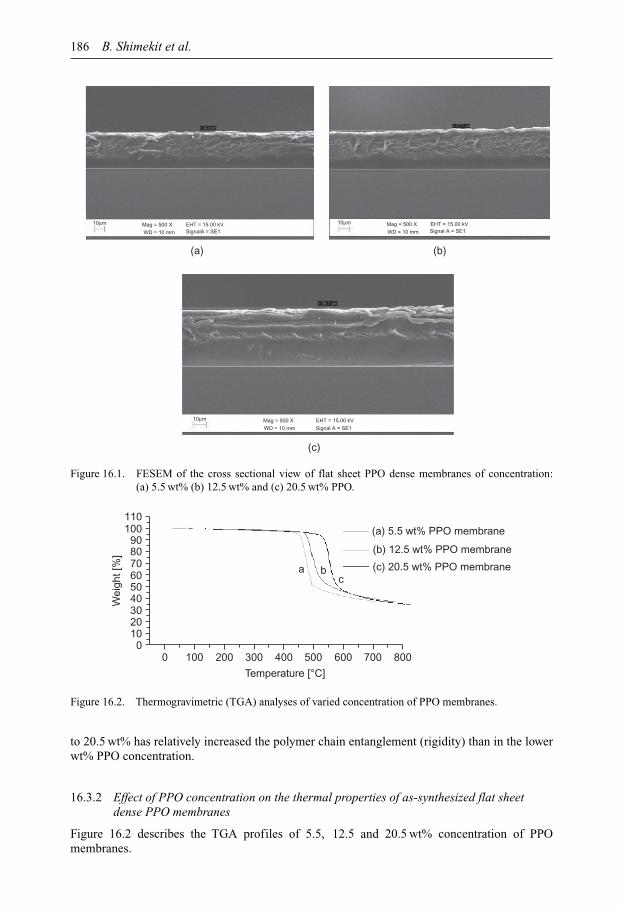
186 B. Shimekit et al.
10µm
(a) (b)
(c)
WD = 10 mmMag = 500 X EHT = 15.00 kV
SignalA = SE1
10µm
WD = 10 mmMag = 500 X EHT = 15.00 kV
Signal A = SE1
10µm
WD = 10 mmMag = 500 X EHT = 15.00 kV
Signal A = SE1
Figure 16.1. FESEM of the cross sectional view of flat sheet PPO dense membranes of concentration:(a) 5.5 wt% (b) 12.5 wt% and (c) 20.5 wt% PPO.
1101009080706050403020100
0 100 200 300 400
Temperature [°C]
Wei
ght [
%]
500 600 700 800
a bc
(a) 5.5 wt% PPO membrane
(b) 12.5 wt% PPO membrane
(c) 20.5 wt% PPO membrane
Figure 16.2. Thermogravimetric (TGA) analyses of varied concentration of PPO membranes.
to 20.5 wt% has relatively increased the polymer chain entanglement (rigidity) than in the lowerwt% PPO concentration.
16.3.2 Effect of PPO concentration on the thermal properties of as-synthesized flat sheetdense PPO membranes
Figure 16.2 describes the TGA profiles of 5.5, 12.5 and 20.5 wt% concentration of PPOmembranes.
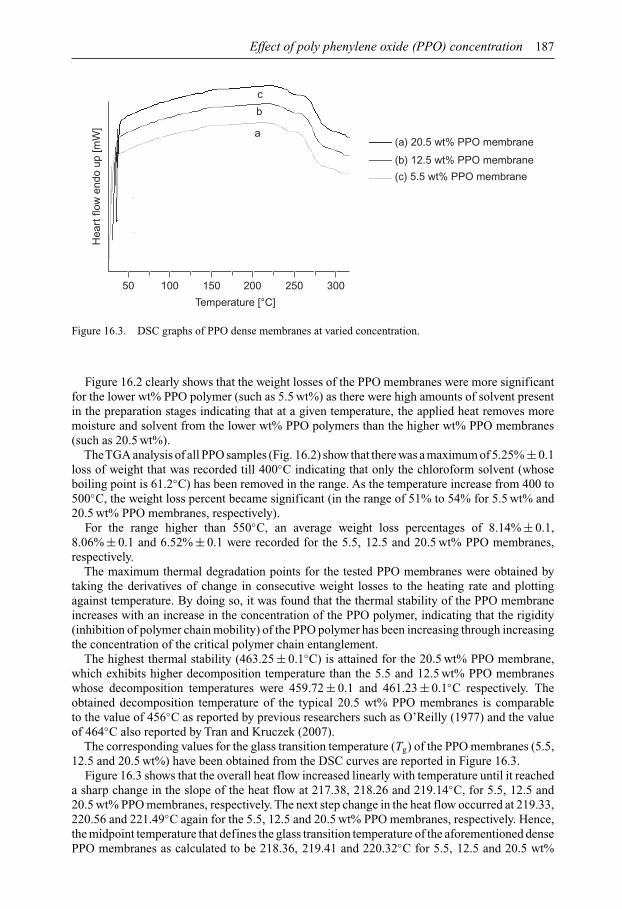
Effect of poly phenylene oxide (PPO) concentration 187
50 100 150 200
Temperature [°C]
Hea
rt fl
ow e
ndo
up [m
W]
250
a
b
c
300
(a) 20.5 wt% PPO membrane
(b) 12.5 wt% PPO membrane
(c) 5.5 wt% PPO membrane
Figure 16.3. DSC graphs of PPO dense membranes at varied concentration.
Figure 16.2 clearly shows that the weight losses of the PPO membranes were more significantfor the lower wt% PPO polymer (such as 5.5 wt%) as there were high amounts of solvent presentin the preparation stages indicating that at a given temperature, the applied heat removes moremoisture and solvent from the lower wt% PPO polymers than the higher wt% PPO membranes(such as 20.5 wt%).
TheTGA analysis of all PPO samples (Fig. 16.2) show that there was a maximum of 5.25% ± 0.1loss of weight that was recorded till 400◦C indicating that only the chloroform solvent (whoseboiling point is 61.2◦C) has been removed in the range. As the temperature increase from 400 to500◦C, the weight loss percent became significant (in the range of 51% to 54% for 5.5 wt% and20.5 wt% PPO membranes, respectively).
For the range higher than 550◦C, an average weight loss percentages of 8.14% ± 0.1,8.06% ± 0.1 and 6.52% ± 0.1 were recorded for the 5.5, 12.5 and 20.5 wt% PPO membranes,respectively.
The maximum thermal degradation points for the tested PPO membranes were obtained bytaking the derivatives of change in consecutive weight losses to the heating rate and plottingagainst temperature. By doing so, it was found that the thermal stability of the PPO membraneincreases with an increase in the concentration of the PPO polymer, indicating that the rigidity(inhibition of polymer chain mobility) of the PPO polymer has been increasing through increasingthe concentration of the critical polymer chain entanglement.
The highest thermal stability (463.25 ± 0.1◦C) is attained for the 20.5 wt% PPO membrane,which exhibits higher decomposition temperature than the 5.5 and 12.5 wt% PPO membraneswhose decomposition temperatures were 459.72 ± 0.1 and 461.23 ± 0.1◦C respectively. Theobtained decomposition temperature of the typical 20.5 wt% PPO membranes is comparableto the value of 456◦C as reported by previous researchers such as O’Reilly (1977) and the valueof 464◦C also reported by Tran and Kruczek (2007).
The corresponding values for the glass transition temperature (Tg) of the PPO membranes (5.5,12.5 and 20.5 wt%) have been obtained from the DSC curves are reported in Figure 16.3.
Figure 16.3 shows that the overall heat flow increased linearly with temperature until it reacheda sharp change in the slope of the heat flow at 217.38, 218.26 and 219.14◦C, for 5.5, 12.5 and20.5 wt% PPO membranes, respectively. The next step change in the heat flow occurred at 219.33,220.56 and 221.49◦C again for the 5.5, 12.5 and 20.5 wt% PPO membranes, respectively. Hence,the midpoint temperature that defines the glass transition temperature of the aforementioned densePPO membranes as calculated to be 218.36, 219.41 and 220.32◦C for 5.5, 12.5 and 20.5 wt%
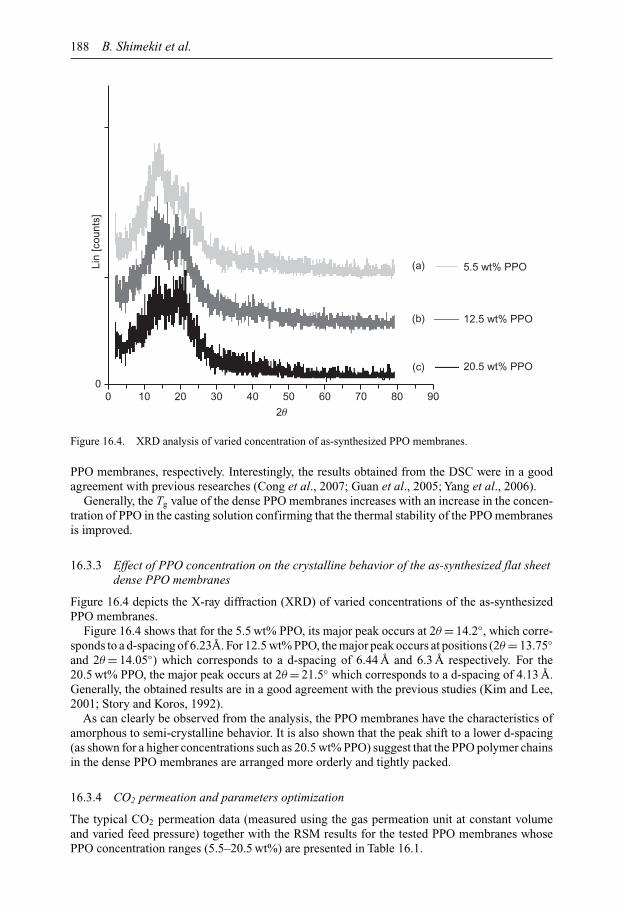
188 B. Shimekit et al.
Lin
[cou
nts]
00 10 20 30 40 50 60
2θ
70 80 90
(a) 5.5 wt% PPO
12.5 wt% PPO
20.5 wt% PPO
(b)
(c)
Figure 16.4. XRD analysis of varied concentration of as-synthesized PPO membranes.
PPO membranes, respectively. Interestingly, the results obtained from the DSC were in a goodagreement with previous researches (Cong et al., 2007; Guan et al., 2005; Yang et al., 2006).
Generally, the Tg value of the dense PPO membranes increases with an increase in the concen-tration of PPO in the casting solution confirming that the thermal stability of the PPO membranesis improved.
16.3.3 Effect of PPO concentration on the crystalline behavior of the as-synthesized flat sheetdense PPO membranes
Figure 16.4 depicts the X-ray diffraction (XRD) of varied concentrations of the as-synthesizedPPO membranes.
Figure 16.4 shows that for the 5.5 wt% PPO, its major peak occurs at 2θ = 14.2◦, which corre-sponds to a d-spacing of 6.23Å. For 12.5 wt% PPO, the major peak occurs at positions (2θ = 13.75◦and 2θ = 14.05◦) which corresponds to a d-spacing of 6.44 Å and 6.3 Å respectively. For the20.5 wt% PPO, the major peak occurs at 2θ = 21.5◦ which corresponds to a d-spacing of 4.13 Å.Generally, the obtained results are in a good agreement with the previous studies (Kim and Lee,2001; Story and Koros, 1992).
As can clearly be observed from the analysis, the PPO membranes have the characteristics ofamorphous to semi-crystalline behavior. It is also shown that the peak shift to a lower d-spacing(as shown for a higher concentrations such as 20.5 wt% PPO) suggest that the PPO polymer chainsin the dense PPO membranes are arranged more orderly and tightly packed.
16.3.4 CO2 permeation and parameters optimization
The typical CO2 permeation data (measured using the gas permeation unit at constant volumeand varied feed pressure) together with the RSM results for the tested PPO membranes whosePPO concentration ranges (5.5–20.5 wt%) are presented in Table 16.1.

Effect of poly phenylene oxide (PPO) concentration 189
Table 16.1. Comparison of the permeance of CO2 using Equation (16.2) with that of the experiment in thePPO membranes.
Permeance [GPU]∗
PtType Blocks PPO [wt%] Pressure [MPa] Experimental Predicted
0 1 12.5 0.6 7.09 7.301 1 20.5 1.0 6.62 7.141 1 5.5 1.0 3.40 3.341 1 5.5 0.2 5.13 5.180 1 12.5 0.6 7.11 7.300 1 12.5 0.6 7.06 7.300 1 12.5 0.6 7.10 7.301 1 5.5 1.0 3.43 3.340 1 12.5 0.6 7.12 7.300 2 12.5 0.6 7.10 7.300 2 12.5 0.6 7.07 7.300 2 12.5 0.6 7.08 7.300 2 12.5 0.6 7.10 7.301 2 5.5 0.2 5.16 5.181 2 20.5 0.2 5.50 6.501 2 20.5 0.2 5.50 6.500 2 12.5 0.6 7.09 7.301 2 20.5 1.0 6.55 7.14
∗GPU: pressure normalized flux or permeance; 1 GPU = 0.33 mol m−2 s−1 Pa−1.
7
6
5
4
5 10 15 200.3
0.60.9
Pressure [MPa]
PPO conc. [%]
Permeance [GPU]
Figure 16.5. Surface plot of permeance of CO2 in PPO homogeneous membrane versus pressure, PPOconcentration.
By employing the RSM via the regression analysis, the measured CO2 permeation data(Table 16.1) were fitted to the second order polynomial of the Equation (16.1). Hence, thequadratic regression model for permeation of typical CO2 gas is given in Equation (16.2).
CO2Permeance = 2.34 + 0.81 × PPO − 0.33 × Pressure − 0.03 × PPO2
+ 0.02 × PPO × Pressure (16.2)
The predicted permeance of CO2 using (Equation (16.2)) is compared with the measured CO2
permeation data (Table 16.1), using relatively few combinations of variables to determine theresponse function.
Further, in order to examine the effect of factors (feed pressure and PPO concentration) towardsthe CO2 permeation, 3D surface graphical representation was used and presented in Figure 16.5.

190 B. Shimekit et al.
As shown from Figure 16.5 and from the response surface methodology (RSM) that opti-mized the experimental conditions for the maximum permeation of CO2 based on the presentexperiments, involving the concentration of PPO (5.5–20.5 wt%) and applied feed pressure (0.2–1.0 MPa), it was found that the optimal permeation of CO2 is estimated at 7.26 GPU, the estimatedoptimum value of PPO concentration is 12.5 wt% and that of feed pressure is 0.25 MPa at 0.99desirability. Hence, the 12.5 wt% PPO concentration is selected to be an optimal concentration.
16.4 CONCLUSION
Flat sheet dense PPO membranes of desired concentration (5.5, 12.5 and 20.5 wt%) were suc-cessfully fabricated in the laboratory. Morphological, thermal, crystalline and CO2 permeationcharacteristic of the as-synthesized PPO membranes were also successfully analyzed. Cross-sectional views of the morphologies of the as-synthesized PPO membranes showed that increasingthe concentration of the PPO polymer from 5.5 to 20.5 wt% demonstrates distinct morphology withpossible polymer rigidification effect. The thermal stability of the PPO membranes also increasedfrom (218.36 to 220.32 ± 0.1◦C) while increasing the concentration of the PPO polymer from(5.5 20.5 wt%). The X-ray diffraction analysis confirmed that the tested PPO membranes had thecharacteristics of amorphous behavior. The response surface methodology (RSM) demonstratedthat for the feed pressure of (0.2–1.0) MPa, the optimal permeation of CO2 was estimated to be7.26 GPU at the 12.5 wt% PPO concentration and feed pressure of 0.25 MPa.
ACKNOWLEDGEMENT
The authors are grateful for the assistance and support provided by Universiti TeknologiPETRONAS.
REFERENCES
Chenar, M.P., Soltanieh, M., Matsuura, T., Tabe-Mohammadi, A. & Feng, C. (2006) Removal of hydrogensulfide from methane using commercial polyphenylene oxide and cardo-type polyimide hollow fibermembranes. Separation and Purification Technology, 51, 359–366.
Cong, H., Hu, X., Radosz, M. & Shen, Y. (2007) Brominated poly(2,6-diphenyl-1,4-phenylene oxide) andits SiO2nanocomposite membranes for gas separation. Industrial and Engineering Chemistry Research,46, 2567–2575.
Guan, R., Gong, C., Lu, D., Zou, H. & Lu, W. (2005) Development and characterization of homogeneousmembranes prepared from sulfonated poly(phenylene oxide). Journal of Applied Polymer Science, 98,1244–1250.
Kim, J.H. & Lee, Y.M. (2001) Gas permeation properties of poly(amide-6-b-ethylene oxide)-silica hybridmembranes. Journal of Membrane Science, 193, 209–225.
Mortazavi, S. (2004) Development of polyphenylene oxide and modified polyphenylene oxide membranes fordehydration of methane. PhD Thesis, University of Ottawa, Ottawa, ON, Canada.
O’Reilly, J.M. (1977) Conformational specific heat of polymers. Journal of Applied Physics, 48, 4043–4048.Shu, S. (2007). Engineering the performance of mixed matrix membranes for gas separation. PhD Thesis,
Georgia Institute of Technology, Atlanta, GA.Sridhar, S., Smitha, B., Ramakrishna, M. & Aminabhavi, T.M. (2006) Modified poly(phenylene oxide)
membranes for the separation of carbon dioxide from methane. Journal of Membrane Science, 280,202–209.
Story, B.J. & Koros, W.J. (1992) Sorption and transport of CO2 and CH4 in chemically modifiedpoly(phenylene oxide). Journal of Membrane Science, 67, 191–210.
Tran, A. & Kruczek, B. (2007) Development and characterization of homopolymers and copolymers fromthe family of polyphenylene oxides. Journal of Applied Polymer Science, 106, 2140–2148.
Yang, S., Gong, C., Guan, R., Zou, H. & Dai, H. (2006) Sulfonated poly(phenylene oxide) membranes aspromising materials for new proton exchange membranes. PolymersAdvancedTechnologies, 17, 360–365.
CHAPTER 17
Critical concentration of PEI in NMP as a criterion for thepreparation of asymmetric membranes for gas separation
Ahmad Arabi Shamsabadi, Masoud Bahrami Babaheidari & Kaveh Majdian
17.1 INTRODUCTION
Separation of gases is one of the essential processes for many industries such as refineries andpetrochemical complexes. There are primarily four conventional techniques for gas separationincluding absorption, adsorption, cryogenic distillation and membrane process. The membraneseparation process offers a number of advantages in terms of no phase change, no usage of sorbentmaterials, small footprint, low maintenance requirements, low cost, high process flexibility andhigh energy efficiency (Takht Ravanchi et al., 2009). Also membranes offer an attractive potentialtechnology to offset traditional bulky and often less environmentally friendly means of separation(Koros and Fleming, 1993). Gas separation by polymer membranes is a proven technology thathas found a wide range of industrial applications (Staudt-Bickel and Koros, 1999). Polymer mem-branes are widely used in separation processes as they have acceptable film forming capability,toughness, flexibility and low costs. They have gained an important place in chemical technologyand are applicable to various separation processes of many chemicals and gases (Seo et al., 2006).
In the olefin plant of Marun Petrochemical Company, hydrogen is used as a green fuel forcracking furnaces and hydrogenation process and in poly-olefins plants it is used to terminatepolymer reaction. Because of the inadequate purity of the methane to use as balance gas in theethylene oxide plant of Marun Petrochemical Co., the stream after turbo-expanders, containinghydrogen and methane, is sent to flare. Hydrogen recovery from this tail gas is an economicaland environmental policy of this company. It can help to recycle hydrogen as a valuable resourceand to purify methane for using, instead of using nitrogen to increase the loading of the ethyleneoxide plant by reducing the recycle gas compressor duty.
Commercially available polyetherimide (PEI) has several important advantages as a membranematerial. This polymer has good chemical and thermal stability. The studies on gas permeation inthe PEI dense film reveal that PEI exhibits impressively high selectivity for many important gaspairs. In 1987, Peinemann (1987) prepared PEI flat-sheet asymmetric membranes for CO2/CH4
and reported selectivity of about 30–40. Kneifel and Peinemann (1992) reported their results inpreparing porous and dense PEI hollow fiber membranes for gas separation and they obtainedselectivity of about 170 for He/N2 separation. Wang et al. (1998) reported the results of PEIhollow fiber membranes for separation of N2 from He, H2, CO2, CH4 and Ar. Kurdi and Tremblay(2003) prepared PEI/metal complex asymmetric hollow fiber membranes for O2/N2 separationand obtained selectivity of 2–7. Ren and Deng (2010) prepared polyetherimide membrane andinvestigated the influence of various non-solvents on membrane morphology.
Low concentration of the polymer solution results in a porous membrane, which is not suitablefor gas separation. Preparation of the polymer membranes with different concentrations is amethod for optimizing the effect of the polymer concentration but it is expensive and time-consuming. Chung and Kafchinskin (1997) reported that for each couple of polymer and solventthere is a concentration at which molecule chains have good linkage and therefore the viscositycan change quickly by the polymer concentration.
191
192 A.A. Shamsabadi, M.B. Babaheidari & K. Majdian
17.2 EXPERIMENTAL
17.2.1 Materials
Polyetherimide (PEI) was obtained from Sigma-Aldrich, USA, in pellet form. Ethanol, methanol,isopropanol, n-hexane and anhydrous 1-methyl-2-pyrrolidinone (EMPLURA®, 99.5%, water<0.1%) were supplied from Merck, Germany.
Demineralized water was supplied from Marun Petrochemical Company. Polydimethylsiloxane(PDMS and curing catalyst) was bought from Z-mark Co., Italy. The pure gases including CH4
(99.9%) and H2 (99.9%) were supplied from Technical gas services. These gases were used inpermeation measurement experiments.
17.2.2 Characterizations
Asymmetric membranes were prepared with 28 wt% PEI in NMP solvent by phase inversionmethod. The PDMS coating solution was prepared by dissolving the PDMS polymer resin andthe cross-linking agent with a weight ratio of 10:1 in n-hexane to obtain a homogeneous solution.A conventional set up was used for gas permeance measurement with highly accurate transmittersand a PLC. The Mettler Toledo digital density meter and a Koehler viscometer (Model HKV3000)were used for density and viscosity measurements.
17.3 RESULTS AND DISCUSSION
17.3.1 The influence of the polymer concentration on the solution density and viscosity
Density of the polymer solution is needed for the calculation of thermodynamics and transportproperties of the polymer solution. Results showed for PEI in NMP at a given temperature,the solution density increased linearly by increasing the polymer mass fraction. Also, as thetemperature increased, the density decreased linearly, as well. The viscosity of the polymersolution depends on concentration and size (i.e., molecular weight) of the dissolved polymer, usedsolvent and temperature. Viscosity techniques are very popular because they are experimentallysimple. By measuring viscosity, studying of the polymer solution properties is possible. Increasingof the polymer concentration can promote the solution viscosity where ln µ vs. X is linear whereµ is the dynamic viscosity of the polymer solution (cp) and X is polymer concentration [wt%]. Astemperature increases, the viscosity decreases. At higher temperatures, the molecular movementof the polymer is easier due to the following reasons:
• Decrease of the solvent viscosity at higher temperatures.• Decrease of the inter-chain liaisons.• Increase in the polymer solubility.
All these factors contribute to decrease the viscosity as the temperature increases.
17.3.2 Critical concentration determination
Above and below of the critical concentration, the entanglement of the macromolecular chainschanges dramatically. Figure 17.1 shows the effect of the polymer mass fraction on the solutionviscosity at 25◦C. It was found that the solution viscosity increased as the polymer concentrationof the solution was raised. As shown in Figure 17.1, the viscosity data showed a drastic slopechange in a range of the polymer concentration between 20 and 30 wt%. The intersection of thetangents at these two concentrations determines the critical concentration of about 24 wt%, wherea significant change in the degree of chain entanglement occurs (Chung and Kafchinskin, 1997).Therefore, the membranes which are cast from solutions with a polymer concentration higherthan 24 wt% have a high entangled conformation, tighter intermolecular chain displacement and
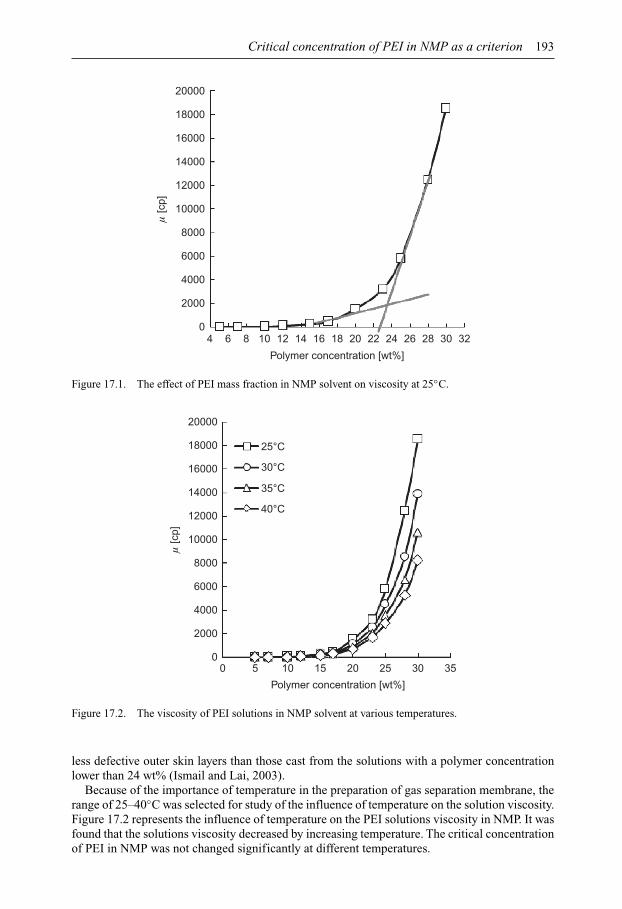
Critical concentration of PEI in NMP as a criterion 193
4 6 8 10 12 14 16 18
Polymer concentration [wt%]
µ [c
p]
20 22 24 26 28 30 320
2000
4000
6000
8000
10000
12000
14000
16000
18000
20000
Figure 17.1. The effect of PEI mass fraction in NMP solvent on viscosity at 25◦C.
Polymer concentration [wt%]
µ [c
p]
25°C
30°C
35°C
40°C
0 5 10 15 20 25 30 350
2000
4000
6000
8000
10000
12000
14000
16000
18000
20000
Figure 17.2. The viscosity of PEI solutions in NMP solvent at various temperatures.
less defective outer skin layers than those cast from the solutions with a polymer concentrationlower than 24 wt% (Ismail and Lai, 2003).
Because of the importance of temperature in the preparation of gas separation membrane, therange of 25–40◦C was selected for study of the influence of temperature on the solution viscosity.Figure 17.2 represents the influence of temperature on the PEI solutions viscosity in NMP. It wasfound that the solutions viscosity decreased by increasing temperature. The critical concentrationof PEI in NMP was not changed significantly at different temperatures.
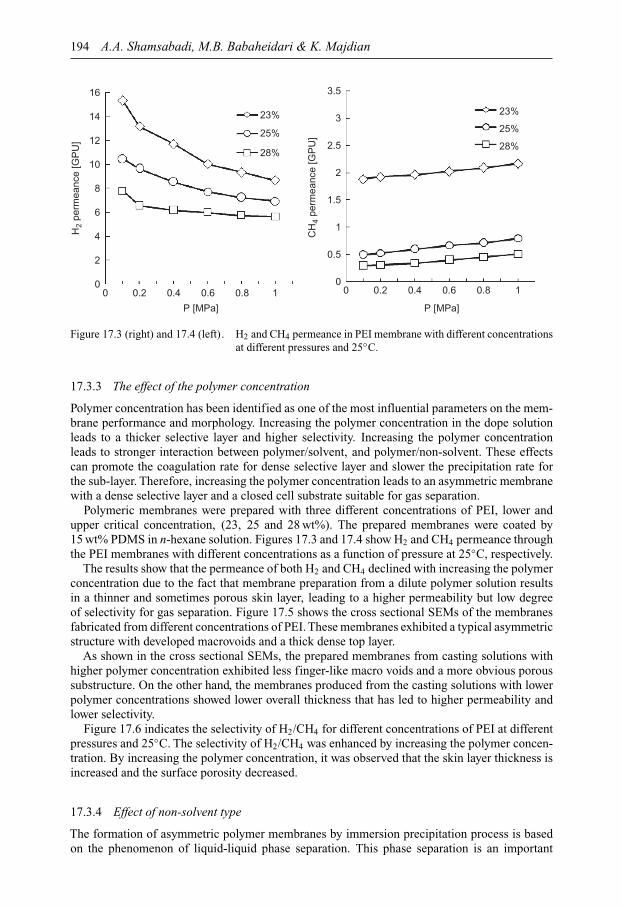
194 A.A. Shamsabadi, M.B. Babaheidari & K. Majdian
0 0.2 0.4 0.6 0.8 1
P [MPa]
23%
25%
28%
H2
perm
eanc
e [G
PU
]
0
2
4
6
8
10
12
14
16
0 0.2 0.4 0.6 0.8 1
P [MPa]
23%
25%
28%
CH
4 pe
rmea
nce
[GP
U]
0
0.5
1
1.5
2
2.5
3
3.5
Figure 17.3 (right) and 17.4 (left). H2 and CH4 permeance in PEI membrane with different concentrationsat different pressures and 25◦C.
17.3.3 The effect of the polymer concentration
Polymer concentration has been identified as one of the most influential parameters on the mem-brane performance and morphology. Increasing the polymer concentration in the dope solutionleads to a thicker selective layer and higher selectivity. Increasing the polymer concentrationleads to stronger interaction between polymer/solvent, and polymer/non-solvent. These effectscan promote the coagulation rate for dense selective layer and slower the precipitation rate forthe sub-layer. Therefore, increasing the polymer concentration leads to an asymmetric membranewith a dense selective layer and a closed cell substrate suitable for gas separation.
Polymeric membranes were prepared with three different concentrations of PEI, lower andupper critical concentration, (23, 25 and 28 wt%). The prepared membranes were coated by15 wt% PDMS in n-hexane solution. Figures 17.3 and 17.4 show H2 and CH4 permeance throughthe PEI membranes with different concentrations as a function of pressure at 25◦C, respectively.
The results show that the permeance of both H2 and CH4 declined with increasing the polymerconcentration due to the fact that membrane preparation from a dilute polymer solution resultsin a thinner and sometimes porous skin layer, leading to a higher permeability but low degreeof selectivity for gas separation. Figure 17.5 shows the cross sectional SEMs of the membranesfabricated from different concentrations of PEI. These membranes exhibited a typical asymmetricstructure with developed macrovoids and a thick dense top layer.
As shown in the cross sectional SEMs, the prepared membranes from casting solutions withhigher polymer concentration exhibited less finger-like macro voids and a more obvious poroussubstructure. On the other hand, the membranes produced from the casting solutions with lowerpolymer concentrations showed lower overall thickness that has led to higher permeability andlower selectivity.
Figure 17.6 indicates the selectivity of H2/CH4 for different concentrations of PEI at differentpressures and 25◦C. The selectivity of H2/CH4 was enhanced by increasing the polymer concen-tration. By increasing the polymer concentration, it was observed that the skin layer thickness isincreased and the surface porosity decreased.
17.3.4 Effect of non-solvent type
The formation of asymmetric polymer membranes by immersion precipitation process is basedon the phenomenon of liquid-liquid phase separation. This phase separation is an important
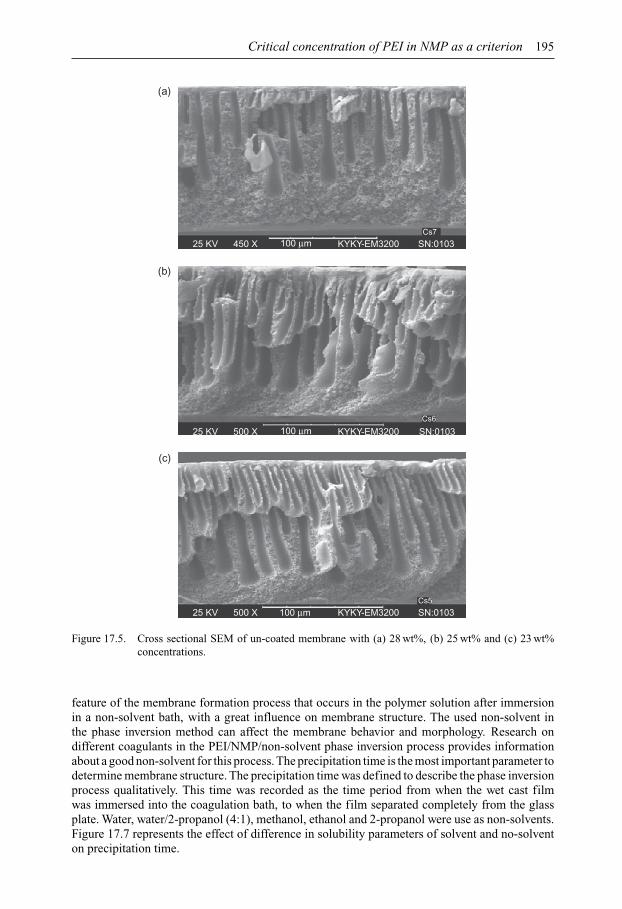
Critical concentration of PEI in NMP as a criterion 195
(a)
(b)
(c)
25 KV 450 X KYKY-EM3200 SN:0103Cs7
100 µm
25 KV 500 X KYKY-EM3200 SN:0103Cs6
100 µm
25 KV 500 X KYKY-EM3200 SN:0103Cs5
100 µm
Figure 17.5. Cross sectional SEM of un-coated membrane with (a) 28 wt%, (b) 25 wt% and (c) 23 wt%concentrations.
feature of the membrane formation process that occurs in the polymer solution after immersionin a non-solvent bath, with a great influence on membrane structure. The used non-solvent inthe phase inversion method can affect the membrane behavior and morphology. Research ondifferent coagulants in the PEI/NMP/non-solvent phase inversion process provides informationabout a good non-solvent for this process. The precipitation time is the most important parameter todetermine membrane structure. The precipitation time was defined to describe the phase inversionprocess qualitatively. This time was recorded as the time period from when the wet cast filmwas immersed into the coagulation bath, to when the film separated completely from the glassplate. Water, water/2-propanol (4:1), methanol, ethanol and 2-propanol were use as non-solvents.Figure 17.7 represents the effect of difference in solubility parameters of solvent and no-solventon precipitation time.
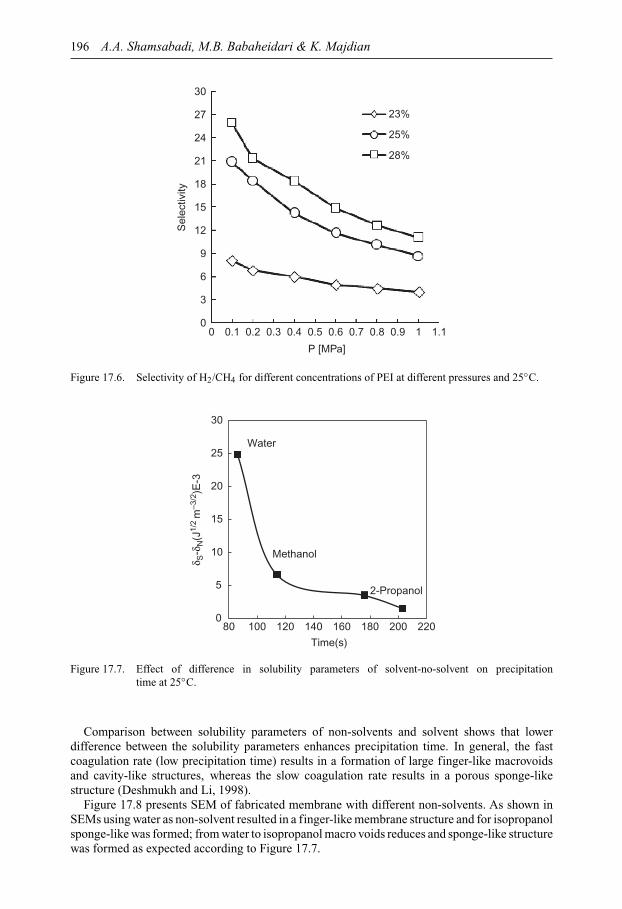
196 A.A. Shamsabadi, M.B. Babaheidari & K. Majdian
P [MPa]
23%
25%
28%
Sel
ectiv
ity
0 0.1 0.2 0.3 0.4 0.5 0.6 0.7 0.8 0.9 1 1.10
3
6
9
12
15
18
21
24
27
30
Figure 17.6. Selectivity of H2/CH4 for different concentrations of PEI at different pressures and 25◦C.
0
5
10
15
20
25
30
80 100 120 140 160 180 200 220
δ S-δ
N(J
1/2
m–3
/2)E
-3
Time(s)
Water
Methanol
2-Propanol
Figure 17.7. Effect of difference in solubility parameters of solvent-no-solvent on precipitationtime at 25◦C.
Comparison between solubility parameters of non-solvents and solvent shows that lowerdifference between the solubility parameters enhances precipitation time. In general, the fastcoagulation rate (low precipitation time) results in a formation of large finger-like macrovoidsand cavity-like structures, whereas the slow coagulation rate results in a porous sponge-likestructure (Deshmukh and Li, 1998).
Figure 17.8 presents SEM of fabricated membrane with different non-solvents. As shown inSEMs using water as non-solvent resulted in a finger-like membrane structure and for isopropanolsponge-like was formed; from water to isopropanol macro voids reduces and sponge-like structurewas formed as expected according to Figure 17.7.
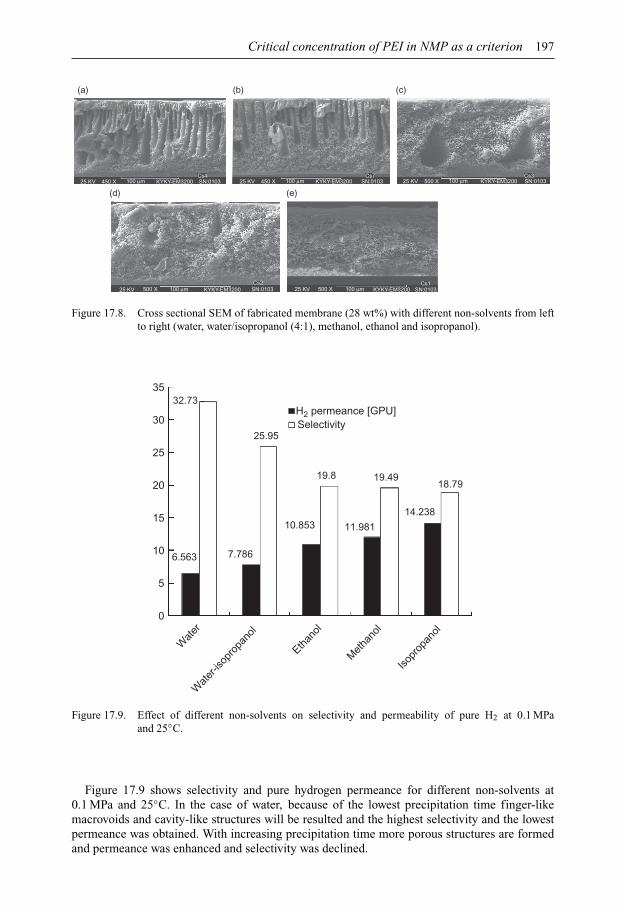
Critical concentration of PEI in NMP as a criterion 197
(a) (b)
(d) (e)
(c)
25 KV 450 X 100 µm KYKY-EM3200 SN:0103 25 KV 450 X 100 µm KYKY-EM3200 SN:0103 25 KV 500 X 100 µm KYKY-EM3200 SN:0103
25 KV 500 X 100 µm KYKY-EM3200 SN:0103 25 KV 500 X 100 µm KYKY-EM3200 SN:0103
Cs4
Cs2 Cs1
Cs3Cs7
Figure 17.8. Cross sectional SEM of fabricated membrane (28 wt%) with different non-solvents from leftto right (water, water/isopropanol (4:1), methanol, ethanol and isopropanol).
0
Wat
erW
ater
-isop
ropa
nol
Ethan
ol
Met
hano
l
Isopr
opan
ol
5
10
15
20
25
30
3532.73
25.95
10.853 11.981
19.8
H2 permeance [GPU]Selectivity
19.4918.79
14.238
7.7866.563
Figure 17.9. Effect of different non-solvents on selectivity and permeability of pure H2 at 0.1 MPaand 25◦C.
Figure 17.9 shows selectivity and pure hydrogen permeance for different non-solvents at0.1 MPa and 25◦C. In the case of water, because of the lowest precipitation time finger-likemacrovoids and cavity-like structures will be resulted and the highest selectivity and the lowestpermeance was obtained. With increasing precipitation time more porous structures are formedand permeance was enhanced and selectivity was declined.
198 A.A. Shamsabadi, M.B. Babaheidari & K. Majdian
17.4 CONCLUSION
Critical concentration of the PEI solutions in NMP solvent was determined by viscometric methodas 24 wt%. The influence of temperature on critical concentration was investigated and no signif-icant effect was observed. The study of the polymer mass fraction and temperature effects on theviscosity and density of the PEI solution in NMP showed that as the temperature increased, boththe viscosity and density decreased. In addition, by increasing the polymer mass fraction the vis-cosity and density of the polymer solution were enhanced. Finally, three asymmetric PDMS/PEImembranes with different concentrations of PEI were prepared and characterized for H2/CH4
separation. The results showed that the selectivity increased for the polymer concentrations inthe dope solution higher than the critical concentration which led to a thick selective layer thatresulted in preparation of more suitable membranes for gas separation. The use of water as non-solvent resulted in denser membrane due to its lower precipitation time (higher difference betweensolubility parameter of solvent and non-solvent). Using isopropanol resulted in membranes withsponge-like structure.
ACKNOWLEDGEMENT
We are grateful for the financial support provided by Marun Petrochemical Company andPetroleum University of Technology. The authors thank Dr. Ali Kargari for his assistance duringthis research.
REFERENCES
Chung, T.S. & Kafchinskin, E.R. (1997) The effects of spinning conditions on asymmetric 6FDA/6FDAMpolyimide hollow fibers for air separation. Journal of Applied Polymer Science, 65, 1555–1569.
Deshmukh, S.P. & Li, K. (1998) Effect of ethanol composition in water coagulation bath on morphology ofPVDF hollow fiber membranes. Journal of Membrane Science, 150, 75–85.
Ismail, A.F. & Lai, P.U. (2003) Effects of phase inversion and rheological factors on formation of defect-freeand ultrathin-skinned asymmetric polysulfone membranes for gas separation. Separation and PurificationTechnology, 33, 127–143.
Kneifel, K. & Peinemann, K.V. (1992) Preparation of hollow fiber membranes from polyetherimide for gasseparation. Journal of Membrane Science, 65, 295–307.
Koros, W.J. & Fleming, G.K. (1993) Membrane-based gas separation. Journal of Membrane Science, 83,1–80.
Kurdi, J. & Tremblay, A.Y. (2003) Improvement in polyetherimide gas separation membranes through theincorporation of nanostructured metal complexes. Polymer, 44, 4533–4540.
Peinemann, K.V. (1987) Method for producing an integral asymmetric membrane and the resultant membrane.US Patent 4,673,418.
Ren, J.Z. & Deng, M. (2010) Morphology transition of asymmetric polyetherimide flat sheet membraneswith different thickness by wet phase-inversion process. Separation and Purification Technology, 74,119–129.
Seo, Y., Kim, S. & Hong, S.U. (2006) Highly selective polymeric membranes for gas separation. Polymer,47, 4501–4504.
Staudt-Bickel, C. & Koros, W.J. (1999) Improvement of CO2/CH4 separation characteristics of polyimidesby chemical crosslinking. Journal of Membrane Science, 155, 145–154.
Takht Ravanchi, M., Kaghazchi, T. & Kargari, A. (2009) Application of membrane separation processes inpetrochemical industry: a review. Desalination, 235, 199–244.
Wang, D., Li, K. & Teo, W.K. (1998) Preparation and characterization of polyetherimide asymmetric hollowfiber membranes for gas separation. Journal of Membrane Science, 138, 193–201.

CHAPTER 18
Powder preparation effect on oxygen permeation flux of hollow fiberLSCF6428 ceramic perovskite membrane
Haikal Mustafa, Ammar Mohd Akhir, Sharifah Aishah Syed Abdul Kadir,Ahmad Fauzi Ismail, Pei Sean Goh, Be Cheer Ng & Mohd Sohaimi Abdullah
18.1 INTRODUCTION
Separation of oxygen from air for industrial applications is a growing operation that producesnearly 100 million tons of oxygen each year. The demand for oxygen will tremendously increasein the near future because virtually all large-scale clean energy technologies will require oxygen asone of the operation feeds (Emsley, 2001). The current industrial standard process to produce pureoxygen from air is using cryogenic distillation or pressure swing adsorption (PSA). The cryogenicdistillation process is known to be complex, expensive and energy intensive. The latter practice,PSA involves the separation of air at ambient temperature using molecular sieve adsorbents to trapnitrogen in order to produce oxygen with purities of 90 to 95%. The inability to achieve higheroxygen purity has reduced the probability of PSA to be used in future clean energy endeavors(Hashim et al., 2011). It is obvious that both methods have their disadvantages.
Based on the finding of Teraoka et al. (1985) oxygen separation from air through perovskitedense ceramic membrane La1−xSrxCo1−yFeyO3−δ showed potential to become an alternativemethod to produce pure O2. Perovskite-type membrane with a structure of ABO3 contains tran-sition metals at the B site that show high electrical conductivity. The partial substitution ofA site cations by other metal cations with lower valencies resulted in the formation of oxygenvacancies and appearance of ionic conduction. This oxygen sorptive property coupled with theelectronic conductive properties as discussed earlier has suggested the possibility of using thedefect perovskite-type oxides as an oxygen permeating membrane which can work without anyneed of electrodes and external electric circuit (Teraoka et al., 1985).
Previous research (Luyten et al., 2000; Tan et al., 2008a; Teraoka et al., 1988; Xu andThomson,1998) also indicated that perovskite dense membranes can provide a reliable and efficient optionto produce pure oxygen.
In order to achieve high oxygen flux through the perovskite dense membrane, several factorsmust be taken into consideration. Firstly, the powder synthesis routes in which the route cho-sen must be able to produce powder with a single phase perovskite structure, maintain correctstoichiometry and exhibit high surface area (Richardson et al., 2003). Secondly, the membraneconfiguration should also exhibit the least oxygen permeation resistance and has appreciablestructural strength under different air flow rate and pressure (Tablet et al., 2005). Lastly, it isimperative that the perovskite chemical composition selected is able to show good chemical sta-bility under a reducing environment and at elevated temperature (Xu and Thomson, 1998). Inthis research, by using laboratory prepared and commercially procured LSCF6428 powders, 2types of hollow fiber membranes were fabricated, characterized and evaluated. The purpose ofthis investigation is to study the relationship between the LSCF6428 powder preparation methodand the oxygen permeation flux of the fabricated hollow fiber membranes.
LSCF6428 powders prepared through 3 methods; solid state reaction, reactive grinding andco-precipitation were used for comparison due to their ability in producing powders that meet thecriteria of single phase perovskite structure, achieving the desired stoichiometry compound and
199

200 H. Mustafa et al.
exhibiting relatively high average surface area value around 5 m2 g−1 (Richardson et al., 2003;Xu and Thomson, 1999; Zawadzki et al., 2011). Furthermore, these 3 methods of preparing theperovskite powder with desired product properties have been well established and the proceduresinvolved are well documented. However, in this study, when compared to commercially procuredLSCF6428 powder, the laboratory prepared powder was certainly less inferior by having a loweraverage surface area value than the commercially procured powder.
Membrane was fabricated in hollow fiber configuration due to several reasons. In mostprevious studies, disc-shaped membranes with only limited membrane area (<5 cm2) wereusually used because they can be easily fabricated using conventional static-pressing meth-ods (Yaremchenko et al., 1999; Zeng et al., 1998). Although a multiple planar stack can beadopted to enlarge the membrane area to a plant scale, many problems such as high temper-ature sealing, connection, and pressure resistance have to be faced (Li et al., 1999). Tubularperovskite membranes were developed to reduce the engineering difficulties, especially the prob-lem associated with high-temperature sealing (Steele, 1996; Zeng et al., 1998). Their maindisadvantages are small surface area/volume ratio and the high membrane thickness, whichwould in turn lead to low oxygen permeation fluxes, and these problems make them unfavor-able in practical applications. On the other hand, hollow-fiber ceramic membranes with anasymmetric structure possess much larger membrane area per unit volume for oxygen perme-ation activities. By adopting long hollow fibers and keeping the two sealing ends away from thehigh-temperature zone, the problem of high-temperature sealing no longer exists. Furthermore,because of the asymmetric structure, the membrane’s resistance to oxygen permeation is substan-tially reduced compared to that of symmetric membranes prepared by conventional methods. Inaddition, the integrated porous layers on either side or both sides of the membrane also providemuch larger gas-membrane interfaces for oxygen-exchange reactions, leading to an enhance-ment of surface oxygen-exchange kinetics and thus to an improved oxygen permeation flux(Tan et al., 2004).
LSCF6428 composition was selected for this research due to its abilities that exhibit chemi-cal stability at reducing environment and elevated temperature. A research by Xu and Thomson(1998) found that LSCF6428 composition showed no phase changes when the LSCF powderwas heated at 850◦C in helium or argon for 8 h or nitrogen for 12 h. The partial substitu-tion of the A site (La3+) with Sr2+ in LSCF can maintain its chemical stability in inert gasat 850◦C. It was also reported that the membrane is able to retain its mechanical and chem-ical stability in air at operating temperatures up to 960◦C. In another research conducted byTan et al. (2010), the extended period stability experiments have recorded excellent stability ofLSCF6428 membranes system which was operated for more than 1167 h at around 960◦C to pro-duce 99.4% purity of oxygen concentration. Obviously, LSCF6428 composition has advantagesto be operated in a reducing environment, high temperature conditions and for a prolonged periodof operation.
18.2 EXPERIMENTAL
18.2.1 LSCF6428 powders
The commercially prepared LSCF6428 powder was purchased from InframatAdvanced Materials,United States of America. In order to acquire laboratory prepared LSCF6428 powder using thesolid state reaction method, stoichiometric amounts of La2O3, Fe2O3, Co2O3, SrCO3 powderswere mixed and milled with water using a planetary ball miller at 300 rpm for duration of 24 h.The mixture was then dried in an oven for 24 h at 80◦C. Finally the sample was calcined in afurnace at 900◦C for 5 h. The reactive grinding route involved milling a stoichiometric mixtureof La2O3, SrCO3, Co2O3 and Fe2O3 powders with ethanol using a ball mill for period of 48 h.The powders were then calcined for 5 h at 900◦C. The last method, the co-precipitation method,involved dissolving a stoichiometric mixture of La(NO3)3·6H2O, Sr(NO3)2, Fe(NO3)3·9H2O and

Powder preparation effect on oxygen permeation flux 201
Co(NO3)3·9H2O in deionized water (0.2 M solution). An equal volume of precipitant solution wasprepared of higher molarity, ensuring the precipitating ion was in excess throughout the experimentsuch as 5 M potassium hydroxide (KOH). Whilst stirring the precipitant solution vigorously, theindividual nitrate solution was gradually added. The resulting slurries were vacuum filtered priorto being washed with deionized water and dried in an oven at 110◦C for 24 h. A mortar andpestle were used to mix together the dried powders. Samples of the powders were characterized todetermine their properties using X-ray diffraction (XRD) analysis, scanning electron microscopic(SEM) imaging and Brunauer, Emmett, Teller (BET) analysis. These values were then comparedto the commercial purchased powders properties, and only one of the laboratory powders thathad the best values was chosen to proceed with the membrane fabrication stage along with thepurchased powder.
18.2.2 Hollow fiber membranes
Previous research work by Tan et al. (2004) was used as reference for the fabrication process. Inthis process, polyethersulfone (PESf) was used as the polymer solution, poly(vinylpyrrolidone)(PVP) as the plasticizer, N -methyl-2-pyrrolidone as the binder. Firstly, a calculated quantity ofPESf with PVP additive was dissolved in the weighed NMP solvent in a 250 mL (wide-neckbottle). The weighed amount of LSCF6428 powder was then added gradually under stirringat around 300 rpm to ensure the uniform dispersion of the powder in the polymer solution. Thestirring was carried out continuously for 48 h before the spinning process. After degassing at roomtemperature for 30 min, the starting solution was then transferred to a stainless steel reservoir andpressurized to 0.10 MPa using nitrogen. A spinneret with an orifice diameter and inner diameterof 2.0 and 1.0 mm, respectively, was used to obtain the hollow fiber precursors. Distilled waterand tap water were used as the internal and external coagulants, respectively. The formed hollowfiber precursors were immersed in a water bath for more than 24 h to complete the solidificationprocess. Finally, the resulting hollow fiber precursors were heated in a furnace at 600◦C for 2 hto remove the organic polymer binder and were then sintered at high temperatures 1300◦C for4 h to allow the fusion and bonding to occur. Through these procedures, two types of hollowfiber membranes were fabricated, i.e. C-LSCF (commercial powder) and L-LSCF (laboratorypowder). The membranes were then characterized through XRD analysis, SEM imaging and3 point bending test.
18.2.3 Oxygen permeation experiments
The experiments were also conducted based on previous work that was reported by Tan et al.(2004; 2005) as point of reference. In order to proceed with oxygen permeation testing, the hol-low fiber membrane module was first prepared by using two types of quartz tube of differentlengths. A ceramic cement paste, Sauereisen Aluseal Adhesive Cement No. 2 purchased fromEllsworth Adhesives, Malaysia was used for the sealing purpose of the module. The exposurelength of the hollow fiber membranes used for the experiment was set at 2 cm due to its lowmechanical strength and brittleness characteristic which inhibits longer exposure length. Afterthe membrane module was set up, it was left to cure for 24 h at room temperature. The finalstage of the rig set up involved the connection of all the gas tubes to the membrane module.Two sets of module that consist of each C-LSCF and L-LSCF membrane, respectively, wereconstructed for the oxygen permeation experiments. In the experiments, both modules weresubjected to 3 different temperatures (800, 850 and 900◦C). In order to achieve proper pres-sure drive, the feed oxygen gas was set at 0.11 MPa and nitrogen gas was set at 0.10 MPa,respectively. When the furnace reached the desired temperature, these gases were released fora period of time to attain a stable condition. Afterward, the sample gas at the module outletwas collected using a sample bag and oxygen concentration was tested using gas chromatogra-phy equipment. The oxygen permeation flux was then calculated using the established formulas.(Tan and Li, 2002).
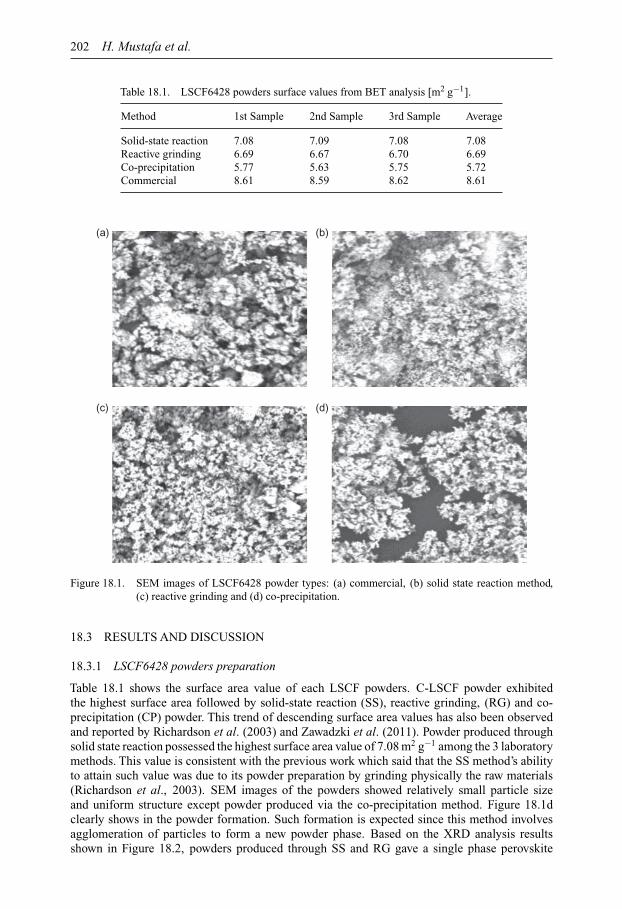
202 H. Mustafa et al.
Table 18.1. LSCF6428 powders surface values from BET analysis [m2 g−1].
Method 1st Sample 2nd Sample 3rd Sample Average
Solid-state reaction 7.08 7.09 7.08 7.08Reactive grinding 6.69 6.67 6.70 6.69Co-precipitation 5.77 5.63 5.75 5.72Commercial 8.61 8.59 8.62 8.61
(a)
(c)
(b)
(d)
Figure 18.1. SEM images of LSCF6428 powder types: (a) commercial, (b) solid state reaction method,(c) reactive grinding and (d) co-precipitation.
18.3 RESULTS AND DISCUSSION
18.3.1 LSCF6428 powders preparation
Table 18.1 shows the surface area value of each LSCF powders. C-LSCF powder exhibitedthe highest surface area followed by solid-state reaction (SS), reactive grinding, (RG) and co-precipitation (CP) powder. This trend of descending surface area values has also been observedand reported by Richardson et al. (2003) and Zawadzki et al. (2011). Powder produced throughsolid state reaction possessed the highest surface area value of 7.08 m2 g−1 among the 3 laboratorymethods. This value is consistent with the previous work which said that the SS method’s abilityto attain such value was due to its powder preparation by grinding physically the raw materials(Richardson et al., 2003). SEM images of the powders showed relatively small particle sizeand uniform structure except powder produced via the co-precipitation method. Figure 18.1dclearly shows in the powder formation. Such formation is expected since this method involvesagglomeration of particles to form a new powder phase. Based on the XRD analysis resultsshown in Figure 18.2, powders produced through SS and RG gave a single phase perovskite

Powder preparation effect on oxygen permeation flux 203
0 10 20
(a)In
tens
ityIn
tens
ityIn
tens
ity
(b)
(c)
30 40 50 60 70 80
SSC-LSCF
90
0 10 20 30 40 50 60 70 80 90
0 10 20 30 40 50 60 70 80 90
2θ [°]
2θ [°]
2θ [°]
RGC-LSCF
CPC-LSCF
Figure 18.2. XRD analysis pattern comparisons between (a) solid-state reaction (SS) (top), (b) reactivegrinding (RG) (top) and (c) co-precipitation (CP) (top) and C-LSCF powder (bottom).
pattern while the powder fabricated via the CP route showed some impurities building up. Asreported by Taheri et al. (2010), the occurrence of impurities in the co-precipitation producedpowder may be due to the loss of strontium hydroxide during washing of the co-precipitated gel.From the preparation process aspect, even though reactive grinding applied the same principle assolid state reaction which is physical compounding, it required a longer period of milling, makingit an unfavorable method to produce large quantity LSCF6428 powder. Also the usage of ethanol

204 H. Mustafa et al.
3000
2500
2000
1500
1000
500
00 10 20 30 40
2θ [°]
Inte
nsity
3000
2500
2000
1500
1000
500
0
Inte
nsity
50 60 70 80 0 10 20 30 402θ [°]
50 60 70 80
Figure 18.3. XRD analysis pattern of (a) laboratory prepared and (b) commercially procured betweenLSCF6428 powder (bottom) and LSCF6428 membrane (top).
(a)
340 µm 350xSSS687 µm 310 µm 624 µm SSD
385x
(b)
Figure 18.4. SEM images of the fabricated LSCF6428 membrane: (a) L-LSCF and (b) C-LSCF.
in its procedure posed some safety issues such as combustion during the milling process. Powderproduced through co-precipitation showed impurities building up in its composition, non-uniformpowder particle size and relatively low surface area value. In addition, co-precipitation methodinvolved numerous steps in its process. Therefore, this method has been identified as a poorchoice to produce a high volume of LSCF6428 powder, given that the powder prepared throughsolid state reaction has achieved the desired requirements; single phase perovskite structure,small and uniform particle size and high surface area value. Its straight forward approach thatonly involves a few parameters makes this method a suitable alternative technique to produceperovskite LSCF6428 in large quantity. Therefore, it was chosen to proceed in the membranefabrication process.
18.3.2 Hollow fiber membranes fabrication
The results of XRD analysis and SEM imaging are shown in Figures 18.3 and 18.4, respectively.From XRD analysis results, it was found that the membrane maintained its single phase perovskitestructure albeit with increased intensity as compared to its powder due to enlargement of thecrystal in the membrane resulting from the sintering process at high temperature. From the SEMimages, both membranes exhibited fingerlike structures that formed near both the inner and
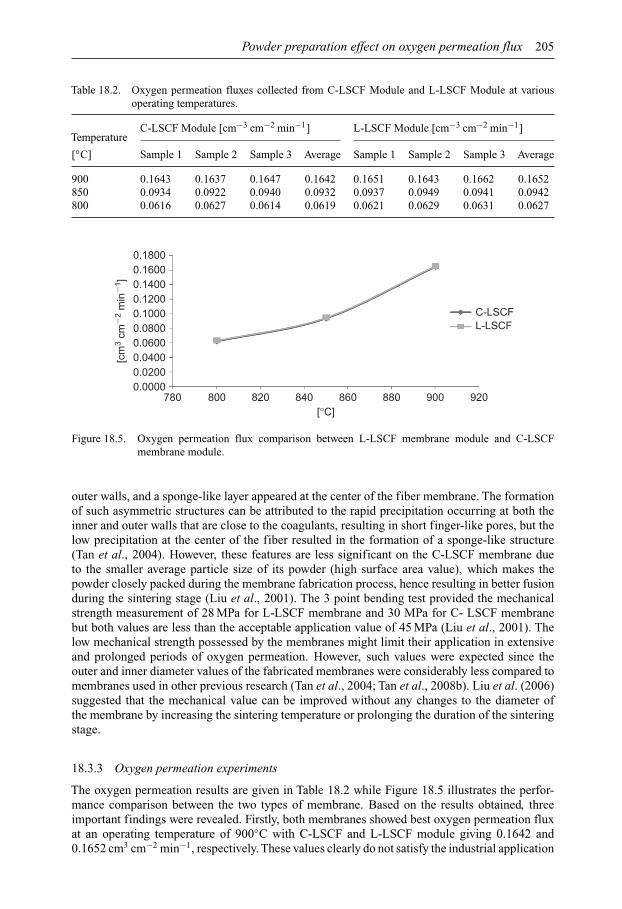
Powder preparation effect on oxygen permeation flux 205
Table 18.2. Oxygen permeation fluxes collected from C-LSCF Module and L-LSCF Module at variousoperating temperatures.
C-LSCF Module [cm−3 cm−2 min−1] L-LSCF Module [cm−3 cm−2 min−1]Temperature
[◦C] Sample 1 Sample 2 Sample 3 Average Sample 1 Sample 2 Sample 3 Average
900 0.1643 0.1637 0.1647 0.1642 0.1651 0.1643 0.1662 0.1652850 0.0934 0.0922 0.0940 0.0932 0.0937 0.0949 0.0941 0.0942800 0.0616 0.0627 0.0614 0.0619 0.0621 0.0629 0.0631 0.0627
0.18000.16000.14000.12000.10000.08000.06000.04000.02000.0000
780 800 820 840[°C]
[cm
3 cm
�2
min
�1 ]
860 880 900 920
C-LSCFL-LSCF
Figure 18.5. Oxygen permeation flux comparison between L-LSCF membrane module and C-LSCFmembrane module.
outer walls, and a sponge-like layer appeared at the center of the fiber membrane. The formationof such asymmetric structures can be attributed to the rapid precipitation occurring at both theinner and outer walls that are close to the coagulants, resulting in short finger-like pores, but thelow precipitation at the center of the fiber resulted in the formation of a sponge-like structure(Tan et al., 2004). However, these features are less significant on the C-LSCF membrane dueto the smaller average particle size of its powder (high surface area value), which makes thepowder closely packed during the membrane fabrication process, hence resulting in better fusionduring the sintering stage (Liu et al., 2001). The 3 point bending test provided the mechanicalstrength measurement of 28 MPa for L-LSCF membrane and 30 MPa for C- LSCF membranebut both values are less than the acceptable application value of 45 MPa (Liu et al., 2001). Thelow mechanical strength possessed by the membranes might limit their application in extensiveand prolonged periods of oxygen permeation. However, such values were expected since theouter and inner diameter values of the fabricated membranes were considerably less compared tomembranes used in other previous research (Tan et al., 2004; Tan et al., 2008b). Liu et al. (2006)suggested that the mechanical value can be improved without any changes to the diameter ofthe membrane by increasing the sintering temperature or prolonging the duration of the sinteringstage.
18.3.3 Oxygen permeation experiments
The oxygen permeation results are given in Table 18.2 while Figure 18.5 illustrates the perfor-mance comparison between the two types of membrane. Based on the results obtained, threeimportant findings were revealed. Firstly, both membranes showed best oxygen permeation fluxat an operating temperature of 900◦C with C-LSCF and L-LSCF module giving 0.1642 and0.1652 cm3 cm−2 min−1, respectively. These values clearly do not satisfy the industrial application
206 H. Mustafa et al.
requirement for oxygen production of 3.5 cm3 cm−2 min−1 (Steele, 1996). Furthermore, the val-ues were far below 0.7343 cm3 cm−2 min−1, which has been previously reported by Tan et al.(2004). It is worth mentioning that, the experiment methodologies of the current research werereferred to that reported by Tan et al. Such low values were attributed to the application of shorterlength hollow fiber membrane in this research. Secondly, the oxygen permeation fluxes exhibitedby both membranes were similar at all 3 temperature settings. Based on previous studies (Liet al., 1999; Zeng et al., 1998), the assumption was made that, by using LSCF powders withhigher surface area value, the membrane module of C-LSCF should provide a higher value ofoxygen permeation flux than the L-LSCF module. However, in those studies, the powder surfacearea values were related to its ability to be compacted into a disk-shaped membrane. One of themain problems encountered in disk membrane application is that the membrane should be asthin as possible to reduce the oxygen permeation resistance without compromising its mechan-ical properties, since mechanical strength is essential for prolonged usage. Higher surface areavalue, which powders of smaller particle size exhibit, allows the powder to be fabricated intothin and dense disk shaped membrane. It seems that the type of membrane configuration chosenfor this research; which is hollow fiber design has played a more significant role in determiningthe value of oxygen permeation flux through the membrane. As shown by previous studies byTablet et al. (2005) and Liu and Gavalas (2005), which had made direct comparison betweendisk-shaped membrane and hollow fiber membrane in terms of oxygen permeation, it has beenclearly affirmed that the hollow fiber membrane configuration demonstrated considerably higherflux value, due to its asymmetric structure which provides less resistance towards the oxygen per-meation and also exhibits larger membrane area per unit volume for oxygen interaction with themembrane surface. Lastly, the values calculated also showed significant increment with higheroperation temperature value. This trend has been explained by previous research studies (Tan andLi, 2002; Tan et al., 2004) which proposed that operating temperature is one of the major factorsin determining the oxygen permeation flux due to the order-disorder transition of oxygen vacancy.The oxygen vacancies tend to disorder at elevated temperatures, maximizing their configurationalentropy, thus becoming highly mobile, which favors greater oxygen permeation flux through themembrane (Kruidhof et al., 1993).
Based on the experiments conducted and results collected, there is no significant informationthat suggested that different types of powder preparation method will affect oxygen permeationflux of the resultant hollow fiber membrane. Nevertheless, as suggested by the previous researchof Richardson et al. (2003), the method chosen must have the ability to create LSCF powder withthe desired stoichiometric composition, small size and uniform powder particle, and relativelyhigh surface area value. These characteristics are required to ensure the successful fabrication ofgas tight hollow fiber membrane. A single phase perovskite structure is required to allow the per-meation of oxygen ions through the membrane. Application of small and uniform powder particlesize will result in greater dispersion of the particle powder in polymer and solvent during the dopepreparation stage in the hollow fiber fabrication process. By having a well mixed dope solution,it will ensure that the solution will react properly with the internal and external coagulant duringthe spinning process to produce the asymmetric structure in the finished hollow fiber (Tan et al.,2004). In terms of the difference in surface area, as evidenced from the SEM images and 3 pointbending results from this research, a higher average surface area and smaller particle size haveresulted in close packing of the powder during the sintering process, followed by improved fusionof the membrane throughout the sintering process. This behavior leads to enhanced mechanicalproperties of the membrane, hence resulting in improved structural strength.
18.4 CONCLUSION
Both membrane modules, L-LSCF and C-LSCF exhibited similar oxygen permeation flux at eachoperating temperature setting. This indicates that hollow fiber membrane derived from LSCF6428powder that was prepared through the solid state reaction method showed the same oxygen
Powder preparation effect on oxygen permeation flux 207
permeation flux as hollow fiber membrane derived from commercially procured LSCF6428 pow-der. Given that the powder derived from solid state reaction has a lower surface area value thanits counterpart, it was hypothetically assumed that the latter would provide better oxygen perme-ation results. However, this correlation was only applicable to oxygen permeation experiments thatinvolved disk shape membrane design. In conclusion, based from the results obtained, the powderpreparation method does not directly affect the oxygen permeation flux of hollow fiber mem-brane. However, it does affect the fabricated membrane properties such as its structural strength.Due to its asymmetric structure that provides the least oxygen permeation resistance and whichoffers a large surface area for oxygen ion interaction, the membrane configuration of hollow fiberdesign seems to be a more important factor in influencing the oxygen permeation flux.
ACKNOWLEDGEMENT
We are grateful for the research facilities provided by Advanced Membrane Research Tech-nology Centre of Universiti Teknologi Malaysia and the research funding received through theFundamental Research Grant Scheme given by the Malaysian Ministry of Higher Education.
REFERENCES
Emsley, J. (2001) Nature’s building blocks: an A-Z guide to the elements. Oxford University Press,Oxford, UK.
Hashim, S.S., Mohamed, A.R. & Bhatia, S. (2011) Oxygen separation from air using ceramic-based mem-brane technology for sustainable fuel production and power generation. Renewable and Sustainable EnergyReviews, 15, 1284–1293.
Kruidhof, H., Bouwmeester, H.J.M., v. Doorn, R.H.E. & Burggraaf, A.J. (1993) Influence of order-disordertransitions on oxygen permeability through selected nonstoichiometric perovskite-type oxides. Solid StateIonics, 63–65, 816–822.
Li, S., Jin, W., Xu, N. & Shi, J. (1999) Synthesis and oxygen permeation properties ofLa0.2Sr0.8Co0.2Fe0.8O3−δ membranes. Solid State Ionics, 124, 161–170.
Liu, S. & Gavalas, G.R. (2005) Oxygen selective ceramic hollow fiber membranes. Journal of MembraneScience, 246, 103–108.
Liu, S., Tan, X., Li, K. & Hughes, R. (2001) Preparation and characterisation of SrCe0.95Yb0.05O2.975 hollowfiber membranes. Journal of Membrane Science, 193, 249–260.
Liu, Y., Tan, X. & Li, K. (2006) SrCe0.95Yb0.05O3−δ (SCYb) hollow fiber membrane: preparation,characterization and performance. Journal of Membrane Science, 283, 380–385.
Luyten, J., Buekenhoudt, A., Adriansens, W., Cooymans, J., Weyten, H., Servaes, F. & Leysen, R. (2000)Preparation of LaSrCoFeO3−δ membranes. Solid State Ionics, 135, 637–642, 2000.
Richardson, R.A., Ormerod, R.M. & Cotton, J.W. (2003) Influence of synthesis route on the powder propertiesof a perovskite-type oxide. Ionics, 9, 77–82.
Steele, B.C.H. (1996) Ceramic ion conducting membranes. Current Opinion in Solid State and MaterialsScience, 1, 684–691.
Tablet, C., Grubert, G., Wang, H., Schiestel, T., Schroeder, M., Langanke, B. & Caro, J. (2005) Oxygenpermeation study of perovskite hollow fiber membranes. Catalysis Today, 104, 126–130.
Taheri, Z., Nazari, K., Seyed-Matin, N., Safekordi, A., Ghanbari, B., Zarrinpashne, S. & Ahmadi, R. (2010)Comparison of oxygen permeation through some perovskite membranes synthesized with EDTNAD.Reaction Kinetics, Mechanisms and Catalysis, 100, 459–469.
Tan, X. & Li, K. (2002) Modeling of air separation in a LSCF hollow-fiber membrane module. AIChEJournal, 48, 1469–1477.
Tan, X., Liu,Y. & Li, K. (2004) Preparation of LSCF ceramic hollow-fiber membranes for oxygen productionby a phase-inversion/sintering technique. Industrial & Engineering Chemistry Research, 44, 61–66.
Tan, X., Liu,Y. & Li, K. (2005) Mixed conducting ceramic hollow-fiber membranes for air separation. AIChEJournal, 51, 1991–2000.
Tan, X., Wang, Z., Liu, H. & Liu, S. (2008a) Enhancement of oxygen permeation throughLa0.6Sr0.4Co0.2Fe0.8O3−α hollow fiber membranes by surface modifications. Journal of MembraneScience, 324, 128–135.
208 H. Mustafa et al.
Tan, X., Pang, Z. & Li, K. (2008b) Oxygen production using La0.6Sr0.4Co0.2Fe0.8O3−α (LSCF) perovskitehollow fiber membrane modules. Journal of Membrane Science, 310, 550–556.
Tan, X., Wang, Z., Meng, B., Meng, X. & Li, K. (2010) Pilot-scale production of oxygen from air usingperovskite hollow fiber membranes. Journal of Membrane Science, 352, 189–196.
Teraoka, Y., Zhang, H.M., Okamoto, K. & Yamazoe, N. (1988) Mixed ionic-electronic conductivity ofLa1−xSrxCo1−yFeyO3−δ perovskite-type oxides. Materials Research Bulletin, 23, 51–58.
Teraoka, Y., Zhang, H.M., Furukawa, S. & Yamazoe, N. (1985) Oxygen permeation through perovskite-typeoxides. Chemistry Letters, 14, 1743–1746.
Xu, S.J. & Thomson, W.J. (1998) Stability of La0.6Sr0.4Co0.2Fe0.8O3−δ perovskite membranes in reducingand nonreducing environments. Industrial & Engineering Chemistry Research, 37, 1290–1299.
Xu, S.J. & Thomson, W.J. (1999) Oxygen permeation rates through ion-conducting perovskite membranes.Chemical Engineering Science, 54, 3839–3850.
Yaremchenko, A.A., Kharton, V.V., Viskup, A.P., Naumovich, E.N., Tikhonovich, V.N. & Lapchuk, N.M.(1999) Mixed electronic and ionic conductivity of LaCo(M)O3 (M = Ga, Cr, Fe or Ni): V. Oxygenpermeability of Mg-doped La(Ga, Co)O8O3−δ perovskites. Solid State Ionics, 120, 65–74.
Zawadzki, M.A., Grabowska, H. & Trawczynski, J. (2011) Effect of synthesis method of LSCF perovskiteon its catalytic properties for phenol methylation. Solid State Ionics, 181, 1131–1139.
Zeng, Y., Lin, Y.S. & Swartz, S.L. (1998) Perovskite-type ceramic membrane: synthesis, oxygen permeationand membrane reactor performance for oxidative coupling of methane. Journal of Membrane Science,150, 87–98.
CHAPTER 19
Preparation of porous PVDF/montmorillonite hollow fibermixed matrix membrane contactor via phase inversionmethod to capture CO2 in membrane contactor
M. Rezaei-DashtArzhandi, Ahmad Fauzi Ismail, Seyed A. Hashemifard,Gholamreza Bakeri & Takeshi Matsuura
19.1 INTRODUCTION
Threatening levels of anthropogenic greenhouse gases, particularly carbon dioxide (CO2), posegreat environmental, economic and operational impacts to the earth. Hence, the reduction ofCO2 content in gas streams and its emission to the atmosphere seems inevitable (Ismail andMansourizadeh, 2010). Membrane contactors, which are designed to absorb CO2, are a newlydevised apparatus with a solid, microporous and hydrophobic membrane. Membrane contactorshave drawn considerable attention due to their superior characteristics compared to conventionalmethods such as high surface area, no flooding, loading, entrainment and modularity. Neverthe-less, the membrane contactors suffer from some drawbacks. For instance, the membrane itselfduring the process causes an additional resistance to the overall mass transport that becomesmore significant when a fraction of membrane pores is filled with liquid absorbent (Hashemifardet al., 2011). Therefore, there is a need to fabricate membranes with low mass transfer resis-tance (high porosity) and high wetting resistance (high hydrophobicity). A number of methodshave been proposed to enhance the membrane hydrophobicity and reduce the wettability, whichdispersing small fillers throughout a polymer called mixed matrix membranes (MMMs) havepresented an interesting approach. Moreover, the organic/inorganic combination is proved toenhance thermal, chemical and mechanical stability of polymeric membranes (Drioli et al., 2006;Sridhar et al., 2007).
Recently, inorganic clay-nanoparticles were developed as fillers or additives in polymer matrix,since the addition of very low clay content (less than 10%) can improve several properties ofpolymeric membranes (Bakeri et al., 2010; Drioli et al., 2006; Sridhar et al., 2007).
In the study, hydrophobic montmorillonite (MMT) was used as filler for the fabrication ofporous PVDF hollow fiber MMM via wet phase inversion method for CO2 absorption in contactor.MMT type clay possesses a high aspect ratio with a layered structure. It has a structure consistingof two silicate tetrahedral sheets with an edge-shared octahedral sheet of either aluminum or mag-nesium hydroxide. The effects of MMT nano-clay on the membrane morphology, permeability,hydrophobicity and CO2 absorption performance were investigated. Since both PVDF polymermatrix and MMT particles are hydrophobic, higher surface hydrophobicity, wetting resistanceand performance can be expected.
19.2 EXPERIMENTAL
19.2.1 Materials
Commercial PVDF polymer pellets (Kynar®740) were supplied by Arkema Inc., PA, USA. Ahydrophobic MMT and Nanomer 1.30TC surface modified by octadecylamine (25–30 wt%) was
209
210 M. Rezaei-DashtArzhandi et al.
purchased from Fluka, and 1-methyl-2-pyrrolidone (NMP >99.5%) was used as solvent withoutfurther purification. Lithium chloride (LiCl, ≥99%) (Sigma-Aldrich®) was used as pore-formeradditive in the polymer dopes. Methanol (GR grade, 99.9%) was purchased from MERCK andused for post-treating the prepared membranes. Tap water was used as the coagulant in the spinningprocess. Distilled water was used as a liquid absorbent in the CO2 absorption experiments.
19.2.2 Fabrication of asymmetric porous hollow fiber MMMs
The selected clay particles, PVDF polymer pallets and LiCl were vacuum dried in an oven for 48 hat 65 ± 2◦C to remove moisture content. Different MMT contents (1.0, 3.0 and 5.0 wt% of PVDF)were dispersed in the solvent (NMP) and sonicated for 1 h at 40◦C. LiCl of 2.5 wt% was added,then 18 wt% PVDF was gradually added to the mixture and to ensure the complete dissolutionof the polymer and nano-filler, the mixture was stirred overnight. The prepared spinning dopesolution was degassed. The hollow fiber spinning details through the wet phase inversion canbe found elsewhere (Bakeri et al., 2011). The prepared membranes then were dried for furthercharacterizations.
19.2.3 Field emission scanning electron microscopy (FESEM) examination
A field emission scanning electron microscope (FESEM) (JEOL JSM-6701F) was used to observethe morphology of the spun PVDF hollow fiber membranes and to investigate the extent of theadhesion between the filler particles and the polymer matrix by the standard methods. The driedhollow fiber samples were cut into small pieces of approximately 5 cm length to be fractured innitrogen for observation of the cross-section. The FESEM micrographs of cross-section, internalsurface and an external surface of the hollow fiber MMMs were taken at various magnifications.
19.2.4 Gas permeation test and contact angle measurement
A hollow fiber with an effective length of 10 cm was glued with epoxy glue at one end and theother end was potted to a stainless steel fitting. The purified nitrogen (N2) gas was supplied tothe shell side and the pressure increased at an interval of 0.05 MPa. The permeation rate of gascoming out from the lumen side was measured by the soap-bubble flow meter.
The hollow fibers were dried at 60 ± 2◦C for 12 h and contact angles were measured on theupper surface of the membranes by the sessile drop technique using a goniometer (model G1,Krüss GmbH, Hamburg, Germany).
19.2.5 Gas absorption test
The CO2 absorption experiment was carried out to evaluate the performance of the fabricatedmembranes. Ten hollow fibers with the effective length of 17.5 cm were packed in a contactormodule. Distilled water and pure CO2 flowed in the lumen and shell sides respectively. The CO2
concentration in the liquid outlet at various flow rates was measured by titration using 0.02 Msodium hydroxide (NaOH) solution and phenolphthalein to determine the CO2 flux.
19.3 RESULTS AND DISCUSSION
19.3.1 Morphology study
Dispersion of hydrophobic nano-fillers into PVDF polymer matrix, the extent of adhesion betweenthem and the morphology of prepared MMMs were investigated by FESEM images. The cross-sectional, inner surface and outer surface micrographs in different clay loading are given inFigure 19.1. It can be seen from cross sectional FESEM images that the membranes have a thinskin layer and the finger-like structure in the substrate extends from the outer surface and meets
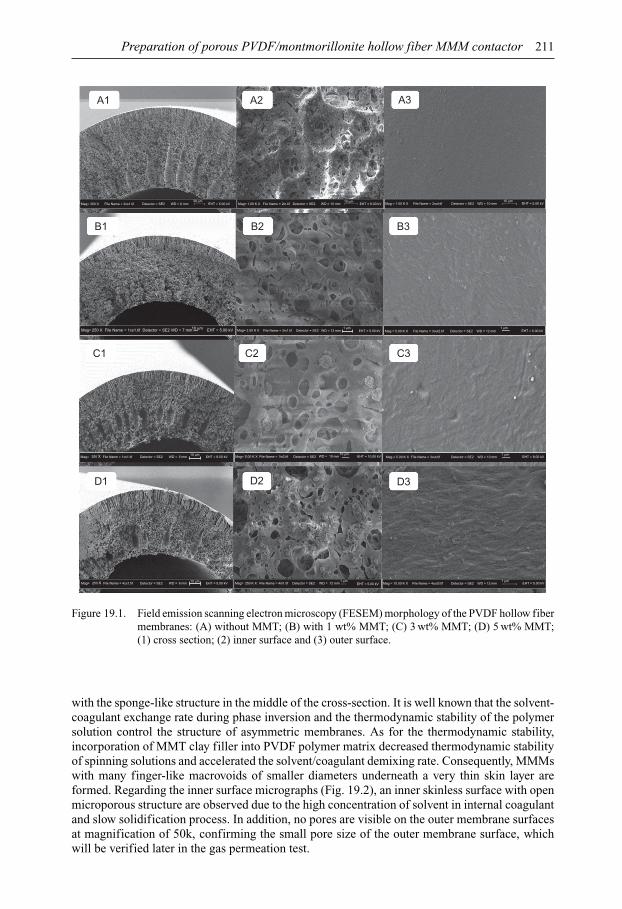
Preparation of porous PVDF/montmorillonite hollow fiber MMM contactor 211
Figure 19.1. Field emission scanning electron microscopy (FESEM) morphology of the PVDF hollow fibermembranes: (A) without MMT; (B) with 1 wt% MMT; (C) 3 wt% MMT; (D) 5 wt% MMT;(1) cross section; (2) inner surface and (3) outer surface.
with the sponge-like structure in the middle of the cross-section. It is well known that the solvent-coagulant exchange rate during phase inversion and the thermodynamic stability of the polymersolution control the structure of asymmetric membranes. As for the thermodynamic stability,incorporation of MMT clay filler into PVDF polymer matrix decreased thermodynamic stabilityof spinning solutions and accelerated the solvent/coagulant demixing rate. Consequently, MMMswith many finger-like macrovoids of smaller diameters underneath a very thin skin layer areformed. Regarding the inner surface micrographs (Fig. 19.2), an inner skinless surface with openmicroporous structure are observed due to the high concentration of solvent in internal coagulantand slow solidification process. In addition, no pores are visible on the outer membrane surfacesat magnification of 50k, confirming the small pore size of the outer membrane surface, whichwill be verified later in the gas permeation test.
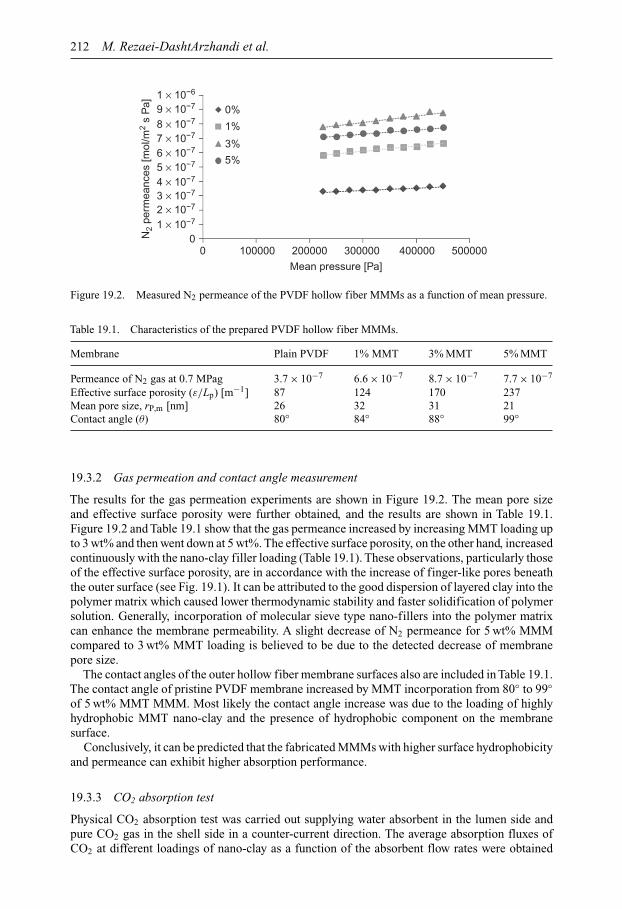
212 M. Rezaei-DashtArzhandi et al.
0 100000 200000
Mean pressure [Pa]
N2
perm
eanc
es [m
ol/m
2 s
Pa]
300000 400000 500000
0%
1%
3%
5%
1 × 10⁻⁶
9 × 10⁻⁷
8 × 10⁻⁷
7 × 10⁻⁷
6 × 10⁻⁷
5 × 10⁻⁷
4 × 10⁻⁷
3 × 10⁻⁷
2 × 10⁻⁷
1 × 10⁻⁷
0
Figure 19.2. Measured N2 permeance of the PVDF hollow fiber MMMs as a function of mean pressure.
Table 19.1. Characteristics of the prepared PVDF hollow fiber MMMs.
Membrane Plain PVDF 1% MMT 3% MMT 5% MMT
Permeance of N2 gas at 0.7 MPag 3.7 × 10⁻⁷ 6.6 × 10⁻⁷ 8.7 × 10⁻⁷ 7.7 × 10⁻⁷
Effective surface porosity (ε/Lp) [m−1] 87 124 170 237Mean pore size, rP,m [nm] 26 32 31 21Contact angle (θ) 80◦ 84◦ 88◦ 99◦
19.3.2 Gas permeation and contact angle measurement
The results for the gas permeation experiments are shown in Figure 19.2. The mean pore sizeand effective surface porosity were further obtained, and the results are shown in Table 19.1.Figure 19.2 and Table 19.1 show that the gas permeance increased by increasing MMT loading upto 3 wt% and then went down at 5 wt%. The effective surface porosity, on the other hand, increasedcontinuously with the nano-clay filler loading (Table 19.1). These observations, particularly thoseof the effective surface porosity, are in accordance with the increase of finger-like pores beneaththe outer surface (see Fig. 19.1). It can be attributed to the good dispersion of layered clay into thepolymer matrix which caused lower thermodynamic stability and faster solidification of polymersolution. Generally, incorporation of molecular sieve type nano-fillers into the polymer matrixcan enhance the membrane permeability. A slight decrease of N2 permeance for 5 wt% MMMcompared to 3 wt% MMT loading is believed to be due to the detected decrease of membranepore size.
The contact angles of the outer hollow fiber membrane surfaces also are included in Table 19.1.The contact angle of pristine PVDF membrane increased by MMT incorporation from 80◦ to 99◦of 5 wt% MMT MMM. Most likely the contact angle increase was due to the loading of highlyhydrophobic MMT nano-clay and the presence of hydrophobic component on the membranesurface.
Conclusively, it can be predicted that the fabricated MMMs with higher surface hydrophobicityand permeance can exhibit higher absorption performance.
19.3.3 CO2 absorption test
Physical CO2 absorption test was carried out supplying water absorbent in the lumen side andpure CO2 gas in the shell side in a counter-current direction. The average absorption fluxes ofCO2 at different loadings of nano-clay as a function of the absorbent flow rates were obtained
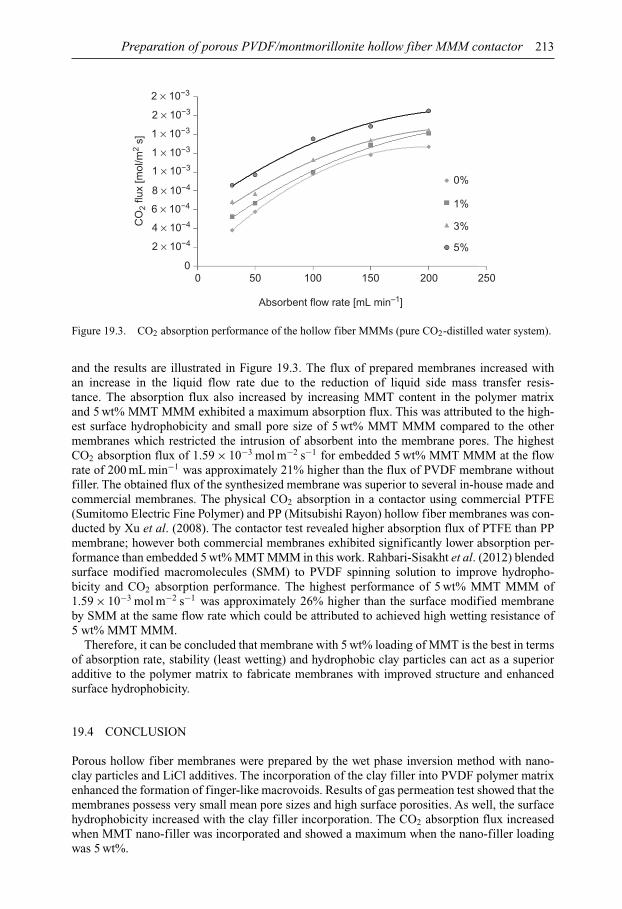
Preparation of porous PVDF/montmorillonite hollow fiber MMM contactor 213
0 50 100 150 200 250
Absorbent flow rate [mL min–1]
CO
2 flu
x [m
ol/m
2 s]
0%
1%
3%
5%
2 × 10⁻³
2 × 10⁻³
1 × 10⁻³
1 × 10⁻³
1 × 10⁻³
8 × 10⁻⁴
6 × 10⁻⁴
4 × 10⁻⁴
2 × 10⁻⁴
0
Figure 19.3. CO2 absorption performance of the hollow fiber MMMs (pure CO2-distilled water system).
and the results are illustrated in Figure 19.3. The flux of prepared membranes increased withan increase in the liquid flow rate due to the reduction of liquid side mass transfer resis-tance. The absorption flux also increased by increasing MMT content in the polymer matrixand 5 wt% MMT MMM exhibited a maximum absorption flux. This was attributed to the high-est surface hydrophobicity and small pore size of 5 wt% MMT MMM compared to the othermembranes which restricted the intrusion of absorbent into the membrane pores. The highestCO2 absorption flux of 1.59 × 10⁻³ mol m−2 s−1 for embedded 5 wt% MMT MMM at the flowrate of 200 mL min−1 was approximately 21% higher than the flux of PVDF membrane withoutfiller. The obtained flux of the synthesized membrane was superior to several in-house made andcommercial membranes. The physical CO2 absorption in a contactor using commercial PTFE(Sumitomo Electric Fine Polymer) and PP (Mitsubishi Rayon) hollow fiber membranes was con-ducted by Xu et al. (2008). The contactor test revealed higher absorption flux of PTFE than PPmembrane; however both commercial membranes exhibited significantly lower absorption per-formance than embedded 5 wt% MMT MMM in this work. Rahbari-Sisakht et al. (2012) blendedsurface modified macromolecules (SMM) to PVDF spinning solution to improve hydropho-bicity and CO2 absorption performance. The highest performance of 5 wt% MMT MMM of1.59 × 10−3 mol m−2 s−1 was approximately 26% higher than the surface modified membraneby SMM at the same flow rate which could be attributed to achieved high wetting resistance of5 wt% MMT MMM.
Therefore, it can be concluded that membrane with 5 wt% loading of MMT is the best in termsof absorption rate, stability (least wetting) and hydrophobic clay particles can act as a superioradditive to the polymer matrix to fabricate membranes with improved structure and enhancedsurface hydrophobicity.
19.4 CONCLUSION
Porous hollow fiber membranes were prepared by the wet phase inversion method with nano-clay particles and LiCl additives. The incorporation of the clay filler into PVDF polymer matrixenhanced the formation of finger-like macrovoids. Results of gas permeation test showed that themembranes possess very small mean pore sizes and high surface porosities. As well, the surfacehydrophobicity increased with the clay filler incorporation. The CO2 absorption flux increasedwhen MMT nano-filler was incorporated and showed a maximum when the nano-filler loadingwas 5 wt%.
214 M. Rezaei-DashtArzhandi et al.
ACKNOWLEDGEMENT
The author is thankful to the Ministry of Education for the Research University Grant votenumber of Q.J130000.3009.00M02 and Research Management Centre (RMC), UTM for researchmanagement activities.
REFERENCES
Bakeri, G., Ismail, A.F., Shariaty-Niassar, M. & Matsuura, T. (2010) Effect of polymer concentration on thestructure and performance of polyetherimide hollow fiber membranes. Journal of Membrane Science,363, 103–111.
Bakeri, G., Ismail, A.F., Rana, D. & Matsuura, T. (2011) The effect of phase inversion promoters on the struc-ture and performance of polyetherimide hollow fiber membrane using in gas-liquid contacting process.Journal of Membrane Science, 383, 159–169.
Drioli, E., Criscuoli, A. & Curcio, E. (eds.) (2006) Membrane contactors: fundamentals, applicationsand potentialities. Membrane Science and Technology, Volume 11. Elsevier Science, Amsterdam, TheNetherlands.
Hashemifard, S.A., Ismail, A.F. & Matsuura, T. (2011) Effects of montmorillonite nano-clay fillers on PEImixed matrix membrane for CO2 removal. Chemical Engineering Journal, 170, 316–325.
Ismail, A.F. & Mansourizadeh, A. (2010) A comparative study on the structure and performance ofporous polyvinylidene fluoride and polysulfone hollow fiber membranes for CO2 absorption. Journalof Membrane Science, 365, 319–328.
Rahbari-Sisakht, M., Ismail, A.F. & Matsuura, T. (2012) A novel surface modified polyvinylidene fluoridehollow fiber membrane contactor for CO2 absorption. Journal of Membrane Science, 415–416, 221–228.
Sridhar, S., Smitha, B. & Aminabhavi, M. (2007) Separation of carbon dioxide from natural gas mixturesthrough polymeric membranes – a review. Separation and Purification Technology, 36, 113–174.
Xu, A., Yang, A., Young, S., de Montigny, D. & Tontiwachwuthikul, P. (2008) Effect of internal coagulant oneffectiveness of polyvinylidene fluoride membrane for carbon dioxide separation and absorption. Journalof Membrane Science, 311, 153–158.
Part VMembranes for environmental
and energy applications(gas separation application)

This page intentionally left blankThis page intentionally left blank

CHAPTER 20
An experimental investigation into the permeability and selectivityof PTFE membrane: a mixture of methane and carbon dioxide
Sina Gilassi & Nejat Rahmanian
20.1 INTRODUCTION
Research and technology innovations in the 1970s led to the significant commercial practice of gasseparation by membranes that exists today. These advances involved developing membrane struc-tures that could produce high fluxes and modules for packing a large amount of membrane areaper unit volume (Murphy et al., 2009). At present, the share of using a polymeric membrane inthe capture of CO2 is increasing and gradually the membrane technology is considered as thepromising method in separation units, although the number of commercial membranes is nothigh. CO2 capture from natural gas is one of the controversial topics that many researchers andengineers try to find the best method satisfying both high efficiency and low capital cost. In com-mon, chemical physical absorption towers are applied to remove CO2 from natural gas in order toprevent pipeline corrosion, even though the other component such as H2S gives rise to operatingproblems. The obscure angle of a conventional unit is related to the high energy consumptionwhile the absorbent needs to be purified by the regeneration units which implement the temper-ature as a unique manipulating parameter for separating amine groups. The great advantages ofusing the membrane in gas industry are the low capital cost, easy installation and maintenance sothat for this simple reason, new membranes come to the market for different types of processes.Capture of CO2 from natural gas accounts for one of the major difficulties so that the engineerstry to employ membrane modules as to alter the process efficiency. However, there are only alimited number of membranes that can be used in real industry and the research still continuesover this interesting topic (Burggraaf and Cot, 1996).
In this research, PTFE film is used which has specific chemical and physical properties such asresistance in high temperature, inertness, high hydrophobicity. The two important factors, whichare taken into account for having better separation performance, are selectivity and permeability.According to Fick’s law, the flux passing through the membrane is a function of the pressuregradient, thickness, diffusivity coefficient and solubility of the pure gas inside the membrane(Geankoplis, 2003):
NA = DS(pA1 − pA2)
l(20.1)
where pA1 and pA2 are the ambient pressures on upstream and downstream of a membrane,respectively. l is the membrane thickness. The product DS is called the permeability coefficientP. There is no doubt that an increase in permeability give rise to making a significant change intotal flux. Some researchers (Brewis and Dahm, 2006) tried to alter this factor using chemicaltreatment and modification. Most of the more recent researches have focused on developingmembrane materials with a better balance of selectivity and productivity (permeability) so that itseems the most likely route for expanding the use of this technology.
In this study, the permeability coefficients of pure and pair gas component CO2 and CH4 aredetermined by experimental work and the results are plotted separately to show the differencesbetween the two measurements. In addition, the diffusivity and solubility factor are defined
217

218 S. Gilassi & N. Rahmanian
according to the gas transport equations. Moreover, the experimental work indicates the effect ofoperating conditions such as pressure and volumetric flow rate of feed on the permeate stream.
20.2 THEORY OF GAS TRANSPORT IN MEMBRANE
The movement of gas molecules through pore channels is described by three parameters, thediffusivity coefficient, solubility and permeability coefficient. The gas molecules are absorbedon one side of the membrane, diffuse through the membrane while the concentration of gas ischanging through the membrane, and finally the molecules leave the other side of the membrane.
Fick’s law governs the correlation between the above-mentioned theory and defines the diffusiv-ity coefficient which is different depending upon the gas component and structure. Generally thediffusivity is a function of pressure, temperature and concentration. Moreover, both experimentalwork and theoretical equations can be applied to predict diffusivity of different gas mixtures (Birdet al., 2007). The solution-diffusion model describes the transport through the dense polymericmembrane which involves the first and second Fick’s law (Pineri and Escoubes, 1993):
F = −D∂C(x, t)
∂x(20.2)
∂C(x, t)
∂t= D
∂2C(x, t)
∂x2(20.3)
As the gas concentration C(x, t) within the membrane at point x and time t is related to the gaspressure p(x, t), it can be expressed by the interpretation of Henry’s law:
C(x, t) = Sp(x, t) (20.4)
As the first Fick’s law defines the gas flux in constant concentration, the volumetric flow rate ofgas, Q, which passes the membrane, is determined by the second Fick’s law when the stationarystate is obtained (Pineri and Escoubes, 1993).
20.2.1 Determination of permeability, diffusivity coefficient
The time lag permeation experiment is an acceptable method to determine the permeability anddiffusivity coefficient of gases in polymer films (Al-Ismaily et al., 2012). The pressurized gasis contacted with the polymeric membrane and the permeation stream, which leaves the lowpressure side is recorded and expressed as a function of time. In this method, there are threestages, which consist of (i) the transient permeation, (ii) pseudo-steady-state permeation as theconcentration difference throughout the membrane is constant, (iii) unsteady state permeationas the concentration of downstream is remarkably high (Chen et al., 2010). After passing acrossthe first stage, the pseudo-steady state is described by the Equation (20.5) (Crank, 1975). Thismethod was originally introduced by Daynes (Do, 2001):
Q = DC1
l
(t − l2
6D
)(20.5)
where Q is the amount of gas that flowed through the membrane whose thickness and surfacearea are shown by l and A during specific time t and C1 is the feed concentration. The differencein concentration and pressure profile leads to independent equations to determine the flux of gasF through the film (Pineri and Escoubes, 1993):
F = −D�C
l= −P
�p
l(20.6)
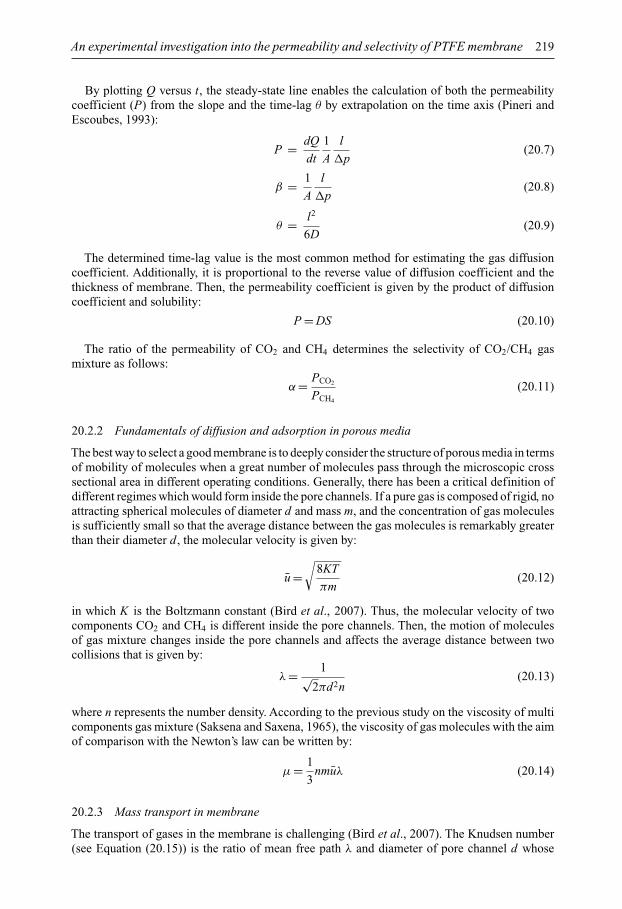
An experimental investigation into the permeability and selectivity of PTFE membrane 219
By plotting Q versus t, the steady-state line enables the calculation of both the permeabilitycoefficient (P) from the slope and the time-lag θ by extrapolation on the time axis (Pineri andEscoubes, 1993):
P = dQ
dt
1
A
l
�p(20.7)
β = 1
A
l
�p(20.8)
θ = l2
6D(20.9)
The determined time-lag value is the most common method for estimating the gas diffusioncoefficient. Additionally, it is proportional to the reverse value of diffusion coefficient and thethickness of membrane. Then, the permeability coefficient is given by the product of diffusioncoefficient and solubility:
P = DS (20.10)
The ratio of the permeability of CO2 and CH4 determines the selectivity of CO2/CH4 gasmixture as follows:
α = PCO2
PCH4
(20.11)
20.2.2 Fundamentals of diffusion and adsorption in porous media
The best way to select a good membrane is to deeply consider the structure of porous media in termsof mobility of molecules when a great number of molecules pass through the microscopic crosssectional area in different operating conditions. Generally, there has been a critical definition ofdifferent regimes which would form inside the pore channels. If a pure gas is composed of rigid, noattracting spherical molecules of diameter d and mass m, and the concentration of gas moleculesis sufficiently small so that the average distance between the gas molecules is remarkably greaterthan their diameter d, the molecular velocity is given by:
u =√
8KT
πm(20.12)
in which K is the Boltzmann constant (Bird et al., 2007). Thus, the molecular velocity of twocomponents CO2 and CH4 is different inside the pore channels. Then, the motion of moleculesof gas mixture changes inside the pore channels and affects the average distance between twocollisions that is given by:
λ = 1√2πd2n
(20.13)
where n represents the number density. According to the previous study on the viscosity of multicomponents gas mixture (Saksena and Saxena, 1965), the viscosity of gas molecules with the aimof comparison with the Newton’s law can be written by:
µ = 1
3nmuλ (20.14)
20.2.3 Mass transport in membrane
The transport of gases in the membrane is challenging (Bird et al., 2007). The Knudsen number(see Equation (20.15)) is the ratio of mean free path λ and diameter of pore channel d whose
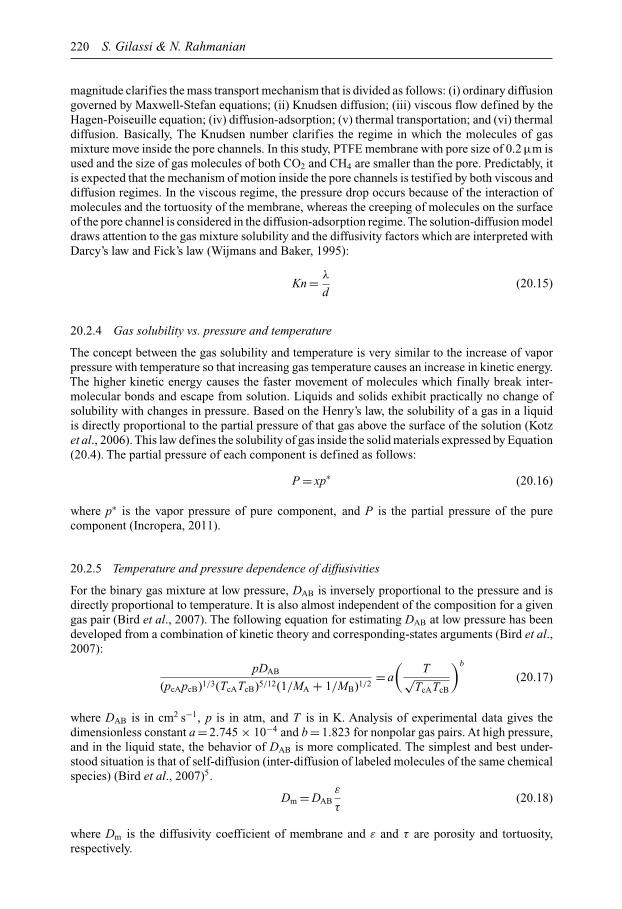
220 S. Gilassi & N. Rahmanian
magnitude clarifies the mass transport mechanism that is divided as follows: (i) ordinary diffusiongoverned by Maxwell-Stefan equations; (ii) Knudsen diffusion; (iii) viscous flow defined by theHagen-Poiseuille equation; (iv) diffusion-adsorption; (v) thermal transportation; and (vi) thermaldiffusion. Basically, The Knudsen number clarifies the regime in which the molecules of gasmixture move inside the pore channels. In this study, PTFE membrane with pore size of 0.2 µm isused and the size of gas molecules of both CO2 and CH4 are smaller than the pore. Predictably, itis expected that the mechanism of motion inside the pore channels is testified by both viscous anddiffusion regimes. In the viscous regime, the pressure drop occurs because of the interaction ofmolecules and the tortuosity of the membrane, whereas the creeping of molecules on the surfaceof the pore channel is considered in the diffusion-adsorption regime. The solution-diffusion modeldraws attention to the gas mixture solubility and the diffusivity factors which are interpreted withDarcy’s law and Fick’s law (Wijmans and Baker, 1995):
Kn = λ
d(20.15)
20.2.4 Gas solubility vs. pressure and temperature
The concept between the gas solubility and temperature is very similar to the increase of vaporpressure with temperature so that increasing gas temperature causes an increase in kinetic energy.The higher kinetic energy causes the faster movement of molecules which finally break inter-molecular bonds and escape from solution. Liquids and solids exhibit practically no change ofsolubility with changes in pressure. Based on the Henry’s law, the solubility of a gas in a liquidis directly proportional to the partial pressure of that gas above the surface of the solution (Kotzet al., 2006). This law defines the solubility of gas inside the solid materials expressed by Equation(20.4). The partial pressure of each component is defined as follows:
P = xp∗ (20.16)
where p∗ is the vapor pressure of pure component, and P is the partial pressure of the purecomponent (Incropera, 2011).
20.2.5 Temperature and pressure dependence of diffusivities
For the binary gas mixture at low pressure, DAB is inversely proportional to the pressure and isdirectly proportional to temperature. It is also almost independent of the composition for a givengas pair (Bird et al., 2007). The following equation for estimating DAB at low pressure has beendeveloped from a combination of kinetic theory and corresponding-states arguments (Bird et al.,2007):
pDAB
(pcApcB)1/3(TcATcB)5/12(1/MA + 1/MB)1/2= a
(T√
TcATcB
)b
(20.17)
where DAB is in cm2 s−1, p is in atm, and T is in K. Analysis of experimental data gives thedimensionless constant a = 2.745 × 10⁻⁴ and b = 1.823 for nonpolar gas pairs. At high pressure,and in the liquid state, the behavior of DAB is more complicated. The simplest and best under-stood situation is that of self-diffusion (inter-diffusion of labeled molecules of the same chemicalspecies) (Bird et al., 2007)5.
Dm = DABε
τ(20.18)
where Dm is the diffusivity coefficient of membrane and ε and τ are porosity and tortuosity,respectively.
An experimental investigation into the permeability and selectivity of PTFE membrane 221
20.2.6 Gas permeation membrane processes
In membrane processes with two gas phases and a solid membrane, the equilibrium relationbetween the solid and gas phase is given by (Geankoplis, 2003):
H = S
22.414= C
p(20.19)
where S is the solubility of A in m3 STP atm−1 m−3 solid, and H is the equilibrium relation inkg mol m−3 atm−1. This is similar to Henry’s law (Geankoplis, 2003).
20.3 EXPERIMENTAL
20.3.1 Materials
PTFE film/membrane with pore size of 0.2 µm, porosity over 60% was provided by Millipore Co.(Ireland). CH4 and CO2 were supplied by Linde Co. (Malaysia) and density of gas componentsin kg m−3 are 0.692 and 1.842, respectively. The temperature was 30◦C and pressure was below0.6 MPa.
20.3.2 Equipment
Both pure and mixed feed stream were supplied to the permeation cell to consider the differencebetween permeability in two various conditions. The equipment is called CO2SMU available atthe Universiti Teknologi Petronas and was fabricated by Spectron Sdn. Bhd. This equipment isemployed to record all the results, which consist of permeation, reject flow rate stream as wellas the concentration with the aim of an online analyzer. This unit is run by programmable logiccontrol and the operator can alter the manipulated parameters and the result is noted in the log file.
20.3.3 Methods
Two different procedures were selected to run the experiments. In the first procedure, the pure gascomponent was fed to the permeation cell with different volumetric flow rates, so that the flowrate of permeate and reject stream showed the capacity of separation in PTFE membrane. Theupstream pressure was gradually increased by 0.6 MPa and in each pressure point, the permeatestream and time required to collect the volume were recorded. Five experiments were made underthe same operating condition (pressure and temperature) for the purpose of validity. The above-mentioned method was performed for both CO2 and CH4 separately. In the second procedure,firstly, two gas components were mixed with the static mixer before the feed gas entered thepermeation cell. Similarly, the flow rates of permeate stream were recorded and compared withthe single component experiment. In addition, by using the fundamental gas separation andtransport equations, all results were classified and plotted versus time.
20.4 RESULTS AND DISCUSSION
As the objective of this work is to find the correct diffusivity and permeability factor of PTFE,firstly pure CO2 is fed to the permeation cell at temperature 30◦C and pressure 0.6 MPag.The permeate and retentate stream are calculated by simple mass balance equation whereas theconcentration of feed is constant.
Figure 20.1 shows the change in downstream volume versus time. According to the Equation(20.7), a line can be fitted to the data and the slope of this line is multiplied by the slope correctionterm, β, which is 0.00639, to define the permeability. In this experiment, the permeability factorfor pure CO2 was found to be 5.24 barrer.
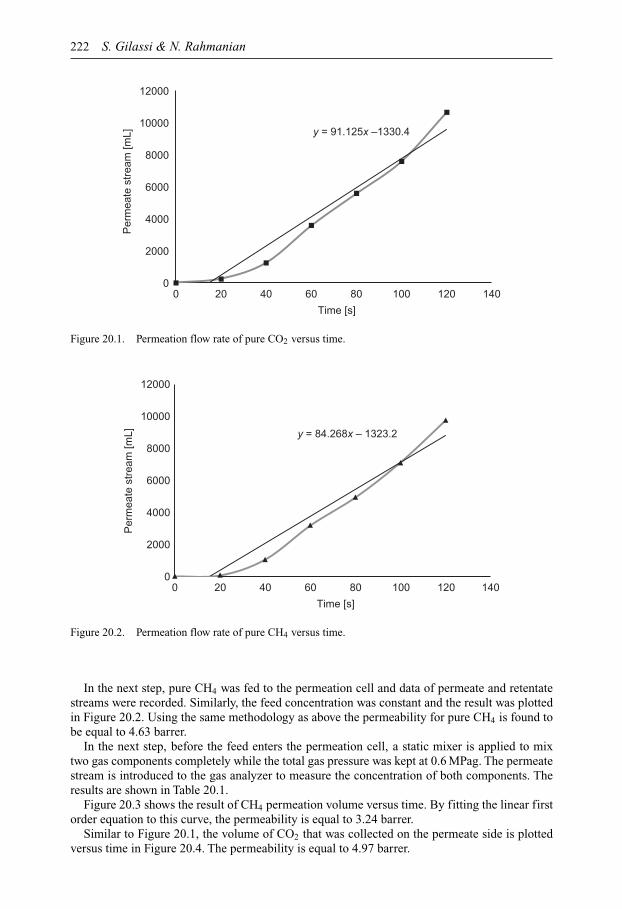
222 S. Gilassi & N. Rahmanian
y = 91.125x –1330.4
0
2000
4000
6000
8000
10000
12000
0 20 40 60 80 100 120 140
Per
mea
te s
trea
m [m
L]
Time [s]
Figure 20.1. Permeation flow rate of pure CO2 versus time.
y = 84.268x – 1323.2
0
2000
4000
6000
8000
10000
12000
0 20 40 60 80 100 120 140
Per
mea
te s
trea
m [m
L]
Time [s]
Figure 20.2. Permeation flow rate of pure CH4 versus time.
In the next step, pure CH4 was fed to the permeation cell and data of permeate and retentatestreams were recorded. Similarly, the feed concentration was constant and the result was plottedin Figure 20.2. Using the same methodology as above the permeability for pure CH4 is found tobe equal to 4.63 barrer.
In the next step, before the feed enters the permeation cell, a static mixer is applied to mixtwo gas components completely while the total gas pressure was kept at 0.6 MPag. The permeatestream is introduced to the gas analyzer to measure the concentration of both components. Theresults are shown in Table 20.1.
Figure 20.3 shows the result of CH4 permeation volume versus time. By fitting the linear firstorder equation to this curve, the permeability is equal to 3.24 barrer.
Similar to Figure 20.1, the volume of CO2 that was collected on the permeate side is plottedversus time in Figure 20.4. The permeability is equal to 4.97 barrer.

An experimental investigation into the permeability and selectivity of PTFE membrane 223
Table 20.1. Flow rate (slpm) and composition of feed and permeate for the CH4/CO2 mixture.
Feed flow CH4 feed CO2 feed Permeate CH4 permeate CO2 permeaterate concentration concentration flow rate concentration concentration[slpm]a [%wt] [%wt] [slpm] [%wt] [%wt]
26 90 10 23.4 81.20 18.726 70 30 23.8 69.1 30.926 50 50 24.1 48.3 51.726 30 70 24.8 29.4 70.626 10 90 25.1 9.1 90.9
aslpm: standard liters per minute
y = 75.873x – 1195.4
0
1000
2000
3000
4000
5000
6000
7000
8000
9000
10000
0 20 40 60 80 100 120 140
Per
mea
tion
stre
am [m
L]
Tiime [s]
Figure 20.3. CH4 permeate volume versus time for the mixed gas experiment (CO2 = 30 wt% at 0.4 MPa).
y = 82.012x – 1197.3
0
2000
4000
6000
8000
10000
12000
0 20 40 60 80 100 120 140
Per
mea
tion
stre
am [m
L]
Time [s]
Figure 20.4. CO2 volume in permeate versus time for the mixed gas experiment (CO2 = 30 wt% at 0.4 MPa).
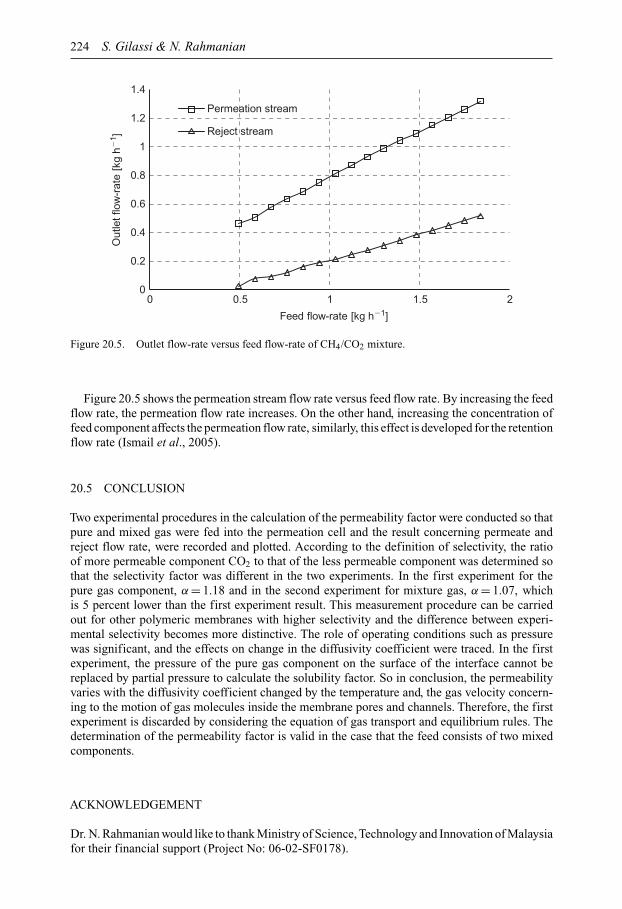
224 S. Gilassi & N. Rahmanian
Figure 20.5. Outlet flow-rate versus feed flow-rate of CH4/CO2 mixture.
Figure 20.5 shows the permeation stream flow rate versus feed flow rate. By increasing the feedflow rate, the permeation flow rate increases. On the other hand, increasing the concentration offeed component affects the permeation flow rate, similarly, this effect is developed for the retentionflow rate (Ismail et al., 2005).
20.5 CONCLUSION
Two experimental procedures in the calculation of the permeability factor were conducted so thatpure and mixed gas were fed into the permeation cell and the result concerning permeate andreject flow rate, were recorded and plotted. According to the definition of selectivity, the ratioof more permeable component CO2 to that of the less permeable component was determined sothat the selectivity factor was different in the two experiments. In the first experiment for thepure gas component, α = 1.18 and in the second experiment for mixture gas, α = 1.07, whichis 5 percent lower than the first experiment result. This measurement procedure can be carriedout for other polymeric membranes with higher selectivity and the difference between experi-mental selectivity becomes more distinctive. The role of operating conditions such as pressurewas significant, and the effects on change in the diffusivity coefficient were traced. In the firstexperiment, the pressure of the pure gas component on the surface of the interface cannot bereplaced by partial pressure to calculate the solubility factor. So in conclusion, the permeabilityvaries with the diffusivity coefficient changed by the temperature and, the gas velocity concern-ing to the motion of gas molecules inside the membrane pores and channels. Therefore, the firstexperiment is discarded by considering the equation of gas transport and equilibrium rules. Thedetermination of the permeability factor is valid in the case that the feed consists of two mixedcomponents.
ACKNOWLEDGEMENT
Dr. N. Rahmanian would like to thank Ministry of Science, Technology and Innovation of Malaysiafor their financial support (Project No: 06-02-SF0178).
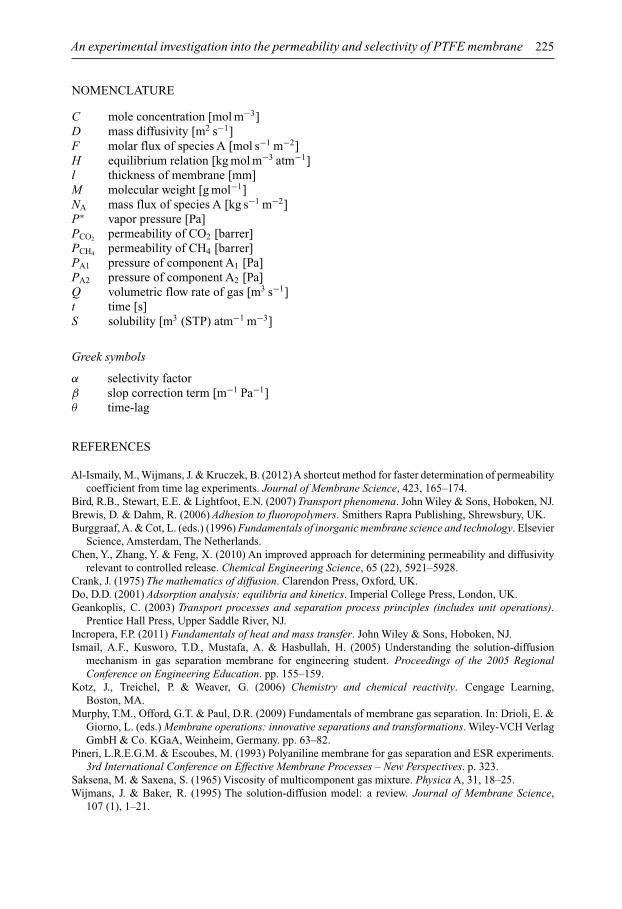
An experimental investigation into the permeability and selectivity of PTFE membrane 225
NOMENCLATURE
C mole concentration [mol m−3]D mass diffusivity [m2 s−1]F molar flux of species A [mol s−1 m−2]H equilibrium relation [kg mol m−3 atm−1]l thickness of membrane [mm]M molecular weight [g mol−1]NA mass flux of species A [kg s−1 m−2]P∗ vapor pressure [Pa]PCO2 permeability of CO2 [barrer]PCH4 permeability of CH4 [barrer]PA1 pressure of component A1 [Pa]PA2 pressure of component A2 [Pa]Q volumetric flow rate of gas [m3 s−1]t time [s]S solubility [m3 (STP) atm−1 m−3]
Greek symbols
α selectivity factorβ slop correction term [m−1 Pa−1]θ time-lag
REFERENCES
Al-Ismaily, M., Wijmans, J. & Kruczek, B. (2012) A shortcut method for faster determination of permeabilitycoefficient from time lag experiments. Journal of Membrane Science, 423, 165–174.
Bird, R.B., Stewart, E.E. & Lightfoot, E.N. (2007) Transport phenomena. John Wiley & Sons, Hoboken, NJ.Brewis, D. & Dahm, R. (2006) Adhesion to fluoropolymers. Smithers Rapra Publishing, Shrewsbury, UK.Burggraaf, A. & Cot, L. (eds.) (1996) Fundamentals of inorganic membrane science and technology. Elsevier
Science, Amsterdam, The Netherlands.Chen, Y., Zhang, Y. & Feng, X. (2010) An improved approach for determining permeability and diffusivity
relevant to controlled release. Chemical Engineering Science, 65 (22), 5921–5928.Crank, J. (1975) The mathematics of diffusion. Clarendon Press, Oxford, UK.Do, D.D. (2001) Adsorption analysis: equilibria and kinetics. Imperial College Press, London, UK.Geankoplis, C. (2003) Transport processes and separation process principles (includes unit operations).
Prentice Hall Press, Upper Saddle River, NJ.Incropera, F.P. (2011) Fundamentals of heat and mass transfer. John Wiley & Sons, Hoboken, NJ.Ismail, A.F., Kusworo, T.D., Mustafa, A. & Hasbullah, H. (2005) Understanding the solution-diffusion
mechanism in gas separation membrane for engineering student. Proceedings of the 2005 RegionalConference on Engineering Education. pp. 155–159.
Kotz, J., Treichel, P. & Weaver, G. (2006) Chemistry and chemical reactivity. Cengage Learning,Boston, MA.
Murphy, T.M., Offord, G.T. & Paul, D.R. (2009) Fundamentals of membrane gas separation. In: Drioli, E. &Giorno, L. (eds.) Membrane operations: innovative separations and transformations. Wiley-VCH VerlagGmbH & Co. KGaA, Weinheim, Germany. pp. 63–82.
Pineri, L.R.E.G.M. & Escoubes, M. (1993) Polyaniline membrane for gas separation and ESR experiments.3rd International Conference on Effective Membrane Processes – New Perspectives. p. 323.
Saksena, M. & Saxena, S. (1965) Viscosity of multicomponent gas mixture. Physica A, 31, 18–25.Wijmans, J. & Baker, R. (1995) The solution-diffusion model: a review. Journal of Membrane Science,
107 (1), 1–21.

This page intentionally left blankThis page intentionally left blank

CHAPTER 21
The effect of piperazine with N -methyldiethanolamine in emulsionliquid membrane for carbon dioxide removal
Norfadilah Dolmat & Khairul S.N. Kamarudin
21.1 INTRODUCTION
Carbon dioxide (CO2) is one of the acid gases that are released from various industrial processes,contributing to global warming (Teramoto et al., 2000). CO2 in natural gas can also cause equip-ment plugging due to dry-ice formation, catalyst poisoning and reduction of the heating value(Aroonwilas andTontiwachwuthikul, 1997). There are several methods that can be used to removeCO2. Chemical and physical absorption, membrane separation, adsorption and cryogenic separa-tion are those methods that have been used for CO2 removal (Mandal and Bandyopadhyay, 2006;Moon and Shim, 2006). Meanwhile, absorption using alkanoamines such as primary, secondaryand tertiary amines is a common technique in separation industries nowadays (Wong and Bioletti,2002). However, amine that is in contact with metal surfaces leads to corrosion and damages theequipment (Kosseim et al., 1984).
Liquid membrane technology is one of the alternative techniques that can be used to remove CO2
efficiently. Liquid membrane consists of an organic phase that separates the two aqueous phaseswhich are the feed and receiving phases. The separation occurs when the solute permeates throughthe liquid phase from the feed to receiving phase. Bulk liquid membrane (BLM), supportedliquid membrane (SLM) and emulsion liquid membrane (ELM) are three different types of liquidmembrane. Among these three types of liquid membrane, ELM seems to have a potential due tothe large mass transfer area and simple operation (Chakraborty et al., 2003). Indeed, ELM wassuccessfully used in the food and dairy, chemical, cosmetic, pharmaceutical and biotechnologyindustries, in waste water treatment and in medical applications (Nath, 2008).
Absorption of carbon dioxide by using ELM technique can prevent corrosion problems (Li,1968). This is due to the fact that, in the ELM technique, the aqueous phase containing aminein the form of small particles is dispersed in the organic phase. The organic layer prevents theamines from being directly in contact with the surface of the equipment. The formation of smallparticles provides a large interfacial area for absorption.
Although N -methyldiethanolamine (MDEA) is corrosive, it is commonly used in the separationprocess due to a high CO2 loading capacity (1 mol CO2 reacts with 1 mol of MDEA). However,MDEA is a slow reacting alkanoamines (Bishnoi, 2000). Therefore, the addition of activator orpromoter such as piperazine (PZ) is necessary to increase the reaction between amine with CO2.PZ contains two basic nitrogen atoms and can theoretically react with 2 mol of CO2. Besides,the reaction rate constant of PZ with CO2 is about one order of magnitude higher than that ofMEA (Bishnoi and Rochelle, 2000). Therefore, PZ is used as a promoter with other aminesfor CO2 capture process (Arunkumar and Bandyopadhyay, 2007; Bishnoi and Rochelle, 2002;Cullinane and Rochelle, 2004; Xu et al., 1992; Zhang et al., 2001). However, to separate CO2
effectively, this process requires a stable emulsion. Hence, the objective of this chapter is todiscuss the stability of emulsion and CO2 absorption at various concentrations of MDEA andPZ. PZ has been used together with MDEA in order to increase the CO2 absorption. Emulsionliquid membrane technique has been applied to prevent corrosion of metal surfaces caused by theMDEA and PZ.
227
228 N. Dolmat & K.S.N. Kamarudin
21.2 EXPERIMENTAL
21.2.1 Materials
Emulsion liquid membrane (ELM) was formed by homogenizing aqueous and organic phases.The aqueous phase consists of MDEA (extractant), PZ (promoter) and NaOH solution, while theorganic phase consists of SPAN 80 (surfactant) and kerosene (diluent). MDEA supplied by QrecTM
and PZ supplied by Merck were used as received. In addition, deionized water and sodium hydrox-ide pellets supplied byAshland Incorporation were used in the preparation of the aqueous solution.
21.2.2 Aqueous phase preparation
100 mL of aqueous phase was prepared by adding a mixture of MDEA and PZ into aqueous 0.1 MNaOH solution. The solution was stirred for 15 min. Different samples were prepared by varyingthe amount of PZ and NaOH solution. Based on previous research, the MDEA solution was fixedat 8% volume (Bhatti and Kamarudin, 2010). Table 21.1 shows the volume of MDEA, PZ andNaOH for aqueous phase preparation. The stirring speed and temperature of the heating platewere fixed at 700 rpm and 30◦C, respectively. Table 21.2 shows the volume of the aqueous phasebased on MDEA/PZ ratio of 4:3. The amount of MDEA and PZ increases while NaOH solutiondecreases to observe the effect of MDEA/PZ on CO2 removal.
21.2.3 Organic phase preparation
The 100 mL organic phase was prepared by adding 8 mL of Span-80 into the 92 mL of kerosene.The solution was heated for 15 min. The stirring speed and temperature of the heating plate wasfixed at 700 rpm and 30◦C, respectively. The same procedure was repeated for other samples.
21.2.4 ELM preparation
Figure 21.1 shows the homogenization of aqueous and organic phase using a high performancedisperser Ultra Turrax® T25 with 18G mixing shaft. The organic phase mixture was placed inthe beaker. Then, the aqueous phase mixture was added drop wise into the organic solutionand homogenized for 5 minutes. The speed of the mixer was fixed at 10,000 rpm. Table 21.3summarizes the formulation of ELM preparation.
Table 21.1. Volume for aqueous phase preparation.
MDEA [mL] PZ [mL] 0.1 M NaOH [mL]
8 0 928 2 908 3 898 4 888 5 878 6 86
Table 21.2. Volume for aqueous phase preparation at differentquantities of MDEA and PZ.
MDEA [mL] PZ [mL] 0.1 M NaOH [mL]
12 9 7916 12 7220 15 6524 18 58

The effect of piperazine with N-methyldiethanolamine in emulsion liquid membrane 229
Figure 21.1. Homogenization of aqueous and organic phase using high performance disperser UltraTurrax®
T25 with 18G mixing shaft.
Table 21.3. Formulation of ELM preparation.
Aqueous phase [mL] Organic phase [mL]
MDEA PZ NaOH, 0.1 M Kerosene Span-80
8 0 92 92 88 2 90 92 88 3 89 92 88 4 88 92 88 5 87 92 88 6 86 92 812 9 79 92 816 12 72 92 820 15 65 92 824 18 58 92 8
21.2.5 ELM characterization and performance
21.2.5.1 Stability studiesTo determine the stability of the emulsion, the samples were filled in the graduated test tubes andplaced in the room at 25◦C.After 24 h, the formation of layers was measured. Demulsification willresult in the formation of 3 layers (organic phase, emulsion, aqueous phase) whereas sedimentationof emulsion will result in the formation of 2 layers. Sedimentation is a process of the particles tosettle down to the bottom of the solution. It is the instability of the particle in the emulsion dueto the size or density of particles. Thus, stability was calculated based on the following equation:
%Stability = VT − VS
VT× 100% (21.1)
whereVT =Total volume [mL]VS =Top layer volume [mL]
230 N. Dolmat & K.S.N. Kamarudin
21.2.5.2 Carbon dioxide absorption analysisA rotating disc contactor (RDC) column (Fig. 21.2) connected to the gas chromatography (GC)was used for the CO2 absorption study. The column was filled with 200 mL of the preparedemulsion. The flow rate of carbon dioxide to the column was fixed at 20 LPM (liter per minute).The gas was allowed to flow into the column for 1 minute. The speed of the rotating disc wasin a range of 450–500 rpm. The pressure of the RDC was also recorded. Gas chromatography(GC) was used to determine the amount of CO2 in the inlet and out streams of the RDC since theamount of substance in a sample is proportional to the area under the peak of that substance. Thepercentage of removal is the amount of CO2 absorbed by the ELM and was calculated based onthe area under the CO2 peak (Equation (21.2)):
Percentage of removal [%] = area CO2 in − area CO2 out
area CO2 in(21.2)
Figure 21.2. Rotating disc contactor column.
21.3 RESULTS AND DISCUSSION
21.3.1 ELM characterization
21.3.1.1 Stability of emulsionThe separation of ELM was measured after the sample was left for 24 h in the graduated testtube at 25◦C. The sample formed 2 layers, which indicates only sedimentation has occurred. Thestability was calculated based on Equation (21.1). Figure 21.3 shows the emulsion stability beforeabsorption at different MDEA/PZ compositions. A sample containing only MDEA has the higheststability (98%). After the addition of 2 mL of PZ into 8 mL of MDEA solution, the stability ofthe emulsion decreased from 98 to 89.9%. The stability of MDEA and PZ was influenced by theviscosity of the solution. When combining PZ with MDEA, the viscosity of the solution increased.In general, a high viscosity solution requires more energy during homogenization to form smallsize particles that are well dispersed in the emulsion. Since the emulsification speed and timewere fixed at 10,000 rpm and 5 minutes respectively, the sedimentation started to occur. Thus,

The effect of piperazine with N-methyldiethanolamine in emulsion liquid membrane 231
8:0
98
89.9 9088.6 88.9 89.3
86.7 86.7 86.3 86.2
100
95
90
85
80
Per
cent
age
of s
tabi
lity
[%]
8:2 8:3 8:4 8:5 8:6 12:9 16:12 20:15 24:18MDEA:PZ composition [mL]
Figure 21.3. The percentages of emulsion stability before CO2 absorption.
90.0 87.385.0
81.1 82.483.9
81.9 80.9 80.478.1
73.1
85.0
80.0
75.0
70.0
65.0Per
cent
age
of s
tabi
lity
[%]
8:0 8:2 8:3 8:4 8:5
MDEA:PZ composition [mL]
8:6 12:9 16:12 20:15 24:18
Figure 21.4. The percentages of emulsion stability after CO2 absorption.
sedimentation is enhanced and emulsion stability is decreased as the viscosity of solution increasesdue to the addition of PZ. The emulsion stability containing 8 mL MDEA and PZ (between 3 and6 mL) were in a range of 88.6 to 90%. However, when the total quantity of MDEA with PZ wasincreased (based on 4:3 ratio), the emulsion stability was further reduced. The sample contained24 mL MDEA with 18 mL PZ has the lowest percentage of emulsion stability (86.2%).
The emulsion stability was further reduced after CO2 absorption due to the particle size increase.Figure 21.4 shows the percentage of emulsion stability after contacting with CO2. The emulsioncontaining 8 mL MDEA retained the highest emulsion stability (87.3%) while 24 mL MDEA with18 mL PZ had the lowest percentage of emulsion stability (73.1%). The emulsion stability forsample containing 8 mL MDEA with an increasing volume of PZ (3 mL to 6 mL) was in the rangeof 81.1 to 83.9%. As the quantity of MDEA and PZ increased (from 8:6 to 24:18), the emulsionstability decreased continuously.
21.3.1.2 pH analysisIn this study, the pH value of the emulsion before and after contacting with CO2 was measured toobserve its relationship with the stability of the emulsion and the percentage of CO2 removal. ThepH value of emulsion before and after contacting with CO2 is shown in Figure 21.5 together withthe composition of MDEA and PZ in the aqueous phase solution. The figure shows that beforethe emulsion contacted with CO2, the sample containing 8 mL MDEA has the lowest pH value(10.83). After addition of PZ (8:2 and 8:3), the pH increased to 11.19 to 11.41. The increase ofpH was due to high pKa value of PZ (pKa = 10.33). Despite this effect, the pH was maintained
232 N. Dolmat & K.S.N. Kamarudin
12.0011.5011.0010.5010.009.509.008.508.00
8:0
pH v
alue
8:2 8:3
MDEA:PZ composition [mL]
8:4 8:5 8:6 12:9 16:12 20:15 24:18
pH before
pH after
Figure 21.5. pH value of emulsion before and after contacting with CO2 at different composition of MDEAand PZ.
below 11.5 for all emulsions. After the absorption, the pH values decreased. This was due to theacidic nature of CO2 gas.
21.3.2 ELM performance
21.3.2.1 Carbon dioxide removalFigure 21.6 illustrates the percentage of CO2 removal using different quantities of MDEA/PZ.The sample containing 8 mL MDEA and 6 mL PZ has the highest percentage of CO2 removal(54.8%) while the sample containing 24 mL MDEA with 18 mL PZ showed the lowest percentageof CO2 removal (34.1%). The percentage of CO2 removal increased as the amount of PZ increased.It clearly shows that the addition of PZ into the solution increases the percentage of CO2 removalas compared to use of MDEA only. For the reaction, MDEA has a CO2 loading capacity of 1.0mol CO2 per mole of amine. However, when more PZ is added, the emulsion becomes less stablebecause of the viscosity increase, which will result in a decreased percentage of CO2 removal.This trend is also found in Figure 21.6.
60.0
50.0
40.0
30.0
20.0
10.0
08:0 8:2
50.9 51.2 51.9 54.847.9 46.7
36.3 34.139.8
45.8
8:3 8:4 8:5 8:6 12:9
MDEA:PZ composition [mL]
Per
cent
age
of C
O2
rem
oval
[%]
16:12 20:15 24:18
Figure 21.6. The percentages of CO2 removal.
21.3.3 Formulation of MDEA and PZ for CO2 removal
Figures 21.7 and 21.8 show the relationship between the percentage of CO2 removal and thepercentage of the emulsion stability, before and after the CO2 removal using different compositionsof MDEA and PZ. From the figures, emulsion containing 8 mL MDEA has the highest percentageof stability before and after absorption, but the percentage of CO2 removal was low. However, theaddition of PZ into the emulsion decreased the percentage of stability of emulsion (before and
The effect of piperazine with N-methyldiethanolamine in emulsion liquid membrane 233
110.0
100.0
90.0
80.0
70.0
60.0
50.0
40.0
30.08:0
39.8
45.8
50.9 51.2 51.9
47.9
34.1
Carbon dioxide removal [%][%]
Stability before [%]
36.3
46.7
54.8
OptimumLine
9889.9 90 89.3
86.7 86.7
86.3 86.288.988.6
8:2 8:3 8:4 8:5
MDEA:PZ composition [mL]
8:6 12:9 16:12 20:15 24:18
Figure 21.7. The relationship between the percentages of CO2 removal and percentage of emulsion stabilitybefore absorption.
100.0
90.0
80.0
70.0
60.0
50.0
40.0
30.0
MDEA:PZ composition [mL]
8:0
39.8
45.851.9
51.250.9
81.1
85.087.3
82.4 81.9 80.4
80.983.9 78.1
73.1
54.8
47.9
Optimumline
46.7
36.334.1
Carbon dioxide removal [%]Stability after [%]
8:2 8:3 8:4 8:5 8:6 12:9 16:12 20:15 24:18
[%]
Figure 21.8. The relationship between the percentages of CO2 removal and percentage of emulsion stabilityafter absorption.
after absorption) but increased the percentage of CO2 removal. When the quantity of MDEA andPZ increased based on the ratio of 4:3, the stability of the emulsion before and after absorption wasreduced. Similarly, the percentage of CO2 removal was also reduced. Based on the formulationof emulsion in Table 21.3, the emulsion containing 8 mL MDEA and 6 mL PZ has the highestpercentage of stability before and after absorption, and the highest CO2 removal. Therefore, thisstudy has shown that using a homogenization speed of 10,000 rpm and homogenization time of 5minutes, emulsion formulation of 8 mL of Span 80, 92 mL of kerosene and 8 mL MDEA + 6 mLPZ has the highest CO2 removal.
21.4 CONCLUSION
This study shows the effect of piperazine (PZ) addition to MDEA in the aqueous phase on stabilityof emulsion and percentage of CO2 removal. The emulsion stability refers to sedimentation ofthe particles that leads to the formation of 2 layers. The stability of emulsion decreased when the

234 N. Dolmat & K.S.N. Kamarudin
PZ was added to MDEA. This was due to high viscosity of solution that required more energyto homogenize the emulsion to produce small particles. In contrast, the addition of PZ to 8 mLof MDEA increased the percentage of CO2 removal. However, with further increase of PZ, theemulsion stability started to decrease. Therefore, this study showed that emulsion formulationcontaining 8 mL of Span 80 and 92 mL of kerosene (organic phase), and 86 mL NaOH, 8 mLMDEA and 6 mL PZ (aqueous phase) was the best formulation for CO2 removal in a rotatingdisc contactor column. The homogenization speed of 10,000 rpm and homogenization time of5 minutes were able to produce a stable emulsion. This result provides new information aboutemulsion formulation and its capability to remove carbon dioxide.
ACKNOWLEDGEMENT
The authors are grateful to the Ministry of Science, Technology and Innovation (MOSTI) andUniversiti Teknologi Malaysia (VotNo. 4S047) for supporting the research on carbon dioxideremoval using emulsion liquid membrane technique.
REFERENCES
Aroonwilas, A. & Tontiwachwuthikul, P. (1997) High-efficiency structured packing for CO2 separation using2-amino-2-methyl-1-propanol (AMP). Separation and Purification Technology, 12, 67–79.
Arunkumar, S. & Bandyopadhyay, S.S. (2007) Kinetics and modeling of carbon dioxide absorption intoaqueous solutions of piperazine. Chemical Engineering Science, 62, 7312–7319.
Bhatti, I. & Kamarudin, K.S.N. (2010) Removal of carbon dioxide using water-in-oil emulsion liquidmembrane containing triethanolamine (TEA). Journal Applied Science Research, 6 (12), 2251–2256.
Bishnoi, S. (2000) Carbon dioxide absorption and solution equilibrium in piperazine activatedmethyldiethanolamine. PhD Thesis, The University Of Texas at Austin, Austin, TX.
Bishnoi, S. & Rochelle, G.T. (2000) Absorption of carbon dioxide into aqueous piperazine: reaction kinetics,mass transfer and solubility. Chemical Engineering Science, 55, 5531–5543.
Bishnoi, S. & Rochelle, G. (2002)Absorption of carbon dioxide in aqueous piperazine/methyldiethanolamine.American Institute of Chemical Engineering Journal, 48, 2788–2799.
Chakraborty, M., Bhattacharya, C. &. Datta, S. (2003) Studies on the applicability of artificial neural network(ANN) in emulsion liquid membranes. Journal of Membrane Science, 220 (1–2), 155–164.
Cullinane, J. & Rochelle, G. (2004) Carbon dioxide absorption with aqueous potassium carbonate promotedby piperazine. Chemical Engineering Science, 59, 3619–3630.
Kosseim, A.J., McCullough, J.G. & Butwell, K.F. (1984) Treating acid & sour gas: corrosion-inhibited amineguard ST process. Chemical Engineering Progress, 80 (10), 64–71.
Li, N.N. (1968). Separating hydrocarbons with liquid membranes. US Patent 3,410,794.Mandal, B.P. & Bandyopadhyay, S.S. (2006) Absorption of carbon dioxide into aqueous blends of 2-amino-
2-methyl-1-propanol and monoethanolamine. Chemical Engineering Science, 61, 5440–5447.Moon, S.H. & Shim, J.W. (2006) A novel process for CO2/CH4 gas separation on activated carbon fibers-
electric swing adsorption. Journal of Colloid and Interface Science, 298, 523–528.Nath, K. (2008) Membrane separation process. Phi Learning Pvt. Ltd., New Delhi, India.Teramoto, M., Sakaida, Y., Fu, S.S., Ohnishi, N. & Matsuyama, H. (2000) An attempt for the stabilization of
supported liquid membrane. Separation and Purification Technology, 21 (1–2), 137–144.Wong, S. & Bioletti, R. (2002) Carbon dioxide separation technologies. Alberta Research Council, Canada.Xu, G.W., Zhang, C.F., Qin, S.J. & Wang,Y.W. (1992)Absorption of carbon dioxide into solutions of activated
methyldiethanolamine. Industrial Engineering Chemistry Research, 31, 921–927.Zhang, X., Zhang, C.F. & Xu, G.W. (2001). An experimental apparatus to mimic CO2 removal and optimum
concentration of MDEA aqueous solution. Industrial Engineering Chemistry Research, 40, 898–901.
CHAPTER 22
Separation of olefins from paraffins by membranecontactor – a review
Gholamreza Bakeri, Ali Kazemi Joujili, Mostafa Rahimnejad,Ahmad Fauzi Ismail & Takeshi Matsuura
22.1 INTRODUCTION
Olefins are among the most important products in petrochemical plants. Generally, they aremixed with paraffins therefore it is necessary to use efficient technologies with lower energyconsumption for difficult separation of olefins from paraffins. Because of high operating costsand capital investment for current commercially practiced separation processes, many researcheshave been done into better olefin/paraffin separation techniques.
An olefin/paraffin separation scheme using membrane based techniques offers great advantagessuch as reducing the operating cost and capital investment, as well as eliminating the operatingproblems in distillation towers such as flooding, entrainment, etc. (Faiz and Li, 2012). Most of theresearches in this field have been devoted to gas separation membranes which have some problemssuch as low flux and selectivity that prohibit their application in petrochemical industries.
On the other hand, membrane contactor offers many advantages such as high flux and selectivitythat are related to the separation mechanism in the contactor. As the membrane is porous and solutegas diffuses through the pores, the flux is much higher than a gas separation membrane where thegas should dissolve in the membrane and then diffuse through the dense skin layer. Furthermore,the selectivity in contactor applications depends on the absorbent that can be chosen to maximizethe selectivity. Chilukuri et al. (2007) studied the separation of propylene from propane usingmembrane contactor with a capacity of 300 tons/year and achieved reasonable results. Therefore,the application of contactor with an efficient membrane for olefin/paraffin separation would bean attractive alternative to replace the current separation processes.
22.2 OLEFIN AND PARAFFIN
Nowadays, olefin based products (especially with low molecular weight such as C2–C5) encom-pass an important part of the petrochemical industries and people’s lives and yield a wide rangeof products such as cosmetics, textile products, paints, tools etc. (Fallanza et al., 2012). Ethyleneand propylene, with a purity of more than 99.9%, are the most important olefins that are used asfeedstock in petrochemical plants for producing not only polyethylene and polypropylene but alsomany kinds of chemicals such as ethylene oxide, vinyl chloride, etc. (Ceresana, 2011; Hilyard,2008). Since olefins are so important in petrochemical industries, their production and consump-tion capacity show increasing trends, e.g. in 1995, USA production capacity for ethylene was21.3 million metric tons while in 1998, it increased to 23.6 million tons (Bessarabov, 1998; Burnsand Koros, 2003).
22.2.1 Olefin production technologies
About 70% of the olefins are produced by the cracking method and the other 30% are made throughcatalytic cracking and paraffin dehydrogenation processes (Fallanza et al., 2011; Hilyard, 2008).
235

236 G. Bakeri et al.
As cracking methods are not selective, new technologies with higher selectivity in reaction (suchas methanol to propylene, MTP) were developed (Lurgi & NPC-RT, 2007).
22.2.2 The importance of olefin/paraffin separation
Since olefin and paraffin (with the same carbon number) have close physical properties such asboiling point, their separation is so hard and needs a distillation tower with many trays, whichincreases the operating costs and capital investment (Hirschfelder et al., 1964; Perry and Green,1984; Rajabzadeh et al., 2010). On the other hand, in olefin production processes a mixtureof olefin and paraffin is produced that needs efficient methods for separation. Furthermore, oilrefinery plants produce a mixture of olefin/paraffin which, when used as a fuel, emits toxicmaterials (Safarik and Eldridge, 1998). Therefore, it is worthwhile to develop new technologiesfor separation of olefin from paraffin.
22.2.3 Olefin/paraffin separation methods
There are several methods for olefin/paraffin separation such as cryogenic distillation, extractivedistillation, molecular sieve adsorption, absorption and membrane based processes (Chang et al.,2002; Ghosh et al., 1993). Among these methods, membrane technologies are the newest oneswhich present some advantages over the other methods such as modularity, lower operatingcost etc.
22.2.4 Membrane processes
Membranes have been known to be used in separation processes for about 100 years (Lonsdale,1982) but this technology was not used in industry for a long time. In the 1940s, membranewas used for separation of uranium isotopes on a commercial scale. With the development ofasymmetric membranes by Loeb and Sourirajan (1963) in the early 1960s, membrane separationprocesses have been widely used in the dairy, food and beverage industries (Jiao et al., 2004).Membrane technologies present some advantages such as lower energy consumption (Scholz andLucas, 2003), modular design with smaller equipment (Porter, 1990; Scholz and Lucas, 2003),higher surface to volume ratio (Drioli et al., 2006), more flexibility in operation (Drioli et al.,2006) and less environmental pollution.
22.3 MEMBRANE CONTACTOR
Membrane contactor is one of the newest techniques for gas separation where mass transfer occursbetween gas stream and liquid absorbent without dispersion of phases into each other. The streamsflow on opposite sides of a porous membrane and the gas fills the pores of the membrane while theliquid is immobilized at the entrance of the pores, so the phases are in contact with each other atthe mouth of the pores. In other words, unlike traditional separation equipment, there is no directcontact between phases (Baker, 2012). Membrane contactor has some advantages compared toother separation techniques (Bakeri et al., 2011; Gabelman and Hwang, 1999; Nymeijer D.C.et al., 2004; Rajabzadeh et al., 2010) such as:
• The available contact area between phases remains nearly constant at different flow rates as itdepends on the membrane characteristics.
• As there is no phase dispersion, no emulsion forms.• Scale up/down or capacity change of contactor system is very straightforward as the system
is modular.

Separation of olefins from paraffins by membrane contactor – a review 237
• Higher efficiency is obtained in comparison to dispersive systems such as packed towersbecause of the higher contact area, as reported that the contact area in contactor systems is4–30 times more than in packed towers (Simioni et al., 2011).
• The separation process in membrane can be done with high selectivity since as strong anabsorbent as possible can be selected.
As the energy consumption in contactor systems is low and the flux and selectivity are high, thistechnology offers higher efficiency as reported by Klassen et al. (2005). However, membranecontactor has some disadvantageous such as (Gabelman and Hwang, 1999):
• Membrane makes an extra resistance in mass transfer between phases. However, this resistanceis compensated by the high contact area generated by membrane.
• Membranes may be subjected to fouling which is not easy to be controlled.• Membrane life time is limited so the cost of periodic membrane replacement should be
considered.
In summary, even though membrane contactor has some limitations, its benefits are large enoughto use it on a commercial scale.
Most of the researches in the field of membrane contactors were devoted to CO2 separationand few studies were done on olefin/paraffin separation. Qi and Cussler (1985a; 1985b) were thefirst who worked on the CO2 capture using membrane contactor. Bessarabov et al. (1995) usednon-porous membrane in two stages for ethane/ethylene separation. In recent years, a number ofresearches have been done on olefin/paraffin separation, most of which were for ethane/ethyleneand propane/propylene separation Bessarabov et al. (1995).
In membrane contactor, olefin reacts with the absorbent and makes a complex with Ag and Cuions that are used as absorbent. Then, in the next stage gas should be separated from the absorbentby breaking the complex through a change in temperature and pressure. Even though it seemsthat the separation process is performed in two stages and membrane increases the mass transferresistance, the high interfacial area provided by the membrane enhances the overall performanceof the contactor system.
22.4 MEMBRANE CHARACTERISTICS
Some membrane properties such as porosity and hydrophobicity affect the performance of mem-brane in contactor applications. Li et al. (1999) reported that the membrane mass transfercoefficient depends on membrane porosity, membrane tortuosity and membrane thickness:
km = Deε
τlm(22.1)
where lm is membrane thickness, τ is membrane tortuosity, ε is membrane porosity and De iseffective diffusivity that depends on membrane pore size (r) as presented by:
De = 1(1D + 3
2r
√πM8RT
) (22.2)
where M is the molecular weight of diffusing gas, D is bulk diffusivity, R is the universal gasconstant and T is absolute temperature. The diffusivity of gas through membrane pores dependson pores size, i.e. for pore diameter less than 100 nm the Knudsen mechanism is the governingone, for diameters more than 100 nm the bulk diffusion is the governing one and between thesetwo ranges, both mechanisms are dominant (Kumar et al., 2003).
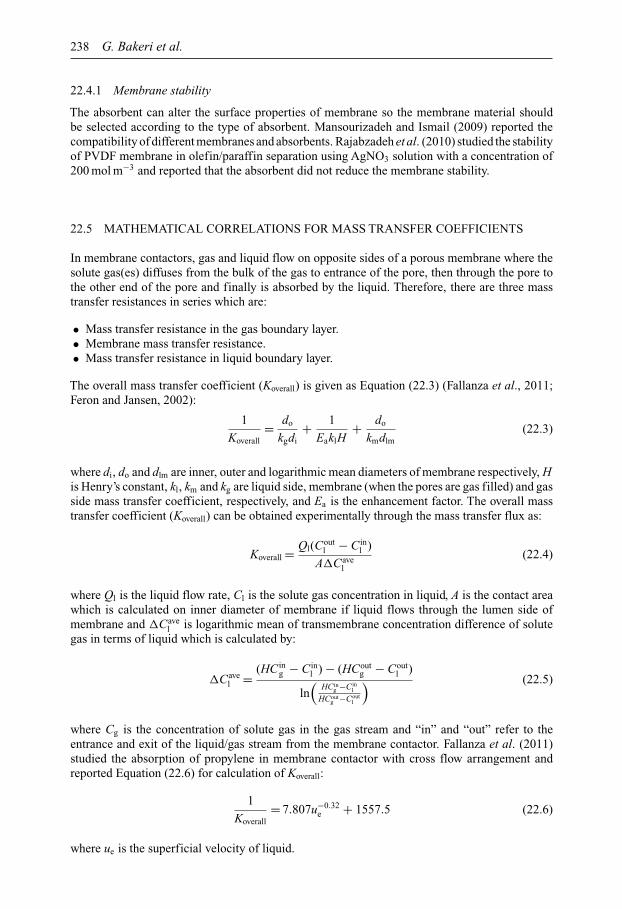
238 G. Bakeri et al.
22.4.1 Membrane stability
The absorbent can alter the surface properties of membrane so the membrane material shouldbe selected according to the type of absorbent. Mansourizadeh and Ismail (2009) reported thecompatibility of different membranes and absorbents. Rajabzadeh et al. (2010) studied the stabilityof PVDF membrane in olefin/paraffin separation using AgNO3 solution with a concentration of200 mol m−3 and reported that the absorbent did not reduce the membrane stability.
22.5 MATHEMATICAL CORRELATIONS FOR MASS TRANSFER COEFFICIENTS
In membrane contactors, gas and liquid flow on opposite sides of a porous membrane where thesolute gas(es) diffuses from the bulk of the gas to entrance of the pore, then through the pore tothe other end of the pore and finally is absorbed by the liquid. Therefore, there are three masstransfer resistances in series which are:
• Mass transfer resistance in the gas boundary layer.• Membrane mass transfer resistance.• Mass transfer resistance in liquid boundary layer.
The overall mass transfer coefficient (Koverall) is given as Equation (22.3) (Fallanza et al., 2011;Feron and Jansen, 2002):
1
Koverall= do
kgdi+ 1
EaklH+ do
kmdlm(22.3)
where di, do and dlm are inner, outer and logarithmic mean diameters of membrane respectively, His Henry’s constant, kl, km and kg are liquid side, membrane (when the pores are gas filled) and gasside mass transfer coefficient, respectively, and Ea is the enhancement factor. The overall masstransfer coefficient (Koverall) can be obtained experimentally through the mass transfer flux as:
Koverall = Ql(Coutl − C in
l )
A�Cavel
(22.4)
where Ql is the liquid flow rate, Cl is the solute gas concentration in liquid, A is the contact areawhich is calculated on inner diameter of membrane if liquid flows through the lumen side ofmembrane and �Cave
l is logarithmic mean of transmembrane concentration difference of solutegas in terms of liquid which is calculated by:
�Cavel = (HC in
g − C inl ) − (HCout
g − Coutl )
ln(
HC ing −C in
l
HCoutg −Cout
l
) (22.5)
where Cg is the concentration of solute gas in the gas stream and “in” and “out” refer to theentrance and exit of the liquid/gas stream from the membrane contactor. Fallanza et al. (2011)studied the absorption of propylene in membrane contactor with cross flow arrangement andreported Equation (22.6) for calculation of Koverall:
1
Koverall= 7.807u−0.32
e + 1557.5 (22.6)
where ue is the superficial velocity of liquid.
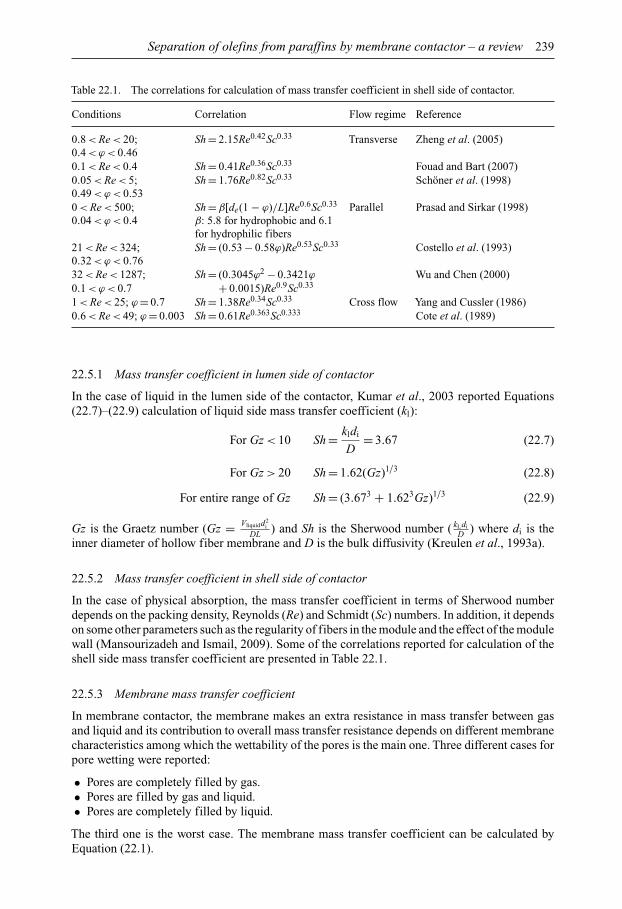
Separation of olefins from paraffins by membrane contactor – a review 239
Table 22.1. The correlations for calculation of mass transfer coefficient in shell side of contactor.
Conditions Correlation Flow regime Reference
0.8 < Re < 20; Sh = 2.15Re0.42Sc0.33 Transverse Zheng et al. (2005)0.4 < ϕ < 0.460.1 < Re < 0.4 Sh = 0.41Re0.36Sc0.33 Fouad and Bart (2007)0.05 < Re < 5; Sh = 1.76Re0.82Sc0.33 Schöner et al. (1998)0.49 < ϕ < 0.530 < Re < 500; Sh = β[de(1 − ϕ)/L]Re0.6Sc0.33 Parallel Prasad and Sirkar (1998)0.04 < ϕ < 0.4 β: 5.8 for hydrophobic and 6.1
for hydrophilic fibers21 < Re < 324; Sh = (0.53 − 0.58ϕ)Re0.53Sc0.33 Costello et al. (1993)0.32 < ϕ < 0.7632 < Re < 1287; Sh = (0.3045ϕ2 − 0.3421ϕ Wu and Chen (2000)0.1 < ϕ < 0.7 + 0.0015)Re0.9Sc0.33
1 < Re < 25; ϕ = 0.7 Sh = 1.38Re0.34Sc0.33 Cross flow Yang and Cussler (1986)0.6 < Re < 49; ϕ = 0.003 Sh = 0.61Re0.363Sc0.333 Cote et al. (1989)
22.5.1 Mass transfer coefficient in lumen side of contactor
In the case of liquid in the lumen side of the contactor, Kumar et al., 2003 reported Equations(22.7)–(22.9) calculation of liquid side mass transfer coefficient (kl):
For Gz < 10 Sh = kldi
D= 3.67 (22.7)
For Gz > 20 Sh = 1.62(Gz)1/3 (22.8)
For entire range of Gz Sh = (3.673 + 1.623Gz)1/3 (22.9)
Gz is the Graetz number (Gz = Vliquidd2i
DL ) and Sh is the Sherwood number ( kLdi
D ) where di is theinner diameter of hollow fiber membrane and D is the bulk diffusivity (Kreulen et al., 1993a).
22.5.2 Mass transfer coefficient in shell side of contactor
In the case of physical absorption, the mass transfer coefficient in terms of Sherwood numberdepends on the packing density, Reynolds (Re) and Schmidt (Sc) numbers. In addition, it dependson some other parameters such as the regularity of fibers in the module and the effect of the modulewall (Mansourizadeh and Ismail, 2009). Some of the correlations reported for calculation of theshell side mass transfer coefficient are presented in Table 22.1.
22.5.3 Membrane mass transfer coefficient
In membrane contactor, the membrane makes an extra resistance in mass transfer between gasand liquid and its contribution to overall mass transfer resistance depends on different membranecharacteristics among which the wettability of the pores is the main one. Three different cases forpore wetting were reported:
• Pores are completely filled by gas.• Pores are filled by gas and liquid.• Pores are completely filled by liquid.
The third one is the worst case. The membrane mass transfer coefficient can be calculated byEquation (22.1).
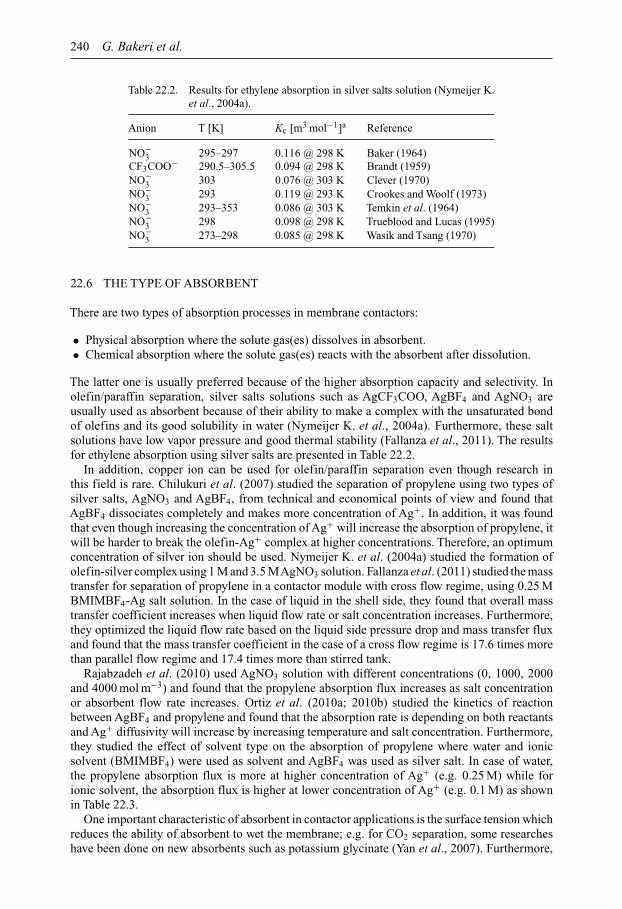
240 G. Bakeri et al.
Table 22.2. Results for ethylene absorption in silver salts solution (Nymeijer K.et al., 2004a).
Anion T [K] Kc [m3 mol−1]a Reference
NO−3 295–297 0.116 @ 298 K Baker (1964)
CF3COO− 290.5–305.5 0.094 @ 298 K Brandt (1959)NO−
3 303 0.076 @ 303 K Clever (1970)NO−
3 293 0.119 @ 293 K Crookes and Woolf (1973)NO−
3 293–353 0.086 @ 303 K Temkin et al. (1964)NO−
3 298 0.098 @ 298 K Trueblood and Lucas (1995)NO−
3 273–298 0.085 @ 298 K Wasik and Tsang (1970)
22.6 THE TYPE OF ABSORBENT
There are two types of absorption processes in membrane contactors:
• Physical absorption where the solute gas(es) dissolves in absorbent.• Chemical absorption where the solute gas(es) reacts with the absorbent after dissolution.
The latter one is usually preferred because of the higher absorption capacity and selectivity. Inolefin/paraffin separation, silver salts solutions such as AgCF3COO, AgBF4 and AgNO3 areusually used as absorbent because of their ability to make a complex with the unsaturated bondof olefins and its good solubility in water (Nymeijer K. et al., 2004a). Furthermore, these saltsolutions have low vapor pressure and good thermal stability (Fallanza et al., 2011). The resultsfor ethylene absorption using silver salts are presented in Table 22.2.
In addition, copper ion can be used for olefin/paraffin separation even though research inthis field is rare. Chilukuri et al. (2007) studied the separation of propylene using two types ofsilver salts, AgNO3 and AgBF4, from technical and economical points of view and found thatAgBF4 dissociates completely and makes more concentration of Ag+. In addition, it was foundthat even though increasing the concentration of Ag+ will increase the absorption of propylene, itwill be harder to break the olefin-Ag+ complex at higher concentrations. Therefore, an optimumconcentration of silver ion should be used. Nymeijer K. et al. (2004a) studied the formation ofolefin-silver complex using 1 M and 3.5 MAgNO3 solution. Fallanza et al. (2011) studied the masstransfer for separation of propylene in a contactor module with cross flow regime, using 0.25 MBMIMBF4-Ag salt solution. In the case of liquid in the shell side, they found that overall masstransfer coefficient increases when liquid flow rate or salt concentration increases. Furthermore,they optimized the liquid flow rate based on the liquid side pressure drop and mass transfer fluxand found that the mass transfer coefficient in the case of a cross flow regime is 17.6 times morethan parallel flow regime and 17.4 times more than stirred tank.
Rajabzadeh et al. (2010) used AgNO3 solution with different concentrations (0, 1000, 2000and 4000 mol m−3) and found that the propylene absorption flux increases as salt concentrationor absorbent flow rate increases. Ortiz et al. (2010a; 2010b) studied the kinetics of reactionbetween AgBF4 and propylene and found that the absorption rate is depending on both reactantsand Ag+ diffusivity will increase by increasing temperature and salt concentration. Furthermore,they studied the effect of solvent type on the absorption of propylene where water and ionicsolvent (BMIMBF4) were used as solvent and AgBF4 was used as silver salt. In case of water,the propylene absorption flux is more at higher concentration of Ag+ (e.g. 0.25 M) while forionic solvent, the absorption flux is higher at lower concentration of Ag+ (e.g. 0.1 M) as shownin Table 22.3.
One important characteristic of absorbent in contactor applications is the surface tension whichreduces the ability of absorbent to wet the membrane; e.g. for CO2 separation, some researcheshave been done on new absorbents such as potassium glycinate (Yan et al., 2007). Furthermore,
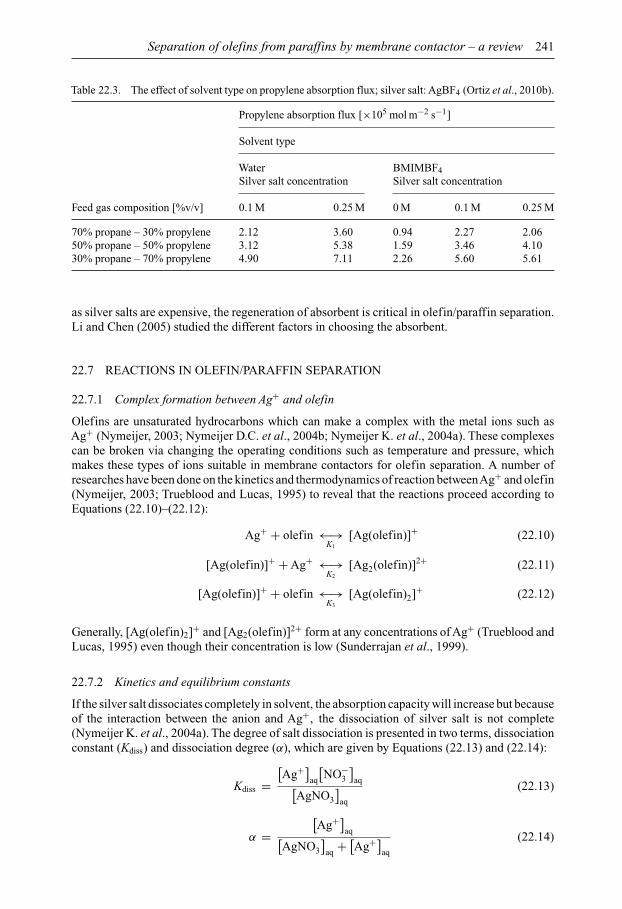
Separation of olefins from paraffins by membrane contactor – a review 241
Table 22.3. The effect of solvent type on propylene absorption flux; silver salt: AgBF4 (Ortiz et al., 2010b).
Propylene absorption flux [×105 mol m−2 s−1]
Solvent type
Water BMIMBF4Silver salt concentration Silver salt concentration
Feed gas composition [%v/v] 0.1 M 0.25 M 0 M 0.1 M 0.25 M
70% propane – 30% propylene 2.12 3.60 0.94 2.27 2.0650% propane – 50% propylene 3.12 5.38 1.59 3.46 4.1030% propane – 70% propylene 4.90 7.11 2.26 5.60 5.61
as silver salts are expensive, the regeneration of absorbent is critical in olefin/paraffin separation.Li and Chen (2005) studied the different factors in choosing the absorbent.
22.7 REACTIONS IN OLEFIN/PARAFFIN SEPARATION
22.7.1 Complex formation between Ag+ and olefin
Olefins are unsaturated hydrocarbons which can make a complex with the metal ions such asAg+ (Nymeijer, 2003; Nymeijer D.C. et al., 2004b; Nymeijer K. et al., 2004a). These complexescan be broken via changing the operating conditions such as temperature and pressure, whichmakes these types of ions suitable in membrane contactors for olefin separation. A number ofresearches have been done on the kinetics and thermodynamics of reaction betweenAg+ and olefin(Nymeijer, 2003; Trueblood and Lucas, 1995) to reveal that the reactions proceed according toEquations (22.10)–(22.12):
Ag+ + olefin ←→K1
[Ag(olefin)]+ (22.10)
[Ag(olefin)]+ + Ag+ ←→K2
[Ag2(olefin)]2+ (22.11)
[Ag(olefin)]+ + olefin ←→K3
[Ag(olefin)2]+ (22.12)
Generally, [Ag(olefin)2]+ and [Ag2(olefin)]2+ form at any concentrations of Ag+ (Trueblood andLucas, 1995) even though their concentration is low (Sunderrajan et al., 1999).
22.7.2 Kinetics and equilibrium constants
If the silver salt dissociates completely in solvent, the absorption capacity will increase but becauseof the interaction between the anion and Ag+, the dissociation of silver salt is not complete(Nymeijer K. et al., 2004a). The degree of salt dissociation is presented in two terms, dissociationconstant (Kdiss) and dissociation degree (α), which are given by Equations (22.13) and (22.14):
Kdiss =[Ag+]
aq
[NO−
3
]aq[
AgNO3
]aq
(22.13)
α =[Ag+]
aq[AgNO3
]aq + [Ag+]
aq
(22.14)
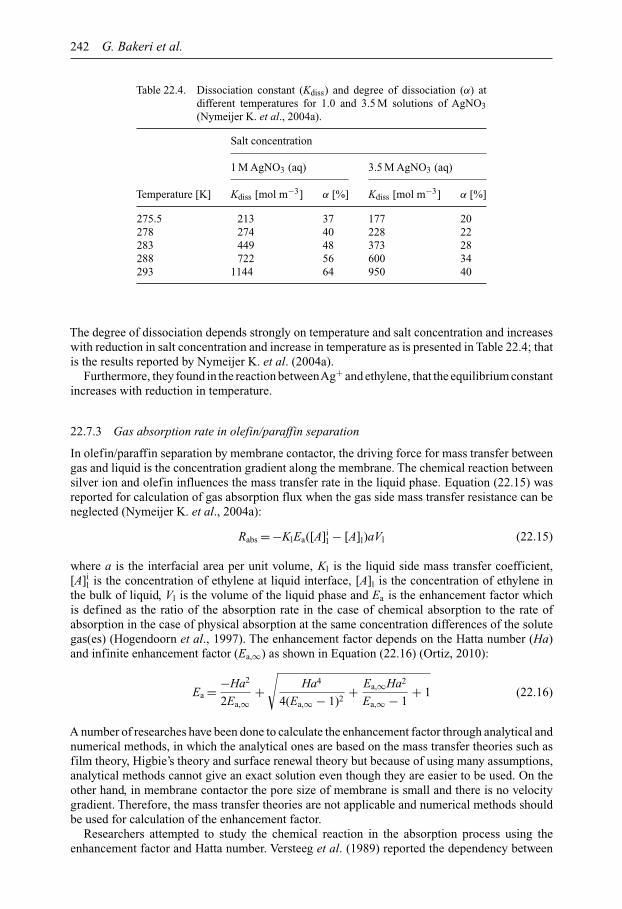
242 G. Bakeri et al.
Table 22.4. Dissociation constant (Kdiss) and degree of dissociation (α) atdifferent temperatures for 1.0 and 3.5 M solutions of AgNO3(Nymeijer K. et al., 2004a).
Salt concentration
1 M AgNO3 (aq) 3.5 M AgNO3 (aq)
Temperature [K] Kdiss [mol m−3] α [%] Kdiss [mol m−3] α [%]
275.5 213 37 177 20278 274 40 228 22283 449 48 373 28288 722 56 600 34293 1144 64 950 40
The degree of dissociation depends strongly on temperature and salt concentration and increaseswith reduction in salt concentration and increase in temperature as is presented in Table 22.4; thatis the results reported by Nymeijer K. et al. (2004a).
Furthermore, they found in the reaction betweenAg+ and ethylene, that the equilibrium constantincreases with reduction in temperature.
22.7.3 Gas absorption rate in olefin/paraffin separation
In olefin/paraffin separation by membrane contactor, the driving force for mass transfer betweengas and liquid is the concentration gradient along the membrane. The chemical reaction betweensilver ion and olefin influences the mass transfer rate in the liquid phase. Equation (22.15) wasreported for calculation of gas absorption flux when the gas side mass transfer resistance can beneglected (Nymeijer K. et al., 2004a):
Rabs = −KlEa([A]il − [A]l)aVl (22.15)
where a is the interfacial area per unit volume, Kl is the liquid side mass transfer coefficient,[A]i
l is the concentration of ethylene at liquid interface, [A]l is the concentration of ethylene inthe bulk of liquid, Vl is the volume of the liquid phase and Ea is the enhancement factor whichis defined as the ratio of the absorption rate in the case of chemical absorption to the rate ofabsorption in the case of physical absorption at the same concentration differences of the solutegas(es) (Hogendoorn et al., 1997). The enhancement factor depends on the Hatta number (Ha)and infinite enhancement factor (Ea,∞) as shown in Equation (22.16) (Ortiz, 2010):
Ea = −Ha2
2Ea,∞+√
Ha4
4(Ea,∞ − 1)2+ Ea,∞Ha2
Ea,∞ − 1+ 1 (22.16)
A number of researches have been done to calculate the enhancement factor through analytical andnumerical methods, in which the analytical ones are based on the mass transfer theories such asfilm theory, Higbie’s theory and surface renewal theory but because of using many assumptions,analytical methods cannot give an exact solution even though they are easier to be used. On theother hand, in membrane contactor the pore size of membrane is small and there is no velocitygradient. Therefore, the mass transfer theories are not applicable and numerical methods shouldbe used for calculation of the enhancement factor.
Researchers attempted to study the chemical reaction in the absorption process using theenhancement factor and Hatta number. Versteeg et al. (1989) reported the dependency between
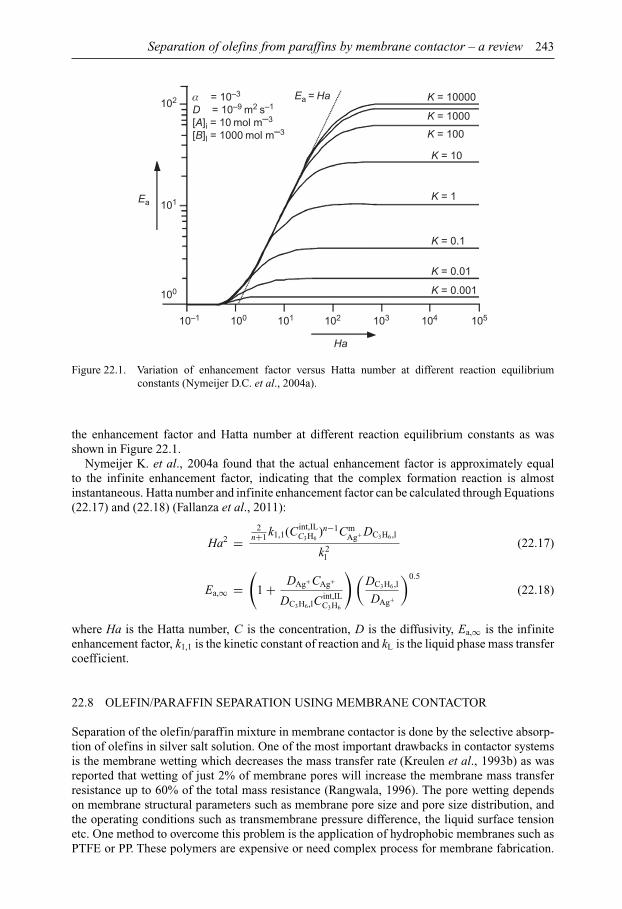
Separation of olefins from paraffins by membrane contactor – a review 243
10–1
101
102
100
100 101 102
Ha
103 104 105
Ea
Ea = Ha K = 10000
K = 1000
K = 100
K = 10
K = 1
K = 0.1
K = 0.01
K = 0.001
α = 10–3
D = 10–9 m2 s–1
[A]i = 10 mol m–3
[B]l = 1000 mol m–3
Figure 22.1. Variation of enhancement factor versus Hatta number at different reaction equilibriumconstants (Nymeijer D.C. et al., 2004a).
the enhancement factor and Hatta number at different reaction equilibrium constants as wasshown in Figure 22.1.
Nymeijer K. et al., 2004a found that the actual enhancement factor is approximately equalto the infinite enhancement factor, indicating that the complex formation reaction is almostinstantaneous. Hatta number and infinite enhancement factor can be calculated through Equations(22.17) and (22.18) (Fallanza et al., 2011):
Ha2 =2
n+1 k1,1(C int,ILC3H6
)n−1CmAg+ DC3H6,l
k2l
(22.17)
Ea,∞ =(
1 + DAg+ CAg+
DC3H6,lCint,ILC3H6
)(DC3H6,l
DAg+
)0.5
(22.18)
where Ha is the Hatta number, C is the concentration, D is the diffusivity, Ea,∞ is the infiniteenhancement factor, k1,1 is the kinetic constant of reaction and kL is the liquid phase mass transfercoefficient.
22.8 OLEFIN/PARAFFIN SEPARATION USING MEMBRANE CONTACTOR
Separation of the olefin/paraffin mixture in membrane contactor is done by the selective absorp-tion of olefins in silver salt solution. One of the most important drawbacks in contactor systemsis the membrane wetting which decreases the mass transfer rate (Kreulen et al., 1993b) as wasreported that wetting of just 2% of membrane pores will increase the membrane mass transferresistance up to 60% of the total mass resistance (Rangwala, 1996). The pore wetting dependson membrane structural parameters such as membrane pore size and pore size distribution, andthe operating conditions such as transmembrane pressure difference, the liquid surface tensionetc. One method to overcome this problem is the application of hydrophobic membranes such asPTFE or PP. These polymers are expensive or need complex process for membrane fabrication.
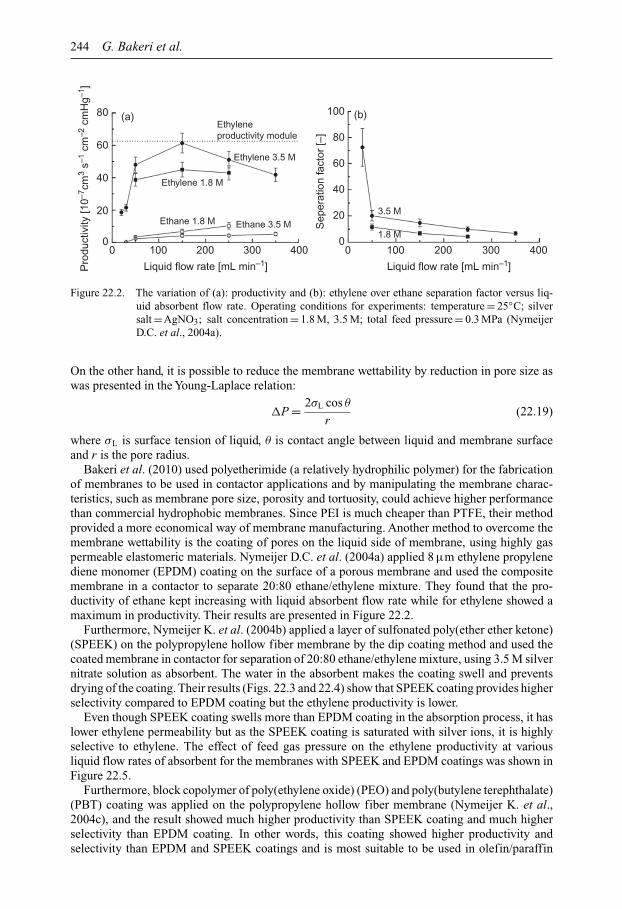
244 G. Bakeri et al.
80
60
40
20
00 100 200
Liquid flow rate [mL min–1]Pro
duct
ivity
[10–7
cm3
s–1 c
m–2
cm
Hg–1
]
Ethylene 1.8 M
Ethyleneproductivity module
Ethane 1.8 M3.5 M
1.8 MEthane 3.5 M
Ethylene 3.5 M
Liquid flow rate [mL min–1]
Sep
erat
ion
fact
or [–
]
300 400 0 100 200 300 400
80
100
60
40
20
0
(a) (b)
Figure 22.2. The variation of (a): productivity and (b): ethylene over ethane separation factor versus liq-uid absorbent flow rate. Operating conditions for experiments: temperature = 25◦C; silversalt =AgNO3; salt concentration = 1.8 M, 3.5 M; total feed pressure = 0.3 MPa (NymeijerD.C. et al., 2004a).
On the other hand, it is possible to reduce the membrane wettability by reduction in pore size aswas presented in the Young-Laplace relation:
�P = 2σL cos θ
r(22.19)
where σL is surface tension of liquid, θ is contact angle between liquid and membrane surfaceand r is the pore radius.
Bakeri et al. (2010) used polyetherimide (a relatively hydrophilic polymer) for the fabricationof membranes to be used in contactor applications and by manipulating the membrane charac-teristics, such as membrane pore size, porosity and tortuosity, could achieve higher performancethan commercial hydrophobic membranes. Since PEI is much cheaper than PTFE, their methodprovided a more economical way of membrane manufacturing. Another method to overcome themembrane wettability is the coating of pores on the liquid side of membrane, using highly gaspermeable elastomeric materials. Nymeijer D.C. et al. (2004a) applied 8 µm ethylene propylenediene monomer (EPDM) coating on the surface of a porous membrane and used the compositemembrane in a contactor to separate 20:80 ethane/ethylene mixture. They found that the pro-ductivity of ethane kept increasing with liquid absorbent flow rate while for ethylene showed amaximum in productivity. Their results are presented in Figure 22.2.
Furthermore, Nymeijer K. et al. (2004b) applied a layer of sulfonated poly(ether ether ketone)(SPEEK) on the polypropylene hollow fiber membrane by the dip coating method and used thecoated membrane in contactor for separation of 20:80 ethane/ethylene mixture, using 3.5 M silvernitrate solution as absorbent. The water in the absorbent makes the coating swell and preventsdrying of the coating. Their results (Figs. 22.3 and 22.4) show that SPEEK coating provides higherselectivity compared to EPDM coating but the ethylene productivity is lower.
Even though SPEEK coating swells more than EPDM coating in the absorption process, it haslower ethylene permeability but as the SPEEK coating is saturated with silver ions, it is highlyselective to ethylene. The effect of feed gas pressure on the ethylene productivity at variousliquid flow rates of absorbent for the membranes with SPEEK and EPDM coatings was shown inFigure 22.5.
Furthermore, block copolymer of poly(ethylene oxide) (PEO) and poly(butylene terephthalate)(PBT) coating was applied on the polypropylene hollow fiber membrane (Nymeijer K. et al.,2004c), and the result showed much higher productivity than SPEEK coating and much higherselectivity than EPDM coating. In other words, this coating showed higher productivity andselectivity than EPDM and SPEEK coatings and is most suitable to be used in olefin/paraffin
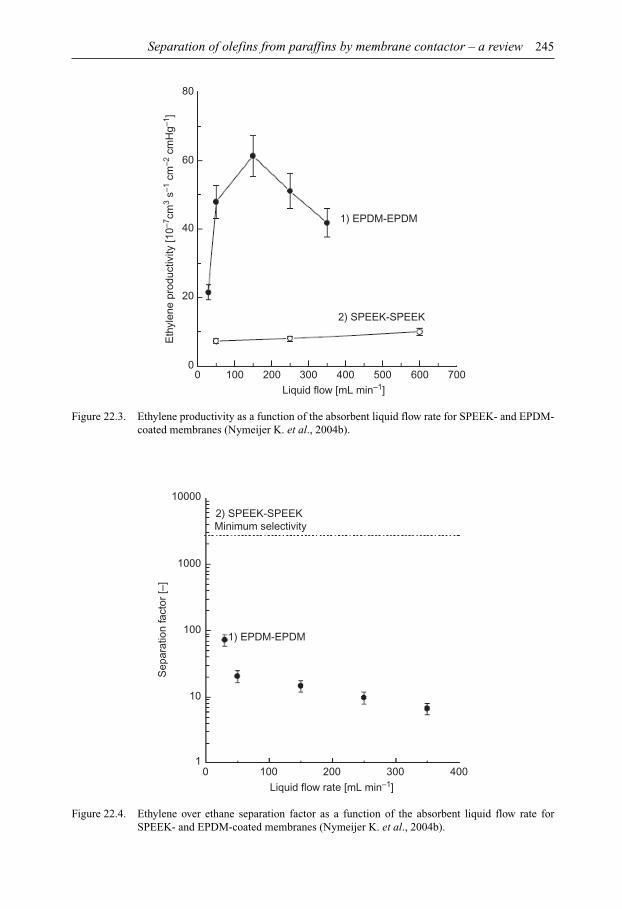
Separation of olefins from paraffins by membrane contactor – a review 245
80
60
40
20
00 100 200 300 400
Liquid flow [mL min–1]
2) SPEEK-SPEEK
Eth
ylen
e pr
oduc
tivity
[10–7
cm3
s–1 c
m–2
cm
Hg–1
]
1) EPDM-EPDM
500 600 700
Figure 22.3. Ethylene productivity as a function of the absorbent liquid flow rate for SPEEK- and EPDM-coated membranes (Nymeijer K. et al., 2004b).
10000
1000
100
10
10 100 200 300 400
Liquid flow rate [mL min–1]
1) EPDM-EPDM
2) SPEEK-SPEEK Minimum selectivity
Sep
arat
ion
fact
or [–
]
Figure 22.4. Ethylene over ethane separation factor as a function of the absorbent liquid flow rate forSPEEK- and EPDM-coated membranes (Nymeijer K. et al., 2004b).

246 G. Bakeri et al.
00
20
40
60
80
200 400
1) EPDM-EPDM 0.3 MPa (filled) and 0.1 MPa (open)
2) SPEEK-SPEEK 0.1 MPa
3) SPEEK-SPEEK 0.3 MPa
600Liquid flow rate [mL min–1]
Eth
ylen
e pr
oduc
tivity
[10–7
cm3
s–1 c
m–2
cm
Hg–1
]
Figure 22.5. Ethylene productivity as a function of the liquid absorbent flow rate and the feed gas pressurefor SPEEK- or EPDM-coated hollow fiber membranes (Nymeijer K. et al., 2004b).
Table 22.5. The permeability and swelling properties of different coatingsused for olefin separation.
Permeability [barrer] Swelling [wt%]
Coating type C2H6 C2H4 H2Oa H2O 3.5 M AgNO3
PEO/PBT 10.4 16.5 5.4 × 10⁵ 53.7 84.7EPDM 40.2 46.4 1.5 × 10³ 0.3 0.1SPEEK NAb NA 1.2 × 10⁵ 88.0 51.0
a3.5 M AgNO3 (aq); bNot applicablebarrer: 10−10 cm3 · cm
cm2 · s · cmHg
separation by membrane contactor. The results for permeability and selectivity of the films ofdifferent coatings are presented in Table 22.5.
The high permeability of water through the coatings causes the permeate stream to be humid.Even though membrane coating can overcome the membrane wettability, adding a layer on themembrane surface increases membrane mass transfer resistance. Ceramic membrane was alsoproposed to reduce membrane wetting in olefin/paraffin separation (Faiz et al., 2012).
22.9 RECOMMENDATIONS
Even though many researches have been done in the field of membrane contactor and consideringthe important advantages of membrane contactor (such as higher absorption flux and selectivity)
Separation of olefins from paraffins by membrane contactor – a review 247
compared to traditional separation equipment and other membrane based separation processessuch as gas separation membrane or facilitated transport membrane, it still needs more studiesto be commercialized especially in the field of olefin/paraffin separation. Most of the researchesfor olefin/paraffin separation have been done at normal temperatures however it is still neededto study the separation process at higher temperatures as the reaction rate between silver ionand olefin increases with temperature even though the thermal stability of membrane shouldbe considered. Although, silver salts are mostly used as absorbent, their high price limits theapplication in commercial scale. So, studies on other types of absorbent, such as copper ion,would be advantageous.
Application of other types of polymer for membrane fabrication can reduce the cost of process,e.g. PEI was used for membrane fabrication and presented higher performance than hydrophobicmembranes (Cote et al., 1989). Furthermore, surface modification using surface modifyingmacromolecules (Bakeri et al., 2012a; 2012b) or hydrophobic nanoparticles can be applied toenhance the performance of membrane in contactor applications and reduce the process costs.
It is also essential to investigate the long term stability of membrane in contactor applicationfor olefin/paraffin separation process and at different operating conditions such as temperatureand pressure.
REFERENCES
Baker, B.B. (1964) The effect of metal fluoroborates on the absorption of ethylene by silver ion. InorganicChemistry 3 (2), 200–202.
Baker, R.W. (2012) Membrane technology and applications. 3rd edition. John Wiley & Sons, Chichester, UK.Bakeri, Gh., Matsuura, T. & Ismail, A.F. (2011) The effect of phase inversion promoters on the structure and
performance of polyetherimide hollow fiber membrane using in gas-liquid contacting process. Journalof Membrane Science, 383, 159–169.
Bakeri, Gh., Ismail, A.F. & Matsuura, T. (2010) Effect of polymer concentration on the structureand performance of polyetherimide hollow fiber membranes. Journal of Membrane Science, 363,103–111.
Bakeri, Gh., Matsuura, T., Ismail, A.F. & Rana, D. (2012a). A novel surface modified polyetherimidehollow fiber membrane for gas-liquid contacting processes. Separation & Purification Technology, 89,160–170.
Bakeri, Gh., Ismail, A.F., Rana, D. & Matsuura, T. (2012b). Development of high performance surface mod-ified polyetherimide hollow fiber membrane for gas-liquid contacting processes. Chemical EngineeringJournal, 198–199, 327–337.
Bessarabov, D.G. (1998) Phenomenological analysis of ethylene transport in a membrane contactor containingsolutions of silver nitrate. Desalination, 115, 265–277.
Bessarabov, D.G., Sanderson, R.D., Jacobs, E.P. & Beckman, I.E. (1995) High-efficiency separationof an ethylene/ethane mixture by a large-scale liquid-membrane contactor containing flat-sheet non-porous polymeric gas-separation membranes and a selective flowing-liquid absorbent. Industrial &Engineering Chemistry Research, 34, 1769–1778.
Brandt, P. (1959) Addition compounds of olefins with metal salts. II. The reaction of ethylene with silverions in aqueous solutions. Acta Chemica Scandinavica, 13, 1639–1659.
Burns, R.L. & Koros, W.J. (2003) Defining the challenges for C3H6/C3H8 separation using polymericmembranes. Journal of Membrane Science, 211, 299–309.
Ceresana (2011) Market study, propylene (UC-1705), January 2011. Konstanz, Germany.Chang, J.W., Marrero, T.R. & Yasuda, H.K. (2002) Continuous process for propylene/propane separation by
use of silver nitrate carrier and zirconia porous membrane. Journal of Membrane Science, 205, 91–102.Chilukuri, P., Rademakers, K., Nymeijer, K., van der Ham, L. & van der Berg, H. (2007) Propylene/
propane separation with a gas/liquid membrane contactor using a silver salt solution. Industrial &Engineering Chemistry Research, 46, 8701–8709.
Clever, H.L., Baker, E.R. & Hale, W.R. (1970) Solubility of ethylene in aqueous silver nitrate and potassiumnitrate solutions – silver ion-ethylene association constant. Journal of Chemical Engineering Data, 15 (3),411–413.
248 G. Bakeri et al.
Costello, M.J., Fane, A.G., Hogan, P.A. & Schofield, R.W. (1993) The effect of shell-side hydrodynamics onthe performance of axial flow hollow fiber modules. Journal of Membrane Science, 80, 1–11.
Cote, P., Bersillon, J.L. & Huyard, A. (1989) Bubble-free aeration using membranes: mass transfer analysis.Journal of Membrane Science, 47, 91–106.
Crookes, J.V. & Woolf, A.A. (1973) Competitive interactions in the complexing of ethylene with silver (I)salt solutions. Journal of the Chemical Society, Dalton Transactions, 12, 1241–1247.
Drioli, E., Criscuoli, A. & Curcio, E. (2006) Membrane contactors: fundamental, applications andpotentialities. Elsevier, Amsterdam, The Netherlands.
Faiz, R. & Li, K. (2012) Olefin/paraffin separation using membrane based facilitated transport/chemicalabsorption techniques. Chemical Engineering Science, 73, 261–284.
Faiz, R., Fallanza, M., Ortiz, I. & Li, K. (2012) Olefin/paraffin separation using ceramic hollow fiber mem-brane contactors, Euromembrane 2012: 23–27 September 2012, London, United Kingdom. ProcediaEngineering, 44, 662–666.
Fallanza, M., Ortiz, A., Gorri, D. & Ortiz, I. (2011) Improving the mass transfer rate in G-L membrane con-tactors with ionic liquids as absorption medium: recovery of propylene. Journal of Membrane Science,385–386, 217–225.
Fallanza, M., Ortiz, A., Gorri, D. & Ortiz, I. (2012) Experimental study of the separation of propane/propylenemixtures by supported ionic liquid membranes containing Ag+-RTILs as carrier. Separation &Purification Technology, 97, 83–89.
Feron, P.H.M. & Jansen, A.E. (2002) CO2 separation with polyolefin membrane contactors and dedicatedabsorption liquids: performances and prospects. Separation & Purification Technology, 27, 231–242.
Fouad, E.A. & Bart, H.J. (2007) Separation of zinc by a non-dispersion solvent extraction process in a hollowfiber contactor. Solvent Extraction and Ion Exchange, 25, 857–877.
Gabelman, A. & Hwang, S.T. (1999) Hollow fiber membrane contactors. Journal of Membrane Science, 159,61–106.
Ghosh, T.K., Lin, H.D. & Hines, A.L. (1993) Hybrid adsorption-distillation process for separating propaneand propylene. Industrial & Engineering Chemistry Research, 32 (10), 2390–2399.
Hilyard, J. (2008) International petroleum encyclopedia. PennWell Corporation, Tulsa, OK.Hirschfelder, J.H., Curtiss, C.F. & Bird, R.B. (1964) Molecular theory of gases and liquids. John Wiley and
Sons, New York, NY.Hogendoorn, J.A., Vas Bhat, R.D., Kuipers, J.A.M., van Swaaij, W.P.M. & Versteeg, G.F. (1997) Approxi-
mation for the enhancement factor applicable to reversible reactions of finite rate in chemically loadedsolution. Chemical Engineering Science, 52 (24), 4547–4559.
Jiao, B., Cassano, A. & Drioli, E. (2004) Recent advances on membrane processes for the concentration offruit juices: a review. Journal of Food Engineering, 63, 303–324.
Klaassen, R., Feron, P.H.M. & Jansen, A.E. (2005) Membrane contactors in industrial applications. ChemicalEngineering Research & Design, 83, 234–246.
Kreulen, H., Smolders, C.A., Versteeg, G.F. & van Swaaij, W.P.M. (1993a) Microporous hollow fiber mem-brane modules as gas-liquid contactors. Part 1: Physical mass transfer processes. Journal of MembraneScience, 78, 197–216.
Kreulen, H., Smolders, C.A., Versteeg, G.F. & van Swaaij, W.P.M. (1993b) Determination of mass transferrates in wetted and non-wetted microporous membranes. Chemical Engineering Science, 48, 2093–2102.
Kumar, P.S., Hogendoorn, J.A., Feron, P.H.M. & Versteeg, G.F. (2003) Approximate solution to predictthe enhancement factor for the reactive absorption of a gas in a liquid flowing through a microporousmembrane hollow fiber. Journal of Membrane Science, 213, 231–245.
Li, J.L. & Chen, B.H. (2005) Review of CO2 absorption using chemical solvents in hollow fiber membranecontactors. Separation & Purification Technology, 41, 109–122.
Li, K., Kong, J.F., Wang, D. & Teo, W.K. (1999) Tailor-made asymmetric PVDF hollow fibers for solublegas removal. AIChE Journal, 45 (6), 1211–1219.
Loeb, S. & Sourirajan, S. (1963) Seawater demineralization by means of an osmotic membrane. AmericanChemical Society, Los Angeles, CA.
Lonsdale, H.K. (1982) The growth of membrane technology. Journal of Membrane Science, 10, 81–181.Lurgi & NPC-RT (2007) Operating Manual, M.T.P. Demo Plant, Introduction Section. Lurgi GmbH,
Frankfurt, Germany.Mansourizadeh, A. & Ismail, A.F. (2009) Hollow fiber gas-liquid membrane contactors for acid gas capture:
a review. Journal of Hazardous Materials, 171, 38–53.Nymeijer, D.C. (2003) Gas-liquid membrane contactors for olefin/paraffin separation. PhD Thesis, Twente
University, Twente, The Netherlands.
Separation of olefins from paraffins by membrane contactor – a review 249
Nymeijer, D.C., Visser, T., Assen, R. & Wessling, M. (2004a) Composite hollow fiber gas-liquid membranecontactors for olefin/paraffin separation. Separation & Purification Technology 37, 209–220.
Nymeijer, D.C., Folkers, B., Breebaart, I., Mulder, M.H.V. & Wessling, M. (2004b) Selection oftop layer materials for gas-liquid membrane contactors. Journal of Applied Polymer Science, 92,323–334.
Nymeijer, K., Visser, T., Brilman, W. & Wessling, W. (2004a) Analysis of the complexation reaction betweenAg+ and ethylene. Industrial & Engineering Chemistry Research, 43, 2627–2635.
Nymeijer, K., Visser, T., Assen, R. & Wessling, M. (2004b) Superselective membranes in gas-liquidmembrane contactors for olefin/paraffin separation. Journal of Membrane Science, 232, 107–114.
Nymeijer, K., Visser, T., Assen, R. & Wessling, M. (2004c) Olefin-selective membranes in gas-liquidmembrane contactors for olefin/paraffin separation. Industrial & Engineering Chemistry Research, 43,720–727.
Ortiz, A. (2010) Process intensification in the separation of olefin/paraffin mixtures. VDM Verlag Dr. Müller,Saarbrücken, Germany.
Ortiz, A., Galán, L.M., Gorri, D., de Haan, A.B. & Ortiz, I. (2010a) Kinetics of reactive absorption ofpropylene in RTIL-Ag+ media. Separation & Purification Technology, 73, 106–113.
Ortiz, A., Gorri, D., Irabien, A. & Ortiz, I. (2010b) Separation of propylene/propane mixtures using Ag+-RTIL solutions – evaluation and comparison of the performance of gas-liquid contactors. Journal ofMembrane Science, 360, 130–141.
Ortiz, A., Galan Sanchez, L.M., Gorri, D., De Haan, A.B. & Ortiz, I. (2010c) Reactive ionic liquid media forthe separation of propylene/propane gaseous mixtures. Industrial & Engineering Chemistry Research,49 (16), 7227–7233.
Perry, R.H. & Green, D. (1984) Perry’s chemical engineers handbook. 6th edition. McGraw Hill,New York, NY.
Porter, M.C. (1990) Handbook of industrial membrane technology. William Andrew Publishing/Noyes,Park Ridge, NJ.
Prasad, R. & Sirkar, K.K. (1998) Dispersion-free solvent extraction with microporous hollow-fiber modules.AIChE Journal, 34, 177–188.
Qi, Z. & Cussler, E.L. (1985a) Microporous hollow fibers for gas absorption. Part 1: Mass transfer in theliquid. Journal of Membrane Science, 23, 321–332.
Qi, Z. & Cussler, E.L. (1985b) Microporous hollow fibers for gas absorption. Part 2: Mass transfer acrossthe membrane. Journal of Membrane Science, 23, 333–345.
Rajabzadeh, S., Teramoto, M., Al-Marzouqi, H., Kamio, E., Ohmukai, Y., Maruyama T. & Matsuyama,H. (2010) Experimental and theoretical study on propylene absorption by using PVDF hollow fibermembrane contactors with various membrane structures. Journal of Membrane Science, 346, 86–97.
Rangwala, H.A. (1996) Absorption of carbon dioxide into aqueous solutions using hollow fiber membranecontactors. Journal of Membrane Science, 112, 229–240.
Safarik, D.J. & Eldridge, R.B. (1998) Olefin/paraffin separations by reactive absorption: a review.Industrial & Engineering Chemistry Research, 37, 2571–2581.
Scholz, W. & Lucas, M. (2003) Techno-economic evaluation of membrane filtration for the recovery andre-use of tanning chemicals. Water Research, 37, 1859–1867.
Schöner, P., Plucinski, P., Nitsch, W. & Daiminger, U. (1998) Mass transfer in the shell side of cross flowhollow fiber modules. Chemical Engineering Science, 53, 2319–2326.
Simioni, M., Kentish, S.E. & Stevens, G.W. (2011) Membrane stripping: desorption of carbon dioxide fromalkali solvents. Journal of Membrane Science, 378, 18–27.
Sunderrajan, S., Freeman, B.D. & Hall, C.K. (1999) Fourier transform infrared spectroscopic characteriza-tion of olefin complexation by silver salts in solution. Industrial & Engineering Chemistry Research, 38,4051–4059.
Temkin, O.N., Ginzburg, A.G. & Flid, R.M. (1964) Soluble complexes of unsaturated hydrocarbons withmetal salts and their effect on catalytic reactions. Kinetics and Catalysis, 5, 195–200.
Trueblood, K.N. & Lucas, H.J. (1995) Coordination of silver ion with unsaturated compounds. V. Ethyleneand propene. The Journal of the American Chemical Society, 74, 1338–1339.
Versteeg, G.F., Kuipers, J.A.M., van Beckum, F.P.H. & van Swaaij, W.P.M. (1989) Mass transfer with com-plex reversible chemical reactions. 1. Single reversible chemical reaction. Chemical Engineering Science,44 (10), 2295–2310.
Wasik, S.P. & Tsang, W. (1970) Gas chromatographic determination of partition coefficients of some unsat-urated hydrocarbons and their deuterated isomers in aqueous silver nitrate solutions. Journal of PhysicalChemistry, 74 (15), 2970–2976.
250 G. Bakeri et al.
Wu, J. & Chen, V. (2000) Shell-side mass transfer performance of randomly packed hollow fiber modules.Journal of Membrane Science, 172, 59–74.
Yan, S.P., Fang, M.X., Zhang, W.F., Wang, S.Y., Zu, Z.L., Luo, Z.Y. & Cen, K.F. (2007) Experimental studyon the separation of CO2 from flue gas using hollow fiber membrane contactors without wetting. FuelProcessing Technology, 88, 501–511.
Yang, M.C. & Cussler, E.L. (1986) Designing hollow-fiber contactors. AIChE Journal 32, 1910–1916.Zheng, J.M., Dai, Z.W., Wong, F.S. & Xu, Z.K. (2005) Shell side mass transfer in a transverse flow hollow
fiber membrane contactor. Journal of Membrane Science, 261, 114–120.
CHAPTER 23
The reliability of the conventional gas permeationtesting method for characterizing the porous asymmetricmembranes: a conceptual review
Seyed A. Hashemifard, Ahmad Fauzi Ismail & Takeshi Matsuura
23.1 INTRODUCTION
Attempts have been made to employ extensively asymmetric membranes with porous skin layerfor ultrafiltration (UF), microfiltration (MF), membrane distillation (MD) and, more recently,membrane contactor (MC) as separation processes in various industries. Selection of an adequatemembrane for a specific application requires a deep understanding of its permeation mechanismand also information on surface porosity, bubble point, mean pore size, and pore-size distribution.The pore size and its distribution have been measured using various methods, best exemplifiedby gas permeation testing, bubble point method, liquid displacement method, solute probe tech-niques, and atomic force microscopy (Lee et al., 2002). Each method has its own unique distinctionby which it is suitable for specific types of membranes, hence, poses some limitations for theother types of membranes. The important aspect is the accuracy of the method in measuring orestimating the pore size, which in turn arises from a strong theoretical background. One of theeasiest and the most frequently used approaches is the well-known conventional gas permeationtesting (GPT).
Gas permeation testing was introduced for the first time by Carman in 1956 for characterizationof porous media (Carman, 1956). Later Yasuda and Tsai (1974) employed a constant volumepermeation testing setup in order to characterize a polymeric membrane made from polysulfone.A porous membrane was placed in a Millipore high-pressure cell, and the assembled cell wasconnected to a stainless steel tank (16.4 × 10⁻³ m3 capacity) which had a pressure transducer.After the tank was pressurized to a predetermined pressure, the ball valve between the tank andthe permeability cell was opened and the pressure decay was recorded. It was empirically foundthat the initial stage of pressure decay was not representative of the steady flux. In order to avoidthe initial transient stage of pressure decay, the tank was pressurized to a pressure of approximately50% higher than the pressure needed for the measurement. The gas was then allowed to permeatethrough the test membrane before recording the pressure. The slopes of the pressure decay curvewere measured and recorded at various pressures on a linear strip-chart recorder and were usedto plot against the mean pressure. Wang et al. (1995) adopted the technique in an easier way, i.e.constant pressure gas permeation testing. Two kinds of pure non-sorbable gases (H2 and N2) wereused to determine the permeability and the separation factor of the asymmetric membrane similarto those employed in Monsanto’s prism system. A mathematical model was developed to relatethe gas permeation characteristics to the membrane structural parameters (the mean pore size andthe surface porosity) of the asymmetric membrane. The models were applied to characterize theasymmetric polysulfone flat and hollow fiber membranes prepared in their laboratory.
Many researchers (Altena et al., 1983; Bird et al., 2007; Schofield et al., 1990; Uchytil et al.,1992; 1995; Wang et al., 1990) applied the gas permeation testing for integrated porous skin layermembrane characterization for different purposes, e.g. UF, MF, MD and MC. Khayet and Matsuura(2001) fabricated polyvinylidene fluoride (PVDF) flat-sheet membranes for membrane distillation(MD) with different pore sizes and porosities from casting solutions containing 15 wt% of PVDF,dimethylacetamide, and different concentrations of pure water. They used the conventional GPT
251
252 S.A. Hashemifard, A.F. Ismail & T. Matsuura
method to estimate the membranes pore size. Mansurizadeh and Ismail (2011) used this techniqueto measure the pore size of a PVDF membrane for the purpose of CO2 removal by a MC. Bakeriet al. (2010) applied the technique to measure the pore size and effective surface porosity of MCmembranes prepared from different concentrations of polyetherimide (dissolved in N -methyl-2-pyrrolidone). The concentration of polymer in the spinning dope was varied from 10 to 15 wt%and water was used as the internal and external coagulant. Increasing PEI concentration in thespinning dope decreased the mean pore size and the effective surface porosity at the skin layerand the bulk void fraction. Tailor-made asymmetric PVDF hollow-fiber membranes and theirmembrane modules were fabricated by Li et al. (1999) to remove soluble gas H2S. Hollow fiberswith different morphological structures were prepared using the phase-inversion process, andwere characterized by the gas permeation technique. Results revealed that the skin location islargely dependent on the coagulation medium. The addition of a substantial amount of ethanol tothe coagulation medium would greatly affect the formation of the skin.
Even though all the above mentioned works are very important since they are providing theinformation on the porous structure at the membrane surface, the methods they employed areprone to some inaccuracy caused by inadequate experimental and theoretical techniques. In thiswork we intend to conduct a thorough analysis of the conventional GPT, especially in its theoreticalaspect. As well, we intend to present an improved approach.
23.2 THEORETICAL BACKGROUND
The diffusion and flow of gases through porous media such as integrated porous skin layer mem-branes can occur by different mechanisms. For solids with relatively narrow pore size distributions,several distinct regimes of behavior are observed, depending upon the ratio of the mean free pathof gas molecules to the mean pore diameter, which is known as Knudsen number:
Kn = λ
2rp(23.1)
where, Kn is the Knudsen number, rp is the pore radius [m]. λ is gas mean free path [m] given bykinetic theory of gases (Bird et al., 2007):
λ = 1√2
kBT
πσ2P(23.2)
where kB is the Boltzmann constant (equal to 1.38 × 10⁻²³ J K−1), T is the absolute temperature[K], σ is the collision diameter [m] and P is system mean pressure [Pa]. When an isothermalcondition is assumed, the mass transfer in the pores of the porous medium can take place byKnudsen diffusion, molecular diffusion or viscous flow. Different driving forces are responsiblefor each diffusion mechanism. Gradient of total pressure (dp/dx) leads to a viscous flow and/orKnudsen diffusion, whereas, a concentration gradient (dX i/dx) leads to molecular diffusion and/orKnudsen diffusion (Kast and Hohenthanner, 2000).
There are several issues associated with gas permeability through the capillary porous mem-brane namely: (i) characterization of flow conditions applying the Knudsen number, (ii) describingthe mechanism involved and the governing theory, (iii) distinguishing the contribution of everyindividual mechanism in the overall gas flow, and (iv) validity of the proposed modeling approach(Civan, 2010).
Three different regimes in integrated porous skin layer membranes can be considered, depend-ing on the Knudsen number, Kn, which is used as a criteria to distinguish the flow regimes. Itshould however be noted that, according to different researchers, there is an order of magnitudedifference in the Knudsen number upper or lower limits that is applicable to each flow regime(Bird et al., 2007; Knudsen, 1909). Therefore, we adopt the criteria proposed by Roy et al. (2003)
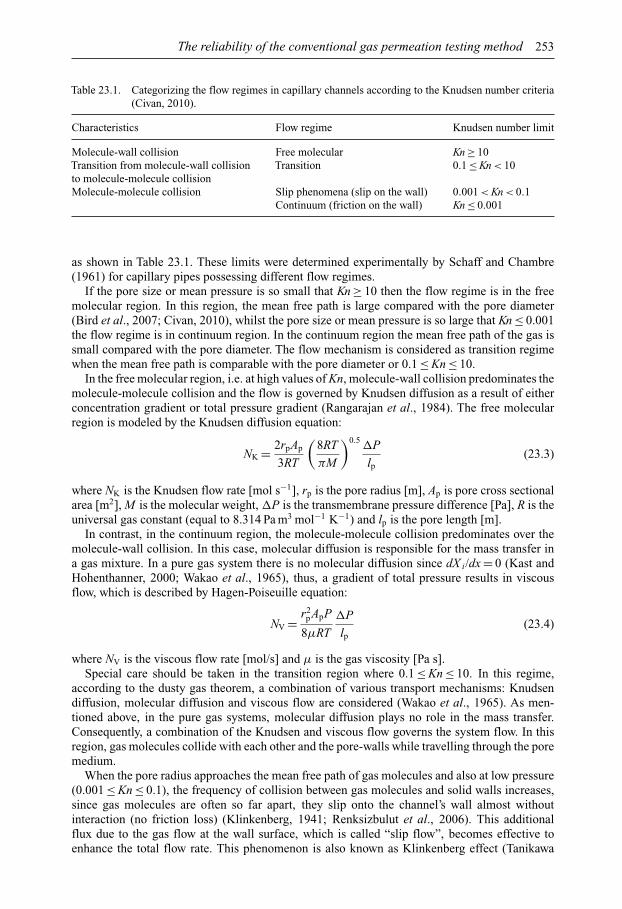
The reliability of the conventional gas permeation testing method 253
Table 23.1. Categorizing the flow regimes in capillary channels according to the Knudsen number criteria(Civan, 2010).
Characteristics Flow regime Knudsen number limit
Molecule-wall collision Free molecular Kn ≥ 10Transition from molecule-wall collision Transition 0.1 ≤ Kn < 10to molecule-molecule collisionMolecule-molecule collision Slip phenomena (slip on the wall) 0.001 < Kn < 0.1
Continuum (friction on the wall) Kn ≤ 0.001
as shown in Table 23.1. These limits were determined experimentally by Schaff and Chambre(1961) for capillary pipes possessing different flow regimes.
If the pore size or mean pressure is so small that Kn ≥ 10 then the flow regime is in the freemolecular region. In this region, the mean free path is large compared with the pore diameter(Bird et al., 2007; Civan, 2010), whilst the pore size or mean pressure is so large that Kn ≤ 0.001the flow regime is in continuum region. In the continuum region the mean free path of the gas issmall compared with the pore diameter. The flow mechanism is considered as transition regimewhen the mean free path is comparable with the pore diameter or 0.1 ≤ Kn ≤ 10.
In the free molecular region, i.e. at high values of Kn, molecule-wall collision predominates themolecule-molecule collision and the flow is governed by Knudsen diffusion as a result of eitherconcentration gradient or total pressure gradient (Rangarajan et al., 1984). The free molecularregion is modeled by the Knudsen diffusion equation:
NK = 2rpAp
3RT
(8RT
πM
)0.5�P
lp(23.3)
where NK is the Knudsen flow rate [mol s−1], rp is the pore radius [m], Ap is pore cross sectionalarea [m2], M is the molecular weight, �P is the transmembrane pressure difference [Pa], R is theuniversal gas constant (equal to 8.314 Pa m3 mol−1 K−1) and lp is the pore length [m].
In contrast, in the continuum region, the molecule-molecule collision predominates over themolecule-wall collision. In this case, molecular diffusion is responsible for the mass transfer ina gas mixture. In a pure gas system there is no molecular diffusion since dX i/dx = 0 (Kast andHohenthanner, 2000; Wakao et al., 1965), thus, a gradient of total pressure results in viscousflow, which is described by Hagen-Poiseuille equation:
NV = r2pApP
8µRT
�P
lp(23.4)
where NV is the viscous flow rate [mol/s] and µ is the gas viscosity [Pa s].Special care should be taken in the transition region where 0.1 ≤ Kn ≤ 10. In this regime,
according to the dusty gas theorem, a combination of various transport mechanisms: Knudsendiffusion, molecular diffusion and viscous flow are considered (Wakao et al., 1965). As men-tioned above, in the pure gas systems, molecular diffusion plays no role in the mass transfer.Consequently, a combination of the Knudsen and viscous flow governs the system flow. In thisregion, gas molecules collide with each other and the pore-walls while travelling through the poremedium.
When the pore radius approaches the mean free path of gas molecules and also at low pressure(0.001 ≤ Kn ≤ 0.1), the frequency of collision between gas molecules and solid walls increases,since gas molecules are often so far apart, they slip onto the channel’s wall almost withoutinteraction (no friction loss) (Klinkenberg, 1941; Renksizbulut et al., 2006). This additionalflux due to the gas flow at the wall surface, which is called “slip flow”, becomes effective toenhance the total flow rate. This phenomenon is also known as Klinkenberg effect (Tanikawa

254 S.A. Hashemifard, A.F. Ismail & T. Matsuura
et al., 2006; Ursin and Zolotukhin, 1997). What is important and has been widely ignored inasymmetric porous membrane is that, to what extent each flow mechanism is contributing to totalgas flow rate?
The three mechanisms (Knudsen, slip and viscous) considered all involve diffusion through thegas phase. If there is significant adsorption on the pore wall, (in the case of condensable gases,e.g. carbon dioxide, ammonia, sulfur dioxide, etc.) there is the possibility of an additional gaspermeation due to diffusion through the adsorbed phase or “surface diffusion”. Surface diffusionis an activated process, but the diffusional activation energy is generally smaller than the heatof adsorption. As a result, surface diffusion increases with decreasing temperature. Therefore,surface diffusion is generally insignificant at temperatures which are high relative to the normalboiling point of the adsorbate gas such as nitrogen, methane, hydrogen and helium (Karger andRuthven, 1992).
When UF, MF, and MC membranes are characterized via the GPT method, the pressures areusually in the range, where the transition regime is applicable, which means Knudsen flow, viscousflow as well as slip flow are contributing to the total flow.
Most attempts at describing the Knudsen/viscous transition region involve a combinationof Equations (23.3) and (23.4). For example, Weber (1954) proposed the combination ofKnudsen and viscous flow permeabilities, with the Knudsen permeability being multiplied by(π/4+λ/2rp)/(1 + λ/2rp), to describe the transition region for the flow along capillary tubes.Creutz (1974) adopted a similar approach, including an adjustable parameter to fit the experi-mental data. Various authors have integrated these (and other) capillary equations over the rangeof pore sizes in a porous medium with reasonable success (for example Schneider, 1975). Othersadopted a similar approach including adjustable parameters to fit experimental data, e.g. Shofieldet al. (1990) stated that, for a range of gases and membranes, flux can be expressed by a simpleequation, J = aPb�P, where a is the membrane mass transfer constant and b is a measure of theextent of viscous flow. As can be seen in all of these attempts, the effect of the slip flow was nottaken into consideration.
The authors believe that the contribution of the slip flow at the wall should be included whenthe transport of membrane pores is discussed, particularly for the ranges of pressures and poresizes we are dealing with. Scott and Dullien (1962) by using modern kinetic theory conceptsdescribed the slip flow mechanism by:
NS = rpAp
RT
(πRT
8M
)0.5�P
lp(23.5)
Wakao et al. (1965), after a rigorous algebraic formulation showed that for a pure gas system,total gas flow N , is given by:
N = cAp
RT
�P
lp(23.6)
where:
C =(
1
1 + 1Kn
)2
3rp
(8RT
πM
)0.5
+(
1
1 + Kn
)[rp
(πRT
8M
)0.5
+ r2pP
8µ
](23.7)
where on the right hand side, the first term is the Knudsen flow, the first term in the squarebracket is the slip flow and the second term is the viscous flow. The path of a molecule in a tubeis interrupted either by collision with the tube wall or with another molecule. Wakao et al. (1965)also proposed the probability of collisions with the wall be ϕ, that is:
ϕ = Wall collision frequency
Total collision frequency(23.8)

The reliability of the conventional gas permeation testing method 255
0.00010
0.2
0.4
0.6
Wal
l-mol
ecul
e co
llisi
on p
roba
bilit
yfu
nctio
n
0.8
1
1.2
Continuum Slip Transition Free molecular
(Wall-molecule collision)(Molecule-molecule collision)
0.001 0.01 0.1
Knudsen number
1 10 100 1000
Figure 23.1. Wall-molecule probability function (ϕ) versus Knudsen number (Kn), combined with thedomain of the individual mechanism.
With this concept the total flow rate through the tube is:
N = (probability of wall-molecule collisions)NK
+ (probability of molecule-molecule collisions) (NS + NV) (23.9)
andN = ϕNK + (1 − ϕ)(NS + NV) (23.10)
where, NK is the Knudsen flow rate, NS is the slip flow rate, and NV is the viscous flow rate.By comparing Equations (23.3)–(23.7) with Equation (23.10) they concluded that:
ϕ = 1
1 + 1Kn
(23.11)
ϕ was also called wall-molecule collision probability function. Figure 23.1 illustrates ϕ versus Kn.The domain of the individual mechanism associated with the corresponding range of Knudsennumber is shown in Figure 23.1 as well.
Scott and Dullien (1962) derived an approximate expression similar to Equation (23.7) byapplying the kinetic theory. Their equations were derived by supposing the molecules to be hardspheres. With this assumption, the results could be expressed in terms of a mean free path.
Their results are the same as that of Wakao et al. (1965) except for a different probabilityfunction defined by:
ϕ = exp[−sinh
(1
Kn
)](23.12)
The two expressions for ϕ, i.e. Equations (23.11) and (23.12), state that ϕ is a function of theKnudsen number. Eventually the final form of the total flow rate over the entire range of theKnudsen number including the transition regime is given by:
N ={
ϕ2rp
3RT
(8RT
πM
)0.5
+ (1 − ϕ)
[rp
RT
(πRT
8M
)0.5
+ r2pP
8µRT
]}AP�P
lp(23.13)
Equation (23.13) has the ability to predict the gas flow for different flow regimes correspondingto various ranges of the Knudsen number and also match the end limits. When ϕ approaches to
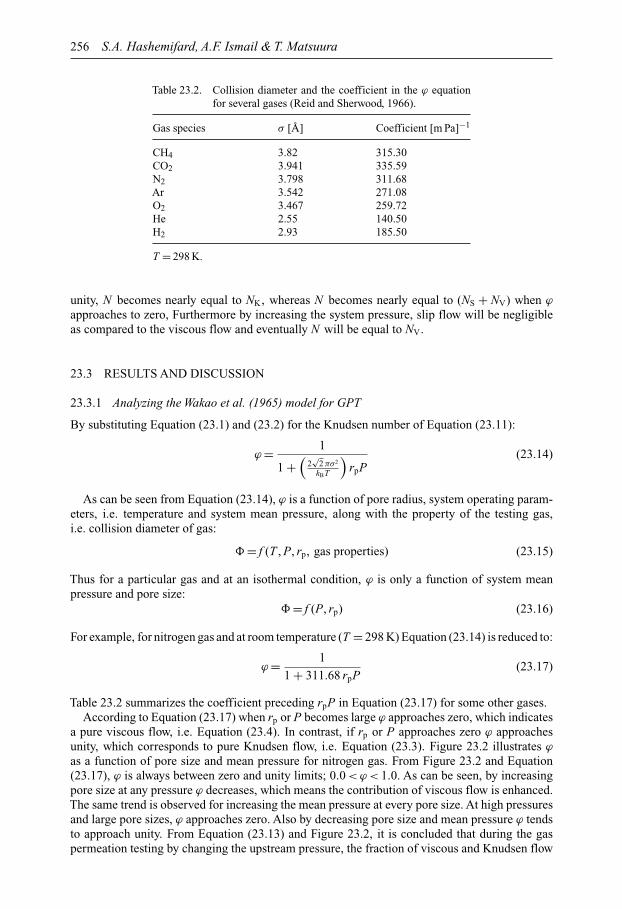
256 S.A. Hashemifard, A.F. Ismail & T. Matsuura
Table 23.2. Collision diameter and the coefficient in the ϕ equationfor several gases (Reid and Sherwood, 1966).
Gas species σ [Å] Coefficient [m Pa]−1
CH4 3.82 315.30CO2 3.941 335.59N2 3.798 311.68Ar 3.542 271.08O2 3.467 259.72He 2.55 140.50H2 2.93 185.50
T = 298 K.
unity, N becomes nearly equal to NK, whereas N becomes nearly equal to (NS + NV) when ϕ
approaches to zero, Furthermore by increasing the system pressure, slip flow will be negligibleas compared to the viscous flow and eventually N will be equal to NV.
23.3 RESULTS AND DISCUSSION
23.3.1 Analyzing the Wakao et al. (1965) model for GPT
By substituting Equation (23.1) and (23.2) for the Knudsen number of Equation (23.11):
ϕ = 1
1 +(
2√
2 πσ2
kBT
)rpP
(23.14)
As can be seen from Equation (23.14), ϕ is a function of pore radius, system operating param-eters, i.e. temperature and system mean pressure, along with the property of the testing gas,i.e. collision diameter of gas:
� = f (T , P, rp, gas properties) (23.15)
Thus for a particular gas and at an isothermal condition, ϕ is only a function of system meanpressure and pore size:
� = f (P, rp) (23.16)
For example, for nitrogen gas and at room temperature (T = 298 K) Equation (23.14) is reduced to:
ϕ = 1
1 + 311.68 rpP(23.17)
Table 23.2 summarizes the coefficient preceding rpP in Equation (23.17) for some other gases.According to Equation (23.17) when rp or P becomes large ϕ approaches zero, which indicates
a pure viscous flow, i.e. Equation (23.4). In contrast, if rp or P approaches zero ϕ approachesunity, which corresponds to pure Knudsen flow, i.e. Equation (23.3). Figure 23.2 illustrates ϕ
as a function of pore size and mean pressure for nitrogen gas. From Figure 23.2 and Equation(23.17), ϕ is always between zero and unity limits; 0.0 < ϕ < 1.0. As can be seen, by increasingpore size at any pressure ϕ decreases, which means the contribution of viscous flow is enhanced.The same trend is observed for increasing the mean pressure at every pore size. At high pressuresand large pore sizes, ϕ approaches zero. Also by decreasing pore size and mean pressure ϕ tendsto approach unity. From Equation (23.13) and Figure 23.2, it is concluded that during the gaspermeation testing by changing the upstream pressure, the fraction of viscous and Knudsen flow
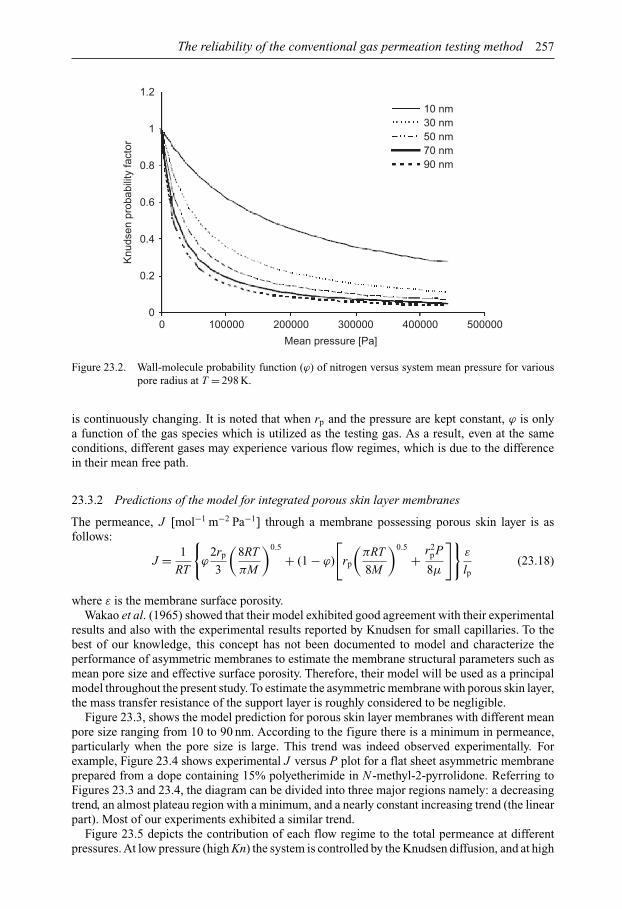
The reliability of the conventional gas permeation testing method 257
Mean pressure [Pa]
Knu
dsen
pro
babi
lity
fact
or
0 100000 200000 300000 400000
10 nm30 nm50 nm70 nm90 nm
5000000
0.2
0.4
0.6
0.8
1
1.2
Figure 23.2. Wall-molecule probability function (ϕ) of nitrogen versus system mean pressure for variouspore radius at T = 298 K.
is continuously changing. It is noted that when rp and the pressure are kept constant, ϕ is onlya function of the gas species which is utilized as the testing gas. As a result, even at the sameconditions, different gases may experience various flow regimes, which is due to the differencein their mean free path.
23.3.2 Predictions of the model for integrated porous skin layer membranes
The permeance, J [mol−1 m−2 Pa−1] through a membrane possessing porous skin layer is asfollows:
J = 1
RT
{ϕ
2rp
3
(8RT
πM
)0.5
+ (1 − ϕ)
[rp
(πRT
8M
)0.5
+ r2pP
8µ
]}ε
lp(23.18)
where ε is the membrane surface porosity.Wakao et al. (1965) showed that their model exhibited good agreement with their experimental
results and also with the experimental results reported by Knudsen for small capillaries. To thebest of our knowledge, this concept has not been documented to model and characterize theperformance of asymmetric membranes to estimate the membrane structural parameters such asmean pore size and effective surface porosity. Therefore, their model will be used as a principalmodel throughout the present study. To estimate the asymmetric membrane with porous skin layer,the mass transfer resistance of the support layer is roughly considered to be negligible.
Figure 23.3, shows the model prediction for porous skin layer membranes with different meanpore size ranging from 10 to 90 nm. According to the figure there is a minimum in permeance,particularly when the pore size is large. This trend was indeed observed experimentally. Forexample, Figure 23.4 shows experimental J versus P plot for a flat sheet asymmetric membraneprepared from a dope containing 15% polyetherimide in N -methyl-2-pyrrolidone. Referring toFigures 23.3 and 23.4, the diagram can be divided into three major regions namely: a decreasingtrend, an almost plateau region with a minimum, and a nearly constant increasing trend (the linearpart). Most of our experiments exhibited a similar trend.
Figure 23.5 depicts the contribution of each flow regime to the total permeance at differentpressures. At low pressure (high Kn) the system is controlled by the Knudsen diffusion, and at high

258 S.A. Hashemifard, A.F. Ismail & T. Matsuura
00
3 × 10⁻⁶
6 × 10⁻⁶
9 × 10⁻⁶
1.2 × 10⁻⁵
1.5 × 10⁻⁵
1.8 × 10⁻⁵
2.1 × 10⁻⁵
Per
mea
nce
[mol
s–1
m–2
Pa–1
] 2.4 × 10⁻⁵
2.7 × 10⁻⁵
3 × 10⁻⁵
50000 100000 150000Mean pressure [Pa]
200000 250000 300000
10 nm
30 nm
50 nm
70 nm
90 nm
Figure 23.3. Wakao model: permeance (J ) of nitrogen versus system mean pressure (P) for various poreradii, at T = 298 K.
00
2
4
Per
mea
nce
[10–6
mol
s–1
m–2
Pa–1
]
6
8
10
12
1 2
Mean pressure [10–5 Pa]
3 4 5 6
Figure 23.4. Permeance (J ) versus system mean pressure (P) of nitrogen at T = 298 K, for a system of15% polyetherimide concentration (dissolved in N -methyl-2-pyrrolidone) asymmetric flatsheet membrane.
pressure (low Kn) the system is governed by the viscous flow mechanism, whereas at intermediatepressures the Knudsen, slip and viscous flow are contributing almost equally. Experimental dataas well as theoretical work have demonstrated a nonlinear dependence of mass flow rate on thepressure drop for the slip flow regime. In fact, the minimum point in the J versus P indicatesthe area of transition from Knudsen flow toward viscous flow which the slip flow mechanism onthe pore walls also interfere the total flow mechanism. This nonlinear dependence of permeanceon pressure was also reported by other researchers (Altena et al., 1983; Beskok and Karniadakis,1999; Beskok et al., 1995; Dullien, 1979).
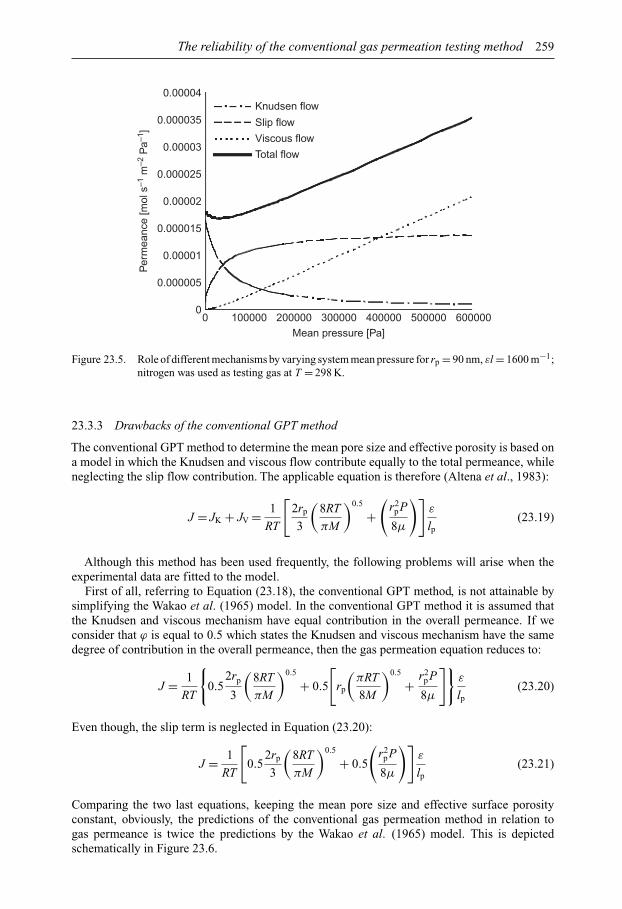
The reliability of the conventional gas permeation testing method 259
00
0.000005
0.00001
0.000015
0.00002
0.000025
Per
mea
nce
[mol
s–1
m–2
Pa–1
]0.00003
0.000035
0.00004Knudsen flow
Slip flow
Viscous flow
Total flow
100000 200000 300000Mean pressure [Pa]
400000 500000 600000
Figure 23.5. Role of different mechanisms by varying system mean pressure for rp = 90 nm, εl = 1600 m−1;nitrogen was used as testing gas at T = 298 K.
23.3.3 Drawbacks of the conventional GPT method
The conventional GPT method to determine the mean pore size and effective porosity is based ona model in which the Knudsen and viscous flow contribute equally to the total permeance, whileneglecting the slip flow contribution. The applicable equation is therefore (Altena et al., 1983):
J = JK + JV = 1
RT
[2rp
3
(8RT
πM
)0.5
+(
r2pP
8µ
)]ε
lp(23.19)
Although this method has been used frequently, the following problems will arise when theexperimental data are fitted to the model.
First of all, referring to Equation (23.18), the conventional GPT method, is not attainable bysimplifying the Wakao et al. (1965) model. In the conventional GPT method it is assumed thatthe Knudsen and viscous mechanism have equal contribution in the overall permeance. If weconsider that ϕ is equal to 0.5 which states the Knudsen and viscous mechanism have the samedegree of contribution in the overall permeance, then the gas permeation equation reduces to:
J = 1
RT
{0.5
2rp
3
(8RT
πM
)0.5
+ 0.5
[rp
(πRT
8M
)0.5
+ r2pP
8µ
]}ε
lp(23.20)
Even though, the slip term is neglected in Equation (23.20):
J = 1
RT
[0.5
2rp
3
(8RT
πM
)0.5
+ 0.5
(r2
pP
8µ
)]ε
lp(23.21)
Comparing the two last equations, keeping the mean pore size and effective surface porosityconstant, obviously, the predictions of the conventional gas permeation method in relation togas permeance is twice the predictions by the Wakao et al. (1965) model. This is depictedschematically in Figure 23.6.
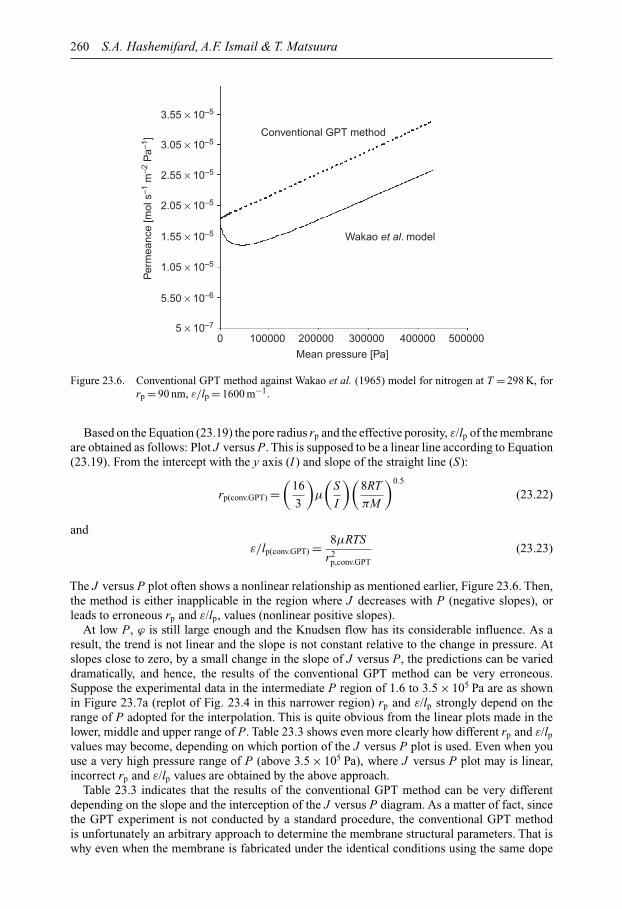
260 S.A. Hashemifard, A.F. Ismail & T. Matsuura
5 × 10⁻⁷
0 100000 200000 300000
Mean pressure [Pa]
400000
Wakao et al. model
Conventional GPT method
500000
5.50 × 10⁻⁶
1.05 × 10⁻⁵
1.55 × 10⁻⁵
2.05 × 10⁻⁵
2.55 × 10⁻⁵
Per
mea
nce
[mol
s–1
m–2
Pa–1
]3.05 × 10⁻⁵
3.55 × 10⁻⁵
Figure 23.6. Conventional GPT method against Wakao et al. (1965) model for nitrogen at T = 298 K, forrp = 90 nm, ε/lp = 1600 m−1.
Based on the Equation (23.19) the pore radius rp and the effective porosity, ε/lp of the membraneare obtained as follows: Plot J versus P. This is supposed to be a linear line according to Equation(23.19). From the intercept with the y axis (I ) and slope of the straight line (S):
rp(conv.GPT) =(
16
3
)µ
(S
I
)(8RT
πM
)0.5
(23.22)
and
ε/lp(conv.GPT) = 8µRTS
r2p,conv.GPT
(23.23)
The J versus P plot often shows a nonlinear relationship as mentioned earlier, Figure 23.6. Then,the method is either inapplicable in the region where J decreases with P (negative slopes), orleads to erroneous rp and ε/lp, values (nonlinear positive slopes).
At low P, ϕ is still large enough and the Knudsen flow has its considerable influence. As aresult, the trend is not linear and the slope is not constant relative to the change in pressure. Atslopes close to zero, by a small change in the slope of J versus P, the predictions can be varieddramatically, and hence, the results of the conventional GPT method can be very erroneous.Suppose the experimental data in the intermediate P region of 1.6 to 3.5 × 10⁵ Pa are as shownin Figure 23.7a (replot of Fig. 23.4 in this narrower region) rp and ε/lp strongly depend on therange of P adopted for the interpolation. This is quite obvious from the linear plots made in thelower, middle and upper range of P. Table 23.3 shows even more clearly how different rp and ε/lp
values may become, depending on which portion of the J versus P plot is used. Even when youuse a very high pressure range of P (above 3.5 × 10⁵ Pa), where J versus P plot may is linear,incorrect rp and ε/lp values are obtained by the above approach.
Table 23.3 indicates that the results of the conventional GPT method can be very differentdepending on the slope and the interception of the J versus P diagram. As a matter of fact, sincethe GPT experiment is not conducted by a standard procedure, the conventional GPT methodis unfortunately an arbitrary approach to determine the membrane structural parameters. That iswhy even when the membrane is fabricated under the identical conditions using the same dope

The reliability of the conventional gas permeation testing method 261
05.5
7.5
7
6.5
6
5.50 0.5
Mean pressure [105 Pa]
0
05.5
6
6.5
7
7.5
5.5
6
6.5
7
7.5
0.5 1 1.5 2 2.5 3 3.5 4
1 2 3 4
Mean pressure [105 Pa]
Mean pressure [105 Pa]
1 1.5 2 2.5 3 3.5 4
6
6.5P
erm
eanc
e[1
0–6 m
ol s
–1 m
–2 P
a–1]
Per
mea
nce
[10–6
mol
s–1
m–2
Pa–1
]P
erm
eanc
e[1
0–6 m
ol s
–1 m
–2 P
a–1]
Per
mea
nce
[10–6
mol
s–1
m–2
Pa–1
]
7
7.5(a) Whole diagram
(b) The lower part
(c) The middle part
(d) The upper part
1
Mean pressure [105 Pa]
2 43
Figure 23.7. Permeance (J ) versus system mean pressure (P) of nitrogen at T = 298 K, for a system of 15%polyetherimide (dissolved in NMP) flat sheet asymmetric membrane, (a) the whole positivesloped part, (b) the lower part, (c) the middle part, and (d) the upper part.
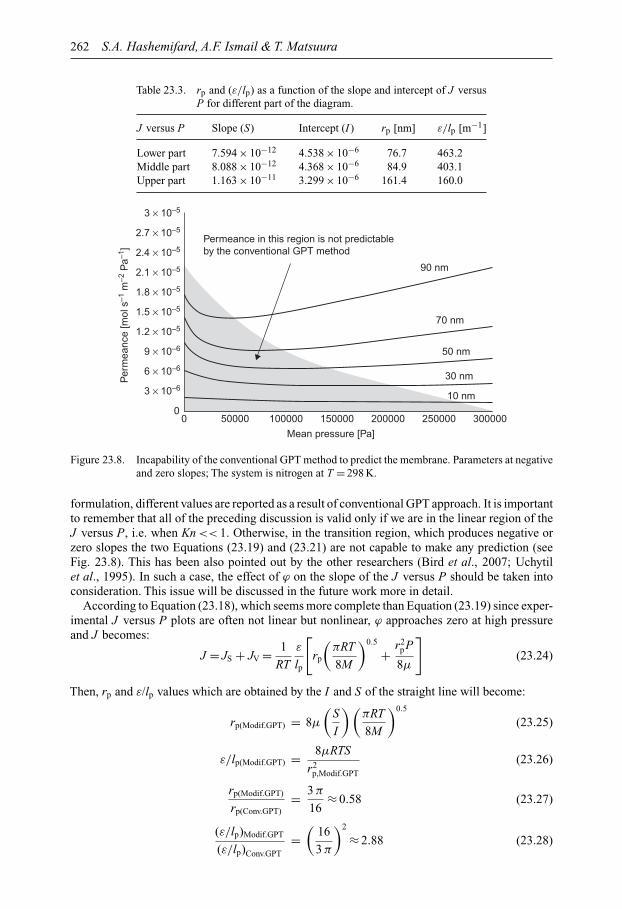
262 S.A. Hashemifard, A.F. Ismail & T. Matsuura
Table 23.3. rp and (ε/lp) as a function of the slope and intercept of J versusP for different part of the diagram.
J versus P Slope (S) Intercept (I ) rp [nm] ε/lp [m−1]
Lower part 7.594 × 10⁻¹² 4.538 × 10⁻⁶ 76.7 463.2Middle part 8.088 × 10⁻¹² 4.368 × 10⁻⁶ 84.9 403.1Upper part 1.163 × 10⁻¹¹ 3.299 × 10⁻⁶ 161.4 160.0
00 50000 100000 150000
Mean pressure [Pa]
200000
90 nm
Permeance in this region is not predictableby the conventional GPT method
70 nm
50 nm
30 nm
10 nm
250000 300000
3 × 10⁻⁶
6 × 10⁻⁶
9 × 10⁻⁶
1.2 × 10⁻⁵
1.5 × 10⁻⁵
1.8 × 10⁻⁵
2.1 × 10⁻⁵
Per
mea
nce
[mol
s–1
m–2
Pa–1
] 2.4 × 10⁻⁵
2.7 × 10⁻⁵
3 × 10⁻⁵
Figure 23.8. Incapability of the conventional GPT method to predict the membrane. Parameters at negativeand zero slopes; The system is nitrogen at T = 298 K.
formulation, different values are reported as a result of conventional GPT approach. It is importantto remember that all of the preceding discussion is valid only if we are in the linear region of theJ versus P, i.e. when Kn << 1. Otherwise, in the transition region, which produces negative orzero slopes the two Equations (23.19) and (23.21) are not capable to make any prediction (seeFig. 23.8). This has been also pointed out by the other researchers (Bird et al., 2007; Uchytilet al., 1995). In such a case, the effect of ϕ on the slope of the J versus P should be taken intoconsideration. This issue will be discussed in the future work more in detail.
According to Equation (23.18), which seems more complete than Equation (23.19) since exper-imental J versus P plots are often not linear but nonlinear, ϕ approaches zero at high pressureand J becomes:
J = JS + JV = 1
RT
ε
lp
[rp
(πRT
8M
)0.5
+ r2pP
8µ
](23.24)
Then, rp and ε/lp values which are obtained by the I and S of the straight line will become:
rp(Modif.GPT) = 8µ
(S
I
)(πRT
8M
)0.5
(23.25)
ε/lp(Modif.GPT) = 8µRTS
r2p,Modif.GPT
(23.26)
rp(Modif.GPT)
rp(Conv.GPT)= 3 π
16≈ 0.58 (23.27)
(ε/lp)Modif.GPT
(ε/lp)Conv.GPT=(
16
3 π
)2
≈ 2.88 (23.28)
The reliability of the conventional gas permeation testing method 263
Therefore, much smaller rp and much larger ε/lp are obtained by using Equation (23.18). Thebest approach seems to use the entire range of P that is covered by experiments and fit the datato Equation (23.18). Implementation of Equation (23.18) and comparing the predicted values forstructural properties of asymmetric porous membrane with the experimental points is the topicof our future study.
23.4 CONCLUSION
A theoretical analysis along with some experimental data was presented in order to study thecapability of the conventional GPT method with reference to the membrane structural parameters.Although the conventional GPT method is relatively easy and fast to be implemented, it suffersfrom several conceptual drawbacks. First of all, it is based on a rather weak theoretical background.That is the reason why the conventional GPT does not necessarily describe the experimentaldata very well. It was shown that simple addition of the Knudsen and viscous terms may leadto erroneous conclusions. By comparing the conventional GPT method with the Wakao et al.(1965) model, it was concluded that the modified values of rp and (ε/lp) were different from theconventional ones by the factor of 3π/16, and (16/3π)2, respectively. In addition, the slope of Jversus P plot depends on the adopted region of the mean pressure. In the other words, depending onwhich region of the J versus P plot is selected, different rp and (ε/lp) will be achieved. Finally, at theregions which the slope is negative or zero, the conventional GPT method is simply not applicable.Since the GPT experiment was not conducted by a standard procedure, the conventional GPTmethod was unfortunately an arbitrary approach to determine the structural parameters. That iswhy, sometimes with the same membrane fabrication conditions and the same dope formulation,the structural parameters obtained by the conventional GPT method do not agree with each other.The best approach seems to use the entire range of P that is covered by experiments and fit the datato Equation (23.18). Implementation of Equation (23.18) and comparing the predicted values forstructural properties of asymmetric porous membrane with the experimental points is the topicof our future study.
ACKNOWLEDGEMENT
The authors are thankful to Advance Membrane Technology Centre (AMTEC), UTM for supportin research management activities for this chapter.
REFERENCES
Altena, F.W., Knoef, H.A.M., Heskamp, H., Bargeman, D. & Smolders, C.A. (1983) Some commentson the applicability of gas permeation methods to characterize porous membranes based on improvedexperimental accuracy and data handling. Journal of Membrane Science, 12, 313–322.
Bakeria, Gh., Ismail, A.F., Shariaty-Niassar, M. & Matsuura, T. (2010) Effect of polymer concentration onthe structure and performance of polyetherimide hollow fiber membranes. Journal of Membrane Science,363, 103–111.
Beskok, A. & Karniadakis, G.E. (1999) Report: a model for flows in channels, pipes, and ducts at micro andnano scales. Thermal Engineering, 3, 43–77.
Beskok, A., Trimmer, W. & Karniadakis, G.E. (1995) Rarefaction and compressibility and thermal creepeffects in gas microflows. IMECE 95, Proceedings ASME Dynamic Systems and Control Division, 57,877–892.
Bird, R.B., Stewart, W.E. & Lightfoot, E.N. (2007) Transport phenomena. Revised 2nd edition. John Wiley& Sons, New York, NY.
Carman, P.C. (1956) Flow of gases through porous media. Butterworth Publications, London, UK.Civan, F. (2010) A review of approaches for describing gas transfer through extremely tight porous media,
porous media and its applications in science, engineering, and industry. In: Vafai, K. (ed.) Proceedings
264 S.A. Hashemifard, A.F. Ismail & T. Matsuura
of 3rd International Conference, 20–25 June 2010, Montecatini, Italy. American Institute of Physics,Melville, NY.
Creutz, E. (1974) The permeability minimum and the viscosity of gases at low pressure. Nuclear Scienceand Engineering, 53, 107–109.
Dullien, F.A.L. (1979) Porous media, fluid transport and pore structure. Academic Press, New York, NY.Karger, J. & Ruthven, D.M. (1992). Diffusion in zeolites and other microporous materials. Wiley,
New York, NY.Kast, W. & Hohenthanner, C.R. (2000) Mass transfer within the gas-phase of porous media. International
Journal of Heat and Mass Transfer, 43, 807–823.Khayet, M. & Matsuura, T. (2001) Preparation and characterization of polyvinylidene fluoride membranes
for membrane distillation. Industrial & Engineering Chemistry Research, 40, 5710–5718.Klinkenberg, L.J. (1941)The permeability of porous media to liquids and gases. American Petroleum Institute,
Drilling and Productions Practices, 200–213.Knudsen, M. (1909) Die Gesetze der Molekularströmung und der Innerenreibungsströmung der Gase durch
Röhren. Annalen der Physik, 28, 75–130.Lee, S., Park, G., Amy, G., Hong, S.-K., Moon, S.-H., Lee, D.-H. & Cho, J. (2002) Determination of
membrane pore size distribution using the fractional rejection of nonionic and charged macromolecules.Journal of Membrane Science, 201, 191–201.
Li, K., Kong, J.F., Wang, D. & Teo, W.K. (1999) Tailor-made asymmetric PVDF hollow fibers for solublegas removal. AIChE Journal, 45, 1211–1219.
Mansourizadeh, A. & Ismail, A.F. (2011) A developed asymmetric PVDF hollow fiber membrane structurefor CO2 absorption. International Journal of Greenhouse Gas Control, 5, 374–380.
Rangarajan, R.M., Mazid, M.A., Matsuura, T. & Sourirajan, S. (1984) Permeation of pure gases under pres-sure through asymmetric porous membranes: membrane characterization and prediction of performance.Industrial and Engineering Chemistry Process Design and Development, 23, 79–87.
Reid, R.C. & Sherwood, T.K. (1966) The properties of gases and liquids. McGraw-Hill, New York, NY.Renksizbulut, M., Niazmand, H. &Tercan, G. (2006) Slip-flow and heat transfer in rectangular microchannels
with constant wall temperature. International Journal of Thermal Sciences, 45, 870–881.Roy, S., Raju, R., Chuang, H.F., Cruden, B.A. & Meyyappan, M. (2003) Modeling gas flow through
icrochannels and nanopores. Journal of Applied Physics, 93, 4870–4879.Schaaf S.A. & Chambre, P.L, (1961) Flow of rarefied gases. Princeton University Press, Princeton, NJ.Schneider, P. (1975) Permeation of simple gases through a porous medium. Collection of Czechoslovak
Chemical Communications, 40, 3114–3122.Schofield, R.W., Fane, A.G. & Fell, C.J.D. (1990) Gas and vapour transport through microporous membranes.
I. Knudsen-viscous transition. Journal of Membrane Science, 53, 159–171.Scott, D.S. & Dullien, F.A.L. (1962) The flow of rare field gas. AIChE Journal, 8, 113–117.Tanikawa, W., Shimamoto, T. & Klinkenberg, L.J. (2006) Effect for gas permeability and its comparison to
water permeability for porous sedimentary rocks. Hydrology and Earth System Sciences Discussions, 3,1315–1338.
Uchytil, P., Nguyen, X.Q. & Broz, Z. (1992) Characterization of membrane skin defects by gas permeationmethod. Journal of Membrane Science, 73, 47–53.
Uchytil, P., Wagner, Z., Rocek, J. & Brož, Z. (1995) Possibility of pore size determination in separation layerof ceramic membrane using permeation method. Journal of Membrane Science,103, 151–157.
Ursin, J.R. & Zolotukhin, A.B. (1997) Fundamentals of petroleum reservoir engineering. HøyskoleforlagetNorwegian Academic Press, Oslo. Norway.
Wakao, N., Otani, S. & Smith, J.M. (1965) Significance of pressure gradients in porous materials. Part I.Diffusion and flow in fine capillaries. AIChE Journal, 11, 435–439.
Wang, D.L., Xu, R.X., Jiang, G.L. & Zhu, B.L. (1990) Determination of surface dense layer structureparameters of the asymmetric membrane by gas permeation method. Journal of Membrane Science, 52,97–108.
Wang, D., Li, K. & Teo, W.K. (1995) Effects of temperature and pressure on gas permselection properties inasymmetric membranes. Journal of Membrane Science, 105, 89–101.
Weber, S. (1954) Danske Matematisk Fysiske Meddelelser, 28: 1.Yasuda, H. & Tsai, J.T. (1974) Pore size of microporous polymer membrane. Journal of Applied Polymer
Science, 18, 805–819.

CHAPTER 24
Modeling of concurrent and counter-current flow hollow fibermembrane modules for multi-component systems
Serene Sow Mun Lock, Kok Keong Lau & Azmi Mohd Shariff
24.1 INTRODUCTION
The combined United States market for membranes employed in gas and liquid separating applica-tions is reported to be worth approximately US$ 2.2 billion in 2013 (BCC Research, 2014). Basedon forecasts of analysts, the gas separation and pervaporation market, which is solely based in theUnited States, is expected to boost from US$ 247 million in 2014 to US$ 380 million in 2019,achieving a compound annual growth rate of 7.9% during the five-year period (BCC Research,2014). The rapid growth of membrane separation techniques is due to the fact that they exhibitmany advantages in comparison to the conventional separation technologies for gases, such asoccupying a relatively smaller footprint, chemical free operation, cost effectiveness, high processflexibility and high energy efficiency (Baker and Lokhandwala, 2008). The promising expansionof membrane gas separation is also attributed to improved membrane performance due to devel-opment of new membrane material with enhanced permeability and selectivity over recent years(Marriott and Sorensen, 2003). Among all the commercially available membrane types, hollowfiber membrane modules are exceptionally favorable in industrial applications because a largemembrane area can be packed within a small volume, which allows for more effective separation(Baker, 2002).
In order to assist in the optimal design of the hollow fiber membrane module in industrialapplication, such as the required module specification and operating conditions, an accurate math-ematical model in characterizing membrane permeation process is vital (Baker and Lokhandwala,2008; Makaruk and Harasek, 2009). It can be adapted to minimize the technical risks that areinherent in the development of the newer process. The availability of the mathematical modelalso eliminates the need for the time consuming and costly pilot plant and experimental studies toevaluate the required conditions in order to optimize the membrane process behavior. In addition,the mathematical model can also be applied in the process of membrane material developmentby determining the favorable characteristics of various operating conditions and the scale-up ofthe fabricated materials in industry scale.
The currently available model characterizing separation within hollow fiber membrane moduleis analyzed to determine the pros and cons associated to each method, as well as outlining the gappresented. The findings are summarized in Table 24.1.
Based on a review of the published literature, it is concluded that the favorable mathematicalmodel should be easy to be implemented to ensure stability and convergence of the solutionprocedure. In addition, over-complexity associated to the mathematical modeling often requiresexcessive level of detail or algorithms that constraint the applicability of the mathematical model.However, the methodology should not be over-simplified, such as that of the averaging method(Pettersen and Lien, 1999), which reduces the model prediction accuracy. In this context, thestage-wise coupled with mass conservation approach is found to be appealing since it involvesmerely reducing the membrane module into a number of entities, in which the mass transfersare assumed to be constant and independent of one another (Thundyil and Koros, 1997). Non-ideal effects, such as pressure drop, can also be incorporated easily in conjunction with the mass
265
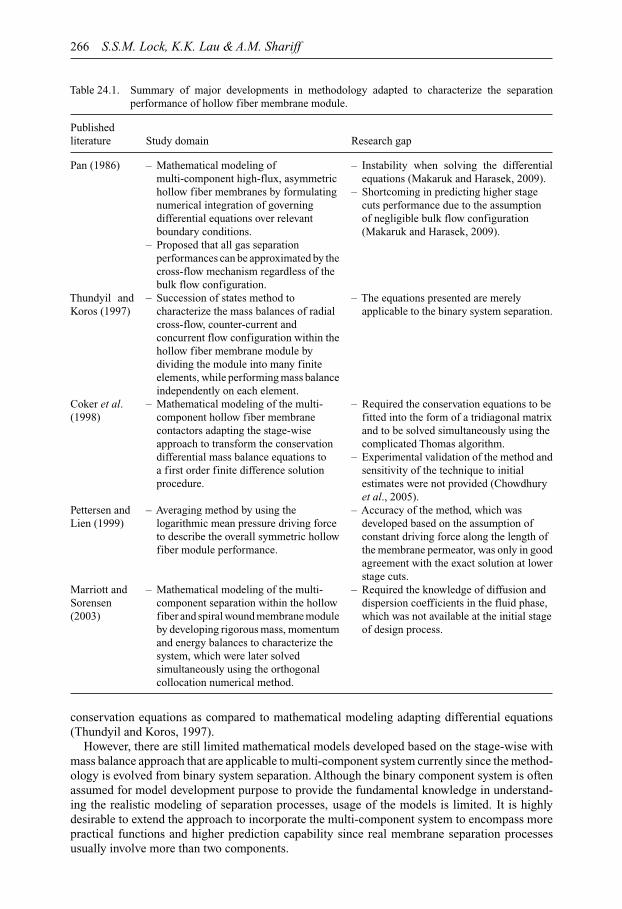
266 S.S.M. Lock, K.K. Lau & A.M. Shariff
Table 24.1. Summary of major developments in methodology adapted to characterize the separationperformance of hollow fiber membrane module.
Publishedliterature Study domain Research gap
Pan (1986) – Mathematical modeling ofmulti-component high-flux, asymmetrichollow fiber membranes by formulatingnumerical integration of governingdifferential equations over relevantboundary conditions.
– Instability when solving the differentialequations (Makaruk and Harasek, 2009).
– Shortcoming in predicting higher stagecuts performance due to the assumptionof negligible bulk flow configuration(Makaruk and Harasek, 2009).
– Proposed that all gas separationperformances can be approximated by thecross-flow mechanism regardless of thebulk flow configuration.
Thundyil andKoros (1997)
– Succession of states method tocharacterize the mass balances of radialcross-flow, counter-current andconcurrent flow configuration within thehollow fiber membrane module bydividing the module into many finiteelements, while performing mass balanceindependently on each element.
– The equations presented are merelyapplicable to the binary system separation.
Coker et al.(1998)
– Mathematical modeling of the multi-component hollow fiber membranecontactors adapting the stage-wiseapproach to transform the conservationdifferential mass balance equations toa first order finite difference solutionprocedure.
– Required the conservation equations to befitted into the form of a tridiagonal matrixand to be solved simultaneously using thecomplicated Thomas algorithm.
– Experimental validation of the method andsensitivity of the technique to initialestimates were not provided (Chowdhuryet al., 2005).
Pettersen andLien (1999)
– Averaging method by using thelogarithmic mean pressure driving forceto describe the overall symmetric hollowfiber module performance.
– Accuracy of the method, which wasdeveloped based on the assumption ofconstant driving force along the length ofthe membrane permeator, was only in goodagreement with the exact solution at lowerstage cuts.
Marriott andSorensen(2003)
– Mathematical modeling of the multi-component separation within the hollowfiber and spiral wound membrane moduleby developing rigorous mass, momentumand energy balances to characterize thesystem, which were later solvedsimultaneously using the orthogonalcollocation numerical method.
– Required the knowledge of diffusion anddispersion coefficients in the fluid phase,which was not available at the initial stageof design process.
conservation equations as compared to mathematical modeling adapting differential equations(Thundyil and Koros, 1997).
However, there are still limited mathematical models developed based on the stage-wise withmass balance approach that are applicable to multi-component system currently since the method-ology is evolved from binary system separation. Although the binary component system is oftenassumed for model development purpose to provide the fundamental knowledge in understand-ing the realistic modeling of separation processes, usage of the models is limited. It is highlydesirable to extend the approach to incorporate the multi-component system to encompass morepractical functions and higher prediction capability since real membrane separation processesusually involve more than two components.

Modeling of concurrent and counter-current flow hollow fiber membrane modules 267
Therefore, in this work, an experimentally validated multi-component hollow fiber membranemathematical model is developed to characterize the counter-current and concurrent flow con-figuration based on a “multi-component progressive cell balance” methodology. The chapter alsodemonstrates the case study of CO2 removal from natural gas through adaptation of hollow fibermembrane module to compare the performance of the different flow configurations based on theirseparation efficiency.
24.2 METHODOLOGY
24.2.1 Multi-component progressive cell balance methodology
The “multi-component progressive cell balance methodology” involves reducing the problem intoa number of finite entities. The outlet condition of the entity is computed based on the specifiedinlet condition provided and will be the inlet condition of the subsequent entity. Therefore, fromone entity, the computation proceeds to the next and is completed over the entire membranemodule. Coker et al. (1998), Marriot and Sorensen (2003), Soni et al. (2009) and Thundyiland Koros (1997) highlighted that the counter-current and concurrent flow configuration can besufficiently described using the one dimension approach along the axial direction of the membranemodule since the characteristic of the fibers in the radial direction can be assumed to be the same.
The membrane bundle specifications are provided by the end user to determine the activemembrane area of each finite entity based on the predetermined number of entities, m. It is doneby dividing the membrane module along the longitudinal direction. Among the input parametersrequired to determine the active membrane area of each entity are as followed:
• Active length of the fiber bundle, L• Radius of the fiber bundle, R• Inner and outer diameter of the hollow fibers, di and do
• Packing density, ∅, or porosity, ε, or number of fibers, nf , of the membrane module, whichare related to one another, as depicted as (Li et al., 2004):
∅ = 1 − ε = nfAf
Amodule(24.1)
The area calculation is adapted from Rautenbach as well as Thundyil and Koros published liter-ature, in which the active area for permeation of each entity, Am, is determined from the volume(Rautenbach, 1990; Thundyil and Koros, 1997), whereby the geometry is defined as a cylinderwith radius, R, and axial thickness, �z = L/m:
Am = 4πR2(�z)(1 − ε)
do(24.2)
In addition, several assumptions have been outlined when developing the “multi-component pro-gressive cell balance” mathematical model to simplify the modeling approach. These assumptionsare provided as following:
• The model assumes no mixing in the tube and shell sides and can be sufficiently described byplug flow (Pan and Habgood, 1978; Pettersen and Lien, 1994; Stern and Walawender, 1969;Thundyil and Koros, 1997; Weller and Steiner, 1950). Therefore, the mass balance of eachplug can be solved independently provided the previous plug state is known.
• The shell side pressure variations are negligible while the permeate side pressure drop can beadequately described using the Hagen-Poiseuille equation (Coker et al., 1998; Davis, 2002;Pan, 1986; Thundyil and Koros, 1997).
• Operation within the hollow fiber membrane module is isothermal (Davis, 2002; Pan, 1986;Thundyil and Koros, 1997).

268 S.S.M. Lock, K.K. Lau & A.M. Shariff
Figure 24.1. Schematic representation of (a) concurrent hollow fiber membrane module and (b) entitieswithin the multi-component progressive cell balance methodology for mathematical modeling.
24.2.2 Multi-component progressive cell balance in concurrent flow mechanism
Figure 24.1a shows the schematic representation of the concurrent hollow fiber membrane modulewith the feed introduced through the shell side. The feed gas flows in the axial direction parallelto the hollow fibers until the retentate end, while the permeate stream diffuses into the fibers inthe same direction with the feed. The end of the fiber bundle near the feed gas is sealed withepoxy glue while the other end allows the fibers to protrude through the seal for permeate gas tobe separated from the retentate. Figure 24.1b depicts the schematic representation of the multi-component progressive cell balance approach to characterize the mass balance of the concurrenthollow fiber membrane module. From Figure 24.1b, there are two types of entity, which are Type Iwith feed on only the shell side, and Type II with feed on both the shell and tube sides.
24.2.3 Multi-component progressive cell balance in concurrent flow mechanism: Type I entitywith feed on the shell side
The solution algorithm of the concurrent flow pattern is relatively simple because the computationproceeds from the feed end using the feed known composition to the retentate end. For a binarysystem separation, such as that of Thundyil and Koros’s (1997) work, the permeate compositionat the membrane module sealed end-sheet, y1, can be easily calculated using Equation (24.3)(Brubaker and Kammermeyer, 1954; Pan and Habgood, 1978; Thundyil and Koros, 1997):
y1 = (α − 1)(βx1 + 1) + β − [((α − 1)(βx1 + 1) + β)2 − 4αβx1(α − 1)]0.5
2(α − 1)(24.3)
Based on computation of the permeate composition near the sealed end, the calculation proceedsthroughout the entire hollow fiber membrane module. However, Equation (24.3) is only confinedto the binary separation.

Modeling of concurrent and counter-current flow hollow fiber membrane modules 269
For the multi-component system, a simple yet versatile iterative technique is required to ensurequick convergence of the solution. The following solution procedure has been implemented, whichis characterized based on solution-diffusion model. According to the solution-diffusion model,separation is achieved among different components because some gases are more soluble in themembrane material, and pass more readily through the membrane than other components in thegas. The governing flux equation of the solution-diffusion model that characterizes the transportmechanism of component n for a Type I entity within the concurrent flow hollow fiber membranemodule can be sufficiently described using Fick’s law of diffusion (Baker, 2012), as provided inexpression (24.4). The driving force for separation of the longitudinal flow is the partial pressuresof the shell side retentate to the tube side permeate leaving the entity, as described by Barrer et al.(1962), Coker et al. (1998), and Graham (1866).
yn(1)θ∗Qf = PnAm
{ph
1 − θ∗[xf ,n − θ∗yn(1)
]− plyn(1)}
(24.4)
Coupled with the Newton bisection methodology in Visual Basic subroutine, the guessedpermeate composition, yn(1), is initiated from both the low and the high sides to ensure quickconvergence. The solution algorithm is as follows:
• The value of the permeate composition of the first component, y1(1), is assumed.• The local stage cut, θ∗, is estimated from Equation (24.4).• QT(1) is computed based on the estimated θ∗.• The sum of all the compositions in the permeate stream is calculated and compared to unity.
This procedure is iterated until the summation meets unity within pre-defined tolerance, ∈, of0.1%, as shown in expression (24.5).
δ = abs
(N∑
n=1
yn(1) − 1
)� ∈ (24.5)
• The local retentate composition is determined from Equation (24.6), which followed from theType I entity balance:
xn(1) =[xf ,n − θ∗yn(1)
](1 − θ∗)
(24.6)
24.2.4 Multi-component progressive cell balance in concurrent flow mechanism: Type IIentity with feed on the shell and tube sides
For the Type II entity, the characterization of the transport across the concurrent flow hollowfiber membrane module with shell and tube sides feed using Fick’s law of diffusion is describedby (24.7)
yn( j)θ∗QS( j − 1) − yn( j − 1)QT( j − 1)
= PnAm
⎧⎪⎪⎨⎪⎪⎩
ph[xn( j − 1) − yn( j)θ∗ + yn( j − 1)QT( j − 1)/QS( j − 1)]
1 + QT( j − 1)
QS( j − 1)− θ∗
− plyn( j)
⎫⎪⎪⎬⎪⎪⎭ (24.7)
The same solution procedure as outlined in the previous section has been applied to determinethe permeate composition followed by the local retentate composition of each Type II entityusing (24.8).
xn( j) =xn( j − 1) − yn( j)θ∗ + yn( j − 1)QT( j − 1)
QS( j − 1)
1 + QT( j − 1)
QS( j − 1)− θ∗
(24.8)
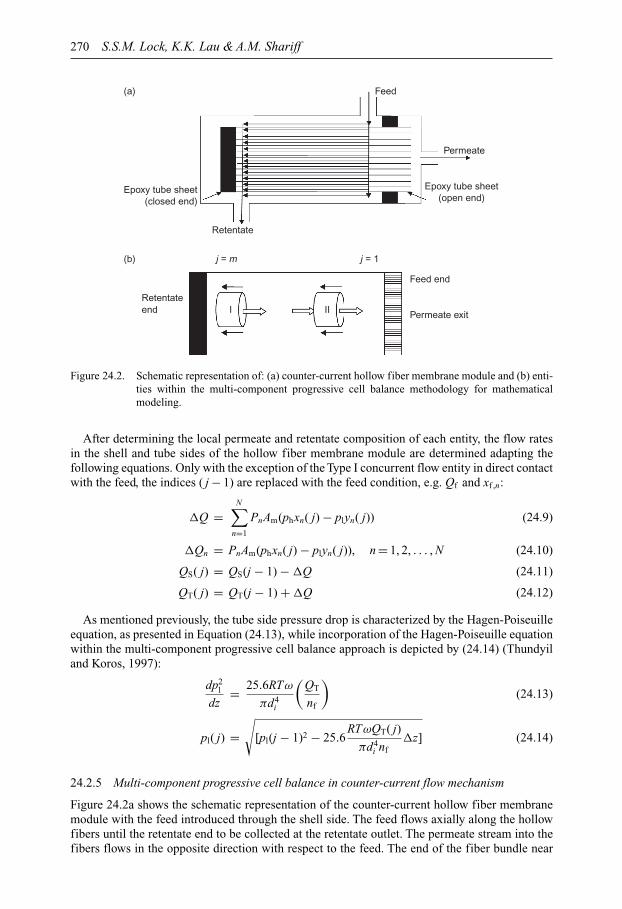
270 S.S.M. Lock, K.K. Lau & A.M. Shariff
(a)
Epoxy tube sheet(closed end)
Epoxy tube sheet(open end)
Retentate
Retentate
Feed end
j = m j = 1
I II Permeate exitend
Permeate
Feed
(b)
Figure 24.2. Schematic representation of: (a) counter-current hollow fiber membrane module and (b) enti-ties within the multi-component progressive cell balance methodology for mathematicalmodeling.
After determining the local permeate and retentate composition of each entity, the flow ratesin the shell and tube sides of the hollow fiber membrane module are determined adapting thefollowing equations. Only with the exception of the Type I concurrent flow entity in direct contactwith the feed, the indices ( j − 1) are replaced with the feed condition, e.g. Qf and xf ,n:
�Q =N∑
n=1
PnAm(phxn( j) − plyn( j)) (24.9)
�Qn = PnAm(phxn( j) − plyn( j)), n = 1, 2, . . . , N (24.10)
QS( j) = QS(j − 1) − �Q (24.11)
QT( j) = QT(j − 1) + �Q (24.12)
As mentioned previously, the tube side pressure drop is characterized by the Hagen-Poiseuilleequation, as presented in Equation (24.13), while incorporation of the Hagen-Poiseuille equationwithin the multi-component progressive cell balance approach is depicted by (24.14) (Thundyiland Koros, 1997):
dp2l
dz= 25.6RTω
πd4i
(QT
nf
)(24.13)
pl( j) =√
[pl(j − 1)2 − 25.6RTωQT( j)
πd4i nf
�z] (24.14)
24.2.5 Multi-component progressive cell balance in counter-current flow mechanism
Figure 24.2a shows the schematic representation of the counter-current hollow fiber membranemodule with the feed introduced through the shell side. The feed flows axially along the hollowfibers until the retentate end to be collected at the retentate outlet. The permeate stream into thefibers flows in the opposite direction with respect to the feed. The end of the fiber bundle near
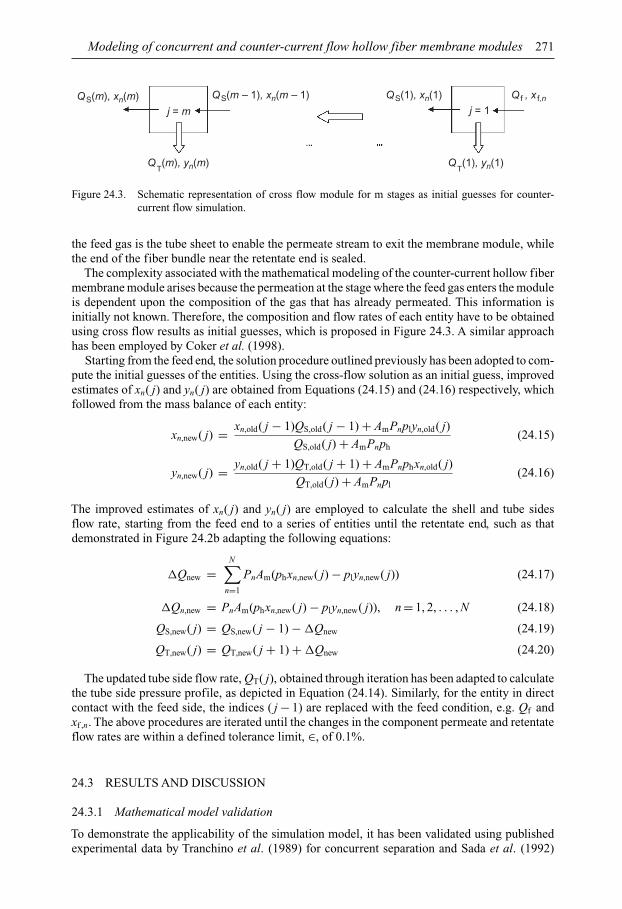
Modeling of concurrent and counter-current flow hollow fiber membrane modules 271
QT(m), yn(m)
QS(1), xn(1)
QT(1), yn(1)
Q f , x f,n QS(m), xn(m) QS(m – 1), xn(m – 1)
j = m j = 1
Figure 24.3. Schematic representation of cross flow module for m stages as initial guesses for counter-current flow simulation.
the feed gas is the tube sheet to enable the permeate stream to exit the membrane module, whilethe end of the fiber bundle near the retentate end is sealed.
The complexity associated with the mathematical modeling of the counter-current hollow fibermembrane module arises because the permeation at the stage where the feed gas enters the moduleis dependent upon the composition of the gas that has already permeated. This information isinitially not known. Therefore, the composition and flow rates of each entity have to be obtainedusing cross flow results as initial guesses, which is proposed in Figure 24.3. A similar approachhas been employed by Coker et al. (1998).
Starting from the feed end, the solution procedure outlined previously has been adopted to com-pute the initial guesses of the entities. Using the cross-flow solution as an initial guess, improvedestimates of xn( j) and yn( j) are obtained from Equations (24.15) and (24.16) respectively, whichfollowed from the mass balance of each entity:
xn,new( j) = xn,old( j − 1)QS,old( j − 1) + AmPnplyn,old( j)
QS,old( j) + AmPnph(24.15)
yn,new( j) = yn,old( j + 1)QT,old( j + 1) + AmPnphxn,old( j)
QT,old( j) + AmPnpl(24.16)
The improved estimates of xn( j) and yn( j) are employed to calculate the shell and tube sidesflow rate, starting from the feed end to a series of entities until the retentate end, such as thatdemonstrated in Figure 24.2b adapting the following equations:
�Qnew =N∑
n=1
PnAm(phxn,new( j) − plyn,new( j)) (24.17)
�Qn,new = PnAm(phxn,new( j) − plyn,new( j)), n = 1, 2, . . . , N (24.18)
QS,new( j) = QS,new( j − 1) − �Qnew (24.19)
QT,new( j) = QT,new( j + 1) + �Qnew (24.20)
The updated tube side flow rate, QT( j), obtained through iteration has been adapted to calculatethe tube side pressure profile, as depicted in Equation (24.14). Similarly, for the entity in directcontact with the feed side, the indices ( j − 1) are replaced with the feed condition, e.g. Qf andxf ,n. The above procedures are iterated until the changes in the component permeate and retentateflow rates are within a defined tolerance limit, ∈, of 0.1%.
24.3 RESULTS AND DISCUSSION
24.3.1 Mathematical model validation
To demonstrate the applicability of the simulation model, it has been validated using publishedexperimental data by Tranchino et al. (1989) for concurrent separation and Sada et al. (1992)
272 S.S.M. Lock, K.K. Lau & A.M. Shariff
Table 24.2. Input parameters adapted for model validation (Sada et al., 1992; Tranchino et al., 1989).
Published literature Tranchino et al. (1989) Sada et al. (1992)
Flow configuration Concurrent, shell side feed Counter-current, shell side feedFeed pressure [MPa] 0.4053 1.570Permeate pressure [MPa] 0.1013 0.1013Feed composition 60.0% CO2, 40.0 CH4 50.0% CO2, 10.5% O2, 39.5% N2Permeance [GPU] PCO2 = 9.44, PCH4 = 2.63 PCO2 = 61.01, PO2 = 17.99, PN2 = 3.91Fiber active length [cm] 15 26Number of fibers 6 270Inner and outer diameter 735/389 156/63of fiber [µm]
0.6
0.65
0.7
0.75
0.8
0.85
0.9
0.05 0.15 0.25 0.35 0.45 0.55 0.65 0.75
CO
2 pe
rmea
te c
ompo
sitio
n
Stage cut
Figure 24.4. Model validation with published literature using Tranchino et al. (1989) experimental data forconcurrent flow (�), and Sada et al. (1992) experimental data for counter-current flow (�).(—— Counter-current simulation model; – – – – Concurrent simulation model).
for counter-current separation. The simulation conditions adapted for the model validation aresummarized in Table 24.2, while the model validation is provided in Figure 24.4.
As illustrated in Figure 24.4, the suggested simulation model gives good approximation tothe published experiment data for both the counter-current flow and concurrent flow, whichdemonstrates the accuracy of the mathematical model.
24.3.2 Comparison between concurrent and counter-current flow
To compare the performance of the counter-current and concurrent flow, the hollow fiber mem-brane module is simulated as a simple single stage membrane. The simulations are run under1,000,000 cm3(STP) s−1 feed gas flow rate with 5.0 MPa pressure. Feed gas containing 10% CO2,70% methane, 10% ethane and 10% nitrogen, corresponding to the sweetening of natural gas withlow quantities of acid gas is simulated. The ratio of the feed pressure to the permeate pressure,β, is maintained at 50, analogous to atmospheric pressure for the permeate stream. The fiberbundle is assumed to be 50% packed with hollow fibers of inner diameter 100 µm and outerdiameter 250 µm (Thundyil and Koros, 1997). The material of fabrication of the membrane isassumed to be the commonly used cellulose triacetate for acid gas separation with permeancevalues as followed: PCH4 = 2.86 GPU, PC2H6 = 2 GPU and PN2 = 3.57 GPU (Coker et al., 1998;Kundu et al., 2012). High selectivity and low selectivity membranes are simulated using αCO2/CH4 .40 and 20 respectively. The active length of the hollow fibers, L, is altered within the range of100–500 cm while the radius of the fiber bundle, R, is changed within the range of 10–25 cm tovary the membrane area. The performance of the hollow fiber membrane module for the 10%CO2 case is presented in Figure 24.5a–c.

Modeling of concurrent and counter-current flow hollow fiber membrane modules 273
0.05
0.1
0.15
0.2
0.25
0.3S
tage
cut
Membrane area [million cm2]
Counter-current – Low selectivity membrane
Concurrent – Low selectivity membrane
Counter-current – High selectivity membrane
Concurrent – High selectivity membrane
(a)
0
0.01
0.02
0.03
0.04
0.05
0.06
0.07
CO
2 co
mpo
sitio
n in
res
idue
Counter-current – Low selectivity membrane
Concurrent – Low selectivity membrane
Counter-current – High selectivity membrane
Concurrent – High selectivity membrane
(b)
80
82
84
86
88
90
92
94
96
98
100
2.5 4.5 6.5 8.5 10.5 12.5 14.5
Membrane area [million cm2]
2.5 4.5 6.5 8.5 10.5 12.5 14.5
Membrane area [million cm2]
2.51 4.51 6.51 8.51 10.51 12.51 14.51
Hyd
roca
rbon
rec
over
y [%
]
Counter-current – Low selectivity membrane
Concurrent – Low selectivity membrane
Counter-current – High selectivity membrane
Concurrent – High selectivity membrane
(c)
Figure 24.5. Separation performance of hollow fiber membrane module permeators under counter-currentand concurrent flow configuration as a function of membrane area for low and high selectivitymembrane: (a) stage cut, (b) CO2 composition in the residue and (c) fraction of hydrocarbonrecovered (CO2 feed composition = 10%).

274 S.S.M. Lock, K.K. Lau & A.M. Shariff
As depicted in Figure 24.5a–c, in order to analyze the performance and separation efficiencyof the hollow fiber permeators under different flow configuration, the membrane area is plottedagainst the stage cut, the CO2 composition in the residue stream and the fraction of hydrocarbonrecovered.
The effect of the availability of membrane area to the stage cut is depicted in Figure 24.5a.The stage cut is defined as the flow rate of permeate over the flow rate of the feed. When moremembrane area is available for permeation, the readily permeable CO2 permeates more throughthe hollow fibers. Therefore, the stage cut increases when the permeate flow increases. It is alsoobserved from Figure 24.5a that the stage cut of the higher selectivity membrane is greater thanthat of the lower selectivity membrane. Similarly, it is attributed to more permeation of CO2 sincethe membrane has a higher CO2 permeability characteristic, which further increases the permeateflux. The superiority of the higher selectivity membrane to the lower selectivity membrane interms of stage cut becomes less substantial when the membrane area is further increased sincethe availability of the permeable CO2 in the shell side decreases.
Figure 24.5b demonstrates the effect of the membrane area to the CO2 residue composition.It is observed that the CO2 residue composition decreases with the membrane area attributed tothe permeation of more CO2 to the permeate stream when more membrane area is available. Thehigher selectivity membrane exhibits more pronounced impact by allowing more CO2 to transportthrough the hollow fibers when provided with the same membrane area as compared to the lowerselectivity membrane. The less significant impact of the CO2 change at higher membrane area asdescribed previously is demonstrated through the slow decrement of the CO2 residue composition,which is especially substantial for the high selectivity membrane.
The effect of the membrane area to the hydrocarbon recovery is depicted in Figure 24.5c.Hydrocarbon recovery is defined as the percentage of the hydrocarbon recovered in the residuestream as compared to the total amount of hydrocarbon contained in the feed. It is depictedthat the hydrocarbon recovery decreases with increment in the membrane area. This is due toavailability of more membrane area that also enables permeation of more hydrocarbons to thepermeate stream. It is also depicted from Figure 24.5c that the hydrocarbon recovery of the highand low selectivity membrane is similar since the membrane under investigation exhibits similarcharacteristics to permeation of methane. However, the percentage hydrocarbon recovery of thehigher selectivity membrane decreases slightly in comparison to the lower selectivity membraneat high membrane area. This is attributed to the excessive membrane area that further leads toincreased hydrocarbons lost in the permeate stream when there is reducing availability of themore permeable CO2 in the shell side.
Viewing from the aspect of the flow configuration, the counter-current flow is demonstratedto provide higher separative performance by displaying outputs, such as increased stage cut,decreased CO2 concentration in the residue stream, and improved hydrocarbon recovery whenprovided with the same membrane area for permeation as compared to the concurrent flow.The superiority of the counter-current flow is attributed to the partial pressure driving forcedistribution. The opposite flow of the tube and shell sides contributes to the slowly decliningpressure gradient that enables the pressure driving force to be maximized along the module length(Ho and Sirkar, 1992). Therefore higher permeation of the CO2 is achieved for the counter-currentflow while retaining the hydrocarbon in the residue stream in comparison to the concurrent pattern(Ho and Sirkar, 1992; Makaruk and Harasek, 2009; Thundyil and Koros, 1997).
Parameter sensitivity of the feed composition is also conducted by altering the feed compositionto 60% CO2, 20% methane, 10% ethane and 10% nitrogen. This simulation condition is analogousto the natural gas processing in enriched oil recovery with high impurities concentration. Themembrane selectivity, αCO2/CH4 , is maintained at 20 in this case study to determine the effect ofharsh feed condition (e.g. high impurities composition) on lower performance membranes (Locket al., 2015). The performance of the hollow fiber membrane module for the 60% CO2 case ascompared to the 10% case is presented in Figure 24.6a–b.
It is depicted from Figure 24.6a–b that the performances at the higher feed concentrations ismerely an amplification of the results obtained at the lower feed concentrations, such as increased
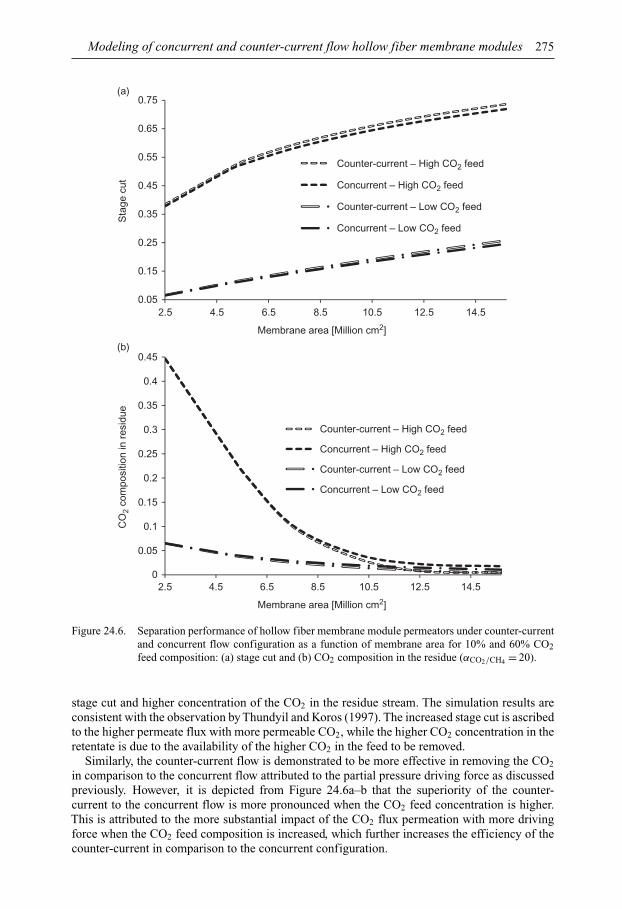
Modeling of concurrent and counter-current flow hollow fiber membrane modules 275
0.05
0.15
0.25
0.35
0.45
0.55
0.65
0.75
Sta
ge c
ut
Membrane area [Million cm2]
(a)
Counter-current – High CO2 feed
Concurrent – High CO2 feed
Counter-current – Low CO2 feed
Concurrent – Low CO2 feed
0
0.05
0.1
0.15
0.2
0.25
0.3
0.35
0.4
0.45
2.5 4.5 6.5 8.5 10.5 12.5 14.5
Membrane area [Million cm2]
2.5 4.5 6.5 8.5 10.5 12.5 14.5
CO
2 co
mpo
sitio
n in
res
idue
Counter-current – High CO2 feed
Concurrent – High CO2 feed
Counter-current – Low CO2 feed
Concurrent – Low CO2 feed
(b)
Figure 24.6. Separation performance of hollow fiber membrane module permeators under counter-currentand concurrent flow configuration as a function of membrane area for 10% and 60% CO2feed composition: (a) stage cut and (b) CO2 composition in the residue (αCO2/CH4 = 20).
stage cut and higher concentration of the CO2 in the residue stream. The simulation results areconsistent with the observation by Thundyil and Koros (1997). The increased stage cut is ascribedto the higher permeate flux with more permeable CO2, while the higher CO2 concentration in theretentate is due to the availability of the higher CO2 in the feed to be removed.
Similarly, the counter-current flow is demonstrated to be more effective in removing the CO2
in comparison to the concurrent flow attributed to the partial pressure driving force as discussedpreviously. However, it is depicted from Figure 24.6a–b that the superiority of the counter-current to the concurrent flow is more pronounced when the CO2 feed concentration is higher.This is attributed to the more substantial impact of the CO2 flux permeation with more drivingforce when the CO2 feed composition is increased, which further increases the efficiency of thecounter-current in comparison to the concurrent configuration.
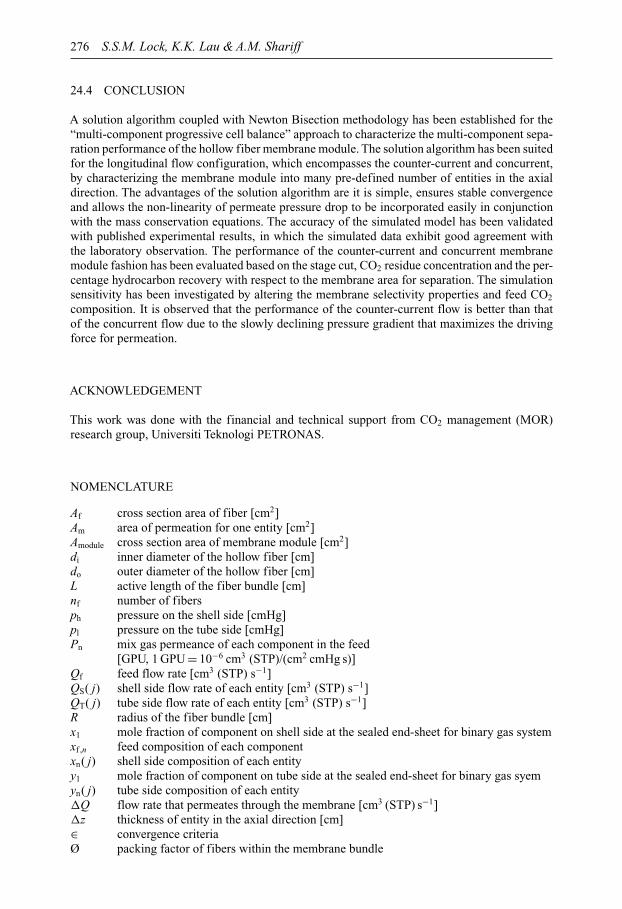
276 S.S.M. Lock, K.K. Lau & A.M. Shariff
24.4 CONCLUSION
A solution algorithm coupled with Newton Bisection methodology has been established for the“multi-component progressive cell balance” approach to characterize the multi-component sepa-ration performance of the hollow fiber membrane module. The solution algorithm has been suitedfor the longitudinal flow configuration, which encompasses the counter-current and concurrent,by characterizing the membrane module into many pre-defined number of entities in the axialdirection. The advantages of the solution algorithm are it is simple, ensures stable convergenceand allows the non-linearity of permeate pressure drop to be incorporated easily in conjunctionwith the mass conservation equations. The accuracy of the simulated model has been validatedwith published experimental results, in which the simulated data exhibit good agreement withthe laboratory observation. The performance of the counter-current and concurrent membranemodule fashion has been evaluated based on the stage cut, CO2 residue concentration and the per-centage hydrocarbon recovery with respect to the membrane area for separation. The simulationsensitivity has been investigated by altering the membrane selectivity properties and feed CO2
composition. It is observed that the performance of the counter-current flow is better than thatof the concurrent flow due to the slowly declining pressure gradient that maximizes the drivingforce for permeation.
ACKNOWLEDGEMENT
This work was done with the financial and technical support from CO2 management (MOR)research group, Universiti Teknologi PETRONAS.
NOMENCLATURE
Af cross section area of fiber [cm2]Am area of permeation for one entity [cm2]Amodule cross section area of membrane module [cm2]di inner diameter of the hollow fiber [cm]do outer diameter of the hollow fiber [cm]L active length of the fiber bundle [cm]nf number of fibersph pressure on the shell side [cmHg]pl pressure on the tube side [cmHg]Pn mix gas permeance of each component in the feed
[GPU, 1 GPU = 10−6 cm3 (STP)/(cm2 cmHg s)]Qf feed flow rate [cm3 (STP) s−1]QS( j) shell side flow rate of each entity [cm3 (STP) s−1]QT( j) tube side flow rate of each entity [cm3 (STP) s−1]R radius of the fiber bundle [cm]x1 mole fraction of component on shell side at the sealed end-sheet for binary gas systemxf ,n feed composition of each componentxn( j) shell side composition of each entityy1 mole fraction of component on tube side at the sealed end-sheet for binary gas syemyn( j) tube side composition of each entity�Q flow rate that permeates through the membrane [cm3 (STP) s−1]�z thickness of entity in the axial direction [cm]∈ convergence criteriaØ packing factor of fibers within the membrane bundle
Modeling of concurrent and counter-current flow hollow fiber membrane modules 277
GREEK SYMBOLS
α selectivity of the higher permeance component to the lower permeance componentβ ratio of the pressure on the shell side to the pressure on the tube sideδ difference between the check conditions with the datumε porosityθ∗ local stage cut of each entityω viscosity [cm2 s−1]
REFERENCES
Baker, R.W. (2002) Future directions of membrane gas separation technology. Industrial & EngineeringChemistry Research, 41, 1393–1411.
Baker, R.W. (2012) Membrane technology and applications. 3rd edition. John Wiley and Sons Ltd.,Chichester, UK.
Baker, R.W. & Lokhandwala, K. (2008) Natural gas processing with membranes: an overview. Industrial &Engineering Chemistry Research, 47, 2109–2112.
Barrer, R.M., Barrie, J.A. & Raman, N.K. (1962) Solution and diffusion in silicone rubber. I.A. Comparisonwith natural rubber. Polymer, 3, 595–603.
BCC Research (2014) Membrane technology for liquid and gas separations. BCC Research, New York, NY.Brubaker, D.W. & Kammermeyer, K. (1954) Separation of gases by plastic membranes – permeation rates
and extent of separation. Industrial & Engineering Chemistry, 46, 733–739.Chowdhury, M.H.M., Feng, X., Douglas, P. & Croiset, E. (2005) A new numerical approach for a detailed
multicomponent gas separation membrane model and AspenPlus simulation. Chemical Engineering &Technology, 28, 773–782.
Coker, D.T., Freeman, B.D. & Fleming, G.K. (1998) Modeling multicomponent gas separation using hollow-fiber membrane contactors. AICHE Journal, 44 (6), 1289–1302.
Davis, R.A. (2002) Simple gas permeation and pervaporation membrane unit operation models for processsimulators. Chemical Engineering & Technology, 25, 717–722.
Graham, T. (1866) On the absoprtion and dialytic separation of gases by colloid septa: action of a septum ofcaoutchouc. Philosophical Magazine, 32, 399–439.
Ho, W.S.W. & Sirkar, K.K. (1992) Membrane handbook, Volume I. Springer Science and Business Media,New York, NY.
Kundu, P.K., Chakma, A. & Feng, X. (2012) Simulation of binary gas separation with asymmetric hollowfibre membranes and case studies of air separation. The Canadian Journal of Chemical Engineering, 90,1253–1268.
Li, D.R. Wang & Chung, T.S. (2004) Fabrication of lab-scale hollow fiber membrane modules with highpacking density. Separation and Purification Technology, 40, 15–30.
Lock, S.S.M., Lau, K.K. & Shariff, A.M. (2015) Effect of recycle ratio on the cost of natural gas processingin counter-current hollow fiber membrane system. Journal of Industrial and Engineering Chemistry, 21,542–551.
Makaruk, A. & Harasek, M. (2009) Numerical algorithm for modeling multicomponent multipermeatorsystems. Journal of Membrane Science, 344, 258–265.
Marriott, J. & Sorensen, E. (2003) A general approach to modeling membrane modules. ChemicalEngineering Science, 58, 4975–4990.
Pan, C.Y. (1986) Gas separation by high-flux, asymmetric hollow-fiber membrane. AICHE Journal, 32,2020–2026.
Pan, C.Y. & Habgood, H.W. (1978) Gas separation by permeation. Part I. Calculation methods and parametricanalysis. The Canadian Journal of Chemical Engineering, 56, 197–209.
Pettersen, T. & Lien, K.M. (1994) A new robust design model for gas separating membrane modules,based on analogy with counter-current heat exchangers. Computers & Chemical Engineering, 18,427–439.
Rautenbach, R. (1990) Handbook of industrial membrane technology. Noyes Publication, Park Ridge, NJ.pp. 349–400.
Sada, E., Kumuzawam, H., Wang, J.S. & Koizumi, M. (1992) Separation of carbon dioxide by asymmetrichollow fiber membrane of cellulose triacetate. Journal of Applied Polymer Science, 45, 2181–2186.
278 S.S.M. Lock, K.K. Lau & A.M. Shariff
Soni, V., Abildskov, J., Jonsson, G. & Gani, R. (2009) A general model for membrane-based separationprocesses. Computers & Chemical Engineering, 33, 644–659.
Stern, S. & Walawender, W. (1969) Analysis of membrane separation parameters. Journal of SeparationScience, 4, 129–159.
Thundyil, M.J. & Koros, W.J. (1997) Mathematical modeling of gas separation permeators – for radialcrossflow, countercurrent, and cocurrent hollow fiber membrane modules. Journal of Membrane Science,125, 275–291.
Tranchino, L., Santarossa, R., Carta, F., Fabiani, C. & Bimbi, L. (1989) Gas separation in a membrane unit:experimental results and theoretical predictions. Separation Science and Technology, 24, 1207–1226.
Weller, S. & Steiner, W. (1950) Separation of gases by fractional permeation through membranes. Journalof Applied Physics, 21, 279–285.
Part VIMembranes for other applications

This page intentionally left blankThis page intentionally left blank
CHAPTER 25
Preparation of sulfonated polyether ether ketone (SPEEK)and optimization of degree of sulfonation for using inmicrobial fuel cells
Mostafa Ghasemi, Wan Ramli Wan Daud, Ahmad Fauzi Ismail & Takeshi Matsuura
25.1 INTRODUCTION
Recently by depletion of fossil fuels and environmental pollution, fuel cells have attracted attentiondue to low emissions of pollutants and high efficiency. Microbial fuel cells (MFCs) as a noveltechnology, convert the chemical energy in organic compounds into electricity and biohydrogen,by the aid of microorganisms as biocatalyst (Ghasemi et al., 2011). Generally, MFC is a devicethat simultaneously produces energy and treats the wastewater (Ghasemi et al., 2013a). AlsoMFC can be applied for bioremediation of some chemicals. MFC, similar to all other fuel cellsand batteries, consists of two parts (anode, cathode) which are separated by a proton exchangemembrane (PEM). The performance of a MFC depends on several factors including, type ofelectrodes, cathode catalyst, PEM, distance of the electrodes, microorganisms etc., but amongthem membrane has one of the most significant roles as it separates anode and cathode and mustsupport the transfer of protons from anode to cathode while, at the same time, should inhibittransferring of media from anode to cathode (Ghasemi et al., 2013b). One of the big obstacles ofcommercialization of MFC is high capital cost of the PEMs which cover about 40% of the expenseof MFC (Ghasemi et al., 2013c; 2013d). There are a lot of researches about different types ofPEM (nano-composite, ultrafiltration etc.) in MFCs, but due to complication of the MFC systemand existence of several factors, the proper membrane has not been found yet (Lim et al., 2012).
Recent researches into developing suitable and cost efficient PEMs in fuel cells have focusedon aromatic polymers such as polyimide (PI), polybenzimidazole (PBI) and poly ether etherketone (PEEK) composite membranes (Ghasemi et al., 2013e). Among the various polymericmembranes, with diverse mechanical, thermal and electrical properties PEEK was shown to be oneof considerable promise due to long term stability, cost efficiency and performance. The studiesfound that PEEK has good thermal stability, high proton conductivity and mechanical stability.All of these properties depend on degree of sulfonation of the polymer (Leong et al., 2013).
As we mentioned, there are a lot of works about various types of membranes for PEM in MFCbut there is not much study about the application of sulfonated poly ether ether ketone (SPEEK)in MFCs, although it was used widely in other types of fuel cell (Ilbeygi et al., 2015). Our grouphas studied some types of membranes in MFCs. Ghasemi et al. (2012) developed and appliedactivated carbon nano-fiber/Nafion as PEM in MFC. It produced the power of 1.5 times more thanNafion 117, a PEM traditionally used in MFC. Also in another study Rahimnejad et al. (2012)fabricated Fe3O4/PES nano-composite membranes and compared its performance with Nafion117. The Fe3O4/PES PEM also produced the power of 1.3 times more than Nafion 117. However,the big obstacle for using this type of membrane in MFC is their porous nature which allows thepassage of media from anode to cathode and also oxygen from cathode to anode, disturbing thelong term performance of MFC.
The objective of this study is to maximize the performance of MFC by using sulfonatedpolyether ether ketones (SPEEKs) of different degrees of sulfonation as PEM.
281
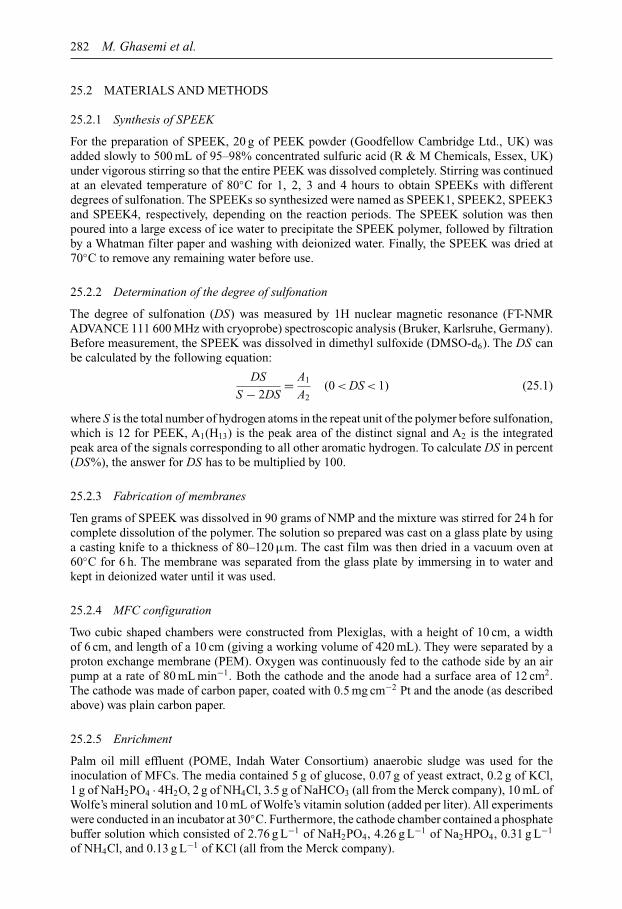
282 M. Ghasemi et al.
25.2 MATERIALS AND METHODS
25.2.1 Synthesis of SPEEK
For the preparation of SPEEK, 20 g of PEEK powder (Goodfellow Cambridge Ltd., UK) wasadded slowly to 500 mL of 95–98% concentrated sulfuric acid (R & M Chemicals, Essex, UK)under vigorous stirring so that the entire PEEK was dissolved completely. Stirring was continuedat an elevated temperature of 80◦C for 1, 2, 3 and 4 hours to obtain SPEEKs with differentdegrees of sulfonation. The SPEEKs so synthesized were named as SPEEK1, SPEEK2, SPEEK3and SPEEK4, respectively, depending on the reaction periods. The SPEEK solution was thenpoured into a large excess of ice water to precipitate the SPEEK polymer, followed by filtrationby a Whatman filter paper and washing with deionized water. Finally, the SPEEK was dried at70◦C to remove any remaining water before use.
25.2.2 Determination of the degree of sulfonation
The degree of sulfonation (DS) was measured by 1H nuclear magnetic resonance (FT-NMRADVANCE 111 600 MHz with cryoprobe) spectroscopic analysis (Bruker, Karlsruhe, Germany).Before measurement, the SPEEK was dissolved in dimethyl sulfoxide (DMSO-d6). The DS canbe calculated by the following equation:
DS
S − 2DS= A1
A2(0 < DS < 1) (25.1)
where S is the total number of hydrogen atoms in the repeat unit of the polymer before sulfonation,which is 12 for PEEK, A1(H13) is the peak area of the distinct signal and A2 is the integratedpeak area of the signals corresponding to all other aromatic hydrogen. To calculate DS in percent(DS%), the answer for DS has to be multiplied by 100.
25.2.3 Fabrication of membranes
Ten grams of SPEEK was dissolved in 90 grams of NMP and the mixture was stirred for 24 h forcomplete dissolution of the polymer. The solution so prepared was cast on a glass plate by usinga casting knife to a thickness of 80–120 µm. The cast film was then dried in a vacuum oven at60◦C for 6 h. The membrane was separated from the glass plate by immersing in to water andkept in deionized water until it was used.
25.2.4 MFC configuration
Two cubic shaped chambers were constructed from Plexiglas, with a height of 10 cm, a widthof 6 cm, and length of a 10 cm (giving a working volume of 420 mL). They were separated by aproton exchange membrane (PEM). Oxygen was continuously fed to the cathode side by an airpump at a rate of 80 mL min−1. Both the cathode and the anode had a surface area of 12 cm2.The cathode was made of carbon paper, coated with 0.5 mg cm−2 Pt and the anode (as describedabove) was plain carbon paper.
25.2.5 Enrichment
Palm oil mill effluent (POME, Indah Water Consortium) anaerobic sludge was used for theinoculation of MFCs. The media contained 5 g of glucose, 0.07 g of yeast extract, 0.2 g of KCl,1 g of NaH2PO4 · 4H2O, 2 g of NH4Cl, 3.5 g of NaHCO3 (all from the Merck company), 10 mL ofWolfe’s mineral solution and 10 mL of Wolfe’s vitamin solution (added per liter). All experimentswere conducted in an incubator at 30◦C. Furthermore, the cathode chamber contained a phosphatebuffer solution which consisted of 2.76 g L−1 of NaH2PO4, 4.26 g L−1 of Na2HPO4, 0.31 g L−1
of NH4Cl, and 0.13 g L−1 of KCl (all from the Merck company).
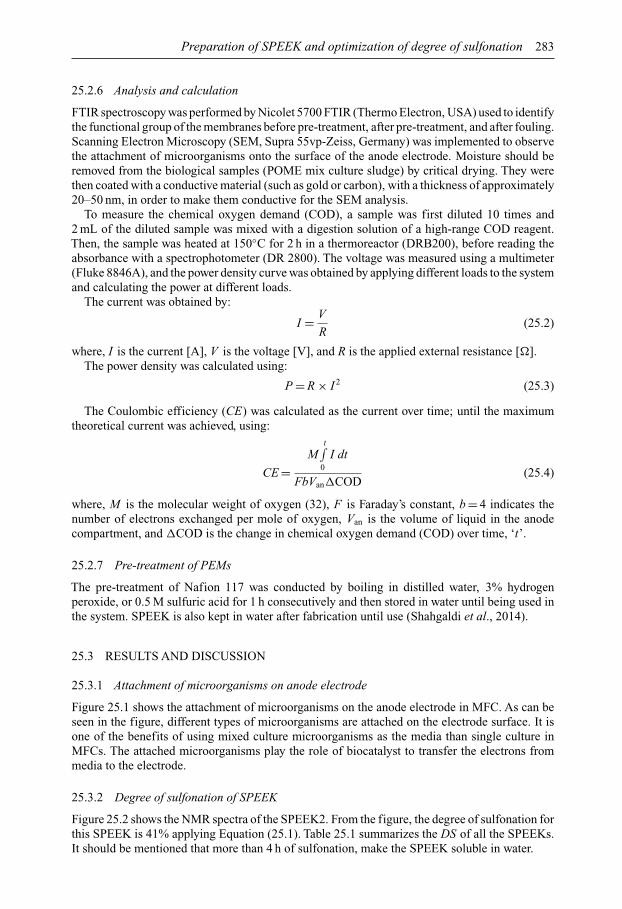
Preparation of SPEEK and optimization of degree of sulfonation 283
25.2.6 Analysis and calculation
FTIR spectroscopy was performed by Nicolet 5700 FTIR (Thermo Electron, USA) used to identifythe functional group of the membranes before pre-treatment, after pre-treatment, and after fouling.Scanning Electron Microscopy (SEM, Supra 55vp-Zeiss, Germany) was implemented to observethe attachment of microorganisms onto the surface of the anode electrode. Moisture should beremoved from the biological samples (POME mix culture sludge) by critical drying. They werethen coated with a conductive material (such as gold or carbon), with a thickness of approximately20–50 nm, in order to make them conductive for the SEM analysis.
To measure the chemical oxygen demand (COD), a sample was first diluted 10 times and2 mL of the diluted sample was mixed with a digestion solution of a high-range COD reagent.Then, the sample was heated at 150◦C for 2 h in a thermoreactor (DRB200), before reading theabsorbance with a spectrophotometer (DR 2800). The voltage was measured using a multimeter(Fluke 8846A), and the power density curve was obtained by applying different loads to the systemand calculating the power at different loads.
The current was obtained by:
I = V
R(25.2)
where, I is the current [A], V is the voltage [V], and R is the applied external resistance [�].The power density was calculated using:
P = R × I 2 (25.3)
The Coulombic efficiency (CE) was calculated as the current over time; until the maximumtheoretical current was achieved, using:
CE =M
t∫0
I dt
FbVan�COD(25.4)
where, M is the molecular weight of oxygen (32), F is Faraday’s constant, b = 4 indicates thenumber of electrons exchanged per mole of oxygen, Van is the volume of liquid in the anodecompartment, and �COD is the change in chemical oxygen demand (COD) over time, ‘t’.
25.2.7 Pre-treatment of PEMs
The pre-treatment of Nafion 117 was conducted by boiling in distilled water, 3% hydrogenperoxide, or 0.5 M sulfuric acid for 1 h consecutively and then stored in water until being used inthe system. SPEEK is also kept in water after fabrication until use (Shahgaldi et al., 2014).
25.3 RESULTS AND DISCUSSION
25.3.1 Attachment of microorganisms on anode electrode
Figure 25.1 shows the attachment of microorganisms on the anode electrode in MFC. As can beseen in the figure, different types of microorganisms are attached on the electrode surface. It isone of the benefits of using mixed culture microorganisms as the media than single culture inMFCs. The attached microorganisms play the role of biocatalyst to transfer the electrons frommedia to the electrode.
25.3.2 Degree of sulfonation of SPEEK
Figure 25.2 shows the NMR spectra of the SPEEK2. From the figure, the degree of sulfonation forthis SPEEK is 41% applying Equation (25.1). Table 25.1 summarizes the DS of all the SPEEKs.It should be mentioned that more than 4 h of sulfonation, make the SPEEK soluble in water.
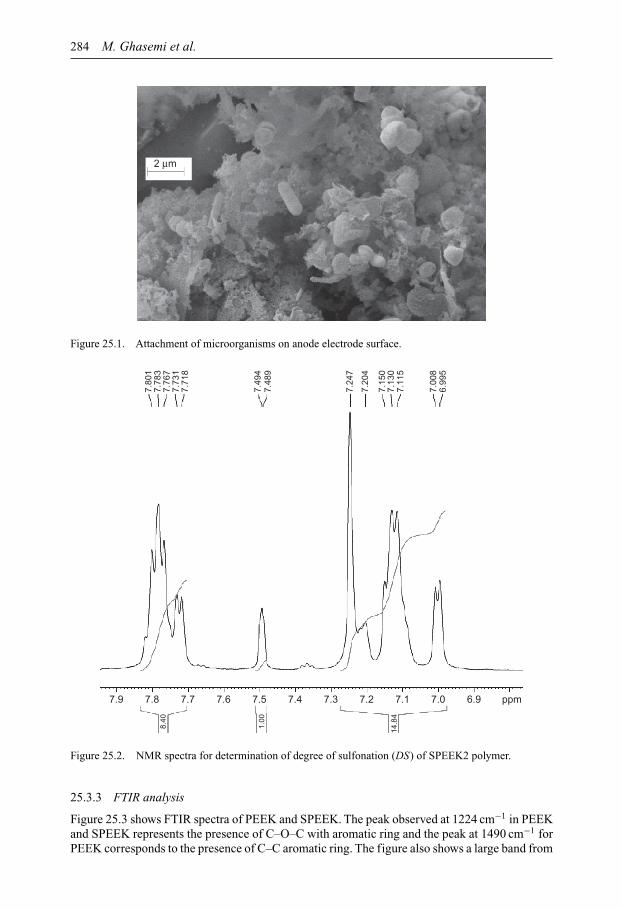
284 M. Ghasemi et al.
2 µm
Figure 25.1. Attachment of microorganisms on anode electrode surface.
7.9 7.8 7.7
8.40
1.00
7.80
17.
783
7.76
77.
731
7.71
8
7.49
47.
489
7.24
7
7.20
4
7.15
07.
130
7.11
5
7.00
86.
995
14.8
4
7.6 7.5 7.4 7.3 7.2 7.1 7.0 6.9 ppm
Figure 25.2. NMR spectra for determination of degree of sulfonation (DS) of SPEEK2 polymer.
25.3.3 FTIR analysis
Figure 25.3 shows FTIR spectra of PEEK and SPEEK. The peak observed at 1224 cm−1 in PEEKand SPEEK represents the presence of C–O–C with aromatic ring and the peak at 1490 cm−1 forPEEK corresponds to the presence of C–C aromatic ring. The figure also shows a large band from
Preparation of SPEEK and optimization of degree of sulfonation 285
Table 25.1. Degree of sulfonation (DS) of SPEEKs synthesizedin this work.
Membrane Time of sulfonation [h] DS
SPEEK1 1 20.8SPEEK2 2 41SPEEK3 3 63.6SPEEK4 4 76
0 1000 2000 3000
PEEK
SPEEK
Abs
orba
nce
Wavenumber [cm–1]
4000
Figure 25.3. FT-IR spectra for PEEK and SPEEK polymer.
3200–3500 cm−1 for SPEEK, which represents the O–S–O stretching vibration of sulfonic acidgroups.
25.3.4 Power density and polarization curve
Figure 25.4 shows the power density of the MFCs constructed using the membranes understudy. As the figure shows the MFC working with SPEEK3 (DS = 63.6%) produced the high-est power density (68.6408 mW m−2) among all the tested membranes, followed by SPEEK4(DS = 76%, 54.83 mW m−2), SPEEK2 (DS = 41%, 42.56 mW m−2) and SPEEK1 (DS = 20.8%,29.48 mW m−2). The results can be due to the fact that the sulfonation enhances proton transportcation exchange capacity. However, sulfonation also enhances the transport of metal cations suchas Na+, K+ etc. which are present in the media. That is the reason why the power density ofSPEEK4 membrane is not the highest among all the SPEEK membranes.
Figure 25.5 shows the polarization curve of different MFCs. The internal resistance of thesystems can be calculated from this figure as the slope of the line of current density vs. voltage. Theresults showed that the smallest internal resistance belongs to the system with SPEEK (DS = 63%)but the internal resistance of the other three SPEEKs are also nearly the same as that of SPEEK3.
25.3.5 COD removal and CE
Figure 25.6 shows the CE and COD removal of the studied systems. As the figure shows thehighest CE (26%) belongs to the system working with SPEEK3 as PEM, followed by SPEEK4

286 M. Ghasemi et al.
0 200 400 600
SPEEK1SPEEK2SPEEK3SPEEK4
Voltage [mV]
Pow
er d
ensi
ty [m
W m
–2]
8000
20
40
60
80
Figure 25.4. Power density of MFC systems with different DS of SPEEK membranes.
Voltage [mV]
0 100 200 300 400 500 600 700 800
SPEEK1SPEEK2SPEEK3SPEEK4
Cur
rent
den
sity
[mA
m–2
]
0
100
200
300
400
500
600
Figure 25.5. Polarization curve for MFC systems with different DS of SPEEK membranes.
(18.5%) SPEEK2 (18%) and SPEEK1 (14%). Thus the order of SPEEK appearance in the CElevel is the same as the order in the power density. This is because MFC’s performance dependson PEM’s ability to conduct proton while preventing the crossover of oxygen, which enables tokeep the anaerobic (Ghoreishi et al., 2014).
The figure also shows that all the systems have high COD removal (>80%), indicating the highpotential of MFC as a new method for wastewater treatment.
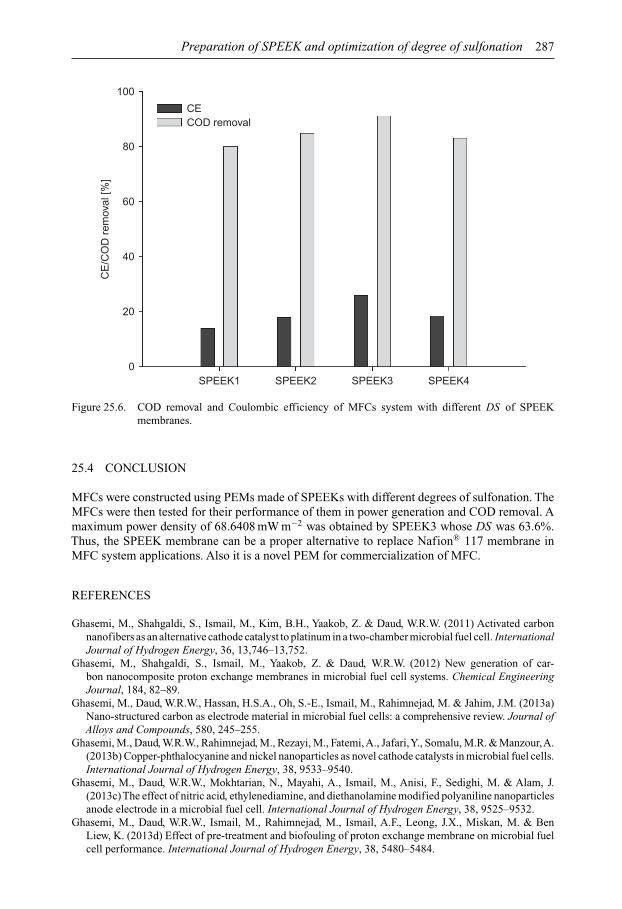
Preparation of SPEEK and optimization of degree of sulfonation 287
SPEEK1
CECOD removal
CE
/CO
D r
emov
al [%
]
SPEEK2 SPEEK3 SPEEK40
20
40
60
80
100
Figure 25.6. COD removal and Coulombic efficiency of MFCs system with different DS of SPEEKmembranes.
25.4 CONCLUSION
MFCs were constructed using PEMs made of SPEEKs with different degrees of sulfonation. TheMFCs were then tested for their performance of them in power generation and COD removal. Amaximum power density of 68.6408 mW m−2 was obtained by SPEEK3 whose DS was 63.6%.Thus, the SPEEK membrane can be a proper alternative to replace Nafion® 117 membrane inMFC system applications. Also it is a novel PEM for commercialization of MFC.
REFERENCES
Ghasemi, M., Shahgaldi, S., Ismail, M., Kim, B.H., Yaakob, Z. & Daud, W.R.W. (2011) Activated carbonnanofibers as an alternative cathode catalyst to platinum in a two-chamber microbial fuel cell. InternationalJournal of Hydrogen Energy, 36, 13,746–13,752.
Ghasemi, M., Shahgaldi, S., Ismail, M., Yaakob, Z. & Daud, W.R.W. (2012) New generation of car-bon nanocomposite proton exchange membranes in microbial fuel cell systems. Chemical EngineeringJournal, 184, 82–89.
Ghasemi, M., Daud, W.R.W., Hassan, H.S.A., Oh, S.-E., Ismail, M., Rahimnejad, M. & Jahim, J.M. (2013a)Nano-structured carbon as electrode material in microbial fuel cells: a comprehensive review. Journal ofAlloys and Compounds, 580, 245–255.
Ghasemi, M., Daud, W.R.W., Rahimnejad, M., Rezayi, M., Fatemi,A., Jafari,Y., Somalu, M.R. & Manzour,A.(2013b) Copper-phthalocyanine and nickel nanoparticles as novel cathode catalysts in microbial fuel cells.International Journal of Hydrogen Energy, 38, 9533–9540.
Ghasemi, M., Daud, W.R.W., Mokhtarian, N., Mayahi, A., Ismail, M., Anisi, F., Sedighi, M. & Alam, J.(2013c)The effect of nitric acid, ethylenediamine, and diethanolamine modified polyaniline nanoparticlesanode electrode in a microbial fuel cell. International Journal of Hydrogen Energy, 38, 9525–9532.
Ghasemi, M., Daud, W.R.W., Ismail, M., Rahimnejad, M., Ismail, A.F., Leong, J.X., Miskan, M. & BenLiew, K. (2013d) Effect of pre-treatment and biofouling of proton exchange membrane on microbial fuelcell performance. International Journal of Hydrogen Energy, 38, 5480–5484.
288 M. Ghasemi et al.
Ghasemi, M., Ismail, M., Kamarudin, S.K., Saeedfar, K., Daud, W.R.W., Hassan, S.H.A., Heng, L.Y.,Alam, J. & Oh, S.-E. (2013e). Carbon nanotube as an alternative cathode support and catalyst for microbialfuel cells. Applied Energy, 102, 1050–1056.
Ghoreishi, K.B., Ghasemi, M., Rahimnejad, M., Yarmo, M.A., Daud, W.R.W., Asim, N. & Ismail, M. (2014)Development and application of vanadium oxide/polyaniline composite as a novel cathode catalyst inmicrobial fuel cell. International Journal of Energy Research, 38, 70–77.
Ilbeygi, H., Ghasemi, M., Emadzadeh, D., Ismail, A.F., Zaidi, S.M.J., Aljlil, A., Jaafar, J., Martin, D. &Keshani, S. (2015) Power generation and wastewater treatment using a novel SPEEK nanocompositemembrane in a dual chamber microbial fuel cell. International Journal of Hydrogen Energy, 40, 477–487.
Leong, J.X., Daud, W.R.W., Ghasemi, M., Liew, K.B. & Ismail, M. (2013) Ion exchange membranes asseparators in microbial fuel cells for bioenergy conversion: a comprehensive review. Renewable andSustainable Energy Reviews, 28, 575–587.
Lim, S.S., Daud, W.R.W., Md Jahim, J., Ghasemi, M., Chong, P.S. & Ismail, M. (2012) Sulfonated poly(etherether ketone)/poly(ether sulfone) composite membranes as an alternative proton exchange membrane inmicrobial fuel cells. International Journal of Hydrogen Energy, 37, 11,409–11,424.
Rahimnejad, M., Ghasemi, M., Najafpour, G.D., Ismail, M., Mohammad, A.W., Ghoreyshi, A.A. & Hassan,S.H.A. (2012) Synthesis, characterization and application studies of self-made Fe3O4/PES nanocompositemembranes in microbial fuel cell. Electrochimica Acta, 85, 700–706.
Shahgaldi S., Ghasemi, M., Daud, W.R.W., Yaakob, Z., Sedighi, M., Alam, J. & Ismail, A.F. (2014) Per-formance enhancement of microbial fuel cell by PVDF/Nafion nanofibre composite proton exchangemembrane. Fuel Processing Technology, 124, 290–295.
CHAPTER 26
Performance of polyphenylsulfone solvent resistant nanofiltrationmembrane: effects of polymer concentration, membranepretreatment and operating pressure
Nur Aimie Abdullah Sani, Woei Jye Lau & Ahmad Fauzi Ismail
26.1 INTRODUCTION
The presence of trace amount of organic acids such as naphthenic acid in crude oil and distilledfractions could cause corrosion problems damaging pipelines and separation equipment in theoil and gas industry (Yépez, 2007). Therefore, it is desirable to reduce the acidity of crude oilby removing the amount of naphthenic acid. Generally, naphthenic acid is removed by extractionwith methanol and then the methanol is recovered using distillation. However, these conven-tional separation processes are associated with many significant drawbacks such as high energyconsumption and need for large amounts of solvents (Subramanian et al., 2004).
Membrane technology especially nanofiltration (NF), experiences increasing attention com-pared to these separation techniques as it offers many unique advantages. For instance, it consumesless energy and requires no additive during the treatment process, leading to relatively lowoperating cost (Dobrak et al., 2010). NF of organic solutions also known as solvent resistantnanofiltration (SRNF) is applied to separate compounds dissolved in solvents with molecularweight (MW) in the range from 200 to 1400 Da with simultaneous passing of the organic solventthrough the membrane.
It must be pointed out that the applications of NF membrane in organic solution are not verysuccessful compared to their uses in aqueous solution. The use of polymeric membranes in SRNFhas been employed by a growing number of researchers (Machado et al., 1999; Soroko et al.,2011; Tsarkov et al., 2012; Van der Bruggen et al., 2002a; 2002b), however, these membranesshow severe performance loss due to their chemical instability in organic solvents. Among theproblems, infinite flux caused by either the membrane swelling or dissolving (Raman et al.,1996), zero flux due to membrane collapse (Raman et al., 1996), poor selectivity or rejection(Subramanian et al., 1998) and membrane performance deterioration as a function of filtrationtime are always reported (Bridge et al., 2002).
Several solutions have been proposed in the literature to overcome the recurrent problems. Aertset al. (2006) have prepared plasma modified polydimethylsiloxane (PDMS) membrane subjectedfor the separation of dyes in alcohol solvents such as methanol, ethanol and isopropanol. Bitteret al. (1988) have used halogen-substituted silicon rubber for the separation of solvents fromhydrocarbons dissolved in the toluene and methyl ethyl ketone. However, both approaches werenot practical for industrial applications due to the significant flux reduction after a short period ofoperation. In view of this, the aim of this study is to evaluate the third member of the polysulfonefamily – polyphenylsulfone (PPSF) for organic solvent NF application. In this work, the propertiesof PPSF NF membranes were investigated by varying the polymer concentration in dope solution,the duration of membrane pretreatment using methanol solvent and the operating pressure duringorganic solvent application. The influences of these three variables on the performance of the mem-branes were characterized with respect to methanol flux and dye rejection (Reactive Black 5, RB5).Performance comparison was also made to compare the performances of in-house made PPSFmembranes with a commercially available SRNF membrane, i.e. NF030306F (SolSep BV, CA).
289
290 N.A.A. Sani, W.J. Lau & A.F. Ismail
Table 26.1. Condition for PPSF membranes pretreatment prior to testing.
Designation Solvent used in pretreatment Duration
Case 1 Methanol 5 minCase 2 1 day
26.2 EXPERIMENTAL
26.2.1 Materials
PPSF polymer pellets with MW of 11,044 gmol−1 purchased from Sigma-Aldrich, Malaysia wasused as the main membrane forming material for SRNF preparation. N -methyl-2-pyrrolidinone(NMP) obtained from Merck, Malaysia was used as solvent to dissolve the polymer in pellet form.Methanol (analytical grade >99%) used in this study was supplied by Merck, Malaysia and isthe common solvent used in deacidification of crude oil. Reactive Black 5 (RB5) with MW of991 g mol−1 from Sigma-Aldrich, Malaysia was selected to represent naphthenic acid which hasMW in the range of 180–2400 g mol−1.
26.2.2 Preparation of membranes
PPSF membrane was prepared by dissolving a pre-weighed quantity of the polymer pellets inNMP at room temperature to form 17, 21 and 25 wt% polymer dope solution. Then, the solutionwas stirred overnight to ensure complete polymer dissolution. The solution was left at least 24 hto remove air bubbles before it was used for membrane casting. The polymer solution was caston a glass plate without any non-woven support using a casting knife at room temperature. It wassubsequently immersed in a non-solvent bath of tap water and kept for 24 h. The membrane wassubjected to air drying process at room temperature for at least 24 h prior to use. The morphologyof prepared membrane was observed by scanning electron microscope (SEM) (TM3000, Hitachi,Japan). Samples of SEM analysis were prepared by fracturing the membrane in liquid nitrogen.The commercial membrane used for the comparison purpose was NF030306F manufactured bySolSep BV, CA and was supplied in dry form. This membrane was made of silicone polymer.
26.2.3 Experimental procedure
The separation performances of the membranes were carried out using dead-end stirred cell(Sterlitech HP4750, Sterlitech Corporation, USA) with maximum capacity of 300 mL. The activemembrane area was approximately 14.6 cm2. A nitrogen cylinder equipped with a two-stagepressure regulator was connected to the top of the stirred cells to supply the desired pressure forfiltration experiments. In order to minimize concentration polarization during the experiments, aTeflon-coated magnetic stirring bar was used and was controlled at 700 rpm on top of the activeside of membrane.
To study the effect of membrane pretreatment process on membranes performance, the mem-branes were first subjected to two different pretreatment conditions as shown in Table 26.1followed by compaction at pressure of 3.0 MPa for about 1 h. The experiment was then performedat 0.5 and 2.5 MPa using pure methanol.
To study the effect of operating pressure on membrane flux and rejection, the pressure wasvaried between 0.5 and 2.5 MPa and before the experiment, the membrane was compacted atpressure of 2.6 MPa with the tested solvent for about 1 h. The permeate was collected after 30 minof experiment when flux had achieved steady-state and measured every 10 min for up to 2 h. Theflux (J ) [L h−1 m−2] was calculated by the following equation where V , A and t are permeate
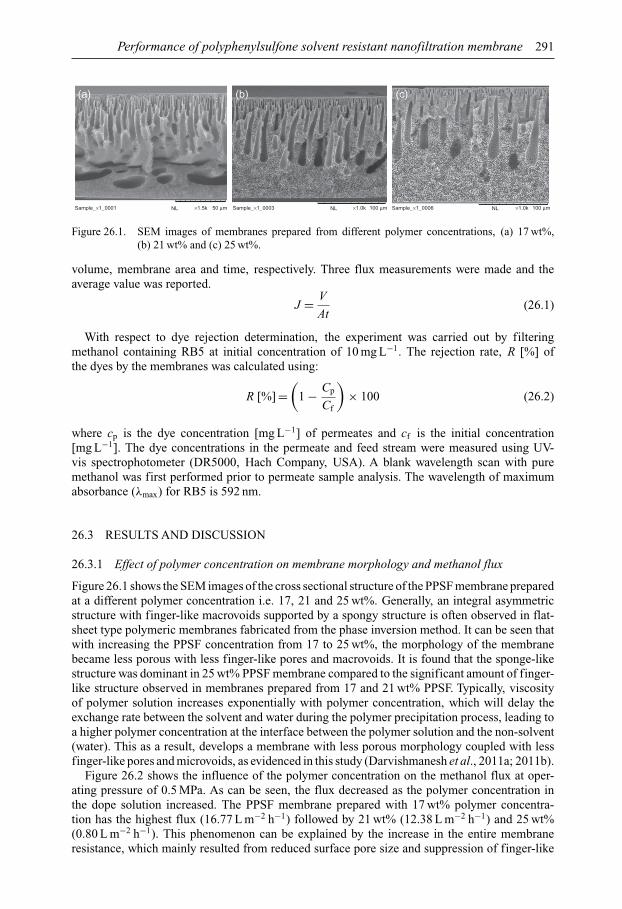
Performance of polyphenylsulfone solvent resistant nanofiltration membrane 291
(a) (b) (c)
Sample_×1_0001 NL 50 µm×1.5k Sample_×1_0003 NL 100 µm×1.0k Sample_×1_0006 NL 100 µm×1.0k
Figure 26.1. SEM images of membranes prepared from different polymer concentrations, (a) 17 wt%,(b) 21 wt% and (c) 25 wt%.
volume, membrane area and time, respectively. Three flux measurements were made and theaverage value was reported.
J = V
At(26.1)
With respect to dye rejection determination, the experiment was carried out by filteringmethanol containing RB5 at initial concentration of 10 mg L−1. The rejection rate, R [%] ofthe dyes by the membranes was calculated using:
R [%] =(
1 − Cp
Cf
)× 100 (26.2)
where cp is the dye concentration [mg L−1] of permeates and cf is the initial concentration[mg L−1]. The dye concentrations in the permeate and feed stream were measured using UV-vis spectrophotometer (DR5000, Hach Company, USA). A blank wavelength scan with puremethanol was first performed prior to permeate sample analysis. The wavelength of maximumabsorbance (λmax) for RB5 is 592 nm.
26.3 RESULTS AND DISCUSSION
26.3.1 Effect of polymer concentration on membrane morphology and methanol flux
Figure 26.1 shows the SEM images of the cross sectional structure of the PPSF membrane preparedat a different polymer concentration i.e. 17, 21 and 25 wt%. Generally, an integral asymmetricstructure with finger-like macrovoids supported by a spongy structure is often observed in flat-sheet type polymeric membranes fabricated from the phase inversion method. It can be seen thatwith increasing the PPSF concentration from 17 to 25 wt%, the morphology of the membranebecame less porous with less finger-like pores and macrovoids. It is found that the sponge-likestructure was dominant in 25 wt% PPSF membrane compared to the significant amount of finger-like structure observed in membranes prepared from 17 and 21 wt% PPSF. Typically, viscosityof polymer solution increases exponentially with polymer concentration, which will delay theexchange rate between the solvent and water during the polymer precipitation process, leading toa higher polymer concentration at the interface between the polymer solution and the non-solvent(water). This as a result, develops a membrane with less porous morphology coupled with lessfinger-like pores and microvoids, as evidenced in this study (Darvishmanesh et al., 2011a; 2011b).
Figure 26.2 shows the influence of the polymer concentration on the methanol flux at oper-ating pressure of 0.5 MPa. As can be seen, the flux decreased as the polymer concentration inthe dope solution increased. The PPSF membrane prepared with 17 wt% polymer concentra-tion has the highest flux (16.77 L m−2 h−1) followed by 21 wt% (12.38 L m−2 h−1) and 25 wt%(0.80 L m−2 h−1). This phenomenon can be explained by the increase in the entire membraneresistance, which mainly resulted from reduced surface pore size and suppression of finger-like
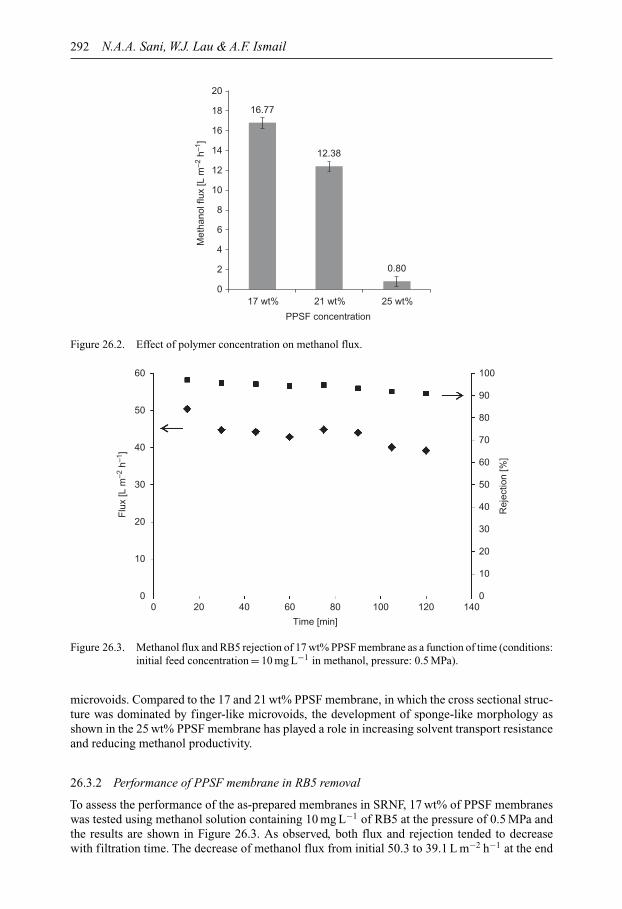
292 N.A.A. Sani, W.J. Lau & A.F. Ismail
20
16.7718
16
14
12
10
8
6
4
2
017 wt% 21 wt% 25 wt%
PPSF concentration
Met
hano
l flu
x [L
m–2
h–1
]
12.38
0.80
Figure 26.2. Effect of polymer concentration on methanol flux.
Time [min]
Flu
x [L
m–2
h–1
]
Rej
ectio
n [%
]
0 20 40 60 80 100 120 1400
10
20
30
40
50
60
0
10
20
30
40
50
60
70
80
90
100
Figure 26.3. Methanol flux and RB5 rejection of 17 wt% PPSF membrane as a function of time (conditions:initial feed concentration = 10 mg L−1 in methanol, pressure: 0.5 MPa).
microvoids. Compared to the 17 and 21 wt% PPSF membrane, in which the cross sectional struc-ture was dominated by finger-like microvoids, the development of sponge-like morphology asshown in the 25 wt% PPSF membrane has played a role in increasing solvent transport resistanceand reducing methanol productivity.
26.3.2 Performance of PPSF membrane in RB5 removal
To assess the performance of the as-prepared membranes in SRNF, 17 wt% of PPSF membraneswas tested using methanol solution containing 10 mg L−1 of RB5 at the pressure of 0.5 MPa andthe results are shown in Figure 26.3. As observed, both flux and rejection tended to decreasewith filtration time. The decrease of methanol flux from initial 50.3 to 39.1 L m−2 h−1 at the end

Performance of polyphenylsulfone solvent resistant nanofiltration membrane 293
0.5 2.5Pressure [MPa]
Case 1 Case 2
Flu
x [L
m–2
h–1
]
0
50
100
150
200
250
300
350
0.5 2.5Pressure [MPa]
Case 1 Case 2
Rej
ectio
n [%
]
0
20
40
60
80
100(b)(a)
Figure 26.4. Effect of pretreatment process on PPSF membrane performances: (a) flux of methanol and(b) rejection of RB5.
of the experiment was caused by the pressure compaction on the membrane. This phenomenoncan be related to the finger-like macrovoids structure of the membrane as shown in Figure 26.1a.As suggested by Persson et al. (1995), the finger-like macrovoids structure is more affected bycompaction than a sponge-like structure. The compaction preferentially occurs in the bulk layerwhere most of the pore volume, i.e. large pores and macrovoids are situated (Jonsson, 1977).Another possible explanation of the reduction of flux is the pore blockage by solvent molecules,and similar observation has been reported elsewhere (Whu et al., 2000; Yang et al., 2001).In comparison to membrane flux, it was found that the rejection ability of PPSF membrane wasnot significantly affected throughout the entire experimental period. Its rejection remained in therange of 90.8–96.9%.
26.3.3 Effect of pretreatment process duration on membrane performance
Membrane pretreatment process plays an important role in membrane performance for non-aqueous systems. Pretreating the membrane before testing becomes critical because the solvent-membrane interactions significantly affect the performance of the membrane. The purpose ofpretreating the membrane with organic solvent is to make the membrane in stable condition priorto any experiment. It is because the sudden exposure of membrane to the solvent of filtrationmay result in inconsistent flux and sudden swell of the membrane. Figure 26.4 presents the effectof pretreatment conditions on the solvent flux and dye rejection of 17 wt% PPSF membrane attwo different operating pressures. As shown, fluxes of methanol significantly changed when themembranes were pretreated with different treatment conditions. A longer period of immersioncauses the membranes to be more resistant towards methanol flux probably due to the swellingof the membrane structure. The rejection of dye was measured to evaluate the effect of thepretreatment process on membrane pore size. The significant increase in the dye rejection fromCase 1 to 2 indicates decrease in the pretreated membrane pore size. Ebert and Cuperus (1999)reported that when a porous membrane swells, the pores become narrower and therefore increasesthe membrane rejection. With respect to the effect of pressure on the performance of the pretreatedmembrane, it was found that the methanol flux and the dye rejection were increased as the pressure
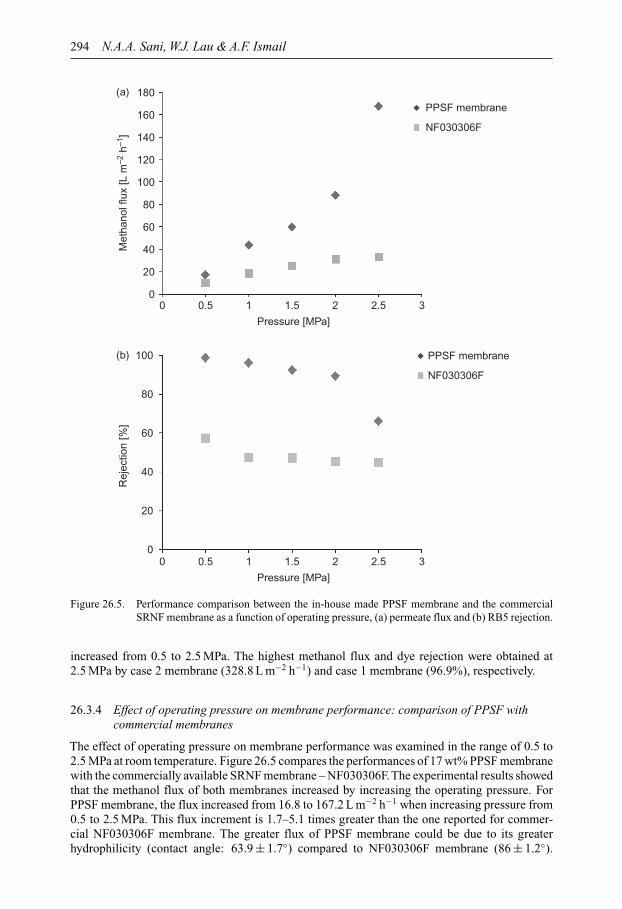
294 N.A.A. Sani, W.J. Lau & A.F. Ismail
Pressure [MPa]
Pressure [MPa]
NF030306FM
etha
nol f
lux
[L m
–2 h
–1]
0 0.5 1 1.5 2 2.5 3
0 0.5 1 1.5 2 2.5 3
0
20
40
60
80
100
120
140
160
(a)
(b)
180
Rej
ectio
n [%
]
0
20
40
60
80
100
PPSF membrane
NF030306F
PPSF membrane
Figure 26.5. Performance comparison between the in-house made PPSF membrane and the commercialSRNF membrane as a function of operating pressure, (a) permeate flux and (b) RB5 rejection.
increased from 0.5 to 2.5 MPa. The highest methanol flux and dye rejection were obtained at2.5 MPa by case 2 membrane (328.8 L m−2 h−1) and case 1 membrane (96.9%), respectively.
26.3.4 Effect of operating pressure on membrane performance: comparison of PPSF withcommercial membranes
The effect of operating pressure on membrane performance was examined in the range of 0.5 to2.5 MPa at room temperature. Figure 26.5 compares the performances of 17 wt% PPSF membranewith the commercially available SRNF membrane – NF030306F.The experimental results showedthat the methanol flux of both membranes increased by increasing the operating pressure. ForPPSF membrane, the flux increased from 16.8 to 167.2 L m−2 h−1 when increasing pressure from0.5 to 2.5 MPa. This flux increment is 1.7–5.1 times greater than the one reported for commer-cial NF030306F membrane. The greater flux of PPSF membrane could be due to its greaterhydrophilicity (contact angle: 63.9 ± 1.7◦) compared to NF030306F membrane (86 ± 1.2◦).
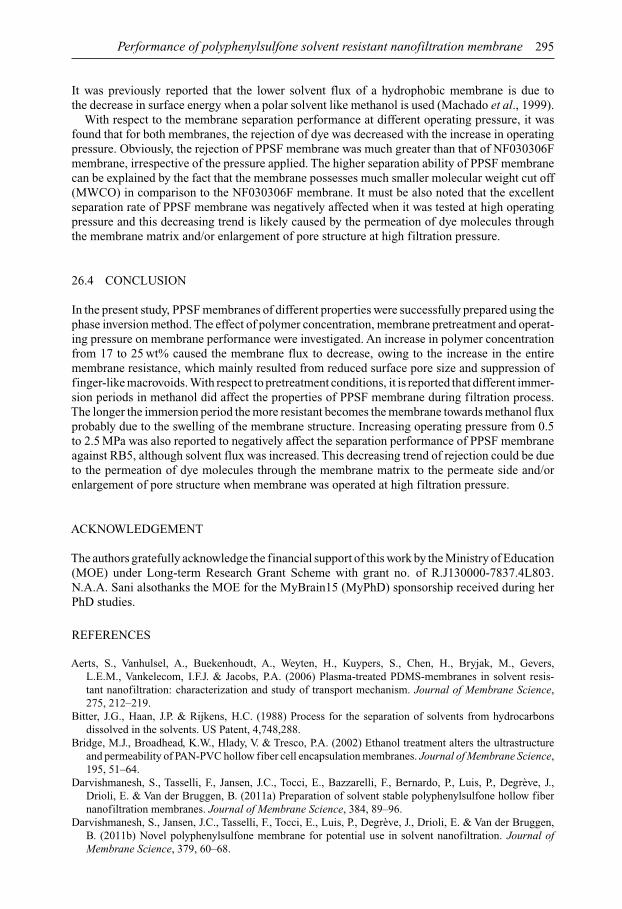
Performance of polyphenylsulfone solvent resistant nanofiltration membrane 295
It was previously reported that the lower solvent flux of a hydrophobic membrane is due tothe decrease in surface energy when a polar solvent like methanol is used (Machado et al., 1999).
With respect to the membrane separation performance at different operating pressure, it wasfound that for both membranes, the rejection of dye was decreased with the increase in operatingpressure. Obviously, the rejection of PPSF membrane was much greater than that of NF030306Fmembrane, irrespective of the pressure applied. The higher separation ability of PPSF membranecan be explained by the fact that the membrane possesses much smaller molecular weight cut off(MWCO) in comparison to the NF030306F membrane. It must be also noted that the excellentseparation rate of PPSF membrane was negatively affected when it was tested at high operatingpressure and this decreasing trend is likely caused by the permeation of dye molecules throughthe membrane matrix and/or enlargement of pore structure at high filtration pressure.
26.4 CONCLUSION
In the present study, PPSF membranes of different properties were successfully prepared using thephase inversion method. The effect of polymer concentration, membrane pretreatment and operat-ing pressure on membrane performance were investigated. An increase in polymer concentrationfrom 17 to 25 wt% caused the membrane flux to decrease, owing to the increase in the entiremembrane resistance, which mainly resulted from reduced surface pore size and suppression offinger-like macrovoids. With respect to pretreatment conditions, it is reported that different immer-sion periods in methanol did affect the properties of PPSF membrane during filtration process.The longer the immersion period the more resistant becomes the membrane towards methanol fluxprobably due to the swelling of the membrane structure. Increasing operating pressure from 0.5to 2.5 MPa was also reported to negatively affect the separation performance of PPSF membraneagainst RB5, although solvent flux was increased. This decreasing trend of rejection could be dueto the permeation of dye molecules through the membrane matrix to the permeate side and/orenlargement of pore structure when membrane was operated at high filtration pressure.
ACKNOWLEDGEMENT
The authors gratefully acknowledge the financial support of this work by the Ministry of Education(MOE) under Long-term Research Grant Scheme with grant no. of R.J130000-7837.4L803.N.A.A. Sani alsothanks the MOE for the MyBrain15 (MyPhD) sponsorship received during herPhD studies.
REFERENCES
Aerts, S., Vanhulsel, A., Buekenhoudt, A., Weyten, H., Kuypers, S., Chen, H., Bryjak, M., Gevers,L.E.M., Vankelecom, I.F.J. & Jacobs, P.A. (2006) Plasma-treated PDMS-membranes in solvent resis-tant nanofiltration: characterization and study of transport mechanism. Journal of Membrane Science,275, 212–219.
Bitter, J.G., Haan, J.P. & Rijkens, H.C. (1988) Process for the separation of solvents from hydrocarbonsdissolved in the solvents. US Patent, 4,748,288.
Bridge, M.J., Broadhead, K.W., Hlady, V. & Tresco, P.A. (2002) Ethanol treatment alters the ultrastructureand permeability of PAN-PVC hollow fiber cell encapsulation membranes. Journal of Membrane Science,195, 51–64.
Darvishmanesh, S., Tasselli, F., Jansen, J.C., Tocci, E., Bazzarelli, F., Bernardo, P., Luis, P., Degrève, J.,Drioli, E. & Van der Bruggen, B. (2011a) Preparation of solvent stable polyphenylsulfone hollow fibernanofiltration membranes. Journal of Membrane Science, 384, 89–96.
Darvishmanesh, S., Jansen, J.C., Tasselli, F., Tocci, E., Luis, P., Degrève, J., Drioli, E. & Van der Bruggen,B. (2011b) Novel polyphenylsulfone membrane for potential use in solvent nanofiltration. Journal ofMembrane Science, 379, 60–68.

296 N.A.A. Sani, W.J. Lau & A.F. Ismail
Dobrak, A., Verrecht, B., Van den Dungen, H., Buekenhoudt, A., Vankelecom, I.F.J. & Van der Bruggen, B.(2010) Solvent flux behavior and rejection characteristics of hydrophilic and hydrophobic mesoporousand microporous TiO2 and ZrO2 membranes. Journal of Membrane Science, 346, 344–352.
Ebert, K. & Petrus Cuperus, F. (1999) Solvent resistant nano-filtration membranes in edible oil processing.Membrane Technology, 1999, 5–8.
Jonsson, G. (1977) Methods for determining the selectivity of reverse osmosis membranes. Desalination,24, 19–37.
Machado, D.R., Hasson, D. & Semiat, R. (1999) Effect of solvent properties on permeate flow throughnanofiltration membranes. Part I. Investigation of parameters affecting solvent flux. Journal of MembraneScience, 163, 93–102.
Persson, K.M., Gekas, V. & Trägårdh, G. (1995) Study of membrane compaction and its influence onultrafiltration water permeability. Journal of Membrane Science, 100, 155–162.
Raman, L., Cheryan, M. & Rajagopalan, N. (1996) Deacidification of soybean oil by membrane technology.Journal of the American Oil Chemists’ Society, 73, 219–224.
Soroko, I., Lopes, M.P. & Livingston,A. (2011)The effect of membrane formation parameters on performanceof polyimide membranes for organic solvent nanofiltration (OSN). Part A. Effect of polymer/solvent/non-solvent system choice. Journal of Membrane Science, 381, 152–162.
Subramanian, R., Nakajima, M. & Kawakatsu, T. (1998) Processing of vegetable oils using polymericcomposite membranes. Journal of Food Engineering, 38, 41–56.
Subramanian, R., Nakajima, M., Raghavarao, K.S.M.S. & Kimura, T. (2004) Processing vegetable oils usingnonporous denser polymeric composite membranes. Journal of the American Oil Chemists’ Society, 81,313–322.
Tsarkov, S., Khotimskiy, V., Budd, P.M., Volkov, V., Kukushkina, J. & Volkov, A. (2012) Solvent nanofiltrationthrough high permeability glassy polymers: effect of polymer and solute nature. Journal of MembraneScience, 423, 65–72.
Van der Bruggen, B., Geens, J. & Vandecasteele, C. (2002a) Fluxes and rejections for nanofiltration withsolvent stable polymeric membranes in water, ethanol and n-hexane. Chemical Engineering Science, 57,2511–2518.
Van der Bruggen, B., Geens, J. & Vandecasteele, C. (2002b) Influence of organic solvents on the performanceof polymeric nanofiltration membranes. Separation Science and Technology, 37, 783–797.
Whu, J.A., Baltzis, B.C. & Sirkar, K.K. (2000) Nanofiltration studies of larger organic microsolutes inmethanol solutions. Journal of Membrane Science, 170, 159–172.
Yang, X.J., Livingston, A.G. & Freitas dos Santos, L. (2001) Experimental observations of nanofiltrationwith organic solvents. Journal of Membrane Science, 190, 45–55.
Yépez, O. (2007) On the chemical reaction between carboxylic acids and iron, including the special case ofnaphthenic acid. Fuel, 86, 1162–1168.

CHAPTER 27
Application of membrane technology in degummingand deacidification of vegetable oils refining
Noor Hidayu Othman, Ahmadilfitri Md Noor, Mohd Suria Affandi Yusoff,Ahmad Fauzi Ismail, Pei Sean Goh & Woei Jye Lau
27.1 INTRODUCTION
World consumption of oils and fats has grown steadily during last 25 years. The ‘Oil World’statistics indicate that oils and fats consumption has increased from 152 million metric tons in2007 to 183 million tons in 2012 (Basiron, 2013). Vegetable oils and fats are not only used forhuman consumption, but also in animal feed, medical purposes and certain technical applications.Production of the major oils, derived from palm, soybean, rapeseed and sunflower seed, grewby over 70% and accounted for 88% of the increase in world output of all oils and fats (R.E.A.,2013). According to the 2012 revision of the official United Nations population estimates andprojections, the world population of 7.2 billion in mid-2013 is projected to increase by almost onebillion people within the next twelve years, reaching 8.1 billion in 2025, and to further increase to9.6 billion in 2050 and 10.9 billion by 2100 (UN, 2013). Thus, there will be new challenges to thefood producers and processors to develop new technologies, processing methods, and agriculturaltechniques to meet food demands of a growing population.
The vegetable oils industry involves the extraction and processing of oils and fats from a varietyof fruits, seeds, and nuts. The objectives of refining are to remove the undesirable constituents(e.g.: FFA, PLs, metal ions, color pigments and others) from crude oils, to preserve valuablevitamins (e.g., tocopherols and tocotrienols – natural antioxidants), to protect the oils againstdegradation, and ensuring a good quality and stability of end product (Lin and Koseoglu, 2005).However, several drawbacks are identified from conventional refining processes such as highenergy usage, losses of neutral oil, large amounts of water and chemical are used and heavilycontaminated effluents are produced (Gibon et al., 2007).
Membrane technology is a mature industry and has been successfully applied in variousfood industries for separation of undesirable fractions from valuable components. Commercialmembrane separation processes are offered in the areas of nitrogen production and waste-watertreatment application. The developing membrane application in vegetable oils processing includessolvent recovery, degumming, deacidification, pigment removal, wax removal and extraction ofminor components (tocopherols and carotenoids) (Cheryan, 2005).
The application of membrane technology in vegetable oils refining has been receiving attentionin the light of various inherent advantages associated with membrane processes. It seems to bea simple and promising tool to refine vegetable oils due to low energy consumption, ambienttemperature operation, no addition of chemicals, and retention of nutrients and other desirablecomponents that contributes to cost and energy effectiveness and eco-friendliness (de MoraisCoutinho et al., 1990; Koseoglu and Engelgau, 1990; Raman et al., 1994a).
27.1.1 Membrane technology and its basic principles
Membranes can be defined as semipermeable barriers that separate two phases and restrict thetransport of various substances in a specific way. The primordial function of a membrane is to
297
298 N.H. Othman et al.
act as a selective barrier, allowing the passage of certain components and the retention of othersfrom a determined mixture, implying the concentration of one or more components both in thepermeate and in the retentate (Ladhe and Kumar, 2010). Its selectivity is related to the dimensionsof the molecule or particle of interest for separation and the pore size, as also the solute diffusivityin the matrix and the associated electric charges (Strathmann, 1990).
In the chemical process industry one often encounters the problem of separating a mixturein its components. Membranes can in principle carry out most of the separation processes andcan complement or form an alternative for processes like distillation, extraction, fractionation,adsorption etc. The basic membrane systems commercially available include microfiltration (MF),ultrafiltration (UF), nanofiltration (NF), and reverse osmosis (RO), each of which depending onthe nature of particle or on the molecular size of the solutes that are separated. Generally, MFaddresses the largest macromolecules from 200,000 to 1 million molecular weight (MW) (500–2million angstrom units); UF with middle-range molecules from 10,000–300,000 MW (40–2000angstrom units); NF with small molecules of 15,000–150 MW (80–80 Angström units); and ROwith ions and smallest molecules up to 600 MW (20 Angström units) (Lin and Koseoglu, 2005).
The success of using membranes is closely related to the intrinsic properties of the membrane.Interfacial interactions between membrane surface, surrounding environment and solutes governmembrane performance to a great extent (Cheryan, 1998). There are four essential featuresrequired for the efficient operation of a membrane process: (ii) selectivity which determinesproduct purity, (ii) flux which determines the product throughput, (iii) rate of separation whichdetermines the equipment size and (iv) durability/ease of cleaning which determines the operatingcost. The use of membranes in industrial applications is growing at a rapid rate. Equipmentsuppliers and academicians have generated a great deal of information about the performance,capabilities, and applications of membrane systems (Cheremisinoff, 2002).
The factor that distinguishes between the common membrane separation processes of MF,UF, NF and RO is the application of hydraulic pressure as the driving force for mass transport.Nevertheless the nature of the membrane controls which components will permeate and whichwill be retained, since they are selectively separated according to their molar masses or particlesize (Strathmann, 1990). In a conventional filtration system, the fluid flow, be it liquid or gaseousis perpendicular to the membrane surface, such that solutes deposit on it, requiring periodicinterruption of the process to clean or substitute the filter. In tangential membrane filtration thefluid flow is parallel to the membrane surface, and the solutes that tend to accumulate on the surfaceare stripped away due to the high velocity, making the process more efficient (Muralidhara, 2010).
27.2 VEGETABLE OILS AND DEGUMMING
27.2.1 Overview and principle of degumming process
Crude oil obtained by screw pressing and solvent extraction of oilseeds will throw a deposit ofso-called gums on storage. The chemical nature of these gums has been difficult to determine.These gums consist mainly of phosphatides but also contain entrained oil and mill particles. Theyare formed when the oil absorbs water that causes some of the phosphatides to become hydratedand thereby oil-insoluble. Accordingly, hydrating the gums and removing the hydrated gums fromthe oil before storing the oil can prevent the formation of a gum deposit (Paulson et al., 1984). Fivebasic principles of degumming processes are described as water degumming, dry degumming,acid degumming, acid refining and soft degumming as shown in Figure 27.1.
Water degumming is the oldest degumming treatment and also forms the basis of the productionof commercial lecithin. It is the simplest method for phosphatide reduction where the hot wateris mixed into warm oil (70–90◦C). Hydratable phospholipids (PLs) absorb water to agglomerateinto a gum phase, which is, after a certain holding time, separated in separators or decanters. Theprocedure may be sufficient for some types of vegetable oils, e.g. 99% of PLs are removed byheating oil to 80–85◦C with water and then filtering at 55–60◦C (Deffense, 2011a). The classic
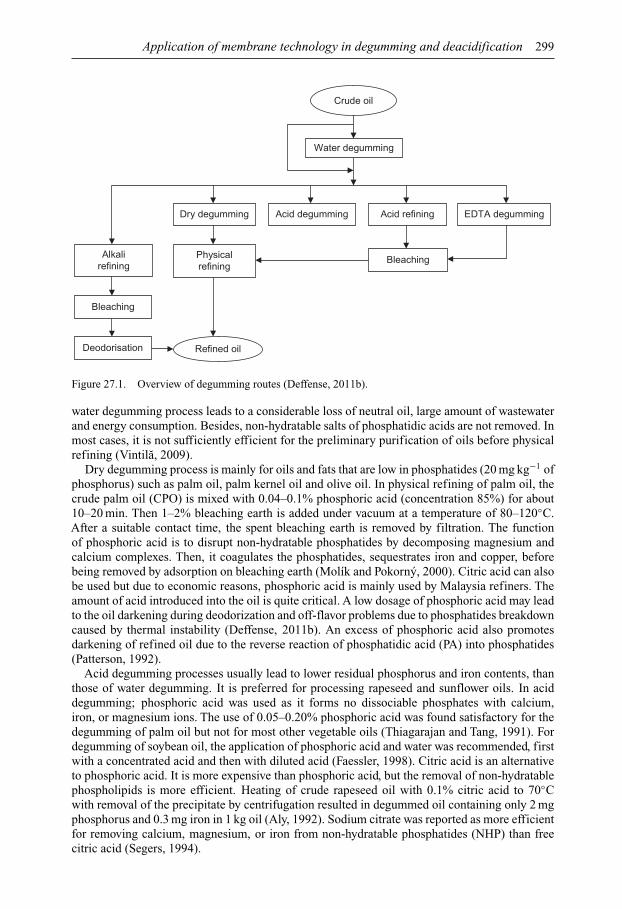
Application of membrane technology in degumming and deacidification 299
Bleaching
Deodorisation
Crude oil
Water degumming
Dry degumming Acid degumming
Physicalrefining
Alkalirefining
Acid refining EDTA degumming
Refined oil
Bleaching
Figure 27.1. Overview of degumming routes (Deffense, 2011b).
water degumming process leads to a considerable loss of neutral oil, large amount of wastewaterand energy consumption. Besides, non-hydratable salts of phosphatidic acids are not removed. Inmost cases, it is not sufficiently efficient for the preliminary purification of oils before physicalrefining (Vintila, 2009).
Dry degumming process is mainly for oils and fats that are low in phosphatides (20 mg kg−1 ofphosphorus) such as palm oil, palm kernel oil and olive oil. In physical refining of palm oil, thecrude palm oil (CPO) is mixed with 0.04–0.1% phosphoric acid (concentration 85%) for about10–20 min. Then 1–2% bleaching earth is added under vacuum at a temperature of 80–120◦C.After a suitable contact time, the spent bleaching earth is removed by filtration. The functionof phosphoric acid is to disrupt non-hydratable phosphatides by decomposing magnesium andcalcium complexes. Then, it coagulates the phosphatides, sequestrates iron and copper, beforebeing removed by adsorption on bleaching earth (Molík and Pokorný, 2000). Citric acid can alsobe used but due to economic reasons, phosphoric acid is mainly used by Malaysia refiners. Theamount of acid introduced into the oil is quite critical. A low dosage of phosphoric acid may leadto the oil darkening during deodorization and off-flavor problems due to phosphatides breakdowncaused by thermal instability (Deffense, 2011b). An excess of phosphoric acid also promotesdarkening of refined oil due to the reverse reaction of phosphatidic acid (PA) into phosphatides(Patterson, 1992).
Acid degumming processes usually lead to lower residual phosphorus and iron contents, thanthose of water degumming. It is preferred for processing rapeseed and sunflower oils. In aciddegumming; phosphoric acid was used as it forms no dissociable phosphates with calcium,iron, or magnesium ions. The use of 0.05–0.20% phosphoric acid was found satisfactory for thedegumming of palm oil but not for most other vegetable oils (Thiagarajan and Tang, 1991). Fordegumming of soybean oil, the application of phosphoric acid and water was recommended, firstwith a concentrated acid and then with diluted acid (Faessler, 1998). Citric acid is an alternativeto phosphoric acid. It is more expensive than phosphoric acid, but the removal of non-hydratablephospholipids is more efficient. Heating of crude rapeseed oil with 0.1% citric acid to 70◦Cwith removal of the precipitate by centrifugation resulted in degummed oil containing only 2 mgphosphorus and 0.3 mg iron in 1 kg oil (Aly, 1992). Sodium citrate was reported as more efficientfor removing calcium, magnesium, or iron from non-hydratable phosphatides (NHP) than freecitric acid (Segers, 1994).

300 N.H. Othman et al.
Acid refining is applicable for both water degummed oil and oils that have not yet beendegummed (Molík and Pokorný, 2000). Similar to acid degumming, non-hydratable phospho-lipids are firstly decomposed by a sufficiently strong acid. Instead of diluting the degummingacid with water, the hydratability of phospholipids is achieved by the addition of a base, such assodium hydroxide, caustic soda, or sodium silicate. Only partially degumming acid was neutral-ized to prevent soap formation (Vintila, 2009). Various processes have been developed based onpartial neutralization of PA by sodium hydroxide without touching the free fatty acids such as TOPdegumming by Vandemoortele (original process) (Dijkstra and Opstal, 1989); Uni-degummingby Unilever as a post-treatment like in the TOP degumming has been added to the Super degum-ming (Sande van de and Segers, 1989); special degumming developed on crude oils by AlfaLaval (Johansson et al., 1988); UF degumming using lower temperature than in the TOP and lowagitation by Krupp (Rohdenburg et al., 1993); and the Impac degumming using additionally awetting agent by De Smet (2013). TOP is a Dutch acronym derived from “Totaal OntslijmingsProcess” meaning total degumming process.
Soft degumming is another option to remove phosphatides from crude palm oil with high phos-phatide and iron contents (Gibon and Tirtiaux, 1998). In this case, the oil is heated (75–85◦C) andmixed with a water solution (2%) containing a complexing molecule [ethylenediaminetetraceticacid (EDTA)] and, eventually, a wetting compound [sodium dodecyl sulfate (SDS)]. EDTA is ableto form strong chelates with magnesium, calcium and iron. As a consequence, non-hydratablephospholipids will be more easily removed. After 20 min of retention time followed by centrifu-gation, less than 1 mg kg−1 of phosphorus can be achieved. Iron is reduced to below 0.1 mg kg−1
as it forms an oil-insoluble complex with EDTA (Lin and Koseoglu, 2005). The efficiency of theprocess depends on the degree of dispersion and contact between the chelating agent (EDTA) andthe NHP. A detergent, sodium lauryl sulfate (SLS) is used to facilitate the contact between theNHP in the oil phase and the water phase solution containing the chelating agent. However theseparation of both phases was made more difficult due to the high stability of the emulsion (Jamilet al., 2000).
27.2.2 Membrane degumming of vegetable oils
Membrane separation is primarily a size-exclusion based pressure-driven process. It separatesdifferent components according to the molecular weights or particle sizes and shapes of individualcomponents. Sometimes it depends on their interactions with the membrane surfaces and othercomponents of the mixture (Cheryan, 1986). The performance of membrane separation is affectedby membrane composition, temperature, pressure, velocity of flow and interactions betweencomponents of the feedstock and with the membrane surface (Subramanian and Nakajima, 1997).
Theoretically, PLs and triacylglycerols (TG) have almost similar molecular weights (MW) ofabout 700 Da and 900 Da, respectively which makes them difficult to be separated by a membrane.However PLs are surfactants in nature, having both hydrophilic and hydrophobic groups. It tendsto form reverse micelles with MW of 20 kDa or more in non-aqueous systems such as vegetableoils and oil/hexane micelle that enable their separation by using of appropriate membrane (Gupta,1977; Lin et al., 1997; Ochoa et al., 2001; Pagliero et al., 2001; Subramanian et al., 2001).
According to the previous researches on the processing of vegetable oils using membranetechnology, the degumming process can be conducted using 3 categories of membranes; polymericmembrane, nonporous polymeric composite membrane and ceramic membrane.
27.2.3 Membrane degumming using polymeric membrane
In the last decade, the use of membrane in the degumming of vegetable oils has been a subject ofresearch. Some of the alternatives are based on removal of the PLs from the micelle (oil/hexane)and others from solvent-free oil. Sen Gupta in his pioneering work demonstrated that ultrafiltration(UF) membranes could be used for degumming hexane-oil miscella (Gupta, 1977). Since then,
Application of membrane technology in degumming and deacidification 301
many researchers from various countries followed this technique using porous and non-porousmembrane with different types of source oils.
Different types of polymeric materials were studied including polyvinylidenfluoride (PVDF),polyethersulfone (PES), polysulfone (PSF) and polyimide (PI) in crude soybean oil filtration. TheUF cell resulted up 99% PLs removal by PVDF membrane. A sharp initial decrease in permeateflux especially by PSF membrane explained the membrane behavior in term of concentrationpolarization effects and internal fouling (Pagliero et al., 2001). Similar behavior was observedin a study with PVDF and polyimide (PI) membranes in the same UF cell. PVDF membraneallowed larger pure hexane fluxes than PI at the same transmembrane pressure in the wholetemperature range analyzed. Further study has been made to minimize the surface fouling betweenthe membrane structure and membrane-solvent interaction effects. PVDF and PI membranesgave selectivity values and permeate color that did not differ significantly from each other. ThePLs rejections more than 98% were obtained in all cases while PVDF membrane had higherproductivity than other membranes (Ochoa et al., 2001; Pagliero et al., 2001; 2004).
However, under the influence of the solvent, micelle can greatly increase the effective particlesize of the PLs and enable them to be wholly retained by membrane. Due to hydrophobicity of PImembrane, lower fluxes are indicated in the case of relatively polar solvents, such as water andalcohols. Higher fluxes are evident in the case of non-polar solvent, such as hexane and acetone.Various solvents (water, alcohols, acetone and hexane) fluxes were measured with PLs that wererejected above 90% (Kim et al., 2002).
Besides soybean oil, cottonseed and rice bran oil, the removal of PLs was also studied insunflower oil using a cross-flow UF membrane. Two tubular PES membranes with differentMWCO (4000 and 9000 Da) were used for degumming of sunflower oil micelle. Both membranespresented approximately the same rejection of phospholipids (95–97%), although the 9000 Damembrane showed higher miscella permeate flux, lower oil rejection and higher FFA rejection(García et al., 2006).
The flat sheet PES UF membrane was also investigated for their ability to selectively separatePLs miscella from the desolventized crude soybean oil and from the crude soybean oil/hexane(miscella). The maximum of 77% and 85% PLs were recorded from the disolventized crude soy-bean oil and oil/hexane micelle, respectively. The use of miscella presents an important advantageto the industrial level, where system productivity is measured mainly by permeate flux and solute(phospholipids) removal (de Moura et al., 2005).
27.2.4 Membrane degumming using nonporous polymeric composite membrane
Nonporous membranes offer several advantages over UF membranes, namely higher rejectionof PLs, carotenoids and chlorophylls. Recently, the use of nonporous polymeric compositemembrane was actively investigated for processing of hexane/oil micelle.
Flat sheet polymeric composite membranes (NTGS-2200) with silicon as an active layer andPI as a support layer from Nitto Denko, Japan were used to degum crude rice bran oil andwater-degummed soybean oils after dilution with hexane at required pressure of 3 MPa. Duringmembrane processing, the reduction in PLs varied from 93.8 to 96.4% and from 63.9 to 77.3%in rice bran and soybean oils, respectively (Saravanan et al., 2006).
Similar polymeric composite membrane (NTGS-2200) was used in processing of CPO andpalm olein under both undiluted and hexane-diluted conditions. The membrane showed veryhigh selectivity between TG and PLs even under hexane-diluted conditions and the PLs rejectionwas nearly complete (95–100%). However the oil flux was very low in both undiluted (0.12–0.14 kg m−2 h−1) and hexane diluted (0.9–1.1 kg m−2 h−1), making it industrially not applicable(Arora et al., 2006).
The efficacy of non-porous membrane was further investigated using two composite mem-branes; NTGS-2200 and NTGS-2100 with polydimethylsiloxane (PDMS) as active layer and PIas support layer. Both membranes showed very high reduction (above 99%) of PL content in undi-luted crude oils (Subramaniana et al., 2004). However, due to very low oil flux, hexane-diluted
302 N.H. Othman et al.
condition was applied for processing of crude rice bran oil. The percentage rejection of PL variedfrom 95.1 to 98.8%, which indicated that the membrane posed a very high selectivity for PL evenunder hexane-diluted (Manjula and Subramanian, 2009; Subramaniana et al., 2004).
Generally, the PL content is well above the critical micelle concentration (CMC) in crudesolvent-extracted oils. In such systems, size exclusion may provide a synergistic effect in the rejec-tion (Subramaniana et al., 2004). The nonporous polymeric composite of hydrophobic membrane(NTGS-2200) was very effective in rejecting PLs (98–100%) in crude rice bran oil and groundnutoil. Even in hexane-diluted conditions, the PLs rejection by the membrane was nearly as effectiveas that of undiluted systems (Manjula et al., 2011).
27.2.5 Membrane degumming using ceramic membrane
Ceramic membrane is an inorganic membrane. It shows great mechanical resistance and supportshigh pressures and can tolerate the entire pH range (0–14), high temperatures of over 400◦C.It is also chemically inert (Cuperus and Nijhuis, 1993). A tubular ceramic membrane (MWCO:15 kDa) made of ZrO2 was used to treat a crude soybean oil-hexane micelle using UF module 92–93% of PLs were successfully rejected with a 25% crude soybean oil-hexane mixture (Marenchinoet al., 2006).
Direct membrane filtration to pretreat CPO was studied using ceramic MF membranes (alphaalumina: 0.45 µm and 0.2 µm) and UF membranes (Zirconia: 50 nm and 20 nm). The MF ceramicmembranes and UF ceramic membranes were able to reject 14–56.8% PLs and 60–78.1% PLsrespectively as compared to that of bleached oil with 34.4% PLs rejection. Although the PLs rejec-tion is not higher, the membrane pre-treatment technique showed better prospect than conventionalbleaching method (Iyike et al., 2004).
Corn oil is distinct from other vegetable oils since it has a higher content of waxes that requireremoval. A multichannel ceramic membrane constructed from alumina (support and filter ele-ment) was used for degumming a crude corn oil and crude soybean oil in an oil/hexane micelle,respectively. The membrane was initially conditioned with a solvent of high polarity and con-tinuing up to a nonpolar solvent using pure water, ethyl alcohol, hexane and a combination ofbinary solutions before filtration process. The ceramic membrane showed good performance inthe filtration of both corn oil/hexane miscella and soybean oil/hexane micelle with the maximumrejection of 93.5% PLs and 99% PLs, respectively (de Souza et al., 2008; Ribeiro et al., 2008).
Another attempt for direct membrane filtration using ceramic UF membrane with relativelysmall in MWCO (6 kDa or smaller) was conducted to refine sunflower seed oil. The highest PLsretention of 97% was achieved. It can be stated that the higher the pressure, the greater was theflux, but PL rejection decreased as well. Direct filtration seems not to be efficient enough becauseof the membrane fouling due to the high solid and particle content of the pressed oil (Koris andMarki, 2006).
27.3 VEGETABLE OILS AND DEACIDIFICATION
27.3.1 Conventional method and principle of deacidification process
The removal of free fatty acids (deacidification) is the most critical step in vegetable oil refining.It represents the main economic impact on oil production which determines the quality of thefinal refined product. Any inefficiency in this process has a great impact on the subsequentprocess operations. Chemical, physical and micelle deacidification have been used industriallyfor deacidification (Bhosle and Subramanian, 2005).
Chemical deacidification of palm oil was introduced in the early 1970s in Malaysia (PORAM,2013). The deacidification process accomplished by neutralizing the FFA with sodium hydroxide(NaOH) to remove the FFA in the form of soap-stock as well as any remaining PLs. Sometime anexcess of NaOH is required to reduce color of the refined oil and to ensure the removal of trace
Application of membrane technology in degumming and deacidification 303
elements (Lin and Koseoglu, 2005). Any residual soap will be removed by the addition of hotwater and subsequent centrifugation. FFA content in the crude oil has direct impact in the loss ofsignificant amounts of triglycerides due to saponification (Snape and Nakajima, 1996). However,for oils with high acidity, chemical refining causes high losses of neutral oil due to saponificationand emulsification. In spite of having several disadvantages; chemical deacidification is stillindustrially used upon request by customers.
Physical deacification emerged as a better alternative to chemical deacidification in the late1970s. Since then it was mainly used by modern refineries in Malaysia. Physical deacidificationuses steam distillation where the FFA and other volatile components are distilled off from the oilby using an effective stripping agent under suitable processing conditions (Ceriani and Meirelles,2006). As a consequence, oil losses are reduced, the quality of FFA is improved, and the operationis simplified. Despite all the advantages of reducing the loss of neutral oil, this process con-sumed high energy due to high deodorization temperatures in the range of 240–260◦C. Besides,incomplete removal of undesirable components during pre-treatment of the crude oil has to becompensated by the increased use of bleaching earth which will in turn increase the operationalcost (Bhosle and Subramanian, 2005).
Miscella deacidification is another alternative to conventional chemical and physical refining.In this process, miscella (typically 40–60% oil in hexane) is mixed with sodium hydroxide solutionfor neutralization, reaction with phosphatides, and decolorization. The separated micelle and thesoap stock are both evaporated to remove the solvent (Hodgson, 1996). This micelle refiningprocess results in less oil loss and lighter oil color. However, micelle refining is not widelyused in industry because of several disadvantages. All equipment must be totally enclosed andexplosion-proof, which increases investment considerably. Besides, the refining must be carriedout at the solvent mills to be effective and economical (Anderson, 1996).
27.3.2 Membrane deacidification of vegetable oils
FFA in principle is almost impossible to be removed by membranes itself due to the molecular sizeof FFA (<300 Da) is much smaller than that of TG (∼900 Da) (Cheryan, 2005). Theoretically, theideal process would be to use a membrane with pores so precise that they could effectively separatethe FFAs from the TG (Gibon et al., 2007). Most of the previous researchers had reported the useof solvents in membrane deacidification of vegetable oils. Only a few studies have reported ondirect deacidification of vegetable oils using membrane system.
27.3.2.1 Direct membrane deacidificationThe deacidification of crude soybean and rapeseed oils without addition of organic solventsin undiluted oils was investigated using polymeric membrane. The process produces permeateand retentate fractions containing TG and other oil constituents. The decreasing order of rela-tive preferential permeation in the nonporous membranes is expected to be FFA, tocopherols,TG, aldehydes, peroxides, color pigments and PLs. However, during membrane processing FFApermeated preferentially compared to TG resulting in negative rejection of FFA (Subramanianet al., 1998).
Similar results with negative rejection of FFA using polymeric nonporous membrane wererecorded in refined sunflower oil and oleic acid model system. Oleic acid permeated preferentiallyover triacylglycerols in the nonporous membrane, over a wide range of concentrations (∼5–70%).The differences in molecular size, solubility, diffusivity and polarity between TGs and oleic acidappear insufficient for achieving direct deacidification (Bhosle et al., 2005).
Another attempt was made by using ceramic membrane and polysulfone (PSF) hollow fibermembrane for membrane ultrafiltration of crude soybean oil. Ceramic membrane resulted inhigher rejection than PSF membrane with 54.45 and 34.39% FFA rejections, respectively. How-ever, the permeate flux of the ceramic membrane (4.16 kg m−2 h−1) was much lower than the PSFmembrane (11.58 kg m−2 h−1) (Alicieo et al., 2002).
304 N.H. Othman et al.
27.3.2.2 Membrane deacidification with solventMost of the previous research works on deacidification of vegetable oils were conducted incombination with solvent. This is because the difference in their molecular weights is too smalland membranes alone are very difficult to be used for membrane separation process (Ramanet al., 1994b). If the FFA were extracted from the crude oil by a solvent that selectively dissolvesthe FFA, the extractant (containing the solvent + FFA) can be processed and separated throughthe appropriate membrane.
Hollow fiber UF membranes were used to extract FFA from oil using 1,2-butanediol as aselective extractant. The oil phase was circulated inside the fibers, and butanediol outside thefibers. Some of the membranes tested could be used successfully. However due to the high masstransfer resistance, the required membrane surface area for a given extraction was relatively high(Keurentjes et al., 1992).
In other studies, the deacification of soybean oil was investigated after extracting FFA froma model crude vegetable oil with methanol. A combination of high-rejection and low-rejectionmembranes resulted in a retentate stream of 35% FFA and a permeate stream with less than 0.04%FFA. No alkali is required, no soap-stock is formed, and almost all streams within the membraneprocess are recycled with little discharged as effluent (Raman et al., 1996).
Another attempt using acetone-stable nanofiltration (NF) membranes was investigated forseparation of different vegetable oil/solvent mixtures. The permeate consisted almost entirely offatty acids in acetone, and only small traces of triglycerides were found. This makes it feasibleto selectively remove the fatty acids and reduce loss of triglycerides normally associated withdeacidification (Zwijnenberga et al., 1999).
Different types of commercial nonporous (reverse osmosis and gas separation) polymeric mem-branes were screened for their abilities to separate FFA, MG, DG, andTG from a lipase hydrolysateof high-oleic sunflower oil after diluting with organic solvents (ethanol and hexane). Separationof FFA, MG, and DG from TG may find an industrial application as it could replace or reducethe load on the deacidification and deodorization steps in the conventional refining process. Theconstituents can be separated in suitable solvents using appropriate nonporous membranes (Koikeet al., 2002).
In deacidification of model vegetable oils using polymeric hydrophobic nonporous andhydrophilic NF membranes, dilution with hexane had improved oil flux compared to the modelundiluted system. However, membrane selectivity was completely lost as both triacylglycerolsand oleic acid permeated along with the solvent. Processing of the model oil after diluting withacetone showed that oleic acid was retained less than TG by the NF membrane. However, theselectivity decreased during successive runs, owing to the gradual loss of hydrophilicity due topolarity conditioning of the membrane (Bhosle et al., 2005).
Different types of commercial porous and nonporous polymeric membranes were studied toseparate FFA from hydrolysate of partially hydrogenated soybean oil (PHSO). UF membranePLAC (PLAC is a trade name of a membrane, MW cut off 1000) made from regenerated cellulose(RC) and non-porous membranes of NTR series (Nitto Denko, Japan) had recorded 95.41% FFArejection at 27 kg m−2 h−1 and 95–96% FFA rejection at 5–10 kg m−2 h−1, respectively in theethanol system. In spite of encouraging results, there are still some key issues to be resolved formembrane development. A good compromise between achieving high selectivity and keepinghigh permeate flux, and long term stabilities give promising results for scale-up operation undersolvent conditions (Jala et al., 2011).
27.4 CONCLUSION
The development of membrane technology in degumming and deacidification – independently orin combination with the current technology – has emerged as a new approach to overcome majordrawbacks in conventional refining of vegetable oils. It is a promising tool to refine vegetableoils due to low-energy consumption, mild temperature operation, low maintenance/operation
Application of membrane technology in degumming and deacidification 305
cost, easiness to scale-up, retention of nutrients and other desirable components. However, thedevelopment of suitable membranes that enable achieving higher removal of PLs and FFA atacceptable flux is necessary for industrial adoption of this technology. With this, the consumerexpectation for a sustainable, mild and efficient refining process could be achieved.
ACKNOWLEDGEMENT
The authors are grateful to Sime Darby Research Sdn. Bhd. and Advanced Membrane TechnologyCentre (AMTEC), UTM Skudai, Johor for providing the necessary facilities and technical supportfor successful completion of this review chapter.
REFERENCES
Alicieo, T.V.R., Mendes, E.S., Pereira, N.C. & Motta Lima, O.C. (2002) Membrane ultrafiltration of crudesoybean oil. Desalination, 148, 99–102.
Aly, S.M. (1992) Degumming of soybean oil. Grasas Aceites, 43, 284–286.Anderson, D. (1996) A primer on oils processing technology. In: Hui, Y.H. (ed.) Bailey’s industrial oil and
fat products, Volume 4. 5th edition. John Wiley & Sons, New York, NY. pp. 1–60.Arora, S., Manjula, S., Gopala Krishna, A.G. & Subramanian, R. (2006) Membrane processing of crude
palm oil. Desalination 191, 454–466.Basiron, Y. (2013) Palm oil in the global oils & fats market. Malaysia-Myanmar Palm Oil Trade Fair &
Seminar POTS Myanmar 2013, 28th June 2013, Traders Hotel, Yangon, Myanmar. Slides 7–11.Bhosle, B.M. & Subramanian, R. (2005) New approaches in deacidification of edible oils – a review. Journal
of Food Engineering, 69, 481–494.Bhosle, B.M., Subramanian, R. & Ebert, K. (2005) Deacidification of model vegetable oils using polymeric
membranes. European Journal of Lipid Science and Technology, 107, 746–753.Ceriani, R. & Meirelles, A.J.A. (2006) Simulation of continuous physical refiners for edible oil deacidifica-
tion. Journal of Food Engineering, 76, 261–271.Cheremisinoff, N.P. (2002) Membrane separation technologies. Chapter 9 in Handbook of water and
wastewater treatment technologies. Butterworth-Heinemann, Elsevier, Oxford, UK, pp. 335–371.Cheryan, M. (1986) Ultrafiltration handbook. Technomic Publishing Company, Inc., Lancaster, PA.Cheryan, M. (1998) Ultrafiltration and microfiltration handbook. Technomic Publishing, Chicago, IL.Cheryan, M. (2005) Membrane technology in the vegetable oil industry. Membrane Technology, 2, 5–7.Cmolík, J. & Pokorný J. (2000) Physical refining of edible oils. European Journal of Lipid Science and
Technology, 102, 472–486.Cuperus, F.P. & Nijhuis, H.H. (1993) Applications of membrane technology to food processing. Trends in
Food Science and Technology, 7, 277–282.de Morais Coutinho, C., Chiu, M.C., Basso, R.C., Ribeiro, A.P.B., Gonçalves, L.A.G. & Viotto, L.A.
(2009) State of art of the application of membrane technology to vegetable oils: a review. Food ResearchInternational, 42, 536–550.
de Moura, J.M.L.N., Goncalves, L.A.G., Petrus, J.C.C. &. Viotto, L.A. (2005) Degumming of vegetable oilby microporous membrane. Journal of Food Engineering, 70, 473–478.
De Smet (2013) Refining technology by De Smet – World leader in oils and fats technologies – extractionof oilseeds – vegetable oil. Available from: http://www.refining.be [accessed July 2015].
de Souza, M.P., Petrus, J.C.C, Goncalves, L.A.G. & Viotto, L.A. (2008) Degumming of corn oil/hexanemiscella using a ceramic membrane. Journal of Food Engineering, 86, 557–564.
Deffense, E. (2011a) Crystallisation & Degumming S.P.R.L. AOCS Lipid Library. Available from:http://lipidlibrary.aocs.org/ [accessed July 2015].
Deffense, E. (2011b) Edible oil processing – chemical degumming. AOCS Lipid Library. Available from:http://lipidlibrary.aocs.org/processing/chem-degum/index.htm [accessed July 2015].
Dijkstra, A.J. & Opstal, V. (1989) The total degumming process. Journal of the American Oil Chemists’Society, 66, 1002–1009.
Faessler, P. (1998) Recent developments and improvements in palm oil stripping and fatty acid distillation.In: Leonard, E.C., Perkins, E.G. & Cahn, A. (eds.) Proceedings of the World Conference Palm Coconut
306 N.H. Othman et al.
Oils for the 21th Century: sources, processing, applications, and competition, 1998, Denpasar Indonesia.AOCS Press, Champaign, IL. pp. 67–72.
García, A., Álvarez, S., Riera, F., Álvarez, R. & Coca, J. (2006) Sunflower oil miscella degumming withpolyethersulfone membranes effect of process conditions and MWCO on fluxes and rejections. Journalof Food Engineering, 74, 516–522.
Gibon, V. &Tirtiaux, A. (1998) Soft degumming: the simplest route to physical refining of soft oils. MalaysianOil Science and Technology, 72, 48–54.
Gibon, V., De Greyt, W. & Kellens, M. (2007) Palm oil refining. European Journal of Lipid Science andTechnology, 109, 315–335.
Gupta, A.K.S. (1977) Process for refining crude glyceride oils by membrane filtration. US Patent 4062882.Hodgson, A.S. (1996) Refining and bleaching. In Hui, Y.H. (ed.) Bailey & industrial oil and fat products,
Volume 4. 5th editon. John Wiley & Sons, New York, NY. pp. 157–212.Iyike, S.E., Ahmadun, F.R. & Majid, R.A. (2004) Process intensification of membrane system for crude palm
oil pretreatment. Journal of Food Process Engineering, 27, 476–496.Jala, R.C.R., Guo, Z. & Xu, X. (2011) Separation of FFA from partially hydrogenated soybean oil hydrolysate
by means of membrane processing. Journal of the American Oil Chemists’ Society, 88, 1053–1060.Jamil, S., Dufour, J.-P.G. & Deffense, E.M.J. (2000) Process for degumming a fatty substance and fatty
substance thus obtained. US Patent 6,015,915.Johansson, L.N., Brimberg, U.I. & Haraldsson, G. (1988) Experience of pre-refining of vegetable oils with
acids. European Journal of Lipid Science and Technology, 90, 447–451.Keurentjes, J.T.F., Sluijs, J.T.M., Franssen, R.T.J. & Vant’Riet, K. (1992) Extraction and fractionation of fatty
acids from oil using an ultrafiltration membrane. Industrial Engineering and Chemistry Research, 31,581–587.
Kim, I.C., Kim, J.H., Lee, K.H. & Tak, T.M. (2002) Phospholipids separation (degumming) from crudevegetable oil by polyimide ultrafiltration membrane. Journal of Membrane Science, 205, 113–123.
Koike, S., Subramanian, R., Nabetani, H. & Nakajima, M. (2002) Separation of oil constituents in organicsolvents using polymeric membranes. Journal of the American Oil Chemists’ Society, 79, 937–942.
Koris, A. & Marki, E. (2006) Ceramic ultrafiltration membranes for non-solvent vegetable oil degumming(phospholipid removal). Desalination, 200, 537–539.
Koseoglu, S.S. & Engelgau, D.E. (1990) Membrane applications and research in the edible oil industry: anassessment. Journal of the American Oil Chemists’ Society, 67, 239–249.
Ladhe, A.R. & Kumar, N.S.K. (2010) Application of membrane technology in vegetable oil processing.Chapter 5 in: Cui, Z.F. & Muralidhara, H.S. (eds.) Membrane technology. Elsevier, Savage, MN.pp. 63–75.
Lin, L. & Koseoglu, S.S. (2005) Membrane processing of fats and oils. In: Shahidi, F. (ed.) Bailey’s industrialoils and fats products. Volume 6. 6th Edition. John Wiley & Sons, Hoboken, NJ. pp. 433–457.
Lin, L., Rhee, K.C. & Koseoglu, S.D. (1997) Bench-scale membrane degumming of crude vegetable oil:process optimization. Journal of Membrane Science, 134, 101–108.
Manjula, S. & Subramanian, R. (2009) Simultaneous degumming, dewaxing and decolorizing crude ricebran oil using nonporous membranes. Separation and Purification Technology, 66, 223–228.
Manjula, S., Kobayashi, I. & Subramanian, R. (2011) Characterization of phospholipid reverse micellesin nonaqueous systems in relation to their rejection during membrane processing. Food ResearchInternational, 44, 925–930.
Marenchino, R., Pagliero, C. & Mattea, M. (2006) Vegetable oil degumming using inorganic membranes.Desalination, 200, 562–564.
Muralidhara, H.S. (2010) Challenges of membrane technology in the XXI century. Chapter 2 in: Cui, Z.F. &Muralidhara, H.S. (eds.) Membrane technology. Elsevier, Plymouth, MN. pp. 19–32.
Ochoa, N., Pagliero, C., Marchese, J. & Mattea, M. (2001) Ultrafiltration of vegetable oils degumming bypolymeric membranes. Separation and Purification Technology, 22–23, 417–422.
Pagliero, C., Ochoa, N., Marchese, J. & Mattea, M. (2001) Degumming of crude soybean oil by ultrafiltrationusing polymeric membranes. Journal of American Oil Chemists Society, 78, 793–796.
Pagliero, C., Ochoa, N., Marchese, J. & Mattea, M. (2004) Vegetable oil degumming with polyimide andpolyvinylidenefluoride ultrafiltration membranes. Journal of Chemical Technology and Biotechnology,79, 148–152.
Patterson, H.B.W. (1992) Bleaching and purifying fats and oils, theory and practices. AOCS Press,Champaign, IL.
Paulson, D.J., Wilson, R.L. & Spatz, D.D. (1984) Crossflow membrane technology and its applications. FoodTechnology, 38, 77–87.
Application of membrane technology in degumming and deacidification 307
PORAM (2013) Refining in Malaysia. PORAM – Palm Oil Refiners Association of Malaysia. Availablefrom: www.poram.org.my [accessed July 2013].
R.E.A. (2013) World production of oils & fats, R.E.A Holdings PLC. Available from: http://www.rea.co.uk/rea/en/markets [accessed July 2015].
Raman, L.P., Rajagopalan, N. & Cheryan, M. (1994a) Membrane technology (in vegetable oil processing).Oils Fats International, 10, 28–38.
Raman, L.P., Rajagopalan, N. & Cheryan, M. (1994b) Membrane technology. Fats & Oils International(UK), 10 (6), 28–34.
Raman, L.P., Cheryan, M. & Rajagopalan, N. (1996) Deacidification of soybean oil by membrane technology.Journal of the American Oil Chemists’ Society, 73, 219–224.
Ribeiro, A.P.B., Bei, N., Goncalves, L.A.G., Petrus, J.C.C. & Viotto, L.A. (2008) The optimisation ofsoybean oil degumming on a pilot plant scale using a ceramic membrane. Journal of Food Engineering,87, 514–521.
Rohdenburg, H., Csernitzky, K., Chikány, B., Perédi, J., Boródi, A. & Fábicsné Ruzics, A. (1993) Degummingprocess for plant oils. US Patent 5,239,096 (Krupp Maschinentechnik GmbH).
Sande, R.L.K.M. van de & Segers, J.C. (1989) Method of refining glyceride oils. European Patent 0 348 004(Unilever).
Saravanan, M., Bhosle, B.M. & Subramanian, R. (2006) Processing hexane-oil miscella using a nonporouspolymeric composite membrane. Journal of Food Engineering, 74, 529–535.
Segers, J.C. (1994) Removal of phospholipids from glyceride oil. PCT Int. Appl. WO 1994021762 A1.Snape, J.B. & Nakajima, M. (1996) Processing of agricultural fats and technology oils using membrane
technology. Journal of Food Engineering, 30, 1–41.Strathmann, P.H. (1990) Synthetic membranes and their preparation. In: Porter, M.C. (ed.) Handbook of
industrial membrane technology. Noyes Publications, Park Ridge, NJ. pp. 1–56.Subramanian, R. & Nakajima, M. (1997) Membrane degumming of crude soybean and rapeseed oils. Journal
of the American Oil Chemists’ Society, 74, 971–975.Subramanian, R., Nakajima, M., Kimura, T. & Maekawa, T. (1998) Membrane process for premium quality
expeller-pressed vegetable oils. Food Research International, 31, 587–593.Subramanian, R., Ichikawa, S., Nakajima, M., Kimura, T. & Maekawa, T. (2001) Characterization of phos-
pholipid reverse micelles in relation to membrane processing of vegetable oils. European Journal of LipidScience and Technology, 103, 93–97.
Subramaniana, R., Nakajimab, M., Raghavaraoa, K.S.M.S. & Kimura, T. (2004) Processing vegetable oilsusing nonporous denser polymeric composite membranes. Journal of the American Oil Chemists’Society,81, 313–322.
Thiagarajan, T. & Tang, T.S. (1991) Refinery practices and oil quality. Proceeding of PORIM InternationalPalm Oil Conference. Progress, Prospects Challenges Towards the 21st Century. Chemistry and Technol-ogy, 9–14 September 1991, Kuala Lumpur, Malaysia. Palm Oil Research Institute of Malaysia. (PORIM).pp. 254–267.
UN (2013) World population prospects: the 2012 revision. Population Division of the Department ofEconomic and Social Affairs of the United Nations Secretariat. 2013. United Nations, New York, NY.
Vintila, I. (2009) The physical-chemical mechanism of the edible oils depth refining. Scientific Study &Research. Vol. X (2). pp 179–183.
Zwijnenberga, H.J., Krosse, A.M., Ebert, K., Peinemann, K.-V. & Cuperus, F.P. (1999) Acetone-stablenanofiltration membranes in deacidifying vegetable oil. Journal of the American Oil Chemists’ Society,76, 83–87.

This page intentionally left blankThis page intentionally left blank
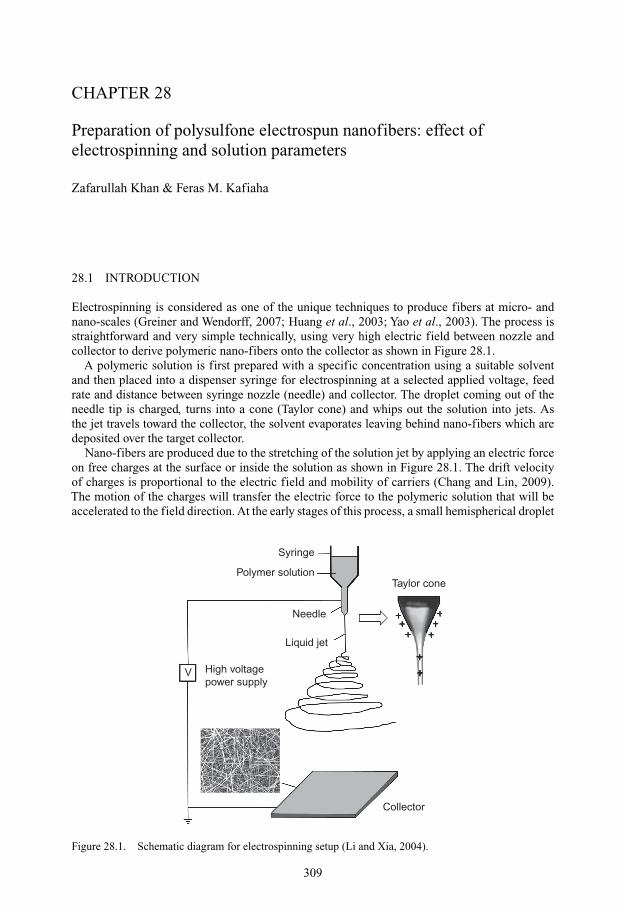
CHAPTER 28
Preparation of polysulfone electrospun nanofibers: effect ofelectrospinning and solution parameters
Zafarullah Khan & Feras M. Kafiaha
28.1 INTRODUCTION
Electrospinning is considered as one of the unique techniques to produce fibers at micro- andnano-scales (Greiner and Wendorff, 2007; Huang et al., 2003; Yao et al., 2003). The process isstraightforward and very simple technically, using very high electric field between nozzle andcollector to derive polymeric nano-fibers onto the collector as shown in Figure 28.1.
A polymeric solution is first prepared with a specific concentration using a suitable solventand then placed into a dispenser syringe for electrospinning at a selected applied voltage, feedrate and distance between syringe nozzle (needle) and collector. The droplet coming out of theneedle tip is charged, turns into a cone (Taylor cone) and whips out the solution into jets. Asthe jet travels toward the collector, the solvent evaporates leaving behind nano-fibers which aredeposited over the target collector.
Nano-fibers are produced due to the stretching of the solution jet by applying an electric forceon free charges at the surface or inside the solution as shown in Figure 28.1. The drift velocityof charges is proportional to the electric field and mobility of carriers (Chang and Lin, 2009).The motion of the charges will transfer the electric force to the polymeric solution that will beaccelerated to the field direction. At the early stages of this process, a small hemispherical droplet
Syringe
Needle
Liquid jet
Collector
Taylor cone
High voltagepower supply
V
Polymer solution
Figure 28.1. Schematic diagram for electrospinning setup (Li and Xia, 2004).
309
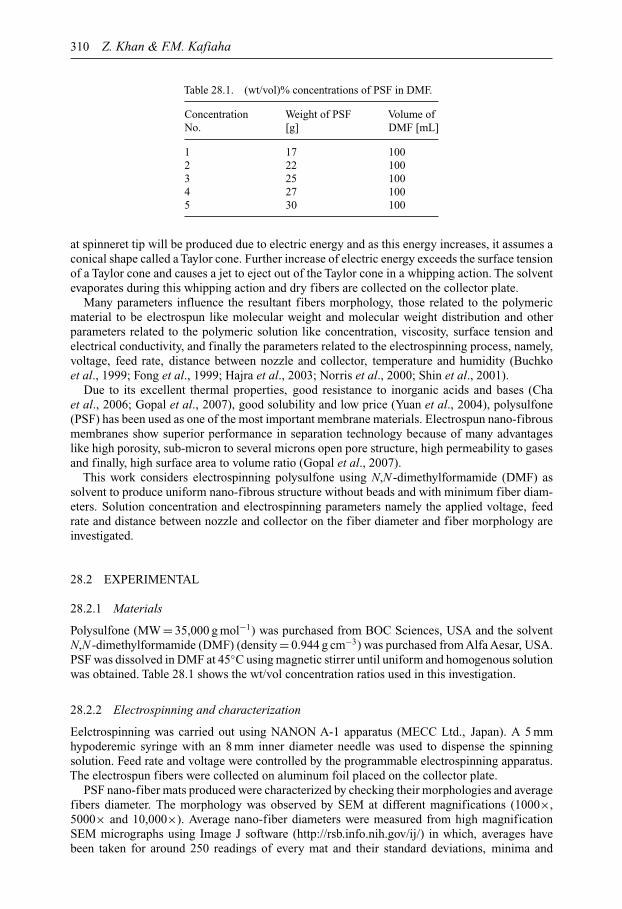
310 Z. Khan & F.M. Kafiaha
Table 28.1. (wt/vol)% concentrations of PSF in DMF.
Concentration Weight of PSF Volume ofNo. [g] DMF [mL]
1 17 1002 22 1003 25 1004 27 1005 30 100
at spinneret tip will be produced due to electric energy and as this energy increases, it assumes aconical shape called a Taylor cone. Further increase of electric energy exceeds the surface tensionof a Taylor cone and causes a jet to eject out of the Taylor cone in a whipping action. The solventevaporates during this whipping action and dry fibers are collected on the collector plate.
Many parameters influence the resultant fibers morphology, those related to the polymericmaterial to be electrospun like molecular weight and molecular weight distribution and otherparameters related to the polymeric solution like concentration, viscosity, surface tension andelectrical conductivity, and finally the parameters related to the electrospinning process, namely,voltage, feed rate, distance between nozzle and collector, temperature and humidity (Buchkoet al., 1999; Fong et al., 1999; Hajra et al., 2003; Norris et al., 2000; Shin et al., 2001).
Due to its excellent thermal properties, good resistance to inorganic acids and bases (Chaet al., 2006; Gopal et al., 2007), good solubility and low price (Yuan et al., 2004), polysulfone(PSF) has been used as one of the most important membrane materials. Electrospun nano-fibrousmembranes show superior performance in separation technology because of many advantageslike high porosity, sub-micron to several microns open pore structure, high permeability to gasesand finally, high surface area to volume ratio (Gopal et al., 2007).
This work considers electrospinning polysulfone using N,N -dimethylformamide (DMF) assolvent to produce uniform nano-fibrous structure without beads and with minimum fiber diam-eters. Solution concentration and electrospinning parameters namely the applied voltage, feedrate and distance between nozzle and collector on the fiber diameter and fiber morphology areinvestigated.
28.2 EXPERIMENTAL
28.2.1 Materials
Polysulfone (MW = 35,000 g mol−1) was purchased from BOC Sciences, USA and the solventN,N -dimethylformamide (DMF) (density = 0.944 g cm−3) was purchased from Alfa Aesar, USA.PSF was dissolved in DMF at 45◦C using magnetic stirrer until uniform and homogenous solutionwas obtained. Table 28.1 shows the wt/vol concentration ratios used in this investigation.
28.2.2 Electrospinning and characterization
Eelctrospinning was carried out using NANON A-1 apparatus (MECC Ltd., Japan). A 5 mmhypoderemic syringe with an 8 mm inner diameter needle was used to dispense the spinningsolution. Feed rate and voltage were controlled by the programmable electrospinning apparatus.The electrospun fibers were collected on aluminum foil placed on the collector plate.
PSF nano-fiber mats produced were characterized by checking their morphologies and averagefibers diameter. The morphology was observed by SEM at different magnifications (1000×,5000× and 10,000×). Average nano-fiber diameters were measured from high magnificationSEM micrographs using Image J software (http://rsb.info.nih.gov/ij/) in which, averages havebeen taken for around 250 readings of every mat and their standard deviations, minima and
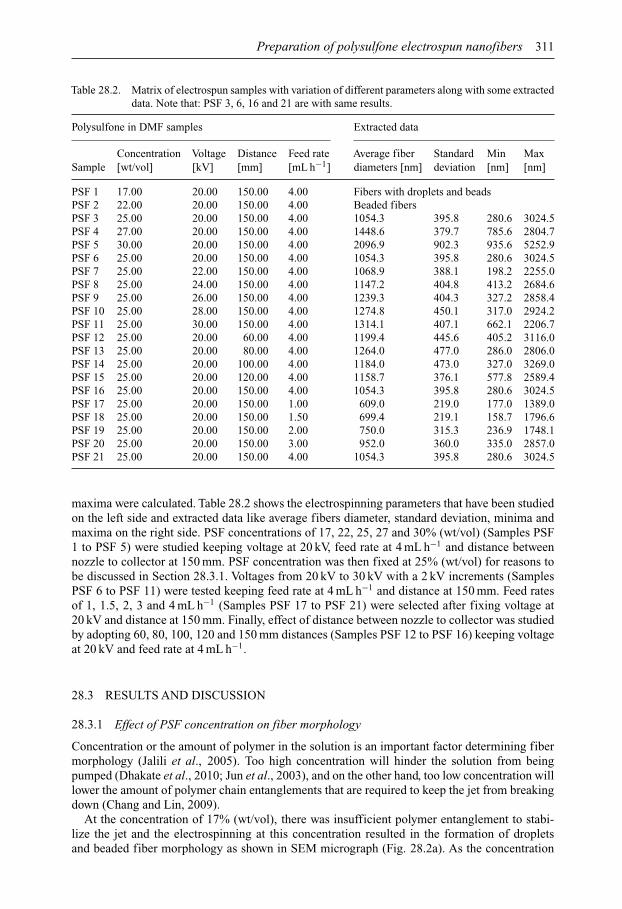
Preparation of polysulfone electrospun nanofibers 311
Table 28.2. Matrix of electrospun samples with variation of different parameters along with some extracteddata. Note that: PSF 3, 6, 16 and 21 are with same results.
Polysulfone in DMF samples Extracted data
Concentration Voltage Distance Feed rate Average fiber Standard Min MaxSample [wt/vol] [kV] [mm] [mL h−1] diameters [nm] deviation [nm] [nm]
PSF 1 17.00 20.00 150.00 4.00 Fibers with droplets and beadsPSF 2 22.00 20.00 150.00 4.00 Beaded fibersPSF 3 25.00 20.00 150.00 4.00 1054.3 395.8 280.6 3024.5PSF 4 27.00 20.00 150.00 4.00 1448.6 379.7 785.6 2804.7PSF 5 30.00 20.00 150.00 4.00 2096.9 902.3 935.6 5252.9PSF 6 25.00 20.00 150.00 4.00 1054.3 395.8 280.6 3024.5PSF 7 25.00 22.00 150.00 4.00 1068.9 388.1 198.2 2255.0PSF 8 25.00 24.00 150.00 4.00 1147.2 404.8 413.2 2684.6PSF 9 25.00 26.00 150.00 4.00 1239.3 404.3 327.2 2858.4PSF 10 25.00 28.00 150.00 4.00 1274.8 450.1 317.0 2924.2PSF 11 25.00 30.00 150.00 4.00 1314.1 407.1 662.1 2206.7PSF 12 25.00 20.00 60.00 4.00 1199.4 445.6 405.2 3116.0PSF 13 25.00 20.00 80.00 4.00 1264.0 477.0 286.0 2806.0PSF 14 25.00 20.00 100.00 4.00 1184.0 473.0 327.0 3269.0PSF 15 25.00 20.00 120.00 4.00 1158.7 376.1 577.8 2589.4PSF 16 25.00 20.00 150.00 4.00 1054.3 395.8 280.6 3024.5PSF 17 25.00 20.00 150.00 1.00 609.0 219.0 177.0 1389.0PSF 18 25.00 20.00 150.00 1.50 699.4 219.1 158.7 1796.6PSF 19 25.00 20.00 150.00 2.00 750.0 315.3 236.9 1748.1PSF 20 25.00 20.00 150.00 3.00 952.0 360.0 335.0 2857.0PSF 21 25.00 20.00 150.00 4.00 1054.3 395.8 280.6 3024.5
maxima were calculated. Table 28.2 shows the electrospinning parameters that have been studiedon the left side and extracted data like average fibers diameter, standard deviation, minima andmaxima on the right side. PSF concentrations of 17, 22, 25, 27 and 30% (wt/vol) (Samples PSF1 to PSF 5) were studied keeping voltage at 20 kV, feed rate at 4 mL h−1 and distance betweennozzle to collector at 150 mm. PSF concentration was then fixed at 25% (wt/vol) for reasons tobe discussed in Section 28.3.1. Voltages from 20 kV to 30 kV with a 2 kV increments (SamplesPSF 6 to PSF 11) were tested keeping feed rate at 4 mL h−1 and distance at 150 mm. Feed ratesof 1, 1.5, 2, 3 and 4 mL h−1 (Samples PSF 17 to PSF 21) were selected after fixing voltage at20 kV and distance at 150 mm. Finally, effect of distance between nozzle to collector was studiedby adopting 60, 80, 100, 120 and 150 mm distances (Samples PSF 12 to PSF 16) keeping voltageat 20 kV and feed rate at 4 mL h−1.
28.3 RESULTS AND DISCUSSION
28.3.1 Effect of PSF concentration on fiber morphology
Concentration or the amount of polymer in the solution is an important factor determining fibermorphology (Jalili et al., 2005). Too high concentration will hinder the solution from beingpumped (Dhakate et al., 2010; Jun et al., 2003), and on the other hand, too low concentration willlower the amount of polymer chain entanglements that are required to keep the jet from breakingdown (Chang and Lin, 2009).
At the concentration of 17% (wt/vol), there was insufficient polymer entanglement to stabi-lize the jet and the electrospinning at this concentration resulted in the formation of dropletsand beaded fiber morphology as shown in SEM micrograph (Fig. 28.2a). As the concentration
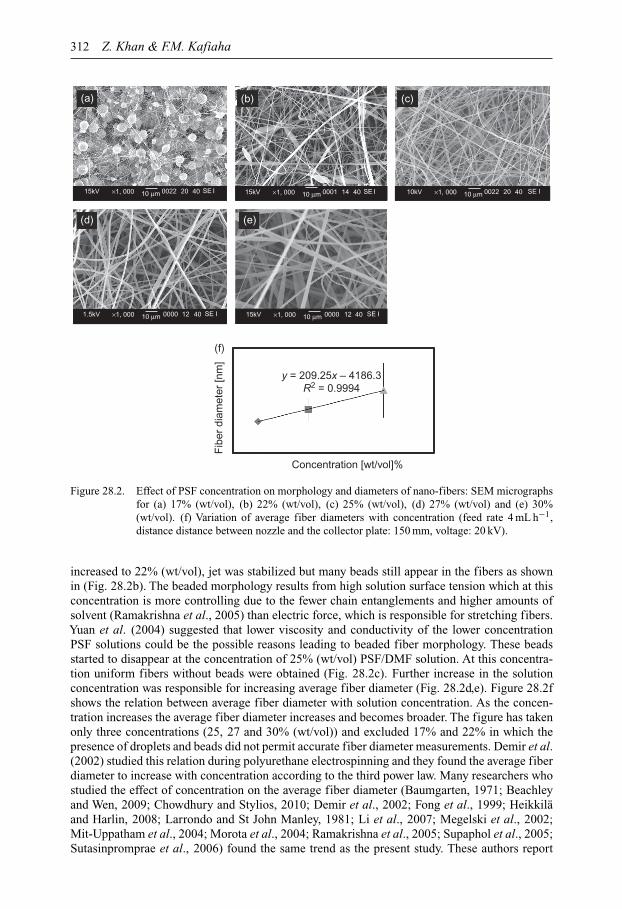
312 Z. Khan & F.M. Kafiaha
(a)
15kV ×1, 000 10 µm 0022 20 SE40 I 15kV ×1, 000 10 µm 0001 14 SE40 10kV ×1, 000 10 µm 0022 20 SE I40
15kV ×1, 000 10 µm 0000 12 SE I401.5kV ×1, 000 10 µm 0000 12 SE I40
I
(b) (c)
(d) (e)
(f)
Concentration [wt/vol]%
y = 209.25x – 4186.3R2 = 0.9994
Fib
er d
iam
eter
[nm
]
Figure 28.2. Effect of PSF concentration on morphology and diameters of nano-fibers: SEM micrographsfor (a) 17% (wt/vol), (b) 22% (wt/vol), (c) 25% (wt/vol), (d) 27% (wt/vol) and (e) 30%(wt/vol). (f) Variation of average fiber diameters with concentration (feed rate 4 mL h−1,distance distance between nozzle and the collector plate: 150 mm, voltage: 20 kV).
increased to 22% (wt/vol), jet was stabilized but many beads still appear in the fibers as shownin (Fig. 28.2b). The beaded morphology results from high solution surface tension which at thisconcentration is more controlling due to the fewer chain entanglements and higher amounts ofsolvent (Ramakrishna et al., 2005) than electric force, which is responsible for stretching fibers.Yuan et al. (2004) suggested that lower viscosity and conductivity of the lower concentrationPSF solutions could be the possible reasons leading to beaded fiber morphology. These beadsstarted to disappear at the concentration of 25% (wt/vol) PSF/DMF solution. At this concentra-tion uniform fibers without beads were obtained (Fig. 28.2c). Further increase in the solutionconcentration was responsible for increasing average fiber diameter (Fig. 28.2d,e). Figure 28.2fshows the relation between average fiber diameter with solution concentration. As the concen-tration increases the average fiber diameter increases and becomes broader. The figure has takenonly three concentrations (25, 27 and 30% (wt/vol)) and excluded 17% and 22% in which thepresence of droplets and beads did not permit accurate fiber diameter measurements. Demir et al.(2002) studied this relation during polyurethane electrospinning and they found the average fiberdiameter to increase with concentration according to the third power law. Many researchers whostudied the effect of concentration on the average fiber diameter (Baumgarten, 1971; Beachleyand Wen, 2009; Chowdhury and Stylios, 2010; Demir et al., 2002; Fong et al., 1999; Heikkiläand Harlin, 2008; Larrondo and St John Manley, 1981; Li et al., 2007; Megelski et al., 2002;Mit-Uppatham et al., 2004; Morota et al., 2004; Ramakrishna et al., 2005; Supaphol et al., 2005;Sutasinpromprae et al., 2006) found the same trend as the present study. These authors report
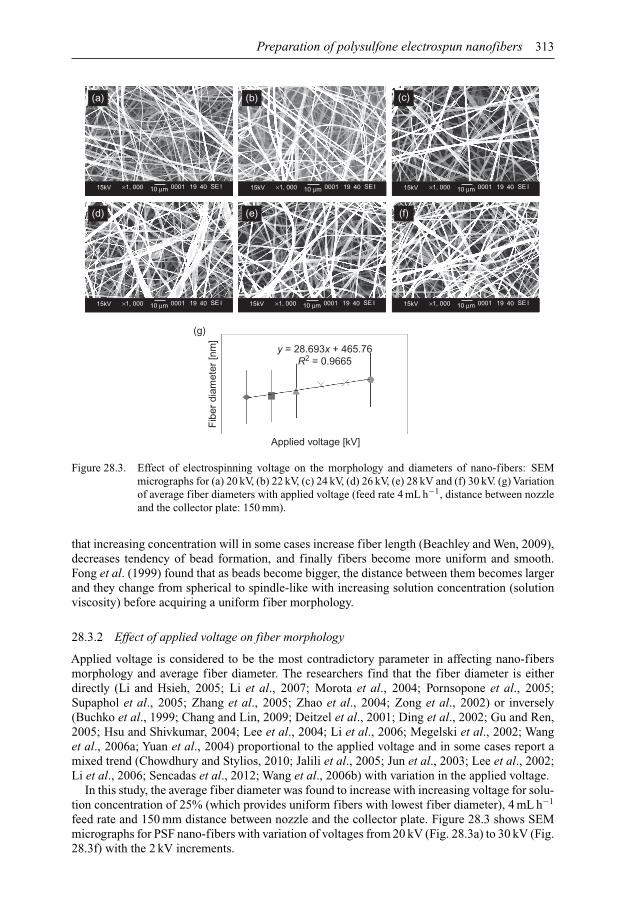
Preparation of polysulfone electrospun nanofibers 313
(a) (b) (c)
(d) (e)
(g)
(f)
Applied voltage [kV]
y = 28.693x + 465.76R2 = 0.9665
Fib
er d
iam
eter
[nm
]
15kV ×1, 000 10 µm 0001 19 SE40 I
15kV ×1, 000 10 µm 0001 19 SE40 I 15kV ×1, 000 10 µm 0001 19 SE40 I 15kV ×1, 000 10 µm 0001 19 SE40 I
15kV ×1, 000 10 µm 0001 19 SE40 I15kV ×1, 000 10 µm 0001 19 SE40 I
Figure 28.3. Effect of electrospinning voltage on the morphology and diameters of nano-fibers: SEMmicrographs for (a) 20 kV, (b) 22 kV, (c) 24 kV, (d) 26 kV, (e) 28 kV and (f) 30 kV. (g) Variationof average fiber diameters with applied voltage (feed rate 4 mL h−1, distance between nozzleand the collector plate: 150 mm).
that increasing concentration will in some cases increase fiber length (Beachley and Wen, 2009),decreases tendency of bead formation, and finally fibers become more uniform and smooth.Fong et al. (1999) found that as beads become bigger, the distance between them becomes largerand they change from spherical to spindle-like with increasing solution concentration (solutionviscosity) before acquiring a uniform fiber morphology.
28.3.2 Effect of applied voltage on fiber morphology
Applied voltage is considered to be the most contradictory parameter in affecting nano-fibersmorphology and average fiber diameter. The researchers find that the fiber diameter is eitherdirectly (Li and Hsieh, 2005; Li et al., 2007; Morota et al., 2004; Pornsopone et al., 2005;Supaphol et al., 2005; Zhang et al., 2005; Zhao et al., 2004; Zong et al., 2002) or inversely(Buchko et al., 1999; Chang and Lin, 2009; Deitzel et al., 2001; Ding et al., 2002; Gu and Ren,2005; Hsu and Shivkumar, 2004; Lee et al., 2004; Li et al., 2006; Megelski et al., 2002; Wanget al., 2006a; Yuan et al., 2004) proportional to the applied voltage and in some cases report amixed trend (Chowdhury and Stylios, 2010; Jalili et al., 2005; Jun et al., 2003; Lee et al., 2002;Li et al., 2006; Sencadas et al., 2012; Wang et al., 2006b) with variation in the applied voltage.
In this study, the average fiber diameter was found to increase with increasing voltage for solu-tion concentration of 25% (which provides uniform fibers with lowest fiber diameter), 4 mL h−1
feed rate and 150 mm distance between nozzle and the collector plate. Figure 28.3 shows SEMmicrographs for PSF nano-fibers with variation of voltages from 20 kV (Fig. 28.3a) to 30 kV (Fig.28.3f) with the 2 kV increments.
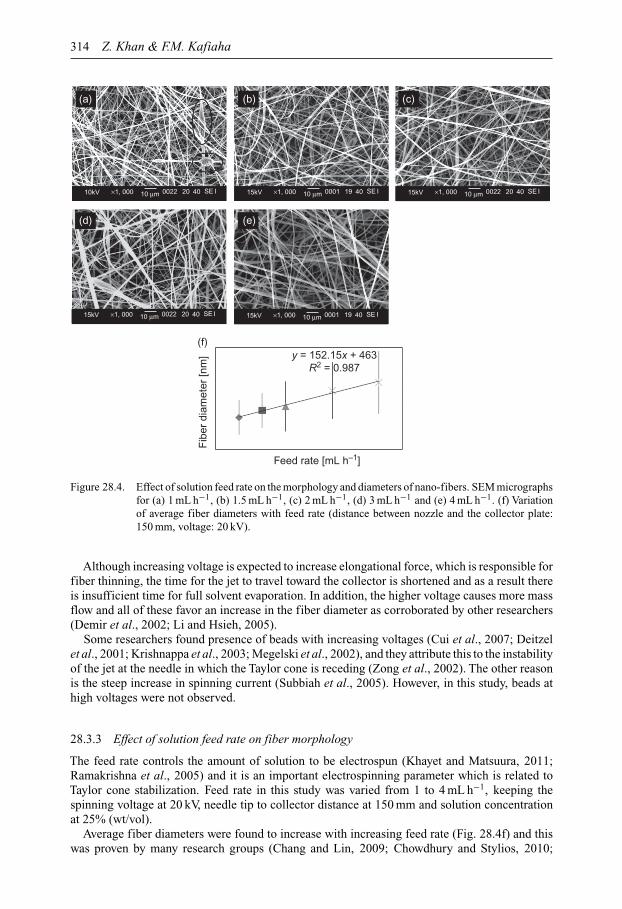
314 Z. Khan & F.M. Kafiaha
(a) (b) (c)
(d) (e)
(f)
Feed rate [mL h–1]
y = 152.15x + 463R2 = 0.987
Fib
er d
iam
eter
[nm
]10kV ×1, 000 10 µm 0022 20 SE40 I 15kV ×1, 000 10 µm 0001 19 SE40 I 15kV ×1, 000 10 µm 0022 20 SE40 I
15kV ×1, 000 10 µm 0001 19 SE40 I15kV ×1, 000 10 µm 0022 20 SE40 I
Figure 28.4. Effect of solution feed rate on the morphology and diameters of nano-fibers. SEM micrographsfor (a) 1 mL h−1, (b) 1.5 mL h−1, (c) 2 mL h−1, (d) 3 mL h−1 and (e) 4 mL h−1. (f) Variationof average fiber diameters with feed rate (distance between nozzle and the collector plate:150 mm, voltage: 20 kV).
Although increasing voltage is expected to increase elongational force, which is responsible forfiber thinning, the time for the jet to travel toward the collector is shortened and as a result thereis insufficient time for full solvent evaporation. In addition, the higher voltage causes more massflow and all of these favor an increase in the fiber diameter as corroborated by other researchers(Demir et al., 2002; Li and Hsieh, 2005).
Some researchers found presence of beads with increasing voltages (Cui et al., 2007; Deitzelet al., 2001; Krishnappa et al., 2003; Megelski et al., 2002), and they attribute this to the instabilityof the jet at the needle in which the Taylor cone is receding (Zong et al., 2002). The other reasonis the steep increase in spinning current (Subbiah et al., 2005). However, in this study, beads athigh voltages were not observed.
28.3.3 Effect of solution feed rate on fiber morphology
The feed rate controls the amount of solution to be electrospun (Khayet and Matsuura, 2011;Ramakrishna et al., 2005) and it is an important electrospinning parameter which is related toTaylor cone stabilization. Feed rate in this study was varied from 1 to 4 mL h−1, keeping thespinning voltage at 20 kV, needle tip to collector distance at 150 mm and solution concentrationat 25% (wt/vol).
Average fiber diameters were found to increase with increasing feed rate (Fig. 28.4f) and thiswas proven by many research groups (Chang and Lin, 2009; Chowdhury and Stylios, 2010;

Preparation of polysulfone electrospun nanofibers 315
(a) (b) (c)
(d) (e)
(f)
Distance [mm]
y = –1.8619x + 1362R2 = 0.7234
Fib
er d
iam
eter
[nm
]
15kV ×1, 000 10 µm 0001 19 SE40 I 15kV ×1, 000 10 µm 0022 20 SE40 I 10kV ×1, 000 10 µm 0022 20 SE40 I
15kV ×1, 000 10 µm 0001 19 SE40 I10kV ×1, 000 10 µm 0022 20 SE40 I
Figure 28.5. Effect of distance between nozzle and collector on the morphology and diameters of nano-fibers. SEM micrographs for (a) 60 mm, (b) 80 mm, (c) 100 mm, (d) 120 mm and (e) 150 mm.(f)Variation of average fiber diameters with nozzle to collector distance (f)Variation of averagefiber diameters with concentration (feed rate 4 mL h−1, voltage: 20 kV).
Feng et al., 2011; Homayoni et al., 2009; Ramakrishna et al., 2005; Touny et al., 2010). Theseresearchers attributed this to the lesser time for the jet to reach the collector and hence lowersolvent evaporation rate which leaves thicker fibers.
At lower feed rates of 1 mL h−1 some beads (red marks) were noticed (as shown in Fig. 28.4a),which start to disappear with increasing feed rate (Fig. 28.4b–e). This could be due to the smallervolume of polymer coming out of needle which at high applied voltage makes the jet unstableand discontinuous resulting in an increase in the surface tension and favors formation of beads.
It was also noted (as shown in Fig. 28.4f and Table 28.2) that an increase in the fiber diameteroccurs with increasing feed rate in which standard deviation of readings at 1 mL h−1 is almosthalf of 4 mL h−1 feed rate. This could again be attributed to the increase in time for completesolvent evaporation at lower feed.
28.3.4 Effect of distance between nozzle and collector on fiber morphology
The distance between nozzle and collector influences two important parameters related to fibermorphology. First is the jet travelling time that is coined with solvent evaporation rate and secondis the field strength which describes the voltage over distance (Chang and Lin, 2009; Subbiahet al., 2005). Decreasing this distance will shorten the time for jet travel and increase the fieldstrength, which will result in higher fiber diameters (Chowdhury and Stylios, 2010; Hekmatiet al., 2013; Kameoka and Craighead, 2003; Zhao et al., 2004). Figure 28.5a–e shows SEM

316 Z. Khan & F.M. Kafiaha
micrographs for 25% (wt/vol) PSF nano-fibers electrospun at 20 kV voltage, 4 mL h−1 feed rateand different needle to collector distances varied from 60 to 150 mm.
A slight decrease in average fiber diameter was noticed by changing the needle to collec-tor distance. In the case of 60 mm distance fiber diameters were measured to be equal to1199.4 ± 445.6 nm whereas at 150 mm distance, the fiber diameters decreased to 1054.3 ±395.8 nm. This slight decrease in the fiber diameter could be attributed to the extra time forsolvent evaporation that causes fiber thinning on one hand and to the lower field strength (lowerstretching force) on the other hand.
Unlike some results found in the literature (Hsu and Shivkumar, 2004; Megelski et al., 2002),distance between nozzle and collector was unrelated with the appearance of beads. Megelski et al.(2002) found that average fiber diameter doesn’t change significantly with needle to collectordistance and their observations are consistent with the findings of this study. But on the otherhand, these authors found some elongated beads along Polystyrene (PS) fibers.
28.4 CONCLUSION
In this study, the effect of solution concentration and process parameters on the electrospun fibermorphology for Polysulfone/DMF was investigated. It was found that droplets and beads disap-peared and fibers became uniform after reaching 25% (wt/vol) PSF concentration. Increasingconcentration above this value causes an increase in average fiber diameter. Increasing electro-spinning applied voltage and feed rate was found to increase average fiber diameter as well. Onthe other hand, increasing the nozzle to collector distance resulted in a slight decrease in averagefiber diameters.
The smallest fiber diameters (around 700 nm) with uniform structure and without beads werefound in the case of PSF/DMF solution concentration of 25% (wt/vol) at the electrospinningvoltage of 20 kV, feed rate of 1.5 mL h−1 and needle to collector distance of 150 mm.
ACKNOWLEDGEMENT
The authors wish to gratefully acknowledge the support of King Fahd University of Petroleumand Minerals, Dhahran, Saudi Arabia for supporting this research under the Center of Excellencein Research Collaboration with MIT grant CW-R5-08.
REFERENCES
Baumgarten, P.K. (1971) Electrostatic spinning of acrylic microfibers. Journal of Colloid and InterfaceScience, 36, 71–79.
Beachley, V. & Wen, X. (2009) Effect of electrospinning parameters on the nanofiber diameter and length.Materials Science and Engineering C, 29, 663–668.
Buchko, C.J., Chen, L.C., Shen, Y. & Martin, D.C. (1999) Processing and microstructural characterizationof porous biocompatible protein polymer thin films. Polymer, 40, 7397–7407.
Buruaga, L., Gonzalez, A. & Iruin, J.J. (2009) Electrospinning of poly (2-ethyl-2-oxazoline). Journal ofMaterials Science, 44, 3186–3191.
Cha, D.I., Kim, K.W., Chu, G.H., Kim, H.Y., Lee, K.H. & Bhattarai, N. (2006) Mechanical behaviors andcharacterization of electrospun polysulfone/polyurethane blend nonwovens. Macromolecular Research,14, 331–337.
Chang, K.-H. & Lin, H.-L. (2009) Electrospin of polysulfone in N ,N ′-dimethyl acetamide solutions. Journalof Polymer Research, 16, 611–622.
Chowdhury, M. & Stylios, G. (2010) Effect of experimental parameters on the morphology of electrospunNylon 6 fibres. International Journal of Basic & Applied Sciences, 10, 116–131.
Cui, W., Li, X., Zhou, S. & Weng, J. (2007) Investigation on process parameters of electrospinning systemthrough orthogonal experimental design. Journal of Applied Polymer Science, 103, 3105–3112.
Preparation of polysulfone electrospun nanofibers 317
Deitzel, J., Kleinmeyer, J., Harris, D.E.A. & Beck Tan, N. (2001) The effect of processing variables on themorphology of electrospun nanofibers and textiles. Polymer, 42, 261–272.
Demir, M.M., Yilgor, I., Yilgor, E. & Erman, B. (2002) Electrospinning of polyurethane fibers. Polymer, 43,3303–3309.
Dhakate, S., Singla, B., Uppal, M. & Mathur, R. (2010) Effect of processing parameters on morphology andthermal properties of electrospun polycarbonate nanofibers. Advanced Materials Letters, 1, 200–204.
Ding, B., Kim, H.-Y., Lee, S.-C., Lee, D.-R. & Choi, K.-J. (2002) Preparation and characterization ofnanoscaled poly (vinyl alcohol) fibers via electrospinning. Fibers and Polymers, 3, 73–79.
Feng, Y., Meng, F., Xiao, R., Zhao, H. & Guo, J. (2011) Electrospinning of polycarbonate urethanebiomaterials. Frontiers of Chemical Science and Engineering, 5, 11–18.
Fong, H., Chun, I. & Reneker, D. (1999) Beaded nanofibers formed during electrospinning. Polymer, 40,4585–4592.
Gopal, R., Kaur, S., Feng, C.Y., Chan, C., Ramakrishna, S., Tabe, S. & Matsuura, T. (2007) Electrospunnanofibrous polysulfone membranes as pre-filters: particulate removal. Journal of Membrane Science,289, 210–219.
Greiner, A. & Wendorff, J.H. (2007) Electrospinning: a fascinating method for the preparation of ultrathinfibers. Angewandte Chemie International Edition, 46, 5670–5703.
Gu, S.Y. & Ren, J. (2005) Process optimization and empirical modeling for electrospun poly (D,L-lactide)fibers using response surface methodology. Macromolecular Materials and Engineering, 290, 1097–1105.
Hajra, M.G., Mehta, K. & Chase, G.G. (2003) Effects of humidity, temperature, and nanofibers on dropcoalescence in glass fiber media. Separation and Purification Technology, 30, 79–88.
Heikkilä, P. & Harlin, H. (2008) Parameter study of electrospinning of polyamide-6. European PolymerJournal, 44, 3067–3079.
Hekmati, A.H., Rashidi, A., Ghazisaeidi, R. & Drean, Y.-D. (2013) Effect of needle length, electrospinningdistance, and solution concentration on morphological properties of polyamide-6 electrospun nanowebs.Textile Research Journal, 83, 1452–1466.
Homayoni, H., Ravandi, S.A.H. & Valizadeh, N. (2009) Electrospinning of chitosan nanofibers: processingoptimization. Carbohydrate Polymers, 77, 656–661.
Hsu, C.-M. & Shivkumar, S. (2004) Nano-sized beads and porous fiber constructs of poly (ε-caprolactone)produced by electrospinning. Journal of Materials Science, 39, 3003–3013.
Huang, Z.-M., Zhang,Y.Z., Kotaki, M. & Ramakrishna, S. (2003)A review on polymer nanofibers by electro-spinning and their applications in nanocomposites. Composites Science and Technology, 63, 2223–2253.
Jalili, R., Hosseini, S.A. & Morshed, M. (2005) The effects of operating parameters on the morphology ofelectrospun polyacrilonitrile nanofibers. Iranian Polymer Journal, 14, 1074.
Jun, K., Reid, O., Yanou, Y., David, C., Robert, M., Geoffrey, W.C. & Craighead, H.G. (2003) A scanning tipelectrospinning source for deposition of oriented nanofibers. Nanotechnology, 14, 1124.
Kameoka, J. & Craighead, H. (2003) Fabrication of oriented polymeric nanofibers on planar surfaces byelectrospinning. Applied Physics Letters, 83, 371–373.
Khayet, M. & Matsuura, T. (2011) Membrane distillation: principles and applications. Elsevier, Amsterdam,The Netherlands.
Krishnappa, R., Desai, K. & Sung, C. (2003) Morphological study of electrospun polycarbonates as a functionof the solvent and processing voltage. Journal of Materials Science, 38, 2357–2365.
Larrondo, L. & St John Manley, R. (1981) Electrostatic fiber spinning from polymer melts. I. Experimentalobservations on fiber formation and properties. Journal of Polymer Science B: Polymer Physics, 19,909–920.
Lee, C.K., Kim, S.I. & Kim, S.J. (2005) The influence of added ionic salt on nanofiber uniformity forelectrospinning of electrolyte polymer. Synthetic Metals, 154, 209–212.
Lee, J.S., Choi, K.H., Ghim, H.D., Kim, S.S., Chun, D.H., Kim, H.Y. & Lyoo, W.S. (2004) Role of molecularweight of atactic poly (vinyl alcohol) (PVA) in the structure and properties of PVA nanofabric preparedby electrospinning. Journal of Applied Polymer Science, 93, 1638–1646.
Lee, K.H., Kim, H.Y., La, Y.M., Lee, D.R. & Sung, N.H. (2002) Influence of a mixing solvent with tetrahy-drofuran and N,N -dimethylformamide on electrospun poly (vinyl chloride) nonwoven mats. Journal ofPolymer Science B: Polymer Physics, 40, 2259–2268.
Li, D. & Xia, Y. (2004) Electrospinning of nanofibers: reinventing the wheel? Advanced Material, 16,1151–1170.
Li, L. & Hsieh, Y.-L. (2005) Ultra-fine polyelectrolyte fibers from electrospinning of poly (acrylic acid).Polymer, 46, 5133–5139.

318 Z. Khan & F.M. Kafiaha
Li, Q., Jia, Z., Yang, Y., Wang, L. & Zhicheng, G. (2007) Preparation and properties of poly(vinyl alcohol)nanofibers by electrospinning. 9th International Conference on Solid Dielectrics (ICSD 2007), July 8–13,2007, Winchester, UK. pp. 215–218.
Li, Y., Huang, Z. & Lü, Y. (2006) Electrospinning of nylon-6, 66, 1010 terpolymer. European PolymerJournal, 42, 1696–1704.
Liu, F., Guo, R., Shen, M., Wang, S. & Shi, X. (2009) Effect of processing variables on the morphol-ogy of electrospun poly [(lactic acid)-co-(glycolic acid)] nanofibers. Macromolecular Materials andEngineering, 294, 666–672.
Megelski, S., Stephens, J.S., Chase, D.B. & Rabolt, J.F. (2002) Micro-and nanostructured surface morphologyon electrospun polymer fibers. Macromolecules, 35, 8456–8466.
Mit-Uppatham, C., Nithitanakul, M. & Supaphol, P. (2004) Effects of solution concentration, emitting elec-trode polarity, solvent type, and salt addition on electrospun polyamide-6 fibers: a preliminary report.Macromolecular Symposia. Vol. 216, Wiley Online Library. pp. 293–300.
Morota, K., Matsumoto, H., Mizukoshi, T., Konosu,Y., Minagawa, M., Tanioka, A.,Yamagata,Y. & Inoue, K.(2004) Poly (ethylene oxide) thin films produced by electrospray deposition: morphology control andadditive effects of alcohols on nanostructure. Journal of Colloid and Interface Science, 279, 484–492.
Norris, I.D., Shaker, M.M., Ko, F.K. & MacDiarmid, A.G. (2000) Electrostatic fabrication of ultrafineconducting fibers: polyaniline/polyethylene oxide blends. Synthetic Metals, 114, 109–114.
Pornsopone, V., Supaphol, P., Rangkupan, R. & Tantayanon, S. (2005) Electrospinning of methacrylate-based copolymers: effects of solution concentration and applied electrical potential on morphologicalappearance of as-spun fibers. Polymer Engineering & Science, 45, 1073–1080.
Ramakrishna, S., Fujihara, K., Teo, W.-E., Lim, T.-C. & Ma, Z. (2005) An introduction to electrospinningand nanofibers. World Scientific.
Sencadas, V., Correia, D., Areias, A., Botelho, G., Fonseca, A., Neves, I., Gomez Ribelles, J. & LancerosMendez, S. (2012) Determination of the parameters affecting electrospun chitosan fiber size distributionand morphology. Carbohydrate Polymers, 87, 1295–1301.
Shin, Y.M., Hohman, M.M., Brenner, M.P. & Rutledge, G.C. (2001) Experimental characterization ofelectrospinning: the electrically forced jet and instabilities. Polymer, 42, 09955–09967.
Subbiah, T., Bhat, G., Tock, R., Parameswaran, S. & Ramkumar, S. (2005) Electrospinning of nanofibers.Journal of Applied Polymer Science, 96, 557–569.
Supaphol, P., Mit-Uppatham, C. & Nithitanakul, M. (2005) Ultrafine electrospun polyamide-6 fibers: effectof emitting electrode polarity on morphology and average fiber diameter. Journal of Polymer Science B:Polymer Physics, 43, 3699–3712.
Sutasinpromprae, J., Jitjaicham, S., Nithitanakul, M., Meechaisue, C. & Supaphol, P. (2006) Preparation andcharacterization of ultrafine electrospun polyacrylonitrile fibers and their subsequent pyrolysis to carbonfibers. Polymer International, 55, 825–833.
Touny, A.H., Lawrence, J.G., Jones, A.D. & Bhaduri, S.B. (2010) Effect of electrospinning parameters onthe characterization of PLA/HNT nanocomposite fibers. Journal of Materials Research, 25, 857–865.
Wang, C., Hsu, C.-H. & Lin, J.-H. (2006a) Scaling laws in electrospinning of polystyrene solutions.Macromolecules, 39, 7662–7672.
Wang, C., Zhang, W., Huang, Z., Yan, E. & Su, Y. (2006b) Effect of concentration, voltage, take-over dis-tance and diameter of pinhead on precursory poly (phenylene vinylene) electrospinning. Pigment & ResinTechnology, 35, 278–283.
Yao, L., Haas, T.W., Guiseppi-Elie, A., Bowlin, G.L., Simpson, D.G. & Wnek, G.E. (2003) Electrospinningand stabilization of fully hydrolyzed poly (vinyl alcohol) fibers. Chemistry of Materials, 15, 1860–1864.
Yuan, X., Zhang, Y., Dong, C. & Sheng, J. (2004) Morphology of ultrafine polysulfone fibers prepared byelectrospinning. Polymer International, 53, 1704–1710.
Zhang, C., Yuan, X., Wu, L., Han, Y. & Sheng, J. (2005) Study on morphology of electrospun poly (vinylalcohol) mats. European Polymer Journal, 41, 423–432.
Zhao, S., Wu, X., Wang, L. & Huang,Y. (2004) Electrospinning of ethyl-cyanoethyl cellulose/tetrahydrofuransolutions. Journal of Applied Polymer Science, 91, 242–246.
Zong, X., Kim, K., Fang, D., Ran, S., Hsiao, B.S. & Chu, B. (2002) Structure and process relationship ofelectrospun bioabsorbable nanofiber membranes. Polymer, 43, 4403–4412.

Sustainable Water Developments
Book Series Editor: Jochen Bundschuh
ISSN: 2373-7506
Publisher: CRC Press/Balkema, Taylor & Francis Group
1. Membrane Technologies for Water Treatment: Removal of Toxic TraceElements with Emphasis on Arsenic, Fluoride and UraniumEditors: Alberto Figoli, Jan Hoinkis & Jochen Bundschuh2016ISBN: 978-1-138-02720-6 (Hbk)
2. Innovative Materials and Methods for Water Treatment:Solutions for Arsenic and Chromium RemovalEditors: Marek Bryjak, Nalan Kabay, Bernabé L. Rivas & Jochen Bundschuh2016ISBN: 978-1-138-02749-7 (Hbk)
3. Membrane Technology for Water and Wastewater Treatment,Energy and EnvironmentEditors: Ahmad Fauzi Ismail & Takeshi Matsuura2016ISBN: 978-1-138-02901-9 (Hbk)

This page intentionally left blankThis page intentionally left blank
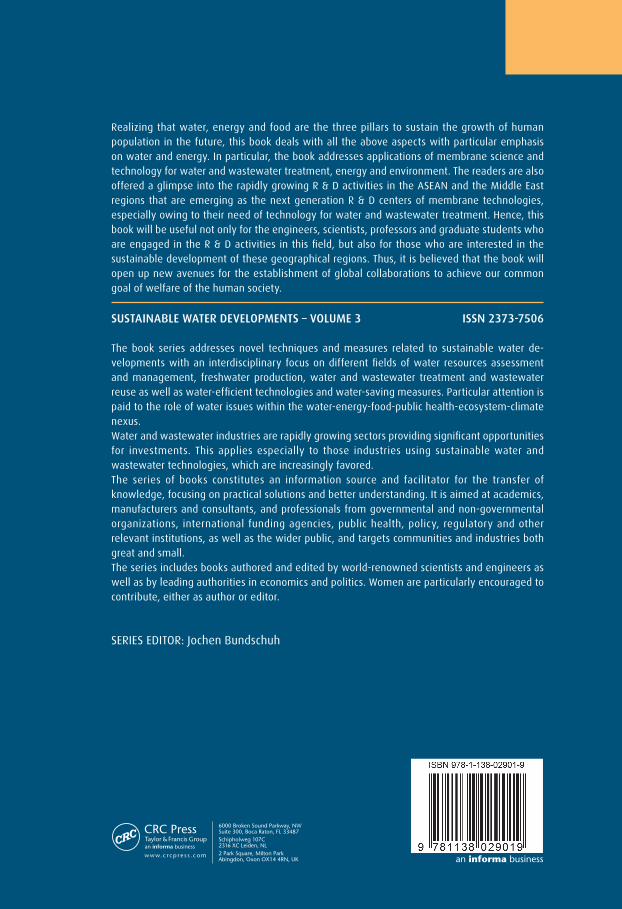
Editors: Ahmad Fauzi Ismail & Takeshi Matsuura
IsmailMatsuura
3
Mem
brane Technology for Water and W
astewater Treatm
ent,Energy and Environm
ent
Series: Sustainable Water Developments 3
Membrane Technology for Water and Wastewater Treatment, Energy and Environment
an informa business
SUSTAINABLE WATER DEVELOPMENTS – VOLUME 3 ISSN 2373-7506
The book series addresses novel techniques and measures related to sustainable water de-velopments with an interdisciplinary focus on different fields of water resources assessment and management, freshwater production, water and wastewater treatment and wastewater reuse as well as water-efficient technologies and water-saving measures. Particular attention is paid to the role of water issues within the water-energy-food-public health-ecosystem-climate nexus. Water and wastewater industries are rapidly growing sectors providing significant opportunities for investments. This applies especially to those industries using sustainable water and wastewater technologies, which are increasingly favored. The series of books constitutes an information source and facilitator for the transfer of knowledge, focusing on practical solutions and better understanding. It is aimed at academics, manufacturers and consultants, and professionals from governmental and non-governmental organizations, international funding agencies, public health, policy, regulatory and other relevant institutions, as well as the wider public, and targets communities and industries both great and small.The series includes books authored and edited by world-renowned scientists and engineers as well as by leading authorities in economics and politics. Women are particularly encouraged to contribute, either as author or editor.
SERIES EDITOR: Jochen Bundschuh
Realizing that water, energy and food are the three pillars to sustain the growth of human population in the future, this book deals with all the above aspects with particular emphasis on water and energy. In particular, the book addresses applications of membrane science and technology for water and wastewater treatment, energy and environment. The readers are also offered a glimpse into the rapidly growing R & D activities in the ASEAN and the Middle East regions that are emerging as the next generation R & D centers of membrane technologies, especially owing to their need of technology for water and wastewater treatment. Hence, this book will be useful not only for the engineers, scientists, professors and graduate students who are engaged in the R & D activities in this field, but also for those who are interested in the sustainable development of these geographical regions. Thus, it is believed that the book will open up new avenues for the establishment of global collaborations to achieve our common goal of welfare of the human society.