Treatment and Valorisation of Saline Wastewater - Oapen
202
Treatment and Valorisation of Saline Wastewater PRINCIPLES AND PRACTICE Anuska Mosquera Corral, Ángeles Val del Río and José Luis Campos Gómez FIRST BOOK TO CONSIDER THE TREATMENT AND VALORISATION OF SALINE WASTEWATER
-
Upload
khangminh22 -
Category
Documents
-
view
0 -
download
0
Transcript of Treatment and Valorisation of Saline Wastewater - Oapen

iwapublishing.com
@IWAPublishing
ISBN: 9781789060638 (Paperback)
ISBN: 9781789060645 (eBook)
Treatment and Valorisation of S
aline Wastew
aterA
nuska Mosquera Corral, Á
ngeles Val del Río
and José Luis Campos G
ómez
This book covers the principles and practices of processes and technologies applied for the treatment of saline wastewater with discharge and reuse purpose, and those applied for its valorisation. Saline wastewater was considered to present electrical conductivities over 2 mS/cm, which is the limit for crop irrigation.
Saline wastewater management is described with respect to:
Basics about salinity characterisation and environmental impact
Effects of salinity on the wastewater physical-chemical treatments
Effects of salinity on biological treatment processes
Valorisation of saline wastewater for energy and materials production
Technologies for saline wastewater treatment and salt recovery
Urban and industrial saline wastewater treatment
Treatment and Valorisation of Saline Wastewater includes two case studies evaluating the treatment of the effluents from a fish cannery and from a WWTP with seawater intrusions in the collecting system. This book is intended as a text reference book for post-graduate, PhD students and researchers interested in the effects of salinity on the wastewater treatment and valorisation processes. It also serves as a reference text for professionals working in the industrial and urban wastewater sector that deal with saline wastewater.
Treatment and Valorisation of Saline WastewaterPRINCIPLES AND PRACTICE
Anuska Mosquera Corral, Ángeles Val del Río and José Luis Campos Gómez
FIRST BOOK TO CONSIDER THE
TREATMENT AND VALORISATION
OF SALINE WASTEWATER
0606387817899
ISBN 9781789060638
Treatment and Valorisation of Saline Wastewater_layout_2.0.indd 1 29/03/2021 19:10

Treatment and Valorisationof Saline Wastewater:Principles and Practice


Treatment and Valorisationof Saline Wastewater:Principles and Practice
Anuska Mosquera Corral, Ángeles Val del Ríoand José Luis Campos Gómez

Published by IWA PublishingRepublic – Export Building, 1st Floor2 Clove CrescentLondon E14 2BE, UKTelephone: +44 (0)20 7654 5500Fax: +44 (0)20 7654 5555Email: [email protected]: www.iwapublishing.com
First published 2021© 2021 IWA Publishing
Apart from any fair dealing for the purposes of research or private study, or criticism or review, aspermitted under the UK Copyright, Designs and Patents Act (1998), no part of this publicationmay be reproduced, stored or transmitted in any form or by any means, without the priorpermission in writing of the publisher, or, in the case of photographic reproduction, inaccordance with the terms of licenses issued by the Copyright Licensing Agency in the UK, orin accordance with the terms of licenses issued by the appropriate reproduction rightsorganization outside the UK. Enquiries concerning reproduction outside the terms stated hereshould be sent to IWA Publishing at the address printed above.
The publisher makes no representation, express or implied, with regard to the accuracy ofthe information contained in this book and cannot accept any legal responsibility or liability forerrors or omissions that may be made.
DisclaimerThe information provided and the opinions given in this publication are not necessarily those ofIWA and should not be acted upon without independent consideration and professional advice.IWA and the Editors and Authors will not accept responsibility for any loss or damage suffered byany person acting or refraining from acting upon any material contained in this publication.
British Library Cataloguing in Publication DataA CIP catalogue record for this book is available from the British Library
ISBN: 9781789060638 (paperback)ISBN: 9781789060645 (eBook)
This eBook was made Open Access in April 2021.
© 2021 The Authors
This is an Open Access eBook distributed under the terms of the Creative Commons AttributionLicence (CC BY-NC-ND 4.0), which permits copying and redistribution for non-commercialpurposes with no derivatives, provided the original work is properly cited (https://creativecommons.org/licenses/by-nc-nd/4.0/). This does not affect the rights licensed orassigned from any third party in this book.

Contents
Authors . . . . . . . . . . . . . . . . . . . . . . . . . . . . . . . . . . . . . . . . . . . . . . . . . . ix
Acknowledgements . . . . . . . . . . . . . . . . . . . . . . . . . . . . . . . . . . . . . . . xi
Chapter 1Introduction . . . . . . . . . . . . . . . . . . . . . . . . . . . . . . . . . . . . . . . . . . . . . . 11.1 Salinisation . . . . . . . . . . . . . . . . . . . . . . . . . . . . . . . . . . . . . . . . . . . . . . . 11.2 Salinity Quantification . . . . . . . . . . . . . . . . . . . . . . . . . . . . . . . . . . . . . . 3
1.2.1 Classification of saline water . . . . . . . . . . . . . . . . . . . . . . . . . 41.2.2 Salinity in recycled water for irrigation . . . . . . . . . . . . . . . . . . 4
1.3 Origin of Secondary Salinisation . . . . . . . . . . . . . . . . . . . . . . . . . . . . . 51.3.1 Domestic sewage . . . . . . . . . . . . . . . . . . . . . . . . . . . . . . . . . . . 61.3.2 Industrial effluents . . . . . . . . . . . . . . . . . . . . . . . . . . . . . . . . . . 8
1.4 Water Salinisation Effects . . . . . . . . . . . . . . . . . . . . . . . . . . . . . . . . . 121.4.1 Damaging living organisms . . . . . . . . . . . . . . . . . . . . . . . . . . 121.4.2 Limiting economic and social development . . . . . . . . . . . . 131.4.3 Impacting the environment . . . . . . . . . . . . . . . . . . . . . . . . . . 14
1.5 Conclusions . . . . . . . . . . . . . . . . . . . . . . . . . . . . . . . . . . . . . . . . . . . . . 17References . . . . . . . . . . . . . . . . . . . . . . . . . . . . . . . . . . . . . . . . . . . . . . . . . . 18
Chapter 2Salinity effects on physical-chemical treatments . . . . . . . . . . 232.1 Introduction . . . . . . . . . . . . . . . . . . . . . . . . . . . . . . . . . . . . . . . . . . . . . . 23
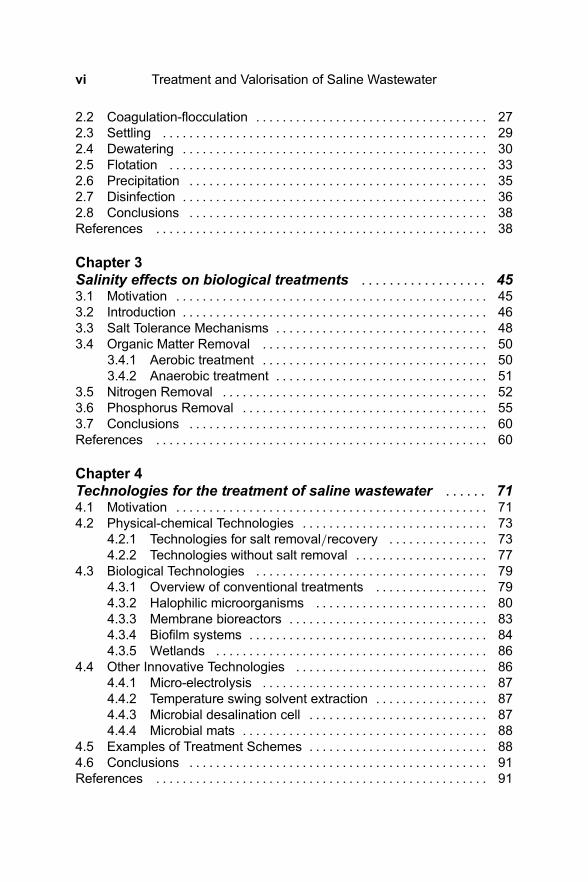
2.2 Coagulation-flocculation . . . . . . . . . . . . . . . . . . . . . . . . . . . . . . . . . . . 272.3 Settling . . . . . . . . . . . . . . . . . . . . . . . . . . . . . . . . . . . . . . . . . . . . . . . . . 292.4 Dewatering . . . . . . . . . . . . . . . . . . . . . . . . . . . . . . . . . . . . . . . . . . . . . . 302.5 Flotation . . . . . . . . . . . . . . . . . . . . . . . . . . . . . . . . . . . . . . . . . . . . . . . . 332.6 Precipitation . . . . . . . . . . . . . . . . . . . . . . . . . . . . . . . . . . . . . . . . . . . . . 352.7 Disinfection . . . . . . . . . . . . . . . . . . . . . . . . . . . . . . . . . . . . . . . . . . . . . . 362.8 Conclusions . . . . . . . . . . . . . . . . . . . . . . . . . . . . . . . . . . . . . . . . . . . . . 38References . . . . . . . . . . . . . . . . . . . . . . . . . . . . . . . . . . . . . . . . . . . . . . . . . . 38
Chapter 3Salinity effects on biological treatments . . . . . . . . . . . . . . . . . . 453.1 Motivation . . . . . . . . . . . . . . . . . . . . . . . . . . . . . . . . . . . . . . . . . . . . . . . 453.2 Introduction . . . . . . . . . . . . . . . . . . . . . . . . . . . . . . . . . . . . . . . . . . . . . . 463.3 Salt Tolerance Mechanisms . . . . . . . . . . . . . . . . . . . . . . . . . . . . . . . . 483.4 Organic Matter Removal . . . . . . . . . . . . . . . . . . . . . . . . . . . . . . . . . . 50
3.4.1 Aerobic treatment . . . . . . . . . . . . . . . . . . . . . . . . . . . . . . . . . . 503.4.2 Anaerobic treatment . . . . . . . . . . . . . . . . . . . . . . . . . . . . . . . . 51
3.5 Nitrogen Removal . . . . . . . . . . . . . . . . . . . . . . . . . . . . . . . . . . . . . . . . 523.6 Phosphorus Removal . . . . . . . . . . . . . . . . . . . . . . . . . . . . . . . . . . . . . 553.7 Conclusions . . . . . . . . . . . . . . . . . . . . . . . . . . . . . . . . . . . . . . . . . . . . . 60References . . . . . . . . . . . . . . . . . . . . . . . . . . . . . . . . . . . . . . . . . . . . . . . . . . 60
Chapter 4Technologies for the treatment of saline wastewater . . . . . . 714.1 Motivation . . . . . . . . . . . . . . . . . . . . . . . . . . . . . . . . . . . . . . . . . . . . . . . 714.2 Physical-chemical Technologies . . . . . . . . . . . . . . . . . . . . . . . . . . . . 73
4.2.1 Technologies for salt removal/recovery . . . . . . . . . . . . . . . 734.2.2 Technologies without salt removal . . . . . . . . . . . . . . . . . . . . 77
4.3 Biological Technologies . . . . . . . . . . . . . . . . . . . . . . . . . . . . . . . . . . . 794.3.1 Overview of conventional treatments . . . . . . . . . . . . . . . . . 794.3.2 Halophilic microorganisms . . . . . . . . . . . . . . . . . . . . . . . . . . 804.3.3 Membrane bioreactors . . . . . . . . . . . . . . . . . . . . . . . . . . . . . . 834.3.4 Biofilm systems . . . . . . . . . . . . . . . . . . . . . . . . . . . . . . . . . . . . 844.3.5 Wetlands . . . . . . . . . . . . . . . . . . . . . . . . . . . . . . . . . . . . . . . . . 86
4.4 Other Innovative Technologies . . . . . . . . . . . . . . . . . . . . . . . . . . . . . 864.4.1 Micro-electrolysis . . . . . . . . . . . . . . . . . . . . . . . . . . . . . . . . . . 874.4.2 Temperature swing solvent extraction . . . . . . . . . . . . . . . . . 874.4.3 Microbial desalination cell . . . . . . . . . . . . . . . . . . . . . . . . . . . 874.4.4 Microbial mats . . . . . . . . . . . . . . . . . . . . . . . . . . . . . . . . . . . . . 88
4.5 Examples of Treatment Schemes . . . . . . . . . . . . . . . . . . . . . . . . . . . 884.6 Conclusions . . . . . . . . . . . . . . . . . . . . . . . . . . . . . . . . . . . . . . . . . . . . . 91References . . . . . . . . . . . . . . . . . . . . . . . . . . . . . . . . . . . . . . . . . . . . . . . . . . 91
Treatment and Valorisation of Saline Wastewatervi

Chapter 5Valorization of saline wastewater . . . . . . . . . . . . . . . . . . . . . . . . . 975.1 Motivation . . . . . . . . . . . . . . . . . . . . . . . . . . . . . . . . . . . . . . . . . . . . . . . 975.2 By-Products Obtainment . . . . . . . . . . . . . . . . . . . . . . . . . . . . . . . . . . 99
5.2.1 Organic compounds production . . . . . . . . . . . . . . . . . . . . . . 995.2.2 Nutrient recovery . . . . . . . . . . . . . . . . . . . . . . . . . . . . . . . . . 1065.2.3 Salts recovery . . . . . . . . . . . . . . . . . . . . . . . . . . . . . . . . . . . . 1075.2.4 Energy recovery . . . . . . . . . . . . . . . . . . . . . . . . . . . . . . . . . . 108
5.3 Water Reuse Potential . . . . . . . . . . . . . . . . . . . . . . . . . . . . . . . . . . . 1105.3.1 Reuse alternatives . . . . . . . . . . . . . . . . . . . . . . . . . . . . . . . . 110
5.4 Conclusions . . . . . . . . . . . . . . . . . . . . . . . . . . . . . . . . . . . . . . . . . . . . 116References . . . . . . . . . . . . . . . . . . . . . . . . . . . . . . . . . . . . . . . . . . . . . . . . . 117
Chapter 6Case study: Treatment of fish-canning effluents . . . . . . . . . . 1236.1 Motivation . . . . . . . . . . . . . . . . . . . . . . . . . . . . . . . . . . . . . . . . . . . . . . 1236.2 Characteristics and Flows of Fish-Canning Effluents . . . . . . . . . 1246.3 Current Treatment Systems . . . . . . . . . . . . . . . . . . . . . . . . . . . . . . . 126
6.3.1 Physical-chemical processes . . . . . . . . . . . . . . . . . . . . . . . 1286.3.2 Biological processes . . . . . . . . . . . . . . . . . . . . . . . . . . . . . . 129
6.4 Innovative Technologies . . . . . . . . . . . . . . . . . . . . . . . . . . . . . . . . . . 1336.4.1 Aerobic granular sludge systems . . . . . . . . . . . . . . . . . . . . 1346.4.2 Membrane bioreactors . . . . . . . . . . . . . . . . . . . . . . . . . . . . . 136
6.5 Case Study: Wastewater Treatment Plant in a FishCanning Facility . . . . . . . . . . . . . . . . . . . . . . . . . . . . . . . . . . . . . . . . . 1386.5.1 Fish-canning wastewater . . . . . . . . . . . . . . . . . . . . . . . . . . 1386.5.2 Applied wastewater treatment processes . . . . . . . . . . . . . 1396.5.3 Alternative evaluation . . . . . . . . . . . . . . . . . . . . . . . . . . . . . 142
6.6 Conclusions . . . . . . . . . . . . . . . . . . . . . . . . . . . . . . . . . . . . . . . . . . . . 146References . . . . . . . . . . . . . . . . . . . . . . . . . . . . . . . . . . . . . . . . . . . . . . . . . 146
Chapter 7Case study: Urban wastewater treatment plant with salineintrusions . . . . . . . . . . . . . . . . . . . . . . . . . . . . . . . . . . . . . . . . . . . . . . 1517.1 Motivation . . . . . . . . . . . . . . . . . . . . . . . . . . . . . . . . . . . . . . . . . . . . . . 1517.2 Occurrence of Saline Urban Wastewater . . . . . . . . . . . . . . . . . . . 152
7.2.1 Facing seawater intrusions . . . . . . . . . . . . . . . . . . . . . . . . . 1537.2.2 Seawater used for toilet flushing . . . . . . . . . . . . . . . . . . . . 1547.2.3 Saline industrial wastewater discharge . . . . . . . . . . . . . . . 155
7.3 Treatment Considerations in WWTPS . . . . . . . . . . . . . . . . . . . . . . 1557.3.1 Hydrogen sulphide production . . . . . . . . . . . . . . . . . . . . . . 158
Contents vii

7.3.2 Solid separation . . . . . . . . . . . . . . . . . . . . . . . . . . . . . . . . . . 1597.3.3 Biological processes . . . . . . . . . . . . . . . . . . . . . . . . . . . . . . 160
7.4 Case Study: Urban Wastewater Treatment Plant . . . . . . . . . . . . . 1617.4.1 Case studies definition . . . . . . . . . . . . . . . . . . . . . . . . . . . . 1617.4.2 Comparison of case studies . . . . . . . . . . . . . . . . . . . . . . . . 167
7.5 Conclusions . . . . . . . . . . . . . . . . . . . . . . . . . . . . . . . . . . . . . . . . . . . . 169References . . . . . . . . . . . . . . . . . . . . . . . . . . . . . . . . . . . . . . . . . . . . . . . . . 169
Annex 1Calculations case study: Treatment of fish-canningeffluents . . . . . . . . . . . . . . . . . . . . . . . . . . . . . . . . . . . . . . . . . . . . . . . . 173A1.1 Scenario A . . . . . . . . . . . . . . . . . . . . . . . . . . . . . . . . . . . . . . . . . . . . 173A1.2 Scenario B . . . . . . . . . . . . . . . . . . . . . . . . . . . . . . . . . . . . . . . . . . . . 174A1.3 Scenario C . . . . . . . . . . . . . . . . . . . . . . . . . . . . . . . . . . . . . . . . . . . . 175A1.4 Scenario D . . . . . . . . . . . . . . . . . . . . . . . . . . . . . . . . . . . . . . . . . . . . 176A1.5 Base Data for Costs Calculation . . . . . . . . . . . . . . . . . . . . . . . . . 177
Annex 2Calculations case study: Urban wastewater treatmentplant with saline intrusions . . . . . . . . . . . . . . . . . . . . . . . . . . . . . . 179A2.1 Composition of the Seawater . . . . . . . . . . . . . . . . . . . . . . . . . . . . 179A2.2 Equations Used for Technical Calculations . . . . . . . . . . . . . . . . 179
A2.2.1 Net waste activated sludge produced (PX,VSS)in the activated sludge system . . . . . . . . . . . . . . . . . . . 180
A2.2.2 Activated sludge wasted (WX,TSS) . . . . . . . . . . . . . . . . 180A2.2.3 Total solids wasted in the WWTP (TWX,TSS) . . . . . . . 181A2.2.4 Total oxygen required for aerobic biological
processes . . . . . . . . . . . . . . . . . . . . . . . . . . . . . . . . . . . . 181A2.2.5 Energy consumption due to aeration and pumping
activities . . . . . . . . . . . . . . . . . . . . . . . . . . . . . . . . . . . . . . 182A2.2.6 WWTP discharge fee . . . . . . . . . . . . . . . . . . . . . . . . . . . 182
A2.3 Dependency of Oxygen Solubility . . . . . . . . . . . . . . . . . . . . . . . . 183Reference . . . . . . . . . . . . . . . . . . . . . . . . . . . . . . . . . . . . . . . . . . . . . . . . . . 184
Nomenclature . . . . . . . . . . . . . . . . . . . . . . . . . . . . . . . . . . . . . . . . . . 185
Treatment and Valorisation of Saline Wastewaterviii

Authors
Anuska Mosquera CorralCRETUS, Department of ChemicalEngineering,Universidade de Santiago deCompostela (USC),15782 Santiago de Compostela,Galicia, [email protected]
Ángeles Val del RíoCRETUS, Department of ChemicalEngineering,Universidade de Santiago deCompostela (USC),15782 Santiago de Compostela,Galicia, [email protected]
José Luis Campos GómezFaculty of Engineering and Sciences,Universidad Adolfo Ibáñez (UAI),Avda. Padre Hurtado 750, 2503500,Viña del Mar, [email protected].


Acknowledgements
The elaboration of this book in the USC was supported by the Spanish Government(AEI) through the TREASURE project [CTQ2017-83225-C2-1-R] co-funded byFEDER (UE) and, in the UAI, by the Chilean Government through the ProjectsFONDECYT 1200850 and CRHIAM Centre grant number ANID/FONDAP/15130015. Anuska Mosquera Corral and Ángeles Val del Río belong to theInterdisciplinary Research Center in Environmental Technologies (CRETUS) andto a Galician Competitive Research Group (GRC), the latter programme co-funded by FEDER (UE) as well. José Luis Campos Gómez thanks Carlos Jérez,dean of the Faculty of Engineering and Sciences (UAI), for the reduction of theteaching load granted to promote his collaboration in the writing of this book.

Chapter 1
Introduction
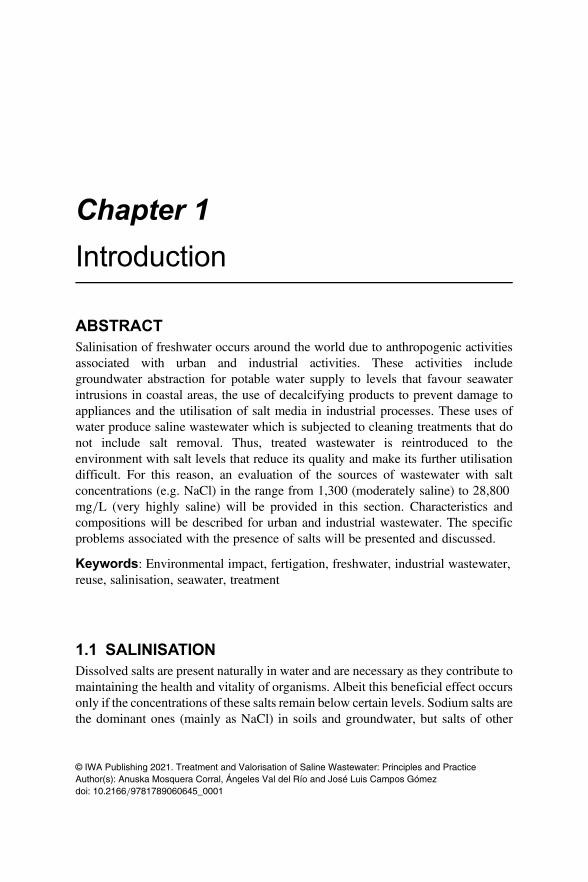
ABSTRACTSalinisation of freshwater occurs around the world due to anthropogenic activitiesassociated with urban and industrial activities. These activities includegroundwater abstraction for potable water supply to levels that favour seawaterintrusions in coastal areas, the use of decalcifying products to prevent damage toappliances and the utilisation of salt media in industrial processes. These uses ofwater produce saline wastewater which is subjected to cleaning treatments that donot include salt removal. Thus, treated wastewater is reintroduced to theenvironment with salt levels that reduce its quality and make its further utilisationdifficult. For this reason, an evaluation of the sources of wastewater with saltconcentrations (e.g. NaCl) in the range from 1,300 (moderately saline) to 28,800mg/L (very highly saline) will be provided in this section. Characteristics andcompositions will be described for urban and industrial wastewater. The specificproblems associated with the presence of salts will be presented and discussed.
Keywords: Environmental impact, fertigation, freshwater, industrial wastewater,reuse, salinisation, seawater, treatment
1.1 SALINISATIONDissolved salts are present naturally in water and are necessary as they contribute tomaintaining the health and vitality of organisms. Albeit this beneficial effect occursonly if the concentrations of these salts remain below certain levels. Sodium salts arethe dominant ones (mainly as NaCl) in soils and groundwater, but salts of other
© IWA Publishing 2021. Treatment and Valorisation of Saline Wastewater: Principles and PracticeAuthor(s): Anuska Mosquera Corral, Ángeles Val del Río and José Luis Campos Gómezdoi: 10.2166/9781789060645_0001

cations such as calcium, magnesium, iron, boron, sulphate, carbonate, andbicarbonate are also found in different concentrations, mainly depending on thespecific locations. If salt concentrations exceed the limiting values this candamage the organisms of the ecosystem. Nowadays, due to human activities(urban, industrial or irrigation uses), a large amount of the water resources in theworld are experiencing an increase in salinity. This salinisation of water bodiesbecomes a problem when it reaches a level that impacts on health, agriculturalproduction, environmental ecosystems equilibrium, and economic welfare.
The salinisation of continental water is directly related to the salinisation of soil.Although the idea that soil salinisation occurs mainly in arid and semi-arid regions isgenerally widespread, its effects are present all over the world. Major water salinityproblems have been reported in the USA, Australia, India, Argentina, Sudan,Israel and many countries in Central Asia (Shtull-Trauring et al., 2020; WWAP,2017). Water and soil salinisation are classified as primary or secondary. Primarysalinisation refers to salinisation processes mobilising natural salts (naturally presentin the environment), while secondary salinisation refers to salinisation processesincreased or induced by human activity (also called anthropogenic salinisation).
Primary salinisation is a complex process involving the movement of saltsand water in soils during seasonal cycles and their interactions with groundwater.While rainfall, aeolian deposits, mineral weathering, and stored salts are thesources of salts, surface and groundwater can redistribute these accumulated salts(Rengasamy, 2006). Furthermore, seawater intrusion into land, due togroundwater overdraft and an increase of the seawater level due to climatechange or in recent tsunami-affected regions, can deposit huge amounts of salts inthe soils of coastal lands (Flood & Cahoon, 2011).
However, although the groundwater or surface water salinisation is a function ofnatural phenomena, it is exacerbated by anthropogenic factors, in secondarysalinisation. Human activities such as agriculture and livestock farming, as wellas the production of domestic sewage (in some regions water softeners and saltsare added to prevent calcification in water-using appliances), can be highlightedas the most important contributors to salinisation phenomena. In all theseactivities saline wastewater is produced. Moreover, utilisation of seawater as asupplement to water supply in situations where high quality freshwater isunnecessary also increases the amount of saline wastewater. In agriculture the useof poor-quality irrigation water contributes to salt accumulation in irrigated soils.As an example, Martín-Queller et al. (2010) observed that in a semi-aridMediterranean region (Flumen River, Spain) urban activity and livestock farmingincreased the concentration of salts in the order of 240–541 μS/cm. Specifically,these authors measured the increase of nitrate concentration from 8.5 to 20.8 mgNO3
−/L during irrigation months, associated with high levels of irrigation returnflows. Additionally, urban surrounding areas contributed to an increase ofphosphorus concentrations from 0.19 to 0.42 mg P/L in the river. Finally, theirdata also indicated that salinisation of soils, subsoils, surface water, and
Treatment and Valorisation of Saline Wastewater2

groundwater can be an unwelcome result of the application of pig manure forfertilisation which increased sodium concentrations from 77.9 to 138.6 mg Na+/L.
In certain cold regions, the direct application of salts to roadways and sidewalksto melt ice and snow contributes significantly to this phenomenon as well. Forexample, Meriano et al. (2009) reported that in Ontario (Canada) 50% of the saltapplied to paved road surfaces is conveyed to catchment streams andFrenchman’s Bay Lagoon via surface runoff. The remaining 50% enters thesubsurface as aquifer recharge and migrates towards Frenchman’s Bay Lagoon.As a result, stream water quality is seriously degraded year-round due to theinflux of salt from both runoff and baseflow. Therefore, chloride concentrationsthroughout the watershed consistently exceed the Ontario Provincial WaterQuality Objective of 250 mg Cl−/L.
As stated here, salinisation of water is occurring all over the world and willprogressively decrease the water resources available for food production andfreshwater uses. For this reason, it is important to define strategies to preserve theexisting freshwater reservoirs and restore the conditions of produced wastewaterto discharge non- or low-saline treated effluents to the environment.
1.2 SALINITY QUANTIFICATIONAs salt concentration in water can be due to the presence of very differentcompounds (including a wide variety of ions and cations), the common parameterused to quantify the salinity is electrical conductivity (EC) measured at 25°C. TheEC does not identify the dissolved salts but gives a reliable indication of salinitylevels via an easy and inexpensive measurement. The EC is measured in theInternational System of Units (SI) as siemens per metre (S/m), although it can befound in the literature expressed in other units (mS/cm, dS/m, mmhos/cm andμS/cm). The salinity can also be measured as total dissolved solids (TDS, inmg/L); however this measurement is more time consuming and for this reasonthe TDS value can be obtained indirectly as a function of EC through the use ofconversion factors.
Therefore, in the literature salt concentration appears expressed sometimes as ECand other times as TDS. The equivalence between these units is presented(Table 1.1), to help with the understanding and comparison of the parametersused to express salinity throughout this book.
Table 1.1 Equivalence between units for salinity.
EC (S/////m) EC (mS/////cm, dS/////m,mmhos/////cm)
EC (μS/////cm) TDS (mg/////L)
0.1 1.0 1,000 TDS=K · EC (μS/cm)a
aVariable values of K (0.50–0.75) depending on the EC value (Walton, 1989).
Introduction 3

1.2.1 Classification of saline waterWater resources can be classified depending on their salt concentration according tothe rank established by the Food and Agriculture Organization of the United Nations(FAO) (Rhoades et al., 1992) that is summarised in Table 1.2. This classificationhelps with understanding the possible uses of saline water and wastewater forcrop production, as only very tolerant crops can be successfully produced withwater with EC that exceeds 10 mS/cm.
1.2.2 Salinity in recycled water for irrigationThe increasing trend towards using treated wastewater for irrigation or landapplication is contributing to the salinisation rise in soils. It was widely reportedthat this effect does not depend only on the EC of the effluent, but also on othercomponents, such as suspended solids and organic matter, that can alter thehydraulic conductivity and infiltration rates. To measure these effects an indexcalled the Sodium Adsorption Ratio (SAR) is used. The SAR expresses therelative activity of sodium ions in the exchange reactions taking place in the soil.This ratio is an indicator of the suitability of a certain water to be used in landirrigation and, also, a standard diagnostic parameter for the sodicity hazard that itexerts on the soil. Equation (1.1), applied to determine the SAR, considers therelative concentration of sodium referred to the calcium and magnesium ones as:
SAR = [Na+]�����������������������[Ca+2]+ [Mg+2]
2
( )√ (1.1)
Table 1.2 Classification of saline water according to FAO (Rhoades et al., 1992).
Water Class ElectricalConductivity(mS/////cm)
TDS(mg/////L)a
Type of Water
Non-saline ,0.7 ,450 Drinking and irrigation water
Slightly saline 0.7–2.0 450–1,300 Irrigation water
Moderatelysaline
2–10 1,300–6,400 Primary drainage water andgroundwater
Highly saline 10–25 6,400–16,000
Secondary drainage water andgroundwater
Very highlysaline
25–45 16,000–28,800
Very saline groundwater
Brine .45 .28,800 SeawateraAssuming an average value of K= 0.64 for the conversion of EC (as µS/cm) to TDS (as mg/L)(Metcalf & Eddy, 2003).
Treatment and Valorisation of Saline Wastewater4

The suitability of reclaimed water for use in land irrigation as a function of theSAR value can be defined as follows:
• For SAR values below 3.0: no restriction exists.• For SAR values from 3.0–9.0: care needs to be taken when irrigating sensitive
crops. Soils should be sampled and tested every 1 or 2 years to determinewhether the water is increasing the sodium content.
• For SAR values over 9.0: water is not suitable for irrigation and risk of severedamage of the soil exists.
1.3 ORIGIN OF SECONDARY SALINISATIONThe salinisation of water and soil by natural phenomena is out of the scope of thisbook and for this reason this section is focused only on the discussion of secondarysalinisation causes. Anthropogenic activities which can be highlighted as the majorsources of secondary salinisation in water can be classified in three main categories:groundwater overdraft, agriculture practices and wastewater (domestic andindustrial) discharges.
Groundwater overdraft: in some locations, groundwater overdraft (excessivewater abstraction) has caused the natural groundwater gradient to reverse andallowed seawater to intrude coastal aquifers that historically contained onlyfreshwater. Seawater intrusion can be detrimental to drinking water and irrigationwells and render some areas unsuitable for continued agriculture. To preventadditional seawater intrusion, some communities have installed subsurfacebarriers and injection wells to restore or at least diminish the salinity of thegroundwater. Tularam and Krishna (2009) revised the long-term consequences ofgroundwater pumping and they found that the majority of the affected areas arecoastal regions where population density is high. These authors report examplesof seawater intrusion due to groundwater overdraft in different world regionssuch as South-Central Kansas (USA), Mediterranean and South-Atlanticcoastlines (Spain), Israel, Mexico, Chile, Peru, Cyprus, Australia, etc. Zektseret al. (2005) evaluated different case studies of the south-western United Stateswhere groundwater extraction together with overdraft occurs, to highlight theimportance of the development of corresponding environmental regulations.These authors stated that the four main impacts associated with these twoactivities are reduction of streamflow and lake levels, diminishment orelimination of vegetation, land subsidence and seawater intrusion. One exampleof seawater intrusion into groundwater occurred in the Korban aquifer(north-eastern Tunisia). In this case, treated domestic wastewater is used toartificially recharge the aquifer level and reduce the salinity in the groundwater(Horriche & Benabdallah, 2020).
Agriculture practices: plants can naturally increase soil salinity as they uptakewater and exclude salts. However, the main sources of salinisation in agriculture are
Introduction 5

irrigation and fertilisation techniques. Application of synthetic fertilisers canincrease nitrate concentrations in surface and groundwater, while the use ofmanure from confined animal facilities, rich in nutrients and other salts, can alsoincrease salinity levels in receiving water bodies. Furthermore, inefficientirrigation and drainage systems cause an excessive water leakage and increase therisk of salinisation and inundation in irrigation areas. Performed estimationsindicate that of the annual production of wastewater in the world (approximately30 million tons) 70% is consumed as an agricultural fertiliser and irrigationsource (Barbera & Gurnari, 2018). Additionally, the abusive groundwateroverdraft for agriculture purposes contributes to seawater intrusion (Ben-Asheret al., 2002). According to Smedema and Shiati (2002) the salinisation problemprovoked by agriculture practices is more severe in arid soils, estimating thatfrom the land dedicated to agriculture 60% corresponds to humid climaticconditions and the remaining 40% to semi-arid regions. In these semi-aridregions, the salinisation is a more severe problem because of two features: thenaturally highly saline soil and the very high rates of evapo(transpi)ration. Theseauthors indicate that as crops absorb only a fraction of the salt of the consumedwater, irrigation causes these diluted salts to become concentrated. Therefore,they estimate that from 3 to 5 tons of salt are concentrated in soils per irrigatedha, per year.
Wastewater discharges: detergents, water softeners, and some industrialprocesses contain or use salts. Wastewater collected in wastewater treatmentplants (WWTPs) and septic systems is often saltier than the freshwater used inthe process it originates from and when released to the environment can increasethe salinity of the receiving water bodies. Overwatering of lawns and residentialuses can also contribute to augmenting water salinity, as can many industrialprocesses, such as printing, dyeing, refining, chemical production, mining,currieries, pharmaceuticals, power plants and food processing plants. Data fromthe United States (Dieter et al., 2018) indicate that of the total water withdrawalsin 2015 6% was saline. Of these saline discharges 97% corresponded to thethermoelectric industry, 2% to the industrial sector and 1% to mining. Thesalinisation potential of domestic and industrial effluents is analysed in moredetail in the following sections.
1.3.1 Domestic sewageThe wastewater produced in households contains higher salinity than the suppliedfreshwater because of the use of water softeners, detergents, cleaning products,soaps, shampoos, etc. For this reason, the EC of used water is generally between70 and 100 mS/cm higher than that of potable water (HWT, 2020). Additionally,when water source separation is practised some of the obtained streamsexperience a rise in salinity. This trend is like that observed when seawater isutilised to flush toilets. For example, some coastal cities, such as Hong Kong and
Treatment and Valorisation of Saline Wastewater6

Qingdao, use seawater for fire control, road flushing, toilet flushing and otheruses that do not required direct contact with human beings, to reduce the pressureon freshwater (Yiyi Zhao et al., 2020). However, these practices produce salinewastewater effluents which cannot always be treated with conventional processes.
Normally, the conventional wastewater treatment processes are not designed toremove salts, but they can help reducing the salinity to a certain level. Levlin(2010) reported that processes such as the removal of suspended solids,through sedimentation or filtration, have no effect on the EC. However, thebiological nitrogen removal contribution to the conductivity decrease issignificant, since ammonium nitrogen and alkalinity contribute approximately33% and 14% of the EC, respectively. For example, it is estimated that if theamount of available alkalinity is high enough (meaning one mole of alkalinityper mole of ammonia) biological nitrogen removal via nitrification followedby denitrification, will give a decrease in conductivity of 842 μS · m2/g N(expressed as the ratio between the EC, μS/m, and N concentration, g N/m3).Nevertheless, as the contribution of phosphate ions to EC is approximately1% of the measured conductivity, phosphorous removal will not result in anydecrease in conductivity.
Regarding the EC value and/or salt concentration of domestic sewage, differentvalues are reported depending on the geographical zone where it originates, theconsumption habits, and the existence of mixing with industrial effluents(Table 1.3).
Table 1.3 Summary of EC values found in sewage in different geographical zones.
Type ofWastewater
EC (mS/////cm) GeographicalZone
Reference
Raw sewage 0.22–0.37 Warri, Nigeria (Uwidia & Ukulu, 2012)
Treated sewagea 0.75–1.02 East London,South Africa
(Odjadjare & Okoh,2010)
Raw/treatedsewage
0.22–1.78/0.15–1.78
Jiaxing City, China (Yu et al., 2019)
Raw sewage 0.88–1.88 Ciudad de Mexico,Mexico
(Ontiveros-Capurataet al., 2013)
Freshwater/treatedsewage
0.6/1.00–2.50
Algarrobo, Spain (Muñoz-Sánchez et al.,2018)
Raw/treatedsewage
1.07/1.04 Tunceli, Turkey (Tanyol & Demir, 2016)
Raw sewagea 3.60 Bangladesh, India (Karmoker et al., 2018)aDomestic mixed with industrial sewage.
Introduction 7
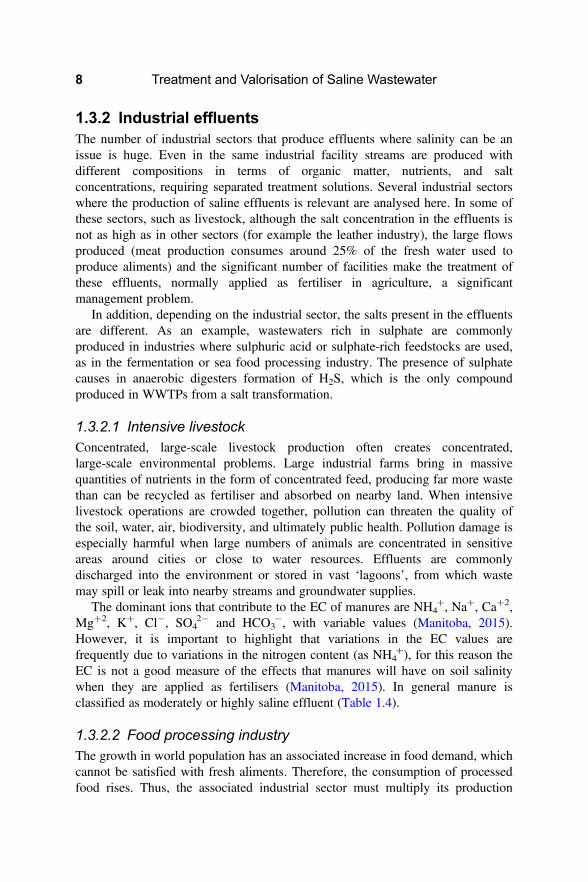
1.3.2 Industrial effluentsThe number of industrial sectors that produce effluents where salinity can be anissue is huge. Even in the same industrial facility streams are produced withdifferent compositions in terms of organic matter, nutrients, and saltconcentrations, requiring separated treatment solutions. Several industrial sectorswhere the production of saline effluents is relevant are analysed here. In some ofthese sectors, such as livestock, although the salt concentration in the effluents isnot as high as in other sectors (for example the leather industry), the large flowsproduced (meat production consumes around 25% of the fresh water used toproduce aliments) and the significant number of facilities make the treatment ofthese effluents, normally applied as fertiliser in agriculture, a significantmanagement problem.
In addition, depending on the industrial sector, the salts present in the effluentsare different. As an example, wastewaters rich in sulphate are commonlyproduced in industries where sulphuric acid or sulphate-rich feedstocks are used,as in the fermentation or sea food processing industry. The presence of sulphatecauses in anaerobic digesters formation of H2S, which is the only compoundproduced in WWTPs from a salt transformation.
1.3.2.1 Intensive livestockConcentrated, large-scale livestock production often creates concentrated,large-scale environmental problems. Large industrial farms bring in massivequantities of nutrients in the form of concentrated feed, producing far more wastethan can be recycled as fertiliser and absorbed on nearby land. When intensivelivestock operations are crowded together, pollution can threaten the quality ofthe soil, water, air, biodiversity, and ultimately public health. Pollution damage isespecially harmful when large numbers of animals are concentrated in sensitiveareas around cities or close to water resources. Effluents are commonlydischarged into the environment or stored in vast ‘lagoons’, from which wastemay spill or leak into nearby streams and groundwater supplies.
The dominant ions that contribute to the EC of manures are NH4+, Na+, Ca+2,
Mg+2, K+, Cl−, SO42− and HCO3
−, with variable values (Manitoba, 2015).However, it is important to highlight that variations in the EC values arefrequently due to variations in the nitrogen content (as NH4
+), for this reason theEC is not a good measure of the effects that manures will have on soil salinitywhen they are applied as fertilisers (Manitoba, 2015). In general manure isclassified as moderately or highly saline effluent (Table 1.4).
1.3.2.2 Food processing industryThe growth in world population has an associated increase in food demand, whichcannot be satisfied with fresh aliments. Therefore, the consumption of processedfood rises. Thus, the associated industrial sector must multiply its production
Treatment and Valorisation of Saline Wastewater8

capacity and consequently the volume of wastewater generated augments inproportion. The characteristics of the effluents from the food-processing industrydiffer depending on the main product processed (milk, vegetables, meat, fish,etc.), and even inside the same sector differences can be found between facilitiesdependent upon the production process arrangement. Nevertheless, there is acommon aspect among these sectors, that is the necessity to move towards moreenvironmentally protective processes in which the resources consumed and thewaste generated are minimised. For this reason, the effluents produced becomemore concentrated (as the use of water is reduced) which results in increasingsalinity.
In the food-processing industry, salt can be used for two purposes: to addnutritional components and/or to conserve the aliments and avoid theirdeterioration with time. Among the industrial facilities of the sector the meatcanning, vegetable pickling and fish-processing plants stand out as the highestsalt consumers (Lefebvre & Moletta, 2006). In Table 1.5 a summary of ECvalues found in literature for the effluents from different industries of this sectorare presented. Regarding the quantity of water consumed, it is estimated thatmore than two-thirds of all freshwater abstraction worldwide (and up to 90% insome countries) goes towards food production (including agriculture) (Barbera &Gurnari, 2018). Food-processing activities consume different volumes of thefreshwater in the following proportions: meat processing 24%, beverages 13%,dairy 12%, fruits and vegetables 10%, bakery and related products 9%, grain andoilseeds 9%, sugar and confectionary 5%, animal food 5%, seafood 2% and otherfood 11% (Bustillo-Lecompte & Mehrvar, 2015).
1.3.2.3 Tannery industryTanneries are typically characterised as pollution intensive industrialcomplexes which generate widely variable, high-strength wastewater. The major
Table 1.4 Summary of EC values found in different types of manure.
Manure Type EC (mS/////cm) Class Reference
Cow 4.84 + 0.289.6
Moderately salineModerately saline
(Santillán et al., 2014)(Irshad et al., 2013)
Cattle 7.04–7.18 Moderately saline (Yunchen Zhao et al., 2014)
Poultry 7.04 + 2.578.3
Moderately salineModerately saline
(Li & Lujia, 2007)(Irshad et al., 2013)
Buffalo 8.6 Moderately saline (Irshad et al., 2013)
Camel 8.7 Moderately saline (Irshad et al., 2013)
Goat 10.3 Highly saline (Irshad et al., 2013)
Pig 9–28 Highly saline (Manitoba, 2015)
Introduction 9
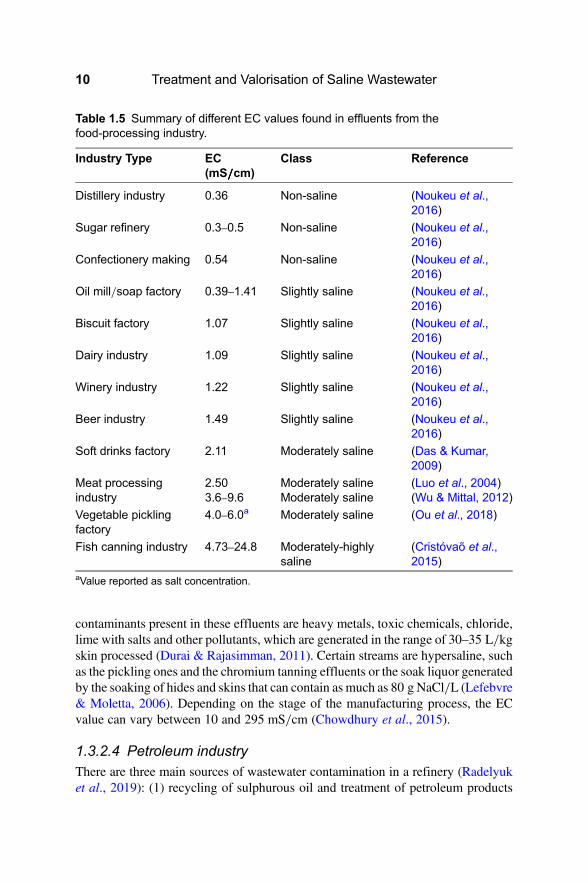
contaminants present in these effluents are heavy metals, toxic chemicals, chloride,lime with salts and other pollutants, which are generated in the range of 30–35 L/kgskin processed (Durai & Rajasimman, 2011). Certain streams are hypersaline, suchas the pickling ones and the chromium tanning effluents or the soak liquor generatedby the soaking of hides and skins that can contain as much as 80 g NaCl/L (Lefebvre& Moletta, 2006). Depending on the stage of the manufacturing process, the ECvalue can vary between 10 and 295 mS/cm (Chowdhury et al., 2015).
1.3.2.4 Petroleum industryThere are three main sources of wastewater contamination in a refinery (Radelyuket al., 2019): (1) recycling of sulphurous oil and treatment of petroleum products
Table 1.5 Summary of different EC values found in effluents from thefood-processing industry.
Industry Type EC(mS/////cm)
Class Reference
Distillery industry 0.36 Non-saline (Noukeu et al.,2016)
Sugar refinery 0.3–0.5 Non-saline (Noukeu et al.,2016)
Confectionery making 0.54 Non-saline (Noukeu et al.,2016)
Oil mill/soap factory 0.39–1.41 Slightly saline (Noukeu et al.,2016)
Biscuit factory 1.07 Slightly saline (Noukeu et al.,2016)
Dairy industry 1.09 Slightly saline (Noukeu et al.,2016)
Winery industry 1.22 Slightly saline (Noukeu et al.,2016)
Beer industry 1.49 Slightly saline (Noukeu et al.,2016)
Soft drinks factory 2.11 Moderately saline (Das & Kumar,2009)
Meat processingindustry
2.503.6–9.6
Moderately salineModerately saline
(Luo et al., 2004)(Wu & Mittal, 2012)
Vegetable picklingfactory
4.0–6.0a Moderately saline (Ou et al., 2018)
Fish canning industry 4.73–24.8 Moderately-highlysaline
(Cristóvaõ et al.,2015)
aValue reported as salt concentration.
Treatment and Valorisation of Saline Wastewater10

with alkalis, which give highly concentrated sulphurous alkaline wastewater; (2)complex processing of oil and gas to produce synthetic products which generatewastewater with organic acids, alcohols, phenols, etc.; and (3) processes ofdesalination and dehydration, which cause the presence of demulsifiers andsulfonaphthones in the wastewater. Therefore, the generated wastewater containssuspended solids, dissolved salts, oil and grease, nitrogen compounds, organicsulphides and other substances (heavy metals, phenols, etc.). Thus, a complextreatment train needs to be applied to comply with discharge requirements.Radelyuk et al. (2019) examined the wastewater treatment trains that arenormally applied in this sector and proposed the use of the following steps: in thepre-treatment screens, sand traps and equalisation tanks; in the primary treatmentoil traps, coagulation-flocculation, dissolved air flotation and electrocoagulation-flocculation; in the secondary treatment activated sludge and moving bed biofilmreactor; finally in the post-treatment wetlands, advanced oxidation processes andmembrane technologies (if water is going to be reused).
Regarding the characteristics of the wastewater, not only the presence of highsalinities, but also other compounds, are a drawback for biological processes.According to Al-Khalid and El-Naas (2018) the effluent from a petroleumrefinery contains average values of: 5.2–6.8 mS/cm (EC), 3,800–6,200 mg/L asTDS, 14.5–16.0 mg SO4
−2/L and 160–185 mg/L as total phenol. Regarding theamount of wastewater generated, these authors indicated that, on average,processing a barrel of crude oil consumes 246–341 litres of water with thesubsequent wastewater production.
1.3.2.5 Mining industryWater is used in the mining sector in different operations and processes such asexploration, mineral processing, (treatment of ore, recovery of metals and thecontrol of dust particles) and closure. Therefore, the effluents generated containdifferent types of dissolved ions, including Na+, Ca+2, Mg+2, K+, Cl−and SO4
2−
among others, that vary depending on the geographical zone (type of soil andclimate), the processes applied, etc. The water can be obtained from a variety ofsources including allocation from the bulk water infrastructure (third-party water),groundwater (mainly in arid regions), surface water (rainfall and runoff), andeven water with low quality or alternative sources of water (Thiruvenkatachari &Su, 2017).
The water consumed and the conductivity of the effluents generated in thissector depend highly on the type of mineral extracted. For example in theextraction of coal a water consumption of 180–220 litres per tonne of coal isestimated with an EC value between 0.5–21.0 mS/cm, while for gold thisconsumption can account for 250 million of litres per tonne and the ECvalue of the stream generated is between 96–289 mS/cm (Thiruvenkatachari &Su, 2017).
Introduction 11

Therefore, the high volumes of water consumed, and the high salinity of theeffluents generated, make the application of treatment processes necessary withthe aim to reuse the effluents in the same industry. Foureaux et al. (2020)compared the use of two different membrane-based technologies (direct contactmembrane distillation process and high temperature nanofiltration process) for thetreatment of an effluent from a gold mine (with EC values of 34–56 mS/cm).Although with both systems these authors obtained large pollutants rejection rates(.92.4%), the direct contact membrane distillation was proved to have the lowestoperational costs, which is important for full-scale application.
1.4 WATER SALINISATION EFFECTSCurrently, about 7% of the world’s land surface and over 20% of the world’sagricultural land are threatened by salinisation. The problems associated withwater salinisation are diverse and with different consequences. Anthropogenicsalinisation disrupts ecosystem functions and services, degrades biologicalsystems, and can negatively affect human health and wellbeing (Schuler et al.,2019). In this chapter these problems are classified into two main categories:effects on living organisms and on economy.
1.4.1 Damaging living organismsAn excess of salinity in water has consequences for living organisms and theirhealth. In the case of human beings, apart from the bad taste, salinised drinkingwater affects mainly kidney function and can also cause hypertension.Furthermore, urban freshwater salinisation can increase the prevalence of salttolerant disease vectors such as mosquitoes, and salts can mobilise toxic heavymetals into drinking water, increasing the risks to human health. Salt alsonegatively affects the health and productivity of livestock, especially pregnantfemales. Typically, small freshwater invertebrates are the most sensitive toincreased salinity, while large vertebrates are generally more tolerant.
In the case of crops and plants it affects their growth and development, especiallyin the early-growth stages. Salt influences how easily plants can extract water fromthe soil. Plants either store salt within their cells or try to exclude it. Either way, plantgrowth and function are reduced, which can ultimately lead to the death of the plant.
Also, ecological effects occur, such as imbalance of ecosystems composition dueto the transition to salt-tolerant species, which can even happen with small increasesin salinity.
All these effects cause problems in the food production chain (crop cultivationand livestock), thus affecting directly human food availability. Khanom (2016)reported these effects for the region of Bangladesh with data from 2000 to 2009.These authors concluded that yield loss in every year has increased and that tocope with soil salinity the native rice varieties need to be changed to others withhigh yield in these conditions. Additionally, it was necessary to increase the use
Treatment and Valorisation of Saline Wastewater12
of fertiliser and pesticides and crops like oilseed, sugarcane and jute were cultivateddiscontinuously due to their inability to cope with salinity level. Sharma et al. (2016)revised the impact of saline water consumption on different animals and highlightthat the presence of ions such as Ca2+, Mg2+, Na+, Cl−, SO4
2−, and HCO3− may
cause harmful effects resulting in poor performance, illness, or even death.Furthermore, they state that tolerance for salinity depends on age, species,requirement, season, and physiological condition. For example, they explain thatfor sheep the desirable maximum drinking water TDS concentration isapproximately 5,000 mg/L, while for cattle it is 2,500 mg/L.
1.4.2 Limiting economic and social developmentSalinisation limits economic and social development affecting different sectors suchas agriculture and livestock, households and public services, and industrialactivities. The consequences in each sector are interconnected resulting in a netreduction of economic development and welfare of the region affected bysalinity. Social consequences include the displacement of hundreds of thousandsto millions of people (migrations) because there is no adequate water and foodfor the entire population, but also due to the scarcity of work associated with thereduction in the economic activity (agriculture, livestock and industry).Additionally, these migrations can be indirectly motivated by the reduction inother ecosystem services in which freshwater is necessary (Schuler et al., 2019).
Salinisation worsens the environment and the quality of the soil and the water,therefore it increases costs of food production (crops and livestock), becausethere are extra costs associated with land and water conditioning, for exampleensuring sufficient quality for irrigation and for animal consumption. Morespecifically, high concentrations of salts in water can damage crops, affect plantgrowth, degrade drinking water for animals, and damage the equipment necessaryfor the agricultural and livestock activities.
For households, the poor water quality due to the presence of salts results in theappearance of diseases, which have negative economic and social impacts. Forexample, the corrosion of copper pipes leads to maintenance cost increases and tohigh levels of dissolved copper in drinking water, which is harmful to humans.Furthermore, the salinisation of water resources reduces the quality of thedrinking water and obligates the installation of costly systems at the treatmentplant to remove the excess salt, resulting in significantly increased rates forresidential and commercial users. Additionally, the public administration is forcedto promote improvements in mandatory regulations to guarantee the welfare ofthe population.
For industries that use water the production process is more expensive as theyneed to pre-treat it, for both freshwater and in the case that it is reused in theplant after its initial utilisation. Additionally, it is important to consider that thesetypes of treatments generate new residues (separated salts, brines, etc.) that need
Introduction 13

to be managed, with the corresponding extra cost for the industry. Furthermore,industrial processes suffer damage to their equipment even though they can usesaline water to a certain extent. With high salinity, equipment such as pumps,metallic pipes and tanks are corroded. Salt will also affect the function of devicessuch as air-conditioners, batteries, boilers, engine radiators, swimming pools, etc.
From the economic point of view, quantifying the costs of salinisation is difficultbecause it impacts in several different aspects, as mentioned previously. To serve asan example, the distribution of the salinisation costs among the different sectors ispresented in the case of the Murray-Darling Basin (Australia) (Wilson, 2004):commerce and industry 21%, households 25%, local government assumes 10%,state government agencies and utilities 11%, dryland agricultural producers 33%,environment and cultural heritage (not valued). In this report the main economiccosts of salinisation are grouped in the following categories:
(1) Repair and maintenance costs: for example, because the infrastructures areaffected more by corrosion under saline conditions.
(2) Costs from the reduced lifespan of infrastructure: attributed to the earlierreplacement than normal because of damage caused by the salinity.
(3) Costs of taking preventive actions: includes the amelioration costs incurredby the community to minimise current and future problems, for examplewith the use of less corrosive materials which are more expensive or withthe installation of extra infrastructures to avoid the scarcity of water bysalinisation (desertification). Additionally, they can include the costsassociated with research programmes related with the salinity issue.
(4) Operating costs: increase of costs related with the use of additional goodsand services which minimise the salinisation, for example, treatment ofgroundwater for drinking.
(5) The value of income foregone: for example, the reduction of incomes in theagricultural sector, the reduction of the property values because they arelocated in a salinised area, etc.
(6) Environmental and cultural heritage costs: it considers the negative impactson the natural environment and cultural heritage.
1.4.3 Impacting the environmentTo evaluate the environmental impact of salinity different tools can be applied.Among them the life cycle assessment (LCA) is a methodology widely extendedto calculate the environmental impact of a product over its entire life cycle. TheLCA results are related to environmental impact categories, which include:abiotic depletion, aquatic ecotoxicity, freshwater acidification, cumulative energydemand, eutrophication, global warming, human toxicity, ozone depletion,photochemical ozone creation, photo-oxidant formation, terrestrial ecotoxicityand water demand. However, salinisation is missing in the range of impact
Treatment and Valorisation of Saline Wastewater14

categories of most LCA case studies, resulting in the lack of a comprehensiveapproach to assess salinisation impacts due to human interventions in the LCAframework. For this reason, there is an increasing interest in developing a newimpact category which relates the effect of salinity. Payen et al. (2016) reviewedthe salinisation impacts in LCA for their consistent integration and concluded thatthere are four relevant aspects to consider associated with human interventionscausing soil and water salinisation (secondary salinisation): 1) land use change, 2)irrigation, 3) brine disposal, and 4) over-reuse of a waterbody. These authorsestablished the relationships between these factors and the impact on humanhealth, ecosystem biodiversity and resource (soil and water) availability for futuregenerations, in order to help to understand the basics to apply salinisation as acategory in the LCA.
1.4.3.1 Water quality for reuseThe most valuable fraction of the wastewater is the water itself (Verstraete et al.,2009). Therefore, recovery of water from waste streams is increasing in interest.Additionally, the new concept of circular economy is forcing the implementationof strategies that improve the water use, reducing the utilisation of naturalresources and recycling the water as much as possible in the productionprocesses. The application of recycled water can be divided into seven categoriesincluding: urban reuse, agricultural reuse, impoundments, environmental reuse,industrial reuse, groundwater recharge/non-potable reuse, and potable reuse, withagricultural water reuse being the dominant application in the world(Shoushtarian & Negahban-Azar, 2020).
Therefore, water reuse is nowadays an option that many countries are applying tosolve the scarcity of water and to replenish freshwater resources. The technologicaldevelopment of new processes which are more and more efficient makes water reusea reality. The benefits of water reuse include among others: the decrease of pressureon the freshwater resources, the reduction of pollutants discharged to water bodiesand the availability of a water source which is more reliable than other water sourcesthat directly depend on rainfall. Nevertheless, the different regulations all over theworld, at international and national level, which describe the quality requirementsfor water reuse are mainly focused on human-health. They appear insufficient tolimit some of the potentially dangerous pollutants, such as emerging compounds,and present large discrepancies when compared with each other. In addition,Shoushtarian and Negahban-Azar (2020), in a review of 70 different regulationsand guidelines from different countries and regions, found that some of theimportant water quality parameters such as pathogens, heavy metals, and salinityare only considered in some of these regulations. In this revision the authorsfound only 14 regulations/guidelines containing specific restrictions for salinity,among them the maximum EC threshold value is fixed at approximately 3mS/cm, in line with FAO guidelines (Table 1.2). A summary of the
Introduction 15

characteristics of salinity that reclaimed water needs to comply with in theseregulations is presented in Table 1.6 (adapted from the review of Shoushtarianand Negahban-Azar (2020)).
1.4.3.2 Greenhouse gas (GHG) emissionsMore specifically the role of salinity in air pollution due to greenhouse gas (GHG)emissions is still unclear and more research is needed to clarify this aspect.Poffenbarger et al. (2011) studied the relationship between methane emissionsand salinity in tidal marshes and they concluded that methane emissions arenegligible in brackish systems but need to be considered relevant inlower-salinity marshes. Similar conclusions were obtained by Wang et al. (2017).These authors studied the impact of seawater concentration on the potentialproduction of CH4, CO2 and N2O. They found that potential CH4 production wasunaffected by salinities from 0 to 7.5‰, but declined significantly at 10‰ andabove, while potential CO2 production was stimulated at intermediate salinities(from 5.0 to 7.5‰), but inhibited by salinities over 15‰. Finally, for thepotential of N2O production they observed that it was unaffected by salinity.
Ardón et al. (2018) measured the emissions of CH4, CO2 and N2O in soilsexposed to marine salt to assess the salinity effect in these GHG emissions andconcluded that regarding CH4 and CO2 no relevant increase in the emissionswere detected, while in the case of N2O the simultaneous presence of salt (NaCl)and sulphate decreased in 72% of the N2O emissions.
Shao et al. (2020) studied the effect of salinity (0–2%) on GHG emissions (CH4,CO2 and N2O) in a wastewater treatment system with constructed wetlands. Theirmain findings were that, as salinity decreases chemical oxygen demand (COD)removal, and as CH4 and CO2 emissions are positively correlated with CODremoval, the increase of salinity reduces their emissions. Regarding N2Oemissions they observed that salinity is negatively correlated with nitrogenremoval, therefore if the salinity reduces the nitrogen removal rate the N2Oemissions increase. Along this line, Tsuneda et al. (2005) studied specifically theN2O emission in the biological nitrogen removal processes for wastewatertreatment and concluded that in the nitrification process N2O emissions increase2.2 times when the salt concentration increases from 1 to 2%, while in thedenitrification process the change in the N2O emission was negligible (even when
Table 1.6 Range of thresholds for parameters related to the salinity found in differentregulations/guidelines for water reuse (adapted from Shoushtarian andNegahban-Azar (2020)).
EC (mS/////cm) TDS (mg/////L) SAR Cl− (mg/////L) Na+ (mg/////L)
0.2–3.0 450–2,000 3–10 100–2,000 70–300
Treatment and Valorisation of Saline Wastewater16

salinity increased from 3 to 5%). Globally in the activated sludge process (withnitrification-denitrification) these authors observed that a salt concentrationincrease from 1.6 to 3.0% increased the N2O emission from 0.7 to 13.0%. Theyconcluded that salinity inhibits the N2O reductase activity and, consequently,more emissions are detected in the biological nitrogen removal processes.
1.4.3.3 Other impactsIn previous sections the most relevant impacts that water salinisation provokes werediscussed. Nevertheless, as a relevant issue there are many other direct or indirectimplications to consider, like its contribution to acid rain and desertification.
Saline wastewater containing sulphur compounds (for example due to seawateruse or its intrusion) can produce H2S in the treatment process (in anaerobicconditions), which is a gas that can be oxidised in the atmosphere into SO2, withthe subsequent transformation into H2SO4, contributing to acid rain (Rubrightet al., 2017).
The nexus between salinisation and desertification is well known. The largest soilareas affected by salinity and sodicity in the world are in Australia and Asia, most ofwhich evolve to desertification of the regions (Singh, 2009). This effect mainlyoccurs due to the irrigation practices in semi-arid regions since, once the waterevaporates, the salts contained in the fertiliser remain concentrated in the soil.Therefore, the salinity of the soils is one of the problems that contributes the mostto their degradation in regions susceptible to desertification.
1.5 CONCLUSIONSSalinisation is a worldwide problem which, although more severe in some placessuch as semi-arid regions, needs to be considered as a global concern thatimpacts lives, economic activities, the environment, and social welfare.Salinisation can be due to natural causes (primary salinisation) or anthropogenicactivities (secondary salinisation). The latter occurs due to practices concerningagriculture and livestock, industrial processes, and household habits. All theseactivities are high freshwater demanders, with consequent wastewater generation.Among the sectors producing saline effluents it is important to highlight that inthe case of the food-processing industry, livestock activities and urban sewage, ifan adequate treatment is applied the effluents can be reused, for example forirrigation. In fact, agriculture is part of the problem and part of the solution forsaline effluents. On the one hand the inadequate irrigation practices areresponsible for the increasing salinity in soil and groundwater, but at the sametime the reuse of saline effluents (from livestock, the food-processing industryand households) reduces the consumption of freshwater resources and decreasesthe use of fertilisers. Considering that agriculture is the consumer of 70% ofthe total water demand, finding alternative water resources to freshwater is
Introduction 17
important, for example to avoid groundwater overdraft and reduce the risk ofseawater intrusion.
REFERENCESAl-Khalid T. and El-Naas M. H. (2018). Organic contaminants in refinery wastewater:
characterization and novel approaches for biotreatment. Recent Insights in PetroleumScience and Engineering, Chapter 18, 371–391.
Ardón M., Helton A. M. and Bernhardt E. S. (2018). Salinity effects on greenhouse gasemissions from wetland soils are contingent upon hydrologic setting: a microcosmexperiment. Biogeochemistry, 140, 217–232.
Barbera M. and Gurnari G. (eds) (2018). Water Reuse in the Food Industry: Quality ofOriginal Wastewater Before Treatments. In: Wastewater Treatment and Reuse in theFood Industry, SpringerBriefs in Molecular Science. Springer, Cham.
Ben-Asher J., Beltrão J., Costa M., Anaç S., Cuartero J. and Soria T. (2002). Modelling theeffect of sea water intrusion on ground water salinity in agricultural areas in Israel,Portugal, Spain and Turkey. Acta Horticulturae, 573, 119–128.
Bustillo-Lecompte C. F. and Mehrvar M. (2015). Slaughterhouse wastewater characteristics,treatment, and management in the meat processing industry: A review on trends andadvances. Journal of Environmental Management, 161, 287–302.
Chowdhury M., Mostafa M. G., Biswas T. K., Mandal A. and Saha A. K. (2015).Characterization of the Effluents from Leather Processing Industries. EnvironmentalProcesses, 2, 173–187.
Cristóvaõ R. O., Botelho C. M., Martins R. J. E., Loureiro J. M. and Boaventura R. A. R.(2015). Fish canning industry wastewater treatment for water reuse – A case Study.Journal of Cleaner Production, 87, 603–612.
Das M. and Kumar A. (2009). Effluent characterization and different modes of reuse inagriculture-a model case study. Environmental Science and Pollution Research, 16(4), 466–73.
Dieter C. A. A., Maupin M. A. A., Caldwell R. R. R., Harris M. A. A., Ivahnenko T. I. I.,Lovelace J. K. K., Barber N. L. L. and Linsey K. S. S. (2018). Estimated Water Usein the United States in 2015. U.S. Geological Survey, circular 1441.
Durai G. and RajasimmanM. (2011). Biological treatment of tannery wastewater –A review.Journal of Environmental Science and Technology, 4(1), 1–17.
Flood J. F. and Cahoon L. B. (2011). Risks to coastal wastewater collectionsystems from sea-level rise and climate change. Journal of Coastal Research, 27,652–660.
Foureaux A. F. S., Lebron Y. A.R., Moreira V. R., Grossi L. B., Santos L. V. S. and AmaralM. C. S. (2020) Technical and economic potential of high-temperature NF and DCMDfor gold mining effluent reclamation. Chemical Engineering Research and Design, 162,149–161.
Horriche F. J. and Benabdallah S. (2020). Assessing aquifer water level and salinity for amanaged artificial recharge site using reclaimed water. Water, 12(2), 341, 1–11.
HWT. (2020). Electrical Conductivity of water. https://hwt.co.za/electrical-conductivity-of-water/ (accessed 8 November 2020).
Treatment and Valorisation of Saline Wastewater18
Irshad M., Eneji A. E., Hussain Z. and Ashraf M. (2013). Chemical characterization of freshand composted livestock manures. Journal of Soil Science and Plant Nutrition, 13(1),115–121.
Karmoker J., Kumar S., Kumer Pal B., Sajal Sorowar M., Aminur Rahman M., HafijurRahaman Khan M. and Islam R. (2018). Characterization of wastewater fromJhenaidah municipality area, Bangladesh: A combined physico-chemical andstatistical approach. AIMS Environmental Science, 5(6), 389–401.
Khanom T. (2016). Effect of salinity on food security in the context of interior coast ofBangladesh. Ocean and Coastal Management, 130, 205–212.
Lefebvre O. and Moletta R. (2006). Treatment of organic pollution in industrial salinewastewater: A literature review. Water Research, 40(20), 3671–3682.
Levlin E. (2010). Conductivity Measurements for Controlling Municipal Waste-WaterTreatment. Joint Polish – Swedish Reports, 15, 51–62.
Li X. and Lujia H. (2007). Evaluation of specific gravity and electrical conductivity fordetermining nutrient concentrations in suspensions of poultry manure. Polish Journalof Environmental Studies, 16(6), 919–925.
Luo J., Lindsey S. and Xue J. (2004). Irrigation of meat processing wastewater onto land.Agriculture, Ecosystems and Environment, 103(1), 123–148.
Manitoba (2015). Properties of Manure. https://www.gov.mb.ca/agriculture/environment/nutrient-management/pubs/properties-of-manure.pdf (accessed 8 November 2020).
Martín-Queller E., Moreno-Mateos D., Pedrocchi C., Cervantes J. and Martínez G. (2010).Impacts of intensive agricultural irrigation and livestock farming on a semi-aridmediterranean catchment. Environmental Monitoring and Assessment, 167(1–4),423–435.
Meriano M., Eyles N. and Howard K. W. F. (2009). Hydrogeological impacts of road saltfrom Canada’s busiest highway on a Lake Ontario watershed (Frenchman’s Bay) andlagoon, City of Pickering. Journal of Contaminant Hydrology, 107(1–2), 66–81.
Metcalf and Eddy (2003). Wastewater Engineering: Treatment and Reuse, 4th edn.McGraw-Hill, New York.
Muñoz-Sánchez D., Bogodist V., García-Cañizares V. M., Frías-Gil D., López-Díaz M. R.,Jaime-Fernández E. and Romero-Aranda M. R. (2018). Assessing quality ofreclaimed urban wastewater from Algarrobo municipality to be used for irrigation.Journal of Water Resource and Protection, 10(11), 1090–1105.
Noukeu N. A., Gouado I., Priso R. J., Ndongo D., Taffouo V. D., Dibong S. D. and EkodeckG. E. (2016). Characterization of effluent from food processing industries and stillagetreatment trial with Eichhornia crassipes (Mart.) and Panicum maximum (Jacq.).Water Resources and Industry, 16, 1–18.
Odjadjare E. E. O. and Okoh A. I. (2010). Physicochemical quality of an urban municipalwastewater effluent and its impact on the receiving environment. EnvironmentalMonitoring and Assessment, 170, 383–394.
Ontiveros-Capurata R. E., Diakite-Diakite L., Álvarez-Sánchez M. E. and Coras-MerinoP. M. (2013). Evaluación de aguas residuales de la ciudad de México utilizadas parariego. Tecnologia y Ciencias Del Agua, 4(4), 127–140.
Ou Y., Gu J., Ran M., Yang H. and Zhang D. (2018). Asynchronous cultivation anddomestication of aerobic activated sludge to treat the pickle wastewater. IOPConference Series: Earth and Environmental Science, 186(3), 1–7.
Introduction 19
Payen S., Basset-Mens C., NúñezM., Follain S., Grünberger O., Marlet S., Perret S. and RouxP. (2016). Salinisation impacts in life cycle assessment: a review of challenges andoptions towards their consistent integration. International Journal of Life CycleAssessment, 21, 577–594.
Poffenbarger H. J., Needelman B. A. and Megonigal J. P. (2011). Salinity influence onmethane emissions from tidal marshes. Wetlands, 31, 381–842.
Radelyuk I., Tussupova K., Zhapargazinova K., Yelubay M. and Persson M. (2019). Pitfallsof wastewater treatment in oil refinery enterprises in Kazakhstan-a system approach.Sustainability, 11, 1618, 1–20.
Rengasamy P. (2006). World salinization with emphasis on Australia. Journal ofExperimental Botany, 57(5), 1017–1023.
Rhoades J., Kandiah A. and Mashali A. (eds) (1992). Chapter 2: Saline waters as resources.In: The Use of Saline Waters for Crop Production, FAO Irrigation and Drainage Paper,48, 5–9.
Rubright S. L. M., Pearce L. L. and Peterson J. (2017) Environmental toxicology of hydrogensulfide. Nitric oxide, 71, 1–13.
Santillán Y., Moreno F., Garcia F. and Sandoval O. (2014). Effect of the application ofmanure of cattle on the properties chemistry of soil in Tizayuca, Hidalgo, Mexico.International Journal of Applied Science and Technology, 4(3), 67–72.
Schuler M. S., Cañedo-Argüelles M., Hintz W. D., Dyack B., Birk S. and Relyea R. A.(2019). Regulations are needed to protect freshwater ecosystems from salinization.Philosophical Transactions of the Royal Society B: Biological Sciences, 374, 1–9.
Shao X., Zhao L., Sheng X. and Wu M. (2020). Effects of influent salinity on waterpurification and greenhouse gas emissions in lab-scale constructed wetlands.Environmental Science and Pollution Research, 27(17), 21487–21496.
Sharma A., Tariq P. H., Kewalramani N. and Kundu S. S. (2016). Livestock rearing on salinewater. In: Innovative Saline Agriculture, J. Dagar, P. Sharma, D. Sharma and A. Singh(eds), Springer, New Delhi, pp. 475–487.
Shtull-Trauring E., Cohen A., Ben-HurM., Tanny J. and BernsteinN. (2020). Reducing salinityof treated waste water with large scale desalination.Water Research, 186, 116322.
Shoushtarian F. and Negahban-Azar M. (2020). World wide regulations and guidelines foragriculturalwater reuse: A critical review. Water, 12, 971, 1–58.
Singh G. (2009). Salinity-related desertification and management strategies: Indianexperience. Land Degradation and Development, 20, 267–385.
Smedema L. K. and Shiati K. (2002). Irrigation and salinity: A perspective review of thesalinity hazards of irrigation development in the arid zone. Irrigation and DrainageSystems, 16, 161–174.
Tanyol M. and Demir V. (2016). Correlations between some operation parameters andefficiency evaluation of domestic wastewater treatment plant in Tunceli (Turkey).Desalination and Water Treatment, 57(58), 28115–28121.
Thiruvenkatachari R. and Su S. (2017) Chapter 5: Aerobic Treatment of Effluents From theMining Industry. In: Current Developments in Biotechnology and Bioengineering,D.-J. Lee, V. Jegatheesan, H. H. Ngo, P. C. Hallenbeck and A. Pandey (eds),Elsevier, pp. 131–143.
Treatment and Valorisation of Saline Wastewater20

Tsuneda S., Mikami M., Kimochi Y. and Hirata A. (2005). Effect of salinity on nitrous oxideemission in the biological nitrogen removal process for industrial wastewater. Journal ofHazardous Materials, 119(1–3), 93–98.
Tularam G. A. and Krishna M. (2009). Long-term consequences of groundwater pumping inAustralia: a review of impacts around the globe. Journal of Applied Science inEnvironmental Sanitation, 4(2), 161–166.
Uwidia I. E. and Ukulu H. S. (2012). Studies on electrical conductivity and total dissolvedsolids concentration in raw domestic wastewater obtained from an estate in Warri,Nigeria. Greener Journal of Physical Sciences, 3(3), 110–114.
Verstraete W., Van de Caveye P. and Diamantis V. (2009). Maximum use of resourcespresent in domestic “used water”. Bioresource Technology, 100, 5537–5545.
Walton N. R. G. (1989). Electrical conductivity and total dissolved solids – what is theirprecise relationship? Desalination, 72(3), 275–292.
Wang C., Tong C., Chambers L. G. and Liu X. (2017). Identifying the salinity thresholds thatimpact greenhouse gas production in subtropical tidal freshwater marsh soils.Wetlands,37, 559–571.
Wilson S.M. (2004). Dryland and Urban Salinity Costs Across theMurray-Darling Basin. AnOverview & Guidelines for Identifying and Valuing the Impacts, Murray-Darling BasinCommission, Canberra.
Wu P. F. and Mittal G. S. (2012). Characterization of provincially inspected slaughterhousewastewater in Ontario, Canada. Canadian Biosystems Engineering/Le Genie DesBiosystems Au Canada, 53, 6.9–6.18.
WWAP (United Nations World Water Assessment Programme) (2017). Wastewater: TheUntapped Resource. In The United Nations World Water Development Report 2017.Paris, UNESCO.
Yiyi Zhao, Zhuang X., Ahmad S., Sung S. and Ni S. Q. (2020). Biotreatment of high-salinitywastewater: current methods and future directions. World Journal of Microbiology andBiotechnology, 36, 1–37.
Yu Q., Liu R., Chen J. and Chen L. (2019). Electrical conductivity in rural domestic sewage:An indication for comprehensive concentrations of influent pollutants and theeffectiveness of treatment facilities. International Biodeterioration andBiodegradation, 143, 104719.
Yunchen Zhao, Yan Z., Qin J. and Xiao Z. (2014). Effects of long-term cattle manureapplication on soil properties and soil heavy metals in corn seed production inNorthwest China. Environmental Science and Pollution Research, 21, 7586–7595.
Zektser S., Liáiciga H. A. and Wolf J. T. (2005). Environmental impacts of groundwateroverdraft: selected case studies in the southwestern United States. EnvironmentalGeology, 47, 396–404.
Introduction 21


Chapter 2
Salinity effects on physical-chemical treatments
ABSTRACTThe aims of the physical-chemical processes applied during wastewater treatmentare generally to guarantee the good performance of biological systems andimprove the effluent quality. Salinity of wastewater affects its ionic strength anddensity and, therefore, the efficiency of coagulation-flocculation, sedimentation,dehydration, precipitation and disinfection processes. Specifically, the ionic forceinfluences the interaction between particles present in wastewater and, so, theirtendency to aggregate. It also affects the growth rate of microorganisms formingflocs, causing changes in the physical structure of the flocs. The increase of thewastewater density negatively affects the settling process. Saline conditionsdecrease the effective concentration of sparingly soluble salt ions, due to thepromotion of electrostatic interactions or the formation of complexes, whichincrease the solubility of these salts. Inorganic ions can also act as promotersand/or scavengers of radicals during disinfection with UV and advancedoxidation processes.
Keywords: Bubbles coalescence, DLVO theory, flocs structure, ion exchange,particles aggregation
2.1 INTRODUCTIONBoth urban and domestic wastewater contain a variety of pollutants that are usuallyremoved by applying physical, chemical and/or biological processes (Figure 2.1).
© IWA Publishing 2021. Treatment and Valorisation of Saline Wastewater: Principles and PracticeAuthor(s): Anuska Mosquera Corral, Ángeles Val del Río and José Luis Campos Gómezdoi: 10.2166/9781789060645_0023
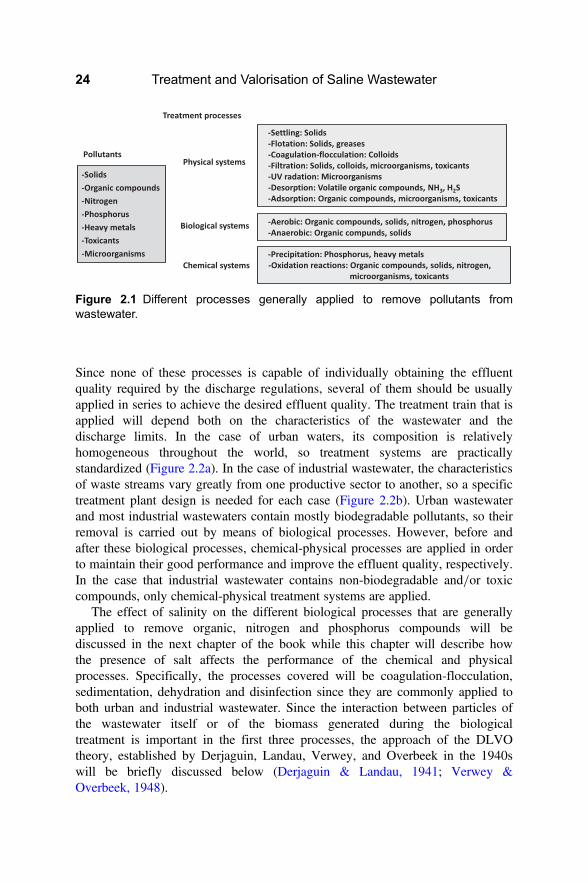
Since none of these processes is capable of individually obtaining the effluentquality required by the discharge regulations, several of them should be usuallyapplied in series to achieve the desired effluent quality. The treatment train that isapplied will depend both on the characteristics of the wastewater and thedischarge limits. In the case of urban waters, its composition is relativelyhomogeneous throughout the world, so treatment systems are practicallystandardized (Figure 2.2a). In the case of industrial wastewater, the characteristicsof waste streams vary greatly from one productive sector to another, so a specifictreatment plant design is needed for each case (Figure 2.2b). Urban wastewaterand most industrial wastewaters contain mostly biodegradable pollutants, so theirremoval is carried out by means of biological processes. However, before andafter these biological processes, chemical-physical processes are applied in orderto maintain their good performance and improve the effluent quality, respectively.In the case that industrial wastewater contains non-biodegradable and/or toxiccompounds, only chemical-physical treatment systems are applied.
The effect of salinity on the different biological processes that are generallyapplied to remove organic, nitrogen and phosphorus compounds will bediscussed in the next chapter of the book while this chapter will describe howthe presence of salt affects the performance of the chemical and physicalprocesses. Specifically, the processes covered will be coagulation-flocculation,sedimentation, dehydration and disinfection since they are commonly applied toboth urban and industrial wastewater. Since the interaction between particles ofthe wastewater itself or of the biomass generated during the biologicaltreatment is important in the first three processes, the approach of the DLVOtheory, established by Derjaguin, Landau, Verwey, and Overbeek in the 1940swill be briefly discussed below (Derjaguin & Landau, 1941; Verwey &Overbeek, 1948).
Figure 2.1 Different processes generally applied to remove pollutants fromwastewater.
Treatment and Valorisation of Saline Wastewater24
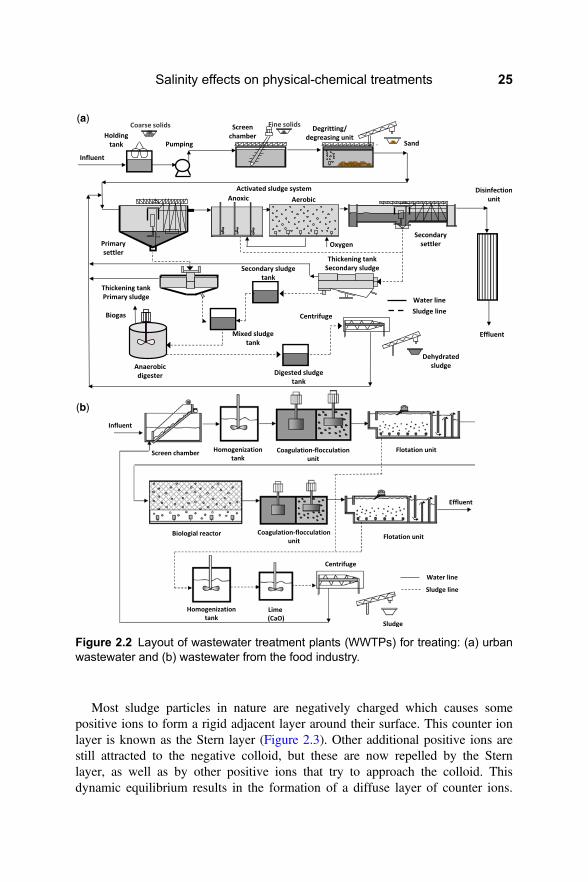
Most sludge particles in nature are negatively charged which causes somepositive ions to form a rigid adjacent layer around their surface. This counter ionlayer is known as the Stern layer (Figure 2.3). Other additional positive ions arestill attracted to the negative colloid, but these are now repelled by the Sternlayer, as well as by other positive ions that try to approach the colloid. Thisdynamic equilibrium results in the formation of a diffuse layer of counter ions.
(a)
(b)
Figure 2.2 Layout of wastewater treatment plants (WWTPs) for treating: (a) urbanwastewater and (b) wastewater from the food industry.
Salinity effects on physical-chemical treatments 25

These counter ions have a high concentration near the surface, which graduallydecreases with distance, until a balance is achieved with the concentration of thecounter ions within the solution. Similarly, although opposite, in the diffuse layerthere is a deficit of negative ions, called co-ions because they have the samecharge as the colloid. Their concentration gradually increases with the distance tothe colloid, while the repulsive forces of the colloid are compensated by positiveions, until equilibrium is reached again. The diffuse layer can be visualized as acharged atmosphere surrounding the colloid. At any distance from the surface,the charge density is equal to the difference in concentration between positiveand negative ions. The charge density is much higher near the colloid andgradually decreases to zero when the concentrations of positive and negative ionsare similar. The counter ions of both Stern and diffuse layers are what is calledthe double layer and its thickness depends on the type and concentration of theions in the solution.
This electrical double layer creates a repulsive force among the particles andprevents them from agglomerating into large flocs (Figure 2.4). However,colloidal particles in a suspension also experience attractive forces as a result ofdipole-dipole interactions also generally known as van der Waals interactions.According to the DLVO theory, the electrostatic double layer forces and the vander Waals forces are independent and, therefore, can be superimposed or added ateach interacting distance between two particles. The van der Waals attractionforce is an inverse power law function of the separation distance and isinsensitive to the ionic strength of the bulk liquid. The electrostatic repulsionforce decays exponentially with separation distance and depends on the ionicstrength of the bulk liquid since it controls the range of the double layer
Figure 2.3 Diagram of electrical double layer. DLVO theory.
Treatment and Valorisation of Saline Wastewater26

interaction. The sum of both forces gives the net interaction energy at a particularseparation distance. This net interaction energy is always attractive at shortdistances and repulsive at intermediate distances while, at large distances, it canbe attractive or repulsive depending on the ionic strength of the bulk liquid. Inany case, the net interaction energy always presents a maximum of repulsion,called the energy barrier, which should be overcome by the kinetic energy of theparticles for them to approach one another. In order to promote particleagglomeration, the energy barrier can be decreased by increasing the ionicstrength of the bulk liquid or by adding active compounds to directly affect theparticle charge. This can be done in practice by increasing the salinity of themedium.
2.2 COAGULATION-FLOCCULATIONThe main purpose of coagulation is to overcome the electrostatic repulsion betweencolloids caused by the negative electrical double layer which surrounds them inwater and maintains their stability by preventing them from adhering to eachother and forming larger particles. Particle destabilization can occur through fourmechanisms: double layer compression, charge neutralization, colloid entrapmentand intraparticle bridging (Teh et al., 2016). The double layer compressionmechanism involves the reduction in this layer around the colloidal particles, bythe increase of ionic strength via salts addition, which allows them to approachmore closely before experiencing repulsion and, then, leads to their coagulation.
Figure 2.4 Forces involved between two colloidal particles in a suspension.
Salinity effects on physical-chemical treatments 27

This mechanism alone is not feasible to treat wastewater at an industrial scale due tothe massive amount of salt needed but double layer compression improves theefficiency of the coagulation process when it occurs by means of chargeneutralization or intraparticle bridging mechanisms.
Flocculation can occur through charge neutralization by the adsorption ofpositively charged dissolved metal hydroxide species (Figure 2.5). In thismechanism, the charge neutralization cancels the electrostatic repulsion betweencolloids, and they can link to form flocs which can be easily removed fromwastewater. Nevertheless, an excessive addition of metal salts to wastewatercauses colloids to acquire a positive surface charge which avoids flocs formation(restabilization). Metal salts (containing iron or aluminium) are generally addedto wastewater to effectively achieve the neutralization of the negative surfacecharge of many types of particles. This mechanism is promoted by the presenceof salts since the high ionic strength of salt water destabilizes colloids at a widerrange of pH and coagulant dose conditions (Edzwald et al., 1974; Hilal et al.,2008; Schneider et al., 2013; Younker & Walsh, 2014; Zhang et al., 2014). Thispromotion is due to the double layer compression which rapidly becomes smalleras the ionic strength increases (Hilal et al., 2008). However, the presence of saltsis beneficial up to a certain concentrations beyond which the rise of saltconcentration hinders coagulation (Wang et al., 2013). This fact is related to theadsorption of Ca+2 or Na+ on the surface of the particles which increases theirpositive surface charge and stabilizes them. This absorption phenomenon occursat high salt concentrations and causes deviations from results expected by theDLVO theory (Pashley & Israelachvili, 1984).
Aluminium and iron salts can be added to wastewater at a dosage higher than thesolubility of their amorphous hydroxides. The metal hydroxides precipitation andtheir later settling entrap and enmesh particles and colloids and remove themfrom the wastewater. Salt presence has a negative effect on the efficiency of this
Figure 2.5 Particle destabilization through charge neutralization: (a) Repulsionforces maintain stability of colloidal particles; (b) Positively charged dissolved metalhydroxide species neutralize particle charges and van der Waals forcespredominate; (c) Particles form flocs and settle.
Treatment and Valorisation of Saline Wastewater28

mechanism since the effective concentration of the metal ions would decrease withincreasing ionic strength because their activity decreases (Wang et al., 2010).
The fourth mechanism of coagulation is interparticle bridging, usually achievedby an addition of water-soluble polymers. This mechanism requires a region of thepolymer chain to attach to the particle surface while the free part of the polymerchain extends to the surrounding bulk liquid for adherence with other particles.According to literature, coagulation by polymers addition is enhanced undersaline conditions (Ajao et al., 2018; Hilal et al., 2008; Ji et al., 2013). Hilal et al.(2008) attribute this positive effect to the double layer compression of bothparticles and polymer molecules. Moreover, Ji et al. (2013) found that, in asolution of high salinity, the polymers have a more condensed conformationwhich enhances their adsorption density (amount of adsorbate adsorbed per unitarea).
2.3 SETTLINGSettling problems of activated sludge flocs in saline wastewaters are often reportedin the literature. Several factors have been provided to explain this phenomenon(Woolard & Irvine, 1995): (1) the buoyancy force raises with increasingwastewater salt concentration due to the increase in the water density whichreduces the terminal settling velocity according to Stokes law; (2) high saltconcentrations cause disintegration of activated sludge flocs and cell plasmolysisdue to the increase of osmotic pressure, which results in a reduction in particlesize and density and, therefore, the formation of ‘pin-point’ sludge flocs (Kargi &Dincer, 1997; Mesquita et al., 2009; Moon et al., 2003); (3) the filamentousbacteria which provide the mechanical integrity and structure of the flocs areseriously affected by high salt concentrations (Zhan, 1999); and (4) salineenvironments cause the reduction of protozoans in the secondary sludge and theeffluent turbidity increases since these microorganisms are predators of dispersivemicroorganisms which are not settleable in wastewater (Salvadó et al., 2001). Incontrast, the sludge volume index (SVI) of biomass tends to diminish with theincrease of the salt content (Campos et al., 2002; Mesquita et al., 2009; Wuet al., 2008). The SVI decrease is probably due to the increase hydrophobicity(Zhan, 1999) or the morphological change of activated sludge flocs (Ng et al.,2005). In spite of the SVI value decreasing at high salt content, the quality of thesettled effluent worsens in terms of turbidity indicating a disaggregationphenomenon, given the intrinsic low mechanical properties of pin-point flocs, andthe formation of new ones by deflocculation of larger aggregates (Mesquita et al.,2009; Wu et al., 2008). Ng et al. (2005) explained that SVI and turbidity are notnecessarily related directly because they reflect different physical issues: the SVIreflects the compactability of the biomass whereas turbidity reflects the ability ofdispersed organisms to flocculate. In fact, the increase of biomass compactioncould be explained by the floc size shrinking in saline water (Chu et al., 1997)
Salinity effects on physical-chemical treatments 29
while the loss of flocculation ability could be attributed to the destabilization of thefloc by an ion exchange mechanism with Na+ ions (Gordon & Millero, 1984;Higgins & Novak, 1997) or to enhancement of hydrophobic interactions andweakening of electrostatic interactions due to the salt presence (Lindahl et al., 1981).
Aerobic granular sludge technology has been extensively studied to improveWWTPs because aerobic granules can settle faster than flocs due to their compactstructure, but their settling properties are also affected by the presence of salts.Winkler et al. (2012) studied the effect of salinity on the granular biomasssettling velocity in a range of 0 to 40 g NaCl/L and found that the settlingvelocity linearly decreased with salinity. These authors attribute this effect to theincrease of water density since the density of granules is only slightly differentfrom water (1005–1070 kg/m3 (Bassin et al., 2012; Batstone & Keller, 2001;Etterer & Wilderer, 2001)) and, therefore, changes in the density of the waterhave a significant impact on the settling behaviour of granules. To carry out theirexperiments, Winkler et al. (2012) pre-incubated aerobic granules in saltsolutions because they tended to float if they were not pre-incubated. This factwould suggest that a sudden increase of the bulk liquid salinity, as happens insome industrial effluents, could cause biomass wash-out.
In the case of inorganic solids, most of the works studying the salt presence effecton their settling properties were not focused on wastewater treatment but on thebehaviour of estuary sediments. These works show that the settling velocity ofinorganic particles improves when salt concentration increases due to theflocculation of the fine-grained sediments in suspension (Ou et al., 2016; Portelaet al., 2013). However, the response of the settling velocity to salinity does nothave a monotone trend, since there is a salinity range where the settling velocityis maximum (Xu et al., 2018). This observation disagrees with that expected bythe DLVO theory since according to this theory, at high electrolyteconcentrations, the net interaction between two surfaces would be attractive at allseparation distances and would result in a strong adhesion. To explain this fact,Gordon and Millero (1984) hypothesize that there is a salt concentration wherethe theoretical double-layer thickness is small and relatively constant and wherean ion-exchange mechanism starts to play an important role.
2.4 DEWATERINGDewatering is a physical process commonly implemented in the sludge line ofWWTPs which aims to reduce the sludge water content, and therefore its volume,to decrease the transportation costs, since they can represent up to 50% of theWWTP operating costs (Collivignarelli et al., 2019). The dewatering technique tobe applied must be chosen taking into account the amount and characteristics ofthe sludge generated and the requirements of its final destination.
Water contained in sludge can be classified in four forms according to the degreeof removal difficulty: free, interstitial, surface and intracellular (Vaxelaire & Cézac,
Treatment and Valorisation of Saline Wastewater30
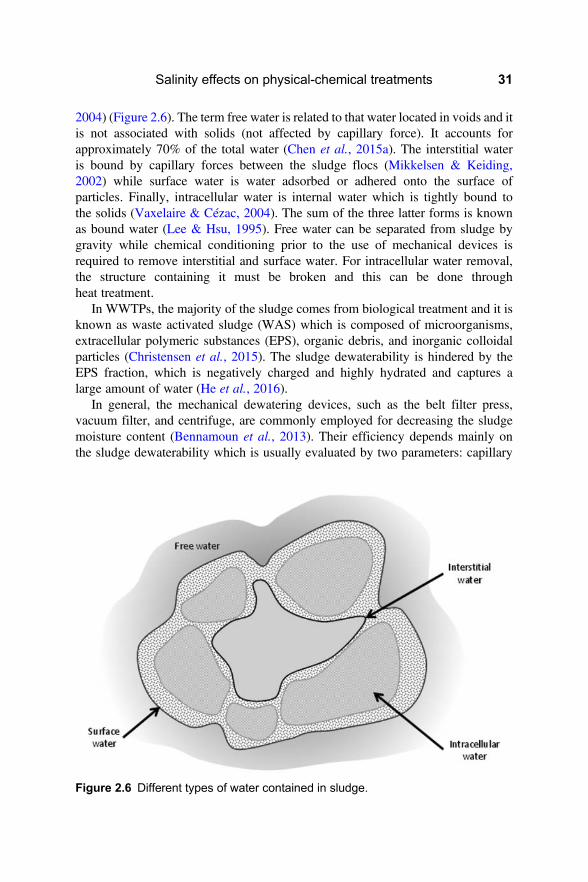
2004) (Figure 2.6). The term free water is related to that water located in voids and itis not associated with solids (not affected by capillary force). It accounts forapproximately 70% of the total water (Chen et al., 2015a). The interstitial wateris bound by capillary forces between the sludge flocs (Mikkelsen & Keiding,2002) while surface water is water adsorbed or adhered onto the surface ofparticles. Finally, intracellular water is internal water which is tightly bound tothe solids (Vaxelaire & Cézac, 2004). The sum of the three latter forms is knownas bound water (Lee & Hsu, 1995). Free water can be separated from sludge bygravity while chemical conditioning prior to the use of mechanical devices isrequired to remove interstitial and surface water. For intracellular water removal,the structure containing it must be broken and this can be done throughheat treatment.
In WWTPs, the majority of the sludge comes from biological treatment and it isknown as waste activated sludge (WAS) which is composed of microorganisms,extracellular polymeric substances (EPS), organic debris, and inorganic colloidalparticles (Christensen et al., 2015). The sludge dewaterability is hindered by theEPS fraction, which is negatively charged and highly hydrated and captures alarge amount of water (He et al., 2016).
In general, the mechanical dewatering devices, such as the belt filter press,vacuum filter, and centrifuge, are commonly employed for decreasing the sludgemoisture content (Bennamoun et al., 2013). Their efficiency depends mainly onthe sludge dewaterability which is usually evaluated by two parameters: capillary
Figure 2.6 Different types of water contained in sludge.
Salinity effects on physical-chemical treatments 31

suction time (CST) and specific resistance in filtration (SRF) (To et al., 2016). It hasbeen found that the floc size and density are the major factors affectingdewaterability. Sludge with higher floc density and larger floc size is much easierto dewater and settle (Wen et al., 1997). In this sense, the application of thecoagulation and flocculation processes before or during mechanical dewateringpromotes particle agglomeration and, therefore, increases floc size and density.As coagulation can disrupt the electrical double layer of the particles, thecoagulated sludge becomes tightly packed and is able to release more boundwater from the sludge to the bulk solution. Although the coagulation/flocculationmechanisms in sludge dewatering are similar to those in pollutants removal, thetreatment conditions and objectives of the two processes are fundamentallydifferent. The latter focuses on the aggregation and separation of pollutantspromoted by coagulants/flocculants; in addition to this effect, the former one stillemphasizes the formation of a suitable structure of sludge cake with goodfiltration performance (Raynaud et al., 2012).
Salinity is also believed to have a significant effect on sludge dewaterability (Chuet al., 1997; Cousin & Ganczarczyk, 1998) and this topic has recently been gainingimportance in urban WWTPs because of the use of seawater in municipal flushingsystems in coastal areas (Wang et al., 2009). Lo et al. (2001) measured the SRF ofsludge under three different salinity levels (5 000, 10 000 and 20 000 ppm) andfound that the sludge SRF decreases with increasing salinity (a reduction in SRFvalue of approximately 30% is achieved by doubling the salinity level). Thisresult agrees with that expected according to the DLVO theory since an increaseof the salt concentration causes the compression of the double layer thickness,reducing the surface charge of particles and promoting particle agglomeration.Moreover, the presence of salt in the sludge might also cause a salting out effect,which enhances the release of bound water from the flocs to the bulk solution.Therefore, the effect of salinity on sludge dewaterability is similar to that ofchemical coagulants when the sludge reaches a high salinity level. In fact, Loet al. (2001) found that the effect of chemical coagulant addition on the SRFvalue obtained is almost insignificant at high salinity levels (20 000 ppm). Thisfinding suggests that the higher the salts content of the sludge, the lower thechemical dosage required to meet a desired SRF. These authors also observedthat the final solid content increases with increasing salinity content in sludge,since the osmotic effect promotes the drainage of intracellular water through themembrane of microorganisms, and sludge without previous chemicalconditioning could achieve a final solid content up to 27% at a salinity of 20 000ppm.
Jean and Lee (1999) evaluated filtration characteristics of activated sludge fordifferent concentrations (0–4% w/w) and contact times with NaCl (1 h, 1 d and1 w). They observed that the salinity only slightly affected the dewaterability fora contact time of 1 h, but salt presence notably increased the dewateringefficiency for contact times longer than 1 day. They also found that the
Treatment and Valorisation of Saline Wastewater32

dewatering efficiency achieved a maximum value at a NaCl concentration of 2% andthen it decreased. This finding is related to the change of the bacteria aggregationmechanism or of sludge flocs stability at a critical salinity concentration (Gordon& Millero, 1984; Higgins & Novak, 1997). Below this critical concentration,the interaction among bacteria is favoured by the double layer compression,according to DLVO theory (Zita & Hermansson, 1994). At a higherconcentration, the tendency for bacteria aggregation decreases with the salinitylevel since Na+ can replace the bridging capability of Ca+2 in the sludge floc.Therefore, the sludge flocs would be destabilized at high salts concentrations duean ion exchange mechanism (Bruus et al., 1992; Rasmussen et al., 1994). Thisbreakdown of aggregates in the compacted filter cake could markedly increasethe collapse of the cake structure, leading to a worse dewaterability. This ionexchange was confirmed by Jean and Lee (1999) by comparing the amount ofCa+2 initially present in the sludge to that of sludge exposed to high saltconcentrations for a contact period of 1 day. However, Zita and Hermansson(1994) did not observe the release of Ca+2 after exposing sludge to high saltconcentrations and, then, proposed that the conformation change of extracellularpolymer could be involved in destroying sludge flocs.
2.5 FLOTATIONThere are different types of flotation processes, with dispersed/induced anddissolved air flotation being the most commonly applied for wastewater treatment(Prakash et al., 2018; Rubio et al., 2002). Dispersed air flotation operates bygenerating gas bubbles, using spargers or gas distributors located at the bottom ofa tank, which are dispersed into the bulk liquid. The range of bubble sizeobtained is about 700–1500 μm in diameter (Rubio et al., 2002). This techniqueis widely used to treat industrial wastewater from refineries, natural gasprocessing plants, and petrochemical and chemical plants (El-Kayar et al., 1993).Dissolved air flotation involves supersaturating water with air under highpressure, which generates microbubbles when released into water underatmospheric pressure. The produced microbubbles size is between 20 and 100 μmin diameter (Edzwald, 2010). Dissolved air flotation is used to separate waterpollutants such as particles or microorganisms in a size range of 10 to 100 μm(Aliff Radzuan et al., 2016) or grease from urban wastewater. To enhance theflotation process, chemical coagulants are often added in order to increase theflocculent structure of floated particles so they can be easily entrapped in the airbubbles (Tetteh & Rathilal, 2019).
Salt presence affects both particle and bubble properties and its overall effect isthe promotion of the flotation which implies saving operating costs since smalleramounts of chemical coagulants are required (Quinn et al., 2007). Thisenhancement is attributed to: (1) the reduction in the electrostatic interactionsbetween particle and bubble that increases particle-bubble attachment efficiencies
Salinity effects on physical-chemical treatments 33
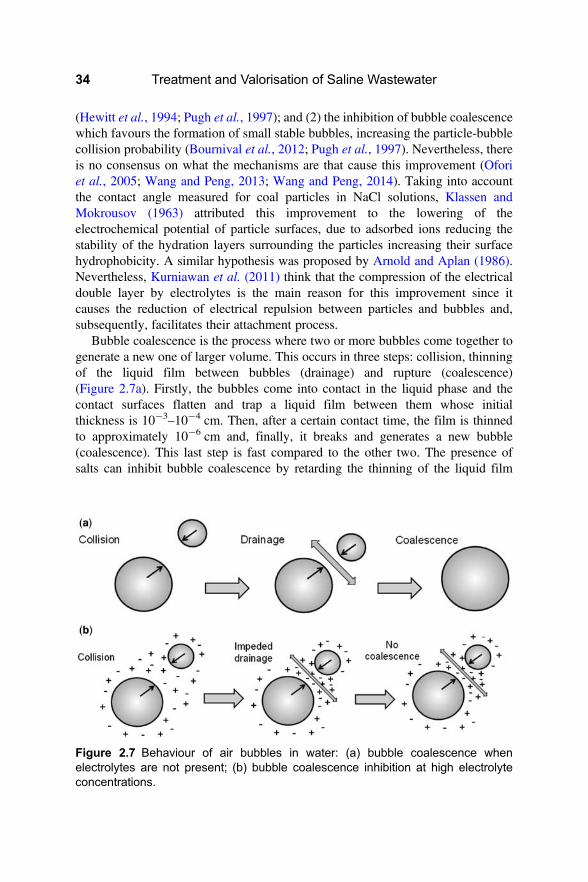
(Hewitt et al., 1994; Pugh et al., 1997); and (2) the inhibition of bubble coalescencewhich favours the formation of small stable bubbles, increasing the particle-bubblecollision probability (Bournival et al., 2012; Pugh et al., 1997). Nevertheless, thereis no consensus on what the mechanisms are that cause this improvement (Oforiet al., 2005; Wang and Peng, 2013; Wang and Peng, 2014). Taking into accountthe contact angle measured for coal particles in NaCl solutions, Klassen andMokrousov (1963) attributed this improvement to the lowering of theelectrochemical potential of particle surfaces, due to adsorbed ions reducing thestability of the hydration layers surrounding the particles increasing their surfacehydrophobicity. A similar hypothesis was proposed by Arnold and Aplan (1986).Nevertheless, Kurniawan et al. (2011) think that the compression of the electricaldouble layer by electrolytes is the main reason for this improvement since itcauses the reduction of electrical repulsion between particles and bubbles and,subsequently, facilitates their attachment process.
Bubble coalescence is the process where two or more bubbles come together togenerate a new one of larger volume. This occurs in three steps: collision, thinningof the liquid film between bubbles (drainage) and rupture (coalescence)(Figure 2.7a). Firstly, the bubbles come into contact in the liquid phase and thecontact surfaces flatten and trap a liquid film between them whose initialthickness is 10−3
–10−4 cm. Then, after a certain contact time, the film is thinnedto approximately 10−6 cm and, finally, it breaks and generates a new bubble(coalescence). This last step is fast compared to the other two. The presence ofsalts can inhibit bubble coalescence by retarding the thinning of the liquid film
Figure 2.7 Behaviour of air bubbles in water: (a) bubble coalescence whenelectrolytes are not present; (b) bubble coalescence inhibition at high electrolyteconcentrations.
Treatment and Valorisation of Saline Wastewater34

between bubbles, because they cannot diffuse away quickly, raising the local saltconcentration and therefore the surface tension. The surface tension increaseprevents draining of the liquid film and retards coalescence (Marrucci, 1969).Moreover, electric charge that accumulates on the surfaces of bubbles produces arepulsive force, preventing them from approaching each other (Figure 2.7b) (Cuiet al., 2003; Marrucci & Nicodemo, 1967). In fact, Craig et al. (1993) suggestthat the coalescence in pure water might be caused by a strong hydrophobicattractive force and the adsorption of certain ion pairs at the air/water interfacereduces it.
2.6 PRECIPITATIONSalt presence can significantly affect the chemical equilibria in the bulk liquid, suchas the solubility product, and, therefore, the efficiency of chemical precipitationprocesses. In non-electrolyte solutions, the intermolecular forces are mainly dueto weak van der Waals interactions, but in ionic solutions electrostaticinteractions of solute-solvent and solute-solute molecules, governed byCoulomb’s law, are significant. Consequently, the behaviour of an electrolytesolution deviates considerably from that of an ideal solution. If ions of solublesalts are present in a solution containing ions of sparingly soluble salts, theformers will be attracted to those slightly soluble salt ions of opposite charge andwill tend to surround them. This phenomenon creates an ionic atmosphere thatreduces the attraction between cations and anions of the sparingly soluble saltsand, therefore, results in a low tendency for them to meet, react and precipitate.That means the ‘effective’ concentration of these cations and anions is below theactual concentration and, for this reason, the activity of the individualcomponents and not the concentration itself should be used to calculate chemicalequilibria under the influence of ionic strength (Willey, 2004). For this purpose,activity coefficients ( f ) can be calculated using the extended Debye-Hückelequation (2.1):
− log (f ) = Az2��I
√
1+ ba��I
√ (2.1)
where A and b are empirical parameters whose values, at 25°C, are 0.51 and 0.33,respectively; z is the ion charge; a is the hydrated radius of the ion (nm); and I isthe ionic strength (Molar) which can be calculated by Equation (2.2):
I = 12
∑ni=1
ciz2i (2.2)
where c is the ion concentration (Molar).According to the extended Debye-Hückel equation, the activity coefficient value
asymptotically declines from a value of 1 at zero ionic strength to a low value at high
Salinity effects on physical-chemical treatments 35
ionic strength. However, the experimental data show that most ions reach aminimum activity coefficient below an ionic strength of 1 M and then, theiractivity coefficient increases. This fact can be explained because, at high ionicstrength, their own electrostatic interactions, which limit ion mobility at low ionicstrength, impose a pairing of charges that increases the effective activity. For thisreason, the application of the extended Debye-Hückel equation to ionic strengthvalues below 0.1 M is advisable. For calculating the activity coefficients at highvalues of ionic strength, the Pitzer equations provide a reasonable accuracy(Sheikholeslami & Ong, 2003).
In some cases, there are specific interactions between ions and solutes come closeenough to get in direct contact and are considered new species. These new speciesare called ion pairs, when ions are separated by water molecules but share their firsthydration shell, or complexes, when ions are in contact and share electrons. Ionspairs and complexes present low reactivity, so their formation lowers the effectiveconcentration of solutes and, therefore, increases their solubility. This is the casein heavy metals removal under saline conditions where the formation ofcomplexes between chloride and the heavy metals stabilizes them avoiding theirprecipitation (Lv et al., 2018).
In practical terms, since the actual solubility of ionic compounds under salineconditions is higher than that determined in pure water, to remove ions bychemical precipitation in the presence of salts would imply an increase of thereagent addition requirements.
Ionic salts also affect the precipitation rate of sparingly soluble salts and the sizedistribution and morphology of the formed crystals due to their influence on thewater of solvation and bulk solvent structure (Kowacz et al. et al., 2010; Zhanget al., 2019). However, the effects observed vary depending on the studied saltand on the ions present in the bulk liquid (Hu et al., 2014; Sheikholeslami &Ong, 2003; Tai & Chen, 1998; Zhang et al., 2019; Zuddas & Mucci, 1998).
2.7 DISINFECTIONThe effect of salinity on the disinfection unit depends on the technology applied toremove microorganisms. One of the most commonly applied technologies to carryout disinfection is based on the radiation of UV light with wavelengths between 100and 400 nm since it causes damage to the DNA of the pathogenic organism. Thisdamage is mainly due to cyclobutane pyrimidine dimers (CPDs) which arephotoproducts generated from irradiated DNA. CPDs can hinder both replicationof DNA and transcription of DNA into RNA, avoiding microorganismreproduction and protein synthesis, respectively (Harm, 1980).
The effect of salinity on UV disinfection is not clear since literature reportscontradictory results. Chen et al. (2018) studied the effect of salinity on the logremoval and inactivation rate of V. cholerae using medium and low pressure (MPand LP) UV lamps and found that a salinity level of 1% or higher had a negative
Treatment and Valorisation of Saline Wastewater36
impact on the performance of both types of lamps especially at high UV doses(3 mJ/cm2 for MP and 4 mJ/cm2 for LP) in spite of this, no significant effects ofsalinity were found on the CPDs levels. These authors had previously foundsimilar results when studying the inactivation of Enterococcus faecalis (Chenet al., 2015b). Rubio et al. (2013) evaluated the disinfection efficiency of E. coliby UV radiation and they also observed that the UV inactivation rate decreasedwhen increasing the salt concentration. These results could be explained byclustering or adsorption of the microorganisms to surfaces promoted at high ionicstrength values which cause a shield effect against UV radiation. Contrary to this,Shang et al. (2009) found that higher salinity resulted in higher level ofinactivation of faecal coliform bacteria at a UV-C dose of 12 mJ/cm2. This couldbe related to the formation of radicals that interact with bacteria (Buschmannet al., 2005; Legrini et al., 1993). It is known that inorganic ions (Cl−, HCO3
−
and SO4−2) exposed to UV light can absorb it and form radicals that interact with
bacteria (Buschmann et al. 2005; Rincon and Pulgarin, 2004; Wright & Cairns1998). Hence, the overall effect of salinity on UV inactivation depends on bothUV light attenuation and radical formation.
Advanced oxidation processes (AOPs) such as UV/H2O2 and UV/TiO2, whichuse powerful oxidizing radicals (mostly hydroxyl (·OH)) that instantaneously reactwith microorganisms, achieve disinfection efficiencies higher than those of UValone in water with high salt concentrations. Nevertheless, in the case of theUV/TiO2 treatment, an important negative effect of salinity on the inactivationrates of Enterococcus faecalis was found due to the ion-blockage of the activesites on the photocatalytic surface (Moreno-Andrés et al., 2017). Rubio et al.(2013) also found that photo-Fenton and H2O2/UV treatments were effective todeactivate E. coli in a wide range of salinity levels but they were affected by thepresence of bicarbonate ions since they were the main scavenger of hydroxylradicals generated during these treatments.
UV-inactivated microorganisms regain activity through the repair of pyrimidinedimers in the genome by utilizing the energy of UV-A and visible light(320–500 nm) with a specific enzyme, photolyase. This phenomenon is calledphotoreactivation and may be of significant concern especially when UV-treatedwastewater is discharged to a natural water environment, because UV-inactivatedmicroorganisms are exposed to sunlight which includes UV-A and visible light.Oguma et al. (2013) observed that photoreactivation of E. coli was significantlysuppressed in NaCl solutions at concentrations of 2.4% or higher, but not in NaClsolutions at 1.9% or lower. Therefore, E. coli in UV-treated wastewater maypossess the potential to perform photoreactivation after being discharged to waterbodies where salinity is rather low. In this sense, Shang et al. (2009) proposed tocarry out disinfection by UV radiation in the presence of TiO2 because, underthese conditions, the repression of bacteria photoreactivation persisted,independent of the salinity level. In the case of salt tolerant organisms, such asEnterococcus faecalis, salinity has a beneficial effect on photoreactivation
Salinity effects on physical-chemical treatments 37

because high salt levels may cause the expression of CPD photolyase leading toDNA double-strand breaks (Chen et al., 2015b; Cheng et al., 2007).
2.8 CONCLUSIONSThe presence of salt in wastewater has a positive effect on the efficiency ofcoagulation, settling (of inorganic particles), dewatering and flotation processesbecause it promotes aggregation of particles. The efficiency of these processesimproves up to a critical salt concentration beyond which a subsequent increasein salinity causes a worsening of the particles’ aggregation. In addition, in thecase of flotation, the presence of salt inhibits the bubble coalescence, whichenhances its efficiency. Salinity has a negative effect on the settling process ofbiological sludge since salts presence decreases the growth rate of essentialmicroorganisms both to maintain the floc structure and to obtain a good effluentquality in terms of solids. Salinity also negatively affects the removal efficiencyof the chemical precipitation process due to the increase in the solubility of ioniccompounds under saline conditions. In the case of the UV disinfection process,the effect of salinity is not clear due to it having different effects on several of themechanisms involved.
REFERENCESAjao V., Bruning H., Rijnaarts H. and Temmink H. (2018). Natural flocculants from fresh and
saline wastewater: Comparative properties and flocculation performances. ChemicalEngineering Journal, 349, 622–632.
Aliff Radzuan M. R., Abia-Biteo Belope M. A. and Thorpe R. B. (2016). Removal of fine oildroplets from oil-in-water mixtures by dissolved air flotation. Chemical EngineeringResearch and Design, 115, 19–33.
Arnold B. J. and Aplan F. F. (1986). The effect of clay slimes on coal flotation, Part II: the roleof water quality. International Journal of Mineral Processing, 17, 243–260.
Bassin J. P., Winkler M. K. H., Kleerebezem R., Dezotti M. and van Loosdrecht M. C. M.(2012). Improved phosphate removal by selective sludge discharge in aerobicgranular sludge reactors. Biotechnology Bioengineering, 109, 1919–1928.
Batstone D. J. and Keller J. (2001). Variation of bulk properties of anaerobic granules withwastewater type. Water Research, 35, 1723–1729.
Bennamoun L., Arlabosse P. and Leonard A. (2013). Review on fundamental aspect ofapplication of drying process to wastewater sludge. Renewable & Sustainable EnergyReviews, 28, 29–43.
Bournival G., Pugh R. J. and Ata S. (2012). Examination of NaCl and MIBC as bubblecoalescence inhibitor in relation to froth flotation. Minerals Engineering, 25, 47–53.
Bruus J. H., Nielsen P. H. and Keiding K. (1992). On the stability of activated sludge flocswith implications to dewatering. Water Research, 26, 1597–1604.
Buschmann J., Canonica S., Lindauer U., Hug S. J. and Sigg L. (2005). Photoirradiation ofdissolved humic acid induces arsenic (III) oxidation. Environmental Science andTechnology, 39, 9541–9546.
Treatment and Valorisation of Saline Wastewater38

Campos J. L., Mosquera-Corral A., Sánchez M., Méndez R. and Lema J. M. (2002).Nitrification in saline wastewater with high ammonia concentration in an activatedsludge unit. Water Research, 36, 2555–2560.
Chen Z., Zhang W. J., Wang D. S., Ma T. and Bai R. Y. (2015a). Enhancement of activatedsludge dewatering performance by combined composite enzymatic lysis and chemicalre-flocculation with inorganic coagulants: kinetics of enzymatic reaction andre-flocculation morphology. Water Research, 83, 367–376.
Chen P. Y., Chu X. N., Liu L. and Hu J. Y. (2015b). Effects of salinity and temperature oninactivation and repair potential of Enterococcus faecalis following medium- andlow-pressure ultraviolet irradiation. Journal of Applied Microbiology, 120, 816–825.
Chen P. Y., Chu X. N., Liu L. and Hu J. Y. (2018). Effect of salinity on medium- and low-pressure UV disinfection of Vibrio cholera. Water Science and Technology, 77,655–661.
Cheng L., Qiao D. R., Lu X. Y., Xiong Y., Bai L. H., Xu H., Yang Y. and Cao Y. (2007).Identification and expression of the gene product encoding a CPD photolyase fromDunaliella salina. Journal of Photochemistry and Photobiology A: Chemistry, B87,137–143.
Christensen M. L., Keiding K., Nielsen P. H. and Jorgensen M. K. (2015). Dewatering inbiological wastewater treatment: a review. Water Research, 82, 14–24.
Chu C. P., Feng W. H., Tsai Y. H. and Lee D. J. (1997). Unidirectional freezing ofwaste-activated sludge: the presence of sodium chloride. Environmental Science andTechnology, 31, 1512–1517.
Collivignarelli M. C., Abbà A., Miino M. C. and Torretta V. (2019). What advancedtreatments can be used to minimize the production of sewage sludge in WWTPs?Applied Sciences, 9, 2650.
Cousin C. P. and Ganczarczyk J. J. (1998). Effects of salinity on physical characteristics ofactivated sludge flocs. Water Quality Research Journal of Canada, 33, 565–587.
Craig V. S. J., Ninham B. W. and Pashley R. M. (1993). Effect of electrolytes on bubblecoalescence. Nature, 364, 317–319.
Cui Q., Chandra S. andMcCahan S. (2003). The effect of dissolving salts in water sprays usedfor quenching a hot surface: Part 1-Boiling of single droplets. Journal of HeatTransfer-ASME Journal, 125, 326–332.
Derjaguin B. and Landau L. (1941). Theory of the stability of strongly charged lyophobic solsand of the adhesion of strongly charged particles in solutions of electrolytes. ActaPhysicochimica URSS, 14, 633–662.
Edzwald J. K. (2010). Dissolved air flotation and me. Water Research, 44, 2077–2106.Edzwald J. K., Upchurch J. B. and O’Melia C. R. (1974). Coagulation in estuaries.
Environmental Science and Technoogy, 8, 58–62.El-Kayar A., Hussein M., Zatout A. A., Hosny A. Y. and Amer A. A. (1993). Removal of oil
from stable oil-water emulsion by induced air flotation technique. SeparationsTechnology, 3, 25–31.
Etterer T. and Wilderer P. A. (2001) Generation and properties of aerobic granular sludge.Water Science and Technology, 43, 19–26.
Gordon A. S. and Millero F. J. (1984). Electrolyte effects on attachment of an estuarinebacterium. Applied and Environmental Microbiology, 47, 495–499.
Harm W. (1980). Biological Effects of Ultraviolet Radiation. Cambridge University Press,New York, NY, USA.
Salinity effects on physical-chemical treatments 39

He D. Q., Luo H. W., Huang B. C., Qian C. and Yu H. Q. (2016). Enhanced dewatering ofexcess activated sludge through decomposing its extracellular polymeric substances by aFe@Fe2O3-based composite conditioner. Bioresource Technology, 218, 526–532.
Hewitt D., Fornasiero D. and Ralston J. (1994). Bubble particle attachment efficiency.Minerals Engineering, 7, 657–665.
Higgins M. J. and Novak J. T. (1997). The effect of cations on the settling and dewatering ofactivated sludges: laboratory results. Water Environment Research, 69, 215–224.
Hilal N., Al-Abri M., Moran A. and Al-Hinai H. (2008). Effects of heavy metals andpolyelectrolytes in humic substance coagulation under saline conditions.Desalination, 220, 85–95.
Hu Y. B., Wolf-Gladrow D. A., Dieckmann G. S., Völker C. and Nehrke G. (2014). Alaboratory study of ikaite (CaCO3·6H2O) precipitation as a function of pH, salinity,temperature and phosphate concentration. Marine Chemistry, 162, 10–18.
Jean D. S. and Lee D. J. (1999). Effects of salinity on expression dewatering of wasteactivated sludge. Journal of Colloid and Interface Science, 215, 443–445.
Ji Y., Lu Q., Liu Q. and Zeng H. (2013). Effect of solution salinity on settling of mineraltailings by polymer flocculants. Colloids and Surfaces A: Physicochemical andEngineering Aspects, 430, 29–38.
Kargi F. and Dincer A. R. (1997). Biological treatment of saline wastewater by fed-batchoperation. Journal of Chemical Technology and Biotechnology, 69, 167–172.
Klassen V. I. and Mokrousov V. A. (1963). An introduction to the theory of flotation, seconded. Butterworths, London.
Kowacz M., Prieto M. and Putnis A. (2010). Kinetics of crystal nucleation in ionic solutions:Electrostatics and hydration forces. Geochimica et Cosmochimica Acta, 74, 469–481.
Kurniawan A. U., Ozdemir O., Nguyen A. V., Ofori P. and Firth B. (2011). Flotation of coalparticles in MgCl2, NaCl, and NaClO3 solutions in the absence and presence ofDowfroth 250. International Journal of Mineral Processing, 98, 137–144.
Lee D. J. and HsuY. H. (1995). Measurement of bound water in sludges: a comparative study.Water Environment Research, 67, 310–317.
Legrini O., Oliveros E. and Braun A. M. (1993). Photochemical processes for watertreatment. Chemical Reviews, 93, 671–698.
Lindahl M., Fads A., Wadstrom T. and Hjerten S. (1981). A new test based on ‘salting out’ tomeasure relative surface hydrophobicity of bacterial cells. Biochimica et BiophysicaActa, 677, 471–476.
Lo I. M. C., Lai K. C. K. and Chen G. H. (2001). Salinity effect on mechanical dewatering ofsludge with and without chemical conditioning. Environmental Science and Technoogy,35, 4691–4696.
Lv L., Yang Y., Tian J., Li Y., Li J. and Yan S. (2018). Effect of salinity on the precipitation ofdissolved metals in the wastewater that produced during fly ash disposal. IOP Conf.Series: Earth and Environmental Science, 121, 032012.
Marrucci G. (1969). A theory of coalescence. Chemical Engineering Science, 24, 975–985.Marrucci G. and Nicodemo L. (1967). Coalescence of gas bubbles in aqueous solutions of
inorganic electrolytes. Chemical Engineering Science, 22, 1257–1265.Mesquita D. P., Amaral A. L., Ferreira E. C. and Coelho M. A. Z. (2009). Study of saline
wastewater influence on activated sludge flocs through automated image analysis.Journal of Chemical Technology and Biotechnology, 84, 554–560.
Treatment and Valorisation of Saline Wastewater40
Mikkelsen L. H. and Keiding K. (2002). Physico-chemical characteristics of full scale sewagesludges with implications to dewatering. Water Research, 36, 2451–2462.
Moon B. H., Seo G. T., Lee T. S., Kim S. S. and Yoon C. H. (2003). Effects of saltconcentration on floc characteristics and pollutants removal efficiencies in treatmentof seafood wastewater by SBR. Water Science and Technology, 47, 65–70.
Moreno-Andrés J., Romero-Martínez L., Acevedo-Merino A. and Nebot E. (2017).UV-based technologies for marine water disinfection and the application to ballastwater: Does salinity interfere with disinfection processes? Science of the TotalEnvironment, 581–582, 144–152.
Ng H. Y., Ong S. L. and NgW. J. (2005). Effects of sodium chloride on the performance of asequencing batch reactor. Journal of Environmental Engineering-ASCE, 131,1557–1564.
Ofori P., Firth B., Franks G., Nguyen A. and Jameson G. (2005). Impact of saline water oncoal flotation. Australian Coal Association, Australia, C13051.
Oguma K., Izaki K. and Katayama H. (2013). Effects of salinity on photoreactivation ofEscherichia coli after UV disinfection. Journal of Water and Health, 11, 457–464.
Ou Y., Li R. and Liang R. (2016). Experimental study on the impact of NaCl concentration onthe flocculating settling of fine sediment in static water. Procedia Engineering, 154,529–535.
Pashley R. M. and Israelachvili J. N. (1984). DLVO and hydration forces between micaSurfaces in Mg+2, Ca+2, Sr+2 and Ba+2 chloride solutions. Journal of Colloid andInterface Science, 97, 446–455.
Portela L. I., Ramos S. and Teixeira A. T. (2013). Effect of salinity on the settling velocity offine sediments of a harbour basin. Journal of Coastal Research, 65, 1188–1193.
Prakash R., Majumder S. K. and Singh A. (2018). Flotation technique: Its mechanisms anddesign parameters. Chemical Engineering and Processing: Process Intensification,127, 249–270.
Pugh R. J., Weissenborn P. and Paulson O. (1997). Flotation in inorganic electrolytes; therelationship between recover of hydrophobic particles, surface tension, bubblecoalescence and gas solubility. International Journal of Mineral Processing, 51,125–138.
Quinn J. J., KrachtW., Gomez C. O., Gagnon C. and Finch J. A. (2007). Comparing the effectof salts and frother (MIBC) on gas dispersion and froth properties. MineralsEngineering, 20, 1296–1302.
Rasmussen H., Bruus J. H., Keiding K. and Nielsen P. H. (1994). Observationson dewaterability and physical, chemical and microbiological changes inanaerobically stored activated sludge from a nutrient removal plant. Water Research,28, 417–425.
RaynaudM., Vaxelaire J., Olivier J., Dieude-Fauvel E. and Baudez J. C. (2012). Compressiondewatering of municipal activated sludge: effects of salt and pH. Water Research, 46,4448–4456.
Rincon A. G. and Pulgarin C. (2004). Effect of pH, inorganic ions, organic matter and H2O2
on E-coli K12 photocatalytic inactivation by TiO2 - Implications in solar waterdisinfection. Applied Catalysis B: Environmental, 51, 283–302.
Rubio J., Souza M. L. and Smith R. W. (2002). Overview of flotation as a wastewatertreatment technique. Minerals Engineering, 15, 139–155.
Salinity effects on physical-chemical treatments 41
Rubio D., Nebot E., Casanueva J. F. and Pulgarin C. (2013). Comparative effect of simulatedsolar light, UV, UV/H2O2 and photo-Fenton treatment (UV-Vis/H2O2/Fe
2+,3+) in theEscherichia coli inactivation in artificial seawater. Water Research, 47, 6367–6379.
Salvadó H., Mas M., Menéndez S. and Gracia M. P. (2001). Effects of shock loads of salt onprotozoan communities of activated sludge. Acta Protozoologica, 40, 177–185.
Schneider O. D., Weinrich L. A., Giraldo E. and LeChevallier M. W. (2013). Impacts of salttype and concentration on coagulation of humic acid and silica. Journal of Water Supply:Research and Technology-Aqua, 62, 339–349.
Shang C., Cheung L. M., Ho C. M. and Zeng M. (2009). Repression of photoreactivation anddark repair of coliform bacteria byTiO2-modified UV-C disinfection. Applied CatalysisB: Environmental, 89, 536–542.
Sheikholeslami R. and Ong H. W. K. (2003). Kinetics and thermodynamics of calciumcarbonate and calcium sulfate at salinities up to 1.5 M. Desalination, 157, 217–234.
Tai C. Y. and Chen F. B. (1998). Polymorphism of CaCO3, precipitated in aconstant-composition environment. AIChe Journal, 44, 1790–1798.
Teh C. Y., Budiman P. M., Shak K. P. Y. and Wu T. Y. (2016). Recent advancement ofcoagulation–flocculation and its application in wastewater treatment. Industrial &Engineering Chemistry Research, 55, 4363–4389.
Tetteh E. and Rathilal S. (2019). Application of Organic Coagulants inWater andWastewaterTreatment. 10.5772/intechopen.84556.
To V. H. P., Nguyen T. V., Vigneswaran S. and Ngo H. H. (2016). A review on sludgedewatering indices. Water Science and Technology, 74, 1–16.
Vaxelaire J. and Cézac P. (2004). Moisture distribution in activated sludges: a review.WaterResearch, 38, 2215–2230.
Verwey E. J. W. and Overbeek J. Th. G. (1948). Theory of the stability of lyophobic colloids,Amsterdam: Elsevier.
Wang B. and Peng Y. (2013). The behaviour of mineral matter in fine coal flotation usingsaline water. Fuel, 109, 309–315.
Wang B. and Peng Y. (2014). The effect of saline water on mineral flotation - A criticalreview. Minerals Engineering, 66, 13–24.
Wang J., Lu H., Chen G. H., Lau G. N., Tsang W. L. and van Loosdrecht M. C. M. (2009). Anovel sulfate reduction, autotrophic denitrification, nitrification integrated (SANI)process for saline wastewater treatment. Water Research, 43, 2363–2372.
Wang Y., Gao B. Y., Xu X. M. and Xu W. Y. (2010). The effect of total hardness and ionicstrength on the coagulation performance and kinetics of aluminum salts to remove humicacid. Chemical Engineering Journal, 160, 150–156.
Wang H. T., Ye Y. Y., Qi J., Li F. T. and Tang Y. L. (2013). Removal of titanium dioxidenanoparticles by coagulation: effects of coagulants, typical ions, alkalinity and naturalorganic matters. Water Science and Technology, 68, 1137–1143.
Wen H. J., Liu C. I. and Lee D. J. J. (1997). Size and density of flocculated sludge flocs.Journal of Environmental Science and Health. Part A: Environmental Science andEngineering and Toxicology, 32, 1125–1137.
Willey J. D. (2004). The effect of ionic strength on the solubility of an electrolyte. Journal ofChemical Education, 81, 1644–1646.
Winkler M. K. H., Bassin J. P., Kleerebezem R., van der Lans R. G. J. M. and van LoosdrechtM. C. M. (2012). Temperature and salt effects on settling velocity in granular sludgetechnology. Water Research, 46, 3897–3902.
Treatment and Valorisation of Saline Wastewater42

Woolard R. and Irvine R. (1995). Treatment of hypersaline wastewater in the sequencingbatch reactor. Water Research, 29, 1159–1168.
Wright H. and Cairns W. (1998). Ultraviolet light. Regional Symposium on Water Quality:Effective disinfection. CEPIS, Lima, pp. 1–26.
Wu G., Guan Y. and Zhan X. (2008). Effect of salinity on the activity, settling and microbialcommunity of activated sludge in sequencing batch reactors treating synthetic salinewastewater. Water Science and Technology, 58, 351–358.
Xu D., Bai Y. and Ji C. (2018). Experimental study on the settling velocity of coastal mud inquiescent water: The Case of Huangmaohai Estuary, South China Sea. Examines inMarine Biology & Oceanography, 1, 61–71.
Younker J. M. and Walsh M. E. (2014). Impact of salinity on coagulation and dissolved airflotation treatment for oil and gas produced water.Water Quality Research Journal, 49,135–143.
Zhan X. (1999). Characteristics of activated sludge processes treating saline wastewater. PhDThesis, Tsinghua University, Beijing, China.
Zhang L., Zhao Q., Wang S., Mashayekhi H., Li X. and Xing B. (2014). Influence of ions onthe coagulation and removal of fullerene in aqueous phase. Science of the TotalEnvironment, 466–467, 604–608.
Zhang D., Lin Q., Xue N., Zhu P., Wang Z., Ji W. Q., Dong L., Yan K., Wu J. and Pan X.(2019). The kinetics, thermodynamics and mineral crystallography of CaCO3
precipitation by dissolved organic matter and salinity. Science of the TotalEnvironment, 673, 546–552.
Zita A. and Hermansson M. (1994). Effects of ionic strength on bacterial adhesion andstability of flocs in a wastewater activated sludge system. Applied and EnvironmentalMicrobiology, 60, 3041–3018.
Zuddas P. and Mucci A. (1998). Kinetics of calcite precipitation from seawater: II. Theinfluence of the ionic strength. Geochimica et Cosmochimica Acta, 62, 757–766.
Salinity effects on physical-chemical treatments 43

Chapter 3
Salinity effects on biologicaltreatments
ABSTRACTHigh salinity environments can cause the denaturation of microbial enzymes and thedestruction of the cell structure. In order to withstand these effects, microorganismsare able to develop mechanisms to both maintain the osmotic pressure balance insidethe cells with the bulk liquid and retain water. Organic matter and nitrogen can beremoved from high salinity effluents by means of biological processes, oncemicroorganisms are previously adapted to the salt presence, but phosphorusremoval efficiency decreases notably under saline conditions, even applying longacclimation periods or using a marine inoculum. Sudden fluctuations ofwastewater salt concentration are the worst scenario for biological treatmentsystems since they cause the loss of pollutant removal efficiency that cannot beavoided even using halophilic microorganisms.
Keywords: Acclimation, halophilic, microorganism diversity, osmotic pressure
3.1 MOTIVATIONDuring wastewater treatment those effluents that contain a significant fraction ofbiodegradable organic matter are mostly treated by means of biological processes.These processes, based on the action of microorganisms, are sensitive to differentconcentrations and types of salts. To understand and determine the specificeffects of salts on the different bacterial populations is of great interest for thedesign and operation of biological systems. In this way the size of the reactor,
© IWA Publishing 2021. Treatment and Valorisation of Saline Wastewater: Principles and PracticeAuthor(s): Anuska Mosquera Corral, Ángeles Val del Río and José Luis Campos Gómezdoi: 10.2166/9781789060645_0045
the treated hydraulic retention time, and the solid retention time of operation can beaccurately defined to guarantee the accomplishment of the required biomassactivities to produce treated effluents with the required quality for dischargeor reuse.
3.2 INTRODUCTIONThe performance of bacterial metabolism depends, among other factors, on theenvironmental osmotic pressure which is closely related to the inorganic saltconcentration in the bulk liquid (Lay et al., 2010). At low salt conditions, osmoticpressure inside the bacteria is higher than that of the surrounding liquid and watermolecules tend to be transported inside the cells to balance the osmotic pressure.This water flux causes the microorganisms to swell and even break (turgorpressure). If salt concentration is stepwise increased, the microbial activity will bestimulated until the osmotic pressure that allows the optimal microbial activity isreached (Mosquera-Corral et al., 2005). Additional increases of salt concentrationwill lead to the decrease of the microbial activity. According to the saltconcentration range within which the microorganisms can grow under optimalconditions, they can be classified as: non-halophilic ones which standconcentrations below 10 g NaCl/L (but part of the non-halophilic microorganismscan tolerate high salt concentrations); marine or slightly halophilic ones in therange of 10–30 g NaCl/L; moderately halophilic ones in the range of 30–150 gNaCl/L; extremely halophilic ones over 150 g NaCl/L (Lay et al., 2010).
Salts presence can affect the activity of the organisms, especially those that arenot adapted to saline environments, in different ways (Figure 3.1):
(1) a direct effect on the enzymatic activity of the microorganisms and thesubsequent deterioration of their metabolism (Cortés-Lorenzo et al., 2012).At very high salt concentration, the increase of water surface tensiongenerates competition between enzymatic proteins and salt ions forhydration and these ions strip off the essential layer of water moleculesfrom the enzymatic proteins surface, which increases hydrophobicinteractions, causing the enzyme denaturation (Sinha & Khare, 2014).
(2) at high salt concentrations an osmotic pressure gradient between theexternal bulk liquid and intracellular medium occurs, which causesmicroorganism dehydration and, in the case of extreme osmotic pressuregradients, the destruction of the bacterial cell structure (plasmolysis)(Ferrer-Polonio et al., 2015).
(3) at increasing salinity, the formation of precipitates, which accumulateinside the biomass, can be induced, hindering the transfer of substrates tobacteria. This phenomenon is especially important in the case ofmicroorganisms with low growth rates such as anaerobic and anammoxbacteria (Chen et al., 2008; Dapena-Mora et al., 2010).
Treatment and Valorisation of Saline Wastewater46

(4) in the case of activated sludge systems the breakage of floc structure, duemainly to the inhibition of filamentous microorganism growth caused bysalinity (Amin et al., 2014), may lead to biomass wash-out (Salmanikhaset al., 2016; Zhao et al., 2016). This wash-out is also promoted by theincrease of water density due to the salt presence. However, some studiessuggest that this inhibition improves sludge settling properties since onlydense flocs would be retained while light flocs would outflow with theeffluent (Moon et al., 2003; Pronk et al., 2014). In any case, membranebioreactors, biofilms or aerobic granular biomass systems can be used asalternative technologies to activated sludge systems to maintain suitablebiomass concentrations under high salinity conditions (Figueroa et al.,2008; Tan et al., 2019).
(5) high salt concentrations reduce the solubility of oxygen and, therefore, itstransfer to the liquid phase, which can lead to a decrease in biomassactivity due to oxygen limitation (Bassin et al., 2011).
Generally, the gradual increase of salt concentration causes an initial loss of thesystem removal efficiency caused by the death and/or wash-out of non-halophilicmicroorganisms. Then, the development of salt-tolerant microorganisms startsand, after a certain period, they become the dominant species in the sludge andthe system recovers its removal efficiency (Cui et al., 2015; van den Brand et al.,2015) (Figure 3.2). Although this operational strategy enables a stable microbialcommunity structure and an activated sludge with good settleability under saline
Figure 3.1 Effects of salinity on biological treatment systems.
Salinity effects on biological treatments 47

conditions to be obtained, it does not avoid the reduction of the biomass diversity asthe salt concentration increases (Corsino et al., 2015; Yang et al., 2020). Moreover,this gradual acclimation of biomass to salt is not a useful strategy for situations, suchas seawater infiltrations in coastal urban wastewater treatment plants (WWTPs)(Flood & Cahoon, 2011) and dealing with industrial wastewater (e.g. wastewaterfrom canneries (Val del Río et al., 2018) or chemical industries (Múñoz-Sierraet al., 2018)), where salt concentration suffers sudden large fluctuations thatmake bacterial communities, especially those with a slow growth rate, unable toadapt (Lefebvre & Moletta, 2006). Even halophilic microorganisms are not ableto manage these sudden fluctuations, especially sudden decreases in saltconcentrations (Mcadam & Judd, 2008).
3.3 SALT TOLERANCE MECHANISMSAs mentioned above, the non-halophilic microorganisms need to adjust theirmetabolism as well, in order to adapt to high salt environments and in thisprocess, they may develop new enzyme systems. However, in high saltenvironments, the enzyme synthesis rate is diminished, so these microorganismsneed a long time to adapt to this environment (Burgess & Pletschke, 2008).Moreover, they have a limited capacity for withstanding high salinities and, over
Figure 3.2 Adaptation process of a microbial community to the increase of saltconcentration.
Treatment and Valorisation of Saline Wastewater48

a certain salt concentration, the organic matter, nitrogen and/or phosphorus removalefficiencies of treatment systems decrease, or even are totally lost (Sharrer et al.,2007; Uygur & Kargi, 2004). In this regard, bioaugmentation by using halophilicmicroorganisms, which already intrinsically have mechanisms to withstand highsalt concentrations, has been proposed to successfully achieve the treatment ofhigh salinity wastewaters (Kargi & Uygur, 2005).
A direct impact of the presence of high salt concentrations is the increase ofosmotic pressure, causing water leakage out from bacteria. In this sense,microorganisms have developed two strategies in order to maintain an osmoticbalance with their external environment (Figure 3.3) (Li et al., 2018): (1)pumping inorganic ions (generally K+) into the cell by mechanisms such ascontractile vacuoles; and (2) accumulating compatible solutes from theirenvironment or synthesizing such compatible solutes as sugars, amino acids,glycine betaine, trehalose and ectoine (Trüper & Galinski, 1990) which help tostabilize the cell membrane and cell ultrastructure (Ontiveros-Valencia et al., 2014).
Since osmotic pressure is related to the contact area and surface tension, the shapeof a microorganism could favour its salt tolerance. Hence, many halophilicmicroorganisms are rod-shaped (Tan et al., 2019).
Moreover, under saline conditions, bacteria can increase their production ofextracellular polymeric substances (EPS) (Li et al., 2018). EPS contribute toenhancing the aggregation of the biomass but also to counteracting the osmoticpressure (Steele et al., 2014). They are located surrounding the cells and, due totheir negative charges (Lu et al., 2019), they have the capacity for bindingcations (Fang et al., 2019), which are the main contributors to salt toxic actions(McCarty & McKinney, 1961). EPS also promote the water-holding capacity ofbacteria (Mazor et al., 1996). These facts could explain the reason why thehigher the biomass aggregation, the higher the resistance under saline conditions(Guo et al., 2017). Nevertheless, the increase of EPS content under salineconditions can be not only attributed to the change of microorganism metabolismbut also to the microbial cell death or sludge flocs partial disintegration (Tanet al., 2019).
Figure 3.3 Salt tolerance mechanisms developed by microorganisms.
Salinity effects on biological treatments 49

Both maintaining an osmotic balance and secreting EPS are high energyconsumers and cause a decrease of the microorganism growth rate since themajority of the energy coming from the metabolic reactions is used formaintaining the microbial functions and, therefore, energy available to carry outcell synthesis decreases (Yogalakshmi & Joseph, 2010). This aspect is especiallyimportant in the case of treatment systems that use slow-growing microorganismssince, in these cases, the systems should be operated at high solids retentions tomaintain a stable performance.
Another mechanism used by halophilic bacteria to mitigate the effects of saltstress is the synthesis of highly negative surface charge proteins which renderthem more flexible at high salt concentrations (Mevarech et al., 2000). Otherstudies also showed that Gram negative species are more tolerant to salt thanGram positive ones since their outer membrane prevents some extracellularsubstances from penetrating the cell, which would increase its tolerance to certaintoxic environments (Tan et al., 2019).
3.4 ORGANIC MATTER REMOVAL3.4.1 Aerobic treatmentThe literature reviews regarding high salinity wastewater treatment show thatorganic matter removal under aerobic conditions can be carried out at highchemical oxygen demand (COD) removal efficiencies (.90%) (Capodici et al.,2020; Lefebvre & Moletta, 2006; Tan et al., 2019). Most of the reported researchworks tested salts concentrations up to 20–35 g NaCl/L but some studies showedthat aerobic organic matter removal can successfully take place at saltconcentrations as high as 80–150 g NaCl/L (Artiga et al., 2008; Dincer & Kargi,2001; Juang et al., 2009; Kubo et al., 2001; Lefebvre et al., 2005). However,decreases of organic matter removal efficiencies under saline conditions werereported mainly due to biomass wash-out (Mirbolooki et al., 2017) or to shortacclimation periods (Johir et al., 2013).
Previous studies also highlight that non-halophilic heterotrophic bacteria cantreat low saline wastewaters without the need for an adaptation period (,10 gNaCl/L) while in the case of salinities between 10 and 40 g NaCl/L, this type ofbiomass must be acclimated by a gradual increase of the salt concentration (Alouiet al., 2009; Kargi & Dincer, 1997; Lefebvre & Moletta, 2006; Ng et al., 2005).Temporary reductions in COD removal could occur during this acclimationperiod due to both biomass death and release of cellular material caused by thesalinity increase (Kincannon & Gaudy, 1968). For concentrations higher than 40 gNaCl/L, the use of halophilic bacteria, such as Pseudomonas putida (Juang et al.,2009), H. halobium (Dincer & Kargi, 2001) or S. xylosus (Abou-Elela et al.,2010), among others, is advisable in order to achieve high organic matterremoval efficiencies.
Treatment and Valorisation of Saline Wastewater50

3.4.2 Anaerobic treatmentThe anaerobic digestion process takes place through four successive stages(hydrolysis, acidogenesis, acetogenesis and methanogenesis) which involve manydifferent bacterial and archaea species, such as hydrolytic, acid forming andacetogenic bacteria, and methanogenic archaea. Studies regarding the effect ofsalinity on the anaerobic digestion process are mainly focused on themethanogenic stage since it is reported as the most sensitive one to the presenceof salts (Mottet et al., 2014; Zhao et al., 2017). Generally, it is accepted thatmethanogenic activity is inhibited when sodium concentrations exceed 10 g/L(Chen et al., 2008; De Vrieze et al., 2016; Rinzema et al., 1988). To overcomethis issue the progressive adaptation of sludge to high salinity or the use ofadapted inoculum are present as suitable strategies to achieve a stablemethanogenic activity at conditions of high salt concentrations (Aspé et al., 1997;Omil et al., 1995). A comparison between both strategies show that similarorganic loading removal rates and COD removal efficiencies can be achievedtreating wastewaters with 35 g NaCl/L (Riffat & Krongthamchat, 2007). Gradualacclimation of anaerobic biomass to Na+ enables an increase in the tolerance ofmethanogens to this cation. As examples, Chen et al. (2003) and Méndez et al.(1995) found that the concentration that caused an inhibition of methanogens of100% and 90% increased from 12.7 to 22.8 g Na+/L and from 12.0 to 17.0 gNa+/L, respectively, after a long-term acclimation period. However, thisacclimation process can take up to 700 days (Méndez et al., 1995). In any case,both strategies have allowed the anaerobic process to be successfully applied fortreating high salinity industrial effluents (15–71 g NaCl/L), such asseafood-processing effluents or tannery soak liquor, obtaining high efficiencies oforganic matter removal (70–90%) (Guerrero et al., 1997; Lefebvre et al., 2006;Mosquera-Corral et al., 2001; Picos-Benítez et al., 2019). In order to alleviate thetoxic effect of Na+, some authors also proposed the addition of potassium ions(Li et al., 2018) or exogenous compatible solutes such as glycine betaine (Zhanget al., 2016) since they can be used by anaerobic microorganisms to maintain theosmotic balance with their external environment. These strategies could shortenthe acclimation periods but their application at full scale would be limited by theoperating costs involved.
Sulphate salts, present sometimes due to the use of seawater in the processeswhere wastewater is produced, can also cause problems during the anaerobictreatment of saline wastewater (Omil et al. 1995; Rinzema et al., 1988), sincesulphate reducing bacteria (SRB) compete with methanogenic microorganismsfor the organic matter and produce hydrogen sulphide (H2S). This compoundinhibits the methanogenic activity by denaturing native proteins through theformation of sulphide and disulphide cross-links between polypeptide chains,interfering with the various coenzyme sulphide linkages and with the assimilatorymetabolism of sulphur (Chen et al., 2008). Hydrogen sulphide levels causing an
Salinity effects on biological treatments 51
activity decrease of 50% (IC50) range between 50 and 250 mgH2S/L and depend onthe pH value (Chen et al., 2008; Koster et al., 1986). This inhibitory effect can bediminished if the biomass is previously acclimated to the saline substrate (Aspéet al., 1997). Furthermore, H2S presence in the biogas requires theimplementation of specific treatment systems to remove it prior to the later use ofthe biogas (Okoro & Sun, 2019) while its presence in the liquid phase can bedetrimental to carrying out a post-treatment to remove nitrogen by anammoxbased processes (Jin et al., 2013) for example. For these reasons, severaloperating strategies were proposed to reduce the H2S concentration insideanaerobic reactors (Guerrero et al., 2016) or, even, to avoid its generation byusing anaerobic purple phototrophic bacteria (Hulsen et al., 2019).
During aerobic treatment, when flocculent biomass is used, the increase of theinlet salinity is correlated to the increase of the effluent turbidity and, therefore,to a worsening of effluent quality (Ali et al., 2019). This could be a drawbackwhen anaerobic membrane bioreactors are used to treat saline wastewater sincemembrane fouling is promoted (Muñoz-Sierra et al., 2018). In this sense,granular systems can be an option to avoid operating problems during thetreatment of saline wastewater since stable granules can be formed at salinities ashigh as 20 g Na+/L (Gagliano et al., 2017; Sudmalis et al., 2018).
Regarding the effect of salinity on the anaerobic bacteria populations, most of theresearch works show that Methanosaeta is the predominant methanogen found athigh salt concentrations of 59 g NaCl/L (Gagliano et al., 2017; Muñoz Sierraet al., 2018; Sudmalis et al., 2018). On the contrary, Ali et al. (2019), in a reactortreating wastewater with 35 g NaCl/L, found that Methanosarcina was thepredominant methanogen which would indicate that, in addition to salinity, thereare other operational conditions that also affect the selection of the methanogenicpopulation.
3.5 NITROGEN REMOVALRemoval of nitrogenous compounds from wastewater is generally carried out bynitrification/denitrification processes. During nitrification, ammonia is firstlyoxidized to nitrite (nitritation) by ammonia oxidizing bacteria (AOB), andsubsequently the nitrite generated is converted to nitrate (nitratation) by nitriteoxidizing bacteria (NOB). Later nitrate is reduced to N2 using organic matter bydenitrifying microorganisms under anoxic conditions. Nitrification is the limitingstep of conventional nitrogen removal since both AOB and NOB have lowgrowth rates and are inhibited by the presence of both ammonia and nitritesubstrates (Park & Bae, 2009). These characteristics imply that nitrifyingmicroorganisms would be the first ones affected by both events of biomasswashout and accumulation of substrates, associated with the decrease of removalefficiencies, caused by salts presence. Nevertheless, data from previous studiesshow that the ammonia oxidation process can perform in a stable manner up to
Treatment and Valorisation of Saline Wastewater52
salt concentrations of 26–56 g NaCl/L when salinity is stepwise increased (Dahlet al., 1997; Panswad & Anan, 1999; Ramaswami et al., 2019; She et al., 2016;Vredenbregt et al., 1997). Gradual adaptation of nitrifying organisms (Panswad& Anan, 1999) or proliferation of salt-tolerant strains (Chen et al., 2003;Cortés-Lorenzo et al., 2015) were proposed as possible mechanisms to explainthe stability of ammonia oxidation at high salt concentrations.
According to literature, NOB are more sensitive to salinity than AOB but the saltconcentration at which nitrite starts to be accumulated differs greatly from oneresearch work to another (5 g NaCl/L, She et al. (2016); 7.6 g salt/L, Ye et al.(2009); 17.3 g NaCl/L, Jeong et al. (2018); 24.1 g NaCl/L, Cortés-Lorenzo et al.(2015); 24.7 g NaCl/L, Vredenbregt et al., (1997)). The discrepancies amongthese salt concentration values could be due to the different operating conditionsimposed (ammonia loading rate applied, biomass concentration, ammonia/alkalinity ratio, ammonia inlet concentration…) and/or the type of reactors used(continuous flow, Sequencing Batch Reactor (SBR), biofilm, activated sludge,…). NOB inhibition by salts presence can be used as an operational strategy toachieve short-cut nitrogen removal, by means of the nitritation process, duringthe treatment of both industrial and urban wastewater (She et al., 2016; Songet al., 2019). However, this nitrite accumulation, associated with salt presence,causes an increase of undesirable N2O emissions (Mannina et al., 2016).Moreover, NOB inhibition is not desired for example during the nitrification ofaquaculture effluents when they are recycled since nitrite is much more toxic thannitrate for fish (Svobodova et al., 2005). The presence of nitrite in WWTPeffluents can also be a problem regarding meeting disposal requirements or whendisinfection by chlorinated compounds is needed due to the increase of reagentconsumption (Wahman and Speitel, 2012).
Similarly, to the nitrification process, several studies show that the denitrificationprocess can take place under saline conditions achieving efficiencies and rates ofnitrate removal comparable to those obtained at low salinity concentrations, whenthe salt concentration is gradually increased (Table 3.1). Moreover, Zhang et al.(2020) reported that the denitrification process can withstand sudden increases ofsalinity from 0 to 50 g NaCl/L without diminishing its efficiency of removal andobserved that this salinity shock can lead to punctual nitrite accumulations whichdisappear after a short time of operation. This high tolerance of denitrifyingbacteria to saline conditions not only depends on the bacteria type but also on theorganic carbon source used as the electron donor. In this sense, Osaka et al.(2008) found that high nitrate removal efficiencies could be achieved atconcentrations up 100 g NaCl/L when acetate was used as organic carbon, butwhen methanol was used, high efficiencies were maintained only up to 30 gNaCl/L.
Although, denitrifiers can withstand saline environments, the presence ofhigh salt concentrations has a negative effect on their enzyme productionsystem (Zhao et al., 2013). In fact, the inhibition of nitrate reductase occurs
Salinity effects on biological treatments 53

above 10 g NaCl/L while the inhibition of nitrite, nitric oxide and nitrous oxidereductases starts at 40 g NaCl/L (Zeng et al., 2020). Since several research worksshow that the nitrite reduction rate is always higher than the nitrate reduction rateunder saline conditions, nitrite accumulation by the denitrification process itself isnot expected (She et al., 2016). However, when nitrification and denitrificationprocesses are coupled to remove nitrogen under saline conditions, nitritegenerated in the nitrifying unit enters the denitrifying unit where it could causethe inhibition of the denitrification process (Dincer & Kargi, 1999; Glass &Silverstein, 1999).
When treated wastewater does not contain enough biodegradable organic matterto carry out denitrification (for example, effluents from anaerobic digesters),nitrogen removal by means of partial nitritation/anammox processes is preferableto save operating costs related to the addition of an external source of organic
Table 3.1 Performance of denitrifying reactors treating highly and very highlysaline wastewater.
SaltConcentration(g NaCl/////L)
NitrogenLoadingRate Applied(g N/////L · d)
NitrogenRemovalEfficiency(%)
WastewaterOrigin
Reference
16 0.06 82.7 Synthetic Xia et al.(2019)
20 3.60 99 Synthetic Jafari et al.(2015)
25 0.66 96.7 Synthetic Zhu et al.(2015)
30 0.24 .95 Fish cannery Capodiciet al., 2018
30 0.05 86.5 Pickledmustard tuberfactory
Wang et al.(2017a)
34 0.06 96 Tannery soakliquor
Lefebvre et al.(2005)
34 0.30 83 Chemicalfactory
Ramos et al.(2007)
40 0.30 100 Synthetic Zeng et al.(2020)
40 0.60 97 Synthetic Zhang et al.(2020)
74 4.80 .95 Power plant Vredenbregtet al. (1997)
Treatment and Valorisation of Saline Wastewater54
matter. During partial nitritation half of the ammonia is oxidized to nitrite and thennitrite is produced and the remaining ammonia are mainly converted to N2 underanoxic conditions by anammox bacteria. Therefore, in this case, NOB activityinhibition by salinity is desirable since this population competes for NO2
− withanammox bacteria and causes a deterioration of the nitrogen removal efficiency(Giustinianovich et al., 2018). This strategy to inhibit NOB activity could beespecially useful in partial nitritation/anammox systems operated at both lownitrogen concentration and temperature (She et al., 2016), since these operationalconditions favour the proliferation of NOB over AOB which causes the loss oftheir operational stability (Gonzalez-Silva et al., 2016; Pedrouso et al., 2017).
On the other hand, salt stress helps to maintain the performance of bothmesophilic nitrifying and anammox bacteria at temperatures up to 50°C(Courtens et al., 2016; Zhang et al., 2018) which opens up the possibleapplication of autotrophic nitrogen removal processes under thermophilicconditions. This increase of thermotolerance can be attributed to: 1) theup-regulation of heat-shock proteins induced by the salt stress (Meng et al.,2018); 2) salt shocks promoting the accumulation of compatible solutes insidebacteria which are osmoprotectants but also tend to inhibit the thermaldenaturation of proteins by increasing their surface area (Vyrides & Stuckey,2017); 3) salt stress enhancing the production of EPS against salt toxicity, whichact against heat stress (Vyrides & Stuckey, 2009).
Several research works have focused on evaluating the effects of salinity onmicrobial communities operating in reactors where nitrogen compounds areremoved and identified the microorganisms present under different saltconcentrations (Table 3.2). The obtained results indicate that the changes ofbacterial populations can be attributed not only to the salt concentration but alsoto the ammonia loading rate and alkalinity of the wastewater, in the case ofnitrifying bacteria (Jeong et al., 2018), or to the type of carbon source used, inthe case of denitrification (Zhang et al., 2020). In this latter case, microbialcommunities fed with complex organic carbon sources are more resistant tovariable salinity conditions than those fed with simple substrates, such as acetate,because of their higher microbial richness and diversity (Zhang et al., 2020). As ageneral conclusion of these studies, microbial diversity decreases with increase insalinity (Jang et al., 2013; Wang et al., 2019; Yoshie et al., 2004) and thisdecrease starts at salt concentrations of 5–10 g NaCl/L (Chen et al., 2003; Janget al., 2013).
3.6 PHOSPHORUS REMOVALBiological P-removal is mainly carried out by phosphorus accumulating organisms(PAOs) whose P content can reach up to 15% of their dry weight, while the P contentstoichiometric requirement for bacterial growth only supposes 1.5–2% of their dryweight. PAOs accumulate P as polyphosphate, in aerobic or anoxic conditions,
Salinity effects on biological treatments 55

Table
3.2
Nitrifying,denitrifyingandanammoxbacteria
reportedin
literature
forwastewatertreatm
entsystemsoperatedunder
differents
alinity
conditions.
Saltconcentration
(gNaCl/////L)
AOB
NOB
Denitrifiers
Anammox
0–10
Nitroso
monas
oligotropha1
Nitroso
monas
europea1,4
Nitroso
coccus
mobilis1
,4
Nitroso
spira
sp.1
Nitroso
monas
eutropha4
Nitroso
monas
halophila
4
Nitroso
monassp
p.2,3
Nitrosp
irasp
p.2
Nitroco
ccussp
.2
Nitrosp
irasp
.1
Nitrobactersp
p.3,4
Nitrosp
irasp
p.2,3,4
Thauera
11
Bacteroidetes1
2
Azo
arcus-like1
2
Methylophaga1
2
Paraco
ccus1
2
Azo
arcus1
3
Ca.K
uenenia
stuttg
artiensis1
6,18,19
Ca.S
calinduawagne
ri16
Ca.J
ette
nia
sp.17,18,23
10–20
Nitroso
monas
europea4,10
Nitroso
coccus
mobilis4
,5
Nitroso
spira
sp.5
Nitroso
monas
eutropha4,10
Nitroso
monas
halophila
4
Nitrobactersp
.4,5
Nitrosp
ira5
Thauera
11
Halomonas1
2,14
Marin
obacter12
Azo
arcus-like1
2
Methylophaga1
2
Paraco
ccus1
2
Azo
arcussp
.15
Ca.J
ette
nia
sp.17,18,23
Ca.K
uenenia
stuttg
artiensis1
8,23
UnclassifiedBroca
diace
ae19
Ca.S
calinduasp
.UK12
0
(Continued)
Treatment and Valorisation of Saline Wastewater56

Table
3.2
Nitrifying,denitrifyingandanammoxbacteria
reportedin
literature
forwastewatertreatm
entsystemsoperatedunder
differents
alinity
conditions
(Contin
ued).
Saltconcentration
(gNaCl/////L)
AOB
NOB
Denitrifiers
Anammox
20–30
Nitroso
spira
sp.5
Nitroso
monas
europea1
Nitroso
coccus
mobilis1
,4
Nitroso
monassp
.5,6
Nitrobactersp
.5
Nitrosp
ira5
Nitrosp
iramarin
a3
Thauera
11
Marin
obacter11,12
Halomonas1
2
Azo
arcus-like1
2
Methylophaga1
2
Paraco
ccus1
2
UnclassifiedBroca
diace
ae19
Ca.K
uenenia
stuttg
artiensis1
6,21,22,23
Ca.S
calinduawagne
ri16
Ca.J
ette
nia
sp.23
30–40
Nitroso
monassp
.6
Nitroso
monas
europea1
Nitroso
monas
cryo
tolerands7
N.mobilis1
,4,8
N.marin
a8
Nitrosp
iramarin
a3,7
Marin
obacter11,12
Halomonas1
2
Azo
arcus-like1
2
Methylophaga1
2
Paraco
ccus1
2
.40
Nitroso
monas
europaea8
Nitroso
monas
eutropha9
Nitroso
monas
marin
a8
Nitroso
coccus
mobilis8
Nitrobacter
winogradskyi9
Halomonas1
2,13
Marin
obacter12
1Mou
ssaeta
l.(2006);
2va
nKesseleta
l.(2010
);3Cortés-Lorenzo
eta
l.(2015
);4Chen
eta
l.(2003);5RejishKumar
eta
l.(2013
);6Gonza
lez-Silvaeta
l.(2016);7Ta
leta
l.(2003);
8Cuie
tal.(2016);9Je
ongeta
l.(201
8);
10Ja
ngeta
l.(2013);
11Zen
geta
l.(2020);1
2Osa
kaeta
l.(2008);
13Lie
tal.(201
8);
14Yosh
ieeta
l.(2004);1
5Ikedaeta
l.(2013);1
6Kartale
tal.(2006);1
7Je
ong
eta
l.(2020
);18Mengeta
l.(2018);1
9Lueta
l.(2019);2
0Kawag
osh
ieta
l.(2019);2
1Gonza
lez-Silvaeta
l.(2017);2
2Yangeta
l.(2011
);23Je
ong
eta
l.(2020
).
Salinity effects on biological treatments 57
which is used as an energy reserve to uptake organic matter (as volatile fatty acids(VFAs)) under unfavourable conditions. This mechanism provides PAOs with acompetitive advantage over ordinary heterotrophs. Nevertheless, glycogenaccumulating organisms (GAOs) can also uptake organic matter in a similar wayto PAOs, but do not accumulate P. The development of GAOs is not desirablebecause they compete with PAOs for the same carbon source and can decreasethe phosphorus removal efficiency of WWTPs (Lopez-Vazquez et al., 2009).Moreover, phosphorus can also be removed under anaerobic-anoxic alternatingconditions using nitrate or nitrite as an electron acceptor, instead of oxygen, bymicroorganisms known as denitrifying PAOs.
Under anaerobic conditions, PAOs uptake VFAs and store them aspolyhydroxyalkanoates (PHA). The energy needed for this process is obtainedfrom polyphosphate hydrolysis or glycogen degradation. The former causes therelease of phosphate into the bulk liquid. In the aerobic/anoxic phase, storedPHA is oxidized and the energy obtained is used for the P uptake and glycogensynthesis (Acevedo et al., 2012). A net accumulation of P is achieved since theamount of P taken up during the aerobic/anoxic phase is higher than that releasedduring the anaerobic phase.
In spite of having a reasonable understanding of the mechanisms associated withthe biological P removal processes, there are few research works that study theeffects of salinity on these processes in comparison with the amount availablewhich evaluate such effects on organic matter and nitrogen removal processes.
The presence of salts negatively affects the activity of the PAOs and, therefore,the phosphorus removal efficiency of WWTPs. This negative effect is mainlyattributed to the nitrite accumulation due to NOB activity inhibition (Bassinet al., 2011; Saito et al., 2004) (Figure 3.4). The accumulation of nitrite causes adecrease of both phosphate release and uptake rates during aerobic/anoxic andanaerobic phases, respectively (He et al., 2019). This decrease is lower when theprocess takes place under anoxic conditions due to the capability of PAOs to usenitrite as an electron acceptor (Wang et al., 2018). Suppression of nitrification, oreven a low presence of nitrite during nitrification, reduces the negative effect ofsalinity, but NaCl itself still leads to a partial or total decrease in PAO activityeven when long operational periods, to promote a possible biomass acclimation,or inocula from seawater are used (He et al., 2019; Jiang et al., 2018; Pronket al., 2014; Sharrer et al., 2007; Wang et al., 2017b). These research worksshowed discrepancies in the inhibition degree caused by NaCl, which could berelated to the PAO clades present in the different experiments (Wang et al.,2018), but all of them reported a decrease of PAO activity of approximately 30–40% from concentrations of 5–10 g NaCl/L. Thus, salt inhibition effects seem tobe more pronounced on PAOs than on microorganisms involved in organicmatter and nitrogen removal processes, probably because PAOs are moresensitive to osmotic pressure (Lefebvre & Moletta, 2006). This sensitivity ishigher in the case where non-acclimated biomass is suddenly exposed to salt
Treatment and Valorisation of Saline Wastewater58

since concentrations of only 1.8 g NaCl/L can cause a decrease of 63% of phosphateuptake rate (Welles et al., 2015). However, it has been observed that whenpotassium ions are present, biological phosphorus removal can successfully occurin seawater salinity conditions, in an aerobic granular sludge system with a veryhigh enrichment of Ca. Accumulibacter phosphatis clade I, since K+ can be usedby microorganisms to balance the osmotic pressure (de Graaff et al., 2020).
Saline conditions also favour the development of GAOs over PAOs (He et al.,2019; Welles et al., 2014). Nevertheless, the shift in microbial community fromPAOs to GAOs can be attributed not only to salts but also to the type of carbonsource used (de Graaff et al., 2020; Lopez-Vazquez et al., 2009).
(a)
(b)
Figure 3.4 (a) Removal of P by phosphorus accumulating organisms (PAOs). (b)Effects of salinity on PAO activity (o.m.: organic matter).
Salinity effects on biological treatments 59

3.7 CONCLUSIONSHigh salt concentrations have direct and indirect negative effects on the bacteriaactivity and on their capacity to be retained inside the bioreactors that, generally,cause the decrease of the treating systems’ efficiencies. A gradual acclimation ofbacteria to saline conditions and the use of halophilic microorganisms are twooperational strategies which have been successfully applied to maintain a goodperformance of systems treating high salinity effluents. Phosphorus removal andnitrite oxidation seem to be the most sensitive processes to salt stress whileaerobic organic removal is the most resistant one. Salinity also exerts a selectionpressure on the species present in the microbial communities and causes a loss oftheir diversity.
REFERENCESAbou-Elela S. I., Kamel M. M. and Fawzy M. E. (2010). Biological treatment of saline
wastewater using a salt-tolerant microorganism. Desalination, 250, 1–5.Acevedo B., Oehmen A., Carvalho G., Seco A., Borrás L. and Barat R. (2012). Metabolic
shift of polyphosphate-accumulating organisms with different levels of polyphosphatestorage. Water Research, 46, 1889–1900.
Ali M., Elreedy A., Ibrahim M. G., Fujii M., Nakatani K. and Tawfik A. (2019). Regulatingacidogenesis and methanogenesis for the separated biogeneration of hydrogen andmethane from saline-to-hypersaline industrial Wastewater. Journal of EnvironmentalManagement, 250, 109546.
Aloui F., Khoufi S., Loukil S. and Sayadi S. (2009). Performances of an activated sludgeprocess for the treatment of fish processing saline wastewater. Desalination, 246,389–396.
Amin M. M., Khiadani M. H., Fatehizadeh A. and Taheri E. (2014). Validation of linear andnon-linear kinetic modeling of saline wastewater treatment by sequencing batch reactorwith adapted and non-adapted consortiums. Desalination, 344, 228–235.
Artiga P., García-Toriello G., Méndez R. and Garrido J. (2008). Use of a hybrid membranebioreactor for the treatment of saline wastewater from a fish canning factory.Desalination, 221, 518–525.
Aspé E., Marti M. C. and Roeckel M. (1997). Anaerobic treatment of fishery wastewaterusing a marine sediment inoculum. Water Research, 31, 2147–2160.
Bassin J. P., PronkM., Muyzer G., Kleerebezem R., Dezotti M. and van Loosdrecht M. C. M.(2011). Effect of elevated salt concentrations on the aerobic granular sludge process:linking microbial activity with microbial community structure. Applied andEnvironmental Microbiology, 77, 7942–7953.
Burgess J. E. and Pletschke B. I. (2008). Hydrolytic enzymes in sewage sludge treatment: amini-review. Water SA, 34, 343–349.
Capodici M., Corsino S. F., Torregrossa M. and Viviani G. (2018). Shortcutnitrification-denitrification by means of autochthonous halophilic biomass in an SBRtreating fish-canning wastewater. Journal of Environmental Management, 208,142–148.
Treatment and Valorisation of Saline Wastewater60
Capodici M., Cosenza A., Di Bella G., Di Trapani D., Viviani G. and Mannina G. (2020).High salinity wastewater treatment by membrane bioreactors. In: CurrentDevelopments in Biotechnology and Bioengineering. Advanced MembraneSeparation Processes for Sustainable Water and Wastewater Management – CaseStudies and Sustainability Analysis, G. Mannina, A. Pandey, C. Larroche, H. Y. Ngand H. H. Ngo (eds), 1st edn, Elsevier, London, England, pp. 177–204.
Chen G. H.,WongaM. T., Okabe S. andWatanabe Y. (2003). Dynamic response of nitrifyingactivated sludge batch culture to increased chloride concentration. Water Research, 37,3125–3135.
Chen Y., Cheng J. J. and Creamer K. S. (2008). Inhibition of anaerobic digestion process: areview. Bioresource Technology, 99, 4044–4064.
Corsino S. F., Campo R., Bella G. D., Torregrossa M. and Viviani G. (2015). Cultivation ofgranular sludge with hypersaline oily wastewater. International Biodeterioration andBiodegradation, 105, 192–202.
Cortés-Lorenzo C., Rodríguez-Díaz M., López-López C., Sánchez-Peinado M., Rodelas B.and González-López J. (2012). Effect of salinity on enzymatic activities in asubmerged fixed bed biofilm reactor for municipal sewage. Bioresource Technology,121, 312–319.
Cortés-Lorenzo C., Rodríguez-Díaz M., Sipkema D., Juárez-Jiménez B., Rodelas B., SmidtH. and González-López J. (2015). Effect of salinity on nitrification efficiency andstructure of ammonia-oxidizing bacterial communities in a submerged fixed bedbioreactor. Chemical Engineering Journal, 266, 233–240.
Courtens E. N., Spieck E., Vilchez-Vargas R., Bodé S., Boeckx P., Schouten S., Jauregui R.,Pieper D. H., Vlaeminck S. E. and Boon N. (2016). A robust nitrifying community in abioreactor at 50°C opens up the path for thermophilic nitrogen removal. ISME Journal,10, 2293–2303.
Cui Y. W., Su H., Chen Y. F., Chen Y. B. and Peng Y. Z. (2015). Mechanism of activatedsludge floc disintegration induced by excess addition of NaCl. Clean-Soil Air Water,43, 1197–1206.
Cui Y. W., Zhang H. Y., Ding J. R. and Peng Y. Z. (2016). The effects of salinity onnitrification using halophilic nitrifiers in a Sequencing Batch Reactor treatinghypersaline wastewater. Scientific Reports, 6, 24825.
Dahl C., Sund C., Kristensen G. H. and Vredenbregt L. (1997). Combined biologicalnitrification and denitrification of high-salinity wastewater. Water Science andTechnology, 36, 345–352.
Dapena-Mora A., Vázquez-Padín J. R., Campos J. L., Mosquera-Corral A., Jetten M. S. M.and Méndez R. (2010). Monitoring the stability of an Anammox reactor under highsalinity conditions. Biochemical Engineeirng Journal, 51, 167–171.
de Graaff D. R., van Loosdrecht M. C. M. and Pronk M. (2020). Biological phosphorusremoval in seawater-adapted aerobic granular sludge. Water Research, 172, 115531.
de Vrieze J., Regueiro L., Props R., Vilchez-Vargas R., Jáuregui R., Pieper D. H., Lema J. M.and Carballa M. (2016). Presence does not imply activity: DNA and RNA patterns differin response to salt perturbation in anaerobic digestion. Biotechnology for Biofuels, 9,244.
Dincer A. R. and Kargi F. (1999). Salt inhibition of nitrification and denitrification in salinewastewater. Environmental Technology, 20, 1147–1153.
Salinity effects on biological treatments 61
Dincer A. R. and Kargi F. (2001). Performance of rotating biological disc system treatingsaline wastewater. Process Biochemistry, 36, 901–906.
Fang P. X., He X. L., Li J. F., Yang G., Wang Z. Y., Sun Z. H., Zhang X. and Zhao C. (2019).Impact of sodium ion on multivalent metal ion content in extracellular polymericsubstances of granular sludge from an expanded granular sludge bed. EnvironmentalTechnology, 40, 3105–3113.
Ferrer-Polonio E., Mendoza-Roca J. A., Iborra-Clar A., Alonso-Molina J. L. andPastor-Alcañiz L. (2015). Comparison of two strategies for the start-up of a biologicalreactor for the treatment of hypersaline effluents from a table olive packagingindustry. Chemical Engineering Journal, 273, 595–602.
Figueroa M., Mosquera-Corral A., Campos J. L. and Méndez R. (2008). Treatment of salinewastewater in SBR aerobic granular reactors.Water Science and Technology, 58, 479–485.
Flood J. F. and Cahoon L. B. (2011). Risks to coastal wastewater collection systems fromsea-level rise and climate change. Journal of Coastal Research, 27, 652–660.
Gagliano M. C., Ismail S. B., Stams A. J. M., Plugge C. M., Temmink H. and Van Lier J. B.(2017). Biofilm formation and granule properties in anaerobic digestion at high salinity.Water Research, 121, 61–71.
Glass C. and Silverstein J. (1999). Denitrification of high-nitrate, high-salinity wastewater.Water Research, 33, 223–229.
Giustinianovich E. A., Campos J. L., Roeckel M. D., Estrada A. J., Mosquera-Corral A. andVal del Río A. (2018). Influence of biomass acclimation on the performance of a partialnitritation-anammox reactor treating industrial saline effluents. Chemosphere, 194,131–138.
Gonzalez-Silva B. M., Jonassen K. R., Bakke I., Østgaard K. and Vadstein O. (2016).Nitrification at different salinities: biofilm community composition and physiologicalplasticity. Water Research, 95, 48–58.
González-Silva B. M., Rønning A. J., Andreassen I. K., Bakke I., Cervantes F. J., Østgaard K.and Vadstein O. (2017). Changes in the microbial community of an anammoxconsortium during adaptation to marine conditions revealed by 454 pyrosequencing.Applied Microbiology and Biotechnology, 101, 5149–5162.
Guerrero L., Omil F., Méndez R. and Lema J. M. (1997). Treatment of saline wastewatersfrom fish meal factories in an anaerobic filter under extreme ammonia concentrations.Bioresource Technology, 61, 69–78.
Guerrero L., Montalvo S., Huiliñir C., Campos J. L., Barahona A. and Borja R. (2016).Advances in the biological removal of sulphides from aqueous phase in anaerobicprocesses: A review. Environmental Reviews, 24, 84–100.
Guo Y., Liu S., Tang X. and Yang F. (2017). Role of c-di-GMP in anammox aggregation andsystematic analysis of its turnover protein in Candidatus Jettenia caeni.Water Research,113, 181–190.
He Q., Wang H., Chen L., Gao S., Zhang W., Song J. and Yu J. (2019). Elevated salinitydeteriorated enhanced biological phosphorus removal in an aerobic granular sludgesequencing batch reactor performing simultaneous nitrification, denitrification andphosphorus removal. Journal of Hazardous Materials, 390, 121782.
Hülsen T., Hsieh K. and Batstone D. J. (2019) Saline wastewater treatment with purplephototrophic bacteria. Water Research, 160, 259–267.
Treatment and Valorisation of Saline Wastewater62

IkedaN., Natori T., OkuboT., SugoA., AokiM., KimuraM., Yamaguchi T., HaradaH., OhashiA. and Uemura S. (2013). Enhancement of denitrification in a down-flow hanging spongereactor by effluent recirculation.Water Science and Technology, 68, 591–598.
Jafari S. J., Moussavi G. and Yaghmaeian K. (2015). High-rate biological denitrification inthe cyclic rotating-bed biological reactor: Effect of COD/NO3
−, nitrate concentrationand salinity and the phylogenetic analysis of denitrifiers. Bioresource Technology,197, 482–488.
Jang D., Hwang Y., Shin H. and Lee W. (2013). Effects of salinity on the characteristics ofbiomass and membrane fouling in membrane bioreactors. Bioresource Technology, 141,50–56.
Jeong D., Cho K., Lee C. H., Lee S. and Bae H. (2018). Effects of salinity on nitrificationefficiency and bacterial community structure in a nitrifying osmotic membranebioreactor. Process Biochemistry, 73, 132–141.
Jeong D., Kim W., Lim H. and Bae H. (2020). Shift in bacterial community structure inresponse to salinity in a continuous anaerobic ammonium oxidation (anammox)reactor. International Biodeterioration and Biodegradation, 147, 104873.
Jiang H., Qi P., Wang T., Wang M., Chen M., Chen N., Pan L. and Chi X. (2018). Isolationand characterization of halotolerant phosphate-solubilizing microorganisms from salinesoils. 3 Biotech, 8, 461.
Jin R. C., Yang G. F., ZhangQ. Q., Ma C., Yu J. J. and Xing B. S. (2013). The effect of sulfideinhibition on the anammox process. Water Research, 47, 1459–1469.
Johir M. A. H., Vigneswaran S., Kandasamy J., Ben-Aim R. and Grasmick A. (2013). Effectof salt concentration on membrane bioreactor (MBR) performances: detailed organiccharacterization. Desalination, 322, 13–20.
Juang R. S., Huang W. C. and Hsu Y. H. (2009). Treatment of phenol in synthetic salinewastewater by solvent extraction and two-phase membrane biodegradation. Journal ofHazardous Materials, 164, 46–52.
Kargi F. and Dincer A. R. (1997). Biological treatment of saline wastewater by fed-batchoperation. Journal of Chemical Technology and Biotechnology, 69, 167–172.
Kargi F. and Uygur A. (2005). Improved nutrient removal from saline wastewater in an SBRby Halobacter supplemented activated sludge. Environmental Engineering Science, 22,170–176.
Kartal B., Koleva M., Arsov R., van der Star W., Jetten M. S. M. and Strous M. (2006).Adaptation of a freshwater anammox population to high salinity wastewater. Journalof Biotechnology, 126, 546–553.
Kawagoshi Y., Yamashita Y., Van Duc L., Hama T. and Ito H. (2019). Changes ofnitrogen-removal performance and that of the bacterial community in a mixed culturecomprising freshwater and marine anammox bacteria under averaged environmentalcondition. Chemosphere, 217, 609–617.
Kincannon D. F. and Gaudy A. F. (1968). Response of biological waste treatment systems tochanges in salt concentrations. Biotechnology and Bioengineering, 10, 483–496.
Koster I. W., Rinzema A., De Vegt A. L. and Lettinga G. (1986). Sulfide inhibition of themethanogenic activity of granular sludge at various pH levels. Water Research, 20,1561–1567.
Kubo M., Hiroe J., Murakami M., Fukami H. and Tachiki T. (2001). Treatment ofhypersaline-containing wastewater with salt- tolerant microorganisms. Journal ofBioscience and Bioengineering, 91, 222–224.
Salinity effects on biological treatments 63

Lay W. C. L., Liu Y. and Fane A. G. (2010). Impacts of salinity on the performance of highretention membrane bioreactors for water reclamation: a review. Water Research, 44,21–40.
Lefebvre O. and Moletta R. (2006). Treatment of organic pollution in industrial salinewastewater: A literature review. Water Research, 40, 3671–3682.
Lefebvre O., Vasudevan N., Torrijos M., Thanasekaran K. and Moletta R. (2005). Halophilicbiological treatment of tannery soak liquor in a sequencing batch reactor. WaterResearch, 39, 1471–1480.
Lefebvre O., Vasudevan N., Torrijos M., Thanasekaran K. and Moletta R. (2006). Anaerobicdigestion of tannery soak liquor with an aerobic post-treatment. Water Research, 40,1492–1500.
Li W., Li H., Liu Y. D., Zheng P. and Shapleigh J. P. (2018). Salinity-aided selection ofprogressive onset denitrifiers as a means of providing nitrite for anammox.Environmental Science and Technology, 52, 10665–10672.
Lopez-Vazquez C. M., Oehmen A., Hooijmans C. M., Brdjanovic D., Gijzen H. J., Yuan Z.and van Loosdrecht M. C. M. (2009). Modeling the PAO-GAO competition: effects ofcarbon source, pH and temperature. Water Research, 43, 450–462.
Lu H., Li Y., Shan X., Abbas G., Zeng Z., Kang D., Wang Y., Zheng P. and ZhangM. (2019).A holistic analysis of anammox process in response to salinity: From adaptation tocollapse. Separation and Purification Technology, 215, 342–350.
Mannina G., Capodici M., Cosenza A., Di Trapani D. and Viviani G. (2016). Sequential batchmembrane bio-reactor for wastewater treatment: the effect of increased salinity.Bioresource Technology, 209, 205–212.
Mazor G., Kidron G. J., Vonshak A. and Abeliovich A. (1996). The role of cyanobacterialexopolysaccharides in structuring desert microbial crusts. FEMS MicrobiologyEcology, 21, 121–130.
Mcadam E. J. and Judd S. J. (2008). Biological treatment of ion-exchange brine regenerant forre-use: a review. Separation and Purification Technology, 62, 264–272.
McCarty P. L. and McKinney R. (1961). Salt toxicity in anaerobic digestion. Journal of theWater Pollution Control Federation, 33, 399–415.
Méndez R., Lema J. M. and Soto M. (1995). Treatment of seafood-processing wastewaters inmesophilic and thermophilic anaerobic filters.Water Environment Research, 67, 33–45.
Meng Y., Yin C., Zhou Z. and Meng F. (2018). Increased salinity triggers significant changesin the functional proteins of ANAMMOX bacteria within a biofilm community.Chemosphere, 207, 655–664.
MevarechM., Frolow F. and Gloss L. M. (2000). Halophilic enzymes: proteins with a grain ofsalt. Biophysical Chemistry, 86, 155–164.
Mirbolooki H., Amirnezhad R. and Pendashteh A. R. (2017). Treatment of high saline textilewastewater by activated sludge microorganisms. Journal of Applied Research andTechnology, 15, 167–172.
Moon B. H., Seo G. T., Lee T. S., Kim S. S. and Yoon C. H. (2003). Effects of saltconcentration on floc characteristics and pollutants removal efficiencies in treatmentof seafood wastewater by SBR. Water Science and Technology, 47, 65–70.
Mosquera-Corral A., Sánchez M., Campos J. L., Méndez R. and Lema J. M. (2001).Simultaneous methanogenesis and denitrification of pretreated effluents from a fishcanning industry. Water Research, 35, 411–418.
Treatment and Valorisation of Saline Wastewater64

Mosquera-Corral A., González F., Campos J. L. andMéndez R. (2005). Partial nitrification ina SHARON reactor in the presence of salts and organic carbon compounds. ProcessBiochemistry, 40, 3109–3118.
Mottet A., Habouzit F. and Steyer J. P. (2014). Anaerobic digestion of marine microalgae indifferent salinity levels. Bioresource Technology, 158, 300–306.
Moussa M. S., Sumanasekera D. U., Ibrahim S. H., Lubberding H. J., Hooijmans C. M.,Gijzen H. J. and van Loosdrecht M. C. M. (2006). Long term effects of salt onactivity, population structure and floc characteristics in enriched bacterial cultures ofnitrifiers. Water Research, 40, 1377–1388.
Múñoz-Sierra J. D., Oosterkamp M. J., Wang W., Spanjers H. and van Lier J. B. (2018).Impact of long-term salinity exposure in anaerobic membrane bioreactors treatingphenolic wastewater: Performance robustness and endured microbial community.Water Research, 141, 172–184.
Ng H. Y., Ong S. L. and Ng W. J. (2005). Effects of sodium chloride on theperformance of a sequencing batch reactor. Journal of Environmental Engineering,131, 1557–1564.
Okoro O. V. and Sun Z. (2019). Desulphurisation of biogas: A systematic qualitative andeconomic-based quantitative review of alternative strategies. ChemEngineering, 3, 76.
Omil F., Mendez R. and Lema J. M. (1995). Anaerobic treatment of saline wastewaters underhigh sulphide and ammonia content. Bioresource Technology, 54, 269–278.
Ontiveros-Valencia A., Tang Y., Krajmalnik-Brown R. and Rittmann B. E. (2014). Managingthe interactions between sulfate- and perchlorate-reducing bacteria when usinghydrogen-fed biofilms to treat a groundwater with a high perchlorate concentration.Water Research, 55, 215–224.
Osaka T., Shirotani K., Yoshie S. and Tsuneda S. (2008). Effects of carbon source ondenitrification efficiency and microbial community structure in a saline wastewatertreatment process. Water Research, 42, 3709–3718.
Panswad T. and Anan C. (1999). Impact of high chloride wastewater on an anaerobic/anoxic/aerobic process with and without inoculation of chloride acclimated seeds.Water Research, 33, 1165–1172.
Park S. and Bae W. (2009). Modeling kinetics of ammonium oxidation and nitrite oxidationunder simultaneous inhibition by free ammonia and free nitrous acid. ProcessBiochemistry, 44, 631–640.
Pedrouso A., Val del Río Á., Morales N., Vázquez-Padín J. R., Campos J. L., Méndez R. andMosquera-Corral A. (2017). Nitrite oxidizing bacteria suppression based on in-situ freenitrous acid production at mainstream conditions. Separation and PurificationTechnology, 186, 55–62.
Picos-Benítez A. R., Peralta-Hernández J. M., López-Hincapié J. D. and Rodríguez-García A.(2019). Biogas production from saline wastewater of the evisceration process of the fishprocessing industry. Journal of Water Process Engineering, 32, 100933.
PronkM., Bassin J. P., de KreukM. K., KleerebezemR. and van LoosdrechtM. C.M. (2014).Evaluating the main and side effects of high salinity on aerobic granular sludge. AppliedMicrobiology and Biotechnology, 98, 1339–1348.
Ramaswami S., Jalal Uddin F.M., Behrendt J. and Otterpohl R. (2019). High-rate nitrificationof saline wastewaters using fixed-bed reactors. Journal of Environmental Management,243, 444–452.
Salinity effects on biological treatments 65

Ramos A. F., Gómez M. A., Hontoria E. and González-López J. (2007). Biological nitrogenand phenol removal from saline industrial wastewater by submerged fixed-film reactor.Journal of Hazardous Materials, 142, 175–183.
Rejish Kumar V. J., Sukumaran V., Achuthan C., Joseph V., Philip R. and Singh Bright I. S.(2013). Molecular characterization of the nitrifying bacterial consortia employed for theactivation of bioreactors used in brackish and marine aquaculture systems. InternationalBiodeterioration and Biodegradation, 78, 74–81.
Riffat R. and Krongthamchat K. (2007). Anaerobic treatment of high-saline wastewater usinghalophilic methanogens in laboratory-scale anaerobic filters. Water EnvironmentResearch, 79, 191–198.
Rinzema A., Van Lier J. and Lettinga G. (1988). Sodium inhibition of acetoclasticmethanogens in granular sludge from a UASB reactor. Enzyme and MicrobialTechnology, 10, 101–109.
Saito T., Brdjanovic D. and van Loosdrecht M. C. M. (2004). Effect of nitrite on phosphateuptake by phosphate accumulating organisms. Water Research, 38, 3760–3768.
Salmanikhas N., Tizghadam M. and Rashidi Mehrabadi A. (2016). Treatment of salinemunicipal wastewater using hybrid growth system. Journal of BiologicalEngineering, 10, 9.
Sharrer M. J., Tal Y., Ferrier D., Hankins J. A. and Summerfelt S. T. (2007). Membranebiological reactor treatment of a saline backwash flow from a recirculatingaquaculture system. Aquacultural Engineering, 36, 159–176.
She Z., Zhao L., Zhang X., Jin C., Guo L., Yang S., Zhao Y. and Gao M. (2016). Partialnitrification and denitrification in a sequencing batch reactor treating high-salinitywastewater. Chemical Engineering Journal, 288, 207–215.
Sinha R. and Khare S. (2014). Protective role of salt in catalysis and maintaining structure ofhalophilic proteins against denaturation. Frontiers in microbiology, 5, 165.
Song K., Sawayanagi K., Numano T., Taniichi Y., Kikuchi T., Takeda T., Kanou H., Riya S.,Hori T., Hosomi M. and Terada A. (2019). High-rate partial nitrification ofsemiconductor wastewater: Implications of online monitoring and microbialcommunity structure. Biochemical Engineering Journal, 143, 34–40.
Sudmalis D., GaglianoM. C., Pei R., Grolle K., Plugge C. M., Rijnaarts H. H. M., Zeeman G.and Temmink H. (2018). Fast anaerobic sludge granulation at elevated salinity. WaterResearch, 128, 293–303.
Steele D. J., Franklin D. J. and Underwood G. J. C. (2014). Protection of cells from salinitystress by extracellular polymeric substances in diatom biofilms. Biofouling, 30,987–998.
Svobodová Z., Máchová J., Poleszczuk G., Hu ̊da J., Hamác ̌ková J. and Kroupová H. (2005).Nitrite poisoning of fish in aquaculture facilities with water-recirculating systems. ActaVeterinaria Brno, 74, 129–137.
Tal Y.,Watts J. E.M., Schreier S. B., Sowers K. R. and Schreier H. J. (2003). Characterizationof the microbial community and nitrogen transformation processes associated withmoving bed bioreactor in a closed recirculated mariculture system. Aquaculture, 215,187–202.
Tan X., Acquah I., Liu H., Li W. and Tan S. (2019). A critical review on saline wastewatertreatment by membrane bioreactor (MBR) from a microbial perspective. Chemosphere,220, 1150–1162.
Treatment and Valorisation of Saline Wastewater66

Trüper H. G. and Galinski E. A. (1990). Biosynthesis and fate of compatible solutes inextremely halophilic phototrophic eubacteria. FEMS Microbiology Letters, 75,247–254.
Uygur A. and Kargi F. (2004). Salt inhibition on biological nutrient removal from salinewastewater in a sequencing batch reactor. Enzyme and Microbial Technology, 34,313–318.
Val del Rio A., Pichel A., Fernandez-Gonzalez N., Pedrouso A., Fra-Vázquez A., Morales N.,Méndez R., Campos J. L. and Mosquera-Corral A. (2018). Performance and microbialfeatures of the partial nitritation-anammox process treating fish canning wastewaterwith variable salt concentrations. Journal of Environmental Management, 208,112–121.
van den Brand T. P. H., Roest K., Chen G. H., Brdjanovic D. and van Loosdrecht M. C. M.(2015). Long-term effect of seawater on sulfate reduction in wastewater treatment.Environmental Engineering Science, 32, 622–630.
van Kessel M. A. H. J., Harhangi H. R., van de Pas-Schoonen K., van de Vossenberg J., FlikG., Jetten M. S. M., Klaren P. H.M. and Op den Camp H. J. M. (2010). Biodiversity ofN-cycle bacteria in nitrogen removing moving bed biofilters for freshwater recirculatingaquaculture systems. Aquaculture, 306, 177–184.
Vredenbregt L. H. J., Potma A. A., Nielsen K., Kristensen G. H. and Sund C. (1997). Fluidbed biological nitrification and denitrification in high salinity wastewater.Water Scienceand Technology, 36, 93–100.
Vyrides I. and Stuckey D. (2009). Adaptation of anaerobic biomass to saline conditions: Roleof compatible solutes and extracellular polysaccharides. Enzyme and MicrobialTechnology, 44, 46–51.
Vyrides I. and Stuckey D. C. (2017). Compatible solute addition to biological systemstreating waste/wastewater to counteract osmotic and other environmental stresses: areview. Critical Reviews in Biotechnology, 37, 865–879.
Wahman D. G. and Speitel G. E. (2012). Relative importance of nitrite oxidation byhypochlorous acid under chloramination conditions. Environmental Science andTechnology, 46, 6056–6064.
Wang J., Gong B., Huang W., Wang Y. and Zhou J. (2017a). Bacterial community structurein simultaneous nitrification, denitrification and organic matter removal process treatingsaline mustard tuber wastewater as revealed by 16S rRNA sequencing. BioresourceTechnology, 228, 31–38.
Wang Z., van Loosdrecht M. C. M. and Saikaly P. E. (2017b). Gradual adaptation to salt anddissolved oxygen: Strategies to minimize adverse effect of salinity on aerobic granularsludge. Water Research, 124, 702–712.
Wang Z., Dunne A., van Loosdrecht M. C. M. and Saikaly P. E. (2018). Effect of salt on themetabolism of ‘candidatus accumulibacter’ clade I and II. Frontiers in Microbiology,9, 479.
Wang H., Li H. X., Fang F., Guo J. S., Chen Y. P., Yan P. and Yang J. X. (2019). Underlyingmechanisms of anammox bacteria adaptation to salinity stress. Journal of IndustrialMicrobiology & Biotechnology, 46, 573–585.
Welles L., Lopez-Vazquez C.M., Hooijmans C.M., van LoosdrechtM. C.M. and BrdjanovicD. (2014). Impact of salinity on the anaerobic metabolism of phosphate-accumulating
Salinity effects on biological treatments 67

organisms (PAO) and glycogen-accumulating organisms (GAO). Applied Microbiologyand Biotechnology, 98, 7609–7622.
Welles L., Lopez-Vazquez C.M., Hooijmans C.M., van LoosdrechtM. C.M. and BrdjanovicD. (2015). Impact of salinity on the aerobic metabolism of phosphate-accumulatingorganisms. Applied Microbiology and Biotechnology, 99, 3659–3672.
Xia Z., Wang Q., She Z., Gao M., Zhao Y., Guo L. and Jin C. (2019). Nitrogen removalpathway and dynamics of microbial community with the increase of salinity insimultaneous nitrification and denitrification process. Science of the TotalEnvironment, 697, 134047.
Yang J., Zhang L., Hira D., Fukuzaki Y. and Furukawa K. (2011). Anammox treatment ofhigh-salinity wastewater at ambient temperature. Bioresource Technology, 102,2367–2372.
Yang Y., Wang L., Xiang F., Zhao L. and Qiao Z. (2020). Activated sludge microbialcommunity and treatment performance of wastewater treatment plants in industrialand municipal zones. International Journal of Environmental Research and PublicHealth, 17, 436.
Ye L., Peng C. Y., Tang B., Wang S. Y., Zhao K. F. and Peng Y. Z. (2009). Determinationeffect of influent salinity and inhibition time on partial nitrification in a sequencing batchreactor treating saline sewage. Desalination, 246, 556–566.
Yogalakshmi K. N. and Joseph K. (2010). Effect of transient sodium chloride shock loads onthe performance of submerged membrane bioreactor. Bioresource Technology, 101,7054–7061.
Yoshie S., Noda N., Tsuneda S., Hirata A. and Inamori Y. (2004). Design of 16SrRNA-targeted oligonucleotide probes and microbial community analysis in thedenitrification process of a saline industrial wastewater treatment system. FEMSMicrobiology Letters, 235, 183–189.
Zeng D., Liang K., Guo F., Wu Y. and Wu G. (2020). Denitrification performance andmicrobial community under salinity and MIT stresses for reverse osmosis concentratetreatment. Separation and Purification Technology, 242, 116799.
Zhang L., Zhu K. and Li A. (2016). Differentiated effects of osmoprotectants on anaerobicsyntrophic microbial populations at saline conditions and its engineering aspects.Chemical Engineering Journal, 288, 116–125.
Zhang Z. Z., Ji Y. X., Cheng Y. F, Xu L. Z. J. and Jin R. C. (2018). Increased salinityimproves the thermotolerance of mesophilic anammox consortia. Science of the TotalEnvironment, 644, 710–716.
Zhang Z., Guo Y., Guo L., Hud F., Zhao Y., Jin C., She Z., Gao M. and Wang G. (2020).Elucidating salinity adaptation and shock loading on denitrification performance:Focusing on microbial community shift and carbon source evaluation. BioresourceTechnology, 305, 123030.
ZhaoW., Wang Y., Liu S., Pan M., Yang J. and Chen S. (2013). Denitrification activities andN2O production under salt stress with varying COD/N ratios and terminal electronacceptors. Chemical Engineering Journal, 215–216, 252–260.
Zhao Y. Y., Park H. D., Park J. H., Zhang F. S., Chen C., Li X. K., Zhao D. and Zhao F. B.(2016). Effect of different salinity adaptation on the performance and microbialcommunity in a sequencing batch reactor. Bioresource Technology, 216, 808–816.
Treatment and Valorisation of Saline Wastewater68

Zhao J., Liu Y., Wang D., Chen F., Li X., Zeng G. and Yang Q. (2017). Potential impact ofsalinity on methane production from food waste anaerobic digestion. WasteManagement, 67, 308–314.
Zhu S. M., Deng Y. L., Ruan Y. J., Guo X. S., Shi M. M. and Shen J. Z. (2015). Biologicaldenitrification using poly(butylene succinate) as carbon source and biofilm carrier forrecirculating aquaculture system effluent treatment. Bioresource Technology, 192,603–610.
Salinity effects on biological treatments 69

Chapter 4
Technologies for the treatmentof saline wastewater
ABSTRACTThe existing technologies applied nowadays for the treatment of saline wastewaterare presented and evaluated including physical-chemical and biological processes.Among the physical-chemical processes are conventional units like dissolved aircoagulation-flocculation tanks, and advanced oxidation processes where salt isnot removed. Also, those processes focused on salt removal are tackled includingmembranes, evaporation systems, and crystallization. Salinity is responsiblefor the increased requirements of reagent addition during coagulation-flocculationof tertiary treatments, which incur increased operational costs. In the case ofbiological systems, those based on suspended and adhered biomass areconsidered. In general, high salt concentrations inhibit the activity of the bacterialpopulations responsible for the main biological processes. However, biofilmsystems are supposed to be more resistant to the presence of potential inhibitorssuch as salts. Thus, innovative technologies based on granular/biofilm biomassare currently under study. In addition, physical-chemical processes for theseparation of salts from wastewater are reviewed here.
Keywords: Inhibition, salt separation, technology
4.1 MOTIVATIONThe treatment methods and technologies applied to saline wastewater can be dividedinto two categories: (i) those that remove/recover salt (simultaneously to othercompounds) and (ii) those that remove pollutants (like organic matter and
© IWA Publishing 2021. Treatment and Valorisation of Saline Wastewater: Principles and PracticeAuthor(s): Anuska Mosquera Corral, Ángeles Val del Río and José Luis Campos Gómezdoi: 10.2166/9781789060645_0071
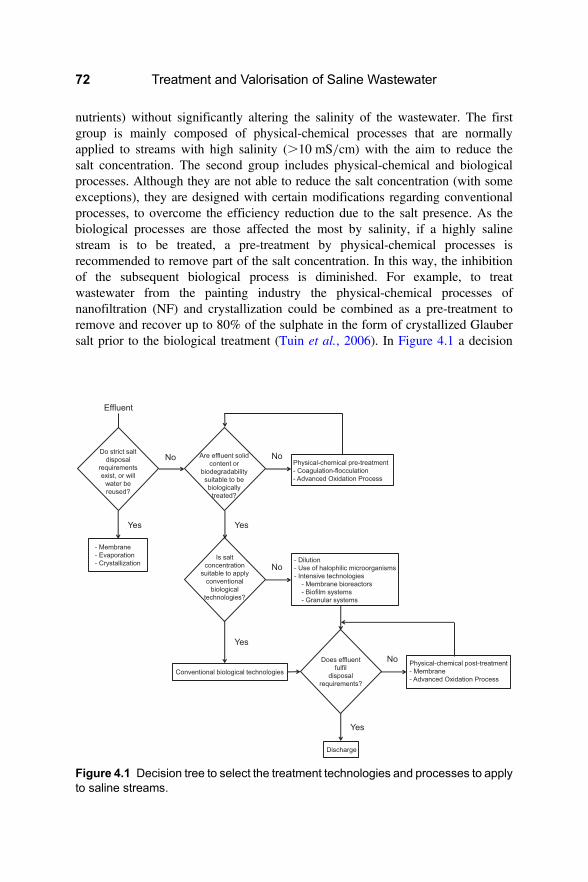
nutrients) without significantly altering the salinity of the wastewater. The firstgroup is mainly composed of physical-chemical processes that are normallyapplied to streams with high salinity (.10 mS/cm) with the aim to reduce thesalt concentration. The second group includes physical-chemical and biologicalprocesses. Although they are not able to reduce the salt concentration (with someexceptions), they are designed with certain modifications regarding conventionalprocesses, to overcome the efficiency reduction due to the salt presence. As thebiological processes are those affected the most by salinity, if a highly salinestream is to be treated, a pre-treatment by physical-chemical processes isrecommended to remove part of the salt concentration. In this way, the inhibitionof the subsequent biological process is diminished. For example, to treatwastewater from the painting industry the physical-chemical processes ofnanofiltration (NF) and crystallization could be combined as a pre-treatment toremove and recover up to 80% of the sulphate in the form of crystallized Glaubersalt prior to the biological treatment (Tuin et al., 2006). In Figure 4.1 a decision
Effluent
Do strict salt disposal
requirements exist, or will
water be reused?
- Membrane- Evaporation- Crystallization
Yes
Are effluent solid content or
biodegradability suitable to be biologically
treated?
No
- Dilution- Use of halophilic microorganisms- Intensive technologies
- Membrane bioreactors- Biofilm systems- Granular systems
Yes
NoPhysical-chemical pre-treatment- Coagulation-flocculation- Advanced Oxidation Process
Is salt concentration
suitable to apply conventional
biological technologies?
No
Yes
Conventional biological technologies
Does effluentfulfil
disposal requirements?
Yes
Discharge
No Physical-chemical post-treatment- Membrane- Advanced Oxidation Process
Figure 4.1 Decision tree to select the treatment technologies and processes to applyto saline streams.
Treatment and Valorisation of Saline Wastewater72
tree is schematized to demonstrate the possible methods of saline wastewatertreatment depending on the final disposal requirements of the treated wastewater.
Zhao et al. (2020), in a review of the methods for saline wastewater treatment,explain that physical-chemical technologies present some disadvantages, such ashigh operational costs and difficulty in achieving the expected treatment results,while biological treatment technologies have the advantage of low operationalcost. Among the physical-chemical technologies, these authors highlight thosebased on evaporation, membrane techniques, such as reverse osmosis (RO) andnanofiltration (NF), ion exchange, advanced oxidation processes (AOPs) andelectrochemical systems. In the case of biological systems, they state that the keyfactor for their efficient performance in treating saline wastewater is to change theenvironment of the bacteria to enhance their salt tolerance and halophilism.Recently, studies have mainly focused on the application of proper, cheap, andenvironmentally friendly biological treatment systems because of their easiermaintenance and the relatively low investment and operational costs(Salmanikhas et al., 2016).
In the present chapter the current technologies applied to saline wastewatertreatment are presented. Although they are not applied independently, and anadequate combination of different processes is necessary to accomplish the fullwastewater treatment (Figure 4.1). Examples of combined processes for completesaline wastewater treatment are described in Chapters 6 and 7, where several casestudies are assessed. It is important to note that in the present chapter the unitsused to describe the salinity of the wastewater in the different applicationexamples are not always the same, and variables like salt concentration, totaldissolved solids (TDS) concentration and electrical conductivity (EC) are useddepending on the information available in the original reference. To understandthe relationship between these variables, Table 1.1 in Chapter 1 can be consulted.
4.2 PHYSICAL-CHEMICAL TECHNOLOGIES4.2.1 Technologies for salt removal/////recoveryAs physical-chemical treatment processes that remove salt are very expensive, theiruse is limited to very specific circumstances, like some industrial streams.Additionally, it is necessary to consider that they generate a very high salineresidue (brine) that sometimes contains other contaminants, like organiccompounds, which should be disposed of as a hazardous waste with thecorresponding cost for this disposal (Zhuo et al., 2017).
In some cases, the separated salts are even recovered. Although this is not afrequent practice, it is increasing in interest nowadays due to the potentialbenefits of the recovered compounds (Bazedi et al., 2013; Kim, 2011). Moreinformation about this aspect is available in Chapter 5.
Brine disposal cost varies from 5% to 33% of the total cost of the processes anddepends on the characteristics and volume of the brine and the level of pre-treatment.
Technologies for the treatment of saline wastewater 73

Methods of saline residue disposal include surface water discharge, sewer discharge,deep-well injection, evaporation ponds and land application (Panagopoulos et al.,2019). However, the environmental impact of brine disposal and the morestringent legislation, has made it necessary to adopt certain technologies fortreatment. These technologies are based on the idea of zero liquid discharge(ZLD) and comprise mainly three stages: pre-concentration, evaporation, andcrystallization.
The technologies for salt removal can be classified in two main categories:membranes and thermal processes. Although specific statistics for salinewastewater treatment are not available, between both categories the data for waterdesalination indicate that membranes, mainly RO, comprise about 80% of thetotal desalination plants today worldwide, and their use continues to increase asmembranes are constantly improving, both in terms of cost and energy efficiency(Anis et al., 2019). Nowadays forward osmosis (FO) membranes to separate saltfrom wastewater are increasing in interest as they require much lower energy thanRO ones for operation (Korenak et al., 2017).
4.2.1.1 MembranesMembranes have several different uses in the field of wastewater treatment, as theycan be applied in both secondary biological and tertiary physical treatment systems.In general, their application is in two fields: water desalination and water reuse.Furthermore, they are the key technology in the sector of water desalination. Forthis reason, there is increasing research and interest in the development ofeffective membranes to cope with fouling problems, reduce energy consumption,increase useful life, improve maintenance, etc.
One of the major constraints of membrane processes is durability of themembranes, particularly during the treatment of wastewaters containing varioussurface-active contaminants (Gryta, 2020). For this reason, the use of membranesto treat saline streams is recommended when they contain low amounts of othercontaminants apart from salts, to preserve the useful life of the membranes.Therefore, membrane technologies are normally applied as a tertiary treatment.
Reverse osmosis membrane systems are the most widely used to desalt salinewaters and obtain a stream with low salt content, although nowadays FO is alsobeing considered for wastewater treatment.
4.2.1.1.1 Reverse osmosis
In the RO process pressure is applied that forces the water to flow through asemi-permeable membrane from the more concentrated side (more contaminants)to the less concentrated side (fewer contaminants), resulting in the permeatehaving a low salt concentration and the brine containing the majority of the salts.RO systems are used not only in desalination but also in water reclamation fromwastewater originating in different industrial sectors such as mining, thermal
Treatment and Valorisation of Saline Wastewater74
power plants, cement mills, fertilizer production, the petrochemical industry,nuclear plants, distilleries, tanneries, and production of sugar, dairy products,dyes and dye intermediates, food, pulp and paper, wood and wool, batteries,pharmaceuticals, pesticides, iron and steel, etc. (Trishitman et al., 2020). Theperformance of RO treatments for a specific industry depends on the effluentcharacteristics and the pre-treatment process. Therefore, evaluation of thecharacteristics of the targeted effluent is needed before implementing a specificRO system.
One common example of RO application to saline industrial wastewater is in thetannery sector. Ranganathan and Kabadgi (2011) studied five tanneries operatingRO membrane technologies in India. These authors observed that treatments suchas neutralization, clari-flocculation and biological processes are necessary toremove organics before applying RO for TDS removal. The average inlet TDSconcentration in the RO units was approximately 3,769–8,060 mg/L (average5,530 mg/L), while in the permeate it was in the range of 118–438 mg/L(average 259 mg/L), which are values well within the drinking water standard.They observed that the removal efficiencies of TDS, sodium and chloride were inthe range of 91–99%, while 70–85% of the wastewater volume was recoveredand recycled in the industrial operations. Regarding the rejected brines, they weresubmitted to evaporation using a solar evaporation system or multiple effectevaporation technology, and the obtained solid wastes were disposed of into asecured landfill site.
Another example of RO application to wastewater reclamation is in the dairyindustry. Brião et al. (2019) proposed the use of RO to produce water for on-siteuse as cooling water (permeate), while the reject stream can be reused in thesame industry by adding it to fermented milk beverages and caramelized milk.Regarding the salinity removal, they observed that the salt concentrationdecreased from 9,480 to 321 mg/L and the conductivity from 2,200 to 95 µS/cm.
4.2.1.1.2 Forward osmosis
With respect to FO, related research studies have increased in number during the lastdecade. In comparison with RO the FO membranes do not require the application ofhydrostatic pressure with consequent energy savings. The water is transportedthrough a semi-permeable membrane due to differences in osmotic pressure, fromthe wastewater (feed solution) to a high salt concentrated draw solution. Then anadditional step is necessary to separate the draw solution from the recoveredwater, which can be membrane distillation, a membrane bioreactor, low pressurereverse osmosis, nanofiltration, electrodialysis or thermal distillation (ValladaresLinares et al., 2014).
Regarding the application of FO for saline wastewater treatment there are twoapproaches: direct FO desalination and indirect FO desalination (ValladaresLinares et al., 2014). In direct FO desalination a reagent is used as the drawsolution (normally NaCl), while in the indirect FO desalination approach the
Technologies for the treatment of saline wastewater 75

draw solution is seawater or a brackish water stream (e.g., a residual stream) withsubsequent cost savings in chemicals. Several examples can be found in theliterature for the direct and indirect approaches with the following combinationsof wastewater-draw solution (Valladares Linares et al., 2014): raw sewage plusNaCl solution; anaerobically digested sludge centrate plus MgCl2 solution;secondary wastewater effluent plus NaCl solution; domestic sewage plusNaCl/MgSO4 solution; drilling wastewater plus NaCl solution; wastewater fromoil plus NH4HCO3 solution; sewage plus seawater.
The main limitation for scaling-up this technology has been identified asmembrane fouling (Korenak et al., 2017). Thus, different membrane materialsand coatings are under exploration to decrease operational costs of maintenance.Furthermore, other critical aspects are the development of a high flux membrane,capable of maintaining an elevated salt rejection and reduced internalconcentration polarization effects, and the availability of appropriate drawsolutions (cost effective and non-toxic), which can be recirculated via an efficientrecovery process (Valladares Linares et al., 2014). A range of draw solutions hasbeen evaluated, particularly to guarantee their regeneration capability to reduceoperational costs. Although NaCl appears to be the best draw solute in terms ofoperation (Korenak et al., 2017), KCl seems more appropriate if the aim is to usethe water draw for fertigation (Sahebi et al., 2020).
4.2.1.2 EvaporationEvaporation is being considered as a good solution in an increasing number ofsaline wastewater treatment applications, for example it is widely used in thetannery industry. Evaporation can be effective for concentrating or removingsalts, but also heavy metals and a variety of hazardous materials. Furthermore,with this technology sometimes it is possible to produce a high quality andreusable stream, which is very important when water conservation is a priority,or even to obtain the salt concentrated as a value-added sub-product. Theevaporators normally used operate under vacuum conditions, so the boilingtemperature of the liquid effluent is lower; thus, saving energy and improvingefficiency. Vacuum evaporators operate between 45–200 mbar and 37–60°C.Modern technologies include multiple-effect evaporators, in which water isboiled in a sequence of vessels, each held at a pressure lower than that of theprevious one.
On the other hand, solar evaporation ponds are a low-cost alternative, but theirapplication is limited by land availability, potential odour problems, andmeteorological and climatological conditions. These traditional evaporation pondshave a low thermal efficiency (approximately 40%), but the development of moreefficient technologies based on interfacial solar evaporation, rather than on bulkwater, are a promising solution as they have a much higher thermal efficiency (upto approximately 90%) (Chen et al., 2019). In these systems the type of solar
Treatment and Valorisation of Saline Wastewater76

absorber used is crucial, and for this reason research effort is focused on thedevelopment of novel solar materials and structures to increase the evaporationrate with higher efficiency. Applications of interfacial water evaporation forwastewater purification of domestic and industrial sewage include sterilization,degradation of dye molecules, removal of heavy metal ions and separation ofemulsified oil/water mixtures (Zhu et al., 2019).
4.2.1.3 CrystallizationCrystallization is a solid-liquid separation technique, in which the solute crystallizesfrom the liquid solution and becomes a pure solid crystalline phase. This makescrystallization techniques effective for the recuperation of a variety of useful andvaluable substances (along with the water) from wastewater, such as the recoveryof NaCl. For example, the crystallization process can transform a salt concentratestream (brine) into a crystalline solid that occupies little space and can be easilymanaged. Crystallizers are usually applied as the final treatment phase tocompletely dry the brine residue. However, they can be used as a single treatmentprocess in some applications.
Lu et al. (2017) revised the application of the crystallization process inwastewater treatment, which mainly includes technologies like evaporationcrystallization, cooling crystallization, reaction crystallization, drowning-outcrystallization, and membrane distillation crystallization. These authors highlightthat crystallization is one of the promising techniques for wastewater treatment,especially for water desalination and salt recovery.
4.2.2 Technologies without salt removalOther physical-chemical technologies are not able to remove salt but are adequatefor example, as pre-treatment of biological ones. This is the case forcoagulation-flocculation processes and AOPs (Figure 4.1). Additionally, theyhave the advantage of removing pollutants (solids, recalcitrant compounds, etc.)with the corresponding beneficial effect (reduction of the inlet load) in thesubsequent biological unit.
Another solution that is adopted in certain cases is the application of dilution,which is a simple option to reduce the salt concentration to overcome problems inbiological processes. In this case it is advisable to have another residual streamwith low organic matter, nutrient and salt concentrations but produced in largevolumes (low-strength wastewater) to mix and dilute the saline stream. Thisoption is not desirable, but common in some industrial sectors like thefish-canning industry.
4.2.2.1 Coagulation-flocculationCoagulation-flocculation technologies can be used as a pre-treatment of salineeffluents to remove their colloidal chemical oxygen demand (COD) (Lefebvre &
Technologies for the treatment of saline wastewater 77
Moletta, 2006). The coagulation-flocculation process is based on the addition ofreagents that help the suspended particles in the wastewater to form flocs ableto settle. The addition of coagulants provokes the breaking down of therepulsive forces between the colloids in suspension and particles can interactwith each other by agglomerating themselves in flakes that increase in sizegradually. Afterwards, by the addition of flocculants, the destabilization ofcolloidal substances occurs to favour their sedimentation. Once flocs havereached such dimensions as to allow their precipitation, the last sedimentationphase begins, in which a calm tank allows them to settle and then be removedfrom the water. Therefore, the last sedimentation stage is crucial to achievegood removal efficiencies. However, the presence of salinity can reduce thesettleability of the flocs formed and, consequently, specific design criteria needto be considered to improve the treatment of saline wastewater, mainly infull-scale plants operated in continuous flow. For example, Bruno et al. (2020)propose to include a deflector element in the passage section from theflocculation to the sedimentation compartment, which favours the sludgesettling and therefore the removal of pollutants from the clarified effluent. Theystudied this design improvement for the application of the coagulation-flocculation process to treat saline wastewater (conductivity between 43–49mS/cm) contaminated with hydrocarbons (1,500–1,900 mg TPH/L, as totalpetroleum hydrocarbons). They obtained removal efficiencies of total suspendedsolids (TSS) of over 90% (fed wastewater containing approximately 2,450 mgTSS/L) and of hydrocarbons close to 100%. These authors observed that thebest results were obtained when the wastewater fed to the system ofcoagulation-flocculation was previously subjected to a treatment in which theoil was removed.
Moreover, specific studies to optimize the dosage of reagents added need to becarried out with saline effluents. For example, Di Bella et al. (2014) treatedwastewater from an oil coastal deposit containing hydrocarbons and with aconductivity of approximately 48 mS/cm to optimize the coagulation-flocculationprocess. These authors concluded that the adequate pre-treatment before thebiological process comprised a dose of aluminium sulphate (between 50–70mg/L) combined with an anionic flocculant (2.5–5.0 mg/L) at neutral pH(around 7).
4.2.2.2 Advanced oxidation processesAOPs can be employed before or after biological processes. These are popularmethods for removing soluble refractory organics with wide applications inindustrial wastewater treatment, and a promising solution for saline effluents.When AOPs are used as a pre-treatment stage, they can convert recalcitrantcompounds into more readily biodegradable intermediates. As a post-treatmentthey improve effluent quality before its disposal.
Treatment and Valorisation of Saline Wastewater78

For example, Moraes et al. (2004) demonstrated that the photo-Fenton process isfeasible for the treatment of wastewaters containing hydrocarbons, even in thepresence of high concentrations of salts.
Zhuo et al. (2017) proposed the catalytic wet peroxide oxidation (CWPO)process for saline wastewater. They explain that this process can operate underrelatively mild conditions (e.g., atmospheric pressure and under 100°C), and itscapital investment costs are much lower than those corresponding to other AOPs.They treated wastewater from epoxy resin synthesis, which contained totalorganic carbon (TOC) and salt (NaCl) concentrations of approximately 2,500–2,700 mg/L, and 18.2–20.5% by weight, respectively. In a pilot trial, at theconditions of pH= 3.3 and temperature of 90°C, these authors obtained a TOCremoval efficiency of 93%. With these results they recommended treatment of thehigh salinity wastewater from epoxy resin synthesis with CWPO before recyclingthe treated wastewater to a chloro-alkali process for reuse.
4.3 BIOLOGICAL TECHNOLOGIES4.3.1 Overview of conventional treatmentsIn biological systems the removal of COD and nitrogen occurs by the activity ofmicroorganisms that can suffer from osmotic pressure if the salt concentration isabove their activity threshold. If this occurs, a fraction of the microbialpopulations dies and consequently the pollutant removal efficiency in thetreatment system diminishes. Generally, to treat saline wastewater in aconventional activated sludge (CAS) system the acclimation of the activatedsludge must be accomplished by gradually increasing the salinity of thewastewater, which undoubtedly lengthens the start-up time and increasesoperational costs. For these reasons, the search, cultivation and domestication ofsalt-tolerant and halophilic microorganisms growing in extreme high-salinityenvironments (such as salt lakes, bay salt fields, saline-alkali soils, and pickledfood factories) is a research hotspot in the treatment of saline wastewater.Halophiles prefer salt and thrive on saline or hypersaline environments. In thissense, microorganisms are classified according to their salt tolerance as truehalophilic organisms if they grow in salt concentrations over 3 M NaCl, whereassalt tolerant organisms do not depend on salt for growth but can tolerateappreciable salt concentrations (over 1 M NaCl) (Zhao et al., 2020).
Salt concentrations of more than 1% (NaCl) cause plasmolysis ofmicroorganisms and reduce their ability to remove organic and inorganicpollutants. Alipour et al. (2016) observed that CAS systems were able toefficiently treat wastewater containing up to 4,000 mg/L of TDS (EC= 7,273µs/cm). However, when wastewater concentration was over 4,000 mg/L of TDS,the organic matter removal in the biological treatment started to decrease and wastotally lost at concentrations of approximately 8,000 mg TDS/L. In this case, thesludge settleability was scarcely affected by the salt presence. The conventional
Technologies for the treatment of saline wastewater 79
CAS systems can be directly used to treat wastewater with salinities below 10 gNaCl/L, while the aerobic systems based in biofilms seem to be able to toleratehigher salt concentrations, because of their large biomass retention capacity(Zhao et al., 2020).
Additionally, the performance of anaerobic digestion systems is also affected bysalinity at mesophilic or thermophilic conditions. In fact, biomass involved in theanaerobic digestion process is more sensitive to salinity content in comparison toactivated sludge (Alipour et al., 2016). In view of the poor performance ofanaerobic bioreactors, compatible solutes have been added into such bioreactorsto help the anaerobic biomass cope with saline conditions, with for exampleglycine betaine (synthesized by some methanogens) being an effective one (Yanget al., 2013). Salinity in special cations (i.e., Na+) has been found to affect theseprocesses. Anaerobic granules and flocs experience salt induced disintegration, inthe presence of sodium cations, which provokes biomass washout. However, theaddition of calcium ions has been proven to benefit anaerobic sludge granulationand also the strength of the formed aggregates (Pevere et al., 2007). Thedisintegration of biomass aggregates can also be counteracted by using membranebioreactors as proposed by Yang et al. (2013).
To cope with saline effluents, the use of sequencing batch reactors (SBRs) iscommon, as they are robust and allow the accumulation of sludge with bettersettling properties than that from continuous systems.
4.3.2 Halophilic microorganismsThe operation of biological processes with halophilic microorganisms for salinewastewater treatment avoids and/or reduces the inhibition by salts. In general,halophilic microorganisms can be classified as slight halophiles (1–5% NaCl),moderate halophiles (5–20% NaCl) or extreme halophiles (20–30% NaCl) (Yanget al., 2013). However, the selection of adequate halophilic microorganisms canbe expensive and time consuming, as they not only need to tolerate salt but alsoneed to be able to metabolize contaminants such as organic matter, nitrogen andphosphorus. In the literature there are several examples of specificmicroorganisms that can be used in different conditions, however, at full scale,bioaugmentation with them is not widely used. In the following sections someexamples of specific halophilic microorganisms found in the literature andapplied for saline wastewater treatment are presented.
4.3.2.1 Aerobic halophilesKargi et al. (2000) performed the bioaugmentation of activated sludge withHalobacter halobium (a salt tolerant bacterial strain) to treat saline picklingwastewater with approximately 3.5% salt content and 4,500 mg COD/L,obtaining COD removal percentages of 95%. With the same type of industrialeffluent Abou-Elela et al. (2010) achieved similar results with other bacterial
Treatment and Valorisation of Saline Wastewater80

cultures. These authors isolated a salt-tolerant microorganism (Staphylococcusxylosus) from a vegetable pickling plant containing about 7.2% salt and then usedit combined with activated sludge to treat the wastewater from the same industry.In this study these authors managed to reach a COD removal of 93% at NaClconcentration of 3%.
4.3.2.2 Anaerobic and anoxic halophilesKapdan and Erten (2007) operated an upflow anaerobic packed bed reactor withsynthetic saline wastewater using Halanaerobium lacusrosei (an anaerobic salttolerant bacteria) as the dominant microbial culture in the process. These authorsevaluated the performance of the reactor at variable concentrations of salt (0–5%NaCl) and organic matter (1,900–3,400 mg COD/L). They observed thatincreasing the hydraulic retention time from 11 h to 30 h resulted in a substantialimprovement in the COD removal from 60 to 84% at around 3,400 mg COD/Land 3% salt concentration. A salt inhibition effect on COD removal was observedat salt concentrations above 3%.
Martínez-Espinosa et al. (2007) studied the application of Haloferaxmediterranei, a denitrifying halophilic archaeon, to remove nitrate and nitritefrom salted water, as it grows at concentrations as high as 2 M of nitrate and 15–25% of NaCl. They observed that this haloarchaeon could be applied to restorewater tables containing high nitrate and nitrite concentrations and high saltconcentrations due to fertilizer overapplication and marine intrusions, respectively.
Ali et al. (2020) demonstrated the application of a novel marine anammoxbacterium (Candidatus Scalindua sp. AMX11) in a membrane bioreactor (MBR)to treat a saline effluent (of approximately 1.2% salt), achieving stableperformance with a nitrogen removal rate of 0.3 kg N/(m3 · d) and a removalefficiency around 90%.
4.3.2.3 Sulphate reducing bacteriaThe organic matter of the wastewater is used by sulphate reducing bacteria (SRB) totransform sulphate into H2S in anaerobic conditions. The produced H2S is partiallydissolved and partially in the biogas phase, depending on its concentration and thepH of the liquid medium. Thus, this process reduces the amount of organic matteravailable for methane production and causes the inhibition of the methanogenicand acetogenic bacteria, apart from being corrosive, having bad odour andcontributing to the COD concentration of the produced effluent (Lens et al.,1998). Although most characterized SRB strains are not well adapted toextreme hypersaline conditions some of them are halophilic organisms likeDesulfovibrio halophilus, Desulfocella halophila, Desulfovibrio oxyclinae, andDesulfohalobium retbaense that have been proven to grow in environments withNaCl concentrations from 18 to 27% (Ben-Dov et al., 2009; Caumette et al.,1991; Kjeldsen et al., 2007). In this sense, Kjeldsen et al. (2007) have reported
Technologies for the treatment of saline wastewater 81

moderate sulphate-reducing activity of 30 nmol/(cm3 · d) in sediments of the GreatSalt Lake (Utah) at a concentration of 27% salt, indicating the difficulty of the SRBto adapt to these conditions. For this reason, in practice H2S production is limited byincreasing salt concentrations as high as 14–18% NaCl, as observed by Ben-Dovet al. (2009) after adding this salt to evaporation ponds with sulphate-containingwastewater coming from several chemical plants (pesticides, pharmaceutical, andaliphatic and aromatic halogens production).
4.3.2.4 Photosynthetic microorganismsAmezaga et al. (2014) conceptualized the process of desalination of wastewater bysunlight and photosynthetic organisms. These authors indicate that the future designand operation of this biodesalination process is likely to build on knowledge of bothalgal bioreactors and wastewater treatment biological processes. They propose theuse of cyanobacterial cultures, because they can generate large amounts ofbiomass in brackish and seawater, thereby forming a low-salt reservoir within thesaline water. The key part of the conceptualized biodesalination process is toemploy a low-salt biological reservoir within the cyanobacteria as an ionexchanger. Uptake of salt into these reservoirs would then be mediated by geneticand/or environmental manipulation of the cyanobacteria. As exemplified bySynechocystis sp. strain PCC 6803 and Synechococcus sp. strain PCC 7002,cyanobacteria have attributes that make them attractive for such applications,because they are fast-growing, tolerant in a wide range of salt concentrations, andamenable to genetic transformation. Furthermore, because the primarymetabolism of cyanobacteria is based upon photosynthesis, nutrient requirementsare minimal and active salt export during growth is powered by sunlight. Solarradiation can also be used to energize subsequent salt accumulation throughexpression of retinal ion pumps. In this way, biodesalination by cyanobacteriacan become an opportunity for saline wastewater treatment to reduce thesalt concentration.
Hülsen et al. (2019) also proposed the use of purple phototrophic bacteria (PPB),for organic compounds and nutrient removal from saline and marine-likewastewaters, in a continuous anaerobic infra-red photo bioreactor. Theyhighlighted that PPB limited electron availability for sulphate reducers when fedwith sea salt (including high sulphate levels), with the advantage that nosubstantial H2S was produced. The reactor microbial community shifted fromAllochromatium sp. and Rhodobacter sp. to Rhodovulum sp. in 190 days ofoperation. The adapted community was halophilic, with an optimum rangebetween 20 and 70 mS/cm, and with the capacity to maintain at least 50% of itsactivity at hypersaline conditions up to 140 mS/cm. These authors’ resultsindicate a rapid adaptation to high-salt conditions (both NaCl and marine), andthe capacity for PPB to form a combined wastewater treatment/resource recoveryprocess, particularly for saline industrial wastewater.
Treatment and Valorisation of Saline Wastewater82

4.3.2.5 MicroalgaeAlthough the application of microalgae to wastewater treatment began morerecently than the CAS systems, some studies have been focused on theirapplication to saline wastewater. In this sense, Shen et al. (2015) stated that,compared with the screening of the organisms acclimated to saline wastewater,the utilization of marine microalgae would be more practical and economical.Marine microalgae are usually efficient in removing nitrogen and phosphorusfrom wastewater and can avoid contamination by biological pollutants such asbacteria, viruses and zooplankton. Additionally, microalgae can achievepotentially high yields of lipid production and high economic value of harvestedbiomass if further produced for fertilizers and biogas obtainment, and so on. Theyshowed the feasibility of Chlorella vulgaris to remove total nitrogen (TN) andtotal phosphorus (TP) efficiently from real saline wastewater (EC values between2,645–8,810 µS/cm), with a lipid accumulation of 35% at 8,810 µS/cm. Anotherexample of microalgae application is the treatment of swine wastewater by thestrains Chlorella vulgaris, Botryococcus braunii and Desmodesmus sp.(Nagarajan et al., 2019).
4.3.3 Membrane bioreactorsThe use of MBRs is a good solution for saline wastewater treatment, becausebiomass will be efficiently retained, providing it with a good opportunity to adaptand perform the removal activities. Furthermore, halophilic microorganisms cangrow in a bioreactor due to membrane-assisted biomass retention and in this waythe adverse effects of fluctuations in the influent salt concentration areminimized, thus they can also survive in environments with a wide range of saltconcentrations. In addition, the retention action of the membrane allowsaccumulation of large biomass concentrations that compensate for the decrease ofthe degradation kinetics due to salt presence and, therefore, maintain thetreatment capacity under saline environments. Finally, the suspended solidsconcentration in the effluent is low improving its quality for reuse. The use ofMBR systems for saline wastewater treatment was until now applied more inaerobic conditions than in anaerobic ones (Yang et al., 2013).
Tan et al. (2019) reviewed MBR applications for saline wastewater treatments inboth, aerobic and anaerobic systems. When the salinity of the influent is below 10 gNaCl/L, the conventional MBR system can be directly used. To improve thebiodegradation activities and prevent the membrane fouling at high salinities (10–100 g/L), modified and hybrid MBR systems may need to be wisely designed.Additionally, to treat hypersaline wastewaters with salinities of up to 100 gNaCl/L, inoculation of halophilic bacteria has been applied in MBR researchworks (Tan et al., 2019).
Munz et al. (2008) compared the performance of anMBRwith a CAS process forthe treatment of tannery wastewater mixed with domestic wastewater (55–45% in
Technologies for the treatment of saline wastewater 83
volume) containing average concentrations of phenol, Cl− and S−2 of 125, 3,260and 27 mg/L, respectively (data of salinity as EC or TDS are not available).These authors’ results showed that the MBR achieved COD removal efficiencies4% higher than the CAS system and operated in a more stable manner reachingcomplete nitrification. Di Trapani et al. (2014) compared the performance of anMBR with carriers (biofilm system) and without them at increasing salinity, tostudy the fouling of the membrane, and concluded that the pore fouling in themembrane was higher without than with carriers. Along this line Ng et al. (2016)also studied the use of bio-carriers in a membrane reactor for salinepharmaceutical wastewater treatment (20,881+ 2,030 mg/L as TDS) andobserved that higher removal efficiencies of COD and TN and lower membranefouling were obtained compared with the MBR without bio-carriers. Therefore,the combination of MBR and biofilm systems provides a good solution to treatsaline wastewater.
4.3.4 Biofilm systemsThe biological processes based on the use of biofilms can overcome some of theproblems of the suspended ones. Although the microorganisms present in thebiomass are in essence the same, their organization in biofilms can provide themwith an ‘extra’ advantage to tackle salt inhibition due to the protective action ofthe biofilm structure itself. It is widely known that the biofilm structure improvesthe retention of biomass and can help to ‘enrich’ the biological system in thosemicroorganisms that better cope with saline conditions. The biofilm can beformed over a carrier material, in which case the use of a support material isnecessary, or grow by self-aggregation of microorganisms in the form of granularsludge. Below, some examples of biofilms systems applied to saline wastewatertreatment are presented, to show their variability in configurations and applications.
4.3.4.1 Moving bed biofilm reactorDifferent types of saline wastewater were treated using moving bed biofilm reactors(MBBRs), like agricultural drainage wastewater with salinity between 2.5–20.0 gTDS/L (Ateia et al., 2015), synthetic wastewater containing phenol (200–1,200mg/L) and salt (10–70 g NaCl/L) (Nakhli et al., 2014), dairy wastewater withelectrical conductivity between 2–62 mS/cm (BEST, 2020), etc. Li et al. (2015)compared the operation of an MBBR with a CAS system for the treatment ofsaline wastewater (carboxymethyl cellulose wastewater with 5–7% salinity) andthey found that the MBBR performed in a more stable manner and reachedhigher removal rates (2.67 kg COD/(m3 · d) versus 1.68 kg COD/(m3 · d)), beingable to resist the impacts of high salinity and organic loading fluctuations.
Salmanikhas et al. (2016) compared the application of a hybrid growth systemwith a CAS system for the treatment of saline wastewater. The hybrid systemconsisted of a fluidized bed where polyethylene media, with an active area of
Treatment and Valorisation of Saline Wastewater84

500 m2/m3, was introduced into a suspended biomass system. The removalpercentages of COD, biological oxygen demand (BOD5), NH4
+, and TP havebeen evaluated at various salinities (0.5, 1.0 and 1.5%). The results showed thatthe removal performances of the hybrid system in all conditions were noticeablybetter than those of the CAS system. For example, they observed COD removalvalues of 80, 71 and 48% with the hybrid system and 62, 48 and 26% with theCAS one at the three salt concentrations tested (0.5, 1.0 and 1.5%), respectively.They attributed the better results of the hybrid system, compared to those of theCAS system, to the capacity of the former to retain the biomass under thesesalinity levels. Moreover, these authors identified additional advantages of thehybrid system, like no biomass recirculation requirements and a higher oxygenmass transfer coefficient for the same flow of aeration.
Another option to cope with salinity in biological treatments can be thecombination of MBBR with membranes, as mentioned in the previous section.For example, Artiga et al. (2008) studied, at pilot scale, a hybridbiofilm-suspended biomass membrane bioreactor to treat wastewater from afish-canning factory (with salt concentration up to 84 g/L). They observed theadaptation of the biomass to salinity after 73 days and obtained COD removalefficiencies of approximately 92%.
4.3.4.2 Anaerobic granular sludgeIn the frame of the project SaltGae (SALTGAE, 2020) successful results wereobtained with a two-phase anaerobic digestion system, with separated acidogenicand methanogenic stages, using granular sludge. The results showed that theproduced biogas was rich in methane (up to 85%) and, therefore, it could be usedfor energy generation. The acidogenic stage allowed treatment of salinewastewaters containing up to 58 g Na+/L, while the methanogenic stage wasmore sensitive and allowed production of up to 0.23 L CH4/(L · d) at a salinityup to 14 g Na+/L. These studies report the highest salinities that an acidogenicsystem can cope with to date and demonstrate its potential to obtain valuableproducts, like volatile fatty acids, from saline wastewater.
4.3.4.3 Aerobic granular sludgeAerobic granular sludge (AGS) for saline wastewater treatment was also used bydiverse authors as an adequate technology to combat the salt inhibitory effectsover biological processes. Carrera et al. (2019) studied the application of differentconfigurations (fully aerobic or anaerobic feeding) for the treatment offish-canning wastewater with salinities between 5.0–13.5 g NaCl/L. In this studynot only was the increase of salinity addressed but also, as a novelty, the effect ofsalinity decrease was tested. The results demonstrated that when the saltconcentration decreased (from 10 to 5 g NaCl/L) the stability of the granularaggregates in the anaerobic feeding reactor was worse than in the aerobic feeding
Technologies for the treatment of saline wastewater 85

one; while when the salinity increased (from 5.5 to 13.5 g NaCl/L) in both systems aloss of biomass retention occurred. Additionally, this study demonstrated therobustness of the AGS technology to treat saline wastewater with removalefficiencies around 80–90% treating organic loading rates between 2.0–6.7 kgCODs/(m
3 · d).Recently, Sarvajith and Nancharaiah (2020) cultivated AGS directly from
the autochthonous planktonic bacterial community of seawater. They used anSBR directly fed with nutrient-amended seawater without inoculum. Theyobtained dense and compact granules with excellent settling velocity (41.2 m/h)in few days (25 d). The microbiological analysis showed an enrichment inα-proteobacteria and that the bacterial diversity of the granules was lower thanthe seawater microbiome. The halophilic AGS was able to efficiently removenitrogen biologically and treat seafood-processing wastewater without previousbiomass acclimation. The ammonium and total nitrogen removals were 92–100%and 81–90%, respectively, while nitrite accumulation was not observed undersaline conditions. Phosphate removal progressively improved and stabilized atover 76% within 2 months from the start-up.
4.3.5 WetlandsLiang et al. (2017) state that for the treatment of saline wastewater, constructedwetlands (CWs) outperform many other processes. These systems have receivedincreasing attention in recent years, especially in developing countries, because oftheir minimal costs, convenient operation, eco-friendly characteristics, andaesthetic value. However, the treatment of industrial saline wastewater by CWshas been tested in limited cases which include the effluents generated in sectorssuch as the tannery, textile, pulp and paper industry, and aquaculture ponds (Lianget al., 2017). In these cases, to achieve adequate removal rates, it is necessary touse specific plants adapted to salinity (e.g., halophytes or salt-tolerant plants).Furthermore, in CWs treatment the role of the microorganism is essential. It wasdemonstrated that CWs inoculated with specific halophilic microorganismsprovide a promising method for treating saline wastewater. Although salts mightpose some negative effects on the performance of CWs, past research suggeststhat the halophytes and halophilic microorganisms that exist in natural saline orhypersaline environments can be introduced into CWs to improve the treatment ofsaline wastewater. An acceptable removal efficiency can be achieved in CWs byusing a combination of halophytes, halophilic microorganisms, and optimalsubstrates.
4.4 OTHER INNOVATIVE TECHNOLOGIESThe growing interest in addressing the increasing salt concentrations present indifferent types of wastewater, is expected to make the development of newtechnologies and processes feasible. Some examples of these new developments
Treatment and Valorisation of Saline Wastewater86

are presented in this section. Most of them are still at an early stage of maturation,without tests at industrial scale, but they are promising options which are worthyof consideration.
4.4.1 Micro-electrolysisFor high salinity wastewater, micro-electrolysis with iron-carbon alloy appears to bea feasible technology to remove salt. Zhou et al. (2015) proposed the pre-treatmentof saline wastewater with a Fe–C alloy filler prepared using iron powder andactivated carbon. These authors tested this technology to treat modified starchwastewater (23,520 mg COD/L, 20,880 mg Cl−/L), pharmaceutical wastewater(5,890 mg COD/L, 21,500 mg Cl−/L) and cellulose ether wastewater (12,400mg COD/L, 15,360 mg Cl−/L). They observed COD and Cl− removals of over55% and approximately 25–30%, respectively. These authors explained thatalthough activated carbon in the filler had physical adsorption ability, Cl− wasabsorbed mainly through electric-absorption caused by the primary cell reactionof the Fe–C alloy. The oxygen consumption curves of the analysed industrialsamples showed that the biodegradability of wastewater could be greatlyimproved by the removal of Cl− using the new filler.
4.4.2 Temperature swing solvent extractionIn 2019 a novel process was proposed to remove salt from hypersaline streamscalled temperature swing solvent extraction (TSSE) (Boo et al., 2019). Thisprocess can treat water that contains a high concentration of salts, even up toseven times saltier than seawater. This methodology is proposed as a radicallydifferent desalination technology because it is membrane-less and not based onevaporative phase change. TSSE operates at relatively low temperature (less than70°C) and uses a low-polarity solvent (with temperature-dependent watersolubility) for the selective extraction of water over salt. The preliminary resultsshowed that it was able to remove up to 98.4% of the salt, which is comparablewith reverse osmosis. But unlike reverse osmosis or other methods ofdesalination, this process does not require high temperatures or high pressures.
4.4.3 Microbial desalination cellZhang et al. (2019) proposed the microbial desalination cell (MDC) as a novel andpromising technology for wastewater desalination. The MDC can produce energyfrom wastewater and simultaneously desalinate it driven by bioelectricitygeneration. The authors state that compared to traditional desalination treatmentprocesses, MCD shows certain advantages, such as less energy consumption andmore mild operating conditions. They studied the biocathode MDC forsimultaneous salt, sulphate, and nitrogen removal from high-salinity mustardtuber wastewater (approximately 20 g TDS/L and EC of approximately 30–35mS/cm). The results showed that 97.4% of salt, 99.7% of sulphate and 99.8% of
Technologies for the treatment of saline wastewater 87

nitrogen could be removed. The relative abundances of electrogenic bacteria in theanode and cathode were 15.95% and 15.10%, respectively, which greatly promotedthe electricity generation and desalination. The bacteria involved in sulphatereduction in the anode were the dominant population, with relative abundance of13.94%. Microbial community analysis of the cathode biofilm indicated thatautotrophic nitrification-anaerobic denitrification, electrochemical reduction, andanaerobic ammonium oxidation might coexist for high-efficiency nitrogen removal.
Yang et al. (2019) revised the application of MDC and other bioelectrochemicalsystems (BESs) to saline wastewater treatment, indicating that to guarantee anadequate treatment producing high quality effluents for potential reuse and toachieve energy self-sufficiency, these systems have been upgraded by integratingmembrane-based treatment technologies. These integrated BESs have beenexpanded to desalination applications and have exhibited improved energyrecovery and wastewater treatment efficiencies compared to conventional BESs.
4.4.4 Microbial matsMicrobial mats are clustered biofilms of mixed microbial communities that occurnaturally in hypersaline habitats, with abundant microbial diversity. Akyon et al.(2015) used engineered microbial mats for the treatment of saline hydraulicfracturing produced water. They observed the highest biodegradation ratesbetween 0 and 50,000 mg TDS/L in the treated water. When the concentrationwas 100,000 mg TDS/L this rate decreased, and no biological substrate removalwas detected for values of 200,000 mg TDS/L. The authors stated that microbialmats have the potential to decrease operational costs and improve the efficiencyof treating saline produced water from hydraulic fracturing. Therefore, microbialmats represent an emerging biological treatment technology to encourageproduced water reuse, improve the performance of physical-chemical treatmentapproaches, remove organic constituents, and reduce chemicals application.
4.5 EXAMPLES OF TREATMENT SCHEMESThe characteristics of the saline wastewater and the disposal or reuse requirementsstrongly affect the type of treatment that needs to be applied (Figure 4.1).In Table 4.1, some examples of treatment trains are presented selected fromdifferent types of industrial saline wastewater (landfill, tannery, textile, refinery,and fish flour/oil industry) together with the different technologies available. It isimportant to highlight that biological treatments are applied in all these examples,emphasizing their relevance for COD and nutrients removal, even in the case ofthe refinery wastewater. Another important aspect is that energy intensiveprocesses like ultrafiltration and reverse osmosis are only applied as apost-treatment when the treated water is going to be reused.
One interesting example is the treatment of landfill leachates from the GreenLane Landfill in St. Thomas (Ontario, Canada). This stream is characterized by
Treatment and Valorisation of Saline Wastewater88

Table
4.1
Exa
mplesoftech
nologiesappliedforthetreatm
ento
fdifferenttyp
esofs
alinewastewater.
Typeof
Effluent
Country
Characteristics
Pre-treatm
ent
BiologicalP
rocess
Post-treatm
ent
Reference
Landfill
leach
ate
Canad
aCOD
(1,000–
5,000mg/
L),
ammonia
(150–
600mg/
L),TDS
(2,000–6,000
mg/L)and
intense
colour
(upto
1,200
Pt-Co)
Coagulatio
n-flocculatio
nandprim
ary
clarificatio
nformetals,h
ardness,
andTDSremova
l
Modified
Ludza
ck-Ettinger
(MLE)proce
ss
Ozo
natio
nto
remov
eco
lourandfiltratio
nto
remove
solids
Arabia
nd
Lugowski
(2015)
Tannery
Ethiopia
pH(8),
conductivity
(21
mS/cm
),COD
(2,100mg/
L),
sulfide(191mg
S/L),su
lfate
(571mgS/L),
ammonia
(32
mgN/L)
Aeratedequalizatio
npondforsu
lfide
oxidatio
n
Aeratedbiological
oxidatio
npondfor
COD
remova
l
Coagulatio
n(for
organics,
phosp
hate,
andch
romium
remov
al)
Abate
etal.
(2020)
(Continued)
Technologies for the treatment of saline wastewater 89

Table
4.1
Exa
mplesoftech
nologiesappliedforthetreatm
ento
fdifferenttyp
esofs
alinewastewater(C
ontin
ued).
Typeof
Effluent
Country
Characteristics
Pre-treatm
ent
BiologicalP
rocess
Post-treatm
ent
Reference
Textile
India
pH(8–9),COD
(970mg/
L),
TDS(3,500
mg/L),co
lour
(3,536Haze
n)
Equalizatio
ntank
andpHadjustment
Aerobic
proce
sswith
specific
microbialc
ulture
addedeach
month
Coagulatio
n-flocculatio
nActivatedca
rbonfilter
(remova
lof
colour/odour)
Ozo
natio
nUltrafiltratio
nReve
rseosm
osis(50%
perm
eate
isreuse
din
theindu
stry)
Nakh
ate
etal.
(2020)
Refin
ery
India
pH(8–9),oiland
grease
(110–
220mg/
L),
COD
(930
mg/L),280
(mg/L)
Prim
ary
oilse
paratio
nbyflo
atatio
nSeco
ndary
oilse
paratio
nbyco
agulatio
n-
flocculatio
n
Bio-towerpackedwith
polypropylenefor
remova
loftoxic
hyd
roca
rbons.
Aeratio
ntankfor
biodegradable
organic
matte
rremova
l
Pressure
sandfilters
andgranularactivated
carbonfilters
forremova
lofturbidity
andco
lour.
Ash
faq
etal.
(2010)
Fish
floura
nd
fishoil
industry
Ecu
ado
r600–800mg
N/L,
30–80mgP/L,
5,000–8,000mg
COD/L
Coolingtowerand
equalizatio
ntank
Aerobic
membrane
bioreactorwith
nitrifica
tion-denitrifica
tion
Ultrafiltratio
nand
reve
rseosm
osis,
for
waterreuse
and
irrigatio
n
Fluence
(2020)
Treatment and Valorisation of Saline Wastewater90

high solid and colloidal organics concentrations, as heavy metals, and xenobioticorganic compounds. The treatment train with a capacity of 300 m3/d includes apre-treatment with chemicals addition and primary clarification to remove metals,hardness, and TDS. Subsequently, there is a biological process and as final stepconsecutive ozonation (to remove colour) and filtration (to remove solids) steps.The complete treatment train achieves removal percentages of 60–80%, 60–70%and 70–90% for COD, TN, and colour, respectively.
4.6 CONCLUSIONSTechnologies applied for the treatment of saline wastewater are mostly the same asthose applied for non-saline ones. In many cases only changes in the operationalconditions are applied to overcome the drawbacks exerted by the salinity.Nevertheless, in the case of the physical-chemical treatments specifictechnologies are applied for the separation of the salt fraction, such as theconventional membrane, evaporation, and crystallization technologies orinnovative technologies like micro-electrolysis, temperature swing solventextraction, microbial desalination cells or microbial mats. Additionally, whenselecting the biological technology to be used, some options are considered toimprove the biomass retention and for this purpose membrane systems or thedevelopment of biofilm or granular sludge are implemented. Also, inoculationwith halophilic cultures has been explored, as a beneficial option to speed up thestart-up and maintain the biological process stability, or the use of systems likewetlands.
However, due to the increase in the volume of wastewater with saline conditionsproduced in the world, it would be an interesting practice to evaluate thedevelopment of specific technologies designed from their concept to deal withsaline wastewater.
REFERENCESAbate T. A., Feleke Desta A. and Love N. G. (2020). Evaluating tannery wastewater treatment
performance based on physicochemical and microbiological characteristics: anEthiopian case study. Water Environment Research, 1364, 1–12.
Abou-Elela S. I., Kamel M. M. and Fawzy M. E. (2010). Biological treatment of salinewastewater using a salt-tolerant microorganism. Desalination, 250, 1–5.
Akyon B., Stachler E., Wei N. and Bibby K. (2015). Microbial mats as a biological treatmentapproach for saline wastewaters: the case of produced water from hydraulic fracturing.Environmental Science and Technology, 49(10), 6172–6180.
Ali M., Shaw D. R. and Saikaly P. E. (2020). Application of an enrichment culture of themarine anammox bacterium ‘Ca. Scalindua sp. AMX11’ for nitrogen removal undermoderate salinity and in the presence of organic carbon. Water Research, 170, 115345.
Alipour V., Moein F. and Rezaei L. (2016). Determining the salt tolerance threshold forbiological treatment of salty wastewater. Health Scope, 6(1), e36425.
Technologies for the treatment of saline wastewater 91

Amezaga J. M., Amtmann A., Biggs C. A., Bond T., Gandy C. J., Honsbein A., KarunakaranE., Lawton L., Madsen M. A., Minas K. and Templeton M. R. (2014). Biodesalination:A case study for applications of photosynthetic bacteria in water treatment. PlantPhysiology, 164, 1661–1676.
Anis S. F., Hashaikeh R. and Hilal N. (2019). Reverse osmosis pretreatment technologies andfuture trends: A comprehensive review. Desalination, 452, 159–195.
Arabi S. and Lugowski A. (2015). Lessons learned from successful applications of biologicallandfill leachate treatment. Environmental & Science Engineering Magazine, https://esemag.com/biosolids/lessons-learned-successful-applications-biological-landfill-leachate-treatment/ (accessed 6 November 2020).
Artiga P., García-Toriello G.,Méndez R. and Garrido J. M. (2008). Use of a hybrid membranebioreactor for the treatment of saline wastewater from a fish canning factory.Desalination, 221, 518–525.
Ashfaq A., Saadia A., Anees S. and Khursheed A. (2010). Environmental waste management:A case study of refinery. Journal of Insdustrial Pollution Control, 26(1), 95–103.
Ateia M., Nasr M., Yoshimura C. and Fujii M. (2015). Organic matter removal from salineagricultural drainage wastewater using a moving bed biofilm reactor. Water Scienceand Technology, 72(8), 1327–1333.
Bazedi G. A., Ettouney R. S., Tewfik S. R., Sorour M. H. and El-Rifai M. A. (2013). Saltrecovery from brine generated by large-scale seawater desalination plants.Desalination and Water Treatment, 52, 4689–4697.
Ben-Dov E., Kushmaro A. and Brenner A. (2009). Long-term surveillance of sulfate-reducing bacteria in highly saline industrial wastewater evaporation ponds. SalineSystems, 5, 1–5.
BEST (2020). Effectiveness of moving bed biofilm reactor (MBBR) technology for industrialwastewater treatment and impact of sodium chloride on the biomass in MBBR.Summary of Project BEST output (WP2.2). Riga Technical University. https://bestbalticproject.eu/wp-content/uploads/2020/05/MBBR-piloting_BEST_RTU.pdf(accessed 6 November 2020).
Boo C., Winton R. K., Conway K. M. and Yip N. Y. (2019). Membrane-less andnon-evaporative desalination of hypersaline brines by temperature swing solventextraction. Environmental Science and Technology Letters, 6, 359–364.
Brião V. B., Vieira Salla A. C., Miorando T., Hemkemeier M. and Cadore Favaretto D. P.(2019). Water recovery from dairy rinse water by reverse osmosis: giving value towater and milk solids. Resources Conservation and Recycing, 140, 313–323.
Bruno P., Campo R., Giustra M. G., De Marchis M. and Di Bella G. (2020). Bench scalecontinuous coagulation-flocculation of saline industrial wastewater contaminated byhydrocarbons. Journal of Water Process Engineering, 34, 101156.
Carrera P., Campo R., Méndez R., Di Bella G., Campos J. L., Mosquera-Corral A. and Val delRio A. (2019). Does the feeding strategy enhance the aerobic granular sludge stabilitytreating saline effluents? Chemosphere, 226, 865–873.
Caumette P., Cohen Y. and Matheron R. (1991). Isolation and characterization ofDesulfovibrio halophilus sp. No., a halophilic sulfate-reducing bacterium isolatedfrom Solar Lake (Sinai). Systematic and Applied Microbiology, 14, 33–38.
Chen C., Kuang Y. and Hu L. (2019). Challenges and opportunities for solar evaporation.Joule, 3(3), 683–718.
Treatment and Valorisation of Saline Wastewater92

Di Bella G., Giustra M. G. and Freni G. (2014). Optimisation of coagulation/flocculation forpre-treatment of high strength and saline wastewater: performance analysis withdifferent coagulant doses. Chemical Engineering Journal, 254, 283–292.
Di Trapani D., Di Bella G., Mannina G., Torregrossa M. and Viviani G. (2014). Comparisonbetween moving bed-membrane bioreactor (MB-MBR) and membrane bioreactor(MBR) systems: influence of wastewater salinity variation. Bioresource Technology,162, 60–69.
Fluence (2020). Aerobic Treatment of Wastewater for Fish Flour and Fish Oil Company forReuse. https://www.fluencecorp.com/wp-content/uploads/2018/12/REUSE_Case-study_Tadel_Eng_lores.pdf (accessed 06 November 2020).
Gryta M. (2020) Separation of saline oily wastewater by membrane distillation. ChemicalPapers, 74, 2277–2286.
Hülsen T., Hsieh K. and Batstone D. J. (2019). Saline wastewater treatment with purplephototrophic bacteria. Water Research, 160, 259–267.
Kapdan I. K. and Erten B. (2007). Anaerobic treatment of saline wastewater byHalanaerobium lacusrosei. Process Biochemistry, 42(3), 449–453.
Kargi F., Dinner A. R. and Pala A. (2000). Characterization and biological treatment ofpickling industry wastewater. Bioprocess Engineering, 23, 371–374.
Kim D. H. (2011). A review of desalting process technique and economic analysis of therecovery of salts from retentates. Desalination, 270, 1–8.
Kjeldsen K. U., Loy A., Jakobsen T. F., Tomsen T. R., Wagner M. and Ingvorsen K. (2007).Diversity of sulfate-reducing bacteria from an extreme hypersaline sediment, Great SaltLake (Utah). FEMS Microbiology Ecology, 60, 287–298.
Korenak J., Basu S., Balakrishnan M., Hélix-Nielsen C. and Petrinic I. (2017). Forwardosmosis in wastewater treatment processes. Acta Chimica Slovenica, 64, 83–94.
Lefebvre O. and Moletta R. (2006). Treatment of organic pollution in industrial salinewastewater: A literature review. Water Research, 40(20), 3671–3682.
Lens P. N. L., Visser A., Janssen A. J. H., Hulshoff Pol L. W. and Lettinga G. (1998).Biotechnological treatment of sulfate-rich wastewaters. Critical Review inEnvironmental Science and Technology, 28(1), 41–88.
Li K., Xu J., Yun G., Zhao Y., Dong Z., Liu J. and Wang K. (2015). Treatment of high saltwastewater in MBBR process strengthened by complex salt-tolerant microorganism.Chinese Journal of Environmental Engineering, 9(6), 2829–2834.
Liang Y., Zhu H., Bañuelos G., Yan B., Zhou Q., Yu X. and Cheng X. (2017). Constructedwetlands for saline wastewater treatment: a review. Ecological Engineering, 98,275–285.
Lu H., Wang J., Wang T., Wang N., Bao Y. and Hao H. (2017). Crystallization techniques inwastewater treatment: an overview of applications. Chemosphere, 173, 474–484.
Martínez-Espinosa R. M., Zafrilla B., Camacho M. and Bonete M. J. (2007). Nitrate andnitrite removal from salted water by Haloferax mediterranei. Biocatalysis andBiotransformation, 25(2–4), 295–300.
Moraes J. E. F., Quina F. H., Nascimento C. A. O., Silva D. N. and Chiavone-Filho O. (2004).Treatment of saline wastewater contaminated with hydrocarbons by the photo-Fentonprocess. Environmental Science and Technology, 38(4), 1183–1187.
Munz G., Gualtiero M., Salvadori L., Claudia B. and Lubello C. (2008). Process efficiencyand microbial monitoring in MBR (membrane bioreactor) and CASP (conventional
Technologies for the treatment of saline wastewater 93

activated sludge process) treatment of tannery wastewater. Bioresource Technology, 99(18), 8559–8564.
Nagarajan D., Kusmayadi A., Yen H. W., Di D. C., Lee D. J. and Chang J. S. (2019). Currentadvances in biological swine wastewater treatment using microalgae-based processes.Bioresource Technology, 289, 121717.
Nakhate P. H., Moradiya K. K., Patil H. G., Marathe K. V. and Yadav G. D. (2020). Casestudy on sustainability of textile wastewater treatment plant based on lifecycleassessment approach. Journal of Cleaner Production, 245, 118929.
Nakhli S. A. A., Ahmadizadeh K., Fereshtehnejad M., Rostami M. H., Safari M. and BorgheiS. M. (2014). Biological removal of phenol from saline wastewater using a movingbed biofilm reactor containing acclimated mixed consortia. Springerplus, 3(112),24616843.
Ng K. K., Shi X., Ong S. L., Lin C. F. and Ng H. Y. (2016). An innovative of aerobicbio-entrapped salt marsh sediment membrane reactor for the treatment of high-salinepharmaceutical wastewater. Chemical Enineering Journal, 295, 317–325.
Panagopoulos A., Haralambous K.-J. and Loizidou M. (2019). Desalination brine disposalmethods and treatment technologies – a review. Science of the Total Environment,693, 133545.
Pevere A., Guibaud G., van Hullebusch E. D., Boughzala W. and Lens P. N. L. (2007). Effectof Na+ and Ca2+ on the aggregation properties of sieved anaerobic granular sludge.Colloids and Surfaces A, 306, 142–149.
Ranganathan K. and Kabadgi S. D. (2011). Studies on feasibility of reverse osmosis(membrane) technology for treatment of tannery wastewater. Journal ofEnvironmental Protection, 2, 37–46.
Sahebi S., Sheikhi M., Ramavandi B., Ahmadi M., Zhao S., Adeleye A. S., Shabani Z. andMohammadi T. (2020). Sustainable management of saline oily wastewater viaforward osmosis using aquaporin membrane. Process Safety and EnvironmentalProtection, 138, 199–207.
Salmanikhas N., Tizghadam M. and Rashidi Mehrabadi A. (2016). Treatment of salinemunicipal wastewater using hybrid growth system. Journal of BiologicalEngineering, 10, 9.
SaltGae (2020). Project Results SaltGae Stakeholders Platform. http://www.stakeholdersaltgae.eu/knowledge-transfer/project-results/ (accessed 6 November 2020).
Sarvajith M. and Nancharaiah Y. V. (2020). Granulation of the autochthonous planktonicbacterial community of seawater for saline wastewater treatment. EnvironmentalScience: Water Research and Technology, 6, 1902–1916.
Shen Q. H., Gong Y. P., Fang W. Z., Bi Z. C., Cheng L. H., Xu X. H. and Chen H. L. (2015).Saline wastewater treatment by Chlorella vulgaris with simultaneous algal lipidaccumulation triggered by nitrate deficiency. Bioresource Technology, 193, 68–75.
Tan X., Acquah I., Liu H., Li W. and Tan S. (2019). A critical review on saline wastewatertreatment by membrane bioreactor (MBR) from a microbial perspective. Chemosphere,220, 1150–1162.
Trishitman D., Cassano A., Basile A. and Rastogi N. K. (2020). 9 – Reverse osmosisfor industrial wastewater treatment. In: Current Trends and Future Developments of(Bio-) Membranes, A. Basile, A. Cassano and N. K. Rastogi (eds), Elsevier,pp. 207–228.
Treatment and Valorisation of Saline Wastewater94
Tuin B. J. W., Geerts R., Westerink J. and van Ginkel C. G. (2006). Pretreatment andbiotreatment of saline industrial wastewaters. Water Science and Technology, 53(3),17–25.
Valladares Linares R., Li Z., Sarp S., Bucs S. S., Amy G. and Vrouwenvelder J. S. (2014).Forward osmosis niches in seawater desalination and wastewater reuse. WaterResearch, 66, 122–139.
Yang J., Spanjers H., Jeison D. and Van Lier J. B. (2013). Impact of Na+ on biologicalwastewater treatment and the potential of anaerobic membrane bioreactors: A review.Critical Reviews in Environmental Science and Technology, 43(24), 2722–2746.
Yang E., Chae K. J., Choi M. J., He Z. and Kim I. S. (2019). Critical review ofbioelectrochemical systems integrated with membrane-based technologies fordesalination, energy self-sufficiency, and high-efficiency water and wastewatertreatment. Desalination, 452, 40–67.
Zhang L., Fu G. and Zhang Z. (2019). High-efficiency salt, sulfate and nitrogen removal andmicrobial community in biocathode microbial desalination cell for mustard tuberwastewater treatment. Bioresource Technology, 289, 121630.
Zhao Y., Zhuang X., Ahmad S., Sung S. and Ni S. Q. (2020). Biotreatment of high-salinitywastewater: current methods and future directions. World Journal of Microbiology andBiotechnology, 36, 37.
Zhou G., Wang X., Liu J., Wang Z. and Li S. (2015). Pretreatment of saline wastewater withFe–C alloy filler. Desalination and Water Treatment, 53(3), 603–609.
Zhu L., GaoM., Peh C. K. N. and HoG.W. (2019). Recent progress in solar-driven interfacialwater evaporation: advanced designs and applications. Nano Energy, 57, 507–518.
Zhuo Y., ShengM., Liang X. and Cao G. (2017). Treatment of high salinity wastewater usingCWPO process for reuse. Journal of Advanced Oxidation Technologies, 20(2),20170024.
Technologies for the treatment of saline wastewater 95


Chapter 5
Valorization of saline wastewater
ABSTRACTIn the current frame of the circular economy, evaluation of the valorization potentialof saline-type wastewater is an objective, as this type of effluent representsapproximately 9% of all the produced wastewater in the world. Apart from theevident water recovery for reuse, accomplishing valorization of the organic andinorganic pollutant compounds is also explored. Obtaining products, such asvolatile fatty acids (VFA), exopolymers (EPS) or polyhydroxyalkanoates (PHA)among others, from organic carbon compounds, entails the development ofinnovative processes, which must produce treated effluents suitable for dischargeor reuse. In addition, the organic compounds can be anaerobically converted tomethane-containing biogas to be used as an energy source. Concerning theinorganic fraction, either nutrients or salts recovery offers an opportunity toextract some economic value from these effluents. Furthermore, there areindustrial processes admitting relatively high saline effluents in their units, suchas some refrigeration towers, that allow for direct water reuse.
Keywords: Biopolymer, energy, nutrient, resource recovery, water reclamation
5.1 MOTIVATIONIn the frame of the circular economy concept, wastewater perception is moving fromconsidering it as a waste to seeing it as a resource of valuable compounds(Figure 5.1). With this general perspective the use of resources will be more
© IWA Publishing 2021. Treatment and Valorisation of Saline Wastewater: Principles and PracticeAuthor(s): Anuska Mosquera Corral, Ángeles Val del Río and José Luis Campos Gómezdoi: 10.2166/9781789060645_0097
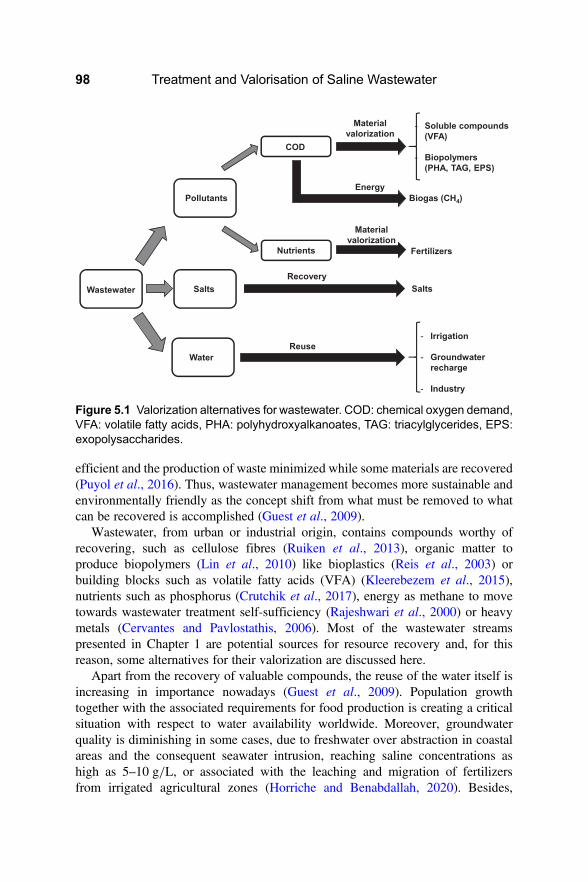
efficient and the production of waste minimized while some materials are recovered(Puyol et al., 2016). Thus, wastewater management becomes more sustainable andenvironmentally friendly as the concept shift from what must be removed to whatcan be recovered is accomplished (Guest et al., 2009).
Wastewater, from urban or industrial origin, contains compounds worthy ofrecovering, such as cellulose fibres (Ruiken et al., 2013), organic matter toproduce biopolymers (Lin et al., 2010) like bioplastics (Reis et al., 2003) orbuilding blocks such as volatile fatty acids (VFA) (Kleerebezem et al., 2015),nutrients such as phosphorus (Crutchik et al., 2017), energy as methane to movetowards wastewater treatment self-sufficiency (Rajeshwari et al., 2000) or heavymetals (Cervantes and Pavlostathis, 2006). Most of the wastewater streamspresented in Chapter 1 are potential sources for resource recovery and, for thisreason, some alternatives for their valorization are discussed here.
Apart from the recovery of valuable compounds, the reuse of the water itself isincreasing in importance nowadays (Guest et al., 2009). Population growthtogether with the associated requirements for food production is creating a criticalsituation with respect to water availability worldwide. Moreover, groundwaterquality is diminishing in some cases, due to freshwater over abstraction in coastalareas and the consequent seawater intrusion, reaching saline concentrations ashigh as 5–10 g/L, or associated with the leaching and migration of fertilizersfrom irrigated agricultural zones (Horriche and Benabdallah, 2020). Besides,
Wastewater
Water
Pollutants
Salts
COD
Reuse
Nutrients
- Irrigation
- Groundwaterrecharge
- Industry
Material valorization
RecoverySalts
Fertilizers
- Soluble compounds(VFA)
- Biopolymers(PHA, TAG, EPS)
Material valorization
EnergyBiogas (CH4)
Figure 5.1 Valorization alternatives for wastewater. COD: chemical oxygen demand,VFA: volatile fatty acids, PHA: polyhydroxyalkanoates, TAG: triacylglycerides, EPS:exopolysaccharides.
Treatment and Valorisation of Saline Wastewater98

climate change is reducing the flows of freshwater which are the basis for thereplenishment of those water basins where human water resources are stored. Incertain places the water availability is so limited that freshwater supply requiresits transportation from long distances and even from different countries (Guestet al., 2009). Recognition should be given to the importance of access to waterfor economic activity development that can be covered by reused wastewater(Jodar-Abellan et al., 2019).
For these reasons, new strategies need to be applied to mitigate or reduce thewater consumption in such a way that its access is guaranteed to all theinhabitants in the world. Different alternatives to diminish freshwaterconsumption have been put into practice beginning with optimizing the use offreshwater in households and industry. Also, dual water supply systemscomprising freshwater for potable uses and seawater to flush toilets have beenapplied in places like Hong Kong where the latter amounts to 20–30% of thewater required in the entire city (Liu et al., 2016). Among these strategies, thereuse of regenerated/reclaimed wastewater is arising in importance. However,saline wastewater needs specific evaluation to establish its potential for reuse asits salt content might constitute a drawback for certain uses.
5.2 BY-PRODUCTS OBTAINMENTProductive sectors such as the chemical, petroleum, pharmaceutical, leathermanufacture, agro-food, and aquaculture industries, among others, producewastewater characterized by large salt contents. These effluents are saline orhypersaline streams that amount to 5% of the produced industrial effluents(Lefebvre and Moletta, 2006). Additionally, the fact that in some places, such asHong Kong, seawater is used for urban purposes, like toilet flushing, increasesthe production of this type of effluent (Liu et al., 2016).
Frequently, saline wastewater also contains large concentrations of organicmatter and nutrients. These pollutants may also be a source of valuablecompounds. If the organic fraction is transformed into organic polymericcompounds or biogas, useful as substitutes for those from chemical origin, thecurrent pressure on petroleum-based materials might be alleviated. This newconcept is feasible as these obtained biopolymers are a source of biofuel,commodities for the biochemical industry and biomaterials (Venkata Mohanet al., 2016), and biogas contains methane which can be used for energyproduction. In addition, simultaneously to the waste valorization, the accuratetreatment of these streams needs to be performed to guarantee achieving theappropriate characteristics of the effluent for discharge or reuse.
5.2.1 Organic compounds productionValorization of the organic matter contained in wastewater streams can be achievedby transforming it into valuable products like volatile fatty acids and biopolymers,
Valorization of saline wastewater 99

produced intra- and extracellularly (Mosquera-Corral et al., 2017). Most of theseprocesses are in a development stage and their application is not widespread.Albeit they are expected to be implemented in the future. A common issue for allthe compounds to be recovered from wastewater is that the recovery/extractionstep needs to be appropriately selected to obtain products with the requiredquality for application (Atasoy et al., 2019). But this issue is outside of the scopeof this book.
5.2.1.1 Volatile fatty acids (VFA)The production of short chain VFA is increasing in interest due to their potentialapplications. These compounds can be used as building blocks for the chemicalindustry (Kleerebezem et al., 2015) or methane generation, as a carbon source forfurther biological processes like nutrient removal or biopolymer production, orfor biodiesel production or electricity generation in microbial fuel cells (Atasoyet al., 2019; Zhou et al., 2018).
Anaerobic digestion (AD) is a biological process applied generally to wastewatercontaining large biodegradable organic matter concentrations. VFA are intermediatecompounds of anaerobic digestion, which has methane as the final product. In theAD process VFA are formed in the acidogenic step before the methanogenesis.Thus, VFA accumulation is an undesired event in those anaerobic systemsintended for biogas production, which suffer from hydraulic or organic overloads.Additionally, in other cases VFA accumulation is a result of the presence ofinhibitory compounds like large salt concentrations (de Vrieze et al., 2017). Thus,the production of VFA relies on the definition of the accurate operationalconditions that stop the complete development of the AD process in theacidogenic or acetogenic steps. The spectrum of the mixture of VFA obtaineddepends on operational conditions such as pH, temperature, flow rate, type andconcentration of substrate, and VFA concentration or feeding pattern, amongothers (Yin et al., 2016). Studies are under development now to elucidate therelationship between these parameters and the obtained VFA mixture (Atasoyet al., 2018).
Wastewater of industrial origin containing large organic matter concentrations isa potential source for VFA production (Table 5.1). The use of saline media for thispurpose has not been widely explored yet (Fra-Vázquez et al., 2020; Scoma et al.,2017). In general, when dealing with waste streams, mixed microbial consortia arepreferred. This is due to their associated low operational cost compared to purecultures as a result of the non-sterile conditions required, variable biochemicalfunctions, applicability to different substrates, large operational flexibility, andeasy process control and scale up (Dahiya et al., 2015). These microbial consortiaproduce different mixtures of VFA containing mainly acetic (HAc), propionic(HPr), butyric (HBu) and valeric acids (HVa), among others. Among theoperational conditions, the optimal pH reported in the literature varies widely and
Treatment and Valorisation of Saline Wastewater100

Table
5.1
VFAproductionfrom
salineindustria
lwastewaterstreams.
Waste
Origin
OLR
gCOD/////(L
·d)
Temperature
(°C)
pH
HRT
(d)
Yield
gCODVFA/////g
CODNVFArem
MaxCOD
toVFA
(%)
Salt(g/////L)
Reference
Molasses1
9.81
34
710
86.8
63.5
20000–90000*
Sco
maetal.
(2017)
Mussel
cooking
proce
ss
2.5
+0.4
37+
14.2
6.3
43
21.8
+2.8
gNaCl/L
Fra-Vázq
uez
etal.(2020)
*Inelectric
alcondu
ctivity
units
(µS/cm
).1Ave
rageva
luesofe
xperim
ents
perform
edwith
terrestria
landmarin
einocu
lum.
OLR:o
rganicloadingrate;C
ODNVFArem:non-volatilefatty
acidsasCODremove
d.
Valorization of saline wastewater 101

depends mostly on the type of wastewater. This parameter ranges fromapproximately 5.25–5.50 for cheese whey (Bengtsson et al., 2008), to 7.0 forkitchen wastes (Zhang et al., 2005), and as high as 10–11 for activated sludge(Chen et al., 2007).
When saline effluents are treated, special attention needs to be paid to biomassdevelopment together with an appropriate adjustment of the operationalconditions and salt concentrations for VFA accumulation. VFA were producedfrom molasses, by microbial communities without acclimation, up toconductivities of 90 000 µS/cm in continuously operated packed-bed biofilmreactors (PBBRs) filled with ceramic carriers (Scoma et al., 2017).
Previous studies indicate that the presence of salts does not negatively affect theVFA accumulation, achieving conversion rates like those obtained with low salineeffluents (Scoma et al., 2017). Even low pH values allowed for the obtainment of43% conversion of soluble COD to VFA in a reactor fed with mussel cookingwastewater with concentrations of 22 g NaCl/L (Fra-Vázquez et al., 2020). Inthis study the major VFA was acetic acid followed by butyric in the initialoperational stages and propionic at the end of the experimental period. Thelimited obtained conversion was due to the presence of proteins which were notconverted due to the low pH of operation.
5.2.1.2 BiopolymersUnder certain limiting operational conditions, microorganisms produce certaincompounds as extra- or intra-cellular biopolymers (Mosquera-Corral et al., 2017).Extracellular compounds, named exopolymeric substances (EPS), have mainlystructural or protective functions for the biomass, in many cases helping theformation of biofilms. Additionally, cells accumulate intracellular compoundsto store carbon and energy that are used in conditions of the absence ofavailable substrate (Thomson et al., 2010). These compounds includepolyhydroxyalkanoates (PHA), triacylglycerides (TAG) and polyglucose (PG)among others.
5.2.1.2.1 Exopolymeric substances (EPS)
Microorganisms excrete exopolymeric substances in conditions of stress such as thepresence of salts, etc. (Chen et al., 2018b). Thus, EPS have a preserving function onthe microbial cells protecting them from the presence of damaging environmentalconditions like inhibitory compounds. These adverse environments include theexistence of high salinity conditions from which these EPS protect the cells(Chen et al., 2018b; Zeng et al., 2016). Although this effect does not alwaysoccur. In the case of anaerobic granular biomass, the salinity hinders theproduction of EPS (Ismail et al., 2010).
Most of the EPS are produced independently of the salinity of the wastewater.Those associated with the presence of salt are not frequent. In this sense, Xue
Treatment and Valorisation of Saline Wastewater102
et al. (2019) obtained bioactive sulphated polysaccharides (SP) (fucoidan,carrageenan and heparin) from activated sludge collected from laboratory andfull-scale reactors treating saline sewage containing sulphates. SP aresulphur-containing macromolecules widely used as industrial feedstock. Theyields obtained by Xue et al. (2019) were of 342.8+ 0.3 and 418.1+ 0.4 gSP/kg VSS (VSS stands for volatile suspended solids) from sludge coming froma laboratory and a full-scale reactor, respectively. The types and contents of theobtained SP were highly influenced by the operating conditions that need to befurther assessed to develop the recovery process.
Although information about these processes applied to saline wastewater is notavailable for all products obtainment the potential for EPS to be generated fromsaline wastewater has been already proven (Ajao et al., 2019).
5.2.1.2.2 Polyhydroxyalkanoates (PHA)
Polyhydroxyalkanoates are compounds with physical-chemical properties like thoseof the plastics from petroleum origin. They are generally co-polymers ofhydroxybutyrate (HB) and hydroxyvalerate (HV) monomers at different ratios.PHA are biodegradable and they are produced from bacterial cultures and usingorganic compounds, like certain wastes, as a substrate. For this reason, they arecalled bioplastics and are expected to substitute conventional plastics in the future.
Many types of microorganisms accumulate PHA in the interior of the cells asstorage compounds, which serve as internal energy and carbon reserves, to beused when organic matter is not available in the liquid media. PHA are producedin aerobic conditions mainly from VFA, in preference to butyrate, lactate oracetate. In this way VFA that are in liquid phase are accumulated inside themicrobial cells. This is a procedure which concentrates the organic matter presentin the wastewater. However, using substrates like glycerol means the previousVFA production can be omitted as this compound can be used directly for PHAstorage in a mixed microbial culture (Moralejo-Gárate et al., 2011).
The production of PHA in halophilic conditions has been studied extensively insystems based on pure cultures (Quillaguamán et al., 2010). Nevertheless,information is scarce regarding PHA obtainment from saline effluents and withnon-pure cultures (Argiz et al., 2020; Palmeiro-Sánchez et al., 2016a, 2016b)(Table 5.2). The use of halophilic mixed cultures presents several advantages. Onthe one hand, non-sterile conditions are feasible, as saline conditions hinderthe activity of competing non-halophilic organisms (Tan et al., 2011), and wastestreams can be used as a substrate. On the other hand, the fact thatPHA-accumulating mixed cultures grow in halophilic conditions is beneficial asit may facilitate further biopolymer extraction by provoking the cells lysis afterexposing them to distilled water, which avoids the use of solvents (Pramaniket al., 2012). In these conditions operational costs decrease compared to thoseprocesses based on pure cultures. However, some drawbacks need to beovercome when dealing, for example, with saline fish canning wastewater, such
Valorization of saline wastewater 103

Table
5.2
PHAaccumulatio
nstud
ieswith
microbialm
ixedcu
ltures(M
MC)usingsa
lineindu
stria
lwastewaterstreamspreviously
acidified.P
rovidedresu
ltsco
rresp
ondto
theaccumulatio
nstep.
Waste
Fed
NaCl
(g/////L)
Temperature
(°C)
Yield
HB:
HV(%
)Max.P
HA
(wt%
)Referen
ce
Cmol
HB/////Cmol
VFA
Cmol
HV/////Cmol
VFA
Syn
thetic
media
0 7 13
20
30
0.529
0.462
0.523
0.556
0.191
0.164
0.128
0.063
2.71
3.13
4.67
6.37
53
34.6
17.4
8.9
Palm
eiro
-Sánch
ez
etal.(2016
a)
Pre-acidifiedco
oke
dmusselp
roce
ssing
industry
12
30
0.538
0.192
70:30
60
Argizetal.(2020)
HB:H
ydroxybutyrate;HV:Hyd
roxyva
lerate;P
HA:Polyhy
droxyalkan
oates.
Treatment and Valorisation of Saline Wastewater104

as the fact that the amount of stored biopolymer decreases due to the presence ofsalt and the monomers composition significantly changes (Palmeiro-Sánchezet al., 2016a).
In all the research studies using saline waste effluents, the PHA productiontook place using mixed microbial cultures (MMC). Furthermore, the appliedprocess is a three-unit system (Valentino et al., 2017). This system comprises anacidification unit to produce the VFA mixture. The obtained VFA-rich stream isthen the substrate for the further two steps: the second one to enrich thePHA-accumulating mixed culture and the third one to evaluate the maximalPHA-accumulation capacity of the previous mixed culture (Mosquera-Corralet al., 2017).
The enrichment of the MMC can take place by applying two different strategies:i) applying aerobic dynamic feeding to establish the feast/famine regime byalternating conditions of the presence/absence of substrate in the liquid media(Johnson et al., 2009); ii) alternating anaerobic/aerobic conditions to select forpolyphosphate- (PAO) and glycogen-accumulating organisms (GAO) (Serafimet al., 2008). The latter allows for low storage percentages of approximately20 wt%.
To enhance PHA accumulation from saline wastewater the implementation of asettling stage after the feast phase in the enrichment unit was assessed. An increasefrom 40 to 60% of maximum PHA accumulation was observed, along with an effecton the co-polymer composition, and HV proportion rose from 17 to 30% (Argizet al., 2020).
The last step of the process comprises the subsequent accumulation step wherethe MMC operates under nutrient limiting conditions to restrict biomass growthwhile the biopolymer accumulation is maximized. The maximal accumulationcapacity of the biomass depends on the used substrate and the operationalconditions imposed. For this reason, an adequate stream to be used as substraterequires careful selection to achieve, both, the correctly enriched culture and thelarge PHA accumulation yields (Rodriguez-Perez et al., 2018).
Examples of mixtures of VFA produced from saline waste streams potentiallyappropriated for PHA storage are provided in Table 5.1. Their use diminishesPHA production costs by 50% (Jiang et al., 2016) as the cost of the substraterepresents 40% of the total PHA-production cost, according to Choi and Lee(1997), and non-sterile operational conditions are acceptable.
The produced PHA can be used as bioplastics, as feedstock for biofuelproduction and the production of chemicals like acrylate and propene (Gao et al.,2011), or as a carbon source for denitrification (Santorio et al., 2019).
With regard to the PHA, its sale price depends on the monomer composition andit usually varies in a range of 2.5–5.0 €/kg which is much lower than the price in thelast decade (10–12 €/kg) (Valentino et al., 2017). This price decreases with time asthe production processes are improving, although there is still a long way to run tothe meet the price of 1.0 €/kg corresponding to the petroleum-based plastics. For
Valorization of saline wastewater 105

this reason, exploring the use of cheap organic carbon sources together with efficientand environmentally friendly processes is needed.
5.2.1.2.3 Triacylglycerides (TAG)
Triacylglycerides are storage compounds produced by eukaryotic microorganisms,plants, or yeasts, and to a less extent by bacteria (Álvarez, 2016). Oleaginousmicroorganisms can accumulate more than 20% of their weight as TAG. Like thecase of PHA, these organisms use them as storage compounds for energy andcarbon source to be used in periods of stress. The interest in TAG has increasedlately due to their potential use in the production of biodiesel. Although theyhave been obtained from different feedstocks, like glycerol or agro-industrialresidues (molasses, whey, olive mill), scarce information is available for theirproduction from saline substrates. Fra-Vázquez et al. (2018) produced TAG fromcrude glycerol containing 14.5 g Na+/L.
Operational conditions such as carbon to nitrogen ratio, oxygen concentration,and substrate addition strategy affect the lipid accumulation (Kosa andRagauskas, 2011).
5.2.2 Nutrient recoveryMany types of salt-containing wastewater also contain large concentrations ofnutrients, nitrogen and phosphorus, which aside from being removed can berecovered (Guerreiro et al., 2020). In particular, phosphorus is obtained fromrocks located in certain places in the world. It is a limited resource and, for thisreason, its obtainment from other sources is under exploration. Among the mostcommonly applied processes to recover phosphorus from wastewater are thosephysical-chemical methods based on precipitation. Some of them are based onorthophosphate precipitation with lime, aluminium, iron, or magnesium salts.Among the latter, the precipitation of struvite (MgNH4PO4 · 6 H2O), whichcontains nitrogen and phosphorus in the molecule, is an interesting option. Thisproduct has fertilizer potential (Ghosh et al., 1996) and its commercialization islikely to increase due to the recent changes in the European Union regulations onfertilizing products. The new regulations consider struvite produced fromwastewater, if it accomplishes certain composition requirements, as one of theseproducts (Regulation (EU) 2019/1009).
The struvite precipitation process from wastewater requires the addition of amagnesium (Mg) source (magnesium hydroxide, magnesium chloride or bitter(Crutchik and Garrido, 2011)). The cost of these compounds affects the final costof the produced struvite. To reduce the struvite production costs, seawater thatcontains over 1 g Mg/L was explored as a source of Mg (Crutchik and Garrido,2011; Matsumiya et al., 2000). Matsumiya et al. (2000) tested seawater as a Mgsource to precipitate struvite from urban wastewater and observed that largeMg/P ratios (over 1.5) enhanced P removal while the increased ion concentration
Treatment and Valorisation of Saline Wastewater106

due to seawater did not affect the treatment process. When seawater addition wasexplored to crystallize struvite from fish canning wastewater its dosage andammonium to phosphate ratio (molar ratio of 4) were identified as relevantfactors affecting quality and efficiency, respectively (Crutchik and Garrido, 2011).
Some authors also claim that nutrients can be recovered by biomassproduction in microalgae systems like those based on Spirulina platensis (Zhouet al., 2017).
In other cases, the potential of the biosolids produced from treatment of industrialwastewater to be used as fertilizers has been explored and is increasing inapplication. As an example, the sludge obtained from the physical-chemicaltreatment (based on the addition of 75 g CaCO3/L+ 1 g FeCl3/L) of cheesemanufacturing wastewater presented pH values between 5.5 and 8.5 and ECvalues below 3 000 µS/cm, and as a consequence was suitable for agriculturalvalorization (Guerreiro et al., 2020).
5.2.3 Salts recoveryApart from organic matter and nutrients, salts also need to be removed fromwastewater except in some cases where it is treated to be discharged to the sea.Different technologies have been tested to remove salts from wastewater (Kim,2011). Some of them have already been applied for seawater desalination orbrine concentration.
Salts present in different types of liquid flows like seawater treated fordesalination, oil and gas production processes, and the food processing industrywhen separation produces brines. In all these cases the concept of zero liquiddischarge (ZLD) is considered to guarantee the appropriate management of theproduced effluents to obtain high-quality freshwater without the necessity todischarge a liquid flow. This approach includes conventional wastewatertreatment systems based on physical-chemical (clarification, precipitation,coagulation-flocculation and filtration) and biological processes, membranetechnologies (micro, ultra and nanofiltration and reverse osmosis), thermaltechnologies for brine treatment (evaporation) and crystallization.
The train of technologies to apply is defined depending on the characteristics ofthe wastewater (flow and composition) and the requirements of the producedfreshwater, etc. (Kim, 2011). They aim to recover salts and produce reusablewastewater.
Technologies for salt separation are based on thermal treatments (i.e.evaporation, thermal crystallization, spray drying), membrane technologies (i.e.reverse osmosis, nanofiltration, electrodialysis), etc.
Concentrated brine is obtained from the thermal crystallization of highly salinewater (100–200 g TS/L) by removing the water (Chen et al., 2018a). Salts likemagnesium hydroxide, sodium chloride, calcium carbonate, sodium sulphate,calcium chloride, etc. can be recovered from brine obtained from the application
Valorization of saline wastewater 107

of nanofiltration and reverse osmosis systems which help to improve the economicsof the separation processes (Bazedi et al., 2013; Kim, 2011).
In the case of the dairy industry, with salinities close to seawater, depending onthe product the salt might be at high concentrations, as is the case in cheeseproduction where sodium chloride salts are applied to the product to reduce wateractivity during the curd (Chen et al., 2018a).
The energy consumption associated with the different commercial technologiesapplied to the treatment of saline wastewater for salt separation is widely variableand increases exponentially with increasing salinity concentration of theprocessed stream; however, treatment costs do not experience the same tendency(Chen et al., 2018a). As an example, Kim (2011) estimated that the production ofCaCO3, NaCl and MgSO4 · 7 H2O by nanofiltration or membrane crystallizationcosts $18/t, while using the Dow chemical process the cost of magnesiumproduction was of $14,146/t. Magnesium is very expensive. Thus, whether theapplied processes are viable or not relies on the sale price of the recovered product.
5.2.4 Energy recoveryBiogas is produced during anaerobic digestion of varying types of wastewatercontaining biodegradable organic compounds and, depending on its quality(presence of impurities like H2O, CO2, H2S, NH3, etc.) and CH4 percentage, maybe utilized to generate heat or electricity on-site, sold to a local natural gasprovider, or used as fuel for vehicles. Biogas with impurities needs to besubmitted to different pre-treatments to remove those compounds that are notwanted for a specific purpose depending on the established requirements.
Methane obtainment, from saline wastewater has been previously discussed inChapter 3. Here an analysis from the point of view of the quality of the producedbiogas is performed (Table 5.3).
Depending on the composition of the wastewater the produced biogas presentsdifferent characteristics. Methane percentage in the produced biogas when salinewastewater, such as that from fish canneries, is treated ranges between 45–80%(Xiao and Roberts, 2010).
The simultaneous production of CH4 and H2 from mono-ethylene glycol (MEG)containing salt concentrations in the range of 10–35 g NaCl/L has also beenevaluated by Ali et al. (2019). These authors observed that at the same OLR theyield of methane and hydrogen slightly increased with the rise of the saltconcentration from 15 to 35 g NaCl/L. The removed OLR also augmented from70 to 80% with the salinity increase which was attributed to the biomassacclimation to the operational conditions.
When saline wastewater is digested anaerobically, apart from the inhibitoryeffect of the salts on the methanogenic activity, the formation of undesiredgaseous compounds, such as hydrogen sulphide (H2S), also takes place. For thisreason, the quality, and consequently the usefulness, of the produced biogas
Treatment and Valorisation of Saline Wastewater108

Table
5.3
Qualityofthebiogasproduce
dfrom
theanaerobictreatm
ento
fsalinewastewaterandpost-treatm
entrequire
dfor
valoriz
atio
npurpose
s.Allexp
erim
ents
were
perform
edat3
5–37°C
.
Industrial
Process
Salin
ity
(g/////L)
Experimen
t(System
Volume,
L)
OLR
kg
COD/////
(m3·d
)
Biogas
Production
(m3Biogas/////kg
CODRem
oved
)
m3CH4/////(m
3
Wastewater·d
)Methan
eContent
(%)
Sulphide
Content
(%)
Reference
Fishca
nning
5.05–
12.63
gNa+
/L
0.59–
2.7
gSO
42−/L
Full-s
cale
(15,000)
3NA
NA
NA
4.25
Omileta
l.(1995
)
Molasses
20,000–
90
000*
Laboratory
(1.7)
10
0.349m
3CH4/kg
CODrem
331
29
NA
Sco
maeta
l.(2017
)
Fishproce
ssing
20
Batch(0.25)
NA
0.49
0.2–0.5
a40–50
NA
Picos
-Benítez
eta
l.(2019)
Mono-ethylene
glyco
l(MEG)
25°C
10g
NaCl/L
Laboratory
(ISABR,2
2.5)
0.64
0.165m
3CH4/kg
CODadded
0.102m
3H2/kg
CODadded
0.105m
3
CH4/(m
3·d
)0.065m
3
H2/(m
3·d
)
49.51
30.74
(H2%)
19.75b
Alieta
l.(2019
)
Mono-ethylene
glyco
l(MEG)
35°C
c
15–
25g
NaCl/L
Laboratory
(ISABR,2
2.5)
0.64
0.322m
3CH4/kg
CODadded0.239m
3
H2/kg
CODadded
0.206m
3
CH4/(m
3·d
)0.153m
3
H2/(m
3·d
)
35.2
26.07
(H2%)
38.73b
Alieta
l.(2019
)
*Inelectric
alcondu
ctivity
units
(µS/cm
).aLitres
ofb
iogas/kg
CODremov
ed.
bPercentageco
rresp
ondingto
othergase
s(C
O2andH2S).
cAve
rageva
luesofexp
erim
entsperform
edwith
terrestria
landmarin
einocu
lum.ISABR:immobilize
dslud
geanaerobicbaffledreac
tor.
Valorization of saline wastewater 109
diminishes. The H2S generates problems of corrosion and cannot be directlysupplied to boilers for energy production due to the generation of SOx in theexhaust gases. For this reason, before biogas utilization the removal of thiscompound is generally required.
As an example, Omil et al. (1995) measured concentrations of H2S of 4.25% inthe biogas at pH values of 7.25 and concentrations of 500 mg S/L of sulphidedissolved in the liquid phase, when the ratio of COD:SO4
2− was 7 g/g.Depending on the final use of the biogas and its H2S concentration, a treatment to
remove this compound could be required. The recommended percentage of H2S inthe produced biogas to be used for direct combustion is of 0.02 to 0.05% w/w(Khoshnevisan et al., 2017). This removal generally takes place by air/oxygendosing of the biogas, iron chloride addition to the digester slurry, or adsorptionon iron oxide pellets or liquids, which are relatively expensive technologies dueto the chemical products employed and the management of the producedchemical waste. More recent developments are based on bio scrubbers orbiotrickling filters (Khoshnevisan et al., 2017) where microorganisms areresponsible for the H2S removal.
Furthermore, water must be removed too in all cases as in combination with H2Sit forms acidic compounds which are corrosive. Water, foam and dust are removedsimultaneously via condensation, drying by cooling, adsorption to silica or usingglycol when the gas is to be applied as natural gas or vehicle fuel. In the case ofsmall-sized AD plants, moisture or water traps are applied.
Also, the CO2 needs to be removed, as it is a non-combustible compound, when itis going to be used for electricity production in some gas engines or injected in thenatural gas network. When biogas is used for direct heating in gas boilers itspresence is not a problem. Finally, dust is also a problematic pollutant whichmust be removed.
5.3 WATER REUSE POTENTIALAs the volume of water accounts for the largest fraction in the wastewatercomposition, one of the most common approaches for reuse of reclaimed waterrelies on the removal, recovery or separation of the pollutants to generate aneffluent with the required quality for valorization. Wastewater from both urbanand industrial origin can be treated for reuse. When wastewater contains salts, thetreatments indicated in Section 5.2.3 are used and a fraction of brine is producedsimultaneously to the reclaimed wastewater. Of course, apart from the salts alsopathogens, toxic compounds (as micropollutants) and eventually nutrients have tobe removed to reach required limits.
5.3.1 Reuse alternativesFor reuse purposes the salt present in the wastewater is a limiting parameter as it isnot removed by the treatment processes of wastewater treatment plants (WWTPs).
Treatment and Valorisation of Saline Wastewater110

Therefore, when it exceeds the concentration limit for reuse the implementation of apost-treatment to remove it from the final effluent is required. In these cases,membrane treatments like those based on reverse osmosis (RO) are commonlyapplied.
When appropriate conditions are achieved, reclaimed water, produced aftersecondary or tertiary treatments in wastewater treatment plants, can be used fordifferent purposes such as irrigation, groundwater recharge, recreational uses,urban/domestic uses, indirect potable reuse, industrial uses, environmental uses,etc. (Table 5.4). The utilization of reclaimed water as a resource increases thewater supply by 17–30% in small countries like Israel and Malta (Hochstratet al., 2008).
Compared to the obtainment of water from seawater desalination plants fornon-potable applications, the use of reclaimed wastewater is less expensive as itsproduction requires less energy consumption (Meneses et al., 2010). To reusereclaimed wastewater, apart from the implementation of appropriate treatmentprocesses, building of the distribution system is required. Thus, costs associatedwith elements like pipes, tanks, reservoir pumps, etc. must be considered toevaluate the feasibility of this option.
The reuse activities differ depending on the region of the world and as anexample agricultural irrigation is the main reuse option in Europe while inAustralia industrial reuse is the most common (Hochstrat et al., 2008). The mostcommon uses for reclaimed wastewater are agricultural irrigation, groundwaterrecharge, and industrial uses, and, for this reason, they will be discussed in thefollowing sections.
5.3.1.1 Agricultural irrigationAgricultural irrigation is the most frequent use for regenerated wastewater beingthe activity that consumes by far the most water. Planned irrigation withreclaimed wastewater in Spain has been a frequent practice since the secondhalf of the last century (Jodar-Abellan et al., 2019) and it is also widespread allover the world (Cherif et al., 2013; Darwish et al., 2015). In countries such asQatar 92% of groundwater abstraction is used for agricultural purposes(Darwish et al., 2015). Irrigation with saline water exerts negative effects onvegetables such as decreasing water uptake into the plant, causing toxicity tothe plant, and altering soil structure and permeability (Kathijotes andPanayiotou, 2013). However, it was reported that the irrigation of grapefruittrees, using drip irrigation, for four years with saline reclaimed wastewater,from a WWTP including an UV tertiary treatment, did not significantly affectthe plant production or fruit quality compared to the use of river irrigationwater (Pedrero et al., 2013). These authors report on the possible riskoccurrence of soil salinization due to medium and long-term use of boron andsalt-containing wastewater.
Valorization of saline wastewater 111

Table
5.4
Reuse
exa
mplesofreclaim
edsa
linewastewaterfrom
urbanandindustria
lorig
in.
Sourceof
Reclaim
ed
Wastewater
Scale
Salin
ityof
Reclaim
edWater
(g/////L)
Treatm
entforRecovery
TypeofValoriza
tion
Reference
Agriculturalirrigation
Urbanwastewater
Full-scale
3,000–
4,000
µS/cm
Tertiary
treatm
ent(U
V)
Drip
irrigatio
nof
grapefruittrees
Pedrero
etal.
(2013)
Urbanwastewater
Full-scale
2,311
2,311
57.09µS/cm
CFF+UV
CFF+UF
CFF+UF+RO
Exceptforfresh
food
Allagric
ultu
ralu
ses
Allagric
ultu
ralu
ses
Melgarejo
etal.
(2016)
Urbanwastewater
Full-scale
2.7
µS/cm
UF+UV(w
henneeded)
Tomato
fruits
and
broccoliheads
Libutti
etal.(2018)
Fishproce
ssing
Laboratory
0–25gNaCl/L
Biologicala
erobic
treatm
ent
Liquid
fertilize
rChingand
Redzw
an(2017)
Cheese
manufacturin
gLaboratory
4,880µS/cm
Physical-c
hemical
CaCO
3+FeCl 3,FeSO
4or
Ca(O
H) 2
Potentia
lagric
ultu
ral
irrigatio
nGuerreiro
etal.
(2020)
Petroch
emicalo
ilyww
Laboratory
27,345–38,350
µS/cm
Forw
ard
Osm
osis(FO)
Dire
ctfertigatio
nSahebie
tal.(2020)
(Continued)
Treatment and Valorisation of Saline Wastewater112

Table
5.4
Reuse
exa
mplesofreclaim
edsa
linewastewaterfrom
urbanandindustria
lorig
in(C
ontin
ued).
Sourceof
Reclaim
ed
Wastewater
Scale
Salin
ityof
Reclaim
edWater
(g/////L)
Treatm
entforRecovery
TypeofValoriza
tion
Reference
Aquiferrecharge
Urbanwastewater
Full-scale
1.8–5.4
gsa
linity/L
Low-lo
adactivatedsludge
plus3infiltratio
nponds
Protect
theaquife
ragainst
marin
eintrusions
Cherif
etal.(2013)
Urbanuses
Urbanwastewater
Full-scale
2,311
2,311
57.09µS/cm
CFF+UV
CFF+UF
CFF+UF+RO
Residentia
land
urbanse
rvices
Urbanse
rvices
Urbanse
rvices
Melgarejo
etal.
(2016)
Industrialapplic
ation
Powerp
lante
ffluents
Full-scale
975–
3,475µS/cm
Tubularreve
rseosm
osis
Plantp
roce
ssSch
utte
eta
l.(1987)
Full-scale
Electrodialysisreve
rsal
Plantp
roce
ss
Tannery
Full-scale
140–740
RO
Plantp
roce
ssRanganathanand
Kabadgi(2011
)
Fishca
nning
wastewater
Laboratory
4,730–
24,800
µS/cm
Tertiary
treatm
ent
Filtratio
n,RO,UV
Plantp
roce
ssCris
tóvã
oetal.
(2015)
CFF=Coag
ulatio
n+flo
cculatio
n+filtratio
n.
Valorization of saline wastewater 113

Research studies performed to evaluate the use of reclaimed wastewater, from aWWTP with seawater intrusions (3.75 mS/cm), for irrigation indicated that thelevels of salts, EC and the sodium absorption ratio (SAR) increased in all layersof the soil while this did not happen when using freshwater (Kathijotes andPanayiotou, 2013). According to these authors soils irrigated with wastewaterbecome saline with time, thus the quality of effluents from WWTPs must becarefully monitored.
Reclaimed water can be used not only to supply water but also for fertigation(application of fertilizer with drip irrigation) to provide nutrients (nitrogen andphosphorus and potassium) to the crops. Therefore, tertiary treatment for nutrientremoval in the WWTP is not needed and wastewater can go from the secondarytreatment directly to the disinfection step. Salt removing technologies like RO,which are expensive, are not recommended either as they remove nutrients aswell. So, salts remain in the wastewater. Although reclaimed water appropriatefor this use is obtained, some organizational and technological limitations,associated with the stringent normative requirements, need to be solved toextensively implement this valorization option (Chojnacka et al., 2020).According to these authors the hypersalinity and sodium toxicity risks areimportant parameters of the wastewater and, associated with them, sodiumcontent should be monitored to guarantee the effective removal of salt from theplant root zones. Melgarejo et al. (2016) evaluated three treatment tertiarytreatments for wastewater with EC values of 2,300 µS/cm including UF(ultrafiltration) and RO (Table 5.4) and determined that irrigation was feasible forthe three cases.
Although the most frequently used reclaimed wastewater for irrigation andfertigation is that from urban origin, industrial wastewater has also been used forthese purposes.
The reclaimed water from the agro-industry appears to be an option for irrigationof vegetable crops. As an example, Libutti et al. (2018) reused 10 000 m3/ha ofwater and successfully subsequently irrigated tomato and broccoli crops during aperiod of 1.5 years and managed to save 6 000 m3/ha per year. These authorssuccessfully applied the water coming from the tertiary treatment of the WWTPcomprising a UF and subsequent UV unit with an EC of 2.7 µS/cm.
Guerreiro et al. (2020) succeeded in obtaining water suitable for agricultureirrigation by applying a coagulation-flocculation post-treatment to cheesemanufacturing wastewater, containing organic matter and nutrients, with an ECof 4,880 µS/cm.
In another study Ching and Redzwan (2017) already pointed out the opportunityfor reuse of treated fish processing wastewater containing different saltconcentrations as liquid fertilizer, containing nitrogen, proteins and phosphorus,in Malaysia; however, they highlighted the necessity of further studies to evaluateits feasibility as a fertilizer and potential effect on irrigated soil, plants and yieldsof crops.
Treatment and Valorisation of Saline Wastewater114
More recently the use of forward osmosis (FO) has been tested for the treatmentof petrochemical oily wastewater containing as average concentrations 1,020 mgCOD/L, 118 mg BOD5/L (BOD5, biological oxygen demand measured after 5days), 64 mg TSS/L (TSS, total suspended solids) and 32,848 µS/cm (as sodiumsalts). Potassium chloride was used as the draw solution for the FO due to itscapability for pure water draw (Phuntsho et al., 2011), and its direct use forfertigation was evaluated to develop a fertilizer drawn forward osmosis (FDFO)(Sahebi et al., 2020). With this technology 40% of the water volume wasreclaimed without the need to apply any hydraulic pressure.
5.3.1.2 Groundwater rechargeMore than half of the biggest cities in the world, those with more than 10 millioninhabitants, depend on groundwater extraction from aquifers which are submittedto abstraction of large water volumes (Werner et al., 2013). These authorsidentified the groundwater extraction and population as factors affecting thegroundwater depletion, and identified China, Spain, Mexico, the USA, andPakistan as nations with the largest groundwater depletion. In countries like Israelthe effluent from the WWTPs is injected into the groundwater to replenish thosebodies submitted to freshwater extraction. Although in general this action is takento reduce salinity from the groundwater by recharging the aquifers withnon-saline treated municipal wastewater (Horriche and Benabdallah, 2020).
Groundwater can be recharged by surface spreading or direct injection to theaquifer (Asano and Cotruvo, 2004). In the first case effluents from WWTPspercolate from the discharge point to the aquifer and the water quality improvesdue to the filtration process. In the second option water with high quality isinjected deeply into the aquifer with no intermediate percolating step.
Thus, recharge of aquifers with reclaimed wastewater needs to consider thecharacteristics of the groundwater. For example, aquifers located on the coastlinecan be replenished with low quality wastewater just to prevent seawaterintrusions due to over abstraction practices (Franks et al., 2007; Hussain et al.,2017), while those placed inland where potable water can be extracted requirehigh quality water.
Uses of water from aquifers, such as potable water, animal drinking andagricultural irrigation, define its required quality.
Cherif et al. (2013) evaluated the replenishment of an aquifer with a salinity of8.5 g/L, to act as a barrier against marine intrusions, with treated water with asalinity of 1.8–5.4 g/L, depending on the season, using three infiltration basins toretain suspended solids, oxidize organic matter and nitrogen, and removepathogens. In this study samples of groundwater were collected for three yearsand a significant decrease of salinity, to 0.5–1.5 g/L, was observed in the areaclose to the recharge plant, however contamination of nitrate and pathogens wasnot yet solved.
Valorization of saline wastewater 115

5.3.1.3 Industrial reuseAmong the reuse alternatives of industrial effluents are reutilization in the industrialproduction process, which is quite a rare option, or use in refrigeration towers, asboiler fed water and for external area cleaning or irrigation. In this way industrialfacilities manage to decrease the water consumption of the production processwhich reduces operational and waste management costs. Although it is not athoroughly explored option, some studies have evaluated treated industrialeffluent for reuse (Table 5.4).
Schutte et al. (1987) managed to recycle, from a full-scale power plant,approximately 70% of the wastewater using tubular reverse osmosis (TRO) toreturn it to the cooling water loop, and 90% using electrodialysis reversal (EDR)to be reused in the process for different purposes including as feed to the boilerfeedwater demineralization plant.
Ranganathan and Kabadgi (2011) monitored the performance of RO systems inoperation in five different tannery facilities producing wastewater characterized byEC values of 6 000–15 900 µS/cm. The resulting permeate from the RO had an ECvalue of 140–740 µS/cm and approximately 70–85% of the wastewater from theindustrial operation was able to be recycled. In this case, the RO rejects wereevaporated and landfilled in a secure site.
Reuse of treated wastewater has been evaluated not only in the chemical industrybut also in the agro-food industry. In this sense, Cristóvão et al. (2015) evaluated theproduction of water of sufficient quality to be used in a fish canning factory after thetreatment of the wastewater generated by the facility. However, they did not specifyfor which use. The wastewater from the fish cannery was submitted to a tertiarytreatment comprising filtration, RO and UV steps resulting in a decrease in theEC value of 99.1%.
5.4 CONCLUSIONSOptions for wastewater valorization are diverse and include product obtainment andwater reclamation. Many of them are technically, economically, andenvironmentally feasible but their implementation at industrial scale is limited bythe applicable legislation and public engagement.
Water reclamation is increasing in importance in those countries with waterscarcity in particular to fulfil agricultural irrigation needs. This kind of reuserelies on the existence of a WWTP with appropriate treatment to provide aneffluent with sufficient quality for this purpose. This implies that countries with alack of freshwater resources, like Qatar (Darwish et al., 2015), are increasing thevolume of wastewater submitted to treatment and consequently the number ofWWTPs. Costs associated with the construction of the reclaimed waterdistribution system must be considered.
Treatment and Valorisation of Saline Wastewater116

REFERENCESAjao V., Millah S., Gagliano M. C., Bruning H., Rijnaarts H. and Temmink H. (2019).
Valorization of glycerol/ethanol-rich wastewater to bioflocculants: recovery,properties, and performance. Journal of Hazardous Materials, 375, 273–280.
Ali M., Elreedy A., Ibrahim M. G., Fujii M. and Tawfik A. (2019). Hydrogen and methanebio-production and microbial community dynamics in a multi-phase anaerobic reactortreating saline industrial wastewater. Energy Conversion and Management, 186, 1–14.
Alvarez H.M. (2016). Triacylglycerol and wax ester-accumulating machinery in prokaryotes.Biochimie, 120, 28–39.
Argiz L., Fra-Vázquez A., Val del Río A. andMosquera-Corral A. (2020). Optimization of anenriched mixed culture to increase PHA accumulation using industrial saline complexwastewater as a substrate. Chemosphere, 247, 125873.
Asano T. and Cotruvo J. A. (2004). Groundwater recharge with reclaimed municipalwastewater: health and regulatory considerations. Water Research, 38, 1941–1951.
Atasoy M., Owusu-Agyeman I., Plaza E. and Cetecioglu Z. (2019). Bio-based volatile fattyacid production and recovery from waste streams: current status and future challenges.Bioresource Technology, 268, 773–786.
Bazedi G. A., Ettouney R. S., Tewfik S. R., Sorour M. H. and El-Rifai M. A. (2013). Saltrecovery from brine generated by large-scale seawater desalination plants.Desalination and Water Treatment, 52, 4689–4697.
Bengtsson S., Hallquist J., Werker A. and Welander T. (2008). Acidogenic fermentation ofindustrial wastewaters: effects of chemostat retention time and pH on volatile fattyacids production. Biochemical Engineering Journal, 40, 492–499.
Cervantes F. J. and Pavlostathis S. G. (2006). Strategies for industrial water pollution control(Chapter 1). In: Advanced Biological Treatment Processes for Industrial Wastewater,F. J. Cervantes, S. G. Pavlostathis and A. C. van Haandel (eds), IWA Publishing,London, UK, 1–15.
Chen Y., Jiang S., Yuan H., Zhou Q. and Gu G. (2007). Hydrolysis and acidification of wasteactivated sludge at different pHs. Water Research, 41(3), 683–689.
ChenG.Q., Gras S. L. andKentish S. E. (2018a). Separation technologies for salty wastewaterreduction in the dairy industry. Separation and Purification Reviews, 00, 1–29.
Chen Y., He H., Liu H., Li H., Zeng G., Xia X. and Yang C. (2018b). Effect of salinity onremoval performance and activated sludge characteristics in sequencing batchreactors. Bioresource Technology, 249, 890–899.
Cherif S., El Ayni F., Jrad A. and Trabelsi-Ayadi M. (2013). Aquifer recharge by treatedwastewaters: Korba case study (Tunisia). Sustainable Sanitation Practice, 14, 41–48.
Ching Y. C. and Redzwan G. (2017). Biological treatment of fish processing salinewastewater for reuse as liquid fertilizer. Sustainability, 9(1062), 1–26.
Choi J. I. and Lee S. Y. (1997). Process analysis and economic evaluation for poly(3-hydroxybutyrate) production by fermentation. Bioprocess Engineering, 17(6),335–342.
Chojnacka K., Witek-Krowiak A., Moustakas K., Skrzypezak D., Mikula K. and LoizidouM.(2020). A transition from conventional irrigation to fertigation with reclaimedwastewater: prospects and challenges. Renewable and Sustainable Energy Reviews,130, 109959.
Valorization of saline wastewater 117

Cristóvão R. O., Botelho C. M., Martins R. J. E., Loureiro J. M. and Boaventura R. A. R.(2015). Fish caning industry wastewater treatment for water reuse – a case study.Journal of Cleaner Production, 87, 603–612.
Crutchik D. and Garrido J. M. (2011). Struvite crystallization versus amorphous magnesiumand calcium phosphate precipitation during the treatment of a saline industrialwastewater. Water Science and Technology, 64(12), 2460–2467.
Crutchik D., Morales N., Vazquez-Padin J. R. and Garrido J. M. (2017). Enhancement ofstruvite pellets crystallization in a full-scale plant using an industrial grademagnesium product. Water Science and Technology, 75(3–4), 609–618.
Dahiya S., Sarkar O., SwamyY. V. andMohan S. V. (2015). Acidogenic fermentation of foodwaste for volatile fatty acid production with co-generation of biohydrogen. BioresourceTechnology, 182, 103–113.
Darwish M., Abdulrahim H., Mabrouk A. N., Hassan A. and Shomar B. (2015). Reclaimedwastewater for agriculture irrigation in Qatar. Global Journal of Agricultural Researchand Reviews, 3(1), 106–120.
De Vrieze J., Christiaens M. E. R., Walraedt D., Devooght A., Ijaz U. Z. and Boon N. (2017).Microbial community redundancy in anaerobic digestion drives process recovery aftersalinity exposure. Water Research, 111, 109–117.
Franks R., Bartels C. R. and Andes K. (2007). Implementing energy saving RO technology inlarge scale wastewater treatment plants. IDA World Congress-Maspalomas, GranCanaria, 21–26 October.
Fra-Vázquez A., Pedrouso A., Palmeiro-Sánchez T., Moralejo-Gárate H. andMosquera-Corral A. (2018). Feasible microbial accumulation of triacylglyceridesfrom crude glycerol. Journal of Chemical Technology and Biotechnology, 93,2644–2651.
Fra-Vázquez A., Pedrouso A., Val del Río A. and Mosquera-Corral A. (2020). Volatile fattyacid production from saline cooked mussel processing wastewater at low pH. Science ofthe Total Environment, 732, 139337.
Gao X., Chen J. C., Wu Q. and Chen G. Q. (2011). Polyhydroxyalkanoates as a source ofchemicals, polymers, and biofuels. Current Opinion in Biotechnology, 22, 768–774.
Ghosh G. K., Mohan K. S. and Sarkar A. K. (1996). Characterization of soil-fertilizer Preaction products and their evaluation as sources of P for gram (Cicer arietinum L.).Nutrient Cycling in Agroecosystems, 46(1), 71–79.
Guerreiro R. C. S., Jerónimo E., Luz S., Pinheiro H. M. and Prazeres A. R. (2020). Cheesemanufacturing wastewater treatment by combined physicochemical processesfor reuse and fertilizer production. Journal of Environmental Management, 264,110470.
Guest J. S., Skerlos S. J., Barnard J. L., Beck M. B., Daigger G. T., Hilger H., Jackson S. J.,Karvazy K., Kelly L., Macpherson L., Mihelcic J. R., Pramanik A., Raskin L., vanLoosdrecht M. C. M., Yeh D. and Love N. G. (2009). A new planning and designparadigm to achieve sustainable resource recovery from wastewater. EnvironmentalScience & Technology, 43(16), 5.
Hochstrat R., Wintgens T. and Melin T. (2008). Development of integrated water reusestrategies. Desalination, 218, 208–217.
Horriche F. J. and Benabdallah S. (2020). Assessing aquifer level and salinity for a managedartificial recharge site using reclaimed water. Water, 12(2), 341–352.
Treatment and Valorisation of Saline Wastewater118
Hussain M. S., Javadi A. A. and Sherif M. M. (2017). Cost-efficient management of coastalaquifers by recharging with treated wastewater. International Journal of Hydrology, 1(6), 183–185.
Ismail S. B., de La Parra C. J., Temmink H. and van Lier J. B. (2010). Extracellular polymericsubstances (EPS) in upflow anaerobic sludge blanket (UASB) reactors operated underhigh salinity conditions. Water Research, 44, 1909–1917.
Jiang G., Hill D. J., Kowalczuk M., Johnston B., Adamus G., Irorere V. and Radecka I.(2016). Carbon sources for polyhydroxyalkanoates and an integrated biorefinery.International Journal of Molecular Sciences, 17(7), 1157–1178.
Jodar-Abellan A., López-Ortiz M. I. and Melgarejo-Moreno J. (2019). Wastewater treatmentand water reuse in Spain. Current situation and perspectives. Water, 11(8), 1551–1574.
Johnson K., Jiang Y., Kleerebezem R., Muyzer G. and van Loosdrecht M. C. M. (2009).Enrichment of a mixed bacterial culture with a high polyhydroxyalkanoate storagecapacity. Biomacromolecules, 10(4), 670–676.
Kathijotes N. and Panayiotou C. (2013). Wastewater reuse for irrigation and seawaterintrusion: evaluation of salinity effects on soils in Cyprus. Journal of Water Reuseand Desalination, 3(4), 392–401.
Khoshnevisan B., Tsapekos P., Alfaro N., Díaz N., Fdz-PolancoM., Rafiee S. and AngelidakiI. (2017). A review on prospects and challenges of biological H2S removal from biogaswith focus on biotrickling filtration and microaerobic desulfurization. Biofuel ResearchJournal, 16, 741–750.
Kim D. H. (2011). A review of desalting process technique and economic analysis of therecovery of salts from retentates. Desalination, 270, 1–8.
Kleerebezem R., Joosse B., Rozendal R. and Van Loosdrecht M. C. M. (2015). Anaerobicdigestion without biogas? Reviews in Environmental Science and Bio/Technology, 14(4), 787–801.
Kosa M. and Ragauskas A. J. (2011). Lipids from heterotrophic microbes: advances inmetabolism research. Trends in Biotechnology, 29(2), 53–61.
Lefebvre O. and Moletta R. (2006). Treatment of organic pollution in industrial salinewastewater: a literature review. Water Research, 40, 3671–3682.
Libutti A., Gatta G., Gagliardi A., Vergine P., Pollice A., Beneduce L., Disciglio G. andTarantino E. (2018). Agro-industrial wastewater reuse for irrigation of a vegetablecrop succession under Mediterranean conditions. Agricultural Water Management,196, 1–14.
Lin Y., de Kreuk M., van Loosdrecht M. C. M. and Adin A. (2010). Characterization ofalginate-like exopolysaccharides isolated from aerobic granular sludge in pilot-plant.Water Research, 44(11), 3355–3364.
Liu X., Dai J., Wu D., Jiang F., Chen G., Chui H.-K. and van Loosdrecht M. C. M. (2016).Sustainable application of a novel water cycle using seawater for toilet flushing.Engineering, 2, 460–469.
Matsumiya Y., Yamasita T. and Nawamura Y. (2000). Phosphorus removal from sidestreamsby crystallization of magnesiumammonium-phosphate using seawater. Journal of theChartered Institution of Water and Environmental Management, 14, 291–296.
Melgarejo J., Prats D., Molina A. and Trapote A. (2016). A case study of urban wastewaterreclamation in Spain: comparison of water quality produced by using alternativeprocesses and related costs. Journal of Water Reuse and Desalination, 6(1), 72–81.
Valorization of saline wastewater 119
Meneses M., Pasqualino J. C. and Castells F. (2010). Environmental assessment of urbanwastewater reuse: treatment alternatives and applications. Chemosphere, 81, 266–272.
Moralejo-Gárate H., Mar’atusalihat E., Kleerebezem R. and van Loosdrecht M. M. (2011).Microbial community engineering for biopolymer production from glycerol. AppliedMicrobiology and Biotechnology, 92(3), 631–639.
Mosquera-Corral A., Carvalho G., Fra-Vázquez A., Ntaikou I., Oleskowicz-Popiel P.,Palmeiro-Sánchez T., Reis M. A. and Suárez-Ojeda M. E. (2017). Recovery oforganic added value products from wastewater (Chapter 18). In: InnovativeWastewater Treatment and Resource Recovery Technologies, J. M. Lema andS. Suárez (eds), IWA Publishing, London, UK, 399–420.
Omil F., Méndez R. and Lema J. M. (1995). Anaerobic treatment of saline wastewaters underhigh sulphide and ammonia content. Bioresource Technology, 54, 269–278.
Palmeiro-Sanchez T., Fra-Vazquez A., Rey-Martinez N., Campos J. L. and Mosquera-CorralA. (2016a). Transient concentrations of NaCl affect the PHA accumulation in mixedmicrobial culture. Journal of Hazardous Materials, 306, 332–339.
Palmeiro-Sánchez T., Oliveira C. S. S., Gouveia A. R., Noronha J. P., Ramos A. M.,Mosquera-Corral A. and Reis M. A. M. (2016b). NaCl presence and purificationaffect the properties of mixed culture PHAs. European Polymer Journal, 85, 256–265.
Pedrero F., Alarcón J. J., Nicolás E. and Mounzer O. (2013). Influence of irrigation withsaline reclaimed water on young grapfruits. Desalination and Water Treatment, 51,2488. .2496.
Phuntsho S., Shon J. K., Hong S., Lee S. and Vigneswaran S. (2011). A novel low energyfertilizer driven forward osmosis desalination for direct fertigation: evaluating theperformance of fertilizer draw solutions. Journal of Membrane Science, 375, 172–181.
Picos-Benítez A. R., Peralta-Hernández J. M., López-Hincapié J. D. and Rodríguez-García A.(2019). Biogas production from saline wastewater of the evisceration process of the fishprocessing industry. Journal of Water Process Engineering, 32, 100933.
Pramanik A., Mitra A., Arumugam M., Bhattacharyya A., Sadhukhan S., Ray A., Haldar S.,Mukhopadhyay U. K. and Mukherjee J. (2012). Utilization of vinasse for the productionof polyhydroxybutyrate by Haloarcula marismortui. Folia Microbiologica, 57, 71–79.
Puyol D., Batstone D. J., Hülsen T., Astals S., Peces M. and Krömer J. O. (2016). ResourceRecovery from Wastewater by Biological Technologies: opportunities, Challenges, andProspects. Frontiers in Microbiology, 7, 2106.
Quillaguamán J., Guzmán H., Van-Thuoc D. and Hatti-Kaul R. (2010). Synthesis andproduction of polyhydroxyalkanoates by halophiles: current potential and futureprospects. Applied Microbial Biotechnology, 85(6), 1687–1696.
Rajeshwari K. V., Balakrishnan M., Kansal A., Lata K. and Kishore V. V. N. (2000).State-of-the-art of anaerobic digestion technology for industrial wastewater treatment.Renewable and Sustainable Energy Reviews, 4(2), 135–156.
Ranganathan K. and Kabadgi S. D. (2011). Studies on the feasibility of reverse osmosis(membrane) technology for treatment of tannery wastewater. Journal ofEnvironmental Protection, 2, 37–46.
Regulation (EU) 2019/1009 of the European parliament and the Council of 5 June 2019laying down rules on the making available on the market of EU fertilising productsand amending Regulations (EC) No 1069/2009 and (EC) No 1107/2009 andrepealing Regulation (EC) No 2003/2003 (OJ L 170, 25.6.2019, p. 1).
Treatment and Valorisation of Saline Wastewater120

Reis M. A. M., Serafim L. S., Lemos P. C., Ramos A. M., Aguiar F. R. and van LoosdrechtM. C. M. (2003). Production of polyhydroxyalkanoates by mixed microbial cultures.Bioprocess and Biosystems Engineering, 25(6), 377–385.
Rodriguez-Perez S., Serrano A., Pantión A. A. and Alonso-Fariñas B. (2018). Challenges ofscaling-up PHA production from waste streams. A review. Journal of EnvironmentalManagement, 205(Supplement C), 215–230.
Ruiken C. J., Breuer G., Klaversma E., Santiago T. and van Loosdrecht M. C. M. (2013).Sieving wastewater – Cellulose recovery, economic and energy evaluation. WaterResearch, 47, 43–48.
Sahebi S., Sheikhi M., Ramavandi B., Ahmadi M., Zhao S., Adeleye A. S., Shabani Z. andMohammadi T. (2020). Sustainable management of saline oily wastewater viaforward osmosis using aquaporin membrane. Process Safety and EnvironmentalProtection, 138, 199–207.
Santorio S., Fra-Vazquez A., Val del Rio A. and Mosquera-Corral A. (2019). Potential ofendogenous PHA as electron donor for denitrification. Science of the TotalEnvironment, 695, 133747.
Schutte C. F., Spencer T., Aspden J. D. and Hanekom D. (1987). Desalination and reuse ofpower plant effluents: frompilot plant to full scale application. Desalination, 67,255–269.
Scoma A., Coma M., Kerckhof F.-M., Boon N. and Rabaey K. (2017). Efficient molassesfermentation under high salinity by inocula of marine and terrestrial origin.Biotechnology for Biofuels, 10(23), 1–17.
Serafim L. S., Lemos P. C., Albuquerque M. G. and Reis M. A. (2008). Strategies for PHAproduction by mixed cultures and renewable waste materials. Applied Microbiology andBiotechnology, 81(4), 615–628.
Tan D., Xue Y. S., Aibaidula G. and Chen G. Q. (2011). Unsterile and continuous productionof polyhydroxybutyrate by Halomonas TD01. Bioresource Technology, 102,8130–8136.
Thomson N., Roy I., Summers D. and Sivaniah E. (2010). In vitro production ofpolyhydroxyalkanoates: achievements and applications. Journal of ChemicalTechnology and Biotechnology, 85(6), 760–767.
Valentino F., Morgan-Sagastume F., Campanari S., Villano M., Werker A. and Majone M.(2017). Carbon recovery from wastewater through bioconversion into biodegradablepolymers. New Biotechnology, 37(Part A), 9–23.
Venkata Mohan S., Nikhil G. N., Chiranjeevi P., Nagendranatha Reddy C., Rohit M. V.,Kumar A. N. and Sarkar O. (2016). Waste biorefinery models towards sustainablecircular bioeconomy: critical review and future perspectives. Bioresource Technology,215, 2–12.
Werner A. D., Xhang Q., Xue L., Smerdon B. D., Li X., Zhu X., Yu L. and Li L. (2013). Aninitial inventory and indexation of groundwater mega-depletion cases. Water ResourceManagement, 27, 507–533.
Xiao Y. and Roberts D. J. (2010). A review of anaerobic treatment of saline wastewater.Environmental Technology, 31(8–9), 1025–1043.
Xue W., Zeng Q., Lin S., Zan F., Hao T., Lin Y., van Loosdrecht M. C. M. and Chen G.(2019). Recovery of high-value and scarce resources from biological wastewatertreatment: Sulfated polysaccharides. Water Research, 163, 114889.
Valorization of saline wastewater 121

Yin J., Yu X., Wang K. and Shen D. (2016). Acidogenic fermentation of the main substratesof food waste to produce volatile fatty acids. International Journal of Hydrogen Energy,41(46), 21713–21720.
Zeng J., Gao J.-M., Chen Y.-P., Yan P., Dong Y., Shen Y., Guo J.-S., Zeng N. and Zhang P.(2016). Composition and aggregation of extracellular polymeric substances (EPS) inhyperhaline and municipal wastewater treatment plants. Scientific Reports, 6, 26721.
Zhang B., Zhang L. L., Zhang S. C., Shi H. Z. and Cai W. M. (2005). The influence of pH onhydrolysis and acidogenesis of kitchen wastes in two-phase anaerobic digestion.Environmental Technology, 26, 329–340.
Zhou W., Li Y., Gao Y. and Zhao H. (2017). Nutrients removal and recovery from salinewastewater by Spirulina platesis. Bioresource Technology, 245, 10–17.
Zhou M., Yan B., Wong J. W. C. and Zhang Y. (2018). Enhanced volatile fatty acidsproduction from anaerobic fermentation of food waste: a mini-review focusing onacidogenic metabolic pathways. Bioresource Technology, 248, 68–78.
Treatment and Valorisation of Saline Wastewater122

Chapter 6
Case study: Treatmentof fish-canning effluents
ABSTRACTThe seafood processing industry represents an important sector in Spain in terms ofbenefits and employment. In the elaboration of seafood cans, significant amounts ofwastewater are generated. The compliance of these facilities with the more stringentregulations implies the development of wastewater treatment processes able to copewith the variable composition of these effluents and the presence of salinity.In the present chapter the current situation regarding the fish-canning industryand the applied wastewater treatment systems are presented and discussed.Special importance is paid to those designing and operating wastewater treatmentfacilities. Available results from full-scale plants performance are provided here.
Keywords: Composition, discharge limit, fats, reuse
6.1 MOTIVATIONThe fish and seafood industry is an important sector in Spain as it contributes 80% ofthe European production and makes Spain the top producing country of canned tunain the EU (EUMOFA, 2019) and the second one in the world. It remains among thetop five exporters in the world and was the biggest exporter from the EU in 2019.During the product processing, large amounts of wastewater are produced whichneed to be further treated before discharge to natural bodies. In many cases,wastewater produced contains salts and, after treatment, it is disposed of throughdischarge pipes to the sea or less frequently to sewage collectors. Nowadays,
© IWA Publishing 2021. Treatment and Valorisation of Saline Wastewater: Principles and PracticeAuthor(s): Anuska Mosquera Corral, Ángeles Val del Río and José Luis Campos Gómezdoi: 10.2166/9781789060645_0123
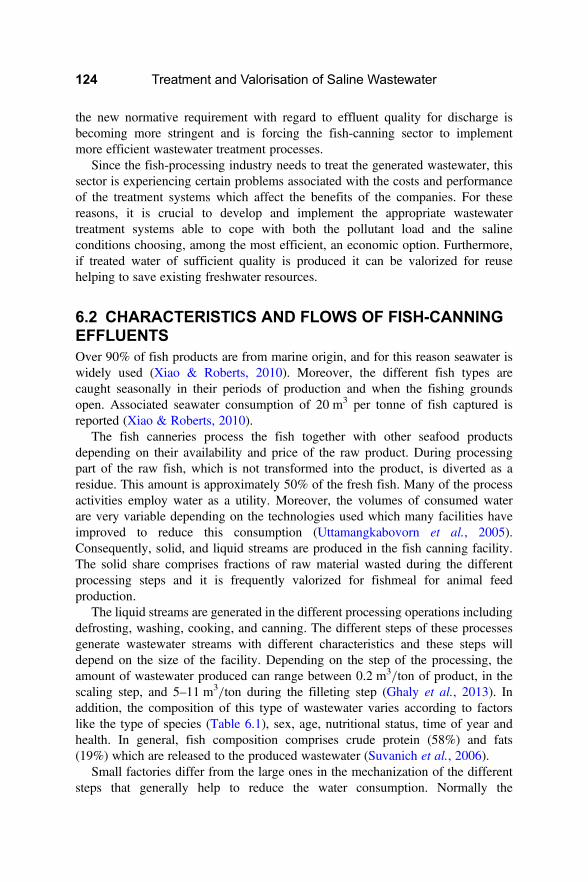
the new normative requirement with regard to effluent quality for discharge isbecoming more stringent and is forcing the fish-canning sector to implementmore efficient wastewater treatment processes.
Since the fish-processing industry needs to treat the generated wastewater, thissector is experiencing certain problems associated with the costs and performanceof the treatment systems which affect the benefits of the companies. For thesereasons, it is crucial to develop and implement the appropriate wastewatertreatment systems able to cope with both the pollutant load and the salineconditions choosing, among the most efficient, an economic option. Furthermore,if treated water of sufficient quality is produced it can be valorized for reusehelping to save existing freshwater resources.
6.2 CHARACTERISTICS AND FLOWS OF FISH-CANNINGEFFLUENTSOver 90% of fish products are from marine origin, and for this reason seawater iswidely used (Xiao & Roberts, 2010). Moreover, the different fish types arecaught seasonally in their periods of production and when the fishing groundsopen. Associated seawater consumption of 20 m3 per tonne of fish captured isreported (Xiao & Roberts, 2010).
The fish canneries process the fish together with other seafood productsdepending on their availability and price of the raw product. During processingpart of the raw fish, which is not transformed into the product, is diverted as aresidue. This amount is approximately 50% of the fresh fish. Many of the processactivities employ water as a utility. Moreover, the volumes of consumed waterare very variable depending on the technologies used which many facilities haveimproved to reduce this consumption (Uttamangkabovorn et al., 2005).Consequently, solid, and liquid streams are produced in the fish canning facility.The solid share comprises fractions of raw material wasted during the differentprocessing steps and it is frequently valorized for fishmeal for animal feedproduction.
The liquid streams are generated in the different processing operations includingdefrosting, washing, cooking, and canning. The different steps of these processesgenerate wastewater streams with different characteristics and these steps willdepend on the size of the facility. Depending on the step of the processing, theamount of wastewater produced can range between 0.2 m3/ton of product, in thescaling step, and 5–11 m3/ton during the filleting step (Ghaly et al., 2013). Inaddition, the composition of this type of wastewater varies according to factorslike the type of species (Table 6.1), sex, age, nutritional status, time of year andhealth. In general, fish composition comprises crude protein (58%) and fats(19%) which are released to the produced wastewater (Suvanich et al., 2006).
Small factories differ from the large ones in the mechanization of the differentsteps that generally help to reduce the water consumption. Normally the
Treatment and Valorisation of Saline Wastewater124

Table
6.1
compositio
nsofd
ifferenttyp
esofw
astewaterco
rresp
ondingto
differentp
roce
sses.
Wastewater
Type
T (°C)pH
tCOD
(g/////L)
sCOD
(g/////L)
TSS
(g/////L)VSS
(g/////L)
NH4+-N
(g/////L)
PO
4−3-P
(g/////L)
Prot.
(g/////L)
Fats
(g/////L)Carbohyd.
(g/////L)
Cl−
(g/////L)SO
42−
(g/////L)
References
Tuna
85
5.7
50
44
2.7
2.6
0.2
0.5
14.8
––
94
–Veiga
(1994)
–6.965.55
–1.57
–0.44a
0.05
–1.45
–1.85
–Ach
our
(2000)
Tuna
45
–34.5
–4.0
b3.6
b–
–77
12
1114.0
–Méndez
(1992)
100
–18.5
–1.4
1.2
––
22
474
13.0
–
Mussel
NA
6.0
18.50
17.25
1.07
0.83
NA
0.06c
3.25
–11
.12
13.45
2.04
Soto
(1991)
Octopus
NA
6.3
22.00
19.12
1.51
1.25
NA
0.21c
10.70
–0.82
15.82
2.51
Soto
(1991)
Fishmeal
NA
5.8
55.20
25.80
16.56
16.10
NA
0.22
15.35
7.46
1.70
8.50
0.54
Soto
(1991)
Anch
ovies
––
16.98
11.36
4.62
–0.29
––
––
92.24
–Corsino
(2016)
aExp
ressedastotaln
itrogen
.bExp
ressedastotalsolids(TS)andvo
latileso
lids(VS)resp
ectively.
cExp
ressedasphosp
hate.
NA:n
ota
vailable;T
SS:totalsusp
ende
dso
lids;
VSS:v
olatilesu
spende
dso
lids;
tCOD:totalchemicalo
xygendeman
d;s
COD:so
luble
chemical
oxygendemand.
Case study: Treatment of fish-canning effluents 125

combination of the different liquid flows constitutes the wastewater produced in thefacility and amounts to 14–22 m3/t of raw fish. Considering that not all of theprocessing steps always take place simultaneously in the industrial process andthat the processed raw material varies throughout time, the characteristics of theproduced wastewater are very variable too (Table 6.1).
The largest load is normally present in the effluent from the cookers andthe composition depends on the processed product. Fish-canning effluents arecharacterized by variable composition and flow throughout the operations ofeach day.
Concerning the wastewater composition, most of the wastewater originatingfrom fish processing activities contains mainly lipids and proteins, except for thatoriginating from mussel processing which is mainly composed of carbohydrates.Organic concentrations range from 10 to 50 g chemical oxygen demand (COD)/L. Temperatures of wastewater flows are variable depending on the fish productand the step of the process where they originate. Heated effluents are produced inthe cookers.
With regard to the composition, salinity of the effluents is also highly dependenton the saline content of the processed product and on the fact that seawater is used inthe manufacturing plant. In these cases, Cl−, Na+, SO4
2–, K+, Ca2+ and Mg+2 arethe ions present. The concentrations of the majority of the ions are widely variable inthe ranges of 8–19 g Cl−/L, 5–12 g Na+/L and 0.6–2.7 g SO4
2−/L.According to the processed product, wastewater may be classified in four
categories: mussel cooking wastewater very rich in carbohydrates, specificallyglycogen; cephalopods and fish cooking wastewater with a compositiondepending on the manufacturing system; fish meal production effluents; andwastewater coming from washing, defrosting and cutting, and cleaning with lowCOD and nutrients concentration.
It is very common for the fish canneries to treat all the effluents together in awastewater treatment plant, although if possible the separation of those streamswith similar compositions helps with the choice of the best applicable treatment(Cristóvão et al., 2012; Carrera, 2020). For those more diluted streams,physical-chemical processes are recommended, however when the stream ishighly loaded a combination of these processes with biological ones is required tocomply with the required effluent discharge quality.
6.3 CURRENT TREATMENT SYSTEMSThe wastewater originating from fish-canning activities contains large organicmatter (mainly lipids, carbohydrates, and sugars), solids, total nitrogen as proteinsand salt concentrations. It is characterized by the large concentrations of thesepollutants and variable composition due to the different processed raw materials(fish products) that are captured in the fishing activities.
Treatment and Valorisation of Saline Wastewater126

This wastewater type is treated by means of physical-chemical and biologicalprocesses (Cristovão et al., 2015a) (Figure 6.1). Usually, for large-size facilitiesthe treatment systems comprise a combination of physical-chemical andbiological processes. In this case, the former constitute the primary treatments(equalization, screening, sedimentation, pH adjustment, flocculation, floatationand microfiltration, etc.) while the latter are the core of the soluble organic matterremoval treatment and rely on aerobic and anaerobic biological processes. Whendealing with small-size industries the physical-chemical processes are preferreddue to their low capital costs and ease of operation. Biological processes such asanaerobic digestion and aerobic oxidation are applied for organic matter removal.When nitrogen removal is needed the combined nitrification and denitrificationprocesses are performed in the biological systems (Achour et al., 2000). In thesecases, the processes can be implemented either after the anaerobic digester or inan activated sludge system consisting of several units, or a sequencing batchreactor (SBR).
Additionally, the salt content is an important drawback for the treatment andreutilization of the wastewater. For reuse purposes, tertiary treatments aredemanded. Among them, membrane systems are applied as they remove salts andpathogens from the wastewater (Cristovão et al., 2015a). Furthermore, ultraviolet(UV) units have been explored in fish canneries to produce pathogen-free effluents.
In the case of large fish canneries, the wastewater treatment system comprisesboth physical-chemical and biological processes. Initially the fats, oils andgreases, and the solids are separated in a dissolved air floatation (DAF) unitcombined with coagulation-flocculation, and the obtained effluent is treated in abiological process, either aerobic or anaerobic. The objective of the biologicalprocess is to remove the organic matter and, when needed, the nutrients toachieve the discharge limits.
The recovery of some fractions of the wastewater, like the proteins, has also beenexplored for use in fish flour. For the recovery of fish proteins and oils processes
Wastewater
Physical-chemical process
Anaerobic digestion
Activated sludge system
Sludge settling Treated
effluent
(a)
(b)
(d)
Figure 6.1 Treatment process layouts applied to the treatment of fish-canningeffluents.
Case study: Treatment of fish-canning effluents 127

such as electrolysis, ultrafiltration, reverse osmosis and hydrocyclones, which arerelatively expensive processes, are applied.
6.3.1 Physical-chemical processesFrequently, fish-canning wastewater treatment takes place by physical-chemicalprocesses where the solid fraction and the grease are removed. These processesconstitute the wastewater treatment especially in small-size facilities because theirconstruction and operational costs are relatively low. They are installed inlarge-size factories normally combined with subsequent biological processes.However, nowadays their application is being questioned due to the morestringent normative requirement of more efficient removal treatments, the largesurface area they need for implantation, and the huge amounts of solids producedthat increase operational costs due to the required management.
Among the different physical-chemical processes that can be applied for thetreatment of fish-canning effluents the most commonly employed ones arescreening, settling, coagulation-flocculation and dissolved air floatation (Tayet al., 2006). Concerning suspended solids removal, the best results wereobtained when a settling step (removing 75% of the fat, oil and grease fraction(FOG) and 48% of TSS) was applied followed by coagulation-flocculation(removing 99.2% of FOG, 85.8% of TSS and 25.2% dissolved organic carbon(DOC)) using FeCl3 (Cristóvão et al., 2014).
Moreover, tertiary treatments necessary to refine the quality of the treatedwastewater before discharge are also physical-chemical.
6.3.1.1 SettlingAlthough in saline conditions, the settling process may experience some drawbacksit is extensively used for the treatment of fish-canning wastewater. Thesedimentation of the fish-canning wastewater for relatively short periods(Cristóvão et al., 2014) allows for the separation of three zones: an upper layercomprising the FOG fraction less dense than water; an intermediate clarified zone(approximately 80% of the total volume); and a bottom layer where the solidssettle. Removal percentages in the range of 67–75% for FOG and close to 48%for TSS were measured (Aguiar & Sant’Anna, 1988; Cristóvão et al., 2014).
6.3.1.2 Coagulation–flocculation (C–F)Coagulation-flocculation units are common in the fish-canning wastewatertreatment facilities. Many of these facilities, independently of their size, have oneof these systems. In general, coagulants are inorganic compounds such as ferrouschloride, aluminium sulphate, etc. (Cristovão et al., 2015a).
Depending on the composition of the treated wastewater the obtained removalpercentages are widely variable. Values between 73–99% for FOG and 70–95%for TSS have been reported for coagulant dosages in the range 75–400 mg/L
Treatment and Valorisation of Saline Wastewater128

(Aguiar & Sant’Anna, 1988; Fahim et al., 2001; Cristóvão et al., 2014).Furthermore, the dosage of coagulant and flocculant also varies significantly andas a result so does the mass of separated solids (Cristóvão et al., 2014). Inaddition, the pH conditions of the coagulation process depend on the type ofwastewater as well. In the experiments of Cristóvão (2014) ferric salts werefound to be the most suitable coagulants, with dosages of 400 mg/L, evenwithout the need for pH adjustment.
6.3.1.3 Dissolved air floatation (DAF)Dissolved air floatation systems are meant to remove mainly FOG, which presentwith low density and tend to float on the water surface. DAF systems baseseparation of these compounds on the formation of microbubbles formed bypressurized air injected to the recycling water that are released once the streamenters the unit and depressurizes. Thus, the microbubbles help the fats to float. Inthese systems efficiency percentages found for fish-canning wastewater were43% of TSS and 94% of FOG (Cristóvão et al., 2014). Important operationalparameters are the air supplied pressure and the air/substrate ratio which can varyfrom 0.058–0.087 kg air/kg FOG for example.
6.3.1.4 Combined processesIt is also common to combine a coagulation-flocculation process with a subsequentDAF. In these cases, the DAF benefits from the fact that the chemical treatmenthelps to destabilize the repulsion forces among the oil droplets and helps to formlarger drops that float more easily. The combination of both processes in a singleunit has been explored attaining removal percentages of 41% of TSS and 96% ofFOG (Cristóvão et al., 2014).
6.3.1.5 Tertiary treatmentsTertiary treatments are needed for the conditioning of the wastewater beforedischarge. Recent studies on the feasibility of treated wastewater reuse in the fishcanning facilities have been conducted indicating that disinfection is crucial toachieve microbiological quality requirements (Cristóvão et al., 2015a). The use ofchlorination for disinfection purposes is widespread, however due to theformation of by-products other treatments based on UV light or reverse osmosisare considered too. (See Chapter 2 for more information on the application ofdisinfection to saline wastewater.)
6.3.2 Biological processesOnce the solids are removed from the wastewater it is ready to be introduced into abiological treatment system where the soluble organic and nitrogen compounds areeliminated. The applied treatments rely on anaerobic, anoxic, and aerobic processes.
Case study: Treatment of fish-canning effluents 129

6.3.2.1 Anaerobic digestionAnaerobic processes are applied for the treatment of fish-canning effluents inparticular for effluents with moderate salt content (Table 6.2). They benefit fromthe wastewater characteristics, the high organic matter concentration, and thetemperature (45–60°C). In general, the effluent with larger loads comes fromseafood cookers. Effluents produced in fish canneries are highly biodegradableand percentages of 90% biodegradability have been measured in batchexperiments (Soto et al., 1991).
In cases where the wastewater presents large salt concentrations, includingsulphate, the production of hydrogen sulphide hinders the valorization of theobtained biogas and makes the reactor operation difficult due to the inhibition ofthe methanogenesis and the associated corrosion events. In this sense, H2Saccumulation in the liquid phase (corresponding to 5% of H2S in the gas and atpH 7 in the liquid phase) has been found to destabilize the anaerobic digestion(Soto et al., 1991).
Nevertheless, anaerobic digestion has been explored for the treatment of thesetypes of saline wastewater in different kinds of reactors at pilot scale(Balsley-Olesen et al., 1990; Méndez et al., 1992; Omil et al., 1995a). It isimportant to consider the kind of reactor system applied to each type ofwastewater. For example, upflow anaerobic sludge blanket (UASB) reactors havebeen found to be inappropriate in the case of effluents with large fatconcentrations. The COD removal efficiencies are low but can be overcome viathe implementation of a pre-hydrolysis step and the control of the alkalinity in thesystem (Puñal & Lema, 1999). On the other hand, central activity digesters(CAD) arose as a good alternative for the treatment of effluents withconcentrations in the range of 15–25 kg COD/m3 at applied loads of 4 kg COD/(m3 · d), attaining COD removal percentages of 76–80% (Méndez et al., 1992).These authors claim that obtained results were possible due to the previousadaptation of the biomass to salt concentrations up to 14 g Cl−/L. Biofilmsystems like upflow anaerobic filters (UAFs) were also tested for the treatment ofpre-centrifuged fishmeal wastewater resulting in COD removal percentages of80% when applied loads were 5 kg COD/(m3 · d) (Guerrero et al., 1997). In thiscase an appropriate recycling ratio of the effluent is needed to overcomeinhibitory events caused by large free ammonia concentrations, due to the factthat it improves the mixture facilitating mass transfer rates and minimizing deadzones inside the reactor. Balsley-Olesen (1990) performed experiments with twopilot-scale reactors, an anaerobic filter (AF) filled with shells and an anaerobicfluidized bed (AFB) filled with quartz sand, to treat herring brine with saltconcentrations of 10–40 g Cl−/L. These authors applied an organic loading rate(OLR) of 3–10 kg COD/(m3 · d) at salt concentrations in the range of 12 to 21 gCl−/L and observed that H2S in the biogas was 1.5% and the percentage ofmethane remained constant at 65%. They also claim that the AFB system
Treatment and Valorisation of Saline Wastewater130
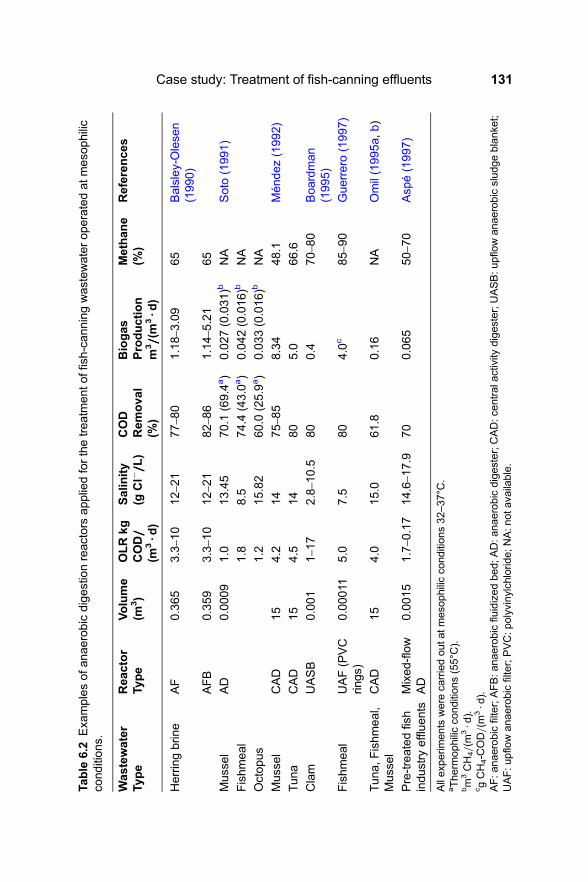
Table
6.2
Exa
mplesofa
naerobicdigestionreactors
appliedforthetreatm
entoffish-canningwastewateroperatedatm
eso
philic
conditions.
Wastewater
Type
Reactor
Type
Volume
(m3)
OLRkg
COD/////
(m3·d
)
Salin
ity
(gCl−/////L)
COD
Removal
(%)
Biogas
Production
m3/////(m
3·d
)
Methan
e(%
)References
Herringbrin
eAF
0.365
3.3–10
12–
21
77–
80
1.18–
3.09
65
Balsley-Olese
n(1990)
AFB
0.359
3.3–10
12–
21
82–
86
1.14–
5.21
65
Mussel
AD
0.0009
1.0
13.45
70.1
(69.4
a)
0.027(0.031)b
NA
Soto
(1991)
Fishmeal
1.8
8.5
74.4
(43.0
a)
0.042(0.016)b
NA
Octopus
1.2
15.82
60.0
(25.9
a)
0.033(0.016)b
NA
Mussel
CAD
15
4.2
14
75–
85
8.34
48.1
Méndez(1992)
Tuna
CAD
15
4.5
14
80
5.0
66.6
Clam
UASB
0.001
1–17
2.8–10.5
80
0.4
70–
80
Boardman
(1995)
Fishmeal
UAF(PVC
rings)
0.00011
5.0
7.5
80
4.0
c85–
90
Guerrero
(1997)
Tuna,F
ishmeal,
Mussel
CAD
15
4.0
15.0
61.8
0.16
NA
Omil(1995a,
b)
Pre-treatedfish
industry
effluents
Mixed-flow
AD
0.0015
1.7–0.17
14.6–17.9
70
0.065
50–
70
Asp
é(1997)
Allexp
erim
ents
were
carriedouta
tmes
ophilic
cond
itions32–
37°C
.aThe
rmophilic
conditions(55°C).
bm
3CH4/(m
3·d
).cgCH4-C
OD/(m
3·d
).AF:a
naerobicfilter;AFB:a
naerobicflu
idizedbed;A
D:a
naerobicdigester;CAD:c
entrala
ctivity
digester;UASB:upflo
wanaerobicsludge
blanke
t;UAF:u
pflo
wanaerobicfilter;PVC:p
olyvinylch
lorid
e;NA:n
ota
vailable.
Case study: Treatment of fish-canning effluents 131

performs better against shock loads as the mixture conditions inside the reactor arestronger than in the AF, although both handle uneven loads and load interruptionsbetter than suspended-biomass systems.
Omil (1995a) operated a pilot plant comprising a pre-digester for wastewaterhomogenization, a CAD and a clarifier and managed to treat different mixtures oftuna, fishmeal, and mussel wastewater. A strategy of biomass adaptation to saltand COD load was applied by diluting the influent wastewater, which allowed forthe accumulation of average biomass concentrations of 12 g VSS/L capable ofdealing with OLR up to 5.5 g COD/(m3 · d) at salinities of 25 g NaCl/L.Approximately 8.2% of the COD fed was removed by the sulphate-reducingbacteria (SRB) activity for H2S production (Omil et al., 1995b). Methaneproduction from fish processing wastewater, pre-treated in a flocculation unitwith ferric chloride, was feasible at a percentage of 50–70% in mixed flowanaerobic digesters operated at a hydraulic retention time (HRT) between 3 and30 days (Aspé et al., 1997).
Most of the anaerobic treatments take place in a single unit. However, whenlipids are present in large concentrations a system comprising two units might beadvisable. In these two-stage systems the hydrolysis and acidogenic processestake place in the first unit while acetogenesis and methanogenesis occur in thesecond one. This process distribution may be accomplished by pH control in acidvalues or by shortening the HRT or the solid retention time (SRT) lengths. Thus,biomass floatation and inhibition of the methanogenic activity are prevented. Inthe case of UASB reactors this option aids the granulation process as well. At thesame time, it prevents events of pH, temperature, hydraulic or organic shocks.
With respect to operational temperatures, these anaerobic digesters usuallyoperate at mesophilic conditions as at thermophilic ones they are less stable (Sotoet al., 1991).
6.3.2.2 Aerobic treatment sludge systemsAerobic processes are also applied for the treatment of fish-canning wastewater. Ingeneral, heterotrophic processes responsible for organic matter removal are resistantto the presence of salts and for this reason these processes perform appropriately in awide range of operational conditions. Percentages of organic matter removal of 85%have been measured in aerobic systems (Achour et al., 2000) and up to 88% removalhas been estimated from the optimization of the process via the application offactorial design (Cristóvão et al., 2015b). Special attention has to be paid to theremoval of the FOG fraction as it floats on the surface of the water andsignificantly affects the oxygen transfer to wastewater, which is crucial for theaerobic biological processes (Chowdhury et al., 2010).
Biofilm systems have been explored for fish processing effluents, as well. As anexample, the effluents from marine-products (cuttlefish, octopus and shrimps)processing factories were treated in a fixed bed reactor at laboratory scale at
Treatment and Valorisation of Saline Wastewater132

increasing loads from 0.25 to 1.00 kg COD/(m3 · d) and with concentrations of17.6–34.5 g Cl−/L (Gharsallah et al., 2002). Achieved COD removal percentageswere over 56% in all cases.
Additionally, Aloui (2009) succeeded in treating wastewater from a fish industryat an organic loading rate of 0.855 kg COD/(m3 · d) in the presence of 40 g NaCl/Lusing an acclimated sludge.
Nevertheless, the nitrogen removal efficiency in conventional activated sludge(CAS) systems depends on the salt concentration and the degree of acclimation tosalt of the sludge used, and it takes place via nitrate if the salt concentrationis under 15 g/L (Artiga et al., 2008) but via nitrite for concentrations of around20 g/L.
The maximum efficiencies obtained in activate sludge systems rely on theoperational conditions and wastewater characteristics. Salinity negatively affectsthe aerobic activity of activated sludge at concentrations over 5–8 g Cl−/L.
6.3.2.3 Anaerobic ammonium oxidation (anammox) based systemsNitrogen removal from fish-canning wastewater is usually achieved biologically bythe combination of the nitrification-denitrification processes. Recently, thealternative of the combined partial nitritation and anammox processes (PN-AMX)has been explored for this purpose. In this process initially half of the ammoniumis oxidized to nitrite and afterwards the remaining ammonium and nitrite areconverted to nitrogen gas. Oxygen consumption and organic matter requirementsare reduced compared to nitrification and denitrification processes.
There are not many studies on the application of this process to fish processingeffluents. Val et al. (2018) treated the effluent from an anaerobic digester fed withthe effluent generated in a fish cannery and determined that after acclimation of thebiomass total nitrogen removal efficiencies of 80% were achieved at nitrogenremoval rates of 0.2 kg/(m3 · d) at concentrations of 7–9 g NaCl/L. Moreover.The biomass without previous adaptation was able to cope with short-term saltshocks of 16 g NaCl/L for 8 days recovering the initial activity in a few days.Using a similar wastewater type, Gustinianovich (2018) found that theacclimation period of the biomass can be shortened if the amount of usedinoculum is large enough to cope with the loss of activity. These authors wereable to obtain nitrogen removal efficiencies of 46.3% after 40 days frominoculation with non-adapted to salinity biomass treating a load of 0.029 kg N/(m3 · d) at 17.4 g NaCl/L. Additionally they managed to diminish nitriteoxidizing bacteria (NOB) activity by intermittent aeration at salt concentrationsbelow 6 g NaCl/L, which are not inhibitory for this bacterial population.
6.4 INNOVATIVE TECHNOLOGIESAlthough in many cases conventional treatments, if operated properly, are suitablefor the achievement of treated effluents that comply with the discharge levels fixed
Case study: Treatment of fish-canning effluents 133

by law, frequently factories do not have enough space to implement them. In thesecases, the development of innovative technologies characterized by their lowimplantation surface requirements is an objective. Among the possible systems,those based on biofilm biomass or membranes provide this advantage. Inaddition, stricter discharge levels are proposed with the aim of protecting thereceiving water bodies and this implies the need for implementation of moreefficient nutrient removal systems.
The following innovative technologies have been tested with this type of effluentto cope with the existing drawbacks.
6.4.1 Aerobic granular sludge systemsAerobic granular sludge (AGS) systems have been explored as an alternativetechnology to treat effluent from the fish-canning industry (Figueroa et al., 2008;Val del Río et al., 2013; Corsino et al., 2016; Carrera et al., 2019). In most ofthese studies, aerobic granular biomass was produced in sequencing batchreactors (SBRs) operated in cycles comprising a short feeding period, an aeratedreaction period, a settling period, and an effluent withdrawal period (Table 6.3).Scarce information is available on the application of AGS systems operated withanaerobic plug feeding and aerobic phases (Carrera et al., 2019). The operationalconditions imposed in the SBR aim at enhancing the biomass aggregation in theform of granules based on the establishment of a feast/famine regime. In fullyaerobic AGS systems (Af) organic matter and nitrogen are removedsimultaneously, while in the anaerobic fed AGS (Anf) reactors phosphorus can bealso removed together with COD and N.
The comparison of the performance of two AGS systems fed with fish-canningwastewater, under aerobic and anaerobic conditions, respectively, indicated that thegranular stability is better in the former case (Carrera et al., 2019). Furthermore,nitrogen removal is higher in this case while phosphorus removal only takesplace in the reactor with anaerobic feeding.
AGS systems can be operated for the purpose of nitrogen removal. Due to saltconcentrations of the wastewater, nitrogen removal takes place via nitrite as NOBactivity is more sensitive than ammonium oxidizing bacteria (AOB) activity tothese conditions. AOB activity was observed to take place, in experiments usingsynthetic media, at 33 g NaCl/L (Bassin et al., 2011) and 50 g NaCl/L (Wanet al., 2014) while NOB activity was completely inhibited at 20 g NaCl/L (Pronket al., 2014). Nitrite accumulation was observed even at low salt concentrationsin systems fed with nitrogen-rich wastewater (Figueroa et al., 2008). In thisstudy, a combined effect of free ammonia concentration (up to 3 mg N/L) andsalinity (26.5–28.3 g NaCl/L) was proposed as the responsible factor for theaccumulation of nitrite observed in the reactor.
In general, the removal of organic matter and nitrogen is feasible in AGS reactors.The formation of granular biomass is possible, and its characteristics depend on the
Treatment and Valorisation of Saline Wastewater134
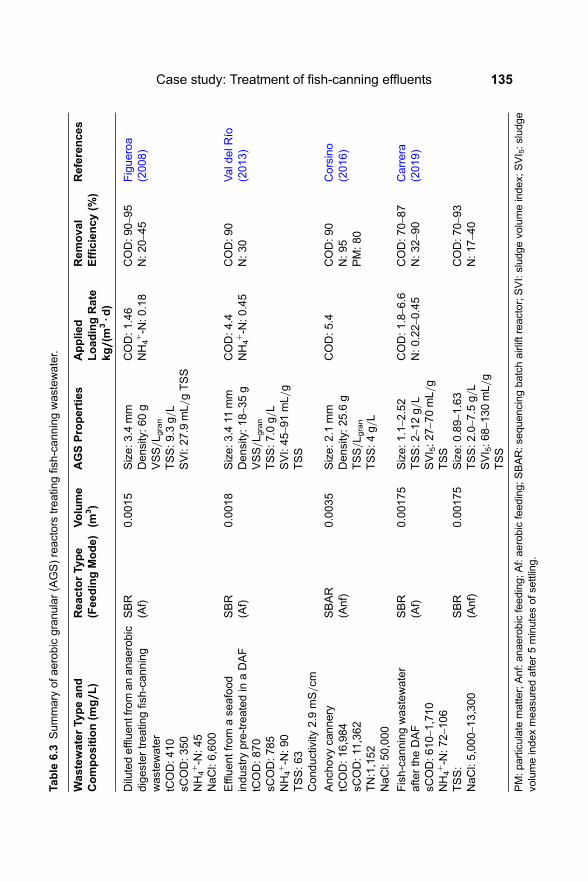
Table
6.3
Summary
ofa
erobicgranular(AGS)reactors
treatin
gfish-canningwastewater.
WastewaterTy
peand
Composition(m
g/////L)
ReactorTy
pe
(FeedingMode)
Volume
(m3)
AGSProperties
Applie
dLoadingRate
kg/////(m
3·d
)
Removal
Efficiency(%
)References
Dilutedeffluentfrom
ananaerobic
digestertreatin
gfish-canning
wastewater
tCOD:410
sCOD:350
NH4+-N
:45
NaCl:6,600
SBR
(Af)
0.0015
Size:3.4
mm
Density:60g
VSS/L g
ran
TSS:9.3
g/L
SVI:27.9
mL/gTSS
COD:1.46
NH4+-N
:0.18
COD:9
0–95
N:2
0–45
Figueroa
(2008)
Effluentfrom
ase
afood
industry
pre-treatedin
aDAF
tCOD:870
sCOD:785
NH4+-N
:90
TSS:63
Conductivity
2.9
mS/cm
SBR
(Af)
0.0018
Size:3.4
11mm
Density:18–
35g
VSS/L g
ran
TSS:7.0
g/L
SVI:45–
91mL/g
TSS
COD:4.4
NH4+-N
:0.45
COD:9
0N:3
0Vald
elR
ío(2013)
Anch
ovy
cannery
tCOD:16,984
sCOD:11
,362
TN:1,152
NaCl:50,000
SBAR
(Anf)
0.0035
Size:2.1
mm
Density:25.6
gTSS/Lgran
TSS:4g/L
COD:5.4
COD:9
0N:9
5PM:80
Corsino
(2016)
Fish-canningwastewater
afte
rtheDAF
sCOD:610–
1,710
NH4+-N
:72–106
TSS:
NaCl:5,000–13,300
SBR
(Af)
0.00175
Size:1.1–2.52
TSS:2–
12g/L
SVI 5:27–
70mL/g
TSS
COD:1.8–6.6
N:0
.22–0.45
COD:7
0–87
N:3
2–90
Carrera
(2019)
SBR
(Anf)
0.00175
Size:0.89–1.63
TSS:2.0–7.5
g/L
SVI 5:68–
130mL/g
TSS
COD:7
0–93
N:1
7–40
PM:p
articulate
matter;Anf:anaerobicfeeding;A
f:aerobicfeed
ing;S
BAR:s
equ
encing
batchairlift
reactor;SVI:sludg
evo
lumeindex;
SVI 5:s
ludg
evo
lumeindexmeasu
redafte
r5minutesofs
ettling.
Case study: Treatment of fish-canning effluents 135

substrate composition. The presence of coagulants coming from the pre-treatmentproduces less dense granules which hinder the stability of the granular bed (Valdel Río et al., 2013). While the efficiency of COD removal is high, close to 90%,the nitrogen removal relies on the salt concentration and eventually on the freeammonia concentration achieved depending on the ammonia concentration andpH of operation (Figueroa et al., 2008).
The best feeding strategy, Af or Anf, was evaluated in two different reactors fedwith the same batch of fish-canning wastewater with the result that the formation ofgranular biomass lasted longer in the Af reactor than in the Anf one (Carrera et al.,2019). Although, in the Af system the granules obtained better resisted the changesin OLR and salt concentrations. Moreover, even if the COD removal was similar, inthe case of nitrogen removal it took place via nitrification-denitrification in the Afreactor and only due to assimilation in the Anf reactor. In the latter, P removalwas not possible by phosphorus-accumulating organisms (PAO) due to the saltconcentrations of the feeding.
6.4.2 Membrane bioreactorsOnly a few studies provide results on the application of membrane systems for thebiological treatment of or product recovery from fish-canning wastewater(Table 6.4).
Afonso and Bórquez (2002) evaluated the recovery of proteins from the effluentsgenerated in a fishmeal factory, with conductivities of 3.1–5.2 μS/cm, using anultrafiltration (UF) membrane. Despite the low protein rejection of approximately3–39%, the obtained results were useful and allow identification of possibleimprovements such as the use of a UF membrane with smaller pore size or theirsubstitution by nanofiltration (NF) membranes.
With regard to their use for wastewater treatment, Artiga (2005) tested aninnovative membrane-assisted hybrid bioreactor for the treatment of fish-canningwastewater. This system comprised a hybrid circulating bed reactor (CBR), wherethe biomass grew on plastic particles, coupled in series to an ultrafiltrationmembrane module (UFM). In this system organic matter and nitrogen wereremoved (Table 6.4). Nitrification (50–60% of the reactor capacity) took placemainly in the biofilm biomass while heterotrophs were mainly present insuspension. The fact that a settler is not needed for biomass retention, due to thepresence of the membrane results in the requirement of a smaller surface forimplantation compared to CAS systems. Membrane bioreactors (MBRs) appearas appropriate systems for the treatment of high saline wastewater as they candeal with saline concentrations up to 83 g/L (Artiga et al., 2008) providingefficiencies of 95% COD removal treating loads of 1.4 kg COD/(m3 · d).However, nitrogen removal is not feasible at these saline conditions.
Sridang (2006) applied a MBR for the treatment of seafood-processingwastewater and observed that the response of the system treating wastewater with
Treatment and Valorisation of Saline Wastewater136

Table
6.4
Exa
mplesofa
erobicmembranereactors
appliedforthetreatm
ento
ffish-canningeffluents.
WastewaterTy
pe
Reactor
Type
Volume
(m3)
OLR
kg
COD/////m
3·d
NLR
kg
NH4+-N
/////m
3·d
Salin
ity
(gNaCl/////L)
COD
Removal
(%)
References
Mixture
ofinflu
entand
effluentfrom
an
industria
lanaerobic
contact
reactor
CBR-U
FM
0.0055–0.0012
6.5
1.8
NA
99%
Artiga
(2005)
Seafoodproce
ssing
wastewater
MBR
0.035
0.28
0.016
NA
97
Srid
ang
(2006)
Effluentfrom
tuna
cookingin
brin
etanks
PilotH
ybrid
MBR
0.5
(0.2
anoxic,
0.2
aerobic,0
.1filtratio
nch
ambers)
0.3–1.4
N.A.
27–
89a
65–
92
Srid
ang
(2006)
Effluentfrom
tuna
cookingwith
steam
injection
0.1–4.0
0.08–
0.70b
20a
50–
90%
CBR:c
irculatin
gbedreactor;UFM:u
ltrafiltratio
nmodule;N
A:n
ota
vailable;N
LR:n
itrog
enloadingrate.
aAsco
nduc
tivity
(mS/cm
).bNitrogenexp
ressedasTN.
Case study: Treatment of fish-canning effluents 137

or without salt was similar, with COD removals up to 97% while total Kjeldahlnitrogen (TKN) removal was limited to 5.3%. Nonetheless, these authors proposethe implementation of subsequent treatments, oxidation, and adsorption, todecrease the COD concentration of the permeate for further reuse and recyclingpurposes.
A specific drawback of the use of membrane systems for the treatment of salinewastewater is the appearance of inorganic scaling of compounds like calciumphosphate or undissolved NaCl (Artiga et al., 2008). This necessitates frequentcleaning cycles for the membrane maintenance.
6.5 CASE STUDY: WASTEWATER TREATMENT PLANT INA FISH CANNING FACILITY6.5.1 Fish-canning wastewaterMost of the canned seafood in the world is tuna. Spain is one of the major producersof canned tuna, approximately two-thirds in terms of volume, which accounts foralmost 64% of the production in the EU (EUMOFA, 2019). Furthermore, thebiggest factories are in the Autonomous Community of Galicia (NW of Spain).Due to the importance of the sector, one of these facilities was chosen as a modelto develop the present case study.
The selected fish canning facility processes, as raw, 5,000 tons of fresh tuna peryear. The wastewater is produced during fish thawing, washing, and eviscerating,fish and cans cooling and washing, cooking, and clean-up of washing areas.Considering the process efficiency of 55%, 2750 tons of canned tuna is producedper year. The volume of wastewater produced is 8 m3 per ton of tuna canned(Henze et al., 1997), thus 22,000 m3/y of wastewater is produced. The flowrateof wastewater generated is 88 m3/d, taking into account that the facility operatesonly five days a week, eight hours a day (Uttamangkaborvorn et al., 2005), andthe corresponding free days each year.
Before discharge, this produced wastewater needs to be treated in the treatmentplant designed for this purpose.
The discharge limits of the different pollutants present in the produced effluentdepend on the discharge point (Table 6.5). Less stringent limits for salts are set inthose cases where the sewage collector is the destiny of the effluent. Stringentlimits exist only when freshwater is the receiving body or the effluent is destinedfor reuse. When it is discharged to the sea, no limitation for salt concentrationsis defined.
The administration, normally the council in which the factory is located, isresponsible for fixing the discharge limits of the different parameters contained inthe produced effluent. For this reason, there are no fixed limits for seawaterdischarge, but they are normally in the range indicated in Table 6.5. In addition,
Treatment and Valorisation of Saline Wastewater138
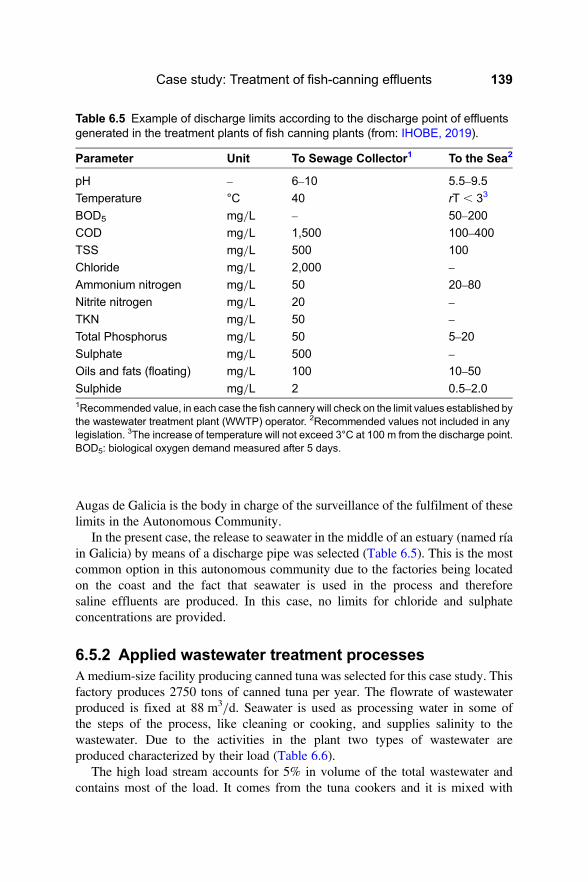
Augas de Galicia is the body in charge of the surveillance of the fulfilment of theselimits in the Autonomous Community.
In the present case, the release to seawater in the middle of an estuary (named ríain Galicia) by means of a discharge pipe was selected (Table 6.5). This is the mostcommon option in this autonomous community due to the factories being locatedon the coast and the fact that seawater is used in the process and thereforesaline effluents are produced. In this case, no limits for chloride and sulphateconcentrations are provided.
6.5.2 Applied wastewater treatment processesAmedium-size facility producing canned tuna was selected for this case study. Thisfactory produces 2750 tons of canned tuna per year. The flowrate of wastewaterproduced is fixed at 88 m3/d. Seawater is used as processing water in some ofthe steps of the process, like cleaning or cooking, and supplies salinity to thewastewater. Due to the activities in the plant two types of wastewater areproduced characterized by their load (Table 6.6).
The high load stream accounts for 5% in volume of the total wastewater andcontains most of the load. It comes from the tuna cookers and it is mixed with
Table 6.5 Example of discharge limits according to the discharge point of effluentsgenerated in the treatment plants of fish canning plants (from: IHOBE, 2019).
Parameter Unit To Sewage Collector1 To the Sea2
pH – 6–10 5.5–9.5
Temperature °C 40 rT , 33
BOD5 mg/L – 50–200
COD mg/L 1,500 100–400
TSS mg/L 500 100
Chloride mg/L 2,000 –
Ammonium nitrogen mg/L 50 20–80
Nitrite nitrogen mg/L 20 –
TKN mg/L 50 –
Total Phosphorus mg/L 50 5–20
Sulphate mg/L 500 –
Oils and fats (floating) mg/L 100 10–50
Sulphide mg/L 2 0.5–2.01Recommended value, in each case the fish cannerywill check on the limit values established bythe wastewater treatment plant (WWTP) operator. 2Recommended values not included in anylegislation. 3The increase of temperature will not exceed 3°C at 100 m from the discharge point.BOD5: biological oxygen demand measured after 5 days.
Case study: Treatment of fish-canning effluents 139

other liquid streams generated in the process containing fats and oils. It contains thehighest concentration of solids, organic matter, and nitrogen. The low load streamcorresponds to 95% in volume of the total wastewater produced and it is lessconcentrated than the previous stream, except for the fact that it contains largesalt concentrations. It is produced mainly in cleaning activities.
Four scenarios have been assessed: (A) both streams are treated together viaphysical-chemical processes; (B) both streams are treated separately combiningphysical-chemical and aerobic biological processes; (C) both streams are treatedseparately combining physical-chemical, aerobic and anaerobic biologicalprocesses; and (D) like case C but including nitrogen removal.
The four proposed treatment schemes must fulfil the following restrictions:
• Preferably, the wastewater types will be treated separately to avoid thegeneration of large loads containing relatively high pollutant concentrationsfrom the mixture of high and low loaded wastewater types.
• The effluent produced from a unit must fulfil the requirements of the next unitin the treatment line. As an example, coarse solids should be removed beforethe DAF or biological treatment systems, or the COD concentration should be
Table 6.6 Representative composition of high and low load wastewater samplescollected in a tuna canning facility which uses seawater as process water employedfor the case studies (using data from Carrera (2020) as reference).
Parameter High Load Low Load
Flowrate m3/d 4.4 83.6
Conductivity mS/cm 18.0 20.9
pH – 6.59 5.91
Total suspended solids mg/L 2,370 225
Volatile suspended solids mg/L 1,070 217
Total COD mg/L 10,800 1,183
Soluble COD mg/L 7,300 691.2
Greases mg/L 1,600 311.41
Volatile fatty acids mg COD/L 3,300 44.46
Ammonia mg N/L 560 3.4
Total nitrogen mg N/L 1,020 18.73
Phosphate mg N/L 130 2.1
Proteins mg/L 2,060 102.76
Carbohydrates mg/L 510 72.31
Chloride mg Cl−/L 4,210 8,410
Sulphate mg SO4−2/L 250 1,130
Sodium mg Na+/L 2,770 4,490
Treatment and Valorisation of Saline Wastewater140

large enough for an anaerobic treatment, or an intense FOG removal isnecessary before the biological processes.
• All the schemes needed the implementation of a sieving system to removecoarse solids from low and high load wastewater types.
• The size of the resulting systems should not be so large as to represent adrawback for the plant.
The treatment units comprising the train processes of each scenario aredescribed below.
Scenario A: For the low load wastewater the system comprises a sieving system(particles larger than 1 mm), a dissolved air floatation (DAF) unit and acoagulation-flocculation unit.
Scenario B: Both streams are treated separately in two treatment lines. The lowload wastewater is treated in three subsequent units: sieving, DAF andcoagulation-flocculation units. The high load wastewater flows through a sievingunit, a DAF unit, and an activated sludge system for organic matter removal. Theeffluents from both treatment lines are mixed before being discharged.
Scenario C: Both streams are treated separately in two treatment lines. The lowload wastewater is treated in three subsequent units: sieving, DAF andcoagulation-flocculation units. The high load wastewater is treated in a sievingand a DAF unit for solid and fat removal and then it is anaerobically digested.The effluents from both treatment lines are mixed before being discharged.
Scenario D: The same as in Scenario C but including nitrogen removal in anactivated sludge (AS) system.
Four scenarios have been proposed based on existing industrial facilities orexperimental set-ups from previous research studies.
The removal percentages corresponding to each treatment have been chosen asthe highest possible values assuming the appropriate performance of each unit(Table 6.7).
Table 6.7 Removal percentages selected for the different wastewater treatmentprocesses applied in the four scenarios evaluated (from: IHOBE, 2019).
BOD5 (%) TSS (%) Fats (%)
Sieving 15 25 30
DAF 30 28 80
Settling 45 70 50
Coagulation-flocculation 70 90 50
Activated sludge 90 90 0
Activated sludge with nitrogen removal 90 90 0
Anaerobic digestion 80 90 90
Case study: Treatment of fish-canning effluents 141

6.5.3 Alternative evaluation6.5.3.1 Technological evaluationCalculations were performed for the four cases, with the aim to remove thepollutants present in each wastewater type (as summarized in Table 6.6). Theseare detailed in Annex 1 (Tables A1.1 to A1.4). Obtained results are presented inTable 6.8 where the discharge limits are provided.
Assumptions made for calculations (Table 6.8):
• Volatile suspended solids concentration for the discharge limit conditions wasestimated as 80% of the TSS limit concentration.
• Soluble COD concentration for the discharge limit conditions was estimatedfrom the concentration of total COD minus the concentration of CODcorresponding to the VSS using the ratio of 1.5 g COD/g VSS.
• In the solid separation units, the ratio VSS/TSS is the same for the solidsseparated and remaining in the treated wastewater flow.
• The removal of soluble COD occurred in the same percentage as the BOD5
considering that most of it corresponds to biodegradable COD.• The percentage of total COD removal was estimated the same as for the TSS
and VSS but considering only the non-soluble fraction.• The percentage of nitrogen removal in the solid removal processes was not
considered as in all the scenarios its concentration was below the dischargelimit.
• According to Balsley-Olesen (1990) 1.5% of H2S can be present in the biogas,which will correspond to a concentration of 0.054 mg H2S/L in the effluentfrom the AD according to Henry’s law. This concentration was estimatedusing the Henry’s law constant of 525.5+16.4 atm/mol fraction (Yongsiriet al., 2005). This concentration is only relevant in Scenario C where thistreatment is the last one before high load wastewater discharge. In ScenarioD the H2S is degraded in the subsequent activated sludge system.
All scenarios evaluated produced effluents in the range of concentrations requiredfor discharge. In the case where nitrogen limits are more restricted theimplementation of an activated sludge system with nitrogen removal for thetreatment of high load wastewater will reduce its concentration by 80% inthe final effluent. The pH value of all the streams was within the ranges definedby the discharge limits. Only in the options with coagulation-flocculation couldits value be significantly different from the desired value.
Cristóvão (2014) proposed that the best system for solid removal fromfish-canning wastewater is a sedimentation followed by a coagulation-flocculation stage; while if the FOG fraction is to be removed they do notrecommend the use of DAF treatments for these effluents even if they arecombined with coagulation-flocculation. Nevertheless, in Galicia many fishcanneries have a DAF system forming part of the physical-chemical wastewater
Treatment and Valorisation of Saline Wastewater142

Table6.8
Effluentq
ualityofthefouro
ptio
nsco
mparedto
thech
ose
ndisch
argelim
itsfortheca
seofu
singadisch
argepipeinthese
a.
Parameter
Units
Dischargelim
itScenarioA
ScenarioB
ScenarioC
ScenarioD
TSS
mg/
L100
17.9
17.9
17.9
12.2
VSS
mg/
L80
14.0
14.0
14.0
11.4
TotalC
OD
mg/
L100–
400
108.2
108.2
108.2
76.1
Soluble
COD
mg/
L280
182.4
138.9
160.6
121.6
Grease
mg/
L10–
50
26.3
31.9
21.8
21.8
Ammonia
mgN/L
20–
80
31.2
31.2
31.2
6.0
Totaln
itrogen
mgN/L
–68.8
68.8
68.8
22.9
Ptotal
mgP/L
5–20
8.5
18.5
18.5
18.5
1
Chlorid
emgCl−/L
8,200
8,200
8,200
8,200
Sulphate
mgSO
4−2/L
1,086
1,086
1,086
1,086
Sulphide
mgH2S/L
0.5–2.0
––
0.0027
–
Sodium
mgNa+/L
4,404
4,404
4,404
4,404
InSce
narioAitco
rresp
onds
totheglobaleffluentfrom
thetwoco
mbinedstreamstreated.
InSce
nariosB,C
andD,itreprese
ntstheco
mpo
sitio
nofthe
combinatio
nofb
oth
streamsafte
rtheirse
parate
treatm
ent
andco
nsiderin
gtheresp
ectiveflo
wrates.
1Phosp
horusasphosp
hate.
Case study: Treatment of fish-canning effluents 143
treatment. Thus, no unique options are applicable for the treatment of fish-canningwastewater and each case needs to be studied individually.
Although Scenario D is the most complex one, it presents advantages such as thefact that the presence of an anaerobic digester before the aerobic unit diminishesodour emission (Achour et al., 2000).
6.5.3.2 Cost evaluationA rough calculation of the operational costs of the four scenarios assessed in terms ofapplied technology was performed based on the type of treatment and thewastewater flow. Energy consumption of the different treatments were taken fromMetcalf and Eddy (2014) referred to the volume of treated wastewater(Table A1.5 in Annex 1). Some assumptions were made for calculations(Table 6.9) and are as follows:
• The fish cannery operates 251 days per year.• The price of the kWh was fixed at 0.11 € (Eurostat, 2019).• The reagent chosen for coagulation-flocculation was ferric chloride with
dosages of 400 mg/L and the corresponding cost of 290 €/t according toCristóvão (2014)
• The level of sludge recycling in the secondary treatment was 0.3 m3
recycled/m3 treated.• The biomass productivity in the AS system was estimated as 0.35 g of VSS
produced/g COD removed. In addition, the ratio 0.75 g VSS/g TSS wasconsidered for the solid production calculation.
• The solid separated from the physical-chemical processes and the sludgepurged from the AS were fed to a gravity thickener where the obtainedconcentration was 45 g TSS/L (Roibás-Rozas et al., 2020).
• The valorization of the produced methane is not included as the qualityof the generated biogas is too low due to its H2S content and wouldrequire the implementation of an expensive post-treatment (Barros et al.,2009).
From the results the cost of the coagulant in the four cases used to treat the mixedor low loaded flows is significant. It represents approximately 35% of the totalestimated operational costs which makes it almost futile to try to optimize theother treatments to enhance the quality of the discharged wastewater.Furthermore, even if this cost was not considered here, the mass of solid wastewhich must be managed increases in proportion to the added coagulant andcontributes to the operational costs of the treatment plant as well by 56–63%.
Thus, looking from another point of view it should not be a problem to implementmore stringent treatments if the coagulation process is improved as there is enoughroom in the huge costs of this treatment to compensate for the new implementedtreatments. This is good news in terms of environment protection.
Treatment and Valorisation of Saline Wastewater144

Table
6.9
Resu
ltsfrom
theoperatio
nalcost
calculatio
nsco
rresp
ondingto
thefourscenario
seva
luated.
Units
SCENARIO
ASCENARIO
BSCENARIO
CSCENARIO
D
Flow
Type
Mixed
High
Load
Low
Load
High
Load
Low
Load
High
Load
Low
Load
Wastewaterflo
w(m
3/d)
88
4.4
83.6
4.4
83.6
4.4
83.6
Wastewaterinflu
entp
umping
kWh/d
3.39
0.17
3.22
0.17
3.22
0.17
3.22
Screens
kWh/d
0.04
0.00
0.03
0.00
0.03
0.00
0.03
Activatedsludge
forBOD
remova
lkW
h/d
–0.62
––
––
–
Activatedsludge
with
nitrifica
tion/denitrifica
tion
kWh/d
––
––
–1.01
–
Return
sludge
pumping
kWh/d
–0.02
––
–0.07
–
Seco
ndary
settling
kWh/d
–0.02
––
–0.02
–
Disso
lvedairflo
atatio
nkW
h/d
3.08
0.15
2.93
0.15
2.93
0.15
2.93
Meso
philicanaerobicdigestion(prim
ary
plus
wasteactivatedsludge)
kWh/d
––
–0.56
–0.56
–
Totale
nergyco
nsu
mptio
nkW
h/d
6.50
0.98
6.18
0.88
6.18
1.98
6.18
OPERATIO
NALCOSTS(energy)
€/ye
ar
180
27
171
24
171
55
171
OPERATIO
NALCOSTSTOTA
L(energy)
€/ye
ar
180
198
195
226
Reagentco
nsu
mptio
nfor
coagulatio
n-flocculatio
n(FeCl 3)
t/d
0.035
–0.033
–0.033
–0.033
Solidsfrom
physical-c
hemicalp
roce
sses
t/d
0.063
–0.056
–0.056
–0.056
Biologicals
olidsfrom
AS
t/d
–0.008
––
–0.002
–
OPERATIO
NALCOSTS(solid
managem
ent)
€/ye
ar
4,733
4,824
4,219
4,340
OPERATIO
NALCOSTSTOTA
L€/ye
ar
7,475
7,455
6,848
6,999
Case study: Treatment of fish-canning effluents 145

6.6 CONCLUSIONSAmong the technologies applied for the treatment of fish-canning wastewater thosebased on physical-chemical processes for solid and FOG fraction separation andbiological processes for soluble COD removal are the most widely used.
Solids removal is needed to fulfil the discharge requirements and to obtain astream appropriate to be treated in the biological processes performed either inaerobic or anaerobic conditions.
The most important compound to be removed in the physical-chemical processesis the grease as it is not easily removed in the biological processes.
Nitrogen removal is not required to fulfil the current discharge limits, however inthe case where the regulations becamemore stringent to limits near those from urbanWWTP technologies, its removal should be considered in the treatment facilities.
Salt is not removed from these effluents. In most cases when the effluent containssalt due to the employment of seawater in the production process it is because theplant is located near to the coast. In these cases, the treated effluent is dischargedback to the sea.
With respect to the operational costs, those associated with the coagulantacquisition are the most important ones. The operation of the treatmenttechnologies represents only 2.4–3.2% distributed as 0.4–0.8% for the high loadwastewater and 2.3–2.5% for the low loaded flow in cases B–D. Improving thesolid separation steps is crucial to decrease these costs in the fish canneries.
REFERENCESAchour M, Khelifi O., Bouazizi I. and Hamdi M. (2000). Design of an integrated bioprocess
for the treatment of tuna processing liquid effluents. Process Biochemistry, 35,1013–1017.
Afonso M. D. and Bórquez R. (2002). Review of the treatment of seafood processingwastewaters and recovery of proteins therein by membrane separationprocesses-prospects of the ultrafiltration of wastewaters from the fish meal industry.Desalination, 142, 29–45.
Aguiar A. L. C. and Sant’Anna G. L. (1988). Liquid effluents of the fish canning industries ofRio de Janeiro state – treatment alternatives. Environmental Technology Letters, 9,421–428.
Aloui F., Khoufi S., Loukil S. and Sayadi S. (2009). Performances of an activated sludgeprocess for the treatment of fish processing saline wastewater. Desalination, 246,389–296.
Artiga P., Oyanedel V., Garrido J. M. and Méndez R. (2005). An innovativebiofilm-suspended biomass hybrid membrane bioreactor for wastewater treatment.Desalination, 179, 171–179.
Artiga P., García-Toriello G.,Méndez R. and Garrido J. M. (2008). Use of a hybrid membranebioreactor for the treatment of saline wastewater from a fish canning factory.Desalination, 221, 518–525.
Treatment and Valorisation of Saline Wastewater146

Aspé E., Martí M. C. and Roeckel M. (1997). Anaerobic treatment of fishery wastewaterusing a marine sediment inoculum. Water Research, 31(9), 2147–2160.
Balsley-Olesen P., Lynggaard-Jensen A. and Nickelsen C. (1990). Pilot-scale experiments onanaerobic treatment of wastewater from a fish processing plant. Water Science andTechnology, 22(1/2), 463–474.
Barros M. C., Magán A., Valiño S., Bello P. M., Casares J. J. and Blanco J. M. (2009).Identification of best available techniques in the seafood industry: a case study.Journal of Cleaner Production, 17, 391–399.
Bassin J. P., PronkM., Muyzer G., Kleerebezem R., Dezotti M. and van Loosdrecht M. C. M.(2011). Effect of elevated salt concentrations on the aerobic granular sludge process:linking microbial activity with microbial community structure. Applied EnvironmentalMicrobiology, 77(22), 7942–7953.
Boardman G. D., Tisinger J. L. and Gallagher D. L. (1995). Treatment of clam processingwastewaters by means of upflow anaerobic sludge blanket technology. WaterResearch, 29(6), 1483–1490.
Carrera P. (2020). Aerobic Granular Sludge Technology for Fish-canning WastewaterTreatment: Optimisation and Scale up. PhD Thesis, USC.
Carrera P., Campo R., Méndez R., Di Bella G., Campos J. L., Mosquera-Corral A. and Val delRio A. (2019). Does the feeding strategy enhance the aerobic granular sludge stabilitytreating saline effluents? Chemosphere, 226, 865–873.
Chowdhury P., Viraraghavan T. and Srinivasan A. (2010). Biological treatmentprocesses for fish processing wastewater – a review. Bioresource Technology, 101(2),439–449.
Corsino S. F., Capodici M., Morici C., Torregrosa M. and Viviani G. (2016). Simultaneousnitritation-denitritation for the treatment of high-strength nitrogen in hypersalinewastewater by aerobic granular sludge. Water Research, 88, 329–336.
Cristóvão R. O., Botelho C. M. S., Martins R. J. E. and Boaventura R. A. R. (2012). Chemicaland biological treatment of fish canning wastewaters. International Journal ofBioscience, Biochemistry and Bioinformatics, 2(4), 237–242.
Cristóvão R. O., Botelho C. M., Martins R. J. E., Loureiro J. M. and Boaventura R. A. R.(2014). Primary treatment optimization of a fish canning wastewater from aPortuguese plant. Water Resources and Industry, 6, 51–63.
Cristóvão R. O., Botelho C. M., Martins R. J. E., Loureiro J. M. and Boaventura R. A. R.(2015a). Fish caning industry wastewater treatment for water reuse – a case study.Journal of Cleaner Production, 87, 603–612.
Cristóvão R. O., Gonçalves C., Botelho C. M., Martins R. J. E., Loureiro J. M. andBoaventura R. A. R. (2015b). Fish canning wastewater treatment by activated sludge:application of factorial design optimization. Biological treatment by activated sludgeof fish canning wastewater. Water Resources Industry, 10, 29–38.
Eurostat. (2019). See https://ec.europa.eu/eurostat/statistics-explained/index.php?title=File:Electricity_prices_for_non-household_consumers,_first_half_2020_(EUR_per_kWh)_v4.png (accessed 24 February 2021).
EUMOFA. (2019). Monthly Highlights, No. 6. See https://www.eumofa.eu/documents/20178/151768/MH+6+2019+EN+final.pdf (accessed 24 February 2021).
Fahim F., Fleita D., Ibrahim A. and El-Dars F. S. (2001). Evaluation of some methods for fishcanning wastewater treatment. Water Air Soil Pollution, 127, 205–226.
Case study: Treatment of fish-canning effluents 147

Figueroa M., Mosquera-Corral A., Campos J. L. and Méndez R. (2008). Treatment of salinewastewater in SBR aerobic granular reactors. Water Science and Technology, 58(2),479–485.
Ghaly A. E., Ramakrishnan V. V., Brooks M. S., Budge S. M. and Dave D. (2013). Fishprocessing wastes as a potential source of proteins, amino acids and oils: a criticalreview. Journal of Microbial and Biochemical Technology, 5, 107–129.
Gharsallah N., Khannous L., Souissi N. and Nasri M. (2002). Biological treatment of salinewastewaters from marine-products processing factories by a fixed-bed reactor. Journalof Chemical Technology and Biotechnology, 77, 865–870.
Giustinianovich E. A., Campos J.-L., Roeckel M. D., Estrada A. J., Mosquera-Corral A. andVal del Río A. (2018). Influence of biomass acclimation on the performance of a partialnitritation-anammox reactor treating industrial saline effluents. Chemosphere, 194,131–138.
Guerrero L., Omil F., Mthdez R. and Lema J. M. (1997) Treatment of saline wastewaters fromfish meal factories in an anaerobic filter under extreme ammoniacal concentrations.Bioresource Technology, 61, 69–78.
HenzeM., Harremoës P., Jansen J. C. and Arvin E. (1997).Wastewater Treatment. Biologicaland Chemical Processes, 2nd ed. Environmental Engineering series. Ed.Springer-Verlag, Berlin. ISBN: 978-3-662-22607-0
IHOBE S. A. (2019). White Book for the waste and emissions minimization. Fish canneries(In Spanish: Libro blanco para la minimización de residuos y emisiones. Conserveras depescado). https://www.azti.es/wp-content/uploads/2019/05/Libro-blanco-para-la-minimizaci%C3%B3n-de-residuos-en-conserveras_azti.pdf (accessed 24 February 2021).
Mendez R., Omil F., Soto M. and Lema J. M. (1992). Pilot plant studies on the anaerobictreatment of different wastewater from a fish-canning factory. Water Science andTechnology, 25(1), 37–44.
Metcalf and Eddy. (2014). Wastewater Engineering: Treatment and Resource Recovery, 5thedn. McGraw-Hill, New York.
Omil F., Méndez R. J. and Lema J. M. (1995a). Characterization of biomass from a pilot plantdigester treating saline wastewater. Journal of Chemical Technology and Biotechnology,63, 384–392.
Omil F., Méndez R. and Lema J. M. (1995b). Anaerobic treatment of salinewastewaters under high sulphide and ammonia content. Bioresource Technology, 54,269–278.
Pronk M., Bassin J. P., De Kreuk M. K., Kleerebezem R. and Van Loosdrecht M. C. M.(2014). Evaluating the main and side effects of high salinity on aerobic granularsludge. Applied Microbiology and Biotechnology, 98(3), 1339–1348.
Puñal A. and Lema J. M. (1999). Anaerobic treatment of wastewater from a fish-canningfactory in a full-scale upflow anaerobic sludge blanket (UASB). Water Science andTechnology, 40(8), 57–62.
Roibás-Rozas A., Mosquera-Corral A. and Hospido A. (2020). Environmental assessment ofcomplex wastewater valorisation by polyhydroxyalkanoates production. Science of theTotal Environment, 744, 140893.
Soto M., Méndez R. and Lema J. M. (1991). Biodegradability and toxicity in theanaerobic treatment of fish canning wastewaters. Environmental Technology, 12,669–677.
Treatment and Valorisation of Saline Wastewater148

Sridang P. C., Kaiman J., Pottier A. and Wisniewski C. (2006). Benefits of MBR in seafoodwastewater treatment and water reuse: study case in southern part of Thailand.Desalination, 200, 712–714.
Suvanich V., Ghaedian R., Chanamai R., Decker E. A. E. A. and McClements D. J. (2006).Prediction of proximate fish composition from ultrasonic properties: catfish, cod,flounder, mackerel and salmon. Journal of Food Science, 63, 966–968.
Tay J.-H., Show K.-Y. and Hung Y.-T. (2006). Wastewater Treatment in the Food ProcessingIndustry. Taylor & Francis, Boca Raton, Fla, USA.
Uttamangkabovorn M., Prasertsan P. and Kittikun A. H. (2005). Water conservation incanned tuna (pet food) plant in Thailand. Journal of Cleaner Production, 13, 547–555.
Val del Río A., Figueroa M., Mosquera-Corral A., Campos J. L. and Méndez R. (2013).Stability of aerobic granular biomass treating the effluent from a seafood industry.International Journal of Environmental Research, 7(2), 265–276.
Val del Río A., Pichel A., Fernández-González N., Pedrouso A., Fra-Vázquez A., Morales N.,Mendez R., Campos J. L. and Mosquera-Corral A. (2018). Performance and microbialfeatures of the partial nitritation-anammox process treating fish canning wastewater withvariable salt concentration. Journal of Environmental Management, 208, 112–121.
Veiga M. C., Méndez R. and Lema J. M. (1994). Anaerobic filter and DSFF reactors inanaerobic treatment of tuna processing wastewater. Water Science and Technology,30(12), 425–432.
Wan C., Yang X., Lee D. J., Liu X., Sun S. and Chen C. (2014). Partial nitrification ofwastewaters with high NaCl concentrations by aerobic granules in continuous flowreactor. Bioresource Technology, 152, 1–6.
Xiao Y. and Roberts D. J. (2010). A review of anaerobic treatment of saline wastewater.Environmental Technology, 31(8–9), 1025–1043.
Yongsiri C., Vollertsen J. and Hvitved-Jacobsen T. (2005). Influence of wastewaterconstituents on hydrogen sulfide emission in sewer networks. Journal ofEnvironmental Engineering, 131(12), 1676–1683.
Case study: Treatment of fish-canning effluents 149


Chapter 7
Case study: Urban wastewatertreatment plant with salineintrusions
ABSTRACTIn this chapter the performance of a wastewater treatment plant (WWTP) treatingwastewater with saline content due to seawater intrusions is evaluated. Aspectsregarding the effects on the removal efficiency and performance of the differentprocesses are considered as well as the solutions put into practice for the differentdrawbacks associated with the salt presence. In particular, the increase of reagentsneeded in the physical-chemical processes, the production of H2S due toanaerobic biological processes and the decrease of biomass activity will beevaluated. Two case studies are assessed based on the salinity of the wastewatertreated (3,000 and 7,000 µS/cm) in a WWTP installed on the Mediterraneancoast of Spain. For both case studies, two possible scenarios are analysed: thedirect discharge of the effluent to the sea or its reuse for agriculture irrigation.
Keywords: Biomass activity, hydrogen sulphide, precipitation, solid production
7.1 MOTIVATIONWater scarcity is one of the challenges to be faced in the future in order to ensure theavailability of freshwater for the population of the world. Of course, the reduction ofwater consumption should be considered as a first action. Independently of the wateravailability this resource has to be considered as limited and consumed wisely. Inparticular, because after its use a proportional amount of wastewater is producedthat requires further treatment. A second action is to recover the water fraction
© IWA Publishing 2021. Treatment and Valorisation of Saline Wastewater: Principles and PracticeAuthor(s): Anuska Mosquera Corral, Ángeles Val del Río and José Luis Campos Gómezdoi: 10.2166/9781789060645_0151
from the produced wastewater by regenerating it in wastewater treatment plants(WWTPs). For this purpose, appropriate treatments need to be applied dependingon the quality required for reuse.
Among the characteristics of the regenerated water influencing its further reusethe salinity needs to be considered. An important amount of the producedwastewater in the world contains salt concentrations which correspond toelectrical conductivity (EC) values over 3,000 µS/cm (total dissolved solids(TDS)= 1.92 g/L) in the range of moderately saline water (Rhoades et al.,1992). The volume of saline wastewater is expected to grow mainly in coastalareas due to the sea level increase caused by the global warming effect or theexploitation of seawater in substitution of freshwater. When saline wastewater isregenerated the conventional treatments applied in the existing WWTP are notable to decrease the salt concentration as, generally, these facilities were notdesigned with consideration of this aspect. In some cases, although theregenerated water is not of high quality it can be used for irrigation with somelimitations. This is the case for effluents with EC values below 3,000 µS/cm. Ithas been estimated that 6% of the world cultivated land has saline conditionsgenerally associated with the presence of NaCl (Pedrero et al., 2018). In othercases salts need to be removed or recovered in posterior treatment stages forfurther reuse. Thus, when the aim is to regenerate saline wastewater the treatmentplants should be designed to obtain the effluent quality required for eachapplication. In the case where good quality regenerated wastewater, in terms ofsalt concentration, is produced it will help to guarantee the availability of enoughfreshwater for the future world population reducing the increasing pressure onnatural resources.
7.2 OCCURRENCE OF SALINE URBAN WASTEWATERUrban wastewater is expected to be produced mainly from the use of freshwater indomestic activities, which already provide certain saline conditions due todecalcifiers and cleaning additives. However, there are cases in which salinestreams are mixed with this freshwater generating wastewater with salinecharacteristics. As a consequence the regenerated water obtained after wastewatertreatment usually contains significant salt concentrations (chlorides, sulphates, etc.).
Among the streams, sources of salinity are the seawater infiltrated in the sewagesystems of WWTPs located in coastal areas (Flood & Cahoon, 2011), the dischargeof saline industrial wastewater to collector systems (Guerreiro et al., 2020) or, inmore limited cases, the use of seawater to flush toilets in substitution offreshwater (Tang et al., 2006). On average seawater intrusions have an EC of8,000 µS/cm, but this value will depend on the volume of seawater intruded. Asa result of its mixture with urban sewage, the produced wastewater presents anEC over 5,000 µS/cm. However, this kind of wastewater does not represent, ingeneral, the largest percentage of all the produced wastewater.
Treatment and Valorisation of Saline Wastewater152

As an example, in the Mediterranean region of Murcia Spain, located on theMediterranean coast, from the 100 Hm3 of treated wastewater used for irrigationper year, 93% has an EC over 2,000 µS/cm and 37% has EC values over 3,000µS/cm (Pedrero et al., 2012). The highest fraction of 56% presents valuesbetween of EC between 2,000 and 3,000 µS/cm and although the quality is nottoo high it can be reused for irrigation purposes. Only 7% of the producedwastewater has an EC below 2,000 µS/cm. For those fractions of wastewaterwith saline contents over those admitted for irrigation, the application ofdesalination processes is required.
Wastewater containing up to 5,000 µS/cm is produced from other types ofintrusions that contribute to supplying salt to the wastewater, such as inresidential areas located on the coast where saline groundwater levels are highand water leaks in basements have to be bailed out. This water flows into thecollecting system. Furthermore, salt is present already in the wastewater due tothe characteristics of the freshwater employed and the products used for washingactivities. In addition, some industries discharge their saline effluents to thesewage system as well.
In coastal areas the amounts of produced saline wastewater are increasing involume and nowadays it is estimated that 9% of the total produced wastewateris saline.
In order to understand the magnitude of the saline effluents in the world, theamount of the population living in coastal areas must be considered. In this sense,according to the SEDAC (Socioeconomic Data and Applications Center)approximately 40% of the population in the world lives within 100 km of thecoast. Furthermore, an estimation indicates that 80% of the largest WWTPs arelocated in coastal areas. Considering the large population of these areas, the foodrequirements and the fact that generally agriculture is the most importantindustrial sector in the region, the amount of water resources becomes animportant issue.
For these reasons, in recent decades the reuse of water from WWTPs hasincreased significantly (Hochstrat et al., 2005; Levine & Asano, 2004). Probablythe most frequent reuse is in agriculture due to several advantages of thesestreams which contain nutrients, reduce fertilizer application and improve themanagement of the effluents in a more effective way (Candela et al., 2007).
7.2.1 Facing seawater intrusionsIn practice most of the wastewater entering sewage systems comprises a variablefraction of waterflow due to infiltrations associated with groundwater levels. Anestimated amount of infiltration referred to the area served by the collectionsystem may range from 0.2 to 28 m3/ha · d (Metcalf & Eddy, 2003). Theinfiltration flow relies on several factors: (i) the quality of the material,workmanship and building connections of the collection system; (ii) the
Case study: Urban wastewater treatment plant with saline intrusions 153

maintenance routines; and (iii) the level of the groundwater in comparison with thatof the collection system. The rate and amount of infiltration varies according to thepopulation densities, which will define the length of the collection system and thearea served, and also to the type of soil and the topographic conditions. Besidesinfiltrations, those sewage systems with leakage problems also present exfiltrationevents. These ones are beyond the scope of this chapter and only infiltration willbe considered.
In addition to the previous considerations, WWTPs that have been designed totreat non-saline wastewater end up needing to cope with seawater intrusions andconsequently operational problems arise. Variable sea levels associated withvariable-intensity tides are responsible for these saline intrusions in collectionsystems. Therefore, several responses are observed in the WWTPs such asdiminishment of the treatment efficiency, increase of water flows resulting inbypass establishment when exceeding the plant capacity, and occurrence ofmechanical effects resulting in increasing operational and maintenance costs(Flood & Cahoon, 2011). Among them, those associated with damage due tocorrosion and loss of activity in the biological systems result in importantreductions of removal efficiency. Furthermore, the fact that salts are present, asin the case of sulphate, enhances the development of new processes notconsidered in the facility design such as the occurrence of sulphate reduction tosulphide.
Saline infiltrations occur to a major or minor extent in all countries withcoastal areas.
7.2.2 Seawater used for toilet flushingIn those areas in the world where water is scarce several alternative options tosolve this limitation are applied. Among them the use of seawater with minimaltreatment (pre-filtration and chlorination) for toilet flushing is an interestingoption. In Hong Kong this has been a normal practice since the 1950s (Liet al., 2005) and it is in place for 80% of its population (Leung et al., 2012).Its utilization is being explored for implementation in other zones, in particularthose which are located 30 km away from the seashore and are highlypopulated (Liu et al., 2016), based on a triple water supply (TWS) thatcomprises fresh water supply, seawater for toilet flushing, and grey water reuseand recycling. Additionally, the specifically developed process of Sulphatereduction, Autotrophic denitrification and Nitrification Integrated (SANI) isbeing studied as well with the aim to reduce overall costs by 50%, energyconsumption by 35% and greenhouse gas (GHG) emissions by 36% (Chenet al., 2012). As a consequence saline wastewater needs to be treated. Severalstudies have proven the adequacy of these practices apart from the economicand environmental benefits obtained (Tang et al., 2006). The application of thisalternative requires changes in the urban management systems and relies on the
Treatment and Valorisation of Saline Wastewater154

existence of a dual water supply system where seawater is only used to flushtoilets while freshwater is used only for potable uses.
In order to determine the economic advantage of the seawater use, a studyperformed by Tang et al. (2006) evaluated the engineering costs of thisalternative in comparison with the utilization of raw freshwater or reclaimedwater. These authors evaluated six scenarios of water supply for toilet flushing.Among them three consisted of the use of separate seawater, freshwater andreclaimed water, respectively. Obtained results indicated that using seawater fortoilet flushing provided the best results (reduction of 44% and 49% of thefreshwater and reclaimed water costs, respectively) compared to the use of freshor reclaimed water.
Although this seems a very advantageous alternative it is not widespread. For thisreason in the next section only the specific case of WWTPs that receive sewagecomprising seawater due to marine intrusions in the collection systems isconsidered.
7.2.3 Saline industrial wastewater dischargeThe salinity associated with industrial saline wastewater discharge depends on thelocation and the industrial activity of the zone. For this reason, its contribution ishighly variable and a representative composition for this contribution is notavailable.
Among the different sources of industrial saline wastewater which are dumped towastewater collector systems are those from cheese production (120,000 µS/cm),detergent production (56,700 µS/cm), the meat industry (35,600 µS/cm), fruitcanneries (25,700 µS/cm), etc. These effluents need to comply with theconcentration limits set for discharge into collector systems.
7.3 TREATMENT CONSIDERATIONS IN WWTPSDepending on the saline conditions of the urban wastewater entering theWWTP theeffects on the different treatment processes will be different as well as the treatmentsolutions to be applied (Table 7.1). In general, salinity affects the activity of thebiological processes (in particular nitrification), solids separation processes (as itaffects settleability, floatation, dehydration), disinfection and odour production(due to H2S production). Furthermore, the fact that saline intrusions enter thecollection system results in an increase in the volume of wastewater to be treatedin the WWTP.
The main aspects related to the influence of salinity on these processes aresummarized in Table 7.1. The solution action adopted or proposed is indicated aswell. A more extensive analysis of this information is provided in the text belowwhere the most relevant effects of the salt presence are analysed.
Case study: Urban wastewater treatment plant with saline intrusions 155

Table
7.1
Summary
oftheeffe
ctsofsalinity
onthedifferenttreatm
entp
roce
ssandfull-scaleadoptedso
lutio
ns(seech
apters
2,3
and
4foramore
detaileddescrip
tionofthedifferentp
roce
sses).
Process
Effectofsalin
ity
Effectonperform
ance
Solution
Sewageco
llector
•Odourproductionassociated
with
H2Sform
atio
n.
•Corrosionoccurrence
.•
Humantoxicity.
•COD
valoriz
atio
nfor
methaneproduction
dim
inishes.
•GHG
emissionincrease
s.
•Reduc
ethetim
esp
entin
the
collectors
byincreasingthe
slopeoftheco
llectionpipes.
•Im
prove
mixingco
nditions
and/
oraeratio
nin
aerobicbioreactors.
•Modify
theenvironmentfor
biologicalp
roce
ssesto
occur.
Settling
•Sludgeflo
atatio
ndueto
the
increase
indensity
ofthe
waterassociatedwith
the
saltco
nce
ntratio
n.
•Sludgevo
lume
indexdecrease
s.•
Turbidity
ofthe
supernatantincrease
s.
•Remova
loffloatin
gso
lidsfrom
thesu
rface
ofthese
ttler.
Floatatio
n•
Enhance
stheform
atio
nof
smallairbubbles.
•Particle-air
bubble
collisions.
•Reduc
ethech
emical
coagulants
addition.
Coagulatio
n-flocculatio
n•
Affe
ctstheperform
ance
ofthe
addedco
agulants.
•Nece
ssity
forh
ighero
rlower
dosa
geofreagents.
•Adjust
theaddeddosa
ge
ofreagents.
Seco
ndary
treatm
ent
•Decrease
ofb
iomass
activity,
inparticular,the
nitrifica
tionproce
ss.
•Biologicalreactorefficiency
decrease
sthustheeffluent
qualityisnotco
mpliedwith
.
•Adjust
theHRT.
•Adjust
theSRTfrom
10to
15
days
inorderto
favo
urthe
nitrifica
tionproce
ss.
Seco
ndary
treatm
ent
•Biomass
floatatio
ndueto
H2Sprodu
ction.
•Solid
retentio
ninsidethe
reactordecrease
sand
conse
quently
theefficiency
oftheproce
ssdim
inishes.
•Deve
lopmento
ffilamentousbacteria
.
•Im
plementabiomembrane
reactorin
substitu
tionofthe
conve
ntio
nala
ctivated
sludge
system.
(Continued)
Treatment and Valorisation of Saline Wastewater156

Table
7.1
Summary
oftheeffe
ctsofsalinity
onthedifferenttreatm
entp
roce
ssandfull-scaleadoptedso
lutio
ns(seech
apters
2,3
and
4foramore
detaileddescrip
tionofthedifferentp
roce
sses)
(Contin
ued).
Process
Effectofsalin
ity
Effectonperform
ance
Solution
Seco
ndary
settling
•Floatatio
nofb
iomass
associatedwith
N2
gasform
atio
n.
•Sludgevo
lume
indexdecrease
s.•
Turbidity
increase
s.
•Controltheretentio
ntim
ein
the
settlerto
avo
idtheprodu
ctionof
H2Sfrom
sulphate
reduction
with
COD
from
thebiomass
inanaerobicco
nditions.
•Shortenretentio
ntim
ein
the
settlerto
avo
iddenitrifica
tion.
•Substitu
tese
ttlingwith
amembranesystem.
Anaerobic
digestion
•Decrease
ofm
ethanogenic
activity.
•ProductionofH
2Satinhibito
ryleve
lsforthebiomass.
•Prese
nce
ofH
2Sinthebiogas.
•Decrease
ofa
naerobic
digesterefficiency.
•Adjust
theSRTfrom
10to
15
days
inorderto
favo
ursludge
anaerobicdigestion.
Effluentquality
•Salinity
exceedsthe
conce
ntratio
nsu
itable
for
reuse
inagric
ultu
reirrigatio
n.
•Im
possibility
ofreclaim
ed
waterreuse
.•
Implementatertiary
treatm
ent
base
donRO
membranes.
Membranefiltratio
n•
Precipita
tionofs
alts
astheir
solubility
isexceededin
the
proximity
ofthemembrane.
•More
intense
wash
ingof
themembrane.
Membranefiltratio
n•
Biofoulingca
use
dbybiomass
particle
decrease
due
tosa
linity.
•Increase
ofe
nergy
consu
mptio
nfor
membraneoperatio
n.
•Less
duratio
nofm
embranes.
•Acclim
ate
biomass
tosa
line
wastewaterto
avo
idnegative
effe
ctsofs
alinity
COD:c
hem
icalo
xygendemand
;GHG:g
reenh
ouse
gase
s;HRT:
hyd
raulic
retentio
ntim
e;SRT:
sludg
eretentio
ntim
e;R
O:reve
rseosm
osis.
Case study: Urban wastewater treatment plant with saline intrusions 157

7.3.1 Hydrogen sulphide productionWastewater reaches the WWTP through a collection system which receives theeffluents produced in a certain region with a surface extension which depends onthe kind of urban nuclei (residential, with small industry, touristic, etc.), thepopulation density and the size of the WWTP. Thus, the time of permanence ofthe wastewater in the collection system relies on the length of the system andconstructive characteristics. The collection systems comprise among others forcemains, gravity sewers, manholes, pumping equipment, etc.
In general hydrogen sulphide (H2S) is naturally formed in wastewater systemsfrom the anaerobic degradation of organic matter (Eq. 7.1). Anaerobic conditionsoccur frequently in the collection systems and other units of the plant wheremixture and aeration conditions are inefficient. This compound represents a majordrawback in the wastewater network (Lens et al., 1998) and is responsible forodour and corrosion (due to H2SO4 formation) production and health impacts onhumans (Churchill & Elmer, 1999; Jiang et al., 2015, 2016; Li et al., 2017;Nielsen et al., 1992). Apart from the release of sulphur from proteins in salinewastewater, sulphates are also present in large concentrations and contribute tohydrogen sulphide production.
C10H19O3N+ 6.25 SO 2−4 + 9.375 H+ � 3.125 H2S+ 3.125 HS−
+ 7 H2O+ 9 CO2 + NH +4 + HCO −
3
(7.1)
In these conditions if the wastewater residence time inside the collectors is longenough anaerobic conditions occur which promote the reduction of sulphates toH2S. Besides in the collector, H2S is produced in other zones in the WWTPwhere anaerobic conditions and presence of sulphates and organic matter coexist.
Low wastewater velocities inside the collection systems correspond to longresidence times and favour the formation of microbial biofilms on their surfaceswhich are responsible for H2S production (Carrera et al., 2016). To avoid theoccurrence of this compound several actions have been proposed which relyeither on collection pipe construction or modification of the existing environmentto prevent H2S production or remove it after its formation. With respect to theformer one, in the design of the collection system it is crucial to providepronounced slopes that enhance the water flow reducing wastewater permanencetime inside the collectors. When dealing with systems of new construction thisalternative is feasible but it is complicated to achieve with existing ones.
With respect to the environment modification, the existing alternatives are alsoapplicable to other units in the plant. This case requires the addition of anexternal compound into the collector system or WWTP unit, like nitrate, ferroussalts, injection/addition of air, pure oxygen, or alkali, to increase pH or metals toprecipitate sulphide (Kulandaivelu et al., 2020). As an example, Churchill andElmer (1999) tested the addition of nitrate which competes for the organic matterwith sulphate reducing bacteria (SRB) avoiding H2S formation. In this case,
Treatment and Valorisation of Saline Wastewater158
nitrate was supplied in a pilot test into a collector section, fitted with H2S meters inthe Town of Bedford (Massachusetts, USC). The authors observed that shortly afterits addition the measured concentration of H2S was zero and concluded that theconfiguration of the collection systems will define the number of dosing stationsneeded to achieve this situation.
The reaction that takes place in the collection system with nitrate addition, andusing the wastewater as organic matter source, is (Eq. 7.2):
0.02C10H19O3N+0.1175 SO 2−4 +0.0021NO −
3 +0.0021H+ � 0.0021C5H7O2N
+0.0588H2S+0.0588HS−+0.1336H2O+0.1693CO2+0.0200NH +4
+0.0200HCO −3 (7.2)
All the possible options have drawbacks associated with energy and maintenancerequirements for air injection, reagents consumption due to the need for dosage inmultiple locations or increase of nitrate load, flocculation and settling of solids(in sewer pipes) after iron salt dosing, etc. The iron dosing was found to be oneof the most applied options from a survey performed in Australia (Ganigué et al.,2018) as it is not very expensive and does not produce harmful by-products.
Moreover, the dosage of iron either in the collection system or the inlet of theWWTP provided beneficial effects in other stages of the process. Its dosage inthe collection network provided iron sufficient for desulfurization of H2S via ironsulphide precipitation from biogas in the anaerobic sludge digester (Ge et al.,2013; Salehin et al., 2019). Kulandaivelu et al. (2020) evaluated its dosage in thesewer pipes and in the inlet of the of the Luggage Point WWTP (Queensland,Australia) and observed the decrease of H2S concentration in the gas phase in theanaerobic digester (36–45%) and an improvement in the digested sludgedewaterability of almost 10%.
The production of H2S during solid anaerobic digestion of the produced sludge intheWWTP is of great importance. Information about this process has been providedin Chapter 4.
7.3.2 Solid separationHigh salt concentrations favour the action of air bubbles on the floatation of particlesand as a consequence decrease the requirements for chemical coagulant addition(Quinn et al., 2007). However, the presence of salt reduces the quality of theeffluent after settling due to the appearance of turbidity although the effect on theSVI (sludge volume index) is to decrease it, indicating an improvement of thesettling properties of the biomass. Chen et al. (2018) observed a decrease in SVIfrom 95 to 19.5 mL/g TSS (total suspended solids) when the salinity increasedfrom 0 to 20 g NaCl/L. Further explanation on the reasons for this behaviour isprovided in Chapter 2 of this book.
Case study: Urban wastewater treatment plant with saline intrusions 159

In the case of the flocculation process, increasing salt concentrations up to certainvalues improved the process, but over these values it was negatively affected asobserved by Wang et al. (2013) when they applied it to separate TiO2
nanoparticles at concentrations over 5.85 g NaCl/L and 3.33 g CaCl2/L. Whenthe formation of flocs is based on overcoming the solubility of the formedhydroxide the presence of salts exerts a negative effect. Wang et al. (2010)observed that the efficiency decreased when AlCl3, PAC (polyaluminiumchloride) and nano-PAC were used to separate humic acids and the concentrationof salt augmented from 2.925 to 14.625 g NaCl/L. On the contrary whencoagulation occurs due to polymers addition the coagulation is improved by saltaddition. In the case of humic substances (HS) (10–40 mg/L) their removalimproved with the decrease of salinity from 25 to 10 g NaCl//L and was 89 and73%, respectively (Hilal et al., 2008). With respect to the coagulation withaluminium sulphate, salinity decreases the concentration of the dosage (0.862–6.840 mg Al2(SO4)3/L) required for organic substances coagulation (Duan et al.,2002).
Membrane filtration in the WWTP is a common practice to obtain an effluentfrom the secondary treatment with enough quality for reuse in agriculture. Theuse of ultrafiltration (UF) membranes (0.04 µm pore size) for the treatment ofsecondary effluents from WWTPs enabled the removal of faecal pathogenicorganisms, without the need for a disinfection step, and the production ofreclaimed wastewater appropriate for agricultural reuse to irrigate tomato, fenneland lettuce (Lopez et al., 2010). These authors observed that the microbialpollution in the reclaimed water was in some cases below that of the freshwaterdue to the existence of illegal discharge of untreated wastewater to aquifers. Forconcentrations of salt below 10 g NaCl/L conventional membrane bioreactor(MBR) systems are applicable (Tan et al., 2019). Salinity affects the sludgeactivity and characteristics, by diminishing the biomass particle size leading to anincrease of the filtration resistance in membrane systems associated with thedevelopment of membrane fouling (Xie et al., 2014). Thus salinity makes theoperation of these reactors more difficult and more research is needed to find outthe exact process taking place.
7.3.3 Biological processesThe effects of salinity on the secondary treatment performance are the decrease ofbiological processes activity, cell death and biomass floatation with consequentwash-out. The bacterial populations involved in the different removal processesare affected differently. There is not a general consensus regarding the resistanceof activated sludge to salinity. Some authors fixed the limit of salt concentrationat 1% (Abou-Elela et al., 2010) while for others activated sludge was able toadapt to salt concentrations up to 5% (Lefebvre and Moletta, 2006). In addition,rapid shifts in salt concentrations, as in the case of seawater intrusions, diminish
Treatment and Valorisation of Saline Wastewater160

the efficiency of the biological processes in WWTPs (Salvadó et al., 2001) unlessthe biomass is acclimated to saline conditions, then, the negative effect comeswhen the salt concentration is decreased (He et al., 2017). For concentrationsunder 10 g NaCl/L microorganisms are capable of acclimating while forconcentrations above 30 g NaCl/L the time required is too long or acclimation isnot possible (Linaric ́ et al., 2013). If the sludge comprises non-halophilicmicroorganisms these might need an acclimation period to perform properly (Tanet al., 2019). However, in the case of transient saline conditions this acclimationmight not possible (Flood & Cahoon, 2011). In order to overcome the decrease ofthe biomass activity the operation SRT is increased. As a consequence, thepumping of returning sludge increases with increasing reactor volume.Considering that the higher the SRT the lower the observed biomass yield, thenet amount of biomass generated in these conditions diminishes. This is a benefitin terms of cost of solid management.
Nitrifying bacteria are affected by saline conditions to different extentsdepending on the time of exposure to saline conditions. Ammonium oxidizingbacteria (AOB) are more sensitive to short and long term exposure to 10 g Cl−/Lthan nitrite oxidizing bacteria (NOB). According to Moussa et al. (2006) theiractivity diminished by 36 and 39% and 5 and 13% for short and long termexposure, respectively.
Salinity also exerts other negative effects like the increase of effluent turbidity(Salvadó et al., 2001), after the secondary settler, caused by the decrease ofdiversity of eukaryotic microorganisms (protozoa and small metazoa) (Salvadóet al., 2001), which normally graze on the particulate material and bacterial cells.In the case of nitrifiers, the increase of salt resulted in an improvement of thebiomass settleability and reduction of the proportion of filamentous bacteria(Moussa et al., 2006).
From the previous analysis it is clear that the effect of salinity can be eitherpositive, inexistent or negative with respect to the correct performance of thestudied processes (He et al., 2017). However, the addition of salts is notconsidered in general to improve any of these processes as these compounds arenot beneficial for further reuse, although they are not a problem in the case oftreated effluent discharged to the sea.
7.4 CASE STUDY: URBAN WASTEWATER TREATMENTPLANT7.4.1 Case studies definitionThe WWTP example chosen for this evaluation was designed with a treatmentcapacity of 130,000 person equivalent and a treated flow of 20,000 m3/d (0.231m3/s). Thus, a person equivalent was estimated to produce 154 L/d ofwastewater to calculate the wastewater flowrate.
Case study: Urban wastewater treatment plant with saline intrusions 161
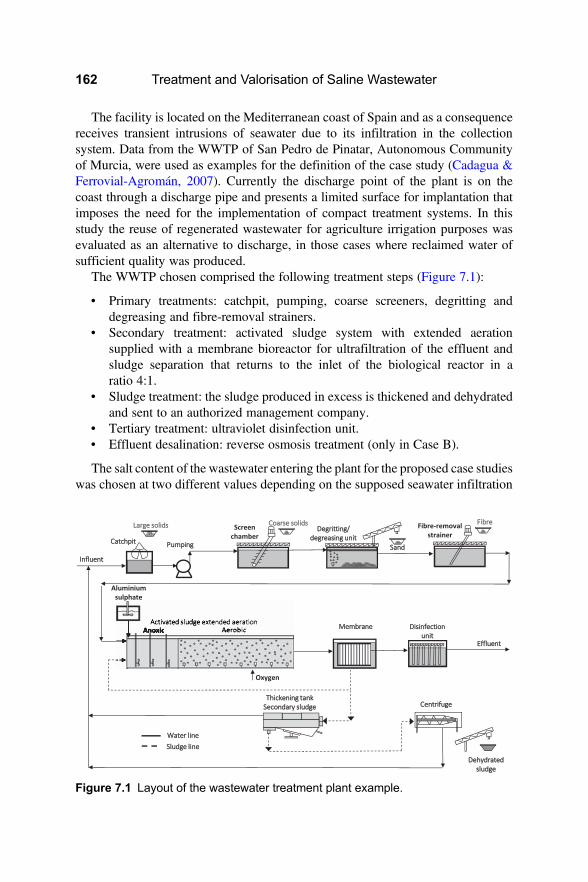
The facility is located on the Mediterranean coast of Spain and as a consequencereceives transient intrusions of seawater due to its infiltration in the collectionsystem. Data from the WWTP of San Pedro de Pinatar, Autonomous Communityof Murcia, were used as examples for the definition of the case study (Cadagua &Ferrovial-Agromán, 2007). Currently the discharge point of the plant is on thecoast through a discharge pipe and presents a limited surface for implantation thatimposes the need for the implementation of compact treatment systems. In thisstudy the reuse of regenerated wastewater for agriculture irrigation purposes wasevaluated as an alternative to discharge, in those cases where reclaimed water ofsufficient quality was produced.
The WWTP chosen comprised the following treatment steps (Figure 7.1):
• Primary treatments: catchpit, pumping, coarse screeners, degritting anddegreasing and fibre-removal strainers.
• Secondary treatment: activated sludge system with extended aerationsupplied with a membrane bioreactor for ultrafiltration of the effluent andsludge separation that returns to the inlet of the biological reactor in aratio 4:1.
• Sludge treatment: the sludge produced in excess is thickened and dehydratedand sent to an authorized management company.
• Tertiary treatment: ultraviolet disinfection unit.• Effluent desalination: reverse osmosis treatment (only in Case B).
The salt content of the wastewater entering the plant for the proposed case studieswas chosen at two different values depending on the supposed seawater infiltration
Figure 7.1 Layout of the wastewater treatment plant example.
Treatment and Valorisation of Saline Wastewater162

ratio: 3,000 fixed µS/cm, which is the maximum value allowed to be present inwater suitable for agriculture irrigation, and 7,000 µS/cm, which means thatproduced regenerated water is not suitable for irrigation without desalinationtreatment.
The composition of the wastewater is detailed in Table 7.2. Some calculationsand assumptions were made to define all the parameters of the wastewaternecessary for each case study and the plant discharge limits, and these areindicated below and in the table footer.
The concentration of salts in the wastewater was estimated from the TDSconcentration minus the concentration of soluble organic matter (sCOD). ThesCOD was calculated as the total chemical oxygen demand (tCOD) minus theCOD associated with the volatile suspended solids (VSS) of the wastewater as130 mg sCOD/L, using the ratio 1.8 kg COD/kg VSS of primary settled solids.The concentration of sCOD as TDS was calculated with the stoichiometricexpression that defined the COD composition of the wastewater, estimated asfollows: (i) 400 mg tCOD/L were converted to carbon using the ratio 12 mgC/32 mg O (150 mg C/L), (ii) thus, the stoichiometric ratio of C, N and P wasdetermined from the concentration 150 mg C/L, 40 mg N/L and 7 mg P/L as 5,1.15 and 0.082 mol, respectively, (iii) the stoichiometric parameters of H and Owere defined, taking as a basis the expression C5H9NO, as 9 and 1, respectively(Mateju et al., 1992). From these calculations, the stoichiometry C5H9N1.14P0.09O(Mw= 103.8 g/mol) was estimated as defining the sCOD concentration of thewastewater. Applying this procedure the soluble organic matter concentration assolids was calculated as 224.9 mg DS/L.
Afterwards, the concentration of salts was estimated from the remainingconcentration of TDS and applying the ratio between the ions existing in theseawater composition, defined according to the standard ASTM D 1141-98(Table A2.1 in Annex 2). Considering that salinity from origins other thanseawater intrusions contributed in low proportion, only the ratio among the ionsin the seawater was used to determine their values for the wastewater and thedischarge limits (Table 7.2).
The defined discharge limit concentrations for water reuse were fixed accordingto the Directive 91/271/CEE and the data provided by the Food and AgricultureOrganization of the United Nations (FAO) as appropriated for agricultureirrigation (FAO, 1985). The optimum value of EC for irrigation was found to bebelow 2,000 µS/cm which was chosen to define the discharge limit for irrigationreuse (Zarzo et al., 2013).
The two different case studies evaluated and compared were defined in terms ofthe EC of the wastewater and the installed treatment processes as follows:
• Case A: treated wastewater (Table 7.2) with a conductivity of 3,000 µS/cm.The treatment plant design included primary treatments, a secondary onecomprising an extended aeration bioreactor with a membrane ultrafiltration
Case study: Urban wastewater treatment plant with saline intrusions 163

Table 7.2 Composition of the wastewater (Cadagua & Ferrovial-Agromán, 2007) and dischargelimits fixed by the directive 91/271/CEE and the FAO limits for irrigation (FAO, 1985).
Parameter Unit WastewaterCompositionCase A
WastewaterCompositionCase B
DischargeLimits for WaterReuse
pH – – – 6.5–8.4(4)
Electricalconductivity
µS/cm 3,000 7,000 2,000
TDS mg/L 1,920(1) 4,480(1) 1,280(1)
BOD5 mg/L 180 180 25
tCOD mg/L 400 400 125
TSS mg/L 200 200 35
Ammonium mg/L
Nitrite mg N/L
Total N mg N/L 40 40 10
Total P mg P/L 7(2) 7(2) 1
Chloride mg Cl−/L 940(3) 2,360(3) 1,065(4)
Boron mg B−/L 0.224(3) 0.56(3) 2(4)
Sodium mgNa+/L 522(3) 1,311(3) 920(4)
Sulphate mgSO4
2−/L131(3) 329(3) 960(4)
Magnesium mgMg2+/L
63(3) 158(3) 61(4)
Calcium mgCa2+/L
20(3) 50(3) 400(4)
Potassium mg K+/L 19(3) 47(3) 2(4)
Oils and fats(floating)
mg/L 90(2) 90(2) 20
Sulphide mg/L 1
Total coliform No./100mL
107–109 (2) 107–109 (2)
Faecal coliform No./100mL
104–106 (2) 104–106 (2)
Cryptosporidiumoocysts
No./100mL
10−1–101 (2) 10−1
–101 (2) ≤1(5)
Giardia lambliacysts
No./100mL
10−1–102 (2) 10−1
–102 (2)
The salinity of the discharge limit was fixed at 2,000 µS/cm as a value of salinity suitable forreuse of the regenerated water in agriculture.1Estimated from the ratio TDS (mg/L)=EC (µS/cm) · 0.64 (Metcalf & Eddy, 2003).2Data from Metcalf & Eddy (2003) for medium strength wastewater type.3Estimated from the composition of artificial seawater model (ASTMD 1141-98) after subtracting259.5 mg/L of organic matter contained in the wastewater.4Limits from the FAO (1985).5Intestinal nematodes (helminth eggs): ≤1 egg/L for irrigation of pastures or forage.BOD5: 5-day biological oxygen demand.
Treatment and Valorisation of Saline Wastewater164

system, and a tertiary disinfection treatment. The produced sludge wasconcentrated and dried for further management.
• Case B: treated wastewater (Table 7.2) with a conductivity of 7,000 µS/cm.The wastewater treatment plant comprised the same treatments as in Case A,and in addition the produced effluent was submitted to a tertiary treatmentwhich includes salt removal via a reverse osmosis (RO) process.
In both cases two options were evaluated, the discharge of the obtained effluent tothe sea (A1 and B1, respectively) and the valorization of the reclaimed water forirrigation (A2 and B2, respectively). This option of reuse is a reasonableapplication as in the Mediterranean coastal area, where the plant is installed,approximately 70% of the WWTP effluents are valorized for this purpose.
The quality of the effluent will be maintained the same in all case studies, in termsof nutrients concentration (nitrogen and phosphorus), in order to comply with thedischarge limits imposed by the Directive 91/271/CEE in the case of sensitiveareas (Table 7.2). Although in the case of agriculture application these nutrientconcentrations could be higher to exploit the fertilization potential of thewastewater, this option was not considered here. This choice was made due tothe special situation of eutrophication of the Mar Menor (Murcia) wherethe irrigation water is supposed to run-off from the production fields receiving thereclaimed water.
The case studies were compared in terms of energy consumption and operationalcosts. Energy consumption associated with aeration, pumping and membranesystems operation was considered. Operational costs were estimated consideringenergy consumption and solids management. Produced sludge was not valorizedfor methane production as the plant used as an example did not have thistreatment. Other operational costs such as personnel and maintenance were notconsidered as no significant differences were expected for this cost in thedifferent scenarios evaluated. These costs contribute to approximately 30% and10% of the total costs, respectively.
After defining the case studies, the following assumptions were made for thecalculations referring to the performance of the activated sludge system. Theequations used are described in Annex 2:
• For calculations of the net waste activated sludge produced (Annex 2, Eq.A2.1), the total COD contained in the wastewater (400 mg tCOD/L) wasfractionated using the following ratios: 3 kg SS/kg Si and 3 kg XS/kg Xi
(estimated from the composition of the wastewater in different countriesfrom Henze et al. (2002)), 1.8 kg COD/ kg VSS (primary settled solids),1.42 kg COD/kg VSS (secondary settled sludge). The obtainedconcentrations were: 140.25, 159.75, 46.75 and 53.25 mg COD/L for Ss(readily biodegradable soluble COD fraction), Xs (slowly biodegradableparticulate COD fraction), Si (non-biodegradable soluble COD fraction)and Xi (non-biodegradable particulate COD fraction), respectively.
Case study: Urban wastewater treatment plant with saline intrusions 165
• Previous calculated biodegradable particulate and soluble COD fractionswere removed in the extended aeration biological reactor in order tocomply with the Directive 91/271/CEE limits (Table 7.2). In practice forcalculations the concentration of tCOD in the effluent was below this limitdue to the need for an electron donor to denitrify the nitrogen content ofthe wastewater and the presence of the UF membrane. Thus, the effluentquality was fixed equal to the composition corresponding to the exampleWWTP of 3 mg SS/L, 17 mg tCOD/L and 2 mg BOD5/L.
• In the pre-treatment steps 60% of the TSS of the wastewater was removedwith a content of 26.6% inerts (Eq. A2.2 and A2.3). This 60% was thenadded to the TSS produced in the plant and that required posteriormanagement. For biomass growth only 40% of this fraction was degradedby the heterotrophic bacteria (Eq. A2.1).
• The organic matter from the influent wastewater was removed in the activatedsludge reactor via denitrification (6.6 kg COD/kg NO3
−-N reduced, accordingto Metcalf & Eddy, 2003) and the amount left was oxidized in the aerationzones.
• The total load of daily produced sludge waste from the plant was estimated asthe produced kg VSS/d from the COD biodegraded minus the kg VSS/dremoved in the effluent plus the solids separated in the pre-treatments(Eq. A2.3). The flow of VSS was then converted into TSS by assumingthat the fraction of VSS corresponded to 75% of the fraction of TSS. Theprice of the solid management was fixed as 200 €/t TSS.
• All nitrogen present in the water was hydrolysed to ammonium, which wasnitrified and subsequently denitrified to achieve a concentration of 10 mgTN/L in the effluent.
• The oxygen consumed was the sum of that required for the oxidation ofammonium to nitrate (4.33 kg O2/kg N oxidized (Werzernak & Gannon,1967)) and that needed for the oxidation of the excess organic matter fordenitrification (Eq. A2.4).
• The price of the reclaimed water for reuse was 0.3 €/m3.• Calculations were performed with the SRT fixed for winter and summer
periods at 25 and 18 days, respectively.• The energy consumed for pumping the wastewater to the activated sludge
system was estimated from the inflow (Case A) and from the inflow plus theamount of seawater infiltrated (Case B). In both cases the energyconsumption was 0.045 kWh/m3. In the case of the sludge recycled fromtheMBR this value was 0.013 kWh/m3. The recycling ratio (R) was fixed at 4.
• Reverse osmosis was chosen to remove the salinity in case study B when theregenerated wastewater was treated for reuse in irrigation.
• The energy consumption attributed to the ultrafiltration system was 0.3kWh/m3 of permeate and to the reverse osmosis without energy recoverywas 0.65 kWh/m3 of permeate (Metcalf & Eddy, 2014).
Treatment and Valorisation of Saline Wastewater166

• The price of the kWh was fixed at 0.11 € (Eurostat, 2019).• In Case B with an EC value of 7,000 µS/cm a correction percentage due to
salinity, calculated to counteract its effect on oxygen solubility (SO2) andoxygen mass transfer coefficient (KLa), was applied to estimate theoxygen required for the secondary treatment (Annex 2). The percentageof variation of the oxygen solubility in the wastewater was estimated as2.68% (Eq. A2.9) meaning that this is the percentage of extra oxygen thathas to be added. This value was calculated for the concentration of 4,480mg TDS/L, considering that compounds other than salts did notcontribute to this concentration significantly. The percentage of variationof the KLa for a concentration of 1,920 (Case A) and 4,48 (Case B) mgTDS/L represents an increase in oxygen transfer of 5.2% according toEq. A2.10. Thus, considering both percentages, the oxygen suppliedincreases by 2.52% which is the percentage of reduction of oxygensupply required.
7.4.2 Comparison of case studiesAccording to the calculations described in Annex 2 the following results wereobtained for the case studies evaluated. The data used for the calculations will notallow for a direct analysis of the obtained costs, and percentages will bedetermined to compare the two cases and alternatives (Table 7.3).
The energy consumed for aeration of the secondary treatment decreased by1.44% in Case B compared to Case A, as the oxygen solubility decreased but itwas compensated by the oxygen transfer increase due to the increase of salinity(Figure A2.1). The most relevant energy-consuming activity is the functioning ofthe MBR and the RO systems. The energy consumption for the MBR contributesto approximately 44.5% of the total energy of Case B when the effluent isproduced for discharge. In addition in Case B when reclaimed water is producedfor reuse the MBR contributes to approximately 22.6% and the reverse osmosisto approximately 49% of the total energy consumption.
The SRT did not need to be modified for Case B as the concentration of salts wasnot sufficiently high to negatively affect the biomass activity. For this reason, themass per day of solids produced in the activated sludge system was the same inboth cases. Thus, the solid management costs remain the same.
With respect to the discharge fee (Annex 2, Eq. A2.8) the obtained amount for theWWTP example accounts for approximately 9–12% of the costs if the compositionof the discharge effluent complies with the limits of the Directive. In the case wherethe reclaimed water is sold for agriculture irrigation the revenue obtained covers theexpenses of the energy consumed and solid management in both cases. In Case Asignificant benefits could be achieved. If the personnel and maintenance costs areadded, as 40% of the total costs, the revenue from the reclaimed water saleswould cover all the costs in Cases A and B.
Case study: Urban wastewater treatment plant with saline intrusions 167

Table
7.3
Summary
ofthemain
resu
ltsobtainedfrom
theca
lculatio
ns.
CaseA
CaseB
A1
A2
B1
B2
Discharge
Reuse
Discharge
Reuse
SRT
d18
25
18
25
18
25
Energyco
nsu
mptio
n
Aeratio
nenergy
kWh/
y2,180,280
2,206,819
2,149,252
2,175,122
2,149,252
2,175,122
Pumpingenergy
kWh/
y708,100
751,535
751,535
MBR
energy
kWh/
y–
2,324,336
2,324,336
Reve
rseosm
osis
kWh/
y–
–5,036,061
TOTA
LENERGY
kWh/
y2,888,380
2,914,919
5,225,123
5,250,993
10,261,183
10,287,054
Operatio
nalc
osts
Energy
€/y
317,722
320,641
574,764
577,609
1,128,730
1,131,576
Solid
management
€/y
117,139
108,371
117,139
108,371
117,139
108,371
TOTA
LCOSTS
€/y
724,768
715,020
1,153,171
1,143,301
2,076,449
2,066,578
Disch
argefee
WWTPexa
mple
€/y
58,503
62,092
Waterreuse
benefits
Reclaim
edwater
€/y
2,190,000
2,324,336
Treatment and Valorisation of Saline Wastewater168

The benefits from selling the reclaimed water increase by 6% in Case Bcompared to Case A. This revenue is of relevance considering the large costs ofthe RO treatment to produce reclaimed water suitable for reuse. If selling thereclaimed water is not feasible, the operational costs of the treatment are too highand might impede the implementation of this treatment.
The obtained results will change if the costs of the different items and the sellingprice of the water are adjusted to other values.
7.5 CONCLUSIONSAfter the evaluation performed the following conclusions can be drawn:
The production of reclaimed water for agriculture irrigation is feasible fromWWTPs with saline wastewater, but it involves the implementation oftechnologies specifically devoted to adjusting the required quality. Membranetechnologies are by far the most commonly employed technologies to guaranteethe saline conditions of the reclaimed effluents.
The energy required to operate the membrane systems represents an increment inthe energy consumption of the plant compared to the base study Case A ofapproximately 22% in the case of the ultrafiltration system and of 49% associatedwith the reverse osmosis implemented for salt removal.
In the case where the regenerated water is sold for 0.3 €/m3, in Cases A and B theamount received (2,190,000 and 2,324,336 €/y, respectively) would be enough tocompensate for the operational expenses incurred including energy consumption,solid management, personnel and maintenance. Thus, it is of great importance notonly to establish appropriate norms to regulate the price of reclaimed water forreuse in agriculture but also to define the concentration limits of the differentpollutants.
REFERENCESAbou-Elela S. I., Kamel M. M. and Fawzy M. E. (2010). Biological treatment of saline
wastewater using a salt-tolerant microorganism. Desalination, 250, 1–5.Cadagua and Ferrovial-Agromán S.A. (2007). Plant Report: Remodelling of San Pedro del
Pinatar Wastewater Treatment Plant in Murcia. Infoenviro, June, 19–33.Candela L., Fabregat S., Josa A., Suriol A., Mas J. and Vigues N. (2007). Assessment of soil
and groundwater impacts by treated urban wastewater reuse. A case study: application ina golf course (Girona, Spain). Science of the Total Environment, 374, 26–35.
Carrera L., Springer F., Lipeme-Kouyi G. and Buffiere P. (2016). A review of sulphideemissions in sewer networks: overall approach and systemic modelling. WaterScience and Technology, 73(6), 1231–1242.
Chen G. H., Chui H. K., Wong C. L., Tang D. T. W., Lu H., Jiang F. and van LoosdrecthM. C. M. (2012). An innovative triple water supply system and an novel SANI®
process to alleviate water shortage and pollution problem for water-scarce coastalareas in China. Journal of Water Sustainability, 2(2), 121–129.
Case study: Urban wastewater treatment plant with saline intrusions 169

Chen Y., He H., Liu H., Li H., Zeng G., Xia X. and Yang C. (2018). Effect of salinity onremoval performance and activated sludge characteristics in sequencing batchreactors. Bioresource Technology, 249. 890–899.
Churchill P. and Elmer D. (1999). Hydrogen sulphide odor control in wastewater collectionsystems. NEWEA Journal, 33(1), 57–63.
Duan J., Wang J., Graham N. andWilson F. (2002). Coagulation of humic acid by aluminiumsulphate in saline water conditions. Desalination, 150, 1–14.
Eurostat (2019). See https://ec.europa.eu/eurostat/statistics-explained/index.php?title=File:Electricity_prices_for_non-household_consumers,_first_half_2020_(EUR_per_kWh)_v4.png (accessed 24 February 2021).
FAO (1985). Water quality for agriculture. FAO Irrigation and Drainage paper 29, Rev. 1,FAO, Rome.
Flood J. F. and Cahoon L. B. (2011). Risks to coastal wastewater collection systems fromsea-level rise and climate change. Journal of Coastal Research, 27, 652–660.
Ganigué R., Jiang G., Liu Y., Sharma K., Wang Y.-C., Gonzalez J., Nguyen T. and Yuan Z.(2018). Improved sulfide mitigation in sewers through on-line control of ferrous saltdosing. Water Research, 135, 302–310.
Ge H., Zhang L., Batstone D. J., Keller J. and Yuan Z. (2013). Impact of iron salt dosage tosewers on downstream anaerobic sludge digesters: sulfide control and methaneproduction. Journal of Environmental Engineering, 139(4), 594–601.
Ghalavand Y., Hatamipour M. S. and Rahimi A. (2015). A review on energy consumption ofdesalination processes. Desalination and Water Treatment, 54, 1526–1541.
Guerreiro R. C. S., Jerónimo E., Luz S., Pinheiro H. M. and Prazeres A. R. (2020). Cheesemanufacturing wastewater treatment by combined physicochemical processes forreuse and fertilizaer production. Journal of Environmental Management, 264, 110470.
He H., Chen Y., Li X., Cheng Y., Yang C. and Zeng G. (2017). Influence of salinity onmicroorganisms in activated sludge processes: A review. InternationalBiodeterioration and Biodegradation, 119, 520–527.
Henze M., Gujer W., Mino T. and van Loosdrecht M. (2002). Activated sludge modelsASM1, ASM2, ASM2d and ASM3. IWA Publishing in its Scientific and TechnicalReport series, London, UK.
Hilal N., Al-Abri M., Moran A. and Al-Hinai H. (2008). Effects of heavy metals andpolyelectrolytes in humic substance coagulation under saline conditions.Desalination, 220, 85–95.
Hochstrat R., Wintgens T., Mellin T. and Jeffrey P. (2005).Wastewater reclamation and reusein Europe – a model-based potential estimation. Water Supply, 5–1, 67–75.
Jiang G., Sun X., Keller J. and Bond P. L. (2015). Identification of controlling factors for theinitiation of corrosion of fresh concrete sewers. Water Research, 80, 30–40.
Jiang G., ZhouM., Chiu T. H., Sun X., Keller J. and Bond P. L. (2016). Wastewater enhancedmicrobial corrosion of concrete sewers. Environmental Science and Technology, 50(15),8084–8092.
Kulandaivelu J., Shrestha S., Khan W., Dwyer J., Steward A., Bell L., Mcphee P., Smith P.,Hu S., Yuan Z. and Jiang G. (2020). Full-scale investigation of ferrous dosing in sewersand a wastewater treatment plant for multiple benefits. Chemosphere, 250, 126221.
Lefebvre O. and Moletta R. (2006). Treatment of organic pollution in industrial salinewastewater: A literature review. Water Research, 40(20), 3671–3682.
Treatment and Valorisation of Saline Wastewater170

Lens P. N. L., Visser A., Janssen A. J. H., Hulshoff Pol L. W. and Lettinga G. (1998).Biotechnological treatment of sulfate-rich wastewaters. Critical Review inEnvironmental Science and Technology, 28(1), 41–88.
Leung R. W. K., Li D. C. H., Yu W. K., Chui H. K., Lee T. O., van Loosdrecht M. C. M. andGhen G. H. (2012). Integration of seawater and grey water reuse to maximize alternativewater resource for coastal areas: the case of the Hong Kong International Airport.WaterScience and Technology, 65(3), 410–417.
Levine A. D. and Asano T. (2004). Recovering sustainable water from wastewater.Environmental Science and Technology, 38(11), 201A–208A.
Li X. Z., Luk S. F. and Tang S. L. (2005). Sustainability of toilet flushing water supply inHong Kong. Water and Environmental Journal, 19(2), 85–90.
Li X., Kappler U., Jiang G. and Curtis T. P. (2017). The ecology of acidophilicmicroorganisms in the corroding concrete sewer environment. Frontiers inMicrobiology, 8(683), 1–16.
Linaric ́ M., Markic ́ M. and Sipos L. (2013). High salinity wastewater treatment. WaterScience and Technology, 68(6), 1400–1405.
Liu X., Dai J., Wu D., Jiang F., Chen G., Chui H.-K. and van Loosdrecht M. C. M. (2016).Sustainable application of a novel water cycle using seawater for toilet flushing.Engineering, 2, 460–469.
Lopez A., Pollice A., Laera G., Lonigro A. and Rubino P. (2010). Membrane filtration ofmunicipal wastewater effluents for implementing agricultural reuse insouthern Italy.Water Science and Technology, 625, 1121–1128.
Mateju V., Cizinska S., Krejci J. and Janoch T. (1992). Biological water denitrification - Areview. Enzyme Microbial Technology, 14, 170–183.
Metcalf and Eddy (2003). Wastewater Engineering: Treatment and Reuse, 4th edn,McGraw-Hill, New York.
Metcalf and Eddy (2014). Wastewater Engineering: Treatment and Resource Recovery.5th Edition, McGraw-Hill, New York.
Moussa M. S., Sumanasekera D. U., Ibrahim S. H., Lubberding H. J., Hooijmans C. M.,Gijzen H. J. and van Loosdrecht M. C. M. (2006). Long term effects of salt onactivity, population structure and floc characteristics in enriched bacterial cultures ofnitrifiers. Water Research, 40, 1377–1388.
Nielsen P. H., Raunkjaer K., Norsker N. H., Jensen A. and Hvitved-Jacobsen T. (1992).Transformations of wastewater in sewer systems – a review. Water Science andTechnology, 25(6), 17–31.
Pedrero F., Alarcón J. J., Nicolás E. and Mounzer O. (2012). Influence of irrigation withsaline reclaimed waer on young grapfruits. Desalination and Water Treatment, 51,2488–2496.
Pedrero F., Camposeo S., Pace B., Cefola M. and Vivaldi G. A. (2018). Use of reclaimedwastewater on fruit quality of nectarine in Southern Italy. Agricultural WaterManagement, 203, 186–192.
Quinn J. J., KrachtW., Gomez C. O., Gagnon C. and Finch J. A. (2007). Comparing the effectof salts and frother (MIBC) on gas dispersion and froth properties. MineralsEngineering, 20, 1296–1302.
Rhoades J. D., Kandiah A. and Mashali A. M. (1992). The use of saline waters for cropproduction. Food and Agricultures Organization of the United Nations, Rome, Italy.
Case study: Urban wastewater treatment plant with saline intrusions 171
Salehin S., Kulandaivelu J., Rebosura M., KhanW.,Wong R., Jiang G., Smith P., McPhee P.,Howard C., Sharma K., Keller J., Donose B. C., Yuan Z. and Pikaar I. (2019).Opportunities for reducing coagulants usage in urban water management: the OxleyCreek Sewage Collection and Treatment System as an example. Water Research, 165,114996.
Salvadó H., Mas M., Menéndez S. and Gracia M. P. (2001). Effects of shock loads of salt onprotozoan communities of activated sludge. Acta Protozoologica, 40, 177–185.
Tan X., Acquah I., Liu H., Li W. and Tan S. (2019). A critical review on saline wastewatertreatment by membrane bioreactor (MBR) from a microbial perspective. Chemosphere,220, 1150–1162.
Tang S. L., Yue Derek P. T. and Li X. Z. (2006). Comparison of engineering costs of rawfreshwater, reclaimed water and seawater for toilet flushing in Hong Kong. Water andEnvironmental Journal, 20, 240–247.
Wang Y., Gao B. Y., Xu X. M. and Xu W. Y. (2010). The effect of total hardness and ionicstrength on the coagulation performance and kinetics of aluminum salts to remove humicacid. Chemical Engineering Journal, 160, 150–156.
Wang H. T., Ye Y. Y., Qi J., Li F. T. and Tang Y. L. (2013). Removal of titanium dioxidenanoparticles by coagulation: effects of coagulants, typical ions, alkalinity and naturalorganic matters. Water Science and Technology, 68, 1137–1143.
Werzernak C. T. and Gannon J. J. (1967). Oxygen-nitrogen relationships in autotrophicnitrification, Applied Microbiology, 15(5), 1211–1215.
Xie K., Xia S., Song J., Li J., Qiu L., Wang J. and Zhang S. (2014). The effect of salinity onmembrane fouling characteristics in an intermittengly aerated membrane bioreactor.Journal of Chemistry, 2014(6–7), 1–7.
Zannotti M. and Giovannetti R. (2015). Kinetic evidence for the effect of salts on the oxygensolubility using laboratory prototype aeration system. Journal of Molecular Liquids,211, 656–666.
Zarzo D., Campos E. and Terrero P. (2013). Spanish experience in desalination foragriculture. Desalination and Water Treatment, 51(1–3), 53–66.
Treatment and Valorisation of Saline Wastewater172

Annex 1
Calculations case study:Treatment of fish-canning effluents
A1.1 SCENARIO A
Table A1.1 Results of the composition of the different flows in the treatment train ofScenario A.
Parameter Unit MixedWastewater
Sieving DAF Coag-floc
Total suspended solids mg/L 332.3 249.2 179.4 17.9
Volatile suspendedsolids
mg/L 259.7 194.7 140.2 14.0
Total COD mg/L 1,664.0 1,503.4 1,082.5 108.2
Soluble COD mg/L 1,021.6 868.4 607.9 182.4
Greases mg/L 375.8 263.1 52.6 26.3
Volatile fatty acids mg COD/L 207.2 0.0 0.0 0.0
Ammonia mg N/L 31.2 31.2 31.2 31.2
Total nitrogen mg N/L 68.8 68.8 68.8 68.8
Phosphate mg P/L 8.5 8.5 8.5 8.5
Chloride mg Cl−/L 8,200.0 8,200.0 8,200.0 8,200.0
Sulphate mgSO4
−2/L1,086.0 1,086.0 1,086.0 1,086.0
Sodium mg Na+/L 4,404.0 4,404.0 4,404.0 4,404.0
Both streams are treated together (Q= 88 m3/d).
© IWA Publishing 2021. Treatment and Valorisation of Saline Wastewater: Principles and PracticeAuthor(s): Anuska Mosquera Corral, Ángeles Val del Río and José Luis Campos Gómezdoi: 10.2166/9781789060645_0173

A1.2 SCENARIO B
Table A1.2 Results of the composition of the different flows in the treatment train ofScenario B.
Parameter Unit Highload
Sieving DAF AS
Total suspended solids mg/L 2,370 1,777.5 1,279.8 128.0
Volatile suspendedsolids
mg/L 1,070 802.5 577.8 57.8
Total COD mg/L 10,800 9,925.0 7,146.0 714.6
Soluble COD mg/L 7,300 6,205.0 4,343.5 434.4
Greases mg/L 1,600 1,120.0 224.0 224.0
Ammonia mg N/L 560 560.0 560.0 560.0
Total nitrogen mg N/L 1,020 1,020.0 1,020.0 1,020.0
Phosphate mg P/L 130 130.0 130.0 130.0
Chloride mg Cl−/L 4,210 4,210.0 4,210.0 4,210.0
Sulphate mgSO4
−2/L250 250.0 250.0 250.0
Sodium mg Na+/L 2,770 2,770.0 2,770.0 2,770.0
Parameter Unit Low load Sieving DAF Coag-floc
Total suspended solids mg/L 225.0 168.8 121.5 12.2
Volatile suspendedsolids
mg/L 217.0 162.8 117.2 11.7
Total COD mg/L 1,183.2 1,060.2 763.3 76.3
Soluble COD mg/L 691.2 587.5 411.3 123.4
Greases mg/L 311.4 218.0 43.6 21.8
Ammonia mg N/L 3.4 3.4 3.4 3.4
Total nitrogen mg N/L 18.7 18.7 18.7 18.7
Phosphate mg P/L 2.1 2.1 2.1 2.1
Chloride mg Cl−/L 8,410.0 8,410.0 8,410.0 8,410.0
Sulphate mgSO4
−2/L1,130.0 1,130.0 1,130.0 1,130.0
Sodium mg Na+/L 4,490.0 4,490.0 4,490.0 4,490.0
Each stream is treated separately, and the global effluent is a mixture of the streams produced ineach treatment line (high loadwastewaterQ= 4.4 m3/d and low loadwastewaterQ= 83.6 m3/d).
Treatment and Valorisation of Saline Wastewater174

A1.3 SCENARIO C
Table A1.3 Results of the composition of the different flows in the treatment train ofScenario C.
Parameter Unit HighLoad
Sieving DAF AD
Total suspended solids mg/L 2,370 1,777.5 1,279.8 128.0
Volatile suspendedsolids
mg/L 1,070 802.5 577.8 57.8
Total COD mg/L 10,800 9,925.0 7,146.0 714.6
Soluble COD mg/L 7,300 6,205.0 4,343.5 868.7
Greases mg/L 1,600 1,120.0 224.0 22.4
Volatile fatty acids mg COD/L 3,300 0.0 0.0 0.0
Ammonia mg N/L 560 560.0 560.0 560.0
Total nitrogen mg N/L 1,020 1,020.0 1,020.0 1,020.0
Phosphate mg P/L 130 130.0 130.0 130.0
Chloride mg Cl−/L 4,210 4,210.0 4,210.0 4,210.0
Sulphate mgSO4
−2/L250 250.0 250.0 250.0
Sulphide mg H2S/L – – – 0.054
Sodium mg Na+/L 2,770 2,770.0 2,770.0 2,770.0
Parameter Unit Low load Sieving DAF Coag-floc
Total suspended solids mg/L 225.0 168.8 121.5 12.2
Volatile suspendedsolids
mg/L 217.0 162.8 117.2 11.7
Total COD mg/L 1,183.2 1,060.2 763.3 76.3
Soluble COD mg/L 691.2 587.5 411.3 123.4
Greases mg/L 311.4 218.0 43.6 21.8
Volatile fatty acids mg COD/L 44.5 0.0 0.0 0.0
Ammonia mg N/L 3.4 3.4 3.4 3.4
Total nitrogen mg N/L 18.7 18.7 18.7 18.7
Phosphate mg P/L 2.1 2.1 2.1 2.1
Chloride mg Cl−/L 8,410.0 8,410.0 8,410.0 8,410.0
Sulphate mgSO4
−2/L1,130.0 1,130.0 1,130.0 1,130.0
Sulphide mg H2S/L – – – –
Sodium mg Na+/L 4,490.0 4,490.0 4,490.0 4,490.0
Each stream is treated separately, and the global effluent is a mixture of the streams produced ineach treatment line (high loadwastewaterQ= 4.4 m3/d and low loadwastewaterQ= 83.6 m3/d).
Calculations case study: Treatment of fish-canning effluents 175

A1.4 SCENARIO D
Table A1.4 Results of the composition of the different flows in the treatment train ofScenario D.
Parameter Unit HighLoad
Sieving DAF AD AS+N/////DN
Totalsuspendedsolids
mg/L 2,370 1,777.5 1,279.8 128.0 12.8
Volatilesuspendedsolids
mg/L 1,070 802.5 577.8 57.8 5.8
Total COD mg/L 10,800 9,925.0 7,146.0 714.6 71.5
Soluble COD mg/L 7,300 6,205.0 4,343.5 868.7 86.9
Greases mg/L 1,600 1,120.0 224.0 22.4 22.4
Ammonia mg N/L 560 560.0 560.0 560.0 56.0
Total nitrogen mg N/L 1,020 1,020.0 1,020.0 1,020.0 102.0
Phosphate mg P/L 130 130.0 130.0 130.0 130.0
Chloride mg Cl−/L 4,210 4,210.0 4,210.0 4,210.0 4,210.0
Sulphate mgSO4
−2/L250 250.0 250.0 250.0 250.0
Sulphide mgH2S/L
– – – 0.054 0.0
Sodium mgNa+/L
2,770 2,770.0 2,770.0 2,770.0 2,770.0
Parameter Unit LowLoad
Sieving DAF Coag-floc
Totalsuspendedsolids
mg/L 225.0 168.8 121.5 12.2
Volatilesuspendedsolids
mg/L 217.0 162.8 117.2 11.7
Total COD mg/L 1183.2 1,060.2 763.3 76.3
Soluble COD mg/L 691.2 587.5 411.3 123.4
Greases mg/L 311.4 218.0 43.6 21.8
Ammonia mg N/L 3.4 3.4 3.4 3.4
Total nitrogen mg N/L 18.7 18.7 18.7 18.7
Phosphate mg P/L 2.1 2.1 2.1 2.1
(Continued )
Treatment and Valorisation of Saline Wastewater176

A1.5 BASE DATA FOR COSTS CALCULATION
REFERENCEMetcalf and Eddy (2014). Wastewater Engineering: Treatment and Resource Recovery.
5th Edition, McGraw-Hill, New York.
Table A1.4 Results of the composition of the different flows in the treatment train ofScenario D (Continued ).
Parameter Unit HighLoad
Sieving DAF AD AS+N/////DN
Chloride mg Cl−/L 8,410.0 8,410.0 8,410.0 8,410.0
Sulphate mgSO4
−2/L1,130.0 1,130.0 1,130.0 1,130.0
Sulphide mgH2S/L
– – – –
Sodium mgNa+/L
4,490.0 4,490.0 4,490.0 4,490.0
Each stream is treated separately, and the global effluent is a mixture of the streams produced ineach treatment line (high loadwastewaterQ= 4.4 m3/d and low loadwastewaterQ= 83.6 m3/d).
Table A1.5 Typical energy consumption of various treatment processes onwastewater treatment according to Metcalf and Eddy (2014).
AveragekWh/////m3
Wastewater influent pumping 0.0385
Screens 0.0004
Activated sludge for BOD removal 0.14
Activated sludge with nitrification/denitrification 0.23
Return sludge pumping 0.0155
Secondary settling 0.0035
Dissolved air floatation 0.035
Mesophilic anaerobic digestion (primary plus waste activatedsludge)
0.1265
Values were chosen as the average of the interval provided in the document.
Calculations case study: Treatment of fish-canning effluents 177

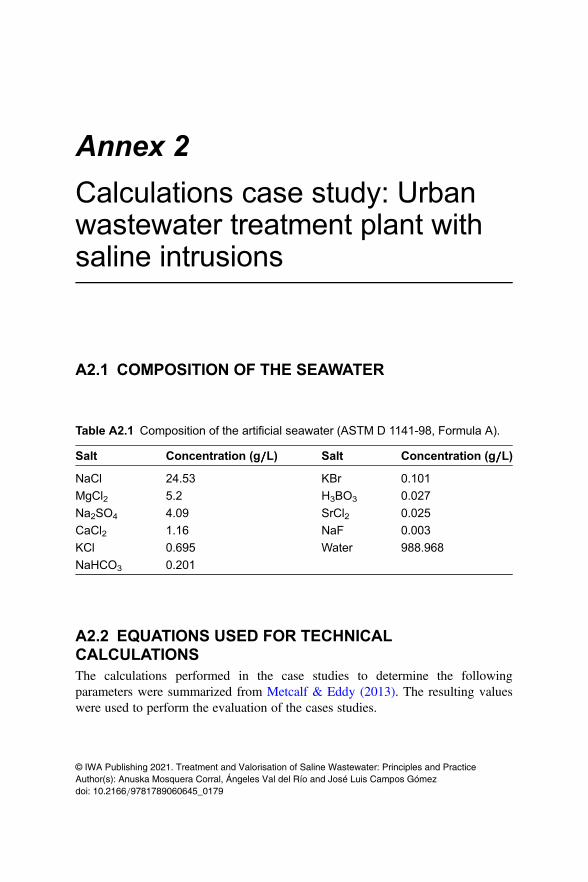
Annex 2
Calculations case study: Urbanwastewater treatment plant withsaline intrusions
A2.1 COMPOSITION OF THE SEAWATER
A2.2 EQUATIONS USED FOR TECHNICALCALCULATIONSThe calculations performed in the case studies to determine the followingparameters were summarized from Metcalf & Eddy (2013). The resulting valueswere used to perform the evaluation of the cases studies.
Table A2.1 Composition of the artificial seawater (ASTM D 1141-98, Formula A).
Salt Concentration (g/////L) Salt Concentration (g/////L)
NaCl 24.53 KBr 0.101
MgCl2 5.2 H3BO3 0.027
Na2SO4 4.09 SrCl2 0.025
CaCl2 1.16 NaF 0.003
KCl 0.695 Water 988.968
NaHCO3 0.201
© IWA Publishing 2021. Treatment and Valorisation of Saline Wastewater: Principles and PracticeAuthor(s): Anuska Mosquera Corral, Ángeles Val del Río and José Luis Campos Gómezdoi: 10.2166/9781789060645_0179
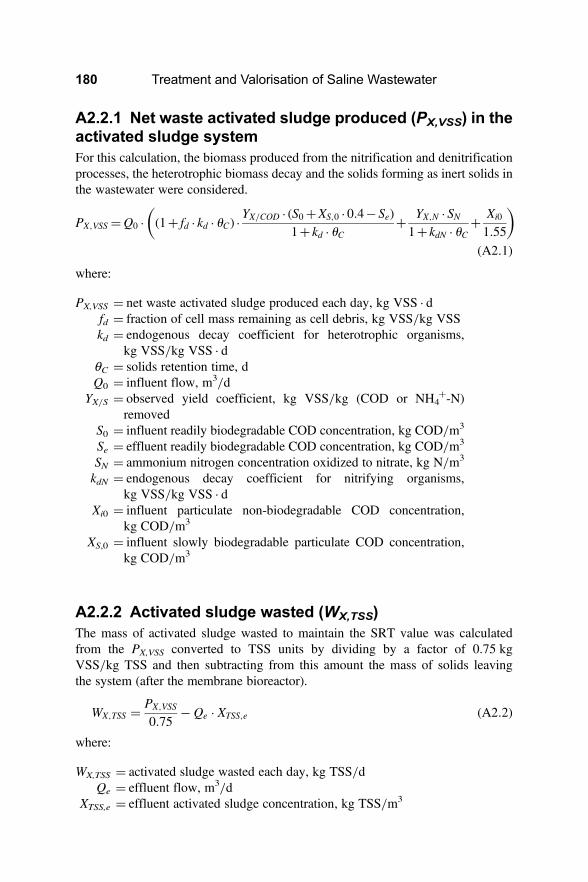
A2.2.1 Net waste activated sludge produced (PX,VSS) in theactivated sludge systemFor this calculation, the biomass produced from the nitrification and denitrificationprocesses, the heterotrophic biomass decay and the solids forming as inert solids inthe wastewater were considered.
PX,VSS =Q0 · (1+ fd · kd ·uC) ·YX/COD · (S0+XS,0 ·0.4−Se)1+ kd ·uC + YX,N ·SN
1+ kdN ·uC +Xi0
1.55
( )(A2.1)
where:
PX,VSS = net waste activated sludge produced each day, kg VSS · dfd = fraction of cell mass remaining as cell debris, kg VSS/kg VSSkd = endogenous decay coefficient for heterotrophic organisms,
kg VSS/kg VSS · dθC = solids retention time, dQ0 = influent flow, m3/d
YX/S = observed yield coefficient, kg VSS/kg (COD or NH4+-N)
removedS0 = influent readily biodegradable COD concentration, kg COD/m3
Se = effluent readily biodegradable COD concentration, kg COD/m3
SN = ammonium nitrogen concentration oxidized to nitrate, kg N/m3
kdN = endogenous decay coefficient for nitrifying organisms,kg VSS/kg VSS · d
Xi0 = influent particulate non-biodegradable COD concentration,kg COD/m3
XS,0 = influent slowly biodegradable particulate COD concentration,kg COD/m3
A2.2.2 Activated sludge wasted (WX,TSS)The mass of activated sludge wasted to maintain the SRT value was calculatedfrom the PX,VSS converted to TSS units by dividing by a factor of 0.75 kgVSS/kg TSS and then subtracting from this amount the mass of solids leavingthe system (after the membrane bioreactor).
WX,TSS = PX,VSS
0.75− Qe · XTSS,e (A2.2)
where:
WX,TSS = activated sludge wasted each day, kg TSS/dQe = effluent flow, m3/d
XTSS,e = effluent activated sludge concentration, kg TSS/m3
Treatment and Valorisation of Saline Wastewater180

A2.2.3 Total solids wasted in the WWTP (TWX,TSS)The total solids wasted in the plant were equal to the activated sludge wasted in theactivated sludge system plus the fraction of solids separated in the pre-treatments,which was estimated as 60% of the solids entering the facility.
TWX,TSS = WX,TSS + Q0 · XS,0 · 0.6 (A2.3)
where:
TWX,TSS= total solids wasted each day in the WWTP, kg TSS/d
A2.2.4 Total oxygen required for aerobic biologicalprocesses
RO2 = Q0 · (S0−S)−1.42 · (1+ fd · kd ·uC) ·Q0 ·YX/COD · (S0−S)1+ kd ·uC +4.33 ·Q0 ·SN
( )(A2.4)
where:
RO2= total oxygen required, kg O2/d
Werzemak and Gannon (1967) found that the actual total oxygen consumptionwas 4.33 g O2/g N with 3.22 g O2/g N used for ammonia oxidation and 1.11 gO2/g N used for nitrite oxidation.
The values chosen for the kinetic parameters (chosen at 20°C) corresponding toheterotrophic and nitrifying bacteria are shown in Table A2.2.
Table A2.2 Values of the kinetic parameters (20°C) chosenfor the calculations (Metcalf & Eddy, 2013).
Coefficient Unit Value
YX/COD kg VSS/kg COD removed 0.40
YX/N kg VSS/kg NH4+-N removed 0.12
fd kg VSS/kg VSS 0.15
kd kg VSS/kg VSS · d 0.12
kdN kg VSS/kg VSS · d 0.08
YX/N: observed yield coefficient, kg VSS/kg NH4+-N removed.
Urban wastewater treatment plant with saline intrusions 181

A2.2.5 Energy consumption due to aeration and pumpingactivities
EnC = RO2 · a+ Q0 · (b1 + b2 · R) (A2.5)where:
EnC = energy consumption due to aeration and pumping activities(kWh/d)
α = power used for mass of oxygen transferred fixed as 1 kWh/kg O2
Qpe =wastewater flow rate corresponding to 1 person equivalent fixedas 0.154 m3/d
β1 = power required to pump the water per day fixed as 0.045kWh/m3
β2 = power required to pump the recycled sludge per day fixed as0.013 kWh/m3
R = recycling ratio
A2.2.6 WWTP discharge feeThe annual fee for discharge (DF) to the sea is calculated according to the SectorialEnvironmental Authorization corresponding to the example WWTP (in San Pedrodel Pinatar) as follows using Eqs. (A2.6), (A2.7) and (A2.8):
PL = SSL+ OML (A2.6)
PU = DPL
RPL(A2.7)
where:
PL = pollution load (kg/y)SSL = load of suspended solids (kg/y)
OML = oxidable matter load equivalent to 2/3 of the COD (kg/y)PU = pollution units that have a price of 6,000 €
DLP = discharged pollution loadRPL =Reference pollution load equal to 53,655 kg (example WWTP)
From the previous results the fee associatfed with effluent discharge is calculatedusing Eq. (A2.8):
DF = PU · 6,000 · k (A2.8)
Treatment and Valorisation of Saline Wastewater182

where:
DF =Discharge fee (€/y)k = factor of correction depending on the type of wastewater. In this
case it is equal to 1 for urban wastewater discharged to the seathrough a discharge pipe.
A2.3 DEPENDENCY OF OXYGEN SOLUBILITYThe effect of salt concentration on the oxygen solubility and oxygen mass transfercoefficient (KLa) was considered for the estimation of the energy needed for oxygensupply in the secondary treatment. The oxygen solubility at 20°C decreased by 5.5%in the case of water without salt compared to a sample of water containing 9 g/Lof salt.
The correlation of the percentage of variation, with respect to the case with nosalt, from the data of Figure A2.1 was adjusted as a function of the saltconcentration (Eq. A2.9) to a variation of 2.68% which corresponds to theincrement of oxygen needed in the activated sludge system.
DSO2(%) = 0.55 · Ssalt + 0.22 (A2.9)Additionally the KLa estimated according to Zanotti and Giovannetti (2015)
using Eq. (A2.10) is:
KLa = 0.5267 · ln (Ssalt)+ 7.8779 (A2.10)
Figure A2.1 Concentration of dissolved oxygen (mg O2/L) as a function oftemperature and salt concentrations of 0 g/L (⬤), 9 g/L (○), 18 g/L (▴), 27 g/L (Δ)and 36 g/L (▪). (Data from EPA-842-B-06-003.)
Urban wastewater treatment plant with saline intrusions 183
REFERENCESEPA-842-B-06-003 (2006). Chapter 9 of the volunteer estuary monitoring manual,
A Methods Manual, 2nd edn. https://www.epa.gov/sites/production/files/2015-09/documents/2009_03_13_estuaries_monitor_chap9.pdf (last access 19/01/2021).
Metcalf & Eddy Inc., Tchobanoglous G., Burton F. L., Tsuchihashi R. and Stensel H. D.(2013). Wastewater engineering: Treatment and resource recovery (5th ed.). McGraw-Hill Professional.
Werzernak C. T. and Gannon J. J. (1967). Oxygen-nitrogen relationships in autotrophicnitrification. Applied Microbiology, 15(5), 1211–1215.
Zanotti M. and Giovannetti R. (2015). Kinetic evidence for the effect of salts on the oxygensolubility using laboratory prototype aeration system. Journal of Molecular Liquids,211, 656–666.
Treatment and Valorisation of Saline Wastewater184

Nomenclature
Acronym Unit Definition
Af Aerobic Feeding
AF Anaerobic Filter
AFB Anaerobic Fluidized Bed
AGS Aerobic Granular Sludge
AD Anaerobic Digester
Anf Anaerobic Feeding
AOB Ammonium Oxidizing Bacteria
AOP Advanced Oxidation Processes
BES BioElectrochemical System
BOD Biological Oxygen Demand
CAD Central Activity Digester
CAS Conventional Activated Sludge
CBR Circulating Bed Reactor
C-F Coagulation – Flocculation
COD Chemical Oxygen Demand
CPD Cyclobutane Pyrimidine Dimers
CST Capillary Suction Time
CW Constructed Wetland
CWPO Catalytic Wet Peroxide Oxidation
DAF Dissolved Air Floatation
(Continued )
© IWA Publishing 2021. Treatment and Valorisation of Saline Wastewater: Principles and PracticeAuthor(s): Anuska Mosquera Corral, Ángeles Val del Río and José Luis Campos Gómezdoi: 10.2166/9781789060645_0185
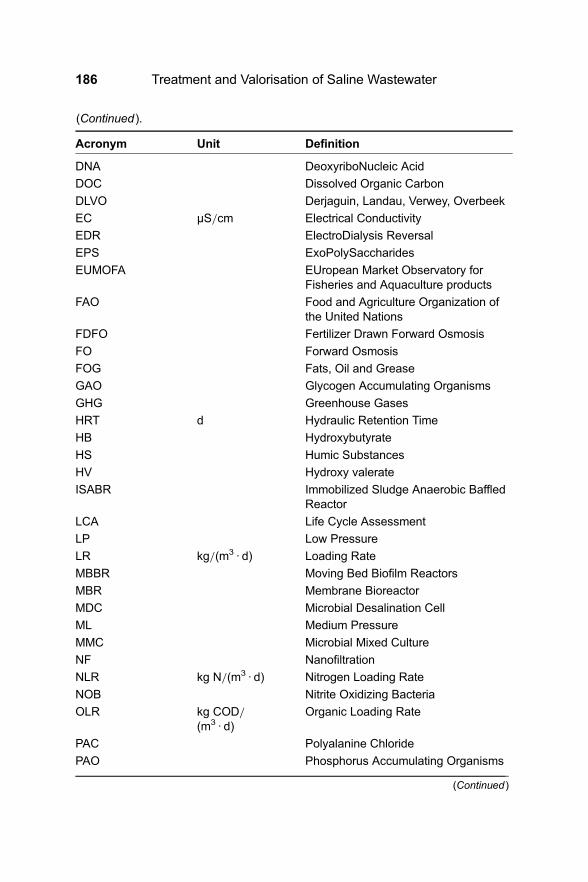
(Continued ).
Acronym Unit Definition
DNA DeoxyriboNucleic Acid
DOC Dissolved Organic Carbon
DLVO Derjaguin, Landau, Verwey, Overbeek
EC µS/cm Electrical Conductivity
EDR ElectroDialysis Reversal
EPS ExoPolySaccharides
EUMOFA EUropean Market Observatory forFisheries and Aquaculture products
FAO Food and Agriculture Organization ofthe United Nations
FDFO Fertilizer Drawn Forward Osmosis
FO Forward Osmosis
FOG Fats, Oil and Grease
GAO Glycogen Accumulating Organisms
GHG Greenhouse Gases
HRT d Hydraulic Retention Time
HB Hydroxybutyrate
HS Humic Substances
HV Hydroxy valerate
ISABR Immobilized Sludge Anaerobic BaffledReactor
LCA Life Cycle Assessment
LP Low Pressure
LR kg/(m3 · d) Loading Rate
MBBR Moving Bed Biofilm Reactors
MBR Membrane Bioreactor
MDC Microbial Desalination Cell
ML Medium Pressure
MMC Microbial Mixed Culture
NF Nanofiltration
NLR kg N/(m3 · d) Nitrogen Loading Rate
NOB Nitrite Oxidizing Bacteria
OLR kg COD/(m3 · d)
Organic Loading Rate
PAC Polyalanine Chloride
PAO Phosphorus Accumulating Organisms
(Continued )
Treatment and Valorisation of Saline Wastewater186

(Continued ).
Acronym Unit Definition
PBBR Packed-Bed Biofilm Reactor
PHA PolyHydroxyAlkanoates
PM Particulate matter
PN-AMX Partial Nitritation – Anammox process
PPB Purple Phototrophic Bacteria
PVC PolyVinylChloride
R Recycling ratio
RO Reverse Osmosis
SANI Sulphate reduction Autotrophicdenitrification and NitrificationIntegrated
SAR Sodium Absorption Ratio
SBAR Sequencing Batch Airlift Reactor
SBR Sequencing Batch Reactor
Si mg COD/L Non-biodegradable soluble CODfraction
SP Sulphated Polysaccharides
SRB Sulphate Reducing Bacteria
SRF Specific Resistance in Filtration
SRT d Sludge Retention Time
Ss mg COD/L Readily biodegradable soluble CODfraction
TDS mg/L Total Dissolved Solids
TKN Total Kjeldahl Nitrogen
TN Total Nitrogen
TPH Total Petroleum Hydrocarbons
TRO Tubular Reverse Osmosis
TSS g/L Total Suspended Solids
TSSE Temperature Swing Solvent Extraction
TWS Triple Water Supply
UAF Upflow Anaerobic Filter
UF UltraFiltration
UFM UltraFiltration Module
UASB Upflow Anaerobic Sludge Blanket
UV UltraViolet
VFA Volatile Fatty Acids
(Continued )
Nomenclature 187

(Continued ).
Acronym Unit Definition
VS Volatile Solids
VSS g/L Volatile Suspended Solids
WAS Waste Activated Sludge
WWTP WasteWater Treatment Plant
Xi mg COD/L Non-biodegradable particulate CODfraction
Xs mg COD/L Slowly biodegradable particulate CODfraction
ZLD Zero Liquid Discharge
Treatment and Valorisation of Saline Wastewater188

iwapublishing.com
@IWAPublishing
ISBN: 9781789060638 (Paperback)
ISBN: 9781789060645 (eBook)
Treatment and Valorisation of S
aline Wastew
aterA
nuska Mosquera Corral, Á
ngeles Val del Río
and José Luis Campos G
ómez
This book covers the principles and practices of processes and technologies applied for the treatment of saline wastewater with discharge and reuse purpose, and those applied for its valorisation. Saline wastewater was considered to present electrical conductivities over 2 mS/cm, which is the limit for crop irrigation.
Saline wastewater management is described with respect to:
Basics about salinity characterisation and environmental impact
Effects of salinity on the wastewater physical-chemical treatments
Effects of salinity on biological treatment processes
Valorisation of saline wastewater for energy and materials production
Technologies for saline wastewater treatment and salt recovery
Urban and industrial saline wastewater treatment
Treatment and Valorisation of Saline Wastewater includes two case studies evaluating the treatment of the effluents from a fish cannery and from a WWTP with seawater intrusions in the collecting system. This book is intended as a text reference book for post-graduate, PhD students and researchers interested in the effects of salinity on the wastewater treatment and valorisation processes. It also serves as a reference text for professionals working in the industrial and urban wastewater sector that deal with saline wastewater.
Treatment and Valorisation of Saline WastewaterPRINCIPLES AND PRACTICE
Anuska Mosquera Corral, Ángeles Val del Río and José Luis Campos Gómez
FIRST BOOK TO CONSIDER THE
TREATMENT AND VALORISATION
OF SALINE WASTEWATER
0606387817899
ISBN 9781789060638
Treatment and Valorisation of Saline Wastewater_layout_2.0.indd 1 29/03/2021 19:10