Chemical industry wastewater treatment
12
Environmentalist (2007) 27:275–286 DOI 10.1007/s10669-007-9004-0 Chemical industry wastewater treatment Fayza A. Nasr · Hala S. Doma · Hisham S. Abdel-Halim · Saber A. El-Shafai Published online: 3 March 2007 C Springer Science + Business Media, LLC 2007 Abstract Treatment of chemical industrial wastewater from building and construction chemicals factory and plastic shoes manufacturing factory was investigated. The two factories discharge their wastewater into the public sewerage network. The results showed the wastewater discharged from the building and construction chemicals factory was highly contaminated with organic compounds. The average values of chemical oxygen demand (COD) and biochemical oxygen demand (BOD) were 2912 and 150 mgO 2 /l. Phenol concentration up to 0.3 mg/l was detected. Chemical treatment using lime aided with ferric chloride proved to be effective and produced an effluent characteristics in compliance with Egyptian permissible limits. With respect to the other factory, industrial wastewater was mixed with domestic wastewater in order to lower the organic load. The COD, BOD values after mixing reached 5239 and 2615 mgO 2 /l. The average concentration of phenol was 0.5 mg/l. Biological treatment using activated sludge or rotating biological contactor (RBC) proved to be an effective treatment system in terms of producing an effluent characteristic within the permissible limits set by the law. Therefore, the characteristics of chemical industrial wastewater determine which treatment system to utilize. Based on laboratory results engineering design of each treatment system was developed and cost estimate prepared. Keywords Biological . Chemical . Chemical industry . Treatment . Wastewater 1 Introduction The chemical industry is of importance in terms of its impact on the environment. The wastewaters from this industry are generally highly concentrated with organic F. A. Nasr () . H. S. Doma . S. A. El-Shafai National Research Center, El-Behoos Street, Dokki, Cairo, Egypt e-mail: [email protected] H. S. Abdel-Halim Faculty of Engineering, Cairo University, Cairo, Egypt Springer
-
Upload
independent -
Category
Documents
-
view
2 -
download
0
Transcript of Chemical industry wastewater treatment

Environmentalist (2007) 27:275–286
DOI 10.1007/s10669-007-9004-0
Chemical industry wastewater treatment
Fayza A. Nasr · Hala S. Doma ·Hisham S. Abdel-Halim · Saber A. El-Shafai
Published online: 3 March 2007C© Springer Science + Business Media, LLC 2007
Abstract Treatment of chemical industrial wastewater from building and constructionchemicals factory and plastic shoes manufacturing factory was investigated. The twofactories discharge their wastewater into the public sewerage network. The resultsshowed the wastewater discharged from the building and construction chemicalsfactory was highly contaminated with organic compounds. The average values ofchemical oxygen demand (COD) and biochemical oxygen demand (BOD) were 2912and 150 mgO2/l. Phenol concentration up to 0.3 mg/l was detected. Chemical treatmentusing lime aided with ferric chloride proved to be effective and produced an effluentcharacteristics in compliance with Egyptian permissible limits. With respect to theother factory, industrial wastewater was mixed with domestic wastewater in orderto lower the organic load. The COD, BOD values after mixing reached 5239 and2615 mgO2/l. The average concentration of phenol was 0.5 mg/l. Biological treatmentusing activated sludge or rotating biological contactor (RBC) proved to be an effectivetreatment system in terms of producing an effluent characteristic within the permissiblelimits set by the law. Therefore, the characteristics of chemical industrial wastewaterdetermine which treatment system to utilize. Based on laboratory results engineeringdesign of each treatment system was developed and cost estimate prepared.
Keywords Biological . Chemical . Chemical industry . Treatment . Wastewater
1 Introduction
The chemical industry is of importance in terms of its impact on the environment.The wastewaters from this industry are generally highly concentrated with organic
F. A. Nasr (�) . H. S. Doma . S. A. El-ShafaiNational Research Center, El-Behoos Street, Dokki, Cairo, Egypte-mail: [email protected]
H. S. Abdel-HalimFaculty of Engineering, Cairo University, Cairo, Egypt
Springer

276 Environmentalist (2007) 27:275–286
and inorganic pollutants and may contain toxic pollutants. Chemical industrial waste-waters usually contain organic and inorganic matter in varying concentrations. Manymaterials in the chemical industry are toxic, mutagenic, carcinogenic or simply al-most non-biodegradable. Surfactants, emulsifiers and petroleum hydrocarbons thatare being used in chemical industry reduce performance efficiency of many treatmentunit operations (EPA, Wastewater Treatment Technologies, 1998) The best strategyfor toxic industrial wastewater is in general to segregate at the source (Peringer, 1997)and sometimes by applying onsite treatment within the production lines with recyclingof treated effluent (Hu et al., 1999).
In the chemical industry, the high variability, stringent effluent permits, and extremeoperating conditions define the practice of wastewater treatment (Bury et al., 2002).Hu et al. (1999) proposed the concept to select the appropriate treatment process forchemical industrial wastewater based on molecular size and biodegradability of thepollutants. Chemical industrial wastewater can be treated by some biological oxidationmethods such as trickling filters, rotating biological contactor (RBC), activated sludge,or lagoons (Nemerow and Dasgupta, 1991; Jobbagy et al., 2000). Pollutants withmolecular sizes larger than 10,000–20,000, can be treated by coagulation followed bysedimentation or flotation (Hu et al., 1999).
Waste minimization in the production process in the chemical industry is the firstand most important step to avoid waste formation during production (Carini, 1999;Alverez et al., 2004). Because of the fluctuation in the strength and flow rate, Buryet al. (2002) applied dynamic simulation to chemical-industry wastewater treatmentto manage and control the treatment plant.
The main objective of the present study was to evaluate the use of alternativemethods for the treatment of chemical industry wastewater.
2 Materials and methods
For this study two factories represent the chemical industry discharging their wastew-ater into the sewerage system were selected (Table 1). Composite samples from thedifferent departments and the final effluents were collected. Physicochemical analyseswere carried out according to the (APHA, 1998). Laboratory experiments have beencarried out to recommend the appropriate treatment. Chemical coagulation precipita-tion and biological treatment via aerobic systems were investigated.
Table 1 Basic information about the selected factories
Item Building and construction chemicals Plastic shoes manufacturing
Product Special building chemicals Plastic shoesNo. of employee 100 150Working shifts 1 2Working hours 8 16Water consumption m3/d 20–25 7Water discharge m3/d 11–15 6Point of discharge Public sewerage system Public sewerage system
Springer
Environmentalist (2007) 27:275–286 277
Table 2 Specification of the continuous chemical treatment unit
Item Unit Flash mixing Flocculation Tank Sedimentation
Dimension cm 10 × 7× 5 15 × 10 × 30 40 × 15 × 25Volume cm3 350 4500 15000Flow rate liter/hour 5 5 5Detention time minute 4.2 54 180
2.1 Chemical treatment
Chemical treatment was applied using lime aided with ferric chloride and lime aidedwith aluminum sulfate. The optimum pH and coagulant dose values, which gavethe best removal, were determined using a jar test procedure. A continuous chemicaltreatment unit (Abou-Elela et al., 1995) was operated at the optimum pH and coagulantdose. A schematic diagram and specification of the treatment unit are given in Table 2and Fig. 1.
2.2 Biological treatment
Biological treatment via activated sludge and RBC was carried out.
Sec. Elevation
Influent 30˚
30˚
30˚
10
3
8.7
8.7
9.6
10
10
5
20
15
Sludge outlet
Effluent
40 5 10 5 7
Plan
Fig. 1 Schematic diagram of continuous chemical treatment unit
Springer

278 Environmentalist (2007) 27:275–286
2.2.1 Activated sludge treatment unit
Batch laboratory experiments were carried out using activated sludge process. Twoliters Plexiglas laboratory columns were used. The wastewater was inoculated withactivated sludge from plant treating domestic sewage. Daily the aeration was stoppedto let the sludge settle then the supernatant was drained and the column was refilledagain with the wastewater till considerable amount of adapted sludge was produced.To study the effect of aeration period on the activated sludge, several experimentswere conducted. A fixed amount of sludge (3–4 g/l) was transferred to a differentcolumn to which the pretreated wastewater was added. A detention time ranging fromone hour to twenty-four hours was examined. Dissolved oxygen concentration wasadjusted to maintain a minimum concentration of 2 mgO2/l. Characterization of thetreated wastewater was carried out after 60 min settlement; sludge analysis was alsocarried out.
2.2.2 Rotating biological contactor (RBC) unit
The aerobic unit was based on bio-film reactor followed by sedimentation tank,Fig. 2 (Watanabe et al., 1995; Badr, 1988). Table 3 represents the geometric data ofthe experimental RBC system.
3 Results and discussion
3.1 Case study 1: Building and construction chemicals factory
The factory produces special building chemicals; concrete add mixture, painting andcoating materials and bitumen emulsion. The factory produces 11–15 m3/d of wastew-ater. Analysis of the end-of-pipe showed that the wastewater was highly contaminatedwith non-biodegradable and toxic organic matter. This is obvious from the averagevalues of BOD (150 mgO2/l) and COD (2912 mgO2/l), (Table 4). The BOD/CODratio was 6% in average. The analysis detected the presence of phenol with a concen-tration reaches 0.3 mg/l. The oil & grease ranged between 149 and 600 mg/l with anaverage value of 371 mg/l. Average value of total suspended solids concentration was200 mg/l.
Table 3 Geometric data of theexperimental RBC • No. of stages 4
• Arrangement of discs 4×8• Disc diameter (cm) 14• Total discs surface area (m2) 0.95• Basin’s volume in liters 5.19• % submersion 50%• Specific surface area (m2/m3) 183• Rotation speed, (rpm) 4• Hydraulic load (m3/m2/d) 0.107
Springer

Environmentalist (2007) 27:275–286 279
Table 4 Characteristics of wastewater from the end-of-pipe (Building and construction chemicalsfactory)
Parameters Units Min. Max. Average Egyptian decree 44 for 2000
pH 6.1 9.5 7.5 6–9.5Chemical Oxygen demand mg O2/l 1870 3924 2912 1100Biological Oxygen Demand mg O2/l 210 570 150 600Total suspended solids mg/l 157 519 200 800Phosphorous mg P/l 0.8 30 9 25Organic Nitrogen mg N2/l 9 25 19 100Phenols mg/l 0.06 0.3 0.1 0.05Oil & Grease mg/l 149 600 371 100
∗Average of 7 samples.
3.1.1 Biological treatment
Biological treatment of the end-of-pipe wastewater using activated sludge was carriedout. Analysis of the wastewater indicated deficiency in the nitrogen and phosphorousconcentration. Nitrogen and phosphorous salts were added to adjust their concentrationto meet requirements of the biomass in the biological treatment unit. Characteristics ofthe treated effluent did not comply with the permissible limits. This result attributed tothe low biodegradability as indicated by the BOD/COD ratio, which provide 6% only.
3.1.2 Chemical treatment
Chemical treatment using lime aided with ferric chloride and lime aided with alu-minum sulfate was carried out on a bench scale, first to get the best coagulant and theoptimum dose and pH then, a continuous system was used.
B
B
11.5
InfluentEffluent
18.0 26.0
16.5 1.01.0
Influent16.5
20 20 20 20
85.0
4.517
24
A A
SludgeSection A-ASection B-B
Plan
Fig. 2 Schematic diagram of the RBC unit
Springer
280 Environmentalist (2007) 27:275–286
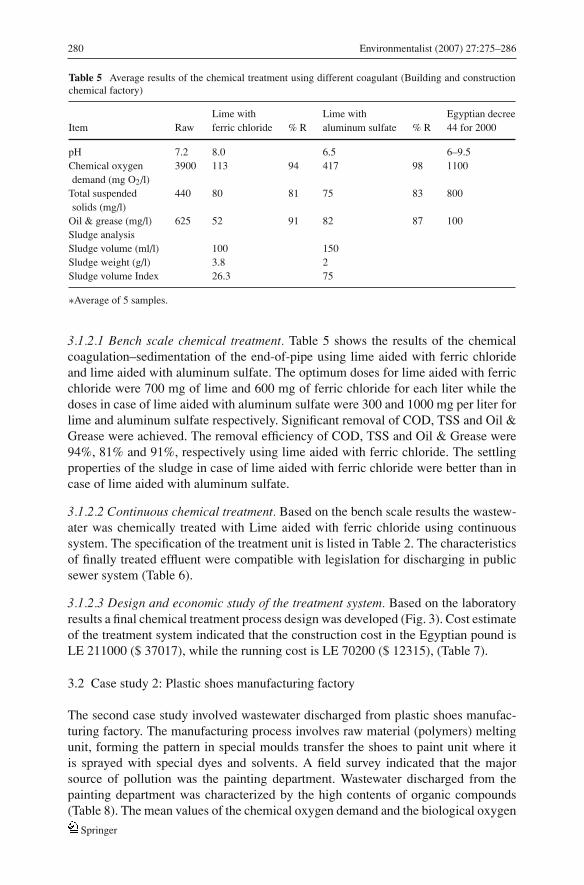
Table 5 Average results of the chemical treatment using different coagulant (Building and constructionchemical factory)
Lime with Lime with Egyptian decreeItem Raw ferric chloride % R aluminum sulfate % R 44 for 2000
pH 7.2 8.0 6.5 6–9.5Chemical oxygen 3900 113 94 417 98 1100demand (mg O2/l)
Total suspended 440 80 81 75 83 800solids (mg/l)
Oil & grease (mg/l) 625 52 91 82 87 100Sludge analysisSludge volume (ml/l) 100 150Sludge weight (g/l) 3.8 2Sludge volume Index 26.3 75
∗Average of 5 samples.
3.1.2.1 Bench scale chemical treatment. Table 5 shows the results of the chemicalcoagulation–sedimentation of the end-of-pipe using lime aided with ferric chlorideand lime aided with aluminum sulfate. The optimum doses for lime aided with ferricchloride were 700 mg of lime and 600 mg of ferric chloride for each liter while thedoses in case of lime aided with aluminum sulfate were 300 and 1000 mg per liter forlime and aluminum sulfate respectively. Significant removal of COD, TSS and Oil &Grease were achieved. The removal efficiency of COD, TSS and Oil & Grease were94%, 81% and 91%, respectively using lime aided with ferric chloride. The settlingproperties of the sludge in case of lime aided with ferric chloride were better than incase of lime aided with aluminum sulfate.
3.1.2.2 Continuous chemical treatment. Based on the bench scale results the wastew-ater was chemically treated with Lime aided with ferric chloride using continuoussystem. The specification of the treatment unit is listed in Table 2. The characteristicsof finally treated effluent were compatible with legislation for discharging in publicsewer system (Table 6).
3.1.2.3 Design and economic study of the treatment system. Based on the laboratoryresults a final chemical treatment process design was developed (Fig. 3). Cost estimateof the treatment system indicated that the construction cost in the Egyptian pound isLE 211000 ($ 37017), while the running cost is LE 70200 ($ 12315), (Table 7).
3.2 Case study 2: Plastic shoes manufacturing factory
The second case study involved wastewater discharged from plastic shoes manufac-turing factory. The manufacturing process involves raw material (polymers) meltingunit, forming the pattern in special moulds transfer the shoes to paint unit where itis sprayed with special dyes and solvents. A field survey indicated that the majorsource of pollution was the painting department. Wastewater discharged from thepainting department was characterized by the high contents of organic compounds(Table 8). The mean values of the chemical oxygen demand and the biological oxygen
Springer

Environmentalist (2007) 27:275–286 281
Table 6 Characteristics of the chemically treated wastewater (Building and construction chemicalfactory)
Parameters Units Raw Treated effluent Egyptian decree 44 for 2000
pH 7.3 7.7 6–9.5Chemical Oxygen demand mg O2/l 3494 229 1100Biological Oxygen demand mg O2/l 642 76 600Total suspended solids mg /l 248 51 800Phosphorous mg P/l 4 1 25Organic Nitrogen mg N2/l 18 7 100Phenols mg/l 0.2 0.02 0.05Oil & Grease mg /l 600 86 100Sludge AnalysisSludge volume ml/l 240Sludge weight mg/l 9.2Sludge volume index 26.6
∗Average of 6 samples.
Fig. 3 Schematic diagram of the chemical treatment system (Building and construction chemicals factory)
demand were 15441 and 7776 mg O2/l, respectively. The average phenol concen-tration was 0.93 mg/l. Thus the industrial wastewater was mixed with the domesticwastewater at ratio of 1 to 3 (based on the rational amounts of sewage and industrialwastewater discharged in the factory) to achieve an end-of-pipe effluent of lowerorganic load. Also, addition of domestic wastewater compensates deficiency of nitro-gen and phosphorous concentration in the industrial wastewater. Meric et al. (1999)recommended biological treatment for such kind of wastewater regarding dilutionrequirements and nitrogen and phosphorus supplement. The average values of CODand BOD of the final effluent of the factory after mixing were 5239 and 2615 mgO2/l,
Springer

282 Environmentalist (2007) 27:275–286
Table 7 Dimension and cost estimate of the chemical treatment system (Building and construction chem-icals factory)
Treatment unit L (m) H (m) W (m) D (m) V (m3) Cost in L.E
Construction cost1. Civil Works (More or less 30,000
depends on soil conditions)2. Treatment units
• Collection Sump 1.75 1.4 1.875 10,0001. Flash mixing Tank 0.45 1.25 0.45 0.156 5,5002. Flocculation Tank 1.7 1.5 0.8 1.718 12,5003. Sedimentation tanks 2.5 2.5 1.0 5.625 15,0004. Sludge Tank 1.5 1.5 1.5 2.7 28,0005. Chemical System 70,0006. Pipes and valves for all plant 10,000
3. Electrical works 30,000Total Cost 211,000Running Cost/year
• Maintenance works 14,000• Operation cost 44,000• Chemical consumption 12,200
Total running cost 70,200
Table 8 Characteristics of the wastewater discharged from plastic shoes manufacturing factory
Painting department Final effluent Egyptiandecree 44
Parameters Unit Min. Max. Avg. Min. Max. Avg. for 2000
pH 5.6 7.6 6.5 6.8 7.8 7.2 6–9.5Chemical Oxygen demand mg O2/l 10254 20490 15441 2124 6775 5239 1100Biological Oxygen demand mg O2/l 5780 10500 7776 1050 3524 2615 600Total suspended solids mg/l 830 1920 1431 192 1054 506 800Phosphorous mg P/l 2 18 6 12.8 20 15.5 25Organic Nitrogen mg N2/l 79 598 338 17.2 210 92 100Phenols mg/l 0.6 1.2 0.93 0.12 1.3 0.5 0.05Oil & Grease mg /l 126 571 377 28 543 218 100
∗Average of 7 samples.
respectively (Table 8), which still exceeds the discharging limits into the sewersystem.
3.2.1 Chemical treatment
Chemical treatment of the final effluent was carried out using lime in combinationwith ferric chloride and Lime with aluminum sulfate; however the characteristics ofthe treated effluent still did not comply with the permissible limits set by the EgyptianLaw. These results are in agreement with (Meric et al., 1999) who mentioned thatmethods such as coagulation, flotation, were not applicable for high concentratedwastewater from polyester manufacturing industry due to the soluble nature of thepollutants.
Springer

Environmentalist (2007) 27:275–286 283
Table 9 Characteristics of the treated wastewater using activated sludge (Plastic shoes manufacturingfactory)∗
Egyptian decreeParameters Unit Raw Initial 1 (hour) 2 (hour) 3 (hour) 4 (hour) 24 (hour) 44 for 2000
COD mgO2/l 5239 4820 2358 1467 1048 629 376 1100Removal % 8 55 72 80 88 93BOD mgO2/l 2615 2354 1046 837 628 392 131 600Removal 10 60 68 76 85 95TSS mg/l 608 535 219 201 182 72 12 800Removal 12 64 67 70 88 98Total Organic mgN2/l 181 42 15 100
NitrogenTotal phosphorous mgP/l 7.2 2.5 1.3 25Phenols mg/l 0.4 0.03 N.D 0.05Oil and Grease mg/l 231 72 26 100Sludge analysisSludge volume ml/l 350 320 270Total sludge weight g/l 4.1 3.5 2.9Sludge volume 85 91 93
index
∗Average of 3 times.
3.2.2 Biological treatment
Aerobic biological treatment using activated sludge and RBC was carried out.
3.2.2.1 Activated sludge treatment unit. The reactor was fed with the end-of-pipewastewater and operated at a detention time ranging from one hour to twenty-fourhours using a MLSS of 3 g/l. Analysis of the treated effluent indicated that thehighest BOD removal was achieved at a retention time of 24 h (Table 9). Aver-age residual values of COD, BOD, TSS and Oil and Grease were 376 mgO2/l,131 mgO2/l, 12 mg/l and 26 mg/l, respectively. These values are in agreement with thestandards set by the Egyptian law for discharging treated wastewater into the seweragesystem.
Table 10 Characteristics of the treated wastewater using RBC (Plastic shoes manufacturing factory)∗
Egyptian decreeParameters Unit Raw Treated % Removal 44 for 2000
PH 7.2 7.0 – 6–9.5Chemical Oxygen demand mg O2/l 5239 474 90 1100Biological Oxygen demand mg O2/l 2615 277 89 600Total organic nitrogen mg N2/l 181 81 56 100Total phosphorous mg P/l 7.2 3 57 25Total suspended solids mg /l 608 76 88 800Phenol mg /l 0.4 0.02 95 0.05Oil & Grease mg/l 231 16 93 100
∗Average of 7 samples.
Springer

284 Environmentalist (2007) 27:275–286
3.2.2.2 Rotating biological contactor unit. The RBC was fed continuously with thefinal effluent with an organic load of 7.8 kgBOD/m3.d for 4 months. The results inTable 10 and Fig. 4, showed that the average COD and BOD concentration valuesof the treated effluent were 474 mgO2/l and 277 mgO2/l, respectively. The averageresidual value of the suspended solids was 76 with a removal value 88%. The oil and
0
2000
4000
6000
8000
1 2 3 4 5 6 7 8Weeks
CO
D m
gO2/
L
influenteffluent
0
1000
2000
3000
1 2 3 4 5 6 7 8Weeks
BO
D m
gO2/
L
influenteffluent
Fig. 4 Characteristics of the treated wastewater using RBC (Plastic shoes manufacturing factory)
Fig. 5 Schematic diagram of the activated sludge treatment system (Plastic shoes manufacturing factory)
Fig. 6 Schematic diagram of the rotating biological contactor system (Plastic shoes manufacturing factory)
Springer

Environmentalist (2007) 27:275–286 285
grease percentage removal was 93% with a residual value of 16 mg/l. Characteristicsof the treated effluent using the RBC were within the permissible limits. These resultsare in agreement with (Hu et al., 1999) who reported that pollutants with a highbiodegradability, i.e., a high value of BOD/COD ratio, could be effectively treatedusing biological treatment process.
3.2.2.3 Design and economic study of the treatment system. Based on the laboratoryresults a final biological treatment process design via activated sludge or RBC was
Table 11 Dimensions and cost estimate of activated sludge system (Plastic shoes manufacturing)
Treatment unit L (m) H (m) W (m) D (m) V (m3) Cost in L.E
Construction cost1. Civil Works (More or less 40,000
depends on soil conditions)2. Treatment units
• Collection Sump 1.0 1.0 0.2 8,000• Balance tank 0.9 1.5 0.9 1.0 11,000• Aeration tank 3.2 2.5 1.25 4.0 150,000• Sedimentation tanks 0.85 2.0 0.85 1.0 12,000• Sludge holding tank 1.8 1.5 1.8 3.99 12,000• Pipes and valves for all plant 10,000• Measuring and control instruments 30,000
3. Electrical works 40,000Total Cost 313,000Running Cost/year
• Maintenance works 17,500• Operation cost 96,000
Total running cost/year 113,500
Table 12 Dimensions and cost estimate of rotating biological contactor (Plastic shoes manufacturingfactory)
Treatment unit L (m) H (m) W (m) D (m) V (m3) Cost in L.E
Construction cost1. Civil Works (More or less 55,000
depends on soil conditions)2. Treatment units
• Collection Sump 1.0 1.0 0.2 8,000• Balance tank 0.9 1.5 0.9 1.0 11,000• Rotary reactor 8.0 1.4 3.0 130,000• Sedimentation tanks 0.85 2.0 0.85 1.0 12,000• Sludge holding tank 1.8 1.5 1.8 3.8 12,000• Pipes and valves for all plant 10,000• Measuring and control instruments 30,000
3. Electrical works 40,000Total Cost 308,000Running Cost/year
• Maintenance works 12,500• Operation cost 48,000
Total running cost/year 60,500
Springer

286 Environmentalist (2007) 27:275–286
developed (Figs. 5 and 6). Cost estimate for the activated sludge indicated that theconstruction system is LE 313000 ($ 54912), while the running cost is LE 113500($ 19912), (Table 11). The construction cost of the RBC is LE 308000 ($ 54035), whilethe running cost is LE 60500 ($ 10614), (Table 12). The RBC system is recommendedbecause of the management and operation of the system is easier and technicallyfeasible by the low-skilled personnel.
4 Conclusion
� Characteristics of chemical industrial wastewater determine the adequate treatmentsystem, specifically, solubility, toxicity and biodegradability of the pollutants.
� In the chemical treatment process of wastewater the bench scale is important beforegoing onwards to the continuous system.
� Dilution of chemical industrial wastewaters using domestic sewage in the factoryeffectively decreases the concentration and toxicity of the pollutants and is costeffective since no chemical salts are required to provide nutrients in the biologicaltreatment system.
� The rotating biological contactor is a simple in operation and management andhighly effective system.
References
Abou-Elela, S.I., El-Kamah, E.M., Aly, H.I., and Abou-Taleb, E.: 1995, ‘Management of Wastewater fromthe Fertilizer Industry,’ Water Science & Technology 32(11), 45–54.
Alvarez, D., Garrido, N., Sans, R., and Carreras, I.: 2004, ‘Minimization-Optimization of Water Use in theProcess of Cleaning Reactors and Containers in a Chemical Industry,’ Journal of Cleaner Production12, 781–787.
APHA: 1998, Standard Methods for the Examination of Water and Wastewater. 20th edn., Washington.DC.
Badr, N.M.: 1988, ‘Factors Affecting Nitrification of Wastewater in the Rotating Biological Contactor,’M.Sc. Thesis. Faculty of Science, Cairo University, Egypt.
Bury, S.J., Groot, C.K., Huth, C., and Hardt, N.: 2002, ‘Dynamic Simulation of Chemical Industry Wastew-ater Treatment Plants,’ Water Science & Technology 45(4–5), 355–363.
Carini, D.: 1999, ‘Treatment of Industrial Wastewater Using Chemical-Biological Sequencing BatchBiofilm Reactor (SBBR) Processes,’ Ph.D. Thesis Swiss Federal Institute of Technology, Zurich,Switzerland.
EPA: 1998, ‘Wastewater Treatment Technologies,’ in: Pollution Prevention (P2) Guidance Manual for thePesticide Formulating, Packaging and Repackaging Industry including implementing the P2 alternative,EPA, 821-B-98–017 June 1998, pp. 41–46.
Hu, H.-Y., Goto, N., and Fujie, K.: 1999, ‘Concepts and Methodologies to Minimize Pollutant Dischargefor Zero-Emission Production,’ Water Science & Technology 10–11, 9–16.
Jobbagy, A., Nerbert, N., Altermatt, R.H., and Samhaber, W.M.: 2000, ‘Encouraging Filament Growth inan Activated Sludge Treatment Plant of the Chemical Industry,’ Water. Research 34(2), 699–703.
Meric, S., Kabdash, I., Tunay, O., and Orhon, D.: 1999, ‘Treatability of Strong Wastewaters from PolyesterManufacturing Industry.’ Water Science & Technology 39(10–11), 1–7.
Nemerow, N.L., and Dasgupta, A.: 1991, Industrial and Hazardous Waste Treatment. New York: VanNostrand Reinhold.
Peringer, P.: 1997, ‘Biologischer Abbau von Xenobiotica,’ BioWorld 1, 4–7.Watanabe, Y., Okabe, S., Hirate, K., and Masuda, S.: 1995, ‘Simultaneous Removal of Organic Material
and Nitrogen by Micro-Aerobic Biofilms,’ Water Science & Technology 31(1), 195–203.
Springer