Phosphorus Removal from Wastewater
57
Phosphorus Removal from Wastewater by Gina Tolley A creative component submitted to the graduate faculty To fulfill the requirements for the degree of MASTER OF SCIENCE Major: Civil Engineering Program of Study Committee: Timothy Ellis, Major Professor Shihwu Sung Vernon Schaefer Iowa State University Ames, IA 2011 Copyright © Gina Tolley, 2011. All rights reserved.
-
Upload
independent -
Category
Documents
-
view
1 -
download
0
Transcript of Phosphorus Removal from Wastewater
Phosphorus Removal from Wastewater
by
Gina Tolley
A creative component submitted to the graduate faculty
To fulfill the requirements for the degree of
MASTER OF SCIENCE
Major: Civil Engineering
Program of Study Committee:
Timothy Ellis, Major Professor
Shihwu Sung
Vernon Schaefer
Iowa State University
Ames, IA
2011
Copyright © Gina Tolley, 2011. All rights reserved.

2
ABSTRACT
Phosphorus is an essential element to all living things. Phosphate is detrimental in trace
amounts. Phosphorus causes eutrophication of freshwater bodies leading to the degradation of
the water quality. Wastewater treatment plants have been classified as a major contributor to
the loading of phosphorus into freshwater. Engineers noticed the importance of phosphorus
removal from wastewater in the mid twentieth century. This paper outlines the different methods
to successfully and efficiently remove phosphorus from wastewater.
BACKGROUND TO PHOSPHORUS REMOVAL
Phosphorus is essential to all living cells because it is a constituent of the cell membrane, RNA, and DNA. Because of its reactivity it does not exist free in nature but it is found in several different compounds (Choi et al., 2011). Phosphate is detrimental in trace amounts (even parts per trillion) because it is a limiting nutrient. Phosphate released through effluent of industrial and municipal waste water treatment plants is often responsible for eutrophication (Zhao and Sengupta, 1997). Eutrophication leads to the degradation of water quality of our freshwaters. Anthropogenic forms of phosphorus are the leading cause of eutrophication in lakes, bays and inland seas.
Evidence is increasingly pointing to wastewater treatment plants as the major point source for phosphorus. The phosphorus is from fecal matter, commercial and industrial sources, and surfactants (Arvin, 1985). This problem poses a health risk to humans, animals, and plants and results in an increase in the cost to treat drinking water (Withers and Jarvie, 2008). Phosphorus discharge is becoming very stringent in the Great Lakes area, Arizona, Colorado, and southern California (Zhao and Sengupta, 1998).
Conventional activated sludge plants are primarily designed to remove organic carbonaceous material; unfortunately they produce treated effluents with high residual levels of phosphorus (Kortsee et al., 1994). Within the last thirty years, many different wastewater treatment plant configurations have been designed and built with biological phosphorus removal in mind. However, this process has been designed and enhanced in an empirical manner; the microbiology involved was not well understood.
The Water Environment Research Foundation Alexandria, VA funded projects in 2001 to investigate the plants that consistently demonstrated low phosphorous levels in their effluents (Seviour et al., 2003). Germany and Europe, in general, have much stricter effluent standards for phosphorous. The more stringent standards are requiring the wastewater treatment plants in these areas to update/improve or build new treatment plants that consistently and effectively remove phosphorus (Jardin and Popel, 1996b).
Recently, molecular RNA-based culture-independent methods have greatly improved our understanding of the microbial processes in enhanced biological phosphorus removal. Many of the unknown factors about phosphate accumulating organisms have been addressed and answered (Loy, et al., 2002).
The presence of glycogen accumulating organisms can greatly reduce the efficiency of
3
enhanced biological phosphorus removal (Oehmen et al., 2007). Glycogen accumulating organisms are organisms that can utilize the same volatile fatty acids as phosphate accumulating organisms (the organisms responsible for biological phosphorus removal) (Filipe et al., 2001). In order to achieve successful phosphorus removal, phosphate accumulating organisms need to outcompete glycogen accumulating organisms.
Struvite (MgNH4PO4·6H2O) can be formed during the treatment of wastewater (Loewenthal et al., 1994). Struvite can cause problems at treatment plants. It can cause scaling in pipes (Jaffer et al., 2002). However, precipitating struvite can lead to increased phosphorus removal (Doyle and Parsons, 2002). Struvite is magnesium, ammonium, and phosphate and it forms a hard crystalline deposit when the molar ratio of Mg:NH4:PO4 is greater than 1:1:1 (Jaffer et al., 2002). The crystallization of struvite is used as a means to remove phosphorus from secondary effluent (Battistoni et al., 2001). Using controlled struvite precipitation in addition to enhanced biological phosphorus removal can ensure the plant effluent concentrations be very low (Munch and Barr, 2000). Utilizing struvite precipitation can effectively recover the nutrients from anaerobically treated wastewater (Miles and Ellis, 2001).
The precipitation of struvite has been demonstrated to reduce phosphate concentrations from 55 mg/L to 2 mg/L. The minimum concentrations of phosphate were shown to occur at a pH levels between 8.9 and 9.3 for every ratio of magnesium to phosphorus (Quintana et al., 2005). When phosphorus is removed using struvite, the volume of sludge production has been reported to decrease by as much as 49%. An additional benefit to the precipitation of struvite is the reduction in the concentration of nitrogen and phosphorus being recycled back through the tank (Woods et al., 1999).
Struvite is typically produced after the anaerobic digestion phase. Ammonium is produced by the break-down of proteins and from bacteria. The phosphorus that is incorporated into bacterial cell mass is released in the anaerobic digester as phosphate. These are the conditions that favor the formation of struvite due to the requirement of ammonium and phosphate (Münch and Barr, 2000). As pH increases, the concentration of ortho-phosphate increases and the concentration of magnesium and ammonium decrease. These conditions create the optimal pH for struvite formation (Buchanan et al., 1994).
Struvite can be an economical commodity because it can be sold as fertilizer (Martí et al., 2010). Shu et al., 2006 have estimated that struvite can be sold for $0.74/kg (Australian, $0.76 US). Phosphorus is a main component of animal and human waste. It can, with the use of struvite, be recycled (Münch and Barr, 2000). When struvite is used as a fertilizer, the nutrients are released slowly which, in turn, allows the plants to uptake the nutrients more efficiently which also results in fewer times the fertilizer is applied (Münch and Barr, 2000).
The addition of precipitating chemicals such as iron and aluminum salts to wastewater is a common method for phosphate removal. The addition of chemicals should be limited because the counterion of salts remains in the water, which increases the salinity of surface waters and chemical precipitates accumulates in the sludge which requires extra cost to remove it (van Loosdrecht et al., 1997). However, it should be noted that precipitation may always be needed for phosphorus removal (Maurer et al., 1997). It is acceptable to still allow precipitation because it will occur in the anaerobic phase and phosphate and the counterion will be released into the liquid.
The use of ion exchange is another possibility for the removal of phosphorus from wastewaters. Using this process the phosphorus is adsorbed to a mesostructure. This reduces the amount of solids produced (Cheng et al., 2009). Onyango et al. (2007) made a list of preconditions for the

4
adsorbent material. 1) The material must have a high selectivity, capacity and rate of adsorption. 2) It must have both physical and chemical strengths. 3) It cannot contain hazardous pollutants. 4) The material must be recyclable. 5) It must not be expensive. Based on this list, ziroconium sulfate has been shown to be an acceptable adsorbent for phosphate removal (Choi et al., 2011).
HISTORY OF BIOLOGICAL PHOSPHORUS REMOVAL
Enhanced biological phosphorus removal is the removal of phosphorus achieved by encouraging the accumulation of phosphorus in bacterial cells in the form of polyphosphate granules in excess of the levels normally required to satisfy the metabolic demand for growth (Seviour et al., 2003). Around 1959, biological phosphate removal was accidentally discovered in a full-scale wastewater treatment plant by Srinath et al. (1959) from India. They found that the effluent from a treatment plant contained an excessive amount of phosphate when aerated. This led to the belief that phosphate uptake was a biological process (van Loosdrecht et al., 1997). The amount of phosphorus removed depends on the net sludge production because the phosphorus is stored in the cell tissue (Chang et al., 1996).
Levin and Shapiro (1965) conducted experiments and investigated the biological process of phosphate uptake in full-scale treatment plants. They observed that under anaerobic conditions phosphate was released and it was taken up under aerobic conditions. When additional substrate was added the phosphate uptake was greater. They also found that at a pH of 9 no phosphate uptake occurred which they concluded meant that chemical precipitation was inhibiting the uptake.
Levin (1966) filed a patent for the “Phostrip” process. During Levin’s Phostrip process the phosphate that was released was collected in a separated tank and then precipitated. This process is still used today; however, it gained more popularity in the 1980s when the microbial process of biological phosphate removal was better understood. Figure 1 on the next page is a layout of Levin’s “Phostrip” wastewater treatment process.
Shapiro et al. (1967) later studied the anaerobic stage of the biological phosphate process. They found that the phosphate removal was not caused or enhanced by endogenous decay; but rather that it could be enhanced by adding poisons (such as KCN). They also noted that the phosphate release was directly associated with the amount of sludge present. Through experiments, Shapiro et al. found that the redox potential, not the oxygen concentration, was triggering the phosphate release.
Milbury et al. (1971) found that a basic requirement for phosphate removal was that the reactor should operate in a plug flow manner and that the first part of the reactor should be anoxic. They also found that the sludge had a maximum capacity of accumulated phosphate. One link that was extremely important and repeatedly not recognized by many (if not all up to this point) was the link between phosphate uptake and release. The design process, up until now, focused solely on the phosphate uptake process. Fuhs and Chen (1975) found through several tests that the genus Acinetobacter was the bacteria responsible for the uptake of phosphate. Actinobacter
are organisms capable of accumulating large amounts of polyphosphate and poly(hydroxybutyrate).
The first full-scale designs were introduced in the late 1970s (van Loosdrecht et al., 1997). The development of these treatment plants were primarily based on observations because of the

5
lack of a complete understanding of the microbial processes occurring during the uptake and release of phosphate. A truly anaerobic phase for the mixing of the return and wastewater is needed and is essential for biological phosphate removal (Nicholls, 1975).
Meganck and Faup (1988) have suggested four operational conditions for successful enhanced biological phosphorus removal. 1) The influent containing readily degradable carbon (energy) source needs to flow into an anaerobic reactor. 2) Nitrate needs to be limited when entering the anaerobic zone. This can be done by having an anoxic zone. The presence of nitrate is detrimental to biological phosphorus removal because the denitrifying bacteria deplete the supply of organic substrates, removing the “food” from the phosphorus accumulating organisms. 3) The anaerobic zone must remain anaerobic. 4) The biomass needs to be recycled between anaerobic and aerobic zones.
Figure 1 is Gilbert V. Levin’s “Phostrip” design, patent number 3236766.
6
Biological processes for phosphorus removal are environmentally protective and are cost-effective. One of the main advantages to biological phosphorus removal is that there is not an increase in the amount of sludge produced. The poly-phosphate storage and phosphorus uptake and the specific operational plant conditions are relatively well understood (Jardin and Popel, 1996b). The poly-phosphorus is stored in organisms known as poly-phosphorus accumulating organisms (Mino et al., 1998).
Theoretically, biological phosphorus removal can affect the waste activated sludge production in three ways. 1) It is due to the uptake of phosphate and storage of polyphosphate, which increases the amount of dry solids produced (Jardin and Popel, 1996a); 2) The growth kinetics of the activated sludge may change with the growth of the phosphate accumulating organisms (Wentzel et al., 1990); 3) Incorporating an anaerobic zone may reduce the overall amount of sludge produced (Randall et al., 1987).
LAYOUTS/SCHEMATICS FOR BIOLOGICAL PHOSPHORUS REMOVAL
The Phoredox system (figure 2a) was proposed by Barnard in 1976. The first tank is the anaerobic tank receiving the influent and the second is the aerobic tank. The return sludge is recycled to the anaerobic tank. This system is only applicable when nitrogen removal is not required. The A/O system has the same layout as the Phoredox system. However, in this system, the influent is introduced into the anaerobic tank in plug flow manner. This promotes the conversion of easily biodegradable material to acetate and increases the phosphorus removal (van Haandel and van der Lubbe, 2007). The Phoredox layout is primarily found in cold regions, e.g., in Europe and the U.S.
In the pre-D and Bardenpho systems (figure 2b and 2c) an anoxic tank is added between the aerobic and anaerobic zones. In these systems, the anaerobic tank also receives the influent and the return sludge. The modified pre-D system is equivalent to the plug flow A2/O system. The modified Bardenpho system is a very accepted configuration for tank layout.
The University of Cape Town (UCT) system and modified UCT configurations are popular tank layouts (Vaiopoulou and Aivasidis, 2008). The UCT system (figure 2d) the recycle stream is taken from the anoxic zone instead of the aerobic zone to avoid the introduction of nitrate into the anaerobic zone. The concentration of nitrate in the anoxic zone is regulated by the “a” recycle line. The modified UCT system (figure 2e) was created to ensure that nitrate would not be introduced into the anaerobic zone. The anoxic zone is split into two zones. The upstream part is where the return sludge is introduced and the downstream part is for denitrification of the nitrate in the recycled line (van Haandel and van der Lubbe, 2007). Figures 3 and 4 are alternative layouts for the UCT configuration (van Loosdrecht, 1997 and Vaiopoulou and Aivasidis, 2008).
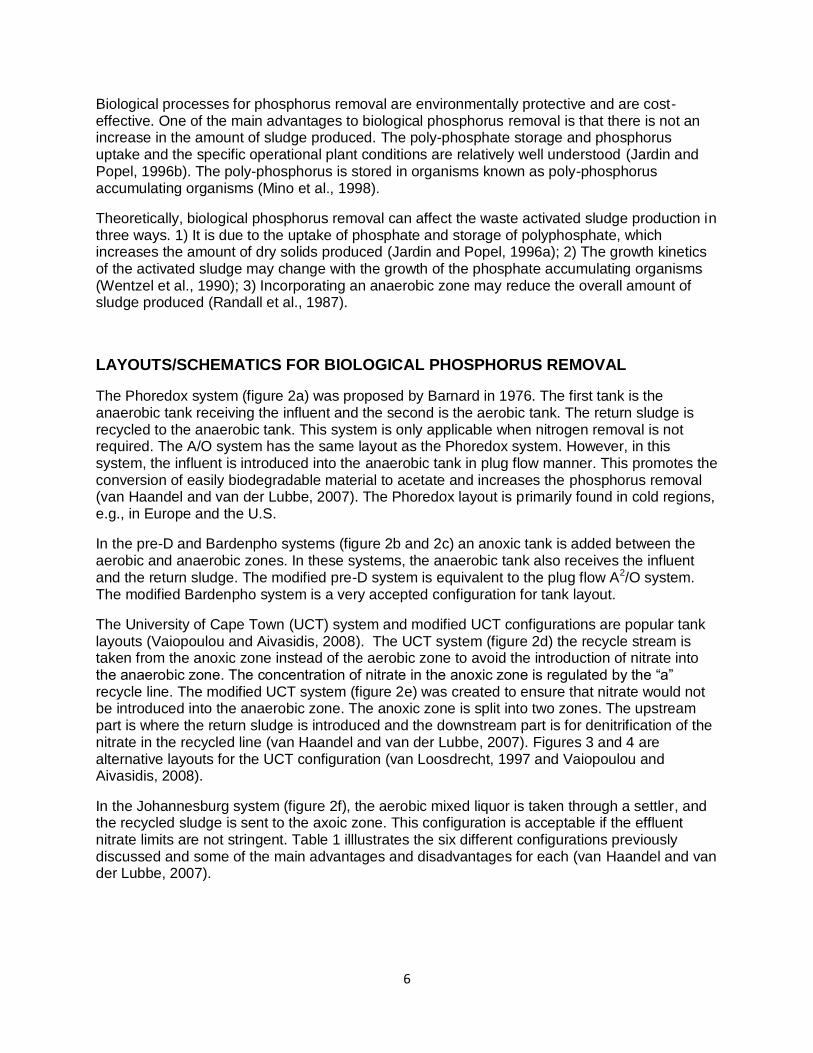
In the Johannesburg system (figure 2f), the aerobic mixed liquor is taken through a settler, and the recycled sludge is sent to the axoic zone. This configuration is acceptable if the effluent nitrate limits are not stringent. Table 1 illlustrates the six different configurations previously discussed and some of the main advantages and disadvantages for each (van Haandel and van der Lubbe, 2007).

7
Figure 2.This figure illustrates several different wastewater treatment plant layouts that are acceptable for achieving biological phosphorus removal (van Haandel and van der Lubbe, 2007).
8
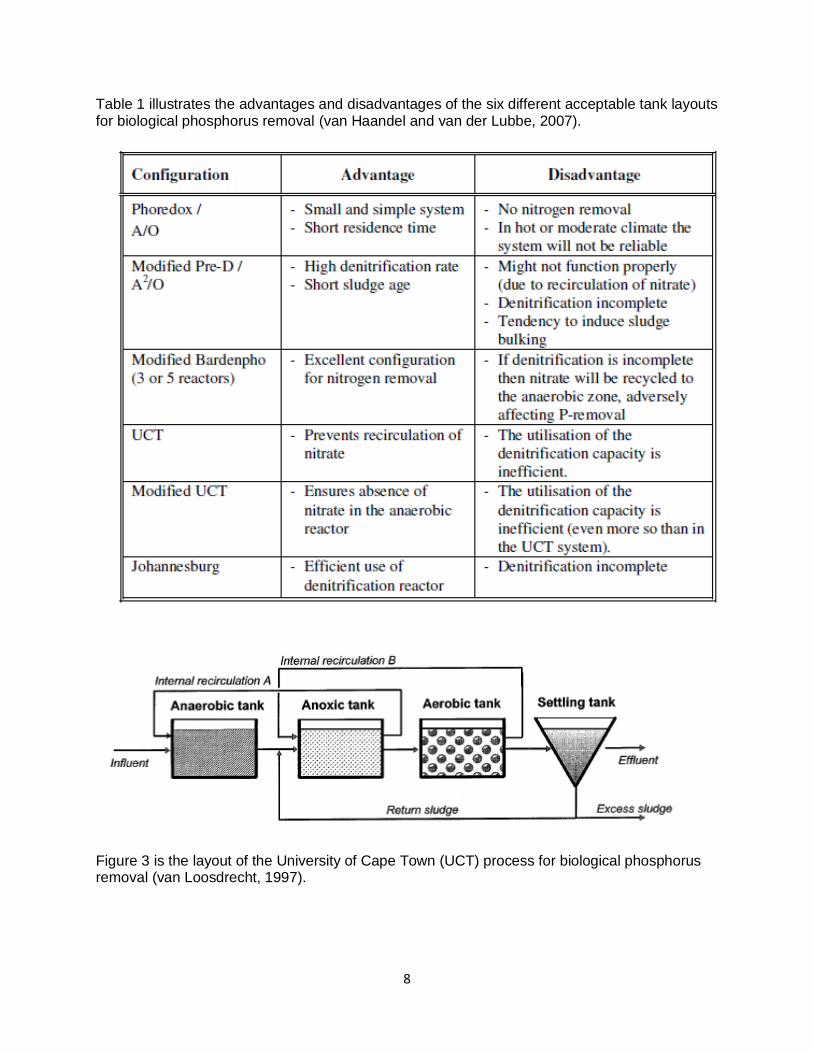
Table 1 illustrates the advantages and disadvantages of the six different acceptable tank layouts for biological phosphorus removal (van Haandel and van der Lubbe, 2007).
Figure 3 is the layout of the University of Cape Town (UCT) process for biological phosphorus removal (van Loosdrecht, 1997).

9
Figure 4 is the experimental setup used by Vaiopoulou and Aivasidis (2008). It is a combined UCT concept and step denitrification for carbon, nitrogen, and phosphorus removal.
Figure 5. VIP, modeled from Shihwu Sung, 2011.
Figure 6. SBR for biological nutrient removal, modeled from Shihwu Sung, 2011.

10
The VIP (Virginia Initiative Plant), shown in figure 5, is much like the A2/O and the UCT layouts. The recycle streams have been altered in this process (Metcalf and Eddy, 2004). In all of the stages, there are at least two completely mixed cells in series. The VIP system was designed for high-rate systems. They maximize the biological phosphorus removal by utilizing a short solids residence time.
The SBR (sequencing batch reactor) is shown in figure 6. The fill stage and the initial react stage are anaerobic. This allows the readily biodegradable COD to be taken up and stored by the phosphate accumulating bacteria (Metcalf and Eddy, 2004). The anaerobic zone in the anaerobic/aerobic tank layout is called a “selector” (Metcalf and Eddy, 2004). It is called a selector because the conditions favor the phosphorus accumulating bacteria as opposed to other heterotrophic bacteria. The processes that the phosphorus accumulating bacteria carry out in both the anaerobic tank and aerobic tanks are very well understood. The understanding of the complex processes that take place in the anoxic tank is less understood.
MICROBIOLOGY OF BIOLOGICAL PHOSPHORUS REMOVAL
The IAWQ Task Group on Mathematical Modelling for Design and Operation of Biological Wastewater Treatment Process suggests that there are three groups of microorganisms that should be in a biological phosphorous removal system: ordinary heterotrophic organisms, autotrophic organisms, and phosphate-accumulating organisms (Chuang and Ouyang, 2000). The enhanced biological phosphorus removal process has become very popular for improving and for new wastewater treatment plants in Germany (Jardin and Popel, 1996b).
Rensink was the first to notice the correlation between phosphate release and uptake. He noted that substrate might be used as poly(hydroxybutyrate) by aerobic organisms in anaerobic conditions with the sacrifice of energy (polyphosphate) (van Loosdrecht et al., 1997). The anaerobic phase thus serves to supply polyphosphate accumulating bacteria with volatile fatty acids and also to give a competitive advantage for substrate uptake over other heterotrophic bacteria (Mino et al., 1998).
In the anaerobic zone, short chain volatile fatty acids can be readily consumed by some bacteria. These are stored as poly-β-hydroxyalkanoates which are then assimilated into poly-β-hydroxybutyrate with acetate and poly-β-hydroxyvalerate with propionate (Wentzel et al., 1985). Intracellular polyphosphate levels decrease and phosphate levels in the solution increase, which is illustrated in figure 2. During the aerobic zone, the poly-β-hydroxybutyrate levels decrease with the phosphate levels increasing in the cell composition (again illustrated in figure 2).
The energy derived from the degradation of the poly-phosphate in bacterial cells is used to sequester and transform the volatile fatty acids to polyhydroxyalkanoates. In the aerobic reactor, the polyhydroxylalkanoates are degraded for energy to drive cell growth. Polyphosphate biosynthesis is driven by the energy derived from aerobic catabolism where polyhydroxyalkanoates are the major carbon source (Pramanik et al., 1999).
When the sludge containing phosphorus is held under anaerobic conditions, phosphorus release will occur (Metcalf and Eddy, 2004). The release of ortho-phosphtate is possible without acetate addition because the bacteria use the stored polyphosphate as an energy source. Ortho-phosphate can also be released after extended contact time in the anaerobic basin. If this occurs the phosphorus may not be able to be taken up in the aerobic tank. This type of phosphorus release is called secondary release (Barnard, 1984).

11
Successful enhanced biological phosphorus removal depends on whether or not the phosphate accumulating organisms achieve dominance during the recycling through the anaerobic and aerobic stages (Seviour et al., 2003). It is thought that under anaerobic conditions, the phosphorus accumulating bacteria can quickly assimilate acetate and synthesize poly-β-hydroxyalkanoates using polyphosphate as the energy source and the orthophosphate that is generated is released into solution. In the aerobic zone, the organisms that have the stored poly-β-hydroxyalkanoates are able to use this as a carbon and energy source and create polyphosphate.
Figure 6. Anaerobic, aerobic, and anoxic phases of biological phosphorus removal (van Loosdrecht et al., 1998)
Phosphorus removal efficiency can change due to the variation in the influent carbon supply (Carucci et al., 1999). Periods of low phosphorus uptake have been known to occur after periods of low organic sewage loading during the weekend and when rain dilutes the influent. There are several different methods to improve the phosphorus removal after weekends. Moser-Engeler et al. (1997) proposed to add an additional supply of organic carbon to supplement the low input during weekends. Carucci et al. (1999). Brdjanovic et al. (1998a) suggested that reducing aeration during weekends would save the internal resources of the phosphate accumulating bacteria. Siegrist et al. (1999) recommend that enhanced aeration or increasing the aerobic/anoxic volume on Mondays and Tuesdays would increase the aerobic/anoxic retention time to allow for an increase in phosphorus uptake.
12
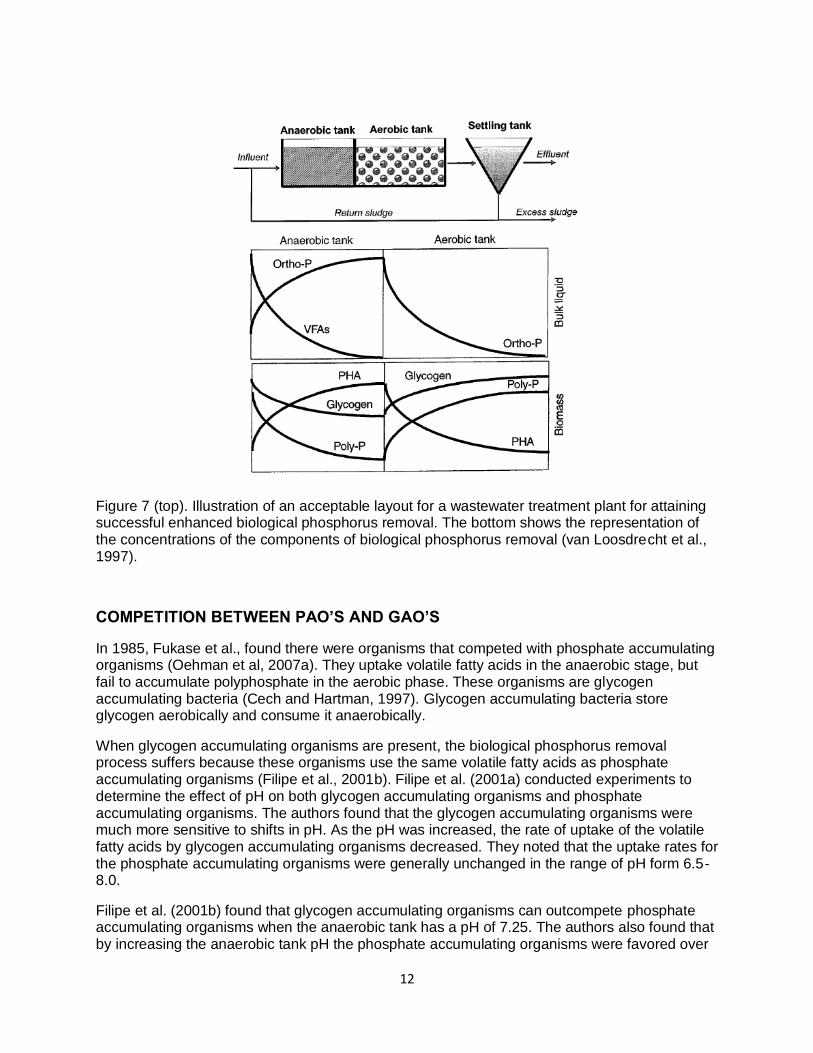
Figure 7 (top). Illustration of an acceptable layout for a wastewater treatment plant for attaining successful enhanced biological phosphorus removal. The bottom shows the representation of the concentrations of the components of biological phosphorus removal (van Loosdrecht et al., 1997).
COMPETITION BETWEEN PAO’S AND GAO’S
In 1985, Fukase et al., found there were organisms that competed with phosphate accumulating organisms (Oehman et al, 2007a). They uptake volatile fatty acids in the anaerobic stage, but fail to accumulate polyphosphate in the aerobic phase. These organisms are glycogen accumulating bacteria (Cech and Hartman, 1997). Glycogen accumulating bacteria store glycogen aerobically and consume it anaerobically.
When glycogen accumulating organisms are present, the biological phosphorus removal process suffers because these organisms use the same volatile fatty acids as phosphate accumulating organisms (Filipe et al., 2001b). Filipe et al. (2001a) conducted experiments to determine the effect of pH on both glycogen accumulating organisms and phosphate accumulating organisms. The authors found that the glycogen accumulating organisms were much more sensitive to shifts in pH. As the pH was increased, the rate of uptake of the volatile fatty acids by glycogen accumulating organisms decreased. They noted that the uptake rates for the phosphate accumulating organisms were generally unchanged in the range of pH form 6.5-8.0.
Filipe et al. (2001b) found that glycogen accumulating organisms can outcompete phosphate accumulating organisms when the anaerobic tank has a pH of 7.25. The authors also found that by increasing the anaerobic tank pH the phosphate accumulating organisms were favored over

13
glycogen accumulating organisms. When the pH was not maintained, the authors could not show consistent biological phosphorus removal.
Lopez-Vazquez et al. (2009) studied the effects of carbon source, pH and temperature on both phosphate accumulating organisms and glycogen accumulating organisms. The authors found that the type of carbon source had direct and indirect effects on the metabolism of both phosphate accumulating organisms and glycogen accumulating organisms. The carbon source directly affected the anaerobic metabolic rates and indirectly affected the aerobic metabolic rates of the organisms. They noted that the phosphate accumulating organisms (in this study Accumlibacter) were able to uptake both acetic acid and propionic acid at the same rate at a temperature of 20°C and pH of 7.0. The glycogen accumulating organisms, however, can store acetic acid at the same rate as the phosphate accumulating organisms but the uptake rate of propionic acid was almost zero. The indirect relation to the aerobic metabolisms is due to the polyhydroxybutyrate fractions for the differing volatile fatty acids. Lopez-Vazquez et al. (2009) noted that both phosphate accumulating organisms’ and glycogen accumulating organisms’ metabolism are dependent on temperature. Figure 8 below shows the combined effects of temperature and pH on the uptake rates of both acetic acid and propionic acid. In the figure, Competibacter and Alphaproteobacteria are the glycogen accumulating organisms and the Accumulibacter are the phosphate accumulating organisms.
Figure 8. a. The combined effects of temperature and pH on the uptake rate for acetic acid (qmax
HAc) for both phosphate accumulating organisms and glycogen accumulating organisms. B. The combined effects of temperature and pH on the uptake rate for propionic acid (qmax
HPr) (Lopez-Vazquez et al., 2009).
The authors found that Accumulibacter dominated at 10°C, which implies that the glycogen accumulating organisms cannot function at low temperatures. At high temperatures (30°C) glycogen accumulating organisms were outcompeted by phosphate accumulating organisms. They also noted that the glycogen accumulating organisms were favored over the phosphate accumulating organisms when the influent phosphorus concentrations were low. Lopez-Vazquez et al. also found that when both acetic acid and propionic acid were present in the substrate, phosphate accumulating organisms were favored. The authors stated that in order to

14
ensure that phosphate accumulating organisms were favored; a pH of 7.0 or below could be utilized at high temperatures. These results are presented in figure 9 below.
Figure 9. The results from the study done by Lopez-Vazquez et al. (2009) on differing pH, carbon sources, and temperatures. The white bars are Accumlibacter, the black bars are Alphaproteobacteria, and the grey bars are Competibacter

15
SPECIFIC EXPERIMENTS USING BIOLOGICAL PHOSPHORUS REMOVAL
Acetic acid and propionic acid
Acetic acid and isovaleric acid have exhibited enhanced removal of phosphorus during short-term experiments and propionic acid was determined to be the least-efficient 2-5 carbon volatile fatty acid studied by Randall and Khouri (1998). Hood and Randall (2001) did further studies with steady-state conditions that promoted enhanced biological phosphorus removal. They used two sequencing batch reactors. One was cultivated with acetic acid, the other propionic acid as the readily degradable influent COD. Both of the influents were seeded with mixed liquor from a nearby wastewater treatment plant that already utilized biological phosphorus removal. They waited to collect any data until at least three mean cell residence times had been reached with the influent.
Hood and Randall, 2001, found that the sequencing batch reactor with the propionic acid exhibited high levels of phosphorus removal after three mean cell residence times (6-6.5 days each). The peak anaerobic phosphorus release averaged 23.1 mg/L (with a maximum of 30 mg/L), aerobic uptake average of 39.4 mg/L (with a maximum of 50 mg/L) and thus a net phosphorus uptake average of 16.3 mg/L (peaking at over 20 mg/L).
In the sequencing batch reactor with the acetic acid, the biological phosphorus removal was initially inhibited due to the nitrates remaining from the nitrification in the previous treatment cycle. Enhanced biological phosphorus removal started once 10 mg/L of the nitrification inhibitor 2-chloro-6-(tricholoromethyl) pyridine was added to the influent (Hood and Randall, 2001). The anaerobic phosphorus release in this reactor averaged 4.4 mg/L, the average aerobic phosphorus uptake was 14.1 and thus the net phosphorus removal averaged 11.7 mg/L.
Hood and Randall, 2001, then added the same nitrification inhibitor to the sequencing batch reactor with the propionic acid so that they could directly compare the results between the two reactors and their net phosphorus removal. When the nitrification inhibitor was added, it was found detrimental to the phosphorus removal in the batch reactor with the propionic acid as the influent COD. 2-chloro-6-(tricholoromethyl) pyridine reduced the anaerobic phosphorus release to an average of 11.2 mg/L, the aerobic phosphorus uptake to 22.9 mg/L and the net phosphorus removal to 11.7 mg/L. It should be noted the MLSS and MLVSS were almost identical during the phase that both of the sequencing batch reactors exhibited enhanced biological phosphorus removal.
Hood and Randall came to several conclusions. 1) Acetic and isovaleric acids are two of the most consistent substrates for enhancing biological phosphorus removal. 2) Propionic acid was not efficient in increasing biological phosphorus removal in batch experiments; however, in long-term cultivation it proved to be effective. 3) Acetic acid strongly selected phosphorus accumulating organisms when nitrification was prevented and did not create anoxic conditions.

16
Figure 10. Illustration of the effects of volatile fatty acids on the observed soluble phosphorus concentrations during batch experiments. For the propionate, the data before the addition of the nitrification inhibitor is used. The values are compared to the supernatant concentrations of the control (Hood and Randall, 2001).
Modified UCT model
Vaiopoulou and Aivasidis (2008) conducted another experiment for the effectiveness of nutrient removal using their design for a modified UCT model. Their UCT model has an initial anaerobic selector and then three identical pairs of tanks. Each pair has both an anoxic tank for denitrification and an aerobic tank for nitrification. The effluent from the aerobic tank is step fed to the three anoxic/aerobic tanks. The pilot plant has been in operation for two years and was fed with influent from Xanthi, Greece. The BOD concentration of the raw wastewater is 320 +/- 112 mg/L; the COD concentration was 510 +/- 147 mg/L; the phosphate-phosphorus concentration was between 2 and 9 mg/L and the total phosphorus concentration varied between 2 and 15 mg/L.
They varied the influent flow distribution to the anaerobic selector to the second and third aerobic tanks; 60/25/15% and 40/30/30% and 45/40/35%. The pilot plant was run until it reached steady-state and a hydraulic retention time of 5 hours obtained by increasing the influent flow. They ran the pilot plant and collected data and samples for two years.
17
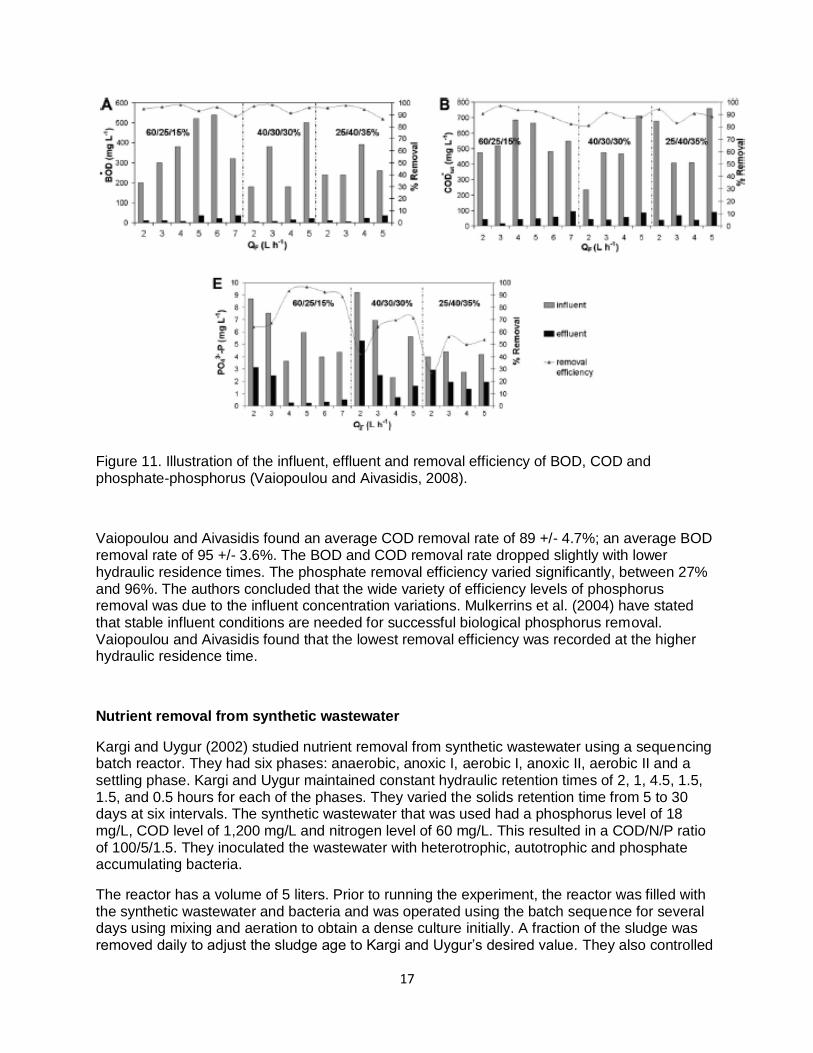
Figure 11. Illustration of the influent, effluent and removal efficiency of BOD, COD and phosphate-phosphorus (Vaiopoulou and Aivasidis, 2008).
Vaiopoulou and Aivasidis found an average COD removal rate of 89 +/- 4.7%; an average BOD removal rate of 95 +/- 3.6%. The BOD and COD removal rate dropped slightly with lower hydraulic residence times. The phosphate removal efficiency varied significantly, between 27% and 96%. The authors concluded that the wide variety of efficiency levels of phosphorus removal was due to the influent concentration variations. Mulkerrins et al. (2004) have stated that stable influent conditions are needed for successful biological phosphorus removal. Vaiopoulou and Aivasidis found that the lowest removal efficiency was recorded at the higher hydraulic residence time.
Nutrient removal from synthetic wastewater
Kargi and Uygur (2002) studied nutrient removal from synthetic wastewater using a sequencing batch reactor. They had six phases: anaerobic, anoxic I, aerobic I, anoxic II, aerobic II and a settling phase. Kargi and Uygur maintained constant hydraulic retention times of 2, 1, 4.5, 1.5, 1.5, and 0.5 hours for each of the phases. They varied the solids retention time from 5 to 30 days at six intervals. The synthetic wastewater that was used had a phosphorus level of 18 mg/L, COD level of 1,200 mg/L and nitrogen level of 60 mg/L. This resulted in a COD/N/P ratio of 100/5/1.5. They inoculated the wastewater with heterotrophic, autotrophic and phosphate accumulating bacteria.
The reactor has a volume of 5 liters. Prior to running the experiment, the reactor was filled with the synthetic wastewater and bacteria and was operated using the batch sequence for several days using mixing and aeration to obtain a dense culture initially. A fraction of the sludge was removed daily to adjust the sludge age to Kargi and Uygur’s desired value. They also controlled

18
the pH, temperature and dissolved oxygen level (in the aerobic phases). They maintained a nearly constant temperature of 25°C, a pH of 7-7.5, and dissolved oxygen was maintained above of 2 mg/L.
Figure 12. The sequencing batch reactor used by Kargi and Uygur (2002).
Figure 13 depicts the variation of the removal efficiency for the varying sludge age. The maximum phosphate removal efficiency of 70% was reached at a sludge age of 10 days. Kargi and Uygur noted that the removal efficiency of 67% and 68% were reached at a sludge age of 15 and 25 days, respectively. The effluent concentration of phosphorus was 3.6 mg/L at a sludge age of 10 days as shown in figure 11.
Figure 13. Illustration of the phosphate removal efficiency for the varying sludge age (adapted from Kargi and Uygur, 2002).

19
Sequencing batch reactor
Bond et al. (1998) studied phosphorus removal in a sequencing batch reactor. The authors examined differing phosphorus removal capabilities in an enhanced biological phosphorus removal system. They set up two stages of operation (A and B). The operational parameters are shown in table 2 below. The reactor was a 2 liter reactor fitted with pH electrodes and a dissolved oxygen electrode.
Table 2. The features of the two stages of the sequencing batch reactor (modified from Bond et al., 1998).
During stage A, the phosphorus removal was less than desired. Between days 29 and 67 there was extremely poor phosphorus removal. Bond et al. believed that phosphorus removal did not occur because the influent concentration was 15.1 mg/L and the effluent concentration averaged 12.0 mg/L. The phosphorus content of the mixed liquor was less than 2%. On day 61, the sludge was labeled “Q” sludge (seen in figure 14).
The phosphorus removal increased when they did not control the pH in the anaerobic period. The sequencing batch reactor was run with these conditions from day 66 to day 117. The phosphorus removal slowly increased; however, it never reached the desired 1 mg/L in the effluent. The sludge during this phase was labeled “R” sludge (figure 14).
Before beginning stage B of the experiment, the reactor was reseeded with sludge from a fully operational enhanced biological phosphorus removal wastewater treatment plant. Beginning at day 111, there was excellent phosphorus removal. The effluent phosphorus concentrations were below 1 mg/L and mostly below the detection limit of 0.05 mg/L. After day 121, the average phosphorus content in the mixed liquor rose to 8%. The sludge during stage B was labeled “P” sludge (figure 14).
Figure 14. Illustration of the performance of the sequencing batch reactor during stages A and B. Phosphate –P in the effluent (□), phosphorus content as a mass percent of the mixed liquor

20
(▲), Phosphate-P in the end of the anaerobic stage mixed liquor ( ○) (adapted from Bond et al., 1998).
Volumetric ratios of anaerobic and aerobic zones
Chang et al. (1996) studied sludge settling in enhanced biological phosphorus removal processes at different sludge ages, and different volumetric ratios of the anaerobic and aerobic zones. They specifically focused on high COD/P ratios. They studied the high COD/P ratio because better phosphorus removal occurs at higher ratios, but more residual substrate is left and tends to favor filamentous microorganisms. They want to achieve high phosphorus removal efficiency and maintain conditions which favor floc forming microorganisms.
Figure 15 below shows the layout of the plant that was used by Chang et al. They used a continuous flow enhanced biological phosphorus removal pilot plant. They maintained a constant temperature of 20°C. The authors used a synthetic wastewater with a constant flow rate of 103 mL/min. The pollutant strength of their synthetic wastewater is similar to that of domestic wastewater in Taipei, Taiwan. They used a 15 liter clarifier for sludge settling. They recycled at a rate 50% of the influent flow from the clarifier back to the anaerobic zone. The sludge was wasted based on the specific sludge age desired. Chang et al. varied the sludge retention time and the volumetric ratio of the anaerobic tank and the aerobic tank. They used sludge ages of 5, 10, and 15 days. The authors also used volumetric ratios of 1:9, 1:4, and 1:2.3 (anaerobic: aerobic tanks).
Table 3. The content of the synthetic wastewater used by Chang et al.
Component Milk C12H22O11 (NH4)2SO4 (NH4)2CO CH3COOH H3PO4 FeCl3
Conc.(mg/L) 135 13.3 2.86 8.57 29.8 7.2 0.1
Figure 15. The schematic of the pilot plant used by Chang et al. (1996).

21
The removal efficiency of phosphorus was able to be maintained at at least 75% during all periods that had an anaerobic zone. The authors found that the sludge volume values varied significantly and that higher phosphorus removal did not mean a lower SVI-value. Based on the values in table 4, the authors concluded that the best volumetric ratio was 1:4 and the optimum sludge age was 10 days.
Table 4 shows the dissolved phosphate concentration during the experimental period (mg/L).
SRT(d) 5 5 5 5 10 10 10 10 15 15 15 15
Van:Va 0:10 1:9 1:4 1:2.3 0:10 1:9 1:4 1:2.3 0:10 1:9 1:4 1:2.3
Pi 4.5 4.01 4.01 4.03 5.03 5.01 5.03 5.02 5.02 5.03 5.02 5.03
Pan - 4.51 6.11 10.7 - 16.69 19.53 22.75 - 12.25 14.9 15.01
Pe 2.11 1.01 1.05 0.8 2.32 0.71 0.1 0.18 3.01 1.26 0.37 0.27
Pi : influent dissolved phosphate concentration, Pan: dissolved phosphate concentration in anaerobic zone, Pe: effluent dissolved phosphate concentration
Low organic loading periods and their effect
Temmink et al. (1996) studied phosphorus removal during periods of low organic loading in enhanced biological phosphorus removal treatment plants. The time frame for low loading periods is on the order of hours to days. As discussed before, low organic loading can dampen the phosphorus removal because of the partial (or complete) depletion of the stored poly-β-hydroxyalkanoates. When the treatment plant tries to recover from the low loading periods, high effluent phosphate concentrations are usually observed (Isaacs et al., 1994). These high concentrations are due to the imbalance between phosphorus release and uptake. Temmink et al. suspect that during the process of recovering phosphorus, the phosphorus release is almost instantaneous whereas the uptake of phosphorus depends on the concentration of poly-β-hydroxyalkanoates (which is slowly rising).
The authors introduced periods of low loading in an alternating (pilot-scale) plant. They used the Activated Sludge Model No. 2 to interpret their results. Figure 14 below shows the layout for Temmink et al.’s pilot plant. They used pre-settled municipal wastewater taken from a buffer tank.
Figure 17 below shows the significant drop in the phosphate concentration when the low loading period began. The graph shows the measurement of phosphate in the influent, anaerobic tank, and one of the aeration tanks. It also illustrates the sudden drop and rise of influent concentration. The author’s expectations were met. The low organic loading caused a significant drop in the phosphorus released in the anaerobic tank. Once the loading was returned to normal the phosphorus release immediately returned to its previous level, then slowly decreased.

22
Figure 16. Illustration of the pilot-scale plant. (AN: anaerobic column; T1, T2: aeration tanks, SE: settler) (Temmink et al., 1996).
Temmink et al. analyzed the sludge leaving the anaerobic column throughout the experiment as well. They found that the poly-β-hydroxyalkanoates concentration quickly fell when the pilot plant was exposed to low organic loading. They also noted that the concentration continued to fall throughout the period of low loading. Once the loading had returned to normal, the poly-β-hydroxyalkanoates followed the same pattern as the phosphate. The authors concluded that enhanced biological phosphorus removal recovery is slow and can result in high phosphorus concentrations in the effluent.
Figure 17. Illustration of the phosphate concentration (Temmink et al., 1996).

23
Effects of nitrite on phosphate uptake
Saito et al. (2004) studied the effects of nitrite on the uptake of phosphate. The authors used a sequencing batch reactor with an anaerobic-anoxic-aerobic cycle. They had a 2 liter reactor with a pH of 7.4 +/- 0.1, dissolved oxygen electrode and temperature regulated to 20-25°C. The cycle was six hours total (2.0 hours for anaerobic, 2.5 hours for anoxic, 0.5 hours for the aerobic phase and 1.0 hour for settling). The dissolved oxygen in the aerobic phase was maintained to a level above 4.0 mg/L. The sludge retention was 12.5 days. The system was originally inoculated with fresh sludge from a nitrogen and phosphorus removal plant in the Netherlands. The authors did phosphate uptake tests with various concentrations of nitrite with three different electron acceptors: oxygen, nitrite, and a mixture of nitrate and nitrite.
Figure 18. Illustration of the behavior of nitrate, nitrite, COD, and phosphate in the sequencing batch reactor. These values plotted are the values collected on day 21 of the experiment (Saito et al., 2004).
Saito et al. found that the concentration of phosphate after the anaerobic phase gradually increased from 30 mg/L to 80 mg/L by day 80. Similarly, they found that the phosphate concentration at the end of the complete cycle decreased to a level of 4 mg/L by day 80 (13 mg/L at day 4). The authors concluded from these results that the phosphate accumulating organisms also gradually increased throughout the experiment.

24
Figure 19. Phosphate concentration at the end of the anaerobic and aerobic phases of the cycle throughout the experimental period, note the “nitrite accident” (Saito et al., 2004)
The importance of nitrite was clearly illustrated by an experimental accident (shown in figure 19). The acetate-feeding pump malfunctioned and did not add any acetate during the entire six hour cycle. This caused an accumulation of nitrite, which decreased the amount of phosphate removed. Based on these observations, the authors concluded that nitrite could have a detrimental effect on phosphate accumulating organisms and thus phosphate removal.
The authors also examined the effect of adding nitrite in the aerobic phase. They found that the aerobic phase might be the most sensitive to phosphate uptake in the presence of nitrite. Saito et al. found that even 2 mg/L of nitrite caused severe inhibition on phosphate uptake (shown in figure 20). They conducted the same test with the addition of 6 and 12 mg/L. With the addition of 6 mg/L, there was almost a complete inhibition of phosphate uptake (only 0.6 mgP/gVSS). The maximum phosphate uptake was achieved in the absence of nitrite (24 mgP/gVSS). The authors concluded that nitrite strongly inhibits the aerobic phase of phosphate uptake. Operational wastewater treatment plants should ensure that nitrite does not accumulate to enhance phosphorus removal.
Figure 20. The effects of phosphate uptake with the introduction of nitrite at various levels (Saito et al., 2004).
25
Filamentous bacteria
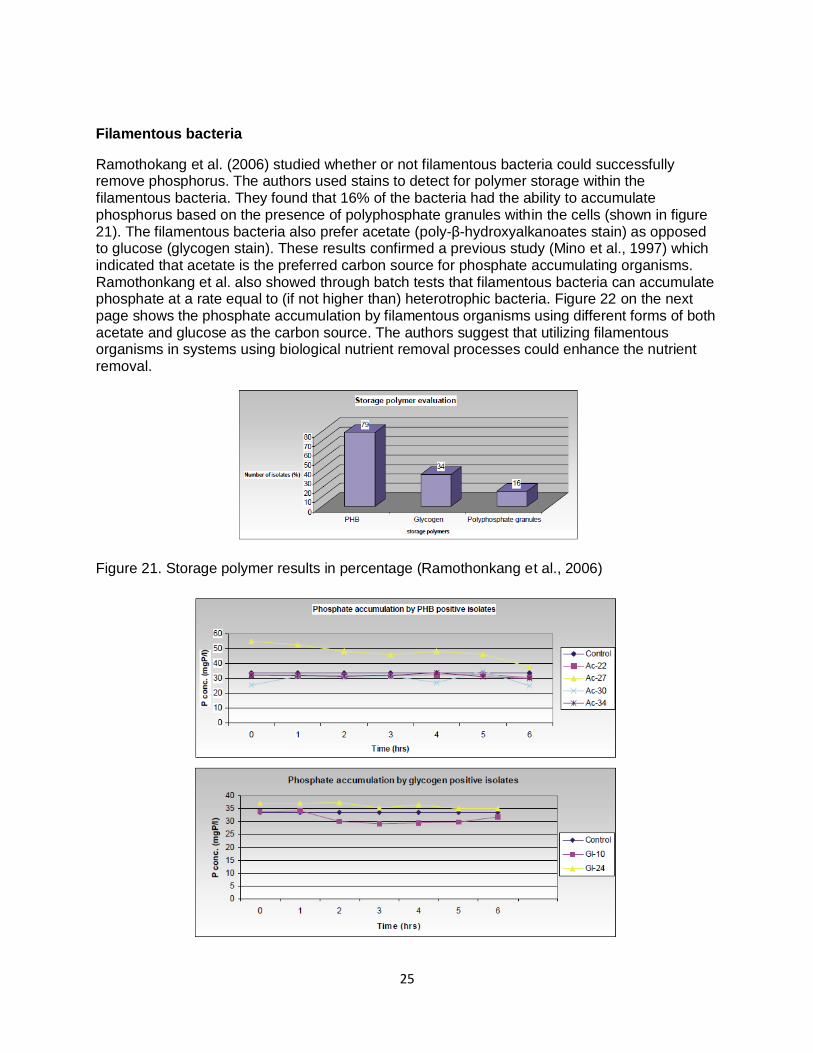
Ramothokang et al. (2006) studied whether or not filamentous bacteria could successfully remove phosphorus. The authors used stains to detect for polymer storage within the filamentous bacteria. They found that 16% of the bacteria had the ability to accumulate phosphorus based on the presence of polyphosphate granules within the cells (shown in figure 21). The filamentous bacteria also prefer acetate (poly-β-hydroxyalkanoates stain) as opposed to glucose (glycogen stain). These results confirmed a previous study (Mino et al., 1997) which indicated that acetate is the preferred carbon source for phosphate accumulating organisms. Ramothonkang et al. also showed through batch tests that filamentous bacteria can accumulate phosphate at a rate equal to (if not higher than) heterotrophic bacteria. Figure 22 on the next page shows the phosphate accumulation by filamentous organisms using different forms of both acetate and glucose as the carbon source. The authors suggest that utilizing filamentous organisms in systems using biological nutrient removal processes could enhance the nutrient removal.
Figure 21. Storage polymer results in percentage (Ramothonkang et al., 2006)

26
Figure 22. Phosphate accumulation by PHB positive isolates and glycogen positive isolates (Ramothokang et al., 2006)
Effects of sludge age on phosphorus removal
Rodrigo et al. (1996) studied the relationship between phosphorus uptake and sludge age. They used a bench-scale A2/O configuration (anaerobic-anoxic-aerobic). The layout of the reactors is shown in figure 23. Compressed air was supplied by diffusers in the aerobic tank which maintained a dissolved oxygen concentration of 2-3 mg/L. The temperature was also regulated to 19-20°C. The authors fed synthetic wastewater which they prepared daily containing acetic acid (200 mg/L), ammonia-nitrogen (30 mg/L), soluble phosphorus (14 mg/L) and trace metal (Apeldoorn, 1992). The system was inoculated with wastewater from a municipal activated sludge plant that does not exhibit biological phosphorus removal.
Figure 23. Layout of the A2/O process used by Rodrigo et al. (1996)
The authors ran the system for 300 days with five different series as outlined in table 5. They also looked at the effect of the volatile fatty acid uptake on the release, removal, and uptake of phosphorus. Rodrigo et al. analyzed plots and fit empirical equations to obtain volatile fatty acid uptake versus phosphorus removal graphs (figure 22). Table 6 gives the empirical equations they derived to obtain figure 24. The authors concluded that phosphorus removal depends on sludge age and volatile fatty acid uptake.
Table 5. Experimental design and sludge age for the five different series.
Series 1 2 3 4 5
Sludge age (d) 11 16 32 49 65
Table 6. List of empirical equations derived from the data collected by Rodrigo et al. (1996)
Phosphorus release (Prel) Prel = α + β x VFAupt
Phosphorus uptake (Pupt) Pupt = γ + σ x ln(VFAupt)
Phosphorus removed (Prem) Prem = Pupt - Prel
α (θx = sludge age) α = -10.61 + 4.64 x ln(θx)
β β = 0.56-0.10 x ln(θx)

27
γ γ = -1578.46 x θx-0.95
σ σ = 269.14 x θx-0.75
Figure 24. Curves from the equations in table 6 show the phosphorus removal at different sludge ages and at different levels of volatile fatty acid uptake levels.
Full-scale wastewater treatment plant
Brdjanovic et al. (2000) studied nutrient removal at a full-scale wastewater treatment plant in Haarlem Waarderpolder, Netherlands. The plant was built in 1969 and renovated in 1995. The layout of the plant is shown on the next page in figure 25. The plant was designed for nutrient and COD removal for industrial wastewaters of Haarlem and five small nearby communities. Figure 26 shows a simplified model for the phosphorus removal at this plant.
The authors did batch tests on the fresh return activated sludge on-site. They performed the tests at a controlled temperature of 20°C and a controlled pH of 7.0 +/- 0.1. The batch tests were analyzed to determine: the anaerobic phosphorus release rate, anoxic phosphate uptake rate, aerobic phosphate uptake rate, the fraction of denitrifying activity of phosphate accumulating organisms, nitrification rate, and endogenous phosphorus release rate.
The results gathered from the batch tests showed that the endogenous phosphorus released was due to one of two factors: either by maintenance processes in the biological phosphorus removal system or endogenous process like the decay of heterotrophic bacteria. The authors also found that the results from the phosphorus uptake tests (both anaerobically and aerobically) closely matched their predictions. The results for anaerobic maximal phosphorus release, aerobic phosphate uptake, anoxic phosphate uptake, and endogenous phosphorus

28
release are shown in figure 27. The charts also show the process that occurred during that phase of phosphorus removal.
Figure 25. Layout of the wastewater treatment plant in Haarlem Waarderpolder (Brdjanovic et al., 2000)
Figure 26. Block process layout of the wastewater treatment plant (numbers represent the number of process units) (Brdjanovic et al., 2000)

29
Figure 27. These are the results for the batch tests. The solid line represents model predictions and the individual points are the actual experiment results (adapted from Brdjanovic et al., 2000).
Effect of temperature on phosphorus removal
Wastewater treatment plants experience sewage temperatures in the range of 5°C to 30°C. Several studies have been done on the release and uptake of phosphorus with varying temperatures. Shapiro et al. (1967), Mamais and Jenkins (1992), and Boughton et al. (1971) all came to the same conclusion; the rate of phosphorus uptake and release increased with increasing temperature of the wastewater.
Brdjanovic et al. (1997) did a study on the short-term (hours) temperature changes on the biological phosphorus removal processes in the anaerobic phase, acetate uptake, phosphate release, polyhydroxyalkanoate synthesis, and metabolic processes during biological phosphorus removal in the aerobic zone. They wanted to look at the effect of temperature on the stoichiometry of the biological phosphorus removal process. The authors took sludge that had been cultivated at a constant 20°C and exposed it for three to four hours to temperatures of 5, 10, 20, and 30°C. The sludge had already been inoculated with phosphate accumulating organisms. The authors then analyzed the sludge once the reactor had reached steady-state

30
(24 days). They used a sludge age of eight days and a hydraulic retention time of 12 hours. The results of their study are shown in tables 7, 8, and 9.
Table 7. Biomass composition at the different temperatures before and after the anaerobic phase (Brdjanovic et al., 1997)
Table 8. Biomass composition at the different temperatures before and after the aerobic phase (Brdjanovic et al., 1997)
Table 9. Production or consumption (-) of the biomass components in both the anaerobic and aerobic phases at the different temperatures (Brdjanovic et al., 1997)
The authors found that the stoichiometry of the anaerobic phase was not sensitive to temperature changes. They did, however, observe changes in the aerobic stoichiometry. The anaerobic phase reactions reached a maximum rate at between 20 and 30°C. The aerobic phase reactions never reached a maximum rate; they continued to increase with an increase in temperature. Brdjanovic et al. also noted that the biological phosphorus removal population structure of microorganisms did not change, but the authors discovered they were more dependent on temperature than heterotrophic bacteria.

31
Brdjanovic et al. (1998b) continued the above study and examined the effect of long-term (weeks) temperature changes on the stoichiometry and kinetics of both the anaerobic and aerobic phases of the biological phosphorus removal process. They started the experiment with a temperature of 20°C. The process for temperature changes is illustrated in figure 28. The sludge age and length at each temperature are presented in the figure as well. At colder temperatures the authors increased the sludge age from 8 days at 30°C to 32 days at 5°C.
Figure 28. The operating schedule for the sequencing batch reactor used by Brdjanovic et al. (1998b)
Figure 29 on the next page shows the phosphate and acetate concentrations throughout the entire experiment. The graphs transition from each temperature during the first cycle and once the batches have reached steady state. The authors reached the conclusion that temperature impact on the stoichiometry of biological phosphorus removal is significant. The minimum sludge age for biological phosphorus removal at 20°C is about two days (Smolders et al., 1995). At 10°C, biological phosphorus removal could not occur at a sludge age of eight days so the authors arbitrarily increased the sludge retention time to 16 days. At 5°C, 16 days was too short of a sludge age to effectively achieve biological phosphorus removal, so again the authors increased the sludge retention time to 32 days.
The authors concluded that the stoichiometry of the anaerobic phase is minimally impacted by temperature changes which agree with their earlier conclusion from the short-term temperature change study. They also concluded that the kinetics of the anaerobic phase is impacted by the change in temperature. The aerobic phase was significantly impacted by the change in temperature.

32
Figure 29. Phosphate and acetate concentrations at the different temperatures during the sequencing batch reactor cycle (Brdjanovic et al., 1998b)
Li et al. (2010) did another study on the effect of temperature on phosphorus absorption and removal in a biological phosphorus removal process. They used three sequencing batch reactors and they were run individually at 5, 15, and 25°C. The sludge age for each temperature was 30, 15, and 8 days respectively. The authors got seed sludge from a local domestic wastewater treatment plant. They operated the reactors with six-hour cycles.
After forty days, when the system had reached steady-state conditions, the phosphorus removal rate for all of three of the reactors (at the three different temperatures) was above 80%. This study showed that the overall phosphorus removal was very temperature dependent. The maximum phosphorus removal rate was 95% at 15°C; the minimum removal rate was 83% at 25°C; and the phosphorus removal rate for the reactor operating at 5°C was 90%. These results are shown in figure 30 on the next page.
Li et al. also concluded that the intracellular phosphorus absorption and extracellular phosphorus removal varied with temperature as well. At a temperature of 5°C the percentage of phosphorus removed via extracellular removal was 13% compared to 4.2% at 15°C, and 4.8% at 25°C. At all temperatures, intracellular phosphorus removal dominated.

33
Figure 30. Phosphate concentrations versus time for the three reactors operating at the three different temperatures (Li et al., 2010)
Effect of pH on phosphorus removal
A higher pH leads to a greater phosphorus release in acetate wastewater because of the increase in energy required for acetate transport (Romansky et al., 1997). Liu et al. (2007) studied the effects of controlling the pH only for the anaerobic phase of the biological phosphorus removal process. The study was conducted using a sequencing batch reactor. The reactor was seeded with wastewater from a treatment plant in Shanghai, China. The authors used eight-hour cycles and maintained a temperature of 21°C. The dissolved oxygen concentration was maintained at 6 mg/L. Liu et al. operated the system with a sludge age of ten days and a hydraulic retention time of 10.2 hours. The initial pH was adjusted to 7.2 by adding HCl or NaOH. The authors tested the sludge using batch tests at five different anaerobic values of pH (6.4, 6.8, 7.2, 7.6, and 8.0).
The authors analyzed the effect of the different pH values on phosphorus removal efficiency of soluble ortho-phosphorus. The results are shown in figure 31. This figure shows that the initial anaerobic release decreased when the pH was increased from 6.4 to 6.8. The authors also noted that the accumulation of polyhydroxyalkanoate decreased linearly with an increase in pH. The authors also noted a sudden increase in pH at the beginning of the aerobic phase. They attribute this to the stripping of CO2 because of the high concentration of dissolved oxygen. Figure 30 shows this increase in all five runs with different pH levels. The pH should initially be adjusted to between 6.4 and 6.8 for optimal enhanced biological phosphorus removal.

34
Figure 31. Soluble ortho-phosphorus removal at various pH levels (Liu et al., 2007)
Figure 32. Variations in pH with time for five different initial pH values (Liu et al., 2007)

35
USING STRUVITE TO REMOVE PHOSPHORUS
Slough sewage treatment plant
Jaffer et al. (2002) did a study on the formation, control, and recovery of struvite at a wastewater treatment plant in Slough, UK. The plant began experiencing problems with struvite shortly after adding biological nutrient removal processes. The struvite had accumulated in the pipe reducing the diameter from 100mm to 50mm. The Slough wastewater treatment plant treats the sewage for a population of about 250,000 and nearly half of the waste is from industrial sources.
The authors created a bench-scale pilot plant shown in figure 33 below. Jaffer et al. fed the pilot plant with liquors from the Slough treatment plant. They also fed magnesium into the reactor. The authors took samples from 15 various locations throughout the pilot plant and analyzed them. The effluent was also sampled daily and analyzed for total kjeldahl nitrogen, ammonia nitrogen, phosphorus, alkalinity, magnesium, and suspended solids. The authors realized that when struvite is formed it is necessary to measure the concentrations of magnesium, ammonia, and phosphorus to better predict when and where the struvite will be formed.
Figure 33. Layout of the bench-scale pilot plant (Jaffer et al., 2002)
Jaffer et al. found that about 26% of the phosphorus and 20% of magnesium entering the plant was due to recirculation. The authors tried to predict when struvite would form by looking at the ionic product of [Mg2+][PO3-
4][NH4+]. The solubility product of struvite is 12.6; therefore, the
authors concluded that if the ionic product was greater than 12.6 struvite would precipitate. If it was less than 12.6 dissolution would occur. They found that the digested sludge had a very high potential for struvite formation. The centrifuge cake (which was sampled just after the sludge left the digester) had the highest potential for struvite formation due to its extremely high concentration of magnesium.
The authors then conducted another bench-scale struvite precipitation test. They used the centrifuged liquor obtained from the Slough treatment plant. The pH of the liquor was 9.0 (it was
36
noted that a pH below 7.5 would inhibit struvite formation). They found that 95% of the total phosphorus could be removed from the centrifuged liquor by precipitating struvite. Next they then increased the amount of magnesium in their pilot plant to a minimum ratio of 1.05:1 (Mg:P). The authors then demonstrated a 95% removal rate of phosphorus in their pilot plant. Jaffer et al. noted that when considering full-scale plants, calcium will need to be considered more carefully to determine the amount of magnesium necessary to precipitate struvite. They noted that a ratio of 1.3:1 would suffice in a full-scale plant.
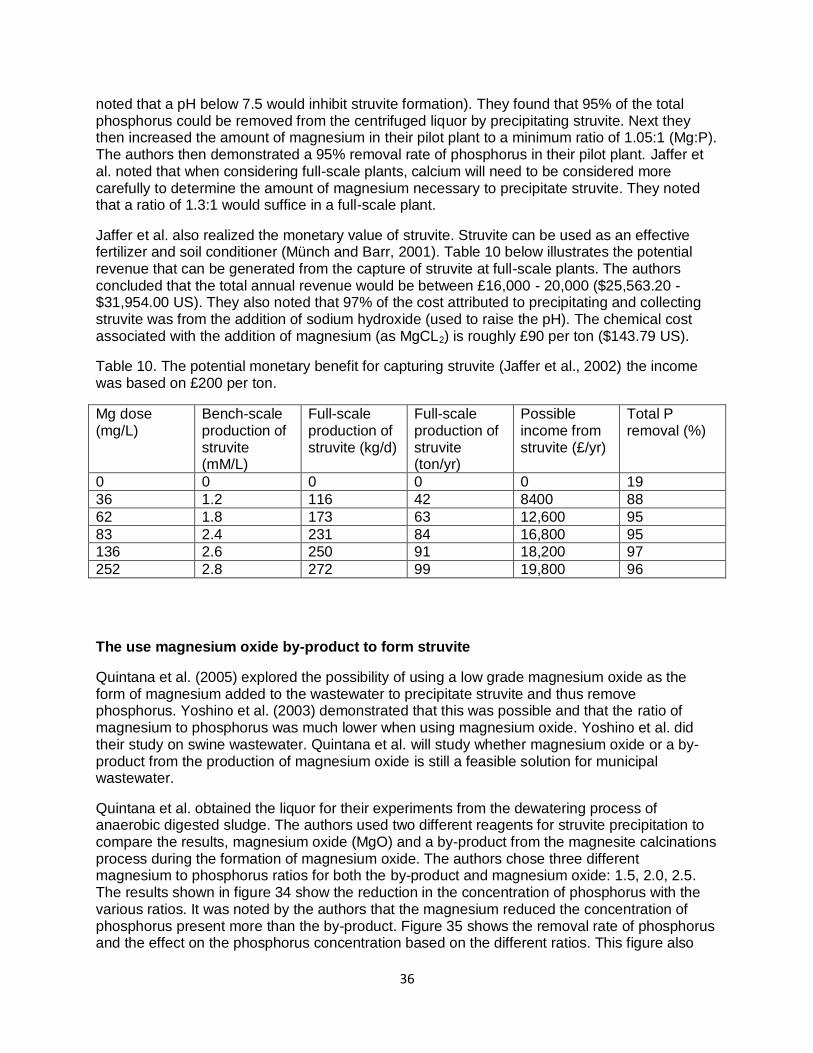
Jaffer et al. also realized the monetary value of struvite. Struvite can be used as an effective fertilizer and soil conditioner (Münch and Barr, 2001). Table 10 below illustrates the potential revenue that can be generated from the capture of struvite at full-scale plants. The authors concluded that the total annual revenue would be between £16,000 - 20,000 ($25,563.20 - $31,954.00 US). They also noted that 97% of the cost attributed to precipitating and collecting struvite was from the addition of sodium hydroxide (used to raise the pH). The chemical cost associated with the addition of magnesium (as MgCL2) is roughly £90 per ton ($143.79 US).
Table 10. The potential monetary benefit for capturing struvite (Jaffer et al., 2002) the income was based on £200 per ton.
Mg dose (mg/L)
Bench-scale production of struvite (mM/L)
Full-scale production of struvite (kg/d)
Full-scale production of struvite (ton/yr)
Possible income from struvite (£/yr)
Total P removal (%)
0 0 0 0 0 19
36 1.2 116 42 8400 88
62 1.8 173 63 12,600 95
83 2.4 231 84 16,800 95
136 2.6 250 91 18,200 97
252 2.8 272 99 19,800 96
The use magnesium oxide by-product to form struvite
Quintana et al. (2005) explored the possibility of using a low grade magnesium oxide as the form of magnesium added to the wastewater to precipitate struvite and thus remove phosphorus. Yoshino et al. (2003) demonstrated that this was possible and that the ratio of magnesium to phosphorus was much lower when using magnesium oxide. Yoshino et al. did their study on swine wastewater. Quintana et al. will study whether magnesium oxide or a by-product from the production of magnesium oxide is still a feasible solution for municipal wastewater.
Quintana et al. obtained the liquor for their experiments from the dewatering process of anaerobic digested sludge. The authors used two different reagents for struvite precipitation to compare the results, magnesium oxide (MgO) and a by-product from the magnesite calcinations process during the formation of magnesium oxide. The authors chose three different magnesium to phosphorus ratios for both the by-product and magnesium oxide: 1.5, 2.0, 2.5. The results shown in figure 34 show the reduction in the concentration of phosphorus with the various ratios. It was noted by the authors that the magnesium reduced the concentration of phosphorus present more than the by-product. Figure 35 shows the removal rate of phosphorus and the effect on the phosphorus concentration based on the different ratios. This figure also

37
illustrates that magnesium oxide was better at removing phosphorus, and it did so at a more rapid rate.
Figure 34. The difference in phosphorus concentration in time for the different Mg:P ratios (BMP represents the magnesium oxide by-product) (Quintana et al., 2005)
Figure 35. Shows the effects on the concentration of phosphorus due to the removal rate for the different Mg:P ratios (Quintana et al., 2005)

38
Struvite crystallization without the addition of chemicals
Battistoni et al. (1997) conducted experiments to successfully precipitate struvite in anaerobic liquors without the addition of any chemicals. They used the liquid from a belt press from a wastewater treatment plant that currently uses denitrification, nitrification, and anaerobic digestion for their tests. The authors added phosphorus in the form of Na3PO4. The supernatant that these authors used had a stoichiometric ratio ten times that which is needed to satisfy the requirements for struvite production. Battistoni et al. believed that they could make the natural evolution of phosphorus to struvite speed up if they stripped CO2 with air.
The authors used a bench-scale fluidized bed reactor to test the removal of phosphorus using struvite crystallization with supernatant containing a low concentration of phosphorus (below 50 mg/L). They filled the fluidized bed reactor with quartz sand. The authors tested the fluidized bed reactor’s removal efficiency with two methods of aeration: external gradual aeration and external continuous aeration. The results are shown below in figure 36.
Figure 36. The removal efficiency (E%) in time for the two different aeration methods (Battistoni et al., 1997)
They concluded that the external continuous aeration sped up the removal rate. The external gradual aeration reached a level of 80% removal in about 300 minutes whereas the external continuous aeration reached a level of 80% removal in about half the time (roughly 150 minutes). Battistoni et al. also concluded that quartz sand and air stripping creates an environment with a suitable pH for successful struvite formation without the addition of chemicals.

39
Properties of struvite, and its use at the Oxley Creek WWTP
Münch and Barr (2000) studied the process of struvite formation. The authors noted that the formation of struvite depended primarily on two factors: 1) the ratio of magnesium, ammonium, and phosphate and 2) the value of the pH in the reactor. Münch and Barr also stated that in many cases magnesium had to be added to ensure complete removal of phosphorus. The authors created a pilot-scale struvite reactor. They modeled it after the “Green MAP II” by Unitika Ltd. (Japan). This company has been able to successfully market and profit from this struvite reactor. Figure 36 below shows the pilot-scale struvite reactor.
“The Phosnix process is based on an air agitated column reactor, with ancillary chemical dosing equipment. Digester effluent is fed into the base of the tower where it is mixed with a magnesium solution to provide Mg:P molar ratio of 1:1.3. Alkali is dosed to ensure a pH range of 8.5-9. Air that is sparged into the base of the column provides the agitation required for complete mixing and suspension of the growing particles.
The crystals grow in size until they sink to the base of the tower where they are periodically removed. The recovered product is then dewatered from the small amount of solution which is lost when the crystals are removed, either by a filter bag system or natural drying” (Brett et al., 1997 as cited by Münch and Barr, 2000).
Figure 37. Schematic of the pilot-scale struvite reactor (Münch and Barr, 2000)

40
The influent that the authors used was from the wastewater treatment plant in Oxley Creek, Brisbane. They did not worry about adding too much magnesium to their pilot-scale reactor. The main purpose was phosphorus removal. They stated that at full-scale operations this would need to be monitored more closely. Figure 38 below illustrates that at lower magnesium concentrations the ortho-phosphate concentrations are higher, meaning that less was removed. Figure 39 is a photograph at 100 times the magnification of struvite crystals.
Figure 38. The effluent concentrations of both soluble magnesium and ortho-phosphate (Münch and Barr, 2000)
Figure 39. Struvite crystals at 100 times magnification (Münch and Barr, 2000)

41
Struvite for phosphorus removal using different operational strategies
Martí et al. (2010) studied phosphorus recovery from four different operational strategies by looking at the sludge line and crystallizer. They used a pilot system comprised of: primary settler, biological nutrient removal system, anaerobic digester, and a crystallization reactor. Figure 40 illustrates the crystallization reactor. They studied four configurations of the sludge treatment line, shown in figure 41.
Figure. 40. The crystallization reactor used by Martí et al., 2010

42
Figure 41. The four different configurations for the sludge line (Martí et al., 2010)
The authors found that for configurations C1 and C2 the phosphorus concentrations in the influent to the crystallizer were three times higher than those in C3 and C4. Also, in C1 and C2 the magnesium concentrations were really low, and they supplemented the low concentrations by adding magnesium chloride. The phosphate recovery and crystallization for the four configurations are shown in table 11.

43
Table 11. Precipitation and recovery efficiency for the four configurations (Martí et al., 2010)
Configuration C1 C2 C3 C4
Precipitation efficiency (%) 89.6 89.6 84.4 82.9
Recovery efficiency (%) 80.2 85.1 79.4 69.9
Based on the results obtained from this experiment, the authors concluded that the agitated crystallizer adequately precipitated struvite and thus recovered phosphorus. They also noted that the sludge line operational setup determines struvite production.
PHOSPHORUS REMOVAL THROUGH ION EXCHANGE
Titanium mesostructure
Choi et al. (2011) realized that zirconium is a viable mesostructure to use for phosphorus removal from wastewater; however, it is very expensive. They also studied titanium as a possible mesostructure because of its similarities to zirconium. They created the mesostructure from hexadecyltrimethylammonium, titanium oxysulfate-sulfuric acid complex hydrate, hydrochloric acid, and distilled water. The authors did a batch test to determine its adsorption capacity by testing the mesostructure with various concentrations of phosphorus. Figure 42 illustrates the amount of phosphorus adsorbed.
Figure 42. Amount of phosphorus adsorbed by the titanium mesostructure (Choi et al., 2011)
Table 12 shows the total cost for several different materials for mesostructures (based on this study as well as others referenced by Choi et al.). $ = US dollar; a = Choi et al., 2011; [37] =

44
Tadaka et al., 2004; [3] = Cheng et al., 2009; [16] = Urano and Tachikawa, 1991; [27] = Chen et al., 2002. (adapted from Choi et al., 2011).
The authors concluded that titanium is capable of adequately removing phosphorus and is an acceptable mesostructure. They also noted that titanium is also suitable because it can easily be regenerated whereas other materials cannot.
Polymeric ligand exchanger for phosphorus removal
Zhao and Sengupta (1998) addressed some of the downfalls of mesostructures for adsorption of phosphorus. They found that other species might outcompete phosphorus such as bicarbonate, dissolved organics, sulfate and chloride. The authors also noted that the ion exchangers have a low capacity at neutral pH. Adsorbers typically are inefficient in regeneration, and they can easily be fouled by organic matter.
Zhao and Sengupta have created a polymeric ligand exchanger which could be an effective fixed-bed exchanger for phosphate removal. “Primary constituents of the polymeric ligand exchanger include: first, a durable styrene-divinylbenzene copolymer like other ion exchangers; second, a covalently bonded chelating functional group with nitrogen donor atoms derived primarily from bi-pyridyl functional groups; and third, a Lewis-acid type metal cation (namely, copper) strongly coordinated to the chelating functional group in a manner that its positive charges are not neutralized.” The polymeric ligand exchanger is shown in figure 43.
Figure 43. Selective uptake of anionic ligand (L2-) onto the polymeric ligand exchanger (Zhao and Sengupta, 1998)
45
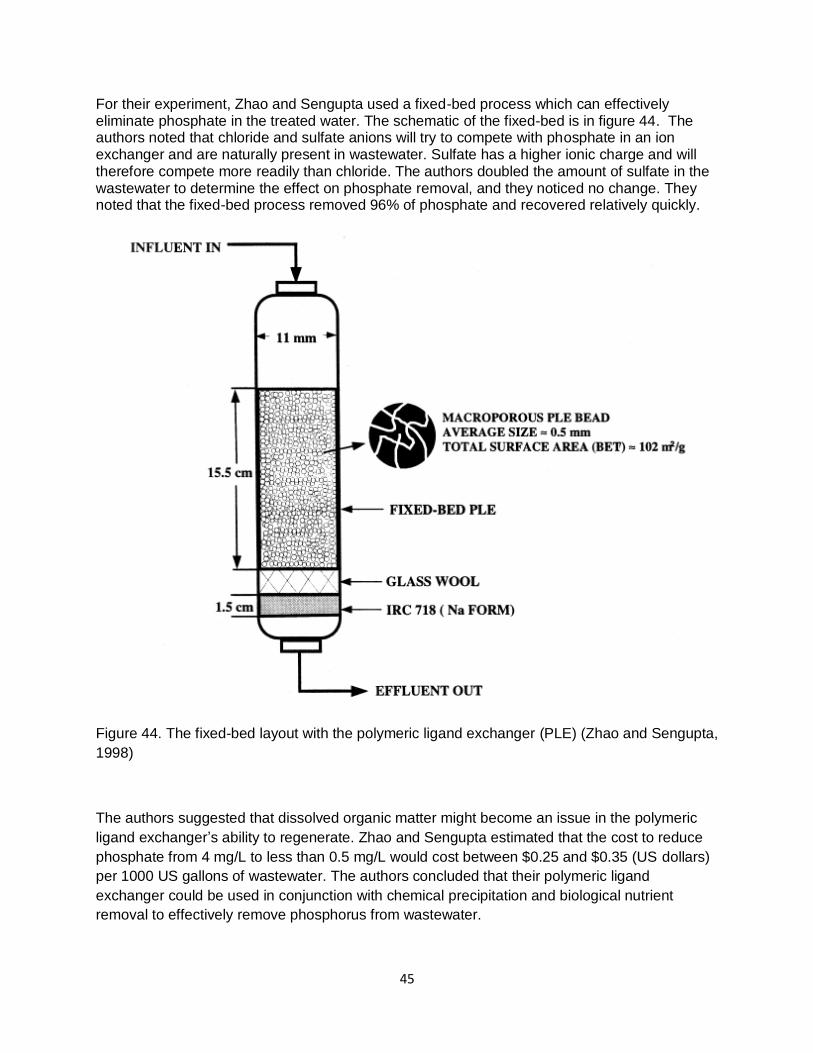
For their experiment, Zhao and Sengupta used a fixed-bed process which can effectively eliminate phosphate in the treated water. The schematic of the fixed-bed is in figure 44. The authors noted that chloride and sulfate anions will try to compete with phosphate in an ion exchanger and are naturally present in wastewater. Sulfate has a higher ionic charge and will therefore compete more readily than chloride. The authors doubled the amount of sulfate in the wastewater to determine the effect on phosphate removal, and they noticed no change. They noted that the fixed-bed process removed 96% of phosphate and recovered relatively quickly.
Figure 44. The fixed-bed layout with the polymeric ligand exchanger (PLE) (Zhao and Sengupta,
1998)
The authors suggested that dissolved organic matter might become an issue in the polymeric
ligand exchanger’s ability to regenerate. Zhao and Sengupta estimated that the cost to reduce
phosphate from 4 mg/L to less than 0.5 mg/L would cost between $0.25 and $0.35 (US dollars)
per 1000 US gallons of wastewater. The authors concluded that their polymeric ligand
exchanger could be used in conjunction with chemical precipitation and biological nutrient
removal to effectively remove phosphorus from wastewater.

46
ENGINEERING SIGNIFICANCE
Oehmen et al. (2007) did research on the competition between phosphate accumulating organisms and glycogen accumulating organisms. They have noted that much more research on these organisms needs to be done to better understand the entire process and which conditions favor the desired phosphate accumulating organisms. The authors also suggested that more research needs to be done in the field of microbiology of these organisms to better understand which species are glycogen accumulating and which species is phosphate accumulating. This could help ensure a better selection process for the treatment plant operation of biological phosphorus removal.
The world population is beginning to recognize the significance of phosphorus and that the world is trending towards running out of our natural “phosphorus bank”. This is leading us, as engineers, towards better technology to recapture/recover the phosphorus that enters wastewater treatment plants. The more stringent regulations that are beginning to be implemented around the world are going to need to be met in an efficient and cost effective means.
The advances that are being made in biological phosphorus removal are helping treatment plants attain the regulations on the phosphorus limitations being put forth by the Environmental Protection Agency and other regulatory agencies around the world. The research that began in the mid nineteenth century put environmental engineers on the right path to paving the way for successful phosphorus removal from wastewater.
Jaffer et al. (2002), Miles and Ellis (2001), Uyger (2002), Chang et al. (1996), Wentzel et al. (1985, 1990) Brdjanovic et al. (1996 and 1997), Temmink et al. (1996), Quintana et al. (2005), Zhao and Sengupta (1998), Filipe et al. (2001) are a few of the pioneering environmental engineers that have realized the importance of phosphorus removal from wastewater. They have all studied different factors that affect the removal of wastewater and the best method to adjust for these parameters. Each of these sets of authors has shaped the current wastewater treatment industry and the successful means of biological phosphorus removal.
Oehmen et al. (2007) believe “the overall goal from each field is to improve the design and operation of EBPR plants in order to maximize the reliability, efficiency and effectiveness of the process.”
CONCLUSION
Phosphorus removal from wastewaters is becoming increasingly important and is starting to be regulated much more stringently. The importance of phosphorus is driving the regulation. Phosphorus leads to eutrophication in lakes and streams. Phosphorus does not occur naturally in an elemental form, and the world’s phosphorus bank is slowly being depleted.
There are three main methods to treat wastewater to effectively remove phosphorus. The most popular and the most studied is biological phosphorus removal. Biological phosphorus removal was first discovered in 1959 (Seviour et al., 2003). Gilbert Levin created a “Phostrip” process in the 1960’s to capture the phosphorus from treated wastewater. Since then, the microbial processes behind the biological treatment of wastewater have greatly improved. The bacteria responsible for the removal of wastewater are better understood, and thus improvements have been made to the overall layout and design of treatment plants utilizing biological phosphorus removal.
47
The design for the treatment process has progressed further since Levin’s design. The most well known schematic for wastewater treatment plants utilizing biological nutrient removal is the University of Cape Town design. This design has been modified and altered to meet specific needs, but the underlying backbone is the UCT design.
For biological phosphorus removal to occur there must be an anaerobic tank followed by an aerobic tank. (An anoxic tank may also be inserted before the aerobic tank if nitrification is also occurring.) Another factor that greatly affects biological phosphorus removal is consistency. Research has been shown that phosphorus removal can be lost during period of low loading (weekends and rain storms) (Temmink et al., 1996). Meganck and Faup (1988) have also concluded that in order to achieve enhanced biological phosphorus removal the anaerobic zone must remain anaerobic and no nitrate can be introduced into the anaerobic zone.
Biological phosphorus removal is carried out by bacteria. In the anaerobic zone, short chain volatile fatty acids can be readily consumed by some bacteria. These are stored as poly-β-hydroxyalkanoates which are then assimilated into poly-β-hydroxybutyrate with acetate and poly-β-hydroxyvalerate with propionate (Wentzel et al., 1985). Intracellular polyphosphate levels decrease and phosphate levels in the solution increase. During the aerobic zone, the poly-β-hydroxybutyrate levels decrease with the phosphate levels increasing in the cell composition. The removal of phosphorus occurs with the removal of the bacteria because the phosphorus is stored as ortho-phosphate within the cell and removed with the sludge. If the sludge is allowed to return to an anaerobic environment, the phosphate will be released again and phosphorus removal will no longer be achieved (Metcalf and Eddy, 2004).
Temperature has been shown to have little effect on the processes occurring in the anaerobic zone for biological phosphorus removal. However, decreasing temperature reduces the rate of phosphorus removal and increasing temperature raises the rate of phosphorus removal in the aerobic zone of biological phosphorus removal processes. This is true in both short-term and long-term temperature changes (Brdjanovic et al., 1997).
Acetic acid strongly selects for phosphate accumulating organisms. Hood and Randall (2001) showed that acetic acid and isovaleric acid were the most consistent substrates for biological phosphorus removal. They also noted that propionic acid was not as effective as carbon source for biological phosphorus removal.
A maximum phosphorus removal rate was achieved at a sludge age of ten days by both Kargi and Uyger (2002) and Chang et al. (1996). The optimal volumetric ratio was also noted as 1:4, anaerobic zone: aerobic zone by Chang et al. (1996). Rodrigo et al. (1996) illustrated the importance of sludge age and volatile fatty acid uptake for successful phosphorus removal. Liu et al. (2007) illustrated that the optimal initial anaerobic pH level to be between 6.4 and 6.8 for effective biological phosphorus uptake. Nitrite significantly inhibits phosphorus removal in the aerobic stage of the process. In their “experimental accident”, Saito et al. (2004) demonstrated the importance of nitrite when their machine malfunctioned and didn’t add it one day. Filamentous bacteria can play a role in biological phosphorus removal, and Ramothokang et al. (2006) have suggested that the utilization of these microorganisms can better improve biological phosphorus removal.
Utilizing the precipitation and capture of struvite can also be an effective means to remove phosphorus from wastewater. Struvite (MgNH4PO4·6H2O) is formed after the anaerobic phase and results from the combination of ammonium, phosphate, and magnesium when the molar ratio is greater than 1:1:1 (Jaffer et al., 2002). Jaffer et al. (2002) noted that the optimal pH for

48
struvite formation is 9.0, and that a pH below 7.5 would inhibit the formation of struvite. They also determined a monetary value for extracted struvite at £16,000-20,000 since struvite can be used as a slow-release fertilizer.
Quinatana et al. (2005) found that magnesium oxide was more effective than a by-product of magnesium oxide production at the formation of struvite and thus the removal of phosphorus. Münch and Barr (2000) utilized the “Green MAP II” which is manufactured in Japan by Unitika Ltd. to crystallize struvite and remove phosphorus. The four different operational designs used by Martí et al. (2010) illustrated the importance of sludge line layout.
The third means of phosphorus removal is through the use of an ion exchanger. Choi et al. (2011) illustrated that titanium was more cost effective than some of the other mesostructures available. Zhao and Sengupta (1998) designed a polymeric ligand exchanger that was proven to effectively remove phosphorus from the wastewater. However, there are several problems with ion exchangers. They are costly; the maintenance is high due to the constant replacement needed; and other ions in the wastewater could compete with the phosphate, they also (mostly) have been studied on a small scale. Ion exchangers do not provide a realistic means to remove phosphorus at a full-scale wastewater treatment plant. They would also need to be used in conjunction with biological phosphorus removal and chemical precipitation.
The best, most practiced and most economical method to treat wastewater for the removal of phosphorus is biological phosphorus removal utilizing struvite precipitation (captured after the digester). The struvite can be extracted and sold thereby generating revenue for the treatment plant. Using the combination of biological phosphorus removal and phosphorus capture using struvite can reduce the concentration of phosphorus to below 1 mg/L.

49
I also created a Biowin model of a five tank UCT treatment plant and modeled the phosphorus
removal. Figure 45 is the plant layout.Below are four graphs illustrating the concentrations of
phosphate in the reactors and the concentration of struvite in the different reactors at an SRT of
10 days and a temperature of 15°C and 5°C (shown in figures 46-50).
Figure 45. The Biowin schematic for the treatment plant.
Figure 46. Struvite concentration in the different reactors at an SRT of 10 days and temperature
of 15°C.

50
Figure 47. Phosphate concentrations in the reactors at an SRT of 10 days and temperature of
15°C.
Figure 48. Struvite concentrations in the reactors at an SRT of 10 days and a temperature of
5°C.

51
Figure 49. The phosphate concentrations in the various tanks at an SRT of 10 days and a
temperature o f 5°C.

52
References
Arvin, E. (1985) Biological Removal of Phosphorus from Wastewaters. CRC Critical Reviews in Environmental Control. 15, 25-64.
Barnard, J. L. (1984) Activated Primary Tanks for Phosphate Removal. Water SA. 10, 3.
Battistoni, P.; Fava, G.; Pavan, P.; Musacoo, A.; Cecchi, F. (1997) Phosphate Removal in Anaerobic Liquors by Struvite Crystallization without Addition of Chemicals: Preliminary Results. Water Research. 31, 2925-2929.
Battistoni, P.; De Angelis, A.; Pavan, P.; Prisciandaro, M.; Cecchi, F. (2001) Phosphorus Removal from a Real Anaerobic Supernatant by Struvite Crystallization. Water Research. 35, 2167-2178.
Bond, P. L.; Keller, J.; Blackall, L. L. (1998) Characterization of Enhanced Biological Phosphorus Removal Activated Sludges with Dissimilar Phosphorus Removal Performances. Water Science and Technology. 37, 567-571.
Boughton, W. H.; Gottfried, R. J.; Sinclair, N. A.; Yall I. (1971) Metabolic Factors Affecting Enhanced Phosphorus Uptake by Activated Sludge. Applied Microbiology. 22, 571-577.
Brdjanovic, D.; van Loosdrecht, M. C. M.; Hooijmans, C. M.; Alaerts, G. J.; Heijnen, J. J. (1997) Temperature Effects on Physiology of Biological Phosphorus Removal. Journal of Environmental Engineering. 123, 144-154.
Brdjanovic, D.; Slamet, A.; van Loosdrecht, M. C. M.; Hooijmans, C. M.; Alaerts, G. J.; Heijnen, J. J. (1998a) Impact of Excessive Aeration on Biological Phosphorus Removal from Wastewater. Water Research. 32, 200-208.
Brdjanovic, D.; Logemann, S.; van Loosdrecht, M. C. M.; Hooijmans, C.; Alaerts, G. J.; Heijnen, J. J. (1998b) Influence of Temperature on Biological Phosphorus Removal: Process and Molecular Ecological Studies. Water Research. 32, 1035-1048.
Brdjanovic, D.; van Loosdrecht, M. C. M.; Versteeg, P.; Hooijmans, C. M.; Alaerts, G. J.; Heihnen, J. J. (2000) Modeling COD, N, and P Removal in a Full-scale WWTP Haarlem Waarderpolder. Water Research. 34, 846-858.
Brett, S.; Guy, J.; Morse, G. K.; Lester J. N. (1997) Phosphorus Removal and Recovery Technologies. SP Publications Division Selper Limited, London.
Buchanan, J. R.; Mote, C. R.; Robinson, R. B. (1994) Thermodynamics of Struvite Formation. Transactions of the American Society of Agricultural Engineers. 37, 617-621.
Carucci, A.; Kuhni, M.; Brun, R.; Carucci, G.; Koch, G.; Maajone, M; Siegrist, H. (1999) Microbial Competition for the Organic Substrates and its Impact on EBPR Systems Under Conditions of Changing Carbon Feed. Water Science and Technology. 39, 75-85.
Cech, J. S. and Hartman, P. (1993) Competition between Phosphate and Polysaccharide Accumulating Bacteria in Enhanced Biological Phosphorus Removal Systems. Water Research. 27, 1219-1225.

53
Chang, W. C.; Chiou, R. J.; Ouyang, C. F. (1996) The Effect of Residual Substrate Utilization on Sludge Settling in an Enhanced Biological Phosphorus Removal Process. Water Science and Technology. 34, 425-430.
Chen, J. P.; Chua, M.; Zhang, B. (2002) Effects of Competitive Ions, Humic Acid, and pH on Removal of Ammonium and Phosphorous from the Synthetic Industrial Effluent by Ion Exchange Resins. Waste Management. 22, 711-719.
Cheng, X.; Huang, X.; Wang, X.; Zhao, B.; Chen, A.; Sun, D. (2009) Phosphate Adsorption from Sewage Sludge Filtrate Using Zinc-aluminum Layered Double Hydroxides. Journal of Hazardous Material. 169, 958-964.
Choi, J.; Lee, S.Y.; Park, K.; Lee, K.; Kim, D.; Lee, S.H.; (2011) Investigation of Phosphorous Removal From Wastewater Through Ion Exchange of Mesostructure Based on Inorganic Material. Desalination. 266, 281-285.
Chuang, S.; Ouyang, C. (2000) The Biomass Fractions of Heterotrophs and Phosphate- Accumulating Organisms in a Nitrogen and Phosphorus Removal System. Water Research. 34, 2283-2290.
Doyle, J. D.; Parsons, S. A. (2002) Struvite Formation: Control and Recovery. Water Research. 36, 3925-3940.
Filipe, C. D. M; Daigger, G. T.; Grady, Jr., C. P. L. (2001a) A Metabolic Model for Acetate Uptake Under Anaerobic Conditions by Glycogen Accumulating Organisms: Stoichiometry, Kinetics, and the Effects of pH. Biotechnology Bioengineering. 76, 17-31.
Filipe, C. D. M.; Daigger, G. T.; Grady, Jr., C. P. L. (2001b) pH as a Key Factor in the Competition between Glycogen-Accumulating Organisms and Phosphorus-Accumulating Organisms. Water Environment Research. 73, 223-232.
Fuhs, G. W.; Chen, M. (1975). Microbiological Basis of Phosphate Removal in the Activated Sludge Process for the Treatment of Wastewater. Microbiology Ecology. 2; 119-138.
Gujer, W. (2006) Activated Sludge Modelling: Past, Present and Future. Water Science and Technology. 53, 111-119.
Hood, C. R. and Randall, A. A. (2001) A Biochemical Hypothesis Explaining the Response of Enhanced Biological Phosphorus Removal Biomass to Organic Substrates. Water Research. 35, 2578-2766.
Isaacs, S.; Hansen, J.; Schmidt, A.; Henze, M. (1994) Examination of the Activated Sludge Model No. 2 with an Alternating Research Environment. Water Science and Technology. 31, 55-66.
Jaffer, Y.; Clark, T. A.; Pearce, P.; Parsons, S. A. (2002) Potential Phosphorus Recovery by Struvite Formation. Water Research. 36, 1834-1842.
Jardin, N. and Popel, H. J. (1996a) Behaviour of Excess Sludge from Enhanced Biological Phosphorus Removal during Sludge Treatment. Water Environment Research. 68, 965-
973.
Jardin, N. and Popel, H. J. (1996b) Influence of the Enhanced Biological Phosphorus Removal on the Waste Activated Sludge Production. Water Science and Technology. 34, 17-23.

54
Kargi, F. and Uyhur, A. (2002) Nutrient Removal Performance of a Sequencing Batch Reactor as a Function of the Sludge Age. Enzyme and Microbial Technology. 31, 842-847.
Kortsee, G. J. J.; Appeldorn, K.J.; Bonting, C. F. C.; van Niel, E. W. J.; van Veen, H. W. (1994) Biology of Phosphate-Accumulating Bacteria Involved in Enhanced Biological Phosphorus Removal. FEMS Microbiology Reviews. 15, 137-153.
Levin, G. V. (1966) Sewage Treatment Process US Patent: 3236766.
Levin, G. V.; Shapiro, J. (1965) Metabolic Uptake of Phosphorus by Wastewater Organisms. Journal of Water Pollution Control Federation. 37, 800-821.
Li, N.; Ren, N.; Wang, X.; Kang, H. (2010) Effect of Temperature on Intracellular Phosphorus Absorption and Extra-cellular Phosphorus Removal in EBPR Process. Bioresource Technology. 101, 6265-6268.
Liu, Y.; Chen, Y.; Zhou, Q. (2007) Effect of Initial pH Control on Enhanced Biological Phosphorus Removal from Wastewater Containing Acetic and Propionic Acids. Chemosphere. 66, 123-129.
Liu, W.; Mino, T.; Nakamura, K.; Matsuo, T. (1996) Biological Phosphorus Removal Processes – Effect of pH on Anaerobic Substrate Metabolism. Water Science and Technology. 34, 25-32.
Loewenthal, R. E.; Kommüller, U. R. C.; van Heerden, E. P. (1994) Modelling Struvite Precipitation in Anaerobic Treatment Systems. Water Science and Technology. 30, 107-
116.
Lopez-Vazquez, C. M.; Oehmen, A.; Hooijmans, C. M.; Brdjanovic, D.; Gijzen, H. J.; Yuan, Z.; van Loosdrecht, M. C. M. (2009) Modeling the PAO-GAO Competition: Effects of Carbon Source, pH and Temperature. Water Research. 43, 450-462.
Loy, A.; Daims, H.; Wagner, M. (2002) Activated Sludge – Molecular Techniques for Determining Community Composition. In: Encyclopedia of Environmental Microbiology (Bitton, G., Ed.), pp. 26-43. Wiley Scientific, New York.
Nicholls, H.A. (1975) Full Scale Experimentation at the New Johannesburg Aeration Plants. Water SA. 1, 121-132.
Mamais, D. and Jenkins (1992) The Effects of NCRT and Temperature on Enhanced Biological Phosphorus Removal. Water Science and Technology. 25, 955-965.
Martí, N.; Pastor,L.; Bouzas, A.; Ferrer, J.; Seco, A. (2010) Phosphorus Recovery by Struvite Crystallization in WWTPs: Influence of the Sludge Treatment Line Operation. Water Research. 44, 2371-2379.
Maurer, M.; Gujer, W.; Hany, R.; Bachmann, S. (1997) Intracellular Carbon Flow in Phosphorus Accumulating Organisms in Activated Sludge Systems. Water Research. 31, 907-917.
Meganck, M. T. J.; Faup, G. M. (1988) Enhanced Biological Phosphorus Removal from Waste Waters. Biotreatment Systems. 3, 11-204.
Metcalf and Eddy. Wastewater Engineering: Treatment and Reuse. McGraw Hill, New York,
2004. Print

55
Milbury, W. F.; McCauley, D.; Hawthorne, C. H. (1971) Operation of Conventional Activated Sludge for Maximum Phosphorus Removal. Journal of Water Pollution Control Federation. 43, 1890-1901.
Miles, A.; Ellis, T. G. (2001) Struvite Precipitation Potential for Nutrient Recovery from Anaerobically Treated Wastes. Water Science and Technology, 43, 259-266.
Mino, T.; Arun, V.; Tsuzuk, T.; Mastuo, T. Effect of Phosphorus Accumulation on Acetate Metabolism in the Biological Phosphorus Removal Process. Pergamon Press, Oxford, UK, 1997. Print
Mino, T.; van Loosdrecht, M. C. M.; Heijnen, J. J. (1998) Microbiology and Biochemistry of the Enhanced Biological Phosphate Removal Process. Water Research. 32, 3193-3207.
Mulkerrins, D.; Dobson, A. D. W.; Colleran, E. (2004) Parameters Affecting Biological Phosphate Removal from Wastewaters. Environment International. 30, 249-259.
Münch, E. and Barr, K. (2000) Controlled Struvite Crystalization for Removing Phosphorus from Anaerobic Digester Sidestreams. Water Research. 35, 151-159.
Oehmen, A.; Lemos, P. C.; Carvalho, G.; Yuan, Z.; Keller, J.; Blackall, L. L.; Reis, M. A. M. (2007a) Advances in Enhanced Biological Phosphorus Removal: from Micro to Macro Scale. Water Research. 41, 2271-2300.
Oehmen, A.; Zeng, R. J. ; Keller, J.; Yuan, Z. (2007b) Modeling the Aerobic metabolism of Polyphosphate-Accumulating Organisms Enriched with Propionate as a Carbon Source. Water Environment Research. 79, 2477-2486.
Onyango, M. S.; Kuchar, D.; Kubota, M.; Matsuda, H. (2007) Adsorptive Removal of Phosphate Ions from Aqueous Solution Using Synthetic Zeolite. Industrial and Engineering Chemistry Research. 46, 894-900.
Pramanik J.; Trelstad, P. L.; Schuler, A. J.; Jenkins, D.; Keasling, J. D. (1999) Development and Validation of a Flux-based Stoichiometric Model for Enhanced Biological Phosphorus Removal Metabolism. Water Research. 33, 462-476.
Quintana, M.; Sánchez, E.; Colmenarejo, M. F.; Barrera, J.; García. G.; Borja, R. (2005) Kinetics of Phosphorus Removal and Struvite Formation by the Utilization of By-product of magnesium oxide Production. Chemical Engineering Journal. 111, 45-52.
Ramothokang, T. R.; Simelane, S. C.; Bux, F. (2006) Biological Nitrogen and Phosphorus Removal by Filamentous Bacteria in Pure Culture. Water SA. 32, 667-672.
Randall, A. A.; and Khouri, T. Z. (1998) The Effect of Organic Substrates on Enhanced Biological Phosphorus Removal in Continuous Culture and Batch Experiments. Advanced Biological Research. 2, 218-231.
Randall, C. W.; Brannan, K. P.; Benefield, L. D. (1987) Factor Affecting Anaerobic during Biological Phosphorus Removal. In: Biological Phosphate Removal from Wastewaters,
R. Ramadori (ed). Rome, Italy, 28-30 September, 1987, 111-122.
Rodrigo, M. A.; Seco, A.; Penya-roja, J. M.; Ferrer, J. (1996) Influence of Sludge Age on Enhanced Phosphorus Removal in Biological Systems. Water Science and Technology. 34, 41-48.
56
Romansky, J.; Heider, M.; Wiesmann, U. (1997) Kinetics of Anaerobic Ortho-phosphate Release and Substrate Uptake in Enhanced Biological Phosphorus Removal from Wastewater. Water Research. 31, 3137-3145.
Saito, T.; Brdjanovic, D.; van Loosdrecht, M. C. M. (2004) Effect of Nitrite on Phosphate Uptake by Phosphate Accumulating Organisms. Water Research. 38, 3760-3768.
Siegrist, H.; Brunner, L.: Koch, G.; Phan Linh, C.; Le van; C. (1999) Reduction of Biomass Decay Rate Under Anoxic and Anaerobic Conditions. Water Science and Technology. 39, 129-137.
Sevious, R. J.; Mino, T.; Onuki, M.; (2003) The Microbiology of Biological Phosphorus Removal in Activated Sludge Systems. FEMS Microbiology Reviews. 27, 99-127.
Shapiro, J.; Levin, G. V.; Zea, H. G. (1967) Anoxically Induced Release of Phosphate in Wastewater Treatment. Journal of Water Pollution Control Federation. 39, 1811-1818.
Shu, L.; Schneider, P.; Jegatheesan, V.; Johnson, J. (2006) An Economic Evaluation of Phosphorus Recovery as Struvite from Digester Supernatant. Bioresource Technology. 97, 2211-2216.
Smolders, G. J. F.; Krop, J. M.; van Loosdrecht, M. C. M.; Heijnen, J. J. (1995) A Metabolic Model for the Biological Phosphorus Removal Process: Effect of the Sludge Retention Time. Biotechnology and Bioengineering. 48, 222-233.
Sung, Shihwu (2011) Biological Nutrient Removal Lecture. Iowa State University.
Tadaka H.; Watanabe, Y.; Iwamoto, M. (2004) Zirconium Sulfate-surfactant Micelle Mesostructure as an Effective Remover of Selenite Ion. Chemistry Letters. 33, 62-63.
Temmink, H.; Petersen, B.; Isaacs, S.; Henze, M. (1996) Recovery of Biological Phosphorus Removal After Periods of Low Organic Loading. Water Science and Technology. 34, 1-8.
Urano, K. and Tachikawa, H. (1991) Process Development for Removal and Recovery of Phosphorus from Wastewater by a New Adsorbent. 1. Preparation Method and Adsorption Capability of a New Adsorbent. Industrial and Engineering Chemistry Research. 30, 1893-1896.
van Haandel, A. and van der Lubbe, J. Handbook Biological Waste Water Treatment: Design and optimization of activated sludge systems. (2007) www.wastewaterhandbook.com Accessed on 3/7/2011
Vaiopoulou, E. and Aivasidis, A. (2008) A Modified UCT Method for Biological Nutrient Removal: Configuration and Performance. Chemosphere, 72, 1062-1068.
van Loosdrecht, M. C. M.; Hooijmans, C. M.; Brdjanovic, D.; Heijnen, J. J. (1997) Biological Phosphate Removal Processes. Applied Microbiology Biotechnology. 48, 289-296.
Wentzel, M. C.; Dold, P. L.; Ekama, G. A.; Marais, G. v. R. (1985) Kinetics of Biological Phosphorus Release. Water Science Technology. 17, 57-71.
Wentzel, M. C.; Ekama, G. A.; Dold, P. L.; Barais, G. v. R. (1990) Biological Phosphorus Removal – Steady State Process Design. Water SA. 16, 29-48.

57
Withers, P. J. A.; Jarvie, H. P. (2008) Delivery and Cycling of Phosphorus in Rivers; A Review. Science of the Total Environment. 400, 379-395.
Woods, N. C.; Sock, S. M.; Daigger, G. T. (1999) Phosphorus Recovery Technology Modelling and Feasibility Evaluation for Municipal Wastewater Treatment Plants. Environmental Technology. 20, 653-680.
Yoshino, M., Yao, M.; Tsuno, H.; Somiya, I. (2003) Removal and Reocery of Phosphate and Ammonium as Struvite from Supernatant in Anaerobic Digestion. Water Science and Technology. 48, 3087-3097.
Zhao, D.; Sengupta, A.K.; (1998) Ultimate Removal of Phosphate from Wastewater Using A New Class of Polymeric Ion Exchangers. Water Research. 32, 1613-1625.