Evaluation of Lead (II) Removal from Wastewater Using ...
10
Introduction Environmental pollution is a major challenge facing many developing countries in this present time. Environmental pollution of water bodies has become a great concern and threat to aquatic life as well as humans. Rapid industrialization and urbanization have led to the generation of toxic heavy metals which pollute the environment. Some of the industrial activities generating heavy metals include, metal plating and galvanizing, paint, thermal power plant, laundry processes, textile etc. Among various heavy metals generated from industrial effluents, lead (Pb) is one of the most toxic heavy metals commonly produced from metal plating and galvanising, paint, laundry process, mining, battery manufacturing and steel industries. Pb(II) is non- biodegradable and the third regularly occurring toxic heavy metal in natural water bodies [1]. Lead (Pb) sticks indefinitely and remains in living tissues all through the food chain [2]. The effects of lead on humans include, damage to the nervous and reproductive systems, hypertension, mental retardation and abortion [3]. It also has great influence on children [4]. There are set rules and regulations to reduce the concentrations of Pol. J. Environ. Stud. Vol. 30, No. 2 (2021), 1487-1496 Original Research Evaluation of Lead (II) Removal from Wastewater Using Banana Peels: Optimization Study Felicia O. Afolabi 1 *, Paul Musonge 2 , Babatunde F. Bakare 3 1 Department of Chemical Engineering, Durban University of Technology, Durban, South Africa 2 Institute of Systems Science, Durban University of Technology, Durban, South Africa 3 Department of Chemical Engineering, Mangosuthu University of Technology, Umlazi, Durban, South Africa Received: 19 March 2020 Accepted: 14 May 2020 Abstract The response surface methodology was used to investigate the removal of Pb (II) from an aqueous solution using banana peel with varying operating parameters in a batch mode. The central composite design was used to study the interactive effects of the operating parameters (initial concentration, pH of the solution, adsorbent dosage and the particle size). The banana peel was characterized by FTIR which showed the functional groups, while SEM and EDS were used to study morphology and elemental composition. The optimum removal of Pb(II) was 98.146 % at initial concentration 100 mg/L, pH 5, adsorbent dosage 0.55 g and particle size 75 µm. The deviation between the experimental and the model predicted percentage removal was 5.17 %. The analysis of variance showed that the regression model was significant with a low probability and the correlation coefficient R 2 value of 0.9153. The results showed that the biosorption of Pb(II) was highly influenced by the pH and the adsorbent dosage, while the particle size had little effect on the biosorption process. Keywords: banana peel, bio-sorption, lead removal, optimization, response surface methodology *e-mail: [email protected] DOI: 10.15244/pjoes/122449 ONLINE PUBLICATION DATE: 2020-11-27
-
Upload
khangminh22 -
Category
Documents
-
view
4 -
download
0
Transcript of Evaluation of Lead (II) Removal from Wastewater Using ...

Introduction
Environmental pollution is a major challenge facing many developing countries in this present time. Environmental pollution of water bodies has become a great concern and threat to aquatic life as well as humans. Rapid industrialization and urbanization have led to the generation of toxic heavy metals which pollute the environment. Some of the industrial activities generating heavy metals include, metal plating
and galvanizing, paint, thermal power plant, laundry processes, textile etc.
Among various heavy metals generated from industrial effluents, lead (Pb) is one of the most toxic heavy metals commonly produced from metal plating and galvanising, paint, laundry process, mining, battery manufacturing and steel industries. Pb(II) is non-biodegradable and the third regularly occurring toxic heavy metal in natural water bodies [1]. Lead (Pb) sticks indefinitely and remains in living tissues all through the food chain [2]. The effects of lead on humans include, damage to the nervous and reproductive systems, hypertension, mental retardation and abortion [3]. It also has great influence on children [4]. There are set rules and regulations to reduce the concentrations of
Pol. J. Environ. Stud. Vol. 30, No. 2 (2021), 1487-1496
Original Research
Evaluation of Lead (II) Removal from Wastewater Using Banana Peels: Optimization Study
Felicia O. Afolabi1*, Paul Musonge2, Babatunde F. Bakare3
1Department of Chemical Engineering, Durban University of Technology, Durban, South Africa2Institute of Systems Science, Durban University of Technology, Durban, South Africa
3Department of Chemical Engineering, Mangosuthu University of Technology, Umlazi, Durban, South Africa
Received: 19 March 2020Accepted: 14 May 2020
Abstract
The response surface methodology was used to investigate the removal of Pb (II) from an aqueous solution using banana peel with varying operating parameters in a batch mode. The central composite design was used to study the interactive effects of the operating parameters (initial concentration, pH of the solution, adsorbent dosage and the particle size). The banana peel was characterized by FTIR which showed the functional groups, while SEM and EDS were used to study morphology and elemental composition. The optimum removal of Pb(II) was 98.146 % at initial concentration 100 mg/L, pH 5, adsorbent dosage 0.55 g and particle size 75 µm. The deviation between the experimental and the model predicted percentage removal was 5.17 %. The analysis of variance showed that the regression model was significant with a low probability and the correlation coefficient R2 value of 0.9153. The results showed that the biosorption of Pb(II) was highly influenced by the pH and the adsorbent dosage, while the particle size had little effect on the biosorption process.
Keywords: banana peel, bio-sorption, lead removal, optimization, response surface methodology
*e-mail: [email protected]
DOI: 10.15244/pjoes/122449 ONLINE PUBLICATION DATE: 2020-11-27
Afolabi F.O., et al.1488
heavy metals in wastewater in order to safeguard human life and the environment. This includes government laws on the types and concentrations of heavy metals in wastewater before discharge into the environment. In South Africa, the limit of Pb(II) discharge into water source is 0.01 mg/L however, the general maximum permissible concentration limit of Pb(II) set by the US EPA is shown in Table 1. Hence, it is imperative to remove lead from industrial effluents before discharge into the environment.
Many conventional methods such as, chemical precipitation, ion exchange, coagulation, membrane separation, complexation, solvent extraction, oxidation or reduction, evaporation and electrochemical treatment, have been used for removing toxic heavy metals from industrial effluents [5-8]. However, these methods have drawbacks which include; production of sludge, high cost of chemicals and regeneration. Hence, the methods require high cost of maintenance [5, 9, 10]. It is therefore necessary to develop a new technology for the removal of heavy metals from wastewater. Lately, adsorption has become a proven technique for removing heavy metals from contaminated wastewater. Adsorption is a process through which substances are transferred from the liquid phase to the solid phase through physical or chemical interactions.
Biosorption is an adsorption on the surface of a compound of biological origin which are referred to as Bio-sorbents. Biosorption is an assuring technique for treating industrial wastewater as it is easy to operate, minimum chemical usage, high efficiency, low-cost, minimize sludge production, allows for regeneration of adsorbent, amongst others. Bio-sorbents generated from agricultural wastes and/or industrial by-products are mostly used for the removal of heavy metals from contaminated effluents. Several bio-sorbents derived from agricultural by-products have been used for treating industrial effluents such as, orange peel [11], banana peel [12, 13], potato peel [14], corn cob [15], lemon peel [16], watermelon rind [17], sugarcane bagasse [18], palm leaf, water hyacinth [19], pine saw dust [20], moringa pod [21], hazelnut shell, peanut shells, rice husk [22]. These bio-sorbents contain cellulose, hemicellulose, lignin, lipids, proteins, hydrocarbons and starch, comprising of various functional groups with possibility of sequestration of many pollutants [23, 24].
This study is focused on the removal of Pb (II) as a single solute from an aqueous solution using
natural banana peels. Banana is the second main produced fruit and one of the fruits consumed in large quantities worldwide. It accounts for 16 % of the world's total fruit production [25]. The flesh is mostly consumed by all, while the peels are thrown away or discarded. These peels constitute a high percentage of the wastes generated from households, markets and chips manufacturers. Banana peels consist of cellulose, hemicellulose, lignin, pectin and comprising of the following functional groups; hydroxyl, carboxyl and amine, which are responsible for heavy metal adsorption [13, 26]. These functional groups are known for the good adsorption efficiency of bio-sorbents. A number of studies have been reported on the use of banana peels for the removal of heavy metals from aqueous solutions where the operating parameters were studied individually [13, 26-28]. However, this technique does not account for the interactive effect of various operating parameters. In addition, for the purpose of scale-up in industrial application, the conventional batch method may not be reliable for the determination of optimum conditions as a lot of experiments will be required thereby, resulting in huge cost of operation and time wastage. Therefore, this challenge can be averted and reduced by studying the interaction and optimization of all the operating parameters using the experimental design method. The aim of this study is to characterize banana peel before and after adsorption, and to carry out batch experiments to optimize the interactive effect of various process parameters such as, initial metal ion concentration, pH, adsorbent dosage and the adsorbent particle size using response surface methodology (RSM). Response surface methodology is a statistical technique used to explain the relationship between different independent variables and one or more responses. This method was developed by [29]. This method has been employed by many researchers as it reduces experimental time, lowers operating cost and reduces the number of variables to the most significant [30]. It allows for interactive effects of the variables thus making it more desirable and efficient than OFAT (one factor at a time) method [31]. The design-Expert software (version 11.1.0.1) was used for this study. The 24 full factorial central composite design (CCD) with face centred gave 30 experimental runs which include 6 replicates. The statistical model and analysis of variance (ANOVA) were used to explain the model fitness.
Material and Methods
Preparation of Bio-Sorbent
The banana peels were collected from a local market in Durban, South Africa and washed thoroughly to remove dirt. Then, it was dried in an oven at 80ºC for 24 hr. The dried peels were crushed into smaller particles using a grinder and then washed to remove
Table 1. Maximum permissible limit of lead.
Heavy metal
MPL in water (mg/L)
MPL* in wastewater
(mg/L)
MPL** in wastewater
(mg/L)
Pb 0.01 1.0 0.01
* Wastewater discharged into public drainage system. ** Wastewater discharged into inland surface water.

Evaluation of Lead (II) Removal from Wastewater... 1489
colour. It was then dried at 50ºC for another 24 hr and ground using a coffee blender to reduce the particle size. The grounded peel was sieved into different particle sizes using a mechanical shaker and stored in an airtight container for use.
Characterization of Bio-Sorbent
The prepared bio-sorbent was characterized using scanning electron microscope (SEM)/energy dispersive x-ray spectroscopy (EDS) and Fourier transform infrared (FT-IR). The SEM was done to determine the morphological and surface structure of the bio-sorbent. The EDS gave the elemental analysis of the bio-sorbent. The FT-IR was done to determine the functional groups present in the bio-sorbent. The FT-IR make use of infrared light to scan the sample thereby identifying the chemical groups that are domicile in the bio-sorbent. The functional groups play a major role in adsorption of heavy metals and helps to determine the type of adsorption process [32].
Preparation of Stock Solution
The stock solution of lead was prepared using lead nitrate (Pb (NO3)2) salt. A calculated amount of lead nitrate was dissolved in deionized water to the level of 1000 mL in a volumetric flask. Different metal concentrations of lead nitrate were prepared from the stock solution. The pH of the solution was adjusted using 0.1 M H2SO4 and 0.1 M NaOH and the value measured using a digital pH meter. The chemicals were of analytical grade and purchased from laboratory analytical supplies limited, South Africa.
Experimental Method
The batch experiments were carried out using a 250 mL conical flask containing 100 mL of solution. The pH of the solution was adjusted accordingly varying from 2-6, and an amount of adsorbent was added to the solution. The conical flasks were arranged in a rotary shaker at 180 rpm for 120 mins. The supernatant portion of the solution was first filtered using a grade 5 filter paper of 2.5 µm and then using a syringe filter of 0.22 µm. The sample was then analysed using MP-AES
(micro plasma- atomic emission spectrophotometer). The percentage removal of lead was calculated using the formula stated below:
(1)
...where Ci and Cf are the initial and final concentrations of lead ion in solution measured in mg/L.
Adsorption Process Optimization
A two-level full factorial CCD was used for the optimization of lead adsorption with four factors (24). The design expert version 11.1.0.1 was used for studying the interactive effects of the variables and for the optimization of the process parameters. The process parameters considered are; initial concentration of lead ion 10-100 mg/L, pH of the solution 2-6, the adsorbent dosage 0.1-1 g and the particle size of the adsorbent 75-455 µm. The influence of these parameters was studied by calculating the percentage removal of lead ion using statistically designed experimental runs and optimizing the results through RSM. The experimental ranges and levels of the process parameters examined are as shown in Table 2. The total of 30 experimental runs were generated from RSM design namely CCD with four-factors (x1, x2, x3 and x4) and three-levels (-1, 0 and +1).
The model equation used to explain the interaction effects of the process parameters and the critical points is given below;
(2)
...where β0, βi, βii, and βij are the regression coefficients for the intercept, linear, quadratic and interaction respectively. xi and xj are the independent parameters while Ɛ is the residual connected to the experiments.
Results and Discussion
Characterization of Adsorbent
Scanning Electron Microscopy (SEM) and Energy Dispersive X-ray Spectroscopy (EDS)
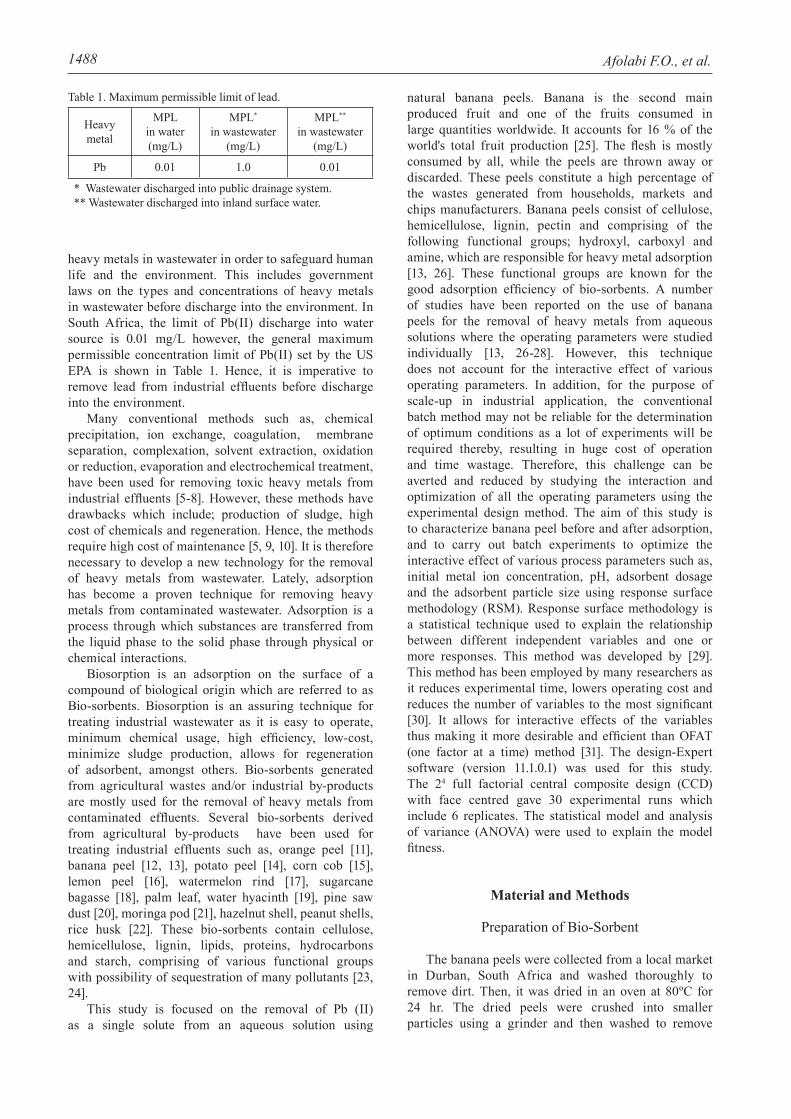
Fig. 1 below shows the images of banana peel at 5.00 Kx magnifications. Fig 1a) shows a rough surface with irregular shape. It also shows that the surface is microporous with vast heterogeneity which can enhance the adsorption of Pb(II), as similarly observed by [26]. However, after adsorption, Fig. 1b) reveals, the surface became regular and filled up. It is evident that adsorption has taken place as the surface is with little or no space.
Table 2. Central composite experimental design input variables.
Input variablesLevels
-1 0 +1X1:Initial concentration 10 55 100X2: Adsorbent dosage 0.1 0.55 1
X3: pH 2 4 6X4: Particle size 75 265* 455
*Actual value used in the experiment was 250 microns due to available sieve sizes.
Afolabi F.O., et al.1490
The EDS of banana peels gives the elemental composition present in the peel before and after adsorption. The elements present in natural banana peel are as stated in Table 3 below. The high percentage of carbon and oxygen indicates that banana peels will be a good adsorbent. However, after adsorption the percentage composition of carbon and oxygen slightly increased while silicon and potassium decreased. This
suggests that carbon and oxygen present in natural banana peel has affinity and great influence on the adsorption process. The composition of silicon and potassium was seen to have decreased after adsorption which implies that exchange of ions have taken place. There is a high possibility that Si and K ion available in the peel have interchanged with metallic ion in the aqueous solution. Potassium is a highly reactive metal
Fig. 1. Scanning electron microscopy (SEM) of a) natural banana peel and b) banana peel after adsorption at x5.
Table 3. Elemental composition of banana peels before and after adsorption.
Elemental composition (%) C O Si K Pb
Before 56.43 38.22 4.74 0.61 -
After 56.98 38.38 0.46 0.25 3.93
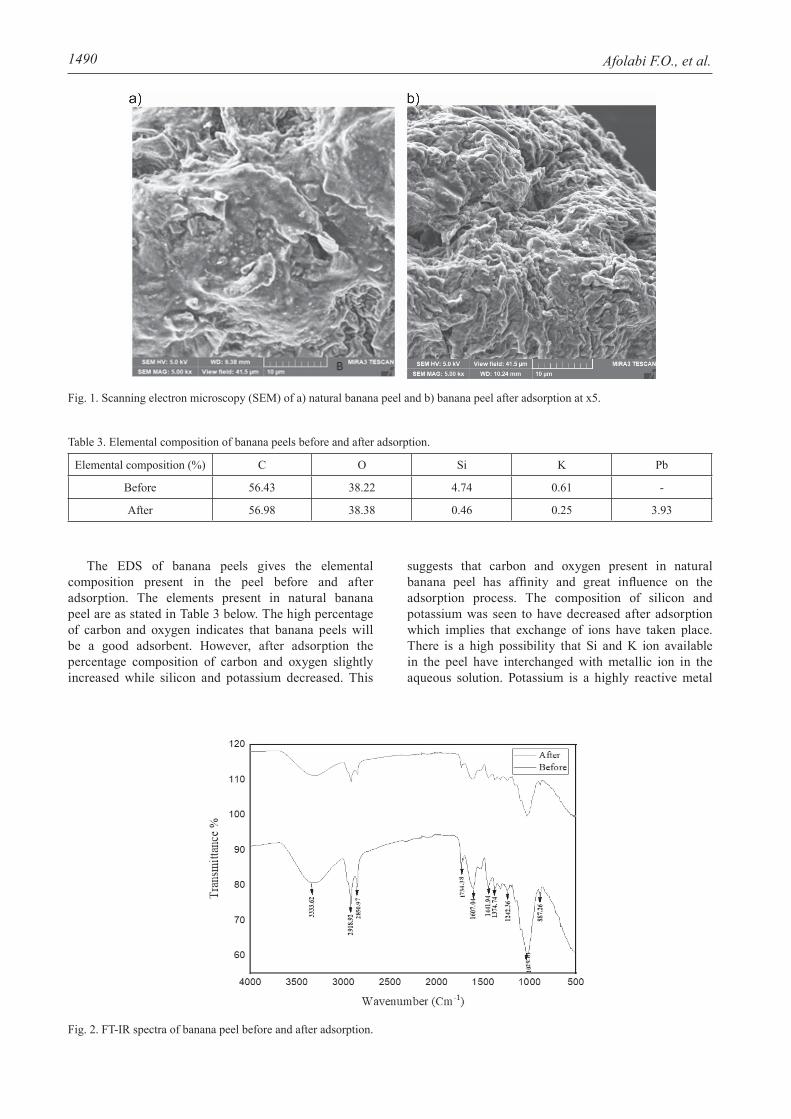
Fig. 2. FT-IR spectra of banana peel before and after adsorption.
Evaluation of Lead (II) Removal from Wastewater... 1491
while silicon is a metalloid however, the presence of these counter ions on the surface of banana peel has greatly influenced the adsorption process. Hence, ion exchange is the major mechanism for the bio-sorption of Pb(II) using banana peels.
Fourier Transform Infrared Ray Analysis
The FT-IR spectroscopy is a method used to determine the organic structure and composition of a material before and after adsorption study. It gives
data that helps to distinguish the unknown sample, reveal the functional groups present in the sample and ascertain that adsorption has really taken place. The FT-IR of banana peel was done using KBr disk technique which provided information on the functional groups present in the sample. The FT-IR of banana peel used in this study showed the presence of broad absorption peaks at 3382.62 cm-1, which indicates the presence of intermolecular bonded O-H group consisting of alcohols and phenols. The peaks at 2918.92 cm-1, 2850.97 cm-1, 1441.94 cm-1, 1374.74 cm-1 and 887.26 cm-1 indicate the
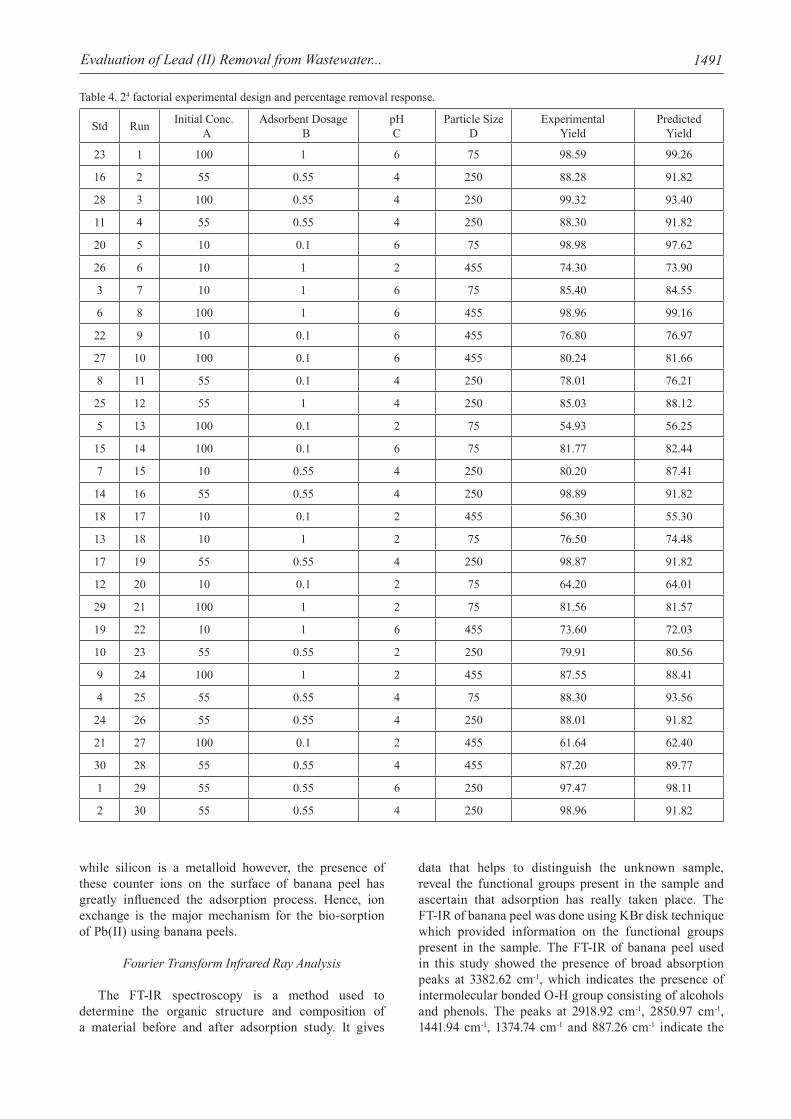
Table 4. 24 factorial experimental design and percentage removal response.
Std Run Initial Conc. A
Adsorbent Dosage B
pHC
Particle SizeD
Experimental Yield
Predicted Yield
23 1 100 1 6 75 98.59 99.26
16 2 55 0.55 4 250 88.28 91.82
28 3 100 0.55 4 250 99.32 93.40
11 4 55 0.55 4 250 88.30 91.82
20 5 10 0.1 6 75 98.98 97.62
26 6 10 1 2 455 74.30 73.90
3 7 10 1 6 75 85.40 84.55
6 8 100 1 6 455 98.96 99.16
22 9 10 0.1 6 455 76.80 76.97
27 10 100 0.1 6 455 80.24 81.66
8 11 55 0.1 4 250 78.01 76.21
25 12 55 1 4 250 85.03 88.12
5 13 100 0.1 2 75 54.93 56.25
15 14 100 0.1 6 75 81.77 82.44
7 15 10 0.55 4 250 80.20 87.41
14 16 55 0.55 4 250 98.89 91.82
18 17 10 0.1 2 455 56.30 55.30
13 18 10 1 2 75 76.50 74.48
17 19 55 0.55 4 250 98.87 91.82
12 20 10 0.1 2 75 64.20 64.01
29 21 100 1 2 75 81.56 81.57
19 22 10 1 6 455 73.60 72.03
10 23 55 0.55 2 250 79.91 80.56
9 24 100 1 2 455 87.55 88.41
4 25 55 0.55 4 75 88.30 93.56
24 26 55 0.55 4 250 88.01 91.82
21 27 100 0.1 2 455 61.64 62.40
30 28 55 0.55 4 455 87.20 89.77
1 29 55 0.55 6 250 97.47 98.11
2 30 55 0.55 4 250 98.96 91.82
Afolabi F.O., et al.1492
presence of saturated C-H substitution bond which can be likened to alkanes. The peaks at 1734.38 cm-1 and 1607.04 cm-1 indicate the presence of carboxylic C=O bond and unsaturated C=C bond respectively which can be attributed to aldehydes and ketones (Fig. 2). These results were comparable to the reported findings, that the bands at 3486-3286 cm-1 are as a result of O-H stretching, 2920-2951 cm-1 represented C-H stretching and 1730 cm-1 is attributed to C=O stretching [27] . The peaks within the range 3600-2800 cm-1 were assigned to O-H stretching while the peak at 1730 cm-1 indicated C=O band [13]. The bands at 3905.88-2800 cm-1 are attributed to O-H while 2928.13-1269.11 cm-1 indicated C-H and C=O groups [33, 34]. After adsorption, there was a significant shift in the peaks of the functional groups. The peaks representing hydroxyl and carboxyl groups were significantly modified; 3333.62 cm-1, 1607.04 cm-1, 1441.94 cm-1 and 1374.74 cm-1 peaks before adsorption shifted respectively to 3331.64 cm-1, 1614.79 cm-1, 1374.4 cm-1 and 1319.8 cm-1. It is therefore evident that banana peel has affinity for Pb(II) due to the presence of certain functional groups which result to substitution and exchange of ions during adsorption process.
Batch Adsorption Study Using Central Composite Design
The factorial experimental setup using 4 independent variables gave a total of 30 experimental runs with percentage removal of Pb as the response (Table 4). The experimental matrix consists of 16 factorial points, 8 axial points and 6 centre points. The empirical connection between the percentage removal of Pb and the independent variables as obtained from quadratic model is expressed below;
% removal of Pb (coded model) = 91.86 + 3.27A + 6.04B + 8.59C – 1.87D + 4.66AB
+ 0.65AC + 3.41AD – 4.00BC – 1.1BD – 2.36CD – 0.6639A2 – 8.9B2 – 1.73C2 – 2.54D2
(3)
...where A is the initial concentration in ppm, B is the adsorbent dosage in grams, C is the pH and D is the particle size in microns. Equation (3) is written in the form of coded factors. The coded equation is important for identifying the relative impact of the factors by comparing the factor coefficients.
In Table 4, the percentage removal of Pb predicted from the quadratic model and the experimental yield are presented. It can be deduced that there is strong agreement between the predicted yield and the experimental yield with little difference in the percentage removal.
Analysis of Variance and Model Significant
The regression analysis of the data obtained and the estimation of the coefficient of regression equation was done using the design expert software. The validation of the equations was done using statistical tests known as the ANOVA (Analysis of variance). The ANOVA helps to determine the significance of each variable and the fitness of the model (Table 5). The ANOVA illustrated that the regression model was significant with a low probability (p˂0.0001) and Fisher’s value (10.48).
The p-value is a useful indicator for predicting the significance of each of the parameters in the model. The smaller the p-values, the more significant are the parameters of the regression model [35]. Based on this study, p-values showed that pH (C), Dosage (B) and
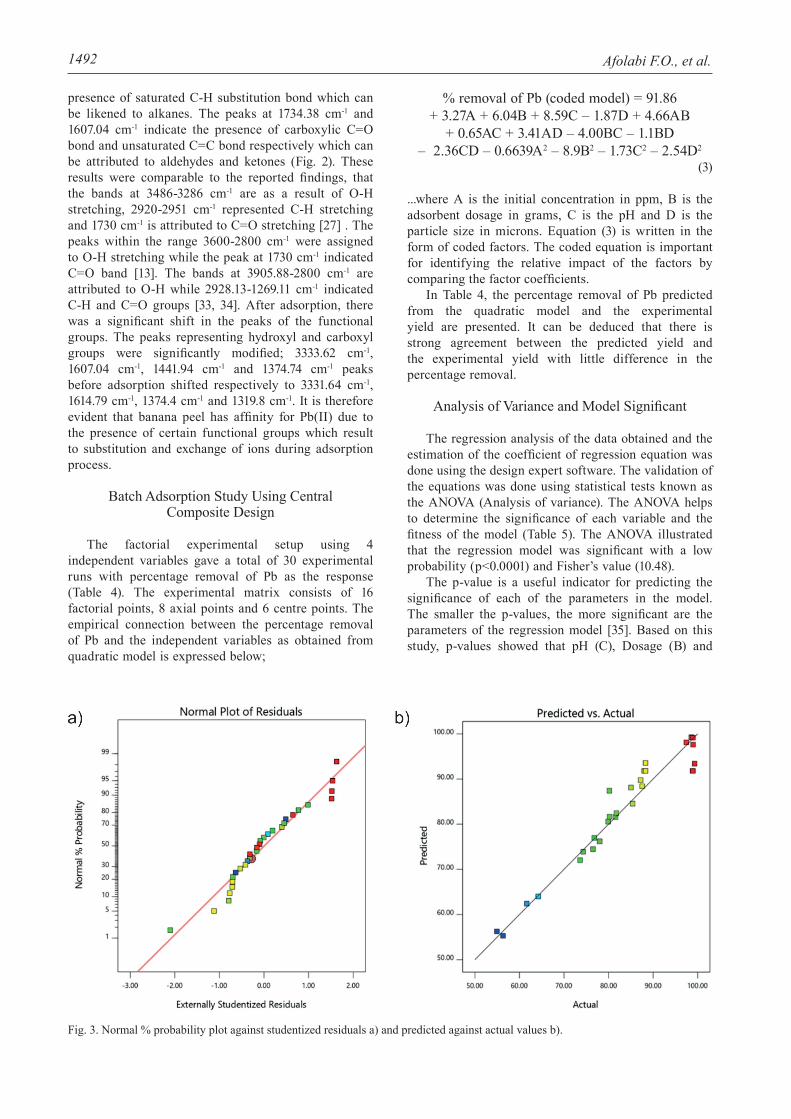
Fig. 3. Normal % probability plot against studentized residuals a) and predicted against actual values b).
Evaluation of Lead (II) Removal from Wastewater... 1493
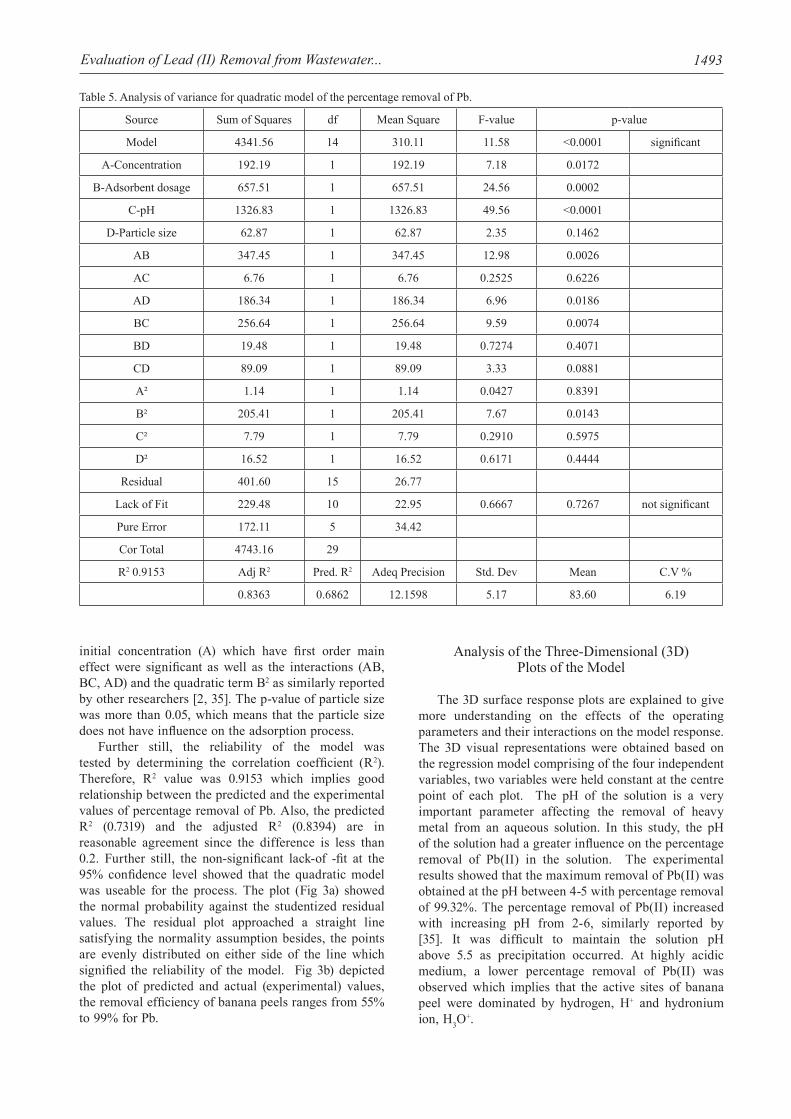
initial concentration (A) which have first order main effect were significant as well as the interactions (AB, BC, AD) and the quadratic term B2 as similarly reported by other researchers [2, 35]. The p-value of particle size was more than 0.05, which means that the particle size does not have influence on the adsorption process.
Further still, the reliability of the model was tested by determining the correlation coefficient (R2). Therefore, R2 value was 0.9153 which implies good relationship between the predicted and the experimental values of percentage removal of Pb. Also, the predicted R2 (0.7319) and the adjusted R2 (0.8394) are in reasonable agreement since the difference is less than 0.2. Further still, the non-significant lack-of -fit at the 95% confidence level showed that the quadratic model was useable for the process. The plot (Fig 3a) showed the normal probability against the studentized residual values. The residual plot approached a straight line satisfying the normality assumption besides, the points are evenly distributed on either side of the line which signified the reliability of the model. Fig 3b) depicted the plot of predicted and actual (experimental) values, the removal efficiency of banana peels ranges from 55% to 99% for Pb.
Analysis of the Three-Dimensional (3D) Plots of the Model
The 3D surface response plots are explained to give more understanding on the effects of the operating parameters and their interactions on the model response. The 3D visual representations were obtained based on the regression model comprising of the four independent variables, two variables were held constant at the centre point of each plot. The pH of the solution is a very important parameter affecting the removal of heavy metal from an aqueous solution. In this study, the pH of the solution had a greater influence on the percentage removal of Pb(II) in the solution. The experimental results showed that the maximum removal of Pb(II) was obtained at the pH between 4-5 with percentage removal of 99.32%. The percentage removal of Pb(II) increased with increasing pH from 2-6, similarly reported by [35]. It was difficult to maintain the solution pH above 5.5 as precipitation occurred. At highly acidic medium, a lower percentage removal of Pb(II) was observed which implies that the active sites of banana peel were dominated by hydrogen, H+ and hydronium ion, H3O
+.
Table 5. Analysis of variance for quadratic model of the percentage removal of Pb.
Source Sum of Squares df Mean Square F-value p-value
Model 4341.56 14 310.11 11.58 <0.0001 significant
A-Concentration 192.19 1 192.19 7.18 0.0172
B-Adsorbent dosage 657.51 1 657.51 24.56 0.0002
C-pH 1326.83 1 1326.83 49.56 <0.0001
D-Particle size 62.87 1 62.87 2.35 0.1462
AB 347.45 1 347.45 12.98 0.0026
AC 6.76 1 6.76 0.2525 0.6226
AD 186.34 1 186.34 6.96 0.0186
BC 256.64 1 256.64 9.59 0.0074
BD 19.48 1 19.48 0.7274 0.4071
CD 89.09 1 89.09 3.33 0.0881
A² 1.14 1 1.14 0.0427 0.8391
B² 205.41 1 205.41 7.67 0.0143
C² 7.79 1 7.79 0.2910 0.5975
D² 16.52 1 16.52 0.6171 0.4444
Residual 401.60 15 26.77
Lack of Fit 229.48 10 22.95 0.6667 0.7267 not significant
Pure Error 172.11 5 34.42
Cor Total 4743.16 29
R2 0.9153 Adj R2 Pred. R2 Adeq Precision Std. Dev Mean C.V %
0.8363 0.6862 12.1598 5.17 83.60 6.19
Afolabi F.O., et al.1494
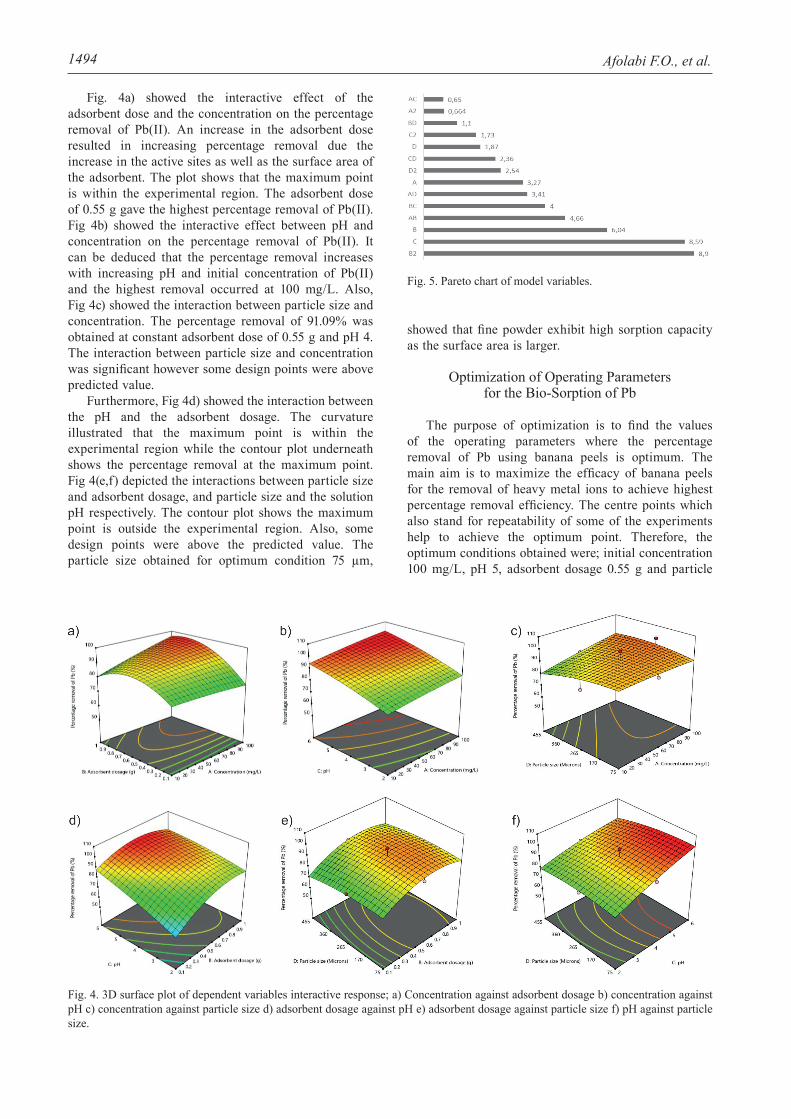
Fig. 4a) showed the interactive effect of the adsorbent dose and the concentration on the percentage removal of Pb(II). An increase in the adsorbent dose resulted in increasing percentage removal due the increase in the active sites as well as the surface area of the adsorbent. The plot shows that the maximum point is within the experimental region. The adsorbent dose of 0.55 g gave the highest percentage removal of Pb(II). Fig 4b) showed the interactive effect between pH and concentration on the percentage removal of Pb(II). It can be deduced that the percentage removal increases with increasing pH and initial concentration of Pb(II) and the highest removal occurred at 100 mg/L. Also, Fig 4c) showed the interaction between particle size and concentration. The percentage removal of 91.09% was obtained at constant adsorbent dose of 0.55 g and pH 4. The interaction between particle size and concentration was significant however some design points were above predicted value.
Furthermore, Fig 4d) showed the interaction between the pH and the adsorbent dosage. The curvature illustrated that the maximum point is within the experimental region while the contour plot underneath shows the percentage removal at the maximum point. Fig 4(e,f) depicted the interactions between particle size and adsorbent dosage, and particle size and the solution pH respectively. The contour plot shows the maximum point is outside the experimental region. Also, some design points were above the predicted value. The particle size obtained for optimum condition 75 µm,
showed that fine powder exhibit high sorption capacity as the surface area is larger.
Optimization of Operating Parameters for the Bio-Sorption of Pb
The purpose of optimization is to find the values of the operating parameters where the percentage removal of Pb using banana peels is optimum. The main aim is to maximize the efficacy of banana peels for the removal of heavy metal ions to achieve highest percentage removal efficiency. The centre points which also stand for repeatability of some of the experiments help to achieve the optimum point. Therefore, the optimum conditions obtained were; initial concentration 100 mg/L, pH 5, adsorbent dosage 0.55 g and particle
Fig. 5. Pareto chart of model variables.
Fig. 4. 3D surface plot of dependent variables interactive response; a) Concentration against adsorbent dosage b) concentration against pH c) concentration against particle size d) adsorbent dosage against pH e) adsorbent dosage against particle size f) pH against particle size.
Evaluation of Lead (II) Removal from Wastewater... 1495
size 75 µm with percentage removal of 98.146%, while the desirability gave 1.000.
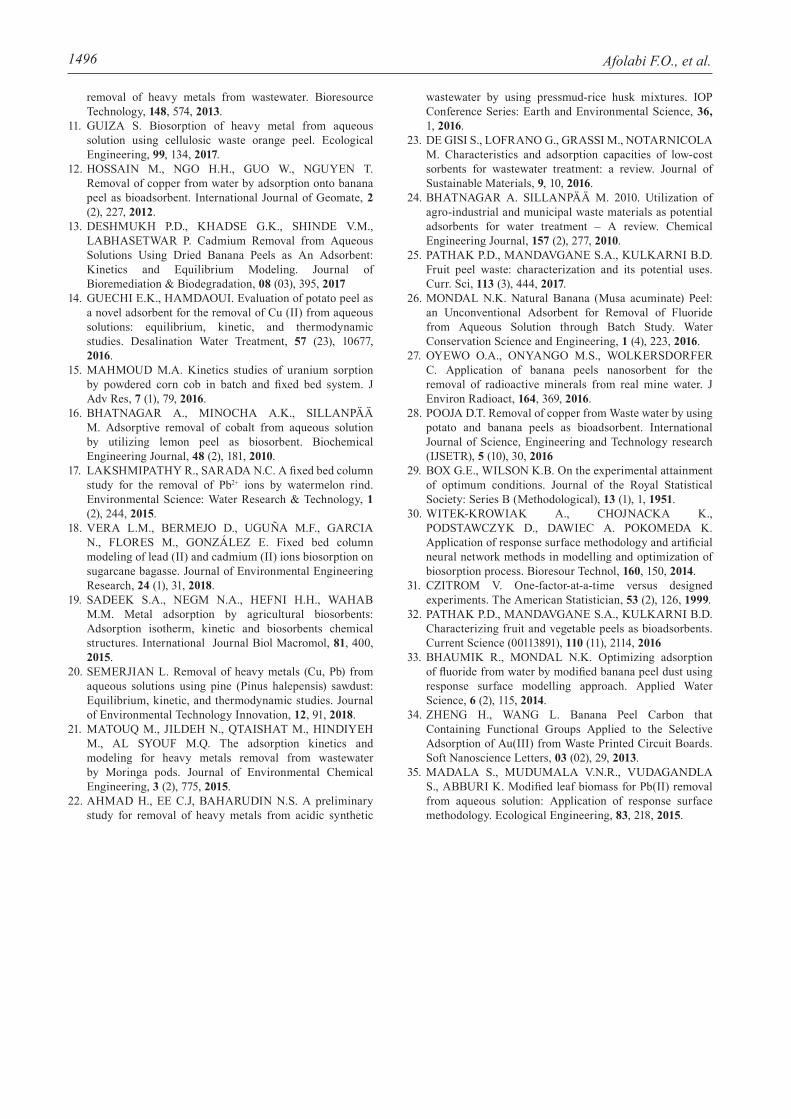
Analysis of Model Parameters Using Pareto Chart
The pareto chart is the plot of the coefficient of all the parameters represented in the model equation. It shows the significance and effect of each parameter in the model equation. In Fig 5., the quadratic term B2 has the highest coefficient value in the model equation. Hence, the adsorbent dosage is highly significant in the adsorption process. The percentage removal of Pb (II) reached the peak with 0.55 g of adsorbent, further increase in adsorbent dosage reduced the percentage removal. The pH of the solution (C) is also a significant parameter as the percentage removal of Pb (II) increases with increase in pH. The percentage removal of Pb (II) increases with increase in the concentration of the solution. Hence, the concentration (A) is also a significant parameter. The quadratic term D2 and the interaction terms AB, AD, BC and CD are also significant as increase or decrease of their coefficients will influence the percentage removal of Pb. Finally, the pareto chart has standardized effect value of 2.36 hence, any factor below the standardized value has no significant effect.
Conclusion
The optimization of many variables has been one of the major challenges in wastewater treatment plant to meet the desired effluent discharge limits. This work focused on the applicability of central composite design (CCD) for the optimization of initial concentration, pH, adsorbent dosage and particle size in a batch system for the removal of Pb (II) from wastewater using banana peel. The response surface design gave the optimum condition; initial concentration of 100 mg/L, pH of 5, adsorbent dosage of 0.55 g and particle size of 75 µm with a percentage removal of 98.146%. The pH of the solution and the adsorbent dosage had the greatest influence on the adsorption process with the lowest p-value. Also, the model predicted was adequate and significant at 95% confidence level. The non-significant lack-of-fit showed that the quadratic model obtained is useful for batch adsorption process.
The FT-IR of banana peel consists of carboxyl and hydroxyl groups which are essential sites for metal sorption. This is also evident in the elemental composition analysis; carbon has the highest percentage followed by oxygen. At high pH value, the carboxylic groups present in banana peel are deprotonated thus enhancing the attraction of positively charged metal ion in the solution. The reduction in the percentage composition of potassium and silicon ions on the surface of the banana peels after adsorption suggests the influence of these ions on the adsorption
mechanism. Therefore, ion exchange is the sorption mechanism responsible for the adsorption of Pb(II). Also, the surface structure of banana peel was microporous which enhanced the sorption capacity. Finally, natural banana peel is efficient and economical for the treatment of Pb(II) contaminated water at low concentrations. In addition, the usability of banana peel for wastewater treatment can be an area of monetary focus to stakeholders for managing the environment as well as reduction of waste.
Acknowledgements
The authors wish to appreciate the National Research Foundation (Grant Nu: 105235) and Durban University of Technology for their financial support.
Conflict of Interest
On behalf of all the authors, the corresponding author declares that there is no conflict of interest.
References
1. CHATTERJEE S., MONDAL S., DE S. Design and scaling up of fixed bed adsorption columns for lead removal by treated laterite. Journal of Cleaner Production, 177, 760, 2018.
2. TABARAKI R., NATEGHI A., AHMADY-ASBCHIN S. Biosorption of lead (II) ions on Sargassum ilicifolium: Application of response surface methodology. International Biodeterioration & Biodegradation, 93, 145, 2014.
3. DONG Y., LIN H. Competitive adsorption of Pb(II) and Zn(II) from aqueous solution by modified beer lees in a fixed bed column. Process Safety and Environmental Protection, 111, 263, 2017.
4. RONDA A., MARTÍN-LARA M., DIONISIO E., BLÁZQUEZ G., CALERO M. Effect of lead in biosorption of copper by almond shell. Journal of the Taiwan Institute of Chemical Engineers, 44 (3), 466, 2013.
5. GUNATILAKE S.K. Methods of Removing Heavy Metals from Industrial Wastewater. Journal of Multidisciplinary Engineering Science Studies (JMESS), 1 (1), 12, 2015.
6. AL-SHANNAG M., AL-QODAH Z., BANI-MELHEM K., QTAISHAT M.R. ALKASRAWI M. Heavy metal ions removal from metal plating wastewater using electrocoagulation: Kinetic study and process performance. Chemical Engineering Journal, 260, 749, 2015.
7. BARAKAT M.A. New trends in removing heavy metals from industrial wastewater. Arabian Journal of Chemistry, 4 (4), 361, 2011.
8. WANG P.Y., LI M., HUANG C. Hazardous Waste Treatment Technologies. Water Environment Research, 88 (10), 1467, 2016.
9. AHALYA N., RAMACHANDRA T., KANAMADI R. Biosorption of heavy metals. Res. J. Chem. Environ, 7 (4), 71, 2003.
10. NGUYEN T.A.H., NGO H.H., GUO W.S., ZHANG J., LIANG S., YUE Q.Y., LI Q. NGUYEN T.V. Applicability of agricultural waste and by-products for adsorptive
Afolabi F.O., et al.1496
removal of heavy metals from wastewater. Bioresource Technology, 148, 574, 2013.
11. GUIZA S. Biosorption of heavy metal from aqueous solution using cellulosic waste orange peel. Ecological Engineering, 99, 134, 2017.
12. HOSSAIN M., NGO H.H., GUO W., NGUYEN T. Removal of copper from water by adsorption onto banana peel as bioadsorbent. International Journal of Geomate, 2 (2), 227, 2012.
13. DESHMUKH P.D., KHADSE G.K., SHINDE V.M., LABHASETWAR P. Cadmium Removal from Aqueous Solutions Using Dried Banana Peels as An Adsorbent: Kinetics and Equilibrium Modeling. Journal of Bioremediation & Biodegradation, 08 (03), 395, 2017
14. GUECHI E.K., HAMDAOUI. Evaluation of potato peel as a novel adsorbent for the removal of Cu (II) from aqueous solutions: equilibrium, kinetic, and thermodynamic studies. Desalination Water Treatment, 57 (23), 10677, 2016.
15. MAHMOUD M.A. Kinetics studies of uranium sorption by powdered corn cob in batch and fixed bed system. J Adv Res, 7 (1), 79, 2016.
16. BHATNAGAR A., MINOCHA A.K., SILLANPÄÄ M. Adsorptive removal of cobalt from aqueous solution by utilizing lemon peel as biosorbent. Biochemical Engineering Journal, 48 (2), 181, 2010.
17. LAKSHMIPATHY R., SARADA N.C. A fixed bed column study for the removal of Pb2+ ions by watermelon rind. Environmental Science: Water Research & Technology, 1 (2), 244, 2015.
18. VERA L.M., BERMEJO D., UGUÑA M.F., GARCIA N., FLORES M., GONZÁLEZ E. Fixed bed column modeling of lead (II) and cadmium (II) ions biosorption on sugarcane bagasse. Journal of Environmental Engineering Research, 24 (1), 31, 2018.
19. SADEEK S.A., NEGM N.A., HEFNI H.H., WAHAB M.M. Metal adsorption by agricultural biosorbents: Adsorption isotherm, kinetic and biosorbents chemical structures. International Journal Biol Macromol, 81, 400, 2015.
20. SEMERJIAN L. Removal of heavy metals (Cu, Pb) from aqueous solutions using pine (Pinus halepensis) sawdust: Equilibrium, kinetic, and thermodynamic studies. Journal of Environmental Technology Innovation, 12, 91, 2018.
21. MATOUQ M., JILDEH N., QTAISHAT M., HINDIYEH M., AL SYOUF M.Q. The adsorption kinetics and modeling for heavy metals removal from wastewater by Moringa pods. Journal of Environmental Chemical Engineering, 3 (2), 775, 2015.
22. AHMAD H., EE C.J, BAHARUDIN N.S. A preliminary study for removal of heavy metals from acidic synthetic
wastewater by using pressmud-rice husk mixtures. IOP Conference Series: Earth and Environmental Science, 36, 1, 2016.
23. DE GISI S., LOFRANO G., GRASSI M., NOTARNICOLA M. Characteristics and adsorption capacities of low-cost sorbents for wastewater treatment: a review. Journal of Sustainable Materials, 9, 10, 2016.
24. BHATNAGAR A. SILLANPÄÄ M. 2010. Utilization of agro-industrial and municipal waste materials as potential adsorbents for water treatment – A review. Chemical Engineering Journal, 157 (2), 277, 2010.
25. PATHAK P.D., MANDAVGANE S.A., KULKARNI B.D. Fruit peel waste: characterization and its potential uses. Curr. Sci, 113 (3), 444, 2017.
26. MONDAL N.K. Natural Banana (Musa acuminate) Peel: an Unconventional Adsorbent for Removal of Fluoride from Aqueous Solution through Batch Study. Water Conservation Science and Engineering, 1 (4), 223, 2016.
27. OYEWO O.A., ONYANGO M.S., WOLKERSDORFER C. Application of banana peels nanosorbent for the removal of radioactive minerals from real mine water. J Environ Radioact, 164, 369, 2016.
28. POOJA D.T. Removal of copper from Waste water by using potato and banana peels as bioadsorbent. International Journal of Science, Engineering and Technology research (IJSETR), 5 (10), 30, 2016
29. BOX G.E., WILSON K.B. On the experimental attainment of optimum conditions. Journal of the Royal Statistical Society: Series B (Methodological), 13 (1), 1, 1951.
30. WITEK-KROWIAK A., CHOJNACKA K., PODSTAWCZYK D., DAWIEC A. POKOMEDA K. Application of response surface methodology and artificial neural network methods in modelling and optimization of biosorption process. Bioresour Technol, 160, 150, 2014.
31. CZITROM V. One-factor-at-a-time versus designed experiments. The American Statistician, 53 (2), 126, 1999.
32. PATHAK P.D., MANDAVGANE S.A., KULKARNI B.D. Characterizing fruit and vegetable peels as bioadsorbents. Current Science (00113891), 110 (11), 2114, 2016
33. BHAUMIK R., MONDAL N.K. Optimizing adsorption of fluoride from water by modified banana peel dust using response surface modelling approach. Applied Water Science, 6 (2), 115, 2014.
34. ZHENG H., WANG L. Banana Peel Carbon that Containing Functional Groups Applied to the Selective Adsorption of Au(III) from Waste Printed Circuit Boards. Soft Nanoscience Letters, 03 (02), 29, 2013.
35. MADALA S., MUDUMALA V.N.R., VUDAGANDLA S., ABBURI K. Modified leaf biomass for Pb(II) removal from aqueous solution: Application of response surface methodology. Ecological Engineering, 83, 218, 2015.