EFFECT OF OSCILLATION AMPLITUDE ON VELOCITY DISTRIBUTIONS IN AN OSCILLATORY BAFFLED COLUMN (OBC
Journal of Environmental Sciences 26 (2014) 726–736
www.jesc.ac.cn
Journal of Environmental Sciences
Available online at www.sciencedirect.com
Pollutant removal from municipal wastewater employing baffled subsurfaceflow and integrated surface flow-floating treatment wetlands
Tanveer Saeed1,∗, Abdullah Al-Muyeed1, Rumana Afrin1, Habibur Rahman2, Guangzhi Sun3
1. Department of Civil Engineering, Ahsanullah University of Science and Technology, Dhaka 1208, Bangladesh2. Department of Civil Engineering, Bangladesh University of Engineering and Technology, Dhaka 1000, Bangladesh3. School of Engineering and Physical Sciences, James Cook University, Townsville, QLD 4811, Australia
a r t i c l e i n f o
Article history:Received 22 May 2013revised 15 August 2013accepted 16 August 2013
Keywords:constructed wetlandsloading fluctuationmedianitrogenorganicsseasonal variation
DOI: 10.1016/S1001-0742(13)60476-3
a b s t r a c t
This article reports pollutant removal performances of baffled subsurface flow, and integrated surfaceflow-floating treatment wetland units, when arranged in series for the treatment of municipalwastewater in Bangladesh. The wetland units (of the hybrid system) included organic, inorganicmedia, and were planted with nineteen types of macrophytes. The wetland train was operated underhydraulic loading fluctuation and seasonal variation. The performance analyses (across the wetlandunits) illustrated simultaneous denitrification and organics removal rates in the first stage vertical flowwetland, due to organic carbon leaching from the employed organic media. Higher mean organicsremoval rates (656.0 g COD/(m2·day)) did not completely inhibit nitrification in the first stage verticalflow system; such pattern could be linked to effective utilization of the trapped oxygen, as theflow was directed throughout the media by the baffle walls. Second stage horizontal flow wetlandshowed enhanced biodegradable organics removal, which depleted organic carbon availability fordenitrification. The final stage integrated wetland system allowed further nitrogen removal fromwastewater, via nutrient uptake by plant roots (along with nitrification), and generation of organiccarbon (by the dead macrophytes) to support denitrification. The system achieved higher E. colimortality through protozoa predation, E. coli oxidation, and destruction by UV radiation. In general,enhanced pollutant removal efficiencies as demonstrated by the structurally modified hybrid wetlandsystem signify the necessity of such modification, when operated under adverse conditions such as:substantial input organics loading, hydraulic loading fluctuation, and seasonal variation.
Introduction
Municipal wastewater contains widely variable amount oforganics and inorganics such as nitrogen, phosphorus, andother solids, depending on water usage patterns in differentcountries (Vymazal, 2009). Such pollutants of variableconcentrations in municipal wastewater can be treatedvia steel-and-concrete, and natural treatment technologies.The former technology often entails substantial operation
∗Corresponding author. E-mail: [email protected];[email protected]
and maintenance costs (Arias and Brown, 2009; Anto-niadis et al., 2010), whereas such problems are generallyencountered by the latter technologies.
Constructed wetland treatment systems, generally re-ferred to as low-cost, green treatment technologies, aredependent on an inter-connected network of plants, media,biomass, and water which facilitate physical, chemical,and biological removal of contaminants from wastewater(Fountoulakis et al., 2009). Such systems exhibit bet-ter efficiencies of organics removal, when employed forwastewater treatment (Vymazal and Kropfelova, 2009);however, higher nitrogen removal performances are of-ten difficult to achieve. To overcome these drawbacks,
Journal of Environmental Sciences 26 (2014) 726–736 727
extensive research is being carried out in adjustment ofoperational and environmental parameters, employing al-ternative media, structural, and arrangement modificationof wetlands (Saeed and Sun, 2012).
To date, a few studies reported the role of media (i.e.organic type), for improving classical nitrogen reduction(from wastewater) in treatment wetlands (Saeed and Sun,2011b; Tee et al., 2012). The mechanism for such mediaoriented performance is involved with leaching of organiccarbon (C) from the employed media (into bulk wastew-ater), that increases organic C availability to supportdenitrification (along with organics removal).
Other studies modified structural configurations ofwetlands, for enhancing removal mechanism. Baffled hor-izontal flow (HF), bio-rack, towery, and integrated downflow-up flow wetlands fall under this category (Ye andLi, 2009; Chang et al., 2012; Tee et al., 2012; Wanget al., 2012a). Enhanced removals were observed insuch engineered wetlands, due to flow direction throughaerobic-anaerobic portions, and improved wastewater con-tact time with increased root surfaces of macrophytes.As such, combination of appropriate media, along withstructural modification of treatment wetlands could furtheraccelerate removal bio-kinetics.
Apart from media oriented performance improvement,or structural modification of wetlands, different arrange-ments of vertical flow (VF) and HF wetland systems (i.e.hybrid systems) had also been examined (Belmont et al.,2004; Abidi et al., 2009; Tunsiper, 2009) for acceleratingbio-reactions. The role of the last stage wetland in suchhybrid system is extremely critical. For example, a laststage VF system can further accelerate nitrification andorganics removal, whereas a final stage HF system cansupport denitrification (Vymazal, 2005; Saeed et al., 2012).However, in both cases, either nitrification or denitrifi-cation becomes the limiting factor (due to absence ofaerobic/anaerobic conditions), which may not meet thestringent pollutant discharge criteria in many countries.Considering these drawbacks, incorporation of a surfaceflow (SF), or floating treatment wetland (that employsfloating mat with emergent macrophytes on water surface)as a final stage unit can further reduce nitrogen contents,as it allows substantial bio-kinetic metabolisms around therhizosphere (Headley and Tanner, 2006; Zachritz II et al.,2008).
This study was designed to investigate the removalefficiency of structurally modified VF and HF systems(with organic and inorganic media), arranged in serieswith an integrated SF-floating treatment wetland, and toprovide municipal wastewater treatment in Bangladesh.The main objective of this study was to examine overallremoval mechanisms for pollutants (nitrogen, organics, E.coli) of the developed engineered wetland systems, whichare subjected to hydraulic loading (HL) fluctuation andseasonal variation.
1 Materials and methods
1.1 Municipal wastewater
Municipal wastewater was collected from a local out-let (prior to disposal into open channels) in Dhaka,Bangladesh. The wastewater was stored in a tank beforebeing dosed as influent, into the experimental wetlandsystem.
1.2 Configuration of the pilot-scale experimental wet-lands
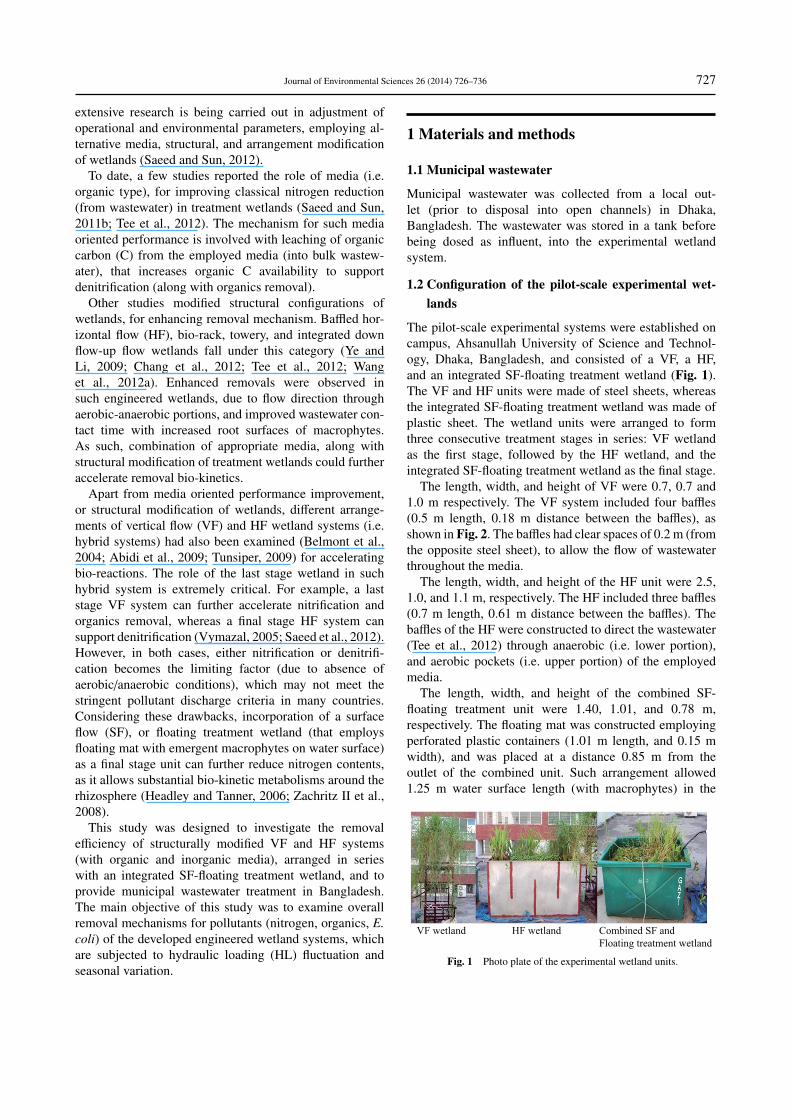
The pilot-scale experimental systems were established oncampus, Ahsanullah University of Science and Technol-ogy, Dhaka, Bangladesh, and consisted of a VF, a HF,and an integrated SF-floating treatment wetland (Fig. 1).The VF and HF units were made of steel sheets, whereasthe integrated SF-floating treatment wetland was made ofplastic sheet. The wetland units were arranged to formthree consecutive treatment stages in series: VF wetlandas the first stage, followed by the HF wetland, and theintegrated SF-floating treatment wetland as the final stage.
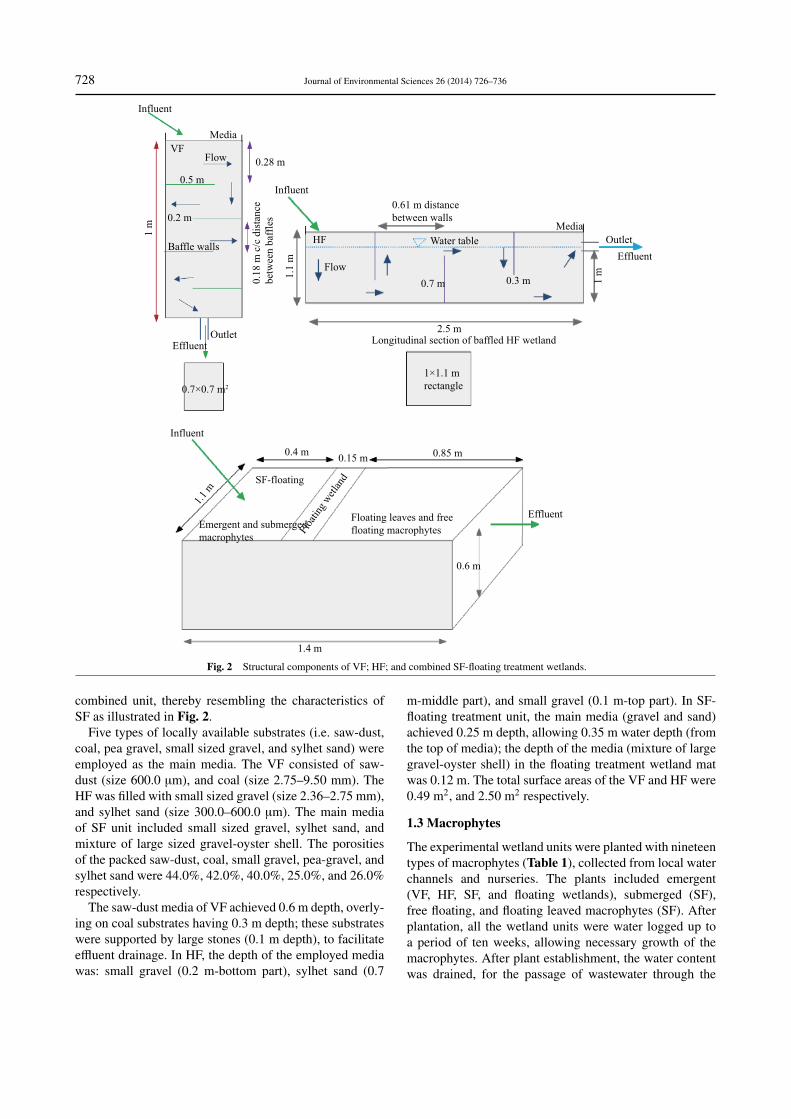
The length, width, and height of VF were 0.7, 0.7 and1.0 m respectively. The VF system included four baffles(0.5 m length, 0.18 m distance between the baffles), asshown in Fig. 2. The baffles had clear spaces of 0.2 m (fromthe opposite steel sheet), to allow the flow of wastewaterthroughout the media.
The length, width, and height of the HF unit were 2.5,1.0, and 1.1 m, respectively. The HF included three baffles(0.7 m length, 0.61 m distance between the baffles). Thebaffles of the HF were constructed to direct the wastewater(Tee et al., 2012) through anaerobic (i.e. lower portion),and aerobic pockets (i.e. upper portion) of the employedmedia.
The length, width, and height of the combined SF-floating treatment unit were 1.40, 1.01, and 0.78 m,respectively. The floating mat was constructed employingperforated plastic containers (1.01 m length, and 0.15 mwidth), and was placed at a distance 0.85 m from theoutlet of the combined unit. Such arrangement allowed1.25 m water surface length (with macrophytes) in the
VF wetland HF wetland Combined SF and
Floating treatment wetland
Fig. 1 Photo plate of the experimental wetland units.
728 Journal of Environmental Sciences 26 (2014) 726–736
Influent
Influent
Influent
Media
Media
Flow
Baffle walls
0.5 m
0.2 m
0.3 m0.7 m
Outlet
Outlet
Effluent
Effluent
Effluent
1 m
1.1
m
1.1
m
1 m
0.1
8 m
c/c
dis
tance
bet
wee
n b
affl
es
0.61 m distance
between walls
0.28 m
Water table
Flow
2.5 m
0.4 m0.15 m
0.85 m
Longitudinal section of baffled HF wetland
1×1.1 m
rectangle0.7×0.7 m2
Emergent and submerged
macrophytes
Floa
ting
wet
land
Floating leaves and free
floating macrophytes
0.6 m
1.4 m
VF
HF
SF-floating
Fig. 2 Structural components of VF; HF; and combined SF-floating treatment wetlands.
combined unit, thereby resembling the characteristics ofSF as illustrated in Fig. 2.
Five types of locally available substrates (i.e. saw-dust,coal, pea gravel, small sized gravel, and sylhet sand) wereemployed as the main media. The VF consisted of saw-dust (size 600.0 µm), and coal (size 2.75–9.50 mm). TheHF was filled with small sized gravel (size 2.36–2.75 mm),and sylhet sand (size 300.0–600.0 µm). The main mediaof SF unit included small sized gravel, sylhet sand, andmixture of large sized gravel-oyster shell. The porositiesof the packed saw-dust, coal, small gravel, pea-gravel, andsylhet sand were 44.0%, 42.0%, 40.0%, 25.0%, and 26.0%respectively.
The saw-dust media of VF achieved 0.6 m depth, overly-ing on coal substrates having 0.3 m depth; these substrateswere supported by large stones (0.1 m depth), to facilitateeffluent drainage. In HF, the depth of the employed mediawas: small gravel (0.2 m-bottom part), sylhet sand (0.7
m-middle part), and small gravel (0.1 m-top part). In SF-floating treatment unit, the main media (gravel and sand)achieved 0.25 m depth, allowing 0.35 m water depth (fromthe top of media); the depth of the media (mixture of largegravel-oyster shell) in the floating treatment wetland matwas 0.12 m. The total surface areas of the VF and HF were0.49 m2, and 2.50 m2 respectively.
1.3 Macrophytes
The experimental wetland units were planted with nineteentypes of macrophytes (Table 1), collected from local waterchannels and nurseries. The plants included emergent(VF, HF, SF, and floating wetlands), submerged (SF),free floating, and floating leaved macrophytes (SF). Afterplantation, all the wetland units were water logged up toa period of ten weeks, allowing necessary growth of themacrophytes. After plant establishment, the water contentwas drained, for the passage of wastewater through the
Journal of Environmental Sciences 26 (2014) 726–736 729
Table 1 Macrophyte types in experimental pilot-scale wetland system
Plant type Scientific name
VF Emergent Phragmites australis, Cyperus difformis, Dracaena sanderiana, Canna indica.HF Emergent Phragmites australis, Cyperus papyrus, Cyperus difformis, Dracaena sanderiana, Hydrocotyle umbellate,
Echinodorus cordifolius, Colocasia esculenta, Caladium sp., Hymenocallis littoralis, Canna indica.SF Emergent Phragmites australis,Echinodorus cordifolius,Ludwigia adscendes, Alternanthera philoxeroides.
Submerged Hygrophila polysperma, Bacopa caroliniana.Rooted floating Nymphea pubescens, Nymphoides indica.Floating leaved Salvinia auriculata, Salvinia minima, Pistia stratiotes.
Floating wetland Emergent Phragmites australis, Cyperus papyrus, Echinodorus cordifolius.
wetland systems.
1.4 Operation of the wetland systems
The pilot-scale wetland train was fed with municipalwastewater for nineteen weeks; wastewater dosing wascommenced from autumn period, and was continued untilthe end of winter period. Municipal wastewater was dosedmanually into the surface of the VF, five days a week, twotimes a day with 3 hr interval between successive dosings.The volume of the influent wastewater was varied (i.e.artificial fluctuation) every week; 306.0 mm/day in oneweek, followed by 204.0 mm/day in the following week,and was continued up to nineteen weeks.
Wastewater was applied into the VF, where it floweddownwards as directed by the baffle walls towards outlet(Fig. 2). The effluent of the first stage VF wetland Awas transferred into the HF, under gravitational force.Wastewater maintained downwards and upwards flow path(while moving towards outlet), as directed by the bafflewalls inside the HF maintaining 1.0 m water depth. Theeffluent of the HF was transferred into the combined SF-floating treatment unit by gravity. Wastewater in such unitpassed through the macrophytes of SF, and the hangingroots of the floating treatment wetland towards outlet,producing final effluent of the system.
1.5 Sampling and analyses
Wastewater was collected from the outlet of each wetlandon a weekly basis. Sixteen sets of samples (across eachexperimental wetland unit) were analyzed for pH, redoxpotential (Eh), dissolved oxygen (DO), NH4-N, NO2-N,NO3-N, turbidity, BOD5, and COD. Eleven sets of sampleswere analyzed for E. coli measurement, and five sets ofsamples were analyzed for phosphorus (P) measurement.Analyses of nitrogenous compounds, P and COD werecarried out using a digital reactor block, and Palintest 5000colorimeter based on standard procedures, as highlightedby the supplier (i.e. ELE International, UK). pH, Eh, andDO were measured by ELE 970 DO2 probe, and 370 pHmeter (i.e. ELE International, UK). BOD5 measurementwas carried out with a manometer BOD instrument, andan incubator operated at 20°C. Wastewater turbidity was
measured with a turbidity meter (ELE International, UK).E. coli in the samples was measured with Macconkey agar,and an incubator operated at 37°C (as indicated by thesupplier).
2 Results and discussion
2.1 Overall performance
Table 2 indicates mean removal performances across theexperimental wetland units. VF achieved higher BOD5 re-moval percentages, when compared with nitrification anddenitrification rates. BOD5 removal efficiencies were alsohigher, as the wastewater passed through the HF; howeversuch stage demonstrated lower nitrogen removal perfor-mances. In addition, the experimental HF was efficient interms of P and E. coli removal from wastewater. The SF-floating treatment showed substantial denitrification andE. Coli removal performances, from influent wastewater(effluent of HF). However BOD5 removal performancesin such stage were lower (over COD removal), whencompared with the previous stages.
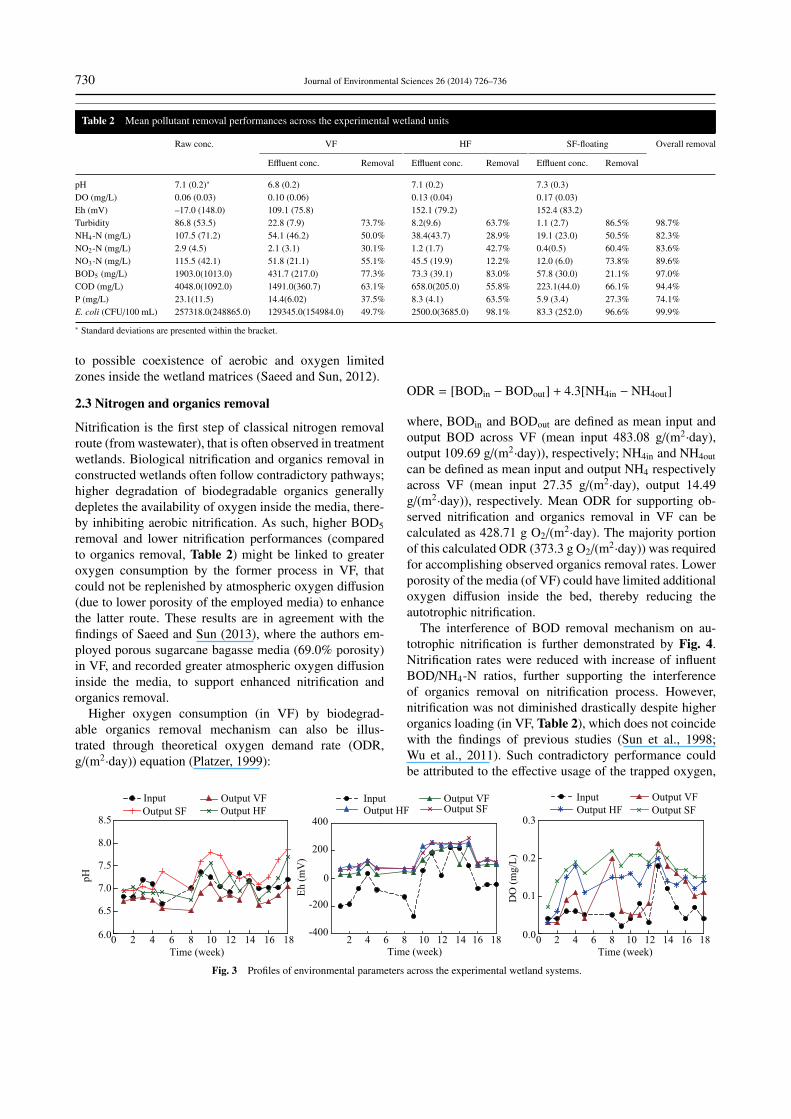
2.2 Profiles of environmental parameters
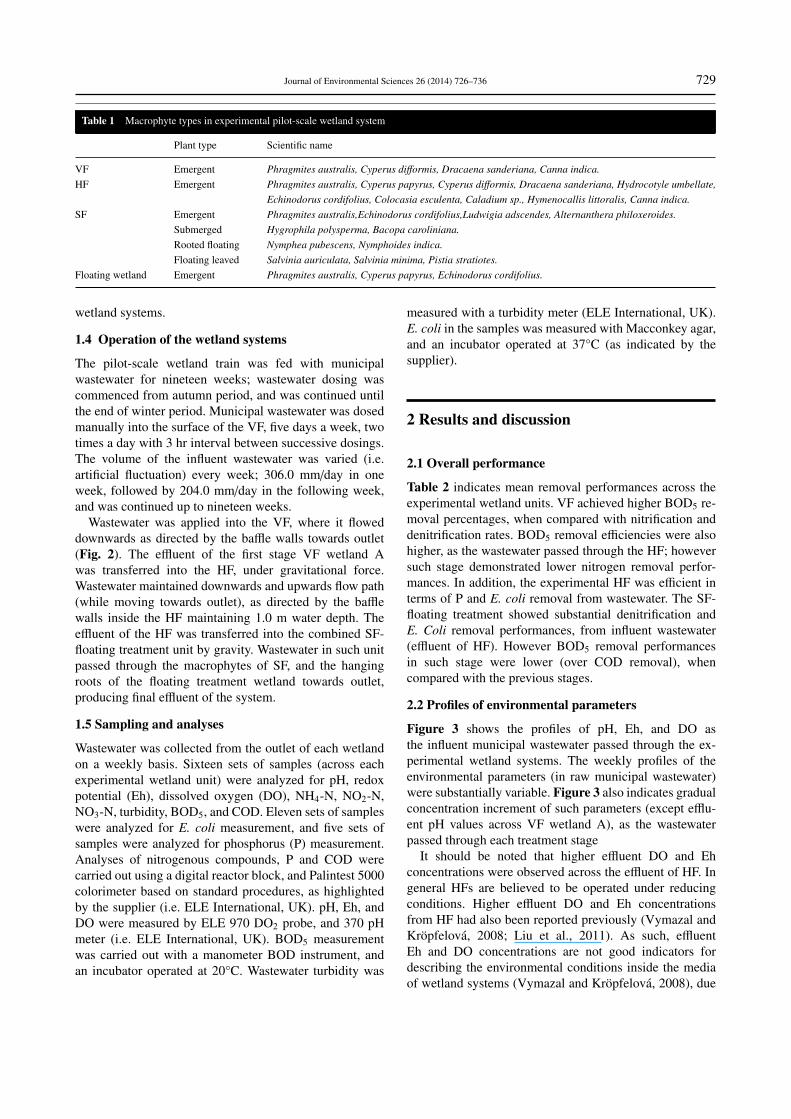
Figure 3 shows the profiles of pH, Eh, and DO asthe influent municipal wastewater passed through the ex-perimental wetland systems. The weekly profiles of theenvironmental parameters (in raw municipal wastewater)were substantially variable. Figure 3 also indicates gradualconcentration increment of such parameters (except efflu-ent pH values across VF wetland A), as the wastewaterpassed through each treatment stage
It should be noted that higher effluent DO and Ehconcentrations were observed across the effluent of HF. Ingeneral HFs are believed to be operated under reducingconditions. Higher effluent DO and Eh concentrationsfrom HF had also been reported previously (Vymazal andKropfelova, 2008; Liu et al., 2011). As such, effluentEh and DO concentrations are not good indicators fordescribing the environmental conditions inside the mediaof wetland systems (Vymazal and Kropfelova, 2008), due
730 Journal of Environmental Sciences 26 (2014) 726–736
Table 2 Mean pollutant removal performances across the experimental wetland units
Raw conc. VF HF SF-floating Overall removal
Effluent conc. Removal Effluent conc. Removal Effluent conc. Removal
pH 7.1 (0.2)∗ 6.8 (0.2) 7.1 (0.2) 7.3 (0.3)DO (mg/L) 0.06 (0.03) 0.10 (0.06) 0.13 (0.04) 0.17 (0.03)Eh (mV) –17.0 (148.0) 109.1 (75.8) 152.1 (79.2) 152.4 (83.2)Turbidity 86.8 (53.5) 22.8 (7.9) 73.7% 8.2(9.6) 63.7% 1.1 (2.7) 86.5% 98.7%NH4-N (mg/L) 107.5 (71.2) 54.1 (46.2) 50.0% 38.4(43.7) 28.9% 19.1 (23.0) 50.5% 82.3%NO2-N (mg/L) 2.9 (4.5) 2.1 (3.1) 30.1% 1.2 (1.7) 42.7% 0.4(0.5) 60.4% 83.6%NO3-N (mg/L) 115.5 (42.1) 51.8 (21.1) 55.1% 45.5 (19.9) 12.2% 12.0 (6.0) 73.8% 89.6%BOD5 (mg/L) 1903.0(1013.0) 431.7 (217.0) 77.3% 73.3 (39.1) 83.0% 57.8 (30.0) 21.1% 97.0%COD (mg/L) 4048.0(1092.0) 1491.0(360.7) 63.1% 658.0(205.0) 55.8% 223.1(44.0) 66.1% 94.4%P (mg/L) 23.1(11.5) 14.4(6.02) 37.5% 8.3 (4.1) 63.5% 5.9 (3.4) 27.3% 74.1%E. coli (CFU/100 mL) 257318.0(248865.0) 129345.0(154984.0) 49.7% 2500.0(3685.0) 98.1% 83.3 (252.0) 96.6% 99.9%
∗ Standard deviations are presented within the bracket.
to possible coexistence of aerobic and oxygen limitedzones inside the wetland matrices (Saeed and Sun, 2012).
2.3 Nitrogen and organics removal
Nitrification is the first step of classical nitrogen removalroute (from wastewater), that is often observed in treatmentwetlands. Biological nitrification and organics removal inconstructed wetlands often follow contradictory pathways;higher degradation of biodegradable organics generallydepletes the availability of oxygen inside the media, there-by inhibiting aerobic nitrification. As such, higher BOD5removal and lower nitrification performances (comparedto organics removal, Table 2) might be linked to greateroxygen consumption by the former process in VF, thatcould not be replenished by atmospheric oxygen diffusion(due to lower porosity of the employed media) to enhancethe latter route. These results are in agreement with thefindings of Saeed and Sun (2013), where the authors em-ployed porous sugarcane bagasse media (69.0% porosity)in VF, and recorded greater atmospheric oxygen diffusioninside the media, to support enhanced nitrification andorganics removal.
Higher oxygen consumption (in VF) by biodegrad-able organics removal mechanism can also be illus-trated through theoretical oxygen demand rate (ODR,g/(m2·day)) equation (Platzer, 1999):
ODR = [BODin − BODout] + 4.3[NH4in − NH4out]
where, BODin and BODout are defined as mean input andoutput BOD across VF (mean input 483.08 g/(m2·day),output 109.69 g/(m2·day)), respectively; NH4in and NH4outcan be defined as mean input and output NH4 respectivelyacross VF (mean input 27.35 g/(m2·day), output 14.49g/(m2·day)), respectively. Mean ODR for supporting ob-served nitrification and organics removal in VF can becalculated as 428.71 g O2/(m2·day). The majority portionof this calculated ODR (373.3 g O2/(m2·day)) was requiredfor accomplishing observed organics removal rates. Lowerporosity of the media (of VF) could have limited additionaloxygen diffusion inside the bed, thereby reducing theautotrophic nitrification.
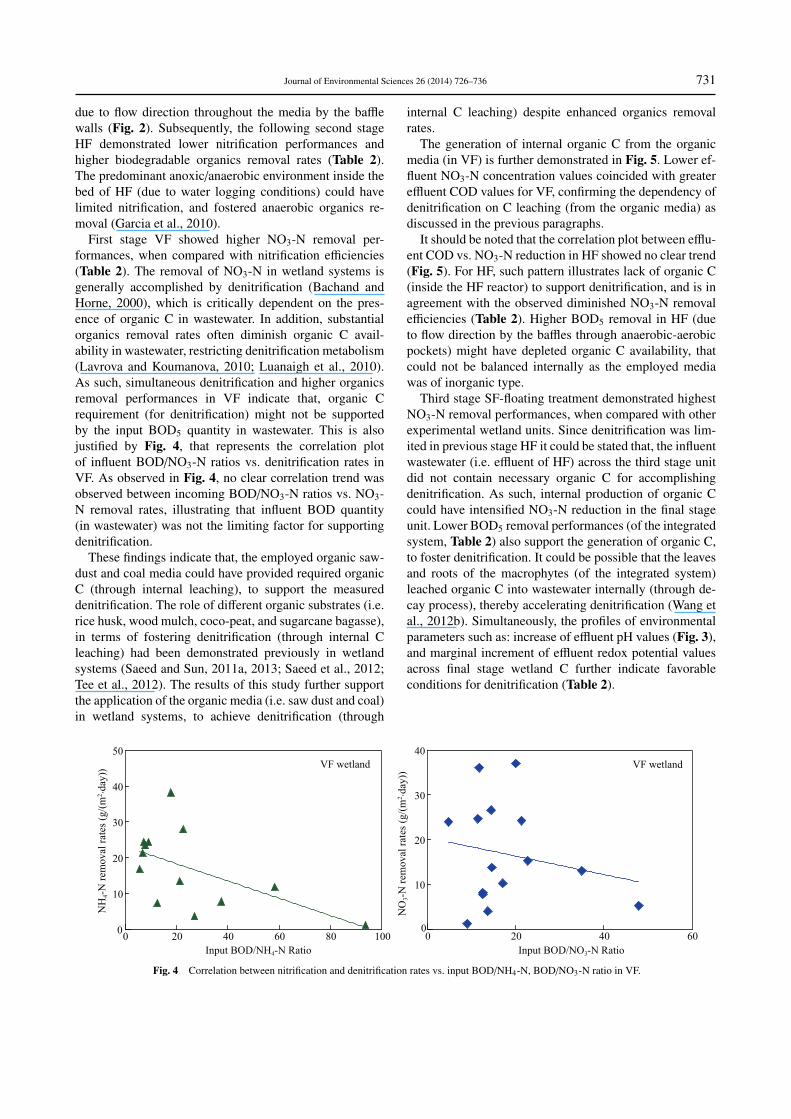
The interference of BOD removal mechanism on au-totrophic nitrification is further demonstrated by Fig. 4.Nitrification rates were reduced with increase of influentBOD/NH4-N ratios, further supporting the interferenceof organics removal on nitrification process. However,nitrification was not diminished drastically despite higherorganics loading (in VF, Table 2), which does not coincidewith the findings of previous studies (Sun et al., 1998;Wu et al., 2011). Such contradictory performance couldbe attributed to the effective usage of the trapped oxygen,
Time (week)
pH
0 2 4 6 8 10 12 14 16 186.0
6.5
7.0
7.5
8.0
8.5
Input Output VF
Output HFOutput SF
Time (week)
Eh (
mV
)
2 4 6 8 10 12 14 16 18-400
-200
0
200
400
InputOutput HF
Output VFOutput SF
Time (week)
DO
(m
g/L
)
0 2 4 6 8 10 12 14 16 180.0
0.1
0.2
0.3
Input Output VF
Output HF Output SF
Fig. 3 Profiles of environmental parameters across the experimental wetland systems.
Journal of Environmental Sciences 26 (2014) 726–736 731
due to flow direction throughout the media by the bafflewalls (Fig. 2). Subsequently, the following second stageHF demonstrated lower nitrification performances andhigher biodegradable organics removal rates (Table 2).The predominant anoxic/anaerobic environment inside thebed of HF (due to water logging conditions) could havelimited nitrification, and fostered anaerobic organics re-moval (Garcia et al., 2010).
First stage VF showed higher NO3-N removal per-formances, when compared with nitrification efficiencies(Table 2). The removal of NO3-N in wetland systems isgenerally accomplished by denitrification (Bachand andHorne, 2000), which is critically dependent on the pres-ence of organic C in wastewater. In addition, substantialorganics removal rates often diminish organic C avail-ability in wastewater, restricting denitrification metabolism(Lavrova and Koumanova, 2010; Luanaigh et al., 2010).As such, simultaneous denitrification and higher organicsremoval performances in VF indicate that, organic Crequirement (for denitrification) might not be supportedby the input BOD5 quantity in wastewater. This is alsojustified by Fig. 4, that represents the correlation plotof influent BOD/NO3-N ratios vs. denitrification rates inVF. As observed in Fig. 4, no clear correlation trend wasobserved between incoming BOD/NO3-N ratios vs. NO3-N removal rates, illustrating that influent BOD quantity(in wastewater) was not the limiting factor for supportingdenitrification.
These findings indicate that, the employed organic saw-dust and coal media could have provided required organicC (through internal leaching), to support the measureddenitrification. The role of different organic substrates (i.e.rice husk, wood mulch, coco-peat, and sugarcane bagasse),in terms of fostering denitrification (through internal Cleaching) had been demonstrated previously in wetlandsystems (Saeed and Sun, 2011a, 2013; Saeed et al., 2012;Tee et al., 2012). The results of this study further supportthe application of the organic media (i.e. saw dust and coal)in wetland systems, to achieve denitrification (through
internal C leaching) despite enhanced organics removalrates.
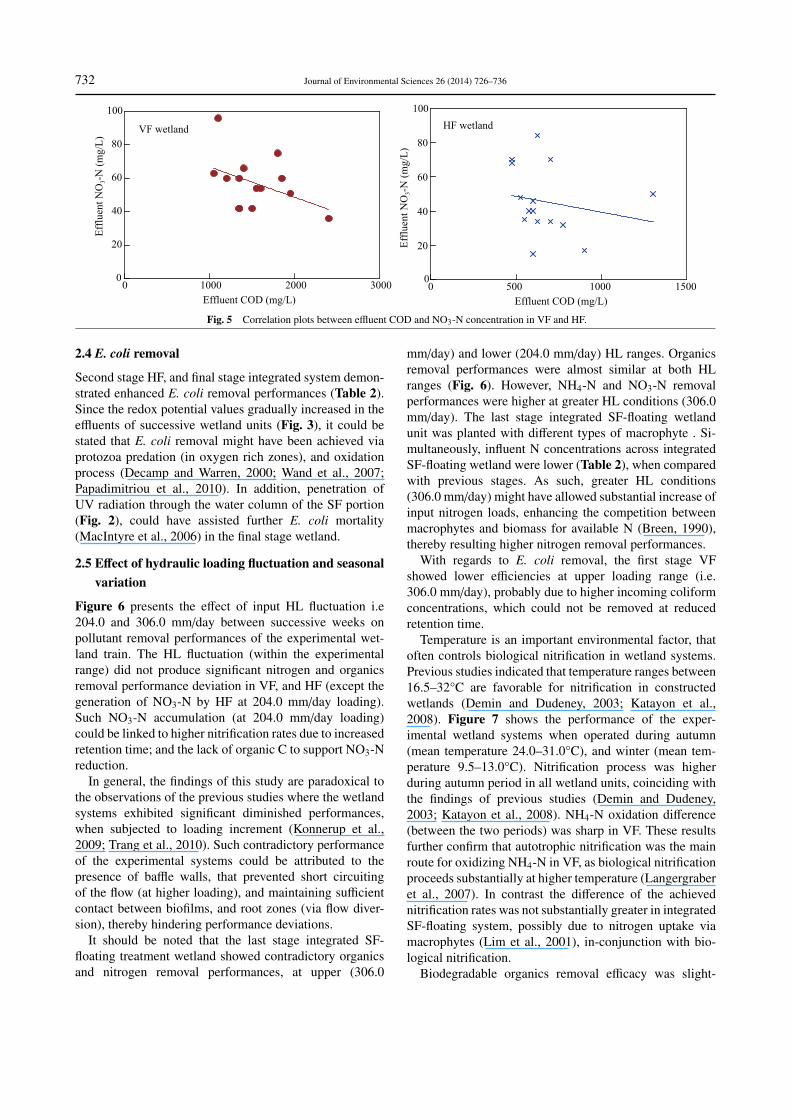
The generation of internal organic C from the organicmedia (in VF) is further demonstrated in Fig. 5. Lower ef-fluent NO3-N concentration values coincided with greatereffluent COD values for VF, confirming the dependency ofdenitrification on C leaching (from the organic media) asdiscussed in the previous paragraphs.
It should be noted that the correlation plot between efflu-ent COD vs. NO3-N reduction in HF showed no clear trend(Fig. 5). For HF, such pattern illustrates lack of organic C(inside the HF reactor) to support denitrification, and is inagreement with the observed diminished NO3-N removalefficiencies (Table 2). Higher BOD5 removal in HF (dueto flow direction by the baffles through anaerobic-aerobicpockets) might have depleted organic C availability, thatcould not be balanced internally as the employed mediawas of inorganic type.
Third stage SF-floating treatment demonstrated highestNO3-N removal performances, when compared with otherexperimental wetland units. Since denitrification was lim-ited in previous stage HF it could be stated that, the influentwastewater (i.e. effluent of HF) across the third stage unitdid not contain necessary organic C for accomplishingdenitrification. As such, internal production of organic Ccould have intensified NO3-N reduction in the final stageunit. Lower BOD5 removal performances (of the integratedsystem, Table 2) also support the generation of organic C,to foster denitrification. It could be possible that the leavesand roots of the macrophytes (of the integrated system)leached organic C into wastewater internally (through de-cay process), thereby accelerating denitrification (Wang etal., 2012b). Simultaneously, the profiles of environmentalparameters such as: increase of effluent pH values (Fig. 3),and marginal increment of effluent redox potential valuesacross final stage wetland C further indicate favorableconditions for denitrification (Table 2).
NH
4-N
rem
ov
al r
ates
(g
/(m
2. d
ay))
0 20 40 60 80 1000
10
20
30
40
50
VF wetland
Input BOD/NO3-N RatioInput BOD/NH4-N Ratio
NO
3-N
rem
oval
rat
es (
g/(
m2. d
ay))
0 20 40 600
10
20
30
40
VF wetland
Fig. 4 Correlation between nitrification and denitrification rates vs. input BOD/NH4-N, BOD/NO3-N ratio in VF.
732 Journal of Environmental Sciences 26 (2014) 726–736
Effluent COD (mg/L)
0 1000 2000 30000
20
40
60
80
100
VF wetland
Effluent COD (mg/L)
Eff
luen
t N
O3-N
(m
g/L
)
Eff
luen
t N
O3-N
(m
g/L
)
0 500 1000 15000
20
40
60
80
100
HF wetland
Fig. 5 Correlation plots between effluent COD and NO3-N concentration in VF and HF.
2.4 E. coli removal
Second stage HF, and final stage integrated system demon-strated enhanced E. coli removal performances (Table 2).Since the redox potential values gradually increased in theeffluents of successive wetland units (Fig. 3), it could bestated that E. coli removal might have been achieved viaprotozoa predation (in oxygen rich zones), and oxidationprocess (Decamp and Warren, 2000; Wand et al., 2007;Papadimitriou et al., 2010). In addition, penetration ofUV radiation through the water column of the SF portion(Fig. 2), could have assisted further E. coli mortality(MacIntyre et al., 2006) in the final stage wetland.
2.5 Effect of hydraulic loading fluctuation and seasonalvariation
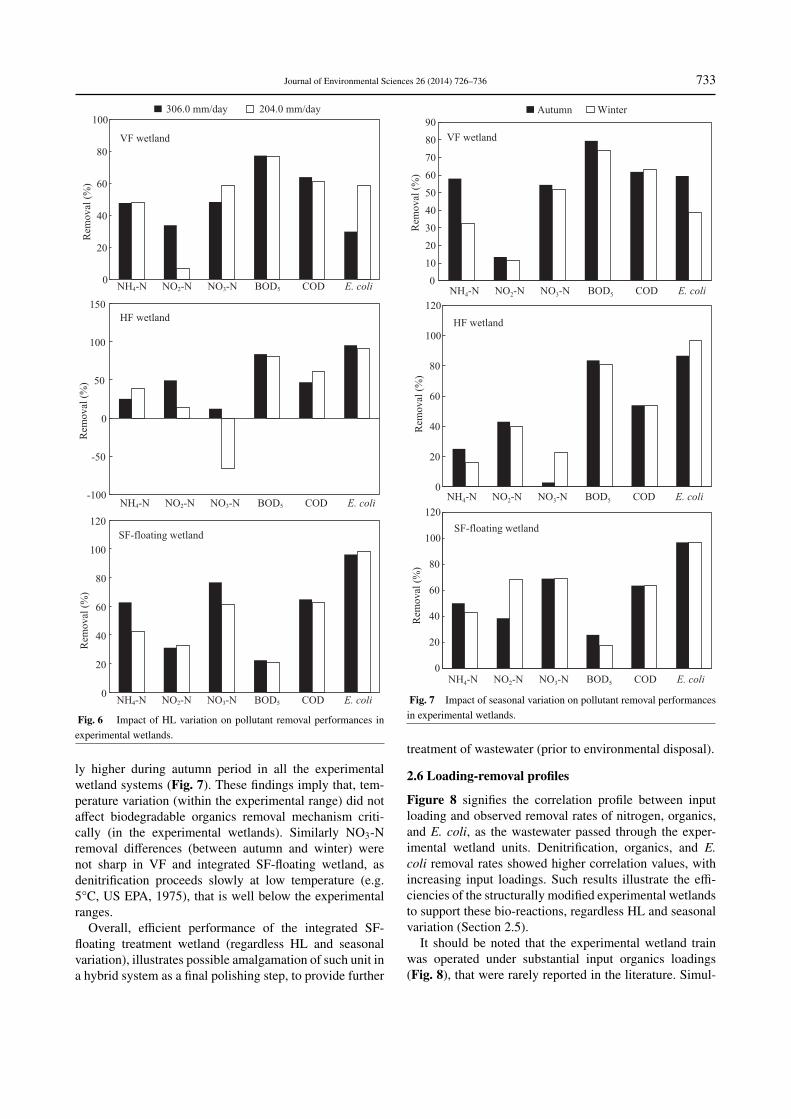
Figure 6 presents the effect of input HL fluctuation i.e204.0 and 306.0 mm/day between successive weeks onpollutant removal performances of the experimental wet-land train. The HL fluctuation (within the experimentalrange) did not produce significant nitrogen and organicsremoval performance deviation in VF, and HF (except thegeneration of NO3-N by HF at 204.0 mm/day loading).Such NO3-N accumulation (at 204.0 mm/day loading)could be linked to higher nitrification rates due to increasedretention time; and the lack of organic C to support NO3-Nreduction.
In general, the findings of this study are paradoxical tothe observations of the previous studies where the wetlandsystems exhibited significant diminished performances,when subjected to loading increment (Konnerup et al.,2009; Trang et al., 2010). Such contradictory performanceof the experimental systems could be attributed to thepresence of baffle walls, that prevented short circuitingof the flow (at higher loading), and maintaining sufficientcontact between biofilms, and root zones (via flow diver-sion), thereby hindering performance deviations.
It should be noted that the last stage integrated SF-floating treatment wetland showed contradictory organicsand nitrogen removal performances, at upper (306.0
mm/day) and lower (204.0 mm/day) HL ranges. Organicsremoval performances were almost similar at both HLranges (Fig. 6). However, NH4-N and NO3-N removalperformances were higher at greater HL conditions (306.0mm/day). The last stage integrated SF-floating wetlandunit was planted with different types of macrophyte . Si-multaneously, influent N concentrations across integratedSF-floating wetland were lower (Table 2), when comparedwith previous stages. As such, greater HL conditions(306.0 mm/day) might have allowed substantial increase ofinput nitrogen loads, enhancing the competition betweenmacrophytes and biomass for available N (Breen, 1990),thereby resulting higher nitrogen removal performances.
With regards to E. coli removal, the first stage VFshowed lower efficiencies at upper loading range (i.e.306.0 mm/day), probably due to higher incoming coliformconcentrations, which could not be removed at reducedretention time.
Temperature is an important environmental factor, thatoften controls biological nitrification in wetland systems.Previous studies indicated that temperature ranges between16.5–32°C are favorable for nitrification in constructedwetlands (Demin and Dudeney, 2003; Katayon et al.,2008). Figure 7 shows the performance of the exper-imental wetland systems when operated during autumn(mean temperature 24.0–31.0°C), and winter (mean tem-perature 9.5–13.0°C). Nitrification process was higherduring autumn period in all wetland units, coinciding withthe findings of previous studies (Demin and Dudeney,2003; Katayon et al., 2008). NH4-N oxidation difference(between the two periods) was sharp in VF. These resultsfurther confirm that autotrophic nitrification was the mainroute for oxidizing NH4-N in VF, as biological nitrificationproceeds substantially at higher temperature (Langergraberet al., 2007). In contrast the difference of the achievednitrification rates was not substantially greater in integratedSF-floating system, possibly due to nitrogen uptake viamacrophytes (Lim et al., 2001), in-conjunction with bio-logical nitrification.
Biodegradable organics removal efficacy was slight-
Journal of Environmental Sciences 26 (2014) 726–736 733
0
20
40
60
80
100
Rem
ov
al (
%)
Rem
oval
(%
)R
emo
val
(%
)
306.0 mm/day 204.0 mm/day
VF wetland
-100
-50
0
50
100
150
HF wetland
0
20
40
60
80
100
120
SF-floating wetland
NH4-N NO2-N NO3-N BOD5 COD E. coli
NH4-N NO2-N NO3-N BOD5 COD E. coli
NH4-N NO2-N NO3-N BOD5 COD E. coli
Fig. 6 Impact of HL variation on pollutant removal performances inexperimental wetlands.
ly higher during autumn period in all the experimentalwetland systems (Fig. 7). These findings imply that, tem-perature variation (within the experimental range) did notaffect biodegradable organics removal mechanism criti-cally (in the experimental wetlands). Similarly NO3-Nremoval differences (between autumn and winter) werenot sharp in VF and integrated SF-floating wetland, asdenitrification proceeds slowly at low temperature (e.g.5°C, US EPA, 1975), that is well below the experimentalranges.
Overall, efficient performance of the integrated SF-floating treatment wetland (regardless HL and seasonalvariation), illustrates possible amalgamation of such unit ina hybrid system as a final polishing step, to provide further
0
10
20
30
40
50
60
70
80
90
NH4-N NO2-N NO3-N BOD5 COD E. coli
Rem
ov
al (
%)
NH4-N NO2-N NO3-N BOD5 COD E. coli
NH4-N NO2-N NO3-N BOD5 COD E. coli
Autumn Winter
VF wetland
0
20
40
60
80
100
120
Rem
oval
(%
)
HF wetland
0
20
40
60
80
100
120
Rem
oval
(%
)
SF-floating wetland
Fig. 7 Impact of seasonal variation on pollutant removal performancesin experimental wetlands.
treatment of wastewater (prior to environmental disposal).
2.6 Loading-removal profiles
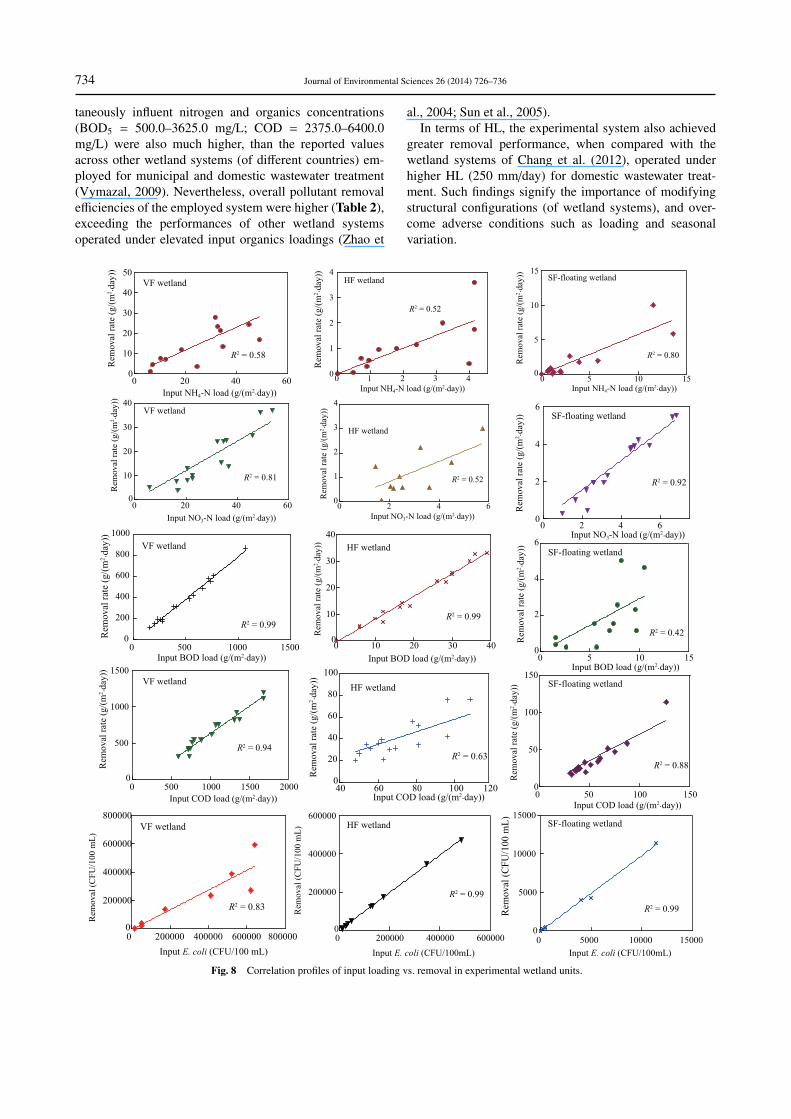
Figure 8 signifies the correlation profile between inputloading and observed removal rates of nitrogen, organics,and E. coli, as the wastewater passed through the exper-imental wetland units. Denitrification, organics, and E.coli removal rates showed higher correlation values, withincreasing input loadings. Such results illustrate the effi-ciencies of the structurally modified experimental wetlandsto support these bio-reactions, regardless HL and seasonalvariation (Section 2.5).
It should be noted that the experimental wetland trainwas operated under substantial input organics loadings(Fig. 8), that were rarely reported in the literature. Simul-
734 Journal of Environmental Sciences 26 (2014) 726–736
taneously influent nitrogen and organics concentrations(BOD5 = 500.0–3625.0 mg/L; COD = 2375.0–6400.0mg/L) were also much higher, than the reported valuesacross other wetland systems (of different countries) em-ployed for municipal and domestic wastewater treatment(Vymazal, 2009). Nevertheless, overall pollutant removalefficiencies of the employed system were higher (Table 2),exceeding the performances of other wetland systemsoperated under elevated input organics loadings (Zhao et
al., 2004; Sun et al., 2005).In terms of HL, the experimental system also achieved
greater removal performance, when compared with thewetland systems of Chang et al. (2012), operated underhigher HL (250 mm/day) for domestic wastewater treat-ment. Such findings signify the importance of modifyingstructural configurations (of wetland systems), and over-come adverse conditions such as loading and seasonalvariation.
Input NH4-N load (g/(m2.day))
Input NO3-N load (g/(m2.day)) Input NO3-N load (g/(m2.day))
Input NH4-N load (g/(m2.day))
Rem
oval
rat
e (g
/(m
2. d
ay))
Rem
ov
al r
ate
(g/(
m2. d
ay))
Rem
oval
rat
e (g
/(m
2. d
ay))
Rem
ov
al r
ate
(g/(
m2. d
ay))
Rem
ov
al r
ate
(g/(
m2. d
ay))
Rem
ov
al r
ate
(g/(
m2. d
ay))
Rem
ov
al r
ate
(g/(
m2. d
ay))
Rem
ov
al r
ate
(g/(
m2. d
ay))
0 20 40 600
10
20
30
40
50VF wetland
R2 = 0.58
0 20 40 600
10
20
30
40
R2 = 0.81
VF wetland
Input BOD load (g/(m2.day)) Input BOD load (g/(m2.day))
0 500 1000 15000
200
400
600
800
1000
VF wetland
R2 = 0.99
Input COD load (g/(m2.day)) Input COD load (g/(m2.day))0 500 1000 1500 2000
0
500
1000
1500
VF wetland
R2 = 0.94
Input E. coli (CFU/100 mL)
Rem
oval
(C
FU
/100 m
L)
Rem
oval
(C
FU
/100 m
L)
0 200000 400000 600000 8000000
200000
400000
600000
800000
VF wetland
R2 = 0.83
0 1 2 3 40
1
2
3
4HF wetland
R2 = 0.52
0 2 4 60
1
2
3
4
R2 = 0.52
HF wetland
0 10 20 30 400
10
20
30
40
R2 = 0.99
HF wetland
40 60 80 100 1200
20
40
60
80
100
R2 = 0.63
HF wetland
Input E. coli (CFU/100mL)
0 200000 400000 6000000
200000
400000
600000
R2 = 0.99
HF wetland
Input NO3-N load (g/(m2.day))
Input NH4-N load (g/(m2.day))
Rem
oval
rat
e (g
/(m
2. d
ay))
Rem
oval
rat
e (g
/(m
2. d
ay))
Rem
ov
al r
ate
(g/(
m2. d
ay))
Rem
ov
al r
ate
(g/(
m2. d
ay))
Input BOD load (g/(m2.day))
Input COD load (g/(m2.day))
Rem
ov
al (
CF
U/1
00
mL
)
0 5 10 150
5
10
15
R2 = 0.80
SF-floating wetland
0 2 4 60
2
4
6
R2 = 0.92
SF-floating wetland
0 5 10 150
2
4
6
R2 = 0.42
SF-floating wetland
0 50 100 1500
50
100
150
R2 = 0.88
SF-floating wetland
Input E. coli (CFU/100mL)
0 5000 10000 150000
5000
10000
15000
R2 = 0.99
SF-floating wetland
Fig. 8 Correlation profiles of input loading vs. removal in experimental wetland units.
Journal of Environmental Sciences 26 (2014) 726–736 735
It should be noted that, final effluent pollutant con-centrations (particularly COD in Table 2) were higheracross the three stage hybrid system, as it was operatedunder substantial input pollutant and hydraulic loadings(Fig. 8). These values might not fulfill stringent dischargeguidelines in many countries. As such, field-scale trials arerequired to identify optimum loading ranges (across thebaffled wetlands), and system arrangement prior to appli-cation. In general, the results indicate the importance ofincorporating baffle walls in wetland systems for allowingspace-efficient designs, particularly in countries such asBangladesh where land availability is scarce.
3 Conclusions
Enhanced organics removal rates depleted oxygen avail-ability, thereby reducing nitrification rates in first stage VFwetland; however, nitrification rates were not completelyinhibited inside the first stage reactor. Such phenomenamight be linked to effective usage of the trapped oxygen,due to flow direction throughout the media by the bafflewalls. In addition, enhanced organics removal rates didnot limit organic C availability for denitrification process(in VF), due to internal C generation from the employedorganic media. Second stage HF wetland was inefficientin reducing incoming NO3-N. Higher organics removaldepleted organic C availability in the system, that couldnot support denitrification. In contrast, internal organicC generation (through the decay of dead macrophytes)intensified denitrification metabolism in the final stageintegrated SF-floating wetland.
Higher overall observed removal performances (of theexperimental hybrid wetland system) illustrate the necessi-ty of structural modification, when operated under adverseconditions such as: substantial input organics loading,hydraulic loading fluctuation, and seasonal variation.
Acknowledgments
The authors would like to acknowledge Mr. Masnun Alam,Mr. Samiul Alam, Mr. Tanvir Shihab, Mr. Omar Chistee,and Mr. Sarthak Dipta for providing necessary assistanceduring the operation of the experimental wetlands.
r e f e r e n c e s
Abidi, S., Kallali, H., Jedidi, N., Bouzaiane, O., Hassen, A., 2009.Comparative pilot study of the performances of two constructedwetland wastewater treatment hybrid systems. Desalination 246,370–377.
Antoniadis, A., Takavakoglou, V., Zalidis, G., Darakas, E., Poulios, I.,2010. Municipal wastewater treatment by sequential combinationof photocatalytic oxidation with constructed wetlands. Catal. Today151, 114–118.
Arias, M.E., Brown, M.T., 2009. Feasibility of using constructed treat-ment wetlands for municipal wastewater treatment in the BogotSavannah, Colombia. Ecol. Eng. 35, 1070–1078.
Bachand, P., Horne, A., 2000. Denitrification in constructed free watersurface wetlands: I. Very high nitrate removal rates in a macrocosmstudy. Ecol. Eng. 14, 9–15.
Belmont, M.A., Cantellano, E., Thompson, S., Williamson, M., Sanchez,A., Metcalfe, C.D., 2004. Treatment of domestic wastewater in apilot-scale natural treatment system in central Mexico. Ecol. Eng.23, 299–311.
Breen, P., 1990. A mass balance method for assessing the potential ofartificial wetlands for wastewater treatment. Water Res. 24(6), 689–697.
Chang, J.J., Wu, S.Q., Dai, Y.R., Liang, W., Wu, Z.B., 2012. Treatmentperformance of integrated vertical-flow constructed wetland plotsfor domestic wastewater. Ecol. Eng. 44, 152–159.
Decamp, O., Warren, A., 2000. Investigation of Escherichia coli removalin various designs of subsurface flow wetlands used for wastewatertreatment. Ecol. Eng. 14(3), 293–299.
Demin, O., Dudeney, A., 2003. Nitrification in constructed wetlandstreating ochreous mine water. Mine Water Environ. 22(1), 15–21.
Fountoulakis, M., Terzakis, S., Chatzinotas, A., Brix, H., Kalogerakis, N.,Manios, T., 2009. Pilot-scale comparison of constructed wetlandsoperated under high hydraulic loading rates and attached biofilmreactors for domestic wastewater treatment. Sci. Total Environ.407(8), 2996–3003.
Garcia, J., Rousseau, D.P.L., Morato, J., Lesage, E., Matamoros, V.,Bayona, J.M., 2010. Contaminant removal processes in subsurface-flow constructed wetlands: A review. Crit. Rev. Environ. Sci.Technol. 40(7), 561–661.
Headley, T., Tanner, C., 2006. Application of floating wetlands forenhanced stormwater treatment: A review. In: Research ReportNo. HAM2006–123 of National Institute of Water & AtmosphericResearch Ltd. Hamilton, New Zealand.
Katayon, S., Fiona, Z., Noor, M.J.M.M., Halim, G.A., Ahmad, J.,2008. Treatment of mild domestic wastewater using subsurfaceconstructed wetlands in Malaysia. Inter. J. Environ. Stud. 65(1),87–102.
Konnerup, D., Koottatep, T., Brix, H., 2009. Treatment of domesticwastewater in tropical, subsurface flow constructed wetlands plant-ed with Canna and Heliconia. Ecol. Eng. 35, 248–257.
Langergraber, G., Prandtstetten C, Pressl, A., Rohrhofer, R., Haberl,R., 2007. Optimization of subsurface vertical flow constructedwetlands for wastewater treatment. Water Sci. Technol. 55(7), 71–78.
Lavrova, S., Koumanova, B., 2010. Influence of recirculation in a lab-scale vertical flow constructed wetland on the treatment efficiencyof landfill leachate. Bioresour. Technol. 101, 1756–1761.
Lim, P.E., Wong, T.F., Lim, D.V., 2001. Oxygen demand, nitrogen andcopper removal by free-water-surface and subsurface-flow con-structed wetlands under tropical conditions. Environ. Inter. 26(5-6),425–431.
Liu, S.Y., Yan, B.X., Wang, L.X., 2011. The layer effect in nutrientremoval by two indigenous plant species in horizontal flow con-structed wetlands. Ecol. Eng. 37(12), 2101–2104.
Luanaigh, N.D., Goodhue, R., Gill, L.W., 2010. Nutrient removal fromon-site domestic wastewater in horizontal subsurface flow reedbeds in Ireland. Ecol. Eng. 36(10), 1266–1276.
736 Journal of Environmental Sciences 26 (2014) 726–736
MacIntyre, M.E., Warner, B.G., Slawson, R.M., 2006. Escherichia colicontrol in a surface flow treatment wetland. J. Water Health 4(2),211–214.
Papadimitriou, C.A., Papatheodoulou, A., Takavakoglou, V., Zdragas,A., Samaras, P., Sakellaropoulos, G.P. et al., 2010. Investigationof protozoa as indicators of wastewater treatment efficiency inconstructed wetlands. Desalination 250(1), 378–382.
Platzer, C., 1999. Design recommendations for subsurface flow construct-ed wetlands for nitrification and denitrification. Water Sci. Technol.40(3), 257–263.
Saeed, T., Sun, G.Z., 2011a. A comparative study on the removal ofnutrients and organic matter in wetland reactors employing organicmedia. Chem. Eng. J. 171(2), 439–447.
Saeed, T., Sun, G.Z., 2011b. Enhanced denitrification and organicsremoval in hybrid wetland columns: Comparative experiments.Bioresour. Technol. 102(2), 967–974.
Saeed, T., Afrin, R., Muyeed, A., Sun, G.Z., 2012. Treatment of tannerywastewater in a pilot-scale hybrid constructed wetland system inBangladesh. Chemosphere 88, 1065–1073.
Saeed, T., Sun, G.Z., 2012. A review on nitrogen and organics removalmechanisms in subsurface flow constructed wetlands: Dependencyon environmental parameters, operating conditions and supportingmedia. J. Environ. Manag. 112, 429–448.
Saeed, T., Sun, G., 2013. A lab-scale study of constructed wetlandswith sugarcane bagasse and sand media for the treatment of textilewastewater. Bioresour. Technol. 128, 438–447.
Sun, G., Gray, K., Biddlestone, A., 1998. Treatment of agriculturalwastewater in downflow reed beds: Experimental trials and mathe-matical model. J. Agr. Eng. Res. 69(1), 63–71.
Sun, G.Z., Zhao, Y.Q., Allen, S., 2005. Enhanced removal of organicmatter and ammoniacal nitrogen in a column experiment of tidalflow constructed wetland systems. J. Biotechnol. 115, 189–197.
Tee, H.C., Lim, P.E., Seng, C.E., Nawi, M., 2012. Newly developedbaffled subsurface-flow constructed wetland for the enhancementof nitrogen removal. Bioresour. Technol. 104, 235–242.
Trang, N.T.D., Konnerup, D., Schierup, H.H., Chiem, N.H., Tuan, L.,Brix, H., 2010. Kinetics of pollutant removal from domesticwastewater in a tropical horizontal subsurface flow constructedwetland system: Effects of hydraulic loading rate. Ecol. Eng. 36(4),527–535.
Tunsiper, B., 2009. Nitrogen removal in a combined vertical and hor-izontal subsurface-flow constructed wetland system. Desalination
247(1-3), 466–475.US EPA (U.S. Environmental Protection Agency), 1975. Process Design
Manual for Nitrogen Control. Office of Technology Transfer,Washington DC, USA.
Vymazal, J., 2005. Horizontal sub-surface flow and hybrid constructedwetlands systems for wastewater treatment. Ecol. Eng. 25(5), 478–490.
Vymazal, J., 2009. The use constructed wetlands with horizontal sub-surface flow for various types of wastewater. Ecol. Eng. 35(1), 1–17.
Vymazal, J., Kropfelova, L., 2008. Is concentration of dissolved oxygena good indicator of processes in filtration beds of horizontal-flow constructed wetlands? In: Vymazal, J., (Eds.). WastewaterTreatment, Plant Dynamics and Management in Constructed andNatural Wetlands. Springer, Netherlands. 311–317.
Vymazal, J., Kropfelova, L., 2009. Removal of organics in constructedwetlands with horizontal sub-surface flow: A review of the fieldexperience. Sci. Total Environ. 407(13), 3911–3922.
Wand, H., Vacca, G., Kuschk, P., Kruger M., Kastner, M., 2007. Removalof bacteria by filtration in planted and non-planted sand columns.Water Res. 41(1), 159–167.
Wang, J., Zhang, L.Y., Lu, S.Y., Jin, X.C., Gan, S., 2012a. Contaminantremoval from low concentration polluted river water by the bio-rack wetlands. J. Environ. Sci. 24(6), 1006–1013.
Wang, W.L., Gao, J.Q., Guo, X., Li, W.C., Tian, X.Y., Zhang, R.Q.,2012b. Long-term effects and performance of two-stage baffledsurface flow constructed wetland treating polluted river. Ecol. Eng.49, 93–103.
Wu, S.B., Zhang, D.X., Austin, D., Dong R.J., Pang, C., 2011. Evaluationof a lab-scale tidal flow constructed wetland performance: Oxygentransfer capacity, organic matter and ammonium removal. Ecol.Eng. 37(11), 1789–1795.
Ye, F.X., Li, Y., 2009. Enhancement of nitrogen removal in towery hybridconstructed wetland to treat domestic wastewater for small ruralcommunities. Ecol. Eng. 35(7), 1043–1050.
Zachritz, W.I.I., Hanson, A., Sauceda, J., Fitzsimmons, K.M., 2008.Evaluation of submerged surface flow (SSF) constructed wetlandsfor recirculating tilapia production systems. Aquacult. Eng. 39(1),16–23.
Zhao, Y., Sun, G., Allen, S., 2004. Purification capacity of a highlyloaded laboratory scale tidal flow reed bed system with effluentrecirculation. Sci. Total Environ. 330(1-3), 1–8.
Copyright © 2022 FDOKUMEN