appendix r kemper county igcc project hazardous air pollutant ...
26
APPENDIX R KEMPER COUNTY IGCC PROJECT HAZARDOUS AIR POLLUTANT RISK SCREENING ANALYSES
-
Upload
khangminh22 -
Category
Documents
-
view
1 -
download
0
Transcript of appendix r kemper county igcc project hazardous air pollutant ...
APPENDIX R
KEMPER COUNTY IGCC PROJECT HAZARDOUS AIR POLLUTANT RISK SCREENING ANALYSES

This page intentionally left blank.

Prepared for: Southern Company Services, Inc.
Tier 2 Risk Screening Analysis of
Hazardous Air Pollutant Emissions from
the Proposed Kemper County IGCC
Facility,
67% CO2 Capture Case
Kemper County, Mississippi
AECOM, Inc.
February 2010
Document No.: 06204-041-0002

Prepared for: Southern Company Services, Inc.
Tier 2 Risk Screening Analysis of
Hazardous Air Pollutant Emissions from
the Proposed Kemper County IGCC
Facility, Kemper County, Mississippi
_________________________________ Prepared By: David Heinold
_________________________________ Reviewed By: Brian Stormwind
AECOM, Inc.
February 2010
Document No.: 06204-041-0002

i Tier 2 Risk Screening Analysis
Proposed Kemper County IGCC Facility
Contents
1.0 Introduction ................................................................................................................................................ 1
2.0 Methodology ............................................................................................................................................... 1
2.1 HAP Emissions .................................................................................................................................... 1
2.2 HAP Risk Factors ................................................................................................................................ 1
2.3 Addressing Mercury as a PBT Pollutant ............................................................................................. 2
3.0 HEM-3 Analysis .......................................................................................................................................... 3
3.1 HEM-3 Application ............................................................................................................................... 3
3.2 Selection of Stack Parameters for the Air Toxics and Mercury Deposition Assessments ................ 3
3.3 HEM-3 Results ..................................................................................................................................... 4
4.0 MMREM Analysis for Mercury .................................................................................................................. 4
4.1 Mercury Emissions .............................................................................................................................. 5
4.2 AERMOD Modeling ............................................................................................................................. 5
4.3 MMREM Application ............................................................................................................................ 6
5.0 Summary ..................................................................................................................................................... 7
6.0 References .................................................................................................................................................. 7
List of Tables
Table 1: HAP Emissions for Each of Two IGCC Stacks for Siemens Turbines and U.S. EPA Health Risk
Criteria for Long-Term Inhalation Exposure ................................................................................ 9
Table 2: IGCC Stack Parameters for Primary and Alternate Operations ............................................... 10
Table 3: HEM-3 Results – Chronic Hazard Index and Cancer Risk ....................................................... 11
Table 4: HEM- 3 Results – Acute Risk ..................................................................................................... 12
Table 5: Modeled Mercury Deposition IGCC Stacks (g/m2/year) ............................................................ 13
Table 6: MMREM Results – Non-cancer Risk Associated with Fish Ingestion ...................................... 13

ii Tier 2 Risk Screening Analysis
Proposed Kemper County IGCC Facility
List of Figures
Figure 1: Relative Location of Kemper IGCC Project Site, Meteorological Data Sources, and Ambient
Mercury Monitor .......................................................................................................................... 14
Figure 2: Meridian Key Field 5-year (1991-1995) Wind Rose .................................................................. 15
Figure 3: Detailed Receptor Grid Used to Determine Maximum Offsite Impacts – Near-Field Receptors16
Figure 4: Detailed Receptor Grid Used to Determine Maximum Offsite Impacts – Far-Field Receptors17
Figure 5: HEM-3 Population Centroid Receptors and Maximum Modeled Impact Locations ................. 18
Figure 6: Lake Okatibbee Watershed........................................................................................................ 19

1 Tier 2 Risk Screening Analysis
Proposed Kemper County IGCC Facility
1.0 Introduction
AECOM has conducted a Tier 2 human health risk assessment addressing potential inhalation of Hazardous
Air Pollutant (HAP) emissions associated with the proposed Kemper County IGCC facility in accordance with
EPA’s Facility-Specific Risk Assessment guidance (U.S. EPA, 2004a). In this Tier 2 assessment, risks
associated with inhalation of HAPs emitted from the facility are addressed by applying U.S. EPA’s Human
Exposure Model, Version three (HEM-3) with the AERMOD model dispersion option. In addition, in
recognizing that mercury associated with coal combustion is among the priority Persistent Bioaccumulative
and Toxic (PBT) air pollutants (U.S. EPA, 2001), this Tier 2 risk assessment has been extended to evaluate
the fate, transport and human health risk associated with mercury emissions from the proposed facility. This
has been accomplished by applying MMREM, a screening mercury risk assessment methodology for
combustion sources developed by the Minnesota Pollution Control Agency (MPCA, 2006).
2.0 Methodology
2.1 HAP Emissions
The evaluation considered the HAP emissions associated with continuous firing of syngas in the combustion
turbines. The emission rates were estimated from emissions factors developed in A Study of Toxic Emissions
from a Coal-Fired Gasification Plant (Radian, 1995). Although the combustion turbines are also capable of
combusting natural gas, the fraction of time that natural gas alone would be fired is expected to be small.
Siemens turbines were addressed in this assessment. The HAP emission rates for the Siemens turbine at
maximum operating capacity are provided in Table 1. It was conservatively assumed that these maximum
emission rates persist throughout the year.
The plant will be permitted to operate in two modes, a primary operating mode where carbon dioxide is
removed and transported off-site via pipeline and an alternate (by-pass) mode where the carbon dioxide
stream is ducted to the IGCC stacks. In the alternate configuration, small amounts of carbonyl sulfide (COS)
are released with the carbon dioxide stream through the IGCC stacks. The maximum short-term COS
emission rate is estimated at 7.5 lb/hr for each IGCC stack. The plant’s COS emissions will be limited on an
annual basis with the total permitted emissions of COS being 8.6 tons per year for both IGCC stacks
combined. For short-term modeling it is assumed that both IGCC stacks simultaneously emit COS at the
maximum rate and that on an annual basis, each IGCC stack emits 4.3 tons per year. The alternate operating
mode does not affect emissions of any other HAP.
2.2 HAP Risk Factors
This assessment addressed three classes of health risk: carcinogenic risk, chronic non-carcinogenic risk and
acute risk. Carcinogenic risk and chronic non-carcinogenic risk are associated with long-term inhalation
exposure represented by annual average modeled airborne concentrations. Acute risk is based on maximum
1-hour modeled concentrations. HEM-3 generates chronic cancer risk and chronic and acute hazard
estimates by performing three main operations: dispersion modeling, estimation of population exposure, and
estimation of human health risks. HEM-3 utilizes a receptor data base of Census 2000 block locations which
provides the basis for carcinogenic and chronic risk calculations. In addition HEM-3 was used to evaluate
maximum acute risk over a grid of user-specified receptor locations covering all areas beyond the facility
boundary.
HEM-3 utilizes a library of pollutant Unit Risk Factors (URF) for carcinogenic effects and Reference Air
Concentrations (RAC) for non-cancer effects, both of which are used along with modeled concentrations of the
HAPs to calculate risks. URFs and RACs (also listed in Table 1) are based on the values listed in a table:
Prioritized Chronic Dose-Response Values (U.S. EPA, 2007a).

2 Tier 2 Risk Screening Analysis
Proposed Kemper County IGCC Facility
The lifetime cancer risk associated with a lifetime (70-year) exposure is computed by the product of the
modeled annual average HAP concentration and the URF. The sum of the cancer risk over all HAPs and the
two IGCC emission sources represents the total lifetime cancer risk. A cancer risk less than 1 x 10⁻⁶
has been
interpreted by EPA and state regulatory agencies to be insignificant (U.S. EPA, 1991).
Chronic non-carcinogenic risk is characterized by a Hazard Quotient (HQ) which is computed by dividing the
annual average HAP concentration by the RAC. The sum of the HQs over all HAPs and the two IGCC
emission sources results in the Hazard Index (HI) associated with the facility. This method of adding chronic
non-carcinogenic effects of multiple HAPs is recognized to be conservative (U.S. EPA, 2004a) and HI values
less than 1 are regarded as insignificant.
The acute risk evaluation used acute reference concentration levels compiled by EPA in a table: Acute Dose-
Response Values for Screening Risk Assessments (U.S. EPA 2007b). This table lists values for several acute
thresholds, including Acute Exposure Guideline Levels (AEGL), Emergency Response Planning Guidelines
(ERPG), ATSDR Minimum Risk Levels (MRL) and California EPA Reference Exposure Level (REL), one-tenth
of the NIOSH Imminently Dangerous to Life and Health level (IDLH/10) and for HAPs with no other acute
values, U.S. DOE Temporary Emergency Exposure Limits (TEEL). An acute HQ was computed for each HAP
by dividing the maximum modeled 1-hour concentration by lowest (most conservative) value listed in EPA’s
table. The HQs were then summed to compute an acute HI.
Note that EPA’s dose-response tables do not contain values for all of the polycyclic aromatic hydrocarbon
(PAH) species of HAPs listed in Table 1. Therefore, to provide a conservative risk estimate, dose response
factors for the most toxic PAH, Benzo(a)pyrene, was applied to unspecified PAH emissions. In the absence of
EPA dose-response values for COS, the values for hydrogen sulfide were applied because COS metabolizes
to hydrogen sulfide and carbon dioxide (U.S. EPA, 1994).
2.3 Addressing Mercury as a PBT Pollutant
EPA has identified twelve Priority Level-1 PBT pollutants, which are thought to pose potential health hazards
due to indirect routes of exposure. Among the HAPs listed in Table 1, the only pollutant that is also listed
among the twelve Priority Level-1 PBTs is mercury (U.S. EPA, 2001). Mercury from the IGCC process is
emitted in three forms, elemental mercury vapor, reactive gaseous mercury (RGM) and particulate mercury.
The reducing conditions of the gasification process limit the amount of oxidized mercury (RGM) to the small
amount that could be formed during the short time the mercury passes through the combustion turbine.
Based on test results from existing gasification plants, it is estimated that over 90% of the mercury in the IGCC
exhaust gas will be elemental mercury with the remaining 10% being emitted as RGM (EPRI, 2003).
It is recognized that the routine ingestion of fish that contain elevated concentrations of mercury can pose non-
carcinogenic chronic health risk. Some of the mercury in fish may result from deposition of airborne
concentrations onto watersheds and subsequent bioaccumulation through the aquatic food chain. Although
the presence of mercury in the ambient environment is a global issue, the local dispersion and deposition of
this HAP from the IGCC stacks were evaluated using the MPCA Mercury Risk Estimation Method (MMREM)
screening spreadsheet. MMREM was used to estimate the annual rate of ingestion of mercury due to the
routine consumption of fish caught from a local lake, including the mercury currently present in the
environment and the additional mercury associated with the proposed facility’s emissions. The ratio of the
estimated mercury ingestion rate due to facility emissions to the chronic oral reference ingestion rate for
methyl mercury (1 x 10⁻⁴
mg/kg/day) is computed as an oral hazard quotient.

3 Tier 2 Risk Screening Analysis
Proposed Kemper County IGCC Facility
3.0 HEM-3 Analysis
3.1 HEM-3 Application
HEM-3, which employs the U.S EPA’s AERMOD dispersion model, was applied to estimate carcinogenic risk
and non-carcinogenic risk for long- and short-term (acute and chronic) inhalation of airborne concentrations
associated with the IGCC HAP emissions. HEM-3 was applied with a year of representative meteorological
data (1991) provided by U.S. EPA for use with HEM-3, consisting of hourly surface observations from the
National Weather Service (NWS) station at Meridian Key Field in Meridian, MS and upper air data from
Jackson International Airport in Jackson, MS. The relative location of the meteorological measurement sites
with respect to the project site are provided in Figure 1. The wind rose shown in Figure 2 indicates prevailing
winds are southerly, but northerly winds are also frequent.
Two sets of receptors were used in the analysis. One set of receptors, developed for the air quality modeling
in support of the project permitting effort, was applied to model the highest concentrations that could occur
anywhere beyond the site boundary, regardless of whether the location is populated. This receptor grid
consisted of nearby receptors spaced 50 m apart along the fence line and extending in a square grid out 500
m from the fence-line. Beyond 500 m a nested grid was used with a spacing of 100 m out to 1 km, 500 m out
to 5 km, 1000 m out to 10 km and 2000 m out to 20 km. Near field receptors are shown in Figure 3 and far
field receptors are shown in Figure 4.
Another set of receptors were used to estimate long-term exposure and risk where people live. HEM-3
utilizes a data base of Census block centroid locations to identify maximum risk for receptors located in
populated areas out to 50 kilometers from the project site. The near field population-based receptors are
shown in Figure 5.
Table 2 provides the IGCC stack parameters used to apply HEM-3. The modeling was conducted in a manner
consistent with U.S. EPA guidance and standard practices, including the use of regulatory default options, as
appropriate. The building downwash analysis was performed using the most recent version of EPA’s Building
Profile Input Program (BPIP) (Version 04274) with the plume rise model enhancements (PRIME) building
downwash algorithms, consistent with the air quality modeling.
3.2 Selection of Stack Parameters for the Air Toxics and Mercury Deposition
Assessments
With the exception of COS, the emissions of all air toxics were assumed to be the same for primary and
alternate operations. Thus, the only other difference between the risk modeling associated with the primary
and alternate operating mode was the different exhaust temperature and velocity, as noted in Table 2.
The primary case stack exit temperature is greater than for the alternate case but the exit velocity is greater for
the alternate case than the primary case. Therefore, to determine which set of stack parameters would result
in greater modeled risk, a comparative modeling analysis using AERMOD was conducted to determine which
case would result in higher ground-level HAP concentrations. Two averaging times were evaluated, annual
and maximum 1-hour. The findings indicated that the alternate case resulted in slightly higher maximum
ground-level concentrations for both averaging times, with the difference at the maximum annual receptor of
about 2% higher for the alternate case and the difference at the maximum 1-hour receptor of about 1% higher
for the alternate case. To verify that the use of the alternate stack parameters is also suitably conservative at
greater distances where mercury deposition is important, a similar comparison was made for the annual
average concentration at all off-site locations. Modeling confirmed that impacts for the alternate case were
slightly greater than the primary case with a maximum difference at any location of less than 3%.

4 Tier 2 Risk Screening Analysis
Proposed Kemper County IGCC Facility
Given that the maximum modeled concentrations for the alternate case stack parameters for both averaging
periods were slightly greater, the air toxics analysis was conservatively conducted assuming that the IGCC will
continuously operate with stack parameters corresponding to the alternate operation mode.
3.3 HEM-3 Results
The HEM-3 chronic cancer and non-cancer risk results based on the assessment of all HAPs are provided in
Table 3. Table 3 summarizes the results for maximum off-site risk and the maximum risk at population-based
receptors. The receptor locations corresponding to these impacts are shown in Figure 5. The total maximum
cancer risk from all HAPs combined is less than 2 x 10⁻⁷
for all population-oriented receptors and less than 4 x
10-7
at any off-site location. These values are well below EPA’s recommended significance level of 1x10⁻⁶.
The maximum off-site chronic HI in populated areas is about 0.004 and at any off-site location about 0.01.
These values are well less than EPA’s recommended significance level of 1.0. The results of the acute
analysis, summarized in Table 4, indicate that the maximum acute HI is less than 0.04, which is also well
below the 1.0 significance threshold.
This analysis demonstrates that the proposed IGCC units will not cause or contribute significantly to inhalation
risk in terms of acute or chronic health effects or cancer.
4.0 MMREM Analysis for Mercury
For the ingestion pathway, it is widely known that mercury in fish has the potential to pose the greatest health
concern when considering HAP emissions from coal combustion. A conservative fish ingestion-pathway
screening assessment for mercury was conducted using an adaptation of the MPCA Mercury Risk Estimation
Method (MMREM) screening spreadsheet-based computer program. MMREM was used to estimate the
non-cancer Oral HQ associated with fish tissue consumption for baseline mercury deposition and fish tissue
concentrations, and the increase in mercury deposition and fish tissue concentrations associated with the
small amount of mercury emitted from the IGCC units.
MMREM was applied in accordance with guidance provided in MPCA Mercury Risk Estimation Method (MMREM) for the Fish Consumption Pathway: Impact Assessment of a Nearby Emission Source (MPCA, 2006). The analysis utilized the most recent version of the MMREM spreadsheet provided on MPCA’s website (http://www.pca.state.mn.us/air/aera-mercury.html). The original version of MMREM estimated ambient background and facility deposition by multiplying estimated air concentrations by generic deposition velocities for each mercury species. To improve the accuracy of the calculations for the present application, adaptations to MMREM were made to include the ambient background mercury deposition representative of Mississippi, and modeled mercury deposition from the facility based on AERMOD modeling. MMREM was used to assess the incremental mercury risk associated with eating fish from the Okatibbee Reservoir. The location of the Okatibbee Reservoir and its watershed are shown in Figure 6. The proposed facility location is just within the northeast portion of the watershed approximately 13 kilometers to the north-northwest of Okatibbee Reservoir.
MMREM requires the area (in acres) of the water body and watershed, existing mercury concentration in fish, and facility modeled average impacts over the water body and watershed areas. MMREM requires that areal model results be determined for the water body surface and watershed. A receptor grid consisting of 500 meter spaced receptors was developed that covered the water body and entire watershed. AERMOD was then applied to estimate mercury deposition over the water body and watershed receptors. The modeled deposition rates were then averaged for the water body receptors and watershed receptors, respectively, to determine the areal averages input to MMREM.

5 Tier 2 Risk Screening Analysis
Proposed Kemper County IGCC Facility
4.1 Mercury Emissions
Mercury is emitted in three forms, elemental mercury vapor, reactive gaseous mercury (RGM), and particulate-
bound mercury (PBM). As indicated in Table 1, it is estimated that 90% of the total mercury emitted from the
IGCCs is in the form of elemental mercury, 10% RGM and un-quantified trace amounts of PBM. In terms of
the contribution to wet or dry deposition, elemental mercury is essentially inert because it has an extremely low
solubility and is non-reactive. Therefore, most of the elemental mercury remains airborne and is transported
over long distances (U.S. EPA, 1997). PBM is deposited with the particles with which it is incorporated, but in
this case the rate of emission is so low that the rate of PBM deposition cannot be quantified. In contrast, RGM
is soluble and reactive such that it is subject to both dry and wet deposition. Dry deposition occurs when
airborne RGM comes into contact with elements on the earth’s surface such as vegetation and water bodies.
Wet deposition occurs when precipitation falling through the plume captures soluble RGM vapor. Deposition
of RGM through wet and dry processes was simulated by U. S. EPA’s AERMOD air quality model to develop
the modeled data required by MMREM.
4.2 AERMOD Modeling
U.S. EPA’s AERMOD model was applied to estimate total deposition (wet and dry components) of RGM
mercury emitted from the IGCC units. Five years of representative meteorological data (1991-1995) were
applied, including National Weather Service (NWS) surface and precipitation data from Meridian Key Field in
Meridian, MS and upper air data from Jackson International Airport in Jackson, MS. AERMOD-ready
meteorological data was provided by the Mississippi Department of Environmental Quality (MDEQ) on their
website (http://www.mississippi.gov/frameset.jsp?URL=http%3A%2F%2F
%2Fwww.deq.state.ms.us%2FMDEQ.nsf%2Fpage%2FMain_Home%3FOpenDocument).
MMREM requires that area-wide average model results be provided for the water body surface and
watershed. A receptor grid consisting of 500 meter spaced receptors was developed that covered the water
body and entire watershed. Receptor elevations were developed using the National Elevation Dataset (NED)
acquired from the United States Geological Service (USGS) and AERMAP, the AERMOD model receptor
preprocessor.
Table 2 provides the IGCC stack parameters used in the AERMOD application. For the mercury deposition
analysis, the general modeling procedures and options specified in the current versions of the AERMOD
User’s Guide (U.S. EPA 2004b), AERMOD Implementation Guide (U.S. EPA 2009), and the Guideline on Air
Quality Models (GAQM; U.S. EPA 2005) were followed. Plume depletion was accounted for in the deposition
modeling. Modeling was conducted in a manner consistent with U.S. EPA guidance and standard practices,
including the use of regulatory default options, as appropriate. The building downwash analysis was
performed using the most recent version of EPA’s Building Profile Input Program (BPIP) (Version 04274) with
the plume rise model enhancements (PRIME) building downwash algorithms, consistent with the air quality
modeling.
Aerial imagery (2004) was examined to determine the land-use characteristics around the project site for use
as input into the model for mercury deposition calculations. The area in the vicinity of the project was found to
be heavily forested. As a result, category 4 (forest) was used for the gas dry deposition land-use category for
all 36 10o radials in the mercury deposition modeling as described in the Addendum to the AERMOD User’s
Guide (U.S EPA, 2006).
The transport and mobility of a pollutant are determined by the physical properties of the specific pollutant. For
deposition modeling, AERMOD requires several pollutant-specific parameters: (1) diffusivity in air; (2)
diffusivity in water; (3) leaf cuticular resistance to lipid uptake; and (4) the Henry’s Law constant. The following
values of these parameters recommended by U.S. EPA were applied:

6 Tier 2 Risk Screening Analysis
Proposed Kemper County IGCC Facility
• diffusivity in air: 6.0 x 10⁻²
cm2/sec
(1)
• diffusivity in water: 5.25 x 10⁻⁶ cm
2/sec
(2)
• Cuticular resistance: 1.0 x 10⁷ sec/m
(1)
• Henry’s Law constant: 6.0 x 10⁻⁶ pa-m
3/mol
(1)
• Reactivity factor: 1.0 (1)
(1)
Source is Wesley, M.L., Doskey, P.V., and Shannon, J.D. Deposition Parameterizations for the Industrial Source Complex (ISC3) Model, Argonne National Laboratory, June, 2002, Table 7 (p.27).
(2) Source is U.S. EPA’s Human Health Risk Assessment Protocol for Hazardous Waste Combustion Facilities –
[Publication No. EPA 530-R-05-006], September 2005. Information from companion HHRAP Database – Value for mercuric chloride. http://www.epa.gov/osw/hazard/tsd/td/combust/riskvol.htm#volume2 - scroll down to “Download HHRAP Companion Database (ACCESS)”.
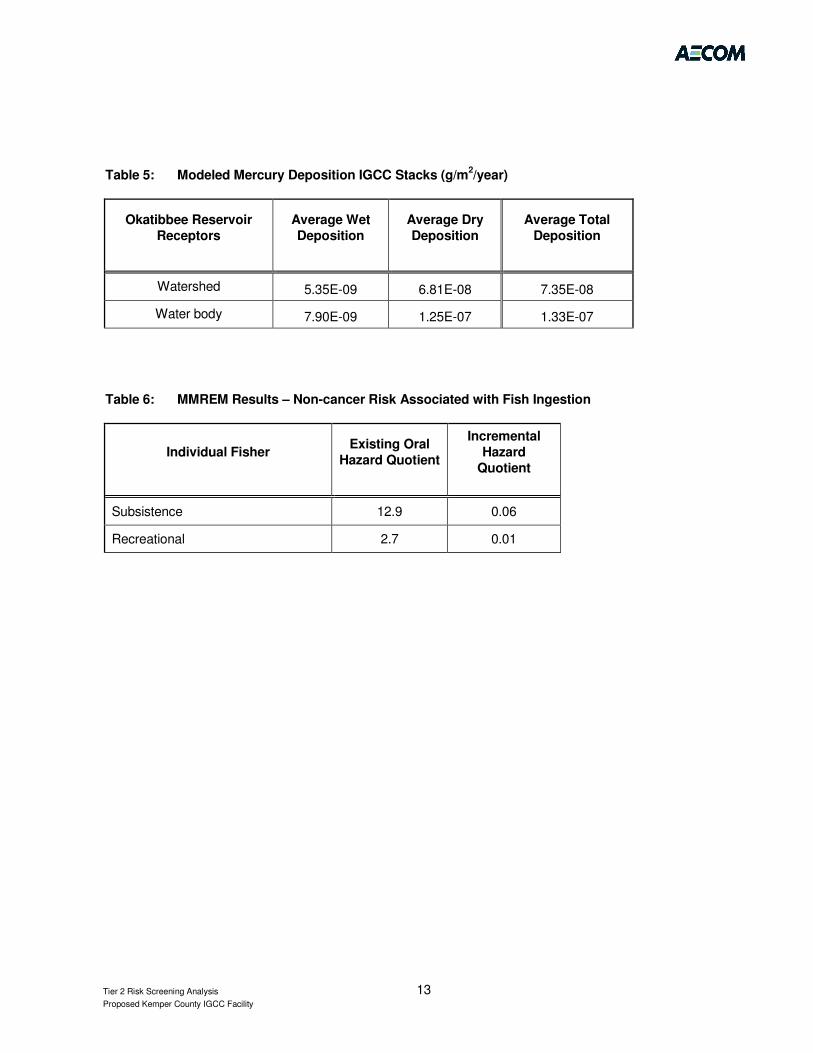
The AERMOD deposition modeling results are summarized in Table 5, which lists the average modeled
mercury deposition values for the Okatibbee Reservoir. The values for the water body and the watershed
required by MMREM were determined by averaging the modeled results for each respective receptor set.
4.3 MMREM Application
MMREM was applied with the following information:
• Area of water body = 4,144 acres.
• Area of watershed = 98,432 acres.
• Existing ambient fish concentration = 0.59 mg/kg mercury. Source is U.S. EPA Database: National
Survey of Mercury Concentrations in Fish (1990-1995)
http://www.epa.gov/waterscience/fish/technical/mercurydata.html). Data were derived from the average of
Okatibbee Reservoir fish samples; 6 samples were available, 5 largemouth bass and one catfish
sample. The average mercury concentration from all six fish samples was used to simulate a person
that eats a variety of fish.
• Ambient background mercury deposition = 17.2 µg/m2-yr. Data from OLF Mercury Study (2005-2008)
provided by Southern Company represents total deposition (wet and dry components); range is 15.9-
17.2 µg/m2-yr.
• Modeled total RGM deposition averaged over the water body receptors = 0.133 µg/m2-yr.
• Modeled total RGM deposition averaged over the watershed receptors = 0.074 µg/m2-yr.
The MMREM results are summarized in Table 6. Two oral HQs are computed by MMREM, one for a
subsistence fisher and another for a recreational fisher. For each type of fisher, two HQs are provided, an
Ambient HQ (based on measured levels of atmospheric deposition and mercury levels in fish tissue) and the
Incremental HQ (based on modeled mercury deposition associated with the proposed IGCC stack emissions).
The Ambient HQ for the subsistence fisher is 12.9 while the Incremental HQ is only 0.06. The Ambient HQ for
the recreational fisher is 2.7 while the Incremental HQ is only 0.01. These results indicate that the project
contribution to HQ is much lower than the U.S. EPA significance level (HQ of 1.0) and it is far overshadowed
by current ambient conditions. The MMREM analysis therefore demonstrates that the project will not
contribute substantially to non-cancer oral hazard quotients associated with fish tissue consumption.

7 Tier 2 Risk Screening Analysis
Proposed Kemper County IGCC Facility
5.0 Summary
An assessment of the HAP emissions from the proposed IGCC units was conducted using the conservative
assumption that the IGCC units will operate continuously at 100% load on syngas, for the worst-case alternate
(by-pass) mode where the carbon dioxide stream is ducted to the IGCC stacks. Modeling of HAP air
concentrations was conducted with U.S. EPA’s HEM-3 model to support an inhalation risk assessment for the
proposed Kemper County IGCC stacks. In addition, the analysis also included an evaluation of the fate,
transport and risk due to mercury emissions following the MMREM screening methodology, a fish ingestion-
pathway screening assessment for mercury. MMREM was used to estimate the non-cancer oral hazard
quotients associated with fish tissue consumption based on increases in mercury deposition to assess the
incremental mercury risk associated with eating fish from the Okatibbee Reservoir. The results of the
assessment indicate that the HAPs emitted from the project will not result in, or contribute to, human health
risk due to inhalation. In addition, the incremental non-cancer risk associated with fish ingestion from the
Okatibbee Reservoir is estimated to be insignificantly small compared to existing ambient conditions.
6.0 References
EPRI, 2003, Measurement and Control of Trace Element Emissions from IGCC Power Plants, EPRI, Palo Alto,
CA, J. WHeeldon: December, 2003. {1004536}.
MPCA, 2006. MPCA Mercury Risk Estimation Method (MMREM) for the Fish Consumption Pathway: Impact
Assessment of a Nearby Emission Source, December.
Radian Corporation, 1995. A Study of Toxic Emissions from a Coal-Fired Gasification Plant, prepared for the
U.S. Department of Energy, December. [http://www.fischer-tropsch.org/DOE/DOE_reports/93253/pc-93253-
t2/pc-93253-t2_toc.htm]
U.S.EPA, 1991. Role of the Baseline Risk Assessment in Superfund Remedy Selection Decisions. OSWER
Directive #9355.0-30. April. [http://www.epa.gov/oswer/riskassessment/pdf/baseline.pdf].
U.S. EPA, 1994. Chemical Summary for Carbonyl Sulfide. Office of Pollution Prevention and Air Toxics, EPA
749-F-94-009a, [http://www.epa.gov/chemfact/s_carbns.txt]
U.S. EPA, 1997. Mercury Study Report to Congress, Volume III: Fate and Transport of Mercury in the
Environment, EPA-452/R-97-005, December.
U.S. EPA, 2001. 2000 PBT Program Accomplishments, Office of Pollution Prevention and Air Toxics. EPA-
742-R-01-003, November. [http://www.epa.gov/oppt/pbt/pubs/PBT2000annualreport.pdf].
U.S. EPA, 2004a. Air Toxics Risk Assessment Reference Library: Volume 2 - Facility-Specific Assessment,
EPA-453-K-04-001B, April.
U.S. EPA, 2004b. Users Guide for the AMS/EPA Regulatory Model – AERMOD. EPA-454/B-03-001.
September.
U.S. EPA, 2005. Guideline on Air Quality Models (as incorporated in Appendix W of 40 CFR Part 51).
U.S. EPA, 2005. Human Health Risk Assessment Protocol for Hazardous Waste Combustion Facilities –
[Publication No. EPA 530-R-05-006], September 2005.
8 Tier 2 Risk Screening Analysis
Proposed Kemper County IGCC Facility
U.S. EPA, 2006. Addendum: Users Guide for the AMS/EPA Regulatory Model – AERMOD (EPA-454/B-03-
001, September 2004), December.
U.S. EPA, 2007a. Table 1. Prioritized Chronic Dose-Response Values (6/12/2007), Technology Transfer
Network Air Toxics Web Site [http://www.epa.gov/ttn/atw/toxsource/table1.pdf].
U.S. EPA, 2007b. Table 2. Acute Dose-Response Values for Screening Risk Assessments (6/12/2007)
[http://www.epa.gov/ttn/atw/toxsource/table2.pdf].
U.S. EPA, 2009. AERMOD Implementation Guide – Revised, March 19, 2009.
9 Tier 2 Risk Screening Analysis
Proposed Kemper County IGCC Facility
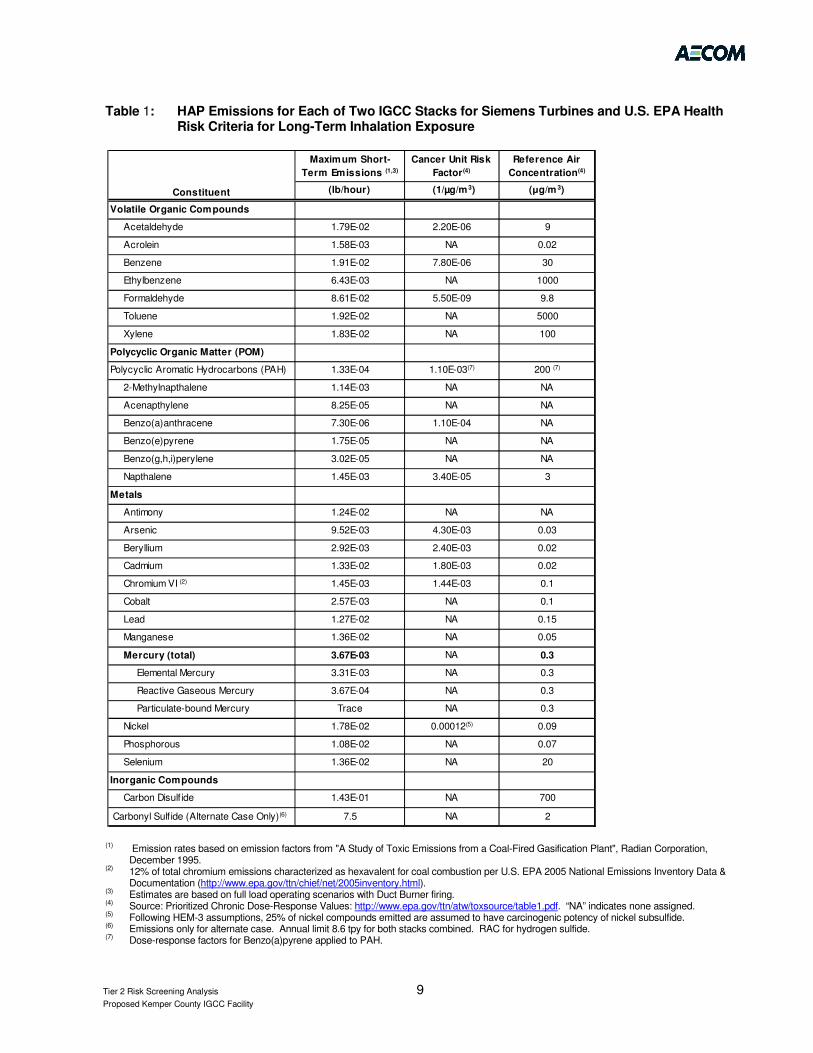
Table 1: HAP Emissions for Each of Two IGCC Stacks for Siemens Turbines and U.S. EPA Health Risk Criteria for Long-Term Inhalation Exposure
(1) Emission rates based on emission factors from "A Study of Toxic Emissions from a Coal-Fired Gasification Plant", Radian Corporation, December 1995.
(2) 12% of total chromium emissions characterized as hexavalent for coal combustion per U.S. EPA 2005 National Emissions Inventory Data & Documentation (http://www.epa.gov/ttn/chief/net/2005inventory.html).
(3) Estimates are based on full load operating scenarios with Duct Burner firing. (4) Source: Prioritized Chronic Dose-Response Values: http://www.epa.gov/ttn/atw/toxsource/table1.pdf. “NA” indicates none assigned. (5) Following HEM-3 assumptions, 25% of nickel compounds emitted are assumed to have carcinogenic potency of nickel subsulfide. (6) Emissions only for alternate case. Annual limit 8.6 tpy for both stacks combined. RAC for hydrogen sulfide. (7) Dose-response factors for Benzo(a)pyrene applied to PAH.
Maximum Short-
Term Emissions (1,3)
Cancer Unit Risk
Factor (4)
Reference Air
Concentration(4)
(lb/hour) (1/µg/m3) (µg/m 3)
Volatile Organic Compounds
Acetaldehyde 1.79E-02 2.20E-06 9
Acrolein 1.58E-03 NA 0.02
Benzene 1.91E-02 7.80E-06 30
Ethylbenzene 6.43E-03 NA 1000
Formaldehyde 8.61E-02 5.50E-09 9.8
Toluene 1.92E-02 NA 5000
Xylene 1.83E-02 NA 100
Polycyclic Organic Matter (POM)
Polycyclic Aromatic Hydrocarbons (PAH) 1.33E-04 1.10E-03(7) 200 (7)
2-Methylnapthalene 1.14E-03 NA NA
Acenapthylene 8.25E-05 NA NA
Benzo(a)anthracene 7.30E-06 1.10E-04 NA
Benzo(e)pyrene 1.75E-05 NA NA
Benzo(g,h,i)perylene 3.02E-05 NA NA
Napthalene 1.45E-03 3.40E-05 3
Metals
Antimony 1.24E-02 NA NA
Arsenic 9.52E-03 4.30E-03 0.03
Beryllium 2.92E-03 2.40E-03 0.02
Cadmium 1.33E-02 1.80E-03 0.02
Chromium VI (2) 1.45E-03 1.44E-03 0.1
Cobalt 2.57E-03 NA 0.1
Lead 1.27E-02 NA 0.15
Manganese 1.36E-02 NA 0.05
Mercury (total) 3.67E-03 NA 0.3
Elemental Mercury 3.31E-03 NA 0.3
Reactive Gaseous Mercury 3.67E-04 NA 0.3
Particulate-bound Mercury Trace NA 0.3
Nickel 1.78E-02 0.00012(5) 0.09
Phosphorous 1.08E-02 NA 0.07
Selenium 1.36E-02 NA 20
Inorganic Compounds
Carbon Disulfide 1.43E-01 NA 700
Carbonyl Sulfide (Alternate Case Only)(6) 7.5 NA 2
Constituent

10 Tier 2 Risk Screening Analysis
Proposed Kemper County IGCC Facility
Table 2: IGCC Stack Parameters for Primary and Alternate Operations
Parameter Value
Primary Operations Alternate Operation
Stack Base Elevation (ft) 474 474
Stack Height (ft) 325 325
Stack Diameter (ft)
24 24
Exit Temperature (oF) 213 198
Exit Velocity (ft/sec) 46.0 48.4

11 Tier 2 Risk Screening Analysis
Proposed Kemper County IGCC Facility
Table 3: HEM-3 Results – Chronic Hazard Index and Cancer Risk
Hazardous Air Pollutant
Maximum Long Term Risk
in Populated Areas(1)
Maximum Long-Term Risk
at Any Off-site Location(2)
Lifetime
Individual
Cancer Risk
Chronic
Hazard
Index
Lifetime
Individual
Cancer Risk
Chronic
Hazard
Index
Acetaldehyde 6.9E-11 3.5E-06 1.7E-10 8.6E-06
Acrolein NA 1.4E-04 NA 3.4E-04
Antimony compounds NA 1.1E-04 NA 2.7E-04
Arsenic compounds 7.1E-08 5.5E-04 1.8E-07 1.4E-03
Benz(a)anthracene 1.4E-12 NA 3.5E-12 NA
Benzene 2.6E-10 1.1E-06 6.5E-10 2.8E-06
PAH (as Benzo(a)pyrene) 2.5E-10 NA 6.3E-10 NA
Beryllium compounds 1.2E-08 2.5E-04 3.0E-08 6.3E-04
Cadmium compounds 4.2E-08 1.2E-03 1.0E-07 2.9E-03
Carbon Disulfide NA 3.6E-07 NA 8.8E-07
Chromium (VI) compounds 3.0E-08 2.5E-05 7.5E-08 6.3E-05
Cobalt compounds NA 4.5E-05 NA 1.1E-04
Ethyl benzene NA 1.1E-08 NA 2.8E-08
Formaldehyde 8.3E-13 1.5E-05 2.1E-12 3.8E-05
Hydrogen sulfide NA 8.6E-04 NA 2.1E-03
Lead compounds NA 1.5E-05 NA 3.7E-05
Manganese compounds NA 4.8E-04 NA 1.2E-03
Mercury (elemental) NA 2.1E-05 NA 5.3E-05
Naphthalene 8.6E-11 8.4E-07 2.1E-10 2.1E-06
Nickel compounds 3.7E-09 3.4E-04 9.2E-09 8.6E-04
Phosphorus NA 2.7E-04 NA 6.7E-04
Selenium compounds NA 1.2E-06 NA 3.0E-06
Toluene NA 6.7E-09 NA 1.7E-08
Xylenes NA 3.2E-07 NA 8.0E-07
Total Risk for All HAPs 1.6E-07 4.3E-03 4.0E-07 1.1E-02
Note: “NA” indicates that EPA has not assigned a dose-response factor
(1) Maximum among HEM-3 Census 2000 population centroid receptors
(2) Maximum among all HEM-3 receptors

12 Tier 2 Risk Screening Analysis
Proposed Kemper County IGCC Facility
Table 4: HEM- 3 Results – Acute Risk
Hazardous Air Pollutant
Acute Reference Air
Concentration(1)
(µg/m
3)
Maximum Offsite 1-hr
Concentration Anywhere Off-site
(2)
(µg/m3)
Acute Hazard
Quotient Anywhere
Off-site
Maximum 1-hr Concentration in Populated
Areas(3)
(µg/m
3)
Acute Hazard
Quotient In Populated
Areas
2-Methylnaphthalene 6.0E+03 1.7E-04 2.9E-08 1.3E-04 2.2E-08
Acenaphthylene 1.0E+09 1.2E-05 1.2E-14 9.7E-06 9.7E-15
Acetaldehyde 8.1E+04 2.7E-03 3.3E-08 2.1E-03 2.6E-08
Acrolein 1.9E-01 2.4E-04 1.2E-03 1.9E-04 9.8E-04
Antimony compounds 5.0E+03 1.9E-03 3.7E-07 1.5E-03 2.9E-07
Arsenic compounds 1.9E-01 1.4E-03 7.5E-03 1.1E-03 5.9E-03
Benz(a)anthracene 1.0E+02 1.1E-06 1.1E-08 8.6E-07 8.6E-09
Benzene 2.9E+01 2.9E-03 9.9E-05 2.3E-03 7.8E-05
PAH (as Benzo(a)pyrene) 2.0E+02 2.0E-05 9.9E-08 1.6E-05 7.8E-08
Benzo(e)pyrene 1.0E+09 2.6E-06 2.6E-15 2.1E-06 2.1E-15
Benzo(ghi)perylene 1.0E+04 4.5E-06 4.5E-10 3.6E-06 3.6E-10
Beryllium compounds 2.5E+01 4.4E-04 1.7E-05 3.4E-04 1.4E-05
Cadmium compounds 9.0E+02 2.0E-03 2.2E-06 1.6E-03 1.7E-06
Carbon Disulfide 6.2E+03 2.1E-02 3.4E-06 1.7E-02 2.7E-06
Chromium (VI)
compounds 1.5E+03 2.2E-04 1.4E-07 1.7E-04 1.1E-07
Cobalt compounds 2.0E+03 3.8E-04 1.9E-07 3.0E-04 1.5E-07
Ethyl benzene 3.5E+05 9.6E-04 2.8E-09 7.6E-04 2.2E-09
Formaldehyde 4.9E+01 1.3E-02 2.6E-04 1.0E-02 2.1E-04
COS as Hydrogen sulfide 4.2E+01 1.1E+00 2.7E-02 8.9E-01 2.1E-02
Lead compounds 1.0E+04 1.9E-03 1.9E-07 1.5E-03 1.5E-07
Manganese compounds 5.0E+04 2.0E-03 4.1E-08 1.6E-03 3.2E-08
Mercury 1.8E+00 5.5E-04 3.1E-04 4.3E-04 2.4E-04
Naphthalene 1.3E+05 2.2E-04 1.7E-09 1.7E-04 1.3E-09
Nickel compounds 6.0E+00 2.7E-03 4.4E-04 2.1E-03 3.5E-04
Phosphorus 2.0E+01 1.6E-03 8.1E-05 1.3E-03 6.4E-05
Selenium compounds 1.0E+02 2.0E-03 2.0E-05 1.6E-03 1.6E-05
Toluene 3.8E+03 2.9E-03 7.6E-07 2.3E-03 6.0E-07
Xylenes 8.7E+03 2.7E-03 3.2E-07 2.2E-03 2.5E-07
Acute Hazard Indices 0.037 0.029
(1) Source: Acute Dose-Response Values for Screening Risk Assessments (6/12/2007)
http://www.epa.gov/ttn/atw/toxsource/table2.pdf.
(2) Maximum among all HEM-3 receptors
(3) Maximum among HEM-3 Census 2000 population centroid receptors
13 Tier 2 Risk Screening Analysis
Proposed Kemper County IGCC Facility
Table 5: Modeled Mercury Deposition IGCC Stacks (g/m2/year)
Okatibbee Reservoir
Receptors
Average Wet
Deposition
Average Dry
Deposition
Average Total
Deposition
Watershed 5.35E-09 6.81E-08 7.35E-08
Water body 7.90E-09 1.25E-07 1.33E-07
Table 6: MMREM Results – Non-cancer Risk Associated with Fish Ingestion
Individual Fisher Existing Oral
Hazard Quotient
Incremental
Hazard
Quotient
Subsistence 12.9 0.06
Recreational 2.7 0.01

14 Tier 2 Risk Screening Analysis
Proposed Kemper County IGCC Facility
Figure 1: Relative Location of Kemper IGCC Project Site, Meteorological Data Sources, and Ambient
Mercury Monitor

15 Tier 2 Risk Screening Analysis
Proposed Kemper County IGCC Facility
Figure 2: Meridian Key Field 5-year (1991-1995) Wind Rose

16 Tier 2 Risk Screening Analysis
Proposed Kemper County IGCC Facility
Figure 3: Detailed Receptor Grid Used to Determine Maximum Offsite Impacts – Near-Field
Receptors

17 Tier 2 Risk Screening Analysis
Proposed Kemper County IGCC Facility
Figure 4: Detailed Receptor Grid Used to Determine Maximum Offsite Impacts – Far-Field Receptors

18 Tier 2 Risk Screening Analysis
Proposed Kemper County IGCC Facility
Figure 5: HEM-3 Population Centroid Receptors and Maximum Modeled Impact Locations

19 Tier 2 Risk Screening Analysis
Proposed Kemper County IGCC Facility
Figure 6: Lake Okatibbee Watershed

This page intentionally left blank.