Taking Stock 1999: Sourcebook - North American Pollutant ...
318
TAKING STOCK 1999 North American Pollutant Releases and Transfers SOURCEBOOK COMMISSION FOR ENVIRONMENTAL COOPERATION OF NORTH AMERICA 2 0 0 2
-
Upload
khangminh22 -
Category
Documents
-
view
0 -
download
0
Transcript of Taking Stock 1999: Sourcebook - North American Pollutant ...
TAKING STOCK 1999
North American Pollutant Releases and Transfers
SOURCEBOOK
COMMISSION FOR ENVIRONMENTAL COOPERATION OF NORTH AMERICA
2 0 0 2
Disclaimer The National Pollutant Release Inventory (NPRI) and the Toxics Release Inventory (TRI) data sets are constantly evolving, as facilities revise previous submissions to correct reporting errors or make other changes. For this reason, both Canada and the United States “lock” their data sets on a specific date and use the “locked” data set for annual summary reports. Each year, both countries issue revised databases that cover all reporting years.
The CEC follows a similar process. For the purposes of this report, the TRI data set of April 2001 and the NPRI data set of May 2001 were used. The CEC is aware that changes have occurred to both data sets for the reporting year 1999 since this time that are not reflected in this report. These changes will be reflected in the next reports, which will summarize the 2000 data and make year-to-year comparisons with previous years’ data.
This publication was prepared by the Secretariat of the Commission for Environmental Cooperation (CEC). The views contained herein do not necessarily reflect the views of the CEC, or the governments of Canada, Mexico or the United States of America.
Reproduction of this document in whole or in part and in any form for educational or non-profit purposes may be made without special permission from the CEC Secretariat, provided acknowledgement of the source is made. The CEC would appreciate receiving a copy of any publication or material that uses this document as a source.
Published by the Communications and Public Outreach Department of the CEC Secretariat.
For more information about this or other publications from the CEC, contact:
COMMISSION FOR ENVIRONMENTAL COOPERATION
393, rue St-Jacques Ouest, bureau 200
Montréal (Québec) Canada H2Y 1N9
Tel: (514) 350-4300 • Fax: (514) 350-4314
http://www.cec.org
ISBN 2–922305–69–4 (French edition: ISBN 2–922305–70–8 Spanish edition: ISBN 2–922305–71–6
© Commission for Environmental Cooperation, 2002
Legal Deposit-Bibliothèque nationale du Québec, 2002 Legal Deposit-Bibliothèque nationale du Canada, 2002
Disponible en français – Disponible en español
Layout: Jean Racicot
Printed in Canada
Table of Contents
iii
Chapter
1
2
3
4
5
6
7
8
TAKING STOCK Preface......................................................................................................................................... v
Acknowledgements .................................................................................................................. vi
List of Acronyms....................................................................................................................... vii
List of Definitions ....................................................................................................................... ix
Overview of PRTRs in North America..................................................................................... 1
User’s Guide to North American PRTR Data ....................................................................... 13
Releases On- and Off-site, 1999 ............................................................................................. 39
Transfers to Recycling and Other Transfers for Further Management, 1999 ................ 87
Total Reported Amounts of Releases and Transfers, 1999 ............................................. 113
Total Reported Amounts of Releases and Transfers, 1998–1999 ................................... 127
Releases and Transfers, 1995–1999 .................................................................................... 173
Cross-Border Transfers......................................................................................................... 211
Appendix A – A Comparison of Chemicals Listed under 1999 TRI, NPRI and RETC ... 237
Appendix B – Matched Chemicals – Listed in both TRI and NPRI, 1999 ...................... 253
Appendix C – List of Facilities that Appear in Tables....................................................... 259
Appendix D – Human Health Effects of Chemicals on the”Top 25” Lists ..................... 269
Appendix E – Uses of Chemicals on the “Top 25” Lists .................................................. 273
Appendix F – TRI Reporting Form ....................................................................................... 277
Appendix G – NPRI Reporting Form.................................................................................... 283
Appendix H – Annual Certificate for the Operation of Industrial Facilities under Federal Jurisdiction for the Year 1999 (Cédula de Operación Anual ) ... 295

Preface
v
Preface Tracking pollutant data is important not only for what it tells us about the environment around us but also for the questions it can raise. This year’s Taking Stock takes a five-year look at the amounts of toxic releases and transfers reported by industrial facilities in North America, from 1995 to 1999. Based on data from the national pollutant release and transfer registers (PRTRs), this five-year span provides us with an opportunity to assess key trends and ask ourselves the central question: are we making sufficient progress in reducing the amounts of these substances we are releasing into the environment and transferring into and through our communities each year.
The results are mixed. While we have achieved a slight overall decrease of 3 percent in the total amounts reported by industries in the 1995–1999 time period, when we look at the underlying figures we find some very different patterns. Facilities have made good progress in cutting releases to air (down by 25 percent), but over the same time period the amounts sent to surface waters—lakes, rivers, streams—have actually increased by 26 percent. The picture is also quite different when we look at total releases—amounts put directly into air, water and land—as compared with quantities shipped to other locations for further management (e.g., to sewage or for other treatment). Releases are down 6 percent, but the transfers of chemicals by truck, train or other modes of transport have increased over the five-year period by 12 percent. These five-year trends are for the manufacturing sectors only. As of the 1998 reporting year, we now also have comparable data for additional industry sectors such as electric utilities and hazardous waste management facilities, as well as on transfers for recycling and energy recovery.
These mixed results should prompt all of us—industry, government, NGOs and citizens—to ask ourselves what can be done to get all of the PRTR trends pointing in a downward direction. We have made progress in reducing toxic releases to air. Now, how can we do the same for water and land releases? Why are more substances being shipped off-site for management? Is this indicative of facilities’ desire to send their wastes to locations that are better equipped to manage them effectively? Or does it signal that end-of-the-pipe approaches are still too frequently employed instead of preventing pollution at the source? How can the right mix of requirements, incentives and tools be brought to bear to foster a decisive shift to the use of preventive approaches that will safeguard our environment and the health of our populations?
These are vital questions for us to explore and answer in our common pursuit for sustainable development here in North America and worldwide. Indeed, the use of PRTRs to identify opportunities for improvement, to stimulate pollution reductions and to put the power of information into the hands of citizens are gathering momentum around the world. Recent global meetings have called upon countries to develop PRTRs as tools for sound management of chemicals and the public’s right-to-know. And there is increasing interest in the use of PRTRs regionally and even globally to track progress on chemicals that are the focus of global concern, such as the persistent organic pollutants (POPs) targeted under the Stockholm Convention. The CEC and the three North American countries are working hard—individually and collectively— to pioneer some of these applications and to share what we are learning with others around the world.
In addition to the five-year trends in pollutant releases and transfers, this year’s report provides North Americans with valuable new information as a result of important developments in the national programs for the 1999 reporting year. Due to a recent expansion of NPRI reporting, we now have comparable Canadian and US data for a number of new chemicals, including some of the substances that are known to deplete the ozone layer. We have also included analyses of certain subsets of chemicals, including the ozone depleters, chemicals listed as toxic in the Canadian Environmental Protection Act (CEPA) and chemicals appearing on the California Proposition 65 list of carcinogens and reproductive toxins.
We hope that this report provides you, the reader, with a basis for exploring the issues and questions that are of greatest interest to you. As always, we welcome your suggestions on ways in which Taking Stock can keep pace with your interests and needs.
Janine Ferretti
CEC Executive Director
Taking Stock: North American Pollutant Releases and Transfers 1999
vi
Acknowledgements Numerous groups and individuals have played important roles in bringing this report to fruition.
Officials from Environment Canada, Semarnat and the US EPA contributed vital information and assistance throughout the report’s development. This past year we have worked with the following officials from these agencies: Canada— Alain Chung and François Lavallée; Mexico—Juan Barrera Cordero, Hilda Martínez Salgado, Maricruz Rodríguez Gallego, Juan David Reyes Vázquez and Floreida Paz; and the United States—Maria Doa and John Harman.
Special thanks and recognition go to the team of consultants who worked tirelessly to put this report together: Catherine Miller and Nancy Levine of Hampshire Research Institute (United States); Sarah Rang of Environmental Economics International (Canada); Isabel Kreiner of UV Lateinamerika S. de R.L. de C.V. Thanks also go to Hampshire Research Institute, in particular, to Rich Puchalsky and Catherine Miller, for their work in creating the Taking Stock Online web site <www.cec.org/takingstock/>.
A number of CEC Secretariat staff have been involved in the development and launching of this report and the companion web site. Erica Phipps, program manager for CEC’s PRTR project, is responsible for guiding the development of the Taking Stock series, including coordinating the public consultations. The CEC’s publications staff—Jeffrey Stoub, Douglas Kirk, Raymonde Lanthier, Miguel López, Carol Smith and Kevin Crombie—have handled the tremendous task of coordinating the editing, translation and publication of the document in the three languages. Patrick Scantland, CEC webmaster, has contributed greatly to the development of Taking Stock OnLine.
Above all, the CEC would like to thank the many individuals and groups from throughout North America who have given generously of their time and ideas to the development of this report through their participation in the Consultative Group for the North American PRTR Project.
List of Acronyms
vii
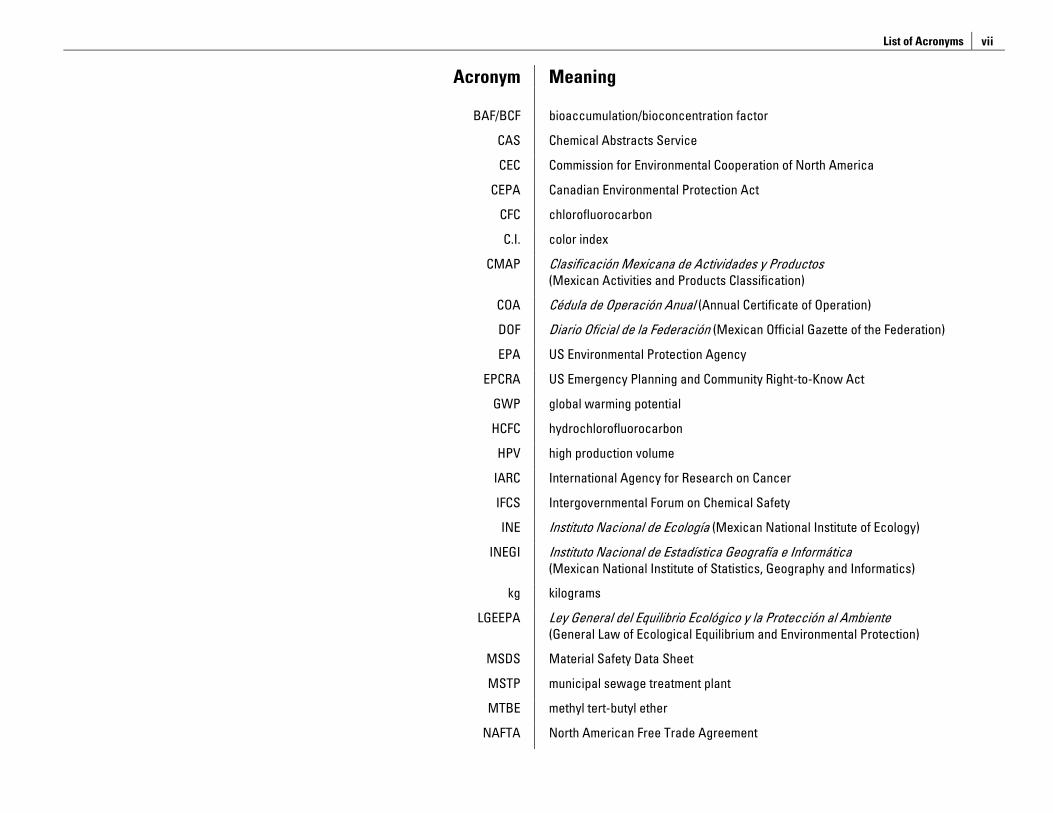
Acronym Meaning
BAF/BCF bioaccumulation/bioconcentration factor
CAS Chemical Abstracts Service
CEC Commission for Environmental Cooperation of North America
CEPA Canadian Environmental Protection Act
CFC chlorofluorocarbon
C.I. color index
CMAP Clasificación Mexicana de Actividades y Productos (Mexican Activities and Products Classification)
COA Cédula de Operación Anual (Annual Certificate of Operation)
DOF Diario Oficial de la Federación (Mexican Official Gazette of the Federation)
EPA US Environmental Protection Agency
EPCRA US Emergency Planning and Community Right-to-Know Act
GWP global warming potential
HCFC hydrochlorofluorocarbon
HPV high production volume
IARC International Agency for Research on Cancer
IFCS Intergovernmental Forum on Chemical Safety
INE Instituto Nacional de Ecología (Mexican National Institute of Ecology)
INEGI Instituto Nacional de Estadística Geografía e Informática (Mexican National Institute of Statistics, Geography and Informatics)
kg kilograms
LGEEPA Ley General del Equilibrio Ecológico y la Protección al Ambiente (General Law of Ecological Equilibrium and Environmental Protection)
MSDS Material Safety Data Sheet
MSTP municipal sewage treatment plant
MTBE methyl tert-butyl ether
NAFTA North American Free Trade Agreement
Taking Stock: North American Pollutant Releases and Transfers 1999
viii
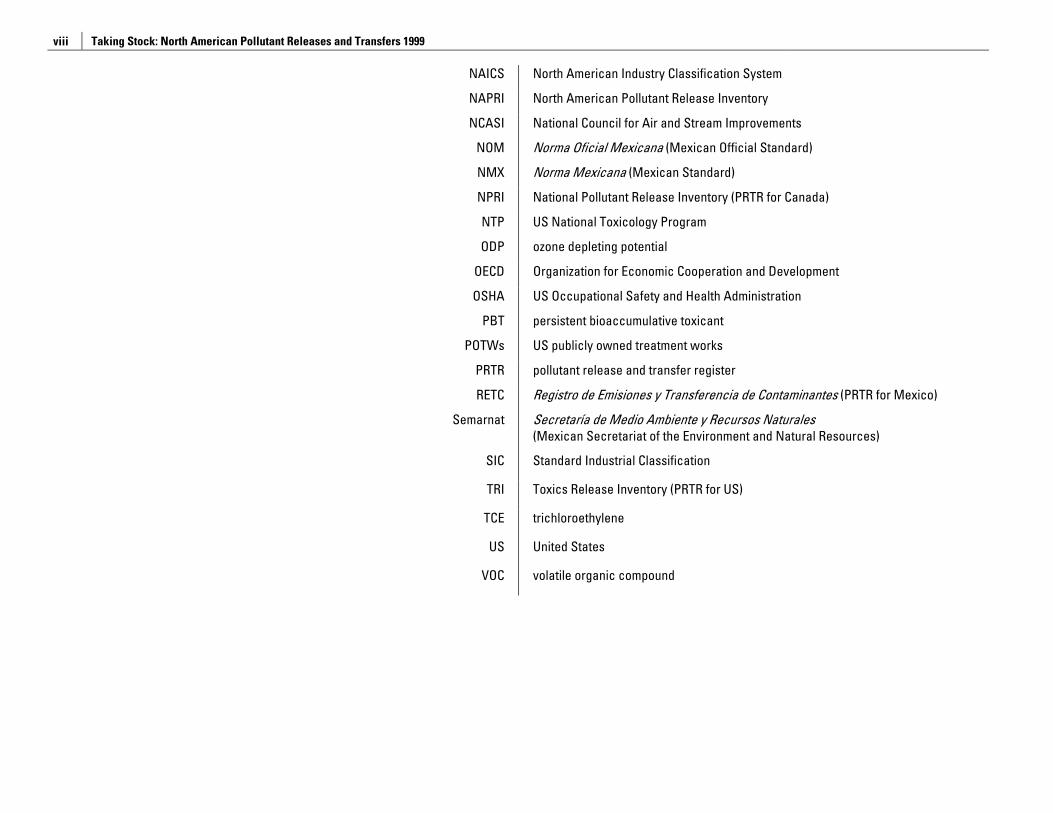
NAICS North American Industry Classification System
NAPRI North American Pollutant Release Inventory
NCASI National Council for Air and Stream Improvements
NOM Norma Oficial Mexicana (Mexican Official Standard)
NMX Norma Mexicana (Mexican Standard)
NPRI National Pollutant Release Inventory (PRTR for Canada)
NTP US National Toxicology Program
ODP ozone depleting potential
OECD Organization for Economic Cooperation and Development
OSHA US Occupational Safety and Health Administration
PBT persistent bioaccumulative toxicant
POTWs US publicly owned treatment works
PRTR pollutant release and transfer register
RETC Registro de Emisiones y Transferencia de Contaminantes (PRTR for Mexico)
Semarnat Secretaría de Medio Ambiente y Recursos Naturales (Mexican Secretariat of the Environment and Natural Resources)
SIC Standard Industrial Classification
TRI Toxics Release Inventory (PRTR for US)
TCE trichloroethylene
US United States
VOC volatile organic compound
List of Definitions
ix
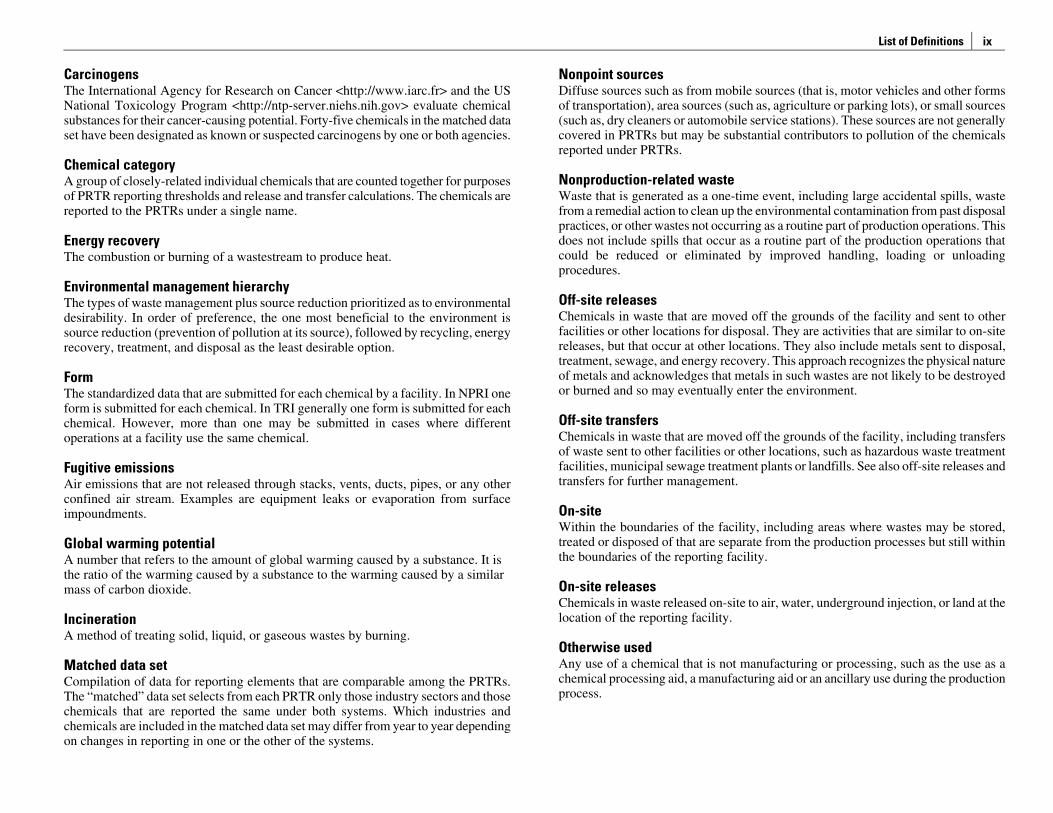
Carcinogens The International Agency for Research on Cancer <http://www.iarc.fr> and the US National Toxicology Program <http://ntp-server.niehs.nih.gov> evaluate chemical substances for their cancer-causing potential. Forty-five chemicals in the matched data set have been designated as known or suspected carcinogens by one or both agencies.
Chemical category A group of closely-related individual chemicals that are counted together for purposes of PRTR reporting thresholds and release and transfer calculations. The chemicals are reported to the PRTRs under a single name.
Energy recovery The combustion or burning of a wastestream to produce heat.
Environmental management hierarchy The types of waste management plus source reduction prioritized as to environmental desirability. In order of preference, the one most beneficial to the environment is source reduction (prevention of pollution at its source), followed by recycling, energy recovery, treatment, and disposal as the least desirable option.
Form The standardized data that are submitted for each chemical by a facility. In NPRI one form is submitted for each chemical. In TRI generally one form is submitted for each chemical. However, more than one may be submitted in cases where different operations at a facility use the same chemical.
Fugitive emissions Air emissions that are not released through stacks, vents, ducts, pipes, or any other confined air stream. Examples are equipment leaks or evaporation from surface impoundments.
Global warming potential A number that refers to the amount of global warming caused by a substance. It is the ratio of the warming caused by a substance to the warming caused by a similar mass of carbon dioxide.
Incineration A method of treating solid, liquid, or gaseous wastes by burning.
Matched data set Compilation of data for reporting elements that are comparable among the PRTRs. The “matched” data set selects from each PRTR only those industry sectors and those chemicals that are reported the same under both systems. Which industries and chemicals are included in the matched data set may differ from year to year depending on changes in reporting in one or the other of the systems.
Nonpoint sources Diffuse sources such as from mobile sources (that is, motor vehicles and other forms of transportation), area sources (such as, agriculture or parking lots), or small sources (such as, dry cleaners or automobile service stations). These sources are not generally covered in PRTRs but may be substantial contributors to pollution of the chemicals reported under PRTRs.
Nonproduction-related waste Waste that is generated as a one-time event, including large accidental spills, waste from a remedial action to clean up the environmental contamination from past disposal practices, or other wastes not occurring as a routine part of production operations. This does not include spills that occur as a routine part of the production operations that could be reduced or eliminated by improved handling, loading or unloading procedures.
Off-site releases Chemicals in waste that are moved off the grounds of the facility and sent to other facilities or other locations for disposal. They are activities that are similar to on-site releases, but that occur at other locations. They also include metals sent to disposal, treatment, sewage, and energy recovery. This approach recognizes the physical nature of metals and acknowledges that metals in such wastes are not likely to be destroyed or burned and so may eventually enter the environment.
Off-site transfers Chemicals in waste that are moved off the grounds of the facility, including transfers of waste sent to other facilities or other locations, such as hazardous waste treatment facilities, municipal sewage treatment plants or landfills. See also off-site releases and transfers for further management.
On-site Within the boundaries of the facility, including areas where wastes may be stored, treated or disposed of that are separate from the production processes but still within the boundaries of the reporting facility.
On-site releases Chemicals in waste released on-site to air, water, underground injection, or land at the location of the reporting facility.
Otherwise used Any use of a chemical that is not manufacturing or processing, such as the use as a chemical processing aid, a manufacturing aid or an ancillary use during the production process.
Taking Stock: North American Pollutant Releases and Transfers 1999
x
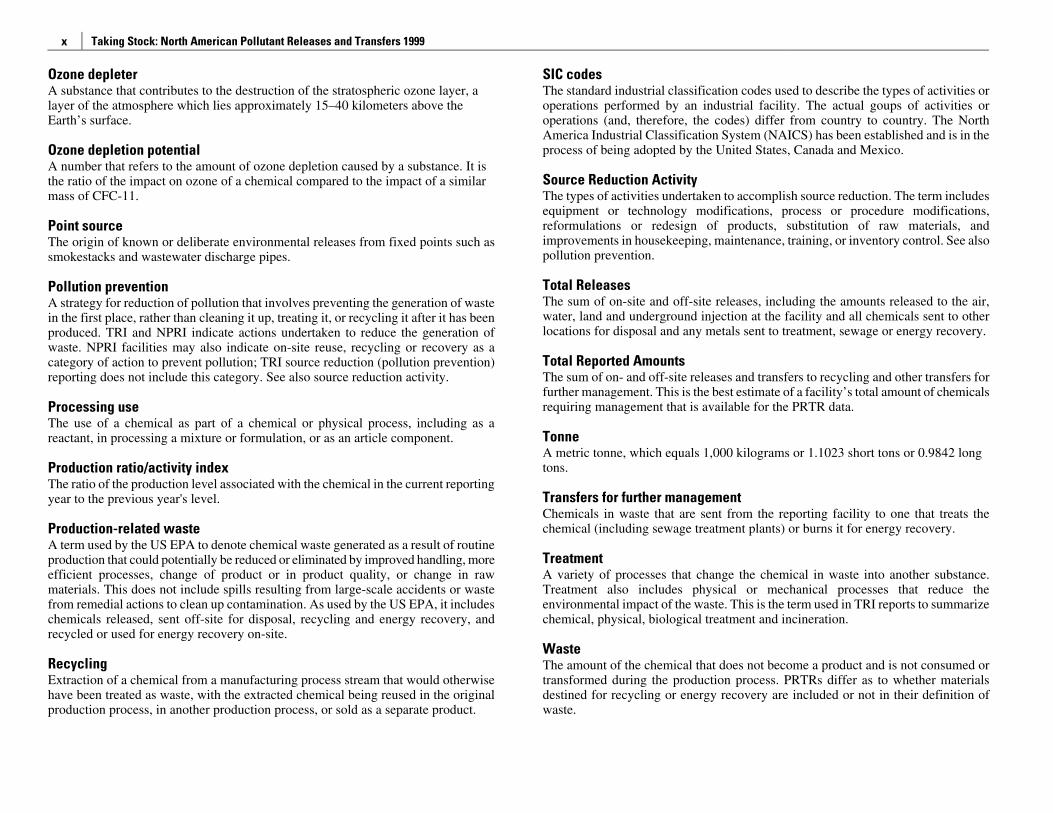
Ozone depleter A substance that contributes to the destruction of the stratospheric ozone layer, a layer of the atmosphere which lies approximately 15–40 kilometers above the Earth’s surface.
Ozone depletion potential A number that refers to the amount of ozone depletion caused by a substance. It is the ratio of the impact on ozone of a chemical compared to the impact of a similar mass of CFC-11.
Point source The origin of known or deliberate environmental releases from fixed points such as smokestacks and wastewater discharge pipes.
Pollution prevention A strategy for reduction of pollution that involves preventing the generation of waste in the first place, rather than cleaning it up, treating it, or recycling it after it has been produced. TRI and NPRI indicate actions undertaken to reduce the generation of waste. NPRI facilities may also indicate on-site reuse, recycling or recovery as a category of action to prevent pollution; TRI source reduction (pollution prevention) reporting does not include this category. See also source reduction activity.
Processing use The use of a chemical as part of a chemical or physical process, including as a reactant, in processing a mixture or formulation, or as an article component.
Production ratio/activity index The ratio of the production level associated with the chemical in the current reporting year to the previous year's level.
Production-related waste A term used by the US EPA to denote chemical waste generated as a result of routine production that could potentially be reduced or eliminated by improved handling, more efficient processes, change of product or in product quality, or change in raw materials. This does not include spills resulting from large-scale accidents or waste from remedial actions to clean up contamination. As used by the US EPA, it includes chemicals released, sent off-site for disposal, recycling and energy recovery, and recycled or used for energy recovery on-site.
Recycling Extraction of a chemical from a manufacturing process stream that would otherwise have been treated as waste, with the extracted chemical being reused in the original production process, in another production process, or sold as a separate product.
SIC codes The standard industrial classification codes used to describe the types of activities or operations performed by an industrial facility. The actual goups of activities or operations (and, therefore, the codes) differ from country to country. The North America Industrial Classification System (NAICS) has been established and is in the process of being adopted by the United States, Canada and Mexico.
Source Reduction Activity The types of activities undertaken to accomplish source reduction. The term includes equipment or technology modifications, process or procedure modifications, reformulations or redesign of products, substitution of raw materials, and improvements in housekeeping, maintenance, training, or inventory control. See also pollution prevention.
Total Releases The sum of on-site and off-site releases, including the amounts released to the air, water, land and underground injection at the facility and all chemicals sent to other locations for disposal and any metals sent to treatment, sewage or energy recovery.
Total Reported Amounts The sum of on- and off-site releases and transfers to recycling and other transfers for further management. This is the best estimate of a facility’s total amount of chemicals requiring management that is available for the PRTR data.
Tonne A metric tonne, which equals 1,000 kilograms or 1.1023 short tons or 0.9842 long tons.
Transfers for further management Chemicals in waste that are sent from the reporting facility to one that treats the chemical (including sewage treatment plants) or burns it for energy recovery.
Treatment A variety of processes that change the chemical in waste into another substance. Treatment also includes physical or mechanical processes that reduce the environmental impact of the waste. This is the term used in TRI reports to summarize chemical, physical, biological treatment and incineration.
Waste The amount of the chemical that does not become a product and is not consumed or transformed during the production process. PRTRs differ as to whether materials destined for recycling or energy recovery are included or not in their definition of waste.
Chapter 1 – Overview of PRTRs in North America
1
Table of Contents
1.1 Introduction......................................................................................................................3 1.1.1 What is a Pollutant Release and Transfer Register? ...................................4
1.2 Overview of Existing PRTR Programs in North America.........................................7 1.2.1 The US TRI...........................................................................................................7 1.2.2 Canada’s NPRI....................................................................................................8 1.2.3 The RETC in Mexico...........................................................................................8
1.3 North American PRTR Contacts .................................................................................12
Boxes
CEC’s Consultative Process for the PRTR Program..............................................................4 PRTRs Globally............................................................................................................................5 PRTRs: A Priority Focus for CEC ..............................................................................................6 CEC’s Air Quality Program.........................................................................................................9 1999 Reporting under the Mexican Registro de Emisiones y Transferencias de Contaminantes (RETC) .......................................................................................................10

Chapter 1 – Overview of PRTRs in North America
3
Introduction to Taking Stock 1999 • Chapter 1 provides an introduction to PRTRs and the CEC. It describes the PRTR programs in the US, Canada and
Mexico and provides program contacts and web sites.
• Chapter 2 offers guidance on using the North American PRTR data, explains how the data from the Canadian NPRI and United States TRI are compiled for this report (comparable data for Mexican facilities for 1999 are not available) and provides context for understanding the data and their limitations.
• Chapter 3 presents data for on- and off-site releases. These data cover releases on-site to the air, surface waters, underground injection and land. The analyses also cover off-site releases, i.e., the amounts that facilities transfer to other locations for disposal.
• Chapter 4 presents data on transfers for further management. These data show the amount of the chemicals sent off-site to another location for recycling, energy recovery, and treatment and to municipal sewage treatment plants.
• Chapter 5 presents data on total releases and transfers in 1999. These data show the total amounts of chemicals that were reported for the 1999 reporting year, based on the matched North American data set. The data include amounts released on- or off-site, transferred for recycling, and transferred for further management for 210 chemicals, including chemicals newly added to NPRI for the 1999 reporting year.
• Chapter 6 presents changes in releases and transfers for 1998–1999. The data do not include chemicals added to NPRI for the 1999 reporting year, but do include all industry sectors and transfer categories in the matched data set.
• Chapter 7 presents trends in releases and transfers for 1995–1999. The data do not include transfers to recycling since such data were not required to be reported under NPRI until 1998. They also do not include data from the new industrial sectors added to TRI for 1998 or chemicals added to NPRI for 1999.
• Chapter 8 provides a more detailed analysis of off-site transfers, including transfers to recycling and to disposal and treatment. While the data in other chapters are presented from the perspective of the originating facilities, the focus in this chapter is on where the transfers are sent.
• Appendix A lists the chemicals required to be reported under the three national PRTRs. Appendix B is the list of chemicals in the matched data set. Appendix C identifies facilities that appear in tables in this report. Appendix D indicates potential health effects of chemicals with large totals for releases, transfers, or both. Appendix E indicates uses of chemicals with large totals for releases, transfers, or both. Appendices F through H show the reporting forms for 1999 for the US TRI, the Canadian NPRI, and the Mexican COA, which includes the RETC as Section V.
1.1 Introduction North Americans are concerned about the effects of chemicals on their health and the environment. Central registries of the releases and movement of toxic substances can help provide information to the public on the sources and handling of these chemicals. Known as pollutant release and transfer registers (PRTRs), these national registries are designed to track the quantities of chemicals that are released into the air, water or land or that are transferred off-site for further management or disposal. Data on releases and transfers of chemicals are submitted by individual facilities. These data are then fed into a national, publicly available database. PRTRs are a cornerstone in the effort to provide all members of society—citizens, corporate leaders, environmental advocates, researchers, government officials—with a valuable tool for setting priorities, promoting environmental improvement and tracking progress.
This report is the sixth in the annual Taking Stock series prepared by the Commission for Environmental Cooperation of North America (CEC). It analyzes the amounts of chemicals released and transferred by facilities. It draws from existing publicly available data from the US Toxics Release Inventory (TRI), the Canadian National Pollutant Release Inventory (NPRI) and, to a limited extent, from the Mexican Registro de Emisiones y Transferencia de Contaminantes (RETC). It contains several new analyses of groups of chemicals, in particular those ozone depleters that have been included in reporting under NPRI for the 1999 reporting year.
Taking Stock: North American Pollutant Releases and Transfers 1999
4
Taking Stock 1999 comprises two volumes. The Summary volume provides highlights of the 1999 matched data set and trends from 1995–1999. This second volume, the Sourcebook, provides the detailed analyses of the same data. Both volumes are available from the CEC in hard copy or on the CEC web site at <www.cec.org>.
Through the publication of its annual Taking Stock report, the CEC aims to:
• provide an overview of North American pollutant releases and transfers, thereby enabling citizens to better understand the sources and handling of industrial pollution;
• provide information to help national, state and provincial governments as well as industry and communities identify priorities for pollution reduction;
• invite reductions in North American pollutant releases and transfers through information comparison;
• enable a more informed dialogue among citizens, industry and government and foster collaborative actions towards a more healthy environment;
• provide analyses and contextual information to assist citizens in understanding North American PRTR data; and
• encourage enhanced comparability of North American PRTR systems.
The preparation of this Taking Stock report, as in previous years, has benefited from the valuable input and suggestions provided by a broad range of stakeholders through the annual consultative process. The CEC would like to thank those groups and individuals who have contributed their ideas, time and enthusiasm to the continued development of the Taking Stock series.
1.1.1 What is a Pollutant Release and Transfer Register? Pollutant release and transfer registers generally provide detailed data on types, locations and amounts of chemicals released on-site and transferred off-site by industrial and other facilities. The register provides data on the amounts of listed chemicals released by the facilities to all environmental media, including air, water and land. The facilities also report on transfers of these chemicals sent to other sites for recycling, treatment or disposal. PRTRs are recognized as an important tool for fulfilling the public’s “right-to-know.” Governments compile annual reports based on PRTR data that are made available to the public; the databases are also made publicly accessible.
PRTRs are an innovative tool that can be used for a variety of purposes. They track certain chemicals and, thereby, can help industry, government and citizens identify ways to prevent pollution, reduce waste generation, decrease releases and transfers and increase responsibility for chemical use. For example, many corporations use the data to report on their environmental performance and identify opportunities for reducing/preventing pollution. Governments can use PRTR data to shift program priorities. New government programs or enforcement measures can be tailored to accomplish specific goals, such as reducing certain chemicals or targeting releases in a particular region. Communities and citizens use PRTR data to gain an understanding of
the sources and management of pollutants and as a basis for dialogue with facilities and governments.
While there are many different environmental reporting databases, the CEC Council Resolution 00-07 identified a set of basic elements that are central to the effectiveness of PRTR systems:
• reporting on individual substances,
• reporting by individual facilities,
• covering all environmental media (i.e., releases to air, water, land and underground injections, and transfers off-site for further management),
• mandatory, periodic reporting (i.e., annually),
• public disclosure of reported data on a facility- and chemical-specific basis,
CEC’s Consultative Process for the PRTR Program One of the principal products of the CEC PRTR program is the development of the annual Taking Stock reports. From the beginning, public feedback has been an essential component of the report development process. Although comments on the project are welcome at any time, the formal public consultative process includes:
• Dissemination of a discussion paper to members of the Consultative Group, outlining options for the upcoming report. The Consultative Group is composed of representatives of industry, government, public interest and environmental groups and other interested parties from all three countries.
• Convening of a public meeting of the Consultative Group, during which stakeholders have the opportunity to discuss the options for the upcoming report and provide input on other relevant aspects of the North American PRTR project.
• Receipt of written comments from members of the Consultative Group and other interested individuals and organizations.
• Preparation and dissemination of a “Response to Comments” based on the written and verbal comments received and explaining how CEC plans to incorporate the comments into the report.
If you are interested in participating in the consultative process, please contact:
Erica Phipps Program Manager Commission for Environmental Cooperation 393, rue St-Jacques ouest, Bureau 200 Montréal (Québec) Canada H2Y 1N9 E-mail: [email protected]
Chapter 1 – Overview of PRTRs in North America
5
• standardized reporting using computerized data management,
• limited data confidentiality and indicating what is being held confidential,
• comprehensive scope, and
• mechanism for public feedback for improvement of the system.
PRTRs collect data on individual chemicals, rather than on the volume of wastestreams containing mixtures of substances, because this allows the compilation and tracking of data on releases and transfers of individual chemicals. Reporting by facility is key to locating where releases occur and who or what generated them. This allows interested persons and groups to identify local industrial sources for releases of chemicals. It also supports regional and other geographically-based analyses of the data. Facility-specific information may be supplemented with data about more diffused sources of such releases.
Concerns about pollutants may arise in connection with any environmental medium. In addition, releases to one environmental medium may be transported to others. Volatile chemicals in releases to water, for example, may vaporize into the air. Therefore, the reporting of releases and transfers to all environmental media is important.
To determine the current status and time trends in releases and transfers, reports must be made periodically, cover the same period of time for all facilities reporting, and cover a comprehensive set of facilities and chemicals. Without these, data from one facility cannot be compared to another or with previous reports from the same facility.
The ability to compile, sort, rank, and otherwise analyze the data depends upon their structure. A clearly defined, computerized database allows for a wide range of analyses. The ability to analyze quickly and easily a large number of reports on chemical releases and transfers depends upon the submissions being managed in a computer database. While the data may be collected on paper, the design and structure of the reports are standardized so that computer management and analysis can reduce costs and errors and provide standardized analyses over time.
Much of the power of a PRTR comes from public disclosure of its contents. Active dissemination to a wide range of users in both raw and summarized form is important. Impediments to public availability of facility-specific information should be limited. This is achieved by limiting the data confidentiality claims allowable under the system. In cases where information is held as confidential, users of the PRTR must know what types of data are being held back from disclosure (for instance, if a facility substituted a generic name for a substance in order to conceal the identity of the specific chemical.)
PRTRs Globally PRTRs are gaining increasing interest and policy support worldwide. Following are some of the key developments at the international level:
• Chapter 19 of Agenda 21, adopted by some 150 heads of state and government during the 1992 United Nations Conference on Environment and Development (the “Earth Summit”), calls for the establishment of pollutant emission registers and promotes the principle of right-to-know.
• The Organisation for Economic Cooperation and Development (OECD), through a 1996 Council Recommendation, has called on member countries to take steps to establish, implement and make publicly available a PRTR system and published a Guidance Manual for Governments which addressed the key factors countries should consider when developing a PRTR. The Council Recommendation also promotes comparability among national PRTRs and sharing of PRTR data between neighboring countries. A 1999 survey found that eight member countries have PRTRs and eight others are developing them. OECD has undertaken a project to compile available guidance for reporting industries on techniques for estimating releases and transfers of pollutants and to make this information widely available through an online clearinghouse <www.oecd.org/ehs/prtr/index.htm>.
• Recognizing the growing interest in establishing national PRTRs, not only among industrialized nations but also among industrializing countries and countries with economies in transition, the Intergovernmental Forum on Chemical Safety (IFCS) had a special session on PRTRs during its Forum III meeting in Salvador, Brazil, in October 2000. The meeting encouraged countries without PRTR systems to take steps to initiate a process to design national PRTRs that involves all affected and interested parties in the design, that take into account national circumstances and needs, and to link reporting requirements of international agreements to the national PRTRs <www.who.int/ifcs>.
• A Working Group on PRTRs was established under the United Nations Economic Commission for Europe (UN/ECE) Convention on Access to Information, Public Participation in Decision-making and Access to Justice in Environmental Matters, called the Aarhus Convention. The Convention came into force in October 2001, with the signatures of 16 countries. The Working Group is charged with the task of developing a proposed protocol on PRTRs. The Convention requires signatory parties to take steps to establish pollution inventories or registers <www.unece.org/env/pp/>.
.
Taking Stock: North American Pollutant Releases and Transfers 1999
6
PRTRs: A Priority Focus for CEC The Commission for Environmental Cooperation (CEC) of North America, mandated under the terms of the North American Agreement on Environmental Cooperation (NAAEC), facilitates cooperation and public participation in fostering the conservation, protection and enhancement of the North American environment for the benefit of present and future generations, in the context of increasing economic, trade and social links between Canada, the United States and Mexico. The CEC recognizes the importance of pollutant release and transfer registerssuch as the Toxics Release Inventory (TRI) in the United States, the National Pollutant Release Inventory (NPRI) in Canada and the Registro de Emisiones y Transferencia de Contaminantes (RETC) in Mexicofor their potential to enhance the quality of the North American environment.
At the Second Annual Regular Session of the CEC in 1995, the Environment Ministers of the three North American countries (the Council) noted in the Communiqué:
This past year, the NAFTA partners began to examine their common need for an inventory of polluting emissions. We have decided to create a North American Pollutant Release Inventory which will bring together, for the first time, existing national public information about emissions and long-range transportation of pollutants. This vital tool for improving the quality of the environment will be the result of harmonized methods of reporting on pollutant emissions of mutual concern.
At the Third Annual Regular Session in August 1996 the Ministers noted in the Communiqué:
The Council announced that the intention to produce the first annual North American Pollutant Release Inventory (NAPRI) will be published…as part of an effort to provide the public with information on pollutant sources and risks. This inventory will bring together for the first time existing national public information from the three countries about emissions. In the long run, the NAPRI will help improve the quality of the environment by providing the public with information to assess North American pollutant sources and risks. It also serves as a model for similar efforts in other parts of the world because North America represents the largest land mass ever to be subjected to compatible methods of reporting on pollutant emissions of mutual concern.
At the Fourth Annual Regular Session of the CEC in June 1997 the Ministers passed Council Resolution 97-04 “Promoting Comparability of Pollutant Release and Transfer Registers (PRTRs).”
This resolution commits the three governments to work toward adopting more comparable PRTRs, to collaborate on the development of an Internet site to present a matched subset of data from the three North American PRTRs, as well as to cooperate with the CEC in the preparation of the annual CEC North American PRTR report. While recognizing that a higher degree of comparability among the PRTRs is desirable, the resolution specifically notes that each national PRTR program has developed a unique process for the collection and manipulation of environmental data sets.
At the Sixth Annual Regular Session of the CEC in June 1999, the Ministers noted in their Communiqué:
The Council reaffirms its commitment to assure that the peoples of North America have access to accurate information about the release and transfer of toxic chemicals from specific facilities into and through their communities. The Council supports the continued development and improvement of the North American PRTR system, with a goal of mandatory reporting for all nations.
At the Seventh Annual Regular Session of the CEC in June 2000, the Ministers passed Council Resolution 00-07 on “Pollutant Release and Transfer Registers”:
Through this Resolution, the Council emphasized the value of PRTRs as tools for sound management of chemicals, for encouraging improvements in environmental performance, and for providing the public with access to information on pollutants in their communities. The ministers also noted the opportunities for North America to serve as a global leader in the development and use of PRTRs.
At the Eighth Annual Regular Session of the CEC in June 2001, the Ministers stressed the importance of environmental information in their Communiqué:
Timely and accurate environmental information is essential for rational decision making and the development of sound environmental policies. Strengthening our capacity to acquire and share knowledge among all sectors of society is fundamental to the ability of citizens to take informed action.
The Council also committed to support Mexico through capacity building, in light of Mexico’s decision to seek legislation to establish a mandatory reporting system for pollutant releases and transfers.
Chapter 1 – Overview of PRTRs in North America
7
1.2 Overview of Existing PRTR Programs in North America The first of the North American databases to be established was the Toxics Release Inventory (TRI) in the United States, which began collecting information for the year 1987. Canada’s facilities first reported their releases and transfers to the National Pollutant Release Inventory (NPRI) for the year 1993. Mexico, in 1996, completed a successful case study demonstrating its proposed inventory. National implementation of this inventory, the Registro de Emisiones y Transferencia de Contaminantes (RETC), started in 1998 with the collection of data reported by facilities on a voluntary basis for 1997. In December 2001, the Mexican Congress passed legislation to establish reporting on a mandatory basis.
Only the data from Canada and the US are currently comparable. The two inventories in Canada and the United States have many basic similarities since they stem from the same primary purpose—to provide publicly available information on a facility’s releases and transfers to air, water and land. The Mexican RETC is part of an integrated reporting form called Cédula de Operación Anual (COA). Section V of the COA is the section providing data on pollutant releases and transfers. Reporting under Section V is currently voluntary and, thus, the data are not comparable to the mandatory data collected under TRI and NPRI. The Mexican data are also not made publicly available on a facility-specific basis. Thus, while there are similarities among the three North American PRTRs, each inventory also has its unique aspects, which result from its historical development and the special industrial characteristics of the country.
Chapter 2, which focuses on using and interpreting the information presented in Taking Stock 1999, examines the similarities and differences among the three national programs in greater depth. The forms that are filled out by facilities in each country are reproduced in Appendices to this report. Appendix F contains the US TRI form, Appendix G the Canadian NPRI form, and Appendix H the Mexican COA, which includes the RETC as Section V.
1.2.1 The US TRI The 1999 reporting year is the thirteenth year for the US TRI, which was created under the Emergency Planning and Community Right-to-know Act (EPCRA) of 1986. The original TRI list contained over 300 chemicals, covered manufacturing sectors, and required information on on-site releases, transfers off-site for disposal and transfers off-site for treatment. Passage of the Pollution Prevention Act of 1990 broadened the information TRI collects to include off-site transfers to recycling and energy recovery as well as facilities’ management of toxic chemicals in waste on-site, such as on-site treatment, recycling and energy recovery, as well as qualitative information on pollution prevention activities at the facility. The first year for the expanded information reporting was 1991.
There have also been yearly changes to the TRI chemical list as industry and the public petitioned EPA to add or remove chemicals. One of the most significant expansions to the TRI list of chemicals was the addition of nearly 300 chemicals starting with the 1995 reporting year. There are now over 650 chemicals on the TRI list.
Section 313 of EPCRA, the law that created TRI, had identified the manufacturing sector as the original set of industries required to submit TRI reports. Beginning with the 1998 reporting year, several new industries were added to TRI to capture information in industries closely related to the manufacturing sector, providing energy or services or further managing products or waste from the manufacturing sector. The seven new industrial sectors added to TRI were metal mines, coal mines, electricity-generating facilities, petroleum bulk storage terminals, chemical wholesale distributors, hazardous waste management facilities and solvent recovery facilities. Those new TRI industries that have similar reporting requirements under NPRI (coal mining, electric generation, chemical wholesalers and hazardous waste management and solvent recovery facilities) are included in Taking Stock for the 1998 and 1999 data analyses.
Addition of PBTs and new reporting thresholds for 1999 The most recent changes for TRI include a focus on chemicals that are persistent, bioaccumulative and toxic (PBT). EPA issued a rule on 29 October 1999 on PBT chemicals. This rule takes three actions regarding certain PBT chemicals: (1) the addition of seven PBT chemicals and one chemical category to the TRI chemical list; (2) a reporting threshold for these chemicals below the present levels; and (3) a lower threshold for certain chemicals and chemical categories already on the TRI chemical list. The first reporting year at the lower reporting thresholds is 2000. In addition, a rule on 17 January 2001 lowered the reporting threshold for lead and lead compounds. Reporting for lead and lead compounds starts with the 2001 reporting year.
There are three distinct new reporting thresholds. For dioxin and dioxin-like compounds, the threshold is 0.1 grams. For chemicals that persist in the environment with a half-life greater than six months and have a bioaccumulation/bioconcentration factor (BAF/BCF) of greater than 5000 (a BCF of 5000, for example, indicates a concentration of the targeted substance in an organism, such as a fish, at 5000 times the level in the surrounding medium, i.e., water), the threshold is 10 pounds (4.5 kg) per year. For chemicals that persist in the environment with a half-life between two and six months and that have a BAF/BCF between 1000 and 5000 and/or human bioaccumulative data, the threshold is 100 pounds (45 kg) per year. The rule can be found on the Internet at <www.epa.gov/tri/pbtrule.htm>.
EPA is reviewing exemptions for “otherwise use” of TRI chemicals, including the motor vehicle exemption. These modifications will establish more limited interpretations of the exemptions that facilities can claim for “otherwise use.” The goal is to ensure the public’s access to information on the on-site release, off-site transfer to disposal, and other waste management options for toxic chemicals in greater than de minimis amounts.
Future changes for TRI Other future changes to TRI include the possible addition of airports. Action on a petition EPA received from environmental groups, requesting the addition of airports, will follow the review of the “otherwise use” exemptions. Under present guidance, the
Taking Stock: North American Pollutant Releases and Transfers 1999
8
motor vehicle exemption would limit the amount of information TRI would collect from airports. Action is expected before the 2002 reporting year.
Ongoing program to improve public access to chemical toxicity data TRI also will benefit from a related program on chemicals testing. EPA is presently working on a program in cooperation with industry and environmental groups to collect more complete toxicity information on high production volume (HPV) chemicals. These are substances that are produced or imported in excess of 1 million pounds (454 tonnes) per year.
Of the nearly 3,000 HPV chemicals in the United States, 203 are TRI chemicals. A primary objective of this program is to make the toxicity information available to the public, especially through the Internet. Further information on the program can be found on the Internet at <www.epa.gov/chemrtk/volchall.htm>. OECD has also initiated a cooperative action program among member countries (which include Canada, Mexico and the US) to investigate these HPV chemicals <www.oecd.org/ehs/hpv.htm>.
1.2.2 Canada’s NPRI The 1999 data are the seventh set reported to NPRI. The NPRI was established with the help of a multi-stakeholder advisory committee, which included representatives from industry, environmental and labor organizations, and provincial ministries as well as federal departments. In the 1999 renewal of the Canadian Environmental Protection Act (CEPA) were provisions that enshrine mandatory NPRI reporting and the annual publication of a summary report.
Ongoing stakeholder consultations have modified reporting requirements since the first reporting year 1993. NPRI requires information on on-site releases and off-site transfers to treatment and disposal. Off-site transfers to recycling and energy recovery were made mandatory, beginning with the 1998 reporting year. Starting with the 1997 reporting year, Environment Canada required mandatory reporting on pollution prevention activities. Facilities are asked to identify the measures they have taken to prevent the generation of pollutants or wastes. This provides a picture of the types of activities such as product redesign or good operating practices, but not a numerical estimate of the amounts of waste reduced through pollution prevention activities.
Addition of new substances for 1999 Environment Canada added 73 new substances to the 1999 NPRI list. This brings the total number of substances on which companies must report in 1999 to 246, including 20 identified as toxic under the Canadian Environmental Protection Act.
For the 2000 reporting year, four new substances (acrolein, polymeric diphenyl-methane diisocyanate and two nonylphenols) were added at the existing 10 tonne threshold. In addition, several categories of PBTs (dioxins/furans, hexachlorobenzene, and polycyclic aromatic hydrocarbons) have been added to the NPRI list at lower reporting thresholds. Hexachlorobenzene and dioxins/furans must be reported by certain sources with no kilogram reporting threshold. Polycyclic aromatic hydrocarbons (PAHs) have a 50 kg-reporting threshold based on incidental manufacture and the total quantity
of chemicals released and transferred. The reporting threshold for mercury and its compounds has been lowered to 5 kg per year for manufacture, process or “otherwise used”. This brings the total number of substances to 268 for the 2000 reporting year.
Addition of criteria air contaminants and other future changes NPRI has established a permanent process for modifying the NPRI and is now working on several proposed changes for the 2002 to 2004 reporting years. These proposed changes include the addition of criteria air contaminants (nitrogen oxides, sulfur oxides, particulate matter, carbon monoxide, and volatile organic compounds) to the NPRI list for 2002 and the addition of greenhouse gases (e.g., carbon dioxide, methane, hydrofluorocarbons). Other changes under consideration are a framework to screen proposed substances for listing at alternate thresholds, the addition of substances under assessment or declared to be toxic under CEPA, and the addition of substances referred for future consideration by the working group on substances. NPRI is also reviewing substances listed in the Ontario “Airborne Contaminants Discharge, Monitoring and Reporting” regulations to ensure greater harmonization between the NPRI program and the Ontario regulations.
These changes to the NPRI program result from Environment Canada’s ongoing consultations with industry, environmental groups and other federal and provincial governments. Reports on stakeholder recommendations and Environment Canada’s response to these recommendations can be found on the Environment Canada web site at <www.ec.gc.ca/pdb/npri>.
1.2.3 The RETC in Mexico Industrial facilities in Mexico under federal jurisdiction report their annual releases and transfers of pollutants in Section V of the Annual Certificate of Operation (Cédula de Operación Anual—COA). The Secretariat of Environment and Natural Resources (Secretaría de Medio Ambiente y Recursos Naturales—Semarnat) is the federal environmental authority in charge of the collection, management and analysis of COA data. The first reporting cycle covered the reporting year 1997. Section V, “Pollutant Releases and Transfers,” is the portion of the COA that contains information on releases to all media and transfers off-site and is most comparable to the PRTR data from Canada and the US. Section V was optional for the 1999 reporting year.
During 2001, the Mexican RETC experienced some important advances in the establishment of a national PRTR through the collaboration of state authorities and the legal framework.
Legal framework for PRTR reporting established There has been a major step forward in the legal framework for RETC, with the passage of enabling legislation by the Mexican Congress on 31 December 2001. Article 109 of the federal environmental law, Ley General del Equilibrio Ecológico y la Protección Ambiental, was modified. Semarnat, the states, the Federal District and municipalities are now required to integrate an RETC based on the data and documents contained in the environmental authorizations, licenses, reports, permits and concessions received by
Chapter 1 – Overview of PRTRs in North America
9
the different authorities. The physical and moral persons responsible for the pollutant sources are obliged to submit to the authorities all information, data, and documents necessary to integrate the RETC. The reported information will be public and will function as a declaration. Access to this information is given by the Ministry and will be actively disseminated.
States are establishing PRTRs Mexico has established the Program of Institutional Environmental Development (Programa de Desarrollo Institucional Ambiental—PDIA) to decentralize environmental responsibilities. Until 2001, 15 states were participating in this program, and they will establish their own state RETC. The first state to assume responsibility of the RETC was Aguascalientes. The state PRTRs cover more industry sectors than the federal one, including such sectors as vegetable and animal products, wood and its derivatives, food products, textiles and dress making, printing products, metal products, and graphic arts. Some service facilities are also required to report, including public bath installations, sports centers, hotels, laundry and dry cleaners, bakeries, hospitals and sanatoriums, restaurants and tortillerias and flour mills.
Improvements in reporting for 1999 The voluntary reporting to the RETC has been aided by the publication of a Mexican norm (NMX-AA-118-SCFI-2001), which came into effect in June 2001. This norm establishes the list of substances for RETC, the procedures to modify the substance lists, the reporting format and reporting procedures.
For the 1999 reporting year, 1,525 COA forms were received, of which 353 forms had filled in Section V (the RETC), which is the voluntary reporting of releases and transfers. Facilities covered by the COA are those under federal jurisdiction and include facilities in 11 industrial sectors: petroleum, chemical and petrochemical, paints and dyes, metallurgy (includes the iron and steel industry), automobile manufacture, cellulose and paper, cement and limestone, asbestos, glass, electric power generation, and hazardous waste management. These industry sectors were chosen based on their use of processes that may emit to the atmosphere gases or solid or liquid particles and that involve chemical reactions, thermal operations, foundry or metal tempering. Required reporting (Sections I and II of the COA) is limited to air emissions of sulfur dioxide, nitrogen oxide, particulates and VOCs. Other criteria air contaminants covered by the COA (but whose reporting is voluntary) include unburned hydrocarbons, carbon monoxide, and carbon dioxide.
A number of measures have been undertaken to improve reporting, including:
• Updating of the COA reporting software, now available at <www.semarnat.gob.mx/dgmic/tramites/requisitos/r03-001.shtml>. This electronic program helps users avoid the most common errors, such as reporting using incorrect units and problems in the conversion of units.
• Updating of Guidelines for completing the COA, now available in print and electronic versions.
• Improving the internal quality assurance system, especially the collection and the evaluation of the quality and quantity of the reported information.
CEC’s Air Quality Program A suggestion by the Consultative Group for Taking Stock and a previous CEC study on existing data on non-point sources has led to a new CEC initiative, guided by Council Resolution 01-05. The CEC has begun a project to compile existing information on criteria air pollutants in the three countries. This project is focusing on ways to enhance the comparability of air emission inventories in the three countries. Possible contaminants to include are sulfur dioxide, nitrogen oxides, VOCs, particulate matter (PM2.5 and PM10), total suspended particulates and carbon monoxide. The project could assist with atmospheric modeling and track trends, support reciprocity in data exchange among the countries, provide transparency in cross-border trading, and give public access to environmental information.
A summary document describing the current state of emission inventories in Canada, Mexico and the US has been developed, and is available from the CEC. Governmental agencies met in November 2001 to discuss the current state of inventories, and potential areas of cooperation. At this meeting, potential areas of cooperation identified included increased training and information exchange on mobile sources and increased data sharing and exchange using one sector, the power plants. In December 2001, a public meeting was held in conjunction with the annual meeting of the PRTR Consultative Group to obtain stakeholder input on the air emissions inventories project. The CEC is also working with the Western Governors Association to assist with the development of criteria air contaminant inventories in Mexico.
Other activities include working with Mexico to establish a professional association of air quality managers and activities focusing on trade and transportation issues. An initial document proposed a series of voluntary steps to improve air quality in border towns. Some potential projects include the development of a trinational smoke-testing protocol and analyzing diesel exposure and health concerns among congested corridors using common methods.
For more information, contact Paul Miller at CEC at (514) 350 4326 or <[email protected]>.
Taking Stock: North American Pollutant Releases and Transfers 1999
10
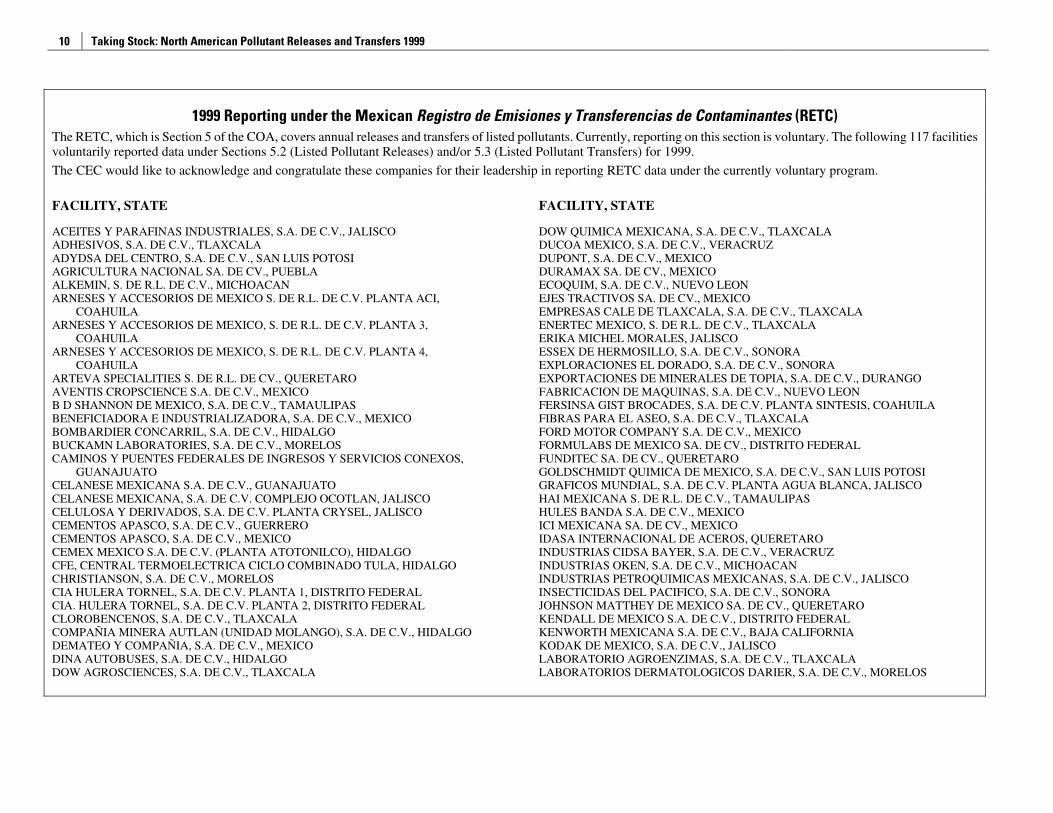
1999 Reporting under the Mexican Registro de Emisiones y Transferencias de Contaminantes (RETC) The RETC, which is Section 5 of the COA, covers annual releases and transfers of listed pollutants. Currently, reporting on this section is voluntary. The following 117 facilities voluntarily reported data under Sections 5.2 (Listed Pollutant Releases) and/or 5.3 (Listed Pollutant Transfers) for 1999.
The CEC would like to acknowledge and congratulate these companies for their leadership in reporting RETC data under the currently voluntary program.
FACILITY, STATE FACILITY, STATE
ACEITES Y PARAFINAS INDUSTRIALES, S.A. DE C.V., JALISCO ADHESIVOS, S.A. DE C.V., TLAXCALA ADYDSA DEL CENTRO, S.A. DE C.V., SAN LUIS POTOSI AGRICULTURA NACIONAL SA. DE CV., PUEBLA ALKEMIN, S. DE R.L. DE C.V., MICHOACAN ARNESES Y ACCESORIOS DE MEXICO S. DE R.L. DE C.V. PLANTA ACI,
COAHUILA ARNESES Y ACCESORIOS DE MEXICO, S. DE R.L. DE C.V. PLANTA 3,
COAHUILA ARNESES Y ACCESORIOS DE MEXICO, S. DE R.L. DE C.V. PLANTA 4,
COAHUILA ARTEVA SPECIALITIES S. DE R.L. DE CV., QUERETARO AVENTIS CROPSCIENCE S.A. DE C.V., MEXICO B D SHANNON DE MEXICO, S.A. DE C.V., TAMAULIPAS BENEFICIADORA E INDUSTRIALIZADORA, S.A. DE C.V., MEXICO BOMBARDIER CONCARRIL, S.A. DE C.V., HIDALGO BUCKAMN LABORATORIES, S.A. DE C.V., MORELOS CAMINOS Y PUENTES FEDERALES DE INGRESOS Y SERVICIOS CONEXOS,
GUANAJUATO CELANESE MEXICANA S.A. DE C.V., GUANAJUATO CELANESE MEXICANA, S.A. DE C.V. COMPLEJO OCOTLAN, JALISCO CELULOSA Y DERIVADOS, S.A. DE C.V. PLANTA CRYSEL, JALISCO CEMENTOS APASCO, S.A. DE C.V., GUERRERO CEMENTOS APASCO, S.A. DE C.V., MEXICO CEMEX MEXICO S.A. DE C.V. (PLANTA ATOTONILCO), HIDALGO CFE, CENTRAL TERMOELECTRICA CICLO COMBINADO TULA, HIDALGO CHRISTIANSON, S.A. DE C.V., MORELOS CIA HULERA TORNEL, S.A. DE C.V. PLANTA 1, DISTRITO FEDERAL CIA. HULERA TORNEL, S.A. DE C.V. PLANTA 2, DISTRITO FEDERAL CLOROBENCENOS, S.A. DE C.V., TLAXCALA COMPAÑIA MINERA AUTLAN (UNIDAD MOLANGO), S.A. DE C.V., HIDALGO DEMATEO Y COMPAÑIA, S.A. DE C.V., MEXICO DINA AUTOBUSES, S.A. DE C.V., HIDALGO DOW AGROSCIENCES, S.A. DE C.V., TLAXCALA
DOW QUIMICA MEXICANA, S.A. DE C.V., TLAXCALA DUCOA MEXICO, S.A. DE C.V., VERACRUZ DUPONT, S.A. DE C.V., MEXICO DURAMAX SA. DE CV., MEXICO ECOQUIM, S.A. DE C.V., NUEVO LEON EJES TRACTIVOS SA. DE CV., MEXICO EMPRESAS CALE DE TLAXCALA, S.A. DE C.V., TLAXCALA ENERTEC MEXICO, S. DE R.L. DE C.V., TLAXCALA ERIKA MICHEL MORALES, JALISCO ESSEX DE HERMOSILLO, S.A. DE C.V., SONORA EXPLORACIONES EL DORADO, S.A. DE C.V., SONORA EXPORTACIONES DE MINERALES DE TOPIA, S.A. DE C.V., DURANGO FABRICACION DE MAQUINAS, S.A. DE C.V., NUEVO LEON FERSINSA GIST BROCADES, S.A. DE C.V. PLANTA SINTESIS, COAHUILA FIBRAS PARA EL ASEO, S.A. DE C.V., TLAXCALA FORD MOTOR COMPANY S.A. DE C.V., MEXICO FORMULABS DE MEXICO SA. DE CV., DISTRITO FEDERAL FUNDITEC SA. DE CV., QUERETARO GOLDSCHMIDT QUIMICA DE MEXICO, S.A. DE C.V., SAN LUIS POTOSI GRAFICOS MUNDIAL, S.A. DE C.V. PLANTA AGUA BLANCA, JALISCO HAI MEXICANA S. DE R.L. DE C.V., TAMAULIPAS HULES BANDA S.A. DE C.V., MEXICO ICI MEXICANA SA. DE CV., MEXICO IDASA INTERNACIONAL DE ACEROS, QUERETARO INDUSTRIAS CIDSA BAYER, S.A. DE C.V., VERACRUZ INDUSTRIAS OKEN, S.A. DE C.V., MICHOACAN INDUSTRIAS PETROQUIMICAS MEXICANAS, S.A. DE C.V., JALISCO INSECTICIDAS DEL PACIFICO, S.A. DE C.V., SONORA JOHNSON MATTHEY DE MEXICO SA. DE CV., QUERETARO KENDALL DE MEXICO S.A. DE C.V., DISTRITO FEDERAL KENWORTH MEXICANA S.A. DE C.V., BAJA CALIFORNIA KODAK DE MEXICO, S.A. DE C.V., JALISCO LABORATORIO AGROENZIMAS, S.A. DE C.V., TLAXCALA LABORATORIOS DERMATOLOGICOS DARIER, S.A. DE C.V., MORELOS
Chapter 1 – Overview of PRTRs in North America
11
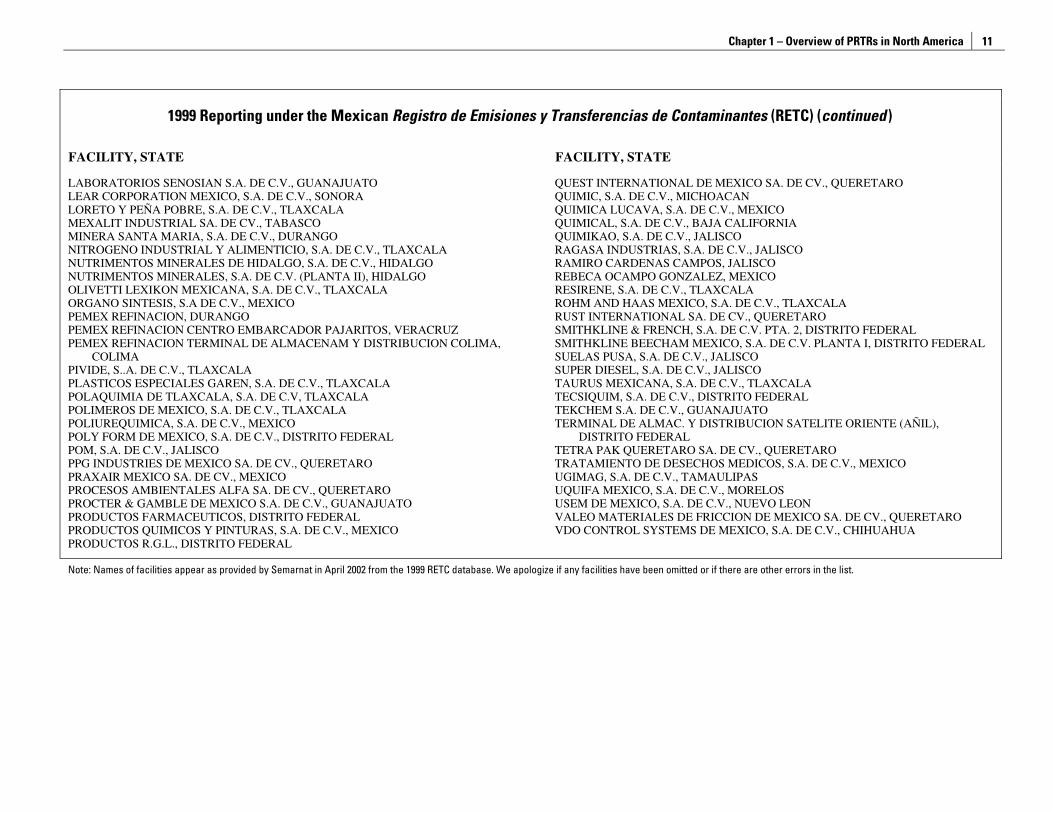
1999 Reporting under the Mexican Registro de Emisiones y Transferencias de Contaminantes (RETC) (continued )
FACILITY, STATE FACILITY, STATE
LABORATORIOS SENOSIAN S.A. DE C.V., GUANAJUATO LEAR CORPORATION MEXICO, S.A. DE C.V., SONORA LORETO Y PEÑA POBRE, S.A. DE C.V., TLAXCALA MEXALIT INDUSTRIAL SA. DE CV., TABASCO MINERA SANTA MARIA, S.A. DE C.V., DURANGO NITROGENO INDUSTRIAL Y ALIMENTICIO, S.A. DE C.V., TLAXCALA NUTRIMENTOS MINERALES DE HIDALGO, S.A. DE C.V., HIDALGO NUTRIMENTOS MINERALES, S.A. DE C.V. (PLANTA II), HIDALGO OLIVETTI LEXIKON MEXICANA, S.A. DE C.V., TLAXCALA ORGANO SINTESIS, S.A DE C.V., MEXICO PEMEX REFINACION, DURANGO PEMEX REFINACION CENTRO EMBARCADOR PAJARITOS, VERACRUZ PEMEX REFINACION TERMINAL DE ALMACENAM Y DISTRIBUCION COLIMA,
COLIMA PIVIDE, S..A. DE C.V., TLAXCALA PLASTICOS ESPECIALES GAREN, S.A. DE C.V., TLAXCALA POLAQUIMIA DE TLAXCALA, S.A. DE C.V, TLAXCALA POLIMEROS DE MEXICO, S.A. DE C.V., TLAXCALA POLIUREQUIMICA, S.A. DE C.V., MEXICO POLY FORM DE MEXICO, S.A. DE C.V., DISTRITO FEDERAL POM, S.A. DE C.V., JALISCO PPG INDUSTRIES DE MEXICO SA. DE CV., QUERETARO PRAXAIR MEXICO SA. DE CV., MEXICO PROCESOS AMBIENTALES ALFA SA. DE CV., QUERETARO PROCTER & GAMBLE DE MEXICO S.A. DE C.V., GUANAJUATO PRODUCTOS FARMACEUTICOS, DISTRITO FEDERAL PRODUCTOS QUIMICOS Y PINTURAS, S.A. DE C.V., MEXICO PRODUCTOS R.G.L., DISTRITO FEDERAL
QUEST INTERNATIONAL DE MEXICO SA. DE CV., QUERETARO QUIMIC, S.A. DE C.V., MICHOACAN QUIMICA LUCAVA, S.A. DE C.V., MEXICO QUIMICAL, S.A. DE C.V., BAJA CALIFORNIA QUIMIKAO, S.A. DE C.V., JALISCO RAGASA INDUSTRIAS, S.A. DE C.V., JALISCO RAMIRO CARDENAS CAMPOS, JALISCO REBECA OCAMPO GONZALEZ, MEXICO RESIRENE, S.A. DE C.V., TLAXCALA ROHM AND HAAS MEXICO, S.A. DE C.V., TLAXCALA RUST INTERNATIONAL SA. DE CV., QUERETARO SMITHKLINE & FRENCH, S.A. DE C.V. PTA. 2, DISTRITO FEDERAL SMITHKLINE BEECHAM MEXICO, S.A. DE C.V. PLANTA I, DISTRITO FEDERAL SUELAS PUSA, S.A. DE C.V., JALISCO SUPER DIESEL, S.A. DE C.V., JALISCO TAURUS MEXICANA, S.A. DE C.V., TLAXCALA TECSIQUIM, S.A. DE C.V., DISTRITO FEDERAL TEKCHEM S.A. DE C.V., GUANAJUATO TERMINAL DE ALMAC. Y DISTRIBUCION SATELITE ORIENTE (AÑIL),
DISTRITO FEDERAL TETRA PAK QUERETARO SA. DE CV., QUERETARO TRATAMIENTO DE DESECHOS MEDICOS, S.A. DE C.V., MEXICO UGIMAG, S.A. DE C.V., TAMAULIPAS UQUIFA MEXICO, S.A. DE C.V., MORELOS USEM DE MEXICO, S.A. DE C.V., NUEVO LEON VALEO MATERIALES DE FRICCION DE MEXICO SA. DE CV., QUERETARO VDO CONTROL SYSTEMS DE MEXICO, S.A. DE C.V., CHIHUAHUA
Note: Names of facilities appear as provided by Semarnat in April 2002 from the 1999 RETC database. We apologize if any facilities have been omitted or if there are other errors in the list.
Taking Stock: North American Pollutant Releases and Transfers 1999
12
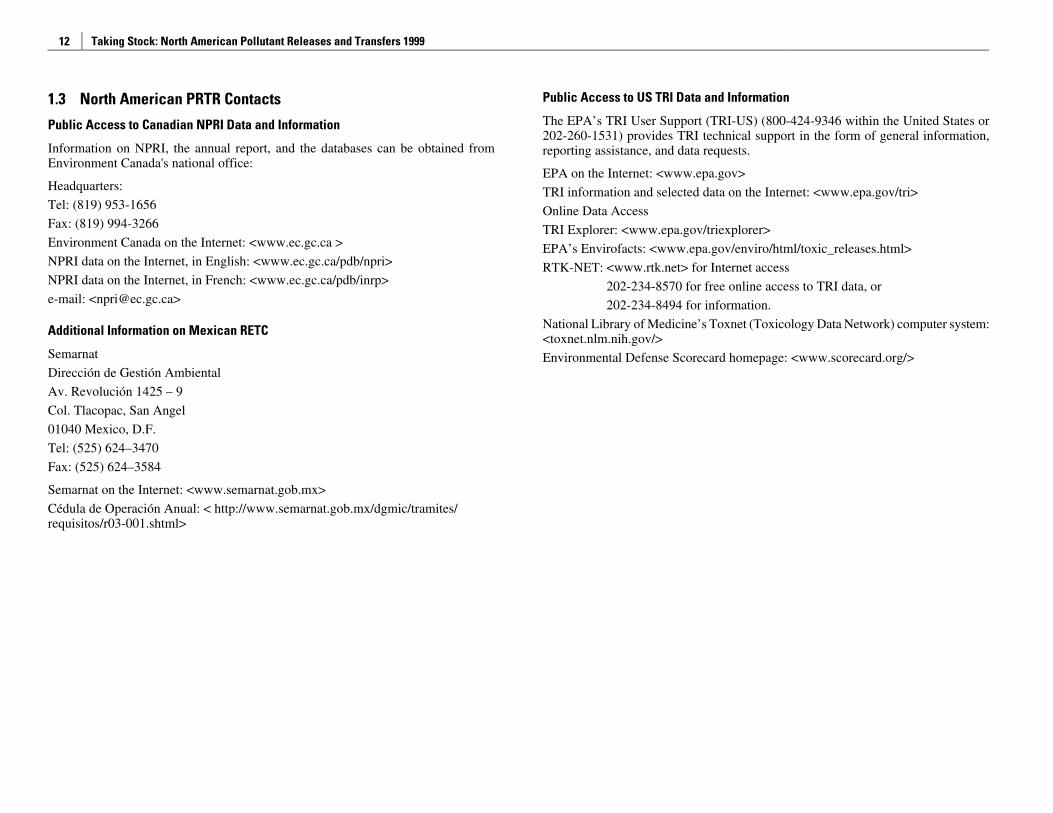
1.3 North American PRTR Contacts
Public Access to Canadian NPRI Data and Information
Information on NPRI, the annual report, and the databases can be obtained from Environment Canada's national office:
Headquarters:
Tel: (819) 953-1656
Fax: (819) 994-3266
Environment Canada on the Internet: <www.ec.gc.ca >
NPRI data on the Internet, in English: <www.ec.gc.ca/pdb/npri>
NPRI data on the Internet, in French: <www.ec.gc.ca/pdb/inrp>
e-mail: <[email protected]>
Additional Information on Mexican RETC
Semarnat
Dirección de Gestión Ambiental
Av. Revolución 1425 – 9
Col. Tlacopac, San Angel
01040 Mexico, D.F.
Tel: (525) 624–3470
Fax: (525) 624–3584
Semarnat on the Internet: <www.semarnat.gob.mx>
Cédula de Operación Anual: < http://www.semarnat.gob.mx/dgmic/tramites/ requisitos/r03-001.shtml>
Public Access to US TRI Data and Information
The EPA’s TRI User Support (TRI-US) (800-424-9346 within the United States or 202-260-1531) provides TRI technical support in the form of general information, reporting assistance, and data requests.
EPA on the Internet: <www.epa.gov>
TRI information and selected data on the Internet: <www.epa.gov/tri>
Online Data Access
TRI Explorer: <www.epa.gov/triexplorer>
EPA’s Envirofacts: <www.epa.gov/enviro/html/toxic_releases.html>
RTK-NET: <www.rtk.net> for Internet access
202-234-8570 for free online access to TRI data, or
202-234-8494 for information.
National Library of Medicine’s Toxnet (Toxicology Data Network) computer system: <toxnet.nlm.nih.gov/>
Environmental Defense Scorecard homepage: <www.scorecard.org/>
Chapter 2 – User’s Guide to North American PRTR Data
13
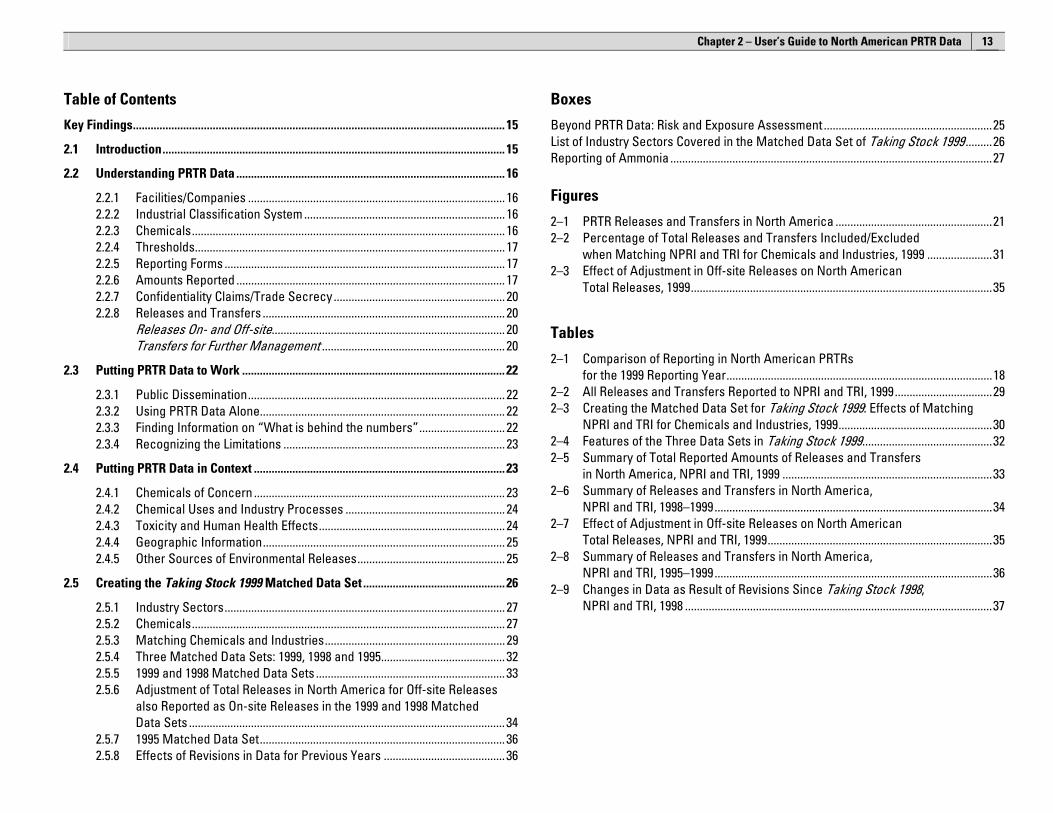
Table of Contents
Key Findings.............................................................................................................................. 15 2.1 Introduction.................................................................................................................... 15 2.2 Understanding PRTR Data ........................................................................................... 16
2.2.1 Facilities/Companies ....................................................................................... 16 2.2.2 Industrial Classification System .................................................................... 16 2.2.3 Chemicals.......................................................................................................... 16 2.2.4 Thresholds......................................................................................................... 17 2.2.5 Reporting Forms ............................................................................................... 17 2.2.6 Amounts Reported ........................................................................................... 17 2.2.7 Confidentiality Claims/Trade Secrecy.......................................................... 20 2.2.8 Releases and Transfers .................................................................................. 20
Releases On- and Off-site............................................................................... 20 Transfers for Further Management .............................................................. 20
2.3 Putting PRTR Data to Work ......................................................................................... 22 2.3.1 Public Dissemination....................................................................................... 22 2.3.2 Using PRTR Data Alone................................................................................... 22 2.3.3 Finding Information on “What is behind the numbers”............................. 22 2.3.4 Recognizing the Limitations ........................................................................... 23
2.4 Putting PRTR Data in Context ..................................................................................... 23 2.4.1 Chemicals of Concern ..................................................................................... 23 2.4.2 Chemical Uses and Industry Processes ...................................................... 24 2.4.3 Toxicity and Human Health Effects............................................................... 24 2.4.4 Geographic Information.................................................................................. 25 2.4.5 Other Sources of Environmental Releases.................................................. 25
2.5 Creating the Taking Stock 1999 Matched Data Set ................................................ 26 2.5.1 Industry Sectors............................................................................................... 27 2.5.2 Chemicals.......................................................................................................... 27 2.5.3 Matching Chemicals and Industries............................................................. 29 2.5.4 Three Matched Data Sets: 1999, 1998 and 1995.......................................... 32 2.5.5 1999 and 1998 Matched Data Sets ................................................................ 33 2.5.6 Adjustment of Total Releases in North America for Off-site Releases
also Reported as On-site Releases in the 1999 and 1998 Matched Data Sets ........................................................................................................... 34
2.5.7 1995 Matched Data Set................................................................................... 36 2.5.8 Effects of Revisions in Data for Previous Years ......................................... 36
Boxes
Beyond PRTR Data: Risk and Exposure Assessment .........................................................25 List of Industry Sectors Covered in the Matched Data Set of Taking Stock 1999.........26 Reporting of Ammonia.............................................................................................................27 Figures
2–1 PRTR Releases and Transfers in North America .....................................................21 2–2 Percentage of Total Releases and Transfers Included/Excluded
when Matching NPRI and TRI for Chemicals and Industries, 1999 ......................31 2–3 Effect of Adjustment in Off-site Releases on North American
Total Releases, 1999......................................................................................................35
Tables
2–1 Comparison of Reporting in North American PRTRs for the 1999 Reporting Year..........................................................................................18
2–2 All Releases and Transfers Reported to NPRI and TRI, 1999.................................29 2–3 Creating the Matched Data Set for Taking Stock 1999: Effects of Matching
NPRI and TRI for Chemicals and Industries, 1999....................................................30 2–4 Features of the Three Data Sets in Taking Stock 1999............................................32 2–5 Summary of Total Reported Amounts of Releases and Transfers
in North America, NPRI and TRI, 1999 .......................................................................33 2–6 Summary of Releases and Transfers in North America,
NPRI and TRI, 1998–1999..............................................................................................34 2–7 Effect of Adjustment in Off-site Releases on North American
Total Releases, NPRI and TRI, 1999............................................................................35 2–8 Summary of Releases and Transfers in North America,
NPRI and TRI, 1995–1999..............................................................................................36 2–9 Changes in Data as Result of Revisions Since Taking Stock 1998,
NPRI and TRI, 1998 ........................................................................................................37

Chapter 2 – User’s Guide to North American PRTR Data
15
Key Findings • Taking Stock compiles comparable data from the US and Canada PRTR systems to give a North American perspective of
the amounts of chemicals released to the air, water and land and transferred off-site for recycling or other management. A “matched” data set is prepared that includes only those chemicals and industrial sectors for which comparable data are available from the two systems. Data from Mexico’s RETC are not available for the 1995–1999 reporting years.
• Two-thirds of the chemical reports under NPRI and over 80 percent under TRI are included in the Taking Stock matched data set for 1999. These comparable reports represent approximately 21 percent of NPRI total reported amounts and 59 percent of TRI amounts.
• The North American matched data set has grown for the 1999 reporting year, with the addition of a number of new chemicals added to NPRI. However, one of these new NPRI chemicals, hydrogen sulfide, is not on the current TRI list and thus is not included in the matched data set, but represents almost 70 percent of the chemical amounts reported to NPRI for 1999. The matched data set represents 66 percent of the total reported amounts in NPRI, excluding hydrogen sulfide.
• Data for previous years (1995 to 1998) are also included in this Taking Stock report. There are three different matched data sets in this report: (1) the 1999 matched set of chemicals and industries, (2) the 1998 matched data set which is used to look at changes from 1998 to 1999, and (3) the 1995 matched data set which is used for analyses of five-year trends from 1995–1999. The 1998 matched data set excludes chemicals added to NPRI for 1999. The 1995 matched data set excludes industry sectors added to TRI for 1998, NPRI chemicals added for 1999 and transfers to recycling and energy recovery. These exclusions are made to make it possible to compare across years during which the reporting requirements have changed.
• PRTR data show the amounts of listed chemicals released or transferred from a facility. However, PRTR data are limited in what information they can provide. For example, information is not included on releases from other sources, such as smaller facilities (e.g., dry-cleaning establishments and service stations), or from agricultural operations, transportation or natural sources. They also do not provide information on all chemicals of concern.
• An important point to remember in interpreting the analyses in this report is that PRTR data cannot themselves be used to measure risk to humans or ecological populations from the releases and transfers of these chemicals. Additional data on exposure levels and the toxicological or hazardous nature of the chemicals is needed to begin to assess the potential impacts on human health and the environment of the releases and transfers.
2.1 Introduction This chapter offers guidance on using the North American data, with specific references to the data from Canada and the United States. Taking Stock 1999 summarizes PRTR data from reports that industrial facilities filed for the 1999 reporting year, the most recent public data available at the time this report was written.
Chapter 2 contains sections on:
• Understanding PRTR data (what types of data are in PRTRs)
• Putting PRTR data to work (how can PRTR data be used, and their limitations)
• Putting PRTR data in context (what other information can help broaden the perspective of PRTR data and where to find it)
• Creating the Taking Stock matched data sets (there are three matched data sets: the 1999 data set, the most comprehensive of the three, which includes the new NPRI chemicals, the newly added industrial sectors and transfers to recycling and energy recovery; the 1998 data set, which includes the new industries and new transfer types; and the 1995 data set, which is used to track trends from 1995–1999 and which only covers those chemicals, sectors and data categories that were comparable in 1995. When reading the tables, take note of which of these three data sets is being used. This will tell you what information is covered and what has been excluded. Table 2–4 below provides a useful reference as to what is covered in each of the matched data sets.
Taking Stock: North American Pollutant Releases and Transfers 1999
16
2.2 Understanding PRTR Data Simply put, facilities report to PRTRs the amounts of listed chemicals that they release to the environment on-site and that they transfer off-site to other locations for recycling, energy recovery, treatment, or disposal. However, for each PRTR, these basic rules differ in the details. Thus, to use data from different PRTRs effectively, it is important to understand how the programs differ and how they are the same. Table 2–1 summarizes the basic data elements of each country’s PRTR.
2.2.1 Facilities/Companies Each PRTR system covers specified types of business activities. Canada’s NPRI covers all business activities, with very few exceptions. Canada exempts those involved with the distribution, storage or retail sale of fuels; agriculture, mining and oil and gas well drilling, if these facilities do not process or otherwise use the substances; research and training institutions; and transportation vehicle repair facilities. In the United States, manufacturers have been required to report to TRI since its inception, and federally owned facilities were added in 1994. Beginning with reporting for 1998, several additional industries associated with manufacturing must also report to TRI.
Mexico’s reporting scheme applies to any facility under federal jurisdiction. These include the following industrial sectors: petroleum, chemical and petrochemical, paints and inks, metallurgical, automotive, cellulose and paper, cement and limestone, asbestos, glass, electric power generation, and hazardous waste management. Federal jurisdiction is further limited to those facilities with thermal treatment processes or a foundry. The recently passed legislation in Mexico that calls for a mandatory PRTR system also applies to the state and municipal levels.
Note that “companies” do not report to PRTRs. Instead, each individual facility submits reports. Although some companies may centralize reporting procedures for all their facilities, individual submissions must be made for each facility. Both NPRI and TRI ask facilities to identify their parent companies. Although this information can be used to analyze PRTR reporting at the corporate level, painstaking care is needed to identify all versions of a corporate name (for example: GM, General Motors, Delco Div. of General Motors, etc.)
2.2.2 Industrial Classification System Facilities are classified according to the type of industrial operations they carry out. This allows both the determination that they are required to report as well as comparisons among industrial sectors. All three countries require that facilities report using a type of industrial classification system, but these systems differ among the countries. Both the United States and Canada use a “Standard Industrial Classification” system, such that industries are identified by their “SIC code.” These systems, however, are not the same. The Mexican COA uses the Mexican Activities and Products Classification (Clasificación Mexicana de Actividades y Productos—CMAP code), which is different yet again.
Fortunately for comparison purposes, Canada supplies facilities with a table that correlates Canadian SIC codes to their US equivalents and requires each facility to report both the Canadian and the US SIC code that characterizes the majority of its operations. This is essential to comparing the NPRI and TRI data, because there is no direct correspondence between the two SIC code systems.
Canada, Mexico and the United States are working together to develop a common North American Industry Classification System (NAICS) that, if used, will allow more far-reaching comparisons in the future. In reporting year 1998, NPRI facilities began reporting their NAICS code, along with the Canadian and US SIC codes. The US TRI and the Mexican RETC are expected to implement the NAICS sometime in the future. Information on NAICS is available from Statistics Canada on the Internet at <www.statcan.ca/english/Subjects/Standard/index.htm>. The US government has information on NAICS at: <www.ntis.gov/yellowbk/1nty205.htm>. For information on NAICS in Spanish, see the INEGI web site <www.inegi.gob.mx/>.
2.2.3 Chemicals Each PRTR system covers a specific list of chemicals. These include both individual chemicals, such as toluene and 1,1,1-trichloroethane, and certain chemical groups, such as polycyclic aromatic compounds or zinc and zinc compounds.
Chemicals often have more than one name (synonyms). Methyl bromide and bromomethane, for example, are names for the same chemical, an ozone-depleting chemical whose production and use have been limited under the Montreal Protocol. PRTRs rely on the identification systems of various authorities to specify the exact chemicals that are to be reported. NPRI and TRI use Chemical Abstracts Service (CAS) Registry Numbers, which is a service of the American Chemical Society. The CAS number of bromomethane, for example, is 74-83-9. Tables in Taking Stock that present chemical-specific data include CAS numbers.
The Chemical Abstracts Service lists more than 19 million chemical substances and identifies more than 225,000 of them as regulated or covered by chemical inventories worldwide <www.cas.org/cgi-bin/regreport.pl>. Of this immense universe, NPRI covers almost 250 chemical substances and TRI approximately 650. (Counts of the number of substances on a list vary, as some observers may count individual substances within a chemical category and others may not.) Seven pollutants are listed in the section of the Mexican COA (Section II) that is required to be filled out. These are sulfur oxides, nitrogen oxides, particulates, volatile organic compounds, unburned hydrocarbons, carbon monoxide, and carbon dioxide, although reporting on only the first four is mandatory. None of these are on the NPRI or TRI lists, however NPRI plans to add the criteria air contaminants sulfur oxides, nitrogen oxides, particulate matter, carbon monoxide, and volatile organic compounds for the 2002 reporting year. There are 104 chemicals in the list for the RETC, the voluntary Section V of the Mexican COA, which is the section that corresponds to the TRI and NPRI PRTR reporting. As explained below in Section 2.5, NPRI and TRI listed 210 substances in common in 1999. For a detailed comparison of the chemical lists in the three countries, see Appendix A.
Chapter 2 – User’s Guide to North American PRTR Data
17
2.2.4 Thresholds One other central criterion determines who must report what data to a PRTR: a reporting threshold. PRTRs set parameters for minimum amounts of a reportable substance involved in certain activities—a facility’s first responsibility under a PRTR is to determine whether it meets this reporting threshold. Typically, the reporting threshold involves manufacturing a listed substance, using a listed substance in a process (for example, as a reagent or catalyst), or otherwise using a listed substance (for example, in cleaning industrial equipment). For NPRI, if 10 tonnes (22,050 lbs) or more of the substance is manufactured, processed or “otherwise used,” then releases and transfers must be reported. For TRI, the thresholds are more than 25,000 lbs (11.34 tonnes) if a substance is manufactured or processed and 10,000 lbs (4.54 tonnes) if it is “otherwise used.”
For the 1995 and subsequent reporting years, Canada, as does the United States, requires that the total weight of the byproduct, regardless of concentration, be included in the calculation of the reporting threshold, eliminating one difference between the two systems. For this reason, the base year used in this report for analysis of changes over time is 1995.
The other major difference in threshold requirements between TRI and NPRI is the amount of the substance in a mixture. Both countries require reporting if this amount equals or exceeds one percent by weight. However, the United States has an additional lower threshold for carcinogenic chemicals: chemicals identified as carcinogens by the Occupational Safety and Health Administration (OSHA) standard must be reported at levels of 0.1 percent.
The net effect of these differences in threshold is that, in general, US facilities will meet the threshold at slightly lower levels of chemical activity/use than Canadian ones.
The Mexican RETC-type of threshold differs from the standard one used by NPRI and TRI. RETC thresholds are based on on-site releases, whereas that in NPRI and TRI is based on the amount manufactured or processed or otherwise used. Also, the RETC reporting thresholds vary by type of substance. For example, the threshold for organohalogens, including ozone depleters, is 1,000 kg/year, whereas the threshold for metals, such as lead or mercury, is 1 kg/year. A further difference is that RETC reporting thresholds are based on amount of on-site releases only. Amounts that are transferred off-site are not included when calculating whether the reporting threshold has been met. Some alternative thresholds for a few substances in NPRI are based on the amount of releases and transfers. The mandatory portion (section 2) of the Mexican COA does not have reporting thresholds. However, only facilities under federal jurisdiction, which is limited to those facilities with thermal treatment processes or a foundry, must report, and smaller facilities are not expected to fall under this classification.
The United States also has set an alternative threshold calculation for facilities with relatively small reportable amounts of a listed chemical. If a facility does not manufacture, process, or otherwise use more than 1 million pounds (454 tonnes) of the
chemical, and if the facility’s “total reportable amount”—all on-site and off-site recycling, energy recovery, and treatment, plus production-related on-site releases and off-site transfers for disposal—is less than 500 pounds (227 kg), the facility may file a short certification statement that identifies the chemical but does not supply any quantitative information.
2.2.5 Reporting Forms Facilities submit one form per listed substance for which they must report. A facility reporting on 10 chemicals files 10 forms (electronically in Canada and electronically or on hard copy in the United States). Thus, the individual, chemical-specific forms are the critical source of data for reports such as NPRI’s annual Summary Report, TRI’s annual Public Data Release, and the annual Taking Stock reports. Mexican facilities submit one form per facility, listing all chemicals used on the one form.
This point is important for understanding certain analyses of PRTR data, especially analyses of US data by industry sector. Using up to six SIC codes, TRI facilities identify the business activities or industry sectors associated with manufacture or use of each chemical on which they report. A facility may use the same SIC codes on all its TRI forms or it may use different SIC codes to describe its industrial activities for various chemicals. For example, a petrochemical facility may indicate petroleum refining as the industrial activity associated with one chemical, while it reports chemical manufacturing for another. One chemical form will be analyzed with other forms in petroleum refining and the second in chemical manufacturing. However, the facility itself—with the sum of all its reports—cannot be accounted as either a petroleum refinery or a chemical manufacturing plant for purposes of industry-based analyses of TRI data. In the analyses in Taking Stock, such facilities will appear in the industry category called “multiple SIC codes.” (See Box 2–1, below, for a list of US SIC codes included in the matched data sets.)
2.2.6 Amounts Reported Amounts reported to NPRI and TRI are estimates. These estimates may reflect monitoring, engineering calculations, emission factors (which identify the amounts of a chemical that can be expected to result from particular industrial processes or from the use of specific equipment), or other estimation techniques. Although the numbers represent estimates, NPRI and TRI require facilities to report releases and transfers to the tonne or pound, respectively. (For production-related waste management, in a separate section of the TRI form, facilities may report quantities rounded to two significant digits—for example, 2,100,000 pounds rather than 2,145,678 pounds.)
For releases of a substance that total less than one tonne, NPRI allows facilities to report just the total amount released and not the amounts in individual release categories by environmental medium. Therefore, in summary tables in this report, total releases will be more than the sum of the separate release categories. In contrast, the amounts of the individual releases for each medium are reported in TRI. Both NPRI and TRI require reporting of the amounts of individual types of transfers.
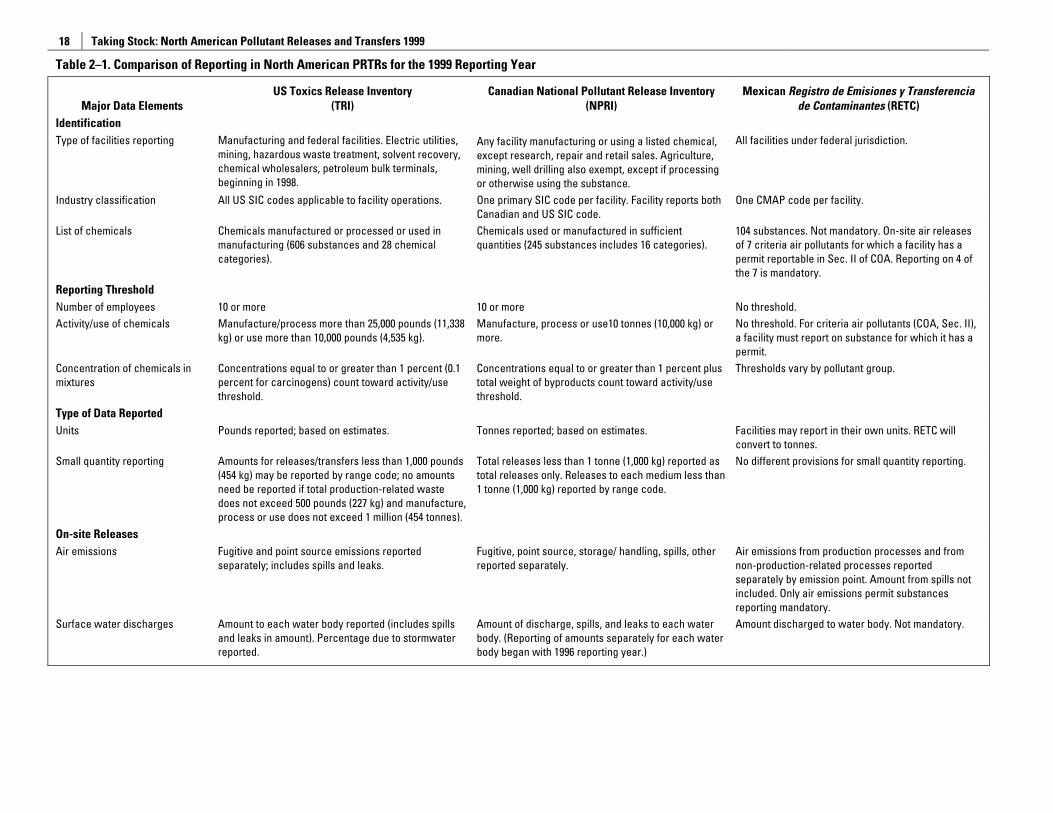
Taking Stock: North American Pollutant Releases and Transfers 1999
18
Table 2–1. Comparison of Reporting in North American PRTRs for the 1999 Reporting Year
Major Data Elements
US Toxics Release Inventory (TRI)
Canadian National Pollutant Release Inventory (NPRI)
Mexican Registro de Emisiones y Transferencia de Contaminantes (RETC)
Identification Type of facilities reporting Manufacturing and federal facilities. Electric utilities,
mining, hazardous waste treatment, solvent recovery, chemical wholesalers, petroleum bulk terminals, beginning in 1998.
Any facility manufacturing or using a listed chemical, except research, repair and retail sales. Agriculture, mining, well drilling also exempt, except if processing or otherwise using the substance.
All facilities under federal jurisdiction.
Industry classification All US SIC codes applicable to facility operations. One primary SIC code per facility. Facility reports both Canadian and US SIC code.
One CMAP code per facility.
List of chemicals Chemicals manufactured or processed or used in manufacturing (606 substances and 28 chemical categories).
Chemicals used or manufactured in sufficient quantities (245 substances includes 16 categories).
104 substances. Not mandatory. On-site air releases of 7 criteria air pollutants for which a facility has a permit reportable in Sec. II of COA. Reporting on 4 of the 7 is mandatory.
Reporting Threshold Number of employees 10 or more 10 or more No threshold. Activity/use of chemicals Manufacture/process more than 25,000 pounds (11,338
kg) or use more than 10,000 pounds (4,535 kg). Manufacture, process or use10 tonnes (10,000 kg) or more.
No threshold. For criteria air pollutants (COA, Sec. II), a facility must report on substance for which it has a permit.
Concentration of chemicals in mixtures
Concentrations equal to or greater than 1 percent (0.1 percent for carcinogens) count toward activity/use threshold.
Concentrations equal to or greater than 1 percent plus total weight of byproducts count toward activity/use threshold.
Thresholds vary by pollutant group.
Type of Data Reported Units Pounds reported; based on estimates. Tonnes reported; based on estimates. Facilities may report in their own units. RETC will
convert to tonnes. Small quantity reporting Amounts for releases/transfers less than 1,000 pounds
(454 kg) may be reported by range code; no amounts need be reported if total production-related waste does not exceed 500 pounds (227 kg) and manufacture, process or use does not exceed 1 million (454 tonnes).
Total releases less than 1 tonne (1,000 kg) reported as total releases only. Releases to each medium less than 1 tonne (1,000 kg) reported by range code.
No different provisions for small quantity reporting.
On-site Releases Air emissions Fugitive and point source emissions reported
separately; includes spills and leaks. Fugitive, point source, storage/ handling, spills, other reported separately.
Air emissions from production processes and from non-production-related processes reported separately by emission point. Amount from spills not included. Only air emissions permit substances reporting mandatory.
Surface water discharges Amount to each water body reported (includes spills and leaks in amount). Percentage due to stormwater reported.
Amount of discharge, spills, and leaks to each water body. (Reporting of amounts separately for each water body began with 1996 reporting year.)
Amount discharged to water body. Not mandatory.
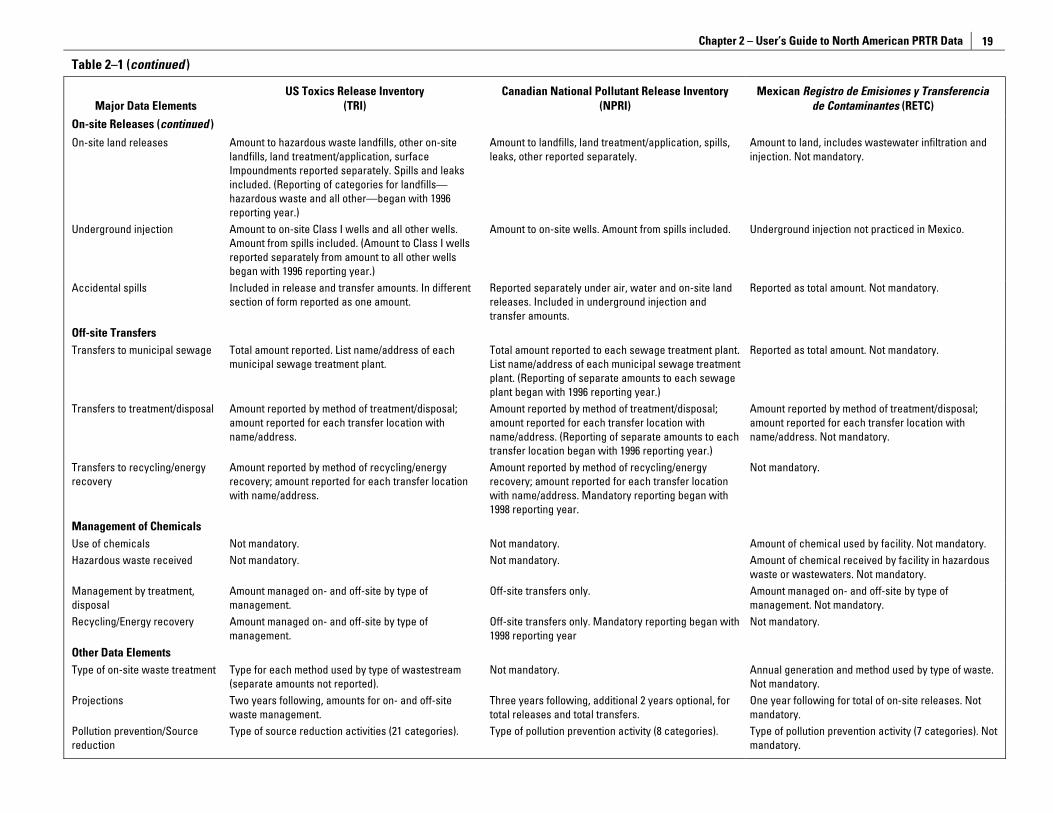
Chapter 2 – User’s Guide to North American PRTR Data
19
Table 2–1 (continued )
Major Data Elements
US Toxics Release Inventory (TRI)
Canadian National Pollutant Release Inventory (NPRI)
Mexican Registro de Emisiones y Transferencia de Contaminantes (RETC)
On-site Releases (continued ) On-site land releases Amount to hazardous waste landfills, other on-site
landfills, land treatment/application, surface Impoundments reported separately. Spills and leaks included. (Reporting of categories for landfills—hazardous waste and all other—began with 1996 reporting year.)
Amount to landfills, land treatment/application, spills, leaks, other reported separately.
Amount to land, includes wastewater infiltration and injection. Not mandatory.
Underground injection Amount to on-site Class I wells and all other wells. Amount from spills included. (Amount to Class I wells reported separately from amount to all other wells began with 1996 reporting year.)
Amount to on-site wells. Amount from spills included. Underground injection not practiced in Mexico.
Accidental spills Included in release and transfer amounts. In different section of form reported as one amount.
Reported separately under air, water and on-site land releases. Included in underground injection and transfer amounts.
Reported as total amount. Not mandatory.
Off-site Transfers Transfers to municipal sewage Total amount reported. List name/address of each
municipal sewage treatment plant. Total amount reported to each sewage treatment plant. List name/address of each municipal sewage treatment plant. (Reporting of separate amounts to each sewage plant began with 1996 reporting year.)
Reported as total amount. Not mandatory.
Transfers to treatment/disposal Amount reported by method of treatment/disposal; amount reported for each transfer location with name/address.
Amount reported by method of treatment/disposal; amount reported for each transfer location with name/address. (Reporting of separate amounts to each transfer location began with 1996 reporting year.)
Amount reported by method of treatment/disposal; amount reported for each transfer location with name/address. Not mandatory.
Transfers to recycling/energy recovery
Amount reported by method of recycling/energy recovery; amount reported for each transfer location with name/address.
Amount reported by method of recycling/energy recovery; amount reported for each transfer location with name/address. Mandatory reporting began with 1998 reporting year.
Not mandatory.
Management of Chemicals Use of chemicals Not mandatory. Not mandatory. Amount of chemical used by facility. Not mandatory. Hazardous waste received Not mandatory. Not mandatory. Amount of chemical received by facility in hazardous
waste or wastewaters. Not mandatory. Management by treatment, disposal
Amount managed on- and off-site by type of management.
Off-site transfers only. Amount managed on- and off-site by type of management. Not mandatory.
Recycling/Energy recovery Amount managed on- and off-site by type of management.
Off-site transfers only. Mandatory reporting began with 1998 reporting year
Not mandatory.
Other Data Elements Type of on-site waste treatment Type for each method used by type of wastestream
(separate amounts not reported). Not mandatory. Annual generation and method used by type of waste.
Not mandatory. Projections Two years following, amounts for on- and off-site
waste management. Three years following, additional 2 years optional, for total releases and total transfers.
One year following for total of on-site releases. Not mandatory.
Pollution prevention/Source reduction
Type of source reduction activities (21 categories). Type of pollution prevention activity (8 categories). Type of pollution prevention activity (7 categories). Not mandatory.
Taking Stock: North American Pollutant Releases and Transfers 1999
20
2.2.7 Confidentiality Claims/Trade Secrecy The purpose of the Canadian and US databases is to provide the public with data about chemicals arising from industrial activities, so in general, both databases limit the type of information that facilities can claim as secret and withhold from public disclosure. In the United States, the only claim of trade secrecy that can be made is for the identity of the chemical. All data on release and transfer amounts are part of the database. Claiming trade secrecy is not widespread: only 3 TRI forms out of 84,068 submitted for 1999 contained such claims. The trade secrecy claims were for substances for which there were zero releases and transfers. In Canada, all information in a report, including the identity of the facility, may be held confidential if it conforms to the criteria under the Federal Access to Information Act. According to the NPRI summary report, 6 facilities and 46 forms out of the national total of 8,595 forms were given confidential status for the 1999 NPRI reporting year. This represented 4,273 tonnes of releases and transfers.
2.2.8 Releases and Transfers PRTRs collect data on two basic types of releases and transfers: those resulting from normal business activities—these represent the greatest potential for pollution prevention efforts—and those arising from accidents, from clean-up activities to remedy earlier releases, or from other one-time events. This section gives general descriptions of the types of releases and transfers. Both the NPRI and TRI databases contain much greater detail than is presented in these descriptions or in summary tables throughout Taking Stock.
Reporting instructions for NPRI and TRI give detailed information on the releases and transfers that facilities must report, and both systems supply guidance to specific industries in published manuals and/or training sessions (these may be available for previous years, however, they can be found most readily for the current reporting year).
Figure 2–1 illustrates the releases and transfers classification scheme used in this report.
Releases On- and Off-site Releases represent the entry of a chemical substance into the environment. Facilities report amounts of the listed chemicals they have released to the environment at their own location (“on-site”). Amounts are reported separately for each environmental medium:
• Air emissions—Releases to air that occur through identified outlets such as stacks (“smokestacks”) or vents are labeled “stack” or “point” emissions. Air releases that occur because of leaks are labeled “fugitive” or “non-point” emissions. Generally, facilities apply pollution-control devices or technologies to limit stack emissions of listed chemicals. Some facilities have found PRTR reporting beneficial in helping to identify unexpected emissions sources, such as leaking ducts or pipes, which can then be corrected.
• Surface water discharges—Releases to surface water bodies such as rivers and lakes generally occur through discharge pipes. (Wastewater is generally treated
first, to remove or minimize its pollutant content.) Rainwater may also wash pollutants from on-site waste storage areas into surface waters. These releases from run-off are also reportable.
• Underground injection—Facilities may inject listed chemicals in waste into deep underground wells, a practice more common in certain parts of the United States than in Canada. Underground injection is regulated, and deep wells that receive toxic waste are intended to isolate the pollutants from groundwater sources. Underground injection is not practiced in Mexico.
• On-site land releases—Releases to land at the facility include burying chemical waste in landfills, incorporating it into soil (“land treatment”), holding it in surface impoundments, accumulating it in waste piles, or disposing of it by other methods.
Facilities also report transfers off-site that represent releases to the environment at the off-site location. These include:
• Disposal—Waste sent off-site for disposal may be disposed of on land or by underground injection. These methods are the same as on-site land releases and underground injection, although they occur at locations away from the originating facility.
• Transfers of Metals—In the Taking Stock analyses transfers of metals to disposal, sewage, treatment and energy recovery are included in the off-site releases category to make the TRI and NPRI data comparable. TRI classifies all transfers of metals as transfers to disposal because metals sent to energy recovery, treatment or to sewage treatment may be captured and removed from waste and disposed of in landfills or by other disposal methods, but are not destroyed by treatment processes or burned in energy recovery units.
Transfers for Further Management Facilities report amounts of the listed chemicals they have sent to other locations for further management. In PRTRs, the amount of the chemical in the material transferred is reported and not the total volume of the material. Both NPRI and TRI have collected data on off-site transfers for treatment and for disposal since the respective inventories began (1993 for NPRI and 1987 for TRI). In 1991, TRI began requiring facilities to report transfers for recycling and energy recovery. Reporting of these transfer types had been optional in NPRI until the 1998 reporting year.
• Recycling—Chemicals in the materials sent off-site for recycling are generally recovered by a variety of recycling methods, including solvent recovery and metals recovery. They can be sent off-site for processing, cleaning or reclamation and returned to the originating facility or made available for use by other facilities. They can also include materials that are sent back to suppliers for credit or payment.
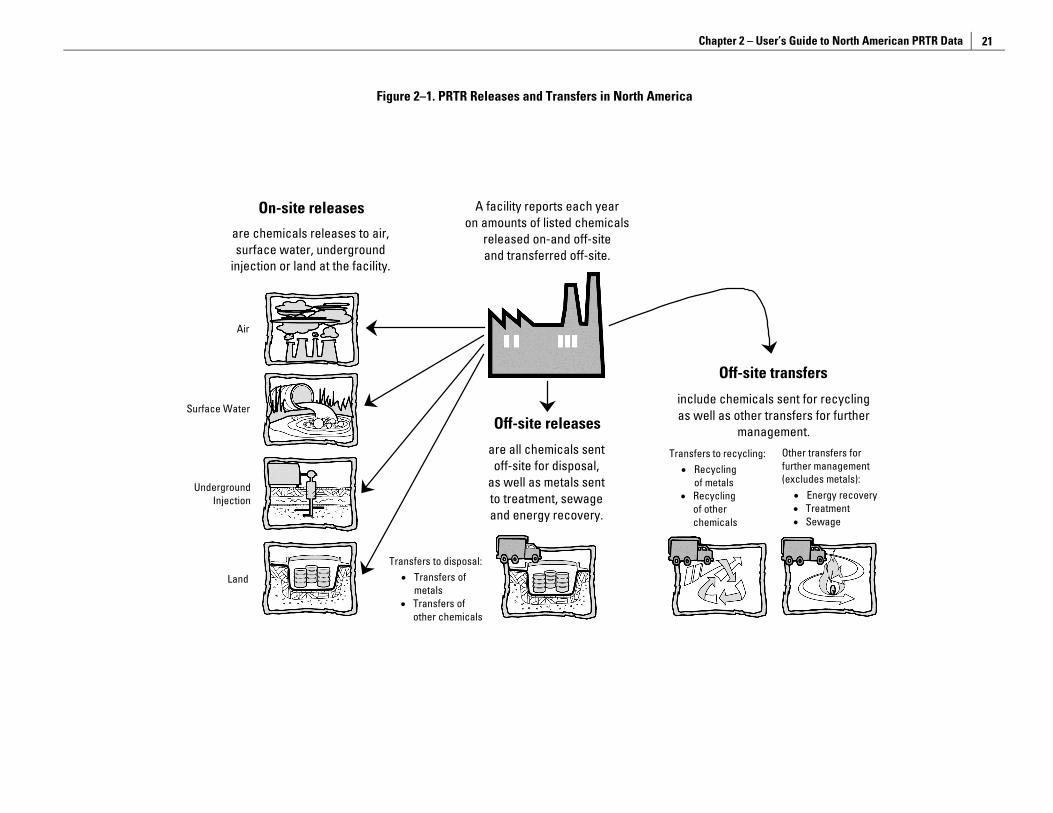
Chapter 2 – User’s Guide to North American PRTR Data
21
Figure 2–1. PRTR Releases and Transfers in North America
On-site releases
Off-site releases
Air
Surface Waterinclude chemicals sent for recycling as well as other transfers for further
management.
UndergroundInjection
Land
are all chemicals sent off-site for disposal,
as well as metals sent to treatment, sewage and energy recovery.
are chemicals releases to air, surface water, underground
injection or land at the facility.
Off-site transfers
A facility reports each year on amounts of listed chemicals
released on-and off-site and transferred off-site.
Transfers to disposal:• Transfers of
metals • Transfers of
other chemicals
Transfers to recycling:• Recycling
of metals • Recycling
of other chemicals
Other transfers for further management (excludes metals):
• Energy recovery• Treatment • Sewage
Taking Stock: North American Pollutant Releases and Transfers 1999
22
• Energy Recovery—Chemicals in materials sent off-site for energy recovery are combusted in industrial furnaces (including kilns) or boilers that generate heat or energy for use at the off-site location. Energy recovery is applicable only when the material has a significant heating value and when it is used as an alternate for fossil fuel or other forms of energy.
• Treatment—Chemicals can be sent for physical, chemical, or biological treatment. Neutralization is an example of chemical treatment and incineration is an example of physical treatment. Treatment is intended to alter or destroy the chemical. Treatment processes must be appropriate for the particular substance—a chemical that will not burn, for example, cannot be successfully incinerated.
• Sewage Treatment—Facilities may send their chemical waste to sewage treatment facilities—municipal sewage treatment plants (MSTPs) in Canada or publicly owned treatment works (POTWs) in the United States. Effectiveness of sewage treatment depends on both the substance and the sewage plant’s processes. Volatile chemicals are likely to evaporate (releases to air). Typically, secondary treatment processes apply microorganisms (with aeration or oxygenation) to biodegrade organic compounds.
It should be noted that PRTRs do not measure all environmental releases occurring from off-site transfers. Transfers sent for disposal and transfers of metals to energy recovery/treatment/sewage/disposal indicate off-site releases at the receiving site, but other types of transfers may also result in releases. Residues from recycling operations must be disposed of. Energy recovery and treatment processes are seldom 100 percent effective, and some releases to the environment may occur.
2.3 Putting PRTR Data to Work
2.3.1 Public Dissemination As one of the purposes of the databases is to provide the PRTR information to the public, both TRI and NPRI are available in a variety of formats: annual summary reports, detailed data in hard and electronic form, and over the Internet (see contact information in Chapter 1). The Mexican RETC data are aggregated by municipality and by state in annual reports.
While governments have the responsibility of publishing the data and making it readily available to the public, public interest groups and others are playing an increasingly active role in North America in enabling citizens—including those without expertise or experience working with data sets—to access, use and understand the data. The NPRI and TRI data are available on web sites maintained by some of these groups along with access to other environmental data as well. (See below for more information on these web sites.) Some industry associations are also helping to get PRTR numbers out into the public domain. They publish their own PRTR numbers annually, and some companies hold regular meetings for neighborhood communities to discuss their PRTR data as well other local issues.
2.3.2 Using PRTR Data Alone PRTR data have a wealth of potential uses beyond the needs and resources of government. Companies and individual facilities use PRTR data to report on their waste management activities and environmental performances. Publicly available PRTR data also provide a basis for local citizens and industries to track progress in reducing pollutant releases and transfers. The data can also be used to build a regional picture of releases and transfers, and to encourage companies to expand their environmental management programs.
PRTR data are valuable for what they reveal. Using PRTR data alone, releases and transfers can be analyzed by chemical, by facility, by business sector, or for a geographical area—and over time. What chemical is released in the largest amount in a given community? Where are transfers of chemicals in waste into a particular province or state coming from? What chemicals are reported in surface water discharges to tributaries throughout a watershed? How does one facility compare with another in the same business? Such analyses can also show overall progress or lack thereof. Are local facilities reducing the releases they report? Are reductions in on-site releases accompanied by increases in transfers of listed substances off-site? What industry-wide trends are evident?
PRTR data can answer these questions. In turn, many answers point to new questions that require more information than PRTRs typically supply. For example, how have facilities reduced their releases? Although facilities indicate what pollution prevention activities they have undertaken during the year (beginning with the 1997 reporting year in NPRI and the 1991 reporting year in TRI), specific reductions in releases and transfers cannot be linked directly to any such activity reported in the PRTR data. TRI facilities also report a production index, showing how much production levels have increased or declined since the previous year; reporting a production index to NPRI is voluntary. Again, specific reductions cannot be linked to this index since the index reflects changes due to all factors, including, for example, changes in production levels or changes in pollution control equipment.
2.3.3 Finding Information on “What is behind the numbers” While PRTR data alone can provide much information of potential interest, some questions can only be answered by finding out more about what is “behind the numbers.” For example, how have facilities reduced their releases? Did facilities take specific actions to bring about these reductions? Have facilities eliminated or reduced releases of one chemical by switching to processes that use another? If so, is that substance less potentially harmful—or not? To be able to answer such questions, it is necessary to find out more about the facilities. NPRI facilities have the opportunity to comment on their releases and on their transfers, and a facility’s comments—included in the NPRI database—may explain its increases or decreases in reported amounts from previous years. The TRI database does not contain such comments. Most often, however, calling a facility is the only way to obtain an explanation of its releases and
Chapter 2 – User’s Guide to North American PRTR Data
23
transfers and their year-to-year changes. Contact points are provided by facilities as part of their PRTR reporting forms.
2.3.4 Recognizing the Limitations A principal factor in making good use of PRTR data is to know their limitations. PRTR data:
• do not encompass all potentially harmful substances,
• do not address all sources from which chemicals of concern move into the environment,
• do not identify all on-site releases and off-site transfers from a facility,
• do not measure releases and transfers—they estimate them,
• do not supply a direct perspective on the ultimate environmental fate of chemical substances that reporting facilities release or ship off-site for disposal or other disposition,
• do not provide information on the toxicity or potential health effects of substances released or transferred by reporting facilities,
• do not indicate risks from substances released or transferred by reporting facilities,
• do not identify exposures of human or ecological populations to substances released or transferred by reporting facilities.
Other important information also lies beyond the bounds of PRTR data. For example, information about local/regional geography, demographics, and economics may be needed to interpret PRTR data appropriately in community and ecological contexts.
2.4 Putting PRTR Data in Context Releases and transfers reported to PRTRs do not happen in a vacuum. They occur in many contexts—physical and chemical, economic and regulatory, geographic and ecological.
Substances that are released on-site or transferred off-site have physical and chemical characteristics that influence their ultimate disposition and their potential consequences for human and ecological life. Some of these substances are used or produced for particular aims—to induce a necessary reaction during manufacture of desired products, to give a product improved performance, a longer life or a better appearance, to clean a surface, to meet a certain demand in the commercial or industrial marketplace. Others result as spills or leaks or manufacturing by products or delivery of services (such as waste generated from production of electricity). Facilities that report to NPRI or TRI may expand, cut back, or change product lines, bringing about change in their releases and transfers. Some have actively sought ways to reduce the amounts of toxic chemicals they use, to reduce their contributions to pollution—and their costs. Regulations focused on protecting air and water have fostered such improvements at many facilities.
Reportable substances are released to air, water, or land or injected underground at known locations under specific conditions. Prevailing winds, for example, can shape the plume emitted from a stack and influence the distance and direction that pollutants travel. Populations both near and far may potentially be affected. Reportable substances may also be shipped across town or out of the country for recycling or energy recovery or for treatment or disposal.
There are many different methods of disposal and treatment. Chemicals can be physically, chemically, and biologically treated, incinerated, landfilled, stored, sent to a sewage treatment plant, injected underground, and incorporated into the land. The type of method chosen will depend on many factors including the chemical and physical nature of the substance, the availability of facilities, and cost. The ecological and health impacts will vary with the substance, the type and effectiveness of treatment and the nature of the surrounding environment. Chemicals of concern released to the environment or transferred off-site for disposal by PRTR facilities join those that originate from other sources—from agriculture and transportation, from sectors not required to report (to TRI), and from small sources such as service stations and dry-cleaning establishments.
2.4.1 Chemicals of Concern Some questions require external information from the start. How effective has the Montreal Protocol been in reducing releases of ozone-depleting chemicals? PRTRs collect data on ozone-depleters, but the databases do not explicitly identify these chemicals. Users will need a list of the substances covered by the Montreal Protocol <www.unep.org/ozone/montreal.shtml> to begin investigating releases of those substances reported to NPRI and TRI. (See Chapter 3 for 1999 data for these substances in the matched data set and the companion Summary volume for information on progress under the Montreal Protocol meeting the ban on production of these substances.)
Another question might be, what are the releases of substances listed as toxic under the Canadian Environmental Protection Act (CEPA) or on the California Proposition 65 list of chemicals known to the state of California to cause cancer, birth defects or other reproductive harm. Subsets of these groups of chemicals are in the matched data set, where to find the lists is discussed later in this chapter, and what their releases for 1999 were is discussed in Chapter 3 of this report.
A similar step is required to analyze NPRI or TRI data for carcinogens, endocrine disruptors, persistent bioaccumulating toxic pollutants, or other chemical groups. Resources for identifying these groups include:
• Carcinogens—International Agency for Research on Cancer (IARC) <www.iarc.fr/> and US National Toxicological Program (NTP) <ntp-server.niehs.nih.gov/>. (Note: releases and transfers of known and suspected carcinogens reported to both NPRI and TRI are analyzed in Chapters 3, 6 and 7 of this report.)
Taking Stock: North American Pollutant Releases and Transfers 1999
24
• Endocrine disrupters—OECD (discusses research but does not list substances) <www.oecd.org/ehs/endocrin.htm>.
• PBTs—US EPA’s proposed TRI regulations and related developments <www.epa.gov/tri/>.
2.4.2 Chemical Uses and Industry Processes Releases and transfers arise from particular industrial processes or activities. To assess the significance of the chemicals and amounts reported to PRTRs involves understanding their use.
Many general sources summarize the industrial and commercial uses of specific chemicals. Trichloroethylene (TCE), for example, is used in degreasing fabricated metal parts and as a chemical intermediary in fluorocarbon production. Patterns of releases from these two principal uses differ substantially. TCE has replaced an ozone-depleting chemical, 1,1,1-trichloroethane, in metal degreasing, an application likely to generate air emissions. However, the predominant—and growing—use of TCE is in producing the hydrofluorocarbon HFC-134a, a use less likely to yield TCE emissions to air. Factsheets and other reference materials that supply toxicity data often summarize uses as well, and the Environmental Defense Scorecard also offers such information. Appendix E provides basic information on uses for the 25 chemicals with the largest releases and/or total reported amounts of releases and transfers.
Other resources include:
• US National Safety Council’s Environment Writer Chemical Backgrounder Index <www.nsc.org/ehc/ew/chemical.htm>,
• Environmental Chemicals Data and Information Network (ECDIN) <agnic.nal.usda.gov/agdb/env_chem.html>,
• New Jersey’s Right-to-Know Hazardous Substance Fact Sheets <www.state.nj.us/health/eoh/rtkweb/rtkhsfs.htm>, and
• ChemExpo <www.chemexpo.com>.
Some PRTRs—those in the states of New Jersey and Massachusetts are examples—collect additional data on facilities’ use of toxic chemicals. Known in various contexts as throughput data, materials accounting, or chemical-use data, this information allows a more complete accounting of a facility’s use of a toxic chemical—how much is brought on-site, produced, held in inventory, shipped in product, transferred as waste to other locations, and released to the environment. Such data support a much more extensive range of analyses than the limited release and transfer data available in NPRI and TRI. One example would be assessments of the relative efficiency of facilities that manufacture the same product.
2.4.3 Toxicity and Human Health Effects “How dangerous are these chemical releases and transfers to my health?” Newcomers to PRTR-type information are likely to ask this question early on, especially if they are
examining data from nearby facilities. This question also underlies many more sophisticated analyses of PRTR data. There are no simple answers.
The potential of a substance to cause harm arises from both:
• its inherent toxicity—how harmful is it?—and
• exposure to it—how much and by what route?
What is known about the toxicity and ill effects of various chemicals results principally from studies of animals and human beings that have been exposed to them (ranging from laboratory tests to accidental exposures of human populations, such as workers). Various authoritative bodies have collected such data and, while PRTR data do not contain such information, the NPRI and TRI web sites link users to various sources of it.
The NPRI web site directs users to:
• the US Agency for Toxic Substances and Disease Registry for ToxFAQs summaries about hazardous substances <www.atsdr.cdc.gov/toxfaq.html>;
• the HazDat database, which includes information on the effects of hazardous substances on human health <www.atsdr.cdc.gov/hazdat.html>;
• the International Agency for Research on Cancer <www.iarc.fr/>; and Toxicology Excellence for Risk Assessment <www.tera.org/>, which compiles human health risk values from various international health organizations.
US EPA’s TRI web site offers links to:
• summaries of effects, exposures, and environmental fate for some 40 selected TRI chemicals <www.epa.gov/chemfact/> and
• the ToxFAQs summaries mentioned above <www.atsdr.cdc.gov/toxfaq.html>.
Other sources of health and safety information about chemical substances include:
• Canadian Centre for Occupational Health and Safety—<www.ccohs.ca/oshanswers/>
• State of New Jersey, Department of Health, Right-to-Know Hazardous Substances Fact Sheets—<www.state.nj.us/health/eoh/rtkweb/rtkhsfs.htm>
• National Safety Council, Crossroads on Chemical Databases and Material Safety Data Sheets (MSDSs)—<www.nsc.org/xroads/chem.htm>
In its Scorecard <www.scorecard.org>, Environmental Defense has on-line information about potential ecological and human health effects for more than 6,500 chemicals. Scorecard reports on recognized and suspected health hazards associated with the chemical in several different categories, including cancer, cardiovascular or blood toxicity, developmental toxicity, endocrine toxicity, neurotoxicity, and reproductive toxicity, among others).
Scorecard also supplies hazard rankings for each chemical. These indicate whether a chemical has been found to be more or less hazardous in particular respects than other chemicals in the database. Existing ranking systems weigh toxicity alone or in
Chapter 2 – User’s Guide to North American PRTR Data
25
combination with the persistence of a chemical in an environmental medium, and such ranking systems have addressed both human health effects and ecological effects.
Three environmental organizations have developed PollutionWatch, a web-based Scorecard for NPRI data: the Canadian Institute for Environmental Law and Policy, the Canadian Environmental Law Association, and the Canadian Environmental Defence Fund. PollutionWatch can be found at <www.pollutionwatch.org> or through a link from the Scorecard site.
These sources can help PRTR data users begin to weigh the risks posed by releases of specific substances and set priorities for prevention and protection. As noted in the Scorecard web site <www.scorecard.org/env-releases/us-map.tcl>: “Scorecard cannot tell you whether the amount of pollution in your own area is safe or unsafe, and it does not calculate the amount of health risk that reported pollution in your area poses. Scorecard tells you which chemical releases in your area might be of potential health concern, based on available data, and helps you identify the highest priorities among those chemical releases.”
2.4.4 Geographic Information Every release has a particular place of originate. What happens next depends on landforms, stream flow, and air currents—as well as on the physico-chemical properties of the substances of concern. PRTR data can be aggregated by geographic location—postal code, municipality, county or census division, province or state. Data can be mapped. (Environmental Defense’s Scorecard <www.scorecard.org> and US EPA’s
Envirofacts <www.epa.gov/enviro/index_java.html> map TRI data on the Internet. Canada’s NPRI web site <www.ec.gc.ca/pdb/npri/> and the PollutionWatch site <www.pollutionwatch.org> offer mapping capability for NPRI data.) Maps can correlate releases and transfers with demographic data, sensitive ecological populations, locations of non-PRTR sources of pollution, and other geographic information. Watershed and airshed maps are especially valuable for assessing the cumulative impacts of pollutant sources.
2.4.5 Other Sources of Environmental Releases Facilities that report to PRTRs are not the only sources of pollutant releases to the environment. For example, neither NPRI nor TRI capture release and transfer data for small factories and businesses that do not meet the reporting thresholds. Further prior to 1998, TRI did not cover non-manufacturing sources, except for federal facilities. Another seven industries related to manufacturing began reporting to TRI for the 1998 reporting year. Thus, because of reporting thresholds and/or industry classification, entities such as dry-cleaning establishments and automobile service stations do not report to the North American PRTRs. Nor do NPRI or TRI capture releases from mobile sources (that is, motor vehicles and other forms of transportation) or from agriculture.
Moreover, the lists of substances covered by the North American PRTRs do not include all chemicals or classes of chemicals for which environmental releases may cause concern. Releases of PRTR-listed substances, and the burdens they impose on the environment, need to be considered in the context of other (similar or different) environmental burdens posed by non-listed pollutants from many sources, large and small.
Information about these other releases may be gathered from various sources. For example, air and water permitting systems may require regular reporting of emissions. In other cases, governments may estimate the contribution of other sources of environmental releases, as in annual inventories of emissions of “criteria air pollutants.” Motor vehicle emissions, for example, may be estimated from such data as gasoline consumption (and its chemical composition), national or regional estimates of mileage driven under urban or highway conditions, etc. All three North American countries have estimated their national greenhouse gas emissions in response to the United Nations’ Framework Convention on Climate Change.
NPRI Summary Reports supply national summaries of such information, when available. The 1996 report, for example, reviewed available data on architectural surface coatings (paints), commercial and consumer solvents, dry cleaning and solvent degreasing. The 1997 NPRI report included national estimates of releases of NPRI substances due to fuel distribution and mobile sources and estimates of criteria air contaminants. For the 1998 and 1999 report, estimates of greenhouse gas emissions were included. In the United States, the 1996 TRI Public Data Release compared TRI reporting of selected chemicals with fertilizer and pesticide uses and with estimated total emissions of volatile organic compounds (VOCs).
Beyond PRTR Data: Risk and Exposure Assessment PRTR data supply information on amounts of substances released to the environment at specific locations. Identifying and assessing potential harm from particular releases of a chemical to the environment is a complex task, requiring information additional to that given in PRTRs, and the results are always tentative or, at best, relative.
A substance is released to a specific medium (air, water, land)—does it remain in that medium or does it move from one to another? How long does it remain in the environment—in which medium—and in what form? How far does it travel? If deposited from air to land in agricultural communities, will it be taken up by crops? How much of such a crop will people eat? What is the physical relationship of the releases to human populations—are the pollutants discharged to surface waters in which people swim or upstream of drinking water intakes? Do prevailing winds carry air emissions toward or away from human populations? Are susceptible populations—school children, the elderly—likely to be exposed to these pollutants?
Answering these questions—and many more—constitutes a risk and exposure assessment. Such assessments should make clear their assumptions and the scientific uncertainties involved in their results.
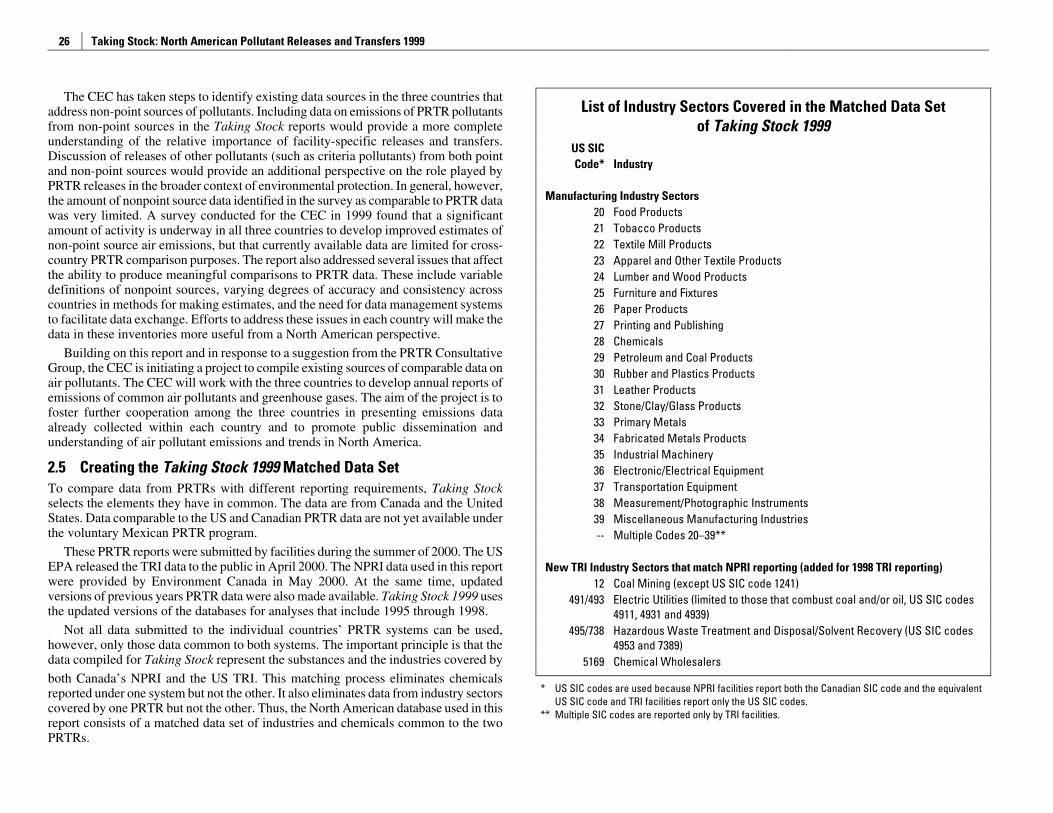
Taking Stock: North American Pollutant Releases and Transfers 1999
26
The CEC has taken steps to identify existing data sources in the three countries that address non-point sources of pollutants. Including data on emissions of PRTR pollutants from non-point sources in the Taking Stock reports would provide a more complete understanding of the relative importance of facility-specific releases and transfers. Discussion of releases of other pollutants (such as criteria pollutants) from both point and non-point sources would provide an additional perspective on the role played by PRTR releases in the broader context of environmental protection. In general, however, the amount of nonpoint source data identified in the survey as comparable to PRTR data was very limited. A survey conducted for the CEC in 1999 found that a significant amount of activity is underway in all three countries to develop improved estimates of non-point source air emissions, but that currently available data are limited for cross-country PRTR comparison purposes. The report also addressed several issues that affect the ability to produce meaningful comparisons to PRTR data. These include variable definitions of nonpoint sources, varying degrees of accuracy and consistency across countries in methods for making estimates, and the need for data management systems to facilitate data exchange. Efforts to address these issues in each country will make the data in these inventories more useful from a North American perspective.
Building on this report and in response to a suggestion from the PRTR Consultative Group, the CEC is initiating a project to compile existing sources of comparable data on air pollutants. The CEC will work with the three countries to develop annual reports of emissions of common air pollutants and greenhouse gases. The aim of the project is to foster further cooperation among the three countries in presenting emissions data already collected within each country and to promote public dissemination and understanding of air pollutant emissions and trends in North America.
2.5 Creating the Taking Stock 1999 Matched Data Set To compare data from PRTRs with different reporting requirements, Taking Stock selects the elements they have in common. The data are from Canada and the United States. Data comparable to the US and Canadian PRTR data are not yet available under the voluntary Mexican PRTR program.
These PRTR reports were submitted by facilities during the summer of 2000. The US EPA released the TRI data to the public in April 2000. The NPRI data used in this report were provided by Environment Canada in May 2000. At the same time, updated versions of previous years PRTR data were also made available. Taking Stock 1999 uses the updated versions of the databases for analyses that include 1995 through 1998.
Not all data submitted to the individual countries’ PRTR systems can be used, however, only those data common to both systems. The important principle is that the data compiled for Taking Stock represent the substances and the industries covered by
both Canada’s NPRI and the US TRI. This matching process eliminates chemicals reported under one system but not the other. It also eliminates data from industry sectors covered by one PRTR but not the other. Thus, the North American database used in this report consists of a matched data set of industries and chemicals common to the two PRTRs.
List of Industry Sectors Covered in the Matched Data Set of Taking Stock 1999
US SIC Code* Industry
Manufacturing Industry Sectors
20 Food Products 21 Tobacco Products 22 Textile Mill Products 23 Apparel and Other Textile Products 24 Lumber and Wood Products 25 Furniture and Fixtures 26 Paper Products 27 Printing and Publishing 28 Chemicals 29 Petroleum and Coal Products 30 Rubber and Plastics Products 31 Leather Products 32 Stone/Clay/Glass Products 33 Primary Metals 34 Fabricated Metals Products 35 Industrial Machinery 36 Electronic/Electrical Equipment 37 Transportation Equipment 38 Measurement/Photographic Instruments 39 Miscellaneous Manufacturing Industries -- Multiple Codes 20–39**
New TRI Industry Sectors that match NPRI reporting (added for 1998 TRI reporting)
12 Coal Mining (except US SIC code 1241) 491/493 Electric Utilities (limited to those that combust coal and/or oil, US SIC codes
4911, 4931 and 4939) 495/738 Hazardous Waste Treatment and Disposal/Solvent Recovery (US SIC codes
4953 and 7389) 5169 Chemical Wholesalers
* US SIC codes are used because NPRI facilities report both the Canadian SIC code and the equivalent US SIC code and TRI facilities report only the US SIC codes.
** Multiple SIC codes are reported only by TRI facilities.
Chapter 2 – User’s Guide to North American PRTR Data
27
2.5.1 Industry Sectors As in previous years, all manufacturing industries are included in the matched data set. For 1998 and following, the US TRI included reporting from several additional industry sectors that are linked to manufacturing—those providing energy (coal mining and electric utilities), further managing products (metal mining, chemical wholesalers and petroleum bulk terminals) or wastes from the manufacturing sector (hazardous waste treatment and solvent recovery facilities).
These additional TRI industries have been reporting to NPRI since its inception, with the exception of petroleum bulk terminals. Also, the reporting criteria for the metal mining sector differ between TRI and NPRI. Under TRI, but not under NPRI, releases and other waste management activities of TRI chemicals in waste rock are reportable. Waste rock consists of barren or submarginal rock that is removed in order to gain access to the ore.
Because of these differences, Taking Stock 1999 includes the following industry sectors:
• manufacturing (US SIC codes 20–39),
• coal mining,
• electric utilities,
• chemical wholesalers and
• hazardous waste treatment and solvent recovery facilities.
In the text, the latter four are often referred to collectively as the “newly added industries.”
2.5.2 Chemicals In creating the matched data set, specific differences between the two systems must be taken into account. The matched data sets include only those substances on both lists.
However, while certain chemicals may be reportable in both systems, they may be defined differently. For sulfuric acid and hydrochloric acid, for example, under TRI only aerosol forms are reportable; these are released only to air. All forms of these acids are reportable to NPRI. For comparing TRI and NPRI data then, the matched data set includes only air emissions of these two chemicals.
In addition, while ammonia and isopropyl alcohol appear on both lists, they are not included in the matched data set because the definition for these substances differs. Total ammonia is reportable to NPRI, while only 10 percent of aqueous forms of ammonia, along with all anhydrous forms, are reportable to TRI. Only forms of isopropyl alcohol manufactured by the strong acid process are reportable to TRI, while all forms are reportable to NPRI.
TRI facilities report separately for certain chemicals and their compounds, while in NPRI, a chemical and its compounds count as one category. For example, TRI lists both lead and lead compounds, counting them as two separate substances, while NPRI lists
Reporting of Ammonia As in previous years, the substance ammonia is not included in the analyses for this report. While facilities in both countries must report on ammonia, in the TRI, US facilities determine their threshold for reporting and report amounts based on 100 percent of anhydrous ammonia and 10 percent of total aqueous ammonia in use or manufactured at their site. Canadian facilities, on the other hand, determine their threshold and report based on 100 percent of total ammonia, anhydrous and aqueous forms.
After discussions with governmental representatives, ammonia has not been included in the matched chemical set and, hence, in this Taking Stock report for two reasons:
1) Differences in reporting thresholds: the different calculations used to determine reporting thresholds (whether or not a facility has to report) means that it is not possible to account for those facilities not reporting under TRI.
2) Differences in the amount of ammonia reported: the different calculations will result in different amounts being reported under the two systems.
An example may help to understand the effect of these two differences:
1) Differences in reporting threshold
If we imagine a facility that releases 8 tonnes of ammonia to air and 10 tonnes to water: under the NPRI system, this facility would calculate the reporting threshold as: 10+8 = 18 tonnes of ammonia. The facility would have to report its releases to NPRI since they are above the 10-tonne reporting threshold. However, under the TRI system, this same facility would calculate the reporting threshold as: 8+1 = 9 tonnes (8 tonnes to air plus 10% of 10 tonnes to water). The facility would not report since its releases are below the reporting 11-tonne (25,000 pound) reporting threshold.
2) Differences in amount reported
Now imagine a facility that releases 10 tonnes to air and 50 tonnes to water. Under NPRI, this facility would report: 10+50 = 60 tonnes of ammonia released. But under TRI, this same facility would report: 10 tonnes to air plus 10% of 50 tonnes to water = 10+5=15 tonnes of ammonia released.
Therefore, the same facility would report four times more ammonia under NPRI than it would under TRI.
As shown in Table 2–3, the amount of ammonia reported in 1999 was about two percent of total releases and transfers in both NPRI and TRI. Had the TRI facilities reported 100 percent of their aqueous ammonia, as they would have under the NPRI system, the total releases and transfers of ammonia reported by the matched TRI industries would have been almost four times as much as was actually reported (387 million kg rather than 99.6 million kg). Therefore, because of the differences in reporting, ammonia is not included in the matched list of chemicals in Taking Stock.
Taking Stock: North American Pollutant Releases and Transfers 1999
28
the single category, lead and its compounds. All the analyses in Taking Stock 1999 add the TRI amount reported for the given chemical to the amount reported for its compounds, to correspond with NPRI practice.
There are three different matched chemical sets used in this report. The matched data set for 1999 includes data on 210 substances. New chemicals were added to NPRI reporting for the year 1999, and those new chemicals that are also on the TRI list are included in the matched data set for 1999. The addition of these new chemicals results in an approximately 25 percent increase in the number of chemicals analyzed in this Taking Stock 1999. The matched chemical set used for analyzing the years 1995 through 1998 contains 165 substances, corresponding to chemicals on the NPRI and TRI lists before the NPRI additions for 1999. (See Appendix B for the list of 210 chemicals and the subset of 165 chemicals.)
Ozone Depleters Among the chemicals added to the NPRI list for 1999 are ozone depleters. These chemicals are the focus of special analyses in Chapter 3. Fifteen of the substances in the 1999 matched data set are ozone depleters. Further description of the Montreal Protocol governing the production of these chemicals and progress in reducing their releases can be found in the Taking Stock Summary report, the companion volume to this Sourcebook.
The ozone layer is a protective layer of ozone molecules high above the earth, which shields us from the sun’s harmful ultraviolet rays. Any thinning of the ozone layer permits more ultraviolet rays to reach the earth, which can lead to higher incidence of skin cancer, cataracts and weakened immune systems. Increases in ultraviolet radiation can also reduce crop yields and damage food webs in the oceans.
Some chemicals can damage the ozone layer by reacting with the ozone molecules. Chlorofluorocarbons (CFCs) were invented in 1928 and were rapidly employed in aerosols, foams, refrigerators, air conditioners, solvents and fire extinguishers. They are a large group of chemicals, many of which have now been replaced by hydrochlorofluorocarbons (HCFCs) that are generally less harmful to the ozone layer.
In the 1980s, amid growing concern over the thinning of the ozone layer, countries developed the Montreal Protocol, an international agreement regulating the production and consumption of ozone-depleting chemicals. Production of some of the most damaging ozone-depleting substances was eliminated, except for a few uses, by 1996 in developed countries and by 2010 in developing countries. Approximately 175 countries have supported the Montreal Protocol, including Canada, US and Mexico. Canada and the United States are bound to the 1996 phase-out date and Mexico operates under the provisions for developing countries, which have later phase-out dates. The original Montreal Protocol adopted in 1988 has been modified five times so far to increase control measures. To view the text of the Montreal Protocol and the amendments in different languages go to <www.unep.org/ozone/treaties.shtml>.
The Montreal Protocol sets different control requirements depending on the chemical. Generally, countries supporting the Protocol agree to:
1) Stop consumption or production of chemicals in Group 1 of Annex A after 1 January 1996 for developed countries and 1 January 2010 for developing countries (CFC-11, CFC-12, CFC-113, CFC-114 and CFC-115).
2) Stop consumption or production of chemicals on Group 2 of Annex A after 1 January 1994 for developed countries (Halon-1211, Halon-1301 and Halon-2402).
3) Stop consumption or production of chemicals on Groups 1, 2, and 3 of Annex B after 1 January 1996 (CFC-13, CFC-111, CFC-112, CFC-211, CFC-212, CFC-213, CFC-214, CFCF-215, CFC-216, CFC-217, carbon tetrachloride and 1,1,1-trichloroethane).
4) Reduce consumption or production of hydrochorofluorocarbons listed in Group 1 of Annex C to 1989 levels.
5) Reduce consumption or production of methyl bromide to 75 percent of 1991 levels, beginning in 1999.
It is estimated that one chlorine atom can break apart more than 100,000 ozone molecules and one bromine atom can be even more destructive, breaking apart more than 4,000,000 ozone molecules. Scientists have developed a measure of the differing ability of chemicals to destroy ozone molecules. The measure, called the Ozone Depletion Potential (ODP), is the ratio of the impact on ozone (the calculated ozone depletion) of a chemical compared to the impact of a similar mass of the reference gas, CFC-11, which has a set ODP of 1.0. Some chemicals will be more destructive of the ozone layer than CFC-11, and so have an ODP greater than 1.0. Other chemicals will be less destructive of the ozone layer and have a lower ODP, or an ODP less than 1.0. This system allows different chemicals to be compared using CFC-11 equivalents as a common unit.
Many CFCs are also greenhouses gases, and so contribute to climate change. A measure of their effectiveness in doing so is called the Global Warming Potential (GWP), which represents how much a given mass of a chemical contributes to global warming over a given time period compared to the same mass of carbon dioxide. The GWP of carbon dioxide is defined as 1.0. These GWP values are being updated as further research into global warming develops. The GWP values used here are calculated over a 100-year time horizon and are taken from the Scientific Assessment of Ozone Depletion: 1998, a report issued by the Global Ozone Research and Monitoring Project of the World Meteorological Organization and UNEP.
For more information on ozone depletion go to <www.unep.org/unep/secretar/ ozone/>. For information on activities to reduce ozone depleters in Mexico, go to <www.semarnat.gob.mx/estadisticas_ambientales/estadisticas_am_98/atmosfera/ atmosfera06.shtml>, for such activities in Canada, go to <www.ec.gc.ca/ozone/>, and in the US, go to <www.epa.gov/ozone/>. The US site also has information on Ozone Depletion Potentials and Global Warming Potentials of substitutes for ozone-depleting substances.

1999 All Chemicals and Industries Chapter 2 – User’s Guide to North American PRTR Data
29
CEPA Toxics Another group of chemicals that are the focus of special analyses in Chapter 3 are those classified as toxic under the Canadian Environmental Protection Act (CEPA) of 1999. Thirty-one of the substances in the 1999 matched data set are CEPA toxics.
In Canada, chemicals are assessed to identify which chemicals can pose a risk to the environment or human life and health. To be classified as “toxic” under CEPA, a chemical is entering or may enter the environment in a quantity or concentration or under conditions that:
1) have or may have an immediate or long-term harmful effect on the environment or biological diversity,
2) constitute or may constitute a danger to the environment on which life depends or
3) constitute or may constitute a danger to human life or health.
Once a chemical has been classified as toxic, it is usually placed on Schedule 1, which then gives the federal government authority to regulate the chemical. The federal government has two years to develop preventative or control measures for toxic chemicals and a further 18 months to finalize the measures.
As of 9 May 2001, 52 chemicals had been found to be toxic and listed on Schedule 1. (For the list of chemicals on Schedule 1 go to <www.ec.gc.ca/CEPARegistry/ subs_list/>). For the Taking Stock analyses, chemicals that have been assessed and proposed to be toxic were considered CEPA toxic. While hexavalent chromium is considered toxic under CEPA, the most common form of chromium is trivalent chromium. Hexavalent forms (Cr VI) are more toxic than trivalent (Cr III) forms. Inhalation effects include irritation/damage to nose, lungs, stomach, and intestines. Ingestion can lead to stomach upset and ulcers, convulsions, and damage to kidneys and liver. Under some conditions, trivalent chromium may be converted to hexavalent chromium. Because both TRI and NPRI require reporting on the group of chromium compounds rather than the individual members of the group, it is not possible to analyze releases and transfers of only hexavalent chromium. Because of the toxicity of some chromium compounds and its ability to convert from one form to another, chromium and its compounds are included in the analysis of CEPA chemicals.
California Proposition 65 Chemicals Chemicals in a third group selected for special analysis in Chapter 3 are those on the California Proposition 65 list. In 1986, California voters approved an initiative (Proposition 65 on the ballot) to address the growing concerns about exposures to toxic chemicals. The subsequent act (The Safe Drinking Water and Toxic Enforcement Act of 1986) requires the Governor of California to publish a list of chemicals that are known to the state of California to cause cancer, birth defects or other reproductive harm. The list is updated at least once a year. The list as of June 2001 contained almost 700 substances, of which 77 are in the 1999 matched data set. The full list can be found on the Internet at <www.oehha.ca.gov/risk/ChemicalDB/index.asp>.
2.5.3 Matching Chemicals and Industries In 1999, 2,201 Canadian facilities in all industries reported 1.49 billion kg of releases and transfers to NPRI, and the 22,639 United States facilities reported 5.2 billion kg of releases and transfers (Table 2–2). However, not all of these reports match the reporting in the other country (Table 2–3).
Table 2–2. All Releases and Transfers Reported to NPRI and TRI, 1999
NPRI TRI Number Number
Total Facilities 2,201 22,639 Total Forms 8,634 84,068
Releases On- and Off-site kg kg
On-site Releases 324,197,470 * 3,307,307,989 Air 122,640,761 920,346,677 Surface Water 20,783,735 117,406,701 Underground Injection 136,643,057 116,845,870 Land 43,930,261 2,152,708,741
Off-site Releases 54,755,970 264,806,507 Transfers to Disposal (except metals) 19,654,470 37,917,263 Transfers of Metals** 35,101,500 *** 226,889,244
Total Releases 378,953,440 3,572,114,496
Off-site Transfers for Further Management
Off-site Transfers to Recycling 1,066,198,096 957,651,217 Transfers to Recycling of Metals 101,607,352 145,399,890 Transfers to Recycling (except metals) 964,590,744 812,251,327
Other Off-site Transfers for Further Management 45,714,596 629,816,144 Energy Recovery (except metals) 14,697,952 352,542,859 Treatment (except metals) 20,992,433 131,712,932 Sewage (except metals) 10,024,211 145,560,352
Total Reported Amounts of Releases and Transfers 1,490,866,132 5,159,581,857
Note: Canada and US data only. Mexico data not available for 1999. * The sum of air, surface water, underground injection and land releases in NPRI does not equal the
total on-site releases because in NPRI, releases of less than 1 tonne may be reported as an aggregate amount.
** Includes transfers of metals and metal compounds to energy recovery, treatment, sewage and disposal.
*** One NPRI facility incorrectly reported transfers to disposal of metals of 46,000 tonnes. The forms for this facility have been omitted in all tables in this report.
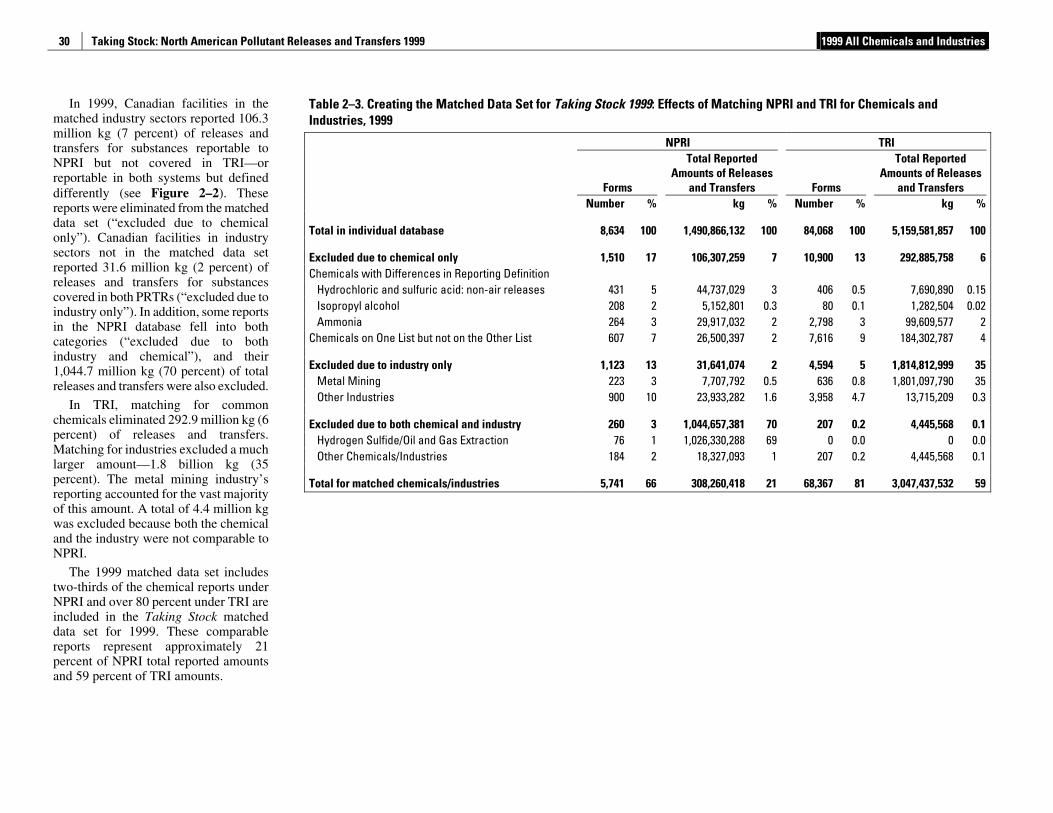
Taking Stock: North American Pollutant Releases and Transfers 1999 1999 All Chemicals and Industries
30
Table 2–3. Creating the Matched Data Set for Taking Stock 1999: Effects of Matching NPRI and TRI for Chemicals and Industries, 1999
NPRI TRI
Forms
Total Reported Amounts of Releases
and Transfers Forms
Total Reported Amounts of Releases
and Transfers Number % kg % Number % kg %
Total in individual database 8,634 100 1,490,866,132 100 84,068 100 5,159,581,857 100
Excluded due to chemical only 1,510 17 106,307,259 7 10,900 13 292,885,758 6 Chemicals with Differences in Reporting Definition
Hydrochloric and sulfuric acid: non-air releases 431 5 44,737,029 3 406 0.5 7,690,890 0.15 Isopropyl alcohol 208 2 5,152,801 0.3 80 0.1 1,282,504 0.02 Ammonia 264 3 29,917,032 2 2,798 3 99,609,577 2
Chemicals on One List but not on the Other List 607 7 26,500,397 2 7,616 9 184,302,787 4
Excluded due to industry only 1,123 13 31,641,074 2 4,594 5 1,814,812,999 35 Metal Mining 223 3 7,707,792 0.5 636 0.8 1,801,097,790 35 Other Industries 900 10 23,933,282 1.6 3,958 4.7 13,715,209 0.3
Excluded due to both chemical and industry 260 3 1,044,657,381 70 207 0.2 4,445,568 0.1 Hydrogen Sulfide/Oil and Gas Extraction 76 1 1,026,330,288 69 0 0.0 0 0.0 Other Chemicals/Industries 184 2 18,327,093 1 207 0.2 4,445,568 0.1
Total for matched chemicals/industries 5,741 66 308,260,418 21 68,367 81 3,047,437,532 59
In 1999, Canadian facilities in the matched industry sectors reported 106.3 million kg (7 percent) of releases and transfers for substances reportable to NPRI but not covered in TRI—or reportable in both systems but defined differently (see Figure 2–2). These reports were eliminated from the matched data set (“excluded due to chemical only”). Canadian facilities in industry sectors not in the matched data set reported 31.6 million kg (2 percent) of releases and transfers for substances covered in both PRTRs (“excluded due to industry only”). In addition, some reports in the NPRI database fell into both categories (“excluded due to both industry and chemical”), and their 1,044.7 million kg (70 percent) of total releases and transfers were also excluded.
In TRI, matching for common chemicals eliminated 292.9 million kg (6 percent) of releases and transfers. Matching for industries excluded a much larger amount—1.8 billion kg (35 percent). The metal mining industry’s reporting accounted for the vast majority of this amount. A total of 4.4 million kg was excluded because both the chemical and the industry were not comparable to NPRI.
The 1999 matched data set includes two-thirds of the chemical reports under NPRI and over 80 percent under TRI are included in the Taking Stock matched data set for 1999. These comparable reports represent approximately 21 percent of NPRI total reported amounts and 59 percent of TRI amounts.
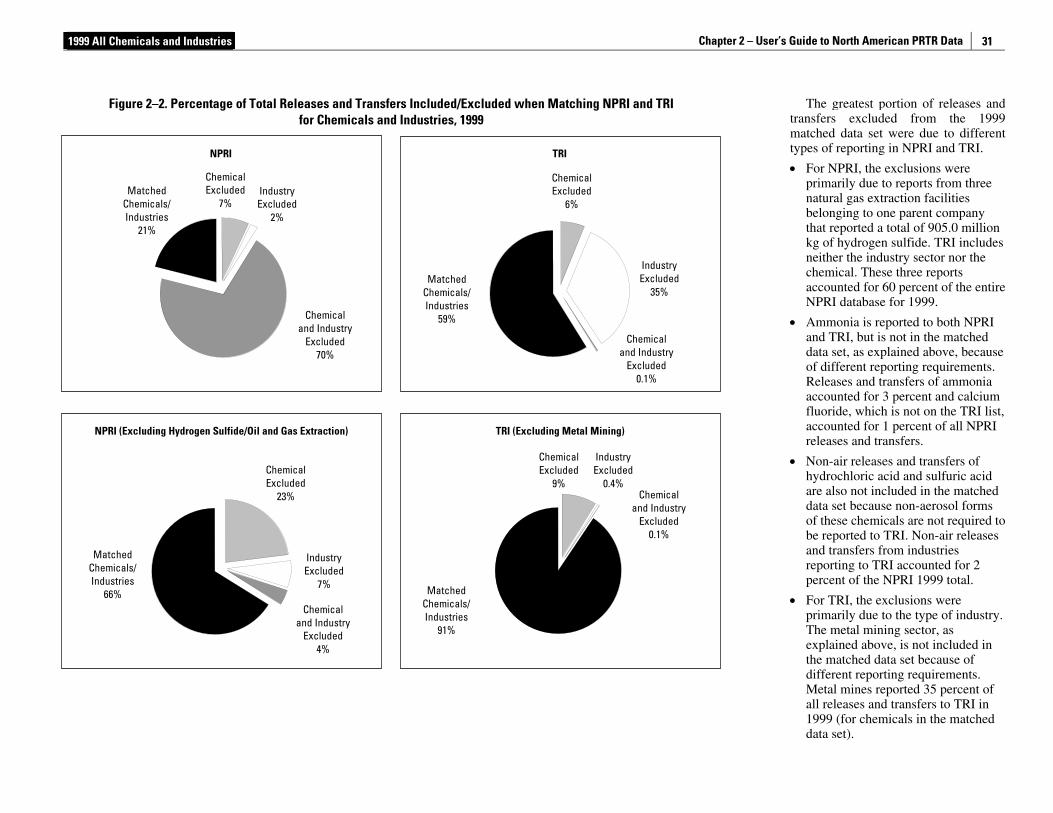
1999 All Chemicals and Industries Chapter 2 – User’s Guide to North American PRTR Data
31
The greatest portion of releases and transfers excluded from the 1999 matched data set were due to different types of reporting in NPRI and TRI.
• For NPRI, the exclusions were primarily due to reports from three natural gas extraction facilities belonging to one parent company that reported a total of 905.0 million kg of hydrogen sulfide. TRI includes neither the industry sector nor the chemical. These three reports accounted for 60 percent of the entire NPRI database for 1999.
• Ammonia is reported to both NPRI and TRI, but is not in the matched data set, as explained above, because of different reporting requirements. Releases and transfers of ammonia accounted for 3 percent and calcium fluoride, which is not on the TRI list, accounted for 1 percent of all NPRI releases and transfers.
• Non-air releases and transfers of hydrochloric acid and sulfuric acid are also not included in the matched data set because non-aerosol forms of these chemicals are not required to be reported to TRI. Non-air releases and transfers from industries reporting to TRI accounted for 2 percent of the NPRI 1999 total.
• For TRI, the exclusions were primarily due to the type of industry. The metal mining sector, as explained above, is not included in the matched data set because of different reporting requirements. Metal mines reported 35 percent of all releases and transfers to TRI in 1999 (for chemicals in the matched data set).
Figure 2–2. Percentage of Total Releases and Transfers Included/Excluded when Matching NPRI and TRI for Chemicals and Industries, 1999
Matched Chemicals/ Industries
21%
MatchedChemicals/Industries
59%
Matched Chemicals/ Industries
66% MatchedChemicals/Industries
91%
Chemical Excluded
7%
ChemicalExcluded
6%
Chemical Excluded
23%
ChemicalExcluded
9%
Industry Excluded
2%
IndustryExcluded
35%
IndustryExcluded
7%
Industry Excluded
0.4%
Chemicaland Industry
Excluded70%
Chemicaland Industry
Excluded0.1%
Chemicaland Industry
Excluded4%
Chemicaland Industry
Excluded0.1%
NPRI TRI
NPRI (Excluding Hydrogen Sulfide/Oil and Gas Extraction) TRI (Excluding Metal Mining)
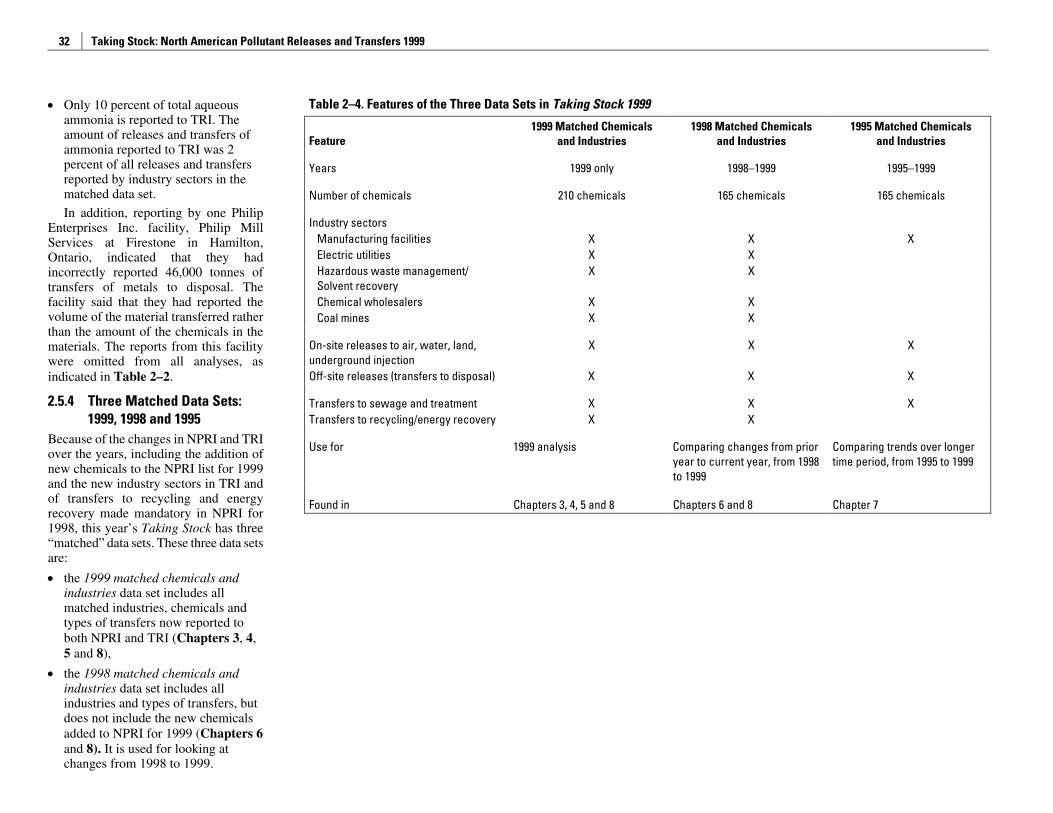
Taking Stock: North American Pollutant Releases and Transfers 1999
32
• Only 10 percent of total aqueous ammonia is reported to TRI. The amount of releases and transfers of ammonia reported to TRI was 2 percent of all releases and transfers reported by industry sectors in the matched data set.
In addition, reporting by one Philip Enterprises Inc. facility, Philip Mill Services at Firestone in Hamilton, Ontario, indicated that they had incorrectly reported 46,000 tonnes of transfers of metals to disposal. The facility said that they had reported the volume of the material transferred rather than the amount of the chemicals in the materials. The reports from this facility were omitted from all analyses, as indicated in Table 2–2.
2.5.4 Three Matched Data Sets: 1999, 1998 and 1995
Because of the changes in NPRI and TRI over the years, including the addition of new chemicals to the NPRI list for 1999 and the new industry sectors in TRI and of transfers to recycling and energy recovery made mandatory in NPRI for 1998, this year’s Taking Stock has three “matched” data sets. These three data sets are:
• the 1999 matched chemicals and industries data set includes all matched industries, chemicals and types of transfers now reported to both NPRI and TRI (Chapters 3, 4, 5 and 8),
• the 1998 matched chemicals and industries data set includes all industries and types of transfers, but does not include the new chemicals added to NPRI for 1999 (Chapters 6 and 8). It is used for looking at changes from 1998 to 1999.
Table 2–4. Features of the Three Data Sets in Taking Stock 1999
Feature 1999 Matched Chemicals
and Industries 1998 Matched Chemicals
and Industries 1995 Matched Chemicals
and Industries
Years 1999 only 1998–1999 1995–1999
Number of chemicals 210 chemicals 165 chemicals 165 chemicals
Industry sectors Manufacturing facilities X X X Electric utilities X X Hazardous waste management/ Solvent recovery
X X
Chemical wholesalers X X Coal mines X X
On-site releases to air, water, land, underground injection
X X X
Off-site releases (transfers to disposal) X X X
Transfers to sewage and treatment X X X Transfers to recycling/energy recovery X X
Use for 1999 analysis Comparing changes from prior year to current year, from 1998 to 1999
Comparing trends over longer time period, from 1995 to 1999
Found in Chapters 3, 4, 5 and 8 Chapters 6 and 8 Chapter 7
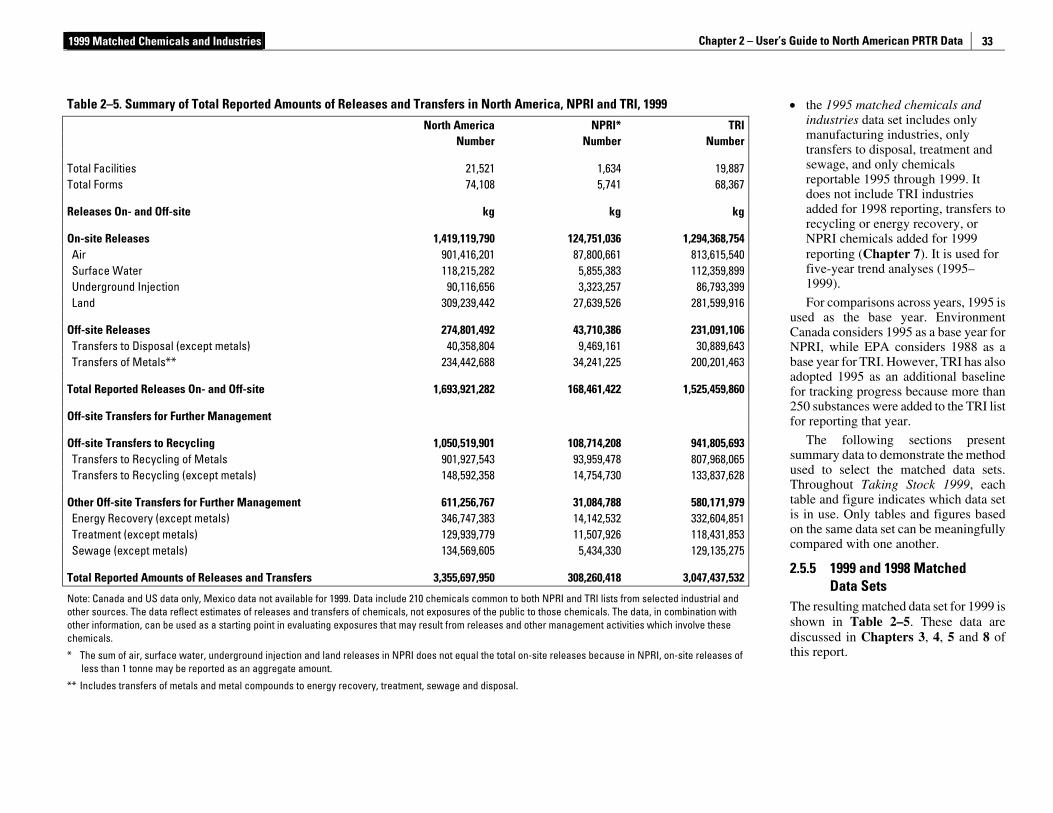
1999 Matched Chemicals and Industries Chapter 2 – User’s Guide to North American PRTR Data
33
• the 1995 matched chemicals and industries data set includes only manufacturing industries, only transfers to disposal, treatment and sewage, and only chemicals reportable 1995 through 1999. It does not include TRI industries added for 1998 reporting, transfers to recycling or energy recovery, or NPRI chemicals added for 1999 reporting (Chapter 7). It is used for five-year trend analyses (1995–1999).
For comparisons across years, 1995 is used as the base year. Environment Canada considers 1995 as a base year for NPRI, while EPA considers 1988 as a base year for TRI. However, TRI has also adopted 1995 as an additional baseline for tracking progress because more than 250 substances were added to the TRI list for reporting that year.
The following sections present summary data to demonstrate the method used to select the matched data sets. Throughout Taking Stock 1999, each table and figure indicates which data set is in use. Only tables and figures based on the same data set can be meaningfully compared with one another.
2.5.5 1999 and 1998 Matched Data Sets
The resulting matched data set for 1999 is shown in Table 2–5. These data are discussed in Chapters 3, 4, 5 and 8 of this report.
Table 2–5. Summary of Total Reported Amounts of Releases and Transfers in North America, NPRI and TRI, 1999
North America NPRI* TRINumber Number Number
Total Facilities 21,521 1,634 19,887Total Forms 74,108 5,741 68,367
Releases On- and Off-site kg kg kg
On-site Releases 1,419,119,790 124,751,036 1,294,368,754Air 901,416,201 87,800,661 813,615,540Surface Water 118,215,282 5,855,383 112,359,899Underground Injection 90,116,656 3,323,257 86,793,399Land 309,239,442 27,639,526 281,599,916
Off-site Releases 274,801,492 43,710,386 231,091,106Transfers to Disposal (except metals) 40,358,804 9,469,161 30,889,643Transfers of Metals** 234,442,688 34,241,225 200,201,463
Total Reported Releases On- and Off-site 1,693,921,282 168,461,422 1,525,459,860
Off-site Transfers for Further Management
Off-site Transfers to Recycling 1,050,519,901 108,714,208 941,805,693Transfers to Recycling of Metals 901,927,543 93,959,478 807,968,065Transfers to Recycling (except metals) 148,592,358 14,754,730 133,837,628
Other Off-site Transfers for Further Management 611,256,767 31,084,788 580,171,979Energy Recovery (except metals) 346,747,383 14,142,532 332,604,851Treatment (except metals) 129,939,779 11,507,926 118,431,853Sewage (except metals) 134,569,605 5,434,330 129,135,275
Total Reported Amounts of Releases and Transfers 3,355,697,950 308,260,418 3,047,437,532
Note: Canada and US data only, Mexico data not available for 1999. Data include 210 chemicals common to both NPRI and TRI lists from selected industrial and other sources. The data reflect estimates of releases and transfers of chemicals, not exposures of the public to those chemicals. The data, in combination with other information, can be used as a starting point in evaluating exposures that may result from releases and other management activities which involve these chemicals.
* The sum of air, surface water, underground injection and land releases in NPRI does not equal the total on-site releases because in NPRI, on-site releases of less than 1 tonne may be reported as an aggregate amount.
** Includes transfers of metals and metal compounds to energy recovery, treatment, sewage and disposal.
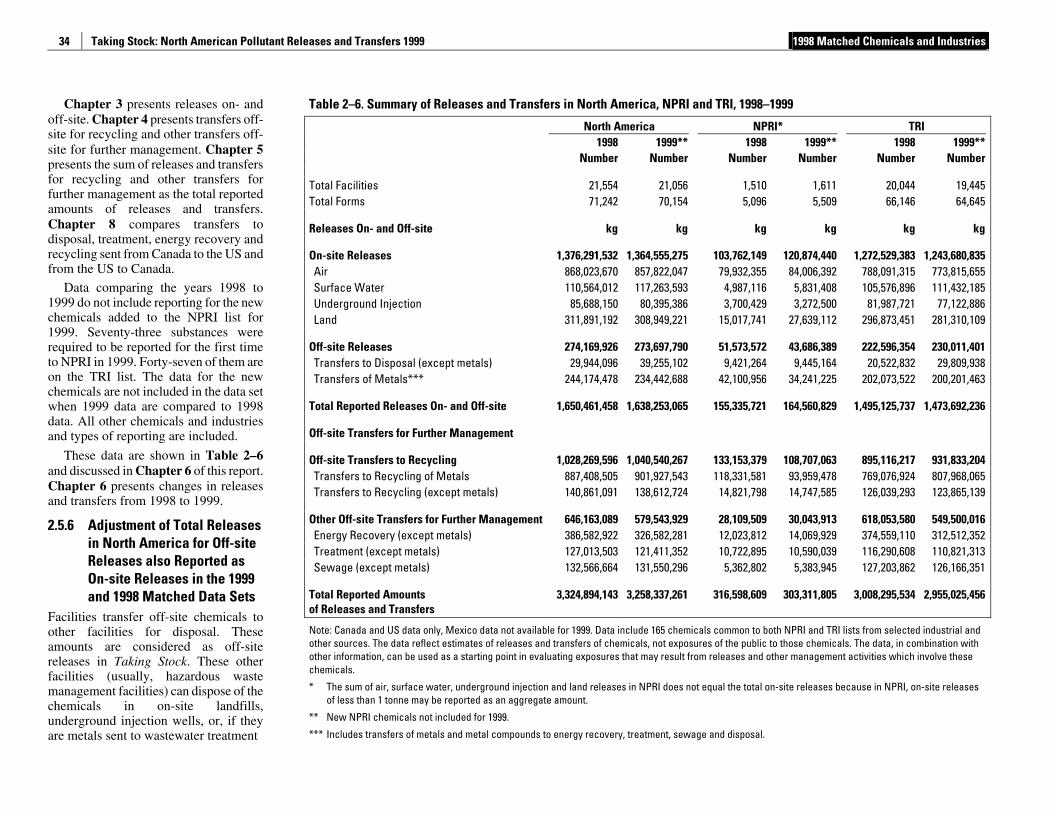
Taking Stock: North American Pollutant Releases and Transfers 1999 1998 Matched Chemicals and Industries
34
Chapter 3 presents releases on- and off-site. Chapter 4 presents transfers off-site for recycling and other transfers off-site for further management. Chapter 5 presents the sum of releases and transfers for recycling and other transfers for further management as the total reported amounts of releases and transfers. Chapter 8 compares transfers to disposal, treatment, energy recovery and recycling sent from Canada to the US and from the US to Canada.
Data comparing the years 1998 to 1999 do not include reporting for the new chemicals added to the NPRI list for 1999. Seventy-three substances were required to be reported for the first time to NPRI in 1999. Forty-seven of them are on the TRI list. The data for the new chemicals are not included in the data set when 1999 data are compared to 1998 data. All other chemicals and industries and types of reporting are included.
These data are shown in Table 2–6 and discussed in Chapter 6 of this report. Chapter 6 presents changes in releases and transfers from 1998 to 1999.
2.5.6 Adjustment of Total Releases in North America for Off-site Releases also Reported as On-site Releases in the 1999 and 1998 Matched Data Sets
Facilities transfer off-site chemicals to other facilities for disposal. These amounts are considered as off-site releases in Taking Stock. These other facilities (usually, hazardous waste management facilities) can dispose of the chemicals in on-site landfills, underground injection wells, or, if they are metals sent to wastewater treatment
Table 2–6. Summary of Releases and Transfers in North America, NPRI and TRI, 1998–1999
North America NPRI* TRI 1998 1999** 1998 1999** 1998 1999** Number Number Number Number Number Number
Total Facilities 21,554 21,056 1,510 1,611 20,044 19,445 Total Forms 71,242 70,154 5,096 5,509 66,146 64,645
Releases On- and Off-site kg kg kg kg kg kg
On-site Releases 1,376,291,532 1,364,555,275 103,762,149 120,874,440 1,272,529,383 1,243,680,835 Air 868,023,670 857,822,047 79,932,355 84,006,392 788,091,315 773,815,655 Surface Water 110,564,012 117,263,593 4,987,116 5,831,408 105,576,896 111,432,185 Underground Injection 85,688,150 80,395,386 3,700,429 3,272,500 81,987,721 77,122,886 Land 311,891,192 308,949,221 15,017,741 27,639,112 296,873,451 281,310,109
Off-site Releases 274,169,926 273,697,790 51,573,572 43,686,389 222,596,354 230,011,401 Transfers to Disposal (except metals) 29,944,096 39,255,102 9,421,264 9,445,164 20,522,832 29,809,938 Transfers of Metals*** 244,174,478 234,442,688 42,100,956 34,241,225 202,073,522 200,201,463
Total Reported Releases On- and Off-site 1,650,461,458 1,638,253,065 155,335,721 164,560,829 1,495,125,737 1,473,692,236
Off-site Transfers for Further Management
Off-site Transfers to Recycling 1,028,269,596 1,040,540,267 133,153,379 108,707,063 895,116,217 931,833,204 Transfers to Recycling of Metals 887,408,505 901,927,543 118,331,581 93,959,478 769,076,924 807,968,065 Transfers to Recycling (except metals) 140,861,091 138,612,724 14,821,798 14,747,585 126,039,293 123,865,139
Other Off-site Transfers for Further Management 646,163,089 579,543,929 28,109,509 30,043,913 618,053,580 549,500,016 Energy Recovery (except metals) 386,582,922 326,582,281 12,023,812 14,069,929 374,559,110 312,512,352 Treatment (except metals) 127,013,503 121,411,352 10,722,895 10,590,039 116,290,608 110,821,313 Sewage (except metals) 132,566,664 131,550,296 5,362,802 5,383,945 127,203,862 126,166,351
Total Reported Amounts of Releases and Transfers
3,324,894,143 3,258,337,261 316,598,609 303,311,805 3,008,295,534 2,955,025,456
Note: Canada and US data only, Mexico data not available for 1999. Data include 165 chemicals common to both NPRI and TRI lists from selected industrial and other sources. The data reflect estimates of releases and transfers of chemicals, not exposures of the public to those chemicals. The data, in combination with other information, can be used as a starting point in evaluating exposures that may result from releases and other management activities which involve these chemicals.
* The sum of air, surface water, underground injection and land releases in NPRI does not equal the total on-site releases because in NPRI, on-site releases of less than 1 tonne may be reported as an aggregate amount.
** New NPRI chemicals not included for 1999.
*** Includes transfers of metals and metal compounds to energy recovery, treatment, sewage and disposal.
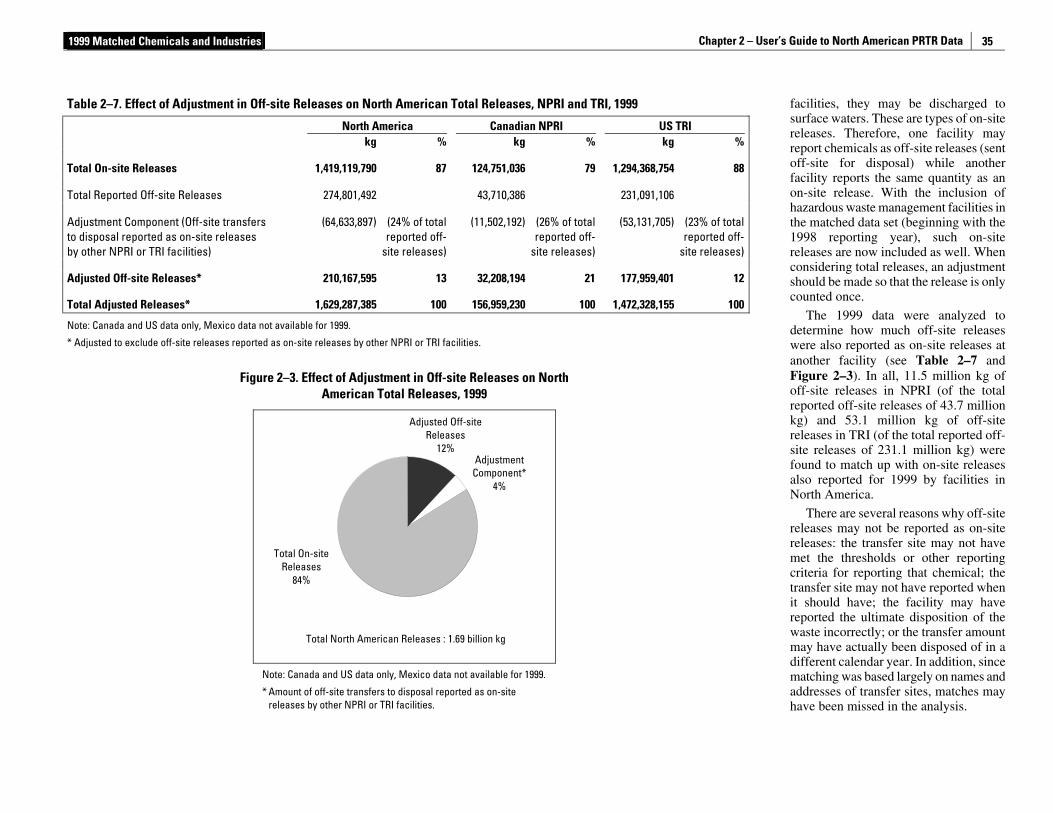
1999 Matched Chemicals and Industries Chapter 2 – User’s Guide to North American PRTR Data
35
facilities, they may be discharged to surface waters. These are types of on-site releases. Therefore, one facility may report chemicals as off-site releases (sent off-site for disposal) while another facility reports the same quantity as an on-site release. With the inclusion of hazardous waste management facilities in the matched data set (beginning with the 1998 reporting year), such on-site releases are now included as well. When considering total releases, an adjustment should be made so that the release is only counted once.
The 1999 data were analyzed to determine how much off-site releases were also reported as on-site releases at another facility (see Table 2–7 and Figure 2–3). In all, 11.5 million kg of off-site releases in NPRI (of the total reported off-site releases of 43.7 million kg) and 53.1 million kg of off-site releases in TRI (of the total reported off-site releases of 231.1 million kg) were found to match up with on-site releases also reported for 1999 by facilities in North America.
There are several reasons why off-site releases may not be reported as on-site releases: the transfer site may not have met the thresholds or other reporting criteria for reporting that chemical; the transfer site may not have reported when it should have; the facility may have reported the ultimate disposition of the waste incorrectly; or the transfer amount may have actually been disposed of in a different calendar year. In addition, since matching was based largely on names and addresses of transfer sites, matches may have been missed in the analysis.
Table 2–7. Effect of Adjustment in Off-site Releases on North American Total Releases, NPRI and TRI, 1999
North America Canadian NPRI US TRI kg % kg % kg %
Total On-site Releases 1,419,119,790 87 124,751,036 79 1,294,368,754 88
Total Reported Off-site Releases 274,801,492 43,710,386 231,091,106
Adjustment Component (Off-site transfers to disposal reported as on-site releases by other NPRI or TRI facilities)
(64,633,897) (24% of total reported off-
site releases)
(11,502,192) (26% of total reported off-
site releases)
(53,131,705) (23% of total reported off-
site releases)
Adjusted Off-site Releases* 210,167,595 13 32,208,194 21 177,959,401 12
Total Adjusted Releases* 1,629,287,385 100 156,959,230 100 1,472,328,155 100
Note: Canada and US data only, Mexico data not available for 1999.
* Adjusted to exclude off-site releases reported as on-site releases by other NPRI or TRI facilities.
Figure 2–3. Effect of Adjustment in Off-site Releases on North American Total Releases, 1999
Adjusted Off-siteReleases
12%Adjustment
Component* 4%
Total North American Releases : 1.69 billion kg
Total On-siteReleases
84%
Note: Canada and US data only, Mexico data not available for 1999.
* Amount of off-site transfers to disposal reported as on-site releases by other NPRI or TRI facilities.
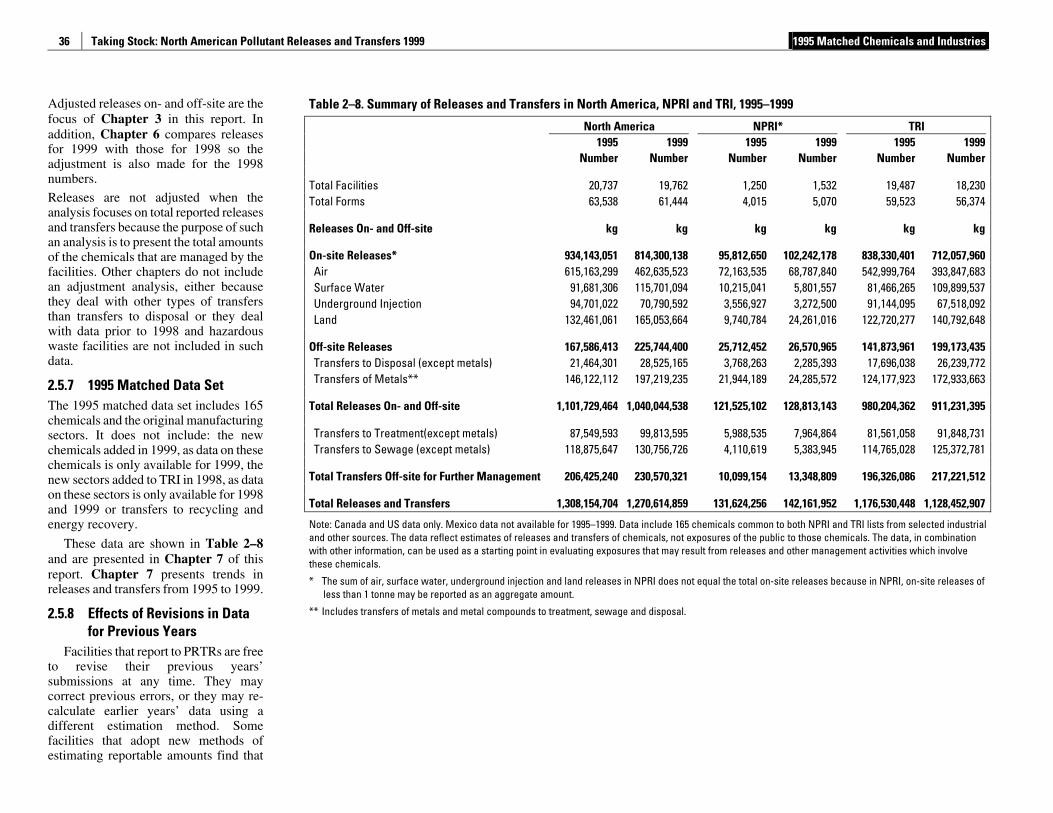
Taking Stock: North American Pollutant Releases and Transfers 1999 1995 Matched Chemicals and Industries
36
Adjusted releases on- and off-site are the focus of Chapter 3 in this report. In addition, Chapter 6 compares releases for 1999 with those for 1998 so the adjustment is also made for the 1998 numbers.
Releases are not adjusted when the analysis focuses on total reported releases and transfers because the purpose of such an analysis is to present the total amounts of the chemicals that are managed by the facilities. Other chapters do not include an adjustment analysis, either because they deal with other types of transfers than transfers to disposal or they deal with data prior to 1998 and hazardous waste facilities are not included in such data.
2.5.7 1995 Matched Data Set The 1995 matched data set includes 165 chemicals and the original manufacturing sectors. It does not include: the new chemicals added in 1999, as data on these chemicals is only available for 1999, the new sectors added to TRI in 1998, as data on these sectors is only available for 1998 and 1999 or transfers to recycling and energy recovery.
These data are shown in Table 2–8 and are presented in Chapter 7 of this report. Chapter 7 presents trends in releases and transfers from 1995 to 1999.
2.5.8 Effects of Revisions in Data for Previous Years
Facilities that report to PRTRs are free to revise their previous years’ submissions at any time. They may correct previous errors, or they may re-calculate earlier years’ data using a different estimation method. Some facilities that adopt new methods of estimating reportable amounts find that
Table 2–8. Summary of Releases and Transfers in North America, NPRI and TRI, 1995–1999
North America NPRI* TRI 1995 1999 1995 1999 1995 1999 Number Number Number Number Number Number
Total Facilities 20,737 19,762 1,250 1,532 19,487 18,230 Total Forms 63,538 61,444 4,015 5,070 59,523 56,374
Releases On- and Off-site kg kg kg kg kg kg
On-site Releases* 934,143,051 814,300,138 95,812,650 102,242,178 838,330,401 712,057,960 Air 615,163,299 462,635,523 72,163,535 68,787,840 542,999,764 393,847,683 Surface Water 91,681,306 115,701,094 10,215,041 5,801,557 81,466,265 109,899,537 Underground Injection 94,701,022 70,790,592 3,556,927 3,272,500 91,144,095 67,518,092 Land 132,461,061 165,053,664 9,740,784 24,261,016 122,720,277 140,792,648
Off-site Releases 167,586,413 225,744,400 25,712,452 26,570,965 141,873,961 199,173,435 Transfers to Disposal (except metals) 21,464,301 28,525,165 3,768,263 2,285,393 17,696,038 26,239,772 Transfers of Metals** 146,122,112 197,219,235 21,944,189 24,285,572 124,177,923 172,933,663
Total Releases On- and Off-site 1,101,729,464 1,040,044,538 121,525,102 128,813,143 980,204,362 911,231,395
Transfers to Treatment(except metals) 87,549,593 99,813,595 5,988,535 7,964,864 81,561,058 91,848,731 Transfers to Sewage (except metals) 118,875,647 130,756,726 4,110,619 5,383,945 114,765,028 125,372,781
Total Transfers Off-site for Further Management 206,425,240 230,570,321 10,099,154 13,348,809 196,326,086 217,221,512
Total Releases and Transfers 1,308,154,704 1,270,614,859 131,624,256 142,161,952 1,176,530,448 1,128,452,907
Note: Canada and US data only. Mexico data not available for 1995–1999. Data include 165 chemicals common to both NPRI and TRI lists from selected industrial and other sources. The data reflect estimates of releases and transfers of chemicals, not exposures of the public to those chemicals. The data, in combination with other information, can be used as a starting point in evaluating exposures that may result from releases and other management activities which involve these chemicals.
* The sum of air, surface water, underground injection and land releases in NPRI does not equal the total on-site releases because in NPRI, on-site releases of less than 1 tonne may be reported as an aggregate amount.
** Includes transfers of metals and metal compounds to treatment, sewage and disposal.
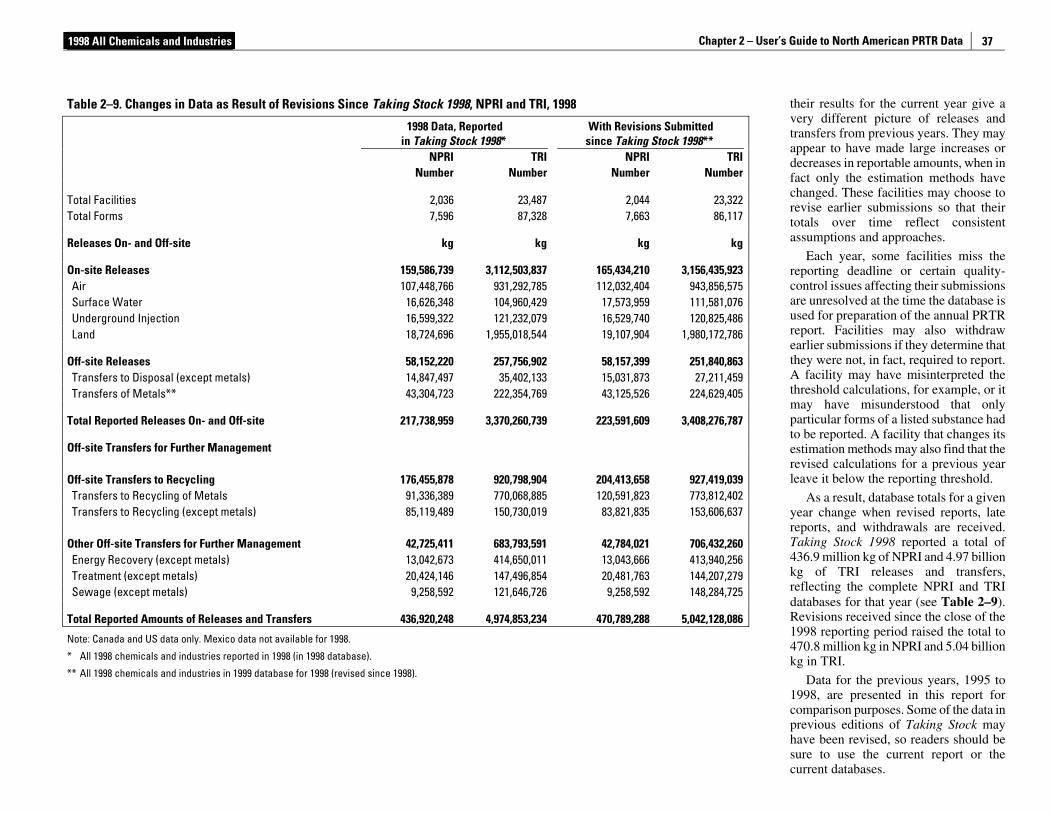
1998 All Chemicals and Industries Chapter 2 – User’s Guide to North American PRTR Data
37
their results for the current year give a very different picture of releases and transfers from previous years. They may appear to have made large increases or decreases in reportable amounts, when in fact only the estimation methods have changed. These facilities may choose to revise earlier submissions so that their totals over time reflect consistent assumptions and approaches.
Each year, some facilities miss the reporting deadline or certain quality-control issues affecting their submissions are unresolved at the time the database is used for preparation of the annual PRTR report. Facilities may also withdraw earlier submissions if they determine that they were not, in fact, required to report. A facility may have misinterpreted the threshold calculations, for example, or it may have misunderstood that only particular forms of a listed substance had to be reported. A facility that changes its estimation methods may also find that the revised calculations for a previous year leave it below the reporting threshold.
As a result, database totals for a given year change when revised reports, late reports, and withdrawals are received. Taking Stock 1998 reported a total of 436.9 million kg of NPRI and 4.97 billion kg of TRI releases and transfers, reflecting the complete NPRI and TRI databases for that year (see Table 2–9). Revisions received since the close of the 1998 reporting period raised the total to 470.8 million kg in NPRI and 5.04 billion kg in TRI.
Data for the previous years, 1995 to 1998, are presented in this report for comparison purposes. Some of the data in previous editions of Taking Stock may have been revised, so readers should be sure to use the current report or the current databases.
Table 2–9. Changes in Data as Result of Revisions Since Taking Stock 1998, NPRI and TRI, 1998
1998 Data, Reported
in Taking Stock 1998* With Revisions Submitted
since Taking Stock 1998** NPRI TRI NPRI TRI Number Number Number Number
Total Facilities 2,036 23,487 2,044 23,322Total Forms 7,596 87,328 7,663 86,117
Releases On- and Off-site kg kg kg kg
On-site Releases 159,586,739 3,112,503,837 165,434,210 3,156,435,923Air 107,448,766 931,292,785 112,032,404 943,856,575Surface Water 16,626,348 104,960,429 17,573,959 111,581,076Underground Injection 16,599,322 121,232,079 16,529,740 120,825,486Land 18,724,696 1,955,018,544 19,107,904 1,980,172,786
Off-site Releases 58,152,220 257,756,902 58,157,399 251,840,863Transfers to Disposal (except metals) 14,847,497 35,402,133 15,031,873 27,211,459Transfers of Metals** 43,304,723 222,354,769 43,125,526 224,629,405
Total Reported Releases On- and Off-site 217,738,959 3,370,260,739 223,591,609 3,408,276,787
Off-site Transfers for Further Management Off-site Transfers to Recycling 176,455,878 920,798,904 204,413,658 927,419,039Transfers to Recycling of Metals 91,336,389 770,068,885 120,591,823 773,812,402Transfers to Recycling (except metals) 85,119,489 150,730,019 83,821,835 153,606,637
Other Off-site Transfers for Further Management 42,725,411 683,793,591 42,784,021 706,432,260Energy Recovery (except metals) 13,042,673 414,650,011 13,043,666 413,940,256Treatment (except metals) 20,424,146 147,496,854 20,481,763 144,207,279Sewage (except metals) 9,258,592 121,646,726 9,258,592 148,284,725
Total Reported Amounts of Releases and Transfers 436,920,248 4,974,853,234 470,789,288 5,042,128,086
Note: Canada and US data only. Mexico data not available for 1998.
* All 1998 chemicals and industries reported in 1998 (in 1998 database).
** All 1998 chemicals and industries in 1999 database for 1998 (revised since 1998).

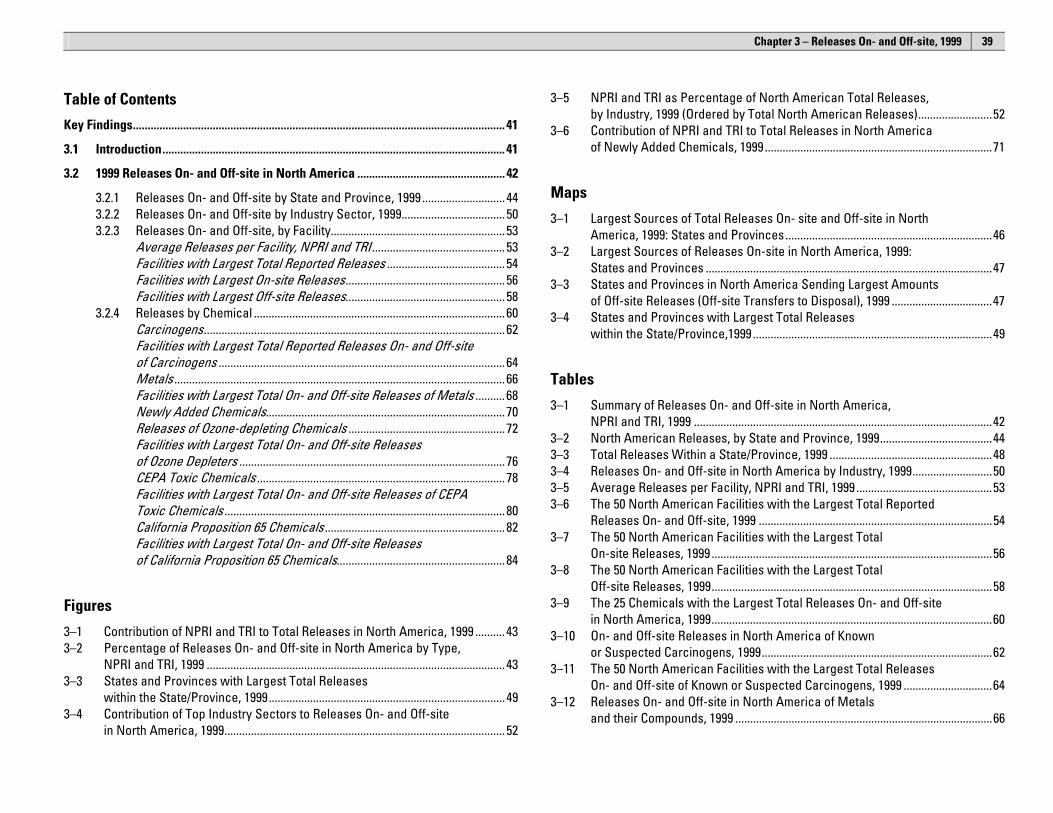
Chapter 3 – Releases On- and Off-site, 1999
39
Table of Contents
Key Findings.............................................................................................................................. 41 3.1 Introduction.................................................................................................................... 41 3.2 1999 Releases On- and Off-site in North America .................................................. 42
3.2.1 Releases On- and Off-site by State and Province, 1999 ............................ 44 3.2.2 Releases On- and Off-site by Industry Sector, 1999................................... 50 3.2.3 Releases On- and Off-site, by Facility........................................................... 53
Average Releases per Facility, NPRI and TRI ............................................. 53 Facilities with Largest Total Reported Releases ........................................ 54 Facilities with Largest On-site Releases...................................................... 56 Facilities with Largest Off-site Releases...................................................... 58
3.2.4 Releases by Chemical ..................................................................................... 60 Carcinogens...................................................................................................... 62 Facilities with Largest Total Reported Releases On- and Off-site of Carcinogens ................................................................................................. 64 Metals ................................................................................................................ 66 Facilities with Largest Total On- and Off-site Releases of Metals .......... 68 Newly Added Chemicals................................................................................. 70 Releases of Ozone-depleting Chemicals ..................................................... 72 Facilities with Largest Total On- and Off-site Releases of Ozone Depleters .......................................................................................... 76 CEPA Toxic Chemicals .................................................................................... 78 Facilities with Largest Total On- and Off-site Releases of CEPA Toxic Chemicals ............................................................................................... 80 California Proposition 65 Chemicals ............................................................. 82 Facilities with Largest Total On- and Off-site Releases of California Proposition 65 Chemicals......................................................... 84
Figures
3–1 Contribution of NPRI and TRI to Total Releases in North America, 1999 .......... 43 3–2 Percentage of Releases On- and Off-site in North America by Type,
NPRI and TRI, 1999 ..................................................................................................... 43 3–3 States and Provinces with Largest Total Releases
within the State/Province, 1999................................................................................ 49 3–4 Contribution of Top Industry Sectors to Releases On- and Off-site
in North America, 1999............................................................................................... 52
3–5 NPRI and TRI as Percentage of North American Total Releases, by Industry, 1999 (Ordered by Total North American Releases).........................52
3–6 Contribution of NPRI and TRI to Total Releases in North America of Newly Added Chemicals, 1999 .............................................................................71
Maps
3–1 Largest Sources of Total Releases On- site and Off-site in North America, 1999: States and Provinces......................................................................46
3–2 Largest Sources of Releases On-site in North America, 1999: States and Provinces .................................................................................................47
3–3 States and Provinces in North America Sending Largest Amounts of Off-site Releases (Off-site Transfers to Disposal), 1999 ..................................47
3–4 States and Provinces with Largest Total Releases within the State/Province,1999 .................................................................................49
Tables
3–1 Summary of Releases On- and Off-site in North America, NPRI and TRI, 1999 .....................................................................................................42
3–2 North American Releases, by State and Province, 1999......................................44 3–3 Total Releases Within a State/Province, 1999 .......................................................48 3–4 Releases On- and Off-site in North America by Industry, 1999...........................50 3–5 Average Releases per Facility, NPRI and TRI, 1999 ..............................................53 3–6 The 50 North American Facilities with the Largest Total Reported
Releases On- and Off-site, 1999 ...............................................................................54 3–7 The 50 North American Facilities with the Largest Total
On-site Releases, 1999 ...............................................................................................56 3–8 The 50 North American Facilities with the Largest Total
Off-site Releases, 1999...............................................................................................58 3–9 The 25 Chemicals with the Largest Total Releases On- and Off-site
in North America, 1999...............................................................................................60 3–10 On- and Off-site Releases in North America of Known
or Suspected Carcinogens, 1999..............................................................................62 3–11 The 50 North American Facilities with the Largest Total Releases
On- and Off-site of Known or Suspected Carcinogens, 1999 ..............................64 3–12 Releases On- and Off-site in North America of Metals
and their Compounds, 1999 .......................................................................................66
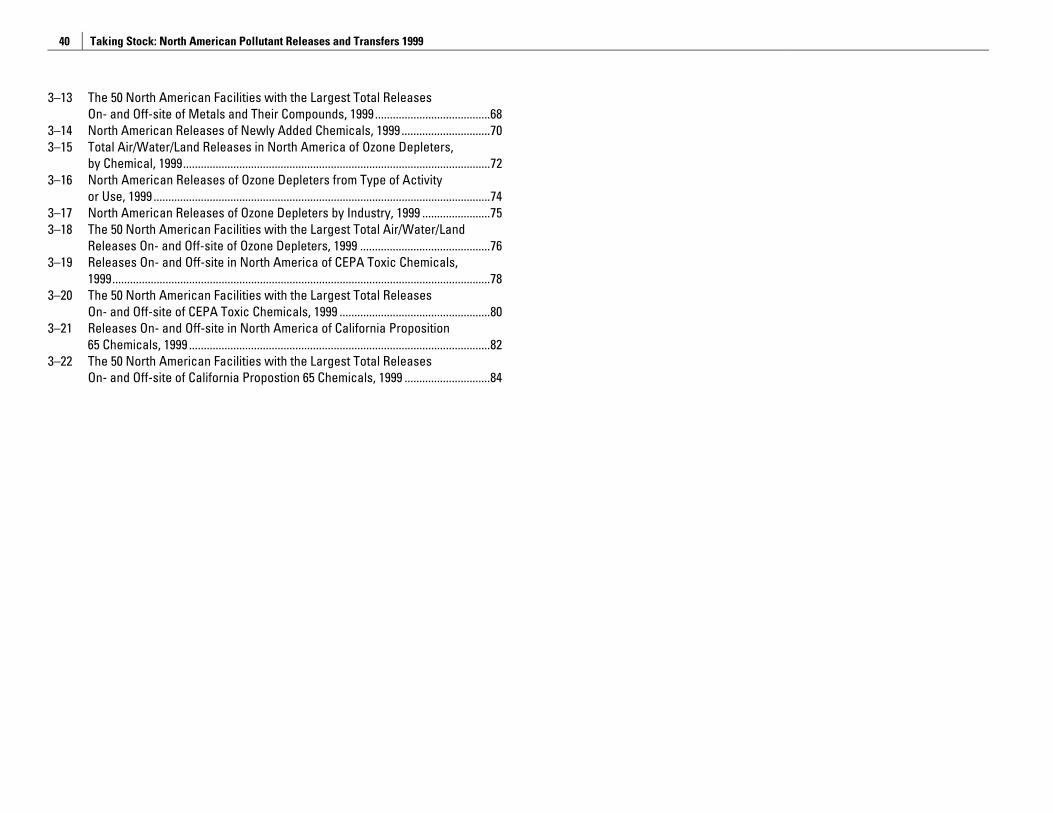
Taking Stock: North American Pollutant Releases and Transfers 1999
40
3–13 The 50 North American Facilities with the Largest Total Releases On- and Off-site of Metals and Their Compounds, 1999.......................................68
3–14 North American Releases of Newly Added Chemicals, 1999 ..............................70 3–15 Total Air/Water/Land Releases in North America of Ozone Depleters,
by Chemical, 1999........................................................................................................72 3–16 North American Releases of Ozone Depleters from Type of Activity
or Use, 1999 ..................................................................................................................74 3–17 North American Releases of Ozone Depleters by Industry, 1999 .......................75 3–18 The 50 North American Facilities with the Largest Total Air/Water/Land
Releases On- and Off-site of Ozone Depleters, 1999 ............................................76 3–19 Releases On- and Off-site in North America of CEPA Toxic Chemicals,
1999................................................................................................................................78 3–20 The 50 North American Facilities with the Largest Total Releases
On- and Off-site of CEPA Toxic Chemicals, 1999 ...................................................80 3–21 Releases On- and Off-site in North America of California Proposition
65 Chemicals, 1999 ......................................................................................................82 3–22 The 50 North American Facilities with the Largest Total Releases
On- and Off-site of California Propostion 65 Chemicals, 1999 .............................84
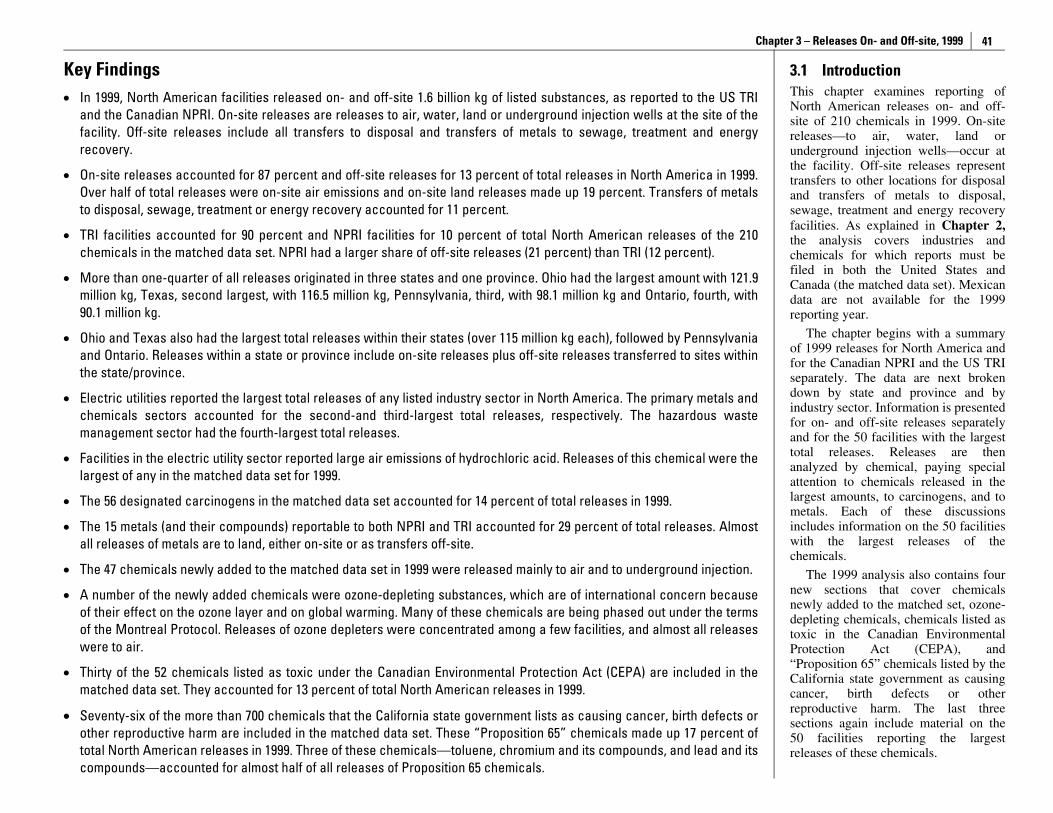
Chapter 3 – Releases On- and Off-site, 1999
41
Key Findings • In 1999, North American facilities released on- and off-site 1.6 billion kg of listed substances, as reported to the US TRI
and the Canadian NPRI. On-site releases are releases to air, water, land or underground injection wells at the site of the facility. Off-site releases include all transfers to disposal and transfers of metals to sewage, treatment and energy recovery.
• On-site releases accounted for 87 percent and off-site releases for 13 percent of total releases in North America in 1999. Over half of total releases were on-site air emissions and on-site land releases made up 19 percent. Transfers of metals to disposal, sewage, treatment or energy recovery accounted for 11 percent.
• TRI facilities accounted for 90 percent and NPRI facilities for 10 percent of total North American releases of the 210 chemicals in the matched data set. NPRI had a larger share of off-site releases (21 percent) than TRI (12 percent).
• More than one-quarter of all releases originated in three states and one province. Ohio had the largest amount with 121.9 million kg, Texas, second largest, with 116.5 million kg, Pennsylvania, third, with 98.1 million kg and Ontario, fourth, with 90.1 million kg.
• Ohio and Texas also had the largest total releases within their states (over 115 million kg each), followed by Pennsylvania and Ontario. Releases within a state or province include on-site releases plus off-site releases transferred to sites within the state/province.
• Electric utilities reported the largest total releases of any listed industry sector in North America. The primary metals and chemicals sectors accounted for the second-and third-largest total releases, respectively. The hazardous waste management sector had the fourth-largest total releases.
• Facilities in the electric utility sector reported large air emissions of hydrochloric acid. Releases of this chemical were the largest of any in the matched data set for 1999.
• The 56 designated carcinogens in the matched data set accounted for 14 percent of total releases in 1999.
• The 15 metals (and their compounds) reportable to both NPRI and TRI accounted for 29 percent of total releases. Almost all releases of metals are to land, either on-site or as transfers off-site.
• The 47 chemicals newly added to the matched data set in 1999 were released mainly to air and to underground injection.
• A number of the newly added chemicals were ozone-depleting substances, which are of international concern because of their effect on the ozone layer and on global warming. Many of these chemicals are being phased out under the terms of the Montreal Protocol. Releases of ozone depleters were concentrated among a few facilities, and almost all releases were to air.
• Thirty of the 52 chemicals listed as toxic under the Canadian Environmental Protection Act (CEPA) are included in the matched data set. They accounted for 13 percent of total North American releases in 1999.
• Seventy-six of the more than 700 chemicals that the California state government lists as causing cancer, birth defects or other reproductive harm are included in the matched data set. These “Proposition 65” chemicals made up 17 percent of total North American releases in 1999. Three of these chemicals—toluene, chromium and its compounds, and lead and its compounds—accounted for almost half of all releases of Proposition 65 chemicals.
3.1 Introduction This chapter examines reporting of North American releases on- and off-site of 210 chemicals in 1999. On-site releases—to air, water, land or underground injection wells—occur at the facility. Off-site releases represent transfers to other locations for disposal and transfers of metals to disposal, sewage, treatment and energy recovery facilities. As explained in Chapter 2, the analysis covers industries and chemicals for which reports must be filed in both the United States and Canada (the matched data set). Mexican data are not available for the 1999 reporting year.
The chapter begins with a summary of 1999 releases for North America and for the Canadian NPRI and the US TRI separately. The data are next broken down by state and province and by industry sector. Information is presented for on- and off-site releases separately and for the 50 facilities with the largest total releases. Releases are then analyzed by chemical, paying special attention to chemicals released in the largest amounts, to carcinogens, and to metals. Each of these discussions includes information on the 50 facilities with the largest releases of the chemicals.
The 1999 analysis also contains four new sections that cover chemicals newly added to the matched set, ozone-depleting chemicals, chemicals listed as toxic in the Canadian Environmental Protection Act (CEPA), and “Proposition 65” chemicals listed by the California state government as causing cancer, birth defects or other reproductive harm. The last three sections again include material on the 50 facilities reporting the largest releases of these chemicals.
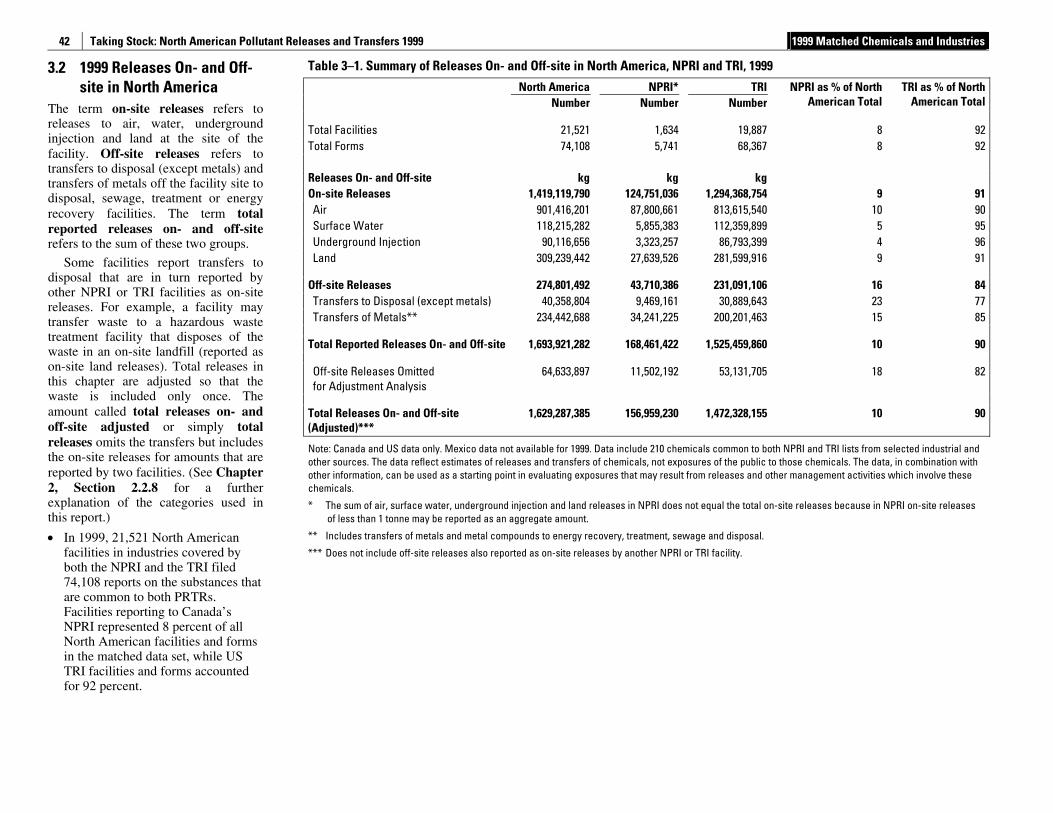
Taking Stock: North American Pollutant Releases and Transfers 1999 1999 Matched Chemicals and Industries
42
3.2 1999 Releases On- and Off-site in North America
The term on-site releases refers to releases to air, water, underground injection and land at the site of the facility. Off-site releases refers to transfers to disposal (except metals) and transfers of metals off the facility site to disposal, sewage, treatment or energy recovery facilities. The term total reported releases on- and off-site refers to the sum of these two groups.
Some facilities report transfers to disposal that are in turn reported by other NPRI or TRI facilities as on-site releases. For example, a facility may transfer waste to a hazardous waste treatment facility that disposes of the waste in an on-site landfill (reported as on-site land releases). Total releases in this chapter are adjusted so that the waste is included only once. The amount called total releases on- and off-site adjusted or simply total releases omits the transfers but includes the on-site releases for amounts that are reported by two facilities. (See Chapter 2, Section 2.2.8 for a further explanation of the categories used in this report.)
• In 1999, 21,521 North American facilities in industries covered by both the NPRI and the TRI filed 74,108 reports on the substances that are common to both PRTRs. Facilities reporting to Canada’s NPRI represented 8 percent of all North American facilities and forms in the matched data set, while US TRI facilities and forms accounted for 92 percent.
Table 3–1. Summary of Releases On- and Off-site in North America, NPRI and TRI, 1999
North America NPRI* TRI Number Number Number
NPRI as % of North American Total
TRI as % of North American Total
Total Facilities 21,521 1,634 19,887 8 92 Total Forms 74,108 5,741 68,367 8 92 Releases On- and Off-site kg kg kg On-site Releases 1,419,119,790 124,751,036 1,294,368,754 9 91 Air 901,416,201 87,800,661 813,615,540 10 90 Surface Water 118,215,282 5,855,383 112,359,899 5 95 Underground Injection 90,116,656 3,323,257 86,793,399 4 96 Land 309,239,442 27,639,526 281,599,916 9 91
Off-site Releases 274,801,492 43,710,386 231,091,106 16 84 Transfers to Disposal (except metals) 40,358,804 9,469,161 30,889,643 23 77 Transfers of Metals** 234,442,688 34,241,225 200,201,463 15 85
Total Reported Releases On- and Off-site 1,693,921,282 168,461,422 1,525,459,860 10 90
Off-site Releases Omitted for Adjustment Analysis
64,633,897 11,502,192 53,131,705 18 82
Total Releases On- and Off-site (Adjusted)***
1,629,287,385 156,959,230 1,472,328,155 10 90
Note: Canada and US data only. Mexico data not available for 1999. Data include 210 chemicals common to both NPRI and TRI lists from selected industrial and other sources. The data reflect estimates of releases and transfers of chemicals, not exposures of the public to those chemicals. The data, in combination with other information, can be used as a starting point in evaluating exposures that may result from releases and other management activities which involve these chemicals.
* The sum of air, surface water, underground injection and land releases in NPRI does not equal the total on-site releases because in NPRI on-site releases of less than 1 tonne may be reported as an aggregate amount.
** Includes transfers of metals and metal compounds to energy recovery, treatment, sewage and disposal.
*** Does not include off-site releases also reported as on-site releases by another NPRI or TRI facility.
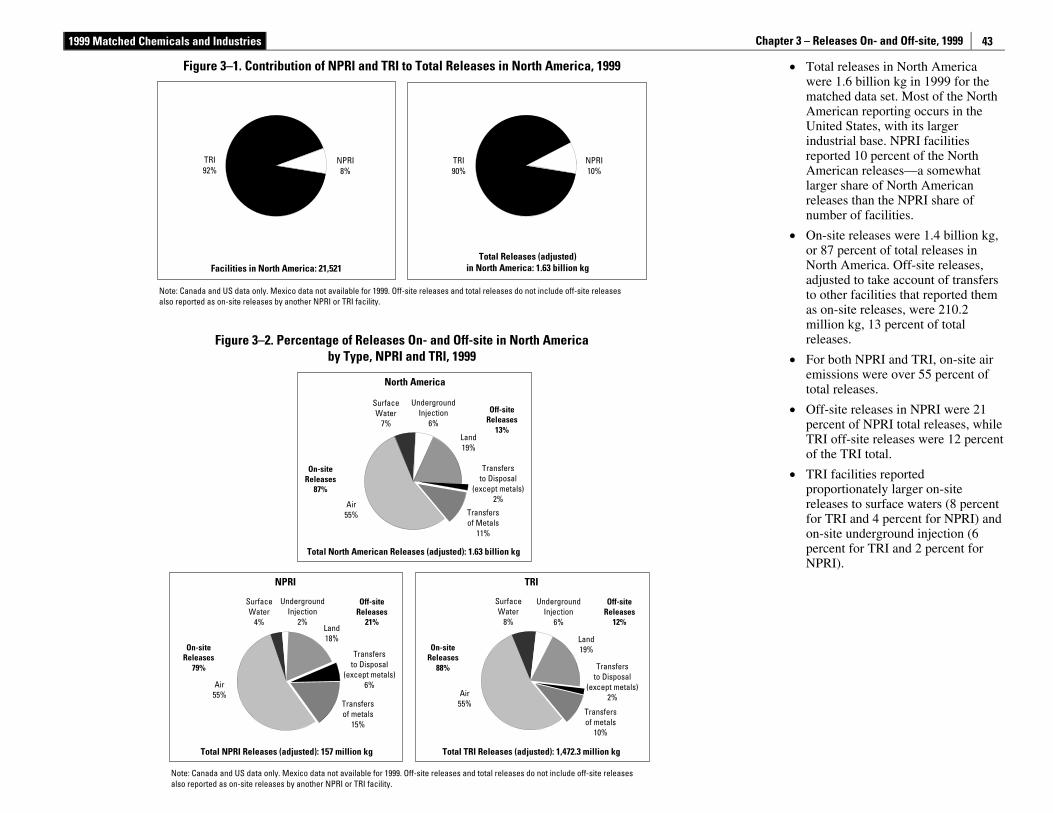
1999 Matched Chemicals and Industries Chapter 3 – Releases On- and Off-site, 1999
43
• Total releases in North America were 1.6 billion kg in 1999 for the matched data set. Most of the North American reporting occurs in the United States, with its larger industrial base. NPRI facilities reported 10 percent of the North American releases—a somewhat larger share of North American releases than the NPRI share of number of facilities.
• On-site releases were 1.4 billion kg, or 87 percent of total releases in North America. Off-site releases, adjusted to take account of transfers to other facilities that reported them as on-site releases, were 210.2 million kg, 13 percent of total releases.
• For both NPRI and TRI, on-site air emissions were over 55 percent of total releases.
• Off-site releases in NPRI were 21 percent of NPRI total releases, while TRI off-site releases were 12 percent of the TRI total.
• TRI facilities reported proportionately larger on-site releases to surface waters (8 percent for TRI and 4 percent for NPRI) and on-site underground injection (6 percent for TRI and 2 percent for NPRI).
Figure 3–1. Contribution of NPRI and TRI to Total Releases in North America, 1999
TRI 92%
NPRI8%
NPRI10%
TRI90%
Facilities in North America: 21,521Total Releases (adjusted)
in North America: 1.63 billion kg Note: Canada and US data only. Mexico data not available for 1999. Off-site releases and total releases do not include off-site releases also reported as on-site releases by another NPRI or TRI facility.
Figure 3–2. Percentage of Releases On- and Off-site in North America
by Type, NPRI and TRI, 1999
On-site Releases
87%
Off-site Releases
13%
SurfaceWater
7%
Underground Injection
6%
Land19%
Air55%
Total North American Releases (adjusted): 1.63 billion kg
North America
On-site Releases
79%
Off-site Releases
21% Land18%
Underground Injection
2%
Surface Water
4%
Air 55%
Total NPRI Releases (adjusted): 157 million kg
NPRI
On-site Releases
88%
Off-site Releases
12%
Land19%
Underground Injection
6%
SurfaceWater
8%
Air55%
Total TRI Releases (adjusted): 1,472.3 million kg
TRI
Transfersto Disposal
(except metals)2%
Transfersof Metals
11%
Transfersto Disposal
(except metals)6%
Transfersof metals
15%
Transfers to Disposal
(except metals) 2%
Transfers of metals
10%
Note: Canada and US data only. Mexico data not available for 1999. Off-site releases and total releases do not include off-site releases also reported as on-site releases by another NPRI or TRI facility.
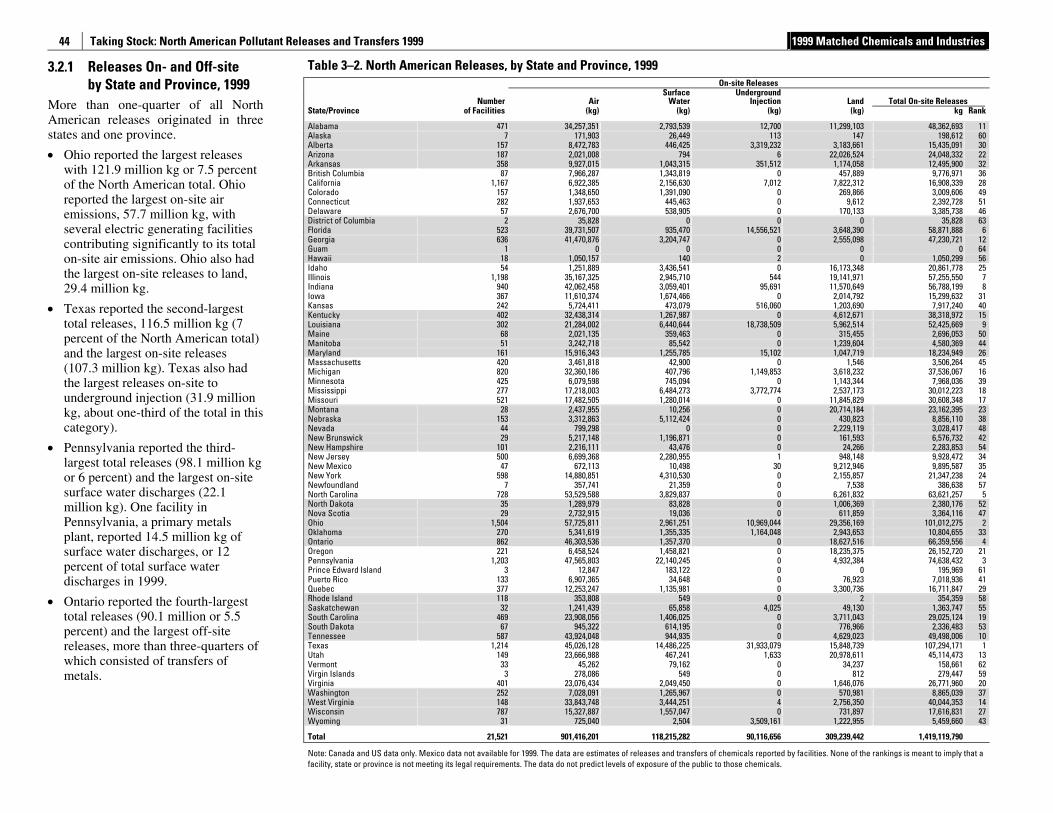
Taking Stock: North American Pollutant Releases and Transfers 1999 1999 Matched Chemicals and Industries
44
3.2.1 Releases On- and Off-site by State and Province, 1999
More than one-quarter of all North American releases originated in three states and one province.
• Ohio reported the largest releases with 121.9 million kg or 7.5 percent of the North American total. Ohio reported the largest on-site air emissions, 57.7 million kg, with several electric generating facilities contributing significantly to its total on-site air emissions. Ohio also had the largest on-site releases to land, 29.4 million kg.
• Texas reported the second-largest total releases, 116.5 million kg (7 percent of the North American total) and the largest on-site releases (107.3 million kg). Texas also had the largest releases on-site to underground injection (31.9 million kg, about one-third of the total in this category).
• Pennsylvania reported the third-largest total releases (98.1 million kg or 6 percent) and the largest on-site surface water discharges (22.1 million kg). One facility in Pennsylvania, a primary metals plant, reported 14.5 million kg of surface water discharges, or 12 percent of total surface water discharges in 1999.
• Ontario reported the fourth-largest total releases (90.1 million or 5.5 percent) and the largest off-site releases, more than three-quarters of which consisted of transfers of metals.
Table 3–2. North American Releases, by State and Province, 1999 On-site Releases Number Air
SurfaceWater
UndergroundInjection Land Total On-site Releases
State/Province of Facilities (kg) (kg) (kg) (kg) kg Rank Alabama 471 34,257,351 2,793,539 12,700 11,299,103 48,362,693 11 Alaska 7 171,903 26,449 113 147 198,612 60 Alberta 157 8,472,783 446,425 3,319,232 3,183,661 15,435,091 30 Arizona 187 2,021,008 794 6 22,026,524 24,048,332 22 Arkansas 358 9,927,015 1,043,315 351,512 1,174,058 12,495,900 32 British Columbia 87 7,966,287 1,343,819 0 457,889 9,776,971 36 California 1,167 6,922,385 2,156,630 7,012 7,822,312 16,908,339 28 Colorado 157 1,348,650 1,391,090 0 269,866 3,009,606 49 Connecticut 282 1,937,653 445,463 0 9,612 2,392,728 51 Delaware 57 2,676,700 538,905 0 170,133 3,385,738 46 District of Columbia 2 35,828 0 0 0 35,828 63 Florida 523 39,731,507 935,470 14,556,521 3,648,390 58,871,888 6 Georgia 636 41,470,876 3,204,747 0 2,555,098 47,230,721 12 Guam 1 0 0 0 0 0 64 Hawaii 18 1,050,157 140 2 0 1,050,299 56 Idaho 54 1,251,889 3,436,541 0 16,173,348 20,861,778 25 Illinois 1,198 35,167,325 2,945,710 544 19,141,971 57,255,550 7 Indiana 940 42,062,458 3,059,401 95,691 11,570,649 56,788,199 8 Iowa 367 11,610,374 1,674,466 0 2,014,792 15,299,632 31 Kansas 242 5,724,411 473,079 516,060 1,203,690 7,917,240 40 Kentucky 402 32,438,314 1,267,987 0 4,612,671 38,318,972 15 Louisiana 302 21,284,002 6,440,644 18,738,509 5,962,514 52,425,669 9 Maine 68 2,021,135 359,463 0 315,455 2,696,053 50 Manitoba 51 3,242,718 85,542 0 1,239,604 4,580,369 44 Maryland 161 15,916,343 1,255,785 15,102 1,047,719 18,234,949 26 Massachusetts 420 3,461,818 42,900 0 1,546 3,506,264 45 Michigan 820 32,360,186 407,796 1,149,853 3,618,232 37,536,067 16 Minnesota 425 6,079,598 745,094 0 1,143,344 7,968,036 39 Mississippi 277 17,218,003 6,484,273 3,772,774 2,537,173 30,012,223 18 Missouri 521 17,482,505 1,280,014 0 11,845,829 30,608,348 17 Montana 28 2,437,955 10,256 0 20,714,184 23,162,395 23 Nebraska 153 3,312,863 5,112,424 0 430,823 8,856,110 38 Nevada 44 799,298 0 0 2,229,119 3,028,417 48 New Brunswick 29 5,217,148 1,196,871 0 161,593 6,576,732 42 New Hampshire 101 2,216,111 43,476 0 24,266 2,283,853 54 New Jersey 500 6,699,368 2,280,955 1 948,148 9,928,472 34 New Mexico 47 672,113 10,498 30 9,212,946 9,895,587 35 New York 598 14,880,851 4,310,530 0 2,155,857 21,347,238 24 Newfoundland 7 357,741 21,359 0 7,538 386,638 57 North Carolina 728 53,529,588 3,829,837 0 6,261,832 63,621,257 5 North Dakota 35 1,289,979 83,828 0 1,006,369 2,380,176 52 Nova Scotia 29 2,732,915 19,036 0 611,859 3,364,116 47 Ohio 1,504 57,725,811 2,961,251 10,969,044 29,356,169 101,012,275 2 Oklahoma 270 5,341,619 1,355,335 1,164,048 2,943,653 10,804,655 33 Ontario 862 46,303,536 1,357,370 0 18,627,516 66,359,556 4 Oregon 221 6,458,524 1,458,821 0 18,235,375 26,152,720 21 Pennsylvania 1,203 47,565,803 22,140,245 0 4,932,384 74,638,432 3 Prince Edward Island 3 12,847 183,122 0 0 195,969 61 Puerto Rico 133 6,907,365 34,648 0 76,923 7,018,936 41 Quebec 377 12,253,247 1,135,981 0 3,300,736 16,711,847 29 Rhode Island 118 353,808 549 0 2 354,359 58 Saskatchewan 32 1,241,439 65,858 4,025 49,130 1,363,747 55 South Carolina 469 23,908,056 1,406,025 0 3,711,043 29,025,124 19 South Dakota 67 945,322 614,195 0 776,966 2,336,483 53 Tennessee 587 43,924,048 944,935 0 4,629,023 49,498,006 10 Texas 1,214 45,026,128 14,486,225 31,933,079 15,848,739 107,294,171 1 Utah 149 23,666,988 467,241 1,633 20,978,611 45,114,473 13 Vermont 33 45,262 79,162 0 34,237 158,661 62 Virgin Islands 3 278,086 549 0 812 279,447 59 Virginia 401 23,076,434 2,049,450 0 1,646,076 26,771,960 20 Washington 252 7,028,091 1,265,967 0 570,981 8,865,039 37 West Virginia 148 33,843,748 3,444,251 4 2,756,350 40,044,353 14 Wisconsin 787 15,327,887 1,557,047 0 731,897 17,616,831 27 Wyoming 31 725,040 2,504 3,509,161 1,222,955 5,459,660 43 Total 21,521 901,416,201 118,215,282 90,116,656 309,239,442 1,419,119,790
Note: Canada and US data only. Mexico data not available for 1999. The data are estimates of releases and transfers of chemicals reported by facilities. None of the rankings is meant to imply that a facility, state or province is not meeting its legal requirements. The data do not predict levels of exposure of the public to those chemicals.
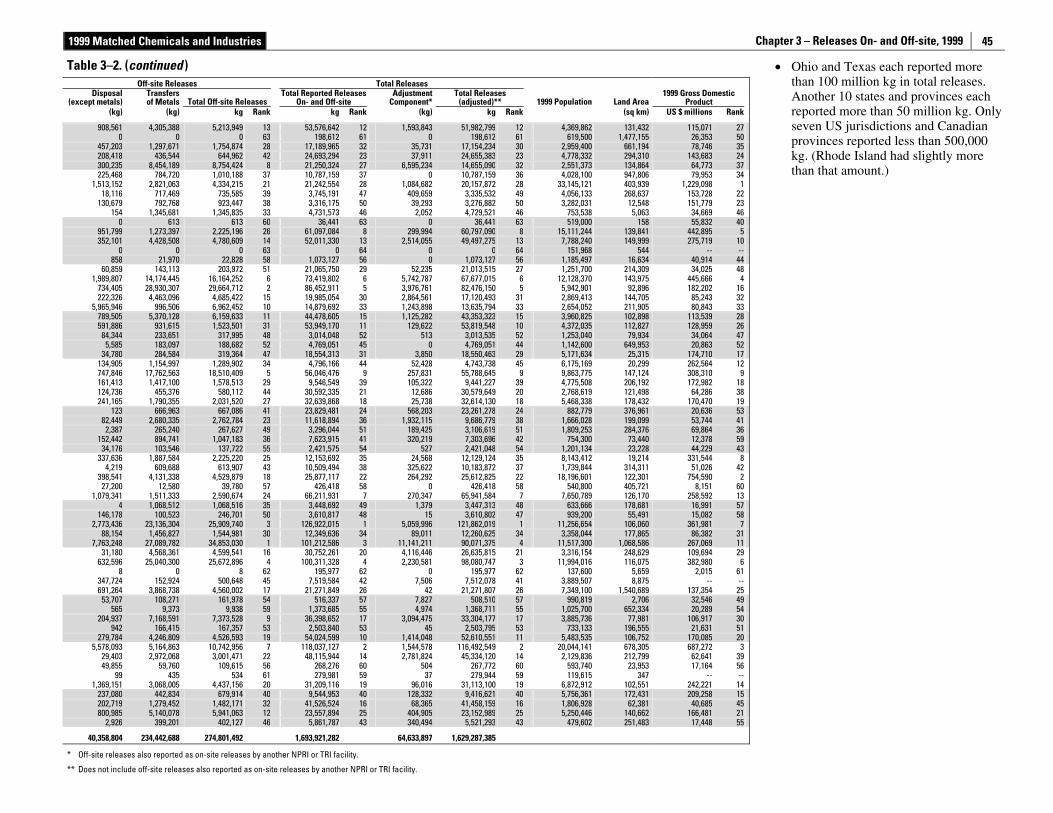
1999 Matched Chemicals and Industries Chapter 3 – Releases On- and Off-site, 1999
45
• Ohio and Texas each reported more than 100 million kg in total releases. Another 10 states and provinces each reported more than 50 million kg. Only seven US jurisdictions and Canadian provinces reported less than 500,000 kg. (Rhode Island had slightly more than that amount.)
Table 3–2. (continued )
Off-site Releases Total Releases Disposal
(except metals) Transfers of Metals Total Off-site Releases
Total Reported Releases On- and Off-site
Adjustment Component*
Total Releases (adjusted)** 1999 Population Land Area
1999 Gross Domestic Product
(kg) (kg) kg Rank kg Rank (kg) kg Rank (sq km) US $ millions Rank
908,561 4,305,388 5,213,949 13 53,576,642 12 1,593,843 51,982,799 12 4,369,862 131,432 115,071 270 0 0 63 198,612 61 0 198,612 61 619,500 1,477,155 26,353 50
457,203 1,297,671 1,754,874 28 17,189,965 32 35,731 17,154,234 30 2,959,400 661,194 78,746 35208,418 436,544 644,962 42 24,693,294 23 37,911 24,655,383 23 4,778,332 294,310 143,683 24300,235 8,454,189 8,754,424 8 21,250,324 27 6,595,234 14,655,090 32 2,551,373 134,864 64,773 37225,468 784,720 1,010,188 37 10,787,159 37 0 10,787,159 36 4,028,100 947,806 79,953 34
1,513,152 2,821,063 4,334,215 21 21,242,554 28 1,084,682 20,157,872 28 33,145,121 403,939 1,229,098 118,116 717,469 735,585 39 3,745,191 47 409,659 3,335,532 49 4,056,133 268,637 153,728 22
130,679 792,768 923,447 38 3,316,175 50 39,293 3,276,882 50 3,282,031 12,548 151,779 23154 1,345,681 1,345,835 33 4,731,573 46 2,052 4,729,521 46 753,538 5,063 34,669 46
0 613 613 60 36,441 63 0 36,441 63 519,000 158 55,832 40951,799 1,273,397 2,225,196 26 61,097,084 8 299,994 60,797,090 8 15,111,244 139,841 442,895 5352,101 4,428,508 4,780,609 14 52,011,330 13 2,514,055 49,497,275 13 7,788,240 149,999 275,719 10
0 0 0 63 0 64 0 0 64 151,968 544 -- --858 21,970 22,828 58 1,073,127 56 0 1,073,127 56 1,185,497 16,634 40,914 44
60,859 143,113 203,972 51 21,065,750 29 52,235 21,013,515 27 1,251,700 214,309 34,025 481,989,807 14,174,445 16,164,252 6 73,419,802 6 5,742,787 67,677,015 6 12,128,370 143,975 445,666 4
734,405 28,930,307 29,664,712 2 86,452,911 5 3,976,761 82,476,150 5 5,942,901 92,896 182,202 16222,326 4,463,096 4,685,422 15 19,985,054 30 2,864,561 17,120,493 31 2,869,413 144,705 85,243 32
5,965,946 996,506 6,962,452 10 14,879,692 33 1,243,898 13,635,794 33 2,654,052 211,905 80,843 33789,505 5,370,128 6,159,633 11 44,478,605 15 1,125,282 43,353,323 15 3,960,825 102,898 113,539 28591,886 931,615 1,523,501 31 53,949,170 11 129,622 53,819,548 10 4,372,035 112,827 128,959 26
84,344 233,651 317,995 48 3,014,048 52 513 3,013,535 52 1,253,040 79,934 34,064 475,585 183,097 188,682 52 4,769,051 45 0 4,769,051 44 1,142,600 649,953 20,863 52
34,780 284,584 319,364 47 18,554,313 31 3,850 18,550,463 29 5,171,634 25,315 174,710 17134,905 1,154,997 1,289,902 34 4,796,166 44 52,428 4,743,738 45 6,175,169 20,299 262,564 12747,846 17,762,563 18,510,409 5 56,046,476 9 257,831 55,788,645 9 9,863,775 147,124 308,310 9161,413 1,417,100 1,578,513 29 9,546,549 39 105,322 9,441,227 39 4,775,508 206,192 172,982 18124,736 455,376 580,112 44 30,592,335 21 12,686 30,579,649 20 2,768,619 121,498 64,286 38241,165 1,790,355 2,031,520 27 32,639,868 18 25,738 32,614,130 18 5,468,338 178,432 170,470 19
123 666,963 667,086 41 23,829,481 24 568,203 23,261,278 24 882,779 376,961 20,636 5382,449 2,680,335 2,762,784 23 11,618,894 36 1,932,115 9,686,779 38 1,666,028 199,099 53,744 41
2,387 265,240 267,627 49 3,296,044 51 189,425 3,106,619 51 1,809,253 284,376 69,864 36152,442 894,741 1,047,183 36 7,623,915 41 320,219 7,303,696 42 754,300 73,440 12,378 59
34,176 103,546 137,722 55 2,421,575 54 527 2,421,048 54 1,201,134 23,228 44,229 43337,636 1,887,584 2,225,220 25 12,153,692 35 24,568 12,129,124 35 8,143,412 19,214 331,544 8
4,219 609,688 613,907 43 10,509,494 38 325,622 10,183,872 37 1,739,844 314,311 51,026 42398,541 4,131,338 4,529,879 18 25,877,117 22 264,292 25,612,825 22 18,196,601 122,301 754,590 2
27,200 12,580 39,780 57 426,418 58 0 426,418 58 540,800 405,721 8,151 601,079,341 1,511,333 2,590,674 24 66,211,931 7 270,347 65,941,584 7 7,650,789 126,170 258,592 13
4 1,068,512 1,068,516 35 3,448,692 49 1,379 3,447,313 48 633,666 178,681 16,991 57146,178 100,523 246,701 50 3,610,817 48 15 3,610,802 47 939,200 55,491 15,082 58
2,773,436 23,136,304 25,909,740 3 126,922,015 1 5,059,996 121,862,019 1 11,256,654 106,060 361,981 788,154 1,456,827 1,544,981 30 12,349,636 34 89,011 12,260,625 34 3,358,044 177,865 86,382 31
7,763,248 27,089,782 34,853,030 1 101,212,586 3 11,141,211 90,071,375 4 11,517,300 1,068,586 267,069 1131,180 4,568,361 4,599,541 16 30,752,261 20 4,116,446 26,635,815 21 3,316,154 248,629 109,694 29
632,596 25,040,300 25,672,896 4 100,311,328 4 2,230,581 98,080,747 3 11,994,016 116,075 382,980 68 0 8 62 195,977 62 0 195,977 62 137,600 5,659 2,015 61
347,724 152,924 500,648 45 7,519,584 42 7,506 7,512,078 41 3,889,507 8,875 -- --691,264 3,868,738 4,560,002 17 21,271,849 26 42 21,271,807 26 7,349,100 1,540,689 137,354 25
53,707 108,271 161,978 54 516,337 57 7,827 508,510 57 990,819 2,706 32,546 49565 9,373 9,938 59 1,373,685 55 4,974 1,368,711 55 1,025,700 652,334 20,289 54
204,937 7,168,591 7,373,528 9 36,398,652 17 3,094,475 33,304,177 17 3,885,736 77,981 106,917 30942 166,415 167,357 53 2,503,840 53 45 2,503,795 53 733,133 196,555 21,631 51
279,784 4,246,809 4,526,593 19 54,024,599 10 1,414,048 52,610,551 11 5,483,535 106,752 170,085 205,578,093 5,164,863 10,742,956 7 118,037,127 2 1,544,578 116,492,549 2 20,044,141 678,305 687,272 3
29,403 2,972,068 3,001,471 22 48,115,944 14 2,781,824 45,334,120 14 2,129,836 212,799 62,641 3949,855 59,760 109,615 56 268,276 60 504 267,772 60 593,740 23,953 17,164 56
99 435 534 61 279,981 59 37 279,944 59 119,615 347 -- --1,369,151 3,068,005 4,437,156 20 31,209,116 19 96,016 31,113,100 19 6,872,912 102,551 242,221 14
237,080 442,834 679,914 40 9,544,953 40 128,332 9,416,621 40 5,756,361 172,431 209,258 15202,719 1,279,452 1,482,171 32 41,526,524 16 68,365 41,458,159 16 1,806,928 62,381 40,685 45800,985 5,140,078 5,941,063 12 23,557,894 25 404,905 23,152,989 25 5,250,446 140,662 166,481 21
2,926 399,201 402,127 46 5,861,787 43 340,494 5,521,293 43 479,602 251,483 17,448 55
40,358,804 234,442,688 274,801,492 1,693,921,282 64,633,897 1,629,287,385
* Off-site releases also reported as on-site releases by another NPRI or TRI facility.
** Does not include off-site releases also reported as on-site releases by another NPRI or TRI facility.
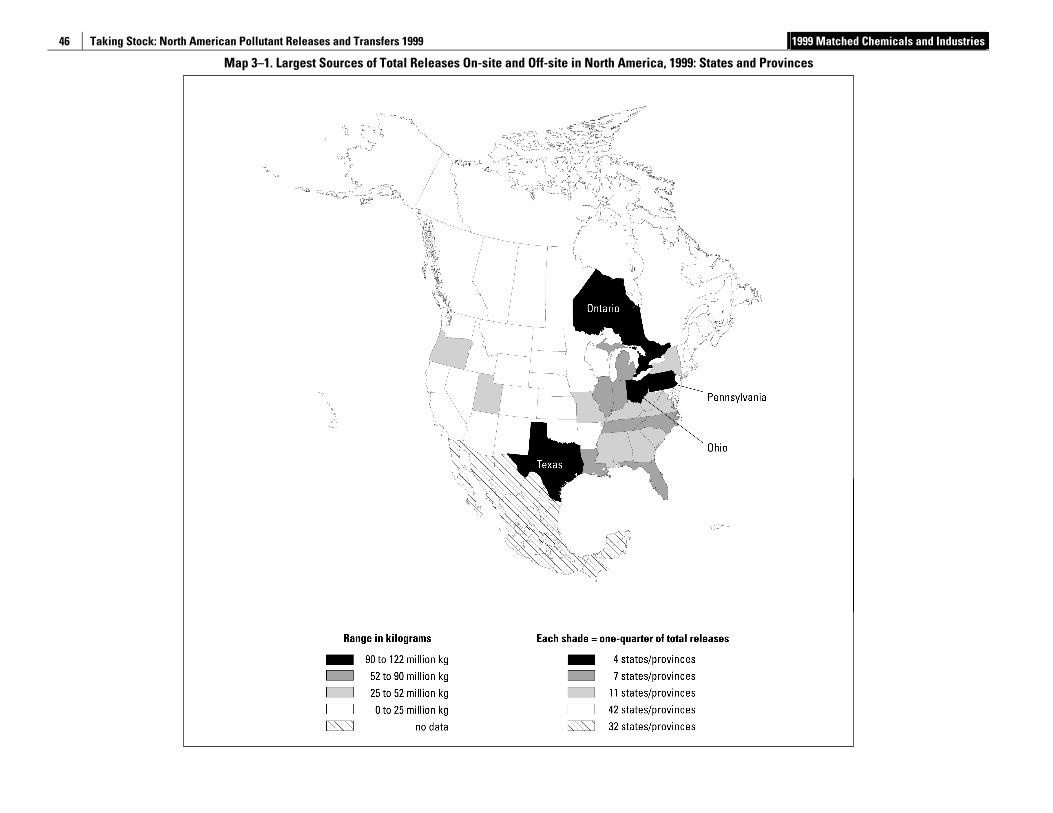
Taking Stock: North American Pollutant Releases and Transfers 1999 1999 Matched Chemicals and Industries
46
Map 3–1. Largest Sources of Total Releases On-site and Off-site in North America, 1999: States and Provinces
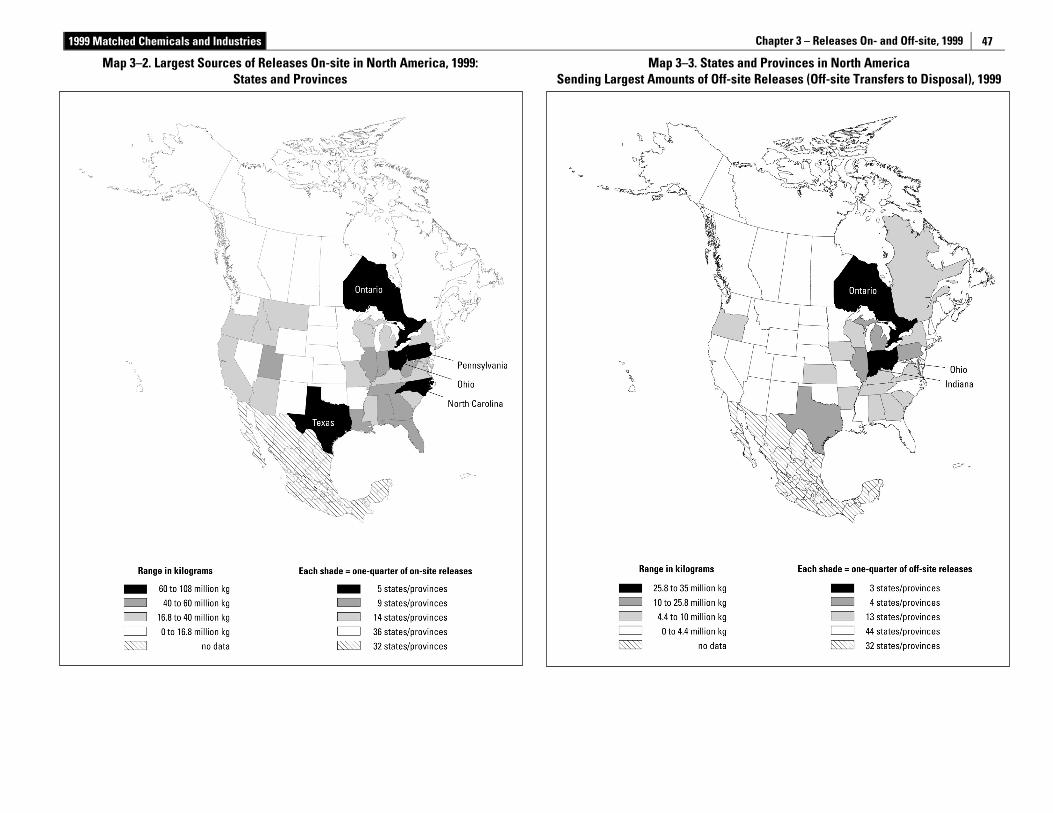
1999 Matched Chemicals and Industries Chapter 3 – Releases On- and Off-site, 1999
47
Map 3–2. Largest Sources of Releases On-site in North America, 1999: States and Provinces
Map 3–3. States and Provinces in North America Sending Largest Amounts of Off-site Releases (Off-site Transfers to Disposal), 1999
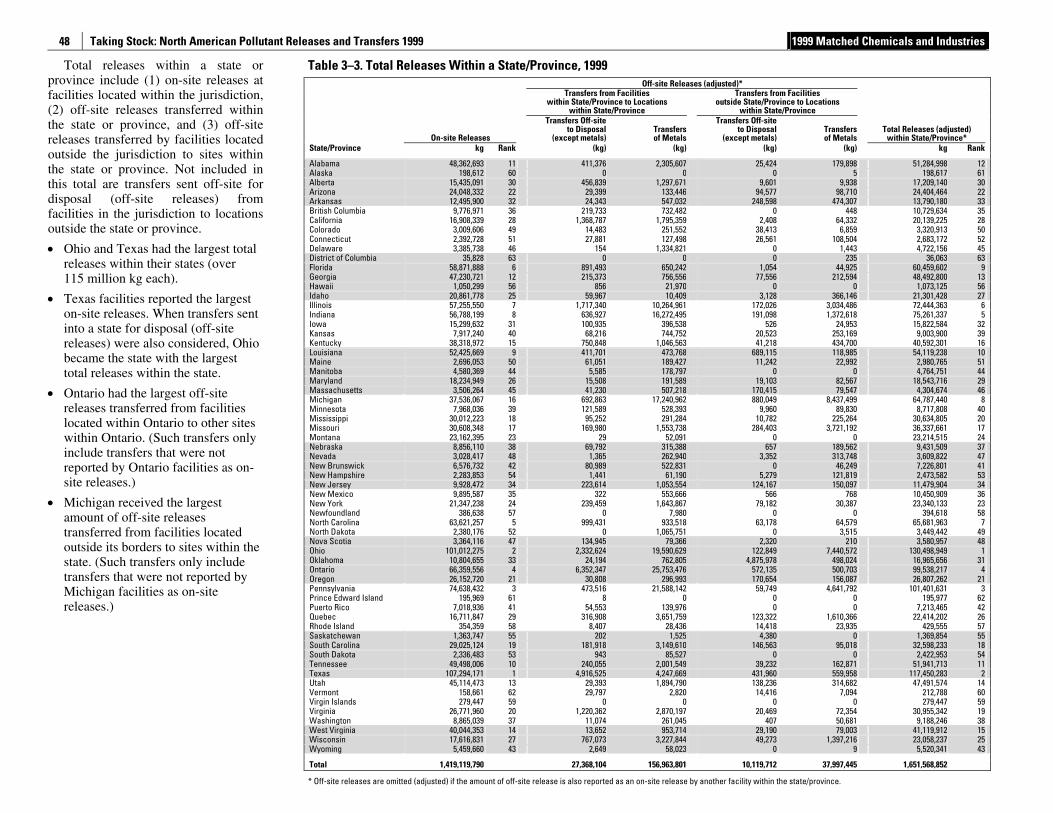
Taking Stock: North American Pollutant Releases and Transfers 1999 1999 Matched Chemicals and Industries
48
Total releases within a state or province include (1) on-site releases at facilities located within the jurisdiction, (2) off-site releases transferred within the state or province, and (3) off-site releases transferred by facilities located outside the jurisdiction to sites within the state or province. Not included in this total are transfers sent off-site for disposal (off-site releases) from facilities in the jurisdiction to locations outside the state or province.
• Ohio and Texas had the largest total releases within their states (over 115 million kg each).
• Texas facilities reported the largest on-site releases. When transfers sent into a state for disposal (off-site releases) were also considered, Ohio became the state with the largest total releases within the state.
• Ontario had the largest off-site releases transferred from facilities located within Ontario to other sites within Ontario. (Such transfers only include transfers that were not reported by Ontario facilities as on-site releases.)
• Michigan received the largest amount of off-site releases transferred from facilities located outside its borders to sites within the state. (Such transfers only include transfers that were not reported by Michigan facilities as on-site releases.)
Table 3–3. Total Releases Within a State/Province, 1999 Off-site Releases (adjusted)*
Transfers from Facilities within State/Province to Locations
within State/Province
Transfers from Facilities outside State/Province to Locations
within State/Province
On-site Releases
Transfers Off-siteto Disposal
(except metals)Transfersof Metals
Transfers Off-siteto Disposal
(except metals)Transfersof Metals
Total Releases (adjusted) within State/Province*
State/Province kg Rank (kg) (kg) (kg) (kg) kg Rank Alabama 48,362,693 11 411,376 2,305,607 25,424 179,898 51,284,998 12 Alaska 198,612 60 0 0 0 5 198,617 61 Alberta 15,435,091 30 456,839 1,297,671 9,601 9,938 17,209,140 30 Arizona 24,048,332 22 29,399 133,446 94,577 98,710 24,404,464 22 Arkansas 12,495,900 32 24,343 547,032 248,598 474,307 13,790,180 33 British Columbia 9,776,971 36 219,733 732,482 0 448 10,729,634 35 California 16,908,339 28 1,368,787 1,795,359 2,408 64,332 20,139,225 28 Colorado 3,009,606 49 14,483 251,552 38,413 6,859 3,320,913 50 Connecticut 2,392,728 51 27,881 127,498 26,561 108,504 2,683,172 52 Delaware 3,385,738 46 154 1,334,821 0 1,443 4,722,156 45 District of Columbia 35,828 63 0 0 0 235 36,063 63 Florida 58,871,888 6 891,493 650,242 1,054 44,925 60,459,602 9 Georgia 47,230,721 12 215,373 756,556 77,556 212,594 48,492,800 13 Hawaii 1,050,299 56 856 21,970 0 0 1,073,125 56 Idaho 20,861,778 25 59,967 10,409 3,128 366,146 21,301,428 27 Illinois 57,255,550 7 1,717,340 10,264,961 172,026 3,034,486 72,444,363 6 Indiana 56,788,199 8 636,927 16,272,495 191,098 1,372,618 75,261,337 5 Iowa 15,299,632 31 100,935 396,538 526 24,953 15,822,584 32 Kansas 7,917,240 40 68,216 744,752 20,523 253,169 9,003,900 39 Kentucky 38,318,972 15 750,848 1,046,563 41,218 434,700 40,592,301 16 Louisiana 52,425,669 9 411,701 473,768 689,115 118,985 54,119,238 10 Maine 2,696,053 50 61,051 189,427 11,242 22,992 2,980,765 51 Manitoba 4,580,369 44 5,585 178,797 0 0 4,764,751 44 Maryland 18,234,949 26 15,508 191,589 19,103 82,567 18,543,716 29 Massachusetts 3,506,264 45 41,230 507,218 170,415 79,547 4,304,674 46 Michigan 37,536,067 16 692,863 17,240,962 880,049 8,437,499 64,787,440 8 Minnesota 7,968,036 39 121,589 528,393 9,960 89,830 8,717,808 40 Mississippi 30,012,223 18 95,252 291,284 10,782 225,264 30,634,805 20 Missouri 30,608,348 17 169,980 1,553,738 284,403 3,721,192 36,337,661 17 Montana 23,162,395 23 29 52,091 0 0 23,214,515 24 Nebraska 8,856,110 38 69,792 315,388 657 189,562 9,431,509 37 Nevada 3,028,417 48 1,365 262,940 3,352 313,748 3,609,822 47 New Brunswick 6,576,732 42 80,989 522,831 0 46,249 7,226,801 41 New Hampshire 2,283,853 54 1,441 61,190 5,279 121,819 2,473,582 53 New Jersey 9,928,472 34 223,614 1,053,554 124,167 150,097 11,479,904 34 New Mexico 9,895,587 35 322 553,666 566 768 10,450,909 36 New York 21,347,238 24 239,459 1,643,867 79,182 30,387 23,340,133 23 Newfoundland 386,638 57 0 7,980 0 0 394,618 58 North Carolina 63,621,257 5 999,431 933,518 63,178 64,579 65,681,963 7 North Dakota 2,380,176 52 0 1,065,751 0 3,515 3,449,442 49 Nova Scotia 3,364,116 47 134,945 79,366 2,320 210 3,580,957 48 Ohio 101,012,275 2 2,332,624 19,590,629 122,849 7,440,572 130,498,949 1 Oklahoma 10,804,655 33 24,194 762,805 4,875,978 498,024 16,965,656 31 Ontario 66,359,556 4 6,352,347 25,753,476 572,135 500,703 99,538,217 4 Oregon 26,152,720 21 30,808 296,993 170,654 156,087 26,807,262 21 Pennsylvania 74,638,432 3 473,516 21,588,142 59,749 4,641,792 101,401,631 3 Prince Edward Island 195,969 61 8 0 0 0 195,977 62 Puerto Rico 7,018,936 41 54,553 139,976 0 0 7,213,465 42 Quebec 16,711,847 29 316,908 3,651,759 123,322 1,610,366 22,414,202 26 Rhode Island 354,359 58 8,407 28,436 14,418 23,935 429,555 57 Saskatchewan 1,363,747 55 202 1,525 4,380 0 1,369,854 55 South Carolina 29,025,124 19 181,918 3,149,610 146,563 95,018 32,598,233 18 South Dakota 2,336,483 53 943 85,527 0 0 2,422,953 54 Tennessee 49,498,006 10 240,055 2,001,549 39,232 162,871 51,941,713 11 Texas 107,294,171 1 4,916,525 4,247,669 431,960 559,958 117,450,283 2 Utah 45,114,473 13 29,393 1,894,790 138,236 314,682 47,491,574 14 Vermont 158,661 62 29,797 2,820 14,416 7,094 212,788 60 Virgin Islands 279,447 59 0 0 0 0 279,447 59 Virginia 26,771,960 20 1,220,362 2,870,197 20,469 72,354 30,955,342 19 Washington 8,865,039 37 11,074 261,045 407 50,681 9,188,246 38 West Virginia 40,044,353 14 13,652 953,714 29,190 79,003 41,119,912 15 Wisconsin 17,616,831 27 767,073 3,227,844 49,273 1,397,216 23,058,237 25 Wyoming 5,459,660 43 2,649 58,023 0 9 5,520,341 43 Total 1,419,119,790 27,368,104 156,963,801 10,119,712 37,997,445 1,651,568,852
* Off-site releases are omitted (adjusted) if the amount of off-site release is also reported as an on-site release by another facility within the state/province.
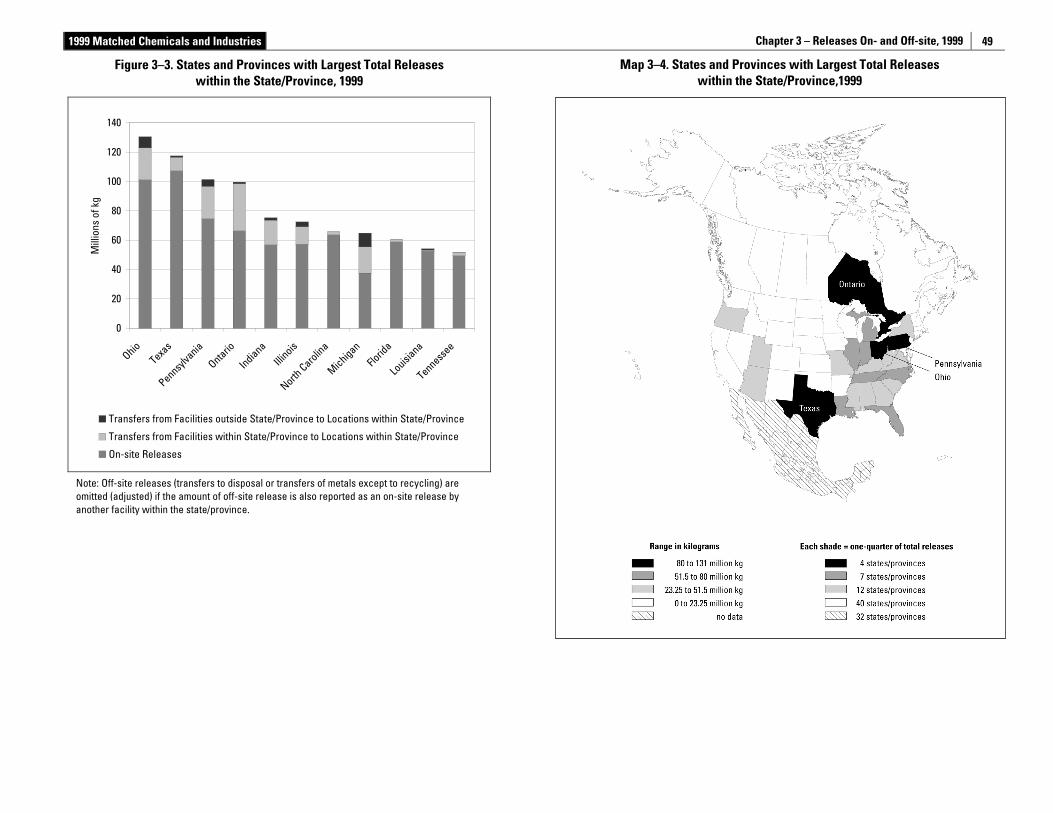
1999 Matched Chemicals and Industries Chapter 3 – Releases On- and Off-site, 1999
49
Map 3–4. States and Provinces with Largest Total Releases within the State/Province,1999
Figure 3–3. States and Provinces with Largest Total Releases within the State/Province, 1999
0
20
40
60
80
100
120
140
Ohio
Texas
Pennsylva
niaOntarioIndiana
Illinois
North Carolin
aMichigan
Florid
aLo
uisiana
Tennessee
Mill
ions
of k
g
Transfers from Facilities outside State/Province to Locations within State/Province
Transfers from Facilities within State/Province to Locations within State/Province
On-site Releases
Note: Off-site releases (transfers to disposal or transfers of metals except to recycling) are omitted (adjusted) if the amount of off-site release is also reported as an on-site release by another facility within the state/province.
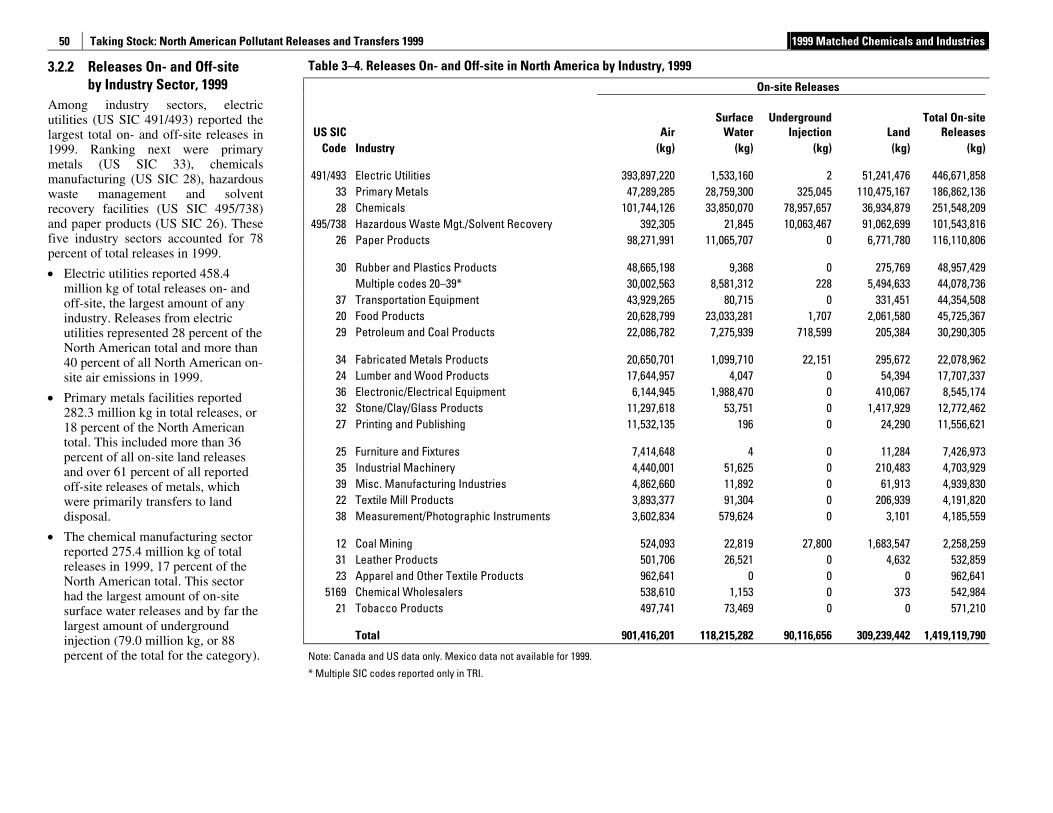
Taking Stock: North American Pollutant Releases and Transfers 1999 1999 Matched Chemicals and Industries
50
3.2.2 Releases On- and Off-site by Industry Sector, 1999
Among industry sectors, electric utilities (US SIC 491/493) reported the largest total on- and off-site releases in 1999. Ranking next were primary metals (US SIC 33), chemicals manufacturing (US SIC 28), hazardous waste management and solvent recovery facilities (US SIC 495/738) and paper products (US SIC 26). These five industry sectors accounted for 78 percent of total releases in 1999.
• Electric utilities reported 458.4 million kg of total releases on- and off-site, the largest amount of any industry. Releases from electric utilities represented 28 percent of the North American total and more than 40 percent of all North American on-site air emissions in 1999.
• Primary metals facilities reported 282.3 million kg in total releases, or 18 percent of the North American total. This included more than 36 percent of all on-site land releases and over 61 percent of all reported off-site releases of metals, which were primarily transfers to land disposal.
• The chemical manufacturing sector reported 275.4 million kg of total releases in 1999, 17 percent of the North American total. This sector had the largest amount of on-site surface water releases and by far the largest amount of underground injection (79.0 million kg, or 88 percent of the total for the category).
Table 3–4. Releases On- and Off-site in North America by Industry, 1999
On-site Releases
US SIC AirSurface
WaterUnderground
Injection LandTotal On-site
Releases Code Industry (kg) (kg) (kg) (kg) (kg)
491/493 Electric Utilities 393,897,220 1,533,160 2 51,241,476 446,671,858 33 Primary Metals 47,289,285 28,759,300 325,045 110,475,167 186,862,136 28 Chemicals 101,744,126 33,850,070 78,957,657 36,934,879 251,548,209
495/738 Hazardous Waste Mgt./Solvent Recovery 392,305 21,845 10,063,467 91,062,699 101,543,816 26 Paper Products 98,271,991 11,065,707 0 6,771,780 116,110,806
30 Rubber and Plastics Products 48,665,198 9,368 0 275,769 48,957,429 Multiple codes 20–39* 30,002,563 8,581,312 228 5,494,633 44,078,736
37 Transportation Equipment 43,929,265 80,715 0 331,451 44,354,508 20 Food Products 20,628,799 23,033,281 1,707 2,061,580 45,725,367 29 Petroleum and Coal Products 22,086,782 7,275,939 718,599 205,384 30,290,305
34 Fabricated Metals Products 20,650,701 1,099,710 22,151 295,672 22,078,962 24 Lumber and Wood Products 17,644,957 4,047 0 54,394 17,707,337 36 Electronic/Electrical Equipment 6,144,945 1,988,470 0 410,067 8,545,174 32 Stone/Clay/Glass Products 11,297,618 53,751 0 1,417,929 12,772,462 27 Printing and Publishing 11,532,135 196 0 24,290 11,556,621
25 Furniture and Fixtures 7,414,648 4 0 11,284 7,426,973 35 Industrial Machinery 4,440,001 51,625 0 210,483 4,703,929 39 Misc. Manufacturing Industries 4,862,660 11,892 0 61,913 4,939,830 22 Textile Mill Products 3,893,377 91,304 0 206,939 4,191,820 38 Measurement/Photographic Instruments 3,602,834 579,624 0 3,101 4,185,559
12 Coal Mining 524,093 22,819 27,800 1,683,547 2,258,259 31 Leather Products 501,706 26,521 0 4,632 532,859 23 Apparel and Other Textile Products 962,641 0 0 0 962,641
5169 Chemical Wholesalers 538,610 1,153 0 373 542,984 21 Tobacco Products 497,741 73,469 0 0 571,210
Total 901,416,201 118,215,282 90,116,656 309,239,442 1,419,119,790
Note: Canada and US data only. Mexico data not available for 1999.
* Multiple SIC codes reported only in TRI.
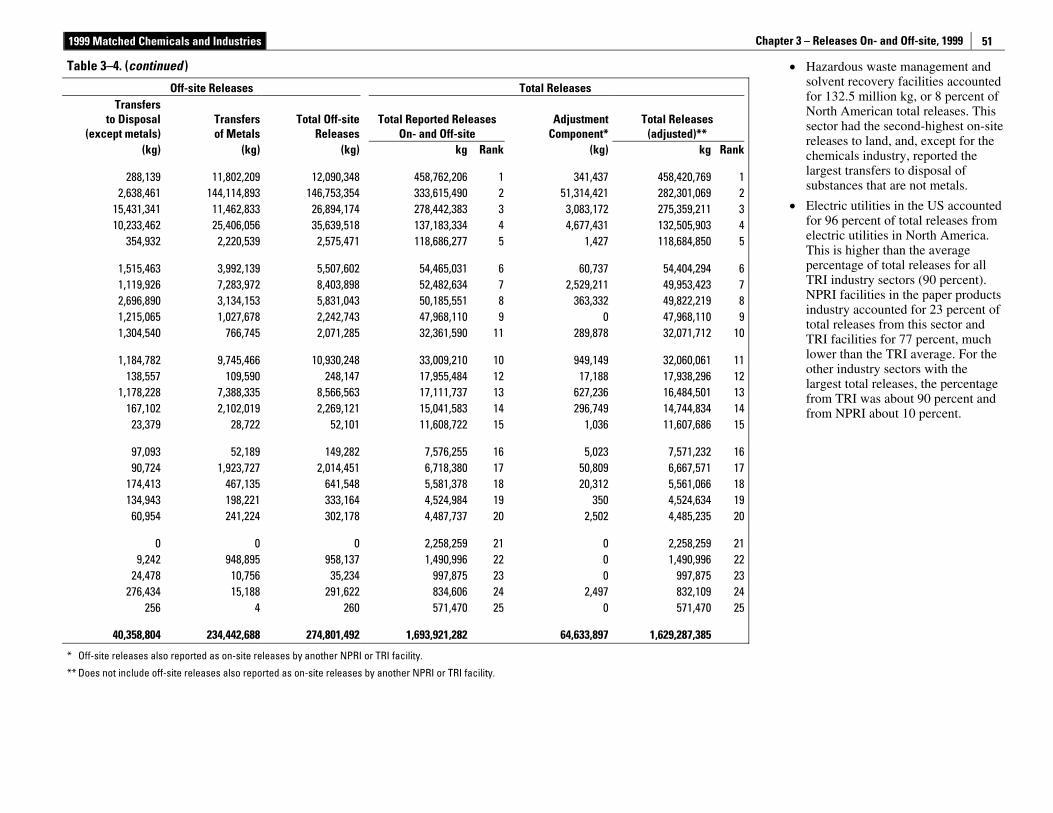
1999 Matched Chemicals and Industries Chapter 3 – Releases On- and Off-site, 1999
51
• Hazardous waste management and solvent recovery facilities accounted for 132.5 million kg, or 8 percent of North American total releases. This sector had the second-highest on-site releases to land, and, except for the chemicals industry, reported the largest transfers to disposal of substances that are not metals.
• Electric utilities in the US accounted for 96 percent of total releases from electric utilities in North America. This is higher than the average percentage of total releases for all TRI industry sectors (90 percent). NPRI facilities in the paper products industry accounted for 23 percent of total releases from this sector and TRI facilities for 77 percent, much lower than the TRI average. For the other industry sectors with the largest total releases, the percentage from TRI was about 90 percent and from NPRI about 10 percent.
Table 3–4. (continued )
Off-site Releases Total Releases Transfers
to Disposal (except metals)
Transfers of Metals
Total Off-site Releases
Total Reported Releases On- and Off-site
Adjustment Component*
Total Releases (adjusted)**
(kg) (kg) (kg) kg Rank (kg) kg Rank
288,139 11,802,209 12,090,348 458,762,206 1 341,437 458,420,769 12,638,461 144,114,893 146,753,354 333,615,490 2 51,314,421 282,301,069 2
15,431,341 11,462,833 26,894,174 278,442,383 3 3,083,172 275,359,211 310,233,462 25,406,056 35,639,518 137,183,334 4 4,677,431 132,505,903 4
354,932 2,220,539 2,575,471 118,686,277 5 1,427 118,684,850 5
1,515,463 3,992,139 5,507,602 54,465,031 6 60,737 54,404,294 61,119,926 7,283,972 8,403,898 52,482,634 7 2,529,211 49,953,423 72,696,890 3,134,153 5,831,043 50,185,551 8 363,332 49,822,219 81,215,065 1,027,678 2,242,743 47,968,110 9 0 47,968,110 91,304,540 766,745 2,071,285 32,361,590 11 289,878 32,071,712 10
1,184,782 9,745,466 10,930,248 33,009,210 10 949,149 32,060,061 11138,557 109,590 248,147 17,955,484 12 17,188 17,938,296 12
1,178,228 7,388,335 8,566,563 17,111,737 13 627,236 16,484,501 13167,102 2,102,019 2,269,121 15,041,583 14 296,749 14,744,834 14
23,379 28,722 52,101 11,608,722 15 1,036 11,607,686 15
97,093 52,189 149,282 7,576,255 16 5,023 7,571,232 1690,724 1,923,727 2,014,451 6,718,380 17 50,809 6,667,571 17
174,413 467,135 641,548 5,581,378 18 20,312 5,561,066 18134,943 198,221 333,164 4,524,984 19 350 4,524,634 19
60,954 241,224 302,178 4,487,737 20 2,502 4,485,235 20
0 0 0 2,258,259 21 0 2,258,259 219,242 948,895 958,137 1,490,996 22 0 1,490,996 22
24,478 10,756 35,234 997,875 23 0 997,875 23276,434 15,188 291,622 834,606 24 2,497 832,109 24
256 4 260 571,470 25 0 571,470 25
40,358,804 234,442,688 274,801,492 1,693,921,282 64,633,897 1,629,287,385
* Off-site releases also reported as on-site releases by another NPRI or TRI facility.
** Does not include off-site releases also reported as on-site releases by another NPRI or TRI facility.
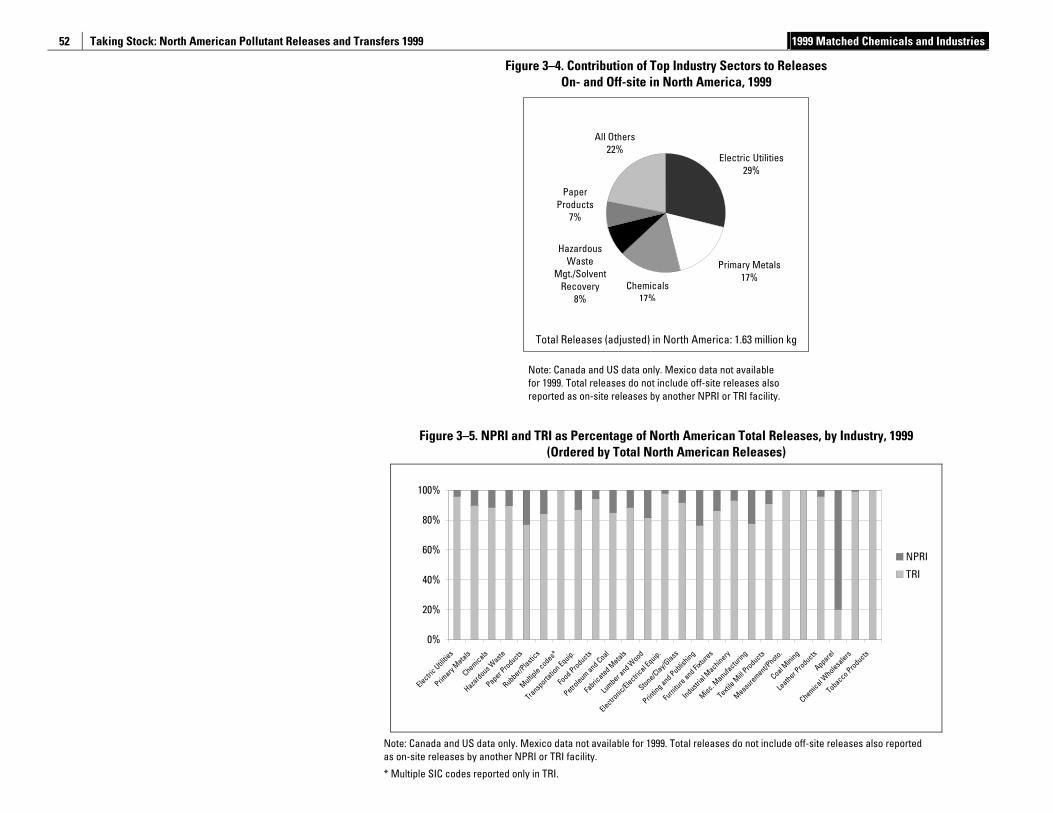
Taking Stock: North American Pollutant Releases and Transfers 1999 1999 Matched Chemicals and Industries
52
Figure 3–4. Contribution of Top Industry Sectors to Releases
On- and Off-site in North America, 1999
Primary Metals17%
Electric Utilities29%
Total Releases (adjusted) in North America: 1.63 million kg
Chemicals17%
All Others 22%
HazardousWaste
Mgt./SolventRecovery
8%
PaperProducts
7%
Note: Canada and US data only. Mexico data not available for 1999. Total releases do not include off-site releases also reported as on-site releases by another NPRI or TRI facility.
Figure 3–5. NPRI and TRI as Percentage of North American Total Releases, by Industry, 1999
(Ordered by Total North American Releases)
0%
20%
40%
60%
80%
100%
Electric Utili
ties
Primary
MetalsChemicals
Hazardous W
aste
Paper Products
Rubber/Plasti
cs
Multiple codes*
Transporta
tion Equip.
Food Products
Petroleum and Coal
Fabric
ated Metals
Lumber a
nd Wood
Electronic/Electric
al Equip.
Stone/Clay/Glass
Printin
g and Publishing
Furnitu
re and Fixtu
res
Industrial M
achinery
Misc. M
anufacturing
Textile M
ill Products
Measurement/P
hoto.Coal M
ining
Leather P
roductsApparel
Chemical Wholesa
lers
Tobacco Products
NPRI
TRI
Note: Canada and US data only. Mexico data not available for 1999. Total releases do not include off-site releases also reported as on-site releases by another NPRI or TRI facility.
* Multiple SIC codes reported only in TRI.
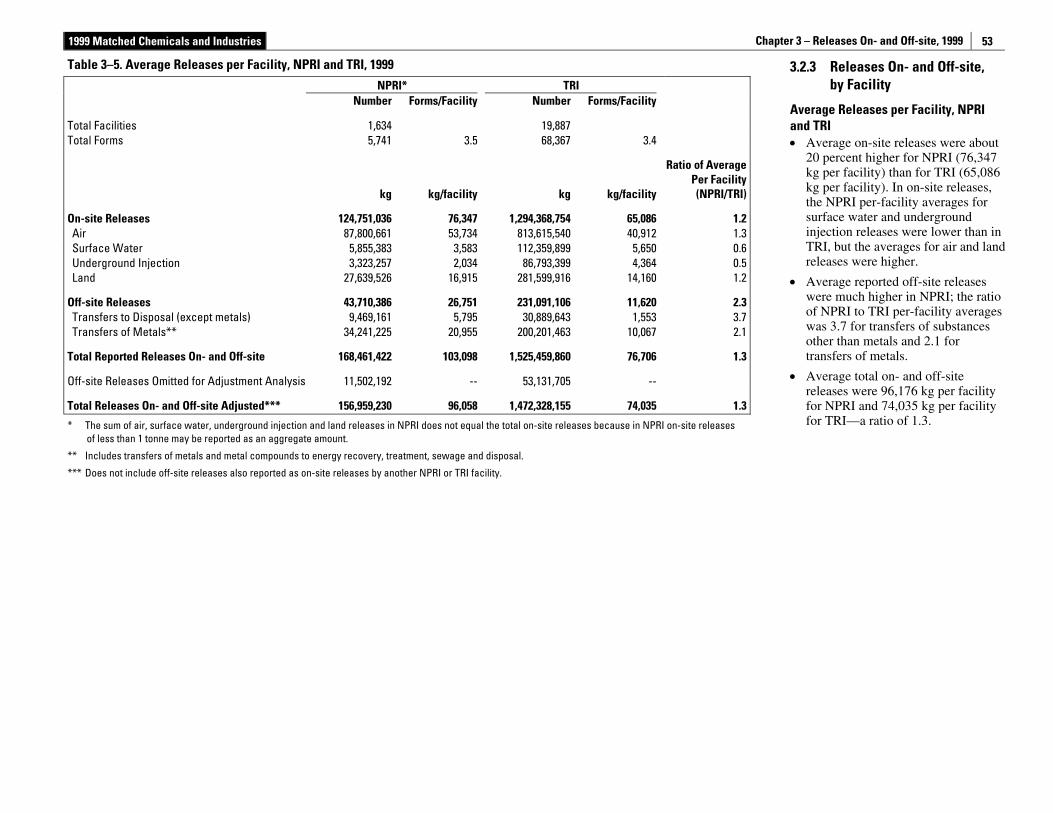
1999 Matched Chemicals and Industries Chapter 3 – Releases On- and Off-site, 1999
53
3.2.3 Releases On- and Off-site, by Facility
Average Releases per Facility, NPRI and TRI • Average on-site releases were about
20 percent higher for NPRI (76,347 kg per facility) than for TRI (65,086 kg per facility). In on-site releases, the NPRI per-facility averages for surface water and underground injection releases were lower than in TRI, but the averages for air and land releases were higher.
• Average reported off-site releases were much higher in NPRI; the ratio of NPRI to TRI per-facility averages was 3.7 for transfers of substances other than metals and 2.1 for transfers of metals.
• Average total on- and off-site releases were 96,176 kg per facility for NPRI and 74,035 kg per facility for TRI—a ratio of 1.3.
Table 3–5. Average Releases per Facility, NPRI and TRI, 1999
NPRI* TRI Number Forms/Facility Number Forms/Facility
Total Facilities 1,634 19,887 Total Forms 5,741 3.5 68,367 3.4
kg kg/facility kg kg/facility
Ratio of Average Per Facility (NPRI/TRI)
On-site Releases 124,751,036 76,347 1,294,368,754 65,086 1.2Air 87,800,661 53,734 813,615,540 40,912 1.3Surface Water 5,855,383 3,583 112,359,899 5,650 0.6Underground Injection 3,323,257 2,034 86,793,399 4,364 0.5Land 27,639,526 16,915 281,599,916 14,160 1.2
Off-site Releases 43,710,386 26,751 231,091,106 11,620 2.3Transfers to Disposal (except metals) 9,469,161 5,795 30,889,643 1,553 3.7Transfers of Metals** 34,241,225 20,955 200,201,463 10,067 2.1
Total Reported Releases On- and Off-site 168,461,422 103,098 1,525,459,860 76,706 1.3
Off-site Releases Omitted for Adjustment Analysis 11,502,192 -- 53,131,705 --
Total Releases On- and Off-site Adjusted*** 156,959,230 96,058 1,472,328,155 74,035 1.3
* The sum of air, surface water, underground injection and land releases in NPRI does not equal the total on-site releases because in NPRI on-site releases of less than 1 tonne may be reported as an aggregate amount.
** Includes transfers of metals and metal compounds to energy recovery, treatment, sewage and disposal.
*** Does not include off-site releases also reported as on-site releases by another NPRI or TRI facility.
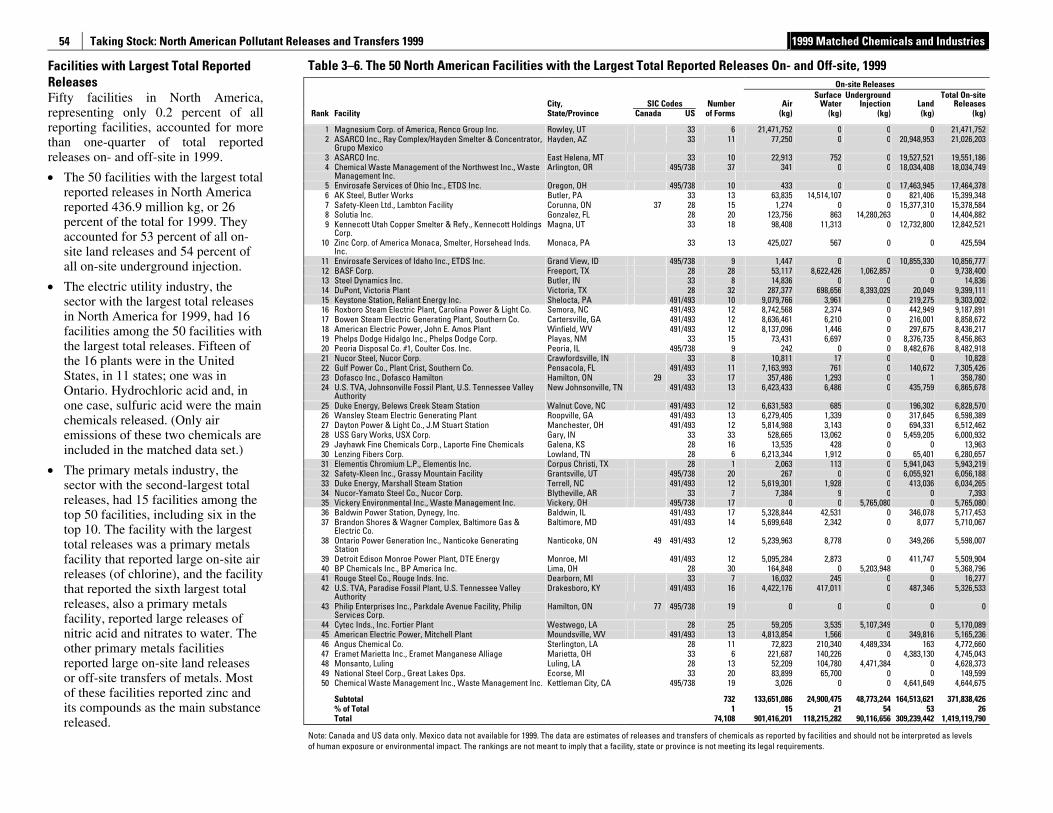
Taking Stock: North American Pollutant Releases and Transfers 1999 1999 Matched Chemicals and Industries
54
Facilities with Largest Total Reported Releases Fifty facilities in North America, representing only 0.2 percent of all reporting facilities, accounted for more than one-quarter of total reported releases on- and off-site in 1999.
• The 50 facilities with the largest total reported releases in North America reported 436.9 million kg, or 26 percent of the total for 1999. They accounted for 53 percent of all on-site land releases and 54 percent of all on-site underground injection.
• The electric utility industry, the sector with the largest total releases in North America for 1999, had 16 facilities among the 50 facilities with the largest total releases. Fifteen of the 16 plants were in the United States, in 11 states; one was in Ontario. Hydrochloric acid and, in one case, sulfuric acid were the main chemicals released. (Only air emissions of these two chemicals are included in the matched data set.)
• The primary metals industry, the sector with the second-largest total releases, had 15 facilities among the top 50 facilities, including six in the top 10. The facility with the largest total releases was a primary metals facility that reported large on-site air releases (of chlorine), and the facility that reported the sixth largest total releases, also a primary metals facility, reported large releases of nitric acid and nitrates to water. The other primary metals facilities reported large on-site land releases or off-site transfers of metals. Most of these facilities reported zinc and its compounds as the main substance released.
Table 3–6. The 50 North American Facilities with the Largest Total Reported Releases On- and Off-site, 1999 On-site Releases
City, SIC Codes Number AirSurface
WaterUnderground
Injection LandTotal On-site
Releases Rank Facility State/Province Canada US of Forms (kg) (kg) (kg) (kg) (kg)
1 Magnesium Corp. of America, Renco Group Inc. Rowley, UT 33 6 21,471,752 0 0 0 21,471,752 2 ASARCO Inc., Ray Complex/Hayden Smelter & Concentrator,
Grupo Mexico Hayden, AZ 33 11 77,250 0 0 20,948,953 21,026,203
3 ASARCO Inc. East Helena, MT 33 10 22,913 752 0 19,527,521 19,551,186 4 Chemical Waste Management of the Northwest Inc., Waste
Management Inc. Arlington, OR 495/738 37 341 0 0 18,034,408 18,034,749
5 Envirosafe Services of Ohio Inc., ETDS Inc. Oregon, OH 495/738 10 433 0 0 17,463,945 17,464,378 6 AK Steel, Butler Works Butler, PA 33 13 63,835 14,514,107 0 821,406 15,399,348 7 Safety-Kleen Ltd., Lambton Facility Corunna, ON 37 28 15 1,274 0 0 15,377,310 15,378,584 8 Solutia Inc. Gonzalez, FL 28 20 123,756 863 14,280,263 0 14,404,882 9 Kennecott Utah Copper Smelter & Refy., Kennecott Holdings
Corp. Magna, UT 33 18 98,408 11,313 0 12,732,800 12,842,521
10 Zinc Corp. of America Monaca, Smelter, Horsehead Inds. Inc.
Monaca, PA 33 13 425,027 567 0 0 425,594
11 Envirosafe Services of Idaho Inc., ETDS Inc. Grand View, ID 495/738 9 1,447 0 0 10,855,330 10,856,777 12 BASF Corp. Freeport, TX 28 28 53,117 8,622,426 1,062,857 0 9,738,400 13 Steel Dynamics Inc. Butler, IN 33 8 14,836 0 0 0 14,836 14 DuPont, Victoria Plant Victoria, TX 28 32 287,377 698,656 8,393,029 20,049 9,399,111 15 Keystone Station, Reliant Energy Inc. Shelocta, PA 491/493 10 9,079,766 3,961 0 219,275 9,303,002 16 Roxboro Steam Electric Plant, Carolina Power & Light Co. Semora, NC 491/493 12 8,742,568 2,374 0 442,949 9,187,891 17 Bowen Steam Electric Generating Plant, Southern Co. Cartersville, GA 491/493 12 8,636,461 6,210 0 216,001 8,858,672 18 American Electric Power, John E. Amos Plant Winfield, WV 491/493 12 8,137,096 1,446 0 297,675 8,436,217 19 Phelps Dodge Hidalgo Inc., Phelps Dodge Corp. Playas, NM 33 15 73,431 6,697 0 8,376,735 8,456,863 20 Peoria Disposal Co. #1, Coulter Cos. Inc. Peoria, IL 495/738 9 242 0 0 8,482,676 8,482,918 21 Nucor Steel, Nucor Corp. Crawfordsville, IN 33 8 10,811 17 0 0 10,828 22 Gulf Power Co., Plant Crist, Southern Co. Pensacola, FL 491/493 11 7,163,993 761 0 140,672 7,305,426 23 Dofasco Inc., Dofasco Hamilton Hamilton, ON 29 33 17 357,486 1,293 0 1 358,780 24 U.S. TVA, Johnsonville Fossil Plant, U.S. Tennessee Valley
Authority New Johnsonville, TN 491/493 13 6,423,433 6,486 0 435,759 6,865,678
25 Duke Energy, Belews Creek Steam Station Walnut Cove, NC 491/493 12 6,631,583 685 0 196,302 6,828,570 26 Wansley Steam Electric Generating Plant Roopville, GA 491/493 13 6,279,405 1,339 0 317,645 6,598,389 27 Dayton Power & Light Co., J.M Stuart Station Manchester, OH 491/493 12 5,814,988 3,143 0 694,331 6,512,462 28 USS Gary Works, USX Corp. Gary, IN 33 33 528,665 13,062 0 5,459,205 6,000,932 29 Jayhawk Fine Chemicals Corp., Laporte Fine Chemicals Galena, KS 28 16 13,535 428 0 0 13,963 30 Lenzing Fibers Corp. Lowland, TN 28 6 6,213,344 1,912 0 65,401 6,280,657 31 Elementis Chromium L.P., Elementis Inc. Corpus Christi, TX 28 1 2,063 113 0 5,941,043 5,943,219 32 Safety-Kleen Inc., Grassy Mountain Facility Grantsville, UT 495/738 20 267 0 0 6,055,921 6,056,188 33 Duke Energy, Marshall Steam Station Terrell, NC 491/493 12 5,619,301 1,928 0 413,036 6,034,265 34 Nucor-Yamato Steel Co., Nucor Corp. Blytheville, AR 33 7 7,384 9 0 0 7,393 35 Vickery Environmental Inc., Waste Management Inc. Vickery, OH 495/738 17 0 0 5,765,080 0 5,765,080 36 Baldwin Power Station, Dynegy, Inc. Baldwin, IL 491/493 17 5,328,844 42,531 0 346,078 5,717,453 37 Brandon Shores & Wagner Complex, Baltimore Gas &
Electric Co. Baltimore, MD 491/493 14 5,699,648 2,342 0 8,077 5,710,067
38 Ontario Power Generation Inc., Nanticoke Generating Station
Nanticoke, ON 49 491/493 12 5,239,963 8,778 0 349,266 5,598,007
39 Detroit Edison Monroe Power Plant, DTE Energy Monroe, MI 491/493 12 5,095,284 2,873 0 411,747 5,509,904 40 BP Chemicals Inc., BP America Inc. Lima, OH 28 30 164,848 0 5,203,948 0 5,368,796 41 Rouge Steel Co., Rouge Inds. Inc. Dearborn, MI 33 7 16,032 245 0 0 16,277 42 U.S. TVA, Paradise Fossil Plant, U.S. Tennessee Valley
Authority Drakesboro, KY 491/493 16 4,422,176 417,011 0 487,346 5,326,533
43 Philip Enterprises Inc., Parkdale Avenue Facility, Philip Services Corp.
Hamilton, ON 77 495/738 19 0 0 0 0 0
44 Cytec Inds., Inc. Fortier Plant Westwego, LA 28 25 59,205 3,535 5,107,349 0 5,170,089 45 American Electric Power, Mitchell Plant Moundsville, WV 491/493 13 4,813,854 1,566 0 349,816 5,165,236 46 Angus Chemical Co. Sterlington, LA 28 11 72,823 210,340 4,489,334 163 4,772,660 47 Eramet Marietta Inc., Eramet Manganese Alliage Marietta, OH 33 6 221,687 140,226 0 4,383,130 4,745,043 48 Monsanto, Luling Luling, LA 28 13 52,209 104,780 4,471,384 0 4,628,373 49 National Steel Corp., Great Lakes Ops. Ecorse, MI 33 20 83,899 65,700 0 0 149,599 50 Chemical Waste Management Inc., Waste Management Inc. Kettleman City, CA 495/738 19 3,026 0 0 4,641,649 4,644,675
Subtotal 732 133,651,086 24,900,475 48,773,244 164,513,621 371,838,426 % of Total 1 15 21 54 53 26 Total 74,108 901,416,201 118,215,282 90,116,656 309,239,442 1,419,119,790
Note: Canada and US data only. Mexico data not available for 1999. The data are estimates of releases and transfers of chemicals as reported by facilities and should not be interpreted as levels of human exposure or environmental impact. The rankings are not meant to imply that a facility, state or province is not meeting its legal requirements.
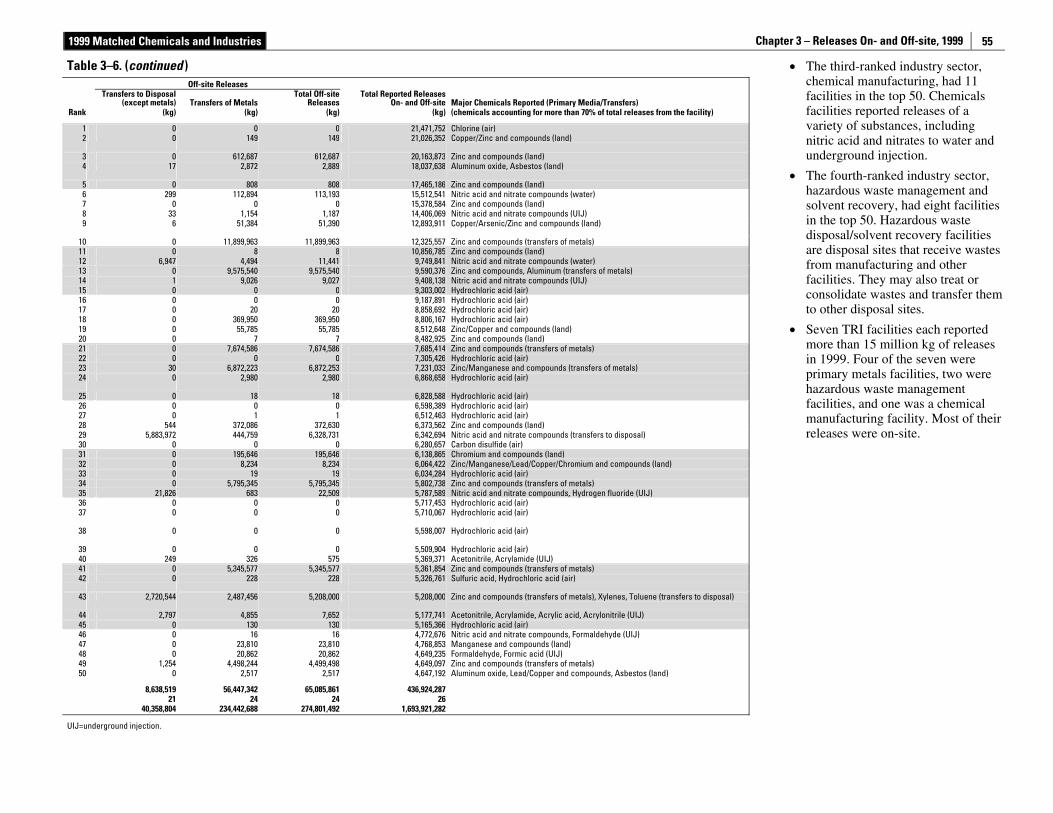
1999 Matched Chemicals and Industries Chapter 3 – Releases On- and Off-site, 1999
55
• The third-ranked industry sector, chemical manufacturing, had 11 facilities in the top 50. Chemicals facilities reported releases of a variety of substances, including nitric acid and nitrates to water and underground injection.
• The fourth-ranked industry sector, hazardous waste management and solvent recovery, had eight facilities in the top 50. Hazardous waste disposal/solvent recovery facilities are disposal sites that receive wastes from manufacturing and other facilities. They may also treat or consolidate wastes and transfer them to other disposal sites.
• Seven TRI facilities each reported more than 15 million kg of releases in 1999. Four of the seven were primary metals facilities, two were hazardous waste management facilities, and one was a chemical manufacturing facility. Most of their releases were on-site.
Table 3–6. (continued ) Off-site Releases
Transfers to Disposal
(except metals) Transfers of Metals Total Off-site
ReleasesTotal Reported Releases
On- and Off-site Major Chemicals Reported (Primary Media/Transfers) Rank (kg) (kg) (kg) (kg) (chemicals accounting for more than 70% of total releases from the facility)
1 0 0 0 21,471,752 Chlorine (air) 2 0 149 149 21,026,352 Copper/Zinc and compounds (land)
3 0 612,687 612,687 20,163,873 Zinc and compounds (land) 4 17 2,872 2,889 18,037,638 Aluminum oxide, Asbestos (land)
5 0 808 808 17,465,186 Zinc and compounds (land) 6 299 112,894 113,193 15,512,541 Nitric acid and nitrate compounds (water) 7 0 0 0 15,378,584 Zinc and compounds (land) 8 33 1,154 1,187 14,406,069 Nitric acid and nitrate compounds (UIJ) 9 6 51,384 51,390 12,893,911 Copper/Arsenic/Zinc and compounds (land)
10 0 11,899,963 11,899,963 12,325,557 Zinc and compounds (transfers of metals) 11 0 8 8 10,856,785 Zinc and compounds (land) 12 6,947 4,494 11,441 9,749,841 Nitric acid and nitrate compounds (water) 13 0 9,575,540 9,575,540 9,590,376 Zinc and compounds, Aluminum (transfers of metals) 14 1 9,026 9,027 9,408,138 Nitric acid and nitrate compounds (UIJ) 15 0 0 0 9,303,002 Hydrochloric acid (air) 16 0 0 0 9,187,891 Hydrochloric acid (air) 17 0 20 20 8,858,692 Hydrochloric acid (air) 18 0 369,950 369,950 8,806,167 Hydrochloric acid (air) 19 0 55,785 55,785 8,512,648 Zinc/Copper and compounds (land) 20 0 7 7 8,482,925 Zinc and compounds (land) 21 0 7,674,586 7,674,586 7,685,414 Zinc and compounds (transfers of metals) 22 0 0 0 7,305,426 Hydrochloric acid (air) 23 30 6,872,223 6,872,253 7,231,033 Zinc/Manganese and compounds (transfers of metals) 24 0 2,980 2,980 6,868,658 Hydrochloric acid (air)
25 0 18 18 6,828,588 Hydrochloric acid (air) 26 0 0 0 6,598,389 Hydrochloric acid (air) 27 0 1 1 6,512,463 Hydrochloric acid (air) 28 544 372,086 372,630 6,373,562 Zinc and compounds (land) 29 5,883,972 444,759 6,328,731 6,342,694 Nitric acid and nitrate compounds (transfers to disposal) 30 0 0 0 6,280,657 Carbon disulfide (air) 31 0 195,646 195,646 6,138,865 Chromium and compounds (land) 32 0 8,234 8,234 6,064,422 Zinc/Manganese/Lead/Copper/Chromium and compounds (land) 33 0 19 19 6,034,284 Hydrochloric acid (air) 34 0 5,795,345 5,795,345 5,802,738 Zinc and compounds (transfers of metals) 35 21,826 683 22,509 5,787,589 Nitric acid and nitrate compounds, Hydrogen fluoride (UIJ) 36 0 0 0 5,717,453 Hydrochloric acid (air) 37 0 0 0 5,710,067 Hydrochloric acid (air)
38 0 0 0 5,598,007 Hydrochloric acid (air)
39 0 0 0 5,509,904 Hydrochloric acid (air) 40 249 326 575 5,369,371 Acetonitrile, Acrylamide (UIJ) 41 0 5,345,577 5,345,577 5,361,854 Zinc and compounds (transfers of metals) 42 0 228 228 5,326,761 Sulfuric acid, Hydrochloric acid (air)
43 2,720,544 2,487,456 5,208,000 5,208,000 Zinc and compounds (transfers of metals), Xylenes, Toluene (transfers to disposal)
44 2,797 4,855 7,652 5,177,741 Acetonitrile, Acrylamide, Acrylic acid, Acrylonitrile (UIJ) 45 0 130 130 5,165,366 Hydrochloric acid (air) 46 0 16 16 4,772,676 Nitric acid and nitrate compounds, Formaldehyde (UIJ) 47 0 23,810 23,810 4,768,853 Manganese and compounds (land) 48 0 20,862 20,862 4,649,235 Formaldehyde, Formic acid (UIJ) 49 1,254 4,498,244 4,499,498 4,649,097 Zinc and compounds (transfers of metals) 50 0 2,517 2,517 4,647,192 Aluminum oxide, Lead/Copper and compounds, Asbestos (land)
8,638,519 56,447,342 65,085,861 436,924,287 21 24 24 26 40,358,804 234,442,688 274,801,492 1,693,921,282
UIJ=underground injection.
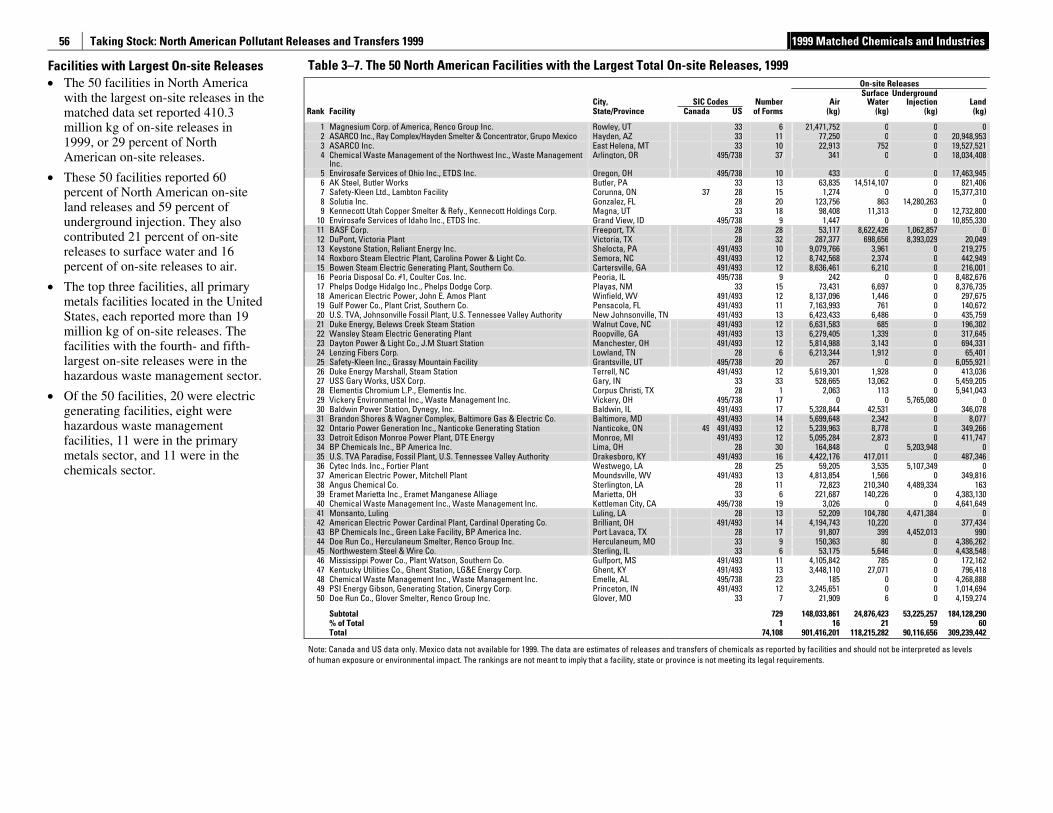
Taking Stock: North American Pollutant Releases and Transfers 1999 1999 Matched Chemicals and Industries
56
Facilities with Largest On-site Releases • The 50 facilities in North America
with the largest on-site releases in the matched data set reported 410.3 million kg of on-site releases in 1999, or 29 percent of North American on-site releases.
• These 50 facilities reported 60 percent of North American on-site land releases and 59 percent of underground injection. They also contributed 21 percent of on-site releases to surface water and 16 percent of on-site releases to air.
• The top three facilities, all primary metals facilities located in the United States, each reported more than 19 million kg of on-site releases. The facilities with the fourth- and fifth-largest on-site releases were in the hazardous waste management sector.
• Of the 50 facilities, 20 were electric generating facilities, eight were hazardous waste management facilities, 11 were in the primary metals sector, and 11 were in the chemicals sector.
Table 3–7. The 50 North American Facilities with the Largest Total On-site Releases, 1999 On-site Releases
City, SIC Codes Number AirSurface
WaterUnderground
Injection Land Rank Facility State/Province Canada US of Forms (kg) (kg) (kg) (kg)
1 Magnesium Corp. of America, Renco Group Inc. Rowley, UT 33 6 21,471,752 0 0 0 2 ASARCO Inc., Ray Complex/Hayden Smelter & Concentrator, Grupo Mexico Hayden, AZ 33 11 77,250 0 0 20,948,953 3 ASARCO Inc. East Helena, MT 33 10 22,913 752 0 19,527,521 4 Chemical Waste Management of the Northwest Inc., Waste Management
Inc. Arlington, OR 495/738 37 341 0 0 18,034,408
5 Envirosafe Services of Ohio Inc., ETDS Inc. Oregon, OH 495/738 10 433 0 0 17,463,945 6 AK Steel, Butler Works Butler, PA 33 13 63,835 14,514,107 0 821,406 7 Safety-Kleen Ltd., Lambton Facility Corunna, ON 37 28 15 1,274 0 0 15,377,310 8 Solutia Inc. Gonzalez, FL 28 20 123,756 863 14,280,263 0 9 Kennecott Utah Copper Smelter & Refy., Kennecott Holdings Corp. Magna, UT 33 18 98,408 11,313 0 12,732,800
10 Envirosafe Services of Idaho Inc., ETDS Inc. Grand View, ID 495/738 9 1,447 0 0 10,855,330 11 BASF Corp. Freeport, TX 28 28 53,117 8,622,426 1,062,857 0 12 DuPont, Victoria Plant Victoria, TX 28 32 287,377 698,656 8,393,029 20,049 13 Keystone Station, Reliant Energy Inc. Shelocta, PA 491/493 10 9,079,766 3,961 0 219,275 14 Roxboro Steam Electric Plant, Carolina Power & Light Co. Semora, NC 491/493 12 8,742,568 2,374 0 442,949 15 Bowen Steam Electric Generating Plant, Southern Co. Cartersville, GA 491/493 12 8,636,461 6,210 0 216,001 16 Peoria Disposal Co. #1, Coulter Cos. Inc. Peoria, IL 495/738 9 242 0 0 8,482,676 17 Phelps Dodge Hidalgo Inc., Phelps Dodge Corp. Playas, NM 33 15 73,431 6,697 0 8,376,735 18 American Electric Power, John E. Amos Plant Winfield, WV 491/493 12 8,137,096 1,446 0 297,675 19 Gulf Power Co., Plant Crist, Southern Co. Pensacola, FL 491/493 11 7,163,993 761 0 140,672 20 U.S. TVA, Johnsonville Fossil Plant, U.S. Tennessee Valley Authority New Johnsonville, TN 491/493 13 6,423,433 6,486 0 435,759 21 Duke Energy, Belews Creek Steam Station Walnut Cove, NC 491/493 12 6,631,583 685 0 196,302 22 Wansley Steam Electric Generating Plant Roopville, GA 491/493 13 6,279,405 1,339 0 317,645 23 Dayton Power & Light Co., J.M Stuart Station Manchester, OH 491/493 12 5,814,988 3,143 0 694,331 24 Lenzing Fibers Corp. Lowland, TN 28 6 6,213,344 1,912 0 65,401 25 Safety-Kleen Inc., Grassy Mountain Facility Grantsville, UT 495/738 20 267 0 0 6,055,921 26 Duke Energy Marshall, Steam Station Terrell, NC 491/493 12 5,619,301 1,928 0 413,036 27 USS Gary Works, USX Corp. Gary, IN 33 33 528,665 13,062 0 5,459,205 28 Elementis Chromium L.P., Elementis Inc. Corpus Christi, TX 28 1 2,063 113 0 5,941,043 29 Vickery Environmental Inc., Waste Management Inc. Vickery, OH 495/738 17 0 0 5,765,080 0 30 Baldwin Power Station, Dynegy, Inc. Baldwin, IL 491/493 17 5,328,844 42,531 0 346,078 31 Brandon Shores & Wagner Complex, Baltimore Gas & Electric Co. Baltimore, MD 491/493 14 5,699,648 2,342 0 8,077 32 Ontario Power Generation Inc., Nanticoke Generating Station Nanticoke, ON 49 491/493 12 5,239,963 8,778 0 349,266 33 Detroit Edison Monroe Power Plant, DTE Energy Monroe, MI 491/493 12 5,095,284 2,873 0 411,747 34 BP Chemicals Inc., BP America Inc. Lima, OH 28 30 164,848 0 5,203,948 0 35 U.S. TVA Paradise, Fossil Plant, U.S. Tennessee Valley Authority Drakesboro, KY 491/493 16 4,422,176 417,011 0 487,346 36 Cytec Inds. Inc., Fortier Plant Westwego, LA 28 25 59,205 3,535 5,107,349 0 37 American Electric Power, Mitchell Plant Moundsville, WV 491/493 13 4,813,854 1,566 0 349,816 38 Angus Chemical Co. Sterlington, LA 28 11 72,823 210,340 4,489,334 163 39 Eramet Marietta Inc., Eramet Manganese Alliage Marietta, OH 33 6 221,687 140,226 0 4,383,130 40 Chemical Waste Management Inc., Waste Management Inc. Kettleman City, CA 495/738 19 3,026 0 0 4,641,649 41 Monsanto, Luling Luling, LA 28 13 52,209 104,780 4,471,384 0 42 American Electric Power Cardinal Plant, Cardinal Operating Co. Brilliant, OH 491/493 14 4,194,743 10,220 0 377,434 43 BP Chemicals Inc., Green Lake Facility, BP America Inc. Port Lavaca, TX 28 17 91,807 399 4,452,013 990 44 Doe Run Co., Herculaneum Smelter, Renco Group Inc. Herculaneum, MO 33 9 150,363 80 0 4,386,262 45 Northwestern Steel & Wire Co. Sterling, IL 33 6 53,175 5,646 0 4,438,548 46 Mississippi Power Co., Plant Watson, Southern Co. Gulfport, MS 491/493 11 4,105,842 785 0 172,162 47 Kentucky Utilities Co., Ghent Station, LG&E Energy Corp. Ghent, KY 491/493 13 3,448,110 27,071 0 796,418 48 Chemical Waste Management Inc., Waste Management Inc. Emelle, AL 495/738 23 185 0 0 4,268,888 49 PSI Energy Gibson, Generating Station, Cinergy Corp. Princeton, IN 491/493 12 3,245,651 0 0 1,014,694 50 Doe Run Co., Glover Smelter, Renco Group Inc. Glover, MO 33 7 21,909 6 0 4,159,274
Subtotal 729 148,033,861 24,876,423 53,225,257 184,128,290 % of Total 1 16 21 59 60 Total 74,108 901,416,201 118,215,282 90,116,656 309,239,442
Note: Canada and US data only. Mexico data not available for 1999. The data are estimates of releases and transfers of chemicals as reported by facilities and should not be interpreted as levels of human exposure or environmental impact. The rankings are not meant to imply that a facility, state or province is not meeting its legal requirements.
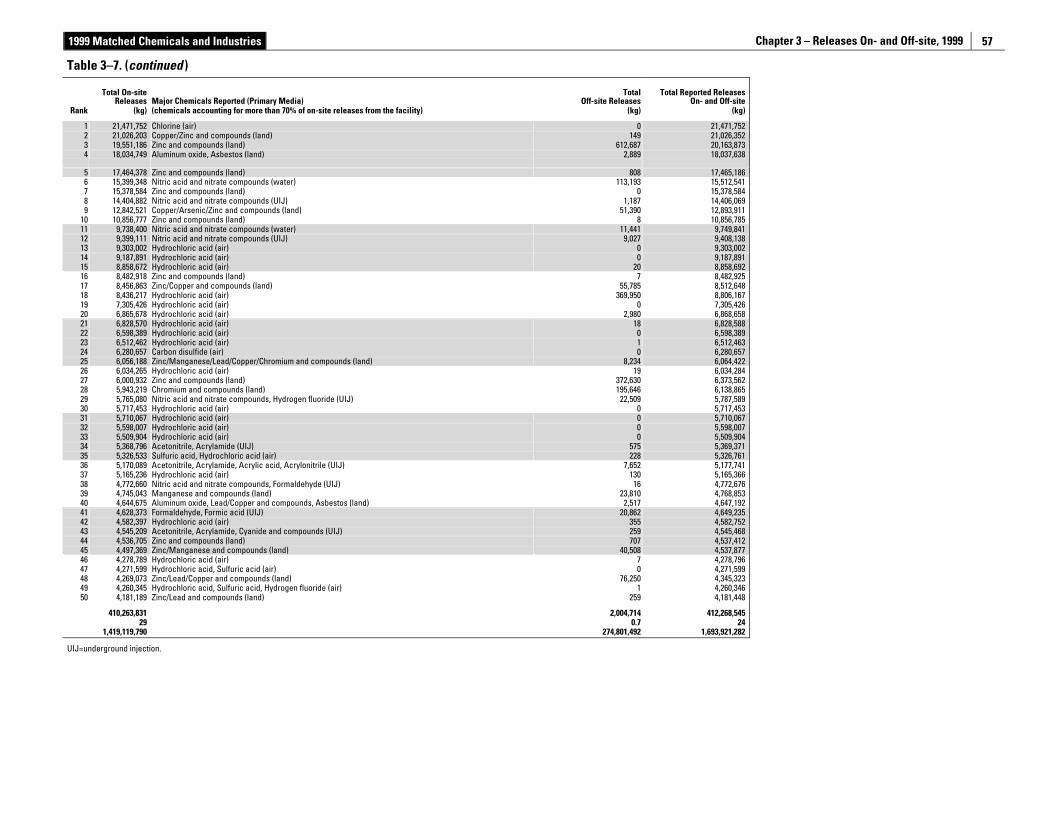
1999 Matched Chemicals and Industries Chapter 3 – Releases On- and Off-site, 1999
57
Table 3–7. (continued )
Total On-site
Releases Major Chemicals Reported (Primary Media) Total
Off-site Releases Total Reported Releases
On- and Off-site Rank (kg) (chemicals accounting for more than 70% of on-site releases from the facility) (kg) (kg)
1 21,471,752 Chlorine (air) 0 21,471,7522 21,026,203 Copper/Zinc and compounds (land) 149 21,026,3523 19,551,186 Zinc and compounds (land) 612,687 20,163,8734 18,034,749 Aluminum oxide, Asbestos (land) 2,889 18,037,638
5 17,464,378 Zinc and compounds (land) 808 17,465,1866 15,399,348 Nitric acid and nitrate compounds (water) 113,193 15,512,5417 15,378,584 Zinc and compounds (land) 0 15,378,5848 14,404,882 Nitric acid and nitrate compounds (UIJ) 1,187 14,406,0699 12,842,521 Copper/Arsenic/Zinc and compounds (land) 51,390 12,893,911
10 10,856,777 Zinc and compounds (land) 8 10,856,78511 9,738,400 Nitric acid and nitrate compounds (water) 11,441 9,749,84112 9,399,111 Nitric acid and nitrate compounds (UIJ) 9,027 9,408,13813 9,303,002 Hydrochloric acid (air) 0 9,303,00214 9,187,891 Hydrochloric acid (air) 0 9,187,89115 8,858,672 Hydrochloric acid (air) 20 8,858,69216 8,482,918 Zinc and compounds (land) 7 8,482,92517 8,456,863 Zinc/Copper and compounds (land) 55,785 8,512,64818 8,436,217 Hydrochloric acid (air) 369,950 8,806,16719 7,305,426 Hydrochloric acid (air) 0 7,305,42620 6,865,678 Hydrochloric acid (air) 2,980 6,868,65821 6,828,570 Hydrochloric acid (air) 18 6,828,58822 6,598,389 Hydrochloric acid (air) 0 6,598,38923 6,512,462 Hydrochloric acid (air) 1 6,512,46324 6,280,657 Carbon disulfide (air) 0 6,280,65725 6,056,188 Zinc/Manganese/Lead/Copper/Chromium and compounds (land) 8,234 6,064,42226 6,034,265 Hydrochloric acid (air) 19 6,034,28427 6,000,932 Zinc and compounds (land) 372,630 6,373,56228 5,943,219 Chromium and compounds (land) 195,646 6,138,86529 5,765,080 Nitric acid and nitrate compounds, Hydrogen fluoride (UIJ) 22,509 5,787,58930 5,717,453 Hydrochloric acid (air) 0 5,717,45331 5,710,067 Hydrochloric acid (air) 0 5,710,06732 5,598,007 Hydrochloric acid (air) 0 5,598,00733 5,509,904 Hydrochloric acid (air) 0 5,509,90434 5,368,796 Acetonitrile, Acrylamide (UIJ) 575 5,369,37135 5,326,533 Sulfuric acid, Hydrochloric acid (air) 228 5,326,76136 5,170,089 Acetonitrile, Acrylamide, Acrylic acid, Acrylonitrile (UIJ) 7,652 5,177,74137 5,165,236 Hydrochloric acid (air) 130 5,165,36638 4,772,660 Nitric acid and nitrate compounds, Formaldehyde (UIJ) 16 4,772,67639 4,745,043 Manganese and compounds (land) 23,810 4,768,85340 4,644,675 Aluminum oxide, Lead/Copper and compounds, Asbestos (land) 2,517 4,647,19241 4,628,373 Formaldehyde, Formic acid (UIJ) 20,862 4,649,23542 4,582,397 Hydrochloric acid (air) 355 4,582,75243 4,545,209 Acetonitrile, Acrylamide, Cyanide and compounds (UIJ) 259 4,545,46844 4,536,705 Zinc and compounds (land) 707 4,537,41245 4,497,369 Zinc/Manganese and compounds (land) 40,508 4,537,87746 4,278,789 Hydrochloric acid (air) 7 4,278,79647 4,271,599 Hydrochloric acid, Sulfuric acid (air) 0 4,271,59948 4,269,073 Zinc/Lead/Copper and compounds (land) 76,250 4,345,32349 4,260,345 Hydrochloric acid, Sulfuric acid, Hydrogen fluoride (air) 1 4,260,34650 4,181,189 Zinc/Lead and compounds (land) 259 4,181,448
410,263,831 2,004,714 412,268,545 29 0.7 24 1,419,119,790 274,801,492 1,693,921,282
UIJ=underground injection.
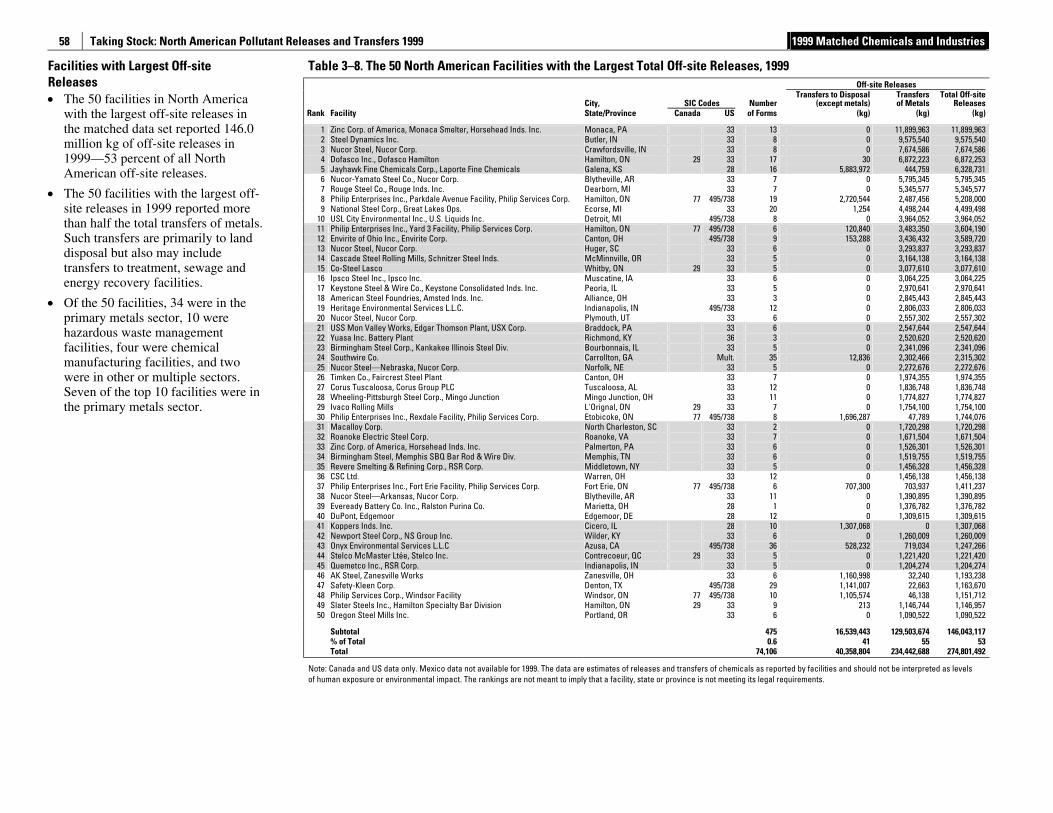
Taking Stock: North American Pollutant Releases and Transfers 1999 1999 Matched Chemicals and Industries
58
Facilities with Largest Off-site Releases • The 50 facilities in North America
with the largest off-site releases in the matched data set reported 146.0 million kg of off-site releases in 1999—53 percent of all North American off-site releases.
• The 50 facilities with the largest off-site releases in 1999 reported more than half the total transfers of metals. Such transfers are primarily to land disposal but also may include transfers to treatment, sewage and energy recovery facilities.
• Of the 50 facilities, 34 were in the primary metals sector, 10 were hazardous waste management facilities, four were chemical manufacturing facilities, and two were in other or multiple sectors. Seven of the top 10 facilities were in the primary metals sector.
Table 3–8. The 50 North American Facilities with the Largest Total Off-site Releases, 1999 Off-site Releases
City, SIC Codes Number Transfers to Disposal
(except metals)Transfersof Metals
Total Off-site Releases
Rank Facility State/Province Canada US of Forms (kg) (kg) (kg)
1 Zinc Corp. of America, Monaca Smelter, Horsehead Inds. Inc. Monaca, PA 33 13 0 11,899,963 11,899,963 2 Steel Dynamics Inc. Butler, IN 33 8 0 9,575,540 9,575,540 3 Nucor Steel, Nucor Corp. Crawfordsville, IN 33 8 0 7,674,586 7,674,586 4 Dofasco Inc., Dofasco Hamilton Hamilton, ON 29 33 17 30 6,872,223 6,872,253 5 Jayhawk Fine Chemicals Corp., Laporte Fine Chemicals Galena, KS 28 16 5,883,972 444,759 6,328,731 6 Nucor-Yamato Steel Co., Nucor Corp. Blytheville, AR 33 7 0 5,795,345 5,795,345 7 Rouge Steel Co., Rouge Inds. Inc. Dearborn, MI 33 7 0 5,345,577 5,345,577 8 Philip Enterprises Inc., Parkdale Avenue Facility, Philip Services Corp. Hamilton, ON 77 495/738 19 2,720,544 2,487,456 5,208,000 9 National Steel Corp., Great Lakes Ops. Ecorse, MI 33 20 1,254 4,498,244 4,499,498
10 USL City Environmental Inc., U.S. Liquids Inc. Detroit, MI 495/738 8 0 3,964,052 3,964,052 11 Philip Enterprises Inc., Yard 3 Facility, Philip Services Corp. Hamilton, ON 77 495/738 6 120,840 3,483,350 3,604,190 12 Envirite of Ohio Inc., Envirite Corp. Canton, OH 495/738 9 153,288 3,436,432 3,589,720 13 Nucor Steel, Nucor Corp. Huger, SC 33 6 0 3,293,837 3,293,837 14 Cascade Steel Rolling Mills, Schnitzer Steel Inds. McMinnville, OR 33 5 0 3,164,138 3,164,138 15 Co-Steel Lasco Whitby, ON 29 33 5 0 3,077,610 3,077,610 16 Ipsco Steel Inc., Ipsco Inc. Muscatine, IA 33 6 0 3,064,225 3,064,225 17 Keystone Steel & Wire Co., Keystone Consolidated Inds. Inc. Peoria, IL 33 5 0 2,970,641 2,970,641 18 American Steel Foundries, Amsted Inds. Inc. Alliance, OH 33 3 0 2,845,443 2,845,443 19 Heritage Environmental Services L.L.C. Indianapolis, IN 495/738 12 0 2,806,033 2,806,033 20 Nucor Steel, Nucor Corp. Plymouth, UT 33 6 0 2,557,302 2,557,302 21 USS Mon Valley Works, Edgar Thomson Plant, USX Corp. Braddock, PA 33 6 0 2,547,644 2,547,644 22 Yuasa Inc. Battery Plant Richmond, KY 36 3 0 2,520,620 2,520,620 23 Birmingham Steel Corp., Kankakee Illinois Steel Div. Bourbonnais, IL 33 5 0 2,341,096 2,341,096 24 Southwire Co. Carrollton, GA Mult. 35 12,836 2,302,466 2,315,302 25 Nucor Steel—Nebraska, Nucor Corp. Norfolk, NE 33 5 0 2,272,676 2,272,676 26 Timken Co., Faircrest Steel Plant Canton, OH 33 7 0 1,974,355 1,974,355 27 Corus Tuscaloosa, Corus Group PLC Tuscaloosa, AL 33 12 0 1,836,748 1,836,748 28 Wheeling-Pittsburgh Steel Corp., Mingo Junction Mingo Junction, OH 33 11 0 1,774,827 1,774,827 29 Ivaco Rolling Mills L'Orignal, ON 29 33 7 0 1,754,100 1,754,100 30 Philip Enterprises Inc., Rexdale Facility, Philip Services Corp. Etobicoke, ON 77 495/738 8 1,696,287 47,789 1,744,076 31 Macalloy Corp. North Charleston, SC 33 2 0 1,720,298 1,720,298 32 Roanoke Electric Steel Corp. Roanoke, VA 33 7 0 1,671,504 1,671,504 33 Zinc Corp. of America, Horsehead Inds. Inc. Palmerton, PA 33 6 0 1,526,301 1,526,301 34 Birmingham Steel, Memphis SBQ Bar Rod & Wire Div. Memphis, TN 33 6 0 1,519,755 1,519,755 35 Revere Smelting & Refining Corp., RSR Corp. Middletown, NY 33 5 0 1,456,328 1,456,328 36 CSC Ltd. Warren, OH 33 12 0 1,456,138 1,456,138 37 Philip Enterprises Inc., Fort Erie Facility, Philip Services Corp. Fort Erie, ON 77 495/738 6 707,300 703,937 1,411,237 38 Nucor Steel—Arkansas, Nucor Corp. Blytheville, AR 33 11 0 1,390,895 1,390,895 39 Eveready Battery Co. Inc., Ralston Purina Co. Marietta, OH 28 1 0 1,376,782 1,376,782 40 DuPont, Edgemoor Edgemoor, DE 28 12 0 1,309,615 1,309,615 41 Koppers Inds. Inc. Cicero, IL 28 10 1,307,068 0 1,307,068 42 Newport Steel Corp., NS Group Inc. Wilder, KY 33 6 0 1,260,009 1,260,009 43 Onyx Environmental Services L.L.C Azusa, CA 495/738 36 528,232 719,034 1,247,266 44 Stelco McMaster Ltée, Stelco Inc. Contrecoeur, QC 29 33 5 0 1,221,420 1,221,420 45 Quemetco Inc., RSR Corp. Indianapolis, IN 33 5 0 1,204,274 1,204,274 46 AK Steel, Zanesville Works Zanesville, OH 33 6 1,160,998 32,240 1,193,238 47 Safety-Kleen Corp. Denton, TX 495/738 29 1,141,007 22,663 1,163,670 48 Philip Services Corp., Windsor Facility Windsor, ON 77 495/738 10 1,105,574 46,138 1,151,712 49 Slater Steels Inc., Hamilton Specialty Bar Division Hamilton, ON 29 33 9 213 1,146,744 1,146,957 50 Oregon Steel Mills Inc. Portland, OR 33 6 0 1,090,522 1,090,522
Subtotal 475 16,539,443 129,503,674 146,043,117 % of Total 0.6 41 55 53 Total 74,106 40,358,804 234,442,688 274,801,492
Note: Canada and US data only. Mexico data not available for 1999. The data are estimates of releases and transfers of chemicals as reported by facilities and should not be interpreted as levels of human exposure or environmental impact. The rankings are not meant to imply that a facility, state or province is not meeting its legal requirements.
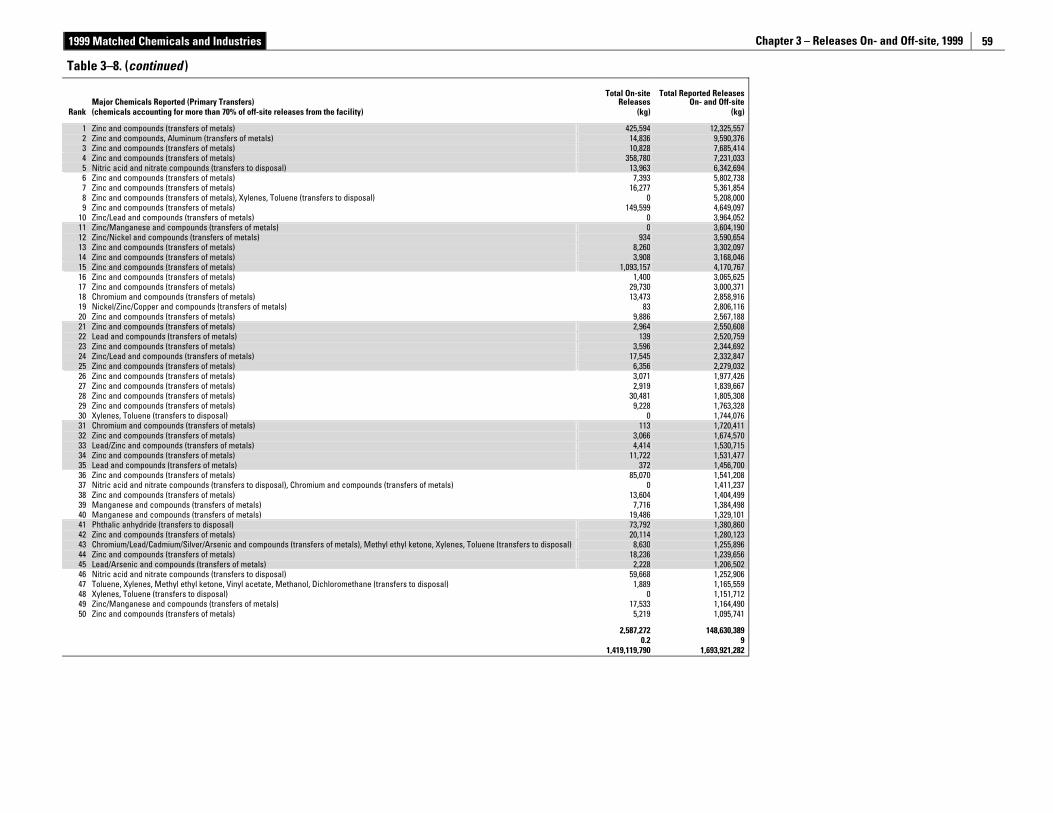
1999 Matched Chemicals and Industries Chapter 3 – Releases On- and Off-site, 1999
59
Table 3–8. (continued )
Major Chemicals Reported (Primary Transfers)
Total On-site
Releases Total Reported Releases
On- and Off-site Rank (chemicals accounting for more than 70% of off-site releases from the facility) (kg) (kg)
1 Zinc and compounds (transfers of metals) 425,594 12,325,557 2 Zinc and compounds, Aluminum (transfers of metals) 14,836 9,590,376 3 Zinc and compounds (transfers of metals) 10,828 7,685,414 4 Zinc and compounds (transfers of metals) 358,780 7,231,033 5 Nitric acid and nitrate compounds (transfers to disposal) 13,963 6,342,694 6 Zinc and compounds (transfers of metals) 7,393 5,802,738 7 Zinc and compounds (transfers of metals) 16,277 5,361,854 8 Zinc and compounds (transfers of metals), Xylenes, Toluene (transfers to disposal) 0 5,208,000 9 Zinc and compounds (transfers of metals) 149,599 4,649,097
10 Zinc/Lead and compounds (transfers of metals) 0 3,964,052 11 Zinc/Manganese and compounds (transfers of metals) 0 3,604,190 12 Zinc/Nickel and compounds (transfers of metals) 934 3,590,654 13 Zinc and compounds (transfers of metals) 8,260 3,302,097 14 Zinc and compounds (transfers of metals) 3,908 3,168,046 15 Zinc and compounds (transfers of metals) 1,093,157 4,170,767 16 Zinc and compounds (transfers of metals) 1,400 3,065,625 17 Zinc and compounds (transfers of metals) 29,730 3,000,371 18 Chromium and compounds (transfers of metals) 13,473 2,858,916 19 Nickel/Zinc/Copper and compounds (transfers of metals) 83 2,806,116 20 Zinc and compounds (transfers of metals) 9,886 2,567,188 21 Zinc and compounds (transfers of metals) 2,964 2,550,608 22 Lead and compounds (transfers of metals) 139 2,520,759 23 Zinc and compounds (transfers of metals) 3,596 2,344,692 24 Zinc/Lead and compounds (transfers of metals) 17,545 2,332,847 25 Zinc and compounds (transfers of metals) 6,356 2,279,032 26 Zinc and compounds (transfers of metals) 3,071 1,977,426 27 Zinc and compounds (transfers of metals) 2,919 1,839,667 28 Zinc and compounds (transfers of metals) 30,481 1,805,308 29 Zinc and compounds (transfers of metals) 9,228 1,763,328 30 Xylenes, Toluene (transfers to disposal) 0 1,744,076 31 Chromium and compounds (transfers of metals) 113 1,720,411 32 Zinc and compounds (transfers of metals) 3,066 1,674,570 33 Lead/Zinc and compounds (transfers of metals) 4,414 1,530,715 34 Zinc and compounds (transfers of metals) 11,722 1,531,477 35 Lead and compounds (transfers of metals) 372 1,456,700 36 Zinc and compounds (transfers of metals) 85,070 1,541,208 37 Nitric acid and nitrate compounds (transfers to disposal), Chromium and compounds (transfers of metals) 0 1,411,237 38 Zinc and compounds (transfers of metals) 13,604 1,404,499 39 Manganese and compounds (transfers of metals) 7,716 1,384,498 40 Manganese and compounds (transfers of metals) 19,486 1,329,101 41 Phthalic anhydride (transfers to disposal) 73,792 1,380,860 42 Zinc and compounds (transfers of metals) 20,114 1,280,123 43 Chromium/Lead/Cadmium/Silver/Arsenic and compounds (transfers of metals), Methyl ethyl ketone, Xylenes, Toluene (transfers to disposal) 8,630 1,255,896 44 Zinc and compounds (transfers of metals) 18,236 1,239,656 45 Lead/Arsenic and compounds (transfers of metals) 2,228 1,206,502 46 Nitric acid and nitrate compounds (transfers to disposal) 59,668 1,252,906 47 Toluene, Xylenes, Methyl ethyl ketone, Vinyl acetate, Methanol, Dichloromethane (transfers to disposal) 1,889 1,165,559 48 Xylenes, Toluene (transfers to disposal) 0 1,151,712 49 Zinc/Manganese and compounds (transfers of metals) 17,533 1,164,490 50 Zinc and compounds (transfers of metals) 5,219 1,095,741
2,587,272 148,630,389 0.2 9 1,419,119,790 1,693,921,282
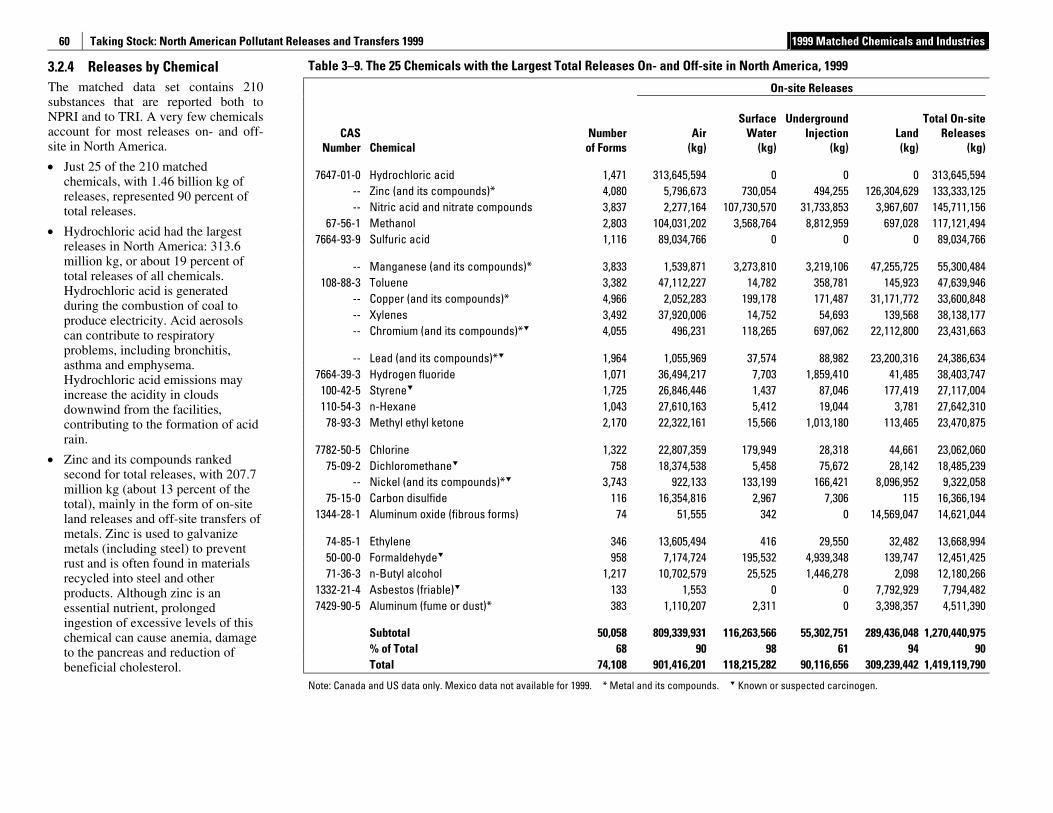
Taking Stock: North American Pollutant Releases and Transfers 1999 1999 Matched Chemicals and Industries
60
3.2.4 Releases by Chemical The matched data set contains 210 substances that are reported both to NPRI and to TRI. A very few chemicals account for most releases on- and off-site in North America.
• Just 25 of the 210 matched chemicals, with 1.46 billion kg of releases, represented 90 percent of total releases.
• Hydrochloric acid had the largest releases in North America: 313.6 million kg, or about 19 percent of total releases of all chemicals. Hydrochloric acid is generated during the combustion of coal to produce electricity. Acid aerosols can contribute to respiratory problems, including bronchitis, asthma and emphysema. Hydrochloric acid emissions may increase the acidity in clouds downwind from the facilities, contributing to the formation of acid rain.
• Zinc and its compounds ranked second for total releases, with 207.7 million kg (about 13 percent of the total), mainly in the form of on-site land releases and off-site transfers of metals. Zinc is used to galvanize metals (including steel) to prevent rust and is often found in materials recycled into steel and other products. Although zinc is an essential nutrient, prolonged ingestion of excessive levels of this chemical can cause anemia, damage to the pancreas and reduction of beneficial cholesterol.
Table 3–9. The 25 Chemicals with the Largest Total Releases On- and Off-site in North America, 1999
On-site Releases
CAS Number Chemical
Number of Forms
Air(kg)
Surface Water
(kg)
Underground Injection
(kg)Land(kg)
Total On-site Releases
(kg)
7647-01-0 Hydrochloric acid 1,471 313,645,594 0 0 0 313,645,594 -- Zinc (and its compounds)* 4,080 5,796,673 730,054 494,255 126,304,629 133,333,125 -- Nitric acid and nitrate compounds 3,837 2,277,164 107,730,570 31,733,853 3,967,607 145,711,156
67-56-1 Methanol 2,803 104,031,202 3,568,764 8,812,959 697,028 117,121,494 7664-93-9 Sulfuric acid 1,116 89,034,766 0 0 0 89,034,766
-- Manganese (and its compounds)* 3,833 1,539,871 3,273,810 3,219,106 47,255,725 55,300,484 108-88-3 Toluene 3,382 47,112,227 14,782 358,781 145,923 47,639,946
-- Copper (and its compounds)* 4,966 2,052,283 199,178 171,487 31,171,772 33,600,848 -- Xylenes 3,492 37,920,006 14,752 54,693 139,568 38,138,177 -- Chromium (and its compounds)* 4,055 496,231 118,265 697,062 22,112,800 23,431,663
-- Lead (and its compounds)* 1,964 1,055,969 37,574 88,982 23,200,316 24,386,634 7664-39-3 Hydrogen fluoride 1,071 36,494,217 7,703 1,859,410 41,485 38,403,747
100-42-5 Styrene 1,725 26,846,446 1,437 87,046 177,419 27,117,004 110-54-3 n-Hexane 1,043 27,610,163 5,412 19,044 3,781 27,642,310
78-93-3 Methyl ethyl ketone 2,170 22,322,161 15,566 1,013,180 113,465 23,470,875
7782-50-5 Chlorine 1,322 22,807,359 179,949 28,318 44,661 23,062,060 75-09-2 Dichloromethane 758 18,374,538 5,458 75,672 28,142 18,485,239
-- Nickel (and its compounds)* 3,743 922,133 133,199 166,421 8,096,952 9,322,058 75-15-0 Carbon disulfide 116 16,354,816 2,967 7,306 115 16,366,194
1344-28-1 Aluminum oxide (fibrous forms) 74 51,555 342 0 14,569,047 14,621,044
74-85-1 Ethylene 346 13,605,494 416 29,550 32,482 13,668,994 50-00-0 Formaldehyde 958 7,174,724 195,532 4,939,348 139,747 12,451,425 71-36-3 n-Butyl alcohol 1,217 10,702,579 25,525 1,446,278 2,098 12,180,266
1332-21-4 Asbestos (friable) 133 1,553 0 0 7,792,929 7,794,482 7429-90-5 Aluminum (fume or dust)* 383 1,110,207 2,311 0 3,398,357 4,511,390
Subtotal 50,058 809,339,931 116,263,566 55,302,751 289,436,048 1,270,440,975 % of Total 68 90 98 61 94 90 Total 74,108 901,416,201 118,215,282 90,116,656 309,239,442 1,419,119,790
Note: Canada and US data only. Mexico data not available for 1999. * Metal and its compounds. Known or suspected carcinogen.
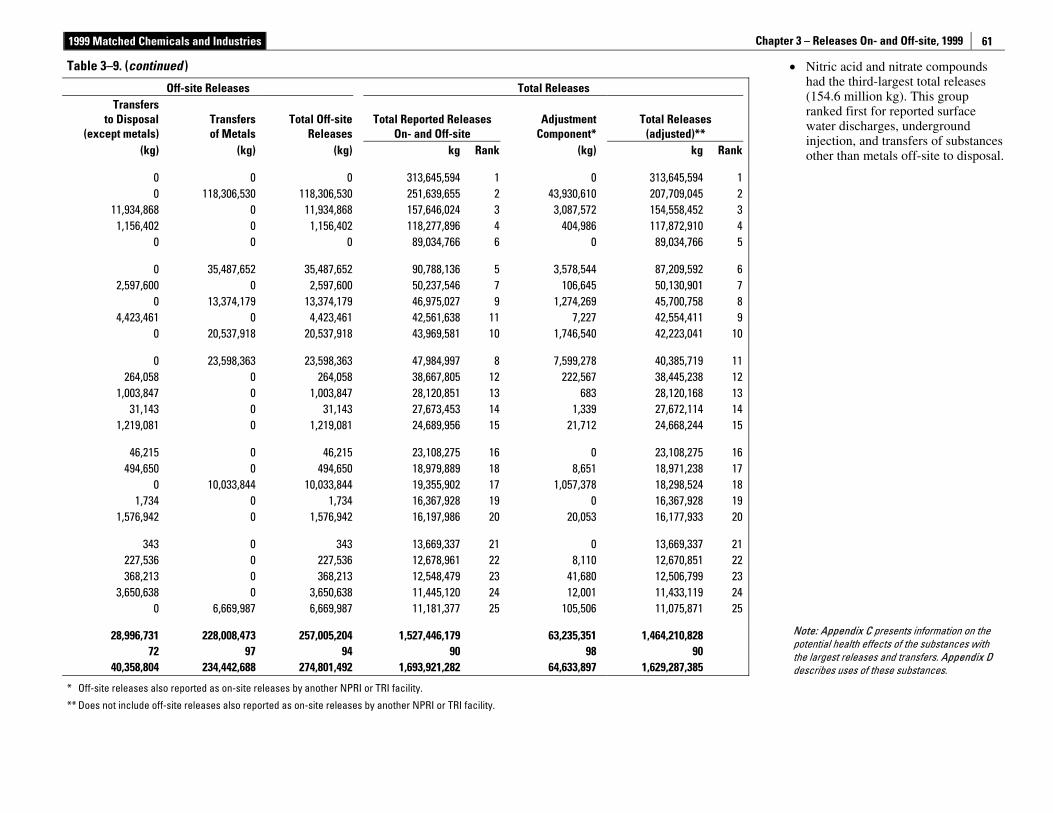
1999 Matched Chemicals and Industries Chapter 3 – Releases On- and Off-site, 1999
61
• Nitric acid and nitrate compounds had the third-largest total releases (154.6 million kg). This group ranked first for reported surface water discharges, underground injection, and transfers of substances other than metals off-site to disposal.
Note: Appendix C presents information on the potential health effects of the substances with the largest releases and transfers. Appendix D describes uses of these substances.
Table 3–9. (continued )
Off-site Releases Total Releases Transfers
to Disposal (except metals)
Transfers of Metals
Total Off-site Releases
Total Reported Releases On- and Off-site
Adjustment Component*
Total Releases (adjusted)**
(kg) (kg) (kg) kg Rank (kg) kg Rank
0 0 0 313,645,594 1 0 313,645,594 10 118,306,530 118,306,530 251,639,655 2 43,930,610 207,709,045 2
11,934,868 0 11,934,868 157,646,024 3 3,087,572 154,558,452 31,156,402 0 1,156,402 118,277,896 4 404,986 117,872,910 4
0 0 0 89,034,766 6 0 89,034,766 5
0 35,487,652 35,487,652 90,788,136 5 3,578,544 87,209,592 62,597,600 0 2,597,600 50,237,546 7 106,645 50,130,901 7
0 13,374,179 13,374,179 46,975,027 9 1,274,269 45,700,758 84,423,461 0 4,423,461 42,561,638 11 7,227 42,554,411 9
0 20,537,918 20,537,918 43,969,581 10 1,746,540 42,223,041 10
0 23,598,363 23,598,363 47,984,997 8 7,599,278 40,385,719 11264,058 0 264,058 38,667,805 12 222,567 38,445,238 12
1,003,847 0 1,003,847 28,120,851 13 683 28,120,168 1331,143 0 31,143 27,673,453 14 1,339 27,672,114 14
1,219,081 0 1,219,081 24,689,956 15 21,712 24,668,244 15
46,215 0 46,215 23,108,275 16 0 23,108,275 16494,650 0 494,650 18,979,889 18 8,651 18,971,238 17
0 10,033,844 10,033,844 19,355,902 17 1,057,378 18,298,524 181,734 0 1,734 16,367,928 19 0 16,367,928 19
1,576,942 0 1,576,942 16,197,986 20 20,053 16,177,933 20
343 0 343 13,669,337 21 0 13,669,337 21227,536 0 227,536 12,678,961 22 8,110 12,670,851 22368,213 0 368,213 12,548,479 23 41,680 12,506,799 23
3,650,638 0 3,650,638 11,445,120 24 12,001 11,433,119 240 6,669,987 6,669,987 11,181,377 25 105,506 11,075,871 25
28,996,731 228,008,473 257,005,204 1,527,446,179 63,235,351 1,464,210,82872 97 94 90 98 90
40,358,804 234,442,688 274,801,492 1,693,921,282 64,633,897 1,629,287,385
* Off-site releases also reported as on-site releases by another NPRI or TRI facility.
** Does not include off-site releases also reported as on-site releases by another NPRI or TRI facility.
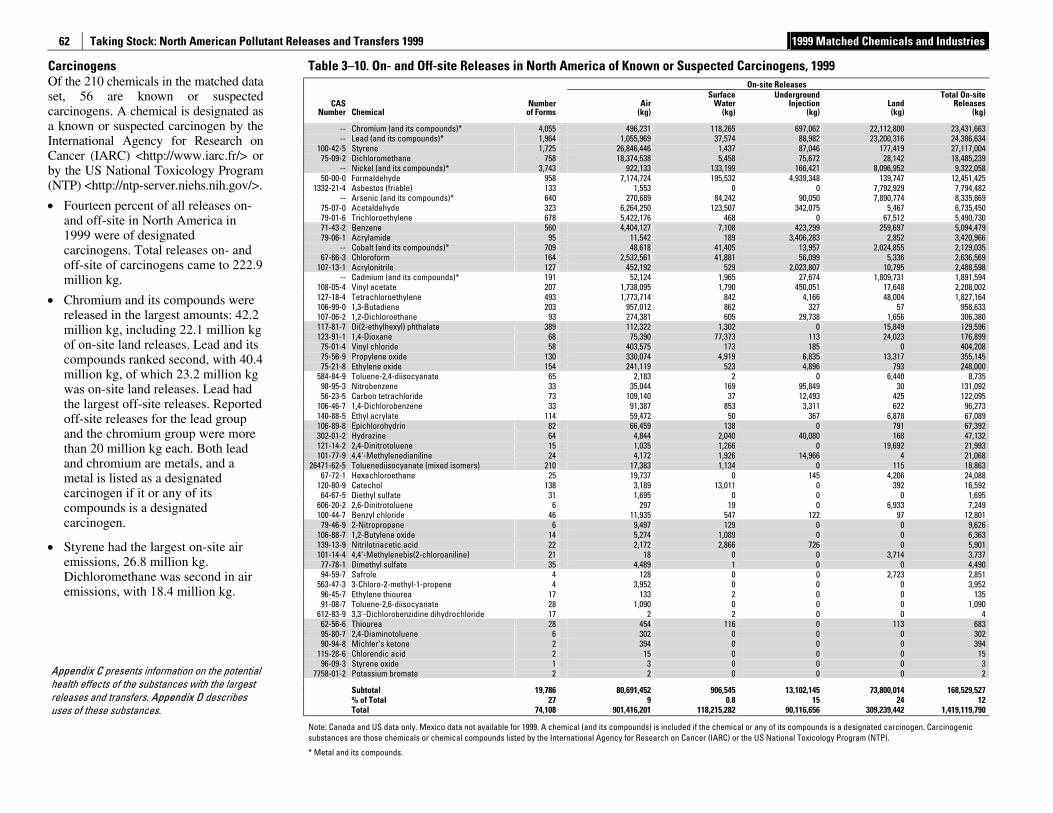
Taking Stock: North American Pollutant Releases and Transfers 1999 1999 Matched Chemicals and Industries
62
Carcinogens Of the 210 chemicals in the matched data set, 56 are known or suspected carcinogens. A chemical is designated as a known or suspected carcinogen by the International Agency for Research on Cancer (IARC) <http://www.iarc.fr/> or by the US National Toxicology Program (NTP) <http://ntp-server.niehs.nih.gov/>.
• Fourteen percent of all releases on- and off-site in North America in 1999 were of designated carcinogens. Total releases on- and off-site of carcinogens came to 222.9 million kg.
• Chromium and its compounds were released in the largest amounts: 42.2 million kg, including 22.1 million kg of on-site land releases. Lead and its compounds ranked second, with 40.4 million kg, of which 23.2 million kg was on-site land releases. Lead had the largest off-site releases. Reported off-site releases for the lead group and the chromium group were more than 20 million kg each. Both lead and chromium are metals, and a metal is listed as a designated carcinogen if it or any of its compounds is a designated carcinogen.
• Styrene had the largest on-site air emissions, 26.8 million kg. Dichloromethane was second in air emissions, with 18.4 million kg.
Appendix C presents information on the potential health effects of the substances with the largest releases and transfers. Appendix D describes uses of these substances.
Table 3–10. On- and Off-site Releases in North America of Known or Suspected Carcinogens, 1999 On-site Releases
CAS Number Chemical
Numberof Forms
Air (kg)
SurfaceWater
(kg)
UndergroundInjection
(kg)Land(kg)
Total On-site Releases
(kg)
-- Chromium (and its compounds)* 4,055 496,231 118,265 697,062 22,112,800 23,431,663 -- Lead (and its compounds)* 1,964 1,055,969 37,574 88,982 23,200,316 24,386,634
100-42-5 Styrene 1,725 26,846,446 1,437 87,046 177,419 27,117,004 75-09-2 Dichloromethane 758 18,374,538 5,458 75,672 28,142 18,485,239
-- Nickel (and its compounds)* 3,743 922,133 133,199 166,421 8,096,952 9,322,058 50-00-0 Formaldehyde 958 7,174,724 195,532 4,939,348 139,747 12,451,425
1332-21-4 Asbestos (friable) 133 1,553 0 0 7,792,929 7,794,482 -- Arsenic (and its compounds)* 640 270,689 84,242 90,050 7,890,774 8,335,869
75-07-0 Acetaldehyde 323 6,264,250 123,507 342,075 5,467 6,735,450 79-01-6 Trichloroethylene 678 5,422,176 468 0 67,512 5,490,730 71-43-2 Benzene 560 4,404,127 7,108 423,299 259,697 5,094,479 79-06-1 Acrylamide 95 11,542 189 3,406,283 2,852 3,420,966
-- Cobalt (and its compounds)* 709 48,618 41,405 13,957 2,024,855 2,129,035 67-66-3 Chloroform 164 2,532,561 41,881 56,099 5,336 2,636,569
107-13-1 Acrylonitrile 127 452,192 529 2,023,807 10,795 2,488,598 -- Cadmium (and its compounds)* 191 52,124 1,965 27,674 1,809,731 1,891,594
108-05-4 Vinyl acetate 207 1,738,095 1,790 450,051 17,648 2,208,002 127-18-4 Tetrachloroethylene 493 1,773,714 842 4,166 48,004 1,827,164 106-99-0 1,3-Butadiene 203 957,012 862 327 57 958,633 107-06-2 1,2-Dichloroethane 93 274,381 605 29,738 1,656 306,380 117-81-7 Di(2-ethylhexyl) phthalate 389 112,322 1,302 0 15,849 129,596 123-91-1 1,4-Dioxane 68 75,390 77,373 113 24,023 176,899
75-01-4 Vinyl chloride 58 403,575 173 185 0 404,208 75-56-9 Propylene oxide 130 330,074 4,919 6,835 13,317 355,145 75-21-8 Ethylene oxide 154 241,119 523 4,896 793 248,000
584-84-9 Toluene-2,4-diisocyanate 65 2,183 2 0 6,440 8,735 98-95-3 Nitrobenzene 33 35,044 169 95,849 30 131,092 56-23-5 Carbon tetrachloride 73 109,140 37 12,493 425 122,095
106-46-7 1,4-Dichlorobenzene 33 91,387 853 3,311 622 96,273 140-88-5 Ethyl acrylate 114 59,472 50 367 6,878 67,089 106-89-8 Epichlorohydrin 82 66,459 138 0 791 67,392 302-01-2 Hydrazine 64 4,844 2,040 40,080 168 47,132 121-14-2 2,4-Dinitrotoluene 15 1,035 1,266 0 19,692 21,993 101-77-9 4,4'-Methylenedianiline 24 4,172 1,926 14,966 4 21,068
26471-62-5 Toluenediisocyanate (mixed isomers) 210 17,383 1,134 0 115 18,863 67-72-1 Hexachloroethane 25 19,737 0 145 4,206 24,088
120-80-9 Catechol 138 3,189 13,011 0 392 16,592 64-67-5 Diethyl sulfate 31 1,695 0 0 0 1,695
606-20-2 2,6-Dinitrotoluene 6 297 19 0 6,933 7,249 100-44-7 Benzyl chloride 46 11,935 547 122 97 12,801
79-46-9 2-Nitropropane 6 9,497 129 0 0 9,626 106-88-7 1,2-Butylene oxide 14 5,274 1,089 0 0 6,363 139-13-9 Nitrilotriacetic acid 22 2,172 2,866 726 0 5,901 101-14-4 4,4'-Methylenebis(2-chloroaniline) 21 18 0 0 3,714 3,737
77-78-1 Dimethyl sulfate 35 4,489 1 0 0 4,490 94-59-7 Safrole 4 128 0 0 2,723 2,851
563-47-3 3-Chloro-2-methyl-1-propene 4 3,952 0 0 0 3,952 96-45-7 Ethylene thiourea 17 133 2 0 0 135 91-08-7 Toluene-2,6-diisocyanate 28 1,090 0 0 0 1,090
612-83-9 3,3'-Dichlorobenzidine dihydrochloride 17 2 2 0 0 4 62-56-6 Thiourea 28 454 116 0 113 683 95-80-7 2,4-Diaminotoluene 6 302 0 0 0 302 90-94-8 Michler's ketone 2 394 0 0 0 394
115-28-6 Chlorendic acid 2 15 0 0 0 15 96-09-3 Styrene oxide 1 3 0 0 0 3
7758-01-2 Potassium bromate 2 2 0 0 0 2
Subtotal 19,786 80,691,452 906,545 13,102,145 73,800,014 168,529,527 % of Total 27 9 0.8 15 24 12 Total 74,108 901,416,201 118,215,282 90,116,656 309,239,442 1,419,119,790
Note: Canada and US data only. Mexico data not available for 1999. A chemical (and its compounds) is included if the chemical or any of its compounds is a designated carcinogen. Carcinogenic substances are those chemicals or chemical compounds listed by the International Agency for Research on Cancer (IARC) or the US National Toxicology Program (NTP).
* Metal and its compounds.
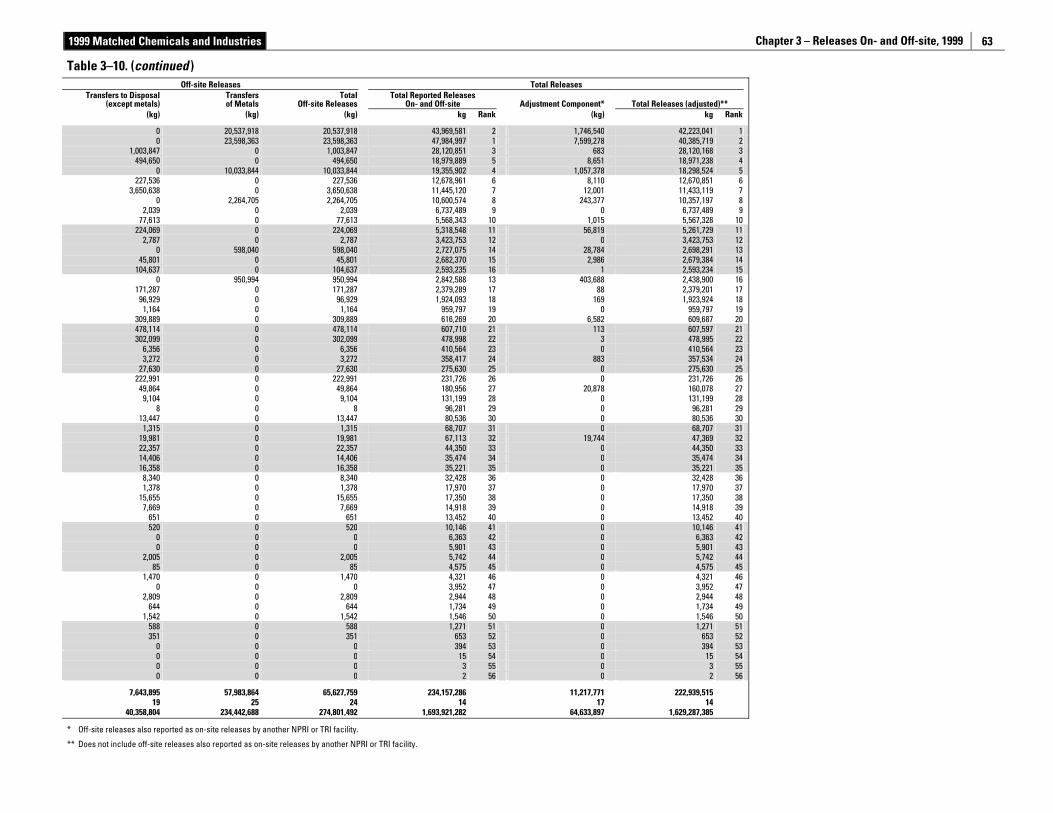
1999 Matched Chemicals and Industries Chapter 3 – Releases On- and Off-site, 1999
63
Table 3–10. (continued ) Off-site Releases Total Releases
Transfers to Disposal (except metals)
Transfers of Metals
TotalOff-site Releases
Total Reported Releases On- and Off-site Adjustment Component* Total Releases (adjusted)**
(kg) (kg) (kg) kg Rank (kg) kg Rank
0 20,537,918 20,537,918 43,969,581 2 1,746,540 42,223,041 10 23,598,363 23,598,363 47,984,997 1 7,599,278 40,385,719 2
1,003,847 0 1,003,847 28,120,851 3 683 28,120,168 3494,650 0 494,650 18,979,889 5 8,651 18,971,238 4
0 10,033,844 10,033,844 19,355,902 4 1,057,378 18,298,524 5227,536 0 227,536 12,678,961 6 8,110 12,670,851 6
3,650,638 0 3,650,638 11,445,120 7 12,001 11,433,119 70 2,264,705 2,264,705 10,600,574 8 243,377 10,357,197 8
2,039 0 2,039 6,737,489 9 0 6,737,489 977,613 0 77,613 5,568,343 10 1,015 5,567,328 10
224,069 0 224,069 5,318,548 11 56,819 5,261,729 112,787 0 2,787 3,423,753 12 0 3,423,753 12
0 598,040 598,040 2,727,075 14 28,784 2,698,291 1345,801 0 45,801 2,682,370 15 2,986 2,679,384 14
104,637 0 104,637 2,593,235 16 1 2,593,234 150 950,994 950,994 2,842,588 13 403,688 2,438,900 16
171,287 0 171,287 2,379,289 17 88 2,379,201 1796,929 0 96,929 1,924,093 18 169 1,923,924 18
1,164 0 1,164 959,797 19 0 959,797 19309,889 0 309,889 616,269 20 6,582 609,687 20478,114 0 478,114 607,710 21 113 607,597 21302,099 0 302,099 478,998 22 3 478,995 22
6,356 0 6,356 410,564 23 0 410,564 233,272 0 3,272 358,417 24 883 357,534 24
27,630 0 27,630 275,630 25 0 275,630 25222,991 0 222,991 231,726 26 0 231,726 26
49,864 0 49,864 180,956 27 20,878 160,078 279,104 0 9,104 131,199 28 0 131,199 28
8 0 8 96,281 29 0 96,281 2913,447 0 13,447 80,536 30 0 80,536 30
1,315 0 1,315 68,707 31 0 68,707 3119,981 0 19,981 67,113 32 19,744 47,369 3222,357 0 22,357 44,350 33 0 44,350 3314,406 0 14,406 35,474 34 0 35,474 3416,358 0 16,358 35,221 35 0 35,221 35
8,340 0 8,340 32,428 36 0 32,428 361,378 0 1,378 17,970 37 0 17,970 37
15,655 0 15,655 17,350 38 0 17,350 387,669 0 7,669 14,918 39 0 14,918 39
651 0 651 13,452 40 0 13,452 40520 0 520 10,146 41 0 10,146 41
0 0 0 6,363 42 0 6,363 420 0 0 5,901 43 0 5,901 43
2,005 0 2,005 5,742 44 0 5,742 4485 0 85 4,575 45 0 4,575 45
1,470 0 1,470 4,321 46 0 4,321 460 0 0 3,952 47 0 3,952 47
2,809 0 2,809 2,944 48 0 2,944 48644 0 644 1,734 49 0 1,734 49
1,542 0 1,542 1,546 50 0 1,546 50588 0 588 1,271 51 0 1,271 51351 0 351 653 52 0 653 52
0 0 0 394 53 0 394 530 0 0 15 54 0 15 540 0 0 3 55 0 3 550 0 0 2 56 0 2 56
7,643,895 57,983,864 65,627,759 234,157,286 11,217,771 222,939,515 19 25 24 14 17 14
40,358,804 234,442,688 274,801,492 1,693,921,282 64,633,897 1,629,287,385
* Off-site releases also reported as on-site releases by another NPRI or TRI facility.
** Does not include off-site releases also reported as on-site releases by another NPRI or TRI facility.
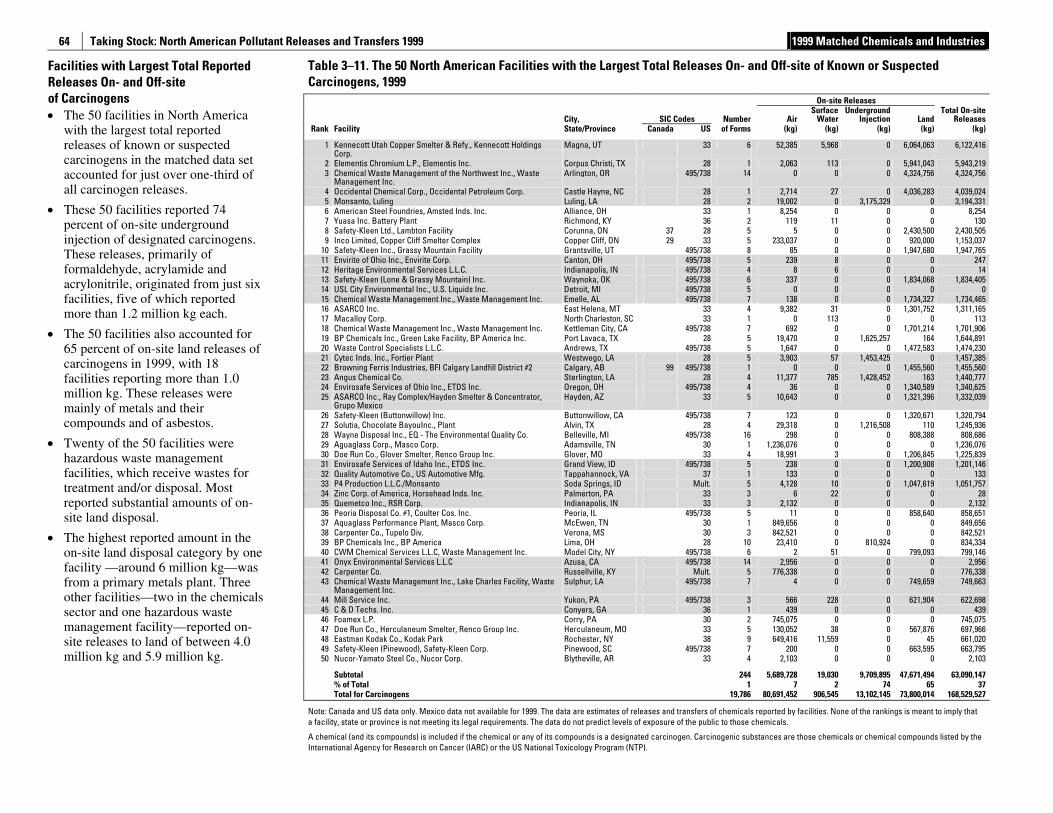
Taking Stock: North American Pollutant Releases and Transfers 1999 1999 Matched Chemicals and Industries
64
Facilities with Largest Total Reported Releases On- and Off-site of Carcinogens • The 50 facilities in North America
with the largest total reported releases of known or suspected carcinogens in the matched data set accounted for just over one-third of all carcinogen releases.
• These 50 facilities reported 74 percent of on-site underground injection of designated carcinogens. These releases, primarily of formaldehyde, acrylamide and acrylonitrile, originated from just six facilities, five of which reported more than 1.2 million kg each.
• The 50 facilities also accounted for 65 percent of on-site land releases of carcinogens in 1999, with 18 facilities reporting more than 1.0 million kg. These releases were mainly of metals and their compounds and of asbestos.
• Twenty of the 50 facilities were hazardous waste management facilities, which receive wastes for treatment and/or disposal. Most reported substantial amounts of on-site land disposal.
• The highest reported amount in the on-site land disposal category by one facility —around 6 million kg—was from a primary metals plant. Three other facilities—two in the chemicals sector and one hazardous waste management facility—reported on-site releases to land of between 4.0 million kg and 5.9 million kg.
Table 3–11. The 50 North American Facilities with the Largest Total Releases On- and Off-site of Known or Suspected Carcinogens, 1999
On-site Releases
City, SIC Codes Number AirSurface
WaterUnderground
Injection LandTotal On-site
Releases Rank Facility State/Province Canada US of Forms (kg) (kg) (kg) (kg) (kg)
1 Kennecott Utah Copper Smelter & Refy., Kennecott Holdings Corp.
Magna, UT 33 6 52,385 5,968 0 6,064,063 6,122,416
2 Elementis Chromium L.P., Elementis Inc. Corpus Christi, TX 28 1 2,063 113 0 5,941,043 5,943,219 3 Chemical Waste Management of the Northwest Inc., Waste
Management Inc. Arlington, OR 495/738 14 0 0 0 4,324,756 4,324,756
4 Occidental Chemical Corp., Occidental Petroleum Corp. Castle Hayne, NC 28 1 2,714 27 0 4,036,283 4,039,024 5 Monsanto, Luling Luling, LA 28 2 19,002 0 3,175,329 0 3,194,331 6 American Steel Foundries, Amsted Inds. Inc. Alliance, OH 33 1 8,254 0 0 0 8,254 7 Yuasa Inc. Battery Plant Richmond, KY 36 2 119 11 0 0 130 8 Safety-Kleen Ltd., Lambton Facility Corunna, ON 37 28 5 5 0 0 2,430,500 2,430,505 9 Inco Limited, Copper Cliff Smelter Complex Copper Cliff, ON 29 33 5 233,037 0 0 920,000 1,153,037
10 Safety-Kleen Inc., Grassy Mountain Facility Grantsville, UT 495/738 8 85 0 0 1,947,680 1,947,765 11 Envirite of Ohio Inc., Envirite Corp. Canton, OH 495/738 5 239 8 0 0 247 12 Heritage Environmental Services L.L.C. Indianapolis, IN 495/738 4 8 6 0 0 14 13 Safety-Kleen (Lone & Grassy Mountain) Inc. Waynoka, OK 495/738 6 337 0 0 1,834,068 1,834,405 14 USL City Environmental Inc., U.S. Liquids Inc. Detroit, MI 495/738 5 0 0 0 0 0 15 Chemical Waste Management Inc., Waste Management Inc. Emelle, AL 495/738 7 138 0 0 1,734,327 1,734,465 16 ASARCO Inc. East Helena, MT 33 4 9,382 31 0 1,301,752 1,311,165 17 Macalloy Corp. North Charleston, SC 33 1 0 113 0 0 113 18 Chemical Waste Management Inc., Waste Management Inc. Kettleman City, CA 495/738 7 692 0 0 1,701,214 1,701,906 19 BP Chemicals Inc., Green Lake Facility, BP America Inc. Port Lavaca, TX 28 5 19,470 0 1,625,257 164 1,644,891 20 Waste Control Specialists L.L.C. Andrews, TX 495/738 5 1,647 0 0 1,472,583 1,474,230 21 Cytec Inds. Inc., Fortier Plant Westwego, LA 28 5 3,903 57 1,453,425 0 1,457,385 22 Browning Ferris Industries, BFI Calgary Landfill District #2 Calgary, AB 99 495/738 1 0 0 0 1,455,560 1,455,560 23 Angus Chemical Co. Sterlington, LA 28 4 11,377 785 1,428,452 163 1,440,777 24 Envirosafe Services of Ohio Inc., ETDS Inc. Oregon, OH 495/738 4 36 0 0 1,340,589 1,340,625 25 ASARCO Inc., Ray Complex/Hayden Smelter & Concentrator,
Grupo Mexico Hayden, AZ 33 5 10,643 0 0 1,321,396 1,332,039
26 Safety-Kleen (Buttonwillow) Inc. Buttonwillow, CA 495/738 7 123 0 0 1,320,671 1,320,794 27 Solutia, Chocolate BayouInc., Plant Alvin, TX 28 4 29,318 0 1,216,508 110 1,245,936 28 Wayne Disposal Inc., EQ - The Environmental Quality Co. Belleville, MI 495/738 16 298 0 0 808,388 808,686 29 Aguaglass Corp., Masco Corp. Adamsville, TN 30 1 1,236,076 0 0 0 1,236,076 30 Doe Run Co., Glover Smelter, Renco Group Inc. Glover, MO 33 4 18,991 3 0 1,206,845 1,225,839 31 Envirosafe Services of Idaho Inc., ETDS Inc. Grand View, ID 495/738 5 238 0 0 1,200,908 1,201,146 32 Quality Automotive Co., US Automotive Mfg. Tappahannock, VA 37 1 133 0 0 0 133 33 P4 Production L.L.C./Monsanto Soda Springs, ID Mult. 5 4,128 10 0 1,047,619 1,051,757 34 Zinc Corp. of America, Horsehead Inds. Inc. Palmerton, PA 33 3 6 22 0 0 28 35 Quemetco Inc., RSR Corp. Indianapolis, IN 33 3 2,132 0 0 0 2,132 36 Peoria Disposal Co. #1, Coulter Cos. Inc. Peoria, IL 495/738 5 11 0 0 858,640 858,651 37 Aquaglass Performance Plant, Masco Corp. McEwen, TN 30 1 849,656 0 0 0 849,656 38 Carpenter Co., Tupelo Div. Verona, MS 30 3 842,521 0 0 0 842,521 39 BP Chemicals Inc., BP America Lima, OH 28 10 23,410 0 810,924 0 834,334 40 CWM Chemical Services L.L.C, Waste Management Inc. Model City, NY 495/738 6 2 51 0 799,093 799,146 41 Onyx Environmental Services L.L.C Azusa, CA 495/738 14 2,956 0 0 0 2,956 42 Carpenter Co. Russellville, KY Mult. 5 776,338 0 0 0 776,338 43 Chemical Waste Management Inc., Lake Charles Facility, Waste
Management Inc. Sulphur, LA 495/738 7 4 0 0 749,659 749,663
44 Mill Service Inc. Yukon, PA 495/738 3 566 228 0 621,904 622,698 45 C & D Techs. Inc. Conyers, GA 36 1 439 0 0 0 439 46 Foamex L.P. Corry, PA 30 2 745,075 0 0 0 745,075 47 Doe Run Co., Herculaneum Smelter, Renco Group Inc. Herculaneum, MO 33 5 130,052 38 0 567,876 697,966 48 Eastman Kodak Co., Kodak Park Rochester, NY 38 9 649,416 11,559 0 45 661,020 49 Safety-Kleen (Pinewood), Safety-Kleen Corp. Pinewood, SC 495/738 7 200 0 0 663,595 663,795 50 Nucor-Yamato Steel Co., Nucor Corp. Blytheville, AR 33 4 2,103 0 0 0 2,103
Subtotal 244 5,689,728 19,030 9,709,895 47,671,494 63,090,147 % of Total 1 7 2 74 65 37 Total for Carcinogens 19,786 80,691,452 906,545 13,102,145 73,800,014 168,529,527
Note: Canada and US data only. Mexico data not available for 1999. The data are estimates of releases and transfers of chemicals reported by facilities. None of the rankings is meant to imply that a facility, state or province is not meeting its legal requirements. The data do not predict levels of exposure of the public to those chemicals.
A chemical (and its compounds) is included if the chemical or any of its compounds is a designated carcinogen. Carcinogenic substances are those chemicals or chemical compounds listed by the International Agency for Research on Cancer (IARC) or the US National Toxicology Program (NTP).
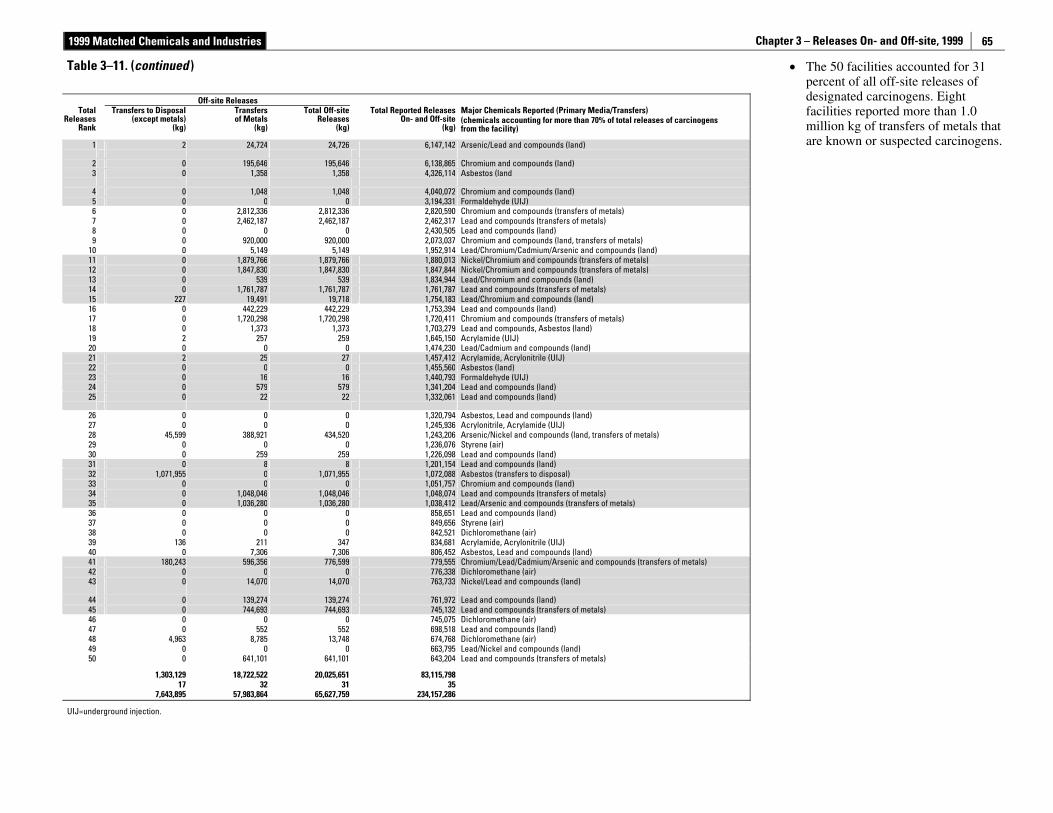
1999 Matched Chemicals and Industries Chapter 3 – Releases On- and Off-site, 1999
65
• The 50 facilities accounted for 31 percent of all off-site releases of designated carcinogens. Eight facilities reported more than 1.0 million kg of transfers of metals that are known or suspected carcinogens.
Table 3–11. (continued )
Off-site Releases Major Chemicals Reported (Primary Media/Transfers) Total
Releases Rank
Transfers to Disposal (except metals)
(kg)
Transfers of Metals
(kg)
Total Off-site Releases
(kg)
Total Reported Releases On- and Off-site
(kg)(chemicals accounting for more than 70% of total releases of carcinogens from the facility)
1
2
24,724
24,726
6,147,142 Arsenic/Lead and compounds (land)
2 0 195,646 195,646 6,138,865 Chromium and compounds (land) 3
0
1,358
1,358
4,326,114 Asbestos (land
4 0 1,048 1,048 4,040,072 Chromium and compounds (land) 5 0 0 0 3,194,331 Formaldehyde (UIJ) 6 0 2,812,336 2,812,336 2,820,590 Chromium and compounds (transfers of metals) 7 0 2,462,187 2,462,187 2,462,317 Lead and compounds (transfers of metals) 8 0 0 0 2,430,505 Lead and compounds (land) 9 0 920,000 920,000 2,073,037 Chromium and compounds (land, transfers of metals)
10 0 5,149 5,149 1,952,914 Lead/Chromium/Cadmium/Arsenic and compounds (land) 11 0 1,879,766 1,879,766 1,880,013 Nickel/Chromium and compounds (transfers of metals) 12 0 1,847,830 1,847,830 1,847,844 Nickel/Chromium and compounds (transfers of metals) 13 0 539 539 1,834,944 Lead/Chromium and compounds (land) 14 0 1,761,787 1,761,787 1,761,787 Lead and compounds (transfers of metals) 15 227 19,491 19,718 1,754,183 Lead/Chromium and compounds (land) 16 0 442,229 442,229 1,753,394 Lead and compounds (land) 17 0 1,720,298 1,720,298 1,720,411 Chromium and compounds (transfers of metals) 18 0 1,373 1,373 1,703,279 Lead and compounds, Asbestos (land) 19 2 257 259 1,645,150 Acrylamide (UIJ) 20 0 0 0 1,474,230 Lead/Cadmium and compounds (land) 21 2 25 27 1,457,412 Acrylamide, Acrylonitrile (UIJ) 22 0 0 0 1,455,560 Asbestos (land) 23 0 16 16 1,440,793 Formaldehyde (UIJ) 24 0 579 579 1,341,204 Lead and compounds (land) 25
0
22
22
1,332,061 Lead and compounds (land)
26 0 0 0 1,320,794 Asbestos, Lead and compounds (land) 27 0 0 0 1,245,936 Acrylonitrile, Acrylamide (UIJ) 28 45,599 388,921 434,520 1,243,206 Arsenic/Nickel and compounds (land, transfers of metals) 29 0 0 0 1,236,076 Styrene (air) 30 0 259 259 1,226,098 Lead and compounds (land) 31 0 8 8 1,201,154 Lead and compounds (land) 32 1,071,955 0 1,071,955 1,072,088 Asbestos (transfers to disposal) 33 0 0 0 1,051,757 Chromium and compounds (land) 34 0 1,048,046 1,048,046 1,048,074 Lead and compounds (transfers of metals) 35 0 1,036,280 1,036,280 1,038,412 Lead/Arsenic and compounds (transfers of metals) 36 0 0 0 858,651 Lead and compounds (land) 37 0 0 0 849,656 Styrene (air) 38 0 0 0 842,521 Dichloromethane (air) 39 136 211 347 834,681 Acrylamide, Acrylonitrile (UIJ) 40 0 7,306 7,306 806,452 Asbestos, Lead and compounds (land) 41 180,243 596,356 776,599 779,555 Chromium/Lead/Cadmium/Arsenic and compounds (transfers of metals) 42 0 0 0 776,338 Dichloromethane (air) 43
0
14,070
14,070
763,733 Nickel/Lead and compounds (land)
44 0 139,274 139,274 761,972 Lead and compounds (land) 45 0 744,693 744,693 745,132 Lead and compounds (transfers of metals) 46 0 0 0 745,075 Dichloromethane (air) 47 0 552 552 698,518 Lead and compounds (land) 48 4,963 8,785 13,748 674,768 Dichloromethane (air) 49 0 0 0 663,795 Lead/Nickel and compounds (land) 50 0 641,101 641,101 643,204 Lead and compounds (transfers of metals)
1,303,129 18,722,522 20,025,651 83,115,798 17 32 31 35 7,643,895 57,983,864 65,627,759 234,157,286
UIJ=underground injection.
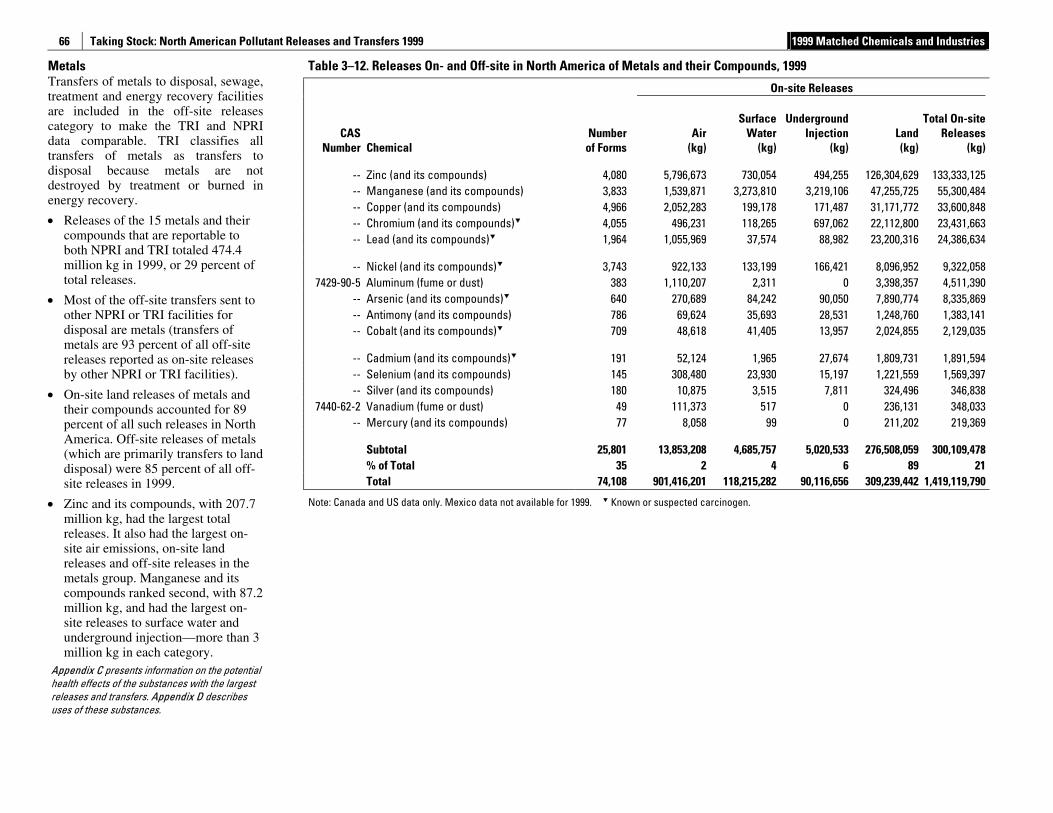
Taking Stock: North American Pollutant Releases and Transfers 1999 1999 Matched Chemicals and Industries
66
Metals Transfers of metals to disposal, sewage, treatment and energy recovery facilities are included in the off-site releases category to make the TRI and NPRI data comparable. TRI classifies all transfers of metals as transfers to disposal because metals are not destroyed by treatment or burned in energy recovery.
• Releases of the 15 metals and their compounds that are reportable to both NPRI and TRI totaled 474.4 million kg in 1999, or 29 percent of total releases.
• Most of the off-site transfers sent to other NPRI or TRI facilities for disposal are metals (transfers of metals are 93 percent of all off-site releases reported as on-site releases by other NPRI or TRI facilities).
• On-site land releases of metals and their compounds accounted for 89 percent of all such releases in North America. Off-site releases of metals (which are primarily transfers to land disposal) were 85 percent of all off-site releases in 1999.
• Zinc and its compounds, with 207.7 million kg, had the largest total releases. It also had the largest on-site air emissions, on-site land releases and off-site releases in the metals group. Manganese and its compounds ranked second, with 87.2 million kg, and had the largest on-site releases to surface water and underground injection—more than 3 million kg in each category.
Appendix C presents information on the potential health effects of the substances with the largest releases and transfers. Appendix D describes uses of these substances.
Table 3–12. Releases On- and Off-site in North America of Metals and their Compounds, 1999
On-site Releases
CAS Number Chemical
Number of Forms
Air(kg)
Surface Water
(kg)
Underground Injection
(kg)Land(kg)
Total On-site Releases
(kg)
-- Zinc (and its compounds) 4,080 5,796,673 730,054 494,255 126,304,629 133,333,125 -- Manganese (and its compounds) 3,833 1,539,871 3,273,810 3,219,106 47,255,725 55,300,484 -- Copper (and its compounds) 4,966 2,052,283 199,178 171,487 31,171,772 33,600,848 -- Chromium (and its compounds) 4,055 496,231 118,265 697,062 22,112,800 23,431,663 -- Lead (and its compounds) 1,964 1,055,969 37,574 88,982 23,200,316 24,386,634
-- Nickel (and its compounds) 3,743 922,133 133,199 166,421 8,096,952 9,322,058 7429-90-5 Aluminum (fume or dust) 383 1,110,207 2,311 0 3,398,357 4,511,390
-- Arsenic (and its compounds) 640 270,689 84,242 90,050 7,890,774 8,335,869 -- Antimony (and its compounds) 786 69,624 35,693 28,531 1,248,760 1,383,141 -- Cobalt (and its compounds) 709 48,618 41,405 13,957 2,024,855 2,129,035
-- Cadmium (and its compounds) 191 52,124 1,965 27,674 1,809,731 1,891,594 -- Selenium (and its compounds) 145 308,480 23,930 15,197 1,221,559 1,569,397 -- Silver (and its compounds) 180 10,875 3,515 7,811 324,496 346,838
7440-62-2 Vanadium (fume or dust) 49 111,373 517 0 236,131 348,033 -- Mercury (and its compounds) 77 8,058 99 0 211,202 219,369
Subtotal 25,801 13,853,208 4,685,757 5,020,533 276,508,059 300,109,478 % of Total 35 2 4 6 89 21 Total 74,108 901,416,201 118,215,282 90,116,656 309,239,442 1,419,119,790
Note: Canada and US data only. Mexico data not available for 1999. Known or suspected carcinogen.
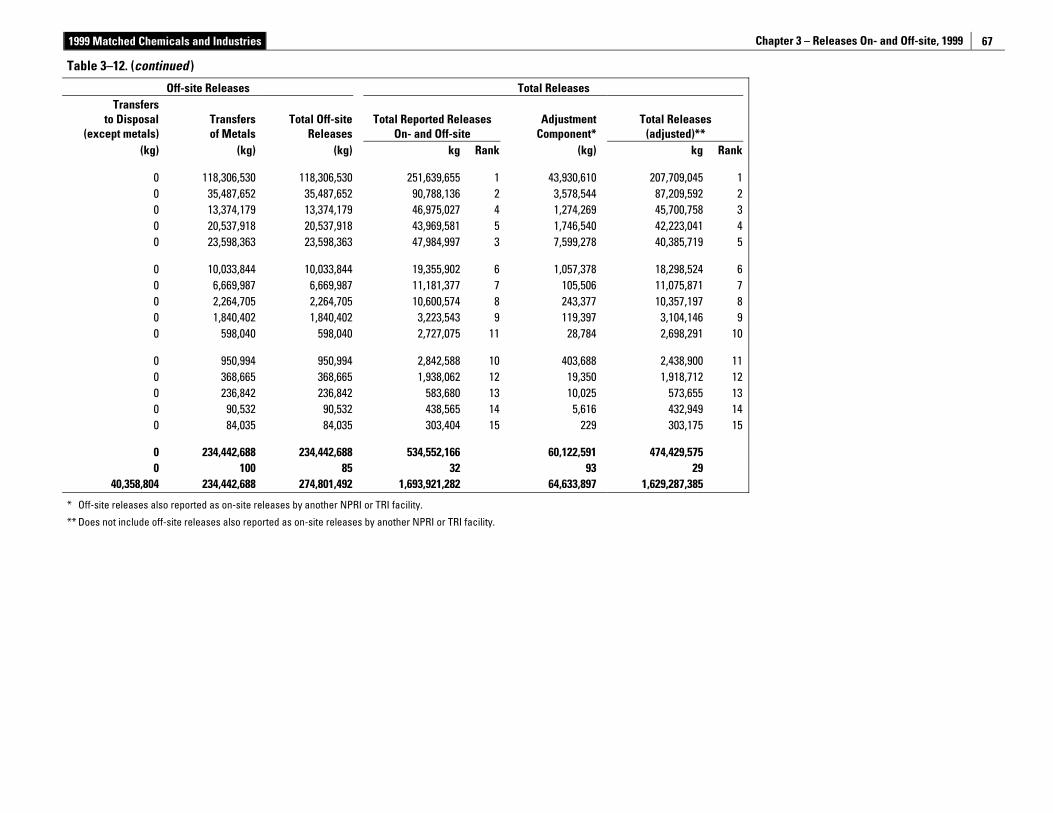
1999 Matched Chemicals and Industries Chapter 3 – Releases On- and Off-site, 1999
67
Table 3–12. (continued )
Off-site Releases Total Releases Transfers
to Disposal (except metals)
Transfers of Metals
Total Off-site Releases
Total Reported Releases On- and Off-site
Adjustment Component*
Total Releases (adjusted)**
(kg) (kg) (kg) kg Rank (kg) kg Rank
0 118,306,530 118,306,530 251,639,655 1 43,930,610 207,709,045 10 35,487,652 35,487,652 90,788,136 2 3,578,544 87,209,592 20 13,374,179 13,374,179 46,975,027 4 1,274,269 45,700,758 30 20,537,918 20,537,918 43,969,581 5 1,746,540 42,223,041 40 23,598,363 23,598,363 47,984,997 3 7,599,278 40,385,719 5
0 10,033,844 10,033,844 19,355,902 6 1,057,378 18,298,524 60 6,669,987 6,669,987 11,181,377 7 105,506 11,075,871 70 2,264,705 2,264,705 10,600,574 8 243,377 10,357,197 80 1,840,402 1,840,402 3,223,543 9 119,397 3,104,146 90 598,040 598,040 2,727,075 11 28,784 2,698,291 10
0 950,994 950,994 2,842,588 10 403,688 2,438,900 110 368,665 368,665 1,938,062 12 19,350 1,918,712 120 236,842 236,842 583,680 13 10,025 573,655 130 90,532 90,532 438,565 14 5,616 432,949 140 84,035 84,035 303,404 15 229 303,175 15
0 234,442,688 234,442,688 534,552,166 60,122,591 474,429,575 0 100 85 32 93 29
40,358,804 234,442,688 274,801,492 1,693,921,282 64,633,897 1,629,287,385
* Off-site releases also reported as on-site releases by another NPRI or TRI facility.
** Does not include off-site releases also reported as on-site releases by another NPRI or TRI facility.
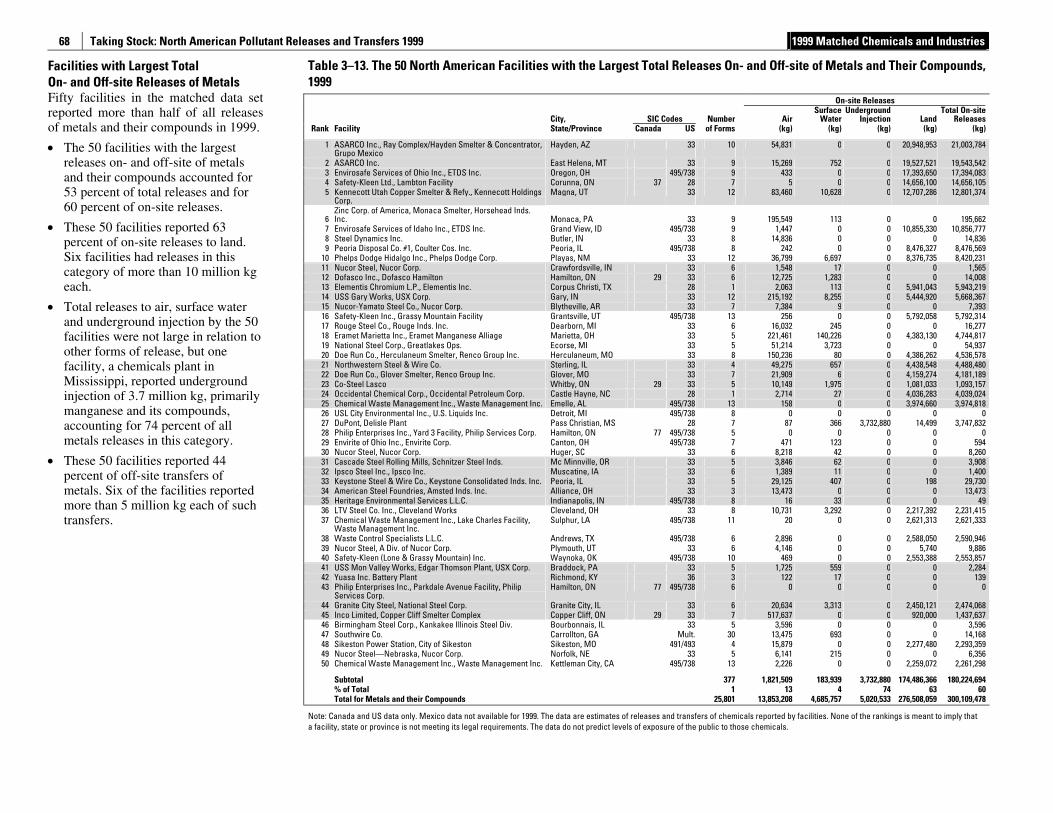
Taking Stock: North American Pollutant Releases and Transfers 1999 1999 Matched Chemicals and Industries
68
Facilities with Largest Total On- and Off-site Releases of Metals Fifty facilities in the matched data set reported more than half of all releases of metals and their compounds in 1999.
• The 50 facilities with the largest releases on- and off-site of metals and their compounds accounted for 53 percent of total releases and for 60 percent of on-site releases.
• These 50 facilities reported 63 percent of on-site releases to land. Six facilities had releases in this category of more than 10 million kg each.
• Total releases to air, surface water and underground injection by the 50 facilities were not large in relation to other forms of release, but one facility, a chemicals plant in Mississippi, reported underground injection of 3.7 million kg, primarily manganese and its compounds, accounting for 74 percent of all metals releases in this category.
• These 50 facilities reported 44 percent of off-site transfers of metals. Six of the facilities reported more than 5 million kg each of such transfers.
Table 3–13. The 50 North American Facilities with the Largest Total Releases On- and Off-site of Metals and Their Compounds, 1999
On-site Releases
City, SIC Codes Number AirSurface
WaterUnderground
Injection LandTotal On-site
Releases Rank Facility State/Province Canada US of Forms (kg) (kg) (kg) (kg) (kg)
1 ASARCO Inc., Ray Complex/Hayden Smelter & Concentrator, Grupo Mexico
Hayden, AZ 33 10 54,831 0 0 20,948,953 21,003,784
2 ASARCO Inc. East Helena, MT 33 9 15,269 752 0 19,527,521 19,543,542 3 Envirosafe Services of Ohio Inc., ETDS Inc. Oregon, OH 495/738 9 433 0 0 17,393,650 17,394,083 4 Safety-Kleen Ltd., Lambton Facility Corunna, ON 37 28 7 5 0 0 14,656,100 14,656,105 5 Kennecott Utah Copper Smelter & Refy., Kennecott Holdings
Corp. Magna, UT 33 12 83,460 10,628 0 12,707,286 12,801,374
6 Zinc Corp. of America, Monaca Smelter, Horsehead Inds. Inc. Monaca, PA 33 9 195,549 113 0 0 195,662
7 Envirosafe Services of Idaho Inc., ETDS Inc. Grand View, ID 495/738 9 1,447 0 0 10,855,330 10,856,777 8 Steel Dynamics Inc. Butler, IN 33 8 14,836 0 0 0 14,836 9 Peoria Disposal Co. #1, Coulter Cos. Inc. Peoria, IL 495/738 8 242 0 0 8,476,327 8,476,569
10 Phelps Dodge Hidalgo Inc., Phelps Dodge Corp. Playas, NM 33 12 36,799 6,697 0 8,376,735 8,420,231 11 Nucor Steel, Nucor Corp. Crawfordsville, IN 33 6 1,548 17 0 0 1,565 12 Dofasco Inc., Dofasco Hamilton Hamilton, ON 29 33 6 12,725 1,283 0 0 14,008 13 Elementis Chromium L.P., Elementis Inc. Corpus Christi, TX 28 1 2,063 113 0 5,941,043 5,943,219 14 USS Gary Works, USX Corp. Gary, IN 33 12 215,192 8,255 0 5,444,920 5,668,367 15 Nucor-Yamato Steel Co., Nucor Corp. Blytheville, AR 33 7 7,384 9 0 0 7,393 16 Safety-Kleen Inc., Grassy Mountain Facility Grantsville, UT 495/738 13 256 0 0 5,792,058 5,792,314 17 Rouge Steel Co., Rouge Inds. Inc. Dearborn, MI 33 6 16,032 245 0 0 16,277 18 Eramet Marietta Inc., Eramet Manganese Alliage Marietta, OH 33 5 221,461 140,226 0 4,383,130 4,744,817 19 National Steel Corp., Greatlakes Ops. Ecorse, MI 33 5 51,214 3,723 0 0 54,937 20 Doe Run Co., Herculaneum Smelter, Renco Group Inc. Herculaneum, MO 33 8 150,236 80 0 4,386,262 4,536,578 21 Northwestern Steel & Wire Co. Sterling, IL 33 4 49,275 657 0 4,438,548 4,488,480 22 Doe Run Co., Glover Smelter, Renco Group Inc. Glover, MO 33 7 21,909 6 0 4,159,274 4,181,189 23 Co-Steel Lasco Whitby, ON 29 33 5 10,149 1,975 0 1,081,033 1,093,157 24 Occidental Chemical Corp., Occidental Petroleum Corp. Castle Hayne, NC 28 1 2,714 27 0 4,036,283 4,039,024 25 Chemical Waste Management Inc., Waste Management Inc. Emelle, AL 495/738 13 158 0 0 3,974,660 3,974,818 26 USL City Environmental Inc., U.S. Liquids Inc. Detroit, MI 495/738 8 0 0 0 0 0 27 DuPont, Delisle Plant Pass Christian, MS 28 7 87 366 3,732,880 14,499 3,747,832 28 Philip Enterprises Inc., Yard 3 Facility, Philip Services Corp. Hamilton, ON 77 495/738 5 0 0 0 0 0 29 Envirite of Ohio Inc., Envirite Corp. Canton, OH 495/738 7 471 123 0 0 594 30 Nucor Steel, Nucor Corp. Huger, SC 33 6 8,218 42 0 0 8,260 31 Cascade Steel Rolling Mills, Schnitzer Steel Inds. Mc Minnville, OR 33 5 3,846 62 0 0 3,908 32 Ipsco Steel Inc., Ipsco Inc. Muscatine, IA 33 6 1,389 11 0 0 1,400 33 Keystone Steel & Wire Co., Keystone Consolidated Inds. Inc. Peoria, IL 33 5 29,125 407 0 198 29,730 34 American Steel Foundries, Amsted Inds. Inc. Alliance, OH 33 3 13,473 0 0 0 13,473 35 Heritage Environmental Services L.L.C. Indianapolis, IN 495/738 8 16 33 0 0 49 36 LTV Steel Co. Inc., Cleveland Works Cleveland, OH 33 8 10,731 3,292 0 2,217,392 2,231,415 37 Chemical Waste Management Inc., Lake Charles Facility,
Waste Management Inc. Sulphur, LA 495/738 11 20 0 0 2,621,313 2,621,333
38 Waste Control Specialists L.L.C. Andrews, TX 495/738 6 2,896 0 0 2,588,050 2,590,946 39 Nucor Steel, A Div. of Nucor Corp. Plymouth, UT 33 6 4,146 0 0 5,740 9,886 40 Safety-Kleen (Lone & Grassy Mountain) Inc. Waynoka, OK 495/738 10 469 0 0 2,553,388 2,553,857 41 USS Mon Valley Works, Edgar Thomson Plant, USX Corp. Braddock, PA 33 5 1,725 559 0 0 2,284 42 Yuasa Inc. Battery Plant Richmond, KY 36 3 122 17 0 0 139 43 Philip Enterprises Inc., Parkdale Avenue Facility, Philip
Services Corp. Hamilton, ON 77 495/738 6 0 0 0 0 0
44 Granite City Steel, National Steel Corp. Granite City, IL 33 6 20,634 3,313 0 2,450,121 2,474,068 45 Inco Limited, Copper Cliff Smelter Complex Copper Cliff, ON 29 33 7 517,637 0 0 920,000 1,437,637 46 Birmingham Steel Corp., Kankakee Illinois Steel Div. Bourbonnais, IL 33 5 3,596 0 0 0 3,596 47 Southwire Co. Carrollton, GA Mult. 30 13,475 693 0 0 14,168 48 Sikeston Power Station, City of Sikeston Sikeston, MO 491/493 4 15,879 0 0 2,277,480 2,293,359 49 Nucor Steel—Nebraska, Nucor Corp. Norfolk, NE 33 5 6,141 215 0 0 6,356 50 Chemical Waste Management Inc., Waste Management Inc. Kettleman City, CA 495/738 13 2,226 0 0 2,259,072 2,261,298
Subtotal 377 1,821,509 183,939 3,732,880 174,486,366 180,224,694 % of Total 1 13 4 74 63 60 Total for Metals and their Compounds 25,801 13,853,208 4,685,757 5,020,533 276,508,059 300,109,478
Note: Canada and US data only. Mexico data not available for 1999. The data are estimates of releases and transfers of chemicals reported by facilities. None of the rankings is meant to imply that a facility, state or province is not meeting its legal requirements. The data do not predict levels of exposure of the public to those chemicals.
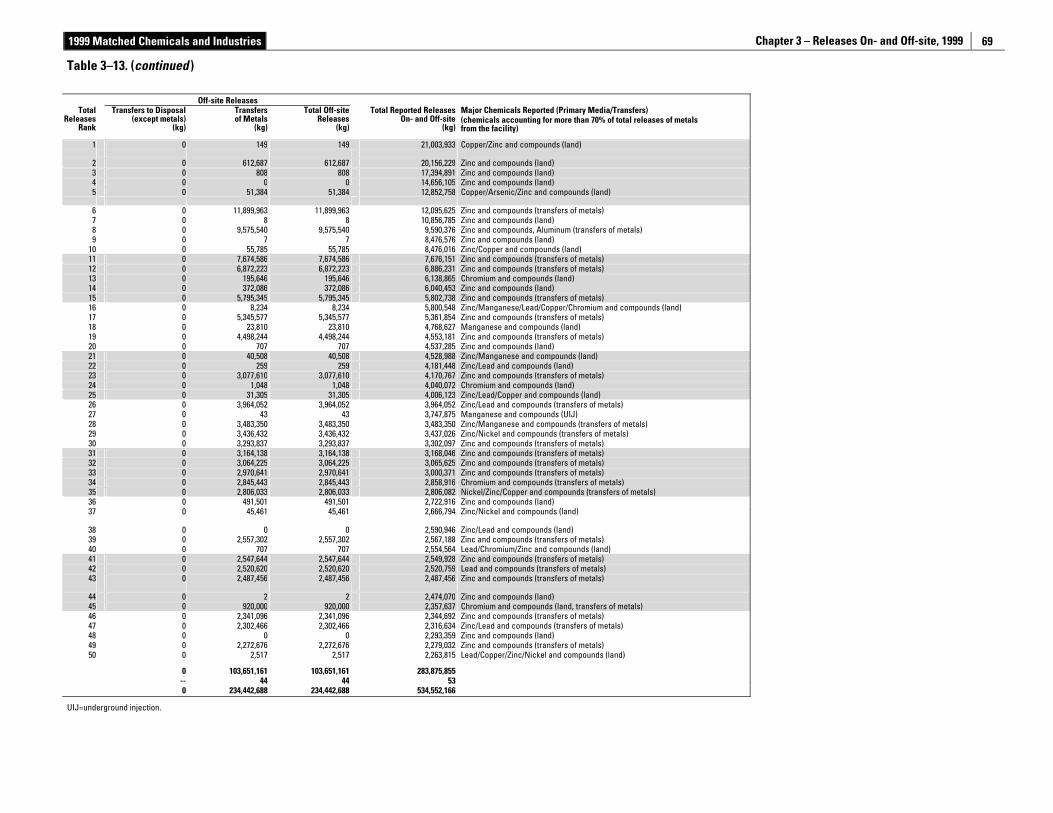
1999 Matched Chemicals and Industries Chapter 3 – Releases On- and Off-site, 1999
69
Table 3–13. (continued )
Off-site Releases Major Chemicals Reported (Primary Media/Transfers) Total
Releases Rank
Transfers to Disposal (except metals)
(kg)
Transfers of Metals
(kg)
Total Off-site Releases
(kg)
Total Reported Releases On- and Off-site
(kg)(chemicals accounting for more than 70% of total releases of metals from the facility)
1
0
149
149
21,003,933 Copper/Zinc and compounds (land)
2 0 612,687 612,687 20,156,229 Zinc and compounds (land) 3 0 808 808 17,394,891 Zinc and compounds (land) 4 0 0 0 14,656,105 Zinc and compounds (land) 5
0
51,384
51,384
12,852,758 Copper/Arsenic/Zinc and compounds (land)
6 0 11,899,963 11,899,963 12,095,625 Zinc and compounds (transfers of metals) 7 0 8 8 10,856,785 Zinc and compounds (land) 8 0 9,575,540 9,575,540 9,590,376 Zinc and compounds, Aluminum (transfers of metals) 9 0 7 7 8,476,576 Zinc and compounds (land)
10 0 55,785 55,785 8,476,016 Zinc/Copper and compounds (land) 11 0 7,674,586 7,674,586 7,676,151 Zinc and compounds (transfers of metals) 12 0 6,872,223 6,872,223 6,886,231 Zinc and compounds (transfers of metals) 13 0 195,646 195,646 6,138,865 Chromium and compounds (land) 14 0 372,086 372,086 6,040,453 Zinc and compounds (land) 15 0 5,795,345 5,795,345 5,802,738 Zinc and compounds (transfers of metals) 16 0 8,234 8,234 5,800,548 Zinc/Manganese/Lead/Copper/Chromium and compounds (land) 17 0 5,345,577 5,345,577 5,361,854 Zinc and compounds (transfers of metals) 18 0 23,810 23,810 4,768,627 Manganese and compounds (land) 19 0 4,498,244 4,498,244 4,553,181 Zinc and compounds (transfers of metals) 20 0 707 707 4,537,285 Zinc and compounds (land) 21 0 40,508 40,508 4,528,988 Zinc/Manganese and compounds (land) 22 0 259 259 4,181,448 Zinc/Lead and compounds (land) 23 0 3,077,610 3,077,610 4,170,767 Zinc and compounds (transfers of metals) 24 0 1,048 1,048 4,040,072 Chromium and compounds (land) 25 0 31,305 31,305 4,006,123 Zinc/Lead/Copper and compounds (land) 26 0 3,964,052 3,964,052 3,964,052 Zinc/Lead and compounds (transfers of metals) 27 0 43 43 3,747,875 Manganese and compounds (UIJ) 28 0 3,483,350 3,483,350 3,483,350 Zinc/Manganese and compounds (transfers of metals) 29 0 3,436,432 3,436,432 3,437,026 Zinc/Nickel and compounds (transfers of metals) 30 0 3,293,837 3,293,837 3,302,097 Zinc and compounds (transfers of metals) 31 0 3,164,138 3,164,138 3,168,046 Zinc and compounds (transfers of metals) 32 0 3,064,225 3,064,225 3,065,625 Zinc and compounds (transfers of metals) 33 0 2,970,641 2,970,641 3,000,371 Zinc and compounds (transfers of metals) 34 0 2,845,443 2,845,443 2,858,916 Chromium and compounds (transfers of metals) 35 0 2,806,033 2,806,033 2,806,082 Nickel/Zinc/Copper and compounds (transfers of metals) 36 0 491,501 491,501 2,722,916 Zinc and compounds (land) 37
0
45,461
45,461
2,666,794 Zinc/Nickel and compounds (land)
38 0 0 0 2,590,946 Zinc/Lead and compounds (land) 39 0 2,557,302 2,557,302 2,567,188 Zinc and compounds (transfers of metals) 40 0 707 707 2,554,564 Lead/Chromium/Zinc and compounds (land) 41 0 2,547,644 2,547,644 2,549,928 Zinc and compounds (transfers of metals) 42 0 2,520,620 2,520,620 2,520,759 Lead and compounds (transfers of metals) 43
0
2,487,456
2,487,456
2,487,456 Zinc and compounds (transfers of metals)
44 0 2 2 2,474,070 Zinc and compounds (land) 45 0 920,000 920,000 2,357,637 Chromium and compounds (land, transfers of metals) 46 0 2,341,096 2,341,096 2,344,692 Zinc and compounds (transfers of metals) 47 0 2,302,466 2,302,466 2,316,634 Zinc/Lead and compounds (transfers of metals) 48 0 0 0 2,293,359 Zinc and compounds (land) 49 0 2,272,676 2,272,676 2,279,032 Zinc and compounds (transfers of metals) 50 0 2,517 2,517 2,263,815 Lead/Copper/Zinc/Nickel and compounds (land)
0 103,651,161 103,651,161 283,875,855 -- 44 44 53 0 234,442,688 234,442,688 534,552,166
UIJ=underground injection.
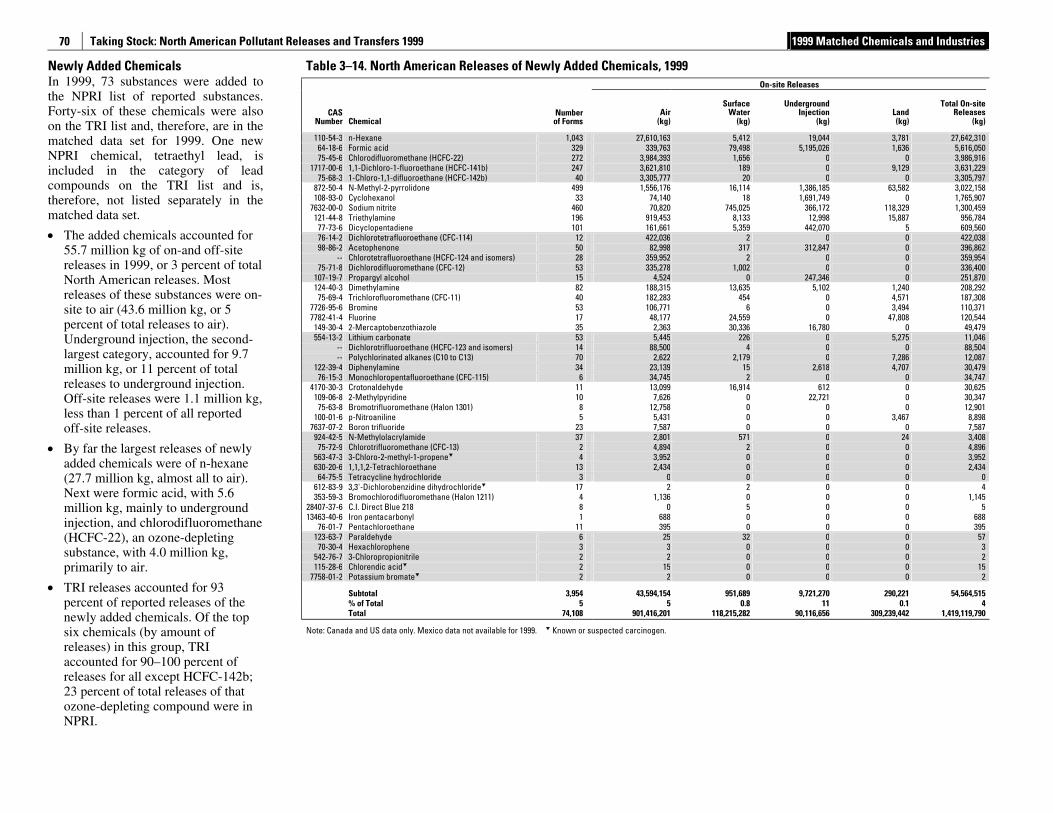
Taking Stock: North American Pollutant Releases and Transfers 1999 1999 Matched Chemicals and Industries
70
Newly Added Chemicals In 1999, 73 substances were added to the NPRI list of reported substances. Forty-six of these chemicals were also on the TRI list and, therefore, are in the matched data set for 1999. One new NPRI chemical, tetraethyl lead, is included in the category of lead compounds on the TRI list and is, therefore, not listed separately in the matched data set.
• The added chemicals accounted for 55.7 million kg of on-and off-site releases in 1999, or 3 percent of total North American releases. Most releases of these substances were on-site to air (43.6 million kg, or 5 percent of total releases to air). Underground injection, the second-largest category, accounted for 9.7 million kg, or 11 percent of total releases to underground injection. Off-site releases were 1.1 million kg, less than 1 percent of all reported off-site releases.
• By far the largest releases of newly added chemicals were of n-hexane (27.7 million kg, almost all to air). Next were formic acid, with 5.6 million kg, mainly to underground injection, and chlorodifluoromethane (HCFC-22), an ozone-depleting substance, with 4.0 million kg, primarily to air.
• TRI releases accounted for 93 percent of reported releases of the newly added chemicals. Of the top six chemicals (by amount of releases) in this group, TRI accounted for 90–100 percent of releases for all except HCFC-142b; 23 percent of total releases of that ozone-depleting compound were in NPRI.
Table 3–14. North American Releases of Newly Added Chemicals, 1999 On-site Releases
CAS Number Chemical
Numberof Forms
Air(kg)
SurfaceWater
(kg)
Underground Injection
(kg)Land(kg)
Total On-site Releases
(kg)
110-54-3 n-Hexane 1,043 27,610,163 5,412 19,044 3,781 27,642,310 64-18-6 Formic acid 329 339,763 79,498 5,195,026 1,636 5,616,050 75-45-6 Chlorodifluoromethane (HCFC-22) 272 3,984,393 1,656 0 0 3,986,916
1717-00-6 1,1-Dichloro-1-fluoroethane (HCFC-141b) 247 3,621,810 189 0 9,129 3,631,229 75-68-3 1-Chloro-1,1-difluoroethane (HCFC-142b) 40 3,305,777 20 0 0 3,305,797
872-50-4 N-Methyl-2-pyrrolidone 499 1,556,176 16,114 1,386,185 63,582 3,022,158 108-93-0 Cyclohexanol 33 74,140 18 1,691,749 0 1,765,907
7632-00-0 Sodium nitrite 460 70,820 745,025 366,172 118,329 1,300,459 121-44-8 Triethylamine 196 919,453 8,133 12,998 15,887 956,784
77-73-6 Dicyclopentadiene 101 161,661 5,359 442,070 5 609,560 76-14-2 Dichlorotetrafluoroethane (CFC-114) 12 422,036 2 0 0 422,038 98-86-2 Acetophenone 50 82,998 317 312,847 0 396,862
-- Chlorotetrafluoroethane (HCFC-124 and isomers) 28 359,952 2 0 0 359,954 75-71-8 Dichlorodifluoromethane (CFC-12) 53 335,278 1,002 0 0 336,400
107-19-7 Propargyl alcohol 15 4,524 0 247,346 0 251,870 124-40-3 Dimethylamine 82 188,315 13,635 5,102 1,240 208,292
75-69-4 Trichlorofluoromethane (CFC-11) 40 182,283 454 0 4,571 187,308 7726-95-6 Bromine 53 106,771 6 0 3,494 110,371 7782-41-4 Fluorine 17 48,177 24,559 0 47,808 120,544
149-30-4 2-Mercaptobenzothiazole 35 2,363 30,336 16,780 0 49,479 554-13-2 Lithium carbonate 53 5,445 226 0 5,275 11,046
-- Dichlorotrifluoroethane (HCFC-123 and isomers) 14 88,500 4 0 0 88,504 -- Polychlorinated alkanes (C10 to C13) 70 2,622 2,179 0 7,286 12,087
122-39-4 Diphenylamine 34 23,139 15 2,618 4,707 30,479 76-15-3 Monochloropentafluoroethane (CFC-115) 6 34,745 2 0 0 34,747
4170-30-3 Crotonaldehyde 11 13,099 16,914 612 0 30,625 109-06-8 2-Methylpyridine 10 7,626 0 22,721 0 30,347
75-63-8 Bromotrifluoromethane (Halon 1301) 8 12,758 0 0 0 12,901 100-01-6 p-Nitroaniline 5 5,431 0 0 3,467 8,898
7637-07-2 Boron trifluoride 23 7,587 0 0 0 7,587 924-42-5 N-Methylolacrylamide 37 2,801 571 0 24 3,408
75-72-9 Chlorotrifluoromethane (CFC-13) 2 4,894 2 0 0 4,896 563-47-3 3-Chloro-2-methyl-1-propene 4 3,952 0 0 0 3,952 630-20-6 1,1,1,2-Tetrachloroethane 13 2,434 0 0 0 2,434
64-75-5 Tetracycline hydrochloride 3 0 0 0 0 0 612-83-9 3,3'-Dichlorobenzidine dihydrochloride 17 2 2 0 0 4 353-59-3 Bromochlorodifluoromethane (Halon 1211) 4 1,136 0 0 0 1,145
28407-37-6 C.I. Direct Blue 218 8 0 5 0 0 5 13463-40-6 Iron pentacarbonyl 1 688 0 0 0 688
76-01-7 Pentachloroethane 11 395 0 0 0 395 123-63-7 Paraldehyde 6 25 32 0 0 57
70-30-4 Hexachlorophene 3 3 0 0 0 3 542-76-7 3-Chloropropionitrile 2 2 0 0 0 2 115-28-6 Chlorendic acid 2 15 0 0 0 15
7758-01-2 Potassium bromate 2 2 0 0 0 2
Subtotal 3,954 43,594,154 951,689 9,721,270 290,221 54,564,515 % of Total 5 5 0.8 11 0.1 4 Total 74,108 901,416,201 118,215,282 90,116,656 309,239,442 1,419,119,790
Note: Canada and US data only. Mexico data not available for 1999. Known or suspected carcinogen.
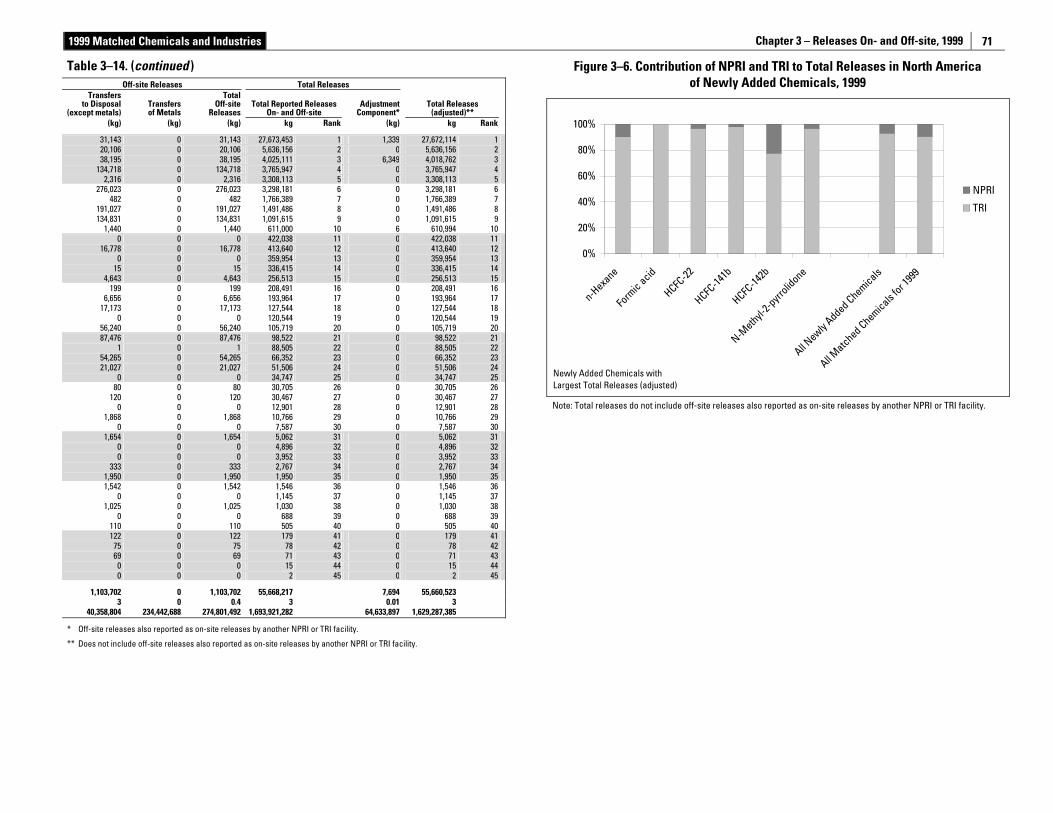
1999 Matched Chemicals and Industries Chapter 3 – Releases On- and Off-site, 1999
71
Table 3–14. (continued ) Off-site Releases Total Releases
Transfers to Disposal
(except metals) Transfers of Metals
Total Off-site
Releases Total Reported Releases
On- and Off-site Adjustment
Component*Total Releases
(adjusted)** (kg) (kg) (kg) kg Rank (kg) kg Rank
31,143 0 31,143 27,673,453 1 1,339 27,672,114 1 20,106 0 20,106 5,636,156 2 0 5,636,156 2 38,195 0 38,195 4,025,111 3 6,349 4,018,762 3
134,718 0 134,718 3,765,947 4 0 3,765,947 4 2,316 0 2,316 3,308,113 5 0 3,308,113 5
276,023 0 276,023 3,298,181 6 0 3,298,181 6 482 0 482 1,766,389 7 0 1,766,389 7
191,027 0 191,027 1,491,486 8 0 1,491,486 8 134,831 0 134,831 1,091,615 9 0 1,091,615 9
1,440 0 1,440 611,000 10 6 610,994 100 0 0 422,038 11 0 422,038 11
16,778 0 16,778 413,640 12 0 413,640 12 0 0 0 359,954 13 0 359,954 13
15 0 15 336,415 14 0 336,415 14 4,643 0 4,643 256,513 15 0 256,513 15
199 0 199 208,491 16 0 208,491 16 6,656 0 6,656 193,964 17 0 193,964 17
17,173 0 17,173 127,544 18 0 127,544 18 0 0 0 120,544 19 0 120,544 19
56,240 0 56,240 105,719 20 0 105,719 20 87,476 0 87,476 98,522 21 0 98,522 21
1 0 1 88,505 22 0 88,505 22 54,265 0 54,265 66,352 23 0 66,352 23 21,027 0 21,027 51,506 24 0 51,506 24
0 0 0 34,747 25 0 34,747 25 80 0 80 30,705 26 0 30,705 26
120 0 120 30,467 27 0 30,467 27 0 0 0 12,901 28 0 12,901 28
1,868 0 1,868 10,766 29 0 10,766 29 0 0 0 7,587 30 0 7,587 30
1,654 0 1,654 5,062 31 0 5,062 31 0 0 0 4,896 32 0 4,896 32 0 0 0 3,952 33 0 3,952 33
333 0 333 2,767 34 0 2,767 34 1,950 0 1,950 1,950 35 0 1,950 35 1,542 0 1,542 1,546 36 0 1,546 36
0 0 0 1,145 37 0 1,145 37 1,025 0 1,025 1,030 38 0 1,030 38
0 0 0 688 39 0 688 39 110 0 110 505 40 0 505 40 122 0 122 179 41 0 179 41
75 0 75 78 42 0 78 42 69 0 69 71 43 0 71 43
0 0 0 15 44 0 15 44 0 0 0 2 45 0 2 45
1,103,702 0 1,103,702 55,668,217 7,694 55,660,523 3 0 0.4 3 0.01 3
40,358,804 234,442,688 274,801,492 1,693,921,282 64,633,897 1,629,287,385
* Off-site releases also reported as on-site releases by another NPRI or TRI facility.
** Does not include off-site releases also reported as on-site releases by another NPRI or TRI facility.
Figure 3–6. Contribution of NPRI and TRI to Total Releases in North America of Newly Added Chemicals, 1999
0%
20%
40%
60%
80%
100%
n-Hexa
neFo
rmic acid
HCFC-22
HCFC-14
1bHCFC
-142b
N-Methyl-
2-pyrr
olidone
All Newly
Added Chemicals
All Matched Chemicals
for 199
9
NPRI
TRI
Newly Added Chemicals with Largest Total Releases (adjusted)
Note: Total releases do not include off-site releases also reported as on-site releases by another NPRI or TRI facility.
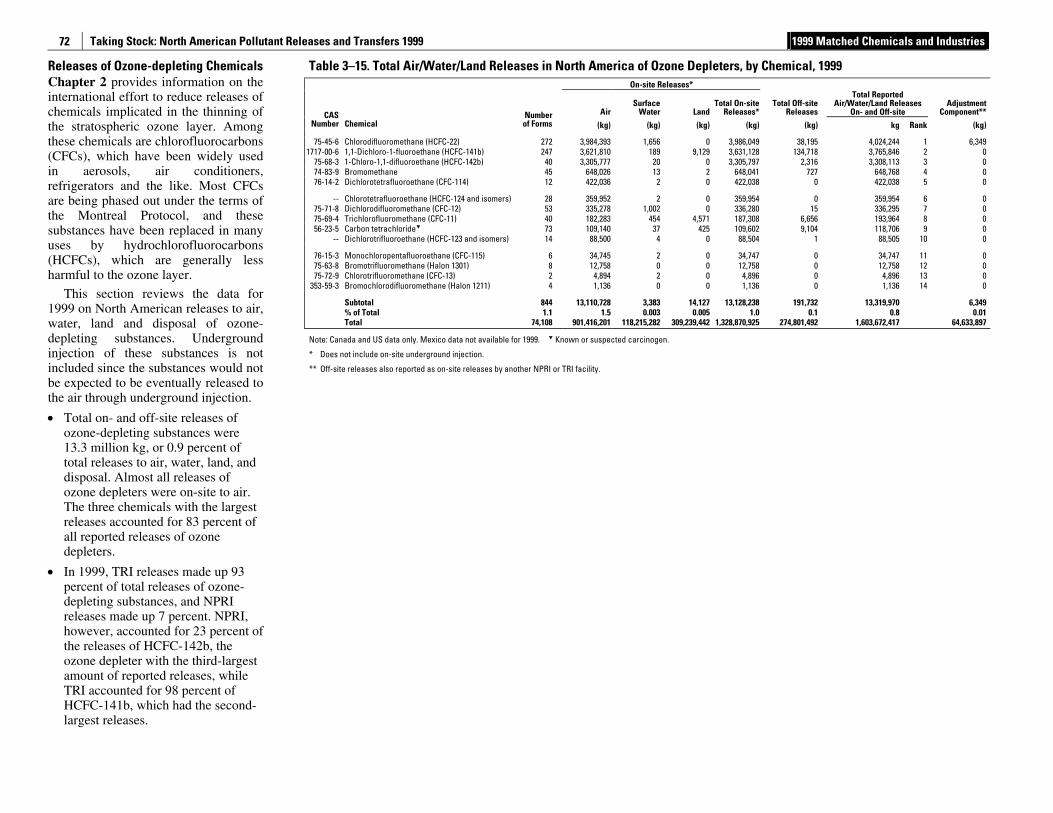
Taking Stock: North American Pollutant Releases and Transfers 1999 1999 Matched Chemicals and Industries
72
Releases of Ozone-depleting Chemicals Chapter 2 provides information on the international effort to reduce releases of chemicals implicated in the thinning of the stratospheric ozone layer. Among these chemicals are chlorofluorocarbons (CFCs), which have been widely used in aerosols, air conditioners, refrigerators and the like. Most CFCs are being phased out under the terms of the Montreal Protocol, and these substances have been replaced in many uses by hydrochlorofluorocarbons (HCFCs), which are generally less harmful to the ozone layer.
This section reviews the data for 1999 on North American releases to air, water, land and disposal of ozone-depleting substances. Underground injection of these substances is not included since the substances would not be expected to be eventually released to the air through underground injection.
• Total on- and off-site releases of ozone-depleting substances were 13.3 million kg, or 0.9 percent of total releases to air, water, land, and disposal. Almost all releases of ozone depleters were on-site to air. The three chemicals with the largest releases accounted for 83 percent of all reported releases of ozone depleters.
• In 1999, TRI releases made up 93 percent of total releases of ozone-depleting substances, and NPRI releases made up 7 percent. NPRI, however, accounted for 23 percent of the releases of HCFC-142b, the ozone depleter with the third-largest amount of reported releases, while TRI accounted for 98 percent of HCFC-141b, which had the second-largest releases.
Table 3–15. Total Air/Water/Land Releases in North America of Ozone Depleters, by Chemical, 1999 On-site Releases*
Air Surface
Water LandTotal On-site
Releases*Total Off-site
Releases
Total Reported Air/Water/Land Releases
On- and Off-site Adjustment
Component** CAS Number Chemical
Number of Forms (kg) (kg) (kg) (kg) (kg) kg Rank (kg)
75-45-6 Chlorodifluoromethane (HCFC-22) 272 3,984,393 1,656 0 3,986,049 38,195 4,024,244 1 6,349 1717-00-6 1,1-Dichloro-1-fluoroethane (HCFC-141b) 247 3,621,810 189 9,129 3,631,128 134,718 3,765,846 2 0
75-68-3 1-Chloro-1,1-difluoroethane (HCFC-142b) 40 3,305,777 20 0 3,305,797 2,316 3,308,113 3 0 74-83-9 Bromomethane 45 648,026 13 2 648,041 727 648,768 4 0 76-14-2 Dichlorotetrafluoroethane (CFC-114) 12 422,036 2 0 422,038 0 422,038 5 0
-- Chlorotetrafluoroethane (HCFC-124 and isomers) 28 359,952 2 0 359,954 0 359,954 6 0 75-71-8 Dichlorodifluoromethane (CFC-12) 53 335,278 1,002 0 336,280 15 336,295 7 0 75-69-4 Trichlorofluoromethane (CFC-11) 40 182,283 454 4,571 187,308 6,656 193,964 8 0 56-23-5 Carbon tetrachloride 73 109,140 37 425 109,602 9,104 118,706 9 0
-- Dichlorotrifluoroethane (HCFC-123 and isomers) 14 88,500 4 0 88,504 1 88,505 10 0
76-15-3 Monochloropentafluoroethane (CFC-115) 6 34,745 2 0 34,747 0 34,747 11 0 75-63-8 Bromotrifluoromethane (Halon 1301) 8 12,758 0 0 12,758 0 12,758 12 0 75-72-9 Chlorotrifluoromethane (CFC-13) 2 4,894 2 0 4,896 0 4,896 13 0
353-59-3 Bromochlorodifluoromethane (Halon 1211) 4 1,136 0 0 1,136 0 1,136 14 0
Subtotal 844 13,110,728 3,383 14,127 13,128,238 191,732 13,319,970 6,349 % of Total 1.1 1.5 0.003 0.005 1.0 0.1 0.8 0.01 Total 74,108 901,416,201 118,215,282 309,239,442 1,328,870,925 274,801,492 1,603,672,417 64,633,897
Note: Canada and US data only. Mexico data not available for 1999. Known or suspected carcinogen.
* Does not include on-site underground injection.
** Off-site releases also reported as on-site releases by another NPRI or TRI facility.
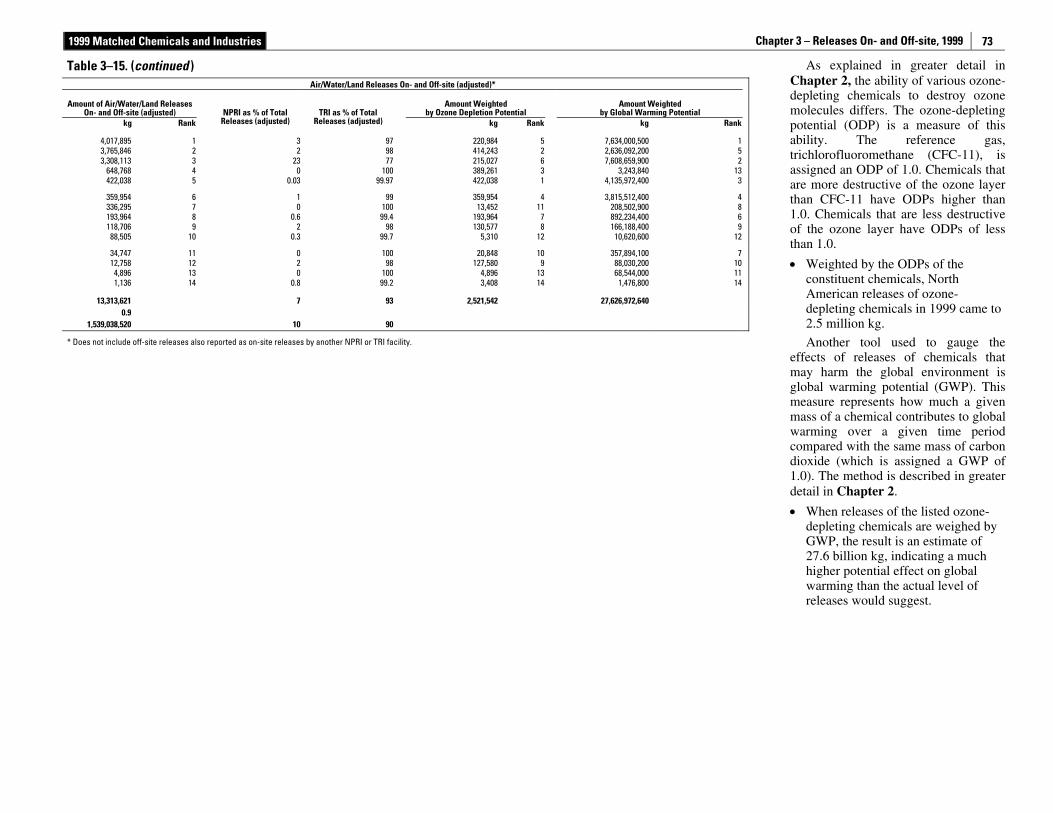
1999 Matched Chemicals and Industries Chapter 3 – Releases On- and Off-site, 1999
73
As explained in greater detail in Chapter 2, the ability of various ozone-depleting chemicals to destroy ozone molecules differs. The ozone-depleting potential (ODP) is a measure of this ability. The reference gas, trichlorofluoromethane (CFC-11), is assigned an ODP of 1.0. Chemicals that are more destructive of the ozone layer than CFC-11 have ODPs higher than 1.0. Chemicals that are less destructive of the ozone layer have ODPs of less than 1.0.
• Weighted by the ODPs of the constituent chemicals, North American releases of ozone-depleting chemicals in 1999 came to 2.5 million kg.
Another tool used to gauge the effects of releases of chemicals that may harm the global environment is global warming potential (GWP). This measure represents how much a given mass of a chemical contributes to global warming over a given time period compared with the same mass of carbon dioxide (which is assigned a GWP of 1.0). The method is described in greater detail in Chapter 2.
• When releases of the listed ozone-depleting chemicals are weighed by GWP, the result is an estimate of 27.6 billion kg, indicating a much higher potential effect on global warming than the actual level of releases would suggest.
Table 3–15. (continued ) Air/Water/Land Releases On- and Off-site (adjusted)*
Amount of Air/Water/Land Releases
On- and Off-site (adjusted) Amount Weighted
by Ozone Depletion Potential Amount Weighted
by Global Warming Potential kg Rank
NPRI as % of Total Releases (adjusted)
TRI as % of Total Releases (adjusted) kg Rank kg Rank
4,017,895 1 3 97 220,984 5 7,634,000,500 1 3,765,846 2 2 98 414,243 2 2,636,092,200 5 3,308,113 3 23 77 215,027 6 7,608,659,900 2
648,768 4 0 100 389,261 3 3,243,840 13 422,038 5 0.03 99.97 422,038 1 4,135,972,400 3
359,954 6 1 99 359,954 4 3,815,512,400 4 336,295 7 0 100 13,452 11 208,502,900 8 193,964 8 0.6 99.4 193,964 7 892,234,400 6 118,706 9 2 98 130,577 8 166,188,400 9
88,505 10 0.3 99.7 5,310 12 10,620,600 12
34,747 11 0 100 20,848 10 357,894,100 7 12,758 12 2 98 127,580 9 88,030,200 10
4,896 13 0 100 4,896 13 68,544,000 11 1,136 14 0.8 99.2 3,408 14 1,476,800 14
13,313,621 7 93 2,521,542 27,626,972,640 0.9
1,539,038,520 10 90
* Does not include off-site releases also reported as on-site releases by another NPRI or TRI facility.
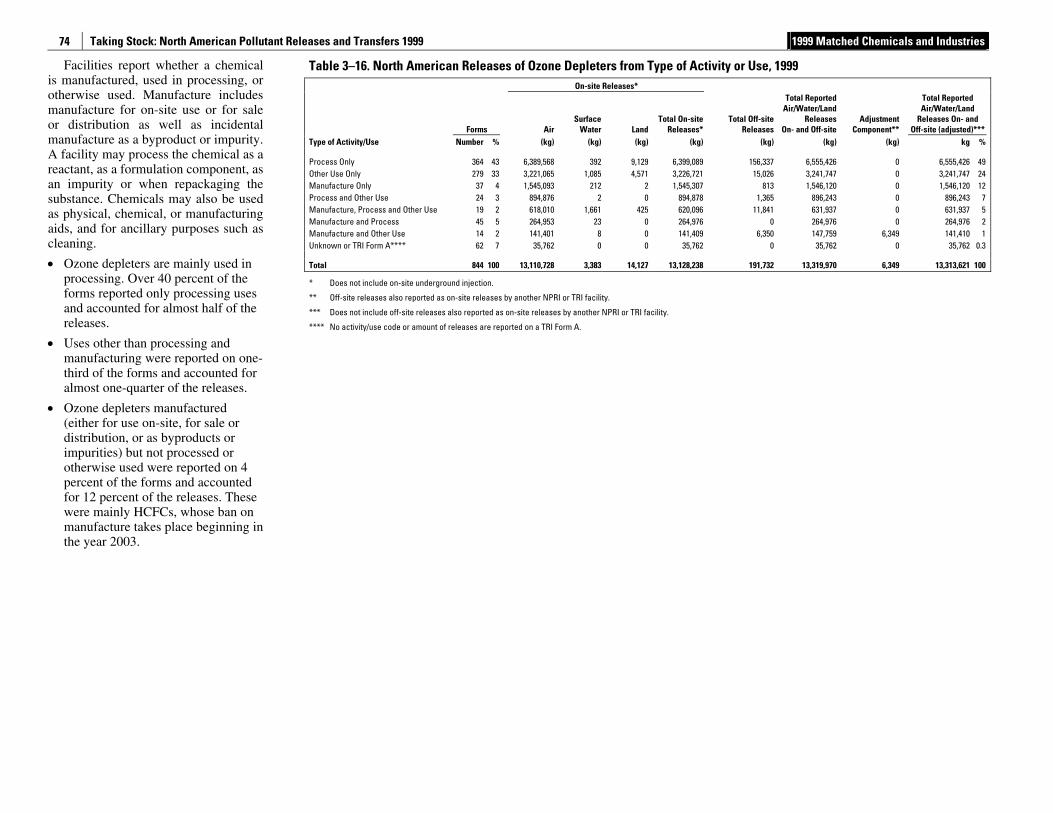
Taking Stock: North American Pollutant Releases and Transfers 1999 1999 Matched Chemicals and Industries
74
Facilities report whether a chemical is manufactured, used in processing, or otherwise used. Manufacture includes manufacture for on-site use or for sale or distribution as well as incidental manufacture as a byproduct or impurity. A facility may process the chemical as a reactant, as a formulation component, as an impurity or when repackaging the substance. Chemicals may also be used as physical, chemical, or manufacturing aids, and for ancillary purposes such as cleaning.
• Ozone depleters are mainly used in processing. Over 40 percent of the forms reported only processing uses and accounted for almost half of the releases.
• Uses other than processing and manufacturing were reported on one-third of the forms and accounted for almost one-quarter of the releases.
• Ozone depleters manufactured (either for use on-site, for sale or distribution, or as byproducts or impurities) but not processed or otherwise used were reported on 4 percent of the forms and accounted for 12 percent of the releases. These were mainly HCFCs, whose ban on manufacture takes place beginning in the year 2003.
Table 3–16. North American Releases of Ozone Depleters from Type of Activity or Use, 1999 On-site Releases*
Forms AirSurface
Water Land Total On-site
Releases*Total Off-site
Releases
Total Reported Air/Water/Land
ReleasesOn- and Off-site
Adjustment Component**
Total Reported Air/Water/Land
Releases On- and Off-site (adjusted)***
Type of Activity/Use Number % (kg) (kg) (kg) (kg) (kg) (kg) (kg) kg %
Process Only 364 43 6,389,568 392 9,129 6,399,089 156,337 6,555,426 0 6,555,426 49 Other Use Only 279 33 3,221,065 1,085 4,571 3,226,721 15,026 3,241,747 0 3,241,747 24 Manufacture Only 37 4 1,545,093 212 2 1,545,307 813 1,546,120 0 1,546,120 12 Process and Other Use 24 3 894,876 2 0 894,878 1,365 896,243 0 896,243 7 Manufacture, Process and Other Use 19 2 618,010 1,661 425 620,096 11,841 631,937 0 631,937 5 Manufacture and Process 45 5 264,953 23 0 264,976 0 264,976 0 264,976 2 Manufacture and Other Use 14 2 141,401 8 0 141,409 6,350 147,759 6,349 141,410 1 Unknown or TRI Form A**** 62 7 35,762 0 0 35,762 0 35,762 0 35,762 0.3
Total 844 100 13,110,728 3,383 14,127 13,128,238 191,732 13,319,970 6,349 13,313,621 100
* Does not include on-site underground injection.
** Off-site releases also reported as on-site releases by another NPRI or TRI facility.
*** Does not include off-site releases also reported as on-site releases by another NPRI or TRI facility.
**** No activity/use code or amount of releases are reported on a TRI Form A.
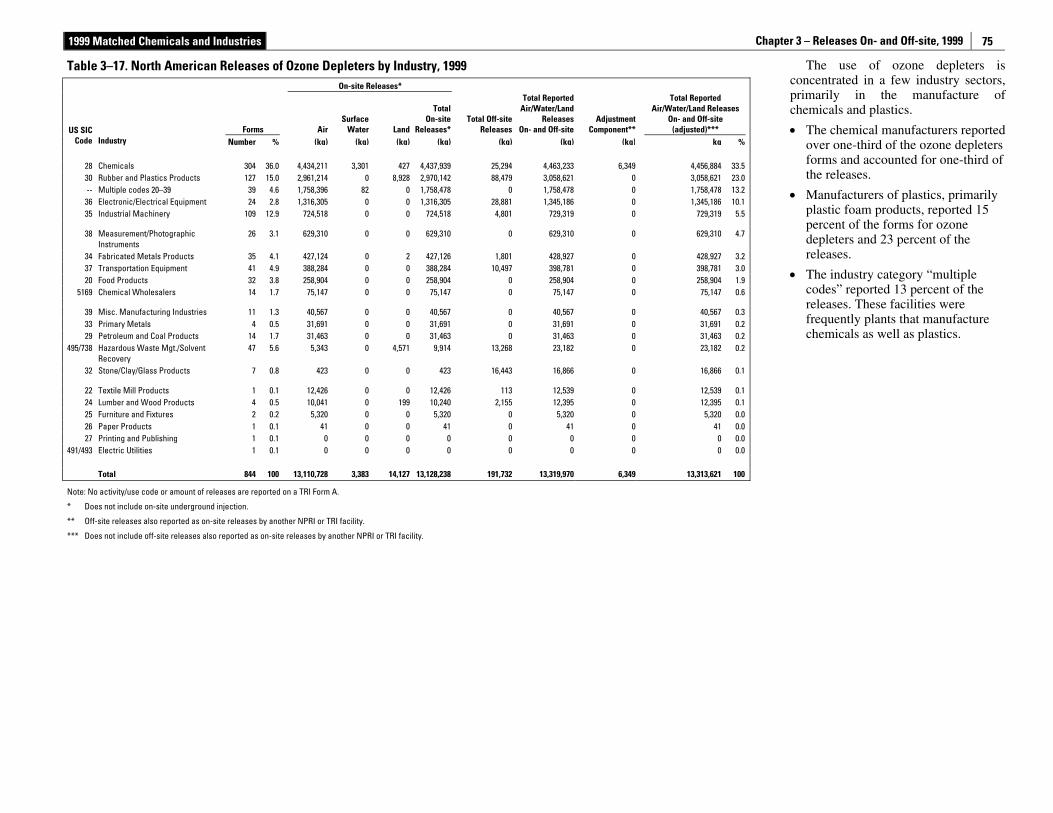
1999 Matched Chemicals and Industries Chapter 3 – Releases On- and Off-site, 1999
75
The use of ozone depleters is concentrated in a few industry sectors, primarily in the manufacture of chemicals and plastics.
• The chemical manufacturers reported over one-third of the ozone depleters forms and accounted for one-third of the releases.
• Manufacturers of plastics, primarily plastic foam products, reported 15 percent of the forms for ozone depleters and 23 percent of the releases.
• The industry category “multiple codes” reported 13 percent of the releases. These facilities were frequently plants that manufacture chemicals as well as plastics.
Table 3–17. North American Releases of Ozone Depleters by Industry, 1999 On-site Releases*
Forms AirSurface
Water Land
TotalOn-site
Releases*Total Off-site
Releases
Total Reported Air/Water/Land
ReleasesOn- and Off-site
Adjustment Component**
Total Reported Air/Water/Land Releases
On- and Off-site (adjusted)*** US SIC
Code Industry Number % (kg) (kg) (kg) (kg) (kg) (kg) (kg) kg %
28 Chemicals 304 36.0 4,434,211 3,301 427 4,437,939 25,294 4,463,233 6,349 4,456,884 33.530 Rubber and Plastics Products 127 15.0 2,961,214 0 8,928 2,970,142 88,479 3,058,621 0 3,058,621 23.0-- Multiple codes 20–39 39 4.6 1,758,396 82 0 1,758,478 0 1,758,478 0 1,758,478 13.2
36 Electronic/Electrical Equipment 24 2.8 1,316,305 0 0 1,316,305 28,881 1,345,186 0 1,345,186 10.135 Industrial Machinery 109 12.9 724,518 0 0 724,518 4,801 729,319 0 729,319 5.5
38 Measurement/Photographic Instruments
26 3.1 629,310 0 0 629,310 0 629,310 0 629,310 4.7
34 Fabricated Metals Products 35 4.1 427,124 0 2 427,126 1,801 428,927 0 428,927 3.237 Transportation Equipment 41 4.9 388,284 0 0 388,284 10,497 398,781 0 398,781 3.020 Food Products 32 3.8 258,904 0 0 258,904 0 258,904 0 258,904 1.9
5169 Chemical Wholesalers 14 1.7 75,147 0 0 75,147 0 75,147 0 75,147 0.6
39 Misc. Manufacturing Industries 11 1.3 40,567 0 0 40,567 0 40,567 0 40,567 0.333 Primary Metals 4 0.5 31,691 0 0 31,691 0 31,691 0 31,691 0.229 Petroleum and Coal Products 14 1.7 31,463 0 0 31,463 0 31,463 0 31,463 0.2
495/738 Hazardous Waste Mgt./Solvent Recovery
47 5.6 5,343 0 4,571 9,914 13,268 23,182 0 23,182 0.2
32 Stone/Clay/Glass Products 7 0.8 423 0 0 423 16,443 16,866 0 16,866 0.1
22 Textile Mill Products 1 0.1 12,426 0 0 12,426 113 12,539 0 12,539 0.124 Lumber and Wood Products 4 0.5 10,041 0 199 10,240 2,155 12,395 0 12,395 0.125 Furniture and Fixtures 2 0.2 5,320 0 0 5,320 0 5,320 0 5,320 0.026 Paper Products 1 0.1 41 0 0 41 0 41 0 41 0.027 Printing and Publishing 1 0.1 0 0 0 0 0 0 0 0 0.0
491/493 Electric Utilities 1 0.1 0 0 0 0 0 0 0 0 0.0 Total 844 100 13,110,728 3,383 14,127 13,128,238 191,732 13,319,970 6,349 13,313,621 100
Note: No activity/use code or amount of releases are reported on a TRI Form A.
* Does not include on-site underground injection.
** Off-site releases also reported as on-site releases by another NPRI or TRI facility.
*** Does not include off-site releases also reported as on-site releases by another NPRI or TRI facility.
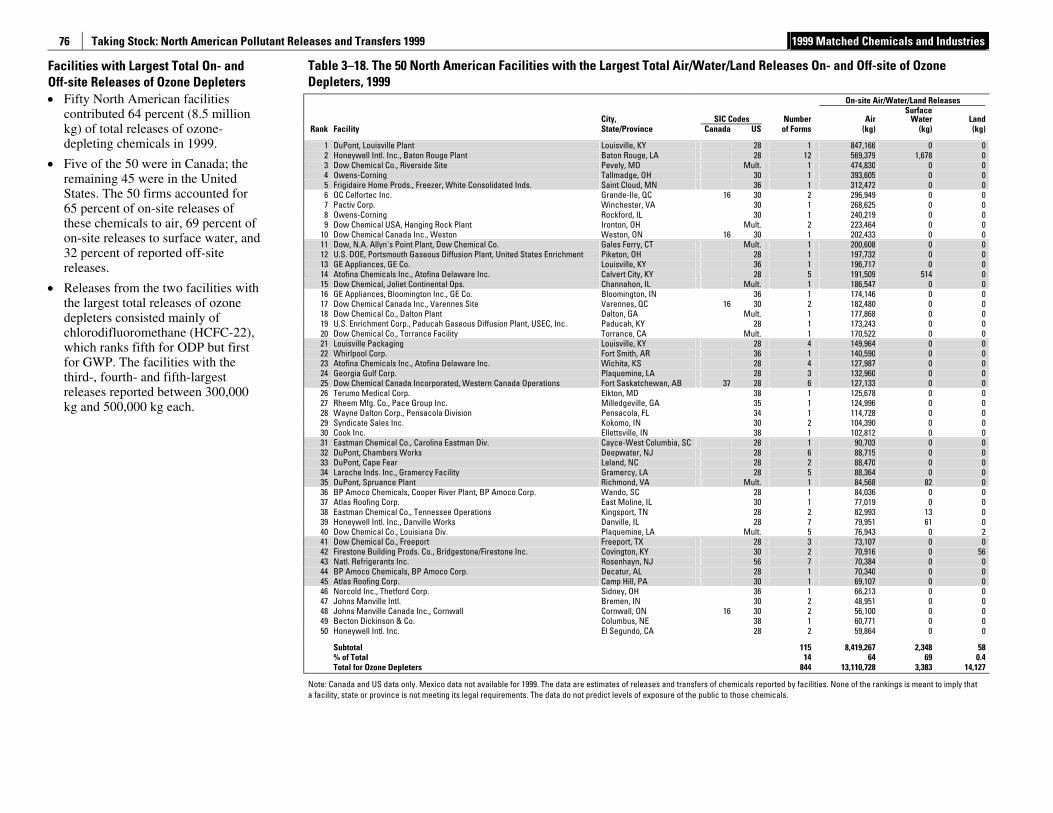
Taking Stock: North American Pollutant Releases and Transfers 1999 1999 Matched Chemicals and Industries
76
Facilities with Largest Total On- and Off-site Releases of Ozone Depleters • Fifty North American facilities
contributed 64 percent (8.5 million kg) of total releases of ozone-depleting chemicals in 1999.
• Five of the 50 were in Canada; the remaining 45 were in the United States. The 50 firms accounted for 65 percent of on-site releases of these chemicals to air, 69 percent of on-site releases to surface water, and 32 percent of reported off-site releases.
• Releases from the two facilities with the largest total releases of ozone depleters consisted mainly of chlorodifluoromethane (HCFC-22), which ranks fifth for ODP but first for GWP. The facilities with the third-, fourth- and fifth-largest releases reported between 300,000 kg and 500,000 kg each.
Table 3–18. The 50 North American Facilities with the Largest Total Air/Water/Land Releases On- and Off-site of Ozone Depleters, 1999
On-site Air/Water/Land Releases
City, SIC Codes Number AirSurface
Water Land Rank Facility State/Province Canada US of Forms (kg) (kg) (kg)
1 DuPont, Louisville Plant Louisville, KY 28 1 847,166 0 0 2 Honeywell Intl. Inc., Baton Rouge Plant Baton Rouge, LA 28 12 569,379 1,678 0 3 Dow Chemical Co., Riverside Site Pevely, MO Mult. 1 474,830 0 0 4 Owens-Corning Tallmadge, OH 30 1 393,605 0 0 5 Frigidaire Home Prods., Freezer, White Consolidated Inds. Saint Cloud, MN 36 1 312,472 0 0 6 OC Celfortec Inc. Grande-Ile, QC 16 30 2 296,949 0 0 7 Pactiv Corp. Winchester, VA 30 1 268,625 0 0 8 Owens-Corning Rockford, IL 30 1 240,219 0 0 9 Dow Chemical USA, Hanging Rock Plant Ironton, OH Mult. 2 223,464 0 0
10 Dow Chemical Canada Inc., Weston Weston, ON 16 30 1 202,433 0 0 11 Dow, N.A. Allyn's Point Plant, Dow Chemical Co. Gales Ferry, CT Mult. 1 200,608 0 0 12 U.S. DOE, Portsmouth Gaseous Diffusion Plant, United States Enrichment Piketon, OH 28 1 197,732 0 0 13 GE Appliances, GE Co. Louisville, KY 36 1 196,717 0 0 14 Atofina Chemicals Inc., Atofina Delaware Inc. Calvert City, KY 28 5 191,509 514 0 15 Dow Chemical, Joliet Continental Ops. Channahon, IL Mult. 1 186,547 0 0 16 GE Appliances, Bloomington Inc., GE Co. Bloomington, IN 36 1 174,146 0 0 17 Dow Chemical Canada Inc., Varennes Site Varennes, QC 16 30 2 182,480 0 0 18 Dow Chemical Co., Dalton Plant Dalton, GA Mult. 1 177,868 0 0 19 U.S. Enrichment Corp., Paducah Gaseous Diffusion Plant, USEC, Inc. Paducah, KY 28 1 173,243 0 0 20 Dow Chemical Co., Torrance Facility Torrance, CA Mult. 1 170,522 0 0 21 Louisville Packaging Louisville, KY 28 4 149,964 0 0 22 Whirlpool Corp. Fort Smith, AR 36 1 140,590 0 0 23 Atofina Chemicals Inc., Atofina Delaware Inc. Wichita, KS 28 4 127,987 0 0 24 Georgia Gulf Corp. Plaquemine, LA 28 3 132,960 0 0 25 Dow Chemical Canada Incorporated, Western Canada Operations Fort Saskatchewan, AB 37 28 6 127,133 0 0 26 Terumo Medical Corp. Elkton, MD 38 1 125,678 0 0 27 Rheem Mfg. Co., Pace Group Inc. Milledgeville, GA 35 1 124,996 0 0 28 Wayne Dalton Corp., Pensacola Division Pensacola, FL 34 1 114,728 0 0 29 Syndicate Sales Inc. Kokomo, IN 30 2 104,390 0 0 30 Cook Inc. Ellettsville, IN 38 1 102,812 0 0 31 Eastman Chemical Co., Carolina Eastman Div. Cayce-West Columbia, SC 28 1 90,703 0 0 32 DuPont, Chambers Works Deepwater, NJ 28 6 88,715 0 0 33 DuPont, Cape Fear Leland, NC 28 2 88,470 0 0 34 Laroche Inds. Inc., Gramercy Facility Gramercy, LA 28 5 88,364 0 0 35 DuPont, Spruance Plant Richmond, VA Mult. 1 84,568 82 0 36 BP Amoco Chemicals, Cooper River Plant, BP Amoco Corp. Wando, SC 28 1 84,036 0 0 37 Atlas Roofing Corp. East Moline, IL 30 1 77,019 0 0 38 Eastman Chemical Co., Tennessee Operations Kingsport, TN 28 2 82,993 13 0 39 Honeywell Intl. Inc., Danville Works Danville, IL 28 7 79,951 61 0 40 Dow Chemical Co., Louisiana Div. Plaquemine, LA Mult. 5 76,943 0 2 41 Dow Chemical Co., Freeport Freeport, TX 28 3 73,107 0 0 42 Firestone Building Prods. Co., Bridgestone/Firestone Inc. Covington, KY 30 2 70,916 0 56 43 Natl. Refrigerants Inc. Rosenhayn, NJ 56 7 70,384 0 0 44 BP Amoco Chemicals, BP Amoco Corp. Decatur, AL 28 1 70,340 0 0 45 Atlas Roofing Corp. Camp Hill, PA 30 1 69,107 0 0 46 Norcold Inc., Thetford Corp. Sidney, OH 36 1 66,213 0 0 47 Johns Manville Intl. Bremen, IN 30 2 48,951 0 0 48 Johns Manville Canada Inc., Cornwall Cornwall, ON 16 30 2 56,100 0 0 49 Becton Dickinson & Co. Columbus, NE 38 1 60,771 0 0 50 Honeywell Intl. Inc. El Segundo, CA 28 2 59,864 0 0
Subtotal 115 8,419,267 2,348 58 % of Total 14 64 69 0.4 Total for Ozone Depleters 844 13,110,728 3,383 14,127
Note: Canada and US data only. Mexico data not available for 1999. The data are estimates of releases and transfers of chemicals reported by facilities. None of the rankings is meant to imply that a facility, state or province is not meeting its legal requirements. The data do not predict levels of exposure of the public to those chemicals.
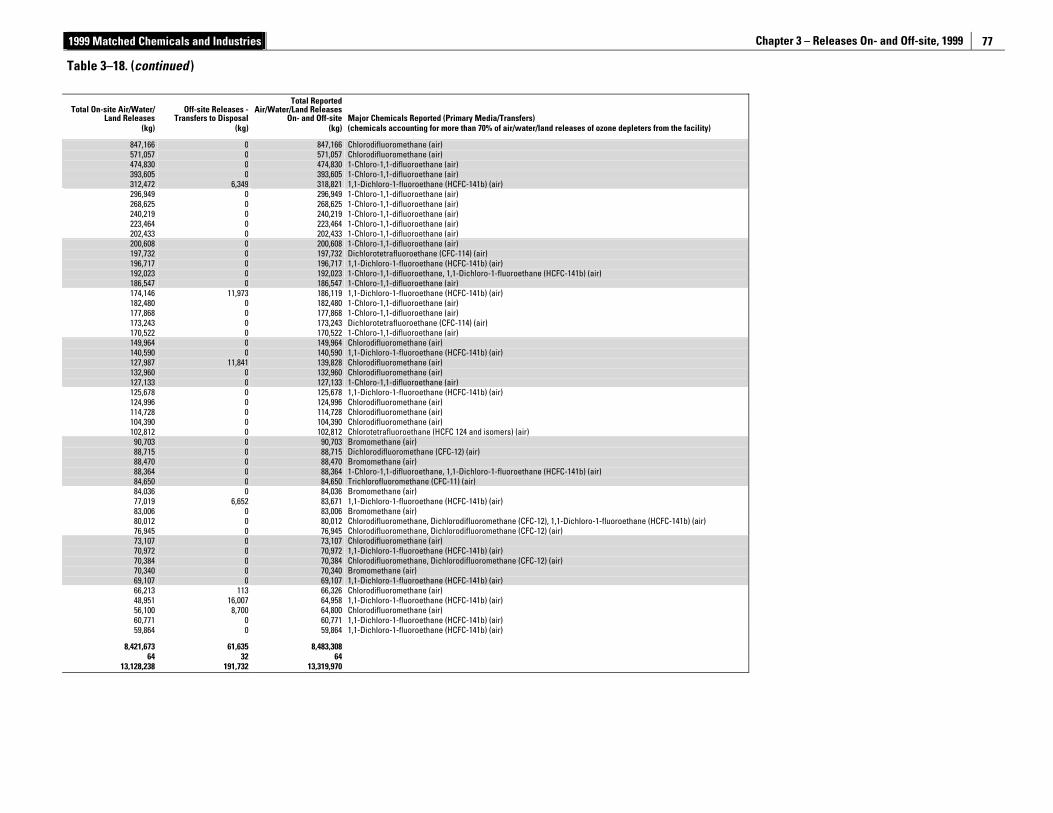
1999 Matched Chemicals and Industries Chapter 3 – Releases On- and Off-site, 1999
77
Table 3–18. (continued )
Total On-site Air/Water/ Land Releases
Off-site Releases - Transfers to Disposal
Total Reported Air/Water/Land Releases
On- and Off-site Major Chemicals Reported (Primary Media/Transfers) (kg) (kg) (kg) (chemicals accounting for more than 70% of air/water/land releases of ozone depleters from the facility)
847,166 0 847,166 Chlorodifluoromethane (air) 571,057 0 571,057 Chlorodifluoromethane (air) 474,830 0 474,830 1-Chloro-1,1-difluoroethane (air) 393,605 0 393,605 1-Chloro-1,1-difluoroethane (air) 312,472 6,349 318,821 1,1-Dichloro-1-fluoroethane (HCFC-141b) (air) 296,949 0 296,949 1-Chloro-1,1-difluoroethane (air) 268,625 0 268,625 1-Chloro-1,1-difluoroethane (air) 240,219 0 240,219 1-Chloro-1,1-difluoroethane (air) 223,464 0 223,464 1-Chloro-1,1-difluoroethane (air) 202,433 0 202,433 1-Chloro-1,1-difluoroethane (air) 200,608 0 200,608 1-Chloro-1,1-difluoroethane (air) 197,732 0 197,732 Dichlorotetrafluoroethane (CFC-114) (air) 196,717 0 196,717 1,1-Dichloro-1-fluoroethane (HCFC-141b) (air) 192,023 0 192,023 1-Chloro-1,1-difluoroethane, 1,1-Dichloro-1-fluoroethane (HCFC-141b) (air) 186,547 0 186,547 1-Chloro-1,1-difluoroethane (air) 174,146 11,973 186,119 1,1-Dichloro-1-fluoroethane (HCFC-141b) (air) 182,480 0 182,480 1-Chloro-1,1-difluoroethane (air) 177,868 0 177,868 1-Chloro-1,1-difluoroethane (air) 173,243 0 173,243 Dichlorotetrafluoroethane (CFC-114) (air) 170,522 0 170,522 1-Chloro-1,1-difluoroethane (air) 149,964 0 149,964 Chlorodifluoromethane (air) 140,590 0 140,590 1,1-Dichloro-1-fluoroethane (HCFC-141b) (air) 127,987 11,841 139,828 Chlorodifluoromethane (air) 132,960 0 132,960 Chlorodifluoromethane (air) 127,133 0 127,133 1-Chloro-1,1-difluoroethane (air) 125,678 0 125,678 1,1-Dichloro-1-fluoroethane (HCFC-141b) (air) 124,996 0 124,996 Chlorodifluoromethane (air) 114,728 0 114,728 Chlorodifluoromethane (air) 104,390 0 104,390 Chlorodifluoromethane (air) 102,812 0 102,812 Chlorotetrafluoroethane (HCFC 124 and isomers) (air)
90,703 0 90,703 Bromomethane (air) 88,715 0 88,715 Dichlorodifluoromethane (CFC-12) (air) 88,470 0 88,470 Bromomethane (air) 88,364 0 88,364 1-Chloro-1,1-difluoroethane, 1,1-Dichloro-1-fluoroethane (HCFC-141b) (air) 84,650 0 84,650 Trichlorofluoromethane (CFC-11) (air) 84,036 0 84,036 Bromomethane (air) 77,019 6,652 83,671 1,1-Dichloro-1-fluoroethane (HCFC-141b) (air) 83,006 0 83,006 Bromomethane (air) 80,012 0 80,012 Chlorodifluoromethane, Dichlorodifluoromethane (CFC-12), 1,1-Dichloro-1-fluoroethane (HCFC-141b) (air) 76,945 0 76,945 Chlorodifluoromethane, Dichlorodifluoromethane (CFC-12) (air) 73,107 0 73,107 Chlorodifluoromethane (air) 70,972 0 70,972 1,1-Dichloro-1-fluoroethane (HCFC-141b) (air) 70,384 0 70,384 Chlorodifluoromethane, Dichlorodifluoromethane (CFC-12) (air) 70,340 0 70,340 Bromomethane (air) 69,107 0 69,107 1,1-Dichloro-1-fluoroethane (HCFC-141b) (air) 66,213 113 66,326 Chlorodifluoromethane (air) 48,951 16,007 64,958 1,1-Dichloro-1-fluoroethane (HCFC-141b) (air) 56,100 8,700 64,800 Chlorodifluoromethane (air) 60,771 0 60,771 1,1-Dichloro-1-fluoroethane (HCFC-141b) (air) 59,864 0 59,864 1,1-Dichloro-1-fluoroethane (HCFC-141b) (air)
8,421,673 61,635 8,483,308 64 32 64
13,128,238 191,732 13,319,970
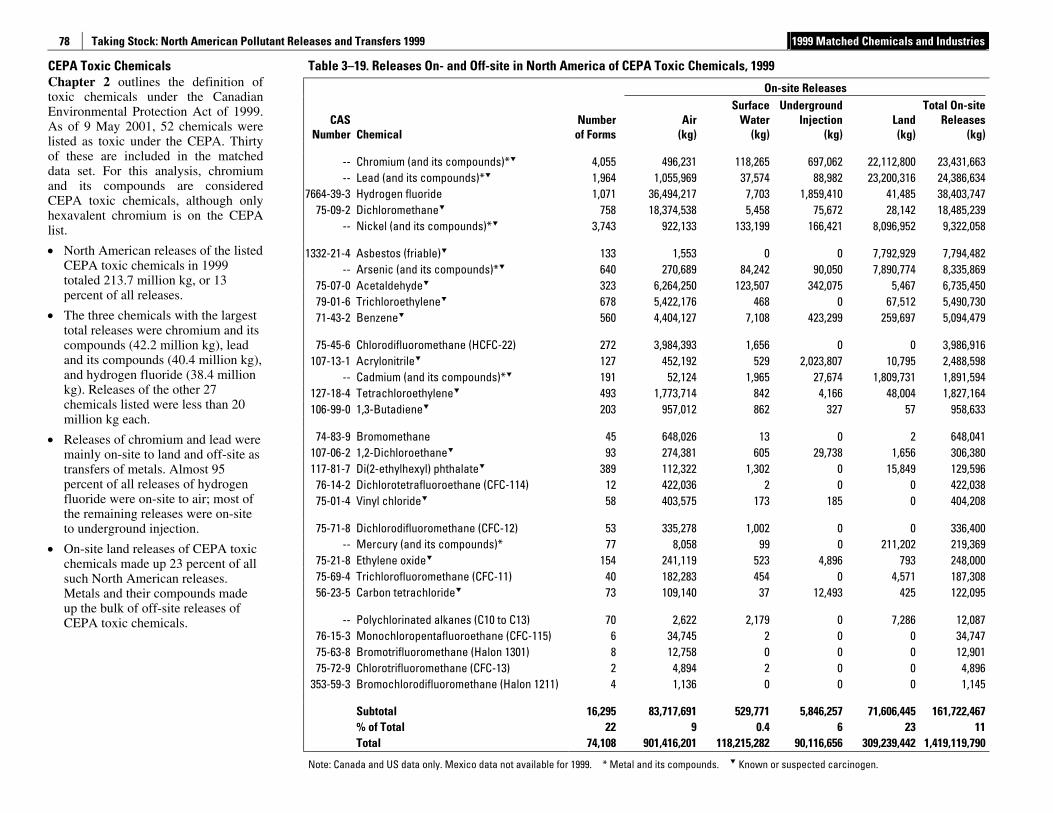
Taking Stock: North American Pollutant Releases and Transfers 1999 1999 Matched Chemicals and Industries
78
CEPA Toxic Chemicals Chapter 2 outlines the definition of toxic chemicals under the Canadian Environmental Protection Act of 1999. As of 9 May 2001, 52 chemicals were listed as toxic under the CEPA. Thirty of these are included in the matched data set. For this analysis, chromium and its compounds are considered CEPA toxic chemicals, although only hexavalent chromium is on the CEPA list.
• North American releases of the listed CEPA toxic chemicals in 1999 totaled 213.7 million kg, or 13 percent of all releases.
• The three chemicals with the largest total releases were chromium and its compounds (42.2 million kg), lead and its compounds (40.4 million kg), and hydrogen fluoride (38.4 million kg). Releases of the other 27 chemicals listed were less than 20 million kg each.
• Releases of chromium and lead were mainly on-site to land and off-site as transfers of metals. Almost 95 percent of all releases of hydrogen fluoride were on-site to air; most of the remaining releases were on-site to underground injection.
• On-site land releases of CEPA toxic chemicals made up 23 percent of all such North American releases. Metals and their compounds made up the bulk of off-site releases of CEPA toxic chemicals.
Table 3–19. Releases On- and Off-site in North America of CEPA Toxic Chemicals, 1999
On-site Releases
CAS Number Chemical
Number of Forms
Air(kg)
Surface Water
(kg)
Underground Injection
(kg)Land(kg)
Total On-site Releases
(kg)
-- Chromium (and its compounds)* 4,055 496,231 118,265 697,062 22,112,800 23,431,663 -- Lead (and its compounds)* 1,964 1,055,969 37,574 88,982 23,200,316 24,386,634
7664-39-3 Hydrogen fluoride 1,071 36,494,217 7,703 1,859,410 41,485 38,403,747 75-09-2 Dichloromethane 758 18,374,538 5,458 75,672 28,142 18,485,239
-- Nickel (and its compounds)* 3,743 922,133 133,199 166,421 8,096,952 9,322,058
1332-21-4 Asbestos (friable) 133 1,553 0 0 7,792,929 7,794,482 -- Arsenic (and its compounds)* 640 270,689 84,242 90,050 7,890,774 8,335,869
75-07-0 Acetaldehyde 323 6,264,250 123,507 342,075 5,467 6,735,450 79-01-6 Trichloroethylene 678 5,422,176 468 0 67,512 5,490,730 71-43-2 Benzene 560 4,404,127 7,108 423,299 259,697 5,094,479
75-45-6 Chlorodifluoromethane (HCFC-22) 272 3,984,393 1,656 0 0 3,986,916 107-13-1 Acrylonitrile 127 452,192 529 2,023,807 10,795 2,488,598
-- Cadmium (and its compounds)* 191 52,124 1,965 27,674 1,809,731 1,891,594 127-18-4 Tetrachloroethylene 493 1,773,714 842 4,166 48,004 1,827,164 106-99-0 1,3-Butadiene 203 957,012 862 327 57 958,633
74-83-9 Bromomethane 45 648,026 13 0 2 648,041 107-06-2 1,2-Dichloroethane 93 274,381 605 29,738 1,656 306,380 117-81-7 Di(2-ethylhexyl) phthalate 389 112,322 1,302 0 15,849 129,596
76-14-2 Dichlorotetrafluoroethane (CFC-114) 12 422,036 2 0 0 422,038 75-01-4 Vinyl chloride 58 403,575 173 185 0 404,208
75-71-8 Dichlorodifluoromethane (CFC-12) 53 335,278 1,002 0 0 336,400 -- Mercury (and its compounds)* 77 8,058 99 0 211,202 219,369
75-21-8 Ethylene oxide 154 241,119 523 4,896 793 248,000 75-69-4 Trichlorofluoromethane (CFC-11) 40 182,283 454 0 4,571 187,308 56-23-5 Carbon tetrachloride 73 109,140 37 12,493 425 122,095
-- Polychlorinated alkanes (C10 to C13) 70 2,622 2,179 0 7,286 12,087 76-15-3 Monochloropentafluoroethane (CFC-115) 6 34,745 2 0 0 34,747 75-63-8 Bromotrifluoromethane (Halon 1301) 8 12,758 0 0 0 12,901 75-72-9 Chlorotrifluoromethane (CFC-13) 2 4,894 2 0 0 4,896
353-59-3 Bromochlorodifluoromethane (Halon 1211) 4 1,136 0 0 0 1,145
Subtotal 16,295 83,717,691 529,771 5,846,257 71,606,445 161,722,467 % of Total 22 9 0.4 6 23 11 Total 74,108 901,416,201 118,215,282 90,116,656 309,239,442 1,419,119,790
Note: Canada and US data only. Mexico data not available for 1999. * Metal and its compounds. Known or suspected carcinogen.
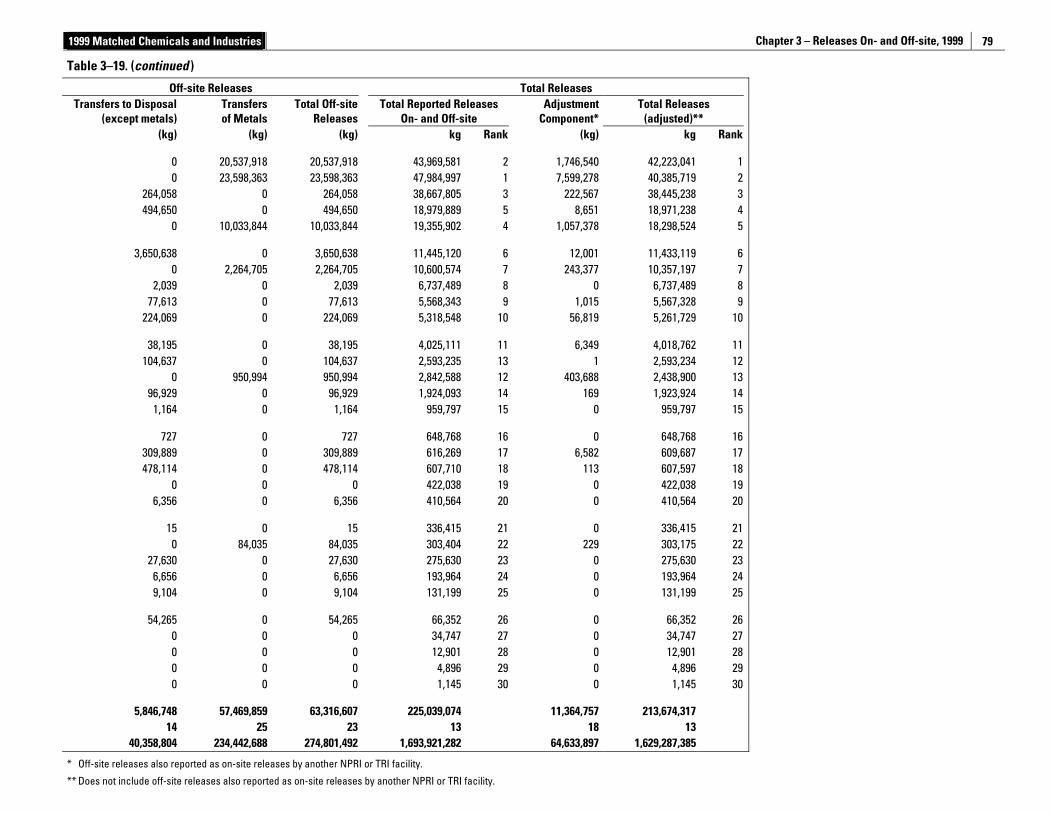
1999 Matched Chemicals and Industries Chapter 3 – Releases On- and Off-site, 1999
79
Table 3–19. (continued )
Off-site Releases Total Releases Transfers to Disposal
(except metals) Transfers of Metals
Total Off-site Releases
Total Reported Releases On- and Off-site
Adjustment Component*
Total Releases (adjusted)**
(kg) (kg) (kg) kg Rank (kg) kg Rank
0 20,537,918 20,537,918 43,969,581 2 1,746,540 42,223,041 10 23,598,363 23,598,363 47,984,997 1 7,599,278 40,385,719 2
264,058 0 264,058 38,667,805 3 222,567 38,445,238 3494,650 0 494,650 18,979,889 5 8,651 18,971,238 4
0 10,033,844 10,033,844 19,355,902 4 1,057,378 18,298,524 5
3,650,638 0 3,650,638 11,445,120 6 12,001 11,433,119 60 2,264,705 2,264,705 10,600,574 7 243,377 10,357,197 7
2,039 0 2,039 6,737,489 8 0 6,737,489 877,613 0 77,613 5,568,343 9 1,015 5,567,328 9
224,069 0 224,069 5,318,548 10 56,819 5,261,729 10
38,195 0 38,195 4,025,111 11 6,349 4,018,762 11104,637 0 104,637 2,593,235 13 1 2,593,234 12
0 950,994 950,994 2,842,588 12 403,688 2,438,900 1396,929 0 96,929 1,924,093 14 169 1,923,924 14
1,164 0 1,164 959,797 15 0 959,797 15
727 0 727 648,768 16 0 648,768 16309,889 0 309,889 616,269 17 6,582 609,687 17478,114 0 478,114 607,710 18 113 607,597 18
0 0 0 422,038 19 0 422,038 196,356 0 6,356 410,564 20 0 410,564 20
15 0 15 336,415 21 0 336,415 210 84,035 84,035 303,404 22 229 303,175 22
27,630 0 27,630 275,630 23 0 275,630 236,656 0 6,656 193,964 24 0 193,964 249,104 0 9,104 131,199 25 0 131,199 25
54,265 0 54,265 66,352 26 0 66,352 260 0 0 34,747 27 0 34,747 270 0 0 12,901 28 0 12,901 280 0 0 4,896 29 0 4,896 290 0 0 1,145 30 0 1,145 30
5,846,748 57,469,859 63,316,607 225,039,074 11,364,757 213,674,31714 25 23 13 18 13
40,358,804 234,442,688 274,801,492 1,693,921,282 64,633,897 1,629,287,385
* Off-site releases also reported as on-site releases by another NPRI or TRI facility.
** Does not include off-site releases also reported as on-site releases by another NPRI or TRI facility.
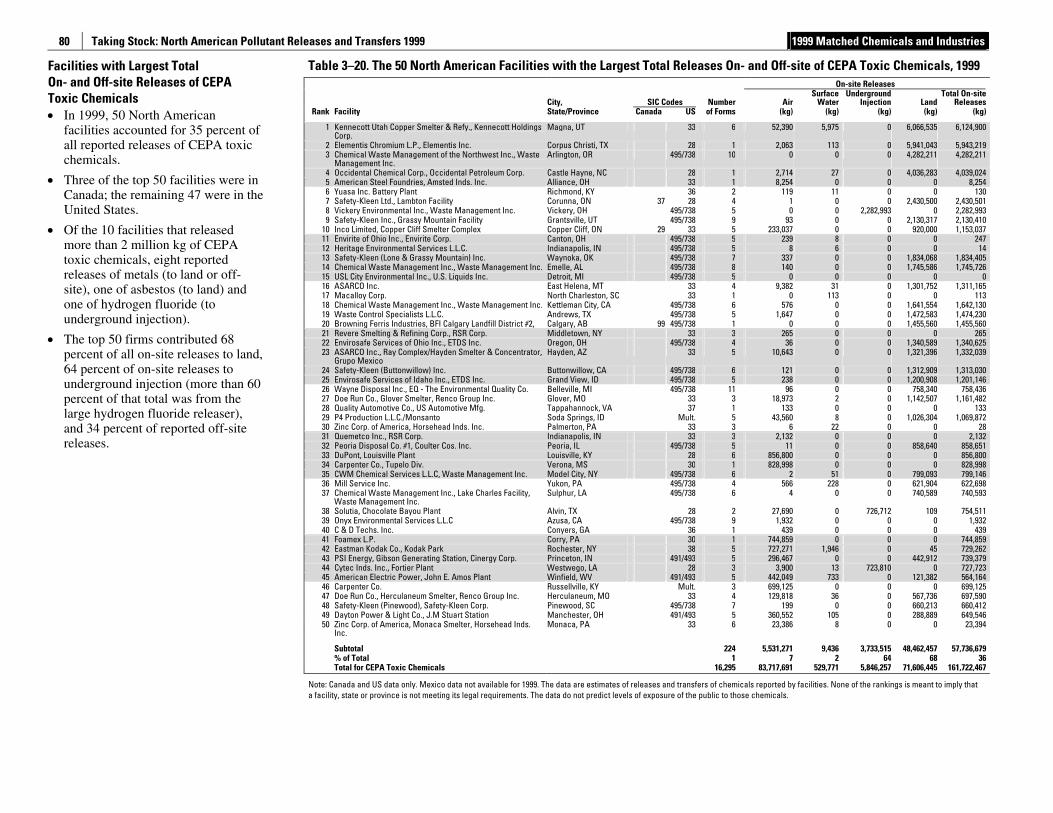
Taking Stock: North American Pollutant Releases and Transfers 1999 1999 Matched Chemicals and Industries
80
Facilities with Largest Total On- and Off-site Releases of CEPA Toxic Chemicals • In 1999, 50 North American
facilities accounted for 35 percent of all reported releases of CEPA toxic chemicals.
• Three of the top 50 facilities were in Canada; the remaining 47 were in the United States.
• Of the 10 facilities that released more than 2 million kg of CEPA toxic chemicals, eight reported releases of metals (to land or off-site), one of asbestos (to land) and one of hydrogen fluoride (to underground injection).
• The top 50 firms contributed 68 percent of all on-site releases to land, 64 percent of on-site releases to underground injection (more than 60 percent of that total was from the large hydrogen fluoride releaser), and 34 percent of reported off-site releases.
Table 3–20. The 50 North American Facilities with the Largest Total Releases On- and Off-site of CEPA Toxic Chemicals, 1999 On-site Releases
City, SIC Codes Number AirSurface
WaterUnderground
Injection LandTotal On-site
Releases Rank Facility State/Province Canada US of Forms (kg) (kg) (kg) (kg) (kg)
1 Kennecott Utah Copper Smelter & Refy., Kennecott Holdings Corp.
Magna, UT 33 6 52,390 5,975 0 6,066,535 6,124,900
2 Elementis Chromium L.P., Elementis Inc. Corpus Christi, TX 28 1 2,063 113 0 5,941,043 5,943,219 3 Chemical Waste Management of the Northwest Inc., Waste
Management Inc. Arlington, OR 495/738 10 0 0 0 4,282,211 4,282,211
4 Occidental Chemical Corp., Occidental Petroleum Corp. Castle Hayne, NC 28 1 2,714 27 0 4,036,283 4,039,024 5 American Steel Foundries, Amsted Inds. Inc. Alliance, OH 33 1 8,254 0 0 0 8,254 6 Yuasa Inc. Battery Plant Richmond, KY 36 2 119 11 0 0 130 7 Safety-Kleen Ltd., Lambton Facility Corunna, ON 37 28 4 1 0 0 2,430,500 2,430,501 8 Vickery Environmental Inc., Waste Management Inc. Vickery, OH 495/738 5 0 0 2,282,993 0 2,282,993 9 Safety-Kleen Inc., Grassy Mountain Facility Grantsville, UT 495/738 9 93 0 0 2,130,317 2,130,410
10 Inco Limited, Copper Cliff Smelter Complex Copper Cliff, ON 29 33 5 233,037 0 0 920,000 1,153,037 11 Envirite of Ohio Inc., Envirite Corp. Canton, OH 495/738 5 239 8 0 0 247 12 Heritage Environmental Services L.L.C. Indianapolis, IN 495/738 5 8 6 0 0 14 13 Safety-Kleen (Lone & Grassy Mountain) Inc. Waynoka, OK 495/738 7 337 0 0 1,834,068 1,834,405 14 Chemical Waste Management Inc., Waste Management Inc. Emelle, AL 495/738 8 140 0 0 1,745,586 1,745,726 15 USL City Environmental Inc., U.S. Liquids Inc. Detroit, MI 495/738 5 0 0 0 0 0 16 ASARCO Inc. East Helena, MT 33 4 9,382 31 0 1,301,752 1,311,165 17 Macalloy Corp. North Charleston, SC 33 1 0 113 0 0 113 18 Chemical Waste Management Inc., Waste Management Inc. Kettleman City, CA 495/738 6 576 0 0 1,641,554 1,642,130 19 Waste Control Specialists L.L.C. Andrews, TX 495/738 5 1,647 0 0 1,472,583 1,474,230 20 Browning Ferris Industries, BFI Calgary Landfill District #2, Calgary, AB 99 495/738 1 0 0 0 1,455,560 1,455,560 21 Revere Smelting & Refining Corp., RSR Corp. Middletown, NY 33 3 265 0 0 0 265 22 Envirosafe Services of Ohio Inc., ETDS Inc. Oregon, OH 495/738 4 36 0 0 1,340,589 1,340,625 23 ASARCO Inc., Ray Complex/Hayden Smelter & Concentrator,
Grupo Mexico Hayden, AZ 33 5 10,643 0 0 1,321,396 1,332,039
24 Safety-Kleen (Buttonwillow) Inc. Buttonwillow, CA 495/738 6 121 0 0 1,312,909 1,313,030 25 Envirosafe Services of Idaho Inc., ETDS Inc. Grand View, ID 495/738 5 238 0 0 1,200,908 1,201,146 26 Wayne Disposal Inc., EQ - The Environmental Quality Co. Belleville, MI 495/738 11 96 0 0 758,340 758,436 27 Doe Run Co., Glover Smelter, Renco Group Inc. Glover, MO 33 3 18,973 2 0 1,142,507 1,161,482 28 Quality Automotive Co., US Automotive Mfg. Tappahannock, VA 37 1 133 0 0 0 133 29 P4 Production L.L.C./Monsanto Soda Springs, ID Mult. 5 43,560 8 0 1,026,304 1,069,872 30 Zinc Corp. of America, Horsehead Inds. Inc. Palmerton, PA 33 3 6 22 0 0 28 31 Quemetco Inc., RSR Corp. Indianapolis, IN 33 3 2,132 0 0 0 2,132 32 Peoria Disposal Co. #1, Coulter Cos. Inc. Peoria, IL 495/738 5 11 0 0 858,640 858,651 33 DuPont, Louisville Plant Louisville, KY 28 6 856,800 0 0 0 856,800 34 Carpenter Co., Tupelo Div. Verona, MS 30 1 828,998 0 0 0 828,998 35 CWM Chemical Services L.L.C, Waste Management Inc. Model City, NY 495/738 6 2 51 0 799,093 799,146 36 Mill Service Inc. Yukon, PA 495/738 4 566 228 0 621,904 622,698 37 Chemical Waste Management Inc., Lake Charles Facility,
Waste Management Inc. Sulphur, LA 495/738 6 4 0 0 740,589 740,593
38 Solutia, Chocolate Bayou Plant Alvin, TX 28 2 27,690 0 726,712 109 754,511 39 Onyx Environmental Services L.L.C Azusa, CA 495/738 9 1,932 0 0 0 1,932 40 C & D Techs. Inc. Conyers, GA 36 1 439 0 0 0 439 41 Foamex L.P. Corry, PA 30 1 744,859 0 0 0 744,859 42 Eastman Kodak Co., Kodak Park Rochester, NY 38 5 727,271 1,946 0 45 729,262 43 PSI Energy, Gibson Generating Station, Cinergy Corp. Princeton, IN 491/493 5 296,467 0 0 442,912 739,379 44 Cytec Inds. Inc., Fortier Plant Westwego, LA 28 3 3,900 13 723,810 0 727,723 45 American Electric Power, John E. Amos Plant Winfield, WV 491/493 5 442,049 733 0 121,382 564,164 46 Carpenter Co. Russellville, KY Mult. 3 699,125 0 0 0 699,125 47 Doe Run Co., Herculaneum Smelter, Renco Group Inc. Herculaneum, MO 33 4 129,818 36 0 567,736 697,590 48 Safety-Kleen (Pinewood), Safety-Kleen Corp. Pinewood, SC 495/738 7 199 0 0 660,213 660,412 49 Dayton Power & Light Co., J.M Stuart Station Manchester, OH 491/493 5 360,552 105 0 288,889 649,546 50 Zinc Corp. of America, Monaca Smelter, Horsehead Inds.
Inc. Monaca, PA 33 6 23,386 8 0 0 23,394
Subtotal 224 5,531,271 9,436 3,733,515 48,462,457 57,736,679 % of Total 1 7 2 64 68 36 Total for CEPA Toxic Chemicals 16,295 83,717,691 529,771 5,846,257 71,606,445 161,722,467
Note: Canada and US data only. Mexico data not available for 1999. The data are estimates of releases and transfers of chemicals reported by facilities. None of the rankings is meant to imply that a facility, state or province is not meeting its legal requirements. The data do not predict levels of exposure of the public to those chemicals.
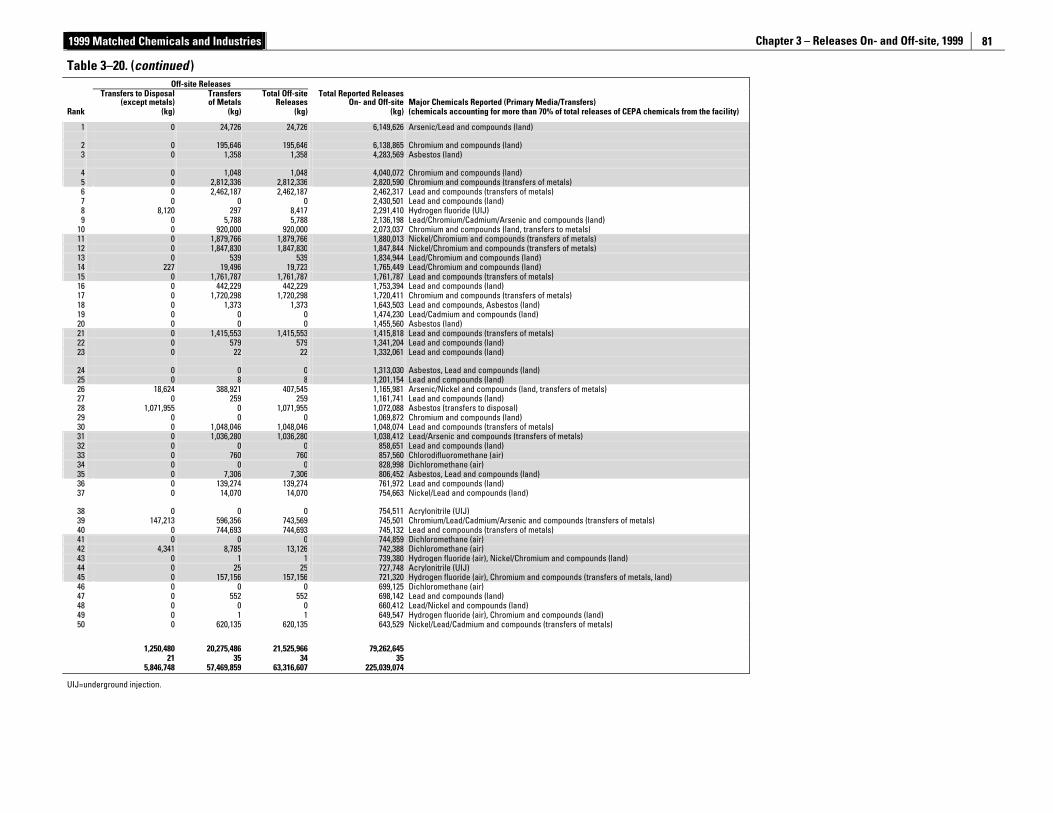
1999 Matched Chemicals and Industries Chapter 3 – Releases On- and Off-site, 1999
81
Table 3–20. (continued )
Off-site Releases
Transfers to Disposal
(except metals) Transfers of Metals
Total Off-site Releases
Total Reported ReleasesOn- and Off-site Major Chemicals Reported (Primary Media/Transfers)
Rank (kg) (kg) (kg) (kg) (chemicals accounting for more than 70% of total releases of CEPA chemicals from the facility)
1
0
24,726
24,726
6,149,626 Arsenic/Lead and compounds (land)
2 0 195,646 195,646 6,138,865 Chromium and compounds (land) 3
0
1,358
1,358
4,283,569 Asbestos (land)
4 0 1,048 1,048 4,040,072 Chromium and compounds (land) 5 0 2,812,336 2,812,336 2,820,590 Chromium and compounds (transfers of metals) 6 0 2,462,187 2,462,187 2,462,317 Lead and compounds (transfers of metals) 7 0 0 0 2,430,501 Lead and compounds (land) 8 8,120 297 8,417 2,291,410 Hydrogen fluoride (UIJ) 9 0 5,788 5,788 2,136,198 Lead/Chromium/Cadmium/Arsenic and compounds (land)
10 0 920,000 920,000 2,073,037 Chromium and compounds (land, transfers to metals) 11 0 1,879,766 1,879,766 1,880,013 Nickel/Chromium and compounds (transfers of metals) 12 0 1,847,830 1,847,830 1,847,844 Nickel/Chromium and compounds (transfers of metals) 13 0 539 539 1,834,944 Lead/Chromium and compounds (land) 14 227 19,496 19,723 1,765,449 Lead/Chromium and compounds (land) 15 0 1,761,787 1,761,787 1,761,787 Lead and compounds (transfers of metals) 16 0 442,229 442,229 1,753,394 Lead and compounds (land) 17 0 1,720,298 1,720,298 1,720,411 Chromium and compounds (transfers of metals) 18 0 1,373 1,373 1,643,503 Lead and compounds, Asbestos (land) 19 0 0 0 1,474,230 Lead/Cadmium and compounds (land) 20 0 0 0 1,455,560 Asbestos (land) 21 0 1,415,553 1,415,553 1,415,818 Lead and compounds (transfers of metals) 22 0 579 579 1,341,204 Lead and compounds (land) 23
0
22
22
1,332,061 Lead and compounds (land)
24 0 0 0 1,313,030 Asbestos, Lead and compounds (land) 25 0 8 8 1,201,154 Lead and compounds (land) 26 18,624 388,921 407,545 1,165,981 Arsenic/Nickel and compounds (land, transfers of metals) 27 0 259 259 1,161,741 Lead and compounds (land) 28 1,071,955 0 1,071,955 1,072,088 Asbestos (transfers to disposal) 29 0 0 0 1,069,872 Chromium and compounds (land) 30 0 1,048,046 1,048,046 1,048,074 Lead and compounds (transfers of metals) 31 0 1,036,280 1,036,280 1,038,412 Lead/Arsenic and compounds (transfers of metals) 32 0 0 0 858,651 Lead and compounds (land) 33 0 760 760 857,560 Chlorodifluoromethane (air) 34 0 0 0 828,998 Dichloromethane (air) 35 0 7,306 7,306 806,452 Asbestos, Lead and compounds (land) 36 0 139,274 139,274 761,972 Lead and compounds (land) 37
0
14,070
14,070
754,663 Nickel/Lead and compounds (land)
38 0 0 0 754,511 Acrylonitrile (UIJ) 39 147,213 596,356 743,569 745,501 Chromium/Lead/Cadmium/Arsenic and compounds (transfers of metals) 40 0 744,693 744,693 745,132 Lead and compounds (transfers of metals) 41 0 0 0 744,859 Dichloromethane (air) 42 4,341 8,785 13,126 742,388 Dichloromethane (air) 43 0 1 1 739,380 Hydrogen fluoride (air), Nickel/Chromium and compounds (land) 44 0 25 25 727,748 Acrylonitrile (UIJ) 45 0 157,156 157,156 721,320 Hydrogen fluoride (air), Chromium and compounds (transfers of metals, land) 46 0 0 0 699,125 Dichloromethane (air) 47 0 552 552 698,142 Lead and compounds (land) 48 0 0 0 660,412 Lead/Nickel and compounds (land) 49 0 1 1 649,547 Hydrogen fluoride (air), Chromium and compounds (land) 50
0
620,135
620,135
643,529 Nickel/Lead/Cadmium and compounds (transfers of metals)
1,250,480 20,275,486 21,525,966 79,262,645 21 35 34 35 5,846,748 57,469,859 63,316,607 225,039,074
UIJ=underground injection.
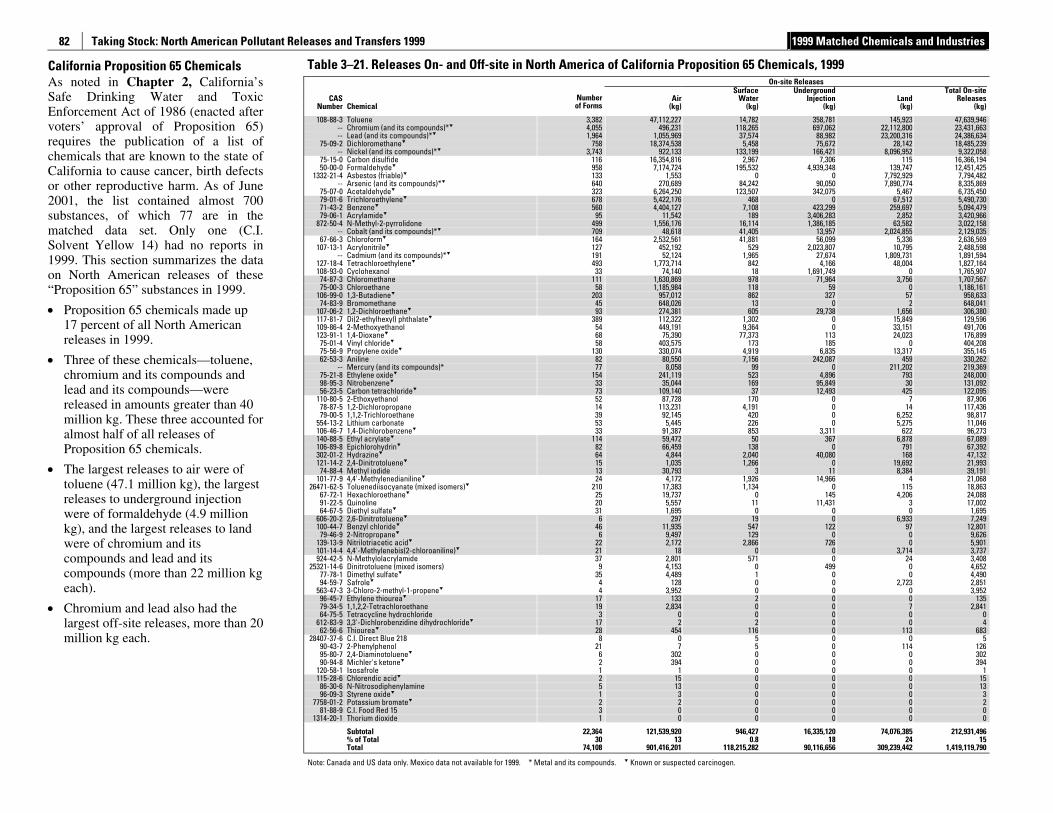
Taking Stock: North American Pollutant Releases and Transfers 1999 1999 Matched Chemicals and Industries
82
California Proposition 65 Chemicals As noted in Chapter 2, California’s Safe Drinking Water and Toxic Enforcement Act of 1986 (enacted after voters’ approval of Proposition 65) requires the publication of a list of chemicals that are known to the state of California to cause cancer, birth defects or other reproductive harm. As of June 2001, the list contained almost 700 substances, of which 77 are in the matched data set. Only one (C.I. Solvent Yellow 14) had no reports in 1999. This section summarizes the data on North American releases of these “Proposition 65” substances in 1999.
• Proposition 65 chemicals made up 17 percent of all North American releases in 1999.
• Three of these chemicals—toluene, chromium and its compounds and lead and its compounds—were released in amounts greater than 40 million kg. These three accounted for almost half of all releases of Proposition 65 chemicals.
• The largest releases to air were of toluene (47.1 million kg), the largest releases to underground injection were of formaldehyde (4.9 million kg), and the largest releases to land were of chromium and its compounds and lead and its compounds (more than 22 million kg each).
• Chromium and lead also had the largest off-site releases, more than 20 million kg each.
Table 3–21. Releases On- and Off-site in North America of California Proposition 65 Chemicals, 1999 On-site Releases
CAS AirSurface
WaterUnderground
Injection LandTotal On-site
Releases Number Chemical
Numberof Forms (kg) (kg) (kg) (kg) (kg)
108-88-3 Toluene 3,382 47,112,227 14,782 358,781 145,923 47,639,946
-- Chromium (and its compounds)* 4,055 496,231 118,265 697,062 22,112,800 23,431,663 -- Lead (and its compounds)* 1,964 1,055,969 37,574 88,982 23,200,316 24,386,634
75-09-2 Dichloromethane 758 18,374,538 5,458 75,672 28,142 18,485,239 -- Nickel (and its compounds)* 3,743 922,133 133,199 166,421 8,096,952 9,322,058
75-15-0 Carbon disulfide 116 16,354,816 2,967 7,306 115 16,366,194 50-00-0 Formaldehyde 958 7,174,724 195,532 4,939,348 139,747 12,451,425
1332-21-4 Asbestos (friable) 133 1,553 0 0 7,792,929 7,794,482 -- Arsenic (and its compounds)* 640 270,689 84,242 90,050 7,890,774 8,335,869
75-07-0 Acetaldehyde 323 6,264,250 123,507 342,075 5,467 6,735,450 79-01-6 Trichloroethylene 678 5,422,176 468 0 67,512 5,490,730 71-43-2 Benzene 560 4,404,127 7,108 423,299 259,697 5,094,479 79-06-1 Acrylamide 95 11,542 189 3,406,283 2,852 3,420,966
872-50-4 N-Methyl-2-pyrrolidone 499 1,556,176 16,114 1,386,185 63,582 3,022,158 -- Cobalt (and its compounds)* 709 48,618 41,405 13,957 2,024,855 2,129,035
67-66-3 Chloroform 164 2,532,561 41,881 56,099 5,336 2,636,569 107-13-1 Acrylonitrile 127 452,192 529 2,023,807 10,795 2,488,598
-- Cadmium (and its compounds)* 191 52,124 1,965 27,674 1,809,731 1,891,594 127-18-4 Tetrachloroethylene 493 1,773,714 842 4,166 48,004 1,827,164 108-93-0 Cyclohexanol 33 74,140 18 1,691,749 0 1,765,907 74-87-3 Chloromethane 111 1,630,869 978 71,964 3,756 1,707,567 75-00-3 Chloroethane 58 1,185,984 118 59 0 1,186,161
106-99-0 1,3-Butadiene 203 957,012 862 327 57 958,633 74-83-9 Bromomethane 45 648,026 13 0 2 648,041
107-06-2 1,2-Dichloroethane 93 274,381 605 29,738 1,656 306,380 117-81-7 Di(2-ethylhexyl) phthalate 389 112,322 1,302 0 15,849 129,596 109-86-4 2-Methoxyethanol 54 449,191 9,364 0 33,151 491,706 123-91-1 1,4-Dioxane 68 75,390 77,373 113 24,023 176,899 75-01-4 Vinyl chloride 58 403,575 173 185 0 404,208 75-56-9 Propylene oxide 130 330,074 4,919 6,835 13,317 355,145 62-53-3 Aniline 82 80,550 7,156 242,087 459 330,262
-- Mercury (and its compounds)* 77 8,058 99 0 211,202 219,369 75-21-8 Ethylene oxide 154 241,119 523 4,896 793 248,000 98-95-3 Nitrobenzene 33 35,044 169 95,849 30 131,092 56-23-5 Carbon tetrachloride 73 109,140 37 12,493 425 122,095
110-80-5 2-Ethoxyethanol 52 87,728 170 0 7 87,906 78-87-5 1,2-Dichloropropane 14 113,231 4,191 0 14 117,436 79-00-5 1,1,2-Trichloroethane 39 92,145 420 0 6,252 98,817
554-13-2 Lithium carbonate 53 5,445 226 0 5,275 11,046 106-46-7 1,4-Dichlorobenzene 33 91,387 853 3,311 622 96,273 140-88-5 Ethyl acrylate 114 59,472 50 367 6,878 67,089 106-89-8 Epichlorohydrin 82 66,459 138 0 791 67,392 302-01-2 Hydrazine 64 4,844 2,040 40,080 168 47,132 121-14-2 2,4-Dinitrotoluene 15 1,035 1,266 0 19,692 21,993 74-88-4 Methyl iodide 13 30,793 3 11 8,384 39,191
101-77-9 4,4'-Methylenedianiline 24 4,172 1,926 14,966 4 21,068 26471-62-5 Toluenediisocyanate (mixed isomers) 210 17,383 1,134 0 115 18,863
67-72-1 Hexachloroethane 25 19,737 0 145 4,206 24,088 91-22-5 Quinoline 20 5,557 11 11,431 3 17,002 64-67-5 Diethyl sulfate 31 1,695 0 0 0 1,695
606-20-2 2,6-Dinitrotoluene 6 297 19 0 6,933 7,249 100-44-7 Benzyl chloride 46 11,935 547 122 97 12,801 79-46-9 2-Nitropropane 6 9,497 129 0 0 9,626
139-13-9 Nitrilotriacetic acid 22 2,172 2,866 726 0 5,901 101-14-4 4,4'-Methylenebis(2-chloroaniline) 21 18 0 0 3,714 3,737 924-42-5 N-Methylolacrylamide 37 2,801 571 0 24 3,408
25321-14-6 Dinitrotoluene (mixed isomers) 9 4,153 0 499 0 4,652 77-78-1 Dimethyl sulfate 35 4,489 1 0 0 4,490 94-59-7 Safrole 4 128 0 0 2,723 2,851
563-47-3 3-Chloro-2-methyl-1-propene 4 3,952 0 0 0 3,952 96-45-7 Ethylene thiourea 17 133 2 0 0 135 79-34-5 1,1,2,2-Tetrachloroethane 19 2,834 0 0 7 2,841 64-75-5 Tetracycline hydrochloride 3 0 0 0 0 0
612-83-9 3,3'-Dichlorobenzidine dihydrochloride 17 2 2 0 0 4 62-56-6 Thiourea 28 454 116 0 113 683
28407-37-6 C.I. Direct Blue 218 8 0 5 0 0 5 90-43-7 2-Phenylphenol 21 7 5 0 114 126 95-80-7 2,4-Diaminotoluene 6 302 0 0 0 302 90-94-8 Michler's ketone 2 394 0 0 0 394
120-58-1 Isosafrole 1 1 0 0 0 1 115-28-6 Chlorendic acid 2 15 0 0 0 15 86-30-6 N-Nitrosodiphenylamine 5 13 0 0 0 13 96-09-3 Styrene oxide 1 3 0 0 0 3
7758-01-2 Potassium bromate 2 2 0 0 0 2 81-88-9 C.I. Food Red 15 3 0 0 0 0 0
1314-20-1 Thorium dioxide 1 0 0 0 0 0
Subtotal 22,364 121,539,920 946,427 16,335,120 74,076,385 212,931,496 % of Total 30 13 0.8 18 24 15 Total 74,108 901,416,201 118,215,282 90,116,656 309,239,442 1,419,119,790
Note: Canada and US data only. Mexico data not available for 1999. * Metal and its compounds. Known or suspected carcinogen.
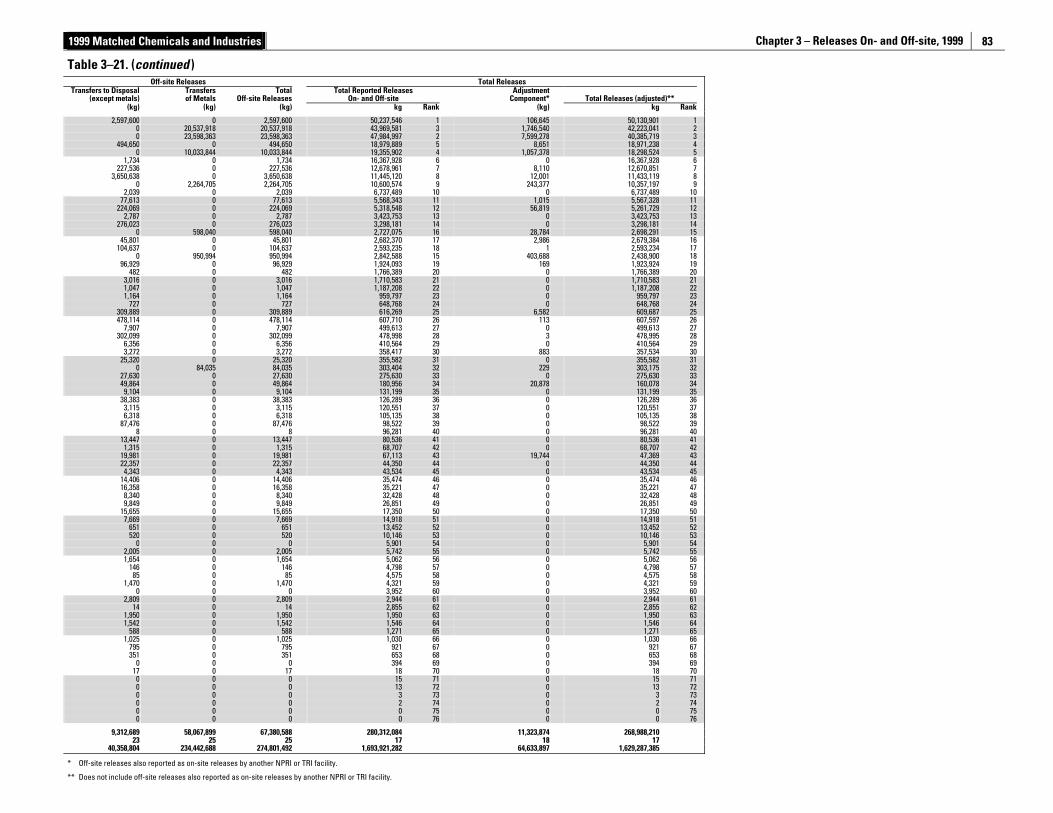
1999 Matched Chemicals and Industries Chapter 3 – Releases On- and Off-site, 1999
83
Table 3–21. (continued ) Off-site Releases Total Releases
Transfers to Disposal (except metals)
Transfers of Metals
Total Off-site Releases
Total Reported Releases On- and Off-site
AdjustmentComponent* Total Releases (adjusted)**
(kg) (kg) (kg) kg Rank (kg) kg Rank
2,597,600 0 2,597,600 50,237,546 1 106,645 50,130,901 1 0 20,537,918 20,537,918 43,969,581 3 1,746,540 42,223,041 2 0 23,598,363 23,598,363 47,984,997 2 7,599,278 40,385,719 3
494,650 0 494,650 18,979,889 5 8,651 18,971,238 4 0 10,033,844 10,033,844 19,355,902 4 1,057,378 18,298,524 5
1,734 0 1,734 16,367,928 6 0 16,367,928 6 227,536 0 227,536 12,678,961 7 8,110 12,670,851 7
3,650,638 0 3,650,638 11,445,120 8 12,001 11,433,119 8 0 2,264,705 2,264,705 10,600,574 9 243,377 10,357,197 9
2,039 0 2,039 6,737,489 10 0 6,737,489 10 77,613 0 77,613 5,568,343 11 1,015 5,567,328 11
224,069 0 224,069 5,318,548 12 56,819 5,261,729 12 2,787 0 2,787 3,423,753 13 0 3,423,753 13
276,023 0 276,023 3,298,181 14 0 3,298,181 14 0 598,040 598,040 2,727,075 16 28,784 2,698,291 15
45,801 0 45,801 2,682,370 17 2,986 2,679,384 16 104,637 0 104,637 2,593,235 18 1 2,593,234 17
0 950,994 950,994 2,842,588 15 403,688 2,438,900 18 96,929 0 96,929 1,924,093 19 169 1,923,924 19
482 0 482 1,766,389 20 0 1,766,389 20 3,016 0 3,016 1,710,583 21 0 1,710,583 21 1,047 0 1,047 1,187,208 22 0 1,187,208 22 1,164 0 1,164 959,797 23 0 959,797 23
727 0 727 648,768 24 0 648,768 24 309,889 0 309,889 616,269 25 6,582 609,687 25 478,114 0 478,114 607,710 26 113 607,597 26
7,907 0 7,907 499,613 27 0 499,613 27 302,099 0 302,099 478,998 28 3 478,995 28
6,356 0 6,356 410,564 29 0 410,564 29 3,272 0 3,272 358,417 30 883 357,534 30
25,320 0 25,320 355,582 31 0 355,582 31 0 84,035 84,035 303,404 32 229 303,175 32
27,630 0 27,630 275,630 33 0 275,630 33 49,864 0 49,864 180,956 34 20,878 160,078 34 9,104 0 9,104 131,199 35 0 131,199 35
38,383 0 38,383 126,289 36 0 126,289 36 3,115 0 3,115 120,551 37 0 120,551 37 6,318 0 6,318 105,135 38 0 105,135 38
87,476 0 87,476 98,522 39 0 98,522 39 8 0 8 96,281 40 0 96,281 40
13,447 0 13,447 80,536 41 0 80,536 41 1,315 0 1,315 68,707 42 0 68,707 42
19,981 0 19,981 67,113 43 19,744 47,369 43 22,357 0 22,357 44,350 44 0 44,350 44 4,343 0 4,343 43,534 45 0 43,534 45
14,406 0 14,406 35,474 46 0 35,474 46 16,358 0 16,358 35,221 47 0 35,221 47 8,340 0 8,340 32,428 48 0 32,428 48 9,849 0 9,849 26,851 49 0 26,851 49
15,655 0 15,655 17,350 50 0 17,350 50 7,669 0 7,669 14,918 51 0 14,918 51
651 0 651 13,452 52 0 13,452 52 520 0 520 10,146 53 0 10,146 53
0 0 0 5,901 54 0 5,901 54 2,005 0 2,005 5,742 55 0 5,742 55 1,654 0 1,654 5,062 56 0 5,062 56
146 0 146 4,798 57 0 4,798 57 85 0 85 4,575 58 0 4,575 58
1,470 0 1,470 4,321 59 0 4,321 59 0 0 0 3,952 60 0 3,952 60
2,809 0 2,809 2,944 61 0 2,944 61 14 0 14 2,855 62 0 2,855 62
1,950 0 1,950 1,950 63 0 1,950 63 1,542 0 1,542 1,546 64 0 1,546 64
588 0 588 1,271 65 0 1,271 65 1,025 0 1,025 1,030 66 0 1,030 66
795 0 795 921 67 0 921 67 351 0 351 653 68 0 653 68
0 0 0 394 69 0 394 69 17 0 17 18 70 0 18 70 0 0 0 15 71 0 15 71 0 0 0 13 72 0 13 72 0 0 0 3 73 0 3 73 0 0 0 2 74 0 2 74 0 0 0 0 75 0 0 75 0 0 0 0 76 0 0 76
9,312,689 58,067,899 67,380,588 280,312,084 11,323,874 268,988,210
23 25 25 17 18 17 40,358,804 234,442,688 274,801,492 1,693,921,282 64,633,897 1,629,287,385
* Off-site releases also reported as on-site releases by another NPRI or TRI facility.
** Does not include off-site releases also reported as on-site releases by another NPRI or TRI facility.
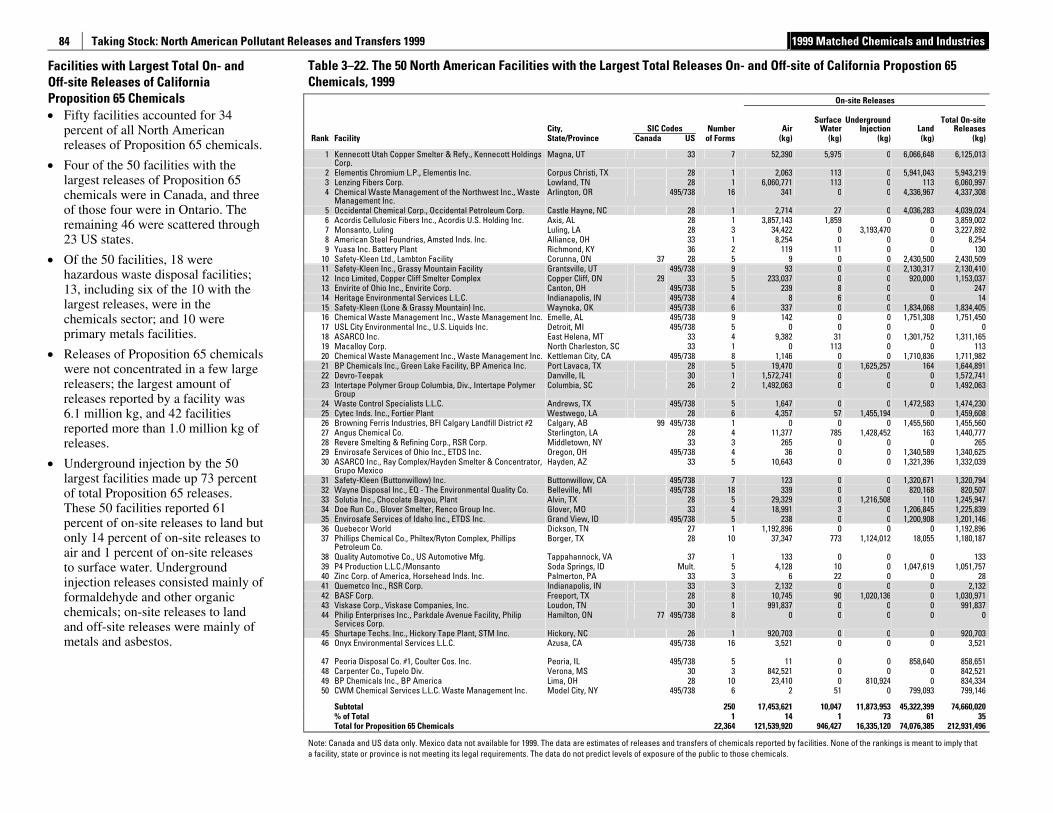
Taking Stock: North American Pollutant Releases and Transfers 1999 1999 Matched Chemicals and Industries
84
Facilities with Largest Total On- and Off-site Releases of California Proposition 65 Chemicals • Fifty facilities accounted for 34
percent of all North American releases of Proposition 65 chemicals.
• Four of the 50 facilities with the largest releases of Proposition 65 chemicals were in Canada, and three of those four were in Ontario. The remaining 46 were scattered through 23 US states.
• Of the 50 facilities, 18 were hazardous waste disposal facilities; 13, including six of the 10 with the largest releases, were in the chemicals sector; and 10 were primary metals facilities.
• Releases of Proposition 65 chemicals were not concentrated in a few large releasers; the largest amount of releases reported by a facility was 6.1 million kg, and 42 facilities reported more than 1.0 million kg of releases.
• Underground injection by the 50 largest facilities made up 73 percent of total Proposition 65 releases. These 50 facilities reported 61 percent of on-site releases to land but only 14 percent of on-site releases to air and 1 percent of on-site releases to surface water. Underground injection releases consisted mainly of formaldehyde and other organic chemicals; on-site releases to land and off-site releases were mainly of metals and asbestos.
Table 3–22. The 50 North American Facilities with the Largest Total Releases On- and Off-site of California Propostion 65 Chemicals, 1999
On-site Releases
City, SIC Codes Number AirSurface
WaterUnderground
Injection LandTotal On-site
Releases Rank Facility State/Province Canada US of Forms (kg) (kg) (kg) (kg) (kg)
1 Kennecott Utah Copper Smelter & Refy., Kennecott Holdings Corp.
Magna, UT 33 7 52,390 5,975 0 6,066,648 6,125,013
2 Elementis Chromium L.P., Elementis Inc. Corpus Christi, TX 28 1 2,063 113 0 5,941,043 5,943,219 3 Lenzing Fibers Corp. Lowland, TN 28 1 6,060,771 113 0 113 6,060,997 4 Chemical Waste Management of the Northwest Inc., Waste
Management Inc. Arlington, OR 495/738 16 341 0 0 4,336,967 4,337,308
5 Occidental Chemical Corp., Occidental Petroleum Corp. Castle Hayne, NC 28 1 2,714 27 0 4,036,283 4,039,024 6 Acordis Cellulosic Fibers Inc., Acordis U.S. Holding Inc. Axis, AL 28 1 3,857,143 1,859 0 0 3,859,002 7 Monsanto, Luling Luling, LA 28 3 34,422 0 3,193,470 0 3,227,892 8 American Steel Foundries, Amsted Inds. Inc. Alliance, OH 33 1 8,254 0 0 0 8,254 9 Yuasa Inc. Battery Plant Richmond, KY 36 2 119 11 0 0 130
10 Safety-Kleen Ltd., Lambton Facility Corunna, ON 37 28 5 9 0 0 2,430,500 2,430,509 11 Safety-Kleen Inc., Grassy Mountain Facility Grantsville, UT 495/738 9 93 0 0 2,130,317 2,130,410 12 Inco Limited, Copper Cliff Smelter Complex Copper Cliff, ON 29 33 5 233,037 0 0 920,000 1,153,037 13 Envirite of Ohio Inc., Envirite Corp. Canton, OH 495/738 5 239 8 0 0 247 14 Heritage Environmental Services L.L.C. Indianapolis, IN 495/738 4 8 6 0 0 14 15 Safety-Kleen (Lone & Grassy Mountain) Inc. Waynoka, OK 495/738 6 337 0 0 1,834,068 1,834,405 16 Chemical Waste Management Inc., Waste Management Inc. Emelle, AL 495/738 9 142 0 0 1,751,308 1,751,450 17 USL City Environmental Inc., U.S. Liquids Inc. Detroit, MI 495/738 5 0 0 0 0 0 18 ASARCO Inc. East Helena, MT 33 4 9,382 31 0 1,301,752 1,311,165 19 Macalloy Corp. North Charleston, SC 33 1 0 113 0 0 113 20 Chemical Waste Management Inc., Waste Management Inc. Kettleman City, CA 495/738 8 1,146 0 0 1,710,836 1,711,982 21 BP Chemicals Inc., Green Lake Facility, BP America Inc. Port Lavaca, TX 28 5 19,470 0 1,625,257 164 1,644,891 22 Devro-Teepak Danville, IL 30 1 1,572,741 0 0 0 1,572,741 23 Intertape Polymer Group Columbia, Div., Intertape Polymer
Group Columbia, SC 26 2 1,492,063 0 0 0 1,492,063
24 Waste Control Specialists L.L.C. Andrews, TX 495/738 5 1,647 0 0 1,472,583 1,474,230 25 Cytec Inds. Inc., Fortier Plant Westwego, LA 28 6 4,357 57 1,455,194 0 1,459,608 26 Browning Ferris Industries, BFI Calgary Landfill District #2 Calgary, AB 99 495/738 1 0 0 0 1,455,560 1,455,560 27 Angus Chemical Co. Sterlington, LA 28 4 11,377 785 1,428,452 163 1,440,777 28 Revere Smelting & Refining Corp., RSR Corp. Middletown, NY 33 3 265 0 0 0 265 29 Envirosafe Services of Ohio Inc., ETDS Inc. Oregon, OH 495/738 4 36 0 0 1,340,589 1,340,625 30 ASARCO Inc., Ray Complex/Hayden Smelter & Concentrator,
Grupo Mexico Hayden, AZ 33 5 10,643 0 0 1,321,396 1,332,039
31 Safety-Kleen (Buttonwillow) Inc. Buttonwillow, CA 495/738 7 123 0 0 1,320,671 1,320,794 32 Wayne Disposal Inc., EQ - The Environmental Quality Co. Belleville, MI 495/738 18 339 0 0 820,168 820,507 33 Solutia Inc., Chocolate Bayou, Plant Alvin, TX 28 5 29,329 0 1,216,508 110 1,245,947 34 Doe Run Co., Glover Smelter, Renco Group Inc. Glover, MO 33 4 18,991 3 0 1,206,845 1,225,839 35 Envirosafe Services of Idaho Inc., ETDS Inc. Grand View, ID 495/738 5 238 0 0 1,200,908 1,201,146 36 Quebecor World Dickson, TN 27 1 1,192,896 0 0 0 1,192,896 37 Phillips Chemical Co., Philtex/Ryton Complex, Phillips
Petroleum Co. Borger, TX 28 10 37,347 773 1,124,012 18,055 1,180,187
38 Quality Automotive Co., US Automotive Mfg. Tappahannock, VA 37 1 133 0 0 0 133 39 P4 Production L.L.C./Monsanto Soda Springs, ID Mult. 5 4,128 10 0 1,047,619 1,051,757 40 Zinc Corp. of America, Horsehead Inds. Inc. Palmerton, PA 33 3 6 22 0 0 28 41 Quemetco Inc., RSR Corp. Indianapolis, IN 33 3 2,132 0 0 0 2,132 42 BASF Corp. Freeport, TX 28 8 10,745 90 1,020,136 0 1,030,971 43 Viskase Corp., Viskase Companies, Inc. Loudon, TN 30 1 991,837 0 0 0 991,837 44 Philip Enterprises Inc., Parkdale Avenue Facility, Philip
Services Corp. Hamilton, ON 77 495/738 8 0 0 0 0 0
45 Shurtape Techs. Inc., Hickory Tape Plant, STM Inc. Hickory, NC 26 1 920,703 0 0 0 920,703 46
Onyx Environmental Services L.L.C.
Azusa, CA
495/738
16
3,521 0 0 0 3,521
47 Peoria Disposal Co. #1, Coulter Cos. Inc. Peoria, IL 495/738 5 11 0 0 858,640 858,651 48 Carpenter Co., Tupelo Div. Verona, MS 30 3 842,521 0 0 0 842,521 49 BP Chemicals Inc., BP America Lima, OH 28 10 23,410 0 810,924 0 834,334 50 CWM Chemical Services L.L.C. Waste Management Inc. Model City, NY 495/738 6 2 51 0 799,093 799,146
Subtotal 250 17,453,621 10,047 11,873,953 45,322,399 74,660,020 % of Total 1 14 1 73 61 35 Total for Proposition 65 Chemicals 22,364 121,539,920 946,427 16,335,120 74,076,385 212,931,496
Note: Canada and US data only. Mexico data not available for 1999. The data are estimates of releases and transfers of chemicals reported by facilities. None of the rankings is meant to imply that a facility, state or province is not meeting its legal requirements. The data do not predict levels of exposure of the public to those chemicals.
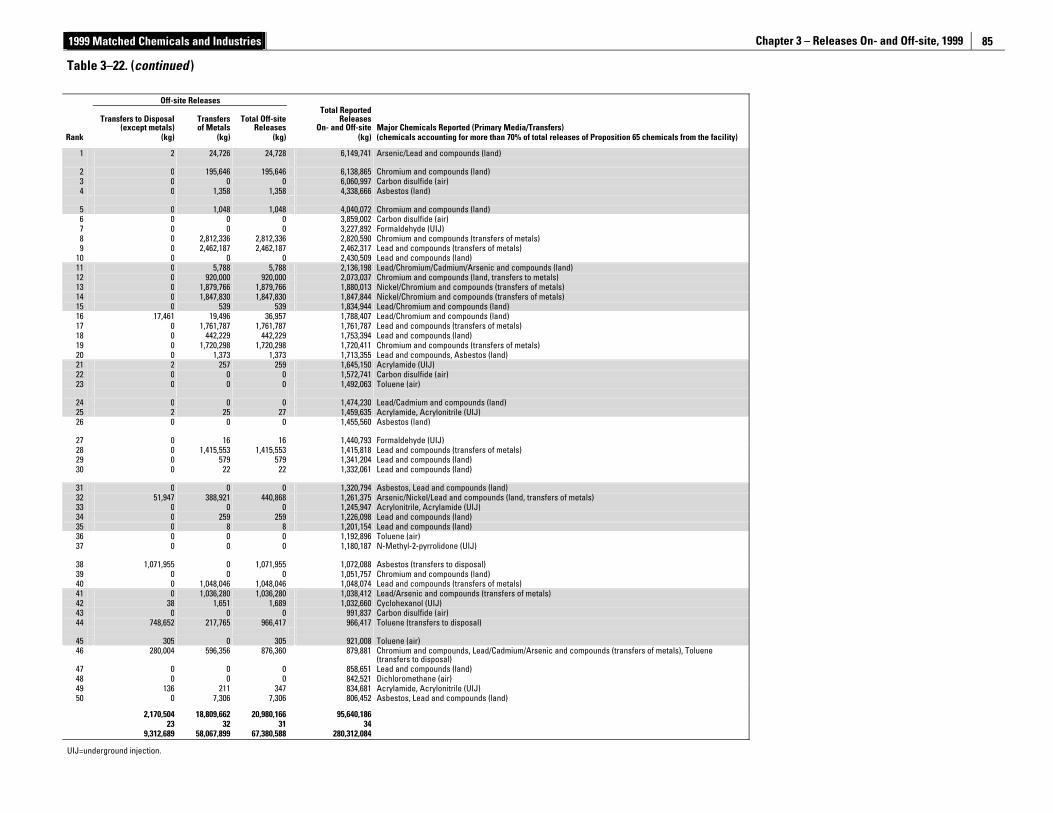
1999 Matched Chemicals and Industries Chapter 3 – Releases On- and Off-site, 1999
85
Table 3–22. (continued )
Off-site Releases
Transfers to Disposal
(except metals) Transfers of Metals
Total Off-site Releases
Total Reported Releases
On- and Off-site Major Chemicals Reported (Primary Media/Transfers) Rank (kg) (kg) (kg) (kg) (chemicals accounting for more than 70% of total releases of Proposition 65 chemicals from the facility)
1
2
24,726
24,728
6,149,741 Arsenic/Lead and compounds (land)
2 0 195,646 195,646 6,138,865 Chromium and compounds (land) 3 0 0 0 6,060,997 Carbon disulfide (air) 4
0
1,358
1,358
4,338,666 Asbestos (land)
5 0 1,048 1,048 4,040,072 Chromium and compounds (land) 6 0 0 0 3,859,002 Carbon disulfide (air) 7 0 0 0 3,227,892 Formaldehyde (UIJ) 8 0 2,812,336 2,812,336 2,820,590 Chromium and compounds (transfers of metals) 9 0 2,462,187 2,462,187 2,462,317 Lead and compounds (transfers of metals)
10 0 0 0 2,430,509 Lead and compounds (land) 11 0 5,788 5,788 2,136,198 Lead/Chromium/Cadmium/Arsenic and compounds (land) 12 0 920,000 920,000 2,073,037 Chromium and compounds (land, transfers to metals) 13 0 1,879,766 1,879,766 1,880,013 Nickel/Chromium and compounds (transfers of metals) 14 0 1,847,830 1,847,830 1,847,844 Nickel/Chromium and compounds (transfers of metals) 15 0 539 539 1,834,944 Lead/Chromium and compounds (land) 16 17,461 19,496 36,957 1,788,407 Lead/Chromium and compounds (land) 17 0 1,761,787 1,761,787 1,761,787 Lead and compounds (transfers of metals) 18 0 442,229 442,229 1,753,394 Lead and compounds (land) 19 0 1,720,298 1,720,298 1,720,411 Chromium and compounds (transfers of metals) 20 0 1,373 1,373 1,713,355 Lead and compounds, Asbestos (land) 21 2 257 259 1,645,150 Acrylamide (UIJ) 22 0 0 0 1,572,741 Carbon disulfide (air) 23
0
0
0
1,492,063 Toluene (air)
24 0 0 0 1,474,230 Lead/Cadmium and compounds (land) 25 2 25 27 1,459,635 Acrylamide, Acrylonitrile (UIJ) 26
0
0
0
1,455,560 Asbestos (land)
27 0 16 16 1,440,793 Formaldehyde (UIJ) 28 0 1,415,553 1,415,553 1,415,818 Lead and compounds (transfers of metals) 29 0 579 579 1,341,204 Lead and compounds (land) 30
0
22
22
1,332,061 Lead and compounds (land)
31 0 0 0 1,320,794 Asbestos, Lead and compounds (land) 32 51,947 388,921 440,868 1,261,375 Arsenic/Nickel/Lead and compounds (land, transfers of metals) 33 0 0 0 1,245,947 Acrylonitrile, Acrylamide (UIJ) 34 0 259 259 1,226,098 Lead and compounds (land) 35 0 8 8 1,201,154 Lead and compounds (land) 36 0 0 0 1,192,896 Toluene (air) 37
0
0
0
1,180,187 N-Methyl-2-pyrrolidone (UIJ)
38 1,071,955 0 1,071,955 1,072,088 Asbestos (transfers to disposal) 39 0 0 0 1,051,757 Chromium and compounds (land) 40 0 1,048,046 1,048,046 1,048,074 Lead and compounds (transfers of metals) 41 0 1,036,280 1,036,280 1,038,412 Lead/Arsenic and compounds (transfers of metals) 42 38 1,651 1,689 1,032,660 Cyclohexanol (UIJ) 43 0 0 0 991,837 Carbon disulfide (air) 44
748,652
217,765
966,417
966,417 Toluene (transfers to disposal)
45 305 0 305 921,008 Toluene (air) 46 280,004 596,356 876,360 879,881 Chromium and compounds, Lead/Cadmium/Arsenic and compounds (transfers of metals), Toluene
(transfers to disposal) 47 0 0 0 858,651 Lead and compounds (land) 48 0 0 0 842,521 Dichloromethane (air) 49 136 211 347 834,681 Acrylamide, Acrylonitrile (UIJ) 50 0 7,306 7,306 806,452 Asbestos, Lead and compounds (land)
2,170,504 18,809,662 20,980,166 95,640,186 23 32 31 34 9,312,689 58,067,899 67,380,588 280,312,084
UIJ=underground injection.

Chapter 4 – Transfers to Recycling and Other Transfers for Further Management, 1999
87
Table of Contents
Key Findings.............................................................................................................................. 89 4.1 Introduction.................................................................................................................... 89 4.2 Transfers to Recycling, 1999 ....................................................................................... 90
4.2.1 Transfers to Recycling by State and Province, 1999.................................. 92 4.2.2 Transfers to Recycling by Industry Sector, 1999 ........................................ 94 4.2.3 Facilities with the Largest Transfers to Recycling, 1999 ........................... 96 4.2.4 Transfers to Recycling by Chemical, 1999 ................................................... 98
4.3 Other Transfers for Further Management, 1999..................................................... 100 4.3.1 Other Transfers for Further Management by State and Province,
1999................................................................................................................... 102 4.3.2 Other Transfers for Further Management by Industry Sector, 1999 ..... 104 4.3.3 Facilities Reporting the Largest Amounts of Transfers to Energy
Recovery, Treatment and Sewage, 1999.................................................... 106 Facilities Reporting the Largest Transfers to Energy Recovery, 1999 ..106 Facilities Reporting the Largest Transfers to Treatment, 1999 .............. 107 Facilities Reporting the Largest Transfers to Sewage, 1999 .................. 108
4.3.4 Other Transfers for Further Management by Chemical, 1999 ................ 108 Largest Transfers to Energy Recovery by Chemical, 1999...................... 109 Largest Transfers to Treatment by Chemical, 1999.................................. 110 Largest Transfers to Sewage by Chemical, 1999 ..................................... 111
Figures
4–1 Percentage of Transfers to Recycling in North America by Type, NPRI and TRI, 1999 ..................................................................................................... 91
4–2 Average Kilograms per Facility of Transfers to Recycling, NPRI and TRI, 1999 ..................................................................................................... 91
4–3 Percentage Contribution of Top Industry Sectors to Transfers to Recycling, NPRI and TRI, 1999 ............................................................................. 95
4–4 Percentage of Other Transfers for Further Management in North America by Type, NPRI and TRI, 1999.................................................... 101
4–5 Average Kilograms per Facility of Other Transfers for Further Management, NPRI and TRI, 1999 ..................................................... 101
4–6 Percentage Contribution of Top Industry Sectors to Other Transfers for Further Management, NPRI and TRI, 1999 ..................................................... 105
Maps
4–1 States and Provinces in North America Sending Largest Amounts of Transfers to Recycling, 1999 ................................................................................93
4–2 States and Provinces in North America with Largest Other Off-Site Transfers for Further Management, 1999 .............................................................103
Tables
4–1 Summary of Transfers to Recycling in North America, NPRI and TRI, 1999 .....................................................................................................90
4–2 Transfers to Recycling in North America, by State and Province, 1999............92 4–3 Transfers to Recycling in North America, by Industry, 1999 ...............................94 4–4 The 50 North American Facilities with the Largest Transfers
to Recycling, 1999 .......................................................................................................96 4–5 The 25 Chemicals with the Largest Transfers to Recycling
in North America, 1999...............................................................................................98 4–6 Summary of Other Transfers for Further Management in North America,
NPRI and TRI, 1999 ...................................................................................................100 4–7 Other Transfers for Further Management in North America,
by State and Province, 1999 ....................................................................................102 4–8 Other Transfers for Further Management in North America
by Industry, 1999........................................................................................................104 4–9 The 50 North American Facilities with the Largest Transfers
to Energy Recovery (except metals), 1999............................................................106 4–10 The 50 North American Facilities with the Largest Transfers
to Treatment (except metals), 1999........................................................................107 4–11 The 50 North American Facilities with the Largest Transfers to Sewage
(except metals), 1999................................................................................................108 4–12 The 25 Chemicals with the Largest Transfers to Energy Recovery
(except metals) in North America, 1999................................................................109 4–13 The 25 Chemicals with the Largest Transfers to Treatment
(except metals) in North America, 1999................................................................110 4–14 The 25 Chemicals with the Largest Transfers to Sewage
(except metals) in North America, 1999................................................................111

Chapter 4 – Transfers to Recycling and Other Transfers for Further Management, 1999
89
Key Findings Transfers to Recycling
• In 1999, North American facilities sent 1.05 billion kg of chemicals included in the matched data set to off-site locations for recycling. These are transfers from the industries in the 1999 matched data set.
• Transfers of metals and their compounds represented the bulk (86 percent) of all substances sent for recycling.
• The primary metals industry reported sending the largest amounts of chemicals for recycling (368.6 million kg, primarily as metals and their compounds). TRI facilities reported 91 percent of this amount.
• The fabricated metals industry reported the second-largest amount, 202.6 million kg, also primarily as metals and their compounds. NPRI facilities reported 22 percent of this amount.
• Facilities in Ohio and Ontario reported transferring the largest amounts (81.7 million kg and 81.2 million kg, respectively) to recycling, each reporting close to 8 percent of all such transfers in North America in 1999.
• Facilities in Pennsylvania reported the third-largest transfers to recycling, 78.7 million kg, or 7.5 percent of all such transfers reported in North America in 1999.
Other Transfers for Further Management
• In 1999, North American facilities reported transferring 611.3 million kg off-site for other types of management, including transfers to energy recovery (346.7 million kg), treatment (129.9 million kg) and sewage (134.6 million kg). These transfers do not include metals and their compounds, which are included as off-site releases in the analysis in Chapter 3.
• The chemical manufacturing sector reported the largest amount of other transfers for further management, 316.8 million kg. Chemicals facilities ranked first in transfers to energy recovery, treatment and sewage. Hazardous waste management/solvent recovery facilities reported the second-largest other transfers for further management, 143.5 million kg.
• Of the chemicals in the matched data set other than metals and their compounds, toluene, with 73.7 million kg, accounted for the largest transfers to energy recovery in 1999. Methanol (22.1 million kg) ranked first in transfers to treatment. Nitric acid and nitrate compounds (72.4 million kg) had the largest transfers to sewage, making up almost 54 percent of total such transfers.
4.1 Introduction This chapter examines reporting of off-site transfers for further management of PRTR-listed substances in North America in 1999. As explained in Chapter 2, the analysis covers data for industries and chemicals that must be reported in both the United States and Canada (the matched data set). Mexican data are not available for the 1999 reporting year.
Off-site transfers for further management include transfers to recycling and other transfers to energy recovery, treatment, and sewage. Off-site transfers represent transfers from a facility to other locations—nearby, out of the state or province, or outside the country. This chapter examines the amounts of transfers and their places of origin; Chapter 8 examines their destinations.
The category transfers to recycling includes all substances in the matched data set transferred off-site for recycling. Other transfers for further management refers to chemicals in the matched data set, except for metals and their compounds, that are transferred off-site to energy recovery, treatment or sewage. Off-site transfers of metals and their compounds to energy recovery, treatment and sewage are analyzed in Chapter 3. Transfers of metals to disposal, sewage, treatment and energy recovery are included in the off-site releases category to make the TRI and NPRI data comparable. TRI classifies all transfers of metals as transfers to disposal because metals are not destroyed by treatment or burned in energy recovery.
The data on recycling are presented first, followed by information on other transfers for further management.
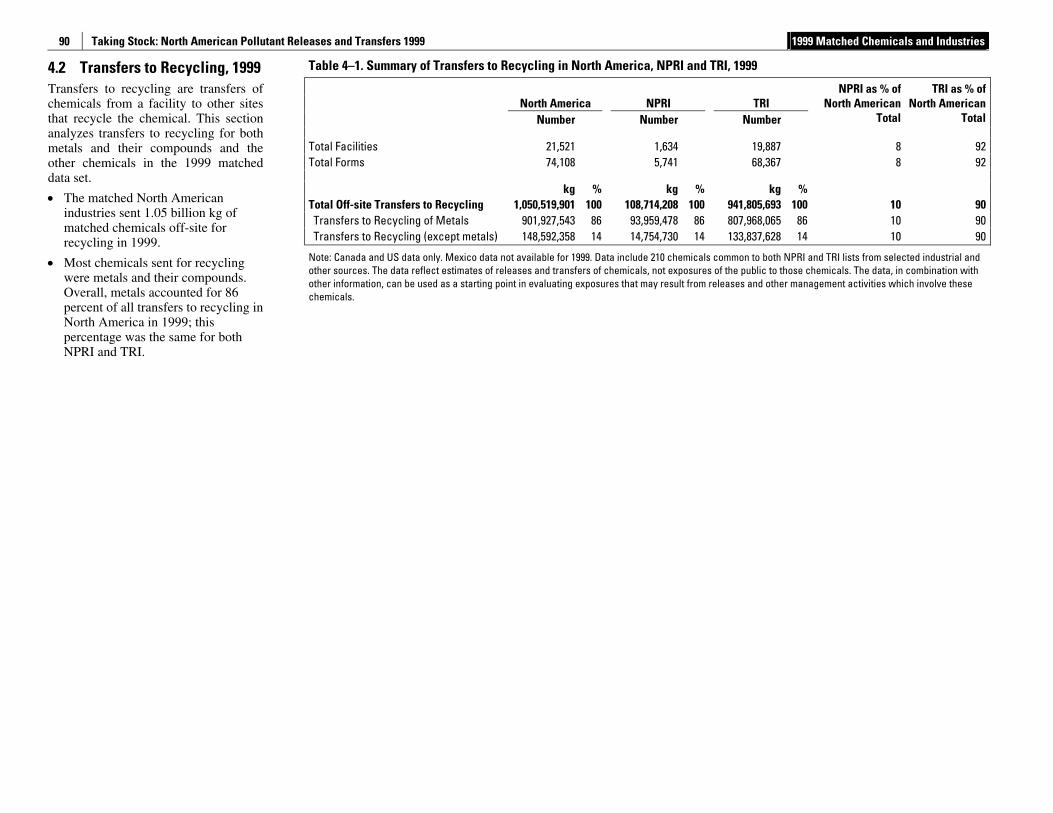
Taking Stock: North American Pollutant Releases and Transfers 1999 1999 Matched Chemicals and Industries
90
4.2 Transfers to Recycling, 1999 Transfers to recycling are transfers of chemicals from a facility to other sites that recycle the chemical. This section analyzes transfers to recycling for both metals and their compounds and the other chemicals in the 1999 matched data set.
• The matched North American industries sent 1.05 billion kg of matched chemicals off-site for recycling in 1999.
• Most chemicals sent for recycling were metals and their compounds. Overall, metals accounted for 86 percent of all transfers to recycling in North America in 1999; this percentage was the same for both NPRI and TRI.
Table 4–1. Summary of Transfers to Recycling in North America, NPRI and TRI, 1999
North America NPRI TRI
Number Number Number
NPRI as % of North American
Total
TRI as % of North American
Total
Total Facilities 21,521 1,634 19,887 8 92 Total Forms 74,108 5,741 68,367 8 92
kg % kg % kg % Total Off-site Transfers to Recycling 1,050,519,901 100 108,714,208 100 941,805,693 100 10 90 Transfers to Recycling of Metals 901,927,543 86 93,959,478 86 807,968,065 86 10 90 Transfers to Recycling (except metals) 148,592,358 14 14,754,730 14 133,837,628 14 10 90
Note: Canada and US data only. Mexico data not available for 1999. Data include 210 chemicals common to both NPRI and TRI lists from selected industrial and other sources. The data reflect estimates of releases and transfers of chemicals, not exposures of the public to those chemicals. The data, in combination with other information, can be used as a starting point in evaluating exposures that may result from releases and other management activities which involve these chemicals.
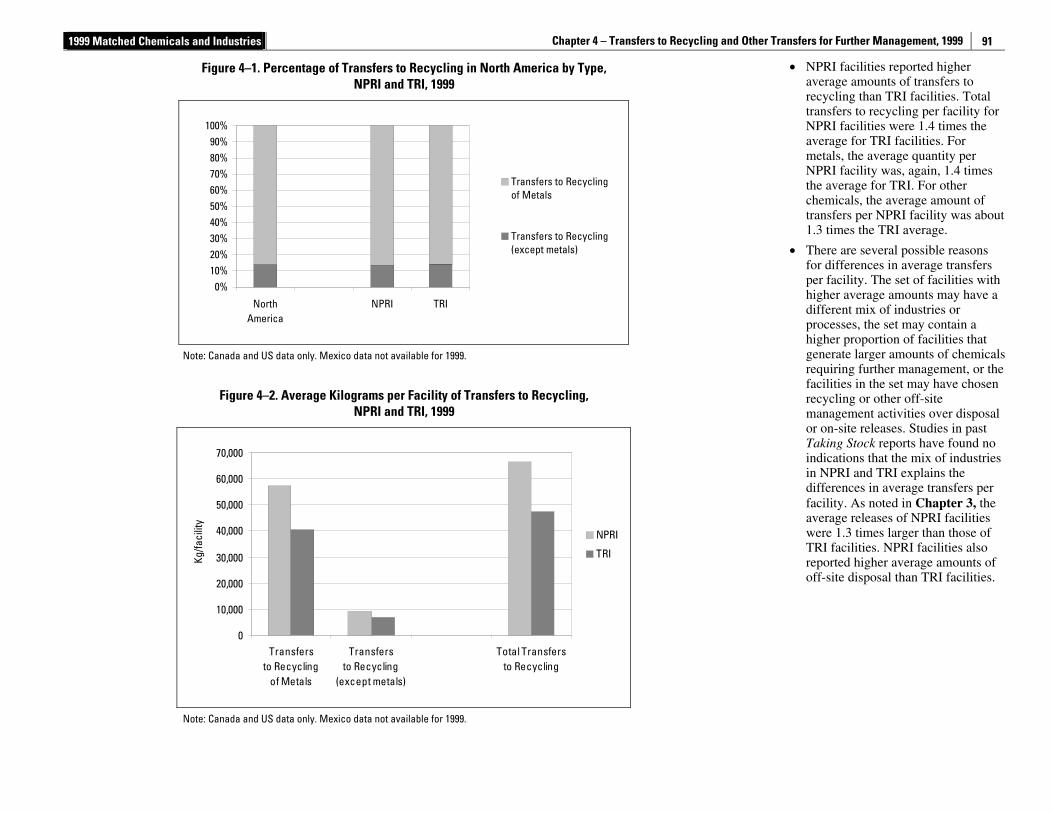
1999 Matched Chemicals and Industries Chapter 4 – Transfers to Recycling and Other Transfers for Further Management, 1999
91
• NPRI facilities reported higher average amounts of transfers to recycling than TRI facilities. Total transfers to recycling per facility for NPRI facilities were 1.4 times the average for TRI facilities. For metals, the average quantity per NPRI facility was, again, 1.4 times the average for TRI. For other chemicals, the average amount of transfers per NPRI facility was about 1.3 times the TRI average.
• There are several possible reasons for differences in average transfers per facility. The set of facilities with higher average amounts may have a different mix of industries or processes, the set may contain a higher proportion of facilities that generate larger amounts of chemicals requiring further management, or the facilities in the set may have chosen recycling or other off-site management activities over disposal or on-site releases. Studies in past Taking Stock reports have found no indications that the mix of industries in NPRI and TRI explains the differences in average transfers per facility. As noted in Chapter 3, the average releases of NPRI facilities were 1.3 times larger than those of TRI facilities. NPRI facilities also reported higher average amounts of off-site disposal than TRI facilities.
Figure 4–1. Percentage of Transfers to Recycling in North America by Type, NPRI and TRI, 1999
0%10%20%30%40%50%60%70%80%90%
100%
NorthAmerica
NPRI TRI
Transfers to Recyclingof Metals
Transfers to Recycling(except metals)
Note: Canada and US data only. Mexico data not available for 1999.
Figure 4–2. Average Kilograms per Facility of Transfers to Recycling,
NPRI and TRI, 1999
0
10,000
20,000
30,000
40,000
50,000
60,000
70,000
Transfersto Recycling
of Metals
Transfersto Recycling
(except metals)
Total Transfersto Recycling
Kg/fa
cilit
y
NPRI
TRI
Note: Canada and US data only. Mexico data not available for 1999.
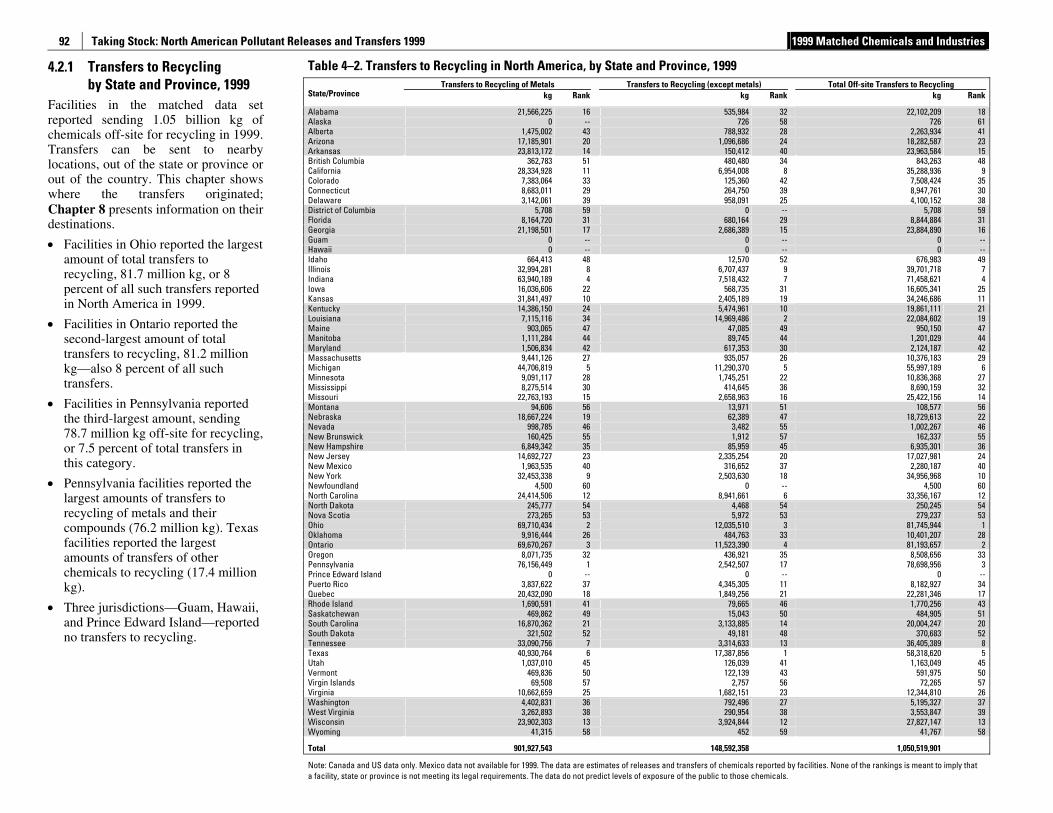
Taking Stock: North American Pollutant Releases and Transfers 1999 1999 Matched Chemicals and Industries
92
4.2.1 Transfers to Recycling by State and Province, 1999
Facilities in the matched data set reported sending 1.05 billion kg of chemicals off-site for recycling in 1999. Transfers can be sent to nearby locations, out of the state or province or out of the country. This chapter shows where the transfers originated; Chapter 8 presents information on their destinations.
• Facilities in Ohio reported the largest amount of total transfers to recycling, 81.7 million kg, or 8 percent of all such transfers reported in North America in 1999.
• Facilities in Ontario reported the second-largest amount of total transfers to recycling, 81.2 million kg—also 8 percent of all such transfers.
• Facilities in Pennsylvania reported the third-largest amount, sending 78.7 million kg off-site for recycling, or 7.5 percent of total transfers in this category.
• Pennsylvania facilities reported the largest amounts of transfers to recycling of metals and their compounds (76.2 million kg). Texas facilities reported the largest amounts of transfers of other chemicals to recycling (17.4 million kg).
• Three jurisdictions—Guam, Hawaii, and Prince Edward Island—reported no transfers to recycling.
Table 4–2. Transfers to Recycling in North America, by State and Province, 1999 Transfers to Recycling of Metals Transfers to Recycling (except metals) Total Off-site Transfers to Recycling
State/Province kg Rank kg Rank kg Rank
Alabama 21,566,225 16 535,984 32 22,102,209 18 Alaska 0 -- 726 58 726 61 Alberta 1,475,002 43 788,932 28 2,263,934 41 Arizona 17,185,901 20 1,096,686 24 18,282,587 23 Arkansas 23,813,172 14 150,412 40 23,963,584 15 British Columbia 362,783 51 480,480 34 843,263 48 California 28,334,928 11 6,954,008 8 35,288,936 9 Colorado 7,383,064 33 125,360 42 7,508,424 35 Connecticut 8,683,011 29 264,750 39 8,947,761 30 Delaware 3,142,061 39 958,091 25 4,100,152 38 District of Columbia 5,708 59 0 -- 5,708 59 Florida 8,164,720 31 680,164 29 8,844,884 31 Georgia 21,198,501 17 2,686,389 15 23,884,890 16 Guam 0 -- 0 -- 0 -- Hawaii 0 -- 0 -- 0 -- Idaho 664,413 48 12,570 52 676,983 49 Illinois 32,994,281 8 6,707,437 9 39,701,718 7 Indiana 63,940,189 4 7,518,432 7 71,458,621 4 Iowa 16,036,606 22 568,735 31 16,605,341 25 Kansas 31,841,497 10 2,405,189 19 34,246,686 11 Kentucky 14,386,150 24 5,474,961 10 19,861,111 21 Louisiana 7,115,116 34 14,969,486 2 22,084,602 19 Maine 903,065 47 47,085 49 950,150 47 Manitoba 1,111,284 44 89,745 44 1,201,029 44 Maryland 1,506,834 42 617,353 30 2,124,187 42 Massachusetts 9,441,126 27 935,057 26 10,376,183 29 Michigan 44,706,819 5 11,290,370 5 55,997,189 6 Minnesota 9,091,117 28 1,745,251 22 10,836,368 27 Mississippi 8,275,514 30 414,645 36 8,690,159 32 Missouri 22,763,193 15 2,658,963 16 25,422,156 14 Montana 94,606 56 13,971 51 108,577 56 Nebraska 18,667,224 19 62,389 47 18,729,613 22 Nevada 998,785 46 3,482 55 1,002,267 46 New Brunswick 160,425 55 1,912 57 162,337 55 New Hampshire 6,849,342 35 85,959 45 6,935,301 36 New Jersey 14,692,727 23 2,335,254 20 17,027,981 24 New Mexico 1,963,535 40 316,652 37 2,280,187 40 New York 32,453,338 9 2,503,630 18 34,956,968 10 Newfoundland 4,500 60 0 -- 4,500 60 North Carolina 24,414,506 12 8,941,661 6 33,356,167 12 North Dakota 245,777 54 4,468 54 250,245 54 Nova Scotia 273,265 53 5,972 53 279,237 53 Ohio 69,710,434 2 12,035,510 3 81,745,944 1 Oklahoma 9,916,444 26 484,763 33 10,401,207 28 Ontario 69,670,267 3 11,523,390 4 81,193,657 2 Oregon 8,071,735 32 436,921 35 8,508,656 33 Pennsylvania 76,156,449 1 2,542,507 17 78,698,956 3 Prince Edward Island 0 -- 0 -- 0 -- Puerto Rico 3,837,622 37 4,345,305 11 8,182,927 34 Quebec 20,432,090 18 1,849,256 21 22,281,346 17 Rhode Island 1,690,591 41 79,665 46 1,770,256 43 Saskatchewan 469,862 49 15,043 50 484,905 51 South Carolina 16,870,362 21 3,133,885 14 20,004,247 20 South Dakota 321,502 52 49,181 48 370,683 52 Tennessee 33,090,756 7 3,314,633 13 36,405,389 8 Texas 40,930,764 6 17,387,856 1 58,318,620 5 Utah 1,037,010 45 126,039 41 1,163,049 45 Vermont 469,836 50 122,139 43 591,975 50 Virgin Islands 69,508 57 2,757 56 72,265 57 Virginia 10,662,659 25 1,682,151 23 12,344,810 26 Washington 4,402,831 36 792,496 27 5,195,327 37 West Virginia 3,262,893 38 290,954 38 3,553,847 39 Wisconsin 23,902,303 13 3,924,844 12 27,827,147 13 Wyoming 41,315 58 452 59 41,767 58
Total 901,927,543 148,592,358 1,050,519,901
Note: Canada and US data only. Mexico data not available for 1999. The data are estimates of releases and transfers of chemicals reported by facilities. None of the rankings is meant to imply that a facility, state or province is not meeting its legal requirements. The data do not predict levels of exposure of the public to those chemicals.
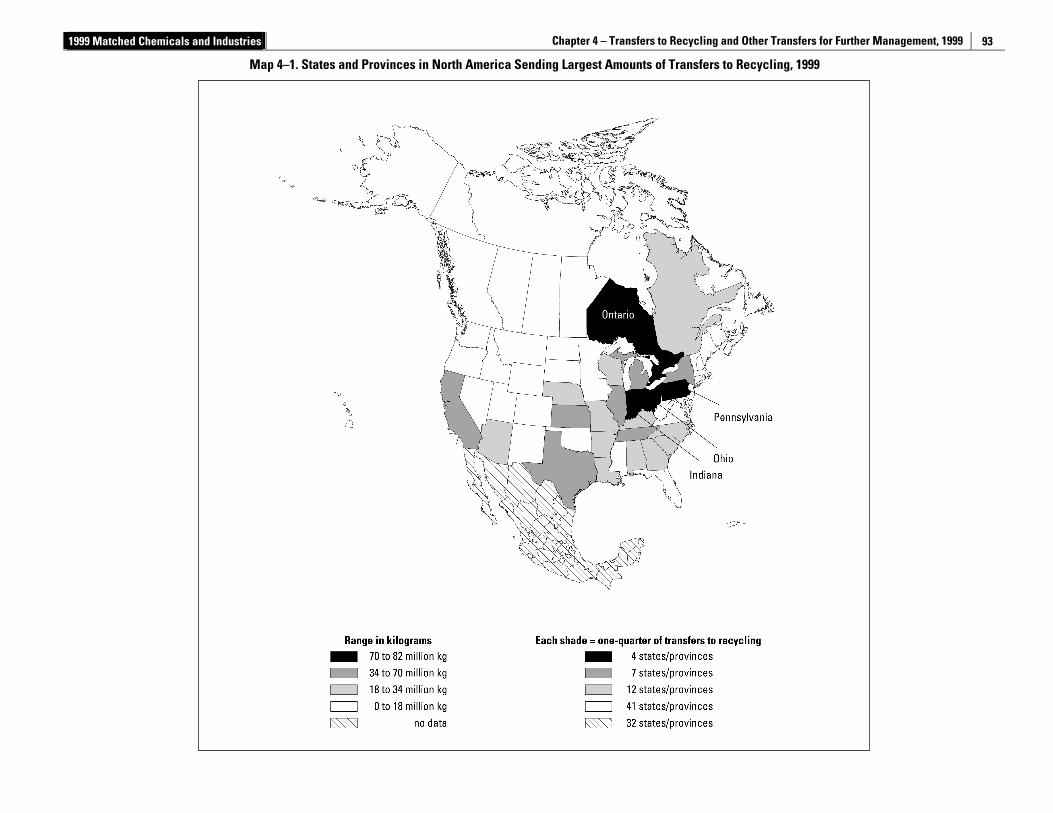
1999 Matched Chemicals and Industries Chapter 4 – Transfers to Recycling and Other Transfers for Further Management, 1999
93
Map 4–1. States and Provinces in North America Sending Largest Amounts of Transfers to Recycling, 1999
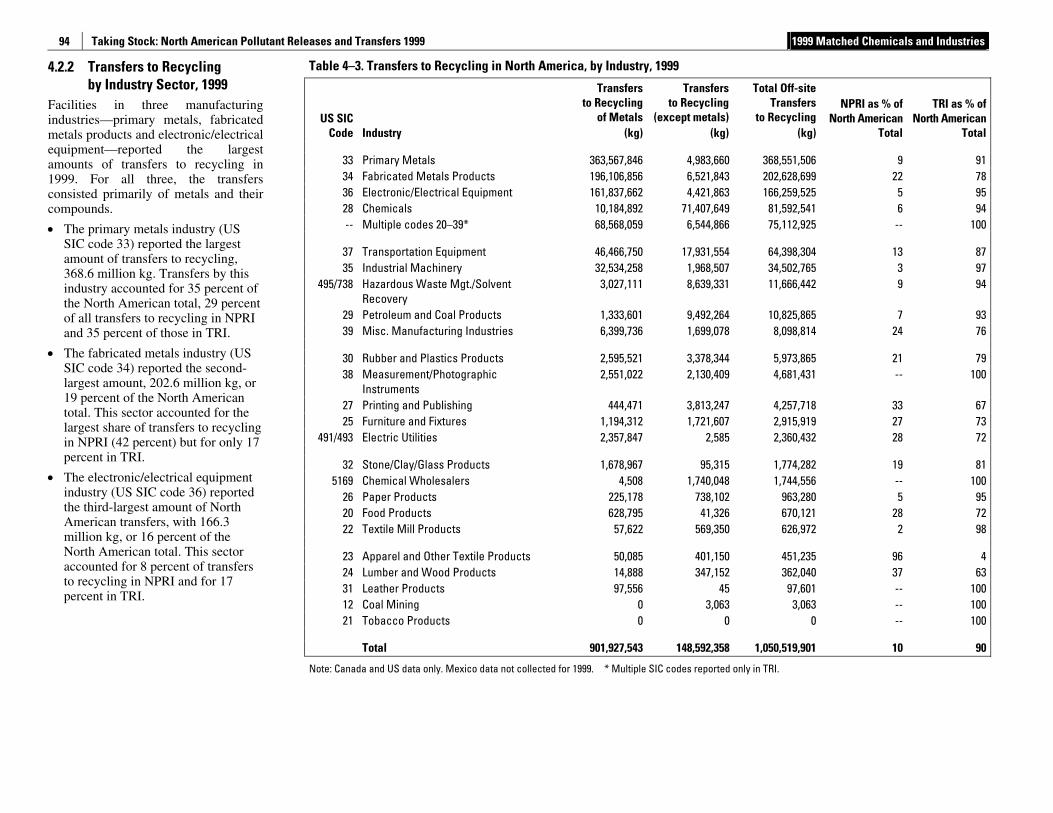
Taking Stock: North American Pollutant Releases and Transfers 1999 1999 Matched Chemicals and Industries
94
4.2.2 Transfers to Recycling by Industry Sector, 1999
Facilities in three manufacturing industries—primary metals, fabricated metals products and electronic/electrical equipment—reported the largest amounts of transfers to recycling in 1999. For all three, the transfers consisted primarily of metals and their compounds.
• The primary metals industry (US SIC code 33) reported the largest amount of transfers to recycling, 368.6 million kg. Transfers by this industry accounted for 35 percent of the North American total, 29 percent of all transfers to recycling in NPRI and 35 percent of those in TRI.
• The fabricated metals industry (US SIC code 34) reported the second-largest amount, 202.6 million kg, or 19 percent of the North American total. This sector accounted for the largest share of transfers to recycling in NPRI (42 percent) but for only 17 percent in TRI.
• The electronic/electrical equipment industry (US SIC code 36) reported the third-largest amount of North American transfers, with 166.3 million kg, or 16 percent of the North American total. This sector accounted for 8 percent of transfers to recycling in NPRI and for 17 percent in TRI.
Table 4–3. Transfers to Recycling in North America, by Industry, 1999
US SIC Code Industry
Transfers to Recycling
of Metals (kg)
Transfersto Recycling
(except metals)(kg)
Total Off-site Transfers
to Recycling(kg)
NPRI as % of North American
Total
TRI as % of North American
Total
33 Primary Metals 363,567,846 4,983,660 368,551,506 9 91 34 Fabricated Metals Products 196,106,856 6,521,843 202,628,699 22 78 36 Electronic/Electrical Equipment 161,837,662 4,421,863 166,259,525 5 95 28 Chemicals 10,184,892 71,407,649 81,592,541 6 94 -- Multiple codes 20–39* 68,568,059 6,544,866 75,112,925 -- 100
37 Transportation Equipment 46,466,750 17,931,554 64,398,304 13 87 35 Industrial Machinery 32,534,258 1,968,507 34,502,765 3 97
495/738 Hazardous Waste Mgt./Solvent Recovery
3,027,111 8,639,331 11,666,442 9 94
29 Petroleum and Coal Products 1,333,601 9,492,264 10,825,865 7 93 39 Misc. Manufacturing Industries 6,399,736 1,699,078 8,098,814 24 76
30 Rubber and Plastics Products 2,595,521 3,378,344 5,973,865 21 79 38 Measurement/Photographic
Instruments 2,551,022 2,130,409 4,681,431 -- 100
27 Printing and Publishing 444,471 3,813,247 4,257,718 33 67 25 Furniture and Fixtures 1,194,312 1,721,607 2,915,919 27 73
491/493 Electric Utilities 2,357,847 2,585 2,360,432 28 72
32 Stone/Clay/Glass Products 1,678,967 95,315 1,774,282 19 81 5169 Chemical Wholesalers 4,508 1,740,048 1,744,556 -- 100
26 Paper Products 225,178 738,102 963,280 5 95 20 Food Products 628,795 41,326 670,121 28 72 22 Textile Mill Products 57,622 569,350 626,972 2 98
23 Apparel and Other Textile Products 50,085 401,150 451,235 96 4 24 Lumber and Wood Products 14,888 347,152 362,040 37 63 31 Leather Products 97,556 45 97,601 -- 100 12 Coal Mining 0 3,063 3,063 -- 100 21 Tobacco Products 0 0 0 -- 100
Total 901,927,543 148,592,358 1,050,519,901 10 90
Note: Canada and US data only. Mexico data not collected for 1999. * Multiple SIC codes reported only in TRI.
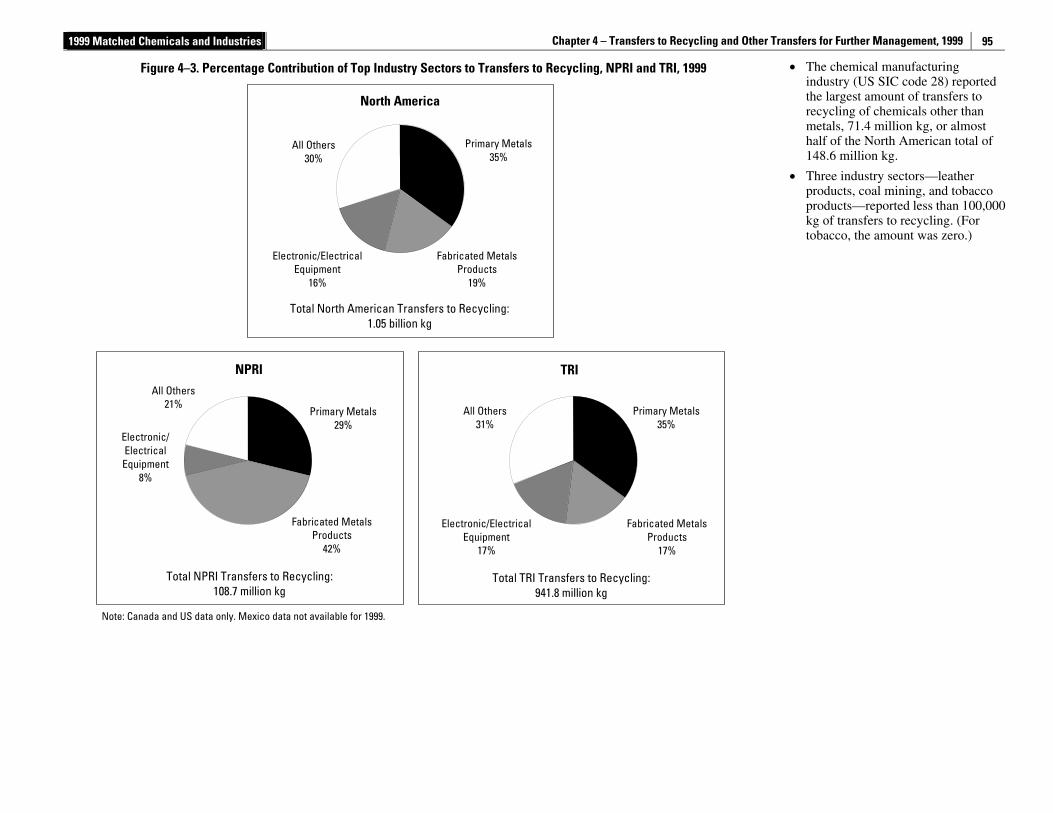
1999 Matched Chemicals and Industries Chapter 4 – Transfers to Recycling and Other Transfers for Further Management, 1999
95
• The chemical manufacturing industry (US SIC code 28) reported the largest amount of transfers to recycling of chemicals other than metals, 71.4 million kg, or almost half of the North American total of 148.6 million kg.
• Three industry sectors—leather products, coal mining, and tobacco products—reported less than 100,000 kg of transfers to recycling. (For tobacco, the amount was zero.)
Figure 4–3. Percentage Contribution of Top Industry Sectors to Transfers to Recycling, NPRI and TRI, 1999
Primary Metals35%
NPRI TRI
North America
Electronic/ElectricalEquipment
16%
All Others30%
Primary Metals29%
All Others 21%
Electronic/ Electrical Equipment
8%
Electronic/ElectricalEquipment
17%
Primary Metals35%
All Others31%
Total North American Transfers to Recycling: 1.05 billion kg
Total NPRI Transfers to Recycling: 108.7 million kg
Total TRI Transfers to Recycling: 941.8 million kg
Fabricated MetalsProducts
19%
Fabricated MetalsProducts
42%
Fabricated MetalsProducts
17%
Note: Canada and US data only. Mexico data not available for 1999.
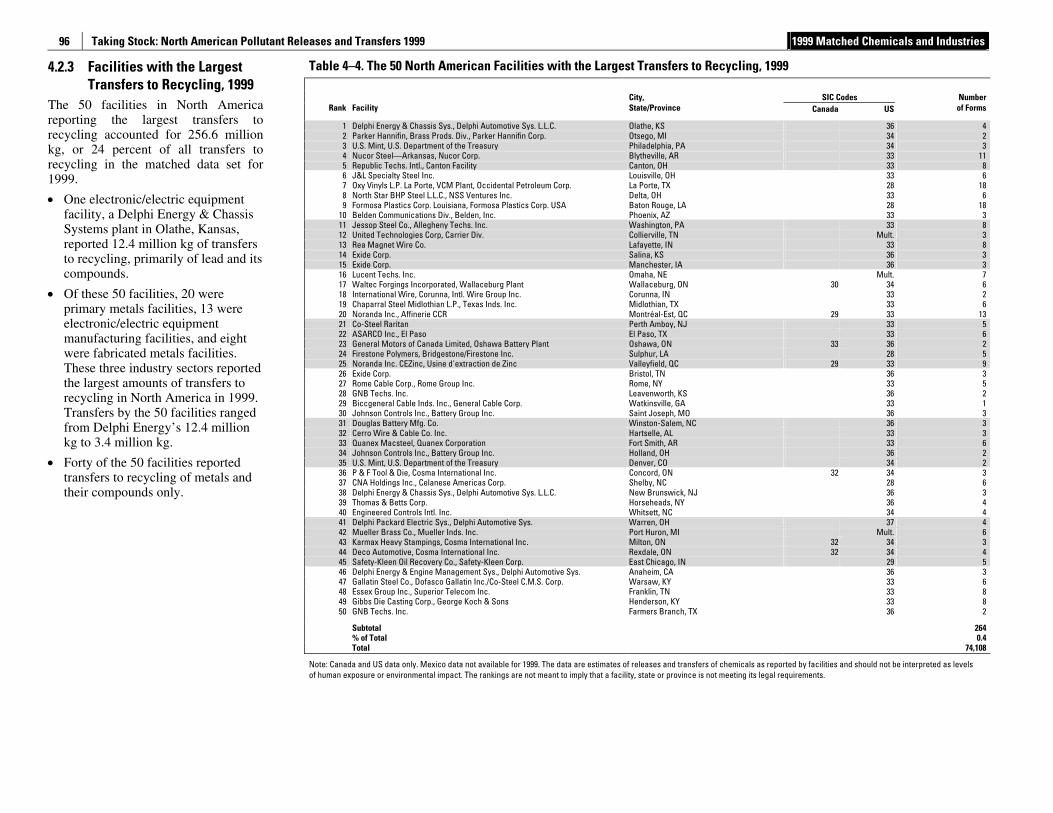
Taking Stock: North American Pollutant Releases and Transfers 1999 1999 Matched Chemicals and Industries
96
4.2.3 Facilities with the Largest Transfers to Recycling, 1999
The 50 facilities in North America reporting the largest transfers to recycling accounted for 256.6 million kg, or 24 percent of all transfers to recycling in the matched data set for 1999.
• One electronic/electric equipment facility, a Delphi Energy & Chassis Systems plant in Olathe, Kansas, reported 12.4 million kg of transfers to recycling, primarily of lead and its compounds.
• Of these 50 facilities, 20 were primary metals facilities, 13 were electronic/electric equipment manufacturing facilities, and eight were fabricated metals facilities. These three industry sectors reported the largest amounts of transfers to recycling in North America in 1999. Transfers by the 50 facilities ranged from Delphi Energy’s 12.4 million kg to 3.4 million kg.
• Forty of the 50 facilities reported transfers to recycling of metals and their compounds only.
Table 4–4. The 50 North American Facilities with the Largest Transfers to Recycling, 1999
SIC Codes Rank Facility
City, State/Province Canada US
Number of Forms
1 Delphi Energy & Chassis Sys., Delphi Automotive Sys. L.L.C. Olathe, KS 36 4 2 Parker Hannifin, Brass Prods. Div., Parker Hannifin Corp. Otsego, MI 34 2 3 U.S. Mint, U.S. Department of the Treasury Philadelphia, PA 34 3 4 Nucor Steel—Arkansas, Nucor Corp. Blytheville, AR 33 11 5 Republic Techs. Intl., Canton Facility Canton, OH 33 8 6 J&L Specialty Steel Inc. Louisville, OH 33 6 7 Oxy Vinyls L.P. La Porte, VCM Plant, Occidental Petroleum Corp. La Porte, TX 28 18 8 North Star BHP Steel L.L.C., NSS Ventures Inc. Delta, OH 33 6 9 Formosa Plastics Corp. Louisiana, Formosa Plastics Corp. USA Baton Rouge, LA 28 18
10 Belden Communications Div., Belden, Inc. Phoenix, AZ 33 3 11 Jessop Steel Co., Allegheny Techs. Inc. Washington, PA 33 8 12 United Technologies Corp, Carrier Div. Collierville, TN Mult. 3 13 Rea Magnet Wire Co. Lafayette, IN 33 8 14 Exide Corp. Salina, KS 36 3 15 Exide Corp. Manchester, IA 36 3 16 Lucent Techs. Inc. Omaha, NE Mult. 7 17 Waltec Forgings Incorporated, Wallaceburg Plant Wallaceburg, ON 30 34 6 18 International Wire, Corunna, Intl. Wire Group Inc. Corunna, IN 33 2 19 Chaparral Steel Midlothian L.P., Texas Inds. Inc. Midlothian, TX 33 6 20 Noranda Inc., Affinerie CCR Montréal-Est, QC 29 33 13 21 Co-Steel Raritan Perth Amboy, NJ 33 5 22 ASARCO Inc., El Paso El Paso, TX 33 6 23 General Motors of Canada Limited, Oshawa Battery Plant Oshawa, ON 33 36 2 24 Firestone Polymers, Bridgestone/Firestone Inc. Sulphur, LA 28 5 25 Noranda Inc. CEZinc, Usine d'extraction de Zinc Valleyfield, QC 29 33 9 26 Exide Corp. Bristol, TN 36 3 27 Rome Cable Corp., Rome Group Inc. Rome, NY 33 5 28 GNB Techs. Inc. Leavenworth, KS 36 2 29 Biccgeneral Cable Inds. Inc., General Cable Corp. Watkinsville, GA 33 1 30 Johnson Controls Inc., Battery Group Inc. Saint Joseph, MO 36 3 31 Douglas Battery Mfg. Co. Winston-Salem, NC 36 3 32 Cerro Wire & Cable Co. Inc. Hartselle, AL 33 3 33 Quanex Macsteel, Quanex Corporation Fort Smith, AR 33 6 34 Johnson Controls Inc., Battery Group Inc. Holland, OH 36 2 35 U.S. Mint, U.S. Department of the Treasury Denver, CO 34 2 36 P & F Tool & Die, Cosma International Inc. Concord, ON 32 34 3 37 CNA Holdings Inc., Celanese Americas Corp. Shelby, NC 28 6 38 Delphi Energy & Chassis Sys., Delphi Automotive Sys. L.L.C. New Brunswick, NJ 36 3 39 Thomas & Betts Corp. Horseheads, NY 36 4 40 Engineered Controls Intl. Inc. Whitsett, NC 34 4 41 Delphi Packard Electric Sys., Delphi Automotive Sys. Warren, OH 37 4 42 Mueller Brass Co., Mueller Inds. Inc. Port Huron, MI Mult. 6 43 Karmax Heavy Stampings, Cosma International Inc. Milton, ON 32 34 3 44 Deco Automotive, Cosma International Inc. Rexdale, ON 32 34 4 45 Safety-Kleen Oil Recovery Co., Safety-Kleen Corp. East Chicago, IN 29 5 46 Delphi Energy & Engine Management Sys., Delphi Automotive Sys. Anaheim, CA 36 3 47 Gallatin Steel Co., Dofasco Gallatin Inc./Co-Steel C.M.S. Corp. Warsaw, KY 33 6 48 Essex Group Inc., Superior Telecom Inc. Franklin, TN 33 8 49 Gibbs Die Casting Corp., George Koch & Sons Henderson, KY 33 8 50 GNB Techs. Inc. Farmers Branch, TX 36 2
Subtotal 264 % of Total 0.4 Total 74,108
Note: Canada and US data only. Mexico data not available for 1999. The data are estimates of releases and transfers of chemicals as reported by facilities and should not be interpreted as levels of human exposure or environmental impact. The rankings are not meant to imply that a facility, state or province is not meeting its legal requirements.
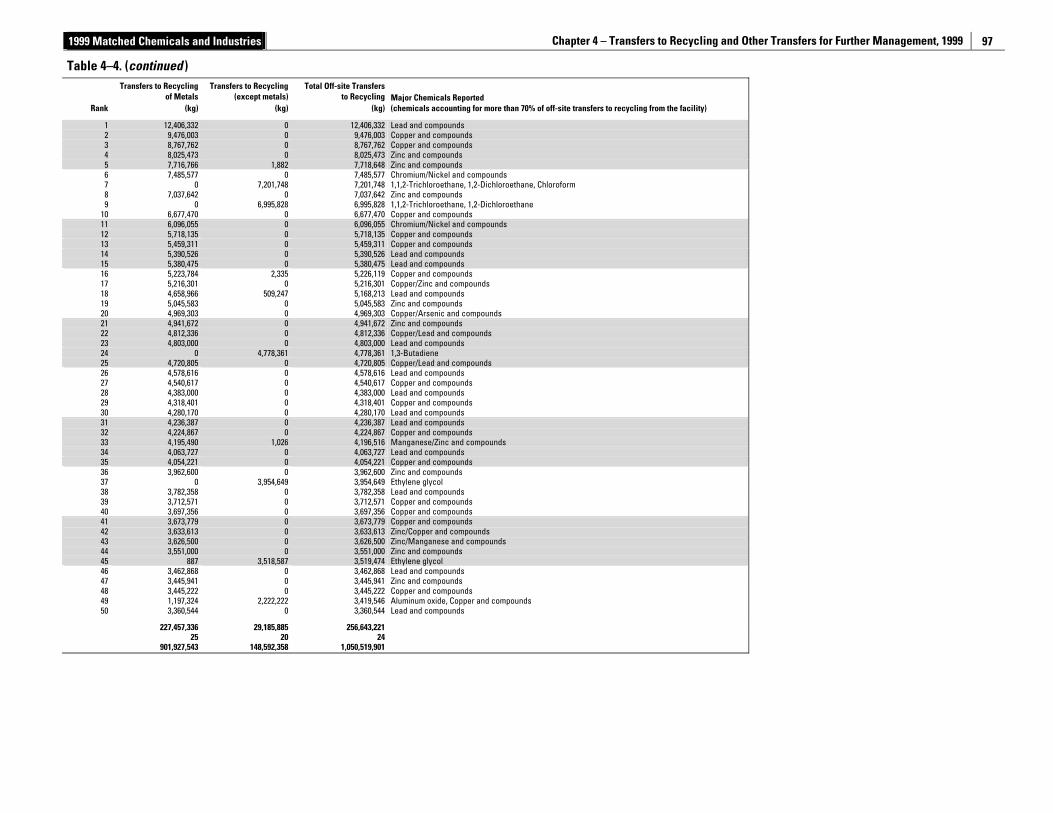
1999 Matched Chemicals and Industries Chapter 4 – Transfers to Recycling and Other Transfers for Further Management, 1999
97
Table 4–4. (continued )
Rank
Transfers to Recycling of Metals
(kg)
Transfers to Recycling (except metals)
(kg)
Total Off-site Transfersto Recycling
(kg)Major Chemicals Reported (chemicals accounting for more than 70% of off-site transfers to recycling from the facility)
1 12,406,332 0 12,406,332 Lead and compounds 2 9,476,003 0 9,476,003 Copper and compounds 3 8,767,762 0 8,767,762 Copper and compounds 4 8,025,473 0 8,025,473 Zinc and compounds 5 7,716,766 1,882 7,718,648 Zinc and compounds 6 7,485,577 0 7,485,577 Chromium/Nickel and compounds 7 0 7,201,748 7,201,748 1,1,2-Trichloroethane, 1,2-Dichloroethane, Chloroform 8 7,037,642 0 7,037,642 Zinc and compounds 9 0 6,995,828 6,995,828 1,1,2-Trichloroethane, 1,2-Dichloroethane
10 6,677,470 0 6,677,470 Copper and compounds 11 6,096,055 0 6,096,055 Chromium/Nickel and compounds 12 5,718,135 0 5,718,135 Copper and compounds 13 5,459,311 0 5,459,311 Copper and compounds 14 5,390,526 0 5,390,526 Lead and compounds 15 5,380,475 0 5,380,475 Lead and compounds 16 5,223,784 2,335 5,226,119 Copper and compounds 17 5,216,301 0 5,216,301 Copper/Zinc and compounds 18 4,658,966 509,247 5,168,213 Lead and compounds 19 5,045,583 0 5,045,583 Zinc and compounds 20 4,969,303 0 4,969,303 Copper/Arsenic and compounds 21 4,941,672 0 4,941,672 Zinc and compounds 22 4,812,336 0 4,812,336 Copper/Lead and compounds 23 4,803,000 0 4,803,000 Lead and compounds 24 0 4,778,361 4,778,361 1,3-Butadiene 25 4,720,805 0 4,720,805 Copper/Lead and compounds 26 4,578,616 0 4,578,616 Lead and compounds 27 4,540,617 0 4,540,617 Copper and compounds 28 4,383,000 0 4,383,000 Lead and compounds 29 4,318,401 0 4,318,401 Copper and compounds 30 4,280,170 0 4,280,170 Lead and compounds 31 4,236,387 0 4,236,387 Lead and compounds 32 4,224,867 0 4,224,867 Copper and compounds 33 4,195,490 1,026 4,196,516 Manganese/Zinc and compounds 34 4,063,727 0 4,063,727 Lead and compounds 35 4,054,221 0 4,054,221 Copper and compounds 36 3,962,600 0 3,962,600 Zinc and compounds 37 0 3,954,649 3,954,649 Ethylene glycol 38 3,782,358 0 3,782,358 Lead and compounds 39 3,712,571 0 3,712,571 Copper and compounds 40 3,697,356 0 3,697,356 Copper and compounds 41 3,673,779 0 3,673,779 Copper and compounds 42 3,633,613 0 3,633,613 Zinc/Copper and compounds 43 3,626,500 0 3,626,500 Zinc/Manganese and compounds 44 3,551,000 0 3,551,000 Zinc and compounds 45 887 3,518,587 3,519,474 Ethylene glycol 46 3,462,868 0 3,462,868 Lead and compounds 47 3,445,941 0 3,445,941 Zinc and compounds 48 3,445,222 0 3,445,222 Copper and compounds 49 1,197,324 2,222,222 3,419,546 Aluminum oxide, Copper and compounds 50 3,360,544 0 3,360,544 Lead and compounds
227,457,336 29,185,885 256,643,221 25 20 24 901,927,543 148,592,358 1,050,519,901
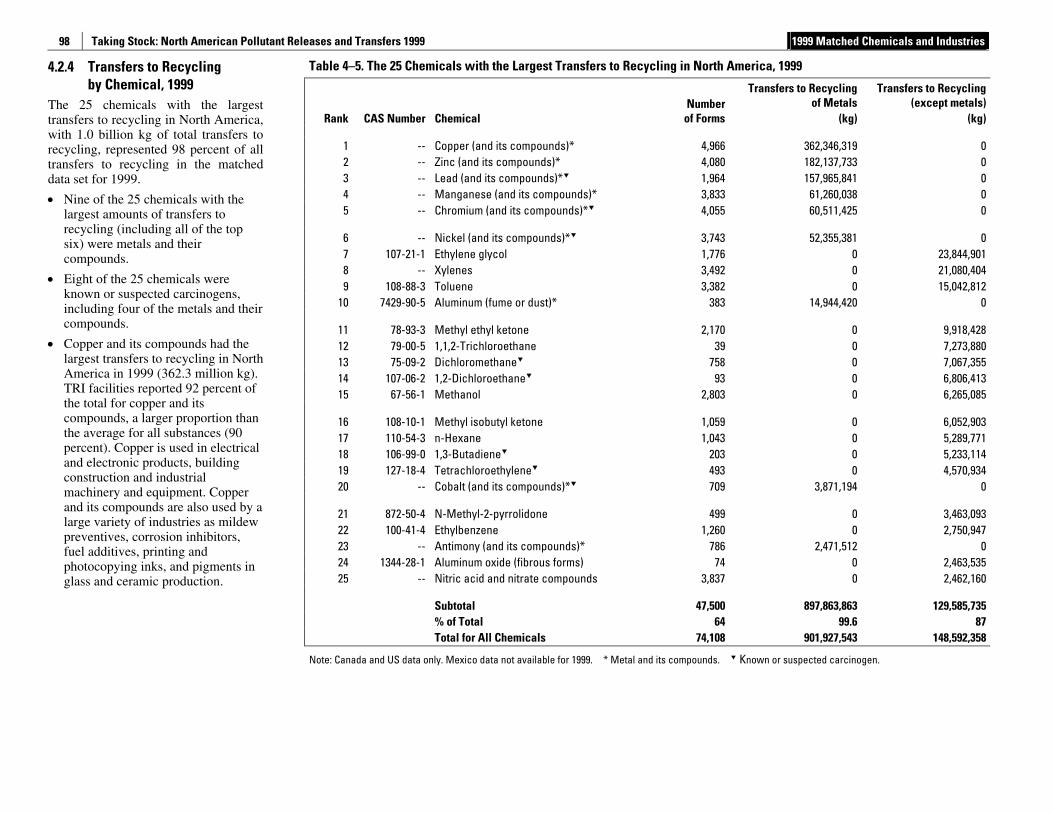
Taking Stock: North American Pollutant Releases and Transfers 1999 1999 Matched Chemicals and Industries
98
4.2.4 Transfers to Recycling by Chemical, 1999
The 25 chemicals with the largest transfers to recycling in North America, with 1.0 billion kg of total transfers to recycling, represented 98 percent of all transfers to recycling in the matched data set for 1999.
• Nine of the 25 chemicals with the largest amounts of transfers to recycling (including all of the top six) were metals and their compounds.
• Eight of the 25 chemicals were known or suspected carcinogens, including four of the metals and their compounds.
• Copper and its compounds had the largest transfers to recycling in North America in 1999 (362.3 million kg). TRI facilities reported 92 percent of the total for copper and its compounds, a larger proportion than the average for all substances (90 percent). Copper is used in electrical and electronic products, building construction and industrial machinery and equipment. Copper and its compounds are also used by a large variety of industries as mildew preventives, corrosion inhibitors, fuel additives, printing and photocopying inks, and pigments in glass and ceramic production.
Table 4–5. The 25 Chemicals with the Largest Transfers to Recycling in North America, 1999
Rank CAS Number Chemical Number
of Forms
Transfers to Recyclingof Metals
(kg)
Transfers to Recycling (except metals)
(kg)
1 -- Copper (and its compounds)* 4,966 362,346,319 0 2 -- Zinc (and its compounds)* 4,080 182,137,733 0 3 -- Lead (and its compounds)* 1,964 157,965,841 0 4 -- Manganese (and its compounds)* 3,833 61,260,038 0 5 -- Chromium (and its compounds)* 4,055 60,511,425 0
6 -- Nickel (and its compounds)* 3,743 52,355,381 0 7 107-21-1 Ethylene glycol 1,776 0 23,844,901 8 -- Xylenes 3,492 0 21,080,404 9 108-88-3 Toluene 3,382 0 15,042,812
10 7429-90-5 Aluminum (fume or dust)* 383 14,944,420 0
11 78-93-3 Methyl ethyl ketone 2,170 0 9,918,428 12 79-00-5 1,1,2-Trichloroethane 39 0 7,273,880 13 75-09-2 Dichloromethane 758 0 7,067,355 14 107-06-2 1,2-Dichloroethane 93 0 6,806,413 15 67-56-1 Methanol 2,803 0 6,265,085
16 108-10-1 Methyl isobutyl ketone 1,059 0 6,052,903 17 110-54-3 n-Hexane 1,043 0 5,289,771 18 106-99-0 1,3-Butadiene 203 0 5,233,114 19 127-18-4 Tetrachloroethylene 493 0 4,570,934 20 -- Cobalt (and its compounds)* 709 3,871,194 0
21 872-50-4 N-Methyl-2-pyrrolidone 499 0 3,463,093 22 100-41-4 Ethylbenzene 1,260 0 2,750,947 23 -- Antimony (and its compounds)* 786 2,471,512 0 24 1344-28-1 Aluminum oxide (fibrous forms) 74 0 2,463,535 25 -- Nitric acid and nitrate compounds 3,837 0 2,462,160
Subtotal 47,500 897,863,863 129,585,735 % of Total 64 99.6 87 Total for All Chemicals 74,108 901,927,543 148,592,358
Note: Canada and US data only. Mexico data not available for 1999. * Metal and its compounds. Known or suspected carcinogen.
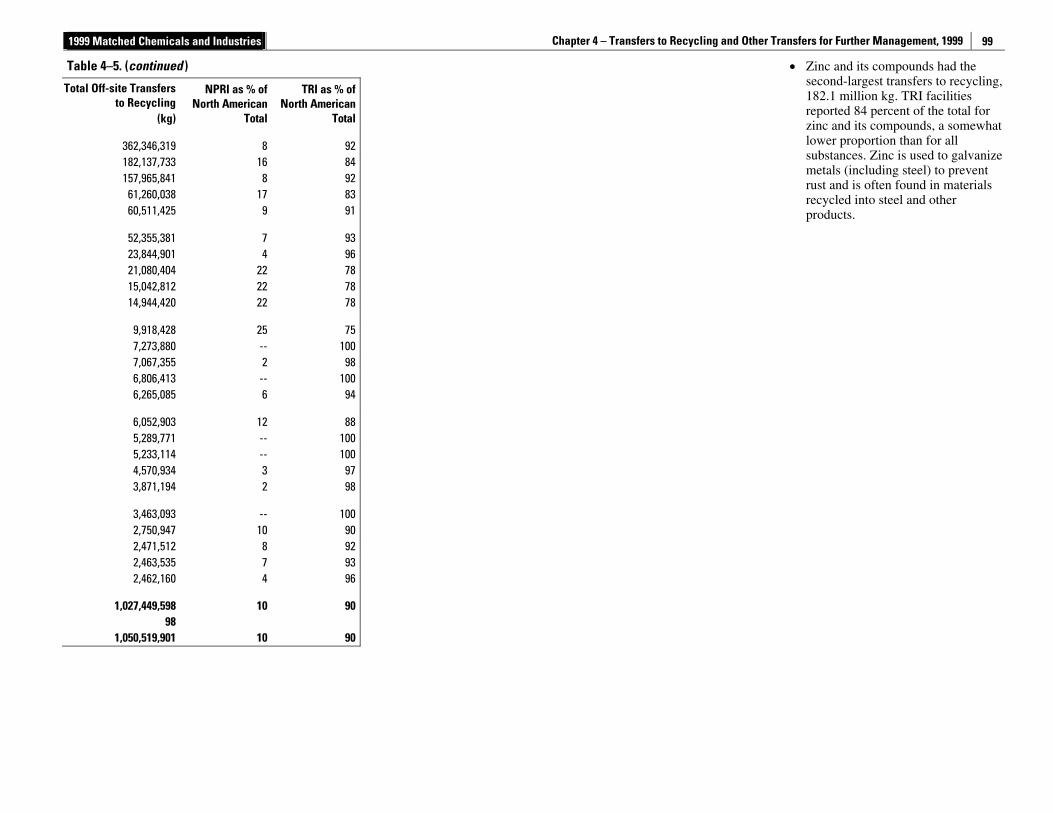
1999 Matched Chemicals and Industries Chapter 4 – Transfers to Recycling and Other Transfers for Further Management, 1999
99
• Zinc and its compounds had the second-largest transfers to recycling, 182.1 million kg. TRI facilities reported 84 percent of the total for zinc and its compounds, a somewhat lower proportion than for all substances. Zinc is used to galvanize metals (including steel) to prevent rust and is often found in materials recycled into steel and other products.
Table 4–5. (continued )
Total Off-site Transfers to Recycling
(kg)
NPRI as % of North American
Total
TRI as % ofNorth American
Total
362,346,319 8 92182,137,733 16 84157,965,841 8 92
61,260,038 17 8360,511,425 9 91
52,355,381 7 9323,844,901 4 9621,080,404 22 7815,042,812 22 7814,944,420 22 78
9,918,428 25 757,273,880 -- 1007,067,355 2 986,806,413 -- 1006,265,085 6 94
6,052,903 12 885,289,771 -- 1005,233,114 -- 1004,570,934 3 973,871,194 2 98
3,463,093 -- 1002,750,947 10 902,471,512 8 922,463,535 7 932,462,160 4 96
1,027,449,598 10 9098
1,050,519,901 10 90
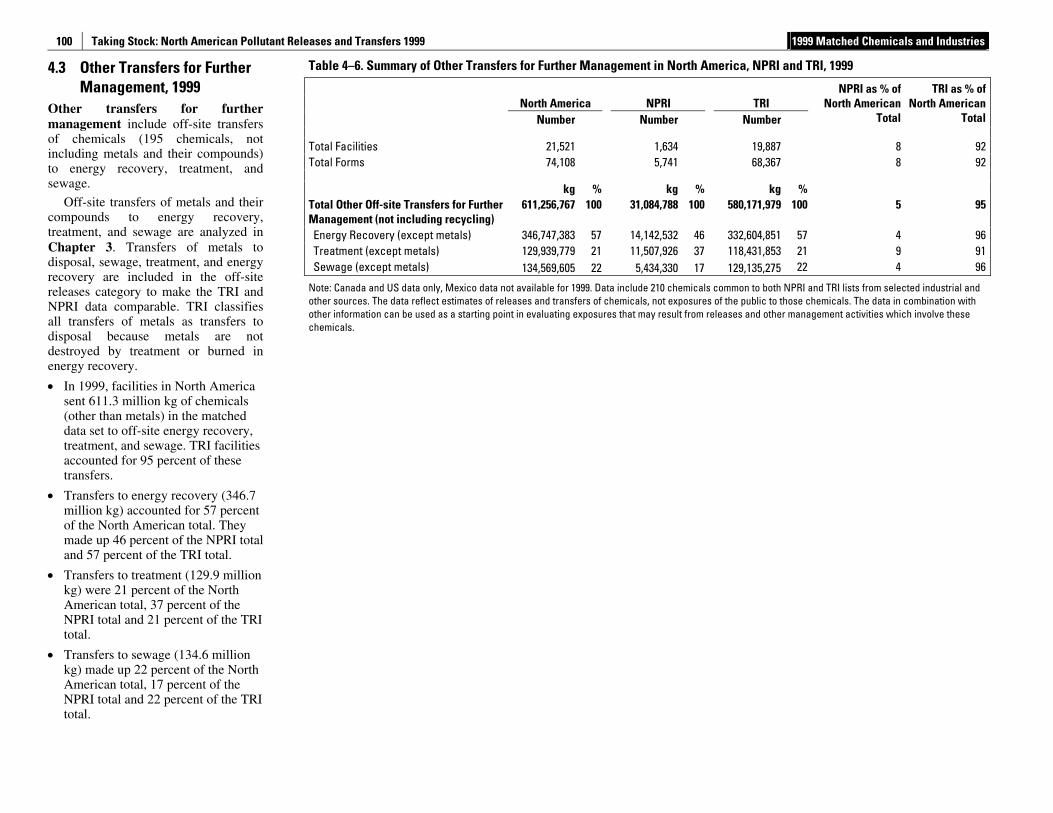
Taking Stock: North American Pollutant Releases and Transfers 1999 1999 Matched Chemicals and Industries
100
4.3 Other Transfers for Further Management, 1999
Other transfers for further management include off-site transfers of chemicals (195 chemicals, not including metals and their compounds) to energy recovery, treatment, and sewage.
Off-site transfers of metals and their compounds to energy recovery, treatment, and sewage are analyzed in Chapter 3. Transfers of metals to disposal, sewage, treatment, and energy recovery are included in the off-site releases category to make the TRI and NPRI data comparable. TRI classifies all transfers of metals as transfers to disposal because metals are not destroyed by treatment or burned in energy recovery.
• In 1999, facilities in North America sent 611.3 million kg of chemicals (other than metals) in the matched data set to off-site energy recovery, treatment, and sewage. TRI facilities accounted for 95 percent of these transfers.
• Transfers to energy recovery (346.7 million kg) accounted for 57 percent of the North American total. They made up 46 percent of the NPRI total and 57 percent of the TRI total.
• Transfers to treatment (129.9 million kg) were 21 percent of the North American total, 37 percent of the NPRI total and 21 percent of the TRI total.
• Transfers to sewage (134.6 million kg) made up 22 percent of the North American total, 17 percent of the NPRI total and 22 percent of the TRI total.
Table 4–6. Summary of Other Transfers for Further Management in North America, NPRI and TRI, 1999
North America NPRI TRI
Number Number Number
NPRI as % of North American
Total
TRI as % of North American
Total
Total Facilities 21,521 1,634 19,887 8 92 Total Forms 74,108 5,741 68,367 8 92
kg % kg % kg % Total Other Off-site Transfers for Further Management (not including recycling)
611,256,767 100 31,084,788 100 580,171,979 100 5 95
Energy Recovery (except metals) 346,747,383 57 14,142,532 46 332,604,851 57 4 96 Treatment (except metals) 129,939,779 21 11,507,926 37 118,431,853 21 9 91 Sewage (except metals) 134,569,605 22 5,434,330 17 129,135,275 22 4 96
Note: Canada and US data only, Mexico data not available for 1999. Data include 210 chemicals common to both NPRI and TRI lists from selected industrial and other sources. The data reflect estimates of releases and transfers of chemicals, not exposures of the public to those chemicals. The data in combination with other information can be used as a starting point in evaluating exposures that may result from releases and other management activities which involve these chemicals.
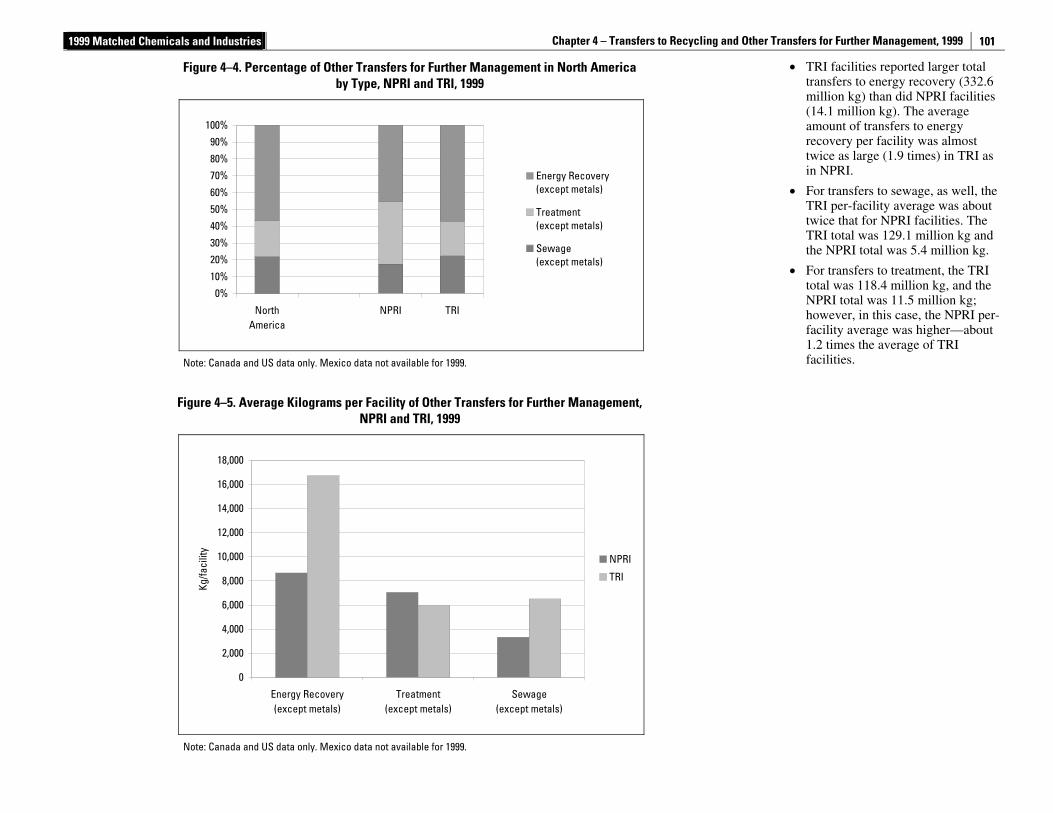
1999 Matched Chemicals and Industries Chapter 4 – Transfers to Recycling and Other Transfers for Further Management, 1999
101
• TRI facilities reported larger total transfers to energy recovery (332.6 million kg) than did NPRI facilities (14.1 million kg). The average amount of transfers to energy recovery per facility was almost twice as large (1.9 times) in TRI as in NPRI.
• For transfers to sewage, as well, the TRI per-facility average was about twice that for NPRI facilities. The TRI total was 129.1 million kg and the NPRI total was 5.4 million kg.
• For transfers to treatment, the TRI total was 118.4 million kg, and the NPRI total was 11.5 million kg; however, in this case, the NPRI per-facility average was higher—about 1.2 times the average of TRI facilities.
Figure 4–4. Percentage of Other Transfers for Further Management in North America by Type, NPRI and TRI, 1999
0%
10%
20%
30%
40%
50%
60%
70%
80%
90%
100%
NorthAmerica
NPRI TRI
Energy Recovery(except metals)
Treatment(except metals)
Sewage(except metals)
Note: Canada and US data only. Mexico data not available for 1999.
Figure 4–5. Average Kilograms per Facility of Other Transfers for Further Management,
NPRI and TRI, 1999
0
2,000
4,000
6,000
8,000
10,000
12,000
14,000
16,000
18,000
Energy Recovery(except metals)
Treatment(except metals)
Sewage(except metals)
Kg/fa
cilit
y
NPRI
TRI
Note: Canada and US data only. Mexico data not available for 1999.
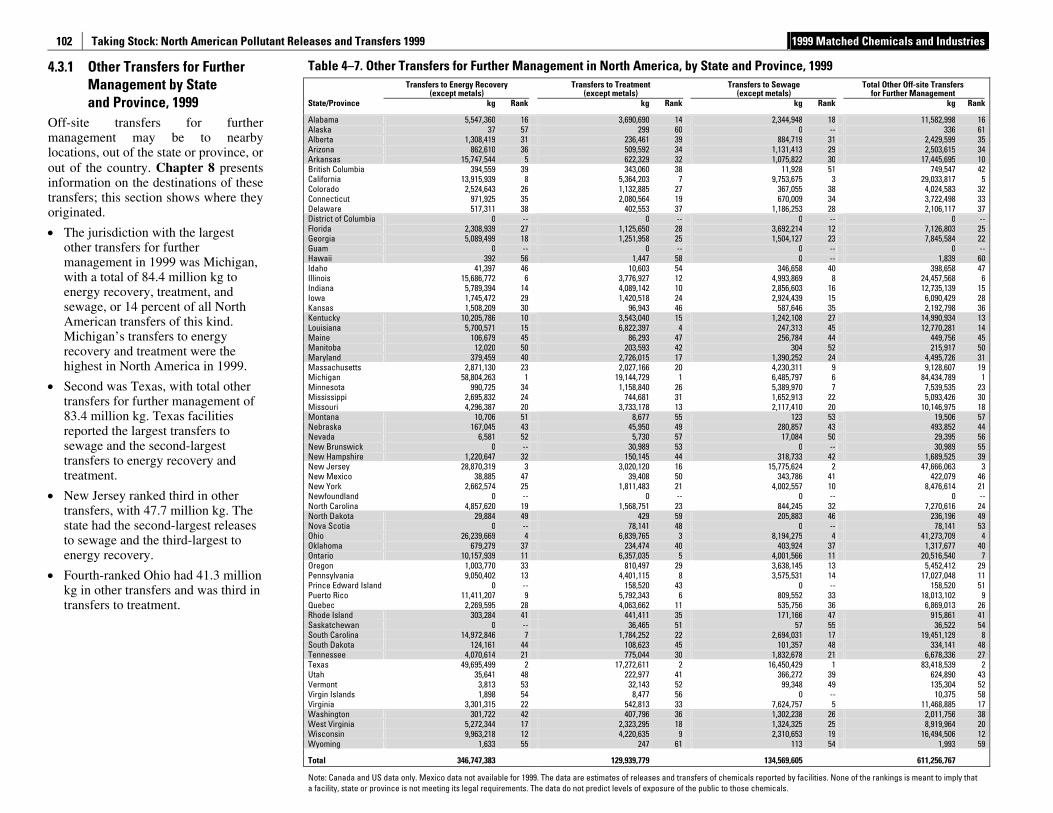
Taking Stock: North American Pollutant Releases and Transfers 1999 1999 Matched Chemicals and Industries
102
4.3.1 Other Transfers for Further Management by State and Province, 1999
Off-site transfers for further management may be to nearby locations, out of the state or province, or out of the country. Chapter 8 presents information on the destinations of these transfers; this section shows where they originated.
• The jurisdiction with the largest other transfers for further management in 1999 was Michigan, with a total of 84.4 million kg to energy recovery, treatment, and sewage, or 14 percent of all North American transfers of this kind. Michigan’s transfers to energy recovery and treatment were the highest in North America in 1999.
• Second was Texas, with total other transfers for further management of 83.4 million kg. Texas facilities reported the largest transfers to sewage and the second-largest transfers to energy recovery and treatment.
• New Jersey ranked third in other transfers, with 47.7 million kg. The state had the second-largest releases to sewage and the third-largest to energy recovery.
• Fourth-ranked Ohio had 41.3 million kg in other transfers and was third in transfers to treatment.
Table 4–7. Other Transfers for Further Management in North America, by State and Province, 1999
Transfers to Energy Recovery
(except metals) Transfers to Treatment
(except metals) Transfers to Sewage
(except metals) Total Other Off-site Transfers
for Further Management State/Province kg Rank kg Rank kg Rank kg Rank Alabama 5,547,360 16 3,690,690 14 2,344,948 18 11,582,998 16 Alaska 37 57 299 60 0 -- 336 61 Alberta 1,308,419 31 236,461 39 884,719 31 2,429,599 35 Arizona 862,610 36 509,592 34 1,131,413 29 2,503,615 34 Arkansas 15,747,544 5 622,329 32 1,075,822 30 17,445,695 10 British Columbia 394,559 39 343,060 38 11,928 51 749,547 42 California 13,915,939 8 5,364,203 7 9,753,675 3 29,033,817 5 Colorado 2,524,643 26 1,132,885 27 367,055 38 4,024,583 32 Connecticut 971,925 35 2,080,564 19 670,009 34 3,722,498 33 Delaware 517,311 38 402,553 37 1,186,253 28 2,106,117 37 District of Columbia 0 -- 0 -- 0 -- 0 -- Florida 2,308,939 27 1,125,650 28 3,692,214 12 7,126,803 25 Georgia 5,089,499 18 1,251,958 25 1,504,127 23 7,845,584 22 Guam 0 -- 0 -- 0 -- 0 -- Hawaii 392 56 1,447 58 0 -- 1,839 60 Idaho 41,397 46 10,603 54 346,658 40 398,658 47 Illinois 15,686,772 6 3,776,927 12 4,993,869 8 24,457,568 6 Indiana 5,789,394 14 4,089,142 10 2,856,603 16 12,735,139 15 Iowa 1,745,472 29 1,420,518 24 2,924,439 15 6,090,429 28 Kansas 1,508,209 30 96,943 46 587,646 35 2,192,798 36 Kentucky 10,205,786 10 3,543,040 15 1,242,108 27 14,990,934 13 Louisiana 5,700,571 15 6,822,397 4 247,313 45 12,770,281 14 Maine 106,679 45 86,293 47 256,784 44 449,756 45 Manitoba 12,020 50 203,593 42 304 52 215,917 50 Maryland 379,459 40 2,726,015 17 1,390,252 24 4,495,726 31 Massachusetts 2,871,130 23 2,027,166 20 4,230,311 9 9,128,607 19 Michigan 58,804,263 1 19,144,729 1 6,485,797 6 84,434,789 1 Minnesota 990,725 34 1,158,840 26 5,389,970 7 7,539,535 23 Mississippi 2,695,832 24 744,681 31 1,652,913 22 5,093,426 30 Missouri 4,296,387 20 3,733,178 13 2,117,410 20 10,146,975 18 Montana 10,706 51 8,677 55 123 53 19,506 57 Nebraska 167,045 43 45,950 49 280,857 43 493,852 44 Nevada 6,581 52 5,730 57 17,084 50 29,395 56 New Brunswick 0 -- 30,989 53 0 -- 30,989 55 New Hampshire 1,220,647 32 150,145 44 318,733 42 1,689,525 39 New Jersey 28,870,319 3 3,020,120 16 15,775,624 2 47,666,063 3 New Mexico 38,885 47 39,408 50 343,786 41 422,079 46 New York 2,662,574 25 1,811,483 21 4,002,557 10 8,476,614 21 Newfoundland 0 -- 0 -- 0 -- 0 -- North Carolina 4,857,620 19 1,568,751 23 844,245 32 7,270,616 24 North Dakota 29,884 49 429 59 205,883 46 236,196 49 Nova Scotia 0 -- 78,141 48 0 -- 78,141 53 Ohio 26,239,669 4 6,839,765 3 8,194,275 4 41,273,709 4 Oklahoma 679,279 37 234,474 40 403,924 37 1,317,677 40 Ontario 10,157,939 11 6,357,035 5 4,001,566 11 20,516,540 7 Oregon 1,003,770 33 810,497 29 3,638,145 13 5,452,412 29 Pennsylvania 9,050,402 13 4,401,115 8 3,575,531 14 17,027,048 11 Prince Edward Island 0 -- 158,520 43 0 -- 158,520 51 Puerto Rico 11,411,207 9 5,792,343 6 809,552 33 18,013,102 9 Quebec 2,269,595 28 4,063,662 11 535,756 36 6,869,013 26 Rhode Island 303,284 41 441,411 35 171,166 47 915,861 41 Saskatchewan 0 -- 36,465 51 57 55 36,522 54 South Carolina 14,972,846 7 1,784,252 22 2,694,031 17 19,451,129 8 South Dakota 124,161 44 108,623 45 101,357 48 334,141 48 Tennessee 4,070,614 21 775,044 30 1,832,678 21 6,678,336 27 Texas 49,695,499 2 17,272,611 2 16,450,429 1 83,418,539 2 Utah 35,641 48 222,977 41 366,272 39 624,890 43 Vermont 3,813 53 32,143 52 99,348 49 135,304 52 Virgin Islands 1,898 54 8,477 56 0 -- 10,375 58 Virginia 3,301,315 22 542,813 33 7,624,757 5 11,468,885 17 Washington 301,722 42 407,796 36 1,302,238 26 2,011,756 38 West Virginia 5,272,344 17 2,323,295 18 1,324,325 25 8,919,964 20 Wisconsin 9,963,218 12 4,220,635 9 2,310,653 19 16,494,506 12 Wyoming 1,633 55 247 61 113 54 1,993 59
Total 346,747,383 129,939,779 134,569,605 611,256,767
Note: Canada and US data only. Mexico data not available for 1999. The data are estimates of releases and transfers of chemicals reported by facilities. None of the rankings is meant to imply that a facility, state or province is not meeting its legal requirements. The data do not predict levels of exposure of the public to those chemicals.
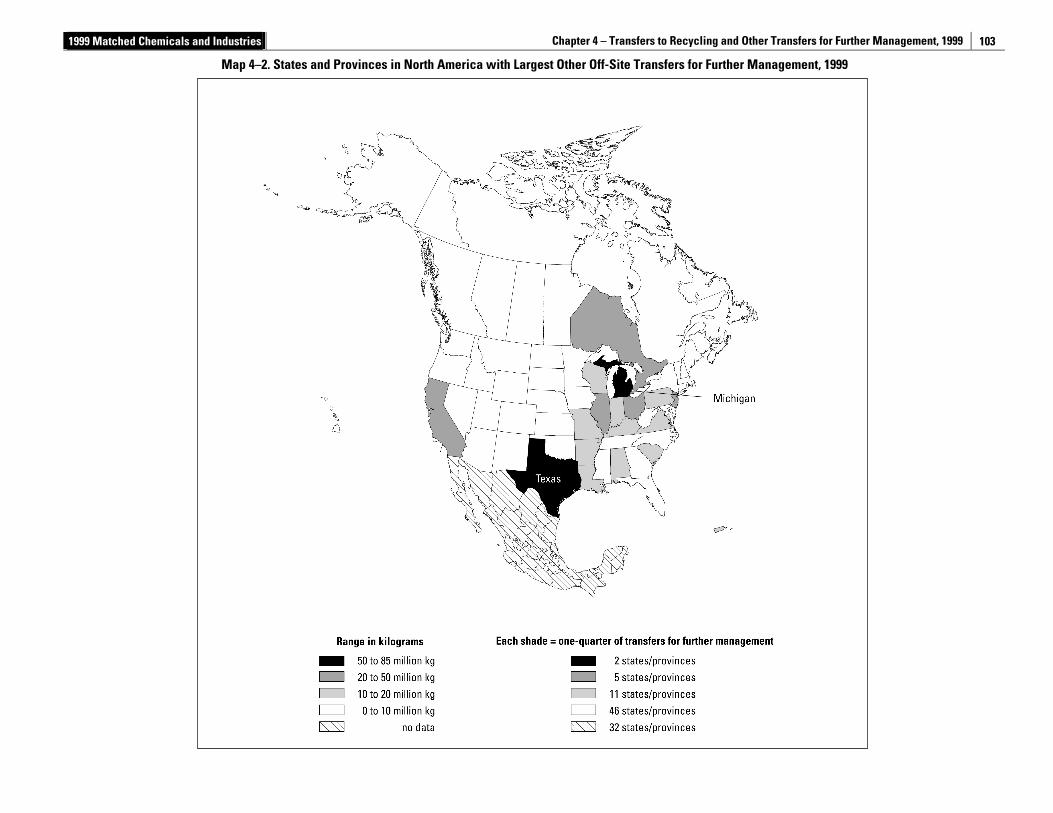
1999 Matched Chemicals and Industries Chapter 4 – Transfers to Recycling and Other Transfers for Further Management, 1999
103
Map 4–2. States and Provinces in North America with Largest Other Off-Site Transfers for Further Management, 1999
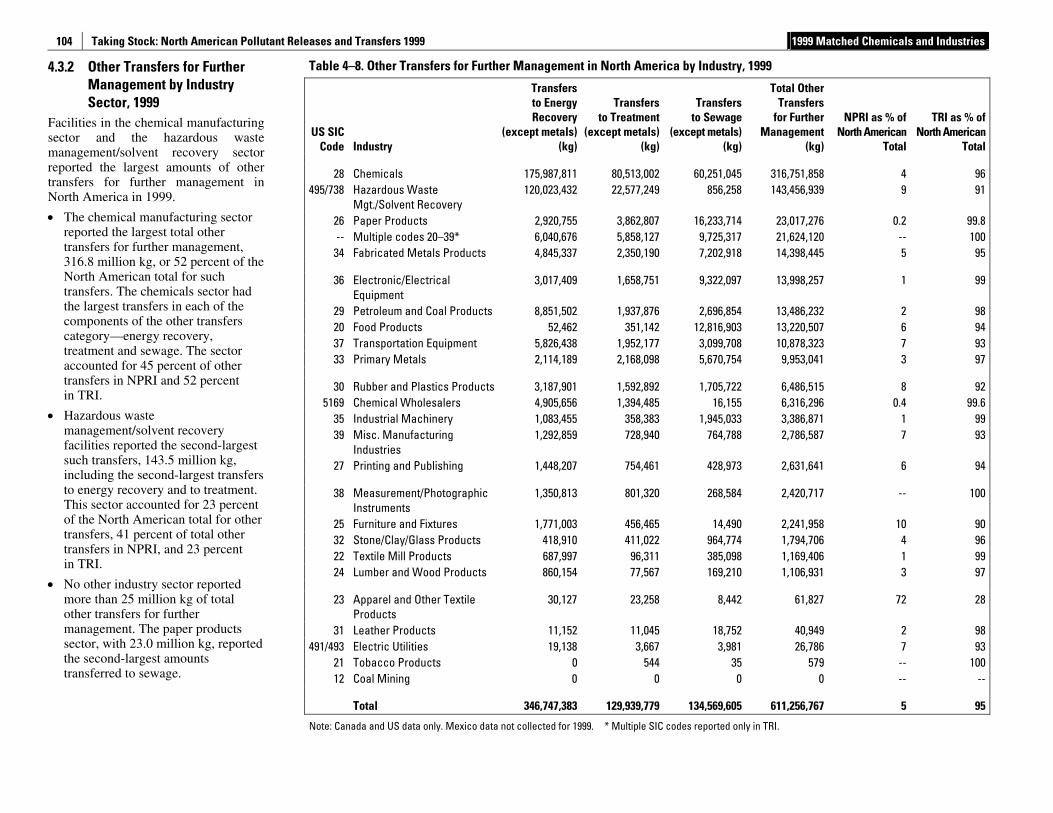
Taking Stock: North American Pollutant Releases and Transfers 1999 1999 Matched Chemicals and Industries
104
4.3.2 Other Transfers for Further Management by Industry Sector, 1999
Facilities in the chemical manufacturing sector and the hazardous waste management/solvent recovery sector reported the largest amounts of other transfers for further management in North America in 1999.
• The chemical manufacturing sector reported the largest total other transfers for further management, 316.8 million kg, or 52 percent of the North American total for such transfers. The chemicals sector had the largest transfers in each of the components of the other transfers category—energy recovery, treatment and sewage. The sector accounted for 45 percent of other transfers in NPRI and 52 percent in TRI.
• Hazardous waste management/solvent recovery facilities reported the second-largest such transfers, 143.5 million kg, including the second-largest transfers to energy recovery and to treatment. This sector accounted for 23 percent of the North American total for other transfers, 41 percent of total other transfers in NPRI, and 23 percent in TRI.
• No other industry sector reported more than 25 million kg of total other transfers for further management. The paper products sector, with 23.0 million kg, reported the second-largest amounts transferred to sewage.
Table 4–8. Other Transfers for Further Management in North America by Industry, 1999
US SIC Code Industry
Transfersto Energy Recovery
(except metals)(kg)
Transfersto Treatment
(except metals)(kg)
Transfersto Sewage
(except metals)(kg)
Total Other Transfers
for Further Management
(kg)
NPRI as % of North American
Total
TRI as % of North American
Total
28 Chemicals 175,987,811 80,513,002 60,251,045 316,751,858 4 96 495/738 Hazardous Waste
Mgt./Solvent Recovery 120,023,432 22,577,249 856,258 143,456,939 9 91
26 Paper Products 2,920,755 3,862,807 16,233,714 23,017,276 0.2 99.8 -- Multiple codes 20–39* 6,040,676 5,858,127 9,725,317 21,624,120 -- 100
34 Fabricated Metals Products 4,845,337 2,350,190 7,202,918 14,398,445 5 95
36 Electronic/Electrical Equipment
3,017,409 1,658,751 9,322,097 13,998,257 1 99
29 Petroleum and Coal Products 8,851,502 1,937,876 2,696,854 13,486,232 2 98 20 Food Products 52,462 351,142 12,816,903 13,220,507 6 94 37 Transportation Equipment 5,826,438 1,952,177 3,099,708 10,878,323 7 93 33 Primary Metals 2,114,189 2,168,098 5,670,754 9,953,041 3 97
30 Rubber and Plastics Products 3,187,901 1,592,892 1,705,722 6,486,515 8 92 5169 Chemical Wholesalers 4,905,656 1,394,485 16,155 6,316,296 0.4 99.6
35 Industrial Machinery 1,083,455 358,383 1,945,033 3,386,871 1 99 39 Misc. Manufacturing
Industries 1,292,859 728,940 764,788 2,786,587 7 93
27 Printing and Publishing 1,448,207 754,461 428,973 2,631,641 6 94
38 Measurement/Photographic Instruments
1,350,813 801,320 268,584 2,420,717 -- 100
25 Furniture and Fixtures 1,771,003 456,465 14,490 2,241,958 10 90 32 Stone/Clay/Glass Products 418,910 411,022 964,774 1,794,706 4 96 22 Textile Mill Products 687,997 96,311 385,098 1,169,406 1 99 24 Lumber and Wood Products 860,154 77,567 169,210 1,106,931 3 97
23 Apparel and Other Textile Products
30,127 23,258 8,442 61,827 72 28
31 Leather Products 11,152 11,045 18,752 40,949 2 98 491/493 Electric Utilities 19,138 3,667 3,981 26,786 7 93
21 Tobacco Products 0 544 35 579 -- 100 12 Coal Mining 0 0 0 0 -- --
Total 346,747,383 129,939,779 134,569,605 611,256,767 5 95
Note: Canada and US data only. Mexico data not collected for 1999. * Multiple SIC codes reported only in TRI.
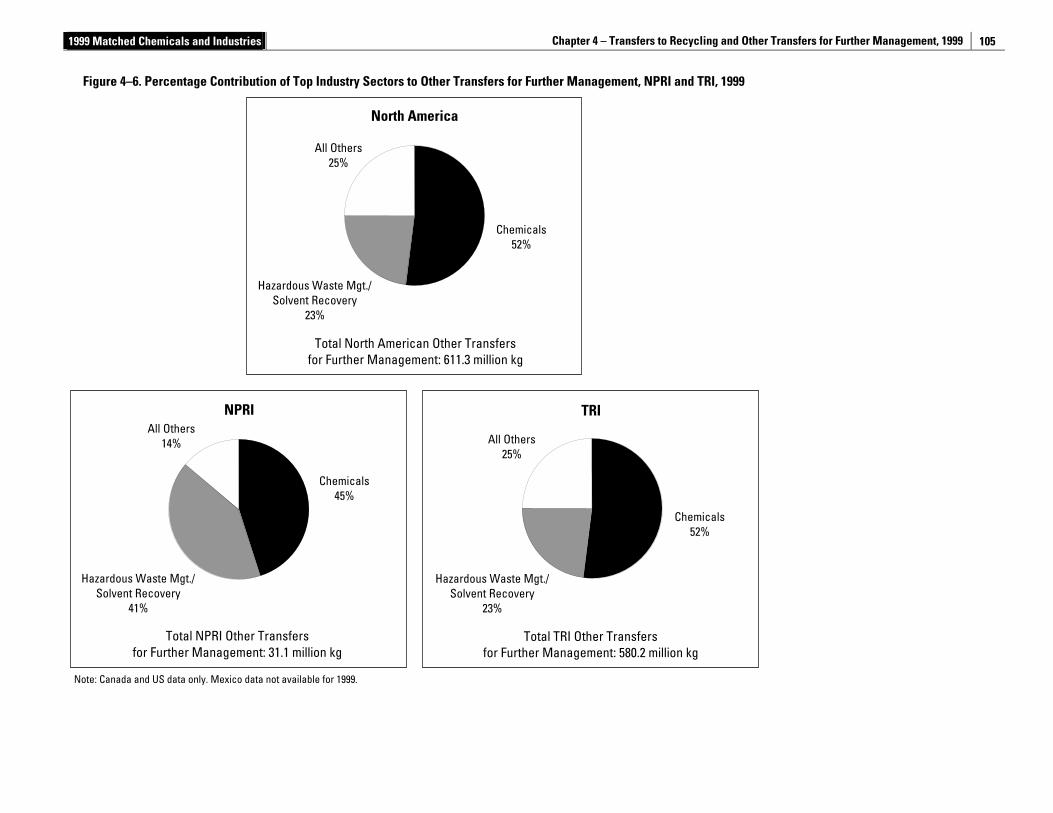
1999 Matched Chemicals and Industries Chapter 4 – Transfers to Recycling and Other Transfers for Further Management, 1999
105
Figure 4–6. Percentage Contribution of Top Industry Sectors to Other Transfers for Further Management, NPRI and TRI, 1999
Chemicals52%
NPRI TRI
North America
Hazardous Waste Mgt./Solvent Recovery
23%
All Others25%
Chemicals45%
All Others 14%
Hazardous Waste Mgt./ Solvent Recovery
41%
Hazardous Waste Mgt./Solvent Recovery
23%
Chemicals52%
All Others25%
Total North American Other Transfers for Further Management: 611.3 million kg
Total NPRI Other Transfers for Further Management: 31.1 million kg
Total TRI Other Transfers for Further Management: 580.2 million kg
Note: Canada and US data only. Mexico data not available for 1999.
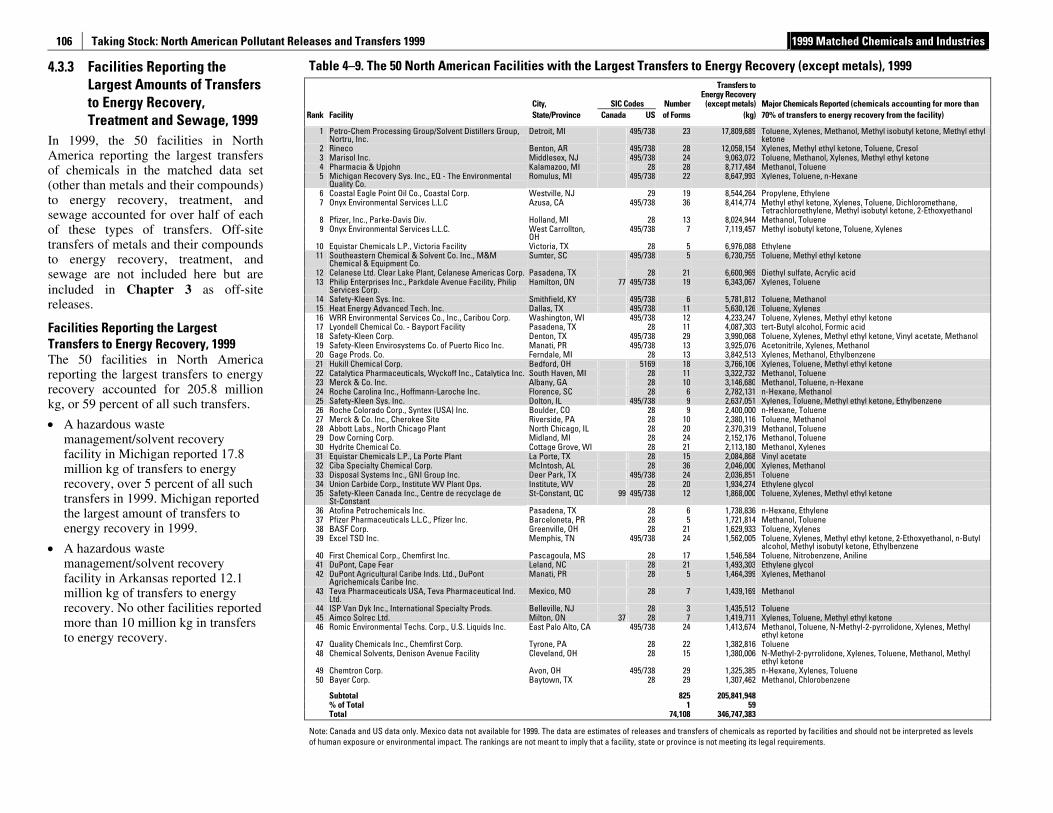
Taking Stock: North American Pollutant Releases and Transfers 1999 1999 Matched Chemicals and Industries
106
4.3.3 Facilities Reporting the Largest Amounts of Transfers to Energy Recovery, Treatment and Sewage, 1999
In 1999, the 50 facilities in North America reporting the largest transfers of chemicals in the matched data set (other than metals and their compounds) to energy recovery, treatment, and sewage accounted for over half of each of these types of transfers. Off-site transfers of metals and their compounds to energy recovery, treatment, and sewage are not included here but are included in Chapter 3 as off-site releases.
Facilities Reporting the Largest Transfers to Energy Recovery, 1999 The 50 facilities in North America reporting the largest transfers to energy recovery accounted for 205.8 million kg, or 59 percent of all such transfers.
• A hazardous waste management/solvent recovery facility in Michigan reported 17.8 million kg of transfers to energy recovery, over 5 percent of all such transfers in 1999. Michigan reported the largest amount of transfers to energy recovery in 1999.
• A hazardous waste management/solvent recovery facility in Arkansas reported 12.1 million kg of transfers to energy recovery. No other facilities reported more than 10 million kg in transfers to energy recovery.
Table 4–9. The 50 North American Facilities with the Largest Transfers to Energy Recovery (except metals), 1999
City,
SIC Codes Number
Transfers toEnergy Recovery
(except metals) Major Chemicals Reported (chemicals accounting for more than Rank Facility State/Province Canada US of Forms (kg) 70% of transfers to energy recovery from the facility)
1 Petro-Chem Processing Group/Solvent Distillers Group, Nortru, Inc.
Detroit, MI 495/738 23 17,809,689 Toluene, Xylenes, Methanol, Methyl isobutyl ketone, Methyl ethyl ketone
2 Rineco Benton, AR 495/738 28 12,058,154 Xylenes, Methyl ethyl ketone, Toluene, Cresol 3 Marisol Inc. Middlesex, NJ 495/738 24 9,063,072 Toluene, Methanol, Xylenes, Methyl ethyl ketone 4 Pharmacia & Upjohn Kalamazoo, MI 28 28 8,717,484 Methanol, Toluene 5 Michigan Recovery Sys. Inc., EQ - The Environmental
Quality Co. Romulus, MI 495/738 22 8,647,993 Xylenes, Toluene, n-Hexane
6 Coastal Eagle Point Oil Co., Coastal Corp. Westville, NJ 29 19 8,544,264 Propylene, Ethylene 7 Onyx Environmental Services L.L.C Azusa, CA 495/738 36 8,414,774 Methyl ethyl ketone, Xylenes, Toluene, Dichloromethane,
Tetrachloroethylene, Methyl isobutyl ketone, 2-Ethoxyethanol 8 Pfizer, Inc., Parke-Davis Div. Holland, MI 28 13 8,024,944 Methanol, Toluene 9 Onyx Environmental Services L.L.C. West Carrollton,
OH 495/738 7 7,119,457 Methyl isobutyl ketone, Toluene, Xylenes
10 Equistar Chemicals L.P., Victoria Facility Victoria, TX 28 5 6,976,088 Ethylene 11 Southeastern Chemical & Solvent Co. Inc., M&M
Chemical & Equipment Co. Sumter, SC 495/738 5 6,730,755 Toluene, Methyl ethyl ketone
12 Celanese Ltd. Clear Lake Plant, Celanese Americas Corp. Pasadena, TX 28 21 6,600,969 Diethyl sulfate, Acrylic acid 13 Philip Enterprises Inc., Parkdale Avenue Facility, Philip
Services Corp. Hamilton, ON 77 495/738 19 6,343,067 Xylenes, Toluene
14 Safety-Kleen Sys. Inc. Smithfield, KY 495/738 6 5,781,812 Toluene, Methanol 15 Heat Energy Advanced Tech. Inc. Dallas, TX 495/738 11 5,630,126 Toluene, Xylenes 16 WRR Environmental Services Co., Inc., Caribou Corp. Washington, WI 495/738 12 4,233,247 Toluene, Xylenes, Methyl ethyl ketone 17 Lyondell Chemical Co. - Bayport Facility Pasadena, TX 28 11 4,087,303 tert-Butyl alcohol, Formic acid 18 Safety-Kleen Corp. Denton, TX 495/738 29 3,990,068 Toluene, Xylenes, Methyl ethyl ketone, Vinyl acetate, Methanol 19 Safety-Kleen Envirosystems Co. of Puerto Rico Inc. Manati, PR 495/738 13 3,925,076 Acetonitrile, Xylenes, Methanol 20 Gage Prods. Co. Ferndale, MI 28 13 3,842,513 Xylenes, Methanol, Ethylbenzene 21 Hukill Chemical Corp. Bedford, OH 5169 18 3,766,106 Xylenes, Toluene, Methyl ethyl ketone 22 Catalytica Pharmaceuticals, Wyckoff Inc., Catalytica Inc. South Haven, MI 28 11 3,322,732 Methanol, Toluene 23 Merck & Co. Inc. Albany, GA 28 10 3,146,680 Methanol, Toluene, n-Hexane 24 Roche Carolina Inc., Hoffmann-Laroche Inc. Florence, SC 28 6 2,782,131 n-Hexane, Methanol 25 Safety-Kleen Sys. Inc. Dolton, IL 495/738 9 2,637,051 Xylenes, Toluene, Methyl ethyl ketone, Ethylbenzene 26 Roche Colorado Corp., Syntex (USA) Inc. Boulder, CO 28 9 2,400,000 n-Hexane, Toluene 27 Merck & Co. Inc., Cherokee Site Riverside, PA 28 10 2,380,116 Toluene, Methanol 28 Abbott Labs., North Chicago Plant North Chicago, IL 28 20 2,370,319 Methanol, Toluene 29 Dow Corning Corp. Midland, MI 28 24 2,152,176 Methanol, Toluene 30 Hydrite Chemical Co. Cottage Grove, WI 28 21 2,113,180 Methanol, Xylenes 31 Equistar Chemicals L.P., La Porte Plant La Porte, TX 28 15 2,084,868 Vinyl acetate 32 Ciba Specialty Chemical Corp. McIntosh, AL 28 36 2,046,000 Xylenes, Methanol 33 Disposal Systems Inc., GNI Group Inc. Deer Park, TX 495/738 24 2,036,851 Toluene 34 Union Carbide Corp., Institute WV Plant Ops. Institute, WV 28 20 1,934,274 Ethylene glycol 35 Safety-Kleen Canada Inc., Centre de recyclage de
St-Constant St-Constant, QC 99 495/738 12 1,868,000 Toluene, Xylenes, Methyl ethyl ketone
36 Atofina Petrochemicals Inc. Pasadena, TX 28 6 1,738,836 n-Hexane, Ethylene 37 Pfizer Pharmaceuticals L.L.C., Pfizer Inc. Barceloneta, PR 28 5 1,721,814 Methanol, Toluene 38 BASF Corp. Greenville, OH 28 21 1,629,933 Toluene, Xylenes 39 Excel TSD Inc. Memphis, TN 495/738 24 1,562,005 Toluene, Xylenes, Methyl ethyl ketone, 2-Ethoxyethanol, n-Butyl
alcohol, Methyl isobutyl ketone, Ethylbenzene 40 First Chemical Corp., Chemfirst Inc. Pascagoula, MS 28 17 1,546,584 Toluene, Nitrobenzene, Aniline 41 DuPont, Cape Fear Leland, NC 28 21 1,493,303 Ethylene glycol 42 DuPont Agricultural Caribe Inds. Ltd., DuPont
Agrichemicals Caribe Inc. Manati, PR 28 5 1,464,399 Xylenes, Methanol
43 Teva Pharmaceuticals USA, Teva Pharmaceutical Ind. Ltd.
Mexico, MO 28 7 1,439,169 Methanol
44 ISP Van Dyk Inc., International Specialty Prods. Belleville, NJ 28 3 1,435,512 Toluene 45 Aimco Solrec Ltd. Milton, ON 37 28 7 1,419,711 Xylenes, Toluene, Methyl ethyl ketone 46 Romic Environmental Techs. Corp., U.S. Liquids Inc. East Palo Alto, CA 495/738 24 1,413,674 Methanol, Toluene, N-Methyl-2-pyrrolidone, Xylenes, Methyl
ethyl ketone 47 Quality Chemicals Inc., Chemfirst Corp. Tyrone, PA 28 22 1,382,816 Toluene 48 Chemical Solvents, Denison Avenue Facility Cleveland, OH 28 15 1,380,006 N-Methyl-2-pyrrolidone, Xylenes, Toluene, Methanol, Methyl
ethyl ketone 49 Chemtron Corp. Avon, OH 495/738 29 1,325,385 n-Hexane, Xylenes, Toluene 50 Bayer Corp. Baytown, TX 28 29 1,307,462 Methanol, Chlorobenzene
Subtotal 825 205,841,948 % of Total 1 59 Total 74,108 346,747,383
Note: Canada and US data only. Mexico data not available for 1999. The data are estimates of releases and transfers of chemicals as reported by facilities and should not be interpreted as levels of human exposure or environmental impact. The rankings are not meant to imply that a facility, state or province is not meeting its legal requirements.
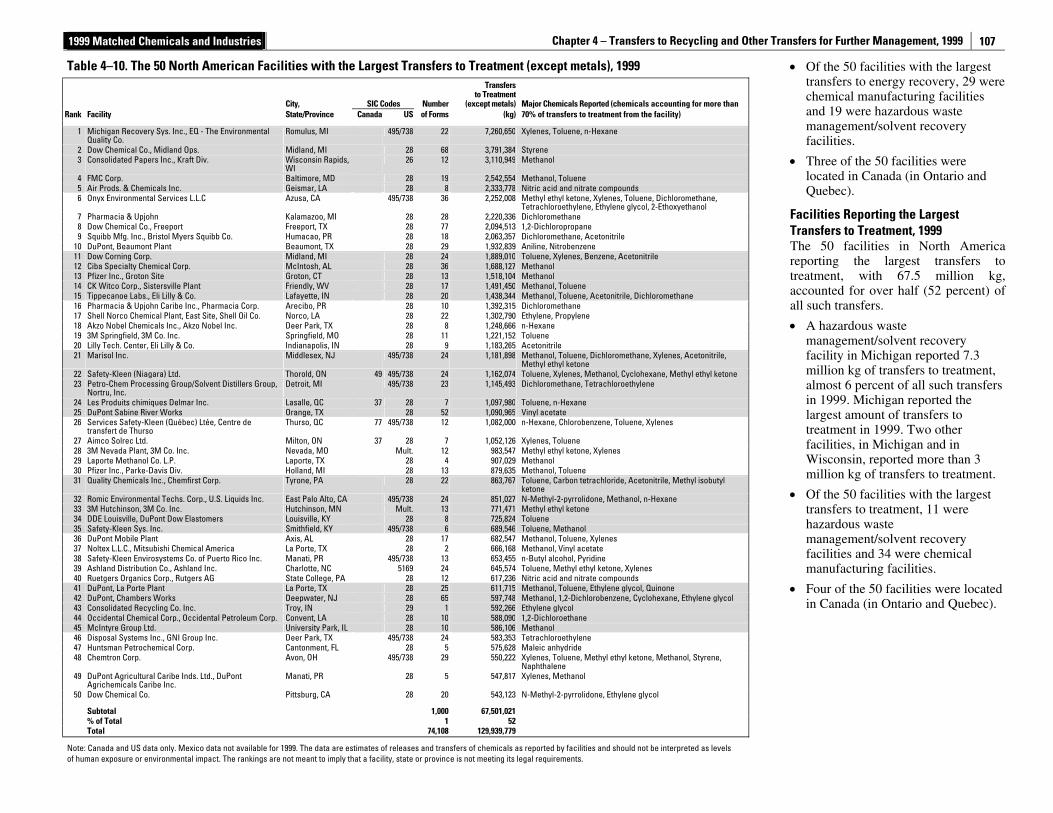
1999 Matched Chemicals and Industries Chapter 4 – Transfers to Recycling and Other Transfers for Further Management, 1999
107
• Of the 50 facilities with the largest transfers to energy recovery, 29 were chemical manufacturing facilities and 19 were hazardous waste management/solvent recovery facilities.
• Three of the 50 facilities were located in Canada (in Ontario and Quebec).
Facilities Reporting the Largest Transfers to Treatment, 1999 The 50 facilities in North America reporting the largest transfers to treatment, with 67.5 million kg, accounted for over half (52 percent) of all such transfers.
• A hazardous waste management/solvent recovery facility in Michigan reported 7.3 million kg of transfers to treatment, almost 6 percent of all such transfers in 1999. Michigan reported the largest amount of transfers to treatment in 1999. Two other facilities, in Michigan and in Wisconsin, reported more than 3 million kg of transfers to treatment.
• Of the 50 facilities with the largest transfers to treatment, 11 were hazardous waste management/solvent recovery facilities and 34 were chemical manufacturing facilities.
• Four of the 50 facilities were located in Canada (in Ontario and Quebec).
Table 4–10. The 50 North American Facilities with the Largest Transfers to Treatment (except metals), 1999
City,
SIC Codes Number
Transfersto Treatment
(except metals) Major Chemicals Reported (chemicals accounting for more than Rank Facility State/Province Canada US of Forms (kg) 70% of transfers to treatment from the facility)
1 Michigan Recovery Sys. Inc., EQ - The Environmental Quality Co.
Romulus, MI 495/738 22 7,260,650 Xylenes, Toluene, n-Hexane
2 Dow Chemical Co., Midland Ops. Midland, MI 28 68 3,791,384 Styrene 3 Consolidated Papers Inc., Kraft Div. Wisconsin Rapids,
WI 26 12 3,110,949 Methanol
4 FMC Corp. Baltimore, MD 28 19 2,542,554 Methanol, Toluene 5 Air Prods. & Chemicals Inc. Geismar, LA 28 8 2,333,778 Nitric acid and nitrate compounds 6 Onyx Environmental Services L.L.C Azusa, CA 495/738 36 2,252,008 Methyl ethyl ketone, Xylenes, Toluene, Dichloromethane,
Tetrachloroethylene, Ethylene glycol, 2-Ethoxyethanol 7 Pharmacia & Upjohn Kalamazoo, MI 28 28 2,220,336 Dichloromethane 8 Dow Chemical Co., Freeport Freeport, TX 28 77 2,094,513 1,2-Dichloropropane 9 Squibb Mfg. Inc., Bristol Myers Squibb Co. Humacao, PR 28 18 2,063,357 Dichloromethane, Acetonitrile
10 DuPont, Beaumont Plant Beaumont, TX 28 29 1,932,839 Aniline, Nitrobenzene 11 Dow Corning Corp. Midland, MI 28 24 1,889,010 Toluene, Xylenes, Benzene, Acetonitrile 12 Ciba Specialty Chemical Corp. McIntosh, AL 28 36 1,688,127 Methanol 13 Pfizer Inc., Groton Site Groton, CT 28 13 1,518,104 Methanol 14 CK Witco Corp., Sistersville Plant Friendly, WV 28 17 1,491,450 Methanol, Toluene 15 Tippecanoe Labs., Eli Lilly & Co. Lafayette, IN 28 20 1,438,344 Methanol, Toluene, Acetonitrile, Dichloromethane 16 Pharmacia & Upjohn Caribe Inc., Pharmacia Corp. Arecibo, PR 28 10 1,392,315 Dichloromethane 17 Shell Norco Chemical Plant, East Site, Shell Oil Co. Norco, LA 28 22 1,302,790 Ethylene, Propylene 18 Akzo Nobel Chemicals Inc., Akzo Nobel Inc. Deer Park, TX 28 8 1,248,666 n-Hexane 19 3M Springfield, 3M Co. Inc. Springfield, MO 28 11 1,221,152 Toluene 20 Lilly Tech. Center, Eli Lilly & Co. Indianapolis, IN 28 9 1,183,265 Acetonitrile 21 Marisol Inc. Middlesex, NJ 495/738 24 1,181,898 Methanol, Toluene, Dichloromethane, Xylenes, Acetonitrile,
Methyl ethyl ketone 22 Safety-Kleen (Niagara) Ltd. Thorold, ON 49 495/738 24 1,162,074 Toluene, Xylenes, Methanol, Cyclohexane, Methyl ethyl ketone 23 Petro-Chem Processing Group/Solvent Distillers Group,
Nortru, Inc. Detroit, MI 495/738 23 1,145,493 Dichloromethane, Tetrachloroethylene
24 Les Produits chimiques Delmar Inc. Lasalle, QC 37 28 7 1,097,980 Toluene, n-Hexane 25 DuPont Sabine River Works Orange, TX 28 52 1,090,965 Vinyl acetate 26 Services Safety-Kleen (Québec) Ltée, Centre de
transfert de Thurso Thurso, QC 77 495/738 12 1,082,000 n-Hexane, Chlorobenzene, Toluene, Xylenes
27 Aimco Solrec Ltd. Milton, ON 37 28 7 1,052,126 Xylenes, Toluene 28 3M Nevada Plant, 3M Co. Inc. Nevada, MO Mult. 12 983,547 Methyl ethyl ketone, Xylenes 29 Laporte Methanol Co. L.P. Laporte, TX 28 4 907,029 Methanol 30 Pfizer Inc., Parke-Davis Div. Holland, MI 28 13 879,635 Methanol, Toluene 31 Quality Chemicals Inc., Chemfirst Corp. Tyrone, PA 28 22 863,767 Toluene, Carbon tetrachloride, Acetonitrile, Methyl isobutyl
ketone 32 Romic Environmental Techs. Corp., U.S. Liquids Inc. East Palo Alto, CA 495/738 24 851,027 N-Methyl-2-pyrrolidone, Methanol, n-Hexane 33 3M Hutchinson, 3M Co. Inc. Hutchinson, MN Mult. 13 771,471 Methyl ethyl ketone 34 DDE Louisville, DuPont Dow Elastomers Louisville, KY 28 8 725,824 Toluene 35 Safety-Kleen Sys. Inc. Smithfield, KY 495/738 6 689,546 Toluene, Methanol 36 DuPont Mobile Plant Axis, AL 28 17 682,547 Methanol, Toluene, Xylenes 37 Noltex L.L.C., Mitsubishi Chemical America La Porte, TX 28 2 666,168 Methanol, Vinyl acetate 38 Safety-Kleen Envirosystems Co. of Puerto Rico Inc. Manati, PR 495/738 13 653,455 n-Butyl alcohol, Pyridine 39 Ashland Distribution Co., Ashland Inc. Charlotte, NC 5169 24 645,574 Toluene, Methyl ethyl ketone, Xylenes 40 Ruetgers Organics Corp., Rutgers AG State College, PA 28 12 617,236 Nitric acid and nitrate compounds 41 DuPont, La Porte Plant La Porte, TX 28 25 611,715 Methanol, Toluene, Ethylene glycol, Quinone 42 DuPont, Chambers Works Deepwater, NJ 28 65 597,748 Methanol, 1,2-Dichlorobenzene, Cyclohexane, Ethylene glycol 43 Consolidated Recycling Co. Inc. Troy, IN 29 1 592,266 Ethylene glycol 44 Occidental Chemical Corp., Occidental Petroleum Corp. Convent, LA 28 10 588,090 1,2-Dichloroethane 45 McIntyre Group Ltd. University Park, IL 28 10 586,106 Methanol 46 Disposal Systems Inc., GNI Group Inc. Deer Park, TX 495/738 24 583,353 Tetrachloroethylene 47 Huntsman Petrochemical Corp. Cantonment, FL 28 5 575,628 Maleic anhydride 48 Chemtron Corp. Avon, OH 495/738 29 550,222 Xylenes, Toluene, Methyl ethyl ketone, Methanol, Styrene,
Naphthalene 49 DuPont Agricultural Caribe Inds. Ltd., DuPont
Agrichemicals Caribe Inc. Manati, PR 28 5 547,817 Xylenes, Methanol
50 Dow Chemical Co. Pittsburg, CA 28 20 543,123 N-Methyl-2-pyrrolidone, Ethylene glycol
Subtotal 1,000 67,501,021 % of Total 1 52 Total 74,108 129,939,779
Note: Canada and US data only. Mexico data not available for 1999. The data are estimates of releases and transfers of chemicals as reported by facilities and should not be interpreted as levels of human exposure or environmental impact. The rankings are not meant to imply that a facility, state or province is not meeting its legal requirements.
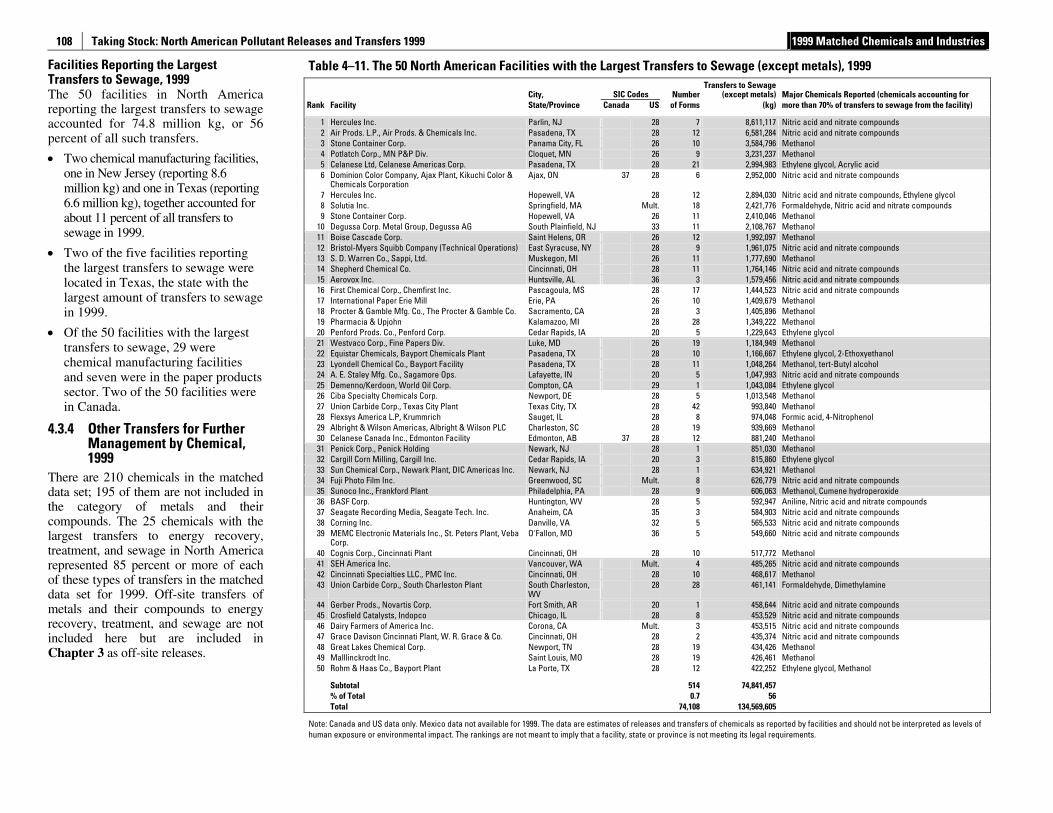
Taking Stock: North American Pollutant Releases and Transfers 1999 1999 Matched Chemicals and Industries
108
Facilities Reporting the Largest Transfers to Sewage, 1999 The 50 facilities in North America reporting the largest transfers to sewage accounted for 74.8 million kg, or 56 percent of all such transfers.
• Two chemical manufacturing facilities, one in New Jersey (reporting 8.6 million kg) and one in Texas (reporting 6.6 million kg), together accounted for about 11 percent of all transfers to sewage in 1999.
• Two of the five facilities reporting the largest transfers to sewage were located in Texas, the state with the largest amount of transfers to sewage in 1999.
• Of the 50 facilities with the largest transfers to sewage, 29 were chemical manufacturing facilities and seven were in the paper products sector. Two of the 50 facilities were in Canada.
4.3.4 Other Transfers for Further Management by Chemical, 1999
There are 210 chemicals in the matched data set; 195 of them are not included in the category of metals and their compounds. The 25 chemicals with the largest transfers to energy recovery, treatment, and sewage in North America represented 85 percent or more of each of these types of transfers in the matched data set for 1999. Off-site transfers of metals and their compounds to energy recovery, treatment, and sewage are not included here but are included in Chapter 3 as off-site releases.
Table 4–11. The 50 North American Facilities with the Largest Transfers to Sewage (except metals), 1999
City,
SIC Codes NumberTransfers to Sewage
(except metals) Major Chemicals Reported (chemicals accounting for Rank Facility State/Province Canada US of Forms (kg) more than 70% of transfers to sewage from the facility)
1 Hercules Inc. Parlin, NJ 28 7 8,611,117 Nitric acid and nitrate compounds 2 Air Prods. L.P., Air Prods. & Chemicals Inc. Pasadena, TX 28 12 6,581,284 Nitric acid and nitrate compounds 3 Stone Container Corp. Panama City, FL 26 10 3,584,796 Methanol 4 Potlatch Corp., MN P&P Div. Cloquet, MN 26 9 3,231,237 Methanol 5 Celanese Ltd, Celanese Americas Corp. Pasadena, TX 28 21 2,994,983 Ethylene glycol, Acrylic acid 6 Dominion Color Company, Ajax Plant, Kikuchi Color &
Chemicals Corporation Ajax, ON 37 28 6 2,952,000 Nitric acid and nitrate compounds
7 Hercules Inc. Hopewell, VA 28 12 2,894,030 Nitric acid and nitrate compounds, Ethylene glycol 8 Solutia Inc. Springfield, MA Mult. 18 2,421,776 Formaldehyde, Nitric acid and nitrate compounds 9 Stone Container Corp. Hopewell, VA 26 11 2,410,046 Methanol
10 Degussa Corp. Metal Group, Degussa AG South Plainfield, NJ 33 11 2,108,767 Methanol 11 Boise Cascade Corp. Saint Helens, OR 26 12 1,992,097 Methanol 12 Bristol-Myers Squibb Company (Technical Operations) East Syracuse, NY 28 9 1,961,075 Nitric acid and nitrate compounds 13 S. D. Warren Co., Sappi, Ltd. Muskegon, MI 26 11 1,777,690 Methanol 14 Shepherd Chemical Co. Cincinnati, OH 28 11 1,764,146 Nitric acid and nitrate compounds 15 Aerovox Inc. Huntsville, AL 36 3 1,579,456 Nitric acid and nitrate compounds 16 First Chemical Corp., Chemfirst Inc. Pascagoula, MS 28 17 1,444,523 Nitric acid and nitrate compounds 17 International Paper Erie Mill Erie, PA 26 10 1,409,679 Methanol 18 Procter & Gamble Mfg. Co., The Procter & Gamble Co. Sacramento, CA 28 3 1,405,896 Methanol 19 Pharmacia & Upjohn Kalamazoo, MI 28 28 1,349,222 Methanol 20 Penford Prods. Co., Penford Corp. Cedar Rapids, IA 20 5 1,229,643 Ethylene glycol 21 Westvaco Corp., Fine Papers Div. Luke, MD 26 19 1,184,949 Methanol 22 Equistar Chemicals, Bayport Chemicals Plant Pasadena, TX 28 10 1,166,667 Ethylene glycol, 2-Ethoxyethanol 23 Lyondell Chemical Co., Bayport Facility Pasadena, TX 28 11 1,048,264 Methanol, tert-Butyl alcohol 24 A. E. Staley Mfg. Co., Sagamore Ops. Lafayette, IN 20 5 1,047,993 Nitric acid and nitrate compounds 25 Demenno/Kerdoon, World Oil Corp. Compton, CA 29 1 1,043,084 Ethylene glycol 26 Ciba Specialty Chemicals Corp. Newport, DE 28 5 1,013,548 Methanol 27 Union Carbide Corp., Texas City Plant Texas City, TX 28 42 993,840 Methanol 28 Flexsys America L.P, Krummrich Sauget, IL 28 8 974,048 Formic acid, 4-Nitrophenol 29 Albright & Wilson Americas, Albright & Wilson PLC Charleston, SC 28 19 939,669 Methanol 30 Celanese Canada Inc., Edmonton Facility Edmonton, AB 37 28 12 881,240 Methanol 31 Penick Corp., Penick Holding Newark, NJ 28 1 851,030 Methanol 32 Cargill Corn Milling, Cargill Inc. Cedar Rapids, IA 20 3 815,860 Ethylene glycol 33 Sun Chemical Corp., Newark Plant, DIC Americas Inc. Newark, NJ 28 1 634,921 Methanol 34 Fuji Photo Film Inc. Greenwood, SC Mult. 8 626,779 Nitric acid and nitrate compounds 35 Sunoco Inc., Frankford Plant Philadelphia, PA 28 9 606,063 Methanol, Cumene hydroperoxide 36 BASF Corp. Huntington, WV 28 5 592,947 Aniline, Nitric acid and nitrate compounds 37 Seagate Recording Media, Seagate Tech. Inc. Anaheim, CA 35 3 584,903 Nitric acid and nitrate compounds 38 Corning Inc. Danville, VA 32 5 565,533 Nitric acid and nitrate compounds 39 MEMC Electronic Materials Inc., St. Peters Plant, Veba
Corp. O'Fallon, MO 36 5 549,660 Nitric acid and nitrate compounds
40 Cognis Corp., Cincinnati Plant Cincinnati, OH 28 10 517,772 Methanol 41 SEH America Inc. Vancouver, WA Mult. 4 485,265 Nitric acid and nitrate compounds 42 Cincinnati Specialties LLC., PMC Inc. Cincinnati, OH 28 10 468,617 Methanol 43 Union Carbide Corp., South Charleston Plant South Charleston,
WV 28 28 461,141 Formaldehyde, Dimethylamine
44 Gerber Prods., Novartis Corp. Fort Smith, AR 20 1 458,644 Nitric acid and nitrate compounds 45 Crosfield Catalysts, Indopco Chicago, IL 28 8 453,529 Nitric acid and nitrate compounds 46 Dairy Farmers of America Inc. Corona, CA Mult. 3 453,515 Nitric acid and nitrate compounds 47 Grace Davison Cincinnati Plant, W. R. Grace & Co. Cincinnati, OH 28 2 435,374 Nitric acid and nitrate compounds 48 Great Lakes Chemical Corp. Newport, TN 28 19 434,426 Methanol 49 Malllinckrodt Inc. Saint Louis, MO 28 19 426,461 Methanol 50 Rohm & Haas Co., Bayport Plant La Porte, TX 28 12 422,252 Ethylene glycol, Methanol
Subtotal 514 74,841,457 % of Total 0.7 56 Total 74,108 134,569,605
Note: Canada and US data only. Mexico data not available for 1999. The data are estimates of releases and transfers of chemicals as reported by facilities and should not be interpreted as levels of human exposure or environmental impact. The rankings are not meant to imply that a facility, state or province is not meeting its legal requirements.
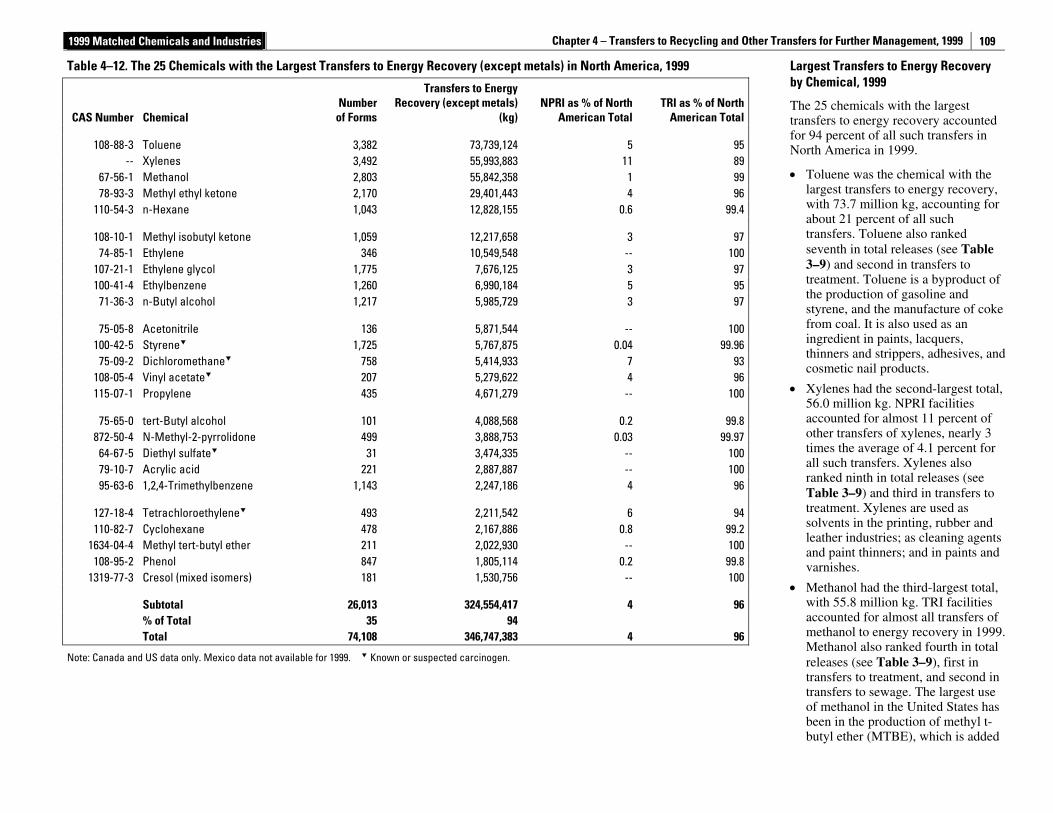
1999 Matched Chemicals and Industries Chapter 4 – Transfers to Recycling and Other Transfers for Further Management, 1999
109
Largest Transfers to Energy Recovery by Chemical, 1999
The 25 chemicals with the largest transfers to energy recovery accounted for 94 percent of all such transfers in North America in 1999.
• Toluene was the chemical with the largest transfers to energy recovery, with 73.7 million kg, accounting for about 21 percent of all such transfers. Toluene also ranked seventh in total releases (see Table 3–9) and second in transfers to treatment. Toluene is a byproduct of the production of gasoline and styrene, and the manufacture of coke from coal. It is also used as an ingredient in paints, lacquers, thinners and strippers, adhesives, and cosmetic nail products.
• Xylenes had the second-largest total, 56.0 million kg. NPRI facilities accounted for almost 11 percent of other transfers of xylenes, nearly 3 times the average of 4.1 percent for all such transfers. Xylenes also ranked ninth in total releases (see Table 3–9) and third in transfers to treatment. Xylenes are used as solvents in the printing, rubber and leather industries; as cleaning agents and paint thinners; and in paints and varnishes.
• Methanol had the third-largest total, with 55.8 million kg. TRI facilities accounted for almost all transfers of methanol to energy recovery in 1999. Methanol also ranked fourth in total releases (see Table 3–9), first in transfers to treatment, and second in transfers to sewage. The largest use of methanol in the United States has been in the production of methyl t-butyl ether (MTBE), which is added
Table 4–12. The 25 Chemicals with the Largest Transfers to Energy Recovery (except metals) in North America, 1999
CAS Number Chemical Number
of Forms
Transfers to Energy Recovery (except metals)
(kg)NPRI as % of North
American Total TRI as % of North
American Total
108-88-3 Toluene 3,382 73,739,124 5 95-- Xylenes 3,492 55,993,883 11 89
67-56-1 Methanol 2,803 55,842,358 1 9978-93-3 Methyl ethyl ketone 2,170 29,401,443 4 96
110-54-3 n-Hexane 1,043 12,828,155 0.6 99.4
108-10-1 Methyl isobutyl ketone 1,059 12,217,658 3 9774-85-1 Ethylene 346 10,549,548 -- 100
107-21-1 Ethylene glycol 1,775 7,676,125 3 97100-41-4 Ethylbenzene 1,260 6,990,184 5 95
71-36-3 n-Butyl alcohol 1,217 5,985,729 3 97
75-05-8 Acetonitrile 136 5,871,544 -- 100100-42-5 Styrene 1,725 5,767,875 0.04 99.96
75-09-2 Dichloromethane 758 5,414,933 7 93108-05-4 Vinyl acetate 207 5,279,622 4 96115-07-1 Propylene 435 4,671,279 -- 100
75-65-0 tert-Butyl alcohol 101 4,088,568 0.2 99.8872-50-4 N-Methyl-2-pyrrolidone 499 3,888,753 0.03 99.97
64-67-5 Diethyl sulfate 31 3,474,335 -- 10079-10-7 Acrylic acid 221 2,887,887 -- 10095-63-6 1,2,4-Trimethylbenzene 1,143 2,247,186 4 96
127-18-4 Tetrachloroethylene 493 2,211,542 6 94110-82-7 Cyclohexane 478 2,167,886 0.8 99.2
1634-04-4 Methyl tert-butyl ether 211 2,022,930 -- 100108-95-2 Phenol 847 1,805,114 0.2 99.8
1319-77-3 Cresol (mixed isomers) 181 1,530,756 -- 100
Subtotal 26,013 324,554,417 4 96 % of Total 35 94 Total 74,108 346,747,383 4 96
Note: Canada and US data only. Mexico data not available for 1999. Known or suspected carcinogen.
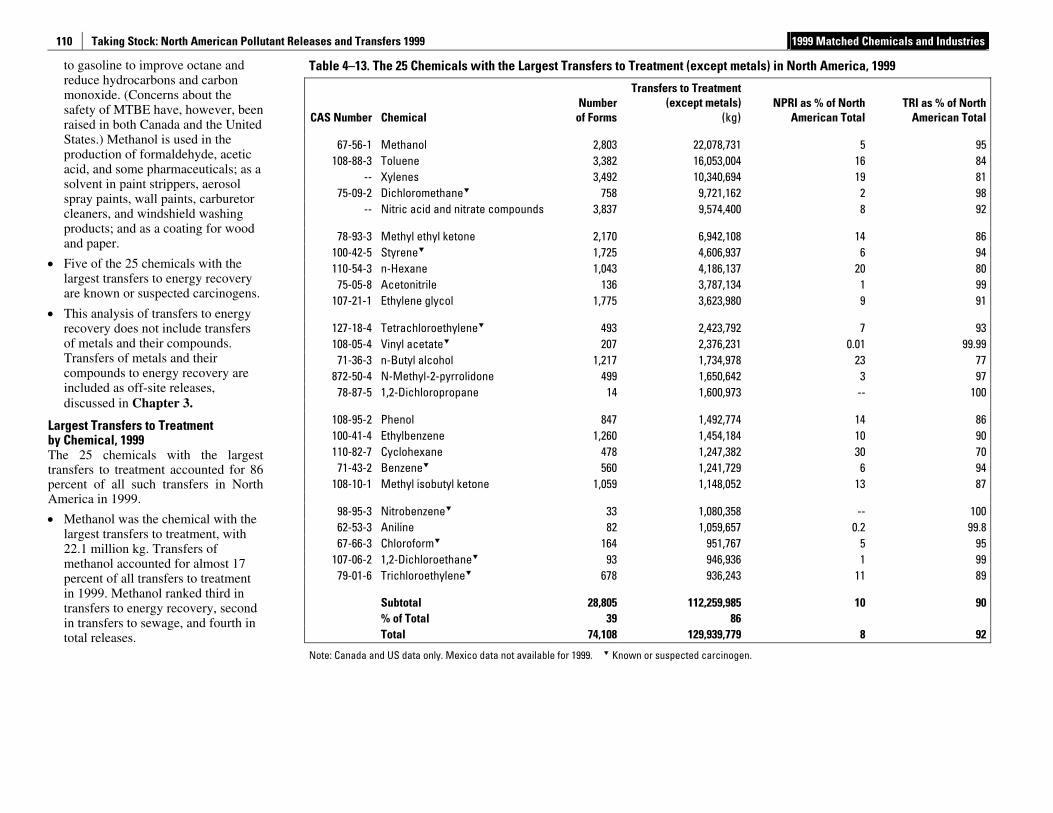
Taking Stock: North American Pollutant Releases and Transfers 1999 1999 Matched Chemicals and Industries
110
to gasoline to improve octane and reduce hydrocarbons and carbon monoxide. (Concerns about the safety of MTBE have, however, been raised in both Canada and the United States.) Methanol is used in the production of formaldehyde, acetic acid, and some pharmaceuticals; as a solvent in paint strippers, aerosol spray paints, wall paints, carburetor cleaners, and windshield washing products; and as a coating for wood and paper.
• Five of the 25 chemicals with the largest transfers to energy recovery are known or suspected carcinogens.
• This analysis of transfers to energy recovery does not include transfers of metals and their compounds. Transfers of metals and their compounds to energy recovery are included as off-site releases, discussed in Chapter 3.
Largest Transfers to Treatment by Chemical, 1999 The 25 chemicals with the largest transfers to treatment accounted for 86 percent of all such transfers in North America in 1999.
• Methanol was the chemical with the largest transfers to treatment, with 22.1 million kg. Transfers of methanol accounted for almost 17 percent of all transfers to treatment in 1999. Methanol ranked third in transfers to energy recovery, second in transfers to sewage, and fourth in total releases.
Table 4–13. The 25 Chemicals with the Largest Transfers to Treatment (except metals) in North America, 1999
CAS Number Chemical Number
of Forms
Transfers to Treatment (except metals)
(kg)NPRI as % of North
American TotalTRI as % of North
American Total
67-56-1 Methanol 2,803 22,078,731 5 95 108-88-3 Toluene 3,382 16,053,004 16 84
-- Xylenes 3,492 10,340,694 19 81 75-09-2 Dichloromethane 758 9,721,162 2 98
-- Nitric acid and nitrate compounds 3,837 9,574,400 8 92
78-93-3 Methyl ethyl ketone 2,170 6,942,108 14 86 100-42-5 Styrene 1,725 4,606,937 6 94 110-54-3 n-Hexane 1,043 4,186,137 20 80
75-05-8 Acetonitrile 136 3,787,134 1 99 107-21-1 Ethylene glycol 1,775 3,623,980 9 91
127-18-4 Tetrachloroethylene 493 2,423,792 7 93 108-05-4 Vinyl acetate 207 2,376,231 0.01 99.99
71-36-3 n-Butyl alcohol 1,217 1,734,978 23 77 872-50-4 N-Methyl-2-pyrrolidone 499 1,650,642 3 97
78-87-5 1,2-Dichloropropane 14 1,600,973 -- 100
108-95-2 Phenol 847 1,492,774 14 86 100-41-4 Ethylbenzene 1,260 1,454,184 10 90 110-82-7 Cyclohexane 478 1,247,382 30 70
71-43-2 Benzene 560 1,241,729 6 94 108-10-1 Methyl isobutyl ketone 1,059 1,148,052 13 87
98-95-3 Nitrobenzene 33 1,080,358 -- 100 62-53-3 Aniline 82 1,059,657 0.2 99.8 67-66-3 Chloroform 164 951,767 5 95
107-06-2 1,2-Dichloroethane 93 946,936 1 99 79-01-6 Trichloroethylene 678 936,243 11 89
Subtotal 28,805 112,259,985 10 90 % of Total 39 86 Total 74,108 129,939,779 8 92
Note: Canada and US data only. Mexico data not available for 1999. Known or suspected carcinogen.
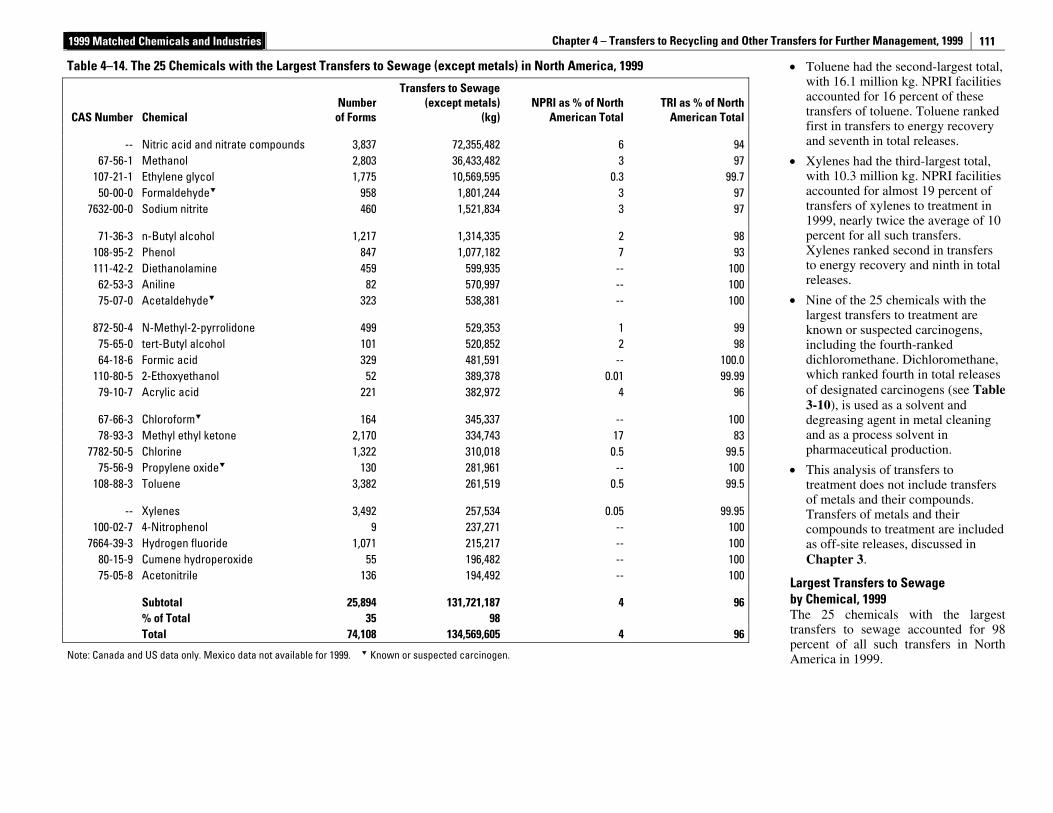
1999 Matched Chemicals and Industries Chapter 4 – Transfers to Recycling and Other Transfers for Further Management, 1999
111
• Toluene had the second-largest total, with 16.1 million kg. NPRI facilities accounted for 16 percent of these transfers of toluene. Toluene ranked first in transfers to energy recovery and seventh in total releases.
• Xylenes had the third-largest total, with 10.3 million kg. NPRI facilities accounted for almost 19 percent of transfers of xylenes to treatment in 1999, nearly twice the average of 10 percent for all such transfers. Xylenes ranked second in transfers to energy recovery and ninth in total releases.
• Nine of the 25 chemicals with the largest transfers to treatment are known or suspected carcinogens, including the fourth-ranked dichloromethane. Dichloromethane, which ranked fourth in total releases of designated carcinogens (see Table 3-10), is used as a solvent and degreasing agent in metal cleaning and as a process solvent in pharmaceutical production.
• This analysis of transfers to treatment does not include transfers of metals and their compounds. Transfers of metals and their compounds to treatment are included as off-site releases, discussed in Chapter 3.
Largest Transfers to Sewage by Chemical, 1999 The 25 chemicals with the largest transfers to sewage accounted for 98 percent of all such transfers in North America in 1999.
Table 4–14. The 25 Chemicals with the Largest Transfers to Sewage (except metals) in North America, 1999
CAS Number Chemical Number
of Forms
Transfers to Sewage (except metals)
(kg)NPRI as % of North
American Total TRI as % of North
American Total
-- Nitric acid and nitrate compounds 3,837 72,355,482 6 9467-56-1 Methanol 2,803 36,433,482 3 97
107-21-1 Ethylene glycol 1,775 10,569,595 0.3 99.750-00-0 Formaldehyde 958 1,801,244 3 97
7632-00-0 Sodium nitrite 460 1,521,834 3 97
71-36-3 n-Butyl alcohol 1,217 1,314,335 2 98108-95-2 Phenol 847 1,077,182 7 93111-42-2 Diethanolamine 459 599,935 -- 100
62-53-3 Aniline 82 570,997 -- 10075-07-0 Acetaldehyde 323 538,381 -- 100
872-50-4 N-Methyl-2-pyrrolidone 499 529,353 1 9975-65-0 tert-Butyl alcohol 101 520,852 2 9864-18-6 Formic acid 329 481,591 -- 100.0
110-80-5 2-Ethoxyethanol 52 389,378 0.01 99.9979-10-7 Acrylic acid 221 382,972 4 96
67-66-3 Chloroform 164 345,337 -- 10078-93-3 Methyl ethyl ketone 2,170 334,743 17 83
7782-50-5 Chlorine 1,322 310,018 0.5 99.575-56-9 Propylene oxide 130 281,961 -- 100
108-88-3 Toluene 3,382 261,519 0.5 99.5
-- Xylenes 3,492 257,534 0.05 99.95100-02-7 4-Nitrophenol 9 237,271 -- 100
7664-39-3 Hydrogen fluoride 1,071 215,217 -- 10080-15-9 Cumene hydroperoxide 55 196,482 -- 10075-05-8 Acetonitrile 136 194,492 -- 100
Subtotal 25,894 131,721,187 4 96 % of Total 35 98 Total 74,108 134,569,605 4 96
Note: Canada and US data only. Mexico data not available for 1999. Known or suspected carcinogen.
Taking Stock: North American Pollutant Releases and Transfers 1999
112
• Nitric acid and nitrate compounds had the largest transfers to sewage, with 72.4 million kg, or almost 54 percent of total transfers to sewage in 1999. Nitric acid and nitrate compounds ranked third in total releases and fifth in transfers to treatment. The chief use of nitric acid is in producing ammonium nitrate fertilizer. Nitrates are used in producing explosives, including gunpowder.
• Methanol had the second-largest total, with 36.4 million kg—about 27 percent of all transfers to sewage in 1999. Methanol ranked third in transfers to energy recovery, first in transfers to treatment, and fourth in total releases.
• Ethylene glycol had the third-largest total, with 10.6 million kg. Ethylene glycol is used primarily in antifreeze and de-icing solutions for cars, airplanes, and boats. It is also used in manufacturing polyester fiber and PET resins (for bottles and film).
• No other matched chemical had transfers to sewage of more than 2.0 million kg.
• Four of the 25 chemicals with the largest transfers to sewage are known or suspected carcinogens.
• Except for chloroform, for which the NPRI share of transfers was almost 17 percent, TRI facilities reported transferring between 93 and 100 percent of these chemicals to sewage.
• This analysis of transfers to sewage does not include transfers of metals and their compounds. Transfers of metals and their compounds to sewage are included as off-site releases, discussed in Chapter 3.
Chapter 5 – Total Reported Amounts of Releases and Transfers, 1999
113
Table of Contents
5.1 Introduction.................................................................................................................. 115 5.2 Total Reported Amounts of Releases and Transfers, 1999 .................................. 116
5.2.1 Total Reported Amounts of Releases and Transfers by State and Province, 1999 ......................................................................... 118
5.2.2 Total Reported Amounts of Releases and Transfers by Industry Sector, 1999................................................................................ 120
5.2.3 Facilities with the Largest Total Reported Amounts of Releases and Transfers, 1999.................................................................. 122
5.2.4 Total Reported Amounts of Releases and Transfers by Chemical, 1999........................................................................................... 124
Figures
5–1 Percentage of Total Reported Amounts of Releases and Transfers in North America by Type, NPRI and TRI, 1999.................................................... 117
5–2 Contribution of NPRI and TRI to Total Reported Amounts of Releases and Transfers in North America, 1999................................................................... 117
5–3 Percentage Contribution of Top Industry Sectors to Total Reported Amounts of Releases and Transfers, NPRI and TRI, 1999 ................................. 121
Map
5–1 Largest Sources of Total Releases and Transfers in North America, 1999: States and Provinces .....................................................................................119
Tables
5–1 Summary of Total Reported Amounts of Releases and Transfers in North America, NPRI and TRI, 1999...................................................................116
5–2 Total Reported Amounts of Releases and Transfers in North America, by State and Province, 1999 ....................................................................................118
5–3 Total Reported Amounts of Releases and Transfers in North America by Industry, 1999........................................................................................................120
5–4 The 50 North American Facilities with the Largest Total Reported Amounts of Releases and Transfers, 1999 ...........................................................122
5–5 The 25 Chemicals with the Largest Total Reported Amounts of Releases and Transfers in North America, 1999...................................................................124

Chapter 5 – Total Reported Amounts of Releases and Transfers, 1999
115
Key Findings • In 1999, total reported releases and transfers in North America were 3.36 billion kg for the matched data set of
industries and chemicals.
• Releases represented 51 percent of all reported releases and transfers. On-site releases were 43 percent, and off-site releases were 8 percent.
• Off-site transfers to recycling were 31 percent of total reported releases and transfers in North America, and other off-site transfers for further management were 18 percent.
• The pattern of releases and transfers differed somewhat between NPRI and TRI. While on-site releases were about the same proportion of the total reported amounts in both countries, off-site releases represented a larger share of NPRI releases and transfers (14 percent) than those of TRI (8 percent). Off-site transfers to recycling were larger in NPRI than in TRI (35 percent versus 31 percent); however, other off-site transfers for further management (to energy recovery, treatment, and sewage) made up a smaller share of the total releases and transfers in NPRI (10 percent) than in TRI (19 percent).
• Four US states (Texas, Ohio, Michigan and Pennsylvania) and one Canadian province (Ontario) each reported more than 190 million kg. Together, these five jurisdictions reported about one-third (33 percent) of total reported releases and transfers in North America in 1999.
• Two manufacturing industries, primary metals and chemicals, reported more than 600 million kg in total releases and transfers, each representing over 20 percent of the North American total reported in 1999. The electric utilities and hazardous waste management/solvent recovery sectors had the third- and fourth-largest totals; electric utilities accounted for 14 percent of total North American releases and transfers, and hazardous waste management facilities made up 9 percent.
• Fifty North American facilities accounted for 16 percent of total reported releases and transfers. Four of the five facilities with the largest releases were in the primary metals sector.
• The 25 chemicals with the largest total reported releases and transfers accounted for 90 percent of the North American total. The top four chemicals, ranked by amount of transfers and releases, were zinc and its compounds, copper and its compounds, hydrochloric acid, and nitric acid and nitrate compounds.
5.1 Introduction Chapter 5 examines total reported amounts of releases and transfers in North America for 1999. As explained in Chapter 2, this chapter analyzes data for industries and chemicals that must be reported in both the United States and Canada (the matched data set). Comparable Mexican data are not available for the 1999 reporting year.
Releases include on-site releases to air, water, land, and underground injection wells, as well as off-site releases (off-site transfers to disposal and all transfers of metals except those sent for recycling). In Chapter 3, releases are adjusted for off-site releases that are reported as on-site releases by other NPRI or TRI facilities. This chapter, however, analyzes all reported releases because it focuses on how facilities manage the total amounts they report.
The total reported amounts are the closest estimate we have of total amounts of chemicals arising from facilities’ activities that require handling or management. Questions such as what kinds and types of waste are being sent off-site, what portion of materials are being recycled or transferred for disposal, what portion of chemicals are being released on-site, or which states or provinces account for the largest share of the chemicals being managed can be answered when all types of releases and transfers are considered.
Transfers include off-site transfers to recycling and other off-site transfers of substances (other than metals and their compounds) to energy recovery, treatment, and sewage. These transfers are discussed in Chapter 4. It has been mandatory to report off-site transfers to recycling and energy recovery in NPRI since 1998.
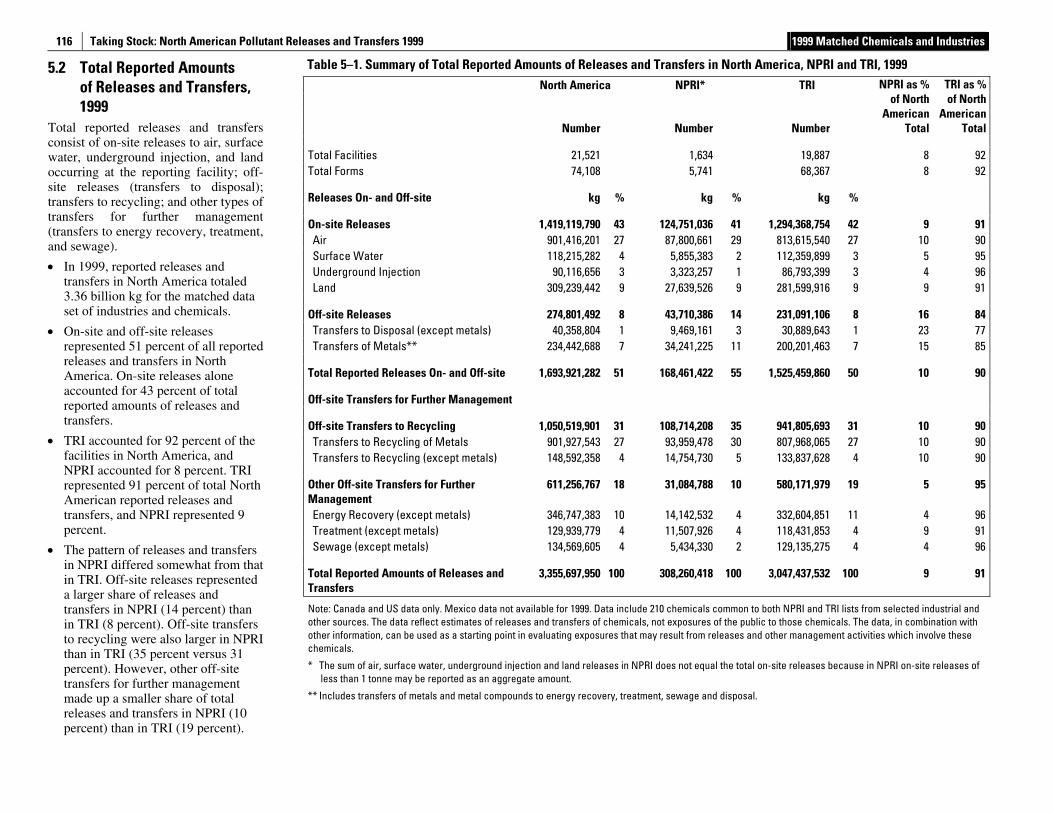
Taking Stock: North American Pollutant Releases and Transfers 1999 1999 Matched Chemicals and Industries
116
5.2 Total Reported Amounts of Releases and Transfers, 1999
Total reported releases and transfers consist of on-site releases to air, surface water, underground injection, and land occurring at the reporting facility; off-site releases (transfers to disposal); transfers to recycling; and other types of transfers for further management (transfers to energy recovery, treatment, and sewage).
• In 1999, reported releases and transfers in North America totaled 3.36 billion kg for the matched data set of industries and chemicals.
• On-site and off-site releases represented 51 percent of all reported releases and transfers in North America. On-site releases alone accounted for 43 percent of total reported amounts of releases and transfers.
• TRI accounted for 92 percent of the facilities in North America, and NPRI accounted for 8 percent. TRI represented 91 percent of total North American reported releases and transfers, and NPRI represented 9 percent.
• The pattern of releases and transfers in NPRI differed somewhat from that in TRI. Off-site releases represented a larger share of releases and transfers in NPRI (14 percent) than in TRI (8 percent). Off-site transfers to recycling were also larger in NPRI than in TRI (35 percent versus 31 percent). However, other off-site transfers for further management made up a smaller share of total releases and transfers in NPRI (10 percent) than in TRI (19 percent).
Table 5–1. Summary of Total Reported Amounts of Releases and Transfers in North America, NPRI and TRI, 1999 North America NPRI* TRI
Number Number Number
NPRI as %of North
American Total
TRI as % of North
American Total
Total Facilities 21,521 1,634 19,887 8 92 Total Forms 74,108 5,741 68,367 8 92
Releases On- and Off-site kg % kg % kg %
On-site Releases 1,419,119,790 43 124,751,036 41 1,294,368,754 42 9 91 Air 901,416,201 27 87,800,661 29 813,615,540 27 10 90 Surface Water 118,215,282 4 5,855,383 2 112,359,899 3 5 95 Underground Injection 90,116,656 3 3,323,257 1 86,793,399 3 4 96 Land 309,239,442 9 27,639,526 9 281,599,916 9 9 91
Off-site Releases 274,801,492 8 43,710,386 14 231,091,106 8 16 84 Transfers to Disposal (except metals) 40,358,804 1 9,469,161 3 30,889,643 1 23 77 Transfers of Metals** 234,442,688 7 34,241,225 11 200,201,463 7 15 85
Total Reported Releases On- and Off-site 1,693,921,282 51 168,461,422 55 1,525,459,860 50 10 90
Off-site Transfers for Further Management
Off-site Transfers to Recycling 1,050,519,901 31 108,714,208 35 941,805,693 31 10 90 Transfers to Recycling of Metals 901,927,543 27 93,959,478 30 807,968,065 27 10 90 Transfers to Recycling (except metals) 148,592,358 4 14,754,730 5 133,837,628 4 10 90
Other Off-site Transfers for Further Management
611,256,767 18 31,084,788 10
580,171,979 19 5 95
Energy Recovery (except metals) 346,747,383 10 14,142,532 4 332,604,851 11 4 96 Treatment (except metals) 129,939,779 4 11,507,926 4 118,431,853 4 9 91 Sewage (except metals) 134,569,605 4 5,434,330 2 129,135,275 4 4 96
Total Reported Amounts of Releases and Transfers
3,355,697,950 100 308,260,418 100 3,047,437,532 100 9 91
Note: Canada and US data only. Mexico data not available for 1999. Data include 210 chemicals common to both NPRI and TRI lists from selected industrial and other sources. The data reflect estimates of releases and transfers of chemicals, not exposures of the public to those chemicals. The data, in combination with other information, can be used as a starting point in evaluating exposures that may result from releases and other management activities which involve these chemicals.
* The sum of air, surface water, underground injection and land releases in NPRI does not equal the total on-site releases because in NPRI on-site releases of less than 1 tonne may be reported as an aggregate amount.
** Includes transfers of metals and metal compounds to energy recovery, treatment, sewage and disposal.
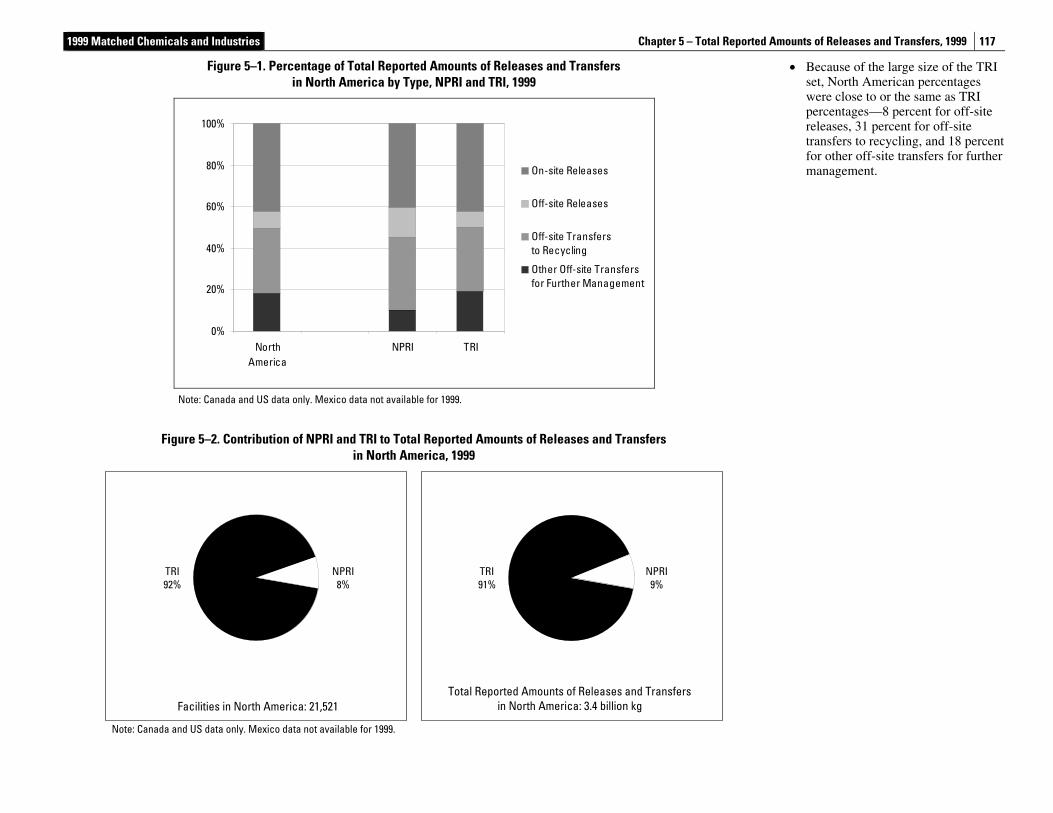
1999 Matched Chemicals and Industries Chapter 5 – Total Reported Amounts of Releases and Transfers, 1999
117
• Because of the large size of the TRI set, North American percentages were close to or the same as TRI percentages—8 percent for off-site releases, 31 percent for off-site transfers to recycling, and 18 percent for other off-site transfers for further management.
Figure 5–1. Percentage of Total Reported Amounts of Releases and Transfers in North America by Type, NPRI and TRI, 1999
0%
20%
40%
60%
80%
100%
NorthAmerica
NPRI TRI
On-site Releases
Off-site Releases
Off-site Transfersto Recycling
Other Off-site Transfersfor Further Management
Note: Canada and US data only. Mexico data not available for 1999.
Figure 5–2. Contribution of NPRI and TRI to Total Reported Amounts of Releases and Transfers
in North America, 1999
NPRI8%
TRI 92%
NPRI9%
TRI91%
Facilities in North America: 21,521Total Reported Amounts of Releases and Transfers
in North America: 3.4 billion kg
Note: Canada and US data only. Mexico data not available for 1999.
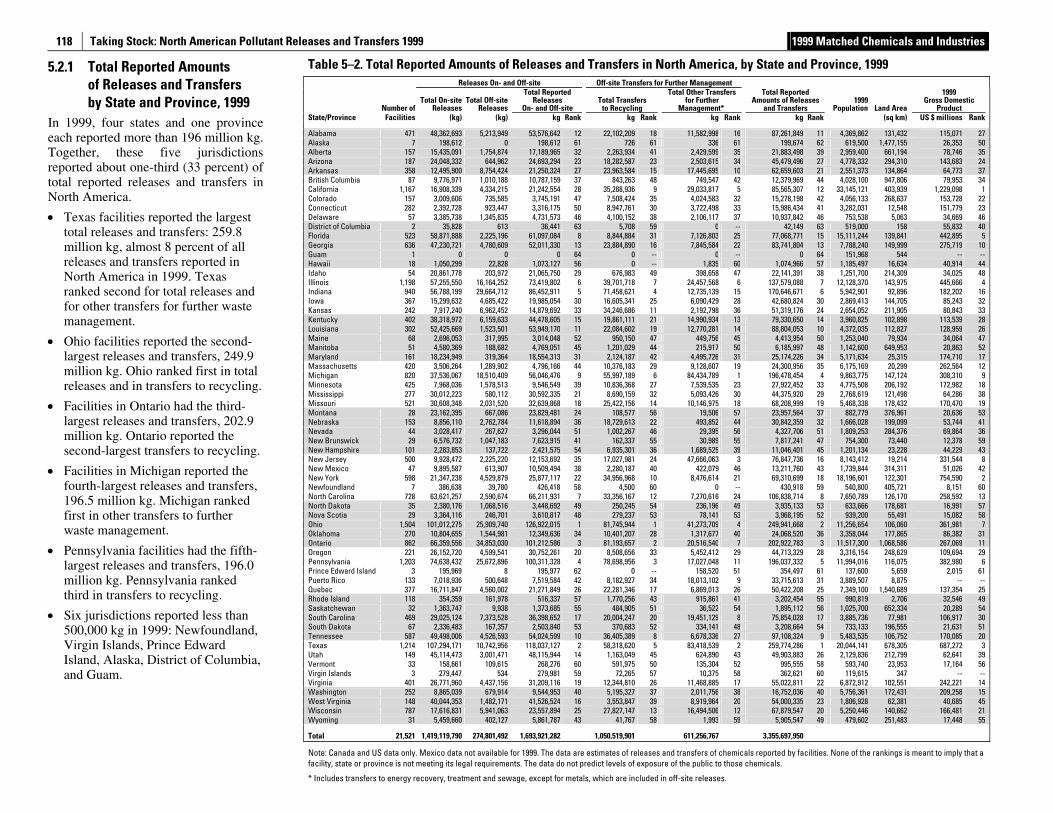
Taking Stock: North American Pollutant Releases and Transfers 1999 1999 Matched Chemicals and Industries
118
5.2.1 Total Reported Amounts of Releases and Transfers by State and Province, 1999
In 1999, four states and one province each reported more than 196 million kg. Together, these five jurisdictions reported about one-third (33 percent) of total reported releases and transfers in North America.
• Texas facilities reported the largest total releases and transfers: 259.8 million kg, almost 8 percent of all releases and transfers reported in North America in 1999. Texas ranked second for total releases and for other transfers for further waste management.
• Ohio facilities reported the second-largest releases and transfers, 249.9 million kg. Ohio ranked first in total releases and in transfers to recycling.
• Facilities in Ontario had the third-largest releases and transfers, 202.9 million kg. Ontario reported the second-largest transfers to recycling.
• Facilities in Michigan reported the fourth-largest releases and transfers, 196.5 million kg. Michigan ranked first in other transfers to further waste management.
• Pennsylvania facilities had the fifth-largest releases and transfers, 196.0 million kg. Pennsylvania ranked third in transfers to recycling.
• Six jurisdictions reported less than 500,000 kg in 1999: Newfoundland, Virgin Islands, Prince Edward Island, Alaska, District of Columbia, and Guam.
Table 5–2. Total Reported Amounts of Releases and Transfers in North America, by State and Province, 1999 Releases On- and Off-site Off-site Transfers for Further Management
Number ofTotal On-site
ReleasesTotal Off-site
Releases
Total Reported Releases
On- and Off-site Total Transfers
to Recycling
Total Other Transfers for Further
Management*
Total Reported Amounts of Releases
and Transfers 1999
Population Land Area
1999 Gross Domestic
Product State/Province Facilities (kg) (kg) kg Rank kg Rank kg Rank kg Rank (sq km) US $ millions Rank
Alabama 471 48,362,693 5,213,949 53,576,642 12 22,102,209 18 11,582,998 16 87,261,849 11 4,369,862 131,432 115,071 27 Alaska 7 198,612 0 198,612 61 726 61 336 61 199,674 62 619,500 1,477,155 26,353 50 Alberta 157 15,435,091 1,754,874 17,189,965 32 2,263,934 41 2,429,599 35 21,883,498 39 2,959,400 661,194 78,746 35 Arizona 187 24,048,332 644,962 24,693,294 23 18,282,587 23 2,503,615 34 45,479,496 27 4,778,332 294,310 143,683 24 Arkansas 358 12,495,900 8,754,424 21,250,324 27 23,963,584 15 17,445,695 10 62,659,603 21 2,551,373 134,864 64,773 37 British Columbia 87 9,776,971 1,010,188 10,787,159 37 843,263 48 749,547 42 12,379,969 44 4,028,100 947,806 79,953 34 California 1,167 16,908,339 4,334,215 21,242,554 28 35,288,936 9 29,033,817 5 85,565,307 12 33,145,121 403,939 1,229,098 1 Colorado 157 3,009,606 735,585 3,745,191 47 7,508,424 35 4,024,583 32 15,278,198 42 4,056,133 268,637 153,728 22 Connecticut 282 2,392,728 923,447 3,316,175 50 8,947,761 30 3,722,498 33 15,986,434 41 3,282,031 12,548 151,779 23 Delaware 57 3,385,738 1,345,835 4,731,573 46 4,100,152 38 2,106,117 37 10,937,842 46 753,538 5,063 34,669 46 District of Columbia 2 35,828 613 36,441 63 5,708 59 0 -- 42,149 63 519,000 158 55,832 40 Florida 523 58,871,888 2,225,196 61,097,084 8 8,844,884 31 7,126,803 25 77,068,771 15 15,111,244 139,841 442,895 5 Georgia 636 47,230,721 4,780,609 52,011,330 13 23,884,890 16 7,845,584 22 83,741,804 13 7,788,240 149,999 275,719 10 Guam 1 0 0 0 64 0 -- 0 -- 0 64 151,968 544 -- -- Hawaii 18 1,050,299 22,828 1,073,127 56 0 -- 1,839 60 1,074,966 57 1,185,497 16,634 40,914 44 Idaho 54 20,861,778 203,972 21,065,750 29 676,983 49 398,658 47 22,141,391 38 1,251,700 214,309 34,025 48 Illinois 1,198 57,255,550 16,164,252 73,419,802 6 39,701,718 7 24,457,568 6 137,579,088 7 12,128,370 143,975 445,666 4 Indiana 940 56,788,199 29,664,712 86,452,911 5 71,458,621 4 12,735,139 15 170,646,671 6 5,942,901 92,896 182,202 16 Iowa 367 15,299,632 4,685,422 19,985,054 30 16,605,341 25 6,090,429 28 42,680,824 30 2,869,413 144,705 85,243 32 Kansas 242 7,917,240 6,962,452 14,879,692 33 34,246,686 11 2,192,798 36 51,319,176 24 2,654,052 211,905 80,843 33 Kentucky 402 38,318,972 6,159,633 44,478,605 15 19,861,111 21 14,990,934 13 79,330,650 14 3,960,825 102,898 113,539 28 Louisiana 302 52,425,669 1,523,501 53,949,170 11 22,084,602 19 12,770,281 14 88,804,053 10 4,372,035 112,827 128,959 26 Maine 68 2,696,053 317,995 3,014,048 52 950,150 47 449,756 45 4,413,954 50 1,253,040 79,934 34,064 47 Manitoba 51 4,580,369 188,682 4,769,051 45 1,201,029 44 215,917 50 6,185,997 48 1,142,600 649,953 20,863 52 Maryland 161 18,234,949 319,364 18,554,313 31 2,124,187 42 4,495,726 31 25,174,226 34 5,171,634 25,315 174,710 17 Massachusetts 420 3,506,264 1,289,902 4,796,166 44 10,376,183 29 9,128,607 19 24,300,956 35 6,175,169 20,299 262,564 12 Michigan 820 37,536,067 18,510,409 56,046,476 9 55,997,189 6 84,434,789 1 196,478,454 4 9,863,775 147,124 308,310 9 Minnesota 425 7,968,036 1,578,513 9,546,549 39 10,836,368 27 7,539,535 23 27,922,452 33 4,775,508 206,192 172,982 18 Mississippi 277 30,012,223 580,112 30,592,335 21 8,690,159 32 5,093,426 30 44,375,920 29 2,768,619 121,498 64,286 38 Missouri 521 30,608,348 2,031,520 32,639,868 18 25,422,156 14 10,146,975 18 68,208,999 19 5,468,338 178,432 170,470 19 Montana 28 23,162,395 667,086 23,829,481 24 108,577 56 19,506 57 23,957,564 37 882,779 376,961 20,636 53 Nebraska 153 8,856,110 2,762,784 11,618,894 36 18,729,613 22 493,852 44 30,842,359 32 1,666,028 199,099 53,744 41 Nevada 44 3,028,417 267,627 3,296,044 51 1,002,267 46 29,395 56 4,327,706 51 1,809,253 284,376 69,864 36 New Brunswick 29 6,576,732 1,047,183 7,623,915 41 162,337 55 30,989 55 7,817,241 47 754,300 73,440 12,378 59 New Hampshire 101 2,283,853 137,722 2,421,575 54 6,935,301 36 1,689,525 39 11,046,401 45 1,201,134 23,228 44,229 43 New Jersey 500 9,928,472 2,225,220 12,153,692 35 17,027,981 24 47,666,063 3 76,847,736 16 8,143,412 19,214 331,544 8 New Mexico 47 9,895,587 613,907 10,509,494 38 2,280,187 40 422,079 46 13,211,760 43 1,739,844 314,311 51,026 42 New York 598 21,347,238 4,529,879 25,877,117 22 34,956,968 10 8,476,614 21 69,310,699 18 18,196,601 122,301 754,590 2 Newfoundland 7 386,638 39,780 426,418 58 4,500 60 0 -- 430,918 59 540,800 405,721 8,151 60 North Carolina 728 63,621,257 2,590,674 66,211,931 7 33,356,167 12 7,270,616 24 106,838,714 8 7,650,789 126,170 258,592 13 North Dakota 35 2,380,176 1,068,516 3,448,692 49 250,245 54 236,196 49 3,935,133 53 633,666 178,681 16,991 57 Nova Scotia 29 3,364,116 246,701 3,610,817 48 279,237 53 78,141 53 3,968,195 52 939,200 55,491 15,082 58 Ohio 1,504 101,012,275 25,909,740 126,922,015 1 81,745,944 1 41,273,709 4 249,941,668 2 11,256,654 106,060 361,981 7 Oklahoma 270 10,804,655 1,544,981 12,349,636 34 10,401,207 28 1,317,677 40 24,068,520 36 3,358,044 177,865 86,382 31 Ontario 862 66,359,556 34,853,030 101,212,586 3 81,193,657 2 20,516,540 7 202,922,783 3 11,517,300 1,068,586 267,069 11 Oregon 221 26,152,720 4,599,541 30,752,261 20 8,508,656 33 5,452,412 29 44,713,329 28 3,316,154 248,629 109,694 29 Pennsylvania 1,203 74,638,432 25,672,896 100,311,328 4 78,698,956 3 17,027,048 11 196,037,332 5 11,994,016 116,075 382,980 6 Prince Edward Island 3 195,969 8 195,977 62 0 -- 158,520 51 354,497 61 137,600 5,659 2,015 61 Puerto Rico 133 7,018,936 500,648 7,519,584 42 8,182,927 34 18,013,102 9 33,715,613 31 3,889,507 8,875 -- -- Quebec 377 16,711,847 4,560,002 21,271,849 26 22,281,346 17 6,869,013 26 50,422,208 25 7,349,100 1,540,689 137,354 25 Rhode Island 118 354,359 161,978 516,337 57 1,770,256 43 915,861 41 3,202,454 55 990,819 2,706 32,546 49 Saskatchewan 32 1,363,747 9,938 1,373,685 55 484,905 51 36,522 54 1,895,112 56 1,025,700 652,334 20,289 54 South Carolina 469 29,025,124 7,373,528 36,398,652 17 20,004,247 20 19,451,129 8 75,854,028 17 3,885,736 77,981 106,917 30 South Dakota 67 2,336,483 167,357 2,503,840 53 370,683 52 334,141 48 3,208,664 54 733,133 196,555 21,631 51 Tennessee 587 49,498,006 4,526,593 54,024,599 10 36,405,389 8 6,678,336 27 97,108,324 9 5,483,535 106,752 170,085 20 Texas 1,214 107,294,171 10,742,956 118,037,127 2 58,318,620 5 83,418,539 2 259,774,286 1 20,044,141 678,305 687,272 3 Utah 149 45,114,473 3,001,471 48,115,944 14 1,163,049 45 624,890 43 49,903,883 26 2,129,836 212,799 62,641 39 Vermont 33 158,661 109,615 268,276 60 591,975 50 135,304 52 995,555 58 593,740 23,953 17,164 56 Virgin Islands 3 279,447 534 279,981 59 72,265 57 10,375 58 362,621 60 119,615 347 -- -- Virginia 401 26,771,960 4,437,156 31,209,116 19 12,344,810 26 11,468,885 17 55,022,811 22 6,872,912 102,551 242,221 14 Washington 252 8,865,039 679,914 9,544,953 40 5,195,327 37 2,011,756 38 16,752,036 40 5,756,361 172,431 209,258 15 West Virginia 148 40,044,353 1,482,171 41,526,524 16 3,553,847 39 8,919,964 20 54,000,335 23 1,806,928 62,381 40,685 45 Wisconsin 787 17,616,831 5,941,063 23,557,894 25 27,827,147 13 16,494,506 12 67,879,547 20 5,250,446 140,662 166,481 21 Wyoming 31 5,459,660 402,127 5,861,787 43 41,767 58 1,993 59 5,905,547 49 479,602 251,483 17,448 55
Total 21,521 1,419,119,790 274,801,492 1,693,921,282 1,050,519,901 611,256,767 3,355,697,950
Note: Canada and US data only. Mexico data not available for 1999. The data are estimates of releases and transfers of chemicals reported by facilities. None of the rankings is meant to imply that a facility, state or province is not meeting its legal requirements. The data do not predict levels of exposure of the public to those chemicals.
* Includes transfers to energy recovery, treatment and sewage, except for metals, which are included in off-site releases.
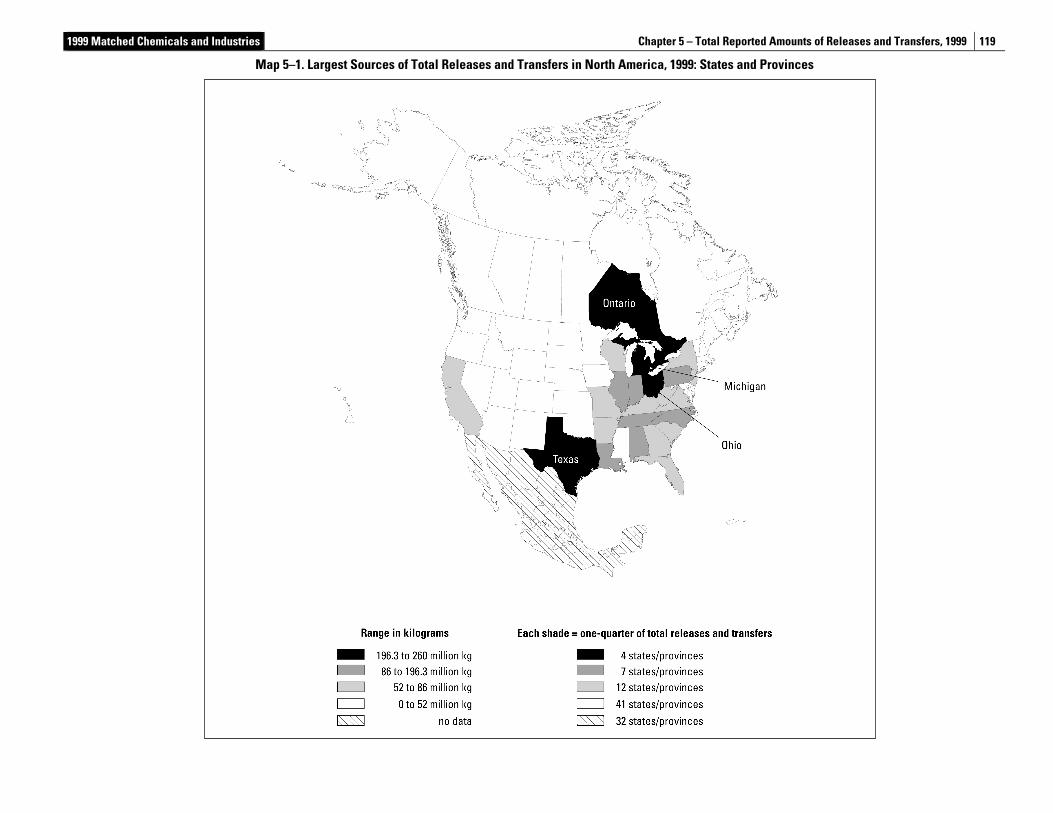
1999 Matched Chemicals and Industries Chapter 5 – Total Reported Amounts of Releases and Transfers, 1999
119
Map 5–1. Largest Sources of Total Releases and Transfers in North America, 1999: States and Provinces
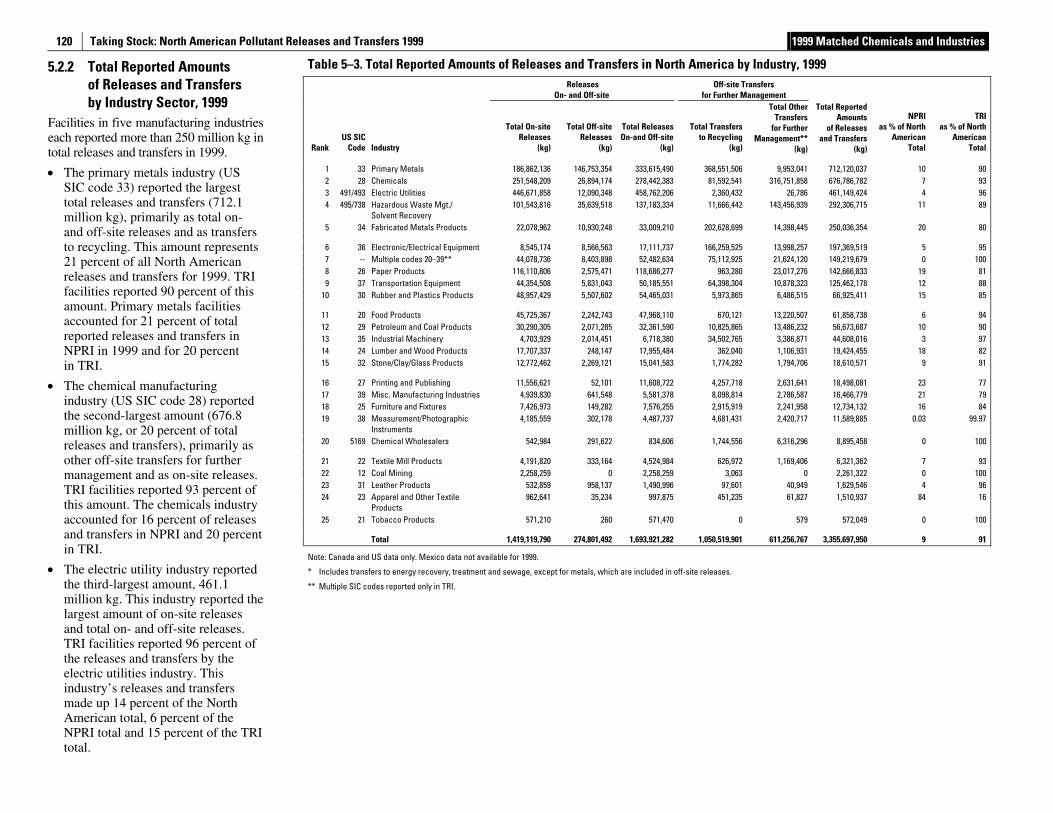
Taking Stock: North American Pollutant Releases and Transfers 1999 1999 Matched Chemicals and Industries
120
5.2.2 Total Reported Amounts of Releases and Transfers by Industry Sector, 1999
Facilities in five manufacturing industries each reported more than 250 million kg in total releases and transfers in 1999.
• The primary metals industry (US SIC code 33) reported the largest total releases and transfers (712.1 million kg), primarily as total on- and off-site releases and as transfers to recycling. This amount represents 21 percent of all North American releases and transfers for 1999. TRI facilities reported 90 percent of this amount. Primary metals facilities accounted for 21 percent of total reported releases and transfers in NPRI in 1999 and for 20 percent in TRI.
• The chemical manufacturing industry (US SIC code 28) reported the second-largest amount (676.8 million kg, or 20 percent of total releases and transfers), primarily as other off-site transfers for further management and as on-site releases. TRI facilities reported 93 percent of this amount. The chemicals industry accounted for 16 percent of releases and transfers in NPRI and 20 percent in TRI.
• The electric utility industry reported the third-largest amount, 461.1 million kg. This industry reported the largest amount of on-site releases and total on- and off-site releases. TRI facilities reported 96 percent of the releases and transfers by the electric utilities industry. This industry’s releases and transfers made up 14 percent of the North American total, 6 percent of the NPRI total and 15 percent of the TRI total.
Table 5–3. Total Reported Amounts of Releases and Transfers in North America by Industry, 1999
Releases
On- and Off-site Off-site Transfers
for Further Management
Rank US SIC
Code Industry
Total On-site Releases
(kg)
Total Off-site Releases
(kg)
Total Releases On-and Off-site
(kg)
Total Transfersto Recycling
(kg)
Total Other Transfers
for Further Management**
(kg)
Total Reported Amounts
of Releasesand Transfers
(kg)
NPRIas % of North
AmericanTotal
TRI as % of North
American Total
1 33 Primary Metals 186,862,136 146,753,354 333,615,490 368,551,506 9,953,041 712,120,037 10 90 2 28 Chemicals 251,548,209 26,894,174 278,442,383 81,592,541 316,751,858 676,786,782 7 93 3 491/493 Electric Utilities 446,671,858 12,090,348 458,762,206 2,360,432 26,786 461,149,424 4 96 4 495/738 Hazardous Waste Mgt./
Solvent Recovery 101,543,816 35,639,518 137,183,334 11,666,442 143,456,939 292,306,715 11 89
5 34 Fabricated Metals Products 22,078,962 10,930,248 33,009,210 202,628,699 14,398,445 250,036,354 20 80
6 36 Electronic/Electrical Equipment 8,545,174 8,566,563 17,111,737 166,259,525 13,998,257 197,369,519 5 95 7 -- Multiple codes 20–39** 44,078,736 8,403,898 52,482,634 75,112,925 21,624,120 149,219,679 0 100 8 26 Paper Products 116,110,806 2,575,471 118,686,277 963,280 23,017,276 142,666,833 19 81 9 37 Transportation Equipment 44,354,508 5,831,043 50,185,551 64,398,304 10,878,323 125,462,178 12 88
10 30 Rubber and Plastics Products 48,957,429 5,507,602 54,465,031 5,973,865 6,486,515 66,925,411 15 85
11 20 Food Products 45,725,367 2,242,743 47,968,110 670,121 13,220,507 61,858,738 6 94 12 29 Petroleum and Coal Products 30,290,305 2,071,285 32,361,590 10,825,865 13,486,232 56,673,687 10 90 13 35 Industrial Machinery 4,703,929 2,014,451 6,718,380 34,502,765 3,386,871 44,608,016 3 97 14 24 Lumber and Wood Products 17,707,337 248,147 17,955,484 362,040 1,106,931 19,424,455 18 82 15 32 Stone/Clay/Glass Products 12,772,462 2,269,121 15,041,583 1,774,282 1,794,706 18,610,571 9 91
16 27 Printing and Publishing 11,556,621 52,101 11,608,722 4,257,718 2,631,641 18,498,081 23 77 17 39 Misc. Manufacturing Industries 4,939,830 641,548 5,581,378 8,098,814 2,786,587 16,466,779 21 79 18 25 Furniture and Fixtures 7,426,973 149,282 7,576,255 2,915,919 2,241,958 12,734,132 16 84 19 38 Measurement/Photographic
Instruments 4,185,559 302,178 4,487,737 4,681,431 2,420,717 11,589,885 0.03 99.97
20 5169 Chemical Wholesalers 542,984 291,622 834,606 1,744,556 6,316,296 8,895,458 0 100
21 22 Textile Mill Products 4,191,820 333,164 4,524,984 626,972 1,169,406 6,321,362 7 93 22 12 Coal Mining 2,258,259 0 2,258,259 3,063 0 2,261,322 0 100 23 31 Leather Products 532,859 958,137 1,490,996 97,601 40,949 1,629,546 4 96 24 23 Apparel and Other Textile
Products 962,641 35,234 997,875 451,235 61,827 1,510,937 84 16
25 21 Tobacco Products 571,210 260 571,470 0 579 572,049 0 100
Total 1,419,119,790 274,801,492 1,693,921,282 1,050,519,901 611,256,767 3,355,697,950 9 91
Note: Canada and US data only. Mexico data not available for 1999.
* Includes transfers to energy recovery, treatment and sewage, except for metals, which are included in off-site releases.
** Multiple SIC codes reported only in TRI.
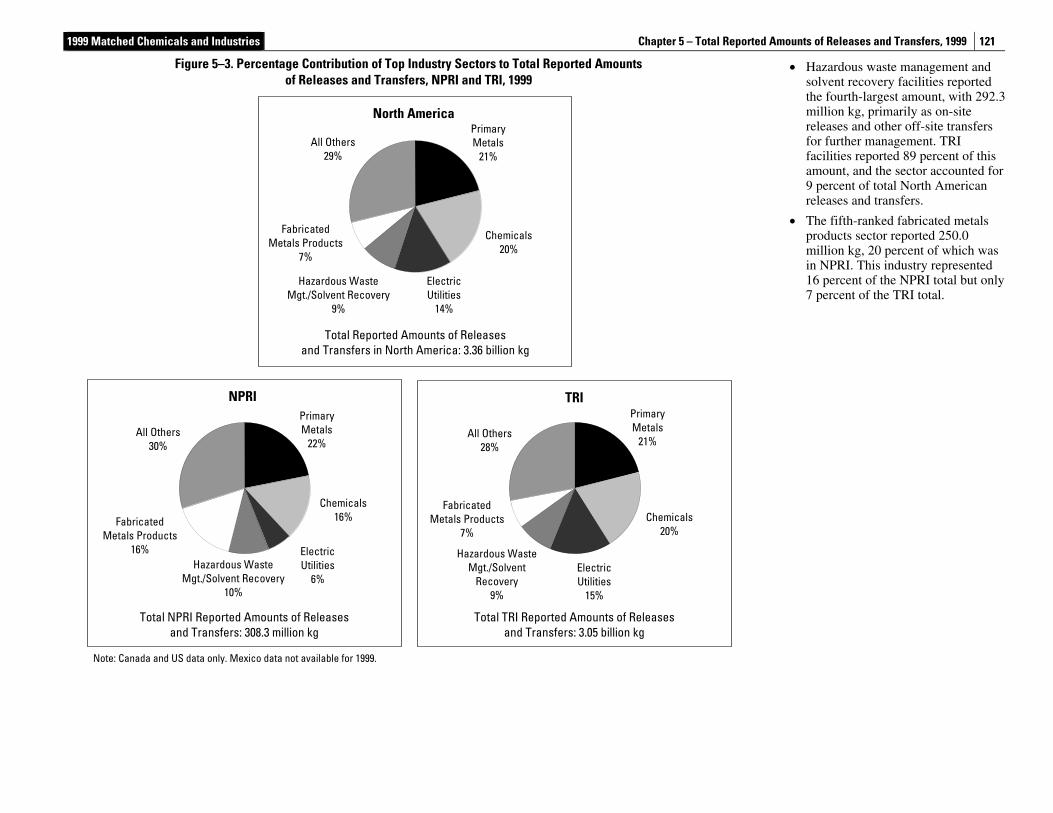
1999 Matched Chemicals and Industries Chapter 5 – Total Reported Amounts of Releases and Transfers, 1999
121
• Hazardous waste management and solvent recovery facilities reported the fourth-largest amount, with 292.3 million kg, primarily as on-site releases and other off-site transfers for further management. TRI facilities reported 89 percent of this amount, and the sector accounted for 9 percent of total North American releases and transfers.
• The fifth-ranked fabricated metals products sector reported 250.0 million kg, 20 percent of which was in NPRI. This industry represented 16 percent of the NPRI total but only 7 percent of the TRI total.
Figure 5–3. Percentage Contribution of Top Industry Sectors to Total Reported Amounts of Releases and Transfers, NPRI and TRI, 1999
Hazardous WasteMgt./Solvent Recovery
9%
Chemicals20%
FabricatedMetals Products
7%
All Others29%
PrimaryMetals
21%
ElectricUtilities
14%
Total Reported Amounts of Releases and Transfers in North America: 3.36 billion kg
North America
Fabricated Metals Products
7%
Electric Utilities
15%
Chemicals20%
Primary Metals
21%All Others
28%
Hazardous Waste Mgt./Solvent
Recovery 9%
Total TRI Reported Amounts of Releases and Transfers: 3.05 billion kg
TRI
Fabricated Metals Products
16%
Chemicals16%
ElectricUtilities
6%
PrimaryMetals
22%
Hazardous Waste Mgt./Solvent Recovery
10%
Total NPRI Reported Amounts of Releases and Transfers: 308.3 million kg
NPRI
All Others 30%
Note: Canada and US data only. Mexico data not available for 1999.
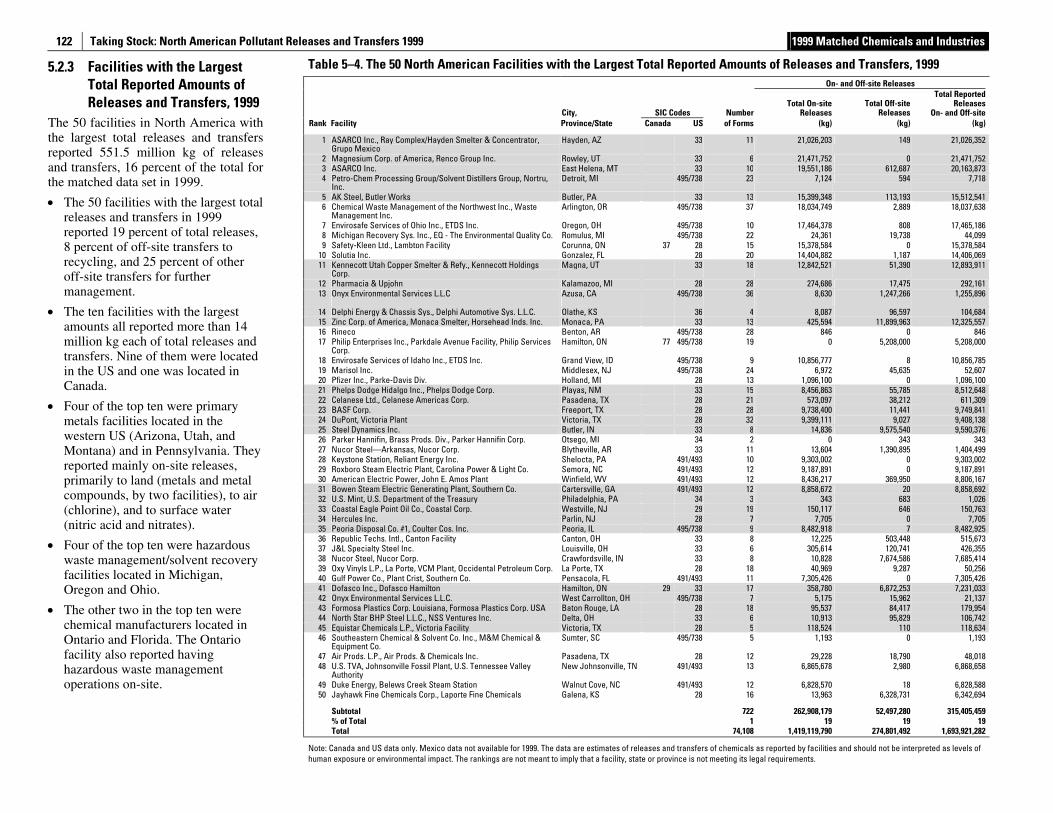
Taking Stock: North American Pollutant Releases and Transfers 1999 1999 Matched Chemicals and Industries
122
5.2.3 Facilities with the Largest Total Reported Amounts of Releases and Transfers, 1999
The 50 facilities in North America with the largest total releases and transfers reported 551.5 million kg of releases and transfers, 16 percent of the total for the matched data set in 1999.
• The 50 facilities with the largest total releases and transfers in 1999 reported 19 percent of total releases, 8 percent of off-site transfers to recycling, and 25 percent of other off-site transfers for further management.
• The ten facilities with the largest amounts all reported more than 14 million kg each of total releases and transfers. Nine of them were located in the US and one was located in Canada.
• Four of the top ten were primary metals facilities located in the western US (Arizona, Utah, and Montana) and in Pennsylvania. They reported mainly on-site releases, primarily to land (metals and metal compounds, by two facilities), to air (chlorine), and to surface water (nitric acid and nitrates).
• Four of the top ten were hazardous waste management/solvent recovery facilities located in Michigan, Oregon and Ohio.
• The other two in the top ten were chemical manufacturers located in Ontario and Florida. The Ontario facility also reported having hazardous waste management operations on-site.
Table 5–4. The 50 North American Facilities with the Largest Total Reported Amounts of Releases and Transfers, 1999 On- and Off-site Releases
City, SIC Codes NumberTotal On-site
ReleasesTotal Off-site
Releases
Total Reported Releases
On- and Off-site Rank Facility Province/State Canada US of Forms (kg) (kg) (kg)
1 ASARCO Inc., Ray Complex/Hayden Smelter & Concentrator, Grupo Mexico
Hayden, AZ 33 11 21,026,203 149 21,026,352
2 Magnesium Corp. of America, Renco Group Inc. Rowley, UT 33 6 21,471,752 0 21,471,752 3 ASARCO Inc. East Helena, MT 33 10 19,551,186 612,687 20,163,873 4 Petro-Chem Processing Group/Solvent Distillers Group, Nortru,
Inc. Detroit, MI 495/738 23 7,124 594 7,718
5 AK Steel, Butler Works Butler, PA 33 13 15,399,348 113,193 15,512,541 6 Chemical Waste Management of the Northwest Inc., Waste
Management Inc. Arlington, OR 495/738 37 18,034,749 2,889 18,037,638
7 Envirosafe Services of Ohio Inc., ETDS Inc. Oregon, OH 495/738 10 17,464,378 808 17,465,186 8 Michigan Recovery Sys. Inc., EQ - The Environmental Quality Co. Romulus, MI 495/738 22 24,361 19,738 44,099 9 Safety-Kleen Ltd., Lambton Facility Corunna, ON 37 28 15 15,378,584 0 15,378,584
10 Solutia Inc. Gonzalez, FL 28 20 14,404,882 1,187 14,406,069 11 Kennecott Utah Copper Smelter & Refy., Kennecott Holdings
Corp. Magna, UT 33 18 12,842,521 51,390 12,893,911
12 Pharmacia & Upjohn Kalamazoo, MI 28 28 274,686 17,475 292,161 13
Onyx Environmental Services L.L.C
Azusa, CA
495/738 36 8,630 1,247,266 1,255,896
14 Delphi Energy & Chassis Sys., Delphi Automotive Sys. L.L.C. Olathe, KS 36 4 8,087 96,597 104,684 15 Zinc Corp. of America, Monaca Smelter, Horsehead Inds. Inc. Monaca, PA 33 13 425,594 11,899,963 12,325,557 16 Rineco Benton, AR 495/738 28 846 0 846 17 Philip Enterprises Inc., Parkdale Avenue Facility, Philip Services
Corp. Hamilton, ON 77 495/738 19 0 5,208,000 5,208,000
18 Envirosafe Services of Idaho Inc., ETDS Inc. Grand View, ID 495/738 9 10,856,777 8 10,856,785 19 Marisol Inc. Middlesex, NJ 495/738 24 6,972 45,635 52,607 20 Pfizer Inc., Parke-Davis Div. Holland, MI 28 13 1,096,100 0 1,096,100 21 Phelps Dodge Hidalgo Inc., Phelps Dodge Corp. Playas, NM 33 15 8,456,863 55,785 8,512,648 22 Celanese Ltd., Celanese Americas Corp. Pasadena, TX 28 21 573,097 38,212 611,309 23 BASF Corp. Freeport, TX 28 28 9,738,400 11,441 9,749,841 24 DuPont, Victoria Plant Victoria, TX 28 32 9,399,111 9,027 9,408,138 25 Steel Dynamics Inc. Butler, IN 33 8 14,836 9,575,540 9,590,376 26 Parker Hannifin, Brass Prods. Div., Parker Hannifin Corp. Otsego, MI 34 2 0 343 343 27 Nucor Steel—Arkansas, Nucor Corp. Blytheville, AR 33 11 13,604 1,390,895 1,404,499 28 Keystone Station, Reliant Energy Inc. Shelocta, PA 491/493 10 9,303,002 0 9,303,002 29 Roxboro Steam Electric Plant, Carolina Power & Light Co. Semora, NC 491/493 12 9,187,891 0 9,187,891 30 American Electric Power, John E. Amos Plant Winfield, WV 491/493 12 8,436,217 369,950 8,806,167 31 Bowen Steam Electric Generating Plant, Southern Co. Cartersville, GA 491/493 12 8,858,672 20 8,858,692 32 U.S. Mint, U.S. Department of the Treasury Philadelphia, PA 34 3 343 683 1,026 33 Coastal Eagle Point Oil Co., Coastal Corp. Westville, NJ 29 19 150,117 646 150,763 34 Hercules Inc. Parlin, NJ 28 7 7,705 0 7,705 35 Peoria Disposal Co. #1, Coulter Cos. Inc. Peoria, IL 495/738 9 8,482,918 7 8,482,925 36 Republic Techs. Intl., Canton Facility Canton, OH 33 8 12,225 503,448 515,673 37 J&L Specialty Steel Inc. Louisville, OH 33 6 305,614 120,741 426,355 38 Nucor Steel, Nucor Corp. Crawfordsville, IN 33 8 10,828 7,674,586 7,685,414 39 Oxy Vinyls L.P., La Porte, VCM Plant, Occidental Petroleum Corp. La Porte, TX 28 18 40,969 9,287 50,256 40 Gulf Power Co., Plant Crist, Southern Co. Pensacola, FL 491/493 11 7,305,426 0 7,305,426 41 Dofasco Inc., Dofasco Hamilton Hamilton, ON 29 33 17 358,780 6,872,253 7,231,033 42 Onyx Environmental Services L.L.C. West Carrollton, OH 495/738 7 5,175 15,962 21,137 43 Formosa Plastics Corp. Louisiana, Formosa Plastics Corp. USA Baton Rouge, LA 28 18 95,537 84,417 179,954 44 North Star BHP Steel L.L.C., NSS Ventures Inc. Delta, OH 33 6 10,913 95,829 106,742 45 Equistar Chemicals L.P., Victoria Facility Victoria, TX 28 5 118,524 110 118,634 46 Southeastern Chemical & Solvent Co. Inc., M&M Chemical &
Equipment Co. Sumter, SC 495/738 5 1,193 0 1,193
47 Air Prods. L.P., Air Prods. & Chemicals Inc. Pasadena, TX 28 12 29,228 18,790 48,018 48 U.S. TVA, Johnsonville Fossil Plant, U.S. Tennessee Valley
Authority New Johnsonville, TN 491/493 13 6,865,678 2,980 6,868,658
49 Duke Energy, Belews Creek Steam Station Walnut Cove, NC 491/493 12 6,828,570 18 6,828,588 50 Jayhawk Fine Chemicals Corp., Laporte Fine Chemicals Galena, KS 28 16 13,963 6,328,731 6,342,694
Subtotal 722 262,908,179 52,497,280 315,405,459 % of Total 1 19 19 19 Total 74,108 1,419,119,790 274,801,492 1,693,921,282
Note: Canada and US data only. Mexico data not available for 1999. The data are estimates of releases and transfers of chemicals as reported by facilities and should not be interpreted as levels of human exposure or environmental impact. The rankings are not meant to imply that a facility, state or province is not meeting its legal requirements.
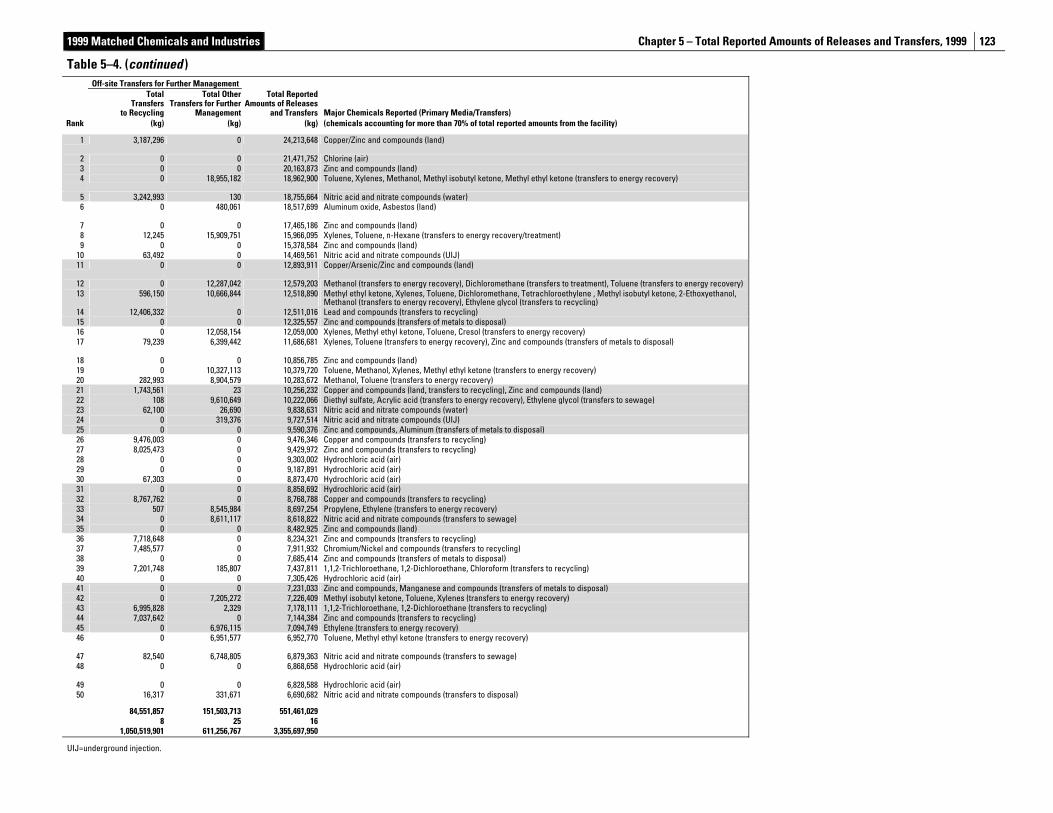
1999 Matched Chemicals and Industries Chapter 5 – Total Reported Amounts of Releases and Transfers, 1999
123
Table 5–4. (continued ) Off-site Transfers for Further Management
Total Transfers
to Recycling
Total Other Transfers for Further
Management
Total Reported Amounts of Releases
and Transfers Major Chemicals Reported (Primary Media/Transfers) Rank (kg) (kg) (kg) (chemicals accounting for more than 70% of total reported amounts from the facility)
1
3,187,296 0 24,213,648 Copper/Zinc and compounds (land)
2 0 0 21,471,752 Chlorine (air) 3 0 0 20,163,873 Zinc and compounds (land) 4
0 18,955,182 18,962,900 Toluene, Xylenes, Methanol, Methyl isobutyl ketone, Methyl ethyl ketone (transfers to energy recovery)
5 3,242,993 130 18,755,664 Nitric acid and nitrate compounds (water) 6
0 480,061 18,517,699 Aluminum oxide, Asbestos (land)
7 0 0 17,465,186 Zinc and compounds (land) 8 12,245 15,909,751 15,966,095 Xylenes, Toluene, n-Hexane (transfers to energy recovery/treatment) 9 0 0 15,378,584 Zinc and compounds (land)
10 63,492 0 14,469,561 Nitric acid and nitrate compounds (UIJ) 11
0 0 12,893,911 Copper/Arsenic/Zinc and compounds (land)
12 0 12,287,042 12,579,203 Methanol (transfers to energy recovery), Dichloromethane (transfers to treatment), Toluene (transfers to energy recovery) 13
596,150
10,666,844
12,518,890
Methyl ethyl ketone, Xylenes, Toluene, Dichloromethane, Tetrachloroethylene , Methyl isobutyl ketone, 2-Ethoxyethanol, Methanol (transfers to energy recovery), Ethylene glycol (transfers to recycling)
14 12,406,332 0 12,511,016 Lead and compounds (transfers to recycling) 15 0 0 12,325,557 Zinc and compounds (transfers of metals to disposal) 16 0 12,058,154 12,059,000 Xylenes, Methyl ethyl ketone, Toluene, Cresol (transfers to energy recovery) 17
79,239 6,399,442 11,686,681 Xylenes, Toluene (transfers to energy recovery), Zinc and compounds (transfers of metals to disposal)
18 0 0 10,856,785 Zinc and compounds (land) 19 0 10,327,113 10,379,720 Toluene, Methanol, Xylenes, Methyl ethyl ketone (transfers to energy recovery) 20 282,993 8,904,579 10,283,672 Methanol, Toluene (transfers to energy recovery) 21 1,743,561 23 10,256,232 Copper and compounds (land, transfers to recycling), Zinc and compounds (land) 22 108 9,610,649 10,222,066 Diethyl sulfate, Acrylic acid (transfers to energy recovery), Ethylene glycol (transfers to sewage) 23 62,100 26,690 9,838,631 Nitric acid and nitrate compounds (water) 24 0 319,376 9,727,514 Nitric acid and nitrate compounds (UIJ) 25 0 0 9,590,376 Zinc and compounds, Aluminum (transfers of metals to disposal) 26 9,476,003 0 9,476,346 Copper and compounds (transfers to recycling) 27 8,025,473 0 9,429,972 Zinc and compounds (transfers to recycling) 28 0 0 9,303,002 Hydrochloric acid (air) 29 0 0 9,187,891 Hydrochloric acid (air) 30 67,303 0 8,873,470 Hydrochloric acid (air) 31 0 0 8,858,692 Hydrochloric acid (air) 32 8,767,762 0 8,768,788 Copper and compounds (transfers to recycling) 33 507 8,545,984 8,697,254 Propylene, Ethylene (transfers to energy recovery) 34 0 8,611,117 8,618,822 Nitric acid and nitrate compounds (transfers to sewage) 35 0 0 8,482,925 Zinc and compounds (land) 36 7,718,648 0 8,234,321 Zinc and compounds (transfers to recycling) 37 7,485,577 0 7,911,932 Chromium/Nickel and compounds (transfers to recycling) 38 0 0 7,685,414 Zinc and compounds (transfers of metals to disposal) 39 7,201,748 185,807 7,437,811 1,1,2-Trichloroethane, 1,2-Dichloroethane, Chloroform (transfers to recycling) 40 0 0 7,305,426 Hydrochloric acid (air) 41 0 0 7,231,033 Zinc and compounds, Manganese and compounds (transfers of metals to disposal) 42 0 7,205,272 7,226,409 Methyl isobutyl ketone, Toluene, Xylenes (transfers to energy recovery) 43 6,995,828 2,329 7,178,111 1,1,2-Trichloroethane, 1,2-Dichloroethane (transfers to recycling) 44 7,037,642 0 7,144,384 Zinc and compounds (transfers to recycling) 45 0 6,976,115 7,094,749 Ethylene (transfers to energy recovery) 46
0 6,951,577 6,952,770 Toluene, Methyl ethyl ketone (transfers to energy recovery)
47 82,540 6,748,805 6,879,363 Nitric acid and nitrate compounds (transfers to sewage) 48
0 0 6,868,658 Hydrochloric acid (air)
49 0 0 6,828,588 Hydrochloric acid (air) 50 16,317 331,671 6,690,682 Nitric acid and nitrate compounds (transfers to disposal)
84,551,857 151,503,713 551,461,029 8 25 16 1,050,519,901 611,256,767 3,355,697,950
UIJ=underground injection.
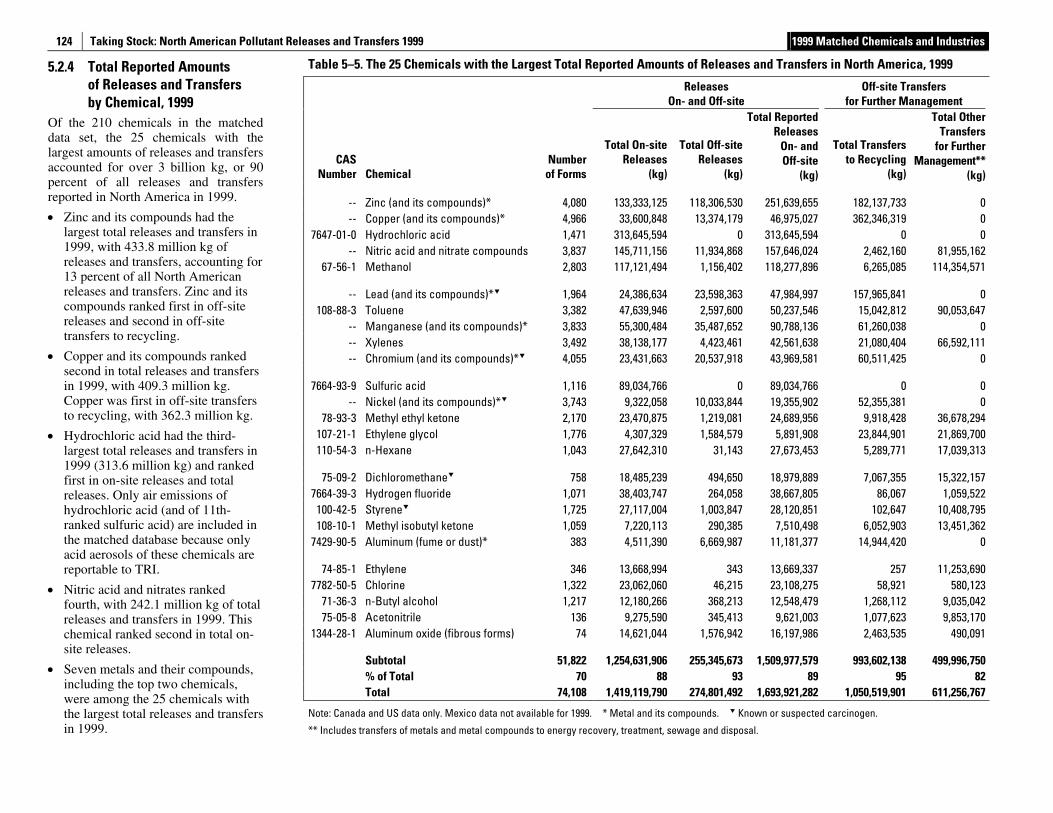
Taking Stock: North American Pollutant Releases and Transfers 1999 1999 Matched Chemicals and Industries
124
5.2.4 Total Reported Amounts of Releases and Transfers by Chemical, 1999
Of the 210 chemicals in the matched data set, the 25 chemicals with the largest amounts of releases and transfers accounted for over 3 billion kg, or 90 percent of all releases and transfers reported in North America in 1999.
• Zinc and its compounds had the largest total releases and transfers in 1999, with 433.8 million kg of releases and transfers, accounting for 13 percent of all North American releases and transfers. Zinc and its compounds ranked first in off-site releases and second in off-site transfers to recycling.
• Copper and its compounds ranked second in total releases and transfers in 1999, with 409.3 million kg. Copper was first in off-site transfers to recycling, with 362.3 million kg.
• Hydrochloric acid had the third-largest total releases and transfers in 1999 (313.6 million kg) and ranked first in on-site releases and total releases. Only air emissions of hydrochloric acid (and of 11th-ranked sulfuric acid) are included in the matched database because only acid aerosols of these chemicals are reportable to TRI.
• Nitric acid and nitrates ranked fourth, with 242.1 million kg of total releases and transfers in 1999. This chemical ranked second in total on-site releases.
• Seven metals and their compounds, including the top two chemicals, were among the 25 chemicals with the largest total releases and transfers in 1999.
Table 5–5. The 25 Chemicals with the Largest Total Reported Amounts of Releases and Transfers in North America, 1999
Releases
On- and Off-site Off-site Transfers
for Further Management
CAS Number Chemical
Number of Forms
Total On-site Releases
(kg)
Total Off-site Releases
(kg)
Total Reported Releases
On- andOff-site
(kg)
Total Transfers to Recycling
(kg)
Total Other Transfers
for Further Management**
(kg)
-- Zinc (and its compounds)* 4,080 133,333,125 118,306,530 251,639,655 182,137,733 0 -- Copper (and its compounds)* 4,966 33,600,848 13,374,179 46,975,027 362,346,319 0
7647-01-0 Hydrochloric acid 1,471 313,645,594 0 313,645,594 0 0 -- Nitric acid and nitrate compounds 3,837 145,711,156 11,934,868 157,646,024 2,462,160 81,955,162
67-56-1 Methanol 2,803 117,121,494 1,156,402 118,277,896 6,265,085 114,354,571
-- Lead (and its compounds)* 1,964 24,386,634 23,598,363 47,984,997 157,965,841 0 108-88-3 Toluene 3,382 47,639,946 2,597,600 50,237,546 15,042,812 90,053,647
-- Manganese (and its compounds)* 3,833 55,300,484 35,487,652 90,788,136 61,260,038 0 -- Xylenes 3,492 38,138,177 4,423,461 42,561,638 21,080,404 66,592,111 -- Chromium (and its compounds)* 4,055 23,431,663 20,537,918 43,969,581 60,511,425 0
7664-93-9 Sulfuric acid 1,116 89,034,766 0 89,034,766 0 0 -- Nickel (and its compounds)* 3,743 9,322,058 10,033,844 19,355,902 52,355,381 0
78-93-3 Methyl ethyl ketone 2,170 23,470,875 1,219,081 24,689,956 9,918,428 36,678,294 107-21-1 Ethylene glycol 1,776 4,307,329 1,584,579 5,891,908 23,844,901 21,869,700 110-54-3 n-Hexane 1,043 27,642,310 31,143 27,673,453 5,289,771 17,039,313
75-09-2 Dichloromethane 758 18,485,239 494,650 18,979,889 7,067,355 15,322,157 7664-39-3 Hydrogen fluoride 1,071 38,403,747 264,058 38,667,805 86,067 1,059,522
100-42-5 Styrene 1,725 27,117,004 1,003,847 28,120,851 102,647 10,408,795 108-10-1 Methyl isobutyl ketone 1,059 7,220,113 290,385 7,510,498 6,052,903 13,451,362
7429-90-5 Aluminum (fume or dust)* 383 4,511,390 6,669,987 11,181,377 14,944,420 0
74-85-1 Ethylene 346 13,668,994 343 13,669,337 257 11,253,690 7782-50-5 Chlorine 1,322 23,062,060 46,215 23,108,275 58,921 580,123
71-36-3 n-Butyl alcohol 1,217 12,180,266 368,213 12,548,479 1,268,112 9,035,042 75-05-8 Acetonitrile 136 9,275,590 345,413 9,621,003 1,077,623 9,853,170
1344-28-1 Aluminum oxide (fibrous forms) 74 14,621,044 1,576,942 16,197,986 2,463,535 490,091
Subtotal 51,822 1,254,631,906 255,345,673 1,509,977,579 993,602,138 499,996,750 % of Total 70 88 93 89 95 82 Total 74,108 1,419,119,790 274,801,492 1,693,921,282 1,050,519,901 611,256,767
Note: Canada and US data only. Mexico data not available for 1999. * Metal and its compounds. Known or suspected carcinogen.
** Includes transfers of metals and metal compounds to energy recovery, treatment, sewage and disposal.
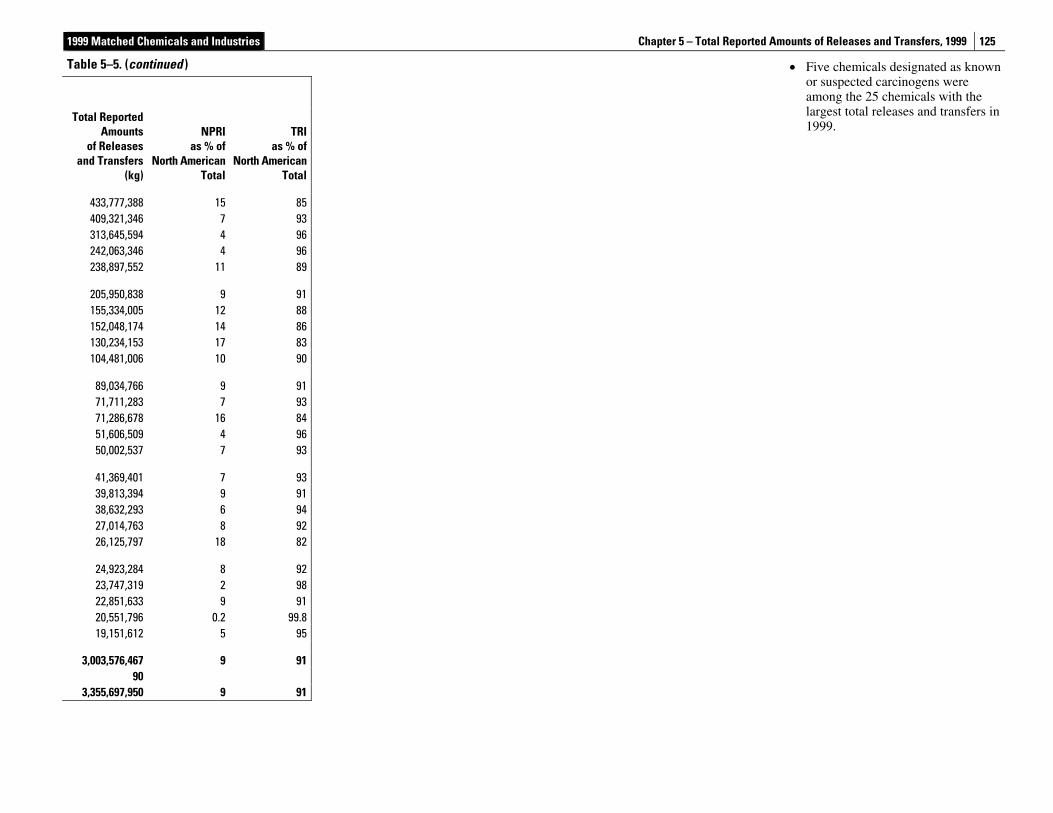
1999 Matched Chemicals and Industries Chapter 5 – Total Reported Amounts of Releases and Transfers, 1999
125
• Five chemicals designated as known or suspected carcinogens were among the 25 chemicals with the largest total releases and transfers in 1999.
Table 5–5. (continued )
Total Reported Amounts
of Releases and Transfers
(kg)
NPRI as % of
North American Total
TRI as % of
North American Total
433,777,388 15 85 409,321,346 7 93 313,645,594 4 96 242,063,346 4 96 238,897,552 11 89
205,950,838 9 91 155,334,005 12 88 152,048,174 14 86 130,234,153 17 83 104,481,006 10 90
89,034,766 9 91 71,711,283 7 93 71,286,678 16 84 51,606,509 4 96 50,002,537 7 93
41,369,401 7 93 39,813,394 9 91 38,632,293 6 94 27,014,763 8 92 26,125,797 18 82
24,923,284 8 92 23,747,319 2 98 22,851,633 9 91 20,551,796 0.2 99.8 19,151,612 5 95
3,003,576,467 9 91 90
3,355,697,950 9 91

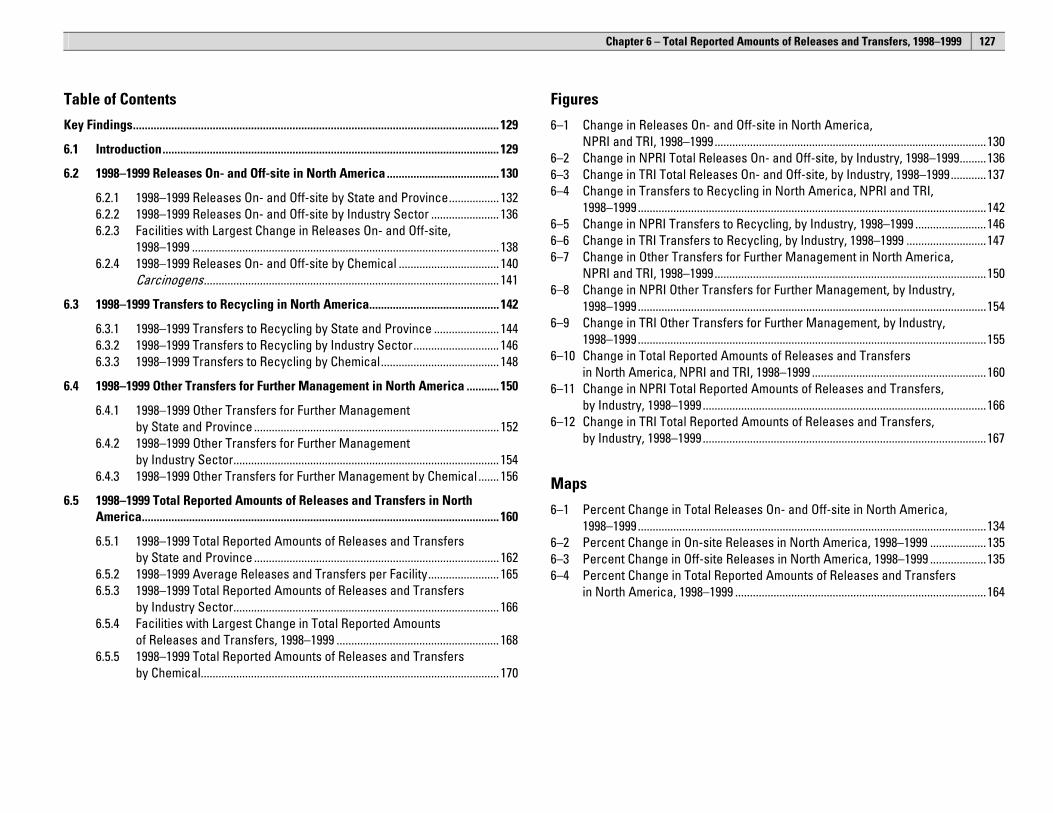
Chapter 6 – Total Reported Amounts of Releases and Transfers, 1998–1999
127
Table of Contents
Key Findings............................................................................................................................ 129
6.1 Introduction.................................................................................................................. 129
6.2 1998–1999 Releases On- and Off-site in North America ...................................... 130
6.2.1 1998–1999 Releases On- and Off-site by State and Province................. 132 6.2.2 1998–1999 Releases On- and Off-site by Industry Sector ....................... 136 6.2.3 Facilities with Largest Change in Releases On- and Off-site,
1998–1999 ........................................................................................................ 138 6.2.4 1998–1999 Releases On- and Off-site by Chemical .................................. 140
Carcinogens.................................................................................................... 141 6.3 1998–1999 Transfers to Recycling in North America............................................ 142
6.3.1 1998–1999 Transfers to Recycling by State and Province ...................... 144 6.3.2 1998–1999 Transfers to Recycling by Industry Sector............................. 146 6.3.3 1998–1999 Transfers to Recycling by Chemical........................................ 148
6.4 1998–1999 Other Transfers for Further Management in North America ........... 150
6.4.1 1998–1999 Other Transfers for Further Management by State and Province ................................................................................... 152
6.4.2 1998–1999 Other Transfers for Further Management by Industry Sector.......................................................................................... 154
6.4.3 1998–1999 Other Transfers for Further Management by Chemical ....... 156 6.5 1998–1999 Total Reported Amounts of Releases and Transfers in North
America......................................................................................................................... 160
6.5.1 1998–1999 Total Reported Amounts of Releases and Transfers by State and Province ................................................................................... 162
6.5.2 1998–1999 Average Releases and Transfers per Facility........................ 165 6.5.3 1998–1999 Total Reported Amounts of Releases and Transfers
by Industry Sector.......................................................................................... 166 6.5.4 Facilities with Largest Change in Total Reported Amounts
of Releases and Transfers, 1998–1999 ....................................................... 168 6.5.5 1998–1999 Total Reported Amounts of Releases and Transfers
by Chemical..................................................................................................... 170
Figures
6–1 Change in Releases On- and Off-site in North America, NPRI and TRI, 1998–1999............................................................................................130
6–2 Change in NPRI Total Releases On- and Off-site, by Industry, 1998–1999.........136 6–3 Change in TRI Total Releases On- and Off-site, by Industry, 1998–1999............137 6–4 Change in Transfers to Recycling in North America, NPRI and TRI,
1998–1999......................................................................................................................142 6–5 Change in NPRI Transfers to Recycling, by Industry, 1998–1999 ........................146 6–6 Change in TRI Transfers to Recycling, by Industry, 1998–1999 ...........................147 6–7 Change in Other Transfers for Further Management in North America,
NPRI and TRI, 1998–1999............................................................................................150 6–8 Change in NPRI Other Transfers for Further Management, by Industry,
1998–1999......................................................................................................................154 6–9 Change in TRI Other Transfers for Further Management, by Industry,
1998–1999......................................................................................................................155 6–10 Change in Total Reported Amounts of Releases and Transfers
in North America, NPRI and TRI, 1998–1999 ...........................................................160 6–11 Change in NPRI Total Reported Amounts of Releases and Transfers,
by Industry, 1998–1999................................................................................................166 6–12 Change in TRI Total Reported Amounts of Releases and Transfers,
by Industry, 1998–1999................................................................................................167
Maps
6–1 Percent Change in Total Releases On- and Off-site in North America, 1998–1999......................................................................................................................134
6–2 Percent Change in On-site Releases in North America, 1998–1999 ...................135 6–3 Percent Change in Off-site Releases in North America, 1998–1999 ...................135 6–4 Percent Change in Total Reported Amounts of Releases and Transfers
in North America, 1998–1999 .....................................................................................164
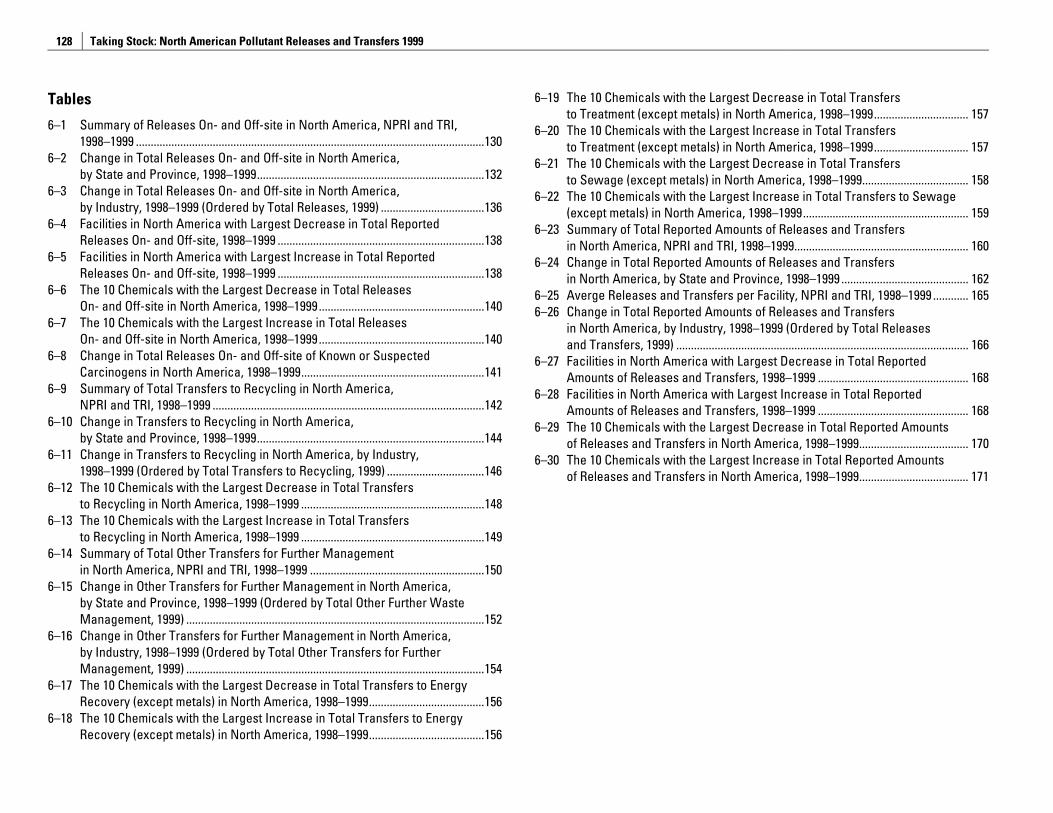
Taking Stock: North American Pollutant Releases and Transfers 1999
128
Tables
6–1 Summary of Releases On- and Off-site in North America, NPRI and TRI, 1998–1999 ......................................................................................................................130
6–2 Change in Total Releases On- and Off-site in North America, by State and Province, 1998–1999.............................................................................132
6–3 Change in Total Releases On- and Off-site in North America, by Industry, 1998–1999 (Ordered by Total Releases, 1999) ...................................136
6–4 Facilities in North America with Largest Decrease in Total Reported Releases On- and Off-site, 1998–1999 ......................................................................138
6–5 Facilities in North America with Largest Increase in Total Reported Releases On- and Off-site, 1998–1999 ......................................................................138
6–6 The 10 Chemicals with the Largest Decrease in Total Releases On- and Off-site in North America, 1998–1999........................................................140
6–7 The 10 Chemicals with the Largest Increase in Total Releases On- and Off-site in North America, 1998–1999........................................................140
6–8 Change in Total Releases On- and Off-site of Known or Suspected Carcinogens in North America, 1998–1999..............................................................141
6–9 Summary of Total Transfers to Recycling in North America, NPRI and TRI, 1998–1999 ............................................................................................142
6–10 Change in Transfers to Recycling in North America, by State and Province, 1998–1999.............................................................................144
6–11 Change in Transfers to Recycling in North America, by Industry, 1998–1999 (Ordered by Total Transfers to Recycling, 1999) .................................146
6–12 The 10 Chemicals with the Largest Decrease in Total Transfers to Recycling in North America, 1998–1999 ..............................................................148
6–13 The 10 Chemicals with the Largest Increase in Total Transfers to Recycling in North America, 1998–1999 ..............................................................149
6–14 Summary of Total Other Transfers for Further Management in North America, NPRI and TRI, 1998–1999 ...........................................................150
6–15 Change in Other Transfers for Further Management in North America, by State and Province, 1998–1999 (Ordered by Total Other Further Waste Management, 1999) .....................................................................................................152
6–16 Change in Other Transfers for Further Management in North America, by Industry, 1998–1999 (Ordered by Total Other Transfers for Further Management, 1999) .....................................................................................................154
6–17 The 10 Chemicals with the Largest Decrease in Total Transfers to Energy Recovery (except metals) in North America, 1998–1999.......................................156
6–18 The 10 Chemicals with the Largest Increase in Total Transfers to Energy Recovery (except metals) in North America, 1998–1999.......................................156
6–19 The 10 Chemicals with the Largest Decrease in Total Transfers to Treatment (except metals) in North America, 1998–1999................................ 157
6–20 The 10 Chemicals with the Largest Increase in Total Transfers to Treatment (except metals) in North America, 1998–1999................................ 157
6–21 The 10 Chemicals with the Largest Decrease in Total Transfers to Sewage (except metals) in North America, 1998–1999.................................... 158
6–22 The 10 Chemicals with the Largest Increase in Total Transfers to Sewage (except metals) in North America, 1998–1999........................................................ 159
6–23 Summary of Total Reported Amounts of Releases and Transfers in North America, NPRI and TRI, 1998–1999........................................................... 160
6–24 Change in Total Reported Amounts of Releases and Transfers in North America, by State and Province, 1998–1999 ........................................... 162
6–25 Averge Releases and Transfers per Facility, NPRI and TRI, 1998–1999 ............ 165 6–26 Change in Total Reported Amounts of Releases and Transfers
in North America, by Industry, 1998–1999 (Ordered by Total Releases and Transfers, 1999) ................................................................................................... 166
6–27 Facilities in North America with Largest Decrease in Total Reported Amounts of Releases and Transfers, 1998–1999 ................................................... 168
6–28 Facilities in North America with Largest Increase in Total Reported Amounts of Releases and Transfers, 1998–1999 ................................................... 168
6–29 The 10 Chemicals with the Largest Decrease in Total Reported Amounts of Releases and Transfers in North America, 1998–1999..................................... 170
6–30 The 10 Chemicals with the Largest Increase in Total Reported Amounts of Releases and Transfers in North America, 1998–1999..................................... 171
Chapter 6 – Total Reported Amounts of Releases and Transfers, 1998–1999
129
Key Findings • In 1999, facilities in North America released 1.57 billion kg of listed substances on- and off-site, as reported to TRI
and NPRI. This total was 1 percent lower than in 1998.
• The jurisdictions with the highest total releases were the same in 1999 as in 1998: Ohio, Texas, Pennsylvania, Ontario, and Indiana. The amounts were lower than in 1998 for Ohio, Texas, and Ontario.
• In both 1998 and 1999, the industry that accounted for the largest total releases was electric utilities, followed by primary metals, chemicals, and hazardous waste management/solvent recovery.
• Total releases on- and off-site of known and suspected carcinogens decreased by 5 percent. The largest quantity decrease was for friable asbestos, and the largest increases were for formaldehyde and styrene.
• North American off-site transfers to recycling rose slightly between 1998 and 1999, but in NPRI they fell 18 percent, mainly because of a 21-percent decline in transfers to recycling of metals.
• North American off-site transfers of chemicals (excluding metals) for other types of further management (energy recovery, treatment, and sewage) declined 10 percent between 1998 and 1999. In NPRI, off-site transfers to energy recovery increased by 17 percent, while in TRI such transfers fell by 17 percent.
• Total North American releases and transfers declined from 3.32 billion kg in 1998 to 3.26 billion kg in 1999. The main reduction was in off-site transfers to energy recovery.
• Ohio, Texas and Ontario had the highest total releases and transfers in 1999; Ontario was in fourth place in 1998 while Michigan ranked third in 1998.
• The primary metals sector reported the largest total North American releases and transfers, in both 1998 and 1999. The chemicals, electric utilities, and hazardous waste management industries followed, with their rankings unchanged. The total for hazardous waste management/solvent recovery, however, decreased by 22 percent between 1998 and 1999.
• The chemical with the largest reported decrease in total releases and transfers for 1998–1999 was xylenes. The largest overall increase was for hydrochloric acid, followed by nitric acid and nitrate compounds.
6.1 Introduction This chapter examines changes in reported amounts of North American releases and transfers from 1998 to 1999, including on- and off-site releases, transfers to recycling, and other transfers for further management. It analyzes data for industries and chemicals that reported in both the United States and Canada (the matched data set) for the years 1998 and 1999. Comparable Mexican data are not available for these years. The information in this chapter does not include the new chemicals added to NPRI for the 1999 reporting year because data for these chemicals are not available for 1998. The 1999 data presented in this chapter are therefore a subset of the 1999 data presented in Chapters 3, 4 and 5.
The information is presented under the same categories as in previous chapters. Data for releases on- and off-site are presented first; these are the “adjusted” releases similar to those in Chapter 3. Next come data on transfers to recycling and other transfers for further management (that is, to energy recovery, treatment, and sewage) and, finally, total reported releases and transfers. Within sections, the data is presented in the following order: by states and provinces, by industry sector, by facilities with the largest changes (for total releases and for total releases and transfers) and, finally, by chemical.
Further details of facilities’ reporting and their changes can be found on the Taking Stock web site <www.cec.org/ takingstock>.
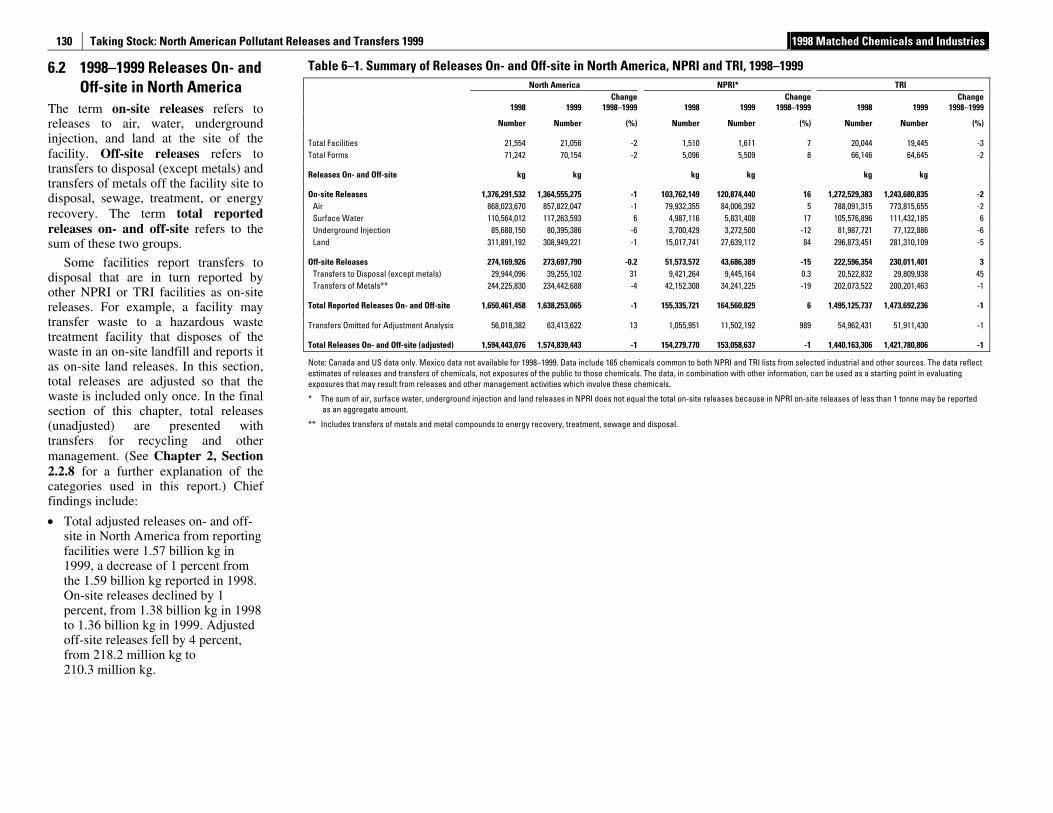
Taking Stock: North American Pollutant Releases and Transfers 1999 1998 Matched Chemicals and Industries
130
6.2 1998–1999 Releases On- and Off-site in North America
The term on-site releases refers to releases to air, water, underground injection, and land at the site of the facility. Off-site releases refers to transfers to disposal (except metals) and transfers of metals off the facility site to disposal, sewage, treatment, or energy recovery. The term total reported releases on- and off-site refers to the sum of these two groups.
Some facilities report transfers to disposal that are in turn reported by other NPRI or TRI facilities as on-site releases. For example, a facility may transfer waste to a hazardous waste treatment facility that disposes of the waste in an on-site landfill and reports it as on-site land releases. In this section, total releases are adjusted so that the waste is included only once. In the final section of this chapter, total releases (unadjusted) are presented with transfers for recycling and other management. (See Chapter 2, Section 2.2.8 for a further explanation of the categories used in this report.) Chief findings include:
• Total adjusted releases on- and off-site in North America from reporting facilities were 1.57 billion kg in 1999, a decrease of 1 percent from the 1.59 billion kg reported in 1998. On-site releases declined by 1 percent, from 1.38 billion kg in 1998 to 1.36 billion kg in 1999. Adjusted off-site releases fell by 4 percent, from 218.2 million kg to 210.3 million kg.
Table 6–1. Summary of Releases On- and Off-site in North America, NPRI and TRI, 1998–1999 North America NPRI* TRI
1998 1999Change
1998–1999 1998 1999Change
1998–1999 1998 1999Change
1998–1999
Number Number (%) Number Number (%) Number Number (%)
Total Facilities 21,554 21,056 -2 1,510 1,611 7 20,044 19,445 -3
Total Forms 71,242 70,154 -2 5,096 5,509 8 66,146 64,645 -2
Releases On- and Off-site kg kg kg kg kg kg
On-site Releases 1,376,291,532 1,364,555,275 -1 103,762,149 120,874,440 16 1,272,529,383 1,243,680,835 -2
Air 868,023,670 857,822,047 -1 79,932,355 84,006,392 5 788,091,315 773,815,655 -2
Surface Water 110,564,012 117,263,593 6 4,987,116 5,831,408 17 105,576,896 111,432,185 6
Underground Injection 85,688,150 80,395,386 -6 3,700,429 3,272,500 -12 81,987,721 77,122,886 -6
Land 311,891,192 308,949,221 -1 15,017,741 27,639,112 84 296,873,451 281,310,109 -5
Off-site Releases 274,169,926 273,697,790 -0.2 51,573,572 43,686,389 -15 222,596,354 230,011,401 3
Transfers to Disposal (except metals) 29,944,096 39,255,102 31 9,421,264 9,445,164 0.3 20,522,832 29,809,938 45
Transfers of Metals** 244,225,830 234,442,688 -4 42,152,308 34,241,225 -19 202,073,522 200,201,463 -1
Total Reported Releases On- and Off-site 1,650,461,458 1,638,253,065 -1 155,335,721 164,560,829 6 1,495,125,737 1,473,692,236 -1
Transfers Omitted for Adjustment Analysis 56,018,382 63,413,622 13 1,055,951 11,502,192 989 54,962,431 51,911,430 -1
Total Releases On- and Off-site (adjusted) 1,594,443,076 1,574,839,443 -1 154,279,770 153,058,637 -1 1,440,163,306 1,421,780,806 -1
Note: Canada and US data only. Mexico data not available for 1998–1999. Data include 165 chemicals common to both NPRI and TRI lists from selected industrial and other sources. The data reflect estimates of releases and transfers of chemicals, not exposures of the public to those chemicals. The data, in combination with other information, can be used as a starting point in evaluating exposures that may result from releases and other management activities which involve these chemicals.
* The sum of air, surface water, underground injection and land releases in NPRI does not equal the total on-site releases because in NPRI on-site releases of less than 1 tonne may be reported as an aggregate amount.
** Includes transfers of metals and metal compounds to energy recovery, treatment, sewage and disposal.
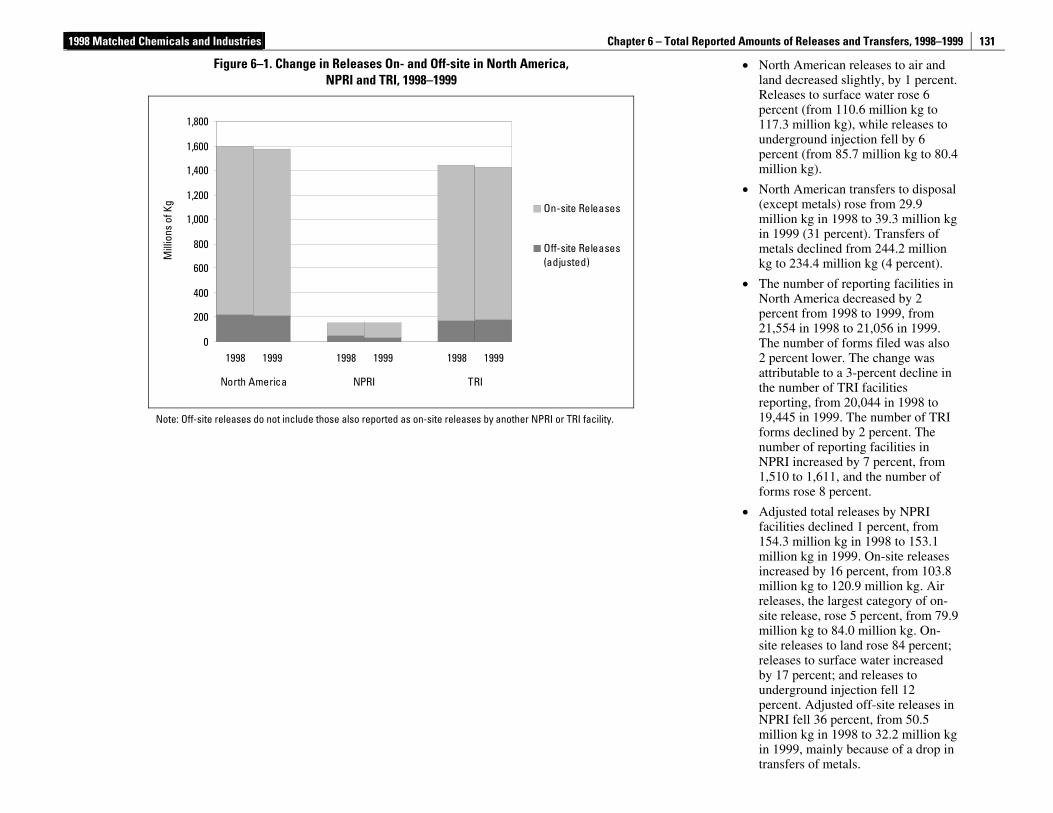
1998 Matched Chemicals and Industries Chapter 6 – Total Reported Amounts of Releases and Transfers, 1998–1999
131
• North American releases to air and land decreased slightly, by 1 percent. Releases to surface water rose 6 percent (from 110.6 million kg to 117.3 million kg), while releases to underground injection fell by 6 percent (from 85.7 million kg to 80.4 million kg).
• North American transfers to disposal (except metals) rose from 29.9 million kg in 1998 to 39.3 million kg in 1999 (31 percent). Transfers of metals declined from 244.2 million kg to 234.4 million kg (4 percent).
• The number of reporting facilities in North America decreased by 2 percent from 1998 to 1999, from 21,554 in 1998 to 21,056 in 1999. The number of forms filed was also 2 percent lower. The change was attributable to a 3-percent decline in the number of TRI facilities reporting, from 20,044 in 1998 to 19,445 in 1999. The number of TRI forms declined by 2 percent. The number of reporting facilities in NPRI increased by 7 percent, from 1,510 to 1,611, and the number of forms rose 8 percent.
• Adjusted total releases by NPRI facilities declined 1 percent, from 154.3 million kg in 1998 to 153.1 million kg in 1999. On-site releases increased by 16 percent, from 103.8 million kg to 120.9 million kg. Air releases, the largest category of on-site release, rose 5 percent, from 79.9 million kg to 84.0 million kg. On-site releases to land rose 84 percent; releases to surface water increased by 17 percent; and releases to underground injection fell 12 percent. Adjusted off-site releases in NPRI fell 36 percent, from 50.5 million kg in 1998 to 32.2 million kg in 1999, mainly because of a drop in transfers of metals.
Figure 6–1. Change in Releases On- and Off-site in North America, NPRI and TRI, 1998–1999
0
200
400
600
800
1,000
1,200
1,400
1,600
1,800
1998 1999 1998 1999 1998 1999
North America NPRI TRI
Mill
ions
of K
g On-site Releases
Off-site Releases(adjusted)
Note: Off-site releases do not include those also reported as on-site releases by another NPRI or TRI facility.
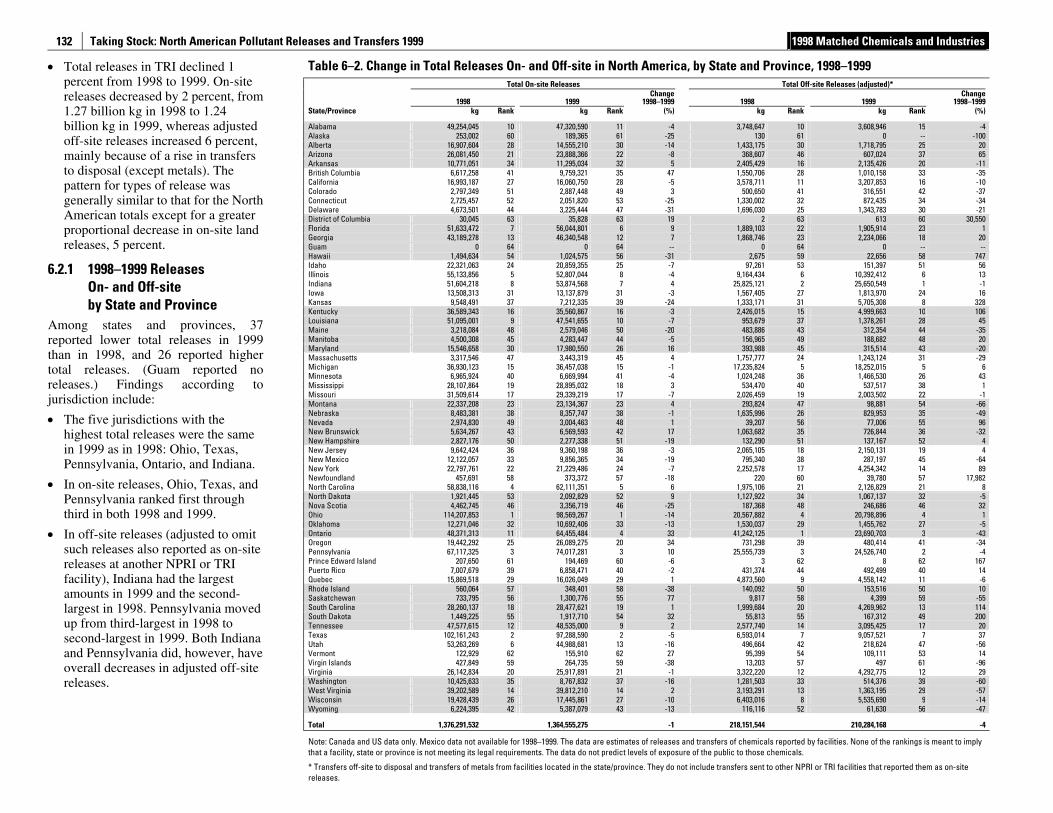
Taking Stock: North American Pollutant Releases and Transfers 1999 1998 Matched Chemicals and Industries
132
• Total releases in TRI declined 1 percent from 1998 to 1999. On-site releases decreased by 2 percent, from 1.27 billion kg in 1998 to 1.24 billion kg in 1999, whereas adjusted off-site releases increased 6 percent, mainly because of a rise in transfers to disposal (except metals). The pattern for types of release was generally similar to that for the North American totals except for a greater proportional decrease in on-site land releases, 5 percent.
6.2.1 1998–1999 Releases On- and Off-site by State and Province
Among states and provinces, 37 reported lower total releases in 1999 than in 1998, and 26 reported higher total releases. (Guam reported no releases.) Findings according to jurisdiction include: • The five jurisdictions with the
highest total releases were the same in 1999 as in 1998: Ohio, Texas, Pennsylvania, Ontario, and Indiana.
• In on-site releases, Ohio, Texas, and Pennsylvania ranked first through third in both 1998 and 1999.
• In off-site releases (adjusted to omit such releases also reported as on-site releases at another NPRI or TRI facility), Indiana had the largest amounts in 1999 and the second-largest in 1998. Pennsylvania moved up from third-largest in 1998 to second-largest in 1999. Both Indiana and Pennsylvania did, however, have overall decreases in adjusted off-site releases.
Table 6–2. Change in Total Releases On- and Off-site in North America, by State and Province, 1998–1999 Total On-site Releases Total Off-site Releases (adjusted)*
1998 1999 Change
1998–1999 1998 1999 Change
1998–1999 State/Province kg Rank kg Rank (%) kg Rank kg Rank (%)
Alabama 49,254,045 10 47,320,590 11 -4 3,748,647 10 3,608,946 15 -4 Alaska 253,002 60 189,365 61 -25 130 61 0 -- -100 Alberta 16,907,604 28 14,555,210 30 -14 1,433,175 30 1,718,795 25 20 Arizona 26,081,450 21 23,888,366 22 -8 368,607 46 607,024 37 65 Arkansas 10,771,051 34 11,295,034 32 5 2,405,429 16 2,135,426 20 -11 British Columbia 6,617,258 41 9,759,321 35 47 1,550,706 28 1,010,158 33 -35 California 16,993,187 27 16,060,750 28 -5 3,578,711 11 3,207,853 16 -10 Colorado 2,797,349 51 2,887,448 49 3 500,650 41 316,551 42 -37 Connecticut 2,725,457 52 2,051,820 53 -25 1,330,002 32 872,435 34 -34 Delaware 4,673,501 44 3,225,444 47 -31 1,696,030 25 1,343,783 30 -21 District of Columbia 30,045 63 35,828 63 19 2 63 613 60 30,550 Florida 51,633,472 7 56,044,801 6 9 1,889,103 22 1,905,914 23 1 Georgia 43,189,278 13 46,340,548 12 7 1,868,746 23 2,234,066 18 20 Guam 0 64 0 64 -- 0 64 0 -- -- Hawaii 1,494,634 54 1,024,575 56 -31 2,675 59 22,656 58 747 Idaho 22,321,063 24 20,859,355 25 -7 97,261 53 151,397 51 56 Illinois 55,133,856 5 52,807,044 8 -4 9,164,434 6 10,392,412 6 13 Indiana 51,604,218 8 53,874,568 7 4 25,825,121 2 25,650,549 1 -1 Iowa 13,508,313 31 13,137,879 31 -3 1,567,405 27 1,813,970 24 16 Kansas 9,548,491 37 7,212,335 39 -24 1,333,171 31 5,705,308 8 328 Kentucky 36,589,343 16 35,560,867 16 -3 2,426,015 15 4,999,663 10 106 Louisiana 51,095,001 9 47,541,655 10 -7 953,679 37 1,378,261 28 45 Maine 3,218,084 48 2,579,046 50 -20 483,886 43 312,354 44 -35 Manitoba 4,500,308 45 4,283,447 44 -5 156,965 49 188,682 48 20 Maryland 15,546,658 30 17,980,550 26 16 393,988 45 315,514 43 -20 Massachusetts 3,317,546 47 3,443,319 45 4 1,757,777 24 1,243,124 31 -29 Michigan 36,930,123 15 36,457,038 15 -1 17,235,824 5 18,252,015 5 6 Minnesota 6,965,924 40 6,669,994 41 -4 1,024,248 36 1,466,530 26 43 Mississippi 28,107,864 19 28,895,032 18 3 534,470 40 537,517 38 1 Missouri 31,509,614 17 29,339,219 17 -7 2,026,459 19 2,003,502 22 -1 Montana 22,337,208 23 23,134,367 23 4 293,824 47 98,881 54 -66 Nebraska 8,483,381 38 8,357,747 38 -1 1,635,996 26 829,953 35 -49 Nevada 2,974,830 49 3,004,463 48 1 39,207 56 77,006 55 96 New Brunswick 5,634,267 43 6,569,593 42 17 1,063,682 35 726,844 36 -32 New Hampshire 2,827,176 50 2,277,338 51 -19 132,290 51 137,167 52 4 New Jersey 9,642,424 36 9,360,198 36 -3 2,065,105 18 2,150,131 19 4 New Mexico 12,122,057 33 9,856,365 34 -19 795,340 38 287,197 45 -64 New York 22,797,761 22 21,229,486 24 -7 2,252,578 17 4,254,342 14 89 Newfoundland 457,691 58 373,372 57 -18 220 60 39,780 57 17,982 North Carolina 58,838,116 4 62,111,351 5 6 1,975,106 21 2,126,829 21 8 North Dakota 1,921,445 53 2,092,829 52 9 1,127,922 34 1,067,137 32 -5 Nova Scotia 4,462,745 46 3,356,719 46 -25 187,368 48 246,686 46 32 Ohio 114,207,853 1 98,569,267 1 -14 20,567,882 4 20,798,896 4 1 Oklahoma 12,271,046 32 10,692,406 33 -13 1,530,037 29 1,455,762 27 -5 Ontario 48,371,313 11 64,455,484 4 33 41,242,125 1 23,690,703 3 -43 Oregon 19,442,292 25 26,089,275 20 34 731,298 39 480,414 41 -34 Pennsylvania 67,117,325 3 74,017,281 3 10 25,555,739 3 24,526,740 2 -4 Prince Edward Island 207,650 61 194,469 60 -6 3 62 8 62 167 Puerto Rico 7,007,679 39 6,858,471 40 -2 431,374 44 492,499 40 14 Quebec 15,869,518 29 16,026,049 29 1 4,873,560 9 4,558,142 11 -6 Rhode Island 560,064 57 348,401 58 -38 140,092 50 153,516 50 10 Saskatchewan 733,795 56 1,300,776 55 77 9,817 58 4,399 59 -55 South Carolina 28,260,137 18 28,477,621 19 1 1,999,684 20 4,269,962 13 114 South Dakota 1,449,225 55 1,917,710 54 32 55,813 55 167,312 49 200 Tennessee 47,577,615 12 48,535,000 9 2 2,577,740 14 3,095,425 17 20 Texas 102,161,243 2 97,288,590 2 -5 6,593,014 7 9,057,521 7 37 Utah 53,263,269 6 44,988,681 13 -16 496,664 42 218,624 47 -56 Vermont 122,929 62 155,910 62 27 95,399 54 109,111 53 14 Virgin Islands 427,849 59 264,735 59 -38 13,203 57 497 61 -96 Virginia 26,142,834 20 25,917,891 21 -1 3,322,220 12 4,292,775 12 29 Washington 10,425,633 35 8,767,832 37 -16 1,281,503 33 514,376 39 -60 West Virginia 39,202,589 14 39,812,210 14 2 3,193,291 13 1,363,195 29 -57 Wisconsin 19,428,439 26 17,445,861 27 -10 6,403,016 8 5,535,690 9 -14 Wyoming 6,224,395 42 5,387,079 43 -13 116,116 52 61,630 56 -47
Total 1,376,291,532 1,364,555,275 -1 218,151,544 210,284,168 -4
Note: Canada and US data only. Mexico data not available for 1998–1999. The data are estimates of releases and transfers of chemicals reported by facilities. None of the rankings is meant to imply that a facility, state or province is not meeting its legal requirements. The data do not predict levels of exposure of the public to those chemicals.
* Transfers off-site to disposal and transfers of metals from facilities located in the state/province. They do not include transfers sent to other NPRI or TRI facilities that reported them as on-site releases.
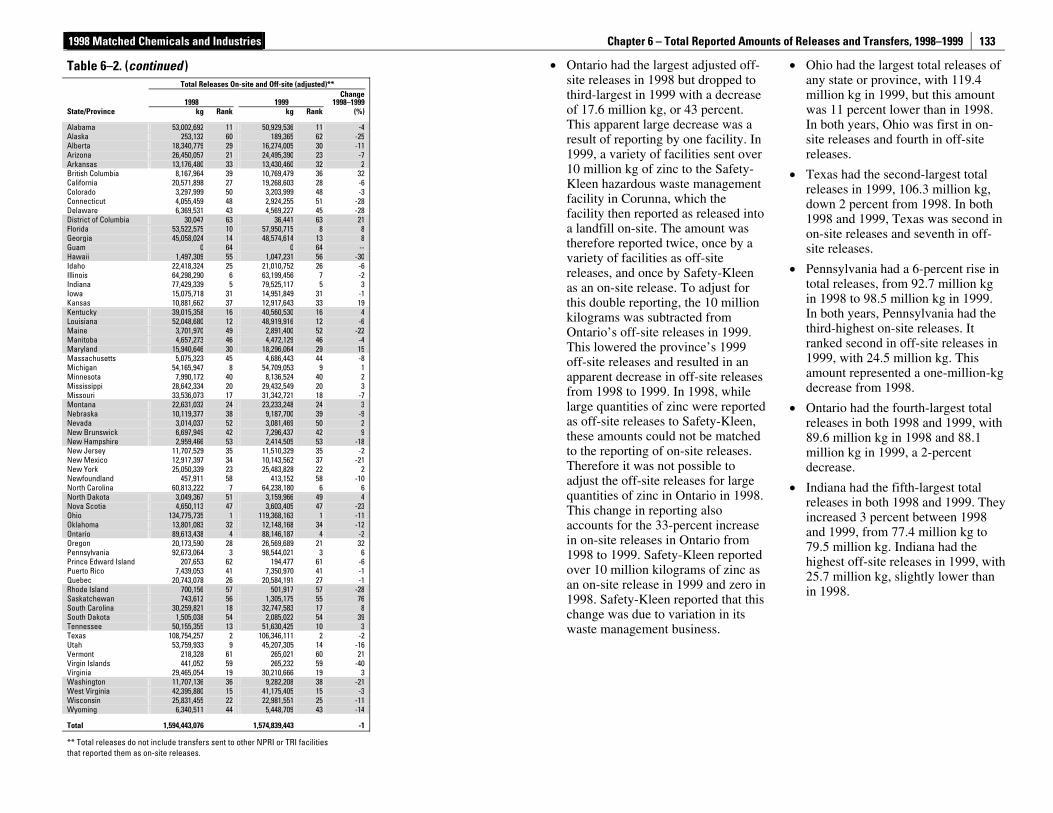
1998 Matched Chemicals and Industries Chapter 6 – Total Reported Amounts of Releases and Transfers, 1998–1999
133
• Ontario had the largest adjusted off-site releases in 1998 but dropped to third-largest in 1999 with a decrease of 17.6 million kg, or 43 percent. This apparent large decrease was a result of reporting by one facility. In 1999, a variety of facilities sent over 10 million kg of zinc to the Safety-Kleen hazardous waste management facility in Corunna, which the facility then reported as released into a landfill on-site. The amount was therefore reported twice, once by a variety of facilities as off-site releases, and once by Safety-Kleen as an on-site release. To adjust for this double reporting, the 10 million kilograms was subtracted from Ontario’s off-site releases in 1999. This lowered the province’s 1999 off-site releases and resulted in an apparent decrease in off-site releases from 1998 to 1999. In 1998, while large quantities of zinc were reported as off-site releases to Safety-Kleen, these amounts could not be matched to the reporting of on-site releases. Therefore it was not possible to adjust the off-site releases for large quantities of zinc in Ontario in 1998. This change in reporting also accounts for the 33-percent increase in on-site releases in Ontario from 1998 to 1999. Safety-Kleen reported over 10 million kilograms of zinc as an on-site release in 1999 and zero in 1998. Safety-Kleen reported that this change was due to variation in its waste management business.
• Ohio had the largest total releases of any state or province, with 119.4 million kg in 1999, but this amount was 11 percent lower than in 1998. In both years, Ohio was first in on-site releases and fourth in off-site releases.
• Texas had the second-largest total releases in 1999, 106.3 million kg, down 2 percent from 1998. In both 1998 and 1999, Texas was second in on-site releases and seventh in off-site releases.
• Pennsylvania had a 6-percent rise in total releases, from 92.7 million kg in 1998 to 98.5 million kg in 1999. In both years, Pennsylvania had the third-highest on-site releases. It ranked second in off-site releases in 1999, with 24.5 million kg. This amount represented a one-million-kg decrease from 1998.
• Ontario had the fourth-largest total releases in both 1998 and 1999, with 89.6 million kg in 1998 and 88.1 million kg in 1999, a 2-percent decrease.
• Indiana had the fifth-largest total releases in both 1998 and 1999. They increased 3 percent between 1998 and 1999, from 77.4 million kg to 79.5 million kg. Indiana had the highest off-site releases in 1999, with 25.7 million kg, slightly lower than in 1998.
Table 6–2. (continued ) Total Releases On-site and Off-site (adjusted)**
1998 1999 Change
1998–1999State/Province kg Rank kg Rank (%)
Alabama 53,002,692 11 50,929,536 11 -4Alaska 253,132 60 189,365 62 -25Alberta 18,340,779 29 16,274,005 30 -11Arizona 26,450,057 21 24,495,390 23 -7Arkansas 13,176,480 33 13,430,460 32 2British Columbia 8,167,964 39 10,769,479 36 32California 20,571,898 27 19,268,603 28 -6Colorado 3,297,999 50 3,203,999 48 -3Connecticut 4,055,459 48 2,924,255 51 -28Delaware 6,369,531 43 4,569,227 45 -28District of Columbia 30,047 63 36,441 63 21Florida 53,522,575 10 57,950,715 8 8Georgia 45,058,024 14 48,574,614 13 8Guam 0 64 0 64 --Hawaii 1,497,309 55 1,047,231 56 -30Idaho 22,418,324 25 21,010,752 26 -6Illinois 64,298,290 6 63,199,456 7 -2Indiana 77,429,339 5 79,525,117 5 3Iowa 15,075,718 31 14,951,849 31 -1Kansas 10,881,662 37 12,917,643 33 19Kentucky 39,015,358 16 40,560,530 16 4Louisiana 52,048,680 12 48,919,916 12 -6Maine 3,701,970 49 2,891,400 52 -22Manitoba 4,657,273 46 4,472,129 46 -4Maryland 15,940,646 30 18,296,064 29 15Massachusetts 5,075,323 45 4,686,443 44 -8Michigan 54,165,947 8 54,709,053 9 1Minnesota 7,990,172 40 8,136,524 40 2Mississippi 28,642,334 20 29,432,549 20 3Missouri 33,536,073 17 31,342,721 18 -7Montana 22,631,032 24 23,233,248 24 3Nebraska 10,119,377 38 9,187,700 39 -9Nevada 3,014,037 52 3,081,469 50 2New Brunswick 6,697,949 42 7,296,437 42 9New Hampshire 2,959,466 53 2,414,505 53 -18New Jersey 11,707,529 35 11,510,329 35 -2New Mexico 12,917,397 34 10,143,562 37 -21New York 25,050,339 23 25,483,828 22 2Newfoundland 457,911 58 413,152 58 -10North Carolina 60,813,222 7 64,238,180 6 6North Dakota 3,049,367 51 3,159,966 49 4Nova Scotia 4,650,113 47 3,603,405 47 -23Ohio 134,775,735 1 119,368,163 1 -11Oklahoma 13,801,083 32 12,148,168 34 -12Ontario 89,613,438 4 88,146,187 4 -2Oregon 20,173,590 28 26,569,689 21 32Pennsylvania 92,673,064 3 98,544,021 3 6Prince Edward Island 207,653 62 194,477 61 -6Puerto Rico 7,439,053 41 7,350,970 41 -1Quebec 20,743,078 26 20,584,191 27 -1Rhode Island 700,156 57 501,917 57 -28Saskatchewan 743,612 56 1,305,175 55 76South Carolina 30,259,821 18 32,747,583 17 8South Dakota 1,505,038 54 2,085,022 54 39Tennessee 50,155,355 13 51,630,425 10 3Texas 108,754,257 2 106,346,111 2 -2Utah 53,759,933 9 45,207,305 14 -16Vermont 218,328 61 265,021 60 21Virgin Islands 441,052 59 265,232 59 -40Virginia 29,465,054 19 30,210,666 19 3Washington 11,707,136 36 9,282,208 38 -21West Virginia 42,395,880 15 41,175,405 15 -3Wisconsin 25,831,455 22 22,981,551 25 -11Wyoming 6,340,511 44 5,448,709 43 -14
Total 1,594,443,076 1,574,839,443 -1
** Total releases do not include transfers sent to other NPRI or TRI facilities that reported them as on-site releases.
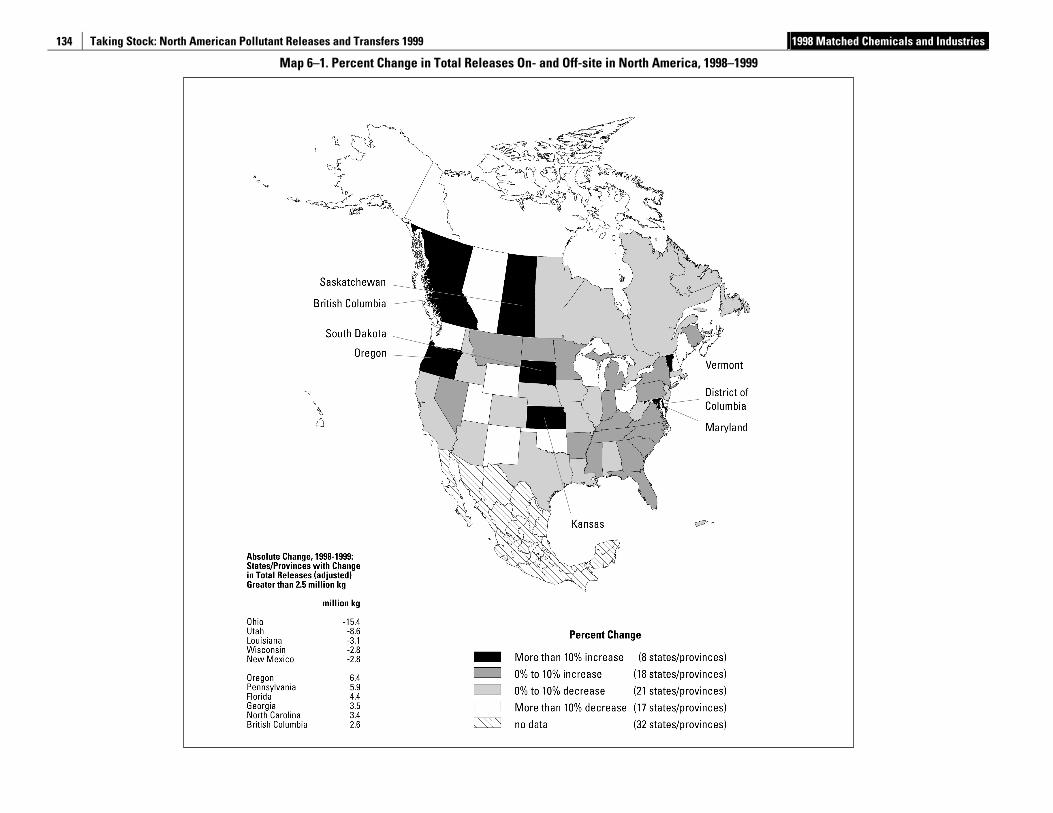
Taking Stock: North American Pollutant Releases and Transfers 1999 1998 Matched Chemicals and Industries
134
Map 6–1. Percent Change in Total Releases On- and Off-site in North America, 1998–1999
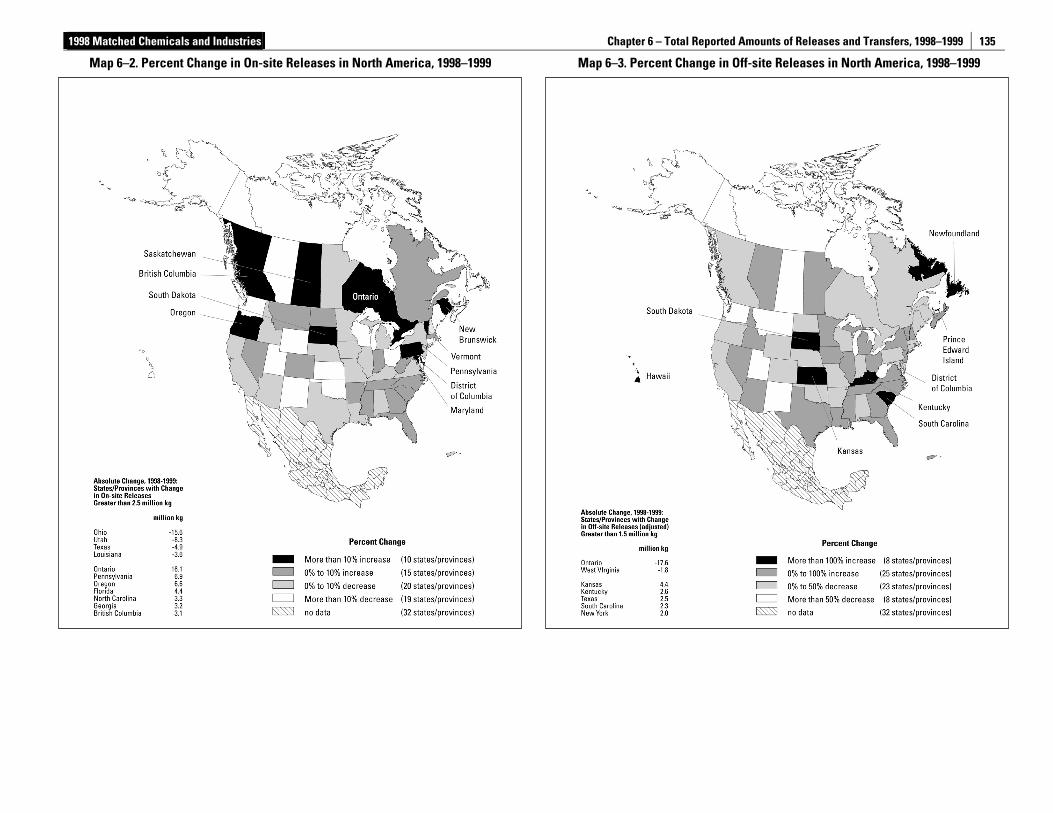
1998 Matched Chemicals and Industries Chapter 6 – Total Reported Amounts of Releases and Transfers, 1998–1999
135
Map 6–2. Percent Change in On-site Releases in North America, 1998–1999 Map 6–3. Percent Change in Off-site Releases in North America, 1998–1999
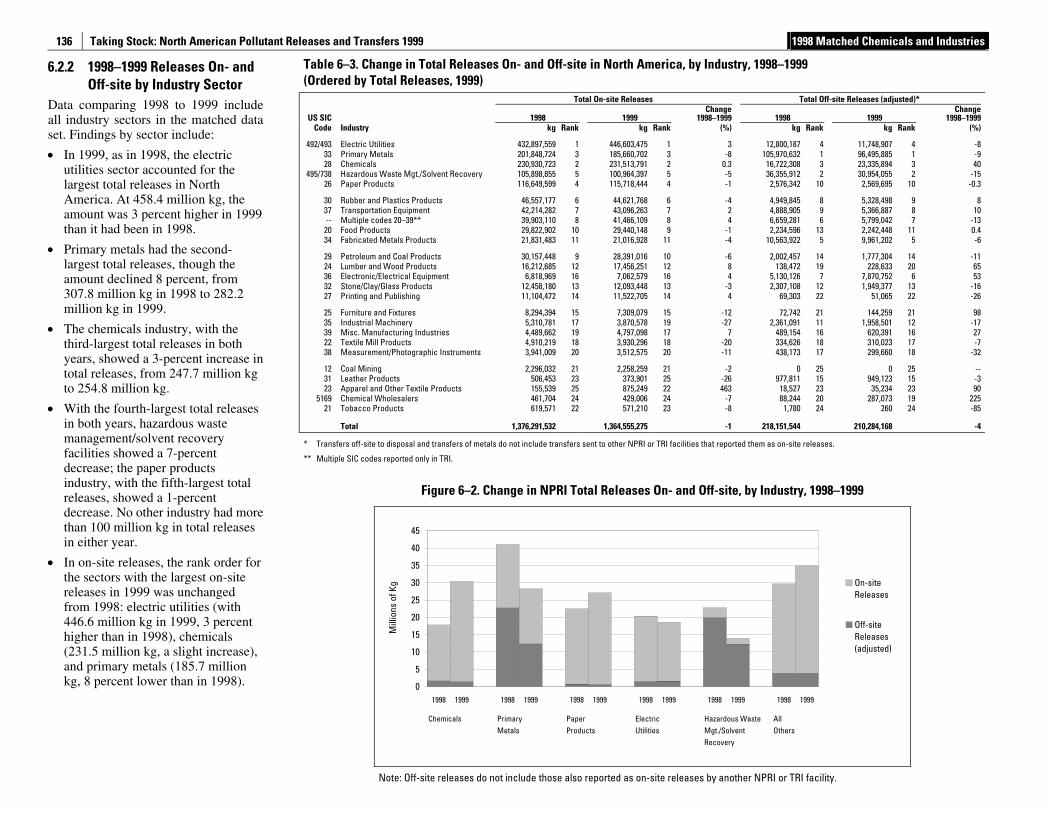
Taking Stock: North American Pollutant Releases and Transfers 1999 1998 Matched Chemicals and Industries
136
6.2.2 1998–1999 Releases On- and Off-site by Industry Sector
Data comparing 1998 to 1999 include all industry sectors in the matched data set. Findings by sector include:
• In 1999, as in 1998, the electric utilities sector accounted for the largest total releases in North America. At 458.4 million kg, the amount was 3 percent higher in 1999 than it had been in 1998.
• Primary metals had the second-largest total releases, though the amount declined 8 percent, from 307.8 million kg in 1998 to 282.2 million kg in 1999.
• The chemicals industry, with the third-largest total releases in both years, showed a 3-percent increase in total releases, from 247.7 million kg to 254.8 million kg.
• With the fourth-largest total releases in both years, hazardous waste management/solvent recovery facilities showed a 7-percent decrease; the paper products industry, with the fifth-largest total releases, showed a 1-percent decrease. No other industry had more than 100 million kg in total releases in either year.
• In on-site releases, the rank order for the sectors with the largest on-site releases in 1999 was unchanged from 1998: electric utilities (with 446.6 million kg in 1999, 3 percent higher than in 1998), chemicals (231.5 million kg, a slight increase), and primary metals (185.7 million kg, 8 percent lower than in 1998).
Table 6–3. Change in Total Releases On- and Off-site in North America, by Industry, 1998–1999 (Ordered by Total Releases, 1999)
Total On-site Releases Total Off-site Releases (adjusted)*
US SIC 1998 1999 Change
1998–1999 1998 1999 Change
1998–1999 Code Industry kg Rank kg Rank (%) kg Rank kg Rank (%)
492/493 Electric Utilities 432,897,559 1 446,603,475 1 3 12,800,187 4 11,748,907 4 -8 33 Primary Metals 201,848,724 3 185,660,702 3 -8 105,970,632 1 96,495,885 1 -9 28 Chemicals 230,930,723 2 231,513,791 2 0.3 16,722,308 3 23,335,894 3 40
495/738 Hazardous Waste Mgt./Solvent Recovery 105,898,855 5 100,964,397 5 -5 36,355,912 2 30,954,055 2 -15 26 Paper Products 116,649,599 4 115,718,444 4 -1 2,576,342 10 2,569,695 10 -0.3
30 Rubber and Plastics Products 46,557,177 6 44,621,768 6 -4 4,949,845 8 5,328,498 9 8 37 Transportation Equipment 42,214,282 7 43,096,263 7 2 4,888,905 9 5,366,887 8 10 -- Multiple codes 20–39** 39,903,110 8 41,466,109 8 4 6,659,281 6 5,799,042 7 -13
20 Food Products 29,822,902 10 29,440,148 9 -1 2,234,596 13 2,242,448 11 0.4 34 Fabricated Metals Products 21,831,483 11 21,016,928 11 -4 10,563,922 5 9,961,202 5 -6
29 Petroleum and Coal Products 30,157,448 9 28,391,016 10 -6 2,002,457 14 1,777,304 14 -11 24 Lumber and Wood Products 16,212,685 12 17,456,251 12 8 138,472 19 228,633 20 65 36 Electronic/Electrical Equipment 6,818,969 16 7,062,579 16 4 5,130,126 7 7,870,752 6 53 32 Stone/Clay/Glass Products 12,458,180 13 12,093,448 13 -3 2,307,108 12 1,949,377 13 -16 27 Printing and Publishing 11,104,472 14 11,522,705 14 4 69,303 22 51,065 22 -26
25 Furniture and Fixtures 8,294,394 15 7,309,079 15 -12 72,742 21 144,259 21 98 35 Industrial Machinery 5,310,781 17 3,870,578 19 -27 2,361,091 11 1,958,501 12 -17 39 Misc. Manufacturing Industries 4,489,662 19 4,797,098 17 7 489,154 16 620,391 16 27 22 Textile Mill Products 4,910,219 18 3,930,296 18 -20 334,626 18 310,023 17 -7 38 Measurement/Photographic Instruments 3,941,009 20 3,512,575 20 -11 438,173 17 299,660 18 -32
12 Coal Mining 2,296,032 21 2,258,259 21 -2 0 25 0 25 -- 31 Leather Products 506,453 23 373,901 25 -26 977,811 15 949,123 15 -3 23 Apparel and Other Textile Products 155,539 25 875,249 22 463 18,527 23 35,234 23 90
5169 Chemical Wholesalers 461,704 24 429,006 24 -7 88,244 20 287,073 19 225 21 Tobacco Products 619,571 22 571,210 23 -8 1,780 24 260 24 -85
Total 1,376,291,532 1,364,555,275 -1 218,151,544 210,284,168 -4
* Transfers off-site to disposal and transfers of metals do not include transfers sent to other NPRI or TRI facilities that reported them as on-site releases.
** Multiple SIC codes reported only in TRI.
Figure 6–2. Change in NPRI Total Releases On- and Off-site, by Industry, 1998–1999
0
5
10
15
20
25
30
35
40
45
1998 1999 1998 1999 1998 1999 1998 1999 1998 1999 1998 1999
Chemicals PrimaryMetals
PaperProducts
ElectricUtilities
Hazardous WasteMgt./SolventRecovery
AllOthers
Mill
ions
of K
g On-siteReleases
Off-siteReleases(adjusted)
Note: Off-site releases do not include those also reported as on-site releases by another NPRI or TRI facility.
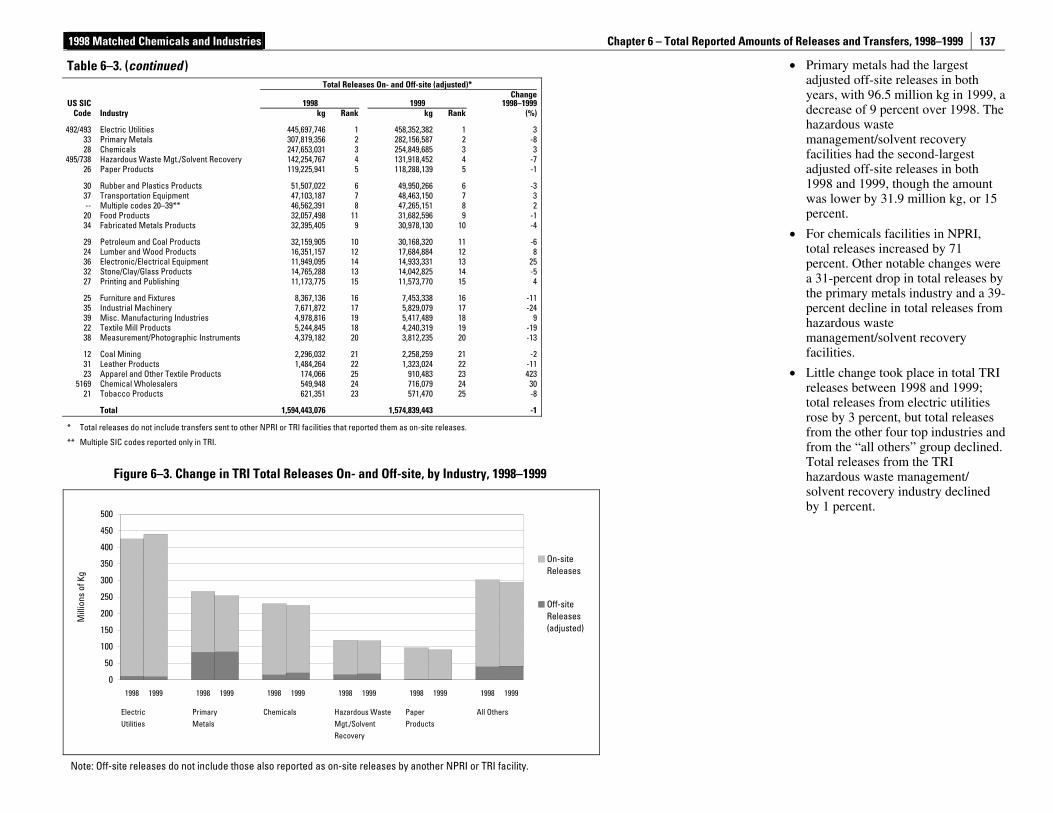
1998 Matched Chemicals and Industries Chapter 6 – Total Reported Amounts of Releases and Transfers, 1998–1999
137
Table 6–3. (continued ) Total Releases On- and Off-site (adjusted)*
US SIC 1998 1999 Change
1998–1999 Code Industry kg Rank kg Rank (%)
492/493 Electric Utilities 445,697,746 1 458,352,382 1 3 33 Primary Metals 307,819,356 2 282,156,587 2 -8 28 Chemicals 247,653,031 3 254,849,685 3 3
495/738 Hazardous Waste Mgt./Solvent Recovery 142,254,767 4 131,918,452 4 -7 26 Paper Products 119,225,941 5 118,288,139 5 -1
30 Rubber and Plastics Products 51,507,022 6 49,950,266 6 -3 37 Transportation Equipment 47,103,187 7 48,463,150 7 3 -- Multiple codes 20–39** 46,562,391 8 47,265,151 8 2
20 Food Products 32,057,498 11 31,682,596 9 -1 34 Fabricated Metals Products 32,395,405 9 30,978,130 10 -4
29 Petroleum and Coal Products 32,159,905 10 30,168,320 11 -6 24 Lumber and Wood Products 16,351,157 12 17,684,884 12 8 36 Electronic/Electrical Equipment 11,949,095 14 14,933,331 13 25 32 Stone/Clay/Glass Products 14,765,288 13 14,042,825 14 -5 27 Printing and Publishing 11,173,775 15 11,573,770 15 4
25 Furniture and Fixtures 8,367,136 16 7,453,338 16 -11 35 Industrial Machinery 7,671,872 17 5,829,079 17 -24 39 Misc. Manufacturing Industries 4,978,816 19 5,417,489 18 9 22 Textile Mill Products 5,244,845 18 4,240,319 19 -19 38 Measurement/Photographic Instruments 4,379,182 20 3,812,235 20 -13
12 Coal Mining 2,296,032 21 2,258,259 21 -2 31 Leather Products 1,484,264 22 1,323,024 22 -11 23 Apparel and Other Textile Products 174,066 25 910,483 23 423
5169 Chemical Wholesalers 549,948 24 716,079 24 30 21 Tobacco Products 621,351 23 571,470 25 -8
Total 1,594,443,076 1,574,839,443 -1
* Total releases do not include transfers sent to other NPRI or TRI facilities that reported them as on-site releases.
** Multiple SIC codes reported only in TRI.
• Primary metals had the largest adjusted off-site releases in both years, with 96.5 million kg in 1999, a decrease of 9 percent over 1998. The hazardous waste management/solvent recovery facilities had the second-largest adjusted off-site releases in both 1998 and 1999, though the amount was lower by 31.9 million kg, or 15 percent.
• For chemicals facilities in NPRI, total releases increased by 71 percent. Other notable changes were a 31-percent drop in total releases by the primary metals industry and a 39-percent decline in total releases from hazardous waste management/solvent recovery facilities.
• Little change took place in total TRI releases between 1998 and 1999; total releases from electric utilities rose by 3 percent, but total releases from the other four top industries and from the “all others” group declined. Total releases from the TRI hazardous waste management/ solvent recovery industry declined by 1 percent.
Figure 6–3. Change in TRI Total Releases On- and Off-site, by Industry, 1998–1999
0
50
100
150
200
250
300
350
400
450
500
1998 1999 1998 1999 1998 1999 1998 1999 1998 1999 1998 1999
ElectricUtilities
PrimaryMetals
Chemicals Hazardous WasteMgt./SolventRecovery
PaperProducts
All Others
Mill
ions
of K
g
On-siteReleases
Off-siteReleases(adjusted)
Note: Off-site releases do not include those also reported as on-site releases by another NPRI or TRI facility.
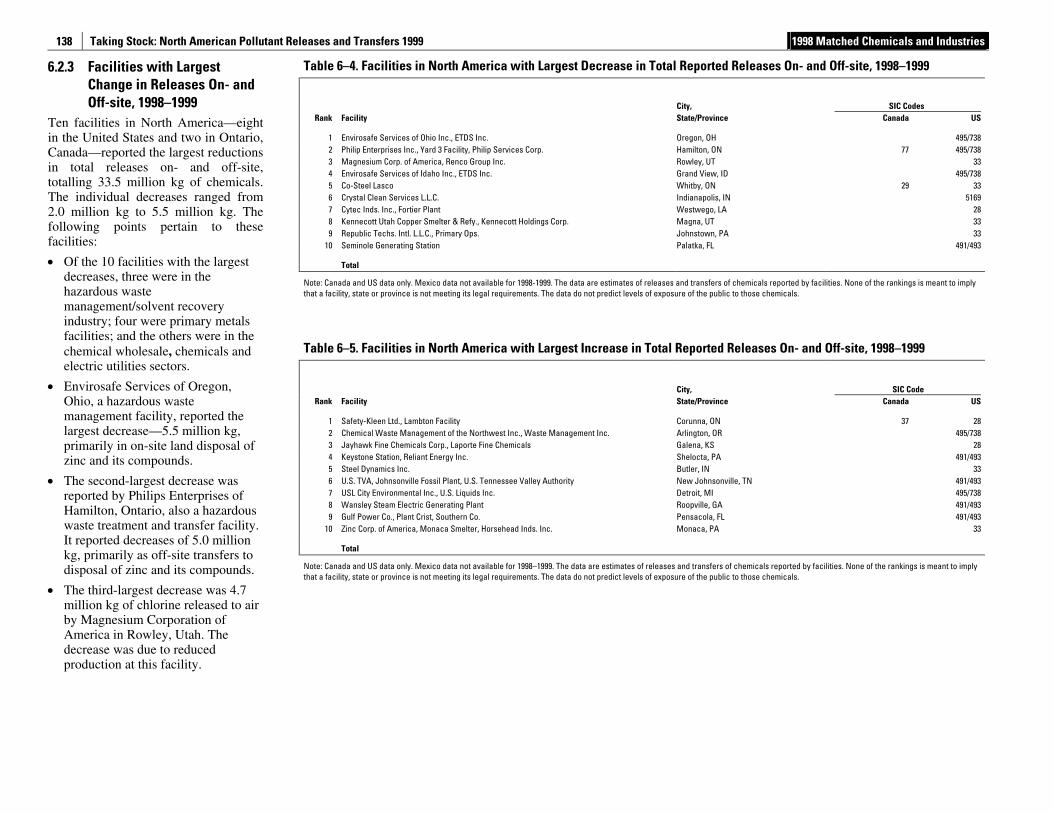
Taking Stock: North American Pollutant Releases and Transfers 1999 1998 Matched Chemicals and Industries
138
6.2.3 Facilities with Largest Change in Releases On- and Off-site, 1998–1999
Ten facilities in North America—eight in the United States and two in Ontario, Canada—reported the largest reductions in total releases on- and off-site, totalling 33.5 million kg of chemicals. The individual decreases ranged from 2.0 million kg to 5.5 million kg. The following points pertain to these facilities:
• Of the 10 facilities with the largest decreases, three were in the hazardous waste management/solvent recovery industry; four were primary metals facilities; and the others were in the chemical wholesale, chemicals and electric utilities sectors.
• Envirosafe Services of Oregon, Ohio, a hazardous waste management facility, reported the largest decrease—5.5 million kg, primarily in on-site land disposal of zinc and its compounds.
• The second-largest decrease was reported by Philips Enterprises of Hamilton, Ontario, also a hazardous waste treatment and transfer facility. It reported decreases of 5.0 million kg, primarily as off-site transfers to disposal of zinc and its compounds.
• The third-largest decrease was 4.7 million kg of chlorine released to air by Magnesium Corporation of America in Rowley, Utah. The decrease was due to reduced production at this facility.
Table 6–4. Facilities in North America with Largest Decrease in Total Reported Releases On- and Off-site, 1998–1999
City,
SIC Codes Rank Facility State/Province Canada US
1 Envirosafe Services of Ohio Inc., ETDS Inc. Oregon, OH 495/738 2 Philip Enterprises Inc., Yard 3 Facility, Philip Services Corp. Hamilton, ON 77 495/738 3 Magnesium Corp. of America, Renco Group Inc. Rowley, UT 33 4 Envirosafe Services of Idaho Inc., ETDS Inc. Grand View, ID 495/738 5 Co-Steel Lasco Whitby, ON 29 33 6 Crystal Clean Services L.L.C. Indianapolis, IN 5169 7 Cytec Inds. Inc., Fortier Plant Westwego, LA 28 8 Kennecott Utah Copper Smelter & Refy., Kennecott Holdings Corp. Magna, UT 33 9 Republic Techs. Intl. L.L.C., Primary Ops. Johnstown, PA 33
10 Seminole Generating Station Palatka, FL 491/493
Total
Note: Canada and US data only. Mexico data not available for 1998-1999. The data are estimates of releases and transfers of chemicals reported by facilities. None of the rankings is meant to imply that a facility, state or province is not meeting its legal requirements. The data do not predict levels of exposure of the public to those chemicals.
Table 6–5. Facilities in North America with Largest Increase in Total Reported Releases On- and Off-site, 1998–1999
City,
SIC Code Rank Facility State/Province Canada US
1 Safety-Kleen Ltd., Lambton Facility Corunna, ON 37 28 2 Chemical Waste Management of the Northwest Inc., Waste Management Inc. Arlington, OR 495/738 3 Jayhawk Fine Chemicals Corp., Laporte Fine Chemicals Galena, KS 28 4 Keystone Station, Reliant Energy Inc. Shelocta, PA 491/493 5 Steel Dynamics Inc. Butler, IN 33 6 U.S. TVA, Johnsonville Fossil Plant, U.S. Tennessee Valley Authority New Johnsonville, TN 491/493 7 USL City Environmental Inc., U.S. Liquids Inc. Detroit, MI 495/738 8 Wansley Steam Electric Generating Plant Roopville, GA 491/493 9 Gulf Power Co., Plant Crist, Southern Co. Pensacola, FL 491/493
10 Zinc Corp. of America, Monaca Smelter, Horsehead Inds. Inc. Monaca, PA 33
Total
Note: Canada and US data only. Mexico data not available for 1998–1999. The data are estimates of releases and transfers of chemicals reported by facilities. None of the rankings is meant to imply that a facility, state or province is not meeting its legal requirements. The data do not predict levels of exposure of the public to those chemicals.
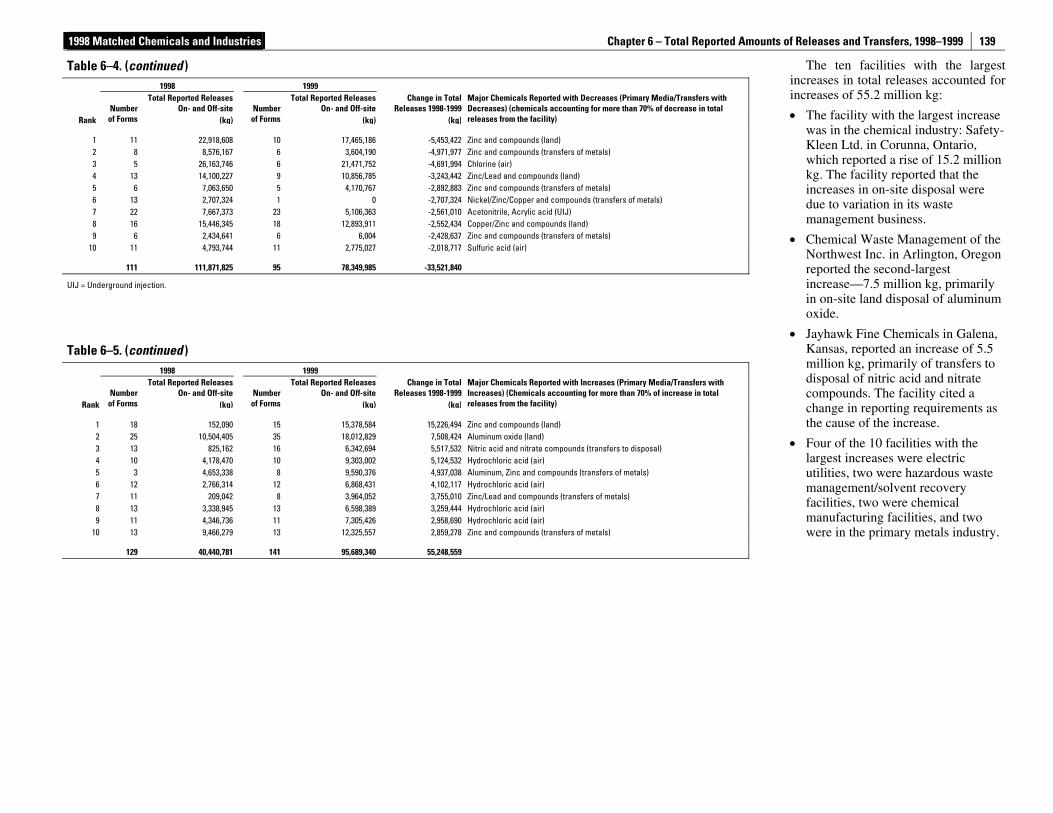
1998 Matched Chemicals and Industries Chapter 6 – Total Reported Amounts of Releases and Transfers, 1998–1999
139
The ten facilities with the largest increases in total releases accounted for increases of 55.2 million kg:
• The facility with the largest increase was in the chemical industry: Safety-Kleen Ltd. in Corunna, Ontario, which reported a rise of 15.2 million kg. The facility reported that the increases in on-site disposal were due to variation in its waste management business.
• Chemical Waste Management of the Northwest Inc. in Arlington, Oregon reported the second-largest increase—7.5 million kg, primarily in on-site land disposal of aluminum oxide.
• Jayhawk Fine Chemicals in Galena, Kansas, reported an increase of 5.5 million kg, primarily of transfers to disposal of nitric acid and nitrate compounds. The facility cited a change in reporting requirements as the cause of the increase.
• Four of the 10 facilities with the largest increases were electric utilities, two were hazardous waste management/solvent recovery facilities, two were chemical manufacturing facilities, and two were in the primary metals industry.
Table 6–4. (continued ) 1998 1999
Total Reported Releases
On- and Off-site Total Reported Releases
On- and Off-siteChange in Total
Releases 1998-1999Rank
Number of Forms (kg)
Number of Forms (kg) (kg)
Major Chemicals Reported with Decreases (Primary Media/Transfers with Decreases) (chemicals accounting for more than 70% of decrease in total releases from the facility)
1 11 22,918,608 10 17,465,186 -5,453,422 Zinc and compounds (land) 2 8 8,576,167 6 3,604,190 -4,971,977 Zinc and compounds (transfers of metals) 3 5 26,163,746 6 21,471,752 -4,691,994 Chlorine (air) 4 13 14,100,227 9 10,856,785 -3,243,442 Zinc/Lead and compounds (land) 5 6 7,063,650 5 4,170,767 -2,892,883 Zinc and compounds (transfers of metals) 6 13 2,707,324 1 0 -2,707,324 Nickel/Zinc/Copper and compounds (transfers of metals) 7 22 7,667,373 23 5,106,363 -2,561,010 Acetonitrile, Acrylic acid (UIJ) 8 16 15,446,345 18 12,893,911 -2,552,434 Copper/Zinc and compounds (land) 9 6 2,434,641 6 6,004 -2,428,637 Zinc and compounds (transfers of metals)
10 11 4,793,744 11 2,775,027 -2,018,717 Sulfuric acid (air)
111 111,871,825 95 78,349,985 -33,521,840
UIJ = Underground injection.
Table 6–5. (continued )
1998 1999
Total Reported Releases
On- and Off-site Total Reported Releases
On- and Off-siteChange in Total
Releases 1998-1999Rank
Number of Forms (kg)
Number of Forms (kg) (kg)
Major Chemicals Reported with Increases (Primary Media/Transfers with Increases) (Chemicals accounting for more than 70% of increase in total releases from the facility)
1 18 152,090 15 15,378,584 15,226,494 Zinc and compounds (land) 2 25 10,504,405 35 18,012,829 7,508,424 Aluminum oxide (land) 3 13 825,162 16 6,342,694 5,517,532 Nitric acid and nitrate compounds (transfers to disposal) 4 10 4,178,470 10 9,303,002 5,124,532 Hydrochloric acid (air) 5 3 4,653,338 8 9,590,376 4,937,038 Aluminum, Zinc and compounds (transfers of metals) 6 12 2,766,314 12 6,868,431 4,102,117 Hydrochloric acid (air) 7 11 209,042 8 3,964,052 3,755,010 Zinc/Lead and compounds (transfers of metals) 8 13 3,338,945 13 6,598,389 3,259,444 Hydrochloric acid (air) 9 11 4,346,736 11 7,305,426 2,958,690 Hydrochloric acid (air)
10 13 9,466,279 13 12,325,557 2,859,278 Zinc and compounds (transfers of metals)
129 40,440,781 141 95,689,340 55,248,559
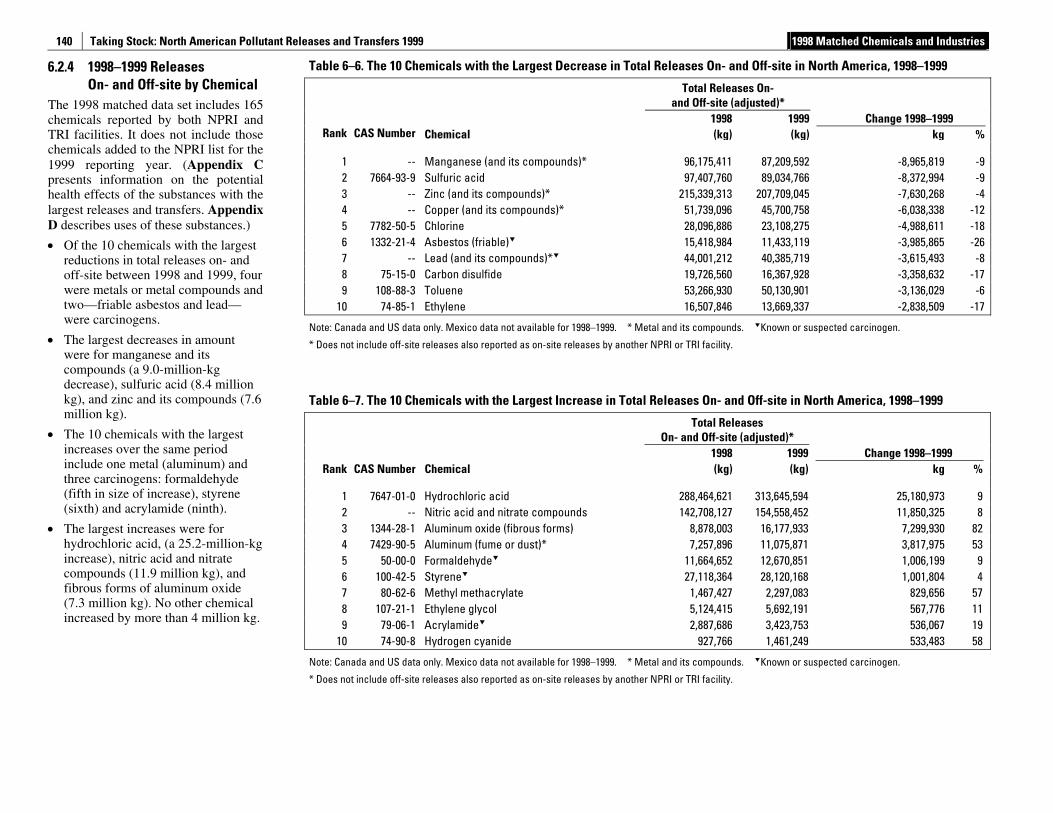
Taking Stock: North American Pollutant Releases and Transfers 1999 1998 Matched Chemicals and Industries
140
6.2.4 1998–1999 Releases On- and Off-site by Chemical
The 1998 matched data set includes 165 chemicals reported by both NPRI and TRI facilities. It does not include those chemicals added to the NPRI list for the 1999 reporting year. (Appendix C presents information on the potential health effects of the substances with the largest releases and transfers. Appendix D describes uses of these substances.)
• Of the 10 chemicals with the largest reductions in total releases on- and off-site between 1998 and 1999, four were metals or metal compounds and two—friable asbestos and lead—were carcinogens.
• The largest decreases in amount were for manganese and its compounds (a 9.0-million-kg decrease), sulfuric acid (8.4 million kg), and zinc and its compounds (7.6 million kg).
• The 10 chemicals with the largest increases over the same period include one metal (aluminum) and three carcinogens: formaldehyde (fifth in size of increase), styrene (sixth) and acrylamide (ninth).
• The largest increases were for hydrochloric acid, (a 25.2-million-kg increase), nitric acid and nitrate compounds (11.9 million kg), and fibrous forms of aluminum oxide (7.3 million kg). No other chemical increased by more than 4 million kg.
Table 6–6. The 10 Chemicals with the Largest Decrease in Total Releases On- and Off-site in North America, 1998–1999
Total Releases On-
and Off-site (adjusted)* 1998 1999 Change 1998–1999
Rank CAS Number Chemical (kg) (kg) kg %
1 -- Manganese (and its compounds)* 96,175,411 87,209,592 -8,965,819 -9 2 7664-93-9 Sulfuric acid 97,407,760 89,034,766 -8,372,994 -9 3 -- Zinc (and its compounds)* 215,339,313 207,709,045 -7,630,268 -4 4 -- Copper (and its compounds)* 51,739,096 45,700,758 -6,038,338 -12 5 7782-50-5 Chlorine 28,096,886 23,108,275 -4,988,611 -18 6 1332-21-4 Asbestos (friable) 15,418,984 11,433,119 -3,985,865 -26 7 -- Lead (and its compounds)* 44,001,212 40,385,719 -3,615,493 -8 8 75-15-0 Carbon disulfide 19,726,560 16,367,928 -3,358,632 -17 9 108-88-3 Toluene 53,266,930 50,130,901 -3,136,029 -6
10 74-85-1 Ethylene 16,507,846 13,669,337 -2,838,509 -17
Note: Canada and US data only. Mexico data not available for 1998–1999. * Metal and its compounds. Known or suspected carcinogen.
* Does not include off-site releases also reported as on-site releases by another NPRI or TRI facility.
Table 6–7. The 10 Chemicals with the Largest Increase in Total Releases On- and Off-site in North America, 1998–1999
Total Releases
On- and Off-site (adjusted)* 1998 1999 Change 1998–1999
Rank CAS Number Chemical (kg) (kg) kg %
1 7647-01-0 Hydrochloric acid 288,464,621 313,645,594 25,180,973 9 2 -- Nitric acid and nitrate compounds 142,708,127 154,558,452 11,850,325 8 3 1344-28-1 Aluminum oxide (fibrous forms) 8,878,003 16,177,933 7,299,930 82 4 7429-90-5 Aluminum (fume or dust)* 7,257,896 11,075,871 3,817,975 53 5 50-00-0 Formaldehyde 11,664,652 12,670,851 1,006,199 9 6 100-42-5 Styrene 27,118,364 28,120,168 1,001,804 4 7 80-62-6 Methyl methacrylate 1,467,427 2,297,083 829,656 57 8 107-21-1 Ethylene glycol 5,124,415 5,692,191 567,776 11 9 79-06-1 Acrylamide 2,887,686 3,423,753 536,067 19
10 74-90-8 Hydrogen cyanide 927,766 1,461,249 533,483 58
Note: Canada and US data only. Mexico data not available for 1998–1999. * Metal and its compounds. Known or suspected carcinogen.
* Does not include off-site releases also reported as on-site releases by another NPRI or TRI facility.
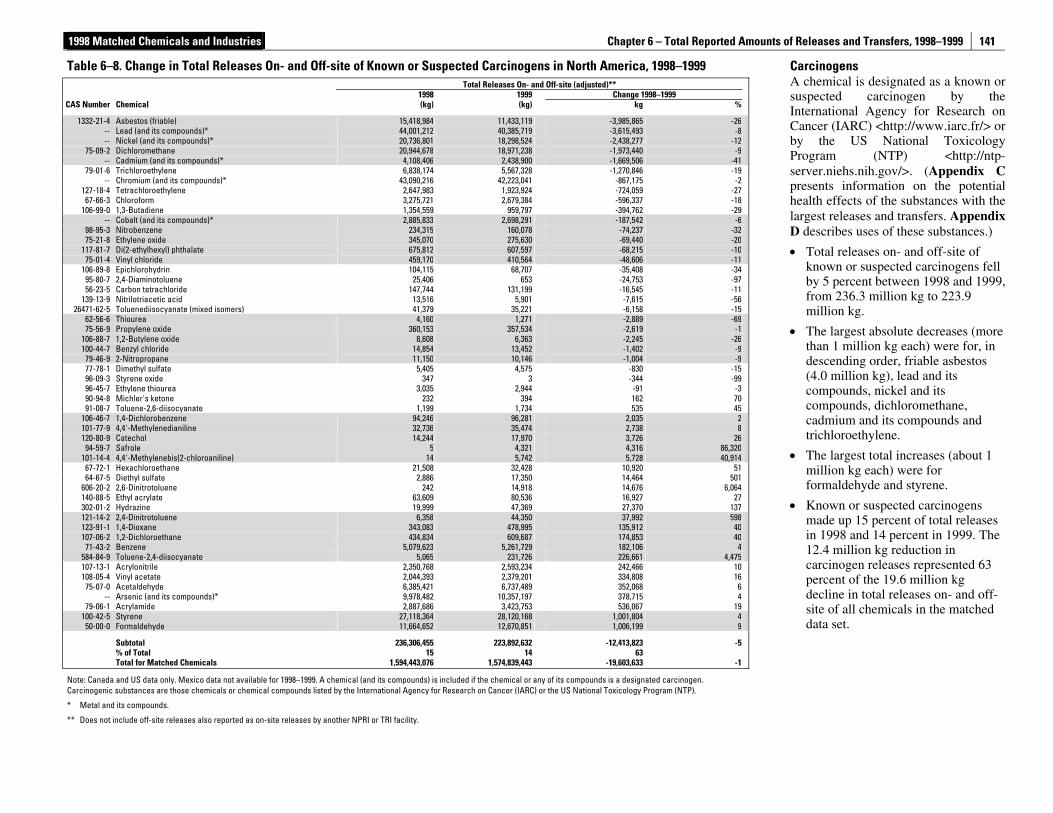
1998 Matched Chemicals and Industries Chapter 6 – Total Reported Amounts of Releases and Transfers, 1998–1999
141
Carcinogens A chemical is designated as a known or suspected carcinogen by the International Agency for Research on Cancer (IARC) <http://www.iarc.fr/> or by the US National Toxicology Program (NTP) <http://ntp-server.niehs.nih.gov/>. (Appendix C presents information on the potential health effects of the substances with the largest releases and transfers. Appendix D describes uses of these substances.)
• Total releases on- and off-site of known or suspected carcinogens fell by 5 percent between 1998 and 1999, from 236.3 million kg to 223.9 million kg.
• The largest absolute decreases (more than 1 million kg each) were for, in descending order, friable asbestos (4.0 million kg), lead and its compounds, nickel and its compounds, dichloromethane, cadmium and its compounds and trichloroethylene.
• The largest total increases (about 1 million kg each) were for formaldehyde and styrene.
• Known or suspected carcinogens made up 15 percent of total releases in 1998 and 14 percent in 1999. The 12.4 million kg reduction in carcinogen releases represented 63 percent of the 19.6 million kg decline in total releases on- and off-site of all chemicals in the matched data set.
Table 6–8. Change in Total Releases On- and Off-site of Known or Suspected Carcinogens in North America, 1998–1999 Total Releases On- and Off-site (adjusted)**
1998 1999 Change 1998–1999 CAS Number Chemical (kg) (kg) kg %
1332-21-4 Asbestos (friable) 15,418,984 11,433,119 -3,985,865 -26 -- Lead (and its compounds)* 44,001,212 40,385,719 -3,615,493 -8 -- Nickel (and its compounds)* 20,736,801 18,298,524 -2,438,277 -12
75-09-2 Dichloromethane 20,944,678 18,971,238 -1,973,440 -9 -- Cadmium (and its compounds)* 4,108,406 2,438,900 -1,669,506 -41
79-01-6 Trichloroethylene 6,838,174 5,567,328 -1,270,846 -19 -- Chromium (and its compounds)* 43,090,216 42,223,041 -867,175 -2
127-18-4 Tetrachloroethylene 2,647,983 1,923,924 -724,059 -27 67-66-3 Chloroform 3,275,721 2,679,384 -596,337 -18
106-99-0 1,3-Butadiene 1,354,559 959,797 -394,762 -29 -- Cobalt (and its compounds)* 2,885,833 2,698,291 -187,542 -6
98-95-3 Nitrobenzene 234,315 160,078 -74,237 -32 75-21-8 Ethylene oxide 345,070 275,630 -69,440 -20
117-81-7 Di(2-ethylhexyl) phthalate 675,812 607,597 -68,215 -10 75-01-4 Vinyl chloride 459,170 410,564 -48,606 -11
106-89-8 Epichlorohydrin 104,115 68,707 -35,408 -34 95-80-7 2,4-Diaminotoluene 25,406 653 -24,753 -97 56-23-5 Carbon tetrachloride 147,744 131,199 -16,545 -11
139-13-9 Nitrilotriacetic acid 13,516 5,901 -7,615 -56 26471-62-5 Toluenediisocyanate (mixed isomers) 41,379 35,221 -6,158 -15
62-56-6 Thiourea 4,160 1,271 -2,889 -69 75-56-9 Propylene oxide 360,153 357,534 -2,619 -1
106-88-7 1,2-Butylene oxide 8,608 6,363 -2,245 -26 100-44-7 Benzyl chloride 14,854 13,452 -1,402 -9
79-46-9 2-Nitropropane 11,150 10,146 -1,004 -9 77-78-1 Dimethyl sulfate 5,405 4,575 -830 -15 96-09-3 Styrene oxide 347 3 -344 -99 96-45-7 Ethylene thiourea 3,035 2,944 -91 -3 90-94-8 Michler's ketone 232 394 162 70 91-08-7 Toluene-2,6-diisocyanate 1,199 1,734 535 45
106-46-7 1,4-Dichlorobenzene 94,246 96,281 2,035 2 101-77-9 4,4'-Methylenedianiline 32,736 35,474 2,738 8 120-80-9 Catechol 14,244 17,970 3,726 26
94-59-7 Safrole 5 4,321 4,316 86,320 101-14-4 4,4'-Methylenebis(2-chloroaniline) 14 5,742 5,728 40,914
67-72-1 Hexachloroethane 21,508 32,428 10,920 51 64-67-5 Diethyl sulfate 2,886 17,350 14,464 501
606-20-2 2,6-Dinitrotoluene 242 14,918 14,676 6,064 140-88-5 Ethyl acrylate 63,609 80,536 16,927 27 302-01-2 Hydrazine 19,999 47,369 27,370 137 121-14-2 2,4-Dinitrotoluene 6,358 44,350 37,992 598 123-91-1 1,4-Dioxane 343,083 478,995 135,912 40 107-06-2 1,2-Dichloroethane 434,834 609,687 174,853 40
71-43-2 Benzene 5,079,623 5,261,729 182,106 4 584-84-9 Toluene-2,4-diisocyanate 5,065 231,726 226,661 4,475 107-13-1 Acrylonitrile 2,350,768 2,593,234 242,466 10 108-05-4 Vinyl acetate 2,044,393 2,379,201 334,808 16
75-07-0 Acetaldehyde 6,385,421 6,737,489 352,068 6 -- Arsenic (and its compounds)* 9,978,482 10,357,197 378,715 4
79-06-1 Acrylamide 2,887,686 3,423,753 536,067 19 100-42-5 Styrene 27,118,364 28,120,168 1,001,804 4
50-00-0 Formaldehyde 11,664,652 12,670,851 1,006,199 9
Subtotal 236,306,455 223,892,632 -12,413,823 -5 % of Total 15 14 63 Total for Matched Chemicals 1,594,443,076 1,574,839,443 -19,603,633 -1
Note: Canada and US data only. Mexico data not available for 1998–1999. A chemical (and its compounds) is included if the chemical or any of its compounds is a designated carcinogen. Carcinogenic substances are those chemicals or chemical compounds listed by the International Agency for Research on Cancer (IARC) or the US National Toxicology Program (NTP).
* Metal and its compounds.
** Does not include off-site releases also reported as on-site releases by another NPRI or TRI facility.
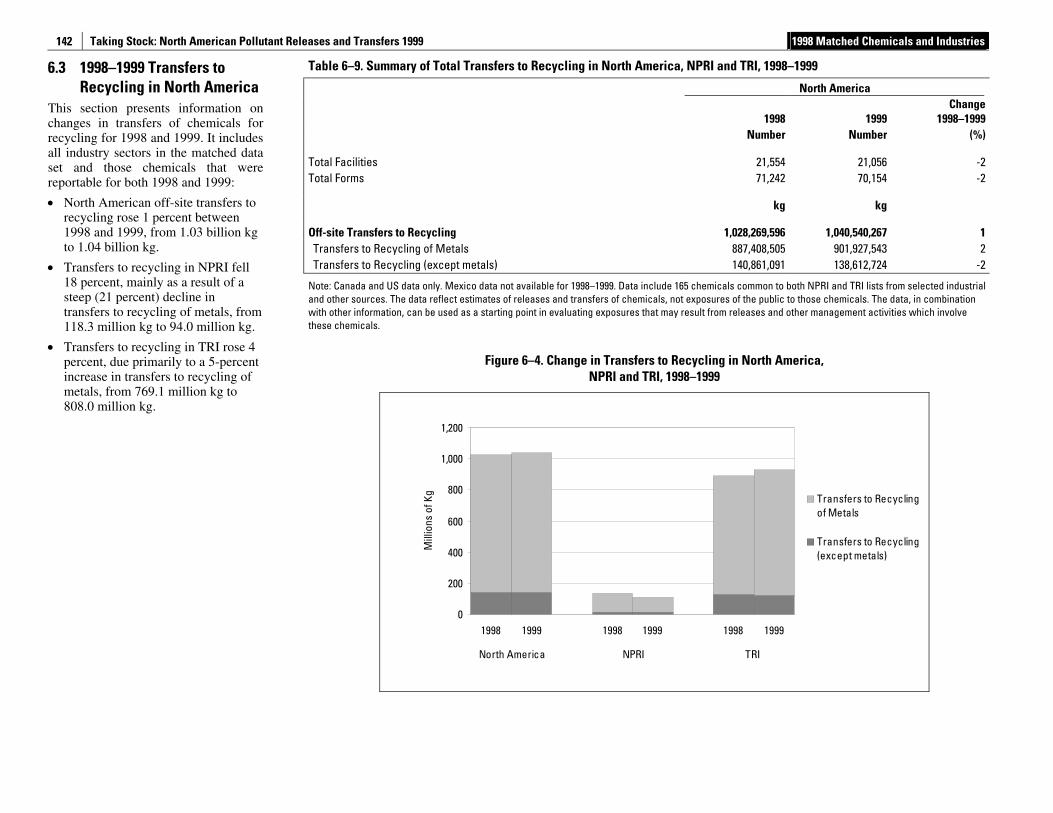
Taking Stock: North American Pollutant Releases and Transfers 1999 1998 Matched Chemicals and Industries
142
6.3 1998–1999 Transfers to Recycling in North America
This section presents information on changes in transfers of chemicals for recycling for 1998 and 1999. It includes all industry sectors in the matched data set and those chemicals that were reportable for both 1998 and 1999:
• North American off-site transfers to recycling rose 1 percent between 1998 and 1999, from 1.03 billion kg to 1.04 billion kg.
• Transfers to recycling in NPRI fell 18 percent, mainly as a result of a steep (21 percent) decline in transfers to recycling of metals, from 118.3 million kg to 94.0 million kg.
• Transfers to recycling in TRI rose 4 percent, due primarily to a 5-percent increase in transfers to recycling of metals, from 769.1 million kg to 808.0 million kg.
Table 6–9. Summary of Total Transfers to Recycling in North America, NPRI and TRI, 1998–1999
North America
1998 1999Change
1998–1999 Number Number (%)
Total Facilities 21,554 21,056 -2 Total Forms 71,242 70,154 -2
kg kg
Off-site Transfers to Recycling 1,028,269,596 1,040,540,267 1 Transfers to Recycling of Metals 887,408,505 901,927,543 2 Transfers to Recycling (except metals) 140,861,091 138,612,724 -2
Note: Canada and US data only. Mexico data not available for 1998–1999. Data include 165 chemicals common to both NPRI and TRI lists from selected industrial and other sources. The data reflect estimates of releases and transfers of chemicals, not exposures of the public to those chemicals. The data, in combination with other information, can be used as a starting point in evaluating exposures that may result from releases and other management activities which involve these chemicals.
Figure 6–4. Change in Transfers to Recycling in North America, NPRI and TRI, 1998–1999
0
200
400
600
800
1,000
1,200
1998 1999 1998 1999 1998 1999
North America NPRI TRI
Mill
ions
of K
g Transfers to Recyclingof Metals
Transfers to Recycling(except metals)
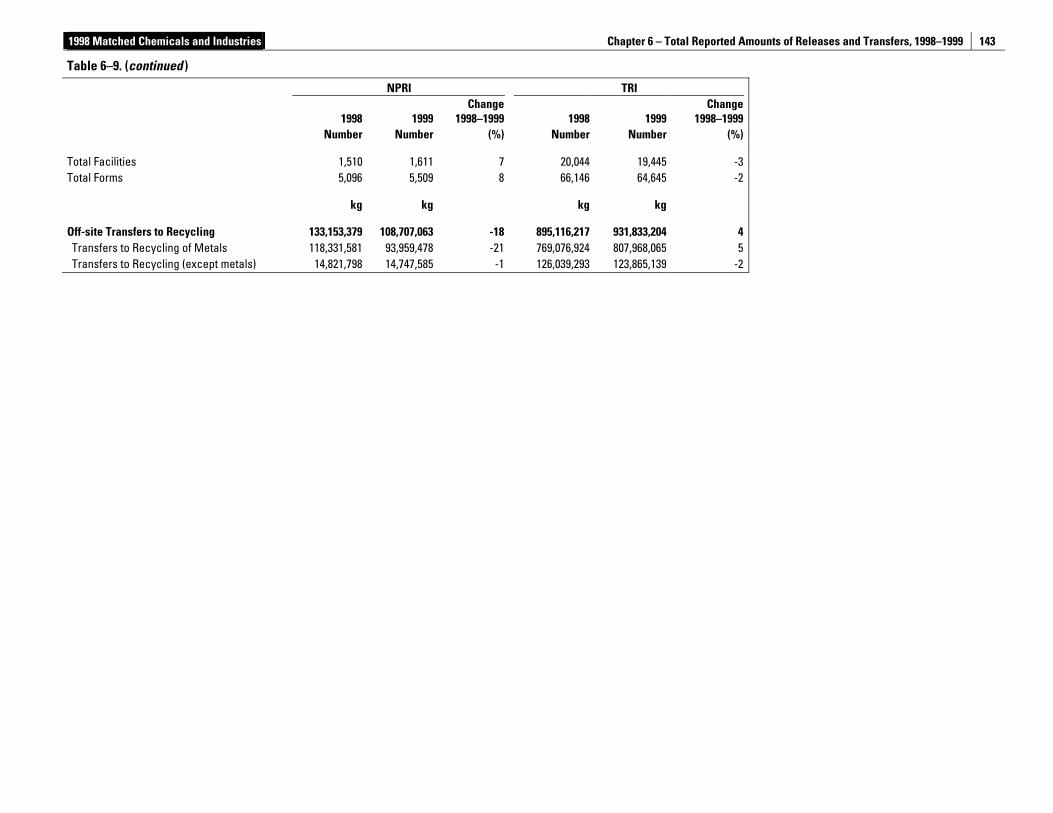
1998 Matched Chemicals and Industries Chapter 6 – Total Reported Amounts of Releases and Transfers, 1998–1999
143
Table 6–9. (continued )
NPRI TRI
1998 1999Change
1998–1999 1998 1999Change
1998–1999 Number Number (%) Number Number (%)
Total Facilities 1,510 1,611 7 20,044 19,445 -3Total Forms 5,096 5,509 8 66,146 64,645 -2
kg kg kg kg
Off-site Transfers to Recycling 133,153,379 108,707,063 -18 895,116,217 931,833,204 4Transfers to Recycling of Metals 118,331,581 93,959,478 -21 769,076,924 807,968,065 5Transfers to Recycling (except metals) 14,821,798 14,747,585 -1 126,039,293 123,865,139 -2
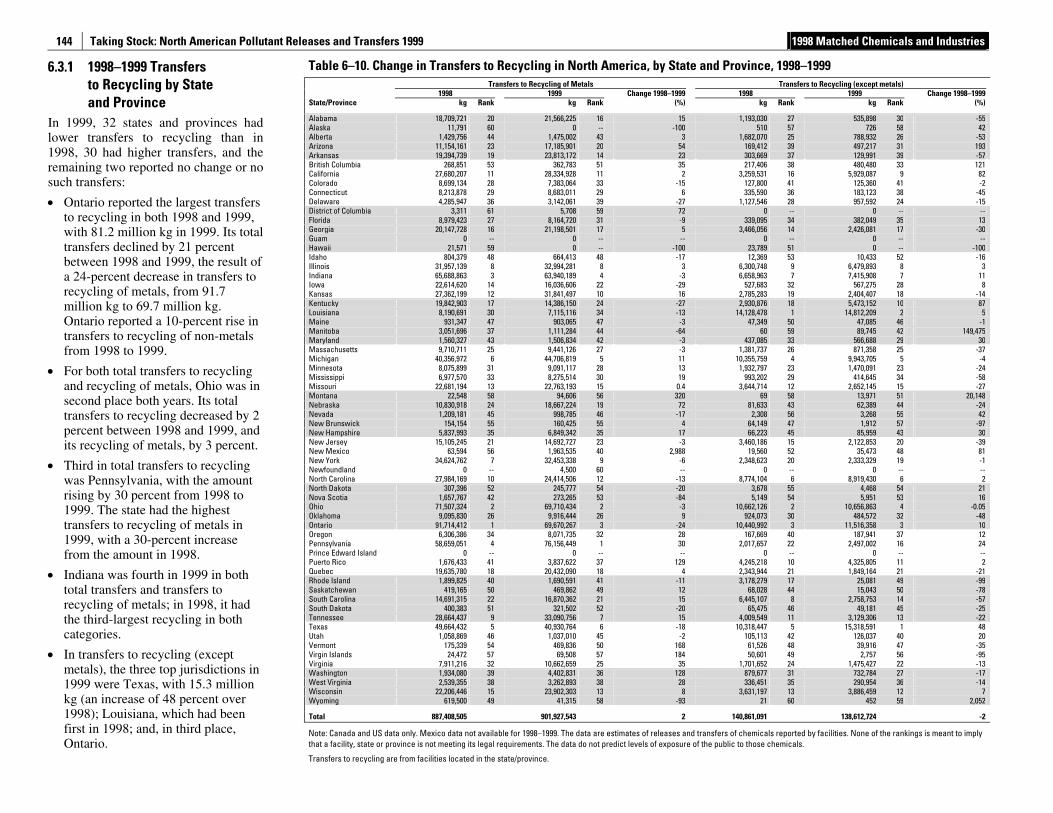
Taking Stock: North American Pollutant Releases and Transfers 1999 1998 Matched Chemicals and Industries
144
6.3.1 1998–1999 Transfers to Recycling by State and Province
In 1999, 32 states and provinces had lower transfers to recycling than in 1998, 30 had higher transfers, and the remaining two reported no change or no such transfers:
• Ontario reported the largest transfers to recycling in both 1998 and 1999, with 81.2 million kg in 1999. Its total transfers declined by 21 percent between 1998 and 1999, the result of a 24-percent decrease in transfers to recycling of metals, from 91.7 million kg to 69.7 million kg. Ontario reported a 10-percent rise in transfers to recycling of non-metals from 1998 to 1999.
• For both total transfers to recycling and recycling of metals, Ohio was in second place both years. Its total transfers to recycling decreased by 2 percent between 1998 and 1999, and its recycling of metals, by 3 percent.
• Third in total transfers to recycling was Pennsylvania, with the amount rising by 30 percent from 1998 to 1999. The state had the highest transfers to recycling of metals in 1999, with a 30-percent increase from the amount in 1998.
• Indiana was fourth in 1999 in both total transfers and transfers to recycling of metals; in 1998, it had the third-largest recycling in both categories.
• In transfers to recycling (except metals), the three top jurisdictions in 1999 were Texas, with 15.3 million kg (an increase of 48 percent over 1998); Louisiana, which had been first in 1998; and, in third place, Ontario.
Table 6–10. Change in Transfers to Recycling in North America, by State and Province, 1998–1999 Transfers to Recycling of Metals Transfers to Recycling (except metals) 1998 1999 Change 1998–1999 1998 1999 Change 1998–1999 State/Province kg Rank kg Rank (%) kg Rank kg Rank (%)
Alabama 18,709,721 20 21,566,225 16 15 1,193,030 27 535,898 30 -55 Alaska 11,791 60 0 -- -100 510 57 726 58 42 Alberta 1,429,756 44 1,475,002 43 3 1,682,070 25 788,932 26 -53 Arizona 11,154,161 23 17,185,901 20 54 169,412 39 497,217 31 193 Arkansas 19,394,739 19 23,813,172 14 23 303,669 37 129,991 39 -57 British Columbia 268,851 53 362,783 51 35 217,406 38 480,480 33 121 California 27,680,207 11 28,334,928 11 2 3,259,531 16 5,929,087 9 82 Colorado 8,699,134 28 7,383,064 33 -15 127,800 41 125,360 41 -2 Connecticut 8,213,878 29 8,683,011 29 6 335,590 36 183,123 38 -45 Delaware 4,285,947 36 3,142,061 39 -27 1,127,546 28 957,592 24 -15 District of Columbia 3,311 61 5,708 59 72 0 -- 0 -- -- Florida 8,979,423 27 8,164,720 31 -9 339,095 34 382,049 35 13 Georgia 20,147,728 16 21,198,501 17 5 3,466,056 14 2,426,081 17 -30 Guam 0 -- 0 -- -- 0 -- 0 -- -- Hawaii 21,571 59 0 -- -100 23,789 51 0 -- -100 Idaho 804,379 48 664,413 48 -17 12,369 53 10,433 52 -16 Illinois 31,957,139 8 32,994,281 8 3 6,300,748 9 6,479,893 8 3 Indiana 65,688,863 3 63,940,189 4 -3 6,658,963 7 7,415,908 7 11 Iowa 22,614,620 14 16,036,606 22 -29 527,683 32 567,275 28 8 Kansas 27,362,199 12 31,841,497 10 16 2,785,283 19 2,404,407 18 -14 Kentucky 19,842,903 17 14,386,150 24 -27 2,930,876 18 5,473,152 10 87 Louisiana 8,190,691 30 7,115,116 34 -13 14,128,478 1 14,812,209 2 5 Maine 931,347 47 903,065 47 -3 47,349 50 47,085 46 -1 Manitoba 3,051,696 37 1,111,284 44 -64 60 59 89,745 42 149,475 Maryland 1,560,327 43 1,506,834 42 -3 437,085 33 566,688 29 30 Massachusetts 9,710,711 25 9,441,126 27 -3 1,381,737 26 871,358 25 -37 Michigan 40,356,972 6 44,706,819 5 11 10,355,759 4 9,943,705 5 -4 Minnesota 8,075,899 31 9,091,117 28 13 1,932,797 23 1,470,091 23 -24 Mississippi 6,977,570 33 8,275,514 30 19 993,202 29 414,645 34 -58 Missouri 22,681,194 13 22,763,193 15 0.4 3,644,714 12 2,652,145 15 -27 Montana 22,548 58 94,606 56 320 69 58 13,971 51 20,148 Nebraska 10,830,918 24 18,667,224 19 72 81,633 43 62,389 44 -24 Nevada 1,209,181 45 998,785 46 -17 2,308 56 3,268 55 42 New Brunswick 154,154 55 160,425 55 4 64,149 47 1,912 57 -97 New Hampshire 5,837,993 35 6,849,342 35 17 66,223 45 85,959 43 30 New Jersey 15,105,245 21 14,692,727 23 -3 3,460,186 15 2,122,853 20 -39 New Mexico 63,594 56 1,963,535 40 2,988 19,560 52 35,473 48 81 New York 34,624,762 7 32,453,338 9 -6 2,348,623 20 2,333,329 19 -1 Newfoundland 0 -- 4,500 60 -- 0 -- 0 -- -- North Carolina 27,984,169 10 24,414,506 12 -13 8,774,104 6 8,919,430 6 2 North Dakota 307,396 52 245,777 54 -20 3,678 55 4,468 54 21 Nova Scotia 1,657,767 42 273,265 53 -84 5,149 54 5,951 53 16 Ohio 71,507,324 2 69,710,434 2 -3 10,662,126 2 10,656,863 4 -0.05 Oklahoma 9,095,830 26 9,916,444 26 9 924,073 30 484,572 32 -48 Ontario 91,714,412 1 69,670,267 3 -24 10,440,992 3 11,516,358 3 10 Oregon 6,306,386 34 8,071,735 32 28 167,669 40 187,941 37 12 Pennsylvania 58,659,051 4 76,156,449 1 30 2,017,657 22 2,497,002 16 24 Prince Edward Island 0 -- 0 -- -- 0 -- 0 -- -- Puerto Rico 1,676,433 41 3,837,622 37 129 4,245,218 10 4,325,805 11 2 Quebec 19,635,780 18 20,432,090 18 4 2,343,944 21 1,849,164 21 -21 Rhode Island 1,899,825 40 1,690,591 41 -11 3,178,279 17 25,081 49 -99 Saskatchewan 419,165 50 469,862 49 12 68,028 44 15,043 50 -78 South Carolina 14,691,315 22 16,870,362 21 15 6,445,107 8 2,758,753 14 -57 South Dakota 400,383 51 321,502 52 -20 65,475 46 49,181 45 -25 Tennessee 28,664,437 9 33,090,756 7 15 4,009,549 11 3,129,306 13 -22 Texas 49,664,432 5 40,930,764 6 -18 10,318,447 5 15,318,591 1 48 Utah 1,058,869 46 1,037,010 45 -2 105,113 42 126,037 40 20 Vermont 175,339 54 469,836 50 168 61,526 48 39,916 47 -35 Virgin Islands 24,472 57 69,508 57 184 50,601 49 2,757 56 -95 Virginia 7,911,216 32 10,662,659 25 35 1,701,652 24 1,475,427 22 -13 Washington 1,934,080 39 4,402,831 36 128 879,677 31 732,784 27 -17 West Virginia 2,539,355 38 3,262,893 38 28 336,451 35 290,954 36 -14 Wisconsin 22,206,446 15 23,902,303 13 8 3,631,197 13 3,886,459 12 7 Wyoming 619,500 49 41,315 58 -93 21 60 452 59 2,052
Total 887,408,505 901,927,543 2 140,861,091 138,612,724 -2
Note: Canada and US data only. Mexico data not available for 1998–1999. The data are estimates of releases and transfers of chemicals reported by facilities. None of the rankings is meant to imply that a facility, state or province is not meeting its legal requirements. The data do not predict levels of exposure of the public to those chemicals.
Transfers to recycling are from facilities located in the state/province.
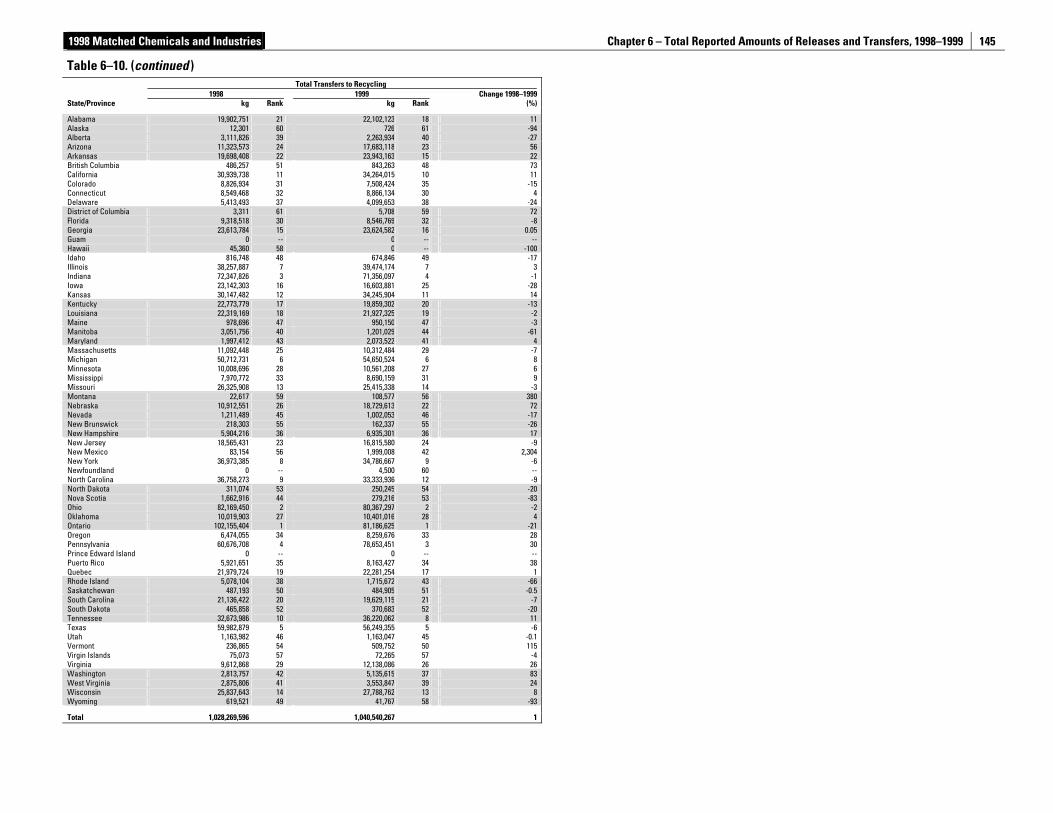
1998 Matched Chemicals and Industries Chapter 6 – Total Reported Amounts of Releases and Transfers, 1998–1999
145
Table 6–10. (continued ) Total Transfers to Recycling 1998 1999 Change 1998–1999 State/Province kg Rank kg Rank (%)
Alabama 19,902,751 21 22,102,123 18 11 Alaska 12,301 60 726 61 -94 Alberta 3,111,826 39 2,263,934 40 -27 Arizona 11,323,573 24 17,683,118 23 56 Arkansas 19,698,408 22 23,943,163 15 22 British Columbia 486,257 51 843,263 48 73 California 30,939,738 11 34,264,015 10 11 Colorado 8,826,934 31 7,508,424 35 -15 Connecticut 8,549,468 32 8,866,134 30 4 Delaware 5,413,493 37 4,099,653 38 -24 District of Columbia 3,311 61 5,708 59 72 Florida 9,318,518 30 8,546,769 32 -8 Georgia 23,613,784 15 23,624,582 16 0.05 Guam 0 -- 0 -- -- Hawaii 45,360 58 0 -- -100 Idaho 816,748 48 674,846 49 -17 Illinois 38,257,887 7 39,474,174 7 3 Indiana 72,347,826 3 71,356,097 4 -1 Iowa 23,142,303 16 16,603,881 25 -28 Kansas 30,147,482 12 34,245,904 11 14 Kentucky 22,773,779 17 19,859,302 20 -13 Louisiana 22,319,169 18 21,927,325 19 -2 Maine 978,696 47 950,150 47 -3 Manitoba 3,051,756 40 1,201,029 44 -61 Maryland 1,997,412 43 2,073,522 41 4 Massachusetts 11,092,448 25 10,312,484 29 -7 Michigan 50,712,731 6 54,650,524 6 8 Minnesota 10,008,696 28 10,561,208 27 6 Mississippi 7,970,772 33 8,690,159 31 9 Missouri 26,325,908 13 25,415,338 14 -3 Montana 22,617 59 108,577 56 380 Nebraska 10,912,551 26 18,729,613 22 72 Nevada 1,211,489 45 1,002,053 46 -17 New Brunswick 218,303 55 162,337 55 -26 New Hampshire 5,904,216 36 6,935,301 36 17 New Jersey 18,565,431 23 16,815,580 24 -9 New Mexico 83,154 56 1,999,008 42 2,304 New York 36,973,385 8 34,786,667 9 -6 Newfoundland 0 -- 4,500 60 -- North Carolina 36,758,273 9 33,333,936 12 -9 North Dakota 311,074 53 250,245 54 -20 Nova Scotia 1,662,916 44 279,216 53 -83 Ohio 82,169,450 2 80,367,297 2 -2 Oklahoma 10,019,903 27 10,401,016 28 4 Ontario 102,155,404 1 81,186,625 1 -21 Oregon 6,474,055 34 8,259,676 33 28 Pennsylvania 60,676,708 4 78,653,451 3 30 Prince Edward Island 0 -- 0 -- -- Puerto Rico 5,921,651 35 8,163,427 34 38 Quebec 21,979,724 19 22,281,254 17 1 Rhode Island 5,078,104 38 1,715,672 43 -66 Saskatchewan 487,193 50 484,905 51 -0.5 South Carolina 21,136,422 20 19,629,115 21 -7 South Dakota 465,858 52 370,683 52 -20 Tennessee 32,673,986 10 36,220,062 8 11 Texas 59,982,879 5 56,249,355 5 -6 Utah 1,163,982 46 1,163,047 45 -0.1 Vermont 236,865 54 509,752 50 115 Virgin Islands 75,073 57 72,265 57 -4 Virginia 9,612,868 29 12,138,086 26 26 Washington 2,813,757 42 5,135,615 37 83 West Virginia 2,875,806 41 3,553,847 39 24 Wisconsin 25,837,643 14 27,788,762 13 8 Wyoming 619,521 49 41,767 58 -93
Total 1,028,269,596 1,040,540,267 1
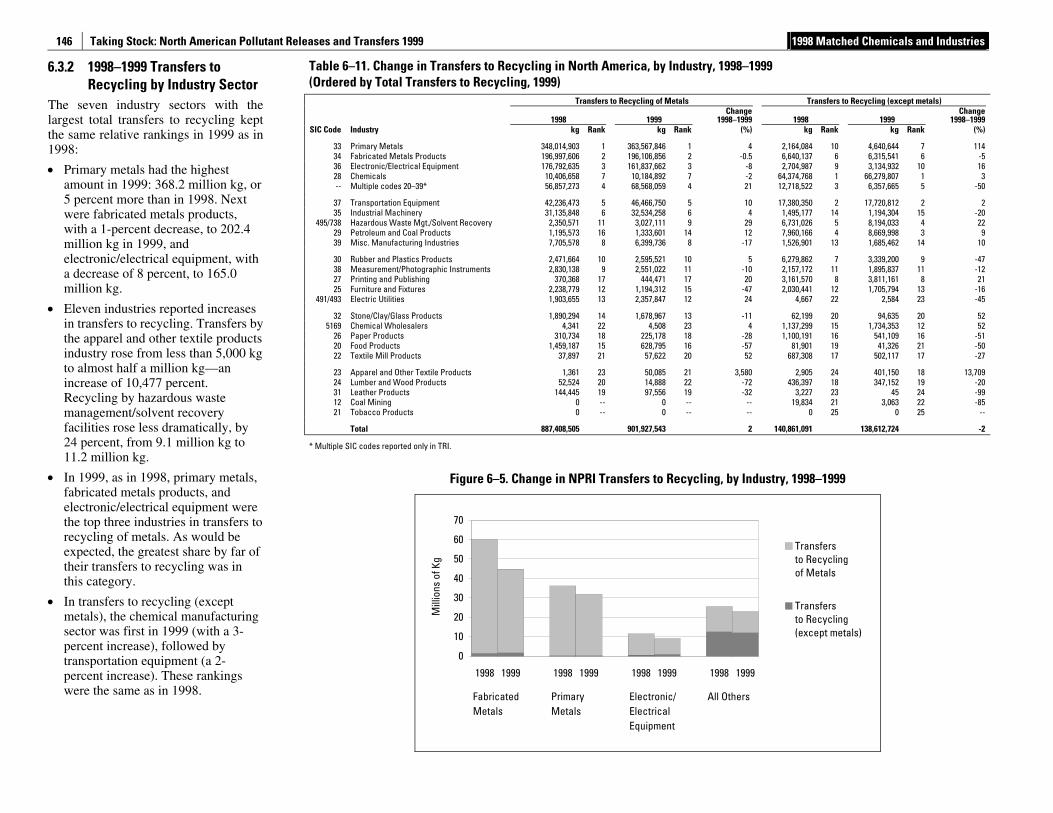
Taking Stock: North American Pollutant Releases and Transfers 1999 1998 Matched Chemicals and Industries
146
6.3.2 1998–1999 Transfers to Recycling by Industry Sector
The seven industry sectors with the largest total transfers to recycling kept the same relative rankings in 1999 as in 1998:
• Primary metals had the highest amount in 1999: 368.2 million kg, or 5 percent more than in 1998. Next were fabricated metals products, with a 1-percent decrease, to 202.4 million kg in 1999, and electronic/electrical equipment, with a decrease of 8 percent, to 165.0 million kg.
• Eleven industries reported increases in transfers to recycling. Transfers by the apparel and other textile products industry rose from less than 5,000 kg to almost half a million kg—an increase of 10,477 percent. Recycling by hazardous waste management/solvent recovery facilities rose less dramatically, by 24 percent, from 9.1 million kg to 11.2 million kg.
• In 1999, as in 1998, primary metals, fabricated metals products, and electronic/electrical equipment were the top three industries in transfers to recycling of metals. As would be expected, the greatest share by far of their transfers to recycling was in this category.
• In transfers to recycling (except metals), the chemical manufacturing sector was first in 1999 (with a 3-percent increase), followed by transportation equipment (a 2-percent increase). These rankings were the same as in 1998.
Table 6–11. Change in Transfers to Recycling in North America, by Industry, 1998–1999 (Ordered by Total Transfers to Recycling, 1999)
Transfers to Recycling of Metals Transfers to Recycling (except metals)
1998 1999 Change
1998–1999 1998 1999 Change
1998–1999 SIC Code Industry kg Rank kg Rank (%) kg Rank kg Rank (%)
33 Primary Metals 348,014,903 1 363,567,846 1 4 2,164,084 10 4,640,644 7 114 34 Fabricated Metals Products 196,997,606 2 196,106,856 2 -0.5 6,640,137 6 6,315,541 6 -5 36 Electronic/Electrical Equipment 176,792,635 3 161,837,662 3 -8 2,704,987 9 3,134,932 10 16 28 Chemicals 10,406,658 7 10,184,892 7 -2 64,374,768 1 66,279,807 1 3 -- Multiple codes 20–39* 56,857,273 4 68,568,059 4 21 12,718,522 3 6,357,665 5 -50
37 Transportation Equipment 42,236,473 5 46,466,750 5 10 17,380,350 2 17,720,812 2 2 35 Industrial Machinery 31,135,848 6 32,534,258 6 4 1,495,177 14 1,194,304 15 -20
495/738 Hazardous Waste Mgt./Solvent Recovery 2,350,571 11 3,027,111 9 29 6,731,026 5 8,194,033 4 22 29 Petroleum and Coal Products 1,195,573 16 1,333,601 14 12 7,960,166 4 8,669,998 3 9 39 Misc. Manufacturing Industries 7,705,578 8 6,399,736 8 -17 1,526,901 13 1,685,462 14 10
30 Rubber and Plastics Products 2,471,664 10 2,595,521 10 5 6,279,862 7 3,339,200 9 -47 38 Measurement/Photographic Instruments 2,830,138 9 2,551,022 11 -10 2,157,172 11 1,895,837 11 -12 27 Printing and Publishing 370,368 17 444,471 17 20 3,161,570 8 3,811,161 8 21 25 Furniture and Fixtures 2,238,779 12 1,194,312 15 -47 2,030,441 12 1,705,794 13 -16
491/493 Electric Utilities 1,903,655 13 2,357,847 12 24 4,667 22 2,584 23 -45
32 Stone/Clay/Glass Products 1,890,294 14 1,678,967 13 -11 62,199 20 94,635 20 52 5169 Chemical Wholesalers 4,341 22 4,508 23 4 1,137,299 15 1,734,353 12 52
26 Paper Products 310,734 18 225,178 18 -28 1,100,191 16 541,109 16 -51 20 Food Products 1,459,187 15 628,795 16 -57 81,901 19 41,326 21 -50 22 Textile Mill Products 37,897 21 57,622 20 52 687,308 17 502,117 17 -27
23 Apparel and Other Textile Products 1,361 23 50,085 21 3,580 2,905 24 401,150 18 13,709 24 Lumber and Wood Products 52,524 20 14,888 22 -72 436,397 18 347,152 19 -20 31 Leather Products 144,445 19 97,556 19 -32 3,227 23 45 24 -99 12 Coal Mining 0 -- 0 -- -- 19,834 21 3,063 22 -85 21 Tobacco Products 0 -- 0 -- -- 0 25 0 25 --
Total 887,408,505 901,927,543 2 140,861,091 138,612,724 -2
* Multiple SIC codes reported only in TRI.
Figure 6–5. Change in NPRI Transfers to Recycling, by Industry, 1998–1999
0
10
20
30
40
50
60
70
1998 1999 1998 1999 1998 1999 1998 1999
FabricatedMetals
PrimaryMetals
Electronic/ElectricalEquipment
All Others
Mill
ions
of K
g
Transfersto Recyclingof Metals
Transfersto Recycling(except metals)
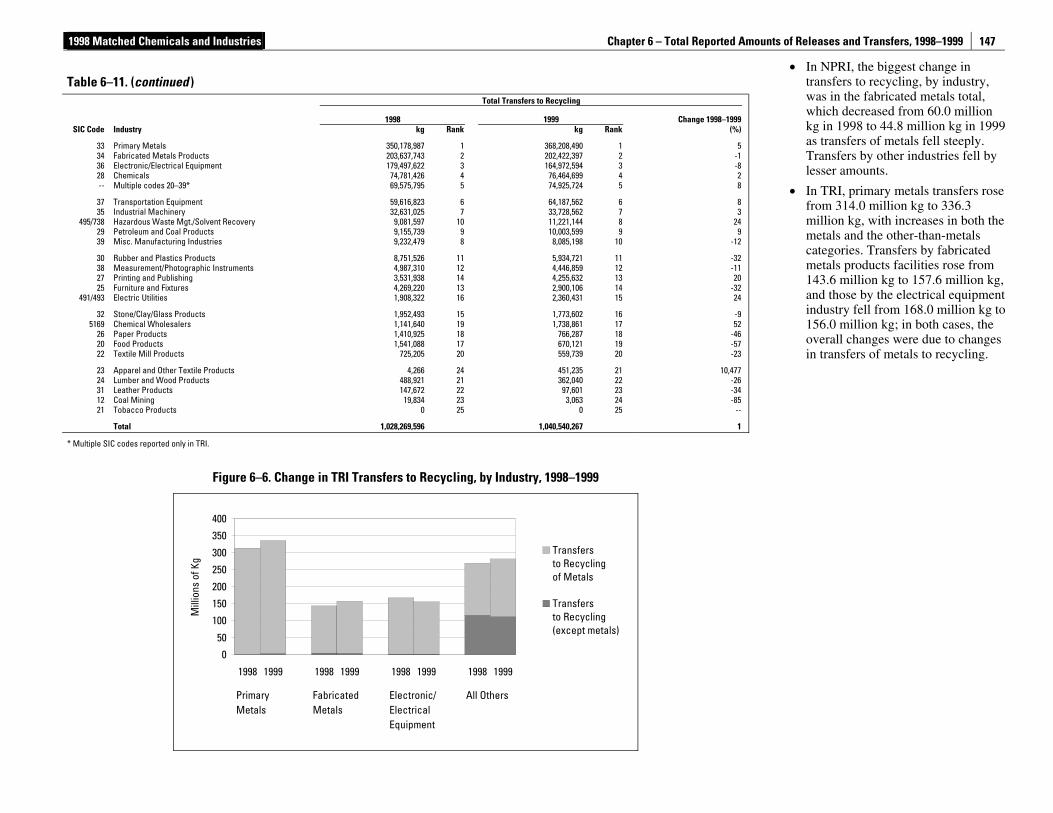
1998 Matched Chemicals and Industries Chapter 6 – Total Reported Amounts of Releases and Transfers, 1998–1999
147
• In NPRI, the biggest change in transfers to recycling, by industry, was in the fabricated metals total, which decreased from 60.0 million kg in 1998 to 44.8 million kg in 1999 as transfers of metals fell steeply. Transfers by other industries fell by lesser amounts.
• In TRI, primary metals transfers rose from 314.0 million kg to 336.3 million kg, with increases in both the metals and the other-than-metals categories. Transfers by fabricated metals products facilities rose from 143.6 million kg to 157.6 million kg, and those by the electrical equipment industry fell from 168.0 million kg to 156.0 million kg; in both cases, the overall changes were due to changes in transfers of metals to recycling.
Table 6–11. (continued )
Total Transfers to Recycling
1998 1999 Change 1998–1999 SIC Code Industry kg Rank kg Rank (%)
33 Primary Metals 350,178,987 1 368,208,490 1 5 34 Fabricated Metals Products 203,637,743 2 202,422,397 2 -1 36 Electronic/Electrical Equipment 179,497,622 3 164,972,594 3 -8 28 Chemicals 74,781,426 4 76,464,699 4 2 -- Multiple codes 20–39* 69,575,795 5 74,925,724 5 8
37 Transportation Equipment 59,616,823 6 64,187,562 6 8 35 Industrial Machinery 32,631,025 7 33,728,562 7 3
495/738 Hazardous Waste Mgt./Solvent Recovery 9,081,597 10 11,221,144 8 24 29 Petroleum and Coal Products 9,155,739 9 10,003,599 9 9 39 Misc. Manufacturing Industries 9,232,479 8 8,085,198 10 -12
30 Rubber and Plastics Products 8,751,526 11 5,934,721 11 -32 38 Measurement/Photographic Instruments 4,987,310 12 4,446,859 12 -11 27 Printing and Publishing 3,531,938 14 4,255,632 13 20 25 Furniture and Fixtures 4,269,220 13 2,900,106 14 -32
491/493 Electric Utilities 1,908,322 16 2,360,431 15 24
32 Stone/Clay/Glass Products 1,952,493 15 1,773,602 16 -9 5169 Chemical Wholesalers 1,141,640 19 1,738,861 17 52
26 Paper Products 1,410,925 18 766,287 18 -46 20 Food Products 1,541,088 17 670,121 19 -57 22 Textile Mill Products 725,205 20 559,739 20 -23
23 Apparel and Other Textile Products 4,266 24 451,235 21 10,477 24 Lumber and Wood Products 488,921 21 362,040 22 -26 31 Leather Products 147,672 22 97,601 23 -34 12 Coal Mining 19,834 23 3,063 24 -85 21 Tobacco Products 0 25 0 25 --
Total 1,028,269,596 1,040,540,267 1
* Multiple SIC codes reported only in TRI.
Figure 6–6. Change in TRI Transfers to Recycling, by Industry, 1998–1999
0
50
100
150
200
250
300
350
400
1998 1999 1998 1999 1998 1999 1998 1999
PrimaryMetals
FabricatedMetals
Electronic/ElectricalEquipment
All Others
Mill
ions
of K
g
Transfersto Recyclingof Metals
Transfersto Recycling(except metals)
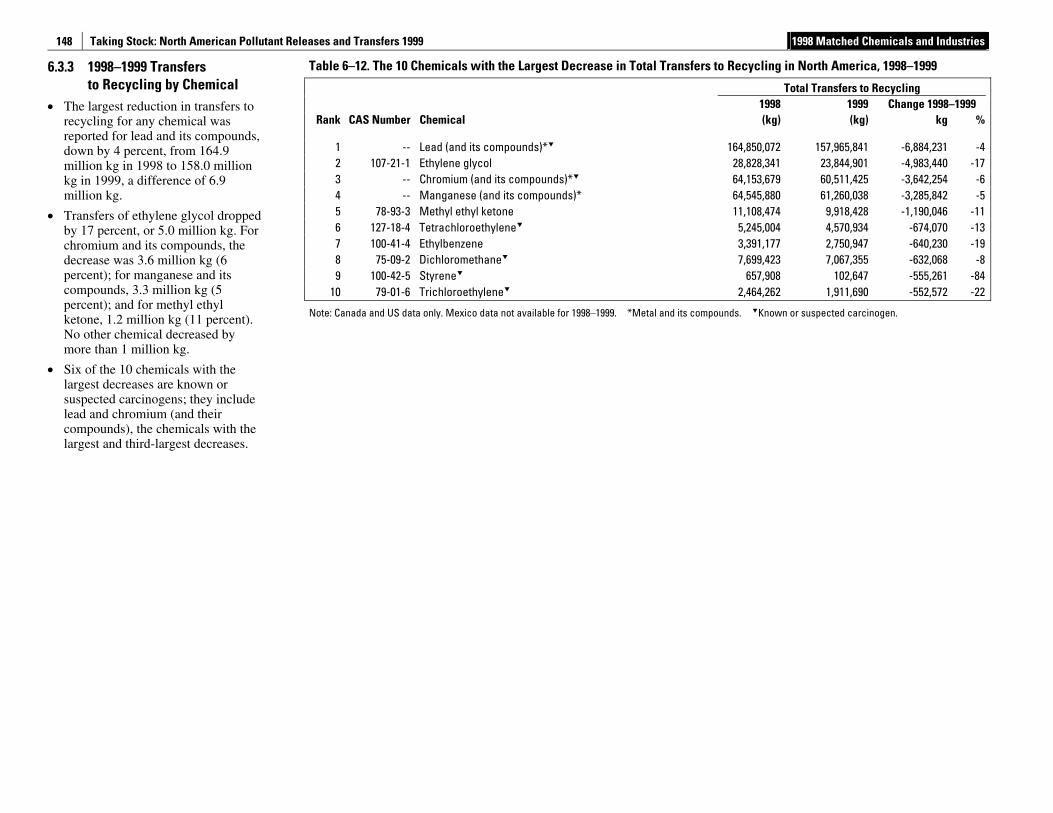
Taking Stock: North American Pollutant Releases and Transfers 1999 1998 Matched Chemicals and Industries
148
6.3.3 1998–1999 Transfers to Recycling by Chemical
• The largest reduction in transfers to recycling for any chemical was reported for lead and its compounds, down by 4 percent, from 164.9 million kg in 1998 to 158.0 million kg in 1999, a difference of 6.9 million kg.
• Transfers of ethylene glycol dropped by 17 percent, or 5.0 million kg. For chromium and its compounds, the decrease was 3.6 million kg (6 percent); for manganese and its compounds, 3.3 million kg (5 percent); and for methyl ethyl ketone, 1.2 million kg (11 percent). No other chemical decreased by more than 1 million kg.
• Six of the 10 chemicals with the largest decreases are known or suspected carcinogens; they include lead and chromium (and their compounds), the chemicals with the largest and third-largest decreases.
Table 6–12. The 10 Chemicals with the Largest Decrease in Total Transfers to Recycling in North America, 1998–1999
Total Transfers to Recycling 1998 1999 Change 1998–1999
Rank CAS Number Chemical (kg) (kg) kg %
1 -- Lead (and its compounds)* 164,850,072 157,965,841 -6,884,231 -4 2 107-21-1 Ethylene glycol 28,828,341 23,844,901 -4,983,440 -17 3 -- Chromium (and its compounds)* 64,153,679 60,511,425 -3,642,254 -6 4 -- Manganese (and its compounds)* 64,545,880 61,260,038 -3,285,842 -5 5 78-93-3 Methyl ethyl ketone 11,108,474 9,918,428 -1,190,046 -11 6 127-18-4 Tetrachloroethylene 5,245,004 4,570,934 -674,070 -13 7 100-41-4 Ethylbenzene 3,391,177 2,750,947 -640,230 -19 8 75-09-2 Dichloromethane 7,699,423 7,067,355 -632,068 -8 9 100-42-5 Styrene 657,908 102,647 -555,261 -84
10 79-01-6 Trichloroethylene 2,464,262 1,911,690 -552,572 -22
Note: Canada and US data only. Mexico data not available for 1998–1999. *Metal and its compounds. Known or suspected carcinogen.
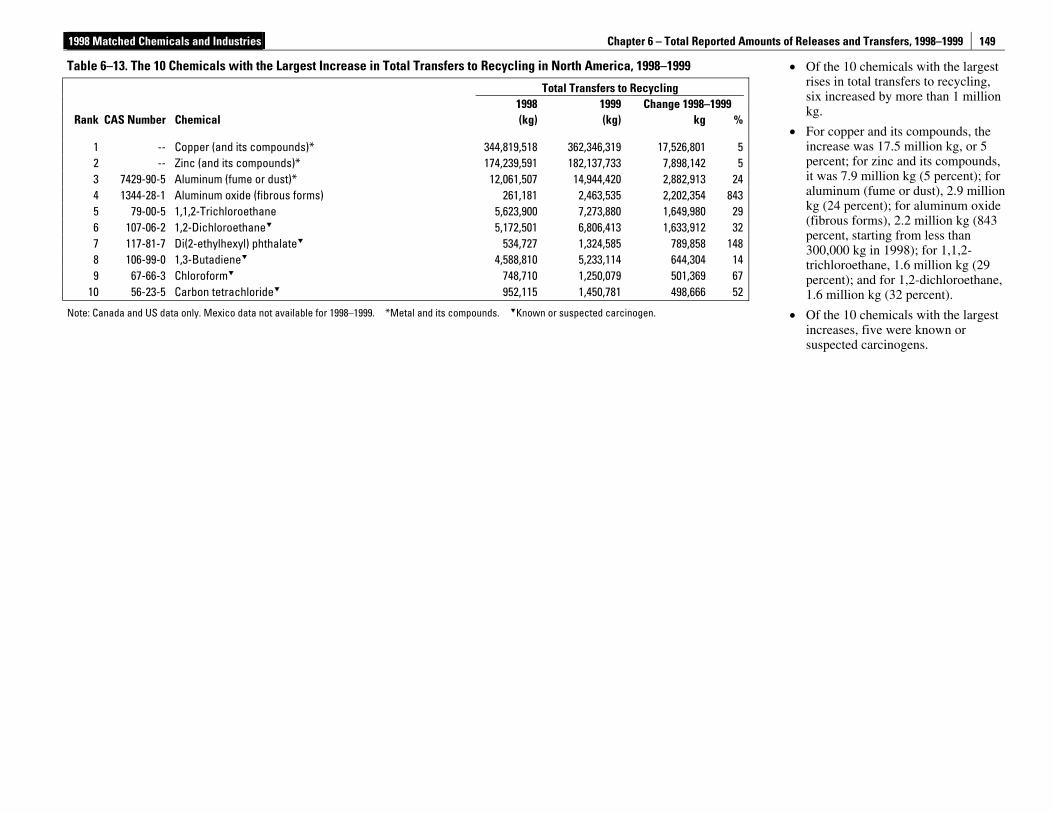
1998 Matched Chemicals and Industries Chapter 6 – Total Reported Amounts of Releases and Transfers, 1998–1999
149
• Of the 10 chemicals with the largest rises in total transfers to recycling, six increased by more than 1 million kg.
• For copper and its compounds, the increase was 17.5 million kg, or 5 percent; for zinc and its compounds, it was 7.9 million kg (5 percent); for aluminum (fume or dust), 2.9 million kg (24 percent); for aluminum oxide (fibrous forms), 2.2 million kg (843 percent, starting from less than 300,000 kg in 1998); for 1,1,2- trichloroethane, 1.6 million kg (29 percent); and for 1,2-dichloroethane, 1.6 million kg (32 percent).
• Of the 10 chemicals with the largest increases, five were known or suspected carcinogens.
Table 6–13. The 10 Chemicals with the Largest Increase in Total Transfers to Recycling in North America, 1998–1999
Total Transfers to Recycling 1998 1999 Change 1998–1999
Rank CAS Number Chemical (kg) (kg) kg %
1 -- Copper (and its compounds)* 344,819,518 362,346,319 17,526,801 52 -- Zinc (and its compounds)* 174,239,591 182,137,733 7,898,142 53 7429-90-5 Aluminum (fume or dust)* 12,061,507 14,944,420 2,882,913 244 1344-28-1 Aluminum oxide (fibrous forms) 261,181 2,463,535 2,202,354 8435 79-00-5 1,1,2-Trichloroethane 5,623,900 7,273,880 1,649,980 296 107-06-2 1,2-Dichloroethane 5,172,501 6,806,413 1,633,912 327 117-81-7 Di(2-ethylhexyl) phthalate 534,727 1,324,585 789,858 1488 106-99-0 1,3-Butadiene 4,588,810 5,233,114 644,304 149 67-66-3 Chloroform 748,710 1,250,079 501,369 67
10 56-23-5 Carbon tetrachloride 952,115 1,450,781 498,666 52
Note: Canada and US data only. Mexico data not available for 1998–1999. *Metal and its compounds. Known or suspected carcinogen.
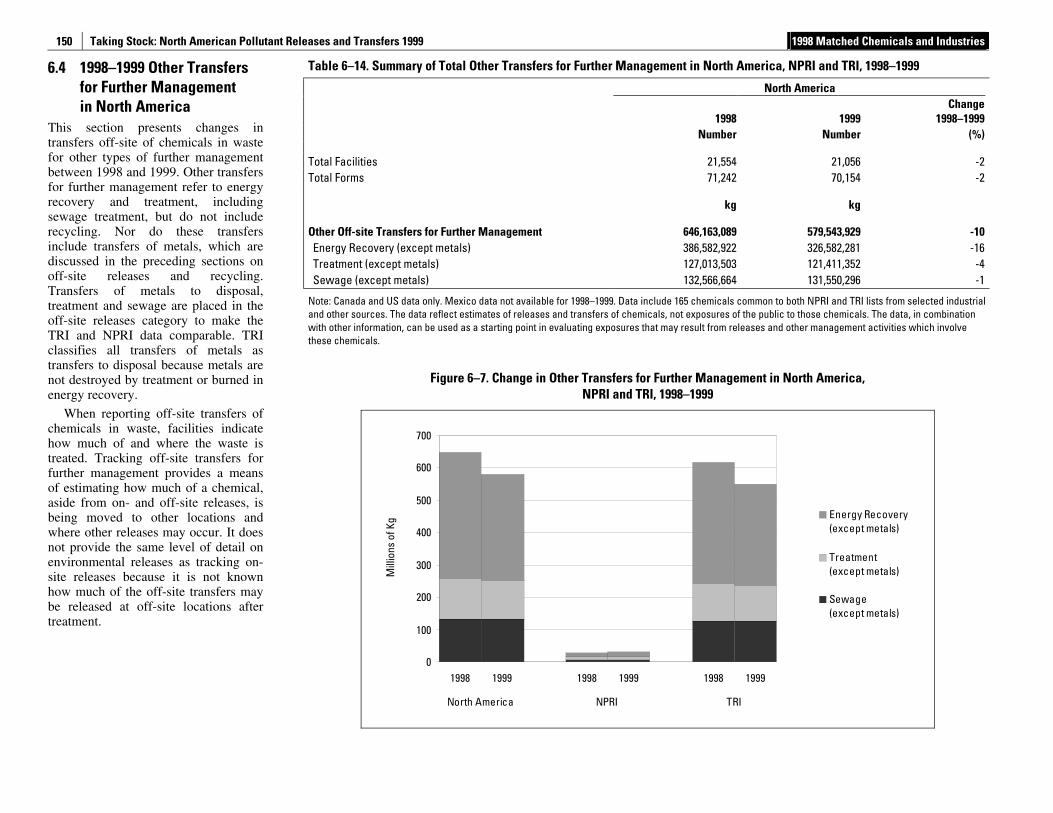
Taking Stock: North American Pollutant Releases and Transfers 1999 1998 Matched Chemicals and Industries
150
6.4 1998–1999 Other Transfers for Further Management in North America
This section presents changes in transfers off-site of chemicals in waste for other types of further management between 1998 and 1999. Other transfers for further management refer to energy recovery and treatment, including sewage treatment, but do not include recycling. Nor do these transfers include transfers of metals, which are discussed in the preceding sections on off-site releases and recycling. Transfers of metals to disposal, treatment and sewage are placed in the off-site releases category to make the TRI and NPRI data comparable. TRI classifies all transfers of metals as transfers to disposal because metals are not destroyed by treatment or burned in energy recovery.
When reporting off-site transfers of chemicals in waste, facilities indicate how much of and where the waste is treated. Tracking off-site transfers for further management provides a means of estimating how much of a chemical, aside from on- and off-site releases, is being moved to other locations and where other releases may occur. It does not provide the same level of detail on environmental releases as tracking on- site releases because it is not known how much of the off-site transfers may be released at off-site locations after treatment.
Table 6–14. Summary of Total Other Transfers for Further Management in North America, NPRI and TRI, 1998–1999
North America
1998 1999Change
1998–1999
Number Number (%)
Total Facilities 21,554 21,056 -2 Total Forms 71,242 70,154 -2
kg kg
Other Off-site Transfers for Further Management 646,163,089 579,543,929 -10 Energy Recovery (except metals) 386,582,922 326,582,281 -16 Treatment (except metals) 127,013,503 121,411,352 -4 Sewage (except metals) 132,566,664 131,550,296 -1
Note: Canada and US data only. Mexico data not available for 1998–1999. Data include 165 chemicals common to both NPRI and TRI lists from selected industrial and other sources. The data reflect estimates of releases and transfers of chemicals, not exposures of the public to those chemicals. The data, in combination with other information, can be used as a starting point in evaluating exposures that may result from releases and other management activities which involve these chemicals.
Figure 6–7. Change in Other Transfers for Further Management in North America, NPRI and TRI, 1998–1999
0
100
200
300
400
500
600
700
1998 1999 1998 1999 1998 1999
North America NPRI TRI
Mill
ions
of K
g Energy Recovery(except metals)
Treatment(except metals)
Sewage(except metals)
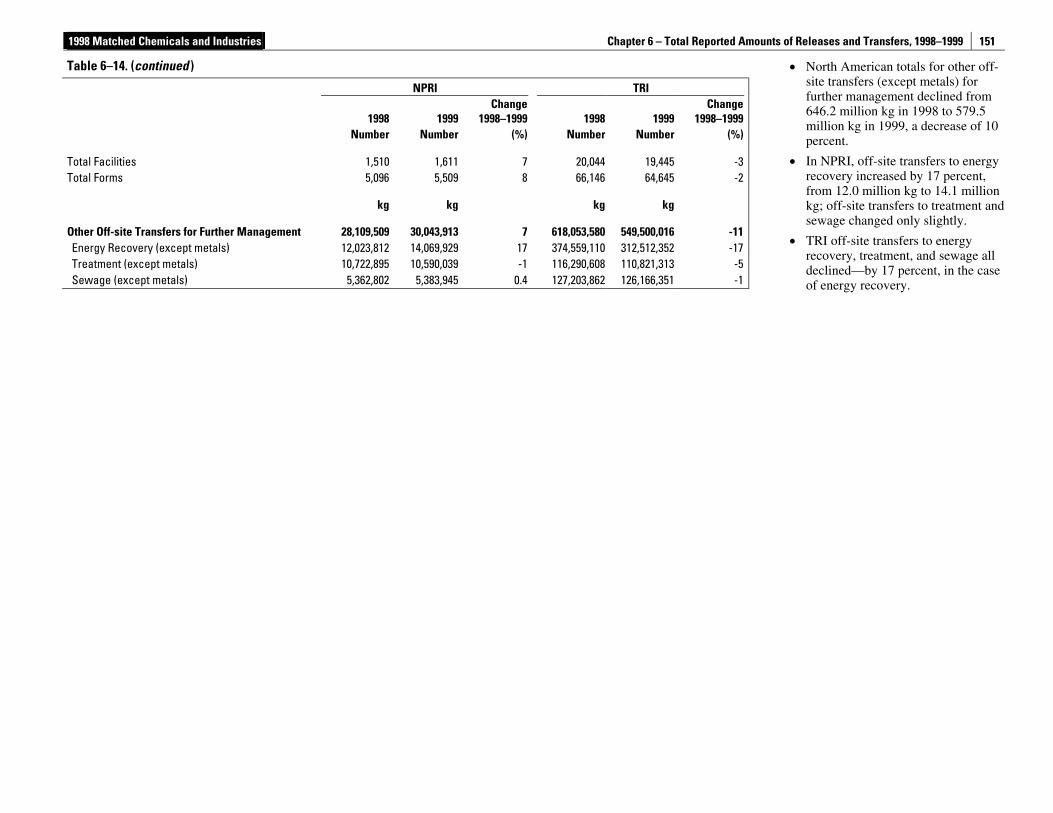
1998 Matched Chemicals and Industries Chapter 6 – Total Reported Amounts of Releases and Transfers, 1998–1999
151
• North American totals for other off-site transfers (except metals) for further management declined from 646.2 million kg in 1998 to 579.5 million kg in 1999, a decrease of 10 percent.
• In NPRI, off-site transfers to energy recovery increased by 17 percent, from 12.0 million kg to 14.1 million kg; off-site transfers to treatment and sewage changed only slightly.
• TRI off-site transfers to energy recovery, treatment, and sewage all declined—by 17 percent, in the case of energy recovery.
Table 6–14. (continued )
NPRI TRI
1998 1999Change
1998–1999 1998 1999Change
1998–1999 Number Number (%) Number Number (%)
Total Facilities 1,510 1,611 7 20,044 19,445 -3Total Forms 5,096 5,509 8 66,146 64,645 -2
kg kg kg kg
Other Off-site Transfers for Further Management 28,109,509 30,043,913 7 618,053,580 549,500,016 -11Energy Recovery (except metals) 12,023,812 14,069,929 17 374,559,110 312,512,352 -17Treatment (except metals) 10,722,895 10,590,039 -1 116,290,608 110,821,313 -5Sewage (except metals) 5,362,802 5,383,945 0.4 127,203,862 126,166,351 -1
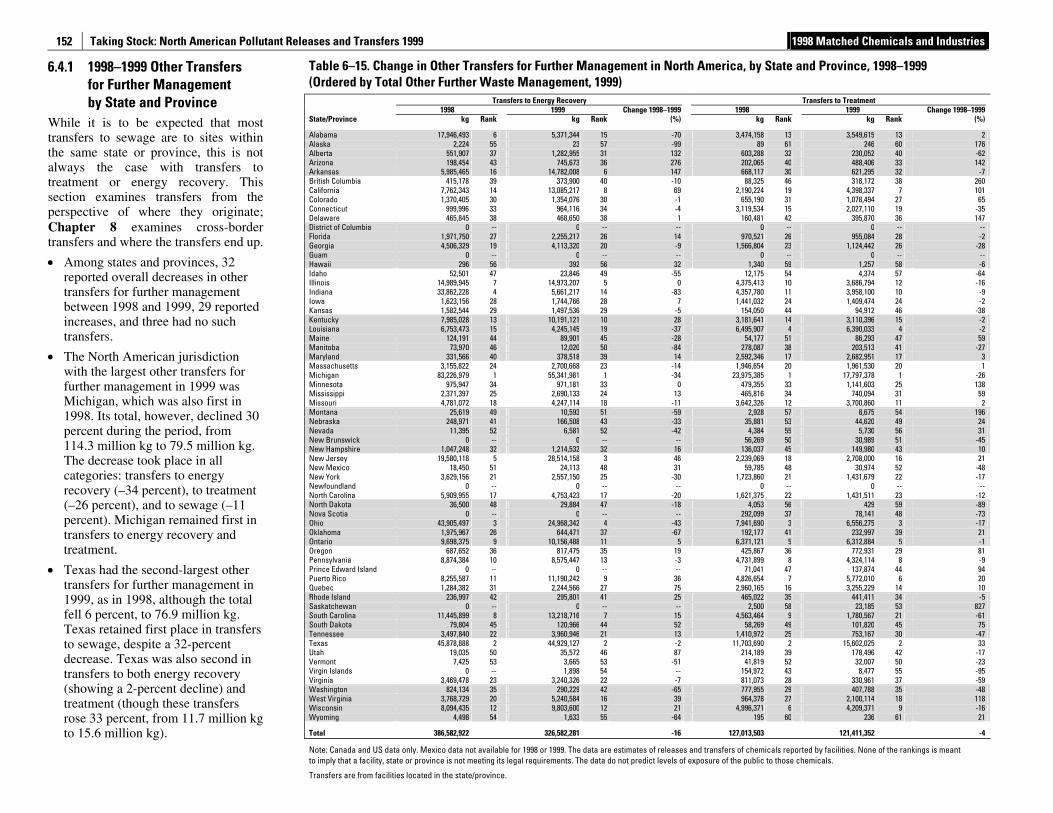
Taking Stock: North American Pollutant Releases and Transfers 1999 1998 Matched Chemicals and Industries
152
6.4.1 1998–1999 Other Transfers for Further Management by State and Province
While it is to be expected that most transfers to sewage are to sites within the same state or province, this is not always the case with transfers to treatment or energy recovery. This section examines transfers from the perspective of where they originate; Chapter 8 examines cross-border transfers and where the transfers end up.
• Among states and provinces, 32 reported overall decreases in other transfers for further management between 1998 and 1999, 29 reported increases, and three had no such transfers.
• The North American jurisdiction with the largest other transfers for further management in 1999 was Michigan, which was also first in 1998. Its total, however, declined 30 percent during the period, from 114.3 million kg to 79.5 million kg. The decrease took place in all categories: transfers to energy recovery (–34 percent), to treatment (–26 percent), and to sewage (–11 percent). Michigan remained first in transfers to energy recovery and treatment.
• Texas had the second-largest other transfers for further management in 1999, as in 1998, although the total fell 6 percent, to 76.9 million kg. Texas retained first place in transfers to sewage, despite a 32-percent decrease. Texas was also second in transfers to both energy recovery (showing a 2-percent decline) and treatment (though these transfers rose 33 percent, from 11.7 million kg to 15.6 million kg).
Table 6–15. Change in Other Transfers for Further Management in North America, by State and Province, 1998–1999 (Ordered by Total Other Further Waste Management, 1999) Transfers to Energy Recovery Transfers to Treatment 1998 1999 Change 1998–1999 1998 1999 Change 1998–1999 State/Province kg Rank kg Rank (%) kg Rank kg Rank (%)
Alabama 17,946,493 6 5,371,344 15 -70 3,474,158 13 3,549,615 13 2 Alaska 2,224 55 23 57 -99 89 61 246 60 176 Alberta 551,907 37 1,282,955 31 132 603,288 32 230,052 40 -62 Arizona 198,454 43 745,673 36 276 202,065 40 488,406 33 142 Arkansas 5,985,465 16 14,782,008 6 147 668,117 30 621,295 32 -7 British Columbia 415,178 39 373,900 40 -10 88,325 46 318,172 38 260 California 7,762,343 14 13,085,217 8 69 2,190,224 19 4,398,337 7 101 Colorado 1,370,405 30 1,354,076 30 -1 655,190 31 1,078,494 27 65 Connecticut 999,996 33 964,116 34 -4 3,119,534 15 2,027,110 19 -35 Delaware 465,845 38 468,650 38 1 160,481 42 395,870 36 147 District of Columbia 0 -- 0 -- -- 0 -- 0 -- -- Florida 1,971,750 27 2,255,217 26 14 970,521 26 955,084 28 -2 Georgia 4,506,329 19 4,113,320 20 -9 1,566,804 23 1,124,442 26 -28 Guam 0 -- 0 -- -- 0 -- 0 -- -- Hawaii 296 56 392 56 32 1,340 59 1,257 58 -6 Idaho 52,501 47 23,846 49 -55 12,175 54 4,374 57 -64 Illinois 14,989,945 7 14,973,207 5 0 4,375,413 10 3,686,794 12 -16 Indiana 33,862,228 4 5,661,217 14 -83 4,357,780 11 3,958,100 10 -9 Iowa 1,623,156 28 1,744,766 28 7 1,441,032 24 1,409,474 24 -2 Kansas 1,582,544 29 1,497,536 29 -5 154,050 44 94,912 46 -38 Kentucky 7,985,028 13 10,191,121 10 28 3,181,641 14 3,110,396 15 -2 Louisiana 6,753,473 15 4,245,145 19 -37 6,495,907 4 6,390,033 4 -2 Maine 124,191 44 89,901 45 -28 54,177 51 86,293 47 59 Manitoba 73,970 46 12,020 50 -84 278,087 38 203,513 41 -27 Maryland 331,566 40 378,518 39 14 2,592,346 17 2,682,951 17 3 Massachusetts 3,155,822 24 2,700,668 23 -14 1,946,654 20 1,961,530 20 1 Michigan 83,226,979 1 55,341,981 1 -34 23,975,385 1 17,797,378 1 -26 Minnesota 975,947 34 971,181 33 0 479,355 33 1,141,603 25 138 Mississippi 2,371,397 25 2,690,133 24 13 465,816 34 740,094 31 59 Missouri 4,781,072 18 4,247,114 18 -11 3,642,326 12 3,700,860 11 2 Montana 25,619 49 10,593 51 -59 2,928 57 8,675 54 196 Nebraska 248,971 41 166,508 43 -33 35,881 53 44,620 49 24 Nevada 11,395 52 6,581 52 -42 4,384 55 5,730 56 31 New Brunswick 0 -- 0 -- -- 56,269 50 30,989 51 -45 New Hampshire 1,047,248 32 1,214,532 32 16 136,037 45 149,980 43 10 New Jersey 19,580,118 5 28,514,158 3 46 2,239,069 18 2,708,000 16 21 New Mexico 18,450 51 24,113 48 31 59,785 48 30,974 52 -48 New York 3,629,156 21 2,557,150 25 -30 1,723,860 21 1,431,679 22 -17 Newfoundland 0 -- 0 -- -- 0 -- 0 -- -- North Carolina 5,909,955 17 4,753,423 17 -20 1,621,375 22 1,431,511 23 -12 North Dakota 36,500 48 29,884 47 -18 4,053 56 429 59 -89 Nova Scotia 0 -- 0 -- -- 292,099 37 78,141 48 -73 Ohio 43,905,497 3 24,968,342 4 -43 7,941,690 3 6,556,275 3 -17 Oklahoma 1,975,967 26 644,471 37 -67 192,177 41 232,997 39 21 Ontario 9,698,375 9 10,156,488 11 5 6,371,121 5 6,312,884 5 -1 Oregon 687,652 36 817,475 35 19 425,867 36 772,931 29 81 Pennsylvania 8,874,384 10 8,575,447 13 -3 4,731,899 8 4,324,114 8 -9 Prince Edward Island 0 -- 0 -- -- 71,041 47 137,874 44 94 Puerto Rico 8,255,587 11 11,190,242 9 36 4,826,654 7 5,772,010 6 20 Quebec 1,284,382 31 2,244,566 27 75 2,960,165 16 3,255,229 14 10 Rhode Island 236,997 42 295,801 41 25 465,022 35 441,411 34 -5 Saskatchewan 0 -- 0 -- -- 2,500 58 23,185 53 827 South Carolina 11,445,899 8 13,218,716 7 15 4,563,464 9 1,780,567 21 -61 South Dakota 79,804 45 120,966 44 52 58,269 49 101,820 45 75 Tennessee 3,497,840 22 3,960,946 21 13 1,410,972 25 753,167 30 -47 Texas 45,878,888 2 44,929,127 2 -2 11,703,690 2 15,602,025 2 33 Utah 19,035 50 35,572 46 87 214,189 39 178,496 42 -17 Vermont 7,425 53 3,665 53 -51 41,819 52 32,007 50 -23 Virgin Islands 0 -- 1,898 54 -- 154,972 43 8,477 55 -95 Virginia 3,469,478 23 3,240,326 22 -7 811,073 28 330,961 37 -59 Washington 824,134 35 290,229 42 -65 777,955 29 407,788 35 -48 West Virginia 3,768,729 20 5,240,584 16 39 964,378 27 2,100,114 18 118 Wisconsin 8,094,435 12 9,803,600 12 21 4,996,371 6 4,209,371 9 -16 Wyoming 4,498 54 1,633 55 -64 195 60 236 61 21
Total 386,582,922 326,582,281 -16 127,013,503 121,411,352 -4
Note: Canada and US data only. Mexico data not available for 1998 or 1999. The data are estimates of releases and transfers of chemicals reported by facilities. None of the rankings is meant to imply that a facility, state or province is not meeting its legal requirements. The data do not predict levels of exposure of the public to those chemicals.
Transfers are from facilities located in the state/province.
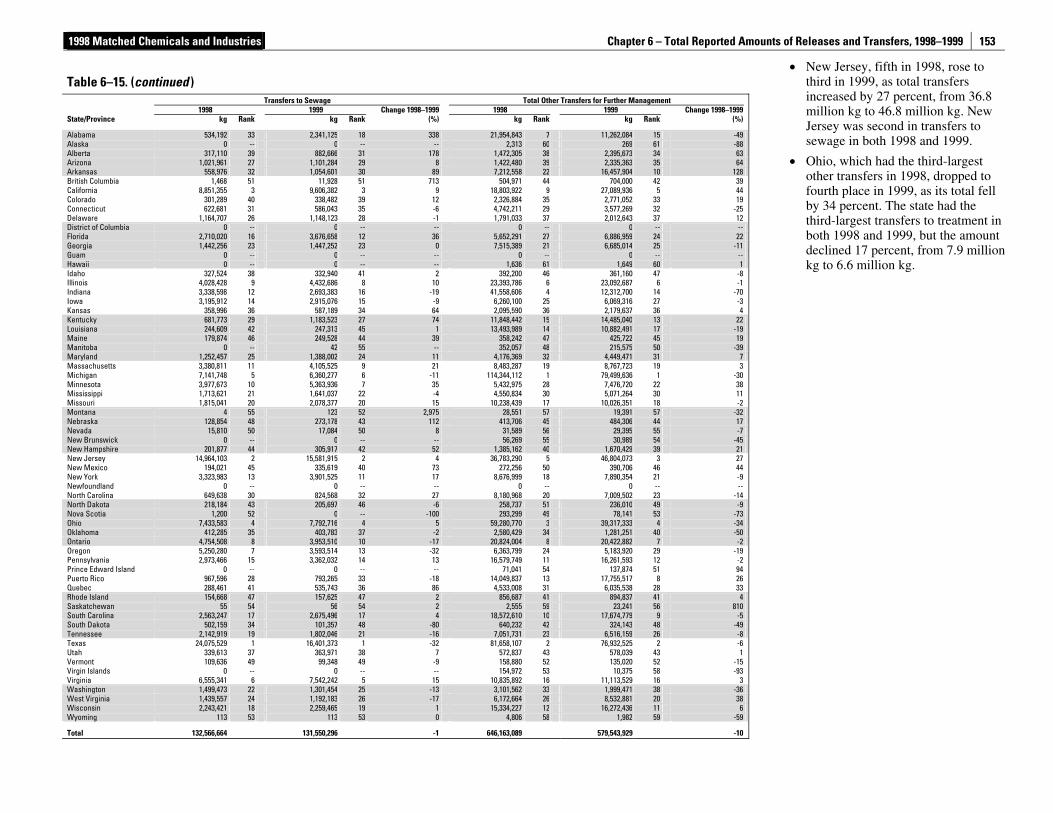
1998 Matched Chemicals and Industries Chapter 6 – Total Reported Amounts of Releases and Transfers, 1998–1999
153
• New Jersey, fifth in 1998, rose to third in 1999, as total transfers increased by 27 percent, from 36.8 million kg to 46.8 million kg. New Jersey was second in transfers to sewage in both 1998 and 1999.
• Ohio, which had the third-largest other transfers in 1998, dropped to fourth place in 1999, as its total fell by 34 percent. The state had the third-largest transfers to treatment in both 1998 and 1999, but the amount declined 17 percent, from 7.9 million kg to 6.6 million kg.
Table 6–15. (continued )
Transfers to Sewage Total Other Transfers for Further Management 1998 1999 Change 1998–1999 1998 1999 Change 1998–1999State/Province kg Rank kg Rank (%) kg Rank kg Rank (%)
Alabama 534,192 33 2,341,125 18 338 21,954,843 7 11,262,084 15 -49Alaska 0 -- 0 -- -- 2,313 60 269 61 -88Alberta 317,110 39 882,666 31 178 1,472,305 38 2,395,673 34 63Arizona 1,021,961 27 1,101,284 29 8 1,422,480 39 2,335,363 35 64Arkansas 558,976 32 1,054,601 30 89 7,212,558 22 16,457,904 10 128British Columbia 1,468 51 11,928 51 713 504,971 44 704,000 42 39California 8,851,355 3 9,606,382 3 9 18,803,922 9 27,089,936 5 44Colorado 301,289 40 338,482 39 12 2,326,884 35 2,771,052 33 19Connecticut 622,681 31 586,043 35 -6 4,742,211 29 3,577,269 32 -25Delaware 1,164,707 26 1,148,123 28 -1 1,791,033 37 2,012,643 37 12District of Columbia 0 -- 0 -- -- 0 -- 0 -- --Florida 2,710,020 16 3,676,658 12 36 5,652,291 27 6,886,959 24 22Georgia 1,442,256 23 1,447,252 23 0 7,515,389 21 6,685,014 25 -11Guam 0 -- 0 -- -- 0 -- 0 -- --Hawaii 0 -- 0 -- -- 1,636 61 1,649 60 1Idaho 327,524 38 332,940 41 2 392,200 46 361,160 47 -8Illinois 4,028,428 9 4,432,686 8 10 23,393,786 6 23,092,687 6 -1Indiana 3,338,598 12 2,693,383 16 -19 41,558,606 4 12,312,700 14 -70Iowa 3,195,912 14 2,915,076 15 -9 6,260,100 25 6,069,316 27 -3Kansas 358,996 36 587,189 34 64 2,095,590 36 2,179,637 36 4Kentucky 681,773 29 1,183,523 27 74 11,848,442 15 14,485,040 13 22Louisiana 244,609 42 247,313 45 1 13,493,989 14 10,882,491 17 -19Maine 179,874 46 249,528 44 39 358,242 47 425,722 45 19Manitoba 0 -- 42 55 -- 352,057 48 215,575 50 -39Maryland 1,252,457 25 1,388,002 24 11 4,176,369 32 4,449,471 31 7Massachusetts 3,380,811 11 4,105,525 9 21 8,483,287 19 8,767,723 19 3Michigan 7,141,748 5 6,360,277 6 -11 114,344,112 1 79,499,636 1 -30Minnesota 3,977,673 10 5,363,936 7 35 5,432,975 28 7,476,720 22 38Mississippi 1,713,621 21 1,641,037 22 -4 4,550,834 30 5,071,264 30 11Missouri 1,815,041 20 2,078,377 20 15 10,238,439 17 10,026,351 18 -2Montana 4 55 123 52 2,975 28,551 57 19,391 57 -32Nebraska 128,854 48 273,178 43 112 413,706 45 484,306 44 17Nevada 15,810 50 17,084 50 8 31,589 56 29,395 55 -7New Brunswick 0 -- 0 -- -- 56,269 55 30,989 54 -45New Hampshire 201,877 44 305,917 42 52 1,385,162 40 1,670,429 39 21New Jersey 14,964,103 2 15,581,915 2 4 36,783,290 5 46,804,073 3 27New Mexico 194,021 45 335,619 40 73 272,256 50 390,706 46 44New York 3,323,983 13 3,901,525 11 17 8,676,999 18 7,890,354 21 -9Newfoundland 0 -- 0 -- -- 0 -- 0 -- --North Carolina 649,638 30 824,568 32 27 8,180,968 20 7,009,502 23 -14North Dakota 218,184 43 205,697 46 -6 258,737 51 236,010 49 -9Nova Scotia 1,200 52 0 -- -100 293,299 49 78,141 53 -73Ohio 7,433,583 4 7,792,716 4 5 59,280,770 3 39,317,333 4 -34Oklahoma 412,285 35 403,783 37 -2 2,580,429 34 1,281,251 40 -50Ontario 4,754,508 8 3,953,510 10 -17 20,824,004 8 20,422,882 7 -2Oregon 5,250,280 7 3,593,514 13 -32 6,363,799 24 5,183,920 29 -19Pennsylvania 2,973,466 15 3,362,032 14 13 16,579,749 11 16,261,593 12 -2Prince Edward Island 0 -- 0 -- -- 71,041 54 137,874 51 94Puerto Rico 967,596 28 793,265 33 -18 14,049,837 13 17,755,517 8 26Quebec 288,461 41 535,743 36 86 4,533,008 31 6,035,538 28 33Rhode Island 154,668 47 157,625 47 2 856,687 41 894,837 41 4Saskatchewan 55 54 56 54 2 2,555 59 23,241 56 810South Carolina 2,563,247 17 2,675,496 17 4 18,572,610 10 17,674,779 9 -5South Dakota 502,159 34 101,357 48 -80 640,232 42 324,143 48 -49Tennessee 2,142,919 19 1,802,046 21 -16 7,051,731 23 6,516,159 26 -8Texas 24,075,529 1 16,401,373 1 -32 81,658,107 2 76,932,525 2 -6Utah 339,613 37 363,971 38 7 572,837 43 578,039 43 1Vermont 109,636 49 99,348 49 -9 158,880 52 135,020 52 -15Virgin Islands 0 -- 0 -- -- 154,972 53 10,375 58 -93Virginia 6,555,341 6 7,542,242 5 15 10,835,892 16 11,113,529 16 3Washington 1,499,473 22 1,301,454 25 -13 3,101,562 33 1,999,471 38 -36West Virginia 1,439,557 24 1,192,183 26 -17 6,172,664 26 8,532,881 20 38Wisconsin 2,243,421 18 2,259,465 19 1 15,334,227 12 16,272,436 11 6Wyoming 113 53 113 53 0 4,806 58 1,982 59 -59
Total 132,566,664 131,550,296 -1 646,163,089 579,543,929 -10
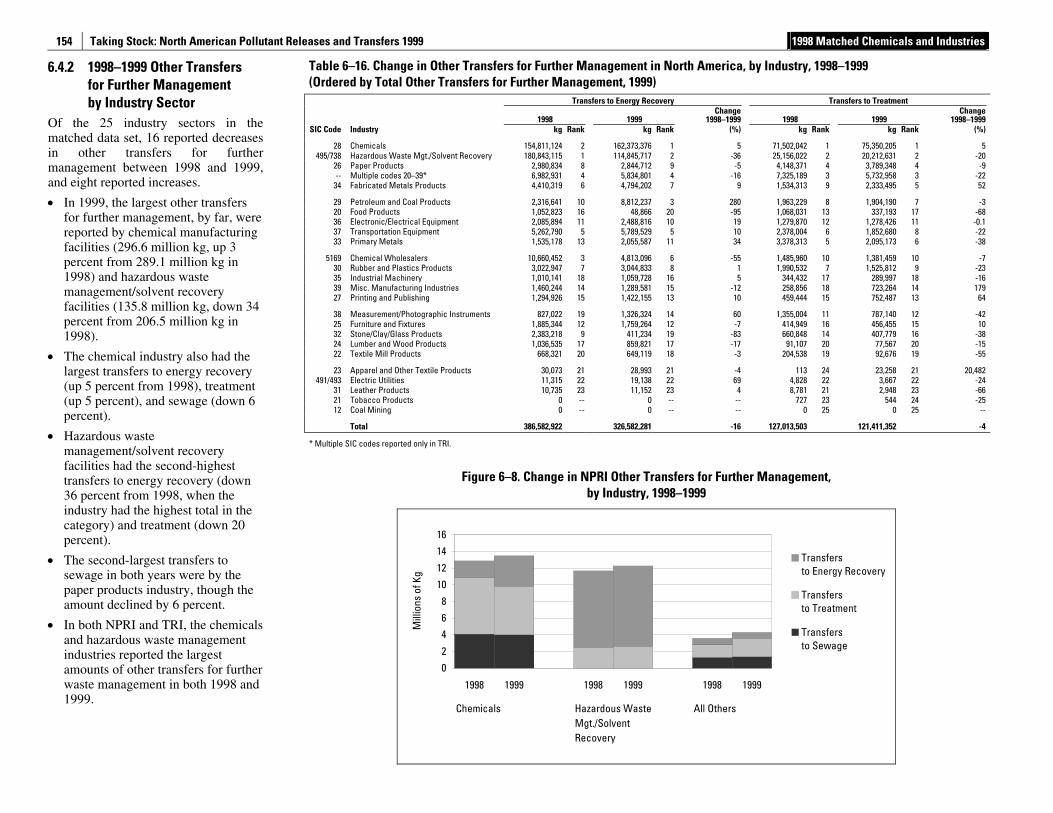
Taking Stock: North American Pollutant Releases and Transfers 1999 1998 Matched Chemicals and Industries
154
6.4.2 1998–1999 Other Transfers for Further Management by Industry Sector
Of the 25 industry sectors in the matched data set, 16 reported decreases in other transfers for further management between 1998 and 1999, and eight reported increases.
• In 1999, the largest other transfers for further management, by far, were reported by chemical manufacturing facilities (296.6 million kg, up 3 percent from 289.1 million kg in 1998) and hazardous waste management/solvent recovery facilities (135.8 million kg, down 34 percent from 206.5 million kg in 1998).
• The chemical industry also had the largest transfers to energy recovery (up 5 percent from 1998), treatment (up 5 percent), and sewage (down 6 percent).
• Hazardous waste management/solvent recovery facilities had the second-highest transfers to energy recovery (down 36 percent from 1998, when the industry had the highest total in the category) and treatment (down 20 percent).
• The second-largest transfers to sewage in both years were by the paper products industry, though the amount declined by 6 percent.
• In both NPRI and TRI, the chemicals and hazardous waste management industries reported the largest amounts of other transfers for further waste management in both 1998 and 1999.
Table 6–16. Change in Other Transfers for Further Management in North America, by Industry, 1998–1999 (Ordered by Total Other Transfers for Further Management, 1999)
Transfers to Energy Recovery Transfers to Treatment
1998 1999 Change
1998–1999 1998 1999 Change
1998–1999 SIC Code Industry kg Rank kg Rank (%) kg Rank kg Rank (%)
28 Chemicals 154,811,124 2 162,373,376 1 5 71,502,042 1 75,350,205 1 5 495/738 Hazardous Waste Mgt./Solvent Recovery 180,843,115 1 114,845,717 2 -36 25,156,022 2 20,212,631 2 -20
26 Paper Products 2,980,834 8 2,844,712 9 -5 4,148,371 4 3,789,348 4 -9 -- Multiple codes 20–39* 6,982,931 4 5,834,801 4 -16 7,325,189 3 5,732,958 3 -22
34 Fabricated Metals Products 4,410,319 6 4,794,202 7 9 1,534,313 9 2,333,495 5 52
29 Petroleum and Coal Products 2,316,641 10 8,812,237 3 280 1,963,229 8 1,904,190 7 -3 20 Food Products 1,052,823 16 48,866 20 -95 1,068,031 13 337,193 17 -68 36 Electronic/Electrical Equipment 2,085,894 11 2,488,816 10 19 1,279,870 12 1,278,426 11 -0.1 37 Transportation Equipment 5,262,790 5 5,789,529 5 10 2,378,004 6 1,852,680 8 -22 33 Primary Metals 1,535,178 13 2,055,587 11 34 3,378,313 5 2,095,173 6 -38
5169 Chemical Wholesalers 10,660,452 3 4,813,096 6 -55 1,485,960 10 1,381,459 10 -7 30 Rubber and Plastics Products 3,022,947 7 3,044,833 8 1 1,990,532 7 1,525,812 9 -23 35 Industrial Machinery 1,010,141 18 1,059,728 16 5 344,432 17 289,997 18 -16 39 Misc. Manufacturing Industries 1,460,244 14 1,289,581 15 -12 258,856 18 723,264 14 179 27 Printing and Publishing 1,294,926 15 1,422,155 13 10 459,444 15 752,487 13 64
38 Measurement/Photographic Instruments 827,022 19 1,326,324 14 60 1,355,004 11 787,140 12 -42 25 Furniture and Fixtures 1,885,344 12 1,759,264 12 -7 414,949 16 456,455 15 10 32 Stone/Clay/Glass Products 2,383,218 9 411,234 19 -83 660,848 14 407,779 16 -38 24 Lumber and Wood Products 1,036,535 17 859,821 17 -17 91,107 20 77,567 20 -15 22 Textile Mill Products 668,321 20 649,119 18 -3 204,538 19 92,676 19 -55
23 Apparel and Other Textile Products 30,073 21 28,993 21 -4 113 24 23,258 21 20,482 491/493 Electric Utilities 11,315 22 19,138 22 69 4,828 22 3,667 22 -24
31 Leather Products 10,735 23 11,152 23 4 8,781 21 2,948 23 -66 21 Tobacco Products 0 -- 0 -- -- 727 23 544 24 -25 12 Coal Mining 0 -- 0 -- -- 0 25 0 25 --
Total 386,582,922 326,582,281 -16 127,013,503 121,411,352 -4
* Multiple SIC codes reported only in TRI.
Figure 6–8. Change in NPRI Other Transfers for Further Management, by Industry, 1998–1999
0
2
4
6
8
10
12
14
16
1998 1999 1998 1999 1998 1999
Chemicals Hazardous WasteMgt./SolventRecovery
All Others
Mill
ions
of K
g
Transfersto Energy Recovery
Transfersto Treatment
Transfersto Sewage
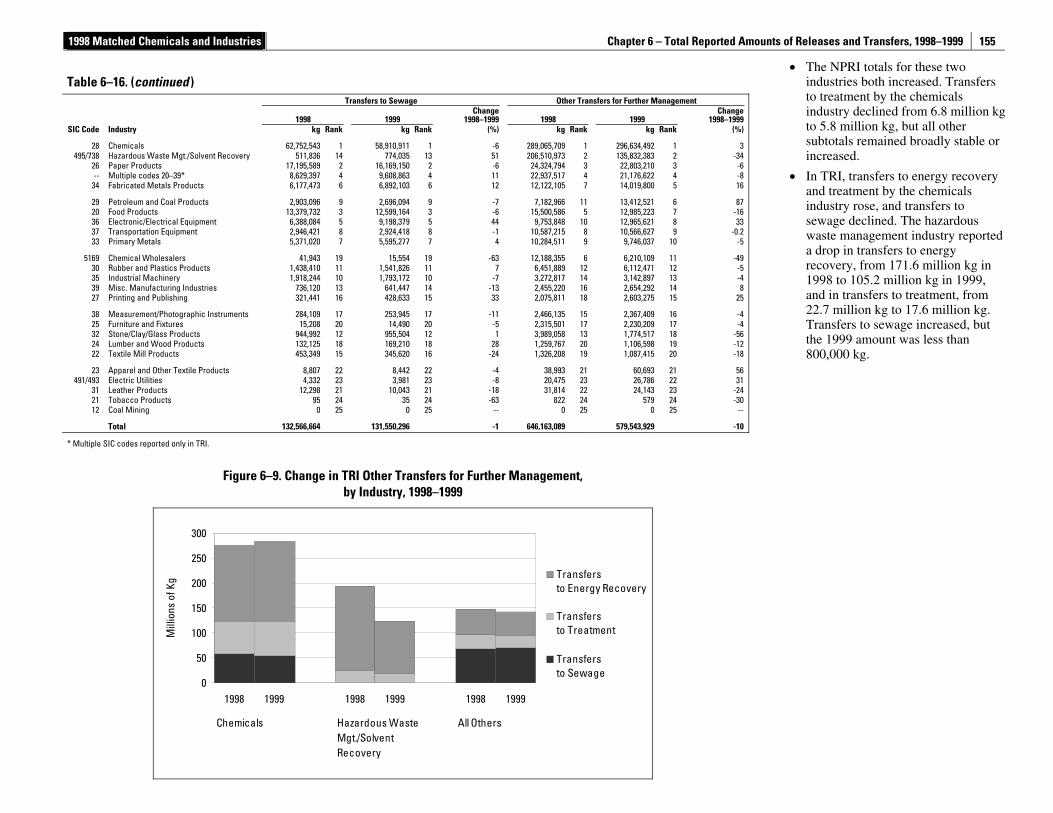
1998 Matched Chemicals and Industries Chapter 6 – Total Reported Amounts of Releases and Transfers, 1998–1999
155
• The NPRI totals for these two industries both increased. Transfers to treatment by the chemicals industry declined from 6.8 million kg to 5.8 million kg, but all other subtotals remained broadly stable or increased.
• In TRI, transfers to energy recovery and treatment by the chemicals industry rose, and transfers to sewage declined. The hazardous waste management industry reported a drop in transfers to energy recovery, from 171.6 million kg in 1998 to 105.2 million kg in 1999, and in transfers to treatment, from 22.7 million kg to 17.6 million kg. Transfers to sewage increased, but the 1999 amount was less than 800,000 kg.
Table 6–16. (continued )
Transfers to Sewage Other Transfers for Further Management
1998 1999 Change
1998–1999 1998 1999 Change
1998–1999SIC Code Industry kg Rank kg Rank (%) kg Rank kg Rank (%)
28 Chemicals 62,752,543 1 58,910,911 1 -6 289,065,709 1 296,634,492 1 3495/738 Hazardous Waste Mgt./Solvent Recovery 511,836 14 774,035 13 51 206,510,973 2 135,832,383 2 -34
26 Paper Products 17,195,589 2 16,169,150 2 -6 24,324,794 3 22,803,210 3 -6-- Multiple codes 20–39* 8,629,397 4 9,608,863 4 11 22,937,517 4 21,176,622 4 -8
34 Fabricated Metals Products 6,177,473 6 6,892,103 6 12 12,122,105 7 14,019,800 5 16
29 Petroleum and Coal Products 2,903,096 9 2,696,094 9 -7 7,182,966 11 13,412,521 6 8720 Food Products 13,379,732 3 12,599,164 3 -6 15,500,586 5 12,985,223 7 -1636 Electronic/Electrical Equipment 6,388,084 5 9,198,379 5 44 9,753,848 10 12,965,621 8 3337 Transportation Equipment 2,946,421 8 2,924,418 8 -1 10,587,215 8 10,566,627 9 -0.233 Primary Metals 5,371,020 7 5,595,277 7 4 10,284,511 9 9,746,037 10 -5
5169 Chemical Wholesalers 41,943 19 15,554 19 -63 12,188,355 6 6,210,109 11 -4930 Rubber and Plastics Products 1,438,410 11 1,541,826 11 7 6,451,889 12 6,112,471 12 -535 Industrial Machinery 1,918,244 10 1,793,172 10 -7 3,272,817 14 3,142,897 13 -439 Misc. Manufacturing Industries 736,120 13 641,447 14 -13 2,455,220 16 2,654,292 14 827 Printing and Publishing 321,441 16 428,633 15 33 2,075,811 18 2,603,275 15 25
38 Measurement/Photographic Instruments 284,109 17 253,945 17 -11 2,466,135 15 2,367,409 16 -425 Furniture and Fixtures 15,208 20 14,490 20 -5 2,315,501 17 2,230,209 17 -432 Stone/Clay/Glass Products 944,992 12 955,504 12 1 3,989,058 13 1,774,517 18 -5624 Lumber and Wood Products 132,125 18 169,210 18 28 1,259,767 20 1,106,598 19 -1222 Textile Mill Products 453,349 15 345,620 16 -24 1,326,208 19 1,087,415 20 -18
23 Apparel and Other Textile Products 8,807 22 8,442 22 -4 38,993 21 60,693 21 56491/493 Electric Utilities 4,332 23 3,981 23 -8 20,475 23 26,786 22 31
31 Leather Products 12,298 21 10,043 21 -18 31,814 22 24,143 23 -2421 Tobacco Products 95 24 35 24 -63 822 24 579 24 -3012 Coal Mining 0 25 0 25 -- 0 25 0 25 --
Total 132,566,664 131,550,296 -1 646,163,089 579,543,929 -10
* Multiple SIC codes reported only in TRI.
Figure 6–9. Change in TRI Other Transfers for Further Management, by Industry, 1998–1999
0
50
100
150
200
250
300
1998 1999 1998 1999 1998 1999
Chemicals Hazardous WasteMgt./SolventRecovery
All Others
Mill
ions
of K
g Transfersto Energy Recovery
Transfersto Treatment
Transfersto Sewage
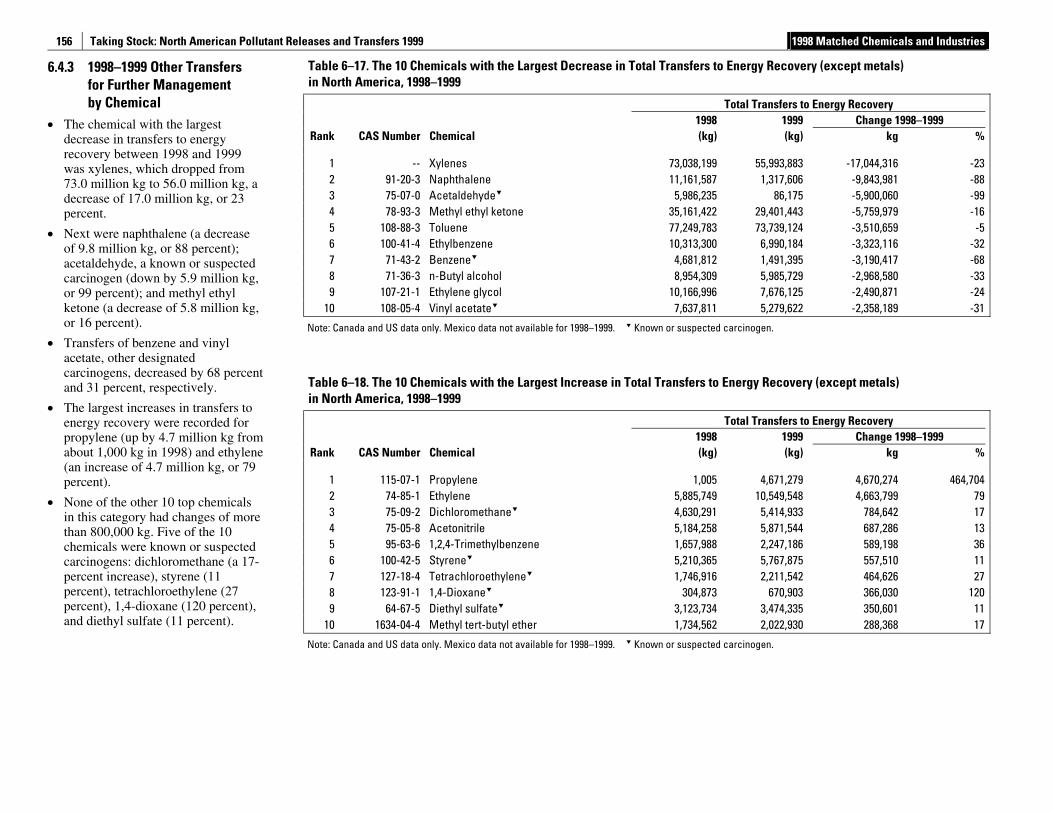
Taking Stock: North American Pollutant Releases and Transfers 1999 1998 Matched Chemicals and Industries
156
6.4.3 1998–1999 Other Transfers for Further Management by Chemical
• The chemical with the largest decrease in transfers to energy recovery between 1998 and 1999 was xylenes, which dropped from 73.0 million kg to 56.0 million kg, a decrease of 17.0 million kg, or 23 percent.
• Next were naphthalene (a decrease of 9.8 million kg, or 88 percent); acetaldehyde, a known or suspected carcinogen (down by 5.9 million kg, or 99 percent); and methyl ethyl ketone (a decrease of 5.8 million kg, or 16 percent).
• Transfers of benzene and vinyl acetate, other designated carcinogens, decreased by 68 percent and 31 percent, respectively.
• The largest increases in transfers to energy recovery were recorded for propylene (up by 4.7 million kg from about 1,000 kg in 1998) and ethylene (an increase of 4.7 million kg, or 79 percent).
• None of the other 10 top chemicals in this category had changes of more than 800,000 kg. Five of the 10 chemicals were known or suspected carcinogens: dichloromethane (a 17-percent increase), styrene (11 percent), tetrachloroethylene (27 percent), 1,4-dioxane (120 percent), and diethyl sulfate (11 percent).
Table 6–17. The 10 Chemicals with the Largest Decrease in Total Transfers to Energy Recovery (except metals) in North America, 1998–1999
Total Transfers to Energy Recovery 1998 1999 Change 1998–1999
Rank CAS Number Chemical (kg) (kg) kg %
1 -- Xylenes 73,038,199 55,993,883 -17,044,316 -23 2 91-20-3 Naphthalene 11,161,587 1,317,606 -9,843,981 -88 3 75-07-0 Acetaldehyde 5,986,235 86,175 -5,900,060 -99 4 78-93-3 Methyl ethyl ketone 35,161,422 29,401,443 -5,759,979 -16 5 108-88-3 Toluene 77,249,783 73,739,124 -3,510,659 -5 6 100-41-4 Ethylbenzene 10,313,300 6,990,184 -3,323,116 -32 7 71-43-2 Benzene 4,681,812 1,491,395 -3,190,417 -68 8 71-36-3 n-Butyl alcohol 8,954,309 5,985,729 -2,968,580 -33 9 107-21-1 Ethylene glycol 10,166,996 7,676,125 -2,490,871 -24
10 108-05-4 Vinyl acetate 7,637,811 5,279,622 -2,358,189 -31
Note: Canada and US data only. Mexico data not available for 1998–1999. Known or suspected carcinogen.
Table 6–18. The 10 Chemicals with the Largest Increase in Total Transfers to Energy Recovery (except metals) in North America, 1998–1999
Total Transfers to Energy Recovery 1998 1999 Change 1998–1999
Rank CAS Number Chemical (kg) (kg) kg %
1 115-07-1 Propylene 1,005 4,671,279 4,670,274 464,704 2 74-85-1 Ethylene 5,885,749 10,549,548 4,663,799 79 3 75-09-2 Dichloromethane 4,630,291 5,414,933 784,642 17 4 75-05-8 Acetonitrile 5,184,258 5,871,544 687,286 13 5 95-63-6 1,2,4-Trimethylbenzene 1,657,988 2,247,186 589,198 36 6 100-42-5 Styrene 5,210,365 5,767,875 557,510 11 7 127-18-4 Tetrachloroethylene 1,746,916 2,211,542 464,626 27 8 123-91-1 1,4-Dioxane 304,873 670,903 366,030 120 9 64-67-5 Diethyl sulfate 3,123,734 3,474,335 350,601 11
10 1634-04-4 Methyl tert-butyl ether 1,734,562 2,022,930 288,368 17
Note: Canada and US data only. Mexico data not available for 1998–1999. Known or suspected carcinogen.
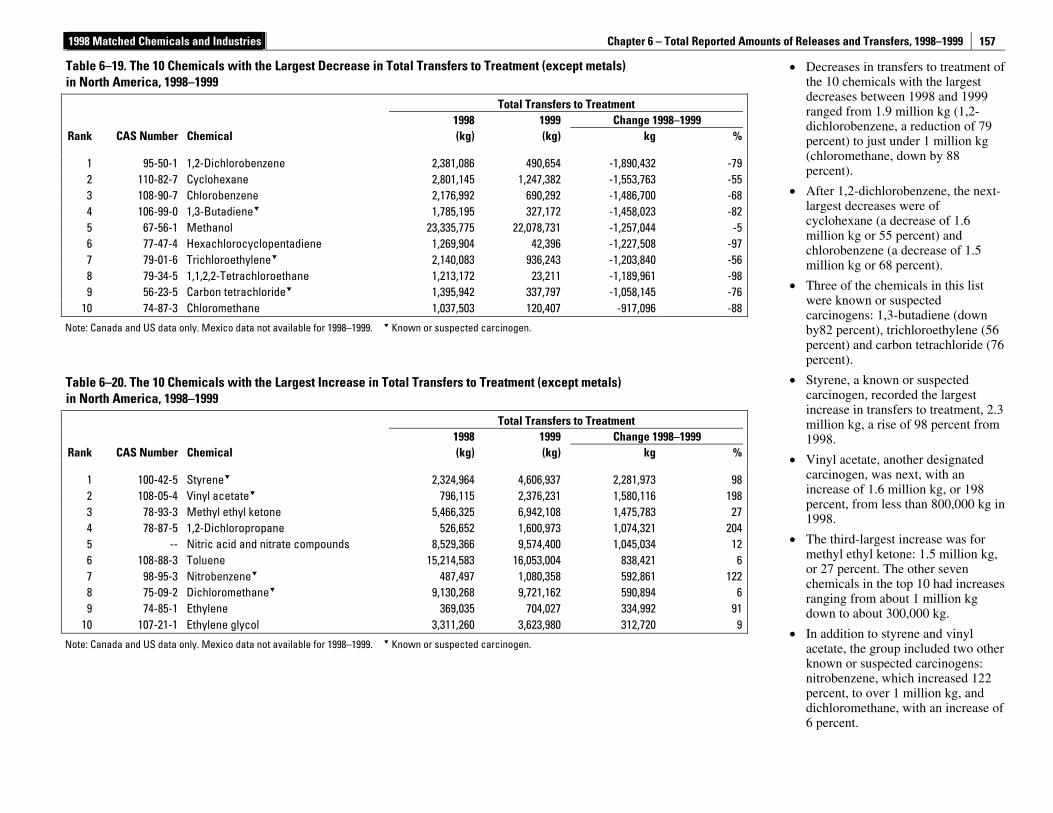
1998 Matched Chemicals and Industries Chapter 6 – Total Reported Amounts of Releases and Transfers, 1998–1999
157
• Decreases in transfers to treatment of the 10 chemicals with the largest decreases between 1998 and 1999 ranged from 1.9 million kg (1,2-dichlorobenzene, a reduction of 79 percent) to just under 1 million kg (chloromethane, down by 88 percent).
• After 1,2-dichlorobenzene, the next-largest decreases were of cyclohexane (a decrease of 1.6 million kg or 55 percent) and chlorobenzene (a decrease of 1.5 million kg or 68 percent).
• Three of the chemicals in this list were known or suspected carcinogens: 1,3-butadiene (down by82 percent), trichloroethylene (56 percent) and carbon tetrachloride (76 percent).
• Styrene, a known or suspected carcinogen, recorded the largest increase in transfers to treatment, 2.3 million kg, a rise of 98 percent from 1998.
• Vinyl acetate, another designated carcinogen, was next, with an increase of 1.6 million kg, or 198 percent, from less than 800,000 kg in 1998.
• The third-largest increase was for methyl ethyl ketone: 1.5 million kg, or 27 percent. The other seven chemicals in the top 10 had increases ranging from about 1 million kg down to about 300,000 kg.
• In addition to styrene and vinyl acetate, the group included two other known or suspected carcinogens: nitrobenzene, which increased 122 percent, to over 1 million kg, and dichloromethane, with an increase of 6 percent.
Table 6–19. The 10 Chemicals with the Largest Decrease in Total Transfers to Treatment (except metals) in North America, 1998–1999
Total Transfers to Treatment 1998 1999 Change 1998–1999
Rank CAS Number Chemical (kg) (kg) kg %
1 95-50-1 1,2-Dichlorobenzene 2,381,086 490,654 -1,890,432 -792 110-82-7 Cyclohexane 2,801,145 1,247,382 -1,553,763 -553 108-90-7 Chlorobenzene 2,176,992 690,292 -1,486,700 -684 106-99-0 1,3-Butadiene 1,785,195 327,172 -1,458,023 -825 67-56-1 Methanol 23,335,775 22,078,731 -1,257,044 -56 77-47-4 Hexachlorocyclopentadiene 1,269,904 42,396 -1,227,508 -977 79-01-6 Trichloroethylene 2,140,083 936,243 -1,203,840 -568 79-34-5 1,1,2,2-Tetrachloroethane 1,213,172 23,211 -1,189,961 -989 56-23-5 Carbon tetrachloride 1,395,942 337,797 -1,058,145 -76
10 74-87-3 Chloromethane 1,037,503 120,407 -917,096 -88
Note: Canada and US data only. Mexico data not available for 1998–1999. Known or suspected carcinogen.
Table 6–20. The 10 Chemicals with the Largest Increase in Total Transfers to Treatment (except metals) in North America, 1998–1999
Total Transfers to Treatment 1998 1999 Change 1998–1999
Rank CAS Number Chemical (kg) (kg) kg %
1 100-42-5 Styrene 2,324,964 4,606,937 2,281,973 982 108-05-4 Vinyl acetate 796,115 2,376,231 1,580,116 1983 78-93-3 Methyl ethyl ketone 5,466,325 6,942,108 1,475,783 274 78-87-5 1,2-Dichloropropane 526,652 1,600,973 1,074,321 2045 -- Nitric acid and nitrate compounds 8,529,366 9,574,400 1,045,034 126 108-88-3 Toluene 15,214,583 16,053,004 838,421 67 98-95-3 Nitrobenzene 487,497 1,080,358 592,861 1228 75-09-2 Dichloromethane 9,130,268 9,721,162 590,894 69 74-85-1 Ethylene 369,035 704,027 334,992 91
10 107-21-1 Ethylene glycol 3,311,260 3,623,980 312,720 9
Note: Canada and US data only. Mexico data not available for 1998–1999. Known or suspected carcinogen.
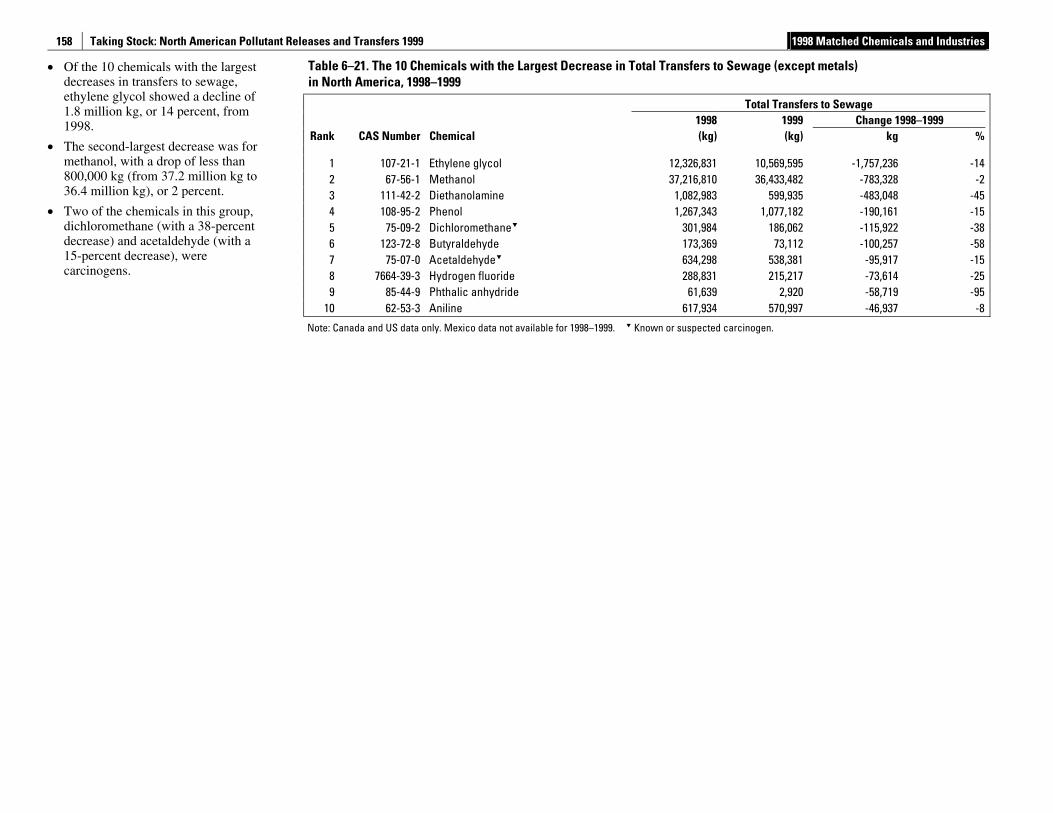
Taking Stock: North American Pollutant Releases and Transfers 1999 1998 Matched Chemicals and Industries
158
• Of the 10 chemicals with the largest decreases in transfers to sewage, ethylene glycol showed a decline of 1.8 million kg, or 14 percent, from 1998.
• The second-largest decrease was for methanol, with a drop of less than 800,000 kg (from 37.2 million kg to 36.4 million kg), or 2 percent.
• Two of the chemicals in this group, dichloromethane (with a 38-percent decrease) and acetaldehyde (with a 15-percent decrease), were carcinogens.
Table 6–21. The 10 Chemicals with the Largest Decrease in Total Transfers to Sewage (except metals) in North America, 1998–1999
Total Transfers to Sewage 1998 1999 Change 1998–1999
Rank CAS Number Chemical (kg) (kg) kg %
1 107-21-1 Ethylene glycol 12,326,831 10,569,595 -1,757,236 -14 2 67-56-1 Methanol 37,216,810 36,433,482 -783,328 -2 3 111-42-2 Diethanolamine 1,082,983 599,935 -483,048 -45 4 108-95-2 Phenol 1,267,343 1,077,182 -190,161 -15 5 75-09-2 Dichloromethane 301,984 186,062 -115,922 -38 6 123-72-8 Butyraldehyde 173,369 73,112 -100,257 -58 7 75-07-0 Acetaldehyde 634,298 538,381 -95,917 -15 8 7664-39-3 Hydrogen fluoride 288,831 215,217 -73,614 -25 9 85-44-9 Phthalic anhydride 61,639 2,920 -58,719 -95
10 62-53-3 Aniline 617,934 570,997 -46,937 -8
Note: Canada and US data only. Mexico data not available for 1998–1999. Known or suspected carcinogen.
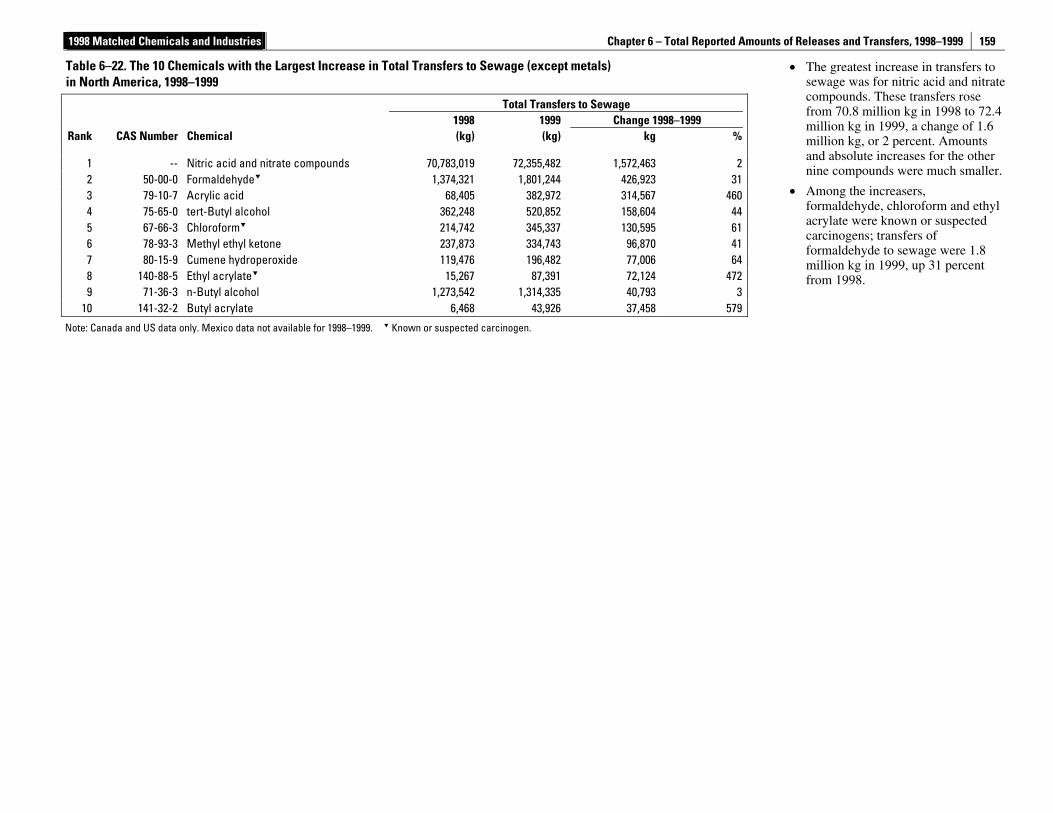
1998 Matched Chemicals and Industries Chapter 6 – Total Reported Amounts of Releases and Transfers, 1998–1999
159
• The greatest increase in transfers to sewage was for nitric acid and nitrate compounds. These transfers rose from 70.8 million kg in 1998 to 72.4 million kg in 1999, a change of 1.6 million kg, or 2 percent. Amounts and absolute increases for the other nine compounds were much smaller.
• Among the increasers, formaldehyde, chloroform and ethyl acrylate were known or suspected carcinogens; transfers of formaldehyde to sewage were 1.8 million kg in 1999, up 31 percent from 1998.
Table 6–22. The 10 Chemicals with the Largest Increase in Total Transfers to Sewage (except metals) in North America, 1998–1999
Total Transfers to Sewage 1998 1999 Change 1998–1999
Rank CAS Number Chemical (kg) (kg) kg %
1 -- Nitric acid and nitrate compounds 70,783,019 72,355,482 1,572,463 22 50-00-0 Formaldehyde 1,374,321 1,801,244 426,923 313 79-10-7 Acrylic acid 68,405 382,972 314,567 4604 75-65-0 tert-Butyl alcohol 362,248 520,852 158,604 445 67-66-3 Chloroform 214,742 345,337 130,595 616 78-93-3 Methyl ethyl ketone 237,873 334,743 96,870 417 80-15-9 Cumene hydroperoxide 119,476 196,482 77,006 648 140-88-5 Ethyl acrylate 15,267 87,391 72,124 4729 71-36-3 n-Butyl alcohol 1,273,542 1,314,335 40,793 3
10 141-32-2 Butyl acrylate 6,468 43,926 37,458 579
Note: Canada and US data only. Mexico data not available for 1998–1999. Known or suspected carcinogen.
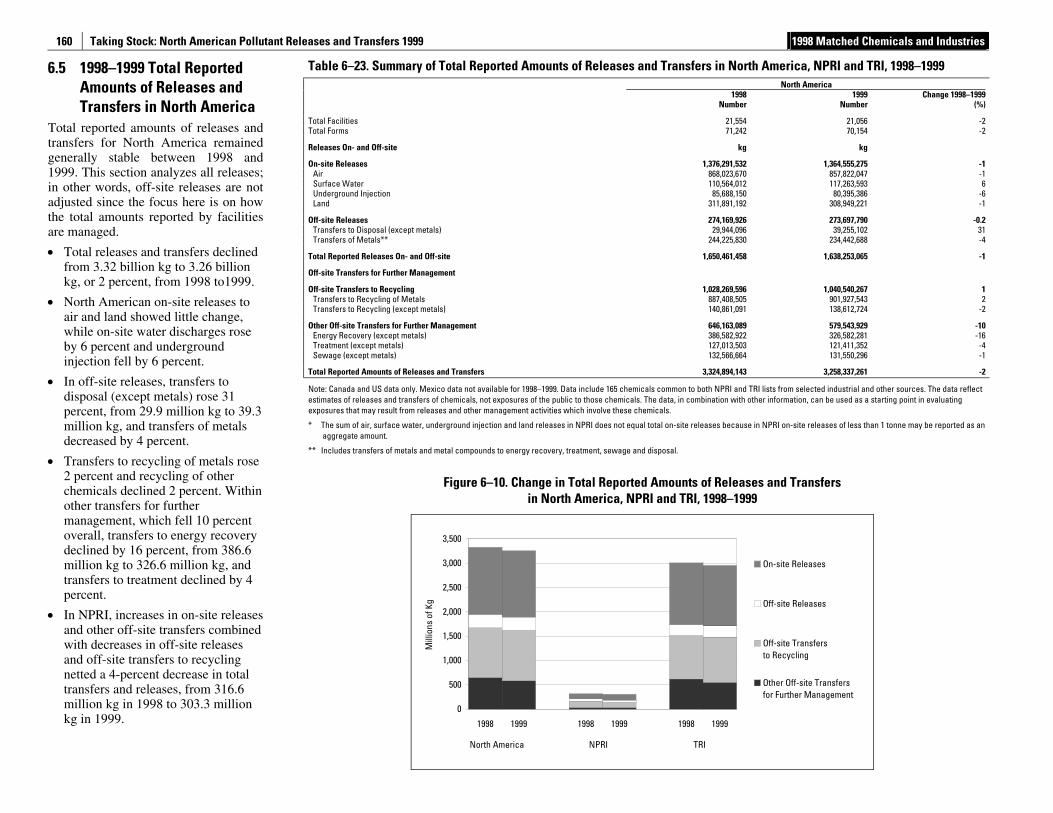
Taking Stock: North American Pollutant Releases and Transfers 1999 1998 Matched Chemicals and Industries
160
6.5 1998–1999 Total Reported Amounts of Releases and Transfers in North America
Total reported amounts of releases and transfers for North America remained generally stable between 1998 and 1999. This section analyzes all releases; in other words, off-site releases are not adjusted since the focus here is on how the total amounts reported by facilities are managed.
• Total releases and transfers declined from 3.32 billion kg to 3.26 billion kg, or 2 percent, from 1998 to1999.
• North American on-site releases to air and land showed little change, while on-site water discharges rose by 6 percent and underground injection fell by 6 percent.
• In off-site releases, transfers to disposal (except metals) rose 31 percent, from 29.9 million kg to 39.3 million kg, and transfers of metals decreased by 4 percent.
• Transfers to recycling of metals rose 2 percent and recycling of other chemicals declined 2 percent. Within other transfers for further management, which fell 10 percent overall, transfers to energy recovery declined by 16 percent, from 386.6 million kg to 326.6 million kg, and transfers to treatment declined by 4 percent.
• In NPRI, increases in on-site releases and other off-site transfers combined with decreases in off-site releases and off-site transfers to recycling netted a 4-percent decrease in total transfers and releases, from 316.6 million kg in 1998 to 303.3 million kg in 1999.
Table 6–23. Summary of Total Reported Amounts of Releases and Transfers in North America, NPRI and TRI, 1998–1999 North America 1998 1999 Change 1998–1999 Number Number (%)
Total Facilities 21,554 21,056 -2 Total Forms 71,242 70,154 -2
Releases On- and Off-site kg kg
On-site Releases 1,376,291,532 1,364,555,275 -1 Air 868,023,670 857,822,047 -1 Surface Water 110,564,012 117,263,593 6 Underground Injection 85,688,150 80,395,386 -6 Land 311,891,192 308,949,221 -1
Off-site Releases 274,169,926 273,697,790 -0.2 Transfers to Disposal (except metals) 29,944,096 39,255,102 31 Transfers of Metals** 244,225,830 234,442,688 -4
Total Reported Releases On- and Off-site 1,650,461,458 1,638,253,065 -1
Off-site Transfers for Further Management
Off-site Transfers to Recycling 1,028,269,596 1,040,540,267 1 Transfers to Recycling of Metals 887,408,505 901,927,543 2 Transfers to Recycling (except metals) 140,861,091 138,612,724 -2
Other Off-site Transfers for Further Management 646,163,089 579,543,929 -10 Energy Recovery (except metals) 386,582,922 326,582,281 -16 Treatment (except metals) 127,013,503 121,411,352 -4 Sewage (except metals) 132,566,664 131,550,296 -1
Total Reported Amounts of Releases and Transfers 3,324,894,143 3,258,337,261 -2
Note: Canada and US data only. Mexico data not available for 1998–1999. Data include 165 chemicals common to both NPRI and TRI lists from selected industrial and other sources. The data reflect estimates of releases and transfers of chemicals, not exposures of the public to those chemicals. The data, in combination with other information, can be used as a starting point in evaluating exposures that may result from releases and other management activities which involve these chemicals.
* The sum of air, surface water, underground injection and land releases in NPRI does not equal total on-site releases because in NPRI on-site releases of less than 1 tonne may be reported as an aggregate amount.
** Includes transfers of metals and metal compounds to energy recovery, treatment, sewage and disposal.
Figure 6–10. Change in Total Reported Amounts of Releases and Transfers in North America, NPRI and TRI, 1998–1999
0
500
1,000
1,500
2,000
2,500
3,000
3,500
1998 1999 1998 1999 1998 1999
North America NPRI TRI
Mill
ions
of K
g
On-site Releases
Off-site Releases
Off-site Transfersto Recycling
Other Off-site Transfersfor Further Management
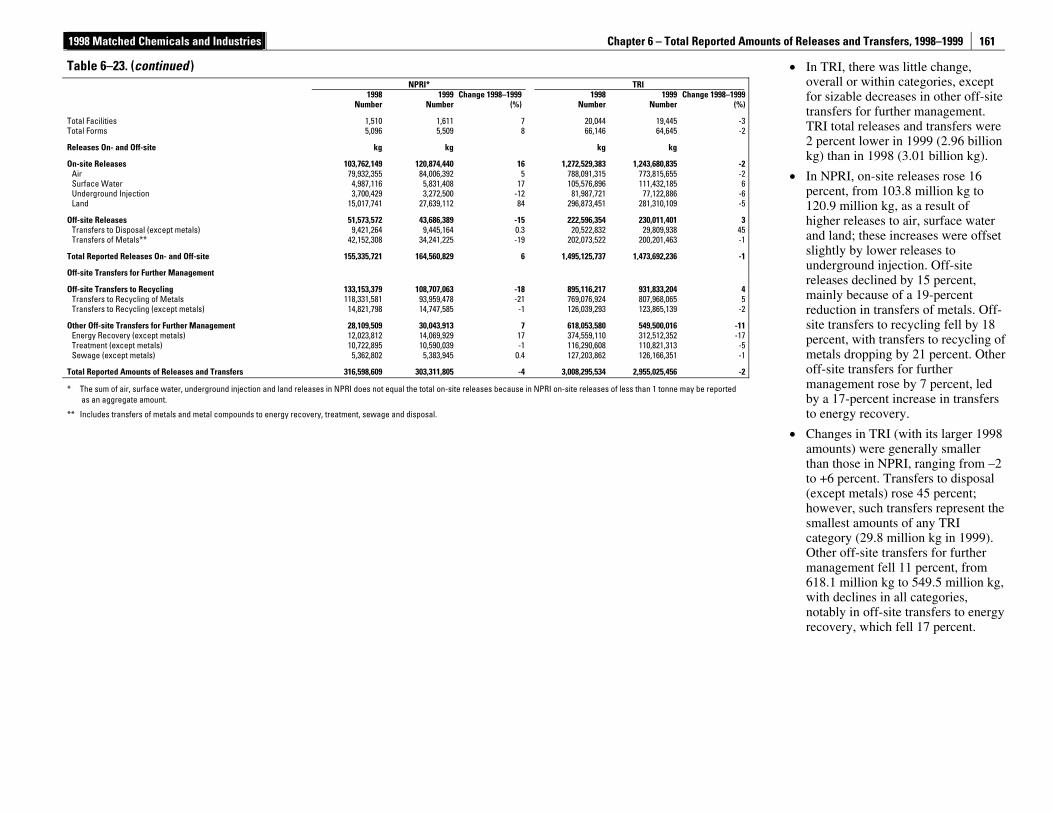
1998 Matched Chemicals and Industries Chapter 6 – Total Reported Amounts of Releases and Transfers, 1998–1999
161
• In TRI, there was little change, overall or within categories, except for sizable decreases in other off-site transfers for further management. TRI total releases and transfers were 2 percent lower in 1999 (2.96 billion kg) than in 1998 (3.01 billion kg).
• In NPRI, on-site releases rose 16 percent, from 103.8 million kg to 120.9 million kg, as a result of higher releases to air, surface water and land; these increases were offset slightly by lower releases to underground injection. Off-site releases declined by 15 percent, mainly because of a 19-percent reduction in transfers of metals. Off-site transfers to recycling fell by 18 percent, with transfers to recycling of metals dropping by 21 percent. Other off-site transfers for further management rose by 7 percent, led by a 17-percent increase in transfers to energy recovery.
• Changes in TRI (with its larger 1998 amounts) were generally smaller than those in NPRI, ranging from –2 to +6 percent. Transfers to disposal (except metals) rose 45 percent; however, such transfers represent the smallest amounts of any TRI category (29.8 million kg in 1999). Other off-site transfers for further management fell 11 percent, from 618.1 million kg to 549.5 million kg, with declines in all categories, notably in off-site transfers to energy recovery, which fell 17 percent.
Table 6–23. (continued ) NPRI* TRI 1998 1999 Change 1998–1999 1998 1999 Change 1998–1999 Number Number (%) Number Number (%)
Total Facilities 1,510 1,611 7 20,044 19,445 -3Total Forms 5,096 5,509 8 66,146 64,645 -2
Releases On- and Off-site kg kg kg kg
On-site Releases 103,762,149 120,874,440 16 1,272,529,383 1,243,680,835 -2Air 79,932,355 84,006,392 5 788,091,315 773,815,655 -2Surface Water 4,987,116 5,831,408 17 105,576,896 111,432,185 6Underground Injection 3,700,429 3,272,500 -12 81,987,721 77,122,886 -6Land 15,017,741 27,639,112 84 296,873,451 281,310,109 -5
Off-site Releases 51,573,572 43,686,389 -15 222,596,354 230,011,401 3Transfers to Disposal (except metals) 9,421,264 9,445,164 0.3 20,522,832 29,809,938 45Transfers of Metals** 42,152,308 34,241,225 -19 202,073,522 200,201,463 -1
Total Reported Releases On- and Off-site 155,335,721 164,560,829 6 1,495,125,737 1,473,692,236 -1
Off-site Transfers for Further Management
Off-site Transfers to Recycling 133,153,379 108,707,063 -18 895,116,217 931,833,204 4Transfers to Recycling of Metals 118,331,581 93,959,478 -21 769,076,924 807,968,065 5Transfers to Recycling (except metals) 14,821,798 14,747,585 -1 126,039,293 123,865,139 -2
Other Off-site Transfers for Further Management 28,109,509 30,043,913 7 618,053,580 549,500,016 -11Energy Recovery (except metals) 12,023,812 14,069,929 17 374,559,110 312,512,352 -17Treatment (except metals) 10,722,895 10,590,039 -1 116,290,608 110,821,313 -5Sewage (except metals) 5,362,802 5,383,945 0.4 127,203,862 126,166,351 -1
Total Reported Amounts of Releases and Transfers 316,598,609 303,311,805 -4 3,008,295,534 2,955,025,456 -2
* The sum of air, surface water, underground injection and land releases in NPRI does not equal the total on-site releases because in NPRI on-site releases of less than 1 tonne may be reported as an aggregate amount.
** Includes transfers of metals and metal compounds to energy recovery, treatment, sewage and disposal.
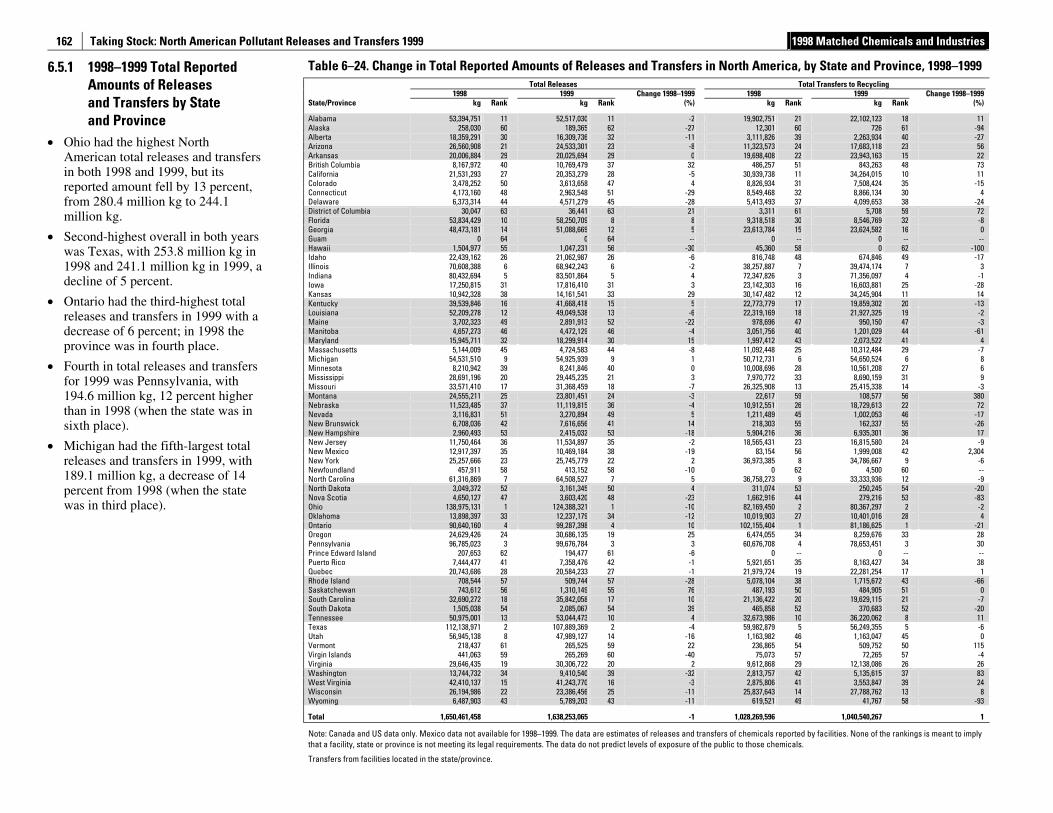
Taking Stock: North American Pollutant Releases and Transfers 1999 1998 Matched Chemicals and Industries
162
6.5.1 1998–1999 Total Reported Amounts of Releases and Transfers by State and Province
• Ohio had the highest North American total releases and transfers in both 1998 and 1999, but its reported amount fell by 13 percent, from 280.4 million kg to 244.1 million kg.
• Second-highest overall in both years was Texas, with 253.8 million kg in 1998 and 241.1 million kg in 1999, a decline of 5 percent.
• Ontario had the third-highest total releases and transfers in 1999 with a decrease of 6 percent; in 1998 the province was in fourth place.
• Fourth in total releases and transfers for 1999 was Pennsylvania, with 194.6 million kg, 12 percent higher than in 1998 (when the state was in sixth place).
• Michigan had the fifth-largest total releases and transfers in 1999, with 189.1 million kg, a decrease of 14 percent from 1998 (when the state was in third place).
Table 6–24. Change in Total Reported Amounts of Releases and Transfers in North America, by State and Province, 1998–1999 Total Releases Total Transfers to Recycling 1998 1999 Change 1998–1999 1998 1999 Change 1998–1999 State/Province kg Rank kg Rank (%) kg Rank kg Rank (%)
Alabama 53,394,751 11 52,517,030 11 -2 19,902,751 21 22,102,123 18 11 Alaska 258,030 60 189,365 62 -27 12,301 60 726 61 -94 Alberta 18,359,291 30 16,309,736 32 -11 3,111,826 39 2,263,934 40 -27 Arizona 26,560,908 21 24,533,301 23 -8 11,323,573 24 17,683,118 23 56 Arkansas 20,006,884 29 20,025,694 29 0 19,698,408 22 23,943,163 15 22 British Columbia 8,167,972 40 10,769,479 37 32 486,257 51 843,263 48 73 California 21,531,293 27 20,353,279 28 -5 30,939,738 11 34,264,015 10 11 Colorado 3,478,252 50 3,613,658 47 4 8,826,934 31 7,508,424 35 -15 Connecticut 4,173,160 48 2,963,548 51 -29 8,549,468 32 8,866,134 30 4 Delaware 6,373,314 44 4,571,279 45 -28 5,413,493 37 4,099,653 38 -24 District of Columbia 30,047 63 36,441 63 21 3,311 61 5,708 59 72 Florida 53,834,429 10 58,250,709 8 8 9,318,518 30 8,546,769 32 -8 Georgia 48,473,181 14 51,088,669 12 5 23,613,784 15 23,624,582 16 0 Guam 0 64 0 64 -- 0 -- 0 -- -- Hawaii 1,504,977 55 1,047,231 56 -30 45,360 58 0 62 -100 Idaho 22,439,162 26 21,062,987 26 -6 816,748 48 674,846 49 -17 Illinois 70,608,388 6 68,942,243 6 -2 38,257,887 7 39,474,174 7 3 Indiana 80,432,694 5 83,501,864 5 4 72,347,826 3 71,356,097 4 -1 Iowa 17,250,815 31 17,816,410 31 3 23,142,303 16 16,603,881 25 -28 Kansas 10,942,328 38 14,161,541 33 29 30,147,482 12 34,245,904 11 14 Kentucky 39,539,846 16 41,668,418 15 5 22,773,779 17 19,859,302 20 -13 Louisiana 52,209,278 12 49,049,538 13 -6 22,319,169 18 21,927,325 19 -2 Maine 3,702,323 49 2,891,913 52 -22 978,696 47 950,150 47 -3 Manitoba 4,657,273 46 4,472,129 46 -4 3,051,756 40 1,201,029 44 -61 Maryland 15,945,711 32 18,299,914 30 15 1,997,412 43 2,073,522 41 4 Massachusetts 5,144,009 45 4,724,583 44 -8 11,092,448 25 10,312,484 29 -7 Michigan 54,531,510 9 54,925,939 9 1 50,712,731 6 54,650,524 6 8 Minnesota 8,210,942 39 8,241,846 40 0 10,008,696 28 10,561,208 27 6 Mississippi 28,691,196 20 29,445,235 21 3 7,970,772 33 8,690,159 31 9 Missouri 33,571,410 17 31,368,459 18 -7 26,325,908 13 25,415,338 14 -3 Montana 24,555,211 25 23,801,451 24 -3 22,617 59 108,577 56 380 Nebraska 11,523,485 37 11,119,815 36 -4 10,912,551 26 18,729,613 22 72 Nevada 3,116,831 51 3,270,894 49 5 1,211,489 45 1,002,053 46 -17 New Brunswick 6,708,036 42 7,616,656 41 14 218,303 55 162,337 55 -26 New Hampshire 2,960,493 53 2,415,032 53 -18 5,904,216 36 6,935,301 36 17 New Jersey 11,750,464 36 11,534,897 35 -2 18,565,431 23 16,815,580 24 -9 New Mexico 12,917,397 35 10,469,184 38 -19 83,154 56 1,999,008 42 2,304 New York 25,257,666 23 25,745,779 22 2 36,973,385 8 34,786,667 9 -6 Newfoundland 457,911 58 413,152 58 -10 0 62 4,500 60 -- North Carolina 61,316,869 7 64,508,527 7 5 36,758,273 9 33,333,936 12 -9 North Dakota 3,049,372 52 3,161,345 50 4 311,074 53 250,245 54 -20 Nova Scotia 4,650,127 47 3,603,420 48 -23 1,662,916 44 279,216 53 -83 Ohio 138,975,131 1 124,388,321 1 -10 82,169,450 2 80,367,297 2 -2 Oklahoma 13,898,397 33 12,237,179 34 -12 10,019,903 27 10,401,016 28 4 Ontario 90,640,160 4 99,287,398 4 10 102,155,404 1 81,186,625 1 -21 Oregon 24,629,426 24 30,686,135 19 25 6,474,055 34 8,259,676 33 28 Pennsylvania 96,785,023 3 99,676,784 3 3 60,676,708 4 78,653,451 3 30 Prince Edward Island 207,653 62 194,477 61 -6 0 -- 0 -- -- Puerto Rico 7,444,477 41 7,358,476 42 -1 5,921,651 35 8,163,427 34 38 Quebec 20,743,686 28 20,584,233 27 -1 21,979,724 19 22,281,254 17 1 Rhode Island 708,544 57 509,744 57 -28 5,078,104 38 1,715,672 43 -66 Saskatchewan 743,612 56 1,310,149 55 76 487,193 50 484,905 51 0 South Carolina 32,690,272 18 35,842,058 17 10 21,136,422 20 19,629,115 21 -7 South Dakota 1,505,038 54 2,085,067 54 39 465,858 52 370,683 52 -20 Tennessee 50,975,001 13 53,044,473 10 4 32,673,986 10 36,220,062 8 11 Texas 112,138,971 2 107,889,369 2 -4 59,982,879 5 56,249,355 5 -6 Utah 56,945,138 8 47,989,127 14 -16 1,163,982 46 1,163,047 45 0 Vermont 218,437 61 265,525 59 22 236,865 54 509,752 50 115 Virgin Islands 441,063 59 265,269 60 -40 75,073 57 72,265 57 -4 Virginia 29,646,435 19 30,306,722 20 2 9,612,868 29 12,138,086 26 26 Washington 13,744,732 34 9,410,540 39 -32 2,813,757 42 5,135,615 37 83 West Virginia 42,410,137 15 41,243,770 16 -3 2,875,806 41 3,553,847 39 24 Wisconsin 26,194,986 22 23,386,456 25 -11 25,837,643 14 27,788,762 13 8 Wyoming 6,487,903 43 5,789,203 43 -11 619,521 49 41,767 58 -93
Total 1,650,461,458 1,638,253,065 -1 1,028,269,596 1,040,540,267 1
Note: Canada and US data only. Mexico data not available for 1998–1999. The data are estimates of releases and transfers of chemicals reported by facilities. None of the rankings is meant to imply that a facility, state or province is not meeting its legal requirements. The data do not predict levels of exposure of the public to those chemicals.
Transfers from facilities located in the state/province.
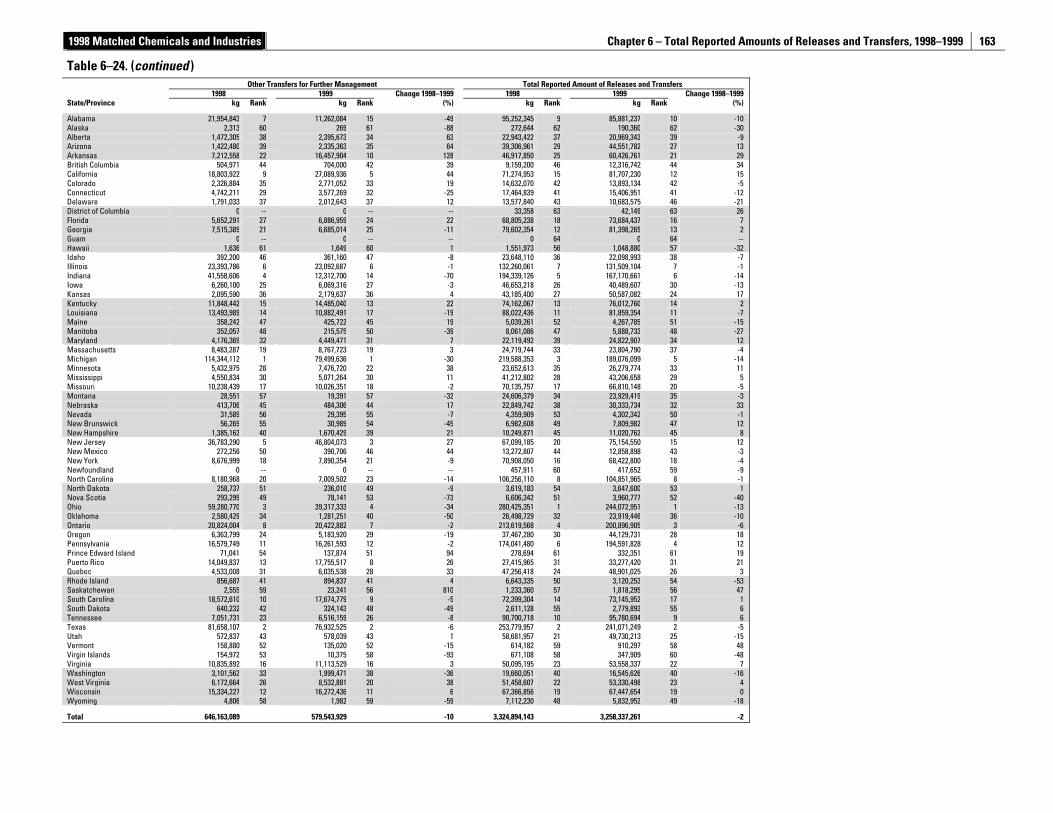
1998 Matched Chemicals and Industries Chapter 6 – Total Reported Amounts of Releases and Transfers, 1998–1999
163
Table 6–24. (continued ) Other Transfers for Further Management Total Reported Amount of Releases and Transfers 1998 1999 Change 1998–1999 1998 1999 Change 1998–1999 State/Province kg Rank kg Rank (%) kg Rank kg Rank (%)
Alabama 21,954,843 7 11,262,084 15 -49 95,252,345 9 85,881,237 10 -10 Alaska 2,313 60 269 61 -88 272,644 62 190,360 62 -30 Alberta 1,472,305 38 2,395,673 34 63 22,943,422 37 20,969,343 39 -9 Arizona 1,422,480 39 2,335,363 35 64 39,306,961 29 44,551,782 27 13 Arkansas 7,212,558 22 16,457,904 10 128 46,917,850 25 60,426,761 21 29 British Columbia 504,971 44 704,000 42 39 9,159,200 46 12,316,742 44 34 California 18,803,922 9 27,089,936 5 44 71,274,953 15 81,707,230 12 15 Colorado 2,326,884 35 2,771,052 33 19 14,632,070 42 13,893,134 42 -5 Connecticut 4,742,211 29 3,577,269 32 -25 17,464,839 41 15,406,951 41 -12 Delaware 1,791,033 37 2,012,643 37 12 13,577,840 43 10,683,575 46 -21 District of Columbia 0 -- 0 -- -- 33,358 63 42,149 63 26 Florida 5,652,291 27 6,886,959 24 22 68,805,238 18 73,684,437 16 7 Georgia 7,515,389 21 6,685,014 25 -11 79,602,354 12 81,398,265 13 2 Guam 0 -- 0 -- -- 0 64 0 64 -- Hawaii 1,636 61 1,649 60 1 1,551,973 56 1,048,880 57 -32 Idaho 392,200 46 361,160 47 -8 23,648,110 36 22,098,993 38 -7 Illinois 23,393,786 6 23,092,687 6 -1 132,260,061 7 131,509,104 7 -1 Indiana 41,558,606 4 12,312,700 14 -70 194,339,126 5 167,170,661 6 -14 Iowa 6,260,100 25 6,069,316 27 -3 46,653,218 26 40,489,607 30 -13 Kansas 2,095,590 36 2,179,637 36 4 43,185,400 27 50,587,082 24 17 Kentucky 11,848,442 15 14,485,040 13 22 74,162,067 13 76,012,760 14 2 Louisiana 13,493,989 14 10,882,491 17 -19 88,022,436 11 81,859,354 11 -7 Maine 358,242 47 425,722 45 19 5,039,261 52 4,267,785 51 -15 Manitoba 352,057 48 215,575 50 -39 8,061,086 47 5,888,733 48 -27 Maryland 4,176,369 32 4,449,471 31 7 22,119,492 39 24,822,907 34 12 Massachusetts 8,483,287 19 8,767,723 19 3 24,719,744 33 23,804,790 37 -4 Michigan 114,344,112 1 79,499,636 1 -30 219,588,353 3 189,076,099 5 -14 Minnesota 5,432,975 28 7,476,720 22 38 23,652,613 35 26,279,774 33 11 Mississippi 4,550,834 30 5,071,264 30 11 41,212,802 28 43,206,658 29 5 Missouri 10,238,439 17 10,026,351 18 -2 70,135,757 17 66,810,148 20 -5 Montana 28,551 57 19,391 57 -32 24,606,379 34 23,929,419 35 -3 Nebraska 413,706 45 484,306 44 17 22,849,742 38 30,333,734 32 33 Nevada 31,589 56 29,395 55 -7 4,359,909 53 4,302,342 50 -1 New Brunswick 56,269 55 30,989 54 -45 6,982,608 49 7,809,982 47 12 New Hampshire 1,385,162 40 1,670,429 39 21 10,249,871 45 11,020,762 45 8 New Jersey 36,783,290 5 46,804,073 3 27 67,099,185 20 75,154,550 15 12 New Mexico 272,256 50 390,706 46 44 13,272,807 44 12,858,898 43 -3 New York 8,676,999 18 7,890,354 21 -9 70,908,050 16 68,422,800 18 -4 Newfoundland 0 -- 0 -- -- 457,911 60 417,652 59 -9 North Carolina 8,180,968 20 7,009,502 23 -14 106,256,110 8 104,851,965 8 -1 North Dakota 258,737 51 236,010 49 -9 3,619,183 54 3,647,600 53 1 Nova Scotia 293,299 49 78,141 53 -73 6,606,342 51 3,960,777 52 -40 Ohio 59,280,770 3 39,317,333 4 -34 280,425,351 1 244,072,951 1 -13 Oklahoma 2,580,429 34 1,281,251 40 -50 26,498,729 32 23,919,446 36 -10 Ontario 20,824,004 8 20,422,882 7 -2 213,619,568 4 200,896,905 3 -6 Oregon 6,363,799 24 5,183,920 29 -19 37,467,280 30 44,129,731 28 18 Pennsylvania 16,579,749 11 16,261,593 12 -2 174,041,480 6 194,591,828 4 12 Prince Edward Island 71,041 54 137,874 51 94 278,694 61 332,351 61 19 Puerto Rico 14,049,837 13 17,755,517 8 26 27,415,965 31 33,277,420 31 21 Quebec 4,533,008 31 6,035,538 28 33 47,256,418 24 48,901,025 26 3 Rhode Island 856,687 41 894,837 41 4 6,643,335 50 3,120,253 54 -53 Saskatchewan 2,555 59 23,241 56 810 1,233,360 57 1,818,295 56 47 South Carolina 18,572,610 10 17,674,779 9 -5 72,399,304 14 73,145,952 17 1 South Dakota 640,232 42 324,143 48 -49 2,611,128 55 2,779,893 55 6 Tennessee 7,051,731 23 6,516,159 26 -8 90,700,718 10 95,780,694 9 6 Texas 81,658,107 2 76,932,525 2 -6 253,779,957 2 241,071,249 2 -5 Utah 572,837 43 578,039 43 1 58,681,957 21 49,730,213 25 -15 Vermont 158,880 52 135,020 52 -15 614,182 59 910,297 58 48 Virgin Islands 154,972 53 10,375 58 -93 671,108 58 347,909 60 -48 Virginia 10,835,892 16 11,113,529 16 3 50,095,195 23 53,558,337 22 7 Washington 3,101,562 33 1,999,471 38 -36 19,660,051 40 16,545,626 40 -16 West Virginia 6,172,664 26 8,532,881 20 38 51,458,607 22 53,330,498 23 4 Wisconsin 15,334,227 12 16,272,436 11 6 67,366,856 19 67,447,654 19 0 Wyoming 4,806 58 1,982 59 -59 7,112,230 48 5,832,952 49 -18
Total 646,163,089 579,543,929 -10 3,324,894,143 3,258,337,261 -2
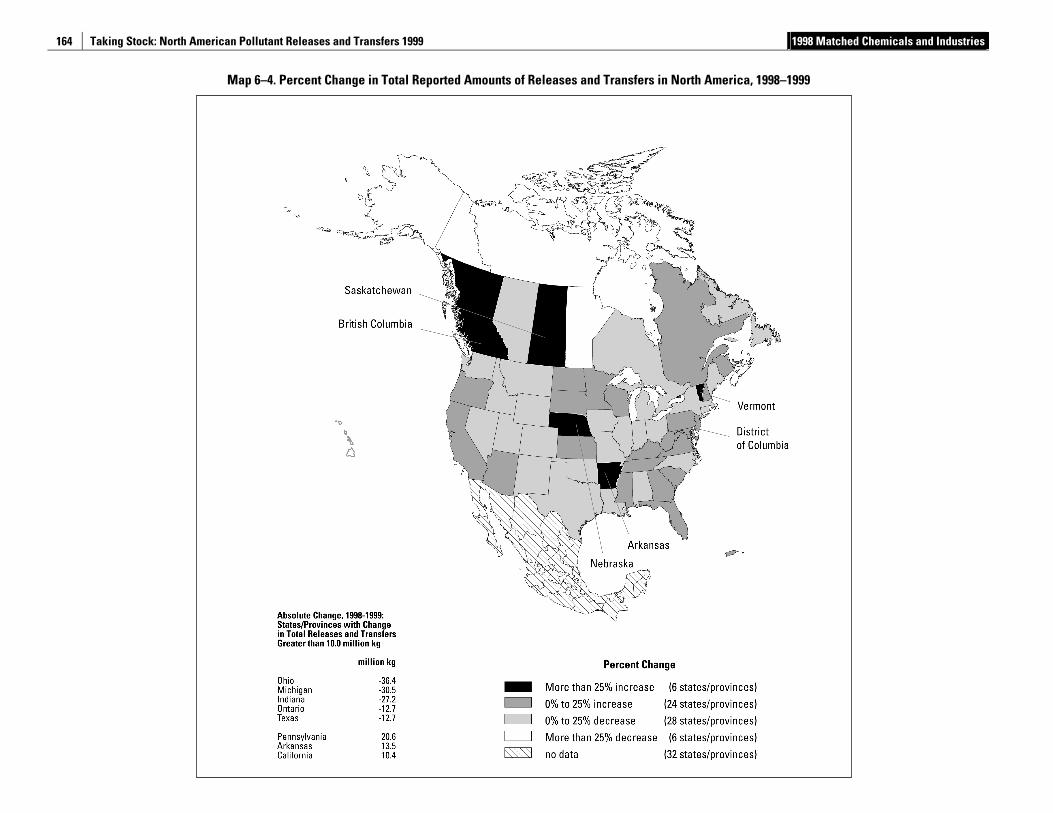
Taking Stock: North American Pollutant Releases and Transfers 1999 1998 Matched Chemicals and Industries
164
Map 6–4. Percent Change in Total Reported Amounts of Releases and Transfers in North America, 1998–1999
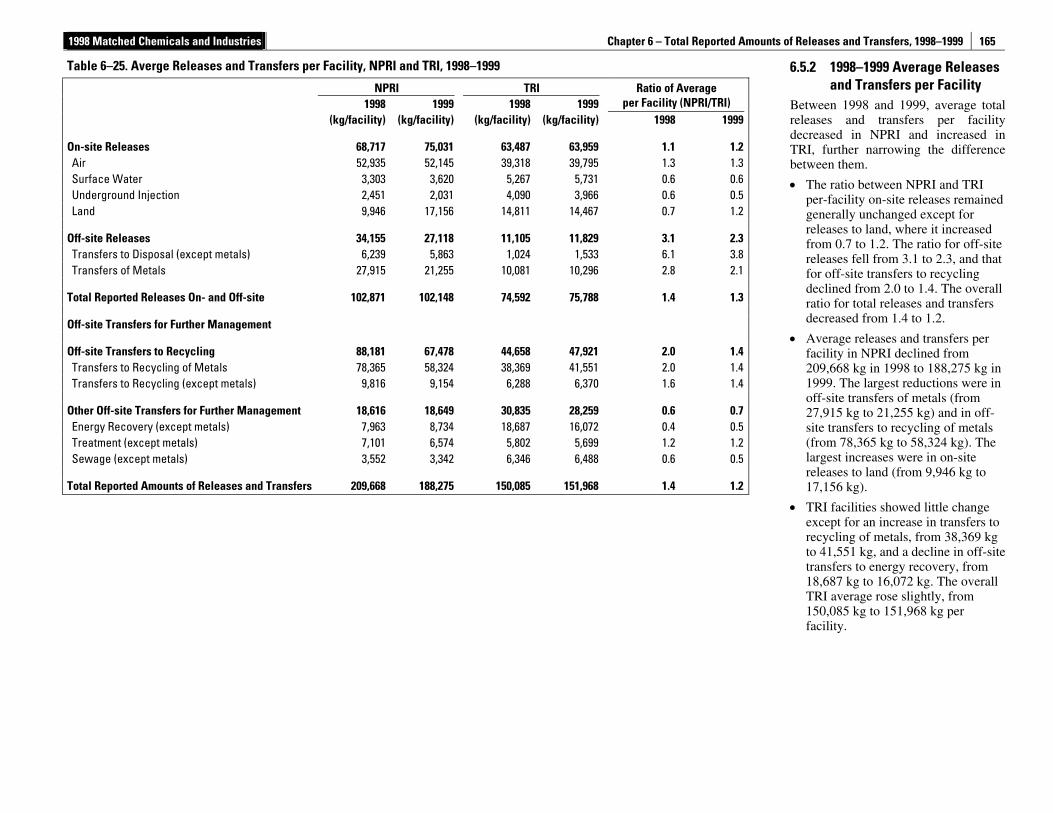
1998 Matched Chemicals and Industries Chapter 6 – Total Reported Amounts of Releases and Transfers, 1998–1999
165
6.5.2 1998–1999 Average Releases and Transfers per Facility
Between 1998 and 1999, average total releases and transfers per facility decreased in NPRI and increased in TRI, further narrowing the difference between them.
• The ratio between NPRI and TRI per-facility on-site releases remained generally unchanged except for releases to land, where it increased from 0.7 to 1.2. The ratio for off-site releases fell from 3.1 to 2.3, and that for off-site transfers to recycling declined from 2.0 to 1.4. The overall ratio for total releases and transfers decreased from 1.4 to 1.2.
• Average releases and transfers per facility in NPRI declined from 209,668 kg in 1998 to 188,275 kg in 1999. The largest reductions were in off-site transfers of metals (from 27,915 kg to 21,255 kg) and in off-site transfers to recycling of metals (from 78,365 kg to 58,324 kg). The largest increases were in on-site releases to land (from 9,946 kg to 17,156 kg).
• TRI facilities showed little change except for an increase in transfers to recycling of metals, from 38,369 kg to 41,551 kg, and a decline in off-site transfers to energy recovery, from 18,687 kg to 16,072 kg. The overall TRI average rose slightly, from 150,085 kg to 151,968 kg per facility.
Table 6–25. Averge Releases and Transfers per Facility, NPRI and TRI, 1998–1999
NPRI TRI 1998 1999 1998 1999
Ratio of Average per Facility (NPRI/TRI)
(kg/facility) (kg/facility) (kg/facility) (kg/facility) 1998 1999
On-site Releases 68,717 75,031 63,487 63,959 1.1 1.2Air 52,935 52,145 39,318 39,795 1.3 1.3Surface Water 3,303 3,620 5,267 5,731 0.6 0.6Underground Injection 2,451 2,031 4,090 3,966 0.6 0.5Land 9,946 17,156 14,811 14,467 0.7 1.2
Off-site Releases 34,155 27,118 11,105 11,829 3.1 2.3Transfers to Disposal (except metals) 6,239 5,863 1,024 1,533 6.1 3.8Transfers of Metals 27,915 21,255 10,081 10,296 2.8 2.1
Total Reported Releases On- and Off-site 102,871 102,148 74,592 75,788 1.4 1.3
Off-site Transfers for Further Management
Off-site Transfers to Recycling 88,181 67,478 44,658 47,921 2.0 1.4Transfers to Recycling of Metals 78,365 58,324 38,369 41,551 2.0 1.4Transfers to Recycling (except metals) 9,816 9,154 6,288 6,370 1.6 1.4
Other Off-site Transfers for Further Management 18,616 18,649 30,835 28,259 0.6 0.7Energy Recovery (except metals) 7,963 8,734 18,687 16,072 0.4 0.5Treatment (except metals) 7,101 6,574 5,802 5,699 1.2 1.2Sewage (except metals) 3,552 3,342 6,346 6,488 0.6 0.5
Total Reported Amounts of Releases and Transfers 209,668 188,275 150,085 151,968 1.4 1.2
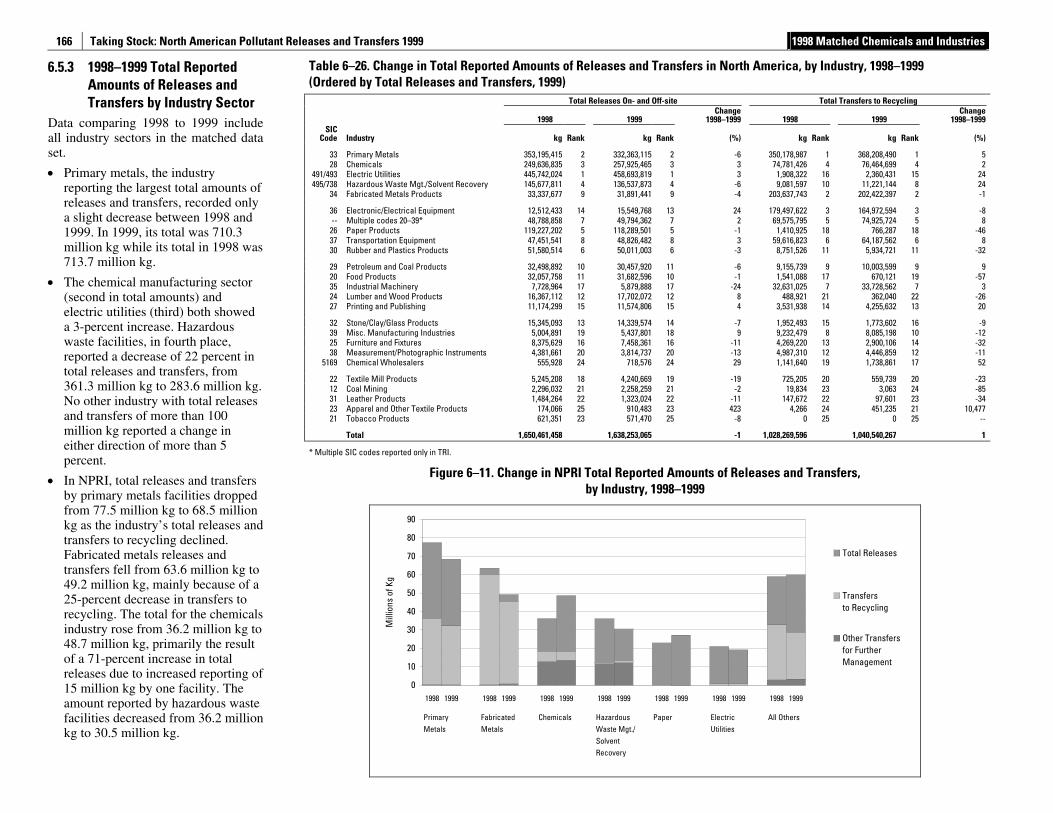
Taking Stock: North American Pollutant Releases and Transfers 1999 1998 Matched Chemicals and Industries
166
6.5.3 1998–1999 Total Reported Amounts of Releases and Transfers by Industry Sector
Data comparing 1998 to 1999 include all industry sectors in the matched data set.
• Primary metals, the industry reporting the largest total amounts of releases and transfers, recorded only a slight decrease between 1998 and 1999. In 1999, its total was 710.3 million kg while its total in 1998 was 713.7 million kg.
• The chemical manufacturing sector (second in total amounts) and electric utilities (third) both showed a 3-percent increase. Hazardous waste facilities, in fourth place, reported a decrease of 22 percent in total releases and transfers, from 361.3 million kg to 283.6 million kg. No other industry with total releases and transfers of more than 100 million kg reported a change in either direction of more than 5 percent.
• In NPRI, total releases and transfers by primary metals facilities dropped from 77.5 million kg to 68.5 million kg as the industry’s total releases and transfers to recycling declined. Fabricated metals releases and transfers fell from 63.6 million kg to 49.2 million kg, mainly because of a 25-percent decrease in transfers to recycling. The total for the chemicals industry rose from 36.2 million kg to 48.7 million kg, primarily the result of a 71-percent increase in total releases due to increased reporting of 15 million kg by one facility. The amount reported by hazardous waste facilities decreased from 36.2 million kg to 30.5 million kg.
Table 6–26. Change in Total Reported Amounts of Releases and Transfers in North America, by Industry, 1998–1999 (Ordered by Total Releases and Transfers, 1999)
Total Releases On- and Off-site Total Transfers to Recycling
1998 1999 Change
1998–1999 1998 1999 Change
1998–1999 SIC
Code Industry kg Rank kg Rank (%) kg Rank kg Rank (%)
33 Primary Metals 353,195,415 2 332,363,115 2 -6 350,178,987 1 368,208,490 1 5 28 Chemicals 249,636,835 3 257,925,465 3 3 74,781,426 4 76,464,699 4 2
491/493 Electric Utilities 445,742,024 1 458,693,819 1 3 1,908,322 16 2,360,431 15 24 495/738 Hazardous Waste Mgt./Solvent Recovery 145,677,811 4 136,537,873 4 -6 9,081,597 10 11,221,144 8 24
34 Fabricated Metals Products 33,337,677 9 31,891,441 9 -4 203,637,743 2 202,422,397 2 -1
36 Electronic/Electrical Equipment 12,512,433 14 15,549,768 13 24 179,497,622 3 164,972,594 3 -8 -- Multiple codes 20–39* 48,788,858 7 49,794,362 7 2 69,575,795 5 74,925,724 5 8
26 Paper Products 119,227,202 5 118,289,501 5 -1 1,410,925 18 766,287 18 -46 37 Transportation Equipment 47,451,541 8 48,826,482 8 3 59,616,823 6 64,187,562 6 8 30 Rubber and Plastics Products 51,580,514 6 50,011,003 6 -3 8,751,526 11 5,934,721 11 -32
29 Petroleum and Coal Products 32,498,892 10 30,457,920 11 -6 9,155,739 9 10,003,599 9 9 20 Food Products 32,057,758 11 31,682,596 10 -1 1,541,088 17 670,121 19 -57 35 Industrial Machinery 7,728,964 17 5,879,888 17 -24 32,631,025 7 33,728,562 7 3 24 Lumber and Wood Products 16,367,112 12 17,702,072 12 8 488,921 21 362,040 22 -26 27 Printing and Publishing 11,174,299 15 11,574,806 15 4 3,531,938 14 4,255,632 13 20
32 Stone/Clay/Glass Products 15,345,093 13 14,339,574 14 -7 1,952,493 15 1,773,602 16 -9 39 Misc. Manufacturing Industries 5,004,891 19 5,437,801 18 9 9,232,479 8 8,085,198 10 -12 25 Furniture and Fixtures 8,375,629 16 7,458,361 16 -11 4,269,220 13 2,900,106 14 -32 38 Measurement/Photographic Instruments 4,381,661 20 3,814,737 20 -13 4,987,310 12 4,446,859 12 -11
5169 Chemical Wholesalers 555,928 24 718,576 24 29 1,141,640 19 1,738,861 17 52
22 Textile Mill Products 5,245,208 18 4,240,669 19 -19 725,205 20 559,739 20 -23 12 Coal Mining 2,296,032 21 2,258,259 21 -2 19,834 23 3,063 24 -85 31 Leather Products 1,484,264 22 1,323,024 22 -11 147,672 22 97,601 23 -34 23 Apparel and Other Textile Products 174,066 25 910,483 23 423 4,266 24 451,235 21 10,477 21 Tobacco Products 621,351 23 571,470 25 -8 0 25 0 25 --
Total 1,650,461,458 1,638,253,065 -1 1,028,269,596 1,040,540,267 1
* Multiple SIC codes reported only in TRI.
Figure 6–11. Change in NPRI Total Reported Amounts of Releases and Transfers, by Industry, 1998–1999
0
10
20
30
40
50
60
70
80
90
1998 1999 1998 1999 1998 1999 1998 1999 1998 1999 1998 1999 1998 1999
PrimaryMetals
FabricatedMetals
Chemicals HazardousWaste Mgt./SolventRecovery
Paper ElectricUtilities
All Others
Mill
ions
of K
g
Total Releases
Transfersto Recycling
Other Transfersfor FurtherManagement
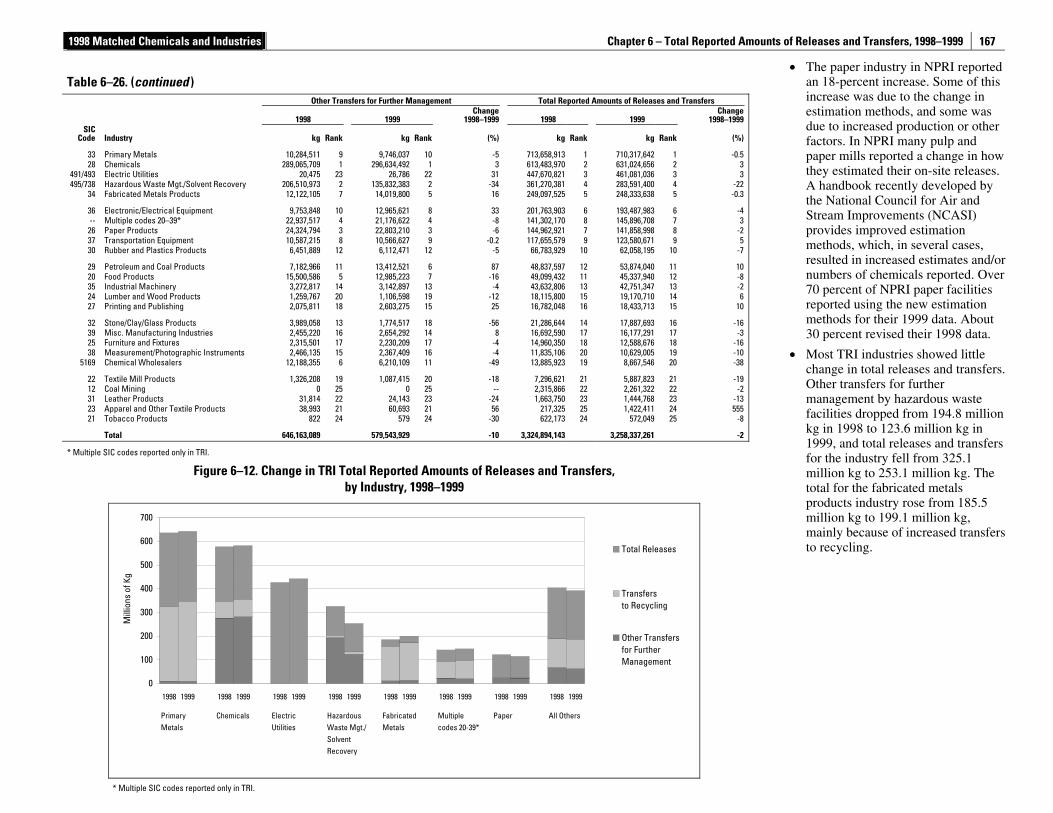
1998 Matched Chemicals and Industries Chapter 6 – Total Reported Amounts of Releases and Transfers, 1998–1999
167
• The paper industry in NPRI reported an 18-percent increase. Some of this increase was due to the change in estimation methods, and some was due to increased production or other factors. In NPRI many pulp and paper mills reported a change in how they estimated their on-site releases. A handbook recently developed by the National Council for Air and Stream Improvements (NCASI) provides improved estimation methods, which, in several cases, resulted in increased estimates and/or numbers of chemicals reported. Over 70 percent of NPRI paper facilities reported using the new estimation methods for their 1999 data. About 30 percent revised their 1998 data.
• Most TRI industries showed little change in total releases and transfers. Other transfers for further management by hazardous waste facilities dropped from 194.8 million kg in 1998 to 123.6 million kg in 1999, and total releases and transfers for the industry fell from 325.1 million kg to 253.1 million kg. The total for the fabricated metals products industry rose from 185.5 million kg to 199.1 million kg, mainly because of increased transfers to recycling.
Table 6–26. (continued )
Other Transfers for Further Management Total Reported Amounts of Releases and Transfers
1998 1999 Change
1998–1999 1998 1999 Change
1998–1999SIC
Code Industry kg Rank kg Rank (%) kg Rank kg Rank (%)
33 Primary Metals 10,284,511 9 9,746,037 10 -5 713,658,913 1 710,317,642 1 -0.528 Chemicals 289,065,709 1 296,634,492 1 3 613,483,970 2 631,024,656 2 3
491/493 Electric Utilities 20,475 23 26,786 22 31 447,670,821 3 461,081,036 3 3495/738 Hazardous Waste Mgt./Solvent Recovery 206,510,973 2 135,832,383 2 -34 361,270,381 4 283,591,400 4 -22
34 Fabricated Metals Products 12,122,105 7 14,019,800 5 16 249,097,525 5 248,333,638 5 -0.3
36 Electronic/Electrical Equipment 9,753,848 10 12,965,621 8 33 201,763,903 6 193,487,983 6 -4-- Multiple codes 20–39* 22,937,517 4 21,176,622 4 -8 141,302,170 8 145,896,708 7 3
26 Paper Products 24,324,794 3 22,803,210 3 -6 144,962,921 7 141,858,998 8 -237 Transportation Equipment 10,587,215 8 10,566,627 9 -0.2 117,655,579 9 123,580,671 9 530 Rubber and Plastics Products 6,451,889 12 6,112,471 12 -5 66,783,929 10 62,058,195 10 -7
29 Petroleum and Coal Products 7,182,966 11 13,412,521 6 87 48,837,597 12 53,874,040 11 1020 Food Products 15,500,586 5 12,985,223 7 -16 49,099,432 11 45,337,940 12 -835 Industrial Machinery 3,272,817 14 3,142,897 13 -4 43,632,806 13 42,751,347 13 -224 Lumber and Wood Products 1,259,767 20 1,106,598 19 -12 18,115,800 15 19,170,710 14 627 Printing and Publishing 2,075,811 18 2,603,275 15 25 16,782,048 16 18,433,713 15 10
32 Stone/Clay/Glass Products 3,989,058 13 1,774,517 18 -56 21,286,644 14 17,887,693 16 -1639 Misc. Manufacturing Industries 2,455,220 16 2,654,292 14 8 16,692,590 17 16,177,291 17 -325 Furniture and Fixtures 2,315,501 17 2,230,209 17 -4 14,960,350 18 12,588,676 18 -1638 Measurement/Photographic Instruments 2,466,135 15 2,367,409 16 -4 11,835,106 20 10,629,005 19 -10
5169 Chemical Wholesalers 12,188,355 6 6,210,109 11 -49 13,885,923 19 8,667,546 20 -38
22 Textile Mill Products 1,326,208 19 1,087,415 20 -18 7,296,621 21 5,887,823 21 -1912 Coal Mining 0 25 0 25 -- 2,315,866 22 2,261,322 22 -231 Leather Products 31,814 22 24,143 23 -24 1,663,750 23 1,444,768 23 -1323 Apparel and Other Textile Products 38,993 21 60,693 21 56 217,325 25 1,422,411 24 55521 Tobacco Products 822 24 579 24 -30 622,173 24 572,049 25 -8
Total 646,163,089 579,543,929 -10 3,324,894,143 3,258,337,261 -2
* Multiple SIC codes reported only in TRI.
Figure 6–12. Change in TRI Total Reported Amounts of Releases and Transfers, by Industry, 1998–1999
0
100
200
300
400
500
600
700
1998 1999 1998 1999 1998 1999 1998 1999 1998 1999 1998 1999 1998 1999 1998 1999
PrimaryMetals
Chemicals ElectricUtilities
HazardousWaste Mgt./SolventRecovery
FabricatedMetals
Multiplecodes 20-39*
Paper All Others
Mill
ions
of K
g
Total Releases
Transfersto Recycling
Other Transfersfor FurtherManagement
* Multiple SIC codes reported only in TRI.
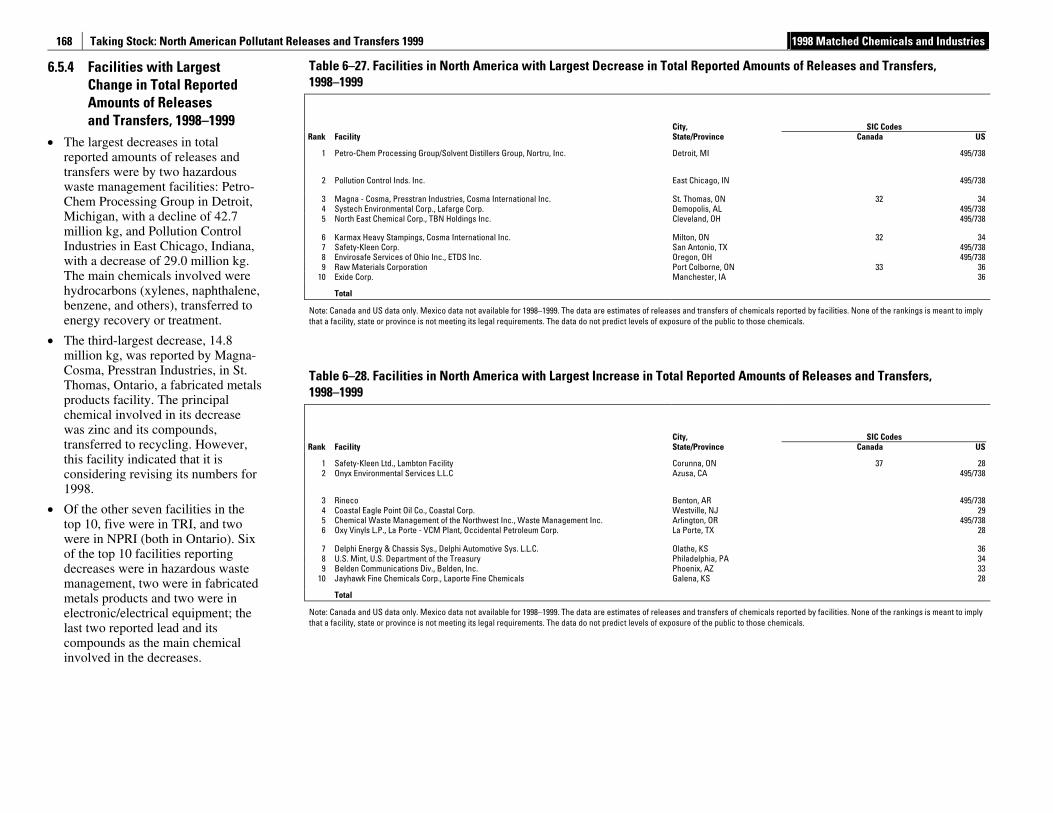
Taking Stock: North American Pollutant Releases and Transfers 1999 1998 Matched Chemicals and Industries
168
6.5.4 Facilities with Largest Change in Total Reported Amounts of Releases and Transfers, 1998–1999
• The largest decreases in total reported amounts of releases and transfers were by two hazardous waste management facilities: Petro-Chem Processing Group in Detroit, Michigan, with a decline of 42.7 million kg, and Pollution Control Industries in East Chicago, Indiana, with a decrease of 29.0 million kg. The main chemicals involved were hydrocarbons (xylenes, naphthalene, benzene, and others), transferred to energy recovery or treatment.
• The third-largest decrease, 14.8 million kg, was reported by Magna-Cosma, Presstran Industries, in St. Thomas, Ontario, a fabricated metals products facility. The principal chemical involved in its decrease was zinc and its compounds, transferred to recycling. However, this facility indicated that it is considering revising its numbers for 1998.
• Of the other seven facilities in the top 10, five were in TRI, and two were in NPRI (both in Ontario). Six of the top 10 facilities reporting decreases were in hazardous waste management, two were in fabricated metals products and two were in electronic/electrical equipment; the last two reported lead and its compounds as the main chemical involved in the decreases.
Table 6–27. Facilities in North America with Largest Decrease in Total Reported Amounts of Releases and Transfers, 1998–1999
City,
SIC Codes Rank Facility State/Province Canada US
1 Petro-Chem Processing Group/Solvent Distillers Group, Nortru, Inc. Detroit, MI 495/738
2 Pollution Control Inds. Inc. East Chicago, IN 495/738
3 Magna - Cosma, Presstran Industries, Cosma International Inc. St. Thomas, ON 32 34 4 Systech Environmental Corp., Lafarge Corp. Demopolis, AL 495/738 5 North East Chemical Corp., TBN Holdings Inc. Cleveland, OH 495/738
6 Karmax Heavy Stampings, Cosma International Inc. Milton, ON 32 34 7 Safety-Kleen Corp. San Antonio, TX 495/738 8 Envirosafe Services of Ohio Inc., ETDS Inc. Oregon, OH 495/738 9 Raw Materials Corporation Port Colborne, ON 33 36
10 Exide Corp. Manchester, IA 36
Total
Note: Canada and US data only. Mexico data not available for 1998–1999. The data are estimates of releases and transfers of chemicals reported by facilities. None of the rankings is meant to imply that a facility, state or province is not meeting its legal requirements. The data do not predict levels of exposure of the public to those chemicals.
Table 6–28. Facilities in North America with Largest Increase in Total Reported Amounts of Releases and Transfers, 1998–1999
City,
SIC Codes Rank Facility State/Province Canada US
1 Safety-Kleen Ltd., Lambton Facility Corunna, ON 37 28 2 Onyx Environmental Services L.L.C Azusa, CA 495/738
3 Rineco Benton, AR 495/738 4 Coastal Eagle Point Oil Co., Coastal Corp. Westville, NJ 29 5 Chemical Waste Management of the Northwest Inc., Waste Management Inc. Arlington, OR 495/738 6 Oxy Vinyls L.P., La Porte - VCM Plant, Occidental Petroleum Corp. La Porte, TX 28
7 Delphi Energy & Chassis Sys., Delphi Automotive Sys. L.L.C. Olathe, KS 36 8 U.S. Mint, U.S. Department of the Treasury Philadelphia, PA 34 9 Belden Communications Div., Belden, Inc. Phoenix, AZ 33
10 Jayhawk Fine Chemicals Corp., Laporte Fine Chemicals Galena, KS 28
Total
Note: Canada and US data only. Mexico data not available for 1998–1999. The data are estimates of releases and transfers of chemicals reported by facilities. None of the rankings is meant to imply that a facility, state or province is not meeting its legal requirements. The data do not predict levels of exposure of the public to those chemicals.
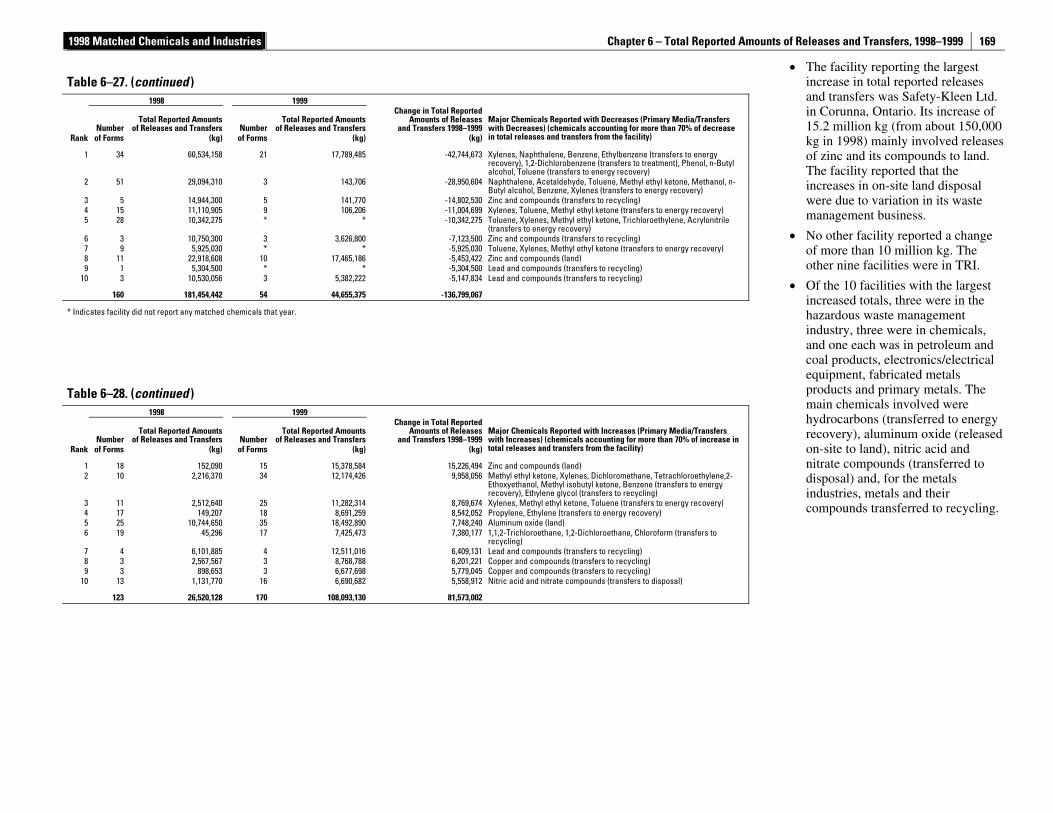
1998 Matched Chemicals and Industries Chapter 6 – Total Reported Amounts of Releases and Transfers, 1998–1999
169
• The facility reporting the largest increase in total reported releases and transfers was Safety-Kleen Ltd. in Corunna, Ontario. Its increase of 15.2 million kg (from about 150,000 kg in 1998) mainly involved releases of zinc and its compounds to land. The facility reported that the increases in on-site land disposal were due to variation in its waste management business.
• No other facility reported a change of more than 10 million kg. The other nine facilities were in TRI.
• Of the 10 facilities with the largest increased totals, three were in the hazardous waste management industry, three were in chemicals, and one each was in petroleum and coal products, electronics/electrical equipment, fabricated metals products and primary metals. The main chemicals involved were hydrocarbons (transferred to energy recovery), aluminum oxide (released on-site to land), nitric acid and nitrate compounds (transferred to disposal) and, for the metals industries, metals and their compounds transferred to recycling.
Table 6–27. (continued )
1998 1999
Number Total Reported Amounts
of Releases and Transfers Number Total Reported Amounts
of Releases and Transfers
Change in Total Reported Amounts of Releases
and Transfers 1998–1999Rank of Forms (kg) of Forms (kg) (kg)
Major Chemicals Reported with Decreases (Primary Media/Transfers with Decreases) (chemicals accounting for more than 70% of decrease in total releases and transfers from the facility)
1 34 60,534,158 21 17,789,485 -42,744,673 Xylenes, Naphthalene, Benzene, Ethylbenzene (transfers to energy recovery), 1,2-Dichlorobenzene (transfers to treatment), Phenol, n-Butyl alcohol, Toluene (transfers to energy recovery)
2 51 29,094,310 3 143,706 -28,950,604 Naphthalene, Acetaldehyde, Toluene, Methyl ethyl ketone, Methanol, n-Butyl alcohol, Benzene, Xylenes (transfers to energy recovery)
3 5 14,944,300 5 141,770 -14,802,530 Zinc and compounds (transfers to recycling) 4 15 11,110,905 9 106,206 -11,004,699 Xylenes, Toluene, Methyl ethyl ketone (transfers to energy recovery) 5 28 10,342,275 * * -10,342,275 Toluene, Xylenes, Methyl ethyl ketone, Trichloroethylene, Acrylonitrile
(transfers to energy recovery) 6 3 10,750,300 3 3,626,800 -7,123,500 Zinc and compounds (transfers to recycling) 7 9 5,925,030 * * -5,925,030 Toluene, Xylenes, Methyl ethyl ketone (transfers to energy recovery) 8 11 22,918,608 10 17,465,186 -5,453,422 Zinc and compounds (land) 9 1 5,304,500 * * -5,304,500 Lead and compounds (transfers to recycling)
10 3 10,530,056 3 5,382,222 -5,147,834 Lead and compounds (transfers to recycling)
160 181,454,442 54 44,655,375 -136,799,067
* Indicates facility did not report any matched chemicals that year.
Table 6–28. (continued )
1998 1999
Number Total Reported Amounts
of Releases and Transfers Number Total Reported Amounts
of Releases and Transfers
Change in Total Reported Amounts of Releases
and Transfers 1998–1999Rank of Forms (kg) of Forms (kg) (kg)
Major Chemicals Reported with Increases (Primary Media/Transfers with Increases) (chemicals accounting for more than 70% of increase in total releases and transfers from the facility)
1 18 152,090 15 15,378,584 15,226,494 Zinc and compounds (land) 2 10 2,216,370 34 12,174,426 9,958,056 Methyl ethyl ketone, Xylenes, Dichloromethane, Tetrachloroethylene,2-
Ethoxyethanol, Methyl isobutyl ketone, Benzene (transfers to energy recovery), Ethylene glycol (transfers to recycling)
3 11 2,512,640 25 11,282,314 8,769,674 Xylenes, Methyl ethyl ketone, Toluene (transfers to energy recovery) 4 17 149,207 18 8,691,259 8,542,052 Propylene, Ethylene (transfers to energy recovery) 5 25 10,744,650 35 18,492,890 7,748,240 Aluminum oxide (land) 6 19 45,296 17 7,425,473 7,380,177 1,1,2-Trichloroethane, 1,2-Dichloroethane, Chloroform (transfers to
recycling) 7 4 6,101,885 4 12,511,016 6,409,131 Lead and compounds (transfers to recycling) 8 3 2,567,567 3 8,768,788 6,201,221 Copper and compounds (transfers to recycling) 9 3 898,653 3 6,677,698 5,779,045 Copper and compounds (transfers to recycling)
10 13 1,131,770 16 6,690,682 5,558,912 Nitric acid and nitrate compounds (transfers to disposal)
123 26,520,128 170 108,093,130 81,573,002
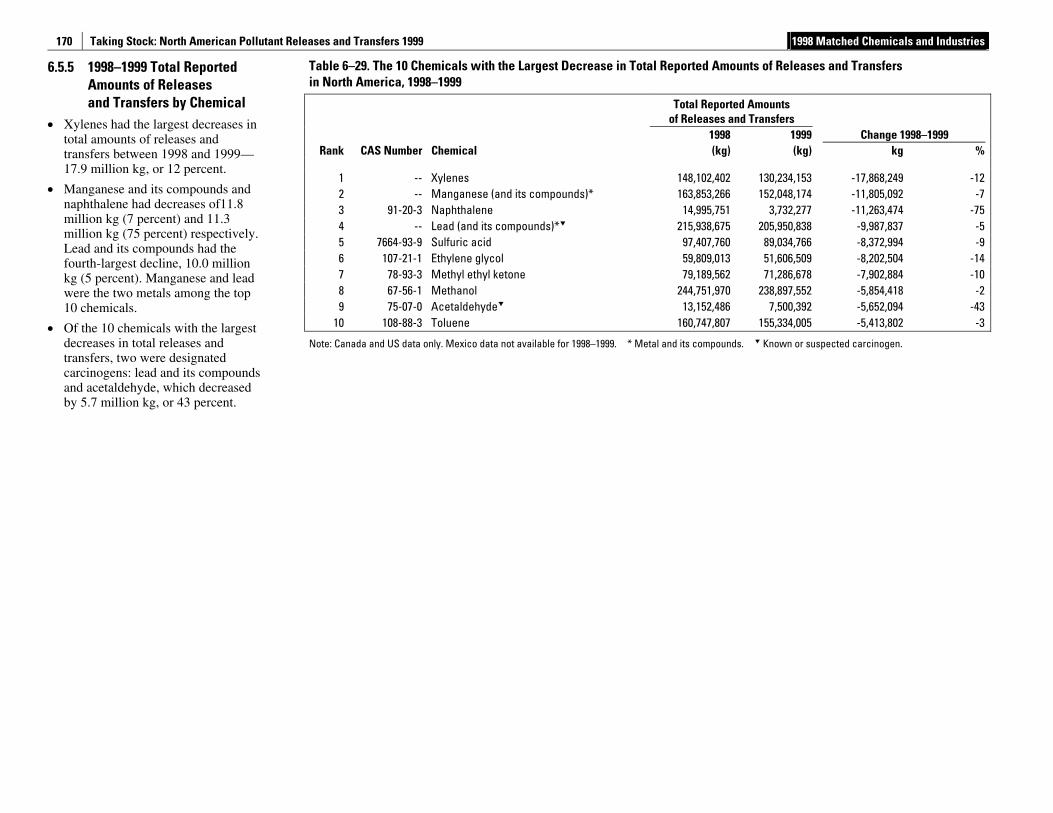
Taking Stock: North American Pollutant Releases and Transfers 1999 1998 Matched Chemicals and Industries
170
6.5.5 1998–1999 Total Reported Amounts of Releases and Transfers by Chemical
• Xylenes had the largest decreases in total amounts of releases and transfers between 1998 and 1999—17.9 million kg, or 12 percent.
• Manganese and its compounds and naphthalene had decreases of11.8 million kg (7 percent) and 11.3 million kg (75 percent) respectively. Lead and its compounds had the fourth-largest decline, 10.0 million kg (5 percent). Manganese and lead were the two metals among the top 10 chemicals.
• Of the 10 chemicals with the largest decreases in total releases and transfers, two were designated carcinogens: lead and its compounds and acetaldehyde, which decreased by 5.7 million kg, or 43 percent.
Table 6–29. The 10 Chemicals with the Largest Decrease in Total Reported Amounts of Releases and Transfers in North America, 1998–1999
Total Reported Amounts
of Releases and Transfers 1998 1999 Change 1998–1999
Rank CAS Number Chemical (kg) (kg) kg %
1 -- Xylenes 148,102,402 130,234,153 -17,868,249 -12 2 -- Manganese (and its compounds)* 163,853,266 152,048,174 -11,805,092 -7 3 91-20-3 Naphthalene 14,995,751 3,732,277 -11,263,474 -75 4 -- Lead (and its compounds)* 215,938,675 205,950,838 -9,987,837 -5 5 7664-93-9 Sulfuric acid 97,407,760 89,034,766 -8,372,994 -9 6 107-21-1 Ethylene glycol 59,809,013 51,606,509 -8,202,504 -14 7 78-93-3 Methyl ethyl ketone 79,189,562 71,286,678 -7,902,884 -10 8 67-56-1 Methanol 244,751,970 238,897,552 -5,854,418 -2 9 75-07-0 Acetaldehyde 13,152,486 7,500,392 -5,652,094 -43
10 108-88-3 Toluene 160,747,807 155,334,005 -5,413,802 -3
Note: Canada and US data only. Mexico data not available for 1998–1999. * Metal and its compounds. Known or suspected carcinogen.
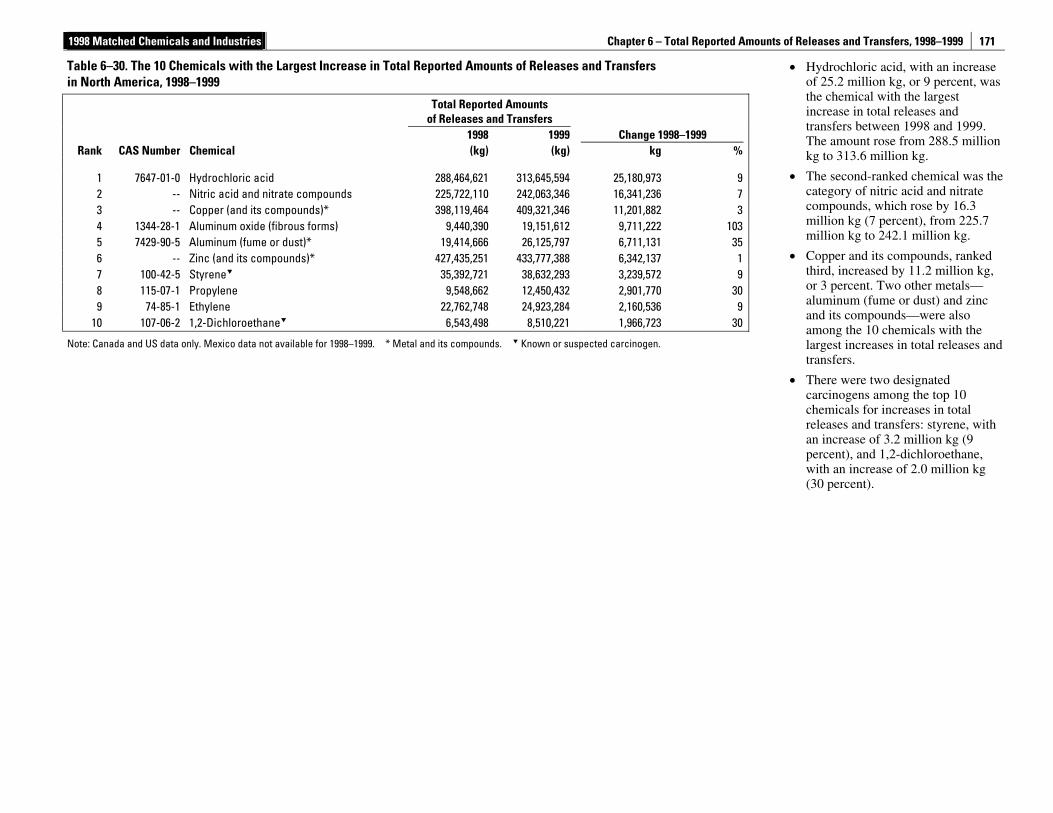
1998 Matched Chemicals and Industries Chapter 6 – Total Reported Amounts of Releases and Transfers, 1998–1999
171
• Hydrochloric acid, with an increase of 25.2 million kg, or 9 percent, was the chemical with the largest increase in total releases and transfers between 1998 and 1999. The amount rose from 288.5 million kg to 313.6 million kg.
• The second-ranked chemical was the category of nitric acid and nitrate compounds, which rose by 16.3 million kg (7 percent), from 225.7 million kg to 242.1 million kg.
• Copper and its compounds, ranked third, increased by 11.2 million kg, or 3 percent. Two other metals—aluminum (fume or dust) and zinc and its compounds—were also among the 10 chemicals with the largest increases in total releases and transfers.
• There were two designated carcinogens among the top 10 chemicals for increases in total releases and transfers: styrene, with an increase of 3.2 million kg (9 percent), and 1,2-dichloroethane, with an increase of 2.0 million kg (30 percent).
Table 6–30. The 10 Chemicals with the Largest Increase in Total Reported Amounts of Releases and Transfers in North America, 1998–1999
Total Reported Amounts
of Releases and Transfers 1998 1999 Change 1998–1999
Rank CAS Number Chemical (kg) (kg) kg %
1 7647-01-0 Hydrochloric acid 288,464,621 313,645,594 25,180,973 92 -- Nitric acid and nitrate compounds 225,722,110 242,063,346 16,341,236 73 -- Copper (and its compounds)* 398,119,464 409,321,346 11,201,882 34 1344-28-1 Aluminum oxide (fibrous forms) 9,440,390 19,151,612 9,711,222 1035 7429-90-5 Aluminum (fume or dust)* 19,414,666 26,125,797 6,711,131 356 -- Zinc (and its compounds)* 427,435,251 433,777,388 6,342,137 17 100-42-5 Styrene 35,392,721 38,632,293 3,239,572 98 115-07-1 Propylene 9,548,662 12,450,432 2,901,770 309 74-85-1 Ethylene 22,762,748 24,923,284 2,160,536 9
10 107-06-2 1,2-Dichloroethane 6,543,498 8,510,221 1,966,723 30
Note: Canada and US data only. Mexico data not available for 1998–1999. * Metal and its compounds. Known or suspected carcinogen.

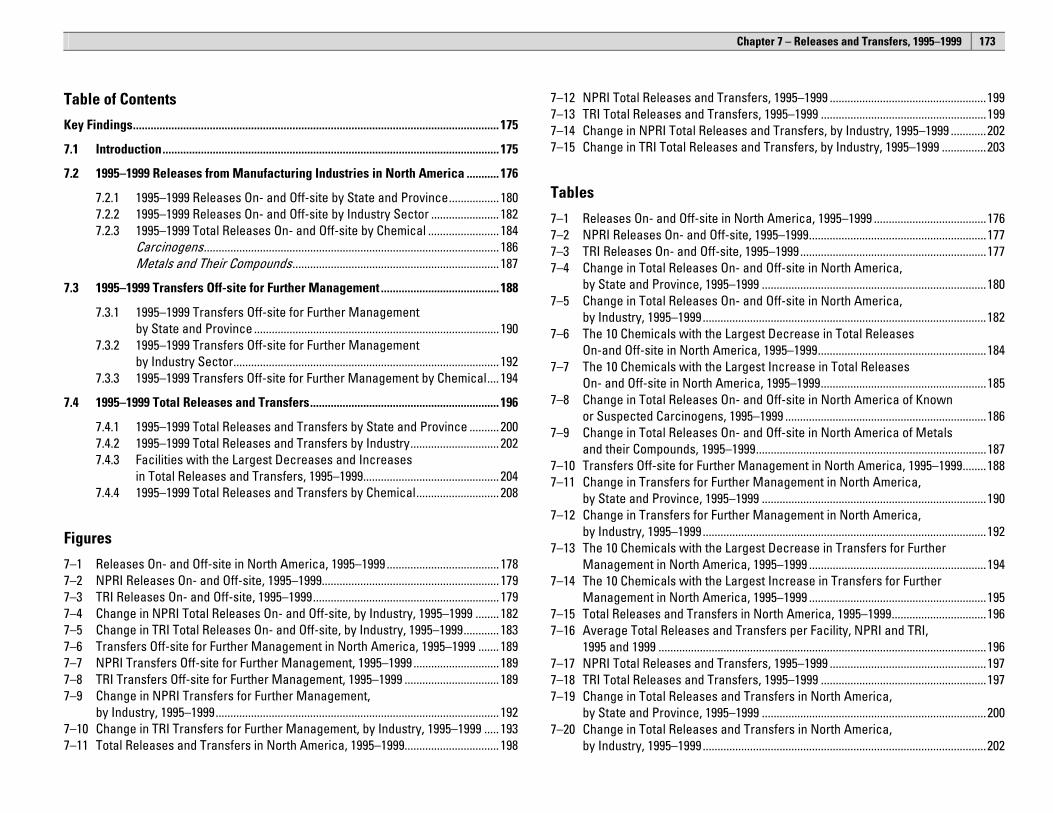
Chapter 7 – Releases and Transfers, 1995–1999
173
Table of Contents
Key Findings............................................................................................................................ 175 7.1 Introduction.................................................................................................................. 175 7.2 1995–1999 Releases from Manufacturing Industries in North America ........... 176
7.2.1 1995–1999 Releases On- and Off-site by State and Province................. 180 7.2.2 1995–1999 Releases On- and Off-site by Industry Sector ....................... 182 7.2.3 1995–1999 Total Releases On- and Off-site by Chemical ........................ 184
Carcinogens.................................................................................................... 186 Metals and Their Compounds...................................................................... 187
7.3 1995–1999 Transfers Off-site for Further Management ........................................ 188 7.3.1 1995–1999 Transfers Off-site for Further Management
by State and Province ................................................................................... 190 7.3.2 1995–1999 Transfers Off-site for Further Management
by Industry Sector.......................................................................................... 192 7.3.3 1995–1999 Transfers Off-site for Further Management by Chemical.... 194
7.4 1995–1999 Total Releases and Transfers................................................................ 196 7.4.1 1995–1999 Total Releases and Transfers by State and Province .......... 200 7.4.2 1995–1999 Total Releases and Transfers by Industry.............................. 202 7.4.3 Facilities with the Largest Decreases and Increases
in Total Releases and Transfers, 1995–1999.............................................. 204 7.4.4 1995–1999 Total Releases and Transfers by Chemical............................ 208
Figures
7–1 Releases On- and Off-site in North America, 1995–1999 ...................................... 178 7–2 NPRI Releases On- and Off-site, 1995–1999............................................................ 179 7–3 TRI Releases On- and Off-site, 1995–1999............................................................... 179 7–4 Change in NPRI Total Releases On- and Off-site, by Industry, 1995–1999 ........ 182 7–5 Change in TRI Total Releases On- and Off-site, by Industry, 1995–1999............ 183 7–6 Transfers Off-site for Further Management in North America, 1995–1999 ....... 189 7–7 NPRI Transfers Off-site for Further Management, 1995–1999 ............................. 189 7–8 TRI Transfers Off-site for Further Management, 1995–1999 ................................ 189 7–9 Change in NPRI Transfers for Further Management,
by Industry, 1995–1999................................................................................................ 192 7–10 Change in TRI Transfers for Further Management, by Industry, 1995–1999 ..... 193 7–11 Total Releases and Transfers in North America, 1995–1999................................ 198
7–12 NPRI Total Releases and Transfers, 1995–1999 .....................................................199 7–13 TRI Total Releases and Transfers, 1995–1999 ........................................................199 7–14 Change in NPRI Total Releases and Transfers, by Industry, 1995–1999 ............202 7–15 Change in TRI Total Releases and Transfers, by Industry, 1995–1999 ...............203
Tables
7–1 Releases On- and Off-site in North America, 1995–1999 ......................................176 7–2 NPRI Releases On- and Off-site, 1995–1999............................................................177 7–3 TRI Releases On- and Off-site, 1995–1999...............................................................177 7–4 Change in Total Releases On- and Off-site in North America,
by State and Province, 1995–1999 ............................................................................180 7–5 Change in Total Releases On- and Off-site in North America,
by Industry, 1995–1999................................................................................................182 7–6 The 10 Chemicals with the Largest Decrease in Total Releases
On-and Off-site in North America, 1995–1999.........................................................184 7–7 The 10 Chemicals with the Largest Increase in Total Releases
On- and Off-site in North America, 1995–1999........................................................185 7–8 Change in Total Releases On- and Off-site in North America of Known
or Suspected Carcinogens, 1995–1999 ....................................................................186 7–9 Change in Total Releases On- and Off-site in North America of Metals
and their Compounds, 1995–1999..............................................................................187 7–10 Transfers Off-site for Further Management in North America, 1995–1999........188 7–11 Change in Transfers for Further Management in North America,
by State and Province, 1995–1999 ............................................................................190 7–12 Change in Transfers for Further Management in North America,
by Industry, 1995–1999................................................................................................192 7–13 The 10 Chemicals with the Largest Decrease in Transfers for Further
Management in North America, 1995–1999 ............................................................194 7–14 The 10 Chemicals with the Largest Increase in Transfers for Further
Management in North America, 1995–1999 ............................................................195 7–15 Total Releases and Transfers in North America, 1995–1999................................196 7–16 Average Total Releases and Transfers per Facility, NPRI and TRI,
1995 and 1999 ...............................................................................................................196 7–17 NPRI Total Releases and Transfers, 1995–1999 .....................................................197 7–18 TRI Total Releases and Transfers, 1995–1999 ........................................................197 7–19 Change in Total Releases and Transfers in North America,
by State and Province, 1995–1999 ............................................................................200 7–20 Change in Total Releases and Transfers in North America,
by Industry, 1995–1999................................................................................................202
Taking Stock: North American Pollutant Releases and Transfers 1999
174
7–21 Facilities in North America with Largest Decrease in Total Releases and Transfers, 1995–1999 ...........................................................................................204
7–22 Facilities in North America with Largest Increase in Total Releases and Transfers, 1995–1999 ...........................................................................................206
7–23 The 10 Chemicals with the Largest Decrease in Total Releases and Transfers in North America, 1995–1999 ...........................................................208
7–24 The 10 Chemicals with the Largest Increase in Total Releases and Transfers in North America, 1995–1999 ...........................................................209
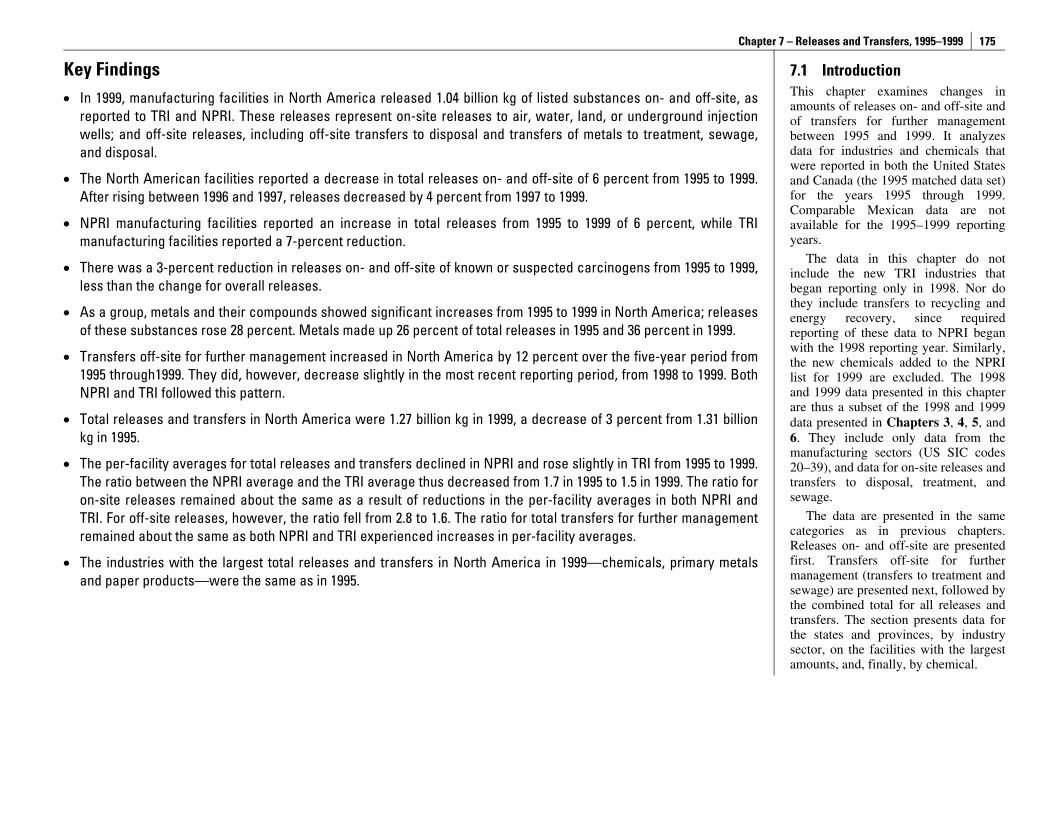
Chapter 7 – Releases and Transfers, 1995–1999
175
Key Findings • In 1999, manufacturing facilities in North America released 1.04 billion kg of listed substances on- and off-site, as
reported to TRI and NPRI. These releases represent on-site releases to air, water, land, or underground injection wells; and off-site releases, including off-site transfers to disposal and transfers of metals to treatment, sewage, and disposal.
• The North American facilities reported a decrease in total releases on- and off-site of 6 percent from 1995 to 1999. After rising between 1996 and 1997, releases decreased by 4 percent from 1997 to 1999.
• NPRI manufacturing facilities reported an increase in total releases from 1995 to 1999 of 6 percent, while TRI manufacturing facilities reported a 7-percent reduction.
• There was a 3-percent reduction in releases on- and off-site of known or suspected carcinogens from 1995 to 1999, less than the change for overall releases.
• As a group, metals and their compounds showed significant increases from 1995 to 1999 in North America; releases of these substances rose 28 percent. Metals made up 26 percent of total releases in 1995 and 36 percent in 1999.
• Transfers off-site for further management increased in North America by 12 percent over the five-year period from 1995 through1999. They did, however, decrease slightly in the most recent reporting period, from 1998 to 1999. Both NPRI and TRI followed this pattern.
• Total releases and transfers in North America were 1.27 billion kg in 1999, a decrease of 3 percent from 1.31 billion kg in 1995.
• The per-facility averages for total releases and transfers declined in NPRI and rose slightly in TRI from 1995 to 1999. The ratio between the NPRI average and the TRI average thus decreased from 1.7 in 1995 to 1.5 in 1999. The ratio for on-site releases remained about the same as a result of reductions in the per-facility averages in both NPRI and TRI. For off-site releases, however, the ratio fell from 2.8 to 1.6. The ratio for total transfers for further management remained about the same as both NPRI and TRI experienced increases in per-facility averages.
• The industries with the largest total releases and transfers in North America in 1999—chemicals, primary metals and paper products—were the same as in 1995.
7.1 Introduction This chapter examines changes in amounts of releases on- and off-site and of transfers for further management between 1995 and 1999. It analyzes data for industries and chemicals that were reported in both the United States and Canada (the 1995 matched data set) for the years 1995 through 1999. Comparable Mexican data are not available for the 1995–1999 reporting years.
The data in this chapter do not include the new TRI industries that began reporting only in 1998. Nor do they include transfers to recycling and energy recovery, since required reporting of these data to NPRI began with the 1998 reporting year. Similarly, the new chemicals added to the NPRI list for 1999 are excluded. The 1998 and 1999 data presented in this chapter are thus a subset of the 1998 and 1999 data presented in Chapters 3, 4, 5, and 6. They include only data from the manufacturing sectors (US SIC codes 20–39), and data for on-site releases and transfers to disposal, treatment, and sewage.
The data are presented in the same categories as in previous chapters. Releases on- and off-site are presented first. Transfers off-site for further management (transfers to treatment and sewage) are presented next, followed by the combined total for all releases and transfers. The section presents data for the states and provinces, by industry sector, on the facilities with the largest amounts, and, finally, by chemical.
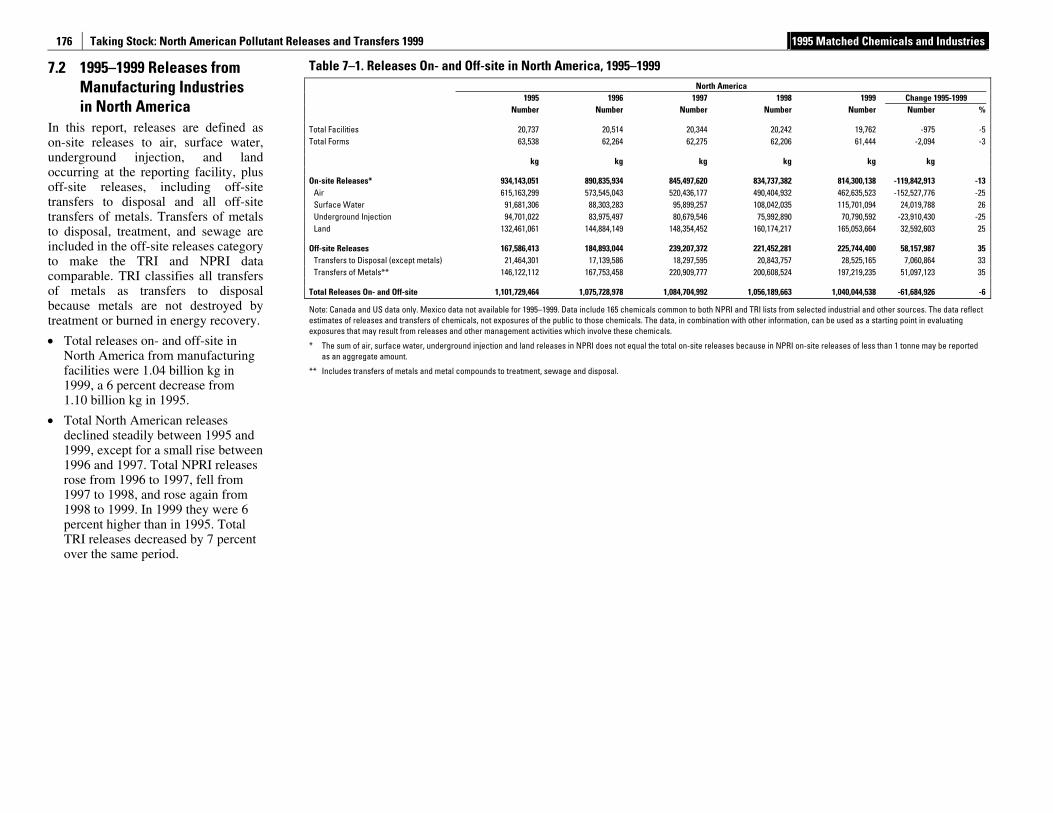
Taking Stock: North American Pollutant Releases and Transfers 1999 1995 Matched Chemicals and Industries
176
7.2 1995–1999 Releases from Manufacturing Industries in North America
In this report, releases are defined as on-site releases to air, surface water, underground injection, and land occurring at the reporting facility, plus off-site releases, including off-site transfers to disposal and all off-site transfers of metals. Transfers of metals to disposal, treatment, and sewage are included in the off-site releases category to make the TRI and NPRI data comparable. TRI classifies all transfers of metals as transfers to disposal because metals are not destroyed by treatment or burned in energy recovery. • Total releases on- and off-site in
North America from manufacturing facilities were 1.04 billion kg in 1999, a 6 percent decrease from 1.10 billion kg in 1995.
• Total North American releases declined steadily between 1995 and 1999, except for a small rise between 1996 and 1997. Total NPRI releases rose from 1996 to 1997, fell from 1997 to 1998, and rose again from 1998 to 1999. In 1999 they were 6 percent higher than in 1995. Total TRI releases decreased by 7 percent over the same period.
Table 7–1. Releases On- and Off-site in North America, 1995–1999 North America 1995 1996 1997 1998 1999 Change 1995-1999 Number Number Number Number Number Number %
Total Facilities 20,737 20,514 20,344 20,242 19,762 -975 -5 Total Forms 63,538 62,264 62,275 62,206 61,444 -2,094 -3
kg kg kg kg kg kg
On-site Releases* 934,143,051 890,835,934 845,497,620 834,737,382 814,300,138 -119,842,913 -13 Air 615,163,299 573,545,043 520,436,177 490,404,932 462,635,523 -152,527,776 -25 Surface Water 91,681,306 88,303,283 95,899,257 108,042,035 115,701,094 24,019,788 26 Underground Injection 94,701,022 83,975,497 80,679,546 75,992,890 70,790,592 -23,910,430 -25 Land 132,461,061 144,884,149 148,354,452 160,174,217 165,053,664 32,592,603 25
Off-site Releases 167,586,413 184,893,044 239,207,372 221,452,281 225,744,400 58,157,987 35 Transfers to Disposal (except metals) 21,464,301 17,139,586 18,297,595 20,843,757 28,525,165 7,060,864 33 Transfers of Metals** 146,122,112 167,753,458 220,909,777 200,608,524 197,219,235 51,097,123 35
Total Releases On- and Off-site 1,101,729,464 1,075,728,978 1,084,704,992 1,056,189,663 1,040,044,538 -61,684,926 -6
Note: Canada and US data only. Mexico data not available for 1995–1999. Data include 165 chemicals common to both NPRI and TRI lists from selected industrial and other sources. The data reflect estimates of releases and transfers of chemicals, not exposures of the public to those chemicals. The data, in combination with other information, can be used as a starting point in evaluating exposures that may result from releases and other management activities which involve these chemicals.
* The sum of air, surface water, underground injection and land releases in NPRI does not equal the total on-site releases because in NPRI on-site releases of less than 1 tonne may be reported as an aggregate amount.
** Includes transfers of metals and metal compounds to treatment, sewage and disposal.
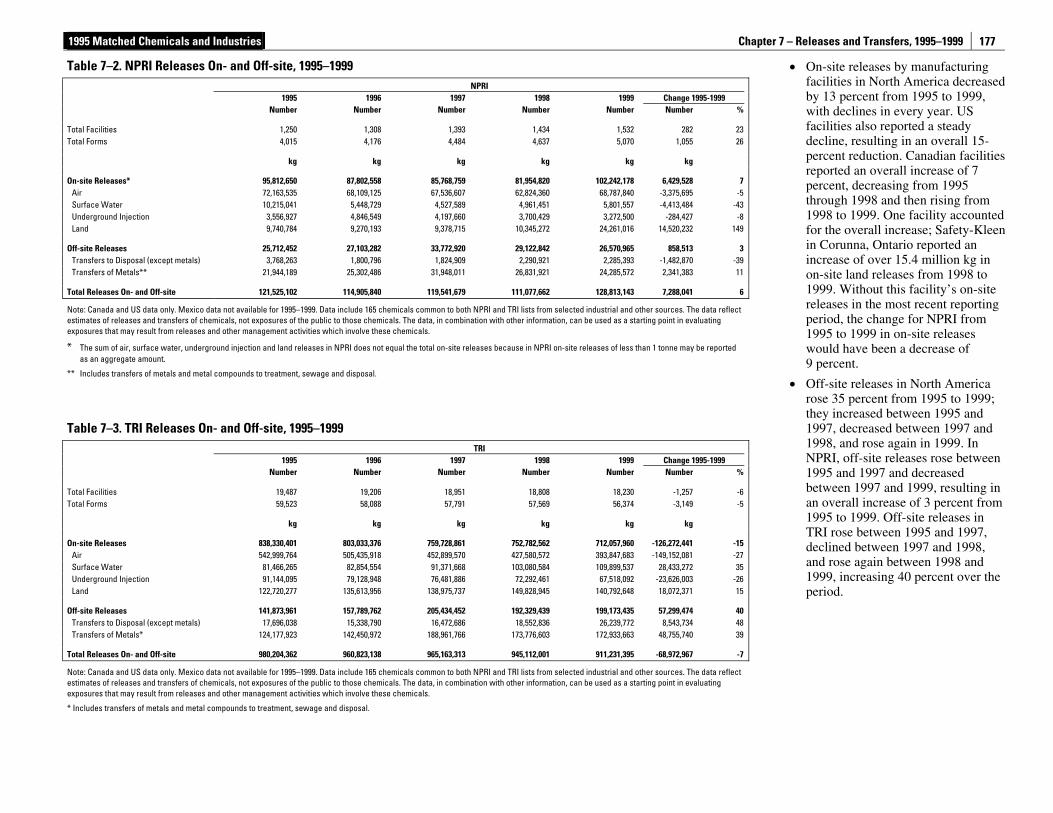
1995 Matched Chemicals and Industries Chapter 7 – Releases and Transfers, 1995–1999
177
• On-site releases by manufacturing facilities in North America decreased by 13 percent from 1995 to 1999, with declines in every year. US facilities also reported a steady decline, resulting in an overall 15-percent reduction. Canadian facilities reported an overall increase of 7 percent, decreasing from 1995 through 1998 and then rising from 1998 to 1999. One facility accounted for the overall increase; Safety-Kleen in Corunna, Ontario reported an increase of over 15.4 million kg in on-site land releases from 1998 to 1999. Without this facility’s on-site releases in the most recent reporting period, the change for NPRI from 1995 to 1999 in on-site releases would have been a decrease of 9 percent.
• Off-site releases in North America rose 35 percent from 1995 to 1999; they increased between 1995 and 1997, decreased between 1997 and 1998, and rose again in 1999. In NPRI, off-site releases rose between 1995 and 1997 and decreased between 1997 and 1999, resulting in an overall increase of 3 percent from 1995 to 1999. Off-site releases in TRI rose between 1995 and 1997, declined between 1997 and 1998, and rose again between 1998 and 1999, increasing 40 percent over the period.
Table 7–2. NPRI Releases On- and Off-site, 1995–1999 NPRI 1995 1996 1997 1998 1999 Change 1995-1999 Number Number Number Number Number Number %
Total Facilities 1,250 1,308 1,393 1,434 1,532 282 23Total Forms 4,015 4,176 4,484 4,637 5,070 1,055 26
kg kg kg kg kg kg
On-site Releases* 95,812,650 87,802,558 85,768,759 81,954,820 102,242,178 6,429,528 7Air 72,163,535 68,109,125 67,536,607 62,824,360 68,787,840 -3,375,695 -5Surface Water 10,215,041 5,448,729 4,527,589 4,961,451 5,801,557 -4,413,484 -43Underground Injection 3,556,927 4,846,549 4,197,660 3,700,429 3,272,500 -284,427 -8Land 9,740,784 9,270,193 9,378,715 10,345,272 24,261,016 14,520,232 149
Off-site Releases 25,712,452 27,103,282 33,772,920 29,122,842 26,570,965 858,513 3Transfers to Disposal (except metals) 3,768,263 1,800,796 1,824,909 2,290,921 2,285,393 -1,482,870 -39Transfers of Metals** 21,944,189 25,302,486 31,948,011 26,831,921 24,285,572 2,341,383 11
Total Releases On- and Off-site 121,525,102 114,905,840 119,541,679 111,077,662 128,813,143 7,288,041 6
Note: Canada and US data only. Mexico data not available for 1995–1999. Data include 165 chemicals common to both NPRI and TRI lists from selected industrial and other sources. The data reflect estimates of releases and transfers of chemicals, not exposures of the public to those chemicals. The data, in combination with other information, can be used as a starting point in evaluating exposures that may result from releases and other management activities which involve these chemicals.
* The sum of air, surface water, underground injection and land releases in NPRI does not equal the total on-site releases because in NPRI on-site releases of less than 1 tonne may be reported as an aggregate amount.
** Includes transfers of metals and metal compounds to treatment, sewage and disposal.
Table 7–3. TRI Releases On- and Off-site, 1995–1999 TRI 1995 1996 1997 1998 1999 Change 1995-1999 Number Number Number Number Number Number %
Total Facilities 19,487 19,206 18,951 18,808 18,230 -1,257 -6Total Forms 59,523 58,088 57,791 57,569 56,374 -3,149 -5
kg kg kg kg kg kg
On-site Releases 838,330,401 803,033,376 759,728,861 752,782,562 712,057,960 -126,272,441 -15Air 542,999,764 505,435,918 452,899,570 427,580,572 393,847,683 -149,152,081 -27Surface Water 81,466,265 82,854,554 91,371,668 103,080,584 109,899,537 28,433,272 35Underground Injection 91,144,095 79,128,948 76,481,886 72,292,461 67,518,092 -23,626,003 -26Land 122,720,277 135,613,956 138,975,737 149,828,945 140,792,648 18,072,371 15
Off-site Releases 141,873,961 157,789,762 205,434,452 192,329,439 199,173,435 57,299,474 40Transfers to Disposal (except metals) 17,696,038 15,338,790 16,472,686 18,552,836 26,239,772 8,543,734 48Transfers of Metals* 124,177,923 142,450,972 188,961,766 173,776,603 172,933,663 48,755,740 39
Total Releases On- and Off-site 980,204,362 960,823,138 965,163,313 945,112,001 911,231,395 -68,972,967 -7
Note: Canada and US data only. Mexico data not available for 1995–1999. Data include 165 chemicals common to both NPRI and TRI lists from selected industrial and other sources. The data reflect estimates of releases and transfers of chemicals, not exposures of the public to those chemicals. The data, in combination with other information, can be used as a starting point in evaluating exposures that may result from releases and other management activities which involve these chemicals.
* Includes transfers of metals and metal compounds to treatment, sewage and disposal.
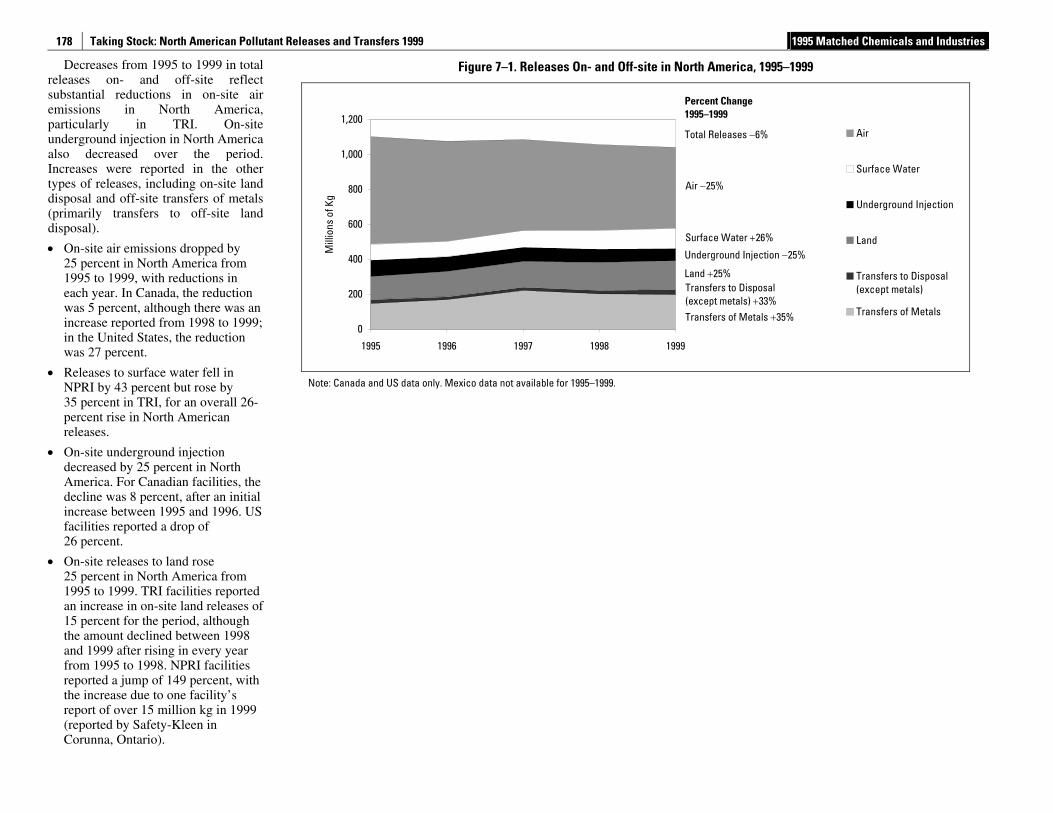
Taking Stock: North American Pollutant Releases and Transfers 1999 1995 Matched Chemicals and Industries
178
Decreases from 1995 to 1999 in total releases on- and off-site reflect substantial reductions in on-site air emissions in North America, particularly in TRI. On-site underground injection in North America also decreased over the period. Increases were reported in the other types of releases, including on-site land disposal and off-site transfers of metals (primarily transfers to off-site land disposal).
• On-site air emissions dropped by 25 percent in North America from 1995 to 1999, with reductions in each year. In Canada, the reduction was 5 percent, although there was an increase reported from 1998 to 1999; in the United States, the reduction was 27 percent.
• Releases to surface water fell in NPRI by 43 percent but rose by 35 percent in TRI, for an overall 26-percent rise in North American releases.
• On-site underground injection decreased by 25 percent in North America. For Canadian facilities, the decline was 8 percent, after an initial increase between 1995 and 1996. US facilities reported a drop of 26 percent.
• On-site releases to land rose 25 percent in North America from 1995 to 1999. TRI facilities reported an increase in on-site land releases of 15 percent for the period, although the amount declined between 1998 and 1999 after rising in every year from 1995 to 1998. NPRI facilities reported a jump of 149 percent, with the increase due to one facility’s report of over 15 million kg in 1999 (reported by Safety-Kleen in Corunna, Ontario).
Figure 7–1. Releases On- and Off-site in North America, 1995–1999
0
200
400
600
800
1,000
1,200
1995 1996 1997 1998 1999
Mill
ions
of K
g
Air
Surface Water
Underground Injection
Land
Transfers to Disposal(except metals)
Transfers of Metals
Note: Canada and US data only. Mexico data not available for 1995–1999.
Underground Injection −25%
Percent Change 1995–1999
Total Releases −6%
Air −25%
Transfers to Disposal (except metals) +33%
Surface Water +26%
Land +25%
Transfers of Metals +35%
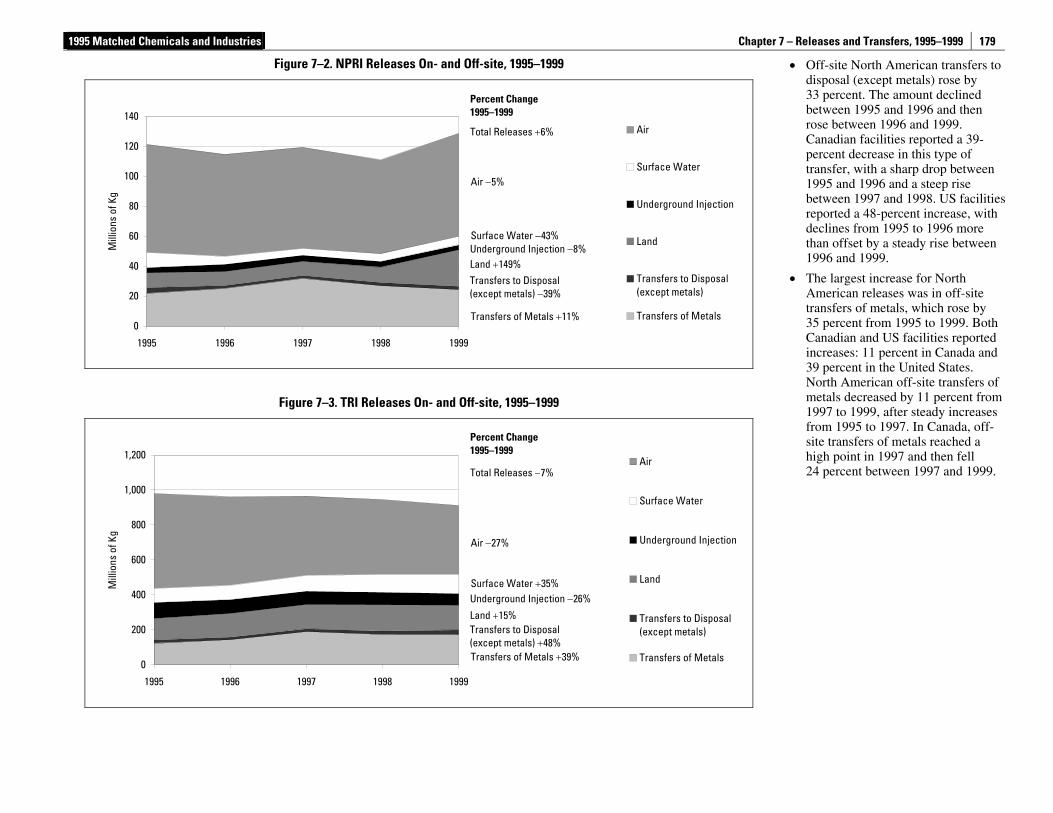
1995 Matched Chemicals and Industries Chapter 7 – Releases and Transfers, 1995–1999
179
• Off-site North American transfers to disposal (except metals) rose by 33 percent. The amount declined between 1995 and 1996 and then rose between 1996 and 1999. Canadian facilities reported a 39-percent decrease in this type of transfer, with a sharp drop between 1995 and 1996 and a steep rise between 1997 and 1998. US facilities reported a 48-percent increase, with declines from 1995 to 1996 more than offset by a steady rise between 1996 and 1999.
• The largest increase for North American releases was in off-site transfers of metals, which rose by 35 percent from 1995 to 1999. Both Canadian and US facilities reported increases: 11 percent in Canada and 39 percent in the United States. North American off-site transfers of metals decreased by 11 percent from 1997 to 1999, after steady increases from 1995 to 1997. In Canada, off-site transfers of metals reached a high point in 1997 and then fell 24 percent between 1997 and 1999.
Figure 7–2. NPRI Releases On- and Off-site, 1995–1999
0
20
40
60
80
100
120
140
1995 1996 1997 1998 1999
Mill
ions
of K
g
Air
Surface Water
Underground Injection
Land
Transfers to Disposal(except metals)
Transfers of Metals
Figure 7–3. TRI Releases On- and Off-site, 1995–1999
0
200
400
600
800
1,000
1,200
1995 1996 1997 1998 1999
Mill
ions
of K
g
Air
Surface Water
Underground Injection
Land
Transfers to Disposal(except metals)
Transfers of Metals
Percent Change 1995–1999
Total Releases +6%
Air −5%
Transfers to Disposal (except metals) −39%
Surface Water −43% Underground Injection −8% Land +149%
Transfers of Metals +11%
Percent Change 1995–1999
Total Releases −7%
Air −27%
Transfers to Disposal (except metals) +48%
Surface Water +35% Underground Injection −26%
Land +15%
Transfers of Metals +39%
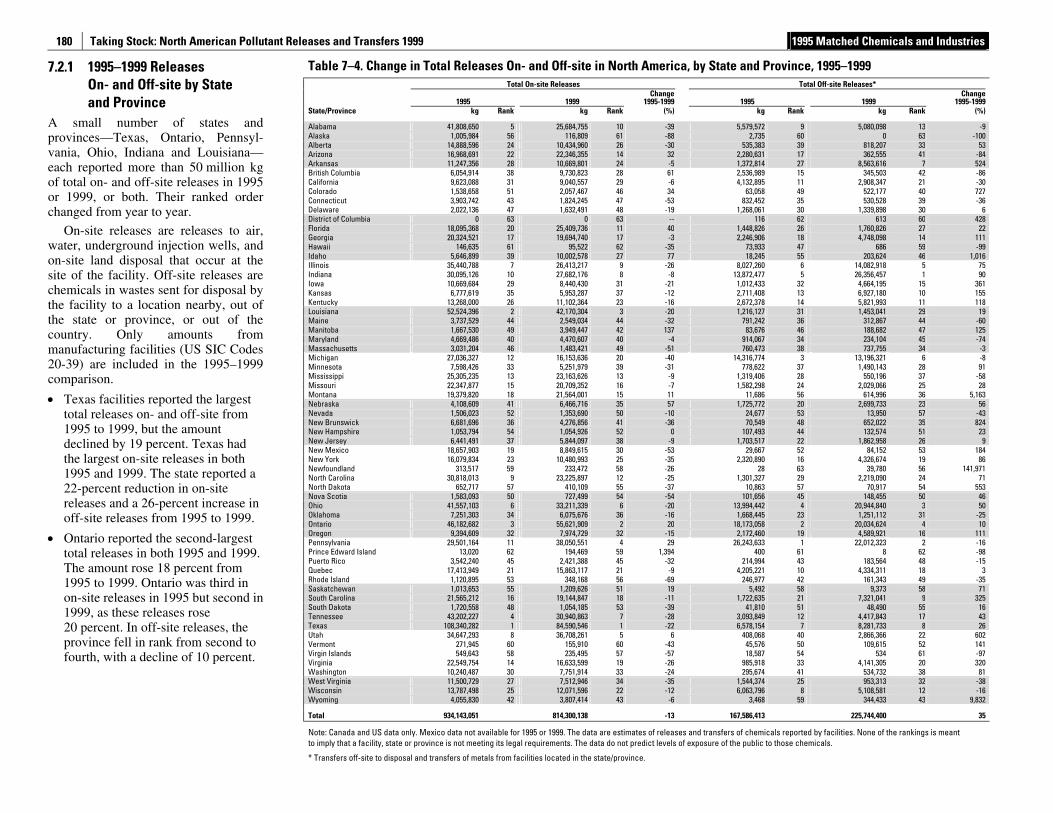
Taking Stock: North American Pollutant Releases and Transfers 1999 1995 Matched Chemicals and Industries
180
7.2.1 1995–1999 Releases On- and Off-site by State and Province
A small number of states and provinces—Texas, Ontario, Pennsyl-vania, Ohio, Indiana and Louisiana—each reported more than 50 million kg of total on- and off-site releases in 1995 or 1999, or both. Their ranked order changed from year to year.
On-site releases are releases to air, water, underground injection wells, and on-site land disposal that occur at the site of the facility. Off-site releases are chemicals in wastes sent for disposal by the facility to a location nearby, out of the state or province, or out of the country. Only amounts from manufacturing facilities (US SIC Codes 20-39) are included in the 1995–1999 comparison.
• Texas facilities reported the largest total releases on- and off-site from 1995 to 1999, but the amount declined by 19 percent. Texas had the largest on-site releases in both 1995 and 1999. The state reported a 22-percent reduction in on-site releases and a 26-percent increase in off-site releases from 1995 to 1999.
• Ontario reported the second-largest total releases in both 1995 and 1999. The amount rose 18 percent from 1995 to 1999. Ontario was third in on-site releases in 1995 but second in 1999, as these releases rose 20 percent. In off-site releases, the province fell in rank from second to fourth, with a decline of 10 percent.
Table 7–4. Change in Total Releases On- and Off-site in North America, by State and Province, 1995–1999 Total On-site Releases Total Off-site Releases*
1995 1999 Change
1995-1999 1995 1999 Change
1995-1999 State/Province kg Rank kg Rank (%) kg Rank kg Rank (%)
Alabama 41,808,650 5 25,684,755 10 -39 5,579,572 9 5,080,098 13 -9 Alaska 1,005,984 56 116,809 61 -88 2,735 60 0 63 -100 Alberta 14,888,596 24 10,434,960 26 -30 535,383 39 818,207 33 53 Arizona 16,968,691 22 22,346,355 14 32 2,280,631 17 362,555 41 -84 Arkansas 11,247,356 28 10,669,801 24 -5 1,372,814 27 8,563,616 7 524 British Columbia 6,054,914 38 9,730,823 28 61 2,536,989 15 345,503 42 -86 California 9,623,088 31 9,040,557 29 -6 4,132,895 11 2,908,347 21 -30 Colorado 1,538,658 51 2,057,467 46 34 63,058 49 522,177 40 727 Connecticut 3,903,742 43 1,824,245 47 -53 832,452 35 530,528 39 -36 Delaware 2,022,136 47 1,632,491 48 -19 1,268,061 30 1,339,898 30 6 District of Columbia 0 63 0 63 -- 116 62 613 60 428 Florida 18,095,368 20 25,409,736 11 40 1,448,826 26 1,760,826 27 22 Georgia 20,324,521 17 19,694,740 17 -3 2,246,906 18 4,748,098 14 111 Hawaii 146,635 61 95,522 62 -35 73,933 47 686 59 -99 Idaho 5,646,899 39 10,002,578 27 77 18,245 55 203,624 46 1,016 Illinois 35,440,788 7 26,413,217 9 -26 8,027,260 6 14,082,918 5 75 Indiana 30,095,126 10 27,682,176 8 -8 13,872,477 5 26,356,457 1 90 Iowa 10,669,684 29 8,440,430 31 -21 1,012,433 32 4,664,195 15 361 Kansas 6,777,619 35 5,953,287 37 -12 2,711,408 13 6,927,180 10 155 Kentucky 13,268,000 26 11,102,364 23 -16 2,672,378 14 5,821,993 11 118 Louisiana 52,524,396 2 42,170,304 3 -20 1,216,127 31 1,453,041 29 19 Maine 3,737,529 44 2,549,034 44 -32 791,242 36 312,867 44 -60 Manitoba 1,667,530 49 3,949,447 42 137 83,676 46 188,682 47 125 Maryland 4,669,486 40 4,470,607 40 -4 914,067 34 234,104 45 -74 Massachusetts 3,031,204 46 1,483,421 49 -51 760,473 38 737,755 34 -3 Michigan 27,036,327 12 16,153,636 20 -40 14,316,774 3 13,196,321 6 -8 Minnesota 7,598,426 33 5,251,979 39 -31 778,622 37 1,490,143 28 91 Mississippi 25,305,235 13 23,163,626 13 -9 1,319,406 28 550,196 37 -58 Missouri 22,347,877 15 20,709,352 16 -7 1,582,298 24 2,029,066 25 28 Montana 19,379,820 18 21,564,001 15 11 11,686 56 614,996 36 5,163 Nebraska 4,108,609 41 6,466,716 35 57 1,725,772 20 2,699,733 23 56 Nevada 1,506,023 52 1,353,690 50 -10 24,677 53 13,950 57 -43 New Brunswick 6,681,696 36 4,276,856 41 -36 70,549 48 652,022 35 824 New Hampshire 1,053,794 54 1,054,926 52 0 107,493 44 132,574 51 23 New Jersey 6,441,491 37 5,844,097 38 -9 1,703,517 22 1,862,958 26 9 New Mexico 18,657,903 19 8,849,615 30 -53 29,667 52 84,152 53 184 New York 16,079,834 23 10,480,993 25 -35 2,320,890 16 4,326,674 19 86 Newfoundland 313,517 59 233,472 58 -26 28 63 39,780 56 141,971 North Carolina 30,818,013 9 23,225,897 12 -25 1,301,327 29 2,219,090 24 71 North Dakota 652,717 57 410,109 55 -37 10,863 57 70,917 54 553 Nova Scotia 1,583,093 50 727,499 54 -54 101,656 45 148,455 50 46 Ohio 41,557,103 6 33,211,339 6 -20 13,994,442 4 20,944,840 3 50 Oklahoma 7,251,303 34 6,075,676 36 -16 1,668,445 23 1,251,112 31 -25 Ontario 46,182,682 3 55,621,909 2 20 18,173,058 2 20,034,624 4 10 Oregon 9,394,609 32 7,974,729 32 -15 2,172,460 19 4,589,921 16 111 Pennsylvania 29,501,164 11 38,050,551 4 29 26,243,633 1 22,012,323 2 -16 Prince Edward Island 13,020 62 194,469 59 1,394 400 61 8 62 -98 Puerto Rico 3,542,240 45 2,421,388 45 -32 214,994 43 183,564 48 -15 Quebec 17,413,949 21 15,863,117 21 -9 4,205,221 10 4,334,311 18 3 Rhode Island 1,120,895 53 348,168 56 -69 246,977 42 161,343 49 -35 Saskatchewan 1,013,653 55 1,209,626 51 19 5,492 58 9,373 58 71 South Carolina 21,565,212 16 19,144,847 18 -11 1,722,635 21 7,321,041 9 325 South Dakota 1,720,558 48 1,054,185 53 -39 41,810 51 48,490 55 16 Tennessee 43,202,227 4 30,940,863 7 -28 3,093,849 12 4,417,843 17 43 Texas 108,340,282 1 84,590,546 1 -22 6,578,154 7 8,281,733 8 26 Utah 34,647,293 8 36,708,261 5 6 408,068 40 2,866,366 22 602 Vermont 271,945 60 155,910 60 -43 45,576 50 109,615 52 141 Virgin Islands 549,643 58 235,495 57 -57 18,587 54 534 61 -97 Virginia 22,549,754 14 16,633,599 19 -26 985,918 33 4,141,305 20 320 Washington 10,240,487 30 7,751,914 33 -24 295,674 41 534,732 38 81 West Virginia 11,500,729 27 7,512,946 34 -35 1,544,374 25 953,313 32 -38 Wisconsin 13,787,498 25 12,071,596 22 -12 6,063,796 8 5,108,581 12 -16 Wyoming 4,055,830 42 3,807,414 43 -6 3,468 59 344,433 43 9,832
Total 934,143,051 814,300,138 -13 167,586,413 225,744,400 35
Note: Canada and US data only. Mexico data not available for 1995 or 1999. The data are estimates of releases and transfers of chemicals reported by facilities. None of the rankings is meant to imply that a facility, state or province is not meeting its legal requirements. The data do not predict levels of exposure of the public to those chemicals.
* Transfers off-site to disposal and transfers of metals from facilities located in the state/province.

1995 Matched Chemicals and Industries Chapter 7 – Releases and Transfers, 1995–1999
181
• Pennsylvania was third in total releases in both 1995 and 1999. In on-site releases, the state rose from 11th in rank in 1995 to fourth in 1999, with an increase of 29 percent. Its off-site releases decreased by 16 percent, and the state moved from first to second place in this category. Pennsylvania facilities’ total releases rose 8 percent from 1995 to 1999.
• Ohio facilities ranked fourth in total releases in both 1995 and 1998, although the amount declined by 3 percent. With a 50-percent rise in off-site releases, Ohio moved from fourth place in this category in 1995 to third in 1999.
• Indiana ranked fifth in total releases in 1999; it had been eighth in 1995. Its total releases increased by 23 percent to amounts slightly lower than Ohio’s. In 1999 Indiana ranked first for off-site releases, which were 90 percent higher than in 1995, when the state ranked fifth in this category.
• Louisiana, which had the fifth-largest total releases in 1995, ranked sixth in 1999. Its total releases fell by 19 percent from 1995 to 1999. The main factor was a 20 percent drop in on-site releases; the state moved from second to third place in this type of release.
Table 7–4. (continued ) Total Releases On-site and Off-site
1995 1999 Change
1995-1999State/Province kg Rank kg Rank (%)
Alabama 47,388,222 6 30,764,853 10 -35Alaska 1,008,719 56 116,809 61 -88Alberta 15,423,979 26 11,253,167 30 -27Arizona 19,249,322 22 22,708,910 18 18Arkansas 12,620,170 29 19,233,417 22 52British Columbia 8,591,903 35 10,076,326 32 17California 13,755,983 27 11,948,904 29 -13Colorado 1,601,716 51 2,579,644 47 61Connecticut 4,736,194 42 2,354,773 48 -50Delaware 3,290,197 47 2,972,389 44 -10District of Columbia 116 63 613 63 428Florida 19,544,194 20 27,170,562 12 39Georgia 22,571,427 17 24,442,838 15 8Hawaii 220,568 61 96,208 62 -56Idaho 5,665,144 40 10,206,202 31 80Illinois 43,468,048 9 40,496,135 7 -7Indiana 43,967,603 8 54,038,633 5 23Iowa 11,682,117 30 13,104,625 26 12Kansas 9,489,027 33 12,880,467 27 36Kentucky 15,940,378 25 16,924,357 24 6Louisiana 53,740,523 5 43,623,345 6 -19Maine 4,528,771 43 2,861,901 45 -37Manitoba 1,751,206 49 4,138,129 43 136Maryland 5,583,553 41 4,704,711 41 -16Massachusetts 3,791,677 45 2,221,176 49 -41Michigan 41,353,101 10 29,349,957 11 -29Minnesota 8,377,048 36 6,742,122 39 -20Mississippi 26,624,641 13 23,713,822 16 -11Missouri 23,930,175 14 22,738,418 17 -5Montana 19,391,506 21 22,178,997 19 14Nebraska 5,834,381 39 9,166,449 33 57Nevada 1,530,700 52 1,367,640 50 -11New Brunswick 6,752,245 38 4,928,878 40 -27New Hampshire 1,161,287 54 1,187,500 52 2New Jersey 8,145,008 37 7,707,055 37 -5New Mexico 18,687,570 23 8,933,767 34 -52New York 18,400,724 24 14,807,667 25 -20Newfoundland 313,545 60 273,252 57 -13North Carolina 32,119,340 12 25,444,987 14 -21North Dakota 663,580 57 481,026 56 -28Nova Scotia 1,684,749 50 875,954 54 -48Ohio 55,551,545 4 54,156,179 4 -3Oklahoma 8,919,748 34 7,326,788 38 -18Ontario 64,355,740 2 75,656,533 2 18Oregon 11,567,069 31 12,564,650 28 8Pennsylvania 55,744,797 3 60,062,874 3 8Prince Edward Island 13,420 62 194,477 60 1,349Puerto Rico 3,757,234 46 2,604,952 46 -31Quebec 21,619,170 18 20,197,428 21 -7Rhode Island 1,367,872 53 509,511 55 -63Saskatchewan 1,019,145 55 1,218,999 51 20South Carolina 23,287,847 16 26,465,888 13 14South Dakota 1,762,368 48 1,102,675 53 -37Tennessee 46,296,076 7 35,358,706 9 -24Texas 114,918,436 1 92,872,279 1 -19Utah 35,055,361 11 39,574,627 8 13Vermont 317,521 59 265,525 58 -16Virgin Islands 568,230 58 236,029 59 -58Virginia 23,535,672 15 20,774,904 20 -12Washington 10,536,161 32 8,286,646 36 -21West Virginia 13,045,103 28 8,466,259 35 -35Wisconsin 19,851,294 19 17,180,177 23 -13Wyoming 4,059,298 44 4,151,847 42 2
Total 1,101,729,464 1,040,044,538 -6
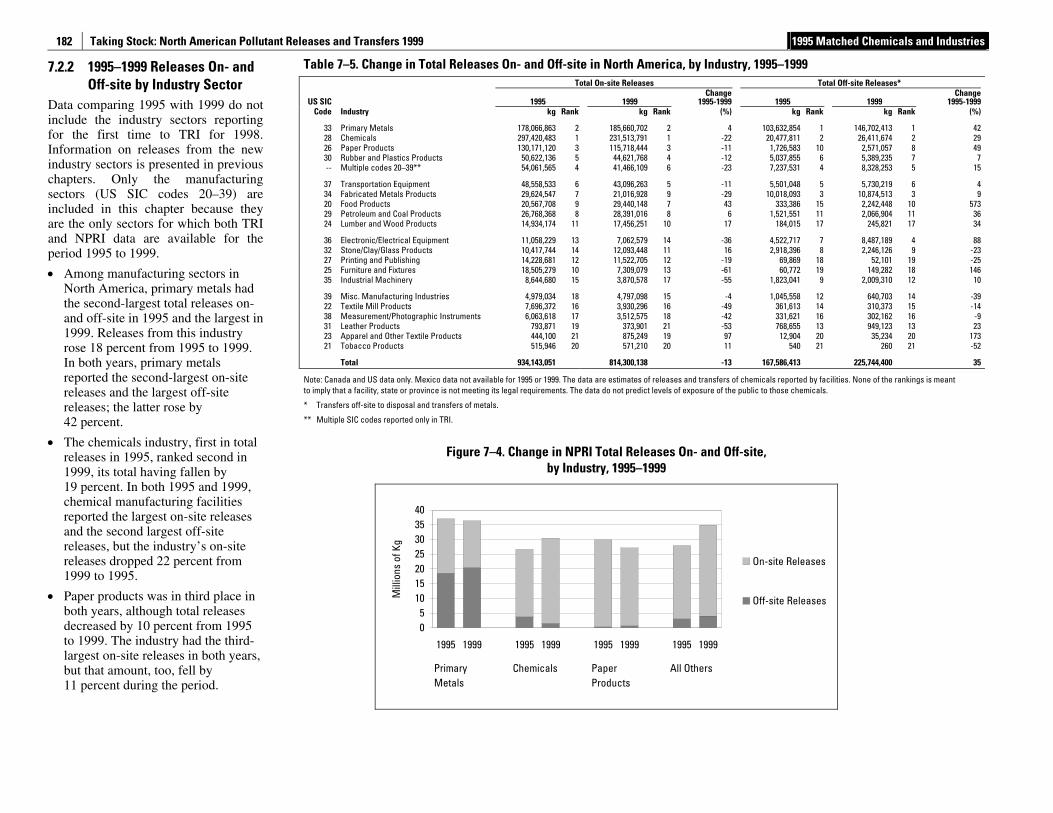
Taking Stock: North American Pollutant Releases and Transfers 1999 1995 Matched Chemicals and Industries
182
7.2.2 1995–1999 Releases On- and Off-site by Industry Sector
Data comparing 1995 with 1999 do not include the industry sectors reporting for the first time to TRI for 1998. Information on releases from the new industry sectors is presented in previous chapters. Only the manufacturing sectors (US SIC codes 20–39) are included in this chapter because they are the only sectors for which both TRI and NPRI data are available for the period 1995 to 1999.
• Among manufacturing sectors in North America, primary metals had the second-largest total releases on- and off-site in 1995 and the largest in 1999. Releases from this industry rose 18 percent from 1995 to 1999. In both years, primary metals reported the second-largest on-site releases and the largest off-site releases; the latter rose by 42 percent.
• The chemicals industry, first in total releases in 1995, ranked second in 1999, its total having fallen by 19 percent. In both 1995 and 1999, chemical manufacturing facilities reported the largest on-site releases and the second largest off-site releases, but the industry’s on-site releases dropped 22 percent from 1999 to 1995.
• Paper products was in third place in both years, although total releases decreased by 10 percent from 1995 to 1999. The industry had the third-largest on-site releases in both years, but that amount, too, fell by 11 percent during the period.
Table 7–5. Change in Total Releases On- and Off-site in North America, by Industry, 1995–1999 Total On-site Releases Total Off-site Releases*
US SIC 1995 1999 Change
1995-1999 1995 1999 Change
1995-1999 Code Industry kg Rank kg Rank (%) kg Rank kg Rank (%)
33 Primary Metals 178,066,863 2 185,660,702 2 4 103,632,854 1 146,702,413 1 42 28 Chemicals 297,420,483 1 231,513,791 1 -22 20,477,811 2 26,411,674 2 29 26 Paper Products 130,171,120 3 115,718,444 3 -11 1,726,583 10 2,571,057 8 49 30 Rubber and Plastics Products 50,622,136 5 44,621,768 4 -12 5,037,855 6 5,389,235 7 7 -- Multiple codes 20–39** 54,061,565 4 41,466,109 6 -23 7,237,531 4 8,328,253 5 15
37 Transportation Equipment 48,558,533 6 43,096,263 5 -11 5,501,048 5 5,730,219 6 4 34 Fabricated Metals Products 29,624,547 7 21,016,928 9 -29 10,018,093 3 10,874,513 3 9 20 Food Products 20,567,708 9 29,440,148 7 43 333,386 15 2,242,448 10 573 29 Petroleum and Coal Products 26,768,368 8 28,391,016 8 6 1,521,551 11 2,066,904 11 36 24 Lumber and Wood Products 14,934,174 11 17,456,251 10 17 184,015 17 245,821 17 34
36 Electronic/Electrical Equipment 11,058,229 13 7,062,579 14 -36 4,522,717 7 8,487,189 4 88 32 Stone/Clay/Glass Products 10,417,744 14 12,093,448 11 16 2,918,396 8 2,246,126 9 -23 27 Printing and Publishing 14,228,681 12 11,522,705 12 -19 69,869 18 52,101 19 -25 25 Furniture and Fixtures 18,505,279 10 7,309,079 13 -61 60,772 19 149,282 18 146 35 Industrial Machinery 8,644,680 15 3,870,578 17 -55 1,823,041 9 2,009,310 12 10
39 Misc. Manufacturing Industries 4,979,034 18 4,797,098 15 -4 1,045,558 12 640,703 14 -39 22 Textile Mill Products 7,696,372 16 3,930,296 16 -49 361,613 14 310,373 15 -14 38 Measurement/Photographic Instruments 6,063,618 17 3,512,575 18 -42 331,621 16 302,162 16 -9 31 Leather Products 793,871 19 373,901 21 -53 768,655 13 949,123 13 23 23 Apparel and Other Textile Products 444,100 21 875,249 19 97 12,904 20 35,234 20 173 21 Tobacco Products 515,946 20 571,210 20 11 540 21 260 21 -52
Total 934,143,051 814,300,138 -13 167,586,413 225,744,400 35
Note: Canada and US data only. Mexico data not available for 1995 or 1999. The data are estimates of releases and transfers of chemicals reported by facilities. None of the rankings is meant to imply that a facility, state or province is not meeting its legal requirements. The data do not predict levels of exposure of the public to those chemicals.
* Transfers off-site to disposal and transfers of metals.
** Multiple SIC codes reported only in TRI.
Figure 7–4. Change in NPRI Total Releases On- and Off-site, by Industry, 1995–1999
05
10152025303540
1995 1999 1995 1999 1995 1999 1995 1999
PrimaryMetals
Chemicals PaperProducts
All Others
Mill
ions
of K
g
On-site Releases
Off-site Releases
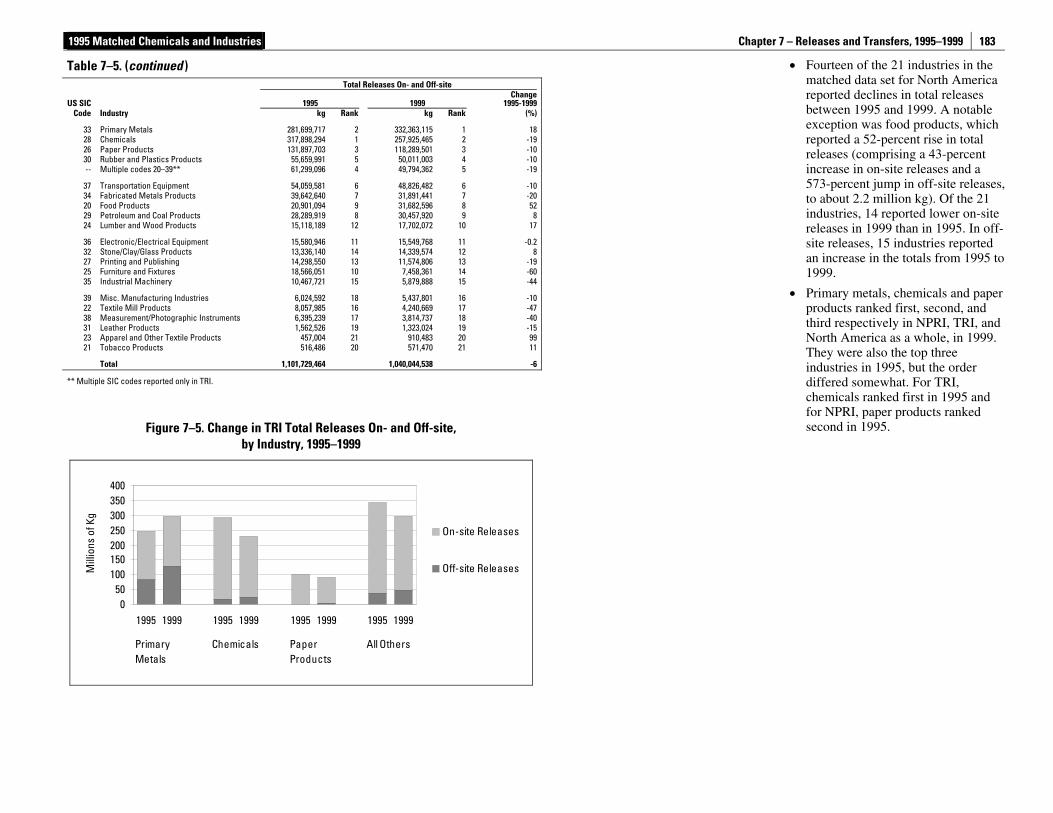
1995 Matched Chemicals and Industries Chapter 7 – Releases and Transfers, 1995–1999
183
Table 7–5. (continued ) Total Releases On- and Off-site
US SIC 1995 1999 Change
1995-1999 Code Industry kg Rank kg Rank (%)
33 Primary Metals 281,699,717 2 332,363,115 1 18 28 Chemicals 317,898,294 1 257,925,465 2 -19 26 Paper Products 131,897,703 3 118,289,501 3 -10 30 Rubber and Plastics Products 55,659,991 5 50,011,003 4 -10 -- Multiple codes 20–39** 61,299,096 4 49,794,362 5 -19
37 Transportation Equipment 54,059,581 6 48,826,482 6 -10 34 Fabricated Metals Products 39,642,640 7 31,891,441 7 -20 20 Food Products 20,901,094 9 31,682,596 8 52 29 Petroleum and Coal Products 28,289,919 8 30,457,920 9 8 24 Lumber and Wood Products 15,118,189 12 17,702,072 10 17
36 Electronic/Electrical Equipment 15,580,946 11 15,549,768 11 -0.2 32 Stone/Clay/Glass Products 13,336,140 14 14,339,574 12 8 27 Printing and Publishing 14,298,550 13 11,574,806 13 -19 25 Furniture and Fixtures 18,566,051 10 7,458,361 14 -60 35 Industrial Machinery 10,467,721 15 5,879,888 15 -44
39 Misc. Manufacturing Industries 6,024,592 18 5,437,801 16 -10 22 Textile Mill Products 8,057,985 16 4,240,669 17 -47 38 Measurement/Photographic Instruments 6,395,239 17 3,814,737 18 -40 31 Leather Products 1,562,526 19 1,323,024 19 -15 23 Apparel and Other Textile Products 457,004 21 910,483 20 99 21 Tobacco Products 516,486 20 571,470 21 11
Total 1,101,729,464 1,040,044,538 -6
** Multiple SIC codes reported only in TRI.
• Fourteen of the 21 industries in the matched data set for North America reported declines in total releases between 1995 and 1999. A notable exception was food products, which reported a 52-percent rise in total releases (comprising a 43-percent increase in on-site releases and a 573-percent jump in off-site releases, to about 2.2 million kg). Of the 21 industries, 14 reported lower on-site releases in 1999 than in 1995. In off-site releases, 15 industries reported an increase in the totals from 1995 to 1999.
• Primary metals, chemicals and paper products ranked first, second, and third respectively in NPRI, TRI, and North America as a whole, in 1999. They were also the top three industries in 1995, but the order differed somewhat. For TRI, chemicals ranked first in 1995 and for NPRI, paper products ranked second in 1995. Figure 7–5. Change in TRI Total Releases On- and Off-site,
by Industry, 1995–1999
050
100150200250300350400
1995 1999 1995 1999 1995 1999 1995 1999
PrimaryMetals
Chemicals PaperProducts
All Others
Mill
ions
of K
g
On-site Releases
Off-site Releases
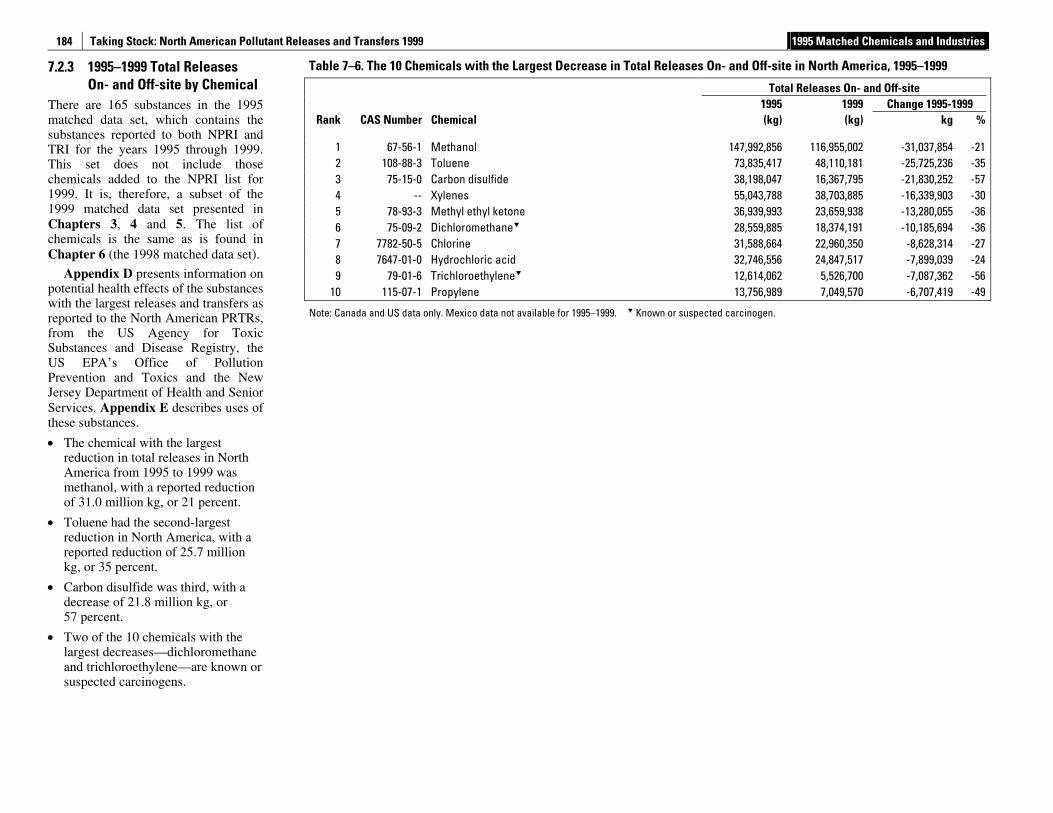
Taking Stock: North American Pollutant Releases and Transfers 1999 1995 Matched Chemicals and Industries
184
7.2.3 1995–1999 Total Releases On- and Off-site by Chemical
There are 165 substances in the 1995 matched data set, which contains the substances reported to both NPRI and TRI for the years 1995 through 1999. This set does not include those chemicals added to the NPRI list for 1999. It is, therefore, a subset of the 1999 matched data set presented in Chapters 3, 4 and 5. The list of chemicals is the same as is found in Chapter 6 (the 1998 matched data set).
Appendix D presents information on potential health effects of the substances with the largest releases and transfers as reported to the North American PRTRs, from the US Agency for Toxic Substances and Disease Registry, the US EPA’s Office of Pollution Prevention and Toxics and the New Jersey Department of Health and Senior Services. Appendix E describes uses of these substances.
• The chemical with the largest reduction in total releases in North America from 1995 to 1999 was methanol, with a reported reduction of 31.0 million kg, or 21 percent.
• Toluene had the second-largest reduction in North America, with a reported reduction of 25.7 million kg, or 35 percent.
• Carbon disulfide was third, with a decrease of 21.8 million kg, or 57 percent.
• Two of the 10 chemicals with the largest decreases—dichloromethane and trichloroethylene—are known or suspected carcinogens.
Table 7–6. The 10 Chemicals with the Largest Decrease in Total Releases On- and Off-site in North America, 1995–1999
Total Releases On- and Off-site 1995 1999 Change 1995-1999
Rank CAS Number Chemical (kg) (kg) kg %
1 67-56-1 Methanol 147,992,856 116,955,002 -31,037,854 -21 2 108-88-3 Toluene 73,835,417 48,110,181 -25,725,236 -35 3 75-15-0 Carbon disulfide 38,198,047 16,367,795 -21,830,252 -57 4 -- Xylenes 55,043,788 38,703,885 -16,339,903 -30 5 78-93-3 Methyl ethyl ketone 36,939,993 23,659,938 -13,280,055 -36 6 75-09-2 Dichloromethane 28,559,885 18,374,191 -10,185,694 -36 7 7782-50-5 Chlorine 31,588,664 22,960,350 -8,628,314 -27 8 7647-01-0 Hydrochloric acid 32,746,556 24,847,517 -7,899,039 -24 9 79-01-6 Trichloroethylene 12,614,062 5,526,700 -7,087,362 -56
10 115-07-1 Propylene 13,756,989 7,049,570 -6,707,419 -49
Note: Canada and US data only. Mexico data not available for 1995–1999. Known or suspected carcinogen.
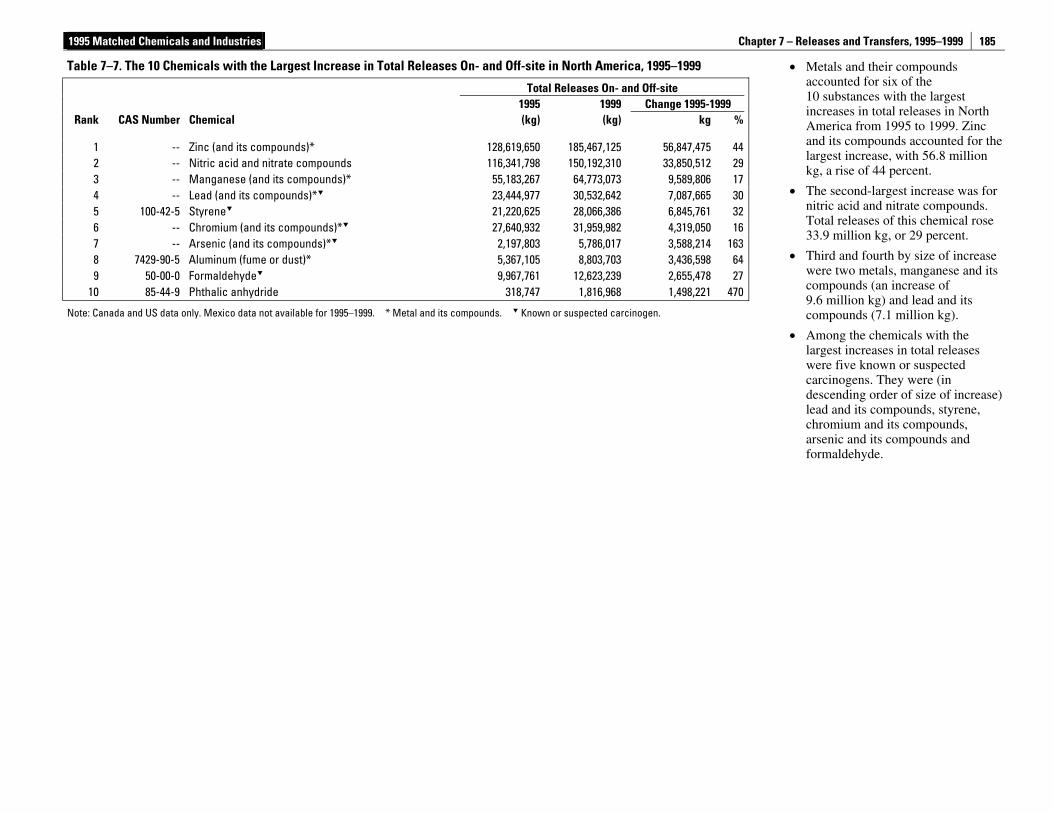
1995 Matched Chemicals and Industries Chapter 7 – Releases and Transfers, 1995–1999
185
• Metals and their compounds accounted for six of the 10 substances with the largest increases in total releases in North America from 1995 to 1999. Zinc and its compounds accounted for the largest increase, with 56.8 million kg, a rise of 44 percent.
• The second-largest increase was for nitric acid and nitrate compounds. Total releases of this chemical rose 33.9 million kg, or 29 percent.
• Third and fourth by size of increase were two metals, manganese and its compounds (an increase of 9.6 million kg) and lead and its compounds (7.1 million kg).
• Among the chemicals with the largest increases in total releases were five known or suspected carcinogens. They were (in descending order of size of increase) lead and its compounds, styrene, chromium and its compounds, arsenic and its compounds and formaldehyde.
Table 7–7. The 10 Chemicals with the Largest Increase in Total Releases On- and Off-site in North America, 1995–1999
Total Releases On- and Off-site 1995 1999 Change 1995-1999
Rank CAS Number Chemical (kg) (kg) kg %
1 -- Zinc (and its compounds)* 128,619,650 185,467,125 56,847,475 442 -- Nitric acid and nitrate compounds 116,341,798 150,192,310 33,850,512 293 -- Manganese (and its compounds)* 55,183,267 64,773,073 9,589,806 174 -- Lead (and its compounds)* 23,444,977 30,532,642 7,087,665 305 100-42-5 Styrene 21,220,625 28,066,386 6,845,761 326 -- Chromium (and its compounds)* 27,640,932 31,959,982 4,319,050 167 -- Arsenic (and its compounds)* 2,197,803 5,786,017 3,588,214 1638 7429-90-5 Aluminum (fume or dust)* 5,367,105 8,803,703 3,436,598 649 50-00-0 Formaldehyde 9,967,761 12,623,239 2,655,478 27
10 85-44-9 Phthalic anhydride 318,747 1,816,968 1,498,221 470
Note: Canada and US data only. Mexico data not available for 1995–1999. * Metal and its compounds. Known or suspected carcinogen.
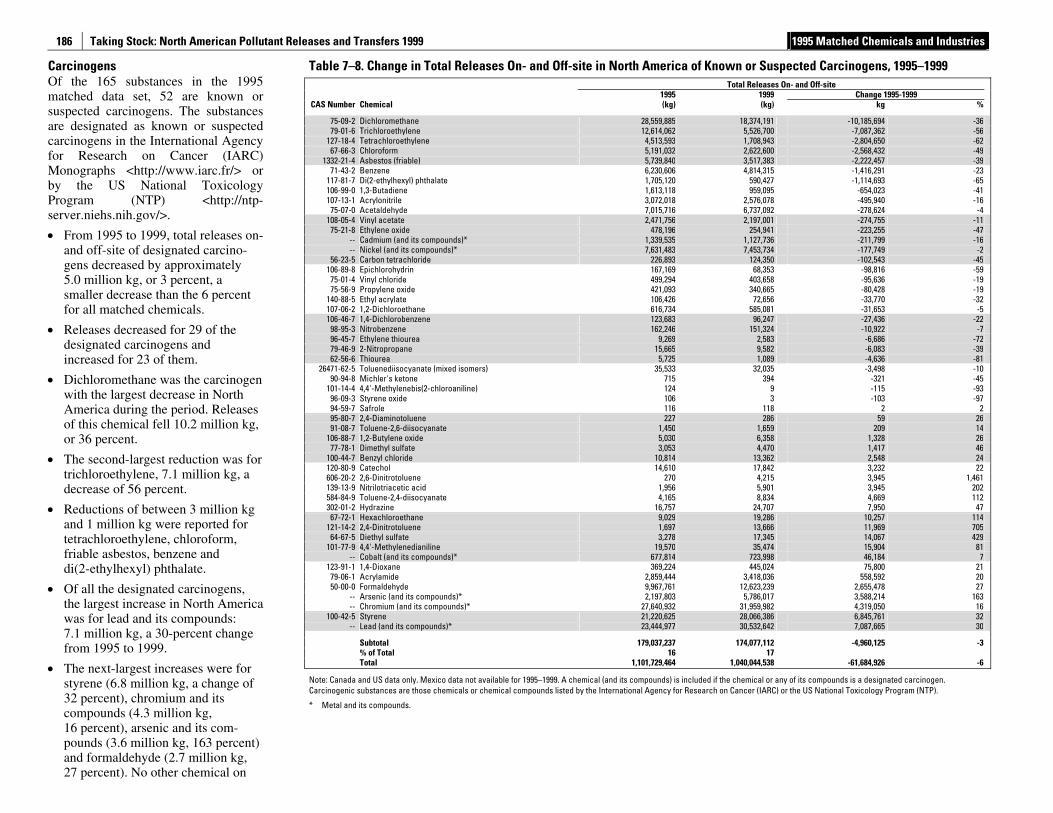
Taking Stock: North American Pollutant Releases and Transfers 1999 1995 Matched Chemicals and Industries
186
Carcinogens Of the 165 substances in the 1995 matched data set, 52 are known or suspected carcinogens. The substances are designated as known or suspected carcinogens in the International Agency for Research on Cancer (IARC) Monographs <http://www.iarc.fr/> or by the US National Toxicology Program (NTP) <http://ntp-server.niehs.nih.gov/>.
• From 1995 to 1999, total releases on- and off-site of designated carcino-gens decreased by approximately 5.0 million kg, or 3 percent, a smaller decrease than the 6 percent for all matched chemicals.
• Releases decreased for 29 of the designated carcinogens and increased for 23 of them.
• Dichloromethane was the carcinogen with the largest decrease in North America during the period. Releases of this chemical fell 10.2 million kg, or 36 percent.
• The second-largest reduction was for trichloroethylene, 7.1 million kg, a decrease of 56 percent.
• Reductions of between 3 million kg and 1 million kg were reported for tetrachloroethylene, chloroform, friable asbestos, benzene and di(2-ethylhexyl) phthalate.
• Of all the designated carcinogens, the largest increase in North America was for lead and its compounds: 7.1 million kg, a 30-percent change from 1995 to 1999.
• The next-largest increases were for styrene (6.8 million kg, a change of 32 percent), chromium and its compounds (4.3 million kg, 16 percent), arsenic and its com-pounds (3.6 million kg, 163 percent) and formaldehyde (2.7 million kg, 27 percent). No other chemical on
Table 7–8. Change in Total Releases On- and Off-site in North America of Known or Suspected Carcinogens, 1995–1999 Total Releases On- and Off-site
1995 1999 Change 1995-1999 CAS Number Chemical (kg) (kg) kg %
75-09-2 Dichloromethane 28,559,885 18,374,191 -10,185,694 -36 79-01-6 Trichloroethylene 12,614,062 5,526,700 -7,087,362 -56
127-18-4 Tetrachloroethylene 4,513,593 1,708,943 -2,804,650 -62 67-66-3 Chloroform 5,191,032 2,622,600 -2,568,432 -49
1332-21-4 Asbestos (friable) 5,739,840 3,517,383 -2,222,457 -39 71-43-2 Benzene 6,230,606 4,814,315 -1,416,291 -23
117-81-7 Di(2-ethylhexyl) phthalate 1,705,120 590,427 -1,114,693 -65 106-99-0 1,3-Butadiene 1,613,118 959,095 -654,023 -41 107-13-1 Acrylonitrile 3,072,018 2,576,078 -495,940 -16
75-07-0 Acetaldehyde 7,015,716 6,737,092 -278,624 -4 108-05-4 Vinyl acetate 2,471,756 2,197,001 -274,755 -11
75-21-8 Ethylene oxide 478,196 254,941 -223,255 -47 -- Cadmium (and its compounds)* 1,339,535 1,127,736 -211,799 -16 -- Nickel (and its compounds)* 7,631,483 7,453,734 -177,749 -2
56-23-5 Carbon tetrachloride 226,893 124,350 -102,543 -45 106-89-8 Epichlorohydrin 167,169 68,353 -98,816 -59
75-01-4 Vinyl chloride 499,294 403,658 -95,636 -19 75-56-9 Propylene oxide 421,093 340,665 -80,428 -19
140-88-5 Ethyl acrylate 106,426 72,656 -33,770 -32 107-06-2 1,2-Dichloroethane 616,734 585,081 -31,653 -5 106-46-7 1,4-Dichlorobenzene 123,683 96,247 -27,436 -22
98-95-3 Nitrobenzene 162,246 151,324 -10,922 -7 96-45-7 Ethylene thiourea 9,269 2,583 -6,686 -72 79-46-9 2-Nitropropane 15,665 9,582 -6,083 -39 62-56-6 Thiourea 5,725 1,089 -4,636 -81
26471-62-5 Toluenediisocyanate (mixed isomers) 35,533 32,035 -3,498 -10 90-94-8 Michler's ketone 715 394 -321 -45
101-14-4 4,4'-Methylenebis(2-chloroaniline) 124 9 -115 -93 96-09-3 Styrene oxide 106 3 -103 -97 94-59-7 Safrole 116 118 2 2 95-80-7 2,4-Diaminotoluene 227 286 59 26 91-08-7 Toluene-2,6-diisocyanate 1,450 1,659 209 14
106-88-7 1,2-Butylene oxide 5,030 6,358 1,328 26 77-78-1 Dimethyl sulfate 3,053 4,470 1,417 46
100-44-7 Benzyl chloride 10,814 13,362 2,548 24 120-80-9 Catechol 14,610 17,842 3,232 22 606-20-2 2,6-Dinitrotoluene 270 4,215 3,945 1,461 139-13-9 Nitrilotriacetic acid 1,956 5,901 3,945 202 584-84-9 Toluene-2,4-diisocyanate 4,165 8,834 4,669 112 302-01-2 Hydrazine 16,757 24,707 7,950 47
67-72-1 Hexachloroethane 9,029 19,286 10,257 114 121-14-2 2,4-Dinitrotoluene 1,697 13,666 11,969 705
64-67-5 Diethyl sulfate 3,278 17,345 14,067 429 101-77-9 4,4'-Methylenedianiline 19,570 35,474 15,904 81
-- Cobalt (and its compounds)* 677,814 723,998 46,184 7 123-91-1 1,4-Dioxane 369,224 445,024 75,800 21
79-06-1 Acrylamide 2,859,444 3,418,036 558,592 20 50-00-0 Formaldehyde 9,967,761 12,623,239 2,655,478 27
-- Arsenic (and its compounds)* 2,197,803 5,786,017 3,588,214 163 -- Chromium (and its compounds)* 27,640,932 31,959,982 4,319,050 16
100-42-5 Styrene 21,220,625 28,066,386 6,845,761 32 -- Lead (and its compounds)* 23,444,977 30,532,642 7,087,665 30
Subtotal 179,037,237 174,077,112 -4,960,125 -3 % of Total 16 17 Total 1,101,729,464 1,040,044,538 -61,684,926 -6
Note: Canada and US data only. Mexico data not available for 1995–1999. A chemical (and its compounds) is included if the chemical or any of its compounds is a designated carcinogen. Carcinogenic substances are those chemicals or chemical compounds listed by the International Agency for Research on Cancer (IARC) or the US National Toxicology Program (NTP).
* Metal and its compounds.
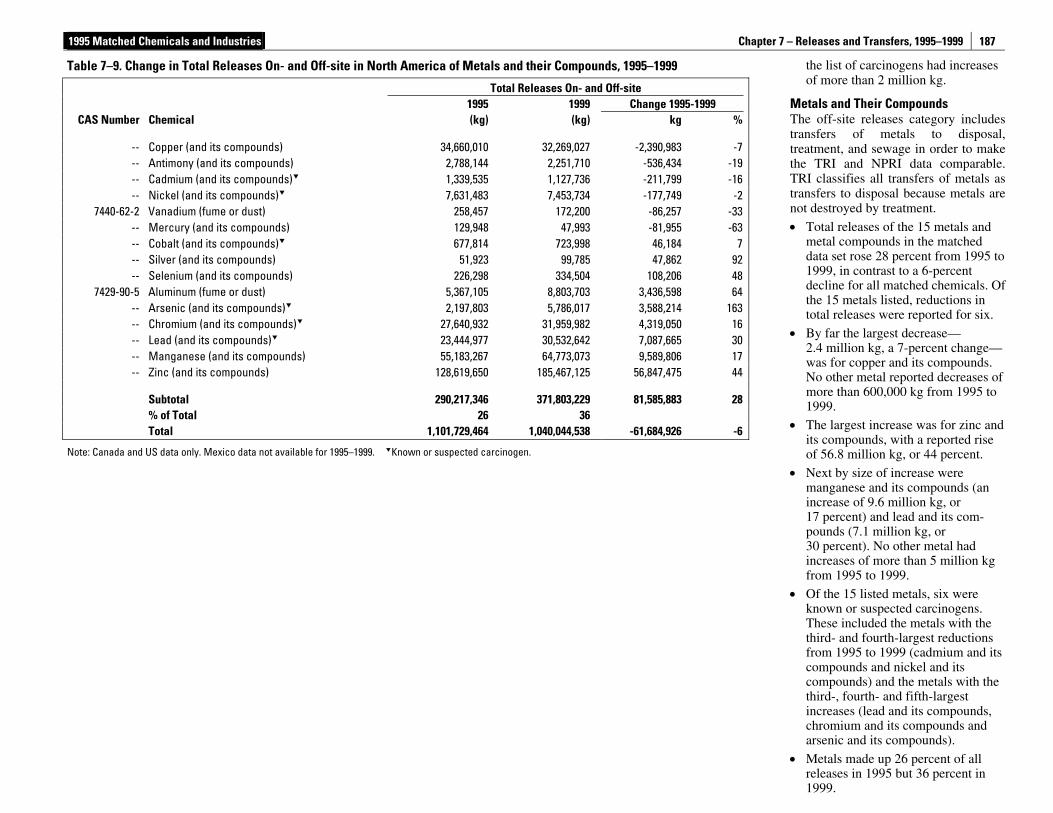
1995 Matched Chemicals and Industries Chapter 7 – Releases and Transfers, 1995–1999
187
the list of carcinogens had increases of more than 2 million kg.
Metals and Their Compounds The off-site releases category includes transfers of metals to disposal, treatment, and sewage in order to make the TRI and NPRI data comparable. TRI classifies all transfers of metals as transfers to disposal because metals are not destroyed by treatment.
• Total releases of the 15 metals and metal compounds in the matched data set rose 28 percent from 1995 to 1999, in contrast to a 6-percent decline for all matched chemicals. Of the 15 metals listed, reductions in total releases were reported for six.
• By far the largest decrease—2.4 million kg, a 7-percent change—was for copper and its compounds. No other metal reported decreases of more than 600,000 kg from 1995 to 1999.
• The largest increase was for zinc and its compounds, with a reported rise of 56.8 million kg, or 44 percent.
• Next by size of increase were manganese and its compounds (an increase of 9.6 million kg, or 17 percent) and lead and its com-pounds (7.1 million kg, or 30 percent). No other metal had increases of more than 5 million kg from 1995 to 1999.
• Of the 15 listed metals, six were known or suspected carcinogens. These included the metals with the third- and fourth-largest reductions from 1995 to 1999 (cadmium and its compounds and nickel and its compounds) and the metals with the third-, fourth- and fifth-largest increases (lead and its compounds, chromium and its compounds and arsenic and its compounds).
• Metals made up 26 percent of all releases in 1995 but 36 percent in 1999.
Table 7–9. Change in Total Releases On- and Off-site in North America of Metals and their Compounds, 1995–1999
Total Releases On- and Off-site 1995 1999 Change 1995-1999
CAS Number Chemical (kg) (kg) kg %
-- Copper (and its compounds) 34,660,010 32,269,027 -2,390,983 -7-- Antimony (and its compounds) 2,788,144 2,251,710 -536,434 -19-- Cadmium (and its compounds) 1,339,535 1,127,736 -211,799 -16-- Nickel (and its compounds) 7,631,483 7,453,734 -177,749 -2
7440-62-2 Vanadium (fume or dust) 258,457 172,200 -86,257 -33-- Mercury (and its compounds) 129,948 47,993 -81,955 -63-- Cobalt (and its compounds) 677,814 723,998 46,184 7-- Silver (and its compounds) 51,923 99,785 47,862 92-- Selenium (and its compounds) 226,298 334,504 108,206 48
7429-90-5 Aluminum (fume or dust) 5,367,105 8,803,703 3,436,598 64-- Arsenic (and its compounds) 2,197,803 5,786,017 3,588,214 163-- Chromium (and its compounds) 27,640,932 31,959,982 4,319,050 16-- Lead (and its compounds) 23,444,977 30,532,642 7,087,665 30-- Manganese (and its compounds) 55,183,267 64,773,073 9,589,806 17-- Zinc (and its compounds) 128,619,650 185,467,125 56,847,475 44
Subtotal 290,217,346 371,803,229 81,585,883 28 % of Total 26 36 Total 1,101,729,464 1,040,044,538 -61,684,926 -6
Note: Canada and US data only. Mexico data not available for 1995–1999. Known or suspected carcinogen.
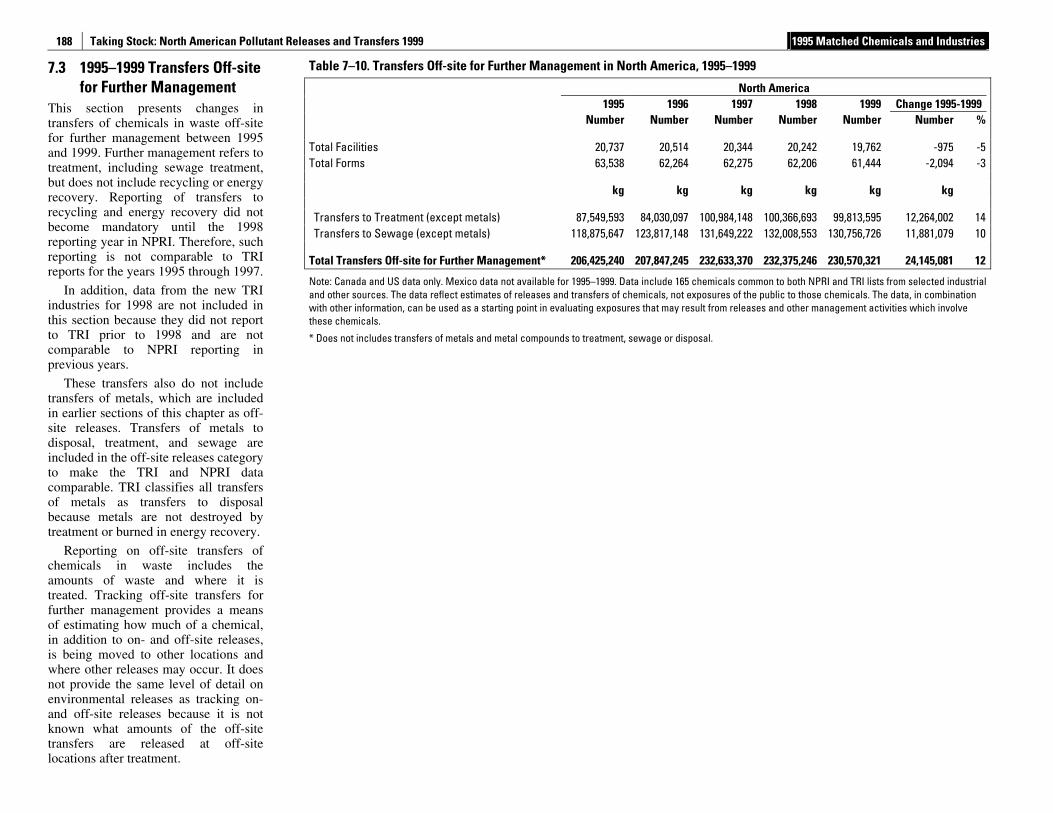
Taking Stock: North American Pollutant Releases and Transfers 1999 1995 Matched Chemicals and Industries
188
7.3 1995–1999 Transfers Off-site for Further Management
This section presents changes in transfers of chemicals in waste off-site for further management between 1995 and 1999. Further management refers to treatment, including sewage treatment, but does not include recycling or energy recovery. Reporting of transfers to recycling and energy recovery did not become mandatory until the 1998 reporting year in NPRI. Therefore, such reporting is not comparable to TRI reports for the years 1995 through 1997.
In addition, data from the new TRI industries for 1998 are not included in this section because they did not report to TRI prior to 1998 and are not comparable to NPRI reporting in previous years.
These transfers also do not include transfers of metals, which are included in earlier sections of this chapter as off-site releases. Transfers of metals to disposal, treatment, and sewage are included in the off-site releases category to make the TRI and NPRI data comparable. TRI classifies all transfers of metals as transfers to disposal because metals are not destroyed by treatment or burned in energy recovery.
Reporting on off-site transfers of chemicals in waste includes the amounts of waste and where it is treated. Tracking off-site transfers for further management provides a means of estimating how much of a chemical, in addition to on- and off-site releases, is being moved to other locations and where other releases may occur. It does not provide the same level of detail on environmental releases as tracking on- and off-site releases because it is not known what amounts of the off-site transfers are released at off-site locations after treatment.
Table 7–10. Transfers Off-site for Further Management in North America, 1995–1999
North America 1995 1996 1997 1998 1999 Change 1995-1999 Number Number Number Number Number Number %
Total Facilities 20,737 20,514 20,344 20,242 19,762 -975 -5 Total Forms 63,538 62,264 62,275 62,206 61,444 -2,094 -3
kg kg kg kg kg kg
Transfers to Treatment (except metals) 87,549,593 84,030,097 100,984,148 100,366,693 99,813,595 12,264,002 14 Transfers to Sewage (except metals) 118,875,647 123,817,148 131,649,222 132,008,553 130,756,726 11,881,079 10
Total Transfers Off-site for Further Management* 206,425,240 207,847,245 232,633,370 232,375,246 230,570,321 24,145,081 12
Note: Canada and US data only. Mexico data not available for 1995–1999. Data include 165 chemicals common to both NPRI and TRI lists from selected industrial and other sources. The data reflect estimates of releases and transfers of chemicals, not exposures of the public to those chemicals. The data, in combination with other information, can be used as a starting point in evaluating exposures that may result from releases and other management activities which involve these chemicals.
* Does not includes transfers of metals and metal compounds to treatment, sewage or disposal.
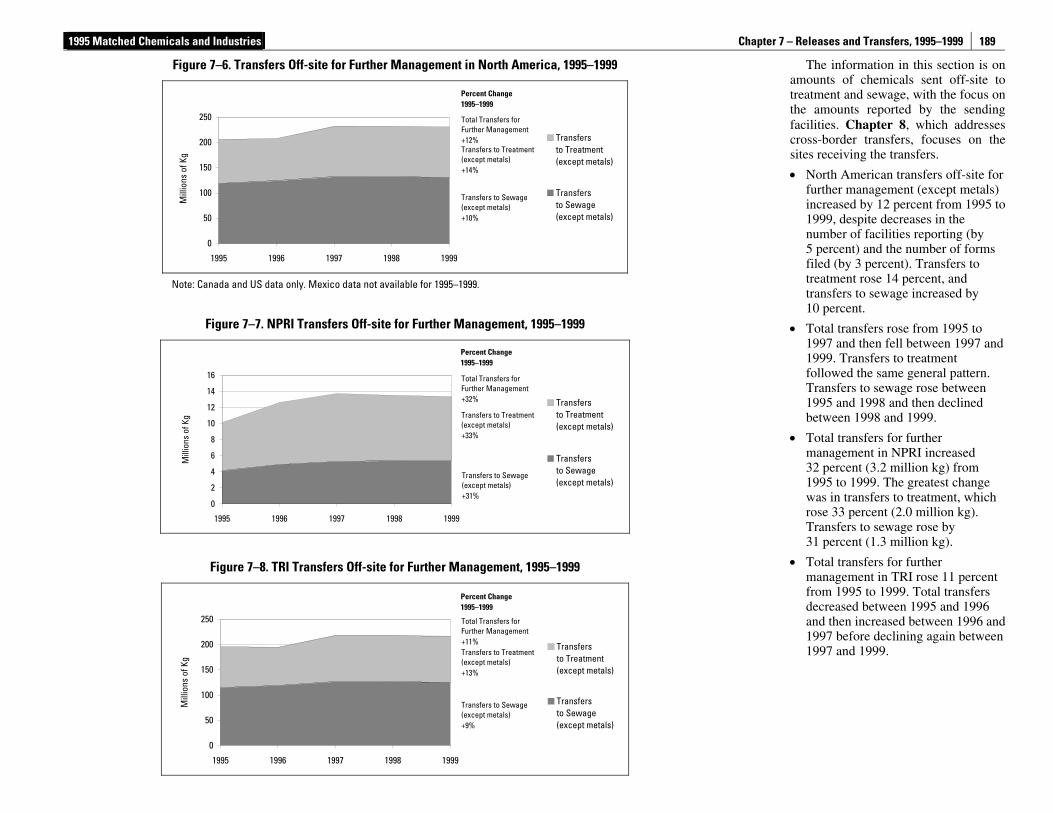
1995 Matched Chemicals and Industries Chapter 7 – Releases and Transfers, 1995–1999
189
The information in this section is on
amounts of chemicals sent off-site to treatment and sewage, with the focus on the amounts reported by the sending facilities. Chapter 8, which addresses cross-border transfers, focuses on the sites receiving the transfers.
• North American transfers off-site for further management (except metals) increased by 12 percent from 1995 to 1999, despite decreases in the number of facilities reporting (by 5 percent) and the number of forms filed (by 3 percent). Transfers to treatment rose 14 percent, and transfers to sewage increased by 10 percent.
• Total transfers rose from 1995 to 1997 and then fell between 1997 and 1999. Transfers to treatment followed the same general pattern. Transfers to sewage rose between 1995 and 1998 and then declined between 1998 and 1999.
• Total transfers for further management in NPRI increased 32 percent (3.2 million kg) from 1995 to 1999. The greatest change was in transfers to treatment, which rose 33 percent (2.0 million kg). Transfers to sewage rose by 31 percent (1.3 million kg).
• Total transfers for further management in TRI rose 11 percent from 1995 to 1999. Total transfers decreased between 1995 and 1996 and then increased between 1996 and 1997 before declining again between 1997 and 1999.
Figure 7–6. Transfers Off-site for Further Management in North America, 1995–1999
0
50
100
150
200
250
1995 1996 1997 1998 1999
Mill
ions
of K
g
Transfersto Treatment(except metals)
Transfersto Sewage(except metals)
Note: Canada and US data only. Mexico data not available for 1995–1999.
Figure 7–7. NPRI Transfers Off-site for Further Management, 1995–1999
0
2
4
6
8
10
12
14
16
1995 1996 1997 1998 1999
Mill
ions
of K
g
Transfersto Treatment(except metals)
Transfersto Sewage(except metals)
Figure 7–8. TRI Transfers Off-site for Further Management, 1995–1999
0
50
100
150
200
250
1995 1996 1997 1998 1999
Mill
ions
of K
g
Transfersto Treatment(except metals)
Transfersto Sewage(except metals)
Percent Change1995–1999
Total Transfers forFurther Management +12% Transfers to Treatment(except metals) +14%
Transfers to Sewage(except metals) +10%
Percent Change1995–1999
Total Transfers forFurther Management +32%
Transfers to Treatment(except metals) +33%
Transfers to Sewage(except metals) +31%
Percent Change1995–1999
Total Transfers forFurther Management +11% Transfers to Treatment(except metals) +13%
Transfers to Sewage(except metals) +9%
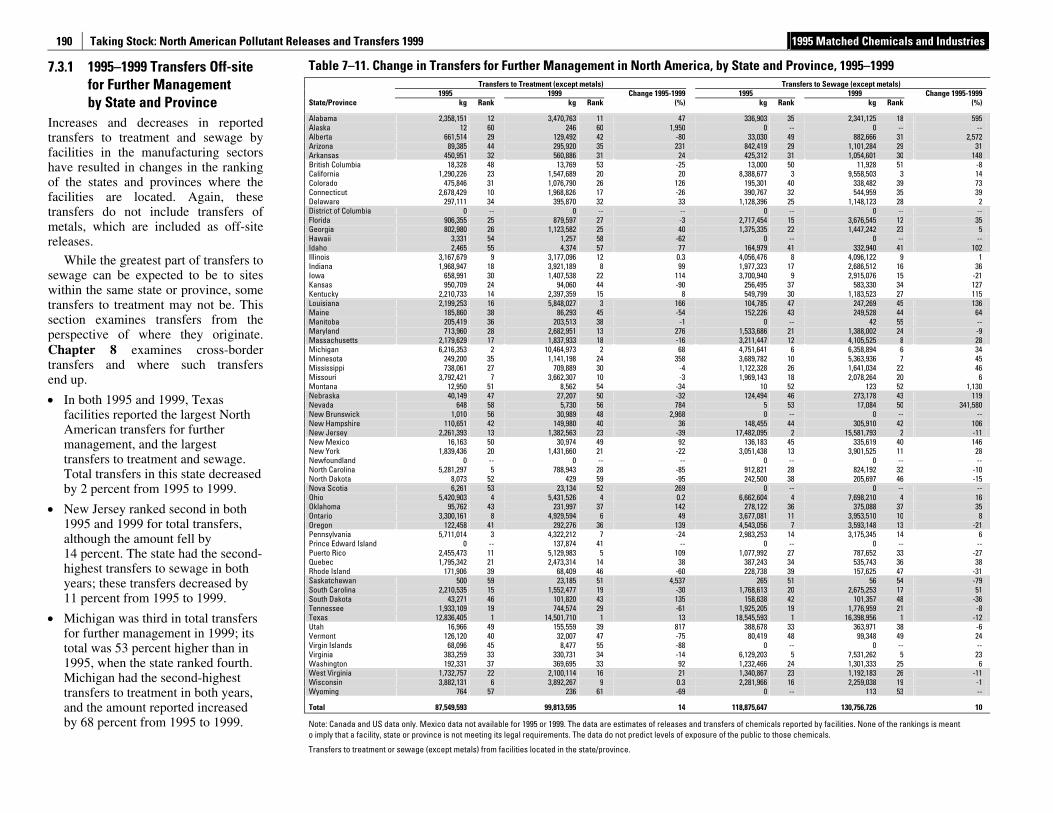
Taking Stock: North American Pollutant Releases and Transfers 1999 1995 Matched Chemicals and Industries
190
7.3.1 1995–1999 Transfers Off-site for Further Management by State and Province
Increases and decreases in reported transfers to treatment and sewage by facilities in the manufacturing sectors have resulted in changes in the ranking of the states and provinces where the facilities are located. Again, these transfers do not include transfers of metals, which are included as off-site releases.
While the greatest part of transfers to sewage can be expected to be to sites within the same state or province, some transfers to treatment may not be. This section examines transfers from the perspective of where they originate. Chapter 8 examines cross-border transfers and where such transfers end up.
• In both 1995 and 1999, Texas facilities reported the largest North American transfers for further management, and the largest transfers to treatment and sewage. Total transfers in this state decreased by 2 percent from 1995 to 1999.
• New Jersey ranked second in both 1995 and 1999 for total transfers, although the amount fell by 14 percent. The state had the second-highest transfers to sewage in both years; these transfers decreased by 11 percent from 1995 to 1999.
• Michigan was third in total transfers for further management in 1999; its total was 53 percent higher than in 1995, when the state ranked fourth. Michigan had the second-highest transfers to treatment in both years, and the amount reported increased by 68 percent from 1995 to 1999.
Table 7–11. Change in Transfers for Further Management in North America, by State and Province, 1995–1999 Transfers to Treatment (except metals) Transfers to Sewage (except metals) 1995 1999 Change 1995-1999 1995 1999 Change 1995-1999 State/Province kg Rank kg Rank (%) kg Rank kg Rank (%)
Alabama 2,358,151 12 3,470,763 11 47 336,903 35 2,341,125 18 595 Alaska 12 60 246 60 1,950 0 -- 0 -- -- Alberta 661,514 29 129,492 42 -80 33,030 49 882,666 31 2,572 Arizona 89,385 44 295,920 35 231 842,419 29 1,101,284 29 31 Arkansas 450,951 32 560,886 31 24 425,312 31 1,054,601 30 148 British Columbia 18,328 48 13,769 53 -25 13,000 50 11,928 51 -8 California 1,290,226 23 1,547,689 20 20 8,388,677 3 9,558,503 3 14 Colorado 475,846 31 1,076,790 26 126 195,301 40 338,482 39 73 Connecticut 2,678,429 10 1,968,826 17 -26 390,767 32 544,959 35 39 Delaware 297,111 34 395,870 32 33 1,128,396 25 1,148,123 28 2 District of Columbia 0 -- 0 -- -- 0 -- 0 -- -- Florida 906,355 25 879,597 27 -3 2,717,454 15 3,676,545 12 35 Georgia 802,980 26 1,123,582 25 40 1,375,335 22 1,447,242 23 5 Hawaii 3,331 54 1,257 58 -62 0 -- 0 -- -- Idaho 2,465 55 4,374 57 77 164,979 41 332,940 41 102 Illinois 3,167,679 9 3,177,096 12 0.3 4,056,476 8 4,096,122 9 1 Indiana 1,968,947 18 3,921,189 8 99 1,977,323 17 2,686,512 16 36 Iowa 658,991 30 1,407,538 22 114 3,700,940 9 2,915,076 15 -21 Kansas 950,709 24 94,060 44 -90 256,495 37 583,330 34 127 Kentucky 2,210,733 14 2,397,359 15 8 549,799 30 1,183,523 27 115 Louisiana 2,199,253 16 5,848,027 3 166 104,785 47 247,269 45 136 Maine 185,860 38 86,293 45 -54 152,226 43 249,528 44 64 Manitoba 205,419 36 203,513 38 -1 0 -- 42 55 -- Maryland 713,960 28 2,682,951 13 276 1,533,686 21 1,388,002 24 -9 Massachusetts 2,179,629 17 1,837,933 18 -16 3,211,447 12 4,105,525 8 28 Michigan 6,216,353 2 10,464,973 2 68 4,751,641 6 6,358,894 6 34 Minnesota 249,200 35 1,141,198 24 358 3,689,782 10 5,363,936 7 45 Mississippi 738,061 27 709,889 30 -4 1,122,328 26 1,641,034 22 46 Missouri 3,792,421 7 3,662,307 10 -3 1,969,143 18 2,078,264 20 6 Montana 12,950 51 8,562 54 -34 10 52 123 52 1,130 Nebraska 40,149 47 27,207 50 -32 124,494 46 273,178 43 119 Nevada 648 58 5,730 56 784 5 53 17,084 50 341,580 New Brunswick 1,010 56 30,989 48 2,968 0 -- 0 -- -- New Hampshire 110,651 42 149,980 40 36 148,455 44 305,910 42 106 New Jersey 2,261,393 13 1,382,563 23 -39 17,482,095 2 15,581,793 2 -11 New Mexico 16,163 50 30,974 49 92 136,183 45 335,619 40 146 New York 1,839,436 20 1,431,660 21 -22 3,051,438 13 3,901,525 11 28 Newfoundland 0 -- 0 -- -- 0 -- 0 -- -- North Carolina 5,281,297 5 788,943 28 -85 912,821 28 824,192 32 -10 North Dakota 8,073 52 429 59 -95 242,500 38 205,697 46 -15 Nova Scotia 6,261 53 23,134 52 269 0 -- 0 -- -- Ohio 5,420,903 4 5,431,526 4 0.2 6,662,604 4 7,698,210 4 16 Oklahoma 95,762 43 231,997 37 142 278,122 36 375,088 37 35 Ontario 3,300,161 8 4,929,594 6 49 3,677,081 11 3,953,510 10 8 Oregon 122,458 41 292,276 36 139 4,543,056 7 3,593,148 13 -21 Pennsylvania 5,711,014 3 4,322,212 7 -24 2,983,253 14 3,175,345 14 6 Prince Edward Island 0 -- 137,874 41 -- 0 -- 0 -- -- Puerto Rico 2,455,473 11 5,129,983 5 109 1,077,992 27 787,652 33 -27 Quebec 1,795,342 21 2,473,314 14 38 387,243 34 535,743 36 38 Rhode Island 171,906 39 68,409 46 -60 228,738 39 157,625 47 -31 Saskatchewan 500 59 23,185 51 4,537 265 51 56 54 -79 South Carolina 2,210,535 15 1,552,477 19 -30 1,768,613 20 2,675,253 17 51 South Dakota 43,271 46 101,820 43 135 158,638 42 101,357 48 -36 Tennessee 1,933,109 19 744,574 29 -61 1,925,205 19 1,776,959 21 -8 Texas 12,836,405 1 14,501,710 1 13 18,545,593 1 16,398,956 1 -12 Utah 16,966 49 155,559 39 817 388,678 33 363,971 38 -6 Vermont 126,120 40 32,007 47 -75 80,419 48 99,348 49 24 Virgin Islands 68,096 45 8,477 55 -88 0 -- 0 -- -- Virginia 383,259 33 330,731 34 -14 6,129,203 5 7,531,262 5 23 Washington 192,331 37 369,695 33 92 1,232,466 24 1,301,333 25 6 West Virginia 1,732,757 22 2,100,114 16 21 1,340,867 23 1,192,183 26 -11 Wisconsin 3,882,131 6 3,892,267 9 0.3 2,281,966 16 2,259,038 19 -1 Wyoming 764 57 236 61 -69 0 -- 113 53 --
Total 87,549,593 99,813,595 14 118,875,647 130,756,726 10
Note: Canada and US data only. Mexico data not available for 1995 or 1999. The data are estimates of releases and transfers of chemicals reported by facilities. None of the rankings is meant o imply that a facility, state or province is not meeting its legal requirements. The data do not predict levels of exposure of the public to those chemicals.
Transfers to treatment or sewage (except metals) from facilities located in the state/province.
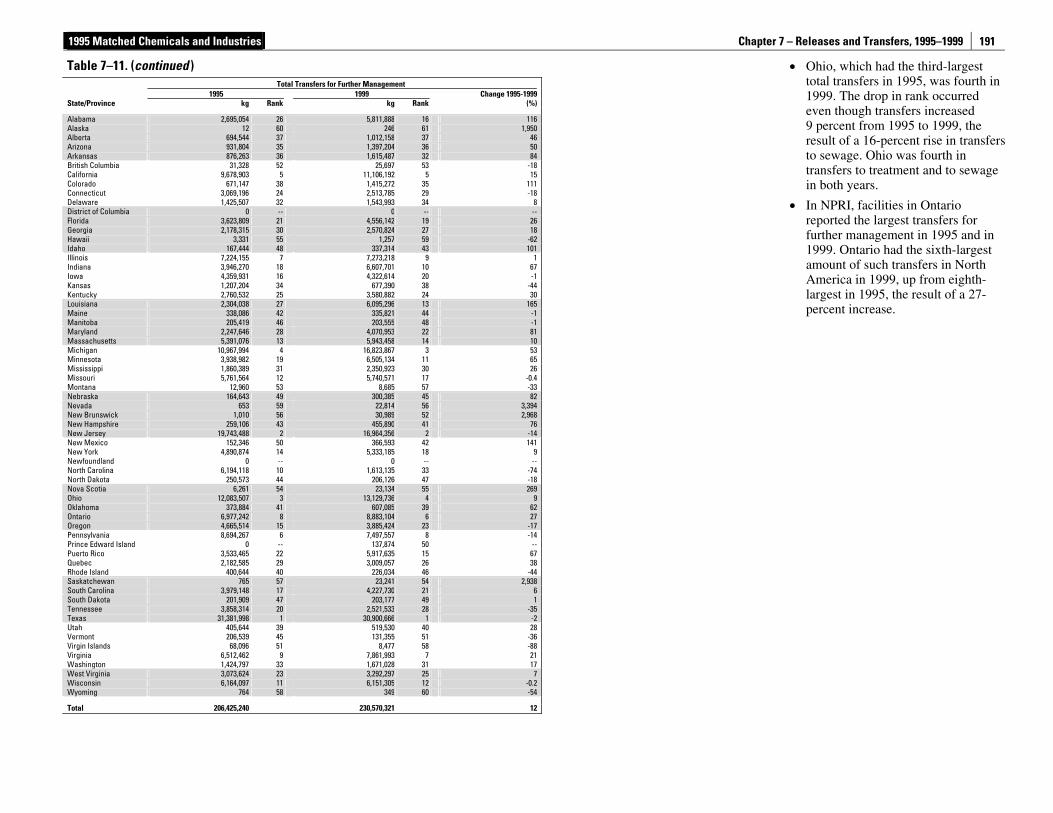
1995 Matched Chemicals and Industries Chapter 7 – Releases and Transfers, 1995–1999
191
• Ohio, which had the third-largest total transfers in 1995, was fourth in 1999. The drop in rank occurred even though transfers increased 9 percent from 1995 to 1999, the result of a 16-percent rise in transfers to sewage. Ohio was fourth in transfers to treatment and to sewage in both years.
• In NPRI, facilities in Ontario reported the largest transfers for further management in 1995 and in 1999. Ontario had the sixth-largest amount of such transfers in North America in 1999, up from eighth-largest in 1995, the result of a 27-percent increase.
Table 7–11. (continued ) Total Transfers for Further Management 1995 1999 Change 1995-1999 State/Province kg Rank kg Rank (%)
Alabama 2,695,054 26 5,811,888 16 116 Alaska 12 60 246 61 1,950 Alberta 694,544 37 1,012,158 37 46 Arizona 931,804 35 1,397,204 36 50 Arkansas 876,263 36 1,615,487 32 84 British Columbia 31,328 52 25,697 53 -18 California 9,678,903 5 11,106,192 5 15 Colorado 671,147 38 1,415,272 35 111 Connecticut 3,069,196 24 2,513,785 29 -18 Delaware 1,425,507 32 1,543,993 34 8 District of Columbia 0 -- 0 -- -- Florida 3,623,809 21 4,556,142 19 26 Georgia 2,178,315 30 2,570,824 27 18 Hawaii 3,331 55 1,257 59 -62 Idaho 167,444 48 337,314 43 101 Illinois 7,224,155 7 7,273,218 9 1 Indiana 3,946,270 18 6,607,701 10 67 Iowa 4,359,931 16 4,322,614 20 -1 Kansas 1,207,204 34 677,390 38 -44 Kentucky 2,760,532 25 3,580,882 24 30 Louisiana 2,304,038 27 6,095,296 13 165 Maine 338,086 42 335,821 44 -1 Manitoba 205,419 46 203,555 48 -1 Maryland 2,247,646 28 4,070,953 22 81 Massachusetts 5,391,076 13 5,943,458 14 10 Michigan 10,967,994 4 16,823,867 3 53 Minnesota 3,938,982 19 6,505,134 11 65 Mississippi 1,860,389 31 2,350,923 30 26 Missouri 5,761,564 12 5,740,571 17 -0.4 Montana 12,960 53 8,685 57 -33 Nebraska 164,643 49 300,385 45 82 Nevada 653 59 22,814 56 3,394 New Brunswick 1,010 56 30,989 52 2,968 New Hampshire 259,106 43 455,890 41 76 New Jersey 19,743,488 2 16,964,356 2 -14 New Mexico 152,346 50 366,593 42 141 New York 4,890,874 14 5,333,185 18 9 Newfoundland 0 -- 0 -- -- North Carolina 6,194,118 10 1,613,135 33 -74 North Dakota 250,573 44 206,126 47 -18 Nova Scotia 6,261 54 23,134 55 269 Ohio 12,083,507 3 13,129,736 4 9 Oklahoma 373,884 41 607,085 39 62 Ontario 6,977,242 8 8,883,104 6 27 Oregon 4,665,514 15 3,885,424 23 -17 Pennsylvania 8,694,267 6 7,497,557 8 -14 Prince Edward Island 0 -- 137,874 50 -- Puerto Rico 3,533,465 22 5,917,635 15 67 Quebec 2,182,585 29 3,009,057 26 38 Rhode Island 400,644 40 226,034 46 -44 Saskatchewan 765 57 23,241 54 2,938 South Carolina 3,979,148 17 4,227,730 21 6 South Dakota 201,909 47 203,177 49 1 Tennessee 3,858,314 20 2,521,533 28 -35 Texas 31,381,998 1 30,900,666 1 -2 Utah 405,644 39 519,530 40 28 Vermont 206,539 45 131,355 51 -36 Virgin Islands 68,096 51 8,477 58 -88 Virginia 6,512,462 9 7,861,993 7 21 Washington 1,424,797 33 1,671,028 31 17 West Virginia 3,073,624 23 3,292,297 25 7 Wisconsin 6,164,097 11 6,151,305 12 -0.2 Wyoming 764 58 349 60 -54
Total 206,425,240 230,570,321 12
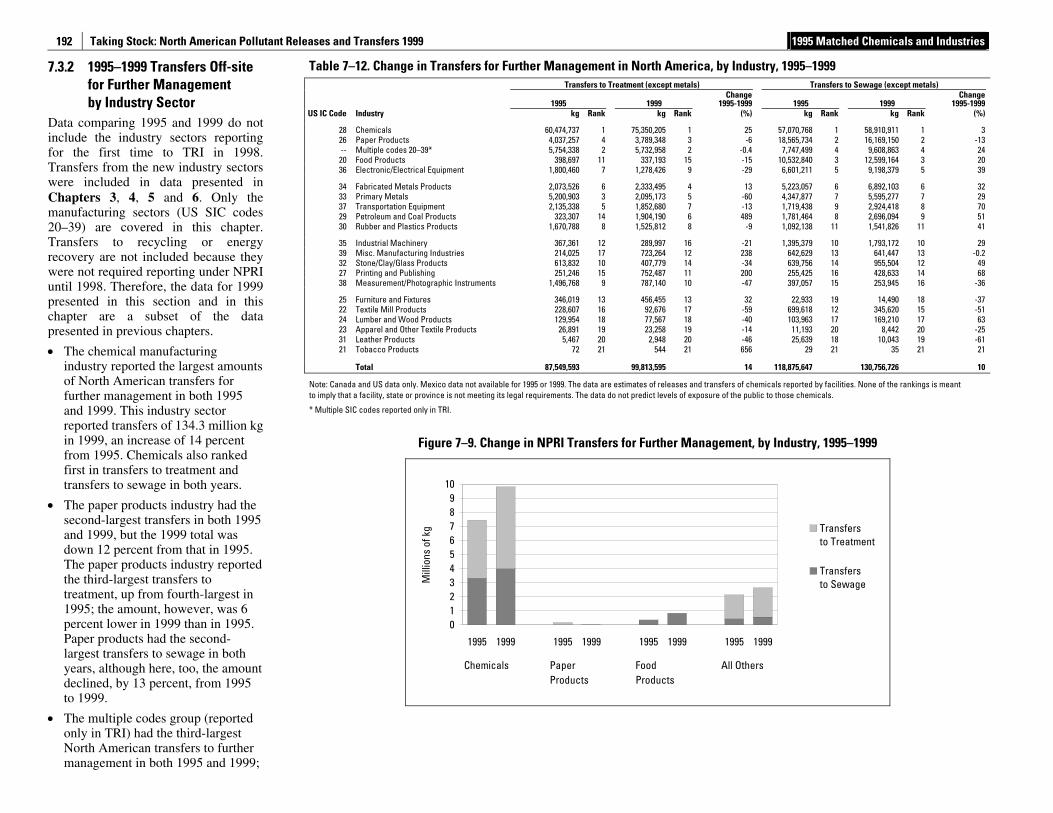
Taking Stock: North American Pollutant Releases and Transfers 1999 1995 Matched Chemicals and Industries
192
7.3.2 1995–1999 Transfers Off-site for Further Management by Industry Sector
Data comparing 1995 and 1999 do not include the industry sectors reporting for the first time to TRI in 1998. Transfers from the new industry sectors were included in data presented in Chapters 3, 4, 5 and 6. Only the manufacturing sectors (US SIC codes 20–39) are covered in this chapter. Transfers to recycling or energy recovery are not included because they were not required reporting under NPRI until 1998. Therefore, the data for 1999 presented in this section and in this chapter are a subset of the data presented in previous chapters.
• The chemical manufacturing industry reported the largest amounts of North American transfers for further management in both 1995 and 1999. This industry sector reported transfers of 134.3 million kg in 1999, an increase of 14 percent from 1995. Chemicals also ranked first in transfers to treatment and transfers to sewage in both years.
• The paper products industry had the second-largest transfers in both 1995 and 1999, but the 1999 total was down 12 percent from that in 1995. The paper products industry reported the third-largest transfers to treatment, up from fourth-largest in 1995; the amount, however, was 6 percent lower in 1999 than in 1995. Paper products had the second-largest transfers to sewage in both years, although here, too, the amount declined, by 13 percent, from 1995 to 1999.
• The multiple codes group (reported only in TRI) had the third-largest North American transfers to further management in both 1995 and 1999;
Table 7–12. Change in Transfers for Further Management in North America, by Industry, 1995–1999 Transfers to Treatment (except metals) Transfers to Sewage (except metals)
1995 1999 Change
1995-1999 1995 1999 Change
1995-1999 US IC Code Industry kg Rank kg Rank (%) kg Rank kg Rank (%)
28 Chemicals 60,474,737 1 75,350,205 1 25 57,070,768 1 58,910,911 1 3 26 Paper Products 4,037,257 4 3,789,348 3 -6 18,565,734 2 16,169,150 2 -13 -- Multiple codes 20–39* 5,754,338 2 5,732,958 2 -0.4 7,747,499 4 9,608,863 4 24
20 Food Products 398,697 11 337,193 15 -15 10,532,840 3 12,599,164 3 20 36 Electronic/Electrical Equipment 1,800,460 7 1,278,426 9 -29 6,601,211 5 9,198,379 5 39
34 Fabricated Metals Products 2,073,526 6 2,333,495 4 13 5,223,057 6 6,892,103 6 32 33 Primary Metals 5,200,903 3 2,095,173 5 -60 4,347,877 7 5,595,277 7 29 37 Transportation Equipment 2,135,338 5 1,852,680 7 -13 1,719,438 9 2,924,418 8 70 29 Petroleum and Coal Products 323,307 14 1,904,190 6 489 1,781,464 8 2,696,094 9 51 30 Rubber and Plastics Products 1,670,788 8 1,525,812 8 -9 1,092,138 11 1,541,826 11 41
35 Industrial Machinery 367,361 12 289,997 16 -21 1,395,379 10 1,793,172 10 29 39 Misc. Manufacturing Industries 214,025 17 723,264 12 238 642,629 13 641,447 13 -0.2 32 Stone/Clay/Glass Products 613,832 10 407,779 14 -34 639,756 14 955,504 12 49 27 Printing and Publishing 251,246 15 752,487 11 200 255,425 16 428,633 14 68 38 Measurement/Photographic Instruments 1,496,768 9 787,140 10 -47 397,057 15 253,945 16 -36
25 Furniture and Fixtures 346,019 13 456,455 13 32 22,933 19 14,490 18 -37 22 Textile Mill Products 228,607 16 92,676 17 -59 699,618 12 345,620 15 -51 24 Lumber and Wood Products 129,954 18 77,567 18 -40 103,963 17 169,210 17 63 23 Apparel and Other Textile Products 26,891 19 23,258 19 -14 11,193 20 8,442 20 -25 31 Leather Products 5,467 20 2,948 20 -46 25,639 18 10,043 19 -61 21 Tobacco Products 72 21 544 21 656 29 21 35 21 21
Total 87,549,593 99,813,595 14 118,875,647 130,756,726 10
Note: Canada and US data only. Mexico data not available for 1995 or 1999. The data are estimates of releases and transfers of chemicals reported by facilities. None of the rankings is meant to imply that a facility, state or province is not meeting its legal requirements. The data do not predict levels of exposure of the public to those chemicals.
* Multiple SIC codes reported only in TRI.
Figure 7–9. Change in NPRI Transfers for Further Management, by Industry, 1995–1999
0123456789
10
1995 1999 1995 1999 1995 1999 1995 1999
Chemicals PaperProducts
FoodProducts
All Others
Mill
ions
of k
g Transfersto Treatment
Transfersto Sewage
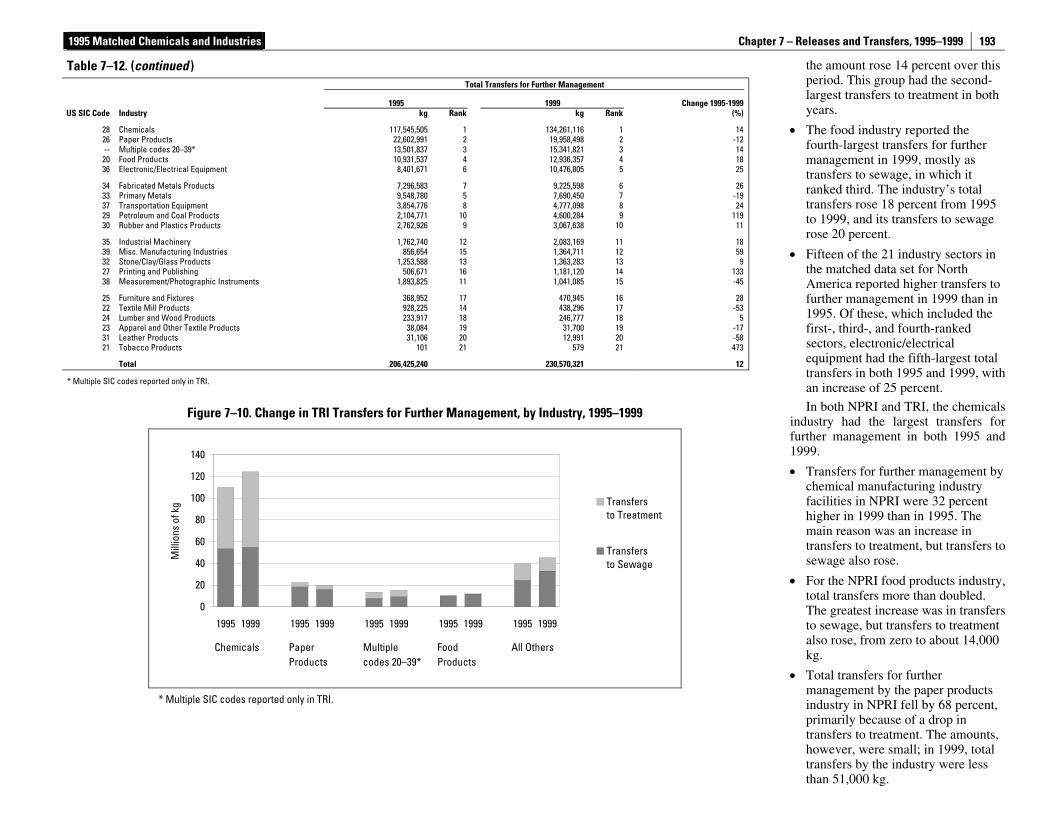
1995 Matched Chemicals and Industries Chapter 7 – Releases and Transfers, 1995–1999
193
the amount rose 14 percent over this period. This group had the second-largest transfers to treatment in both years.
• The food industry reported the fourth-largest transfers for further management in 1999, mostly as transfers to sewage, in which it ranked third. The industry’s total transfers rose 18 percent from 1995 to 1999, and its transfers to sewage rose 20 percent.
• Fifteen of the 21 industry sectors in the matched data set for North America reported higher transfers to further management in 1999 than in 1995. Of these, which included the first-, third-, and fourth-ranked sectors, electronic/electrical equipment had the fifth-largest total transfers in both 1995 and 1999, with an increase of 25 percent.
In both NPRI and TRI, the chemicals industry had the largest transfers for further management in both 1995 and 1999.
• Transfers for further management by chemical manufacturing industry facilities in NPRI were 32 percent higher in 1999 than in 1995. The main reason was an increase in transfers to treatment, but transfers to sewage also rose.
• For the NPRI food products industry, total transfers more than doubled. The greatest increase was in transfers to sewage, but transfers to treatment also rose, from zero to about 14,000 kg.
• Total transfers for further management by the paper products industry in NPRI fell by 68 percent, primarily because of a drop in transfers to treatment. The amounts, however, were small; in 1999, total transfers by the industry were less than 51,000 kg.
Table 7–12. (continued )
Total Transfers for Further Management
1995 1999 Change 1995-1999US SIC Code Industry kg Rank kg Rank (%)
28 Chemicals 117,545,505 1 134,261,116 1 1426 Paper Products 22,602,991 2 19,958,498 2 -12-- Multiple codes 20–39* 13,501,837 3 15,341,821 3 14
20 Food Products 10,931,537 4 12,936,357 4 1836 Electronic/Electrical Equipment 8,401,671 6 10,476,805 5 25
34 Fabricated Metals Products 7,296,583 7 9,225,598 6 2633 Primary Metals 9,548,780 5 7,690,450 7 -1937 Transportation Equipment 3,854,776 8 4,777,098 8 2429 Petroleum and Coal Products 2,104,771 10 4,600,284 9 11930 Rubber and Plastics Products 2,762,926 9 3,067,638 10 11
35 Industrial Machinery 1,762,740 12 2,083,169 11 1839 Misc. Manufacturing Industries 856,654 15 1,364,711 12 5932 Stone/Clay/Glass Products 1,253,588 13 1,363,283 13 927 Printing and Publishing 506,671 16 1,181,120 14 13338 Measurement/Photographic Instruments 1,893,825 11 1,041,085 15 -45
25 Furniture and Fixtures 368,952 17 470,945 16 2822 Textile Mill Products 928,225 14 438,296 17 -5324 Lumber and Wood Products 233,917 18 246,777 18 523 Apparel and Other Textile Products 38,084 19 31,700 19 -1731 Leather Products 31,106 20 12,991 20 -5821 Tobacco Products 101 21 579 21 473
Total 206,425,240 230,570,321 12
* Multiple SIC codes reported only in TRI.
Figure 7–10. Change in TRI Transfers for Further Management, by Industry, 1995–1999
0
20
40
60
80
100
120
140
1995 1999 1995 1999 1995 1999 1995 1999 1995 1999
Chemicals Paper Products
Multiplecodes 20–39*
FoodProducts
All Others
Mill
ions
of k
g Transfersto Treatment
Transfersto Sewage
* Multiple SIC codes reported only in TRI.
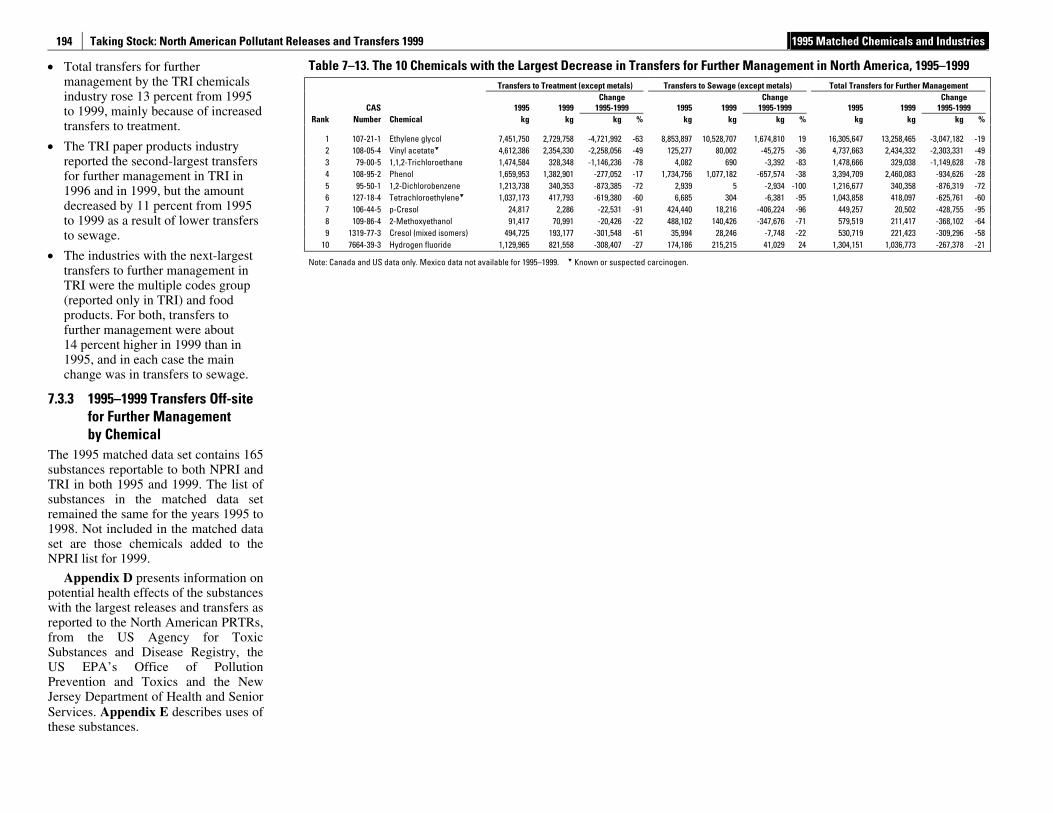
Taking Stock: North American Pollutant Releases and Transfers 1999 1995 Matched Chemicals and Industries
194
• Total transfers for further management by the TRI chemicals industry rose 13 percent from 1995 to 1999, mainly because of increased transfers to treatment.
• The TRI paper products industry reported the second-largest transfers for further management in TRI in 1996 and in 1999, but the amount decreased by 11 percent from 1995 to 1999 as a result of lower transfers to sewage.
• The industries with the next-largest transfers to further management in TRI were the multiple codes group (reported only in TRI) and food products. For both, transfers to further management were about 14 percent higher in 1999 than in 1995, and in each case the main change was in transfers to sewage.
7.3.3 1995–1999 Transfers Off-site for Further Management by Chemical
The 1995 matched data set contains 165 substances reportable to both NPRI and TRI in both 1995 and 1999. The list of substances in the matched data set remained the same for the years 1995 to 1998. Not included in the matched data set are those chemicals added to the NPRI list for 1999.
Appendix D presents information on potential health effects of the substances with the largest releases and transfers as reported to the North American PRTRs, from the US Agency for Toxic Substances and Disease Registry, the US EPA’s Office of Pollution Prevention and Toxics and the New Jersey Department of Health and Senior Services. Appendix E describes uses of these substances.
Table 7–13. The 10 Chemicals with the Largest Decrease in Transfers for Further Management in North America, 1995–1999 Transfers to Treatment (except metals) Transfers to Sewage (except metals) Total Transfers for Further Management
CAS 1995 1999Change
1995-1999 1995 1999Change
1995-1999 1995 1999Change
1995-1999 Rank Number Chemical kg kg kg % kg kg kg % kg kg kg %
1 107-21-1 Ethylene glycol 7,451,750 2,729,758 -4,721,992 -63 8,853,897 10,528,707 1,674,810 19 16,305,647 13,258,465 -3,047,182 -19 2 108-05-4 Vinyl acetate 4,612,386 2,354,330 -2,258,056 -49 125,277 80,002 -45,275 -36 4,737,663 2,434,332 -2,303,331 -49 3 79-00-5 1,1,2-Trichloroethane 1,474,584 328,348 -1,146,236 -78 4,082 690 -3,392 -83 1,478,666 329,038 -1,149,628 -78 4 108-95-2 Phenol 1,659,953 1,382,901 -277,052 -17 1,734,756 1,077,182 -657,574 -38 3,394,709 2,460,083 -934,626 -28 5 95-50-1 1,2-Dichlorobenzene 1,213,738 340,353 -873,385 -72 2,939 5 -2,934 -100 1,216,677 340,358 -876,319 -72 6 127-18-4 Tetrachloroethylene 1,037,173 417,793 -619,380 -60 6,685 304 -6,381 -95 1,043,858 418,097 -625,761 -60 7 106-44-5 p-Cresol 24,817 2,286 -22,531 -91 424,440 18,216 -406,224 -96 449,257 20,502 -428,755 -95 8 109-86-4 2-Methoxyethanol 91,417 70,991 -20,426 -22 488,102 140,426 -347,676 -71 579,519 211,417 -368,102 -64 9 1319-77-3 Cresol (mixed isomers) 494,725 193,177 -301,548 -61 35,994 28,246 -7,748 -22 530,719 221,423 -309,296 -58
10 7664-39-3 Hydrogen fluoride 1,129,965 821,558 -308,407 -27 174,186 215,215 41,029 24 1,304,151 1,036,773 -267,378 -21
Note: Canada and US data only. Mexico data not available for 1995–1999. Known or suspected carcinogen.
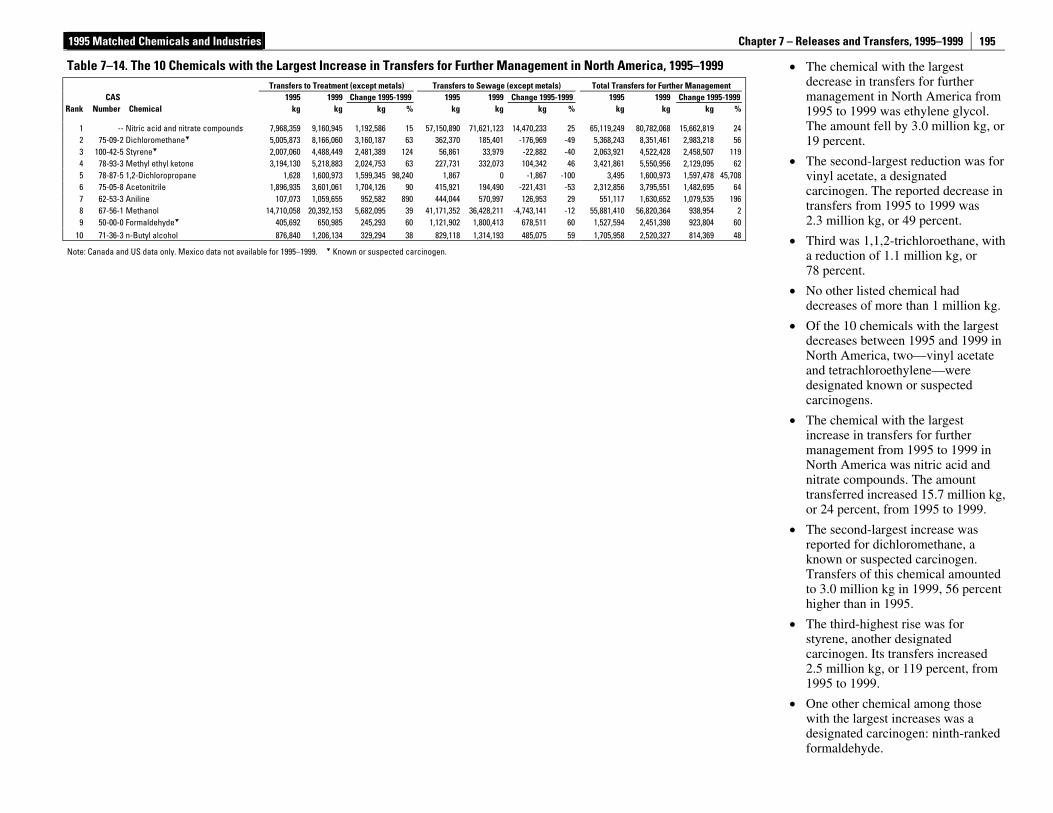
1995 Matched Chemicals and Industries Chapter 7 – Releases and Transfers, 1995–1999
195
• The chemical with the largest decrease in transfers for further management in North America from 1995 to 1999 was ethylene glycol. The amount fell by 3.0 million kg, or 19 percent.
• The second-largest reduction was for vinyl acetate, a designated carcinogen. The reported decrease in transfers from 1995 to 1999 was 2.3 million kg, or 49 percent.
• Third was 1,1,2-trichloroethane, with a reduction of 1.1 million kg, or 78 percent.
• No other listed chemical had decreases of more than 1 million kg.
• Of the 10 chemicals with the largest decreases between 1995 and 1999 in North America, two—vinyl acetate and tetrachloroethylene—were designated known or suspected carcinogens.
• The chemical with the largest increase in transfers for further management from 1995 to 1999 in North America was nitric acid and nitrate compounds. The amount transferred increased 15.7 million kg, or 24 percent, from 1995 to 1999.
• The second-largest increase was reported for dichloromethane, a known or suspected carcinogen. Transfers of this chemical amounted to 3.0 million kg in 1999, 56 percent higher than in 1995.
• The third-highest rise was for styrene, another designated carcinogen. Its transfers increased 2.5 million kg, or 119 percent, from 1995 to 1999.
• One other chemical among those with the largest increases was a designated carcinogen: ninth-ranked formaldehyde.
Table 7–14. The 10 Chemicals with the Largest Increase in Transfers for Further Management in North America, 1995–1999 Transfers to Treatment (except metals) Transfers to Sewage (except metals) Total Transfers for Further Management
CAS 1995 1999 Change 1995-1999 1995 1999 Change 1995-1999 1995 1999 Change 1995-1999Rank Number Chemical kg kg kg % kg kg kg % kg kg kg %
1 -- Nitric acid and nitrate compounds 7,968,359 9,160,945 1,192,586 15 57,150,890 71,621,123 14,470,233 25 65,119,249 80,782,068 15,662,819 242 75-09-2 Dichloromethane 5,005,873 8,166,060 3,160,187 63 362,370 185,401 -176,969 -49 5,368,243 8,351,461 2,983,218 563 100-42-5 Styrene 2,007,060 4,488,449 2,481,389 124 56,861 33,979 -22,882 -40 2,063,921 4,522,428 2,458,507 1194 78-93-3 Methyl ethyl ketone 3,194,130 5,218,883 2,024,753 63 227,731 332,073 104,342 46 3,421,861 5,550,956 2,129,095 625 78-87-5 1,2-Dichloropropane 1,628 1,600,973 1,599,345 98,240 1,867 0 -1,867 -100 3,495 1,600,973 1,597,478 45,7086 75-05-8 Acetonitrile 1,896,935 3,601,061 1,704,126 90 415,921 194,490 -221,431 -53 2,312,856 3,795,551 1,482,695 647 62-53-3 Aniline 107,073 1,059,655 952,582 890 444,044 570,997 126,953 29 551,117 1,630,652 1,079,535 1968 67-56-1 Methanol 14,710,058 20,392,153 5,682,095 39 41,171,352 36,428,211 -4,743,141 -12 55,881,410 56,820,364 938,954 29 50-00-0 Formaldehyde 405,692 650,985 245,293 60 1,121,902 1,800,413 678,511 60 1,527,594 2,451,398 923,804 60
10 71-36-3 n-Butyl alcohol 876,840 1,206,134 329,294 38 829,118 1,314,193 485,075 59 1,705,958 2,520,327 814,369 48
Note: Canada and US data only. Mexico data not available for 1995–1999. Known or suspected carcinogen.
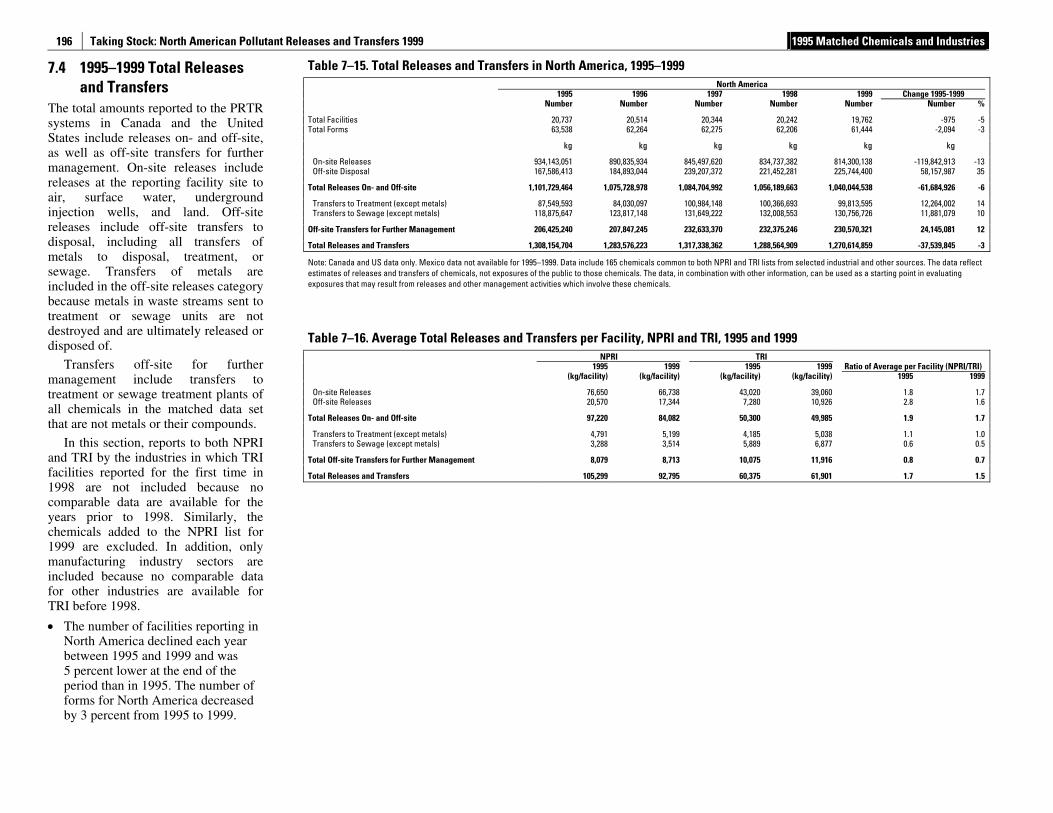
Taking Stock: North American Pollutant Releases and Transfers 1999 1995 Matched Chemicals and Industries
196
7.4 1995–1999 Total Releases and Transfers
The total amounts reported to the PRTR systems in Canada and the United States include releases on- and off-site, as well as off-site transfers for further management. On-site releases include releases at the reporting facility site to air, surface water, underground injection wells, and land. Off-site releases include off-site transfers to disposal, including all transfers of metals to disposal, treatment, or sewage. Transfers of metals are included in the off-site releases category because metals in waste streams sent to treatment or sewage units are not destroyed and are ultimately released or disposed of.
Transfers off-site for further management include transfers to treatment or sewage treatment plants of all chemicals in the matched data set that are not metals or their compounds.
In this section, reports to both NPRI and TRI by the industries in which TRI facilities reported for the first time in 1998 are not included because no comparable data are available for the years prior to 1998. Similarly, the chemicals added to the NPRI list for 1999 are excluded. In addition, only manufacturing industry sectors are included because no comparable data for other industries are available for TRI before 1998.
• The number of facilities reporting in North America declined each year between 1995 and 1999 and was 5 percent lower at the end of the period than in 1995. The number of forms for North America decreased by 3 percent from 1995 to 1999.
Table 7–15. Total Releases and Transfers in North America, 1995–1999 North America 1995 1996 1997 1998 1999 Change 1995-1999 Number Number Number Number Number Number %
Total Facilities 20,737 20,514 20,344 20,242 19,762 -975 -5 Total Forms 63,538 62,264 62,275 62,206 61,444 -2,094 -3
kg kg kg kg kg kg
On-site Releases 934,143,051 890,835,934 845,497,620 834,737,382 814,300,138 -119,842,913 -13 Off-site Disposal 167,586,413 184,893,044 239,207,372 221,452,281 225,744,400 58,157,987 35
Total Releases On- and Off-site 1,101,729,464 1,075,728,978 1,084,704,992 1,056,189,663 1,040,044,538 -61,684,926 -6
Transfers to Treatment (except metals) 87,549,593 84,030,097 100,984,148 100,366,693 99,813,595 12,264,002 14 Transfers to Sewage (except metals) 118,875,647 123,817,148 131,649,222 132,008,553 130,756,726 11,881,079 10
Off-site Transfers for Further Management 206,425,240 207,847,245 232,633,370 232,375,246 230,570,321 24,145,081 12
Total Releases and Transfers 1,308,154,704 1,283,576,223 1,317,338,362 1,288,564,909 1,270,614,859 -37,539,845 -3
Note: Canada and US data only. Mexico data not available for 1995–1999. Data include 165 chemicals common to both NPRI and TRI lists from selected industrial and other sources. The data reflect estimates of releases and transfers of chemicals, not exposures of the public to those chemicals. The data, in combination with other information, can be used as a starting point in evaluating exposures that may result from releases and other management activities which involve these chemicals.
Table 7–16. Average Total Releases and Transfers per Facility, NPRI and TRI, 1995 and 1999 NPRI TRI 1995 1999 1995 1999 Ratio of Average per Facility (NPRI/TRI) (kg/facility) (kg/facility) (kg/facility) (kg/facility) 1995 1999
On-site Releases 76,650 66,738 43,020 39,060 1.8 1.7 Off-site Releases 20,570 17,344 7,280 10,926 2.8 1.6
Total Releases On- and Off-site 97,220 84,082 50,300 49,985 1.9 1.7
Transfers to Treatment (except metals) 4,791 5,199 4,185 5,038 1.1 1.0 Transfers to Sewage (except metals) 3,288 3,514 5,889 6,877 0.6 0.5
Total Off-site Transfers for Further Management 8,079 8,713 10,075 11,916 0.8 0.7
Total Releases and Transfers 105,299 92,795 60,375 61,901 1.7 1.5
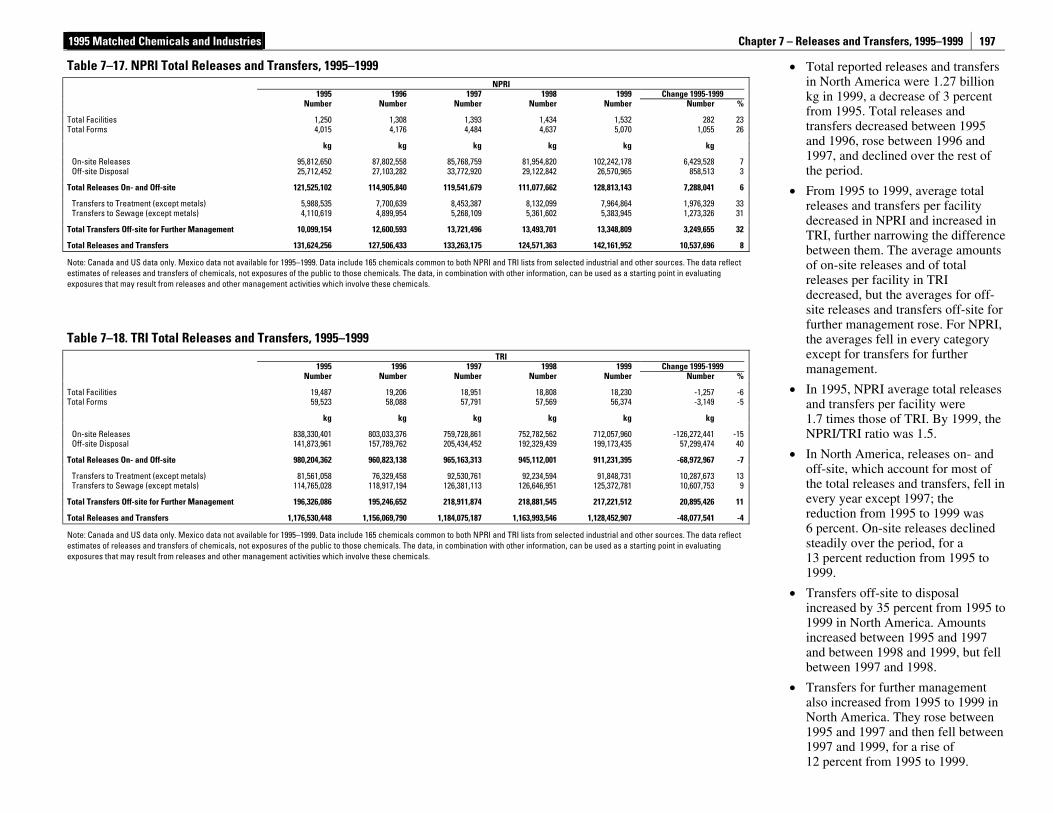
1995 Matched Chemicals and Industries Chapter 7 – Releases and Transfers, 1995–1999
197
• Total reported releases and transfers in North America were 1.27 billion kg in 1999, a decrease of 3 percent from 1995. Total releases and transfers decreased between 1995 and 1996, rose between 1996 and 1997, and declined over the rest of the period.
• From 1995 to 1999, average total releases and transfers per facility decreased in NPRI and increased in TRI, further narrowing the difference between them. The average amounts of on-site releases and of total releases per facility in TRI decreased, but the averages for off-site releases and transfers off-site for further management rose. For NPRI, the averages fell in every category except for transfers for further management.
• In 1995, NPRI average total releases and transfers per facility were 1.7 times those of TRI. By 1999, the NPRI/TRI ratio was 1.5.
• In North America, releases on- and off-site, which account for most of the total releases and transfers, fell in every year except 1997; the reduction from 1995 to 1999 was 6 percent. On-site releases declined steadily over the period, for a 13 percent reduction from 1995 to 1999.
• Transfers off-site to disposal increased by 35 percent from 1995 to 1999 in North America. Amounts increased between 1995 and 1997 and between 1998 and 1999, but fell between 1997 and 1998.
• Transfers for further management also increased from 1995 to 1999 in North America. They rose between 1995 and 1997 and then fell between 1997 and 1999, for a rise of 12 percent from 1995 to 1999.
Table 7–17. NPRI Total Releases and Transfers, 1995–1999 NPRI 1995 1996 1997 1998 1999 Change 1995-1999 Number Number Number Number Number Number %
Total Facilities 1,250 1,308 1,393 1,434 1,532 282 23Total Forms 4,015 4,176 4,484 4,637 5,070 1,055 26
kg kg kg kg kg kg
On-site Releases 95,812,650 87,802,558 85,768,759 81,954,820 102,242,178 6,429,528 7Off-site Disposal 25,712,452 27,103,282 33,772,920 29,122,842 26,570,965 858,513 3
Total Releases On- and Off-site 121,525,102 114,905,840 119,541,679 111,077,662 128,813,143 7,288,041 6
Transfers to Treatment (except metals) 5,988,535 7,700,639 8,453,387 8,132,099 7,964,864 1,976,329 33Transfers to Sewage (except metals) 4,110,619 4,899,954 5,268,109 5,361,602 5,383,945 1,273,326 31
Total Transfers Off-site for Further Management 10,099,154 12,600,593 13,721,496 13,493,701 13,348,809 3,249,655 32
Total Releases and Transfers 131,624,256 127,506,433 133,263,175 124,571,363 142,161,952 10,537,696 8
Note: Canada and US data only. Mexico data not available for 1995–1999. Data include 165 chemicals common to both NPRI and TRI lists from selected industrial and other sources. The data reflect estimates of releases and transfers of chemicals, not exposures of the public to those chemicals. The data, in combination with other information, can be used as a starting point in evaluating exposures that may result from releases and other management activities which involve these chemicals.
Table 7–18. TRI Total Releases and Transfers, 1995–1999 TRI 1995 1996 1997 1998 1999 Change 1995-1999 Number Number Number Number Number Number %
Total Facilities 19,487 19,206 18,951 18,808 18,230 -1,257 -6Total Forms 59,523 58,088 57,791 57,569 56,374 -3,149 -5
kg kg kg kg kg kg
On-site Releases 838,330,401 803,033,376 759,728,861 752,782,562 712,057,960 -126,272,441 -15Off-site Disposal 141,873,961 157,789,762 205,434,452 192,329,439 199,173,435 57,299,474 40
Total Releases On- and Off-site 980,204,362 960,823,138 965,163,313 945,112,001 911,231,395 -68,972,967 -7
Transfers to Treatment (except metals) 81,561,058 76,329,458 92,530,761 92,234,594 91,848,731 10,287,673 13Transfers to Sewage (except metals) 114,765,028 118,917,194 126,381,113 126,646,951 125,372,781 10,607,753 9
Total Transfers Off-site for Further Management 196,326,086 195,246,652 218,911,874 218,881,545 217,221,512 20,895,426 11
Total Releases and Transfers 1,176,530,448 1,156,069,790 1,184,075,187 1,163,993,546 1,128,452,907 -48,077,541 -4
Note: Canada and US data only. Mexico data not available for 1995–1999. Data include 165 chemicals common to both NPRI and TRI lists from selected industrial and other sources. The data reflect estimates of releases and transfers of chemicals, not exposures of the public to those chemicals. The data, in combination with other information, can be used as a starting point in evaluating exposures that may result from releases and other management activities which involve these chemicals.
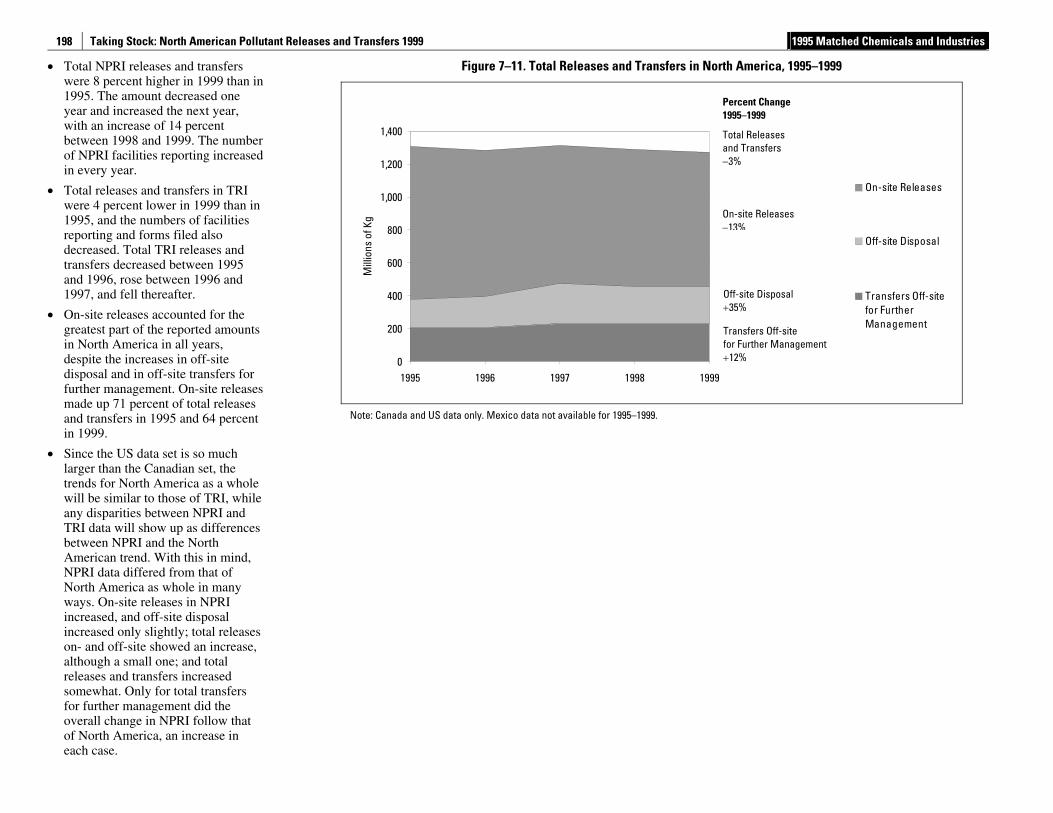
Taking Stock: North American Pollutant Releases and Transfers 1999 1995 Matched Chemicals and Industries
198
• Total NPRI releases and transfers were 8 percent higher in 1999 than in 1995. The amount decreased one year and increased the next year, with an increase of 14 percent between 1998 and 1999. The number of NPRI facilities reporting increased in every year.
• Total releases and transfers in TRI were 4 percent lower in 1999 than in 1995, and the numbers of facilities reporting and forms filed also decreased. Total TRI releases and transfers decreased between 1995 and 1996, rose between 1996 and 1997, and fell thereafter.
• On-site releases accounted for the greatest part of the reported amounts in North America in all years, despite the increases in off-site disposal and in off-site transfers for further management. On-site releases made up 71 percent of total releases and transfers in 1995 and 64 percent in 1999.
• Since the US data set is so much larger than the Canadian set, the trends for North America as a whole will be similar to those of TRI, while any disparities between NPRI and TRI data will show up as differences between NPRI and the North American trend. With this in mind, NPRI data differed from that of North America as whole in many ways. On-site releases in NPRI increased, and off-site disposal increased only slightly; total releases on- and off-site showed an increase, although a small one; and total releases and transfers increased somewhat. Only for total transfers for further management did the overall change in NPRI follow that of North America, an increase in each case.
Figure 7–11. Total Releases and Transfers in North America, 1995–1999
0
200
400
600
800
1,000
1,200
1,400
1995 1996 1997 1998 1999M
illio
ns o
f Kg
On-site Releases
Off-site Disposal
Transfers Off-sitefor FurtherManagement
Note: Canada and US data only. Mexico data not available for 1995–1999.
Percent Change 1995–1999
Total Releases and Transfers −3%
Transfers Off-site for Further Management +12%
On-site Releases −13%
Off-site Disposal +35%
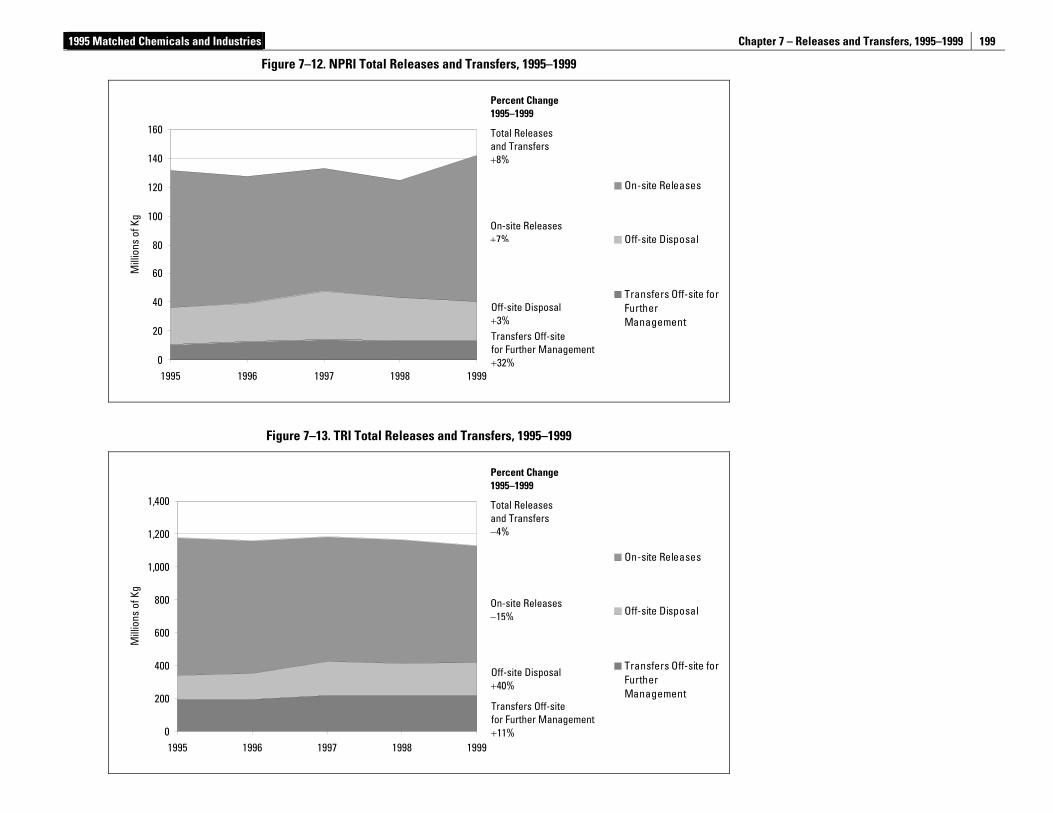
1995 Matched Chemicals and Industries Chapter 7 – Releases and Transfers, 1995–1999
199
Figure 7–12. NPRI Total Releases and Transfers, 1995–1999
0
20
40
60
80
100
120
140
160
1995 1996 1997 1998 1999
Mill
ions
of K
g
On-site Releases
Off-site Disposal
Transfers Off-site forFurtherManagement
Figure 7–13. TRI Total Releases and Transfers, 1995–1999
0
200
400
600
800
1,000
1,200
1,400
1995 1996 1997 1998 1999
Mill
ions
of K
g
On-site Releases
Off-site Disposal
Transfers Off-site forFurtherManagement
Percent Change 1995–1999
Total Releases and Transfers +8%
Transfers Off-site for Further Management +32%
On-site Releases +7%
Off-site Disposal +3%
Percent Change 1995–1999
Total Releases and Transfers −4%
Transfers Off-site for Further Management +11%
On-site Releases −15%
Off-site Disposal +40%
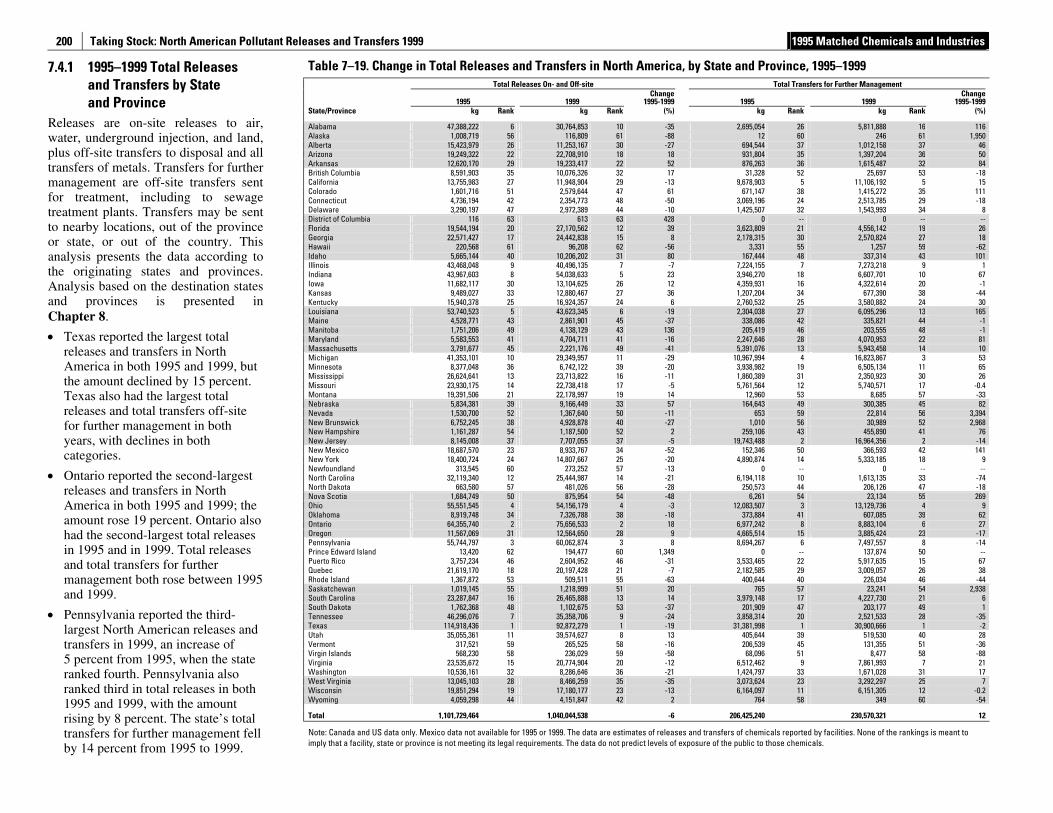
Taking Stock: North American Pollutant Releases and Transfers 1999 1995 Matched Chemicals and Industries
200
7.4.1 1995–1999 Total Releases and Transfers by State and Province
Releases are on-site releases to air, water, underground injection, and land, plus off-site transfers to disposal and all transfers of metals. Transfers for further management are off-site transfers sent for treatment, including to sewage treatment plants. Transfers may be sent to nearby locations, out of the province or state, or out of the country. This analysis presents the data according to the originating states and provinces. Analysis based on the destination states and provinces is presented in Chapter 8.
• Texas reported the largest total releases and transfers in North America in both 1995 and 1999, but the amount declined by 15 percent. Texas also had the largest total releases and total transfers off-site for further management in both years, with declines in both categories.
• Ontario reported the second-largest releases and transfers in North America in both 1995 and 1999; the amount rose 19 percent. Ontario also had the second-largest total releases in 1995 and in 1999. Total releases and total transfers for further management both rose between 1995 and 1999.
• Pennsylvania reported the third-largest North American releases and transfers in 1999, an increase of 5 percent from 1995, when the state ranked fourth. Pennsylvania also ranked third in total releases in both 1995 and 1999, with the amount rising by 8 percent. The state’s total transfers for further management fell by 14 percent from 1995 to 1999.
Table 7–19. Change in Total Releases and Transfers in North America, by State and Province, 1995–1999 Total Releases On- and Off-site Total Transfers for Further Management
1995 1999 Change
1995-1999 1995 1999 Change
1995-1999 State/Province kg Rank kg Rank (%) kg Rank kg Rank (%)
Alabama 47,388,222 6 30,764,853 10 -35 2,695,054 26 5,811,888 16 116 Alaska 1,008,719 56 116,809 61 -88 12 60 246 61 1,950 Alberta 15,423,979 26 11,253,167 30 -27 694,544 37 1,012,158 37 46 Arizona 19,249,322 22 22,708,910 18 18 931,804 35 1,397,204 36 50 Arkansas 12,620,170 29 19,233,417 22 52 876,263 36 1,615,487 32 84 British Columbia 8,591,903 35 10,076,326 32 17 31,328 52 25,697 53 -18 California 13,755,983 27 11,948,904 29 -13 9,678,903 5 11,106,192 5 15 Colorado 1,601,716 51 2,579,644 47 61 671,147 38 1,415,272 35 111 Connecticut 4,736,194 42 2,354,773 48 -50 3,069,196 24 2,513,785 29 -18 Delaware 3,290,197 47 2,972,389 44 -10 1,425,507 32 1,543,993 34 8 District of Columbia 116 63 613 63 428 0 -- 0 -- -- Florida 19,544,194 20 27,170,562 12 39 3,623,809 21 4,556,142 19 26 Georgia 22,571,427 17 24,442,838 15 8 2,178,315 30 2,570,824 27 18 Hawaii 220,568 61 96,208 62 -56 3,331 55 1,257 59 -62 Idaho 5,665,144 40 10,206,202 31 80 167,444 48 337,314 43 101 Illinois 43,468,048 9 40,496,135 7 -7 7,224,155 7 7,273,218 9 1 Indiana 43,967,603 8 54,038,633 5 23 3,946,270 18 6,607,701 10 67 Iowa 11,682,117 30 13,104,625 26 12 4,359,931 16 4,322,614 20 -1 Kansas 9,489,027 33 12,880,467 27 36 1,207,204 34 677,390 38 -44 Kentucky 15,940,378 25 16,924,357 24 6 2,760,532 25 3,580,882 24 30 Louisiana 53,740,523 5 43,623,345 6 -19 2,304,038 27 6,095,296 13 165 Maine 4,528,771 43 2,861,901 45 -37 338,086 42 335,821 44 -1 Manitoba 1,751,206 49 4,138,129 43 136 205,419 46 203,555 48 -1 Maryland 5,583,553 41 4,704,711 41 -16 2,247,646 28 4,070,953 22 81 Massachusetts 3,791,677 45 2,221,176 49 -41 5,391,076 13 5,943,458 14 10 Michigan 41,353,101 10 29,349,957 11 -29 10,967,994 4 16,823,867 3 53 Minnesota 8,377,048 36 6,742,122 39 -20 3,938,982 19 6,505,134 11 65 Mississippi 26,624,641 13 23,713,822 16 -11 1,860,389 31 2,350,923 30 26 Missouri 23,930,175 14 22,738,418 17 -5 5,761,564 12 5,740,571 17 -0.4 Montana 19,391,506 21 22,178,997 19 14 12,960 53 8,685 57 -33 Nebraska 5,834,381 39 9,166,449 33 57 164,643 49 300,385 45 82 Nevada 1,530,700 52 1,367,640 50 -11 653 59 22,814 56 3,394 New Brunswick 6,752,245 38 4,928,878 40 -27 1,010 56 30,989 52 2,968 New Hampshire 1,161,287 54 1,187,500 52 2 259,106 43 455,890 41 76 New Jersey 8,145,008 37 7,707,055 37 -5 19,743,488 2 16,964,356 2 -14 New Mexico 18,687,570 23 8,933,767 34 -52 152,346 50 366,593 42 141 New York 18,400,724 24 14,807,667 25 -20 4,890,874 14 5,333,185 18 9 Newfoundland 313,545 60 273,252 57 -13 0 -- 0 -- -- North Carolina 32,119,340 12 25,444,987 14 -21 6,194,118 10 1,613,135 33 -74 North Dakota 663,580 57 481,026 56 -28 250,573 44 206,126 47 -18 Nova Scotia 1,684,749 50 875,954 54 -48 6,261 54 23,134 55 269 Ohio 55,551,545 4 54,156,179 4 -3 12,083,507 3 13,129,736 4 9 Oklahoma 8,919,748 34 7,326,788 38 -18 373,884 41 607,085 39 62 Ontario 64,355,740 2 75,656,533 2 18 6,977,242 8 8,883,104 6 27 Oregon 11,567,069 31 12,564,650 28 9 4,665,514 15 3,885,424 23 -17 Pennsylvania 55,744,797 3 60,062,874 3 8 8,694,267 6 7,497,557 8 -14 Prince Edward Island 13,420 62 194,477 60 1,349 0 -- 137,874 50 -- Puerto Rico 3,757,234 46 2,604,952 46 -31 3,533,465 22 5,917,635 15 67 Quebec 21,619,170 18 20,197,428 21 -7 2,182,585 29 3,009,057 26 38 Rhode Island 1,367,872 53 509,511 55 -63 400,644 40 226,034 46 -44 Saskatchewan 1,019,145 55 1,218,999 51 20 765 57 23,241 54 2,938 South Carolina 23,287,847 16 26,465,888 13 14 3,979,148 17 4,227,730 21 6 South Dakota 1,762,368 48 1,102,675 53 -37 201,909 47 203,177 49 1 Tennessee 46,296,076 7 35,358,706 9 -24 3,858,314 20 2,521,533 28 -35 Texas 114,918,436 1 92,872,279 1 -19 31,381,998 1 30,900,666 1 -2 Utah 35,055,361 11 39,574,627 8 13 405,644 39 519,530 40 28 Vermont 317,521 59 265,525 58 -16 206,539 45 131,355 51 -36 Virgin Islands 568,230 58 236,029 59 -58 68,096 51 8,477 58 -88 Virginia 23,535,672 15 20,774,904 20 -12 6,512,462 9 7,861,993 7 21 Washington 10,536,161 32 8,286,646 36 -21 1,424,797 33 1,671,028 31 17 West Virginia 13,045,103 28 8,466,259 35 -35 3,073,624 23 3,292,297 25 7 Wisconsin 19,851,294 19 17,180,177 23 -13 6,164,097 11 6,151,305 12 -0.2 Wyoming 4,059,298 44 4,151,847 42 2 764 58 349 60 -54
Total 1,101,729,464 1,040,044,538 -6 206,425,240 230,570,321 12
Note: Canada and US data only. Mexico data not available for 1995 or 1999. The data are estimates of releases and transfers of chemicals reported by facilities. None of the rankings is meant to imply that a facility, state or province is not meeting its legal requirements. The data do not predict levels of exposure of the public to those chemicals.
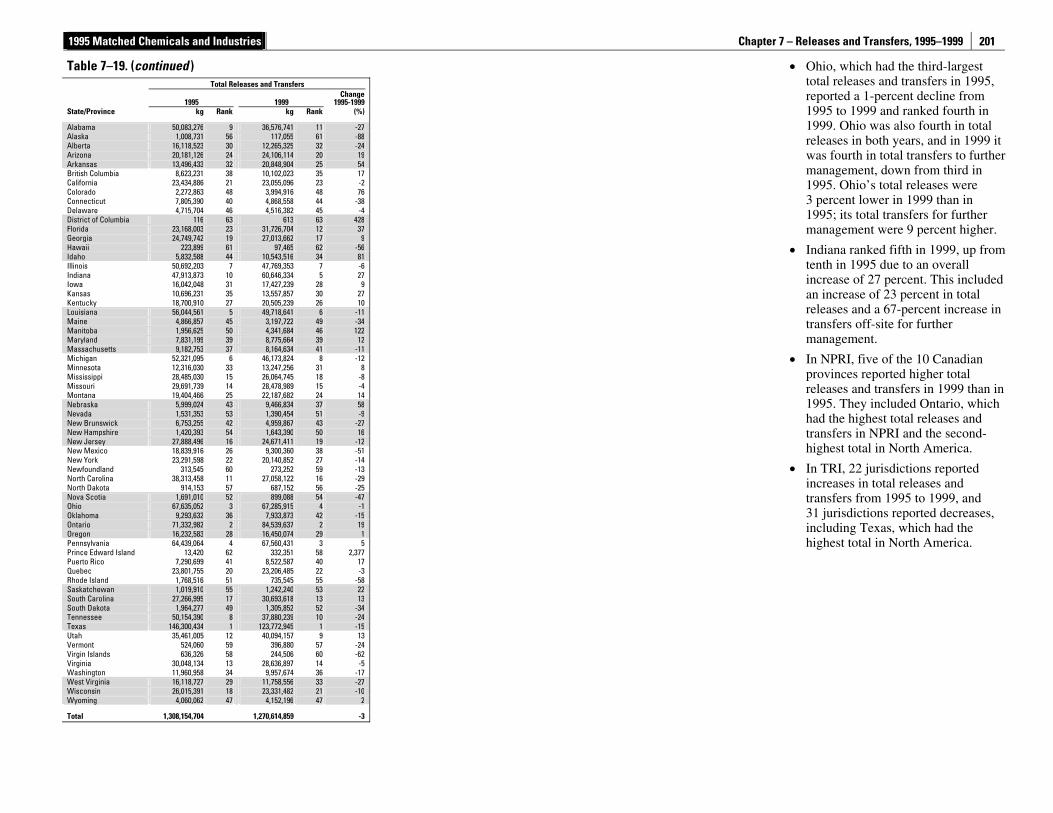
1995 Matched Chemicals and Industries Chapter 7 – Releases and Transfers, 1995–1999
201
• Ohio, which had the third-largest total releases and transfers in 1995, reported a 1-percent decline from 1995 to 1999 and ranked fourth in 1999. Ohio was also fourth in total releases in both years, and in 1999 it was fourth in total transfers to further management, down from third in 1995. Ohio’s total releases were 3 percent lower in 1999 than in 1995; its total transfers for further management were 9 percent higher.
• Indiana ranked fifth in 1999, up from tenth in 1995 due to an overall increase of 27 percent. This included an increase of 23 percent in total releases and a 67-percent increase in transfers off-site for further management.
• In NPRI, five of the 10 Canadian provinces reported higher total releases and transfers in 1999 than in 1995. They included Ontario, which had the highest total releases and transfers in NPRI and the second-highest total in North America.
• In TRI, 22 jurisdictions reported increases in total releases and transfers from 1995 to 1999, and 31 jurisdictions reported decreases, including Texas, which had the highest total in North America.
Table 7–19. (continued ) Total Releases and Transfers
1995 1999 Change
1995-1999State/Province kg Rank kg Rank (%)
Alabama 50,083,276 9 36,576,741 11 -27Alaska 1,008,731 56 117,055 61 -88Alberta 16,118,523 30 12,265,325 32 -24Arizona 20,181,126 24 24,106,114 20 19Arkansas 13,496,433 32 20,848,904 25 54British Columbia 8,623,231 38 10,102,023 35 17California 23,434,886 21 23,055,096 23 -2Colorado 2,272,863 48 3,994,916 48 76Connecticut 7,805,390 40 4,868,558 44 -38Delaware 4,715,704 46 4,516,382 45 -4District of Columbia 116 63 613 63 428Florida 23,168,003 23 31,726,704 12 37Georgia 24,749,742 19 27,013,662 17 9Hawaii 223,899 61 97,465 62 -56Idaho 5,832,588 44 10,543,516 34 81Illinois 50,692,203 7 47,769,353 7 -6Indiana 47,913,873 10 60,646,334 5 27Iowa 16,042,048 31 17,427,239 28 9Kansas 10,696,231 35 13,557,857 30 27Kentucky 18,700,910 27 20,505,239 26 10Louisiana 56,044,561 5 49,718,641 6 -11Maine 4,866,857 45 3,197,722 49 -34Manitoba 1,956,625 50 4,341,684 46 122Maryland 7,831,199 39 8,775,664 39 12Massachusetts 9,182,753 37 8,164,634 41 -11Michigan 52,321,095 6 46,173,824 8 -12Minnesota 12,316,030 33 13,247,256 31 8Mississippi 28,485,030 15 26,064,745 18 -8Missouri 29,691,739 14 28,478,989 15 -4Montana 19,404,466 25 22,187,682 24 14Nebraska 5,999,024 43 9,466,834 37 58Nevada 1,531,353 53 1,390,454 51 -9New Brunswick 6,753,255 42 4,959,867 43 -27New Hampshire 1,420,393 54 1,643,390 50 16New Jersey 27,888,496 16 24,671,411 19 -12New Mexico 18,839,916 26 9,300,360 38 -51New York 23,291,598 22 20,140,852 27 -14Newfoundland 313,545 60 273,252 59 -13North Carolina 38,313,458 11 27,058,122 16 -29North Dakota 914,153 57 687,152 56 -25Nova Scotia 1,691,010 52 899,088 54 -47Ohio 67,635,052 3 67,285,915 4 -1Oklahoma 9,293,632 36 7,933,873 42 -15Ontario 71,332,982 2 84,539,637 2 19Oregon 16,232,583 28 16,450,074 29 1Pennsylvania 64,439,064 4 67,560,431 3 5Prince Edward Island 13,420 62 332,351 58 2,377Puerto Rico 7,290,699 41 8,522,587 40 17Quebec 23,801,755 20 23,206,485 22 -3Rhode Island 1,768,516 51 735,545 55 -58Saskatchewan 1,019,910 55 1,242,240 53 22South Carolina 27,266,995 17 30,693,618 13 13South Dakota 1,964,277 49 1,305,852 52 -34Tennessee 50,154,390 8 37,880,239 10 -24Texas 146,300,434 1 123,772,945 1 -15Utah 35,461,005 12 40,094,157 9 13Vermont 524,060 59 396,880 57 -24Virgin Islands 636,326 58 244,506 60 -62Virginia 30,048,134 13 28,636,897 14 -5Washington 11,960,958 34 9,957,674 36 -17West Virginia 16,118,727 29 11,758,556 33 -27Wisconsin 26,015,391 18 23,331,482 21 -10Wyoming 4,060,062 47 4,152,196 47 2
Total 1,308,154,704 1,270,614,859 -3
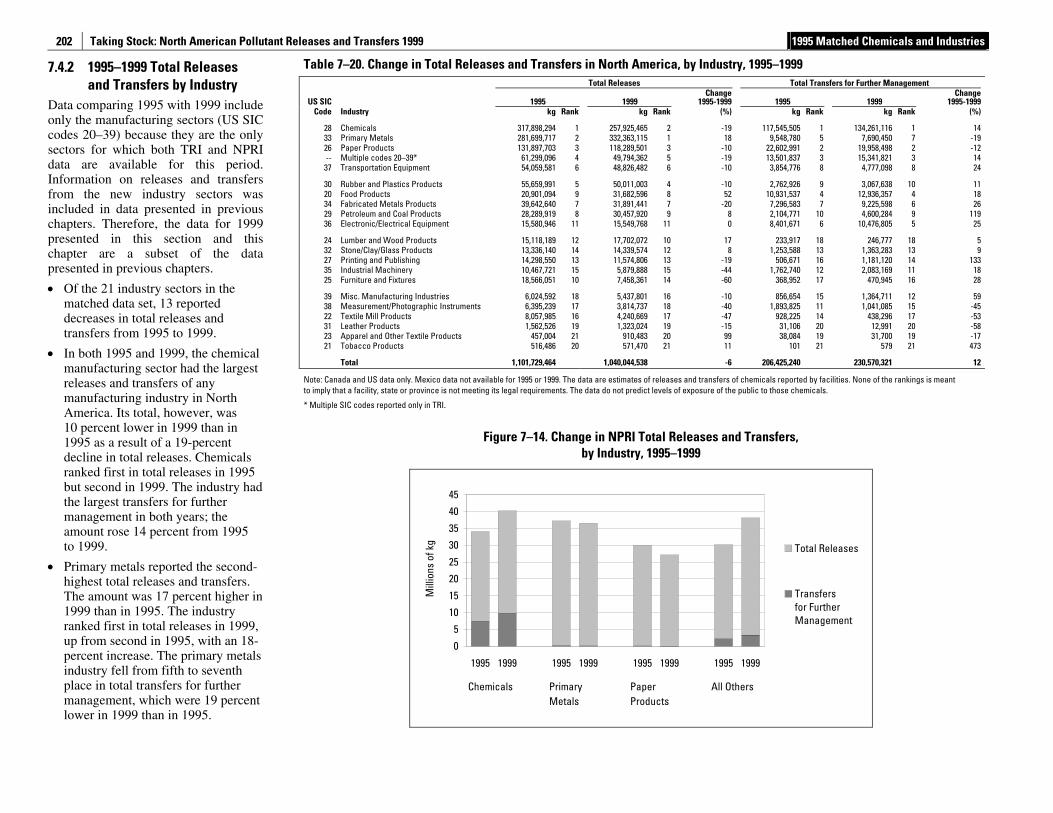
Taking Stock: North American Pollutant Releases and Transfers 1999 1995 Matched Chemicals and Industries
202
7.4.2 1995–1999 Total Releases and Transfers by Industry
Data comparing 1995 with 1999 include only the manufacturing sectors (US SIC codes 20–39) because they are the only sectors for which both TRI and NPRI data are available for this period. Information on releases and transfers from the new industry sectors was included in data presented in previous chapters. Therefore, the data for 1999 presented in this section and this chapter are a subset of the data presented in previous chapters.
• Of the 21 industry sectors in the matched data set, 13 reported decreases in total releases and transfers from 1995 to 1999.
• In both 1995 and 1999, the chemical manufacturing sector had the largest releases and transfers of any manufacturing industry in North America. Its total, however, was 10 percent lower in 1999 than in 1995 as a result of a 19-percent decline in total releases. Chemicals ranked first in total releases in 1995 but second in 1999. The industry had the largest transfers for further management in both years; the amount rose 14 percent from 1995 to 1999.
• Primary metals reported the second-highest total releases and transfers. The amount was 17 percent higher in 1999 than in 1995. The industry ranked first in total releases in 1999, up from second in 1995, with an 18-percent increase. The primary metals industry fell from fifth to seventh place in total transfers for further management, which were 19 percent lower in 1999 than in 1995.
Table 7–20. Change in Total Releases and Transfers in North America, by Industry, 1995–1999 Total Releases Total Transfers for Further Management
US SIC 1995 1999 Change
1995-1999 1995 1999 Change
1995-1999 Code Industry kg Rank kg Rank (%) kg Rank kg Rank (%)
28 Chemicals 317,898,294 1 257,925,465 2 -19 117,545,505 1 134,261,116 1 14 33 Primary Metals 281,699,717 2 332,363,115 1 18 9,548,780 5 7,690,450 7 -19 26 Paper Products 131,897,703 3 118,289,501 3 -10 22,602,991 2 19,958,498 2 -12 -- Multiple codes 20–39* 61,299,096 4 49,794,362 5 -19 13,501,837 3 15,341,821 3 14
37 Transportation Equipment 54,059,581 6 48,826,482 6 -10 3,854,776 8 4,777,098 8 24
30 Rubber and Plastics Products 55,659,991 5 50,011,003 4 -10 2,762,926 9 3,067,638 10 11 20 Food Products 20,901,094 9 31,682,596 8 52 10,931,537 4 12,936,357 4 18 34 Fabricated Metals Products 39,642,640 7 31,891,441 7 -20 7,296,583 7 9,225,598 6 26 29 Petroleum and Coal Products 28,289,919 8 30,457,920 9 8 2,104,771 10 4,600,284 9 119 36 Electronic/Electrical Equipment 15,580,946 11 15,549,768 11 0 8,401,671 6 10,476,805 5 25
24 Lumber and Wood Products 15,118,189 12 17,702,072 10 17 233,917 18 246,777 18 5 32 Stone/Clay/Glass Products 13,336,140 14 14,339,574 12 8 1,253,588 13 1,363,283 13 9 27 Printing and Publishing 14,298,550 13 11,574,806 13 -19 506,671 16 1,181,120 14 133 35 Industrial Machinery 10,467,721 15 5,879,888 15 -44 1,762,740 12 2,083,169 11 18 25 Furniture and Fixtures 18,566,051 10 7,458,361 14 -60 368,952 17 470,945 16 28
39 Misc. Manufacturing Industries 6,024,592 18 5,437,801 16 -10 856,654 15 1,364,711 12 59 38 Measurement/Photographic Instruments 6,395,239 17 3,814,737 18 -40 1,893,825 11 1,041,085 15 -45 22 Textile Mill Products 8,057,985 16 4,240,669 17 -47 928,225 14 438,296 17 -53 31 Leather Products 1,562,526 19 1,323,024 19 -15 31,106 20 12,991 20 -58 23 Apparel and Other Textile Products 457,004 21 910,483 20 99 38,084 19 31,700 19 -17 21 Tobacco Products 516,486 20 571,470 21 11 101 21 579 21 473
Total 1,101,729,464 1,040,044,538 -6 206,425,240 230,570,321 12
Note: Canada and US data only. Mexico data not available for 1995 or 1999. The data are estimates of releases and transfers of chemicals reported by facilities. None of the rankings is meant to imply that a facility, state or province is not meeting its legal requirements. The data do not predict levels of exposure of the public to those chemicals.
* Multiple SIC codes reported only in TRI.
Figure 7–14. Change in NPRI Total Releases and Transfers, by Industry, 1995–1999
0
5
10
15
20
25
30
35
40
45
1995 1999 1995 1999 1995 1999 1995 1999
Chemicals PrimaryMetals
PaperProducts
All Others
Mill
ions
of k
g Total Releases
Transfersfor FurtherManagement
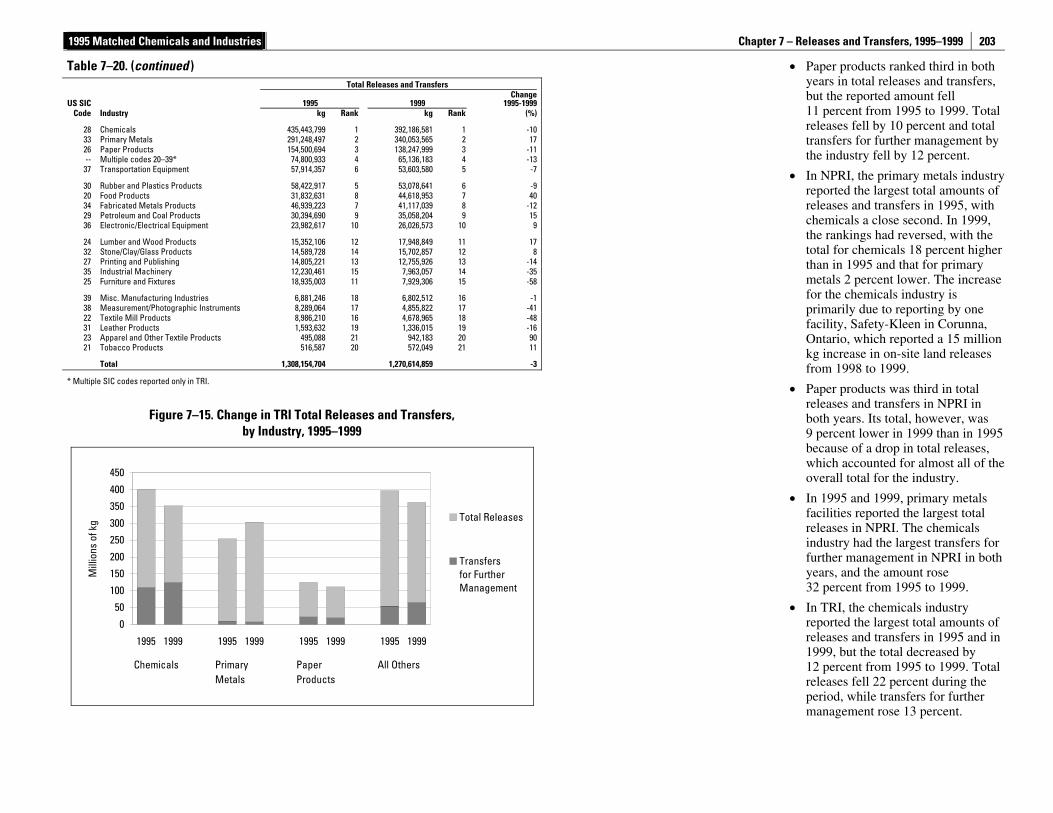
1995 Matched Chemicals and Industries Chapter 7 – Releases and Transfers, 1995–1999
203
• Paper products ranked third in both years in total releases and transfers, but the reported amount fell 11 percent from 1995 to 1999. Total releases fell by 10 percent and total transfers for further management by the industry fell by 12 percent.
• In NPRI, the primary metals industry reported the largest total amounts of releases and transfers in 1995, with chemicals a close second. In 1999, the rankings had reversed, with the total for chemicals 18 percent higher than in 1995 and that for primary metals 2 percent lower. The increase for the chemicals industry is primarily due to reporting by one facility, Safety-Kleen in Corunna, Ontario, which reported a 15 million kg increase in on-site land releases from 1998 to 1999.
• Paper products was third in total releases and transfers in NPRI in both years. Its total, however, was 9 percent lower in 1999 than in 1995 because of a drop in total releases, which accounted for almost all of the overall total for the industry.
• In 1995 and 1999, primary metals facilities reported the largest total releases in NPRI. The chemicals industry had the largest transfers for further management in NPRI in both years, and the amount rose 32 percent from 1995 to 1999.
• In TRI, the chemicals industry reported the largest total amounts of releases and transfers in 1995 and in 1999, but the total decreased by 12 percent from 1995 to 1999. Total releases fell 22 percent during the period, while transfers for further management rose 13 percent.
Table 7–20. (continued ) Total Releases and Transfers
US SIC 1995 1999 Change
1995-1999 Code Industry kg Rank kg Rank (%)
28 Chemicals 435,443,799 1 392,186,581 1 -10 33 Primary Metals 291,248,497 2 340,053,565 2 17 26 Paper Products 154,500,694 3 138,247,999 3 -11 -- Multiple codes 20–39* 74,800,933 4 65,136,183 4 -13
37 Transportation Equipment 57,914,357 6 53,603,580 5 -7
30 Rubber and Plastics Products 58,422,917 5 53,078,641 6 -9 20 Food Products 31,832,631 8 44,618,953 7 40 34 Fabricated Metals Products 46,939,223 7 41,117,039 8 -12 29 Petroleum and Coal Products 30,394,690 9 35,058,204 9 15 36 Electronic/Electrical Equipment 23,982,617 10 26,026,573 10 9
24 Lumber and Wood Products 15,352,106 12 17,948,849 11 17 32 Stone/Clay/Glass Products 14,589,728 14 15,702,857 12 8 27 Printing and Publishing 14,805,221 13 12,755,926 13 -14 35 Industrial Machinery 12,230,461 15 7,963,057 14 -35 25 Furniture and Fixtures 18,935,003 11 7,929,306 15 -58
39 Misc. Manufacturing Industries 6,881,246 18 6,802,512 16 -1 38 Measurement/Photographic Instruments 8,289,064 17 4,855,822 17 -41 22 Textile Mill Products 8,986,210 16 4,678,965 18 -48 31 Leather Products 1,593,632 19 1,336,015 19 -16 23 Apparel and Other Textile Products 495,088 21 942,183 20 90 21 Tobacco Products 516,587 20 572,049 21 11
Total 1,308,154,704 1,270,614,859 -3
* Multiple SIC codes reported only in TRI.
Figure 7–15. Change in TRI Total Releases and Transfers, by Industry, 1995–1999
0
50
100
150
200
250
300
350
400
450
1995 1999 1995 1999 1995 1999 1995 1999
Chemicals PrimaryMetals
PaperProducts
All Others
Mill
ions
of k
g Total Releases
Transfersfor FurtherManagement
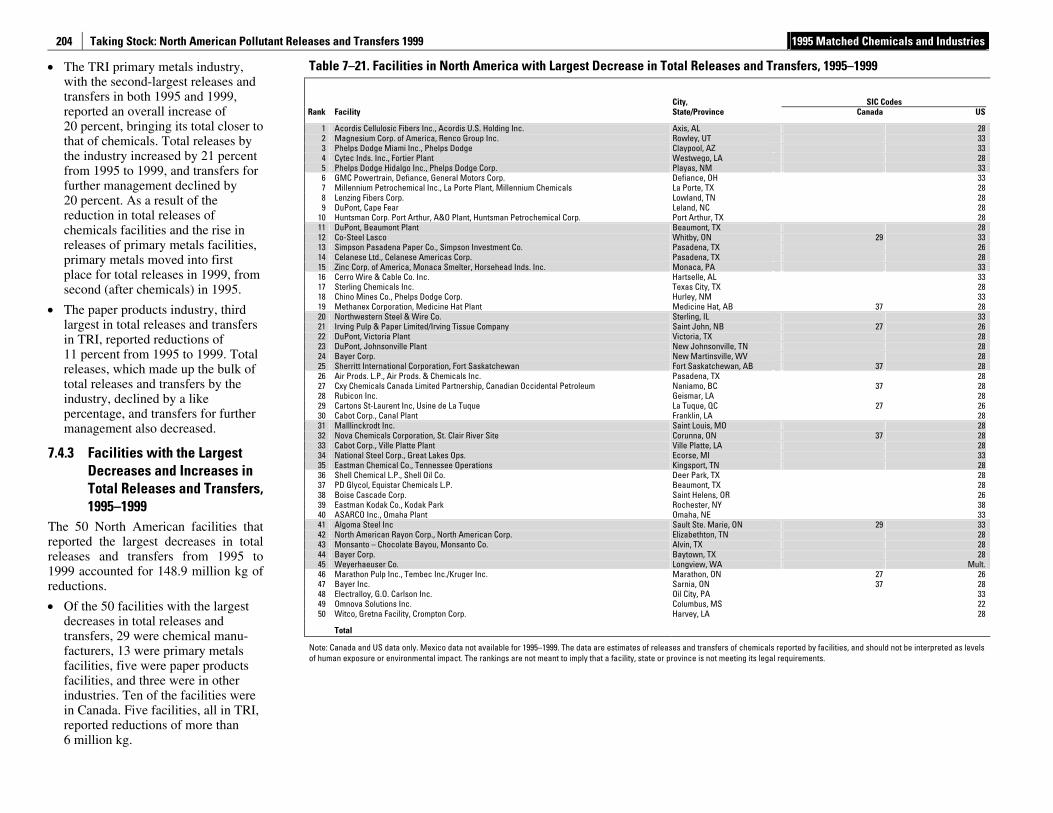
Taking Stock: North American Pollutant Releases and Transfers 1999 1995 Matched Chemicals and Industries
204
• The TRI primary metals industry, with the second-largest releases and transfers in both 1995 and 1999, reported an overall increase of 20 percent, bringing its total closer to that of chemicals. Total releases by the industry increased by 21 percent from 1995 to 1999, and transfers for further management declined by 20 percent. As a result of the reduction in total releases of chemicals facilities and the rise in releases of primary metals facilities, primary metals moved into first place for total releases in 1999, from second (after chemicals) in 1995.
• The paper products industry, third largest in total releases and transfers in TRI, reported reductions of 11 percent from 1995 to 1999. Total releases, which made up the bulk of total releases and transfers by the industry, declined by a like percentage, and transfers for further management also decreased.
7.4.3 Facilities with the Largest Decreases and Increases in Total Releases and Transfers, 1995–1999
The 50 North American facilities that reported the largest decreases in total releases and transfers from 1995 to 1999 accounted for 148.9 million kg of reductions.
• Of the 50 facilities with the largest decreases in total releases and transfers, 29 were chemical manu-facturers, 13 were primary metals facilities, five were paper products facilities, and three were in other industries. Ten of the facilities were in Canada. Five facilities, all in TRI, reported reductions of more than 6 million kg.
Table 7–21. Facilities in North America with Largest Decrease in Total Releases and Transfers, 1995–1999
City,
SIC Codes Rank Facility State/Province Canada US
1 Acordis Cellulosic Fibers Inc., Acordis U.S. Holding Inc. Axis, AL 28 2 Magnesium Corp. of America, Renco Group Inc. Rowley, UT 33 3 Phelps Dodge Miami Inc., Phelps Dodge Claypool, AZ 33 4 Cytec Inds. Inc., Fortier Plant Westwego, LA 28 5 Phelps Dodge Hidalgo Inc., Phelps Dodge Corp. Playas, NM 33 6 GMC Powertrain, Defiance, General Motors Corp. Defiance, OH 33 7 Millennium Petrochemical Inc., La Porte Plant, Millennium Chemicals La Porte, TX 28 8 Lenzing Fibers Corp. Lowland, TN 28 9 DuPont, Cape Fear Leland, NC 28
10 Huntsman Corp. Port Arthur, A&O Plant, Huntsman Petrochemical Corp. Port Arthur, TX 28 11 DuPont, Beaumont Plant Beaumont, TX 28 12 Co-Steel Lasco Whitby, ON 29 33 13 Simpson Pasadena Paper Co., Simpson Investment Co. Pasadena, TX 26 14 Celanese Ltd., Celanese Americas Corp. Pasadena, TX 28 15 Zinc Corp. of America, Monaca Smelter, Horsehead Inds. Inc. Monaca, PA 33 16 Cerro Wire & Cable Co. Inc. Hartselle, AL 33 17 Sterling Chemicals Inc. Texas City, TX 28 18 Chino Mines Co., Phelps Dodge Corp. Hurley, NM 33 19 Methanex Corporation, Medicine Hat Plant Medicine Hat, AB 37 28 20 Northwestern Steel & Wire Co. Sterling, IL 33 21 Irving Pulp & Paper Limited/Irving Tissue Company Saint John, NB 27 26 22 DuPont, Victoria Plant Victoria, TX 28 23 DuPont, Johnsonville Plant New Johnsonville, TN 28 24 Bayer Corp. New Martinsville, WV 28 25 Sherritt International Corporation, Fort Saskatchewan Fort Saskatchewan, AB 37 28 26 Air Prods. L.P., Air Prods. & Chemicals Inc. Pasadena, TX 28 27 Cxy Chemicals Canada Limited Partnership, Canadian Occidental Petroleum Naniamo, BC 37 28 28 Rubicon Inc. Geismar, LA 28 29 Cartons St-Laurent Inc, Usine de La Tuque La Tuque, QC 27 26 30 Cabot Corp., Canal Plant Franklin, LA 28 31 Malllinckrodt Inc. Saint Louis, MO 28 32 Nova Chemicals Corporation, St. Clair River Site Corunna, ON 37 28 33 Cabot Corp., Ville Platte Plant Ville Platte, LA 28 34 National Steel Corp., Great Lakes Ops. Ecorse, MI 33 35 Eastman Chemical Co., Tennessee Operations Kingsport, TN 28 36 Shell Chemical L.P., Shell Oil Co. Deer Park, TX 28 37 PD Glycol, Equistar Chemicals L.P. Beaumont, TX 28 38 Boise Cascade Corp. Saint Helens, OR 26 39 Eastman Kodak Co., Kodak Park Rochester, NY 38 40 ASARCO Inc., Omaha Plant Omaha, NE 33 41 Algoma Steel Inc Sault Ste. Marie, ON 29 33 42 North American Rayon Corp., North American Corp. Elizabethton, TN 28 43 Monsanto – Chocolate Bayou, Monsanto Co. Alvin, TX 28 44 Bayer Corp. Baytown, TX 28 45 Weyerhaeuser Co. Longview, WA Mult. 46 Marathon Pulp Inc., Tembec Inc./Kruger Inc. Marathon, ON 27 26 47 Bayer Inc. Sarnia, ON 37 28 48 Electralloy, G.O. Carlson Inc. Oil City, PA 33 49 Omnova Solutions Inc. Columbus, MS 22 50 Witco, Gretna Facility, Crompton Corp. Harvey, LA 28
Total
Note: Canada and US data only. Mexico data not available for 1995–1999. The data are estimates of releases and transfers of chemicals reported by facilities, and should not be interpreted as levels of human exposure or environmental impact. The rankings are not meant to imply that a facility, state or province is not meeting its legal requirements.
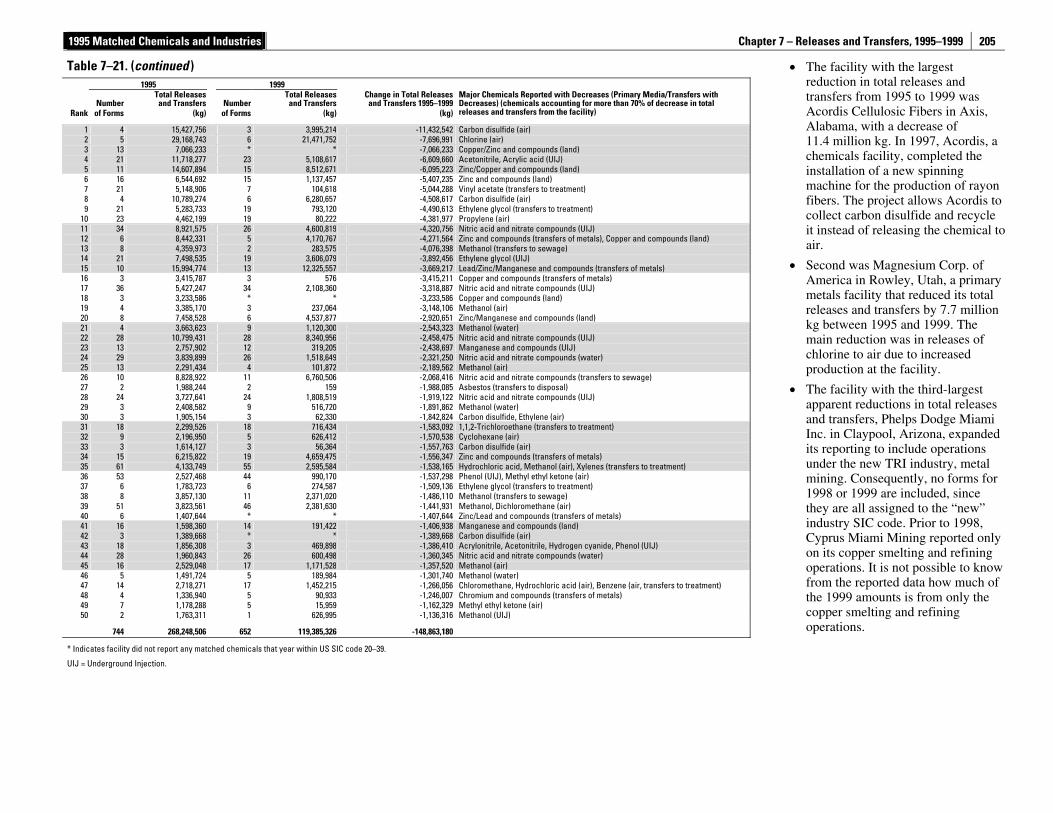
1995 Matched Chemicals and Industries Chapter 7 – Releases and Transfers, 1995–1999
205
• The facility with the largest reduction in total releases and transfers from 1995 to 1999 was Acordis Cellulosic Fibers in Axis, Alabama, with a decrease of 11.4 million kg. In 1997, Acordis, a chemicals facility, completed the installation of a new spinning machine for the production of rayon fibers. The project allows Acordis to collect carbon disulfide and recycle it instead of releasing the chemical to air.
• Second was Magnesium Corp. of America in Rowley, Utah, a primary metals facility that reduced its total releases and transfers by 7.7 million kg between 1995 and 1999. The main reduction was in releases of chlorine to air due to increased production at the facility.
• The facility with the third-largest apparent reductions in total releases and transfers, Phelps Dodge Miami Inc. in Claypool, Arizona, expanded its reporting to include operations under the new TRI industry, metal mining. Consequently, no forms for 1998 or 1999 are included, since they are all assigned to the “new” industry SIC code. Prior to 1998, Cyprus Miami Mining reported only on its copper smelting and refining operations. It is not possible to know from the reported data how much of the 1999 amounts is from only the copper smelting and refining operations.
Table 7–21. (continued ) 1995 1999
Number Total Releases
and Transfers Number Total Releases
and TransfersChange in Total Releases
and Transfers 1995–1999Rank of Forms (kg) of Forms (kg) (kg)
Major Chemicals Reported with Decreases (Primary Media/Transfers with Decreases) (chemicals accounting for more than 70% of decrease in total releases and transfers from the facility)
1 4 15,427,756 3 3,995,214 -11,432,542 Carbon disulfide (air) 2 5 29,168,743 6 21,471,752 -7,696,991 Chlorine (air) 3 13 7,066,233 * * -7,066,233 Copper/Zinc and compounds (land) 4 21 11,718,277 23 5,108,617 -6,609,660 Acetonitrile, Acrylic acid (UIJ) 5 11 14,607,894 15 8,512,671 -6,095,223 Zinc/Copper and compounds (land) 6 16 6,544,692 15 1,137,457 -5,407,235 Zinc and compounds (land) 7 21 5,148,906 7 104,618 -5,044,288 Vinyl acetate (transfers to treatment) 8 4 10,789,274 6 6,280,657 -4,508,617 Carbon disulfide (air) 9 21 5,283,733 19 793,120 -4,490,613 Ethylene glycol (transfers to treatment)
10 23 4,462,199 19 80,222 -4,381,977 Propylene (air) 11 34 8,921,575 26 4,600,819 -4,320,756 Nitric acid and nitrate compounds (UIJ) 12 6 8,442,331 5 4,170,767 -4,271,564 Zinc and compounds (transfers of metals), Copper and compounds (land) 13 8 4,359,973 2 283,575 -4,076,398 Methanol (transfers to sewage) 14 21 7,498,535 19 3,606,079 -3,892,456 Ethylene glycol (UIJ) 15 10 15,994,774 13 12,325,557 -3,669,217 Lead/Zinc/Manganese and compounds (transfers of metals) 16 3 3,415,787 3 576 -3,415,211 Copper and compounds (transfers of metals) 17 36 5,427,247 34 2,108,360 -3,318,887 Nitric acid and nitrate compounds (UIJ) 18 3 3,233,586 * * -3,233,586 Copper and compounds (land) 19 4 3,385,170 3 237,064 -3,148,106 Methanol (air) 20 8 7,458,528 6 4,537,877 -2,920,651 Zinc/Manganese and compounds (land) 21 4 3,663,623 9 1,120,300 -2,543,323 Methanol (water) 22 28 10,799,431 28 8,340,956 -2,458,475 Nitric acid and nitrate compounds (UIJ) 23 13 2,757,902 12 319,205 -2,438,697 Manganese and compounds (UIJ) 24 29 3,839,899 26 1,518,649 -2,321,250 Nitric acid and nitrate compounds (water) 25 13 2,291,434 4 101,872 -2,189,562 Methanol (air) 26 10 8,828,922 11 6,760,506 -2,068,416 Nitric acid and nitrate compounds (transfers to sewage) 27 2 1,988,244 2 159 -1,988,085 Asbestos (transfers to disposal) 28 24 3,727,641 24 1,808,519 -1,919,122 Nitric acid and nitrate compounds (UIJ) 29 3 2,408,582 9 516,720 -1,891,862 Methanol (water) 30 3 1,905,154 3 62,330 -1,842,824 Carbon disulfide, Ethylene (air) 31 18 2,299,526 18 716,434 -1,583,092 1,1,2-Trichloroethane (transfers to treatment) 32 9 2,196,950 5 626,412 -1,570,538 Cyclohexane (air) 33 3 1,614,127 3 56,364 -1,557,763 Carbon disulfide (air) 34 15 6,215,822 19 4,659,475 -1,556,347 Zinc and compounds (transfers of metals) 35 61 4,133,749 55 2,595,584 -1,538,165 Hydrochloric acid, Methanol (air), Xylenes (transfers to treatment) 36 53 2,527,468 44 990,170 -1,537,298 Phenol (UIJ), Methyl ethyl ketone (air) 37 6 1,783,723 6 274,587 -1,509,136 Ethylene glycol (transfers to treatment) 38 8 3,857,130 11 2,371,020 -1,486,110 Methanol (transfers to sewage) 39 51 3,823,561 46 2,381,630 -1,441,931 Methanol, Dichloromethane (air) 40 6 1,407,644 * * -1,407,644 Zinc/Lead and compounds (transfers of metals) 41 16 1,598,360 14 191,422 -1,406,938 Manganese and compounds (land) 42 3 1,389,668 * * -1,389,668 Carbon disulfide (air) 43 18 1,856,308 3 469,898 -1,386,410 Acrylonitrile, Acetonitrile, Hydrogen cyanide, Phenol (UIJ) 44 28 1,960,843 26 600,498 -1,360,345 Nitric acid and nitrate compounds (water) 45 16 2,529,048 17 1,171,528 -1,357,520 Methanol (air) 46 5 1,491,724 5 189,984 -1,301,740 Methanol (water) 47 14 2,718,271 17 1,452,215 -1,266,056 Chloromethane, Hydrochloric acid (air), Benzene (air, transfers to treatment) 48 4 1,336,940 5 90,933 -1,246,007 Chromium and compounds (transfers of metals) 49 7 1,178,288 5 15,959 -1,162,329 Methyl ethyl ketone (air) 50 2 1,763,311 1 626,995 -1,136,316 Methanol (UIJ)
744 268,248,506 652 119,385,326 -148,863,180
* Indicates facility did not report any matched chemicals that year within US SIC code 20–39.
UIJ = Underground Injection.
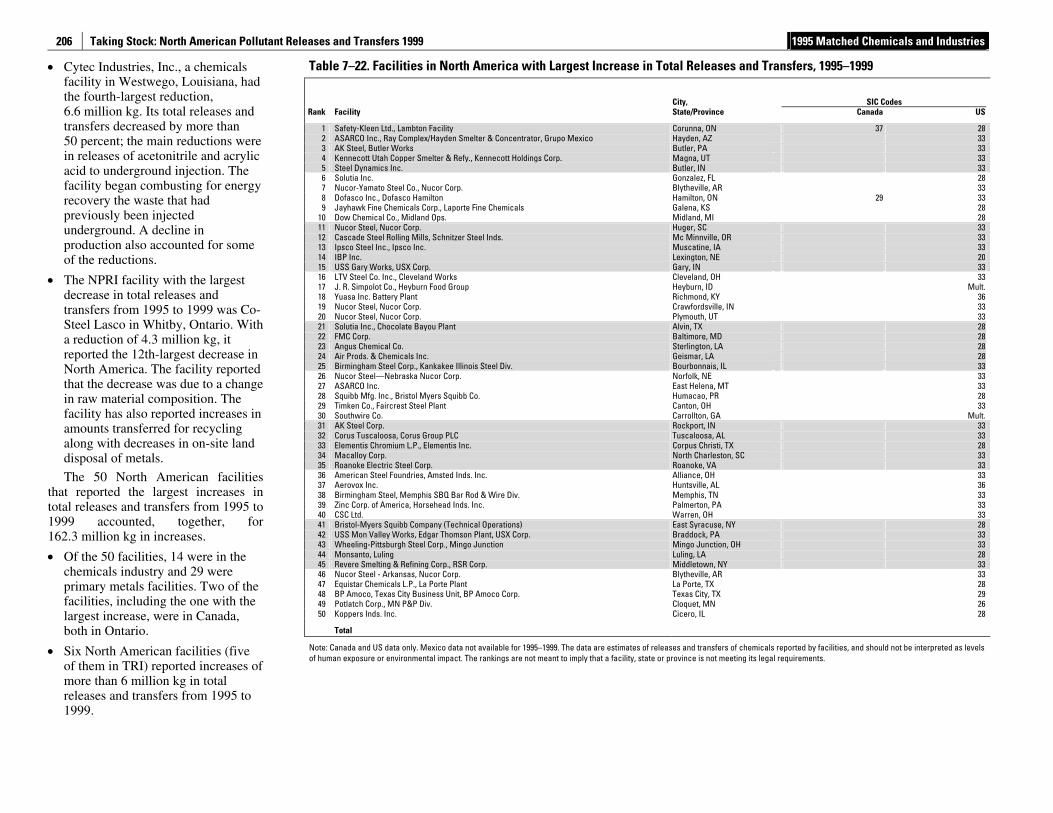
Taking Stock: North American Pollutant Releases and Transfers 1999 1995 Matched Chemicals and Industries
206
• Cytec Industries, Inc., a chemicals facility in Westwego, Louisiana, had the fourth-largest reduction, 6.6 million kg. Its total releases and transfers decreased by more than 50 percent; the main reductions were in releases of acetonitrile and acrylic acid to underground injection. The facility began combusting for energy recovery the waste that had previously been injected underground. A decline in production also accounted for some of the reductions.
• The NPRI facility with the largest decrease in total releases and transfers from 1995 to 1999 was Co-Steel Lasco in Whitby, Ontario. With a reduction of 4.3 million kg, it reported the 12th-largest decrease in North America. The facility reported that the decrease was due to a change in raw material composition. The facility has also reported increases in amounts transferred for recycling along with decreases in on-site land disposal of metals.
The 50 North American facilities that reported the largest increases in total releases and transfers from 1995 to 1999 accounted, together, for 162.3 million kg in increases.
• Of the 50 facilities, 14 were in the chemicals industry and 29 were primary metals facilities. Two of the facilities, including the one with the largest increase, were in Canada, both in Ontario.
• Six North American facilities (five of them in TRI) reported increases of more than 6 million kg in total releases and transfers from 1995 to 1999.
Table 7–22. Facilities in North America with Largest Increase in Total Releases and Transfers, 1995–1999
City,
SIC Codes Rank Facility State/Province Canada US
1 Safety-Kleen Ltd., Lambton Facility Corunna, ON 37 28 2 ASARCO Inc., Ray Complex/Hayden Smelter & Concentrator, Grupo Mexico Hayden, AZ 33 3 AK Steel, Butler Works Butler, PA 33 4 Kennecott Utah Copper Smelter & Refy., Kennecott Holdings Corp. Magna, UT 33 5 Steel Dynamics Inc. Butler, IN 33 6 Solutia Inc. Gonzalez, FL 28 7 Nucor-Yamato Steel Co., Nucor Corp. Blytheville, AR 33 8 Dofasco Inc., Dofasco Hamilton Hamilton, ON 29 33 9 Jayhawk Fine Chemicals Corp., Laporte Fine Chemicals Galena, KS 28
10 Dow Chemical Co., Midland Ops. Midland, MI 28 11 Nucor Steel, Nucor Corp. Huger, SC 33 12 Cascade Steel Rolling Mills, Schnitzer Steel Inds. Mc Minnville, OR 33 13 Ipsco Steel Inc., Ipsco Inc. Muscatine, IA 33 14 IBP Inc. Lexington, NE 20 15 USS Gary Works, USX Corp. Gary, IN 33 16 LTV Steel Co. Inc., Cleveland Works Cleveland, OH 33 17 J. R. Simpolot Co., Heyburn Food Group Heyburn, ID Mult. 18 Yuasa Inc. Battery Plant Richmond, KY 36 19 Nucor Steel, Nucor Corp. Crawfordsville, IN 33 20 Nucor Steel, Nucor Corp. Plymouth, UT 33 21 Solutia Inc., Chocolate Bayou Plant Alvin, TX 28 22 FMC Corp. Baltimore, MD 28 23 Angus Chemical Co. Sterlington, LA 28 24 Air Prods. & Chemicals Inc. Geismar, LA 28 25 Birmingham Steel Corp., Kankakee Illinois Steel Div. Bourbonnais, IL 33 26 Nucor Steel—Nebraska Nucor Corp. Norfolk, NE 33 27 ASARCO Inc. East Helena, MT 33 28 Squibb Mfg. Inc., Bristol Myers Squibb Co. Humacao, PR 28 29 Timken Co., Faircrest Steel Plant Canton, OH 33 30 Southwire Co. Carrollton, GA Mult. 31 AK Steel Corp. Rockport, IN 33 32 Corus Tuscaloosa, Corus Group PLC Tuscaloosa, AL 33 33 Elementis Chromium L.P., Elementis Inc. Corpus Christi, TX 28 34 Macalloy Corp. North Charleston, SC 33 35 Roanoke Electric Steel Corp. Roanoke, VA 33 36 American Steel Foundries, Amsted Inds. Inc. Alliance, OH 33 37 Aerovox Inc. Huntsville, AL 36 38 Birmingham Steel, Memphis SBQ Bar Rod & Wire Div. Memphis, TN 33 39 Zinc Corp. of America, Horsehead Inds. Inc. Palmerton, PA 33 40 CSC Ltd. Warren, OH 33 41 Bristol-Myers Squibb Company (Technical Operations) East Syracuse, NY 28 42 USS Mon Valley Works, Edgar Thomson Plant, USX Corp. Braddock, PA 33 43 Wheeling-Pittsburgh Steel Corp., Mingo Junction Mingo Junction, OH 33 44 Monsanto, Luling Luling, LA 28 45 Revere Smelting & Refining Corp., RSR Corp. Middletown, NY 33 46 Nucor Steel - Arkansas, Nucor Corp. Blytheville, AR 33 47 Equistar Chemicals L.P., La Porte Plant La Porte, TX 28 48 BP Amoco, Texas City Business Unit, BP Amoco Corp. Texas City, TX 29 49 Potlatch Corp., MN P&P Div. Cloquet, MN 26 50 Koppers Inds. Inc. Cicero, IL 28
Total
Note: Canada and US data only. Mexico data not available for 1995–1999. The data are estimates of releases and transfers of chemicals reported by facilities, and should not be interpreted as levels of human exposure or environmental impact. The rankings are not meant to imply that a facility, state or province is not meeting its legal requirements.
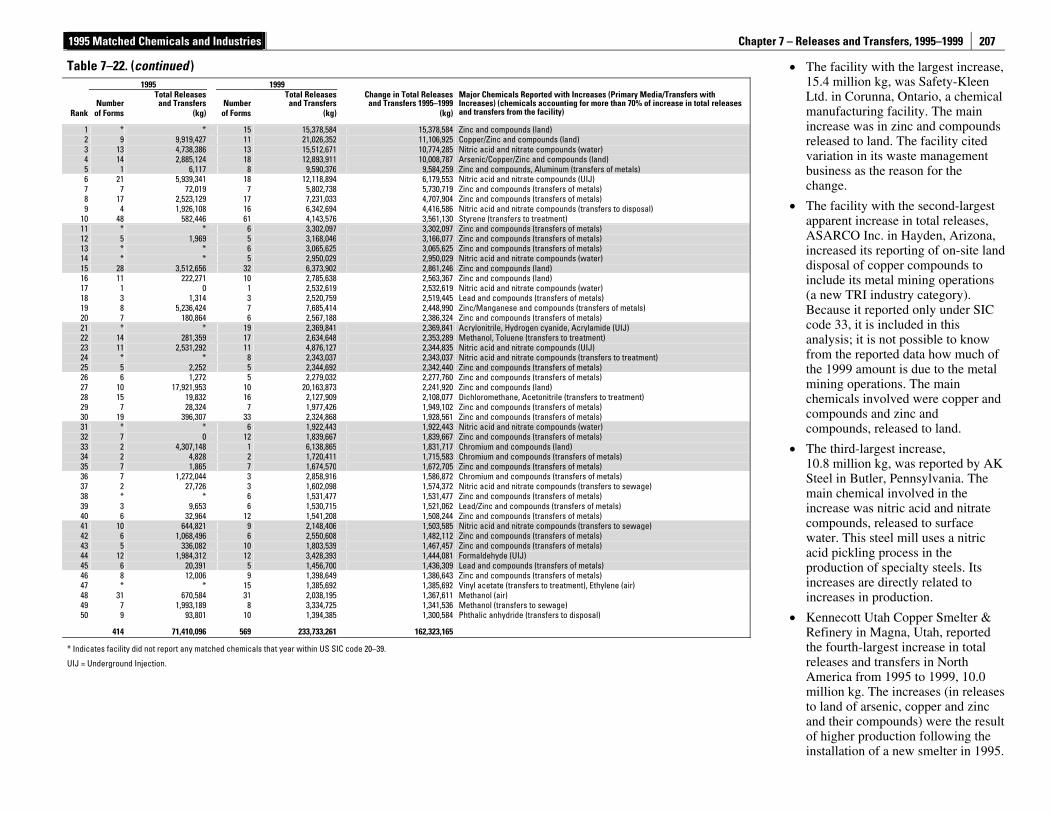
1995 Matched Chemicals and Industries Chapter 7 – Releases and Transfers, 1995–1999
207
• The facility with the largest increase, 15.4 million kg, was Safety-Kleen Ltd. in Corunna, Ontario, a chemical manufacturing facility. The main increase was in zinc and compounds released to land. The facility cited variation in its waste management business as the reason for the change.
• The facility with the second-largest apparent increase in total releases, ASARCO Inc. in Hayden, Arizona, increased its reporting of on-site land disposal of copper compounds to include its metal mining operations (a new TRI industry category). Because it reported only under SIC code 33, it is included in this analysis; it is not possible to know from the reported data how much of the 1999 amount is due to the metal mining operations. The main chemicals involved were copper and compounds and zinc and compounds, released to land.
• The third-largest increase, 10.8 million kg, was reported by AK Steel in Butler, Pennsylvania. The main chemical involved in the increase was nitric acid and nitrate compounds, released to surface water. This steel mill uses a nitric acid pickling process in the production of specialty steels. Its increases are directly related to increases in production.
• Kennecott Utah Copper Smelter & Refinery in Magna, Utah, reported the fourth-largest increase in total releases and transfers in North America from 1995 to 1999, 10.0 million kg. The increases (in releases to land of arsenic, copper and zinc and their compounds) were the result of higher production following the installation of a new smelter in 1995.
Table 7–22. (continued ) 1995 1999
Number Total Releases
and Transfers Number Total Releases
and TransfersChange in Total Releases
and Transfers 1995–1999Rank of Forms (kg) of Forms (kg) (kg)
Major Chemicals Reported with Increases (Primary Media/Transfers with Increases) (chemicals accounting for more than 70% of increase in total releases and transfers from the facility)
1 * * 15 15,378,584 15,378,584 Zinc and compounds (land) 2 9 9,919,427 11 21,026,352 11,106,925 Copper/Zinc and compounds (land) 3 13 4,738,386 13 15,512,671 10,774,285 Nitric acid and nitrate compounds (water) 4 14 2,885,124 18 12,893,911 10,008,787 Arsenic/Copper/Zinc and compounds (land) 5 1 6,117 8 9,590,376 9,584,259 Zinc and compounds, Aluminum (transfers of metals) 6 21 5,939,341 18 12,118,894 6,179,553 Nitric acid and nitrate compounds (UIJ) 7 7 72,019 7 5,802,738 5,730,719 Zinc and compounds (transfers of metals) 8 17 2,523,129 17 7,231,033 4,707,904 Zinc and compounds (transfers of metals) 9 4 1,926,108 16 6,342,694 4,416,586 Nitric acid and nitrate compounds (transfers to disposal)
10 48 582,446 61 4,143,576 3,561,130 Styrene (transfers to treatment) 11 * * 6 3,302,097 3,302,097 Zinc and compounds (transfers of metals) 12 5 1,969 5 3,168,046 3,166,077 Zinc and compounds (transfers of metals) 13 * * 6 3,065,625 3,065,625 Zinc and compounds (transfers of metals) 14 * * 5 2,950,029 2,950,029 Nitric acid and nitrate compounds (water) 15 28 3,512,656 32 6,373,902 2,861,246 Zinc and compounds (land) 16 11 222,271 10 2,785,638 2,563,367 Zinc and compounds (land) 17 1 0 1 2,532,619 2,532,619 Nitric acid and nitrate compounds (water) 18 3 1,314 3 2,520,759 2,519,445 Lead and compounds (transfers of metals) 19 8 5,236,424 7 7,685,414 2,448,990 Zinc/Manganese and compounds (transfers of metals) 20 7 180,864 6 2,567,188 2,386,324 Zinc and compounds (transfers of metals) 21 * * 19 2,369,841 2,369,841 Acrylonitrile, Hydrogen cyanide, Acrylamide (UIJ) 22 14 281,359 17 2,634,648 2,353,289 Methanol, Toluene (transfers to treatment) 23 11 2,531,292 11 4,876,127 2,344,835 Nitric acid and nitrate compounds (UIJ) 24 * * 8 2,343,037 2,343,037 Nitric acid and nitrate compounds (transfers to treatment) 25 5 2,252 5 2,344,692 2,342,440 Zinc and compounds (transfers of metals) 26 6 1,272 5 2,279,032 2,277,760 Zinc and compounds (transfers of metals) 27 10 17,921,953 10 20,163,873 2,241,920 Zinc and compounds (land) 28 15 19,832 16 2,127,909 2,108,077 Dichloromethane, Acetonitrile (transfers to treatment) 29 7 28,324 7 1,977,426 1,949,102 Zinc and compounds (transfers of metals) 30 19 396,307 33 2,324,868 1,928,561 Zinc and compounds (transfers of metals) 31 * * 6 1,922,443 1,922,443 Nitric acid and nitrate compounds (water) 32 7 0 12 1,839,667 1,839,667 Zinc and compounds (transfers of metals) 33 2 4,307,148 1 6,138,865 1,831,717 Chromium and compounds (land) 34 2 4,828 2 1,720,411 1,715,583 Chromium and compounds (transfers of metals) 35 7 1,865 7 1,674,570 1,672,705 Zinc and compounds (transfers of metals) 36 7 1,272,044 3 2,858,916 1,586,872 Chromium and compounds (transfers of metals) 37 2 27,726 3 1,602,098 1,574,372 Nitric acid and nitrate compounds (transfers to sewage) 38 * * 6 1,531,477 1,531,477 Zinc and compounds (transfers of metals) 39 3 9,653 6 1,530,715 1,521,062 Lead/Zinc and compounds (transfers of metals) 40 6 32,964 12 1,541,208 1,508,244 Zinc and compounds (transfers of metals) 41 10 644,821 9 2,148,406 1,503,585 Nitric acid and nitrate compounds (transfers to sewage) 42 6 1,068,496 6 2,550,608 1,482,112 Zinc and compounds (transfers of metals) 43 5 336,082 10 1,803,539 1,467,457 Zinc and compounds (transfers of metals) 44 12 1,984,312 12 3,428,393 1,444,081 Formaldehyde (UIJ) 45 6 20,391 5 1,456,700 1,436,309 Lead and compounds (transfers of metals) 46 8 12,006 9 1,398,649 1,386,643 Zinc and compounds (transfers of metals) 47 * * 15 1,385,692 1,385,692 Vinyl acetate (transfers to treatment), Ethylene (air) 48 31 670,584 31 2,038,195 1,367,611 Methanol (air) 49 7 1,993,189 8 3,334,725 1,341,536 Methanol (transfers to sewage) 50 9 93,801 10 1,394,385 1,300,584 Phthalic anhydride (transfers to disposal)
414 71,410,096 569 233,733,261 162,323,165
* Indicates facility did not report any matched chemicals that year within US SIC code 20–39.
UIJ = Underground Injection.
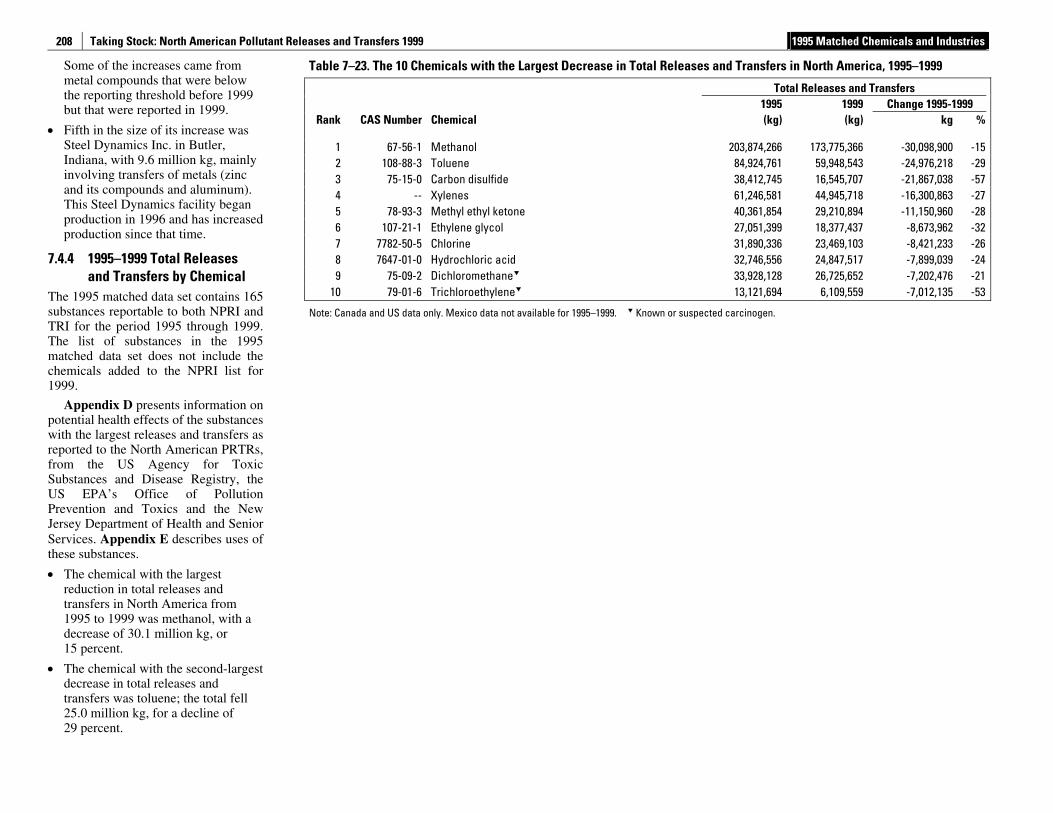
Taking Stock: North American Pollutant Releases and Transfers 1999 1995 Matched Chemicals and Industries
208
Some of the increases came from metal compounds that were below the reporting threshold before 1999 but that were reported in 1999.
• Fifth in the size of its increase was Steel Dynamics Inc. in Butler, Indiana, with 9.6 million kg, mainly involving transfers of metals (zinc and its compounds and aluminum). This Steel Dynamics facility began production in 1996 and has increased production since that time.
7.4.4 1995–1999 Total Releases and Transfers by Chemical
The 1995 matched data set contains 165 substances reportable to both NPRI and TRI for the period 1995 through 1999. The list of substances in the 1995 matched data set does not include the chemicals added to the NPRI list for 1999.
Appendix D presents information on potential health effects of the substances with the largest releases and transfers as reported to the North American PRTRs, from the US Agency for Toxic Substances and Disease Registry, the US EPA’s Office of Pollution Prevention and Toxics and the New Jersey Department of Health and Senior Services. Appendix E describes uses of these substances.
• The chemical with the largest reduction in total releases and transfers in North America from 1995 to 1999 was methanol, with a decrease of 30.1 million kg, or 15 percent.
• The chemical with the second-largest decrease in total releases and transfers was toluene; the total fell 25.0 million kg, for a decline of 29 percent.
Table 7–23. The 10 Chemicals with the Largest Decrease in Total Releases and Transfers in North America, 1995–1999
Total Releases and Transfers 1995 1999 Change 1995-1999
Rank CAS Number Chemical (kg) (kg) kg %
1 67-56-1 Methanol 203,874,266 173,775,366 -30,098,900 -15 2 108-88-3 Toluene 84,924,761 59,948,543 -24,976,218 -29 3 75-15-0 Carbon disulfide 38,412,745 16,545,707 -21,867,038 -57 4 -- Xylenes 61,246,581 44,945,718 -16,300,863 -27 5 78-93-3 Methyl ethyl ketone 40,361,854 29,210,894 -11,150,960 -28 6 107-21-1 Ethylene glycol 27,051,399 18,377,437 -8,673,962 -32 7 7782-50-5 Chlorine 31,890,336 23,469,103 -8,421,233 -26 8 7647-01-0 Hydrochloric acid 32,746,556 24,847,517 -7,899,039 -24 9 75-09-2 Dichloromethane 33,928,128 26,725,652 -7,202,476 -21
10 79-01-6 Trichloroethylene 13,121,694 6,109,559 -7,012,135 -53
Note: Canada and US data only. Mexico data not available for 1995–1999. Known or suspected carcinogen.
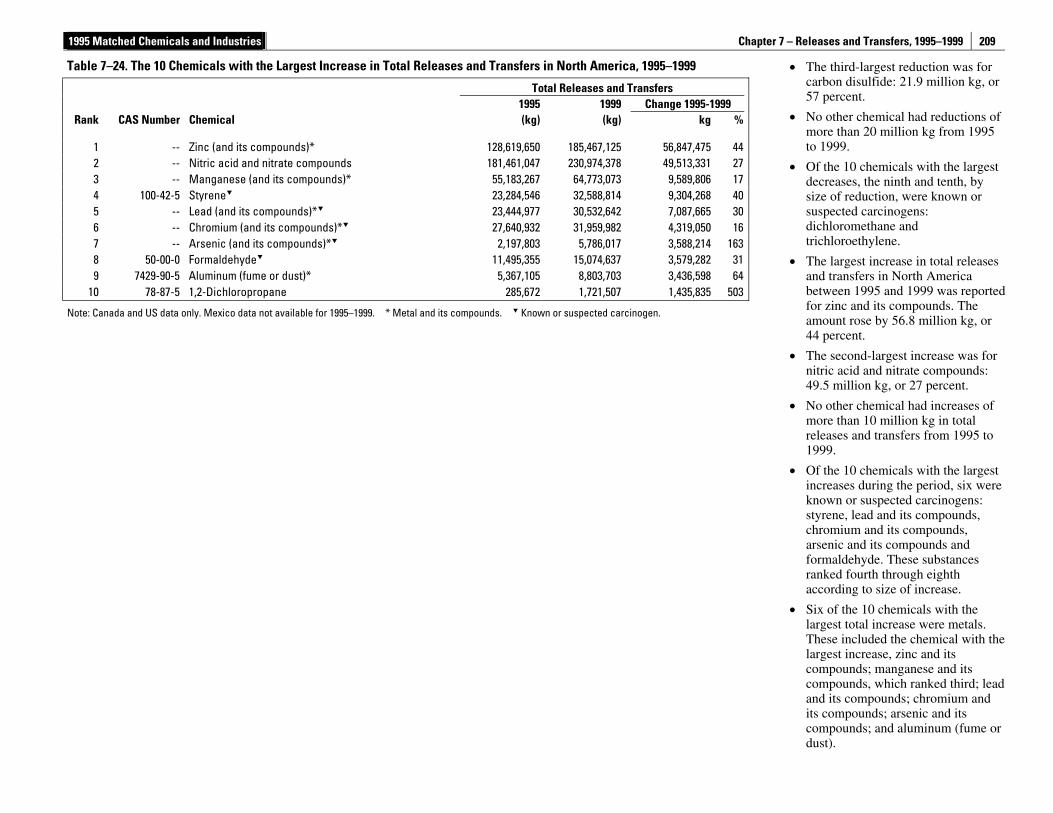
1995 Matched Chemicals and Industries Chapter 7 – Releases and Transfers, 1995–1999
209
• The third-largest reduction was for carbon disulfide: 21.9 million kg, or 57 percent.
• No other chemical had reductions of more than 20 million kg from 1995 to 1999.
• Of the 10 chemicals with the largest decreases, the ninth and tenth, by size of reduction, were known or suspected carcinogens: dichloromethane and trichloroethylene.
• The largest increase in total releases and transfers in North America between 1995 and 1999 was reported for zinc and its compounds. The amount rose by 56.8 million kg, or 44 percent.
• The second-largest increase was for nitric acid and nitrate compounds: 49.5 million kg, or 27 percent.
• No other chemical had increases of more than 10 million kg in total releases and transfers from 1995 to 1999.
• Of the 10 chemicals with the largest increases during the period, six were known or suspected carcinogens: styrene, lead and its compounds, chromium and its compounds, arsenic and its compounds and formaldehyde. These substances ranked fourth through eighth according to size of increase.
• Six of the 10 chemicals with the largest total increase were metals. These included the chemical with the largest increase, zinc and its compounds; manganese and its compounds, which ranked third; lead and its compounds; chromium and its compounds; arsenic and its compounds; and aluminum (fume or dust).
Table 7–24. The 10 Chemicals with the Largest Increase in Total Releases and Transfers in North America, 1995–1999
Total Releases and Transfers 1995 1999 Change 1995-1999
Rank CAS Number Chemical (kg) (kg) kg %
1 -- Zinc (and its compounds)* 128,619,650 185,467,125 56,847,475 442 -- Nitric acid and nitrate compounds 181,461,047 230,974,378 49,513,331 273 -- Manganese (and its compounds)* 55,183,267 64,773,073 9,589,806 174 100-42-5 Styrene 23,284,546 32,588,814 9,304,268 405 -- Lead (and its compounds)* 23,444,977 30,532,642 7,087,665 306 -- Chromium (and its compounds)* 27,640,932 31,959,982 4,319,050 167 -- Arsenic (and its compounds)* 2,197,803 5,786,017 3,588,214 1638 50-00-0 Formaldehyde 11,495,355 15,074,637 3,579,282 319 7429-90-5 Aluminum (fume or dust)* 5,367,105 8,803,703 3,436,598 64
10 78-87-5 1,2-Dichloropropane 285,672 1,721,507 1,435,835 503
Note: Canada and US data only. Mexico data not available for 1995–1999. * Metal and its compounds. Known or suspected carcinogen.

Chapter 8 – Cross-Border Transfers
211
Table of Contents
Key Findings............................................................................................................................ 213 8.1 Introduction.................................................................................................................. 213 8.2 1999 Transfers Outside the Country ......................................................................... 214
8.2.1 Transfers Across North American Borders, 1999 .................................... 216 8.2.2 Transfers between US States and Canadian Provinces, 1999 ............... 220
8.3 1998–1999 Cross-Border Transfers .......................................................................... 230 8.3.1 1998 to 1999 Transfers by Industry.............................................................. 232 8.3.2 1998 to 1999 Transfers by Chemical............................................................ 234
Figures
8–1 Percentage of Transfers sent Within and Outside Country, NPRI and TRI, 1999 ...................................................................................................... 215
8–2 Transfers from NPRI Facilities within Canada and to Other Countries, by Type of Transfer, 1999 ........................................................................................... 215
8–3 Transfers from TRI Facilities within United States and to Other Countries, by Type of Transfer, 1999 ........................................................................................... 215
8–4 Change in Off-site Transfers to/from Canada, US and Mexico, 1998–1999....... 231
Map
8–1 Off-site Transfers across North America, 1999...................................................... 218
Tables
8–1 Transfers from NPRI Facilities within Canada and to Other Countries, 1999....214 8–2 Transfers from TRI Facilities within United States and to Other Countries,
1999 ................................................................................................................................ 214 8–3 NPRI Off-site Transfers to Other Countries from Canada, 1999........................... 216 8–4 TRI Off-site Transfers to Other Countries from the United States, 1999............. 217 8–5 Off-site Transfers across National Boundaries between United States
and Canada, 1999......................................................................................................... 219 8–6 NPRI Facilities with Largest Transfers to US from Canada, 1999........................ 220 8–7 TRI Facilities with Largest Transfers to Canada from US, 1999........................... 220 8–8 Sites in Michigan that Received Largest Transfers from Canada, 1999 ............ 222 8–9 Sites in Ohio that Received Largest Transfers from Canada, 1999 ..................... 222
8–10 Sites in Ontario that Received Largest Transfers from US, 1999.........................224 8–11 Sites in Quebec that Received Largest Transfers from US, 1999........................224 8–12 NPRI Industries Reporting Transfers to US from Canada, 1999 ..........................226 8–13 TRI Industries Reporting Transfers to Canada from US, 1999..............................227 8–14 Chemicals Transferred to US from Canadian NPRI Facilities, 1999....................228 8–15 Chemicals Transferred to Canada from US TRI Facilities, 1999 ..........................229 8–16 Off-site Transfers to/from Canada, US and Mexico, 1998–1999 ..........................230 8–17 NPRI Off-site Transfers to US from Canada, by Industry, 1998–1999
(Ordered by Largest Transfers in 1999)....................................................................232 8–18 TRI Off-site Transfers to Canada from US, by Industry, 1998–1999
(Ordered by Largest Transfers in 1999)....................................................................233 8–19 NPRI Off-site Transfers to US from Canada, by Chemical, 1998–1999
(Chemicals with Largest Transfers in 1999) ............................................................234 8–20 TRI Off-site Transfers to Canada from US, by Chemical, 1998–1999
(Chemicals with Largest Transfers in 1999) ............................................................235

Chapter 8 – Cross-Border Transfers
213
Key Findings • Most transfers sent outside the country of the originating facility were transfers of metals to recycling in 1999—69
percent for NPRI facilities and 77 percent for TRI facilities.
• For both US and Canada, transfers outside the country were more likely to be transfers of metals to recycling and less likely to be transfers of metals to disposal than for transfers sent within the country.
• NPRI facilities sent 29.7 million kg of matched chemicals to US locations in 1999.
• TRI facilities sent 30.9 million kg of matched chemicals to Canadian locations and 27.0 million kg to Mexican locations in 1999.
• Mexico has not begun to collect mandatory data on transfers so it is not known how much was transferred from Mexican facilities to the US or Canada.
• A relatively small number of facilities in each country sent transfers across the US-Canada border—271 TRI facilities and 131 NPRI facilities. A total of 15 facilities in each country accounted for about two-thirds of the cross-border transfers.
• Most cross-border transfers were received at sites in Ontario and Quebec in Canada and in Michigan and Ohio in the United States.
• Cross-border transfers to Canada from the US decreased by 12 percent between 1998 and 1999, from 34.2 million kg to 30.0 million kg. The decrease was primarily in transfers of metals for recycling.
• Cross-border transfers to the US from Canada decreased by 9 percent between 1998 and 1999, from 32.7 million kg to 29.7 million kg. The decrease was primarily in transfers of all substances for recycling.
8.1 Introduction NPRI and TRI facilities report the amounts of chemicals they transfer to off-site locations, along with the address of the off-site location. Most transfers occur to sites within a nation’s borders; however, listed substances can also be shipped to a North American neighbor or to other countries. This chapter examines off-site transfers that were sent to sites across national boundaries in 1998 and 1999. The off-site transfers examined are those to recycling, energy recovery, treatment and disposal. Off-site transfers to sewage are not included because they are sent to local sewage treatment plants.
Off-site transfers represent those sent from a facility to other locations—nearby, within the state or province, or outside the country. While other chapters examine transfers at their point of origin, this chapter examines the destinations of the transfers and the subset of the transfers that are sent across national boundaries.
This chapter presents:
• 1999 data for transfers to disposal, recycling, energy recovery, and treatment; and
• data for the time period 1998–1999.
The 1998–1999 data include only those chemicals in the matched data set for both years. No data for prior years are included because NPRI reporting did not include mandatory reporting on transfers to recycling and energy recovery until the 1998 reporting year.
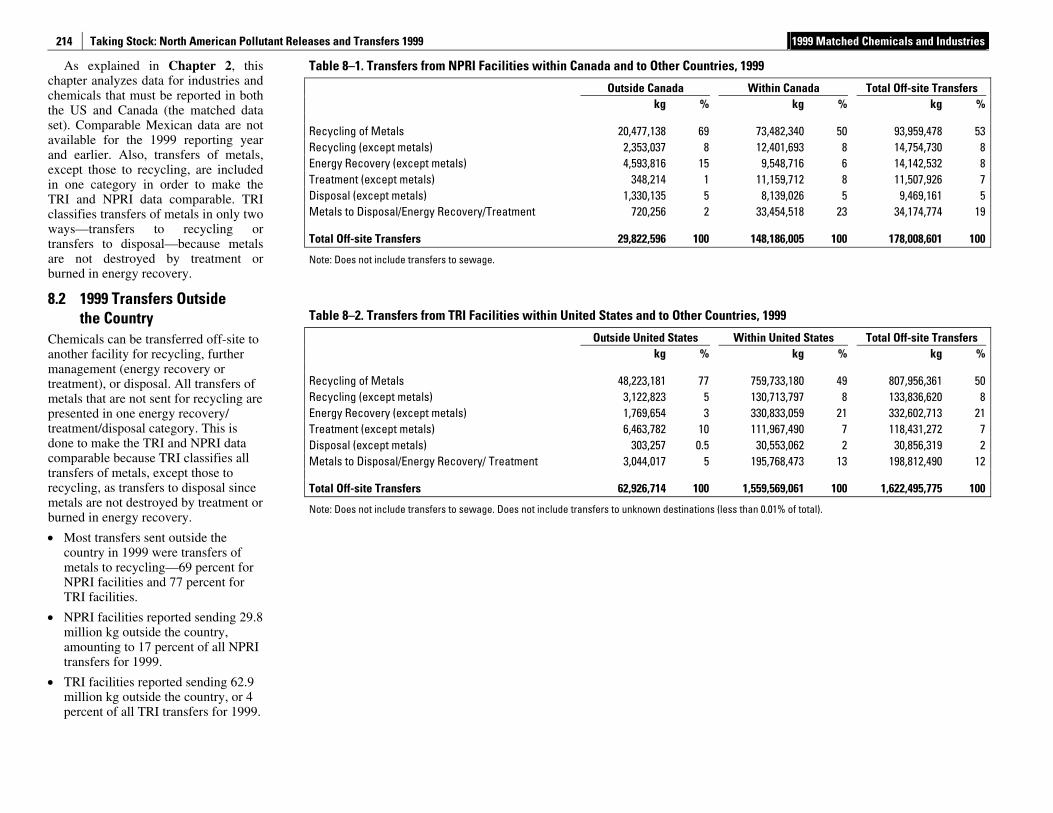
Taking Stock: North American Pollutant Releases and Transfers 1999 1999 Matched Chemicals and Industries
214
As explained in Chapter 2, this chapter analyzes data for industries and chemicals that must be reported in both the US and Canada (the matched data set). Comparable Mexican data are not available for the 1999 reporting year and earlier. Also, transfers of metals, except those to recycling, are included in one category in order to make the TRI and NPRI data comparable. TRI classifies transfers of metals in only two ways—transfers to recycling or transfers to disposal—because metals are not destroyed by treatment or burned in energy recovery.
8.2 1999 Transfers Outside the Country
Chemicals can be transferred off-site to another facility for recycling, further management (energy recovery or treatment), or disposal. All transfers of metals that are not sent for recycling are presented in one energy recovery/ treatment/disposal category. This is done to make the TRI and NPRI data comparable because TRI classifies all transfers of metals, except those to recycling, as transfers to disposal since metals are not destroyed by treatment or burned in energy recovery.
• Most transfers sent outside the country in 1999 were transfers of metals to recycling—69 percent for NPRI facilities and 77 percent for TRI facilities.
• NPRI facilities reported sending 29.8 million kg outside the country, amounting to 17 percent of all NPRI transfers for 1999.
• TRI facilities reported sending 62.9 million kg outside the country, or 4 percent of all TRI transfers for 1999.
Table 8–1. Transfers from NPRI Facilities within Canada and to Other Countries, 1999
Outside Canada Within Canada Total Off-site Transfers kg % kg % kg %
Recycling of Metals 20,477,138 69 73,482,340 50 93,959,478 53 Recycling (except metals) 2,353,037 8 12,401,693 8 14,754,730 8 Energy Recovery (except metals) 4,593,816 15 9,548,716 6 14,142,532 8 Treatment (except metals) 348,214 1 11,159,712 8 11,507,926 7 Disposal (except metals) 1,330,135 5 8,139,026 5 9,469,161 5 Metals to Disposal/Energy Recovery/Treatment 720,256 2 33,454,518 23 34,174,774 19
Total Off-site Transfers 29,822,596 100 148,186,005 100 178,008,601 100
Note: Does not include transfers to sewage.
Table 8–2. Transfers from TRI Facilities within United States and to Other Countries, 1999
Outside United States Within United States Total Off-site Transfers kg % kg % kg %
Recycling of Metals 48,223,181 77 759,733,180 49 807,956,361 50 Recycling (except metals) 3,122,823 5 130,713,797 8 133,836,620 8 Energy Recovery (except metals) 1,769,654 3 330,833,059 21 332,602,713 21 Treatment (except metals) 6,463,782 10 111,967,490 7 118,431,272 7 Disposal (except metals) 303,257 0.5 30,553,062 2 30,856,319 2 Metals to Disposal/Energy Recovery/ Treatment 3,044,017 5 195,768,473 13 198,812,490 12
Total Off-site Transfers 62,926,714 100 1,559,569,061 100 1,622,495,775 100
Note: Does not include transfers to sewage. Does not include transfers to unknown destinations (less than 0.01% of total).
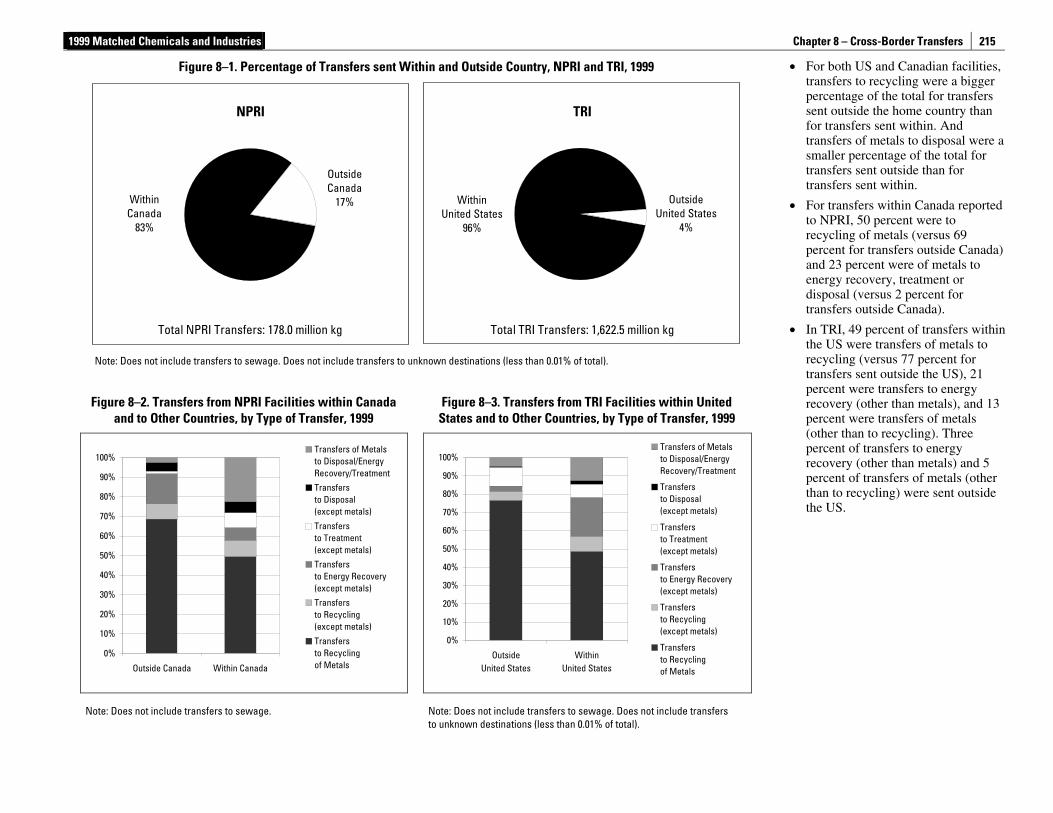
1999 Matched Chemicals and Industries Chapter 8 – Cross-Border Transfers
215
Figure 8–1. Percentage of Transfers sent Within and Outside Country, NPRI and TRI, 1999
OutsideCanada
17%
Within Canada
83%
OutsideUnited States
4%
WithinUnited States
96%
Total NPRI Transfers: 178.0 million kg Total TRI Transfers: 1,622.5 million kg
NPRI TRI
Note: Does not include transfers to sewage. Does not include transfers to unknown destinations (less than 0.01% of total).
Figure 8–2. Transfers from NPRI Facilities within Canada and to Other Countries, by Type of Transfer, 1999
Figure 8–3. Transfers from TRI Facilities within United States and to Other Countries, by Type of Transfer, 1999
Note: Does not include transfers to sewage.
Note: Does not include transfers to sewage. Does not include transfers to unknown destinations (less than 0.01% of total).
• For both US and Canadian facilities, transfers to recycling were a bigger percentage of the total for transfers sent outside the home country than for transfers sent within. And transfers of metals to disposal were a smaller percentage of the total for transfers sent outside than for transfers sent within.
• For transfers within Canada reported to NPRI, 50 percent were to recycling of metals (versus 69 percent for transfers outside Canada) and 23 percent were of metals to energy recovery, treatment or disposal (versus 2 percent for transfers outside Canada).
• In TRI, 49 percent of transfers within the US were transfers of metals to recycling (versus 77 percent for transfers sent outside the US), 21 percent were transfers to energy recovery (other than metals), and 13 percent were transfers of metals (other than to recycling). Three percent of transfers to energy recovery (other than metals) and 5 percent of transfers of metals (other than to recycling) were sent outside the US.
0%
10%
20%
30%
40%
50%
60%
70%
80%
90%
100%
Outside Canada Within Canada
Transfers of Metalsto Disposal/EnergyRecovery/Treatment
Transfersto Disposal(except metals)
Transfersto Treatment(except metals)
Transfersto Energy Recovery(except metals)
Transfersto Recycling(except metals)
Transfersto Recyclingof Metals
0%
10%
20%
30%
40%
50%
60%
70%
80%
90%
100%
OutsideUnited States
WithinUnited States
Transfers of Metalsto Disposal/EnergyRecovery/Treatment
Transfersto Disposal(except metals)
Transfersto Treatment(except metals)
Transfersto Energy Recovery(except metals)
Transfersto Recycling(except metals)
Transfersto Recyclingof Metals
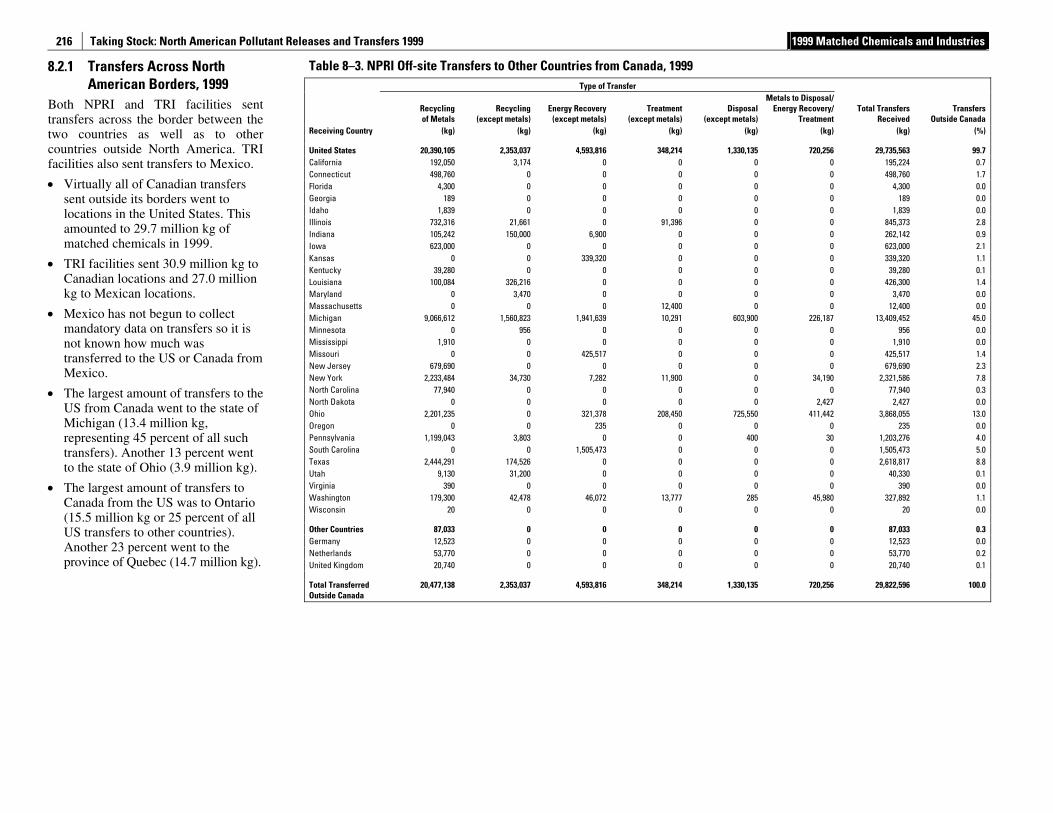
Taking Stock: North American Pollutant Releases and Transfers 1999 1999 Matched Chemicals and Industries
216
8.2.1 Transfers Across North American Borders, 1999
Both NPRI and TRI facilities sent transfers across the border between the two countries as well as to other countries outside North America. TRI facilities also sent transfers to Mexico.
• Virtually all of Canadian transfers sent outside its borders went to locations in the United States. This amounted to 29.7 million kg of matched chemicals in 1999.
• TRI facilities sent 30.9 million kg to Canadian locations and 27.0 million kg to Mexican locations.
• Mexico has not begun to collect mandatory data on transfers so it is not known how much was transferred to the US or Canada from Mexico.
• The largest amount of transfers to the US from Canada went to the state of Michigan (13.4 million kg, representing 45 percent of all such transfers). Another 13 percent went to the state of Ohio (3.9 million kg).
• The largest amount of transfers to Canada from the US was to Ontario (15.5 million kg or 25 percent of all US transfers to other countries). Another 23 percent went to the province of Quebec (14.7 million kg).
Table 8–3. NPRI Off-site Transfers to Other Countries from Canada, 1999 Type of Transfer
Recyclingof Metals
Recycling(except metals)
Energy Recovery (except metals)
Treatment(except metals)
Disposal(except metals)
Metals to Disposal/ Energy Recovery/
TreatmentTotal Transfers
ReceivedTransfers
Outside Canada Receiving Country (kg) (kg) (kg) (kg) (kg) (kg) (kg) (%)
United States 20,390,105 2,353,037 4,593,816 348,214 1,330,135 720,256 29,735,563 99.7 California 192,050 3,174 0 0 0 0 195,224 0.7 Connecticut 498,760 0 0 0 0 0 498,760 1.7 Florida 4,300 0 0 0 0 0 4,300 0.0 Georgia 189 0 0 0 0 0 189 0.0 Idaho 1,839 0 0 0 0 0 1,839 0.0 Illinois 732,316 21,661 0 91,396 0 0 845,373 2.8 Indiana 105,242 150,000 6,900 0 0 0 262,142 0.9 Iowa 623,000 0 0 0 0 0 623,000 2.1 Kansas 0 0 339,320 0 0 0 339,320 1.1 Kentucky 39,280 0 0 0 0 0 39,280 0.1 Louisiana 100,084 326,216 0 0 0 0 426,300 1.4 Maryland 0 3,470 0 0 0 0 3,470 0.0 Massachusetts 0 0 0 12,400 0 0 12,400 0.0 Michigan 9,066,612 1,560,823 1,941,639 10,291 603,900 226,187 13,409,452 45.0 Minnesota 0 956 0 0 0 0 956 0.0 Mississippi 1,910 0 0 0 0 0 1,910 0.0 Missouri 0 0 425,517 0 0 0 425,517 1.4 New Jersey 679,690 0 0 0 0 0 679,690 2.3 New York 2,233,484 34,730 7,282 11,900 0 34,190 2,321,586 7.8 North Carolina 77,940 0 0 0 0 0 77,940 0.3 North Dakota 0 0 0 0 0 2,427 2,427 0.0 Ohio 2,201,235 0 321,378 208,450 725,550 411,442 3,868,055 13.0 Oregon 0 0 235 0 0 0 235 0.0 Pennsylvania 1,199,043 3,803 0 0 400 30 1,203,276 4.0 South Carolina 0 0 1,505,473 0 0 0 1,505,473 5.0 Texas 2,444,291 174,526 0 0 0 0 2,618,817 8.8 Utah 9,130 31,200 0 0 0 0 40,330 0.1 Virginia 390 0 0 0 0 0 390 0.0 Washington 179,300 42,478 46,072 13,777 285 45,980 327,892 1.1 Wisconsin 20 0 0 0 0 0 20 0.0
Other Countries 87,033 0 0 0 0 0 87,033 0.3 Germany 12,523 0 0 0 0 0 12,523 0.0 Netherlands 53,770 0 0 0 0 0 53,770 0.2 United Kingdom 20,740 0 0 0 0 0 20,740 0.1
Total Transferred Outside Canada
20,477,138 2,353,037 4,593,816 348,214 1,330,135 720,256 29,822,596 100.0
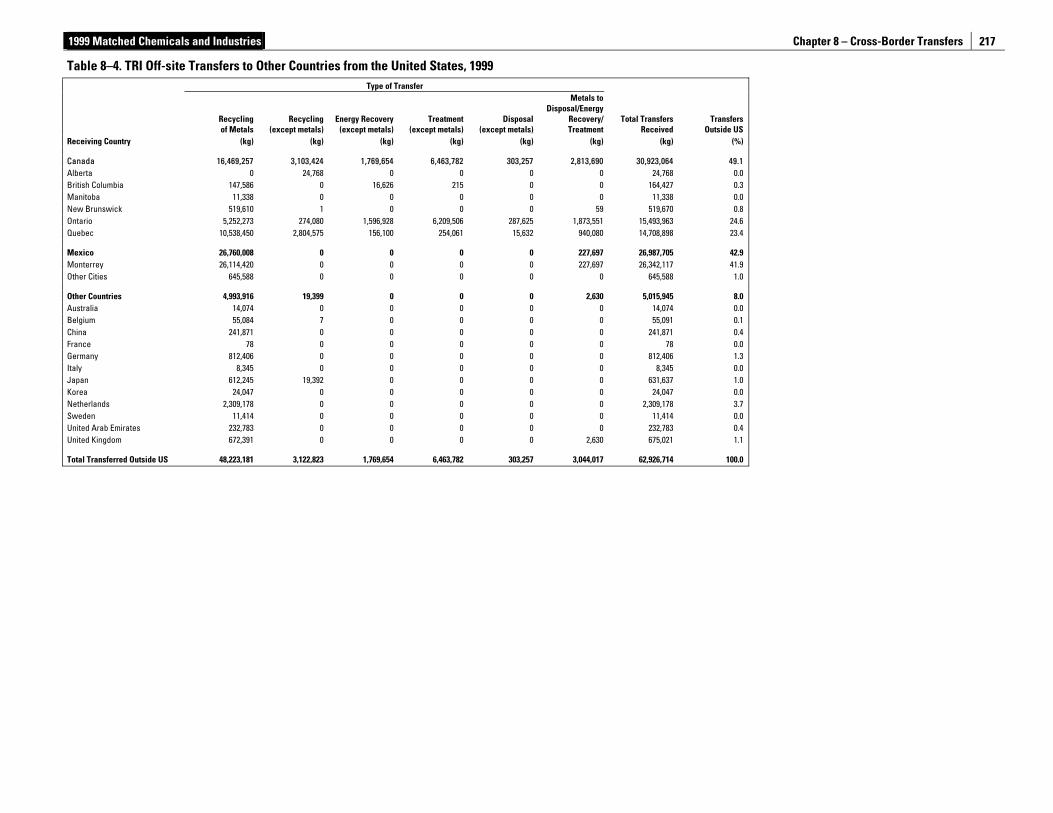
1999 Matched Chemicals and Industries Chapter 8 – Cross-Border Transfers
217
Table 8–4. TRI Off-site Transfers to Other Countries from the United States, 1999
Type of Transfer
Recycling of Metals
Recycling (except metals)
Energy Recovery (except metals)
Treatment(except metals)
Disposal(except metals)
Metals to Disposal/Energy
Recovery/ Treatment
Total Transfers Received
TransfersOutside US
Receiving Country (kg) (kg) (kg) (kg) (kg) (kg) (kg) (%)
Canada 16,469,257 3,103,424 1,769,654 6,463,782 303,257 2,813,690 30,923,064 49.1Alberta 0 24,768 0 0 0 0 24,768 0.0British Columbia 147,586 0 16,626 215 0 0 164,427 0.3Manitoba 11,338 0 0 0 0 0 11,338 0.0New Brunswick 519,610 1 0 0 0 59 519,670 0.8Ontario 5,252,273 274,080 1,596,928 6,209,506 287,625 1,873,551 15,493,963 24.6Quebec 10,538,450 2,804,575 156,100 254,061 15,632 940,080 14,708,898 23.4
Mexico 26,760,008 0 0 0 0 227,697 26,987,705 42.9Monterrey 26,114,420 0 0 0 0 227,697 26,342,117 41.9Other Cities 645,588 0 0 0 0 0 645,588 1.0
Other Countries 4,993,916 19,399 0 0 0 2,630 5,015,945 8.0Australia 14,074 0 0 0 0 0 14,074 0.0Belgium 55,084 7 0 0 0 0 55,091 0.1China 241,871 0 0 0 0 0 241,871 0.4France 78 0 0 0 0 0 78 0.0Germany 812,406 0 0 0 0 0 812,406 1.3Italy 8,345 0 0 0 0 0 8,345 0.0Japan 612,245 19,392 0 0 0 0 631,637 1.0Korea 24,047 0 0 0 0 0 24,047 0.0Netherlands 2,309,178 0 0 0 0 0 2,309,178 3.7Sweden 11,414 0 0 0 0 0 11,414 0.0United Arab Emirates 232,783 0 0 0 0 0 232,783 0.4United Kingdom 672,391 0 0 0 0 2,630 675,021 1.1
Total Transferred Outside US 48,223,181 3,122,823 1,769,654 6,463,782 303,257 3,044,017 62,926,714 100.0
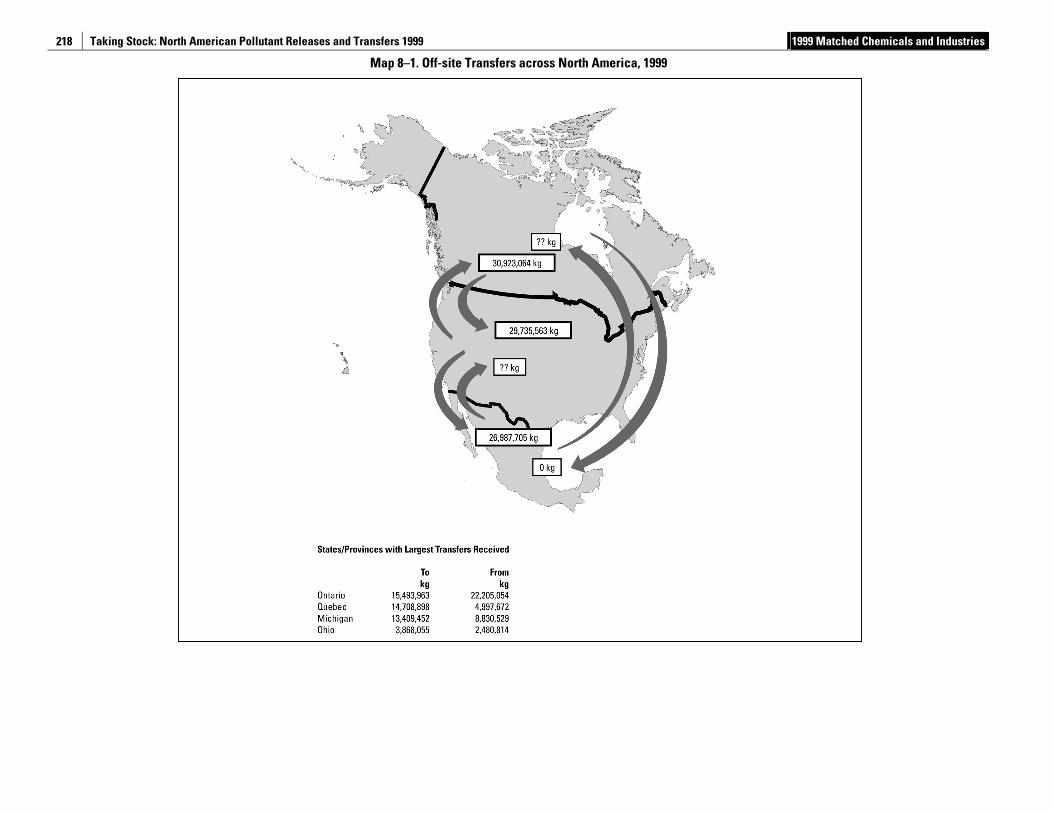
Taking Stock: North American Pollutant Releases and Transfers 1999 1999 Matched Chemicals and Industries
218
Map 8–1. Off-site Transfers across North America, 1999
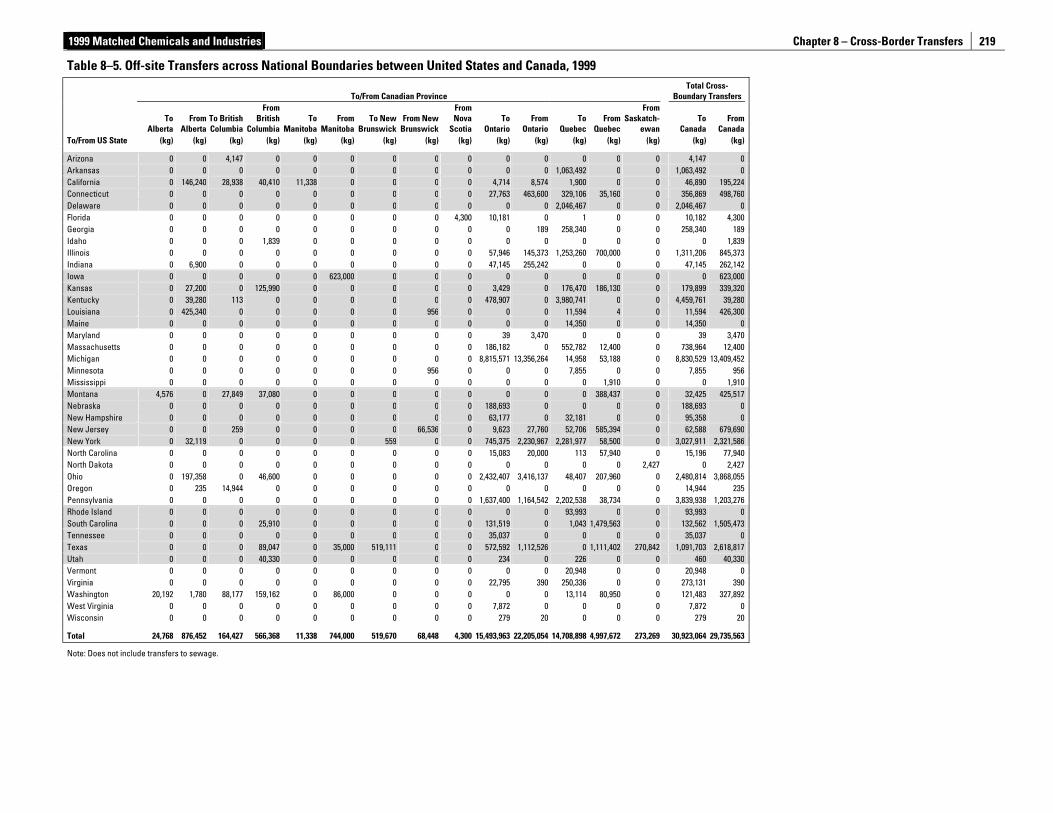
1999 Matched Chemicals and Industries Chapter 8 – Cross-Border Transfers
219
Table 8–5. Off-site Transfers across National Boundaries between United States and Canada, 1999
To/From Canadian Province Total Cross-
Boundary Transfers
To
Alberta From
Alberta To British Columbia
From British
Columbia To
Manitoba From
ManitobaTo New
BrunswickFrom New
Brunswick
From Nova
ScotiaTo
OntarioFrom
OntarioTo
QuebecFrom
Quebec
From Saskatch-
ewanTo
CanadaFrom
CanadaTo/From US State (kg) (kg) (kg) (kg) (kg) (kg) (kg) (kg) (kg) (kg) (kg) (kg) (kg) (kg) (kg) (kg)
Arizona 0 0 4,147 0 0 0 0 0 0 0 0 0 0 0 4,147 0Arkansas 0 0 0 0 0 0 0 0 0 0 0 1,063,492 0 0 1,063,492 0California 0 146,240 28,938 40,410 11,338 0 0 0 0 4,714 8,574 1,900 0 0 46,890 195,224Connecticut 0 0 0 0 0 0 0 0 0 27,763 463,600 329,106 35,160 0 356,869 498,760Delaware 0 0 0 0 0 0 0 0 0 0 0 2,046,467 0 0 2,046,467 0Florida 0 0 0 0 0 0 0 0 4,300 10,181 0 1 0 0 10,182 4,300Georgia 0 0 0 0 0 0 0 0 0 0 189 258,340 0 0 258,340 189Idaho 0 0 0 1,839 0 0 0 0 0 0 0 0 0 0 0 1,839Illinois 0 0 0 0 0 0 0 0 0 57,946 145,373 1,253,260 700,000 0 1,311,206 845,373Indiana 0 6,900 0 0 0 0 0 0 0 47,145 255,242 0 0 0 47,145 262,142Iowa 0 0 0 0 0 623,000 0 0 0 0 0 0 0 0 0 623,000Kansas 0 27,200 0 125,990 0 0 0 0 0 3,429 0 176,470 186,130 0 179,899 339,320Kentucky 0 39,280 113 0 0 0 0 0 0 478,907 0 3,980,741 0 0 4,459,761 39,280Louisiana 0 425,340 0 0 0 0 0 956 0 0 0 11,594 4 0 11,594 426,300Maine 0 0 0 0 0 0 0 0 0 0 0 14,350 0 0 14,350 0Maryland 0 0 0 0 0 0 0 0 0 39 3,470 0 0 0 39 3,470Massachusetts 0 0 0 0 0 0 0 0 0 186,182 0 552,782 12,400 0 738,964 12,400Michigan 0 0 0 0 0 0 0 0 0 8,815,571 13,356,264 14,958 53,188 0 8,830,529 13,409,452Minnesota 0 0 0 0 0 0 0 956 0 0 0 7,855 0 0 7,855 956Mississippi 0 0 0 0 0 0 0 0 0 0 0 0 1,910 0 0 1,910Montana 4,576 0 27,849 37,080 0 0 0 0 0 0 0 0 388,437 0 32,425 425,517Nebraska 0 0 0 0 0 0 0 0 0 188,693 0 0 0 0 188,693 0New Hampshire 0 0 0 0 0 0 0 0 0 63,177 0 32,181 0 0 95,358 0New Jersey 0 0 259 0 0 0 0 66,536 0 9,623 27,760 52,706 585,394 0 62,588 679,690New York 0 32,119 0 0 0 0 559 0 0 745,375 2,230,967 2,281,977 58,500 0 3,027,911 2,321,586North Carolina 0 0 0 0 0 0 0 0 0 15,083 20,000 113 57,940 0 15,196 77,940North Dakota 0 0 0 0 0 0 0 0 0 0 0 0 0 2,427 0 2,427Ohio 0 197,358 0 46,600 0 0 0 0 0 2,432,407 3,416,137 48,407 207,960 0 2,480,814 3,868,055Oregon 0 235 14,944 0 0 0 0 0 0 0 0 0 0 0 14,944 235Pennsylvania 0 0 0 0 0 0 0 0 0 1,637,400 1,164,542 2,202,538 38,734 0 3,839,938 1,203,276Rhode Island 0 0 0 0 0 0 0 0 0 0 0 93,993 0 0 93,993 0South Carolina 0 0 0 25,910 0 0 0 0 0 131,519 0 1,043 1,479,563 0 132,562 1,505,473Tennessee 0 0 0 0 0 0 0 0 0 35,037 0 0 0 0 35,037 0Texas 0 0 0 89,047 0 35,000 519,111 0 0 572,592 1,112,526 0 1,111,402 270,842 1,091,703 2,618,817Utah 0 0 0 40,330 0 0 0 0 0 234 0 226 0 0 460 40,330Vermont 0 0 0 0 0 0 0 0 0 0 0 20,948 0 0 20,948 0Virginia 0 0 0 0 0 0 0 0 0 22,795 390 250,336 0 0 273,131 390Washington 20,192 1,780 88,177 159,162 0 86,000 0 0 0 0 0 13,114 80,950 0 121,483 327,892West Virginia 0 0 0 0 0 0 0 0 0 7,872 0 0 0 0 7,872 0Wisconsin 0 0 0 0 0 0 0 0 0 279 20 0 0 0 279 20
Total 24,768 876,452 164,427 566,368 11,338 744,000 519,670 68,448 4,300 15,493,963 22,205,054 14,708,898 4,997,672 273,269 30,923,064 29,735,563
Note: Does not include transfers to sewage.
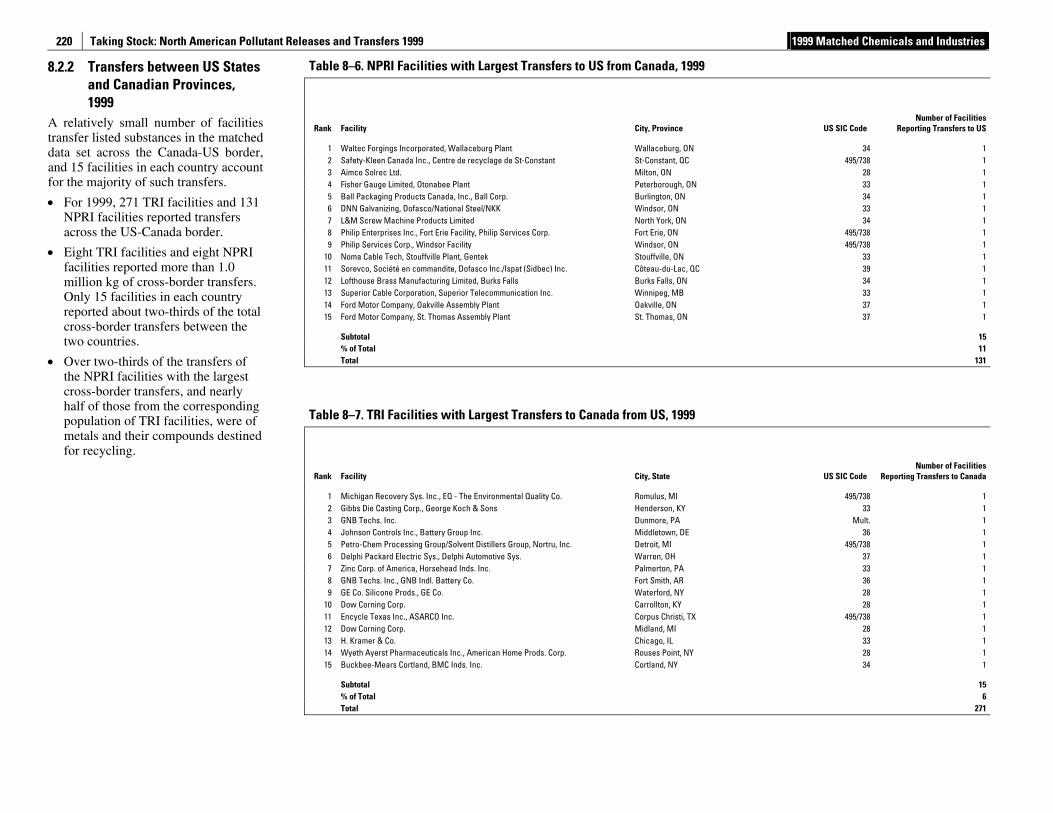
Taking Stock: North American Pollutant Releases and Transfers 1999 1999 Matched Chemicals and Industries
220
8.2.2 Transfers between US States and Canadian Provinces, 1999
A relatively small number of facilities transfer listed substances in the matched data set across the Canada-US border, and 15 facilities in each country account for the majority of such transfers.
• For 1999, 271 TRI facilities and 131 NPRI facilities reported transfers across the US-Canada border.
• Eight TRI facilities and eight NPRI facilities reported more than 1.0 million kg of cross-border transfers. Only 15 facilities in each country reported about two-thirds of the total cross-border transfers between the two countries.
• Over two-thirds of the transfers of the NPRI facilities with the largest cross-border transfers, and nearly half of those from the corresponding population of TRI facilities, were of metals and their compounds destined for recycling.
Table 8–6. NPRI Facilities with Largest Transfers to US from Canada, 1999
Rank Facility City, Province US SIC Code
Number of Facilities Reporting Transfers to US
1 Waltec Forgings Incorporated, Wallaceburg Plant Wallaceburg, ON 34 1 2 Safety-Kleen Canada Inc., Centre de recyclage de St-Constant St-Constant, QC 495/738 1 3 Aimco Solrec Ltd. Milton, ON 28 1 4 Fisher Gauge Limited, Otonabee Plant Peterborough, ON 33 1 5 Ball Packaging Products Canada, Inc., Ball Corp. Burlington, ON 34 1 6 DNN Galvanizing, Dofasco/National Steel/NKK Windsor, ON 33 1 7 L&M Screw Machine Products Limited North York, ON 34 1 8 Philip Enterprises Inc., Fort Erie Facility, Philip Services Corp. Fort Erie, ON 495/738 1 9 Philip Services Corp., Windsor Facility Windsor, ON 495/738 1
10 Noma Cable Tech, Stouffville Plant, Gentek Stouffville, ON 33 1 11 Sorevco, Société en commandite, Dofasco Inc./Ispat (Sidbec) Inc. Côteau-du-Lac, QC 39 1 12 Lofthouse Brass Manufacturing Limited, Burks Falls Burks Falls, ON 34 1 13 Superior Cable Corporation, Superior Telecommunication Inc. Winnipeg, MB 33 1 14 Ford Motor Company, Oakville Assembly Plant Oakville, ON 37 1 15 Ford Motor Company, St. Thomas Assembly Plant St. Thomas, ON 37 1
Subtotal 15 % of Total 11 Total 131
Table 8–7. TRI Facilities with Largest Transfers to Canada from US, 1999
Rank Facility City, State US SIC Code
Number of Facilities Reporting Transfers to Canada
1 Michigan Recovery Sys. Inc., EQ - The Environmental Quality Co. Romulus, MI 495/738 1 2 Gibbs Die Casting Corp., George Koch & Sons Henderson, KY 33 1 3 GNB Techs. Inc. Dunmore, PA Mult. 1 4 Johnson Controls Inc., Battery Group Inc. Middletown, DE 36 1 5 Petro-Chem Processing Group/Solvent Distillers Group, Nortru, Inc. Detroit, MI 495/738 1 6 Delphi Packard Electric Sys., Delphi Automotive Sys. Warren, OH 37 1 7 Zinc Corp. of America, Horsehead Inds. Inc. Palmerton, PA 33 1 8 GNB Techs. Inc., GNB Indl. Battery Co. Fort Smith, AR 36 1 9 GE Co. Silicone Prods., GE Co. Waterford, NY 28 1
10 Dow Corning Corp. Carrollton, KY 28 1 11 Encycle Texas Inc., ASARCO Inc. Corpus Christi, TX 495/738 1 12 Dow Corning Corp. Midland, MI 28 1 13 H. Kramer & Co. Chicago, IL 33 1 14 Wyeth Ayerst Pharmaceuticals Inc., American Home Prods. Corp. Rouses Point, NY 28 1 15 Buckbee-Mears Cortland, BMC Inds. Inc. Cortland, NY 34 1
Subtotal 15 % of Total 6 Total 271
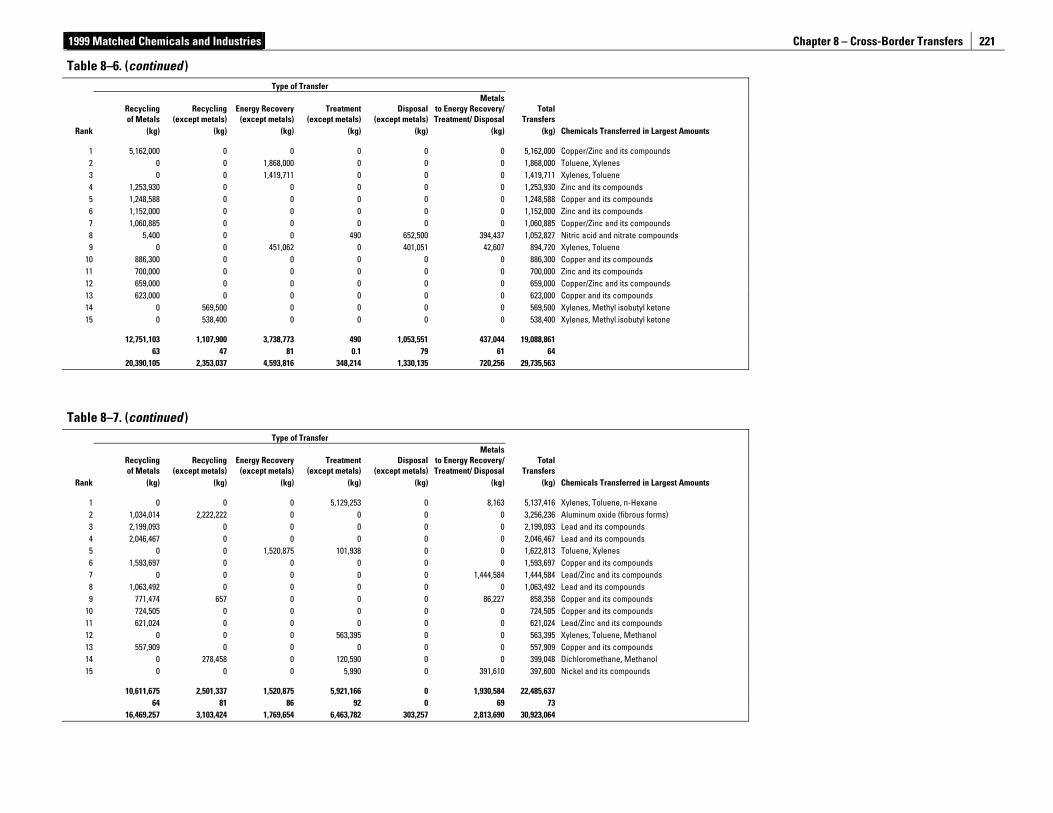
1999 Matched Chemicals and Industries Chapter 8 – Cross-Border Transfers
221
Table 8–6. (continued ) Type of Transfer
Recycling of Metals
Recycling (except metals)
Energy Recovery (except metals)
Treatment(except metals)
Disposal(except metals)
Metalsto Energy Recovery/Treatment/ Disposal
Total Transfers
Rank (kg) (kg) (kg) (kg) (kg) (kg) (kg) Chemicals Transferred in Largest Amounts
1 5,162,000 0 0 0 0 0 5,162,000 Copper/Zinc and its compounds 2 0 0 1,868,000 0 0 0 1,868,000 Toluene, Xylenes 3 0 0 1,419,711 0 0 0 1,419,711 Xylenes, Toluene 4 1,253,930 0 0 0 0 0 1,253,930 Zinc and its compounds 5 1,248,588 0 0 0 0 0 1,248,588 Copper and its compounds 6 1,152,000 0 0 0 0 0 1,152,000 Zinc and its compounds 7 1,060,885 0 0 0 0 0 1,060,885 Copper/Zinc and its compounds 8 5,400 0 0 490 652,500 394,437 1,052,827 Nitric acid and nitrate compounds 9 0 0 451,062 0 401,051 42,607 894,720 Xylenes, Toluene
10 886,300 0 0 0 0 0 886,300 Copper and its compounds 11 700,000 0 0 0 0 0 700,000 Zinc and its compounds 12 659,000 0 0 0 0 0 659,000 Copper/Zinc and its compounds 13 623,000 0 0 0 0 0 623,000 Copper and its compounds 14 0 569,500 0 0 0 0 569,500 Xylenes, Methyl isobutyl ketone 15 0 538,400 0 0 0 0 538,400 Xylenes, Methyl isobutyl ketone
12,751,103 1,107,900 3,738,773 490 1,053,551 437,044 19,088,861 63 47 81 0.1 79 61 64 20,390,105 2,353,037 4,593,816 348,214 1,330,135 720,256 29,735,563
Table 8–7. (continued )
Type of Transfer
Recycling of Metals
Recycling (except metals)
Energy Recovery (except metals)
Treatment(except metals)
Disposal(except metals)
Metalsto Energy Recovery/ Treatment/ Disposal
Total Transfers
Rank (kg) (kg) (kg) (kg) (kg) (kg) (kg) Chemicals Transferred in Largest Amounts
1 0 0 0 5,129,253 0 8,163 5,137,416 Xylenes, Toluene, n-Hexane 2 1,034,014 2,222,222 0 0 0 0 3,256,236 Aluminum oxide (fibrous forms) 3 2,199,093 0 0 0 0 0 2,199,093 Lead and its compounds 4 2,046,467 0 0 0 0 0 2,046,467 Lead and its compounds 5 0 0 1,520,875 101,938 0 0 1,622,813 Toluene, Xylenes 6 1,593,697 0 0 0 0 0 1,593,697 Copper and its compounds 7 0 0 0 0 0 1,444,584 1,444,584 Lead/Zinc and its compounds 8 1,063,492 0 0 0 0 0 1,063,492 Lead and its compounds 9 771,474 657 0 0 0 86,227 858,358 Copper and its compounds
10 724,505 0 0 0 0 0 724,505 Copper and its compounds 11 621,024 0 0 0 0 0 621,024 Lead/Zinc and its compounds 12 0 0 0 563,395 0 0 563,395 Xylenes, Toluene, Methanol 13 557,909 0 0 0 0 0 557,909 Copper and its compounds 14 0 278,458 0 120,590 0 0 399,048 Dichloromethane, Methanol 15 0 0 0 5,990 0 391,610 397,600 Nickel and its compounds
10,611,675 2,501,337 1,520,875 5,921,166 0 1,930,584 22,485,637 64 81 86 92 0 69 73 16,469,257 3,103,424 1,769,654 6,463,782 303,257 2,813,690 30,923,064
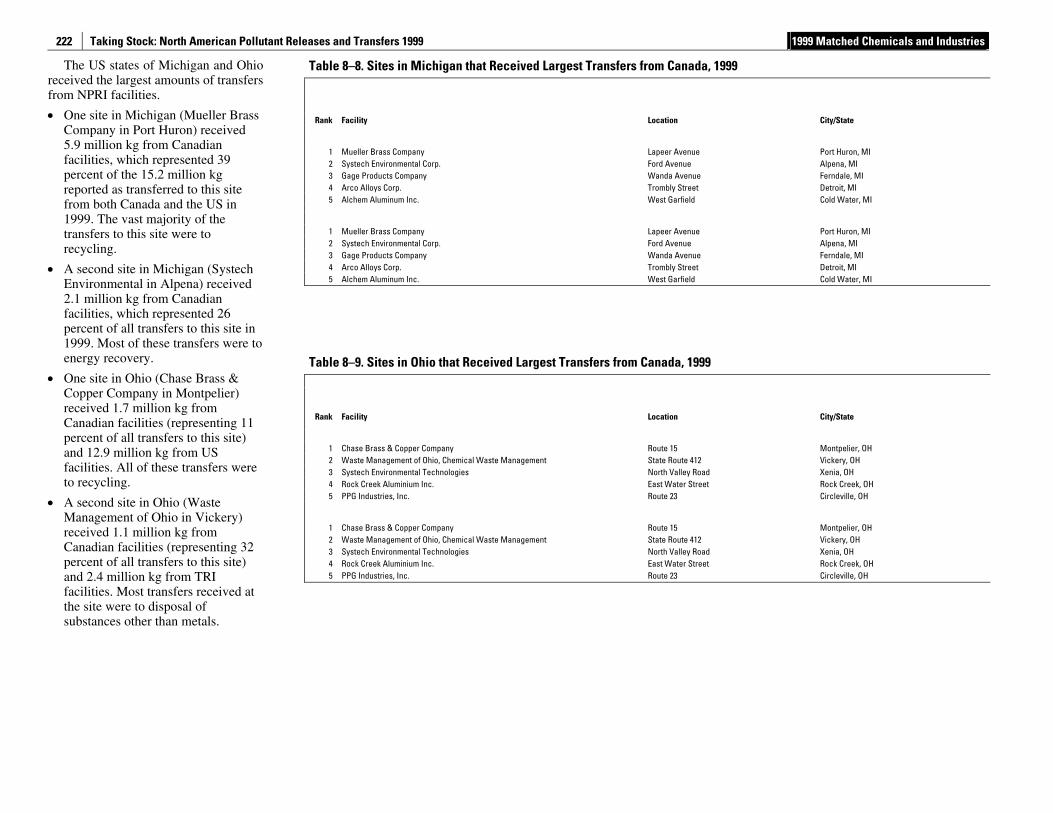
Taking Stock: North American Pollutant Releases and Transfers 1999 1999 Matched Chemicals and Industries
222
The US states of Michigan and Ohio received the largest amounts of transfers from NPRI facilities.
• One site in Michigan (Mueller Brass Company in Port Huron) received 5.9 million kg from Canadian facilities, which represented 39 percent of the 15.2 million kg reported as transferred to this site from both Canada and the US in 1999. The vast majority of the transfers to this site were to recycling.
• A second site in Michigan (Systech Environmental in Alpena) received 2.1 million kg from Canadian facilities, which represented 26 percent of all transfers to this site in 1999. Most of these transfers were to energy recovery.
• One site in Ohio (Chase Brass & Copper Company in Montpelier) received 1.7 million kg from Canadian facilities (representing 11 percent of all transfers to this site) and 12.9 million kg from US facilities. All of these transfers were to recycling.
• A second site in Ohio (Waste Management of Ohio in Vickery) received 1.1 million kg from Canadian facilities (representing 32 percent of all transfers to this site) and 2.4 million kg from TRI facilities. Most transfers received at the site were to disposal of substances other than metals.
Table 8–8. Sites in Michigan that Received Largest Transfers from Canada, 1999
Rank Facility Location City/State
1 Mueller Brass Company Lapeer Avenue Port Huron, MI 2 Systech Environmental Corp. Ford Avenue Alpena, MI 3 Gage Products Company Wanda Avenue Ferndale, MI 4 Arco Alloys Corp. Trombly Street Detroit, MI 5 Alchem Aluminum Inc. West Garfield Cold Water, MI
1 Mueller Brass Company Lapeer Avenue Port Huron, MI 2 Systech Environmental Corp. Ford Avenue Alpena, MI 3 Gage Products Company Wanda Avenue Ferndale, MI 4 Arco Alloys Corp. Trombly Street Detroit, MI 5 Alchem Aluminum Inc. West Garfield Cold Water, MI
Table 8–9. Sites in Ohio that Received Largest Transfers from Canada, 1999
Rank Facility Location City/State
1 Chase Brass & Copper Company Route 15 Montpelier, OH 2 Waste Management of Ohio, Chemical Waste Management State Route 412 Vickery, OH 3 Systech Environmental Technologies North Valley Road Xenia, OH 4 Rock Creek Aluminium Inc. East Water Street Rock Creek, OH 5 PPG Industries, Inc. Route 23 Circleville, OH
1 Chase Brass & Copper Company Route 15 Montpelier, OH 2 Waste Management of Ohio, Chemical Waste Management State Route 412 Vickery, OH 3 Systech Environmental Technologies North Valley Road Xenia, OH 4 Rock Creek Aluminium Inc. East Water Street Rock Creek, OH 5 PPG Industries, Inc. Route 23 Circleville, OH

1999 Matched Chemicals and Industries Chapter 8 – Cross-Border Transfers
223
Table 8–8. (continued )
Type of Transfer
Number of Number Recycling* Energy
Recovery** Treatment** Disposal**Metals to Energy Recovery/
Treatment/ Disposal* Total Transfers Total North American
TransfersFrom
Canada Rank Facilities of Forms (kg) (kg) (kg) (kg) (kg) (kg) (kg) (%)
From Canadian NPRI Facilities 1 3 11 5,873,703 0 0 0 0 5,873,703 15,225,099 39 2 6 42 148,672 1,941,639 0 8,109 5,813 2,104,233 7,973,329 26 3 4 26 1,529,319 0 0 0 0 1,529,319 9,197,911 17 4 1 1 1,152,000 0 0 0 0 1,152,000 1,273,135 90 5 4 14 880,168 0 0 0 0 880,168 2,306,742 38
From US TRI Facilities 1 25 52 9,317,298 0 0 0 34,098 9,351,396 2 9 97 2,948 5,793,985 72,163 0 0 5,869,096 3 33 198 7,668,580 0 0 0 12 7,668,592 4 2 2 121,135 0 0 0 0 121,135 5 21 43 1,426,574 0 0 0 0 1,426,574
* Includes metals and their compounds.
** Does not include metals and their compounds.
Table 8–9. (continued )
Type of Transfer
Number of Number Recycling* Energy
Recovery** Treatment** Disposal**Metals to Energy Recovery/
Treatment/ Disposal* Total Transfers Total North American
TransfersFrom
Canada Rank Facilities of Forms (kg) (kg) (kg) (kg) (kg) (kg) (kg) (%)
From Canadian NPRI Facilities 1 4 12 1,653,160 0 0 0 0 1,653,160 14,536,113 11 2 3 8 0 0 490 725,550 410,487 1,136,527 3,548,451 32 3 3 13 0 140,199 207,960 0 0 348,159 350,419 99 4 2 5 260,362 0 0 0 0 260,362 325,013 80 5 1 13 0 163,188 0 0 625 163,813 1,252,126 13
From US TRI Facilities 1 34 64 12,882,953 0 0 0 0 12,882,953 2 64 136 58,338 0 379,799 1,495,203 478,584 2,411,924 3 2 6 0 2,256 0 0 4 2,260 4 7 20 64,645 0 0 0 6 64,651 5 15 66 6,931 1,068,440 0 0 12,942 1,088,313
* Includes metals and their compounds.
** Does not include metals and their compounds.
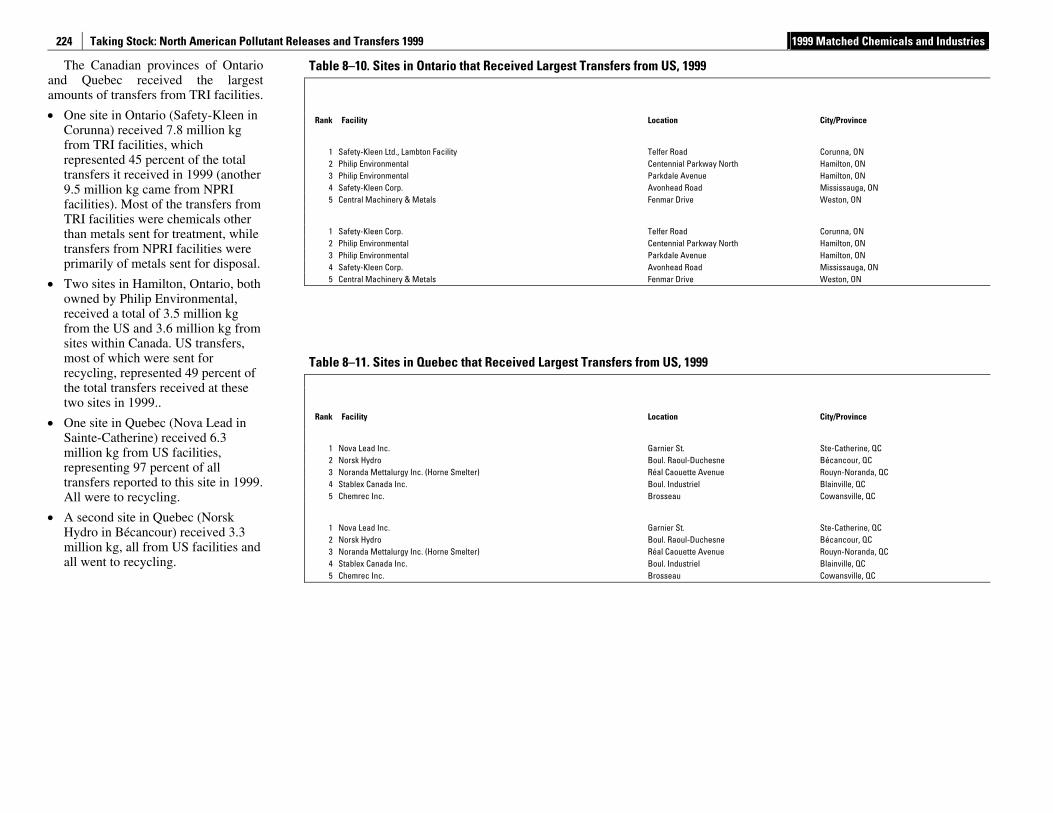
Taking Stock: North American Pollutant Releases and Transfers 1999 1999 Matched Chemicals and Industries
224
The Canadian provinces of Ontario and Quebec received the largest amounts of transfers from TRI facilities.
• One site in Ontario (Safety-Kleen in Corunna) received 7.8 million kg from TRI facilities, which represented 45 percent of the total transfers it received in 1999 (another 9.5 million kg came from NPRI facilities). Most of the transfers from TRI facilities were chemicals other than metals sent for treatment, while transfers from NPRI facilities were primarily of metals sent for disposal.
• Two sites in Hamilton, Ontario, both owned by Philip Environmental, received a total of 3.5 million kg from the US and 3.6 million kg from sites within Canada. US transfers, most of which were sent for recycling, represented 49 percent of the total transfers received at these two sites in 1999..
• One site in Quebec (Nova Lead in Sainte-Catherine) received 6.3 million kg from US facilities, representing 97 percent of all transfers reported to this site in 1999. All were to recycling.
• A second site in Quebec (Norsk Hydro in Bécancour) received 3.3 million kg, all from US facilities and all went to recycling.
Table 8–10. Sites in Ontario that Received Largest Transfers from US, 1999
Rank Facility Location City/Province
1 Safety-Kleen Ltd., Lambton Facility Telfer Road Corunna, ON 2 Philip Environmental Centennial Parkway North Hamilton, ON 3 Philip Environmental Parkdale Avenue Hamilton, ON 4 Safety-Kleen Corp. Avonhead Road Mississauga, ON 5 Central Machinery & Metals Fenmar Drive Weston, ON
1 Safety-Kleen Corp. Telfer Road Corunna, ON 2 Philip Environmental Centennial Parkway North Hamilton, ON 3 Philip Environmental Parkdale Avenue Hamilton, ON 4 Safety-Kleen Corp. Avonhead Road Mississauga, ON 5 Central Machinery & Metals Fenmar Drive Weston, ON
Table 8–11. Sites in Quebec that Received Largest Transfers from US, 1999
Rank Facility Location City/Province
1 Nova Lead Inc. Garnier St. Ste-Catherine, QC 2 Norsk Hydro Boul. Raoul-Duchesne Bécancour, QC 3 Noranda Mettalurgy Inc. (Horne Smelter) Réal Caouette Avenue Rouyn-Noranda, QC 4 Stablex Canada Inc. Boul. Industriel Blainville, QC 5 Chemrec Inc. Brosseau Cowansville, QC
1 Nova Lead Inc. Garnier St. Ste-Catherine, QC 2 Norsk Hydro Boul. Raoul-Duchesne Bécancour, QC 3 Noranda Mettalurgy Inc. (Horne Smelter) Réal Caouette Avenue Rouyn-Noranda, QC 4 Stablex Canada Inc. Boul. Industriel Blainville, QC 5 Chemrec Inc. Brosseau Cowansville, QC
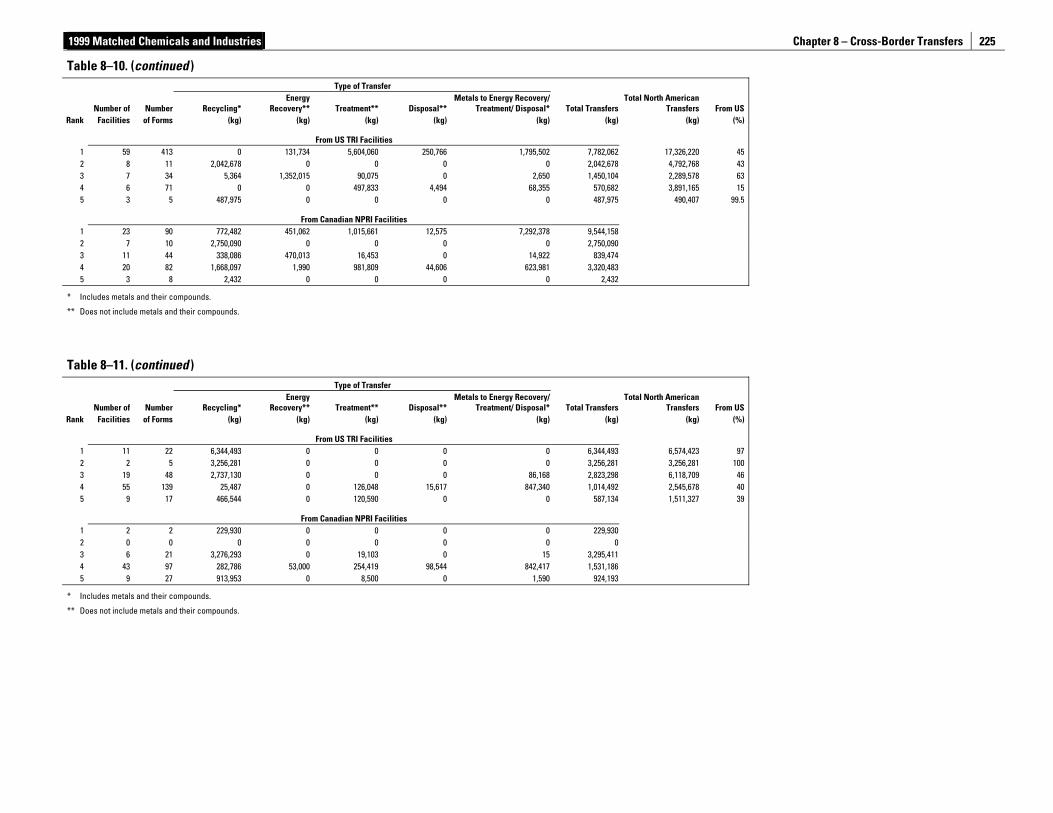
1999 Matched Chemicals and Industries Chapter 8 – Cross-Border Transfers
225
Table 8–10. (continued )
Type of Transfer
Number of Number Recycling* Energy
Recovery** Treatment** Disposal**Metals to Energy Recovery/
Treatment/ Disposal* Total Transfers Total North American
Transfers From US Rank Facilities of Forms (kg) (kg) (kg) (kg) (kg) (kg) (kg) (%)
From US TRI Facilities 1 59 413 0 131,734 5,604,060 250,766 1,795,502 7,782,062 17,326,220 45 2 8 11 2,042,678 0 0 0 0 2,042,678 4,792,768 43 3 7 34 5,364 1,352,015 90,075 0 2,650 1,450,104 2,289,578 63 4 6 71 0 0 497,833 4,494 68,355 570,682 3,891,165 15 5 3 5 487,975 0 0 0 0 487,975 490,407 99.5
From Canadian NPRI Facilities 1 23 90 772,482 451,062 1,015,661 12,575 7,292,378 9,544,158 2 7 10 2,750,090 0 0 0 0 2,750,090 3 11 44 338,086 470,013 16,453 0 14,922 839,474 4 20 82 1,668,097 1,990 981,809 44,606 623,981 3,320,483 5 3 8 2,432 0 0 0 0 2,432
* Includes metals and their compounds.
** Does not include metals and their compounds.
Table 8–11. (continued )
Type of Transfer
Number of Number Recycling* Energy
Recovery** Treatment** Disposal**Metals to Energy Recovery/
Treatment/ Disposal* Total Transfers Total North American
Transfers From US Rank Facilities of Forms (kg) (kg) (kg) (kg) (kg) (kg) (kg) (%)
From US TRI Facilities 1 11 22 6,344,493 0 0 0 0 6,344,493 6,574,423 97 2 2 5 3,256,281 0 0 0 0 3,256,281 3,256,281 100 3 19 48 2,737,130 0 0 0 86,168 2,823,298 6,118,709 46 4 55 139 25,487 0 126,048 15,617 847,340 1,014,492 2,545,678 40 5 9 17 466,544 0 120,590 0 0 587,134 1,511,327 39
From Canadian NPRI Facilities 1 2 2 229,930 0 0 0 0 229,930 2 0 0 0 0 0 0 0 0 3 6 21 3,276,293 0 19,103 0 15 3,295,411 4 43 97 282,786 53,000 254,419 98,544 842,417 1,531,186 5 9 27 913,953 0 8,500 0 1,590 924,193
* Includes metals and their compounds.
** Does not include metals and their compounds.
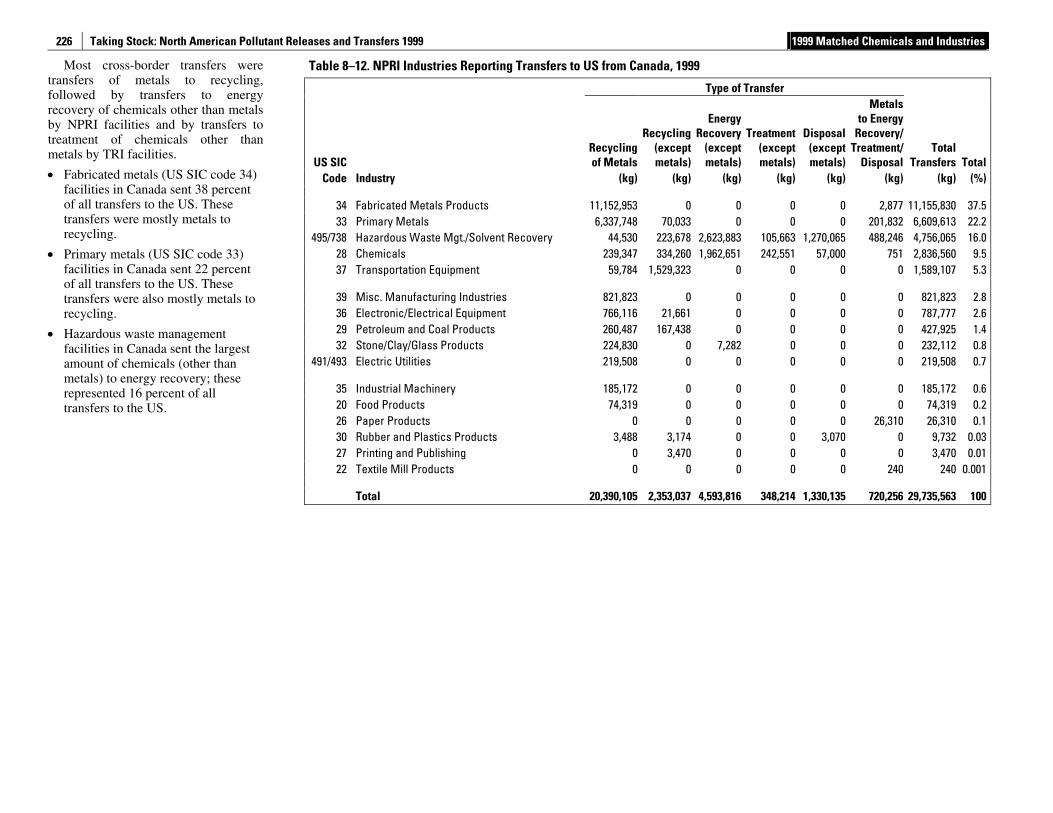
Taking Stock: North American Pollutant Releases and Transfers 1999 1999 Matched Chemicals and Industries
226
Most cross-border transfers were transfers of metals to recycling, followed by transfers to energy recovery of chemicals other than metals by NPRI facilities and by transfers to treatment of chemicals other than metals by TRI facilities.
• Fabricated metals (US SIC code 34) facilities in Canada sent 38 percent of all transfers to the US. These transfers were mostly metals to recycling.
• Primary metals (US SIC code 33) facilities in Canada sent 22 percent of all transfers to the US. These transfers were also mostly metals to recycling.
• Hazardous waste management facilities in Canada sent the largest amount of chemicals (other than metals) to energy recovery; these represented 16 percent of all transfers to the US.
Table 8–12. NPRI Industries Reporting Transfers to US from Canada, 1999
Type of Transfer
US SIC Recycling of Metals
Recycling (except metals)
Energy Recovery
(except metals)
Treatment (except metals)
Disposal (except metals)
Metalsto Energy
Recovery/ Treatment/
DisposalTotal
Transfers Total Code Industry (kg) (kg) (kg) (kg) (kg) (kg) (kg) (%)
34 Fabricated Metals Products 11,152,953 0 0 0 0 2,877 11,155,830 37.5 33 Primary Metals 6,337,748 70,033 0 0 0 201,832 6,609,613 22.2
495/738 Hazardous Waste Mgt./Solvent Recovery 44,530 223,678 2,623,883 105,663 1,270,065 488,246 4,756,065 16.0 28 Chemicals 239,347 334,260 1,962,651 242,551 57,000 751 2,836,560 9.5 37 Transportation Equipment 59,784 1,529,323 0 0 0 0 1,589,107 5.3
39 Misc. Manufacturing Industries 821,823 0 0 0 0 0 821,823 2.8 36 Electronic/Electrical Equipment 766,116 21,661 0 0 0 0 787,777 2.6 29 Petroleum and Coal Products 260,487 167,438 0 0 0 0 427,925 1.4 32 Stone/Clay/Glass Products 224,830 0 7,282 0 0 0 232,112 0.8
491/493 Electric Utilities 219,508 0 0 0 0 0 219,508 0.7
35 Industrial Machinery 185,172 0 0 0 0 0 185,172 0.6 20 Food Products 74,319 0 0 0 0 0 74,319 0.2 26 Paper Products 0 0 0 0 0 26,310 26,310 0.1 30 Rubber and Plastics Products 3,488 3,174 0 0 3,070 0 9,732 0.03 27 Printing and Publishing 0 3,470 0 0 0 0 3,470 0.01 22 Textile Mill Products 0 0 0 0 0 240 240 0.001
Total 20,390,105 2,353,037 4,593,816 348,214 1,330,135 720,256 29,735,563 100
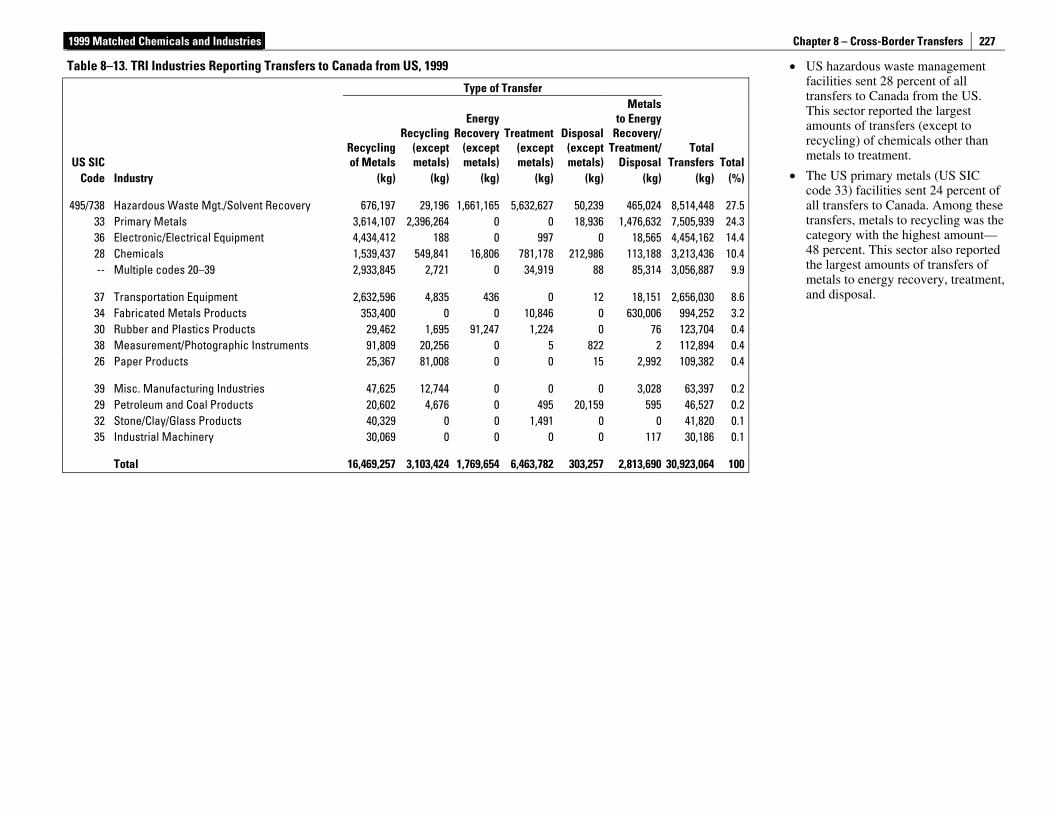
1999 Matched Chemicals and Industries Chapter 8 – Cross-Border Transfers
227
• US hazardous waste management facilities sent 28 percent of all transfers to Canada from the US. This sector reported the largest amounts of transfers (except to recycling) of chemicals other than metals to treatment.
• The US primary metals (US SIC code 33) facilities sent 24 percent of all transfers to Canada. Among these transfers, metals to recycling was the category with the highest amount—48 percent. This sector also reported the largest amounts of transfers of metals to energy recovery, treatment, and disposal.
Table 8–13. TRI Industries Reporting Transfers to Canada from US, 1999
Type of Transfer
US SIC Recycling of Metals
Recycling (except metals)
Energy Recovery
(except metals)
Treatment (except metals)
Disposal (except metals)
Metalsto Energy
Recovery/ Treatment/
DisposalTotal
Transfers TotalCode Industry (kg) (kg) (kg) (kg) (kg) (kg) (kg) (%)
495/738 Hazardous Waste Mgt./Solvent Recovery 676,197 29,196 1,661,165 5,632,627 50,239 465,024 8,514,448 27.533 Primary Metals 3,614,107 2,396,264 0 0 18,936 1,476,632 7,505,939 24.336 Electronic/Electrical Equipment 4,434,412 188 0 997 0 18,565 4,454,162 14.428 Chemicals 1,539,437 549,841 16,806 781,178 212,986 113,188 3,213,436 10.4-- Multiple codes 20–39 2,933,845 2,721 0 34,919 88 85,314 3,056,887 9.9
37 Transportation Equipment 2,632,596 4,835 436 0 12 18,151 2,656,030 8.634 Fabricated Metals Products 353,400 0 0 10,846 0 630,006 994,252 3.230 Rubber and Plastics Products 29,462 1,695 91,247 1,224 0 76 123,704 0.438 Measurement/Photographic Instruments 91,809 20,256 0 5 822 2 112,894 0.426 Paper Products 25,367 81,008 0 0 15 2,992 109,382 0.4
39 Misc. Manufacturing Industries 47,625 12,744 0 0 0 3,028 63,397 0.229 Petroleum and Coal Products 20,602 4,676 0 495 20,159 595 46,527 0.232 Stone/Clay/Glass Products 40,329 0 0 1,491 0 0 41,820 0.135 Industrial Machinery 30,069 0 0 0 0 117 30,186 0.1
Total 16,469,257 3,103,424 1,769,654 6,463,782 303,257 2,813,690 30,923,064 100
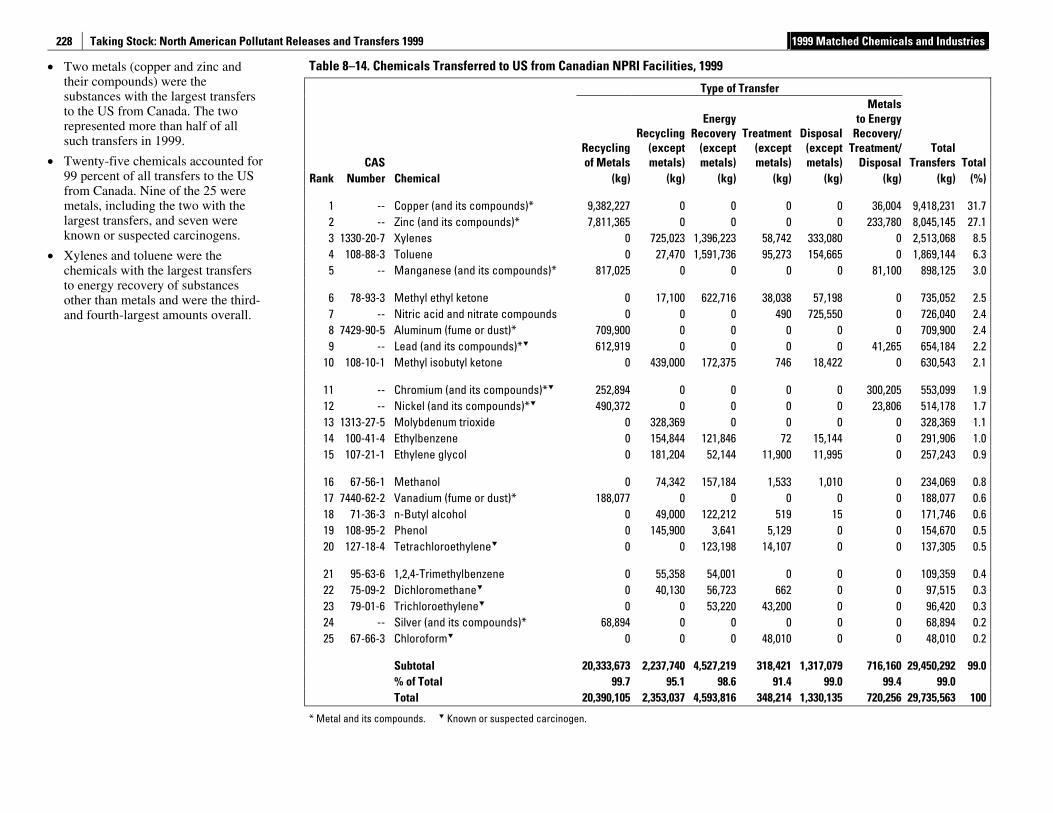
Taking Stock: North American Pollutant Releases and Transfers 1999 1999 Matched Chemicals and Industries
228
• Two metals (copper and zinc and their compounds) were the substances with the largest transfers to the US from Canada. The two represented more than half of all such transfers in 1999.
• Twenty-five chemicals accounted for 99 percent of all transfers to the US from Canada. Nine of the 25 were metals, including the two with the largest transfers, and seven were known or suspected carcinogens.
• Xylenes and toluene were the chemicals with the largest transfers to energy recovery of substances other than metals and were the third- and fourth-largest amounts overall.
Table 8–14. Chemicals Transferred to US from Canadian NPRI Facilities, 1999
Type of Transfer
CAS Recycling of Metals
Recycling (except metals)
Energy Recovery
(except metals)
Treatment (except metals)
Disposal (except metals)
Metalsto Energy
Recovery/ Treatment/
DisposalTotal
Transfers Total Rank Number Chemical (kg) (kg) (kg) (kg) (kg) (kg) (kg) (%)
1 -- Copper (and its compounds)* 9,382,227 0 0 0 0 36,004 9,418,231 31.7 2 -- Zinc (and its compounds)* 7,811,365 0 0 0 0 233,780 8,045,145 27.1 3 1330-20-7 Xylenes 0 725,023 1,396,223 58,742 333,080 0 2,513,068 8.5 4 108-88-3 Toluene 0 27,470 1,591,736 95,273 154,665 0 1,869,144 6.3 5 -- Manganese (and its compounds)* 817,025 0 0 0 0 81,100 898,125 3.0
6 78-93-3 Methyl ethyl ketone 0 17,100 622,716 38,038 57,198 0 735,052 2.5 7 -- Nitric acid and nitrate compounds 0 0 0 490 725,550 0 726,040 2.4 8 7429-90-5 Aluminum (fume or dust)* 709,900 0 0 0 0 0 709,900 2.4 9 -- Lead (and its compounds)* 612,919 0 0 0 0 41,265 654,184 2.2
10 108-10-1 Methyl isobutyl ketone 0 439,000 172,375 746 18,422 0 630,543 2.1
11 -- Chromium (and its compounds)* 252,894 0 0 0 0 300,205 553,099 1.9 12 -- Nickel (and its compounds)* 490,372 0 0 0 0 23,806 514,178 1.7 13 1313-27-5 Molybdenum trioxide 0 328,369 0 0 0 0 328,369 1.1 14 100-41-4 Ethylbenzene 0 154,844 121,846 72 15,144 0 291,906 1.0 15 107-21-1 Ethylene glycol 0 181,204 52,144 11,900 11,995 0 257,243 0.9
16 67-56-1 Methanol 0 74,342 157,184 1,533 1,010 0 234,069 0.8 17 7440-62-2 Vanadium (fume or dust)* 188,077 0 0 0 0 0 188,077 0.6 18 71-36-3 n-Butyl alcohol 0 49,000 122,212 519 15 0 171,746 0.6 19 108-95-2 Phenol 0 145,900 3,641 5,129 0 0 154,670 0.5 20 127-18-4 Tetrachloroethylene 0 0 123,198 14,107 0 0 137,305 0.5
21 95-63-6 1,2,4-Trimethylbenzene 0 55,358 54,001 0 0 0 109,359 0.4 22 75-09-2 Dichloromethane 0 40,130 56,723 662 0 0 97,515 0.3 23 79-01-6 Trichloroethylene 0 0 53,220 43,200 0 0 96,420 0.3 24 -- Silver (and its compounds)* 68,894 0 0 0 0 0 68,894 0.2 25 67-66-3 Chloroform 0 0 0 48,010 0 0 48,010 0.2
Subtotal 20,333,673 2,237,740 4,527,219 318,421 1,317,079 716,160 29,450,292 99.0 % of Total 99.7 95.1 98.6 91.4 99.0 99.4 99.0 Total 20,390,105 2,353,037 4,593,816 348,214 1,330,135 720,256 29,735,563 100
* Metal and its compounds. Known or suspected carcinogen.

1999 Matched Chemicals and Industries Chapter 8 – Cross-Border Transfers
229
• Two metals (lead and copper and their compounds) were the substances with the largest transfers to Canada from the US. These two metals represented almost half of all such transfers in 1999.
• Twenty-five chemicals accounted for 98 percent of all transfers to Canada from the US in 1999. Eight of the 25 were metals, including the two with the largest transfers, and eight were known or suspected carcinogens.
• Toluene and xylenes were the chemicals with the largest transfers to treatment of substances other than metals, constituting the third- and fourth-largest amounts overall.
Table 8–15. Chemicals Transferred to Canada from US TRI Facilities, 1999
Type of Transfer
CAS Recycling of Metals
Recycling (except metals)
Energy Recovery
(except metals)
Treatment (except metals)
Disposal (except metals)
Metalsto Energy
Recovery/ Treatment/
DisposalTotal
Transfers TotalRank Number Chemical (kg) (kg) (kg) (kg) (kg) (kg) (kg) (%)
1 -- Lead (and its compounds)* 6,832,789 0 0 0 0 1,169,126 8,001,915 25.92 -- Copper (and its compounds)* 6,789,506 0 0 0 0 135,905 6,925,411 22.43 108-88-3 Toluene 0 110,845 498,545 1,664,290 13,019 0 2,286,699 7.44 -- Xylenes 0 6,997 303,856 1,924,362 9,721 0 2,244,936 7.35 1344-28-1 Aluminum oxide (fibrous forms) 0 2,222,222 0 0 0 0 2,222,222 7.2
6 -- Zinc (and its compounds)* 1,028,683 0 0 0 0 686,175 1,714,858 5.57 -- Nickel (and its compounds)* 960,891 0 0 0 0 500,807 1,461,698 4.78 67-56-1 Methanol 0 26,832 239,261 528,099 239 0 794,431 2.69 110-54-3 n-Hexane 0 12,451 17,073 725,437 3,016 0 757,977 2.5
10 78-93-3 Methyl ethyl ketone 0 24,969 203,539 360,799 404 0 589,711 1.9
11 75-09-2 Dichloromethane 0 417,982 0 113,129 243 0 531,354 1.712 -- Manganese (and its compounds)* 455,154 0 0 0 0 8,134 463,288 1.513 -- Chromium (and its compounds)* 210,696 0 0 0 0 206,165 416,861 1.314 108-10-1 Methyl isobutyl ketone 0 17,833 130,117 150,889 134 0 298,973 1.015 100-41-4 Ethylbenzene 0 612 86,512 196,337 1,911 0 285,372 0.9
16 107-21-1 Ethylene glycol 0 20,158 589 216,058 388 0 237,193 0.817 872-50-4 N-Methyl-2-pyrrolidone 0 32,241 88,669 57,278 122 0 178,310 0.618 91-20-3 Naphthalene 0 0 5,574 14,916 150,340 0 170,830 0.619 75-01-4 Vinyl chloride 0 158,603 0 113 1 0 158,717 0.520 -- Nitric acid and nitrate compounds 0 50 0 101,783 28,197 0 130,030 0.4
21 71-36-3 n-Butyl alcohol 0 2,911 40,487 67,402 160 0 110,960 0.422 -- Antimony (and its compounds)* 103,169 0 0 0 0 4,688 107,857 0.323 127-18-4 Tetrachloroethylene 0 0 0 98,728 469 0 99,197 0.324 -- Cadmium (and its compounds)* 24,701 0 0 0 0 55,163 79,864 0.325 79-01-6 Trichloroethylene 0 0 0 54,890 116 0 55,006 0.2
Subtotal 16,405,589 3,054,706 1,614,222 6,274,510 208,480 2,766,163 30,323,670 98.1 % of Total 99.6 98.4 91.2 97.1 68.7 98.3 98.1 Total 16,469,257 3,103,424 1,769,654 6,463,782 303,257 2,813,690 30,923,064 100
* Metal and its compounds. Known or suspected carcinogen.
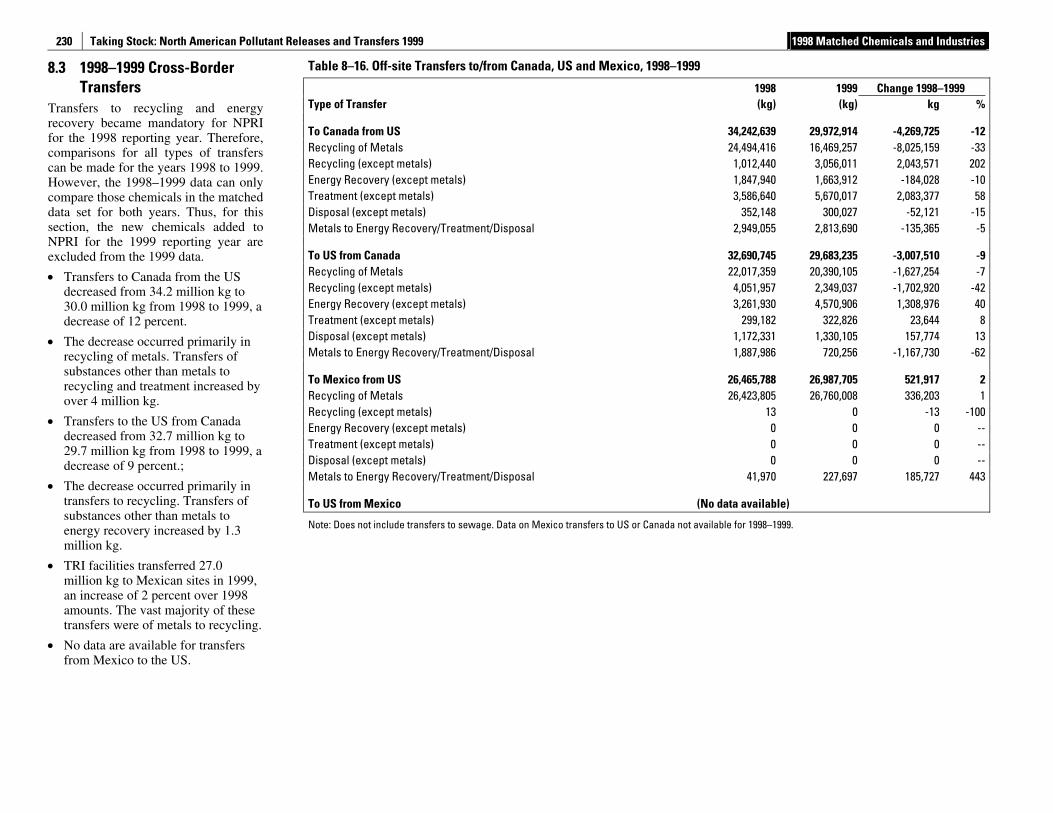
Taking Stock: North American Pollutant Releases and Transfers 1999 1998 Matched Chemicals and Industries
230
8.3 1998–1999 Cross-Border Transfers
Transfers to recycling and energy recovery became mandatory for NPRI for the 1998 reporting year. Therefore, comparisons for all types of transfers can be made for the years 1998 to 1999. However, the 1998–1999 data can only compare those chemicals in the matched data set for both years. Thus, for this section, the new chemicals added to NPRI for the 1999 reporting year are excluded from the 1999 data.
• Transfers to Canada from the US decreased from 34.2 million kg to 30.0 million kg from 1998 to 1999, a decrease of 12 percent.
• The decrease occurred primarily in recycling of metals. Transfers of substances other than metals to recycling and treatment increased by over 4 million kg.
• Transfers to the US from Canada decreased from 32.7 million kg to 29.7 million kg from 1998 to 1999, a decrease of 9 percent.;
• The decrease occurred primarily in transfers to recycling. Transfers of substances other than metals to energy recovery increased by 1.3 million kg.
• TRI facilities transferred 27.0 million kg to Mexican sites in 1999, an increase of 2 percent over 1998 amounts. The vast majority of these transfers were of metals to recycling.
• No data are available for transfers from Mexico to the US.
Table 8–16. Off-site Transfers to/from Canada, US and Mexico, 1998–1999
1998 1999 Change 1998–1999 Type of Transfer (kg) (kg) kg %
To Canada from US 34,242,639 29,972,914 -4,269,725 -12 Recycling of Metals 24,494,416 16,469,257 -8,025,159 -33 Recycling (except metals) 1,012,440 3,056,011 2,043,571 202 Energy Recovery (except metals) 1,847,940 1,663,912 -184,028 -10 Treatment (except metals) 3,586,640 5,670,017 2,083,377 58 Disposal (except metals) 352,148 300,027 -52,121 -15 Metals to Energy Recovery/Treatment/Disposal 2,949,055 2,813,690 -135,365 -5
To US from Canada 32,690,745 29,683,235 -3,007,510 -9 Recycling of Metals 22,017,359 20,390,105 -1,627,254 -7 Recycling (except metals) 4,051,957 2,349,037 -1,702,920 -42 Energy Recovery (except metals) 3,261,930 4,570,906 1,308,976 40 Treatment (except metals) 299,182 322,826 23,644 8 Disposal (except metals) 1,172,331 1,330,105 157,774 13 Metals to Energy Recovery/Treatment/Disposal 1,887,986 720,256 -1,167,730 -62
To Mexico from US 26,465,788 26,987,705 521,917 2 Recycling of Metals 26,423,805 26,760,008 336,203 1 Recycling (except metals) 13 0 -13 -100 Energy Recovery (except metals) 0 0 0 -- Treatment (except metals) 0 0 0 -- Disposal (except metals) 0 0 0 -- Metals to Energy Recovery/Treatment/Disposal 41,970 227,697 185,727 443
To US from Mexico (No data available)
Note: Does not include transfers to sewage. Data on Mexico transfers to US or Canada not available for 1998–1999.
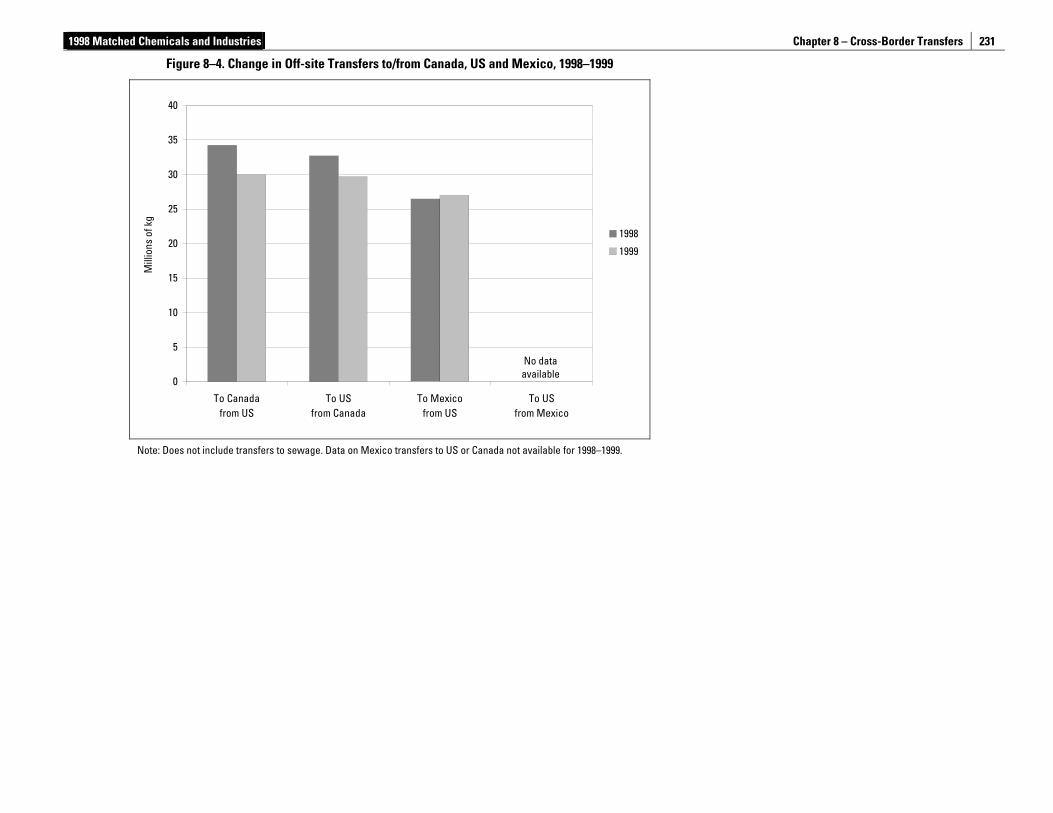
1998 Matched Chemicals and Industries Chapter 8 – Cross-Border Transfers
231
Figure 8–4. Change in Off-site Transfers to/from Canada, US and Mexico, 1998–1999
0
5
10
15
20
25
30
35
40
To Canadafrom US
To USfrom Canada
To Mexicofrom US
To USfrom Mexico
Mill
ions
of k
g
1998
1999
Note: Does not include transfers to sewage. Data on Mexico transfers to US or Canada not available for 1998–1999.
No data available
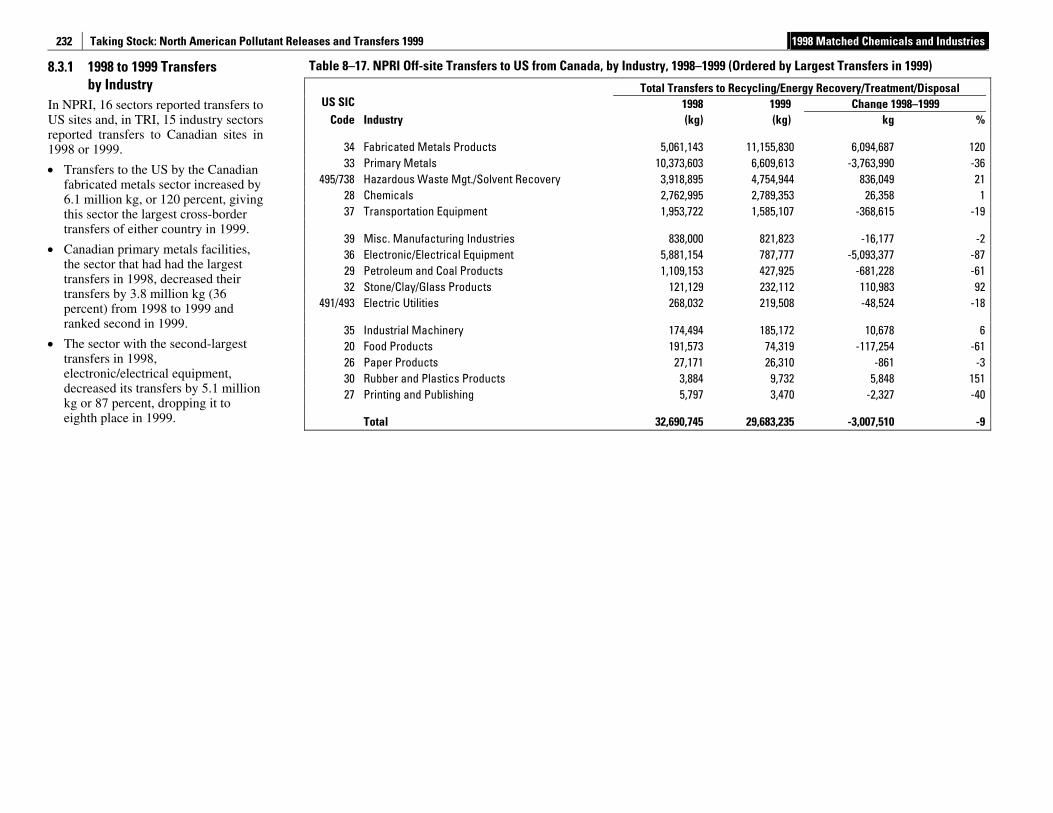
Taking Stock: North American Pollutant Releases and Transfers 1999 1998 Matched Chemicals and Industries
232
8.3.1 1998 to 1999 Transfers by Industry
In NPRI, 16 sectors reported transfers to US sites and, in TRI, 15 industry sectors reported transfers to Canadian sites in 1998 or 1999.
• Transfers to the US by the Canadian fabricated metals sector increased by 6.1 million kg, or 120 percent, giving this sector the largest cross-border transfers of either country in 1999.
• Canadian primary metals facilities, the sector that had had the largest transfers in 1998, decreased their transfers by 3.8 million kg (36 percent) from 1998 to 1999 and ranked second in 1999.
• The sector with the second-largest transfers in 1998, electronic/electrical equipment, decreased its transfers by 5.1 million kg or 87 percent, dropping it to eighth place in 1999.
Table 8–17. NPRI Off-site Transfers to US from Canada, by Industry, 1998–1999 (Ordered by Largest Transfers in 1999)
Total Transfers to Recycling/Energy Recovery/Treatment/Disposal US SIC 1998 1999 Change 1998–1999
Code Industry (kg) (kg) kg %
34 Fabricated Metals Products 5,061,143 11,155,830 6,094,687 120 33 Primary Metals 10,373,603 6,609,613 -3,763,990 -36
495/738 Hazardous Waste Mgt./Solvent Recovery 3,918,895 4,754,944 836,049 21 28 Chemicals 2,762,995 2,789,353 26,358 1 37 Transportation Equipment 1,953,722 1,585,107 -368,615 -19
39 Misc. Manufacturing Industries 838,000 821,823 -16,177 -2 36 Electronic/Electrical Equipment 5,881,154 787,777 -5,093,377 -87 29 Petroleum and Coal Products 1,109,153 427,925 -681,228 -61 32 Stone/Clay/Glass Products 121,129 232,112 110,983 92
491/493 Electric Utilities 268,032 219,508 -48,524 -18
35 Industrial Machinery 174,494 185,172 10,678 6 20 Food Products 191,573 74,319 -117,254 -61 26 Paper Products 27,171 26,310 -861 -3 30 Rubber and Plastics Products 3,884 9,732 5,848 151 27 Printing and Publishing 5,797 3,470 -2,327 -40
Total 32,690,745 29,683,235 -3,007,510 -9
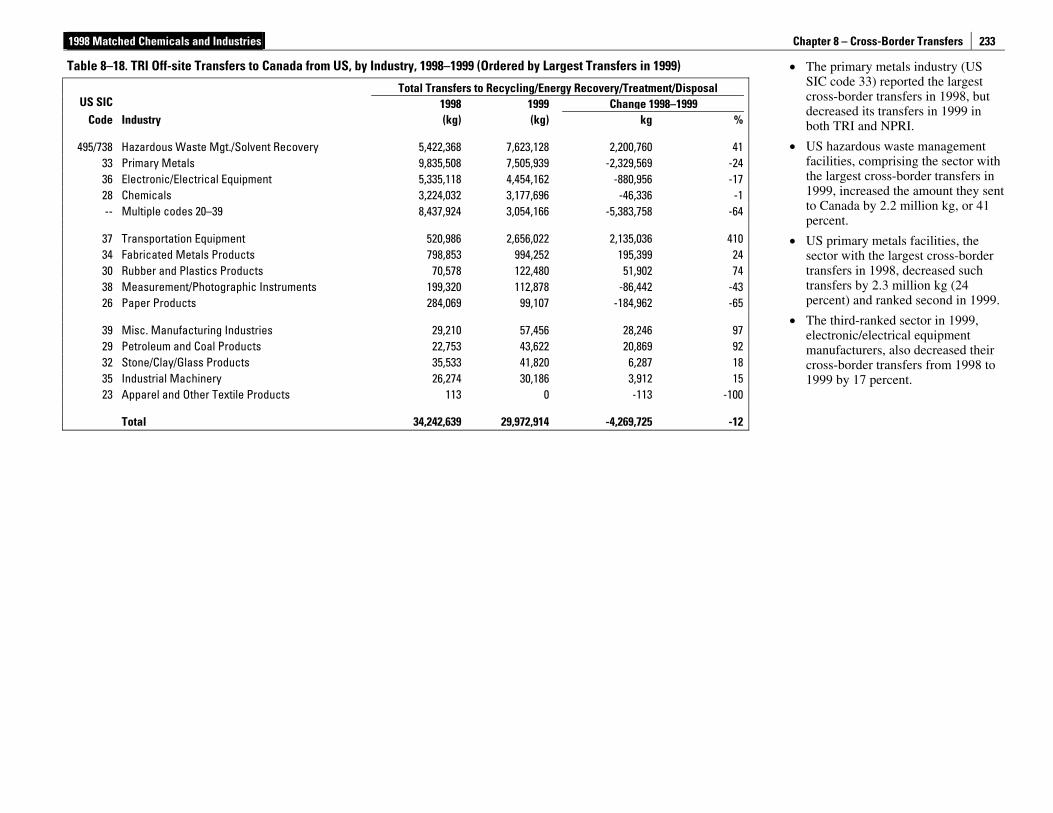
1998 Matched Chemicals and Industries Chapter 8 – Cross-Border Transfers
233
• The primary metals industry (US SIC code 33) reported the largest cross-border transfers in 1998, but decreased its transfers in 1999 in both TRI and NPRI.
• US hazardous waste management facilities, comprising the sector with the largest cross-border transfers in 1999, increased the amount they sent to Canada by 2.2 million kg, or 41 percent.
• US primary metals facilities, the sector with the largest cross-border transfers in 1998, decreased such transfers by 2.3 million kg (24 percent) and ranked second in 1999.
• The third-ranked sector in 1999, electronic/electrical equipment manufacturers, also decreased their cross-border transfers from 1998 to 1999 by 17 percent.
Table 8–18. TRI Off-site Transfers to Canada from US, by Industry, 1998–1999 (Ordered by Largest Transfers in 1999)
Total Transfers to Recycling/Energy Recovery/Treatment/Disposal US SIC 1998 1999 Change 1998–1999
Code Industry (kg) (kg) kg %
495/738 Hazardous Waste Mgt./Solvent Recovery 5,422,368 7,623,128 2,200,760 4133 Primary Metals 9,835,508 7,505,939 -2,329,569 -2436 Electronic/Electrical Equipment 5,335,118 4,454,162 -880,956 -1728 Chemicals 3,224,032 3,177,696 -46,336 -1-- Multiple codes 20–39 8,437,924 3,054,166 -5,383,758 -64
37 Transportation Equipment 520,986 2,656,022 2,135,036 41034 Fabricated Metals Products 798,853 994,252 195,399 2430 Rubber and Plastics Products 70,578 122,480 51,902 7438 Measurement/Photographic Instruments 199,320 112,878 -86,442 -4326 Paper Products 284,069 99,107 -184,962 -65
39 Misc. Manufacturing Industries 29,210 57,456 28,246 9729 Petroleum and Coal Products 22,753 43,622 20,869 9232 Stone/Clay/Glass Products 35,533 41,820 6,287 1835 Industrial Machinery 26,274 30,186 3,912 1523 Apparel and Other Textile Products 113 0 -113 -100
Total 34,242,639 29,972,914 -4,269,725 -12
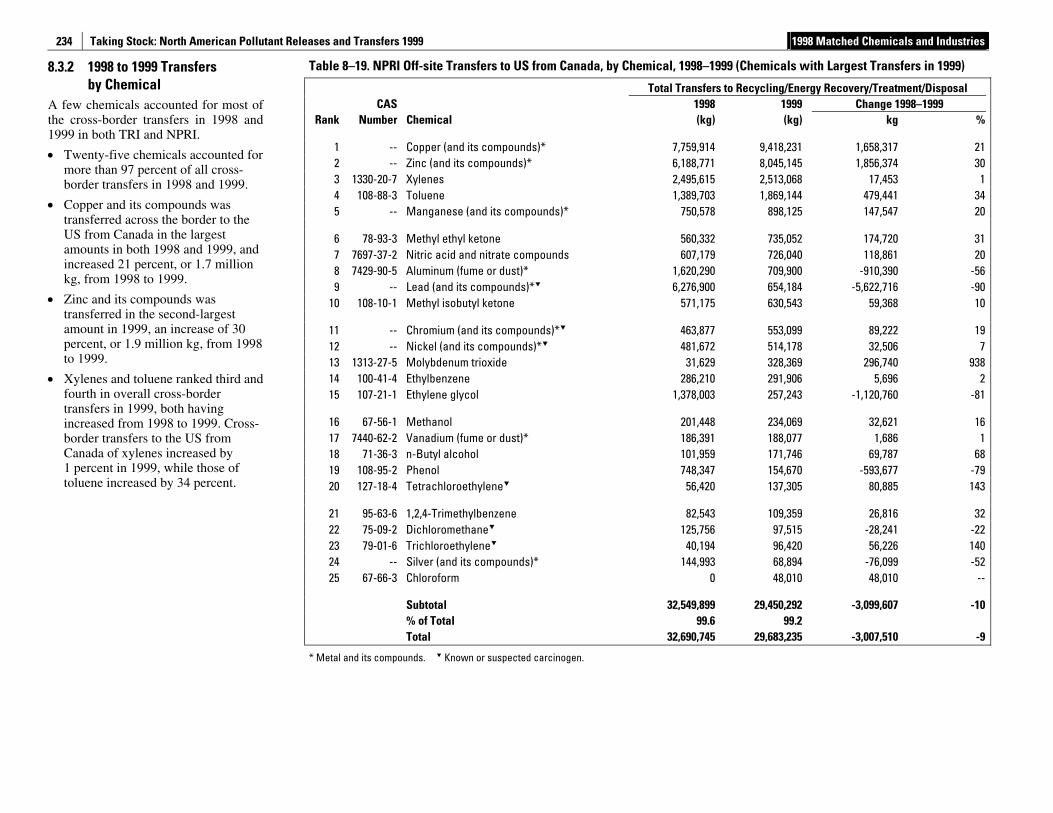
Taking Stock: North American Pollutant Releases and Transfers 1999 1998 Matched Chemicals and Industries
234
8.3.2 1998 to 1999 Transfers by Chemical
A few chemicals accounted for most of the cross-border transfers in 1998 and 1999 in both TRI and NPRI.
• Twenty-five chemicals accounted for more than 97 percent of all cross-border transfers in 1998 and 1999.
• Copper and its compounds was transferred across the border to the US from Canada in the largest amounts in both 1998 and 1999, and increased 21 percent, or 1.7 million kg, from 1998 to 1999.
• Zinc and its compounds was transferred in the second-largest amount in 1999, an increase of 30 percent, or 1.9 million kg, from 1998 to 1999.
• Xylenes and toluene ranked third and fourth in overall cross-border transfers in 1999, both having increased from 1998 to 1999. Cross-border transfers to the US from Canada of xylenes increased by 1 percent in 1999, while those of toluene increased by 34 percent.
Table 8–19. NPRI Off-site Transfers to US from Canada, by Chemical, 1998–1999 (Chemicals with Largest Transfers in 1999)
Total Transfers to Recycling/Energy Recovery/Treatment/Disposal CAS 1998 1999 Change 1998–1999
Rank Number Chemical (kg) (kg) kg %
1 -- Copper (and its compounds)* 7,759,914 9,418,231 1,658,317 21 2 -- Zinc (and its compounds)* 6,188,771 8,045,145 1,856,374 30 3 1330-20-7 Xylenes 2,495,615 2,513,068 17,453 1 4 108-88-3 Toluene 1,389,703 1,869,144 479,441 34 5 -- Manganese (and its compounds)* 750,578 898,125 147,547 20
6 78-93-3 Methyl ethyl ketone 560,332 735,052 174,720 31 7 7697-37-2 Nitric acid and nitrate compounds 607,179 726,040 118,861 20 8 7429-90-5 Aluminum (fume or dust)* 1,620,290 709,900 -910,390 -56 9 -- Lead (and its compounds)* 6,276,900 654,184 -5,622,716 -90
10 108-10-1 Methyl isobutyl ketone 571,175 630,543 59,368 10
11 -- Chromium (and its compounds)* 463,877 553,099 89,222 19 12 -- Nickel (and its compounds)* 481,672 514,178 32,506 7 13 1313-27-5 Molybdenum trioxide 31,629 328,369 296,740 938 14 100-41-4 Ethylbenzene 286,210 291,906 5,696 2 15 107-21-1 Ethylene glycol 1,378,003 257,243 -1,120,760 -81
16 67-56-1 Methanol 201,448 234,069 32,621 16 17 7440-62-2 Vanadium (fume or dust)* 186,391 188,077 1,686 1 18 71-36-3 n-Butyl alcohol 101,959 171,746 69,787 68 19 108-95-2 Phenol 748,347 154,670 -593,677 -79 20 127-18-4 Tetrachloroethylene 56,420 137,305 80,885 143
21 95-63-6 1,2,4-Trimethylbenzene 82,543 109,359 26,816 32 22 75-09-2 Dichloromethane 125,756 97,515 -28,241 -22 23 79-01-6 Trichloroethylene 40,194 96,420 56,226 140 24 -- Silver (and its compounds)* 144,993 68,894 -76,099 -52 25 67-66-3 Chloroform 0 48,010 48,010 --
Subtotal 32,549,899 29,450,292 -3,099,607 -10 % of Total 99.6 99.2 Total 32,690,745 29,683,235 -3,007,510 -9
* Metal and its compounds. Known or suspected carcinogen.
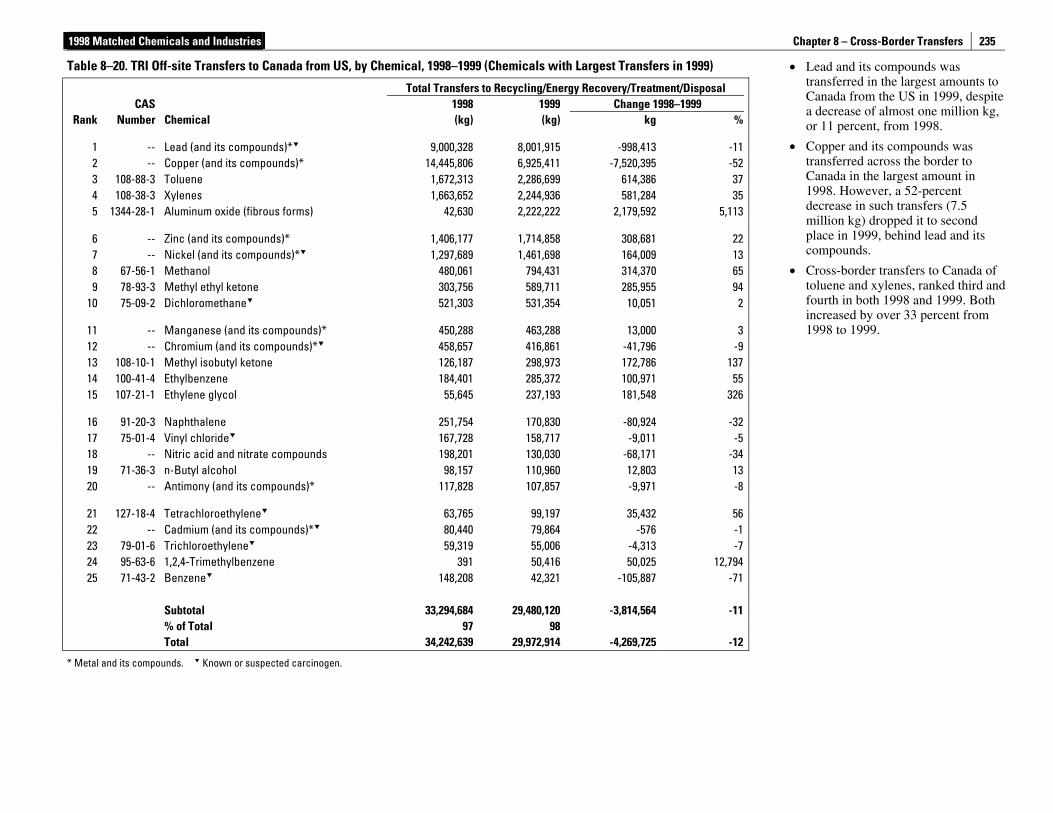
1998 Matched Chemicals and Industries Chapter 8 – Cross-Border Transfers
235
• Lead and its compounds was transferred in the largest amounts to Canada from the US in 1999, despite a decrease of almost one million kg, or 11 percent, from 1998.
• Copper and its compounds was transferred across the border to Canada in the largest amount in 1998. However, a 52-percent decrease in such transfers (7.5 million kg) dropped it to second place in 1999, behind lead and its compounds.
• Cross-border transfers to Canada of toluene and xylenes, ranked third and fourth in both 1998 and 1999. Both increased by over 33 percent from 1998 to 1999.
Table 8–20. TRI Off-site Transfers to Canada from US, by Chemical, 1998–1999 (Chemicals with Largest Transfers in 1999)
Total Transfers to Recycling/Energy Recovery/Treatment/Disposal CAS 1998 1999 Change 1998–1999
Rank Number Chemical (kg) (kg) kg %
1 -- Lead (and its compounds)* 9,000,328 8,001,915 -998,413 -112 -- Copper (and its compounds)* 14,445,806 6,925,411 -7,520,395 -523 108-88-3 Toluene 1,672,313 2,286,699 614,386 374 108-38-3 Xylenes 1,663,652 2,244,936 581,284 355 1344-28-1 Aluminum oxide (fibrous forms) 42,630 2,222,222 2,179,592 5,113
6 -- Zinc (and its compounds)* 1,406,177 1,714,858 308,681 227 -- Nickel (and its compounds)* 1,297,689 1,461,698 164,009 138 67-56-1 Methanol 480,061 794,431 314,370 659 78-93-3 Methyl ethyl ketone 303,756 589,711 285,955 94
10 75-09-2 Dichloromethane 521,303 531,354 10,051 2
11 -- Manganese (and its compounds)* 450,288 463,288 13,000 312 -- Chromium (and its compounds)* 458,657 416,861 -41,796 -913 108-10-1 Methyl isobutyl ketone 126,187 298,973 172,786 13714 100-41-4 Ethylbenzene 184,401 285,372 100,971 5515 107-21-1 Ethylene glycol 55,645 237,193 181,548 326
16 91-20-3 Naphthalene 251,754 170,830 -80,924 -3217 75-01-4 Vinyl chloride 167,728 158,717 -9,011 -518 -- Nitric acid and nitrate compounds 198,201 130,030 -68,171 -3419 71-36-3 n-Butyl alcohol 98,157 110,960 12,803 1320 -- Antimony (and its compounds)* 117,828 107,857 -9,971 -8
21 127-18-4 Tetrachloroethylene 63,765 99,197 35,432 5622 -- Cadmium (and its compounds)* 80,440 79,864 -576 -123 79-01-6 Trichloroethylene 59,319 55,006 -4,313 -724 95-63-6 1,2,4-Trimethylbenzene 391 50,416 50,025 12,79425 71-43-2 Benzene 148,208 42,321 -105,887 -71
Subtotal 33,294,684 29,480,120 -3,814,564 -11 % of Total 97 98 Total 34,242,639 29,972,914 -4,269,725 -12
* Metal and its compounds. Known or suspected carcinogen.

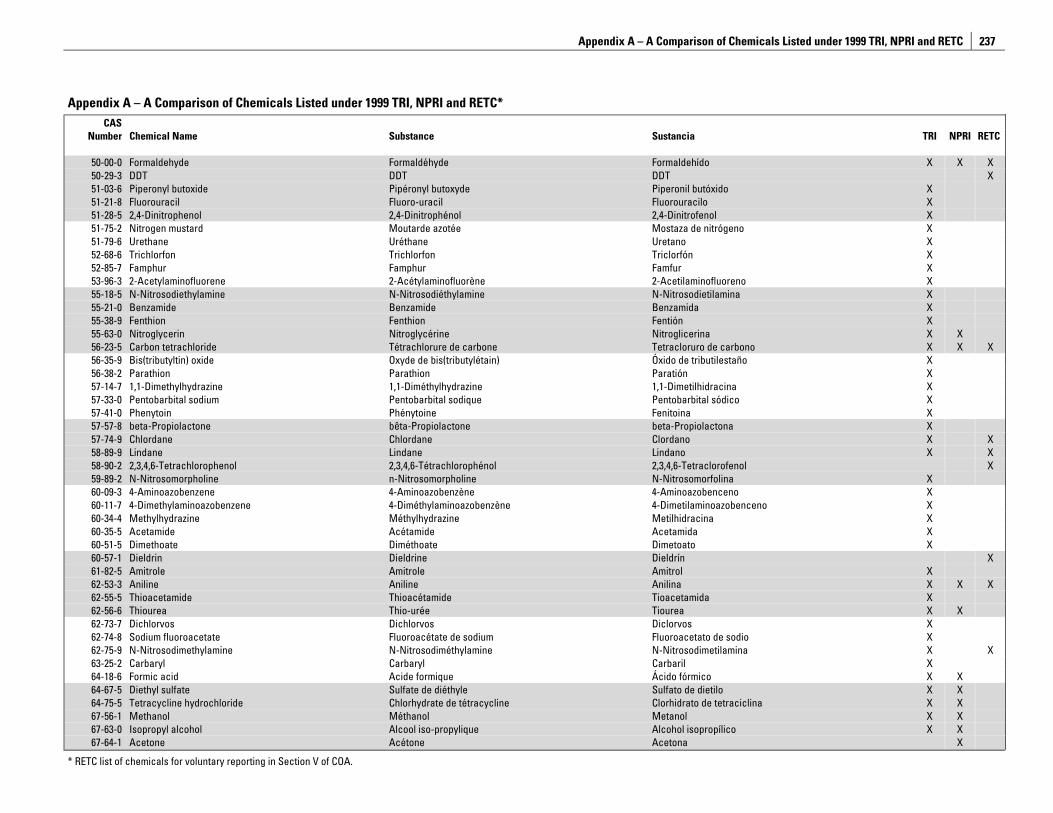
Appendix A – A Comparison of Chemicals Listed under 1999 TRI, NPRI and RETC
237
Appendix A – A Comparison of Chemicals Listed under 1999 TRI, NPRI and RETC* CAS
Number Chemical Name Substance Sustancia TRI NPRI RETC
50-00-0 Formaldehyde Formaldéhyde Formaldehído X X X 50-29-3 DDT DDT DDT X 51-03-6 Piperonyl butoxide Pipéronyl butoxyde Piperonil butóxido X 51-21-8 Fluorouracil Fluoro-uracil Fluorouracilo X 51-28-5 2,4-Dinitrophenol 2,4-Dinitrophénol 2,4-Dinitrofenol X 51-75-2 Nitrogen mustard Moutarde azotée Mostaza de nitrógeno X 51-79-6 Urethane Uréthane Uretano X 52-68-6 Trichlorfon Trichlorfon Triclorfón X 52-85-7 Famphur Famphur Famfur X 53-96-3 2-Acetylaminofluorene 2-Acétylaminofluorène 2-Acetilaminofluoreno X 55-18-5 N-Nitrosodiethylamine N-Nitrosodiéthylamine N-Nitrosodietilamina X 55-21-0 Benzamide Benzamide Benzamida X 55-38-9 Fenthion Fenthion Fentión X 55-63-0 Nitroglycerin Nitroglycérine Nitroglicerina X X 56-23-5 Carbon tetrachloride Tétrachlorure de carbone Tetracloruro de carbono X X X 56-35-9 Bis(tributyltin) oxide Oxyde de bis(tributylétain) Óxido de tributilestaño X 56-38-2 Parathion Parathion Paratión X 57-14-7 1,1-Dimethylhydrazine 1,1-Diméthylhydrazine 1,1-Dimetilhidracina X 57-33-0 Pentobarbital sodium Pentobarbital sodique Pentobarbital sódico X 57-41-0 Phenytoin Phénytoine Fenitoina X 57-57-8 beta-Propiolactone bêta-Propiolactone beta-Propiolactona X 57-74-9 Chlordane Chlordane Clordano X X 58-89-9 Lindane Lindane Lindano X X 58-90-2 2,3,4,6-Tetrachlorophenol 2,3,4,6-Tétrachlorophénol 2,3,4,6-Tetraclorofenol X 59-89-2 N-Nitrosomorpholine n-Nitrosomorpholine N-Nitrosomorfolina X 60-09-3 4-Aminoazobenzene 4-Aminoazobenzène 4-Aminoazobenceno X 60-11-7 4-Dimethylaminoazobenzene 4-Diméthylaminoazobenzène 4-Dimetilaminoazobenceno X 60-34-4 Methylhydrazine Méthylhydrazine Metilhidracina X 60-35-5 Acetamide Acétamide Acetamida X 60-51-5 Dimethoate Diméthoate Dimetoato X 60-57-1 Dieldrin Dieldrine Dieldrín X 61-82-5 Amitrole Amitrole Amitrol X 62-53-3 Aniline Aniline Anilina X X X 62-55-5 Thioacetamide Thioacétamide Tioacetamida X 62-56-6 Thiourea Thio-urée Tiourea X X 62-73-7 Dichlorvos Dichlorvos Diclorvos X 62-74-8 Sodium fluoroacetate Fluoroacétate de sodium Fluoroacetato de sodio X 62-75-9 N-Nitrosodimethylamine N-Nitrosodiméthylamine N-Nitrosodimetilamina X X 63-25-2 Carbaryl Carbaryl Carbaril X 64-18-6 Formic acid Acide formique Ácido fórmico X X 64-67-5 Diethyl sulfate Sulfate de diéthyle Sulfato de dietilo X X 64-75-5 Tetracycline hydrochloride Chlorhydrate de tétracycline Clorhidrato de tetraciclina X X 67-56-1 Methanol Méthanol Metanol X X 67-63-0 Isopropyl alcohol Alcool iso-propylique Alcohol isopropílico X X 67-64-1 Acetone Acétone Acetona X
* RETC list of chemicals for voluntary reporting in Section V of COA.
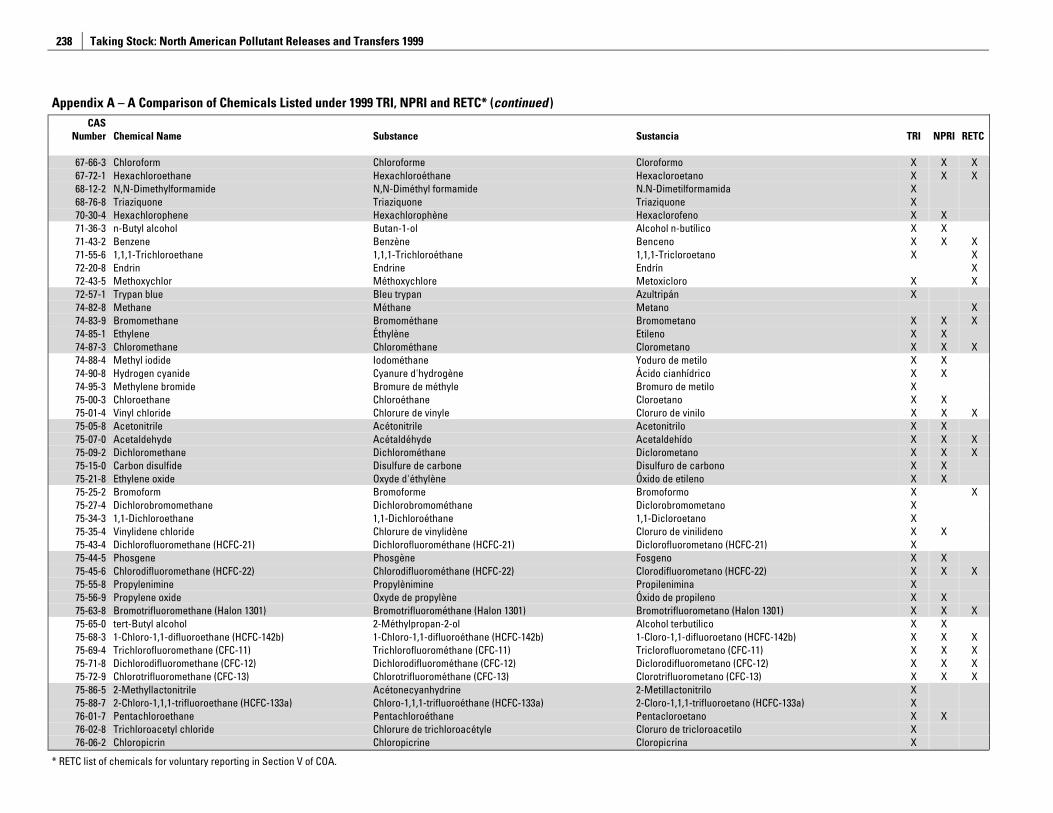
Taking Stock: North American Pollutant Releases and Transfers 1999
238
Appendix A – A Comparison of Chemicals Listed under 1999 TRI, NPRI and RETC* (continued ) CAS
Number Chemical Name Substance Sustancia TRI NPRI RETC
67-66-3 Chloroform Chloroforme Cloroformo X X X 67-72-1 Hexachloroethane Hexachloroéthane Hexacloroetano X X X 68-12-2 N,N-Dimethylformamide N,N-Diméthyl formamide N.N-Dimetilformamida X 68-76-8 Triaziquone Triaziquone Triaziquone X 70-30-4 Hexachlorophene Hexachlorophène Hexaclorofeno X X 71-36-3 n-Butyl alcohol Butan-1-ol Alcohol n-butílico X X 71-43-2 Benzene Benzène Benceno X X X 71-55-6 1,1,1-Trichloroethane 1,1,1-Trichloroéthane 1,1,1-Tricloroetano X X 72-20-8 Endrin Endrine Endrín X 72-43-5 Methoxychlor Méthoxychlore Metoxicloro X X 72-57-1 Trypan blue Bleu trypan Azultripán X 74-82-8 Methane Méthane Metano X 74-83-9 Bromomethane Bromométhane Bromometano X X X 74-85-1 Ethylene Éthylène Etileno X X 74-87-3 Chloromethane Chlorométhane Clorometano X X X 74-88-4 Methyl iodide Iodométhane Yoduro de metilo X X 74-90-8 Hydrogen cyanide Cyanure d'hydrogène Ácido cianhídrico X X 74-95-3 Methylene bromide Bromure de méthyle Bromuro de metilo X 75-00-3 Chloroethane Chloroéthane Cloroetano X X 75-01-4 Vinyl chloride Chlorure de vinyle Cloruro de vinilo X X X 75-05-8 Acetonitrile Acétonitrile Acetonitrilo X X 75-07-0 Acetaldehyde Acétaldéhyde Acetaldehído X X X 75-09-2 Dichloromethane Dichlorométhane Diclorometano X X X 75-15-0 Carbon disulfide Disulfure de carbone Disulfuro de carbono X X 75-21-8 Ethylene oxide Oxyde d'éthylène Óxido de etileno X X 75-25-2 Bromoform Bromoforme Bromoformo X X 75-27-4 Dichlorobromomethane Dichlorobromométhane Diclorobromometano X 75-34-3 1,1-Dichloroethane 1,1-Dichloroéthane 1,1-Dicloroetano X 75-35-4 Vinylidene chloride Chlorure de vinylidène Cloruro de vinilideno X X 75-43-4 Dichlorofluoromethane (HCFC-21) Dichlorofluorométhane (HCFC-21) Diclorofluorometano (HCFC-21) X 75-44-5 Phosgene Phosgène Fosgeno X X 75-45-6 Chlorodifluoromethane (HCFC-22) Chlorodifluorométhane (HCFC-22) Clorodifluorometano (HCFC-22) X X X 75-55-8 Propylenimine Propylènimine Propilenimina X 75-56-9 Propylene oxide Oxyde de propylène Óxido de propileno X X 75-63-8 Bromotrifluoromethane (Halon 1301) Bromotrifluorométhane (Halon 1301) Bromotrifluorometano (Halon 1301) X X X 75-65-0 tert-Butyl alcohol 2-Méthylpropan-2-ol Alcohol terbutílico X X 75-68-3 1-Chloro-1,1-difluoroethane (HCFC-142b) 1-Chloro-1,1-difluoroéthane (HCFC-142b) 1-Cloro-1,1-difluoroetano (HCFC-142b) X X X 75-69-4 Trichlorofluoromethane (CFC-11) Trichlorofluorométhane (CFC-11) Triclorofluorometano (CFC-11) X X X 75-71-8 Dichlorodifluoromethane (CFC-12) Dichlorodifluorométhane (CFC-12) Diclorodifluorometano (CFC-12) X X X 75-72-9 Chlorotrifluoromethane (CFC-13) Chlorotrifluorométhane (CFC-13) Clorotrifluorometano (CFC-13) X X X 75-86-5 2-Methyllactonitrile Acétonecyanhydrine 2-Metillactonitrilo X 75-88-7 2-Chloro-1,1,1-trifluoroethane (HCFC-133a) Chloro-1,1,1-trifluoroéthane (HCFC-133a) 2-Cloro-1,1,1-trifluoroetano (HCFC-133a) X 76-01-7 Pentachloroethane Pentachloroéthane Pentacloroetano X X 76-02-8 Trichloroacetyl chloride Chlorure de trichloroacétyle Cloruro de tricloroacetilo X 76-06-2 Chloropicrin Chloropicrine Cloropicrina X
* RETC list of chemicals for voluntary reporting in Section V of COA.
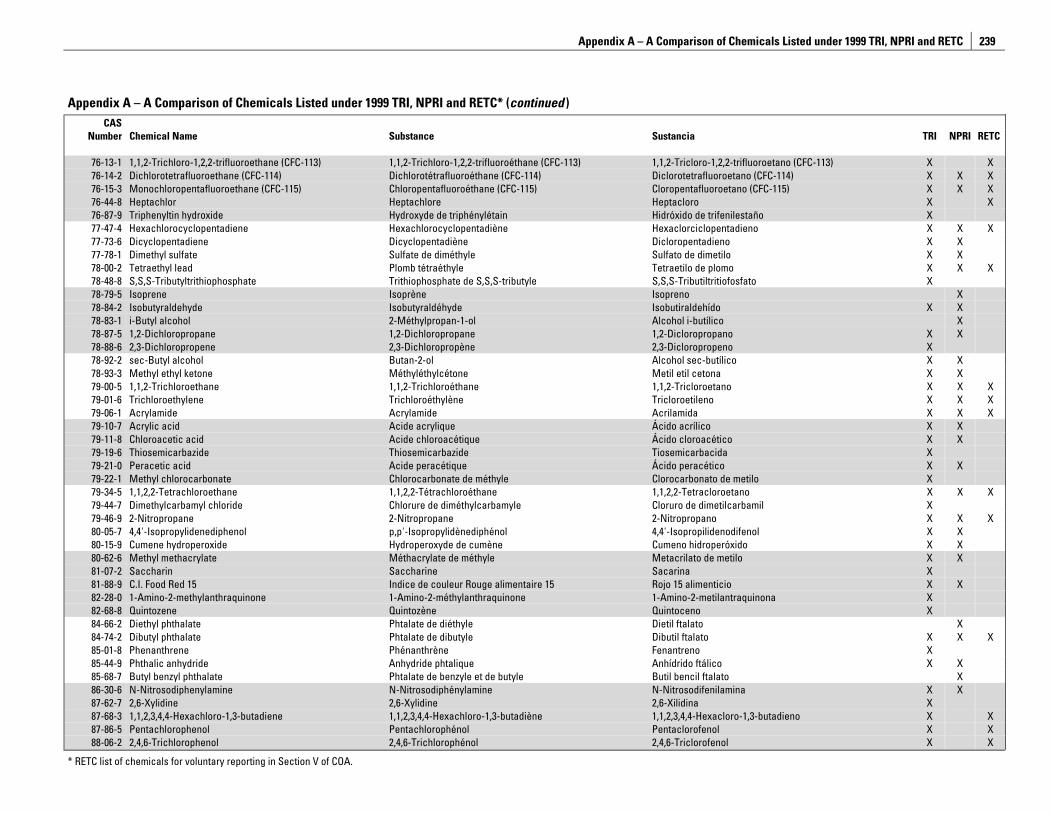
Appendix A – A Comparison of Chemicals Listed under 1999 TRI, NPRI and RETC
239
Appendix A – A Comparison of Chemicals Listed under 1999 TRI, NPRI and RETC* (continued ) CAS
Number Chemical Name Substance Sustancia TRI NPRI RETC
76-13-1 1,1,2-Trichloro-1,2,2-trifluoroethane (CFC-113) 1,1,2-Trichloro-1,2,2-trifluoroéthane (CFC-113) 1,1,2-Tricloro-1,2,2-trifluoroetano (CFC-113) X X 76-14-2 Dichlorotetrafluoroethane (CFC-114) Dichlorotétrafluoroéthane (CFC-114) Diclorotetrafluoroetano (CFC-114) X X X 76-15-3 Monochloropentafluoroethane (CFC-115) Chloropentafluoroéthane (CFC-115) Cloropentafluoroetano (CFC-115) X X X 76-44-8 Heptachlor Heptachlore Heptacloro X X 76-87-9 Triphenyltin hydroxide Hydroxyde de triphénylétain Hidróxido de trifenilestaño X 77-47-4 Hexachlorocyclopentadiene Hexachlorocyclopentadiène Hexaclorciclopentadieno X X X 77-73-6 Dicyclopentadiene Dicyclopentadiène Dicloropentadieno X X 77-78-1 Dimethyl sulfate Sulfate de diméthyle Sulfato de dimetilo X X 78-00-2 Tetraethyl lead Plomb tétraéthyle Tetraetilo de plomo X X X 78-48-8 S,S,S-Tributyltrithiophosphate Trithiophosphate de S,S,S-tributyle S,S,S-Tributiltritiofosfato X 78-79-5 Isoprene Isoprène Isopreno X 78-84-2 Isobutyraldehyde Isobutyraldéhyde Isobutiraldehído X X 78-83-1 i-Butyl alcohol 2-Méthylpropan-1-ol Alcohol i-butílico X 78-87-5 1,2-Dichloropropane 1,2-Dichloropropane 1,2-Dicloropropano X X 78-88-6 2,3-Dichloropropene 2,3-Dichloropropène 2,3-Dicloropropeno X 78-92-2 sec-Butyl alcohol Butan-2-ol Alcohol sec-butílico X X 78-93-3 Methyl ethyl ketone Méthyléthylcétone Metil etil cetona X X 79-00-5 1,1,2-Trichloroethane 1,1,2-Trichloroéthane 1,1,2-Tricloroetano X X X 79-01-6 Trichloroethylene Trichloroéthylène Tricloroetileno X X X 79-06-1 Acrylamide Acrylamide Acrilamida X X X 79-10-7 Acrylic acid Acide acrylique Ácido acrílico X X 79-11-8 Chloroacetic acid Acide chloroacétique Ácido cloroacético X X 79-19-6 Thiosemicarbazide Thiosemicarbazide Tiosemicarbacida X 79-21-0 Peracetic acid Acide peracétique Ácido peracético X X 79-22-1 Methyl chlorocarbonate Chlorocarbonate de méthyle Clorocarbonato de metilo X 79-34-5 1,1,2,2-Tetrachloroethane 1,1,2,2-Tétrachloroéthane 1,1,2,2-Tetracloroetano X X X 79-44-7 Dimethylcarbamyl chloride Chlorure de diméthylcarbamyle Cloruro de dimetilcarbamil X 79-46-9 2-Nitropropane 2-Nitropropane 2-Nitropropano X X X 80-05-7 4,4'-Isopropylidenediphenol p,p'-Isopropylidènediphénol 4,4'-Isopropilidenodifenol X X 80-15-9 Cumene hydroperoxide Hydroperoxyde de cumène Cumeno hidroperóxido X X 80-62-6 Methyl methacrylate Méthacrylate de méthyle Metacrilato de metilo X X 81-07-2 Saccharin Saccharine Sacarina X 81-88-9 C.I. Food Red 15 Indice de couleur Rouge alimentaire 15 Rojo 15 alimenticio X X 82-28-0 1-Amino-2-methylanthraquinone 1-Amino-2-méthylanthraquinone 1-Amino-2-metilantraquinona X 82-68-8 Quintozene Quintozène Quintoceno X 84-66-2 Diethyl phthalate Phtalate de diéthyle Dietil ftalato X 84-74-2 Dibutyl phthalate Phtalate de dibutyle Dibutil ftalato X X X 85-01-8 Phenanthrene Phénanthrène Fenantreno X 85-44-9 Phthalic anhydride Anhydride phtalique Anhídrido ftálico X X 85-68-7 Butyl benzyl phthalate Phtalate de benzyle et de butyle Butil bencil ftalato X 86-30-6 N-Nitrosodiphenylamine N-Nitrosodiphénylamine N-Nitrosodifenilamina X X 87-62-7 2,6-Xylidine 2,6-Xylidine 2,6-Xilidina X 87-68-3 1,1,2,3,4,4-Hexachloro-1,3-butadiene 1,1,2,3,4,4-Hexachloro-1,3-butadiène 1,1,2,3,4,4-Hexacloro-1,3-butadieno X X 87-86-5 Pentachlorophenol Pentachlorophénol Pentaclorofenol X X 88-06-2 2,4,6-Trichlorophenol 2,4,6-Trichlorophénol 2,4,6-Triclorofenol X X
* RETC list of chemicals for voluntary reporting in Section V of COA.
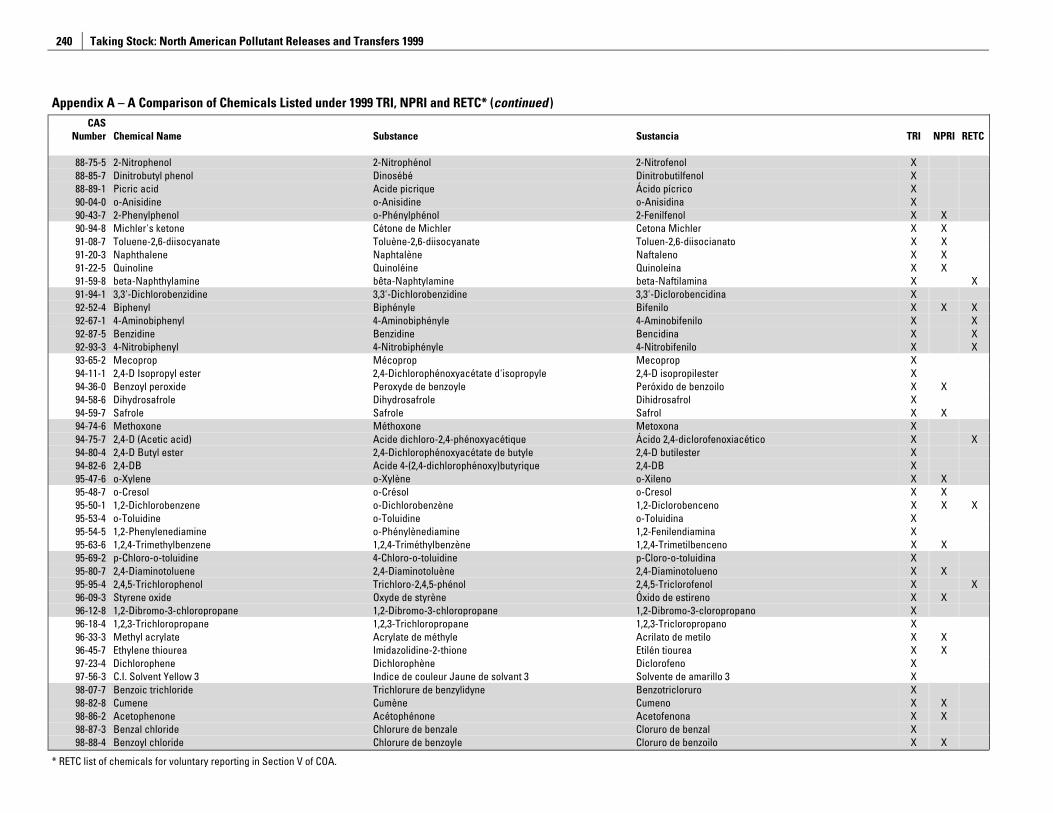
Taking Stock: North American Pollutant Releases and Transfers 1999
240
Appendix A – A Comparison of Chemicals Listed under 1999 TRI, NPRI and RETC* (continued ) CAS
Number Chemical Name Substance Sustancia TRI NPRI RETC
88-75-5 2-Nitrophenol 2-Nitrophénol 2-Nitrofenol X 88-85-7 Dinitrobutyl phenol Dinosébé Dinitrobutilfenol X 88-89-1 Picric acid Acide picrique Ácido pícrico X 90-04-0 o-Anisidine o-Anisidine o-Anisidina X 90-43-7 2-Phenylphenol o-Phénylphénol 2-Fenilfenol X X 90-94-8 Michler's ketone Cétone de Michler Cetona Michler X X 91-08-7 Toluene-2,6-diisocyanate Toluène-2,6-diisocyanate Toluen-2,6-diisocianato X X 91-20-3 Naphthalene Naphtalène Naftaleno X X 91-22-5 Quinoline Quinoléine Quinoleína X X 91-59-8 beta-Naphthylamine bêta-Naphtylamine beta-Naftilamina X X 91-94-1 3,3'-Dichlorobenzidine 3,3'-Dichlorobenzidine 3,3'-Diclorobencidina X 92-52-4 Biphenyl Biphényle Bifenilo X X X 92-67-1 4-Aminobiphenyl 4-Aminobiphényle 4-Aminobifenilo X X 92-87-5 Benzidine Benzidine Bencidina X X 92-93-3 4-Nitrobiphenyl 4-Nitrobiphényle 4-Nitrobifenilo X X 93-65-2 Mecoprop Mécoprop Mecoprop X 94-11-1 2,4-D Isopropyl ester 2,4-Dichlorophénoxyacétate d'isopropyle 2,4-D isopropilester X 94-36-0 Benzoyl peroxide Peroxyde de benzoyle Peróxido de benzoilo X X 94-58-6 Dihydrosafrole Dihydrosafrole Dihidrosafrol X 94-59-7 Safrole Safrole Safrol X X 94-74-6 Methoxone Méthoxone Metoxona X 94-75-7 2,4-D (Acetic acid) Acide dichloro-2,4-phénoxyacétique Ácido 2,4-diclorofenoxiacético X X 94-80-4 2,4-D Butyl ester 2,4-Dichlorophénoxyacétate de butyle 2,4-D butilester X 94-82-6 2,4-DB Acide 4-(2,4-dichlorophénoxy)butyrique 2,4-DB X 95-47-6 o-Xylene o-Xylène o-Xileno X X 95-48-7 o-Cresol o-Crésol o-Cresol X X 95-50-1 1,2-Dichlorobenzene o-Dichlorobenzène 1,2-Diclorobenceno X X X 95-53-4 o-Toluidine o-Toluidine o-Toluidina X 95-54-5 1,2-Phenylenediamine o-Phénylènediamine 1,2-Fenilendiamina X 95-63-6 1,2,4-Trimethylbenzene 1,2,4-Triméthylbenzène 1,2,4-Trimetilbenceno X X 95-69-2 p-Chloro-o-toluidine 4-Chloro-o-toluidine p-Cloro-o-toluidina X 95-80-7 2,4-Diaminotoluene 2,4-Diaminotoluène 2,4-Diaminotolueno X X 95-95-4 2,4,5-Trichlorophenol Trichloro-2,4,5-phénol 2,4,5-Triclorofenol X X 96-09-3 Styrene oxide Oxyde de styrène Óxido de estireno X X 96-12-8 1,2-Dibromo-3-chloropropane 1,2-Dibromo-3-chloropropane 1,2-Dibromo-3-cloropropano X 96-18-4 1,2,3-Trichloropropane 1,2,3-Trichloropropane 1,2,3-Tricloropropano X 96-33-3 Methyl acrylate Acrylate de méthyle Acrilato de metilo X X 96-45-7 Ethylene thiourea Imidazolidine-2-thione Etilén tiourea X X 97-23-4 Dichlorophene Dichlorophène Diclorofeno X 97-56-3 C.I. Solvent Yellow 3 Indice de couleur Jaune de solvant 3 Solvente de amarillo 3 X 98-07-7 Benzoic trichloride Trichlorure de benzylidyne Benzotricloruro X 98-82-8 Cumene Cumène Cumeno X X 98-86-2 Acetophenone Acétophénone Acetofenona X X 98-87-3 Benzal chloride Chlorure de benzale Cloruro de benzal X 98-88-4 Benzoyl chloride Chlorure de benzoyle Cloruro de benzoilo X X
* RETC list of chemicals for voluntary reporting in Section V of COA.
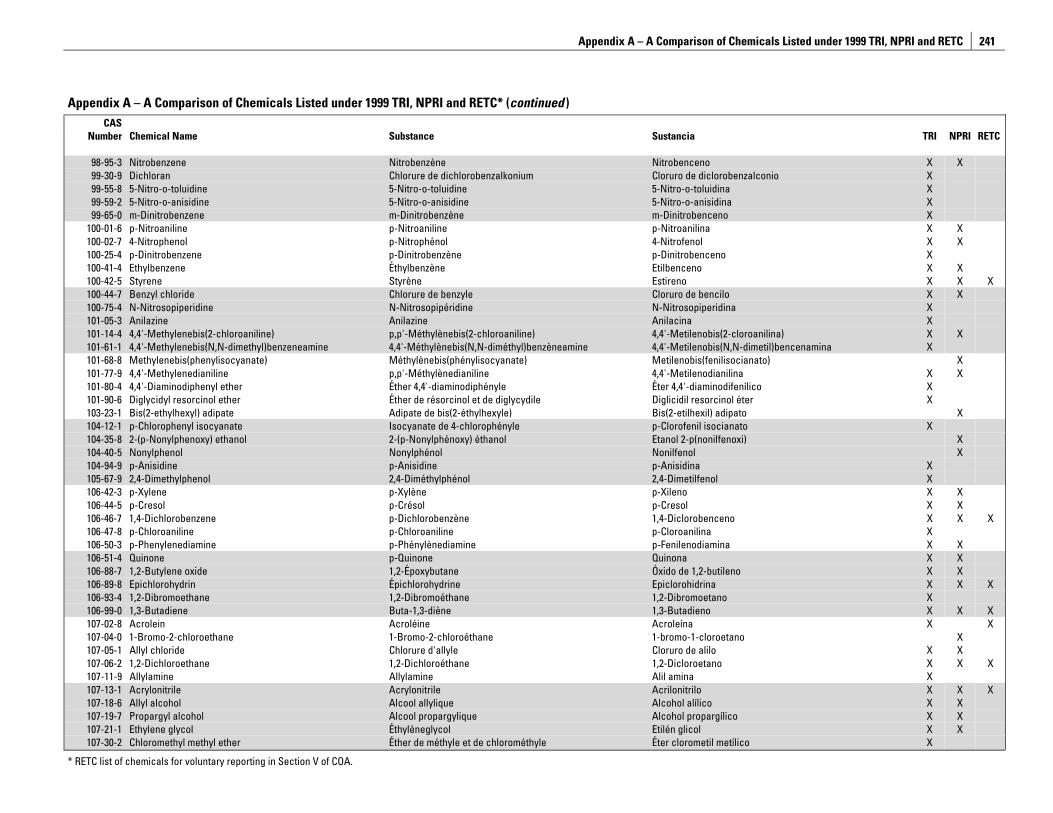
Appendix A – A Comparison of Chemicals Listed under 1999 TRI, NPRI and RETC
241
Appendix A – A Comparison of Chemicals Listed under 1999 TRI, NPRI and RETC* (continued ) CAS
Number Chemical Name Substance Sustancia TRI NPRI RETC
98-95-3 Nitrobenzene Nitrobenzène Nitrobenceno X X 99-30-9 Dichloran Chlorure de dichlorobenzalkonium Cloruro de diclorobenzalconio X 99-55-8 5-Nitro-o-toluidine 5-Nitro-o-toluidine 5-Nitro-o-toluidina X 99-59-2 5-Nitro-o-anisidine 5-Nitro-o-anisidine 5-Nitro-o-anisidina X 99-65-0 m-Dinitrobenzene m-Dinitrobenzène m-Dinitrobenceno X
100-01-6 p-Nitroaniline p-Nitroaniline p-Nitroanilina X X 100-02-7 4-Nitrophenol p-Nitrophénol 4-Nitrofenol X X 100-25-4 p-Dinitrobenzene p-Dinitrobenzène p-Dinitrobenceno X 100-41-4 Ethylbenzene Éthylbenzène Etilbenceno X X 100-42-5 Styrene Styrène Estireno X X X 100-44-7 Benzyl chloride Chlorure de benzyle Cloruro de bencilo X X 100-75-4 N-Nitrosopiperidine N-Nitrosopipéridine N-Nitrosopiperidina X 101-05-3 Anilazine Anilazine Anilacina X 101-14-4 4,4'-Methylenebis(2-chloroaniline) p,p'-Méthylènebis(2-chloroaniline) 4,4'-Metilenobis(2-cloroanilina) X X 101-61-1 4,4'-Methylenebis(N,N-dimethyl)benzeneamine 4,4'-Méthylènebis(N,N-diméthyl)benzèneamine 4,4'-Metilenobis(N,N-dimetil)bencenamina X 101-68-8 Methylenebis(phenylisocyanate) Méthylènebis(phénylisocyanate) Metilenobis(fenilisocianato) X 101-77-9 4,4'-Methylenedianiline p,p'-Méthylènedianiline 4,4'-Metilenodianilina X X 101-80-4 4,4'-Diaminodiphenyl ether Éther 4,4'-diaminodiphényle Éter 4,4'-diaminodifenílico X 101-90-6 Diglycidyl resorcinol ether Éther de résorcinol et de diglycydile Diglicidil resorcinol éter X 103-23-1 Bis(2-ethylhexyl) adipate Adipate de bis(2-éthylhexyle) Bis(2-etilhexil) adipato X 104-12-1 p-Chlorophenyl isocyanate Isocyanate de 4-chlorophényle p-Clorofenil isocianato X 104-35-8 2-(p-Nonylphenoxy) ethanol 2-(p-Nonylphénoxy) éthanol Etanol 2-p(nonilfenoxi) X 104-40-5 Nonylphenol Nonylphénol Nonilfenol X 104-94-9 p-Anisidine p-Anisidine p-Anisidina X 105-67-9 2,4-Dimethylphenol 2,4-Diméthylphénol 2,4-Dimetilfenol X 106-42-3 p-Xylene p-Xylène p-Xileno X X 106-44-5 p-Cresol p-Crésol p-Cresol X X 106-46-7 1,4-Dichlorobenzene p-Dichlorobenzène 1,4-Diclorobenceno X X X 106-47-8 p-Chloroaniline p-Chloroaniline p-Cloroanilina X 106-50-3 p-Phenylenediamine p-Phénylènediamine p-Fenilenodiamina X X 106-51-4 Quinone p-Quinone Quinona X X 106-88-7 1,2-Butylene oxide 1,2-Époxybutane Óxido de 1,2-butileno X X 106-89-8 Epichlorohydrin Épichlorohydrine Epiclorohidrina X X X 106-93-4 1,2-Dibromoethane 1,2-Dibromoéthane 1,2-Dibromoetano X 106-99-0 1,3-Butadiene Buta-1,3-diène 1,3-Butadieno X X X 107-02-8 Acrolein Acroléine Acroleína X X 107-04-0 1-Bromo-2-chloroethane 1-Bromo-2-chloroéthane 1-bromo-1-cloroetano X 107-05-1 Allyl chloride Chlorure d'allyle Cloruro de alilo X X 107-06-2 1,2-Dichloroethane 1,2-Dichloroéthane 1,2-Dicloroetano X X X 107-11-9 Allylamine Allylamine Alil amina X 107-13-1 Acrylonitrile Acrylonitrile Acrilonitrilo X X X 107-18-6 Allyl alcohol Alcool allylique Alcohol alílico X X 107-19-7 Propargyl alcohol Alcool propargylique Alcohol propargílico X X 107-21-1 Ethylene glycol Éthylèneglycol Etilén glicol X X 107-30-2 Chloromethyl methyl ether Éther de méthyle et de chlorométhyle Éter clorometil metílico X
* RETC list of chemicals for voluntary reporting in Section V of COA.
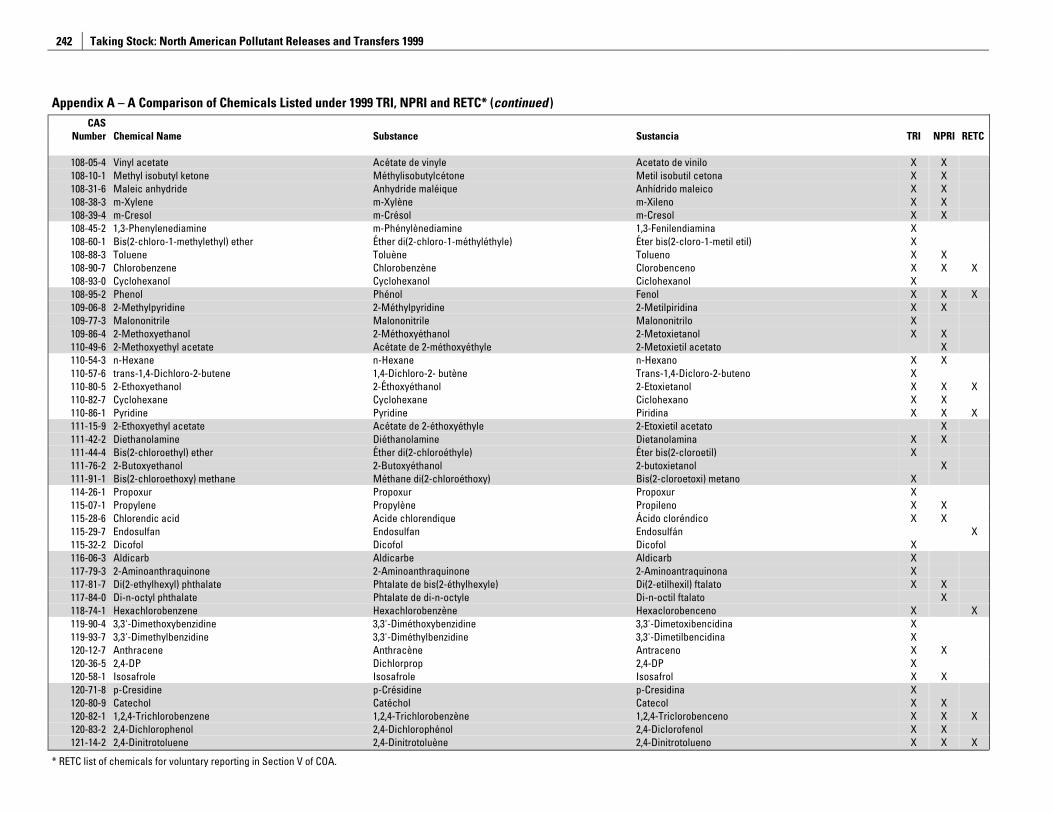
Taking Stock: North American Pollutant Releases and Transfers 1999
242
Appendix A – A Comparison of Chemicals Listed under 1999 TRI, NPRI and RETC* (continued ) CAS
Number Chemical Name Substance Sustancia TRI NPRI RETC
108-05-4 Vinyl acetate Acétate de vinyle Acetato de vinilo X X 108-10-1 Methyl isobutyl ketone Méthylisobutylcétone Metil isobutil cetona X X 108-31-6 Maleic anhydride Anhydride maléique Anhídrido maleico X X 108-38-3 m-Xylene m-Xylène m-Xileno X X 108-39-4 m-Cresol m-Crésol m-Cresol X X 108-45-2 1,3-Phenylenediamine m-Phénylènediamine 1,3-Fenilendiamina X 108-60-1 Bis(2-chloro-1-methylethyl) ether Éther di(2-chloro-1-méthyléthyle) Éter bis(2-cloro-1-metil etil) X 108-88-3 Toluene Toluène Tolueno X X 108-90-7 Chlorobenzene Chlorobenzène Clorobenceno X X X 108-93-0 Cyclohexanol Cyclohexanol Ciclohexanol X 108-95-2 Phenol Phénol Fenol X X X 109-06-8 2-Methylpyridine 2-Méthylpyridine 2-Metilpiridina X X 109-77-3 Malononitrile Malononitrile Malononitrilo X 109-86-4 2-Methoxyethanol 2-Méthoxyéthanol 2-Metoxietanol X X 110-49-6 2-Methoxyethyl acetate Acétate de 2-méthoxyéthyle 2-Metoxietil acetato X 110-54-3 n-Hexane n-Hexane n-Hexano X X 110-57-6 trans-1,4-Dichloro-2-butene 1,4-Dichloro-2- butène Trans-1,4-Dicloro-2-buteno X 110-80-5 2-Ethoxyethanol 2-Éthoxyéthanol 2-Etoxietanol X X X 110-82-7 Cyclohexane Cyclohexane Ciclohexano X X 110-86-1 Pyridine Pyridine Piridina X X X 111-15-9 2-Ethoxyethyl acetate Acétate de 2-éthoxyéthyle 2-Etoxietil acetato X 111-42-2 Diethanolamine Diéthanolamine Dietanolamina X X 111-44-4 Bis(2-chloroethyl) ether Éther di(2-chloroéthyle) Éter bis(2-cloroetil) X 111-76-2 2-Butoxyethanol 2-Butoxyéthanol 2-butoxietanol X 111-91-1 Bis(2-chloroethoxy) methane Méthane di(2-chloroéthoxy) Bis(2-cloroetoxi) metano X 114-26-1 Propoxur Propoxur Propoxur X 115-07-1 Propylene Propylène Propileno X X 115-28-6 Chlorendic acid Acide chlorendique Ácido cloréndico X X 115-29-7 Endosulfan Endosulfan Endosulfán X 115-32-2 Dicofol Dicofol Dicofol X 116-06-3 Aldicarb Aldicarbe Aldicarb X 117-79-3 2-Aminoanthraquinone 2-Aminoanthraquinone 2-Aminoantraquinona X 117-81-7 Di(2-ethylhexyl) phthalate Phtalate de bis(2-éthylhexyle) Di(2-etilhexil) ftalato X X 117-84-0 Di-n-octyl phthalate Phtalate de di-n-octyle Di-n-octil ftalato X 118-74-1 Hexachlorobenzene Hexachlorobenzène Hexaclorobenceno X X 119-90-4 3,3'-Dimethoxybenzidine 3,3'-Diméthoxybenzidine 3,3'-Dimetoxibencidina X 119-93-7 3,3'-Dimethylbenzidine 3,3'-Diméthylbenzidine 3,3'-Dimetilbencidina X 120-12-7 Anthracene Anthracène Antraceno X X 120-36-5 2,4-DP Dichlorprop 2,4-DP X 120-58-1 Isosafrole Isosafrole Isosafrol X X 120-71-8 p-Cresidine p-Crésidine p-Cresidina X 120-80-9 Catechol Catéchol Catecol X X 120-82-1 1,2,4-Trichlorobenzene 1,2,4-Trichlorobenzène 1,2,4-Triclorobenceno X X X 120-83-2 2,4-Dichlorophenol 2,4-Dichlorophénol 2,4-Diclorofenol X X 121-14-2 2,4-Dinitrotoluene 2,4-Dinitrotoluène 2,4-Dinitrotolueno X X X
* RETC list of chemicals for voluntary reporting in Section V of COA.
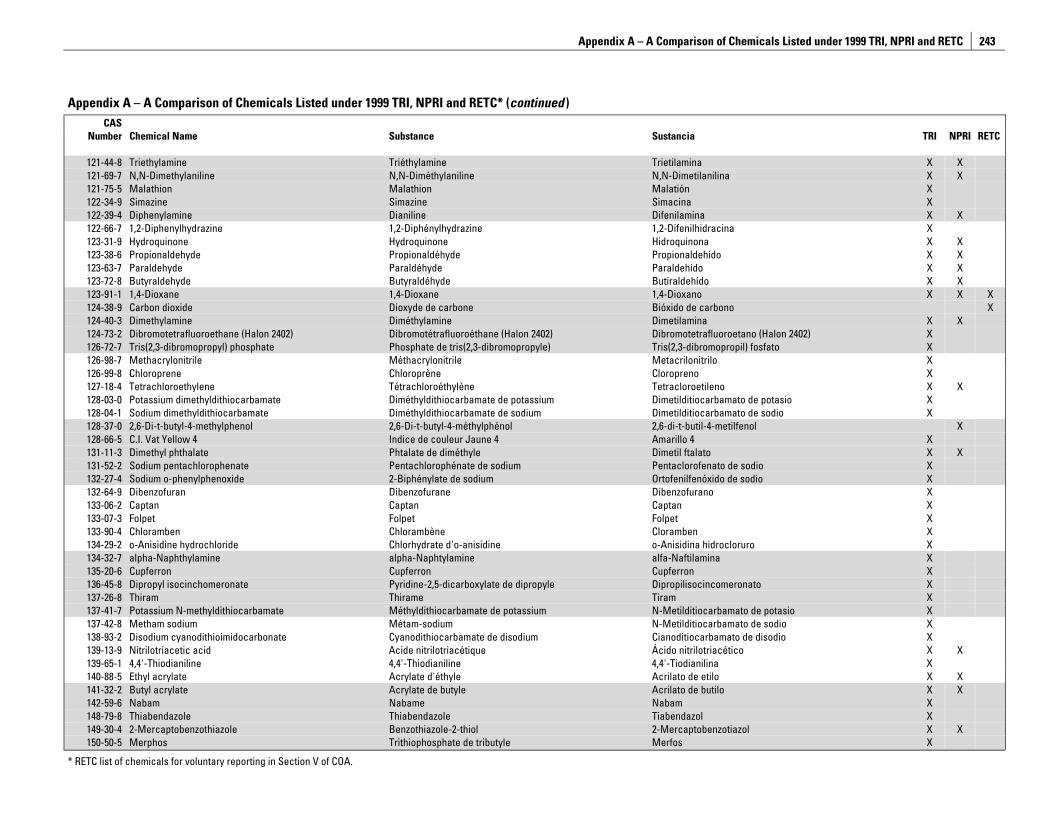
Appendix A – A Comparison of Chemicals Listed under 1999 TRI, NPRI and RETC
243
Appendix A – A Comparison of Chemicals Listed under 1999 TRI, NPRI and RETC* (continued ) CAS
Number Chemical Name Substance Sustancia TRI NPRI RETC
121-44-8 Triethylamine Triéthylamine Trietilamina X X 121-69-7 N,N-Dimethylaniline N,N-Diméthylaniline N,N-Dimetilanilina X X 121-75-5 Malathion Malathion Malatión X 122-34-9 Simazine Simazine Simacina X 122-39-4 Diphenylamine Dianiline Difenilamina X X 122-66-7 1,2-Diphenylhydrazine 1,2-Diphénylhydrazine 1,2-Difenilhidracina X 123-31-9 Hydroquinone Hydroquinone Hidroquinona X X 123-38-6 Propionaldehyde Propionaldéhyde Propionaldehído X X 123-63-7 Paraldehyde Paraldéhyde Paraldehído X X 123-72-8 Butyraldehyde Butyraldéhyde Butiraldehído X X 123-91-1 1,4-Dioxane 1,4-Dioxane 1,4-Dioxano X X X 124-38-9 Carbon dioxide Dioxyde de carbone Bióxido de carbono X 124-40-3 Dimethylamine Diméthylamine Dimetilamina X X 124-73-2 Dibromotetrafluoroethane (Halon 2402) Dibromotétrafluoroéthane (Halon 2402) Dibromotetrafluoroetano (Halon 2402) X 126-72-7 Tris(2,3-dibromopropyl) phosphate Phosphate de tris(2,3-dibromopropyle) Tris(2,3-dibromopropil) fosfato X 126-98-7 Methacrylonitrile Méthacrylonitrile Metacrilonitrilo X 126-99-8 Chloroprene Chloroprène Cloropreno X 127-18-4 Tetrachloroethylene Tétrachloroéthylène Tetracloroetileno X X 128-03-0 Potassium dimethyldithiocarbamate Diméthyldithiocarbamate de potassium Dimetilditiocarbamato de potasio X 128-04-1 Sodium dimethyldithiocarbamate Diméthyldithiocarbamate de sodium Dimetilditiocarbamato de sodio X 128-37-0 2,6-Di-t-butyl-4-methylphenol 2,6-Di-t-butyl-4-méthylphénol 2,6-di-t-butil-4-metilfenol X 128-66-5 C.I. Vat Yellow 4 Indice de couleur Jaune 4 Amarillo 4 X 131-11-3 Dimethyl phthalate Phtalate de diméthyle Dimetil ftalato X X 131-52-2 Sodium pentachlorophenate Pentachlorophénate de sodium Pentaclorofenato de sodio X 132-27-4 Sodium o-phenylphenoxide 2-Biphénylate de sodium Ortofenilfenóxido de sodio X 132-64-9 Dibenzofuran Dibenzofurane Dibenzofurano X 133-06-2 Captan Captan Captan X 133-07-3 Folpet Folpet Folpet X 133-90-4 Chloramben Chlorambène Cloramben X 134-29-2 o-Anisidine hydrochloride Chlorhydrate d'o-anisidine o-Anisidina hidrocloruro X 134-32-7 alpha-Naphthylamine alpha-Naphtylamine alfa-Naftilamina X 135-20-6 Cupferron Cupferron Cupferron X 136-45-8 Dipropyl isocinchomeronate Pyridine-2,5-dicarboxylate de dipropyle Dipropilisocincomeronato X 137-26-8 Thiram Thirame Tiram X 137-41-7 Potassium N-methyldithiocarbamate Méthyldithiocarbamate de potassium N-Metilditiocarbamato de potasio X 137-42-8 Metham sodium Métam-sodium N-Metilditiocarbamato de sodio X 138-93-2 Disodium cyanodithioimidocarbonate Cyanodithiocarbamate de disodium Cianoditiocarbamato de disodio X 139-13-9 Nitrilotriacetic acid Acide nitrilotriacétique Ácido nitrilotriacético X X 139-65-1 4,4'-Thiodianiline 4,4'-Thiodianiline 4,4'-Tiodianilina X 140-88-5 Ethyl acrylate Acrylate d'éthyle Acrilato de etilo X X 141-32-2 Butyl acrylate Acrylate de butyle Acrilato de butilo X X 142-59-6 Nabam Nabame Nabam X 148-79-8 Thiabendazole Thiabendazole Tiabendazol X 149-30-4 2-Mercaptobenzothiazole Benzothiazole-2-thiol 2-Mercaptobenzotiazol X X 150-50-5 Merphos Trithiophosphate de tributyle Merfos X
* RETC list of chemicals for voluntary reporting in Section V of COA.
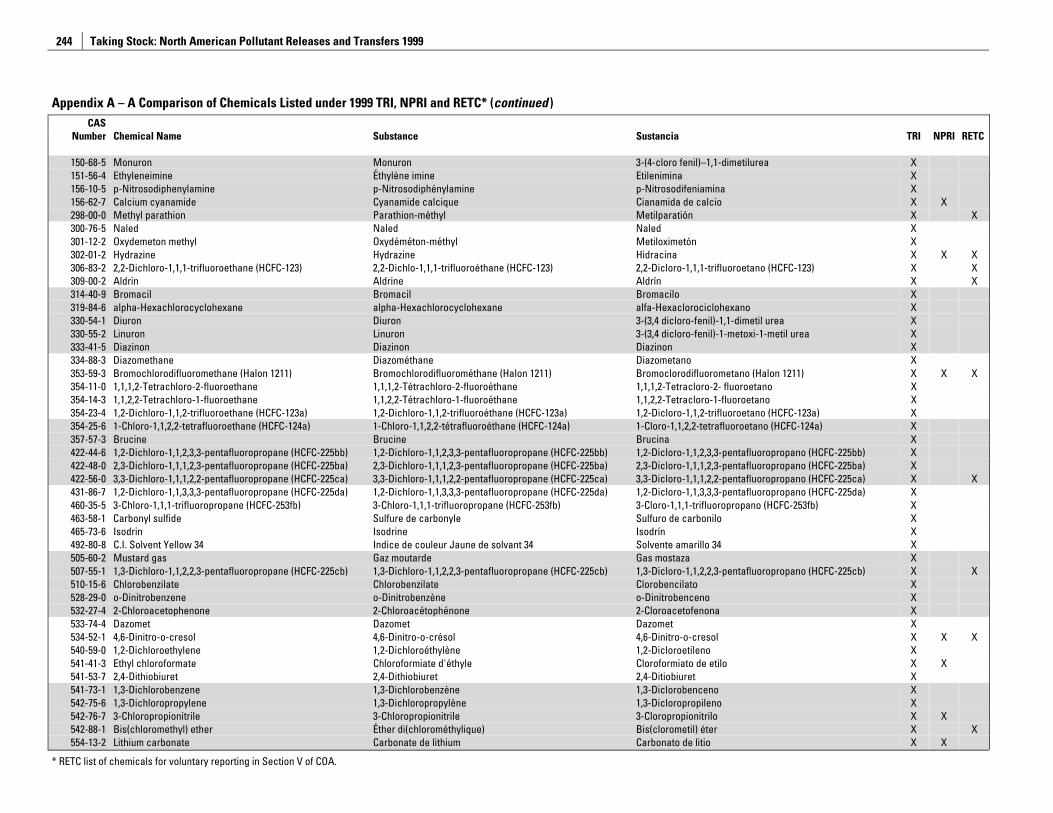
Taking Stock: North American Pollutant Releases and Transfers 1999
244
Appendix A – A Comparison of Chemicals Listed under 1999 TRI, NPRI and RETC* (continued ) CAS
Number Chemical Name Substance Sustancia TRI NPRI RETC
150-68-5 Monuron Monuron 3-(4-cloro fenil)–1,1-dimetilurea X 151-56-4 Ethyleneimine Éthylène imine Etilenimina X 156-10-5 p-Nitrosodiphenylamine p-Nitrosodiphénylamine p-Nitrosodifeniamina X 156-62-7 Calcium cyanamide Cyanamide calcique Cianamida de calcio X X 298-00-0 Methyl parathion Parathion-méthyl Metilparatión X X 300-76-5 Naled Naled Naled X 301-12-2 Oxydemeton methyl Oxydéméton-méthyl Metiloximetón X 302-01-2 Hydrazine Hydrazine Hidracina X X X 306-83-2 2,2-Dichloro-1,1,1-trifluoroethane (HCFC-123) 2,2-Dichlo-1,1,1-trifluoroéthane (HCFC-123) 2,2-Dicloro-1,1,1-trifluoroetano (HCFC-123) X X 309-00-2 Aldrin Aldrine Aldrín X X 314-40-9 Bromacil Bromacil Bromacilo X 319-84-6 alpha-Hexachlorocyclohexane alpha-Hexachlorocyclohexane alfa-Hexaclorociclohexano X 330-54-1 Diuron Diuron 3-(3,4 dicloro-fenil)-1,1-dimetil urea X 330-55-2 Linuron Linuron 3-(3,4 dicloro-fenil)-1-metoxi-1-metil urea X 333-41-5 Diazinon Diazinon Diazinon X 334-88-3 Diazomethane Diazométhane Diazometano X 353-59-3 Bromochlorodifluoromethane (Halon 1211) Bromochlorodifluorométhane (Halon 1211) Bromoclorodifluorometano (Halon 1211) X X X 354-11-0 1,1,1,2-Tetrachloro-2-fluoroethane 1,1,1,2-Tétrachloro-2-fluoroéthane 1,1,1,2-Tetracloro-2- fluoroetano X 354-14-3 1,1,2,2-Tetrachloro-1-fluoroethane 1,1,2,2-Tétrachloro-1-fluoroéthane 1,1,2,2-Tetracloro-1-fluoroetano X 354-23-4 1,2-Dichloro-1,1,2-trifluoroethane (HCFC-123a) 1,2-Dichloro-1,1,2-trifluoroéthane (HCFC-123a) 1,2-Dicloro-1,1,2-trifluoroetano (HCFC-123a) X 354-25-6 1-Chloro-1,1,2,2-tetrafluoroethane (HCFC-124a) 1-Chloro-1,1,2,2-tétrafluoroéthane (HCFC-124a) 1-Cloro-1,1,2,2-tetrafluoroetano (HCFC-124a) X 357-57-3 Brucine Brucine Brucina X 422-44-6 1,2-Dichloro-1,1,2,3,3-pentafluoropropane (HCFC-225bb) 1,2-Dichloro-1,1,2,3,3-pentafluoropropane (HCFC-225bb) 1,2-Dicloro-1,1,2,3,3-pentafluoropropano (HCFC-225bb) X 422-48-0 2,3-Dichloro-1,1,1,2,3-pentafluoropropane (HCFC-225ba) 2,3-Dichloro-1,1,1,2,3-pentafluoropropane (HCFC-225ba) 2,3-Dicloro-1,1,1,2,3-pentafluoropropano (HCFC-225ba) X 422-56-0 3,3-Dichloro-1,1,1,2,2-pentafluoropropane (HCFC-225ca) 3,3-Dichloro-1,1,1,2,2-pentafluoropropane (HCFC-225ca) 3,3-Dicloro-1,1,1,2,2-pentafluoropropano (HCFC-225ca) X X 431-86-7 1,2-Dichloro-1,1,3,3,3-pentafluoropropane (HCFC-225da) 1,2-Dichloro-1,1,3,3,3-pentafluoropropane (HCFC-225da) 1,2-Dicloro-1,1,3,3,3-pentafluoropropano (HCFC-225da) X 460-35-5 3-Chloro-1,1,1-trifluoropropane (HCFC-253fb) 3-Chloro-1,1,1-trifluoropropane (HCFC-253fb) 3-Cloro-1,1,1-trifluoropropano (HCFC-253fb) X 463-58-1 Carbonyl sulfide Sulfure de carbonyle Sulfuro de carbonilo X 465-73-6 Isodrin Isodrine Isodrín X 492-80-8 C.I. Solvent Yellow 34 Indice de couleur Jaune de solvant 34 Solvente amarillo 34 X 505-60-2 Mustard gas Gaz moutarde Gas mostaza X 507-55-1 1,3-Dichloro-1,1,2,2,3-pentafluoropropane (HCFC-225cb) 1,3-Dichloro-1,1,2,2,3-pentafluoropropane (HCFC-225cb) 1,3-Dicloro-1,1,2,2,3-pentafluoropropano (HCFC-225cb) X X 510-15-6 Chlorobenzilate Chlorobenzilate Clorobencilato X 528-29-0 o-Dinitrobenzene o-Dinitrobenzène o-Dinitrobenceno X 532-27-4 2-Chloroacetophenone 2-Chloroacétophénone 2-Cloroacetofenona X 533-74-4 Dazomet Dazomet Dazomet X 534-52-1 4,6-Dinitro-o-cresol 4,6-Dinitro-o-crésol 4,6-Dinitro-o-cresol X X X 540-59-0 1,2-Dichloroethylene 1,2-Dichloroéthylène 1,2-Dicloroetileno X 541-41-3 Ethyl chloroformate Chloroformiate d'éthyle Cloroformiato de etilo X X 541-53-7 2,4-Dithiobiuret 2,4-Dithiobiuret 2,4-Ditiobiuret X 541-73-1 1,3-Dichlorobenzene 1,3-Dichlorobenzène 1,3-Diclorobenceno X 542-75-6 1,3-Dichloropropylene 1,3-Dichloropropylène 1,3-Dicloropropileno X 542-76-7 3-Chloropropionitrile 3-Chloropropionitrile 3-Cloropropionitrilo X X 542-88-1 Bis(chloromethyl) ether Éther di(chlorométhylique) Bis(clorometil) éter X X 554-13-2 Lithium carbonate Carbonate de lithium Carbonato de litio X X
* RETC list of chemicals for voluntary reporting in Section V of COA.
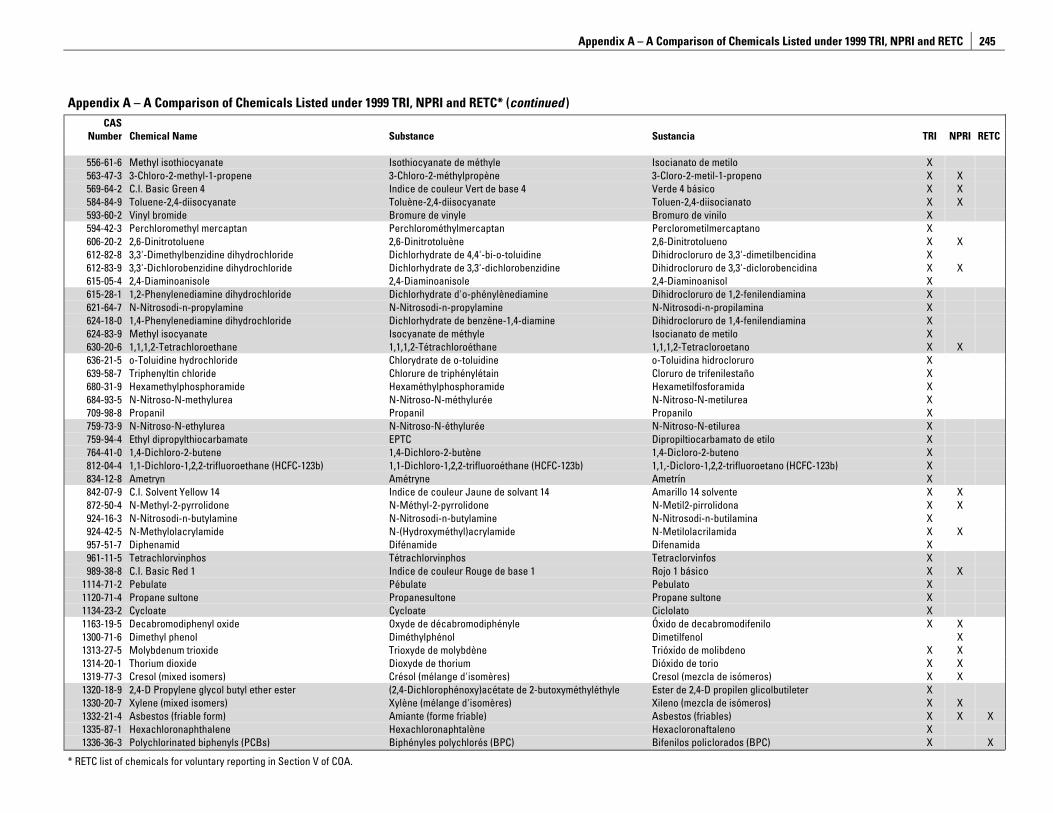
Appendix A – A Comparison of Chemicals Listed under 1999 TRI, NPRI and RETC
245
Appendix A – A Comparison of Chemicals Listed under 1999 TRI, NPRI and RETC* (continued ) CAS
Number Chemical Name Substance Sustancia TRI NPRI RETC
556-61-6 Methyl isothiocyanate Isothiocyanate de méthyle Isocianato de metilo X 563-47-3 3-Chloro-2-methyl-1-propene 3-Chloro-2-méthylpropène 3-Cloro-2-metil-1-propeno X X 569-64-2 C.I. Basic Green 4 Indice de couleur Vert de base 4 Verde 4 básico X X 584-84-9 Toluene-2,4-diisocyanate Toluène-2,4-diisocyanate Toluen-2,4-diisocianato X X 593-60-2 Vinyl bromide Bromure de vinyle Bromuro de vinilo X 594-42-3 Perchloromethyl mercaptan Perchlorométhylmercaptan Perclorometilmercaptano X 606-20-2 2,6-Dinitrotoluene 2,6-Dinitrotoluène 2,6-Dinitrotolueno X X 612-82-8 3,3'-Dimethylbenzidine dihydrochloride Dichlorhydrate de 4,4'-bi-o-toluidine Dihidrocloruro de 3,3'-dimetilbencidina X 612-83-9 3,3'-Dichlorobenzidine dihydrochloride Dichlorhydrate de 3,3'-dichlorobenzidine Dihidrocloruro de 3,3'-diclorobencidina X X 615-05-4 2,4-Diaminoanisole 2,4-Diaminoanisole 2,4-Diaminoanisol X 615-28-1 1,2-Phenylenediamine dihydrochloride Dichlorhydrate d'o-phénylènediamine Dihidrocloruro de 1,2-fenilendiamina X 621-64-7 N-Nitrosodi-n-propylamine N-Nitrosodi-n-propylamine N-Nitrosodi-n-propilamina X 624-18-0 1,4-Phenylenediamine dihydrochloride Dichlorhydrate de benzène-1,4-diamine Dihidrocloruro de 1,4-fenilendiamina X 624-83-9 Methyl isocyanate Isocyanate de méthyle Isocianato de metilo X 630-20-6 1,1,1,2-Tetrachloroethane 1,1,1,2-Tétrachloroéthane 1,1,1,2-Tetracloroetano X X 636-21-5 o-Toluidine hydrochloride Chlorydrate de o-toluidine o-Toluidina hidrocloruro X 639-58-7 Triphenyltin chloride Chlorure de triphénylétain Cloruro de trifenilestaño X 680-31-9 Hexamethylphosphoramide Hexaméthylphosphoramide Hexametilfosforamida X 684-93-5 N-Nitroso-N-methylurea N-Nitroso-N-méthylurée N-Nitroso-N-metilurea X 709-98-8 Propanil Propanil Propanilo X 759-73-9 N-Nitroso-N-ethylurea N-Nitroso-N-éthylurée N-Nitroso-N-etilurea X 759-94-4 Ethyl dipropylthiocarbamate EPTC Dipropiltiocarbamato de etilo X 764-41-0 1,4-Dichloro-2-butene 1,4-Dichloro-2-butène 1,4-Dicloro-2-buteno X 812-04-4 1,1-Dichloro-1,2,2-trifluoroethane (HCFC-123b) 1,1-Dichloro-1,2,2-trifluoroéthane (HCFC-123b) 1,1,-Dicloro-1,2,2-trifluoroetano (HCFC-123b) X 834-12-8 Ametryn Amétryne Ametrín X 842-07-9 C.I. Solvent Yellow 14 Indice de couleur Jaune de solvant 14 Amarillo 14 solvente X X 872-50-4 N-Methyl-2-pyrrolidone N-Méthyl-2-pyrrolidone N-Metil2-pirrolidona X X 924-16-3 N-Nitrosodi-n-butylamine N-Nitrosodi-n-butylamine N-Nitrosodi-n-butilamina X 924-42-5 N-Methylolacrylamide N-(Hydroxyméthyl)acrylamide N-Metilolacrilamida X X 957-51-7 Diphenamid Difénamide Difenamida X 961-11-5 Tetrachlorvinphos Tétrachlorvinphos Tetraclorvinfos X 989-38-8 C.I. Basic Red 1 Indice de couleur Rouge de base 1 Rojo 1 básico X X
1114-71-2 Pebulate Pébulate Pebulato X 1120-71-4 Propane sultone Propanesultone Propane sultone X 1134-23-2 Cycloate Cycloate Ciclolato X 1163-19-5 Decabromodiphenyl oxide Oxyde de décabromodiphényle Óxido de decabromodifenilo X X 1300-71-6 Dimethyl phenol Diméthylphénol Dimetilfenol X 1313-27-5 Molybdenum trioxide Trioxyde de molybdène Trióxido de molibdeno X X 1314-20-1 Thorium dioxide Dioxyde de thorium Dióxido de torio X X 1319-77-3 Cresol (mixed isomers) Crésol (mélange d'isomères) Cresol (mezcla de isómeros) X X 1320-18-9 2,4-D Propylene glycol butyl ether ester (2,4-Dichlorophénoxy)acétate de 2-butoxyméthyléthyle Ester de 2,4-D propilen glicolbutileter X 1330-20-7 Xylene (mixed isomers) Xylène (mélange d'isomères) Xileno (mezcla de isómeros) X X 1332-21-4 Asbestos (friable form) Amiante (forme friable) Asbestos (friables) X X X 1335-87-1 Hexachloronaphthalene Hexachloronaphtalène Hexacloronaftaleno X 1336-36-3 Polychlorinated biphenyls (PCBs) Biphényles polychlorés (BPC) Bifenilos policlorados (BPC) X X
* RETC list of chemicals for voluntary reporting in Section V of COA.
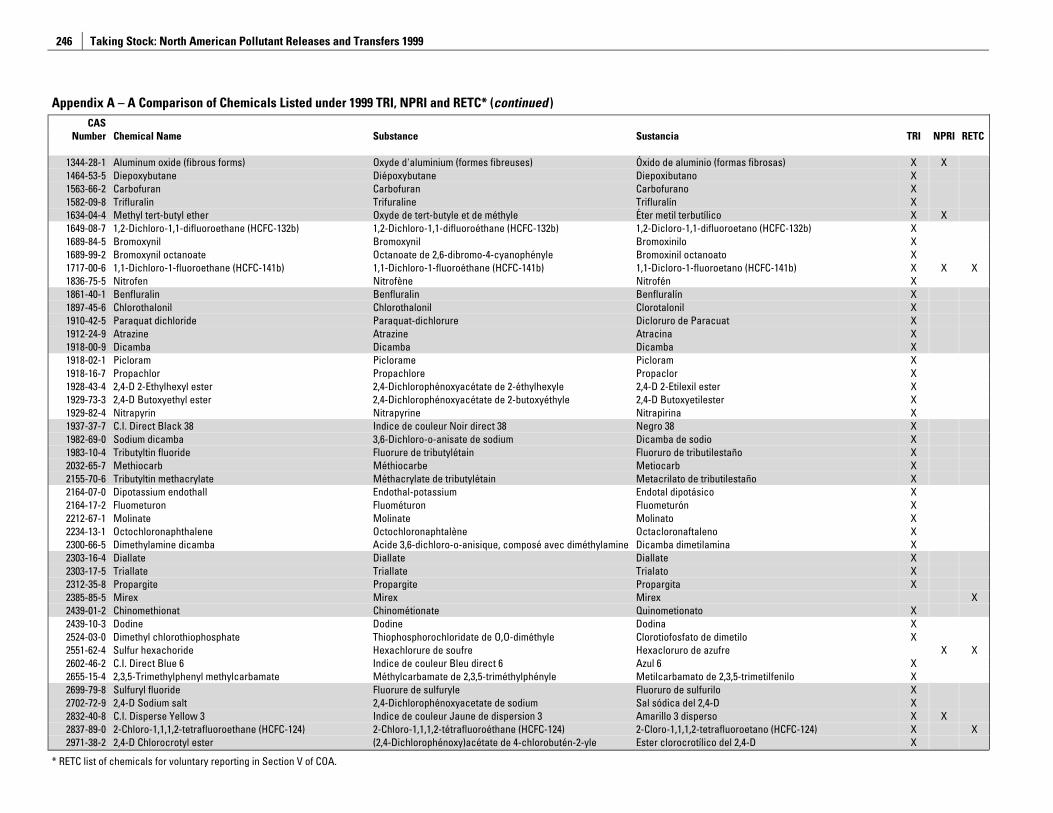
Taking Stock: North American Pollutant Releases and Transfers 1999
246
Appendix A – A Comparison of Chemicals Listed under 1999 TRI, NPRI and RETC* (continued ) CAS
Number Chemical Name Substance Sustancia TRI NPRI RETC
1344-28-1 Aluminum oxide (fibrous forms) Oxyde d'aluminium (formes fibreuses) Óxido de aluminio (formas fibrosas) X X 1464-53-5 Diepoxybutane Diépoxybutane Diepoxibutano X 1563-66-2 Carbofuran Carbofuran Carbofurano X 1582-09-8 Trifluralin Trifuraline Trifluralín X 1634-04-4 Methyl tert-butyl ether Oxyde de tert-butyle et de méthyle Éter metil terbutílico X X 1649-08-7 1,2-Dichloro-1,1-difluoroethane (HCFC-132b) 1,2-Dichloro-1,1-difluoroéthane (HCFC-132b) 1,2-Dicloro-1,1-difluoroetano (HCFC-132b) X 1689-84-5 Bromoxynil Bromoxynil Bromoxinilo X 1689-99-2 Bromoxynil octanoate Octanoate de 2,6-dibromo-4-cyanophényle Bromoxinil octanoato X 1717-00-6 1,1-Dichloro-1-fluoroethane (HCFC-141b) 1,1-Dichloro-1-fluoroéthane (HCFC-141b) 1,1-Dicloro-1-fluoroetano (HCFC-141b) X X X 1836-75-5 Nitrofen Nitrofène Nitrofén X 1861-40-1 Benfluralin Benfluralin Benfluralín X 1897-45-6 Chlorothalonil Chlorothalonil Clorotalonil X 1910-42-5 Paraquat dichloride Paraquat-dichlorure Dicloruro de Paracuat X 1912-24-9 Atrazine Atrazine Atracina X 1918-00-9 Dicamba Dicamba Dicamba X 1918-02-1 Picloram Piclorame Picloram X 1918-16-7 Propachlor Propachlore Propaclor X 1928-43-4 2,4-D 2-Ethylhexyl ester 2,4-Dichlorophénoxyacétate de 2-éthylhexyle 2,4-D 2-Etilexil ester X 1929-73-3 2,4-D Butoxyethyl ester 2,4-Dichlorophénoxyacétate de 2-butoxyéthyle 2,4-D Butoxyetilester X 1929-82-4 Nitrapyrin Nitrapyrine Nitrapirina X 1937-37-7 C.I. Direct Black 38 Indice de couleur Noir direct 38 Negro 38 X 1982-69-0 Sodium dicamba 3,6-Dichloro-o-anisate de sodium Dicamba de sodio X 1983-10-4 Tributyltin fluoride Fluorure de tributylétain Fluoruro de tributilestaño X 2032-65-7 Methiocarb Méthiocarbe Metiocarb X 2155-70-6 Tributyltin methacrylate Méthacrylate de tributylétain Metacrilato de tributilestaño X 2164-07-0 Dipotassium endothall Endothal-potassium Endotal dipotásico X 2164-17-2 Fluometuron Fluométuron Fluometurón X 2212-67-1 Molinate Molinate Molinato X 2234-13-1 Octochloronaphthalene Octochloronaphtalène Octacloronaftaleno X 2300-66-5 Dimethylamine dicamba Acide 3,6-dichloro-o-anisique, composé avec diméthylamine Dicamba dimetilamina X 2303-16-4 Diallate Diallate Diallate X 2303-17-5 Triallate Triallate Trialato X 2312-35-8 Propargite Propargite Propargita X 2385-85-5 Mirex Mirex Mirex X 2439-01-2 Chinomethionat Chinométionate Quinometionato X 2439-10-3 Dodine Dodine Dodina X 2524-03-0 Dimethyl chlorothiophosphate Thiophosphorochloridate de O,O-diméthyle Clorotiofosfato de dimetilo X 2551-62-4 Sulfur hexachoride Hexachlorure de soufre Hexacloruro de azufre X X 2602-46-2 C.I. Direct Blue 6 Indice de couleur Bleu direct 6 Azul 6 X 2655-15-4 2,3,5-Trimethylphenyl methylcarbamate Méthylcarbamate de 2,3,5-triméthylphényle Metilcarbamato de 2,3,5-trimetilfenilo X 2699-79-8 Sulfuryl fluoride Fluorure de sulfuryle Fluoruro de sulfurilo X 2702-72-9 2,4-D Sodium salt 2,4-Dichlorophénoxyacetate de sodium Sal sódica del 2,4-D X 2832-40-8 C.I. Disperse Yellow 3 Indice de couleur Jaune de dispersion 3 Amarillo 3 disperso X X 2837-89-0 2-Chloro-1,1,1,2-tetrafluoroethane (HCFC-124) 2-Chloro-1,1,1,2-tétrafluoroéthane (HCFC-124) 2-Cloro-1,1,1,2-tetrafluoroetano (HCFC-124) X X 2971-38-2 2,4-D Chlorocrotyl ester (2,4-Dichlorophénoxy)acétate de 4-chlorobutén-2-yle Ester clorocrotílico del 2,4-D X
* RETC list of chemicals for voluntary reporting in Section V of COA.
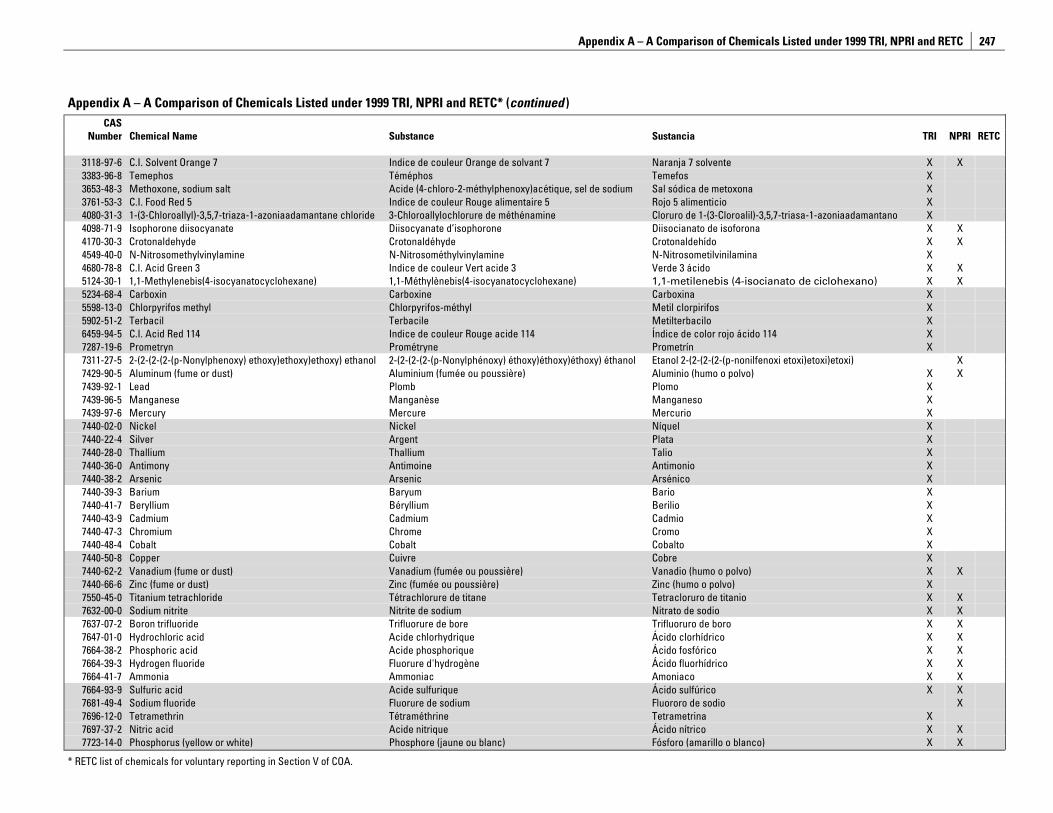
Appendix A – A Comparison of Chemicals Listed under 1999 TRI, NPRI and RETC
247
Appendix A – A Comparison of Chemicals Listed under 1999 TRI, NPRI and RETC* (continued ) CAS
Number Chemical Name Substance Sustancia TRI NPRI RETC
3118-97-6 C.I. Solvent Orange 7 Indice de couleur Orange de solvant 7 Naranja 7 solvente X X 3383-96-8 Temephos Téméphos Temefos X 3653-48-3 Methoxone, sodium salt Acide (4-chloro-2-méthylphenoxy)acétique, sel de sodium Sal sódica de metoxona X 3761-53-3 C.I. Food Red 5 Indice de couleur Rouge alimentaire 5 Rojo 5 alimenticio X 4080-31-3 1-(3-Chloroallyl)-3,5,7-triaza-1-azoniaadamantane chloride 3-Chloroallylochlorure de méthénamine Cloruro de 1-(3-Cloroalil)-3,5,7-triasa-1-azoniaadamantano X 4098-71-9 Isophorone diisocyanate Diisocyanate d’isophorone Diisocianato de isoforona X X 4170-30-3 Crotonaldehyde Crotonaldéhyde Crotonaldehído X X 4549-40-0 N-Nitrosomethylvinylamine N-Nitrosométhylvinylamine N-Nitrosometilvinilamina X 4680-78-8 C.I. Acid Green 3 Indice de couleur Vert acide 3 Verde 3 ácido X X 5124-30-1 1,1-Methylenebis(4-isocyanatocyclohexane) 1,1-Méthylènebis(4-isocyanatocyclohexane) 1,1-metilenebis (4-isocianato de ciclohexano) X X 5234-68-4 Carboxin Carboxine Carboxina X 5598-13-0 Chlorpyrifos methyl Chlorpyrifos-méthyl Metil clorpirifos X 5902-51-2 Terbacil Terbacile Metilterbacilo X 6459-94-5 C.I. Acid Red 114 Indice de couleur Rouge acide 114 Índice de color rojo ácido 114 X 7287-19-6 Prometryn Prométryne Prometrín X 7311-27-5 2-(2-(2-(2-(p-Nonylphenoxy) ethoxy)ethoxy)ethoxy) ethanol 2-(2-(2-(2-(p-Nonylphénoxy) éthoxy)éthoxy)éthoxy) éthanol Etanol 2-(2-(2-(2-(p-nonilfenoxi etoxi)etoxi)etoxi) X 7429-90-5 Aluminum (fume or dust) Aluminium (fumée ou poussière) Aluminio (humo o polvo) X X 7439-92-1 Lead Plomb Plomo X 7439-96-5 Manganese Manganèse Manganeso X 7439-97-6 Mercury Mercure Mercurio X 7440-02-0 Nickel Nickel Níquel X 7440-22-4 Silver Argent Plata X 7440-28-0 Thallium Thallium Talio X 7440-36-0 Antimony Antimoine Antimonio X 7440-38-2 Arsenic Arsenic Arsénico X 7440-39-3 Barium Baryum Bario X 7440-41-7 Beryllium Béryllium Berilio X 7440-43-9 Cadmium Cadmium Cadmio X 7440-47-3 Chromium Chrome Cromo X 7440-48-4 Cobalt Cobalt Cobalto X 7440-50-8 Copper Cuivre Cobre X 7440-62-2 Vanadium (fume or dust) Vanadium (fumée ou poussière) Vanadio (humo o polvo) X X 7440-66-6 Zinc (fume or dust) Zinc (fumée ou poussière) Zinc (humo o polvo) X 7550-45-0 Titanium tetrachloride Tétrachlorure de titane Tetracloruro de titanio X X 7632-00-0 Sodium nitrite Nitrite de sodium Nitrato de sodio X X 7637-07-2 Boron trifluoride Trifluorure de bore Trifluoruro de boro X X 7647-01-0 Hydrochloric acid Acide chlorhydrique Ácido clorhídrico X X 7664-38-2 Phosphoric acid Acide phosphorique Ácido fosfórico X X 7664-39-3 Hydrogen fluoride Fluorure d'hydrogène Ácido fluorhídrico X X 7664-41-7 Ammonia Ammoniac Amoniaco X X 7664-93-9 Sulfuric acid Acide sulfurique Ácido sulfúrico X X 7681-49-4 Sodium fluoride Fluorure de sodium Fluororo de sodio X 7696-12-0 Tetramethrin Tétraméthrine Tetrametrina X 7697-37-2 Nitric acid Acide nitrique Ácido nítrico X X 7723-14-0 Phosphorus (yellow or white) Phosphore (jaune ou blanc) Fósforo (amarillo o blanco) X X
* RETC list of chemicals for voluntary reporting in Section V of COA.
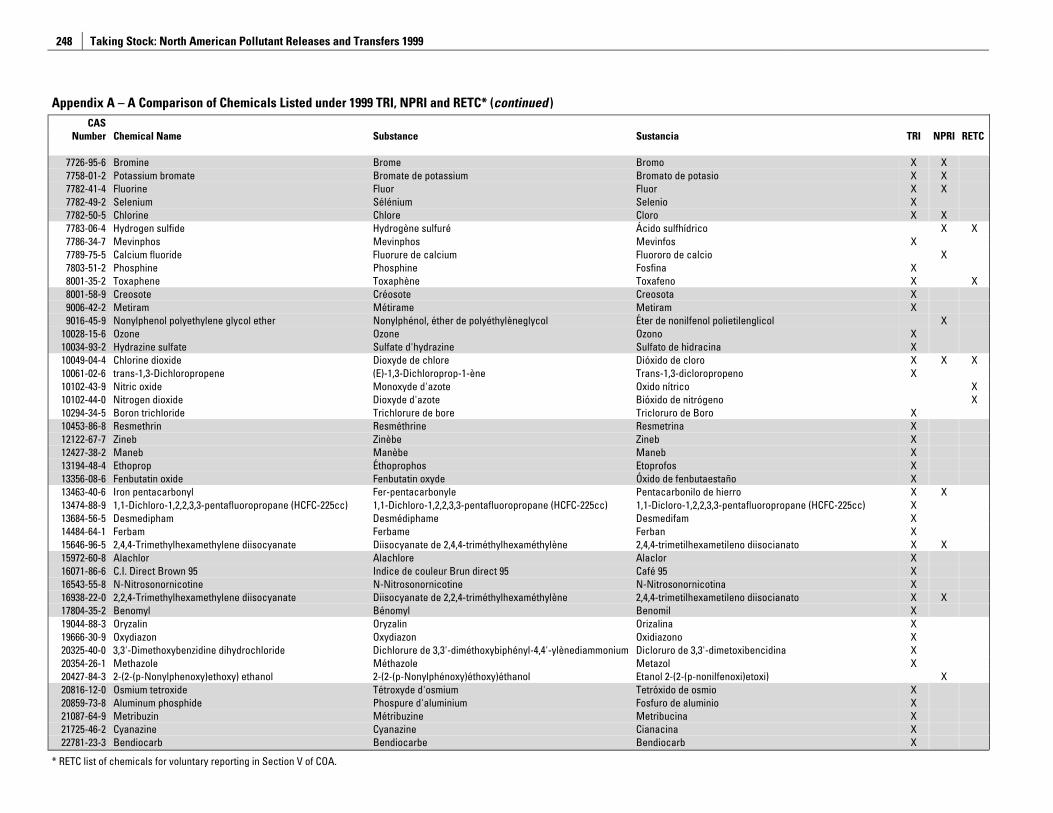
Taking Stock: North American Pollutant Releases and Transfers 1999
248
Appendix A – A Comparison of Chemicals Listed under 1999 TRI, NPRI and RETC* (continued ) CAS
Number Chemical Name Substance Sustancia TRI NPRI RETC
7726-95-6 Bromine Brome Bromo X X 7758-01-2 Potassium bromate Bromate de potassium Bromato de potasio X X 7782-41-4 Fluorine Fluor Fluor X X 7782-49-2 Selenium Sélénium Selenio X 7782-50-5 Chlorine Chlore Cloro X X 7783-06-4 Hydrogen sulfide Hydrogène sulfuré Ácido sulfhídrico X X 7786-34-7 Mevinphos Mevinphos Mevinfos X 7789-75-5 Calcium fluoride Fluorure de calcium Fluororo de calcio X 7803-51-2 Phosphine Phosphine Fosfina X 8001-35-2 Toxaphene Toxaphène Toxafeno X X 8001-58-9 Creosote Créosote Creosota X 9006-42-2 Metiram Métirame Metiram X 9016-45-9 Nonylphenol polyethylene glycol ether Nonylphénol, éther de polyéthylèneglycol Éter de nonilfenol polietilenglicol X
10028-15-6 Ozone Ozone Ozono X 10034-93-2 Hydrazine sulfate Sulfate d'hydrazine Sulfato de hidracina X 10049-04-4 Chlorine dioxide Dioxyde de chlore Dióxido de cloro X X X 10061-02-6 trans-1,3-Dichloropropene (E)-1,3-Dichloroprop-1-ène Trans-1,3-dicloropropeno X 10102-43-9 Nitric oxide Monoxyde d'azote Oxido nítrico X 10102-44-0 Nitrogen dioxide Dioxyde d'azote Bióxido de nitrógeno X 10294-34-5 Boron trichloride Trichlorure de bore Tricloruro de Boro X 10453-86-8 Resmethrin Resméthrine Resmetrina X 12122-67-7 Zineb Zinèbe Zineb X 12427-38-2 Maneb Manèbe Maneb X 13194-48-4 Ethoprop Éthoprophos Etoprofos X 13356-08-6 Fenbutatin oxide Fenbutatin oxyde Óxido de fenbutaestaño X 13463-40-6 Iron pentacarbonyl Fer-pentacarbonyle Pentacarbonilo de hierro X X 13474-88-9 1,1-Dichloro-1,2,2,3,3-pentafluoropropane (HCFC-225cc) 1,1-Dichloro-1,2,2,3,3-pentafluoropropane (HCFC-225cc) 1,1-Dicloro-1,2,2,3,3-pentafluoropropane (HCFC-225cc) X 13684-56-5 Desmedipham Desmédiphame Desmedifam X 14484-64-1 Ferbam Ferbame Ferban X 15646-96-5 2,4,4-Trimethylhexamethylene diisocyanate Diisocyanate de 2,4,4-triméthylhexaméthylène 2,4,4-trimetilhexametileno diisocianato X X 15972-60-8 Alachlor Alachlore Alaclor X 16071-86-6 C.I. Direct Brown 95 Indice de couleur Brun direct 95 Café 95 X 16543-55-8 N-Nitrosonornicotine N-Nitrosonornicotine N-Nitrosonornicotina X 16938-22-0 2,2,4-Trimethylhexamethylene diisocyanate Diisocyanate de 2,2,4-triméthylhexaméthylène 2,4,4-trimetilhexametileno diisocianato X X 17804-35-2 Benomyl Bénomyl Benomil X 19044-88-3 Oryzalin Oryzalin Orizalina X 19666-30-9 Oxydiazon Oxydiazon Oxidiazono X 20325-40-0 3,3'-Dimethoxybenzidine dihydrochloride Dichlorure de 3,3'-diméthoxybiphényl-4,4'-ylènediammonium Dicloruro de 3,3'-dimetoxibencidina X 20354-26-1 Methazole Méthazole Metazol X 20427-84-3 2-(2-(p-Nonylphenoxy)ethoxy) ethanol 2-(2-(p-Nonylphénoxy)éthoxy)éthanol Etanol 2-(2-(p-nonilfenoxi)etoxi) X 20816-12-0 Osmium tetroxide Tétroxyde d'osmium Tetróxido de osmio X 20859-73-8 Aluminum phosphide Phospure d'aluminium Fosfuro de aluminio X 21087-64-9 Metribuzin Métribuzine Metribucina X 21725-46-2 Cyanazine Cyanazine Cianacina X 22781-23-3 Bendiocarb Bendiocarbe Bendiocarb X
* RETC list of chemicals for voluntary reporting in Section V of COA.
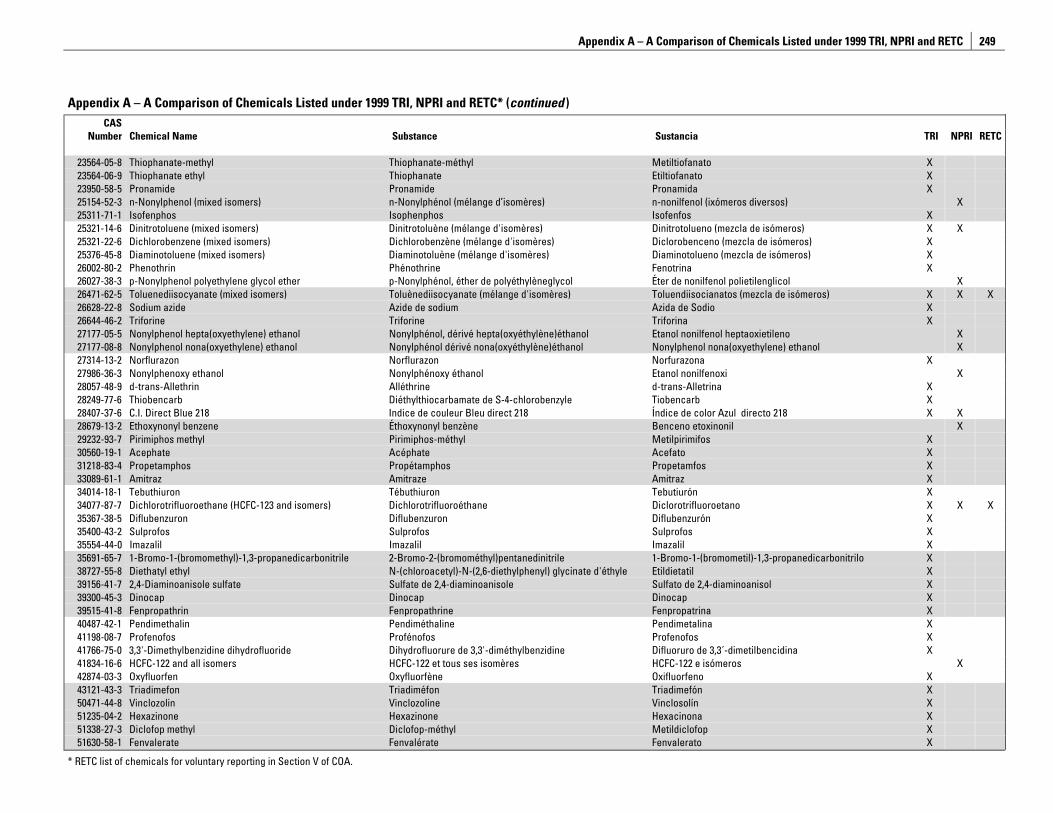
Appendix A – A Comparison of Chemicals Listed under 1999 TRI, NPRI and RETC
249
Appendix A – A Comparison of Chemicals Listed under 1999 TRI, NPRI and RETC* (continued ) CAS
Number Chemical Name Substance Sustancia TRI NPRI RETC
23564-05-8 Thiophanate-methyl Thiophanate-méthyl Metiltiofanato X 23564-06-9 Thiophanate ethyl Thiophanate Etiltiofanato X 23950-58-5 Pronamide Pronamide Pronamida X 25154-52-3 n-Nonylphenol (mixed isomers) n-Nonylphénol (mélange d’isomères) n-nonilfenol (ixómeros diversos) X 25311-71-1 Isofenphos Isophenphos Isofenfos X 25321-14-6 Dinitrotoluene (mixed isomers) Dinitrotoluène (mélange d'isomères) Dinitrotolueno (mezcla de isómeros) X X 25321-22-6 Dichlorobenzene (mixed isomers) Dichlorobenzène (mélange d'isomères) Diclorobenceno (mezcla de isómeros) X 25376-45-8 Diaminotoluene (mixed isomers) Diaminotoluène (mélange d'isomères) Diaminotolueno (mezcla de isómeros) X 26002-80-2 Phenothrin Phénothrine Fenotrina X 26027-38-3 p-Nonylphenol polyethylene glycol ether p-Nonylphénol, éther de polyéthylèneglycol Éter de nonilfenol polietilenglicol X 26471-62-5 Toluenediisocyanate (mixed isomers) Toluènediisocyanate (mélange d'isomères) Toluendiisocianatos (mezcla de isómeros) X X X 26628-22-8 Sodium azide Azide de sodium Azida de Sodio X 26644-46-2 Triforine Triforine Triforina X 27177-05-5 Nonylphenol hepta(oxyethylene) ethanol Nonylphénol, dérivé hepta(oxyéthylène)éthanol Etanol nonilfenol heptaoxietileno X 27177-08-8 Nonylphenol nona(oxyethylene) ethanol Nonylphénol dérivé nona(oxyéthylène)éthanol Nonylphenol nona(oxyethylene) ethanol X 27314-13-2 Norflurazon Norflurazon Norfurazona X 27986-36-3 Nonylphenoxy ethanol Nonylphénoxy éthanol Etanol nonilfenoxi X 28057-48-9 d-trans-Allethrin Alléthrine d-trans-Alletrina X 28249-77-6 Thiobencarb Diéthylthiocarbamate de S-4-chlorobenzyle Tiobencarb X 28407-37-6 C.I. Direct Blue 218 Indice de couleur Bleu direct 218 Índice de color Azul directo 218 X X 28679-13-2 Ethoxynonyl benzene Éthoxynonyl benzène Benceno etoxinonil X 29232-93-7 Pirimiphos methyl Pirimiphos-méthyl Metilpirimifos X 30560-19-1 Acephate Acéphate Acefato X 31218-83-4 Propetamphos Propétamphos Propetamfos X 33089-61-1 Amitraz Amitraze Amitraz X 34014-18-1 Tebuthiuron Tébuthiuron Tebutiurón X 34077-87-7 Dichlorotrifluoroethane (HCFC-123 and isomers) Dichlorotrifluoroéthane Diclorotrifluoroetano X X X 35367-38-5 Diflubenzuron Diflubenzuron Diflubenzurón X 35400-43-2 Sulprofos Sulprofos Sulprofos X 35554-44-0 Imazalil Imazalil Imazalil X 35691-65-7 1-Bromo-1-(bromomethyl)-1,3-propanedicarbonitrile 2-Bromo-2-(bromométhyl)pentanedinitrile 1-Bromo-1-(bromometil)-1,3-propanedicarbonitrilo X 38727-55-8 Diethatyl ethyl N-(chloroacetyl)-N-(2,6-diethylphenyl) glycinate d'éthyle Etildietatil X 39156-41-7 2,4-Diaminoanisole sulfate Sulfate de 2,4-diaminoanisole Sulfato de 2,4-diaminoanisol X 39300-45-3 Dinocap Dinocap Dinocap X 39515-41-8 Fenpropathrin Fenpropathrine Fenpropatrina X 40487-42-1 Pendimethalin Pendiméthaline Pendimetalina X 41198-08-7 Profenofos Profénofos Profenofos X 41766-75-0 3,3'-Dimethylbenzidine dihydrofluoride Dihydrofluorure de 3,3'-diméthylbenzidine Difluoruro de 3,3´-dimetilbencidina X 41834-16-6 HCFC-122 and all isomers HCFC-122 et tous ses isomères HCFC-122 e isómeros X 42874-03-3 Oxyfluorfen Oxyfluorfène Oxifluorfeno X 43121-43-3 Triadimefon Triadiméfon Triadimefón X 50471-44-8 Vinclozolin Vinclozoline Vinclosolín X 51235-04-2 Hexazinone Hexazinone Hexacinona X 51338-27-3 Diclofop methyl Diclofop-méthyl Metildiclofop X 51630-58-1 Fenvalerate Fenvalérate Fenvalerato X
* RETC list of chemicals for voluntary reporting in Section V of COA.
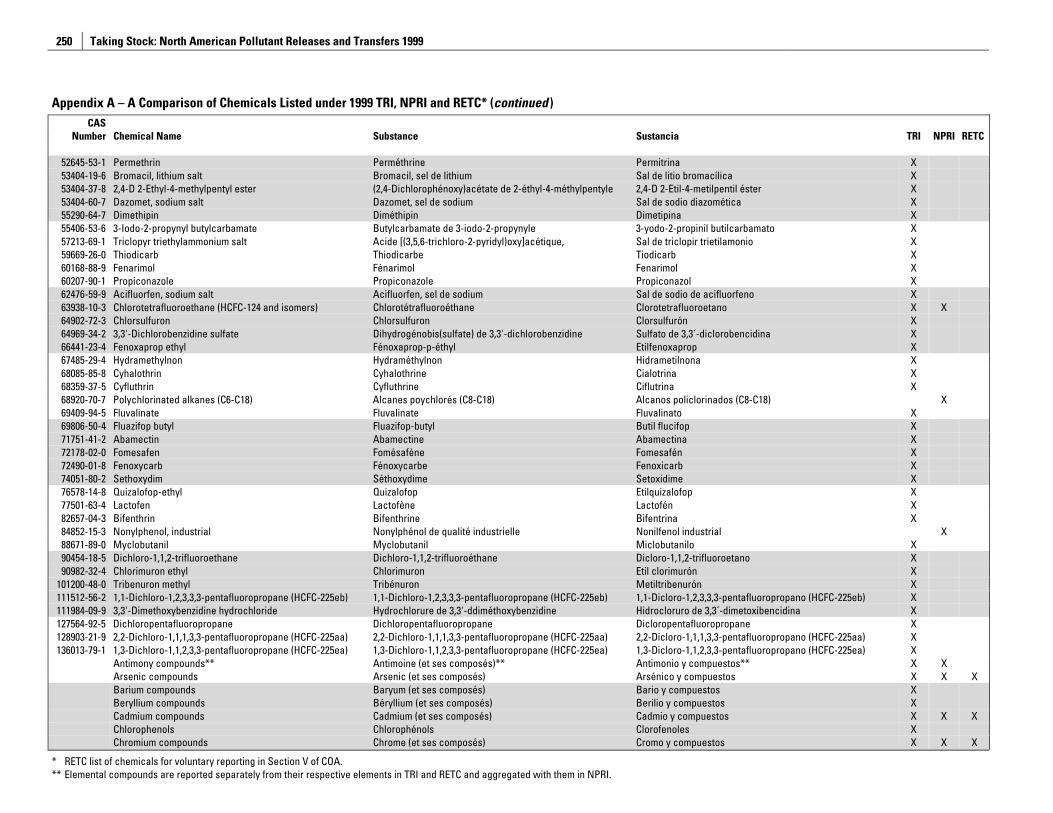
Taking Stock: North American Pollutant Releases and Transfers 1999
250
Appendix A – A Comparison of Chemicals Listed under 1999 TRI, NPRI and RETC* (continued ) CAS
Number Chemical Name Substance Sustancia TRI NPRI RETC
52645-53-1 Permethrin Perméthrine Permitrina X 53404-19-6 Bromacil, lithium salt Bromacil, sel de lithium Sal de litio bromacílica X 53404-37-8 2,4-D 2-Ethyl-4-methylpentyl ester (2,4-Dichlorophénoxy)acétate de 2-éthyl-4-méthylpentyle 2,4-D 2-Etil-4-metilpentil éster X 53404-60-7 Dazomet, sodium salt Dazomet, sel de sodium Sal de sodio diazomética X 55290-64-7 Dimethipin Diméthipin Dimetipina X 55406-53-6 3-Iodo-2-propynyl butylcarbamate Butylcarbamate de 3-iodo-2-propynyle 3-yodo-2-propinil butilcarbamato X 57213-69-1 Triclopyr triethylammonium salt Acide [(3,5,6-trichloro-2-pyridyl)oxy]acétique, Sal de triclopir trietilamonio X 59669-26-0 Thiodicarb Thiodicarbe Tiodicarb X 60168-88-9 Fenarimol Fénarimol Fenarimol X 60207-90-1 Propiconazole Propiconazole Propiconazol X 62476-59-9 Acifluorfen, sodium salt Acifluorfen, sel de sodium Sal de sodio de acifluorfeno X 63938-10-3 Chlorotetrafluoroethane (HCFC-124 and isomers) Chlorotétrafluoroéthane Clorotetrafluoroetano X X 64902-72-3 Chlorsulfuron Chlorsulfuron Clorsulfurón X 64969-34-2 3,3'-Dichlorobenzidine sulfate Dihydrogénobis(sulfate) de 3,3'-dichlorobenzidine Sulfato de 3,3´-diclorobencidina X 66441-23-4 Fenoxaprop ethyl Fénoxaprop-p-éthyl Etilfenoxaprop X 67485-29-4 Hydramethylnon Hydraméthylnon Hidrametilnona X 68085-85-8 Cyhalothrin Cyhalothrine Cialotrina X 68359-37-5 Cyfluthrin Cyfluthrine Ciflutrina X 68920-70-7 Polychlorinated alkanes (C6-C18) Alcanes poychlorés (C8-C18) Alcanos policlorinados (C8-C18) X 69409-94-5 Fluvalinate Fluvalinate Fluvalinato X 69806-50-4 Fluazifop butyl Fluazifop-butyl Butil flucifop X 71751-41-2 Abamectin Abamectine Abamectina X 72178-02-0 Fomesafen Fomésafène Fomesafén X 72490-01-8 Fenoxycarb Fénoxycarbe Fenoxicarb X 74051-80-2 Sethoxydim Séthoxydime Setoxidime X 76578-14-8 Quizalofop-ethyl Quizalofop Etilquizalofop X 77501-63-4 Lactofen Lactofène Lactofén X 82657-04-3 Bifenthrin Bifenthrine Bifentrina X 84852-15-3 Nonylphenol, industrial Nonylphénol de qualité industrielle Nonilfenol industrial X 88671-89-0 Myclobutanil Myclobutanil Miclobutanilo X 90454-18-5 Dichloro-1,1,2-trifluoroethane Dichloro-1,1,2-trifluoroéthane Dicloro-1,1,2-trifluoroetano X 90982-32-4 Chlorimuron ethyl Chlorimuron Etil clorimurón X
101200-48-0 Tribenuron methyl Tribénuron Metiltribenurón X 111512-56-2 1,1-Dichloro-1,2,3,3,3-pentafluoropropane (HCFC-225eb) 1,1-Dichloro-1,2,3,3,3-pentafluoropropane (HCFC-225eb) 1,1-Dicloro-1,2,3,3,3-pentafluoropropano (HCFC-225eb) X 111984-09-9 3,3'-Dimethoxybenzidine hydrochloride Hydrochlorure de 3,3'-ddiméthoxybenzidine Hidrocloruro de 3,3´-dimetoxibencidina X 127564-92-5 Dichloropentafluoropropane Dichloropentafluoropropane Dicloropentafluoropropane X 128903-21-9 2,2-Dichloro-1,1,1,3,3-pentafluoropropane (HCFC-225aa) 2,2-Dichloro-1,1,1,3,3-pentafluoropropane (HCFC-225aa) 2,2-Dicloro-1,1,1,3,3-pentafluoropropano (HCFC-225aa) X 136013-79-1 1,3-Dichloro-1,1,2,3,3-pentafluoropropane (HCFC-225ea) 1,3-Dichloro-1,1,2,3,3-pentafluoropropane (HCFC-225ea) 1,3-Dicloro-1,1,2,3,3-pentafluoropropano (HCFC-225ea) X
Antimony compounds** Antimoine (et ses composés)** Antimonio y compuestos** X X Arsenic compounds Arsenic (et ses composés) Arsénico y compuestos X X X Barium compounds Baryum (et ses composés) Bario y compuestos X Beryllium compounds Béryllium (et ses composés) Berilio y compuestos X Cadmium compounds Cadmium (et ses composés) Cadmio y compuestos X X X Chlorophenols Chlorophénols Clorofenoles X Chromium compounds Chrome (et ses composés) Cromo y compuestos X X X
* RETC list of chemicals for voluntary reporting in Section V of COA. ** Elemental compounds are reported separately from their respective elements in TRI and RETC and aggregated with them in NPRI.
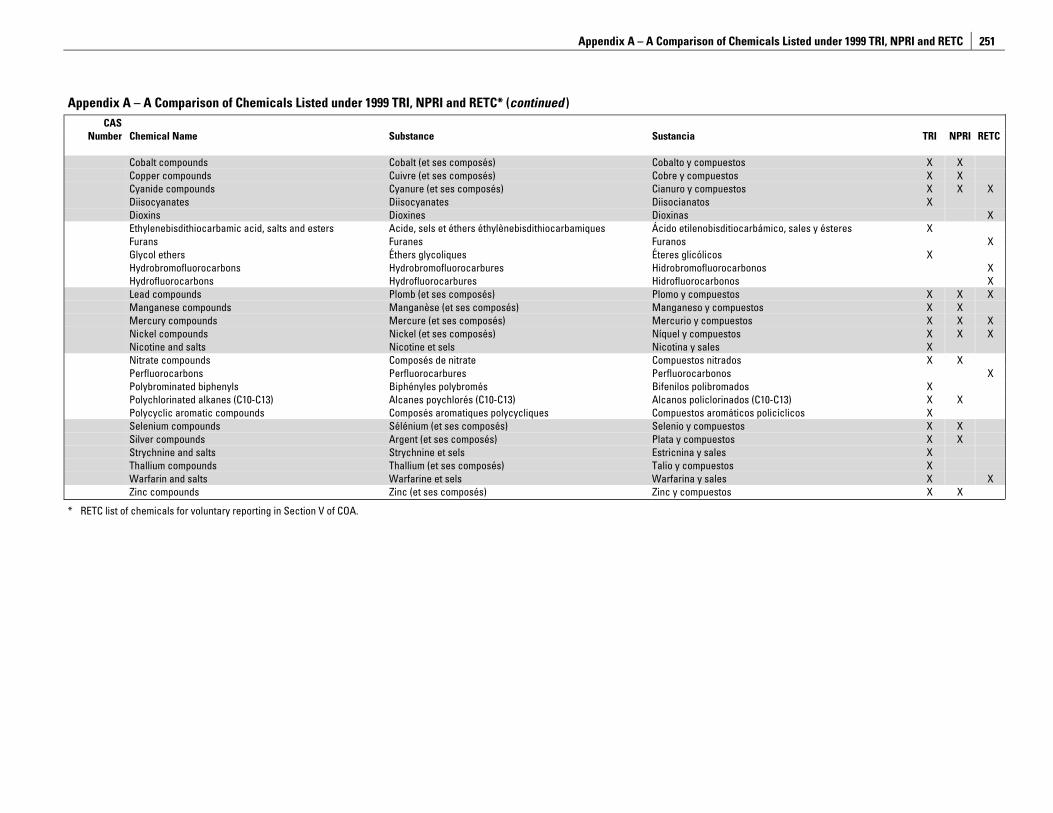
Appendix A – A Comparison of Chemicals Listed under 1999 TRI, NPRI and RETC
251
Appendix A – A Comparison of Chemicals Listed under 1999 TRI, NPRI and RETC* (continued ) CAS
Number Chemical Name Substance Sustancia TRI NPRI RETC Cobalt compounds Cobalt (et ses composés) Cobalto y compuestos X X Copper compounds Cuivre (et ses composés) Cobre y compuestos X X Cyanide compounds Cyanure (et ses composés) Cianuro y compuestos X X X Diisocyanates Diisocyanates Diisocianatos X Dioxins Dioxines Dioxinas X Ethylenebisdithiocarbamic acid, salts and esters Acide, sels et éthers éthylènebisdithiocarbamiques Ácido etilenobisditiocarbámico, sales y ésteres X Furans Furanes Furanos X Glycol ethers Éthers glycoliques Éteres glicólicos X Hydrobromofluorocarbons Hydrobromofluorocarbures Hidrobromofluorocarbonos X Hydrofluorocarbons Hydrofluorocarbures Hidrofluorocarbonos X Lead compounds Plomb (et ses composés) Plomo y compuestos X X X Manganese compounds Manganèse (et ses composés) Manganeso y compuestos X X Mercury compounds Mercure (et ses composés) Mercurio y compuestos X X X Nickel compounds Nickel (et ses composés) Níquel y compuestos X X X Nicotine and salts Nicotine et sels Nicotina y sales X Nitrate compounds Composés de nitrate Compuestos nitrados X X Perfluorocarbons Perfluorocarbures Perfluorocarbonos X Polybrominated biphenyls Biphényles polybromés Bifenilos polibromados X Polychlorinated alkanes (C10-C13) Alcanes poychlorés (C10-C13) Alcanos policlorinados (C10-C13) X X Polycyclic aromatic compounds Composés aromatiques polycycliques Compuestos aromáticos policíclicos X Selenium compounds Sélénium (et ses composés) Selenio y compuestos X X Silver compounds Argent (et ses composés) Plata y compuestos X X Strychnine and salts Strychnine et sels Estricnina y sales X
Thallium compounds Thallium (et ses composés) Talio y compuestos X Warfarin and salts Warfarine et sels Warfarina y sales X X Zinc compounds Zinc (et ses composés) Zinc y compuestos X X
* RETC list of chemicals for voluntary reporting in Section V of COA.

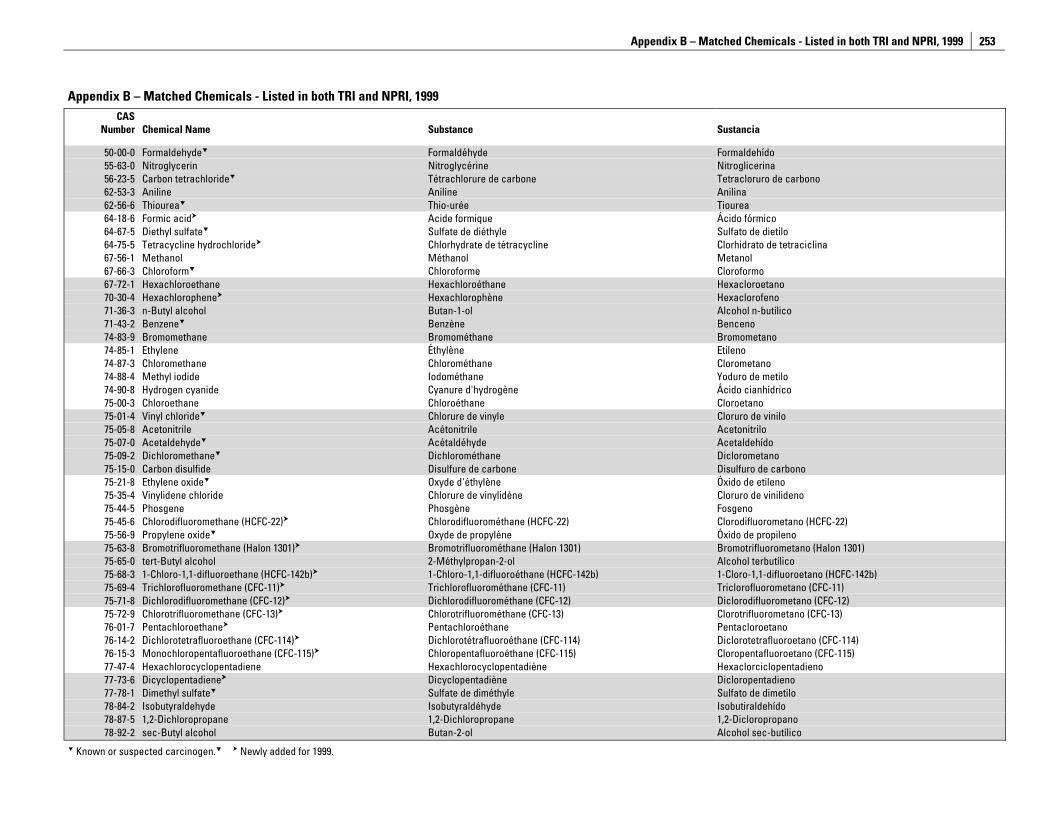
Appendix B – Matched Chemicals - Listed in both TRI and NPRI, 1999
253
Appendix B – Matched Chemicals - Listed in both TRI and NPRI, 1999CAS
Number Chemical Name Substance Sustancia
50-00-0 Formaldehyde Formaldéhyde Formaldehído 55-63-0 Nitroglycerin Nitroglycérine Nitroglicerina 56-23-5 Carbon tetrachloride Tétrachlorure de carbone Tetracloruro de carbono 62-53-3 Aniline Aniline Anilina 62-56-6 Thiourea Thio-urée Tiourea 64-18-6 Formic acid Acide formique Ácido fórmico 64-67-5 Diethyl sulfate Sulfate de diéthyle Sulfato de dietilo 64-75-5 Tetracycline hydrochloride Chlorhydrate de tétracycline Clorhidrato de tetraciclina 67-56-1 Methanol Méthanol Metanol 67-66-3 Chloroform Chloroforme Cloroformo 67-72-1 Hexachloroethane Hexachloroéthane Hexacloroetano 70-30-4 Hexachlorophene Hexachlorophène Hexaclorofeno 71-36-3 n-Butyl alcohol Butan-1-ol Alcohol n-butílico 71-43-2 Benzene Benzène Benceno 74-83-9 Bromomethane Bromométhane Bromometano 74-85-1 Ethylene Éthylène Etileno 74-87-3 Chloromethane Chlorométhane Clorometano 74-88-4 Methyl iodide Iodométhane Yoduro de metilo 74-90-8 Hydrogen cyanide Cyanure d'hydrogène Ácido cianhídrico 75-00-3 Chloroethane Chloroéthane Cloroetano 75-01-4 Vinyl chloride Chlorure de vinyle Cloruro de vinilo 75-05-8 Acetonitrile Acétonitrile Acetonitrilo 75-07-0 Acetaldehyde Acétaldéhyde Acetaldehído 75-09-2 Dichloromethane Dichlorométhane Diclorometano 75-15-0 Carbon disulfide Disulfure de carbone Disulfuro de carbono 75-21-8 Ethylene oxide Oxyde d'éthylène Óxido de etileno 75-35-4 Vinylidene chloride Chlorure de vinylidène Cloruro de vinilideno 75-44-5 Phosgene Phosgène Fosgeno 75-45-6 Chlorodifluoromethane (HCFC-22) Chlorodifluorométhane (HCFC-22) Clorodifluorometano (HCFC-22) 75-56-9 Propylene oxide Oxyde de propylène Óxido de propileno 75-63-8 Bromotrifluoromethane (Halon 1301) Bromotrifluorométhane (Halon 1301) Bromotrifluorometano (Halon 1301) 75-65-0 tert-Butyl alcohol 2-Méthylpropan-2-ol Alcohol terbutílico 75-68-3 1-Chloro-1,1-difluoroethane (HCFC-142b) 1-Chloro-1,1-difluoroéthane (HCFC-142b) 1-Cloro-1,1-difluoroetano (HCFC-142b) 75-69-4 Trichlorofluoromethane (CFC-11) Trichlorofluorométhane (CFC-11) Triclorofluorometano (CFC-11) 75-71-8 Dichlorodifluoromethane (CFC-12) Dichlorodifluorométhane (CFC-12) Diclorodifluorometano (CFC-12) 75-72-9 Chlorotrifluoromethane (CFC-13) Chlorotrifluorométhane (CFC-13) Clorotrifluorometano (CFC-13) 76-01-7 Pentachloroethane Pentachloroéthane Pentacloroetano 76-14-2 Dichlorotetrafluoroethane (CFC-114) Dichlorotétrafluoroéthane (CFC-114) Diclorotetrafluoroetano (CFC-114) 76-15-3 Monochloropentafluoroethane (CFC-115) Chloropentafluoroéthane (CFC-115) Cloropentafluoroetano (CFC-115) 77-47-4 Hexachlorocyclopentadiene Hexachlorocyclopentadiène Hexaclorciclopentadieno 77-73-6 Dicyclopentadiene Dicyclopentadiène Dicloropentadieno 77-78-1 Dimethyl sulfate Sulfate de diméthyle Sulfato de dimetilo 78-84-2 Isobutyraldehyde Isobutyraldéhyde Isobutiraldehído 78-87-5 1,2-Dichloropropane 1,2-Dichloropropane 1,2-Dicloropropano 78-92-2 sec-Butyl alcohol Butan-2-ol Alcohol sec-butílico
Known or suspected carcinogen. Newly added for 1999.
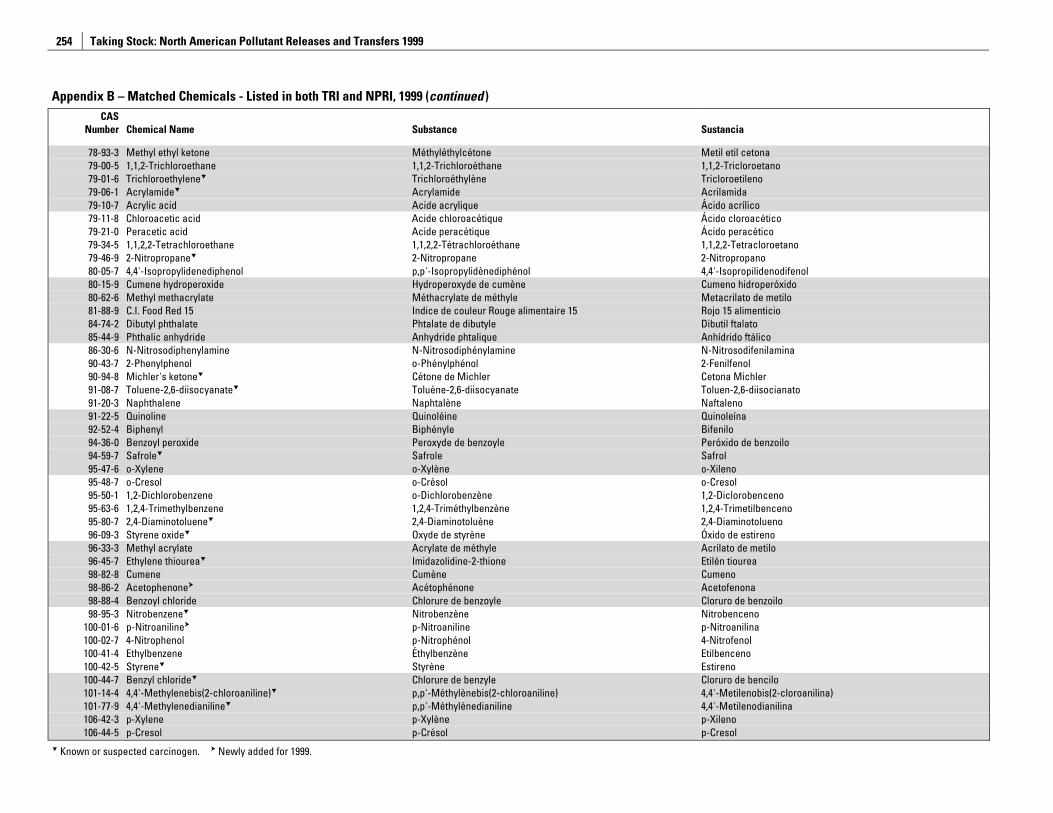
Taking Stock: North American Pollutant Releases and Transfers 1999
254
Appendix B – Matched Chemicals - Listed in both TRI and NPRI, 1999 (continued )CAS
Number Chemical Name Substance Sustancia
78-93-3 Methyl ethyl ketone Méthyléthylcétone Metil etil cetona 79-00-5 1,1,2-Trichloroethane 1,1,2-Trichloroéthane 1,1,2-Tricloroetano 79-01-6 Trichloroethylene Trichloroéthylène Tricloroetileno 79-06-1 Acrylamide Acrylamide Acrilamida 79-10-7 Acrylic acid Acide acrylique Ácido acrílico 79-11-8 Chloroacetic acid Acide chloroacétique Ácido cloroacético 79-21-0 Peracetic acid Acide peracétique Ácido peracético 79-34-5 1,1,2,2-Tetrachloroethane 1,1,2,2-Tétrachloroéthane 1,1,2,2-Tetracloroetano 79-46-9 2-Nitropropane 2-Nitropropane 2-Nitropropano 80-05-7 4,4'-Isopropylidenediphenol p,p'-Isopropylidènediphénol 4,4'-Isopropilidenodifenol 80-15-9 Cumene hydroperoxide Hydroperoxyde de cumène Cumeno hidroperóxido 80-62-6 Methyl methacrylate Méthacrylate de méthyle Metacrilato de metilo 81-88-9 C.I. Food Red 15 Indice de couleur Rouge alimentaire 15 Rojo 15 alimenticio 84-74-2 Dibutyl phthalate Phtalate de dibutyle Dibutil ftalato 85-44-9 Phthalic anhydride Anhydride phtalique Anhídrido ftálico 86-30-6 N-Nitrosodiphenylamine N-Nitrosodiphénylamine N-Nitrosodifenilamina 90-43-7 2-Phenylphenol o-Phénylphénol 2-Fenilfenol 90-94-8 Michler's ketone Cétone de Michler Cetona Michler 91-08-7 Toluene-2,6-diisocyanate Toluène-2,6-diisocyanate Toluen-2,6-diisocianato 91-20-3 Naphthalene Naphtalène Naftaleno 91-22-5 Quinoline Quinoléine Quinoleína 92-52-4 Biphenyl Biphényle Bifenilo 94-36-0 Benzoyl peroxide Peroxyde de benzoyle Peróxido de benzoilo 94-59-7 Safrole Safrole Safrol 95-47-6 o-Xylene o-Xylène o-Xileno 95-48-7 o-Cresol o-Crésol o-Cresol 95-50-1 1,2-Dichlorobenzene o-Dichlorobenzène 1,2-Diclorobenceno 95-63-6 1,2,4-Trimethylbenzene 1,2,4-Triméthylbenzène 1,2,4-Trimetilbenceno 95-80-7 2,4-Diaminotoluene 2,4-Diaminotoluène 2,4-Diaminotolueno 96-09-3 Styrene oxide Oxyde de styrène Óxido de estireno 96-33-3 Methyl acrylate Acrylate de méthyle Acrilato de metilo 96-45-7 Ethylene thiourea Imidazolidine-2-thione Etilén tiourea 98-82-8 Cumene Cumène Cumeno 98-86-2 Acetophenone Acétophénone Acetofenona 98-88-4 Benzoyl chloride Chlorure de benzoyle Cloruro de benzoilo 98-95-3 Nitrobenzene Nitrobenzène Nitrobenceno
100-01-6 p-Nitroaniline p-Nitroaniline p-Nitroanilina 100-02-7 4-Nitrophenol p-Nitrophénol 4-Nitrofenol 100-41-4 Ethylbenzene Éthylbenzène Etilbenceno 100-42-5 Styrene Styrène Estireno 100-44-7 Benzyl chloride Chlorure de benzyle Cloruro de bencilo 101-14-4 4,4'-Methylenebis(2-chloroaniline) p,p'-Méthylènebis(2-chloroaniline) 4,4'-Metilenobis(2-cloroanilina) 101-77-9 4,4'-Methylenedianiline p,p'-Méthylènedianiline 4,4'-Metilenodianilina 106-42-3 p-Xylene p-Xylène p-Xileno 106-44-5 p-Cresol p-Crésol p-Cresol
Known or suspected carcinogen. Newly added for 1999.
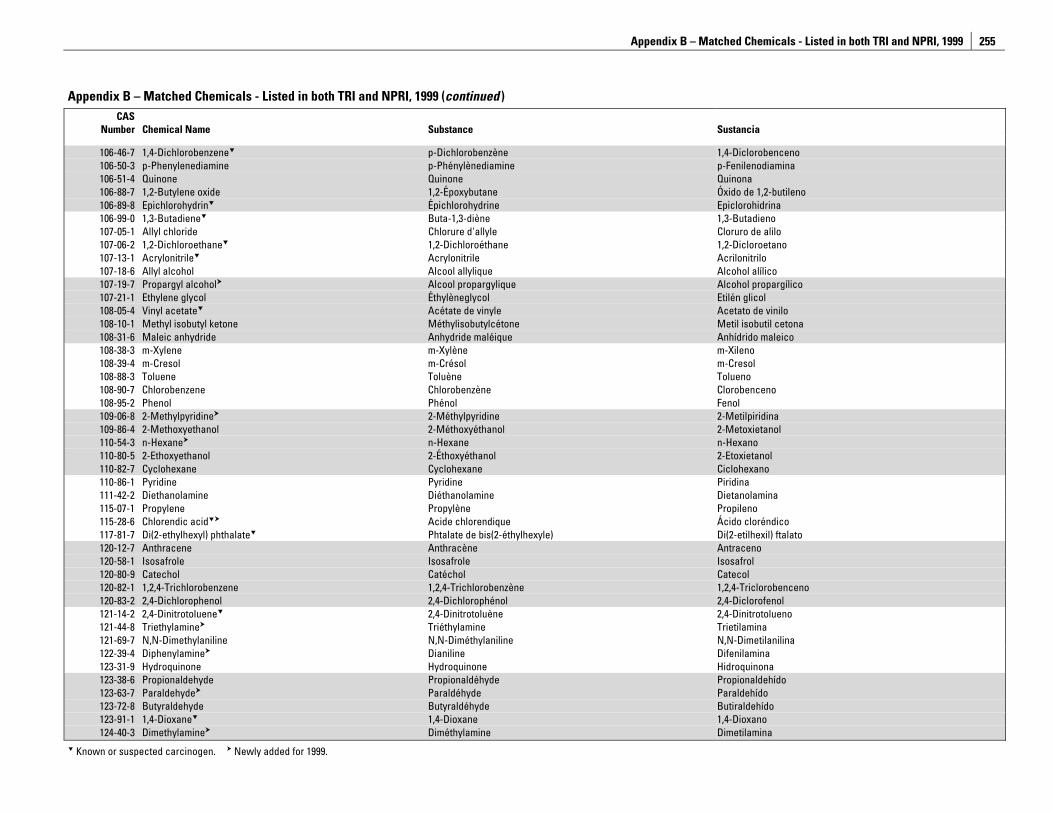
Appendix B – Matched Chemicals - Listed in both TRI and NPRI, 1999
255
Appendix B – Matched Chemicals - Listed in both TRI and NPRI, 1999 (continued )CAS
Number Chemical Name Substance Sustancia
106-46-7 1,4-Dichlorobenzene p-Dichlorobenzène 1,4-Diclorobenceno 106-50-3 p-Phenylenediamine p-Phénylènediamine p-Fenilenodiamina 106-51-4 Quinone Quinone Quinona 106-88-7 1,2-Butylene oxide 1,2-Époxybutane Óxido de 1,2-butileno 106-89-8 Epichlorohydrin Épichlorohydrine Epiclorohidrina 106-99-0 1,3-Butadiene Buta-1,3-diène 1,3-Butadieno 107-05-1 Allyl chloride Chlorure d'allyle Cloruro de alilo 107-06-2 1,2-Dichloroethane 1,2-Dichloroéthane 1,2-Dicloroetano 107-13-1 Acrylonitrile Acrylonitrile Acrilonitrilo 107-18-6 Allyl alcohol Alcool allylique Alcohol alílico 107-19-7 Propargyl alcohol Alcool propargylique Alcohol propargílico 107-21-1 Ethylene glycol Éthylèneglycol Etilén glicol 108-05-4 Vinyl acetate Acétate de vinyle Acetato de vinilo 108-10-1 Methyl isobutyl ketone Méthylisobutylcétone Metil isobutil cetona 108-31-6 Maleic anhydride Anhydride maléique Anhídrido maleico 108-38-3 m-Xylene m-Xylène m-Xileno 108-39-4 m-Cresol m-Crésol m-Cresol 108-88-3 Toluene Toluène Tolueno 108-90-7 Chlorobenzene Chlorobenzène Clorobenceno 108-95-2 Phenol Phénol Fenol 109-06-8 2-Methylpyridine 2-Méthylpyridine 2-Metilpiridina 109-86-4 2-Methoxyethanol 2-Méthoxyéthanol 2-Metoxietanol 110-54-3 n-Hexane n-Hexane n-Hexano 110-80-5 2-Ethoxyethanol 2-Éthoxyéthanol 2-Etoxietanol 110-82-7 Cyclohexane Cyclohexane Ciclohexano 110-86-1 Pyridine Pyridine Piridina 111-42-2 Diethanolamine Diéthanolamine Dietanolamina 115-07-1 Propylene Propylène Propileno 115-28-6 Chlorendic acid Acide chlorendique Ácido cloréndico 117-81-7 Di(2-ethylhexyl) phthalate Phtalate de bis(2-éthylhexyle) Di(2-etilhexil) ftalato 120-12-7 Anthracene Anthracène Antraceno 120-58-1 Isosafrole Isosafrole Isosafrol 120-80-9 Catechol Catéchol Catecol 120-82-1 1,2,4-Trichlorobenzene 1,2,4-Trichlorobenzène 1,2,4-Triclorobenceno 120-83-2 2,4-Dichlorophenol 2,4-Dichlorophénol 2,4-Diclorofenol 121-14-2 2,4-Dinitrotoluene 2,4-Dinitrotoluène 2,4-Dinitrotolueno 121-44-8 Triethylamine Triéthylamine Trietilamina 121-69-7 N,N-Dimethylaniline N,N-Diméthylaniline N,N-Dimetilanilina 122-39-4 Diphenylamine Dianiline Difenilamina 123-31-9 Hydroquinone Hydroquinone Hidroquinona 123-38-6 Propionaldehyde Propionaldéhyde Propionaldehído 123-63-7 Paraldehyde Paraldéhyde Paraldehído 123-72-8 Butyraldehyde Butyraldéhyde Butiraldehído 123-91-1 1,4-Dioxane 1,4-Dioxane 1,4-Dioxano 124-40-3 Dimethylamine Diméthylamine Dimetilamina
Known or suspected carcinogen. Newly added for 1999.
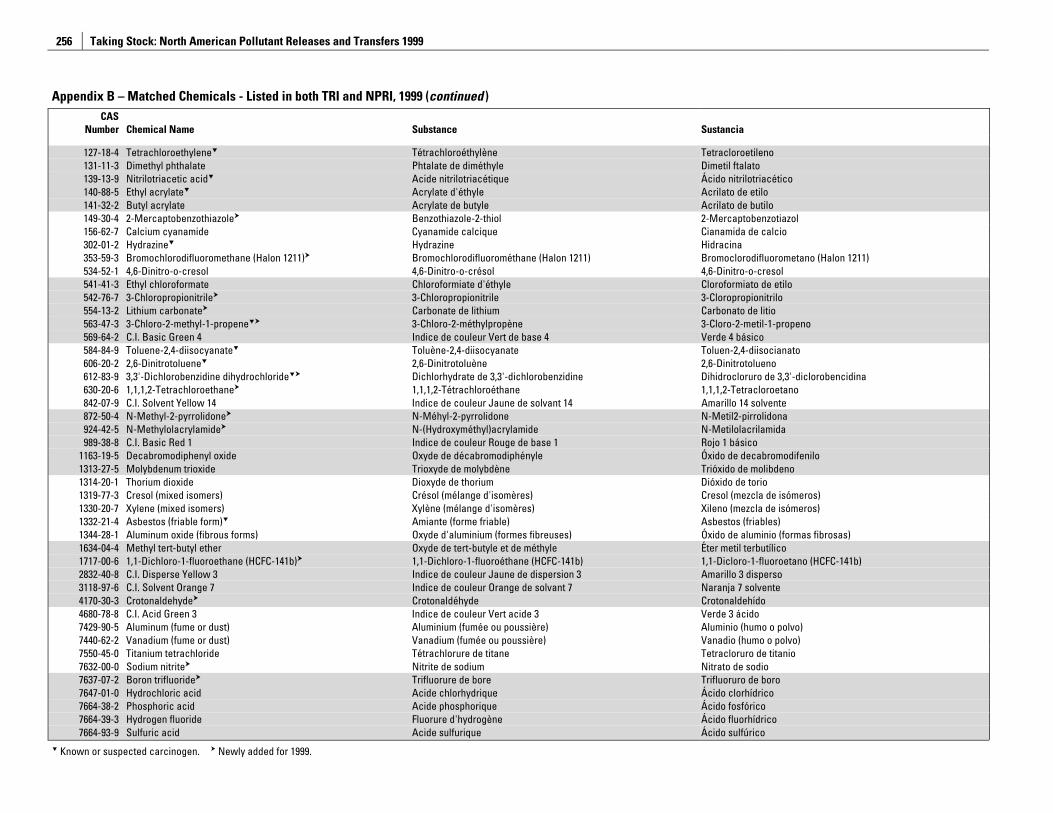
Taking Stock: North American Pollutant Releases and Transfers 1999
256
Appendix B – Matched Chemicals - Listed in both TRI and NPRI, 1999 (continued )CAS
Number Chemical Name Substance Sustancia
127-18-4 Tetrachloroethylene Tétrachloroéthylène Tetracloroetileno 131-11-3 Dimethyl phthalate Phtalate de diméthyle Dimetil ftalato 139-13-9 Nitrilotriacetic acid Acide nitrilotriacétique Ácido nitrilotriacético 140-88-5 Ethyl acrylate Acrylate d'éthyle Acrilato de etilo 141-32-2 Butyl acrylate Acrylate de butyle Acrilato de butilo 149-30-4 2-Mercaptobenzothiazole Benzothiazole-2-thiol 2-Mercaptobenzotiazol 156-62-7 Calcium cyanamide Cyanamide calcique Cianamida de calcio 302-01-2 Hydrazine Hydrazine Hidracina 353-59-3 Bromochlorodifluoromethane (Halon 1211) Bromochlorodifluorométhane (Halon 1211) Bromoclorodifluorometano (Halon 1211) 534-52-1 4,6-Dinitro-o-cresol 4,6-Dinitro-o-crésol 4,6-Dinitro-o-cresol 541-41-3 Ethyl chloroformate Chloroformiate d'éthyle Cloroformiato de etilo 542-76-7 3-Chloropropionitrile 3-Chloropropionitrile 3-Cloropropionitrilo 554-13-2 Lithium carbonate Carbonate de lithium Carbonato de litio 563-47-3 3-Chloro-2-methyl-1-propene 3-Chloro-2-méthylpropène 3-Cloro-2-metil-1-propeno 569-64-2 C.I. Basic Green 4 Indice de couleur Vert de base 4 Verde 4 básico 584-84-9 Toluene-2,4-diisocyanate Toluène-2,4-diisocyanate Toluen-2,4-diisocianato 606-20-2 2,6-Dinitrotoluene 2,6-Dinitrotoluène 2,6-Dinitrotolueno 612-83-9 3,3'-Dichlorobenzidine dihydrochloride Dichlorhydrate de 3,3'-dichlorobenzidine Dihidrocloruro de 3,3'-diclorobencidina 630-20-6 1,1,1,2-Tetrachloroethane 1,1,1,2-Tétrachloroéthane 1,1,1,2-Tetracloroetano 842-07-9 C.I. Solvent Yellow 14 Indice de couleur Jaune de solvant 14 Amarillo 14 solvente 872-50-4 N-Methyl-2-pyrrolidone N-Méhyl-2-pyrrolidone N-Metil2-pirrolidona 924-42-5 N-Methylolacrylamide N-(Hydroxyméthyl)acrylamide N-Metilolacrilamida 989-38-8 C.I. Basic Red 1 Indice de couleur Rouge de base 1 Rojo 1 básico
1163-19-5 Decabromodiphenyl oxide Oxyde de décabromodiphényle Óxido de decabromodifenilo 1313-27-5 Molybdenum trioxide Trioxyde de molybdène Trióxido de molibdeno 1314-20-1 Thorium dioxide Dioxyde de thorium Dióxido de torio 1319-77-3 Cresol (mixed isomers) Crésol (mélange d'isomères) Cresol (mezcla de isómeros) 1330-20-7 Xylene (mixed isomers) Xylène (mélange d'isomères) Xileno (mezcla de isómeros) 1332-21-4 Asbestos (friable form) Amiante (forme friable) Asbestos (friables) 1344-28-1 Aluminum oxide (fibrous forms) Oxyde d'aluminium (formes fibreuses) Óxido de aluminio (formas fibrosas) 1634-04-4 Methyl tert-butyl ether Oxyde de tert-butyle et de méthyle Éter metil terbutílico 1717-00-6 1,1-Dichloro-1-fluoroethane (HCFC-141b) 1,1-Dichloro-1-fluoroéthane (HCFC-141b) 1,1-Dicloro-1-fluoroetano (HCFC-141b) 2832-40-8 C.I. Disperse Yellow 3 Indice de couleur Jaune de dispersion 3 Amarillo 3 disperso 3118-97-6 C.I. Solvent Orange 7 Indice de couleur Orange de solvant 7 Naranja 7 solvente 4170-30-3 Crotonaldehyde Crotonaldéhyde Crotonaldehído 4680-78-8 C.I. Acid Green 3 Indice de couleur Vert acide 3 Verde 3 ácido 7429-90-5 Aluminum (fume or dust) Aluminium (fumée ou poussière) Aluminio (humo o polvo) 7440-62-2 Vanadium (fume or dust) Vanadium (fumée ou poussière) Vanadio (humo o polvo) 7550-45-0 Titanium tetrachloride Tétrachlorure de titane Tetracloruro de titanio 7632-00-0 Sodium nitrite Nitrite de sodium Nitrato de sodio 7637-07-2 Boron trifluoride Trifluorure de bore Trifluoruro de boro 7647-01-0 Hydrochloric acid Acide chlorhydrique Ácido clorhídrico 7664-38-2 Phosphoric acid Acide phosphorique Ácido fosfórico 7664-39-3 Hydrogen fluoride Fluorure d'hydrogène Ácido fluorhídrico 7664-93-9 Sulfuric acid Acide sulfurique Ácido sulfúrico
Known or suspected carcinogen. Newly added for 1999.
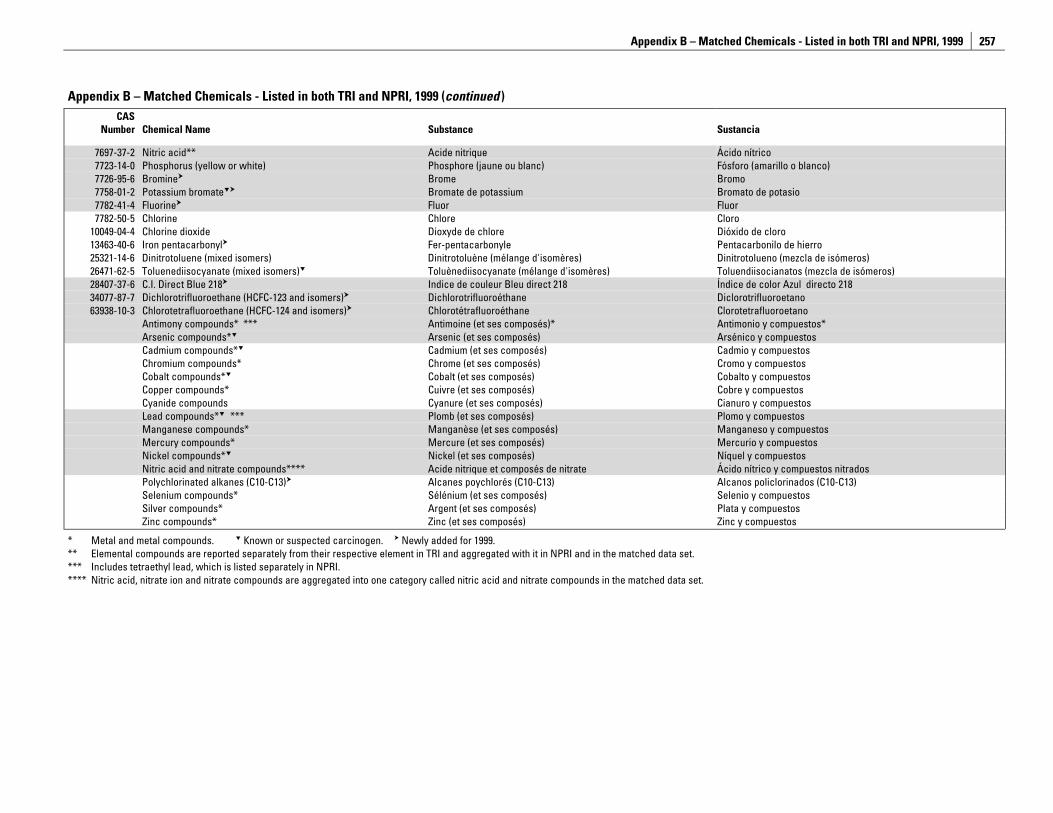
Appendix B – Matched Chemicals - Listed in both TRI and NPRI, 1999
257
Appendix B – Matched Chemicals - Listed in both TRI and NPRI, 1999 (continued )CAS
Number Chemical Name Substance Sustancia
7697-37-2 Nitric acid** Acide nitrique Ácido nítrico 7723-14-0 Phosphorus (yellow or white) Phosphore (jaune ou blanc) Fósforo (amarillo o blanco) 7726-95-6 Bromine Brome Bromo 7758-01-2 Potassium bromate Bromate de potassium Bromato de potasio 7782-41-4 Fluorine Fluor Fluor 7782-50-5 Chlorine Chlore Cloro
10049-04-4 Chlorine dioxide Dioxyde de chlore Dióxido de cloro 13463-40-6 Iron pentacarbonyl Fer-pentacarbonyle Pentacarbonilo de hierro 25321-14-6 Dinitrotoluene (mixed isomers) Dinitrotoluène (mélange d'isomères) Dinitrotolueno (mezcla de isómeros) 26471-62-5 Toluenediisocyanate (mixed isomers) Toluènediisocyanate (mélange d'isomères) Toluendiisocianatos (mezcla de isómeros) 28407-37-6 C.I. Direct Blue 218 Indice de couleur Bleu direct 218 Índice de color Azul directo 218 34077-87-7 Dichlorotrifluoroethane (HCFC-123 and isomers) Dichlorotrifluoroéthane Diclorotrifluoroetano 63938-10-3 Chlorotetrafluoroethane (HCFC-124 and isomers) Chlorotétrafluoroéthane Clorotetrafluoroetano
Antimony compounds* *** Antimoine (et ses composés)* Antimonio y compuestos* Arsenic compounds* Arsenic (et ses composés) Arsénico y compuestos
Cadmium compounds* Cadmium (et ses composés) Cadmio y compuestos Chromium compounds* Chrome (et ses composés) Cromo y compuestos Cobalt compounds* Cobalt (et ses composés) Cobalto y compuestos Copper compounds* Cuivre (et ses composés) Cobre y compuestos Cyanide compounds Cyanure (et ses composés) Cianuro y compuestos Lead compounds* *** Plomb (et ses composés) Plomo y compuestos Manganese compounds* Manganèse (et ses composés) Manganeso y compuestos Mercury compounds* Mercure (et ses composés) Mercurio y compuestos Nickel compounds* Nickel (et ses composés) Níquel y compuestos Nitric acid and nitrate compounds**** Acide nitrique et composés de nitrate Ácido nítrico y compuestos nitrados Polychlorinated alkanes (C10-C13) Alcanes poychlorés (C10-C13) Alcanos policlorinados (C10-C13) Selenium compounds* Sélénium (et ses composés) Selenio y compuestos Silver compounds* Argent (et ses composés) Plata y compuestos Zinc compounds* Zinc (et ses composés) Zinc y compuestos
* Metal and metal compounds. Known or suspected carcinogen. Newly added for 1999. ** Elemental compounds are reported separately from their respective element in TRI and aggregated with it in NPRI and in the matched data set. *** Includes tetraethyl lead, which is listed separately in NPRI. **** Nitric acid, nitrate ion and nitrate compounds are aggregated into one category called nitric acid and nitrate compounds in the matched data set.

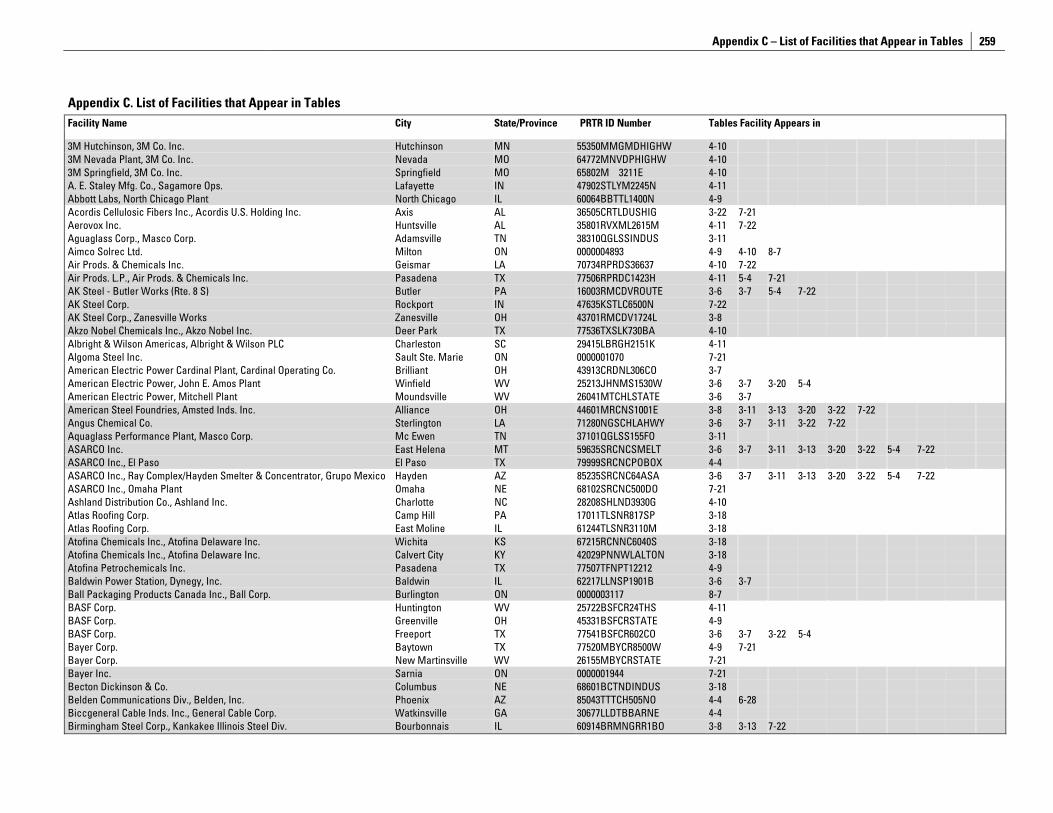
Appendix C – List of Facilities that Appear in Tables
259
Appendix C. List of Facilities that Appear in Tables Facility Name City State/Province PRTR ID Number Tables Facility Appears in
3M Hutchinson, 3M Co. Inc. Hutchinson MN 55350MMGMDHIGHW 4-10 3M Nevada Plant, 3M Co. Inc. Nevada MO 64772MNVDPHIGHW 4-10 3M Springfield, 3M Co. Inc. Springfield MO 65802M 3211E 4-10 A. E. Staley Mfg. Co., Sagamore Ops. Lafayette IN 47902STLYM2245N 4-11 Abbott Labs, North Chicago Plant North Chicago IL 60064BBTTL1400N 4-9 Acordis Cellulosic Fibers Inc., Acordis U.S. Holding Inc. Axis AL 36505CRTLDUSHIG 3-22 7-21 Aerovox Inc. Huntsville AL 35801RVXML2615M 4-11 7-22 Aguaglass Corp., Masco Corp. Adamsville TN 38310QGLSSINDUS 3-11 Aimco Solrec Ltd. Milton ON 0000004893 4-9 4-10 8-7 Air Prods. & Chemicals Inc. Geismar LA 70734RPRDS36637 4-10 7-22 Air Prods. L.P., Air Prods. & Chemicals Inc. Pasadena TX 77506RPRDC1423H 4-11 5-4 7-21 AK Steel - Butler Works (Rte. 8 S) Butler PA 16003RMCDVROUTE 3-6 3-7 5-4 7-22 AK Steel Corp. Rockport IN 47635KSTLC6500N 7-22 AK Steel Corp., Zanesville Works Zanesville OH 43701RMCDV1724L 3-8 Akzo Nobel Chemicals Inc., Akzo Nobel Inc. Deer Park TX 77536TXSLK730BA 4-10 Albright & Wilson Americas, Albright & Wilson PLC Charleston SC 29415LBRGH2151K 4-11 Algoma Steel Inc. Sault Ste. Marie ON 0000001070 7-21 American Electric Power Cardinal Plant, Cardinal Operating Co. Brilliant OH 43913CRDNL306CO 3-7 American Electric Power, John E. Amos Plant Winfield WV 25213JHNMS1530W 3-6 3-7 3-20 5-4 American Electric Power, Mitchell Plant Moundsville WV 26041MTCHLSTATE 3-6 3-7 American Steel Foundries, Amsted Inds. Inc. Alliance OH 44601MRCNS1001E 3-8 3-11 3-13 3-20 3-22 7-22 Angus Chemical Co. Sterlington LA 71280NGSCHLAHWY 3-6 3-7 3-11 3-22 7-22 Aquaglass Performance Plant, Masco Corp. Mc Ewen TN 37101QGLSS155FO 3-11 ASARCO Inc. East Helena MT 59635SRCNCSMELT 3-6 3-7 3-11 3-13 3-20 3-22 5-4 7-22 ASARCO Inc., El Paso El Paso TX 79999SRCNCPOBOX 4-4 ASARCO Inc., Ray Complex/Hayden Smelter & Concentrator, Grupo Mexico Hayden AZ 85235SRCNC64ASA 3-6 3-7 3-11 3-13 3-20 3-22 5-4 7-22 ASARCO Inc., Omaha Plant Omaha NE 68102SRCNC500DO 7-21 Ashland Distribution Co., Ashland Inc. Charlotte NC 28208SHLND3930G 4-10 Atlas Roofing Corp. Camp Hill PA 17011TLSNR817SP 3-18 Atlas Roofing Corp. East Moline IL 61244TLSNR3110M 3-18 Atofina Chemicals Inc., Atofina Delaware Inc. Wichita KS 67215RCNNC6040S 3-18 Atofina Chemicals Inc., Atofina Delaware Inc. Calvert City KY 42029PNNWLALTON 3-18 Atofina Petrochemicals Inc. Pasadena TX 77507TFNPT12212 4-9 Baldwin Power Station, Dynegy, Inc. Baldwin IL 62217LLNSP1901B 3-6 3-7 Ball Packaging Products Canada Inc., Ball Corp. Burlington ON 0000003117 8-7 BASF Corp. Huntington WV 25722BSFCR24THS 4-11 BASF Corp. Greenville OH 45331BSFCRSTATE 4-9 BASF Corp. Freeport TX 77541BSFCR602CO 3-6 3-7 3-22 5-4 Bayer Corp. Baytown TX 77520MBYCR8500W 4-9 7-21 Bayer Corp. New Martinsville WV 26155MBYCRSTATE 7-21 Bayer Inc. Sarnia ON 0000001944 7-21 Becton Dickinson & Co. Columbus NE 68601BCTNDINDUS 3-18 Belden Communications Div., Belden, Inc. Phoenix AZ 85043TTTCH505NO 4-4 6-28 Biccgeneral Cable Inds. Inc., General Cable Corp. Watkinsville GA 30677LLDTBBARNE 4-4 Birmingham Steel Corp., Kankakee Illinois Steel Div. Bourbonnais IL 60914BRMNGRR1BO 3-8 3-13 7-22
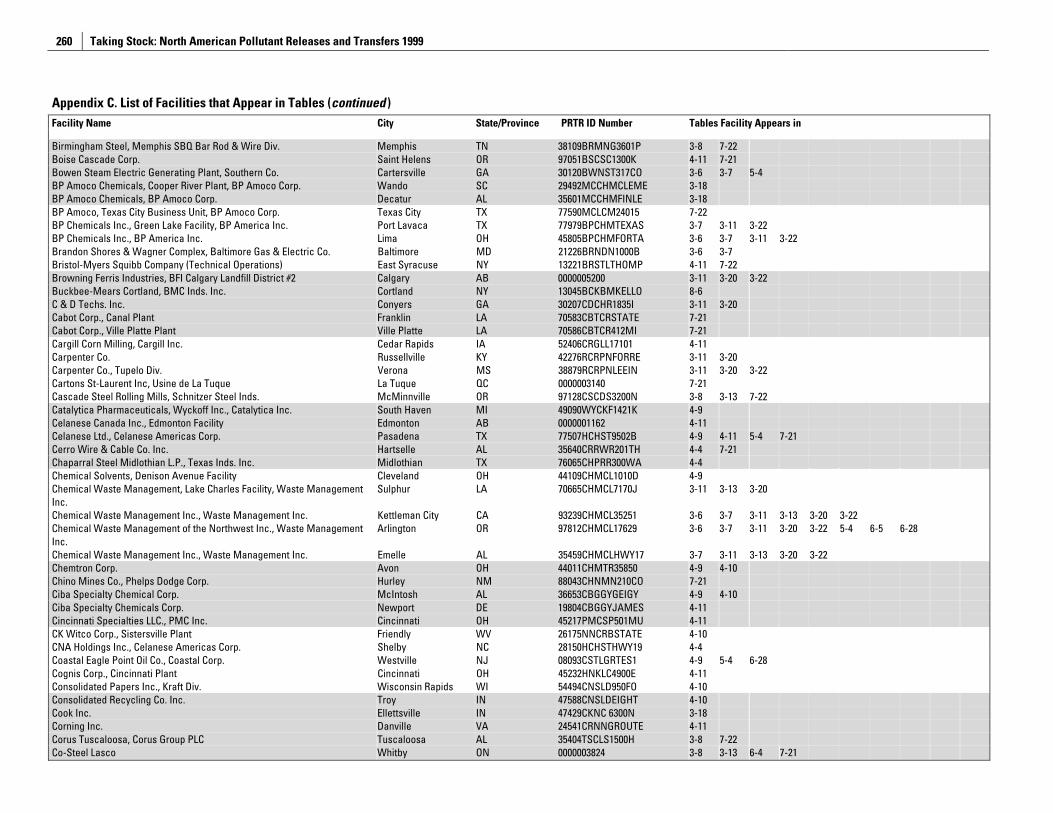
Taking Stock: North American Pollutant Releases and Transfers 1999
260
Appendix C. List of Facilities that Appear in Tables (continued )
Facility Name City State/Province PRTR ID Number Tables Facility Appears in
Birmingham Steel, Memphis SBQ Bar Rod & Wire Div. Memphis TN 38109BRMNG3601P 3-8 7-22 Boise Cascade Corp. Saint Helens OR 97051BSCSC1300K 4-11 7-21 Bowen Steam Electric Generating Plant, Southern Co. Cartersville GA 30120BWNST317CO 3-6 3-7 5-4 BP Amoco Chemicals, Cooper River Plant, BP Amoco Corp. Wando SC 29492MCCHMCLEME 3-18 BP Amoco Chemicals, BP Amoco Corp. Decatur AL 35601MCCHMFINLE 3-18 BP Amoco, Texas City Business Unit, BP Amoco Corp. Texas City TX 77590MCLCM24015 7-22 BP Chemicals Inc., Green Lake Facility, BP America Inc. Port Lavaca TX 77979BPCHMTEXAS 3-7 3-11 3-22 BP Chemicals Inc., BP America Inc. Lima OH 45805BPCHMFORTA 3-6 3-7 3-11 3-22 Brandon Shores & Wagner Complex, Baltimore Gas & Electric Co. Baltimore MD 21226BRNDN1000B 3-6 3-7 Bristol-Myers Squibb Company (Technical Operations) East Syracuse NY 13221BRSTLTHOMP 4-11 7-22 Browning Ferris Industries, BFI Calgary Landfill District #2 Calgary AB 0000005200 3-11 3-20 3-22 Buckbee-Mears Cortland, BMC Inds. Inc. Cortland NY 13045BCKBMKELLO 8-6 C & D Techs. Inc. Conyers GA 30207CDCHR1835I 3-11 3-20 Cabot Corp., Canal Plant Franklin LA 70583CBTCRSTATE 7-21 Cabot Corp., Ville Platte Plant Ville Platte LA 70586CBTCR412MI 7-21 Cargill Corn Milling, Cargill Inc. Cedar Rapids IA 52406CRGLL17101 4-11 Carpenter Co. Russellville KY 42276RCRPNFORRE 3-11 3-20 Carpenter Co., Tupelo Div. Verona MS 38879RCRPNLEEIN 3-11 3-20 3-22 Cartons St-Laurent Inc, Usine de La Tuque La Tuque QC 0000003140 7-21 Cascade Steel Rolling Mills, Schnitzer Steel Inds. McMinnville OR 97128CSCDS3200N 3-8 3-13 7-22 Catalytica Pharmaceuticals, Wyckoff Inc., Catalytica Inc. South Haven MI 49090WYCKF1421K 4-9 Celanese Canada Inc., Edmonton Facility Edmonton AB 0000001162 4-11 Celanese Ltd., Celanese Americas Corp. Pasadena TX 77507HCHST9502B 4-9 4-11 5-4 7-21 Cerro Wire & Cable Co. Inc. Hartselle AL 35640CRRWR201TH 4-4 7-21 Chaparral Steel Midlothian L.P., Texas Inds. Inc. Midlothian TX 76065CHPRR300WA 4-4 Chemical Solvents, Denison Avenue Facility Cleveland OH 44109CHMCL1010D 4-9 Chemical Waste Management, Lake Charles Facility, Waste Management Inc.
Sulphur LA 70665CHMCL7170J 3-11 3-13 3-20
Chemical Waste Management Inc., Waste Management Inc. Kettleman City CA 93239CHMCL35251 3-6 3-7 3-11 3-13 3-20 3-22 Chemical Waste Management of the Northwest Inc., Waste Management Inc.
Arlington OR 97812CHMCL17629 3-6 3-7 3-11 3-20 3-22 5-4 6-5 6-28
Chemical Waste Management Inc., Waste Management Inc. Emelle AL 35459CHMCLHWY17 3-7 3-11 3-13 3-20 3-22 Chemtron Corp. Avon OH 44011CHMTR35850 4-9 4-10 Chino Mines Co., Phelps Dodge Corp. Hurley NM 88043CHNMN210CO 7-21 Ciba Specialty Chemical Corp. McIntosh AL 36653CBGGYGEIGY 4-9 4-10 Ciba Specialty Chemicals Corp. Newport DE 19804CBGGYJAMES 4-11 Cincinnati Specialties LLC., PMC Inc. Cincinnati OH 45217PMCSP501MU 4-11 CK Witco Corp., Sistersville Plant Friendly WV 26175NNCRBSTATE 4-10 CNA Holdings Inc., Celanese Americas Corp. Shelby NC 28150HCHSTHWY19 4-4 Coastal Eagle Point Oil Co., Coastal Corp. Westville NJ 08093CSTLGRTES1 4-9 5-4 6-28 Cognis Corp., Cincinnati Plant Cincinnati OH 45232HNKLC4900E 4-11 Consolidated Papers Inc., Kraft Div. Wisconsin Rapids WI 54494CNSLD950FO 4-10 Consolidated Recycling Co. Inc. Troy IN 47588CNSLDEIGHT 4-10 Cook Inc. Ellettsville IN 47429CKNC 6300N 3-18 Corning Inc. Danville VA 24541CRNNGROUTE 4-11 Corus Tuscaloosa, Corus Group PLC Tuscaloosa AL 35404TSCLS1500H 3-8 7-22 Co-Steel Lasco Whitby ON 0000003824 3-8 3-13 6-4 7-21
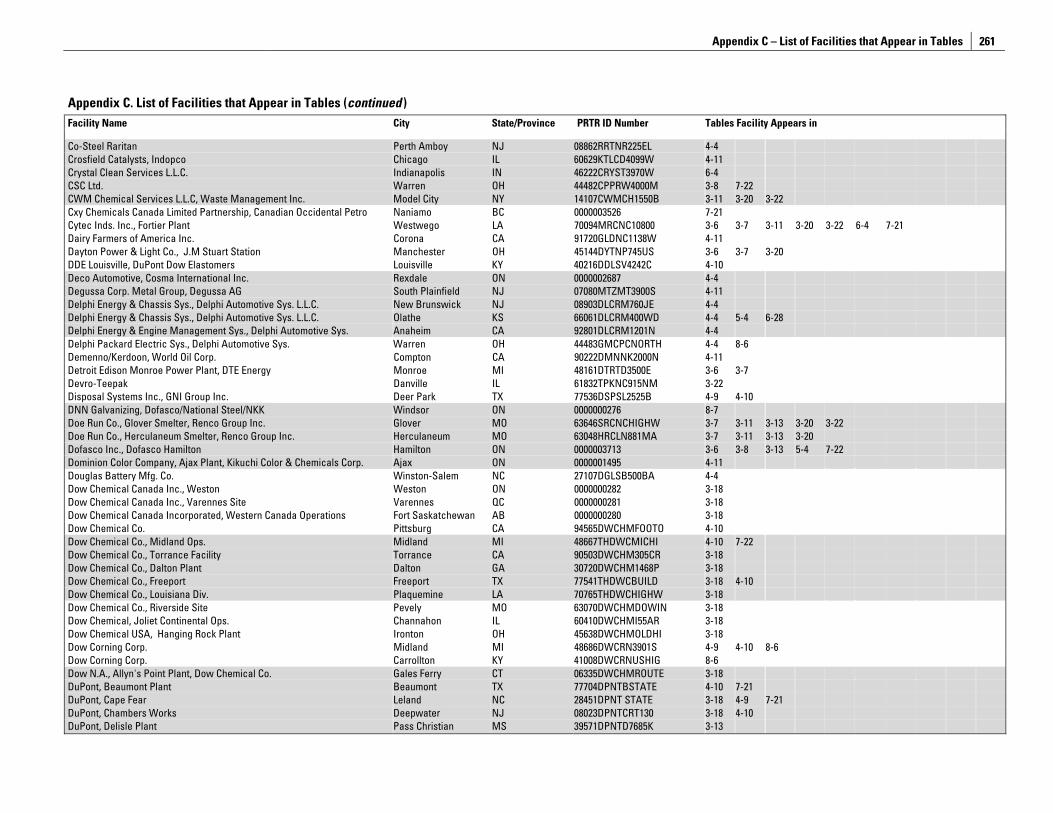
Appendix C – List of Facilities that Appear in Tables
261
Appendix C. List of Facilities that Appear in Tables (continued )
Facility Name City State/Province PRTR ID Number Tables Facility Appears in
Co-Steel Raritan Perth Amboy NJ 08862RRTNR225EL 4-4 Crosfield Catalysts, Indopco Chicago IL 60629KTLCD4099W 4-11 Crystal Clean Services L.L.C. Indianapolis IN 46222CRYST3970W 6-4 CSC Ltd. Warren OH 44482CPPRW4000M 3-8 7-22 CWM Chemical Services L.L.C, Waste Management Inc. Model City NY 14107CWMCH1550B 3-11 3-20 3-22 Cxy Chemicals Canada Limited Partnership, Canadian Occidental Petro Naniamo BC 0000003526 7-21 Cytec Inds. Inc., Fortier Plant Westwego LA 70094MRCNC10800 3-6 3-7 3-11 3-20 3-22 6-4 7-21 Dairy Farmers of America Inc. Corona CA 91720GLDNC1138W 4-11 Dayton Power & Light Co., J.M Stuart Station Manchester OH 45144DYTNP745US 3-6 3-7 3-20 DDE Louisville, DuPont Dow Elastomers Louisville KY 40216DDLSV4242C 4-10 Deco Automotive, Cosma International Inc. Rexdale ON 0000002687 4-4 Degussa Corp. Metal Group, Degussa AG South Plainfield NJ 07080MTZMT3900S 4-11 Delphi Energy & Chassis Sys., Delphi Automotive Sys. L.L.C. New Brunswick NJ 08903DLCRM760JE 4-4 Delphi Energy & Chassis Sys., Delphi Automotive Sys. L.L.C. Olathe KS 66061DLCRM400WD 4-4 5-4 6-28 Delphi Energy & Engine Management Sys., Delphi Automotive Sys. Anaheim CA 92801DLCRM1201N 4-4 Delphi Packard Electric Sys., Delphi Automotive Sys. Warren OH 44483GMCPCNORTH 4-4 8-6 Demenno/Kerdoon, World Oil Corp. Compton CA 90222DMNNK2000N 4-11 Detroit Edison Monroe Power Plant, DTE Energy Monroe MI 48161DTRTD3500E 3-6 3-7 Devro-Teepak Danville IL 61832TPKNC915NM 3-22 Disposal Systems Inc., GNI Group Inc. Deer Park TX 77536DSPSL2525B 4-9 4-10 DNN Galvanizing, Dofasco/National Steel/NKK Windsor ON 0000000276 8-7 Doe Run Co., Glover Smelter, Renco Group Inc. Glover MO 63646SRCNCHIGHW 3-7 3-11 3-13 3-20 3-22 Doe Run Co., Herculaneum Smelter, Renco Group Inc. Herculaneum MO 63048HRCLN881MA 3-7 3-11 3-13 3-20 Dofasco Inc., Dofasco Hamilton Hamilton ON 0000003713 3-6 3-8 3-13 5-4 7-22 Dominion Color Company, Ajax Plant, Kikuchi Color & Chemicals Corp. Ajax ON 0000001495 4-11 Douglas Battery Mfg. Co. Winston-Salem NC 27107DGLSB500BA 4-4 Dow Chemical Canada Inc., Weston Weston ON 0000000282 3-18 Dow Chemical Canada Inc., Varennes Site Varennes QC 0000000281 3-18 Dow Chemical Canada Incorporated, Western Canada Operations Fort Saskatchewan AB 0000000280 3-18 Dow Chemical Co. Pittsburg CA 94565DWCHMFOOTO 4-10 Dow Chemical Co., Midland Ops. Midland MI 48667THDWCMICHI 4-10 7-22 Dow Chemical Co., Torrance Facility Torrance CA 90503DWCHM305CR 3-18 Dow Chemical Co., Dalton Plant Dalton GA 30720DWCHM1468P 3-18 Dow Chemical Co., Freeport Freeport TX 77541THDWCBUILD 3-18 4-10 Dow Chemical Co., Louisiana Div. Plaquemine LA 70765THDWCHIGHW 3-18 Dow Chemical Co., Riverside Site Pevely MO 63070DWCHMDOWIN 3-18 Dow Chemical, Joliet Continental Ops. Channahon IL 60410DWCHMI55AR 3-18 Dow Chemical USA, Hanging Rock Plant Ironton OH 45638DWCHMOLDHI 3-18 Dow Corning Corp. Midland MI 48686DWCRN3901S 4-9 4-10 8-6 Dow Corning Corp. Carrollton KY 41008DWCRNUSHIG 8-6 Dow N.A., Allyn's Point Plant, Dow Chemical Co. Gales Ferry CT 06335DWCHMROUTE 3-18 DuPont, Beaumont Plant Beaumont TX 77704DPNTBSTATE 4-10 7-21 DuPont, Cape Fear Leland NC 28451DPNT STATE 3-18 4-9 7-21 DuPont, Chambers Works Deepwater NJ 08023DPNTCRT130 3-18 4-10 DuPont, Delisle Plant Pass Christian MS 39571DPNTD7685K 3-13
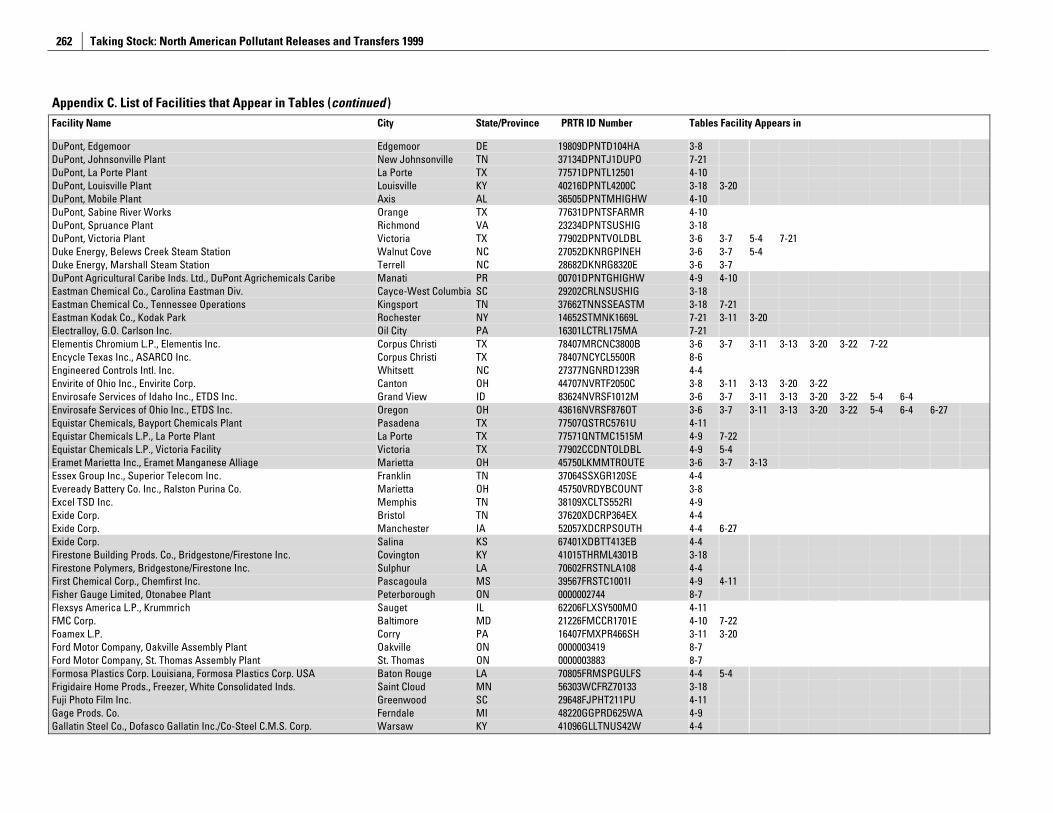
Taking Stock: North American Pollutant Releases and Transfers 1999
262
Appendix C. List of Facilities that Appear in Tables (continued )
Facility Name City State/Province PRTR ID Number Tables Facility Appears in
DuPont, Edgemoor Edgemoor DE 19809DPNTD104HA 3-8 DuPont, Johnsonville Plant New Johnsonville TN 37134DPNTJ1DUPO 7-21 DuPont, La Porte Plant La Porte TX 77571DPNTL12501 4-10 DuPont, Louisville Plant Louisville KY 40216DPNTL4200C 3-18 3-20 DuPont, Mobile Plant Axis AL 36505DPNTMHIGHW 4-10 DuPont, Sabine River Works Orange TX 77631DPNTSFARMR 4-10 DuPont, Spruance Plant Richmond VA 23234DPNTSUSHIG 3-18 DuPont, Victoria Plant Victoria TX 77902DPNTVOLDBL 3-6 3-7 5-4 7-21 Duke Energy, Belews Creek Steam Station Walnut Cove NC 27052DKNRGPINEH 3-6 3-7 5-4 Duke Energy, Marshall Steam Station Terrell NC 28682DKNRG8320E 3-6 3-7 DuPont Agricultural Caribe Inds. Ltd., DuPont Agrichemicals Caribe Manati PR 00701DPNTGHIGHW 4-9 4-10 Eastman Chemical Co., Carolina Eastman Div. Cayce-West Columbia SC 29202CRLNSUSHIG 3-18 Eastman Chemical Co., Tennessee Operations Kingsport TN 37662TNNSSEASTM 3-18 7-21 Eastman Kodak Co., Kodak Park Rochester NY 14652STMNK1669L 7-21 3-11 3-20 Electralloy, G.O. Carlson Inc. Oil City PA 16301LCTRL175MA 7-21 Elementis Chromium L.P., Elementis Inc. Corpus Christi TX 78407MRCNC3800B 3-6 3-7 3-11 3-13 3-20 3-22 7-22 Encycle Texas Inc., ASARCO Inc. Corpus Christi TX 78407NCYCL5500R 8-6 Engineered Controls Intl. Inc. Whitsett NC 27377NGNRD1239R 4-4 Envirite of Ohio Inc., Envirite Corp. Canton OH 44707NVRTF2050C 3-8 3-11 3-13 3-20 3-22 Envirosafe Services of Idaho Inc., ETDS Inc. Grand View ID 83624NVRSF1012M 3-6 3-7 3-11 3-13 3-20 3-22 5-4 6-4 Envirosafe Services of Ohio Inc., ETDS Inc. Oregon OH 43616NVRSF876OT 3-6 3-7 3-11 3-13 3-20 3-22 5-4 6-4 6-27 Equistar Chemicals, Bayport Chemicals Plant Pasadena TX 77507QSTRC5761U 4-11 Equistar Chemicals L.P., La Porte Plant La Porte TX 77571QNTMC1515M 4-9 7-22 Equistar Chemicals L.P., Victoria Facility Victoria TX 77902CCDNTOLDBL 4-9 5-4 Eramet Marietta Inc., Eramet Manganese Alliage Marietta OH 45750LKMMTROUTE 3-6 3-7 3-13 Essex Group Inc., Superior Telecom Inc. Franklin TN 37064SSXGR120SE 4-4 Eveready Battery Co. Inc., Ralston Purina Co. Marietta OH 45750VRDYBCOUNT 3-8 Excel TSD Inc. Memphis TN 38109XCLTS552RI 4-9 Exide Corp. Bristol TN 37620XDCRP364EX 4-4 Exide Corp. Manchester IA 52057XDCRPSOUTH 4-4 6-27 Exide Corp. Salina KS 67401XDBTT413EB 4-4 Firestone Building Prods. Co., Bridgestone/Firestone Inc. Covington KY 41015THRML4301B 3-18 Firestone Polymers, Bridgestone/Firestone Inc. Sulphur LA 70602FRSTNLA108 4-4 First Chemical Corp., Chemfirst Inc. Pascagoula MS 39567FRSTC1001I 4-9 4-11 Fisher Gauge Limited, Otonabee Plant Peterborough ON 0000002744 8-7 Flexsys America L.P., Krummrich Sauget IL 62206FLXSY500MO 4-11 FMC Corp. Baltimore MD 21226FMCCR1701E 4-10 7-22 Foamex L.P. Corry PA 16407FMXPR466SH 3-11 3-20 Ford Motor Company, Oakville Assembly Plant Oakville ON 0000003419 8-7 Ford Motor Company, St. Thomas Assembly Plant St. Thomas ON 0000003883 8-7 Formosa Plastics Corp. Louisiana, Formosa Plastics Corp. USA Baton Rouge LA 70805FRMSPGULFS 4-4 5-4 Frigidaire Home Prods., Freezer, White Consolidated Inds. Saint Cloud MN 56303WCFRZ70133 3-18 Fuji Photo Film Inc. Greenwood SC 29648FJPHT211PU 4-11 Gage Prods. Co. Ferndale MI 48220GGPRD625WA 4-9 Gallatin Steel Co., Dofasco Gallatin Inc./Co-Steel C.M.S. Corp. Warsaw KY 41096GLLTNUS42W 4-4
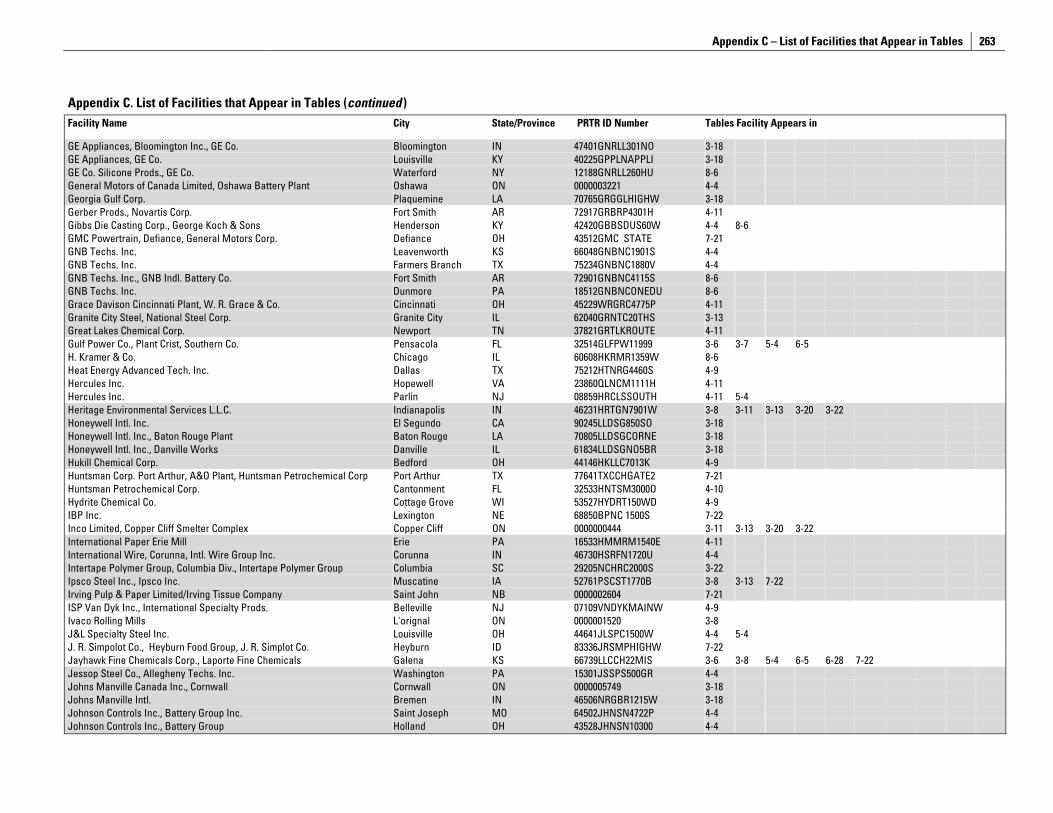
Appendix C – List of Facilities that Appear in Tables
263
Appendix C. List of Facilities that Appear in Tables (continued )
Facility Name City State/Province PRTR ID Number Tables Facility Appears in
GE Appliances, Bloomington Inc., GE Co. Bloomington IN 47401GNRLL301NO 3-18 GE Appliances, GE Co. Louisville KY 40225GPPLNAPPLI 3-18 GE Co. Silicone Prods., GE Co. Waterford NY 12188GNRLL260HU 8-6 General Motors of Canada Limited, Oshawa Battery Plant Oshawa ON 0000003221 4-4 Georgia Gulf Corp. Plaquemine LA 70765GRGGLHIGHW 3-18 Gerber Prods., Novartis Corp. Fort Smith AR 72917GRBRP4301H 4-11 Gibbs Die Casting Corp., George Koch & Sons Henderson KY 42420GBBSDUS60W 4-4 8-6 GMC Powertrain, Defiance, General Motors Corp. Defiance OH 43512GMC STATE 7-21 GNB Techs. Inc. Leavenworth KS 66048GNBNC1901S 4-4 GNB Techs. Inc. Farmers Branch TX 75234GNBNC1880V 4-4 GNB Techs. Inc., GNB Indl. Battery Co. Fort Smith AR 72901GNBNC4115S 8-6 GNB Techs. Inc. Dunmore PA 18512GNBNCONEDU 8-6 Grace Davison Cincinnati Plant, W. R. Grace & Co. Cincinnati OH 45229WRGRC4775P 4-11 Granite City Steel, National Steel Corp. Granite City IL 62040GRNTC20THS 3-13 Great Lakes Chemical Corp. Newport TN 37821GRTLKROUTE 4-11 Gulf Power Co., Plant Crist, Southern Co. Pensacola FL 32514GLFPW11999 3-6 3-7 5-4 6-5 H. Kramer & Co. Chicago IL 60608HKRMR1359W 8-6 Heat Energy Advanced Tech. Inc. Dallas TX 75212HTNRG4460S 4-9 Hercules Inc. Hopewell VA 23860QLNCM1111H 4-11 Hercules Inc. Parlin NJ 08859HRCLSSOUTH 4-11 5-4 Heritage Environmental Services L.L.C. Indianapolis IN 46231HRTGN7901W 3-8 3-11 3-13 3-20 3-22 Honeywell Intl. Inc. El Segundo CA 90245LLDSG850SO 3-18 Honeywell Intl. Inc., Baton Rouge Plant Baton Rouge LA 70805LLDSGCORNE 3-18 Honeywell Intl. Inc., Danville Works Danville IL 61834LLDSGNO5BR 3-18 Hukill Chemical Corp. Bedford OH 44146HKLLC7013K 4-9 Huntsman Corp. Port Arthur, A&O Plant, Huntsman Petrochemical Corp Port Arthur TX 77641TXCCHGATE2 7-21 Huntsman Petrochemical Corp. Cantonment FL 32533HNTSM3000O 4-10 Hydrite Chemical Co. Cottage Grove WI 53527HYDRT150WD 4-9 IBP Inc. Lexington NE 68850BPNC 1500S 7-22 Inco Limited, Copper Cliff Smelter Complex Copper Cliff ON 0000000444 3-11 3-13 3-20 3-22 International Paper Erie Mill Erie PA 16533HMMRM1540E 4-11 International Wire, Corunna, Intl. Wire Group Inc. Corunna IN 46730HSRFN1720U 4-4 Intertape Polymer Group, Columbia Div., Intertape Polymer Group Columbia SC 29205NCHRC2000S 3-22 Ipsco Steel Inc., Ipsco Inc. Muscatine IA 52761PSCST1770B 3-8 3-13 7-22 Irving Pulp & Paper Limited/Irving Tissue Company Saint John NB 0000002604 7-21 ISP Van Dyk Inc., International Specialty Prods. Belleville NJ 07109VNDYKMAINW 4-9 Ivaco Rolling Mills L'orignal ON 0000001520 3-8 J&L Specialty Steel Inc. Louisville OH 44641JLSPC1500W 4-4 5-4 J. R. Simpolot Co., Heyburn Food Group, J. R. Simplot Co. Heyburn ID 83336JRSMPHIGHW 7-22 Jayhawk Fine Chemicals Corp., Laporte Fine Chemicals Galena KS 66739LLCCH22MIS 3-6 3-8 5-4 6-5 6-28 7-22 Jessop Steel Co., Allegheny Techs. Inc. Washington PA 15301JSSPS500GR 4-4 Johns Manville Canada Inc., Cornwall Cornwall ON 0000005749 3-18 Johns Manville Intl. Bremen IN 46506NRGBR1215W 3-18 Johnson Controls Inc., Battery Group Inc. Saint Joseph MO 64502JHNSN4722P 4-4 Johnson Controls Inc., Battery Group Holland OH 43528JHNSN10300 4-4
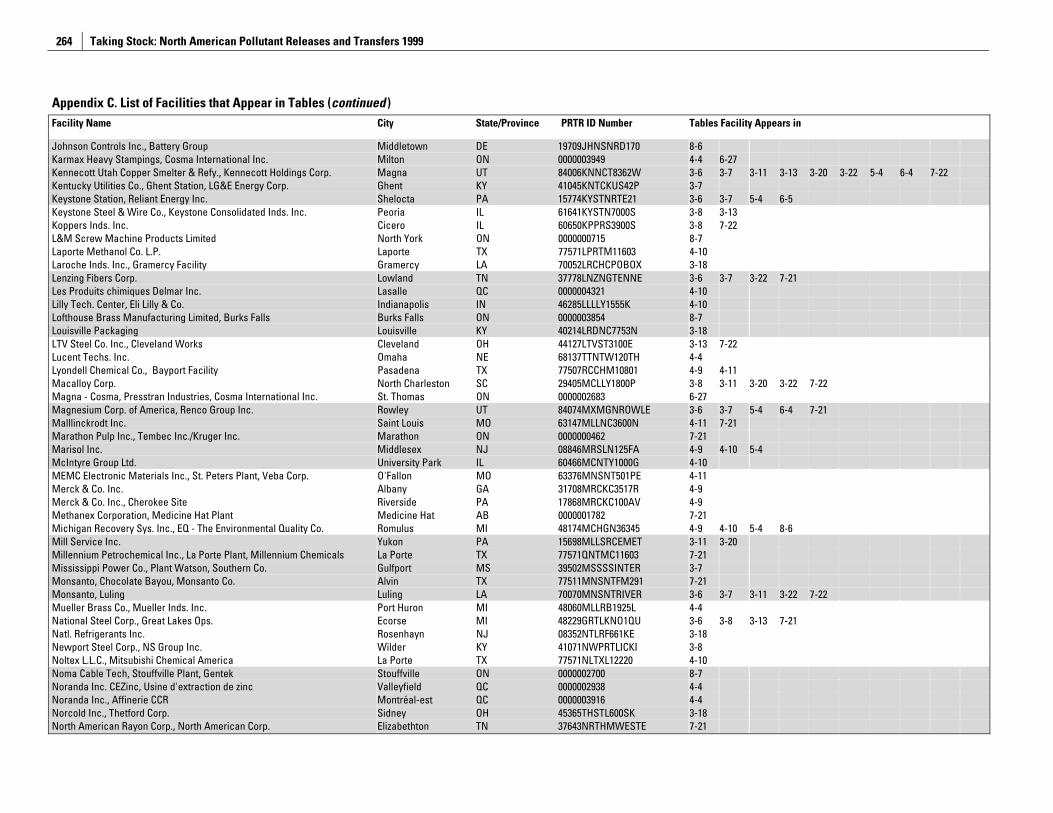
Taking Stock: North American Pollutant Releases and Transfers 1999
264
Appendix C. List of Facilities that Appear in Tables (continued )
Facility Name City State/Province PRTR ID Number Tables Facility Appears in
Johnson Controls Inc., Battery Group Middletown DE 19709JHNSNRD170 8-6 Karmax Heavy Stampings, Cosma International Inc. Milton ON 0000003949 4-4 6-27 Kennecott Utah Copper Smelter & Refy., Kennecott Holdings Corp. Magna UT 84006KNNCT8362W 3-6 3-7 3-11 3-13 3-20 3-22 5-4 6-4 7-22 Kentucky Utilities Co., Ghent Station, LG&E Energy Corp. Ghent KY 41045KNTCKUS42P 3-7 Keystone Station, Reliant Energy Inc. Shelocta PA 15774KYSTNRTE21 3-6 3-7 5-4 6-5 Keystone Steel & Wire Co., Keystone Consolidated Inds. Inc. Peoria IL 61641KYSTN7000S 3-8 3-13 Koppers Inds. Inc. Cicero IL 60650KPPRS3900S 3-8 7-22 L&M Screw Machine Products Limited North York ON 0000000715 8-7 Laporte Methanol Co. L.P. Laporte TX 77571LPRTM11603 4-10 Laroche Inds. Inc., Gramercy Facility Gramercy LA 70052LRCHCPOBOX 3-18 Lenzing Fibers Corp. Lowland TN 37778LNZNGTENNE 3-6 3-7 3-22 7-21 Les Produits chimiques Delmar Inc. Lasalle QC 0000004321 4-10 Lilly Tech. Center, Eli Lilly & Co. Indianapolis IN 46285LLLLY1555K 4-10 Lofthouse Brass Manufacturing Limited, Burks Falls Burks Falls ON 0000003854 8-7 Louisville Packaging Louisville KY 40214LRDNC7753N 3-18 LTV Steel Co. Inc., Cleveland Works Cleveland OH 44127LTVST3100E 3-13 7-22 Lucent Techs. Inc. Omaha NE 68137TTNTW120TH 4-4 Lyondell Chemical Co., Bayport Facility Pasadena TX 77507RCCHM10801 4-9 4-11 Macalloy Corp. North Charleston SC 29405MCLLY1800P 3-8 3-11 3-20 3-22 7-22 Magna - Cosma, Presstran Industries, Cosma International Inc. St. Thomas ON 0000002683 6-27 Magnesium Corp. of America, Renco Group Inc. Rowley UT 84074MXMGNROWLE 3-6 3-7 5-4 6-4 7-21 Malllinckrodt Inc. Saint Louis MO 63147MLLNC3600N 4-11 7-21 Marathon Pulp Inc., Tembec Inc./Kruger Inc. Marathon ON 0000000462 7-21 Marisol Inc. Middlesex NJ 08846MRSLN125FA 4-9 4-10 5-4 McIntyre Group Ltd. University Park IL 60466MCNTY1000G 4-10 MEMC Electronic Materials Inc., St. Peters Plant, Veba Corp. O'Fallon MO 63376MNSNT501PE 4-11 Merck & Co. Inc. Albany GA 31708MRCKC3517R 4-9 Merck & Co. Inc., Cherokee Site Riverside PA 17868MRCKC100AV 4-9 Methanex Corporation, Medicine Hat Plant Medicine Hat AB 0000001782 7-21 Michigan Recovery Sys. Inc., EQ - The Environmental Quality Co. Romulus MI 48174MCHGN36345 4-9 4-10 5-4 8-6 Mill Service Inc. Yukon PA 15698MLLSRCEMET 3-11 3-20 Millennium Petrochemical Inc., La Porte Plant, Millennium Chemicals La Porte TX 77571QNTMC11603 7-21 Mississippi Power Co., Plant Watson, Southern Co. Gulfport MS 39502MSSSSINTER 3-7 Monsanto, Chocolate Bayou, Monsanto Co. Alvin TX 77511MNSNTFM291 7-21 Monsanto, Luling Luling LA 70070MNSNTRIVER 3-6 3-7 3-11 3-22 7-22 Mueller Brass Co., Mueller Inds. Inc. Port Huron MI 48060MLLRB1925L 4-4 National Steel Corp., Great Lakes Ops. Ecorse MI 48229GRTLKNO1QU 3-6 3-8 3-13 7-21 Natl. Refrigerants Inc. Rosenhayn NJ 08352NTLRF661KE 3-18 Newport Steel Corp., NS Group Inc. Wilder KY 41071NWPRTLICKI 3-8 Noltex L.L.C., Mitsubishi Chemical America La Porte TX 77571NLTXL12220 4-10 Noma Cable Tech, Stouffville Plant, Gentek Stouffville ON 0000002700 8-7 Noranda Inc. CEZinc, Usine d'extraction de zinc Valleyfield QC 0000002938 4-4 Noranda Inc., Affinerie CCR Montréal-est QC 0000003916 4-4 Norcold Inc., Thetford Corp. Sidney OH 45365THSTL600SK 3-18 North American Rayon Corp., North American Corp. Elizabethton TN 37643NRTHMWESTE 7-21
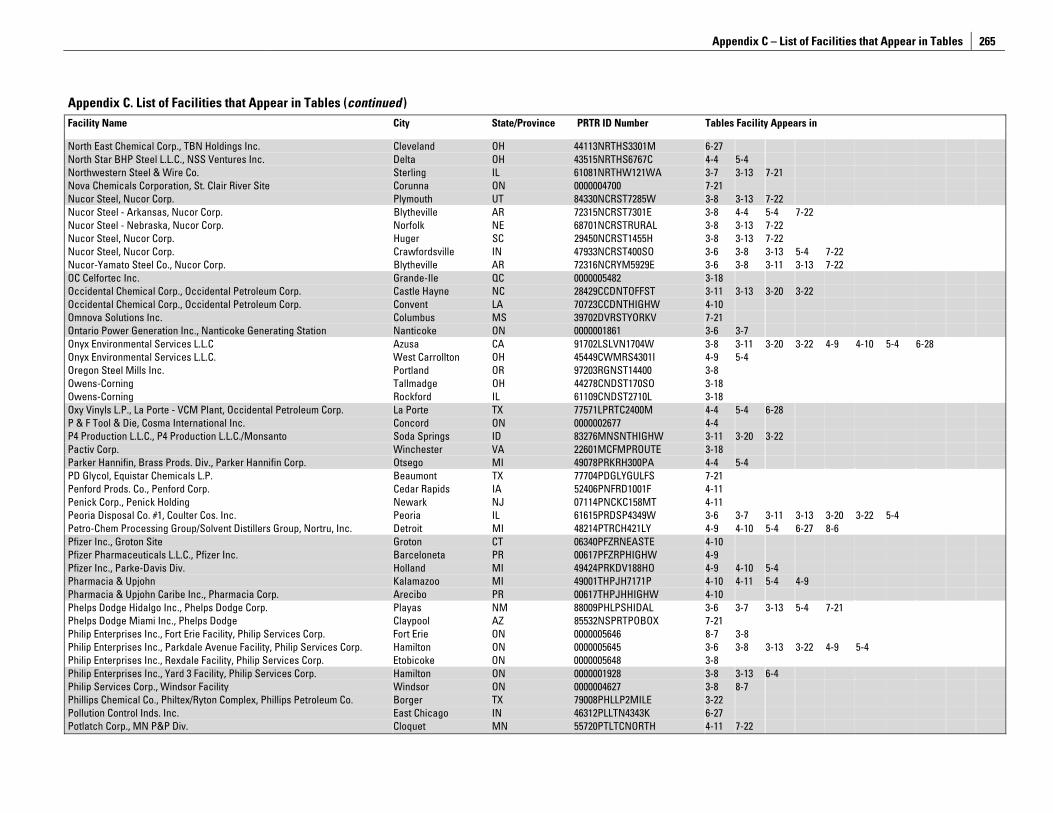
Appendix C – List of Facilities that Appear in Tables
265
Appendix C. List of Facilities that Appear in Tables (continued )
Facility Name City State/Province PRTR ID Number Tables Facility Appears in
North East Chemical Corp., TBN Holdings Inc. Cleveland OH 44113NRTHS3301M 6-27 North Star BHP Steel L.L.C., NSS Ventures Inc. Delta OH 43515NRTHS6767C 4-4 5-4 Northwestern Steel & Wire Co. Sterling IL 61081NRTHW121WA 3-7 3-13 7-21 Nova Chemicals Corporation, St. Clair River Site Corunna ON 0000004700 7-21 Nucor Steel, Nucor Corp. Plymouth UT 84330NCRST7285W 3-8 3-13 7-22 Nucor Steel - Arkansas, Nucor Corp. Blytheville AR 72315NCRST7301E 3-8 4-4 5-4 7-22 Nucor Steel - Nebraska, Nucor Corp. Norfolk NE 68701NCRSTRURAL 3-8 3-13 7-22 Nucor Steel, Nucor Corp. Huger SC 29450NCRST1455H 3-8 3-13 7-22 Nucor Steel, Nucor Corp. Crawfordsville IN 47933NCRST400SO 3-6 3-8 3-13 5-4 7-22 Nucor-Yamato Steel Co., Nucor Corp. Blytheville AR 72316NCRYM5929E 3-6 3-8 3-11 3-13 7-22 OC Celfortec Inc. Grande-Ile QC 0000005482 3-18 Occidental Chemical Corp., Occidental Petroleum Corp. Castle Hayne NC 28429CCDNTOFFST 3-11 3-13 3-20 3-22 Occidental Chemical Corp., Occidental Petroleum Corp. Convent LA 70723CCDNTHIGHW 4-10 Omnova Solutions Inc. Columbus MS 39702DVRSTYORKV 7-21 Ontario Power Generation Inc., Nanticoke Generating Station Nanticoke ON 0000001861 3-6 3-7 Onyx Environmental Services L.L.C Azusa CA 91702LSLVN1704W 3-8 3-11 3-20 3-22 4-9 4-10 5-4 6-28 Onyx Environmental Services L.L.C. West Carrollton OH 45449CWMRS4301I 4-9 5-4 Oregon Steel Mills Inc. Portland OR 97203RGNST14400 3-8 Owens-Corning Tallmadge OH 44278CNDST170SO 3-18 Owens-Corning Rockford IL 61109CNDST2710L 3-18 Oxy Vinyls L.P., La Porte - VCM Plant, Occidental Petroleum Corp. La Porte TX 77571LPRTC2400M 4-4 5-4 6-28 P & F Tool & Die, Cosma International Inc. Concord ON 0000002677 4-4 P4 Production L.L.C., P4 Production L.L.C./Monsanto Soda Springs ID 83276MNSNTHIGHW 3-11 3-20 3-22 Pactiv Corp. Winchester VA 22601MCFMPROUTE 3-18 Parker Hannifin, Brass Prods. Div., Parker Hannifin Corp. Otsego MI 49078PRKRH300PA 4-4 5-4 PD Glycol, Equistar Chemicals L.P. Beaumont TX 77704PDGLYGULFS 7-21 Penford Prods. Co., Penford Corp. Cedar Rapids IA 52406PNFRD1001F 4-11 Penick Corp., Penick Holding Newark NJ 07114PNCKC158MT 4-11 Peoria Disposal Co. #1, Coulter Cos. Inc. Peoria IL 61615PRDSP4349W 3-6 3-7 3-11 3-13 3-20 3-22 5-4 Petro-Chem Processing Group/Solvent Distillers Group, Nortru, Inc. Detroit MI 48214PTRCH421LY 4-9 4-10 5-4 6-27 8-6 Pfizer Inc., Groton Site Groton CT 06340PFZRNEASTE 4-10 Pfizer Pharmaceuticals L.L.C., Pfizer Inc. Barceloneta PR 00617PFZRPHIGHW 4-9 Pfizer Inc., Parke-Davis Div. Holland MI 49424PRKDV188HO 4-9 4-10 5-4 Pharmacia & Upjohn Kalamazoo MI 49001THPJH7171P 4-10 4-11 5-4 4-9 Pharmacia & Upjohn Caribe Inc., Pharmacia Corp. Arecibo PR 00617THPJHHIGHW 4-10 Phelps Dodge Hidalgo Inc., Phelps Dodge Corp. Playas NM 88009PHLPSHIDAL 3-6 3-7 3-13 5-4 7-21 Phelps Dodge Miami Inc., Phelps Dodge Claypool AZ 85532NSPRTPOBOX 7-21 Philip Enterprises Inc., Fort Erie Facility, Philip Services Corp. Fort Erie ON 0000005646 8-7 3-8 Philip Enterprises Inc., Parkdale Avenue Facility, Philip Services Corp. Hamilton ON 0000005645 3-6 3-8 3-13 3-22 4-9 5-4 Philip Enterprises Inc., Rexdale Facility, Philip Services Corp. Etobicoke ON 0000005648 3-8 Philip Enterprises Inc., Yard 3 Facility, Philip Services Corp. Hamilton ON 0000001928 3-8 3-13 6-4 Philip Services Corp., Windsor Facility Windsor ON 0000004627 3-8 8-7 Phillips Chemical Co., Philtex/Ryton Complex, Phillips Petroleum Co. Borger TX 79008PHLLP2MILE 3-22 Pollution Control Inds. Inc. East Chicago IN 46312PLLTN4343K 6-27 Potlatch Corp., MN P&P Div. Cloquet MN 55720PTLTCNORTH 4-11 7-22
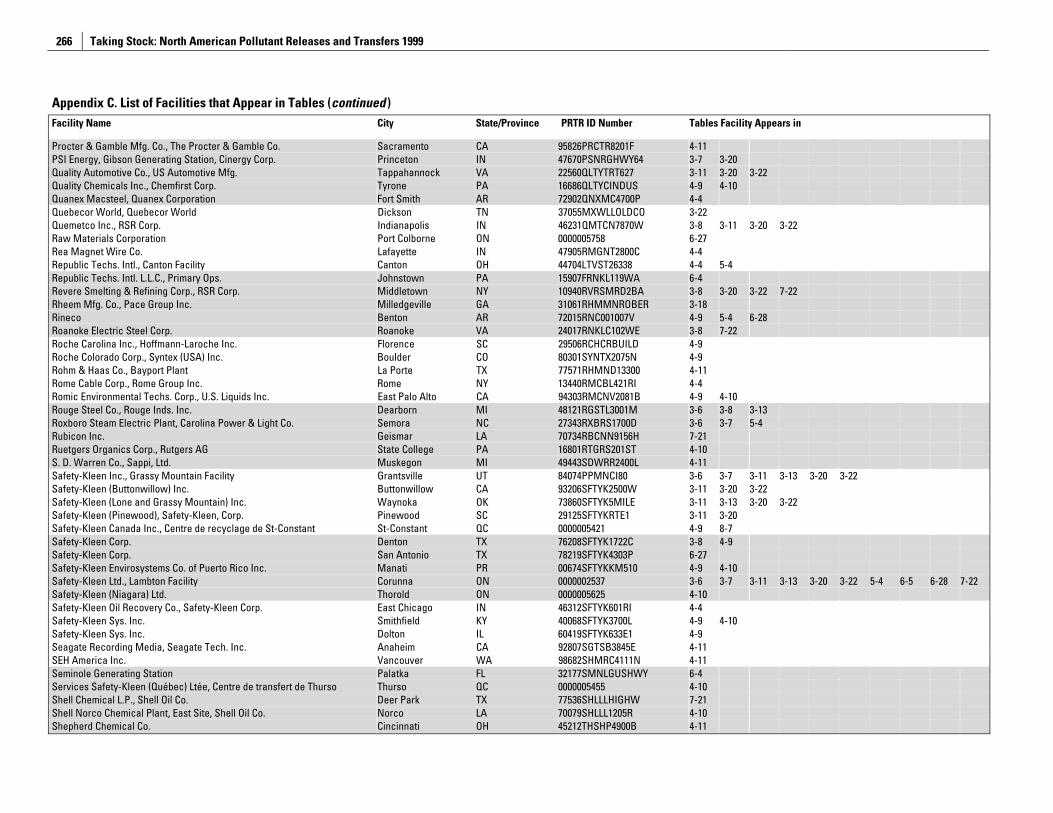
Taking Stock: North American Pollutant Releases and Transfers 1999
266
Appendix C. List of Facilities that Appear in Tables (continued )
Facility Name City State/Province PRTR ID Number Tables Facility Appears in
Procter & Gamble Mfg. Co., The Procter & Gamble Co. Sacramento CA 95826PRCTR8201F 4-11 PSI Energy, Gibson Generating Station, Cinergy Corp. Princeton IN 47670PSNRGHWY64 3-7 3-20 Quality Automotive Co., US Automotive Mfg. Tappahannock VA 22560QLTYTRT627 3-11 3-20 3-22 Quality Chemicals Inc., Chemfirst Corp. Tyrone PA 16686QLTYCINDUS 4-9 4-10 Quanex Macsteel, Quanex Corporation Fort Smith AR 72902QNXMC4700P 4-4 Quebecor World, Quebecor World Dickson TN 37055MXWLLOLDCO 3-22 Quemetco Inc., RSR Corp. Indianapolis IN 46231QMTCN7870W 3-8 3-11 3-20 3-22 Raw Materials Corporation Port Colborne ON 0000005758 6-27 Rea Magnet Wire Co. Lafayette IN 47905RMGNT2800C 4-4 Republic Techs. Intl., Canton Facility Canton OH 44704LTVST26338 4-4 5-4 Republic Techs. Intl. L.L.C., Primary Ops. Johnstown PA 15907FRNKL119WA 6-4 Revere Smelting & Refining Corp., RSR Corp. Middletown NY 10940RVRSMRD2BA 3-8 3-20 3-22 7-22 Rheem Mfg. Co., Pace Group Inc. Milledgeville GA 31061RHMMNROBER 3-18 Rineco Benton AR 72015RNC001007V 4-9 5-4 6-28 Roanoke Electric Steel Corp. Roanoke VA 24017RNKLC102WE 3-8 7-22 Roche Carolina Inc., Hoffmann-Laroche Inc. Florence SC 29506RCHCRBUILD 4-9 Roche Colorado Corp., Syntex (USA) Inc. Boulder CO 80301SYNTX2075N 4-9 Rohm & Haas Co., Bayport Plant La Porte TX 77571RHMND13300 4-11 Rome Cable Corp., Rome Group Inc. Rome NY 13440RMCBL421RI 4-4 Romic Environmental Techs. Corp., U.S. Liquids Inc. East Palo Alto CA 94303RMCNV2081B 4-9 4-10 Rouge Steel Co., Rouge Inds. Inc. Dearborn MI 48121RGSTL3001M 3-6 3-8 3-13 Roxboro Steam Electric Plant, Carolina Power & Light Co. Semora NC 27343RXBRS1700D 3-6 3-7 5-4 Rubicon Inc. Geismar LA 70734RBCNN9156H 7-21 Ruetgers Organics Corp., Rutgers AG State College PA 16801RTGRS201ST 4-10 S. D. Warren Co., Sappi, Ltd. Muskegon MI 49443SDWRR2400L 4-11 Safety-Kleen Inc., Grassy Mountain Facility Grantsville UT 84074PPMNCI80 3-6 3-7 3-11 3-13 3-20 3-22 Safety-Kleen (Buttonwillow) Inc. Buttonwillow CA 93206SFTYK2500W 3-11 3-20 3-22 Safety-Kleen (Lone and Grassy Mountain) Inc. Waynoka OK 73860SFTYK5MILE 3-11 3-13 3-20 3-22 Safety-Kleen (Pinewood), Safety-Kleen, Corp. Pinewood SC 29125SFTYKRTE1 3-11 3-20 Safety-Kleen Canada Inc., Centre de recyclage de St-Constant St-Constant QC 0000005421 4-9 8-7 Safety-Kleen Corp. Denton TX 76208SFTYK1722C 3-8 4-9 Safety-Kleen Corp. San Antonio TX 78219SFTYK4303P 6-27 Safety-Kleen Envirosystems Co. of Puerto Rico Inc. Manati PR 00674SFTYKKM510 4-9 4-10 Safety-Kleen Ltd., Lambton Facility Corunna ON 0000002537 3-6 3-7 3-11 3-13 3-20 3-22 5-4 6-5 6-28 7-22 Safety-Kleen (Niagara) Ltd. Thorold ON 0000005625 4-10 Safety-Kleen Oil Recovery Co., Safety-Kleen Corp. East Chicago IN 46312SFTYK601RI 4-4 Safety-Kleen Sys. Inc. Smithfield KY 40068SFTYK3700L 4-9 4-10 Safety-Kleen Sys. Inc. Dolton IL 60419SFTYK633E1 4-9 Seagate Recording Media, Seagate Tech. Inc. Anaheim CA 92807SGTSB3845E 4-11 SEH America Inc. Vancouver WA 98682SHMRC4111N 4-11 Seminole Generating Station Palatka FL 32177SMNLGUSHWY 6-4 Services Safety-Kleen (Québec) Ltée, Centre de transfert de Thurso Thurso QC 0000005455 4-10 Shell Chemical L.P., Shell Oil Co. Deer Park TX 77536SHLLLHIGHW 7-21 Shell Norco Chemical Plant, East Site, Shell Oil Co. Norco LA 70079SHLLL1205R 4-10 Shepherd Chemical Co. Cincinnati OH 45212THSHP4900B 4-11
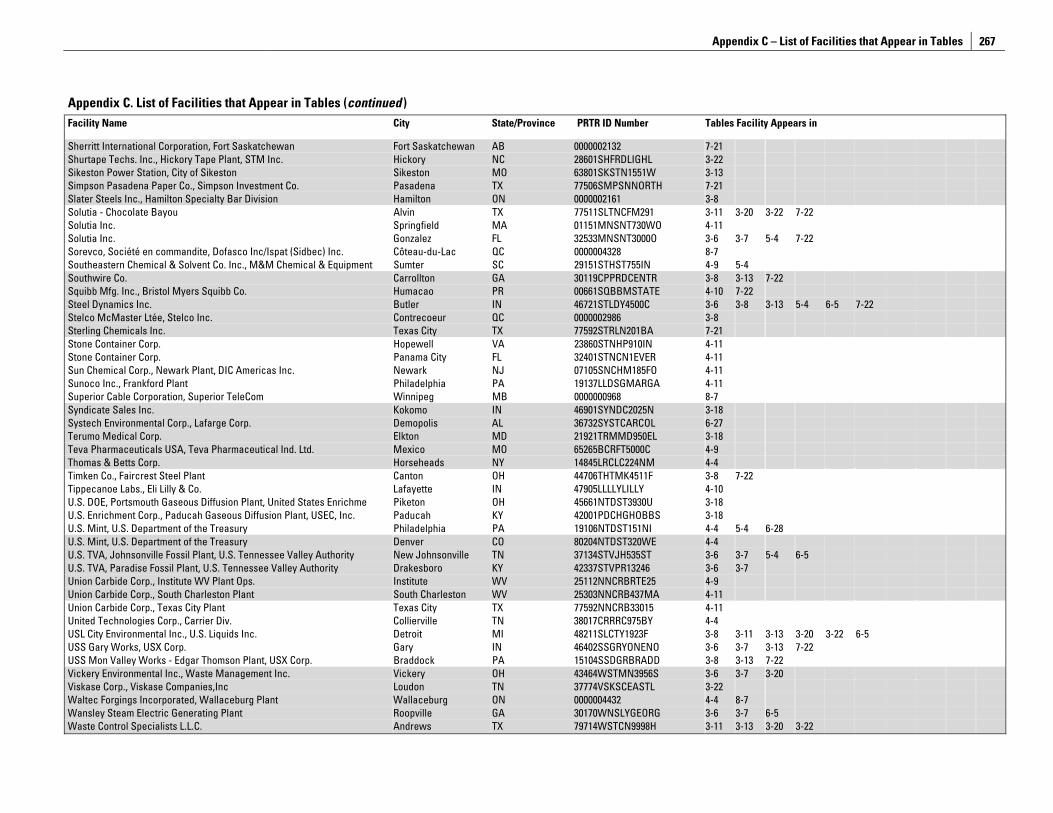
Appendix C – List of Facilities that Appear in Tables
267
Appendix C. List of Facilities that Appear in Tables (continued )
Facility Name City State/Province PRTR ID Number Tables Facility Appears in
Sherritt International Corporation, Fort Saskatchewan Fort Saskatchewan AB 0000002132 7-21 Shurtape Techs. Inc., Hickory Tape Plant, STM Inc. Hickory NC 28601SHFRDLIGHL 3-22 Sikeston Power Station, City of Sikeston Sikeston MO 63801SKSTN1551W 3-13 Simpson Pasadena Paper Co., Simpson Investment Co. Pasadena TX 77506SMPSNNORTH 7-21 Slater Steels Inc., Hamilton Specialty Bar Division Hamilton ON 0000002161 3-8 Solutia - Chocolate Bayou Alvin TX 77511SLTNCFM291 3-11 3-20 3-22 7-22 Solutia Inc. Springfield MA 01151MNSNT730WO 4-11 Solutia Inc. Gonzalez FL 32533MNSNT3000O 3-6 3-7 5-4 7-22 Sorevco, Société en commandite, Dofasco Inc/Ispat (Sidbec) Inc. Côteau-du-Lac QC 0000004328 8-7 Southeastern Chemical & Solvent Co. Inc., M&M Chemical & Equipment Sumter SC 29151STHST755IN 4-9 5-4 Southwire Co. Carrollton GA 30119CPPRDCENTR 3-8 3-13 7-22 Squibb Mfg. Inc., Bristol Myers Squibb Co. Humacao PR 00661SQBBMSTATE 4-10 7-22 Steel Dynamics Inc. Butler IN 46721STLDY4500C 3-6 3-8 3-13 5-4 6-5 7-22 Stelco McMaster Ltée, Stelco Inc. Contrecoeur QC 0000002986 3-8 Sterling Chemicals Inc. Texas City TX 77592STRLN201BA 7-21 Stone Container Corp. Hopewell VA 23860STNHP910IN 4-11 Stone Container Corp. Panama City FL 32401STNCN1EVER 4-11 Sun Chemical Corp., Newark Plant, DIC Americas Inc. Newark NJ 07105SNCHM185FO 4-11 Sunoco Inc., Frankford Plant Philadelphia PA 19137LLDSGMARGA 4-11 Superior Cable Corporation, Superior TeleCom Winnipeg MB 0000000968 8-7 Syndicate Sales Inc. Kokomo IN 46901SYNDC2025N 3-18 Systech Environmental Corp., Lafarge Corp. Demopolis AL 36732SYSTCARCOL 6-27 Terumo Medical Corp. Elkton MD 21921TRMMD950EL 3-18 Teva Pharmaceuticals USA, Teva Pharmaceutical Ind. Ltd. Mexico MO 65265BCRFT5000C 4-9 Thomas & Betts Corp. Horseheads NY 14845LRCLC224NM 4-4 Timken Co., Faircrest Steel Plant Canton OH 44706THTMK4511F 3-8 7-22 Tippecanoe Labs., Eli Lilly & Co. Lafayette IN 47905LLLLYLILLY 4-10 U.S. DOE, Portsmouth Gaseous Diffusion Plant, United States Enrichme Piketon OH 45661NTDST3930U 3-18 U.S. Enrichment Corp., Paducah Gaseous Diffusion Plant, USEC, Inc. Paducah KY 42001PDCHGHOBBS 3-18 U.S. Mint, U.S. Department of the Treasury Philadelphia PA 19106NTDST151NI 4-4 5-4 6-28 U.S. Mint, U.S. Department of the Treasury Denver CO 80204NTDST320WE 4-4 U.S. TVA, Johnsonville Fossil Plant, U.S. Tennessee Valley Authority New Johnsonville TN 37134STVJH535ST 3-6 3-7 5-4 6-5 U.S. TVA, Paradise Fossil Plant, U.S. Tennessee Valley Authority Drakesboro KY 42337STVPR13246 3-6 3-7 Union Carbide Corp., Institute WV Plant Ops. Institute WV 25112NNCRBRTE25 4-9 Union Carbide Corp., South Charleston Plant South Charleston WV 25303NNCRB437MA 4-11 Union Carbide Corp., Texas City Plant Texas City TX 77592NNCRB33015 4-11 United Technologies Corp., Carrier Div. Collierville TN 38017CRRRC975BY 4-4 USL City Environmental Inc., U.S. Liquids Inc. Detroit MI 48211SLCTY1923F 3-8 3-11 3-13 3-20 3-22 6-5 USS Gary Works, USX Corp. Gary IN 46402SSGRYONENO 3-6 3-7 3-13 7-22 USS Mon Valley Works - Edgar Thomson Plant, USX Corp. Braddock PA 15104SSDGRBRADD 3-8 3-13 7-22 Vickery Environmental Inc., Waste Management Inc. Vickery OH 43464WSTMN3956S 3-6 3-7 3-20 Viskase Corp., Viskase Companies,Inc Loudon TN 37774VSKSCEASTL 3-22 Waltec Forgings Incorporated, Wallaceburg Plant Wallaceburg ON 0000004432 4-4 8-7 Wansley Steam Electric Generating Plant Roopville GA 30170WNSLYGEORG 3-6 3-7 6-5 Waste Control Specialists L.L.C. Andrews TX 79714WSTCN9998H 3-11 3-13 3-20 3-22
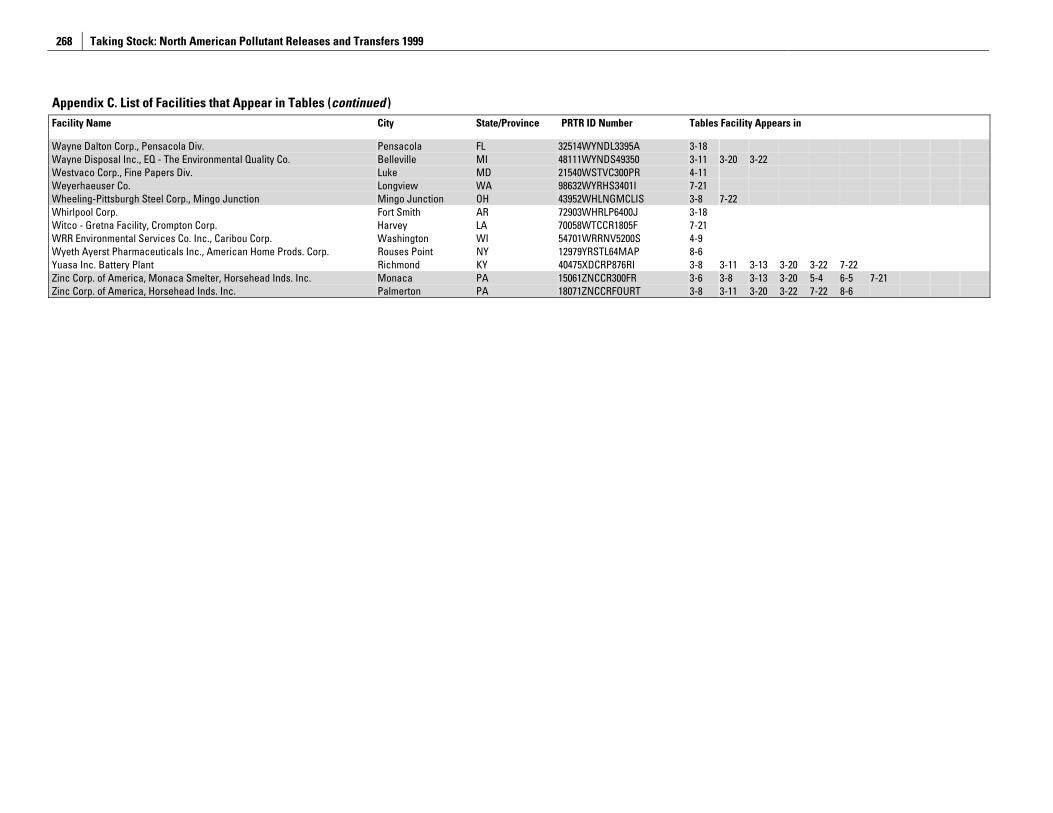
Taking Stock: North American Pollutant Releases and Transfers 1999
268
Appendix C. List of Facilities that Appear in Tables (continued )
Facility Name City State/Province PRTR ID Number Tables Facility Appears in
Wayne Dalton Corp., Pensacola Div. Pensacola FL 32514WYNDL3395A 3-18 Wayne Disposal Inc., EQ - The Environmental Quality Co. Belleville MI 48111WYNDS49350 3-11 3-20 3-22 Westvaco Corp., Fine Papers Div. Luke MD 21540WSTVC300PR 4-11 Weyerhaeuser Co. Longview WA 98632WYRHS3401I 7-21 Wheeling-Pittsburgh Steel Corp., Mingo Junction Mingo Junction OH 43952WHLNGMCLIS 3-8 7-22 Whirlpool Corp. Fort Smith AR 72903WHRLP6400J 3-18 Witco - Gretna Facility, Crompton Corp. Harvey LA 70058WTCCR1805F 7-21 WRR Environmental Services Co. Inc., Caribou Corp. Washington WI 54701WRRNV5200S 4-9 Wyeth Ayerst Pharmaceuticals Inc., American Home Prods. Corp. Rouses Point NY 12979YRSTL64MAP 8-6 Yuasa Inc. Battery Plant Richmond KY 40475XDCRP876RI 3-8 3-11 3-13 3-20 3-22 7-22 Zinc Corp. of America, Monaca Smelter, Horsehead Inds. Inc. Monaca PA 15061ZNCCR300FR 3-6 3-8 3-13 3-20 5-4 6-5 7-21 Zinc Corp. of America, Horsehead Inds. Inc. Palmerton PA 18071ZNCCRFOURT 3-8 3-11 3-20 3-22 7-22 8-6
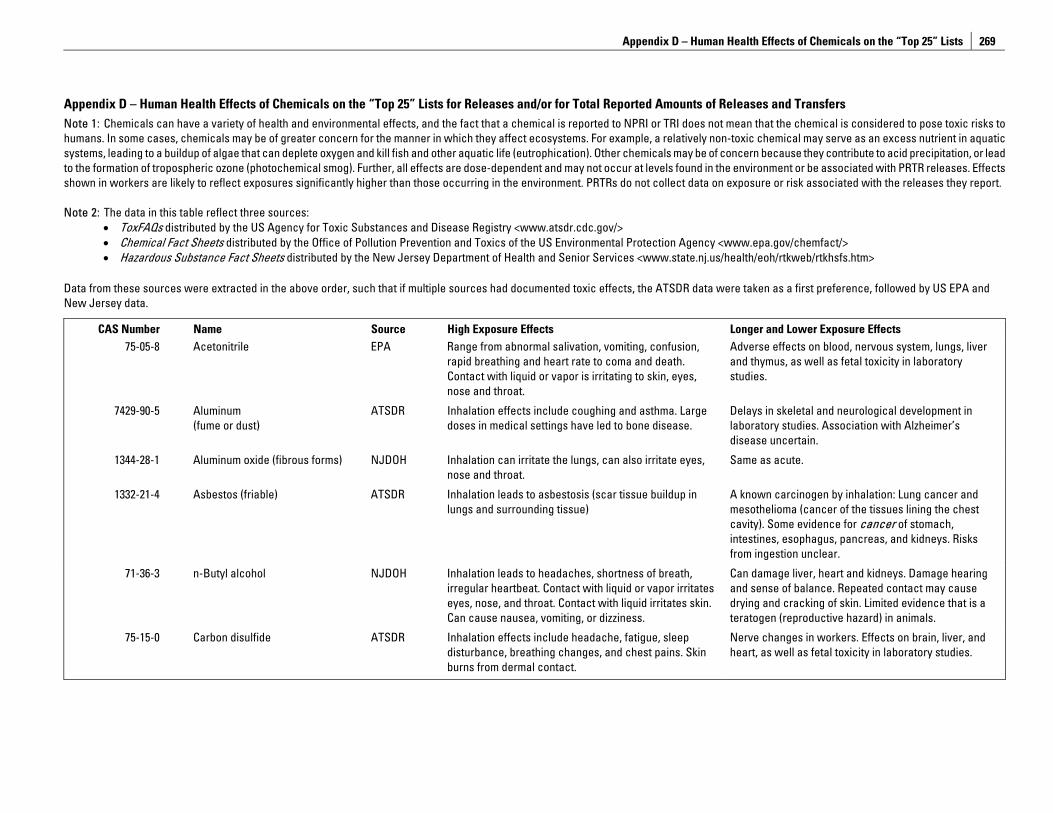
Appendix D – Human Health Effects of Chemicals on the “Top 25” Lists
269
Appendix D – Human Health Effects of Chemicals on the “Top 25” Lists for Releases and/or for Total Reported Amounts of Releases and Transfers Note 1: Chemicals can have a variety of health and environmental effects, and the fact that a chemical is reported to NPRI or TRI does not mean that the chemical is considered to pose toxic risks to humans. In some cases, chemicals may be of greater concern for the manner in which they affect ecosystems. For example, a relatively non-toxic chemical may serve as an excess nutrient in aquatic systems, leading to a buildup of algae that can deplete oxygen and kill fish and other aquatic life (eutrophication). Other chemicals may be of concern because they contribute to acid precipitation, or lead to the formation of tropospheric ozone (photochemical smog). Further, all effects are dose-dependent and may not occur at levels found in the environment or be associated with PRTR releases. Effects shown in workers are likely to reflect exposures significantly higher than those occurring in the environment. PRTRs do not collect data on exposure or risk associated with the releases they report. Note 2: The data in this table reflect three sources:
• ToxFAQs distributed by the US Agency for Toxic Substances and Disease Registry <www.atsdr.cdc.gov/> • Chemical Fact Sheets distributed by the Office of Pollution Prevention and Toxics of the US Environmental Protection Agency <www.epa.gov/chemfact/> • Hazardous Substance Fact Sheets distributed by the New Jersey Department of Health and Senior Services <www.state.nj.us/health/eoh/rtkweb/rtkhsfs.htm>
Data from these sources were extracted in the above order, such that if multiple sources had documented toxic effects, the ATSDR data were taken as a first preference, followed by US EPA and New Jersey data.
CAS Number Name Source High Exposure Effects Longer and Lower Exposure Effects 75-05-8 Acetonitrile EPA Range from abnormal salivation, vomiting, confusion,
rapid breathing and heart rate to coma and death. Contact with liquid or vapor is irritating to skin, eyes, nose and throat.
Adverse effects on blood, nervous system, lungs, liver and thymus, as well as fetal toxicity in laboratory studies.
7429-90-5 Aluminum (fume or dust)
ATSDR Inhalation effects include coughing and asthma. Large doses in medical settings have led to bone disease.
Delays in skeletal and neurological development in laboratory studies. Association with Alzheimer’s disease uncertain.
1344-28-1 Aluminum oxide (fibrous forms) NJDOH Inhalation can irritate the lungs, can also irritate eyes, nose and throat.
Same as acute.
1332-21-4 Asbestos (friable) ATSDR Inhalation leads to asbestosis (scar tissue buildup in lungs and surrounding tissue)
A known carcinogen by inhalation: Lung cancer and mesothelioma (cancer of the tissues lining the chest cavity). Some evidence for cancer of stomach, intestines, esophagus, pancreas, and kidneys. Risks from ingestion unclear.
71-36-3 n-Butyl alcohol NJDOH Inhalation leads to headaches, shortness of breath, irregular heartbeat. Contact with liquid or vapor irritates eyes, nose, and throat. Contact with liquid irritates skin. Can cause nausea, vomiting, or dizziness.
Can damage liver, heart and kidneys. Damage hearing and sense of balance. Repeated contact may cause drying and cracking of skin. Limited evidence that is a teratogen (reproductive hazard) in animals.
75-15-0 Carbon disulfide ATSDR Inhalation effects include headache, fatigue, sleep disturbance, breathing changes, and chest pains. Skin burns from dermal contact.
Nerve changes in workers. Effects on brain, liver, and heart, as well as fetal toxicity in laboratory studies.
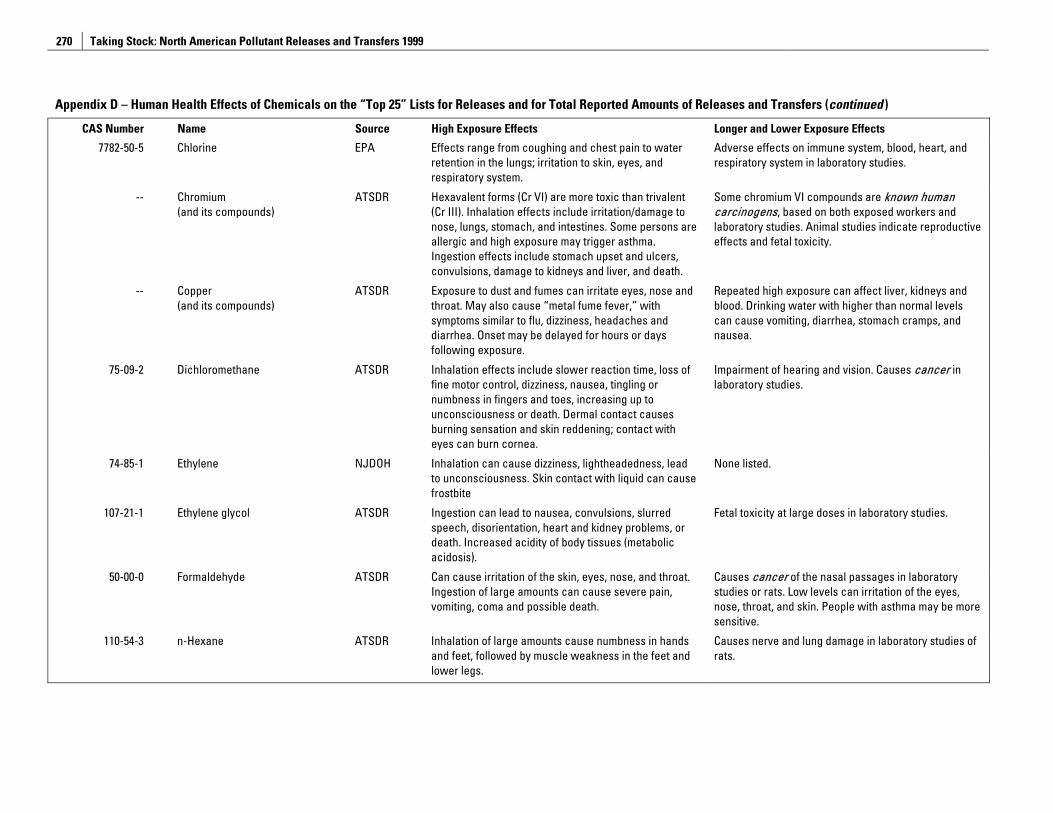
Taking Stock: North American Pollutant Releases and Transfers 1999
270
Appendix D – Human Health Effects of Chemicals on the “Top 25” Lists for Releases and for Total Reported Amounts of Releases and Transfers (continued )
CAS Number Name Source High Exposure Effects Longer and Lower Exposure Effects
7782-50-5 Chlorine EPA Effects range from coughing and chest pain to water retention in the lungs; irritation to skin, eyes, and respiratory system.
Adverse effects on immune system, blood, heart, and respiratory system in laboratory studies.
-- Chromium (and its compounds)
ATSDR Hexavalent forms (Cr VI) are more toxic than trivalent (Cr III). Inhalation effects include irritation/damage to nose, lungs, stomach, and intestines. Some persons are allergic and high exposure may trigger asthma. Ingestion effects include stomach upset and ulcers, convulsions, damage to kidneys and liver, and death.
Some chromium VI compounds are known human carcinogens, based on both exposed workers and laboratory studies. Animal studies indicate reproductive effects and fetal toxicity.
-- Copper (and its compounds)
ATSDR Exposure to dust and fumes can irritate eyes, nose and throat. May also cause “metal fume fever,” with symptoms similar to flu, dizziness, headaches and diarrhea. Onset may be delayed for hours or days following exposure.
Repeated high exposure can affect liver, kidneys and blood. Drinking water with higher than normal levels can cause vomiting, diarrhea, stomach cramps, and nausea.
75-09-2 Dichloromethane ATSDR Inhalation effects include slower reaction time, loss of fine motor control, dizziness, nausea, tingling or numbness in fingers and toes, increasing up to unconsciousness or death. Dermal contact causes burning sensation and skin reddening; contact with eyes can burn cornea.
Impairment of hearing and vision. Causes cancer in laboratory studies.
74-85-1 Ethylene NJDOH Inhalation can cause dizziness, lightheadedness, lead to unconsciousness. Skin contact with liquid can cause frostbite
None listed.
107-21-1 Ethylene glycol ATSDR Ingestion can lead to nausea, convulsions, slurred speech, disorientation, heart and kidney problems, or death. Increased acidity of body tissues (metabolic acidosis).
Fetal toxicity at large doses in laboratory studies.
50-00-0 Formaldehyde ATSDR Can cause irritation of the skin, eyes, nose, and throat. Ingestion of large amounts can cause severe pain, vomiting, coma and possible death.
Causes cancer of the nasal passages in laboratory studies or rats. Low levels can irritation of the eyes, nose, throat, and skin. People with asthma may be more sensitive.
110-54-3 n-Hexane ATSDR Inhalation of large amounts cause numbness in hands and feet, followed by muscle weakness in the feet and lower legs.
Causes nerve and lung damage in laboratory studies of rats.
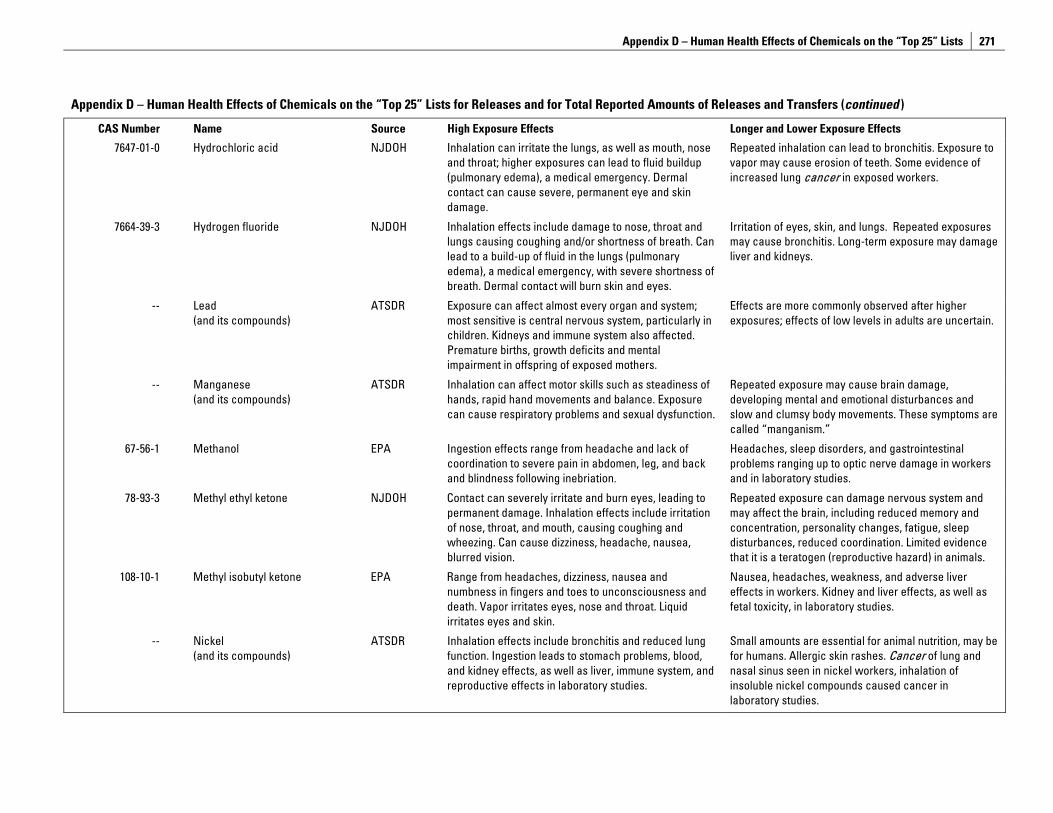
Appendix D – Human Health Effects of Chemicals on the “Top 25” Lists
271
Appendix D – Human Health Effects of Chemicals on the “Top 25” Lists for Releases and for Total Reported Amounts of Releases and Transfers (continued )
CAS Number Name Source High Exposure Effects Longer and Lower Exposure Effects
7647-01-0 Hydrochloric acid NJDOH Inhalation can irritate the lungs, as well as mouth, nose and throat; higher exposures can lead to fluid buildup (pulmonary edema), a medical emergency. Dermal contact can cause severe, permanent eye and skin damage.
Repeated inhalation can lead to bronchitis. Exposure to vapor may cause erosion of teeth. Some evidence of increased lung cancer in exposed workers.
7664-39-3 Hydrogen fluoride NJDOH Inhalation effects include damage to nose, throat and lungs causing coughing and/or shortness of breath. Can lead to a build-up of fluid in the lungs (pulmonary edema), a medical emergency, with severe shortness of breath. Dermal contact will burn skin and eyes.
Irritation of eyes, skin, and lungs. Repeated exposures may cause bronchitis. Long-term exposure may damage liver and kidneys.
-- Lead (and its compounds)
ATSDR Exposure can affect almost every organ and system; most sensitive is central nervous system, particularly in children. Kidneys and immune system also affected. Premature births, growth deficits and mental impairment in offspring of exposed mothers.
Effects are more commonly observed after higher exposures; effects of low levels in adults are uncertain.
-- Manganese (and its compounds)
ATSDR Inhalation can affect motor skills such as steadiness of hands, rapid hand movements and balance. Exposure can cause respiratory problems and sexual dysfunction.
Repeated exposure may cause brain damage, developing mental and emotional disturbances and slow and clumsy body movements. These symptoms are called “manganism.”
67-56-1 Methanol EPA Ingestion effects range from headache and lack of coordination to severe pain in abdomen, leg, and back and blindness following inebriation.
Headaches, sleep disorders, and gastrointestinal problems ranging up to optic nerve damage in workers and in laboratory studies.
78-93-3 Methyl ethyl ketone NJDOH Contact can severely irritate and burn eyes, leading to permanent damage. Inhalation effects include irritation of nose, throat, and mouth, causing coughing and wheezing. Can cause dizziness, headache, nausea, blurred vision.
Repeated exposure can damage nervous system and may affect the brain, including reduced memory and concentration, personality changes, fatigue, sleep disturbances, reduced coordination. Limited evidence that it is a teratogen (reproductive hazard) in animals.
108-10-1 Methyl isobutyl ketone EPA Range from headaches, dizziness, nausea and numbness in fingers and toes to unconsciousness and death. Vapor irritates eyes, nose and throat. Liquid irritates eyes and skin.
Nausea, headaches, weakness, and adverse liver effects in workers. Kidney and liver effects, as well as fetal toxicity, in laboratory studies.
-- Nickel (and its compounds)
ATSDR Inhalation effects include bronchitis and reduced lung function. Ingestion leads to stomach problems, blood, and kidney effects, as well as liver, immune system, and reproductive effects in laboratory studies.
Small amounts are essential for animal nutrition, may be for humans. Allergic skin rashes. Cancer of lung and nasal sinus seen in nickel workers, inhalation of insoluble nickel compounds caused cancer in laboratory studies.
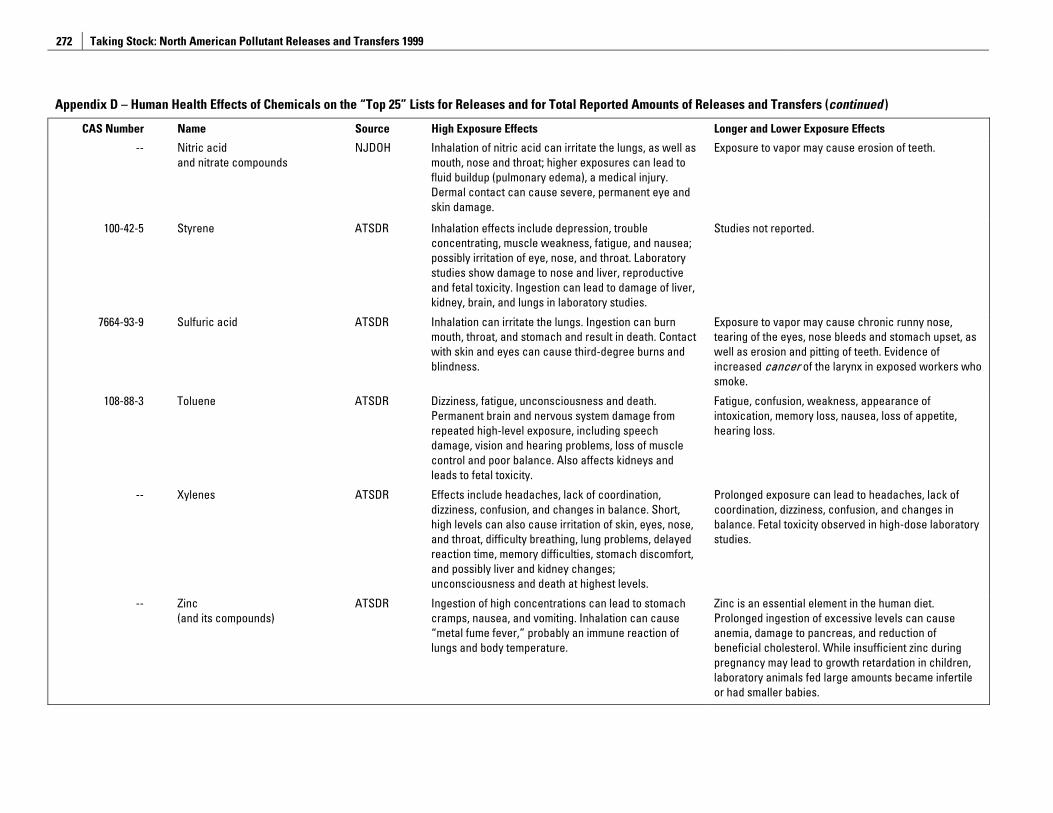
Taking Stock: North American Pollutant Releases and Transfers 1999
272
Appendix D – Human Health Effects of Chemicals on the “Top 25” Lists for Releases and for Total Reported Amounts of Releases and Transfers (continued )
CAS Number Name Source High Exposure Effects Longer and Lower Exposure Effects
-- Nitric acid and nitrate compounds
NJDOH Inhalation of nitric acid can irritate the lungs, as well as mouth, nose and throat; higher exposures can lead to fluid buildup (pulmonary edema), a medical injury. Dermal contact can cause severe, permanent eye and skin damage.
Exposure to vapor may cause erosion of teeth.
100-42-5 Styrene ATSDR Inhalation effects include depression, trouble concentrating, muscle weakness, fatigue, and nausea; possibly irritation of eye, nose, and throat. Laboratory studies show damage to nose and liver, reproductive and fetal toxicity. Ingestion can lead to damage of liver, kidney, brain, and lungs in laboratory studies.
Studies not reported.
7664-93-9 Sulfuric acid ATSDR Inhalation can irritate the lungs. Ingestion can burn mouth, throat, and stomach and result in death. Contact with skin and eyes can cause third-degree burns and blindness.
Exposure to vapor may cause chronic runny nose, tearing of the eyes, nose bleeds and stomach upset, as well as erosion and pitting of teeth. Evidence of increased cancer of the larynx in exposed workers who smoke.
108-88-3 Toluene ATSDR Dizziness, fatigue, unconsciousness and death. Permanent brain and nervous system damage from repeated high-level exposure, including speech damage, vision and hearing problems, loss of muscle control and poor balance. Also affects kidneys and leads to fetal toxicity.
Fatigue, confusion, weakness, appearance of intoxication, memory loss, nausea, loss of appetite, hearing loss.
-- Xylenes ATSDR Effects include headaches, lack of coordination, dizziness, confusion, and changes in balance. Short, high levels can also cause irritation of skin, eyes, nose, and throat, difficulty breathing, lung problems, delayed reaction time, memory difficulties, stomach discomfort, and possibly liver and kidney changes; unconsciousness and death at highest levels.
Prolonged exposure can lead to headaches, lack of coordination, dizziness, confusion, and changes in balance. Fetal toxicity observed in high-dose laboratory studies.
-- Zinc (and its compounds)
ATSDR Ingestion of high concentrations can lead to stomach cramps, nausea, and vomiting. Inhalation can cause “metal fume fever,” probably an immune reaction of lungs and body temperature.
Zinc is an essential element in the human diet. Prolonged ingestion of excessive levels can cause anemia, damage to pancreas, and reduction of beneficial cholesterol. While insufficient zinc during pregnancy may lead to growth retardation in children, laboratory animals fed large amounts became infertile or had smaller babies.
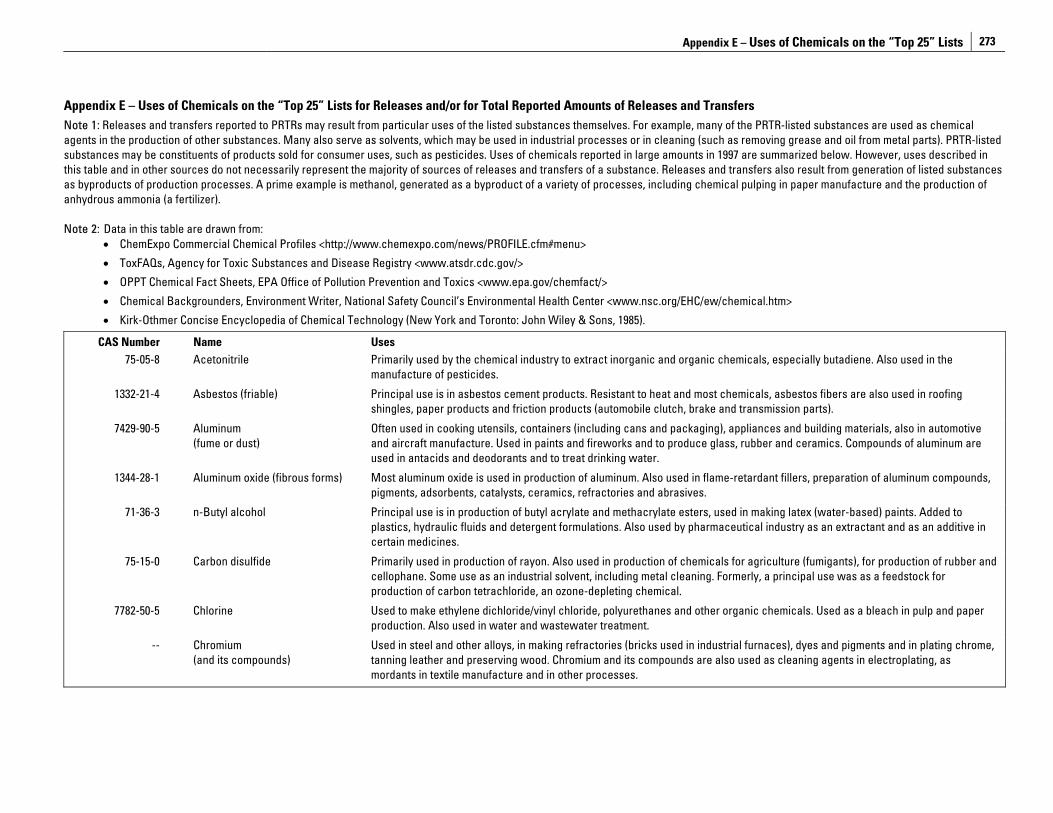
Appendix E – Uses of Chemicals on the “Top 25” Lists
273
Appendix E – Uses of Chemicals on the “Top 25” Lists for Releases and/or for Total Reported Amounts of Releases and Transfers Note 1: Releases and transfers reported to PRTRs may result from particular uses of the listed substances themselves. For example, many of the PRTR-listed substances are used as chemical agents in the production of other substances. Many also serve as solvents, which may be used in industrial processes or in cleaning (such as removing grease and oil from metal parts). PRTR-listed substances may be constituents of products sold for consumer uses, such as pesticides. Uses of chemicals reported in large amounts in 1997 are summarized below. However, uses described in this table and in other sources do not necessarily represent the majority of sources of releases and transfers of a substance. Releases and transfers also result from generation of listed substances as byproducts of production processes. A prime example is methanol, generated as a byproduct of a variety of processes, including chemical pulping in paper manufacture and the production of anhydrous ammonia (a fertilizer). Note 2: Data in this table are drawn from:
• ChemExpo Commercial Chemical Profiles <http://www.chemexpo.com/news/PROFILE.cfm#menu>
• ToxFAQs, Agency for Toxic Substances and Disease Registry <www.atsdr.cdc.gov/>
• OPPT Chemical Fact Sheets, EPA Office of Pollution Prevention and Toxics <www.epa.gov/chemfact/>
• Chemical Backgrounders, Environment Writer, National Safety Council’s Environmental Health Center <www.nsc.org/EHC/ew/chemical.htm>
• Kirk-Othmer Concise Encyclopedia of Chemical Technology (New York and Toronto: John Wiley & Sons, 1985).
CAS Number Name Uses 75-05-8 Acetonitrile Primarily used by the chemical industry to extract inorganic and organic chemicals, especially butadiene. Also used in the
manufacture of pesticides.
1332-21-4 Asbestos (friable) Principal use is in asbestos cement products. Resistant to heat and most chemicals, asbestos fibers are also used in roofing shingles, paper products and friction products (automobile clutch, brake and transmission parts).
7429-90-5 Aluminum (fume or dust)
Often used in cooking utensils, containers (including cans and packaging), appliances and building materials, also in automotive and aircraft manufacture. Used in paints and fireworks and to produce glass, rubber and ceramics. Compounds of aluminum are used in antacids and deodorants and to treat drinking water.
1344-28-1 Aluminum oxide (fibrous forms) Most aluminum oxide is used in production of aluminum. Also used in flame-retardant fillers, preparation of aluminum compounds, pigments, adsorbents, catalysts, ceramics, refractories and abrasives.
71-36-3 n-Butyl alcohol Principal use is in production of butyl acrylate and methacrylate esters, used in making latex (water-based) paints. Added to plastics, hydraulic fluids and detergent formulations. Also used by pharmaceutical industry as an extractant and as an additive in certain medicines.
75-15-0 Carbon disulfide Primarily used in production of rayon. Also used in production of chemicals for agriculture (fumigants), for production of rubber and cellophane. Some use as an industrial solvent, including metal cleaning. Formerly, a principal use was as a feedstock for production of carbon tetrachloride, an ozone-depleting chemical.
7782-50-5 Chlorine Used to make ethylene dichloride/vinyl chloride, polyurethanes and other organic chemicals. Used as a bleach in pulp and paper production. Also used in water and wastewater treatment.
-- Chromium (and its compounds)
Used in steel and other alloys, in making refractories (bricks used in industrial furnaces), dyes and pigments and in plating chrome, tanning leather and preserving wood. Chromium and its compounds are also used as cleaning agents in electroplating, as mordants in textile manufacture and in other processes.
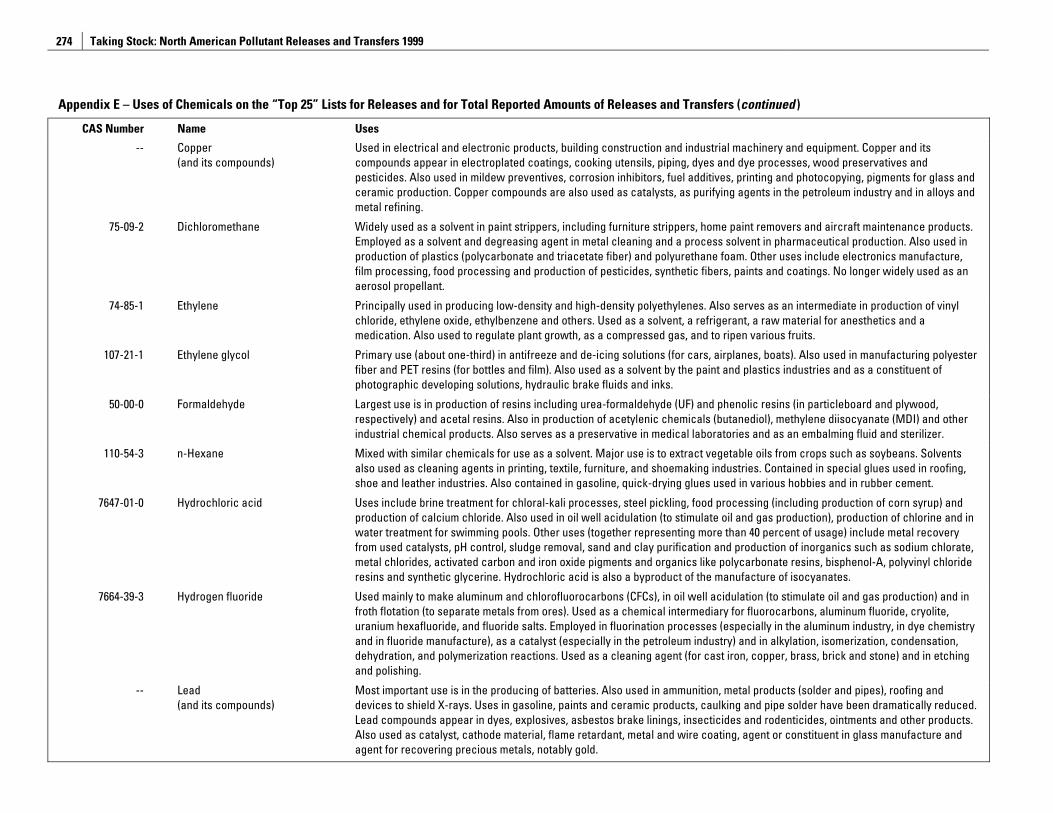
Taking Stock: North American Pollutant Releases and Transfers 1999
274
Appendix E – Uses of Chemicals on the “Top 25” Lists for Releases and for Total Reported Amounts of Releases and Transfers (continued )
CAS Number Name Uses
-- Copper (and its compounds)
Used in electrical and electronic products, building construction and industrial machinery and equipment. Copper and its compounds appear in electroplated coatings, cooking utensils, piping, dyes and dye processes, wood preservatives and pesticides. Also used in mildew preventives, corrosion inhibitors, fuel additives, printing and photocopying, pigments for glass and ceramic production. Copper compounds are also used as catalysts, as purifying agents in the petroleum industry and in alloys and metal refining.
75-09-2 Dichloromethane Widely used as a solvent in paint strippers, including furniture strippers, home paint removers and aircraft maintenance products. Employed as a solvent and degreasing agent in metal cleaning and a process solvent in pharmaceutical production. Also used in production of plastics (polycarbonate and triacetate fiber) and polyurethane foam. Other uses include electronics manufacture, film processing, food processing and production of pesticides, synthetic fibers, paints and coatings. No longer widely used as an aerosol propellant.
74-85-1 Ethylene Principally used in producing low-density and high-density polyethylenes. Also serves as an intermediate in production of vinyl chloride, ethylene oxide, ethylbenzene and others. Used as a solvent, a refrigerant, a raw material for anesthetics and a medication. Also used to regulate plant growth, as a compressed gas, and to ripen various fruits.
107-21-1 Ethylene glycol Primary use (about one-third) in antifreeze and de-icing solutions (for cars, airplanes, boats). Also used in manufacturing polyester fiber and PET resins (for bottles and film). Also used as a solvent by the paint and plastics industries and as a constituent of photographic developing solutions, hydraulic brake fluids and inks.
50-00-0 Formaldehyde Largest use is in production of resins including urea-formaldehyde (UF) and phenolic resins (in particleboard and plywood, respectively) and acetal resins. Also in production of acetylenic chemicals (butanediol), methylene diisocyanate (MDI) and other industrial chemical products. Also serves as a preservative in medical laboratories and as an embalming fluid and sterilizer.
110-54-3 n-Hexane Mixed with similar chemicals for use as a solvent. Major use is to extract vegetable oils from crops such as soybeans. Solvents also used as cleaning agents in printing, textile, furniture, and shoemaking industries. Contained in special glues used in roofing, shoe and leather industries. Also contained in gasoline, quick-drying glues used in various hobbies and in rubber cement.
7647-01-0 Hydrochloric acid Uses include brine treatment for chloral-kali processes, steel pickling, food processing (including production of corn syrup) and production of calcium chloride. Also used in oil well acidulation (to stimulate oil and gas production), production of chlorine and in water treatment for swimming pools. Other uses (together representing more than 40 percent of usage) include metal recovery from used catalysts, pH control, sludge removal, sand and clay purification and production of inorganics such as sodium chlorate, metal chlorides, activated carbon and iron oxide pigments and organics like polycarbonate resins, bisphenol-A, polyvinyl chloride resins and synthetic glycerine. Hydrochloric acid is also a byproduct of the manufacture of isocyanates.
7664-39-3 Hydrogen fluoride Used mainly to make aluminum and chlorofluorocarbons (CFCs), in oil well acidulation (to stimulate oil and gas production) and in froth flotation (to separate metals from ores). Used as a chemical intermediary for fluorocarbons, aluminum fluoride, cryolite, uranium hexafluoride, and fluoride salts. Employed in fluorination processes (especially in the aluminum industry, in dye chemistry and in fluoride manufacture), as a catalyst (especially in the petroleum industry) and in alkylation, isomerization, condensation, dehydration, and polymerization reactions. Used as a cleaning agent (for cast iron, copper, brass, brick and stone) and in etching and polishing.
-- Lead (and its compounds)
Most important use is in the producing of batteries. Also used in ammunition, metal products (solder and pipes), roofing and devices to shield X-rays. Uses in gasoline, paints and ceramic products, caulking and pipe solder have been dramatically reduced. Lead compounds appear in dyes, explosives, asbestos brake linings, insecticides and rodenticides, ointments and other products. Also used as catalyst, cathode material, flame retardant, metal and wire coating, agent or constituent in glass manufacture and agent for recovering precious metals, notably gold.
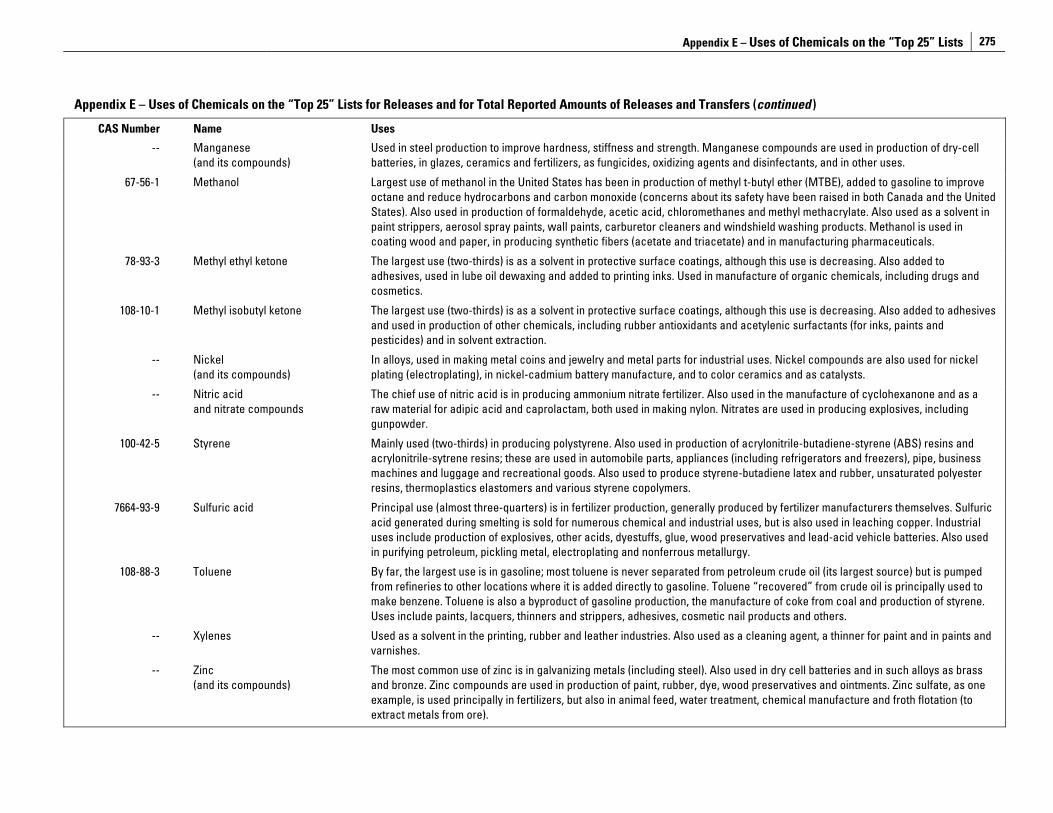
Appendix E – Uses of Chemicals on the “Top 25” Lists
275
Appendix E – Uses of Chemicals on the “Top 25” Lists for Releases and for Total Reported Amounts of Releases and Transfers (continued )
CAS Number Name Uses
-- Manganese (and its compounds)
Used in steel production to improve hardness, stiffness and strength. Manganese compounds are used in production of dry-cell batteries, in glazes, ceramics and fertilizers, as fungicides, oxidizing agents and disinfectants, and in other uses.
67-56-1 Methanol Largest use of methanol in the United States has been in production of methyl t-butyl ether (MTBE), added to gasoline to improve octane and reduce hydrocarbons and carbon monoxide (concerns about its safety have been raised in both Canada and the United States). Also used in production of formaldehyde, acetic acid, chloromethanes and methyl methacrylate. Also used as a solvent in paint strippers, aerosol spray paints, wall paints, carburetor cleaners and windshield washing products. Methanol is used in coating wood and paper, in producing synthetic fibers (acetate and triacetate) and in manufacturing pharmaceuticals.
78-93-3 Methyl ethyl ketone The largest use (two-thirds) is as a solvent in protective surface coatings, although this use is decreasing. Also added to adhesives, used in lube oil dewaxing and added to printing inks. Used in manufacture of organic chemicals, including drugs and cosmetics.
108-10-1 Methyl isobutyl ketone The largest use (two-thirds) is as a solvent in protective surface coatings, although this use is decreasing. Also added to adhesives and used in production of other chemicals, including rubber antioxidants and acetylenic surfactants (for inks, paints and pesticides) and in solvent extraction.
-- Nickel (and its compounds)
In alloys, used in making metal coins and jewelry and metal parts for industrial uses. Nickel compounds are also used for nickel plating (electroplating), in nickel-cadmium battery manufacture, and to color ceramics and as catalysts.
-- Nitric acid and nitrate compounds
The chief use of nitric acid is in producing ammonium nitrate fertilizer. Also used in the manufacture of cyclohexanone and as a raw material for adipic acid and caprolactam, both used in making nylon. Nitrates are used in producing explosives, including gunpowder.
100-42-5 Styrene Mainly used (two-thirds) in producing polystyrene. Also used in production of acrylonitrile-butadiene-styrene (ABS) resins and acrylonitrile-sytrene resins; these are used in automobile parts, appliances (including refrigerators and freezers), pipe, business machines and luggage and recreational goods. Also used to produce styrene-butadiene latex and rubber, unsaturated polyester resins, thermoplastics elastomers and various styrene copolymers.
7664-93-9 Sulfuric acid Principal use (almost three-quarters) is in fertilizer production, generally produced by fertilizer manufacturers themselves. Sulfuric acid generated during smelting is sold for numerous chemical and industrial uses, but is also used in leaching copper. Industrial uses include production of explosives, other acids, dyestuffs, glue, wood preservatives and lead-acid vehicle batteries. Also used in purifying petroleum, pickling metal, electroplating and nonferrous metallurgy.
108-88-3 Toluene By far, the largest use is in gasoline; most toluene is never separated from petroleum crude oil (its largest source) but is pumped from refineries to other locations where it is added directly to gasoline. Toluene “recovered” from crude oil is principally used to make benzene. Toluene is also a byproduct of gasoline production, the manufacture of coke from coal and production of styrene. Uses include paints, lacquers, thinners and strippers, adhesives, cosmetic nail products and others.
-- Xylenes Used as a solvent in the printing, rubber and leather industries. Also used as a cleaning agent, a thinner for paint and in paints and varnishes.
-- Zinc (and its compounds)
The most common use of zinc is in galvanizing metals (including steel). Also used in dry cell batteries and in such alloys as brass and bronze. Zinc compounds are used in production of paint, rubber, dye, wood preservatives and ointments. Zinc sulfate, as one example, is used principally in fertilizers, but also in animal feed, water treatment, chemical manufacture and froth flotation (to extract metals from ore).

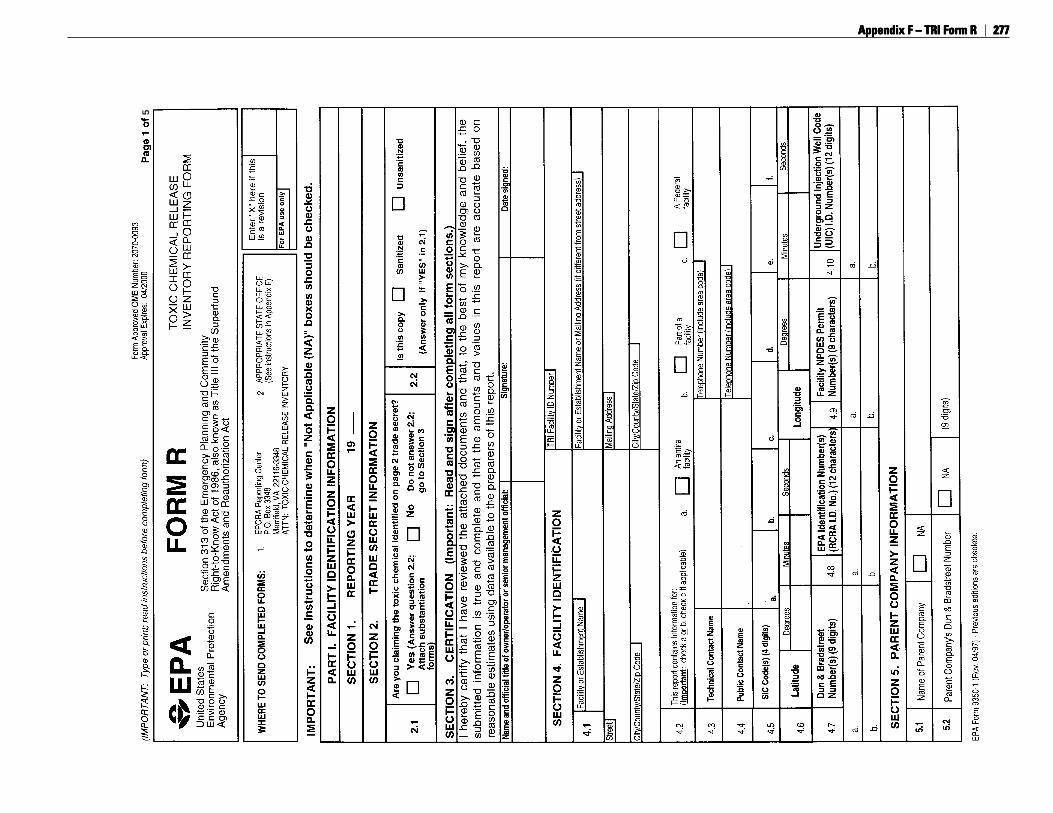
277277277277277Appendix F – TRI Form RAppendix F – TRI Form RAppendix F – TRI Form RAppendix F – TRI Form RAppendix F – TRI Form R
5
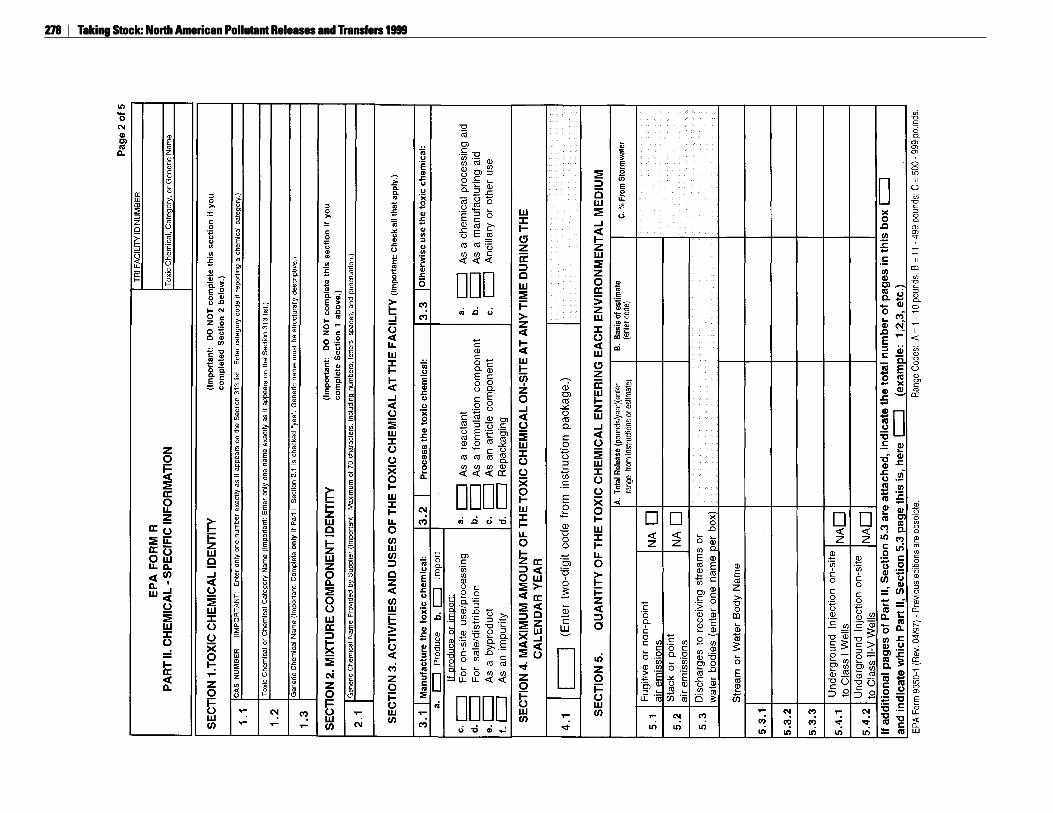
278278278278278 TTTTTaking Stock: North American Pollutant Releases and Taking Stock: North American Pollutant Releases and Taking Stock: North American Pollutant Releases and Taking Stock: North American Pollutant Releases and Taking Stock: North American Pollutant Releases and Transfers 1999ransfers 1999ransfers 1999ransfers 1999ransfers 1999
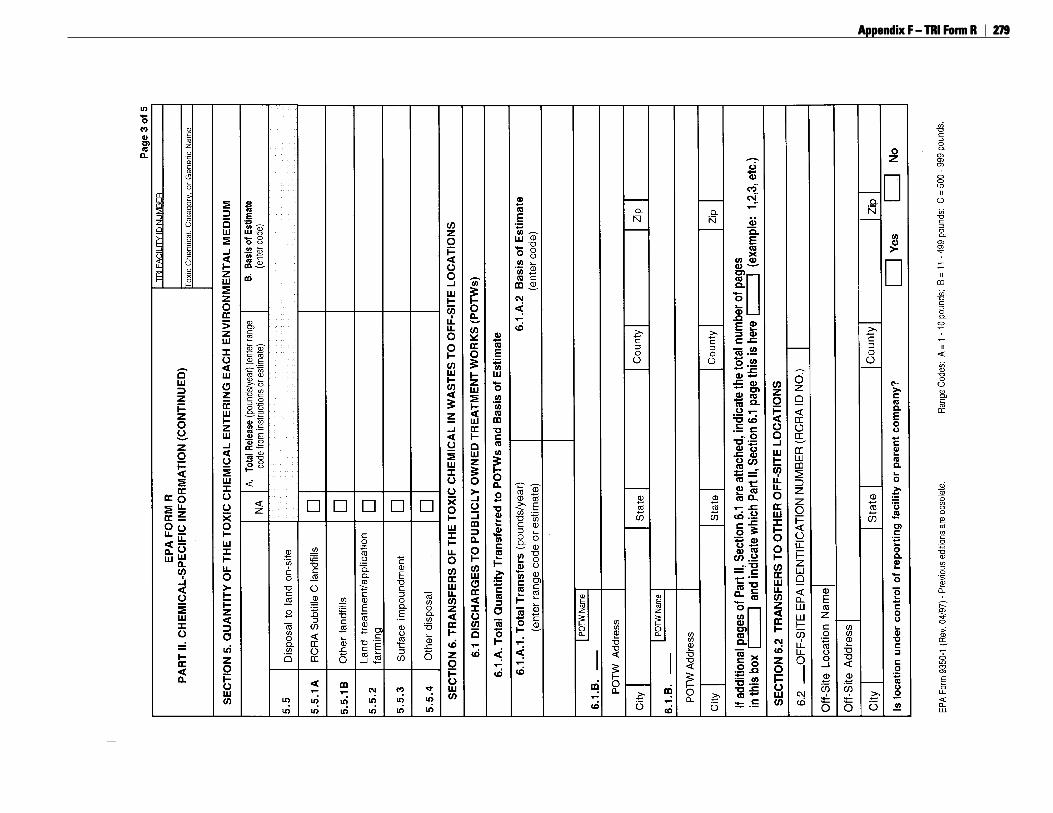
279279279279279Appendix F – TRI Form RAppendix F – TRI Form RAppendix F – TRI Form RAppendix F – TRI Form RAppendix F – TRI Form R
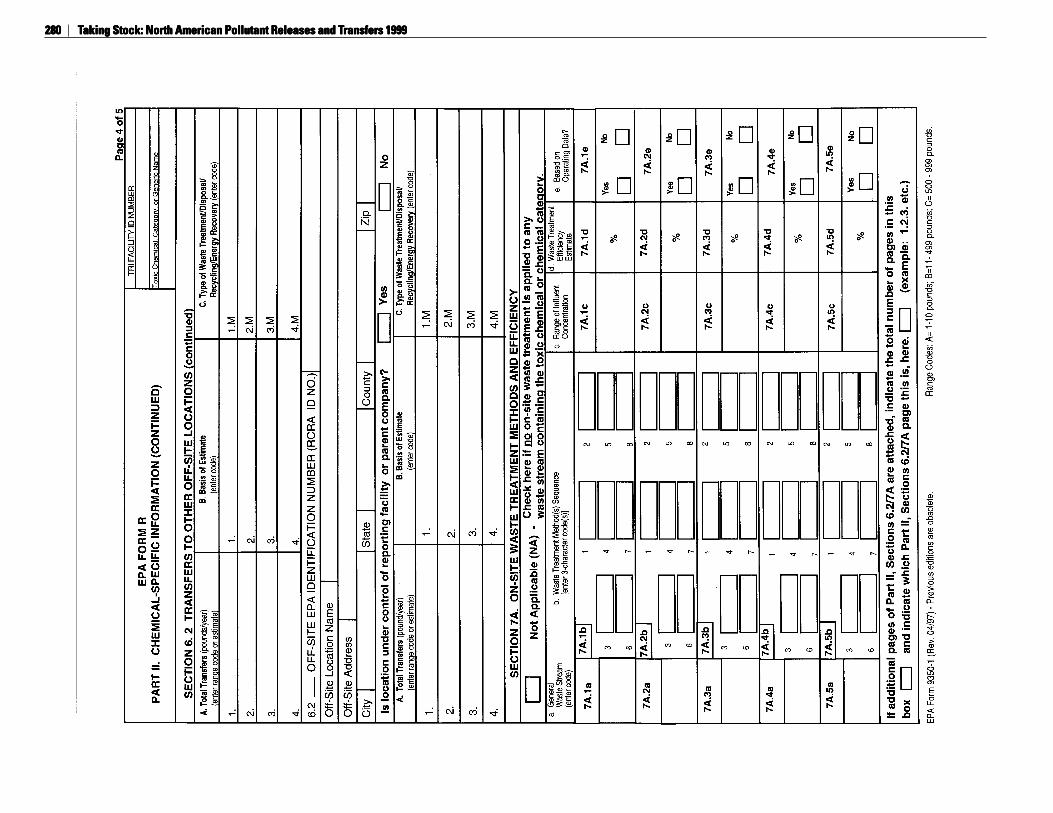
280280280280280 TTTTTaking Stock: North American Pollutant Releases and Taking Stock: North American Pollutant Releases and Taking Stock: North American Pollutant Releases and Taking Stock: North American Pollutant Releases and Taking Stock: North American Pollutant Releases and Transfers 1999ransfers 1999ransfers 1999ransfers 1999ransfers 1999
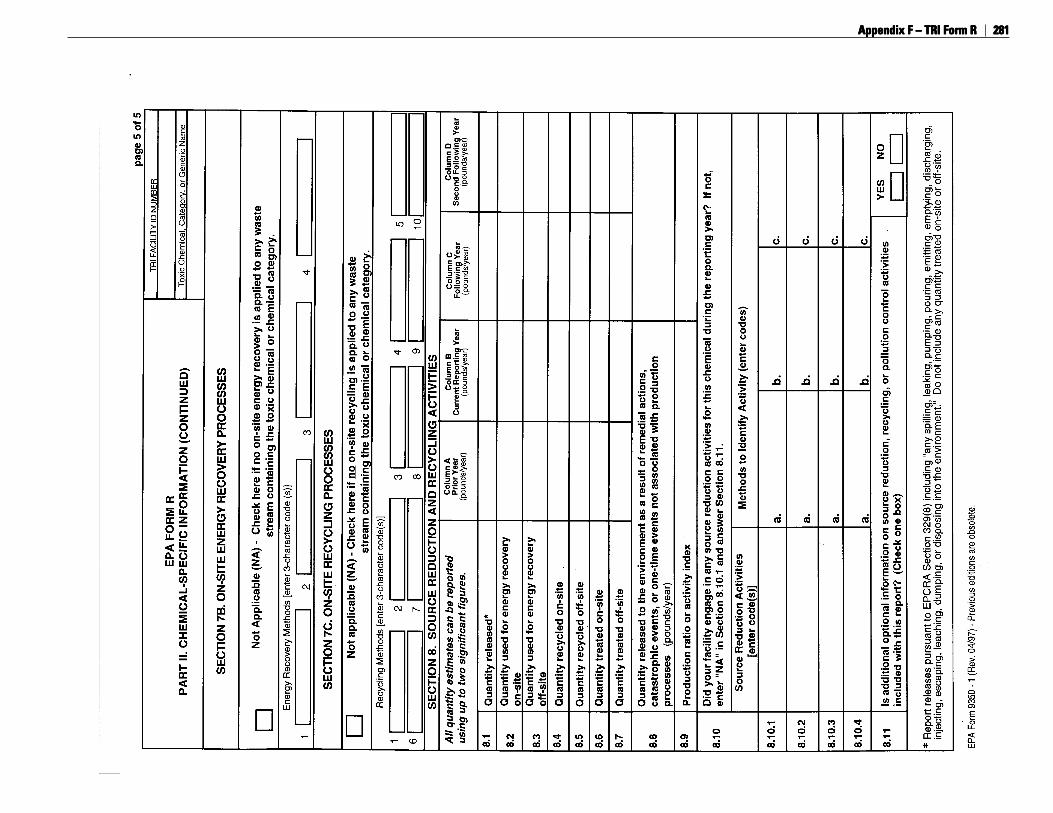
281281281281281Appendix F – TRI Form RAppendix F – TRI Form RAppendix F – TRI Form RAppendix F – TRI Form RAppendix F – TRI Form R

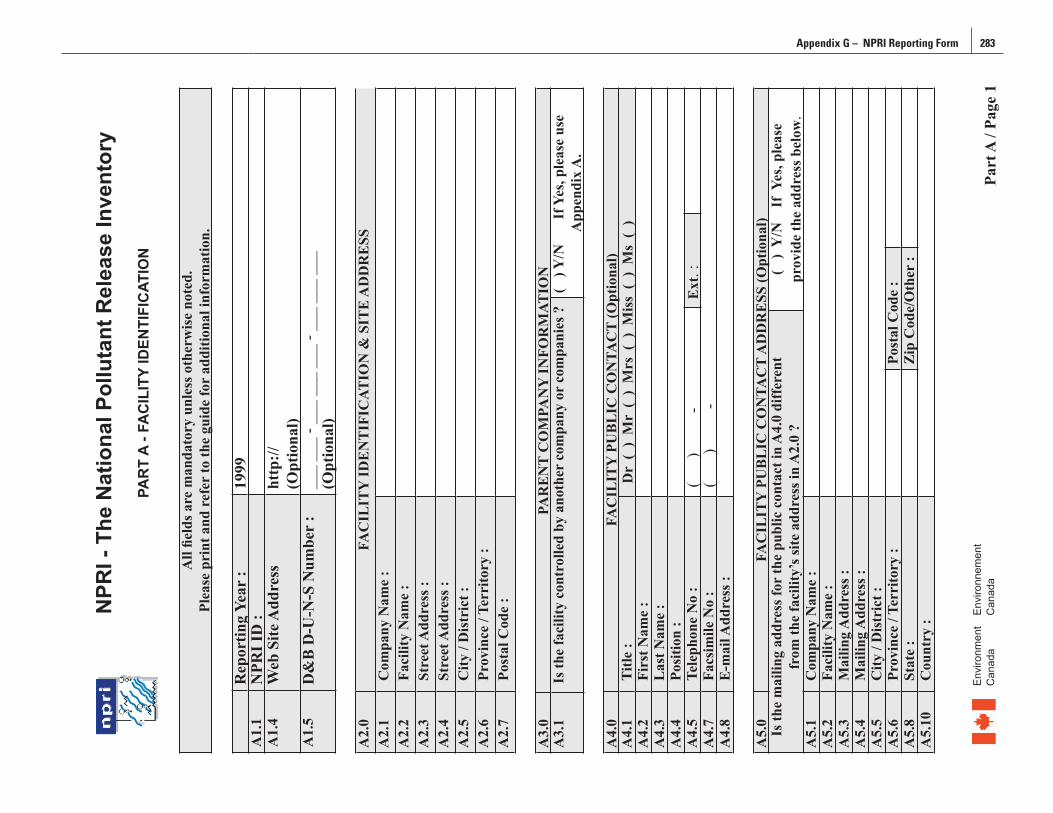
Appendix G – NPRI Reporting Form 283
NPR
I - T
he N
atio
nal P
ollu
tant
Rel
ease
Inve
ntor
yPA
RT
A - F
AC
ILIT
Y ID
ENTI
FIC
ATIO
N
All
field
s are
man
dato
ry u
nles
s oth
erw
ise
note
d.Pl
ease
pri
nt a
nd r
efer
to th
e gu
ide
for
addi
tiona
l inf
orm
atio
n.
Rep
ortin
g Ye
ar :
1999
A1.
1N
PRI I
D :
A1.
4W
eb S
ite A
ddre
ssht
tp://
(Opt
iona
l)A
1.5
D&
B D
-U-N
-S N
umbe
r :
___
___
- ___
___
___
- __
_ __
_ __
_(O
ptio
nal)
A2.
0FA
CIL
ITY
IDE
NT
IFIC
ATIO
N &
SIT
E A
DD
RE
SSA
2.1
Com
pany
Nam
e :
A2.
2
Faci
lity
Nam
e :
A2.
3St
reet
Add
ress
:A
2.4
Stre
et A
ddre
ss :
A2.
5C
ity /
Dis
tric
t :A
2.6
Prov
ince
/ Te
rrito
ry :
A2.
7Po
stal
Cod
e :
A3.
0PA
RE
NT
CO
MPA
NY
INFO
RM
ATIO
NA
3.1
Is th
e fa
cilit
y co
ntro
lled
by a
noth
er c
ompa
ny o
r co
mpa
nies
?(
) Y
/N
If Y
es, p
leas
e us
e
App
endi
x A
.
A4.
0FA
CIL
ITY
PU
BL
IC C
ON
TAC
T (O
ptio
nal)
A4.
1Ti
tle :
Dr
( )
Mr
( )
Mrs
( )
Mis
s (
) M
s (
)A
4.2
Firs
t Nam
e :
A4.
3L
ast N
ame
:A
4.4
Posi
tion
:A
4.5
Tele
phon
e N
o :
(
)
- E
xt. :
A4.
7Fa
csim
ile N
o :
(
)
-A
4.8
E-m
ail A
ddre
ss :
A5.
0FA
CIL
ITY
PU
BL
IC C
ON
TAC
T A
DD
RE
SS (O
ptio
nal)
Is th
e m
ailin
g ad
dres
s for
the
publ
ic c
onta
ct in
A4.
0 di
ffer
ent
from
the
faci
lity’
s site
add
ress
in A
2.0
?(
) Y
/N
If Y
es, p
leas
epr
ovid
e th
e ad
dres
s bel
ow.
A5.
1C
ompa
ny N
ame
:A
5.2
Faci
lity
Nam
e :
A5.
3M
ailin
g A
ddre
ss :
A5.
4M
ailin
g A
ddre
ss :
A5.
5C
ity /
Dis
tric
t :A
5.6
Prov
ince
/ Te
rrito
ry :
Post
al C
ode
:A
5.8
Stat
e :
Zip
Cod
e/O
ther
:A
5.10
Cou
ntry
:
Part
A /
Page
1En
viro
nmen
t En
viro
nnem
ent
Can
ada
Can
ada
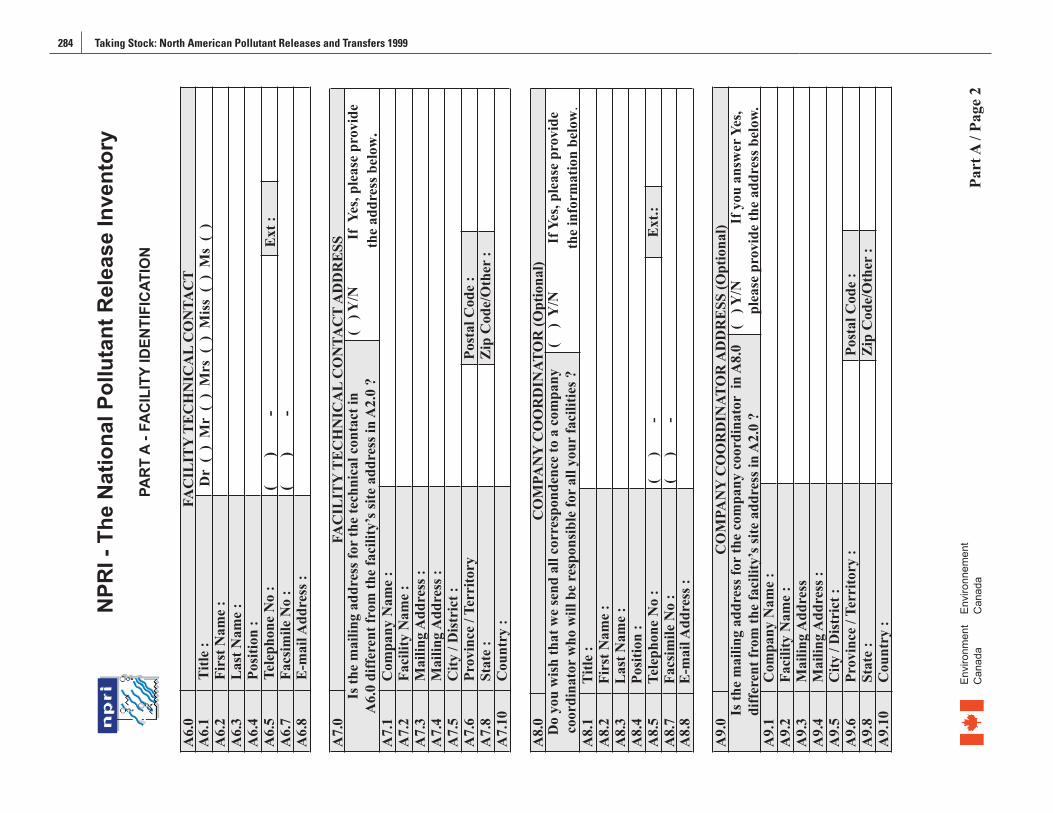
284 Taking Stock: North American Pollutant Releases and Transfers 1999 Appendix G – NPRI Reporting Form 285
NPR
I - T
he N
atio
nal P
ollu
tant
Rel
ease
Inve
ntor
yPA
RT
A - F
AC
ILIT
Y ID
ENTI
FIC
ATIO
N
A6.
0FA
CIL
ITY
TE
CH
NIC
AL
CO
NTA
CT
A6.
1Ti
tle :
Dr
( )
Mr
( )
Mrs
( )
Mis
s (
) M
s (
)A
6.2
Firs
t Nam
e :
A6.
3 L
ast N
ame
:A
6.4
Posi
tion
:A
6.5
Tele
phon
e N
o :
(
)
-
E
xt :
A6.
7Fa
csim
ile N
o :
(
)
-A
6.8
E-m
ail A
ddre
ss :
A7.
0FA
CIL
ITY
TE
CH
NIC
AL
CO
NTA
CT
AD
DR
ESS
Is th
e m
ailin
g ad
dres
s for
the
tech
nica
l con
tact
inA
6.0
diff
eren
t fro
m th
e fa
cilit
y’s s
ite a
ddre
ss in
A2.
0 ?
( )
Y/N
If
Yes
, ple
ase
prov
ide
the
addr
ess b
elow
.A
7.1
Com
pany
Nam
e :
A7.
2Fa
cilit
y N
ame
:A
7.3
Mai
ling
Add
ress
:A
7.4
Mai
ling
Add
ress
:A
7.5
City
/ D
istr
ict :
A7.
6Pr
ovin
ce /
Terr
itory
Post
al C
ode
:A
7.8
Stat
e :
Zip
Cod
e/O
ther
:A
7.10
Cou
ntry
:
A8.
0C
OM
PAN
Y C
OO
RD
INAT
OR
(Opt
iona
l)D
o yo
u w
ish
that
we
send
all
corr
espo
nden
ce to
a c
ompa
ny
coor
dina
tor
who
will
be
resp
onsi
ble
for
all y
our
faci
litie
s ?(
) Y
/N
If Y
es, p
leas
e pr
ovid
e
the
info
rmat
ion
belo
w.
A8.
1Ti
tle :
A8.
2Fi
rst N
ame
:A
8.3
Las
t Nam
e :
A8.
4Po
sitio
n :
A8.
5Te
leph
one
No
:(
)
-E
xt.:
A8.
7Fa
csim
ile N
o :
(
)
-
A8.
8 E
-mai
l Add
ress
:
A9.
0C
OM
PAN
Y C
OO
RD
INAT
OR
AD
DR
ESS
(Opt
iona
l)Is
the
mai
ling
addr
ess f
or th
e co
mpa
ny c
oord
inat
or i
n A
8.0
diff
eren
t fro
m th
e fa
cilit
y’s s
ite a
ddre
ss in
A2.
0 ?
( )
Y/N
If
you
ans
wer
Yes
, pl
ease
pro
vide
the
addr
ess b
elow
. A
9.1
Com
pany
Nam
e :
A9.
2Fa
cilit
y N
ame
:A
9.3
Mai
ling
Add
ress
A9.
4M
ailin
g A
ddre
ss :
A9.
5C
ity /
Dis
tric
t :A
9.6
Prov
ince
/ Te
rrito
ry :
Post
al C
ode
:A
9.8
Stat
e :
Zip
Cod
e/O
ther
:A
9.10
Cou
ntry
:
Part
A /
Page
2En
viro
nmen
t En
viro
nnem
ent
Can
ada
Can
ada
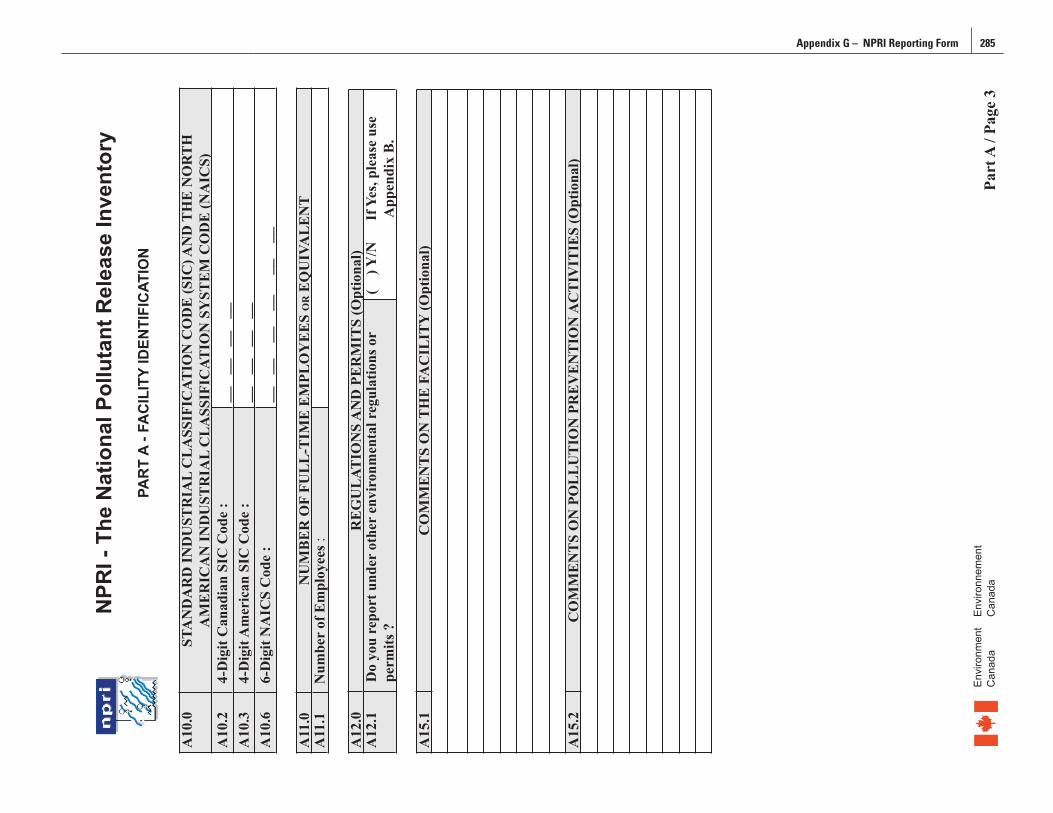
284 Taking Stock: North American Pollutant Releases and Transfers 1999 Appendix G – NPRI Reporting Form 285
NPR
I - T
he N
atio
nal P
ollu
tant
Rel
ease
Inve
ntor
yPA
RT
A - F
AC
ILIT
Y ID
ENTI
FIC
ATIO
N
A10
.0ST
AN
DA
RD
IND
UST
RIA
L C
LA
SSIF
ICAT
ION
CO
DE
(SIC
) AN
D T
HE
NO
RT
H
AM
ER
ICA
N IN
DU
STR
IAL
CL
ASS
IFIC
ATIO
N S
YST
EM
CO
DE
(NA
ICS)
A10
.24-
Dig
it C
anad
ian
SIC
Cod
e :
__
__
__
__A
10.3
4-D
igit
Am
eric
an S
IC C
ode
:__
__
__
__
A10
.66-
Dig
it N
AIC
S C
ode
:__
__
_
_
__
__
__
A11
.0N
UM
BE
R O
F FU
LL
-TIM
E E
MPL
OY
EE
S O
R E
QU
IVA
LE
NT
A11
.1N
umbe
r of
Em
ploy
ees :
A12
.0R
EG
UL
ATIO
NS
AN
D P
ER
MIT
S (O
ptio
nal)
A12
.1D
o yo
u re
port
und
er o
ther
env
iron
men
tal r
egul
atio
ns o
r pe
rmits
?(
) Y
/N
If Y
es, p
leas
e us
e
App
endi
x B
.
A15
.1C
OM
ME
NT
S O
N T
HE
FA
CIL
ITY
(Opt
iona
l)
A15
.2C
OM
ME
NT
S O
N P
OL
LU
TIO
N P
RE
VE
NT
ION
AC
TIV
ITIE
S (O
ptio
nal)
Part
A /
Page
3En
viro
nmen
t En
viro
nnem
ent
Can
ada
Can
ada
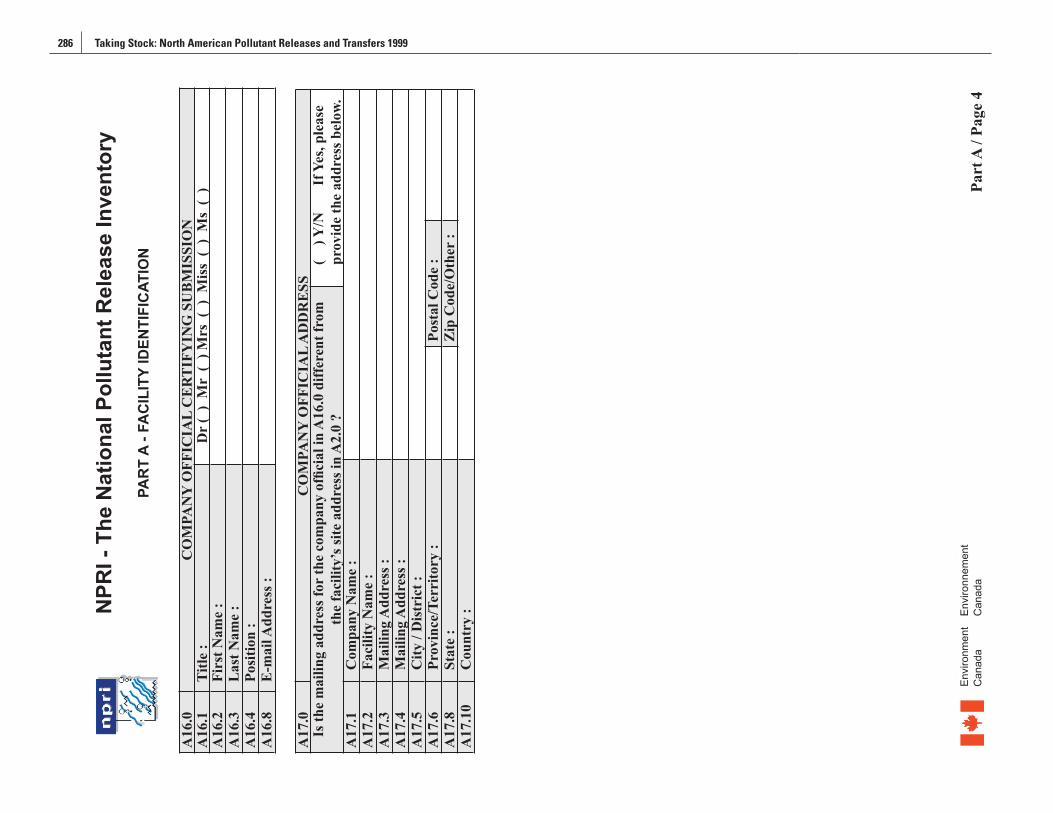
286 Taking Stock: North American Pollutant Releases and Transfers 1999 Appendix G – NPRI Reporting Form 287
NPR
I - T
he N
atio
nal P
ollu
tant
Rel
ease
Inve
ntor
yPA
RT
A - F
AC
ILIT
Y ID
ENTI
FIC
ATIO
N
A16
.0C
OM
PAN
Y O
FFIC
IAL
CE
RT
IFY
ING
SU
BM
ISSI
ON
A16
.1Ti
tle :
Dr
( )
Mr
( )
Mrs
( )
Mis
s (
) M
s (
)A
16.2
Firs
t Nam
e :
A16
.3L
ast N
ame
:A
16.4
Posi
tion
:A
16.8
E-m
ail A
ddre
ss :
A17
.0C
OM
PAN
Y O
FFIC
IAL
AD
DR
ESS
Is th
e m
ailin
g ad
dres
s for
the
com
pany
offi
cial
in A
16.0
diff
eren
t fro
m
the
faci
lity’
s site
add
ress
in A
2.0
?(
) Y
/N
If Y
es, p
leas
e pr
ovid
e th
e ad
dres
s bel
ow.
A17
.1
Com
pany
Nam
e :
A17
.2Fa
cilit
y N
ame
:A
17.3
Mai
ling
Add
ress
:A
17.4
Mai
ling
Add
ress
:A
17.5
City
/ D
istr
ict :
A17
.6Pr
ovin
ce/T
erri
tory
:Po
stal
Cod
e :
A17
.8St
ate
:Z
ip C
ode/
Oth
er :
A17
.10
Cou
ntry
:
Part
A /
Page
4En
viro
nmen
t En
viro
nnem
ent
Can
ada
Can
ada
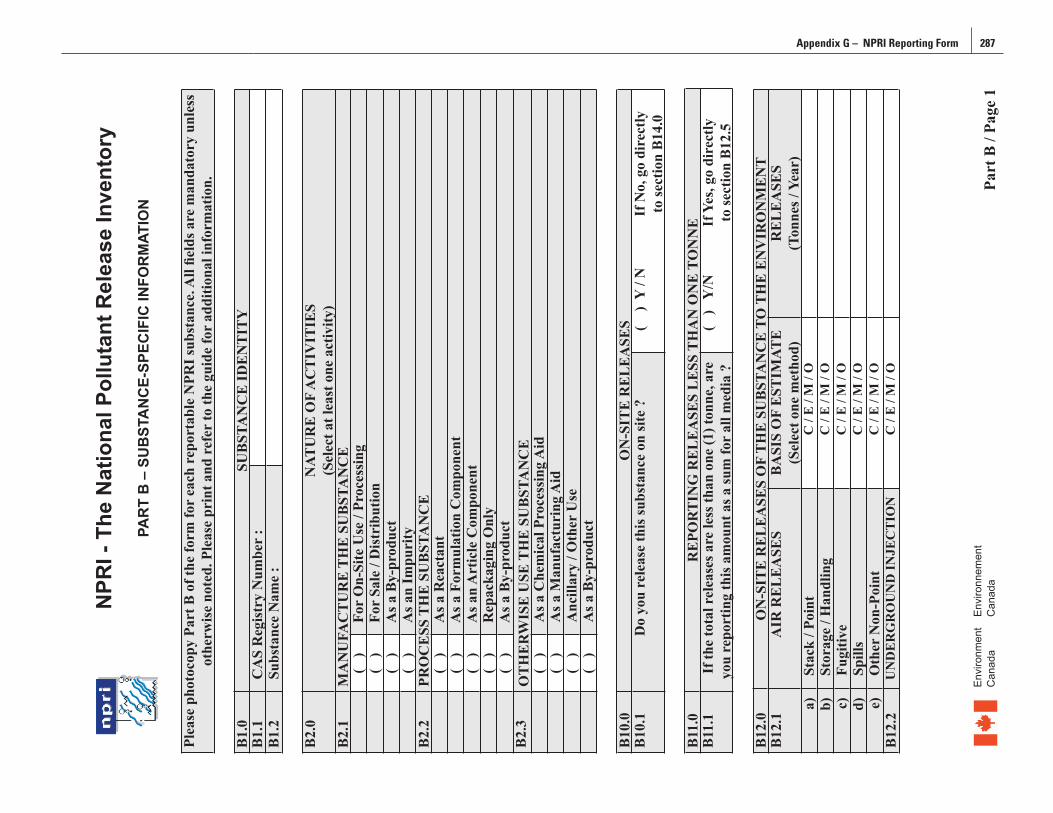
286 Taking Stock: North American Pollutant Releases and Transfers 1999 Appendix G – NPRI Reporting Form 287
NPR
I - T
he N
atio
nal P
ollu
tant
Rel
ease
Inve
ntor
yPA
RT
B –
SU
BST
AN
CE-
SPEC
IFIC
INFO
RM
ATIO
N
Plea
se p
hoto
copy
Par
t B o
f the
form
for
each
rep
orta
ble
NPR
I sub
stan
ce. A
ll fie
lds a
re m
anda
tory
unl
ess
othe
rwis
e no
ted.
Ple
ase
prin
t and
ref
er to
the
guid
e fo
r ad
ditio
nal i
nfor
mat
ion.
B1.
0SU
BST
AN
CE
IDE
NT
ITY
B1.
1C
AS
Reg
istr
y N
umbe
r :
B1.
2Su
bsta
nce
Nam
e :
B2.
0N
ATU
RE
OF
AC
TIV
ITIE
S(S
elec
t at l
east
one
act
ivity
)B
2.1
MA
NU
FAC
TU
RE
TH
E S
UB
STA
NC
E(
)Fo
r O
n-Si
te U
se /
Proc
essi
ng(
)Fo
r Sa
le /
Dis
trib
utio
n(
)A
s a B
y-pr
oduc
t(
)A
s an
Impu
rity
B2.
2PR
OC
ESS
TH
E S
UB
STA
NC
E
( )
As a
Rea
ctan
t(
)A
s a F
orm
ulat
ion
Com
pone
nt(
)A
s an
Art
icle
Com
pone
nt(
)R
epac
kagi
ng O
nly
( )
As a
By-
prod
uct
B2.
3O
TH
ER
WIS
E U
SE T
HE
SU
BST
AN
CE
(
)A
s a C
hem
ical
Pro
cess
ing
Aid
( )
As a
Man
ufac
turi
ng A
id(
)A
ncill
ary
/ Oth
er U
se(
)A
s a B
y-pr
oduc
t
B10
.0O
N-S
ITE
RE
LE
ASE
SB
10.1
Do
you
rele
ase
this
subs
tanc
e on
site
?(
) Y
/ N
If
No,
go
dire
ctly
to
sect
ion
B14
.0
B11
.0R
EPO
RT
ING
RE
LE
ASE
S L
ESS
TH
AN
ON
E T
ON
NE
B11
.1If
the
tota
l rel
ease
s are
less
than
one
(1) t
onne
, are
yo
u re
port
ing
this
am
ount
as a
sum
for
all m
edia
?(
) Y
/N
If Y
es, g
o di
rect
ly
to se
ctio
n B
12.5
B12
.0O
N-S
ITE
RE
LE
ASE
S O
F T
HE
SU
BST
AN
CE
TO
TH
E E
NV
IRO
NM
EN
TB
12.1
AIR
RE
LE
ASE
SB
ASI
S O
F E
STIM
ATE
(S
elec
t one
met
hod)
RE
LE
ASE
S (T
onne
s / Y
ear)
a)St
ack
/ Poi
ntC
/ E
/ M
/ O
b)St
orag
e / H
andl
ing
C /
E /
M /
Oc)
Fugi
tive
C /
E /
M /
Od)
Spill
sC
/ E
/ M
/ O
e)O
ther
Non
-Poi
ntC
/ E
/ M
/ O
B12
.2U
ND
ER
GR
OU
ND
INJE
CT
ION
C /
E /
M /
O
Part
B /
Page
1En
viro
nmen
t En
viro
nnem
ent
Can
ada
Can
ada
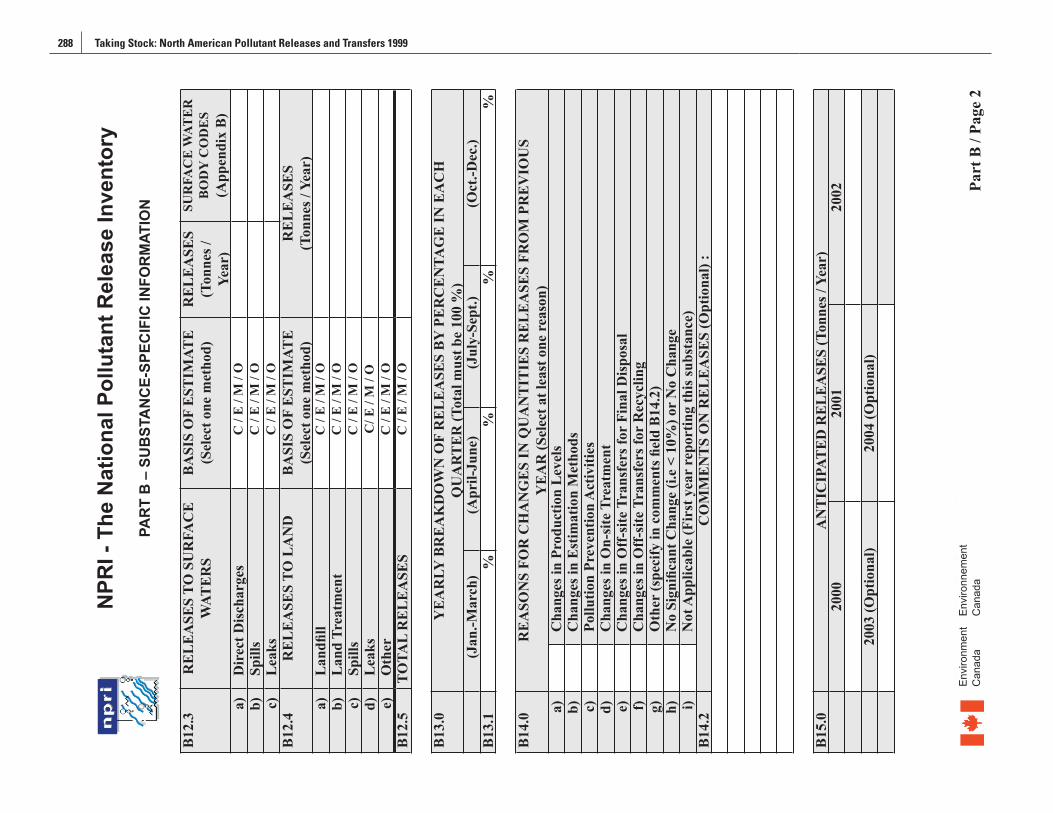
288 Taking Stock: North American Pollutant Releases and Transfers 1999 Appendix G – NPRI Reporting Form 289
NPR
I - T
he N
atio
nal P
ollu
tant
Rel
ease
Inve
ntor
yPA
RT
B –
SU
BST
AN
CE-
SPEC
IFIC
INFO
RM
ATIO
N
B12
.3R
EL
EA
SES
TO S
UR
FAC
E
WAT
ER
SB
ASI
S O
F E
STIM
ATE
(Sel
ect o
ne m
etho
d)R
EL
EA
SES
(Ton
nes /
Ye
ar)
SUR
FAC
E W
ATE
RB
OD
Y C
OD
ES
(App
endi
x B
)a)
Dir
ect D
isch
arge
sC
/ E
/ M
/ O
b)Sp
ills
C /
E /
M /
Oc)
Lea
ksC
/ E
/ M
/ O
B12
.4R
EL
EA
SES
TO L
AN
DB
ASI
S O
F E
STIM
ATE
(Sel
ect o
ne m
etho
d)R
EL
EA
SES
(Ton
nes /
Yea
r)a)
Lan
dfill
C /
E /
M /
Ob)
Lan
d Tr
eatm
ent
C /
E /
M /
Oc)
Spill
sC
/ E
/ M
/ O
d)L
eaks
C/ E
/ M
/ O
e)O
ther
C /
E /
M /
OB
12.5
TOTA
L R
EL
EA
SES
C /
E /
M /
O
B13
.0Y
EA
RLY
BR
EA
KD
OW
N O
F R
EL
EA
SES
BY
PE
RC
EN
TAG
E IN
EA
CH
Q
UA
RT
ER
(Tot
al m
ust b
e 10
0 %
)(J
an.-M
arch
)(A
pril-
June
)(J
uly-
Sept
.)(O
ct.-D
ec.)
B13
.1%
%%
%
B14
.0R
EA
SON
S FO
R C
HA
NG
ES
IN Q
UA
NT
ITIE
S R
EL
EA
SES
FRO
M P
RE
VIO
US
YE
AR
(Sel
ect a
t lea
st o
ne r
easo
n)a)
Cha
nges
in P
rodu
ctio
n L
evel
sb)
Cha
nges
in E
stim
atio
n M
etho
dsc)
Pollu
tion
Prev
entio
n A
ctiv
ities
d)C
hang
es in
On-
site
Tre
atm
ent
e)C
hang
es in
Off
-site
Tra
nsfe
rs fo
r Fi
nal D
ispo
sal
f)C
hang
es in
Off
-site
Tra
nsfe
rs fo
r R
ecyc
ling
g)O
ther
(spe
cify
in c
omm
ents
fiel
d B
14.2
)h)
No
Sign
ifica
nt C
hang
e (i.
e <
10%
) or
No
Cha
nge
i)N
ot A
pplic
able
(Fir
st y
ear
repo
rtin
g th
is su
bsta
nce)
B14
.2C
OM
ME
NT
S O
N R
EL
EA
SES
(Opt
iona
l) :
B15
.0A
NT
ICIP
ATE
D R
EL
EA
SES
(Ton
nes /
Yea
r)20
0020
0120
02
2003
(Opt
iona
l)20
04 (O
ptio
nal)
Part
B /
Page
2En
viro
nmen
t En
viro
nnem
ent
Can
ada
Can
ada
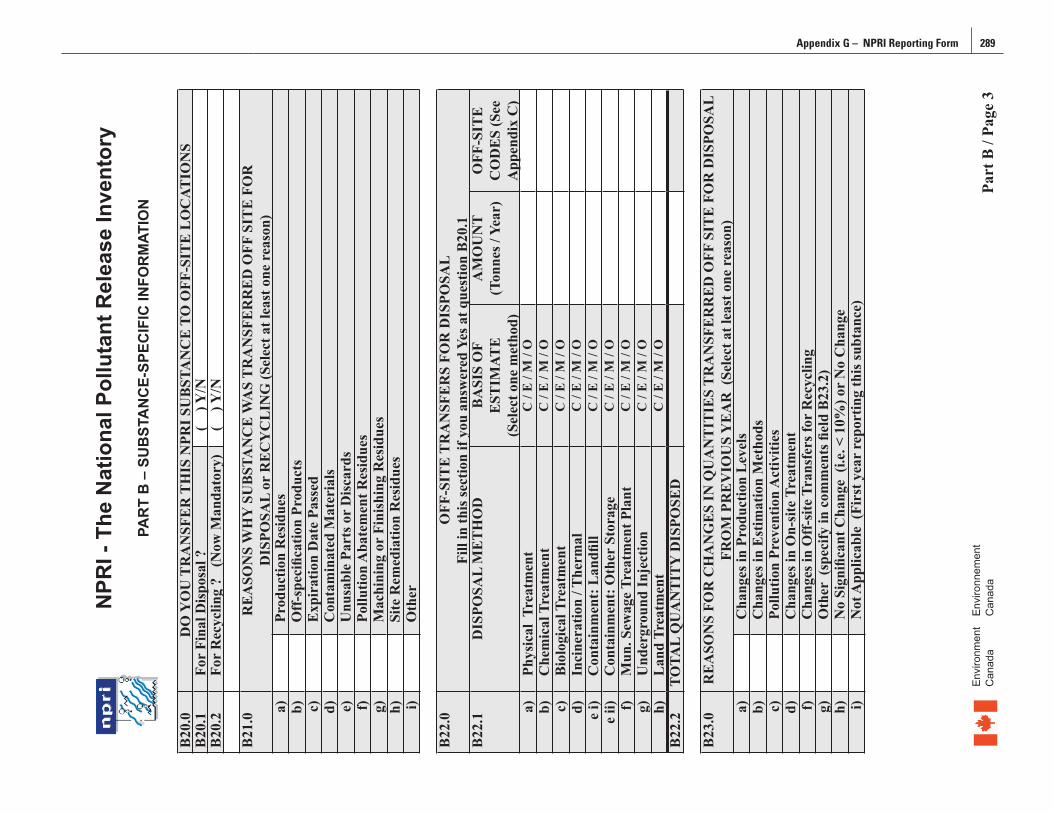
288 Taking Stock: North American Pollutant Releases and Transfers 1999 Appendix G – NPRI Reporting Form 289
NPR
I - T
he N
atio
nal P
ollu
tant
Rel
ease
Inve
ntor
yPA
RT
B –
SU
BST
AN
CE-
SPEC
IFIC
INFO
RM
ATIO
N
B20
.0D
O Y
OU
TR
AN
SFE
R T
HIS
NPR
I SU
BST
AN
CE
TO
OFF
-SIT
E L
OC
ATIO
NS
B20
.1Fo
r Fi
nal D
ispo
sal ?
( )
Y/N
B20
.2Fo
r R
ecyc
ling
? (
Now
Man
dato
ry)
( )
Y/N
B21
.0R
EA
SON
S W
HY
SU
BST
AN
CE
WA
S T
RA
NSF
ER
RE
D O
FF S
ITE
FO
RD
ISPO
SAL
or R
EC
YC
LIN
G (S
elec
t at l
east
one
rea
son)
a)Pr
oduc
tion
Res
idue
sb)
Off
-spe
cific
atio
n Pr
oduc
tsc)
Exp
irat
ion
Dat
e Pa
ssed
d)C
onta
min
ated
Mat
eria
lse)
Unu
sabl
e Pa
rts o
r D
isca
rds
f)Po
llutio
n A
bate
men
t Res
idue
sg)
Mac
hini
ng o
r Fi
nish
ing
Res
idue
sh)
Site
Rem
edia
tion
Res
idue
si)
Oth
er
B22
.0O
FF-S
ITE
TR
AN
SFE
RS
FOR
DIS
POSA
LFi
ll in
this
sect
ion
if yo
u an
swer
ed Y
es a
t que
stio
n B
20.1
B22
.1D
ISPO
SAL
ME
TH
OD
BA
SIS
OF
EST
IMAT
E
(Sel
ect o
ne m
etho
d)
AM
OU
NT
(Ton
nes /
Yea
r)O
FF-S
ITE
C
OD
ES
(See
A
ppen
dix
C)
a)Ph
ysic
al T
reat
men
tC
/ E
/ M
/ O
b)C
hem
ical
Tre
atm
ent
C /
E /
M /
Oc)
Bio
logi
cal T
reat
men
tC
/ E
/ M
/ O
d)In
cine
ratio
n / T
herm
alC
/ E
/ M
/ O
e i)
Con
tain
men
t: L
andfi
llC
/ E
/ M
/ O
e ii)
Con
tain
men
t: O
ther
Sto
rage
C /
E /
M /
Of)
Mun
. Sew
age
Trea
tmen
t Pla
ntC
/ E
/ M
/ O
g)U
nder
grou
nd In
ject
ion
C /
E /
M /
Oh)
Lan
d Tr
eatm
ent
C /
E /
M /
OB
22.2
TOTA
L Q
UA
NT
ITY
DIS
POSE
D
B23
.0R
EA
SON
S FO
R C
HA
NG
ES
IN Q
UA
NT
ITIE
S T
RA
NSF
ER
RE
D O
FF S
ITE
FO
R D
ISPO
SAL
FRO
M P
RE
VIO
US
YE
AR
(Se
lect
at l
east
one
rea
son)
a)C
hang
es in
Pro
duct
ion
Lev
els
b)C
hang
es in
Est
imat
ion
Met
hods
c)Po
llutio
n Pr
even
tion
Act
iviti
esd)
Cha
nges
in O
n-si
te T
reat
men
tf)
Cha
nges
in O
ff-s
ite T
rans
fers
for
Rec
yclin
gg)
Oth
er (
spec
ify in
com
men
ts fi
eld
B23
.2)
h)N
o Si
gnifi
cant
Cha
nge
(i.e
. < 1
0%) o
r N
o C
hang
ei)
Not
App
licab
le (
Firs
t yea
r re
port
ing
this
subt
ance
)
Part
B /
Page
3En
viro
nmen
t En
viro
nnem
ent
Can
ada
Can
ada
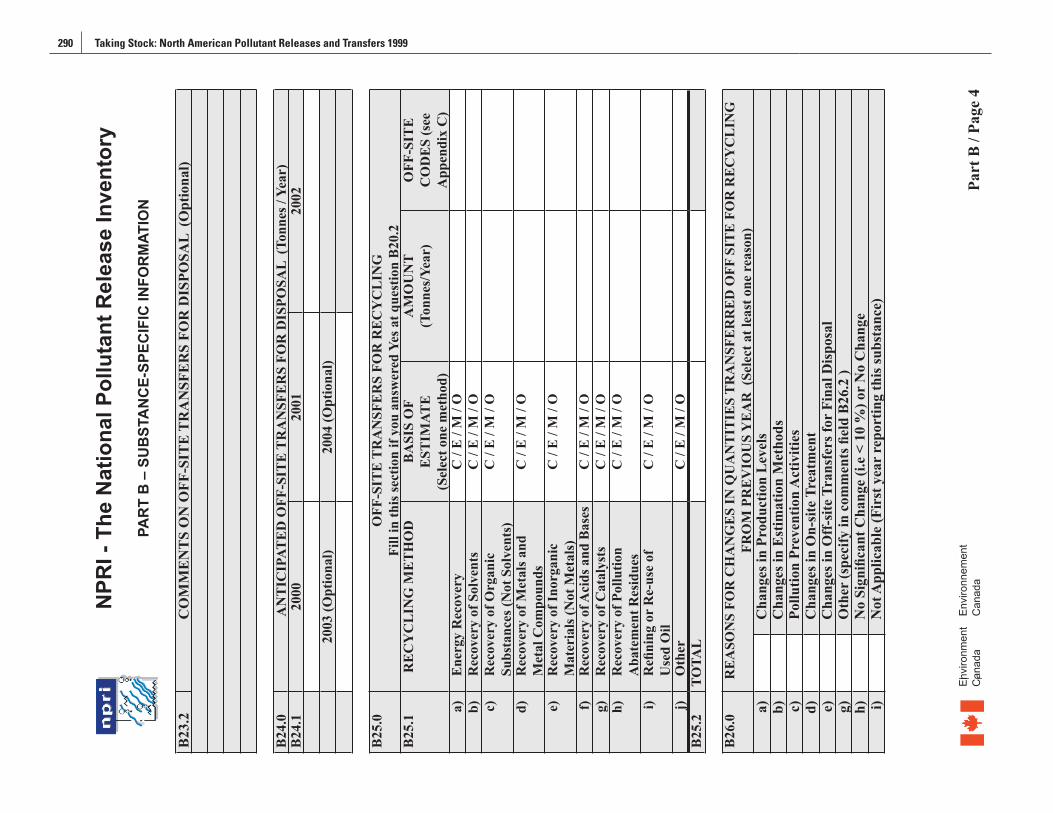
290 Taking Stock: North American Pollutant Releases and Transfers 1999 Appendix G – NPRI Reporting Form 291
NPR
I - T
he N
atio
nal P
ollu
tant
Rel
ease
Inve
ntor
yPA
RT
B –
SU
BST
AN
CE-
SPEC
IFIC
INFO
RM
ATIO
N
B23
.2C
OM
ME
NT
S O
N O
FF-S
ITE
TR
AN
SFE
RS
FOR
DIS
POSA
L (O
ptio
nal)
B24
.0A
NT
ICIP
ATE
D O
FF-S
ITE
TR
AN
SFE
RS
FOR
DIS
POSA
L (T
onne
s / Y
ear)
B24
.120
0020
0120
02
2003
(Opt
iona
l)20
04 (O
ptio
nal)
B25
.0O
FF-S
ITE
TR
AN
SFE
RS
FOR
RE
CY
CL
ING
Fi
ll in
this
sect
ion
if yo
u an
swer
ed Y
es a
t que
stio
n B
20.2
B25
.1R
EC
YC
LIN
G M
ET
HO
DB
ASI
S O
F E
STIM
ATE
(S
elec
t one
met
hod)
AM
OU
NT
(Ton
nes/
Year
)O
FF-S
ITE
C
OD
ES
(see
A
ppen
dix
C)
a)E
nerg
y R
ecov
ery
C /
E /
M /
Ob)
Rec
over
y of
Sol
vent
sC
/ E
/ M
/ O
c)R
ecov
ery
of O
rgan
icSu
bsta
nces
(Not
Sol
vent
s)C
/ E
/ M
/ O
d)R
ecov
ery
of M
etal
s and
Met
al C
ompo
unds
C /
E /
M /
O
e)R
ecov
ery
of In
orga
nic
Mat
eria
ls (N
ot M
etal
s)C
/ E
/ M
/ O
f)R
ecov
ery
of A
cids
and
Bas
esC
/ E
/ M
/ O
g)R
ecov
ery
of C
atal
ysts
C /
E /
M /
Oh)
Rec
over
y of
Pol
lutio
nA
bate
men
t Res
idue
sC
/ E
/ M
/ O
i)R
efini
ng o
r R
e-us
e of
Use
d O
ilC
/ E
/ M
/ O
j)O
ther
C /
E /
M /
OB
25.2
TOTA
L
B26
.0R
EA
SON
S FO
R C
HA
NG
ES
IN Q
UA
NT
ITIE
S T
RA
NSF
ER
RE
D O
FF S
ITE
FO
R R
EC
YC
LIN
G
FRO
M P
RE
VIO
US
YE
AR
(Se
lect
at l
east
one
rea
son)
a)C
hang
es in
Pro
duct
ion
Lev
els
b)C
hang
es in
Est
imat
ion
Met
hods
c)Po
llutio
n Pr
even
tion
Act
iviti
esd)
Cha
nges
in O
n-si
te T
reat
men
te)
Cha
nges
in O
ff-s
ite T
rans
fers
for
Fina
l Dis
posa
lg)
Oth
er (s
peci
fy in
com
men
ts fi
eld
B26
.2 )
h)N
o Si
gnifi
cant
Cha
nge
(i.e
< 10
%) o
r N
o C
hang
ei)
Not
App
licab
le (F
irst
yea
r re
port
ing
this
subs
tanc
e)
Part
B /
Page
4En
viro
nmen
t En
viro
nnem
ent
Can
ada
Can
ada
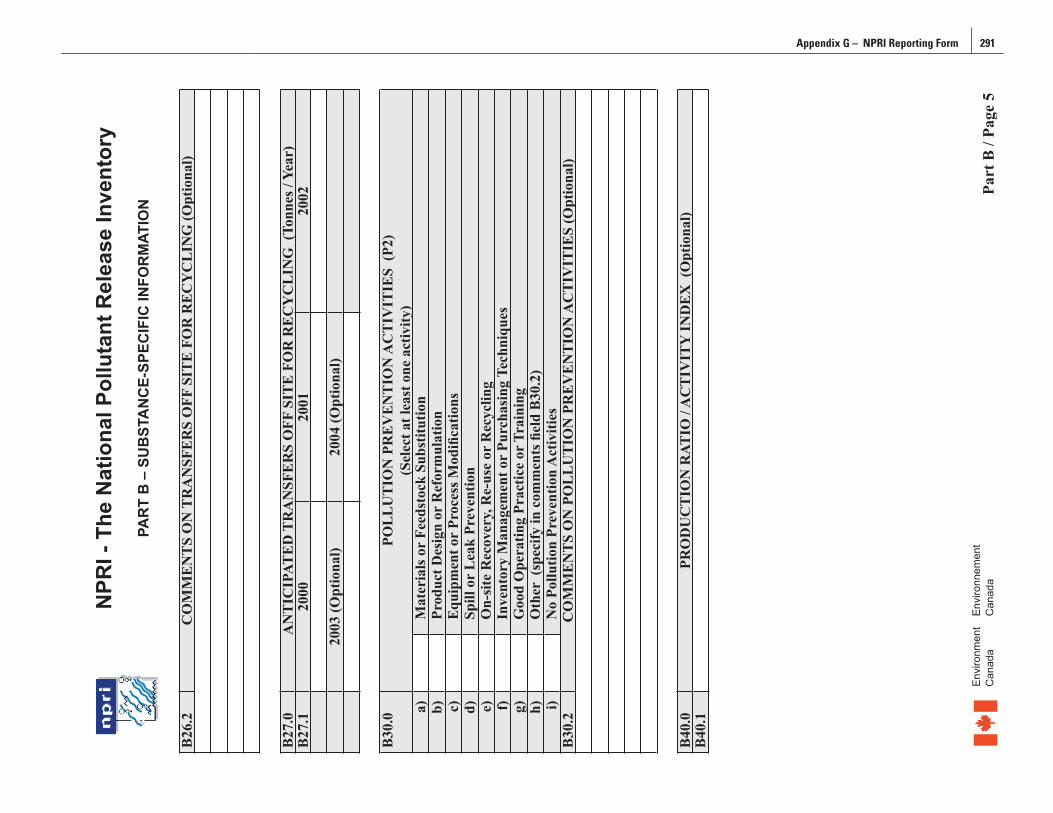
290 Taking Stock: North American Pollutant Releases and Transfers 1999 Appendix G – NPRI Reporting Form 291
NPR
I - T
he N
atio
nal P
ollu
tant
Rel
ease
Inve
ntor
yPA
RT
B –
SU
BST
AN
CE-
SPEC
IFIC
INFO
RM
ATIO
N
B26
.2C
OM
ME
NT
S O
N T
RA
NSF
ER
S O
FF S
ITE
FO
R R
EC
YC
LIN
G (O
ptio
nal)
B27
.0A
NT
ICIP
ATE
D T
RA
NSF
ER
S O
FF S
ITE
FO
R R
EC
YC
LIN
G (
Tonn
es /
Year
) B
27.1
2000
2001
2002
2003
(Opt
iona
l)20
04 (O
ptio
nal)
B30
.0PO
LL
UT
ION
PR
EV
EN
TIO
N A
CT
IVIT
IES
(P2)
(Sel
ect a
t lea
st o
ne a
ctiv
ity)
a)M
ater
ials
or
Feed
stoc
k Su
bstit
utio
nb)
Prod
uct D
esig
n or
Ref
orm
ulat
ion
c)E
quip
men
t or
Proc
ess M
odifi
catio
nsd)
Spill
or
Lea
k Pr
even
tion
e)O
n-si
te R
ecov
ery,
Re-
use
or R
ecyc
ling
f)In
vent
ory
Man
agem
ent o
r Pu
rcha
sing
Tec
hniq
ues
g)G
ood
Ope
ratin
g Pr
actic
e or
Tra
inin
gh)
Oth
er (
spec
ify in
com
men
ts fi
eld
B30
.2)
i)N
o Po
llutio
n Pr
even
tion
Act
iviti
es
B30
.2C
OM
ME
NT
S O
N P
OL
LU
TIO
N P
RE
VE
NT
ION
AC
TIV
ITIE
S (O
ptio
nal)
B40
.0PR
OD
UC
TIO
N R
ATIO
/ A
CT
IVIT
Y IN
DE
X (
Opt
iona
l)B
40.1
Part
B /
Page
5En
viro
nmen
t En
viro
nnem
ent
Can
ada
Can
ada
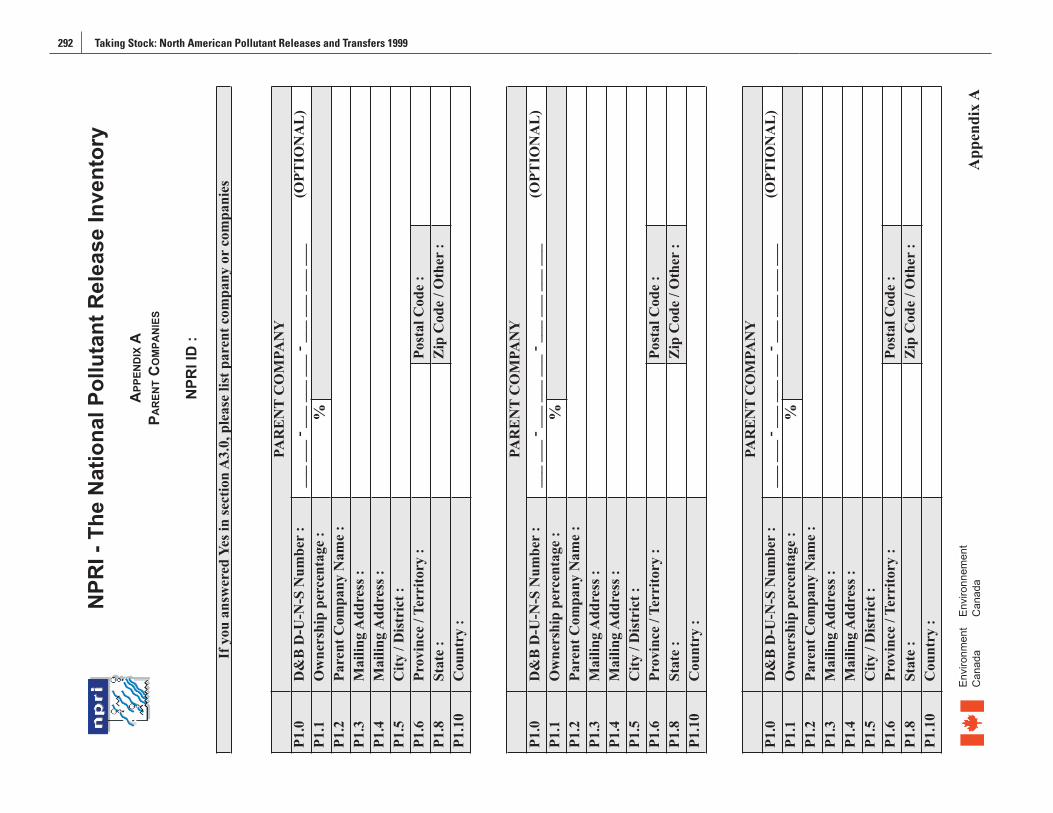
292 Taking Stock: North American Pollutant Releases and Transfers 1999 Appendix G – NPRI Reporting Form 293
NPR
I - T
he N
atio
nal P
ollu
tant
Rel
ease
Inve
ntor
yA
PPEN
DIX
APA
REN
T CO
MPA
NIE
S
NPR
I ID
:
If y
ou a
nsw
ered
Yes
in se
ctio
n A
3.0,
ple
ase
list p
aren
t com
pany
or
com
pani
es
PAR
EN
T C
OM
PAN
YP1
.0D
&B
D-U
-N-S
Num
ber
:__
_ __
_ - _
__ _
__ _
__ -
___
___
___
___
(OPT
ION
AL
)P1
.1O
wne
rshi
p pe
rcen
tage
:%
P1.2
Pare
nt C
ompa
ny N
ame
:P1
.3M
ailin
g A
ddre
ss :
P1.4
Mai
ling
Add
ress
:P1
.5C
ity /
Dis
tric
t :
P1.6
Prov
ince
/ Te
rrito
ry :
Post
al C
ode
:P1
.8St
ate
:Z
ip C
ode
/ Oth
er :
P1.1
0C
ount
ry :
App
endi
x A
Envi
ronm
ent
Envi
ronn
emen
tC
anad
a C
anad
a
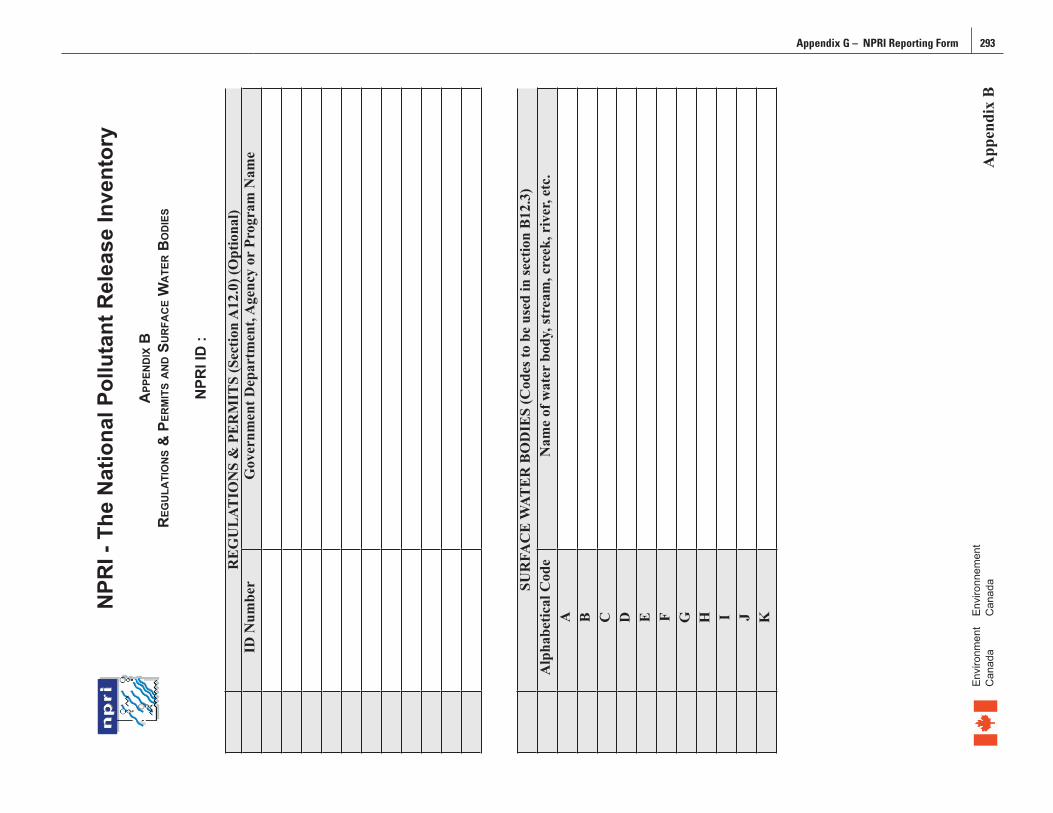
292 Taking Stock: North American Pollutant Releases and Transfers 1999 Appendix G – NPRI Reporting Form 293
NPR
I - T
he N
atio
nal P
ollu
tant
Rel
ease
Inve
ntor
yA
PPEN
DIX
BR
EGU
LATI
ON
S &
PER
MIT
S A
ND S
UR
FAC
E W
ATE
R B
OD
IES
NPR
I ID
:
RE
GU
LAT
ION
S &
PE
RM
ITS
(Sec
tion
A12
.0) (
Opt
iona
l)ID
Num
ber
Gov
ernm
ent D
epar
tmen
t, A
genc
y or
Pro
gram
Nam
e
SUR
FAC
E W
ATE
R B
OD
IES
(Cod
es to
be
used
in se
ctio
n B
12.3
)A
lpha
betic
al C
ode
Nam
e of
wat
er b
ody,
stre
am, c
reek
, riv
er, e
tc.
A B C D E F G H I J K
App
endi
x B
Envi
ronm
ent
Envi
ronn
emen
tC
anad
a C
anad
a

294 Taking Stock: North American Pollutant Releases and Transfers 1999
NPR
I - T
he N
atio
nal P
ollu
tant
Rel
ease
Inve
ntor
yA
PPEN
DIX
CO
FF-S
ITE
FAC
ILIT
IES
NPR
I ID
:
S1.0
OFF
-SIT
E F
AC
ILIT
YS1
.1O
ff-S
ite C
ode
:01
Use
off
-site
cod
es (i
.e. 0
1, 0
2, 0
3 et
c...)
to in
dica
te o
ff-
site
faci
litie
s or
MST
Ps in
sect
ions
B22
.0 a
nd B
25.0
S1.2
Faci
lity
or M
STP
Nam
e :
S1.3
Mai
ling
Add
ress
:S1
.4M
ailin
g A
ddre
ss :
S1.5
City
/ D
istr
ict :
S1.6
Prov
ince
/ Te
rrito
ry :
Post
al C
ode
:S1
.8St
ate
:Z
ip C
ode
/ Oth
er :
S1.1
0C
ount
ry :
S1.0
OFF
-SIT
E F
AC
ILIT
YS1
.1O
ff-S
ite C
ode
:02
Use
off
-site
cod
es (i
.e. 0
1, 0
2, 0
3 et
c...)
to in
dica
te o
ff-
site
faci
litie
s or
MST
Ps in
sect
ions
B22
.0 a
nd B
25.0
S1.2
Faci
lity
or M
STP
Nam
e :
S1.3
Mai
ling
Add
ress
:S1
.4M
ailin
g A
ddre
ss :
S1.5
City
/ D
istr
ict :
S1.6
Prov
ince
/ Te
rrito
ry :
Post
al C
ode
:S1
.8St
ate
:Z
ip C
ode
/ Oth
er :
S1.1
0C
ount
ry :
S1.0
OFF
-SIT
E F
AC
ILIT
YS1
.1O
ff-S
ite C
ode
:03
Use
off
-site
cod
es (i
.e. 0
1, 0
2, 0
3 et
c...)
to in
dica
te o
ff-
site
faci
litie
s or
MST
Ps in
sect
ions
B22
.0 a
nd B
25.0
S1.2
Faci
lity
or M
STP
Nam
e :
S1.3
Mai
ling
Add
ress
:S1
.4M
ailin
g A
ddre
ss :
S1.5
City
/ D
istr
ict :
S1.6
Prov
ince
/ Te
rrito
ry :
Post
al C
ode
:S1
.8St
ate
:Z
ip C
ode
/ Oth
er :
S1.1
0C
ount
ry :
App
endi
x C
Envi
ronm
ent
Envi
ronn
emen
tC
anad
a C
anad
a
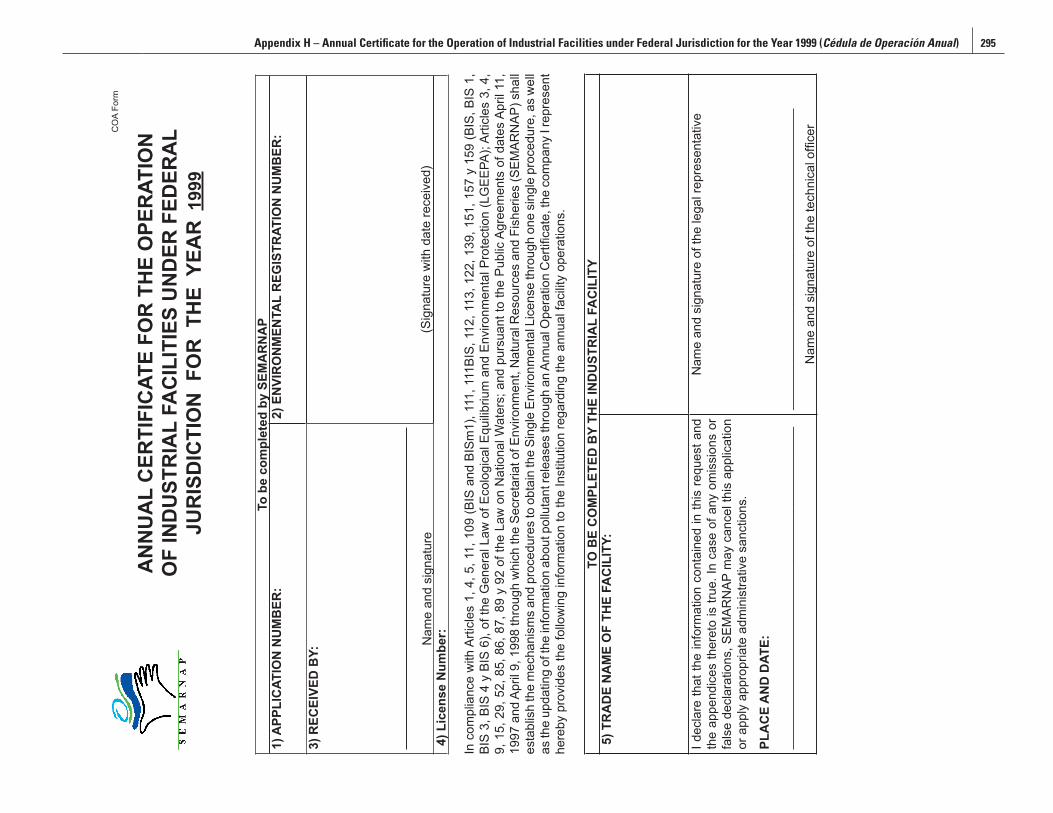
Appendix H – Annual Certificate for the Operation of Industrial Facilities under Federal Jurisdiction for the Year 1999 (Cédula de Operación Anual) 295
CO
A Fo
rm
AN
NU
AL
CER
TIFI
CAT
E FO
R T
HE
OPE
RAT
ION
O
F IN
DU
STR
IAL
FAC
ILIT
IES
UN
DER
FED
ERA
L JU
RIS
DIC
TIO
N F
OR
TH
E Y
EAR
199
9
To b
e co
mpl
eted
by
SEM
AR
NA
P1)
APP
LIC
ATIO
N N
UM
BER
:2)
EN
VIR
ON
MEN
TAL
REG
ISTR
ATIO
N N
UM
BER
:
3) R
ECEI
VED
BY:
Nam
e an
d si
gnat
ure
(Sig
natu
re w
ith d
ate
rece
ived
)4)
Lic
ense
Num
ber:
In c
ompl
ianc
e w
ith A
rticl
es 1
, 4, 5
, 11,
109
(BIS
and
BIS
m1)
, 111
, 111
BIS,
112
, 113
, 122
, 139
, 151
, 157
y 1
59 (B
IS, B
IS 1
, BI
S 3,
BIS
4 y
BIS
6),
of th
e G
ener
al L
aw o
f Eco
logi
cal E
quilib
rium
and
Env
ironm
enta
l Pro
tect
ion
(LG
EEPA
); Ar
ticle
s 3,
4,
9, 1
5, 2
9, 5
2, 8
5, 8
6, 8
7, 8
9 y
92 o
f the
Law
on
Nat
iona
l Wat
ers;
and
pur
suan
t to
the
Publ
ic A
gree
men
ts o
f dat
es A
pril
11,
1997
and
Apr
il 9,
199
8 th
roug
h w
hich
the
Secr
etar
iat o
f Env
ironm
ent,
Nat
ural
Res
ourc
es a
nd F
ishe
ries
(SEM
ARN
AP) s
hall
esta
blis
h th
e m
echa
nism
s an
d pr
oced
ures
to o
btai
n th
e Si
ngle
Env
ironm
enta
l Lic
ense
thro
ugh
one
sing
le p
roce
dure
, as
wel
l as
the
upda
ting
of th
e in
form
atio
n ab
out p
ollu
tant
rele
ases
thro
ugh
an A
nnua
l Ope
ratio
n C
ertifi
cate
, the
com
pany
I re
pres
ent
here
by p
rovi
des
the
follo
win
g in
form
atio
n to
the
Inst
itutio
n re
gard
ing
the
annu
al fa
cilit
y op
erat
ions
.
TO B
E C
OM
PLET
ED B
Y TH
E IN
DU
STR
IAL
FAC
ILIT
Y5)
TR
AD
E N
AM
E O
F TH
E FA
CIL
ITY:
I dec
lare
that
the
info
rmat
ion
cont
aine
d in
this
requ
est a
nd
the
appe
ndic
es th
eret
o is
true
. In
case
of a
ny o
mis
sion
s or
fa
lse
decl
arat
ions
, SEM
ARN
AP m
ay c
ance
l thi
s ap
plic
atio
n or
app
ly a
ppro
pria
te a
dmin
istra
tive
sanc
tions
.
PLA
CE
AN
D D
ATE:
____
____
____
____
____
____
____
____
____
____
____
__
Nam
e an
d si
gnat
ure
of th
e le
gal r
epre
sent
ativ
e
____
____
____
____
____
____
____
____
____
____
___
Nam
e an
d si
gnat
ure
of th
e te
chni
cal o
ffice
r
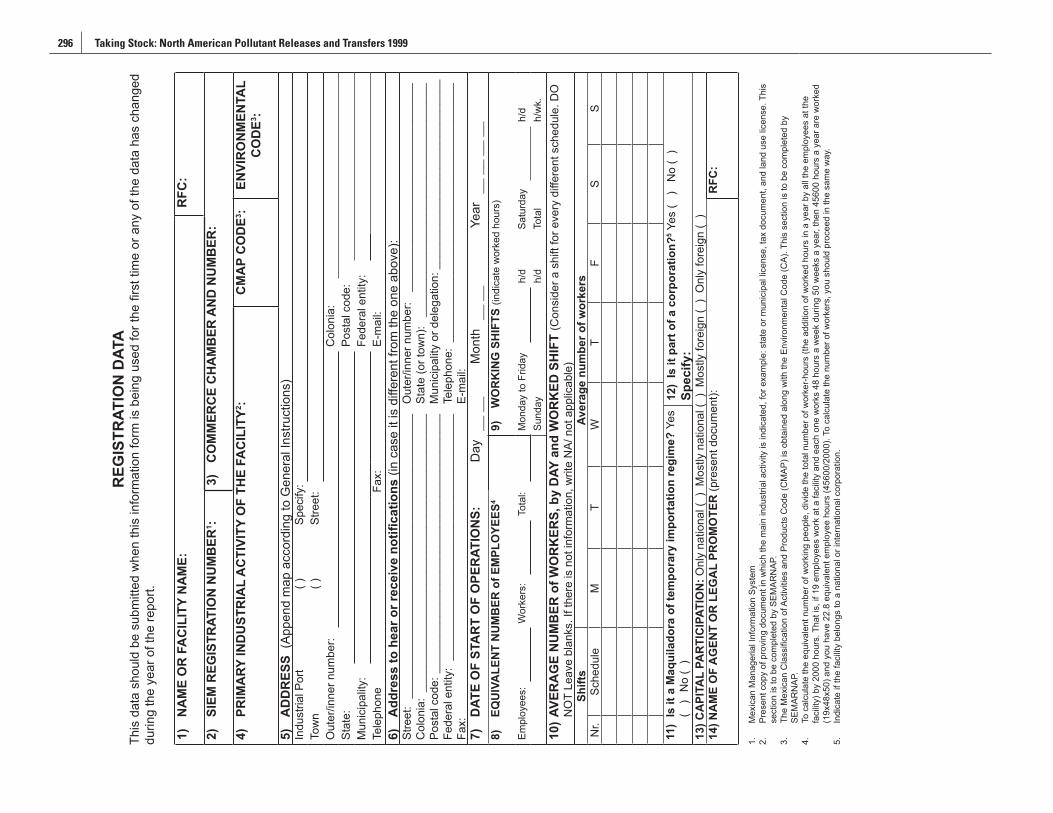
296 Taking Stock: North American Pollutant Releases and Transfers 1999 Appendix H – Annual Certificate for the Operation of Industrial Facilities under Federal Jurisdiction for the Year 1999 (Cédula de Operación Anual) 297
REG
ISTR
ATIO
N D
ATA
This
dat
a sh
ould
be
subm
itted
whe
n th
is in
form
atio
n fo
rm is
bei
ng u
sed
for t
he fi
rst t
ime
or a
ny o
f the
dat
a ha
s ch
ange
d du
ring
the
year
of t
he re
port.
1)
NA
ME
OR
FA
CIL
ITY
NA
ME:
RFC
:
2)
SIEM
REG
ISTR
ATIO
N N
UM
BER
1 :3)
C
OM
MER
CE
CH
AM
BER
AN
D N
UM
BER
:
4)
PRIM
ARY
IND
UST
RIA
L A
CTI
VITY
OF
THE
FAC
ILIT
Y2 :C
MA
P C
OD
E3 :EN
VIR
ON
MEN
TAL
CO
DE3 :
5)
AD
DR
ESS
(App
end
map
acc
ordi
ng to
Gen
eral
Inst
ruct
ions
)In
dust
rial P
ort
( )Sp
ecify
:To
wn
( )St
reet
:O
uter
/inne
r num
ber:
Col
onia
:St
ate:
Post
al c
ode:
Mun
icip
ality
:Fe
dera
l ent
ity:
Tele
phon
eFa
x:E-
mai
l:6)
A
ddre
ss to
hea
r or r
ecei
ve n
otifi
catio
ns (i
n ca
se it
is d
iffer
ent f
rom
the
one
abov
e):
Stre
et:
____
____
____
____
____
____
____
____
____
____
____
_C
olon
ia:
____
____
____
____
____
____
____
____
____
____
____
Post
al c
ode:
___
____
____
____
____
____
____
____
____
____
__Fe
dera
l ent
ity:
____
____
____
____
____
____
____
____
____
___
Fax:
Out
er/in
ner n
umbe
r: _
____
____
____
____
____
____
____
____
Stat
e (o
r tow
n):
____
____
____
____
____
____
____
____
____
_M
unic
ipal
ity o
r del
egat
ion:
___
____
____
____
____
____
____
___
Tele
phon
e: _
____
____
____
____
____
____
____
____
____
____
E-m
ail:
7)
DAT
E O
F ST
AR
T O
F O
PER
ATIO
NS:
Day
__ _
_M
onth
__ _
_ Ye
ar__
__
__ _
_8)
EQ
UIV
ALE
NT
NU
MB
ER o
f EM
PLO
YEES
49)
W
OR
KIN
G S
HIF
TS (i
ndic
ate
wor
ked
hour
s)
Empl
oyee
s:W
orke
rs:
Tota
l:M
onda
y to
Frid
ayh/
dSa
turd
ayh/
dSu
nday
h/d
Tota
lh/
wk.
10) A
VER
AG
E N
UM
BER
of W
OR
KER
S, b
y D
AY a
nd W
OR
KED
SH
IFT
(Con
side
r a s
hift
for e
very
diff
eren
t sch
edul
e. D
O
NO
T Le
ave
blan
ks. I
f the
re is
not
info
rmat
ion,
writ
e N
A/ n
ot a
pplic
able
)Sh
ifts
Aver
age
num
ber o
f wor
kers
Nr.
Sche
dule
MT
WT
FS
S
11)
Is it
a M
aqui
lado
ra o
f tem
pora
ry im
port
atio
n re
gim
e? Y
es
( )
No
( )
12)
Is it
par
t of a
cor
pora
tion?
5 Yes
( )
N
o (
)Sp
ecify
:13
) CA
PITA
L PA
RTI
CIP
ATIO
N: O
nly
natio
nal (
) M
ostly
nat
iona
l ( )
Mos
tly fo
reig
n (
) O
nly
fore
ign
( )
14) N
AM
E O
F A
GEN
T O
R L
EGA
L PR
OM
OTE
R (p
rese
nt d
ocum
ent):
R
FC:
1.
Mex
ican
Man
ager
ial I
nfor
mat
ion
Syst
em2.
Pr
esen
t cop
y of
pro
ving
doc
umen
t in
whi
ch th
e m
ain
indu
stria
l act
ivity
is in
dica
ted,
for e
xam
ple:
sta
te o
r mun
icip
al li
cens
e, ta
x do
cum
ent,
and
land
use
lice
nse.
Thi
s se
ctio
n is
to b
e co
mpl
eted
by
SEM
ARN
AP.
3.
The
Mex
ican
Cla
ssifi
catio
n of
Act
iviti
es a
nd P
rodu
cts
Cod
e (C
MAP
) is
obta
ined
alo
ng w
ith th
e En
viro
nmen
tal C
ode
(CA)
. Thi
s se
ctio
n is
to b
e co
mpl
eted
by
SEM
ARN
AP.
4.
To c
alcu
late
the
equi
vale
nt n
umbe
r of w
orki
ng p
eopl
e, d
ivid
e th
e to
tal n
umbe
r of w
orke
r-hou
rs (t
he a
dditi
on o
f wor
ked
hour
s in
a y
ear b
y al
l the
em
ploy
ees
at th
e fa
cilit
y) b
y 20
00 h
ours
. Tha
t is,
if 1
9 em
ploy
ees
wor
k at
a fa
cilit
y an
d ea
ch o
ne w
orks
48
hour
s a
wee
k du
ring
50 w
eeks
a y
ear,
then
456
00 h
ours
a y
ear a
re w
orke
d (1
9x48
x50)
and
you
hav
e 22
.8 e
quiv
alen
t em
ploy
ee h
ours
(456
00/2
000)
. To
calc
ulat
e th
e nu
mbe
r of w
orke
rs, y
ou s
houl
d pr
ocee
d in
the
sam
e w
ay.
5.
Indi
cate
if th
e fa
cilit
y be
long
s to
a n
atio
nal o
r int
erna
tiona
l cor
pora
tion.
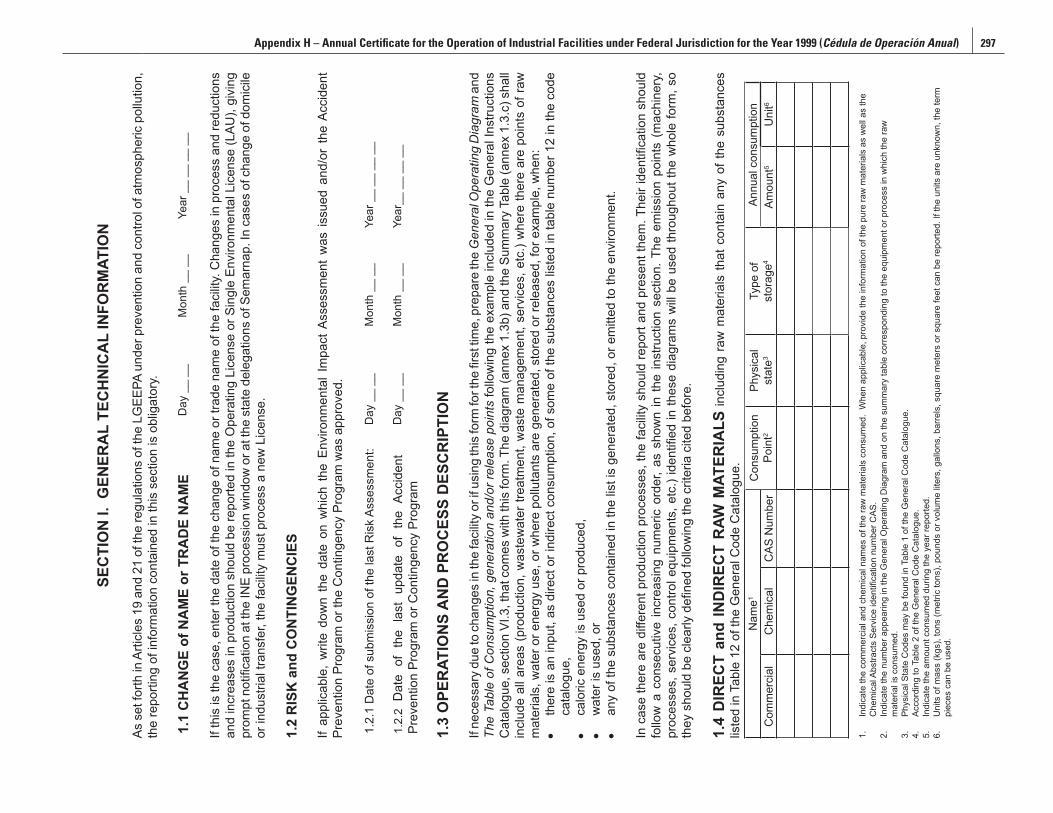
296 Taking Stock: North American Pollutant Releases and Transfers 1999 Appendix H – Annual Certificate for the Operation of Industrial Facilities under Federal Jurisdiction for the Year 1999 (Cédula de Operación Anual) 297
SEC
TIO
N I.
GEN
ERA
L TE
CH
NIC
AL
INFO
RM
ATIO
N
As s
et fo
rth in
Arti
cles
19
and
21 o
f the
regu
latio
ns o
f the
LG
EEPA
und
er p
reve
ntio
n an
d co
ntro
l of a
tmos
pher
ic p
ollu
tion,
th
e re
porti
ng o
f inf
orm
atio
n co
ntai
ned
in th
is s
ectio
n is
obl
igat
ory.
1.1
CH
AN
GE
of N
AM
E or
TR
AD
E N
AM
ED
ay _
_ __
Mon
th _
_ __
Year
__
__ _
_ __
If th
is is
the
case
, ent
er th
e da
te o
f the
cha
nge
of n
ame
or tr
ade
nam
e of
the
faci
lity.
Cha
nges
in p
roce
ss a
nd re
duct
ions
an
d in
crea
ses
in p
rodu
ctio
n sh
ould
be
repo
rted
in th
e O
pera
ting
Lice
nse
or S
ingl
e En
viro
nmen
tal L
icen
se (L
AU),
givi
ng
prom
pt n
otifi
catio
n at
the
INE
proc
essi
on w
indo
w o
r at t
he s
tate
del
egat
ions
of S
emar
nap.
In c
ases
of c
hang
e of
dom
icile
or
indu
stria
l tra
nsfe
r, th
e fa
cilit
y m
ust p
roce
ss a
new
Lic
ense
.
1.2
RIS
K a
nd C
ON
TIN
GEN
CIE
S
If ap
plic
able
, w
rite
dow
n th
e da
te o
n w
hich
the
Env
ironm
enta
l Im
pact
Ass
essm
ent
was
issu
ed a
nd/o
r th
e Ac
cide
nt
Prev
entio
n Pr
ogra
m o
r the
Con
tinge
ncy
Prog
ram
was
app
rove
d.
1.2.
1 D
ate
of s
ubm
issi
on o
f the
last
Ris
k As
sess
men
t:D
ay _
_ __
Mon
th _
_ __
Year
__
__ _
_ __
1.2.
2 D
ate
of t
he l
ast
upda
te o
f th
e Ac
cide
nt
Prev
entio
n Pr
ogra
m o
r Con
tinge
ncy
Prog
ram
Day
__
__M
onth
__
__Ye
ar__
__
__ _
_
1.3
OPE
RAT
ION
S A
ND
PR
OC
ESS
DES
CR
IPTI
ON
If ne
cess
ary
due
to c
hang
es in
the
faci
lity
or if
usi
ng th
is fo
rm fo
r the
firs
t tim
e, p
repa
re th
e G
ener
al O
pera
ting
Dia
gram
and
Th
e Ta
ble
of C
onsu
mpt
ion,
gen
erat
ion
and/
or re
leas
e po
ints
follo
win
g th
e ex
ampl
e in
clud
ed in
the
Gen
eral
Inst
ruct
ions
C
atal
ogue
, sec
tion
VI.3
, tha
t com
es w
ith th
is fo
rm. T
he d
iagr
am (a
nnex
1.3
b) a
nd th
e Su
mm
ary
Tabl
e (a
nnex
1.3
.c) s
hall
incl
ude
all a
reas
(pro
duct
ion,
was
tew
ater
trea
tmen
t, w
aste
man
agem
ent,
serv
ices
, etc
.) w
here
ther
e ar
e po
ints
of r
aw
mat
eria
ls, w
ater
or e
nerg
y us
e, o
r whe
re p
ollu
tant
s ar
e ge
nera
ted,
sto
red
or re
leas
ed, f
or e
xam
ple,
whe
n:•
ther
e is
an
inpu
t, as
dire
ct o
r ind
irect
con
sum
ptio
n, o
f som
e of
the
subs
tanc
es li
sted
in ta
ble
num
ber 1
2 in
the
code
ca
talo
gue,
• ca
loric
ene
rgy
is u
sed
or p
rodu
ced,
• w
ater
is u
sed,
or
• an
y of
the
subs
tanc
es c
onta
ined
in th
e lis
t is
gene
rate
d, s
tore
d, o
r em
itted
to th
e en
viro
nmen
t.
In c
ase
ther
e ar
e di
ffere
nt p
rodu
ctio
n pr
oces
ses,
the
faci
lity
shou
ld re
port
and
pres
ent t
hem
. The
ir id
entifi
catio
n sh
ould
fo
llow
a c
onse
cutiv
e in
crea
sing
num
eric
ord
er, a
s sh
own
in th
e in
stru
ctio
n se
ctio
n. T
he e
mis
sion
poi
nts
(mac
hine
ry,
proc
esse
s, s
ervi
ces,
con
trol e
quip
men
ts, e
tc.)
iden
tified
in th
ese
diag
ram
s w
ill be
use
d th
roug
hout
the
who
le fo
rm, s
o th
ey s
houl
d be
cle
arly
defi
ned
follo
win
g th
e cr
iteria
cite
d be
fore
.
1.4
DIR
ECT
and
IND
IREC
T R
AW M
ATER
IALS
incl
udin
g ra
w m
ater
ials
that
con
tain
any
of t
he s
ubst
ance
s lis
ted
in T
able
12
of th
e G
ener
al C
ode
Cat
alog
ue.
Nam
e1C
onsu
mpt
ion
Poin
t2Ph
ysic
alst
ate3
Type
of
stor
age4
Annu
al c
onsu
mpt
ion
Com
mer
cial
Che
mic
alC
AS N
umbe
rAm
ount
5U
nit6
1.
Indi
cate
the
com
mer
cial
and
che
mic
al n
ames
of t
he ra
w m
ater
ials
con
sum
ed.
Whe
n ap
plic
able
, pro
vide
the
info
rmat
ion
of th
e pu
re ra
w m
ater
ials
as
wel
l as
the
Che
mic
al A
bstra
cts
Serv
ice
iden
tifica
tion
num
ber C
AS.
2.
Indi
cate
the
num
ber a
ppea
ring
in th
e G
ener
al O
pera
ting
Dia
gram
and
on
the
sum
mar
y ta
ble
corre
spon
ding
to th
e eq
uipm
ent o
r pro
cess
in w
hich
the
raw
m
ater
ial i
s co
nsum
ed.
3.
Phys
ical
Sta
te C
odes
may
be
foun
d in
Tab
le 1
of t
he G
ener
al C
ode
Cat
alog
ue.
4.
Acco
rdin
g to
Tab
le 2
of t
he G
ener
al C
ode
Cat
alog
ue.
5.
Indi
cate
the
amou
nt c
onsu
med
dur
ing
the
year
repo
rted.
6.
Uni
ts o
f mas
s (k
gs),
tons
(met
ric to
ns),
poun
ds o
r vol
ume
liter
s, g
allo
ns, b
arre
ls, s
quar
e m
eter
s or
squ
are
feet
can
be
repo
rted.
If th
e un
its a
re u
nkno
wn,
the
term
pi
eces
can
be
used
.
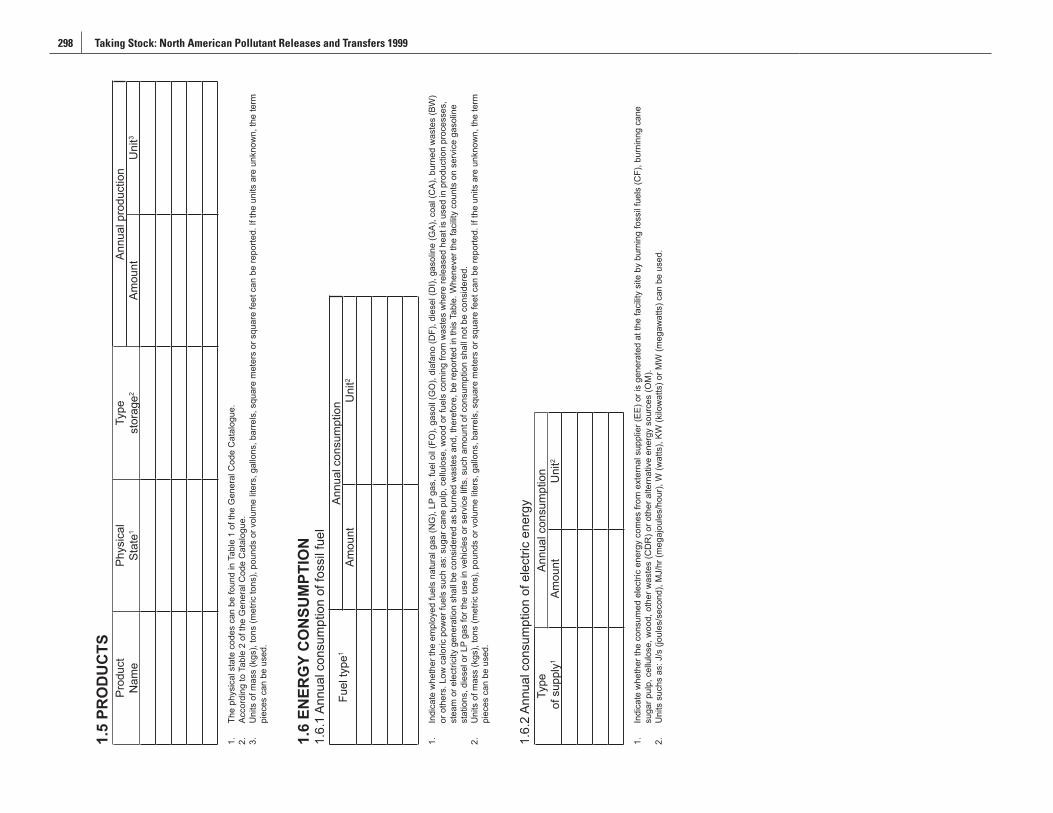
298 Taking Stock: North American Pollutant Releases and Transfers 1999 Appendix H – Annual Certificate for the Operation of Industrial Facilities under Federal Jurisdiction for the Year 1999 (Cédula de Operación Anual) 299
1.5
PRO
DU
CTS
Pr
oduc
tN
ame
Phys
ical
Stat
e1Ty
pest
orag
e2An
nual
pro
duct
ion
Amou
ntU
nit3
1.
The
phys
ical
sta
te c
odes
can
be
foun
d in
Tab
le 1
of t
he G
ener
al C
ode
Cat
alog
ue.
2.
Acco
rdin
g to
Tab
le 2
of t
he G
ener
al C
ode
Cat
alog
ue.
3.
Uni
ts o
f mas
s (k
gs),
tons
(met
ric to
ns),
poun
ds o
r vol
ume
liter
s, g
allo
ns, b
arre
ls, s
quar
e m
eter
s or
squ
are
feet
can
be
repo
rted.
If th
e un
its a
re u
nkno
wn,
the
term
pi
eces
can
be
used
.
1.6
ENER
GY
CO
NSU
MPT
ION
1.6.
1 An
nual
con
sum
ptio
n of
foss
il fu
el
Fuel
type
1An
nual
con
sum
ptio
nAm
ount
Uni
t2
1.
Indi
cate
whe
ther
the
empl
oyed
fuel
s na
tura
l gas
(NG
), LP
gas
, fue
l oil
(FO
), ga
soil
(GO
), di
afan
o (D
F), d
iese
l (D
I), g
asol
ine
(GA)
, coa
l (C
A), b
urne
d w
aste
s (B
W)
or o
ther
s. L
ow c
alor
ic p
ower
fuel
s su
ch a
s: s
ugar
can
e pu
lp, c
ellu
lose
, woo
d or
fuel
s co
min
g fro
m w
aste
s w
here
rele
ased
hea
t is
used
in p
rodu
ctio
n pr
oces
ses,
st
eam
or e
lect
ricity
gen
erat
ion
shal
l be
cons
ider
ed a
s bu
rned
was
tes
and,
ther
efor
e, b
e re
porte
d in
this
Tab
le. W
hene
ver t
he fa
cilit
y co
unts
on
serv
ice
gaso
line
stat
ions
, die
sel o
r LP
gas
for t
he u
se in
veh
icle
s or
ser
vice
lifts
, suc
h am
ount
of c
onsu
mpt
ion
shal
l not
be
cons
ider
ed.
2.
Uni
ts o
f mas
s (k
gs),
tons
(met
ric to
ns),
poun
ds o
r vol
ume
liter
s, g
allo
ns, b
arre
ls, s
quar
e m
eter
s or
squ
are
feet
can
be
repo
rted.
If th
e un
its a
re u
nkno
wn,
the
term
pi
eces
can
be
used
.
1.6.
2 An
nual
con
sum
ptio
n of
ele
ctric
ene
rgy
Type
o
f sup
ply1
Annu
al c
onsu
mpt
ion
Amou
ntU
nit2
1.
Indi
cate
whe
ther
the
cons
umed
ele
ctric
ene
rgy
com
es fr
om e
xter
nal s
uppl
ier (
EE) o
r is
gene
rate
d at
the
faci
lity
site
by
burn
ing
foss
il fu
els
(CF)
, bur
ninn
g ca
ne
suga
r pul
p, c
ellu
lose
, woo
d, o
ther
was
tes
(CD
R) o
r oth
er a
ltern
ativ
e en
ergy
sou
rces
(OM
).2.
U
nits
suc
hs a
s: J
/s (j
oule
s/se
cond
), M
J/hr
(meg
ajou
les/
hour
), W
(wat
ts),
KW (k
ilow
atts
) or M
W (m
egaw
atts
) can
be
used
.
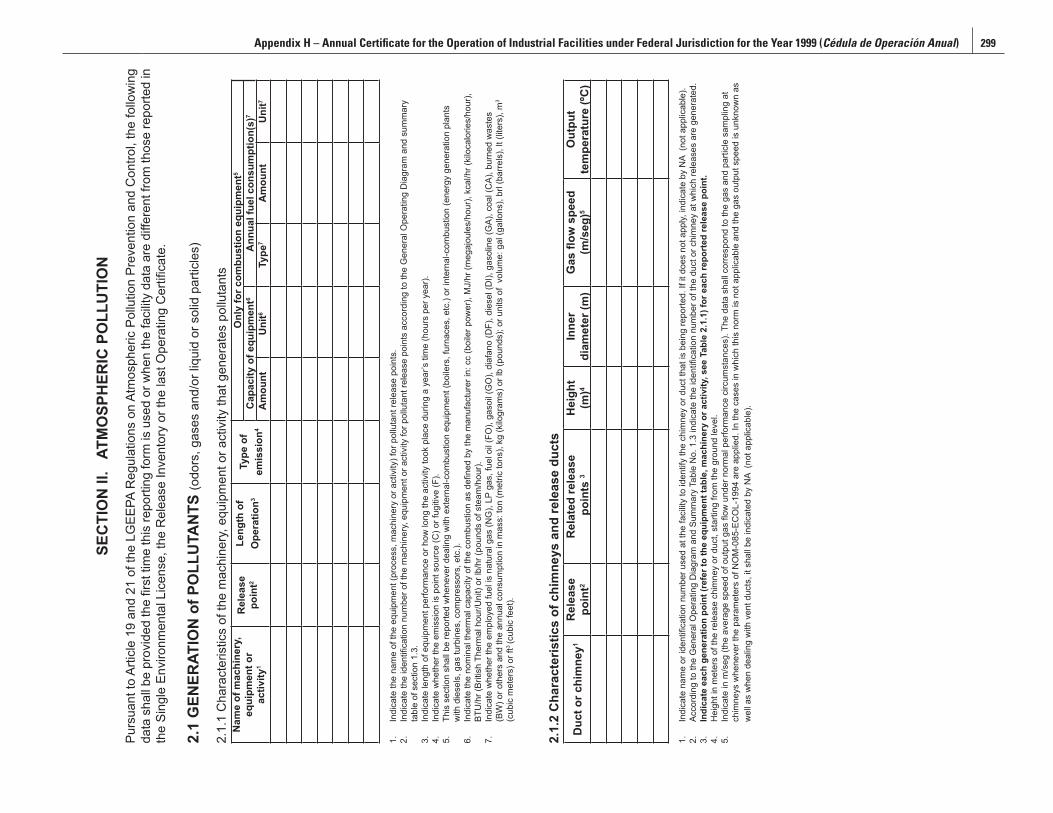
298 Taking Stock: North American Pollutant Releases and Transfers 1999 Appendix H – Annual Certificate for the Operation of Industrial Facilities under Federal Jurisdiction for the Year 1999 (Cédula de Operación Anual) 299
SEC
TIO
N II
. A
TMO
SPH
ERIC
PO
LLU
TIO
N
Purs
uant
to A
rticl
e 19
and
21
of th
e LG
EEPA
Reg
ulat
ions
on
Atm
osph
eric
Pol
lutio
n Pr
even
tion
and
Con
trol,
the
follo
win
g da
ta s
hall
be p
rovi
ded
the
first
tim
e th
is re
porti
ng fo
rm is
use
d or
whe
n th
e fa
cilit
y da
ta a
re d
iffer
ent f
rom
thos
e re
porte
d in
th
e Si
ngle
Env
ironm
enta
l Lic
ense
, the
Rel
ease
Inve
ntor
y or
the
last
Ope
ratin
g C
ertifi
cate
.
2.1
GEN
ERAT
ION
of P
OLL
UTA
NTS
(odo
rs, g
ases
and
/or l
iqui
d or
sol
id p
artic
les)
2.1.
1 C
hara
cter
istic
s of
the
mac
hine
ry, e
quip
men
t or a
ctiv
ity th
at g
ener
ates
pol
luta
nts
Nam
e of
mac
hine
ry,
equi
pmen
t or
activ
ity1
Rel
ease
po
int2
Leng
th o
f O
pera
tion3
Type
of
emis
sion
4
Onl
y fo
r com
bust
ion
equi
pmen
t5
Cap
acity
of e
quip
men
t6A
nnua
l fue
l con
sum
ptio
n(s)
7
Am
ount
Uni
t6Ty
pe7
Am
ount
Uni
t7
1.
Indi
cate
the
nam
e of
the
equi
pmen
t (pr
oces
s, m
achi
nery
or a
ctiv
ity) f
or p
ollu
tant
rele
ase
poin
ts.
2.
Indi
cate
the
iden
tifica
tion
num
ber o
f the
mac
hine
ry, e
quip
men
t or a
ctiv
ity fo
r pol
luta
nt re
leas
e po
ints
acc
ordi
ng to
the
Gen
eral
Ope
ratin
g D
iagr
am a
nd s
umm
ary
tabl
e of
sec
tion
1.3.
3.
Indi
cate
leng
th o
f equ
ipm
ent p
erfo
rman
ce o
r how
long
the
activ
ity to
ok p
lace
dur
ing
a ye
ar’s
tim
e (h
ours
per
yea
r).4.
In
dica
te w
heth
er th
e em
issi
on is
poi
nt s
ourc
e (C
) or f
ugiti
ve (F
). 5.
Th
is s
ectio
n sh
all b
e re
porte
d w
hene
ver d
ealin
g w
ith e
xter
nal-c
ombu
stio
n eq
uipm
ent (
boile
rs, f
urna
ces,
etc
.) or
inte
rnal
-com
bust
ion
(ene
rgy
gene
ratio
n pl
ants
w
ith d
iese
ls, g
as tu
rbin
es, c
ompr
esso
rs, e
tc.).
6.
Indi
cate
the
nom
inal
ther
mal
cap
acity
of t
he c
ombu
stio
n as
defi
ned
by th
e m
anuf
actu
rer i
n: c
c (b
oile
r pow
er),
MJ/
hr (m
egaj
oule
s/ho
ur),
kcal
/hr (
kilo
calo
ries/
hour
), BT
U/h
r (Br
itish
The
rmal
hou
r/Uni
t) or
lb/h
r (po
unds
of s
team
/hou
r).7.
In
dica
te w
heth
er th
e em
ploy
ed fu
el is
nat
ural
gas
(NG
), LP
gas
, fue
l oil
(FO
), ga
soil
(GO
), di
afan
o (D
F), d
iese
l (D
I), g
asol
ine
(GA)
, coa
l (C
A), b
urne
d w
aste
s (B
W) o
r oth
ers
and
the
annu
al c
onsu
mpt
ion
in m
ass:
ton
(met
ric to
ns),
kg (k
ilogr
ams)
or l
b (p
ound
s); o
r uni
ts o
f vo
lum
e: g
al (g
allo
ns),
brl (
barre
ls),
lt (li
ters
), m
3 (c
ubic
met
ers)
or f
t3 (c
ubic
feet
).
2.1.
2 C
hara
cter
istic
s of
chi
mne
ys a
nd re
leas
e du
cts
Duc
t or c
him
ney1
Rel
ease
po
int2
Rel
ated
rele
ase
poi
nts
3H
eigh
t (m
)4In
ner
diam
eter
(m)
Gas
flow
spe
ed
(m/s
eg)5
Out
put
tem
pera
ture
(ºC
)
1.
Indi
cate
nam
e or
iden
tifica
tion
num
ber u
sed
at th
e fa
cilit
y to
iden
tify
the
chim
ney
or d
uct t
hat i
s be
ing
repo
rted.
If it
doe
s no
t app
ly, in
dica
te b
y N
A (n
ot a
pplic
able
).2.
Ac
cord
ing
to th
e G
ener
al O
pera
ting
Dia
gram
and
Sum
mar
y Ta
ble
No.
1.3
indi
cate
the
iden
tifica
tion
num
ber o
f the
duc
t or c
him
ney
at w
hich
rele
ases
are
gen
erat
ed.
3.
Indi
cate
eac
h ge
nera
tion
poin
t (re
fer t
o th
e eq
uipm
ent t
able
, mac
hine
ry o
r act
ivity
, see
Tab
le 2
.1.1
) for
eac
h re
port
ed re
leas
e po
int.
4.
Hei
ght i
n m
eter
s of
the
rele
ase
chim
ney
or d
uct,
star
ting
from
the
grou
nd le
vel.
5.
Indi
cate
in m
/seg
(the
ave
rage
spe
ed o
f out
put g
as fl
ow u
nder
nor
mal
per
form
ance
circ
umst
ance
s). T
he d
ata
shal
l cor
resp
ond
to th
e ga
s an
d pa
rticl
e sa
mpl
ing
at
chim
neys
whe
neve
r the
par
amet
ers
of N
OM
-085
-EC
OL-
1994
are
app
lied.
In th
e ca
ses
in w
hich
this
nor
m is
not
app
licab
le a
nd th
e ga
s ou
tput
spe
ed is
unk
now
n as
w
ell a
s w
hen
deal
ing
with
ven
t duc
ts, i
t sha
ll be
indi
cate
d by
NA
(not
app
licab
le).
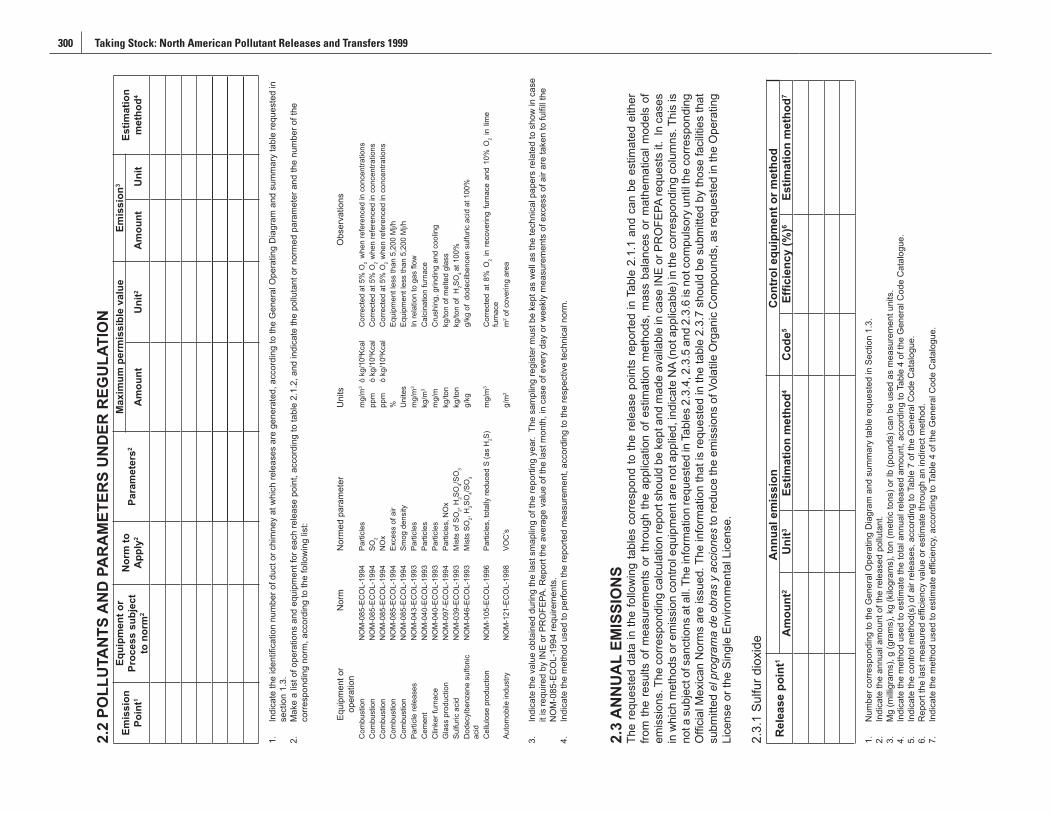
300 Taking Stock: North American Pollutant Releases and Transfers 1999 Appendix H – Annual Certificate for the Operation of Industrial Facilities under Federal Jurisdiction for the Year 1999 (Cédula de Operación Anual) 301
2.2
POLL
UTA
NTS
AN
D P
AR
AM
ETER
S U
ND
ER R
EGU
LATI
ON
Emis
sion
Poin
t1
Equi
pmen
t or
Proc
ess
subj
ect
to n
orm
2
Nor
m to
App
ly2
Para
met
ers2
Max
imum
per
mis
sibl
e va
lue
Emis
sion
3Es
timat
ion
met
hod4
Am
ount
Uni
t2A
mou
ntU
nit
1.
Indi
cate
the
iden
tifica
tion
num
ber o
f duc
t or c
him
ney
at w
hich
rele
ases
are
gen
erat
ed, a
ccor
ding
to th
e G
ener
al O
pera
ting
Dia
gram
and
sum
mar
y ta
ble
requ
este
d in
se
ctio
n 1.
3.2.
M
ake
a lis
t of o
pera
tions
and
equ
ipm
ent f
or e
ach
rele
ase
poin
t, ac
cord
ing
to ta
ble
2.1.
2, a
nd in
dica
te th
e po
lluta
nt o
r nor
med
par
amet
er a
nd th
e nu
mbe
r of t
he
corre
spon
ding
nor
m, a
ccor
ding
to th
e fo
llow
ing
list:
Equi
pmen
t or
oper
atio
nN
orm
Nor
med
par
amet
erU
nits
Obs
erva
tions
Com
bust
ion
Com
bust
ion
Com
bust
ion
Com
bust
ion
Com
bust
ion
NO
M-0
85-E
CO
L-19
94N
OM
-085
-EC
OL-
1994
NO
M-0
85-E
CO
L-19
94N
OM
-085
-EC
OL-
1994
NO
M-0
85-E
CO
L-19
94
Parti
cles
SO2
NO
xEx
cess
of a
irSm
og d
ensi
ty
mg/
m3
ó k
g/10
6 Kca
lpp
m
ó k
g/10
6 Kca
lpp
m
ó k
g/10
6 Kca
l% U
nite
s
Cor
rect
ed a
t 5%
O2 w
hen
refe
renc
ed in
con
cent
ratio
nsC
orre
cted
at 5
% O
2 w
hen
refe
renc
ed in
con
cent
ratio
nsC
orre
cted
at 5
% O
2 w
hen
refe
renc
ed in
con
cent
ratio
nsEq
uipm
ent l
ess
than
5,2
00 M
j/hEq
uipm
ent l
ess
than
5,2
00 M
j/hPa
rticl
e re
leas
esN
OM
-043
-EC
OL-
1993
Parti
cles
mg/
m3
In re
latio
n to
gas
flow
Cem
ent
NO
M-0
40-E
CO
L-19
93Pa
rticl
eskg
/m3
Cal
cina
tion
furn
ace
Clin
ker f
urna
ceN
OM
-040
-EC
OL-
1993
Parti
cles
mg/
mC
rush
ing,
grin
ding
and
coo
ling
Gla
ss p
rodu
ctio
nN
OM
-097
-EC
OL-
1994
Parti
cles
, NO
xkg
/ton
kg/to
n of
mel
ted
glas
sSu
lfuric
aci
dN
OM
-039
-EC
OL-
1993
Mis
ts o
f SO
2, H
2SO
4/SO
3kg
/ton
kg/to
n of
H2S
O4 at
100
%D
odec
ylbe
nzen
e su
lfoni
c ac
idN
OM
-046
-EC
OL-
1993
Mis
ts S
O2,
H2S
O4/S
O3
g/kg
g/kg
of
dode
cilb
ence
n su
lfuric
aci
d at
100
%
Cel
lulo
se p
rodu
ctio
nN
OM
-105
-EC
OL-
1996
Parti
cles
, tot
ally
redu
ced
S (a
s H
2S)
mg/
m3
Cor
rect
ed a
t 8%
O2
in r
ecov
erin
g fu
rnac
e an
d 10
% O
2 in
lim
e fu
rnac
eAu
tom
obile
indu
stry
NO
M-1
21-E
CO
L-19
98VO
C’s
g/m
2m
2 of c
over
ing
area
3.
Indi
cate
the
valu
e ob
tain
ed d
urin
g th
e la
st s
map
ling
of th
e re
porti
ng y
ear.
The
sam
plin
g re
gist
er m
ust b
e ke
pt a
s w
ell a
s th
e te
chni
cal p
aper
s re
late
d to
sho
w in
cas
e it
is re
quire
d by
INE
or P
RO
FEPA
. Rep
ort t
he a
vera
ge v
alue
of t
he la
st m
onth
, in
case
of e
very
day
or w
eekl
y m
easu
rem
ents
of e
xces
s of
air
are
take
n to
fulfi
ll th
e N
OM
-085
-EC
OL-
1994
requ
irem
ents
.4.
In
dica
te th
e m
etho
d us
ed to
per
form
the
repo
rted
mea
sure
men
t, ac
cord
ing
to th
e re
spec
tive
tech
nica
l nor
m.
2.3
AN
NU
AL
EMIS
SIO
NS
The
requ
este
d da
ta in
the
follo
win
g ta
bles
cor
resp
ond
to th
e re
leas
e po
ints
repo
rted
in T
able
2.1
.1 a
nd c
an b
e es
timat
ed e
ither
fro
m th
e re
sults
of m
easu
rem
ents
or
thro
ugh
the
appl
icat
ion
of e
stim
atio
n m
etho
ds, m
ass
bala
nces
or
mat
hem
atic
al m
odel
s of
em
issi
ons.
The
cor
resp
ondi
ng c
alcu
latio
n re
port
shou
ld b
e ke
pt a
nd m
ade
avai
labl
e in
cas
e IN
E or
PR
OFE
PA re
ques
ts it
. In
cas
es
in w
hich
met
hods
or e
mis
sion
con
trol e
quip
men
t are
not
app
lied,
indi
cate
NA
(not
app
licab
le) i
n th
e co
rresp
ondi
ng c
olum
ns. T
his
is
not a
sub
ject
of s
anct
ions
at a
ll. T
he in
form
atio
n re
ques
ted
in T
able
s 2.
3.4,
2.3
.5 a
nd 2
.3.6
is n
ot c
ompu
lsor
y un
til th
e co
rresp
ondi
ng
Offi
cial
Mex
ican
Nor
ms
are
issu
ed. T
he in
form
atio
n th
at is
requ
este
d in
the
tabl
e 2.
3.7
shou
ld b
e su
bmitt
ed b
y th
ose
faci
litie
s th
at
subm
itted
el p
rogr
ama
de o
bras
y a
ccio
nes
to re
duce
the
emis
sion
s of
Vol
atile
Org
anic
Com
poun
ds, a
s re
ques
ted
in th
e O
pera
ting
Lice
nse
or th
e Si
ngle
Env
ironm
enta
l Lic
ense
.
2.3.
1 Su
lfur d
ioxi
de
Rel
ease
poi
nt1
Ann
ual e
mis
sion
Con
trol
equ
ipm
ent o
r met
hod
Am
ount
2U
nit3
Estim
atio
n m
etho
d4C
ode5
Effic
ienc
y (%
)6Es
timat
ion
met
hod7
1.
Num
ber c
orre
spon
ding
to th
e G
ener
al O
pera
ting
Dia
gram
and
sum
mar
y ta
ble
requ
este
d in
Sec
tion
1.3.
2.
In
dica
te th
e an
nual
am
ount
of t
he re
leas
ed p
ollu
tant
.3.
M
g (m
illigr
ams)
, g (g
ram
s), k
g (k
ilogr
ams)
, ton
(met
ric to
ns) o
r lb
(pou
nds)
can
be
used
as
mea
sure
men
t uni
ts.
4.
Indi
cate
the
met
hod
used
to e
stim
ate
the
tota
l ann
ual r
elea
sed
amou
nt, a
ccor
ding
to T
able
4 o
f the
Gen
eral
Cod
e C
atal
ogue
.5.
In
dica
te th
e co
ntro
l met
hod(
s) o
f air
rele
ases
, acc
ordi
ng to
Tab
le 7
of t
he G
ener
al C
ode
Cat
alog
ue.
6.
Rep
ort t
he la
st m
easu
red
effic
ienc
y va
lue
or e
stim
ate
thro
ugh
an in
dire
ct m
etho
d.7.
In
dica
te th
e m
etho
d us
ed to
est
imat
e ef
ficie
ncy,
acc
ordi
ng to
Tab
le 4
of t
he G
ener
al C
ode
Cat
alog
ue.
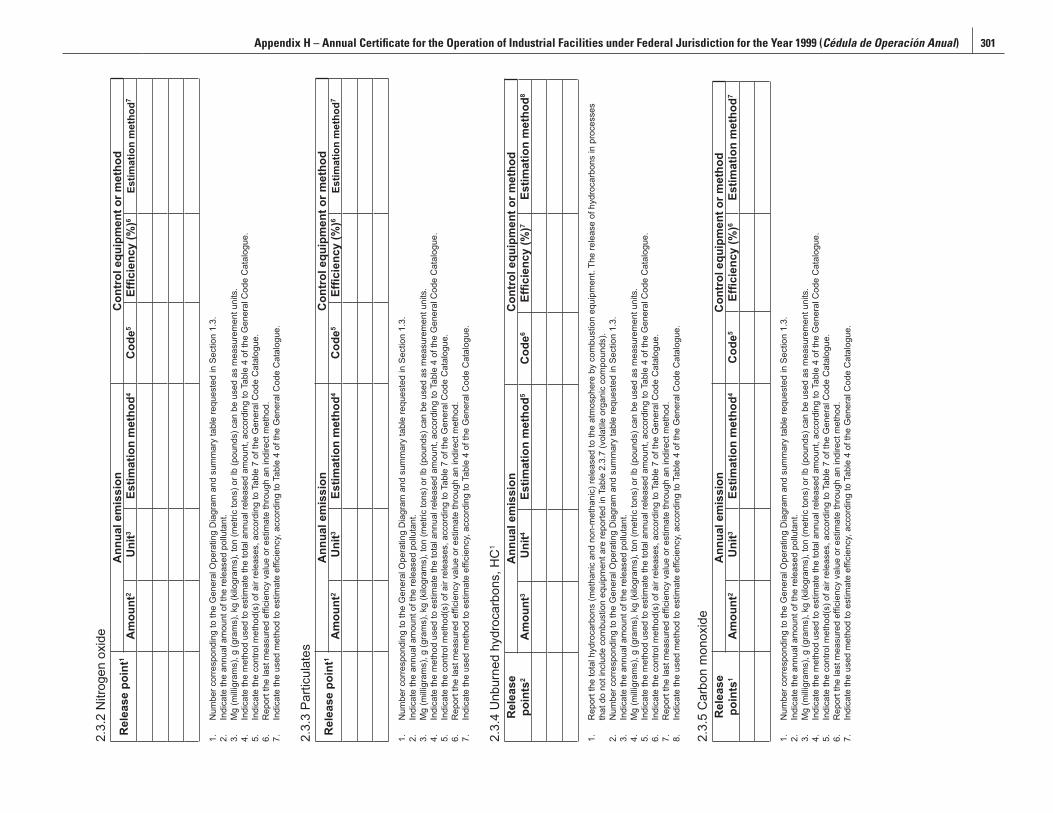
300 Taking Stock: North American Pollutant Releases and Transfers 1999 Appendix H – Annual Certificate for the Operation of Industrial Facilities under Federal Jurisdiction for the Year 1999 (Cédula de Operación Anual) 301
2.3.
2 N
itrog
en o
xide
Rel
ease
poi
nt1
Ann
ual e
mis
sion
Con
trol
equ
ipm
ent o
r met
hod
Am
ount
2U
nit3
Estim
atio
n m
etho
d4C
ode5
Effic
ienc
y (%
)6Es
timat
ion
met
hod7
1.
Num
ber c
orre
spon
ding
to th
e G
ener
al O
pera
ting
Dia
gram
and
sum
mar
y ta
ble
requ
este
d in
Sec
tion
1.3.
2.
In
dica
te th
e an
nual
am
ount
of t
he re
leas
ed p
ollu
tant
.3.
M
g (m
illigr
ams)
, g (g
ram
s), k
g (k
ilogr
ams)
, ton
(met
ric to
ns) o
r lb
(pou
nds)
can
be
used
as
mea
sure
men
t uni
ts.
4.
Indi
cate
the
met
hod
used
to e
stim
ate
the
tota
l ann
ual r
elea
sed
amou
nt, a
ccor
ding
to T
able
4 o
f the
Gen
eral
Cod
e C
atal
ogue
.5.
In
dica
te th
e co
ntro
l met
hod(
s) o
f air
rele
ases
, acc
ordi
ng to
Tab
le 7
of t
he G
ener
al C
ode
Cat
alog
ue.
6.
Rep
ort t
he la
st m
easu
red
effic
ienc
y va
lue
or e
stim
ate
thro
ugh
an in
dire
ct m
etho
d.7.
In
dica
te th
e us
ed m
etho
d to
est
imat
e ef
ficie
ncy,
acc
ordi
ng to
Tab
le 4
of t
he G
ener
al C
ode
Cat
alog
ue.
2.3.
3 Pa
rticu
late
s
Rel
ease
poi
nt1
Ann
ual e
mis
sion
Con
trol
equ
ipm
ent o
r met
hod
Am
ount
2U
nit3
Estim
atio
n m
etho
d4C
ode5
Effic
ienc
y (%
)6Es
timat
ion
met
hod7
1.
Num
ber c
orre
spon
ding
to th
e G
ener
al O
pera
ting
Dia
gram
and
sum
mar
y ta
ble
requ
este
d in
Sec
tion
1.3.
2.
In
dica
te th
e an
nual
am
ount
of t
he re
leas
ed p
ollu
tant
.3.
M
g (m
illigr
ams)
, g (g
ram
s), k
g (k
ilogr
ams)
, ton
(met
ric to
ns) o
r lb
(pou
nds)
can
be
used
as
mea
sure
men
t uni
ts.
4.
Indi
cate
the
met
hod
used
to e
stim
ate
the
tota
l ann
ual r
elea
sed
amou
nt, a
ccor
ding
to T
able
4 o
f the
Gen
eral
Cod
e C
atal
ogue
.5.
In
dica
te th
e co
ntro
l met
hod(
s) o
f air
rele
ases
, acc
ordi
ng to
Tab
le 7
of t
he G
ener
al C
ode
Cat
alog
ue.
6.
Rep
ort t
he la
st m
easu
red
effic
ienc
y va
lue
or e
stim
ate
thro
ugh
an in
dire
ct m
etho
d.7.
In
dica
te th
e us
ed m
etho
d to
est
imat
e ef
ficie
ncy,
acc
ordi
ng to
Tab
le 4
of t
he G
ener
al C
ode
Cat
alog
ue.
2.3.
4 U
nbur
ned
hydr
ocar
bons
, HC
1
Rel
ease
po
ints
2A
nnua
l em
issi
onC
ontr
ol e
quip
men
t or m
etho
d A
mou
nt3
Uni
t4Es
timat
ion
met
hod5
Cod
e6Ef
ficie
ncy
(%)7
Estim
atio
n m
etho
d8
1.
Rep
ort t
he to
tal h
ydro
carb
ons
(met
hani
c an
d no
n-m
etha
nic)
rele
ased
to th
e at
mos
pher
e by
com
bust
ion
equi
pmen
t. Th
e re
leas
e of
hyd
roca
rbon
s in
pro
cess
es
that
do
not i
nclu
de c
ombu
stio
n eq
uipm
ent a
re re
porte
d in
Tab
le 2
.3.7
(vol
atile
org
anic
com
poun
ds).
2.
Num
ber c
orre
spon
ding
to th
e G
ener
al O
pera
ting
Dia
gram
and
sum
mar
y ta
ble
requ
este
d in
Sec
tion
1.3.
3.
Indi
cate
the
annu
al a
mou
nt o
f the
rele
ased
pol
luta
nt.
4.
Mg
(milli
gram
s), g
(gra
ms)
, kg
(kilo
gram
s), t
on (m
etric
tons
) or l
b (p
ound
s) c
an b
e us
ed a
s m
easu
rem
ent u
nits
. 5.
In
dica
te th
e m
etho
d us
ed to
est
imat
e th
e to
tal a
nnua
l rel
ease
d am
ount
, acc
ordi
ng to
Tab
le 4
of t
he G
ener
al C
ode
Cat
alog
ue.
6.
Indi
cate
the
cont
rol m
etho
d(s)
of a
ir re
leas
es, a
ccor
ding
to T
able
7 o
f the
Gen
eral
Cod
e C
atal
ogue
.7.
R
epor
t the
last
mea
sure
d ef
ficie
ncy
valu
e or
est
imat
e th
roug
h an
indi
rect
met
hod.
8.
Indi
cate
the
used
met
hod
to e
stim
ate
effic
ienc
y, a
ccor
ding
to T
able
4 o
f the
Gen
eral
Cod
e C
atal
ogue
.
2.3.
5 C
arbo
n m
onox
ide
Rel
ease
po
ints
1A
nnua
l em
issi
onC
ontr
ol e
quip
men
t or m
etho
d A
mou
nt2
Uni
t3Es
timat
ion
met
hod4
Cod
e5Ef
ficie
ncy
(%)6
Estim
atio
n m
etho
d7
1.
Num
ber c
orre
spon
ding
to th
e G
ener
al O
pera
ting
Dia
gram
and
sum
mar
y ta
ble
requ
este
d in
Sec
tion
1.3.
2.
In
dica
te th
e an
nual
am
ount
of t
he re
leas
ed p
ollu
tant
.3.
M
g (m
illigr
ams)
, g (g
ram
s), k
g (k
ilogr
ams)
, ton
(met
ric to
ns) o
r lb
(pou
nds)
can
be
used
as
mea
sure
men
t uni
ts.
4.
Indi
cate
the
met
hod
used
to e
stim
ate
the
tota
l ann
ual r
elea
sed
amou
nt, a
ccor
ding
to T
able
4 o
f the
Gen
eral
Cod
e C
atal
ogue
.5.
In
dica
te th
e co
ntro
l met
hod(
s) o
f air
rele
ases
, acc
ordi
ng to
Tab
le 7
of t
he G
ener
al C
ode
Cat
alog
ue.
6.
Rep
ort t
he la
st m
easu
red
effic
ienc
y va
lue
or e
stim
ate
thro
ugh
an in
dire
ct m
etho
d.7.
In
dica
te th
e us
ed m
etho
d to
est
imat
e ef
ficie
ncy,
acc
ordi
ng to
Tab
le 4
of t
he G
ener
al C
ode
Cat
alog
ue.
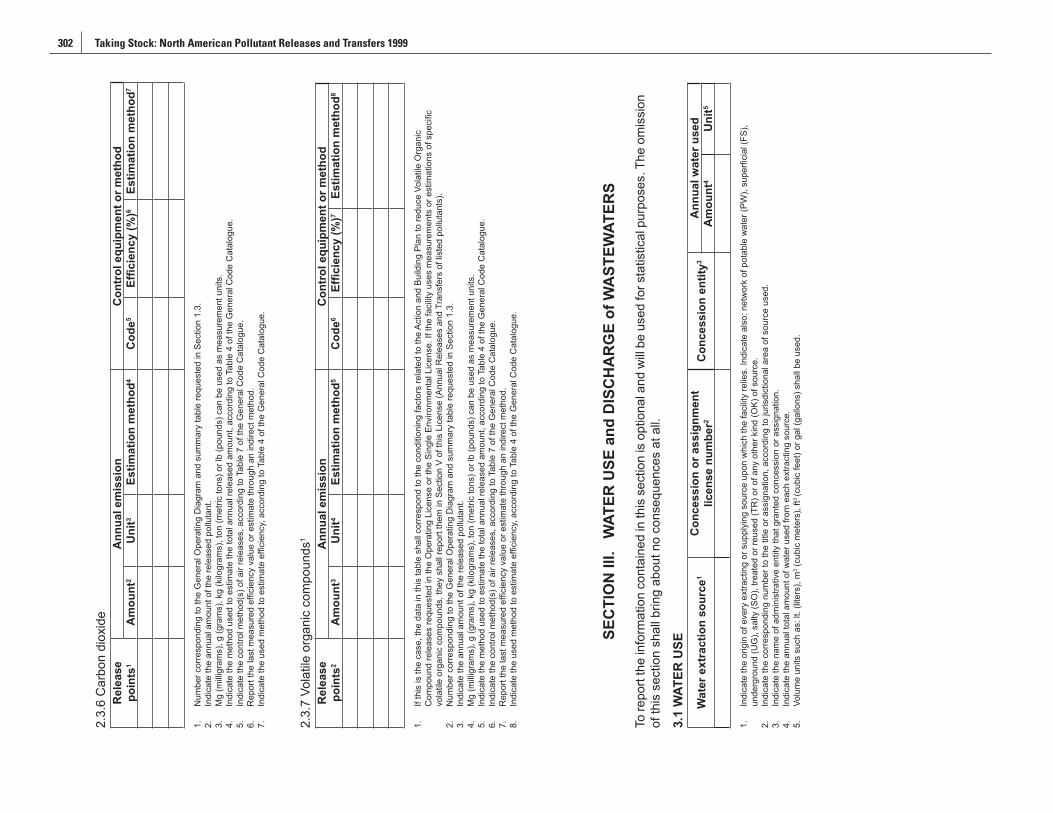
302 Taking Stock: North American Pollutant Releases and Transfers 1999 Appendix H – Annual Certificate for the Operation of Industrial Facilities under Federal Jurisdiction for the Year 1999 (Cédula de Operación Anual) 303
2.3.
6 C
arbo
n di
oxid
eR
elea
se
poin
ts1
Ann
ual e
mis
sion
Con
trol
equ
ipm
ent o
r met
hod
Am
ount
2U
nit3
Estim
atio
n m
etho
d4C
ode5
Effic
ienc
y (%
)6Es
timat
ion
met
hod7
1.
Num
ber c
orre
spon
ding
to th
e G
ener
al O
pera
ting
Dia
gram
and
sum
mar
y ta
ble
requ
este
d in
Sec
tion
1.3.
2.
In
dica
te th
e an
nual
am
ount
of t
he re
leas
ed p
ollu
tant
.3.
M
g (m
illigr
ams)
, g (g
ram
s), k
g (k
ilogr
ams)
, ton
(met
ric to
ns) o
r lb
(pou
nds)
can
be
used
as
mea
sure
men
t uni
ts.
4.
Indi
cate
the
met
hod
used
to e
stim
ate
the
tota
l ann
ual r
elea
sed
amou
nt, a
ccor
ding
to T
able
4 o
f the
Gen
eral
Cod
e C
atal
ogue
.5.
In
dica
te th
e co
ntro
l met
hod(
s) o
f air
rele
ases
, acc
ordi
ng to
Tab
le 7
of t
he G
ener
al C
ode
Cat
alog
ue.
6.
Rep
ort t
he la
st m
easu
red
effic
ienc
y va
lue
or e
stim
ate
thro
ugh
an in
dire
ct m
etho
d.7.
In
dica
te th
e us
ed m
etho
d to
est
imat
e ef
ficie
ncy,
acc
ordi
ng to
Tab
le 4
of t
he G
ener
al C
ode
Cat
alog
ue.
2.3.
7 Vo
latil
e or
gani
c co
mpo
unds
1
Rel
ease
po
ints
2A
nnua
l em
issi
onC
ontr
ol e
quip
men
t or m
etho
d A
mou
nt3
Uni
t4Es
timat
ion
met
hod5
Cod
e6Ef
ficie
ncy
(%)7
Estim
atio
n m
etho
d8
1.
If th
is is
the
case
, the
dat
a in
this
tabl
e sh
all c
orre
spon
d to
the
cond
ition
ing
fact
ors
rela
ted
to th
e Ac
tion
and
Build
ing
Plan
to re
duce
Vol
atile
Org
anic
C
ompo
und
rele
ases
requ
este
d in
the
Ope
ratin
g Li
cens
e or
the
Sing
le E
nviro
nmen
tal L
icen
se. I
f the
faci
lity
uses
mea
sure
men
ts o
r est
imat
ions
of s
peci
fic
vola
tile
orga
nic
com
poun
ds, t
hey
shal
l rep
ort t
hem
in S
ectio
n V
of th
is L
icen
se (A
nnua
l Rel
ease
s an
d Tr
ansf
ers
of li
sted
pol
luta
nts)
.2.
N
umbe
r cor
resp
ondi
ng to
the
Gen
eral
Ope
ratin
g D
iagr
am a
nd s
umm
ary
tabl
e re
ques
ted
in S
ectio
n 1.
3.3.
In
dica
te th
e an
nual
am
ount
of t
he re
leas
ed p
ollu
tant
.4.
M
g (m
illigr
ams)
, g (g
ram
s), k
g (k
ilogr
ams)
, ton
(met
ric to
ns) o
r lb
(pou
nds)
can
be
used
as
mea
sure
men
t uni
ts.
5.
Indi
cate
the
met
hod
used
to e
stim
ate
the
tota
l ann
ual r
elea
sed
amou
nt, a
ccor
ding
to T
able
4 o
f the
Gen
eral
Cod
e C
atal
ogue
.6.
In
dica
te th
e co
ntro
l met
hod(
s) o
f air
rele
ases
, acc
ordi
ng to
Tab
le 7
of t
he G
ener
al C
ode
Cat
alog
ue.
7.
Rep
ort t
he la
st m
easu
red
effic
ienc
y va
lue
or e
stim
ate
thro
ugh
an in
dire
ct m
etho
d.8.
In
dica
te th
e us
ed m
etho
d to
est
imat
e ef
ficie
ncy,
acc
ordi
ng to
Tab
le 4
of t
he G
ener
al C
ode
Cat
alog
ue.
SEC
TIO
N II
I. W
ATER
USE
and
DIS
CH
AR
GE
of W
AST
EWAT
ERS
To re
port
the
info
rmat
ion
cont
aine
d in
this
sec
tion
is o
ptio
nal a
nd w
ill be
use
d fo
r sta
tistic
al p
urpo
ses.
The
om
issi
on
of th
is s
ectio
n sh
all b
ring
abou
t no
cons
eque
nces
at a
ll.
3.1
WAT
ER U
SE
Wat
er e
xtra
ctio
n so
urce
1C
once
ssio
n or
ass
ignm
ent
licen
se n
umbe
r2C
once
ssio
n en
tity3
Ann
ual w
ater
use
dA
mou
nt4
Uni
t5
1.
Indi
cate
the
orig
in o
f eve
ry e
xtra
ctin
g or
sup
plyi
ng s
ourc
e up
on w
hich
the
faci
lity
relie
s. In
dica
te a
lso:
net
wor
k of
pot
able
wat
er (P
W),
supe
rfici
al (F
S),
unde
rgro
und
(UG
), sa
lty (S
O),
treat
ed o
r reu
sed
(TR
) or o
f any
oth
er k
ind
(OK)
of s
ourc
e.2.
In
dica
te th
e co
rresp
ondi
ng n
umbe
r to
the
title
or a
ssig
natio
n, a
ccor
ding
to ju
risdi
ctio
nal a
rea
of s
ourc
e us
ed.
3.
Indi
cate
the
nam
e of
adm
inis
trativ
e en
tity
that
gra
nted
con
cess
ion
or a
ssig
natio
n.4.
In
dica
te th
e an
nual
tota
l am
ount
of w
ater
use
d fro
m e
ach
extra
ctin
g so
urce
.5.
Vo
lum
e un
its s
uch
as: l
t. (li
ters
), m
3 (cu
bic
met
ers)
, ft3
(cub
ic fe
et) o
r gal
(gal
lons
) sha
ll be
use
d.
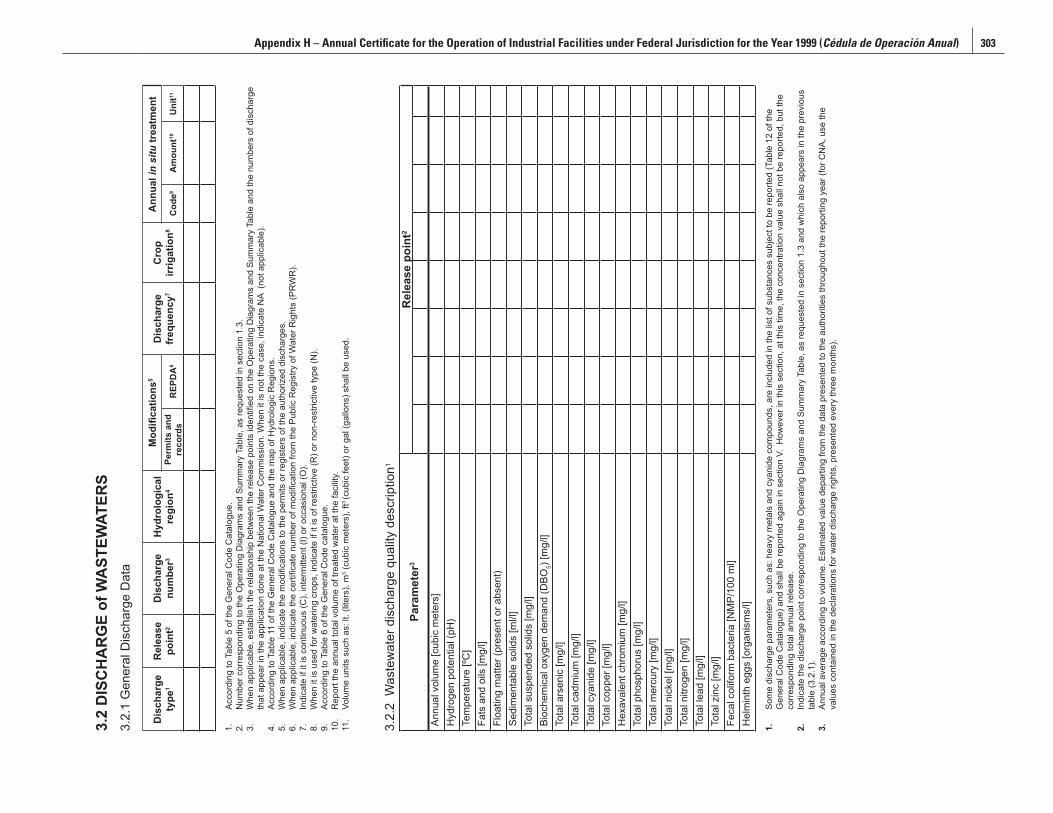
302 Taking Stock: North American Pollutant Releases and Transfers 1999 Appendix H – Annual Certificate for the Operation of Industrial Facilities under Federal Jurisdiction for the Year 1999 (Cédula de Operación Anual) 303
3.2
DIS
CH
AR
GE
of W
AST
EWAT
ERS
3.2.
1 G
ener
al D
isch
arge
Dat
a
Dis
char
ge
type
1R
elea
se
poin
t2D
isch
arge
nu
mbe
r3H
ydro
logi
cal
regi
on4
Mod
ifica
tions
5D
isch
arge
fr
eque
ncy7
Cro
p irr
igat
ion8
Ann
ual i
n si
tu tr
eatm
ent
Perm
its a
nd
reco
rds
REP
DA
6C
ode9
Am
ount
10U
nit11
1.
Acco
rdin
g to
Tab
le 5
of t
he G
ener
al C
ode
Cat
alog
ue.
2.
Num
ber c
orre
spon
ding
to th
e O
pera
ting
Dia
gram
s an
d Su
mm
ary
Tabl
e, a
s re
ques
ted
in s
ectio
n 1.
3.3.
W
hen
appl
icab
le, e
stab
lish
the
rela
tions
hip
betw
een
the
rele
ase
poin
ts id
entifi
ed o
n th
e O
pera
ting
Dia
gram
s an
d Su
mm
ary
Tabl
e an
d th
e nu
mbe
rs o
f dis
char
geth
at a
ppea
r in
the
appl
icat
ion
done
at t
he N
atio
nal W
ater
Com
mis
sion
. Whe
n it
is n
ot th
e ca
se, i
ndic
ate
NA
(not
app
licab
le).
4.
Acco
rdin
g to
Tab
le 1
1 of
the
Gen
eral
Cod
e C
atal
ogue
and
the
map
of H
ydro
logi
c R
egio
ns.
5.
Whe
n ap
plic
able
, ind
icat
e th
e m
odifi
catio
ns to
the
perm
its o
r reg
iste
rs o
f the
aut
horiz
ed d
isch
arge
s.6.
W
hen
appl
icab
le, i
ndic
ate
the
certi
ficat
e nu
mbe
r of m
odifi
catio
n fro
m th
e Pu
blic
Reg
istry
of W
ater
Rig
hts
(PR
WR
).7.
In
dica
te if
it is
con
tinuo
us (C
), in
term
itten
t (I)
or o
ccas
iona
l (O
).8.
W
hen
it is
use
d fo
r wat
erin
g cr
ops,
indi
cate
if it
is o
f res
trict
ive
(R) o
r non
-rest
rictiv
e ty
pe (N
).9.
Ac
cord
ing
to T
able
6 o
f the
Gen
eral
Cod
e ca
talo
gue.
10.
Rep
ort t
he a
nnua
l tot
al v
olum
e of
trea
ted
wat
er a
t the
faci
lity.
11.
Volu
me
units
suc
h as
: lt.
(lite
rs),
m3 (
cubi
c m
eter
s), f
t3 (c
ubic
feet
) or g
al (g
allo
ns) s
hall
be u
sed.
3.2.
2 W
aste
wat
er d
isch
arge
qua
lity
desc
riptio
n1
Para
met
er3
Rel
ease
poi
nt2
Annu
al v
olum
e [c
ubic
met
ers]
Hyd
roge
n po
tent
ial (
pH)
Tem
pera
ture
[ºC
]Fa
ts a
nd o
ils [m
g/l]
Floa
ting
mat
ter (
pres
ent o
r abs
ent)
Sedi
men
tabl
e so
lids
[ml/l
]To
tal s
uspe
nded
sol
ids
[mg/
l]Bi
oche
mic
al o
xyge
n de
man
d (D
BO5)
[mg/
l]To
tal a
rsen
ic [m
g/l]
Tota
l cad
miu
m [m
g/l]
Tota
l cya
nide
[mg/
l]To
tal c
oppe
r [m
g/l]
Hex
aval
ent c
hrom
ium
[mg/
l]To
tal p
hosp
horu
s [m
g/l]
Tota
l mer
cury
[mg/
l]To
tal n
icke
l [m
g/l]
Tota
l nitr
ogen
[mg/
l]To
tal l
ead
[mg/
l]To
tal z
inc
[mg/
l]Fe
cal c
olifo
rm b
acte
ria [N
MP/
100
ml]
Hel
min
th e
ggs
[org
anis
ms/
l]
1.
Som
e di
scha
rge
para
met
ers,
suc
h as
: hea
vy m
etal
s an
d cy
anid
e co
mpo
unds
, are
incl
uded
in th
e lis
t of s
ubst
ance
s su
bjec
t to
be re
porte
d (T
able
12
of th
e G
ener
al C
ode
Cat
alog
ue) a
nd s
hall
be re
porte
d ag
ain
in s
ectio
n V.
How
ever
in th
is s
ectio
n, a
t thi
s tim
e, th
e co
ncen
tratio
n va
lue
shal
l not
be
repo
rted,
but
the
corre
spon
ding
tota
l ann
ual r
elea
se.
2.
Indi
cate
the
disc
harg
e po
int c
orre
spon
ding
to th
e O
pera
ting
Dia
gram
s an
d Su
mm
ary
Tabl
e, a
s re
ques
ted
in s
ectio
n 1.
3 an
d w
hich
als
o ap
pear
s in
the
prev
ious
ta
ble
(3.2
.1).
3.
Annu
al a
vera
ge a
ccor
ding
to v
olum
e. E
stim
ated
val
ue d
epar
ting
from
the
data
pre
sent
ed to
the
auth
oriti
es th
roug
hout
the
repo
rting
yea
r (fo
r CN
A, u
se th
e va
lues
con
tain
ed in
the
decl
arat
ions
for w
ater
dis
char
ge ri
ghts
, pre
sent
ed e
very
thre
e m
onth
s).
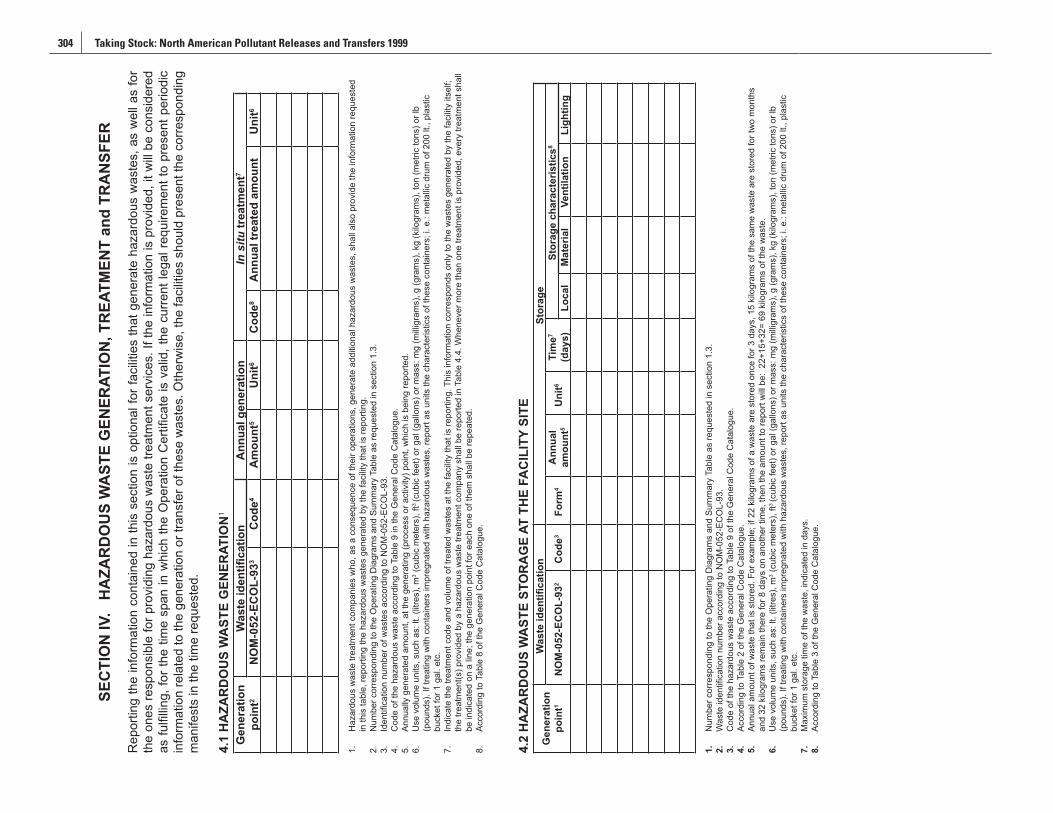
304 Taking Stock: North American Pollutant Releases and Transfers 1999 Appendix H – Annual Certificate for the Operation of Industrial Facilities under Federal Jurisdiction for the Year 1999 (Cédula de Operación Anual) 305
SEC
TIO
N IV
. H
AZA
RD
OU
S W
AST
E G
ENER
ATIO
N, T
REA
TMEN
T an
d TR
AN
SFER
Rep
ortin
g th
e in
form
atio
n co
ntai
ned
in th
is s
ectio
n is
opt
iona
l for
faci
litie
s th
at g
ener
ate
haza
rdou
s w
aste
s, a
s w
ell a
s fo
r th
e on
es re
spon
sibl
e fo
r pro
vidi
ng h
azar
dous
was
te tr
eatm
ent s
ervi
ces.
If th
e in
form
atio
n is
pro
vide
d, it
will
be c
onsi
dere
d as
fulfi
lling,
for t
he ti
me
span
in w
hich
the
Ope
ratio
n C
ertifi
cate
is v
alid
, the
cur
rent
lega
l req
uire
men
t to
pres
ent p
erio
dic
info
rmat
ion
rela
ted
to th
e ge
nera
tion
or tr
ansf
er o
f the
se w
aste
s. O
ther
wis
e, th
e fa
cilit
ies
shou
ld p
rese
nt th
e co
rresp
ondi
ng
man
ifest
s in
the
time
requ
este
d.
4.1
HA
ZAR
DO
US
WA
STE
GEN
ERAT
ION
1 G
ener
atio
n po
int2
Was
te id
entifi
catio
nA
nnua
l gen
erat
ion
In s
itu tr
eatm
ent7
NO
M-0
52-E
CO
L-93
3C
ode4
Am
ount
5U
nit6
Cod
e8A
nnua
l tre
ated
am
ount
Uni
t6
1.
Haz
ardo
us w
aste
trea
tmen
t com
pani
es w
ho, a
s a
cons
eque
nce
of th
eir o
pera
tions
, gen
erat
e ad
ditio
nal h
azar
dous
was
tes,
sha
ll al
so p
rovi
de th
e in
form
atio
n re
ques
ted
in th
is ta
ble,
repo
rting
the
haza
rdou
s w
aste
s ge
nera
ted
by th
e fa
cilit
y th
at is
repo
rting
.2.
N
umbe
r cor
resp
ondi
ng to
the
Ope
ratin
g D
iagr
ams
and
Sum
mar
y Ta
ble
as re
ques
ted
in s
ectio
n 1.
3.3.
Id
entifi
catio
n nu
mbe
r of w
aste
s ac
cord
ing
to N
OM
-052
-EC
OL-
93.
4.
Cod
e of
the
haza
rdou
s w
aste
acc
ordi
ng to
Tab
le 9
in th
e G
ener
al C
ode
Cat
alog
ue.
5.
Annu
ally
gen
erat
ed a
mou
nt, a
t the
gen
erat
ing
(pro
cess
or a
ctiv
ity) p
oint
, whi
ch is
bei
ng re
porte
d.6.
U
se v
olum
e un
its, s
uch
as: l
t. (li
tres)
, m3 (
cubi
c m
eter
s), f
t3 (c
ubic
feet
) or g
al (g
allo
ns) o
r mas
s: m
g (m
illigr
ams)
, g (g
ram
s), k
g (k
ilogr
ams)
, ton
(met
ric to
ns) o
r lb
(pou
nds)
. If t
reat
ing
with
con
tain
ers
impr
egna
ted
with
haz
ardo
us w
aste
s, re
port
as u
nits
the
char
acte
ristic
s of
thes
e co
ntai
ners
; i. e
.: m
etal
lic d
rum
of 2
00 lt
., pl
astic
bu
cket
for 1
gal
. etc
.7.
In
dica
te th
e tre
atm
ent c
ode
and
volu
me
of tr
eate
d w
aste
s at
the
faci
lity
that
is re
porti
ng. T
his
info
rmat
ion
corre
spon
ds o
nly
to th
e w
aste
s ge
nera
ted
by th
e fa
cilit
y its
elf;
the
treat
men
t(s) p
rovi
ded
by a
haz
ardo
us w
aste
trea
tmen
t com
pany
sha
ll be
repo
rted
in T
able
4.4
. Whe
neve
r mor
e th
an o
ne tr
eatm
ent i
s pr
ovid
ed, e
very
trea
tmen
t sha
ll be
indi
cate
d on
a li
ne; t
he g
ener
atio
n po
int f
or e
ach
one
of th
em s
hall
be re
peat
ed.
8.
Acco
rdin
g to
Tab
le 8
of t
he G
ener
al C
ode
Cat
alog
ue.
4.2
HA
ZAR
DO
US
WA
STE
STO
RA
GE
AT T
HE
FAC
ILIT
Y SI
TEG
ener
atio
n po
int1
Was
te id
entifi
catio
nSt
orag
e
NO
M-0
52-E
CO
L-93
2C
ode3
Form
4A
nnua
lam
ount
5U
nit6
Tim
e7
(day
s)St
orag
e ch
arac
teris
tics8
Loca
lM
ater
ial
Vent
ilatio
nLi
ghtin
g
1.
Num
ber c
orre
spon
ding
to th
e O
pera
ting
Dia
gram
s an
d Su
mm
ary
Tabl
e as
requ
este
d in
sec
tion
1.3.
2.
Was
te id
entifi
catio
n nu
mbe
r acc
ordi
ng to
NO
M-0
52-E
CO
L-93
.3.
C
ode
of th
e ha
zard
ous
was
te a
ccor
ding
to T
able
9 o
f the
Gen
eral
Cod
e C
atal
ogue
.4.
Ac
cord
ing
to T
able
2 o
f the
Gen
eral
Cod
e C
atal
ogue
.5.
An
nual
am
ount
of w
aste
that
is s
tore
d. F
or e
xam
ple;
if 2
2 ki
logr
ams
of a
was
te a
re s
tore
d on
ce fo
r 3 d
ays,
15
kilo
gram
s of
the
sam
e w
aste
are
sto
red
for t
wo
mon
ths
and
32 k
ilogr
ams
rem
ain
ther
e fo
r 8 d
ays
on a
noth
er ti
me,
then
the
amou
nt to
repo
rt w
ill be
: 22
+15+
32=
69 k
ilogr
ams
of th
e w
aste
. 6.
U
se v
olum
e un
its, s
uch
as: l
t. (li
tres)
, m3 (
cubi
c m
eter
s), f
t3 (c
ubic
feet
) or g
al (g
allo
ns) o
r mas
s: m
g (m
illigr
ams)
, g (g
ram
s), k
g (k
ilogr
ams)
, ton
(met
ric to
ns) o
r lb
(pou
nds)
. If t
reat
ing
with
con
tain
ers
impr
egna
ted
with
haz
ardo
us w
aste
s, re
port
as u
nits
the
char
acte
ristic
s of
thes
e co
ntai
ners
; i. e
.: m
etal
lic d
rum
of 2
00 lt
., pl
astic
bu
cket
for 1
gal
. etc
.7.
M
axim
um s
tora
ge ti
me
of th
e w
aste
, ind
icat
ed in
day
s.
8.
Acco
rdin
g to
Tab
le 3
of t
he G
ener
al C
ode
Cat
alog
ue.
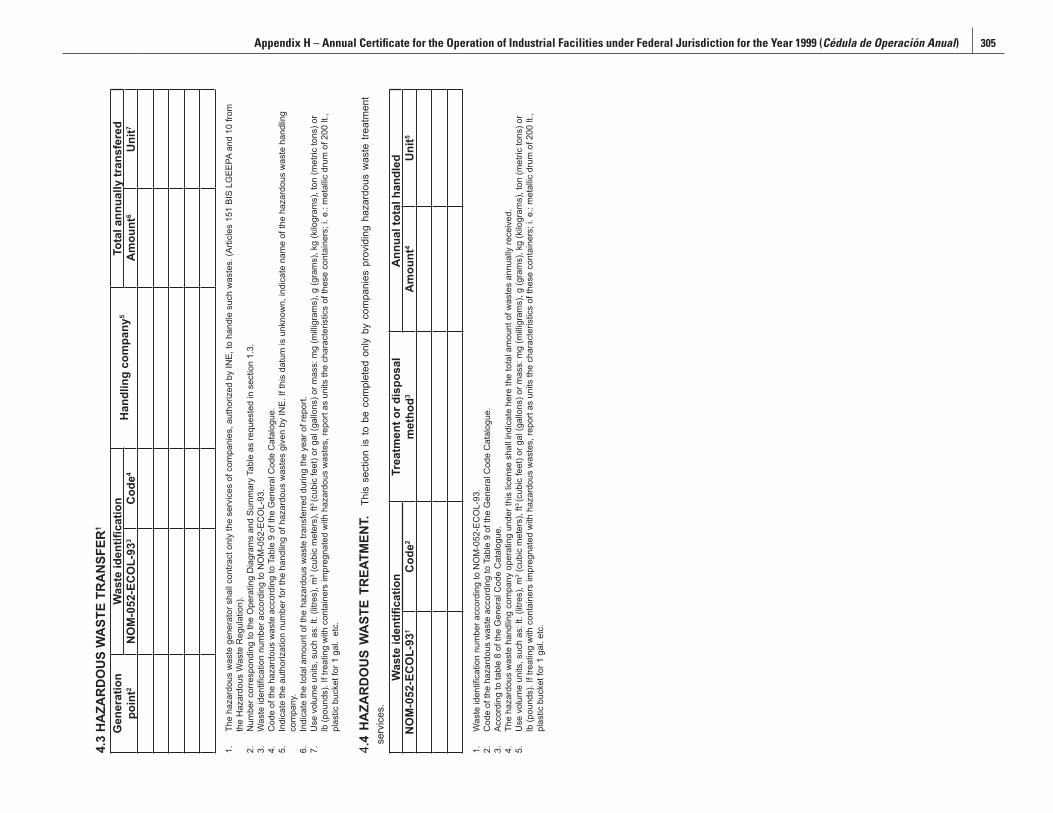
304 Taking Stock: North American Pollutant Releases and Transfers 1999 Appendix H – Annual Certificate for the Operation of Industrial Facilities under Federal Jurisdiction for the Year 1999 (Cédula de Operación Anual) 305
4.3
HA
ZAR
DO
US
WA
STE
TRA
NSF
ER1
Gen
erat
ion
poin
t2W
aste
iden
tifica
tion
Han
dlin
g co
mpa
ny5
Tota
l ann
ually
tran
sfer
edN
OM
-052
-EC
OL-
933
Cod
e4A
mou
nt6
Uni
t7
1.
The
haza
rdou
s w
aste
gen
erat
or s
hall
cont
ract
onl
y th
e se
rvic
es o
f com
pani
es, a
utho
rized
by
INE,
to h
andl
e su
ch w
aste
s. (A
rticl
es 1
51 B
IS L
GEE
PA a
nd 1
0 fro
m
the
Haz
ardo
us W
aste
Reg
ulat
ion)
.2.
N
umbe
r cor
resp
ondi
ng to
the
Ope
ratin
g D
iagr
ams
and
Sum
mar
y Ta
ble
as re
ques
ted
in s
ectio
n 1.
3.3.
W
aste
iden
tifica
tion
num
ber a
ccor
ding
to N
OM
-052
-EC
OL-
93.
4.
Cod
e of
the
haza
rdou
s w
aste
acc
ordi
ng to
Tab
le 9
of t
he G
ener
al C
ode
Cat
alog
ue.
5.
Indi
cate
the
auth
oriz
atio
n nu
mbe
r for
the
hand
ling
of h
azar
dous
was
tes
give
n by
INE.
If th
is d
atum
is u
nkno
wn,
indi
cate
nam
e of
the
haza
rdou
s w
aste
han
dlin
g co
mpa
ny.
6.
Indi
cate
the
tota
l am
ount
of t
he h
azar
dous
was
te tr
ansf
erre
d du
ring
the
year
of r
epor
t.7.
U
se v
olum
e un
its, s
uch
as: l
t. (li
tres)
, m3 (
cubi
c m
eter
s), f
t3 (c
ubic
feet
) or g
al (g
allo
ns) o
r mas
s: m
g (m
illigr
ams)
, g (g
ram
s), k
g (k
ilogr
ams)
, ton
(met
ric to
ns) o
r lb
(pou
nds)
. If t
reat
ing
with
con
tain
ers
impr
egna
ted
with
haz
ardo
us w
aste
s, re
port
as u
nits
the
char
acte
ristic
s of
thes
e co
ntai
ners
; i. e
.: m
etal
lic d
rum
of 2
00 lt
., pl
astic
buc
ket f
or 1
gal
. et
c.
4.4
HA
ZAR
DO
US
WA
STE
TREA
TMEN
T.
This
sec
tion
is to
be
com
plet
ed o
nly
by c
ompa
nies
pro
vidi
ng h
azar
dous
was
te tr
eatm
ent
serv
ices
.W
aste
iden
tifica
tion
Trea
tmen
t or d
ispo
sal
met
hod3
Ann
ual t
otal
han
dled
NO
M-0
52-E
CO
L-93
1C
ode2
Am
ount
4U
nit5
1.
Was
te id
entifi
catio
n nu
mbe
r acc
ordi
ng to
NO
M-0
52-E
CO
L-93
.2.
C
ode
of th
e ha
zard
ous
was
te a
ccor
ding
to T
able
9 o
f the
Gen
eral
Cod
e C
atal
ogue
.3.
Ac
cord
ing
to ta
ble
8 of
the
Gen
eral
Cod
e C
atal
ogue
.4.
Th
e ha
zard
ous
was
te h
andl
ing
com
pany
ope
ratin
g un
der t
his
licen
se s
hall
indi
cate
her
e th
e to
tal a
mou
nt o
f was
tes
annu
ally
rece
ived
.5.
U
se v
olum
e un
its, s
uch
as: l
t. (li
tres)
, m3 (
cubi
c m
eter
s), f
t3 (c
ubic
feet
) or g
al (g
allo
ns) o
r mas
s: m
g (m
illigr
ams)
, g (g
ram
s), k
g (k
ilogr
ams)
, ton
(met
ric to
ns) o
r lb
(pou
nds)
. If t
reat
ing
with
con
tain
ers
impr
egna
ted
with
haz
ardo
us w
aste
s, re
port
as u
nits
the
char
acte
ristic
s of
thes
e co
ntai
ners
; i. e
.: m
etal
lic d
rum
of 2
00 lt
., pl
astic
buc
ket f
or 1
gal
. etc
.
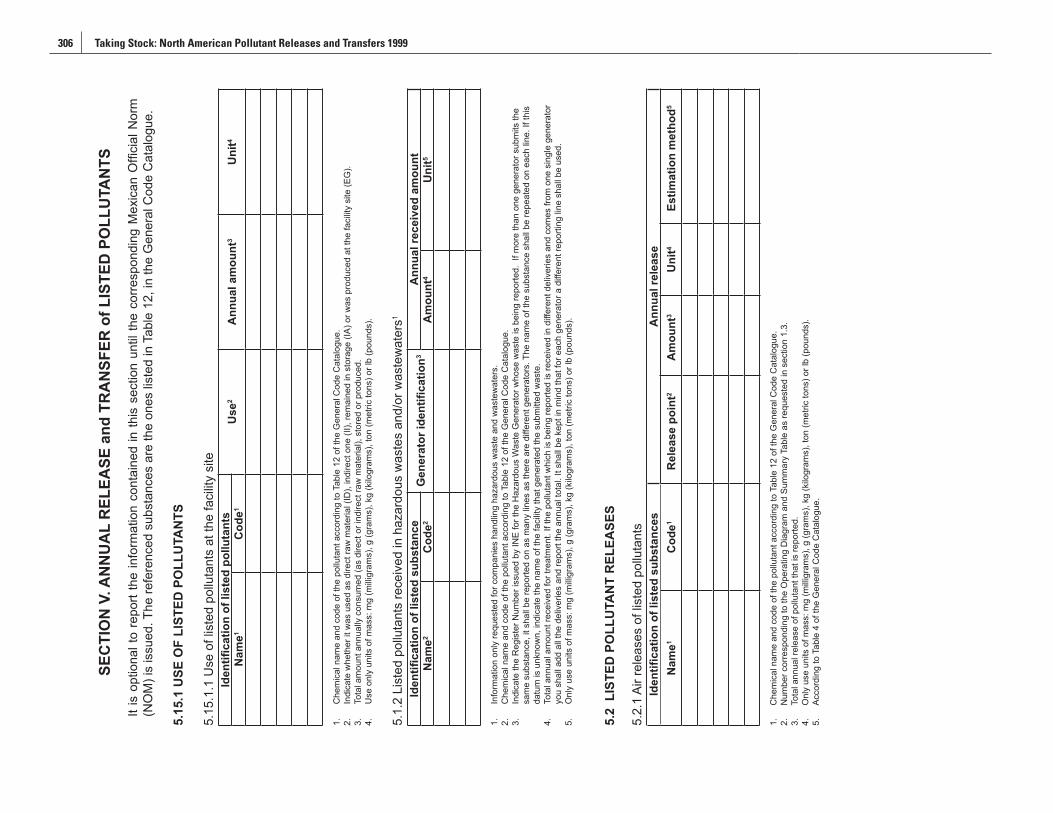
306 Taking Stock: North American Pollutant Releases and Transfers 1999 Appendix H – Annual Certificate for the Operation of Industrial Facilities under Federal Jurisdiction for the Year 1999 (Cédula de Operación Anual) 307
SEC
TIO
N V
. AN
NU
AL
REL
EASE
and
TR
AN
SFER
of L
ISTE
D P
OLL
UTA
NTS
It is
opt
iona
l to
repo
rt th
e in
form
atio
n co
ntai
ned
in th
is s
ectio
n un
til th
e co
rresp
ondi
ng M
exic
an O
ffici
al N
orm
(N
OM
) is
issu
ed. T
he re
fere
nced
sub
stan
ces
are
the
ones
list
ed in
Tab
le 1
2, in
the
Gen
eral
Cod
e C
atal
ogue
.
5.15
.1 U
SE O
F LI
STED
PO
LLU
TAN
TS
5.15
.1.1
Use
of l
iste
d po
lluta
nts
at th
e fa
cilit
y si
teId
entifi
catio
n of
list
ed p
ollu
tant
sU
se2
Ann
ual a
mou
nt3
Uni
t4N
ame1
Cod
e1
1.
Che
mic
al n
ame
and
code
of t
he p
ollu
tant
acc
ordi
ng to
Tab
le 1
2 of
the
Gen
eral
Cod
e C
atal
ogue
.2.
In
dica
te w
heth
er it
was
use
d as
dire
ct ra
w m
ater
ial (
ID),
indi
rect
one
(II),
rem
aine
d in
sto
rage
(IA)
or w
as p
rodu
ced
at th
e fa
cilit
y si
te (E
G).
3.
Tota
l am
ount
ann
ually
con
sum
ed (a
s di
rect
or i
ndire
ct ra
w m
ater
ial),
sto
red
or p
rodu
ced.
4.
Use
onl
y un
its o
f mas
s: m
g (m
illigr
ams)
, g (g
ram
s), k
g (k
ilogr
ams)
, ton
(met
ric to
ns) o
r lb
(pou
nds)
.
5.1.
2 Li
sted
pol
luta
nts
rece
ived
in h
azar
dous
was
tes
and/
or w
aste
wat
ers1
Iden
tifica
tion
of li
sted
sub
stan
ceG
ener
ator
iden
tifica
tion3
Ann
ual r
ecei
ved
amou
ntN
ame2
Cod
e2A
mou
nt4
Uni
t5
1.
Info
rmat
ion
only
requ
este
d fo
r com
pani
es h
andl
ing
haza
rdou
s w
aste
and
was
tew
ater
s.2.
C
hem
ical
nam
e an
d co
de o
f the
pol
luta
nt a
ccor
ding
to T
able
12
of th
e G
ener
al C
ode
Cat
alog
ue.
3.
Indi
cate
the
Reg
iste
r Num
ber i
ssue
d by
INE
for t
he H
azar
dous
Was
te G
ener
ator
who
se w
aste
is b
eing
repo
rted.
If m
ore
than
one
gen
erat
or s
ubm
its th
e sa
me
subs
tanc
e, it
sha
ll be
repo
rted
on a
s m
any
lines
as
ther
e ar
e di
ffere
nt g
ener
ator
s. T
he n
ame
of th
e su
bsta
nce
shal
l be
repe
ated
on
each
line
. If t
his
datu
m is
unk
now
n, in
dica
te th
e na
me
of th
e fa
cilit
y th
at g
ener
ated
the
subm
itted
was
te.
4.
Tota
l ann
ual a
mou
nt re
ceiv
ed fo
r tre
atm
ent.
If th
e po
lluta
nt w
hich
is b
eing
repo
rted
is re
ceiv
ed in
diff
eren
t del
iver
ies
and
com
es fr
om o
ne s
ingl
e ge
nera
tor
you
shal
l add
all
the
deliv
erie
s an
d re
port
the
annu
al to
tal.
It sh
all b
e ke
pt in
min
d th
at fo
r eac
h ge
nera
tor a
diff
eren
t rep
ortin
g lin
e sh
all b
e us
ed.
5.
Onl
y us
e un
its o
f mas
s: m
g (m
illigr
ams)
, g (g
ram
s), k
g (k
ilogr
ams)
, ton
(met
ric to
ns) o
r lb
(pou
nds)
.
5.2
LIS
TED
PO
LLU
TAN
T R
ELEA
SES
5.2.
1 Ai
r rel
ease
s of
list
ed p
ollu
tant
sId
entifi
catio
n of
list
ed s
ubst
ance
s A
nnua
l rel
ease
Nam
e1C
ode1
Rel
ease
poi
nt2
Am
ount
3U
nit4
Estim
atio
n m
etho
d5
1.
Che
mic
al n
ame
and
code
of t
he p
ollu
tant
acc
ordi
ng to
Tab
le 1
2 of
the
Gen
eral
Cod
e C
atal
ogue
.2.
N
umbe
r cor
resp
ondi
ng to
the
Ope
ratin
g D
iagr
am a
nd S
umm
ary
Tabl
e as
requ
este
d in
sec
tion
1.3.
3.
Tota
l ann
ual r
elea
se o
f pol
luta
nt th
at is
repo
rted.
4.
Onl
y us
e un
its o
f mas
s: m
g (m
illigr
ams)
, g (g
ram
s), k
g (k
ilogr
ams)
, ton
(met
ric to
ns) o
r lb
(pou
nds)
. 5.
Ac
cord
ing
to T
able
4 o
f the
Gen
eral
Cod
e C
atal
ogue
.
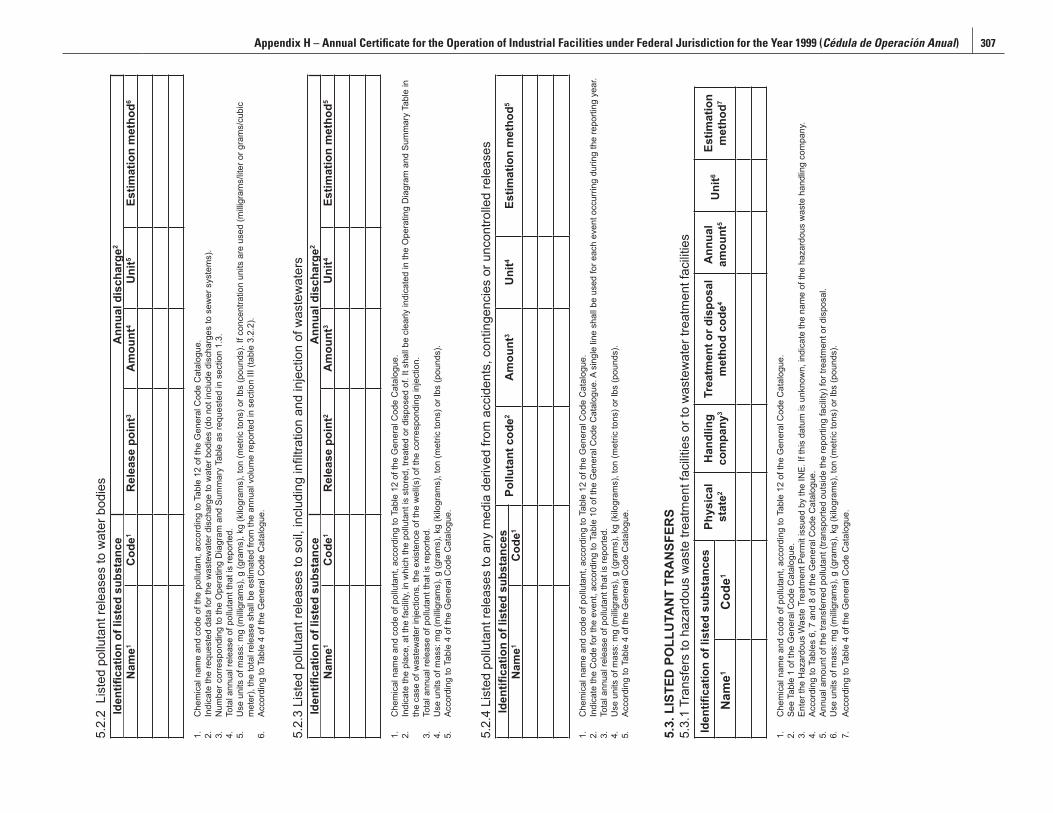
306 Taking Stock: North American Pollutant Releases and Transfers 1999 Appendix H – Annual Certificate for the Operation of Industrial Facilities under Federal Jurisdiction for the Year 1999 (Cédula de Operación Anual) 307
5.2.
2 L
iste
d po
lluta
nt re
leas
es to
wat
er b
odie
sId
entifi
catio
n of
list
ed s
ubst
ance
Ann
ual d
isch
arge
2
Nam
e1C
ode1
Rel
ease
poi
nt3
Am
ount
4U
nit5
Estim
atio
n m
etho
d6
1.
Che
mic
al n
ame
and
code
of t
he p
ollu
tant
, acc
ordi
ng to
Tab
le 1
2 of
the
Gen
eral
Cod
e C
atal
ogue
.2.
In
dica
te th
e re
ques
ted
data
for t
he w
aste
wat
er d
isch
arge
to w
ater
bod
ies
(do
not i
nclu
de d
isch
arge
s to
sew
er s
yste
ms)
.3.
N
umbe
r cor
resp
ondi
ng to
the
Ope
ratin
g D
iagr
am a
nd S
umm
ary
Tabl
e as
requ
este
d in
sec
tion
1.3.
4.
Tota
l ann
ual r
elea
se o
f pol
luta
nt th
at is
repo
rted.
5.
Use
uni
ts o
f mas
s: m
g (m
illigr
ams)
, g (g
ram
s), k
g (k
ilogr
ams)
, ton
(met
ric to
ns) o
r lbs
(pou
nds)
. If c
once
ntra
tion
units
are
use
d (m
illigr
ams/
liter
or g
ram
s/cu
bic
met
er),
the
tota
l rel
ease
sha
ll be
est
imat
ed fr
om th
e an
nual
vol
ume
repo
rted
in s
ectio
n III
(tab
le 3
.2.2
).6.
Ac
cord
ing
to T
able
4 o
f the
Gen
eral
Cod
e C
atal
ogue
.
5.2.
3 Li
sted
pol
luta
nt re
leas
es to
soi
l, in
clud
ing
infil
tratio
n an
d in
ject
ion
of w
aste
wat
ers
Iden
tifica
tion
of li
sted
sub
stan
ceA
nnua
l dis
char
ge2
Nam
e1C
ode1
Rel
ease
poi
nt2
Am
ount
3U
nit4
Estim
atio
n m
etho
d5
1.
Che
mic
al n
ame
and
code
of p
ollu
tant
, acc
ordi
ng to
Tab
le 1
2 of
the
Gen
eral
Cod
e C
atal
ogue
. 2.
In
dica
te th
e pl
ace,
at t
he fa
cilit
y, in
whi
ch th
e po
lluta
nt is
sto
red,
trea
ted
or d
ispo
sed
of. I
t sha
ll be
cle
arly
indi
cate
d in
the
Ope
ratin
g D
iagr
am a
nd S
umm
ary
Tabl
e in
th
e ca
se o
f was
tew
ater
inje
ctio
ns, t
he e
xist
ence
of t
he w
ell(s
) of t
he c
orre
spon
ding
inje
ctio
n.3.
To
tal a
nnua
l rel
ease
of p
ollu
tant
that
is re
porte
d.4.
U
se u
nits
of m
ass:
mg
(milli
gram
s), g
(gra
ms)
, kg
(kilo
gram
s), t
on (m
etric
tons
) or l
bs (p
ound
s).
5.
Acco
rdin
g to
Tab
le 4
of t
he G
ener
al C
ode
Cat
alog
ue.
5.2.
4 Li
sted
pol
luta
nt re
leas
es to
any
med
ia d
eriv
ed fr
om a
ccid
ents
, con
tinge
ncie
s or
unc
ontro
lled
rele
ases
Iden
tifica
tion
of li
sted
sub
stan
ces
Pollu
tant
cod
e2A
mou
nt3
Uni
t4Es
timat
ion
met
hod5
Nam
e1C
ode1
1.
Che
mic
al n
ame
and
code
of p
ollu
tant
, acc
ordi
ng to
Tab
le 1
2 of
the
Gen
eral
Cod
e C
atal
ogue
.2.
In
dica
te th
e C
ode
for t
he e
vent
, acc
ordi
ng to
Tab
le 1
0 of
the
Gen
eral
Cod
e C
atal
ogue
. A s
ingl
e lin
e sh
all b
e us
ed fo
r eac
h ev
ent o
ccur
ring
durin
g th
e re
porti
ng y
ear.
3.
Tota
l ann
ual r
elea
se o
f pol
luta
nt th
at is
repo
rted.
4.
Use
uni
ts o
f mas
s: m
g (m
illigr
ams)
, g (g
ram
s), k
g (k
ilogr
ams)
, ton
(met
ric to
ns) o
r lbs
(pou
nds)
.5.
Ac
cord
ing
to T
able
4 o
f the
Gen
eral
Cod
e C
atal
ogue
.
5.3.
LIS
TED
PO
LLU
TAN
T TR
AN
SFER
S5.
3.1
Tran
sfer
s to
haz
ardo
us w
aste
trea
tmen
t fac
ilitie
s or
to w
aste
wat
er tr
eatm
ent f
acilit
ies
Iden
tifica
tion
of li
sted
sub
stan
ces
Phys
ical
st
ate2
Han
dlin
g co
mpa
ny3
Trea
tmen
t or d
ispo
sal
met
hod
code
4A
nnua
l am
ount
5U
nit6
Estim
atio
n m
etho
d7N
ame1
Cod
e1
1.
Che
mic
al n
ame
and
code
of p
ollu
tant
, acc
ordi
ng to
Tab
le 1
2 of
the
Gen
eral
Cod
e C
atal
ogue
.2.
Se
e Ta
ble
1 of
the
Gen
eral
Cod
e C
atal
ogue
.3.
En
ter t
he H
azar
dous
Was
te T
reat
men
t Per
mit
issu
ed b
y th
e IN
E. If
this
dat
um is
unk
now
n, in
dica
te th
e na
me
of th
e ha
zard
ous
was
te h
andl
ing
com
pany
.4.
Ac
cord
ing
to T
able
s 6,
7 a
nd 8
of t
he G
ener
al C
ode
Cat
alog
ue.
5.
Annu
al a
mou
nt o
f the
tran
sfer
red
pollu
tant
(tra
nspo
rted
outs
ide
the
repo
rting
faci
lity)
for t
reat
men
t or d
ispo
sal.
6.
Use
uni
ts o
f mas
s: m
g (m
illigr
ams)
, g (g
ram
s), k
g (k
ilogr
ams)
, ton
(met
ric to
ns) o
r lbs
(pou
nds)
. 7.
Ac
cord
ing
to T
able
4 o
f the
Gen
eral
Cod
e C
atal
ogue
.
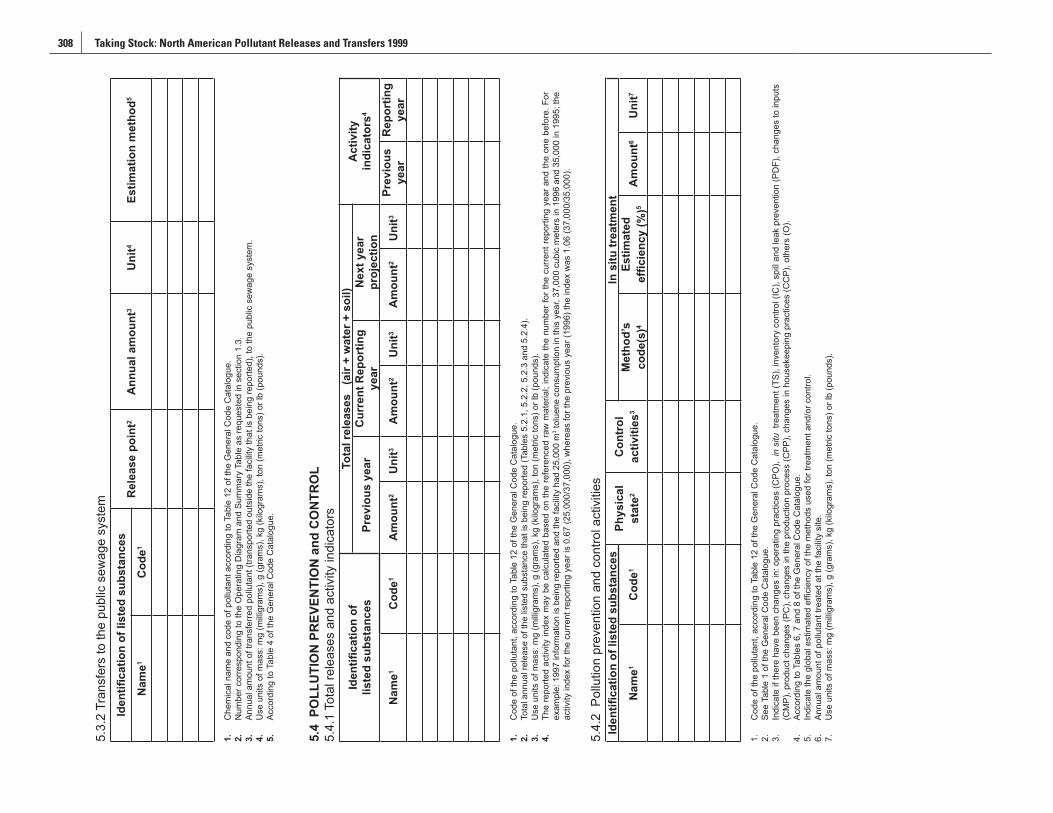
308 Taking Stock: North American Pollutant Releases and Transfers 1999
5.3.
2 Tr
ansf
ers
to th
e pu
blic
sew
age
syst
emId
entifi
catio
n of
list
ed s
ubst
ance
sR
elea
se p
oint
2A
nnua
l am
ount
3U
nit4
Estim
atio
n m
etho
d5
Nam
e1C
ode1
1.
Che
mic
al n
ame
and
code
of p
ollu
tant
acc
ordi
ng to
Tab
le 1
2 of
the
Gen
eral
Cod
e C
atal
ogue
.2.
N
umbe
r cor
resp
ondi
ng to
the
Ope
ratin
g D
iagr
am a
nd S
umm
ary
Tabl
e as
requ
este
d in
sec
tion
1.3.
3.
Annu
al a
mou
nt o
f tra
nsfe
rred
pollu
tant
(tra
nspo
rted
outs
ide
the
faci
lity
that
is b
eing
repo
rted)
, to
the
publ
ic s
ewag
e sy
stem
.4.
U
se u
nits
of m
ass:
mg
(milli
gram
s), g
(gra
ms)
, kg
(kilo
gram
s), t
on (m
etric
tons
) or l
b (p
ound
s).
5.
Acco
rdin
g to
Tab
le 4
of t
he G
ener
al C
ode
Cat
alog
ue.
5.4
PO
LLU
TIO
N P
REV
ENTI
ON
and
CO
NTR
OL
5.4.
1 To
tal r
elea
ses
and
activ
ity in
dica
tors
Iden
tifica
tion
of
liste
d su
bsta
nces
Tota
l rel
ease
s (
air +
wat
er +
soi
l)A
ctiv
ityin
dica
tors
4Pr
evio
us y
ear
Cur
rent
Rep
ortin
g ye
arN
ext y
ear
proj
ectio
nN
ame1
Cod
e1A
mou
nt2
Uni
t3A
mou
nt2
Uni
t3A
mou
nt2
Uni
t3Pr
evio
us
year
Rep
ortin
g ye
ar
1.
Cod
e of
the
pollu
tant
, acc
ordi
ng to
Tab
le 1
2 of
the
Gen
eral
Cod
e C
atal
ogue
.2.
To
tal a
nnua
l rel
ease
of t
he li
sted
sub
stan
ce th
at is
bei
ng re
porte
d (T
able
s 5.
2.1,
5.2
.2, 5
.2.3
and
5.2
.4).
3.
Use
uni
ts o
f mas
s: m
g (m
illigr
ams)
, g (g
ram
s), k
g (k
ilogr
ams)
, ton
(met
ric to
ns) o
r lb
(pou
nds)
. 4.
Th
e re
porte
d ac
tivity
inde
x m
ay b
e ca
lcul
ated
bas
ed o
n th
e re
fere
nced
raw
mat
eria
l; in
dica
te th
e nu
mbe
r for
the
curre
nt re
porti
ng y
ear a
nd th
e on
e be
fore
. For
ex
ampl
e: 1
997
info
rmat
ion
is b
eing
repo
rted
and
the
faci
lity
had
25,0
00 m
3 tol
uene
con
sum
ptio
n in
this
yea
r, 37
,000
cub
ic m
eter
s in
199
6 an
d 35
,000
in 1
995;
the
activ
ity in
dex
for t
he c
urre
nt re
porti
ng y
ear i
s 0.
67 (2
5,00
0/37
,000
), w
here
as fo
r the
pre
viou
s ye
ar (1
996)
the
inde
x w
as 1
.06
(37,
000/
35,0
00).
5.4.
2 P
ollu
tion
prev
entio
n an
d co
ntro
l act
iviti
esId
entifi
catio
n of
list
ed s
ubst
ance
sPh
ysic
al
stat
e2C
ontr
ol
activ
ities
3
In s
itu tr
eatm
ent
Nam
e1C
ode1
Met
hod’
sco
de(s
)4Es
timat
ed
effic
ienc
y (%
)5A
mou
nt6
Uni
t7
1.
Cod
e of
the
pollu
tant
, acc
ordi
ng to
Tab
le 1
2 of
the
Gen
eral
Cod
e C
atal
ogue
.2.
Se
e Ta
ble
1 of
the
Gen
eral
Cod
e C
atal
ogue
.3.
In
dica
te if
ther
e ha
ve b
een
chan
ges
in: o
pera
ting
prac
tices
(CPO
), in
situ
tre
atm
ent (
TS),
inve
ntor
y co
ntro
l (IC
), sp
ill an
d le
ak p
reve
ntio
n (P
DF)
, cha
nges
to in
puts
(C
MP)
, pro
duct
cha
nges
(PC
), ch
ange
s in
the
prod
uctio
n pr
oces
s (C
PP),
chan
ges
in h
ouse
keep
ing
prac
tices
(CC
P), o
ther
s (O
).4.
Ac
cord
ing
to T
able
s 6,
7 a
nd 8
of t
he G
ener
al C
ode
Cat
alog
ue.
5.
Indi
cate
the
glob
al e
stim
ated
effi
cien
cy o
f the
met
hods
use
d fo
r tre
atm
ent a
nd/o
r con
trol.
6.
Annu
al a
mou
nt o
f pol
luta
nt tr
eate
d at
the
faci
lity
site
.7.
U
se u
nits
of m
ass:
mg
(milli
gram
s), g
(gra
ms)
, kg
(kilo
gram
s), t
on (m
etric
tons
) or l
b (p
ound
s).